Lane County - Agenda Cover Memo
555
Agenda Cover Memo First Reading Date: May 1, 2018 Ordinance No. PA 1356 Second Reading/Public Hearing Date: May 15, 2018 Page 1 of 5 AGENDA COVER MEMO Memorandum Date: April 12, 2018 First Reading Date: May 1, 2018 Second Reading/Public Hearing Date: May 15, 2018 TO: Board of County Commissioners DEPARTMENT: Public Works, Land Management Division, Planning Program PRESENTED BY: Lindsey Eichner, Senior Planner AGENDA ITEM TITLE: ORDINANCE NO. PA1356 / In The Matter Of Co-Adopting Amendments To The Coburg Comprehensive Plan Including Expanding The Urban Growth Boundary For Employment Land, Revising Ordinance No. PA1315, And Adopting Savings And Severability Clauses. (File Number 509-PA14-05404, Applicant: City of Coburg) I. MOTION 1. May 1, 2018: I MOVE TO APPROVE THE FIRST READING OF ORDINANCE NO. PA 1356 AND TO SET THE SECOND READING AND PUBLIC HEARING FOR MAY 15, AT 1:30 PM IN HARRIS HALL, PUBLIC SERVICE BUILDING. 2. May 15, 2018: ALTERNATIVE MOTIONS AFTER THE PUBLIC HEARING A. I MOVE TO APPROVE ORDINANCE NO. PA 1356 AS PRESENTED. OR B. I MOVE TO SET A THIRD READING AND TO DIRECT STAFF TO REVISE ORDINANCE NO. PA 1356 AS DIRECTED BY THE BOARD AND TO RETURN WITH A REVISED ORDINANCE FOR THE BOARD’S CONSIDERATION AND ACTION.
-
Upload
khangminh22 -
Category
Documents
-
view
0 -
download
0
Transcript of Lane County - Agenda Cover Memo
Agenda Cover Memo First Reading Date: May 1, 2018 Ordinance No. PA 1356 Second Reading/Public Hearing Date: May 15, 2018 Page 1 of 5
AGENDA COVER MEMO
Memorandum Date: April 12, 2018
First Reading Date: May 1, 2018
Second Reading/Public Hearing Date: May 15, 2018
TO: Board of County Commissioners
DEPARTMENT: Public Works, Land Management Division, Planning Program
PRESENTED BY: Lindsey Eichner, Senior Planner
AGENDA ITEM TITLE: ORDINANCE NO. PA1356 / In The Matter Of Co-Adopting Amendments To The Coburg Comprehensive Plan Including Expanding The Urban Growth Boundary For Employment Land, Revising Ordinance No. PA1315, And Adopting Savings And Severability Clauses. (File Number 509-PA14-05404, Applicant: City of Coburg)
I. MOTION
1. May 1, 2018: I MOVE TO APPROVE THE FIRST READING OF ORDINANCE NO. PA 1356 AND TO SET THE SECOND READING AND PUBLIC HEARING FOR MAY 15, AT 1:30 PM IN HARRIS HALL, PUBLIC SERVICE BUILDING.
2. May 15, 2018: ALTERNATIVE MOTIONS AFTER THE PUBLIC HEARING
A. I MOVE TO APPROVE ORDINANCE NO. PA 1356 AS PRESENTED.
OR
B. I MOVE TO SET A THIRD READING AND TO DIRECT STAFF TO REVISE ORDINANCE NO. PA 1356 AS DIRECTED BY THE BOARD AND TO RETURN WITH A REVISED ORDINANCE FOR THE BOARD’S CONSIDERATION AND ACTION.

Agenda Cover Memo First Reading Date: May 1, 2018 Ordinance No. PA 1356 Second Reading/Public Hearing Date: May 15, 2018 Page 2 of 5
II. AGENDA ITEM SUMMARY
The proposal before the Board of Commissioners is a request by the City of Coburg to repeal and replace the previously adopted Ordinance in response to the remanded decision by the Lane Use Board of Appeals.
III. BACKGROUND/IMPLICATIONS OF ACTION
A. Board Action and Other History On December 8, 2015, the Board adopted Ordinance PA 1315, expanding the Coburg Urban Growth Boundary (UGB).
A timely appeal was filed with the Land Use Board of Appeals, by Land Watch Lane County and Lee Kersten.
The Land Use Board of Appeals issued an Opinion to remand the County’s adopted ordinances, Ordinances 1314 and 1315, on August 1, 2016. (Attachment 2)
A timely appeal was filed with the Oregon Court of Appeals by the City of Coburg.
On December 29, 2016, the Court of Appeals affirmed LUBA’s opinion to remand the ordinance back to the county for revised findings. (Attachment 3)
The Coburg City Council decided to separate the process for residential lands expansion from the process of expanding the UGB for employment lands, specifically for industrial lands.
On September 12, 2017, Coburg City Council adopted Ordinance A-199-F, to expand the City’s UGB for industrial land, and repealed Ordinance A-199-E.
It was determined that Ordinance A-199-F did not address every Oregon Statewide Planning Goal and therefore was insufficient to support the decision.
On January 9, 2018, Coburg City Council adopted Ordinance A-199-G with revised findings, to expand the City’s UGB for industrial land, and repeal Ordinance A-199-E and Ordinance A-199-F.
Notice of public hearing was mailed to parties of record, as provided by the City. Notice of public hearing was published in the Register Guard 21 days prior to the public hearing.
B. Policy Issues
In light of the successful appeal of Ordinance No. PA1315 and the subsequent decision by the City of Coburg to remove the residential lands expansion request from the current proposal, the Board has two primary issues to consider. First, the Board should determine if it is in support of the City’s decision to forego pursuing an expansion for residential lands at this time. Second, assuming this approach is

Agenda Cover Memo First Reading Date: May 1, 2018 Ordinance No. PA 1356 Second Reading/Public Hearing Date: May 15, 2018 Page 3 of 5
agreeable, the Board must determine if the revised supplemental findings adequately address the issues identified through the appeal process.
C. Board Goals
Approval of Ordinance No. PA 1356 following a public hearing, supports the following Lane County Strategic Values adopted by the Board:
Resilient, Diverse, & Sustainable Economy: This proposal increases the amount of employment land within Lane County. It offers additional opportunities for industrial businesses that require 20+ acre parcels.
D. Financial and/or Resource Considerations
There are no direct or immediate financial considerations with regard to any direction from the Board at this time.
The Long Range Work Plan has 0.25 FTE dedicated to Small City Coordination, this application falls under that project. This project will not exceed 0.25 FTE.
E. Health Implications
There are no identified health implications related to the Board’s decision whether or not to approve the remand request. Approval or denial of the land use application is determined by compliance with land use regulations associated with specific approval criteria. Health implications can only be considered insofar as they are incorporated into the Lane County land use code, building code, or sanitation regulations.
F. Analysis
The original proposal by the City of Coburg was to expand the City’s UGB for both residential and employment land needs. The City has reviewed the Land Use Board of Appeals and Court of Appeals opinions and believes they have adequately addressed the concerns with the employment land findings.
The main issue of the remand was discussed in the staff report for the September 12, 2017, City Council meeting: The proposed expansion to include lands for industrial development is based on two categories of need: the City’s local need and a percentage capture of the regional need. LUBA and the Court of Appeals stated the City/County needed to bolster the findings to justify the amount of Industrial land being brought into the UGB. (Attachment 1, Exhibit H to City Ordinance A-199-F)
The owner of the 106-acre parcel, Interstate Properties, Inc., provided evidence and proposed findings to address the issue remanded by the LUBA decision to the City of Coburg.
Agenda Cover Memo First Reading Date: May 1, 2018 Ordinance No. PA 1356 Second Reading/Public Hearing Date: May 15, 2018 Page 4 of 5
The City Council found the revised findings, additional evidence in the record, and the inclusion of the entire Study Area 8 into the City’s UGB was adequate to meet the demonstrated employment land needs.
With the additional findings provided by the City, and the removal of the expansion of residential land, the current proposal appears to satisfy state laws and rules necessary to justify the City’s proposed UGB expansion for employment lands.
G. On the Record Hearing - Limited Additional Testimony
Notice of the remand was sent to parties who are given an opportunity to participate in this on the record hearing. The parties included those listed on LUBA’s Notice of Intent to Appeal. Lane Code (LC) 14.400(2) directs how the approval authority (the Board) may enter additional testimony into the record. Additional information or testimony must be related to the information already in the official record as follows:
LC 14.400(2) states: “The Approval Authority may admit additional testimony and other evidence without holding a de novo hearing, if it is satisfied that the testimony or other evidence could not have been presented at the initial hearing. In deciding such admission, the Approval Authority shall consider:
(a) Prejudice to parties. (b) Convenience or availability of evidence at the time of the initial hearing. (c) Surprise to opposing parties. (d) When notice was given to other parties of the intended attempt to admit the
new evidence. (e) The competency, relevancy, and materiality of the proposed testimony or
other evidence. (f) Whether the matter should be remanded for a de novo hearing under LC
14.400(3) below.
Supplemental information that staff receives will be forwarded to the Board. At the initial public hearing the Board may refer to LC 14.400(2) in deciding to admit such information.
H. Options:
The Board of Commissioners may:
1. Move to approve Ordinance No. PA 1356 as presented
OR

Agenda Cover Memo First Reading Date: May 1, 2018 Ordinance No. PA 1356 Second Reading/Public Hearing Date: May 15, 2018 Page 5 of 5
2. Direct staff to revise Ordinance No. PA 1356 as directed by the Board and to return with a revised Ordinance for the Board’s consideration and action
IV. RECOMMENDATION
Staff recommends Option 1 in support of the revised Urban Growth Boundary Expansion application.
V. TIMING/IMPLEMENTATION
On May 1, 2018, the Board of Commissioners will conduct a First Reading for Ordinance No. PA 1356. On May 15, 2018, the Board of Commissioners will conduct a Second Readings and on the record public hearing prior to issuing a decision. If enacted by the Board of Commissioners, the proposed amendments will become effective 30 days following enactment of the Ordinance.
VI. FOLLOW-UP
Should the Board of Commissioners choose Option 2, staff will revise the Ordinance as directed and return for approval of the revised Ordinance on a date certain set by the Board.
Notice of the Board of Commissioners action will be provided to the Department of Land Conservation and Development and all interested parties as required by law.
VII. ATTACHMENTS
Attachment 1. Ordinance No. PA 1356
Exhibit A: City Ordinance A-199-G with Exhibits
Ord. A-199-F Exhibit A: 2010 Coburg Urbanization Study & June 2014 Update Addendum to the Coburg Urbanization Study
Ord. A-199-F Exhibit B: Regional Economic Analysis (2014) Ord. A-199-F Exhibit C: 2017 Revised Regional Economic Analysis Ord. A-199-F Exhibit D: Revised Coburg Comprehensive Plan Diagram Ord. A-199-F Exhibit E: Findings of Fact for Ordinance A-199-G Ord. A-199-F Exhibit F: Coburg City Staff Report, dated September 12, 2017
Exhibit B: Proposed Lane County Plan Map: Township 16 South, Range 03 West
Exhibit C: Findings and Conclusions in Support of Ordinance No. PA 1356
Attachment 2. Land Use Board of Appeals Opinion, LUBA Nos. 2016003 & 2016004
Attachment 3. Court of Appeals Opinion, 283 Or App 27 (A162909)

Ordinance No. PA 1356 Coburg UGB Expansion Page 1 of 3
BEFORE THE BOARD OF COMMISSIONERS OF LANE COUNTY, OREGON
Ordinance No. PA 1356 IN THE MATTER OF CO-ADOPTING AMENDMENTS TO THE COBURG COMPREHENSIVE PLAN INCLUDING EXPANDING THE URBAN GROWTH BOUNDARY FOR EMPLOYMENT LAND, REPEALING ORDINANCE NO. PA 1315, AND ADOPTING SAVINGS AND SEVERABILITY CLAUSES.
WHEREAS, the City of Coburg and Lane County have entered into an Intergovernmental
Agreement (Order No. 02-1-16-4) regarding coordinated planning and urban services pursuant to ORS 190.003 et. seq. to carry out their respective responsibilities under ORS Chapter 195 and ORS Chapter 197; and
WHEREAS, an Urbanization Study Update was created in April 2010 that reflected a
planning period from 2010 to 2030 and the update has been adopted by the Coburg City Council; and
WHEREAS, the Urbanization Study update was modified in 2014 to reflect a planning
period from 2014-2034 to satisfy requirements of Statewide Planning Goals #2 and #14; and
WHEREAS, the Coburg City Council adopted Ordinance A-199-E on July 14, 2015 expanding the City’s Urban Growth Boundary (UGB) for both employment and residential land needs; and
WHEREAS, Lane County subsequently adopted Lane County Ordinance No. PA 1315 co-
adopting the City’s UGB expansion. Ordinance No. PA 1315 was appealed to the Oregon Land Use Board of Appeals (LUBA) and subsequently to the Oregon Court of Appeals. Ultimately, the ordinance was remanded to the County for further proceedings. As a result of the remand of the co- adopted county ordinance, the City’s expansion determination must be revisited; and
WHEREAS, the Coburg City Council has opted to bifurcate the residential and
employment land need components and move forward with UGB expansion only for the employment land needs at this time; and
WHEREAS, as explained in detail in the findings attached as an exhibit to this ordinance,
the City has determined that the City’s entire need for employment land cannot be satisfied through “efficiency measures,” and the UGB must therefore be expanded to include additional land for employment needs to the east of the I-5 corridor; and
WHEREAS, the Coburg City Council adopted Ordinance A-199-G on January 9, 2018
expanding the City’s UGB for employment land needs; and
WHEREAS, coordinated land use planning for the urbanizable lands outside the Coburg city limits and within the Coburg urban growth boundary requires co-adoption of an amended urban growth boundary and land use diagram maps by Lane County; and
Ordinance No. PA 1356 Coburg UGB Expansion Page 2 of 3
WHEREAS, the Lane County Rural Comprehensive Plan is amended to remove territory from its planning jurisdiction and to add territory to the Coburg Urban Growth Boundary and the Coburg Comprehensive Plan as adopted by the City of Coburg in Ordinance No. A-199-G attached as Exhibit “A” and incorporated here by this reference; and
WHEREAS, the Board conducted a public hearing on May 15, 2018, and is now ready to
take action based upon the above recommendation and evidence and testimony already in the record as well as the evidence and testimony presented at the public hearing; and
WHEREAS, substantial evidence exists within the record demonstrating that the proposal
meets the requirements of the Coburg Comprehensive Plan, Lane Code, and of applicable state and local law.
NOW, THEREFORE, The Board of County Commissioners of Lane County ORDAINS
as follows:
1. The Coburg Comprehensive Plan is amended as described in Ordinance A-199-G (attached as Exhibit “A”) and incorporated here by this reference, to expand the Plan and Coburg Urban Growth Boundary by adding and redesignating 105.72 acres of land for Light Industrial use.
2. The Lane County Rural Comprehensive Plan is amended to remove territory from its
planning jurisdiction and to add territory to the Coburg Urban Growth Boundary and the Coburg Comprehensive Plan, as adopted by the City of Coburg in Ordinance No. A-199-F attached as Exhibit “A” and incorporated here by this reference, as shown on the comprehensive plan map attached as Exhibit “B” and incorporated here by this reference.
3. Ordinance No. PA 1315 is hereby repealed.
4. The prior designations repealed by this Ordinance remain in full force and effect to
authorize prosecution of persons in violation thereof prior to the effective date of this Ordinance.
5. If any section, subsection, sentence, clause, phrase or portion of this Ordinance is for
any reason held invalid or unconstitutional by a court of competent jurisdiction, such portion constitutes a separate, distinct and independent provision, and such holding does not affect the validity of the remaining portions thereof.
While not a part of this Ordinance except as described above, the Board of County Commissioners adopts the findings and conclusions as reflected in Ordinance A-199-G, Exhibit
Ordinance No. PA 1356 Coburg UGB Expansion Page 3 of 3
”A”, and the Findings and Conclusions in Support of Ordinance No PA 1356, attached as Exhibit ”C” and incorporated by this reference, in support of this action.
ENACTED this day of _2018.
Jay Bozievich, Chair Lane County Board of Commissioners
Recording Secretary for this Meeting of the Board
APPROVED AS TO FORM
Date
LANE COUNTY OFFICE OF LEGAL COUNSEL

i Coburg Urbanization Study
Coburg Urbanization Study Update
Prepared for City of Coburg PO Box 8316
Coburg, OR 97408 www.coburgoregon.org
Prepared by Lane Council of Governments
859 Willamette Street, Ste. 500 Eugene, Oregon 97401
www.lcog.org
April 2010 (With June 2014, Update Addendum)
This Study is funded by the Coburg Urban Renewal District


1 Coburg Urbanization Study Addendum, June 2014
2014 Urbanization Study Addendum to increase Planning Period from 2010-2030 to 2014-2034
This addendum contains an update to the Coburg Urbanization Study (2010) to reflect changes for the time period of 2010 to 2014. With the exception of Chapter 7, The UGB Growth Expansion Analysis, the 2010 Urbanization Study that follows this Addendum remains unaltered (including the Executive Summary). Any and all updated information related to growth, forecasts and existing conditions is independently contained within this Addendum.
Background The City of Coburg is developing an Urbanization Study Addendum with the help of the Lane Council of Governments in order to reflect an updated planning period from 2010 to 2030 to 2014-2034, to provide for a 20-year planning period as required by Oregon Administrative Rule. Oregon Administrative Rules provide the following parameters for the 20-year planning period for an urbanization study: OAR 660-024-0040) (2) …If the UGB analysis or amendment is conducted as a post-acknowledgement plan amendment under ORS 197.610 to 197.625, the 20-year planning period must commence … (a) On the date initially scheduled for final adoption of the amendment specified by the local government in the initial notice of the amendment required by OAR 660-018-0020… The 2010 Coburg Urbanization Study has not yet been submitted to the DLCD as required by rule to establish the 20-year planning period; thus DLCD has indicated that the planning period for the Urbanization Study must be updated to provide for a 20-year planning period on the date when the required plan amendment form is submitted to the department. The date of final adoption is assumed to take place in 2014, and thus the planning period is extended to 2014-2034. In 2010 Lane Council of Governments developed an estimate of the land needed to accommodate residential and employment growth over the 20 year planning period between 2010 and 2030. The purpose of the Study was (and continues to be) to: (1) evaluate growth forecasts for population and employment; (2) inventory how much buildable land the City has within its current urban growth boundary (UGB); (3) identify housing and residential land needs;(4) identify employment land need based on an economic opportunities analysis; and (5) determine how much land the City will need to add to its UGB to accommodate growth between 2010 and 2030. Urbanization studies take a comprehensive and extensive look at numerous facets of urban development. Through a combination of public outreach, analysis and decision by elected officials, these studies provide a mechanism that supports a healthy and vibrant community. Coburg’s current Urbanization Study (which was, itself, an update to a 2005 report) reflects years of outreach, meetings and analysis. Oregon Administrative Rules clearly require that the determination of 20-year residential land needs for an urban area must be consistent with the adopted 20-year coordinated population forecast for the urban area, and with the requirements for determining housing, economic (and
2 Coburg Urbanization Study Addendum, June 2014
other) needs (OAR 660-024-0040 (4)). Although Coburg has experienced very recent increases in economic activity (as predicted in the 2010 study), due to the recession of 2008, the City has not experienced virtually any growth between 2010 and 2014. This was due, in part, to the myriad of wastewater system development barriers that needed to be overcome, as well as a recession that was deeper than expected, and a slower than expected recovery. Due to the lack of growth anticipated in the 2010 Urbanization Study, an update to Coburg’s planning period to 2014 - 2034 does not materially change the population and employment forecast for the planning period. For this reason, the City is not conducting a comprehensive update of the entire study. Instead, the impacts and implications of the last four years will be reflected wholly within an addendum to the current Urbanization Study (2010). The Addendum will address changes since 2010 and will provide the factual basis for the findings and conclusions of the 2010 Study for a 2010 – 2034 planning period. The Coburg Urbanization Study 2014 Update builds upon the prior work that has been completed by the City, notably the Coburg Crossroads Vision, 2003, which was adopted by City Council under Resolution #2003-6 on May 20, 2003. This addendum remains true and consistent to the collective visioning of the Coburg Crossroads Visioning process of 2003, as well as the Urbanization Study outreach efforts conducted in 2009 and 2010. This addendum is an extension of Coburg’s commitment to its existing Vision. Impact and Implications of Planning Period Update The Study planning period addendum is organized into the following sections (generally matching the chapters of the 2010 Urbanization Study):
� Population and Employment Forecast. Updates estimates of population and employment growth over the next twenty years. Forecasts are based on a set of assumptions including the adopted Lane County Coordinated Population, Employment, trends identified in the Economic Opportunities Assessment and visioning by the City through public policies to encouraging economic growth and housing for seniors, workers, and young families.
� Buildable Lands Analysis Updates inventories of all types of vacant, potential infill, potential redevelopment and environmentally constrained land within the existing UGB for residential, commercial, and industrial development.
� Housing Needs Analysis. Updates the types and densities of residential development needed within the UGB using the Housing/Land Needs. Address all Goal 10 Housing, and Goal 14 requirements. Housing needs are estimated using a Housing Needs Model.
� Economic Opportunities Analysis. Updates estimates of land needed for commercial and industrial land based on historic and current trends related to employment projections and local economic potential. Identify size and characteristics of employment land needs. Address requirements of Goal 9.
� UGB Expansion Areas Study. Identifies and assesses areas where urban expansion should take place based on expansion criteria per Goal 14, ORS 197.298 , and OAR 660-0024-0060, including (but not limited to) the efficiency of service provision; economic, social, environmental, and energy impacts; compatibility with surrounding uses, as well as other information provided in the previous steps.
The following provides a brief synopsis of any changes of significance from each of these Study
3 Coburg Urbanization Study Addendum, June 2014
components:
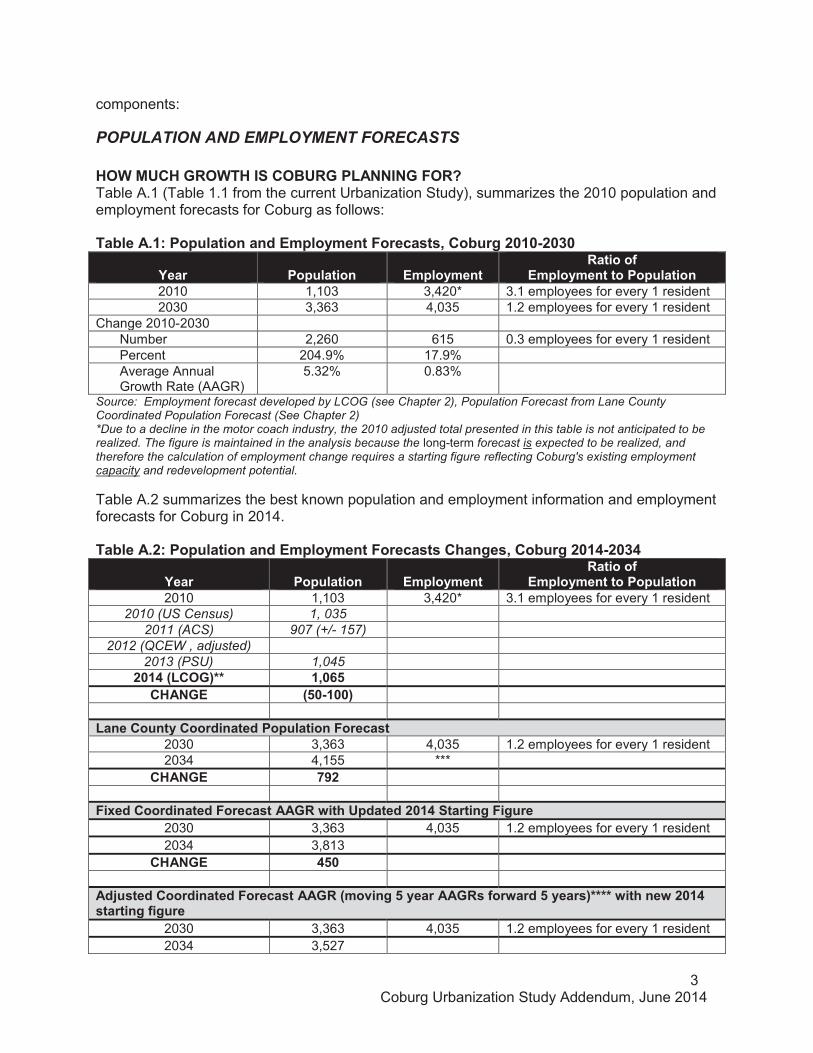
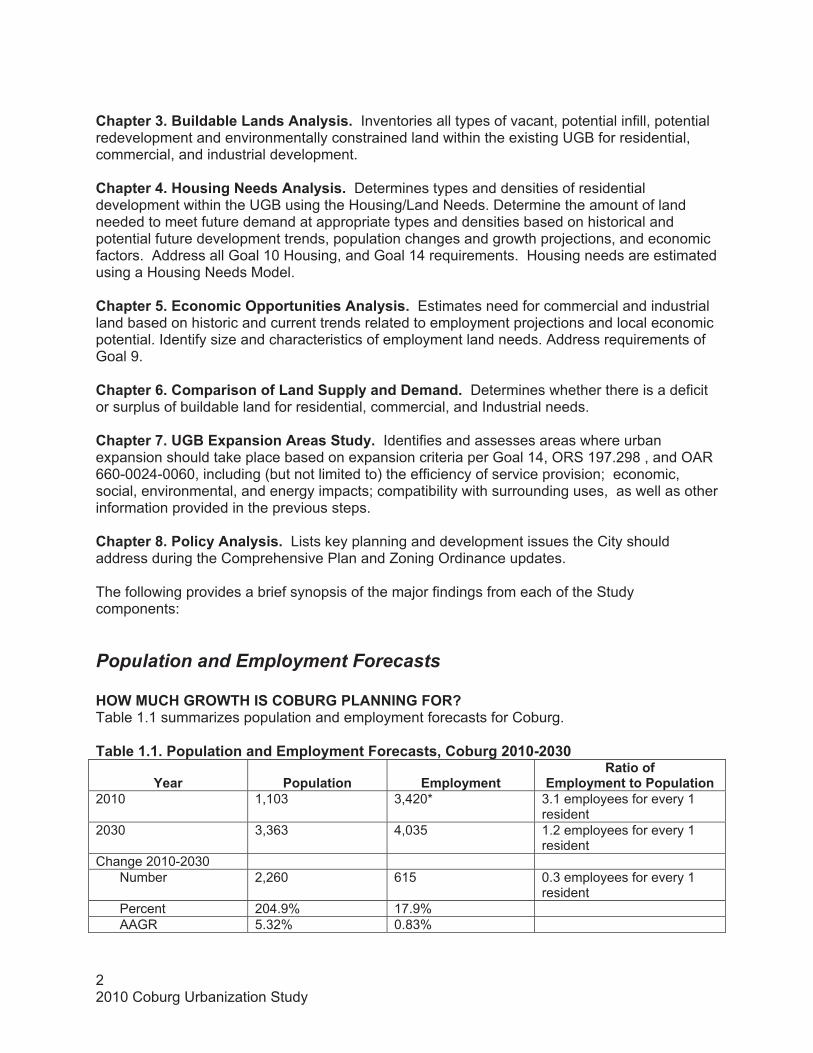
POPULATION AND EMPLOYMENT FORECASTS HOW MUCH GROWTH IS COBURG PLANNING FOR? Table A.1 (Table 1.1 from the current Urbanization Study), summarizes the 2010 population and employment forecasts for Coburg as follows: Table A.1: Population and Employment Forecasts, Coburg 2010-2030
Year Population Employment Ratio of
Employment to Population 2010 1,103 3,420* 3.1 employees for every 1 resident 2030 3,363 4,035 1.2 employees for every 1 resident
Change 2010-2030 Number 2,260 615 0.3 employees for every 1 resident Percent 204.9% 17.9% Average Annual Growth Rate (AAGR)
5.32% 0.83%
Source: Employment forecast developed by LCOG (see Chapter 2), Population Forecast from Lane County Coordinated Population Forecast (See Chapter 2) *Due to a decline in the motor coach industry, the 2010 adjusted total presented in this table is not anticipated to be realized. The figure is maintained in the analysis because the long-term forecast is expected to be realized, and therefore the calculation of employment change requires a starting figure reflecting Coburg's existing employment capacity and redevelopment potential. Table A.2 summarizes the best known population and employment information and employment forecasts for Coburg in 2014. Table A.2: Population and Employment Forecasts Changes, Coburg 2014-2034
Year Population Employment Ratio of
Employment to Population 2010 1,103 3,420* 3.1 employees for every 1 resident
2010 (US Census) 1, 035 2011 (ACS) 907 (+/- 157)
2012 (QCEW , adjusted) 2013 (PSU) 1,045
2014 (LCOG)** 1,065 CHANGE (50-100)
Lane County Coordinated Population Forecast
2030 3,363 4,035 1.2 employees for every 1 resident 2034 4,155 ***
CHANGE 792
Fixed Coordinated Forecast AAGR with Updated 2014 Starting Figure 2030 3,363 4,035 1.2 employees for every 1 resident 2034 3,813
CHANGE 450
Adjusted Coordinated Forecast AAGR (moving 5 year AAGRs forward 5 years)**** with new 2014 starting figure
2030 3,363 4,035 1.2 employees for every 1 resident 2034 3,527
4 Coburg Urbanization Study Addendum, June 2014
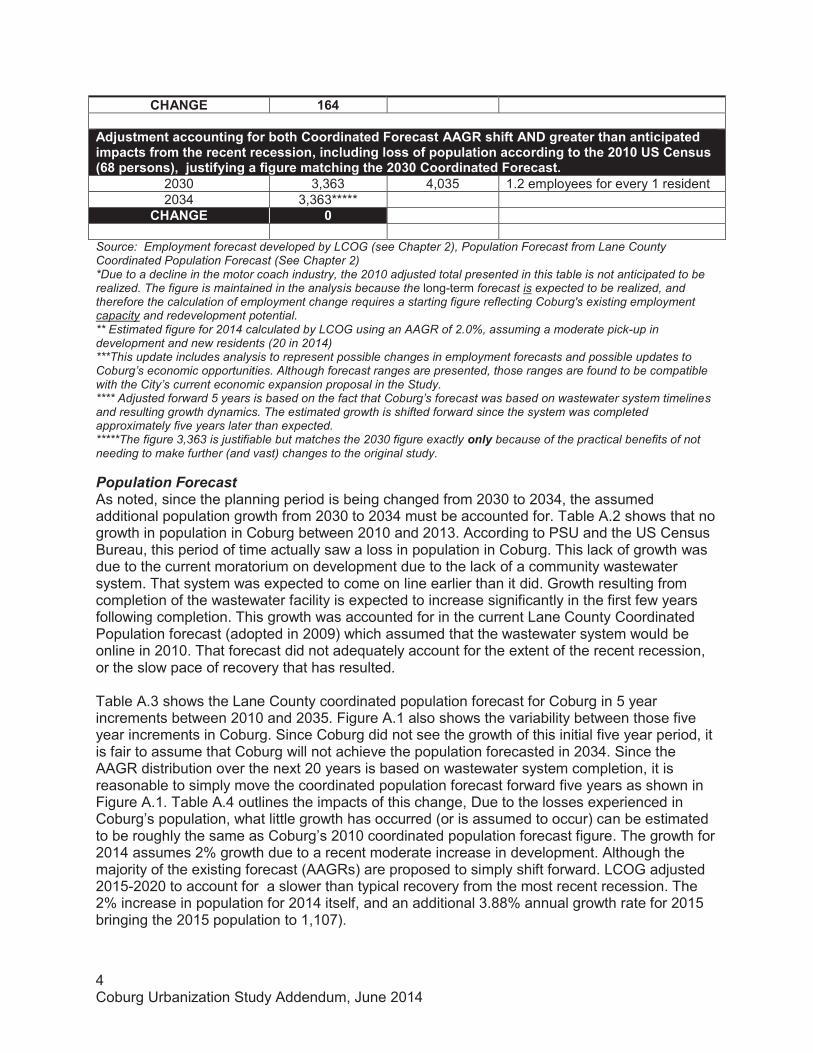
CHANGE 164 Adjustment accounting for both Coordinated Forecast AAGR shift AND greater than anticipated impacts from the recent recession, including loss of population according to the 2010 US Census (68 persons), justifying a figure matching the 2030 Coordinated Forecast.
2030 3,363 4,035 1.2 employees for every 1 resident 2034 3,363*****
CHANGE 0
Source: Employment forecast developed by LCOG (see Chapter 2), Population Forecast from Lane County Coordinated Population Forecast (See Chapter 2) *Due to a decline in the motor coach industry, the 2010 adjusted total presented in this table is not anticipated to be realized. The figure is maintained in the analysis because the long-term forecast is expected to be realized, and therefore the calculation of employment change requires a starting figure reflecting Coburg's existing employment capacity and redevelopment potential. ** Estimated figure for 2014 calculated by LCOG using an AAGR of 2.0%, assuming a moderate pick-up in development and new residents (20 in 2014) ***This update includes analysis to represent possible changes in employment forecasts and possible updates to Coburg’s economic opportunities. Although forecast ranges are presented, those ranges are found to be compatible with the City’s current economic expansion proposal in the Study. **** Adjusted forward 5 years is based on the fact that Coburg’s forecast was based on wastewater system timelines and resulting growth dynamics. The estimated growth is shifted forward since the system was completed approximately five years later than expected. *****The figure 3,363 is justifiable but matches the 2030 figure exactly only because of the practical benefits of not needing to make further (and vast) changes to the original study. Population Forecast As noted, since the planning period is being changed from 2030 to 2034, the assumed additional population growth from 2030 to 2034 must be accounted for. Table A.2 shows that no growth in population in Coburg between 2010 and 2013. According to PSU and the US Census Bureau, this period of time actually saw a loss in population in Coburg. This lack of growth was due to the current moratorium on development due to the lack of a community wastewater system. That system was expected to come on line earlier than it did. Growth resulting from completion of the wastewater facility is expected to increase significantly in the first few years following completion. This growth was accounted for in the current Lane County Coordinated Population forecast (adopted in 2009) which assumed that the wastewater system would be online in 2010. That forecast did not adequately account for the extent of the recent recession, or the slow pace of recovery that has resulted. Table A.3 shows the Lane County coordinated population forecast for Coburg in 5 year increments between 2010 and 2035. Figure A.1 also shows the variability between those five year increments in Coburg. Since Coburg did not see the growth of this initial five year period, it is fair to assume that Coburg will not achieve the population forecasted in 2034. Since the AAGR distribution over the next 20 years is based on wastewater system completion, it is reasonable to simply move the coordinated population forecast forward five years as shown in Figure A.1. Table A.4 outlines the impacts of this change, Due to the losses experienced in Coburg’s population, what little growth has occurred (or is assumed to occur) can be estimated to be roughly the same as Coburg’s 2010 coordinated population forecast figure. The growth for 2014 assumes 2% growth due to a recent moderate increase in development. Although the majority of the existing forecast (AAGRs) are proposed to simply shift forward. LCOG adjusted 2015-2020 to account for a slower than typical recovery from the most recent recession. The 2% increase in population for 2014 itself, and an additional 3.88% annual growth rate for 2015 bringing the 2015 population to 1,107).

5 Coburg Urbanization Study Addendum, June 2014
The proposed shifted growth rates match the Lane County Coordinated Population Forecast exactly with the exception of the five year period between 2015 and 2020, which assumes more moderate initial growth following completion of the wastewater system as a result of slow recovery from the recent recession.
Table A.3 Lane County coordinated population forecast for Coburg, 2010 to 2035 Year 2010 2015 2020 2025 2030 2035 Coordinated Population 1,103 1,387 1934 2,628 3,363 4354 AAGR assumed for preceding 5 year period 4.70% 7.88%
7.18% 5.00% 5.89%
Table A.4 Adjusted population forecast for Coburg, 2010 to 2034
Year 2010 2014 2015 2020 2025 2030 2034 Population 1,035* 1,065** 1,107 1,339 1,944 2,768 3,363 AAGR assumed for preceding time period
3.88%** 7.88% 7.18% 5.00%
*2010 Census figure for Coburg *Population figure of 1,065 is based on PSU’s estimate of 1,045 for 2013 + 2.0% AAGR for 2014
Figure A.1 Population growth forecast adjustment forward
and diminished AAGR for 2015-2020 (4.70% to 3.88%)
The result of the addendum analysis for population forecasting in Coburg for the updated planning period suggests that the population based assumptions and conclusions of the original study remain relevant and applicable, including the support for residential lands expansion and housing needs (including housing mix and densities). Assumptions about employment forecasting will be addressing in more detail within the section addressing impacts and implications for the Economic Opportunities Analysis.
BUILDABLE LANDS INVENTORY HOW MUCH LAND DOES THE CITY CURRENTLY HAVE? In the 2010 Urbanization Study, it was reported that the City of Coburg had approximately 650 acres within the current Urban Growth Boundary (UGB). Of this, about 551 acres (about 85
0.00%2.00%4.00%6.00%8.00%
10.00%
2015 2020 2025 2030 2035
Growth rate for preceding 5 year period
6 Coburg Urbanization Study Addendum, June 2014
percent) were in tax lots; the remaining lands were in public right-of-ways—primarily streets and parks. In 2010, the City had about 112.5 acres of buildable commercial, industrial, and residential land within its UGB. Table S.2 summarizes the buildable land inventory in 2010.
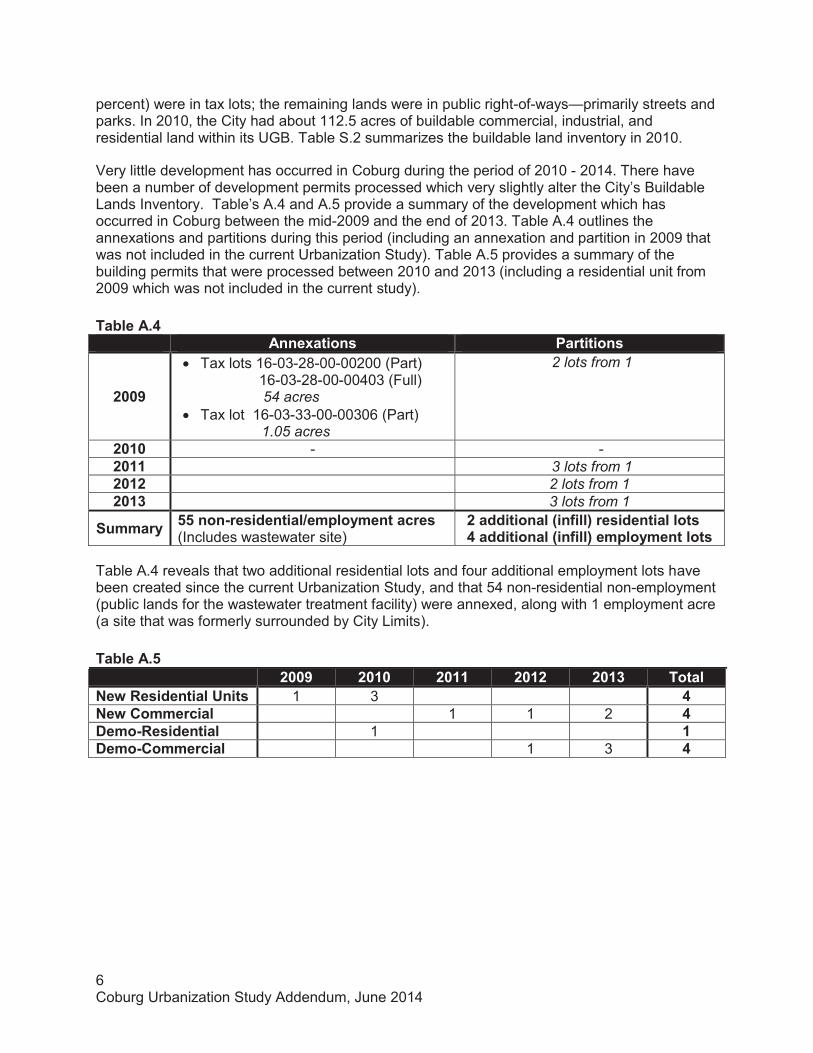
Very little development has occurred in Coburg during the period of 2010 - 2014. There have been a number of development permits processed which very slightly alter the City’s Buildable Lands Inventory. Table’s A.4 and A.5 provide a summary of the development which has occurred in Coburg between the mid-2009 and the end of 2013. Table A.4 outlines the annexations and partitions during this period (including an annexation and partition in 2009 that was not included in the current Urbanization Study). Table A.5 provides a summary of the building permits that were processed between 2010 and 2013 (including a residential unit from 2009 which was not included in the current study). Table A.4 Annexations Partitions
2009
� Tax lots 16-03-28-00-00200 (Part) 16-03-28-00-00403 (Full) 54 acres � Tax lot 16-03-33-00-00306 (Part)
1.05 acres
2 lots from 1
2010 - - 2011 3 lots from 1 2012 2 lots from 1 2013 3 lots from 1
Summary 55 non-residential/employment acres (Includes wastewater site)
2 additional (infill) residential lots 4 additional (infill) employment lots
Table A.4 reveals that two additional residential lots and four additional employment lots have been created since the current Urbanization Study, and that 54 non-residential non-employment (public lands for the wastewater treatment facility) were annexed, along with 1 employment acre (a site that was formerly surrounded by City Limits). Table A.5 2009 2010 2011 2012 2013 Total New Residential Units 1 3 4 New Commercial 1 1 2 4 Demo-Residential 1 1 Demo-Commercial 1 3 4
7 Coburg Urbanization Study Addendum, June 2014
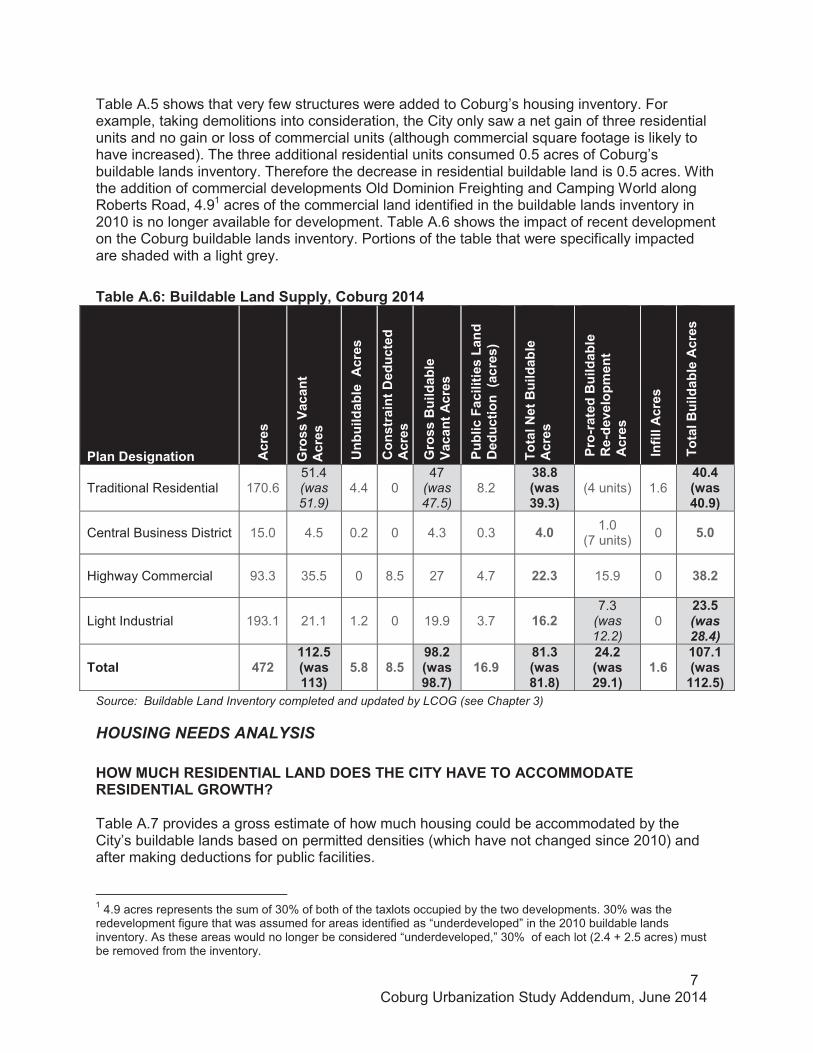
Table A.5 shows that very few structures were added to Coburg’s housing inventory. For example, taking demolitions into consideration, the City only saw a net gain of three residential units and no gain or loss of commercial units (although commercial square footage is likely to have increased). The three additional residential units consumed 0.5 acres of Coburg’s buildable lands inventory. Therefore the decrease in residential buildable land is 0.5 acres. With the addition of commercial developments Old Dominion Freighting and Camping World along Roberts Road, 4.91 acres of the commercial land identified in the buildable lands inventory in 2010 is no longer available for development. Table A.6 shows the impact of recent development on the Coburg buildable lands inventory. Portions of the table that were specifically impacted are shaded with a light grey.
Table A.6: Buildable Land Supply, Coburg 2014
Plan Designation Acr
es
Gro
ss V
acan
t A
cres
Unb
uild
able
Acr
es
Con
stra
int D
educ
ted
A
cres
Gro
ss B
uild
able
V
acan
t Acr
es
Publ
ic F
acili
ties
Land
D
educ
tion
(acr
es)
Tot
al N
et B
uild
able
A
cres
Pro-
rate
d B
uild
able
R
e-de
velo
pmen
t A
cres
Infil
l Acr
es
Tota
l Bui
ldab
le A
cres
Traditional Residential 170.6 51.4 (was 51.9)
4.4 0 47
(was 47.5)
8.2 38.8 (was 39.3)
(4 units) 1.6 40.4 (was 40.9)
Central Business District 15.0 4.5 0.2 0 4.3 0.3 4.0 1.0 (7 units) 0 5.0
Highway Commercial 93.3 35.5 0 8.5 27 4.7 22.3 15.9 0 38.2
Light Industrial 193.1 21.1 1.2 0 19.9 3.7 16.2 7.3
(was 12.2)
0 23.5 (was 28.4)
Total 472 112.5 (was 113)
5.8 8.5 98.2 (was98.7)
16.9 81.3 (was 81.8)
24.2 (was 29.1)
1.6 107.1 (was
112.5)
Source: Buildable Land Inventory completed and updated by LCOG (see Chapter 3)
HOUSING NEEDS ANALYSIS HOW MUCH RESIDENTIAL LAND DOES THE CITY HAVE TO ACCOMMODATE RESIDENTIAL GROWTH? Table A.7 provides a gross estimate of how much housing could be accommodated by the City’s buildable lands based on permitted densities (which have not changed since 2010) and after making deductions for public facilities. 1 4.9 acres represents the sum of 30% of both of the taxlots occupied by the two developments. 30% was the redevelopment figure that was assumed for areas identified as “underdeveloped” in the 2010 buildable lands inventory. As these areas would no longer be considered “underdeveloped,” 30% of each lot (2.4 + 2.5 acres) must be removed from the inventory.
8 Coburg Urbanization Study Addendum, June 2014
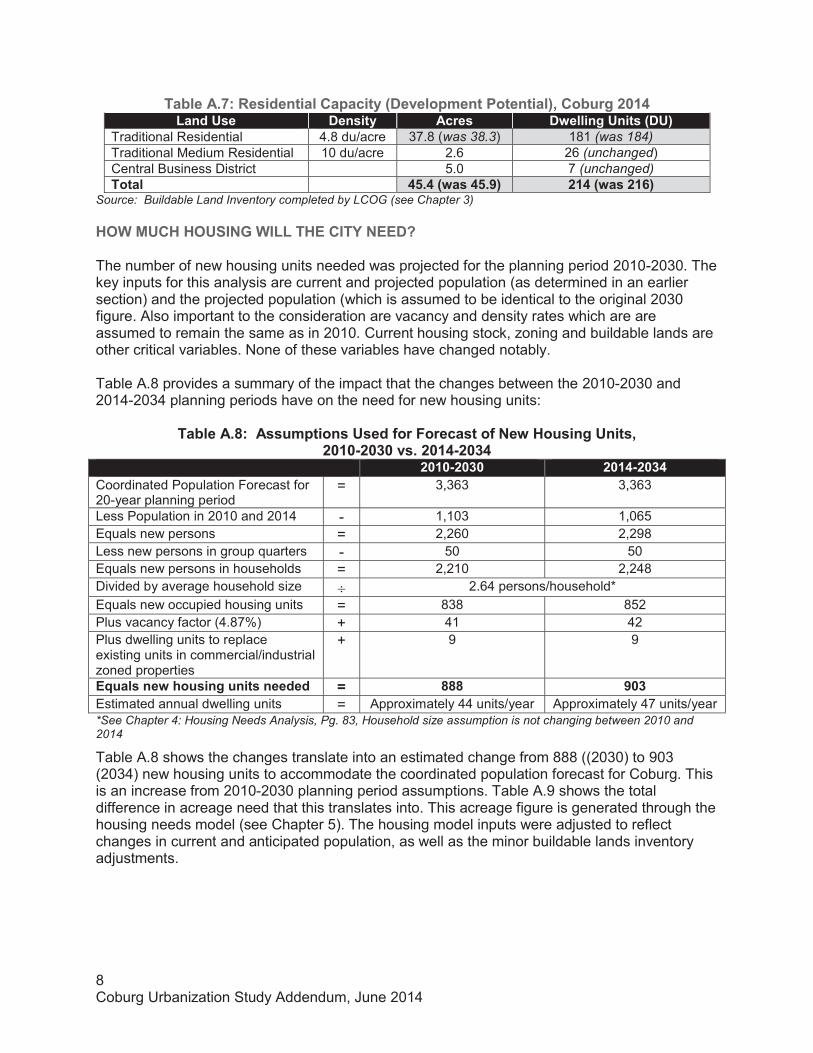
Table A.7: Residential Capacity (Development Potential), Coburg 2014 Land Use Density Acres Dwelling Units (DU)
Traditional Residential 4.8 du/acre 37.8 (was 38.3) 181 (was 184) Traditional Medium Residential 10 du/acre 2.6 26 (unchanged) Central Business District 5.0 7 (unchanged) Total 45.4 (was 45.9) 214 (was 216)
Source: Buildable Land Inventory completed by LCOG (see Chapter 3) HOW MUCH HOUSING WILL THE CITY NEED? The number of new housing units needed was projected for the planning period 2010-2030. The key inputs for this analysis are current and projected population (as determined in an earlier section) and the projected population (which is assumed to be identical to the original 2030 figure. Also important to the consideration are vacancy and density rates which are are assumed to remain the same as in 2010. Current housing stock, zoning and buildable lands are other critical variables. None of these variables have changed notably. Table A.8 provides a summary of the impact that the changes between the 2010-2030 and 2014-2034 planning periods have on the need for new housing units:
Table A.8: Assumptions Used for Forecast of New Housing Units, 2010-2030 vs. 2014-2034
2010-2030 2014-2034 Coordinated Population Forecast for 20-year planning period
= 3,363 3,363
Less Population in 2010 and 2014 - 1,103 1,065 Equals new persons = 2,260 2,298 Less new persons in group quarters - 50 50 Equals new persons in households = 2,210 2,248 Divided by average household size � 2.64 persons/household* Equals new occupied housing units = 838 852 Plus vacancy factor (4.87%) + 41 42 Plus dwelling units to replace existing units in commercial/industrial zoned properties
+ 9 9
Equals new housing units needed = 888 903 Estimated annual dwelling units = Approximately 44 units/year Approximately 47 units/year *See Chapter 4: Housing Needs Analysis, Pg. 83, Household size assumption is not changing between 2010 and 2014
Table A.8 shows the changes translate into an estimated change from 888 ((2030) to 903 (2034) new housing units to accommodate the coordinated population forecast for Coburg. This is an increase from 2010-2030 planning period assumptions. Table A.9 shows the total difference in acreage need that this translates into. This acreage figure is generated through the housing needs model (see Chapter 5). The housing model inputs were adjusted to reflect changes in current and anticipated population, as well as the minor buildable lands inventory adjustments.
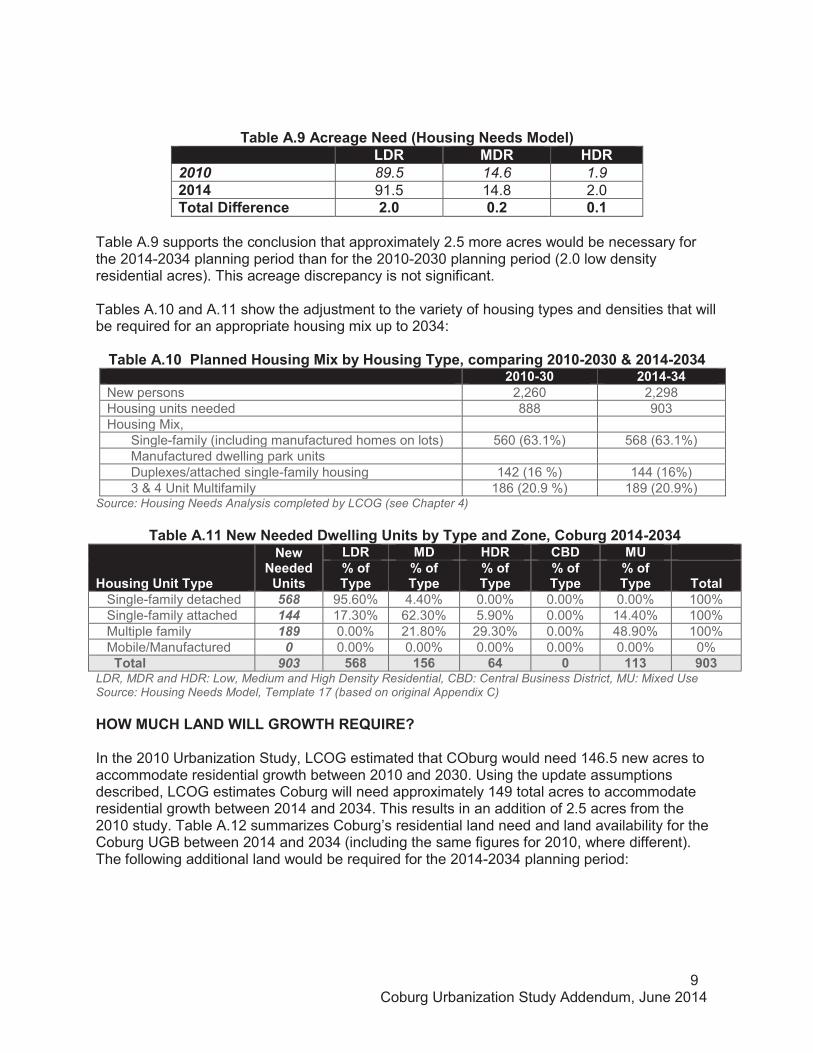
9 Coburg Urbanization Study Addendum, June 2014
Table A.9 Acreage Need (Housing Needs Model) LDR MDR HDR 2010 89.5 14.6 1.9 2014 91.5 14.8 2.0 Total Difference 2.0 0.2 0.1
Table A.9 supports the conclusion that approximately 2.5 more acres would be necessary for the 2014-2034 planning period than for the 2010-2030 planning period (2.0 low density residential acres). This acreage discrepancy is not significant. Tables A.10 and A.11 show the adjustment to the variety of housing types and densities that will be required for an appropriate housing mix up to 2034:
Table A.10 Planned Housing Mix by Housing Type, comparing 2010-2030 & 2014-2034 2010-30 2014-34 New persons 2,260 2,298 Housing units needed 888 903 Housing Mix,
Single-family (including manufactured homes on lots) 560 (63.1%) 568 (63.1%) Manufactured dwelling park units Duplexes/attached single-family housing 142 (16 %) 144 (16%) 3 & 4 Unit Multifamily 186 (20.9 %) 189 (20.9%)
Source: Housing Needs Analysis completed by LCOG (see Chapter 4)
Table A.11 New Needed Dwelling Units by Type and Zone, Coburg 2014-2034
Housing Unit Type
New Needed
Units
LDR MD HDR CBD MU % of Type
% of Type
% of Type
% of Type
% of Type Total
Single-family detached 568 95.60% 4.40% 0.00% 0.00% 0.00% 100% Single-family attached 144 17.30% 62.30% 5.90% 0.00% 14.40% 100% Multiple family 189 0.00% 21.80% 29.30% 0.00% 48.90% 100% Mobile/Manufactured 0 0.00% 0.00% 0.00% 0.00% 0.00% 0% Total 903 568 156 64 0 113 903 LDR, MDR and HDR: Low, Medium and High Density Residential, CBD: Central Business District, MU: Mixed Use Source: Housing Needs Model, Template 17 (based on original Appendix C) HOW MUCH LAND WILL GROWTH REQUIRE? In the 2010 Urbanization Study, LCOG estimated that COburg would need 146.5 new acres to accommodate residential growth between 2010 and 2030. Using the update assumptions described, LCOG estimates Coburg will need approximately 149 total acres to accommodate residential growth between 2014 and 2034. This results in an addition of 2.5 acres from the 2010 study. Table A.12 summarizes Coburg’s residential land need and land availability for the Coburg UGB between 2014 and 2034 (including the same figures for 2010, where different). The following additional land would be required for the 2014-2034 planning period:

10 Coburg Urbanization Study Addendum, June 2014
Table A.12 Residential Supply and Demand Summary, Coburg 2014-2034 LDR MDR HDR MU CBD Total
Acreage Needed (Needed 2010)
114 (112)
15.6 (15.4)
4.5 (4.5)
7.5 (7.4) 0.0 141.7
(139) Buildable Acreage Available (Available 2010)
22 (22.5) 0.8 2.6 15.02 1.0 41.4
(41.9) Net Acreage Needed (Needed 2010)
91.5 (89.5)
14.8 (14.6)
2.0 (1.9)
-7.5 (-7.6) -1.0 99.3
(97.3)
Source: Housing Needs Analysis completed by LCOG (see Chapter 4) Table A.13 provides a summary of the land needs required to meet the public infrastructure needs that will accompany residential growth for the 2014-2034 planning period. These figures have not changed at all from the 2010 assumptions.
Table A.13. Public Infrastructure Needs, Coburg, 2014-2034
Existing Acres Demand
(2010-2030) New Needed Acres Schools 9.3 9.3 0 Streets 99 113.5 14.5 Parks 28 63 35 Total 49.5
Source: The Coburg Parks and Open Space Master Plan (2005)
Table A.14 Residential Supply and Demand Summary, Coburg 2014-2034
Plan Designation Total Residential Buildable Acres
Needed Housing Acres
Total New Needed Acres
Zoned TR (LDR) 22 114 91.5 Zoned TMR (HDR) 2.6 4.5 2.0 Zoned CBD 1 0 -1 New Zone (MDR) 0.8 15.6 14.8 New Zone (MU) 15 7.5 -7.5* Subtotal 99.3 Public Facilities Schools n/a ** n/a Streets n/a ** 14.2 Parks n/a ** 35
TOTAL 41.4 131 148.8
(was 146.5) *Negative Mixed Use figure reflects the range of other uses on Mixed Use land and is not included in the total residential need calculation Source: Housing Needs Analysis completed by LCOG (see Chapter 4)
The difference of an additional 2.3 acres necessary for the 2014-2034 planning period than for the 2010-2030 planning period is well within the margin of error for analysis conducted in 2010 and is not a discrepancy sufficient to merit a re-evaluation of residential UGB expansion areas for Coburg.
2 Assumes re-designation of 15 acre property within current UGB from LDR to MU

11 Coburg Urbanization Study Addendum, June 2014
ECONOMIC OPPORTUNITIES ANALYSIS In the Economic Opportunity Analysis section of the current Urbanization Study, the preliminary conclusion was made by City Council and confirmed by both the Planning Commission and Study Technical Advisory Committee to include, in the report and its recommendations, the need for one to two larger tracts (20-plus acres) of buildable industrial land. Such expansion was found to be supported by an evaluation of Coburg’s economic factors and resulting economic opportunities. Although the City of Coburg was found to actually have a “surplus” of land within all employment categories, that “surplus” for Industrial uses was, according to typical economic development standards, insufficient in acreage and characteristics to accommodate Coburg’s specific economic opportunities. The current Economic Opportunities Analysis therefore recommended the following: The City should add approximately one lot or tract of land consisting of 20-70 acres of land to accommodate flexibility in responding to industry employment opportunities during the planning period (2010-2030). The 2010 Coburg Urbanization Study therefore includes the recommendation that expansion Study Area 8, an area of 106 acres southeast of the I-5 interchange be brought into the UGB to accommodate Coburg’s unique economic opportunities. In 2010, the Planning Commission and City Council approved the proposed expansion recommendation.. WHAT UPDATES TO COBURG’S ECONOMIC FACTORS AND OPPORTUNITIES ARE NECESSARY SINCE 2010? As with population, buildable lands and housing, it is important that the City of Coburg’s current (2014) economic situation be evaluated against the situation characterized in the current Urbanization Study.
As noted, an Economic Opportunities Analysis includes a discussion and evaluation of the City’s economic factors including location, quality of life, provision of services, housing, and availability of labor, among other factors. The 2010 evaluation of Coburg’s economic factors remains largely relevant and accurate, including the characterization of Coburg’s economic priorities and target industries. Since 2009, Coburg has, however, experienced some notable changes to those economic factors. The most relevant of these updates or developments are listed below: Utilities:
� In 2013, fiber was connected to City Hall and the School � Improvements were made to the City’s Water system including a new water booster
station which increases water service capacity. There was also a water telemetry system upgrade and a rebuild of one of the City’s wells.
� Phases 1, 2, and 3 of the City’s decades-long effort to complete a wastewater treatment facility were completed. Phase 4 target completion is March 2014. The treatment plant, collection system and 2/3 commercial and residential hook-up have been completed. Wastewater deficiencies have long been a growth constraint for Coburg.
� A water rates increase was adopted to capture maintenance and capital outlay needs – July, 2013 (within the City Limits) early 2014 (outside the City Limits)
12 Coburg Urbanization Study Addendum, June 2014
� The City of Coburg implemented a Limited Income Assistance program for utility bills in July, 2011.
Transportation: � Improvements to the Coburg I-5 Interchange (Phase 1) were completed in July, 2013 � Coburg has completed a Transportation System Plan which is scheduled for final co-
adoption with Lane County in February, 2014 � Segment 1 of Coburg Loop Path from Pearl St to Roberts Rd. completed in July, 2013 � Final Engineering was recently completed for Segment 2 - Coburg Loop Path Pearl St.
to Sarah Lane and in December 2013, the City acquired funding for Segment 3 of the Coburg Loop Path (from Pearl St. Charter School to Water St.)
Business: � Several businesses have come and gone. Recently, however, there has been a
resurgence of economic development including the following: o In the downtown area, Meso Nutso, Nana’s Caffe, The Country Barrel Antiques,
Retro Rejuvenation, Fine Consign, Design Works Home Garden & Gifts, and The Oregon Handworks Studio have all joined the Coburg community.
o Materne North America, makers of GoGo squeeZ applesauce and squeezable fruit, had extensive discussions with the Coburg North Commercial Industrial Park. Materne announced December 2013 that they did not choose Coburg for their new plant. It did make evident some of the attractiveness and promise that Coburg’s vacant industrial sites have.
o Officials from Business Oregon and Oregon Governor John Kitzhaber's office presented a $100,000 forgivable loan check from the Governor's Strategic Reserve Fund to APEL Aluminum Extrusions (to be located at Coburg North). As a condition of the state incentive, the company agreed to create 25 new jobs and retain an existing 50 jobs over a two-year period.
o Camping World is relocating from Junction City to Roberts Road and will be adding 70 jobs.
o Old Dominion Freight Lines is building a new 24-hour cross dock facility on Roberts Road and brings 70 new jobs.
o A-1 Auto Glass, which provides windshield, and other glass repair and replacement for all vehicle types, has moved a facility to Coburg North and has plans to expand at the Coburg location.
o McDonalds and a new Shell fueling station were built at South Coburg Industrial Way this summer; bringing back or creating about 50 jobs.
o Hamilton Construction Company, one of the West's leading heavy civil construction contractors, moved their headquarters to Coburg North.
o Serenity Lane Health Services will begin building their 15 acre campus on North Coburg Industrial Way this winter. Serenity Lane has had plans in place for a number of years and their proposed development is given significant consideration in the current study.
o Stella Lighting plans to expand from 7 to 15 employees and bring their manufacturing component to Coburg in December of 2013.
Employment: The Oakridge Sand and Gravel firm, with the assistance of economist Eric Hovee, conducted a Regional Economic Analysis for the City of Coburg during the fall and winter of 2013. The analysis they generated, though privately funded and not formally associated with the City’s
13 Coburg Urbanization Study Addendum, June 2014
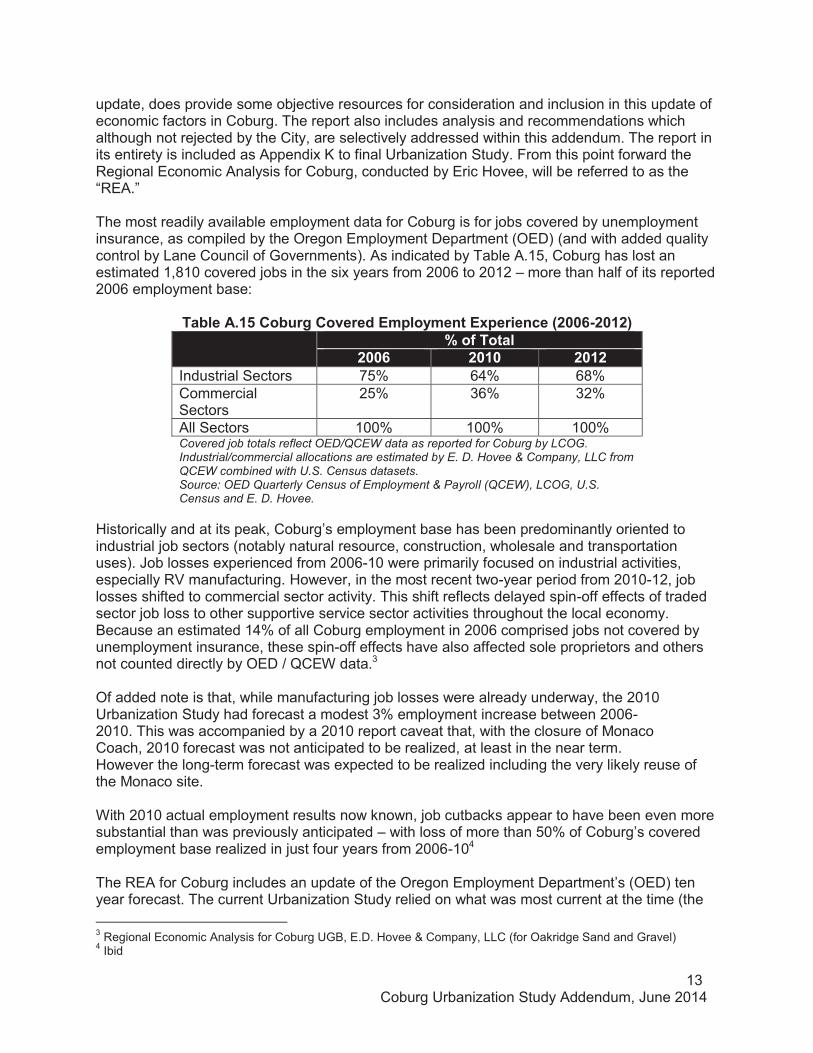
update, does provide some objective resources for consideration and inclusion in this update of economic factors in Coburg. The report also includes analysis and recommendations which although not rejected by the City, are selectively addressed within this addendum. The report in its entirety is included as Appendix K to final Urbanization Study. From this point forward the Regional Economic Analysis for Coburg, conducted by Eric Hovee, will be referred to as the “REA.” The most readily available employment data for Coburg is for jobs covered by unemployment insurance, as compiled by the Oregon Employment Department (OED) (and with added quality control by Lane Council of Governments). As indicated by Table A.15, Coburg has lost an estimated 1,810 covered jobs in the six years from 2006 to 2012 – more than half of its reported 2006 employment base:
Table A.15 Coburg Covered Employment Experience (2006-2012) % of Total
2006 2010 2012 Industrial Sectors 75% 64% 68% Commercial Sectors
25% 36% 32%
All Sectors 100% 100% 100% Covered job totals reflect OED/QCEW data as reported for Coburg by LCOG. Industrial/commercial allocations are estimated by E. D. Hovee & Company, LLC from QCEW combined with U.S. Census datasets. Source: OED Quarterly Census of Employment & Payroll (QCEW), LCOG, U.S. Census and E. D. Hovee.
Historically and at its peak, Coburg’s employment base has been predominantly oriented to industrial job sectors (notably natural resource, construction, wholesale and transportation uses). Job losses experienced from 2006-10 were primarily focused on industrial activities, especially RV manufacturing. However, in the most recent two-year period from 2010-12, job losses shifted to commercial sector activity. This shift reflects delayed spin-off effects of traded sector job loss to other supportive service sector activities throughout the local economy. Because an estimated 14% of all Coburg employment in 2006 comprised jobs not covered by unemployment insurance, these spin-off effects have also affected sole proprietors and others not counted directly by OED / QCEW data.3 Of added note is that, while manufacturing job losses were already underway, the 2010 Urbanization Study had forecast a modest 3% employment increase between 2006- 2010. This was accompanied by a 2010 report caveat that, with the closure of Monaco Coach, 2010 forecast was not anticipated to be realized, at least in the near term. However the long-term forecast was expected to be realized including the very likely reuse of the Monaco site. With 2010 actual employment results now known, job cutbacks appear to have been even more substantial than was previously anticipated – with loss of more than 50% of Coburg’s covered employment base realized in just four years from 2006-104 The REA for Coburg includes an update of the Oregon Employment Department’s (OED) ten year forecast. The current Urbanization Study relied on what was most current at the time (the 3 Regional Economic Analysis for Coburg UGB, E.D. Hovee & Company, LLC (for Oakridge Sand and Gravel) 4 Ibid
14 Coburg Urbanization Study Addendum, June 2014
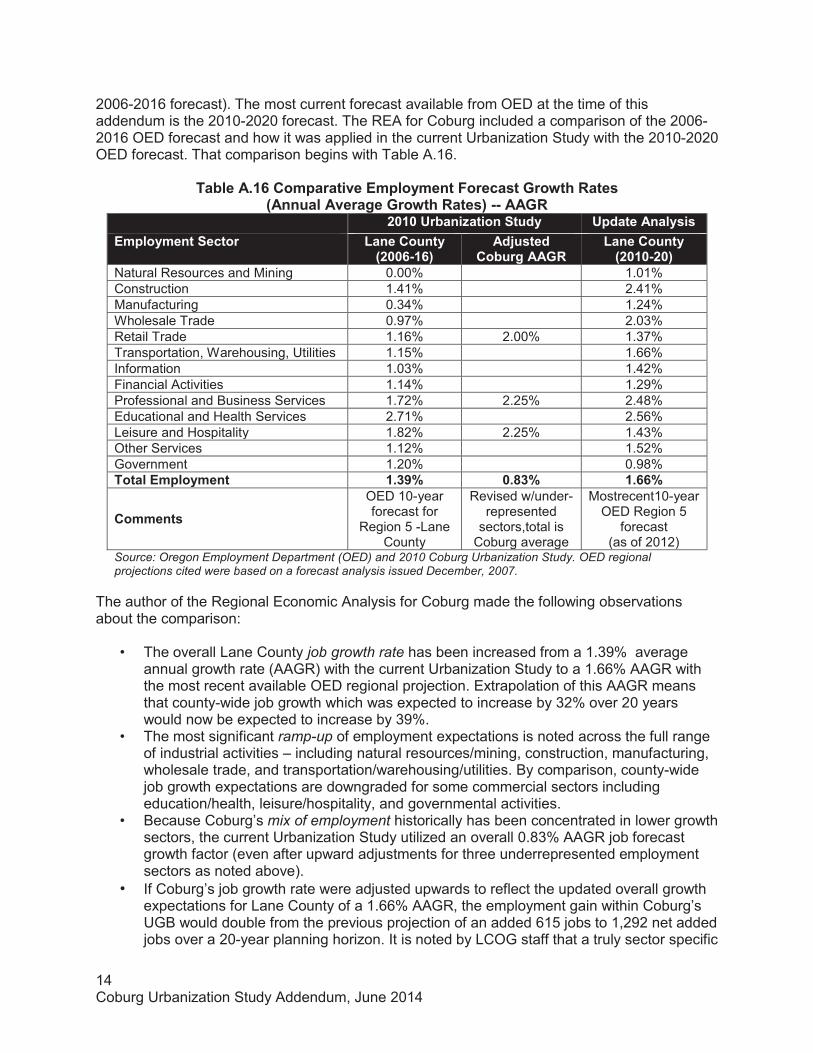
2006-2016 forecast). The most current forecast available from OED at the time of this addendum is the 2010-2020 forecast. The REA for Coburg included a comparison of the 2006-2016 OED forecast and how it was applied in the current Urbanization Study with the 2010-2020 OED forecast. That comparison begins with Table A.16.
Table A.16 Comparative Employment Forecast Growth Rates (Annual Average Growth Rates) -- AAGR
2010 Urbanization Study Update Analysis Employment Sector Lane County
(2006-16) Adjusted
Coburg AAGR Lane County
(2010-20) Natural Resources and Mining 0.00% 1.01% Construction 1.41% 2.41% Manufacturing 0.34% 1.24% Wholesale Trade 0.97% 2.03% Retail Trade 1.16% 2.00% 1.37% Transportation, Warehousing, Utilities 1.15% 1.66% Information 1.03% 1.42% Financial Activities 1.14% 1.29% Professional and Business Services 1.72% 2.25% 2.48% Educational and Health Services 2.71% 2.56% Leisure and Hospitality 1.82% 2.25% 1.43% Other Services 1.12% 1.52% Government 1.20% 0.98% Total Employment 1.39% 0.83% 1.66%
Comments OED 10-year forecast for
Region 5 -Lane County
Revised w/under-represented
sectors,total is Coburg average
Mostrecent10-year OED Region 5
forecast (as of 2012)
Source: Oregon Employment Department (OED) and 2010 Coburg Urbanization Study. OED regional projections cited were based on a forecast analysis issued December, 2007.
The author of the Regional Economic Analysis for Coburg made the following observations about the comparison:
• The overall Lane County job growth rate has been increased from a 1.39% average annual growth rate (AAGR) with the current Urbanization Study to a 1.66% AAGR with the most recent available OED regional projection. Extrapolation of this AAGR means that county-wide job growth which was expected to increase by 32% over 20 years would now be expected to increase by 39%.
• The most significant ramp-up of employment expectations is noted across the full range of industrial activities – including natural resources/mining, construction, manufacturing, wholesale trade, and transportation/warehousing/utilities. By comparison, county-wide job growth expectations are downgraded for some commercial sectors including education/health, leisure/hospitality, and governmental activities.
• Because Coburg’s mix of employment historically has been concentrated in lower growth sectors, the current Urbanization Study utilized an overall 0.83% AAGR job forecast growth factor (even after upward adjustments for three underrepresented employment sectors as noted above).
• If Coburg’s job growth rate were adjusted upwards to reflect the updated overall growth expectations for Lane County of a 1.66% AAGR, the employment gain within Coburg’s UGB would double from the previous projection of an added 615 jobs to 1,292 net added jobs over a 20-year planning horizon. It is noted by LCOG staff that a truly sector specific
15 Coburg Urbanization Study Addendum, June 2014
forecast was not possible given the information that economist Eric Hovee was provided. The figure 1,292, based on Lane County’s AAGR reflects an estimate assuming the highest realization of Coburg matching Lane County growth rates. That number (1,292), in all likelihood would be smaller, and could potentially be significantly smaller.
The State of Oregon Office of Economic Analysis (OEA) provides 10-year economic forecasts as well. While forecasts are made only for the entire state (not counties or economic sub regions), the most recent December 2013 statewide forecast provides a useful point of comparison with the 2012 OED statewide projections. The Regional Economic Analysis for Coburg provides some key observations of a comparison of OEA and OED forecast results for the 2010-20 time period and the 2006-2016 time period which was used in the current Urbanization Study are noted as follows:
• �Overall, OEA’s recent forecast indicates that employment statewide may increase at a somewhat slower rate than has been projected by OED. However, OEA is significantly more bullish on prospects for industrial employment (and softer on the commercial outlook) than OED.
• OEA forecasts stronger rates of growth for the construction, manufacturing and transportation, warehousing & utilities sectors than OED. Within manufacturing, forecasts recently have been revised upward for non-durable goods production – especially food processing.
• Despite “ebbs and flows,” the national and regional economic recovery remains on track. While not overly robust, job growth has been strong enough to allow for gradual reductions of the state’s unemployment rate.
• After a prolonged downturn, home construction is now in recovery mode – though at levels still well below the pre-recession peak. While higher interest rates may raise new challenges for housing affordability nationally and regionally, the need to “catch up” to the underbuilding of recent years means that there is still considerable unmet demand to address in the years ahead.
• A significant economic issue for the nation and state is what the OEA report terms as “job polarization” – resulting in fewer middle wage jobs but more jobs at both the lower and upper ends of the income spectrum. Also noted is a trend toward more part-time employment.5
Review of local and regional economic trends suggests the following noteworthy changes in economic conditions (as outlined by the REA for Coburg):
• Substantial loss of RV equipment industrial employment during the recession with subsequent negative spillover to other Coburg business activities – and resulting need to replace this loss as a pre-condition to future net job growth.
• Overall upgrading of regional (Lane County) job forecasts from what was anticipated in 2010, with resulting long-term opportunity to offset economic losses experienced within Coburg’s historic employment base.
• Further economic opportunity for regional capture of demand for large site industrial users requiring interstate freeway access, offering a distinctive competitive advantage for Coburg relative to alternative industrial sites elsewhere in Lane County.
5 Regional Economic Analysis for Coburg UGB, E.D. Hovee & Company, LLC (for Oakridge Sand and Gravel)
16 Coburg Urbanization Study Addendum, June 2014
Regional Marketable Industrial Properties. A clear indication of the current lack of large industrial properties is provided by a current listing of industrial sites available countywide as maintained by Lane County. As of December 2013, 138 industrial sites are identified as being marketed for sale or lease in Lane County jurisdictions extending from Florence on the coast to the Eugene-Springfield metro area and neighboring communities. If parcels with substantial buildings are excluded, there are a remaining 56 vacant industrial properties plus another six under-improved sites (which have buildings occupying less than 10% of site area). There are only five identified sites of 20-plus acres currently being marketed within Lane County for industrial development. Four of the properties are located distant from the I-5 interstate transportation corridor. Also available for sale is the former Bald Mill veneer plant in Creswell – 10 miles south of Eugene, subject of a major 2008 fire, and with an existing 64,000 square foot building on site.6
Coburg does not have any sites indicated by Lane County as being readily suitable and actively marketed at present for industrial development. However, if such sites were to be designated for industrial use, Coburg properties could represent viable options for industrial users that require direct interstate freeway access proximate to urban area population centers. Lane County7 The findings of the Regional Economic Analysis for Coburg culminate in two recommended scenarios which are outlined as follows: Scenario A – Job Recapture with OED Forecast Update. This first scenario is modeled to align with the forecast methodology provided with the 2010 Urbanization Study. Assumptions integral to this updated forecast estimate are that:
� Coburg job loss experienced during the recession will be recaptured (to refill vacated space) so that forecast job growth occurs as an add-on to pre-recession peak employment conditions requiring net added industrial and commercial land as was previously assumed with the 2010 Urbanization Study.
� Lane County employment forecast projections are updated for consistency with the most current available OED regional forecast – reflecting higher county-wide job growth rates than were utilized with the 2010 Urbanization Study (as is also consistent with DLCD Safe Harbor provisions for estimating EOA land needs).8
Scenario B – Economic Opportunity with Regional Large Site Market Capture. A second scenario is predicated as an economic opportunity for Coburg to serve regional needs for large 20+ acre sites that require I-5 freeway access in addition to capturing its Safe Harbor share of regionally forecast job growth:
� This enhanced economic opportunity is consistent with the findings of the 2010 Urbanization Study that Coburg has been, and could remain, competitive for large manufacturing and distribution-related industrial firms, particularly if 20+ acre sites were designated and made available for industrial development.
6 Ibid 7 Ibid 8Regional Economic Analysis for Coburg UGB, E.D. Hovee & Company, LLC (for Oakridge Sand and Gravel)
17 Coburg Urbanization Study Addendum, June 2014
� Coburg’s competitive opportunity is reinforced by economic analyses recently prepared for other jurisdictions in Lane County – all of which confirm a demand for but relative dearth of 20+ acre sites situated in close proximity to the I-5 transportation corridor.9
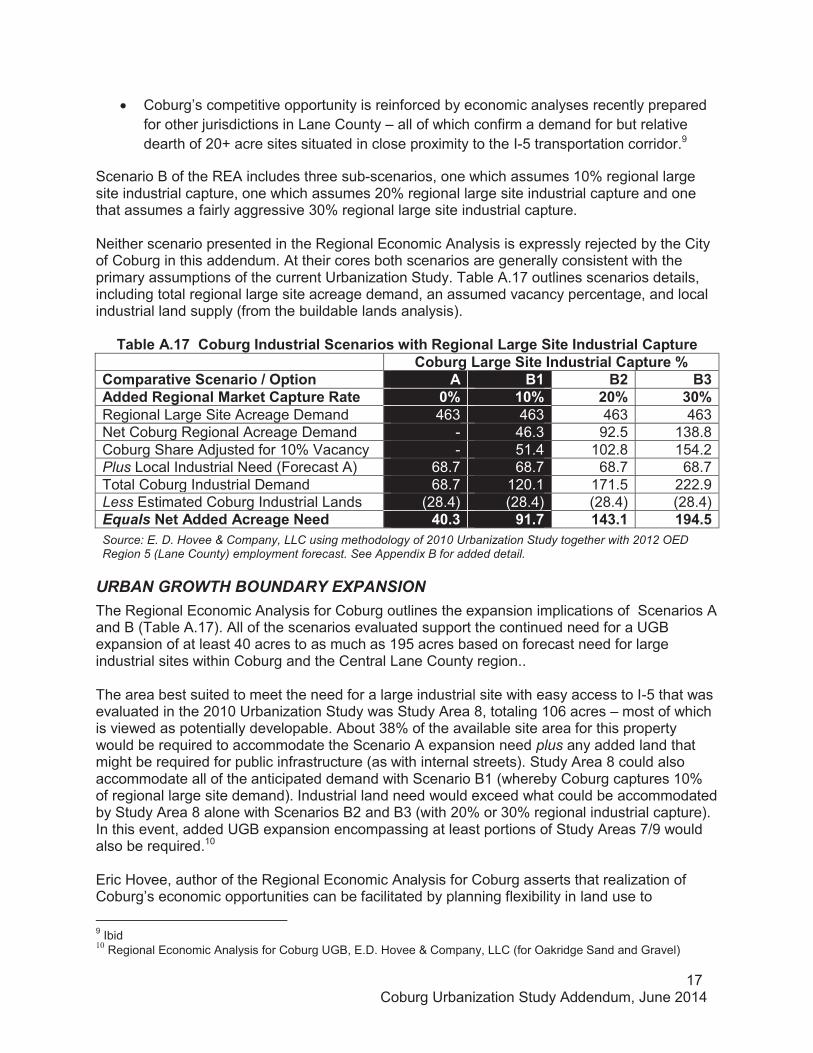
Scenario B of the REA includes three sub-scenarios, one which assumes 10% regional large site industrial capture, one which assumes 20% regional large site industrial capture and one that assumes a fairly aggressive 30% regional large site industrial capture. Neither scenario presented in the Regional Economic Analysis is expressly rejected by the City of Coburg in this addendum. At their cores both scenarios are generally consistent with the primary assumptions of the current Urbanization Study. Table A.17 outlines scenarios details, including total regional large site acreage demand, an assumed vacancy percentage, and local industrial land supply (from the buildable lands analysis).
Table A.17 Coburg Industrial Scenarios with Regional Large Site Industrial Capture Coburg Large Site Industrial Capture % Comparative Scenario / Option A B1 B2 B3 Added Regional Market Capture Rate 0% 10% 20% 30% Regional Large Site Acreage Demand 463 463 463 463 Net Coburg Regional Acreage Demand - 46.3 92.5 138.8 Coburg Share Adjusted for 10% Vacancy - 51.4 102.8 154.2 Plus Local Industrial Need (Forecast A) 68.7 68.7 68.7 68.7 Total Coburg Industrial Demand 68.7 120.1 171.5 222.9 Less Estimated Coburg Industrial Lands (28.4) (28.4) (28.4) (28.4) Equals Net Added Acreage Need 40.3 91.7 143.1 194.5
Source: E. D. Hovee & Company, LLC using methodology of 2010 Urbanization Study together with 2012 OED Region 5 (Lane County) employment forecast. See Appendix B for added detail.
URBAN GROWTH BOUNDARY EXPANSION
The Regional Economic Analysis for Coburg outlines the expansion implications of Scenarios A and B (Table A.17). All of the scenarios evaluated support the continued need for a UGB expansion of at least 40 acres to as much as 195 acres based on forecast need for large industrial sites within Coburg and the Central Lane County region.. The area best suited to meet the need for a large industrial site with easy access to I-5 that was evaluated in the 2010 Urbanization Study was Study Area 8, totaling 106 acres – most of which is viewed as potentially developable. About 38% of the available site area for this property would be required to accommodate the Scenario A expansion need plus any added land that might be required for public infrastructure (as with internal streets). Study Area 8 could also accommodate all of the anticipated demand with Scenario B1 (whereby Coburg captures 10% of regional large site demand). Industrial land need would exceed what could be accommodated by Study Area 8 alone with Scenarios B2 and B3 (with 20% or 30% regional industrial capture). In this event, added UGB expansion encompassing at least portions of Study Areas 7/9 would also be required.10 Eric Hovee, author of the Regional Economic Analysis for Coburg asserts that realization of Coburg’s economic opportunities can be facilitated by planning flexibility in land use to 9 Ibid 10 Regional Economic Analysis for Coburg UGB, E.D. Hovee & Company, LLC (for Oakridge Sand and Gravel)
18 Coburg Urbanization Study Addendum, June 2014
accommodate a range of industrial, related large site and ancillary support uses. The decision on the part of Coburg’s commission and council, to support expansion was based on assumptions of large industrial users. This update provides no further specific updated analysis or discussion on the subject of “related” uses and “ancillary support” to industrial uses. The REA highlights that early provision of required public-private infrastructure will prove instrumental to achieving critical shovel-ready status for sites at a time when full economic recovery remains of continuing significance both locally and regionally. Given Coburg’s infrastructure dynamic for its proposed employment lands expansion, this is indeed an important point for consideration. WHAT EXPANSION ALTERNATIVE IS RECOMMENDED IN 2014? There is no change to the Expansion Area recommendations from the conclusions drawn in 2010. The recommendations in 2010 were the result of significant analysis, public outreach and advisory committee, planning commission and city council debate. The fundamental assumptions of that process remain essentially unchanged. The scenarios selected by City Council in 2010, and which remain the recommended alternatives, are presented below:
� Residential Expansion Alternative 2: 150 Acres (see Map 25 in Chapter 7). � Employment Expansion Alternative 3: 106 Acres (see Map 24 in Chapter 7).
As presented in Table A.9 the conclusion that only eight fewer residential acres would be necessary for the 2014-2034 planning period than for the 2010-2030 planning period is not sufficient to merit a re-evaluation of residential UGB expansion areas for Coburg. Likewise, as presented in Table A.17, an updated look at Coburg’s economic opportunities shows that although aggressive economic forecasts would require additional employment lands than are available in Employment Expansion Alternative 3, more conservative forecasts can be accommodated. The UGB expansion conclusions presented in Chapter 7 of this Urbanization Study (2010) remain relevant and representative of the City’s updated planning period of 2014 to 2014.
iii2010 Coburg Urbanization Study
�
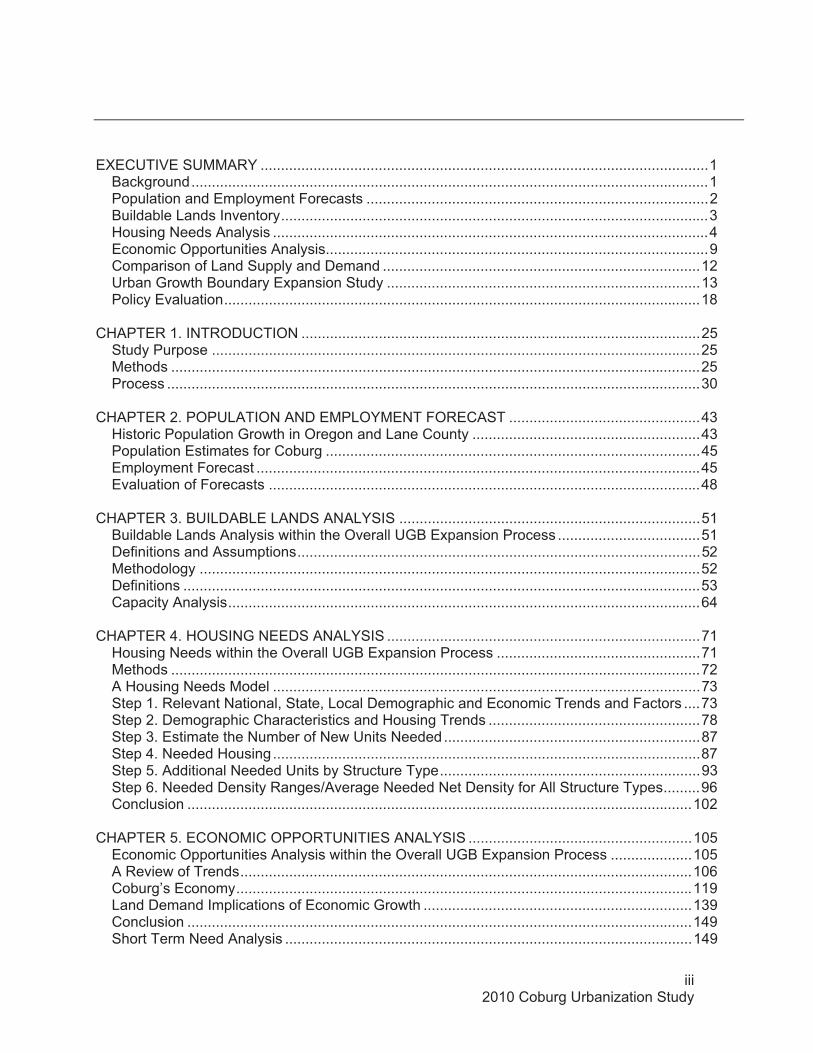
EXECUTIVE SUMMARY ..............................................................................................................1Background...............................................................................................................................1 Population and Employment Forecasts ....................................................................................2 Buildable Lands Inventory.........................................................................................................3 Housing Needs Analysis ...........................................................................................................4 Economic Opportunities Analysis..............................................................................................9 Comparison of Land Supply and Demand ..............................................................................12 Urban Growth Boundary Expansion Study .............................................................................13 Policy Evaluation.....................................................................................................................18
CHAPTER 1. INTRODUCTION ..................................................................................................25 Study Purpose ........................................................................................................................25 Methods ..................................................................................................................................25 Process ...................................................................................................................................30
CHAPTER 2. POPULATION AND EMPLOYMENT FORECAST ...............................................43 Historic Population Growth in Oregon and Lane County ........................................................43 Population Estimates for Coburg ............................................................................................45 Employment Forecast .............................................................................................................45 Evaluation of Forecasts ..........................................................................................................48
CHAPTER 3. BUILDABLE LANDS ANALYSIS ..........................................................................51 Buildable Lands Analysis within the Overall UGB Expansion Process ...................................51 Definitions and Assumptions...................................................................................................52Methodology ...........................................................................................................................52 Definitions ...............................................................................................................................53 Capacity Analysis....................................................................................................................64
CHAPTER 4. HOUSING NEEDS ANALYSIS .............................................................................71 Housing Needs within the Overall UGB Expansion Process ..................................................71 Methods ..................................................................................................................................72 A Housing Needs Model .........................................................................................................73Step 1. Relevant National, State, Local Demographic and Economic Trends and Factors ....73 Step 2. Demographic Characteristics and Housing Trends ....................................................78 Step 3. Estimate the Number of New Units Needed...............................................................87 Step 4. Needed Housing.........................................................................................................87Step 5. Additional Needed Units by Structure Type................................................................93 Step 6. Needed Density Ranges/Average Needed Net Density for All Structure Types.........96 Conclusion ............................................................................................................................102
CHAPTER 5. ECONOMIC OPPORTUNITIES ANALYSIS .......................................................105 Economic Opportunities Analysis within the Overall UGB Expansion Process ....................105 A Review of Trends...............................................................................................................106 Coburg’s Economy................................................................................................................119 Land Demand Implications of Economic Growth ..................................................................139 Conclusion ............................................................................................................................149 Short Term Need Analysis ....................................................................................................149
iv2010 Coburg Urbanization Study
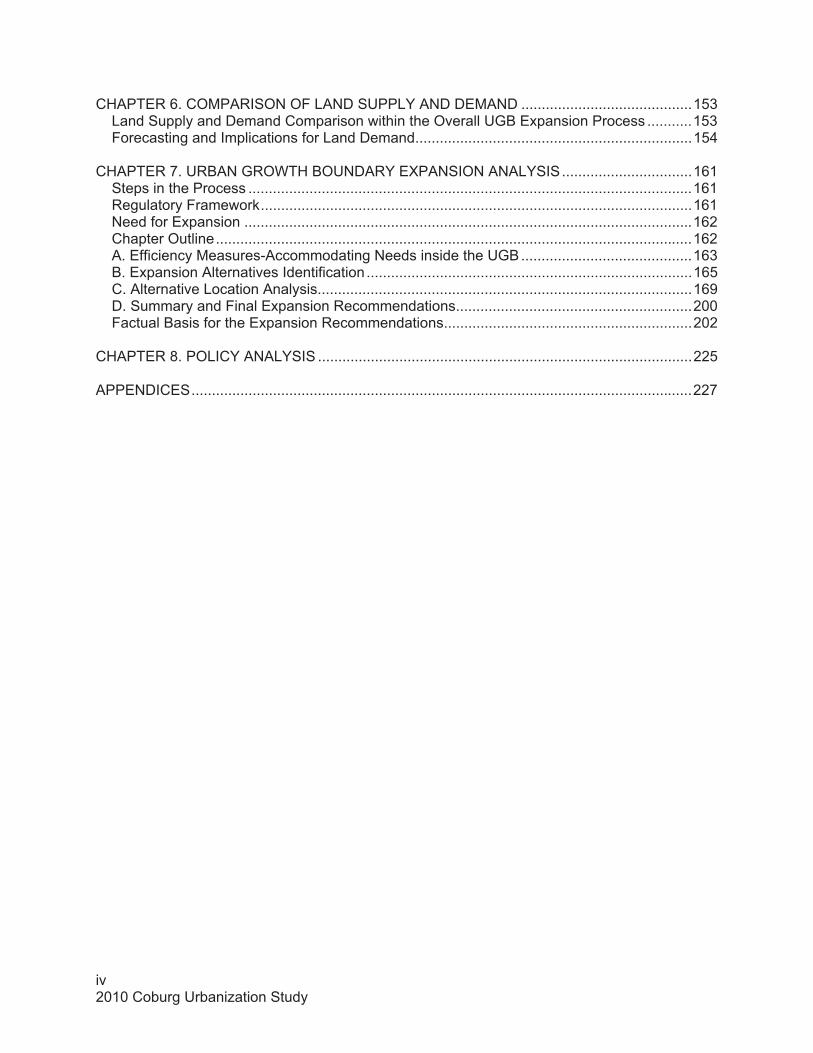
CHAPTER 6. COMPARISON OF LAND SUPPLY AND DEMAND ..........................................153 Land Supply and Demand Comparison within the Overall UGB Expansion Process ...........153 Forecasting and Implications for Land Demand....................................................................154
CHAPTER 7. URBAN GROWTH BOUNDARY EXPANSION ANALYSIS................................161 Steps in the Process .............................................................................................................161 Regulatory Framework..........................................................................................................161Need for Expansion ..............................................................................................................162 Chapter Outline.....................................................................................................................162 A. Efficiency Measures-Accommodating Needs inside the UGB..........................................163 B. Expansion Alternatives Identification ................................................................................165 C. Alternative Location Analysis............................................................................................169D. Summary and Final Expansion Recommendations..........................................................200 Factual Basis for the Expansion Recommendations.............................................................202
CHAPTER 8. POLICY ANALYSIS ............................................................................................225
APPENDICES...........................................................................................................................227

12010 Coburg Urbanization Study
������������� ��
Background
The City of Coburg developed this Study to update its estimate of the land needed to accommodate residential and employment growth over the next 20 years. The purpose of the Study is to: (1) evaluate growth forecasts; (2) inventory how much buildable land the City has; (3) identify housing needs;(4) identify economic development strategies; and (5) determine how much land the City will need to accommodate growth between 2010 and 2030.
The City of Coburg last evaluated its land needs in 2003 and 2004 as part of Periodic Review1
which included Coburg Crossroads community visioning, a Comprehensive Plan and Zoning Code update, Interchange Area Management Plan (transportation), and an Study. During this planning timeframe, approximately 30 acres of land, already developed for commercial uses, were added to Coburg’s urban growth boundary (UGB) to address the need for additional commercial lands. However, further implementation of UGB expansion to meet State requirements was halted due to a multi-year delay in developing Coburg’s wastewater system.
Currently, the myriad of wastewater system development barriers have been overcome, allowing Coburg to proceed with the compulsory planning and implementation to address future growth.
This Study builds upon the prior work that has been completed by the City, notably the CoburgCrossroads Vision, 2003, which was adopted by City Council under Resolution #2003-6 on May 20, 2003. The Coburg Crossroads Vision was based on significant stakeholder feedback and information. The vision established through this process expressed the community’s desires to establish sustainability by balancing housing, economy, schools, transportation, and parks and preserve a small-town identity. This collective vision was directly integrated into the Comprehensive Plan. This Study is an extension of Coburg’s commitment to its Vision.
The Study Update is organized into the following eight chapters:
������������������������� Describes the methods and key policy decisions made as part of the Study process.
���������������������������� ���! ����"�����#�� Estimates the population and employment growth over the next 20 years. Both forecasts are based on a set of assumptions regarding the average annual growth rate and public policies to encourage economic growth and housing for seniors, workers, and young families.
1 Periodic Review is a review process administered by the Department of Land Conservation and Development (DLCD) that is required by state law as described in ORS 197.628-197.644 and OAR 660, Division 25. Periodic review requires that local governments review their Comprehensive Plan and land use regulations to ensure that the Plan continues to provide for the growth and development needs of the community and ensures that the Plan and regulations remain consistent with Oregon Revised Statutes, Oregon Administrative Rules, programs of state agencies, and statewide planning goals. This process emphasizes review and compliance with statewide planning goals related to economic development, needed housing, transportation, public facilities and services, and urbanization.
22010 Coburg Urbanization Study
��������$��%�����&���'���#�����!#�#���Inventories all types of vacant, potential infill, potential redevelopment and environmentally constrained land within the existing UGB for residential, commercial, and industrial development.
��������(��)��#��*�+���#�����!#�#� Determines types and densities of residential development within the UGB using the Housing/Land Needs. Determine the amount of land needed to meet future demand at appropriate types and densities based on historical and potential future development trends, population changes and growth projections, and economic factors. Address all Goal 10 Housing, and Goal 14 requirements. Housing needs are estimated using a Housing Needs Model.
��������,������� ���-�����������#�����!#�#� Estimates need for commercial and industrial land based on historic and current trends related to employment projections and local economic potential. Identify size and characteristics of employment land needs. Address requirements of Goal 9.
��������.���� ����#����/�'��������!�����0� ���� Determines whether there is a deficit or surplus of buildable land for residential, commercial, and Industrial needs.
��������1���2%��3���#��������#����!� Identifies and assesses areas where urban expansion should take place based on expansion criteria per Goal 14, ORS 197.298 , and OAR 660-0024-0060, including (but not limited to) the efficiency of service provision; economic, social, environmental, and energy impacts; compatibility with surrounding uses, as well as other information provided in the previous steps.
��������4�������!�����!#�#� Lists key planning and development issues the City should address during the Comprehensive Plan and Zoning Ordinance updates.
The following provides a brief synopsis of the major findings from each of the Study components:
Population and Employment Forecasts �)-5����)�2 -5�)����-%� 2��'�++�+2�"- 6�Table 1.1 summarizes population and employment forecasts for Coburg.
��&������������������������ ���! ����"�����#�#7���&��*��8�89�8$8�
����� ����������� � ���! ���� ������/�
� ���! ������������������2010 1,103 3,420* 3.1 employees for every 1
resident 2030 3,363 4,035 1.2 employees for every 1
resident Change 2010-2030
Number 2,260 615 0.3 employees for every 1 resident
Percent 204.9% 17.9%AAGR 5.32% 0.83%
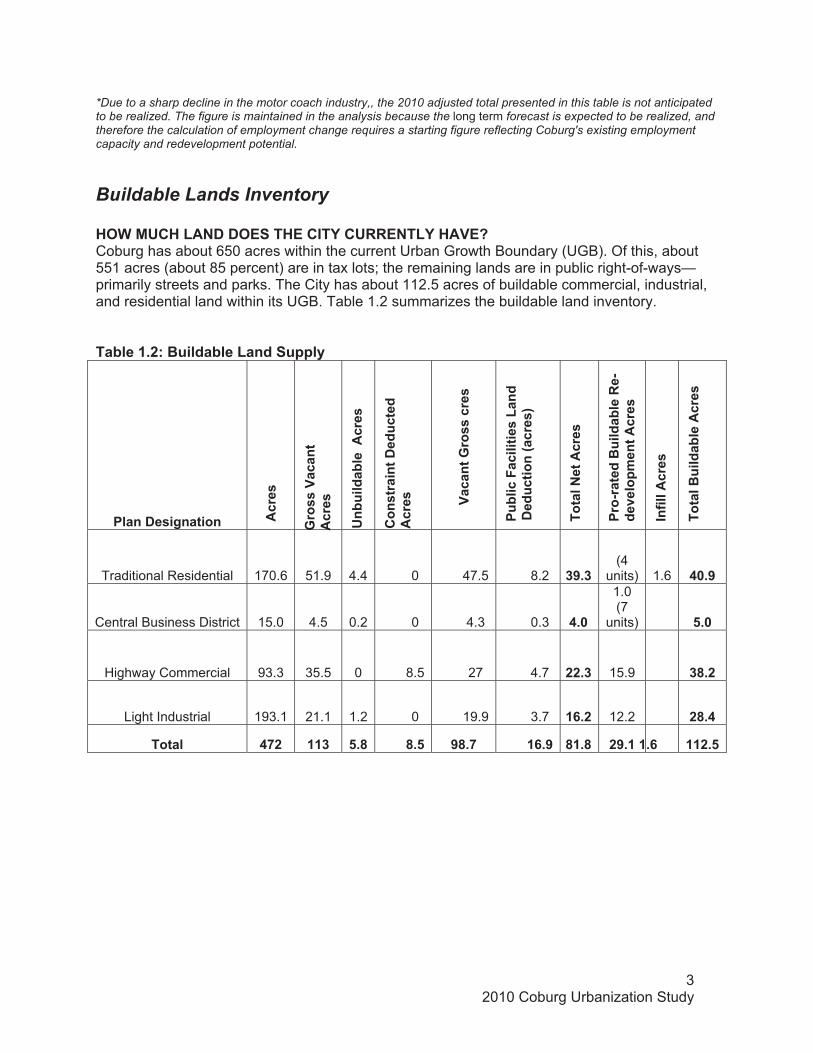
32010 Coburg Urbanization Study
*Due to a sharp decline in the motor coach industry,, the 2010 adjusted total presented in this table is not anticipated to be realized. The figure is maintained in the analysis because the long term forecast is expected to be realized, and therefore the calculation of employment change requires a starting figure reflecting Coburg's existing employment capacity and redevelopment potential. �
Buildable Lands Inventory �)-5����)�'�+0�0-���)��������� �+�'��)��6��Coburg has about 650 acres within the current Urban Growth Boundary (UGB). Of this, about 551 acres (about 85 percent) are in tax lots; the remaining lands are in public right-of-ways—primarily streets and parks. The City has about 112.5 acres of buildable commercial, industrial, and residential land within its UGB. Table 1.2 summarizes the buildable land inventory.
��&������:�%�����&���'��������!�
�����0�#�*������� ����#�
2��##�������
����#�
��&�����&��������#�
���#�������0��������
����#�
������2��##����#�
��&����"��������#�'����
0���������;����#<�
������+�������#�
���9������%�����&��� �9
��=���� ��������#�
��/��������#�
������%�����&�������#�
Traditional Residential 170.6 51.9 4.4 0 47.5 8.2 $>�$�(4
units) 1.6 (8�>�
Central Business District 15.0 4.5 0.2 0 4.3 0.3 (�8�
1.0(7
units) ,�8�
Highway Commercial 93.3 35.5 0 8.5 27 4.7 ���$� 15.9 $4���
Light Industrial 193.1 21.1 1.2 0 19.9 3.7 �.��� 12.2 �4�(�
������ (1�� ��$� ,�4 4�, >4�1� �.�> 4��4� �>�����. ����,

42010 Coburg Urbanization Study
Housing Needs Analysis�)-5����)� ��0�+���'�'�+0�0-���)�������)����-����-��-0���� ��0�+���'�2 -5�)6��The purpose of the residential buildable lands inventory is to estimate the capacity of buildable land in dwelling units. The capacity of residential land is measured in dwelling units and is dependent on densities allowed in specific zones as well as redevelopment potential. In short, land capacity is a function of buildable land and density.����The buildable lands inventory indicates that there are currently 170.6 total acres of residential lands within Coburg’s UGB, of which 168 acres are designated Traditional Residential (TR) (a lower density district that includes the many historically significant parcels in Coburg) and 2.6 acres are designated as Traditional Medium Density Residential (TMR). The total number of buildable acres in Coburg’s UGB is 40.9. That includes 38.3 acres of buildable TR zoned land, and 2.6 acres of buildable TMR zoned land.
The Central Business District zone (C-I) allows residential uses, both as part of a mixed-use development and as a stand-alone use. Single-family uses require road frontage, while residential uses in a mixed-use context are allowed above or behind a commercial use. This zone, therefore, allows both residential and non-residential uses. For the purposes of this Study, it is assumed that approximately seven residential units will be incorporated into the property located within the CBD that is anticipated to redevelop in the form of upper floor units; this unit count is based upon the overall density of 6.5 dwelling units per net acre for new housing that is established in the Comprehensive Plan.
Table 1.3 provides a gross estimate of how much housing could be accommodated by those lands based on permitted densities after making deductions for public facilities.
��&�����$� �#����������������!��
0�=���� ������������� �
'�����#�� 0��#��!� ����#�0?�����*�����#�
;0�<�Traditional Residential 4.8 du/acre 38.3 183Traditional Medium Residential
10 du/acre 2.6 26
Central Business District
5.0 7
������ � (,�>� ��.���)-5����)�)-��+2�5�''��)�������+��06�The starting point in the housing needs analysis is to project the number of new housing units needed during the planning period.
As shown in Table 1.4, the assumptions translate into an estimated need for 888 new housing units to accommodate the coordinated population forecast for Coburg.

52010 Coburg Urbanization Study
��&�����(���##� �����#��#���/���"�����#���/�+�?�)��#��*�����#7��8�89�8$8�Coordinated Population Forecast for 2030 = 3,363Less Population in 2010 - 1,103Equals new persons, 2010-2030 = 2,260Less new persons in group quarters - 50Equals new persons in households, 2010-2030 = 2,210Divided by average household size � 2.64 persons/householdEquals new occupied housing units = 838Plus vacancy factor (4.87%) + 41Plus dwelling units to replace existing units in commercial/industrial zoned properties
+ 9
Equals new housing units needed, 2010-2030 = 888Estimated annual dwelling units = Approximately 44 units/year
Coburg will need to provide about 888 dwelling units to accommodate growth between 2010 and 2030. The existing capacity is not sufficient to meet this demand.
5)���5�''��-%� 2�+��0��-�0-��-��+� ���)���)-��+2������'�%'���-��''��2��+��-"��)���-���+���6�The Urbanization Report also provides an estimate of the need for housing by income and housing type. At a local level, the Study finds that there is an imbalance between the demand for and supply of workforce housing in Coburg and a mismatch between housing prices and household incomes.
Key findings include:
� Growth in housing units has been relatively stagnant. This can largely be attributed to land use constraints resulting froma lack of a wastewater system. As a result, growth in demand for workforce housing has been outpacing the production of units.
� New housing units have been composed of single-family detached units on large lots, which have amplified the cost of new housing units within the City. Because the City has been functioning on septic systems which require extensive drainfields, most smaller lots have not been possible.
� Despite a 2008-2009 steep downturn in the national/regional housing market, home prices have been rising in Coburg. While household income has generally increased, it has not kept pace with housing prices or rents. As a result, new housing units are less affordable for most members of Coburg’s workforce.
To understand the types and density of housing that would be affordable in Coburg, staff used a Housing Needs Model designed by demographer and housing specialist Richard Bjelland.2 The model’s primary benefit is to quantify needed housing and associated land requirements based on community demographics. These demographics include age of householder, household income, and tenure choices. The model provides the user with the number of needed units by tenure, price, and rent assuming each household in the community will find housing it can afford.
One of the major inputs into the Housing Needs Model is anticipated future community demographics. Demographics such as household age, relative income and tenure are
2 Bjelland Consulting

62010 Coburg Urbanization Study
estimated to be consistent with current trends, with relative growth anticipated in younger families (20-44) and seniors (over 65) as compared to the period between 1990-2000.
These demographic inputs are used to generate assumptions on the number of housing units needed by age group, income, and tenure. It is anticipated that key housing needs are for lower income households, young families, senior citizens, and local workers. In general, the model highlights the following anticipated needs and trends:
� A growth in multifamily development to better match expected demographic and income trends.
� A need for higher density, smaller-lot single family detached or attached residential development to better match expected demographic and income trends.
� A continued need for traditional single-family residential development. � A growth in the rental housing market in Coburg. � Increased opportunities for ownership of units other than single-family homes.
The Housing Needs Model uses 1999 dollars (to correspond with available Census data for the City of Coburg) and contemplates the following housing types in Coburg: (1) single family units (including individual manufactured dwelling units), (2) manufactured dwelling park units, (3) duplex units, and (4) triplex and fourplex units. Larger multifamily complexes (containing 5+ dwelling units) were not included as a future housing type as part of the study due to policy guidance provided by the City of Coburg.
These housing needs will require a variety of housing types and densities, as follows:
��&�����,����&��*���������)��#��*���3�New persons, 2010-2030 2,260Housing units needed, 2010-2030 888Housing Mix, 2010-2030
Single-family (including manufactured homes on lots)
560 (63.1%)
Manufactured dwelling park units 0Duplexes/attached single-family housing 142 (16 percent) 3 & 4 Unit Multifamily 186 (20.9 percent)
5)����)�+2��� ��+��0�0��+��� �+��0��'-���+�� �2�'���-+��-�������)��0���+06�
To classify different types of development, DLCD3 has categorized typical residential development into three different density ranges. In this scheme, Low Density Residential (LDR) traditionally consists of density ranges between 2 and 6 dwelling units per acre. Medium Density Residential (MDR) traditionally consists of density ranges between 6 and 12 dwelling units per acre. And finally, High Density Residential (HDR) traditionally consists of density ranges above 12 dwelling units per acre.
Coburg’s current residential zoning consists mainly of what would be considered LDR, Low Density Residential. Coburg’s LDR equivalent is its Traditional Residential (TR) zone. The
3 Safe Harbor Goal 14 (OAR 660-024-0040)
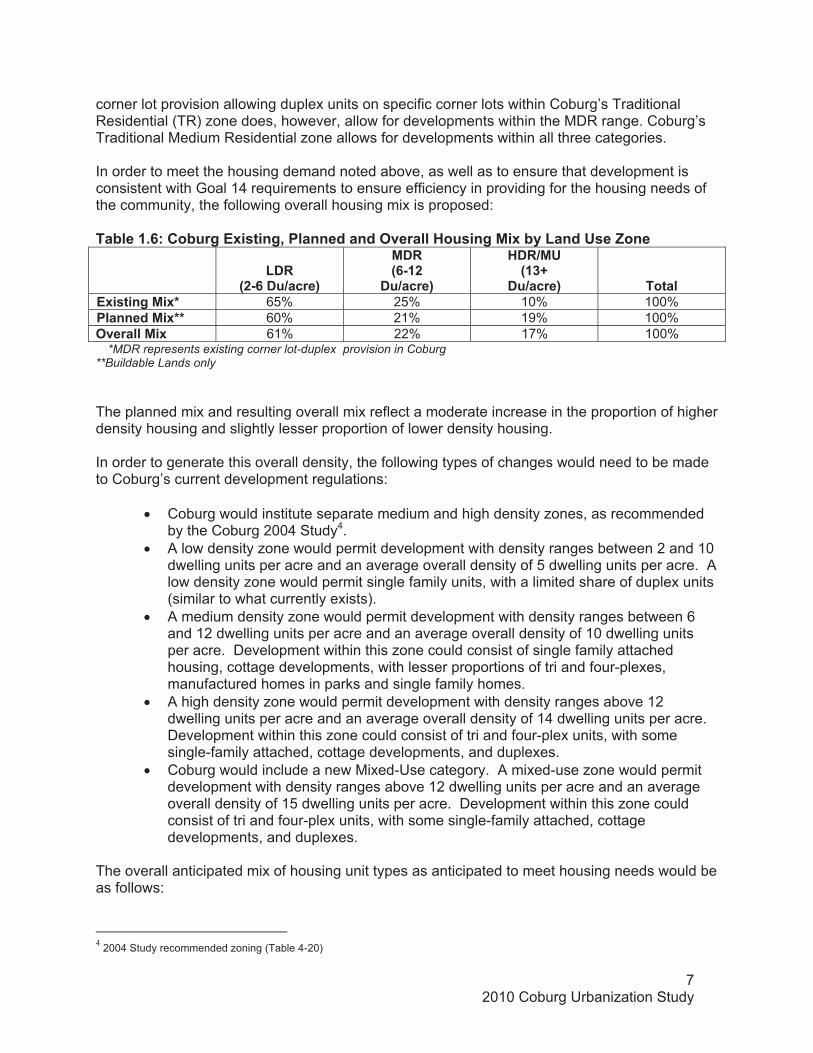
72010 Coburg Urbanization Study
corner lot provision allowing duplex units on specific corner lots within Coburg’s Traditional Residential (TR) zone does, however, allow for developments within the MDR range. Coburg’s Traditional Medium Residential zone allows for developments within all three categories.
In order to meet the housing demand noted above, as well as to ensure that development is consistent with Goal 14 requirements to ensure efficiency in providing for the housing needs of the community, the following overall housing mix is proposed:
��&�����.:���&��*��3�#���*7�������������-=������)��#��*���3�&!�'�����#��@���
'0 �;�9.�0�A����<�
�0 �;.9���0�A����<�
)0 A���;�$B�
0�A����<� �������3�#���*���3C� 65% 25% 10% 100% ����������3CC� 60% 21% 19% 100% -=��������3�� 61% 22% 17% 100%
*MDR represents existing corner lot-duplex provision in Coburg **Buildable Lands only
The planned mix and resulting overall mix reflect a moderate increase in the proportion of higher density housing and slightly lesser proportion of lower density housing.
In order to generate this overall density, the following types of changes would need to be made to Coburg’s current development regulations:
� Coburg would institute separate medium and high density zones, as recommended by the Coburg 2004 Study4.
� A low density zone would permit development with density ranges between 2 and 10 dwelling units per acre and an average overall density of 5 dwelling units per acre. A low density zone would permit single family units, with a limited share of duplex units (similar to what currently exists).
� A medium density zone would permit development with density ranges between 6 and 12 dwelling units per acre and an average overall density of 10 dwelling units per acre. Development within this zone could consist of single family attached housing, cottage developments, with lesser proportions of tri and four-plexes, manufactured homes in parks and single family homes.
� A high density zone would permit development with density ranges above 12 dwelling units per acre and an average overall density of 14 dwelling units per acre. Development within this zone could consist of tri and four-plex units, with some single-family attached, cottage developments, and duplexes.
� Coburg would include a new Mixed-Use category. A mixed-use zone would permit development with density ranges above 12 dwelling units per acre and an average overall density of 15 dwelling units per acre. Development within this zone could consist of tri and four-plex units, with some single-family attached, cottage developments, and duplexes.
The overall anticipated mix of housing unit types as anticipated to meet housing needs would be as follows:
4 2004 Study recommended zoning (Table 4-20)
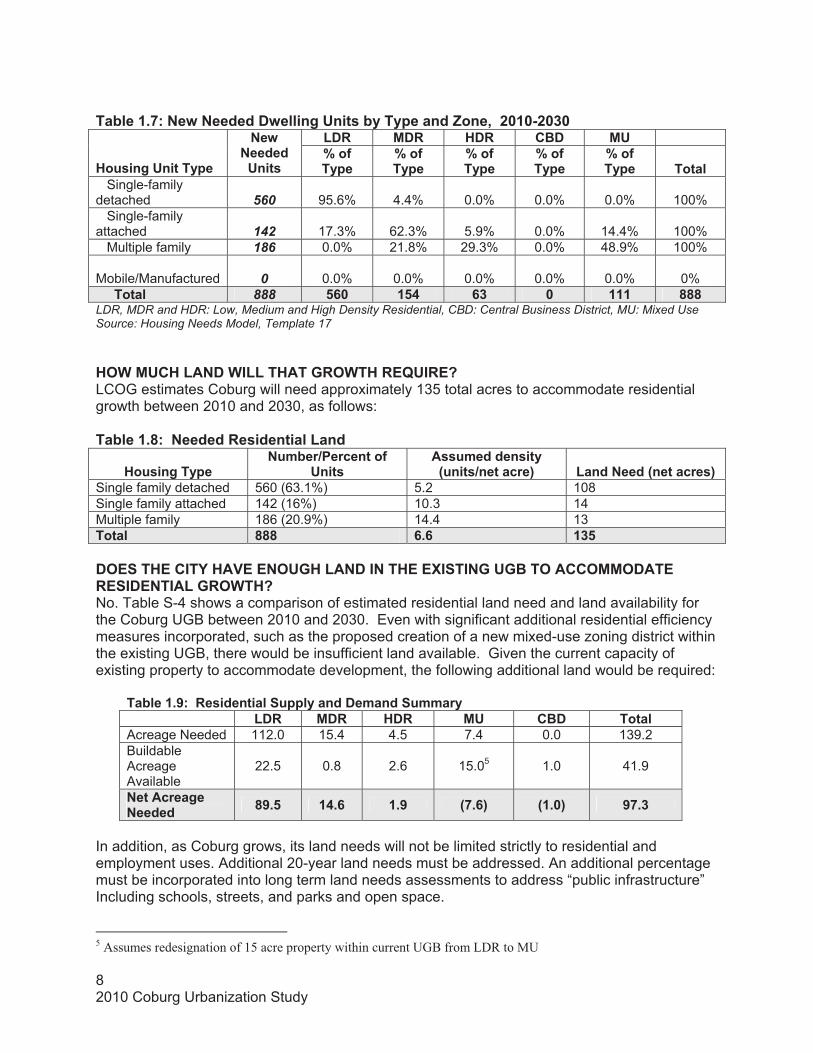
82010 Coburg Urbanization Study
��&�����1:�+�?�+������0?�����*�����#�&!��!�������@���7���8�89�8$8�'0 � �0 � )0 � �%0� ��� �
)��#��*�������!���
+�?�+����������#�
D��/��!���
D��/��!���
D��/��!���
D��/��!���
D��/��!��� ������
Single-family detached 560 95.6% 4.4% 0.0% 0.0% 0.0% 100% Single-family attached 142 17.3% 62.3% 5.9% 0.0% 14.4% 100% Multiple family 186 0.0% 21.8% 29.3% 0.0% 48.9% 100%
Mobile/Manufactured 0 0.0% 0.0% 0.0% 0.0% 0.0% 0% ������������ 888 ,.8� �,(� .$� 8� ���� 444�LDR, MDR and HDR: Low, Medium and High Density Residential, CBD: Central Business District, MU: Mixed Use Source: Housing Needs Model, Template 17
�)-5����)�'�+0�5�''��)���2 -5�)� �E�� �6�LCOG estimates Coburg will need approximately 135 total acres to accommodate residential growth between 2010 and 2030, as follows:
��&�����4:��+������ �#���������'����
)��#��*��!���+� &��A���������/�
����#��##� ������#��!�;����#A��������<� '����+����;��������#<�
Single family detached 560 (63.1%) 5.2 108Single family attached 142 (16%) 10.3 14Multiple family 186 (20.9%) 14.4 13������ 444� .�.� �$,�
0-���)�������)����+-�2)�'�+0��+��)�������+2��2%��-����-��-0���� ��0�+���'�2 -5�)6No. Table S-4 shows a comparison of estimated residential land need and land availability for the Coburg UGB between 2010 and 2030. Even with significant additional residential efficiency measures incorporated, such as the proposed creation of a new mixed-use zoning district within the existing UGB, there would be insufficient land available. Given the current capacity of existing property to accommodate development, the following additional land would be required:
��&�����>:�� �#�������������!�����0� ����� ��!�� '0 � �0 � )0 � ��� �%0� ������
Acreage Needed 112.0 15.4 4.5 7.4 0.0 139.2 BuildableAcreage Available
22.5 0.8 2.6 15.05 1.0 41.9
+��������*��+������ 4>�,� �(�.� ��>� ;1�.<� ;��8<� >1�$�
In addition, as Coburg grows, its land needs will not be limited strictly to residential and employment uses. Additional 20-year land needs must be addressed. An additional percentage must be incorporated into long term land needs assessments to address “public infrastructure” Including schools, streets, and parks and open space.
5 Assumes redesignation of 15 acre property within current UGB from LDR to MU
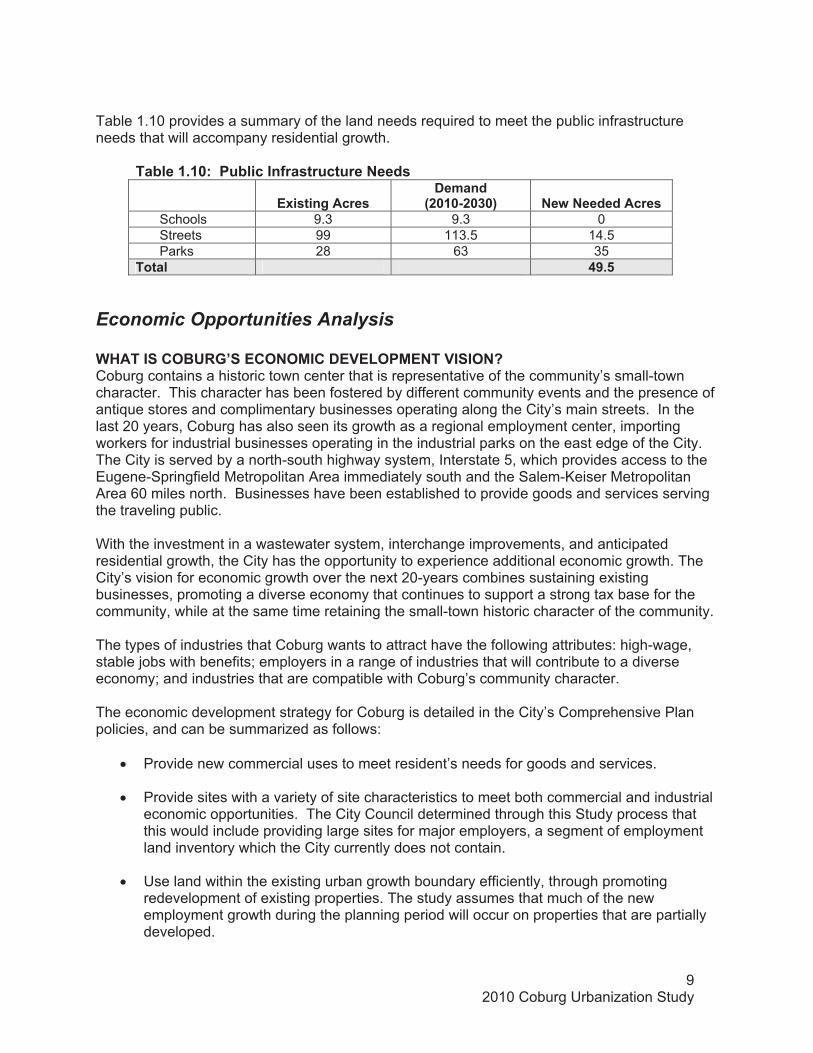
92010 Coburg Urbanization Study
Table 1.10 provides a summary of the land needs required to meet the public infrastructure needs that will accompany residential growth.
��&������8:����&������/��#���������+���#�
�3�#���*�����#�0� ����;�8�89�8$8<� +�?�+����������#�
Schools 9.3 9.3 0 Streets 99 113.5 14.5 Parks 28 63 35
������ � � (>�,�
Economic Opportunities Analysis �5)������-%� 2F���-+-����0��'-���+����-+6Coburg contains a historic town center that is representative of the community’s small-town character. This character has been fostered by different community events and the presence of antique stores and complimentary businesses operating along the City’s main streets. In the last 20 years, Coburg has also seen its growth as a regional employment center, importing workers for industrial businesses operating in the industrial parks on the east edge of the City. The City is served by a north-south highway system, Interstate 5, which provides access to the Eugene-Springfield Metropolitan Area immediately south and the Salem-Keiser Metropolitan Area 60 miles north. Businesses have been established to provide goods and services serving the traveling public. �
With the investment in a wastewater system, interchange improvements, and anticipated residential growth, the City has the opportunity to experience additional economic growth. The City’s vision for economic growth over the next 20-years combines sustaining existing businesses, promoting a diverse economy that continues to support a strong tax base for the community, while at the same time retaining the small-town historic character of the community.
The types of industries that Coburg wants to attract have the following attributes: high-wage, stable jobs with benefits; employers in a range of industries that will contribute to a diverse economy; and industries that are compatible with Coburg’s community character.
The economic development strategy for Coburg is detailed in the City’s Comprehensive Plan policies, and can be summarized as follows:
�� Provide new commercial uses to meet resident’s needs for goods and services.
� Provide sites with a variety of site characteristics to meet both commercial and industrial economic opportunities. The City Council determined through this Study process that this would include providing large sites for major employers, a segment of employment land inventory which the City currently does not contain.
� Use land within the existing urban growth boundary efficiently, through promoting redevelopment of existing properties. The study assumes that much of the new employment growth during the planning period will occur on properties that are partially developed.
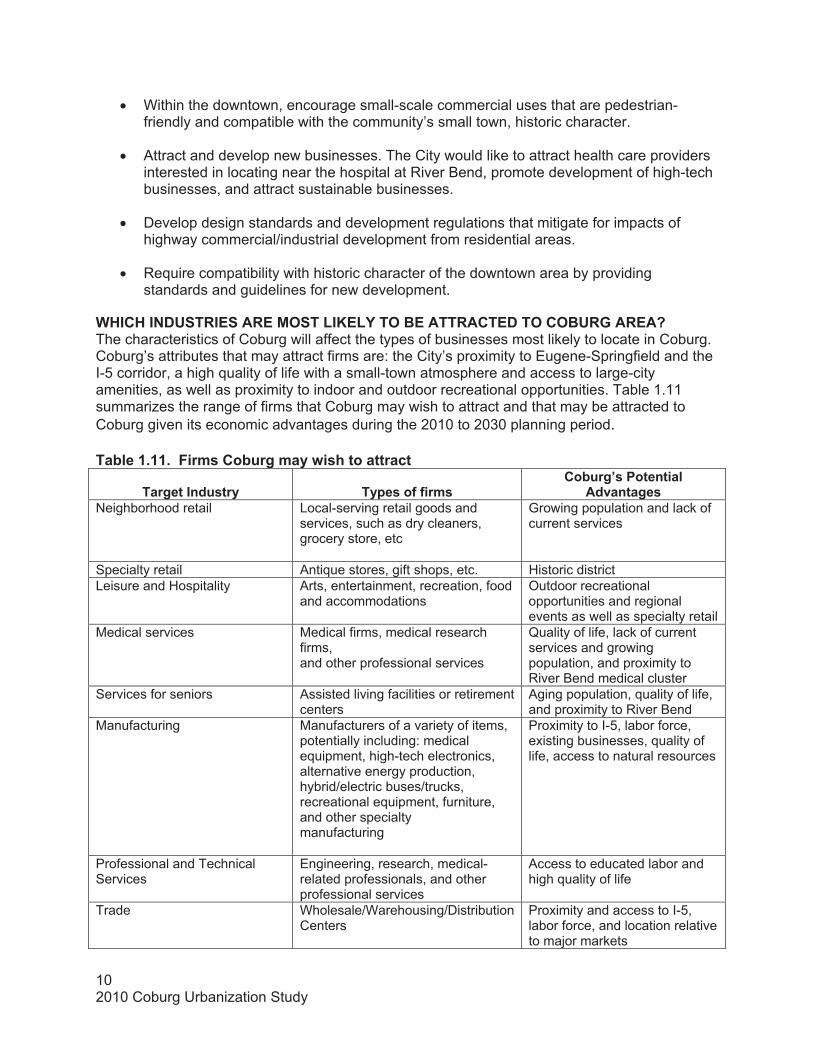
102010 Coburg Urbanization Study
� Within the downtown, encourage small-scale commercial uses that are pedestrian-friendly and compatible with the community’s small town, historic character.
� Attract and develop new businesses. The City would like to attract health care providers interested in locating near the hospital at River Bend, promote development of high-tech businesses, and attract sustainable businesses.
� Develop design standards and development regulations that mitigate for impacts of highway commercial/industrial development from residential areas.
� Require compatibility with historic character of the downtown area by providing standards and guidelines for new development.
5)��)��+0�� ���� ���-��'�G�'���-�%����� ����0��-��-%� 2�� ��6�The characteristics of Coburg will affect the types of businesses most likely to locate in Coburg. Coburg’s attributes that may attract firms are: the City’s proximity to Eugene-Springfield and the I-5 corridor, a high quality of life with a small-town atmosphere and access to large-city amenities, as well as proximity to indoor and outdoor recreational opportunities. Table 1.11 summarizes the range of firms that Coburg may wish to attract and that may be attracted to Coburg given its economic advantages during the 2010 to 2030 planning period.
��&����������"�� #���&��*� �!�?�#�������������
���*�������#��! �!��#��/�/�� #��&��*F#�������������=����*�#
Neighborhood retail Local-serving retail goods and services, such as dry cleaners, grocery store, etc
Growing population and lack of current services
Specialty retail Antique stores, gift shops, etc. Historic district Leisure and Hospitality Arts, entertainment, recreation, food
and accommodations Outdoor recreational opportunities and regional events as well as specialty retail
Medical services Medical firms, medical research firms, and other professional services
Quality of life, lack of current services and growing population, and proximity to River Bend medical cluster
Services for seniors Assisted living facilities or retirement centers
Aging population, quality of life, and proximity to River Bend
Manufacturing Manufacturers of a variety of items, potentially including: medical equipment, high-tech electronics, alternative energy production, hybrid/electric buses/trucks, recreational equipment, furniture, and other specialty manufacturing �
Proximity to I-5, labor force, existing businesses, quality of life, access to natural resources
Professional and Technical Services
Engineering, research, medical-related professionals, and other professional services�
Access to educated labor and high quality of life�
Trade Wholesale/Warehousing/Distribution Centers�
Proximity and access to I-5, labor force, and location relative to major markets�
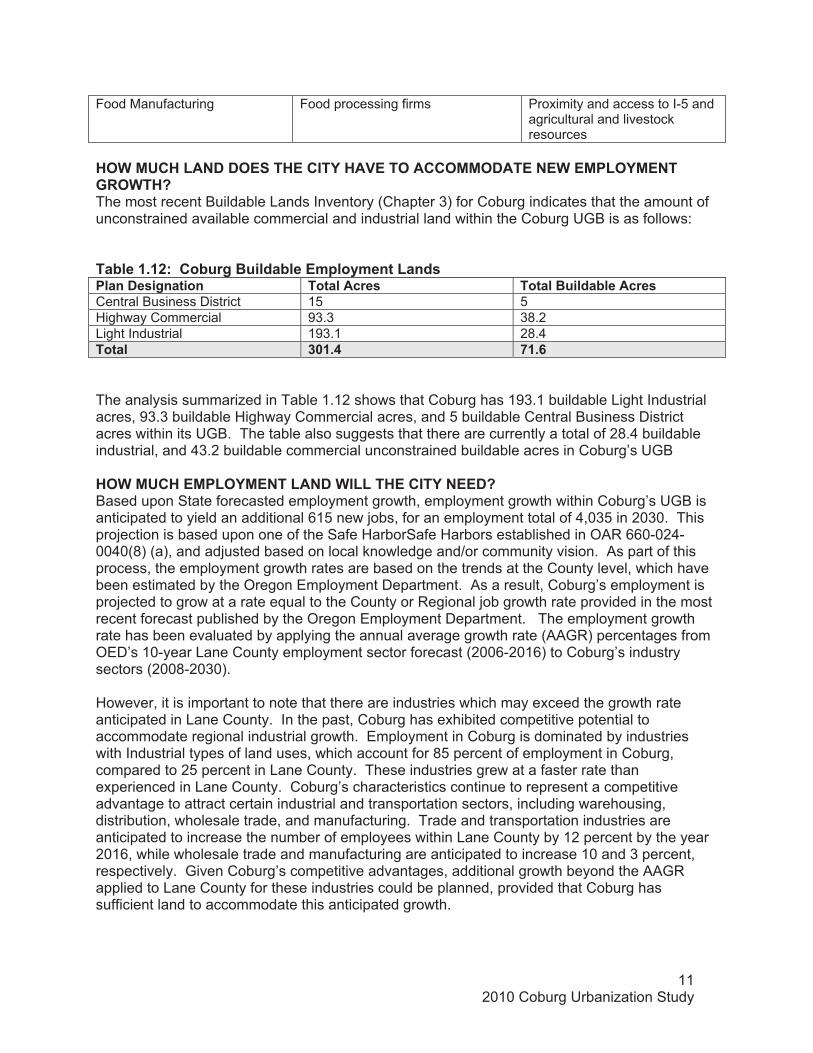
112010 Coburg Urbanization Study
Food Manufacturing Food processing firms Proximity and access to I-5 and agricultural and livestock resources
�)-5����)�'�+0�0-���)�������)����-����-��-0����+�5����'-���+��2 -5�)6�The most recent Buildable Lands Inventory (Chapter 3) for Coburg indicates that the amount of unconstrained available commercial and industrial land within the Coburg UGB is as follows:
��&�������:����&��*�%�����&���� ���! ����'���#������0�#�*������� ����������#� ������%�����&�������#�Central Business District 15 5Highway Commercial 93.3 38.2Light Industrial 193.1 28.4������ $8��(� 1��.�
The analysis summarized in Table 1.12 shows that Coburg has 193.1 buildable Light Industrial acres, 93.3 buildable Highway Commercial acres, and 5 buildable Central Business District acres within its UGB. The table also suggests that there are currently a total of 28.4 buildable industrial, and 43.2 buildable commercial unconstrained buildable acres in Coburg’s UGB
)-5����)����'-���+��'�+0�5�''��)�������+��06�Based upon State forecasted employment growth, employment growth within Coburg’s UGB is anticipated to yield an additional 615 new jobs, for an employment total of 4,035 in 2030. This projection is based upon one of the Safe HarborSafe Harbors established in OAR 660-024-0040(8) (a), and adjusted based on local knowledge and/or community vision. As part of this process, the employment growth rates are based on the trends at the County level, which have been estimated by the Oregon Employment Department. As a result, Coburg’s employment is projected to grow at a rate equal to the County or Regional job growth rate provided in the most recent forecast published by the Oregon Employment Department. The employment growth rate has been evaluated by applying the annual average growth rate (AAGR) percentages from OED’s 10-year Lane County employment sector forecast (2006-2016) to Coburg’s industry sectors (2008-2030).
However, it is important to note that there are industries which may exceed the growth rate anticipated in Lane County. In the past, Coburg has exhibited competitive potential to accommodate regional industrial growth. Employment in Coburg is dominated by industries with Industrial types of land uses, which account for 85 percent of employment in Coburg, compared to 25 percent in Lane County. These industries grew at a faster rate than experienced in Lane County. Coburg’s characteristics continue to represent a competitive advantage to attract certain industrial and transportation sectors, including warehousing, distribution, wholesale trade, and manufacturing. Trade and transportation industries are anticipated to increase the number of employees within Lane County by 12 percent by the year 2016, while wholesale trade and manufacturing are anticipated to increase 10 and 3 percent, respectively. Given Coburg’s competitive advantages, additional growth beyond the AAGR applied to Lane County for these industries could be planned, provided that Coburg has sufficient land to accommodate this anticipated growth. ��
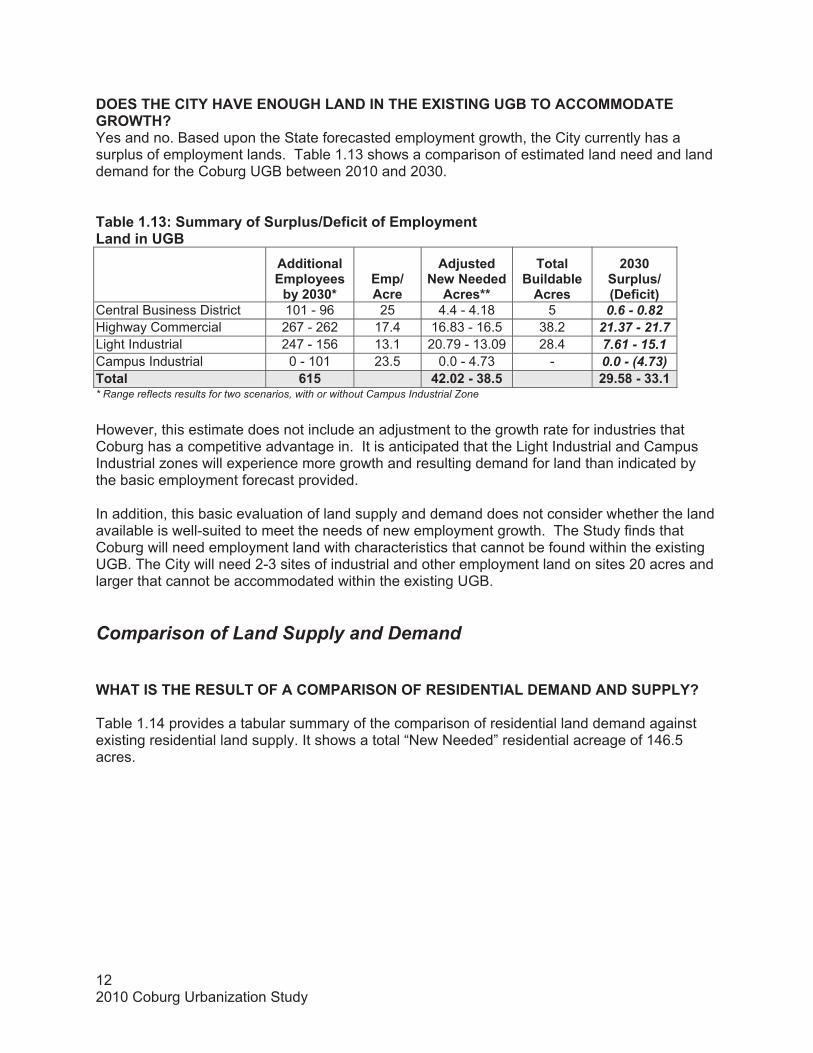
122010 Coburg Urbanization Study
0-���)�������)����+-�2)�'�+0��+��)�������+2��2%��-����-��-0����2 -5�)6�Yes and no. Based upon the State forecasted employment growth, the City currently has a surplus of employment lands. Table 1.13 shows a comparison of estimated land need and land demand for the Coburg UGB between 2010 and 2030.
��&������$:�� ��!��/������#A0�/������/�� ���! ����'��������2%�
�
�
������������ ���!��#�&!��8$8C�
� �A������
��H�#����+�?�+����������#CC�
������%�����&�������#�
�8$8������#A�;0�/����<�
Central Business District 101 - 96 25 4.4 - 4.18 5 0.6 - 0.82 Highway Commercial 267 - 262 17.4 16.83 - 16.5 38.2 21.37 - 21.7Light Industrial 247 - 156 13.1 20.79 - 13.09 28.4 7.61 - 15.1 Campus Industrial 0 - 101 23.5 0.0 - 4.73 - 0.0 - (4.73) ������ .�,� (��8��9�$4�,� � �>�,4�9�$$��* Range reflects results for two scenarios, with or without Campus Industrial Zone
However, this estimate does not include an adjustment to the growth rate for industries that Coburg has a competitive advantage in. It is anticipated that the Light Industrial and Campus Industrial zones will experience more growth and resulting demand for land than indicated by the basic employment forecast provided.
In addition, this basic evaluation of land supply and demand does not consider whether the land available is well-suited to meet the needs of new employment growth. The Study finds that Coburg will need employment land with characteristics that cannot be found within the existing UGB. The City will need 2-3 sites of industrial and other employment land on sites 20 acres and larger that cannot be accommodated within the existing UGB.
Comparison of Land Supply and Demand �
5)������)�� ��'��-"����-��� �-+�-"� ��0�+���'�0���+0��+0����'�6�
Table 1.14 provides a tabular summary of the comparison of residential land demand against existing residential land supply. It shows a total “New Needed” residential acreage of 146.5 acres.
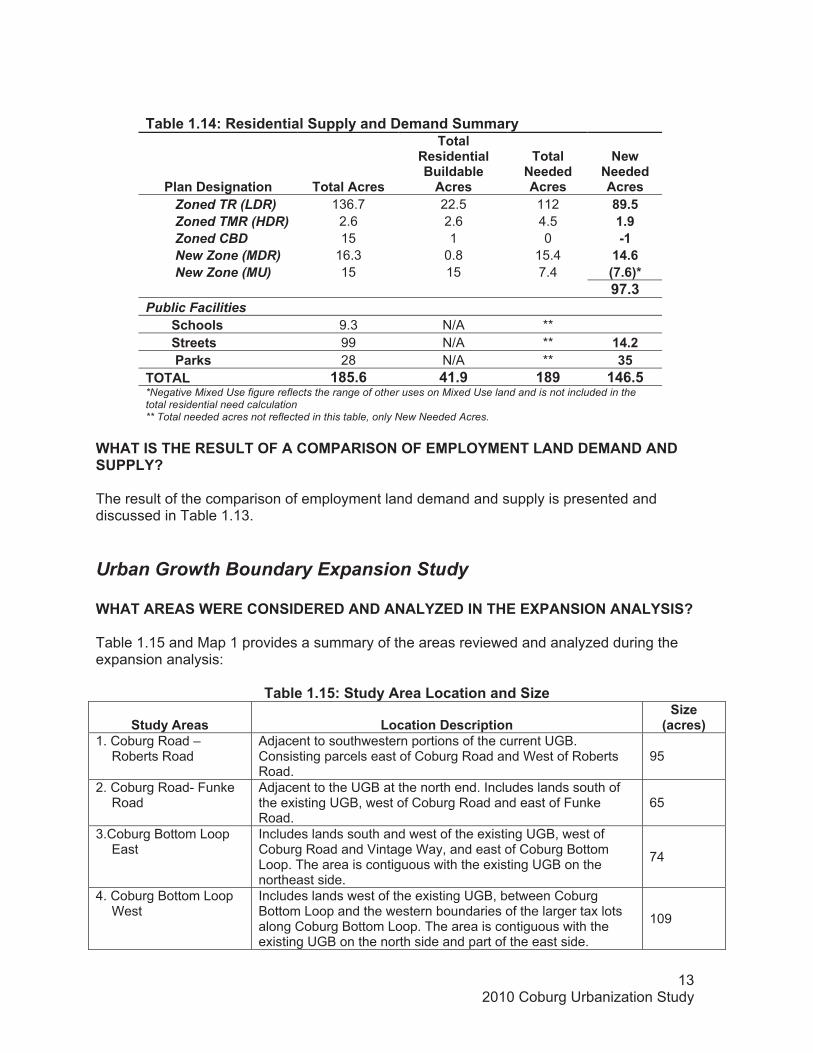
132010 Coburg Urbanization Study
��&������(:� �#�������������!�����0� ����� ��!�
�����0�#�*������� ����������#�
������ �#���������%�����&�������#�
�������+����������#�
+�?�+����������#�
Zoned TR (LDR) 136.7 22.5 112 4>�,� Zoned TMR (HDR) 2.6 2.6 4.5 ��>� Zoned CBD 15 1 0 9�� New Zone (MDR) 16.3 0.8 15.4 �(�.� New Zone (MU) 15 15 7.4 ;1�.<C�
>1�$�Public Facilities ������������#� 9.3 N/A ** �������������#�� 99 N/A ** �(��������������I#� 28 N/A ** $,��-��'�� �4,�.� (��>� �4>� �(.�,�*Negative Mixed Use figure reflects the range of other uses on Mixed Use land and is not included in the total residential need calculation** Total needed acres not reflected in this table, only New Needed Acres.
�5)������)�� ��'��-"����-��� �-+�-"����'-���+��'�+0�0���+0��+0����'�6�
The result of the comparison of employment land demand and supply is presented and discussed in Table 1.13.
Urban Growth Boundary Expansion Study �5)���� ���5� ���-+�0� �0��+0��+�'�@�0��+��)������+�-+��+�'��6�
Table 1.15 and Map 1 provides a summary of the areas reviewed and analyzed during the expansion analysis:
��&������,:����!������'�������������J�
���!�����#� '��������0�#����������J��;����#<�
1. Coburg Road –Roberts Road
Adjacent to southwestern portions of the current UGB. Consisting parcels east of Coburg Road and West of Roberts Road.
95
2. Coburg Road- Funke Road
Adjacent to the UGB at the north end. Includes lands south of the existing UGB, west of Coburg Road and east of Funke Road.
65
3.Coburg Bottom Loop East
Includes lands south and west of the existing UGB, west of Coburg Road and Vintage Way, and east of Coburg Bottom Loop. The area is contiguous with the existing UGB on the northeast side.
74
4. Coburg Bottom Loop West
Includes lands west of the existing UGB, between Coburg Bottom Loop and the western boundaries of the larger tax lots along Coburg Bottom Loop. The area is contiguous with the existing UGB on the north side and part of the east side.
109
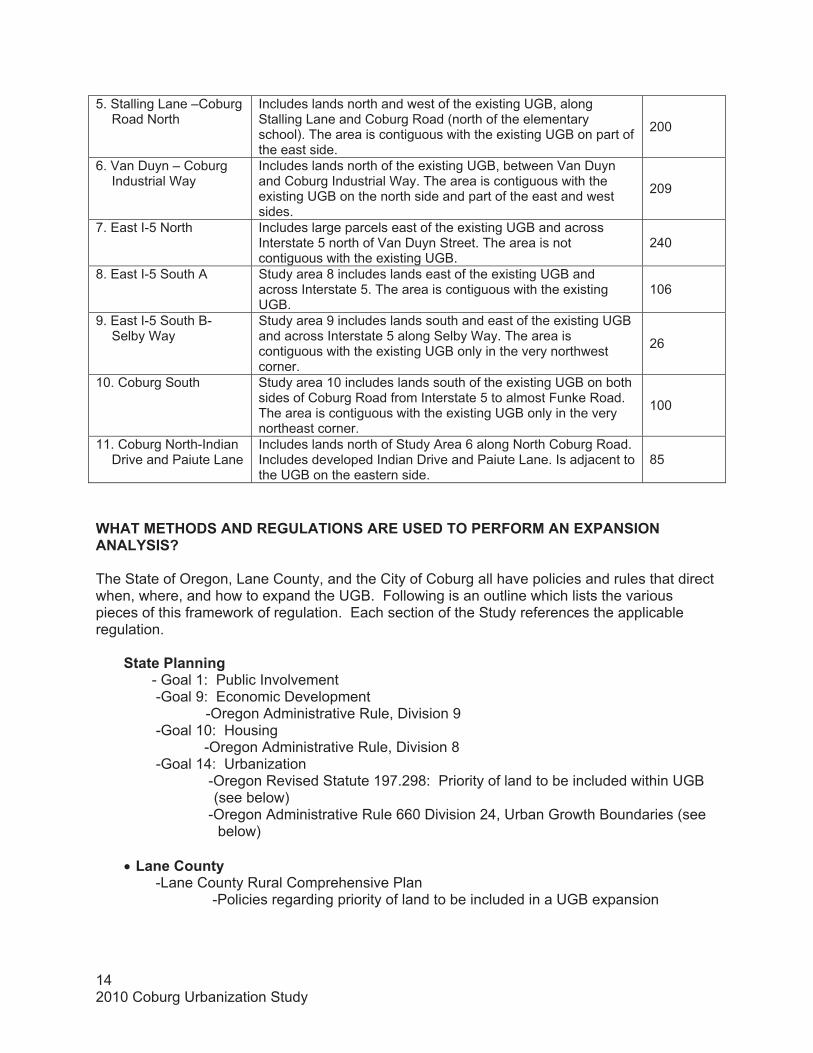
142010 Coburg Urbanization Study
5. Stalling Lane –Coburg Road North
Includes lands north and west of the existing UGB, along Stalling Lane and Coburg Road (north of the elementary school). The area is contiguous with the existing UGB on part of the east side.
200
6. Van Duyn – Coburg Industrial Way
Includes lands north of the existing UGB, between Van Duyn and Coburg Industrial Way. The area is contiguous with the existing UGB on the north side and part of the east and west sides.
209
7. East I-5 North Includes large parcels east of the existing UGB and across Interstate 5 north of Van Duyn Street. The area is not contiguous with the existing UGB.
240
8. East I-5 South A Study area 8 includes lands east of the existing UGB and across Interstate 5. The area is contiguous with the existing UGB.
106
9. East I-5 South B-Selby Way
Study area 9 includes lands south and east of the existing UGB and across Interstate 5 along Selby Way. The area is contiguous with the existing UGB only in the very northwest corner.
26
10. Coburg South Study area 10 includes lands south of the existing UGB on both sides of Coburg Road from Interstate 5 to almost Funke Road. The area is contiguous with the existing UGB only in the very northeast corner.
100
11. Coburg North-Indian Drive and Paiute Lane
Includes lands north of Study Area 6 along North Coburg Road. Includes developed Indian Drive and Paiute Lane. Is adjacent to the UGB on the eastern side.
85
5)������)-0��+0� �2�'���-+�� ����0��-��� "- ���+�����+�-+��+�'��6�
The State of Oregon, Lane County, and the City of Coburg all have policies and rules that direct when, where, and how to expand the UGB. Following is an outline which lists the various pieces of this framework of regulation. Each section of the Study references the applicable regulation.
������������* - Goal 1: Public Involvement
-Goal 9: Economic Development -Oregon Administrative Rule, Division 9
-Goal 10: Housing -Oregon Administrative Rule, Division 8 -Goal 14: Urbanization -Oregon Revised Statute 197.298: Priority of land to be included within UGB (see below) -Oregon Administrative Rule 660 Division 24, Urban Growth Boundaries (see below)
� '���������!� -Lane County Rural Comprehensive Plan -Policies regarding priority of land to be included in a UGB expansion
152010 Coburg Urbanization Study
� ���!��/���&��*� - Local Criteria (see below) �ORS 197.298—Expansion Priorities Analysis Oregon Revised Statute (ORS) 197.298 sets forth priorities for determining what types and areas of land should be considered for inclusion in an Urban Growth Boundary. These priorities serve as an initial guide in developing a study methodology. In the analysis each priority subsection is addressed to determine its relevance to this particular study and to identify what data and analytical approaches would be used to construct a basic expansion alternative evaluation.
1. Established Urban Reserves; 2. Exception land, and farm or forest land (other than high value farm land) surrounded
by exception land; 3. Marginal lands designated pursuant to ORS 197.247; 4. Farm and forest land.
The Study provides summary of the expansion study area and recommended expansion alternative selection process undertaken by staff per the language of ORS 197.298:
Oregon Administrative Rule 660 Division 24, Urban Growth Boundaries (Goal 14) outlines Urban Growth Boundary Location Factors 1-7. The purpose of statewide planning Goal 14 is to “provide for an orderly and efficient transition from rural to urban land use. To accomplish this, statewide planning Goal 14 establishes seven criteria of “location factors” for evaluating UGB expansions. These factors supplement the priorities analysis. They include:
Factor 1. Demonstrated need to accommodate long-range urban population growth requirements consistent with LCDC goals;
Factor 2. Need for housing, employment opportunities, and livability; Factor 3. Orderly and economic provision for public facilities and services; Factor 4. Maximum efficiency of land uses within and on the fringe of the existing urban
area.Factor 5. Environmental, energy, economic and social consequences. Factor 6. Retention of agricultural land as defined, with Class I being the highest priority for
retention and Class VI the lowest priority. Factor 7. Compatibility of the proposed urban uses with nearby agricultural activities.
Oregon Administrative Rule (OAR) 660-024-0060(1)(b) states the following:
If the amount of suitable land in the first priority category exceeds the amount necessary to satisfy the need deficiency, a local government must apply the location factors of Goal 14 to choose which land in that priority to include in the UGB.
Additionally, OAR 660-024-0060(8)(a-c) states the following:
(8) The Goal 14 boundary location determination requires evaluation and comparison of the relative costs, advantages and disadvantages of alternative UGB expansion areas with respect to the provision of public facilities and services needed to urbanize alternative boundary locations. This evaluation and comparison must be conducted in coordination with service providers, including the Oregon Department of Transportation
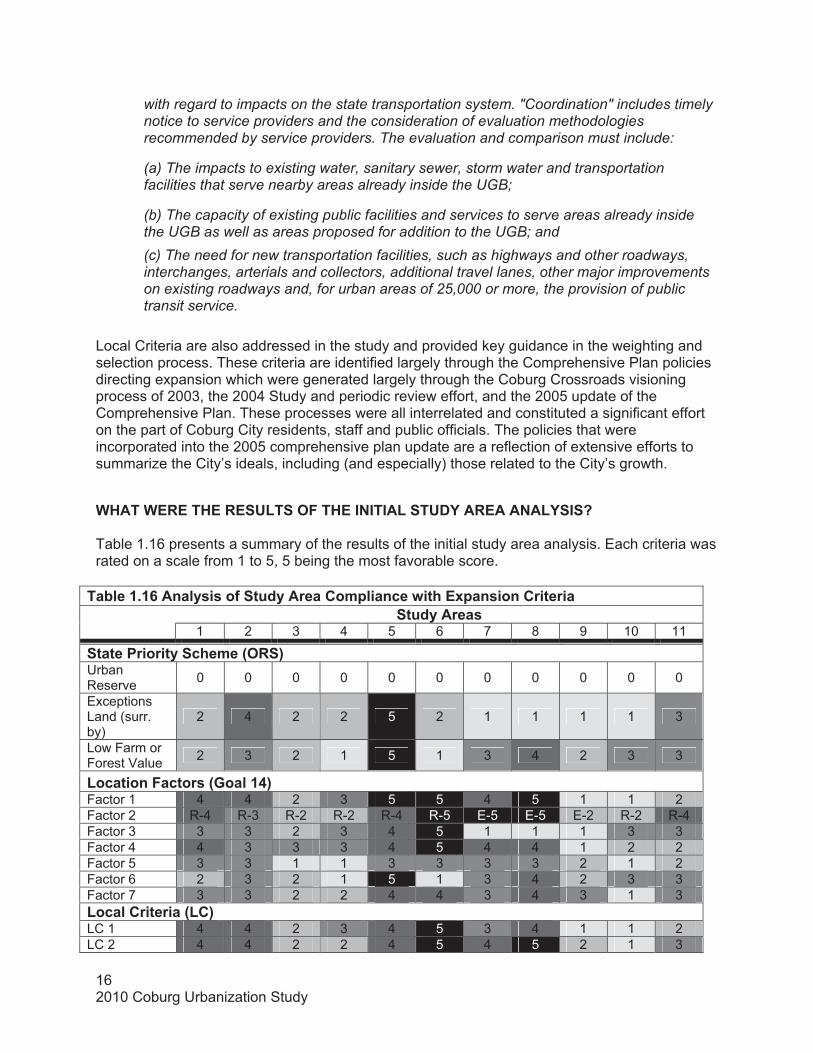
162010 Coburg Urbanization Study
with regard to impacts on the state transportation system. "Coordination" includes timely notice to service providers and the consideration of evaluation methodologies recommended by service providers. The evaluation and comparison must include:
(a) The impacts to existing water, sanitary sewer, storm water and transportation facilities that serve nearby areas already inside the UGB;
(b) The capacity of existing public facilities and services to serve areas already inside the UGB as well as areas proposed for addition to the UGB; and (c) The need for new transportation facilities, such as highways and other roadways, interchanges, arterials and collectors, additional travel lanes, other major improvements on existing roadways and, for urban areas of 25,000 or more, the provision of public transit service.
Local Criteria are also addressed in the study and provided key guidance in the weighting and selection process. These criteria are identified largely through the Comprehensive Plan policies directing expansion which were generated largely through the Coburg Crossroads visioning process of 2003, the 2004 Study and periodic review effort, and the 2005 update of the Comprehensive Plan. These processes were all interrelated and constituted a significant effort on the part of Coburg City residents, staff and public officials. The policies that were incorporated into the 2005 comprehensive plan update are a reflection of extensive efforts to summarize the City’s ideals, including (and especially) those related to the City’s growth. �5)���5� ���)�� ��'��-"��)���+����'���0��� ����+�'��6�
Table 1.16 presents a summary of the results of the initial study area analysis. Each criteria was rated on a scale from 1 to 5, 5 being the most favorable score.
��&������.�����!#�#��/����!�������� ��������?�����3���#����������������!�����#�
1 2 3 4 5 6 7 8 9 10 11
������������!���� ��;- <�Urban Reserve 0 0 0 0 0 0 0 0 0 0 0
Exceptions Land (surr. by)
2 4 2 2 5 2 1 1 1 1 3
Low Farm or Forest Value 2 3 2 1 5 1 3 4 2 3 3
'��������"�����#�;2�����(<�Factor 1 4 4 2 3 5 5 4 5 1 1 2Factor 2 R-4 R-3 R-2 R-2 R-4 R-5 E-5 E-5 E-2 R-2 R-4Factor 3 3 3 2 3 4 5 1 1 1 3 3Factor 4 4 3 3 3 4 5 4 4 1 2 2Factor 5 3 3 1 1 3 3 3 3 2 1 2Factor 6 2 3 2 1 5 1 3 4 2 3 3Factor 7 3 3 2 2 4 4 3 4 3 1 3'��������������;'�<�LC 1 4 4 2 3 4 5 3 4 1 1 2LC 2 4 4 2 2 4 5 4 5 2 1 3
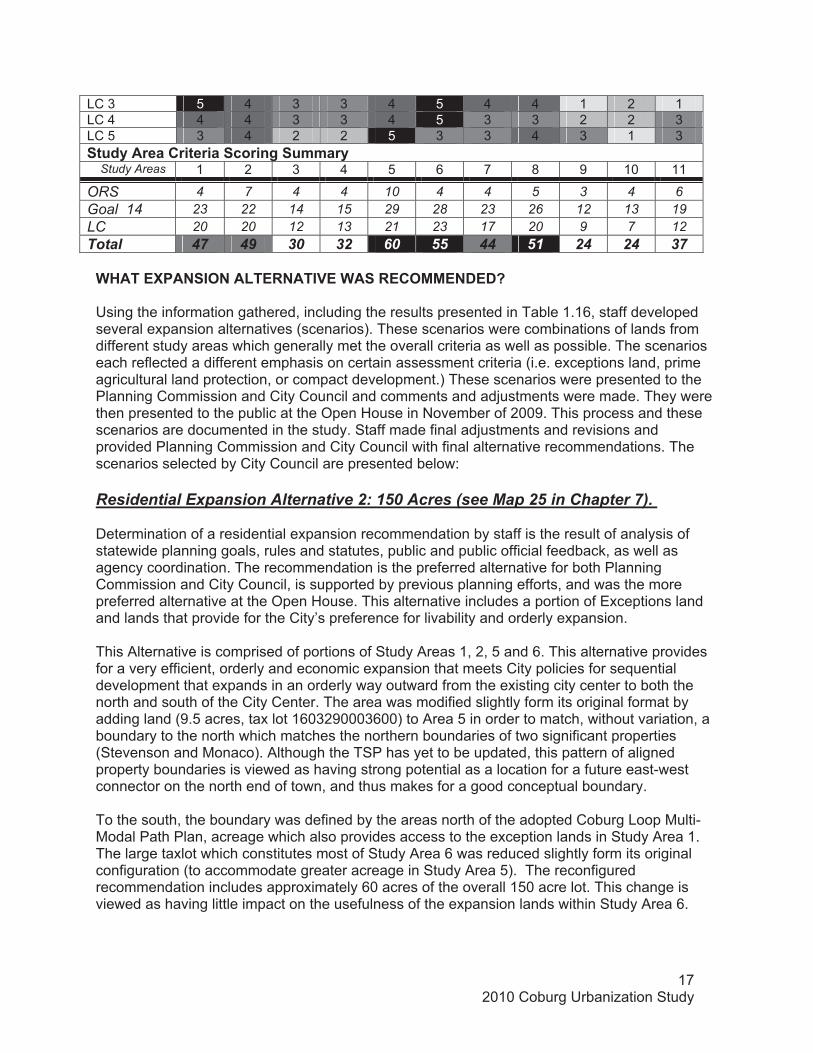
172010 Coburg Urbanization Study
LC 3 5 4 3 3 4 5 4 4 1 2 1LC 4 4 4 3 3 4 5 3 3 2 2 3LC 5 3 4 2 2 5 3 3 4 3 1 3���!��������������������*�� ��!�� Study Areas 1 2 3 4 5 6 7 8 9 10 11
ORS 4 7 4 4 10 4 4 5 3 4 6Goal 14 23 22 14 15 29 28 23 26 12 13 19LC 20 20 12 13 21 23 17 20 9 7 12Total 47 49 30 32 60 55 44 51 24 24 37
5)�������+�-+��'�� +�����5�� ��-���+0�06��
Using the information gathered, including the results presented in Table 1.16, staff developed several expansion alternatives (scenarios). These scenarios were combinations of lands from different study areas which generally met the overall criteria as well as possible. The scenarios each reflected a different emphasis on certain assessment criteria (i.e. exceptions land, prime agricultural land protection, or compact development.) These scenarios were presented to the Planning Commission and City Council and comments and adjustments were made. They were then presented to the public at the Open House in November of 2009. This process and these scenarios are documented in the study. Staff made final adjustments and revisions and provided Planning Commission and City Council with final alternative recommendations. The scenarios selected by City Council are presented below:
Residential Expansion Alternative 2: 150 Acres (see Map 25 in Chapter 7). �
Determination of a residential expansion recommendation by staff is the result of analysis of statewide planning goals, rules and statutes, public and public official feedback, as well as agency coordination. The recommendation is the preferred alternative for both Planning Commission and City Council, is supported by previous planning efforts, and was the more preferred alternative at the Open House. This alternative includes a portion of Exceptions land and lands that provide for the City’s preference for livability and orderly expansion.
This Alternative is comprised of portions of Study Areas 1, 2, 5 and 6. This alternative provides for a very efficient, orderly and economic expansion that meets City policies for sequential development that expands in an orderly way outward from the existing city center to both the north and south of the City Center. The area was modified slightly form its original format by adding land (9.5 acres, tax lot 1603290003600) to Area 5 in order to match, without variation, a boundary to the north which matches the northern boundaries of two significant properties (Stevenson and Monaco). Although the TSP has yet to be updated, this pattern of aligned property boundaries is viewed as having strong potential as a location for a future east-west connector on the north end of town, and thus makes for a good conceptual boundary.
To the south, the boundary was defined by the areas north of the adopted Coburg Loop Multi-Modal Path Plan, acreage which also provides access to the exception lands in Study Area 1. The large taxlot which constitutes most of Study Area 6 was reduced slightly form its original configuration (to accommodate greater acreage in Study Area 5). The reconfigured recommendation includes approximately 60 acres of the overall 150 acre lot. This change is viewed as having little impact on the usefulness of the expansion lands within Study Area 6.
182010 Coburg Urbanization Study
Alternative 2 is comprised of a larger percentage of resource lands than Alternative 1, but includes significant acreage of exceptions land. An additional north-south transportation connector may be needed to better distribute traffic coming from the northern residential development under this alternative. This alternative is predominately comprised of Class II soils, with some Class I and Class IV soils. It is also noted that this alternative also has a higher percentage of Class I and II soils on resource lands than Alternative 1.
Employment Expansion Alternative 3: 105 Acres�(see Map 24 in Chapter 7).
This Alternative depicts expansion of the UGB for employment lands occurring on a significant portion of Study Area 8, located south of Van Duyn. This area is comprised of both Class IV and VI soils. The reconfigured Employment Expansion Alternative 3 included the remaining southern 40 acres of lot number 1603340000202. This portion of the lot would have been separated and essentially useless to the property owners for its current use. Additional acreage was also justified due to anticipated environmental constraints of the site (potentially limiting the “buildable” acres on the site).
Land south of Van Duyn was favored over lands north of Van Duyn largely due to the fact that a frontage road is already planned to be constructed to serve sites south and east of the interchange and because the area is already separated from other like uses by Van Duyn. Areas north of Van Duyn do have the benefit of greater separation from existing residential uses east of the interstate, and freeway frontage (exposure), but in the end Study Area 8 seemed better suited overall.
In the final sections of Chapter 7, the recommended residential and employment expansion alternatives are reviewed for compliance with the statutory requirements of ORS 197.298, Goal 14 location factors, and local criteria.
Policy EvaluationAs previously stated, Periodic Review integrated the community Vision into the Comprehensive Plan and Zoning Ordinance updates of the mid-decade. These policies were the basis for the Study update. Overall, the public outreach and various stakeholder groups concluded that the most of the existing Comprehensive Plan policies remained consistent and relevant for the updated Study. However, this chapter lists key planning and development issues the Study recommends the City should consider during future Comprehensive Plan and Zoning Ordinance updates.
A core component of the Study Update process was to visit the Coburg Comprehensive Plan policies and objectives and determine which elements have been accomplished as well as decide if others remain aligned with the Vision.
A review of existing Comprehensive Plan policies shows that many of the 2004 Study recommendations have been implemented by the City. However, a few areas that have not been addressed include:
� Establishment of agreements with Lane County to manage the use of land that is intended for future urban development but is yet to be
�� Provide a variety of residential housing types;
�� Use of a range of tools to meet housing needs, including multiple residential zones,

192010 Coburg Urbanization Study
annexed.� Establishment of agreements with
Lane County concerning development in and around Coburg.
� Intergovernmental agreements with Lane County and other jurisdictions to preserve the Coburg Hills as a scenic resource.
� Fostering a business environment and land use system that meet a variety of residents’ needs for goods and services, to reduce daily travel to Eugene, while maintaining Coburg’s small town character.
� Development of Urban Reserve Areas.
mixed-use zones, sufficient land to meet identified housing needs, appropriateminimum lot sizes, and accessory dwelling units.
�� Encourage the location of future medium density development and mixed use along high capacity transportation corridors.
�� Promote infill development that includes options such as triplexes on corner lots, mid-block developments (lots fronting a public or private lane), and flag lots. Allow variations in building setbacks and lot dimensions as needed to encourage development of lots that would otherwise be undevelopable, without requiring a variance process.
�� Compatible integration of uses through design standards.
�For each of the issues, the Planning Commission and City Council considered:
1. Whether the policy or recommendation remains aligned with the Community Vision and should be retained, or �
2. Whether the policy should be deleted entirely or replaced with new policies that more accurately reflect current community sentiment.�
The Planning Commission and City Council decided to retain the existing policies that have not been implemented, with the exception of those pertaining to the establishment of Urban Reserve Areas. The Planning Commission and City Council were in agreement not to pursue the establishment of Urban Reserves at this time.
In addition to the analysis of the Comprehensive Plan Policies, the City Council and Planning Commission also conducted an evaluation of the status of implementing policy recommendations stemming from the 2004 Study. A review of these recommendations also found that many have been implemented. Key areas that have not been addressed include:
� Development of a Mixed-Use Plan designation, � Addressing truck traffic in a TSP update, � Development of a cost estimate of servicing the various UGB expansion study areas
as part of the public facilities and services plan update, and � Development of a system of Urban Reserves.
The Planning Commission and City Council reviewed these recommendations and determined that they still have merit to pursue, with the exception of those addressing the establishment of Urban Reserve Areas.
The Study contains a Summary of Recommendations based on the information and the findings of the Buildable Lands Inventory, Housing Needs Analysis, Economic Opportunities Analysis, and UGB Expansion Analysis, the following are key recommendations from this Study:
202010 Coburg Urbanization Study
��0�+���'�0��'-���+���1. �3����������2%�������� ���������#��*�����#. The housing needs analysis identified
a need for UGB expansion for about 97.3 acres of residential land of net land for development, plus an additional 49.5 acres for associated public infrastructure and improvements, for a gross need of 146.8 acres.
2. � �����3�#���*��� ������#�=��������������#������##��*��=���������!����#��!���Thecurrent Comprehensive Plan policies call for the City to meet an overall density of 6.5 dwelling units per net acre for new housing. This is generally consistent with the results of the Housing Needs Analysis, which calls for an overall density of 6.6 dwelling units per acre for new housing.
$�� � ��� ������ �3��9�#����#�*�������?�����������3�#���*��2%����Pursue creation of a transitional mixed use designation to apply to Assessors Map/Tax Lot 16-03-33-00/00105 at the northwest quadrant of the intersection of Pearl Street and Coburg Industrial Way. This would redesignate this property from a low-density residential zone (Traditional Residential) to a zone containing a mix of different housing types and commercial development. Consider establishing additional regulations prior to re-designation of this property, addressing the following issues: 1) Allow for a gradual transition of use intensity and height from east to west across the site, with properties adjoining existing single-family residential neighborhoods designed to be similar in scale and intensity with existing development, b) Provide a new access road for the property along Pearl Street at the west edge of the property and from Coburg Industrial Way to minimize traffic circulation from the project to adjoining residential streets west of the property; and c) Require development of the property under the Master Planning process.�
�(�� � ���������� ������#�=��������������������*�97� ���� 97�������?9���#��!���#�����������#�*������#. A medium density district has been provided on the Zoning Map which allows fourplexes, but this is only for 2.6 acres of land. The Housing Needs Analysis identified the need for approximately 1.9 acres of property developed at an average density of 14 dwelling units/acre, 7.4 acres of mixed-use property developed at an average density of 15 dwelling units/acre, and 14.6 acres of medium density zoned property developed at an average density of 10 dwelling units/acre.�
�,�� �=��?��������#�������=���� ����#�������#������#���� ��� � ���#������������#��!���
The City has adopted minimum residential density provisions which require that lots created through a land division of four or more dwelling units be required to obtain a minimum density of 65 percent of the maximum density. There are certain exceptions to this provision. This type of policy is consistent with provisions established for housing Safe Harbor, which require a MINIMUM density, or “density floor,” for all buildable residential land in the UGB. Under the Safe Harbor, the city must establish zoning that in some manner ensures that development, on average, will not occur at a density of lower than 4 units per net buildable acre. This density is a “floor,” or a bottom limit to the overall average density for buildable residential land in the UGB. In general, this element is intended to discourage very large residential lot sizes for residential development inside the UGB. While the City is not intending to follow the Safe Harbor, it is recommended that the existing minimum density thresholds be reviewed to ensure that a minimum average density of 4 units per net buildable acre is obtained.�
�
212010 Coburg Urbanization Study
.�� �3������������*���/����#��*��!��#�����?���� The current zoning allows for single family detached, duplexes, triplexes and fourplexes. In order to expand the options available for future housing, it is recommended that the City consider the following additional housing options within existing or new zoning districts: �� Attached single family. Single Family Attached (2 or more common-wall single family
dwellings), each on its own lot. This type of provision would provide more flexibility than the duplex provision by enabling the units to be located on individual lots, rather than held in common. This could be implemented in lower density zones through a special permit review process or, alternatively, allowed outright in medium or high density residential zones.
� Cottage housing. Cottage housing is typically characterized as a cluster of single family units contained on one lot oriented around a central common area such as a common green, where the units are smaller in character (typically limited to 1,000 to 1,200 square feet). Density is typically higher in these communities than would otherwise be achieved through standard detached dwelling unit development. As a result, the mass and scale of the buildings is limited. These projects are typically subject to a design review process.
� Small lot single-family housing. This provision would allow reduced lot size beyond what the underlying zoning allows, in order to provide an incentive to retain or create smaller homes on smaller lots. This policy intends to encourage housing diversity by providing more housing choice, and to offer a viable alternative if the market trend in the community is toward large homes maximizing the building envelope and the community is concerned that such development is changing the character of the neighborhoods.
� Historic residence preservation incentives. If removal of historic residences is a concern in Coburg, this provision could be implemented, allowing reduced lot size in order to provide an incentive to preserve historic residences. This policy intends to encourage voluntary retention of remaining historic homes that would otherwise be torn down, making way for larger homes on larger lots and changing the character of the neighborhoods.
1�� � �����3�#���*���=���� ������*�������#���������##���/������=���� ����� The City has made changes to its Zoning Code to better respond to infill development, including allowing accessory dwelling units, allowing duplexes on corner lots, and permitting smaller minimum lot size with provision of wastewater. The City has opted not to permit flag lots or mid-block lanes, as was determined during the last Comprehensive Plan policy amendments and confirmed during this Study process. Additional potential changes that the City could explore include:�� Lot coverage exemptions. Exempt some architectural features from the lot coverage
standards that contribute to streetscape character (e.g., front porches, overhangs, porticos, balconies, etc.) as well as pedestrian-oriented elements (e.g. pedestrian pathways, courtyards, etc.).
� Lot size averaging. Lot size averaging is one mechanism to provide alternatives to rigid lot area and density standards that otherwise conform to the Comprehensive Plan. As an example, the Model Development Code for Small Cities, 2nd Edition allows a [10percent] modification to the lot area and/or lot dimension (width/depth) standards, provided that the overall density of the subdivision does not exceed the allowable density of the district and the approval body finds that granting the modification allows for a greater variety of housing types or it improves development compatibility with natural features or adjacent land uses. The approval body may require that standard size lots be placed at the perimeter of the development where the abutting lots are
222010 Coburg Urbanization Study
standard size or larger; except that this provision shall not apply where the abutting lots are larger than [20,000] square feet.
8. �=�������������#�/������#��=��*��� ����!�������������Some design standards have been developed, but there are continuing concerns about the adequacy of these design standards to address issues of community character. As a result, it is recommended that additional design standards be provided, particularly for multifamily development, attached single family, cottage clusters and other non-traditional housing types within the City of Coburg.�
�+-+9 ��0�+���'�0��'-���+��
1. �3����������2%������#�������������#����!��/�����#������������������#�#�//���������=��#��!���� ������������������?�� ���! ��������#��� The buildable lands inventory identified approximately 28.4 acres of vacant or partially-vacant land designated for industrial uses. These lands could accommodate a significant number of new employees, but the land that is available for development does not accommodate the expected employment growth based on the site characteristics typical of expected uses. In particular, there is a current lack of large acreage sites (20-plus acres) in Coburg’s available industrial inventory. To address this lack of diversity in sites, the City should add at least 40-60 acres in contiguous ownership that can be developed for larger industrial uses. Further, to preserve these areas for users needing larger sites, the City should consider a master plan or minimum lot size requirement.
2. � ��� ������ �3��9�#����#�*�������?�����������3�#���*��2%���Outside of the existing Central Business District7�Coburg does not presently have a plan designation or zoning district that encourages mixed-use development. However, with the growing population and from input during the Study process, it is anticipated that there will be a growing needs for more professional and retail services to serve the residents of Coburg.
3. ������#�*��#�������#�/����� ���������������#�������#�#���Limited design standards have been developed. There is significant concern about future development and how that may impact community character issues. Additional development of design standards should be pursued in response to these concerns.
4. ���#�����������*��� �#�����������K���� ����������������#�������������������*����There is significant redevelopment potential near the interchange of Coburg, a key location both for Coburg in terms of its community character, but also in terms of its economic development potential���Coburg should institute a master planning process to review development proposals for these key sites.
,�� ��I��#���#����������#������H�&#A���#��*�� &���������At its full employment potential, Coburg continues to suffer from a jobs/housing imbalance. �A typical jobs/housing ratio is 1:1. With the proposed employment and population forecasts, Coburg is taking steps to address this existing imbalance. In addition, the Housing Needs Analysis helps to ensure that the City is providing appropriate workforce housing to reduce commuting from outside the City, where possible.�
����
232010 Coburg Urbanization Study
� �+�- ����-+����� �� ���������������������������#����������!#�� ��������The Transportation System
Plan (TSP) must be coordinated with the Comprehensive Plan. The City is in the early stages of a process of updating its TSP and should use the growth scenarios established in this Study as a basis for this effort. Further, the Coburg TSP will need to maintain consistency with the Regional Transportation System Plan (RTSP) process.�
���� � ��� �����������������*�����������*� �������������<. By ordinance the next TSP
update must adopt the IAMP as a Refinement Plan and be implemented. ��$�� �����##�����I����//��������*���������!�������������������������Truck traffic through the
city core is an issue. Truck traffic currently has no other thru option, but the Willamette and Pearl Street intersectipon. Increasing truck traffic is incompatible with the City’s vision to maintain the character of historic Coburg. Downtown Coburg is not a freight route.�
����'��������� �� ��������#�����������/��������� �H���������!���*����#���Water and sewer service are
essential for production and to support households and employees. Coburg is currently taking steps to install sewer service and a new well for the municipal water service. As these efforts continue, there should be continued coordination between public facilities planning and the final decision of where to expand the Coburg UGB. �
���� 0�=�����&��������#���#�� ���#��/�#��=����*�����=�����#��2%��3���#��������#��#�������/�������&����/��������#�����#��=���#��������*��//���#���There are cost uncertainties of expanding services to different UGB expansion areas, particularly properties on the east side of I-5. A cost study was beyond the scope of the Study, but is recommended to determine the timing and cost of extending utility services across Interstate 5. �
+��� �'� �-� ����+0��+� -+��+������ �3����������2%�������� ���������I#�������������&�����#�#��In 2005 Coburg
completed a Parks and Open Space Master Plan. A needs analysis was conducted to determine the City’s current park and open space deficiencies as well as the projected needs for the next twenty years based on population projections at the time. The 2005 analysis determined that the City would need an additional six acres of neighborhood park land, one acre of mini park land, and 26.6 acres of community park land, for a total of approximately 35 new acres to accommodate park needs. That translates into approximately two additional neighborhood parks, two to three additional mini parks, and a single community park. Since 2005, the Coburg Loop Implementation Strategy was adopted (April 2009) which creates a plan for a 5.5 miles multi-use path facility in and around the City.
��� �9�=�����������/����������������/������������I�/��������#���The Coburg Parks and Open Space Master Plan presents recommended general locations for the addition of such parks based upon UGB expansion areas anticipated at the time of the Plan preparation. These assumptions should be re-examined based upon the UGB expansion areas identified in this Study.
242010 Coburg Urbanization Study
�2%�����+�-+��. ������#���������;������&���<��������������2%��The City will need to provide approximately
146.5 acres (including 49 acres for public lands). This land should be designated for low-, medium-, high-density and mixed use housing types as described in the Housing Needs Analysis (Chapter 4). Staff has provided a specific residential expansion recommendation in Chapter 7 (UGB Expansion Analysis). It is also noted that this residential expansion recommendation is consistent with the Hybrid Map developed during the Coburg Crossroads Vision project. �
�� ������ ���! �����������������2%��#�#���������&!��������!��������������&!��������!��������� The Study provides support for the addition of one to two 20-plus acre industrial sites. Staff has provided a specific employment expansion recommendation in Chapter 7 (UGB Expansion Analysis). It is also noted that the 2004 Study recommended that the City consider Study Areas 7 and 8 for employment growth and to take steps to preserve these areas for future employment growth.
�$������������������#��/�#�//�������#�J����� �����������*�#�����I�������/��������������!F#����I� �#����������Park plans�typically have several park classifications. The largest for�communities Coburg’s size is the “community park”�classification which can range from 10 to 20 acres or larger.�The City should ensure land of sufficient area and location is�available to implement the park master plan.

252010 Coburg Urbanization Study
�)���� ������+� -0����-+�This chapter provides an overview of the purpose of the Study Update (Study) and describes the methods and key policy decisions that guided the analysis and Studyconclusions. �Study Purpose Since 1973, Oregon has maintained a strong statewide program for land use planning. The foundation of that program is a set of 19 Statewide Planning Goals. This Study presents all of the State Goal requirements including the associated State Statutes and guidelines for maintaining an Urban Growth Boundary (UGB). The requirements include the following:
� A population and employment forecast consistent with ORS 195.036 and Goal 9 which includes the adopted Lane County Population Forecast (Ordinance No. PA 1255, June 17, 2009)
� A Buildable Lands Inventory consistent with Goal 9 and 10 � A Housing Needs Analysis consistent with Goal 10 and Goal 14 � An Economic Opportunities Analysis consistent with Goal 9 and OAR 660-009 � A comparison of the demand for land with the supply of land. This analysis is
required by statewide Planning Goals 9, 10, and 14 to determine if the City has sufficient buildable land to meet the 20-year demand
� An Urban Growth Area Expansion Analysis consistent with Goal 14 and related Statutes and Administrative Rules that govern UGB expansions (e.g. ORS 197.298, and OAR 660-024)
� Provide a set of recommendations based on “demonstrated needs” (Goal 14) for Coburg City Council to consider regarding future UGB expansion
5�����#������&���2��?���%������!6��An UGB is intended to:
1. Provide for an orderly and efficient transition from rural to urban land use 2. Accommodate urban population and urban employment inside UGBs 3. Ensure efficient use of land, and to provide for livable communities (Goal 14)
There are several key benefits of an UGB, including: • City land use patterns are more efficient, minimizing public service costs, including costs
for roads and other transportation, sewer and water lines, fire and other services. • Effective way to conserve farm and forest land • Reduce the human impact on the balance of the natural environment
Land inside a UGB is intended for development, either in the near-term or long-term (with some exceptions, such a parks or other open space), and must be planned for urban development. The city and county together must formally adopt amendments to the existing UGB as part of the Comprehensive Plan. It must then be submitted for approval by the Land Conservation and Development Commission (LCDC). Once adopted and acknowledged, the plan and UGB are binding on the local governments.
Methods As presented in the Study Purpose section, this Study relies on a series of analyses addressing different elements as they relate to urban expansion. Each of these analyses is based on specific assumptions. Appendix A contains a list of assumptions used in this analysis. In
262010 Coburg Urbanization Study
addition, the following briefly overviews the methods used in compiling the different components of the Study: �%��'0�%'��'�+0�The general structure of the Buildable Lands Inventory contained in Chapter 3 is based on the Department of Lane Conservation and Development’s (DLCD) Planning for Residential Development (PRD) workbook, which specifically addresses residential lands, but is also applicable to commercial and industrial lands. As outlined in the PRD workbook, the steps and sub-steps in the supply inventory are:
�����: Calculate the gross vacant acres by plan designation, including fully vacant and partially vacant parcels.
�����: Calculate gross buildable vacant acres by plan designation by subtracting unbuildable acres from total vacant acres.
����$: Calculate net buildable vacant acres by plan designation by subtracting land for future facilities from gross buildable vacant acres.
����(: Calculate total net buildable acres by plan designation by adding redevelopable acres to net buildable vacant acres.
The total net supply of land is determined by adding the gross vacant acres to the gross redevelopable acres and the gross acres available for infill development, and then subtracting for unbuildable lands. ��)-��+2�The general structure of the Housing Needs Analysis contained in Chapter 4 follows the methodology described in the DLCD report Planning for Residential Growth, referred to as the “Workbook.” The Workbook describes the necessary steps to conduct a housing needs analysis (pgs 26-31):
o Identify relevant national, state, and local demographic trends that will affect the 20-year projection of structure type mix.
o Describe the demographic characteristics of the population, and household trends that relate to demand for different types of housing.
o Estimate the number of new units needed. o Determine the types of housing that are likely to be affordable to the projected
households. o Estimate the number of additional new units by structure type. o Determine the density ranges for all plan designations and the average net density for all
structure types. o Evaluate unmet housing needs and the housing needs of special populations (Goal 10).
While the housing need analysis presented in this chapter follows the methodology described in the Workbook, it does not include as much detail as an analysis that would be required under ORS 197.296. Additionally, the housing needs assessment in Chapter 4 is based on the assumption that Coburg will develop a sanitary sewer system and that it desires to provide housing that meets the needs of individuals that are currently employed in Coburg, families, and seniors. These assumptions are consistent with goals and policies documented in the CoburgComprehensive Plan.
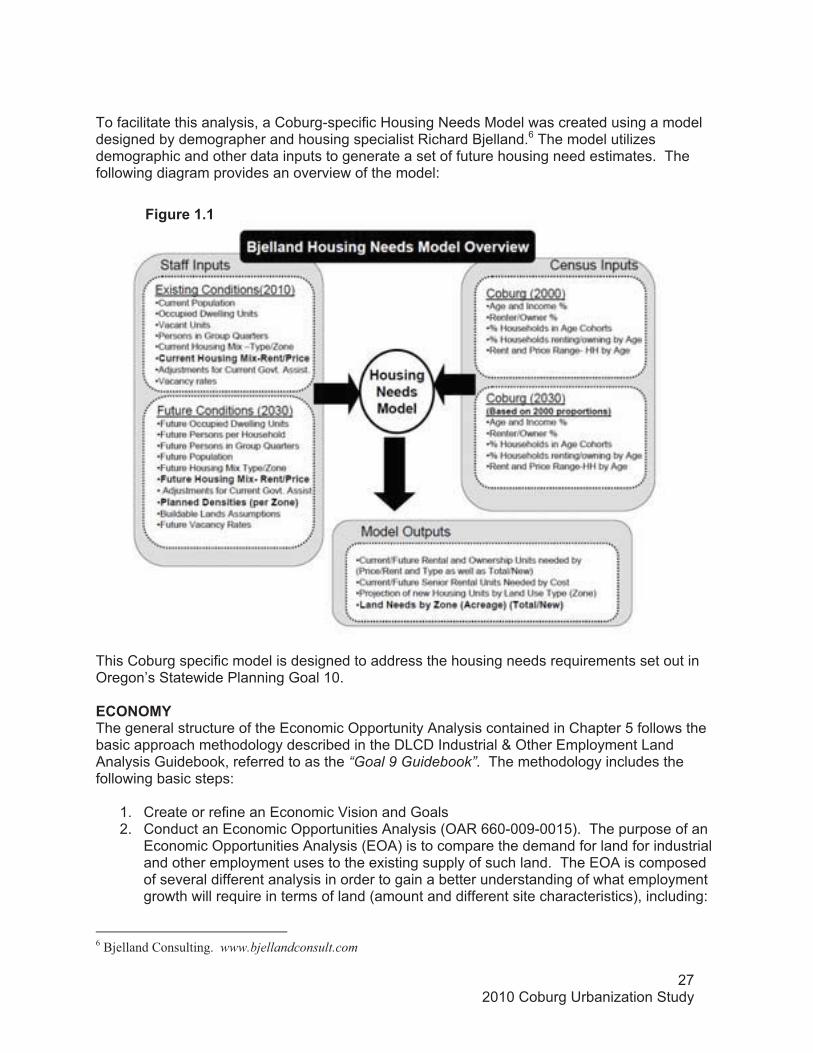
272010 Coburg Urbanization Study
�To facilitate this analysis, a Coburg-specific Housing Needs Model was created using a model designed by demographer and housing specialist Richard Bjelland.6 The model utilizes demographic and other data inputs to generate a set of future housing need estimates. The following diagram provides an overview of the model:
This Coburg specific model is designed to address the housing needs requirements set out in Oregon’s Statewide Planning Goal 10. ����-+-���The general structure of the Economic Opportunity Analysis contained in Chapter 5 follows the basic approach methodology described in the DLCD Industrial & Other Employment Land Analysis Guidebook, referred to as the “Goal 9 Guidebook”. The methodology includes the following basic steps:
1. Create or refine an Economic Vision and Goals 2. Conduct an Economic Opportunities Analysis (OAR 660-009-0015). The purpose of an
Economic Opportunities Analysis (EOA) is to compare the demand for land for industrial and other employment uses to the existing supply of such land. The EOA is composed of several different analysis in order to gain a better understanding of what employment growth will require in terms of land (amount and different site characteristics), including:
6 Bjelland Consulting. www.bjellandconsult.com
"�*��������

282010 Coburg Urbanization Study
• Review of National, State, Regional, County and Local Trends. This information will assist in forecasting what categories of industrial or other employment uses will locate or expand in the planning area based on information about national, state, regional, county or local trends.
• Forecast 20-year population and job growth by sector. • Assess community economic development potential. This information will provide
information on the types and amounts of industrial and other employment uses likely to occur in the planning area in order to better estimate local job capture of regional job growth forecasts.
• Identify the number of sites by type reasonably expected to be needed to accommodate the expected employment growth based on the site characteristics typical of expected uses.
• Estimate job density by sector (e.g. jobs per acre). These assumptions will be used to convert employment growth to land demand by land use type.
• Estimate land demand, applying a vacancy rate. • Determine existing vacant and partially vacant lots and estimate development
constraints. • Reconcile land demand versus land supply. • Determine short term buildable lands needs. • Determine 20-year land need.
��2%�����+�-+�Statewide planning Goals 9, 10 and 14 all require cities to provide a 20-year supply of buildable land within urban growth boundaries (UGBs).
Prior to expanding its urban growth boundary, the City of Coburg will need to demonstrate that it cannot reasonably accommodate the anticipated demand on land already inside the urban growth boundary. Once it has evaluated whether needs can be met within the existing UGB before expanding the UGB, the City needs to conduct an UGB Expansion Analysis.
The process and criteria for justifying an expansion of an existing urban growth boundary are found in several State planning laws and goals. Most important to this process are those found in Oregon Revised Statute 197.298 (Priority of land to be included within urban growth boundary), Goal 2 (Exceptions process), and Goal 14 (Urbanization). ORS 197.298 establishes the following priorities for expanding UGBs:
1. Established Urban Reserves; 2. Exception land, and farm or forest land (other than high value farm land) surrounded by
exception land; 3. Marginal lands designated pursuant to ORS 197.247; 4. Farm and forest land.
Coburg has no urban reserve or marginal lands adjacent to its urban growth boundary. There are, however, exception lands and farm lands adjacent to the Coburg UGB. To provide for the unmet future need, Coburg must inventory and assess the lands that surround its current boundary to determine which lands are most appropriate to accommodate future urban development, consistent with ORS 197.298, Goal 14 and the City’s own vision and expansion policies.
Goal 14 provides some additional guidance on boundary locations with consideration of the following factors:
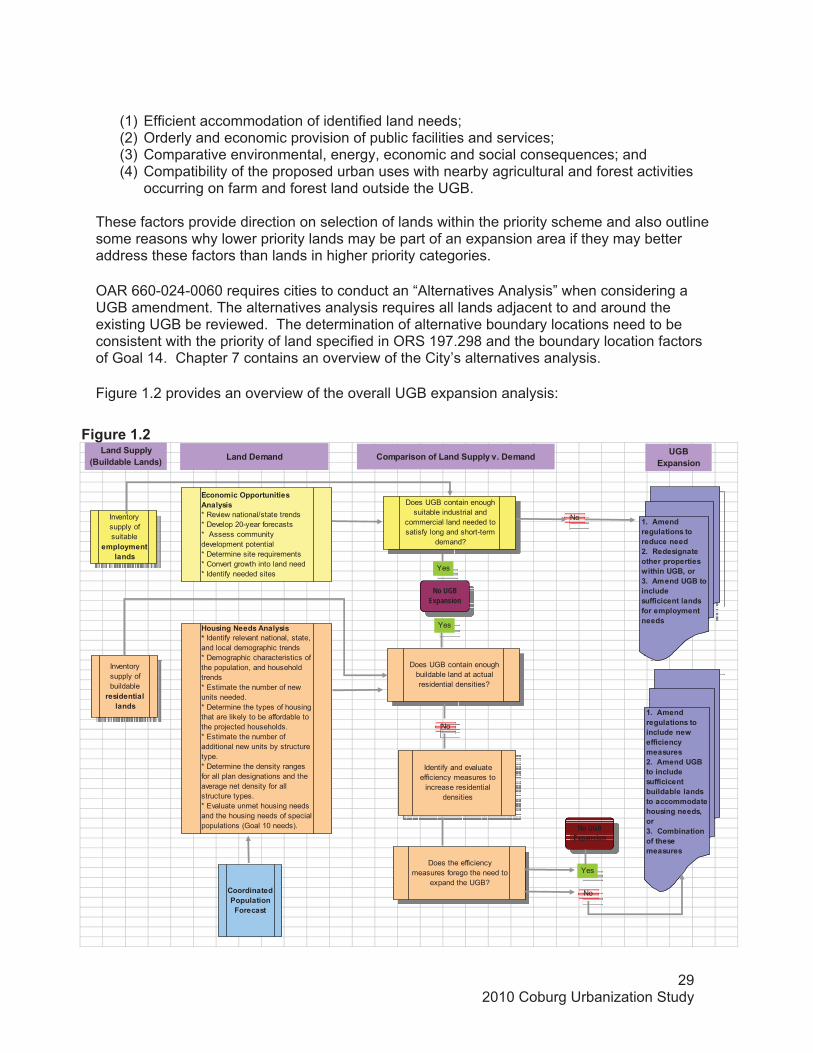
292010 Coburg Urbanization Study
Inventory supply of suitable
� ���! ��������#
����� ������*�������#��������������?��//������!� ��#���#����� �����2%������������#�//��������&�����&�������#�������� ���������#��*�����#7���$����� &���������/����#�� ��#���#
'��������!;%�����&���'���#< '����0� ��� �� ����#����/�'��������!�=��0� ��� �2%�
�3���#���
�����������������������"�����#�
Inventory supply of buildable ��#�������������#
����� ���-�����������#�����!#�#* Review national/state trends* Develop 20-year forecasts* Assess community development potential* Determine site requirements* Convert growth into land need* Identify needed sites
)��#��*�+���#�����!#�#C Identify relevant national, state, and local demographic trends * Demographic characteristics of the population, and household trends* Estimate the number of new units needed. * Determine the types of housing that are likely to be affordable to the projected households.* Estimate the number of additional new units by structure type.* Determine the density ranges for all plan designations and the average net density for all structure types.* Evaluate unmet housing needs and the housing needs of special populations (Goal 10 needs).
Does UGB contain enough suitable industrial and
commercial land needed to satisfy long and short-term
demand?
Does UGB contain enough buildable land at actual residential densities?
Yes
Yes
No UGB Expansion
No
Identify and evaluate efficiency measures to
increase residential densities
Does the efficiency measures forego the need to
expand the UGB?Yes
No
No ����� ������*�������#������������������� ���#�*��������������������#�?�������2%7���$���� �����2%������������#�//������������#�/���� ���! ��������#
No UGB Expansion
(1) Efficient accommodation of identified land needs; (2) Orderly and economic provision of public facilities and services; (3) Comparative environmental, energy, economic and social consequences; and (4) Compatibility of the proposed urban uses with nearby agricultural and forest activities
occurring on farm and forest land outside the UGB.
These factors provide direction on selection of lands within the priority scheme and also outline some reasons why lower priority lands may be part of an expansion area if they may better address these factors than lands in higher priority categories.
OAR 660-024-0060 requires cities to conduct an “Alternatives Analysis” when considering a UGB amendment. The alternatives analysis requires all lands adjacent to and around the existing UGB be reviewed. The determination of alternative boundary locations need to be consistent with the priority of land specified in ORS 197.298 and the boundary location factors of Goal 14. Chapter 7 contains an overview of the City’s alternatives analysis. �Figure 1.2 provides an overview of the overall UGB expansion analysis: �
"�*��������

302010 Coburg Urbanization Study
ProcessStudyA large range of people participated in the development of this Study. As part of this process, a number of different meetings were held with a Technical Advisory Committee (TAC), Planning Commission, City Council, and public workshops. The following is a summary of the various meetings and workshops that have occurred:
o The TAC met nine times over the course of the Study to discuss concepts and provide recommendations. The TAC is described in more detail under the public outreach and involvement section.
� City Council. o The City Council has received monthly progress updates on the Study. o In addition, the City Council has met to discuss the project at four different
Council meetings. � Planning Commission. The Planning Commission discussed the Study four times over
the course of the Study. � Two public workshops were held
�All Staff memos and supporting materials for these meetings and workshops can be found at the project’s website at http://www.lcog.org/coburgurbanization/default.cfm.
G�!������!�0�#��##��������0���#���#�A number of key policy discussions and decisions have occurred that have played a key role in this analysis. These issues are summarized briefly below: ���� �����#������!������ At the outset of the Study process, the TAC and City Council
established the boundaries for the Study Areas, should UGB expansion prove needed (see Map 1). The Study Areas approved by the City Council are generally consistent with those used in the 2004 Study, with the following additional three areas also included: 1) an area south of Study Area 8 which is the subject of development activity at the County and which property owners have expressed interest in being included, 2) an area south of Roberts Court, and 3) an area north of the City which includes Pioneer Valley Estates (PVE) subdivision.�
���� � ���! ����"�����#�#���
a. %�#������� ���! ����"�*������There are a variety of data sources that can be utilized in establishing current employment figures. After reviewing different options, the City Council opted to use County-level Quarterly Census of Employment and Wages (QCEW) "covered employment” data from the Oregon Employment Department (OED) as a base employment figure for each industry sector. The City Council noted that the City has a fair number of self-employed that should be addressed in the baseline employment population. Since non-covered employment (e.g. home-based businesses and other sole proprietorships) are not included in the data from OED, the City Council decided to also address non-covered within the City by evaluating “Total Employment” figures, produced by the Bureau of Economic Analysis, and evaluating business licenses and other information at the local level to modify covered/non-covered
312010 Coburg Urbanization Study
ratios in specific employment sectors (e.g. retail trade, natural resources, and government services).
b. � ���! ����"�����#����Critical to the determination of how much commercial and industrial land will be needed in the future in Coburg is an understanding of how much employment growth Coburg will experience throughout the planning period. Increased demand on commercial and industrial lands will come as a result of new businesses locating in Coburg, the growth of businesses currently in Coburg and existing businesses relocating in Coburg. Employment growth is one commonly accepted measure for increased demand for commercial and industrial land. There is no way to know exactly how much employment growth there will be, however there are methods for forecasting that employment growth.
After reviewing different options, the City Council opted to use an approach that is based upon one of the Safe Harbors established in OAR 660-024-0040(8)(a), and adjusted based on local knowledge and/or community vision. Under the Safe Harbor, Coburg would estimate that the current number of jobs in the urban area will grow during at a rate equal to the County or Regional job growth rate provided in the most recent forecast published by OED. As a result, the employment growth rate would be evaluated by applying the annual average growth rate (AAGR) percentages from OED’s 10-year Lane County employment sector forecast (2006-2016) to Coburg’s industry sectors (2008-2031). Adjustments to specific growth rates in the retail trade, professional services, and leisure and hospitality sectors were made to address a current lack of these services within Coburg as well as respond to anticipated growth in residential development.
�$�� %�����&���'���#���=�����!���The TAC provided recommendations on the following
provisions of the buildable lands inventory:���� Definition of vacant land. The TAC discussed the threshold to be used for the
value of improvements that could occur on a property if that property continued to be classified as vacant. The 2004 Study used an improvement value of less than $5,000 (not including lands that are identified as having mobile homes) for residential properties. The TAC recommended that this threshold continue to be used.�
b. Definition of Partially Vacant Land: The TAC discussed the definition to be used to classify partially vacant land. Partially vacant tax lots have improvements but also have enough undeveloped land to accommodate additional development.For Traditional Residential lots, it was recommended that partially vacant lots be classified by considering the existing district regulations. Based on current minimum lot size standards established in Coburg, it is recommended that partially vacant lands be determined by evaluating all developed lots greater than 15,000 square feet in size (which is equivalent to the area needed to divide property in the Traditional Residential District and exclude 7,500 square feet to account for the lot containing the existing structure).
c. Definition of Undevelopable Land. All new lots must meet the minimum lot size to be created or to be recreated with a lot line adjustment. However, existing legal lots in the residential districts regardless of size may be developed if they meet the other district regulations (e.g. setbacks, access, frontage, etc.) There are some legal lots that will be too small to be developed. The 2004 Study used
322010 Coburg Urbanization Study
a lot size of 2,500 square feet as a starting threshold for determining which lots would be undevelopable, and also included land that has no access or potential access, or land that is already committed to other uses by policy. Since that time, new zoning has been established in the City, which slightly modified the minimum lot size. The TAC recommended that in order to ensure consistency with the 2004 Study, the Study should use 2,500 square feet for properties in the Traditional Medium Residential and Traditional Residential zones; otherwise use 1,500 square feet in the Central Business District. The TAC also recommended further refining this by analyzing access limitations as well as land that is already committed to other uses by policy.
d. Definition of Infill Property. The TAC recommended using a land area of 15,000 square feet or greater, together with a review improvement values and aerial photographs to determine whether there is sufficient land to be further developed.
e. Rate of Infill Build-Out. The TAC discussed this issue and determined that the rate of infill over the planning period is anticipated to be low and recommended a redevelopment rate of 10 percent.
f. Redevelopment. Redevelopable land is land on which development has already occurred but due to market forces or city policies, there is a strong likelihood that the existing development will be converted to, or replaced by, a new or more intensive use. Redevelopment can occur if improvements, renovation, infill, or development of a more intensive use are feasible options. The TAC provided the following feedback on how to include redevelopment:
i. Traditional Residential. Redevelopable properties should consist of corner properties over 8,000 square feet in size (based on City’s duplex ordinance), excluding those properties that have been designated as a historic residence. For redevelopment rate, use same rate as Infill (10 percent).
ii. Commercial/Industrial Land Use. Use a 1:1 improvement to land value ratio to determine whether properties are likely to redevelop. The TAC also recommended reviewing land use information to include land if the existing use is less intensive than planning designation would allow.
g. Redevelopment Build-Out. The 2004 Study used an assumption that 20 percent of the total vacant and redevelopable employment lands would redevelop over the planning period. Input received from the TAC suggests that this redevelopment rate is lower than is likely to occur, based upon the economic advantages of Coburg and, in particular, its strategic location along and access to I-5. As a result, for the Light Industrial and Highway Commercial designations, a higher redevelopment rate of 30 percent has been applied.
h. Property constraints. The TAC discussed how to address property constraints that do not preclude development, but limit the degree to which land can be developed. In particular, the TAC discussed two types of constraints found within Coburg: wetlands and flooded areas. For the purposes of this Study, the following determinations were made:
i. Calculate no deduction for lands identified on the Federal Emergency Management Agency’s (FEMA) Flood Insurance Rate Maps (FIRM) which are required to administer floodplain management regulations and to mitigate flood damage..

332010 Coburg Urbanization Study
ii. Exclude acreage of all wetlands identified as “SIGNIFICANT” in the Local Wetland Inventory (LWI) as unbuildable, but include remaining wetlands as buildable. For property in the southeast quadrant of City that was annexed after LWI was completed, exclude acreage of wetlands mapped in the National Wetland Inventory as unbuildable.
i. Public Facilities Land Needs. For determining the amount of land that needs to be deducted from development area to meet public facility land needs within the UGB, the TAC recommended varying from the Safe Harbor figure of 25 percent to 20 percent. This reduction from the Safe Harbor method has been used based on several factors: � The City has identified a large site within the UGB to use associated with the
wastewater system; this acreage has already been deducted from the inventory of vacant lands as publicly owned property. The capacity of this system has been based on a population and employment forecast similar to that addressed in this Study.
� The anticipated growth within the planning period will likely not result in increased demand for new school facilities within Coburg.
� Plans for expanding the capacity of the water system by drilling a third well is cited outside of the existing UGB due to the location of the water tables in and around the City.
� Coburg’s Parks and Open Space Master Plan (POS), which projects limited need for additional parks within the City’s existing UGB, but does include plans for a 51/2 mile linear pathway system in and around the City to meet both recreational and transportation needs.
(�� ����� ���-�����������#�����!#�#��a. Economic Vision and Target Industries���The TAC reviewed the current economic
vision contained in the Comprehensive Plan and reiterated the vision. The TAC also discussed sectors that the City is interested in pursuing as part of its economic development strategy, which are specifically addressed in Chapter 5. There has been considerable discussion about whether the City should encourage future employment growth in manufacturing, warehousing/distribution and wholesale trade, with the Planning Commission recommending against expanding the UGB for these types of industries. The City Council considered this issue in detail and decided to pursue expansion of employment lands to support employment growth for these types of employment sectors.
&�� Trend Analysis.��The TAC provided input to the trend analysis included in the EOA in Chapter 5.�
���� Economic Strengths and Weaknesses. �The TAC provided input to the analysis
of economic strengths and weaknesses included in the EOA in Chapter 5. The TAC briefly discussed the differences in visual character in the downtown versus near the I-5 interchange and noted the desire to investigate urban design elements or other techniques that would better connect these two areas of the City.�
���� Job density by sector. The TAC provided staff direction related to employment
density assumptions. The TAC reviewed visualizations of employment at
342010 Coburg Urbanization Study
different densities. After this exercise, and based on floor area ratio (FAR) in other Oregon communities as well as general trends and analysis on the potential FAR that a site can achieve without structured parking (because of its high cost, structured parking was not seen as a viable development technique to be used in Coburg), it was concluded that FARs developed for zones within Coburg should represent less density than allowed for in the code. Rather than FARs of 0.7 or 0.6, the TAC recommended that FARs of 0.2-0.4 should be utilized.�
�,�� )��#��*�+���#�����!#�#����
a. Housing Mix and Density. Staff sought guidance from the TAC, Planning Commission and City Council on whether to use either of the density Safe Harbors recently adopted by the State, briefly described as follows: �-�������:����������0��#��!��/��)��&���Under this option, cities with a forecasted population for the urban area inside the UGB at the end of 20 years of 2,501 to 10,000 residents, which would include Coburg, can assume a defined density that will occur over the forecast period, for purposes of the UGB analysis. In this case, the assumed density is six units per net acre.
This density figure establishes the units per net buildable acre that the city may assume will occur over the 20-year planning period. These units per net buildable acre are used to determine residential density within the existing urban area and within any new areas proposed to be added to the UGB. This density figure applies only to buildable residential land.
The Safe Harbor also includes a requirement that the city allow the opportunity for a higher density. Coburg would need to zone land to allow for at least eight units per acre. Additionally, in order to use the average density Safe Harbor, the local government must establish zoning that in some manner ensures that development, on average, will not occur at a density of lower than four units per net buildable acre. This density is a “floor,” or a bottom limit to the overall average density for buildable residential land in the UGB. In general, this element is intended to discourage very large residential lot sizes for residential development inside the UGB.
Finally, this option also requires that the zoning allow for a housing mix consisting of the following minimum percentage of housing density ranges:
o 60 percent low density (2-6 units per net buildable acre) o 20 percent medium density (6-12 units per net buildable acre) o 20 percent high density (12-40 units per net buildable acre)
�-�������:�����������=��0��#��!��/��)��&���/��� �����3��������������#�����)�*�������"�� �'����
Under this option, a local government must first choose the standard density Safe Harbor. If it chooses the standard density Safe Harbor, it may also use (but is not required to use) the Small Exception Parcels and High Value Farmland Safe Harbor.
352010 Coburg Urbanization Study
This new alternative Safe Harbor allows a local government to assume lower density will occur for small exception parcels, (4 dwelling units per net buildable acre in this case). However, at the same time, the local government must assume a higher density will occur on any high value farmland added to a UGB, in this case the zoning must allow a density of 10 units per net buildable acre. The idea is based on two assumptions: 1) authorizing lower density assumptions for small exception parcels recognizes that these parcels frequently have limited potential for future development at urban densities compared to larger exception parcels; thus, using this Safe Harbor removes a disincentive to add these lands to a UGB, and 2) requiring a higher residential density for high value farm land may lead to less farmland added to UGBs, thus better implementing state policies to protect and preserve farmland and ensure efficient use of urban land.
-������$:������� ������0��#��!��/��)��&���
This option was designed for cities that are currently developed at a very low residential density and may consider the density assumptions in Option 1 and 2 above too difficult to achieve given their current low density development patterns.
Under Option 3, Coburg could assume that the overall density of residential development over the forecast 20-year planning period would be 25 percent higher than the overall density of developed residential land in the UGB at the time the City initiated the evaluation or amendment of its UGB. The existing estimated density within the City is 4.7 dwelling units per net buildable acre. As a result, under this provision the density would need to be approximately 5.8 units per net buildable acre. Under this option, the City would still need to meet the zone to allow provisions (8 dwelling units per acre) and required overall minimum density standards (4 dwelling units per net acre) indicated in Option 1.
Under this option, the housing mix would be estimated simply by increasing the proportion of multi-family housing within the existing mix—similar to the concept for the incremental density Safe Harbor. Safe Harbor Option 3 requires that the medium density be increased by 10 percent, and that the high density be increased by 5 percent within the existing developed housing mix, and the low density would be decreased by a proportionate share so that the overall mix total is 100 percent.
After significant discussion and review, the staff and City officials recommended not using the Safe Harbor. In general, it was thought that Coburg’s existing housing mix (65 percent Low Density, 25 percent Medium Density, and 10 percent High Density) was a good starting point, but didn’t match the densities in Option 1. Option 3 posed problems due to the need to increase the Medium Density zone an additional 10 percent, to 35 percent overall. Instead, the TAC recommended using concepts from Option 3, such as increasing the percentage of high density housing, to achieve an overall housing mix closer to that specified in Option 1. Specifically, the TAC provided the following guidance:
362010 Coburg Urbanization Study
� Safe Harbor may not be the best alternative for Coburg. � The TAC supported making minor improvements to Coburg’s existing mix
into the future. The existing mix of 65 percent Low Density, 25 percent Medium Density and 10 percent High Density could be adjusted slightly to support more units of higher density and more appropriate match Coburg’s identified housing needs. Because of wastewater limitations, recent development has not met the City’s traditional mix – therefore if this mix were to be realized it would mean higher proportions of compact development and multifamily development than Coburg has seen in the recent past.
� Assumptions about maximum lot sizes in the single family zones should be considered.
� Rather than the Safe Harbor 60/20/20 mix split outlined in Option 1, the TAC suggested that a 60/25/15 split should be pursued as a baseline for buildable land. Staff’s end result after accounting for all housing factors within the housing needs model was a planned mix (buildable land) of 60/21/19, resulting in an overall 2030 mix of 61/22/17. The land need and development assumptions of this mix were presented and approved by the TAC, Planning Commission and City Council.
&�� Multifamily development.��The Planning Commission and City Council both expressed an understanding for the need for increased housing options and density in new development. In order to address concerns about the type of development, the Planning Commission and City Council opted to retain current policies limiting multi-family residential development to no more than four dwelling units in any single structure. The Housing Needs Model was adjusted to reflect this recommendation.�
���� Efficiency Standards. As part of the Study, the TAC, Planning Commission and
City Council reviewed different infill strategies that could be incorporated into the City’s development regulations to facilitate infill and reduce UGB expansion. In particular, the following key recommendations were made:�
i. Creation of a new Mixed-Use Zone within the existing UGB. The Planning Commission and City Council decided to pursue creation of a transitional mixed use designation to apply to Map Lot 1603330000105 at the northwest quadrant of the intersection of Pearl Street and Coburg Industrial Way (see Map 26 in Chapter 7). This would redesignate this property from a low-density residential zone (Traditional Residential) to a zone containing a mix of different housing types. The Planning Commission strongly recommended that additional regulations be established prior to re-designation of this property In establishing a new Transitional Mixed-Use zone classification, the Planning Commission recommended that the designation 1) Allow for a gradual transition of use intensity and height from east to west across the site, with properties adjoining existing single-family residential neighborhoods designed to be similar in scale and intensity and existing development, b) Provide a new access road for the property along Pearl Street at the west edge of the property and from Coburg Industrial Way to minimize traffic circulation from the project to adjoining residential streets west of the property; and c) Require development of the property under the Master Planning
372010 Coburg Urbanization Study
process. Appendix I contains a rendering that depicts a street view of a potential mixed-use development in Coburg.
ii. Additional infill strategies. The Planning Commission and City Council also recommended that the following potential infill strategies (as described in Appendix G) be further evaluated as part of potential future amendments: � Attached single family; � Cottage housing; � Small lot single-family housing; � Historic residence preservation incentives; � Lot coverage exemptions; and � Lot size averaging.
�.�� ��&����"��������#���The TAC and City Council both discussed whether to use the Safe
Harbor for determining public facility needs in the expanded UGB, or whether to revise those based upon different projected Park/Open Space needs from the City’s Park and Open Space Master Plan. Eventually, it was decided to use the greater public facility needs generated by using the Master Plan estimates. Specific acreage needs are presented and discussed at the conclusion of Chapter 4. �
�1�� �2%��3���#�������������=�#��
a. Coburg’s UGB Expansion Priorities. The TAC, Planning Commission, and City Council reaffirmed that the policies adopted into the Comprehensive Plan that address UGB Expansion should be used in the UGB expansion alternatives to inform the local criteria that will be used.
b. UGB Expansion Alternatives Comparison. The TAC, Planning Commission, and City Council provided input on the different UGB Expansion alternatives. The Final Residential and Employment Expansion Alternatives were approved by the City Council and presented within Chapter 7.
���&����-��������������=��=� ����It is important to note that this Study builds upon the prior work that has been completed by the City. Prior work included significant community involvement in establishing vision for growth and information from these past efforts (Coburg Crossroads, 2004 Study, and 2005 Zoning Code/Comprehensive Plan Amendments) has been used as framework for the current Study.
Several consistent themes emerged from these studies, summarized as follows:
� Maintain Coburg’s small town atmosphere � Quality of life/livability � Attract young families with school-age children � Retain existing elementary school � Plan for parks/open spaces � Protect surrounding agricultural lands � Buffer between residential and industrial lands � Use land efficiently � Plan for sequential development outward from existing city center�
�
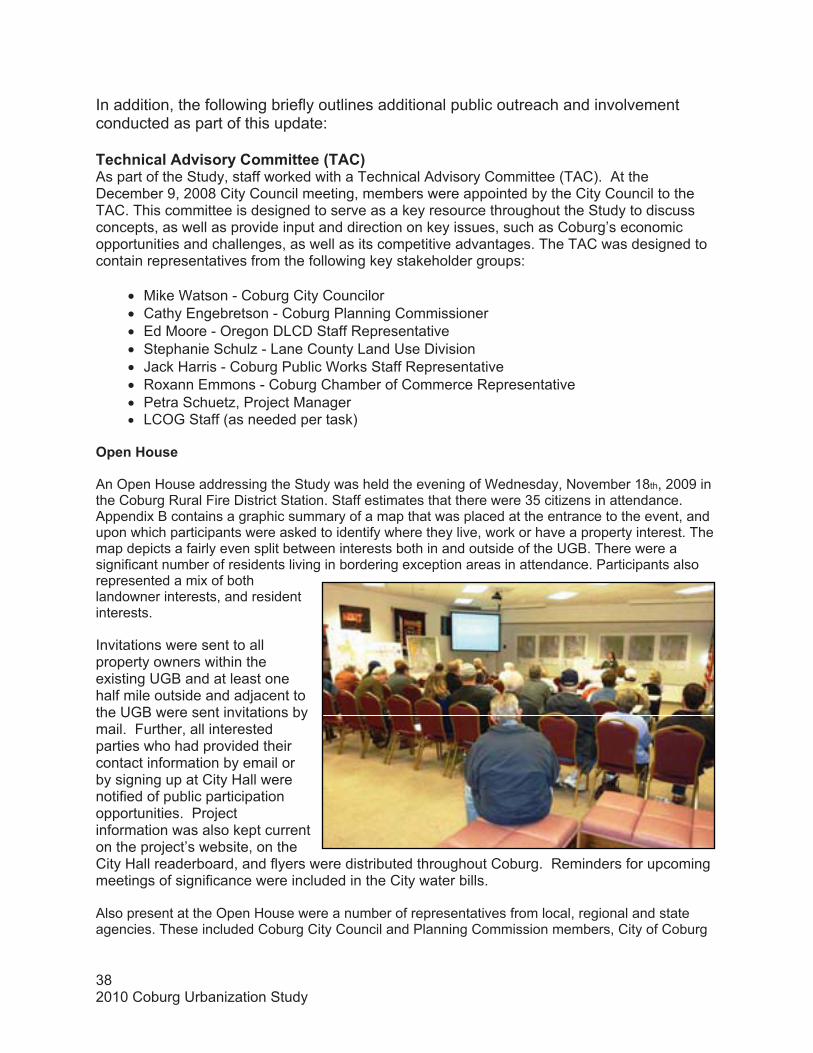
382010 Coburg Urbanization Study
In addition, the following briefly outlines additional public outreach and involvement conducted as part of this update: �������������=�#��!��� ������;���<�As part of the Study, staff worked with a Technical Advisory Committee (TAC). At the December 9, 2008 City Council meeting, members were appointed by the City Council to the TAC. This committee is designed to serve as a key resource throughout the Study to discuss concepts, as well as provide input and direction on key issues, such as Coburg’s economic opportunities and challenges, as well as its competitive advantages. The TAC was designed to contain representatives from the following key stakeholder groups:
� Mike Watson - Coburg City Councilor � Cathy Engebretson - Coburg Planning Commissioner � Ed Moore - Oregon DLCD Staff Representative � Stephanie Schulz - Lane County Land Use Division � Jack Harris - Coburg Public Works Staff Representative � Roxann Emmons - Coburg Chamber of Commerce Representative � Petra Schuetz, Project Manager � LCOG Staff (as needed per task)
-����)��#��
An Open House addressing the Study was held the evening of Wednesday, November 18th, 2009 in the Coburg Rural Fire District Station. Staff estimates that there were 35 citizens in attendance. Appendix B contains a graphic summary of a map that was placed at the entrance to the event, and upon which participants were asked to identify where they live, work or have a property interest. The map depicts a fairly even split between interests both in and outside of the UGB. There were a significant number of residents living in bordering exception areas in attendance. Participants also represented a mix of both landowner interests, and resident interests.
Invitations were sent to all property owners within the existing UGB and at least one half mile outside and adjacent to the UGB were sent invitations by mail. Further, all interested parties who had provided their contact information by email or by signing up at City Hall were notified of public participation opportunities. Project information was also kept current on the project’s website, on the City Hall readerboard, and flyers were distributed throughout Coburg. Reminders for upcoming meetings of significance were included in the City water bills.
Also present at the Open House were a number of representatives from local, regional and state agencies. These included Coburg City Council and Planning Commission members, City of Coburg
392010 Coburg Urbanization Study
Staff, Lane Council of Governments Staff and Oregon Department of Transportation Staff. Several members of the TAC were also present.
During the three-hour Open House, participants had the opportunity to browse wall maps; acquire study summaries and materials; ask questions of Staff; and experience a Power Point presentation addressing the Study process and a review of critical points for feedback and next steps.
Wall maps presented at the Open House included the following:��
� Buildable Lands Inventory Map � Infill and Redevelopment Potential Map � Housing Needs Analysis Process Summary � Overall Study Decision Tree/Process Chart � Study Areas Map � All Six Expansion Alternative Maps (Aerial and Soil Maps)
The presentation, which contains copies of these materials, is available for review at a website devoted to the project: http://www.lcog.org/coburgurbanization/default.cfm. The presentation given at the Open House was essentially identical to the presentation given to the Planning Commission and City Council at their joint work session in November 2009. The Open House presentation dedicated more time and additional slides to the sections regarding the urbanization analyses undertaken up to this point. Staff felt that a primary focus of the Open House was providing the public with a background for how and why expansion happens.����&������ ���#
5������������#���������
Since the 2004 Study was completed, the City has received several written comments concerning urbanization, including the following:
1. Wildish Company. Staff received a request by the Wildlish Companies to include their property within Study Area 2 (shown in Appendix B) within the UGB expansion area. Staff has responded to this comment and indicated that the proposed inclusion of this property would not be consistent with our assessment of the UGB expansion priorities.
2. MBM Group LLC. In 2004, Staff received a request by MBM Group LLC. to include their property (Assessors Map 16-03-28-00, Tax Lots 1500 and 2300, two linear portions of former railroad right-of-way) within Study Area 1 (see Appendix B) within the UGB expansion area and designate the property for commercial uses (e.g. Highway Commercial). This was during the Periodic Review process of 2003-2005. At that time the land was considered, but was not included in any amendment to the UGB. During the Study Update, MBM Group LLC. again provided comment contending that this land should have been included in last UGB expansion. However, Staff has responded that based on the results of the Study, Coburg has a surplus of employment lands; no additional Highway Commercial land is needed/justified (except if the City wanted to attract a large manufacturer or warehousing use which would require a 20+ acre site and which would be restricted to that size and limited use. Those two areas were east of I-5). This is largely because the current Highway Commercial land inventory is largely underdeveloped or vacant and is disproportionate to the residential land needs which have been perpetuating an imbalance in Coburg. As a result, the Study recommends that the property be included in the UGB expansion, but designated as potential residential property.

402010 Coburg Urbanization Study
3. Eugene School District 4J. In 2004, the 4J School District contacted the City requesting that its 28-acre property located in Study Area 5 be examined for potential inclusion in Coburg’s expanded UGB (see Appendix B). Staff considered this issue in its UGB expansion analysis, but determined that the School District’s property, which is not exception land and is located farther to the north than other lands proposed to be incorporated into the UGB, did not meet the criteria for inclusion. The Eugene School District did not comment during the Study update.
��&������#�� ��!�
Since the 2004 Study was completed, the City has heard from citizens concerning urbanization, both in formal testimony and on an information basis. The following is a summary of a recent public testimony:
4. Public testimony was submitted from Raymond Fisher, speaking on behalf of the Knee Deep Cattle Company. Mr. Fisher indicated support for the proposed expansion of the UGB to include Knee Deep owned lands in Study Area 8 and also noted that Study Area 7 would make a good candidate for Urban Reserve Lands.
-����)��#���� ���#�
The November, 2009 Open House provided an ideal environment for citizens to voice concerns, insights and support for the Study’s assumptions and conclusions up to this point. Staff’s presentations garnered a number of insightful and valuable questions from participants. Staff was also able to have a number of valuable one on one conversation with participants which supplemented the group questions and discussions that took place. Throughout the Open House, participants were encouraged to participate in a dot exercise designed to rate their preferences related to the three identified residential expansion alternatives and the three employment expansion alternatives. Finally, staff prepared a comment form with specific questions and ample space for any additional written feedback.
Appendix B provides a detailed summary of this feedback (including staff responses). Points which stood out from the discussion and exercises include the following:
� Concern about the impacts that inclusion in the UGB would have on property owner’s taxes, pressures for development, regulation.
� Concern about the state imposing a “one size fits all” framework on Coburg. � The difference between annexation and being in the UGB � The relationship of the Study’s findings to future Wastewater. � Interest in expanding all land uses (not just employment) east of the interstate. � Property owner concern about expansion boundaries and the resulting consequences
to their property � The possibility of a different and perhaps smaller employment lands alternative. � Concern about and opposition to industrial employment growth � Concern about the transportation impacts of various alternatives � Concern about the location of mixed use development � Concern about expansion to the south (maintaining the buffer between Coburg and
Eugene-Springfield)� Questions about the impacts of development east of I-5 on the I-5 interchange.
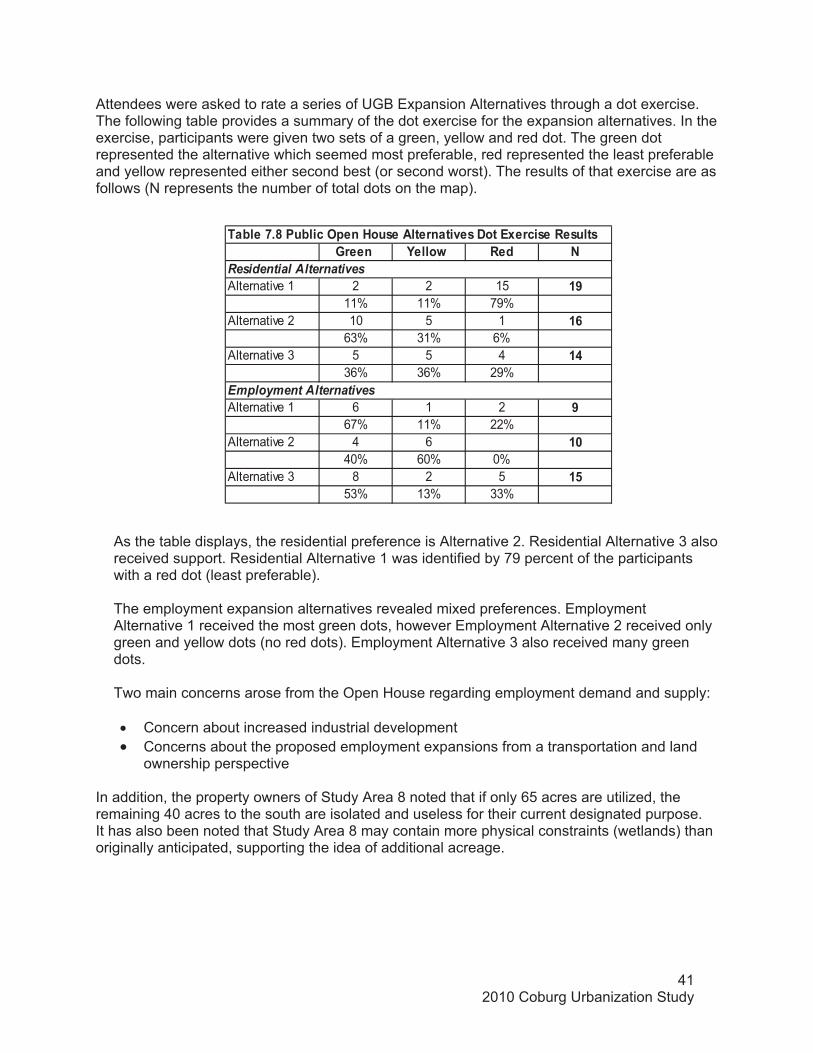
412010 Coburg Urbanization Study
2����� �����?� �� +
Alternative 1 2 2 15 �>11% 11% 79%
Alternative 2 10 5 1 �.63% 31% 6%
Alternative 3 5 5 4 �(36% 36% 29%
Alternative 1 6 1 2 >67% 11% 22%
Alternative 2 4 6 �840% 60% 0%
Alternative 3 8 2 5 �,53% 13% 33%
��&���1�4���&����-����)��#�����������=�#�0����3����#�� �#���#
Residential Alternatives
Employment Alternatives
Attendees were asked to rate a series of UGB Expansion Alternatives through a dot exercise. The following table provides a summary of the dot exercise for the expansion alternatives. In the exercise, participants were given two sets of a green, yellow and red dot. The green dot represented the alternative which seemed most preferable, red represented the least preferable and yellow represented either second best (or second worst). The results of that exercise are as follows (N represents the number of total dots on the map).
As the table displays, the residential preference is Alternative 2. Residential Alternative 3 also received support. Residential Alternative 1 was identified by 79 percent of the participants with a red dot (least preferable).
The employment expansion alternatives revealed mixed preferences. Employment Alternative 1 received the most green dots, however Employment Alternative 2 received only green and yellow dots (no red dots). Employment Alternative 3 also received many green dots.
Two main concerns arose from the Open House regarding employment demand and supply:
� Concern about increased industrial development � Concerns about the proposed employment expansions from a transportation and land
ownership perspective
In addition, the property owners of Study Area 8 noted that if only 65 acres are utilized, the remaining 40 acres to the south are isolated and useless for their current designated purpose. It has also been noted that Study Area 8 may contain more physical constraints (wetlands) than originally anticipated, supporting the idea of additional acreage.

INTER
STATE
5
FUN
KE
CO
BU
RG
PEARL
STA
LLIN
G
VAN DUYN
RO
BER
TS
DELANEY
MIL
LER
MILL
ABBYW
ILLAMETTE
CO
LEM
AN
DIXON
CO
BU
RG
BO
TTO
M L
OO
P
INDIAN
CO
BU
RG
IND
US
TRIA
L
PAIUTE
DIAM
ON
D
MAPLE
HA
RR
ISO
N
VINTAGE THOMAS
STU
AR
T
SH
AN
E
CHRISTIAN
MACY ST
RU
STI
CBRUCE
LOCUST
CO
BUR
G
DIXON
VAN DUYN
1
,.
(
4�
$
�
�8
��
>
Urban Growth Boundary
Map 1: Proposed Study Area(s) ±The information on this map was derived from digital
databases on Lane Council of Governments’ regionalgeographic information system. Care was taken in thecreation of this map, but it is provided "as is".LCOG cannot accept any responsibility for errors,omissions, or positional accuracy in the digital dataor the underlying records. Current designations (e.g.,zoning) for specific parcels should be confirmed withthe appropriate jurisdictions. There are no warranties,expressed or implied, accompanying this product. How-ever, notification of any errors will be appreciated.
0 1,300 2,600 3,900 5,200 6,500 Feet
Coburg Urbanization Study
1 inch = 1,500 feet

432010 Coburg Urbanization Study
�)���� ������-��'���-+��+0����'-���+��"- �����A forecast of expected population and employment growth in Coburg is essential to estimate the demand for buildable land and to assess economic and housing needs. Expected population growth will influence economic opportunities and employment growth in Coburg, which will have implications for demand for non-residential land and public services. Coburg established an employment forecasts for the Coburg UGB based on the State requirements which include using the adopted Coordinated Population Forecast. These forecasts are based on a set of assumptions regarding the average annual growth rate and public policies that affect relationships such as economic growth and housing for seniors, workers, and young families. The time frame for both forecasts is the 20-year planning period which this study is 2010-2030.
Historic Population Growth in Oregon and Lane County The Willamette Valley has been the center of growth in Oregon. The population growth rate in the Willamette Valley has exceeded that of the state in every decade of the 20th century except the 1970s, when population in Southern and Central Oregon grew at a rapid rate. About 2.4 million people or 70 percent of Oregon’s population in 2000 was located in the Willamette Valley, which contains only 14 percent of the state’s land area. Most of the Willamette Valley’s population is in the metropolitan areas of Portland, Salem, and Eugene-Springfield.7
The average annual population growth rate in Lane County exceeded the Oregon average in the 1940s through 1970s, but slowed to rates lower than the Oregon average in the 1980s and 1990s. Census data shows that Lane County’s share of Oregon population peaked in 1980 at 10.5 percent and declined to 9.1 percent in 2007 according to Population estimates by the Portland Research Center at Portland State University.
Population growth in every Oregon region slowed in the 1980s, primarily because of out-migration prompted by poor economic conditions early in the decade. Oregon’s population growth regained momentum in 1988, growing at annual rates of 1.3 percent–3.0 percent between 1988 and 1999. While the Willamette Valley received most of the population growth during this period (72 percent), Central Oregon had the fastest annual population growth rates. Population growth for Oregon slowed to 0.8 percent in 2000, the lowest rate since 1987. Net migration into Oregon dropped from a peak of 67,700 in 1991 to 10,700 in 2000. The reasons most often cited for this slowing of population growth are the recovery of the California economy, the combination of a high cost of living (especially housing) and low wages in Oregon, and a perceived decline in the quality of Oregon’s schools. Population growth in Oregon rebounded in 2001 and 2002, with annual population growth of 1.0 percent to 1.5 percent and annual net migration of 17,600 to 29,400.
Lane County experienced low or negative population growth rates in the early 1980s. Population growth in Lane County has been positive since 1989 but at rates lower than the Oregon average, except in 1997 and 2004 when Lane County grew at roughly the same rate as the State as a whole. In general, population growth in Lane County has been more cyclical than for Oregon as a whole. Figure 2-1 shows the annual population growth rate in Oregon and Lane County between 1991 and 2007.
7 The “Willamette Valley” is composed of Benton, Clackamas, Lane, Linn, Marion, Multnomah, Polk, Washington and Yamhill counties.
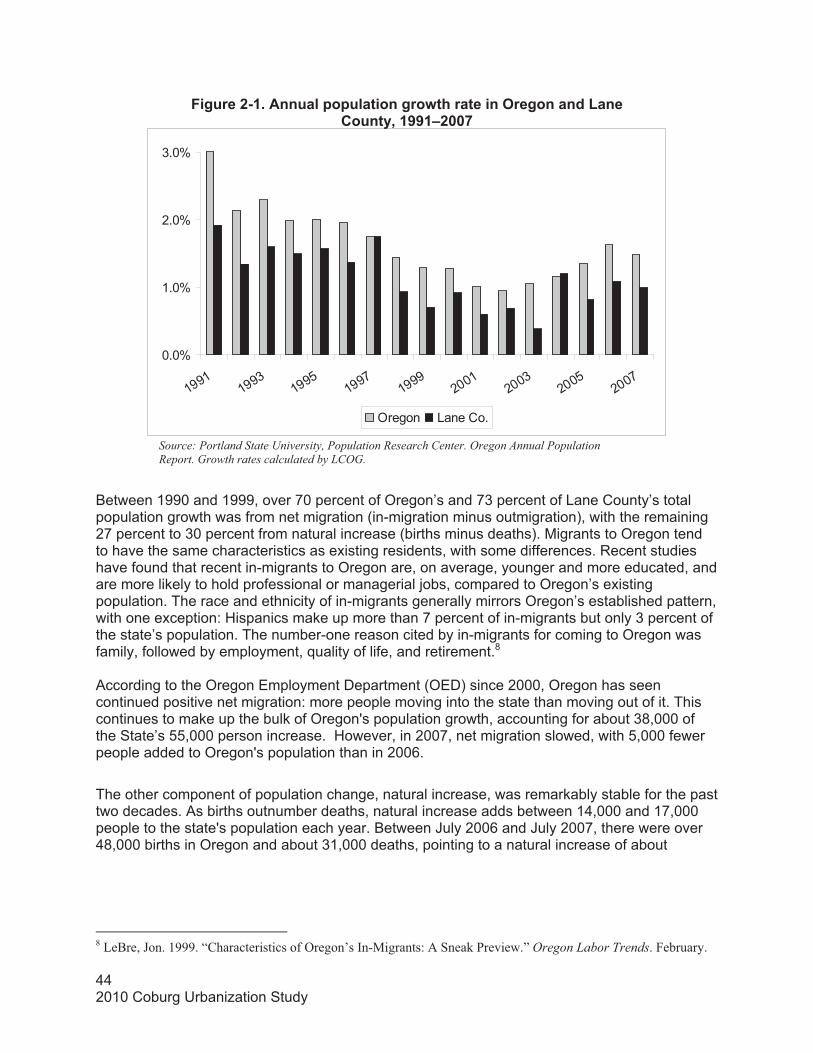
442010 Coburg Urbanization Study
"�*�����9���������������������*��?�����������-��*�������'���������!7��>>�L�881
0.0%
1.0%
2.0%
3.0%
19911993
19951997
19992001
20032005
2007
Oregon Lane Co.
Between 1990 and 1999, over 70 percent of Oregon’s and 73 percent of Lane County’s total population growth was from net migration (in-migration minus outmigration), with the remaining 27 percent to 30 percent from natural increase (births minus deaths). Migrants to Oregon tend to have the same characteristics as existing residents, with some differences. Recent studies have found that recent in-migrants to Oregon are, on average, younger and more educated, and are more likely to hold professional or managerial jobs, compared to Oregon’s existing population. The race and ethnicity of in-migrants generally mirrors Oregon’s established pattern, with one exception: Hispanics make up more than 7 percent of in-migrants but only 3 percent of the state’s population. The number-one reason cited by in-migrants for coming to Oregon was family, followed by employment, quality of life, and retirement.8
According to the Oregon Employment Department (OED) since 2000, Oregon has seen continued positive net migration: more people moving into the state than moving out of it. This continues to make up the bulk of Oregon's population growth, accounting for about 38,000 of the State’s 55,000 person increase. However, in 2007, net migration slowed, with 5,000 fewer people added to Oregon's population than in 2006.
The other component of population change, natural increase, was remarkably stable for the past two decades. As births outnumber deaths, natural increase adds between 14,000 and 17,000 people to the state's population each year. Between July 2006 and July 2007, there were over 48,000 births in Oregon and about 31,000 deaths, pointing to a natural increase of about
8 LeBre, Jon. 1999. “Characteristics of Oregon’s In-Migrants: A Sneak Preview.” Oregon Labor Trends. February.
Source: Portland State University, Population Research Center. Oregon Annual Population Report. Growth rates calculated by LCOG.
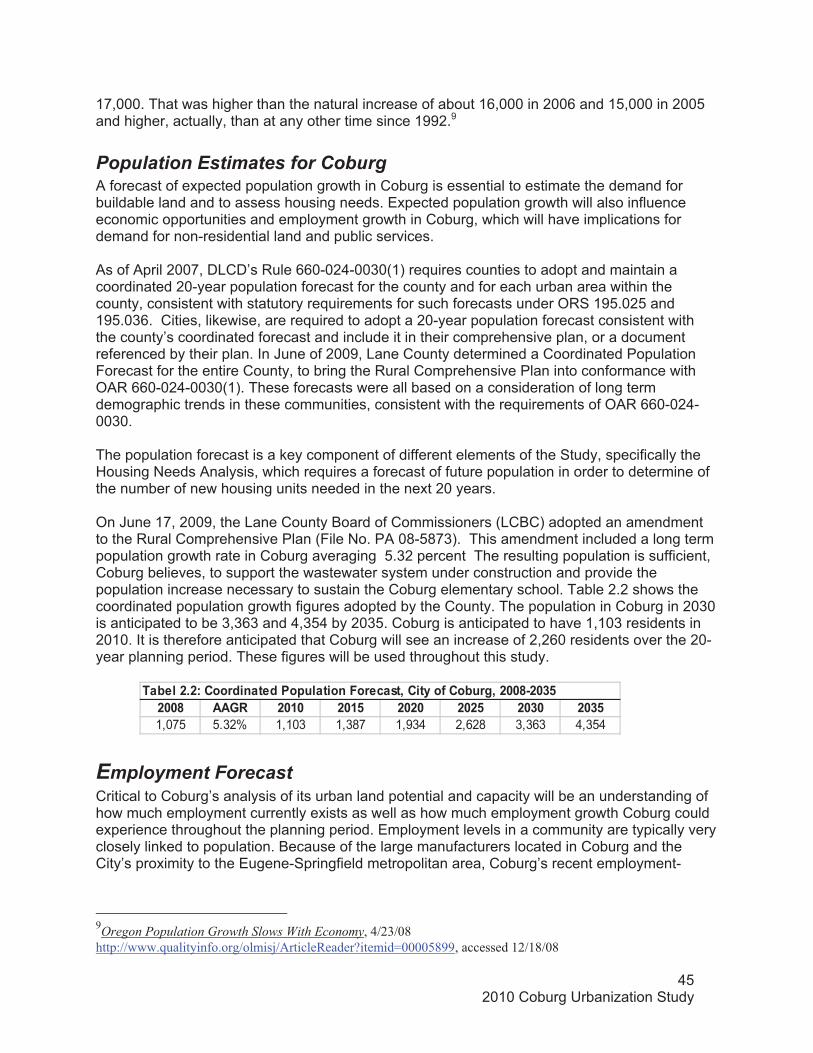
452010 Coburg Urbanization Study
�884 ��2 �8�8 �8�, �8�8 �8�, �8$8 �8$,1,075 5.32% 1,103 1,387 1,934 2,628 3,363 4,354
��&������:������������������������"�����#�7����!��/���&��*7��8849�8$,
17,000. That was higher than the natural increase of about 16,000 in 2006 and 15,000 in 2005 and higher, actually, than at any other time since 1992.9
Population Estimates for Coburg A forecast of expected population growth in Coburg is essential to estimate the demand for buildable land and to assess housing needs. Expected population growth will also influence economic opportunities and employment growth in Coburg, which will have implications for demand for non-residential land and public services.
As of April 2007, DLCD’s Rule 660-024-0030(1) requires counties to adopt and maintain a coordinated 20-year population forecast for the county and for each urban area within the county, consistent with statutory requirements for such forecasts under ORS 195.025 and 195.036. Cities, likewise, are required to adopt a 20-year population forecast consistent with the county’s coordinated forecast and include it in their comprehensive plan, or a document referenced by their plan. In June of 2009, Lane County determined a Coordinated Population Forecast for the entire County, to bring the Rural Comprehensive Plan into conformance with OAR 660-024-0030(1). These forecasts were all based on a consideration of long term demographic trends in these communities, consistent with the requirements of OAR 660-024-0030.
The population forecast is a key component of different elements of the Study, specifically the Housing Needs Analysis, which requires a forecast of future population in order to determine of the number of new housing units needed in the next 20 years.
On June 17, 2009, the Lane County Board of Commissioners (LCBC) adopted an amendment to the Rural Comprehensive Plan (File No. PA 08-5873). This amendment included a long term population growth rate in Coburg averaging 5.32 percent The resulting population is sufficient, Coburg believes, to support the wastewater system under construction and provide the population increase necessary to sustain the Coburg elementary school. Table 2.2 shows the coordinated population growth figures adopted by the County. The population in Coburg in 2030 is anticipated to be 3,363 and 4,354 by 2035. Coburg is anticipated to have 1,103 residents in 2010. It is therefore anticipated that Coburg will see an increase of 2,260 residents over the 20-year planning period. These figures will be used throughout this study.
�
Employment Forecast Critical to Coburg’s analysis of its urban land potential and capacity will be an understanding of how much employment currently exists as well as how much employment growth Coburg could experience throughout the planning period. Employment levels in a community are typically very closely linked to population. Because of the large manufacturers located in Coburg and the City’s proximity to the Eugene-Springfield metropolitan area, Coburg’s recent employment-
9Oregon Population Growth Slows With Economy, 4/23/08 http://www.qualityinfo.org/olmisj/ArticleReader?itemid=00005899, accessed 12/18/08
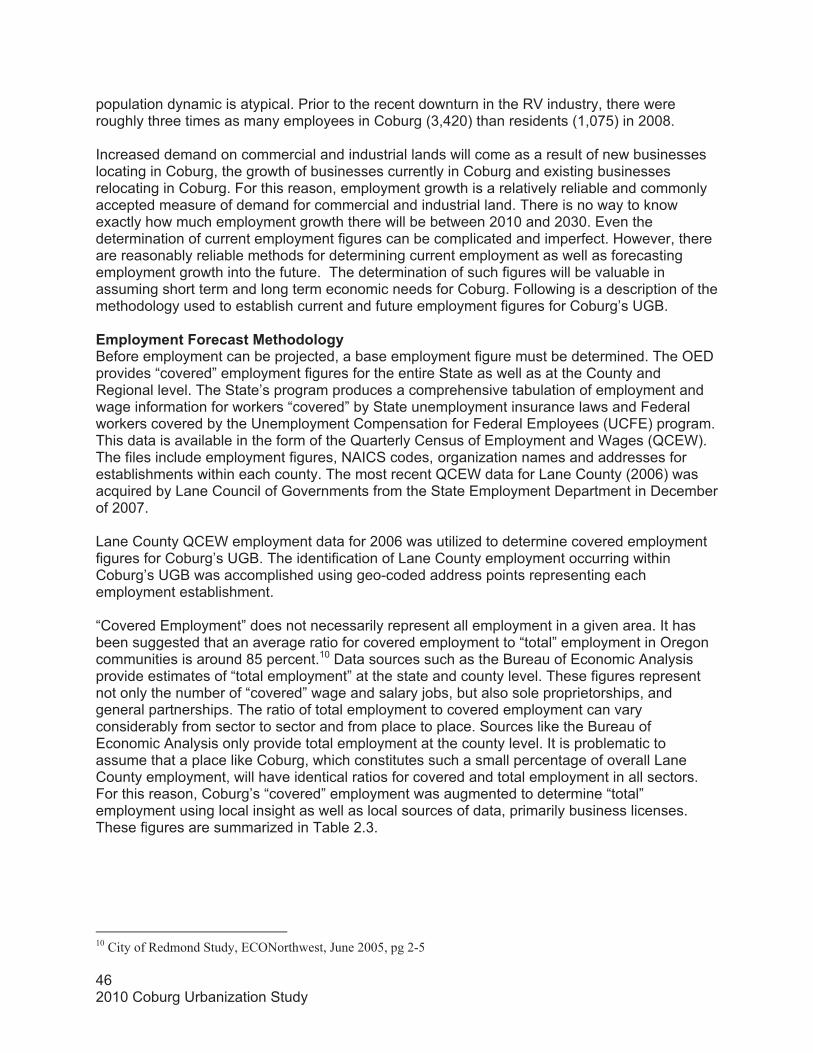
462010 Coburg Urbanization Study
population dynamic is atypical. Prior to the recent downturn in the RV industry, there were roughly three times as many employees in Coburg (3,420) than residents (1,075) in 2008.
Increased demand on commercial and industrial lands will come as a result of new businesses locating in Coburg, the growth of businesses currently in Coburg and existing businesses relocating in Coburg. For this reason, employment growth is a relatively reliable and commonly accepted measure of demand for commercial and industrial land. There is no way to know exactly how much employment growth there will be between 2010 and 2030. Even the determination of current employment figures can be complicated and imperfect. However, there are reasonably reliable methods for determining current employment as well as forecasting employment growth into the future. The determination of such figures will be valuable in assuming short term and long term economic needs for Coburg. Following is a description of the methodology used to establish current and future employment figures for Coburg’s UGB.
� ���! ����"�����#�����������*!�Before employment can be projected, a base employment figure must be determined. The OED provides “covered” employment figures for the entire State as well as at the County and Regional level. The State’s program produces a comprehensive tabulation of employment and wage information for workers “covered” by State unemployment insurance laws and Federal workers covered by the Unemployment Compensation for Federal Employees (UCFE) program. This data is available in the form of the Quarterly Census of Employment and Wages (QCEW). The files include employment figures, NAICS codes, organization names and addresses for establishments within each county. The most recent QCEW data for Lane County (2006) was acquired by Lane Council of Governments from the State Employment Department in December of 2007.
Lane County QCEW employment data for 2006 was utilized to determine covered employment figures for Coburg’s UGB. The identification of Lane County employment occurring within Coburg’s UGB was accomplished using geo-coded address points representing each employment establishment.
“Covered Employment” does not necessarily represent all employment in a given area. It has been suggested that an average ratio for covered employment to “total” employment in Oregon communities is around 85 percent.10 Data sources such as the Bureau of Economic Analysis provide estimates of “total employment” at the state and county level. These figures represent not only the number of “covered” wage and salary jobs, but also sole proprietorships, and general partnerships. The ratio of total employment to covered employment can vary considerably from sector to sector and from place to place. Sources like the Bureau of Economic Analysis only provide total employment at the county level. It is problematic to assume that a place like Coburg, which constitutes such a small percentage of overall Lane County employment, will have identical ratios for covered and total employment in all sectors. For this reason, Coburg’s “covered” employment was augmented to determine “total” employment using local insight as well as local sources of data, primarily business licenses. These figures are summarized in Table 2.3.
10 City of Redmond Study, ECONorthwest, June 2005, pg 2-5
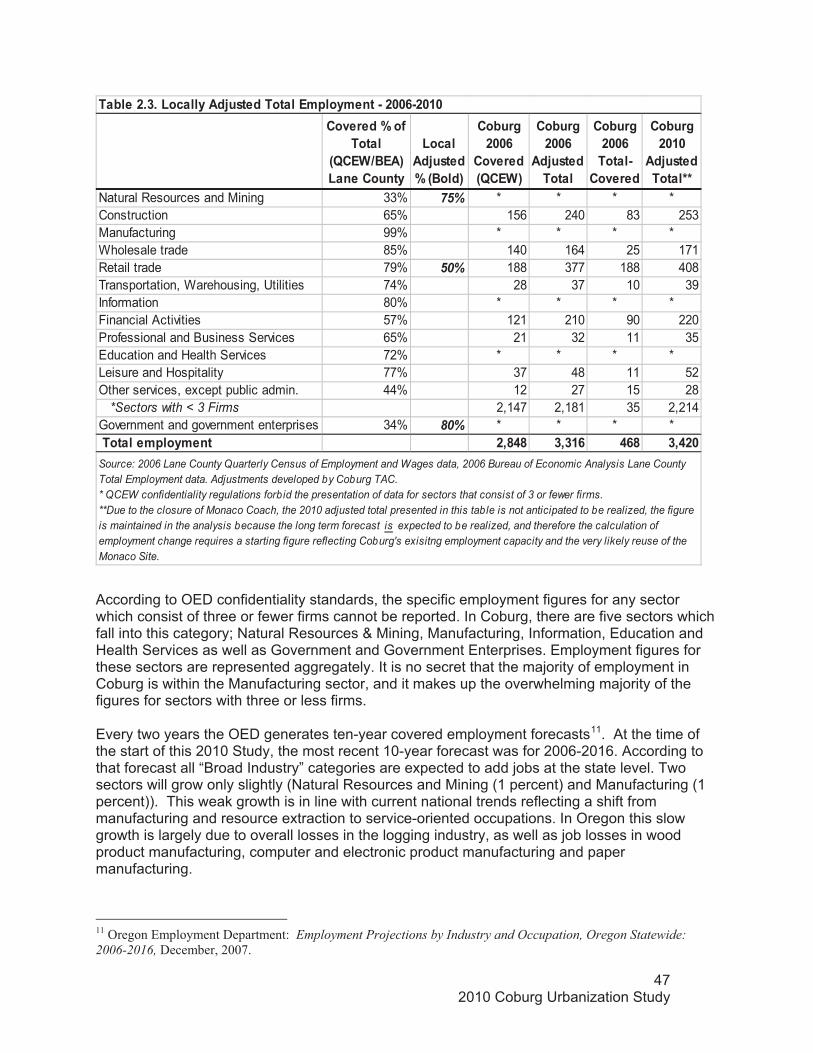
472010 Coburg Urbanization Study
Covered % of Total
(QCEW/BEA) Lane County
Local Adjusted % (Bold)
Coburg 2006
Covered (QCEW)
Coburg 2006
Adjusted Total
Coburg 2006
Total-Covered
Coburg 2010
Adjusted Total**
Natural Resources and Mining 33% 75% * * * *Construction 65% 156 240 83 253Manufacturing 99% * * * *Wholesale trade 85% 140 164 25 171Retail trade 79% 50% 188 377 188 408Transportation, Warehousing, Utilities 74% 28 37 10 39Information 80% * * * *Financial Activities 57% 121 210 90 220Professional and Business Services 65% 21 32 11 35Education and Health Services 72% * * * *Leisure and Hospitality 77% 37 48 11 52Other services, except public admin. 44% 12 27 15 28 *Sectors with < 3 Firms 2,147 2,181 35 2,214Government and government enterprises 34% 80% * * * * Total employment 2,848 3,316 468 3,420
Table 2.3. Locally Adjusted Total Employment - 2006-2010
Source: 2006 Lane County Quarterly Census of Employment and Wages data, 2006 Bureau of Economic Analysis Lane County Total Employment data. Adjustments developed by Coburg TAC. * QCEW confidentiality regulations forbid the presentation of data for sectors that consist of 3 or fewer firms. **Due to the closure of Monaco Coach, the 2010 adjusted total presented in this table is not anticipated to be realized, the figure is maintained in the analysis because the long term forecast is expected to be realized, and therefore the calculation of employment change requires a starting figure reflecting Coburg's exisitng employment capacity and the very likely reuse of the Monaco Site.
According to OED confidentiality standards, the specific employment figures for any sector which consist of three or fewer firms cannot be reported. In Coburg, there are five sectors which fall into this category; Natural Resources & Mining, Manufacturing, Information, Education and Health Services as well as Government and Government Enterprises. Employment figures for these sectors are represented aggregately. It is no secret that the majority of employment in Coburg is within the Manufacturing sector, and it makes up the overwhelming majority of the figures for sectors with three or less firms.
Every two years the OED generates ten-year covered employment forecasts11. At the time of the start of this 2010 Study, the most recent 10-year forecast was for 2006-2016. According to that forecast all “Broad Industry” categories are expected to add jobs at the state level. Two sectors will grow only slightly (Natural Resources and Mining (1 percent) and Manufacturing (1 percent)). This weak growth is in line with current national trends reflecting a shift from manufacturing and resource extraction to service-oriented occupations. In Oregon this slow growth is largely due to overall losses in the logging industry, as well as job losses in wood product manufacturing, computer and electronic product manufacturing and paper manufacturing.
11 Oregon Employment Department: Employment Projections by Industry and Occupation, Oregon Statewide: 2006-2016, December, 2007.

482010 Coburg Urbanization Study
County AAGR
(2006-16)
Adjusted Coburg AAGR
Coburg 2010
Adjusted Total
Projected Emp. 2030 (20-Year)
RTP Projected Emp. 2031
Projected Emp. 2035
Emp. Change
2010-2030
Natural Resources & Mining 0.00% * * * * *Construction 1.41% 253 335 340 360 82Manufacturing 0.34% * * * * *Wholesale trade 0.97% 171 207 209 218 36Retail trade 1.16% 2.00% 408 606 618 669 198Transportation, Warehousing, Utilities 1.15% 39 49 49 52 10Information 1.03% * * * * *Financial Activities 1.14% 220 276 280 293 56Professional and Business Services 1.72% 2.25% 35 53 55 59 18Education and Health Services 2.71% * * * * *Leisure and Hospitality 1.82% 2.25% 52 82 84 92 30Other Services 1.12% 28 35 35 37 7 *Sectors with < 3 Firms 2,214 2,392 2,401 2,438 178Government and Gov. Enterprises 1.20% * * * * *Total Employment 3,420 4,035 4,071 4,218 615
Table 2.4. Adjusted Coburg Employment Growth (2008-2035)
Source: Oregon Employment Department ten-year industry forecast (2006-2016). Adjustments to specific sector AAGR developed by Coburg TAC. * QCEW confidentiality regulations forbid the presentation of data for sectors that consist of 3 or fewer firms.
The OED also produces ten-year covered industry employment projections at the County level. Their estimates predict a 15 percent increase in covered non-farm employment over this decade, for an increase of 22,700 jobs, and an overall increase from 153,500 to 176,100 covered jobs. The ten-year projections are provided by employment sector. Annual Average Growth Rates (AAGRs) can therefore be extracted for each sector. These growth rates can be utilized for future employment projection, if the County’s growth in each sector can be viewed as being reliably consistent with the city in question. For large cities such as Eugene, Corvallis or Roseburg, county level ratios can be more reliable because the cities represent such large share of County employment. In Coburg the figures remain valuable, but local staff and decision makers were concerned about discrepancies within specific sectors. Thus, the county level AAGRs were adjusted for several sectors. These adjustments were largely based on the assumption that Coburg will experience unusually high growth in certain areas as a result of increased infrastructure capacity. The Retail Trade, Professional and Business Services and Leisure and Hospitality sectors have been identified locally as sectors that have been restricted in years passed, and are areas which show local promise and the City wishes to place focused efforts on fostering.
Table 2.4 shows how the ten-year Lane County Industry Employment Forecast was utilized to extract a ten-year AAGR trend for each sector (with some local adjustments as documented). The table shows how those AAGRs were then applied to generate a forecast for Coburg UGB’s total employment through 2035, including the end of the planning period (2030).
The table reveals that Coburg’s adjusted employment total (covered and non-covered employment) in 2010 is approximately 3,420 employees, and approximately 4,035 employees in 2030. This is an increase of approximately 615 employees. These growth forecasts will be used in the Economic Opportunities Analysis (Chapter 5) to better understand how Coburg should provide for its economic needs.
492010 Coburg Urbanization Study
Evaluation of Forecasts Population and employment forecasts for small areas or for long periods of time are subject to a high degree of uncertainty. Long-term forecasts for small areas compound this uncertainty. Several factors contribute to the uncertainty of long-term and small-area forecasts:
• Population and employment forecasts for most communities are projections of the best understanding of current dynamics. Such a forecast implicitly assumes that the underlying factors will play out as anticipated. The longer the forecast period, however, the greater the chances that some underlying factors will change in ways that could affect growth. Examples of underlying conditions that could affect population growth in Coburg include public policy, economic conditions, birth and death rates, transportation costs, and consumer preferences for housing.
• Even if planners had a sophisticated model that explicitly included all of the important underlying factors together (which they do not), they would still face the problem of having to forecast the future of these factors. In the final analysis, all forecasting requires making assumptions about the future.
• Comparisons of past population and employment projections to subsequent population counts have revealed that even much more sophisticated methods than the ones used in Coburg "are often inaccurate even for relatively large populations and for short periods of time."12 The smaller the area and the longer the period of time covered, the worse the results for any statistical method.
• Small areas start from a small base. Single unforeseen events in a small community, such as development of a new subdivision, can cause population to significantly diverge from forecast levels. A new subdivision of 100 homes inside the Portland Urban Growth Boundary has a relatively small effect on total population. That same subdivision in Coburg would increase the community’s housing stock and population by more than 25 percent. Especially for small cities in areas that can have high growth potential (e.g., because they are near to concentrations of demand in neighboring metropolitan areas, or because they have high amenity value for recreation or retirement), there is ample evidence of very high growth rates in short-term; there are also cases (fewer) of high growth rates sustained over 10 to 30 years. In this context, there is a wide range of possible population and employment growth levels in Coburg that could be justified by reasonable assumptions about future conditions. Several factors related to Coburg’s situation could have a substantial effect on forecast or actual population and employment growth:
� Coburg’s proximity to the Eugene-Springfield metropolitan area could generate higher levels of population growth. For example, if just 1 percent of the growth expected over the planning period in Eugene-Springfield went to Coburg instead, growth in Coburg would increase by approximately 350 residents (around 30 percent of its current population). Such a shift in population growth could be driven by economic factors such as housing prices or consumer preferences, or by public policies that encourage growth in Coburg.
12 Murdock, Steve H., et. al. 1991. "Evaluating Small-Area Population Projections." Journal of the American Planning Association, Vol. 57, No. 4, page 432.
502010 Coburg Urbanization Study
� In a similar fashion, attracting a small percentage of employment growth from Eugene-Springfield could significantly increase the level of employment in Coburg.
� Public policies in Coburg to encourage or discourage growth, or that affect the price of land, could result in more or less population growth. All of the City’s population growth scenarios assume that sewer capacity will expand to accommodate growth. The City’s population forecast and previous visioning documents include the assumption that the City will adopt policies to target housing for seniors, workers, and young families. In the future, however, Coburg officials may adopt policies that could result in more or less population growth than forecasted.
Overall, Coburg’s employment and population forecast is based on sound methods and reasonable assumptions. Given Coburg’s proximity to Eugene- Springfield, substantially high levels of population growth can be justified. This proximity even suggests that lower levels of population growth than forecasted are unlikely. This population forecast serves as the basis for the housing needs analysis in Chapter 4. The employment forecast for Coburg is subject to a higher level of variability than the population forecast because employment is more closely tied with changing short-run economic conditions. In addition, the employment forecast is based on an estimate of land supply and assumptions about the number of employees per acre for various land use types. Actual employment densities, however, will be determined by the types of firms that locate in Coburg. The level of redevelopment in Coburg will vary depending on economic conditions. Differences in the density of employment and amount of redevelopment in Coburg will cause actual employment growth to diverge from the forecast.
Finally, public policy has a critical role in determining the level of population and employment growth in a community. Local population and employment growth can be influenced by local policies, especially those regarding land use, public facility provision and pricing (taxes and fees), and economic development (incentives). It is contrary to economic theory and common sense to assume, as state policy on population forecasts is often interpreted, that every jurisdiction has a singular growth path that can be specified independent of the policies it might adopt to curb, accommodate, or stimulate growth. The population and employment forecasts used to estimate land needs in Coburg will need to be explicit about the assumptions regarding public policy (i.e., land use, public facility provision and pricing, and economic development) as it pertains to growth in the community. Moreover, many adjacent lands outside the existing Coburg UGB have Class 1-4 soils and are considered high value farmlands. Based on the Coburg Crossroads Vision, it is not the community’s desire to grow more than it has determined (the preferred alternative growth forecasts were related directly to wastewater capacity). Little growth can be realized until the wastewater facility is constructed. Finally, Coburg recognizes the importance of the agricultural economy and desires to sustain the agricultural industry by not expanding the UGB any more than is required.
512010 Coburg Urbanization Study
�)���� �$���%��'0�%'��'�+0��+�'���The buildable lands inventory is intended to identify lands that are available for development within the UGB. The inventory is sometimes characterized as supply of land to accommodate growth. Population and employment growth drive demand for land. The amount of land needed depends on the density of development. This chapter presents the buildable lands inventory for the City of Coburg. The results are based on input from the Coburg Technical Advisory Committee (TAC).
Buildable Lands Analysis within the Overall UGB Expansion Process
This portion of Coburg’s Study (2010) addresses the supply of lands within Coburg’s UGB that are buildable. This is the first step in determining if the current UGB can supply enough residential and commercial land to accommodate Coburg’s anticipated population and employment growth over the 20-year planning period. The Buildable Lands Analysis will inventory all types of vacant, potential infill, potential redevelopment and environmentally constrained land within the existing UGB for residential, commercial, and industrial land. The steps in the full process of the UGB Expansion study are:
ThisSection ��������$��%�����&���'������=�����!�;%'�<��
�
��������(��)��#��*�+���#�����!#�#:�Determines types and densities of residential development within the UGB using the Housing/Land Needs. Determine the amount of land needed to meet future demand at appropriate types and densities based on historical and potential future development trends, population changes and growth projections, and economic factors. Address all Goal 10 Housing, and Goal 14 requirements. Housing needs are estimated using a Housing Needs Model.�
��������,������� ���-�����������#�����!#�#: Estimates need for commercial and industrial land based on historic and current trends related to employment projections and local economic potential. Identify size and characteristics of employment land needs. Address requirements of Goal 9.
��������.������!�����0� ������ ����#��: Determines whether there is a deficit or surplus of buildable land for residential, commercial, and Industrial needs.�
��������1���2%��3���#��������#����!���Identifies and assesses areas where urban expansion should take place based on expansion criteria per Goal 14, ORS 197.298 , and OAR 660-0024-0060, including (but not limited to) the efficiency of service provision; economic, social, environmental, and energy impacts; compatibility with surrounding uses, as well as other information provided in the previous steps. �
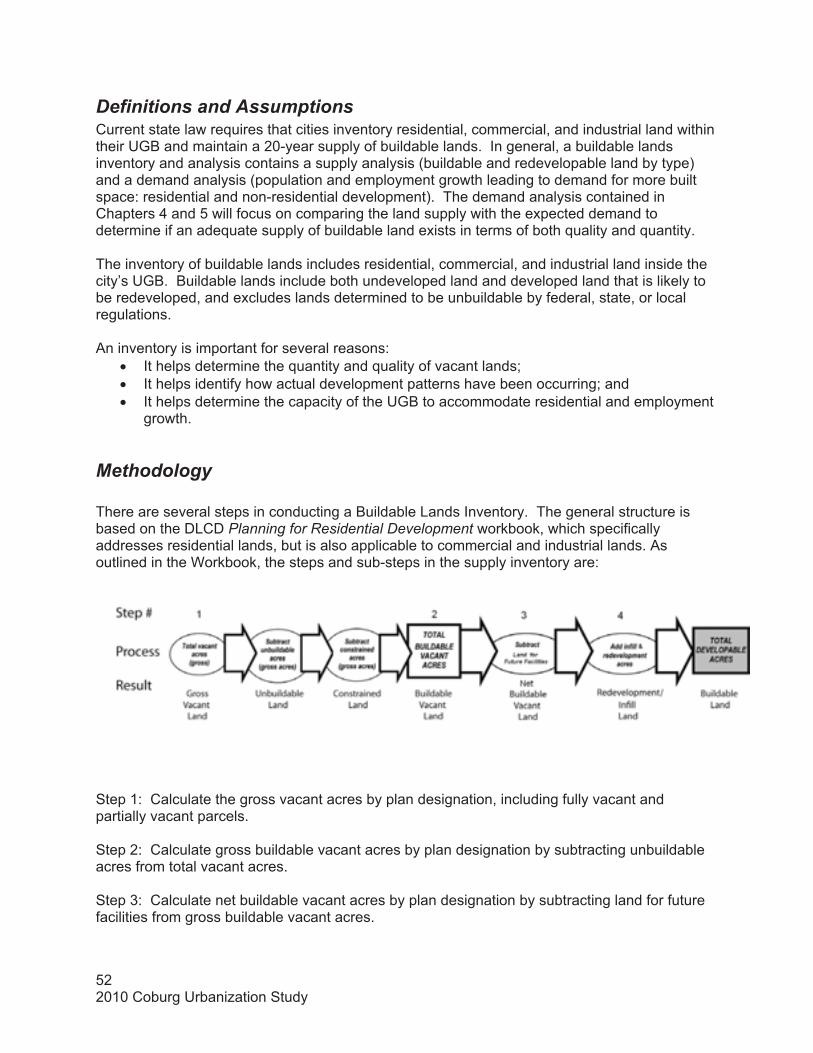
522010 Coburg Urbanization Study
Definitions and Assumptions Current state law requires that cities inventory residential, commercial, and industrial land within their UGB and maintain a 20-year supply of buildable lands. In general, a buildable lands inventory and analysis contains a supply analysis (buildable and redevelopable land by type) and a demand analysis (population and employment growth leading to demand for more built space: residential and non-residential development). The demand analysis contained in Chapters 4 and 5 will focus on comparing the land supply with the expected demand to determine if an adequate supply of buildable land exists in terms of both quality and quantity.
The inventory of buildable lands includes residential, commercial, and industrial land inside the city’s UGB. Buildable lands include both undeveloped land and developed land that is likely to be redeveloped, and excludes lands determined to be unbuildable by federal, state, or local regulations.
An inventory is important for several reasons: � It helps determine the quantity and quality of vacant lands; � It helps identify how actual development patterns have been occurring; and � It helps determine the capacity of the UGB to accommodate residential and employment
growth.
Methodology�There are several steps in conducting a Buildable Lands Inventory. The general structure is based on the DLCD Planning for Residential Development workbook, which specifically addresses residential lands, but is also applicable to commercial and industrial lands. As outlined in the Workbook, the steps and sub-steps in the supply inventory are:
Step 1: Calculate the gross vacant acres by plan designation, including fully vacant and partially vacant parcels.
Step 2: Calculate gross buildable vacant acres by plan designation by subtracting unbuildable acres from total vacant acres.
Step 3: Calculate net buildable vacant acres by plan designation by subtracting land for future facilities from gross buildable vacant acres.
532010 Coburg Urbanization Study
Step 4: Calculate total net buildable acres by plan designation by adding redevelopable acres to net buildable vacant acres.
The total net supply of land is determined by adding the gross vacant acres to the gross redevelopable acres and the gross acres available for infill development, and then subtracting for unbuildable lands.
DefinitionsIn general, the following definitions are used to classify the properties into different categories.
� Vacant and partially vacant land – Tax lots that have no structures or have buildings with very little value. For the purpose of this inventory, lands with improvement values under $5,000 are considered vacant (not including lands that are identified as having mobile homes). Partially vacant tax lots have improvements but also have enough undeveloped land to accommodate additional development.
� Undevelopable land – Land that is under the minimum lot size for the underlying zoning district, land that has no access, or land that is already committed to other uses by policy. Staff used 2,500 square feet for properties in the Traditional Medium Residential and Traditional Residential zones and 1,500 square feet in the Central Business District. Staff further refined the analysis of undevelopable land by analyzing access limitations as well as land that is already committed to other uses by policy.
� Infill land – Partially vacant tax lots are those occupied by a use but which contain enough land to be further subdivided without need of rezoning. Partially vacant residential tax lots must be at least 15,000 square feet in area. Staff used the 15,000 square foot threshold as a preliminary indicator for partially-vacant land, and then reviewed improvement values and aerial photographs to determine whether there was sufficient land to be further developed, given the extent and location of existing improvements as well as zoning requirements for new lots.
� Potentially redevelopable land – Land on which development has already occurred but on which, due to present or expected market forces, there exists the potential that existing development will be converted to more intensive uses during the planning period. Redevelopable residential land would generally address land where there may be potential for redevelopment of parcels with existing uses that are less intense than the planned use; for example, a single family home or mobile home on land that allows for multi-family development. Commercial and industrial redevelopable land would also address land where there may be potential for redevelopment of parcels with existing uses that are less intense than the planned use; for example, if a storage area was replaced with an office building.
� Developed land – Land that is developed at densities consistent with zoning and improvements that make it unlikely to redevelop during the analysis period. Lands not classified as vacant, partially-vacant, potentially redevelopable, or undevelopable are considered developed.
� Public land. Lands in public or semi-public ownership are considered unavailable for development. This includes lands in Federal, State, County, or City ownership as well as

542010 Coburg Urbanization Study
lands owned by churches and other semi-public organizations. STAFF identified such lands using property ownerships.
The BLI will inventory lands by Coburg’s Plan designations and will ultimately estimate the number of dwelling units and non-residential square footage that can be accommodated within the UGB.
The City of Coburg has eight Plan designations and five subzones/overlays. The Plan designations and associated zoning/land use districts include:
�� ������#�=�������0�#�*������� �������&���'�����#��0�#�����;#<Traditional Residential Traditional Residential (TR)
Neighborhood Residential Traditional Medium Density Residential (TMR)
Central Business District Central Business District (C1) Highway Commercial Highway Commercial (C2) Light Industrial Light Industrial (LI) Campus Industrial Campus Industrial (CI) Park/Recreation Park, Recreation and Open Space (PRO) Public Facility Public Facility
Historic Overlay Site Plan Review Overlay Flood Plain Sub-district (FP) Mobile Home Planned Unit Development District (PUD)
Subzone/Overlay Districts
Buffer Overlay
Though designated, not all designations are represented on the current Comprehensive Plan Map. For example, there is no Campus Industrial or Mobile Home Planned Unit Development District (PUD).
'����%�#��
Table 3.1 shows acres by plan designation within the Coburg UGB in 2009. According to the LCOG GIS data, Coburg had about 650 acres within its UGB. Of the 650 acres, 551 acres (about 85%) were in tax lots. Acres not in tax lots were exclusively in streets and other right-of-ways. Map 2 depicts the current zoning in Coburg while Map 3 depicts Land Use Designations in Coburg.
��������������&���$��������#�&!��������#�*������7���&��*��2%7��������88>������0�#�*������� +� &����/���3�'��# ����������#� ���������/�������Traditional Residential 383 170.6 31.0%Neighborhood Residential
0 0 0%
Central Business District
63 15.0 2.7%
Highway Commercial 27 93.3 16.9%
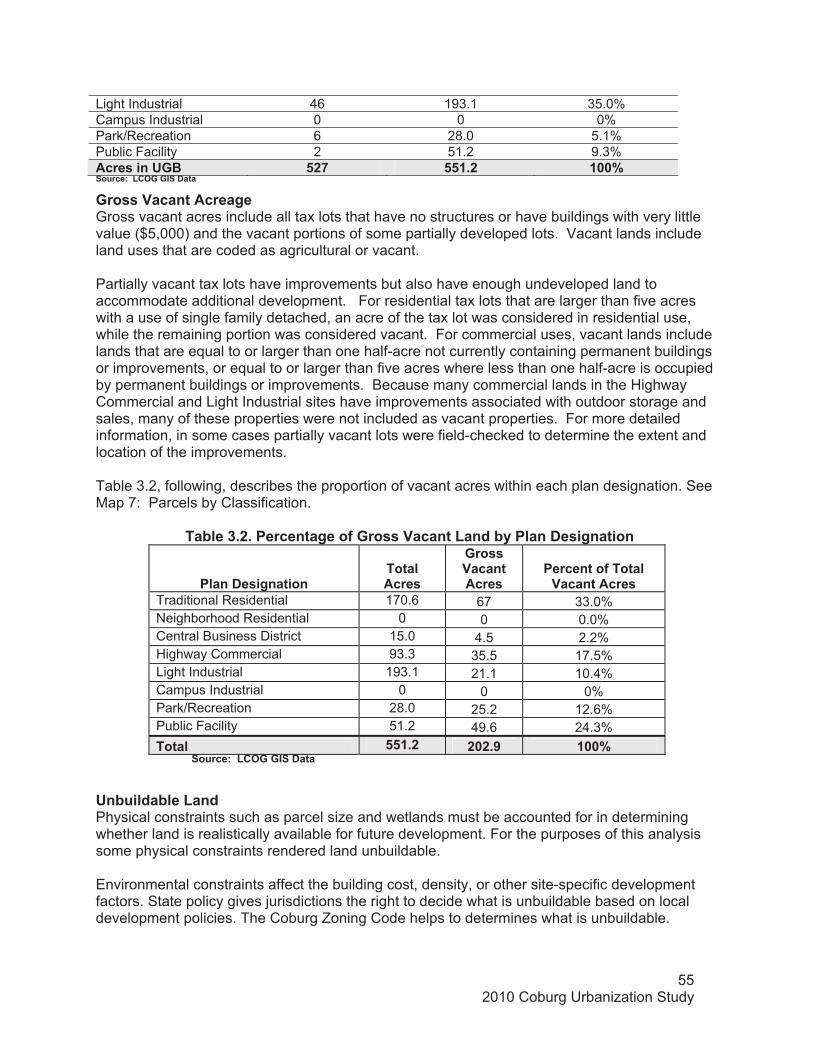
552010 Coburg Urbanization Study
Light Industrial 46 193.1 35.0%Campus Industrial 0 0 0%Park/Recreation 6 28.0 5.1% Public Facility 2 51.2 9.3%����#�����2%� ,�1� ,,���� �88D������:��'�-2�2��0����
2��##������������*��Gross vacant acres include all tax lots that have no structures or have buildings with very little value ($5,000) and the vacant portions of some partially developed lots. Vacant lands include land uses that are coded as agricultural or vacant.
Partially vacant tax lots have improvements but also have enough undeveloped land to accommodate additional development. For residential tax lots that are larger than five acres with a use of single family detached, an acre of the tax lot was considered in residential use, while the remaining portion was considered vacant. For commercial uses, vacant lands include lands that are equal to or larger than one half-acre not currently containing permanent buildings or improvements, or equal to or larger than five acres where less than one half-acre is occupied by permanent buildings or improvements. Because many commercial lands in the Highway Commercial and Light Industrial sites have improvements associated with outdoor storage and sales, many of these properties were not included as vacant properties. For more detailed information, in some cases partially vacant lots were field-checked to determine the extent and location of the improvements.
Table 3.2, following, describes the proportion of vacant acres within each plan designation. See Map 7: Parcels by Classification.
������������������������&���$������������*���/�2��##�������'����&!������0�#�*�������
�����0�#�*�����������������#�
2��##�����������#�
���������/�����������������#�
Traditional Residential 170.6 67 33.0% Neighborhood Residential 0 0 0.0% Central Business District 15.0 4.5 2.2% Highway Commercial 93.3 35.5 17.5% Light Industrial 193.1 21.1 10.4% Campus Industrial 0 0 0% Park/Recreation 28.0 25.2 12.6% Public Facility 51.2 49.6 24.3% ������ ,,���� �8��>� �88D�
�����:��'�-2�2��0���
��&�����&���'����Physical constraints such as parcel size and wetlands must be accounted for in determining whether land is realistically available for future development. For the purposes of this analysis some physical constraints rendered land unbuildable.
Environmental constraints affect the building cost, density, or other site-specific development factors. State policy gives jurisdictions the right to decide what is unbuildable based on local development policies. The Coburg Zoning Code helps to determines what is unbuildable.
562010 Coburg Urbanization Study
The following sections describe how these considerations are used to determine what is unbuildable.
� ��������J�: There are some parcels in the data file that are too small to be developed. All new lots must meet the minimum lot size to be created or to be recreated with a lot line adjustment. However, existing legal lots in the residential districts regardless of size may be developed if they meet the other district regulations (e.g. setbacks, access, frontage, etc.). As a result, for the purposes of this Study, 2,500 square feet was used as the minimum “buildable” lot size for properties in the Traditional Medium Residential and Traditional Residential zones. By the Coburg Zoning Ordinance, 1,500 square feet is the minimum lot size in the Central Business District. As a result, for the purposes of this Study, 1,500 square feet was used as the minimum “buildable” area for properties in the Central Business District. Further refine this by analyzing access limitations, lot width and frontage as well as land that is already committed to other uses by policy, such as future right-of-ways. Parcels within the UGB that are too small to be developed have a total combined area of 2.2 acres. These acres were considered unbuildable and were subtracted from the inventory. This represents about 1.08% of the total vacant land.
�� ���I#����� ���������:�Lands under Parks and Open Space designation are not
considered buildable. Parcels within the UGB that are designated as Parks/Recreation have a total combined area of 28 acres. These acres were considered unbuildable and were subtracted from the inventory. This represents about 13.8% of the total vacant land.�
�� ��&�����������!:��Of the remaining undeveloped land, lands in public or semi-public
ownership were considered unbuildable. This included land that is owned by fraternal organizations, religious institutions, and public schools, as well as land owned by the City. Figure 3-1 shows lands by plan designation within the Coburg UGB. Some of these properties were contained within the Public Facility Plan Designation (49.6 acres), while others were contained within either the Traditional Residential (3.5 acres) or Central Business District Designation (0.1 acres). Using these criteria, a total of 53.2 acres were considered unbuildable and were subtracted from the inventory. This represents about 26.2% of the total vacant land.�
�Table 3.3 shows the amount of acreage affected by unbuildable characteristics for each plan designation. See Map 7: Parcels by Classification.
������������������������������&���$�$����&�����&�������������#�&!������0�#�*������������0�#�*������� ��&�����&�������������#�
Traditional Residential 4.4Neighborhood Residential 0Central Business District 0.2Highway Commercial 0Light Industrial 1.2Campus Industrial 0Park/Recreation 25.2Public Facility 49.6������ 48�.�
�����:��'�-2�2��0����
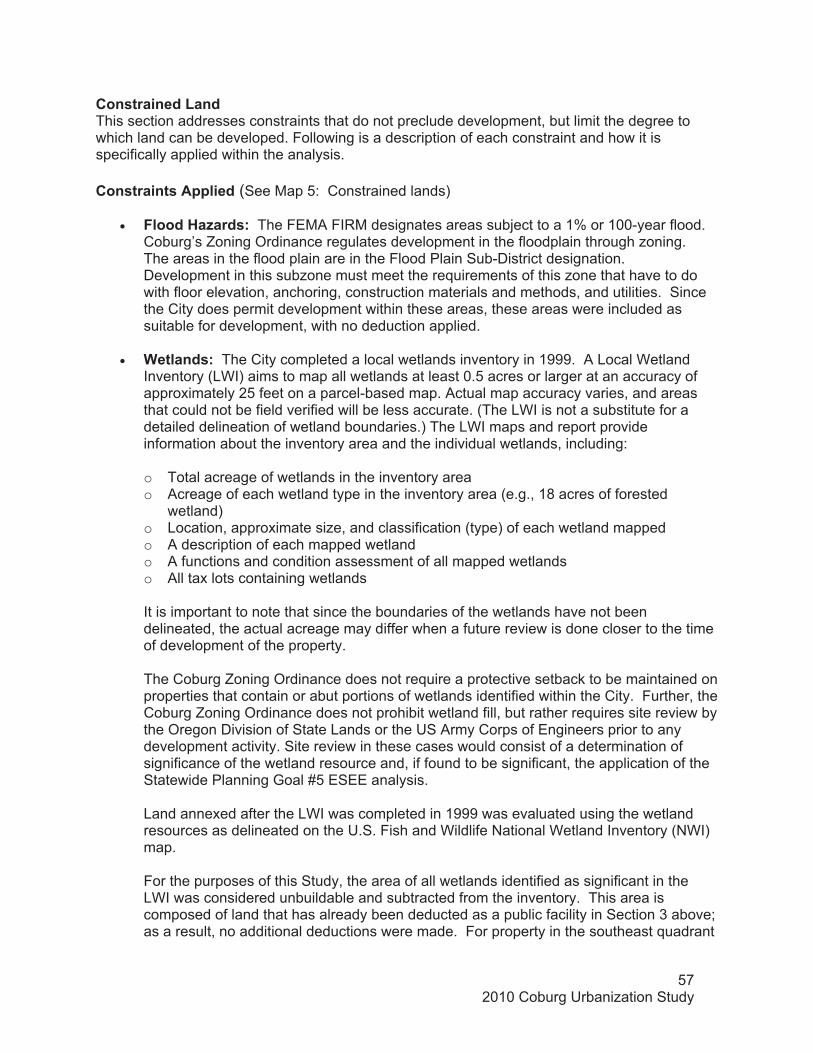
572010 Coburg Urbanization Study
���#��������'����This section addresses constraints that do not preclude development, but limit the degree to which land can be developed. Following is a description of each constraint and how it is specifically applied within the analysis.
���#������#���������(See Map 5: Constrained lands)
� "�����)�J���#: The FEMA FIRM designates areas subject to a 1% or 100-year flood. Coburg’s Zoning Ordinance regulates development in the floodplain through zoning. The areas in the flood plain are in the Flood Plain Sub-District designation. Development in this subzone must meet the requirements of this zone that have to do with floor elevation, anchoring, construction materials and methods, and utilities. Since the City does permit development within these areas, these areas were included as suitable for development, with no deduction applied.
� 5������#: The City completed a local wetlands inventory in 1999. A Local Wetland Inventory (LWI) aims to map all wetlands at least 0.5 acres or larger at an accuracy of approximately 25 feet on a parcel-based map. Actual map accuracy varies, and areas that could not be field verified will be less accurate. (The LWI is not a substitute for a detailed delineation of wetland boundaries.) The LWI maps and report provide information about the inventory area and the individual wetlands, including:
o Total acreage of wetlands in the inventory area o Acreage of each wetland type in the inventory area (e.g., 18 acres of forested
wetland)o Location, approximate size, and classification (type) of each wetland mapped o A description of each mapped wetland o A functions and condition assessment of all mapped wetlands o All tax lots containing wetlands
It is important to note that since the boundaries of the wetlands have not been delineated, the actual acreage may differ when a future review is done closer to the time of development of the property.
The Coburg Zoning Ordinance does not require a protective setback to be maintained on properties that contain or abut portions of wetlands identified within the City. Further, the Coburg Zoning Ordinance does not prohibit wetland fill, but rather requires site review by the Oregon Division of State Lands or the US Army Corps of Engineers prior to any development activity. Site review in these cases would consist of a determination of significance of the wetland resource and, if found to be significant, the application of the Statewide Planning Goal #5 ESEE analysis.
Land annexed after the LWI was completed in 1999 was evaluated using the wetland resources as delineated on the U.S. Fish and Wildlife National Wetland Inventory (NWI) map.
For the purposes of this Study, the area of all wetlands identified as significant in the LWI was considered unbuildable and subtracted from the inventory. This area is composed of land that has already been deducted as a public facility in Section 3 above; as a result, no additional deductions were made. For property in the southeast quadrant
582010 Coburg Urbanization Study
of City that was annexed after LWI was completed, vacant acreage with wetlands mapped in the NWI was considered unbuildable and subtracted from the inventory.
� ��������)�&�������&��I�����#: As part of the local wetlands inventory, an inventory or riparian corridors was also completed. There are two open water courses within the City; both were identified as wetlands within the LWI and therefore are addressed above. The Coburg Zoning Ordinance does not require a protective setback to be maintained on properties that contain or abut portions of the two watercourses identified within the City. As a result, no deduction was made for areas abutting riparian corridors.
� ����#: No land in Coburg is constrained by slopes.
Table 3.4, below shows the amount of Gross Buildable Acres, by plan designation, affected by constrained lands. See Map 7: Parcels by Classification.
�����������������&���$�(��2��##�%�����&�������0������������#�&!������0�#�*�������
�����0�#�*����������#��������0��������
����#�Traditional Residential 0Neighborhood Residential 0Central Business District 0Highway Commercial 8.5Light Industrial 0Campus Industrial 0Park/Recreation 0 Public Facility 0
������ 4�,������:��'�-2�2��0����
�%�����&���������'����
Vacant parcels total some 204 acres in the UGB. From this are subtracted the absolute constraints of unbuildable small lots, parks and open space designation, and public facilities totaling approximately 80.6 acres. Mitigating constraints are comprised of development reductions for wetlands, which reduced the total vacant lands supply by approximately 8.5 acres. The amount of vacant buildable land after these reductions is 114.9 acres. Table 3.5 below shows the amount of Gross Buildable Acres, by plan designation, after unbuildable and constrained acres have been deducted.
����������
592010 Coburg Urbanization Study
��&���$�,�������7�2��##������7�0�������7�M�2��##�%�����&�������#�&!������0�#�*������
�����0�#�*�������
����������#�
2��##�����������#�
��&�����&������#�
���#�������0������������#�
2��##�%�����&���
����������#�Traditional Residential 170.6 67 4.4 0 62.613(47.5)Neighborhood Residential 0 0 0 0 0 Central Business District 15.0 4.5 0.2 0 4.3 Highway Commercial 93.3 35.5 0 8.5 27 Light Industrial 193.1 21.1 1.2 0 19.9 Campus Industrial 0 0 0 0 0 Park/Recreation 28.0 25.2 25.2 0 0 Public Facility 51.2 49.6 49.6 0 0
������ ,,���� �8��>� 48�.� 4�,� ��$�4�$;>4�1<�����:��'�-2�2��0���
Table 3.6 shows vacant land by plan designation by parcel size. This analysis is useful in that it shows the distribution of vacant land by parcel size, which allows an evaluation of whether a sufficient mix of parcels is available. The distribution varies by plan designation. For example, few vacant parcels exist in the Central Business District—a result that is consistent with the level of development in downtown Coburg. The residential designation shows a broader range of parcel sizes.
��&���$�.��2��##�%�����&��������������&!��������#�*������������������#�J�7���&��*��2%�
�����0�#�*������� N����889(�>>�
,�889>�>>�
�8�889�>�>>�
�8�889,8�88� ������
���������/�������
�=*����������J��
����#� Traditional Residential 6.8 2.0 6.9 31.8 47.5 49% 1.8 Central Business District 2.9 1.4 4.3 4% 0.4 Highway Commercial 3.5 23.5 27.0 27% 2.5 Light Industrial 1.4 6.2 12.3 19.9 20% 2.8 ������ �(�.� >�.� �>��� ,,�$� � >4�1� �88D� ��.�
��3���#� Traditional Residential 38 1 1 2 42 58% Central Business District 11 1 12 17% Highway Commercial 8 1 2 11 15% Light Industrial 2 3 2 7 10% ������ ,>� .� $� (� � 1�� �88D� �
�����:��'�-2�2��0���
��&����"��������#�'����+���#�This step is relevant for larger undeveloped parcels. When development occurs, a portion of the undeveloped parcel will be needed for roads, rights-of-way, and other public facilities. Smaller parcels generally have access to existing roadways. For this step, the percentage of land
13 One of the vacant properties included in the inventory above is in the process of undergoing a development activity and therefore was considered to be developed and subtracted from the vacant acreage noted above. The property is approximately 15.06 acres in size and is located within the Traditional Residential designation. If this property is deducted from the gross buildable vacant acres in the Traditional Residential designation, the total is now 47.5 acres and the total vacant acres in the TR designation and >4�1 overall vacant acres within the City.
602010 Coburg Urbanization Study
needed for public facilities was estimated and subtracted from the larger parcels throughout Coburg. This process of subtraction converts gross acres to net acres. Under the provisions of OAR 660-024-0040(9), Coburg can estimate that the 20-year land needs for streets and roads, parks and school facilities will together require an additional amount of land equal to 25% of the net buildable acres for residential land needs. For this Study, the amount of land needed for these facilities has been reduced to 20%; this reduction from the Safe Harbor method has been used based on several factors, as follows:
� The City has identified a large site within the UGB to use associated with the wastewater system; this acreage has already been deducted from the inventory of vacant lands as publicly owned property. The capacity of this system has been based on a population and employment forecast similar to that addressed in this Study.
� The anticipated population increase will likely not result in increased demand for new school facilities within Coburg.
� Plans for expanding the capacity of the water system by drilling new wells is planned to occur outside of the existing UGB boundaries.
� The City has prepared a Parks and Open Space Master Plan, which projected a need for new parks within the City’s existing UGB, based upon projected population forecasts similar to that addressed in this Study.
Within Coburg’s UGB, vacant or partially vacant parcels greater than one acre had 20% of the vacant land removed from the inventory to account for streets and other public facilities. About 16.9 total acres were removed from the gross vacant buildable acreages to account for public facilities. Table 3.7 below shows the amount of land for public facilities was removed, by plan designation.
����������������������������&���$�1��'����0��������/�����&����"��������#�
�����0�#�*�������
������2��##�����#�;/�� ���&���.��&�=�<�
2��##�����#�O�����������#�J��
��&����"��������#�'����0���������
;����#< ������+�������#�Traditional Residential 47.5 40.8 8.2 39.3Central Business District 4.3 1.4 0.3 4.0Highway Commercial 27.0 23.5 4.7 22.3Light Industrial 19.9 18.5 3.7 16.2
������ >4�1� 4(��� �.�>� 4��4������:��'�-2�2��0���
The next steps in the process are to add to the inventory land deemed likely to redevelop or to have additional residential units added through residential infill. ���=���� ����������/������ ���=���� ����Redevelopment potential addresses land that is classified as developed that may redevelop during the planning period. While many methods exist to identify redevelopment potential, a common indicator is improvement to land value ratio.
Redevelopable land is land on which development has already occurred but due to market forces or city policies, there is a strong likelihood that the existing development will be converted to, or replaced by, a new or more intensive use. Redevelopment can occur if improvements, renovation, infill, or development of a more intensive use are feasible options.

612010 Coburg Urbanization Study
�#���������'�����- Redevelopable residential land would generally address land where there may be potential for redevelopment of parcels with existing uses that are less intense than the planned use; for example, a single family home or mobile home on land that allows for multi-family development. In Coburg, the most potential for redevelopment on Residential lands occurs within the Traditional Medium Residential zone, which permits multifamily development. All of the Traditional Medium Residential zoned property is vacant and has been included in the calculation of gross buildable vacant acres noted above.
The other potential area of residential redevelopment is the conversion or replacement of single-family units with duplexes in the Traditional Residential district. Under current zoning, this could occur on corner lots, provided the lot contains a minimum of 8,000 square feet and that the entries to the units could be arranged so that each is oriented to a different street. The duplex development would also need to meet all other requirements of the Zoning Code, such as maximum lot coverage (35%), building height, and minimum yard requirements. According to an initial overview, there are approximately 51 properties in the Traditional Residential Zone that are corner lots and contain a minimum of 8,000 square feet of land area.
Although certain lands may be identified as redevelopable, only a portion of those potential lots are assumed to actually develop. Of the 51 corner properties containing more than 8,000 square feet, approximately 13 are located within the Coburg Historic District boundary and have been evaluated as being a “contributing” property in an architectural study completed by the Oregon State Historic Preservation Office (SHPO) in April 2008. As a result, these properties have not been considered as likely to redevelop. In addition, ten percent of potential redevelopment for duplexes on residential lands is expected to occur in the 20-year timeframe, which would total 4 units. Table 3.8 below shows the number of units forecast to be redeveloped within the Traditional Residential designation.
���������&���$�4:����������� ���=�����&�������#�/��������������� �#���������������#
�����0�#�*�����������������
���������������#� ���=���� ���� �������9 �����
���=���� ��������#�Traditional Residential� 38 10% 4 �����:��'�-2�2��0���
�� ������A����#������'��� – Commercial and Industrial redevelopable land would also address land where there may be potential for redevelopment of parcels with existing uses that are less intense than the planned use; for example, if a storage area was replaced with an office building.
While many methods exist to identify redevelopment potential, a common indicator is improvement to land value ratio. In the 2004 Study, an improvement to land value ratio of 1:1 was used. Under this threshold, if the improvement value (value of buildings and other improvements) is less than the land value, this would indicate a potential for redevelopment. For this Study, this improvement to land value ratio will be used, together with properties where the existing use is less intense than plan designation would allow. For instance, this would include any residual residential development on land that is designated for industrial or commercial uses.
Typically, after lands are identified as available for redevelopment, analysis is done to determine whether all of the lands identified are assumed to actually redevelop within the planning horizon.
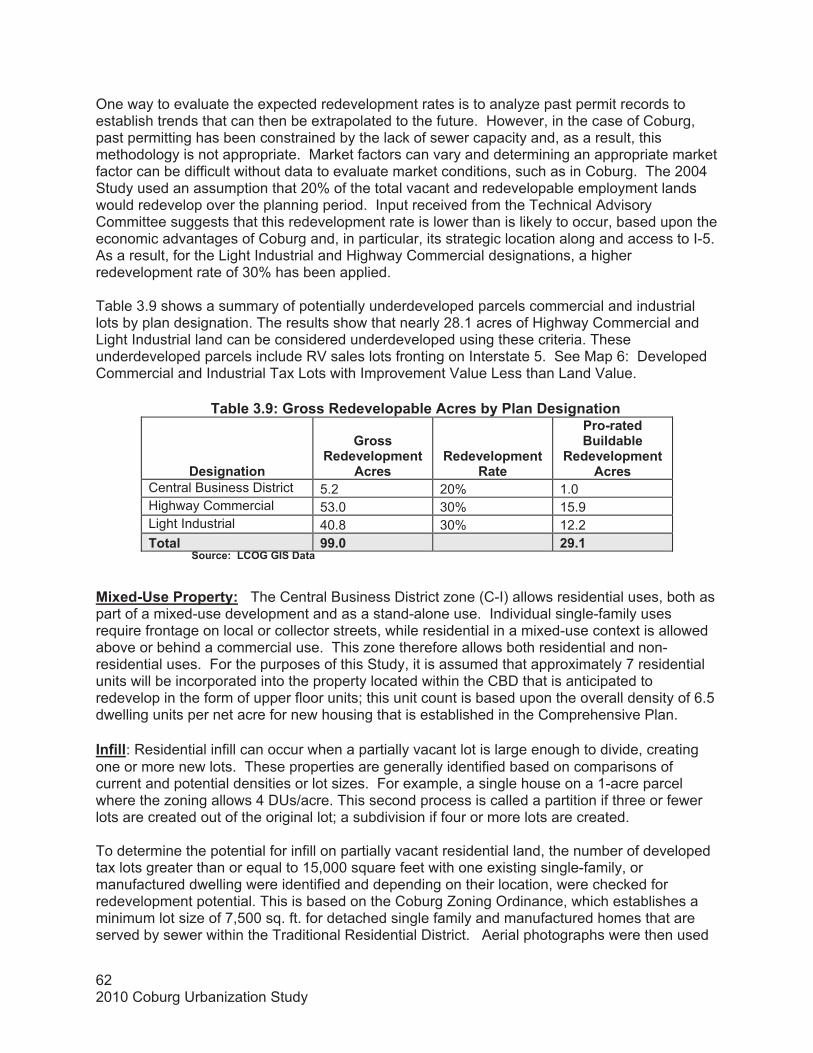
622010 Coburg Urbanization Study
One way to evaluate the expected redevelopment rates is to analyze past permit records to establish trends that can then be extrapolated to the future. However, in the case of Coburg, past permitting has been constrained by the lack of sewer capacity and, as a result, this methodology is not appropriate. Market factors can vary and determining an appropriate market factor can be difficult without data to evaluate market conditions, such as in Coburg. The 2004 Study used an assumption that 20% of the total vacant and redevelopable employment lands would redevelop over the planning period. Input received from the Technical Advisory Committee suggests that this redevelopment rate is lower than is likely to occur, based upon the economic advantages of Coburg and, in particular, its strategic location along and access to I-5. As a result, for the Light Industrial and Highway Commercial designations, a higher redevelopment rate of 30% has been applied.
Table 3.9 shows a summary of potentially underdeveloped parcels commercial and industrial lots by plan designation. The results show that nearly 28.1 acres of Highway Commercial and Light Industrial land can be considered underdeveloped using these criteria. These underdeveloped parcels include RV sales lots fronting on Interstate 5. See Map 6: Developed Commercial and Industrial Tax Lots with Improvement Value Less than Land Value.
����������������������������&���$�>:�2��##� ���=�����&�������#�&!������0�#�*�������
0�#�*�������
2��##� ���=���� ����
����#� ���=���� ����
����
���9������%�����&���
���=���� ��������#�
Central Business District 5.2 20% 1.0 Highway Commercial 53.0 30% 15.9 Light Industrial 40.8 30% 12.2 ������ >>�8� � �>���
�����:��'�-2�2��0����
��3��9�#���������!:�� The Central Business District zone (C-I) allows residential uses, both as part of a mixed-use development and as a stand-alone use. Individual single-family uses require frontage on local or collector streets, while residential in a mixed-use context is allowed above or behind a commercial use. This zone therefore allows both residential and non-residential uses. For the purposes of this Study, it is assumed that approximately 7 residential units will be incorporated into the property located within the CBD that is anticipated to redevelop in the form of upper floor units; this unit count is based upon the overall density of 6.5 dwelling units per net acre for new housing that is established in the Comprehensive Plan.���/���: Residential infill can occur when a partially vacant lot is large enough to divide, creating one or more new lots. These properties are generally identified based on comparisons of current and potential densities or lot sizes. For example, a single house on a 1-acre parcel where the zoning allows 4 DUs/acre. This second process is called a partition if three or fewer lots are created out of the original lot; a subdivision if four or more lots are created.
To determine the potential for infill on partially vacant residential land, the number of developed tax lots greater than or equal to 15,000 square feet with one existing single-family, or manufactured dwelling were identified and depending on their location, were checked for redevelopment potential. This is based on the Coburg Zoning Ordinance, which establishes a minimum lot size of 7,500 sq. ft. for detached single family and manufactured homes that are served by sewer within the Traditional Residential District. Aerial photographs were then used
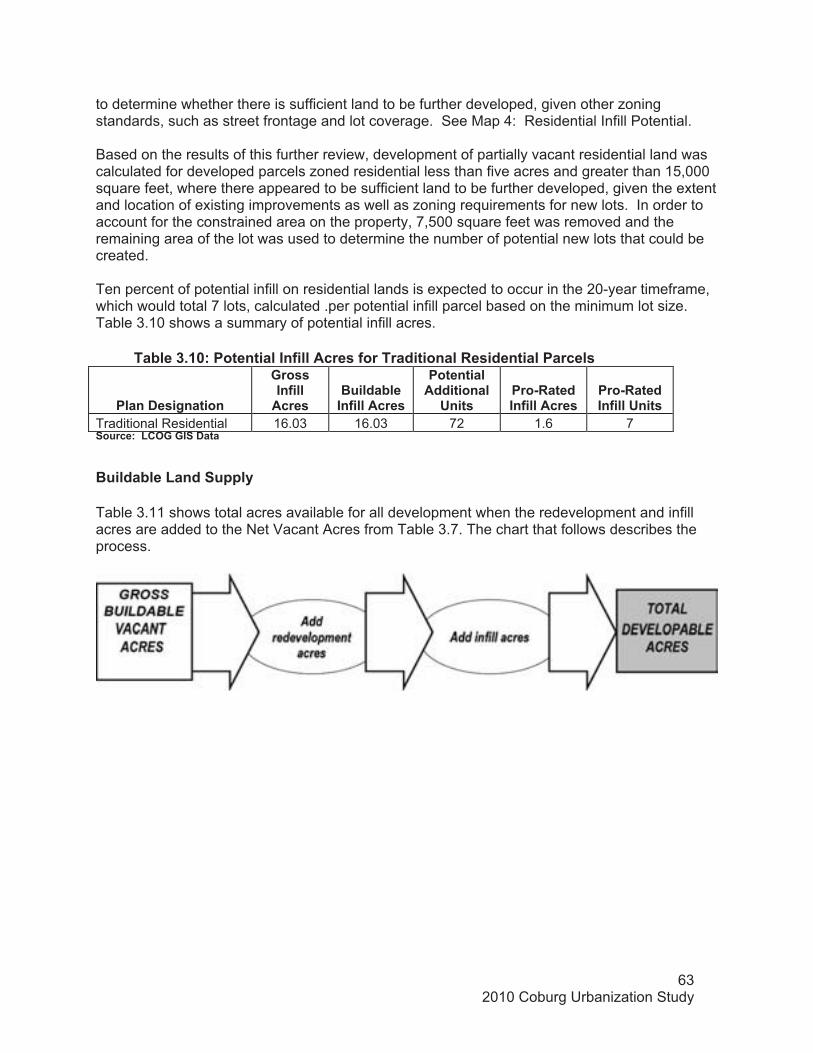
632010 Coburg Urbanization Study
to determine whether there is sufficient land to be further developed, given other zoning standards, such as street frontage and lot coverage. See Map 4: Residential Infill Potential.
Based on the results of this further review, development of partially vacant residential land was calculated for developed parcels zoned residential less than five acres and greater than 15,000 square feet, where there appeared to be sufficient land to be further developed, given the extent and location of existing improvements as well as zoning requirements for new lots. In order to account for the constrained area on the property, 7,500 square feet was removed and the remaining area of the lot was used to determine the number of potential new lots that could be created.
Ten percent of potential infill on residential lands is expected to occur in the 20-year timeframe, which would total 7 lots, calculated .per potential infill parcel based on the minimum lot size. Table 3.10 shows a summary of potential infill acres. ������������&���$��8:�������������/��������#�/��������������� �#���������������#�
�����0�#�*�������
2��##���/��������#�
%�����&�����/��������#�
�������������������������#�
���9 �������/��������#�
���9 �������/��������#�
Traditional Residential� 16.03 16.03 72 1.6 7 �����:��'�-2�2��0�����%�����&���'��������!�
Table 3.11 shows total acres available for all development when the redevelopment and infill acres are added to the Net Vacant Acres from Table 3.7. The chart that follows describes the process.
642010 Coburg Urbanization Study
���&���$���:�%�����&���'��������!��
�����0�#�*������� ����#�
2��##�������
����#�
��&�����&��������#�
���#�������0��������
����#�
������2��##����#�
��&����"��������#�'����
0���������;����#<�
������+�������#�
���9������%�����&��� �9
��=���� ��������#�
��/��������#�
������%�����&�������#�
Traditional Residential 170.6 51.9 4.4 0 47.5 8.2 $>�$�(4
units) 1.6 (8�>�
Central Business District 15.0 4.5 0.2 0 4.3 0.3 (�8�
1.0(7
units) ,�8�
Highway Commercial 93.3 35.5 0 8.5 27 4.7 ���$� 15.9 $4���
Light Industrial 193.1 21.1 1.2 0 19.9 3.7 �.��� 12.2 �4�(�
������ (1�� ��$� ,�4 4�, >4�1� �.�> 4��4� �>��� ��. ����,
Capacity AnalysisThe final step in a residential buildable lands inventory was to estimate the holding capacity of vacant, partially vacant, and redevelopable land. The holding capacity of residential land is measured in dwelling units and is dependent on densities allowed in specific zones. Land capacity is a function of buildable land and density. The buildable lands inventory indicates that Coburg has about 112.5 acres of vacant and partially vacant land. Table 12 provides a general estimate of how much population and employment could be accommodated by those lands. ���������������������������������������&��������#�� �����0�=���� �����������!7���&��*��2%�
0�=���� ��������������'�����#�� 0��#��!� ����#� 0�� P�&#�
Traditional Residential 4.8 du/acre 40.9 196 Central Business District 25 employees/acre 5.0 7 125Highway Commercial 17.4 employees/acre 38.2 664Light Industrial 13.1 employees/acre 28.4 372 ������ � ����,� �>.� �7�.�������:��'�-2�2��0���
While the back-of-the-envelope calculations above provide a crude estimate of residential capacity, several other factors must be considered in developing a more refined capacity estimate. Parcelization patterns, density, development constraints, zoning, and serviceability are some of the more important factors.
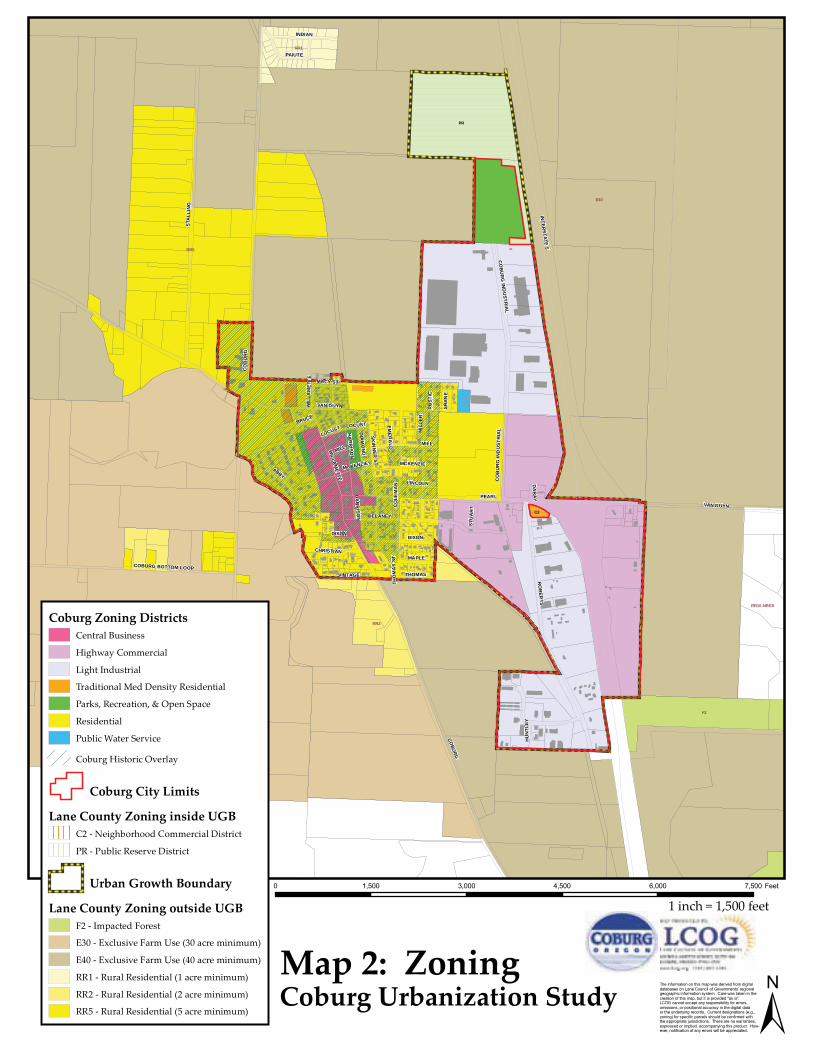
INTER
STATE 5
FUN
KE
CO
BU
RG
PEARL
STA
LLIN
G
VAN DUYN
RO
BER
TS
DELANEY
MIL
LER
WILLA
METTE
MILL
ABBY
CO
LEM
AN
DIXON
COBURG BOTTOM LOOP
INDIAN
CO
BU
RG
IND
USTR
IAL
PAIUTE
MCKENZIE
SKIN
NER
ST
DIA
MO
ND
LINCOLN
MAPLE
HA
RR
ISON
VINTAGE THOMAS
STU
AR
T
SHA
NE
CHRISTIAN
MACY ST
RU
STIC
BRUCE
DA
RAY
LOCUSTEM
ERA
LD
HU
NTL
EY
THO
MA
S S
T
COBURG
LOCUST
DIXON
MILL
VAN DUYN
CO
BU
RG
IND
UST
RIA
L
MCKENZIE
WIL
LAM
ETTE
HA
RR
ISON
PR
C2
E40
E30
RR5
SG
F2
RR2
RR1
RR10-NRES
Coburg Zoning DistrictsCentral Business
Highway Commercial
Light Industrial
Traditional Med Density Residential
Parks, Recreation, & Open Space
Residential
Public Water Service
Coburg Historic Overlay
Coburg City Limits
Lane County Zoning inside UGBC2 - Neighborhood Commercial District
PR - Public Reserve District
Urban Growth Boundary
Lane County Zoning outside UGBF2 - Impacted Forest
E30 - Exclusive Farm Use (30 acre minimum)
E40 - Exclusive Farm Use (40 acre minimum)
RR1 - Rural Residential (1 acre minimum)
RR2 - Rural Residential (2 acre minimum)
RR5 - Rural Residential (5 acre minimum)
Map 2: Zoning
±The information on this map was derived from digitaldatabases on Lane Council of Governments’ regionalgeographic information system. Care was taken in thecreation of this map, but it is provided "as is".LCOG cannot accept any responsibility for errors,omissions, or positional accuracy in the digital dataor the underlying records. Current designations (e.g.,zoning) for specific parcels should be confirmed withthe appropriate jurisdictions. There are no warranties,expressed or implied, accompanying this product. How-ever, notification of any errors will be appreciated.
0 1,500 3,000 4,500 6,000 7,500 Feet
Coburg Urbanization Study
1 inch = 1,500 feet
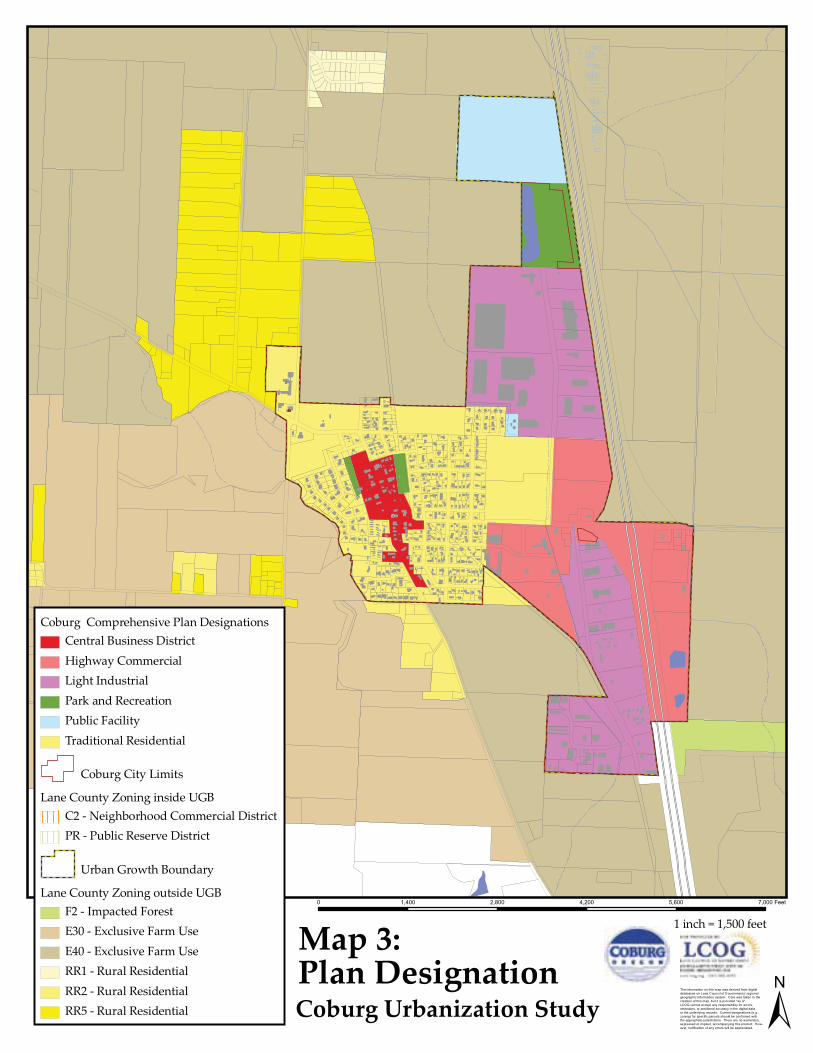
å
²μ
ñ
Coburg Comprehensive Plan DesignationsCentral Business DistrictHighway Commercial Light Industrial Park and RecreationPublic FacilityTraditional Residential
Coburg City Limits
Lane County Zoning inside UGBC2 - Neighborhood Commercial DistrictPR - Public Reserve District
Urban Growth Boundary
Lane County Zoning outside UGBF2 - Impacted ForestE30 - Exclusive Farm Use E40 - Exclusive Farm Use RR1 - Rural Residential RR2 - Rural Residential RR5 - Rural Residential
Map 3: Plan Designation
±The information on this map was derived from digitaldatabases on Lane Council of Governments’ regionalgeographic information system. Care was taken in thecreation of this map, but it is provided "as is".LCOG cannot accept any responsibility for errors,omissions, or positional accuracy in the digital dataor the underlying records. Current designations (e.g.,zoning) for specific parcels should be confirmed withthe appropriate jurisdictions. There are no warranties,expressed or implied, accompanying this product. How-ever, notification of any errors will be appreciated.
0 1,400 2,800 4,200 5,600 7,000 Feet
Coburg Urbanization Study
1 inch = 1,500 feet
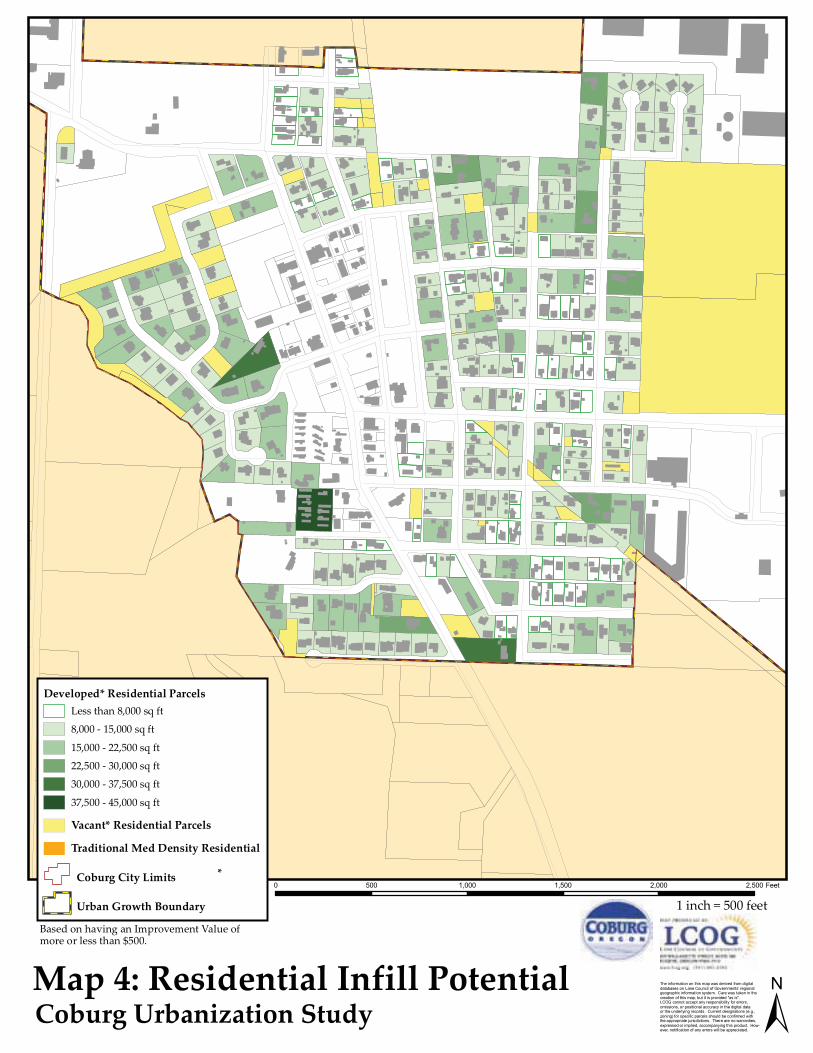
Developed* Residential ParcelsLess than 8,000 sq ft
8,000 - 15,000 sq ft
15,000 - 22,500 sq ft
22,500 - 30,000 sq ft
30,000 - 37,500 sq ft
37,500 - 45,000 sq ft
Vacant* Residential Parcels
Traditional Med Density Residential
Coburg City Limits
Urban Growth Boundary
Based on having an Improvement Value of more or less than $500.
*
Map 4: Residential Infill Potential±
The information on this map was derived from digitaldatabases on Lane Council of Governments’ regionalgeographic information system. Care was taken in thecreation of this map, but it is provided "as is".LCOG cannot accept any responsibility for errors,omissions, or positional accuracy in the digital dataor the underlying records. Current designations (e.g.,zoning) for specific parcels should be confirmed withthe appropriate jurisdictions. There are no warranties,expressed or implied, accompanying this product. How-ever, notification of any errors will be appreciated.
0 500 1,000 1,500 2,000 2,500 Feet
Coburg Urbanization Study
1 inch = 500 feet
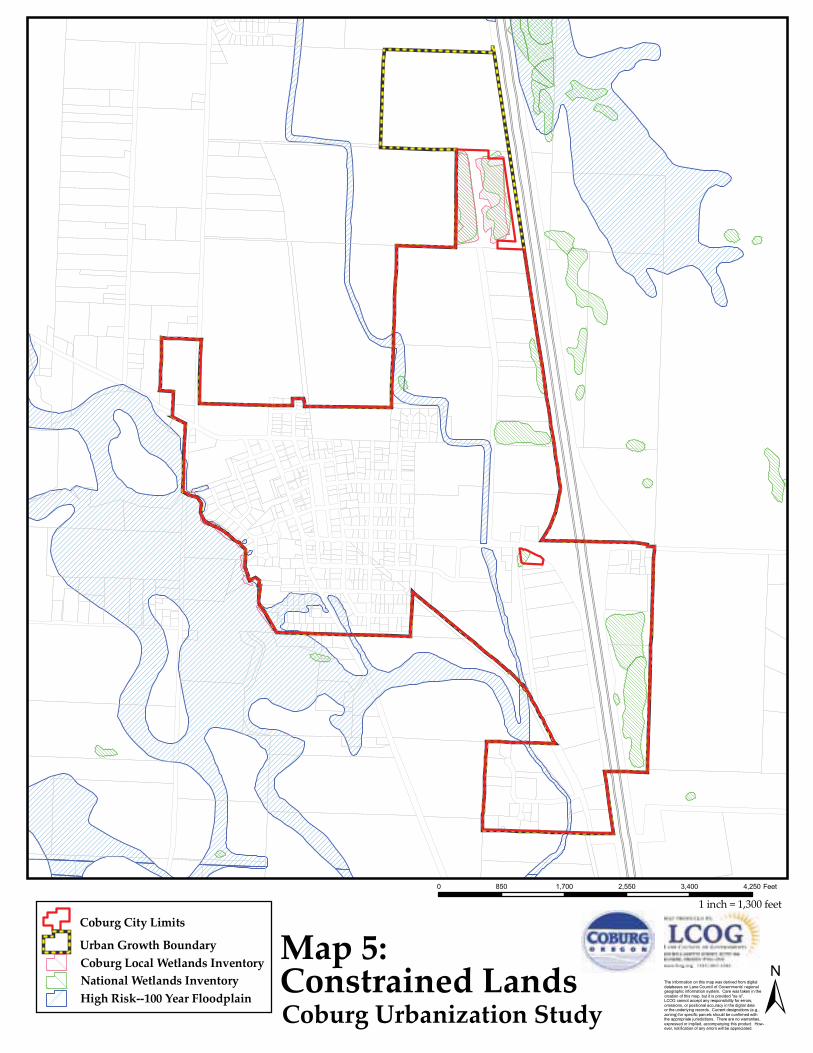
Coburg City Limits
Urban Growth BoundaryCoburg Local Wetlands InventoryNational Wetlands InventoryHigh Risk--100 Year Floodplain
Map 5: Constrained Lands ±The information on this map was derived from digital
databases on Lane Council of Governments’ regionalgeographic information system. Care was taken in thecreation of this map, but it is provided "as is".LCOG cannot accept any responsibility for errors,omissions, or positional accuracy in the digital dataor the underlying records. Current designations (e.g.,zoning) for specific parcels should be confirmed withthe appropriate jurisdictions. There are no warranties,expressed or implied, accompanying this product. How-ever, notification of any errors will be appreciated.
0 850 1,700 2,550 3,400 4,250 Feet
Coburg Urbanization Study
1 inch = 1,300 feet
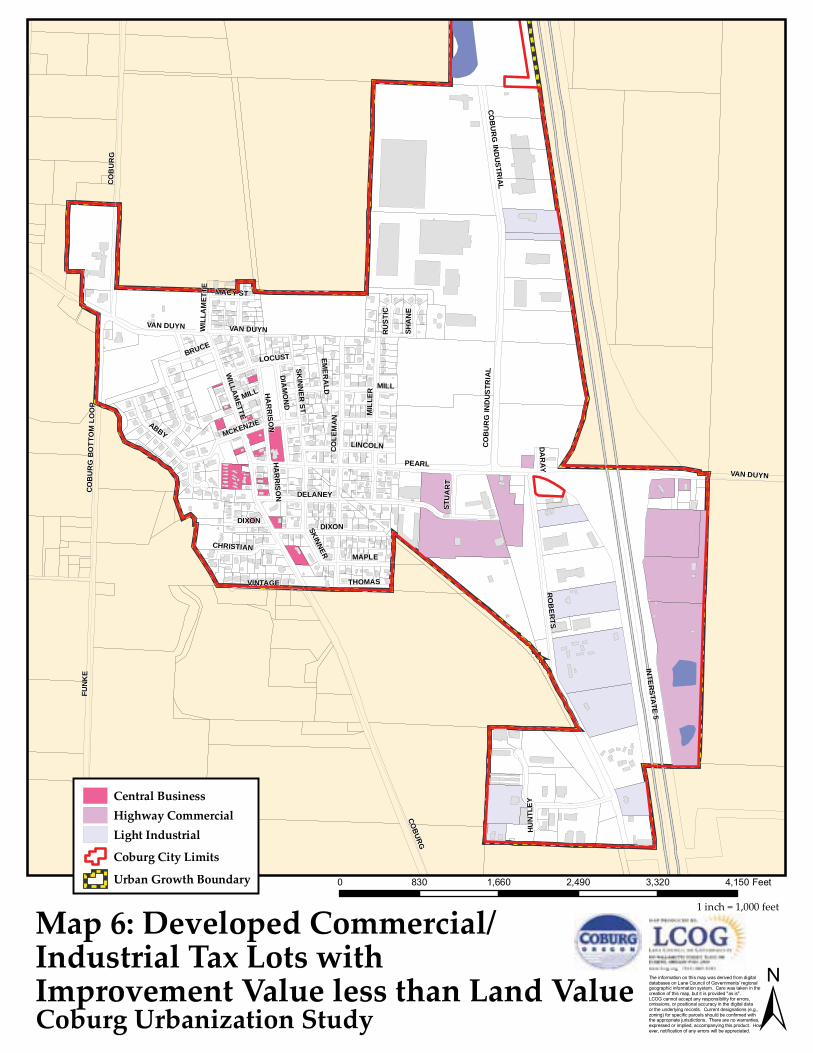
INTERSTATE 5
PEARL
FUNK
E
COBURG
ROB
ERTS
DELANEY
MIL
LER
MILL
WILLA
METTE
ABBY
COLE
MAN
DIXON
VAN DUYN
COB
UR
G IN
DUSTR
IAL
COB
UR
G B
OTT
OM
LO
OP
MCKENZIE
SKINNER
SKIN
NER ST
DIAM
ON
D
LINCOLN
MAPLEHA
RR
ISON
VINTAGE THOMAS
STU
AR
T
SHA
NE
CHRISTIAN
MACY ST
RUST
IC
BRUCE
DAR
AY
LOCUST EMER
ALD
HUN
TLEY
COB
UR
G
VAN DUYN
MILL
WIL
LAM
ETTE
VAN DUYN
COB
UR
G IN
DUS
TRIA
L
DIXON
HAR
RISO
N
Central Business Highway CommercialLight Industrial
Coburg City Limits
Urban Growth Boundary
Map 6: Developed Commercial/Industrial Tax Lots with Improvement Value less than Land Value ±
The information on this map was derived from digitaldatabases on Lane Council of Governments’ regionalgeographic information system. Care was taken in thecreation of this map, but it is provided "as is".LCOG cannot accept any responsibility for errors,omissions, or positional accuracy in the digital dataor the underlying records. Current designations (e.g.,zoning) for specific parcels should be confirmed withthe appropriate jurisdictions. There are no warranties,expressed or implied, accompanying this product. How-ever, notification of any errors will be appreciated.
0 830 1,660 2,490 3,320 4,150 Feet
Coburg Urbanization Study
1 inch = 1,000 feet
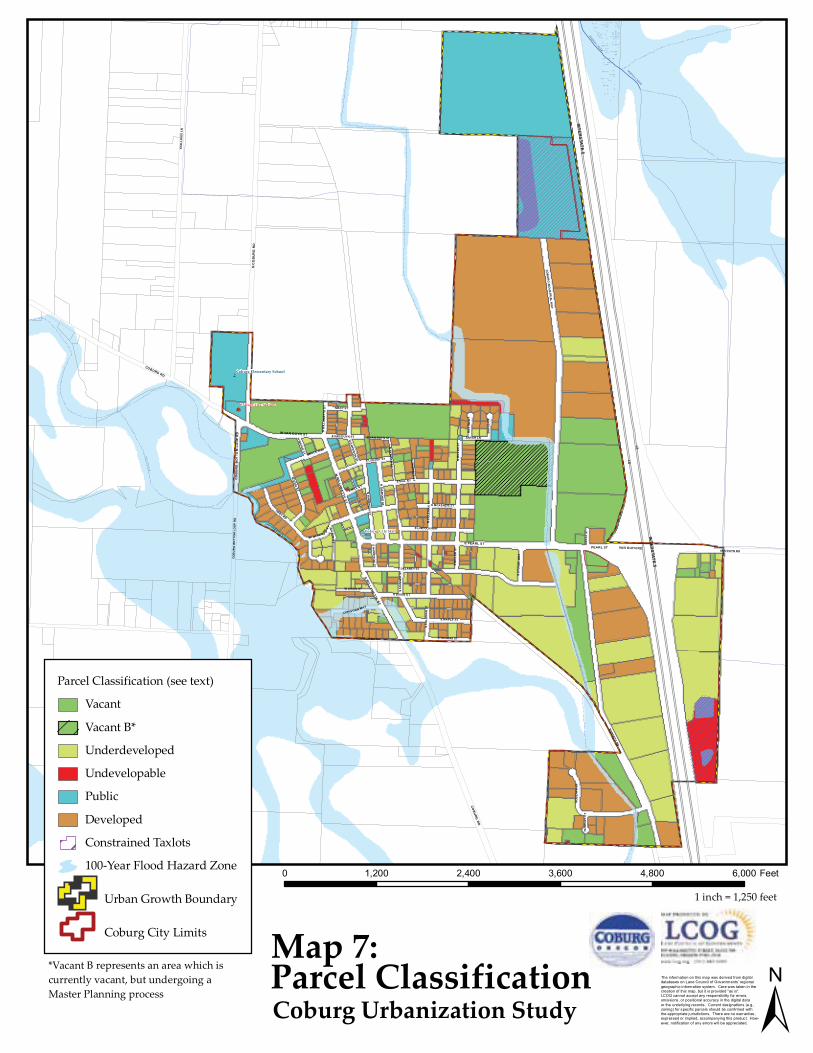
å
²μ
ñ
Coburg Elementary School
Coburg Fire Station
Coburg City Hall
MUDDY CREEK
MUDDY CREEK
MILL SLO
UG
H
INTER
STATE 5
INTER
STATE 5
I-5
N C
OB
UR
G R
D
COB
URG
RD
E PEARL ST
NW
ILLA
ME TT
ES
T
SW
ILLAMETTE
ST
W VAN DUYN ST
VAN DUYN RD
CO
BU
RG
BO
TTO
M L
OO
P R
D
PEARL ST
I-5
COBURG RD
ROBERTS RD
STAL
LIN
GS
LN
FUN
KE R
D
COB
UR
G IN
DUS
TRIAL W
AY
ABBY RD
N M
ILLE
R ST
E MILL ST
COB
UR
G B
OTT
OM
LO
OP
RD
VAN DUYN RD
E DIXON ST
E MCKENZIE ST
E DELANEY ST
N SKIN
NER
ST
N C
OLE
MA
N S
T
ROB
ERTS
CT
S C
OLE
MA
N ST
S S
TUA
RT W
AY
S S
KIN
NER
ST
AUSTIN
ST
N DIA
MO
ND ST
N HAR
RIS
ON
ST
E MAPLE ST
E LINCOLN WAY
E LOCUST ST
VINTAGE WAY
MACY ST
BRUCE WAY
WA
TER
ST
CHRISTIAN WAY
E THOMAS ST
W MCKE NZIEST
W DIXON ST
SARAH LNE VAN DUYN ST
SHA
NE
CT
RUST
IC C
T
S M
ILLE
R S
T
DAR
AY S
T
N W
ILLA
MET
TE S
T
N WATER
ST
S HA
RRISO
N ST
HUN
TLEY
CT
N EMER
ALD S
T
E MILL ST
N HAR
RIS
ON
ST
E VAN DUYN ST
Map 7: Parcel Classification ±
The information on this map was derived from digitaldatabases on Lane Council of Governments’ regionalgeographic information system. Care was taken in thecreation of this map, but it is provided "as is".LCOG cannot accept any responsibility for errors,omissions, or positional accuracy in the digital dataor the underlying records. Current designations (e.g.,zoning) for specific parcels should be confirmed withthe appropriate jurisdictions. There are no warranties,expressed or implied, accompanying this product. How-ever, notification of any errors will be appreciated.
0 1,200 2,400 3,600 4,800 6,000 Feet
Coburg Urbanization Study
1 inch = 1,250 feet
Parcel Classification (see text)
Vacant
Vacant B*
Underdeveloped
Undevelopable
Public
Developed
Constrained Taxlots
100-Year Flood Hazard Zone
Urban Growth Boundary
Coburg City Limits
*Vacant B represents an area which is currently vacant, but undergoing a Master Planning process
712010 Coburg Urbanization Study
�)���� �(���)-��+2�+��0��+�'���
This chapter provides the technical analysis to assess the housing needs of the City of Coburg through the 20-year planning period (2010-2030). Previous studies have indicated that the amount of residential land available for development within Coburg’s current Urban Growth Boundary is insufficient to meet future development needs. Statewide Planning Goal 10 addresses housing in Oregon and provides guidelines for local governments to follow in developing their local comprehensive land use plans and implementing policies intended to provide for the housing needs of residents.
At a minimum, local housing policies must meet the requirements of Goal 10. Goal 10 requires incorporated cities to complete an inventory of buildable residential lands and to encourage the availability of adequate numbers of housing units in price and rent ranges commensurate with the financial capabilities of its households. Goal 10 defines needed housing types as “housing types determined to meet the need shown for housing within an urban growth boundary at particular price ranges and rent levels.” This definition includes government assisted housing and mobile home or manufactured dwelling parks as provided in ORS 197.303 and ORS 197.475 to 197.490. For communities with populations greater than 2,500 and counties with populations greater than 15,000, needed housing types include (but are not limited to):
• Attached and detached single family housing and multiple-family housing for both owner and renter occupancy;
• Manufactured homes on individual lots planned and zoned for single family residential use; and
• Government-assisted housing.
With a current population of approximately 1,103 residents, Coburg does not meet the population threshold for these statutory requirements; however, Goal 10 requires all incorporated cities to address housing need in their comprehensive plans. The housing needs analysis in this chapter therefore addresses these housing types. In 1996, the Oregon legislature passed House Bill 2709 which is now codified as ORS 197.296. It essentially requires jurisdictions to analyze and provide for needed housing. According to DLCD staff, Coburg is not bound to the full requirements of ORS 197.296. The City, however, is bound by many overlapping requirements of Statewide Planning Goal 10 and other Administrative Rules.14 The analysis that follows also assumes that Coburg will have sewers available to serve the population and employment forecasted for the period 2010 – 2030.
Housing Needs within the Overall UGB Expansion Process
This portion of Coburg’s Study (2010) covers the need for additional housing within Coburg’s UGB. This step will outline the types and densities of residential development anticipated and required within the UGB over the planning period. The Housing Needs Analysis addresses all Goal 10 housing requirements, as well Goal 14 goals related to the efficiency of housing provision. Housing needs are estimated using a Housing Needs Model. The steps in the full process of the UGB Expansion study are:
14 Planning for Residential Growth Workbook, DLCD, pg. 4
722010 Coburg Urbanization Study
��������$��%�����&���'������=�����!:�Inventories all types of vacant, potential infill, potential redevelopment and environmentally constrained land within the existing UGB for residential, commercial, and industrial development.
ThisSection� ��������(��)��#��*�+���#�����!#�#��
� ��������,������� ���-�����������#�����!#�#: Estimates need for commercial and industrial land based on historic and current trends related to employment projections and local economic potential. Identify size and characteristics of employment land needs. Address requirements of Goal 9.
��������.������!�����0� ������ ����#��: Determines whether there is a deficit or surplus of buildable land for residential, commercial, and Industrial needs.�
��������1���2%��3���#��������#����!���Identifies and assesses areas where urban expansion should take place based on expansion criteria per Goal 14, ORS 197.298 , and OAR 660-0024-0060, including (but not limited to) the efficiency of service provision; economic, social, environmental, and energy impacts; compatibility with surrounding uses, as well as other information provided in the previous steps. �
Methods While Coburg is not required to comply with all provisions of ORS 197.296, this analysis will closely follow the methodology described in the DLCD report Planning for Residential Development, referred to as the “workbook.” The workbook describes the steps in conducting a housing needs analysis15:
� Identify relevant national, state, and local demographic trends that will affect the 20-year projection of structure type mix.
� Describe the demographic characteristics of the population, and household trends that relate to demand for different types of housing.
� Estimate the number of new units needed. � Determine the types of housing that are likely to be affordable to the projected
households. � Estimate the number of additional new units by structure type. � Determine the density ranges for all plan designations and the average net density for
all structure types. � Evaluate unmet housing needs and the housing needs of special populations (Goal 10
needs).
While the housing need analysis presented in this chapter follows the methodology described in the Workbook, it does not include as much detail as an analysis that would be required under ORS 197.296. Additionally, the housing needs assessment in this chapter is based on the assumption that Coburg will develop a sanitary sewer system and that it desires to provide
15 Planning for Residential Growth Workbook, DLCD, pg. 26-31
732010 Coburg Urbanization Study
housing that meets the needs of individuals that are currently employed in Coburg, families, and seniors. These assumptions are consistent with goals and policies documented in the CoburgComprehensive Plan.
A Housing Needs Model To facilitate this analysis, a Coburg-specific Housing Needs Model was created using a model designed by demographer and housing specialist Richard Bjelland.16 The model utilizes demographic and other data inputs to generate a set of future housing need estimates. This Coburg specific model is designed to address the housing need requirements set out in Oregon’s Statewide Planning Goal 10. Bjelland’s methodology is demographically driven as opposed to historic construction extrapolations, which most previous housing needs analyses relied upon. His models have been stipulated by Oregon’s Department of Land Conservation and Development (DLCD) for use in approved work plans by several Oregon cities and the choice for assessing housing needs by several major regional planning efforts and organizations such as the Center for Housing Research, who have responsibilities for defining housing needs for counties and cities in several states.
The Coburg model utilizes 2000 Census Bureau demographic data for the City of Coburg. The model looks at several different types of housing and predicts the tenure split between rental and owner housing units as well as the needed rental and purchase price points. Data is presented and entered into a set of interconnected spreadsheets or “templates” that make up the model. The results from the model are then used to address the affordable housing needs of the City. The residential land needs module included in the model estimates the land needs by land use designation for the additional housing units indicated by the model. Additional adjustments to the model inputs are made to account for the recognized growth between the time period of 2000 and 2010, and to account for a number of local housing dynamics. �Step 1. Relevant National, State, and Local Demographic and Economic Trends and Factors �The first step in a housing needs assessment is to identify relevant national, state, and local demographic and economic trends and factors that affect local housing markets.
+��������)��#��*������#�
As a general trend, there continues to be a need for greater diversity in housing types to respond to changing demographics. For generations, married couples with children dominated housing markets and caused the suburbs to grow explosively. But today those families comprise fewer households, as the traditional family structure continues to change.17 Today’s fastest growing households are:
o Young professionals o Empty nesters o Single parents o Couples without children
16 Bjelland Consulting 17 U.S. Census Bureau. U.S. Census Bureau, "America’s Families and Living Arrangements: 2009" (March 2009).
742010 Coburg Urbanization Study
o Senior citizens
This new demographic is creating additional demand for apartments, condominiums and townhouses. In addition, the Joint Center for Housing Studies of Harvard University’s The State of the Nation’s Housing, 200918 report provides the following additional details on the current state of housing.
0�?���������)��#��*����I���� In the last several years, the housing market has experienced a significant downturn, with many properties going into foreclosure and sales, sale prices, and construction starts all being adversely affected. Real home equity decreased by 41 percent from their quarterly peaks during the housing boom to the last quarter of 2008. Existing median home prices feel by 27 percent (and at least 40 percent in 26 metropolitan areas), while new home sales declined by 70 percent, and existing home sales by 33 percent.
���##������Problems emanating from the housing market triggered instability in the banking system. Amid fears about the strength of banks and severe losses of both housing and stock wealth, consumer confidence plunged, and households slashed their spending and cut their net borrowing in 2008. With that, the broader economy lurched into a recession.
)��#������0�&�. The number of households paying more than half their incomes for housing jumped by almost six percentage points between 2001 and 2007, from 13.8 million in 2001 to 17.9 million in 2007. While homeowners led this growth, the share of renters with severe burdens remained much larger, nearly twice as high as that of owners. Generally, those who are experiencing affordability problems had low-incomes. �In 2007, nearly three-quarters of severely cost-burdened households had low incomes. Indeed, fully 51 percent of low-income renters and 43 percent of low income owners paid more than half their incomes for housing.
Affordability pressures have continued to increase as employment losses have mounted. Fully 5.7 million jobs were lost from the December 2007 peak through April 2009, and another 11.0 million Americans were either working part-time involuntarily or had stopped looking for work altogether. A recent Federal Reserve report estimates that of the trillions of dollars in real home equity cashed out between 2001 and 2007, homeowners used $874 billion to pay off non-mortgage debt—in effect rolling consumer debt into their home loans. Unlike consumer debt, mortgage debt cannot be discharged through personal bankruptcy. Furthermore, a total of about 3.2 million homeowners entered foreclosure in 2007 and 2008.
2�=��� �������*�� #. The federal government provided additional funding in 2008 and 2009 to help state and local governments deal with foreclosed homes. With the help of the Neighborhood Stabilization Program and an additional $11 billion in housing bond authority, state and local entities are now developing strategies to acquire, renovate, and sell foreclosed one- to four-unit properties. The federal government has also provided funds to redevelop public housing, a tax credit for homebuyers, and an opportunity for homeowners who are up to 5 percent underwater on their mortgages to refinance at lower interest rates. Based upon these conditions, the following is a brief summary of key national housing trends and future outlook: ����*�*��0!�� ��#. As an outcome of the housing downturn, it is anticipated that stricter caps on mortgage payment-to-income ratios and thorough verification of income will likely remain in place and may restrict the market for those with lower incomes or previous credit problems.
18 http://www.jchs.harvard.edu/publications/markets/son2009/index.htm (access March 26, 2010)

752010 Coburg Urbanization Study
� Citing continuing uncertainty on the future strength of demand for housing as a result of the potential length of the recession, the Joint Center for Housing Studies has released two new household projections. The high series projections that as many as 14.8 million units could be added nationally between 2010 and 2020. The lower series assumes a more modest 12.5 additional units nationally in the same time frame.
� Echo boomers, people between the ages of 25 and 44, are continuing to enter the housing market and comprise a larger number of households. As a result, the Joint Center for Housing Studies estimates that the echo boomers will help keep demand strong for the next 10 years and beyond, bolstering the markets for rentals and starter homes. Because their income is less than the preceding baby-bust generation, it is anticipated that the echo-boomers may have a higher demand for more affordable housing types, such as multifamily apartments, townhomes and manufactured homes.
� The Joint Center for Housing Studies notes that the large and diverse echo-boom generation, coupled with immigration, will increase the minority share of households. Under the Center’s low series projections, it is anticipated that minorities will fuel 73 percent of household growth in 2010–20, with Hispanics leading the way at 36 percent. As a result, the minority share of households is projected to increase from 29 percent in 2005 to 35 percent in 2020. The Center anticipates that minorities will add to households across the full spectrum of family types, which may result in changes in household size trends. As the number of minority and foreign-born households grows, the housing industry will increasingly serve groups with lower homeownership rates, incomes, and wealth than traditional buyers. Ethnic identification of some minorities and cultural preferences of recent immigrants will also challenge housing suppliers to tailor their marketing to a more diverse population.
� As the baby-boom generation continues to age, the demand for retirement housing and assisted living facilities is anticipated to increase. A study by the National Association of Home Builders (NAHB) and the MetLife Mature Market Institute (MMI)19 showed that while most baby boomer consumers prefer to stay in their current home as they age, an increasing number (3 percent, compared to 2.2 percent in 2001) will opt for an age-restricted community designed to attract “active adults” with a heavy emphasis on lifestyle.
� In addition, as the baby boomers and older generations begin to turn over their homes to younger households, adjustments to the existing stock are likely, both through remodeling and pricing. The first wave of change will occur in the inner suburbs of large metropolitan areas where people now in their 70s and 80s are concentrated, then fan out to the outer suburbs as the baby boomers start to downsize.
� In response to concerns over carbon emissions and dependency on foreign oil, more effort and consumer interest is expected in upgrading the existing stock with energy-efficiency improvements, as well as increased interest in more compact forms of residential development. Because of past population and employment dispersion, which saw increased job growth outside of central cities in 68 of 75 of the nation’s largest
19 Housing for the 55+ Market: Trends and Insights on Boomers and Beyond http://www.metlife.com/assets/cao/mmi/publications/studies/housing-for-the-55-plus-market.pdf (Accessed on December 15, 2009)
762010 Coburg Urbanization Study
metropolitan areas, efforts to reduce auto use will likely focus on providing transit-oriented and mixed-use development so that workers can live closer to their jobs as well as to non-work destinations.
��������� �*������)��#��*������#:��A number of national factors identified in The State of the Nation’s Housing 2009 will affect housing trends in Oregon and Lane County.
0�?���������'��������#��������� According the US Census Bureau, as reported by the National Home Builders Association, the Eugene Springfield Metropolitan Area saw a 61 percent decrease in Single Family building permits between February 2008 and February 2009. This is greater than the decrease seen at both the national (50 percent) and state (58 percent) levels. Multi-family housing permits were down 81 percent in the Eugene-Springfield metropolitan area, up 18 percent in Oregon and down 53 percent nationally.
�����=��!�)�*��'�=��#��/�)��#��*���#��%������ According to the 2007 Oregon Housing and Community Services Department’s 2007 Needs Analysis Study, Lane County had a 77.1 percent “Rate of Burden.” This means that 77.1 percent of residents in Lane County earning 30-60 percent of the county’s median income, and pay more than 30 percent of their income for housing costs.
�����0� �*������������#�� ��������#��*. According to Oregon’s 2006-2010 Consolidated Plan20, “Oregon’s changing population demographics are having a significant impact on its housing market.” The Study, which includes a detailed housing needs analysis, identified the following population and demographic trends that influence housing needs within the State:
o Growth - Oregon is the 11th fastest growing in the United States; o Housing cost increases; o Declining median and adjusted incomes (less than those of 1999); o Aging; o Increasing diversity; and o Decreasing affluence.
�����A-?��������� The State of Oregon Analysis of Impediments to Fair Housing Choicereport21 completed on May 27, 2005, also provides background information on the state’s and Lane County’s housing supply and demographics. According to this study, statewide, 64 percent of occupied housing units were owner occupied and 36 percent were renter occupied in 2000. Compared to the United States as a whole, Oregon had a slightly lower percentage of owner occupied units (64.2 percent for Oregon vs. 66.2 percent nationally) and a slightly higher percentage of renter occupied housing units (35.8 percent vs. 33.8 percent). In Lane County, 62.3 percent of occupied housing units were owner occupied and 37.7 percent of occupied housing units were renter occupied.
In Lane County, median rental values were not affordable to very low- income households (those earning 50 percent of median county household income). The median rent in Lane County in 2000 was $604; the very low-income households could afford to pay a rent of up to $462 a month without being cost burdened.
20 http://www.ohcs.oregon.gov/OHCS/HRS_Consolidated_Plan_5yearplan.shtml (Accessed on March 26, 2010) 21 Analysis of Impediments to Fair Housing Choice, BBC Research & Consulting , May 27, 2005, www.oregon.gov/OHCS/.../2006-2010FairHousingActionPlan.doc (Access on December 15, 2009)
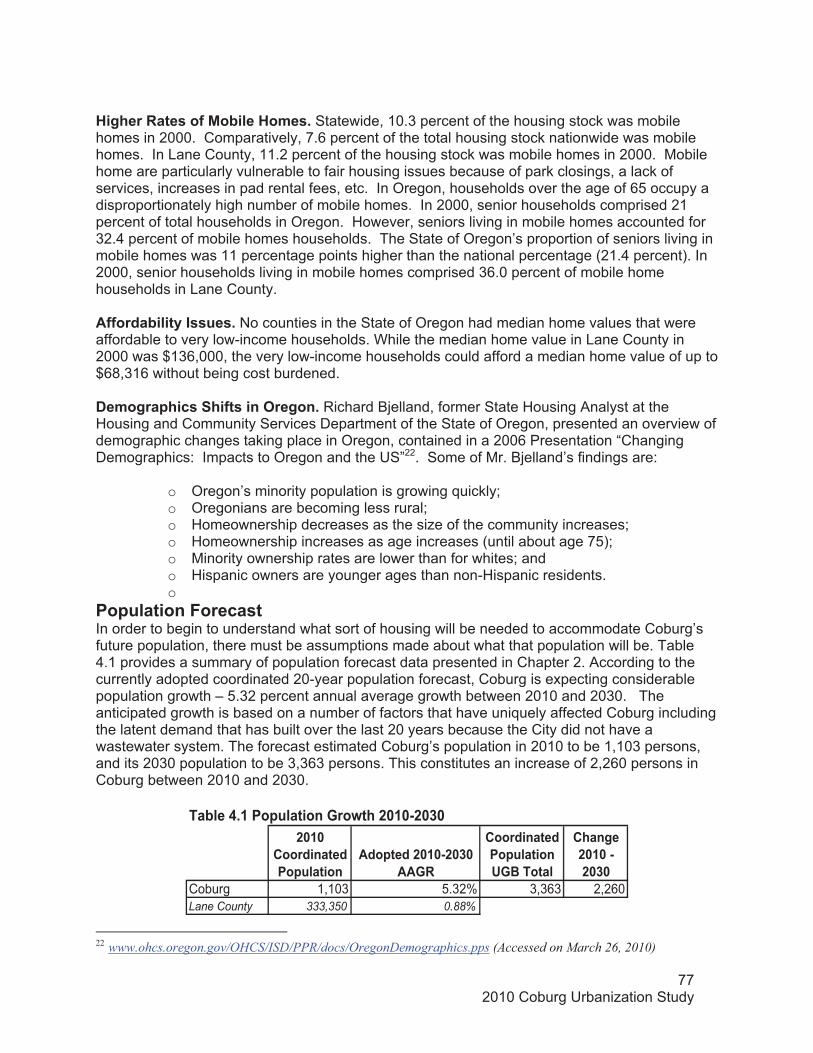
772010 Coburg Urbanization Study
)�*���� ���#��/���&����)� �#� Statewide, 10.3 percent of the housing stock was mobile homes in 2000. Comparatively, 7.6 percent of the total housing stock nationwide was mobile homes. In Lane County, 11.2 percent of the housing stock was mobile homes in 2000. Mobile home are particularly vulnerable to fair housing issues because of park closings, a lack of services, increases in pad rental fees, etc. In Oregon, households over the age of 65 occupy a disproportionately high number of mobile homes. In 2000, senior households comprised 21 percent of total households in Oregon. However, seniors living in mobile homes accounted for 32.4 percent of mobile homes households. The State of Oregon’s proportion of seniors living in mobile homes was 11 percentage points higher than the national percentage (21.4 percent). In 2000, senior households living in mobile homes comprised 36.0 percent of mobile home households in Lane County.
�//����&����!��##��#� No counties in the State of Oregon had median home values that were affordable to very low-income households. While the median home value in Lane County in 2000 was $136,000, the very low-income households could afford a median home value of up to $68,316 without being cost burdened.
0� �*������#���/�#����-��*��� Richard Bjelland, former State Housing Analyst at the Housing and Community Services Department of the State of Oregon, presented an overview of demographic changes taking place in Oregon, contained in a 2006 Presentation “Changing Demographics: Impacts to Oregon and the US”22. Some of Mr. Bjelland’s findings are:
o Oregon’s minority population is growing quickly; o Oregonians are becoming less rural; o Homeownership decreases as the size of the community increases; o Homeownership increases as age increases (until about age 75); o Minority ownership rates are lower than for whites; and o Hispanic owners are younger ages than non-Hispanic residents. o
�����������"�����#��In order to begin to understand what sort of housing will be needed to accommodate Coburg’s future population, there must be assumptions made about what that population will be. Table 4.1 provides a summary of population forecast data presented in Chapter 2. According to the currently adopted coordinated 20-year population forecast, Coburg is expecting considerable population growth – 5.32 percent annual average growth between 2010 and 2030. The anticipated growth is based on a number of factors that have uniquely affected Coburg including the latent demand that has built over the last 20 years because the City did not have a wastewater system. The forecast estimated Coburg’s population in 2010 to be 1,103 persons, and its 2030 population to be 3,363 persons. This constitutes an increase of 2,260 persons in Coburg between 2010 and 2030.
�8�8�����������������������
���������8�89�8$8���2
������������������������2%������
����*���8�8�9��8$8
Coburg 1,103 5.32% 3,363 2,260Lane County 333,350 0.88%
��&���(��������������2��?����8�89�8$8
22 www.ohcs.oregon.gov/OHCS/ISD/PPR/docs/OregonDemographics.pps (Accessed on March 26, 2010)
782010 Coburg Urbanization Study
�Step 2. Demographic Characteristics and Housing Trends
A clear linkage exists between housing trends demographic characteristics and housing choice. This is more typically referred to as the linkage between life-cycle and housing choice and is documented in detail in several publications.23 Using historical or current demographic characteristics of Coburg, however, will probably yield inaccurate results. Not only are the demographic characteristics expected to change regionally, but new residents in Coburg will probably be more diverse in socio-economic and demographic characteristics than current residents.In order to address this issue in the 2004 Coburg Study, Coburg’s consultant used Public Use Microsample (PUMS) data from the 2000 Census to describe the relationship between selected demographic characteristics and housing choice.24 This analysis identified several key relationships:
• Homeownership rates increase as income increases; • Homeownership rates increase as age increases; • Choice of single-family detached housing types increases as income increases; • Renters are much more likely to choose multiple family housing types than single-
family; and • Income is a stronger determinate of tenure and housing type choice for all age
categories.
A review of recent data from the U.S Bureau of Census 2008 Characteristics of New Housing25
was used to identify national trends in the characteristics of new housing. Nationally, several shifts in the characteristics of housing are highlighted by the Bureau: '��*���#��*��9/� ��!�����#����# ���������#��Between 1978 and 2007 the median size of new single-family dwellings increased 45 percent, from 1,700 square feet to 2,456 square feet in the Western Region26. The average single-family house completed in 2008 had 2,519 square feet, 764 more square feet than in 1978.
The average single-family home sold was built on a lot of 18,433 square feet. On average, lot sizes were the largest in the Northeast at 44,781 square feet, and were the smallest in the West at 10,062 square feet
'��*��� ����/� ��!�����#��The average multi-family units completed and built for sale was 1,550 square feet. This was 190 more square feet than in 1999. Between 1994 and 2002, the median size of new multiple family dwelling units in the Western Region increased 15 percent, from 920 square feet to 1,055 square feet Moreover, the percentage of units with less than 600 square feet decreased from 6 percent to 1 percent, while the percentage with more than 1,200 square feet increased from 11 percent to 30 percent. 78 percent of multi-family units had less than 1,400 square feet, up from 69 percent in 2007.
23 This linkage is identified in the DLCD Workbook. It is described in detail in Households and Housing: Choice and Outcomes in the Housing Market, Clark and Dieleman, Center for Policy Research, 1996. 24 ECO used the 1% Public Use Microsample (PUMS) data set for this analysis. A description of the PUMS data can be found at www.census.gov/.25 http://www.census.gov/const/www/highanncharac2008.html, 06/11/09 26 NHBA website http://www.nahb.org/page.aspx/category/sectionID=130 Single family square footage by location 4/23/09
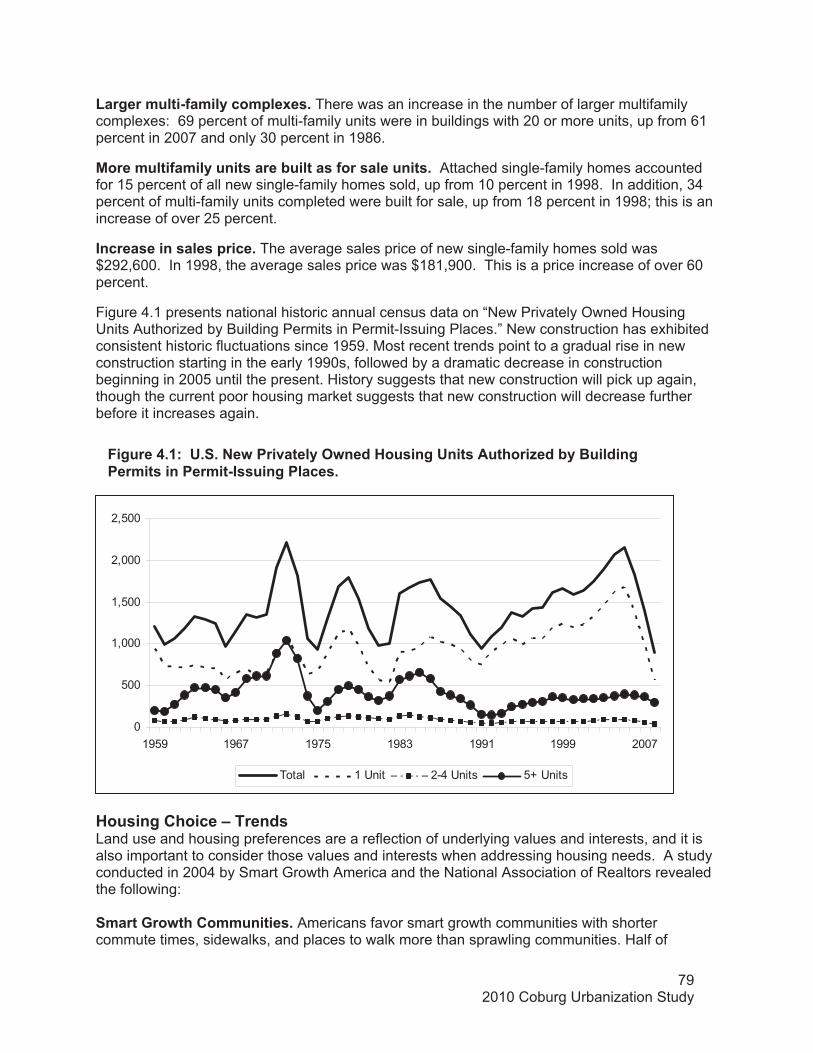
792010 Coburg Urbanization Study
'��*��� ����9/� ��!��� ���3�#� There was an increase in the number of larger multifamily complexes: 69 percent of multi-family units were in buildings with 20 or more units, up from 61 percent in 2007 and only 30 percent in 1986.
����� ����/� ��!�����#�����&������#�/���#��������#� Attached single-family homes accounted for 15 percent of all new single-family homes sold, up from 10 percent in 1998. In addition, 34 percent of multi-family units completed were built for sale, up from 18 percent in 1998; this is an increase of over 25 percent.
������#�����#���#��������The average sales price of new single-family homes sold was $292,600. In 1998, the average sales price was $181,900. This is a price increase of over 60 percent.
Figure 4.1 presents national historic annual census data on “New Privately Owned Housing Units Authorized by Building Permits in Permit-Issuing Places.” New construction has exhibited consistent historic fluctuations since 1959. Most recent trends point to a gradual rise in new construction starting in the early 1990s, followed by a dramatic decrease in construction beginning in 2005 until the present. History suggests that new construction will pick up again, though the current poor housing market suggests that new construction will decrease further before it increases again.
0
500
1,000
1,500
2,000
2,500
1959 1967 1975 1983 1991 1999 2007
Total 1 Unit 2-4 Units 5+ Units
)��#��*��������L������#�Land use and housing preferences are a reflection of underlying values and interests, and it is also important to consider those values and interests when addressing housing needs. A study conducted in 2004 by Smart Growth America and the National Association of Realtors revealed the following: � ����2��?����� ������#� Americans favor smart growth communities with shorter commute times, sidewalks, and places to walk more than sprawling communities. Half of
"�*����(��:������+�?����=����!�-?����)��#��*�����#��������J���&!�%������*���� ��#������� ��9�##���*������#��
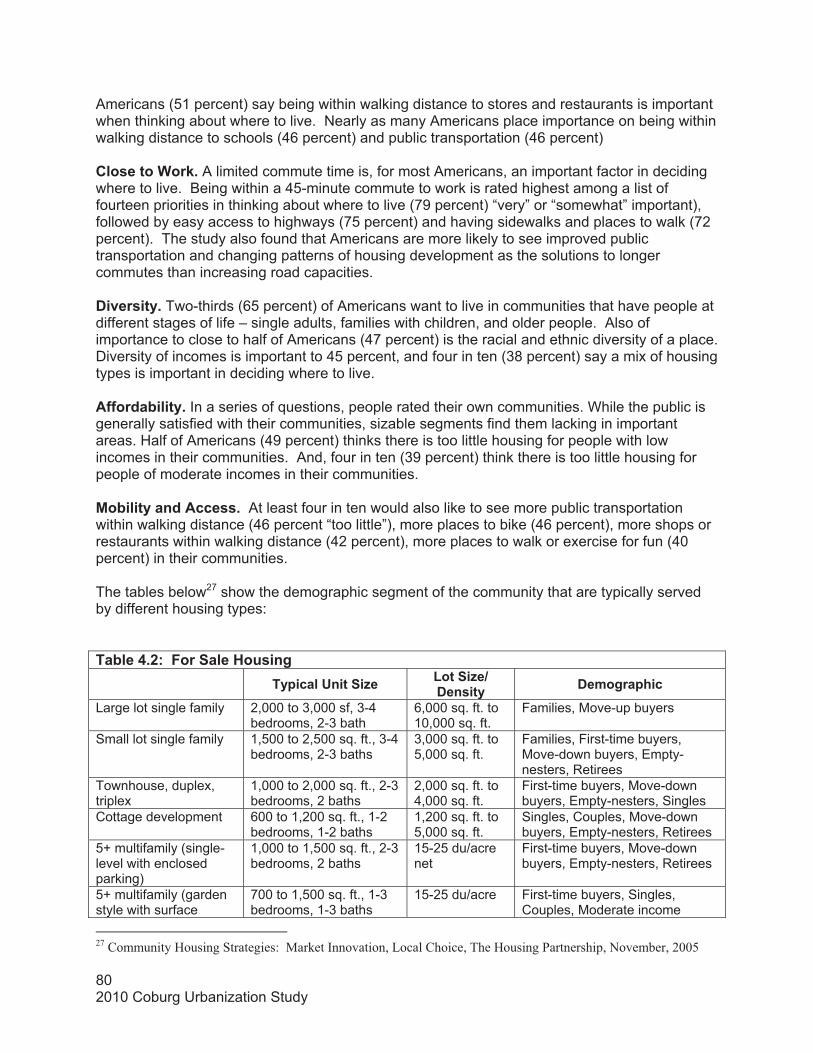
802010 Coburg Urbanization Study
Americans (51 percent) say being within walking distance to stores and restaurants is important when thinking about where to live. Nearly as many Americans place importance on being within walking distance to schools (46 percent) and public transportation (46 percent)
���#�����5��I� A limited commute time is, for most Americans, an important factor in deciding where to live. Being within a 45-minute commute to work is rated highest among a list of fourteen priorities in thinking about where to live (79 percent) “very” or “somewhat” important), followed by easy access to highways (75 percent) and having sidewalks and places to walk (72 percent). The study also found that Americans are more likely to see improved public transportation and changing patterns of housing development as the solutions to longer commutes than increasing road capacities.
0�=��#��!� Two-thirds (65 percent) of Americans want to live in communities that have people at different stages of life – single adults, families with children, and older people. Also of importance to close to half of Americans (47 percent) is the racial and ethnic diversity of a place. Diversity of incomes is important to 45 percent, and four in ten (38 percent) say a mix of housing types is important in deciding where to live.
�//����&����!� In a series of questions, people rated their own communities. While the public is generally satisfied with their communities, sizable segments find them lacking in important areas. Half of Americans (49 percent) thinks there is too little housing for people with low incomes in their communities. And, four in ten (39 percent) think there is too little housing for people of moderate incomes in their communities.
��&����!���������##�� At least four in ten would also like to see more public transportation within walking distance (46 percent “too little”), more places to bike (46 percent), more shops or restaurants within walking distance (42 percent), more places to walk or exercise for fun (40 percent) in their communities.
The tables below27 show the demographic segment of the community that are typically served by different housing types:
��&���(��:��"�������)��#��*��!������������J�� '����J�A�
0��#��!� 0� �*�������Large lot single family 2,000 to 3,000 sf, 3-4
bedrooms, 2-3 bath 6,000 sq. ft. to 10,000 sq. ft.
Families, Move-up buyers
Small lot single family 1,500 to 2,500 sq. ft., 3-4 bedrooms, 2-3 baths
3,000 sq. ft. to 5,000 sq. ft.
Families, First-time buyers, Move-down buyers, Empty-nesters, Retirees
Townhouse, duplex, triplex
1,000 to 2,000 sq. ft., 2-3 bedrooms, 2 baths
2,000 sq. ft. to 4,000 sq. ft.
First-time buyers, Move-down buyers, Empty-nesters, Singles
Cottage development 600 to 1,200 sq. ft., 1-2 bedrooms, 1-2 baths
1,200 sq. ft. to 5,000 sq. ft.
Singles, Couples, Move-down buyers, Empty-nesters, Retirees
5+ multifamily (single-level with enclosed parking)
1,000 to 1,500 sq. ft., 2-3 bedrooms, 2 baths
15-25 du/acre net
First-time buyers, Move-down buyers, Empty-nesters, Retirees
5+ multifamily (garden style with surface
700 to 1,500 sq. ft., 1-3 bedrooms, 1-3 baths
15-25 du/acre First-time buyers, Singles, Couples, Moderate income
27 Community Housing Strategies: Market Innovation, Local Choice, The Housing Partnership, November, 2005
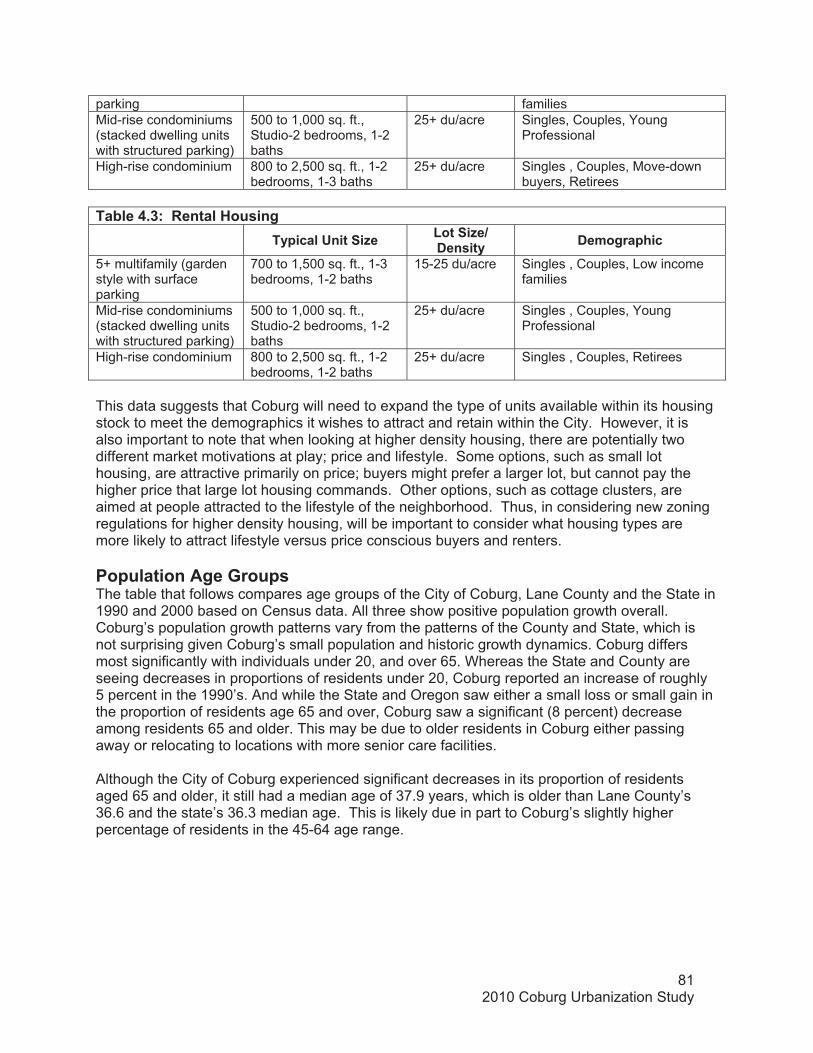
812010 Coburg Urbanization Study
parking families Mid-rise condominiums (stacked dwelling units with structured parking)
500 to 1,000 sq. ft., Studio-2 bedrooms, 1-2 baths
25+ du/acre Singles, Couples, Young Professional
High-rise condominium 800 to 2,500 sq. ft., 1-2 bedrooms, 1-3 baths
25+ du/acre Singles , Couples, Move-down buyers, Retirees
��&���(�$:�� ������)��#��*��!������������J�� '����J�A�
0��#��!� 0� �*�������5+ multifamily (garden style with surface parking
700 to 1,500 sq. ft., 1-3 bedrooms, 1-2 baths
15-25 du/acre Singles , Couples, Low income families
Mid-rise condominiums (stacked dwelling units with structured parking)
500 to 1,000 sq. ft., Studio-2 bedrooms, 1-2 baths
25+ du/acre Singles , Couples, Young Professional
High-rise condominium 800 to 2,500 sq. ft., 1-2 bedrooms, 1-2 baths
25+ du/acre Singles , Couples, Retirees
This data suggests that Coburg will need to expand the type of units available within its housing stock to meet the demographics it wishes to attract and retain within the City. However, it is also important to note that when looking at higher density housing, there are potentially two different market motivations at play; price and lifestyle. Some options, such as small lot housing, are attractive primarily on price; buyers might prefer a larger lot, but cannot pay the higher price that large lot housing commands. Other options, such as cottage clusters, are aimed at people attracted to the lifestyle of the neighborhood. Thus, in considering new zoning regulations for higher density housing, will be important to consider what housing types are more likely to attract lifestyle versus price conscious buyers and renters.
������������*��2����#�The table that follows compares age groups of the City of Coburg, Lane County and the State in 1990 and 2000 based on Census data. All three show positive population growth overall. Coburg’s population growth patterns vary from the patterns of the County and State, which is not surprising given Coburg’s small population and historic growth dynamics. Coburg differs most significantly with individuals under 20, and over 65. Whereas the State and County are seeing decreases in proportions of residents under 20, Coburg reported an increase of roughly 5 percent in the 1990’s. And while the State and Oregon saw either a small loss or small gain in the proportion of residents age 65 and over, Coburg saw a significant (8 percent) decrease among residents 65 and older. This may be due to older residents in Coburg either passing away or relocating to locations with more senior care facilities.
Although the City of Coburg experienced significant decreases in its proportion of residents aged 65 and older, it still had a median age of 37.9 years, which is older than Lane County’s 36.6 and the state’s 36.3 median age. This is likely due in part to Coburg’s slightly higher percentage of residents in the 45-64 age range.
�
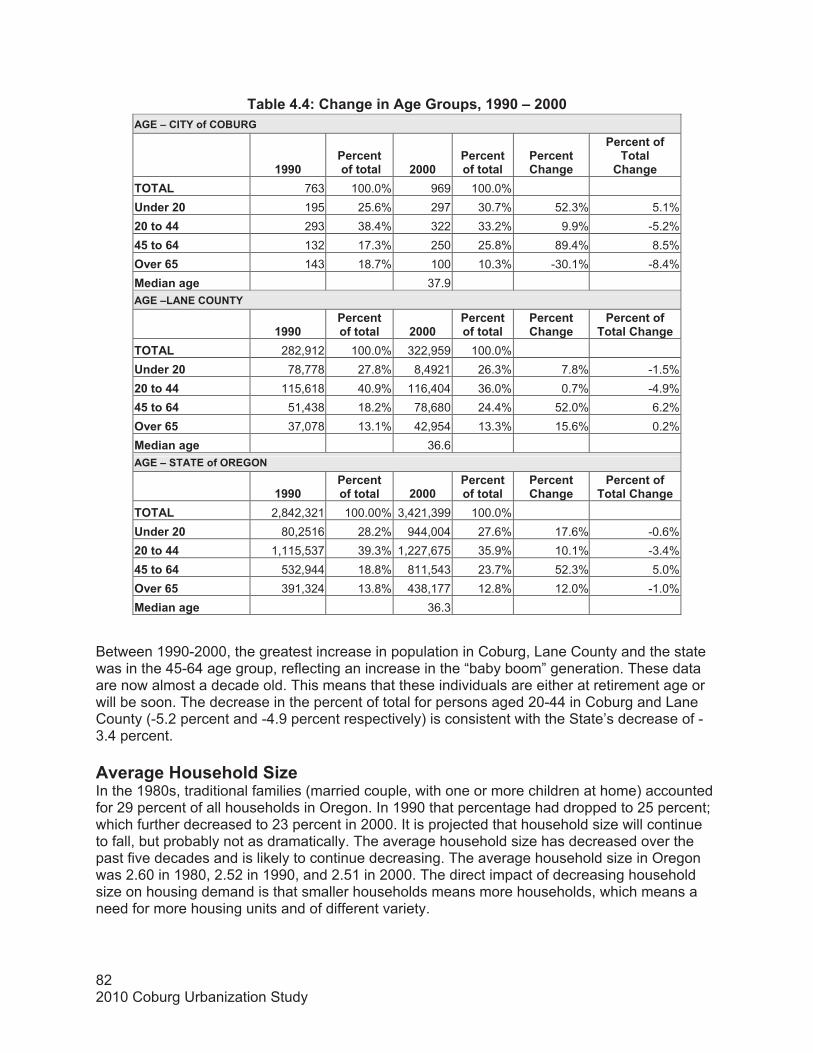
822010 Coburg Urbanization Study
��&���(�(:�����*������*��2����#7��>>8�L��888�
Between 1990-2000, the greatest increase in population in Coburg, Lane County and the state was in the 45-64 age group, reflecting an increase in the “baby boom” generation. These data are now almost a decade old. This means that these individuals are either at retirement age or will be soon. The decrease in the percent of total for persons aged 20-44 in Coburg and Lane County (-5.2 percent and -4.9 percent respectively) is consistent with the State’s decrease of -3.4 percent.
�=���*��)��#�������J��In the 1980s, traditional families (married couple, with one or more children at home) accounted for 29 percent of all households in Oregon. In 1990 that percentage had dropped to 25 percent; which further decreased to 23 percent in 2000. It is projected that household size will continue to fall, but probably not as dramatically. The average household size has decreased over the past five decades and is likely to continue decreasing. The average household size in Oregon was 2.60 in 1980, 2.52 in 1990, and 2.51 in 2000. The direct impact of decreasing household size on housing demand is that smaller households means more households, which means a need for more housing units and of different variety.
�2��L�������/��-%� 2�
�>>8�����������/������� �888�
���������/�������
������������*��
���������/������������*��
�-��'� 763 100.0% 969 100.0%�������8� 195 25.6% 297 30.7% 52.3% 5.1%�8����((� 293 38.4% 322 33.2% 9.9% -5.2%(,����.(� 132 17.3% 250 25.8% 89.4% 8.5%-=���.,� 143 18.7% 100 10.3% -30.1% -8.4%��������*�� 37.9�2��L'�+���-�+���
� �>>8�����������/������� �888�
���������/�������
������������*��
���������/�����������*��
�-��'� 282,912 100.0% 322,959 100.0%�������8� 78,778 27.8% 8,4921 26.3% 7.8% -1.5%�8����((� 115,618 40.9% 116,404 36.0% 0.7% -4.9%(,����.(� 51,438 18.2% 78,680 24.4% 52.0% 6.2%-=���.,� 37,078 13.1% 42,954 13.3% 15.6% 0.2%��������*�� 36.6�2��L�������/�- �2-+
� �>>8�����������/������� �888�
���������/�������
������������*��
���������/�����������*��
�-��'� 2,842,321 100.00% 3,421,399 100.0% �������8� 80,2516 28.2% 944,004 27.6% 17.6% -0.6%�8����((� 1,115,537 39.3% 1,227,675 35.9% 10.1% -3.4%(,����.(� 532,944 18.8% 811,543 23.7% 52.3% 5.0%-=���.,� 391,324 13.8% 438,177 12.8% 12.0% -1.0%��������*�� 36.3
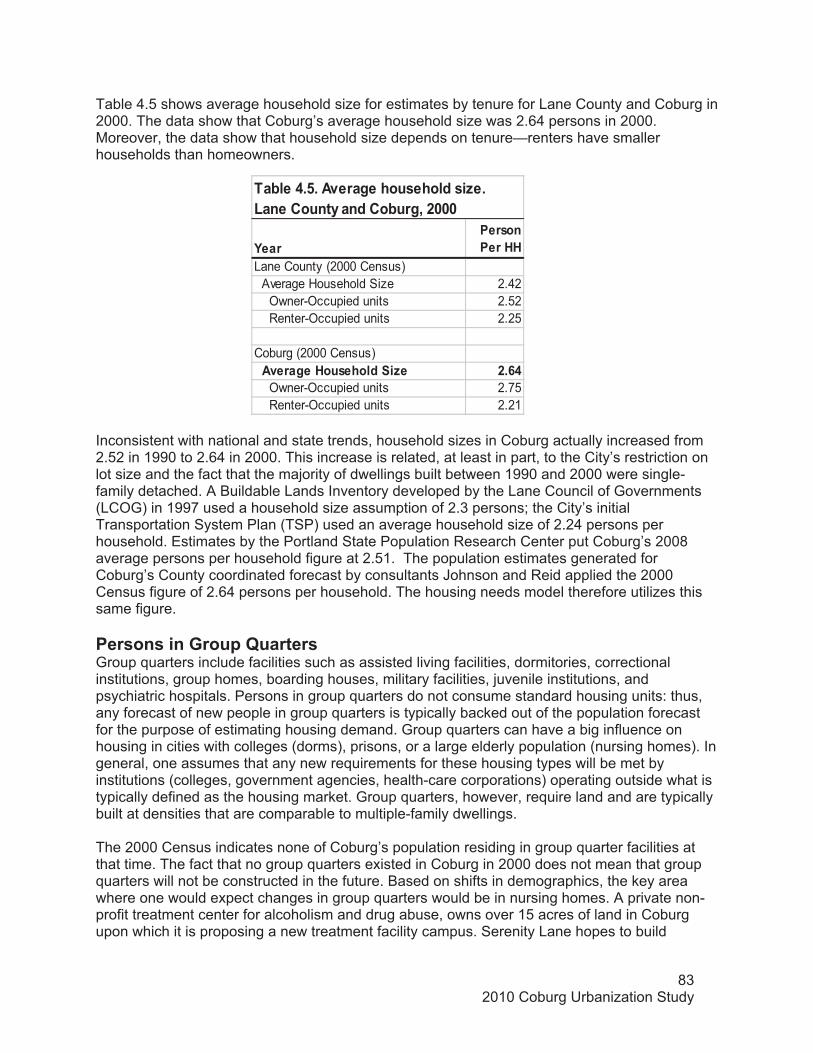
832010 Coburg Urbanization Study
�������#�������))
Lane County (2000 Census) Average Household Size 2.42 Owner-Occupied units 2.52 Renter-Occupied units 2.25
Coburg (2000 Census)���=���*��)��#�������J� ��.( Owner-Occupied units 2.75 Renter-Occupied units 2.21
��&���(�,���=���*�����#������#�J���'���������!�������&��*7��888
Table 4.5 shows average household size for estimates by tenure for Lane County and Coburg in 2000. The data show that Coburg’s average household size was 2.64 persons in 2000. Moreover, the data show that household size depends on tenure—renters have smaller households than homeowners.
Inconsistent with national and state trends, household sizes in Coburg actually increased from 2.52 in 1990 to 2.64 in 2000. This increase is related, at least in part, to the City’s restriction on lot size and the fact that the majority of dwellings built between 1990 and 2000 were single-family detached. A Buildable Lands Inventory developed by the Lane Council of Governments (LCOG) in 1997 used a household size assumption of 2.3 persons; the City’s initial Transportation System Plan (TSP) used an average household size of 2.24 persons per household. Estimates by the Portland State Population Research Center put Coburg’s 2008 average persons per household figure at 2.51. The population estimates generated for Coburg’s County coordinated forecast by consultants Johnson and Reid applied the 2000 Census figure of 2.64 persons per household. The housing needs model therefore utilizes this same figure.
���#��#����2�����E������#�Group quarters include facilities such as assisted living facilities, dormitories, correctional institutions, group homes, boarding houses, military facilities, juvenile institutions, and psychiatric hospitals. Persons in group quarters do not consume standard housing units: thus, any forecast of new people in group quarters is typically backed out of the population forecast for the purpose of estimating housing demand. Group quarters can have a big influence on housing in cities with colleges (dorms), prisons, or a large elderly population (nursing homes). In general, one assumes that any new requirements for these housing types will be met by institutions (colleges, government agencies, health-care corporations) operating outside what is typically defined as the housing market. Group quarters, however, require land and are typically built at densities that are comparable to multiple-family dwellings.
The 2000 Census indicates none of Coburg’s population residing in group quarter facilities at that time. The fact that no group quarters existed in Coburg in 2000 does not mean that group quarters will not be constructed in the future. Based on shifts in demographics, the key area where one would expect changes in group quarters would be in nursing homes. A private non-profit treatment center for alcoholism and drug abuse, owns over 15 acres of land in Coburg upon which it is proposing a new treatment facility campus. Serenity Lane hopes to build
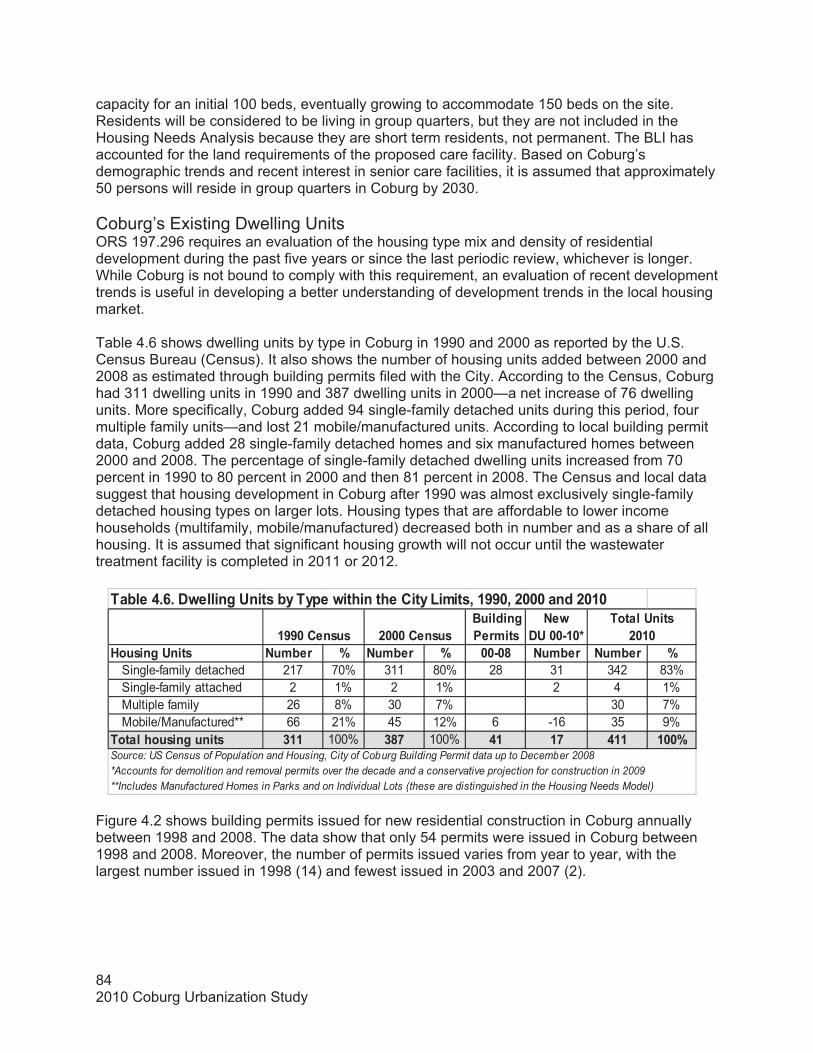
842010 Coburg Urbanization Study
%������*���� ��#
+�?�����0��889�8C
)��#��*�����# +� &�� D +� &�� D 88984 +� &�� +� &�� D Single-family detached 217 70% 311 80% 28 31 342 83% Single-family attached 2 1% 2 1% 2 4 1% Multiple family 26 8% 30 7% 30 7% Mobile/Manufactured** 66 21% 45 12% 6 -16 35 9%���������#��*�����# $�� 100% $41 100% (� �1 (�� �88DSource: US Census of Population and Housing, City of Coburg Building Permit data up to December 2008 *Accounts for demolition and removal permits over the decade and a conservative projection for construction in 2009 **Includes Manufactured Homes in Parks and on Individual Lots (these are distinguished in the Housing Needs Model)
��&���(�.��0?�����*�����#�&!��!���?�������������!�'� ��#7��>>87��888������8�8����������#��������8�8�>>8����#�# �888����#�#
capacity for an initial 100 beds, eventually growing to accommodate 150 beds on the site. Residents will be considered to be living in group quarters, but they are not included in the Housing Needs Analysis because they are short term residents, not permanent. The BLI has accounted for the land requirements of the proposed care facility. Based on Coburg’s demographic trends and recent interest in senior care facilities, it is assumed that approximately 50 persons will reside in group quarters in Coburg by 2030.
Coburg’s Existing Dwelling UnitsORS 197.296 requires an evaluation of the housing type mix and density of residential development during the past five years or since the last periodic review, whichever is longer. While Coburg is not bound to comply with this requirement, an evaluation of recent development trends is useful in developing a better understanding of development trends in the local housing market.
Table 4.6 shows dwelling units by type in Coburg in 1990 and 2000 as reported by the U.S. Census Bureau (Census). It also shows the number of housing units added between 2000 and 2008 as estimated through building permits filed with the City. According to the Census, Coburg had 311 dwelling units in 1990 and 387 dwelling units in 2000—a net increase of 76 dwelling units. More specifically, Coburg added 94 single-family detached units during this period, four multiple family units—and lost 21 mobile/manufactured units. According to local building permit data, Coburg added 28 single-family detached homes and six manufactured homes between 2000 and 2008. The percentage of single-family detached dwelling units increased from 70 percent in 1990 to 80 percent in 2000 and then 81 percent in 2008. The Census and local data suggest that housing development in Coburg after 1990 was almost exclusively single-family detached housing types on larger lots. Housing types that are affordable to lower income households (multifamily, mobile/manufactured) decreased both in number and as a share of all housing. It is assumed that significant housing growth will not occur until the wastewater treatment facility is completed in 2011 or 2012.
Figure 4.2 shows building permits issued for new residential construction in Coburg annually between 1998 and 2008. The data show that only 54 permits were issued in Coburg between 1998 and 2008. Moreover, the number of permits issued varies from year to year, with the largest number issued in 1998 (14) and fewest issued in 2003 and 2007 (2).
���������������������
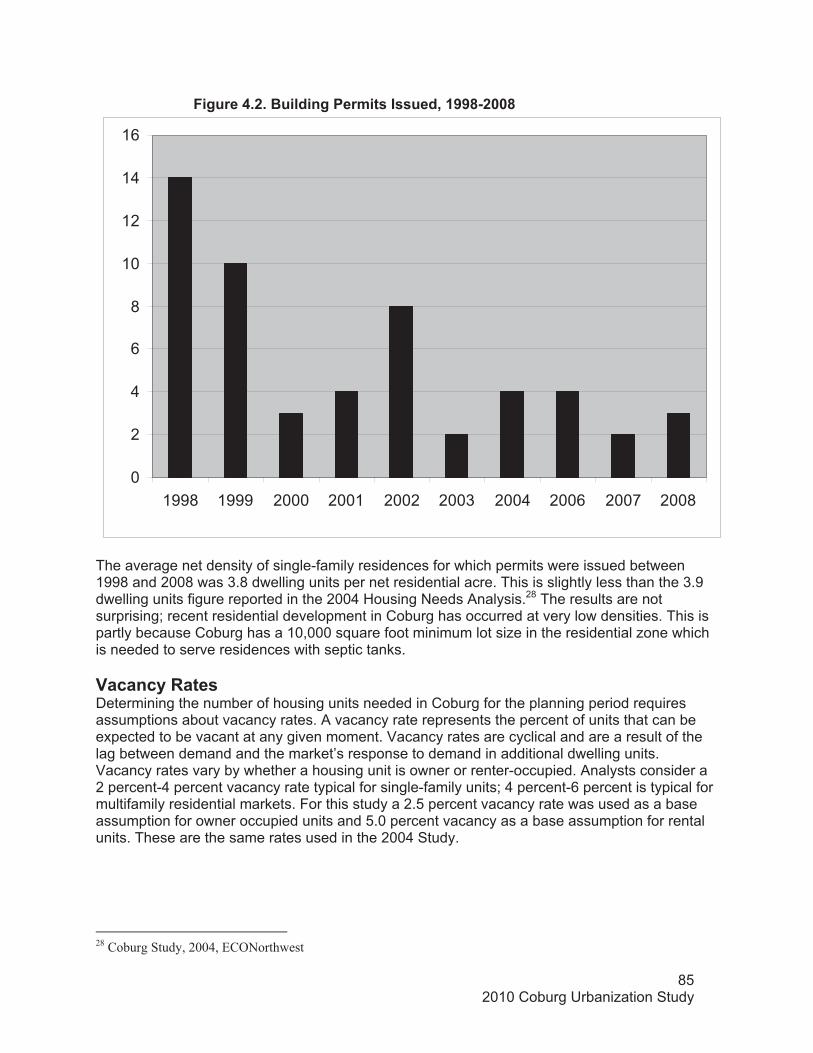
852010 Coburg Urbanization Study
0
2
4
6
8
10
12
14
16
1998 1999 2000 2001 2002 2003 2004 2006 2007 2008
������������������������"�*����(����%������*���� ��#��##���7��>>49�884�
The average net density of single-family residences for which permits were issued between 1998 and 2008 was 3.8 dwelling units per net residential acre. This is slightly less than the 3.9 dwelling units figure reported in the 2004 Housing Needs Analysis.28 The results are not surprising; recent residential development in Coburg has occurred at very low densities. This is partly because Coburg has a 10,000 square foot minimum lot size in the residential zone which is needed to serve residences with septic tanks.
�����!� ���#�Determining the number of housing units needed in Coburg for the planning period requires assumptions about vacancy rates. A vacancy rate represents the percent of units that can be expected to be vacant at any given moment. Vacancy rates are cyclical and are a result of the lag between demand and the market’s response to demand in additional dwelling units. Vacancy rates vary by whether a housing unit is owner or renter-occupied. Analysts consider a 2 percent-4 percent vacancy rate typical for single-family units; 4 percent-6 percent is typical for multifamily residential markets. For this study a 2.5 percent vacancy rate was used as a base assumption for owner occupied units and 5.0 percent vacancy as a base assumption for rental units. These are the same rates used in the 2004 Study.
28 Coburg Study, 2004, ECONorthwest
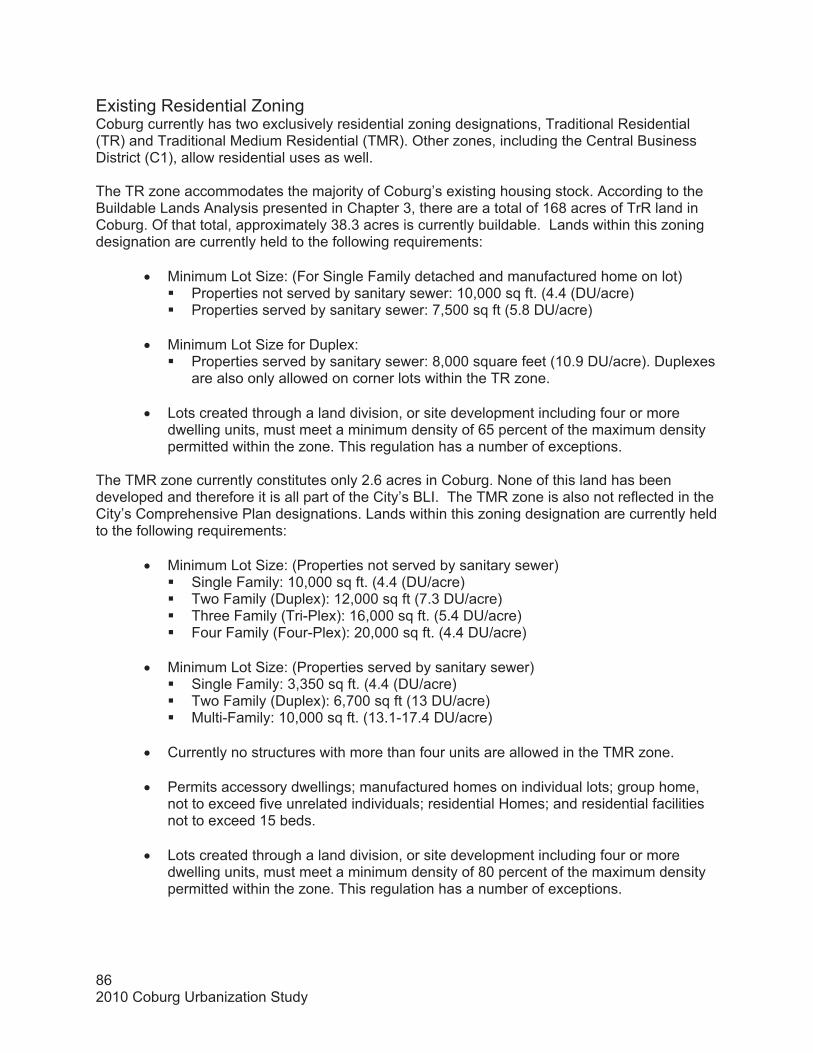
862010 Coburg Urbanization Study
Existing Residential Zoning Coburg currently has two exclusively residential zoning designations, Traditional Residential (TR) and Traditional Medium Residential (TMR). Other zones, including the Central Business District (C1), allow residential uses as well.
The TR zone accommodates the majority of Coburg’s existing housing stock. According to the Buildable Lands Analysis presented in Chapter 3, there are a total of 168 acres of TrR land in Coburg. Of that total, approximately 38.3 acres is currently buildable. Lands within this zoning designation are currently held to the following requirements:
� Minimum Lot Size: (For Single Family detached and manufactured home on lot) � Properties not served by sanitary sewer: 10,000 sq ft. (4.4 (DU/acre) � Properties served by sanitary sewer: 7,500 sq ft (5.8 DU/acre)
� Minimum Lot Size for Duplex: � Properties served by sanitary sewer: 8,000 square feet (10.9 DU/acre). Duplexes
are also only allowed on corner lots within the TR zone.
� Lots created through a land division, or site development including four or more dwelling units, must meet a minimum density of 65 percent of the maximum density permitted within the zone. This regulation has a number of exceptions.
The TMR zone currently constitutes only 2.6 acres in Coburg. None of this land has been developed and therefore it is all part of the City’s BLI. The TMR zone is also not reflected in the City’s Comprehensive Plan designations. Lands within this zoning designation are currently held to the following requirements:
� Minimum Lot Size: (Properties not served by sanitary sewer) � Single Family: 10,000 sq ft. (4.4 (DU/acre) � Two Family (Duplex): 12,000 sq ft (7.3 DU/acre) � Three Family (Tri-Plex): 16,000 sq ft. (5.4 DU/acre) � Four Family (Four-Plex): 20,000 sq ft. (4.4 DU/acre)
� Minimum Lot Size: (Properties served by sanitary sewer) � Single Family: 3,350 sq ft. (4.4 (DU/acre) � Two Family (Duplex): 6,700 sq ft (13 DU/acre) � Multi-Family: 10,000 sq ft. (13.1-17.4 DU/acre)
� Currently no structures with more than four units are allowed in the TMR zone.
� Permits accessory dwellings; manufactured homes on individual lots; group home, not to exceed five unrelated individuals; residential Homes; and residential facilities not to exceed 15 beds.
� Lots created through a land division, or site development including four or more dwelling units, must meet a minimum density of 80 percent of the maximum density permitted within the zone. This regulation has a number of exceptions.
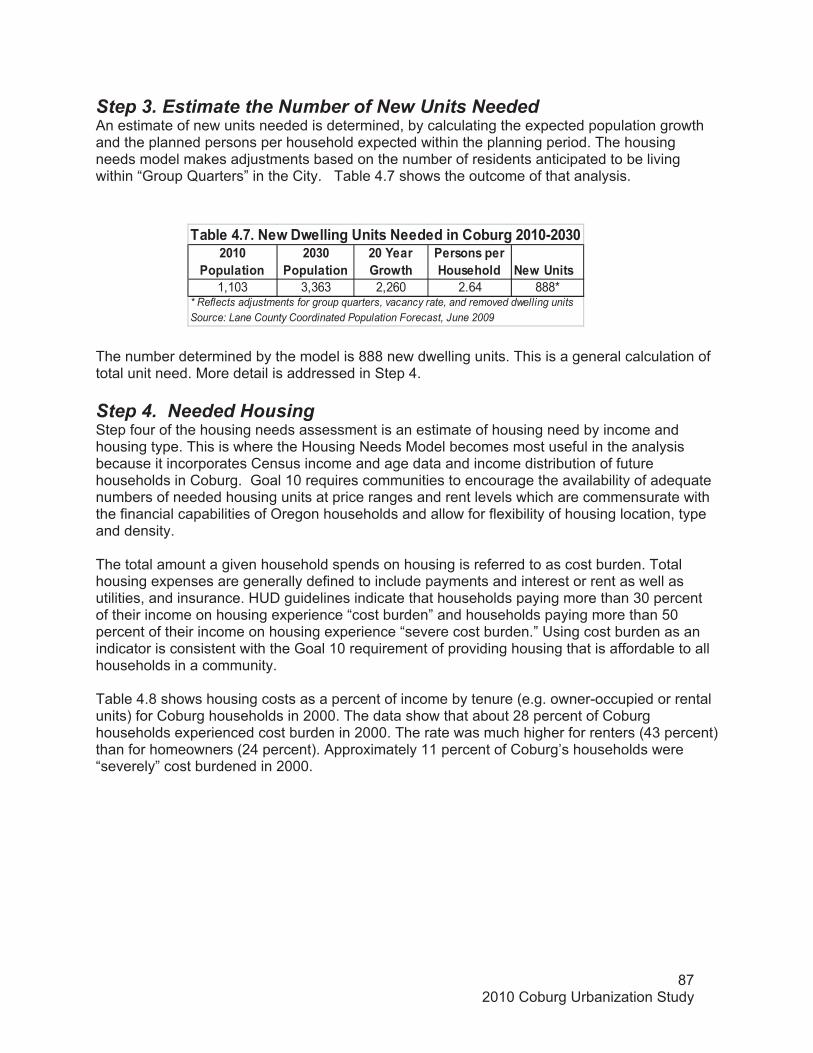
872010 Coburg Urbanization Study
�8�8������������
�8$8������������
�8������2��?���
���#��#�����)��#����� +�?�����#
1,103 3,363 2,260 2.64 888** Reflects adjustments for group quarters, vacancy rate, and removed dwelling units Source: Lane County Coordinated Population Forecast, June 2009
��&���(�1��+�?�0?�����*�����#�+�����������&��*��8�89�8$8
Step 3. Estimate the Number of New Units NeededAn estimate of new units needed is determined, by calculating the expected population growth and the planned persons per household expected within the planning period. The housing needs model makes adjustments based on the number of residents anticipated to be living within “Group Quarters” in the City. Table 4.7 shows the outcome of that analysis.
The number determined by the model is 888 new dwelling units. This is a general calculation of total unit need. More detail is addressed in Step 4.
Step 4. Needed Housing Step four of the housing needs assessment is an estimate of housing need by income and housing type. This is where the Housing Needs Model becomes most useful in the analysis because it incorporates Census income and age data and income distribution of future households in Coburg. Goal 10 requires communities to encourage the availability of adequate numbers of needed housing units at price ranges and rent levels which are commensurate with the financial capabilities of Oregon households and allow for flexibility of housing location, type and density.
The total amount a given household spends on housing is referred to as cost burden. Total housing expenses are generally defined to include payments and interest or rent as well as utilities, and insurance. HUD guidelines indicate that households paying more than 30 percent of their income on housing experience “cost burden” and households paying more than 50 percent of their income on housing experience “severe cost burden.” Using cost burden as an indicator is consistent with the Goal 10 requirement of providing housing that is affordable to all households in a community.
Table 4.8 shows housing costs as a percent of income by tenure (e.g. owner-occupied or rental units) for Coburg households in 2000. The data show that about 28 percent of Coburg households experienced cost burden in 2000. The rate was much higher for renters (43 percent) than for homeowners (24 percent). Approximately 11 percent of Coburg’s households were “severely” cost burdened in 2000.

882010 Coburg Urbanization Study
���� -?�Construction 240 $43,558 20.94 $1,089 $108,895Manufacturing & Wholesale Trade 2,257 $37,200 17.89 $930 $93,000Retail Trade 377 $24,110 11.59 $603 $60,275Services 357 $21,700 10.43 $543 $54,251All Other* 85 $22,613 10.87 $565 $56,533����� $7$�. Q$(7��> �.�(���������� Q4,$ Q4,7$��
�#����//����&���)��#��*�����#����#
��&���(�>��+� &����/�P���=���*��5�*���������#��*��//����&����!�����#����#7���&��*��88.
Source: Oregon Employment Department; analysis by LCOG *It was necessary to group certain industries into larger categories to comply with confidentiality rules.
�����A����#��! P�&#��=*��������
��!�#���)����!�5�*�
��&���(�4:�-?�������� ��������#�#��#�����������*���/�)��#���������� �7���&��*��888 ������ -?���� ������
���������/����� ��
��#�#�&!�+� &���
��#�#�&!���������
��#�#�&!�+� &���
��#�#�&!���������
��#�#�&!�+� &���
��#�#�&!���������
Less than 20% 26 40% 112 45% 138 44% 20%-30% 11 17% 79 31% 90 28% 30% - 40% 9 14% 29 12% 38 12% 40% - 50% 4 6% 10 4% 14 4% 50% or more 15 23% 21 8% 36 11% Total 65 100% 251 100% 316 100%��#��%������ �4� ($D� .8� �(D� 44� �4D�Source: (2004 Study ECONorthwest) 2000 Census
Household income in Coburg has generally increased, although it has not kept pace with housing prices or rents. More households are spending in excess of the recommended 30% of their income on housing. In addition, until recently, housing cost was increasing at a significantly greater annual rate than household income.29
Table 4.9 shows wage levels by industrial sector and housing affordability estimates for Coburg. The data indicate that the average hourly wage for covered employment in Coburg is nearly $16.50. A household income at this level could afford approximately $853 per month for rent or a mortgage of about $85,322. The data show some variation by sector, however, the majority of jobs (about 68 percent) are in the “Manufacturing and Wholesale Trade” sub-category. It is important to note that the data in Table 4.9 represent average pay per worker. According to the 2000 Census about 12 percent of households had no workers, 30 percent of households had one worker, 45 percent had two workers, and 13 percent had three or more workers. Thus, nearly 60 percent of households have multiple incomes.
���
Household Income in Coburg Determining the types of housing that are likely to be affordable to the projected household is based on household income. Higher income is correlated with higher rates of ownership and single-family housing.30 According to the Census, the median household income in Coburg was greater than in both Lane County and the State overall (Table 4.10). Per capita income for all
29 Planning for Residential Growth Workbook, Appendix C, page C-2 30 Ibid, page C-12

892010 Coburg Urbanization Study
three geographies was fairly similar, though Coburg was closer to Oregon as a whole than Lane County.
��&���(��8����������)��#������������������������� �7��888�
������������)��#������
���� �� ��������������� ��Coburg $47,500 $21,696Lane County $36,942 $19,681Oregon $40,916 $21,587
Source: 2000 Census
According to the 2000 Census, the median household income within Coburg was $47,500, and $36,942 for Lane County. Coburg’s higher household and per capita incomes likely explain the City’s 2000 Census home ownership rate of (82 percent), higher than Lane County (64 percent) and the state (63 percent). Additional factors that may contribute to this dynamic include:
� Local land use regulations limiting opportunities for multi-family housing. � Coburg’s attractive small town atmosphere and small town amenities within such close
proximity to the Eugene-Springfield metropolitan area, which draws individuals capable of paying a premium.
Existing Housing Types and Tenure To understand what will be required to meet future housing needs requires making determinations about the types and tenure of housing units to be added. Table 4.11 presents the estimated 2010 percentages for each housing type by tenure generated by using rental and ownership proportions from the 2000 Census.
����������������������&���(���:��#�� ������3�#���*�)��#��*�������������!����8�8
)��#��*��!��� ������ -?���#����-=������
��������*��Single-family detached 29.2% 100% 85%Single-family attached 4.5% 0.0% 1%Multi-family 33.7% 0.0% 7%Mobile/Manufactured in park 32.6% 0.0% 7%������� �88D �88D �88D�
The Census identifies 295 owned units and 67 rental units within Coburg in 2000. This is an approximately 80/20 owner/rental split. Housing in Coburg is predominantly single-family units (85 percent). As noted in table 4.9, all owned units in Coburg are single-family units. Of all rental units, the largest percentage are three to five unit structures (33.7 percent), followed by manufactured homes in parks (32.6 percent) and single family units (29.2 percent). Duplex units make up only 4.5 percent of the rental stock within Coburg’s UGB. As expected, there is a much higher frequency of ownership among single family units, and a much higher frequency of renting among multi-family units.
Existing Types and Tenure by Income Tables 4.12 and 4.13 present a best estimate summary of the number of households that are renters and owners within each income bracket in Coburg. The figures are based upon year 2000 Census owner/renter proportions. Income brackets are broken down by percentage of household median income.

902010 Coburg Urbanization Study
�����������������;D�)��#����������������� �< ����#
��*��9"� ��!�0�������
��*��9"� ��!���������
�����9"� ��!
��&���A�����������/��������������I �����
'�?�#����D 20 100% 100%
'�?��;��9(�D< 18 100% 100%
'�?9����;(�9.$D< 42 100% 100%
���9)�*���;.$94(D< 54 100% 100%
)�*���;4(9�8,D< 106 100% 100%
)�*��#��;�8,DB< 82 100% 100%������ $�� �88�8D 8�8D 8�8D 8�8D �88D
��&���(���:���������*���/��3�#���*�-?����)��#��*�&!������������!���;�8�8<
Source: Lane County Assesor data, Template 6
���������������;D�)��#����������������� �< ����#
��*��9"� ��!�0�������
��*��9"� ��!���������
�����9"� ��!
��&���A����������/��������������I �����
'�?�#����D 14 100.0% 100%'�?��;��9(�D< 18 16.7% 83.3% 100%
'�?9����;(�9.$D< 22 100.0% 100%���9)�*���;.$94(D< 16 43.8% 25.0% 31.3% 100%)�*���;4(9�8,D< 14 100.0% 100%)�*��#��;�8,DB< 5 100.0% 100%
������ 4> �>��D (�,D $$�1D $��.D �88D
��&���(��$:���������*���/��3�#���*� ������)��#��*�&!������������!���;�8�8<
Source: LCOG Estimates, Template 6
Because homeownership generally requires greater financial means, and considering Coburg’s housing stock and development regulations, it is not surprising that existing homeownership in the City is isolated to single-family detached dwellings.
Table 4.13 shows the housing model’s breakdown of existing rentals by type and income. Information about rentals in Coburg is far more limited than for ownership units. The information presented in Table 4.13 is based on interviews and the information available, and generally reflects a pattern one might expect in a community like Coburg. The greatest number of rentals available to lower income households is in the category of “manufactured homes in parks” and “multi-family” units. Because rents and prices are directly related to land values, it stands to reason that higher density units will be more affordable. The higher rental rates are assumed to all be within the single-family detached category for the same reason.
Additional Affordability Considerations The housing needs model also provides some considerations for additional nuances of housing need. These include:
o An “Out Factor,” which represents needed adjustments to reflect households who could afford specific cost levels but chose a lower cost unit.
o “Tenant vouchers,” which accounts for an estimated figure of federal Section 8 (HUD) vouchers/ certificates or similar subsidies used to lower tenant paid rents.
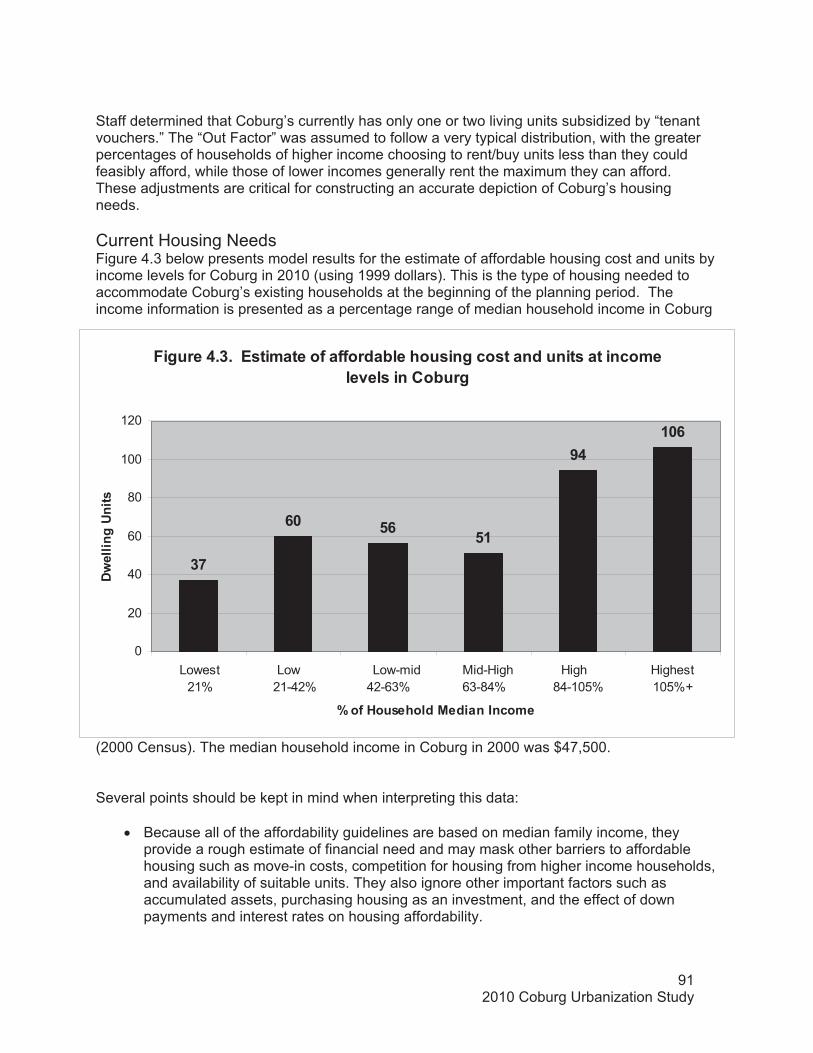
912010 Coburg Urbanization Study
"�*����(�$����#�� �����/��//����&������#��*���#����������#�������� ����=��#������&��*
$1
.8 ,. ,�
>(�8.
0
20
40
60
80
100
120
Lowest 21%
Low 21-42%
Low-mid 42-63%
Mid-High 63-84%
High 84-105%
Highest 105%+
D��/�)��#����������������� �
0?�����*�����#
�Staff determined that Coburg’s currently has only one or two living units subsidized by “tenant vouchers.” The “Out Factor” was assumed to follow a very typical distribution, with the greater percentages of households of higher income choosing to rent/buy units less than they could feasibly afford, while those of lower incomes generally rent the maximum they can afford. These adjustments are critical for constructing an accurate depiction of Coburg’s housing needs.
Current Housing Needs Figure 4.3 below presents model results for the estimate of affordable housing cost and units by income levels for Coburg in 2010 (using 1999 dollars). This is the type of housing needed to accommodate Coburg’s existing households at the beginning of the planning period. The income information is presented as a percentage range of median household income in Coburg
(2000 Census). The median household income in Coburg in 2000 was $47,500.
Several points should be kept in mind when interpreting this data:
� Because all of the affordability guidelines are based on median family income, they provide a rough estimate of financial need and may mask other barriers to affordable housing such as move-in costs, competition for housing from higher income households, and availability of suitable units. They also ignore other important factors such as accumulated assets, purchasing housing as an investment, and the effect of down payments and interest rates on housing affordability.
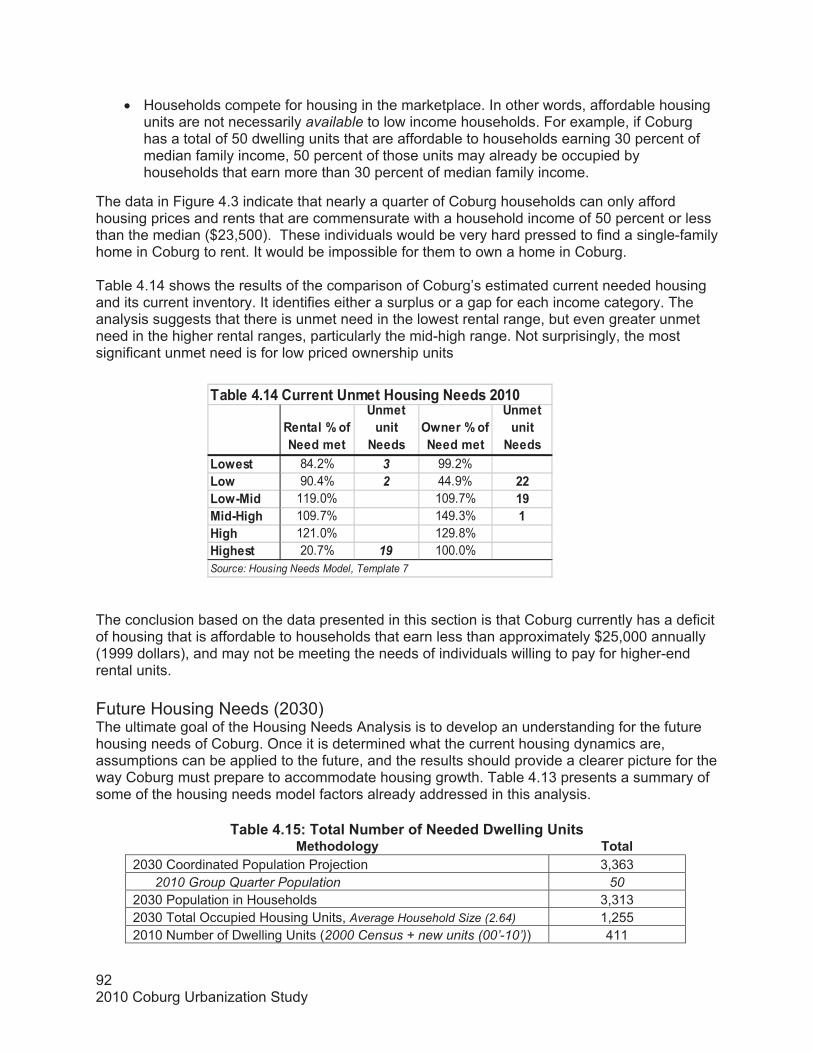
922010 Coburg Urbanization Study
������D��/�+���� ��
�� ��������+���#
-?����D��/�+���� ��
�� ��������+���#
'�?�#� 84.2% 3 99.2%'�? 90.4% 2 44.9% ��'�?9��� 119.0% 109.7% �>���9)�*� 109.7% 149.3% �)�*� 121.0% 129.8%)�*��#� 20.7% 19 100.0%
��&���(��(����������� ���)��#��*�+���#��8�8
Source: Housing Needs Model, Template 7
� Households compete for housing in the marketplace. In other words, affordable housing units are not necessarily available to low income households. For example, if Coburg has a total of 50 dwelling units that are affordable to households earning 30 percent of median family income, 50 percent of those units may already be occupied by households that earn more than 30 percent of median family income.
The data in Figure 4.3 indicate that nearly a quarter of Coburg households can only afford housing prices and rents that are commensurate with a household income of 50 percent or less than the median ($23,500). These individuals would be very hard pressed to find a single-family home in Coburg to rent. It would be impossible for them to own a home in Coburg.
Table 4.14 shows the results of the comparison of Coburg’s estimated current needed housing and its current inventory. It identifies either a surplus or a gap for each income category. The analysis suggests that there is unmet need in the lowest rental range, but even greater unmet need in the higher rental ranges, particularly the mid-high range. Not surprisingly, the most significant unmet need is for low priced ownership units
�
The conclusion based on the data presented in this section is that Coburg currently has a deficit of housing that is affordable to households that earn less than approximately $25,000 annually (1999 dollars), and may not be meeting the needs of individuals willing to pay for higher-end rental units. �
Future Housing Needs (2030) The ultimate goal of the Housing Needs Analysis is to develop an understanding for the future housing needs of Coburg. Once it is determined what the current housing dynamics are, assumptions can be applied to the future, and the results should provide a clearer picture for the way Coburg must prepare to accommodate housing growth. Table 4.13 presents a summary of some of the housing needs model factors already addressed in this analysis.
��&���(��,:�������+� &����/�+������0?�����*�����#���������*!� �������
2030 Coordinated Population Projection 3,363 2010 Group Quarter Population 502030 Population in Households 3,3132030 Total Occupied Housing Units, Average Household Size (2.64) 1,255 2010 Number of Dwelling Units (2000 Census + new units (00’-10’)) 411
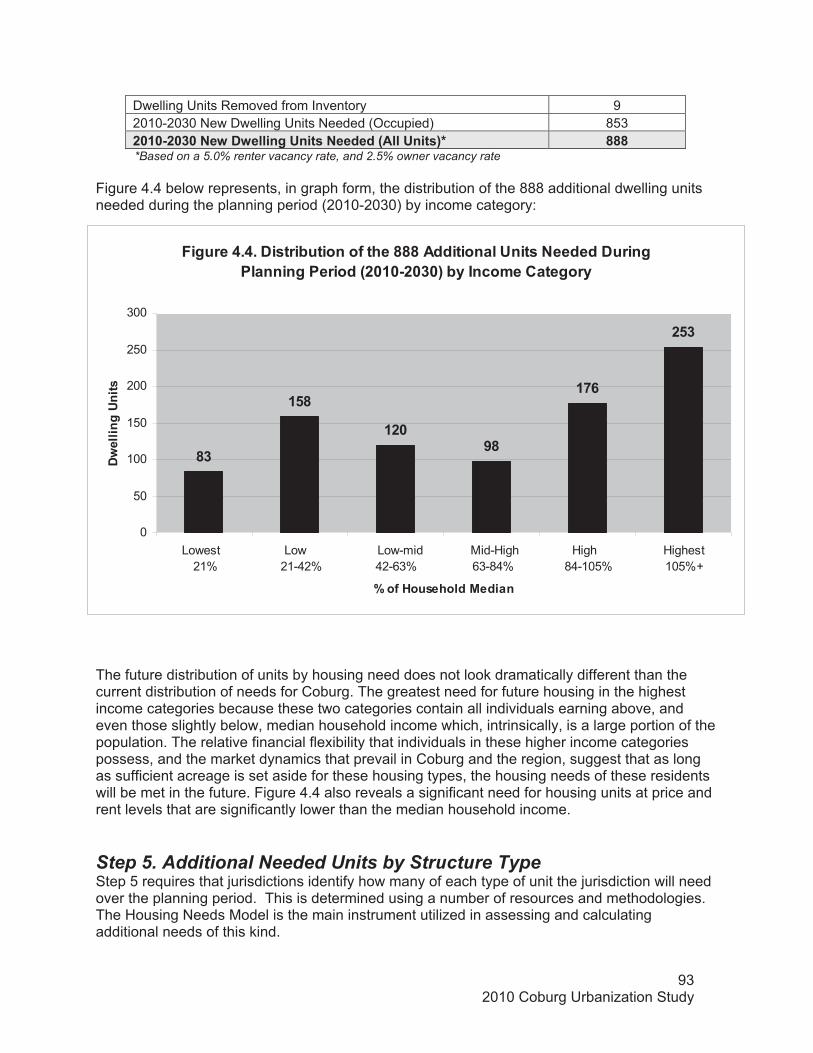
932010 Coburg Urbanization Study
"�*����(�(��0�#���&�������/�����444����������������#�+������0����*��������*��������;�8�89�8$8<�&!����� ������*��!
4$
�,4
��8>4
�1.
�,$
0
50
100
150
200
250
300
Lowest 21%
Low 21-42%
Low-mid 42-63%
Mid-High 63-84%
High 84-105%
Highest 105%+
D��/�)��#������������
0?�����*�����#
Dwelling Units Removed from Inventory 92010-2030 New Dwelling Units Needed (Occupied) 853�8�89�8$8�+�?�0?�����*�����#�+������;��������#<C� 444�
� ��� *Based on a 5.0% renter vacancy rate, and 2.5% owner vacancy rate
Figure 4.4 below represents, in graph form, the distribution of the 888 additional dwelling units needed during the planning period (2010-2030) by income category:
The future distribution of units by housing need does not look dramatically different than the current distribution of needs for Coburg. The greatest need for future housing in the highest income categories because these two categories contain all individuals earning above, and even those slightly below, median household income which, intrinsically, is a large portion of the population. The relative financial flexibility that individuals in these higher income categories possess, and the market dynamics that prevail in Coburg and the region, suggest that as long as sufficient acreage is set aside for these housing types, the housing needs of these residents will be met in the future. Figure 4.4 also reveals a significant need for housing units at price and rent levels that are significantly lower than the median household income.
Step 5. Additional Needed Units by Structure Type Step 5 requires that jurisdictions identify how many of each type of unit the jurisdiction will need over the planning period. This is determined using a number of resources and methodologies. The Housing Needs Model is the main instrument utilized in assessing and calculating additional needs of this kind.
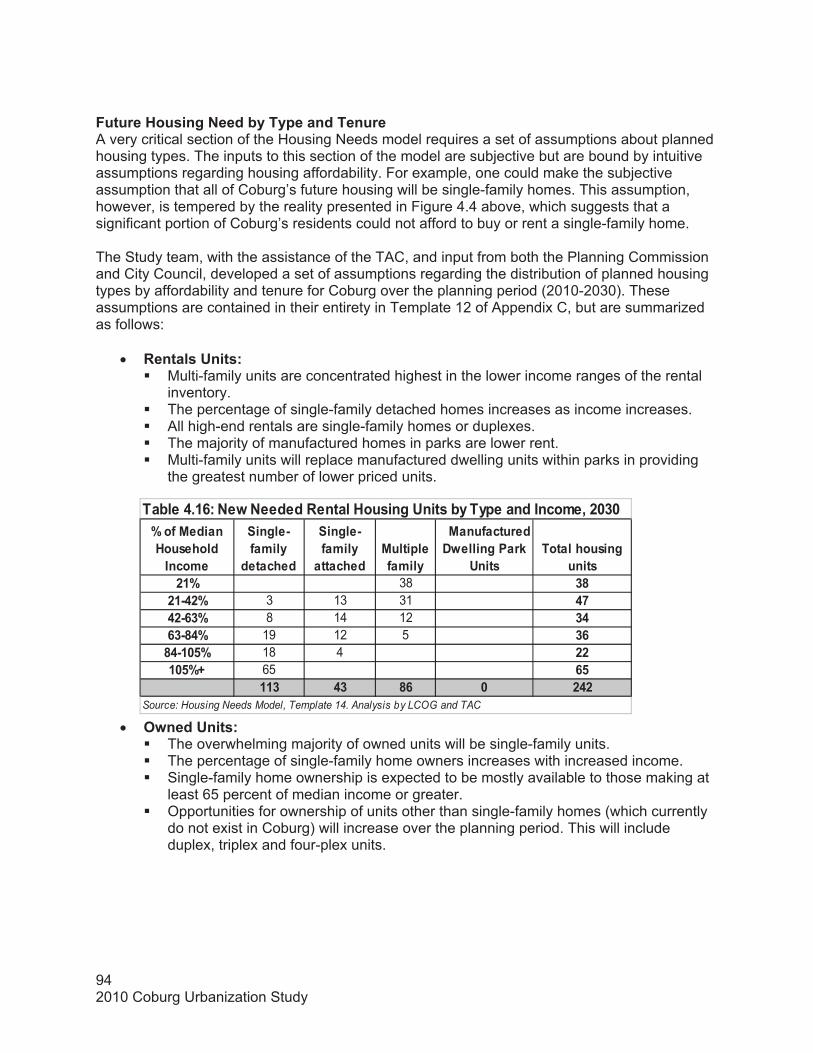
942010 Coburg Urbanization Study
D��/��������)��#���������� �
��*��9/� ��!���������
��*��9/� ��!���������
���������/� ��!
������/��������0?�����*����I�
����#���������#��*�
����#��D 38 $4��9(�D 3 13 31 (1(�9.$D 8 14 12 $(.$94(D 19 12 5 $.4(9�8,D 18 4 ���8,DB 65 .,
��$ ($ 4. 8 �(�Source: Housing Needs Model, Template 14. Analysis by LCOG and TAC
��&���(��.:�+�?�+������ ������)��#��*�����#�&!��!����������� �7��8$8
"������)��#��*�+����&!��!��������������A very critical section of the Housing Needs model requires a set of assumptions about planned housing types. The inputs to this section of the model are subjective but are bound by intuitive assumptions regarding housing affordability. For example, one could make the subjective assumption that all of Coburg’s future housing will be single-family homes. This assumption, however, is tempered by the reality presented in Figure 4.4 above, which suggests that a significant portion of Coburg’s residents could not afford to buy or rent a single-family home.
The Study team, with the assistance of the TAC, and input from both the Planning Commission and City Council, developed a set of assumptions regarding the distribution of planned housing types by affordability and tenure for Coburg over the planning period (2010-2030). These assumptions are contained in their entirety in Template 12 of Appendix C, but are summarized as follows:
� �����#�����#:� Multi-family units are concentrated highest in the lower income ranges of the rental
inventory.� The percentage of single-family detached homes increases as income increases. � All high-end rentals are single-family homes or duplexes. � The majority of manufactured homes in parks are lower rent. � Multi-family units will replace manufactured dwelling units within parks in providing
the greatest number of lower priced units.
� -?��������#:� The overwhelming majority of owned units will be single-family units. � The percentage of single-family home owners increases with increased income. � Single-family home ownership is expected to be mostly available to those making at
least 65 percent of median income or greater. � Opportunities for ownership of units other than single-family homes (which currently
do not exist in Coburg) will increase over the planning period. This will include duplex, triplex and four-plex units.

952010 Coburg Urbanization Study
��*��9/� ��!���������
��*��9/� ��!���������
���������/� ��!
����/��������0?�����*����I�
����#���������#��*�
����#Rental Units 113 43 86 0 �(�Owned Units 446 99 100 0 .(.Total 559 142 186 0 444% of Total .$�8D �.�8D �8�>D 8�8D �88�8D
��&���(��4:���������*�#��/�+�?�+������)��#��*�����#�&!��!�������������7��8$8
Source: Housing Needs Model, Template 14. Analysis by LCOG and TAC
D��/��������)��#���������� �
��*��9/� ��!���������
��*��9/� ��!���������
���������/� ��!
������/��������0?�����*����I�
����#���������#��*�
����#��D 0 16 29 0 (,��9(�D 21 32 58 ���(�9.$D 22 51 13 4..$94(D 62 .�4(9�8,D 154 �,(�8,DB 187 �41
((. >> �88 8 .(,
��&���(��1:�+�?�+������-?����)��#��*�����#�&!��!����������� �7��8$8
Source: Housing Needs Model, Template 14. Analysis by LCOG and TAC
Table 4.18 provides a summary of needed rental and owned units by type and tenure in Coburg. Of the 888 new needed dwelling units, approximately 63 percent are detached single family homes, 16 percent are single family attached (duplex) units, and 20.9 percent are multi-family units (3-4 units). This distribution of housing type is closely related to the density mix that Coburg will be trying to meet.
A further step in planning for Coburg’s housing needs is determining a forecasted distribution of new housing unit types by zoning. Template 17 within the Housing Needs Model provides the functionality to determine these distributions. Table 4.19 summarizes the model forecast for housing types by zoning for the planning period.
)��#��*�������!��
+�?�+����������#
'0 �D��/��!��
�0 �D��/��!��
)0 �D��/��!��
�%0�D��/��!��
���D��/��!�� �����
Single-family detached 560 95.6% 4.4% 0.0% 0.0% 0.0% 100% Single-family attached 142 17.3% 62.3% 5.9% 0.0% 14.4% 100% Multiple family 186 0.0% 21.8% 29.3% 0.0% 48.9% 100% Mobile/Manufactured 0 0.0% 0.0% 0.0% 0.0% 0.0% 0%����������� 444 ,.8 �,( .$ 8 ��� 444
��&���(��>:�+�?�+������0?�����*�����#�&!��!�������@���7���8�89�8$8
LDR, MDR and HDR: Low, Medium and High Density Residential, CBD: Central Business District, MU: Mixed Use Source: Housing Needs Model, Template 17
962010 Coburg Urbanization Study
Within the model, staff use standard zoning designation names and density ranges as identified by DLCD.31 Low Density Residential (LDR) traditionally consists of density ranges between 2 and 6 dwelling units per acre. Medium Density Residential (MDR) traditionally consists of density ranges between 6 and 12 dwelling units per acre. And finally, High Density Residential (HDR) traditionally consists of density ranges above 12 dwelling units per acre.
Coburg’s current residential zoning consists mainly of what would be considered LDR, Low Density Residential. Coburg’s current LDR equivalent is its Traditional Residential (TR) zone. The corner lot provision allowing duplex units on specific corner lots within Coburg’s TR zone does, however, allow for developments within the MDR range. Coburg’s TMR zone allows for developments within all three categories.
Certain assumptions were made by staff and the TTAC about Coburg’s future zoning dynamics in order to generate the information summarized in Table 4.19. These include the following: (as represented in the table)
� Coburg would institute, as recommended by the Coburg 2004 Study,32 separate medium, and high density zones.
� A low density zone would consist generally of single family units, with a limited share of duplex units (similar to what currently exists).
� A medium density zone would consist mostly of single family attached housing, cottage developments, with lesser proportions of tri and four-plexes, manufactured homes in parks and single family homes.
� A high density zone would consist mostly of tri and four-plex units, with some duplexes.
� A mixed-use zone would consist mostly of tri and four-plex units, with some duplexes.
�Step 6. Needed Density Ranges and the Average Needed Net Density for All Structure Types
Calculating Housing Density OAR 660-008-0010 requires that “sufficient buildable land shall be designated on the comprehensive plan map to satisfy housing needs by type and density range as determined in the housing needs projection.”
Density can be expressed in different ways including persons per square mile, units per acre, or floor area ratio. Residential density is typically expressed in housing units per acre and measured as net or gross. Net density is a units-per-acre density measurement that includes only land occupied by residential uses. In its calculation, it does not include streets, parks or other uses. Gross density, in contrast, is a units-per-acre density measurement that includes in the calculation, land occupied by public rights-of-way, recreational, civic, commercial, and other non-residential uses.
The Housing Needs Model uses a gross density figure in order to account for public facilities in its overall land need outcome.
31 Safe Harbor Goal 14 (OAR 660-024-0040) 32 2004 Study recommended zoning (Table 4-20)
972010 Coburg Urbanization Study
Housing Density Background
��&��*����##����#��#�����88$�One of the City’s first steps in its 2003 periodic work program was the development of a community vision. After an extensive public involvement process, the community vision that was developed from this process was reviewed and approved by the Council, and approved by DLCD on December 9, 2003, and is reflected in the Coburg Crossroads Community Vision.
��?���������*����������#�Early in the process, stakeholders agreed to a draft set of town planning principles addressing a number of issues, including housing. The goals, policies, and actions agreed to in these Town Planning Principles addressed many key issues that would form the vision for community growth. Appendix D includes a summary of applicable goals and Policies that resulted from the 2003 visioning process.
Town Plan Map Alternatives Analysis The Coburg community participated in a number of design charettes to consider a town center, neighborhoods, schools, parks, civic buildings, and transportation facilities. Community consensus was found (see Map 8). The land need analysis that supported this town plan map included the following assumptions related to residential development:
� The average overall net density used was 4�1�����#����������� The average overall gross density was .�1�����#���������.� The average overall net density for new single family development used was�.��?�����*�����#�����������
� The average overall net density for new medium density multifamily development used was �(��?�����*�����#����������
� The average overall net density for new higher density multifamily development used was �8��?�����*�����#���������.�
� 18���������of the new development was assumed to be composed of single family units.
� �,���������of the new development was assumed to be composed of medium-density multifamily development.
� ,���������of the new development was assumed to be composed of higher-density multifamily development.
The Vision thereafter played an important role in shaping the Periodic Review of the goals and policies of the existing Comprehensive Plan and the Coburg Zoning Code.
)��#��*�0��#��!�%��I*�����:��88(����!�Another part of the Periodic Review process was the development of the 2004 Study. Study:
� The average �=�������������#��!�?�#�1�8�����#���������.� The average overall net density for new single family development used was .��?�����*�����#�����������
� The average overall net density for new multifamily development used was �$�$��?�����*�����#�����������
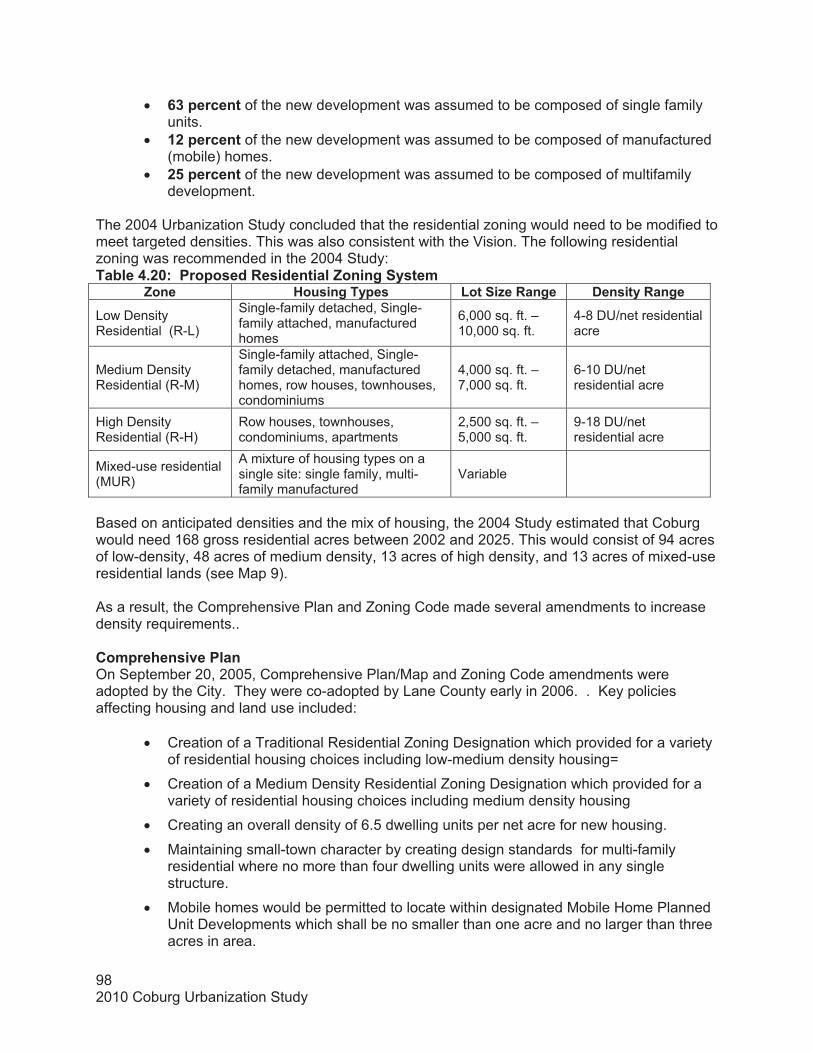
982010 Coburg Urbanization Study
� .$�������� of the new development was assumed to be composed of single family units.
� ���������� of the new development was assumed to be composed of manufactured (mobile) homes.
� �,�������� of the new development was assumed to be composed of multifamily development.
The 2004 Urbanization Study concluded that the residential zoning would need to be modified to meet targeted densities. This was also consistent with the Vision. The following residential zoning was recommended in the 2004 Study:��&���(��8:�������#��� �#���������@����*�!#�� �
@���� )��#��*��!��#� '����J�� ��*�� 0��#��!� ��*��Low Density Residential (R-L)
Single-family detached, Single-family attached, manufactured homes
6,000 sq. ft. – 10,000 sq. ft.
4-8 DU/net residential acre
Medium Density Residential (R-M)
Single-family attached, Single-family detached, manufactured homes, row houses, townhouses, condominiums
4,000 sq. ft. – 7,000 sq. ft.
6-10 DU/net residential acre
High Density Residential (R-H)
Row houses, townhouses, condominiums, apartments
2,500 sq. ft. – 5,000 sq. ft.
9-18 DU/net residential acre
Mixed-use residential (MUR)
A mixture of housing types on a single site: single family, multi-family manufactured
Variable
Based on anticipated densities and the mix of housing, the 2004 Study estimated that Coburg would need 168 gross residential acres between 2002 and 2025. This would consist of 94 acres of low-density, 48 acres of medium density, 13 acres of high density, and 13 acres of mixed-use residential lands (see Map 9).
As a result, the Comprehensive Plan and Zoning Code made several amendments to increase density requirements..
�� ������#�=�������On September 20, 2005, Comprehensive Plan/Map and Zoning Code amendments were adopted by the City. They were co-adopted by Lane County early in 2006. . Key policies affecting housing and land use included:
� Creation of a Traditional Residential Zoning Designation which provided for a variety of residential housing choices including low-medium density housing=�
� Creation of a Medium Density Residential Zoning Designation which provided for a variety of residential housing choices including medium density housing �
� Creating an overall density of 6.5 dwelling units per net acre for new housing.
� Maintaining small-town character by creating design standards for multi-family residential where no more than four dwelling units were allowed in any single structure.
� Mobile homes would be permitted to locate within designated Mobile Home Planned Unit Developments which shall be no smaller than one acre and no larger than three acres in area.
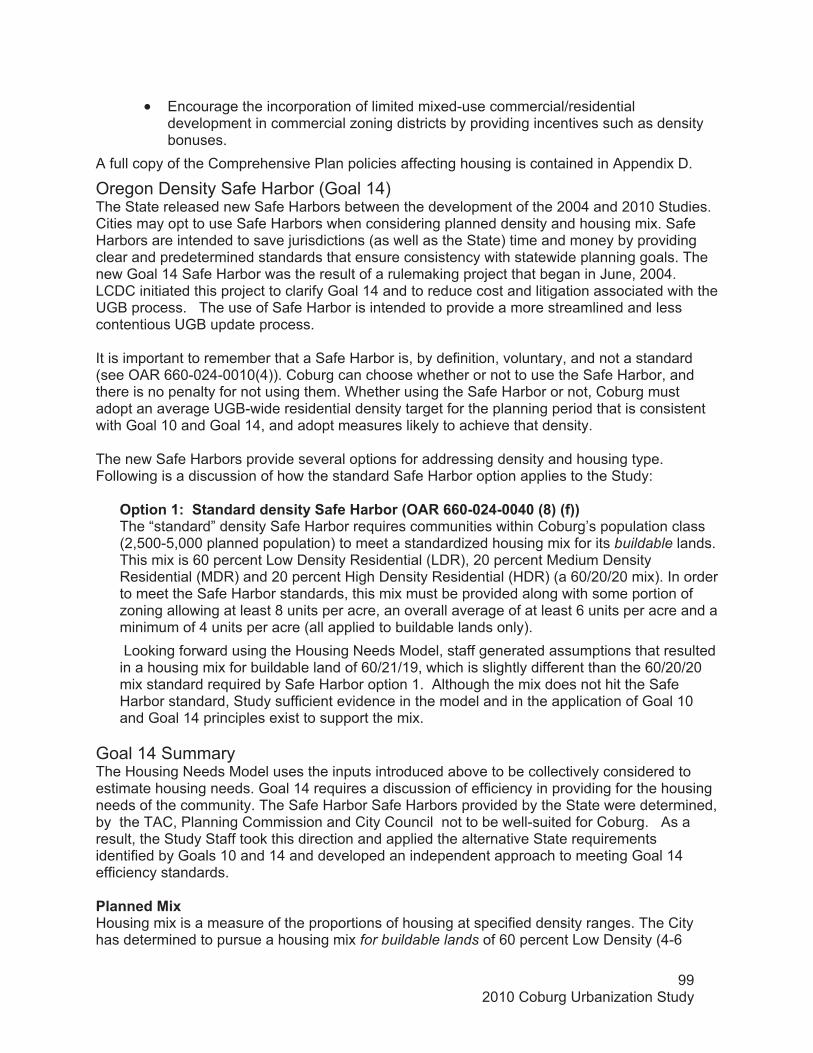
992010 Coburg Urbanization Study
� Encourage the incorporation of limited mixed-use commercial/residential development in commercial zoning districts by providing incentives such as density bonuses.
A full copy of the Comprehensive Plan policies affecting housing is contained in Appendix D.
Oregon Density Safe Harbor (Goal 14) The State released new Safe Harbors between the development of the 2004 and 2010 Studies. Cities may opt to use Safe Harbors when considering planned density and housing mix. Safe Harbors are intended to save jurisdictions (as well as the State) time and money by providing clear and predetermined standards that ensure consistency with statewide planning goals. The new Goal 14 Safe Harbor was the result of a rulemaking project that began in June, 2004. LCDC initiated this project to clarify Goal 14 and to reduce cost and litigation associated with the UGB process. The use of Safe Harbor is intended to provide a more streamlined and less contentious UGB update process.
It is important to remember that a Safe Harbor is, by definition, voluntary, and not a standard (see OAR 660-024-0010(4)). Coburg can choose whether or not to use the Safe Harbor, and there is no penalty for not using them. Whether using the Safe Harbor or not, Coburg must adopt an average UGB-wide residential density target for the planning period that is consistent with Goal 10 and Goal 14, and adopt measures likely to achieve that density.
The new Safe Harbors provide several options for addressing density and housing type. Following is a discussion of how the standard Safe Harbor option applies to the Study:
-�������:�������������#��!��/��)��&���;-� �..898�(988(8�;4<�;/<<The “standard” density Safe Harbor requires communities within Coburg’s population class (2,500-5,000 planned population) to meet a standardized housing mix for its buildable lands. This mix is 60 percent Low Density Residential (LDR), 20 percent Medium Density Residential (MDR) and 20 percent High Density Residential (HDR) (a 60/20/20 mix). In order to meet the Safe Harbor standards, this mix must be provided along with some portion of zoning allowing at least 8 units per acre, an overall average of at least 6 units per acre and a minimum of 4 units per acre (all applied to buildable lands only). Looking forward using the Housing Needs Model, staff generated assumptions that resulted in a housing mix for buildable land of 60/21/19, which is slightly different than the 60/20/20 mix standard required by Safe Harbor option 1. Although the mix does not hit the Safe Harbor standard, Study sufficient evidence in the model and in the application of Goal 10 and Goal 14 principles exist to support the mix. ��
Goal 14 Summary The Housing Needs Model uses the inputs introduced above to be collectively considered to estimate housing needs. Goal 14 requires a discussion of efficiency in providing for the housing needs of the community. The Safe Harbor Safe Harbors provided by the State were determined, by the TAC, Planning Commission and City Council not to be well-suited for Coburg. As a result, the Study Staff took this direction and applied the alternative State requirements identified by Goals 10 and 14 and developed an independent approach to meeting Goal 14 efficiency standards.
����������3��Housing mix is a measure of the proportions of housing at specified density ranges. The City has determined to pursue a housing mix for buildable lands of 60 percent Low Density (4-6
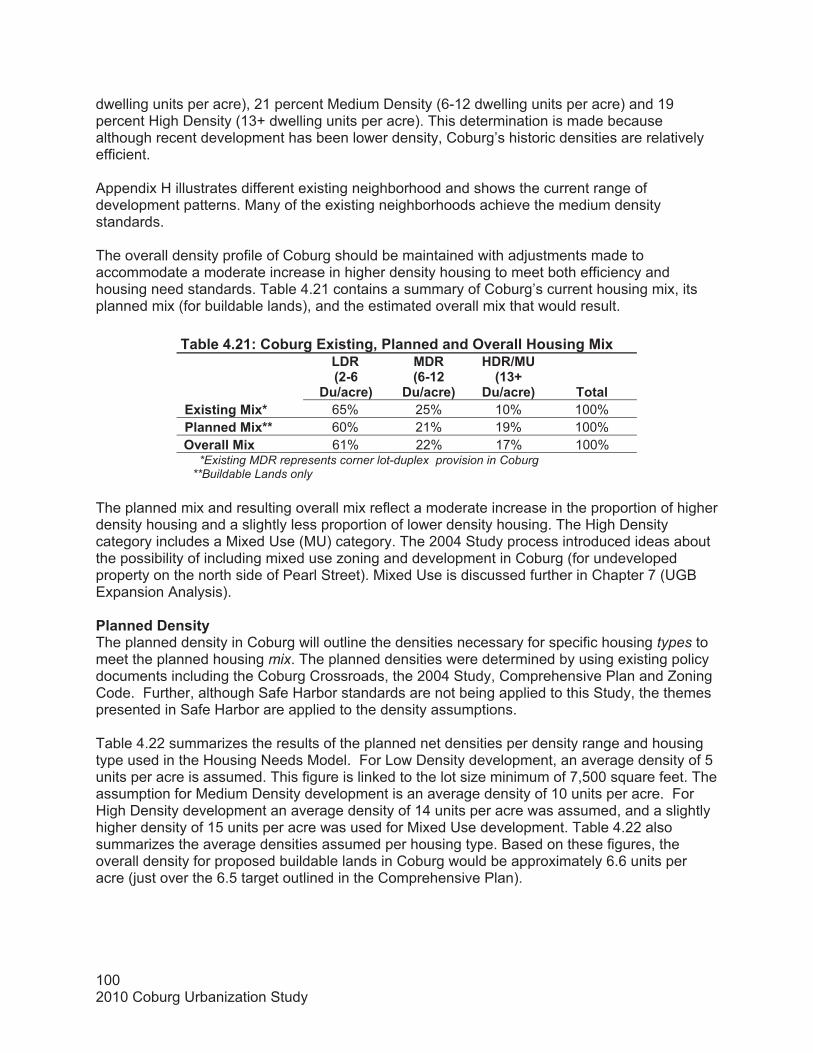
1002010 Coburg Urbanization Study
dwelling units per acre), 21 percent Medium Density (6-12 dwelling units per acre) and 19 percent High Density (13+ dwelling units per acre). This determination is made because although recent development has been lower density, Coburg’s historic densities are relatively efficient.
Appendix H illustrates different existing neighborhood and shows the current range of development patterns. Many of the existing neighborhoods achieve the medium density standards.
The overall density profile of Coburg should be maintained with adjustments made to accommodate a moderate increase in higher density housing to meet both efficiency and housing need standards. Table 4.21 contains a summary of Coburg’s current housing mix, its planned mix (for buildable lands), and the estimated overall mix that would result. ������������The planned mix and resulting overall mix reflect a moderate increase in the proportion of higher density housing and a slightly less proportion of lower density housing. The High Density category includes a Mixed Use (MU) category. The 2004 Study process introduced ideas about the possibility of including mixed use zoning and development in Coburg (for undeveloped property on the north side of Pearl Street). Mixed Use is discussed further in Chapter 7 (UGB Expansion Analysis).���������0��#��!�The planned density in Coburg will outline the densities necessary for specific housing types to meet the planned housing mix. The planned densities were determined by using existing policy documents including the Coburg Crossroads, the 2004 Study, Comprehensive Plan and Zoning Code. Further, although Safe Harbor standards are not being applied to this Study, the themes presented in Safe Harbor are applied to the density assumptions.
Table 4.22 summarizes the results of the planned net densities per density range and housing type used in the Housing Needs Model. For Low Density development, an average density of 5 units per acre is assumed. This figure is linked to the lot size minimum of 7,500 square feet. The assumption for Medium Density development is an average density of 10 units per acre. For High Density development an average density of 14 units per acre was assumed, and a slightly higher density of 15 units per acre was used for Mixed Use development. Table 4.22 also summarizes the average densities assumed per housing type. Based on these figures, the overall density for proposed buildable lands in Coburg would be approximately 6.6 units per acre (just over the 6.5 target outlined in the Comprehensive Plan).
��&���(���:���&��*��3�#���*7�������������-=������)��#��*���3�'0 ��������;�9.�
0�A����<�
�0 ��������;.9���0�A����<�
)0 A������;�$B�
0�A����<� �������3�#���*���3C� 65% 25% 10% 100% ����������3CC� 60% 21% 19% 100% -=��������3�� 61% 22% 17% 100%
*Existing MDR represents corner lot-duplex provision in Coburg **Buildable Lands only
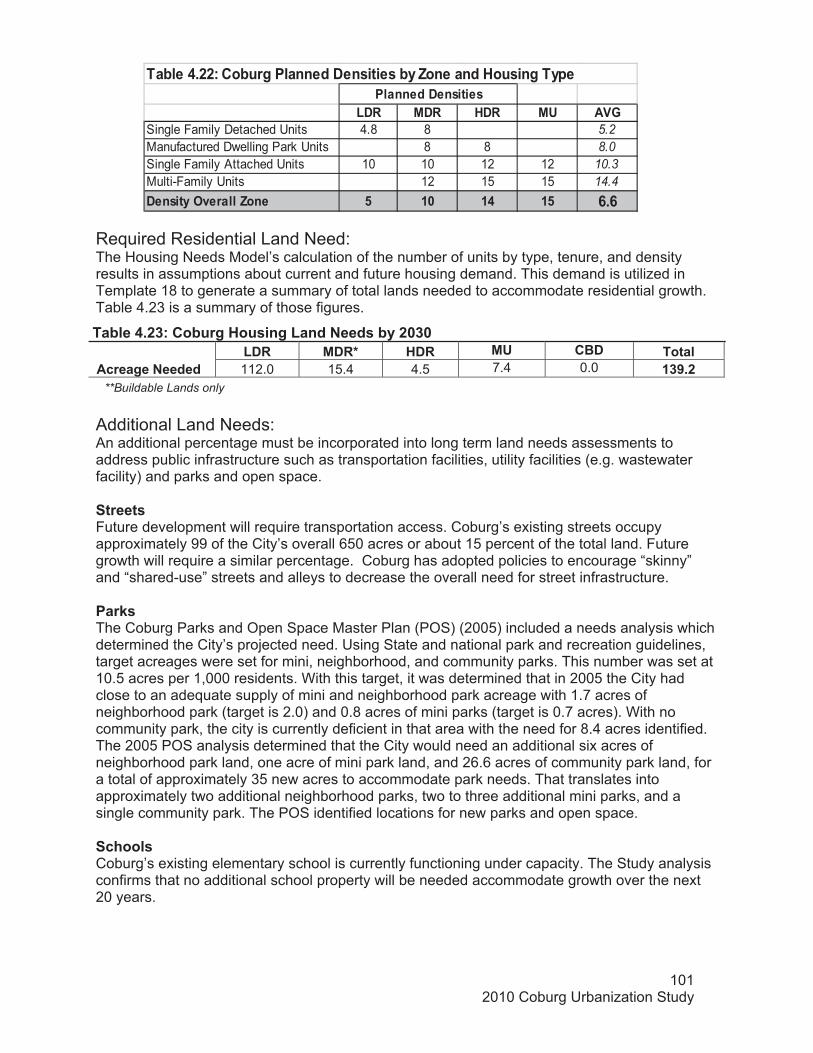
1012010 Coburg Urbanization Study
'0 �0 )0 �� �2Single Family Detached Units 4.8 8 5.2Manufactured Dwelling Park Units 8 8 8.0Single Family Attached Units 10 10 12 12 10.3Multi-Family Units 12 15 15 14.40��#��!�-=������@���� , �8 �( �, .�.
��������0��#����#��&���(���:���&��*���������0��#����#�&!�@��������)��#��*��!��
Required Residential Land Need:The Housing Needs Model’s calculation of the number of units by type, tenure, and density results in assumptions about current and future housing demand. This demand is utilized in Template 18 to generate a summary of total lands needed to accommodate residential growth. Table 4.23 is a summary of those figures.
Additional Land Needs:An additional percentage must be incorporated into long term land needs assessments to address public infrastructure such as transportation facilities, utility facilities (e.g. wastewater facility) and parks and open space.
�����#���Future development will require transportation access. Coburg’s existing streets occupy approximately 99 of the City’s overall 650 acres or about 15 percent of the total land. Future growth will require a similar percentage. Coburg has adopted policies to encourage “skinny” and “shared-use” streets and alleys to decrease the overall need for street infrastructure. ����I#�The Coburg Parks and Open Space Master Plan (POS) (2005) included a needs analysis which determined the City’s projected need. Using State and national park and recreation guidelines, target acreages were set for mini, neighborhood, and community parks. This number was set at 10.5 acres per 1,000 residents. With this target, it was determined that in 2005 the City had close to an adequate supply of mini and neighborhood park acreage with 1.7 acres of neighborhood park (target is 2.0) and 0.8 acres of mini parks (target is 0.7 acres). With no community park, the city is currently deficient in that area with the need for 8.4 acres identified. The 2005 POS analysis determined that the City would need an additional six acres of neighborhood park land, one acre of mini park land, and 26.6 acres of community park land, for a total of approximately 35 new acres to accommodate park needs. That translates into approximately two additional neighborhood parks, two to three additional mini parks, and a single community park. The POS identified locations for new parks and open space.
�����#��Coburg’s existing elementary school is currently functioning under capacity. The Study analysis confirms that no additional school property will be needed accommodate growth over the next 20 years.
��&���(��$:���&��*�)��#��*�'����+���#�&!��8$8�'0 �������� �0 C������� )0 ���� ��� �%0� ������
�����*��+������ 112.0 15.4 4.5 7.4 0.0 �$>���**Buildable Lands only

1022010 Coburg Urbanization Study
�3�#���*�����#
0� ����;�8�89�8$8<
+�?�+����������#
��������#� 9.3 9.3 0��������#� 99 113.5 14.5������I# 28 63 35������ (>�,
��&���(��(����&��������� ����&����"��������#�'����+���#�;�8�89�8$8<
Table 4.24 provides a summary of the land needs required to meet the public infrastructure need.
ConclusionThe City of Coburg’s anticipated housing dynamics which consider population, demographics, and the economic factors, indicate growing housing needs within the planning period. The sum of residential and public facilities land demand is approximately 189 acres (139 + 50). These “Land Demand” conclusions will be paired with the “Land Supply” conclusions from Chapter 3 (Buildable Lands Inventory), to determine housing needs. Chapter 6 (Comparison of Land Supply and Demand) provides this summary of additional acres needed to meet housing demand in Coburg over the 20-year planning period.

INTER
STATE
5
FUN
KE
CO
BU
RG
PEARL
STA
LLIN
G
RO
BER
TS
DELANEY
MIL
LER
MILL
ABBY
WILLAM
ETTE
CO
LEM
AN
VAN DUYN
CO
BU
RG
BO
TTO
M L
OO
P
DIXON
CO
BU
RG
IND
US
TRIA
L
DIAM
ON
D
MAPLE
HA
RR
ISO
N
VINTAGE
PAIUTE
THOMAS
STU
AR
T
SH
AN
E
CHRISTIAN
MACY ST
RU
STI
C
BRUCELOCUST
CO
BUR
G
DIXON
VAN DUYN
56
1
3
2
10
Preffered Growth Scenario
Land Use
Exisitng Rural Residential
Exisitng School
New Residential
New School
Open Space
Parks
Right of Way
Existing UGB
Correspond. 2009 Study Areas
Map 8: Coburg CrossroadsPreffered Growth Scenario ±The information on this map was derived from digital
databases on Lane Council of Governments’ regionalgeographic information system. Care was taken in thecreation of this map, but it is provided "as is".LCOG cannot accept any responsibility for errors,omissions, or positional accuracy in the digital dataor the underlying records. Current designations (e.g.,zoning) for specific parcels should be confirmed withthe appropriate jurisdictions. There are no warranties,expressed or implied, accompanying this product. How-ever, notification of any errors will be appreciated.
0 1,200 2,400 3,600 4,800 6,000 Feet
Coburg Urbanization Study
1 inch = 1,400 feet
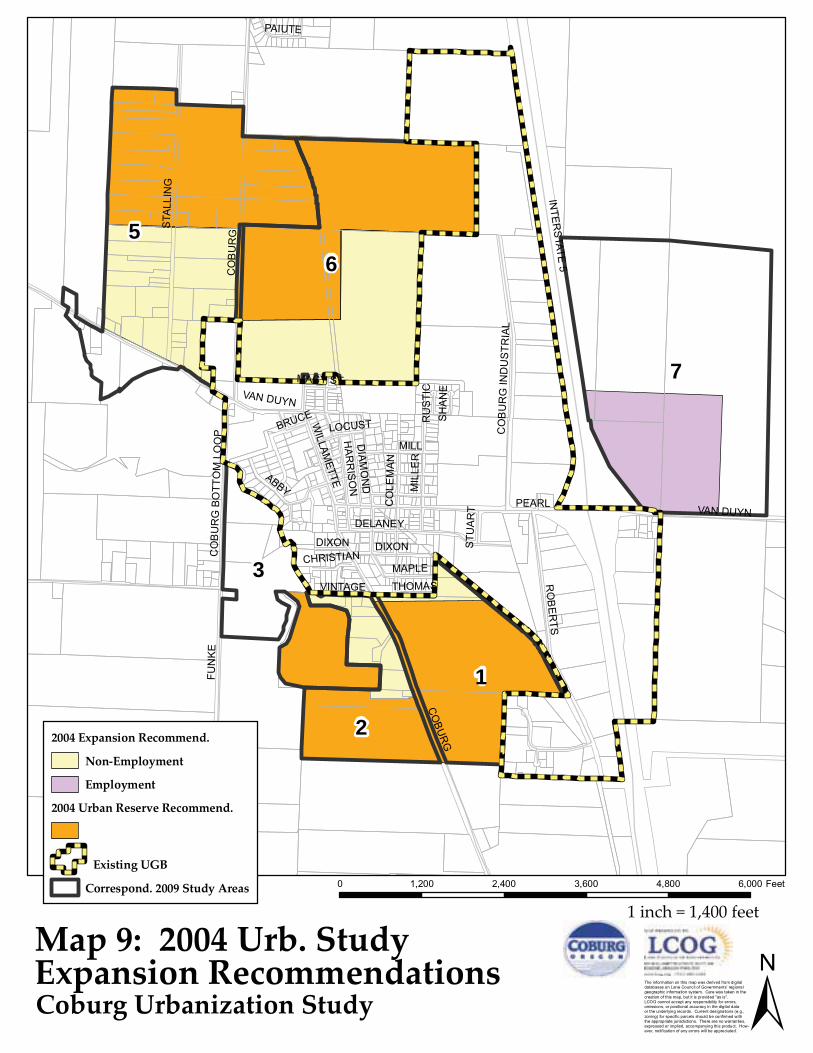
INTER
STATE
5
FUN
KE
CO
BU
RG
PEARL
STA
LLIN
G
RO
BER
TS
VAN DUYNDELANEY
MIL
LER
MILL
ABBYW
ILLAMETTE
CO
LEM
AN
DIXONCO
BU
RG
BO
TTO
M L
OO
P CO
BU
RG
IND
US
TRIA
L
DIAM
ON
D
MAPLE
HA
RR
ISO
N
PAIUTE
VINTAGE THOMAS
STU
AR
T
SH
AN
E
CHRISTIAN
MACY ST
RU
STI
CBRUCE
LOCUST
CO
BUR
G
DIXON
VAN DUYN
7
56
1
3
22004 Expansion Recommend.
Non-Employment
Employment
2004 Urban Reserve Recommend.
Existing UGB
Correspond. 2009 Study Areas
Map 9: 2004 Urb. Study Expansion Recommendations ±The information on this map was derived from digital
databases on Lane Council of Governments’ regionalgeographic information system. Care was taken in thecreation of this map, but it is provided "as is".LCOG cannot accept any responsibility for errors,omissions, or positional accuracy in the digital dataor the underlying records. Current designations (e.g.,zoning) for specific parcels should be confirmed withthe appropriate jurisdictions. There are no warranties,expressed or implied, accompanying this product. How-ever, notification of any errors will be appreciated.
0 1,200 2,400 3,600 4,800 6,000 Feet
Coburg Urbanization Study
1 inch = 1,400 feet
1052010 Coburg Urbanization Study
�)���� �,����-+-����-��- ��+������+�'���This chapter is designed to meet the requirements of Goal 9 and Oregon Administrative Rule (OAR) 660-009 which implements Goal 9. Goal 9 calls for “an analysis of the community's economic patterns, potentialities, strengths, and deficiencies as they relate to state and national trends” and states that “a principal determinant in planning for major industrial and commercial developments should be the comparative advantage of the region within which the developments would be located.” OAR 660-009-0015 (4) requires an assessment of community economic development potential that estimates the types and amounts of industrial and commercial development likely to occur in the planning area. This assessment must be based on the following components:
� A review of national, state, and local economic trends to identify the categories of industrial and commercial uses that can reasonably be expected to locate in the planning area;
� Site requirements for industrial and commercial uses that might expand or locate in the planning area;
� A survey of the expansion plans of major employers; and � An inventory of buildable land and availability of public services.
The assessment of community economic development potential must also consider the planning area’s economic advantages and disadvantages for attracting new or expanded development. Relevant economic advantages and disadvantages include:
� Location relative to markets; � Availability of key transportation facilities and other public services; � Labor market factors; � Materials and energy availability and cost; � Necessary support services; and � Educational and training programs.
OAR 660-009-0025 requires most plans to address the long-term supply of land (20 years), as well as the short term supply (5 years). Recent changes to the OAR’s addressing Economic Analysis have identified that only cities within a Metropolitan Planning Organization (MPO) greater than 2,500 population are subject to short-term supply analysis requirements. Coburg has a population that is under 2,500, therefore the short-term analysis is not required. However, the City determined that the analysis was valuable and pursued elements of it. This Study contains an abbreviated analysis of short-term (5 years) supply and demand.
Economic Opportunities Analysis within the Overall UGB Expansion ProcessThis portion of the Study addresses the demand for commercial and industrial lands within Coburg’s UGB and provides a summary of Coburg’s economic advantages and challenges as they relate to its economic opportunities over the planning period. The Economic Opportunities Analysis (EOA) estimates the need for commercial and industrial land based on historic and current trends related to employment projections and local economic potential. The analysis will identify lot size and characteristics of employment land needs, and address other requirements of Goal 9.:
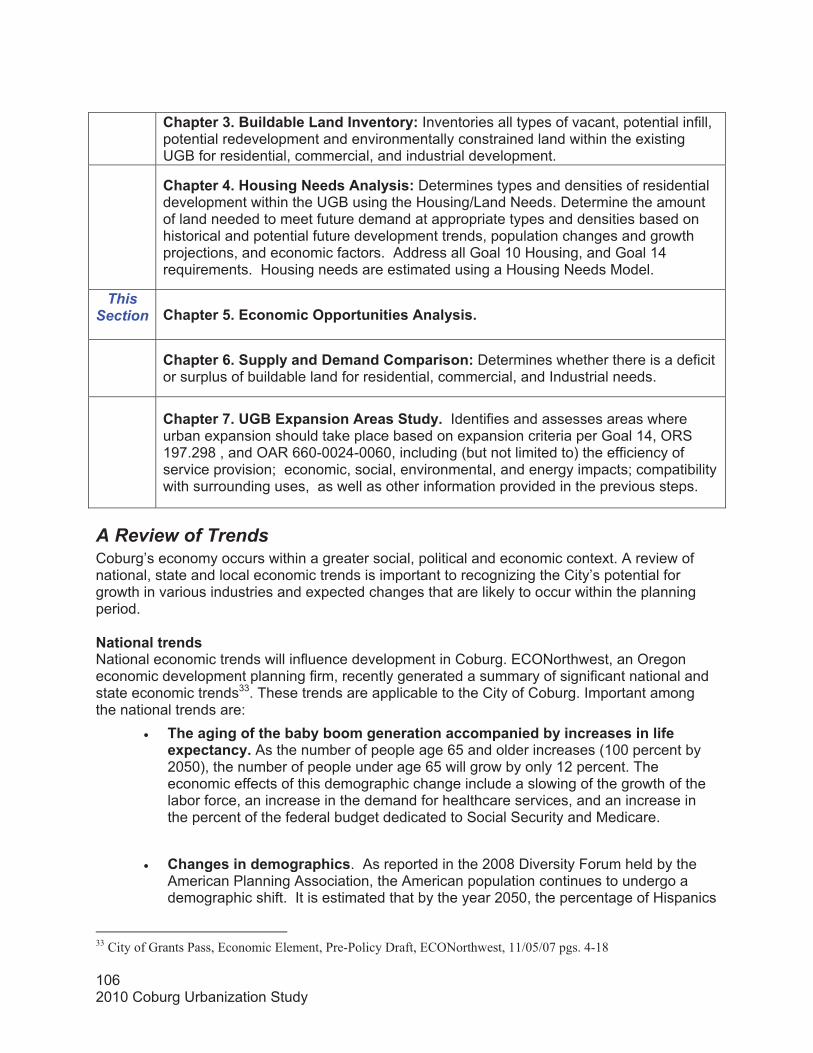
1062010 Coburg Urbanization Study
��������$��%�����&���'������=�����!:�Inventories all types of vacant, potential infill, potential redevelopment and environmentally constrained land within the existing UGB for residential, commercial, and industrial development.
�
��������(��)��#��*�+���#�����!#�#:�Determines types and densities of residential development within the UGB using the Housing/Land Needs. Determine the amount of land needed to meet future demand at appropriate types and densities based on historical and potential future development trends, population changes and growth projections, and economic factors. Address all Goal 10 Housing, and Goal 14 requirements. Housing needs are estimated using a Housing Needs Model.�
ThisSection� ��������,������� ���-�����������#�����!#�#�
��������.������!�����0� ������ ����#��: Determines whether there is a deficit or surplus of buildable land for residential, commercial, and Industrial needs.�
��������1���2%��3���#��������#����!���Identifies and assesses areas where urban expansion should take place based on expansion criteria per Goal 14, ORS 197.298 , and OAR 660-0024-0060, including (but not limited to) the efficiency of service provision; economic, social, environmental, and energy impacts; compatibility with surrounding uses, as well as other information provided in the previous steps. �
A Review of Trends Coburg’s economy occurs within a greater social, political and economic context. A review of national, state and local economic trends is important to recognizing the City’s potential for growth in various industries and expected changes that are likely to occur within the planning period.
+�������������#���National economic trends will influence development in Coburg. ECONorthwest, an Oregon economic development planning firm, recently generated a summary of significant national and state economic trends33. These trends are applicable to the City of Coburg. Important among the national trends are:
� �����*��*��/�����&�&!�&�� �*�������������� �������&!�������#�#������/���3�������!��As the number of people age 65 and older increases (100 percent by 2050), the number of people under age 65 will grow by only 12 percent. The economic effects of this demographic change include a slowing of the growth of the labor force, an increase in the demand for healthcare services, and an increase in the percent of the federal budget dedicated to Social Security and Medicare.
� ����*�#������ �*������#. As reported in the 2008 Diversity Forum held by the American Planning Association, the American population continues to undergo a demographic shift. It is estimated that by the year 2050, the percentage of Hispanics
33 City of Grants Pass, Economic Element, Pre-Policy Draft, ECONorthwest, 11/05/07 pgs. 4-18
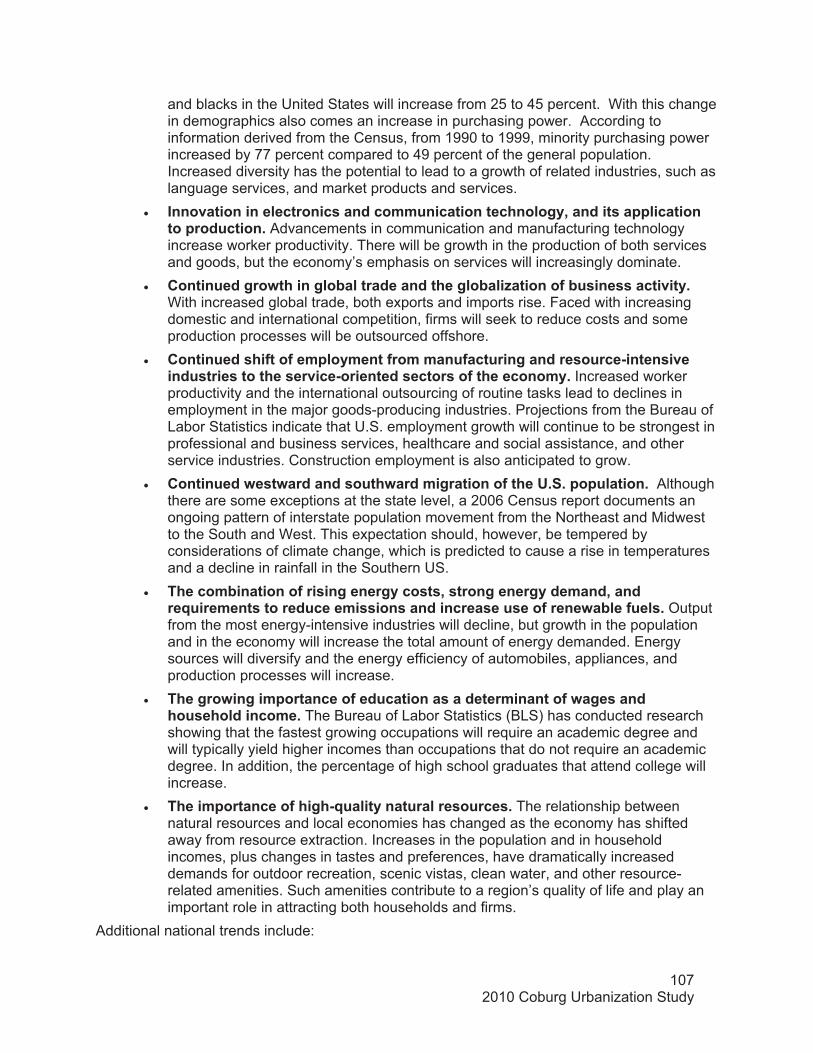
1072010 Coburg Urbanization Study
and blacks in the United States will increase from 25 to 45 percent. With this change in demographics also comes an increase in purchasing power. According to information derived from the Census, from 1990 to 1999, minority purchasing power increased by 77 percent compared to 49 percent of the general population. Increased diversity has the potential to lead to a growth of related industries, such as language services, and market products and services.
� ����=�������������������#������� ������������������*!7�������#����������������������������Advancements in communication and manufacturing technology increase worker productivity. There will be growth in the production of both services and goods, but the economy’s emphasis on services will increasingly dominate.
� ����������*��?������*��&�����������������*��&���J�������/�&�#���##�����=��!��With increased global trade, both exports and imports rise. Faced with increasing domestic and international competition, firms will seek to reduce costs and some production processes will be outsourced offshore.
� ����������#��/���/�� ���! ����/�� � ���/�������*�������#�����9�����#�=������#����#��������#��=���9���������#�����#��/���������� !��Increased worker productivity and the international outsourcing of routine tasks lead to declines in employment in the major goods-producing industries. Projections from the Bureau of Labor Statistics indicate that U.S. employment growth will continue to be strongest in professional and business services, healthcare and social assistance, and other service industries. Construction employment is also anticipated to grow.
� ����������?�#�?��������#����?���� �*��������/����������������������Althoughthere are some exceptions at the state level, a 2006 Census report documents an ongoing pattern of interstate population movement from the Northeast and Midwest to the South and West. This expectation should, however, be tempered by considerations of climate change, which is predicted to cause a rise in temperatures and a decline in rainfall in the Southern US.
� ������ &���������/���#��*�����*!���#�#7�#����*�����*!��� ���7�������K���� ���#������������ �##���#�����������#���#���/�����?�&���/���#��Outputfrom the most energy-intensive industries will decline, but growth in the population and in the economy will increase the total amount of energy demanded. Energy sources will diversify and the energy efficiency of automobiles, appliances, and production processes will increase.
� ����*��?��*�� ����������/������������#�������� �������/�?�*�#��������#���������� ���The Bureau of Labor Statistics (BLS) has conducted research showing that the fastest growing occupations will require an academic degree and will typically yield higher incomes than occupations that do not require an academic degree. In addition, the percentage of high school graduates that attend college will increase.
� ����� ����������/���*�9K�����!�����������#�����#��The relationship between natural resources and local economies has changed as the economy has shifted away from resource extraction. Increases in the population and in household incomes, plus changes in tastes and preferences, have dramatically increased demands for outdoor recreation, scenic vistas, clean water, and other resource-related amenities. Such amenities contribute to a region’s quality of life and play an important role in attracting both households and firms.
Additional national trends include:
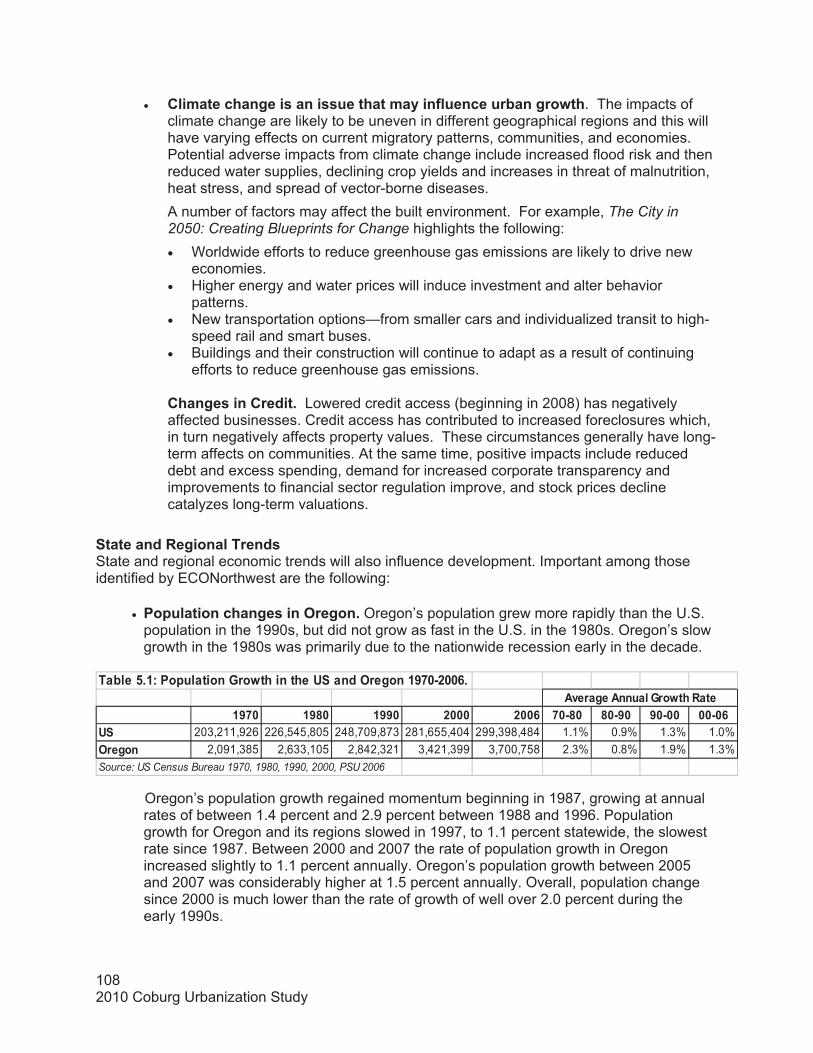
1082010 Coburg Urbanization Study
��&���,��:������������2��?����������������-��*����>189�88.��
�>18 �>48 �>>8 �888 �88. 18948 489>8 >8988 8898.� 203,211,926 226,545,805 248,709,873 281,655,404 299,398,484 1.1% 0.9% 1.3% 1.0%-��*�� 2,091,385 2,633,105 2,842,321 3,421,399 3,700,758 2.3% 0.8% 1.9% 1.3%Source: US Census Bureau 1970, 1980, 1990, 2000, PSU 2006
�=���*���������2��?��� ���
� ��� ��������*���#�����##�������� �!���/���������&���*��?��. The impacts of climate change are likely to be uneven in different geographical regions and this will have varying effects on current migratory patterns, communities, and economies. Potential adverse impacts from climate change include increased flood risk and then reduced water supplies, declining crop yields and increases in threat of malnutrition, heat stress, and spread of vector-borne diseases. A number of factors may affect the built environment. For example, The City in 2050: Creating Blueprints for Change highlights the following: � Worldwide efforts to reduce greenhouse gas emissions are likely to drive new
economies.� Higher energy and water prices will induce investment and alter behavior
patterns.� New transportation options—from smaller cars and individualized transit to high-
speed rail and smart buses. � Buildings and their construction will continue to adapt as a result of continuing
efforts to reduce greenhouse gas emissions.
����*�#�������������Lowered credit access (beginning in 2008) has negatively affected businesses. Credit access has contributed to increased foreclosures which, in turn negatively affects property values. These circumstances generally have long-term affects on communities. At the same time, positive impacts include reduced debt and excess spending, demand for increased corporate transparency and improvements to financial sector regulation improve, and stock prices decline catalyzes long-term valuations.
���������� �*�����������#��State and regional economic trends will also influence development. Important among those identified by ECONorthwest are the following:
� ���������������*�#����-��*����Oregon’s population grew more rapidly than the U.S. population in the 1990s, but did not grow as fast in the U.S. in the 1980s. Oregon’s slow growth in the 1980s was primarily due to the nationwide recession early in the decade. �
Oregon’s population growth regained momentum beginning in 1987, growing at annual rates of between 1.4 percent and 2.9 percent between 1988 and 1996. Population growth for Oregon and its regions slowed in 1997, to 1.1 percent statewide, the slowest rate since 1987. Between 2000 and 2007 the rate of population growth in Oregon increased slightly to 1.1 percent annually. Oregon’s population growth between 2005 and 2007 was considerably higher at 1.5 percent annually. Overall, population change since 2000 is much lower than the rate of growth of well over 2.0 percent during the early 1990s.

1092010 Coburg Urbanization Study
As a result of recent economic downturn, Oregon’s population is expected to grow at a slower pace in the near future. Based on the current forecast, Oregon’s population will reach 4.13 million in the year 2015 with an annual rate of growth of 1.2 percent between 2007 and 2015.34 �
� ������������9 �*�������/�� �������#����#��Migration is the largest component of population growth in Oregon. Although migration slowed in the late 1990’s, the rate of migration increased between 2000 and 2004, averaging about 22,800 people moving to Oregon annually. The reasons most often cited for the slowing of migration after 1996 are the recovery of the California economy, the combination of a high cost of living (especially housing) and low wages in Oregon, and a perceived decline in the quality of Oregon’s schools. According to a U.S. Census study, Oregon had net interstate in-migration (more people moved to Oregon than moved from Oregon) during the period 1990-2004.
The 1999 Oregon In-migration Study found that migrants to Oregon generally have the same characteristics as existing residents. However, include - on average - Oregon’s in-migration has been younger, more educated, and more likely to hold professional or managerial jobs, compared to the existing population. The race and ethnicity of in-migrants generally mirrors Oregon’s established pattern, with one exception: Hispanics make up more than seven percent of in-migrants but only three percent of the State’s population. The number-one reason cited by Oregon in-migrants was family or friends, followed by quality of life and employment.
� 0�#���&�������/����������������� ���! ��������##����������Nearly 70 percent of Oregon’s population lives in the Willamette Valley. With higher growth rates than the rest of the state, the Willamette Valley and Central Oregon have each captured a higher percentage of the state’s population throughout the period 1970-2005. After the Willamette Valley, Southern Oregon is the second-largest population center in the state. �
Employment growth generally follows the same trend as population growth. However, employment growth varies between regions more quickly as people tend to be willing to change jobs before moving their residence.. Total employment increased in each of the state’s regions over the period 1970-2004, but over 70 percent of Oregon’s employment growth in that period occurred in the Willamette Valley.
� ��*������*��/���&��� ��I����#�����#�����/��������*�?��I��#��As baby-boomers reach retirement age over the next two decades, the State may have a scarcity of qualified workers. The sectors with the most employment and the largest share of employees 55 years or older include: Education Services; Real Estate; Transportation and Warehousing; Health Care and Social Assistance; Public Administration; and Agriculture, Forestry, Fishing, and Hunting. The State expects little or no growth in manufacturing employment over the next decade but expects that retirements will create demand for employees in Manufacturing. �
� ��/��/�� �����������#�����9&�#��������*�����������#����#��The composition of Oregon's employment has changed since 1970. Employment growth has been led by the Services sector. The share of Oregon’s total employment in this sector increased from its 1970s average of 19 percent to 30 percent in 2000. Slow growth in Manufacturing caused its share of total employment to decline from its 1970s average of 18 percent to 12 percent in 2000.
34 Quarterly Economic and Review Forecast, November 19, 2008, pg. 4
1102010 Coburg Urbanization Study
During the same period, Oregon started to transition away from reliance on traditional resource-extraction industries. A significant indicator of this transition is the shift within Oregon’s manufacturing sector, with a decline in the level of employment in the Lumber & Wood Products industry and concurrent growth of employment in high-technology manufacturing industries (Industrial Machinery, Electronic Equipment, and Instruments). The peak of Oregon’s employment in the Lumber & Wood Products industry was in 1979. From 1979 to 2000, employment in the Lumber and Wood Products industry declined 40 percent. Over the same time period, employment in high-tech industries increased by 60 percent. The high-tech industry will keep changing, but there are often common needs. For example, the same things that attracted computer chip manufacturers to Oregon in the 1990s are helping attract solar panel manufacturers here now (e.g. good workforce, abundant, affordable and reliable supplies of water and electricity, good transportation connections, favorable tax incentives, etc).
� �������������I��/���=��#��!�������������� !���While the transition from Lumber and Wood Products manufacturing to High-Tech Manufacturing has increased the diversity of employment, it has not significantly improved Oregon's diversity relative to the national economy. Oregon ranked 35th in diversity (1st = most diversified) based on Gross State Product data for 1963–1986, and 32nd based on data for the 1977–1996 period. 2003 data ranks Oregon 33rd. These rankings suggest that Oregon is still highly dependent on a limited number of industries. Low economic diversity increases the risk of economic volatility as measured by changes in output or employment. �
The changing composition of employment has not evenly affected all regions. Growth in High-tTech and Services has been concentrated in urban areas of the Willamette Valley and Southern Oregon, particularly in Washington, Benton, and Josephine Counties. The brunt of the decline in Lumber & Wood Products employment was felt in rural Oregon, where these jobs represented a larger share of total employment and an even larger share of high-paying jobs than in urban areas.
According to the November 2008 Oregon Quarterly and Economic Review Forecast (QERF) produced by the Oregon Office of Economic Analysis (OEA), the following additional key factors will fuel the state’s long-term growth:
� �3�����*��?���������*���� ����!������#: Global economic expansion will increase demand for Oregon commodities, both finished and capital goods. Oregon is well positioned for trade with countries in the Pacific Rim. High commodity prices will benefit agricultural and timber producers in the state.
� ����������#����*�������� �#���� ��I��#:�Continued economic growth in California and other major domestic markets will fuel demand for Oregon products.
� %�#���##���#�#���=����*�#: The Oregon economy will benefit from a comprehensive energy plan. Efforts which have long been in place for electricity planning should extend to all energy sources. If the plan can assure businesses of an abundant, reliable, and relatively inexpensive supply of electricity and other sources of energy, the state (and the Pacific Northwest) will continue to have a relative energy cost advantage over other regions. Oregon has other business cost advantages, such as lower workers’ compensation rates and multi-modal transportation options compared to other states. Equally important is an educated work force that contributes to productivity.
� ��=���� �������##��#:�Salmon protection measures, the Portland Super Fund, and other issues could change the economic landscape.
1112010 Coburg Urbanization Study
� �//����&������#��*:�For most of the late 1990s and the early part of this decade, California, Washington, and the nation as a whole have experienced more rapidly rising housing costs than Oregon. The housing boom once again raised California prices above Oregon’s house prices, and Washington kept pace with Oregon. This relative advantage in housing cost is narrowing as prices in California fall faster than in Oregon, with Washington once again keeping pace with Oregon. If housing costs rise faster in Oregon than in the rest of the nation, companies will face increased difficulties recruiting workers. If Oregon can maintain a relative cost advantage in housing, this factor will be attractive for firm location.
� %����������*!�������������������*!: These sectors are seen by many as the next growth industries. Portland and the State have launched funding plans to promote the biotechnology sector. The platform for the Oregon Business Plan includes nanotechnology as an emerging field for Oregon. It is too early to tell if these are indeed the next growth industries and what returns they may bring.
� ���?�&�������*!������#�����&�����=���� ���:�Centered in the Portland area, this movement in sustainable building practices is spreading throughout the U.S. Uncertainty surrounds the number of new jobs associated with this movement, but it may allow gains in market shares for construction and consulting firms in Oregon. Renewable energy such as solar and wind mills are increasing looking to Oregon as a place to locate.
� E�����!��/���/�:�Oregon will continue to attract financially secure retirees. Companies that place a high premium on quality of life will also want to locate in Oregon.
Additional Statewide trends include the following:
� � ���#�#����%�#���##����#���#��#��������� �����=���� ����#�����*!. In 2003, the Oregon Business Plan placed the development of traded-sector industry clusters at the center of its economic development strategy. Traded-sector clusters are those that sell their products and services outside the state, bringing in fresh dollars that directly sustain high-paying jobs while spurring growth and good jobs among local suppliers, retailers, and service businesses. The State has been involved in a number of initiatives that are aimed at learning about cluster needs so that the community at large can support clusters through a wide range of strategies, including higher education research, education and workforce development, transportation and logistics, recruiting key suppliers, and branding and marketing.
� � ����#���������������#������#���#�������� ��������*�. In the fall of 2008, the University of Oregon’s Climate Leadership Initiative and the National Center for Conservation Science & Policy, in partnership with the MAPSS Team at the U.S. Forest Service Pacific Northwest Research Station, initiated a project to assess the likely consequences of climate change for the Upper Willamette River Basin. In the spring of 2009, the project team released a report, Preparing for Climate Change in the Upper Willamette River Basin of Western Oregon, which seeks to raise awareness about the likely consequences of climate change to natural and built systems in the Upper Willamette Basin, as well as identify actions that can be taken to better prepare aquatic, terrestrial, human, built, and economic systems for climate change. Some of the key findings of this study, related to economic opportunities and risks, are:
o Current supplies of power and water may become increasingly less stable. o Road, rail, and air transportation may face disruption due to increased storm
events, flooding, and wildfires.
1122010 Coburg Urbanization Study
o Rising fuel costs due to potential greenhouse gas mitigation measures, and higher power costs due to reduced hydroelectric supply will likely produce increased street for many facets of the manufacturing, retail, and service economy. In addition, transportation disruptions due to climate related extreme weather events along with more restrictive use of water are likely to affect these sectors.
o Hotter summer temperatures, increased allergens, and reduced air quality may adversely impact the health of the local workforce.
o The optimal tourist season may shift as rising temperatures make summers less attractive. In the summer months, these changes may affect the entire service sector and their suppliers, including motels, hotels, and restaurants.
o As noted elsewhere in this study, sales of motor coaches could be impacted by rising gasoline prices and greater awareness of vehicle emissions that contribute to climate change. However, innovations that reduce emissions could transform the industry due to the demand that is likely to exist if retirees regain recently lost financial security.
o Bicycle manufacturing may increase as incentives are developed for alternative forms of transportation to automobiles.
o Increased crop productivity may result in the short term, with a longer associated growing season increasing crop harvests. Growers may need to shift to different, more diverse crops, and new varieties and types of crops may need to be developed and planted.
o Forestry is likely to be under increasing stress. ����� ���-�����I�/���-��*���Oregon’s economy grew slower than the U.S. economy from 1998 through 2003, but outpaced the nation in growth between 2004 and 2007. According to the November, 2008 Oregon Quarterly and Economic Review Forecast, between 2008 and 2015, employment growth in Oregon is forecasted to be slower than in the mid-1990s. It also suggests that the U.S. economy is expected to have even slower growth than that expected in Oregon. Economic forecaster Global Insight projects Oregon’s Gross State Product to have the second highest growth rate in the nation over the coming years.35
The Oregon Department of Employment’s latest forecast for employment in the 2006–2016 period shows that Education and Health Services and the Trade, Transportation and Utilities sectors are expected to lead employment growth in Oregon—together these sectors are expected to add around 101,000 jobs or 42 percent of total employment growth in Oregon over the ten-year period. Table 5.2 shows the sectors that are expected to have the largest amounts of employment growth and largest percentage employment growth in Oregon during the 2006–2016 period, from the Oregon Employment Department forecast. Three of the sectors with the largest employment growth are Education and Health Services, Trade, Transportation and Utilities, and Professional and Business Services. Each of these sectors are also expected to have some of the largest percentage increase in employment in Oregon over the 2006–2016 period, along with two additional sectors: Leisure and Hospitality, Construction and Other services. Substantial employment growth is also expected in Government, and Manufacturing over the 2006–2016 period.
35 Quarterly Economic and Review Forecast, November 19, 2008, pg. 49-50
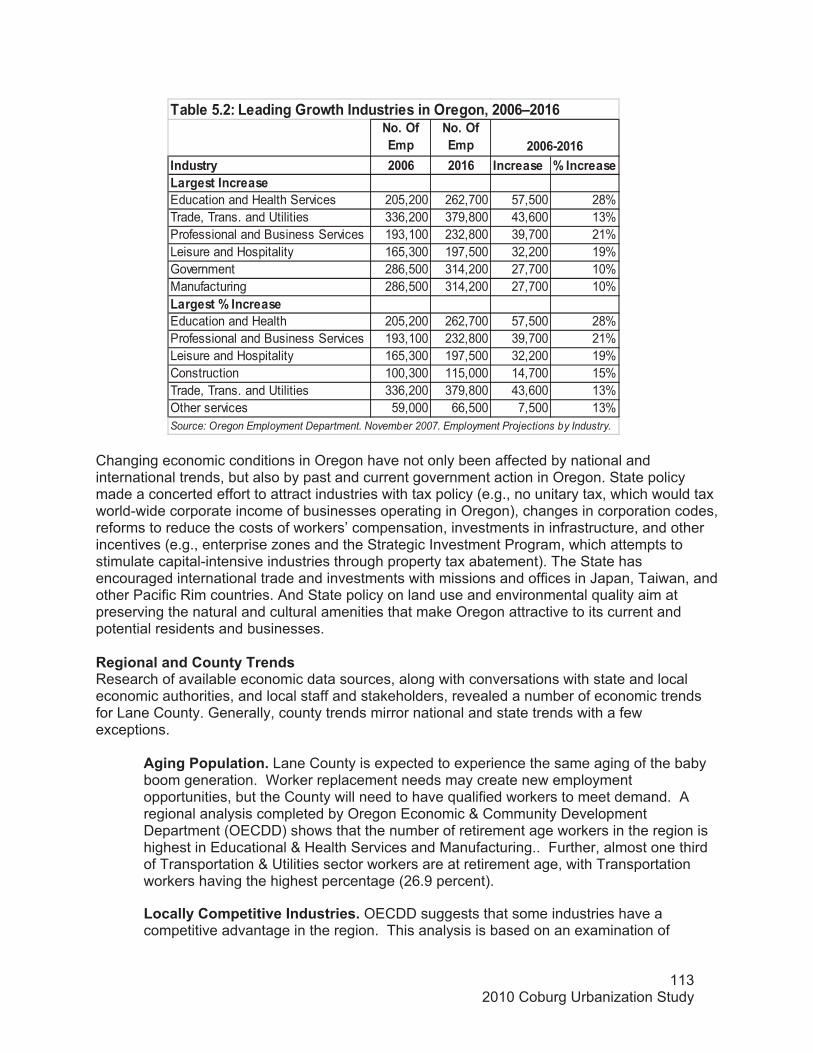
1132010 Coburg Urbanization Study
+���-/�� �
+���-/�� �
����#��!� �88. �8�. ������#� D�������#�'��*�#��������#�Education and Health Services 205,200 262,700 57,500 28%Trade, Trans. and Utilities 336,200 379,800 43,600 13%Professional and Business Services 193,100 232,800 39,700 21%Leisure and Hospitality 165,300 197,500 32,200 19%Government 286,500 314,200 27,700 10%Manufacturing 286,500 314,200 27,700 10%'��*�#��D�������#�Education and Health 205,200 262,700 57,500 28%Professional and Business Services 193,100 232,800 39,700 21%Leisure and Hospitality 165,300 197,500 32,200 19%Construction 100,300 115,000 14,700 15%Trade, Trans. and Utilities 336,200 379,800 43,600 13%Other services 59,000 66,500 7,500 13%
�88.9�8�.
��&���,��:�'�����*�2��?�������#����#����-��*��7��88.L�8�.
Source: Oregon Employment Department. November 2007. Employment Projections by Industry.
Changing economic conditions in Oregon have not only been affected by national and international trends, but also by past and current government action in Oregon. State policy made a concerted effort to attract industries with tax policy (e.g., no unitary tax, which would tax world-wide corporate income of businesses operating in Oregon), changes in corporation codes, reforms to reduce the costs of workers’ compensation, investments in infrastructure, and other incentives (e.g., enterprise zones and the Strategic Investment Program, which attempts to stimulate capital-intensive industries through property tax abatement). The State has encouraged international trade and investments with missions and offices in Japan, Taiwan, and other Pacific Rim countries. And State policy on land use and environmental quality aim at preserving the natural and cultural amenities that make Oregon attractive to its current and potential residents and businesses.�� �*���������������!������#�Research of available economic data sources, along with conversations with state and local economic authorities, and local staff and stakeholders, revealed a number of economic trends for Lane County. Generally, county trends mirror national and state trends with a few exceptions.
�*��*�������������Lane County is expected to experience the same aging of the baby boom generation. Worker replacement needs may create new employment opportunities, but the County will need to have qualified workers to meet demand. A regional analysis completed by Oregon Economic & Community Development Department (OECDD) shows that the number of retirement age workers in the region is highest in Educational & Health Services and Manufacturing.. Further, almost one third of Transportation & Utilities sector workers are at retirement age, with Transportation workers having the highest percentage (26.9 percent).
'�����!��� ������=������#����#� OECDD suggests that some industries have a competitive advantage in the region. This analysis is based on an examination of
1142010 Coburg Urbanization Study
employment concentrations, relative wage levels and differential growth rates within each region to identify industries that appear stronger in the region than elsewhere in the state. Of the competitive industries in the region, 15 are projected to grow faster than the regional average. Ambulatory Health Care Services, Nursing and Residential Care Facilities, and Internet Publishing and Broadcasting are expected to grow fastest. +���� ��������/�%�#���##� The workforce region composed of Benton, Lane, Lincoln and Linn Counties was a net importer of businesses, with the Service industry accounting for the largest share of net moves into the region. ��/��/�� �����/�������*������������*!� In line with national and state trends, Lane County is expected to continue experiencing a shift of employment from manufacturing and resource-intensive industries to the service-oriented sectors of the economy. This is reflected in regional employment projections. It is noted that the region will remain strongly poised for the wood products industry and over the next decade or so, the amount of second-growth timber available from private timberlands could lead to a mini-boom in this industry.����*�������2��?��� There will be an increase in Lane County in the demand for healthcare services. Health care services are projected to have the highest percentage of new workers (33 percent increase from 2006 to 2016) when compared to all the sectors in the County. This will be largely due to the health care needs of the aging population. Employment growth within Lane County is also projected to be strong in Leisure and hospitality (20 percent increase from 2006 to 2016), Food Services (19 percent increase from 2006 to 2016), and Professional and business services (19 percent increase from 2006 to 2016). There will also be an increase in Lane County in the demand for education. Educational and health services are projected to have the second highest percentage of new workers (31 percent increase from 2006 to 2016) when compared to all County sectors.
���#��������� �����'���������!���������+������Figure 5.1 shows the level of per capita income in the United States, Oregon, and Lane County over the 1980–2007 period, in non inflated-adjusted dollars. Per capita income has experienced relatively steady growth since 1980, with the exception of the early-1980s recession in Oregon and Lane County. Figure 5.2 shows that per capita income in Lane County has historically lagged behind the Oregon and U.S. average. In the late 1990s and early part of this decade, Lane County experienced a widening of the gap between its per capita income and the national per capita income. That gap is maintained through this decade and the current per capita figures are reported as $38,564 for the United States, $35,027 for Oregon and $32,281 for Lane County.������������

1152010 Coburg Urbanization Study
5000
10000
15000
20000
25000
30000
35000
40000
1980 1983 1986 1989 1992 1995 1998 2001 2004 2007
United States Oregon Lane Co.
�"�*����,�������������������� ��'���������!7�-��*���M����7��>489�881�
������������������
)�#������� ���! �������'���������!�����-��*���Employment growth has generally followed the trend of population growth, but employment growth varies more because employment is more closely tied to economic conditions. As for population, over 70 percent of Oregon’s employment is located in the Willamette Valley. The Valley also experienced the largest loss of employment in the recession of the early 1980s. Since 1969, employment in Oregon has grown most rapidly in the 1970s, with annual employment growth above 5 percent in 1972–73 and 1977–78. Annual employment growth in Oregon was slow or negative in the early 1980s but peaked at 4.6 percent per year in 1988, declined in the early 1990s and peaked at 4.9 percent in 1994. Annual employment growth in Oregon has declined since 1994, falling to -0.1 percent in 2001. As with population, employment growth in Lane County tends to be more cyclical than employment growth in Oregon as a whole. Annual employment growth in Oregon and Lane County is shown in Figure 5.3 for the 1986–2006 period. Figure 5.2 shows that Lane County has seen periods of both lesser and greater growth than Oregon as whole. The recessions of the early 1990s, and in 2001 saw Lane County experiencing significantly less growth than the state (reductions in fact). Lane County also appears to have grown at a faster rate than Oregon during the recovery from these slow economic times.
�������

1162010 Coburg Urbanization Study
-2.0%
0.0%
2.0%
4.0%
6.0%
1986 1990 1994 1998 2002 2006
Oregon Lane Co.
�"�*����,������������+��/�� �� ���! ����*��?������-��*�������'���������!7��>4.9�88.
The composition of employment in Oregon has changed over the last 40 years. Employment growth during this time period has been led by the Services and Retail Trade sectors.36 The share of total employment in these sectors increased from 35 percent to 49 percent between 1969 and 1995. Slow growth in Manufacturing caused its share of total employment to decline from 22 percent to 13 percent over this period, while other sectors grew at rates close to the statewide average. Employment in Lane County showed a similar pattern, with employment in manufacturing declining from 25 percent to 14 percent of total employment between 1969 and 2001, while the share in Services and Retail Trade increased from 35 percent to 50 percent of total employment in the same period.37
A more recent look at employment trends (2002-2006) is presented in Table 5.3, which also includes growth rates for other counties in the Western Oregon Region. Employment growth is presented by North American Industrial Classification System (NAICS) sector in the table.
���
36 This chapter will make frequent use of the terms sector and industry. Sectors are groups of industries, as defined in the North American Industrial Classification System and the Standard Industrial Classification system used for economic statistics. 37 U.S. Department of Commerce, Bureau of Economic Analysis, 2003. Regional Economic Accounts. http://www.bea.doc.gov/bea/regional/statelocal.htm. Share of total employment by sector calculated by ECONorthwest.
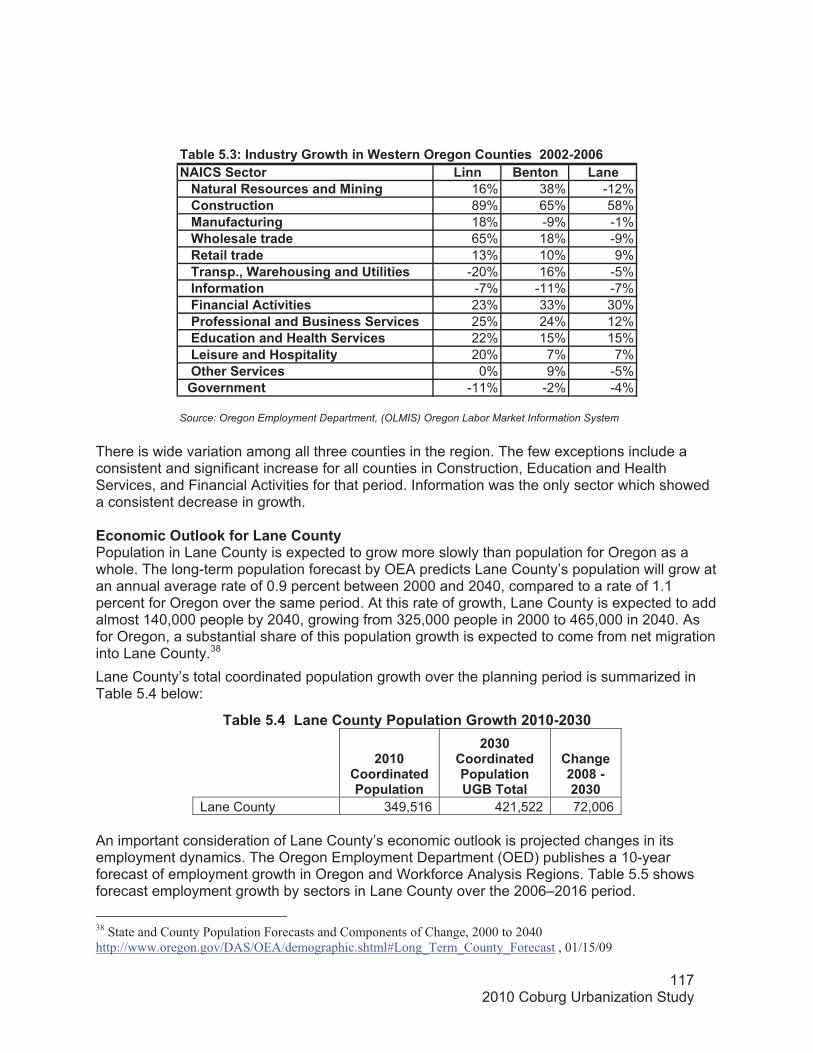
1172010 Coburg Urbanization Study
���
+��������� '��� %����� '������+������� �#�����#����������* 16% 38% -12%������#�������� 89% 65% 58%�������/�������* 18% -9% -1%���5����#��������� 65% 18% -9%��� ����������� 13% 10% 9%�������#��7�5������#��*�������������# -20% 16% -5%�����/�� ����� -7% -11% -7%���"�������������=����# 23% 33% 30%������/�##����������%�#���##���=���# 25% 24% 12%�����������������)��������=���# 22% 15% 15%���'��#��������)�#�������! 20% 7% 7%���-�������=���# 0% 9% -5%��2�=��� ���� -11% -2% -4%
��&���,�$:�����#��!�2��?������5�#�����-��*����������#���88�9�88.
Source: Oregon Employment Department, (OLMIS) Oregon Labor Market Information System ��There is wide variation among all three counties in the region. The few exceptions include a consistent and significant increase for all counties in Construction, Education and Health Services, and Financial Activities for that period. Information was the only sector which showed a consistent decrease in growth. ������ ���-�����I�/���'���������!�Population in Lane County is expected to grow more slowly than population for Oregon as a whole. The long-term population forecast by OEA predicts Lane County’s population will grow at an annual average rate of 0.9 percent between 2000 and 2040, compared to a rate of 1.1 percent for Oregon over the same period. At this rate of growth, Lane County is expected to add almost 140,000 people by 2040, growing from 325,000 people in 2000 to 465,000 in 2040. As for Oregon, a substantial share of this population growth is expected to come from net migration into Lane County.38
Lane County’s total coordinated population growth over the planning period is summarized in Table 5.4 below:
��&���,�(��'���������!������������2��?����8�89�8$8�
�8�8������������������������
�8$8�������������������������2%�������
����*���884�9��8$8�
Lane County 349,516 421,522 72,006
An important consideration of Lane County’s economic outlook is projected changes in its employment dynamics. The Oregon Employment Department (OED) publishes a 10-year forecast of employment growth in Oregon and Workforce Analysis Regions. Table 5.5 shows forecast employment growth by sectors in Lane County over the 2006–2016 period.
38 State and County Population Forecasts and Components of Change, 2000 to 2040 http://www.oregon.gov/DAS/OEA/demographic.shtml#Long_Term_County_Forecast , 01/15/09
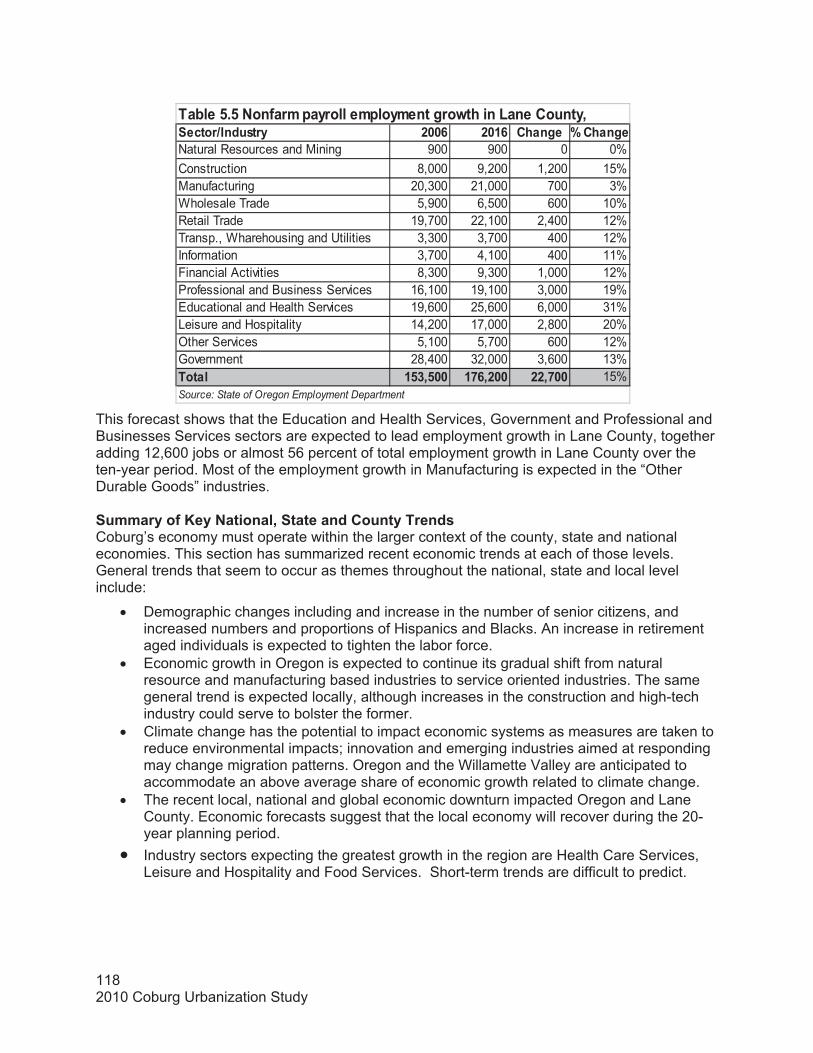
1182010 Coburg Urbanization Study
�����A����#��! �88. �8�. ����*� D�����*�Natural Resources and Mining 900 900 0 0%Construction 8,000 9,200 1,200 15%Manufacturing 20,300 21,000 700 3%Wholesale Trade 5,900 6,500 600 10%Retail Trade 19,700 22,100 2,400 12%Transp., Wharehousing and Utilities 3,300 3,700 400 12%Information 3,700 4,100 400 11%Financial Activities 8,300 9,300 1,000 12%Professional and Business Services 16,100 19,100 3,000 19%Educational and Health Services 19,600 25,600 6,000 31%Leisure and Hospitality 14,200 17,000 2,800 20%Other Services 5,100 5,700 600 12%Government 28,400 32,000 3,600 13%����� �,$7,88 �1.7�88 ��7188 15%
��&���,�,�+��/�� ���!������ ���! ����*��?������'���������!7�
Source: State of Oregon Employment Department
���������������This forecast shows that the Education and Health Services, Government and Professional and Businesses Services sectors are expected to lead employment growth in Lane County, together adding 12,600 jobs or almost 56 percent of total employment growth in Lane County over the ten-year period. Most of the employment growth in Manufacturing is expected in the “Other Durable Goods” industries.
� ��!��/�G�!�+�������7���������������!������#��Coburg’s economy must operate within the larger context of the county, state and national economies. This section has summarized recent economic trends at each of those levels. General trends that seem to occur as themes throughout the national, state and local level include:
� Demographic changes including and increase in the number of senior citizens, and increased numbers and proportions of Hispanics and Blacks. An increase in retirement aged individuals is expected to tighten the labor force.
� Economic growth in Oregon is expected to continue its gradual shift from natural resource and manufacturing based industries to service oriented industries. The same general trend is expected locally, although increases in the construction and high-tech industry could serve to bolster the former.
� Climate change has the potential to impact economic systems as measures are taken to reduce environmental impacts; innovation and emerging industries aimed at responding may change migration patterns. Oregon and the Willamette Valley are anticipated to accommodate an above average share of economic growth related to climate change.
� The recent local, national and global economic downturn impacted Oregon and Lane County. Economic forecasts suggest that the local economy will recover during the 20-year planning period.
� Industry sectors expecting the greatest growth in the region are Health Care Services, Leisure and Hospitality and Food Services. Short-term trends are difficult to predict. �
1192010 Coburg Urbanization Study
Coburg’s Economy This section provides a summary of Coburg’s current economic conditions and a summary of Coburg’s economic outlook. One of the next steps in completing an EOA is to revisit Coburg’s Vision and economic development strategy, identify key changes since the Vision was developed, and evaluate new economic opportunities.
������������� ��������#��� ����5�#��?�����!#�� � The lack of public wastewater service in Coburg has been the
primary constraint for substantial economic and UGB expansion. A wastewater facility is targeted for completion in 2011 or 2012.
� '�?���������������� ���! ���� ����� For over a decade, Coburg has been an exception among Oregon communities; it has three times as many jobs as it does people. The recent downturn in the RV industry has resulted in immediate and dramatic changes in Coburg’s employment figures. However, a long range outlook suggests that Coburg will be inclined to an uneven population to employment ratio based the City’s proximity to Interstate-5.
� ��H�#����� ���! ����"�����#�� More recent analysis of state and county employment trends suggests that the employment target of 5,157 for 2025, established in the 2003 Coburg Crossroads effort, is unlikely. Though significant growth is probable, updated trends suggest more moderate future employment figures (See Chapter 2).
� +�?������ ������ ��#��Anticipated by 2012, a private health related treatment center. This new development would provide 150-170 residential beds and occupy over15 acres near the center of Coburg. The new campus will occupy a large portion of Coburg’s existing large vacant residential acreage.
� ��&��*A�9,����������*�� ����#��������� The Coburg/I-5 Interchange is old and needs replacing. The reconstruction of this facility will provide Coburg with a new Westside gateway.
� 2��?������##����/�� ���*���9����*/����� Coburg is less than three miles from the cities of Eugene and Springfield. The Eugene-Springfield metropolitan area is the second largest in the State and is projected to see significant population increase. Coburg has been and will be subject to the growth dynamics experienced by its geographic region.
� ��������?������������� �����#��!��Coburg’s economic well-being is inseparable from the RV industry. RV manufacturers are the largest employers in Coburg. Trends in this industry will have a significant effect on the future level of employment in Coburg. Figure 5.3 shows total RV shipments in the United States over the 1987– 2007 period. Figure 5.3 shows a general upward trend in RV shipments over the last 20+ years; shipments have increased at an average rate of 3.6 percent per year between 1987 and 2007. While there has been an overall upward trend, RV shipments show some year-to-year declines due to economic conditions. The figures for the better part of 2008 (Figures 5.3 and 5.4) reveal that the RV industry saw an annual drop that may be its worst ever (worse than the decline in 2001).

1202010 Coburg Urbanization Study
0
100
200
300
400
500
1987 1992 1997 2002 2007
0
5
10
15
20
25
30
35
JAN FEB MAR APR MAY JUN JUL AUG SEP OCT
"�*���#�,�$�����,�(�������� �#��� ���#�;�������#���#<�������������������#7�>41L�8817��������P�����!9-���&����884���
�The short-term outlook for the RV industry is for relatively sharp declines in the number
and value of RVs shipped in the United States. Following is a summary of the RV industry outlook generated in December, 2008 by the Recreation Vehicle Industry Association (RVIA)39:
� ����9��� ����H������� As the current recession is expected to affect all sectors of the economy, RV shipments are expected to be lower in 2009 as well. Credit restrictions are causing RV buyers to delay purchases and RV dealers to keep inventories low. Sales in 2009 will be affected by high credit standards, falling employment, and continued declines in household wealth and home prices. Dr. Curtin predicts 2009 shipments will total 186,800, about 25 percent lower than the projected total for 2008.
� '��*9��� �/�����#����The RV marketplace continues to look favorable in the long-term. Current limitations on RV credit are expected to gradually diminish over time since RV owners are, on average, excellent credit risks.
� 0� �*������������#� As the baby boomers continue to age, they will have increasing levels of disposable income and free time. This group currently has the highest rate of RV ownership of any group, and this is expected to increase as a larger share of this age group reaches retirement age.
The 2004 Urbanization Study, which was written during a favorable climate for the RV industry, concluded that the industry is vulnerable to changes in economic conditions. It was asserted that increases in interest rates, increased gas prices, or poor economic conditions could lead to a decrease in the level of RV shipments. These vulnerabilities were realized by 2010.
39 Recreation Vehicle Industry Association Website, http://www.rvia.org/AM/customsource/INCL_BusinessIndicators.cfm?Section=Business_Indicators, 01/13/09

1212010 Coburg Urbanization Study
� ���������#�����'��I�*��Retail demand relates to the volume of retail purchases made by local residents - whether made in the local trade area or elsewhere. Supply is defined as the volume of retail sales activity actually experienced by local businesses. In conditions where demand outstrips supply, retail sales leakage occurs as local residents travel outside the immediate trade area to shop. In some areas, the volume of sales actually experienced by local businesses will outstrip locally generated demand, meaning that retailers are draw beyond the local trade area.
City of Coburg:
� Retail purchasing power generated only by existing Coburg residents is estimated at $12.3 million per year. In�comparison, area retailers capture an estimated $68.2 million in annual retail sales. Therefore, there is no current retail sales leakage overall; however, much of the retail sales supply is provided by the RV industry.
� A majority of retail categories appear to be underserved, largely due to a lack of any business presence to serve local resident demand. Retail categories without an identified presence in Coburg include furniture/home furnishings, electronics/appliances, health and personal care stores, clothing and accessories, sporting goods, hobby, book and music stores, general merchandise retail (both department store and discount-oriented), and nonstore retailers. The ability for local stores to be attracted that would serve these niches is challenging as these store types tend to require customer counts in excess of the population in Coburg.
� Several retail types have a local presence but appear to experience some level of net sales leakage. These include specialty food stores, beer, wine and liquor stores, and gasoline stations.
� Some business types located in Coburg are realizing retail sales in excess of what in-city population alone could be expected to support (indicating substantial tourism and pass-through related business volume). These well-served retail stores types include motor vehicle and parts dealers, building materials, garden equipment and supply stores, food and beverage stores, used merchandise stores, and food services.
While detailed sales data is not available for non-retail businesses, it is noted that Coburg also has an extremely limited inventory of service establishments including finance and medical. These gaps detrimentally affect the livability of the community. Lack of services such as banking also reduces the attractiveness and viability of conducting business in Coburg.
)�#������� ���! ����������!����������&��*�A comparison of total covered employment and payroll in Coburg, Lane County and Oregon reveals some interesting economic characteristics of Coburg. Table 5.6 shows the level of covered employment, payroll, and average pay per employee in Oregon, Lane County, and Coburg in 1998 and 2002. The numbers are shown in 2002 dollars for comparison.
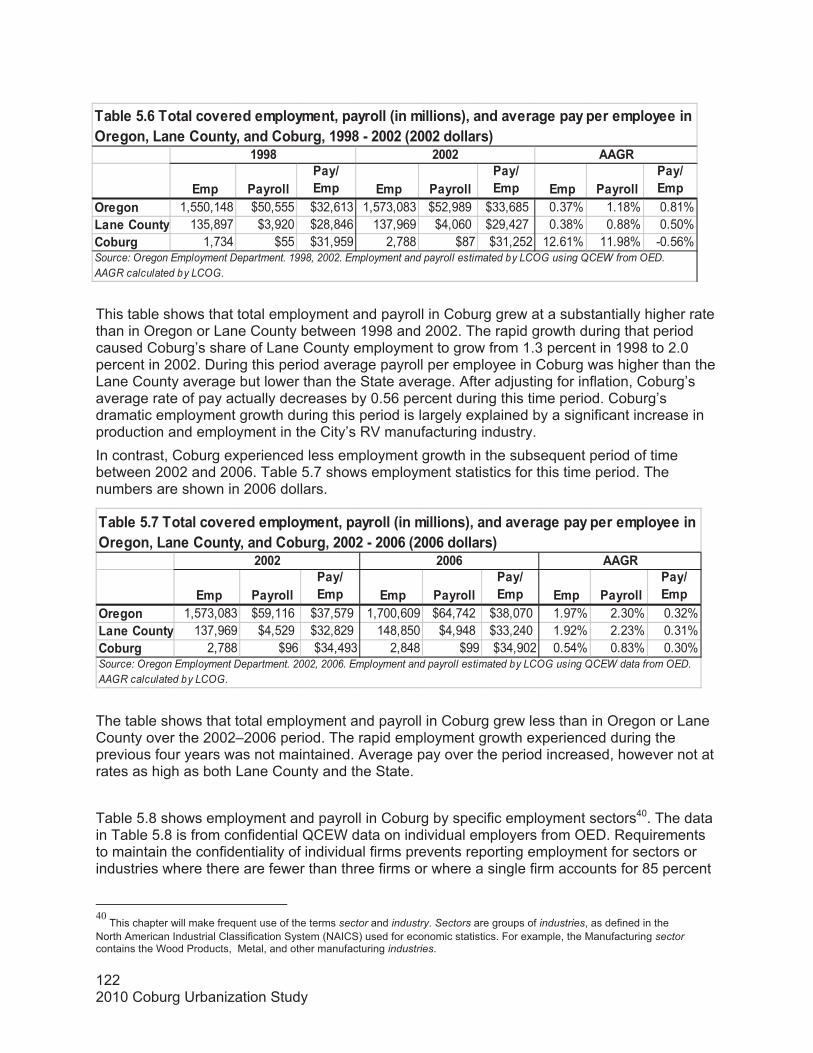
1222010 Coburg Urbanization Study
�� � ���!������!A�� � �� � ���!����
��!A�� � �� � ���!����
��!A�� �
-��*��� 1,550,148 $50,555 $32,613 1,573,083 $52,989 $33,685 0.37% 1.18% 0.81%'���������! 135,897 $3,920 $28,846 137,969 $4,060 $29,427 0.38% 0.88% 0.50%��&��* 1,734 $55 $31,959 2,788 $87 $31,252 12.61% 11.98% -0.56%
��&���,�.���������=������ ���! ���7���!�����;��� ������#<7������=���*����!������ ���!������-��*��7�'���������!7�������&��*7��>>4�9��88��;�88��������#<
�>>4 �88� ��2
Source: Oregon Employment Department. 1998, 2002. Employment and payroll estimated by LCOG using QCEW from OED. AAGR calculated by LCOG.
�� � ���!������!A�� � �� � ���!����
��!A�� � �� � ���!����
��!A�� �
-��*��� 1,573,083 $59,116 $37,579 1,700,609 $64,742 $38,070 1.97% 2.30% 0.32%'���������! 137,969 $4,529 $32,829 148,850 $4,948 $33,240 1.92% 2.23% 0.31%��&��* 2,788 $96 $34,493 2,848 $99 $34,902 0.54% 0.83% 0.30%Source: Oregon Employment Department. 2002, 2006. Employment and payroll estimated by LCOG using QCEW data from OED. AAGR calculated by LCOG.
��&���,�1���������=������ ���! ���7���!�����;��� ������#<7������=���*����!������ ���!������-��*��7�'���������!7�������&��*7��88��9��88.�;�88.�������#<
�88� �88. ��2
This table shows that total employment and payroll in Coburg grew at a substantially higher rate than in Oregon or Lane County between 1998 and 2002. The rapid growth during that period caused Coburg’s share of Lane County employment to grow from 1.3 percent in 1998 to 2.0 percent in 2002. During this period average payroll per employee in Coburg was higher than the Lane County average but lower than the State average. After adjusting for inflation, Coburg’s average rate of pay actually decreases by 0.56 percent during this time period. Coburg’s dramatic employment growth during this period is largely explained by a significant increase in production and employment in the City’s RV manufacturing industry. In contrast, Coburg experienced less employment growth in the subsequent period of time between 2002 and 2006. Table 5.7 shows employment statistics for this time period. The numbers are shown in 2006 dollars.
The table shows that total employment and payroll in Coburg grew less than in Oregon or Lane County over the 2002–2006 period. The rapid employment growth experienced during the previous four years was not maintained. Average pay over the period increased, however not at rates as high as both Lane County and the State.
Table 5.8 shows employment and payroll in Coburg by specific employment sectors40. The data in Table 5.8 is from confidential QCEW data on individual employers from OED. Requirements to maintain the confidentiality of individual firms prevents reporting employment for sectors or industries where there are fewer than three firms or where a single firm accounts for 85 percent
40 This chapter will make frequent use of the terms sector and industry. Sectors are groups of industries, as defined in the
North American Industrial Classification System (NAICS) used for economic statistics. For example, the Manufacturing sectorcontains the Wood Products, Metal, and other manufacturing industries.

1232010 Coburg Urbanization Study
����� � � ��!������!A�� � � � ��!����
��!A�� � � �� ��!�����
��!A�� �
Construction 143 $6.3 $43,995 156 $7.2 $46,126 2.24% 3.46% 1.19%Wholesale trade 125 $5.5 $43,812 140 $6.5 $46,714 2.80% 4.46% 1.62%Retail trade 135 $3.1 $22,703 188 $5.4 $29,079 8.68% 15.62% 6.38%Trans., W.house, Util. 57 $1.6 $27,682 28 $1.2 $43,853 -16.59% -6.43% 12.19%Financial Activities 112 $3.2 $28,131 121 $3.6 $29,559 1.92% 3.19% 1.25%Professional and Bus. 8 $0.1 $12,616 21 $0.7 $34,672 25.24% 61.25% 28.75%Leisure and Hospitality 58 $0.7 $11,429 37 $0.4 $10,095 -10.55% -13.28% -3.06%Other* 2,150 $75.8 $35,275 2,147 $74.3 $34,622 -0.03% -0.50% -0.47%������� �7144 Q>.�� Q$(7(>$ �74(4 Q>>�( Q$(7>8� 8�,(D 8�4$D 8�$8D
��&���,�4���=������ ���! ����������!�����;��� ������#<7�&!�#�����������&��*7��88�9�88.�;�88.�������#<
Source: Oregon Employment Department. 2002, 2006. Employment and payroll estimated by LCOG using sector specific QCEW data from OED. AAGR calculated by LCOG. *Sum of sectors with < 3 firms
�88� �88. ��2
or more of the sector/industry employment. This confidentiality restriction applies to several sectors in Coburg, which are summed in the “Other” sector category in Table 5.8.
Table 5.8 shows that the bulk of Coburg’s employment (77 percent) is in the Other category, which represents sectors with few firms or with a single firm that accounts for a large share of that sector’s employment. The Other category includes Coburg’s two largest employers, Monaco Coach (Navistar) and Marathon Coach, both which manufacture (d) recreational vehicles. These firms are in the Manufacturing Sector. The Other category also includes firms in the Information, Health and Education, Natural Resources, and other sectors. The Other category reflected a minor decrease in employee numbers between 2002 and 2006. Most sector within the Other category experienced decreasing numbers, including the largest portion of that category, Manufacturing, which saw a loss of 18 employees over the period. The Professional and Scientific sector experienced the fastest growth between 2002 and 2006, adding 25 percent over the period. Retail trade saw the greatest employment growth, adding 53 jobs and growing at an average annual rate of 8.7 percent. Most of the employment in the Retail Trade sector is in the Auto Dealers & Service and Eating & Drinking Places industries. The Construction and Wholesale Trade sectors have above-average levels of annual payroll per employee. Payroll per employee in the Other sector is close to the Coburg average, which is not surprising because this sector accounts for such a large share of Coburg’s employment. Annual payroll per employee in the Retail Trade, and Financial Activities sectors was roughly $5,000 below the Coburg average in 2006. The Leisure and Hospitality sector shows a very low payroll per employee figure compared with the Coburg average. Table 5-3 shows that payroll per employee grew in every sector between 2002 and 2006 except Leisure and Hospitality and Other (in constant 2006 dollars). Overall, confidential data provided by the OED shows that employment in Coburg has been dominated by the following activities:
• Recreational vehicle manufacturing • Heavy equipment sales and service • Construction contractors • Trucking • Automobile and truck service stations
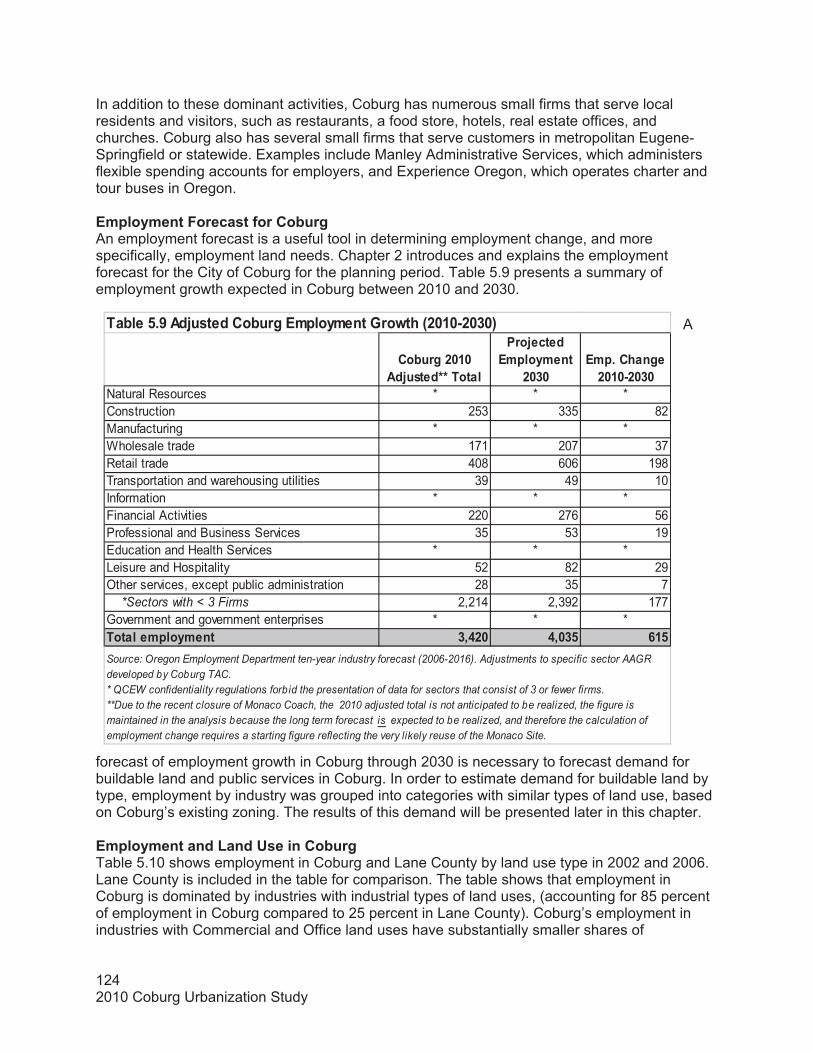
1242010 Coburg Urbanization Study
��&��*��8�8���H�#���CC�������
���H������� ���! ����
�8$8� �������*���8�89�8$8
Natural Resources * * *Construction 253 335 82Manufacturing * * *Wholesale trade 171 207 37Retail trade 408 606 198Transportation and warehousing utilities 39 49 10Information * * *Financial Activities 220 276 56Professional and Business Services 35 53 19Education and Health Services * * *Leisure and Hospitality 52 82 29Other services, except public administration 28 35 7 *Sectors with < 3 Firms 2,214 2,392 177Government and government enterprises * * *������� ���! ��� $7(�8 (78$, .�,Source: Oregon Employment Department ten-year industry forecast (2006-2016). Adjustments to specific sector AAGR developed by Coburg TAC. * QCEW confidentiality regulations forbid the presentation of data for sectors that consist of 3 or fewer firms. **Due to the recent closure of Monaco Coach, the 2010 adjusted total is not anticipated to be realized, the figure is maintained in the analysis because the long term forecast is expected to be realized, and therefore the calculation of employment change requires a starting figure reflecting the very likely reuse of the Monaco Site.
��&���,�>���H�#������&��*�� ���! ����2��?���;�8�89�8$8<
In addition to these dominant activities, Coburg has numerous small firms that serve local residents and visitors, such as restaurants, a food store, hotels, real estate offices, and churches. Coburg also has several small firms that serve customers in metropolitan Eugene-Springfield or statewide. Examples include Manley Administrative Services, which administers flexible spending accounts for employers, and Experience Oregon, which operates charter and tour buses in Oregon.
� ���! ����"�����#��/�����&��*�An employment forecast is a useful tool in determining employment change, and more specifically, employment land needs. Chapter 2 introduces and explains the employment forecast for the City of Coburg for the planning period. Table 5.9 presents a summary of employment growth expected in Coburg between 2010 and 2030.
A
forecast of employment growth in Coburg through 2030 is necessary to forecast demand for buildable land and public services in Coburg. In order to estimate demand for buildable land by type, employment by industry was grouped into categories with similar types of land use, based on Coburg’s existing zoning. The results of this demand will be presented later in this chapter.
� ���! ��������'�����#�������&��*�Table 5.10 shows employment in Coburg and Lane County by land use type in 2002 and 2006. Lane County is included in the table for comparison. The table shows that employment in Coburg is dominated by industries with industrial types of land uses, (accounting for 85 percent of employment in Coburg compared to 25 percent in Lane County). Coburg’s employment in industries with Commercial and Office land uses have substantially smaller shares of
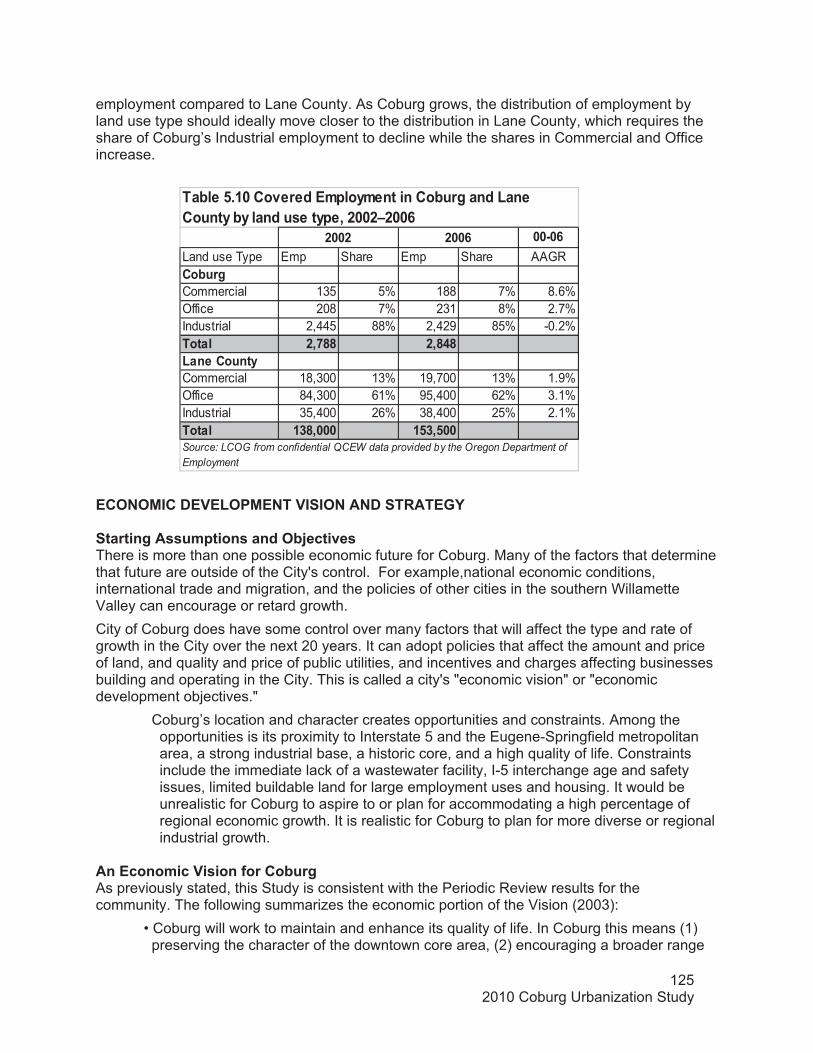
1252010 Coburg Urbanization Study
8898.Land use Type Emp Share Emp Share AAGR��&��*�Commercial 135 5% 188 7% 8.6%Office 208 7% 231 8% 2.7%Industrial 2,445 88% 2,429 85% -0.2%������ �7144 �74(4'���������!�Commercial 18,300 13% 19,700 13% 1.9%Office 84,300 61% 95,400 62% 3.1%Industrial 35,400 26% 38,400 25% 2.1%������ �$47888 �,$7,88
��&���,��8���=������ ���! ���������&��*�����'���������!�&!�������#���!��7��88�L�88.
�88� �88.
Source: LCOG from confidential QCEW data provided by the Oregon Department of Employment
employment compared to Lane County. As Coburg grows, the distribution of employment by land use type should ideally move closer to the distribution in Lane County, which requires the share of Coburg’s Industrial employment to decline while the shares in Commercial and Office increase.����
����-+-����0��'-���+����-+��+0�� ���2��
������*��##� �����#�����-&H����=�#�There is more than one possible economic future for Coburg. Many of the factors that determine that future are outside of the City's control. For example,national economic conditions, international trade and migration, and the policies of other cities in the southern Willamette Valley can encourage or retard growth. City of Coburg does have some control over many factors that will affect the type and rate of growth in the City over the next 20 years. It can adopt policies that affect the amount and price of land, and quality and price of public utilities, and incentives and charges affecting businesses building and operating in the City. This is called a city's "economic vision" or "economic development objectives."
Coburg’s location and character creates opportunities and constraints. Among the opportunities is its proximity to Interstate 5 and the Eugene-Springfield metropolitan area, a strong industrial base, a historic core, and a high quality of life. Constraints include the immediate lack of a wastewater facility, I-5 interchange age and safety issues, limited buildable land for large employment uses and housing. It would be unrealistic for Coburg to aspire to or plan for accommodating a high percentage of regional economic growth. It is realistic for Coburg to plan for more diverse or regional industrial growth.
�������� ����#����/�����&��*��As previously stated, this Study is consistent with the Periodic Review results for the community. The following summarizes the economic portion of the Vision (2003):
• Coburg will work to maintain and enhance its quality of life. In Coburg this means (1) preserving the character of the downtown core area, (2) encouraging a broader range

1262010 Coburg Urbanization Study
of services, and (3) providing housing opportunities for individuals that are employed in Coburg.
• Coburg recognizes its locational advantages (as described in the Economic Opportunity Analysis) and believes it is in its interest to manage economic development and growth in the City.
• To that end, Coburg establishes a 2025 employment target of 5,157; an increase of about 2,000 employees between 2002 and 2025. This figure is consistent with the preferred employment forecast in the Coburg Crossroads Vision. (This figure has been updated based on more recent employment data and trend analysis see Table 5.9)
• Coburg wants new businesses to start, expand, or relocate in the City that will provide higher-wage jobs and a broader range of goods and services for existing and future Coburg residents.
• Coburg desires to encourage new employment to locate in the core area as appropriate. The comprehensive plan will define the types of commercial activities that are appropriate for the core area.
• New businesses will need, among other things, developable land, good services and transportation, and an educated and skilled labor force. The City should take actions to make sure those things are provided at competitive prices. Coburg will welcome industries that help it achieve its economic vision.
• Coburg wants to maintain and increase the livability of its community as it grows. To that end, the City will ensure that adequate public facilities are available to accommodate new employment and residents.
• Coburg should be strategic about any economic incentives it gives to businesses, ensuring that it has the financial resources to maintain the quality of its facilities and services.
The City also identified a set of Goals and related strategies for achieving its economic vision. These goals and strategies are included in this report in their entirety as Appendix F.
�88,��� ������#�=������������ ������ �����������The 2005 Update of the Coburg Comprehensive Plan included an economic element that further articulates the City’s economic goals and objectives. The overarching objective established in this Plan is to “guide community development in such a way that the local economy is improved while maintaining Coburg’s small town atmosphere”. The Comprehensive Plan also contains 27 policies that further articulate this objective, including (but not limited to) the following concepts:
� Provide land suitable for a full range of retail, professional and service uses in the downtown area. Mixed use is encouraged, as are small –scale downtown commercial uses.
� Provide land area adjacent to the I-5 interchange for goods and services that primarily serve the traveling public.
� Provide an adequate amount of level, buildable land which has good access to arterial streets to meet local and regional industrial needs. Group industrial uses together within well-designated industrial parks or subdivisions.
� Promote a diverse economy that continues to support a strong tax base for the community.
1272010 Coburg Urbanization Study
� Discourage big-box retail and strip commercial uses.
� Sustain and enhance business skills and management training available in Coburg.
Despite recent changes in industry trends and potential new opportunities, the vision and policies developed as part of the 2003 Coburg Crossroads and 2005 Comprehensive Plan Update still appear to be relevant. However, since Coburg’s economic vision was updated in 2003 and 2005, there have been changes in the local and regional economy that should be evaluated as part of this Economic Opportunities Analysis. The goals and policies should be revisited as part of the update process to ensure that they continue to reflect the most current economic development vision for Coburg. �"�����#��//�����*������ ���0�=���� ���������&��*�Each place has access to different combinations of productive factors: land (and natural resources), labor (including technological expertise), and capital (investments in infrastructure, technology, and public services). While all places have these factors to some degree, the mix and condition of these factors vary by location. The mix and condition of productive factors may allow firms in one area to produce goods and services more cheaply than firms in other areas. Location also affects transportation costs to markets for goods and services, which may allow firms in one area to generate more revenue or profits per unit than firms in other locations. The mix of factors of production and access to markets in a location relative to other locations is referred to as a location’s comparative advantage. By affecting the cost of production and potential revenue, comparative advantages affect the pattern of economic development in an area relative to other areas. The administrative rule for Goal 9 recognizes this by requiring jurisdictions to include an analysis of economic advantages and disadvantages in an economic opportunities analysis. The forecasts for population and employment growth in Oregon and Lane County presented earlier in this chapter implicitly considered the comparative advantages of the State and County when projecting the rate and composition of growth. This section focuses on the comparative advantages of Coburg relative to Lane County and Oregon.
LocationAs stated, Coburg’s proximity to Eugene-Springfield and the Interstate-5 (I-5) corridor are its two most key comparative advantages that provide:
• A large potential customer base and a skilled workforce. • Suppliers of intermediate production goods, parts, and raw materials. • Distributors of finished products to regional, national, and international markets. • Specialized support services such as marketing, finance, accountants, and attorneys.
Location positions Coburg to compete for expected growth in Manufacturing as well as Warehousing and Distribution. As noted in the summary of trends, the region has historically been particularly competitive in Machinery Manufacturing and although these sectors are expected to grow less than the regional average from 2006 to 2016, Coburg has the potential to accommodate the growth that will occur (see Table 5.22).
Quality of lifeCoburg’s small-town character is also an important comparative advantage. As stated above, Coburg is an attractive location for firms that desire a small-town atmosphere but require the advantages of a larger city. This is particularly true for firms that are concerned about the quality
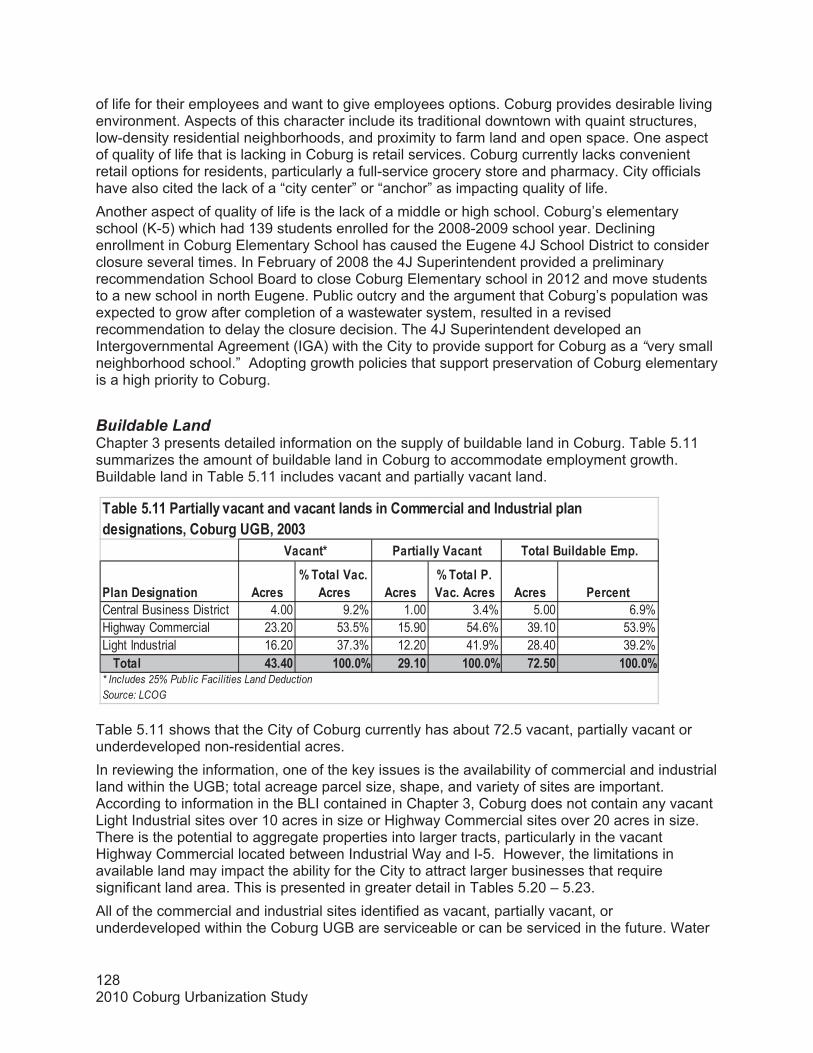
1282010 Coburg Urbanization Study
�����0�#�*������� ����#D���������������# ����#
D������������������# ����# ��������
Central Business District 4.00 9.2% 1.00 3.4% 5.00 6.9%Highway Commercial 23.20 53.5% 15.90 54.6% 39.10 53.9%Light Industrial 16.20 37.3% 12.20 41.9% 28.40 39.2%��������� ($�(8 �88�8D �>��8 �88�8D 1��,8 �88�8D* Includes 25% Public Facilities Land Deduction Source: LCOG
��&���,������������!�=����������=����������#������ ���������������#�������������#�*������#7���&��*��2%7��88$
�����C ��������!������ ������%�����&���� ��
of life for their employees and want to give employees options. Coburg provides desirable living environment. Aspects of this character include its traditional downtown with quaint structures, low-density residential neighborhoods, and proximity to farm land and open space. One aspect of quality of life that is lacking in Coburg is retail services. Coburg currently lacks convenient retail options for residents, particularly a full-service grocery store and pharmacy. City officials have also cited the lack of a “city center” or “anchor” as impacting quality of life. Another aspect of quality of life is the lack of a middle or high school. Coburg’s elementary school (K-5) which had 139 students enrolled for the 2008-2009 school year. Declining enrollment in Coburg Elementary School has caused the Eugene 4J School District to consider closure several times. In February of 2008 the 4J Superintendent provided a preliminary recommendation School Board to close Coburg Elementary school in 2012 and move students to a new school in north Eugene. Public outcry and the argument that Coburg’s population was expected to grow after completion of a wastewater system, resulted in a revised recommendation to delay the closure decision. The 4J Superintendent developed an Intergovernmental Agreement (IGA) with the City to provide support for Coburg as a “very small neighborhood school.” Adopting growth policies that support preservation of Coburg elementary is a high priority to Coburg.
�Buildable Land�Chapter 3 presents detailed information on the supply of buildable land in Coburg. Table 5.11 summarizes the amount of buildable land in Coburg to accommodate employment growth. Buildable land in Table 5.11 includes vacant and partially vacant land.
�Table 5.11 shows that the City of Coburg currently has about 72.5 vacant, partially vacant or underdeveloped non-residential acres. In reviewing the information, one of the key issues is the availability of commercial and industrial land within the UGB; total acreage parcel size, shape, and variety of sites are important. According to information in the BLI contained in Chapter 3, Coburg does not contain any vacant Light Industrial sites over 10 acres in size or Highway Commercial sites over 20 acres in size. There is the potential to aggregate properties into larger tracts, particularly in the vacant Highway Commercial located between Industrial Way and I-5. However, the limitations in available land may impact the ability for the City to attract larger businesses that require significant land area. This is presented in greater detail in Tables 5.20 – 5.23. All of the commercial and industrial sites identified as vacant, partially vacant, or underdeveloped within the Coburg UGB are serviceable or can be serviced in the future. Water
1292010 Coburg Urbanization Study
service is available to all sites on the westside of the interchange. The City intends to complete construction of the wastewater facility by 2012 .
Transportation�Transportation access is critical for economic development. Firms must have transportation access so that workers and customers can reach their destination and shipments of supplies and products can easily arrive and leave. Transportation systems consist of regional and local facilities. The primary regional facility in Coburg is Interstate-5, which provides access to regional, national, and international markets. Proximity to Interstate-5 is an important comparative advantage for Coburg, particularly to attract firms that need a high degree of access for employees, suppliers, customers, and shipping products. Access to Interstate-5 in Coburg is presently limited by an outdated interchange. This interchange currently consists of a narrow overpass that limits the volume to capacity ratio and truck turn-movements; causing a number of safety issues. Further, the current interchange does not provide access for bicycles or pedestrians over Interstate 5. In 2010, the City, Lane County, and the Oregon Department of Transportation (ODOT) adopted the Coburg Interchange Area Management Plan (IAMP). IAMPs manage interchanges and adjacent land to ensure that the transportation planning reflects the local land use assumptions and builds future transportation infrastructure within the IAMP boundary accordingly. Coburg Road is also an important transportation facility which links Coburg to Eugene(South) and Harrisburg (North). Coburg Road becomes Willamette St. within the Coburg city limits. The local street system in Coburg is adequate for current development and to serve existing vacant sites within city limits, though local circulation at the periphery of the city limits needs to be improved; there are several dead-ends. Internal streets will be needed for development of some vacantlots. Extension and improvements to local collector roads will be required in conjunction to future development.Transit service, provided by Lane Transit District, includes minimal circulation within the City, but does provide direct service to Eugene. Transit service helps link Coburg to the larger Eugene-Springfield labor market. Limited transit service may constrain labor supply, particularly for employers that rely on workers that may not have access to a car. Population and employment growth in Coburg may lead to more frequent bus service. Coburg is not served by a railroad. Lack of railroad access makes Coburg a poor location for firms engaged in heavy manufacturing, warehousing and distribution, and other activities that rely on rail access. The location of future transportation corridors and access to I-5 will be key issues to consider if the City determines that expansion of the UGB is needed to accommodate additional employment lands.
Public Services�The availability of public services is crucial to support employment growth in Coburg. Water and sewer service are essential for production and to support employees in the workplace. Police and fire services are needed to protect the assets of firms in Coburg. A major deficiency in Coburg’s existing public service profile is the lack of sewer service; residents and firms in Coburg are served by on-site septic tanks and drainfields. This deficiency is seen as the main cause of Coburg’s lack of economic growth in the recent past. The amount of residential and commercial development in Coburg is limited by the lack of sewer service, and sewer service will be necessary to support forecast population and employment growth.
1302010 Coburg Urbanization Study
�?���The Wastewater Facilities Plan (S1999) identified options for the development of a wastewater collection and treatment system. The City of Coburg chose to pursue a Septic Tank Effluent Pump (STEP) sewage collection and treatment system. As soon as 2012, all residents and businesses will be connected and the plant will be turned on.The City is responsible for maintenance of the STEP system.Coburg’s wastewater facility has capacity to accommodate growth within the 20-year planning period. Coburg’s 2010 wastewater average usage is 760 EDUs. (An EDU is a measure of flow, representing the equivalent of a residence. Commercial usage is approximately 50 percent of the total. The Coburg wastewater facility is being planned and constructed to accommodate approximately 2000 EDUs. All of the system will be built either to immediately accommodate that many users or as a part of a modular system where additional modules can be added in the future. The funding structure is such that existing users are paying for their share of the capacity of the system and future users will pay via system development charges (SDCs).
5�����The City of Coburg owns and operates the Coburg Water System, which serves businesses and residents within the city limits. According to the 2005 Water System Master Plan Update, the current water system is deficient in both supply and storage. Coburg is currently in the process of increasing its water capacity. The City is in the process of selecting a site and design for a new well and City officials assert that water capacity and storage will be sufficient to meet future demands as planned.The 2005 Water System Master Plan estimates future water demand based upon future growth forecast in the 2004 Study for the year 2025, which used a population projection of 3,300 residents, and a land need of 311 acres of employment land, and 78.7 acres of parks and recreation and other public land. The future demand estimate is based upon residential demand increasing proportional to population increases, while industrial and commercial uses were based upon an analysis of water demand based upon water use per acre of developed land, using an evaluation of past billing records. The design for the wastewater system, which was completed after the 2005 Update, allows for reclaimed water to be used for irrigation at parks, schools and businesses, which may decrease overall water demand.
��&�����/��!A� ��*���!���=���#�Coburg receives fire services from the Coburg Rural Fire Department’s two paid and 26 volunteer firefighters out of one station located in the northwest corner of Coburg. Coburg is also served by its own Police Department which consists of two full-time officers, four reserve officers and one police records clerk.41 This level of fire and police protection has been significantly reduced from past levels due to budget constraints, but it should be noted that Coburg's six-officer department remains the largest in Oregon per capita, it is 50 percent larger than the next two largest departments, and twice the size of an average Oregon municipal force. State of the art medical services are available only 5.5 miles away from Coburg at the newly constructed Peacehealth Riverbend hospital in Springfield. The hospital is a comprehensive regional medical center and Level II trauma center. A level II trauma center provides
41 City of Coburg Website, http://www.coburgoregon.org/home/cob/smartlist_64/department_personnel.html,01/27/09

1312010 Coburg Urbanization Study
comprehensive trauma care and supplements the clinical expertise of a level I institution. It provides 24-hour availability of all essential specialties, personnel, and equipment.42
Utilities�According to the Oregon Economic & Community Development Department, Coburg is served by Northwest Natural for natural gas and both Emerald Public Utilities District (EPUD) and Pacific Power and Light (PPAL) for electricity. Properties north of Pearl Street are served by EPUD and properties south of Pearl Street are served of PPAL. Rates for industrial and commercial customers vary by need and may be negotiated for very large consumers of utilities.
Equally critical to the attraction and retention of many business sectors, is the creation and maintenance of a strong technology infrastructure. Coburg’s telecommunications services are provided by Qwest and by Charter High-Speed Cable. Broadband services are available only from QWest. Among these DSL and T1 lines are the primary services used. These services are sufficient to meet the telecommunications needs of most potential firms.
Local Planning and SupportEconomic Development in Coburg and Lane County is served and supported by a number of organizations who are dedicated to elements of economic wellbeing in Coburg and Lane County as a whole. These organizations include: Travel Lane County, Coburg Chamber of Commerce, Lane County Community and Economic Development, Lane Metro Partnership, as well as staff and officials responsible for economic development at the City of Coburg. Most of these organizations address economic development for Lane County or the entire State forcing Coburg to compete with other communities for the resources available for such assistance. Coburg’s development constraints, specifically the lack of sewer service, have made it a challenging area for economic development, however its excellent location and other economic factors have provided for significant industrial development in the recent past. The planned development of Coburg’s wastewater treatment facility is evidence of local planning and support for environmental sustainability and controlled growth opportunities. Coburg’s Comprehensive Plan includes numerous policies and goals aimed at supporting Coburg’s Economy (see Appendix F). As part of its comprehensive planning, the City will have to find some balance between sometimes conflicting goals of, for example, high-quality public services and low costs, or accommodating employment growth with low-cost land and protecting farmland around Coburg from urbanization. Additionally, there are several comprehensive plan policies addressing the preservation of Coburg’s small town atmosphere and quality of life. Economic development will be subject to both sets of local values and priorities.Coburg also has a number of districts and other planning characteristics which lend economic development. These include both Local Improvement Districts and Urban Renewal Districts. A survey was sent to Coburg businesses and local economic development organization personnel. Respondents to that survey identified both positive and negative local planning and support dynamics in Coburg. Due to a relatively meager response to the survey the results should only be considered anecdotally. From those who responded the following themes arose:
42PeaceHealth Medical Group Website, http://www.peacehealth.org/Oregon/News/Facilities, 2/23/09
1322010 Coburg Urbanization Study
� Respondents confirmed that factors attracting business to Coburg are its proximity to Eugene-Springfield, its small town environment, proximity to I-5 and reasonable start-up costs.
� More than one respondent identified the following factors that may detract business from locating in Coburg: small town politics, lack of sewer service, and lack of services. One respondent expressed disappointment with the lack of a strong “anchor” in town.
� Respondents suggested that better dining and grocery opportunities were needed. Others suggested focusing on the antiques industry.
� Among respondents generally, interest in industry growth was limited to areas along the freeway.
� Some respondents expressed concern in making plans during this period of economic recession.
� Respondents generally expressed optimism in Coburg’s economic advantages (proximity to I-5 mentioned multiple times).
� Some concerns for future included “lack of civic protocol”, lack of sufficient City staff, loss of citizen’s trust, lack of clear vision.
� More than one respondent expressed frustration with inconsistencies in design standards, causing confusion and lack of cohesion in town.
The City has established the Coburg Urban Renewal District under the provisions of Oregon Revised Statute Chapter 457. The Coburg Urban Renewal Agency was created for the purpose of providing funding for the City of Coburg to plan and construct a municipal wastewater collection and treatment center. The City does not contain an enterprise zone designated under ORS 285C.250. An enterprise zone is a specific area in which new plant and equipment of “eligible” (typically manufacturing) businesses that create jobs receive exemption from local property taxes for three or more years. Previously, an enterprise zone was established, but this was terminated in 1995. According to the Lane Metro Partnership, the City is also not eligible to reinstate an enterprise zone. The State’s Economic and Community Development Department has an industrial site certification process in place. Site certification can be very helpful to firms looking to locate, as it ensures that sites are “shovel ready”, and can be utilized quickly, without time consuming and risky permit processes. Although there are industrial sites in Coburg that could be considered “shovel ready”, or nearly shovel ready, there are currently no “certified” sites within Coburg’s UGB.
�Labor Force�The labor force in any market consists of the adult population (16 and over) who are working or actively seeking work. The labor force includes both the employed and unemployed. Children, retirees, students, and people who are not actively seeking work are not considered part of the labor force. The labor force in Coburg is not limited to local residents; firms in Coburg attract workers from surrounding communities, and residents of Coburg may work in other communities. The labor market area in Coburg includes the Eugene-Springfield metropolitan area and rural communities in the southern Willamette Valley. In 2007, the Lane Council of Governments (LCOG) conducted a survey for the Lane Transit District (LTD) of employees at Monaco Coach that asked employees their place of residence. As Coburg’s recent largest employer, the extent of

1332010 Coburg Urbanization Study
@������� ���!� ����97402 Eugene 18%97478 Springfield 18%97477 Springfield 16%97404 Eugene 11%97424 Cottage Grove 7%97401 Eugene 6%97448 Junction City 6%97408 Eugene 5%97405 Eugene 4%97426 Creswell 3%97487 Veneta 2%97455 Pleasant Hill 1%97437 Elmira 1%97463 Oakridge 1%97419 Cheshire 1%����� �88D
��&���,����0�#���&�������/��������������� ���!��#�&!��������/���#������7��88�
Source: Lane Council of Governments, 2001
the labor market area for Monaco Coach is a good indicator of the potential labor market area for Coburg as a whole.Table 5.12 shows the place of residence by zip code for Monaco Coach employees that reported this information in the survey. The table shows that 63 percent of Monaco Coach employees in 2001 were from Eugene or Springfield. At least 3 percent of Monaco Coach employees commuted from the communities of Cottage Grove, Junction City, Creswell, and Veneta and Elmira combined. The geographic area bounded by these communities represents the primary labor market area for firms located in Coburg. According to these results, a small share of Monaco Coach employees were from more outlying communities, such as Oakridge and Blue River, but the number of employees is too small to include these communities in the primary labor market area for Coburg. Surprisingly, no employees of Monaco coach reported living in Harrisburg, despite its relative proximity.
The availability of skilled labor is critical for economic development. A recent statewide survey in Oregon found that nearly one-half of Oregon's employers in Lane County said that a shortage of skilled workers made it difficult to find qualified workers to fill job vacancies.43 This shortage was reported at a slightly higher frequency by Lane County employers than Oregon employers. The recent economic downturn will greatly reduce this issue in the short-term, but it will likely remain a long-term issue if not addressed. Availability of labor depends not only on the number of workers available, but the quality, skills, and experience of available workers as well. The Oregon Employment Department reports that Lane County had an unemployment rate of 11.3 percent in February of 2009. This is up 6.3 percent from the 5.0 percent reported in February of 2008. In February 2008, Lane County’s unemployment rate was above the State level of 10.8 percent and the U.S. rate of 8.1 percent.44
43 2008 Region 5 Employer Survey Results, Worksource Oregon Employment Department, October 2008, pg. 644 Unemployment rate chart http://www.qualityinfo.org/olmisj/ChartView?startyear=1996&area=4101000000y&area2=0000000000y&area3=4104000039n&=View+Chart&graph=unemp

1342010 Coburg Urbanization Study
The Oregon Employment Department does not have any information on the skills or experience of unemployed workers in the state. Considering the significant number of manufacturing facility closures, it is safe to assume that Lane County currently has a Labor Force with high levels of skill in the manufacturing sector. Of concern is the chance that skilled laborers will leave the region in search of jobs and create a shortage of employees with such skills.
Housing�Housing is an important component of any economic development strategy. Goal 10 requires cities to develop strategies to provide housing affordable to households at all income levels. In addition to concerns about availability of needed housing, the need for higher quality housing for managers also needs to be considered in both housing and economic development strategies. Moreover, ORS 197.296 requires communities to inventory Buildable residential lands and conduct housing needs analysis. Such an analysis is presented in Chapter 3 of this report. Accommodating this population growth, however, requires expansion of the City’s sewer capacity. Since employees in Coburg could live in Eugene-Springfield or other communities in the southern Willamette Valley, housing capacity is not crucial for increasing employment in Coburg. Housing availability, however, is important if Coburg seeks to attract employers who wish to offer their employees the quality of life and short commute that comes from living and working in a small town. Housing is also important to maintain a balance between jobs and housing to reduce automobile commuting and to achieve other economic development goals. As mentioned before, past planning efforts in Coburg, including the Coburg Crossroads visioning process (2003) provided guidance that the City should adopt policies to target housing for families, in part to help maintain enrollment at Coburg Elementary and to address Comprehensive Plan goals to lower (VMT) Vehicle Miles Traveled.
Renewable and Non-Renewable Resources�Coburg is located near large areas of forest land owned by private owners and under Federal contains access roads and is managed for timber production. Despite reduced logging because of environmental concerns, the proximity to supplies of raw timber mean that forestry, logging, and other production related to the forest will remain important economic activities in the southern Willamette Valley and western Oregon. Coburg’s proximity to timber supplies and I-5 might allow it to attract firms engaged in lumber and wood products manufacturing or related activities. A Weyerhaeuser lumber mill is currently located north of Coburg (employment at this mill is not included in the Coburg employment data presented in this chapter because the mill is too far away from the City’s UGB).Coburg is also located in an area with prime agricultural land, particularly to the north and west of the city. The proximity to prime farmland can help Coburg attract businesses that support farming activities, such as farm equipment manufacturing and sales. Coburg might also attract businesses in food processing or markets that sell local agriculture products, such as organic farms or specialty nurseries. The development of the local agriculture industry can help support the small-town character of Coburg. Development of a farmer’s market or similar farm stands could help attract visitors to Coburg and create synergy with existing businesses and events in the city.Coburg also has several hundred acres of land designated and zoned for sand and gravel extraction and processing along the McKenzie River west of Coburg Road (owned and operated by both Egge Sand & Gravel Co and Wildish Sand & Gravel Co.). Aggregate is a non-renewable resource that is becoming more and more difficult to develop in the Willamette Valley. The
1352010 Coburg Urbanization Study
resource on the north side of the McKenzie has been designated in county planning documents since before 1980, and most of it is zoned and permitted for sand and gravel operations. Based on past conversations with staff at the two aggregate operations, the resources on the north side of the McKenzie could last 25 to 35 or more years. Transport of aggregate is an issue germane to the City’s planning efforts. According to staff at Wildish, the company will be transporting the excavated aggregate to the processing plant on the south side of the McKenzie via a conveyor belt bridge. Egge will continue to use Coburg Road. As part of the UGB expansion analysis (see Chapter 7), aggregate resource needs should be considered so that identified aggregate resources can be protected and conflicting uses can be avoided. None of the lands designated for sand and gravel use are included in the review of areas for potential UGB expansions in this study; this resource should be considered in future studies. �Coburg’s Economic Priorities�A review of recent Coburg community visioning documents, interviews with stakeholders and conversations with the Coburg Technical Advisory Committee reveal a number of priorities for Coburg’s economy. First, it is a clear priority of the City to protect the small town atmosphere that exists in much of Coburg, particularly the area in and around the Central Business District. The City’s economic priorities seem to focus on the possibility of industries that capitalize on that dynamic, or at least do not directly threaten it. Additional priorities include a desire to attract more professional office activity, as well as health related businesses. Also, the City has indicated its continuing commitment to provide an adequate amount of level, buildable land which has good access to arterial streets within existing city limits to meet local and regional industrial needs. In order to better assess business trends and needs and their impact on Coburg’s economic development potential, LCOG staff were in contact with a number of representatives from organizations who are actively involved in economic development issues in the Lane County area. These contacts included Jack Roberts of the Lane Metro Partnership and Bob Warren of the Oregon Economic & Community Development Department, as well as the Region 5 State Economist, Brian Rooney. Their expertise provided important insight into Coburg’s stated economic priorities.
The following describes these different priorities in more detail:
Retail Trade
There is a widely expressed desire for more Retail Trade businesses that focus on Coburg’s reputation and history in antique shops and malls. Connected to that is a desire to develop and attract more businesses in the Leisure and Hospitality Sector. Because of the City’s proximity to I-5 and its uniqueness, Coburg is seen by many as having additional potential as a tourist destination. There was agreement among the economists that there will be demand for retail goods and services with increasing population, but it probably will not be a large economic opportunity for the City. One economist suggested however, that Coburg's economic fortunes could benefit through a stronger retail and service sector that would not only serve its own residents but also the rest of the Eugene-Springfield area. He further explained that unlike some isolated regions, such as the Oregon Coast, where affluent retirees are primarily served by a lower-paid retail service sector base (creating a somewhat unhealthy dichotomy among economic classes), Coburg should consider that

1362010 Coburg Urbanization Study
its residential and employment opportunities exist within the context of the broader economic region of Eugene-Springfield and thus should not see the growth of retail and service sector jobs as in any way unhealthy.
Similarly, the consulting economists confirmed that growth in Leisure and Hospitality sector is a reliable assumption based on Lane County’s dynamics as well as Coburg’s.
Professional Office
Priorities include a desire to attract more professional office activity, and more specifically, health related businesses. Coburg is not far from the new Peacehealth Riverbend Hospital in Springfield and sees its locale as desirable for health related and support services. It is noted that Coburg is currently home to Manley Services which is a licensed third party medical benefits administrator. The consulting economists expressed uncertainty about the potential for Coburg to attract firms in the health industry. In general, there is a tremendous amount of competition for these firms, and as close as Coburg is, it may be regarded as being too far from the new hospital. Therefore, it is projected that the majority of support services to the hospital will locate in Springfield, closer to the hospital. This does not suggest that other office uses should not be able to realize some of Coburg’s comparative economic advantages.
Industrial
Coburg’s residents cannot and do not disregard the City’s potential for industrial business growth. The City lies directly on I-5, the main thoroughfare for ground transportation in the Pacific West. The RV industry currently dominates the industrial lands between downtown Coburg and I-5. With legitimate concern existing regarding the long-term health of the RV Industry, and Coburg’s desire to better realize its economic potential, diversify, and be flexible to respond to a variety of potential business sectors, the City has identified several other industrial priorities. These include:
Clean-Tech Manufactures The clean-tech industry is fairly new and is not easily defined. One summary of the clean tech industry is provided by cleantech.com which states that “clean-tech is new technology and related business models offering competitive returns for investors and customers while providing solutions to global challenges”. The “Clean” industry embraces a diverse range of products, services, and processes across industries, but is generally defined by the following industrial segments:
� Energy Generation � Energy Storage � Energy Infrastructure � Energy Efficiency
� Transportation� Water & Wastewater � Air & Environment Materials
There is a great demand for this type of facility throughout the State and nationally, and the consulting economists noted that Coburg may not have any particular advantages that would attract these businesses to the City over other communities nationally and state-wide. Because this is an emerging industry, the economists cautioned that the

1372010 Coburg Urbanization Study
future of this sector was uncertain at this time, and could be volatile as businesses adapt to changing market factors.
Warehousing/Distribution CentersDistribution centers typically consist of a warehouse or other specialized building with refrigeration or air conditioning which is stocked with products to be re-distributed to retailers or wholesalers. These centers can employ up to 800 employees.
Coburg exhibits a lot of the competitive advantages conducive to warehousing and distribution centers. These include its proximity to I-5, regional markets, and labor. According to the Economic and Community Development Department’s “must “ criteria for Warehouse and Distribution industries, a minimum of 25 net contiguous developable acres is required. Additionally it is required that an interstate or highway be within five miles of the site. Access is key to the warehouse and distribution industry. Lands in Coburg along I-5 provide excellent opportunities for access to transportation. Local distributors place a higher premium on sites that are centrally located and as a result are willing to trade off congestion for a location that can reach a number of places in the region.
Another potential area of emerging growth includes medical equipment distribution centers, which rely on good transportation access. One consulting economist noted the significant size of available land that may be needed to accommodate these uses and the need to resolve the access issues at the I-5 interchange in Coburg, if these uses were to locate within Coburg. As an example, a nearby Lowe’s distribution center is approximately one million square feet, similar to the size of the Target distribution center in Albany.
There are uncertainties about the barriers that may exist within Coburg’s land use regulations pertaining to these uses. Currently Coburg’s zoning does not allow for new warehousing facilities within its Highway Commercial zone and limits wholesaling, warehousing and storage to 250,000 square feet in the Light Industrial zone.
The Technical Advisory Committee along with the City Council and Planning Commission have expressed a disinterest in distribution and warehousing centers as a favorable form of economic development.
General IndustrialGeneral industrial building types can accommodate light to heavy manufacturing activities and encompass a wide range of activities from research, development, manufacturing and fabrication. Buildings can be as large as 400,000 square feet in size. The buildings range from custom built projects for single user company operations to more general spaces that are built as speculative facilities. Heavy manufacturing activities that require bulk materials locate adjacent to rail and port facilities to take advantage of cost savings from these types of transportation facilities. General industrial sites generally require the following site characteristics:
� Freeway access within 3 miles of an interchange via an arterial � Freeway access within 3 miles of an interchange via an arterial street; � Net parcel sizes: varies between 1-5 acres and 10-20 acres, depending upon the
shape of the lot and constraints;
1382010 Coburg Urbanization Study
� Location near other firms to provide access to an adequate labor pool � Stable soils, flat sites to reduce required site work, allow truck access and
interaction between businesses
There was general agreement among the consulting economists that Coburg is well-suited to support industrial development, provided that it has sufficient available land and is able to address the interchange issues.
Manufacturing, Transportation and Warehousing and Wholesale Trade were identified as competitive industries for Coburg, particularly small manufacturing. All economists cautioned that attracting large manufacturers, like another Monaco Coach, is very challenging and that time and energy should instead be focused on smaller regional manufacturers.
One consulting economist did, however, note that if Coburg were to provide a larger sites (50+ acres) it could have a marketable advantage over other communities in the region, such as Eugene and Springfield, which may have limited ability to accommodate large-size sites so near the freeway. There can be a lot of competition for mid- to smaller-sized sites, and businesses looking for this type of site may be drawn to the urban services in Eugene and Springfield, rather than Coburg.
Finally, another consulting economist stressed the need to provide a variety of sites so that the City could be flexible in responding to the needs of different firms. The following sample range of sites was recommended to more flexibly respond to market factors:
� One 50+ acres site � One-to-two 20+ acre sites � Smaller sites with intermix of commercial and industrial uses
Agriculture-related Industry
The 2004 Study identified Agriculture as an industry exhibiting a comparative advantage within Coburg. Businesses that capitalize on the City’s location within the Willamette Valley, proximity to farmlands, and good transportation access, such as natural food manufacturers, were also mentioned. The region has established a good reputation for this type of industry, and Coburg could capitalize on this.
The City has identified a number of economic priorities and target industries. As the City looks to diversify the types of businesses its economy consists of, it is also important to evaluate its policies to ensure that they do not erode industrial lands. The City contains areas that have the potential to be prime industrial land, given their size, topography, provision of utilities, and access to transportation. One of the concepts stressed was the need to have strong vision, but to remain open to options that may come forward. Professional economists and City officials commented on the need for available land and potential limitations for logical expansion areas for industrial development due to existing constraints, such as wetlands, agricultural land, and proximity to residential lands. The eastern side of I-5 was mentioned as a potential logical expansion area.
1392010 Coburg Urbanization Study
Members of the TAC recognize the factors identified by the local economists and the industries that the City may be best poised to attract. The TAC restated the City’s aversion to large and potential unsightly industrial uses (specifically warehousing) that do not fit into the community character envisioned for the City. There was concern that warehousing in particular would not provide for significant employment opportunities, given their historically low employee per acre ratios. There was also concern that an unsightly industrial area will give passers by the wrong impression the character of Coburg. There was discussion about the role that new design standards could provide in mitigating these potential aesthetic and community character concerns. No specific industry direction was provided to staff by the TAC. Instead there was support expressed for an approach of flexibility as suggested by the consulting economists. The idea of securing the availability of one or two mid-sized lots (20+ acres) was supported as a concept.
Summary of Coburg’s Economic Factors�This section has provided information on the range of firms that Coburg may wish to attract and that may be attracted to Coburg given its economic advantages. It also outlined some of Coburg’s comparative advantages in the region and issues that the City may need to address to attract these types of firms and economic growth in general. Any efforts the City of Coburg makes to attract and retain economic activity will be subject to its competitive advantages and disadvantages against other locations in the region, state and nation. Coburg’s economic factors are the foundation of its competitiveness. The economic factors which give Coburg its most competitive advantage include its proximity to the Eugene-Springfield metropolitan area, its access to I-5, and its high quality of life. Its greatest challenges include buildable land in the form of large sites and political support for the realities of economic growth. Coburg exhibits competitive potential to accommodate regional industrial growth. Local policy and priorities will dictate whether fulfillment of this potential can occur or not. For this reason, the supply of buildable land is the primary constraint to significant employment growth in Coburg, and ultimately the employment capacity of existing buildable land (plus expansion and redevelopment) determines the maximum amount of employment growth Coburg can expect over the forecast period.
Land Demand Implications of Economic Growth This section addresses Coburg’s employment land needs by identifying its current resources (supply) and comparing them with current and projected demand. Economic growth requires land for employment as well as other purposes. Cities in Oregon are required by OAR 660-024-004 to provide justification for any expansion of an Urban Growth Boundary. This justification comes in the form of analysis indicating that needed land for future employment, employment opportunities and population growth cannot be accommodated by existing buildable or redevelopable land resources within the current UGB. �� ���! ����0��#��!���There are different methodologies for identifying future land need. A commonly used procedure based on employment density was chosen for this analysis. Employment density is the ratio of employees of a certain type (i.e. industrial, commercial or all) within a specific geographic area. This figure can be compared and measured against the amount of occupied land designated for that specific use (i.e. industrial or commercial) within that same geographic area (i.e. industrial employees in Coburg per industrial acres in Coburg). The Technical Advisory Committee decided to use a floor area ratio (FAR) methodology for calculating employment densities in

1402010 Coburg Urbanization Study
�� ������#�=�������0�#�*�������� ���!��#�����88>
-������������#
� ��A�������
��������%�#���##�0�#����� 175 11.50 �,��)�*�?�!��� ������� 177 57.70 $��'�*�������#������ 2,530 172.00 �(�1Source LCOG
��&���,��$��#�� ������3�#���*�� ���! ����0��#��!
"� � �A#K�/��
�����#������*����
�3�#���*����
R�!�����R����#
��������%�#���##�0�#����� 1 1/400 108 15 15-25�� �������)�*�?�! 0.7 1/500 60.9 3 10-15'�*�������#����� 0.6 1/1000 26.1 15 8-12�� ��#�����#����� 0.5 1/500 43.5 N/A 15-20
��&���,��(����&��*���������"� � �#���#��� ����#��
Coburg. FAR is a commonly used measure for determining employment density. The benefits of FAR analysis include the following:
� Employment density will be closely linked to the realities of what types of development the code will allow. The analysis process also reveals what Coburg’s employment density potential is.
� FAR is better when trying to establish changes to historic employment growth patterns. For example, the Highway Commercial zone currently has an employee per acre (EPA) that is extremely low. FAR analysis reveals the actual employment potential of the zone and allows for wiser consideration of the use of sites within each zone.
The FAR methodology utilizes employee per square foot assumptions to determine employment density. There is general consensus in empirical studies that a typical range for office use is between 300 and 500 square feet per employee; retail can be the same or slightly higher. Industrial and warehousing may reach as high as 600 to 1,000 per employee. Estimates for FAR can be averaged for industry or land use type. Though the Coburg Zoning Ordinance does not establish a floor area maximum or minimum in any of its zoning districts, staff has used other development factors such as building height, lot coverage, and parking to calculate a potential FAR. Using this method, it was determined that the Highway Commercial district has the potential to yield an FAR of 0.7, while the industrial zone has the potential to yield an FAR of 0.6. The potential FAR for the Central Business District could be greater, given the higher allowable lot coverage.Though there is potential to achieve these FARs, market conditions and community sentiment may not support this intensity of development within Coburg. To better understand how this FAR would correspond to a typical Employee per Acre (EPA) analysis, staff has prepared a table summarizing corresponding EPA figures. Table 5.13 shows Coburg’s estimated existing EPA profile. Table 5.14 provides a summary of the EPA associated with the FARs described above in comparison with the Coburg’s existing and common or “typical” EPA figures.

1412010 Coburg Urbanization Study
�� ������#�=�������0�#�*������� "� ������#�������
��������%�#���##�0�#����� 8��, 25.00)�*�?�!��� ������� 8��8 17.40'�*�������#������ 8�$8 13.10�� ��#�����#����� 8��1 23.50Source LCOG
��&���,��,���&��*���������� ���! ����0��#��!
These figures demonstrate that an FAR methodology using a greater development potential will yield significantly more employees per acre than would traditionally be found within Coburg or within ‘typical’ conditions. This can be adjusted by modifying the anticipated FAR. Several other economic opportunity analyses reviewed by staff have used an FAR of 0.3. The TAC reviewed visualizations of employment at different densities. Based on FARs in other Oregon communities and consideration of Coburg appropriate employment density, it was concluded that FARs planned for zones within Coburg should represent less density than allowed for in the code. Rather than planned FARs of 0.7 or 0.6, the TAC recommended that planned FARs of 0.2 to 0.4 be utilized. Table 5.15 shows the planned FARs which are utilized to determine employment density in this study.
���
��
���� ���! ����0��#��!������ ���! �������H������:��In this analysis, future land need is determined using Coburg’s planned FAR figures as well as an Employment projection for Coburg’s UGB (See Table 5.9). Table 5.16 reflects the projected total employment growth by 2-Digit NAICS sector and plan designation over the 20 year planning period. Employment growth within Coburg’s UGB during this period yields an additional 615 new jobs, for an employment total of 4,035 in 2030.
The table reflects the distinction between land use designations. Anticipated growth for each sector is distributed amongst the plan designation types. This distribution was derived using an analysis of Coburg’s current land use code, as well as the current distribution of these employment uses. Because no actual acreage with Campus Industrial District designation currently exists, two employment distribution scenarios are presented. Scenario 1 reflects a future distribution without an active Campus Industrial District (CI), and Scenario 2 reflects a future distribution with such a District.
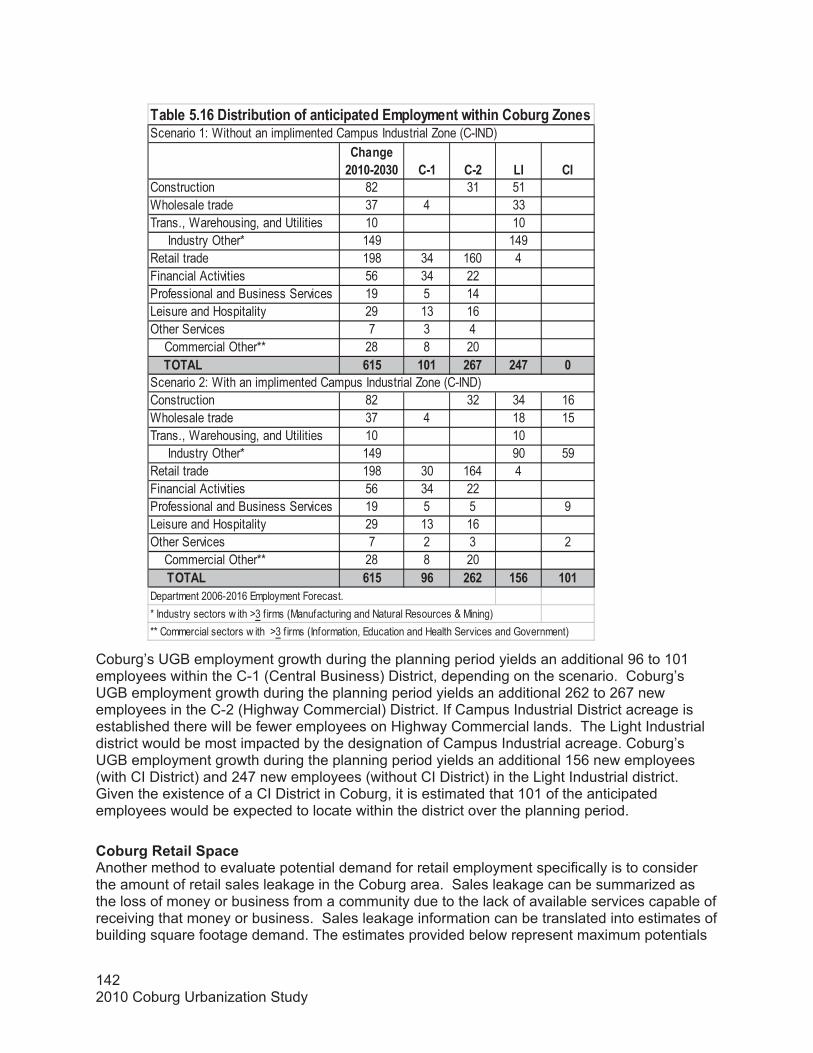
1422010 Coburg Urbanization Study
����*���8�89�8$8 �9� �9� '� ��
Construction 82 31 51Wholesale trade 37 4 33Trans., Warehousing, and Utilities 10 10 Industry Other* 149 149Retail trade 198 34 160 4Financial Activities 56 34 22Professional and Business Services 19 5 14Leisure and Hospitality 29 13 16Other Services 7 3 4 Commercial Other** 28 8 20�����-��' .�, �8� �.1 �(1 8
Construction 82 32 34 16Wholesale trade 37 4 18 15Trans., Warehousing, and Utilities 10 10 Industry Other* 149 90 59Retail trade 198 30 164 4Financial Activities 56 34 22Professional and Business Services 19 5 5 9Leisure and Hospitality 29 13 16Other Services 7 2 3 2 Commercial Other** 28 8 20������-��' .�, >. �.� �,. �8�
** Commercial sectors w ith >3 f irms (Information, Education and Health Services and Government)* Industry sectors w ith >3 f irms (Manufacturing and Natural Resources & Mining)Department 2006-2016 Employment Forecast.
Scenario 1: Without an implimented Campus Industrial Zone (C-IND)��&���,��.�0�#���&�������/�������������� ���! ����?��������&��*�@���#
Scenario 2: With an implimented Campus Industrial Zone (C-IND)
Coburg’s UGB employment growth during the planning period yields an additional 96 to 101 employees within the C-1 (Central Business) District, depending on the scenario. Coburg’s UGB employment growth during the planning period yields an additional 262 to 267 new employees in the C-2 (Highway Commercial) District. If Campus Industrial District acreage is established there will be fewer employees on Highway Commercial lands. The Light Industrial district would be most impacted by the designation of Campus Industrial acreage. Coburg’s UGB employment growth during the planning period yields an additional 156 new employees (with CI District) and 247 new employees (without CI District) in the Light Industrial district. Given the existence of a CI District in Coburg, it is estimated that 101 of the anticipated employees would be expected to locate within the district over the planning period. ���&��*� �����������Another method to evaluate potential demand for retail employment specifically is to consider the amount of retail sales leakage in the Coburg area. Sales leakage can be summarized as the loss of money or business from a community due to the lack of available services capable of receiving that money or business. Sales leakage information can be translated into estimates of building square footage demand. The estimates provided below represent maximum potentials

1432010 Coburg Urbanization Study
assuming 100 percent sales leakage recapture. Also quantified with this analysis are future retail potentials associated with population growth to 2030.
Local Resident Demand: � Coburg’s market could support up to an added estimate of 36,600 square feet of retail
space - to fully serve existing locally generated resident needs and population growth anticipated over a 20-year forecast period to 2030.
� On paper, the greatest future in-city residentially generated retail market need is general merchandise. However, not all of the demand indicated should be expected to be served by new retail stores in Coburg, as the amount of demand supported by the local population alone is often below the minimum size thresholds of retail establishments.
� Additional square footage could be needed as a result of demand generated from tourist trade, as well as trade occurring from residents in the rural areas outlying Coburg.
� A convenience center (10,000-30,000 square feet offering an array of goods and services, typically anchored by a small specialty food mart or pharmacy, together with 5-8 other smaller (1,500-3,000 square foot) businesses) would need about 2,000 residents to be supported and have a typical retail trade area of up to a 1-mile radius45. Given the anticipated population increase within Coburg and current market leakages based on the marketing analysis, there may be potential for a convenience center type development to form within Coburg.
�This information is summarized in Table 5.17: ���&����,��1�����&��*��� ������� ���������������������;�8�89�8$8<� � %������*������0� ����;#/<�
����������*����#� ������
���#AK��"���'��I�*�� ��������
"������2��?���
����������������
Furniture & Home Furnishings Stores $210 1,512 2,518 4,030 Electronics & Appliance Stores $310 975 1,624 2,599 Bldg Materials, Garden Equip. & Supply Stores $390 1,864 1,864
Food & Beverage Stores $410 8,128 8,128 Health & Personal Care Stores $370 693 1,154 1,847 Gasoline Stations $1,350 565 1,806 2,371 Clothing and Clothing Accessories Stores $250 1,618 2,694 4,312
Sporting Goods, Hobby, Book, and Music Stores $220 750 1,249 1,999
General Merchandise Stores $350 5,597 9,319 14,916 Miscellaneous Store Retailers $210 1,330 1,330 Nonstore Retailers N/A - - 0Food Services & Drinking Places $315 9,884 9,884 ������ � >7��$� �17($.� $.7.,>�Source: ESRI Business Info. Solutions, LCOG (based upon methodolody used by E.D. Hovee & Company, LLC46)� �#�����*������*��0� ����Table 5.18 shows how Coburg’s employment density figures and projected employment growth figures can be used to determine new needed acres for the planning period. The table shows how the number of additional employees and employees per acre anticipated based on the FAR analysis, results in the New Needed Acres figure for each plan designation. The employee
45 Sustainable Urbanism: Urban Design with Nature. Farr, Douglas. 2008. 46 E.D. Hovee & Company, LLC, Cascade Locks Economic Op opportunities Analysis, June 2009
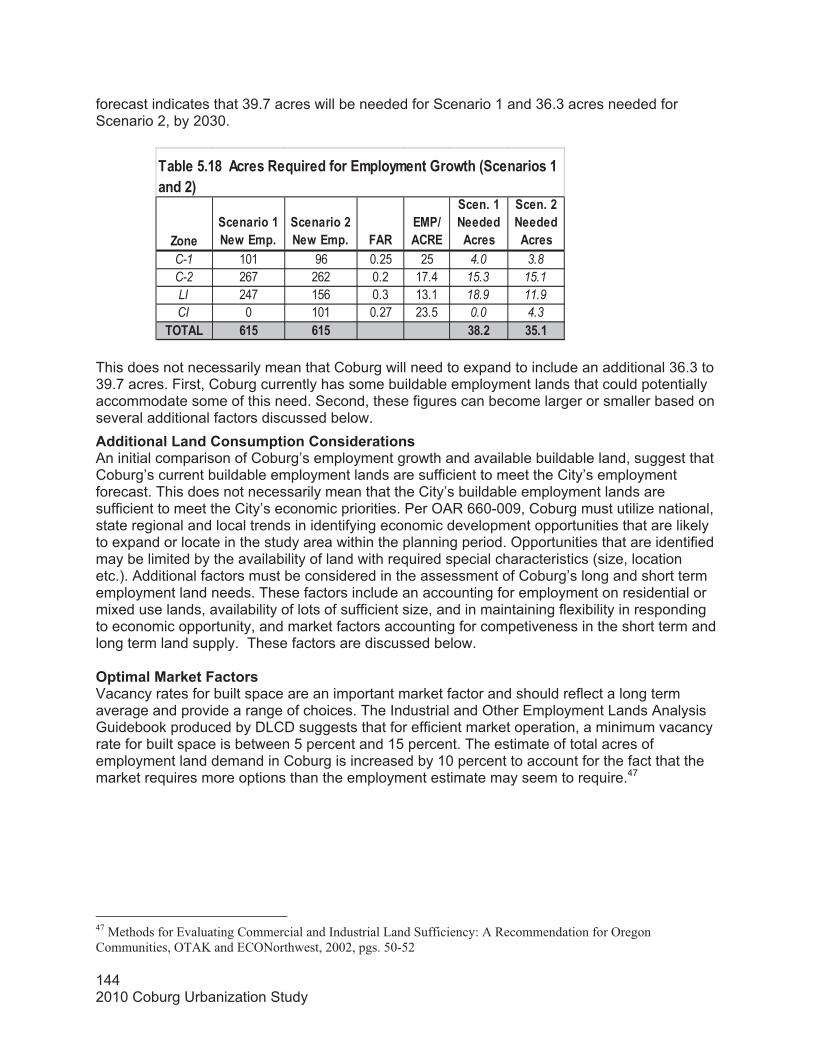
1442010 Coburg Urbanization Study
@�������������+�?�� ���
����������+�?�� ��� "�
���A��� �
�������+����������#
�������+����������#
C-1 101 96 0.25 25 4.0 3.8C-2 267 262 0.2 17.4 15.3 15.1LI 247 156 0.3 13.1 18.9 11.9CI 0 101 0.27 23.5 0.0 4.3
�-��' .�, .�, $4�� $,��
��&���,��4������#� �K������/���� ���! ����2��?���;�������#��������<
forecast indicates that 39.7 acres will be needed for Scenario 1 and 36.3 acres needed for Scenario 2, by 2030.
This does not necessarily mean that Coburg will need to expand to include an additional 36.3 to 39.7 acres. First, Coburg currently has some buildable employment lands that could potentially accommodate some of this need. Second, these figures can become larger or smaller based on several additional factors discussed below. �����������'�������#� ���������#���������#�An initial comparison of Coburg’s employment growth and available buildable land, suggest that Coburg’s current buildable employment lands are sufficient to meet the City’s employment forecast. This does not necessarily mean that the City’s buildable employment lands are sufficient to meet the City’s economic priorities. Per OAR 660-009, Coburg must utilize national, state regional and local trends in identifying economic development opportunities that are likely to expand or locate in the study area within the planning period. Opportunities that are identified may be limited by the availability of land with required special characteristics (size, location etc.). Additional factors must be considered in the assessment of Coburg’s long and short term employment land needs. These factors include an accounting for employment on residential or mixed use lands, availability of lots of sufficient size, and in maintaining flexibility in responding to economic opportunity, and market factors accounting for competiveness in the short term and long term land supply. These factors are discussed below.
-��� ������I���"�����#�Vacancy rates for built space are an important market factor and should reflect a long term average and provide a range of choices. The Industrial and Other Employment Lands Analysis Guidebook produced by DLCD suggests that for efficient market operation, a minimum vacancy rate for built space is between 5 percent and 15 percent. The estimate of total acres of employment land demand in Coburg is increased by 10 percent to account for the fact that the market requires more options than the employment estimate may seem to require.47
47 Methods for Evaluating Commercial and Industrial Land Sufficiency: A Recommendation for Oregon Communities, OTAK and ECONorthwest, 2002, pgs. 50-52
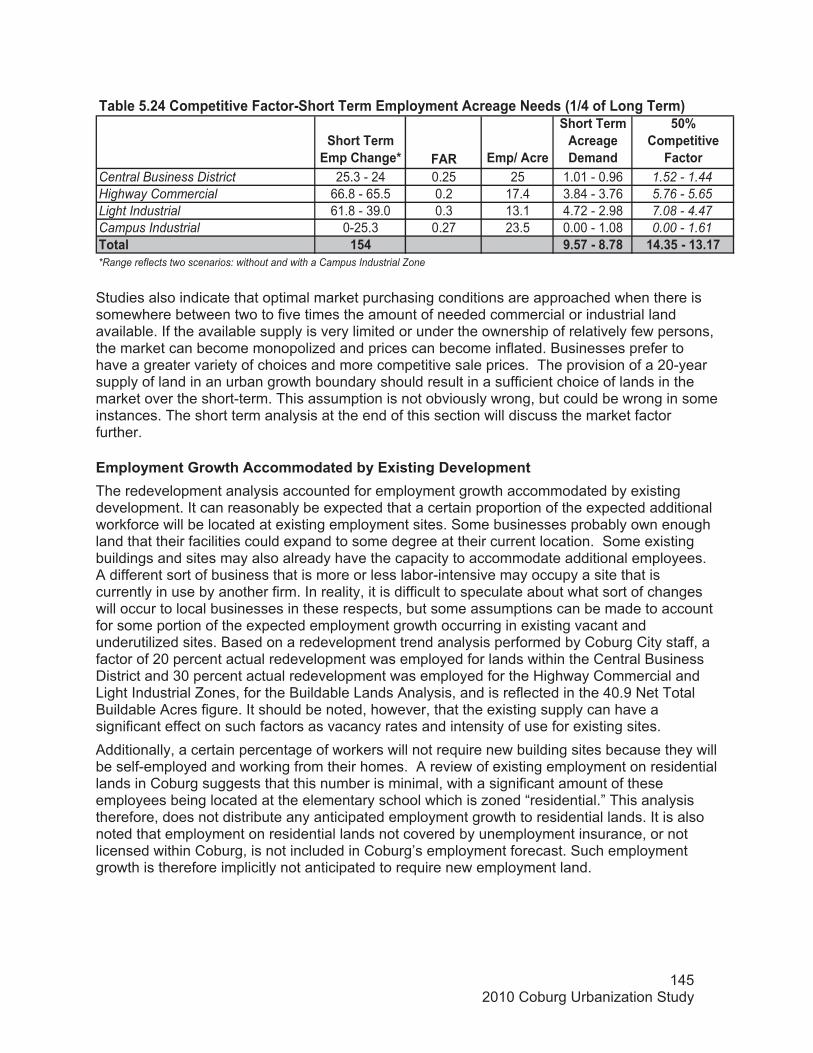
1452010 Coburg Urbanization Study
�������� �� ������*�C "� � �A�����
�������� ������*��0� ���
,8D��� ������=��"�����
Central Business District 25.3 - 24 0.25 25 1.01 - 0.96 1.52 - 1.44Highway Commercial 66.8 - 65.5 0.2 17.4 3.84 - 3.76 5.76 - 5.65Light Industrial 61.8 - 39.0 0.3 13.1 4.72 - 2.98 7.08 - 4.47Campus Industrial 0-25.3 0.27 23.5 0.00 - 1.08 0.00 - 1.61������ �,( >�,1�9�4�14 �(�$,�9��$��1
��&���,��(��� ������=��"�����9�������� �� ���! ���������*��+���#�;�A(��/�'��*���� <
*Range reflects two scenarios: without and with a Campus Industrial Zone
Studies also indicate that optimal market purchasing conditions are approached when there is somewhere between two to five times the amount of needed commercial or industrial land available. If the available supply is very limited or under the ownership of relatively few persons, the market can become monopolized and prices can become inflated. Businesses prefer to have a greater variety of choices and more competitive sale prices. The provision of a 20-year supply of land in an urban growth boundary should result in a sufficient choice of lands in the market over the short-term. This assumption is not obviously wrong, but could be wrong in some instances. The short term analysis at the end of this section will discuss the market factor further.
� ���! ����2��?������� �������&!��3�#���*�0�=���� �����The redevelopment analysis accounted for employment growth accommodated by existing development. It can reasonably be expected that a certain proportion of the expected additional workforce will be located at existing employment sites. Some businesses probably own enough land that their facilities could expand to some degree at their current location. Some existing buildings and sites may also already have the capacity to accommodate additional employees. A different sort of business that is more or less labor-intensive may occupy a site that is currently in use by another firm. In reality, it is difficult to speculate about what sort of changes will occur to local businesses in these respects, but some assumptions can be made to account for some portion of the expected employment growth occurring in existing vacant and underutilized sites. Based on a redevelopment trend analysis performed by Coburg City staff, a factor of 20 percent actual redevelopment was employed for lands within the Central Business District and 30 percent actual redevelopment was employed for the Highway Commercial and Light Industrial Zones, for the Buildable Lands Analysis, and is reflected in the 40.9 Net Total Buildable Acres figure. It should be noted, however, that the existing supply can have a significant effect on such factors as vacancy rates and intensity of use for existing sites. Additionally, a certain percentage of workers will not require new building sites because they will be self-employed and working from their homes. A review of existing employment on residential lands in Coburg suggests that this number is minimal, with a significant amount of these employees being located at the elementary school which is zoned “residential.” This analysis therefore, does not distribute any anticipated employment growth to residential lands. It is also noted that employment on residential lands not covered by unemployment insurance, or not licensed within Coburg, is not included in Coburg’s employment forecast. Such employment growth is therefore implicitly not anticipated to require new employment land. ����
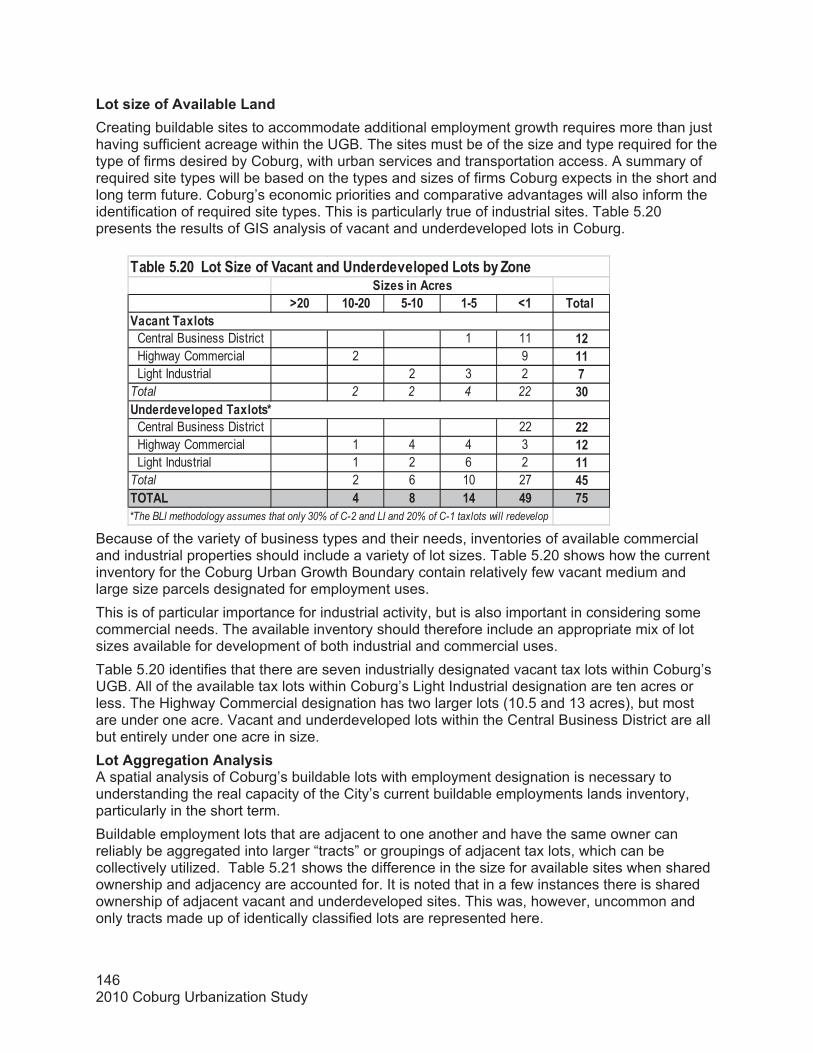
1462010 Coburg Urbanization Study
O�8 �89�8 ,9�8 �9, N� ������
Central Business District 1 11 �� Highway Commercial 2 9 �� Light Industrial 2 3 2 1Total 2 2 4 22 $8
Central Business District 22 �� Highway Commercial 1 4 4 3 �� Light Industrial 1 2 6 2 ��Total 2 6 10 27 (,�-��' ( 4 �( (> 1,
��&���,��8��'����J���/������������������=�������'��#�&!�@���
*The BLI methodology assumes that only 30% of C-2 and LI and 20% of C-1 taxlots will redevelop
�J�#��������#
��������3���#
�������=���������3���#C
'���#�J���/��=����&���'�����Creating buildable sites to accommodate additional employment growth requires more than just having sufficient acreage within the UGB. The sites must be of the size and type required for the type of firms desired by Coburg, with urban services and transportation access. A summary of required site types will be based on the types and sizes of firms Coburg expects in the short and long term future. Coburg’s economic priorities and comparative advantages will also inform the identification of required site types. This is particularly true of industrial sites. Table 5.20 presents the results of GIS analysis of vacant and underdeveloped lots in Coburg.
Because of the variety of business types and their needs, inventories of available commercial and industrial properties should include a variety of lot sizes. Table 5.20 shows how the current inventory for the Coburg Urban Growth Boundary contain relatively few vacant medium and large size parcels designated for employment uses. This is of particular importance for industrial activity, but is also important in considering some commercial needs. The available inventory should therefore include an appropriate mix of lot sizes available for development of both industrial and commercial uses. Table 5.20 identifies that there are seven industrially designated vacant tax lots within Coburg’s UGB. All of the available tax lots within Coburg’s Light Industrial designation are ten acres or less. The Highway Commercial designation has two larger lots (10.5 and 13 acres), but most are under one acre. Vacant and underdeveloped lots within the Central Business District are all but entirely under one acre in size. '����**��*����������!#�#�A spatial analysis of Coburg’s buildable lots with employment designation is necessary to understanding the real capacity of the City’s current buildable employments lands inventory, particularly in the short term. Buildable employment lots that are adjacent to one another and have the same owner can reliably be aggregated into larger “tracts” or groupings of adjacent tax lots, which can be collectively utilized. Table 5.21 shows the difference in the size for available sites when shared ownership and adjacency are accounted for. It is noted that in a few instances there is shared ownership of adjacent vacant and underdeveloped sites. This was, however, uncommon and only tracts made up of identically classified lots are represented here.
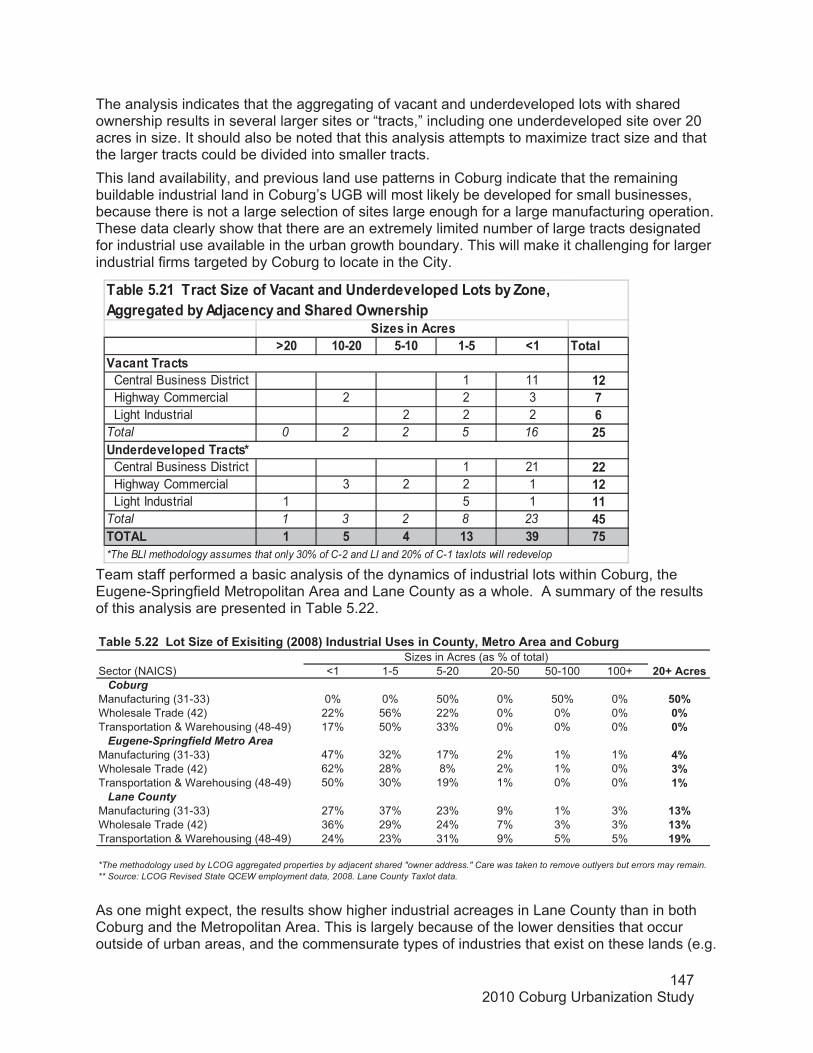
1472010 Coburg Urbanization Study
O�8 �89�8 ,9�8 �9, N� ������
Central Business District 1 11 �� Highway Commercial 2 2 3 1 Light Industrial 2 2 2 .Total 0 2 2 5 16 �,
Central Business District 1 21 �� Highway Commercial 3 2 2 1 �� Light Industrial 1 5 1 ��Total 1 3 2 8 23 (,�-��' � , ( �$ $> 1,
��&���,������������J���/������������������=�������'��#�&!�@���7��**��*�����&!���H�����!�����������-?���#���
*The BLI methodology assumes that only 30% of C-2 and LI and 20% of C-1 taxlots will redevelop
�J�#��������#
�����������#
�������=������������#C
The analysis indicates that the aggregating of vacant and underdeveloped lots with shared ownership results in several larger sites or “tracts,” including one underdeveloped site over 20 acres in size. It should also be noted that this analysis attempts to maximize tract size and that the larger tracts could be divided into smaller tracts. This land availability, and previous land use patterns in Coburg indicate that the remaining buildable industrial land in Coburg’s UGB will most likely be developed for small businesses, because there is not a large selection of sites large enough for a large manufacturing operation. These data clearly show that there are an extremely limited number of large tracts designated for industrial use available in the urban growth boundary. This will make it challenging for larger industrial firms targeted by Coburg to locate in the City.
��
Team staff performed a basic analysis of the dynamics of industrial lots within Coburg, the Eugene-Springfield Metropolitan Area and Lane County as a whole. A summary of the results of this analysis are presented in Table 5.22.
Sector (NAICS) <1 1-5 5-20 20-50 50-100 100+ �8B�����# CoburgManufacturing (31-33) 0% 0% 50% 0% 50% 0% ,8DWholesale Trade (42) 22% 56% 22% 0% 0% 0% 8DTransportation & Warehousing (48-49) 17% 50% 33% 0% 0% 0% 8D Eugene-Springfield Metro AreaManufacturing (31-33) 47% 32% 17% 2% 1% 1% (DWholesale Trade (42) 62% 28% 8% 2% 1% 0% $DTransportation & Warehousing (48-49) 50% 30% 19% 1% 0% 0% �D Lane County Manufacturing (31-33) 27% 37% 23% 9% 1% 3% �$DWholesale Trade (42) 36% 29% 24% 7% 3% 3% �$DTransportation & Warehousing (48-49) 24% 23% 31% 9% 5% 5% �>D
��&���,�����'����J���/��3�#����*�;�884<�����#�������#�#���������!7������������������&��*
*The methodology used by LCOG aggregated properties by adjacent shared "owner address." Care was taken to remove outlyers but errors may remain. ** Source: LCOG Revised State QCEW employment data, 2008. Lane County Taxlot data.
Sizes in Acres (as % of total)
As one might expect, the results show higher industrial acreages in Lane County than in both Coburg and the Metropolitan Area. This is largely because of the lower densities that occur outside of urban areas, and the commensurate types of industries that exist on these lands (e.g.
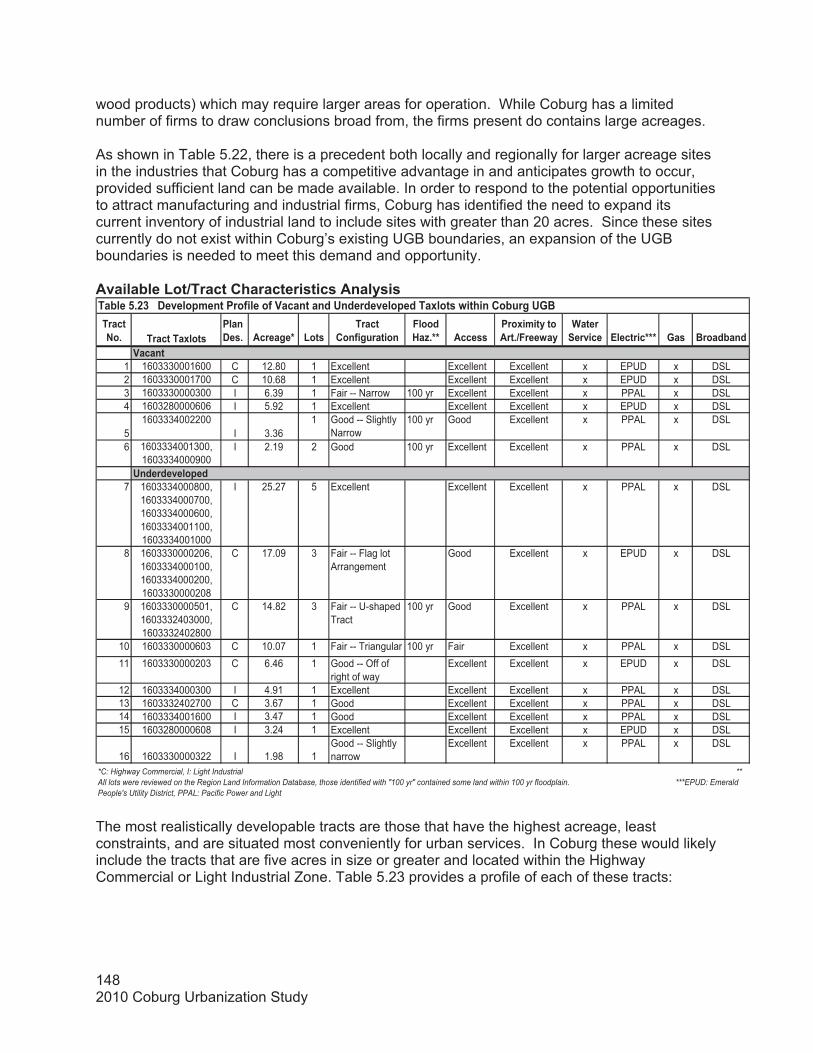
1482010 Coburg Urbanization Study
wood products) which may require larger areas for operation. While Coburg has a limited number of firms to draw conclusions broad from, the firms present do contains large acreages.
As shown in Table 5.22, there is a precedent both locally and regionally for larger acreage sites in the industries that Coburg has a competitive advantage in and anticipates growth to occur, provided sufficient land can be made available. In order to respond to the potential opportunities to attract manufacturing and industrial firms, Coburg has identified the need to expand its current inventory of industrial land to include sites with greater than 20 acres. Since these sites currently do not exist within Coburg’s existing UGB boundaries, an expansion of the UGB boundaries is needed to meet this demand and opportunity. ��=����&���'��A����������������#���#�����!#�#�
������+�� ��������3���#
�����0�#� �����*�C '��#
���������/�*��������
"�����)�J�CC ����##
���3� ��!��������A"���?�!�
5�������=��� ��������CCC 2�# %����&���
1 1603330001600 C 12.80 1 Excellent Excellent Excellent x EPUD x DSL2 1603330001700 C 10.68 1 Excellent Excellent Excellent x EPUD x DSL3 1603330000300 I 6.39 1 Fair -- Narrow 100 yr Excellent Excellent x PPAL x DSL4 1603280000606 I 5.92 1 Excellent Excellent Excellent x EPUD x DSL
51603334002200
I 3.361 Good -- Slightly
Narrow100 yr Good Excellent x PPAL x DSL
6 1603334001300, 1603334000900
I 2.19 2 Good 100 yr Excellent Excellent x PPAL x DSL
7 1603334000800, 1603334000700, 1603334000600, 1603334001100, 1603334001000
I 25.27 5 Excellent Excellent Excellent x PPAL x DSL
8 1603330000206, 1603334000100, 1603334000200, 1603330000208
C 17.09 3 Fair -- Flag lot Arrangement
Good Excellent x EPUD x DSL
9 1603330000501, 1603332403000, 1603332402800
C 14.82 3 Fair -- U-shaped Tract
100 yr Good Excellent x PPAL x DSL
10 1603330000603 C 10.07 1 Fair -- Triangular 100 yr Fair Excellent x PPAL x DSL11 1603330000203 C 6.46 1 Good -- Off of
right of wayExcellent Excellent x EPUD x DSL
12 1603334000300 I 4.91 1 Excellent Excellent Excellent x PPAL x DSL13 1603332402700 C 3.67 1 Good Excellent Excellent x PPAL x DSL14 1603334001600 I 3.47 1 Good Excellent Excellent x PPAL x DSL15 1603280000608 I 3.24 1 Excellent Excellent Excellent x EPUD x DSL
16 1603330000322 I 1.98 1Good -- Slightly narrow
Excellent Excellent x PPAL x DSL
�������=������
�����
��&���,��$���0�=���� �������/�����/������������������=���������3���#�?��������&��*��2%
*C: Highway Commercial, I: Light Industrial ** All lots were reviewed on the Region Land Information Database, those identified with "100 yr" contained some land within 100 yr floodplain. ***EPUD: Emerald People's Utility District, PPAL: Pacific Power and Light
The most realistically developable tracts are those that have the highest acreage, least constraints, and are situated most conveniently for urban services. In Coburg these would likely include the tracts that are five acres in size or greater and located within the Highway Commercial or Light Industrial Zone. Table 5.23 provides a profile of each of these tracts:
1492010 Coburg Urbanization Study
ConclusionThis chapter has presented an analysis of the Coburg’s economic patterns, potentialities, strengths, and deficiencies as they relate to state, national and local trends. Oregon Statewide Planning Goal 9 declares that a “principal determinant in planning for major industrial and commercial developments should be the comparative advantage of the region within which the developments would be located.” The Chapter provided an assessment of community economic development potential and an estimate of the types and amounts of industrial and commercial development likely to occur in the planning area and during the planning period. Chapter 6 Comparison of Land Demand and Supply, presents the results of the comparison of Coburg’s Economic Opportunities and Needs with its capacity to accommodate such needs and opportunities. It includes the final conclusions about overall land needs to meet Coburg’s economic opportunities.
Short Term Need AnalysisTypically, cities within a Metropolitan Planning Organization (MPO) are required by (OAR 660-009-0015) to approximate acreage and percentage of sites within each plan designation that comprise the “short-term” supply of land as part of any inventory of employment lands. Additionally communities are required by OAR 660-009-0020, to adopt the provision of a competitive short-term supply of employment lands as a local policy. However, changes made in 2005 exempted cities with a current population of under 2,500 from this requirement. Since Coburg currently has a population of less than 2,500, it is exempt form this statutory requirement.Coburg has, however, opted to voluntarily perform elements of a short-term economic analysis. By doing so the City hopes to have a greater sense for its capacity for achieving local economic development objectives. A five year outlook is used as the bounds for a short-term analysis. The short-term future for this analysis is therefore considered the period of time between 2010 and 2015 (approximately five years). OAR 660-009-0025(3) now gives three options when planning for the short-term analysis. The previous rules provided only one. Under the rule amendments, cities may choose to maintain 25 percent of the total land supply in short-term status, set their own short-term target based on their Economic Opportunities Analysis, or choose to participate in Oregon’s industrial site certification program. According to the DLCD Industrial and Other Employment Lands Analysis Guidebook, land qualifies as “competitive” short-term if it is ready for development within one year of a permit application or request for service extension. A 20-year land supply where 25 percent of the land is available short-term is considered a competitive supply.48 This analysis has determined that Coburg has a 20-year employment land demand of approximately 38-42 acres. According to the DLCD workbook and OAR 660-009-0025(3) this means that Coburg should ensure that it currently has approximately 10-11 acres (25 percent of 38-42)) of employment land that is ready for development within one year of a permit application or request for service extension. Although Coburg’s long-term future extends well beyond the next twenty years, for the purposes of this analysis the long-term future is the period of time spanning the planning period (2010-2030).
48 Industrial and Other Employment lands Analysis Guidebook, DLCD, 2005, pg. V
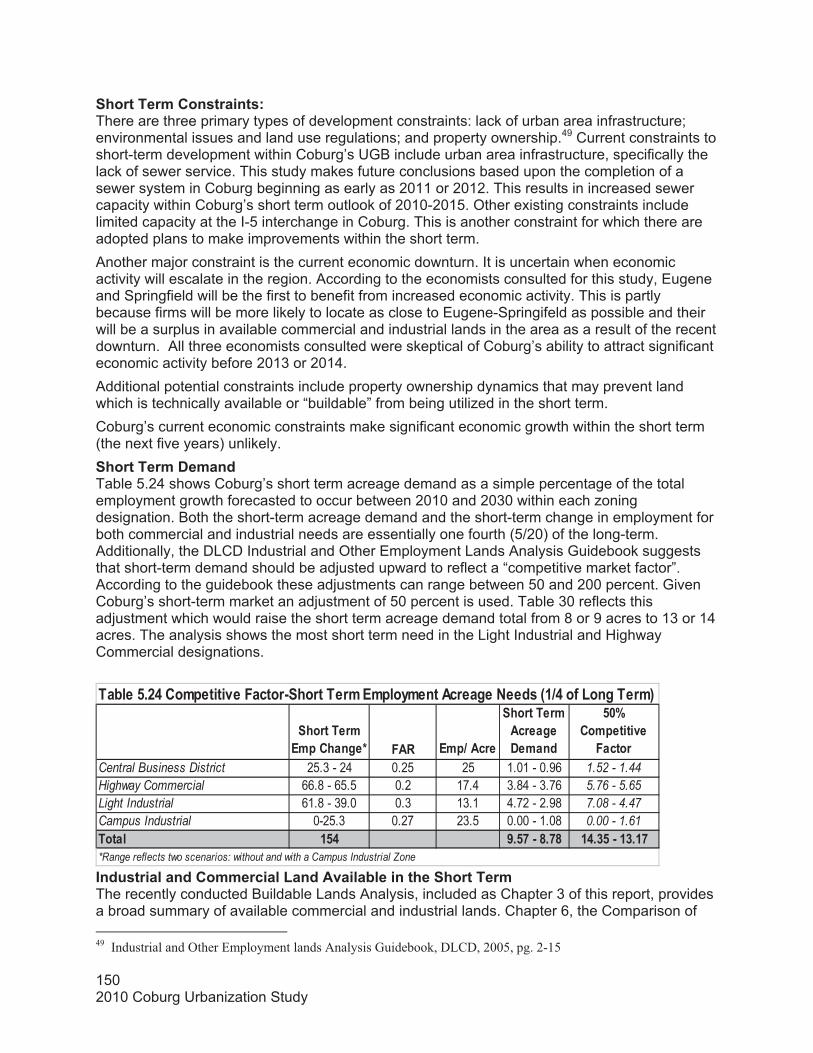
1502010 Coburg Urbanization Study
�������� �� ������*�C "� � �A�����
�������� ������*��0� ���
,8D��� ������=��"�����
Central Business District 25.3 - 24 0.25 25 1.01 - 0.96 1.52 - 1.44Highway Commercial 66.8 - 65.5 0.2 17.4 3.84 - 3.76 5.76 - 5.65Light Industrial 61.8 - 39.0 0.3 13.1 4.72 - 2.98 7.08 - 4.47Campus Industrial 0-25.3 0.27 23.5 0.00 - 1.08 0.00 - 1.61������ �,( >�,1�9�4�14 �(�$,�9��$��1
��&���,��(��� ������=��"�����9�������� �� ���! ���������*��+���#�;�A(��/�'��*���� <
*Range reflects two scenarios: without and with a Campus Industrial Zone
�������� ����#������#:��There are three primary types of development constraints: lack of urban area infrastructure; environmental issues and land use regulations; and property ownership.49 Current constraints to short-term development within Coburg’s UGB include urban area infrastructure, specifically the lack of sewer service. This study makes future conclusions based upon the completion of a sewer system in Coburg beginning as early as 2011 or 2012. This results in increased sewer capacity within Coburg’s short term outlook of 2010-2015. Other existing constraints include limited capacity at the I-5 interchange in Coburg. This is another constraint for which there are adopted plans to make improvements within the short term. Another major constraint is the current economic downturn. It is uncertain when economic activity will escalate in the region. According to the economists consulted for this study, Eugene and Springfield will be the first to benefit from increased economic activity. This is partly because firms will be more likely to locate as close to Eugene-Springifeld as possible and their will be a surplus in available commercial and industrial lands in the area as a result of the recent downturn. All three economists consulted were skeptical of Coburg’s ability to attract significant economic activity before 2013 or 2014. Additional potential constraints include property ownership dynamics that may prevent land which is technically available or “buildable” from being utilized in the short term. Coburg’s current economic constraints make significant economic growth within the short term (the next five years) unlikely.�������� �0� ����Table 5.24 shows Coburg’s short term acreage demand as a simple percentage of the total employment growth forecasted to occur between 2010 and 2030 within each zoning designation. Both the short-term acreage demand and the short-term change in employment for both commercial and industrial needs are essentially one fourth (5/20) of the long-term. Additionally, the DLCD Industrial and Other Employment Lands Analysis Guidebook suggests that short-term demand should be adjusted upward to reflect a “competitive market factor”. According to the guidebook these adjustments can range between 50 and 200 percent. Given Coburg’s short-term market an adjustment of 50 percent is used. Table 30 reflects this adjustment which would raise the short term acreage demand total from 8 or 9 acres to 13 or 14 acres. The analysis shows the most short term need in the Light Industrial and Highway Commercial designations.
����#������������ �������'�����=����&������������������ ��The recently conducted Buildable Lands Analysis, included as Chapter 3 of this report, provides a broad summary of available commercial and industrial lands. Chapter 6, the Comparison of
49 Industrial and Other Employment lands Analysis Guidebook, DLCD, 2005, pg. 2-15
1512010 Coburg Urbanization Study
Land Needs and Demand will discuss in greater detail the specific 20-year acreage demands that result from the Economic Opportunities Analysis and the Buildable Lands Analysis. The question of short-term land availability is a question of Coburg’s capacity to provide shovel-ready sites between 2010 and 2015, specifically 13-15 acres. Table 5.21 shows a summary of vacant and underdeveloped sites within Coburg. This summary suggests that there are a number of sites of sufficient size, and characteristics to meet this short term demand as defined by the DLCD workbook. This short term acreage need of 13-15 acres does not take into account the possibility of one large employer seeking a site of significant acreage (25+ acres) in Coburg. Although it is not anticipated in the short term, Chapter 6 will provide a discussion of Coburg’s need and desire to secure additional industrial land of sufficient size to accommodate industries with larger land needs that are likely to be attracted to Coburg within the long term economic planning period.

1522010 Coburg Urbanization Study
1532010 Coburg Urbanization Study
�)���� �.���-��� �-+�-"�'�+0����'���+0�0���+0�
This chapter summarizes data and analysis presented in Chapters 2 through 5 to compare “demonstrated need” for vacant buildable land with the supply of such land currently within the Coburg UGB and City Limits. Chapter 2 described population and employment forecasts, Chapter 3 described land supply, Chapter 4 described residential land needs, and Chapter 5 described land needed for employment.
Population and economic growth require land for new residents and employment as well as other purposes. Cities in Oregon are required by (OAR 660-024-004) to provide justification for any expansion of an Urban Growth Boundary. This justification comes in the form of analysis indicating that needed land for future employment and population growth cannot be accommodated by existing buildable or redevelopable land resources within the current UGB. This section addresses Coburg’s housing and employment land needs by identifying its current resources (supply) and comparing them with current and projected needs (demand). The chapter concludes, specifically, with a comparison of land supply and land demand for the 2010-2030 time period.
Land Supply and Demand Comparison within the Overall UGB Expansion Process
This portion of Coburg’s Study (2010) provides a summary of whether there is a deficit or surplus of buildable land for residential, commercial, and Industrial needs in Coburg’s UGB.The steps in the full process of the UGB Expansion study are:
��������$��%�����&���'������=�����!:�Inventory all types of vacant, potential infill, potential redevelopment and environmentally constrained land within the existing UGB for residential, commercial, and industrial land.
�
��������(��)��#��*�+���#�����!#�#:�Determine types and densities of residential development within the UGB using the Housing/Land Needs. Determine the amount of land needed to meet future demand at appropriate types and densities based on historical and potential future development trends, population changes and growth projections, and economic factors. Address all Goal 10 Housing, and Goal 14 requirements. Housing needs are estimated using the Housing/Land Needs Model.�
� ��������,������� ���-�����������#�����!#�#: Estimate need for commercial and industrial land based on historic and current trends related to employment projections and local economic potential. Identify size and characteristics of employment land needs. Address requirements of Goal 9.
ThisSection ��������.������!�����0� ������ ����#����
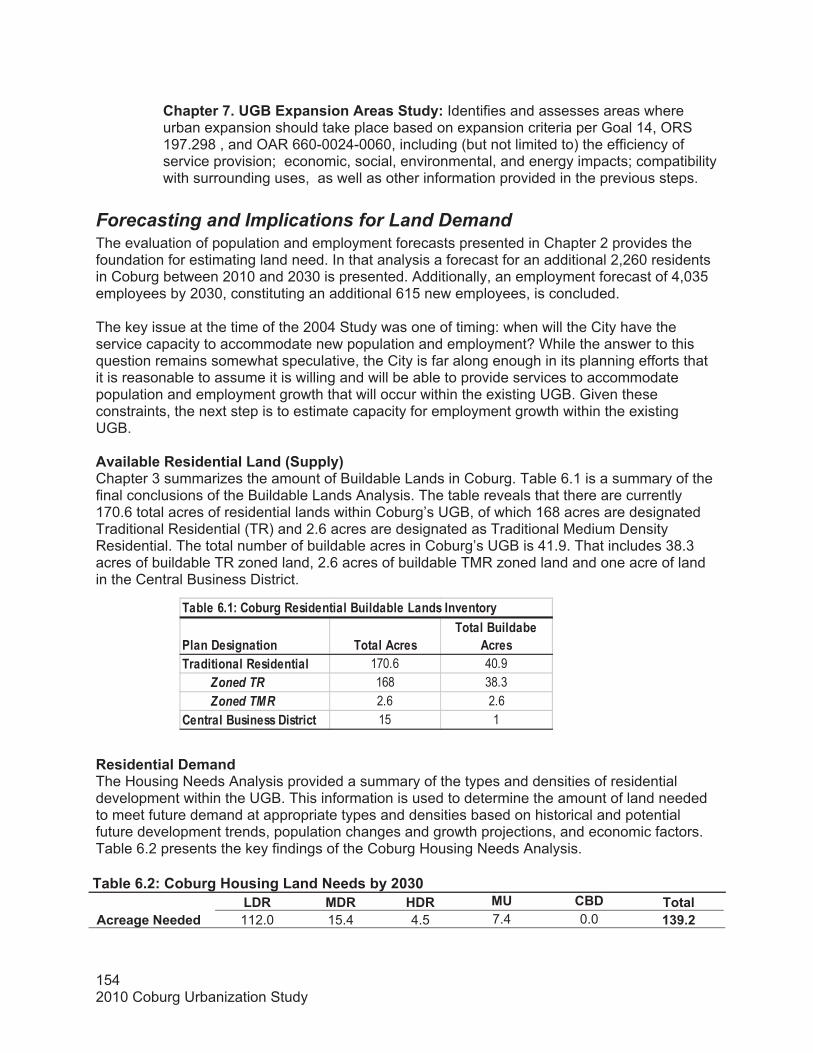
1542010 Coburg Urbanization Study
�����0�#�*������� ����������#������%�����&��
����#������������ �#�������� 170.6 40.9 Zoned TR 168 38.3 Zoned TMR 2.6 2.6��������%�#���##�0�#����� 15 1
��&���.��:���&��*� �#���������%�����&���'���#���=�����!�
��������1���2%��3���#��������#����!:�Identifies and assesses areas where urban expansion should take place based on expansion criteria per Goal 14, ORS 197.298 , and OAR 660-0024-0060, including (but not limited to) the efficiency of service provision; economic, social, environmental, and energy impacts; compatibility with surrounding uses, as well as other information provided in the previous steps.
Forecasting and Implications for Land Demand The evaluation of population and employment forecasts presented in Chapter 2 provides the foundation for estimating land need. In that analysis a forecast for an additional 2,260 residents in Coburg between 2010 and 2030 is presented. Additionally, an employment forecast of 4,035 employees by 2030, constituting an additional 615 new employees, is concluded.
The key issue at the time of the 2004 Study was one of timing: when will the City have the service capacity to accommodate new population and employment? While the answer to this question remains somewhat speculative, the City is far along enough in its planning efforts that it is reasonable to assume it is willing and will be able to provide services to accommodate population and employment growth that will occur within the existing UGB. Given these constraints, the next step is to estimate capacity for employment growth within the existing UGB.
�=����&��� �#���������'����;����!<�Chapter 3 summarizes the amount of Buildable Lands in Coburg. Table 6.1 is a summary of the final conclusions of the Buildable Lands Analysis. The table reveals that there are currently 170.6 total acres of residential lands within Coburg’s UGB, of which 168 acres are designated Traditional Residential (TR) and 2.6 acres are designated as Traditional Medium Density Residential. The total number of buildable acres in Coburg’s UGB is 41.9. That includes 38.3 acres of buildable TR zoned land, 2.6 acres of buildable TMR zoned land and one acre of land in the Central Business District.
������� �#���������0� �����The Housing Needs Analysis provided a summary of the types and densities of residential development within the UGB. This information is used to determine the amount of land needed to meet future demand at appropriate types and densities based on historical and potential future development trends, population changes and growth projections, and economic factors. Table 6.2 presents the key findings of the Coburg Housing Needs Analysis.
��&���.��:���&��*�)��#��*�'����+���#�&!��8$8�'0 �������� �0 �������� )0 ���� ��� �%0� ������
�����*��+������ 112.0 15.4 4.5 7.4 0.0 �$>���
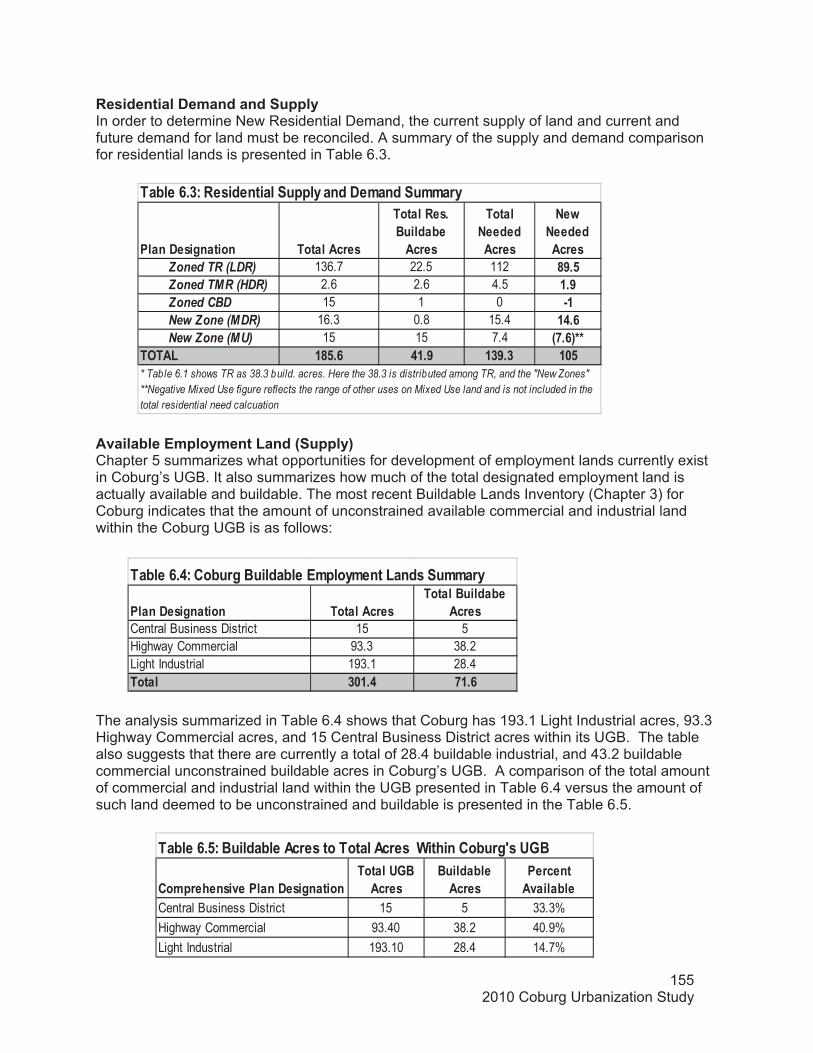
1552010 Coburg Urbanization Study
�� ������#�=�������0�#�*�������������2%�����#�
%�����&�������#�
���������=����&��
Central Business District 15 5 33.3%Highway Commercial 93.40 38.2 40.9%Light Industrial 193.10 28.4 14.7%
��&���.�,:�%�����&�������#��������������#��5��������&��*S#��2%
�����0�#�*������� ����������#������%�����&��
����#Central Business District 15 5Highway Commercial 93.3 38.2Light Industrial 193.1 28.4����� $8��( 1��.
��&���.�(:���&��*�%�����&���� ���! ����'���#�� ��!
�����0�#�*������� ����������#
������ �#��%�����&������#
�������+����������#
+�?�+����������#
Zoned TR (LDR) 136.7 22.5 112 4>�, Zoned TMR (HDR) 2.6 2.6 4.5 ��> Zoned CBD 15 1 0 9� New Zone (MDR) 16.3 0.8 15.4 �(�. New Zone (MU) 15 15 7.4 ;1�.<CC�-��' �4,�. (��> �$>�$ �8,
��&���.�$:� �#�������������!�����0� ����� ��!
* Table 6.1 shows TR as 38.3 build. acres. Here the 38.3 is distributed among TR, and the "New Zones" **Negative Mixed Use figure reflects the range of other uses on Mixed Use land and is not included in the total residential need calcuation
�#���������0� ������������!�In order to determine New Residential Demand, the current supply of land and current and future demand for land must be reconciled. A summary of the supply and demand comparison for residential lands is presented in Table 6.3.
��
�=����&���� ���! ����'����;����!<�Chapter 5 summarizes what opportunities for development of employment lands currently exist in Coburg’s UGB. It also summarizes how much of the total designated employment land is actually available and buildable. The most recent Buildable Lands Inventory (Chapter 3) for Coburg indicates that the amount of unconstrained available commercial and industrial land within the Coburg UGB is as follows:
The analysis summarized in Table 6.4 shows that Coburg has 193.1 Light Industrial acres, 93.3 Highway Commercial acres, and 15 Central Business District acres within its UGB. The table also suggests that there are currently a total of 28.4 buildable industrial, and 43.2 buildable commercial unconstrained buildable acres in Coburg’s UGB. A comparison of the total amount of commercial and industrial land within the UGB presented in Table 6.4 versus the amount of such land deemed to be unconstrained and buildable is presented in the Table 6.5.
1562010 Coburg Urbanization Study
������������ ���!��#�&!��8$8C
� �A�����
+�?�+����������#
��H�#����+�?�+����������#CC
Central Business District 101 - 96 25 4.0 - 3.8 4.4 - 4.18Highway Commercial 267 - 262 17.4 15.3 - 15.0 16.83 - 16.5Light Industrial 247 - 156 13.1 18.9 - 11.9 20.79 - 13.09Campus Industrial 0 - 101 23.5 0.0 - 4.3 0.0 - 4.73����� .�, $4���9�$,�� (��8��9�$4�,* Range reflects results for two scenarios, with or without Campus Industrial Zone ** Adjusted New needed Acres reflects 10% optimal vacancy factor
��&���.�.:�� ��!��/������#A0�/������/�� ���! ����'��������2%
This table indicates that 33.3% of Central Business District lands are available for potential growth, 40.9% of Highway Commercial and 14.7% of Light Industrial lands are available for potential growth. It is, however, particularly important in the analysis of land need to consider the specific needs of each employment type (i.e. suitability and parcel sizes of available land).
As discussed in the EOA, sufficient acreage is not the only requirement for meeting the future economic needs of the community. That acreage must exhibit the specific characteristics needed by the industries that are anticipated to occupy them. � ���! ����2��?���;0� ���<�The employment projections for Coburg provide valuable insights for realistic expectations of the amount of economic growth that can be expected, as well as which types of growth can be expected. Table 6.6 shows what Coburg’s approximate demand is for additional employees for each employment designation within its current UGB. These figures are determined utilizing employment densities discussed in Chapter 5 (EOA). These figures also assume that 20% of Central Business District and 30% of Highway Commercial and Light Industrial lands classified as “Underdeveloped” will redevelop by 2030. The “Adjusted New Needed Acres” column accounts for an optimal vacancy rate of 10%. The two numbers presented in the columns are not intended to represent a range, but rather a scenario with a Campus Industrial Zone, and a scenario without a Campus Industrial Zone. �����
��������� ���! ����0� ������������!��To determine an initial figure of how much industrial and commercial land is needed for future growth in Coburg, the Net New Needed Acres are compared with the amount of Total Buildable Acres. The results of this comparison are presented in Table 6.7. The analysis indicates that after all new needed Central Business District (CBD) employment acres could be accommodated by existing buildable CBD zoned acreage, there would still remain a surplus of 0.6 or 0.82 acres within Coburg’s UGB. Similarly, if after all new needed Highway Commercial (C-2) acres are accommodated by existing buildable C-2 acreage, there would still remain a surplus of 21.37 or 21.7 acres. This is also true for Light Industrial lands which show a surplus of 7.61 or 15.1 acres (a relatively wider range due to the fact the existence of a Campus Industrial District could accommodate much of potential Light Industrial uses).

1572010 Coburg Urbanization Study
������������ ���!��#�&!��8$8C
� �A�����
��H�#����+�?�+����������#CC
������%�����&�������#
�8$8������#A�;0�/����<
��������%�#���##�0�#������ 101 - 96 25 4.4 - 4.18 5 0.6 - 0.82)�*�?�!��� ������� 267 - 262 17.4 16.83 - 16.5 38.2 21.37 - 21.7'�*�������#����� 247 - 156 13.1 20.79 - 13.09 28.4 7.61 - 15.1�� ��#�����#����� 0 - 101 23.5 0.0 - 4.73 - 0.0 - (4.73)�-��' .�, (��8��9�$4�, �>�,4�9�$$��* Range reflects results for two scenarios, with or without Campus Industrial Zone
��&���.�1:�� ��!��/������#A0�/������/�� ���! ����'��������2%
Assuming the employment densities for each plan designation discussed in Chapter 5, it appears that Coburg has within its current UGB, sufficient acreage to meet the demand commensurate with its 20-year employment forecast. But as discussed in Chapter 5, the employment forecast is only one part of Coburg’s Economic Opportunities Analysis. In order to complete a thorough Economic Opportunities Analysis, the City of Coburg must consider the opportunities that may exist independent of the employment forecast. Opportunities that are identified may be limited by the availability of land with required special characteristics (size, location etc.). Per OAR 660-009, Coburg must utilize national, state regional and local trends in identifying economic development opportunities that are likely to expand or locate in the study area within the planning period. An analysis of buildable sites in Coburg (Table 5.23) reveals that the City lacks buildable sites large enough to meet the demand of a large firm.
The City’s economic priorities seem to focus on the possibility of promoting a diverse economy and strong tax base, while preserving (and capitalizing) on the existing small town dynamic, or at least not directly threatening it. Additional priorities include a desire to attract more professional office activity, as well as health related businesses. Also, the City has indicated its continuing commitment to provide an adequate amount of level, buildable land which has good access to arterial streets within existing city limits to meet local and regional industrial needs. Recent visioning and policy efforts all document a priority for taking advantage of these economic opportunities.
One insight provided by the economists consulted during the analysis was that Coburg may be in a position to accommodate a projected employment need for a mix of smaller and mid-sized buildable lots with its current buildable lands inventory, but it is not able to provide sufficient buildable acreage to accommodate a large employer that may find Coburg an attractive location in every other way. In this regard it could be argued that Coburg is not taking advantage of an economic opportunity. There was general agreement among these local decision bodies that Coburg is well-suited to support regional industrial development, and that such opportunities should be pursued or at least not inhibited.
The preliminary conclusion was made by City Council and confirmed by both the Planning Commission and Study Technical Advisory Committee to include in this report, and its recommendations, the need for one to two larger tracts (20-plus acres) of buildable industrial land in order to address the City’s economic opportunities. �� ��!��/�'����+��������0� ����
Table 6.8 shows a comparison of estimated land need and land demand for the Coburg UGB between 2010 and 2030.

1582010 Coburg Urbanization Study
'�����!�� '��������!�;�8�8<'����0� �����;�8�89�8$8<
;0�/����<A�����#�;�8�89�8$8<�
Central Business District 5 4.4 - 4.2 0.6 - 0.8 Highway Commercial 38.2 16.8 - 16.5 21.4 - 21.7 Light Industrial 28.4 20.8 - 13.1 7.6 - 15.3 Campus Industrial - 0.0 - 4.7 0.0 - (4.7)Subtotal 1��. (��9�$4�, 29.6 - 33.1*
Adjusted Subtotal1-2 Sites/
(20-60) Acres
Zoned TR (LDR) 22.5 112 ;4>�,< Zoned TMR (HDR) 2.6 4.5 ;��>< Zoned CBD 1 0 ��8 Zoned TR (MDR--Corner Lots) 0.8 15.4 ;�(�.< New Zone (MU) 15 7.4 1�.CCSubtotal 41.9 139.3 (97.3)
Public and Semi Public Facilities Existing Acres Schools 9.3 9.3 8�8 Streets N/A 14.2 ;�(��< Parks 28 63 ;$,�8<Subtotal (49.2)Total Non-Employment (146.5)
��&���.�4:��� ����#����/�'����0� ������������!7���&��*��2%7��8�89�8$8
* Range reflects results for two scenarios, with or without Campus Industrial Zone ** Negative Mixed Use figure reflects the range of other uses on Mixed Use land and is not included in the total residential need calcuation
Residential
Commercial/Industrial*
**The analysis of forecasted employment growth revealed a "surplus" of employment land in Coburg. However, analysis of economic opportunities resulted in the identified need for 1-2, 20+ acre sites in order to attract firms seeking larger sites.
��The results lead to the following findings:
� The City of Coburg has a surplus of land within all employment categories, however the surplus for Industrial Uses is not seen as sufficient in size or characteristic to accommodate the City’s economic opportunities.
� The City should add approximately one lot or tract of land consisting of 20-70 acres of land to accommodate flexibility in responding to industry employment opportunities during the planning period (2010-2030).
� The City will need approximately 147 acres of land to accommodate residential and other development for the 2010-2030 period, with smaller amounts needed for parks and public/semipublic uses.
�'��*���� �����!A0� ����� ��!�The City of Coburg is currently faced with a supply of buildable land designated for commercial and office purposes that is insufficient to meet future long-term demand. The City is also faced with a limited supply of available and appropriate buildable land designated for industrial purposes.

1592010 Coburg Urbanization Study
State statute requires cities to provide for “sufficient” residential, commercial and industrial land within their Urban Growth Boundaries. Regardless of the policy choices, the methods used to calculate land need for these uses clearly indicate that there is justification for increasing the residential and employment land supply in Coburg’s UGB in order to meet projected future demands. The quantitative analysis as well as subjective consideration of constraints and growth opportunities indicates a need for approximately one to two 20-plus acres sites for employment needs and approximately 147 acres of additional residential (and associated public) land for the next twenty years.
The projection methods used in this study are based upon current residential and employment land use and statistics. Policy choices addressed further in Chapter 8 (Policy Evaluation), will have considerable bearing on how the facts presented in these analyses are utilized to directly influence the future for the City of Coburg’s.

1602010 Coburg Urbanization Study
161 2010 Coburg Urbanization Study
CHAPTER 7. URBAN GROWTH BOUNDARY EXPANSION ANALYSIS
The purpose of this section of the Urbanization Study, the Urban Growth Boundary Expansion Analysis, is to identify where to expand the urban growth boundary (UGB) so that the City has enough land to meet residential, economic, and public land needs for the next twenty years (2010-2030). The analysis meets the Statewide Planning requirements that cities must follow to expand their UGB. This report builds on the Housing Needs Analysis, Economic Opportunities Analysis and the Buildable Land Inventory to analyze where and how much to expand the UGB. The analysis examines eleven possible expansion alternatives and recommends preferred alternatives.
To provide for the unmet future need, Coburg must inventory and assess the lands that surround its current boundary to determine those lands that are most appropriate to accommodate future urban development, consistent with Goal 14 and the City’s plan policies. This chapter presents an evaluation of potential areas for a UGB expansion.
Steps in the ProcessChapter 3. Buildable Land Inventory: Inventories all types of vacant, potential infill, potential redevelopment and environmentally constrained land within the existing UGB for residential, commercial, and industrial development.
Chapter 4. Housing Needs Analysis: Determines types and densities of residential development within the UGB using the Housing/Land Needs. Determine the amount of land needed to meet future demand at appropriate types and densities based on historical and potential future development trends, population changes and growth projections, and economic factors. Address all Goal 10 Housing, and Goal 14 requirements. Housing needs are estimated using a Housing Needs Model. Chapter 5. Economic Opportunities Analysis: Estimates need for commercial and industrial land based on historic and current trends related to employment projections and local economic potential. Identify size and characteristics of employment land needs. Address requirements of Goal 9.
Chapter 6. Supply and Demand Comparison: Determines whether there is a deficit or surplus of buildable land for residential, commercial, and Industrial needs.
ThisSection Chapter 7. UGB Expansion Areas Analysis:
Regulatory Framework The State of Oregon, Lane County, and the City of Coburg all have policies and rules that direct when, where, and how to expand the UGB. The following outline lists the various pieces of this framework of regulation. Each section of the Study references the applicable regulation.
� State Planning -Goal 9: Economic Development -Oregon Administrative Rule, Division 9
-Goal 10: Housing

2010 Coburg Urbanization Study 162
-Oregon Administrative Rule, Division 8 -Goal 14: Urbanization -Oregon Revised Statute 197.298: Priority of land to be included within UGB -Oregon Administrative Rule 660 Division 24, Urban Growth Boundaries
� Lane County -Lane County Rural Comprehensive Plan -Policies regarding priority of land to be included in a UGB expansion
� City of Coburg - Local Criteria
What does this regulatory framework mean? Once a Buildable Lands Inventory determines there is a need for more land within the UGB to accommodate the growth planned for the next twenty years, the City must decide how to meet that need. The options are to increase the development capacity inside the UGB, to expand the UGB, or do both.
Need for ExpansionStatewide planning Goals 9, 10 and 14 all require cities to provide a 20- year supply of buildable land within urban growth boundaries (UGBs). Chapter 6, Table 6.8, presents a summary of the comparison of the City of Coburg’s 20-year Land Supply and 20-year Land Demand. The report has concluded that an additional 147 acres of gross vacant buildable residential (and public) land beyond the current urban growth boundary would be necessary in order to serve the city’s anticipated residential growth to the year 2030. The buildable lands analysis determined that Coburg has 41.9 acres of vacant or underdeveloped residential land, far less than needed for the planning period. Likewise, the Economic Opportunities Analysis also presented the argument that an additional one to two 20 plus acre sites could be added to the existing Coburg employment inventory to accommodate economic potential over the planning period. This employment expansion was also supported by the City Council.
Chapter Outline Following is a summary of the sections included in this chapter and how they address and relate to the expansion analysis:
Section A provides a discussion of Coburg’s efficiency measures for accommodating growth within the UGB.
Section B addresses the state and local priorities for expanding the UGB. The statutes and rules that implement Statewide Planning set forth priorities for determining what types and areas of land should be considered for inclusion in a UGB. These regulations also set forth circumstances under which the priorities may be altered and allow cities to set their own local criteria to tailor the UGB expansion to meet local needs.
Section C evaluates and compares the expansion study areas. The evaluation uses the Goal 14 location factors (OAR-024-0060(1)), “characteristics” identified by the local government to be necessary for land to be suitable for inclusion, as well as the priorities outlined in ORS 197.298. Goal 14 requires that the analysis of each expansion alternative take into account factors such as the feasibility and orderly provision of urban levels of services, and the compatibility with surrounding resource lands. Another Goal 14 requirement is to consider the environmental, economic, social and energy related consequences of selecting each of the expansion
163 2010 Coburg Urbanization Study
alternatives. This essentially is a weighing and balancing of the relative merits and drawbacks of each alternative. This section also analyzes and compares the development status of each expansion alternative based on the amount of vacant buildable land.
Section D provides a summary of the analysis as well the recommendation for expansion. In the majority of cases, recommendations will include combinations of acreage from different study areas. The Goal 14 location factors and Coburg’s local criteria are summarized and compared for each expansion alternative. Further discussion and justification is also provided for the selected alternative(s).
A. Efficiency Measures-Accommodating Needs inside the UGB
One of the organizing principles of Oregon’s land use planning system is an emphasis on using land within the UGB more “efficiently” before expanding the boundary. Land use efficiency measures can address multiple issues - including meeting housing needs, utilizing existing infrastructure, conserving energy, as well as other local objectives. A variety of land use efficiency measures are mentioned in state statute (ORS 197.296), including the following:
1. Increase permitted densities in residential zones 2. Provide financial incentives for higher density housing 3. Permit additional density beyond that generally allowed in the zoning district in exchange
for amenities and features provided by the developer 4. Removal or easing of approval standards or procedures 5. Establish minimum density ranges 6. Develop strategies for infill and redevelopment 7. Authorize housing types not previously allowed by the plan or regulations 8. Adopt an average residential density standard 9. Consider rezoning non-residential land
In order to justify expansion of the City of Coburg’s UGB, the City should outline existing measures, or new measures that encourage the efficient use of land within the UGB in accordance with Goal 14. This document presents a summary of Efficiency Measures that Coburg may choose to implement. All or none may be implemented, but the City must establish to a sufficient degree that measures have been taken to accommodate development within the UGB. These “Efficiency Measures” are included with greater detail within the Study’s Appendix G.
One of the required steps in an analysis of UGB Expansion is to first examine whether additional efficiency measures could be used within existing UGB boundaries to increase residential densities and determine whether these measures would forego the City’s need to expand the UGB. Coburg has previously taken steps to incorporate efficiency measures, such as
� Incorporating increased densities in the Traditional Residential zone, by allowing duplex units on corner lots, and creating a new zone (Traditional Medium Residential) which contains a range of uses and densities.
� Providing a Master Plan process that can allow for increased flexibility in design, including lot size flexibility, as long as the density established in the Comprehensive Plan is not exceeded.
� Establishing minimum density standards for certain developments.
2010 Coburg Urbanization Study 164
� Modification provisions to certain provisions without a requirement for a variance. � Authorizing accessory dwelling units; and � Adopting an average residential density goal for new development in the
Comprehensive Plan.
One measure that was examined as part of the 2004 Urbanization process was to include a mixed-use zone. Staff used this concept in the housing needs model (Chapter 4), to include re-designation of a TR-zoned Stevenson property on the north side of Pearl St., west of Coburg Industrial Way (see Map 26). Based upon City Council direction, staff has presumed that site will be re-designated to a mixed-use area that would allow high density residential development (15 dwelling units per acre), containing a mixture of small lot single-family, duplex units, and triplex-fourplex units.
The option to include mixed-use within the existing UGB was also considered by staff for the following reasons:
� The area proposed to be re-designated for mixed-use development is presently designated as Traditional Residential, a low-density residential zone that would bordered on two sides by major roads (Pearl Street is designated as an arterial, while Coburg Industrial Way is designated as a collector), industrial development to the east, and a planned 15-acre residential rehabilitation facility. The mixed-use development could provide a transition from these higher intensity uses to the adjoining residential development to the west.
� The mixed-use would be located upon a high-capacity transportation corridor (Pearl Street), which is serviced by bus transportation.
� A portion of the Coburg Loop trail is planned along Industrial Way and could be integrated into a mixed-use development proposal.
� A market analysis1 of Coburg (measured within a 1 mile radius of the City Hall) shows a leakage of retail sales in several areas, which could be met with additional retail development in the area, supported in part by higher density development. A convenience center (10,000-30,000 square feet offering an array of goods and services, typically anchored by a small specialty food mart or pharmacy, together with 5-8 other smaller (1,500-3,000 square foot) businesses) would need about 2,000 residents to be supported and have a typical retail trade area of up to a 1-mile radius2. Given the anticipated population increase within Coburg and current market leakages based on the marketing analysis, there may be potential for a convenience center type development to form within Coburg. If the community would support development of this type, then of the vacant or redevelopable sites outside of the CBD, this site would make the most sense, given its location and size.
� In addition, when the larger rural area around Coburg is evaluated (within a 3-mile radius of City Hall) additional leakage is shown, demonstrating the potential for Coburg to provide a larger role in providing area retail services. This is also variable, since future development on the north part of Eugene may compete for retail trade (e.g. a grocery store at Crescent Village).
� While some demand will be met with development within the CBD, the CBD lacks larger parcels sizes that would be needed to accommodate a cluster of businesses
1 ESRI: Retail Market Analyst Online, February, 2010. 2 Sustainable Urbanism: Urban Design with Nature. Farr, Douglas. 2008.
165 2010 Coburg Urbanization Study
like a convenience center, where businesses typically benefit from being located in close proximity.
This option is also supported by several existing policies contained in the Coburg Comprehensive Plan.
B. Expansion Alternatives Identification Goal 14 states that:
The Location of the urban growth boundary and changes to the boundary shall be determined by evaluating alternative boundary locations….
Preferred Alternative Identification Methodology The first step narrows the universe of land surrounding the UGB (the planning area) into a set of manageable study areas. Practically speaking, study areas become a more manageable way to review the benefits and disadvantages associated with expansion into properties with relatively similar dynamics. This is not to say that each of the study areas identified contain properties that are identical. Although care was taken to include like properties in each study area, it was impossible to avoid variation. For this, and other, reasons the preferred expansion alternative may include portions of one or several study areas.
The second step evaluates the study areas against state requirements as well as local criteria and needs. In this study, “study areas” are not viewed as alternatives in and of themselves, since no one study area is likely to satisfy the expansion needs identified in this Urbanization Study. Therefore, the third step includes the formation of expansion alternatives which incorporate the specific acreage needs of expansion with those areas that the study area analysis has shown to be most favorable. The final step would include the selection of a preferred expansion alternative and justification of its selection against state requirements and local criteria. This final step will be presented in Section D.
The following definitions provide a summary of important geographic distinctions in this analysis:
� Planning Area: A broad and general conception of the area surrounding Coburg’s UGB. � Study Areas: A grouping of tax lots and properties of generally similar characteristics
and geographic proximity, for purposes of more easily evaluating the areas around the UGB against state requirements and local criteria. Eleven separate study areas were identified for this Study.
� Expansion Alternatives: Areas that incorporate the results of the study areas analysis as well as limitations of actual acreage demand as identified in Chapter 6 of the Study. These often are composed of acreage from several different study areas. This study identified three final residential expansion alternatives and three final employment expansion alternatives. The three residential alternatives range in size from 132 to 139 acres (addressing a need of 122.7 acres), and the employment alternatives range in size from 42 to 65 acres (addressing a need for one or two 20+ acre sites). One preferred alternative will be selected or identified.
� Preliminary Expansion Recommendations: Utilizing feedback from the public, stakeholders, and advisory and decision making bodies, staff developed recommended employment and residential expansion alternatives. These alternatives were presented to the Technical Advisory Committee, Planning Commission, City Council and public for feedback.
2010 Coburg Urbanization Study 166
� Final Expansion Recommendations: The final expansion recommendations represent the final employment and residential expansion configurations that incorporate feedback from city officials, stakeholders, and the public, and, most importantly, are approved by the Coburg City Council.
ORS 197.298—Expansion Priorities Analysis The selection of preferred growth alternatives must be based on Oregon Revised Statute (ORS) 197.298. ORS 197.298 sets forth priorities for determining what types and areas of land should be considered for inclusion in an urban growth boundary. It also sets forth circumstances under which the priorities may be altered. These priorities serve as an initial guide in developing a study methodology. In the analysis which will precede each priority subsection is addressed to determine its relevance to this particular study and to identify what data and analytical approaches would be used to construct a basic expansion alternative evaluation. Maps 10 through 17 provide a visual reference for the Priorities Analysis. ORS 197.298 establishes the following priorities for expanding UGBs: (listed in the order in which they must be included in or considered for expansion)
1. Established Urban Reserves; 2. Exception land, and farm or forest land (other than high value farm land) surrounded
by exception land; 3. Marginal lands designated pursuant to ORS 197.247; 4. Farm and forest land.
Following is a summary of the expansion study area selection process undertaken by staff per the language of ORS 197.298:
a) First priority is land that is designated urban reserve land under ORS 195.145 (Urban reserves), rule or metropolitan service district action plan.
Although Coburg’s 2004 Urbanizations Study process provided some conceptualization of potential urban reserve areas, Coburg has no adopted urban reserve lands adjacent to its urban growth boundary.
(b) If land under paragraph (a) of this subsection is inadequate to accommodate the amount of land needed, second priority is land adjacent to an urban growth boundary that is identified in an acknowledged comprehensive plan as an exception area or nonresource land. Second priority may include resource land that is completely surrounded by exception areas unless such resource land is high-value farmland as described in ORS 215.710 (High-value farmland description for ORS 215.705).
The area surrounding and adjacent to Coburg’s UGB includes portions of both exceptions and resource land (see Map 11). Exception lands are mostly those County lands near or adjacent to Coburg which have residential zoning (and currently contain interspersed residential uses). These lands are often referred to as “Developed and Committed” lands. There are several study areas that contain these existing areas with development and population of note. Exceptions Land is designated by the County based on it being an approved “exception” to statewide planning goals. That is why these areas are the highest priority for UGB expansions. Map 11 shows that these lands are predominantly located adjacent to the northwest corner of Coburg, in the Stalling Road area. Additional exception areas exist south and west of Coburg as well. Study areas were selected to include all near or adjacent areas identified as exception lands by Lane County.
167 2010 Coburg Urbanization Study
(c) If land under paragraphs (a) to (b) of this subsection is inadequate to accommodate the amount of land needed, third priority is land designated as marginal land pursuant to ORS 197.247
Coburg has no identified marginal lands adjacent to its urban growth boundary.
(d) If land under paragraphs (a) to (c) of this subsection is inadequate to accommodate the amount of land needed, fourth priority is land designated in an acknowledged comprehensive plan for agriculture or forestry, or both.
The majority of land surrounding Coburg’s current UGB is zoned Exclusive Farm Use (30 or 40 acre lot size minimum) by Lane County (see Map 11). Every expansion study area contains some farm land with high-value soils. Because it is anticipated that expansion needs cannot be accommodated on exception lands alone, study areas include farm and forest land (as will recommended expansion alternatives).
(2) Higher priority shall be given to land of lower capability as measured by the capability classification system or by cubic foot site class, whichever is appropriate for the current use.
A summary of the Soil Class dynamics for each study area is presented and considered in the analysis.
(3) Land of lower priority under subsection (1) of this section may be included in an urban growth boundary if land of higher priority is found to be inadequate to accommodate the amount of land estimated in subsection (1) of this section for one or more of the following reasons:
(a) Specific types of identified land needs cannot be reasonably accommodated on higher priority lands;
(b) Future urban services could not reasonably be provided to the high priority lands due to topographical or other physical constraints; or
(c) Maximum efficiency of land uses within a proposed urban growth boundary requires inclusion of lower priority lands in order to include or to provide services to higher priority lands. [1995 c.547 § 5; 1999 c.59 § 56]
The priority provisions outlined above in ORS 197.298 will be given primary consideration in the analysis and comparison of study areas and expansion alternatives. The Goal 14 factors and locally identified expansion priorities will weigh heavily on expansion outcomes related to this provision as well. State OAR 660-024-0060(5) states the following related to local criteria in urban expansion:
If a local government has specified characteristics such as parcel size, topography, or proximity that are necessary for land to be suitable for an identified need, the local government may limit its consideration to land that has the specified characteristics when it conducts the boundary location alternatives analysis and applies ORS 197.298.
Since the study areas contain no urban reserve or marginal land, land analyzed under this statute and goal will be divided into two categories, higher priority exception land and lower priority agricultural land. Within the agricultural land category, sub-priorities will be established for higher priority Class III, IV and VI Soils, and lower priority Class I and II soils.
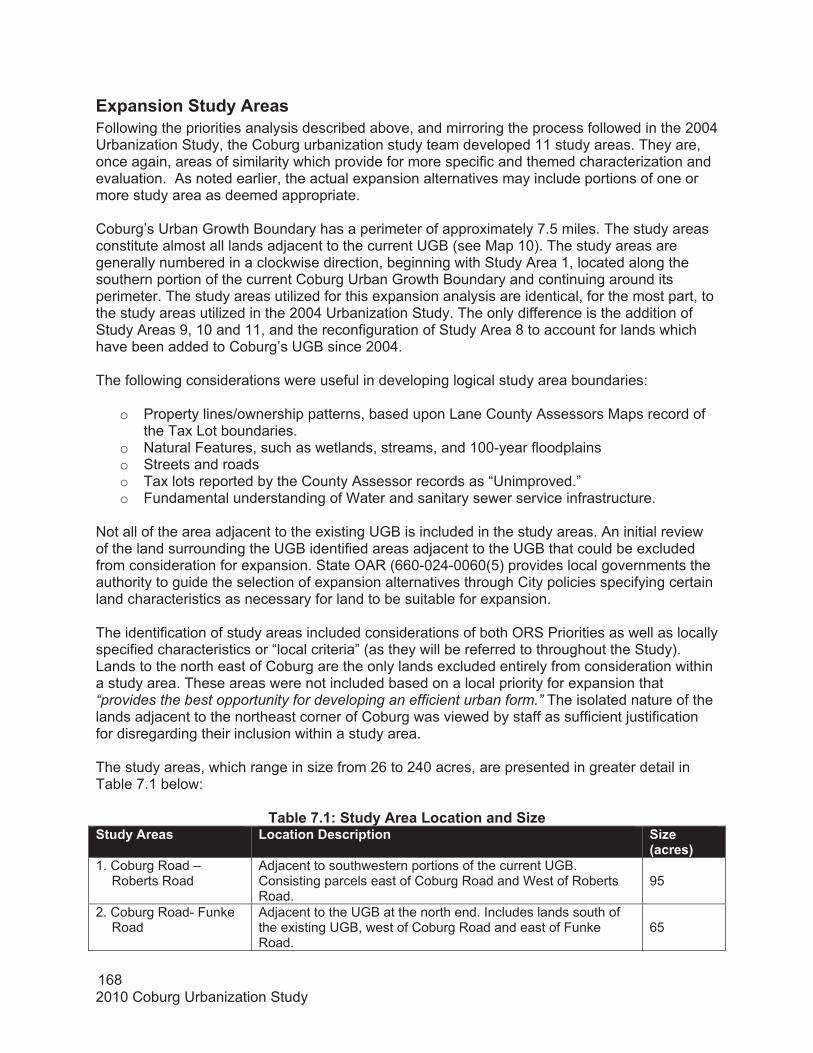
2010 Coburg Urbanization Study 168
Expansion Study Areas Following the priorities analysis described above, and mirroring the process followed in the 2004 Urbanization Study, the Coburg urbanization study team developed 11 study areas. They are, once again, areas of similarity which provide for more specific and themed characterization and evaluation. As noted earlier, the actual expansion alternatives may include portions of one or more study area as deemed appropriate.
Coburg’s Urban Growth Boundary has a perimeter of approximately 7.5 miles. The study areas constitute almost all lands adjacent to the current UGB (see Map 10). The study areas are generally numbered in a clockwise direction, beginning with Study Area 1, located along the southern portion of the current Coburg Urban Growth Boundary and continuing around its perimeter. The study areas utilized for this expansion analysis are identical, for the most part, to the study areas utilized in the 2004 Urbanization Study. The only difference is the addition of Study Areas 9, 10 and 11, and the reconfiguration of Study Area 8 to account for lands which have been added to Coburg’s UGB since 2004.
The following considerations were useful in developing logical study area boundaries:
o Property lines/ownership patterns, based upon Lane County Assessors Maps record of the Tax Lot boundaries.
o Natural Features, such as wetlands, streams, and 100-year floodplains o Streets and roads o Tax lots reported by the County Assessor records as “Unimproved.” o Fundamental understanding of Water and sanitary sewer service infrastructure.
Not all of the area adjacent to the existing UGB is included in the study areas. An initial review of the land surrounding the UGB identified areas adjacent to the UGB that could be excluded from consideration for expansion. State OAR (660-024-0060(5) provides local governments the authority to guide the selection of expansion alternatives through City policies specifying certain land characteristics as necessary for land to be suitable for expansion.
The identification of study areas included considerations of both ORS Priorities as well as locally specified characteristics or “local criteria” (as they will be referred to throughout the Study). Lands to the north east of Coburg are the only lands excluded entirely from consideration within a study area. These areas were not included based on a local priority for expansion that“provides the best opportunity for developing an efficient urban form.” The isolated nature of the lands adjacent to the northeast corner of Coburg was viewed by staff as sufficient justification for disregarding their inclusion within a study area.
The study areas, which range in size from 26 to 240 acres, are presented in greater detail in Table 7.1 below:
Table 7.1: Study Area Location and SizeStudy Areas Location Description Size
(acres) 1. Coburg Road –
Roberts Road Adjacent to southwestern portions of the current UGB. Consisting parcels east of Coburg Road and West of Roberts Road.
95
2. Coburg Road- Funke Road
Adjacent to the UGB at the north end. Includes lands south of the existing UGB, west of Coburg Road and east of Funke Road.
65
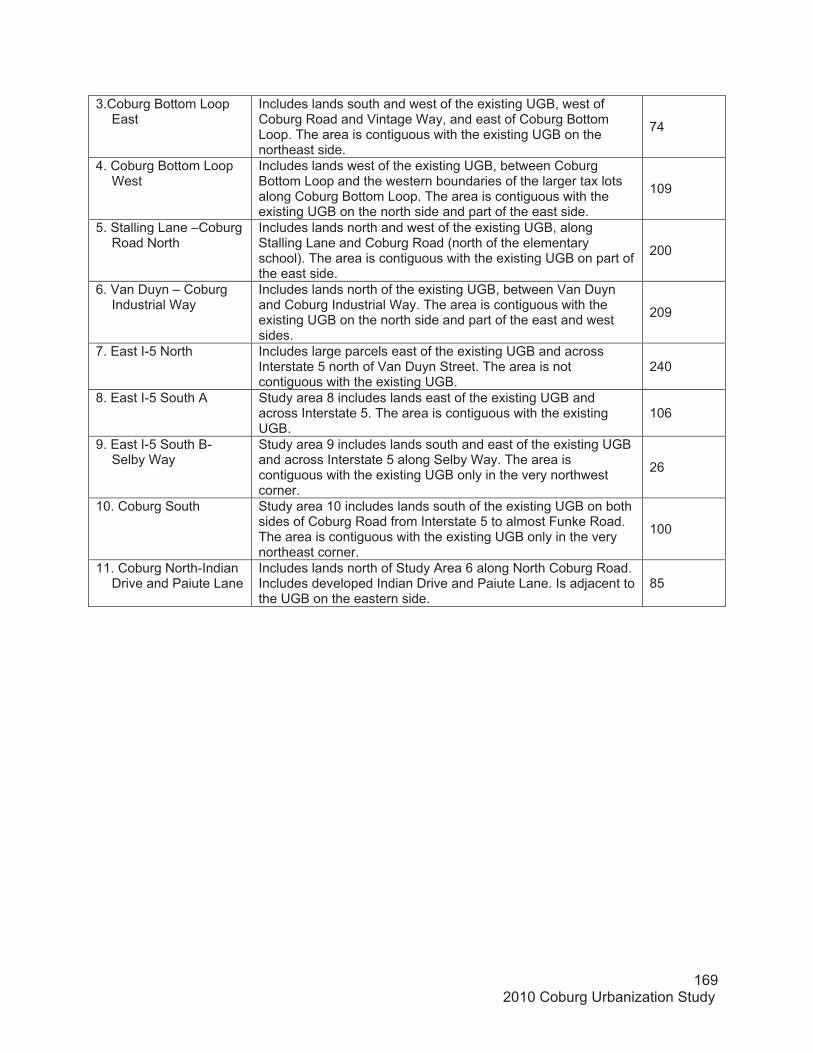
169 2010 Coburg Urbanization Study
3.Coburg Bottom Loop East
Includes lands south and west of the existing UGB, west of Coburg Road and Vintage Way, and east of Coburg Bottom Loop. The area is contiguous with the existing UGB on the northeast side.
74
4. Coburg Bottom Loop West
Includes lands west of the existing UGB, between Coburg Bottom Loop and the western boundaries of the larger tax lots along Coburg Bottom Loop. The area is contiguous with the existing UGB on the north side and part of the east side.
109
5. Stalling Lane –Coburg Road North
Includes lands north and west of the existing UGB, along Stalling Lane and Coburg Road (north of the elementary school). The area is contiguous with the existing UGB on part of the east side.
200
6. Van Duyn – Coburg Industrial Way
Includes lands north of the existing UGB, between Van Duyn and Coburg Industrial Way. The area is contiguous with the existing UGB on the north side and part of the east and west sides.
209
7. East I-5 North Includes large parcels east of the existing UGB and across Interstate 5 north of Van Duyn Street. The area is not contiguous with the existing UGB.
240
8. East I-5 South A Study area 8 includes lands east of the existing UGB and across Interstate 5. The area is contiguous with the existing UGB.
106
9. East I-5 South B-Selby Way
Study area 9 includes lands south and east of the existing UGB and across Interstate 5 along Selby Way. The area is contiguous with the existing UGB only in the very northwest corner.
26
10. Coburg South Study area 10 includes lands south of the existing UGB on both sides of Coburg Road from Interstate 5 to almost Funke Road. The area is contiguous with the existing UGB only in the very northeast corner.
100
11. Coburg North-Indian Drive and Paiute Lane
Includes lands north of Study Area 6 along North Coburg Road. Includes developed Indian Drive and Paiute Lane. Is adjacent to the UGB on the eastern side.
85
[Type text]
C. Alternative Location Analysis This section of the Study provides a comparative analysis of the eleven study areas utilized to determine expansion alternatives for potential inclusion into the UGB. Each study area is to evaluate for consistency with ORS 197.298 priorities, Goal 14 (Urbanization) Boundary Location Factors 1-4, as well as local expansion criteria.
The purpose of statewide planning Goal 14 is to “provide for an orderly and efficient transition from rural to urban land use. To accomplish this, statewide planning Goal 14 establishes four criteria, or “location factors” for evaluating UGB expansions. These factors supplement the priorities analysis. They include:
Factor 1. Efficient accommodation of identified land needs. Factor 2. Orderly and economic provision for public facilities and services; Factor 3. Environmental, energy, economic and social consequences. Factor 4. Compatibility of the proposed urban uses with nearby agricultural and forest
activities occurring on farm and forest land outside the UGB.
Oregon Administrative Rule (OAR) 660-024-0060(1)(b) states the following:
If the amount of suitable land in the first priority category exceeds the amount necessary to satisfy the need deficiency, a local government must apply the location factors of Goal 14 to choose which land in that priority to include in the UGB.
Additionally, OAR 660-024-0060(8)(a-c) states the following:
(8) The Goal 14 boundary location determination requires evaluation and comparison of the relative costs, advantages and disadvantages of alternative UGB expansion areas with respect to the provision of public facilities and services needed to urbanize alternative boundary locations. This evaluation and comparison must be conducted in coordination with service providers, including the Oregon Department of Transportation with regard to impacts on the state transportation system. "Coordination" includes timely notice to service providers and the consideration of evaluation methodologies recommended by service providers. The evaluation and comparison must include:
(a) The impacts to existing water, sanitary sewer, storm water and transportation facilities that serve nearby areas already inside the UGB;
(b) The capacity of existing public facilities and services to serve areas already inside the UGB as well as areas proposed for addition to the UGB; and (c) The need for new transportation facilities, such as highways and other roadways, interchanges, arterials and collectors, additional travel lanes, other major improvements on existing roadways and, for urban areas of 25,000 or more, the provision of public transit service.
Local Expansion Criteria As identified within the Expansion Priorities Analysis section, local governments are given the authority to identify specific criteria to guide the selection of land for expansion per OAR 660-
171 2010 Coburg Urbanization Study
024-0060(5). This section evaluates each expansion alternative based on the Local Criteria identified by the City of Coburg. Coburg Expansion Policy Analysis: Important to note in an analysis of urbanization related policies in the City of Coburg, is a history of the policies developed. Coburg has undertaken a number of expansion related planning processes in the last decade. These include the Coburg Crossroads visioning process of 2003, the 2004 Urbanization study and periodic review effort, and the 2005 update of the Comprehensive Plan. These processes were all interrelated and constituted a significant effort on the part of Coburg City residents, staff and public officials. The policies that were incorporated into the 2005 comprehensive plan update are a reflection of extensive efforts to summarize the City’s ideals, including (and especially) those related to the City’s growth. Below are listed a few of these guiding policies specifically related to outward expansion: Urbanization Policies:
Coburg Objective: Promote land use and development patterns that sustain and improve quality of life, are compatible with mass transit, maintain the community’s identity, protect significant natural and historic resources, and meet the needs of existing and future residents for housing, employment, and parks and open spaces.
Policy 1: The City shall preserve urbanizable land and provide for orderly, efficient development by controlling densities through provision of the Zoning and Subdivision Ordinances, thereby preventing the need for overly extensive public services and restricting urbanization to that commensurate with the carrying capacity of the land.Policy 17: The City shall promote the efficient use of land within the urban growth boundary and sequential development that expands in an orderly way outward from the existing city center. Policy 18: The City shall provide a sufficient supply of developable land within the urban growth boundary to meet the needs of the existing and projected population for residential, commercial, industrial, and recreational uses over the next 20 – 50 years, while preserving the small town character of the community. Policy 19: The City shall accommodate projected growth, expand the urban growth boundary in a manner that balances the need to protect high quality farm and forest resource lands with the needs of the existing and future population and with efficient public facility and service delivery.
Land Use and Development Patterns Policy 40: The City shall promote land use and development patterns that sustain and improve quality of life, are compatible with mass transit, maintain the community’s identity, protect significant natural and historic resources, and meet the needs of existing and future residents for housing, employment, and parks and open spaces.Policy 42: Future residential and commercial development shall be constructed in a manner that preserves the small town, historic character of the community.
Transportation Policy 1: Develop a street network system that evenly distributes traffic throughout the community, lessening traffic impacts on residential streets, and identifying a system of arterials for moving people, goods, and services safely and efficiently.
2010 Coburg Urbanization Study 172
Policy 46: Provide a transportation system that is safe, convenient, accessible, environmentally responsible, efficient, responsive to community needs, and considerate of neighborhood impacts, particularly in the National Historic District.Policy 47: Develop and maintain a street network that is inter-connected.
Sanitary Facilities Policy 15: The city shall expand the urban growth boundary and city limits and provide sanitary sewer service, when available, to existing exception areas and other appropriate areas when such expansion is appropriate to meet city needs.
Housing Policy 21: The City shall promote livability and community in existing and future neighborhoods. Policy 28: The City shall encourage new housing to radiate out from the city center and discourage leapfrog development in order to promote connectivity and community interaction.
Natural Resources Policy 20: The City shall protect, restore, manage, and enhance important natural resources; maintain high quality air, water, land and historic resources; and provide green spaces in and around the community. Policy 21: The City shall protect or mitigate, whenever possible, fish and wildlife habitats including rivers, wetlands, and forests, and significant natural areas and habitats of rare or endangered species.Policy 17: Areas containing any other unique ecological, scenic, aesthetic, scientific or educational values shall be considered in the planning process.Policy 26: The City shall seek to ensure compatibility between the future needs of the community and growth of nearby sand and gravel operations.
Agricultural Lands Coburg Objective: To retain the agricultural use of land in those areas where SCS’s Soil Suitability Classification indicates that it is the highest and best use. Policy 2: To the extent to which it has influence, the City shall promote the retention of lands outside its Urban Growth Boundary for agriculture use by encouraging Lane County to maintain current agricultural zoning within the City’s area of influence as defined in the Intergovernmental Agreement with Lane County.Policy 5: The City supports, and may require, measures to promote compatibility and transition between urban development at the edge of the Urban Growth Boundary and adjacent agricultural areas.Policy 7: The City supports, and shall pursue, establishment of a southern greenbelt that ensures a permanent open character for the area between Coburg and the McKenzie River.Policy 8: The City shall protect high quality farmland surrounding the community from premature development.
Project staff has generated a list of local expansion criteria or “local criteria” from the above listed guiding policies. They are as follows:
173 2010 Coburg Urbanization Study
� Local Criteria 1: Expansion should be limited to areas and tax lots which promote the greatest order and efficiency.
� Local Criteria 2: Expansion should be limited to areas and tax lots that are appropriate to meet city needs.
� Local Criteria 3: Expansion should be limited to areas and tax lots that would promote sequential development that expands in an orderly way outward from the existing city center, and promote a street network that is interconnected in order to promote connectivity and community interaction.
� Local Criteria 4: Expansion should be limited to areas and tax lots that promote livability� Local Criteria 5: Expansion should be limited to areas and tax lots that discourage
premature development of agricultural lands and compatibility and transition between urban development and agricultural areas.
It is also important to note the Coburg’s historic efforts have also produced a number of maps of expansion conceptualizations. These town visioning and expansion visualization exercises have resulted in an expansion theme that can be said to generally represent Coburg’s local expansion policy.
Expansion Area Summary: For each of the sub-areas the City has provided a general site description, vacant acres discussion of development patterns, inventory of available utilities, and discussion of factors influencing future urbanization (Goal 14). The following section provides some big picture summaries of all of the study areas.
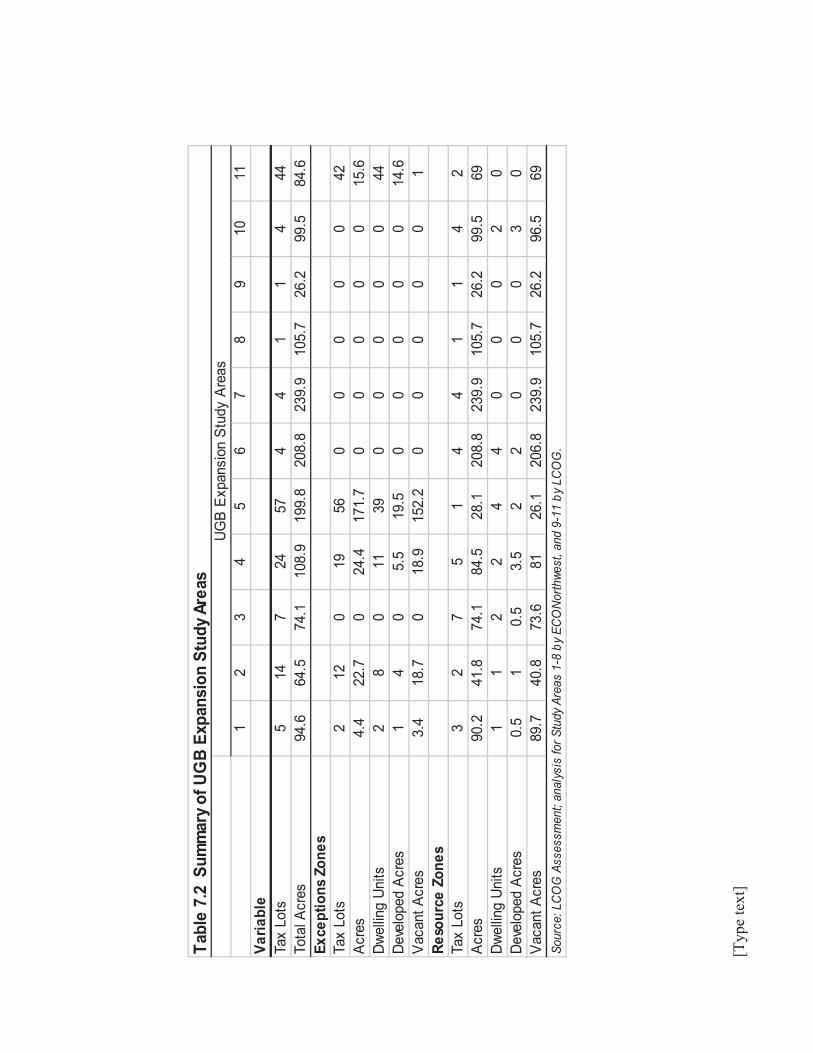
[Typ
e te
xt]
12
34
56
78
910
11Va
riabl
e Ta
x Lo
ts
514
724
574
41
14
44To
tal A
cres
94.6
64.5
74.1
108.
919
9.8
208.
823
9.9
105.
726
.299
.584
.6Ex
cept
ions
Zon
esTa
x Lo
ts
212
019
560
00
00
42Ac
res
4.4
22.7
024
.417
1.7
00
00
015
.6Dw
ellin
g Un
its2
80
1139
00
00
044
Deve
lope
d Ac
res
14
05.
519
.50
00
00
14.6
Vaca
nt A
cres
3.4
18.7
018
.915
2.2
00
00
01
Reso
urce
Zon
esTa
x Lo
ts
32
75
14
41
14
2Ac
res
90.2
41.8
74.1
84.5
28.1
208.
823
9.9
105.
726
.299
.569
Dwel
ling
Units
11
22
44
00
02
0De
velo
ped
Acre
s0.
51
0.5
3.5
22
00
03
0Va
cant
Acr
es89
.740
.873
.681
26.1
206.
823
9.9
105.
726
.296
.569
UGB
Expa
nsio
n St
udy
Area
sTa
ble
7.2
Sum
mar
y of U
GB
Expa
nsio
n St
udy A
reas
Sour
ce: L
CO
G A
sses
smen
t; an
alys
is fo
r Stu
dy A
reas
1-8
by
ECO
Nor
thwe
st, a
nd 9
-11
by L
CO
G.

[Type text]
Study Area Zone I II III IV V VI Total
1 E40 9.5 71.5 4.5 85.52 E30 39.4 2.4 41.83 E30 74.1 74.14 E30 3.1 81.9 85.05 E40 18.7 9.4 28.16 E40 63.6 138.5 5.9 208.07 E40 5.6 230.7 3.7 240.08 E40 1.82 53.2 50.3 105.39 F2 6.2 15 5 26.2
10 E30/E40 5.5 78 16 99.511 E30 13.42 50 0.9 4.6 68.9
1 E40 11% 84% 5% 100%2 E30 94% 6% 100%3 E30 100% 100%4 E30 4% 96% 100%5 E40 67% 33% 100%6 E40 31% 67% 3% 100%7 E40 2% 96% 2% 100%8 E40 2% 51% 48% 100%9 F2 24% 57% 19% 100%
10 E30/E40 6% 78% 16% 100%11 E30 19% 73% 1% 7% 100%
Table 7.3 Summary of Soil Class by UGB study area and zoning
Non-Exception (Resource) Acres in Study Area
Percent of Study Area Resource Acres
Source: Rural Lands Database; analysis by InfoGraphics Lab and ECONorthwest, Additional analysis by LCOG (Areas 9-11)
Soil Class
Table 7.2 summarizes basic parcelization and zoning characteristics of the eleven UGB expansion study areas. In total, the study areas include more than 1,000 acres adjacent to the existing UGB. The study areas include all lands zoned as exceptions that are adjacent to the existing UGB.
Coburg needs land for approximately 888 new dwelling units between 2010 and 2030. The housing capacity in exceptions lands and areas within the UGB may be insufficient to meet the City’s need, thus, Coburg may have justification to bring some non-exception land into the UGB. The City must consider the seven Goal 14 factors when evaluating which resource lands to include in an expanded UGB. SOILS ORS 197.298 and Statewide Planning Goal 14, Factor 6 address the retention of agricultural land “with Class I being the highest priority for retention and Class VI the lowest priority.” Class I soils have the highest agricultural “capability.”
Table 7.3 shows soil class by study area. Study Areas 1, 4, 5, 6, 10 and 11 have Class I soils present within lands zoned for resource uses. With the exception of Study Areas 8 and 9, all of the study areas have Class II soils present. Study Areas 7 and 8 have significant percentages of Class IV or higher soils.
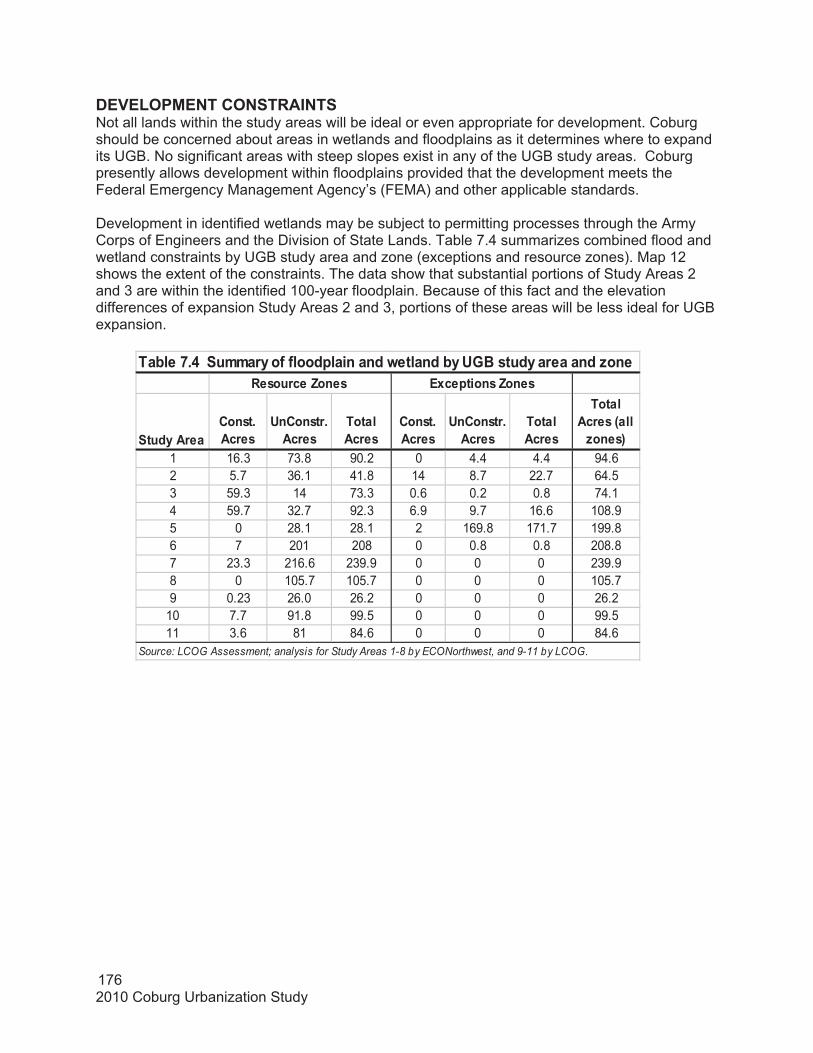
2010 Coburg Urbanization Study 176
Study AreaConst. Acres
UnConstr. Acres
Total Acres
Const. Acres
UnConstr. Acres
Total Acres
Total Acres (all
zones)1 16.3 73.8 90.2 0 4.4 4.4 94.62 5.7 36.1 41.8 14 8.7 22.7 64.53 59.3 14 73.3 0.6 0.2 0.8 74.14 59.7 32.7 92.3 6.9 9.7 16.6 108.95 0 28.1 28.1 2 169.8 171.7 199.86 7 201 208 0 0.8 0.8 208.87 23.3 216.6 239.9 0 0 0 239.98 0 105.7 105.7 0 0 0 105.79 0.23 26.0 26.2 0 0 0 26.2
10 7.7 91.8 99.5 0 0 0 99.511 3.6 81 84.6 0 0 0 84.6
Table 7.4 Summary of floodplain and wetland by UGB study area and zone
Source: LCOG Assessment; analysis for Study Areas 1-8 by ECONorthwest, and 9-11 by LCOG.
Resource Zones Exceptions Zones
DEVELOPMENT CONSTRAINTS Not all lands within the study areas will be ideal or even appropriate for development. Coburg should be concerned about areas in wetlands and floodplains as it determines where to expand its UGB. No significant areas with steep slopes exist in any of the UGB study areas. Coburg presently allows development within floodplains provided that the development meets the Federal Emergency Management Agency’s (FEMA) and other applicable standards.
Development in identified wetlands may be subject to permitting processes through the Army Corps of Engineers and the Division of State Lands. Table 7.4 summarizes combined flood and wetland constraints by UGB study area and zone (exceptions and resource zones). Map 12 shows the extent of the constraints. The data show that substantial portions of Study Areas 2 and 3 are within the identified 100-year floodplain. Because of this fact and the elevation differences of expansion Study Areas 2 and 3, portions of these areas will be less ideal for UGB expansion.

[Type text]
GOAL 14 LOCATION FACTORSIn this section, each of the 4 Goal 14 location factors is discussed as they generally pertain to Coburg’s study areas:
� Factor 1: Efficient accommodation of identified land needs. LUBA has generally used the term “efficiency” to mean “contiguous or adjacent to existing development.” Areas 1 and 6 probably have the greatest ability to meet the intent of this factor due to their proximity to the existing UGB. Area 5 meets this factor to a lesser extent. Areas 10 and 11 provide the least adjacency to the existing UGB. Areas 7, 8, and 9 are noted as prime locations for employment due to their proximity to the interchange. Areas further from the interchange may be good candidates for housing.
� Factor 2: Orderly and economic provision for public facilities and service. LCOG did not conduct a detailed cost study, nor are such estimates included in the City’s water and wastewater plans. LCOG did discuss with City staff the relative cost and efficiency ofservicing the various UGB study areas. Coburg Public Works staff provided this simple summary of their best estimates of relative costs:
Area 6 was identified as the easiest and cheapest area to service due to its proximity to the sewer trunk line and the wastewater treatment plant. Area 11 was also seen as a less expensive alternative due to its proximity to the proposed wastewater treatment facility and the facilities which exist along Indian and Paiute Streets. Areas with large amounts of exceptions lands (Areas 2, 4, 5, and 8) will create challenges to providing services due to significant amounts of pre-existing development. If the City decides to extend services earlier in the planning period, then the remainder of Study Area 8 is agood candidate for inclusion in the UGB. Areas 1, 2, 3, are separated from the City by a water feature, which means extension to this area would be delivered at greater expense.
� Factor 3: Environmental, energy, economic and social consequences. Areas 2, 3, 4 and 10 have the greatest potential for negative environmental consequences given the amount of floodplain in these areas. Areas 1 and 6 probably have the least energy consequences from a transportation and service delivery perspective because of their location to the UGB. Any expansion that affects lands that are actively farmed has
Table 7.5 Public Works Cost Rating for the Extension of Water and Sewer to Study Areas Study Area Cost Rating
1 $$$ 2 $$$ 3 $$$$$ 4 $$$ 5 $$ 6 $ 7 $$$$$$$ 8 $$$$$$$ 9 $$$$$$$
10 $$ 11 $
2010 Coburg Urbanization Study 178
potential for economic impacts. Exceptions areas (predominantly in Areas 1, 2, 4 and 5) have the greatest potential for social impacts. In the Location Analysis section of this document, each study area will be provided an in depth, and individual discussion of its potential Economic, Social, Environmental and Energy consequences.
� Factor 4: Compatibility of the proposed urban uses with nearby agricultural and forest activities occurring on farm and forest land outside the UGB.. Areas with more land contiguous to existing development, such as areas 1 and 6 are probably most compatible with nearby agricultural activities. However, any land that is adjacent toagricultural activities will have an impact with respect to Factor 4. The 2004 Urbanization Study’s evaluation of this factor suggested that the compatibility impacts do not appear to be much different between the UGB study areas.
These factors are discussed in greater detail within the evaluation of each individual study area.
Location Analysis:STUDY AREA 1: Coburg Road-Roberts Road (95 Acres) Study Area 1 includes lands south of the existing UGB, east of Coburg Road and West of Roberts Road. The eastern edge of the study area is bounded by the Southern Pacific Railroad right-of-way. The area is contiguous with the existing UGB on three sides. The area consists of approximately 95 acres in five parcels. More than 90 acres of the site is zoned for agricultural uses (E-40), with 4.4. acres designated RR-2 (an exception area). Three dwelling units exist on the site as well as a few farm-related structures. The land is largely in active farm uses. Topographically, the site is largely flat. While no identified wetlands exist on the site, about 16 acres of the site are in flood zone A (the 100-year floodplain). Lands zoned for agricultural use in the study area are mostly Class I or II soils. Of the 90 acres zoned for agricultural use in the study area, 9.5 acres have Class I soils, and 71.5 acres are identified as Class II soils. Study Area 1 appears relatively easy to service due to its flat topography. The site is a few feet lower than areas just to the north. Water service would be relatively easy to extend to the site, as would electrical. Transportation to the site would be from Roberts Road on the east and Willamette Street on the West. Opportunities exist to extend Coleman and Thomas Streets into the study area.
Economic Consequences Study Area 1 is not seen as the least expensive area to service, nor is it the most. The growth scenarios that were generated from the Coburg Crossroads process identified area 1 as being an area for residential and open space use. It appears that there are limited opportunities in the area for commercial or even industrial uses, however, public sentiment favors residential use for the area. Impacts to existing economic conditions would include the removal of farmland acreage which is currently producing a commercial crop. Also, the area abuts industrial uses off of Roberts Court, and conflicting uses could create limited impacts or limitations (obvious or subtle) to their operation. Social Consequences Study Area 1 is adjacent to sections of Courg’s city limits that are developed with a residential neighborhood (to the north) and industrial uses (to the east). The area also
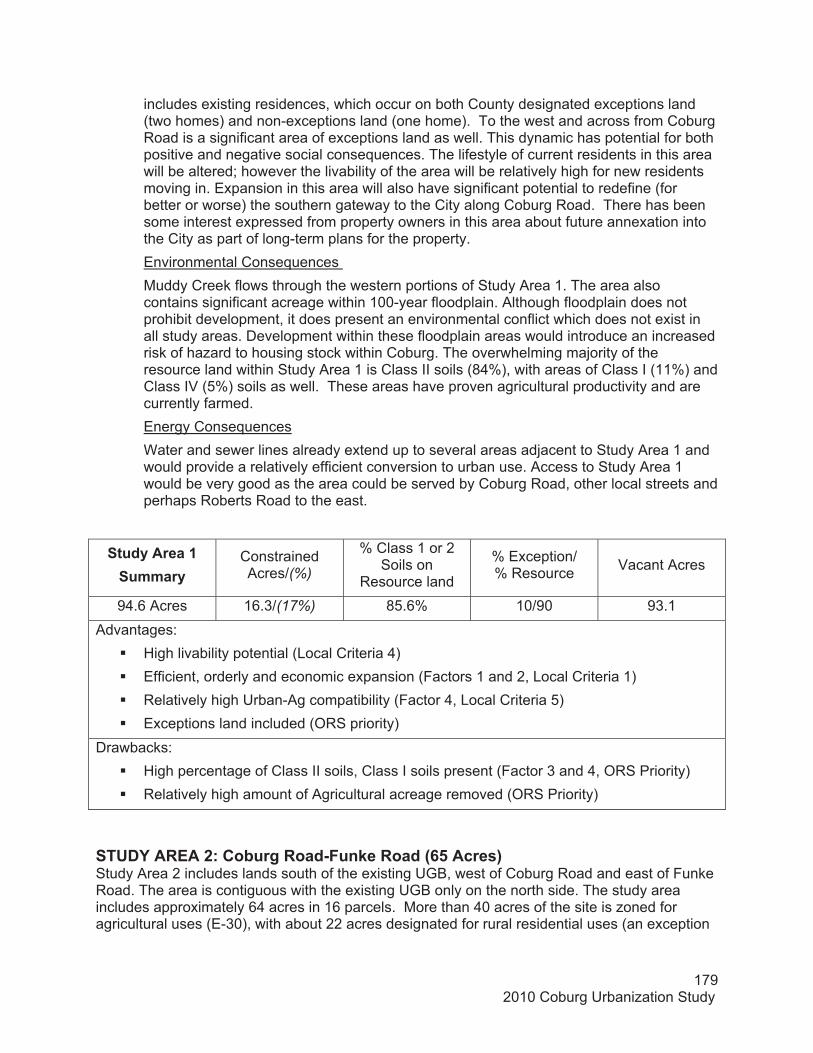
179 2010 Coburg Urbanization Study
includes existing residences, which occur on both County designated exceptions land (two homes) and non-exceptions land (one home). To the west and across from Coburg Road is a significant area of exceptions land as well. This dynamic has potential for both positive and negative social consequences. The lifestyle of current residents in this area will be altered; however the livability of the area will be relatively high for new residents moving in. Expansion in this area will also have significant potential to redefine (for better or worse) the southern gateway to the City along Coburg Road. There has been some interest expressed from property owners in this area about future annexation into the City as part of long-term plans for the property. Environmental Consequences Muddy Creek flows through the western portions of Study Area 1. The area also contains significant acreage within 100-year floodplain. Although floodplain does not prohibit development, it does present an environmental conflict which does not exist in all study areas. Development within these floodplain areas would introduce an increased risk of hazard to housing stock within Coburg. The overwhelming majority of the resource land within Study Area 1 is Class II soils (84%), with areas of Class I (11%) and Class IV (5%) soils as well. These areas have proven agricultural productivity and are currently farmed. Energy Consequences Water and sewer lines already extend up to several areas adjacent to Study Area 1 and would provide a relatively efficient conversion to urban use. Access to Study Area 1 would be very good as the area could be served by Coburg Road, other local streets and perhaps Roberts Road to the east.
Study Area 1 Summary
ConstrainedAcres/(%)
% Class 1 or 2 Soils on
Resource land
% Exception/% Resource Vacant Acres
94.6 Acres 16.3/(17%) 85.6% 10/90 93.1 Advantages:
� High livability potential (Local Criteria 4) � Efficient, orderly and economic expansion (Factors 1 and 2, Local Criteria 1) � Relatively high Urban-Ag compatibility (Factor 4, Local Criteria 5) � Exceptions land included (ORS priority)
Drawbacks:� High percentage of Class II soils, Class I soils present (Factor 3 and 4, ORS Priority) � Relatively high amount of Agricultural acreage removed (ORS Priority)
STUDY AREA 2: Coburg Road-Funke Road (65 Acres) Study Area 2 includes lands south of the existing UGB, west of Coburg Road and east of Funke Road. The area is contiguous with the existing UGB only on the north side. The study area includes approximately 64 acres in 16 parcels. More than 40 acres of the site is zoned for agricultural uses (E-30), with about 22 acres designated for rural residential uses (an exception
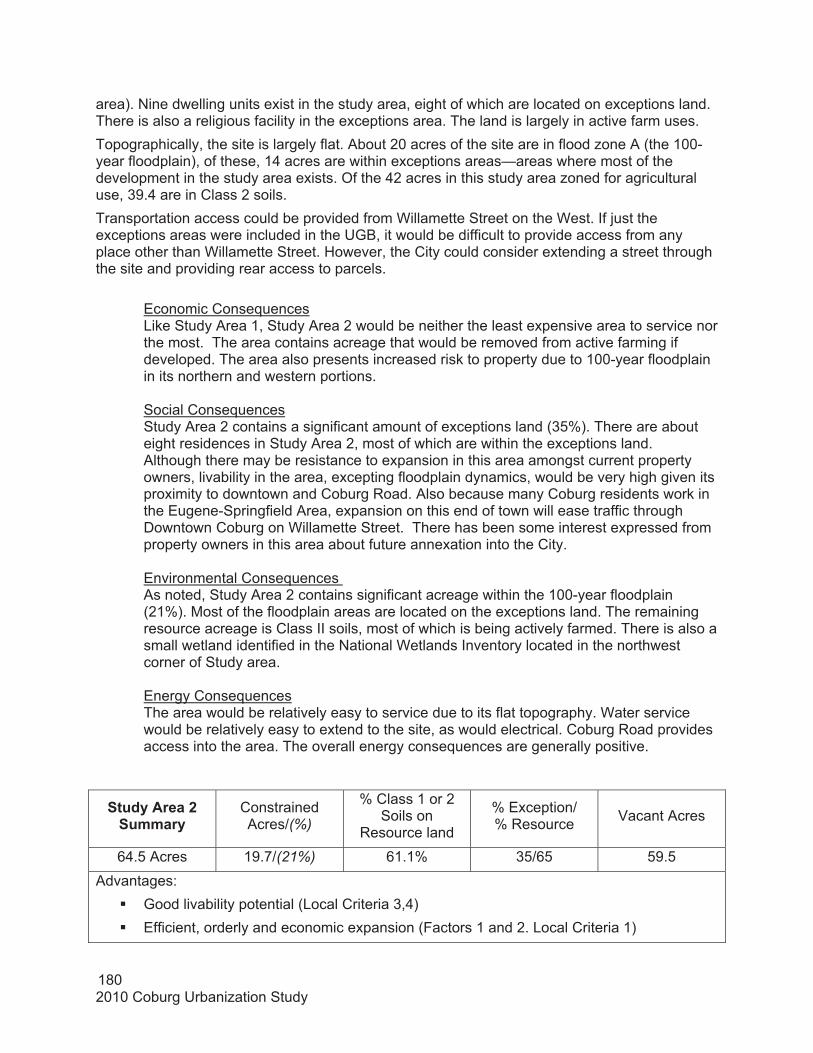
2010 Coburg Urbanization Study 180
area). Nine dwelling units exist in the study area, eight of which are located on exceptions land. There is also a religious facility in the exceptions area. The land is largely in active farm uses. Topographically, the site is largely flat. About 20 acres of the site are in flood zone A (the 100-year floodplain), of these, 14 acres are within exceptions areas—areas where most of the development in the study area exists. Of the 42 acres in this study area zoned for agricultural use, 39.4 are in Class 2 soils. Transportation access could be provided from Willamette Street on the West. If just the exceptions areas were included in the UGB, it would be difficult to provide access from any place other than Willamette Street. However, the City could consider extending a street through the site and providing rear access to parcels.
Economic Consequences Like Study Area 1, Study Area 2 would be neither the least expensive area to service nor the most. The area contains acreage that would be removed from active farming if developed. The area also presents increased risk to property due to 100-year floodplain in its northern and western portions.
Social Consequences Study Area 2 contains a significant amount of exceptions land (35%). There are about eight residences in Study Area 2, most of which are within the exceptions land. Although there may be resistance to expansion in this area amongst current property owners, livability in the area, excepting floodplain dynamics, would be very high given its proximity to downtown and Coburg Road. Also because many Coburg residents work in the Eugene-Springfield Area, expansion on this end of town will ease traffic through Downtown Coburg on Willamette Street. There has been some interest expressed from property owners in this area about future annexation into the City.
Environmental Consequences As noted, Study Area 2 contains significant acreage within the 100-year floodplain (21%). Most of the floodplain areas are located on the exceptions land. The remaining resource acreage is Class II soils, most of which is being actively farmed. There is also a small wetland identified in the National Wetlands Inventory located in the northwest corner of Study area.
Energy Consequences The area would be relatively easy to service due to its flat topography. Water service would be relatively easy to extend to the site, as would electrical. Coburg Road provides access into the area. The overall energy consequences are generally positive.
Study Area 2 Summary
ConstrainedAcres/(%)
% Class 1 or 2 Soils on
Resource land
% Exception/% Resource Vacant Acres
64.5 Acres 19.7/(21%) 61.1% 35/65 59.5 Advantages:
� Good livability potential (Local Criteria 3,4) � Efficient, orderly and economic expansion (Factors 1 and 2. Local Criteria 1)
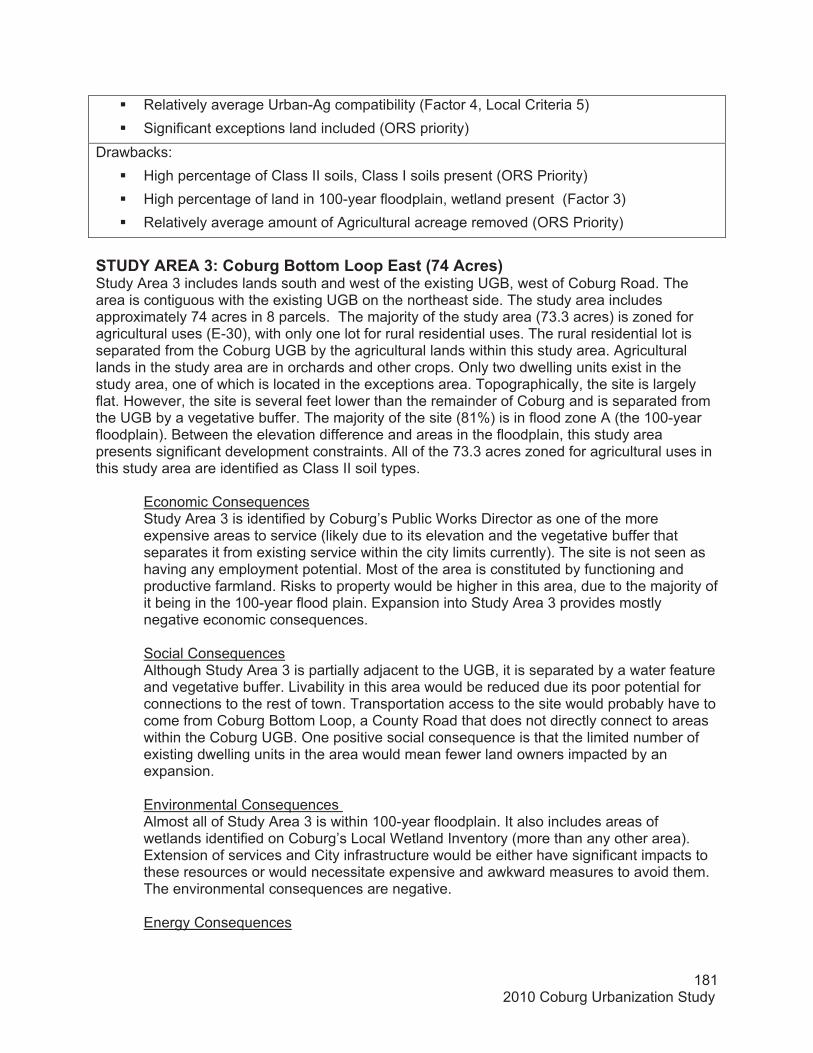
181 2010 Coburg Urbanization Study
� Relatively average Urban-Ag compatibility (Factor 4, Local Criteria 5) � Significant exceptions land included (ORS priority)
Drawbacks:� High percentage of Class II soils, Class I soils present (ORS Priority) � High percentage of land in 100-year floodplain, wetland present (Factor 3) � Relatively average amount of Agricultural acreage removed (ORS Priority)
STUDY AREA 3: Coburg Bottom Loop East (74 Acres) Study Area 3 includes lands south and west of the existing UGB, west of Coburg Road. The area is contiguous with the existing UGB on the northeast side. The study area includes approximately 74 acres in 8 parcels. The majority of the study area (73.3 acres) is zoned for agricultural uses (E-30), with only one lot for rural residential uses. The rural residential lot is separated from the Coburg UGB by the agricultural lands within this study area. Agricultural lands in the study area are in orchards and other crops. Only two dwelling units exist in the study area, one of which is located in the exceptions area. Topographically, the site is largely flat. However, the site is several feet lower than the remainder of Coburg and is separated from the UGB by a vegetative buffer. The majority of the site (81%) is in flood zone A (the 100-year floodplain). Between the elevation difference and areas in the floodplain, this study area presents significant development constraints. All of the 73.3 acres zoned for agricultural uses in this study area are identified as Class II soil types.
Economic Consequences Study Area 3 is identified by Coburg’s Public Works Director as one of the more expensive areas to service (likely due to its elevation and the vegetative buffer that separates it from existing service within the city limits currently). The site is not seen as having any employment potential. Most of the area is constituted by functioning and productive farmland. Risks to property would be higher in this area, due to the majority of it being in the 100-year flood plain. Expansion into Study Area 3 provides mostly negative economic consequences.
Social Consequences Although Study Area 3 is partially adjacent to the UGB, it is separated by a water feature and vegetative buffer. Livability in this area would be reduced due its poor potential for connections to the rest of town. Transportation access to the site would probably have to come from Coburg Bottom Loop, a County Road that does not directly connect to areas within the Coburg UGB. One positive social consequence is that the limited number of existing dwelling units in the area would mean fewer land owners impacted by an expansion.
Environmental Consequences Almost all of Study Area 3 is within 100-year floodplain. It also includes areas of wetlands identified on Coburg’s Local Wetland Inventory (more than any other area). Extension of services and City infrastructure would be either have significant impacts to these resources or would necessitate expensive and awkward measures to avoid them. The environmental consequences are negative.
Energy Consequences
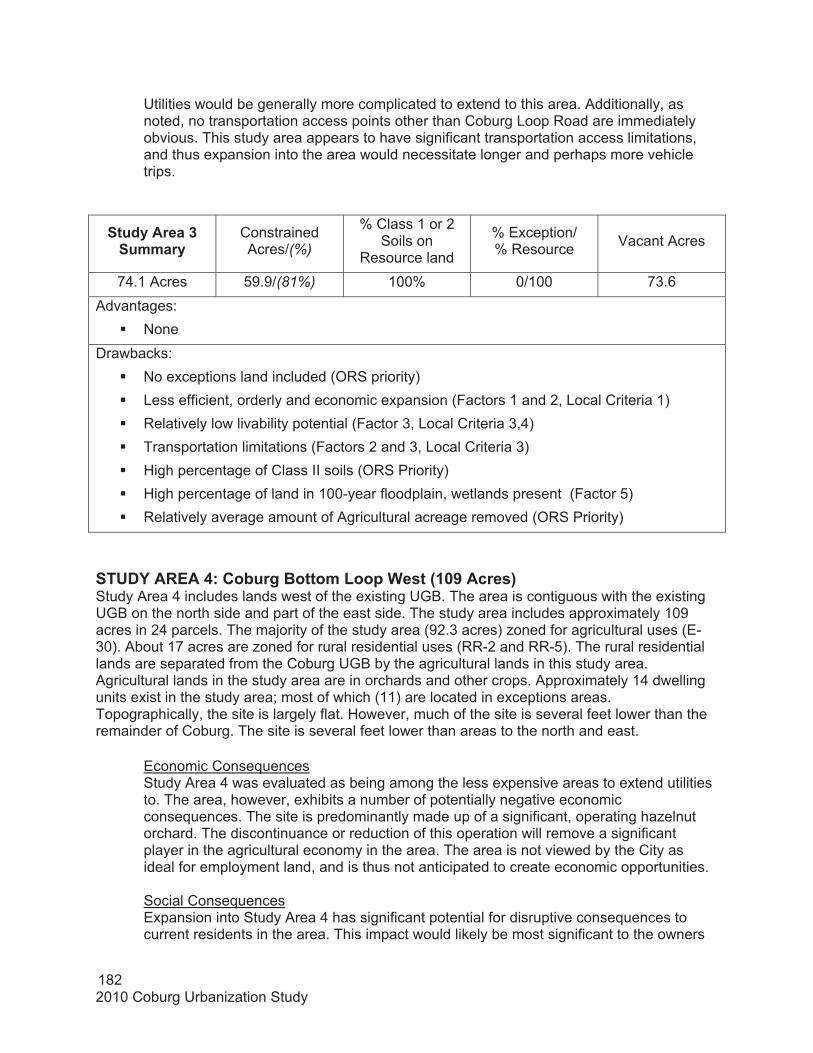
2010 Coburg Urbanization Study 182
Utilities would be generally more complicated to extend to this area. Additionally, as noted, no transportation access points other than Coburg Loop Road are immediately obvious. This study area appears to have significant transportation access limitations, and thus expansion into the area would necessitate longer and perhaps more vehicle trips.
Study Area 3 Summary
ConstrainedAcres/(%)
% Class 1 or 2 Soils on
Resource land
% Exception/% Resource Vacant Acres
74.1 Acres 59.9/(81%) 100% 0/100 73.6 Advantages:
� None Drawbacks:
� No exceptions land included (ORS priority) � Less efficient, orderly and economic expansion (Factors 1 and 2, Local Criteria 1) � Relatively low livability potential (Factor 3, Local Criteria 3,4) � Transportation limitations (Factors 2 and 3, Local Criteria 3) � High percentage of Class II soils (ORS Priority) � High percentage of land in 100-year floodplain, wetlands present (Factor 5) � Relatively average amount of Agricultural acreage removed (ORS Priority)
STUDY AREA 4: Coburg Bottom Loop West (109 Acres) Study Area 4 includes lands west of the existing UGB. The area is contiguous with the existing UGB on the north side and part of the east side. The study area includes approximately 109 acres in 24 parcels. The majority of the study area (92.3 acres) zoned for agricultural uses (E- 30). About 17 acres are zoned for rural residential uses (RR-2 and RR-5). The rural residential lands are separated from the Coburg UGB by the agricultural lands in this study area. Agricultural lands in the study area are in orchards and other crops. Approximately 14 dwelling units exist in the study area; most of which (11) are located in exceptions areas. Topographically, the site is largely flat. However, much of the site is several feet lower than the remainder of Coburg. The site is several feet lower than areas to the north and east.
Economic Consequences Study Area 4 was evaluated as being among the less expensive areas to extend utilities to. The area, however, exhibits a number of potentially negative economic consequences. The site is predominantly made up of a significant, operating hazelnut orchard. The discontinuance or reduction of this operation will remove a significant player in the agricultural economy in the area. The area is not viewed by the City as ideal for employment land, and is thus not anticipated to create economic opportunities.
Social Consequences Expansion into Study Area 4 has significant potential for disruptive consequences to current residents in the area. This impact would likely be most significant to the owners
183 2010 Coburg Urbanization Study
of the hazelnut orchard. The area contains significant acreage of exceptions land. These residential areas are along Funke and Coburg Bottom Loop Roads. An expansion which included only the exceptions land in Study Area 4 would be problematic because the exceptions land is not contiguous with the UGB. An expansion which includes Study Area 3 would provide the exceptions land of Study Area 4 a feasible connection. Livability in Study Area 4 is good, particularly in the north where access to downtown and Coburg Elementary School are ideal. There have been concerns expressed from property owners in this area about urbanization.
Environmental Consequences Like Study Area 3, Study Area 4 presents environmental challenges. The majority of the site (61%) is in flood zone A (the 100-year floodplain). Additionally, of the resource acres in this study area, 75% are Class II soils and 3% are identified as Class I soils.
Energy Consequences Water service would be relatively easy to extend to the site, as would electrical. Transportation access to the site would probably have to come from Coburg Bottom Loop—a County Road. Van Duyn Road could provide access from the North. The northern portions of Study Area 4 present opportunities for energy efficient expansion, due to their proximity to downtown and other facilities. Exceptions lands provide an energy benefit in that they have many services and infrastructure already in place. The exceptions land in Study Area 4 does not have access opportunities that are as ideal as other area alternatives.
Study Area 4 Summary
ConstrainedAcres/(%)
% Class 1 or 2 Soils on
Resource land
% Exception/% Resource Vacant Acres
108.9 Acres 66.6/(61%) 78% 22/78 99.9 Advantages:
� Good livability potential (Local Criteria 3,4) � Efficient, orderly and economic expansion (Factors 1 and 2, Local Criteria 1) � Exceptions land included (ORS priority) � Fair transportation opportunities (Factors 2 and 3, Local Criteria 3)
Drawbacks:� Removal of/ Impact on active orchard (Factors 3 and 4, Local Criteria 5) � High percentage of Class II soils, Class I soils present (ORS Priority) � High percentage of land in 100-year floodplain (Factor 3) � Relatively significant amount of Agricultural acreage removed (ORS Priority)
STUDY AREA 5: Stalling Lane- North Coburg Road (200 Acres) Study Area 5 includes lands north and west of the existing UGB. The area is contiguous with the existing UGB on part of the east side. The study area includes approximately 200 acres in 56 parcels. The majority of the study area (172.3 acres) is in exception areas (RR-5 zoning). Only one tax lot of about 28 acres is in agricultural zoning (E-40). A total of 43 dwelling units exist in
2010 Coburg Urbanization Study 184
the study area; 39 of which are located in exceptions areas. Topographically, the site is largely flat. Of the 28.1 acres in this study area zoned for agricultural uses, 18.1 acres are in Class I soil types and 9.4 acres are identified as Class II soil types. . A pump station may be required to move sewage from the area to the treatment plant on the north end of Coburg. Water service would be relatively easy to extend to the site, as would electrical. Transportation access to the site would probably have to come from Coburg Road and Stallings Lane. There may be opportunities to provide cross streets to improve access to the area.
Economic Consequences According to Coburg’s Public Works Director, Study Area 5 is one of the least expensive areas to extend City water and stormwater service into. This is due to the fact that much of the area is currently served by water along North Coburg Road North. An important consideration in expansion into Study Area 5 is the sewer service obligation to existing residents that will be immediately effective if all or any portion of area 5 is included. This obligation is more significant in Study Area 5 than other areas, and is an important cost related issue for the City to consider. The more northern portions of Study Area 5 would be progressively more expensive to provide services to because of the increased distance from existing city facilities to the south, and would accelerate the need to construct an expensive northern connector road (see Map 17).
Study Area 5 is not identified as an area for employment expansion and expansion would provide no benefit in that regard. The area contains a number of small farms and mid-sized farms. Economic impacts will be more substantial for the relatively few operating--mid sized farms. The only resource land in Study Area 5 is the 28 acre piece owned by Eugene 4J School District. The overall economic consequences of expansion into Study Area 5 are not seen as leaning significantly either way.
Social Consequences Study Area 5 contains many existing residents (43 dwelling units). Expansion impacts will affect many more people in Study Area 5 than in most other areas. It can, however, be argued that the individual impacts will be relatively less to residents in Study Area 5 than in some other areas since the area is currently residentially zoned, of a certain residential character, and already has a relatively significant population. The area contains many rural residences, which, if included in the UGB will receive significant development pressure. Previous efforts have suggested the residents in Study Area 5 are split in their support of expansion in their direction. The area is in very close proximity to Coburg Elementary School, a potential future school site, and the southern portions of this study area are relatively near Coburg’s downtown, all of which promote high livability.
Environmental Consequences The environmental consequences of expansion into Study Area 5 are seen as minimal for about half of the exceptions lands. Although the area consists of Class I and II soils, the area contains significant existing development. The limited resource land within Study Area 5 is predominantly Class I soils. By directing growth to this area, areas of greater environmental significance and with greater potential can be avoided. However, the portion of this study area south of Van Duyn Road is bounded on three sides by agricultural land with Class II soils. Urban development of this area would have significant consequences to adjacent agricultural lands. And the northern half of this study area is a “peninsula” of rural residential development surrounded on three sides by
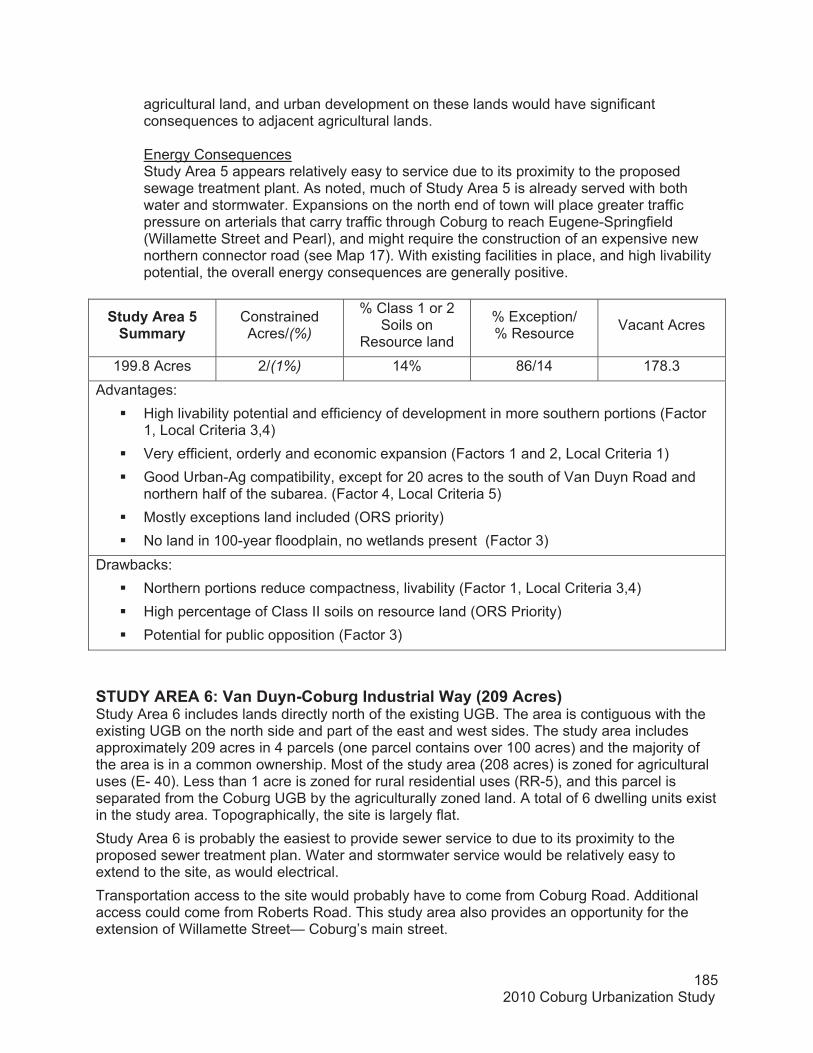
185 2010 Coburg Urbanization Study
agricultural land, and urban development on these lands would have significant consequences to adjacent agricultural lands.
Energy Consequences Study Area 5 appears relatively easy to service due to its proximity to the proposed sewage treatment plant. As noted, much of Study Area 5 is already served with both water and stormwater. Expansions on the north end of town will place greater traffic pressure on arterials that carry traffic through Coburg to reach Eugene-Springfield (Willamette Street and Pearl), and might require the construction of an expensive new northern connector road (see Map 17). With existing facilities in place, and high livability potential, the overall energy consequences are generally positive.
Study Area 5 Summary
ConstrainedAcres/(%)
% Class 1 or 2 Soils on
Resource land
% Exception/% Resource Vacant Acres
199.8 Acres 2/(1%) 14% 86/14 178.3 Advantages:
� High livability potential and efficiency of development in more southern portions (Factor 1, Local Criteria 3,4)
� Very efficient, orderly and economic expansion (Factors 1 and 2, Local Criteria 1) � Good Urban-Ag compatibility, except for 20 acres to the south of Van Duyn Road and
northern half of the subarea. (Factor 4, Local Criteria 5) � Mostly exceptions land included (ORS priority) � No land in 100-year floodplain, no wetlands present (Factor 3)
Drawbacks:� Northern portions reduce compactness, livability (Factor 1, Local Criteria 3,4) � High percentage of Class II soils on resource land (ORS Priority) � Potential for public opposition (Factor 3)
STUDY AREA 6: Van Duyn-Coburg Industrial Way (209 Acres) Study Area 6 includes lands directly north of the existing UGB. The area is contiguous with the existing UGB on the north side and part of the east and west sides. The study area includes approximately 209 acres in 4 parcels (one parcel contains over 100 acres) and the majority of the area is in a common ownership. Most of the study area (208 acres) is zoned for agricultural uses (E- 40). Less than 1 acre is zoned for rural residential uses (RR-5), and this parcel is separated from the Coburg UGB by the agriculturally zoned land. A total of 6 dwelling units exist in the study area. Topographically, the site is largely flat. Study Area 6 is probably the easiest to provide sewer service to due to its proximity to the proposed sewer treatment plan. Water and stormwater service would be relatively easy to extend to the site, as would electrical. Transportation access to the site would probably have to come from Coburg Road. Additional access could come from Roberts Road. This study area also provides an opportunity for the extension of Willamette Street— Coburg’s main street.
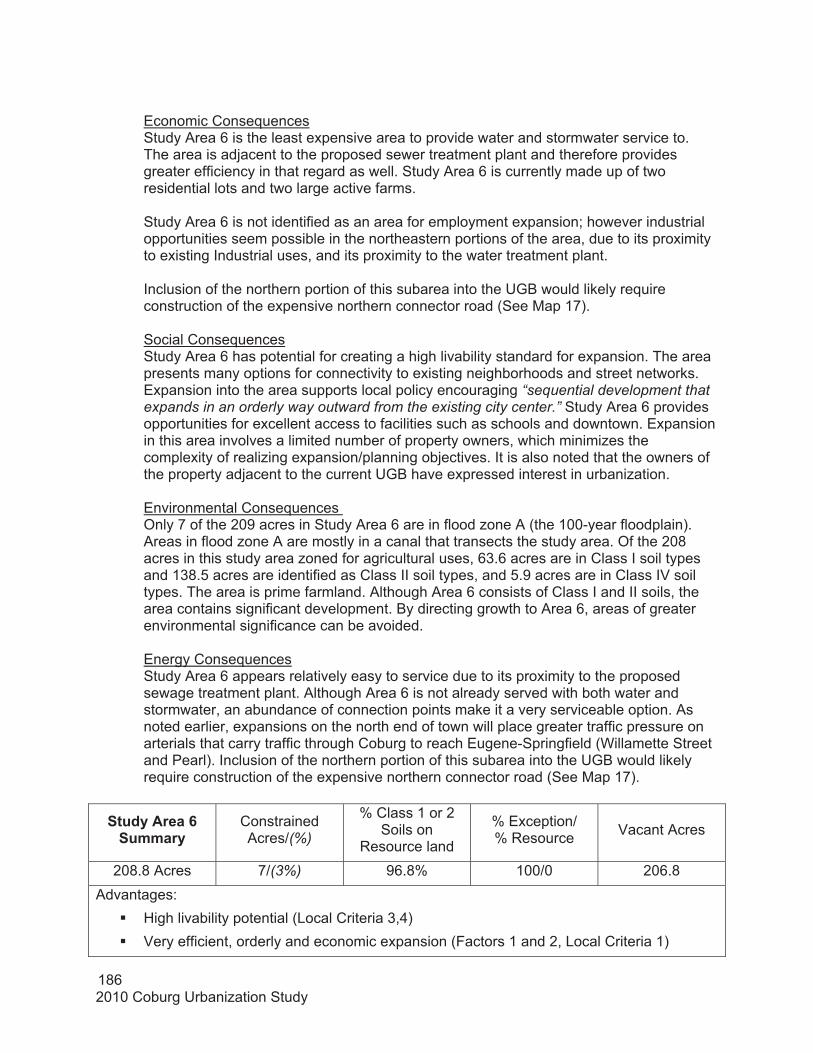
2010 Coburg Urbanization Study 186
Economic Consequences Study Area 6 is the least expensive area to provide water and stormwater service to. The area is adjacent to the proposed sewer treatment plant and therefore provides greater efficiency in that regard as well. Study Area 6 is currently made up of two residential lots and two large active farms.
Study Area 6 is not identified as an area for employment expansion; however industrial opportunities seem possible in the northeastern portions of the area, due to its proximity to existing Industrial uses, and its proximity to the water treatment plant.
Inclusion of the northern portion of this subarea into the UGB would likely require construction of the expensive northern connector road (See Map 17).
Social Consequences Study Area 6 has potential for creating a high livability standard for expansion. The area presents many options for connectivity to existing neighborhoods and street networks. Expansion into the area supports local policy encouraging “sequential development that expands in an orderly way outward from the existing city center.” Study Area 6 provides opportunities for excellent access to facilities such as schools and downtown. Expansion in this area involves a limited number of property owners, which minimizes the complexity of realizing expansion/planning objectives. It is also noted that the owners of the property adjacent to the current UGB have expressed interest in urbanization.
Environmental Consequences Only 7 of the 209 acres in Study Area 6 are in flood zone A (the 100-year floodplain). Areas in flood zone A are mostly in a canal that transects the study area. Of the 208 acres in this study area zoned for agricultural uses, 63.6 acres are in Class I soil types and 138.5 acres are identified as Class II soil types, and 5.9 acres are in Class IV soil types. The area is prime farmland. Although Area 6 consists of Class I and II soils, the area contains significant development. By directing growth to Area 6, areas of greater environmental significance can be avoided.
Energy Consequences Study Area 6 appears relatively easy to service due to its proximity to the proposed sewage treatment plant. Although Area 6 is not already served with both water and stormwater, an abundance of connection points make it a very serviceable option. As noted earlier, expansions on the north end of town will place greater traffic pressure on arterials that carry traffic through Coburg to reach Eugene-Springfield (Willamette Street and Pearl). Inclusion of the northern portion of this subarea into the UGB would likely require construction of the expensive northern connector road (See Map 17).
Study Area 6 Summary
ConstrainedAcres/(%)
% Class 1 or 2 Soils on
Resource land
% Exception/% Resource Vacant Acres
208.8 Acres 7/(3%) 96.8% 100/0 206.8 Advantages:
� High livability potential (Local Criteria 3,4) � Very efficient, orderly and economic expansion (Factors 1 and 2, Local Criteria 1)
187 2010 Coburg Urbanization Study
� Good Urban-Ag compatibility (Factor 4, Local Criteria 5) � Very little acreage in 100-year floodplain, no wetlands present (Factor 3)
Drawbacks:� High percentage of Class II soils, relatively high percentage of Class I soils (ORS
Priority)� No exceptions land included (ORS priority)
STUDY AREA 7: East I-5 North (240 Acres) Study Area 7 includes lands east of the existing UGB and across I-5. The area is not contiguous with the existing UGB except at the study area's southwest corner next to the I-5 interchange. The study area includes approximately 240 acres in 3 very large parcels. The entire study area (239.9 acres) is zoned for agricultural uses (E-40). Agricultural lands in the study area are used primarily for grazing. No development exists in this study area. Topographically, the site is largely flat. The study area has (23 acres) is in flood zone A (the 100-year floodplain) or in identified wetland area. The major development constraint in this study area is extending municipal services across I-5.
Economic Consequences Study Area 7 is seen as more difficult to service due to its location east of I-5. It was among the most expensive alternatives as per Coburg’s Public Works Director. This is because water, sewer, electricity, and storm drainage would all probably require boring under the Interstate. It is of note that Coburg’s recent inclusion of the Country Squire property (east of I-5) places a certain obligation on the City to extend service across the freeway regardless of the outcomes of this expansion process.
The overwhelming majority of the site is currently under one use (a cattle ranch), which also occupies significant acreage surrounding the study area. Due to the area’s proximity to I-5 (as well as the Eugene-Springfield area), it is viewed by the City as having prime employment potential. The economic consequences of the reduction of the ranching activities would likely be outweighed by potential economic gains of utilizing the land for industrial purposes. The economic opportunities for areas east of I-5 have the potential to outweigh the negative economic consequence of expansion into the area (cost of extending service, etc.).
The recently adopted Coburg / Interstate 5 Interchange Area Management Plan (IAMP) traffic forecasts are based on estimated of the growth potential inherent in the current UGB assuming some limited infill. As a result, full realization of the assigned population and employment forecasts will result is greater traffic volumes than assumed in the IAMP. The nature of those traffic increases will depend on the location and intensity of the new growth assumptions. If additional land east of I-5 was included in the UGB, and a development proposal was submitted to the City, the developer may be required to pay for transportation infrastructure improvements beyond the current reconstruction design, if deemed necessary by ODOT. These improvements could prove to be prohibitively expensive.
Social Consequences
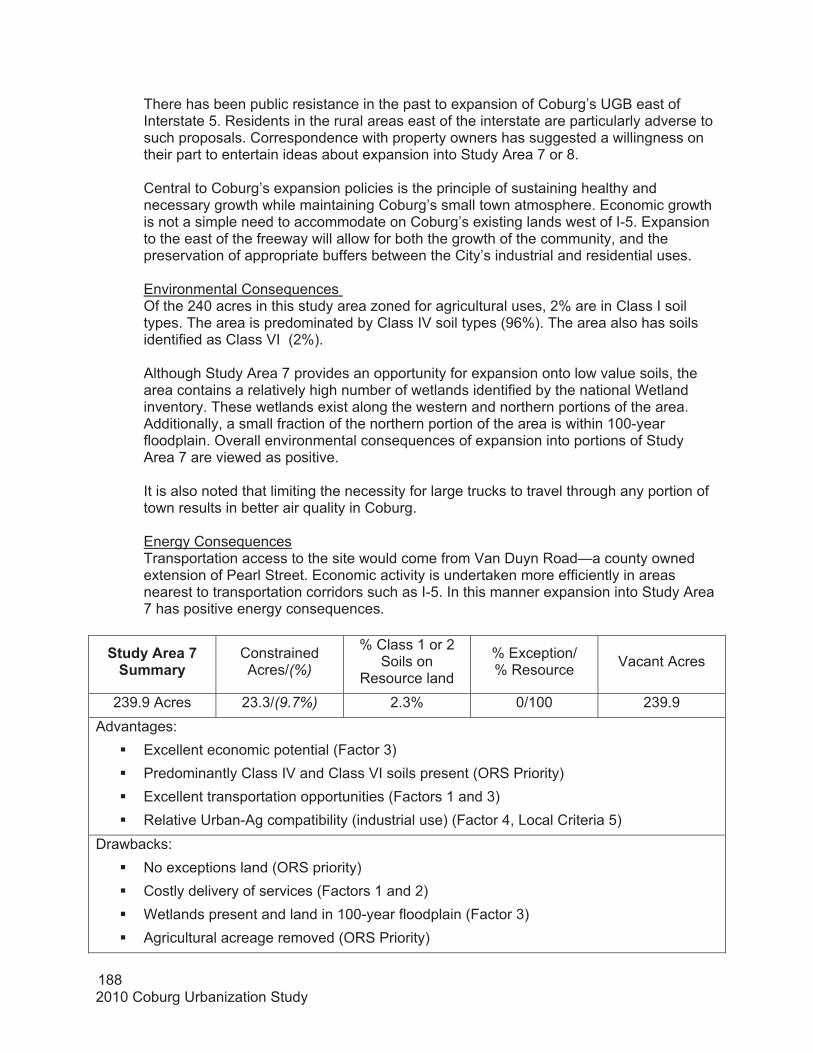
2010 Coburg Urbanization Study 188
There has been public resistance in the past to expansion of Coburg’s UGB east of Interstate 5. Residents in the rural areas east of the interstate are particularly adverse to such proposals. Correspondence with property owners has suggested a willingness on their part to entertain ideas about expansion into Study Area 7 or 8.
Central to Coburg’s expansion policies is the principle of sustaining healthy and necessary growth while maintaining Coburg’s small town atmosphere. Economic growth is not a simple need to accommodate on Coburg’s existing lands west of I-5. Expansion to the east of the freeway will allow for both the growth of the community, and the preservation of appropriate buffers between the City’s industrial and residential uses.
Environmental Consequences Of the 240 acres in this study area zoned for agricultural uses, 2% are in Class I soil types. The area is predominated by Class IV soil types (96%). The area also has soils identified as Class VI (2%).
Although Study Area 7 provides an opportunity for expansion onto low value soils, the area contains a relatively high number of wetlands identified by the national Wetland inventory. These wetlands exist along the western and northern portions of the area. Additionally, a small fraction of the northern portion of the area is within 100-year floodplain. Overall environmental consequences of expansion into portions of Study Area 7 are viewed as positive.
It is also noted that limiting the necessity for large trucks to travel through any portion of town results in better air quality in Coburg.
Energy Consequences Transportation access to the site would come from Van Duyn Road—a county owned extension of Pearl Street. Economic activity is undertaken more efficiently in areas nearest to transportation corridors such as I-5. In this manner expansion into Study Area 7 has positive energy consequences.
Study Area 7 Summary
ConstrainedAcres/(%)
% Class 1 or 2 Soils on
Resource land
% Exception/% Resource Vacant Acres
239.9 Acres 23.3/(9.7%) 2.3% 0/100 239.9 Advantages:
� Excellent economic potential (Factor 3) � Predominantly Class IV and Class VI soils present (ORS Priority) � Excellent transportation opportunities (Factors 1 and 3) � Relative Urban-Ag compatibility (industrial use) (Factor 4, Local Criteria 5)
Drawbacks:� No exceptions land (ORS priority) � Costly delivery of services (Factors 1 and 2) � Wetlands present and land in 100-year floodplain (Factor 3) � Agricultural acreage removed (ORS Priority)

189 2010 Coburg Urbanization Study
STUDY AREA 8: East I-5 South A (106 Acres) Study Area 8 includes lands east of the existing UGB and across I-5. Unlike Study Area 7, Study Area 8 shares a significant border with the existing UGB. A portion of the original Study Area 8, identified in the 2004 Urbanization Study, was brought into the UGB in 2006. Study Area 8 now consists of the remaining acreage that was not included in that expansion. Inclusion of this area would require additional expansion of the UGB across I-5. The study area includes approximately 105 acres in one parcel. The acres in this study area are zoned for agricultural uses (E-40).Agricultural lands in the study area are used primarily for grazing. Topographically, the site is largely flat. The study area has no identified wetland areas per the National Wetland Inventory, but it is suspected that more thorough fieldwork may reveal some jurisdictional wetlands on the site. The major development constraint in this study area is extending municipal services across I-5. Of the 106 acres in this study area zoned for agricultural uses, 2.2 acres are in Class III soil types, 53.2 acres are identified as Class IV soil types, and 50.3 acres are identified as Class VI soil types. Study Area 8 appears more difficult to service due to its location east of I- 5. Water, sewer, electricity, and storm drainage would all probably require boring under the Interstate. A pump station might be required to move sewage from the area to the treatment plant on the north end of Coburg. Transportation access to the site would come from Van Duyn Road—a County Road. Development on the site may be constrained until the I-5 interchange improvements area completed. It is noted that Study Area 8 is adjacent to lands already within the UGB (east of I-5), and for which the City has an obligation to provide service to.
Economic Consequences Like Study Area 7, Study Area 8 is among the most difficult to service due to its location east of I- 5. It is also among the most expensive alternatives because water, sewer, electricity, and storm drainage would all probably require boring under the Interstate. In addition, improvements to the interchange may be necessary to address development not included in the IAMP review.
It should be noted that Study Area 8 is directly adjacent to the only portions of Coburg’s existing UGB east of I-5. The entire site consists of one parcel with one use (a cattle ranch). The acreage belongs to the same ranch operation occupying Study Area 7. Study Area 8 is viewed by the City as having prime employment potential. The economic consequences of the reduction of the ranching activities would likely be outweighed by potential economic gains of utilizing the land for industrial purposes. Additionally, the economic opportunities for areas east of I-5 have the potential to outweigh the negative economic consequence of expansion into the area (cost of extending service, etc.).
Social Consequences Because Study Area 8 is separated from the other ranch properties to the north by Van Duyn, and is surrounded by other uses, the owners may be more amenable to its inclusion than Study Area 7. However, as noted, there has been public resistance in the past to expansion of Coburg’s UGB east of I-5. Study Area 8 is directly adjacent to a number of properties under various ownership and uses, including a few residents in the rural areas east of the interstate. Again, correspondence with property owners has suggested a willingness on their part to entertain ideas about expansion on their property.
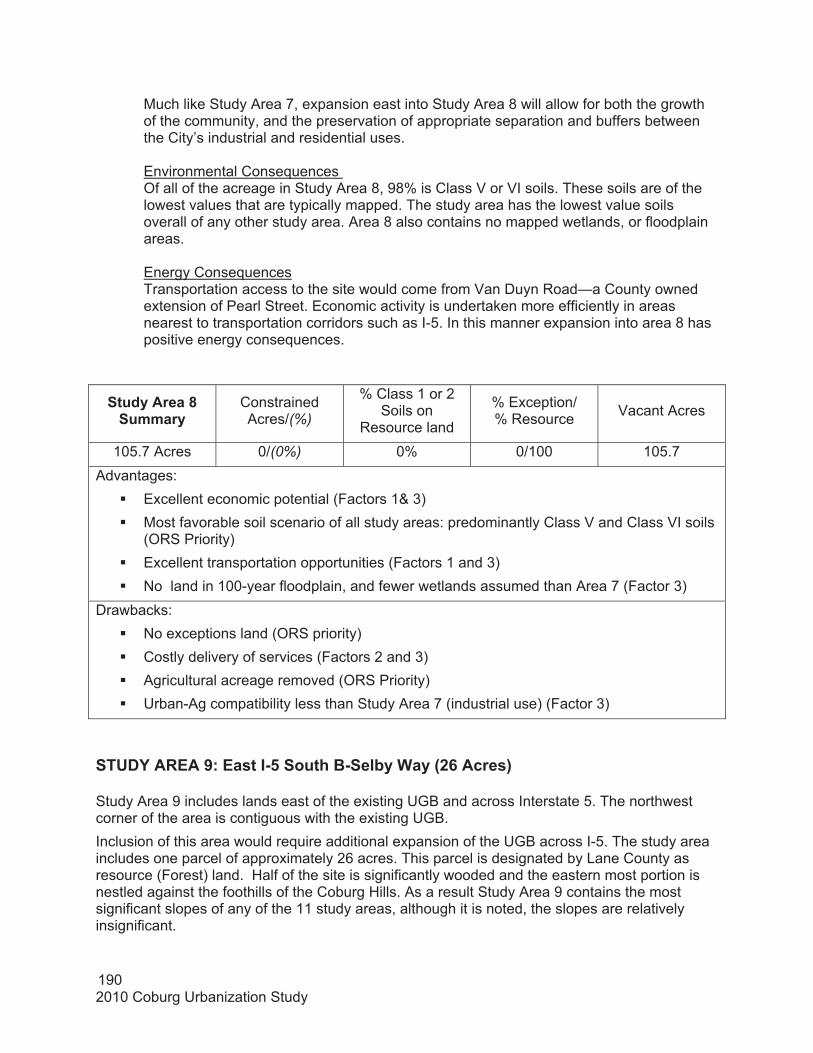
2010 Coburg Urbanization Study 190
Much like Study Area 7, expansion east into Study Area 8 will allow for both the growth of the community, and the preservation of appropriate separation and buffers between the City’s industrial and residential uses.
Environmental Consequences Of all of the acreage in Study Area 8, 98% is Class V or VI soils. These soils are of the lowest values that are typically mapped. The study area has the lowest value soils overall of any other study area. Area 8 also contains no mapped wetlands, or floodplain areas.
Energy Consequences Transportation access to the site would come from Van Duyn Road—a County owned extension of Pearl Street. Economic activity is undertaken more efficiently in areas nearest to transportation corridors such as I-5. In this manner expansion into area 8 has positive energy consequences.
Study Area 8 Summary
ConstrainedAcres/(%)
% Class 1 or 2 Soils on
Resource land
% Exception/% Resource Vacant Acres
105.7 Acres 0/(0%) 0% 0/100 105.7 Advantages:
� Excellent economic potential (Factors 1& 3) � Most favorable soil scenario of all study areas: predominantly Class V and Class VI soils
(ORS Priority) � Excellent transportation opportunities (Factors 1 and 3) � No land in 100-year floodplain, and fewer wetlands assumed than Area 7 (Factor 3)
Drawbacks:� No exceptions land (ORS priority) � Costly delivery of services (Factors 2 and 3) � Agricultural acreage removed (ORS Priority) � Urban-Ag compatibility less than Study Area 7 (industrial use) (Factor 3)
STUDY AREA 9: East I-5 South B-Selby Way (26 Acres) Study Area 9 includes lands east of the existing UGB and across Interstate 5. The northwest corner of the area is contiguous with the existing UGB. Inclusion of this area would require additional expansion of the UGB across I-5. The study area includes one parcel of approximately 26 acres. This parcel is designated by Lane County as resource (Forest) land. Half of the site is significantly wooded and the eastern most portion is nestled against the foothills of the Coburg Hills. As a result Study Area 9 contains the most significant slopes of any of the 11 study areas, although it is noted, the slopes are relatively insignificant.
191 2010 Coburg Urbanization Study
Reed Road/Selby Way connects Study Area 9 to the City of Coburg and all areas west of I-5. Outside of the Coburg I-5 interchange, Selby Way is the only other existing alternative for crossing I-5. Study Area 9 is included as a possible expansion alternative largely due to this characteristic.
Economic Consequences Study Area 9 joins Areas 7 and 8 in being the most expensive areas to extend services due to its location east of I-5. Most significant to Study Area 9’s profile is that the area abuts a rare crossing and connection to areas of Coburg east of I-5. It is also noted, however, that the condition of the bridge is not immediately known. Expensive repairs may be necessary if the bridge is not in proper condition, or does not meet required specifications.
Although Study Area 9 does not share the access advantages of Study Areas 7 and 8, it is in very close proximity to I-5 and is connected to sections of existing industrial land within Coburg via Reed Road/Selby Way. Reduction of or discontinuance of activities currently on the site is not viewed as having negative economic consequences when balanced with the potential positive economic consequences of employment growth on the site.
Social Consequences There is one owner of Study Area 9 and one existing residence. As noted with previous areas, this can reduce the complexity of the expansion process and the potential for reaching planning objectives. It also may result in significant impacts (positive and/or negative) to the individual property owner.
The area would be most appropriately used for employment purposes. It is noted that one advantage for consideration of Study Area 9, is the existing access to the site over I-5 via Selby Way. Access via Selby Way would necessitate a relatively lengthy and circuitous route for commercial and industrial traffic, contributing to noise, pollution and traffic in the area. As compared to Study Areas 7 and 8, Study Area 9 appears to present greater negative social consequences.
Environmental Consequences Study Area 9 includes the only forest designated land within all study areas. It is not prime forest land. Study Area 9’s soil profile is largely Class IV and VI, with smaller portions of Class III. The site includes several small water features; however none are located on either the National or Local Wetlands Inventory. Study Area 9 presents the only expansion alternative that encroaches onto the Urban-Wildland interface (foothills of the Coburg Hills). It is not immediately understood what impacts such expansion might have.
Energy Consequences Study Area 9 will require the extension of all services. If residential uses are directed to the area, it is noted that the area does not have a school site or an existing school within several miles of its boundaries. Transportation access to the site would come from Selby Way—a County Road. The condition of the existing bridge across I-5 is not completely understood. Development on the site may be constrained if the bridge is not in proper condition, or does not meet required specifications.
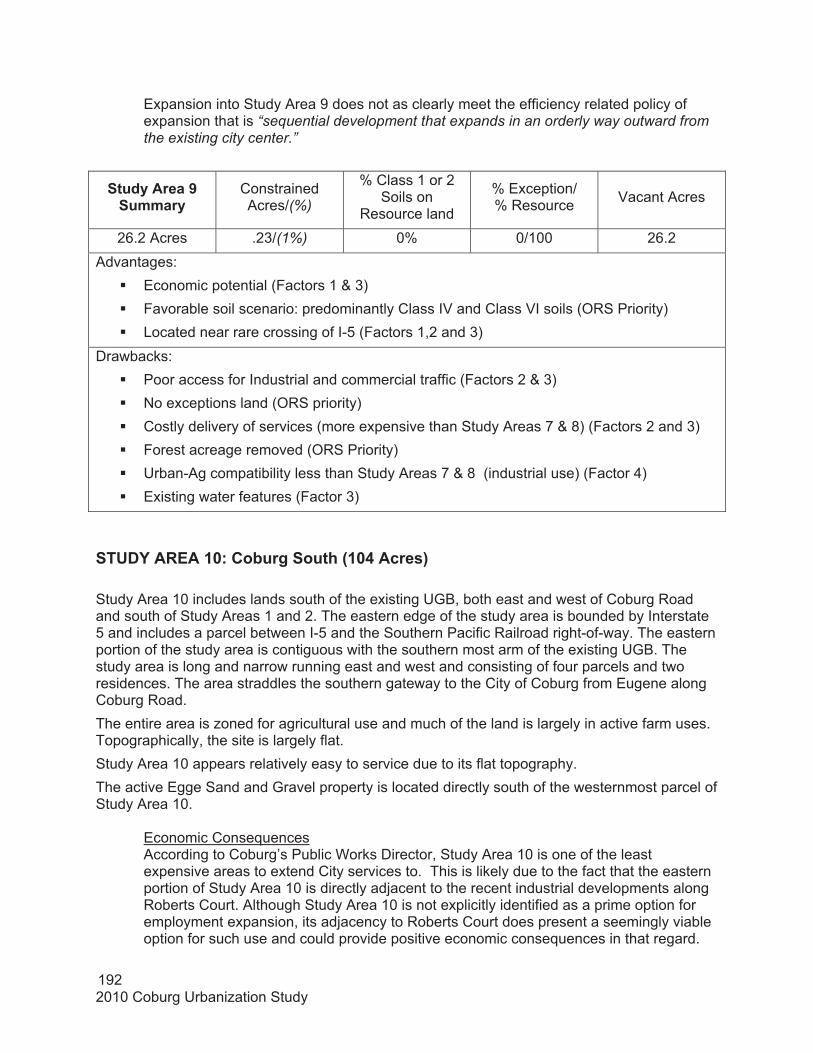
2010 Coburg Urbanization Study 192
Expansion into Study Area 9 does not as clearly meet the efficiency related policy of expansion that is “sequential development that expands in an orderly way outward from the existing city center.”
Study Area 9
Summary ConstrainedAcres/(%)
% Class 1 or 2 Soils on
Resource land
% Exception/% Resource Vacant Acres
26.2 Acres .23/(1%) 0% 0/100 26.2 Advantages:
� Economic potential (Factors 1 & 3) � Favorable soil scenario: predominantly Class IV and Class VI soils (ORS Priority) � Located near rare crossing of I-5 (Factors 1,2 and 3)
Drawbacks:� Poor access for Industrial and commercial traffic (Factors 2 & 3) � No exceptions land (ORS priority) � Costly delivery of services (more expensive than Study Areas 7 & 8) (Factors 2 and 3) � Forest acreage removed (ORS Priority) � Urban-Ag compatibility less than Study Areas 7 & 8 (industrial use) (Factor 4) � Existing water features (Factor 3)
STUDY AREA 10: Coburg South (104 Acres)
Study Area 10 includes lands south of the existing UGB, both east and west of Coburg Road and south of Study Areas 1 and 2. The eastern edge of the study area is bounded by Interstate 5 and includes a parcel between I-5 and the Southern Pacific Railroad right-of-way. The eastern portion of the study area is contiguous with the southern most arm of the existing UGB. The study area is long and narrow running east and west and consisting of four parcels and two residences. The area straddles the southern gateway to the City of Coburg from Eugene along Coburg Road. The entire area is zoned for agricultural use and much of the land is largely in active farm uses. Topographically, the site is largely flat. Study Area 10 appears relatively easy to service due to its flat topography. The active Egge Sand and Gravel property is located directly south of the westernmost parcel of Study Area 10.
Economic Consequences According to Coburg’s Public Works Director, Study Area 10 is one of the least expensive areas to extend City services to. This is likely due to the fact that the eastern portion of Study Area 10 is directly adjacent to the recent industrial developments along Roberts Court. Although Study Area 10 is not explicitly identified as a prime option for employment expansion, its adjacency to Roberts Court does present a seemingly viable option for such use and could provide positive economic consequences in that regard.
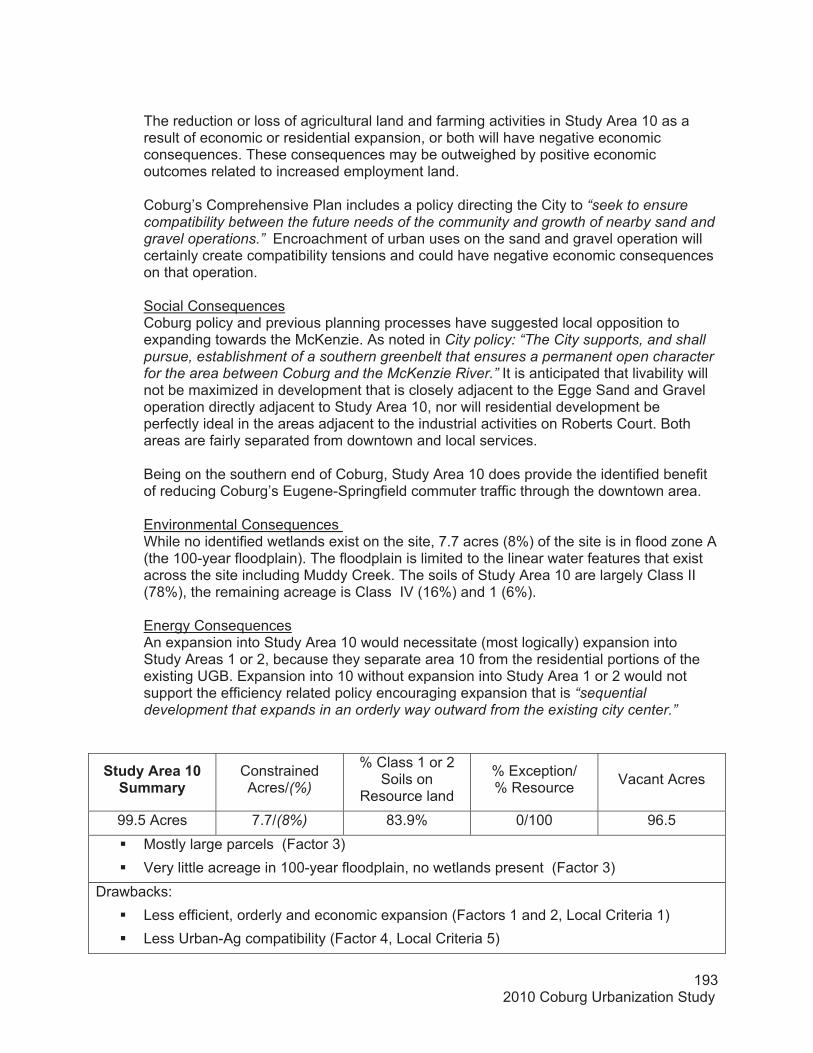
193 2010 Coburg Urbanization Study
The reduction or loss of agricultural land and farming activities in Study Area 10 as a result of economic or residential expansion, or both will have negative economic consequences. These consequences may be outweighed by positive economic outcomes related to increased employment land.
Coburg’s Comprehensive Plan includes a policy directing the City to “seek to ensure compatibility between the future needs of the community and growth of nearby sand and gravel operations.” Encroachment of urban uses on the sand and gravel operation will certainly create compatibility tensions and could have negative economic consequences on that operation.
Social Consequences Coburg policy and previous planning processes have suggested local opposition to expanding towards the McKenzie. As noted in City policy: “The City supports, and shall pursue, establishment of a southern greenbelt that ensures a permanent open character for the area between Coburg and the McKenzie River.” It is anticipated that livability will not be maximized in development that is closely adjacent to the Egge Sand and Gravel operation directly adjacent to Study Area 10, nor will residential development be perfectly ideal in the areas adjacent to the industrial activities on Roberts Court. Both areas are fairly separated from downtown and local services.
Being on the southern end of Coburg, Study Area 10 does provide the identified benefit of reducing Coburg’s Eugene-Springfield commuter traffic through the downtown area.
Environmental Consequences While no identified wetlands exist on the site, 7.7 acres (8%) of the site is in flood zone A (the 100-year floodplain). The floodplain is limited to the linear water features that exist across the site including Muddy Creek. The soils of Study Area 10 are largely Class II (78%), the remaining acreage is Class IV (16%) and 1 (6%).
Energy Consequences An expansion into Study Area 10 would necessitate (most logically) expansion into Study Areas 1 or 2, because they separate area 10 from the residential portions of the existing UGB. Expansion into 10 without expansion into Study Area 1 or 2 would not support the efficiency related policy encouraging expansion that is “sequential development that expands in an orderly way outward from the existing city center.”
Study Area 10
Summary ConstrainedAcres/(%)
% Class 1 or 2 Soils on
Resource land
% Exception/% Resource Vacant Acres
99.5 Acres 7.7/(8%) 83.9% 0/100 96.5 � Mostly large parcels (Factor 3) � Very little acreage in 100-year floodplain, no wetlands present (Factor 3)
Drawbacks: � Less efficient, orderly and economic expansion (Factors 1 and 2, Local Criteria 1) � Less Urban-Ag compatibility (Factor 4, Local Criteria 5)

2010 Coburg Urbanization Study 194
� Discouragement for excessive development to the south: “The City supports, and shall pursue, establishment of a southern greenbelt that ensures a permanent open character for the area between Coburg and the McKenzie River.” (City Policy)
� High percentage of Class II soils, Class I soils present (ORS Priority) � No exceptions land included (ORS priority)
STUDY AREA 11: Coburg North- Indian Drive and Paiute Lane (84 Acres)
Study Area 11 includes lands north of the existing UGB. The area is contiguous with the existing UGB on its east side. This portion of the UGB adjacent to Study Area 11 constitutes the waste water treatment site and is largely removed from the urbanized areas of Coburg. The study area includes approximately 85 acres in 46 parcels (of which 44 are designated as exceptions land). Study Area 11 contains an isolated residential neighborhood along Indian Drive, Winnebago Street, and Paiute Lane. The majority of the study area (67 acres) is one large resource designated parcel. This site contains one residence. The site is owned by the same party as the adjacent open farm acreage that constitutes most of Study Area 6. The remaining 18 acres of exception land is located in the northern portion of the study area, and is separated from the existing urban growth boundary by agricultural land. Access to the site would probably have to come from Coburg Road There may be opportunities to provide cross streets to improve access to the area.
Economic Consequences According to Coburg’s Public Works Director, Study Area 11 is one of the least expensive areas to extend City water to. This is due to the fact that a significant portion of the area is currently served by water, and lines run along North Coburg Road. As previously noted in Study Area 5, an important consideration in expansion into areas with existing development is the sewer service obligation to residents that will be immediately effective if the exceptions land in Study Area 11 is included. This obligation is more significant in Study Area 11 than most other areas, and is an important cost related issue for the City to consider.
Economic impacts may be realized by the loss of the farmland located in Study Area 11. Overall the economic consequences of expansion into Study Area 5 are not seen as significant either way.
Social Consequences Study Area 11 contains more existing residents than any other area (44 dwelling units). Expansion impacts will affect many more people in the study area. As with Study Area 5, however, it can be argued that the individual impacts will be relatively less to residents in Study Area 11 than in some other areas since the area is currently residentially zoned and already has a relatively significant population. Study Area 11 is in fairly close proximity to Coburg Elementary School, and a potential future school site. However livability is not optimized in Study Area 11 due to its isolation from downtown services.
Environmental Consequences
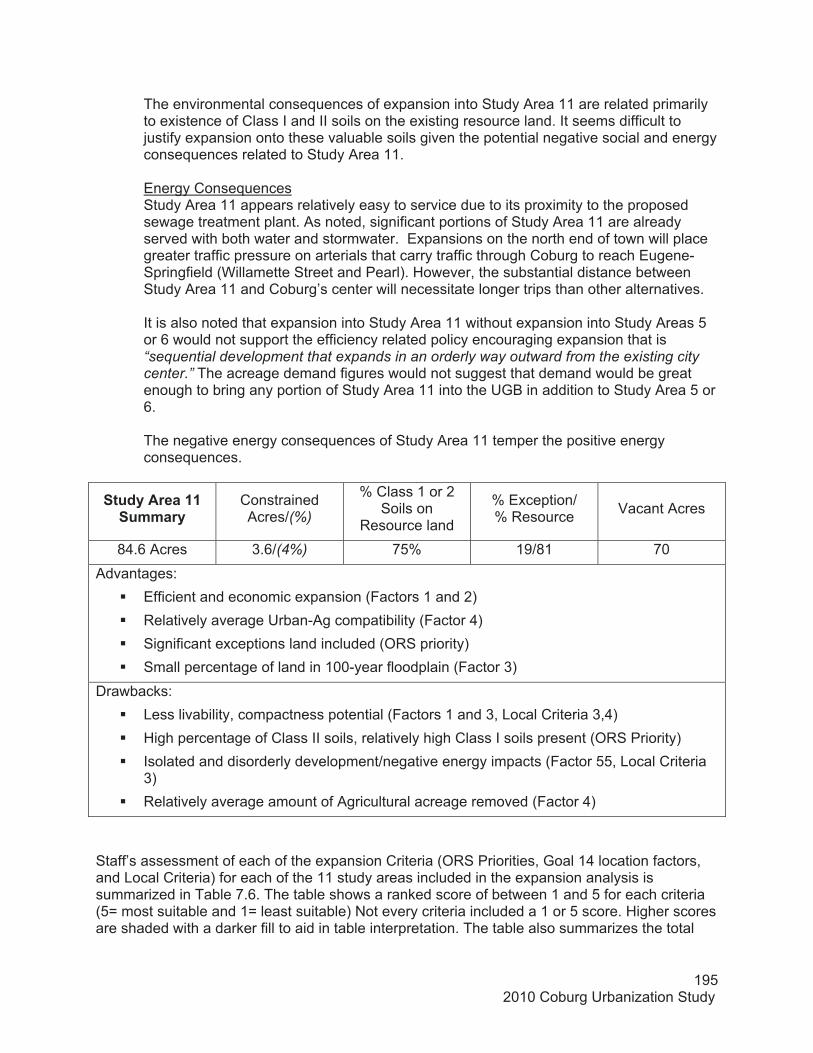
195 2010 Coburg Urbanization Study
The environmental consequences of expansion into Study Area 11 are related primarily to existence of Class I and II soils on the existing resource land. It seems difficult to justify expansion onto these valuable soils given the potential negative social and energy consequences related to Study Area 11.
Energy Consequences Study Area 11 appears relatively easy to service due to its proximity to the proposed sewage treatment plant. As noted, significant portions of Study Area 11 are already served with both water and stormwater. Expansions on the north end of town will place greater traffic pressure on arterials that carry traffic through Coburg to reach Eugene-Springfield (Willamette Street and Pearl). However, the substantial distance between Study Area 11 and Coburg’s center will necessitate longer trips than other alternatives.
It is also noted that expansion into Study Area 11 without expansion into Study Areas 5 or 6 would not support the efficiency related policy encouraging expansion that is “sequential development that expands in an orderly way outward from the existing city center.” The acreage demand figures would not suggest that demand would be great enough to bring any portion of Study Area 11 into the UGB in addition to Study Area 5 or 6.
The negative energy consequences of Study Area 11 temper the positive energy consequences.
Study Area 11 Summary
ConstrainedAcres/(%)
% Class 1 or 2 Soils on
Resource land
% Exception/% Resource Vacant Acres
84.6 Acres 3.6/(4%) 75% 19/81 70 Advantages:
� Efficient and economic expansion (Factors 1 and 2) � Relatively average Urban-Ag compatibility (Factor 4) � Significant exceptions land included (ORS priority) � Small percentage of land in 100-year floodplain (Factor 3)
Drawbacks:� Less livability, compactness potential (Factors 1 and 3, Local Criteria 3,4) � High percentage of Class II soils, relatively high Class I soils present (ORS Priority) � Isolated and disorderly development/negative energy impacts (Factor 55, Local Criteria
3)� Relatively average amount of Agricultural acreage removed (Factor 4)
Staff’s assessment of each of the expansion Criteria (ORS Priorities, Goal 14 location factors, and Local Criteria) for each of the 11 study areas included in the expansion analysis is summarized in Table 7.6. The table shows a ranked score of between 1 and 5 for each criteria (5= most suitable and 1= least suitable) Not every criteria included a 1 or 5 score. Higher scores are shaded with a darker fill to aid in table interpretation. The table also summarizes the total
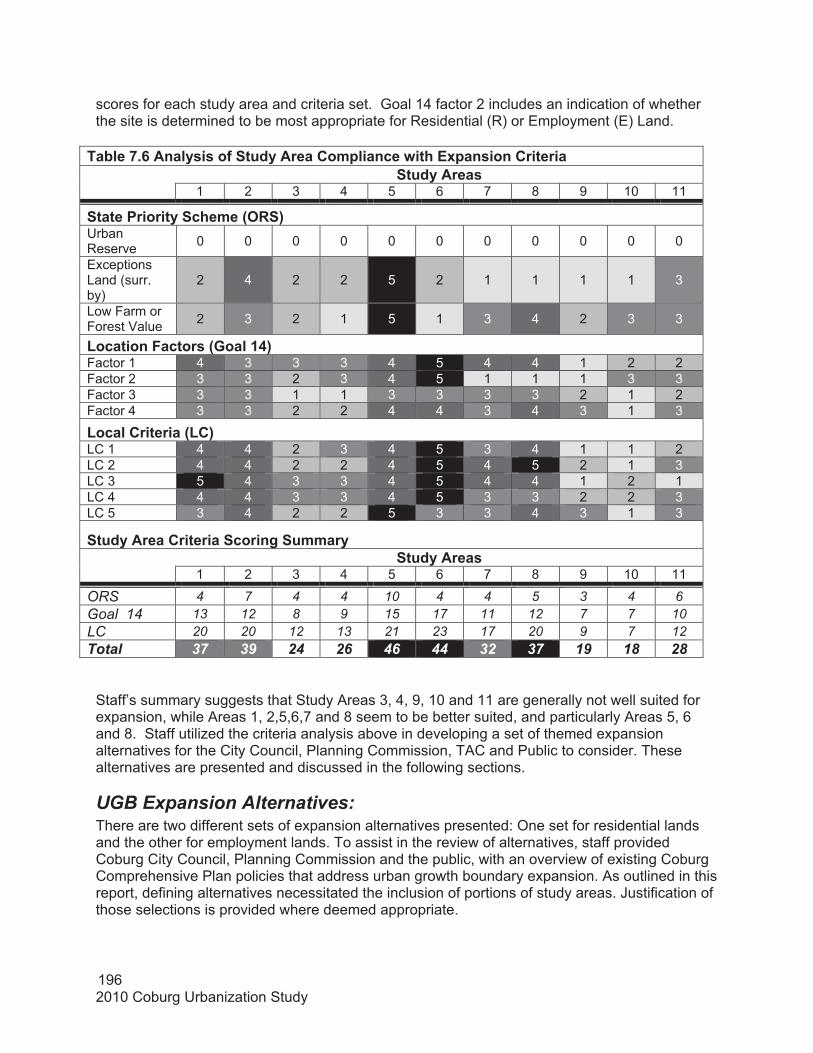
2010 Coburg Urbanization Study 196
scores for each study area and criteria set. Goal 14 factor 2 includes an indication of whether the site is determined to be most appropriate for Residential (R) or Employment (E) Land.
Table 7.6 Analysis of Study Area Compliance with Expansion Criteria Study Areas
1 2 3 4 5 6 7 8 9 10 11
State Priority Scheme (ORS) Urban Reserve 0 0 0 0 0 0 0 0 0 0 0
Exceptions Land (surr. by)
2 4 2 2 5 2 1 1 1 1 3
Low Farm or Forest Value 2 3 2 1 5 1 3 4 2 3 3
Location Factors (Goal 14) Factor 1 4 3 3 3 4 5 4 4 1 2 2Factor 2 3 3 2 3 4 5 1 1 1 3 3Factor 3 3 3 1 1 3 3 3 3 2 1 2Factor 4 3 3 2 2 4 4 3 4 3 1 3
Local Criteria (LC) LC 1 4 4 2 3 4 5 3 4 1 1 2LC 2 4 4 2 2 4 5 4 5 2 1 3LC 3 5 4 3 3 4 5 4 4 1 2 1LC 4 4 4 3 3 4 5 3 3 2 2 3LC 5 3 4 2 2 5 3 3 4 3 1 3
Study Area Criteria Scoring Summary Study Areas
1 2 3 4 5 6 7 8 9 10 11
ORS 4 7 4 4 10 4 4 5 3 4 6Goal 14 13 12 8 9 15 17 11 12 7 7 10 LC 20 20 12 13 21 23 17 20 9 7 12 Total 37 39 24 26 46 44 32 37 19 18 28
Staff’s summary suggests that Study Areas 3, 4, 9, 10 and 11 are generally not well suited for expansion, while Areas 1, 2,5,6,7 and 8 seem to be better suited, and particularly Areas 5, 6 and 8. Staff utilized the criteria analysis above in developing a set of themed expansion alternatives for the City Council, Planning Commission, TAC and Public to consider. These alternatives are presented and discussed in the following sections.
UGB Expansion Alternatives: There are two different sets of expansion alternatives presented: One set for residential lands and the other for employment lands. To assist in the review of alternatives, staff provided Coburg City Council, Planning Commission and the public, with an overview of existing Coburg Comprehensive Plan policies that address urban growth boundary expansion. As outlined in this report, defining alternatives necessitated the inclusion of portions of study areas. Justification of those selections is provided where deemed appropriate.
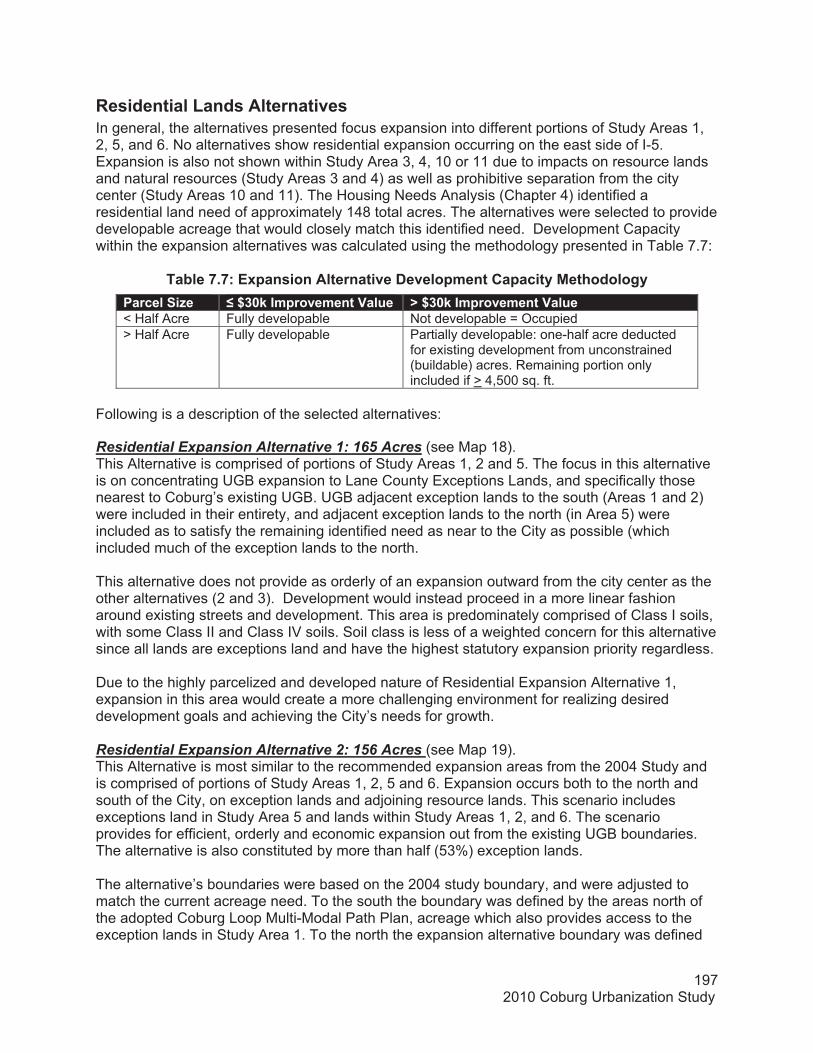
197 2010 Coburg Urbanization Study
Residential Lands Alternatives In general, the alternatives presented focus expansion into different portions of Study Areas 1, 2, 5, and 6. No alternatives show residential expansion occurring on the east side of I-5. Expansion is also not shown within Study Area 3, 4, 10 or 11 due to impacts on resource lands and natural resources (Study Areas 3 and 4) as well as prohibitive separation from the city center (Study Areas 10 and 11). The Housing Needs Analysis (Chapter 4) identified a residential land need of approximately 148 total acres. The alternatives were selected to provide developable acreage that would closely match this identified need. Development Capacity within the expansion alternatives was calculated using the methodology presented in Table 7.7:
Table 7.7: Expansion Alternative Development Capacity Methodology Parcel Size � $30k Improvement Value > $30k Improvement Value < Half Acre Fully developable Not developable = Occupied > Half Acre Fully developable Partially developable: one-half acre deducted
for existing development from unconstrained (buildable) acres. Remaining portion only included if > 4,500 sq. ft.
Following is a description of the selected alternatives:
Residential Expansion Alternative 1: 165 Acres (see Map 18).This Alternative is comprised of portions of Study Areas 1, 2 and 5. The focus in this alternative is on concentrating UGB expansion to Lane County Exceptions Lands, and specifically those nearest to Coburg’s existing UGB. UGB adjacent exception lands to the south (Areas 1 and 2) were included in their entirety, and adjacent exception lands to the north (in Area 5) were included as to satisfy the remaining identified need as near to the City as possible (which included much of the exception lands to the north.
This alternative does not provide as orderly of an expansion outward from the city center as the other alternatives (2 and 3). Development would instead proceed in a more linear fashion around existing streets and development. This area is predominately comprised of Class I soils, with some Class II and Class IV soils. Soil class is less of a weighted concern for this alternative since all lands are exceptions land and have the highest statutory expansion priority regardless.
Due to the highly parcelized and developed nature of Residential Expansion Alternative 1, expansion in this area would create a more challenging environment for realizing desired development goals and achieving the City’s needs for growth.
Residential Expansion Alternative 2: 156 Acres (see Map 19).This Alternative is most similar to the recommended expansion areas from the 2004 Study and is comprised of portions of Study Areas 1, 2, 5 and 6. Expansion occurs both to the north and south of the City, on exception lands and adjoining resource lands. This scenario includes exceptions land in Study Area 5 and lands within Study Areas 1, 2, and 6. The scenario provides for efficient, orderly and economic expansion out from the existing UGB boundaries. The alternative is also constituted by more than half (53%) exception lands.
The alternative’s boundaries were based on the 2004 study boundary, and were adjusted to match the current acreage need. To the south the boundary was defined by the areas north of the adopted Coburg Loop Multi-Modal Path Plan, acreage which also provides access to the exception lands in Study Area 1. To the north the expansion alternative boundary was defined
2010 Coburg Urbanization Study 198
to meet the identified 2004 recommendation as closely as possible. The recommended boundary to the north extends to a point which matches the northern boundaries of two significant properties (Stevenson and Monaco), with the exception of one lot flanked by Stallings and Coburg Roads. It is assumed that an East-West transportation corridor along these property lines may be a future opportunity. The large taxlot which constitutes most of Study Area 6 is divided to include a 70 acre portion of the 150 acre lot. Although Study Area 6 is farm land, it ranked very high on the criteria scoring and is included in both Residential Expansion Alternatives 1 and 2, because of its potential to satisfy many of Coburg’s growth priorities. It is assumed that Inclusion of Study Area 6 in its entirety would be unjustified; therefore the proposed expansion divides the lot. It is noted that the current UGB divides this tax lot further to the south than the 2004 study proposed.
This area is predominately comprised of Class I and II soils, with some Class IV soils. It is noted that most of the Class I soils in Expansion Alternative 1 are within the exceptions land in Study Areas 1 and 5, which are, statutorily, the highest priority for expansion. An additional north-south transportation connector may be needed to better distribute traffic coming from the northern residential development under this alternative.
Residential Expansion Alternative 3: 150 Acres (see Map 20).This Alternative is comprised of portions of Study Areas 1, 2 and 6. Because of the location of the properties, this alternative provides for a very efficient, orderly and economic expansion that provides for sequential development that expands in an orderly way outward from the existing city center to both the north and south of the city center. This alternative, however, is comprised of a larger percentage of resource lands than Residential Expansion Alternative 2. An additional north-south transportation connector may be needed to better distribute traffic coming from the northern residential development under this alternative. The boundaries for Residential Expansion Alternative 2 were defined based on land need and its relationship to tax lot and exception area boundaries.
This area is predominately comprised of Class II soils, with some Class I and Class IV soils. This alternative also has a higher percentage of Class I and II soils on resource lands than Residential Expansion Alternative 1.
Employment Lands Alternatives It is noted that all decision making bodies, as well as the public, were presented with a no “employment expansion” alternative, in addition to the alternatives addressed below. This was due to a finding of the Economic Opportunity Analysis that the Coburg is in a position to make a case for employment expansion or not. Because the “need” is ultimately tied to broader questions of economic priority, the facts directed decision bodies to make a policy decision regarding the matter.
All employment land expansion alternatives show expansion occurring on the east side of I-5 in order to take advantage of the excellent transportation opportunities presented at this location. The Economic Opportunities Analysis (Chapter 5) identified an employment need of 1 or 2 sites of 20 acres or greater. Alternatives were selected to adequately meet this range, while considering possible natural resource constraints on the most ideal properties along Van Duyn.
Employment Expansion Alternative 1: 65 Acres (see Map 21). This Alternative depicts expansion of the UGB for employment lands occurring on a portion of Study Area 7, located north of Van Duyn, with the expansion area primarily configured in a north-south orientation.
199 2010 Coburg Urbanization Study
This Alternative is identical to the recommended employment expansion areas from the 2004 Study. The area was selected du e to its high scoring in the criteria analysis. This area is comprised of lower capability Class IV soils.
Future development in this area may require improvements to the interchange beyond those planned for in the adopted IAMP. In addition, under the IAMP there would be a need to consolidate all accesses to a point at least 1,320 feet from the north-bound ramp terminal intersection, which would require access through land within the County, necessitating an exception to Goal 3. ….Employment Expansion Alternative 2: 67 Acres (see Map 22). This Alternative depicts expansion of the UGB for employment lands occurring on a portion of Study Area 7, located north of Van Duyn. This area differs from alternative 2 in that it is primarily configured to provide increased utilization of Van Duyn Street frontage than Alternative 1 provides. Its boundaries are intended to assume approximately the same acreage as Alternative 1 and to accommodate a land needed for “one or two 20-plus acre sites.” This area is predominately comprised of Class IV soils. Future development in this area may require improvements to the interchange beyond those planned for in the adopted IAMP. In addition, under the IAMP there would be a need to consolidate all accesses to a point at least 1,320 feet from the north-bound ramp terminal intersection.
Employment Expansion Alternative 3: 65 Acres (see Map 23). This Alternative depicts expansion of the UGB for employment lands occurring on a significant portion of Study Area 8, located south of Van Duyn. This area is comprised of both Class IV and VI soils. Study Area 8 was the most favorable employment site in the criteria analysis. Its boundaries are defined based on a fairly subjective assumption of land needed for “one or two 20+ acre sites.”
Like Alternatives 1 and 2, future development in this area may require improvements to the interchange beyond those planned for in the adopted IAMP. However, unlike Alternative 1 and 2, under the adopted IAMP there are already plans to purchase and develop right-of-way needed to construct an access road from the areas with the Coburg UGB east of I-5 to a point approximately 1320 feet east of the northbound ramp terminals. This frontage road alignment would include lands in Study Area 8.
[Type text]
Urban Growth Boundary Future – Public Open House On November 18, 2009, the City of Coburg and CUS staff hosted a public open house addressing the future of Coburg’s Urban Growth Boundary. Approximately 35 residents attended the open house which included a formal presentation and opportunities for formal and informal questions and feedback. Following is a summary of the open house and its outcomes:
What was shared? During the three hour Open House, participants had the opportunity to browse wall maps, acquire study summaries and materials, ask questions of staff, and experience a Power Point presentation addressing the Urbanization Study process, a review of critical points for feedback and a summary of the next steps of the project.
Wall maps presented at the Open House included the following: � Buildable Lands Inventory Map (see Map 7 in Chapter 3)� Infill and Redevelopment Potential Map (see Map 4 in Chapter 3) � Housing Needs Analysis Process Summary � Overall Urbanization Study Decision Tree/Process Chart (Chapter 3) � Study Areas Map (see Map 1 in Chapter 1) � All Six Expansion Alternative Maps (Aerial and Soil Maps) (Maps 18-23)
The presentation given at the Open House was identical to the presentation given to the Planning Commission and City Council at a joint worksession in November, 2009. The Open House presentation summarized the urbanization analyses supporting expansion (BLI, HNA, EOA) up to that point. Staff felt that a primary focus of the Open House was providing the public with a background for how and why expansion happens. The second portion of the presentation presented expansion alternatives and the statutory analysis process which led to them.
Open House Conclusions: It was staff’s impression, that the open house provided an ideal environment for citizens to voice concerns, insights and support for the Urbanization Study’s assumptions and conclusions up to this point. Staff’s presentations garnered a number of insightful and valuable questions from participants. Staff was also able to have a number of valuable one-on-one conversations with participants which supplemented the group questions and discussions that took place. Throughout the open house, participants were encouraged to participate in a dot exercise designed to rate their preferences related to the three identified residential expansion alternatives and the three employment expansion alternatives. Finally, staff prepared a comment form with specific questions and ample space for any additional written feedback.
Appendix B provides a detailed summary of this feedback (including staff responses). Points which stood out from the discussion and exercises include the following:
� Concern about the impacts that inclusion in the UGB would have on property owner’s taxes, pressures for development, regulation.
� Concern about the state imposing a “one size fits all” framework on Coburg. � The difference between annexation and being in the UGB � The relationship of the Urbanization Study’s findings to future Wastewater. � Interest in expanding all land uses (not just employment) east of the interstate. � Property owner concern about expansion boundaries and the resulting consequences to
their property � The possibility of a different and perhaps smaller employment lands alternative.
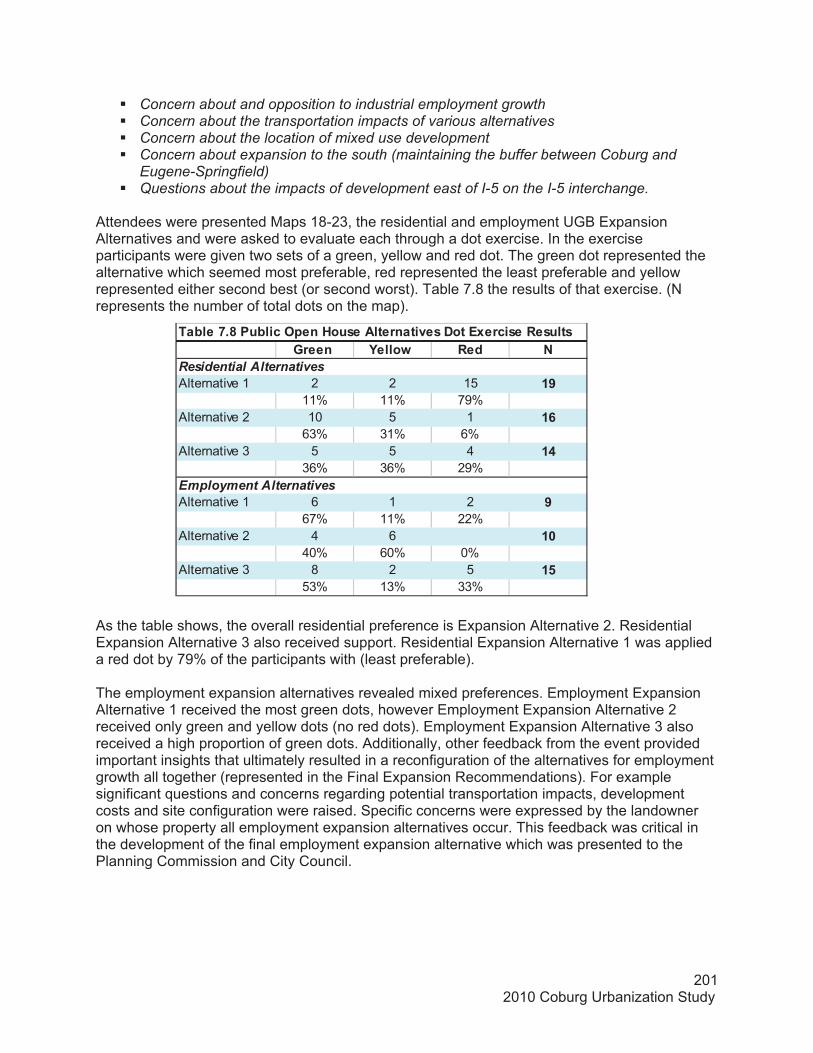
201 2010 Coburg Urbanization Study
Green Yellow Red N
Alternative 1 2 2 15 1911% 11% 79%
Alternative 2 10 5 1 1663% 31% 6%
Alternative 3 5 5 4 1436% 36% 29%
Alternative 1 6 1 2 967% 11% 22%
Alternative 2 4 6 1040% 60% 0%
Alternative 3 8 2 5 1553% 13% 33%
Table 7.8 Public Open House Alternatives Dot Exercise Results
Residential Alternatives
Employment Alternatives
� Concern about and opposition to industrial employment growth � Concern about the transportation impacts of various alternatives � Concern about the location of mixed use development � Concern about expansion to the south (maintaining the buffer between Coburg and
Eugene-Springfield)� Questions about the impacts of development east of I-5 on the I-5 interchange.
Attendees were presented Maps 18-23, the residential and employment UGB Expansion Alternatives and were asked to evaluate each through a dot exercise. In the exercise participants were given two sets of a green, yellow and red dot. The green dot represented the alternative which seemed most preferable, red represented the least preferable and yellow represented either second best (or second worst). Table 7.8 the results of that exercise. (N represents the number of total dots on the map).
As the table shows, the overall residential preference is Expansion Alternative 2. Residential Expansion Alternative 3 also received support. Residential Expansion Alternative 1 was applied a red dot by 79% of the participants with (least preferable).
The employment expansion alternatives revealed mixed preferences. Employment Expansion Alternative 1 received the most green dots, however Employment Expansion Alternative 2 received only green and yellow dots (no red dots). Employment Expansion Alternative 3 also received a high proportion of green dots. Additionally, other feedback from the event provided important insights that ultimately resulted in a reconfiguration of the alternatives for employment growth all together (represented in the Final Expansion Recommendations). For example significant questions and concerns regarding potential transportation impacts, development costs and site configuration were raised. Specific concerns were expressed by the landowner on whose property all employment expansion alternatives occur. This feedback was critical in the development of the final employment expansion alternative which was presented to the Planning Commission and City Council.
2010 Coburg Urbanization Study 202
D. Summary and Final Expansion Recommendations The question of employment growth alternatives was brought before the Coburg City Council in early December of 2009. In a 3-2 vote the Council expressed approval of employment expansion and specifically within staff’s recommended employment expansion alternative (a reconfiguration Employment Expansion Alternative 3). Because Planning Commission had not yet provided a recommendation to the Council, it was decided that Planning Commission feedback would be incorporated into a decision identified at the foregoing months Council meeting.
Planning Commission met in mid December of 2009 and voted 4-1 in opposition of employment expansion citing concerns about the form that industrial uses would take in the proposed location as well as well questions about the need for more industrial uses in Coburg.
In January 2009, the question of preferred expansion alternatives was once again brought before the Coburg City Council. The Council voted 4-1 in support of the employment expansion presented below. It is therefore recommended that expansion of the Coburg UGB be accomplished to include the land within the residential and employment expansion alternatives presented below. The recommended expansion alternatives are depicted in Maps 24 and 25.
Final Expansion Recommendations: City Council Approved
Final Residential Expansion Recommendation: 169 Acres (see Map 25).Determination of a residential expansion recommendation by staff is the result of analysis of statewide planning goals, rules and statutes, public and public official feedback, as well as agency coordination. The Final Residential Expansion Recommendation is a slightly reconfigured version of Residential Expansion Alternative 2. The recommendation is the preferred alternative for both Planning Commission and City Council, is supported by previous planning efforts, and was the more preferred alternative at the Open House. This recommendation includes a justifiable balance of exceptions land and lands that provide for the City’s preference for livability and orderly expansion. Although 169 acres are proposed for inclusion in the UGB, approximately 145 acres of that land is assumed to be “developable.”
The Final Residential Expansion Recommendation is comprised of portions of Study Areas 1, 2, 5 and 6. The alternative provides for a very efficient, orderly and economic expansion that provides for sequential development that expands in an orderly way outward from the existing city center to both the north and south of the city center. The area was modified slightly from its original format by adding land (9.5 acres, tax lot 1603290003600) from Study Area 5 in order to match, without variation, the boundary to the north which matches the northern boundaries of two significant properties (Stevenson and Monaco). Although the TSP has yet to be updated, this pattern of aligned property boundaries is viewed as having strong potential as a location for a future east-west connector on the north end of town, and thus makes for a good conceptual boundary.
To the south the boundary was defined by the areas north of the adopted Coburg Loop Multi-Modal Path Plan, acreage which also provides access to the exception lands in Study Area 1. The large taxlot which constitutes most of Study Area 6 was reduced slightly from its original configuration (to accommodate the increased acreage from Study Area 5). The reconfigured recommendation includes approximately 60 acres of the overall 150 acre lot. This change is
203 2010 Coburg Urbanization Study
viewed as not having a detrimental impact on the usefulness of the expansion lands within Study Area 6.
The Final Residential Expansion Recommendation is comprised of a larger percentage of resource lands than Residential Expansion Alternative 1, but includes significant acreage of exceptions land. It is noted that an additional north-south transportation connector may be needed to better distribute traffic coming from the northern residential development under this alternative. This alternative is predominately comprised of Class II soils, with some Class I and Class IV soils (noted in Map 19). It is also noted that this alternative also has a higher percentage of Class I and II soils on resource lands than Residential Expansion Alternative 1. It is also noted that this recommendation is consistent with the Hybrid Map developed during the Coburg Crossroads Vision project.
Final Employment Expansion Recommendation: 106 Acres (see Map 24). This alternative depicts expansion of the UGB for employment lands occurring on all of Study Area 8. The Final Employment Expansion Recommendation is a reconfigured version of Employment Expansion Alternative 3. The Final Employment Expansion Recommendation was reconfigured to include the remaining southern 40 acres of lot number 1603340000202, increasing the total expansion from 65 to 106 acres. It was determined after consultation with the property owners, that this southern portion of the lot, if separated from Van Duyn, and isolated by development, would be essentially useless to the property owners as agricultural land. Additional acreage was further justified due to the anticipated environmental constraints of the site (potentially limiting the “buildable” acres on the site). This area is comprised of both Class IV and VI soils.
Land south of Van Duyn (Study Area 8) was favored over lands north of Van Duyn (Study Area 7) largely due to the fact that a frontage road is already planned to be constructed to serve sites south and east of the interchange and because the area to the south (Area 8) is already separated from other like uses (Area 7) to the north by Van Duyn. Areas north of Van Duyn do have the benefit of greater separation from existing residential uses east of the interstate, and freeway frontage (exposure), but in the end Study Area 8 seemed better suited to the need overall. It is also noted that the 2004 Urbanization Study recommended that the City consider Study Areas 7 and 8 for employment growth and to take steps to preserve these areas for future employment growth.
In the final section, the City Council’s preferred residential and employment expansion alternatives (staff’s recommendations) are evaluated against the statutory requirements of ORS 197.298, Goal 14 location factors, and local criteria.
2010 Coburg Urbanization Study 204
Factual Basis for the Expansion Recommendations Oregon law requires that alterations of a UGB be based on ORS 197.298, seven need and location factors identified by Statewide Planning Goal 14, and local policies addressing expansion. This section of the report describes the factual basis supporting the final UGB employment and residential expansion recommendations.
ORS 197.298- PRIORITIES FOR INCLUSION Referring to the ORS priorities address earlier within this Study, ORS 197.298 states that
“In addition to any requirements established by rule addressing urbanization, land may not be included within an urban area growth boundary except under the following priorities…”
RESIDENTIAL LAND ALTERNATIVE
For Coburg to adopt the preferred residential land alternative, it must make appropriate findings pursuant to ORS 197.298 that justify this alternative in contrast to Expansion Alternative #1. Expansion Alternative #1 proposed UGB additions for residential development (178 acres, 151 developable) that consisted entirely of exceptions lands, while the city’s preferred residential land alternative adds 169 acres (143 developable), 88 acres of exceptions land and 81 acres of resource land.
For Coburg to adopt the preferred employment land alternative, it must also make appropriate findings pursuant to ORS 197.298 that justify the alternative in contrast to inclusion of higher priority exception lands to meet the employment land need. The preferred employment land alternative would add 115 acres of agricultural land, and no exception lands.
ORS 197.298(3) allows land of lower priority under the statute be included in an urban growth boundary if land of higher priority is found to be inadequate to accommodate the amount of land need established if:
(a) Specific types of identified land needs cannot be reasonably accommodated on higher priority lands;
(b) Future urban services could not reasonably be provided to the higher priority lands due to topographical or other physical constraints; or
(c) Maximum efficiency of land uses within a proposed urban growth boundary requires inclusion of lower priority lands in order to include or to provide services to higher priority lands.
And in addition, land of higher priority can be found to be inadequate to accommodate the amount of land need established based upon the following two Goal 14 locational factors, which are not duplicative of the statutory criteria:
Factor 3. Environmental, energy, economic and social consequences.
Factor 4. Compatibility of the proposed urban uses with nearby agricultural and forest activities occurring on farm and forest land outside the UGB.
205 2010 Coburg Urbanization Study
The residential preferred alternative does not include higher priority exception lands in Study Areas 2, 4, 5, and 11. Note that it also does not include exception lands in subareas 3 and 6 – however the amount of exception lands in these subareas is negligible and the negligible exception lands in these subareas are separated from the existing Coburg urban growth boundary by agricultural land. It also does not include higher priority agricultural and forest lands with lower soils classifications (Class III, Class IV, and Class VI) that are within Study Areas 7, 8, and 9. The city makes the following findings justifying lowering the priority for inclusion of these lands in the urban growth boundary, and adding lower priority lands in their place:
EXCEPTION LANDS
Study Area 2: 12 acres of exception land, located south of nine acres of exception land that is proposed for addition to the urban growth boundary, is not proposed for addition to the boundary because it is inadequate to accommodate the residential land need. Eight of the 12 acres is located within the 100-year floodplain, which is an environmental consequence pursuant to Factor 3 of Goal 14. In addition this land is bounded on three sides by agricultural land with Class II soils, and development with urban uses would pose compatibility issues with these agriculture activities pursuant to Factor 4 of Goal 14. For these reasons, inclusion of this exception land into the urban growth boundary is inappropriate and would not accommodate the residential need.
Study Area 4: 17 acres of exception land within this subarea is not proposed to be added to the urban growth boundary. The 17 acres is located at the southern end of the study area, and is separated from the existing Coburg Urban Growth Boundary by agricultural land with Class II soils, which would also have to be brought into the boundary as part of including this exception area. This exception area is surrounded by agricultural land with Class II soils. Inclusion of this exception land into the urban growth boundary is inappropriate and would not accommodate the residential land need pursuant to Factor 3, the economic and social consequences of removing the intervening agricultural land from agricultural use, and Factor 4, the impact of potential urban uses on this exception land upon agricultural land surrounding the exception area.
Study Area 5:
Study Area 5 contains 172 acres of exception lands. The residential preferred alternative includes 75 acres of these lands, and excludes 97 acres; 20 acres at the southern end of the exception area on the south side of Van Duyn Road, and 77 acres at the northern end of the exception area.
The southern 20 acre area is bounded on three sides by agricultural lands with Class II soils – exclusion of this area would place the urban growth boundary along Van Duyn Road, which would provide an appropriate transition between urban and agricultural uses. Inclusion of this exception land into the urban growth boundary is inappropriate and would not accommodate the residential land need pursuant to Factor 4, the impact of potential urban uses on this exception land upon agricultural land surrounding the exception area.
The northern 77 acre area is farthest from the existing urban growth boundary among exception lands in Study Area 5. As such, it would be more expensive to serve with public facilities such as water, sewer, and transportation facilities, perhaps hastening the need for
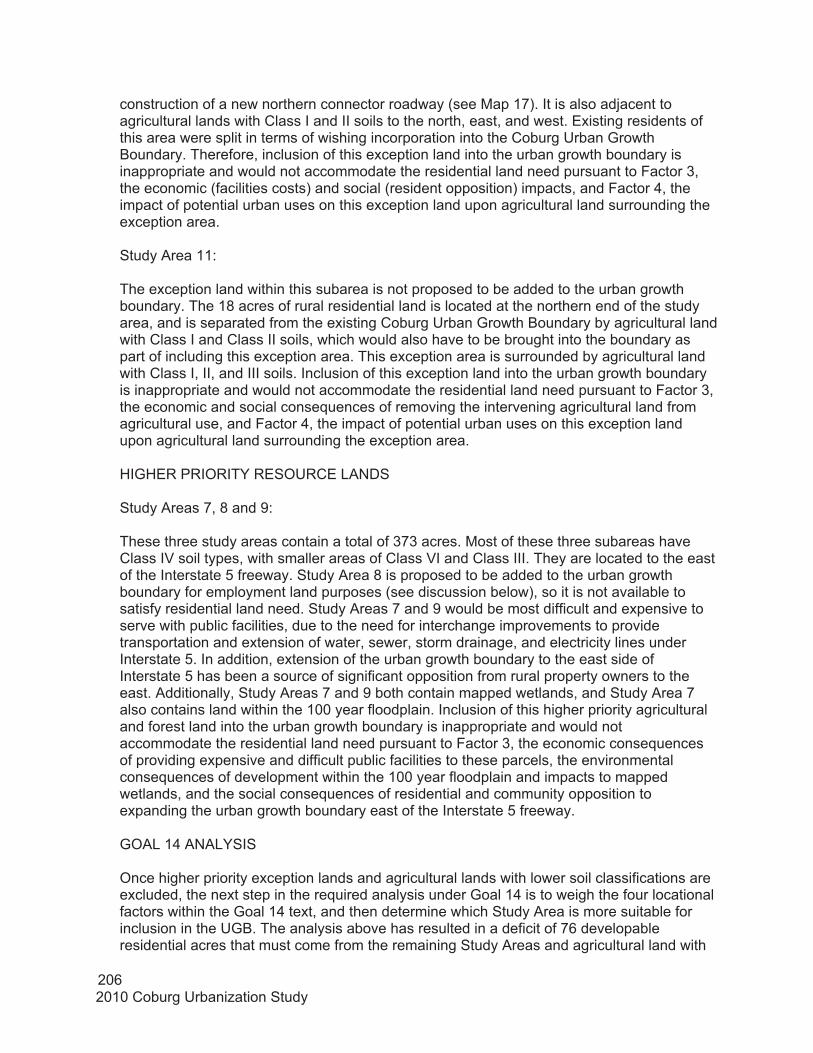
2010 Coburg Urbanization Study 206
construction of a new northern connector roadway (see Map 17). It is also adjacent to agricultural lands with Class I and II soils to the north, east, and west. Existing residents of this area were split in terms of wishing incorporation into the Coburg Urban Growth Boundary. Therefore, inclusion of this exception land into the urban growth boundary is inappropriate and would not accommodate the residential land need pursuant to Factor 3, the economic (facilities costs) and social (resident opposition) impacts, and Factor 4, the impact of potential urban uses on this exception land upon agricultural land surrounding the exception area.
Study Area 11:
The exception land within this subarea is not proposed to be added to the urban growth boundary. The 18 acres of rural residential land is located at the northern end of the study area, and is separated from the existing Coburg Urban Growth Boundary by agricultural land with Class I and Class II soils, which would also have to be brought into the boundary as part of including this exception area. This exception area is surrounded by agricultural land with Class I, II, and III soils. Inclusion of this exception land into the urban growth boundary is inappropriate and would not accommodate the residential land need pursuant to Factor 3, the economic and social consequences of removing the intervening agricultural land from agricultural use, and Factor 4, the impact of potential urban uses on this exception land upon agricultural land surrounding the exception area.
HIGHER PRIORITY RESOURCE LANDS
Study Areas 7, 8 and 9:
These three study areas contain a total of 373 acres. Most of these three subareas have Class IV soil types, with smaller areas of Class VI and Class III. They are located to the east of the Interstate 5 freeway. Study Area 8 is proposed to be added to the urban growth boundary for employment land purposes (see discussion below), so it is not available to satisfy residential land need. Study Areas 7 and 9 would be most difficult and expensive to serve with public facilities, due to the need for interchange improvements to provide transportation and extension of water, sewer, storm drainage, and electricity lines under Interstate 5. In addition, extension of the urban growth boundary to the east side of Interstate 5 has been a source of significant opposition from rural property owners to the east. Additionally, Study Areas 7 and 9 both contain mapped wetlands, and Study Area 7 also contains land within the 100 year floodplain. Inclusion of this higher priority agricultural and forest land into the urban growth boundary is inappropriate and would not accommodate the residential land need pursuant to Factor 3, the economic consequences of providing expensive and difficult public facilities to these parcels, the environmental consequences of development within the 100 year floodplain and impacts to mapped wetlands, and the social consequences of residential and community opposition to expanding the urban growth boundary east of the Interstate 5 freeway.
GOAL 14 ANALYSIS
Once higher priority exception lands and agricultural lands with lower soil classifications are excluded, the next step in the required analysis under Goal 14 is to weigh the four locational factors within the Goal 14 text, and then determine which Study Area is more suitable for inclusion in the UGB. The analysis above has resulted in a deficit of 76 developable residential acres that must come from the remaining Study Areas and agricultural land with

207 2010 Coburg Urbanization Study
Class I or II soils. Table 7.6 summarizes the analysis of the four factors discussed earlier in this chapter. Study Area 6, with 17 points, and Study Area 2, with 13 points, score higher than any of the other Study Areas other than Study Area 5, which consists of exception lands except for one parcel in the northern portion of the study area owned by the Eugene School District, and suffering from issues similar to those that resulted in the exclusion of the northern portion of Subarea 5 from the Coburg urban growth boundary. Further discussion of the Goal 14 locational factors is included below.
EMPLOYMENT LAND ALTERNATIVE
For Coburg to adopt the preferred residential land alternative, it must make appropriate findings pursuant to ORS 197.298 that justify this alternative instead of incorporating alternative exception lands into the urban growth boundary to satisfy the need for employment land. Among resource lands, Study Area 8 has worse soils (Class IV and Class VI) than all other agricultural and forest lands except for Study Area 9, which has an approximately equal amount of Class IV and Class VI soils.
Regarding employment lands, Coburg finds that all exception lands within the Study Areas are unsuitable for industrial development for the following reasons:
The Economic Opportunities Analysis states that Coburg’s employment land need is for one or two parcels of at least 20 acres. All of the exception lands within the 11 study areas are already divided into parcels significantly smaller than 20 acres in size. Therefore, they are all inappropriate, and would not accommodate employment land need pursuant to ORS 197.298(3)(a), because the specific types of identified employment land needs cannot be reasonably accommodated on the exception land parcels.
Regarding Study Area 9, since the soil classifications on this Study Area and Study Area 8 are similar, the next step in the required analysis under Goal 14 is to weigh the four locational factors within the Goal language, and determine which Study Area is more suitable for inclusion in the UGB. Table 7.6 summarizes the analysis of the four factors discussed earlier in this chapter. Based upon the analysis, Study Area 8 scores 12 points, while Subarea 9 scores only seven points. Further discussion of the Goal 14 locational factors is included below.
GOAL 14 LOCATION FACTORS:
Factor 1: Efficient accommodation of identified land needs. The analysis and discussion presented in this Study are intended to ensure that the Final Residential and Employment Expansion Recommendations maximize the efficiency of land uses both within and on the fringe of the existing urban area. The final recommendations were the result of careful consideration and balancing of priorities ranging from agricultural land preservation, efficient transportation provision, smart growth principals and economic well-being. Staff is comfortable that the area within and surrounding Coburg’s UGB can realize maximum efficiency under the expansion recommendations.

2010 Coburg Urbanization Study 208
Factor 2: Orderly and economic provision for public facilities and service. A review of the costs of extending services to each of the eleven expansion alternatives identified in the Study concluded that the Final Residential and Employment Expansion Recommendations both include areas that were rated among the least expensive alternatives.
Both Expansion Recommendations provide relatively efficient accommodation of the land required for the development of Coburg’s housing and employment needs, when compared to other alternatives.
Factor 3: Environmental, energy, economic and social consequences. The areas selected and including in the Final Expansion Recommendations were those which showed comparative advantages with respect to the economic, social, environmental and energy consequences as compared to other areas.Any possible economic concerns of impact to agricultural operations in Study Area 6 seem to be offset by the possibility of lower development costs, and greater opportunity to realizing high livability within the area (as well as the landowners expressed willingness to develop). Because the area would likely become an island of agricultural use surrounded by employment and residential lands, it is better suited to meet expansion needs than areas lacking that surrounding land use dynamic. The residential expansion recommendation also provides the social benefit of housing developments near shopping and jobs, particularly the affordable housing provisions described in Chapter 4. Much of the expansion area is also very close to Coburg elementary school.Employment expansion of any kind has considerable potential to have positive economic consequences. Coburg’s locational factors (proximity to I-5, Eugene-Springfield, and local, national and world markets) justify expansion to lands near the I-5 interchange (lands of a highly desired, and rare type). Employment expansion per staff’s recommendation would occur on lands of the lowest soil capability. Expansion into Study Area 8 was identified as having a negative social consequence. This is due to the expressed aversion of rural residents (east of the interstate near Study Area 8) to develop of any nature. This is a significant concern, and was weighed by staff, the TAC, Planning Commission and City Council. Ultimately Council regarded the potential economic benefits to the community over the twenty-year time frame as justification for the potential expansion.It is also noted that the comparative energy consequences for expansion into the Residential and Employment Expansion Recommendations appear to be positive.
Factor 4: Compatibility of the proposed urban uses with nearby agricultural and forest activities occurring on farm and forest land outside the UGB.. As noted in Factor 1 the final recommendations were the result of careful consideration and balancing of a number of priorities including agricultural land preservation. The analysis of each study provides some discussion of the land uses of adjacent areas. Certain areas were not consider for residential or employment expansion due to their proximity and potential impact on existing agricultural uses. Because Coburg is surrounded by lands in agricultural use, assessing “compatibility” was an exercise in relativity. The proposed expansion
209 2010 Coburg Urbanization Study
recommendations may not be the most compatible with agricultural use. They are however, the most compatible alternatives after accounting for other critical factors. Additionally, development at City standards and the resultant increase of density within the urban area may be critical to protecting the remaining agricultural resources in Lane County.
LOCAL CRITERIA
Local Criteria 1: Expansion should be limited to areas and tax lots which promote the greatest order and efficiency. Local Criteria 1 essentially serves as a reiteration (and emphasis) of Location Factor 3. Staff is satisfied that these criteria were duly addressed and represented in the final recommendations.
Local Criteria 2: Expansion should be limited to areas and tax lots that are appropriate to meet city needs. Although very similar to Location Factor 2, (need to accommodate long-range urban population growth, and a need for housing, employment opportunities, and livability), Local Criteria 2 is based upon Coburg’s visioning process and expressed expansion policies (as outlined previously in this section). Care and coordination was used in applying these criteria for both the Residential and Employment Expansion Recommendations. In selecting the Residential Expansion Recommendation a balance of the State’s emphasis on Exceptions lands and the City’s desire for housing development of a certain nature (and within a certain timeframe) led to the inclusion of lands within both exception and resource lands.
For employment needs, the expansion took into account that Coburg lacks employment lands of significant acreage to seize regional economic opportunities. These were included as the Employment Expansion Recommendation.
Local Criteria 3: Expansion should be limited to areas and tax lots that would promote sequential development that expands in an orderly way outward from the existing city center, and promote a street network that is interconnected in order to promote connectivity and community interaction.
Local Criteria 4: Expansion should be limited to areas and tax lots that promote livability Local Criteria 3 and 4 were critical in tempering the ORS 197.298 priorities requirement that expansion demands be met by Exception lands before other lands (Farm and Forest). Strict adherence to that provision would have resulted in an expansion configuration that would meet none of the principles outlined in Local Criteria 3 and 4. To promote interconnectedness, sequential development, livability and orderly expansion non-exceptions land needed to be included.
Local Criteria 5: Expansion should be limited to areas and tax lots that discourage premature development of agricultural lands and
2010 Coburg Urbanization Study 210
compatibility and transition between urban development and agricultural areas. Like many communities, Coburg is surrounded by lands in agricultural use; therefore any significant expansion is going to include agricultural areas. Local Criteria 5 emphasizes the importance of discouraging “prematurely” imposing development on agricultural lands. As with all considerations in this Study “premature” becomes a relative terms. What expansion alternative would result in the least “premature” development of agricultural land. Due to the dynamics of lands adjacent to Study Areas 1 and 6, and considering property owner dynamics of these areas, they were viewed as being among the most favorable in this regard.
The two most preferred employment expansion alternatives were owned by the same landowner (Knee Deep Cattle Co.) Their feedback and direction were critical in deciding the “premature” nature of development on those sites. Area 8 was selected partially to provide an accommodating and compatible environment for the continuation of Knee Deep’s operations to the north (Study Area 7).
Conclusion In summary, the City faces some difficult decisions regarding where to expand its UGB. ORS 197.298 requires the City to look at exceptions lands first. There is significant capacity for new housing on exceptions lands, however, there may not be support of existing landowners to be brought into the UGB and the development patterns in the exceptions areas, particularly those in Study areas 2 and 5, present significant service obligations to the City. Moreover, expansion into exceptions areas alone will not meet all of the City’s outlined expansion policies (especially Local Criteria 3 and 4). From an urban form, efficiency, and cost of service perspective, the Final Residential Expansion Recommendation (portions of Study Areas 1, 2, 5 and 6) appears to be the best choice. Study Areas 2 and 5 meet the exceptions requirement; Study Area 6 would round out the UGB and provide opportunities for extending Willamette Street. Unfortunately, Study Area 6 is primarily in Class I and II soils, making it lower priority based on Goal 14 Factor 6. Study Area 1 has many similar attributes as Area 6. Moreover, these are areas that were identified in the visioning process as highest priority.
Study Areas 7 and 8 are the highest rated lands based on the Goal 14 Factor 6 hierarchy. The Final Employment Expansion Recommendation constitutes all of Study Area 8. This area would require the City to expand further across I-5 (there is already some UGB land on eastern side) as well as extending water and sewer services to the areas. The area is prime land for industrial and office employment. Workshops held as part of the Coburg Crossroads visioning process suggest the public is supportive of taking steps to secure these lands for future employment.
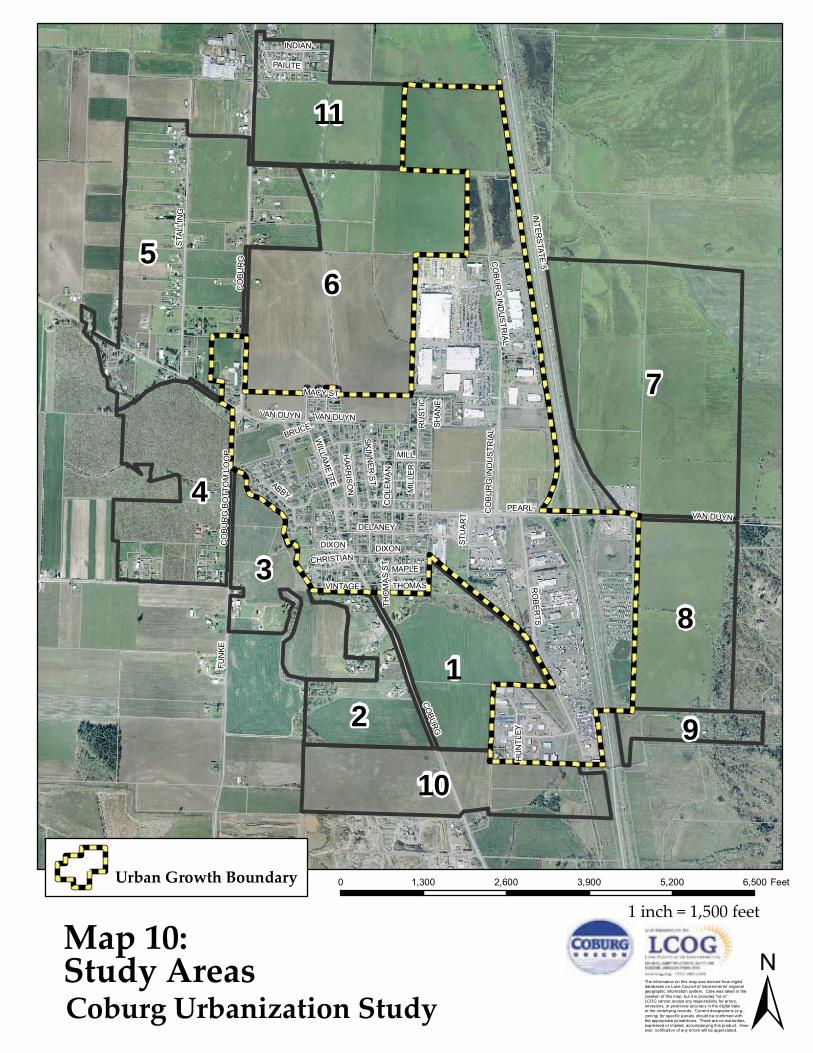
INTER
STATE
5
FUN
KE
CO
BU
RG
PEARL
STAL
LIN
G
VAN DUYN
RO
BER
TS
DELANEY
MIL
LER
WILLAM
ETTE
MILL
ABBY
CO
LEM
AN
DIXON
CO
BU
RG
BO
TTO
M L
OO
P
INDIAN
CO
BU
RG
IND
US
TRIA
L
PAIUTE
SKIN
NER
ST
MAPLE
HAR
RIS
ON
VINTAGE THOMAS
STU
AR
T
SHA
NE
CHRISTIAN
MACY ST
RU
STIC
BRUCE
HU
NTL
EY
THO
MA
S S
TC
OBU
RG
DIXON
CO
BU
RG
IND
US
TRIA
L
VAN DUYN VAN DUYN
7
56
4
81
3
2
10
11
9
Urban Growth Boundary
Map 10: Study Areas ±The information on this map was derived from digital
databases on Lane Council of Governments’ regionalgeographic information system. Care was taken in thecreation of this map, but it is provided "as is".LCOG cannot accept any responsibility for errors,omissions, or positional accuracy in the digital dataor the underlying records. Current designations (e.g.,zoning) for specific parcels should be confirmed withthe appropriate jurisdictions. There are no warranties,expressed or implied, accompanying this product. How-ever, notification of any errors will be appreciated.
0 1,300 2,600 3,900 5,200 6,500 Feet
Coburg Urbanization Study
1 inch = 1,500 feet
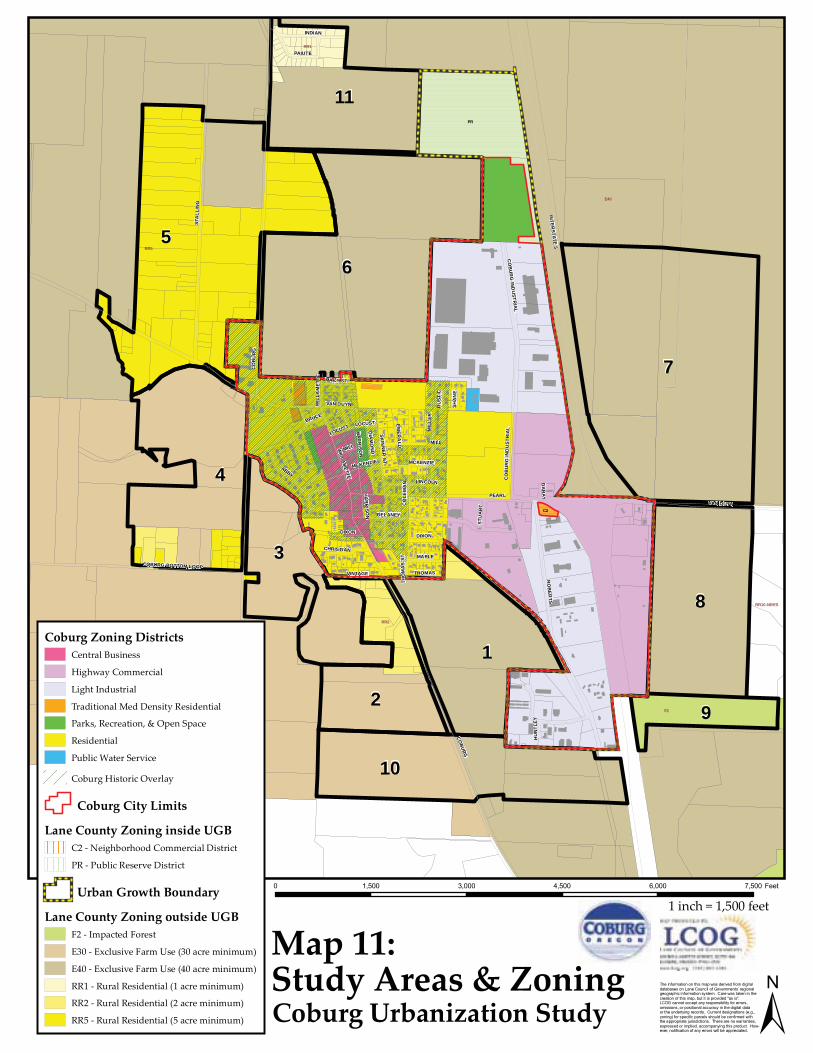
INTER
STATE 5
FUN
KE
CO
BU
RG
PEARL
STA
LLIN
G
VAN DUYN
RO
BER
TS
DELANEY
MIL
LER
WILLA
METTE
MILL
ABBY
CO
LEM
AN
COBURG BOTTOM LOOP
DIXON
INDIAN
CO
BU
RG
IND
USTR
IAL
PAIUTE
MCKENZIE
SKIN
NER
ST
DIA
MO
ND
LINCOLN
MAPLE
HA
RR
ISON
VINTAGE THOMAS
STU
AR
T
SHA
NE
CHRISTIAN
MACY ST
RU
STIC
BRUCE
DA
RAY
LOCUST
EMER
ALD
HU
NTL
EY
THO
MA
S S
T
COBURG
LOCUST
DIXON
MILL
VAN DUYN
CO
BU
RG
IND
UST
RIA
L
MCKENZIE
WIL
LAM
ETTE
HA
RR
ISON
7
56
4
8
1
3
2
10
11
9
PR
C2
E40
E30
RR5
SG
F2
RR2
RR1
RR10-NRES
Coburg Zoning DistrictsCentral Business
Highway Commercial
Light Industrial
Traditional Med Density Residential
Parks, Recreation, & Open Space
Residential
Public Water Service
Coburg Historic Overlay
Coburg City Limits
Lane County Zoning inside UGBC2 - Neighborhood Commercial District
PR - Public Reserve District
Urban Growth Boundary
Lane County Zoning outside UGBF2 - Impacted Forest
E30 - Exclusive Farm Use (30 acre minimum)
E40 - Exclusive Farm Use (40 acre minimum)
RR1 - Rural Residential (1 acre minimum)
RR2 - Rural Residential (2 acre minimum)
RR5 - Rural Residential (5 acre minimum)
Map 11: Study Areas & Zoning
±The information on this map was derived from digitaldatabases on Lane Council of Governments’ regionalgeographic information system. Care was taken in thecreation of this map, but it is provided "as is".LCOG cannot accept any responsibility for errors,omissions, or positional accuracy in the digital dataor the underlying records. Current designations (e.g.,zoning) for specific parcels should be confirmed withthe appropriate jurisdictions. There are no warranties,expressed or implied, accompanying this product. How-ever, notification of any errors will be appreciated.
0 1,500 3,000 4,500 6,000 7,500 Feet
Coburg Urbanization Study
1 inch = 1,500 feet
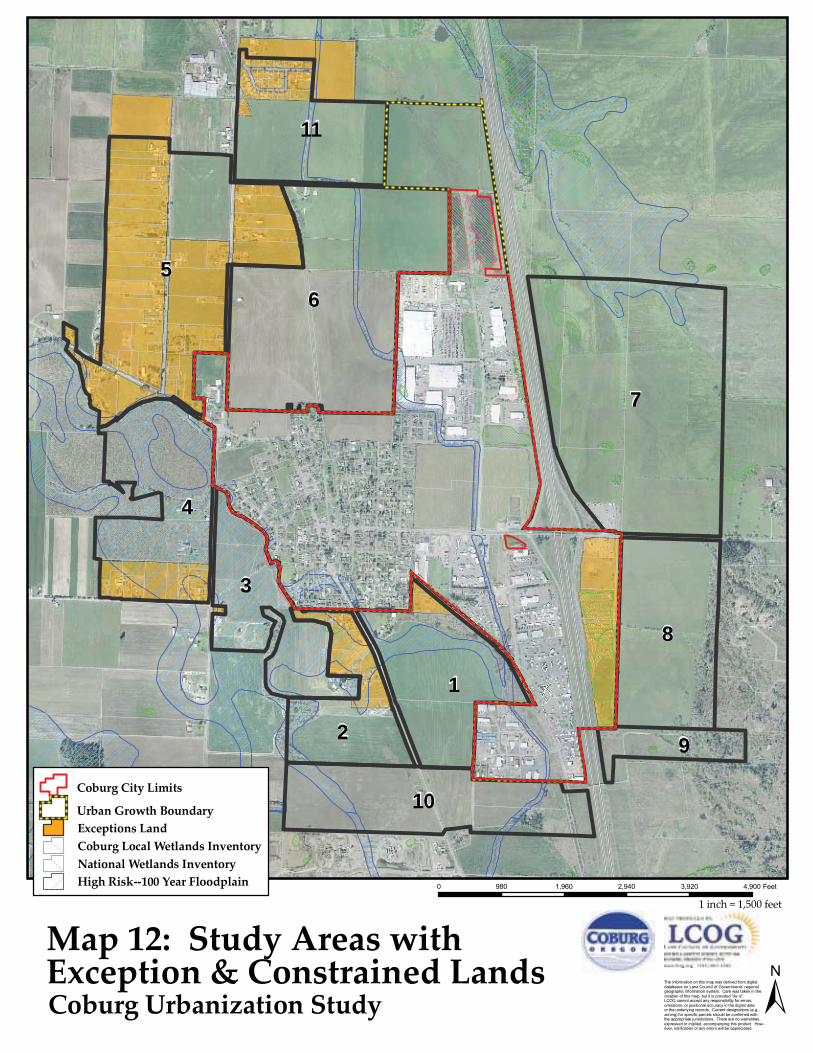
7
56
4
8
1
3
2
10
11
9
Coburg City Limits
Urban Growth BoundaryExceptions LandCoburg Local Wetlands InventoryNational Wetlands InventoryHigh Risk--100 Year Floodplain
Map 12: Study Areas withException & Constrained Lands ±The information on this map was derived from digital
databases on Lane Council of Governments’ regionalgeographic information system. Care was taken in thecreation of this map, but it is provided "as is".LCOG cannot accept any responsibility for errors,omissions, or positional accuracy in the digital dataor the underlying records. Current designations (e.g.,zoning) for specific parcels should be confirmed withthe appropriate jurisdictions. There are no warranties,expressed or implied, accompanying this product. How-ever, notification of any errors will be appreciated.
0 980 1,960 2,940 3,920 4,900 Feet
Coburg Urbanization Study
1 inch = 1,500 feet
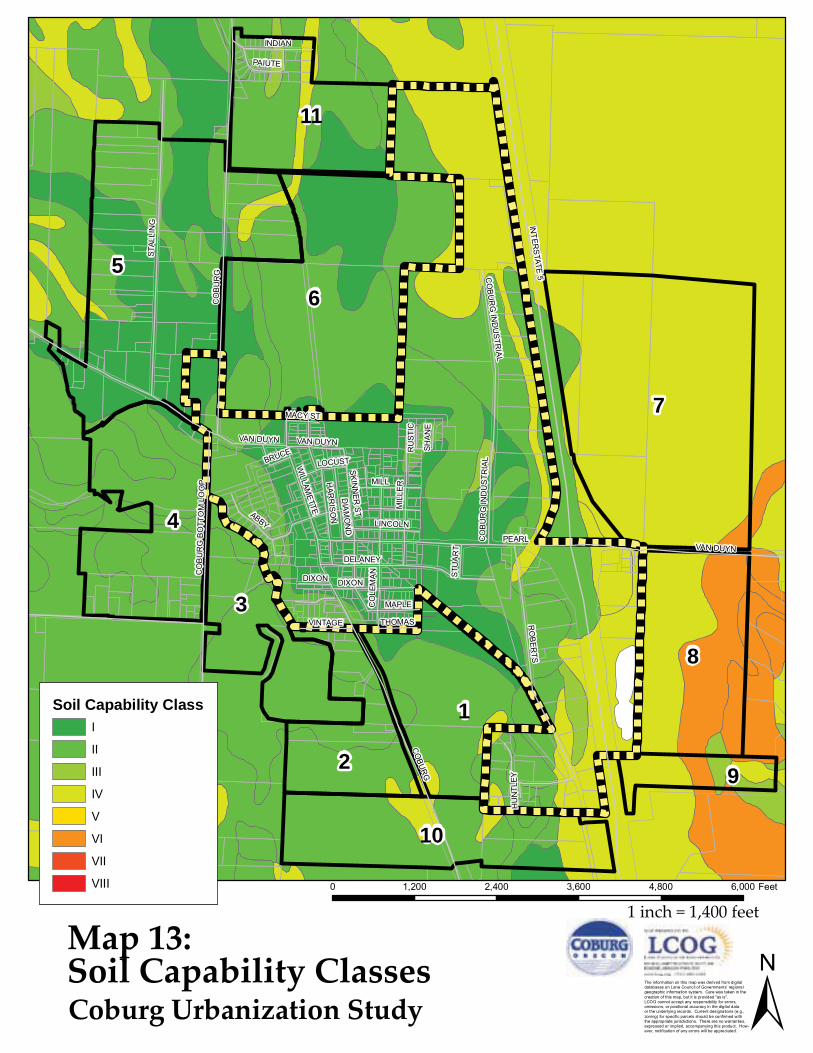
INTER
STATE
5
CO
BU
RG
PEARL
FUN
KE
STAL
LIN
G
VAN DUYN
RO
BER
TS
DELANEY
MIL
LER
WILLAM
ETTE
MILL
ABBY
CO
LEM
AN
DIXON
CO
BU
RG
BO
TTO
M L
OO
P
INDIAN
CO
BU
RG
IND
US
TRIA
L
PAIUTE
SKIN
NER
ST
DIA
MO
ND LINCOLN
MAPLE
HAR
RIS
ON
VINTAGE THOMAS
STU
AR
T
SHA
NE
MACY STR
UST
IC
BRUCELOCUST
HU
NTL
EY
CO
BUR
G
DIXON
CO
BU
RG
IND
US
TRIA
L
VAN DUYN VAN DUYN
7
56
4
8
1
3
2
10
11
9
Soil Capability ClassI
II
III
IV
V
VI
VII
VIII
Map 13: Soil Capability Classes ±The information on this map was derived from digital
databases on Lane Council of Governments’ regionalgeographic information system. Care was taken in thecreation of this map, but it is provided "as is".LCOG cannot accept any responsibility for errors,omissions, or positional accuracy in the digital dataor the underlying records. Current designations (e.g.,zoning) for specific parcels should be confirmed withthe appropriate jurisdictions. There are no warranties,expressed or implied, accompanying this product. How-ever, notification of any errors will be appreciated.
0 1,200 2,400 3,600 4,800 6,000 Feet
Coburg Urbanization Study
1 inch = 1,400 feet
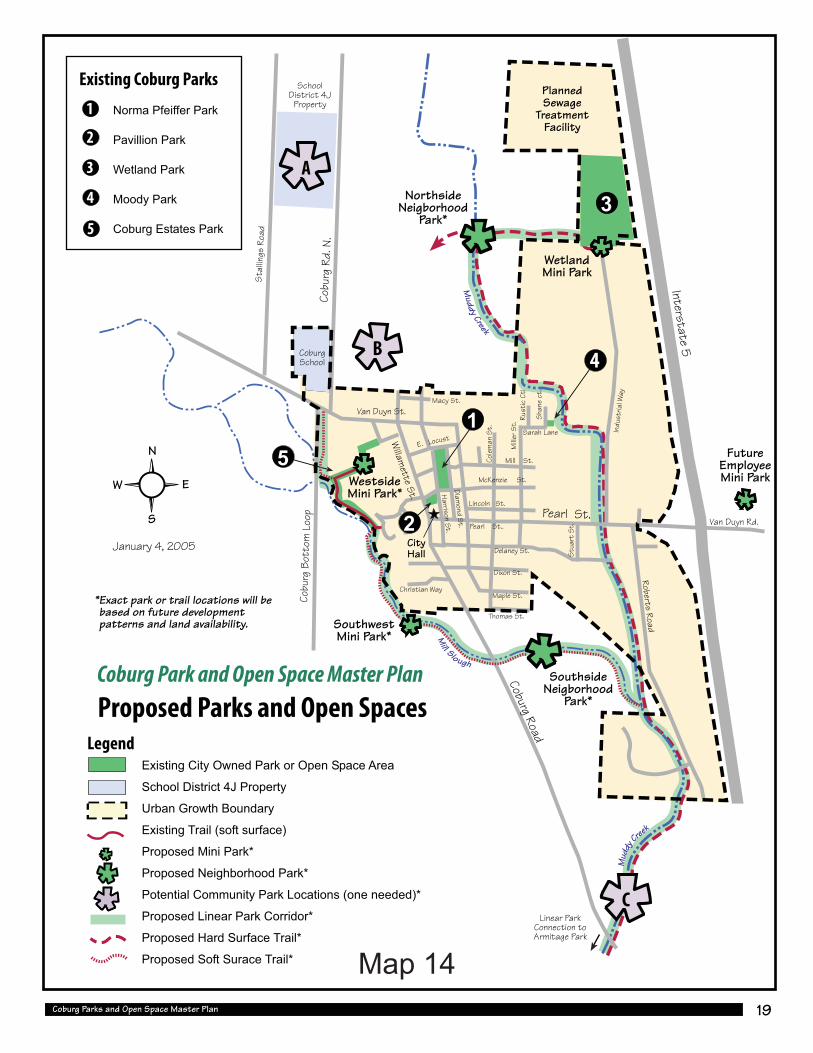
Map 14

�����,:���&��*�'����������������� �#
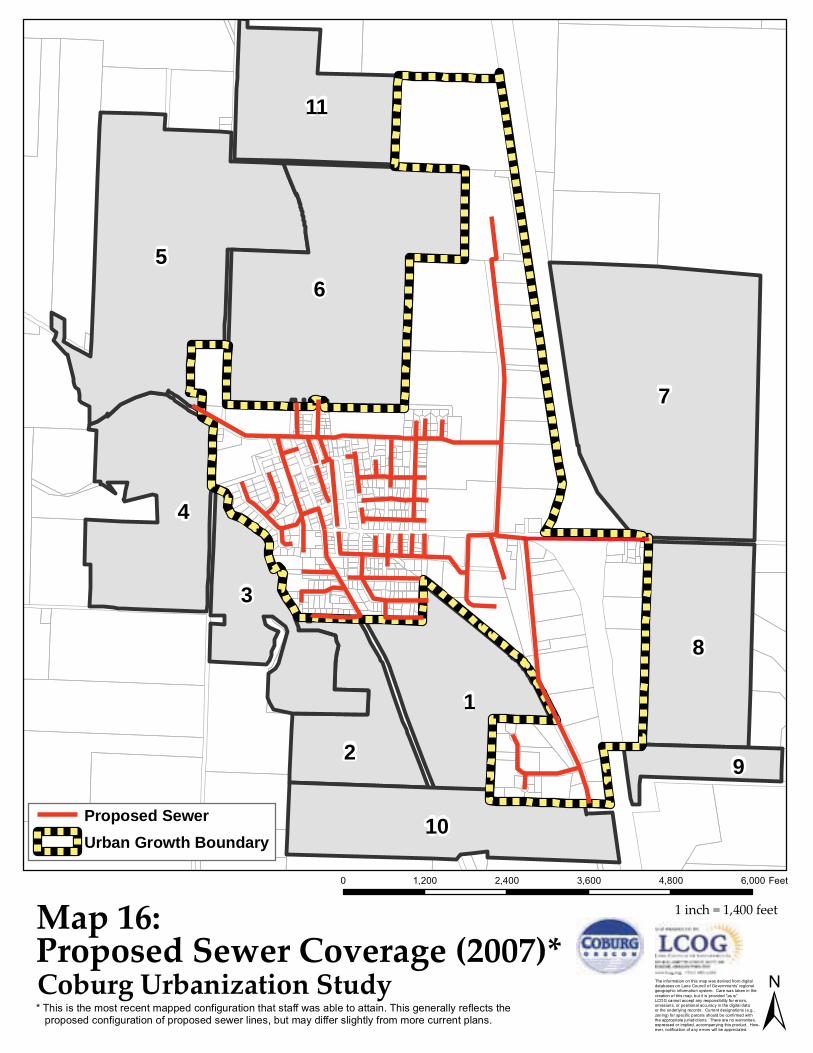
7
56
4
8
1
3
2
10
11
9
Proposed SewerUrban Growth Boundary
Map 16: Proposed Sewer Coverage (2007)*
±The information on this map was derived from digitaldatabases on Lane Council of Governments’ regionalgeographic information system. Care was taken in thecreation of this map, but it is provided "as is".LCOG cannot accept any responsibility for errors,omissions, or positional accuracy in the digital dataor the underlying records. Current designations (e.g.,zoning) for specific parcels should be confirmed withthe appropriate jurisdictions. There are no warranties,expressed or implied, accompanying this product. How-ever, notification of any errors will be appreciated.
0 1,200 2,400 3,600 4,800 6,000 Feet
Coburg Urbanization Study
1 inch = 1,400 feet
* This is the most recent mapped configuration that staff was able to attain. This generally reflects the proposed configuration of proposed sewer lines, but may differ slightly from more current plans.
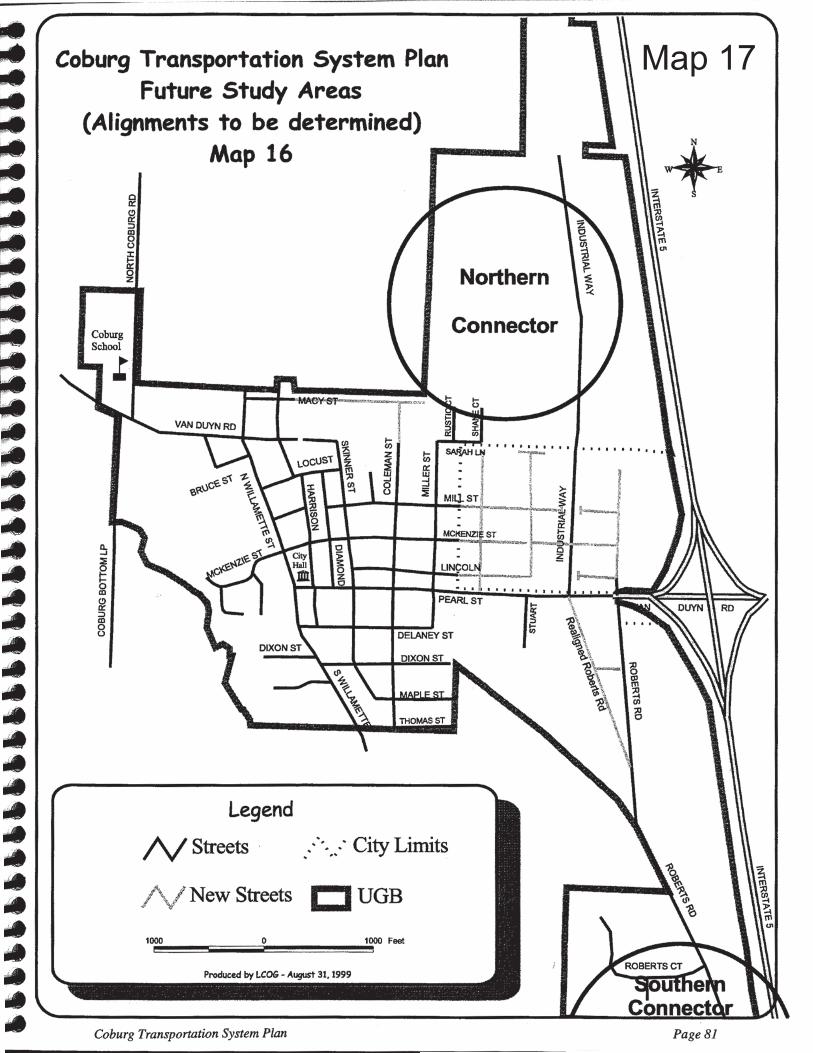
Map 17
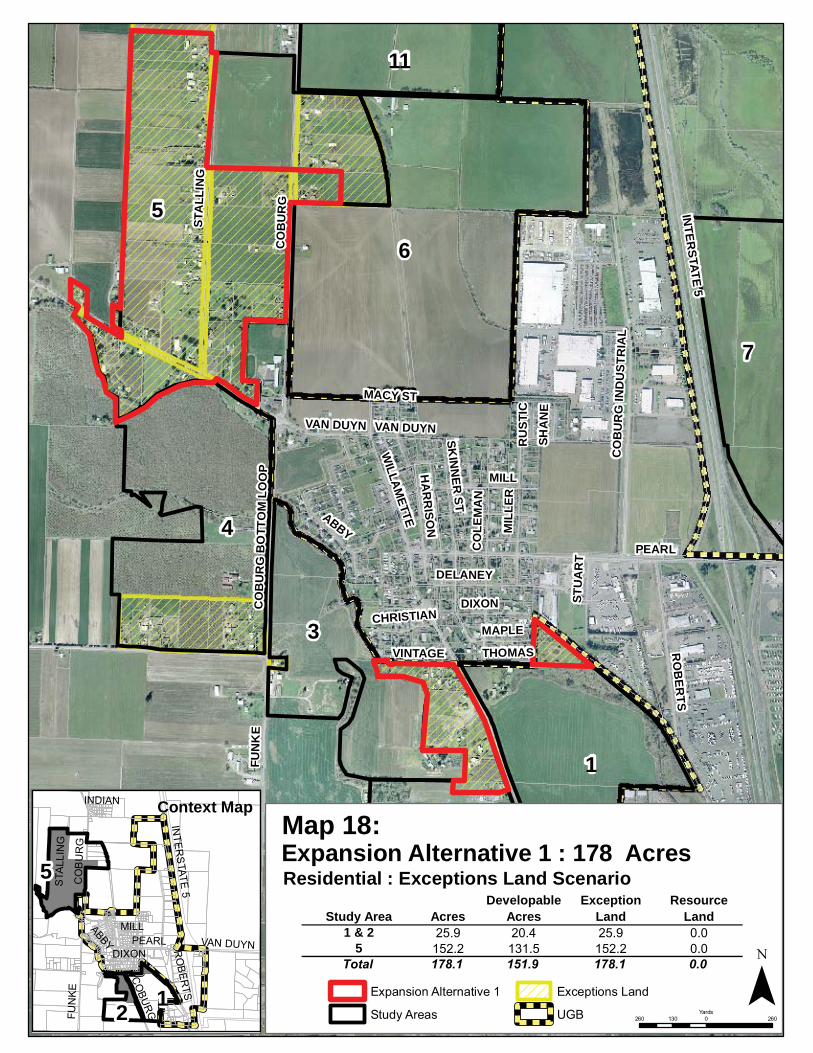
INTER
STATE 5
FUN
KE
COBURG
PEARL
STA
LLIN
G
RO
BER
TS
DELANEY
MIL
LER
WILLAM
ETTE
MILL
ABBY
CO
LEM
AN
DIXONCO
BU
RG
BO
TTO
M L
OO
P
CO
BU
RG
IND
UST
RIA
L
SKIN
NER
ST
MAPLE
VAN DUYN
HA
RR
ISON
VINTAGE THOMAS
STU
AR
T
SHA
NE
CHRISTIAN
MACY ST
RU
STIC
CO
BU
RG
VAN DUYN
5
6
4
1
3
7
2
10
11
INTER
STATE
5
CO
BU
RG
PEARL
STA
LLIN
GFU
NK
E
VAN DUYNRO
BER
TS
MILLABBY
DIXON
INDIAN
CO
BUR
G
5
12
Expansion Alternative 1 : 178 Acres
Expansion Alternative 1
Study Areas
Exceptions Land
UGB¯
260 0 260130Yards
Context Map
Residential Need: 148 Acres
Study Area AcresDevelopable
AcresException
Land Resource
Land1 & 2 25.9 20.4 25.9 0.0
5 152.2 131.5 152.2 0.0Total 178.1 151.9 178.1 0.0
Residential : Exceptions Land Scenario
Map 18:

FUN
KE
PEARL
COBURG
DELANEY
MIL
LER
WILLAM
ETTE
MILL
STA
LLIN
G
ABBY
CO
LEM
AN
DIXON
CO
BU
RG
BO
TTO
M L
OO
P
CO
BU
RG
IND
USTR
IAL
MCKENZIE
SKIN
NER
ST
LINCOLN
MAPLE
VAN DUYN HARRISON
VINTAGE THOMAS
STU
AR
T
SHA
NE
CHRISTIAN
MACY ST
RU
STIC
BRUCE
THO
MA
S ST
DIXON
CO
BU
RG
CO
BU
RG
IND
UST
RIA
L
HA
RR
ISON
6
4
5
1
3
2
10
INTER
STATE
5
CO
BU
RG
PEARL
STA
LLIN
GFU
NK
E
VAN DUYN
ROBERTS
MILLABBY
DIXON
INDIAN
VAN DUYN
CO
BUR
G
65
12
Expansion Alternative 2 : 169 Acres
Expansion Alternative 2
Study Areas
Exceptions Land
UGB¯
180 0 18090Yards
Context Map
Residential Need: 148 Acres
Study Area AcresDevelopable
AcresException
Land Resource
Land1 & 2 32 27.3 13.8 18.3
5 65.2 54.1 65.2 06 72 72 0 72
Total 169.2 153.4 79 90.3
Residential: 2004 Recommendation Alternative
Map 19:
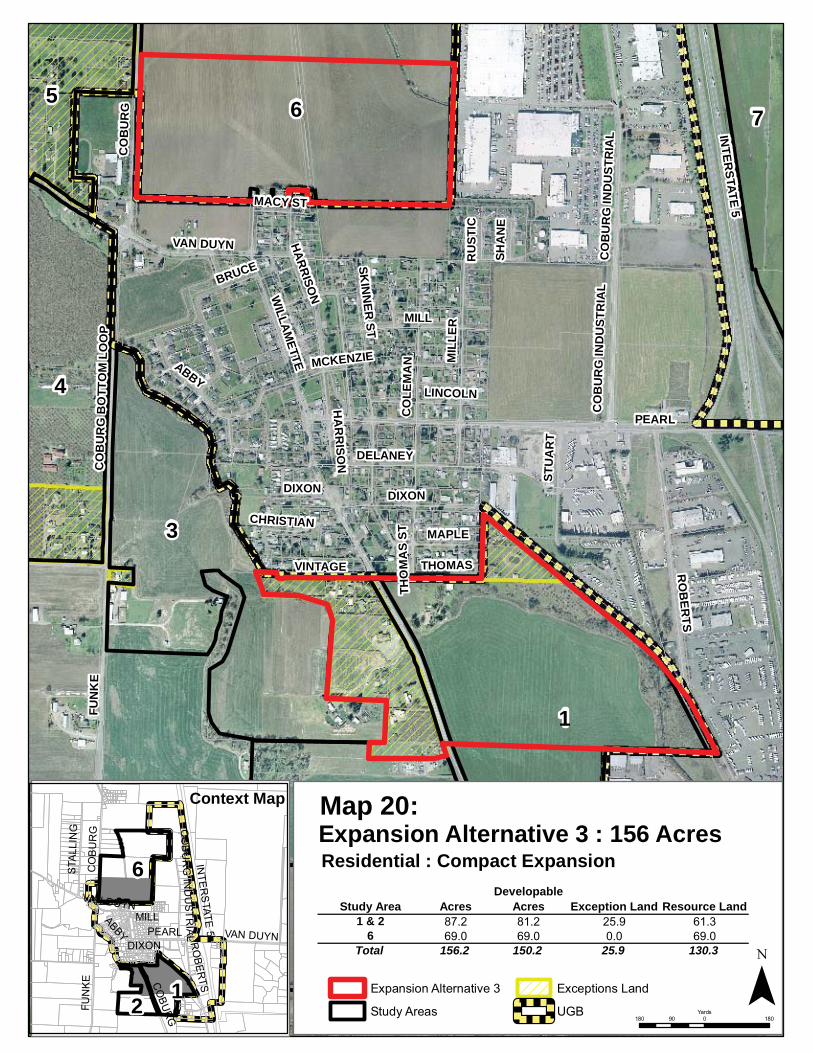
FUN
KE
PEARL
COBURG
INTER
STATE 5
RO
BER
TS
DELANEYM
ILLE
R
WILLAM
ETTE
MILL
ABBY
CO
LEM
AN
DIXON
CO
BU
RG
BO
TTO
M L
OO
P
MCKENZIE
SKIN
NER
ST
LINCOLN
MAPLE
VAN DUYN
CO
BU
RG
IND
UST
RIA
L
HARRISON
VINTAGE THOMASST
UA
RT
SHA
NE
CHRISTIAN
MACY ST
RU
STIC
BRUCE
HU
NTL
EY
THO
MA
S ST
CO
BU
RG
DIXON
CO
BU
RG
IND
UST
RIA
L
HA
RR
ISON
1
6
3
2
10
4
75
INTER
STATE
5
CO
BU
RG
PEARL
FUN
KE
STA
LLIN
G
VAN DUYNRO
BER
TS
MILLABBY
DIXON
CO
BU
RG
IND
US
TRIA
L
VAN DUYN
CO
BUR
G
6
12
Map 20:
Expansion Alternative 3
Study Areas
Exceptions Land
UGB¯
180 0 18090Yards
Context Map
Residential Need: 148 Acres
Study Area AcresDevelopable
Acres Exception Land Resource Land1 & 2 87.2 81.2 25.9 61.3
6 69.0 69.0 0.0 69.0Total 156.2 150.2 25.9 130.3
Residential : Compact ExpansionExpansion Alternative 3 : 156 Acres
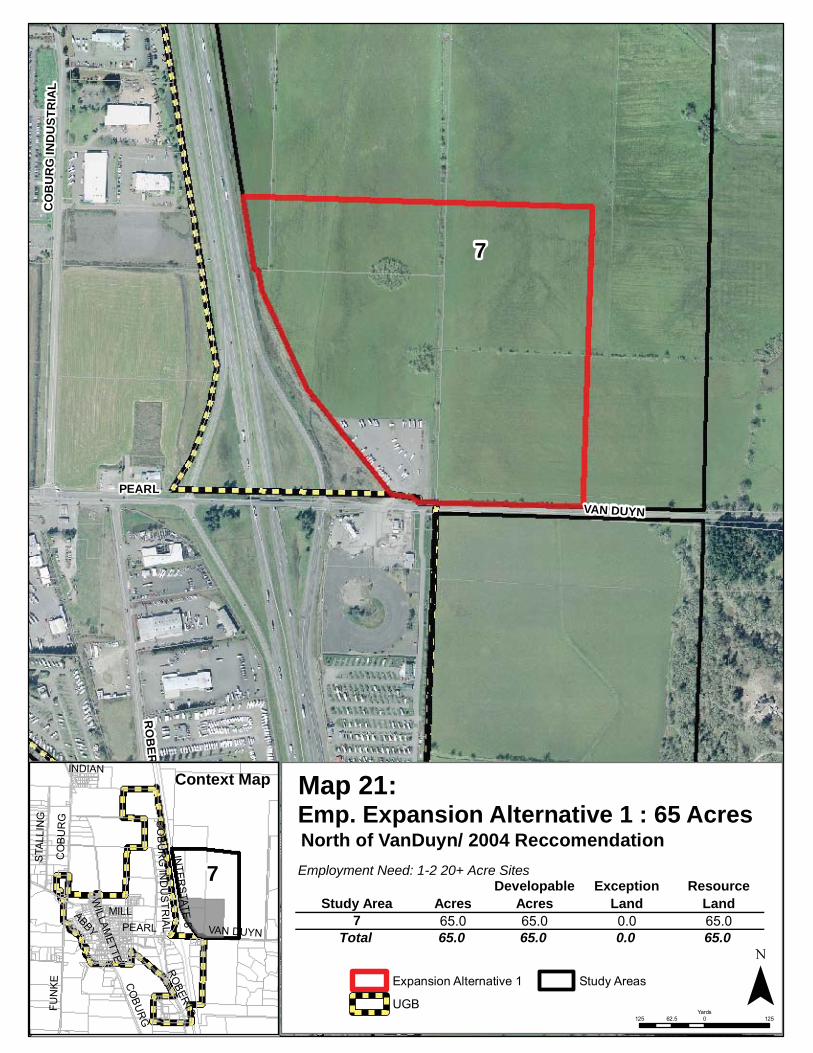
INTER
STATE 5
RO
BER
TS
VAN DUYN
PEARL
CO
BU
RG
IND
UST
RIA
L
7
8
1
9
INTER
STATE
5
CO
BU
RG
PEARL
FUN
KE
STA
LLIN
G
VAN DUYN
ROBERTS
MILLABBYW
ILLAMETTE
INDIAN
CO
BU
RG
IND
US
TRIA
L
CO
BUR
G
7
Emp. Expansion Alternative 1 : 65 Acres
Expansion Alternative 1
UGB
Study Areas ¯125 0 12562.5
Yards
Employment Need: 1-2 20+ Acre Sites
Study Area AcresDevelopable
AcresException
Land Resource
Land7 65.0 65.0 0.0 65.0
Total 65.0 65.0 0.0 65.0
Context Map
North of VanDuyn/ 2004 Reccomendation
Map 21:
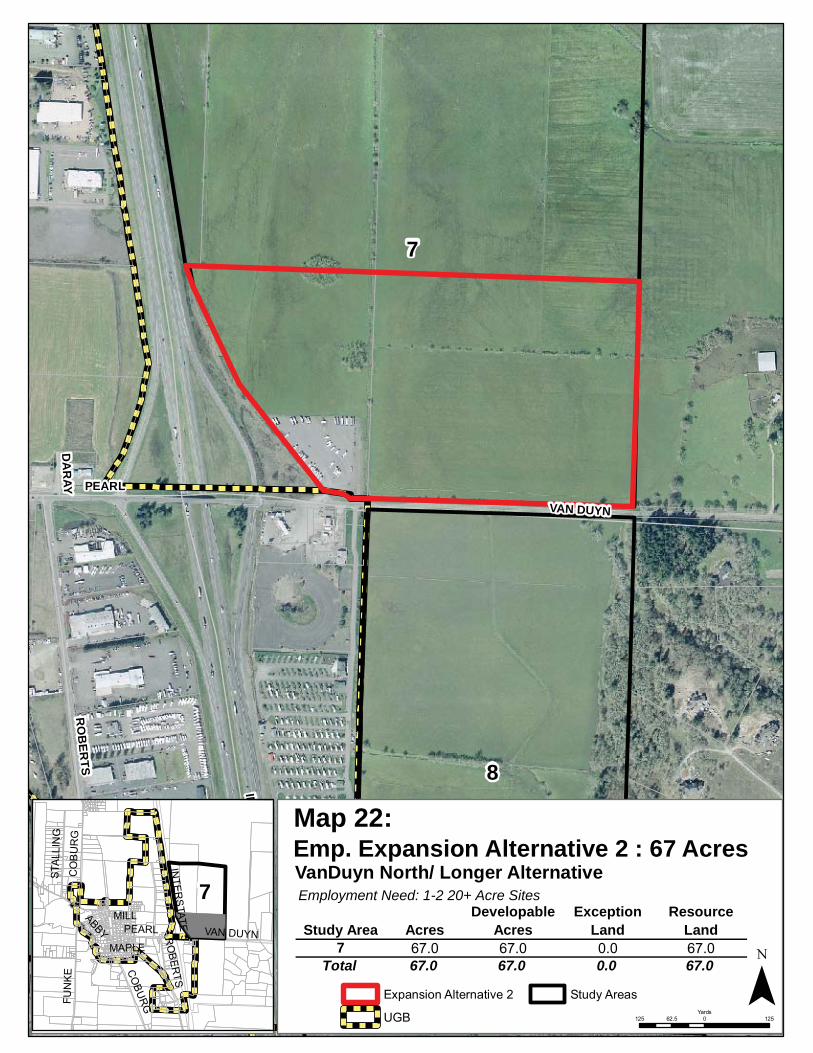
INTER
STATE 5
VAN DUYN
RO
BER
TS
PEARL
DA
RAY
7
8
1
9
INTER
STATE
5
CO
BU
RG
FUN
KE
PEARL VAN DUYN
STA
LLIN
G
RO
BER
TS
MILLABBY
MAPLE
CO
BUR
G
7
Emp. Expansion Alternative 2 : 67 Acres
Expansion Alternative 2
UGB
Study Areas ¯125 0 12562.5
Yards
VanDuyn North/ Longer AlternativeEmployment Need: 1-2 20+ Acre Sites
Study Area AcresDevelopable
AcresException
Land Resource
Land7 67.0 67.0 0.0 67.0
Total 67.0 67.0 0.0 67.0
Map 22:

INTER
STATE 5
VAN DUYN
RO
BER
TS
PEARL
DA
RAY
8
7
9
10
1IN
TERS
TATE 5
CO
BU
RG
PEARL
FUN
KE
VAN DUYN
STA
LLIN
G
ROBERTS
MILLABBY
DIXON
CO
BU
RG
IND
US
TRIA
L
VINTAGE
VAN DUYN
CO
BUR
G
8
Map 23:
Expansion Alternative 3
UGB
Study Areas ¯125 0 12562.5
Yards
VanDuyn South Scenario
Context Map
Employment Need :1-2 20+ Acre Sites
Study Area AcresDevelopable
AcresException
Land Resource
Land8 65.0 65.0 0.0 65.0
Total 65.0 65.0 0.0 65.0
Emp. Expansion Alternative 3 : 65 Acres

INTER
STATE 5
VAN DUYN
RO
BER
TS
PEARL
COBURG
DELANEY
CO
BU
RG
IND
UST
RIA
L
DA
RAY
HU
NTL
EY
8
7
1
10
9
INTER
STATE
5
CO
BU
RG
PEARL
FUN
KE
VAN DUYN
STA
LLIN
G
ROBERTS
MILLABBY
DIXON
CO
BU
RG
IND
US
TRIA
L
VINTAGE
VAN DUYN
CO
BUR
G
8
Emp. Final Recommendation: 105 Acres
Final Employment Recommendation
UGB
Study Areas ¯170 0 17085
Yards
Knee Deep South Scenario
Context Map
Employment Need :1-2 20+ Acre Sites
Study Area AcresDevelopable
Acres*Exception
Land Resource
Land8 105.0 80.0 0.0 105.0
Total 105.0 80.0 0.0 105.0* Estimating for constrained lands
Map 24:
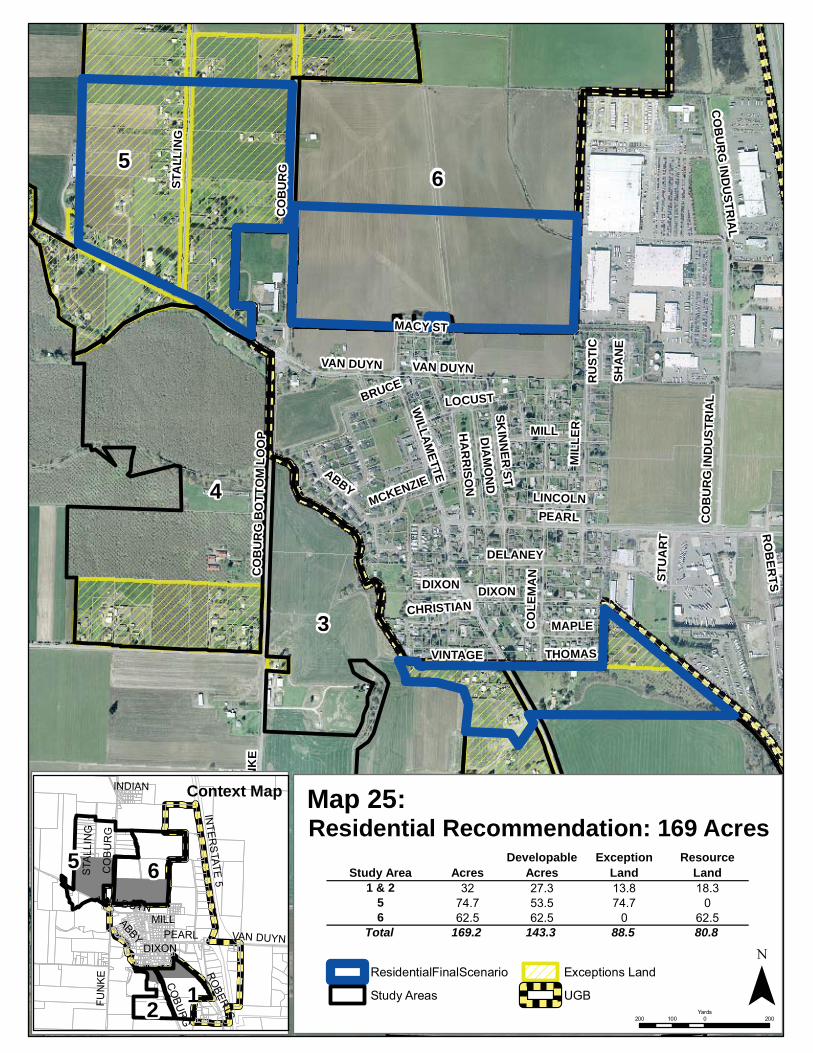
FUN
KE
PEARL
COBURG
DELANEY
STA
LLIN
G
MIL
LER
WILLAM
ETTE
RO
BER
TS
MILL
ABBY
CO
LEM
AN
DIXON
CO
BU
RG
BO
TTO
M L
OO
P
CO
BU
RG
IND
USTR
IAL
MCKENZIE
SKIN
NER
ST
DIA
MO
ND
LINCOLN
MAPLE
VAN DUYNH
AR
RISO
N
VINTAGE THOMASST
UA
RT
SHA
NE
CHRISTIAN
MACY ST
RU
STIC
BRUCELOCUST
HU
NTL
EY
CO
BU
RG
CO
BU
RG
IND
UST
RIA
L
DIXON
VAN DUYN
65
4
1
3
2
10
INTER
STATE
5
CO
BU
RG
PEARL
STA
LLIN
GFU
NK
E
VAN DUYN
ROBERTS
MILLABBY
DIXON
INDIAN
VAN DUYN
CO
BUR
G
65
12
ResidentialFinalScenario
Study Areas
Exceptions Land
UGB ¯200 0 200100
Yards
Context Map
Residential Need: 148 Acres
Study Area AcresDevelopable
AcresException
Land Resource
Land1 & 2 32 27.3 13.8 18.3
5 74.7 53.5 74.7 06 62.5 62.5 0 62.5
Total 169.2 143.3 88.5 80.8
Residential Recommendation: 169 AcresMap 25:
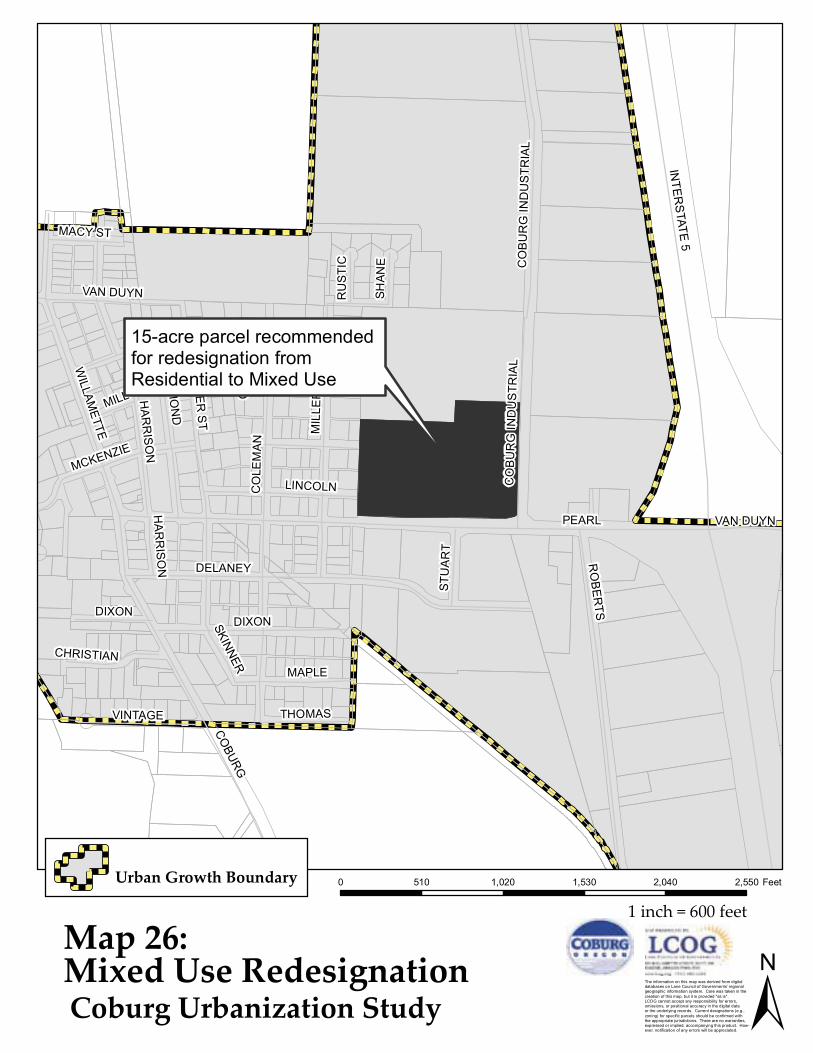
PEARL
INTE
RS
TATE 5
DELANEY
MIL
LER
WILLAM
ETTE
RO
BE
RTS
MILL
CO
LEM
AN
DIXONSKINNERCO
BURG
SKIN
NE
R S
T
DIA
MO
ND
LINCOLN
MAPLE
MCKENZIE
HA
RR
ISO
N
CO
BU
RG
IND
US
TRIA
L
VINTAGE
VAN DUYN
THOMAS
STU
AR
T
SHAN
E
CHRISTIAN
MACY ST
RU
STI
CLOCUST EM
ER
ALD
HA
RR
ISO
N
CO
BU
RG
IND
US
TRIA
L
MILL
DIXON
VAN DUYN
Urban Growth Boundary
Map 26: Mixed Use Redesignation ±The information on this map was derived from digital
databases on Lane Council of Governments’ regionalgeographic information system. Care was taken in thecreation of this map, but it is provided "as is".LCOG cannot accept any responsibility for errors,omissions, or positional accuracy in the digital dataor the underlying records. Current designations (e.g.,zoning) for specific parcels should be confirmed withthe appropriate jurisdictions. There are no warranties,expressed or implied, accompanying this product. How-ever, notification of any errors will be appreciated.
0 510 1,020 1,530 2,040 2,550 Feet
Coburg Urbanization Study
1 inch = 600 feet
15-acre parcel recommended for redesignation from Residential to Mixed Use

2242010 Coburg Urbanization Study
2252010 Coburg Urbanization Study
�)���� �4����-'�����+�'���
This chapter lists key planning and development issues the City should address during the Comprehensive Plan and Zoning Ordinance updates.
A core component of the Study Update is to visit the Coburg Comprehensive Plan policies and objectives and determine which elements have been accomplished as well as decide if others remain aligned with the community’s vision. Table 8.1 in Appendix J contains an overview of some of the key Comprehensive Plan Policies addressing urbanization and analyzes the extent to which these policies have already been implemented. As noted, many of the recommendations have been implemented. Key areas that have not been addressed include:
� Establishment of agreements with Lane County to manage the use of land that is intended for future urban development but is yet to be annexed.
� Establishment of agreements with Lane County concerning development in and around Coburg.
� Intergovernmental agreements with Lane County and other jurisdictions to preserve the Coburg Hills as a scenic resource.
� Fostering a business environment and land use system that meet a variety of residents’ needs for goods and services, to reduce daily travel to Eugene, while maintaining Coburg’s small town character.
� Development of Urban Reserve Areas.
�� Provide a variety of residential housing types;
�� Use of a range of tools to meet housing needs, including multiple residential zones,mixed-use zones, sufficient land to meet identified housing needs, appropriateminimum lot sizes, and accessory dwelling units.
�� Encourage the location of future medium density development and mixed use along high capacity transportation corridors.
�� Promote infill development that includes options such as triplexes on corner lots, mid-block developments (lots fronting a public or private lane), and flag lots. Allow variations in building setbacks and lot dimensions as needed to encourage development of lots that would otherwise be undevelopable, without requiring a variance process.
�� Compatible integration of uses through design standards.
�For each of the issues, the Planning Commission and City Council considered:
3. Whether the policy or recommendation remains aligned with the Community Vision and should be retained, or �
4. Whether the policy should be deleted entirely or replaced with new policies that more accurately reflect current community sentiment.�
The Planning Commission and City Council decided to retain the existing policies that have not been implemented, with the exception of those pertaining to the establishment of Urban Reserve Areas. The Planning Commission and City Council were in agreement not to pursue the establishment of Urban Reserves at this time.
In addition to the analysis of the Comprehensive Plan Policies, the City Council and Planning Commission also conducted an evaluation of the status of implementing policy recommendations stemming from the 2004 Study. Table 8.2 in Appendix J examines these
2262010 Coburg Urbanization Study
recommendations and notes how they have or have not been implemented. As noted, many of the recommendations have been implemented. Key areas that have not been addressed include:
� Development of a Mixed-Use Plan designation, � Addressing truck traffic in a TSP update, � Development of a cost estimate of servicing the various UGB expansion study areas
as part of the public facilities and services plan update, and � Development of a system of Urban Reserves.
The Planning Commission and City Council reviewed these recommendations and determined that they still have merit to pursue, with the exception of those addressing the establishment of Urban Reserve Areas.
Finally, the Planning Commission and City Council both reviewed potential gaps in existing policies, based on issues that arose during the Study process. There was general agreement to pursue new policies identified in Table 8.3 in Appendix J. Note: The policies contained in Table 8.3 express general concepts, and agreement on precise language is still needed.
2272010 Coburg Urbanization Study
����+0����
Appendix A – Baseline Assumptions Appendix B – Public Process Materials Appendix C – Housing Needs Model Appendix D – Coburg Comprehensive Plan Policies addressing Housing Appendix E – Coburg Preferred Town Map Appendix F - Coburg Comprehensive Plan Policies addressing the Economy Appendix G – Residential Infill Strategies Appendix H – Example of Existing Residential Densities within Coburg Appendix I Rendering of Mixed-Use Development in Coburg�Appendix J – Policy Analysis Summary Tables Appendix K - Regional Economic Analysis for Coburg UGB, Eric Hovee, January 2014
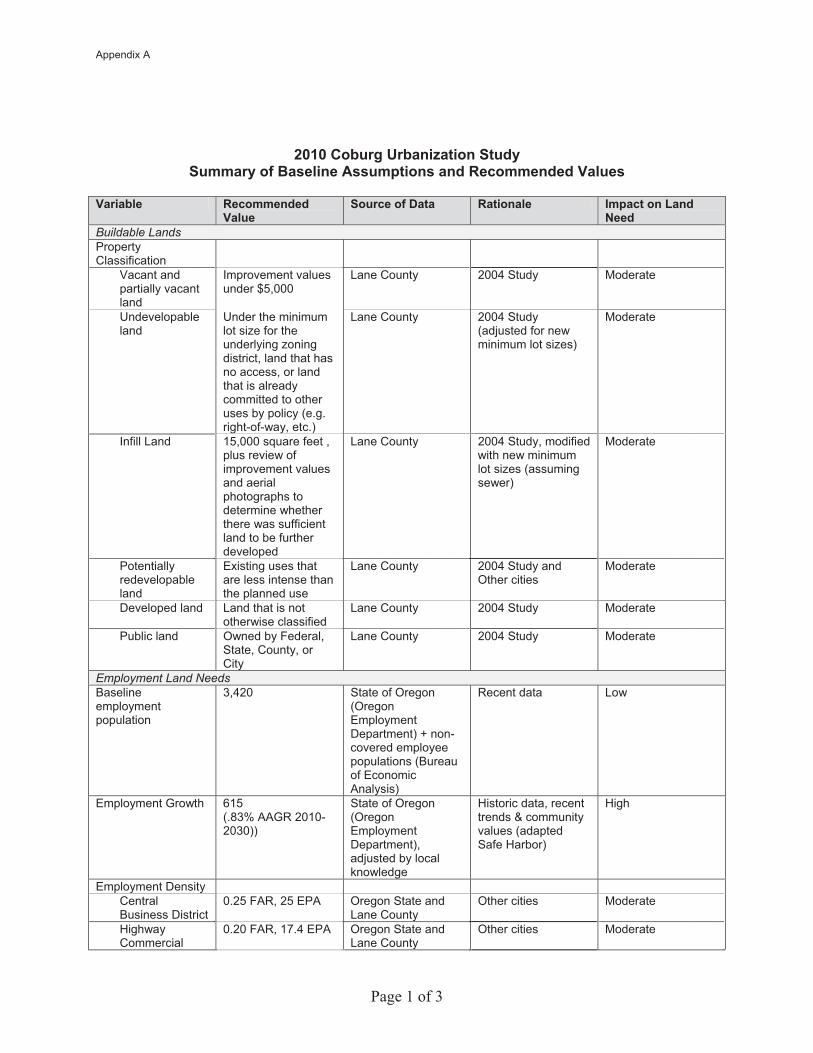
Page 1 of 3
�8�8���&��*���&���J���������!�� ��!��/�%�#�������##� �����#����� ��� ����������#�
����&��� ��� �����������
�������/�0���� ��������� � ��������'����+����
Buildable Lands Property Classification
Vacant and partially vacant land
Improvement values under $5,000
Lane County 2004 Study Moderate
Undevelopable land
Under the minimum lot size for the underlying zoning district, land that has no access, or land that is already committed to other uses by policy (e.g. right-of-way, etc.)
Lane County 2004 Study (adjusted for new minimum lot sizes)
Moderate
Infill Land 15,000 square feet , plus review of improvement values and aerial photographs to determine whether there was sufficient land to be further developed
Lane County 2004 Study, modified with new minimum lot sizes (assuming sewer)
Moderate
Potentially redevelopable land
Existing uses that are less intense than the planned use
Lane County 2004 Study and Other cities
Moderate
Developed land Land that is not otherwise classified
Lane County 2004 Study Moderate
Public land Owned by Federal, State, County, or City
Lane County 2004 Study Moderate
Employment Land Needs Baseline employment population
3,420 State of Oregon (OregonEmployment Department) + non-covered employee populations (Bureau of Economic Analysis)
Recent data Low
Employment Growth 615 (.83% AAGR 2010-2030))
State of Oregon (OregonEmployment Department),adjusted by local knowledge
Historic data, recent trends & community values (adapted Safe Harbor)
High
Employment Density Central Business District
0.25 FAR, 25 EPA Oregon State and Lane County
Other cities Moderate
Highway Commercial
0.20 FAR, 17.4 EPA Oregon State and Lane County
Other cities Moderate
Appendix A
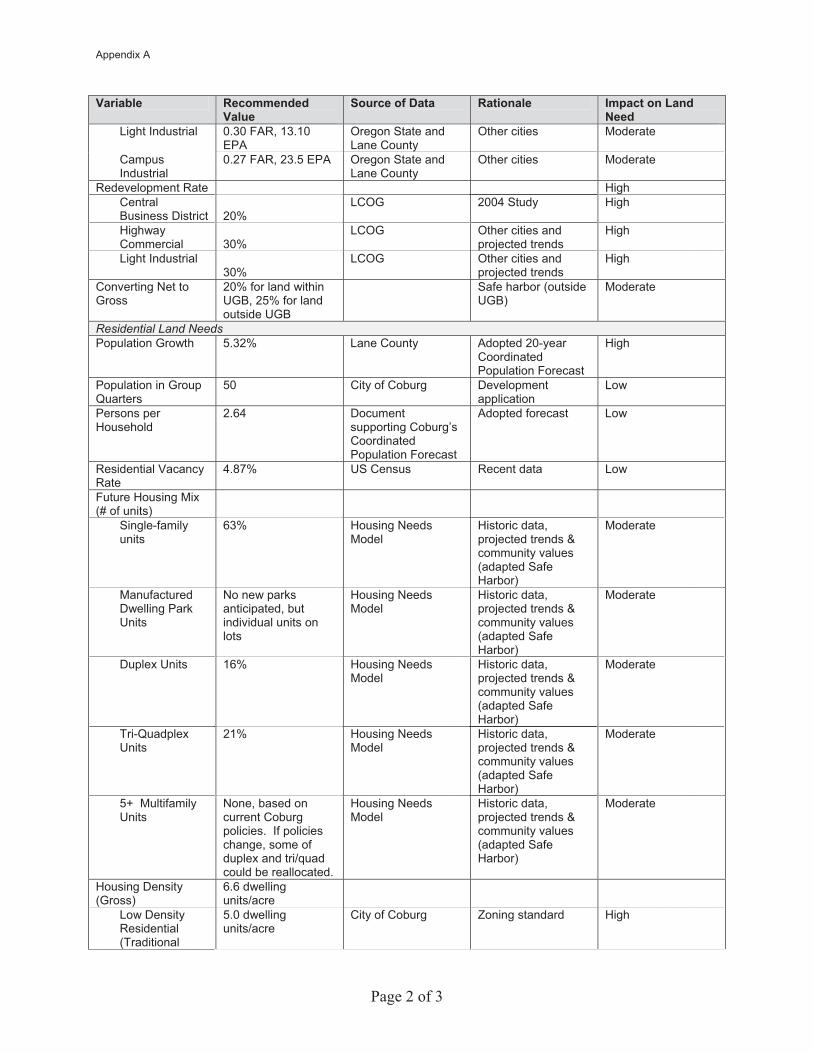
Page 2 of 3
����&��� ��� �����������
�������/�0���� ��������� � ��������'����+����
Light Industrial 0.30 FAR, 13.10 EPA
Oregon State and Lane County
Other cities Moderate
Campus Industrial
0.27 FAR, 23.5 EPA Oregon State and Lane County
Other cities Moderate
Redevelopment Rate High Central Business District 20%
LCOG 2004 Study High
Highway Commercial 30%
LCOG Other cities and projected trends
High
Light Industrial 30%
LCOG Other cities and projected trends
High
Converting Net to Gross
20% for land within UGB, 25% for land outside UGB
Safe harbor (outside UGB)
Moderate
Residential Land Needs Population Growth 5.32% Lane County Adopted 20-year
Coordinated Population Forecast
High
Population in Group Quarters
50 City of Coburg Development application
Low
Persons per Household
2.64 Document supporting Coburg’s Coordinated Population Forecast
Adopted forecast Low
Residential Vacancy Rate
4.87% US Census Recent data Low
Future Housing Mix (# of units)
Single-family units
63% Housing Needs Model
Historic data, projected trends & community values (adapted Safe Harbor)
Moderate
Manufactured Dwelling Park Units
No new parks anticipated, but individual units on lots
Housing Needs Model
Historic data, projected trends & community values (adapted Safe Harbor)
Moderate
Duplex Units 16% Housing Needs Model
Historic data, projected trends & community values (adapted Safe Harbor)
Moderate
Tri-Quadplex Units
21% Housing Needs Model
Historic data, projected trends & community values (adapted Safe Harbor)
Moderate
5+ Multifamily Units
None, based on current Coburg policies. If policies change, some of duplex and tri/quad could be reallocated.
Housing Needs Model
Historic data, projected trends & community values (adapted Safe Harbor)
Moderate
Housing Density (Gross)
6.6 dwelling units/acre
Low Density Residential (Traditional
5.0 dwelling units/acre
City of Coburg Zoning standard High
Appendix A
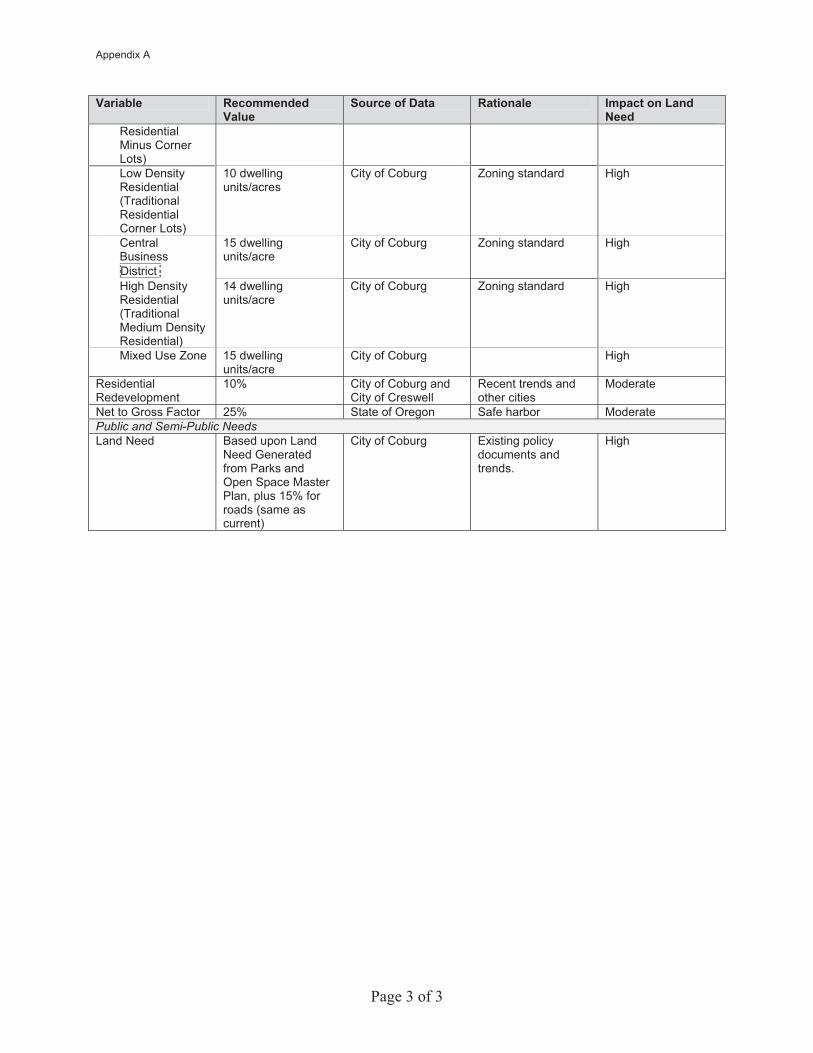
Page 3 of 3
����&��� ��� �����������
�������/�0���� ��������� � ��������'����+����
Residential Minus Corner Lots)Low Density Residential (Traditional Residential Corner Lots)
10 dwelling units/acres
City of Coburg Zoning standard High
Central BusinessDistrict
15 dwelling units/acre
City of Coburg Zoning standard High
High Density Residential (Traditional Medium Density Residential)
14 dwelling units/acre
City of Coburg Zoning standard High
Mixed Use Zone 15 dwelling units/acre
City of Coburg High
Residential Redevelopment
10% City of Coburg and City of Creswell
Recent trends and other cities
Moderate
Net to Gross Factor 25% State of Oregon Safe harbor Moderate Public and Semi-Public Needs Land Need Based upon Land
Need Generated from Parks and Open Space Master Plan, plus 15% for roads (same as current)
City of Coburg Existing policy documents and trends.
High
Appendix A
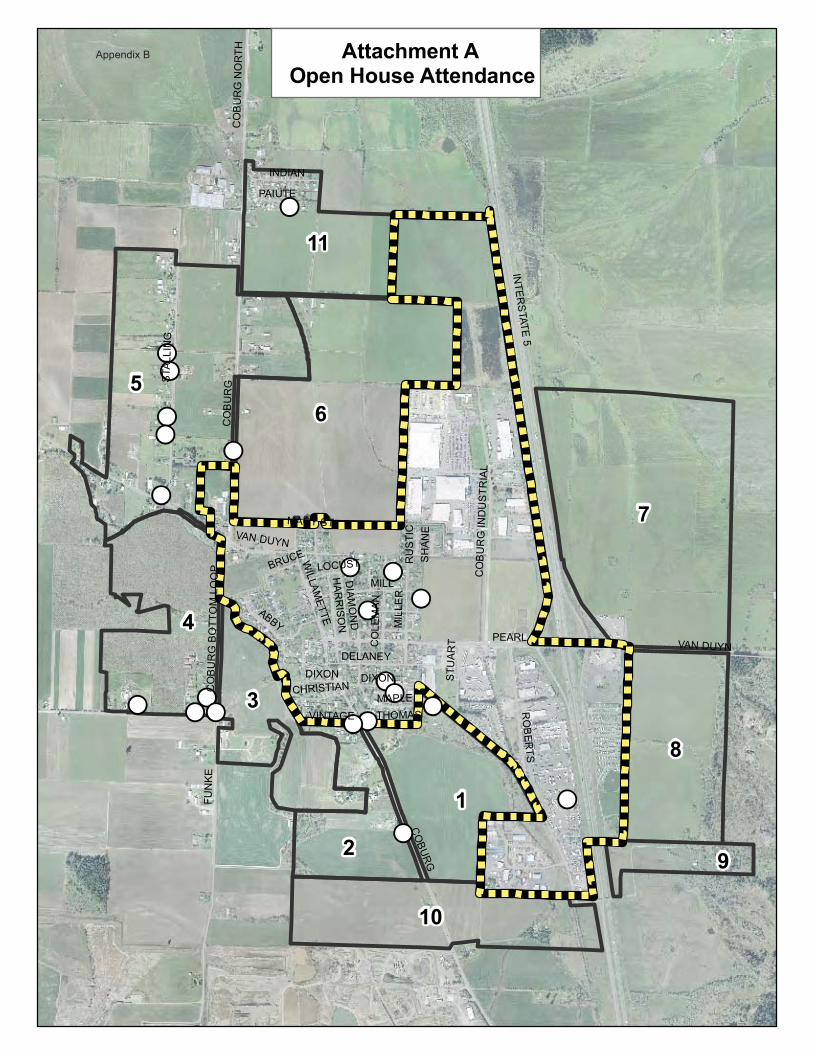
!!
!!!!
!!!!
!!
!! !!!!!!
!! !!!!!!
!!!!!!
!!
!!
!!!!
!!
INTER
STATE
5
FUN
KE
CO
BU
RG
PEARL
STA
LLIN
G
VAN DUYN
RO
BER
TS
DELANEY
MIL
LER
MILL
ABBY
WILLAM
ETTE
CO
LEM
AN
DIXON
CO
BU
RG
BO
TTO
M L
OO
P
INDIAN
CO
BU
RG
NO
RTH
CO
BU
RG
IND
US
TRIA
L
PAIUTE
DIAM
ON
D
MAPLE
HA
RR
ISO
N
VINTAGE THOMAS
STU
AR
T
SH
AN
E
CHRISTIAN
MACY ST
RU
STI
C
BRUCELOCUST
CO
BUR
G
DIXON
VAN DUYN
1
,.
(
4
�
$
�
�8
��
>
��������������� �����-����)��#�������������
Appendix B
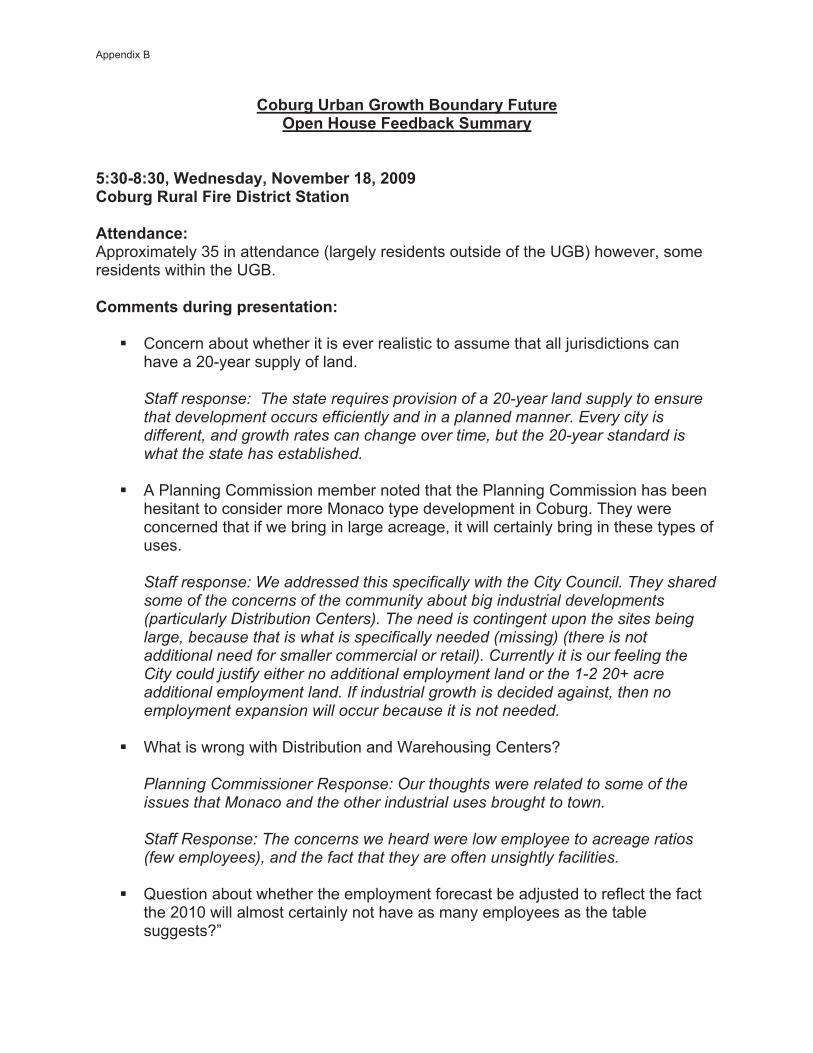
��&��*���&���2��?���%������!�"������-����)��#��"���&��I�� ��!�
�,:$894:$87�5����#��!7�+�=� &����47��88>���&��*� �����"����0�#�������������������������:Approximately 35 in attendance (largely residents outside of the UGB) however, some residents within the UGB.
�� ���#������*����#��������:��
� Concern about whether it is ever realistic to assume that all jurisdictions can have a 20-year supply of land.
Staff response: The state requires provision of a 20-year land supply to ensure that development occurs efficiently and in a planned manner. Every city is different, and growth rates can change over time, but the 20-year standard is what the state has established.
� A Planning Commission member noted that the Planning Commission has been hesitant to consider more Monaco type development in Coburg. They were concerned that if we bring in large acreage, it will certainly bring in these types of uses.
Staff response: We addressed this specifically with the City Council. They shared some of the concerns of the community about big industrial developments (particularly Distribution Centers). The need is contingent upon the sites being large, because that is what is specifically needed (missing) (there is not additional need for smaller commercial or retail). Currently it is our feeling the City could justify either no additional employment land or the 1-2 20+ acre additional employment land. If industrial growth is decided against, then no employment expansion will occur because it is not needed.
� What is wrong with Distribution and Warehousing Centers?
Planning Commissioner Response: Our thoughts were related to some of the issues that Monaco and the other industrial uses brought to town.
Staff Response: The concerns we heard were low employee to acreage ratios (few employees), and the fact that they are often unsightly facilities.
� Question about whether the employment forecast be adjusted to reflect the fact the 2010 will almost certainly not have as many employees as the table suggests?”
Appendix B
Staff response: It is a good point, showing “2010” figures is flawed, because after Monaco’s closure they will not be at the level identified. We will make adjustments to how we present the data, but we assume still that the end outcome will remain unchanged form long term forecasts.
� Planning Commission member who was on the commission during the 2004 periodic review process was concerned about how the mixed use area ended up on the (Stevenson property). The original intent was for the downtown area to have a mix of uses”
Staff Responses: We are operating from maps that document those processes, it shows up in map after map. We intentionally included these original copies to show that it is not something that WE made up.
� Resident outside of current UGB: “If I am brought into the UGB or annexed, doesn’t that mean that I need to give up my animals?”
Staff Response: No, if annexed you could keep your animals – these would be grandfathered in.
� Resident outside of current UGB: “When will my property taxes change if I am brought into the UGB?”
Staff Response: No your taxes will not change unless you annex into the City.
These questions suggest a need to describe the implications of being in a UGB.Essentially, inclusion in the UGB only removes a major obstacle to urban development.It does not:
� Change the zoning on the property - there will be no change to the legal use of your land. All current land use regulations and zoning remain the same and still apply;
� Require the property owner to pay City taxes; � Require a property owner to redevelop their property; � Require the property owner to annex their property; or � Result in an assessment for City utilities.
� Question about how a development proposal on the eastside of I-5 would affectthe Coburg/I-5 interchange? �
�Staff Response: The current Interchange Area Management Plan (IAMP) which provides the City, County and State transportation requirements around the interchange, does not include analysis of additional City land east of I-5 because no IAMP may modal future development outside the adopted Comprehensive Plan Map. If additional land east of I-5 was included in the UGB, and a development proposal was submitted to the City; the developer would be
Appendix B
required to pay for transportation infrastructure improvements beyond the current reconstruction design if deemed necessary by ODOT.
�� ���#�/�� ����#����������������:��
� Expression of frustration that all jurisdictions must conform to the state’s narrow regulations for urbanization/growth/expansion. Wondering if there is a way for Coburg to remain a small rural feeling town without the state requiring more
� “My teenage daughter told me before I came that she doesn’t want to see homes like they have in Avalon Village in West Eugene”
� Area six seems like a very logical place to expand because of existing streets and utilities.
� “Will I pay City taxes if my land comes into the UGB
� “If land comes into the UGB does it have to develop?”
Staff Response: Personal property owners will always have the say in whether there land is developed or not. Inclusion in the UGB only removes a major obstacle to urban development.
� Since the poor quality soils are on the East side of the Highway. We should put all development over there
� “What if the wastewater does not happen?”
Staff Response: The pressing issues and significant inputs into this study become null and void.
� Concern about expanding to the south – want to retain a separation between Eugene.
� Area 5 would put more housing near the school, creating more of a community around the school.
� Employment Land Alternative 3 raises concerns from a management perspective because it leaves a section on the south side of the property in resource land without access or direct connection to the contiguous property. That property would be surrounded by development on three sides and would greatly diminished in size. If Alternative 3 is pursued, all of the property should be brought into the UGB. At the same time, Alternative 3 makes sense for employment land because it will contain the frontage road serving the commercial properties located closer to the interchange which cannot have direct
Appendix B
access to Van Duyn. Would also like to see a live/walk/work neighborhood developed on this property – there is a good opportunity to provide higher density residential development in this area as well as employment land..
� Concern about how Employment Land Alternatives 1 and 2 impact management of resource lands.
� There could be another Employment Land option that includes part of Study Area 7 (around existing parking lot) and part of Study Area 8 (but still providing a corridor for access to remaining portion of Study Area 8).
Appendix B

�+��
�����,
"�+G�
��� '
�-%� 2��''�+2
-%� �
0�'�+��
��''�
5�''��
����
��''
�%%�
�-'���+
0��-+�-%� 2�%-��-��'--�
�-%� 2��+0�� ��'
G�++� ��
���'�
�+�0��+
)� �-+
�+��2� �)-��
��� �
)�+�
�) ����+
������
����
�-%� 2
�+�0��+
,
.
(
�
$
�
�8
1
��
INTER
STATE
5
CO
BU
RG
PEARL
STA
LLIN
GFU
NK
E
VAN DUYNRO
BER
TS
MILLABBY
DIXON
INDIAN
CO
BUR
G
,
��
�3���#�������������=����:��14������#
Expansion Scenario 3
Study Areas
Exceptions Land
UGB¯
260 0 260130Yards
�����3������
�#���������:��3�������#�'�����������Residential Need: 148 Acres
���!����� ����#0�=�����&�������#
�3��������'����
�#������'���
��M�� 25.9 20.4 25.9 0.0, 152.2 131.5 152.2 0.0
Total 178.1 151.9 178.1 0.0
Appendix B
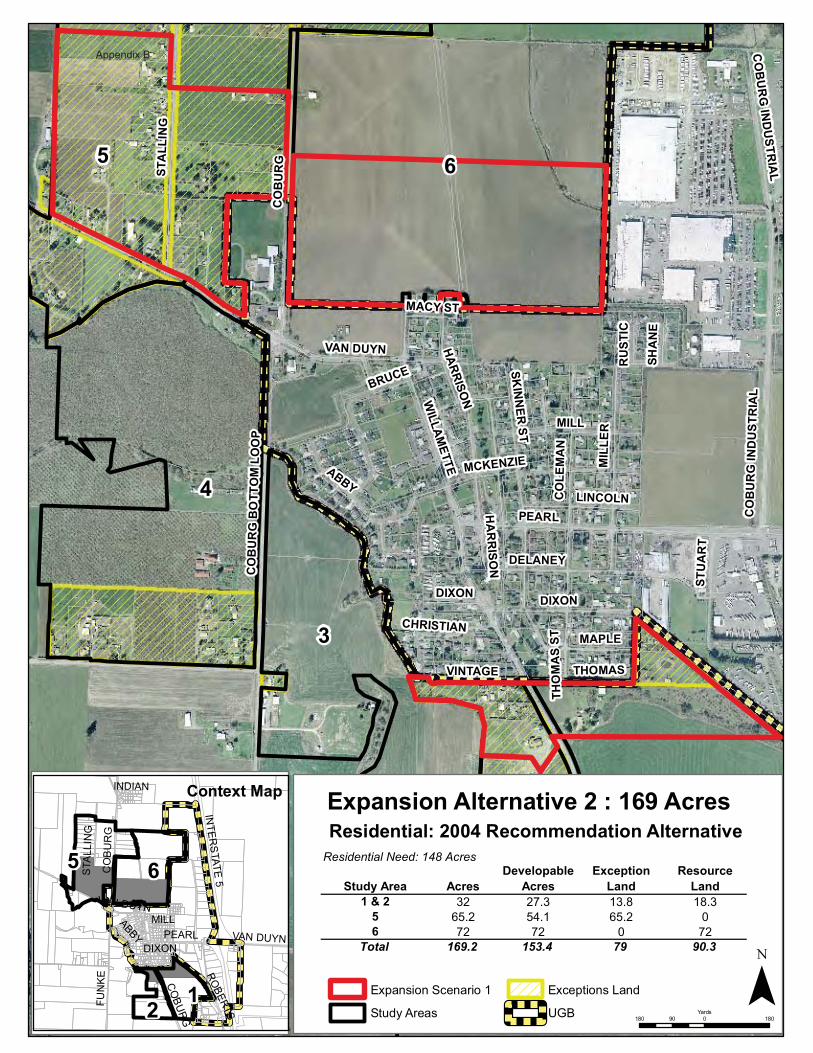
"�+G�
��� '
�-%� 2
0�'�+��
��''�
5�''��
����
��''
��''�+2
�%%�
�-'���+
0��-+
�-%� 2�%-��-��'--�
�-%� 2��+0��
��'
��G�+@��
G�++� ��
'�+�-'+
���'�
�+�0��+ )� �-+
�+��2� �)-��
��� �
)�+�
�) ����+
������
����
% ���
�)-����
0��-+
�-%� 2
�-%� 2��+0�� ��'
)� �-+
.
(
,
�
$
�
�8
INTER
STATE
5
CO
BU
RG
PEARL
STA
LLIN
GFU
NK
E
VAN DUYN
ROBERTS
MILLABBY
DIXON
INDIAN
VAN DUYN
CO
BUR
G
.,
��
�3���#�������������=����:��.>�����#
Expansion Scenario 1
Study Areas
Exceptions Land
UGB¯
180 0 18090Yards
�����3������
�#��������:��88(� ��� ������������������=�Residential Need: 148 Acres
���!����� ����#0�=�����&�������#
�3��������'����
�#������'���
��M�� 32 27.3 13.8 18.3, 65.2 54.1 65.2 0. 72 72 0 72
Total 169.2 153.4 79 90.3
Appendix B
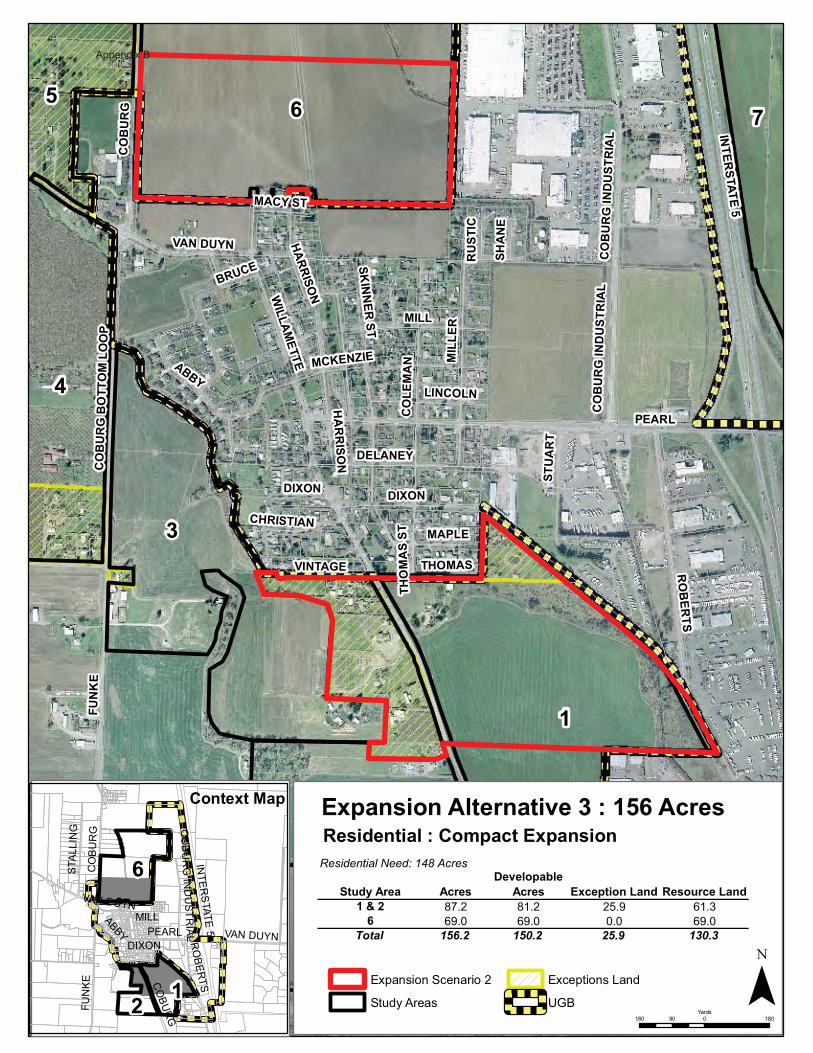
"�+G�
��� '
�-%� 2
�+��
�����,
-%� �
0�'�+����''�
5�''��
����
��''
�%%�
�-'���+
0��-+
�-%� 2�%-��-��'--�
��G�+@��
G�++� ��
'�+�-'+
���'�
�+�0��+
�-%� 2��+0�� ��'
)� �-+
�+��2� �)-����� �
)�+�
�) ����+
������
����
% ���
)�+�'��
�)-����
�-%� 2
0��-+
�-%� 2��+0�� ��'
)� �-+
�
.
$
�
�8
(
1,
INTER
STATE
5
CO
BU
RG
PEARL
FUN
KE
STA
LLIN
G
VAN DUYNRO
BER
TS
MILLABBY
DIXON
CO
BU
RG
IND
US
TRIA
L
VAN DUYN
CO
BUR
G
.
��
�3���#�������������=��$�:��,.�����#
Expansion Scenario 2
Study Areas
Exceptions Land
UGB ¯180 0 18090
Yards
�����3������
�#���������:��� ������3���#���Residential Need: 148 Acres
���!����� ����#0�=�����&�������# �3��������'���� �#������'���
��M�� 87.2 81.2 25.9 61.3. 69.0 69.0 0.0 69.0
Total 156.2 150.2 25.9 130.3
Appendix B
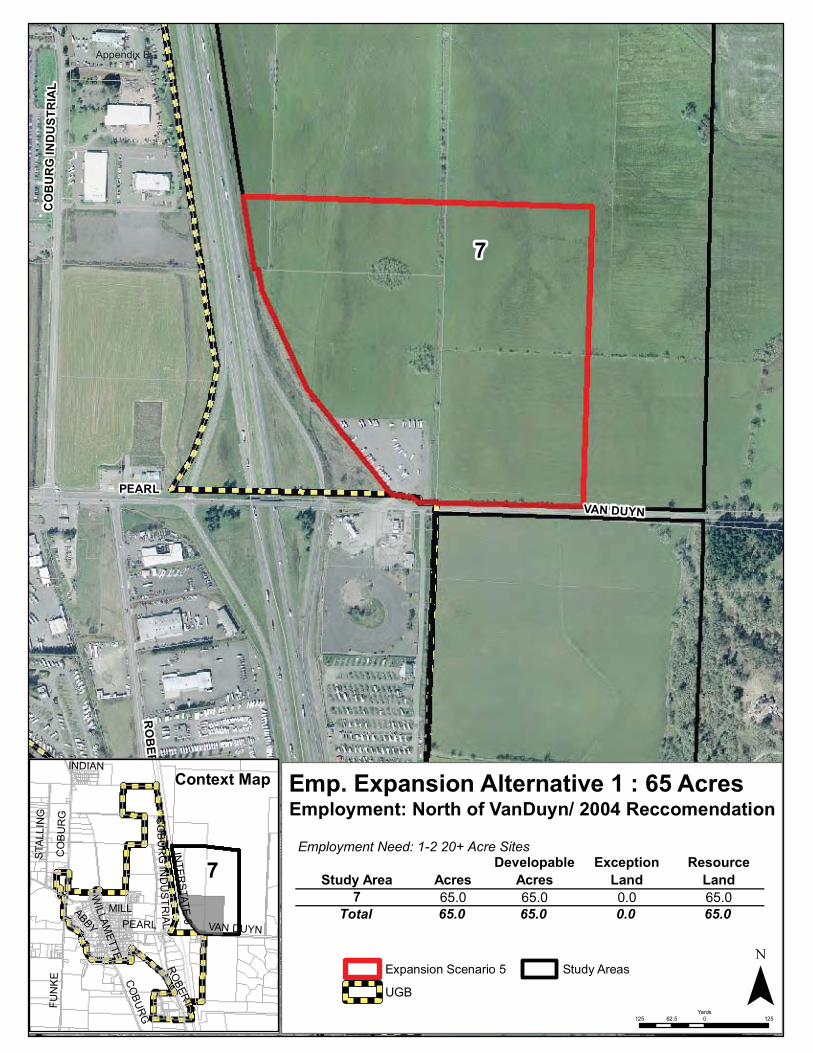
�+��
�����,
-%� �
�+�0��+
��� '
�-%� 2��+0�� ��'
1
4
�
>
INTER
STATE
5
CO
BU
RG
PEARL
FUN
KE
STA
LLIN
G
VAN DUYN
ROBERTS
MILLABBYW
ILLAMETTE
INDIAN
CO
BU
RG
IND
US
TRIA
L
CO
BUR
G
1
� ����3���#�������������=����:�.,�����#
Expansion Scenario 5
UGB
Study Areas ¯125 0 12562.5
Yards
Employment Need: 1-2 20+ Acre Sites
���!����� ����#0�=�����&�������#
�3��������'����
�#������'���
1 65.0 65.0 0.0 65.0Total 65.0 65.0 0.0 65.0
�����3������
� ���! ���:�+������/���0�!�A��88(� ���� ��������
Appendix B
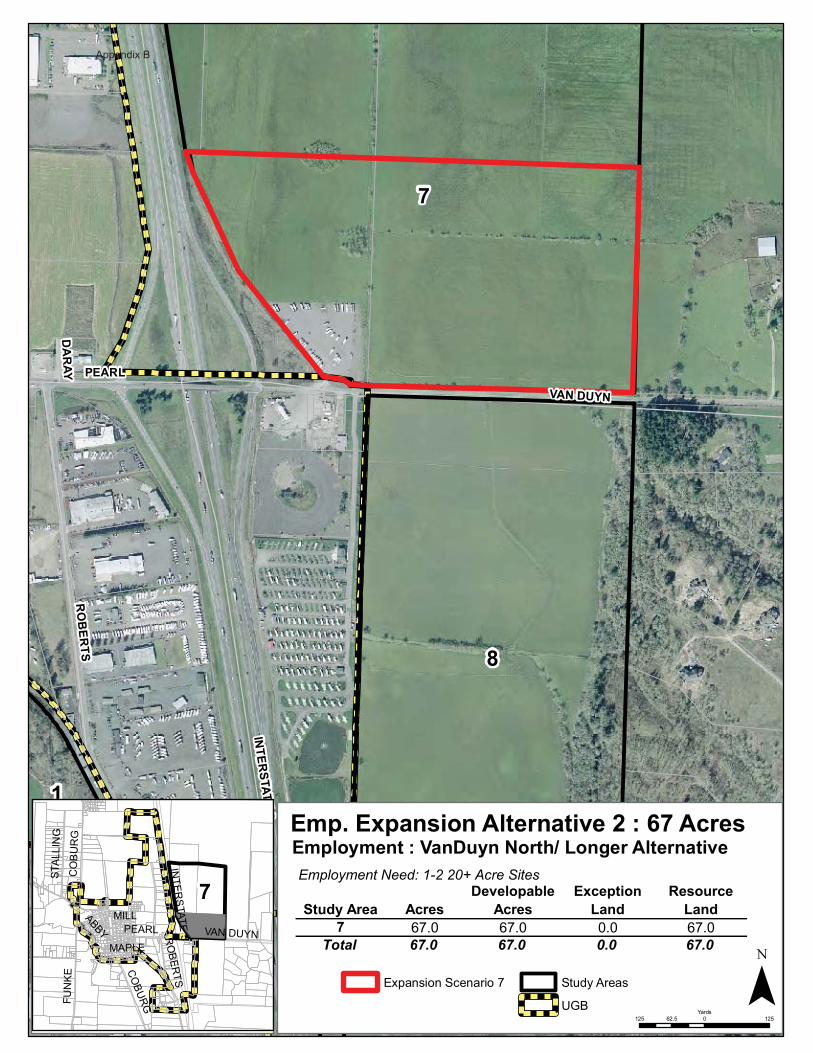
�+��
�����,
�+�0��+
-%� �
��� '
0� ��
)�+�'��
1
4
>
�
INTER
STATE
5
CO
BU
RG
FUN
KE
PEARL VAN DUYN
STA
LLIN
G
RO
BER
TS
MILLABBY
MAPLE
CO
BUR
G
1
� ����3���#�������������=����:�.1�����#
Expansion Scenario 7 Study Areas
UGB ¯125 0 12562.5
Yards
� ���! ����:���0�!��+����A�'��*������������=�Employment Need: 1-2 20+ Acre Sites
���!����� ����#0�=�����&�������#
�3��������'����
�#������'���
1 67.0 67.0 0.0 67.0Total 67.0 67.0 0.0 67.0
Appendix B

�+��
�����,
-%� �
�+�0��+
��� '
0� ��
4
1
>
�8
�IN
TERS
TATE 5
CO
BU
RG
PEARL
FUN
KE
VAN DUYN
STA
LLIN
G
ROBERTS
MILLABBY
DIXON
CO
BU
RG
IND
US
TRIA
L
VINTAGE
VAN DUYN
CO
BUR
G
4
� ����3���#�������������=��$�:�.,�����#
Expansion Scenario 6 Study Areas
UGB ¯125 0 12562.5
Yards
� ���! ����:���0�!�������������������3�����
Employment Need :1-2 20+ Acre Sites
���!����� ����#0�=�����&�������#
�3��������'����
�#������'���
4 65.0 65.0 0.0 65.0Total 65.0 65.0 0.0 65.0
Appendix B

CLAUSON Stacy A
From: CLAUSON Stacy ASent: Monday, December 07, 2009 1:15 PMTo: 'Randy Hledik'Subject: RE: Coburg UGB Expansion
Page 1 of 3
12/7/2009
Dear Mr. Hledick,
Yes, a copy of your letter will be made available for the City Council meeting this Tuesday and Planning Commission next week. Again, thank you.
Stacy ClausonAssistant PlannerLane Council of Governments859 Willamette Street, Suite 500Eugene, OR 97401541-682-3177Fax: [email protected]://www.lcog.org
����������������� ������������������������������������������������ ��!���"#�$%�����&'()*+,�*�����(��� ������-��&��.�/�)01�-23�������
… thank you for your response and explanation …
… is it possible to include my initial email with the information that will be presented to the City Council and Planning Commission in the next two weeks?
������&'()*+,�*�����(� ������*&'()*+,�'��/���/������������������������� ��!����4�$%��������������������*&�)-56�$���7�&(''8*5-��9�����:'&+0;��� ������<��&��.�/�)01�-23������
Dear Mr. Hledick,
Thank you for your comments, which were forwarded to the Coburg Urbanization Study Team by Petra Schuetz. It is certainly helpful for the City and Study Team to hear from property owners and better understand their desires concerning UGB expansion. As you noted, there has been a balancing of interests that has influenced the Study Team's approach to preparing several Residential UGB expansion alternatives for review. Key factors that have influenced our recommendations have included:
� Location of exception lands.� Previous planning efforts, which included significant public involvement, and focused most new growth to
Appendix B

the north, with some exception lands included on the south side of the current UGB.� Current policies in the Comprehensive Plan that emphasize maintaining a separation from Eugene and
resulting emphasis on growth away from Eugene (see Policy 7 under Agricultural Goal, Policy 5 under the Open Space Goal, and Policy 44 under the Urbanization Goal).
At 30 acres, the site you mention would constitute a significant portion of the residential land need, and if it were to be included in the UGB, there would need to be additional neighboring lands included to ensure that there was contiguous development outward from the existing City boundaries. This type of expansion to the south of the City would not be consistent with the priority factors noted above and, as a result, has not been recommended by the Study Team.
Please note that the Study Team's work is only advisory, and that the Planning Commission and City Council will both be considering these issues in more detail over the next coming months. This item is scheduled to come before the City Council at their December 8th meeting and the Planning Commission at their December 16th meeting. At the December 8th meeting, the Study Team will be presenting a recommended Residential Expansion for the Council consideration. Additional information can be found at the project's website, http://www.lcog.org/coburgurbanization/default.cfm. If you have any questions, please feel free to contact any member of the Study Team.
Jacob Callister, [email protected], 541-682-4114
Stacy Clauson, [email protected] 541-682-3177
Petra Schuetz, [email protected] 541-682-3639 (Coburg: 682-7858)
Again, thank you for your comments.
Stacy Clauson Assistant Planner Lane Council of Governments 859 Willamette Street, Suite 500 Eugene, OR 97401 541-682-3177 Fax: 541-682-4099 [email protected] http://www.lcog.org
����������������� ��������������������������������������,�=���� ��� ��!�>�#"�$%�����&+1)�0�$�����/��� �����&��.�/�)01�-23������
Petra –
We’ve had a chance to review and digest the information you presented at the open house earlier this week.
Our company owns Tax Lot 1500, Map 16-03-33 – this lot consists of approximately 30 acres, and is identified on your maps as the southern portion of Study Area 2.
We are very interested in the UGB expansion process, and would be a very willing landowner to have this property included within the UGB.
As shown on the matrix titled “Analysis of Expansion Analysis Subarea Compliance with Location Factors”, Area 2 compares very favorably against the other areas for residential expansion.
Page 2 of 3
12/7/2009
Appendix B

However, on each of the three residential UGB expansion alternatives presented, the southern portion, ie, our property, is excluded from consideration.
It appears that some balancing of interests is occurring, ie, expand some to the southwest, some to the southeast, and some to the northwest or north ….
We believe that expansion more significantly to the south has the key advantage of directing growth toward the already urbanized area of Eugene, thereby preventing sprawl from encroaching on high value farmland and the agricultural character of the areas located to the north. Additionally, directing development toward the south, as opposed to the north, would likely result in fewer vehicle miles travelled (VMT) since the travel distance to/from the Eugene-Springfield metro area would be reduced. This would also mimize increased traffic congestion in the heart of town.
Given this initial reasoning, we request that favorable consideration be given to expanding the UGB to include our Tax Lot 1500 in Area 2.
We would be pleased to have a more in-depth discussion with you about this at your convenience.
Thank you … and please keep us posted on future opportunities to influence the process.
Randy
Randall S. HledikDirector, General ServicesWildish companiesPO Box 7428 / 3600 Wildish LaneEugene, OR 97401 / 97408Tel: (541) 683-7712Fax: (541) 683-7722
Page 3 of 3
12/7/2009
Appendix B
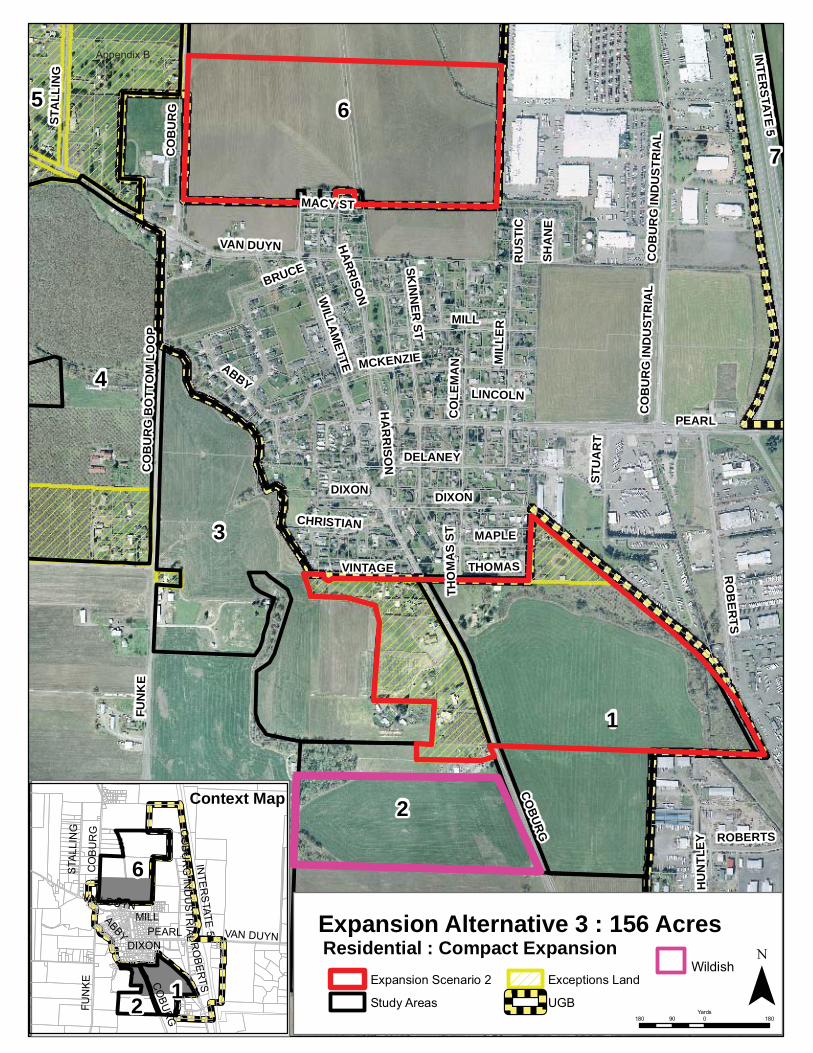
FUN
KE
PEARL
COBURG
RO
BER
TS
DELANEY
MIL
LER
WILLAM
ETTE
MILL
ABBY
CO
LEM
AN
DIXON
INTER
STATE 5
CO
BU
RG
BO
TTO
M L
OO
P
STA
LLIN
G
MCKENZIE
SKIN
NER
STLINCOLN
MAPLE
CO
BU
RG
IND
UST
RIA
L
VAN DUYN HARRISON
VINTAGE THOMAS
STU
AR
T
SHA
NE
CHRISTIAN
MACY ST
RU
STIC
BRUCE
HU
NTL
EY
THO
MA
S ST
CO
BU
RG
DIXON
CO
BU
RG
IND
UST
RIA
L
ROBERTS
HA
RR
ISON
1
6
3
4
2
10
5
7
INTER
STATE
5
CO
BU
RG
PEARL
FUN
KE
STA
LLIN
G
VAN DUYNRO
BER
TS
MILLABBY
DIXON
CO
BU
RG
IND
US
TRIA
L
VAN DUYN
CO
BUR
G
6
12
Expansion Alternative 3 : 156 Acres
Expansion Scenario 2
Study Areas
Exceptions Land
UGB ¯180 0 18090
Yards
Context Map
Residential : Compact ExpansionWildish
Appendix B
Appendix B
Appendix B

Appendix B
Appendix B
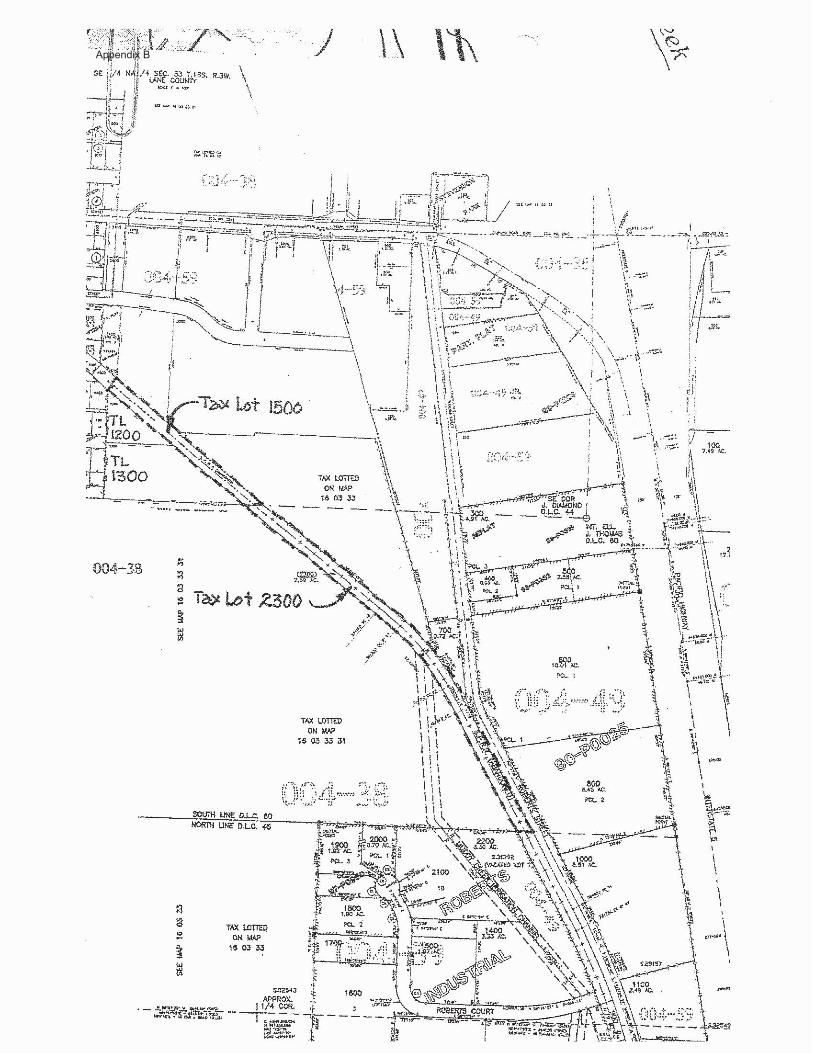
Appendix B
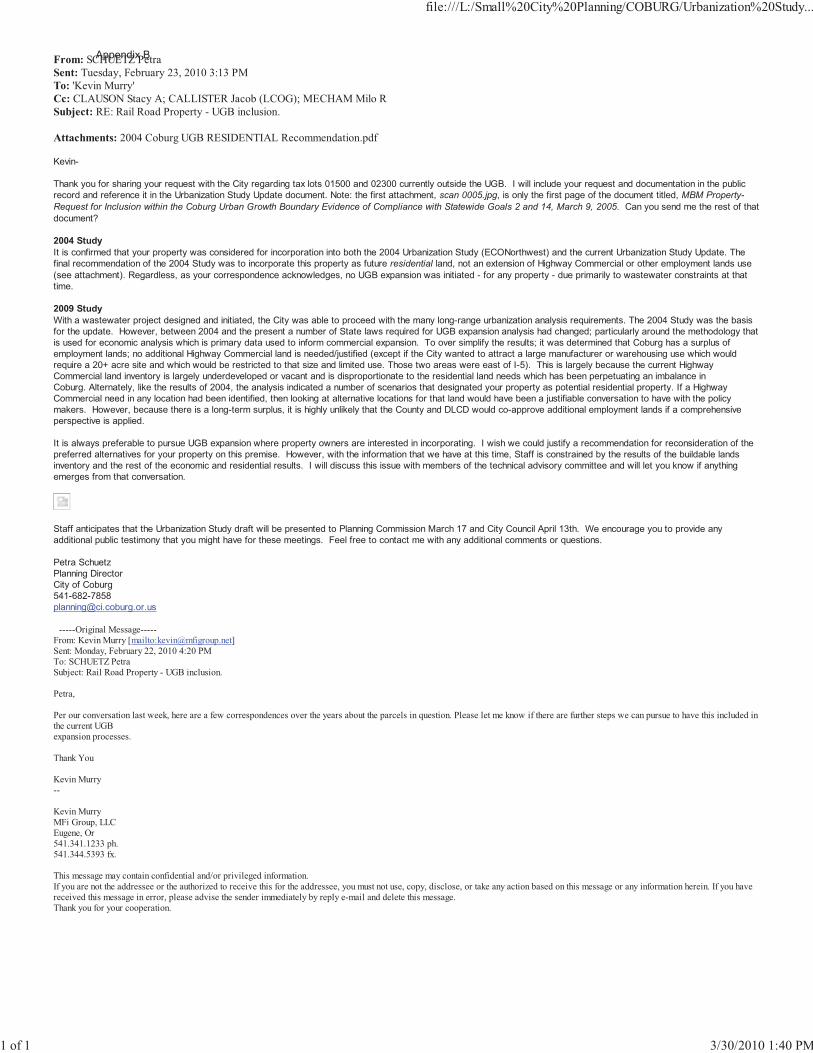
From: SCHUETZ PetraSent: Tuesday, February 23, 2010 3:13 PMTo: 'Kevin Murry'Cc: CLAUSON Stacy A; CALLISTER Jacob (LCOG); MECHAM Milo RSubject: RE: Rail Road Property - UGB inclusion.
Attachments: 2004 Coburg UGB RESIDENTIAL Recommendation.pdf
Kevin-
Thank you for sharing your request with the City regarding tax lots 01500 and 02300 currently outside the UGB. I will include your request and documentation in the publicrecord and reference it in the Urbanization Study Update document. Note: the first attachment, scan 0005.jpg, is only the first page of the document titled, MBM Property-Request for Inclusion within the Coburg Urban Growth Boundary Evidence of Compliance with Statewide Goals 2 and 14, March 9, 2005. Can you send me the rest of thatdocument?
�88(����!It is confirmed that your property was considered for incorporation into both the 2004 Urbanization Study (ECONorthwest) and the current Urbanization Study Update. Thefinal recommendation of the 2004 Study was to incorporate this property as future residential land, not an extension of Highway Commercial or other employment lands use(see attachment). Regardless, as your correspondence acknowledges, no UGB expansion was initiated - for any property - due primarily to wastewater constraints at thattime.
�88>����!With a wastewater project designed and initiated, the City was able to proceed with the many long-range urbanization analysis requirements. The 2004 Study was the basisfor the update. However, between 2004 and the present a number of State laws required for UGB expansion analysis had changed; particularly around the methodology thatis used for economic analysis which is primary data used to inform commercial expansion. To over simplify the results; it was determined that Coburg has a surplus ofemployment lands; no additional Highway Commercial land is needed/justified (except if the City wanted to attract a large manufacturer or warehousing use which wouldrequire a 20+ acre site and which would be restricted to that size and limited use. Those two areas were east of I-5). This is largely because the current HighwayCommercial land inventory is largely underdeveloped or vacant and is disproportionate to the residential land needs which has been perpetuating an imbalance inCoburg. Alternately, like the results of 2004, the analysis indicated a number of scenarios that designated your property as potential residential property. If a HighwayCommercial need in any location had been identified, then looking at alternative locations for that land would have been a justifiable conversation to have with the policymakers. However, because there is a long-term surplus, it is highly unlikely that the County and DLCD would co-approve additional employment lands if a comprehensiveperspective is applied.
It is always preferable to pursue UGB expansion where property owners are interested in incorporating. I wish we could justify a recommendation for reconsideration of thepreferred alternatives for your property on this premise. However, with the information that we have at this time, Staff is constrained by the results of the buildable landsinventory and the rest of the economic and residential results. I will discuss this issue with members of the technical advisory committee and will let you know if anythingemerges from that conversation.
Staff anticipates that the Urbanization Study draft will be presented to Planning Commission March 17 and City Council April 13th. We encourage you to provide anyadditional public testimony that you might have for these meetings. Feel free to contact me with any additional comments or questions.
Petra SchuetzPlanning DirectorCity of [email protected]
-----Original Message-----From: Kevin Murry [mailto:[email protected]]Sent: Monday, February 22, 2010 4:20 PMTo: SCHUETZ PetraSubject: Rail Road Property - UGB inclusion.
Petra,
Per our conversation last week, here are a few correspondences over the years about the parcels in question. Please let me know if there are further steps we can pursue to have this included inthe current UGBexpansion processes.
Thank You
Kevin Murry--
Kevin MurryMFi Group, LLCEugene, Or541.341.1233 ph.541.344.5393 fx.
This message may contain confidential and/or privileged information.If you are not the addressee or the authorized to receive this for the addressee, you must not use, copy, disclose, or take any action based on this message or any information herein. If you havereceived this message in error, please advise the sender immediately by reply e-mail and delete this message.Thank you for your cooperation.
file:///L:/Small%20City%20Planning/COBURG/Urbanization%20Study...
1 of 1 3/30/2010 1:40 PM
Appendix B
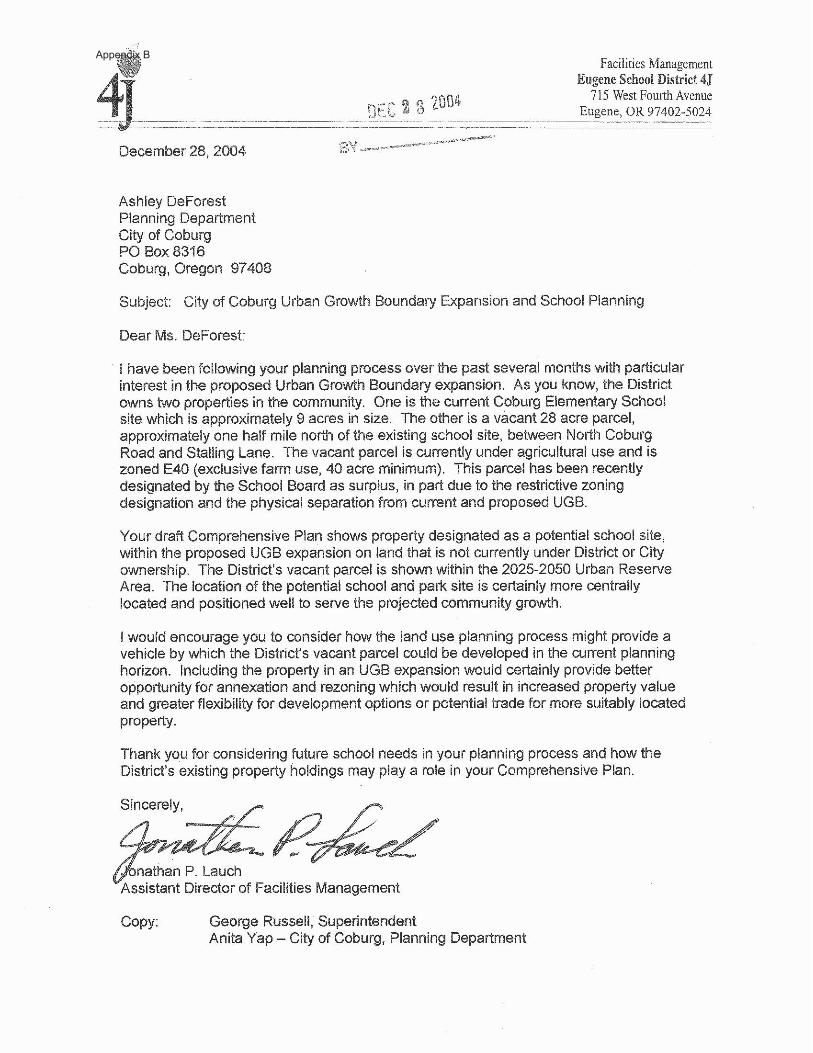
Appendix B
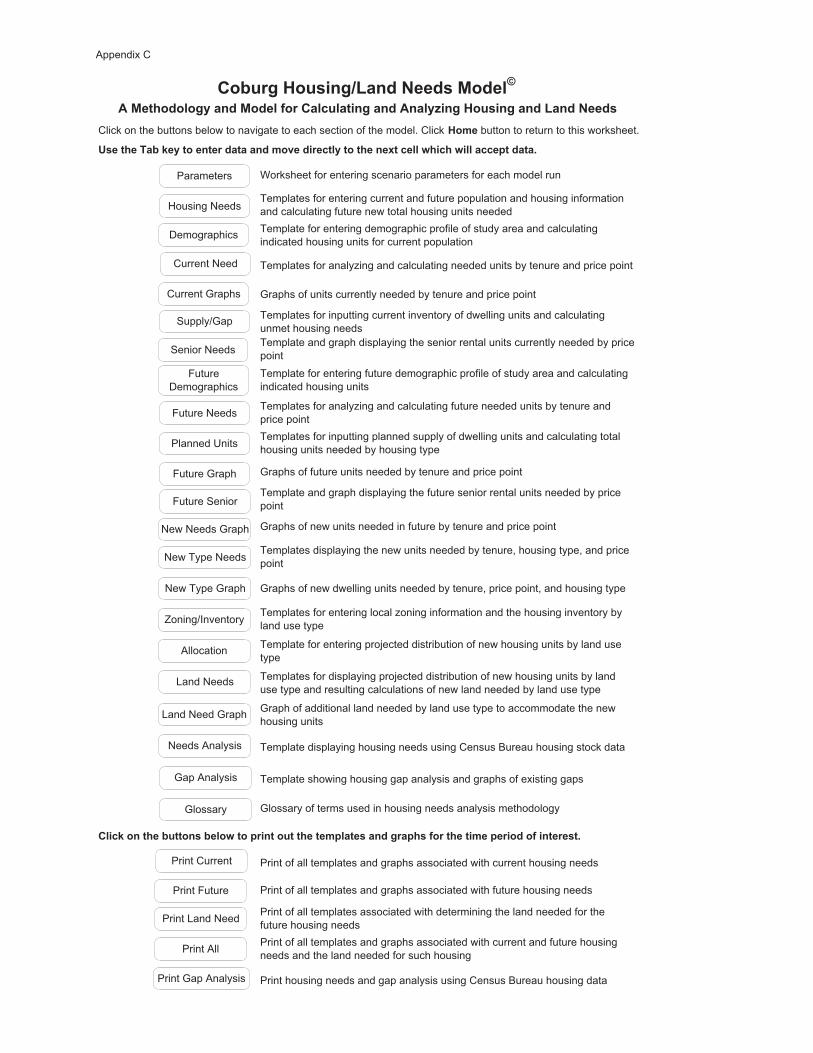
Click on the buttons below to navigate to each section of the model. Click )� � button to return to this worksheet.
�#��������&�I�!������������������� �=���������!����������3�������?�����?����������������
Worksheet for entering scenario parameters for each model run
Template displaying housing needs using Census Bureau housing stock data
Template showing housing gap analysis and graphs of existing gaps
����I��������&�����#�&���?�������������������� �����#�����*����#�/��������� ����������/�������#��
Print housing needs and gap analysis using Census Bureau housing data
Print of all templates and graphs associated with current and future housing needs and the land needed for such housing
Print of all templates associated with determining the land needed for the future housing needs
Glossary of terms used in housing needs analysis methodology
Templates for entering local zoning information and the housing inventory by land use type
Template for entering projected distribution of new housing units by land use type
Templates for displaying projected distribution of new housing units by land use type and resulting calculations of new land needed by land use type
Graph of additional land needed by land use type to accommodate the new housing units
Graphs of new units needed in future by tenure and price point
Template and graph displaying the future senior rental units needed by price point
Print of all templates and graphs associated with current housing needs
Print of all templates and graphs associated with future housing needs
Template for entering future demographic profile of study area and calculating indicated housing units
Templates for analyzing and calculating future needed units by tenure and price pointTemplates for inputting planned supply of dwelling units and calculating total housing units needed by housing type
Graphs of future units needed by tenure and price point
Template and graph displaying the senior rental units currently needed by price point
Templates displaying the new units needed by tenure, housing type, and price point
Graphs of new dwelling units needed by tenure, price point, and housing type
��&��*�)��#��*A'����+���#������T�����������*!�����������/�������������*���������!J��*�)��#��*�����'����+���#
Templates for entering current and future population and housing information and calculating future new total housing units neededTemplate for entering demographic profile of study area and calculating indicated housing units for current population
Templates for analyzing and calculating needed units by tenure and price point
Graphs of units currently needed by tenure and price point
Templates for inputting current inventory of dwelling units and calculating unmet housing needs
Housing Needs
Demographics
Current Need
Current Graphs
Supply/Gap
FutureDemographics
Future Needs
Planned Units
Future Graph
New Needs Graph
New Type Needs
New Type Graph
Glossary
Print Current
Print Future
Print All
Zoning/Inventory
Allocation
Land Needs
Print Land Need
Parameters
Land Need Graph
Senior Needs
Future Senior
Needs Analysis
Gap Analysis
Print Gap Analysis
Appendix C
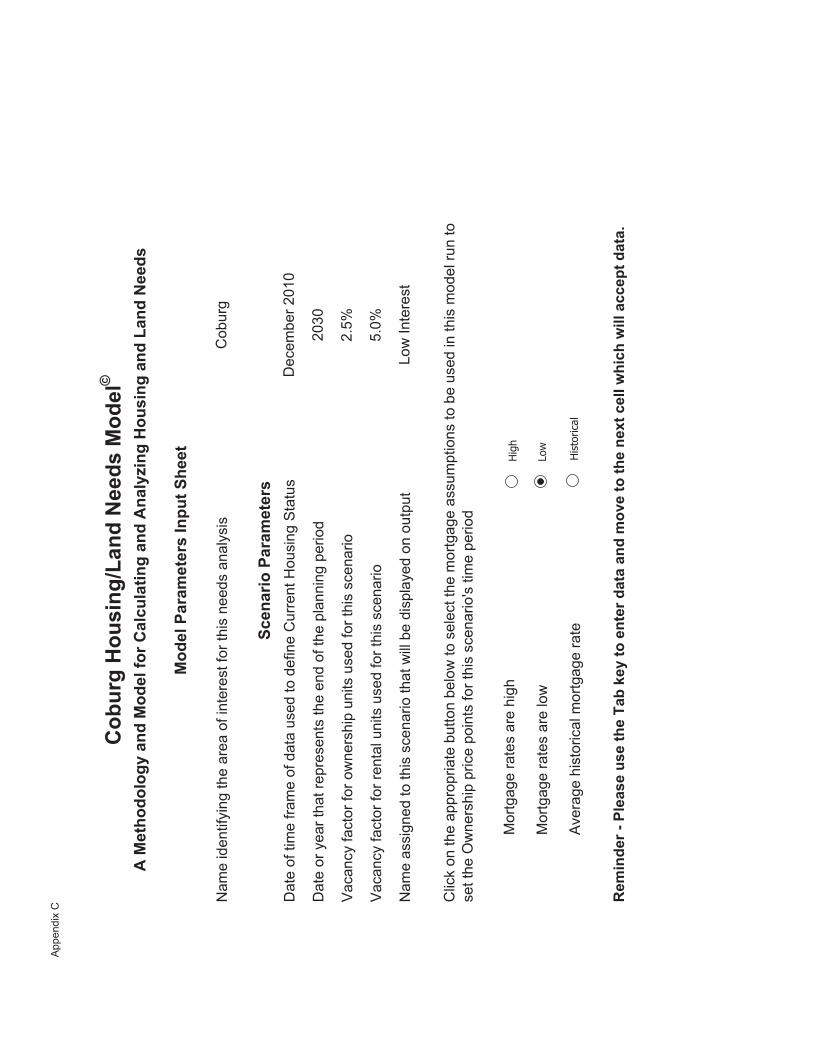
Nam
e id
entif
ying
the
area
of i
nter
est f
or th
is n
eeds
ana
lysi
s
Dat
e of
tim
e fra
me
of d
ata
used
to d
efin
e C
urre
nt H
ousi
ng S
tatu
s
Dat
e or
yea
r tha
t rep
rese
nts
the
end
of th
e pl
anni
ng p
erio
d
Vac
ancy
fact
or fo
r ow
ners
hip
units
use
d fo
r thi
s sc
enar
io
Vac
ancy
fact
or fo
r ren
tal u
nits
use
d fo
r thi
s sc
enar
io
Nam
e as
sign
ed to
this
sce
nario
that
will
be
disp
laye
d on
out
put
Mor
tgag
e ra
tes
are
high
Mor
tgag
e ra
tes
are
low
Ave
rage
his
toric
al m
ortg
age
rate
� ������9�����#���#��������&�I�!������������������� �=�����������3�������?�����?����������������
��&��*�)��#��*A'����+���#������T
�����������*!�����������/�������������*���������!J��*�)��#��*�����'����+���#
���������� ����#�����������
������������ ����#
Cob
urg
2.5%
Low
Inte
rest
Clic
k on
the
appr
opria
te b
utto
n be
low
to s
elec
t the
mor
tgag
e as
sum
ptio
ns to
be
used
in th
is m
odel
run
to
set t
he O
wne
rshi
p pr
ice
poin
ts fo
r thi
s sc
enar
io's
tim
e pe
riod
Dec
embe
r 201
0
2030
5.0%
H
igh
L
ow
H
isto
rical
App
endi
x C
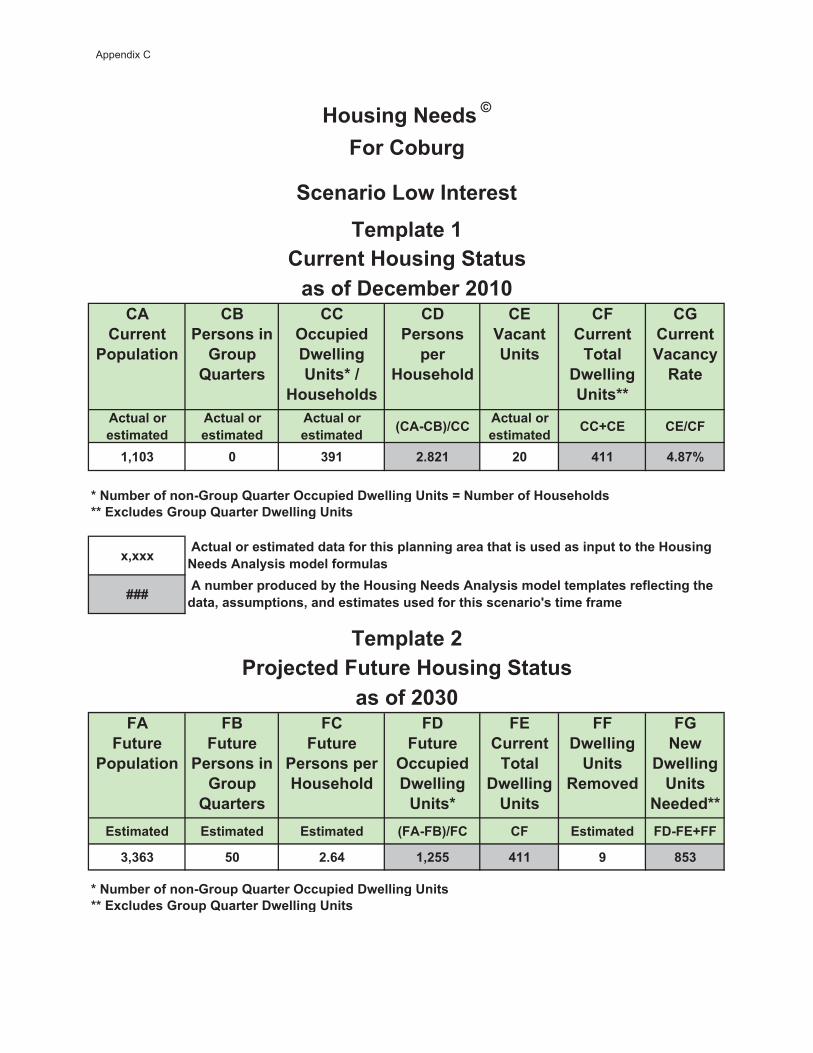
��������������������
�%���#��#����2�����E������#
��-��������0?�����*�����#C�A�
)��#�����#
�0���#��#�����
)��#�����
������������#
�"��������������0?�����*�����#CC
�2�������������!� ���
�����������#�� ����
�����������#�� ����
�����������#�� ���� ;��9�%<A�� ����������
�#�� ���� ��B�� ��A�"
�7�8$ 8 $>� ��4�� �8 (�� (�41D
C�+� &����/����92�����E�������-��������0?�����*�����#�U�+� &����/�)��#�����#CC��3�����#�2�����E�������0?�����*�����#
37333
VVV
"�"������
����������
"%�"������
���#��#����2�����E������#
"�"������
���#��#�����)��#�����
"0�"������-��������0?�����*�����#C
"����������������0?�����*�����#
""�0?�����*�����#�
� �=��
"2�+�?�
0?�����*�����#�
+�����CC�#�� ���� �#�� ���� �#�� ���� ;"�9"%<A"� �" �#�� ���� "09"�B""
$7$.$ ,8 ��.( �7�,, (�� > 4,$
C�+� &����/����92�����E�������-��������0?�����*�����#CC��3�����#�2�����E�������0?�����*�����#
�� �������
�� �������
)��#��*�+���#�T
��������)��#��*�����#
"�����&��*
��������'�?�������#�
�#��/�0��� &����8�8
�#��/��8$8���H������"������)��#��*�����#
������������#�� ����������/������#��������*������������#��#����#��������������)��#��*�+���#�����!#�#� �����/�� ���#����� &������������&!�����)��#��*�+���#�����!#�#� ������� �����#���/������*���������7��##� �����#7������#�� ���#��#���/������#�#�������S#��� ��/�� �
Appendix C

))#������������#�D��/�����))#
����������))#
�*� ���� ��;+�����<
����������D
)� ��?����D 391 +� &�� ����� -?��� D��/�))#�
;+�����<-?��������#�-��
� �����*�����#
N�8I 92.6% 7.4% 0.2809% 1 1.0 0.1 8�9��>( N$(��I �8D 0.0 0.1�8I�N�8I 83.0% 17.0% 0.5618% 2 1.8 0.4 �>,�9�(�� $(��I�N1��$I �8D 0.1 0.3�8I�N$8I 75.1% 24.9% 0.0000% 0 0.0 0.0 (�$�9�.,, 1��$I�N��8��I �,D 0.0 0.0$8I�N(8I 64.9% 35.1% 0.0000% 0 0.0 0.0 .,.�9�4>1 ��8��I�N�(1�.I �,D 0.0 0.0(8I�N,8I 59.1% 40.9% 0.0000% 0 0.0 0.0 4>4�9���$� �(1�.I�N�4,�$I 4D 0.0 0.0,8I�N1,I 55.2% 44.8% 1.6854% 7 3.6 3.0 ��$$�9��1$> �4,�$I�N�1>�$I ,D 0.1 2.81,IB 50.8% 49.2% 0.0000% 0 0.0 0.0 �1(8B �1>�$IB ,D 0.0 0.0N�8I 69.1% 30.9% 0.8427% 3 2.3 1.0 8�9��>( N$(��I �8D 0.2 0.8
�8I�N�8I 63.6% 36.4% 1.6854% 7 4.2 2.4 �>,�9�(�� $(��I�N1��$I �8D 0.5 1.9�8I�N$8I 59.9% 40.1% 1.9663% 8 4.6 3.1 (�$�9�.,, 1��$I�N��8��I �,D 0.5 2.6$8I�N(8I 51.8% 48.2% 1.1236% 4 2.3 2.1 .,.�9�4>1 ��8��I�N�(1�.I �,D 0.3 1.8(8I�N,8I 43.0% 57.0% 2.5281% 10 4.3 5.6 4>4�9���$� �(1�.I�N�4,�$I 4D 0.5 5.2,8I�N1,I 25.0% 75.0% 4.2135% 16 4.1 12.4 ��$$�9��1$> �4,�$I�N�1>�$I ,D 0.6 11.71,IB 14.0% 86.0% 2.2472% 9 1.2 7.6 �1(8B �1>�$IB ,D 0.4 7.2N�8I 67.9% 32.1% 0.0000% 0 0.0 0.0 8�9��>( N$(��I �8D 0.0 0.0
�8I�N�8I 59.9% 40.1% 3.3708% 13 7.9 5.3 �>,�9�(�� $(��I�N1��$I �8D 1.1 4.2�8I�N$8I 48.0% 52.0% 3.0899% 12 5.8 6.3 (�$�9�.,, 1��$I�N��8��I �,D 0.9 5.3$8I�N(8I 35.9% 64.1% 3.9326% 15 5.5 9.9 .,.�9�4>1 ��8��I�N�(1�.I �,D 1.5 8.4(8I�N,8I 27.0% 73.0% 1.1236% 4 1.2 3.2 4>4�9���$� �(1�.I�N�4,�$I 4D 0.3 3.0,8I�N1,I 16.0% 84.0% 8.4270% 33 5.3 27.7 ��$$�9��1$> �4,�$I�N�1>�$I ,D 1.4 26.31,IB 12.1% 87.9% 7.8652% 31 3.7 27.0 �1(8B �1>�$IB ,D 1.4 25.7N�8I 59.6% 40.4% 1.1236% 4 2.6 1.8 8�9��>( N$(��I $8D 0.5 1.2
�8I�N�8I 44.3% 55.7% 1.1236% 4 1.9 2.4 �>,�9�(�� $(��I�N1��$I $8D 0.7 1.7�8I�N$8I 29.9% 70.1% 3.0899% 12 3.6 8.5 (�$�9�.,, 1��$I�N��8��I �8D 1.7 6.8$8I�N(8I 24.9% 75.1% 4.2135% 16 4.1 12.4 .,.�9�4>1 ��8��I�N�(1�.I �,D 1.9 10.5(8I�N,8I 19.9% 80.1% 1.1236% 4 0.9 3.5 4>4�9���$� �(1�.I�N�4,�$I �,D 0.5 3.0,8I�N1,I 13.9% 86.1% 6.1798% 24 3.4 20.8 ��$$�9��1$> �4,�$I�N�1>�$I �,D 3.1 17.71,IB 8.9% 91.1% 10.1124% 40 3.5 36.0 �1(8B �1>�$IB �8D 3.6 32.4N�8I 40.8% 59.2% 0.5618% 2 0.9 1.3 8�9��>( N$(��I 18D 0.9 0.4
�8I�N�8I 33.6% 66.4% 2.2472% 9 3.0 5.8 �>,�9�(�� $(��I�N1��$I ,8D 2.9 2.9�8I�N$8I 27.0% 73.0% 0.0000% 0 0.0 0.0 (�$�9�.,, 1��$I�N��8��I $,D 0.0 0.0$8I�N(8I 16.9% 83.1% 1.1236% 4 0.7 3.7 .,.�9�4>1 ��8��I�N�(1�.I $,D 1.3 2.4(8I�N,8I 10.9% 89.1% 1.9663% 8 0.8 6.9 4>4�9���$� �(1�.I�N�4,�$I $8D 2.1 4.8,8I�N1,I 7.9% 92.1% 1.6854% 7 0.5 6.1 ��$$�9��1$> �4,�$I�N�1>�$I $8D 1.8 4.21,IB 5.9% 94.1% 2.2472% 9 0.5 8.3 �1(8B �1>�$IB �,D 1.2 7.0N�8I 35.1% 64.9% 2.2472% 9 3.1 5.7 8�9��>( N$(��I 48D 4.6 1.1
�8I�N�8I 25.1% 74.9% 0.0000% 0 0.0 0.0 �>,�9�(�� $(��I�N1��$I .8D 0.0 0.0�8I�N$8I 10.1% 89.9% 0.0000% 0 0.0 0.0 (�$�9�.,, 1��$I�N��8��I 1,D 0.0 0.0$8I�N(8I 8.1% 91.9% 2.8090% 11 0.9 10.1 .,.�9�4>1 ��8��I�N�(1�.I .8D 6.1 4.0(8I�N,8I 7.0% 93.0% 0.0000% 0 0.0 0.0 4>4�9���$� �(1�.I�N�4,�$I ,,D 0.0 0.0,8I�N1,I 5.5% 94.5% 1.4045% 5 0.3 5.2 ��$$�9��1$> �4,�$I�N�1>�$I (,D 2.3 2.91,IB 5.0% 95.0% 0.0000% 0 0.0 0.0 �1(8B �1>�$IB (,D 0.0 0.0N�8I 36.8% 63.2% 3.3708% 13 4.9 8.3 8�9��>( N$(��I 48D 6.7 1.7
�8I�N�8I 26.1% 73.9% 2.2472% 9 2.3 6.5 �>,�9�(�� $(��I�N1��$I 48D 5.2 1.3�8I�N$8I 16.1% 83.9% 2.2472% 9 1.4 7.4 (�$�9�.,, 1��$I�N��8��I 4,D 6.3 1.1$8I�N(8I 13.1% 86.9% 1.4045% 5 0.7 4.8 .,.�9�4>1 ��8��I�N�(1�.I >8D 4.3 0.5(8I�N,8I 12.1% 87.9% 0.8427% 3 0.4 2.9 4>4�9���$� �(1�.I�N�4,�$I 48D 2.3 0.6,8I�N1,I 12.0% 88.0% 0.0000% 0 0.0 0.0 ��$$�9��1$> �4,�$I�N�1>�$I 48D 0.0 0.01,IB 12.0% 88.0% 1.6854% 7 0.8 5.8 �1(8B �1>�$IB 18D 4.1 1.7
�88�8D $>� �88 �>�Note 1-Income, Rent, and Price are stated in 1999 dollars. Rent and Price Ranges for each Income cohort represent the upper limits for affordable housing for that cohort, i.e., housing that is non-cost burdened where no more than 30% of the household income is spent on housing.Note 2 - % of HHs is the percent of owner households in this cohort who live in a housing unit at a higher price point and can afford that unit due to no or low mortgage payments.
Label or data descriptor for data element
The percentage of Households in this Age / Income cohort that will own or rent - Census 2000 Summary File 3 - Sample Data
The percentage of Households that are in this Age / Income cohort - Census 2000 Summary File 3 - Sample Data
A number produced by the Housing Needs Analysis template reflecting the data, assumptions, and estimates used in this scenario
�����#
N�,
�,�N$,
1,�B
$,�N(,
(,�N,,
,,�N.,
.,�N1,
����#�������������H�#� ����/���))#�5�����������*�*�#
�� ������$0?�����*������+���#�����������&!��������������������//����&�����#��T
"�����&��*��#��/�0��� &����8�8��������'�?�������#�
������ ���� ��*��;+�����<
������ ��*��;+�����<
������ ����#����������������&!�)��#��*�������
Appendix C
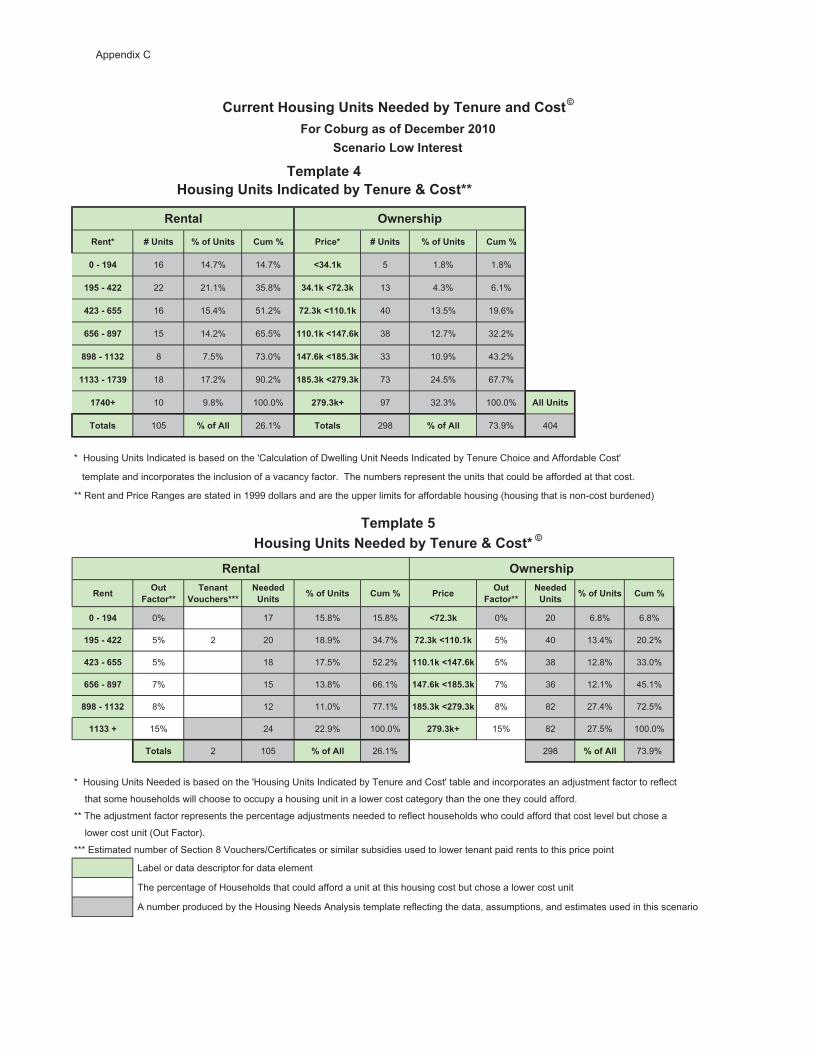
���C V�����# D��/�����# �� �D �����C V�����# D��/�����# �� �D
8�9��>( 16 14.7% 14.7% N$(��I 5 1.8% 1.8%
�>,�9�(�� 22 21.1% 35.8% $(��I�N1��$I 13 4.3% 6.1%
(�$�9�.,, 16 15.4% 51.2% 1��$I�N��8��I 40 13.5% 19.6%
.,.�9�4>1 15 14.2% 65.5% ��8��I�N�(1�.I 38 12.7% 32.2%
4>4�9���$� 8 7.5% 73.0% �(1�.I�N�4,�$I 33 10.9% 43.2%
��$$�9��1$> 18 17.2% 90.2% �4,�$I�N�1>�$I 73 24.5% 67.7%
�1(8B 10 9.8% 100.0% �1>�$IB 97 32.3% 100.0% ��������#
�����# 105 D��/���� 26.1% �����# 298 D��/���� 73.9% 404
* Housing Units Indicated is based on the 'Calculation of Dwelling Unit Needs Indicated by Tenure Choice and Affordable Cost'
template and incorporates the inclusion of a vacancy factor. The numbers represent the units that could be afforded at that cost.
** Rent and Price Ranges are stated in 1999 dollars and are the upper limits for affordable housing (housing that is non-cost burdened)
��� -���"�����CC
�������������#CCC
+����������# D��/�����# �� �D ����� -���
"�����CC+����������# D��/�����# �� �D
8�9��>( 0% 17 15.8% 15.8% N1��$I 0% 20 6.8% 6.8%
�>,�9�(�� 5% 2 20 18.9% 34.7% 1��$I�N��8��I 5% 40 13.4% 20.2%
(�$�9�.,, 5% 18 17.5% 52.2% ��8��I�N�(1�.I 5% 38 12.8% 33.0%
.,.�9�4>1 7% 15 13.8% 66.1% �(1�.I�N�4,�$I 7% 36 12.1% 45.1%
4>4�9���$� 8% 12 11.0% 77.1% �4,�$I�N�1>�$I 8% 82 27.4% 72.5%
��$$�B 15% 24 22.9% 100.0% �1>�$IB 15% 82 27.5% 100.0%
�����# 2 105 D��/���� 26.1% 298 D��/���� 73.9%
* Housing Units Needed is based on the 'Housing Units Indicated by Tenure and Cost' table and incorporates an adjustment factor to reflect
that some households will choose to occupy a housing unit in a lower cost category than the one they could afford.
** The adjustment factor represents the percentage adjustments needed to reflect households who could afford that cost level but chose a
lower cost unit (Out Factor).
*** Estimated number of Section 8 Vouchers/Certificates or similar subsidies used to lower tenant paid rents to this price point
Label or data descriptor for data element
The percentage of Households that could afford a unit at this housing cost but chose a lower cost unit
A number produced by the Housing Needs Analysis template reflecting the data, assumptions, and estimates used in this scenario
�� ������,
��������'�?�������#�
-?���#��� �����
��������)��#��*�����#�+������&!��������������#��T
����� -?���#���
)��#��*�����#�+������&!��������M���#�C�T
)��#��*�����#�����������&!��������M���#�CC
"�����&��*��#��/�0��� &����8�8
�� ������(
Appendix C
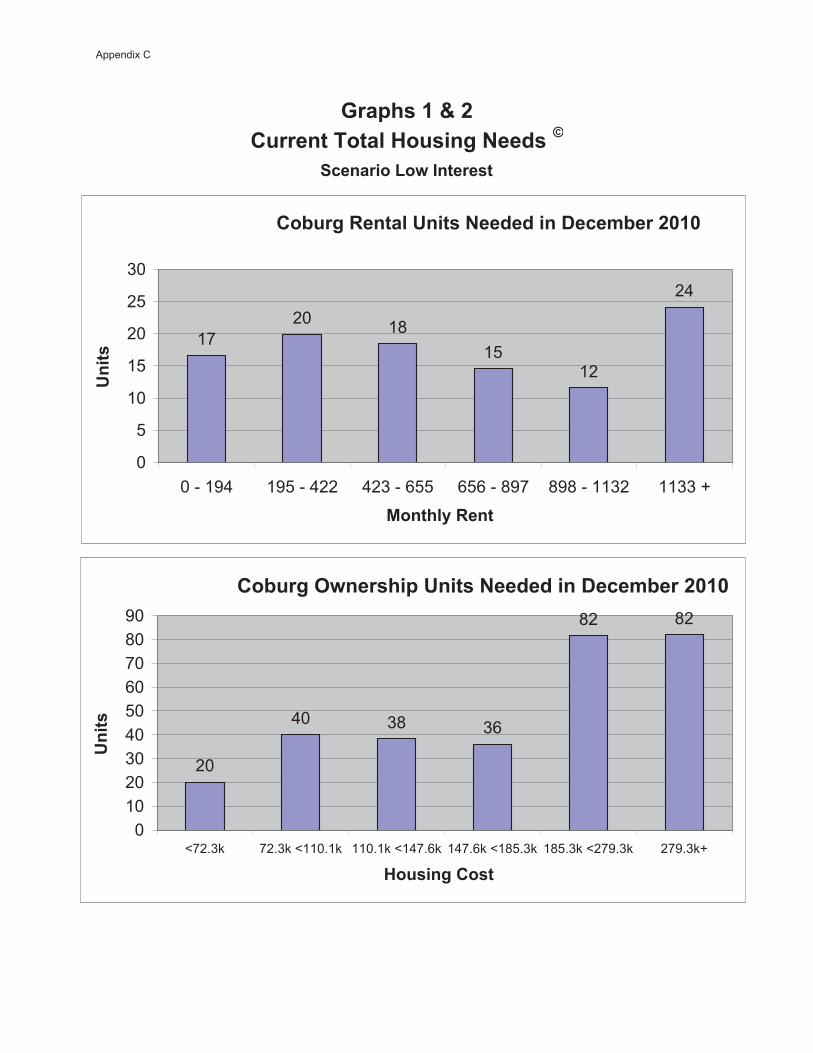
��������������)��#��*�+���#�T2����#���M��
��������'�?�������#�
��&��*� ����������#�+���������0��� &����8�8
1720 18
1512
24
0
5
10
15
20
25
30
0 - 194 195 - 422 423 - 655 656 - 897 898 - 1132 1133 +
������!� ���
����#
��&��*�-?���#��������#�+���������0��� &����8�8
20
40 38 36
82 82
0102030405060708090
<72.3k 72.3k <110.1k 110.1k <147.6k 147.6k <185.3k 185.3k <279.3k 279.3k+
)��#��*���#�
����#
Appendix C
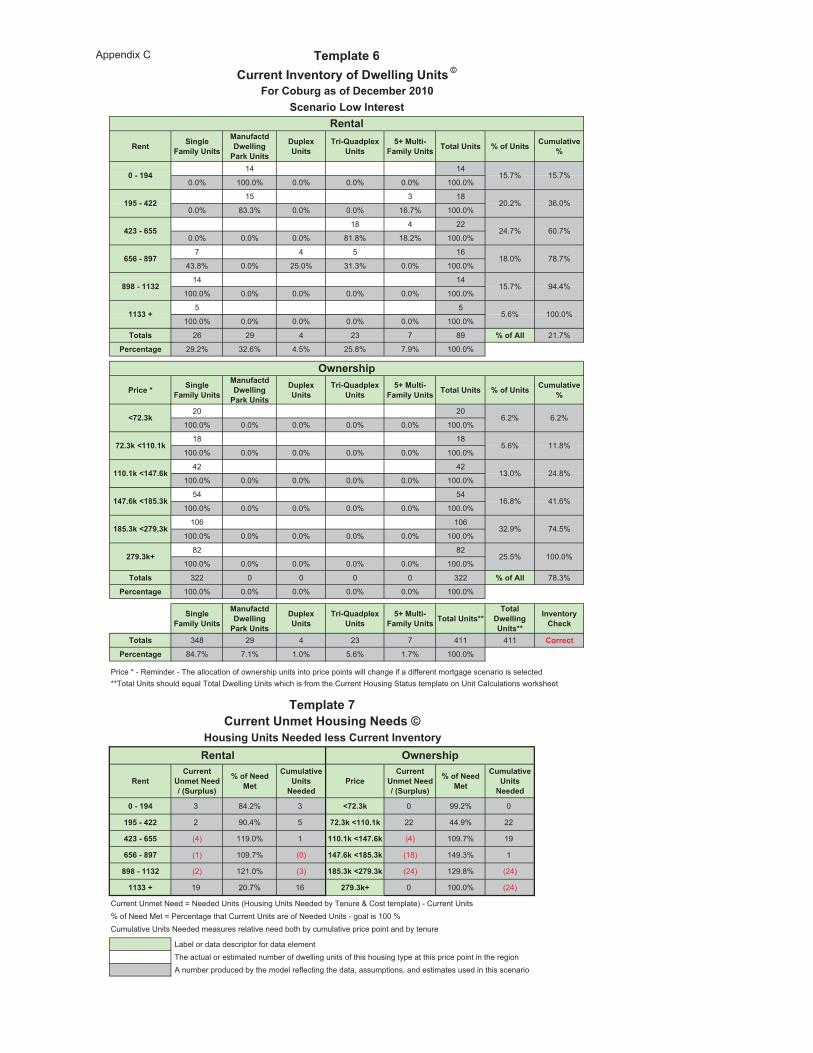
��� ��*���"� ��!�����#
����/�����0?�����*����I�����#
0����3�����#
���9E������3�����#
,B������9"� ��!�����# ����������# D��/�����# �� �����=��
D
14 14
0.0% 100.0% 0.0% 0.0% 0.0% 100.0%
15 3 18
0.0% 83.3% 0.0% 0.0% 16.7% 100.0%
18 4 22
0.0% 0.0% 0.0% 81.8% 18.2% 100.0%
7 4 5 16
43.8% 0.0% 25.0% 31.3% 0.0% 100.0%
14 14
100.0% 0.0% 0.0% 0.0% 0.0% 100.0%
5 5
100.0% 0.0% 0.0% 0.0% 0.0% 100.0%
�����# 26 29 4 23 7 89 D��/���� 21.7%
��������*� 29.2% 32.6% 4.5% 25.8% 7.9% 100.0%
������C ��*���"� ��!�����#
����/�����0?�����*����I�����#
0����3�����#
���9E������3�����#
,B������9"� ��!�����# ����������# D��/�����# �� �����=��
D
20 20
100.0% 0.0% 0.0% 0.0% 0.0% 100.0%
18 18
100.0% 0.0% 0.0% 0.0% 0.0% 100.0%
42 42
100.0% 0.0% 0.0% 0.0% 0.0% 100.0%
54 54
100.0% 0.0% 0.0% 0.0% 0.0% 100.0%
106 106
100.0% 0.0% 0.0% 0.0% 0.0% 100.0%
82 82
100.0% 0.0% 0.0% 0.0% 0.0% 100.0%
�����# 322 0 0 0 0 322 D��/���� 78.3%
��������*� 100.0% 0.0% 0.0% 0.0% 0.0% 100.0%
��*���"� ��!�����#
����/�����0?�����*����I�����#
0����3�����#
���9E������3�����#
,B������9"� ��!�����# ����������#CC
������0?�����*�����#CC
��=�����!�����I
�����# 348 29 4 23 7 411 411 ���������������*� 84.7% 7.1% 1.0% 5.6% 1.7% 100.0%
Price * - Reminder - The allocation of ownership units into price points will change if a different mortgage scenario is selected**Total Units should equal Total Dwelling Units which is from the Current Housing Status template on Unit Calculations worksheet
�����������
�� ���+����A�;�����#<
D��/�+�������
�� �����=������#�+�����
�������������
�� ���+����A�;�����#<
D��/�+�������
�� �����=������#�+�����
8�9��>( 3 84.2% 3 N1��$I 0 99.2% 0
�>,�9�(�� 2 90.4% 5 1��$I�N��8��I 22 44.9% 22
(�$�9�.,, (4) 119.0% 1 ��8��I�N�(1�.I (4) 109.7% 19
.,.�9�4>1 (1) 109.7% (0) �(1�.I�N�4,�$I (18) 149.3% 1
4>4�9���$� (2) 121.0% (3) �4,�$I�N�1>�$I (24) 129.8% (24)
��$$�B 19 20.7% 16 �1>�$IB 0 100.0% (24)
Current Unmet Need = Needed Units (Housing Units Needed by Tenure & Cost template) - Current Units % of Need Met = Percentage that Current Units are of Needed Units - goal is 100 %Cumulative Units Needed measures relative need both by cumulative price point and by tenure
Label or data descriptor for data element The actual or estimated number of dwelling units of this housing type at this price point in the region A number produced by the model reflecting the data, assumptions, and estimates used in this scenario
��������'�?�������#�
32.9% 74.5%
25.5% 100.0%
�4,�$I�N�1>�$I
�1>�$IB
6.2% 6.2%
5.6%
N1��$I
1��$I�N��8��I
��8��I�N�(1�.I
�(1�.I�N�4,�$I
11.8%
13.0% 24.8%
16.8% 41.6%
15.7%
20.2% 36.0%
24.7% 60.7%
78.7%
15.7% 94.4%
5.6% 100.0%
����� -?���#���
���������� ���)��#��*�+���#�T)��#��*�����#�+��������##�����������=�����!
4>4�9���$�
��$$�B
15.7%
18.0%
"�����&��*��#��/�0��� &����8�8
�� ������.
�� ������1
�����
����������=�����!��/�0?�����*�����#�T
-?���#���
8�9��>(
�>,�9�(��
(�$�9�.,,
.,.�9�4>1
Appendix C

���� �CC ��� V�����# D��/�����# �� �D V�����# D��/�����# �� �D
N�8I 8�9��>( 3 72.1% 72.1% 5 47.4% 47.4%
�8I�N�8I �>,�9�(�� 0 0.0% 72.1% 2 21.5% 68.9%
�8I�N$8I (�$�9�.,, 0 1.5% 73.6% 1 13.3% 82.2%
$8I�N(8I .,.�9�4>1 1 19.4% 92.9% 1 6.7% 88.9%
(8I�N,8I 4>4�9���$� 0 1.1% 94.0% 1 4.6% 93.6%
,8I�B ��$$�B 0 6.0% 100.0% 1 6.4% 100.0%
�����# 4 D��/���� 29.0% 11 D��/���� 71.0% 15
* Senior Housing Units Needed is based on the 'Calculation of Dwelling Unit Needs Indicated by Tenure Choice and Affordable Cost template and incorporates the inclusion of a vacancy factor and the Out Factor** Income represents range of income needed to pay the rent and be affordable. # Units is not the same as number of households at that Income due to Out Factor and vacancy factors used to arrive at # Units.
�������������� ������)��#��*�����#�+������&!���#�C�T
2�����$
)��#���������*��1,�B
"�����&��*��#��/�0��� &����8�8��������'�?�������#��� ������4
)��#���������*��.,�9�1(
������ ����������#�+�����
3
0 0
1
0 0
5
2
1
1 1 1
0
1
2
3
4
5
6
8�9��>( �>,�9�(�� (�$�9�.,, .,.�9�4>1 4>4�9���$� ��$$�B ���
����#
)��#��������.,91( )��#��������1,����������
Appendix C
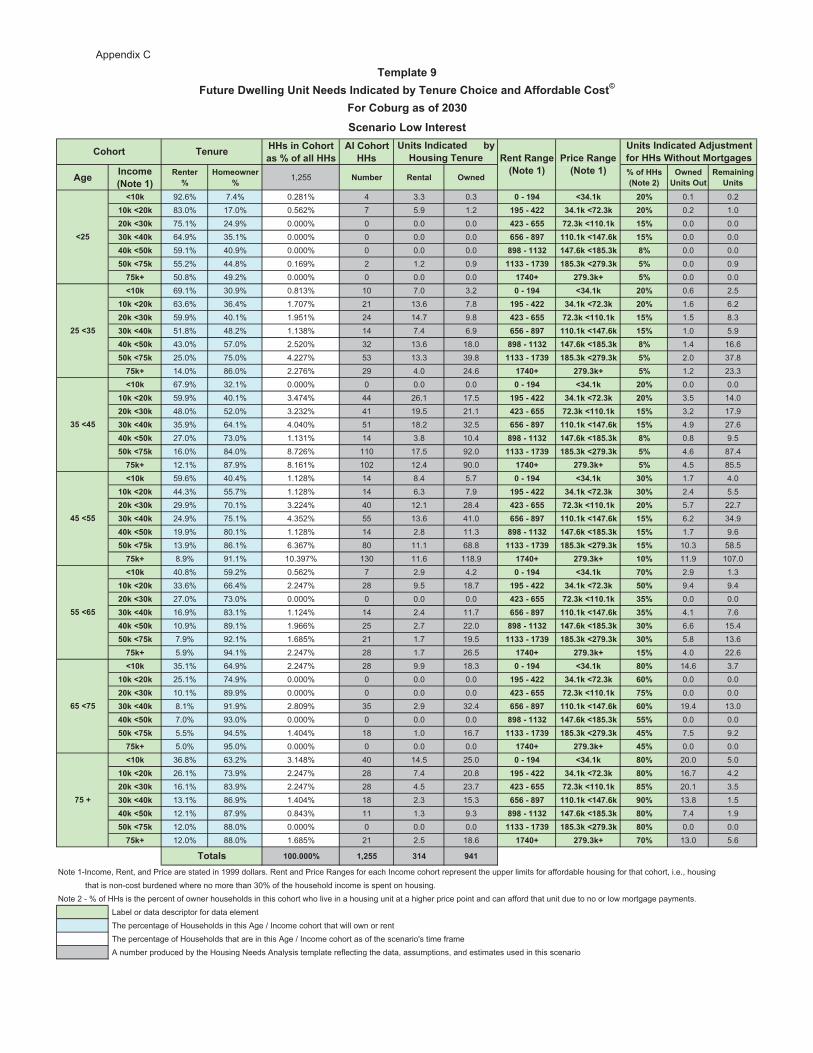
))#������������#�D��/�����))#
����������))#
�*� ���� ��;+�����<
����������D
)� ��?����D 1,255 +� &�� ����� -?��� D��/�))#�
;+�����<-?��������#�-��
� �����*�����#
N�8I 92.6% 7.4% 0.281% 4 3.3 0.3 8�9��>( N$(��I �8D 0.1 0.2�8I�N�8I 83.0% 17.0% 0.562% 7 5.9 1.2 �>,�9�(�� $(��I�N1��$I �8D 0.2 1.0�8I�N$8I 75.1% 24.9% 0.000% 0 0.0 0.0 (�$�9�.,, 1��$I�N��8��I �,D 0.0 0.0$8I�N(8I 64.9% 35.1% 0.000% 0 0.0 0.0 .,.�9�4>1 ��8��I�N�(1�.I �,D 0.0 0.0(8I�N,8I 59.1% 40.9% 0.000% 0 0.0 0.0 4>4�9���$� �(1�.I�N�4,�$I 4D 0.0 0.0,8I�N1,I 55.2% 44.8% 0.169% 2 1.2 0.9 ��$$�9��1$> �4,�$I�N�1>�$I ,D 0.0 0.91,IB 50.8% 49.2% 0.000% 0 0.0 0.0 �1(8B �1>�$IB ,D 0.0 0.0N�8I 69.1% 30.9% 0.813% 10 7.0 3.2 8�9��>( N$(��I �8D 0.6 2.5
�8I�N�8I 63.6% 36.4% 1.707% 21 13.6 7.8 �>,�9�(�� $(��I�N1��$I �8D 1.6 6.2�8I�N$8I 59.9% 40.1% 1.951% 24 14.7 9.8 (�$�9�.,, 1��$I�N��8��I �,D 1.5 8.3$8I�N(8I 51.8% 48.2% 1.138% 14 7.4 6.9 .,.�9�4>1 ��8��I�N�(1�.I �,D 1.0 5.9(8I�N,8I 43.0% 57.0% 2.520% 32 13.6 18.0 4>4�9���$� �(1�.I�N�4,�$I 4D 1.4 16.6,8I�N1,I 25.0% 75.0% 4.227% 53 13.3 39.8 ��$$�9��1$> �4,�$I�N�1>�$I ,D 2.0 37.81,IB 14.0% 86.0% 2.276% 29 4.0 24.6 �1(8B �1>�$IB ,D 1.2 23.3N�8I 67.9% 32.1% 0.000% 0 0.0 0.0 8�9��>( N$(��I �8D 0.0 0.0
�8I�N�8I 59.9% 40.1% 3.474% 44 26.1 17.5 �>,�9�(�� $(��I�N1��$I �8D 3.5 14.0�8I�N$8I 48.0% 52.0% 3.232% 41 19.5 21.1 (�$�9�.,, 1��$I�N��8��I �,D 3.2 17.9$8I�N(8I 35.9% 64.1% 4.040% 51 18.2 32.5 .,.�9�4>1 ��8��I�N�(1�.I �,D 4.9 27.6(8I�N,8I 27.0% 73.0% 1.131% 14 3.8 10.4 4>4�9���$� �(1�.I�N�4,�$I 4D 0.8 9.5,8I�N1,I 16.0% 84.0% 8.726% 110 17.5 92.0 ��$$�9��1$> �4,�$I�N�1>�$I ,D 4.6 87.41,IB 12.1% 87.9% 8.161% 102 12.4 90.0 �1(8B �1>�$IB ,D 4.5 85.5N�8I 59.6% 40.4% 1.128% 14 8.4 5.7 8�9��>( N$(��I $8D 1.7 4.0
�8I�N�8I 44.3% 55.7% 1.128% 14 6.3 7.9 �>,�9�(�� $(��I�N1��$I $8D 2.4 5.5�8I�N$8I 29.9% 70.1% 3.224% 40 12.1 28.4 (�$�9�.,, 1��$I�N��8��I �8D 5.7 22.7$8I�N(8I 24.9% 75.1% 4.352% 55 13.6 41.0 .,.�9�4>1 ��8��I�N�(1�.I �,D 6.2 34.9(8I�N,8I 19.9% 80.1% 1.128% 14 2.8 11.3 4>4�9���$� �(1�.I�N�4,�$I �,D 1.7 9.6,8I�N1,I 13.9% 86.1% 6.367% 80 11.1 68.8 ��$$�9��1$> �4,�$I�N�1>�$I �,D 10.3 58.51,IB 8.9% 91.1% 10.397% 130 11.6 118.9 �1(8B �1>�$IB �8D 11.9 107.0N�8I 40.8% 59.2% 0.562% 7 2.9 4.2 8�9��>( N$(��I 18D 2.9 1.3
�8I�N�8I 33.6% 66.4% 2.247% 28 9.5 18.7 �>,�9�(�� $(��I�N1��$I ,8D 9.4 9.4�8I�N$8I 27.0% 73.0% 0.000% 0 0.0 0.0 (�$�9�.,, 1��$I�N��8��I $,D 0.0 0.0$8I�N(8I 16.9% 83.1% 1.124% 14 2.4 11.7 .,.�9�4>1 ��8��I�N�(1�.I $,D 4.1 7.6(8I�N,8I 10.9% 89.1% 1.966% 25 2.7 22.0 4>4�9���$� �(1�.I�N�4,�$I $8D 6.6 15.4,8I�N1,I 7.9% 92.1% 1.685% 21 1.7 19.5 ��$$�9��1$> �4,�$I�N�1>�$I $8D 5.8 13.61,IB 5.9% 94.1% 2.247% 28 1.7 26.5 �1(8B �1>�$IB �,D 4.0 22.6N�8I 35.1% 64.9% 2.247% 28 9.9 18.3 8�9��>( N$(��I 48D 14.6 3.7
�8I�N�8I 25.1% 74.9% 0.000% 0 0.0 0.0 �>,�9�(�� $(��I�N1��$I .8D 0.0 0.0�8I�N$8I 10.1% 89.9% 0.000% 0 0.0 0.0 (�$�9�.,, 1��$I�N��8��I 1,D 0.0 0.0$8I�N(8I 8.1% 91.9% 2.809% 35 2.9 32.4 .,.�9�4>1 ��8��I�N�(1�.I .8D 19.4 13.0(8I�N,8I 7.0% 93.0% 0.000% 0 0.0 0.0 4>4�9���$� �(1�.I�N�4,�$I ,,D 0.0 0.0,8I�N1,I 5.5% 94.5% 1.404% 18 1.0 16.7 ��$$�9��1$> �4,�$I�N�1>�$I (,D 7.5 9.21,IB 5.0% 95.0% 0.000% 0 0.0 0.0 �1(8B �1>�$IB (,D 0.0 0.0N�8I 36.8% 63.2% 3.148% 40 14.5 25.0 8�9��>( N$(��I 48D 20.0 5.0
�8I�N�8I 26.1% 73.9% 2.247% 28 7.4 20.8 �>,�9�(�� $(��I�N1��$I 48D 16.7 4.2�8I�N$8I 16.1% 83.9% 2.247% 28 4.5 23.7 (�$�9�.,, 1��$I�N��8��I 4,D 20.1 3.5$8I�N(8I 13.1% 86.9% 1.404% 18 2.3 15.3 .,.�9�4>1 ��8��I�N�(1�.I >8D 13.8 1.5(8I�N,8I 12.1% 87.9% 0.843% 11 1.3 9.3 4>4�9���$� �(1�.I�N�4,�$I 48D 7.4 1.9,8I�N1,I 12.0% 88.0% 0.000% 0 0.0 0.0 ��$$�9��1$> �4,�$I�N�1>�$I 48D 0.0 0.01,IB 12.0% 88.0% 1.685% 21 2.5 18.6 �1(8B �1>�$IB 18D 13.0 5.6
�88�888D �7�,, $�( >(�
Note 1-Income, Rent, and Price are stated in 1999 dollars. Rent and Price Ranges for each Income cohort represent the upper limits for affordable housing for that cohort, i.e., housing that is non-cost burdened where no more than 30% of the household income is spent on housing.Note 2 - % of HHs is the percent of owner households in this cohort who live in a housing unit at a higher price point and can afford that unit due to no or low mortgage payments.
Label or data descriptor for data element The percentage of Households in this Age / Income cohort that will own or rent The percentage of Households that are in this Age / Income cohort as of the scenario's time frame A number produced by the Housing Needs Analysis template reflecting the data, assumptions, and estimates used in this scenario
�����#
N�,
�,�N$,
1,�B
$,�N(,
(,�N,,
,,�N.,
.,�N1,
����#�������������H�#� ����/���))#�5�����������*�*�#
�� ������>"������0?�����*������+���#�����������&!��������������������//����&�����#��T
"�����&��*��#��/��8$8��������'�?�������#�
������ ����#����������������&!�)��#��*������� ���� ��*��
;+�����<
������ ������ ��*��;+�����<
Appendix C
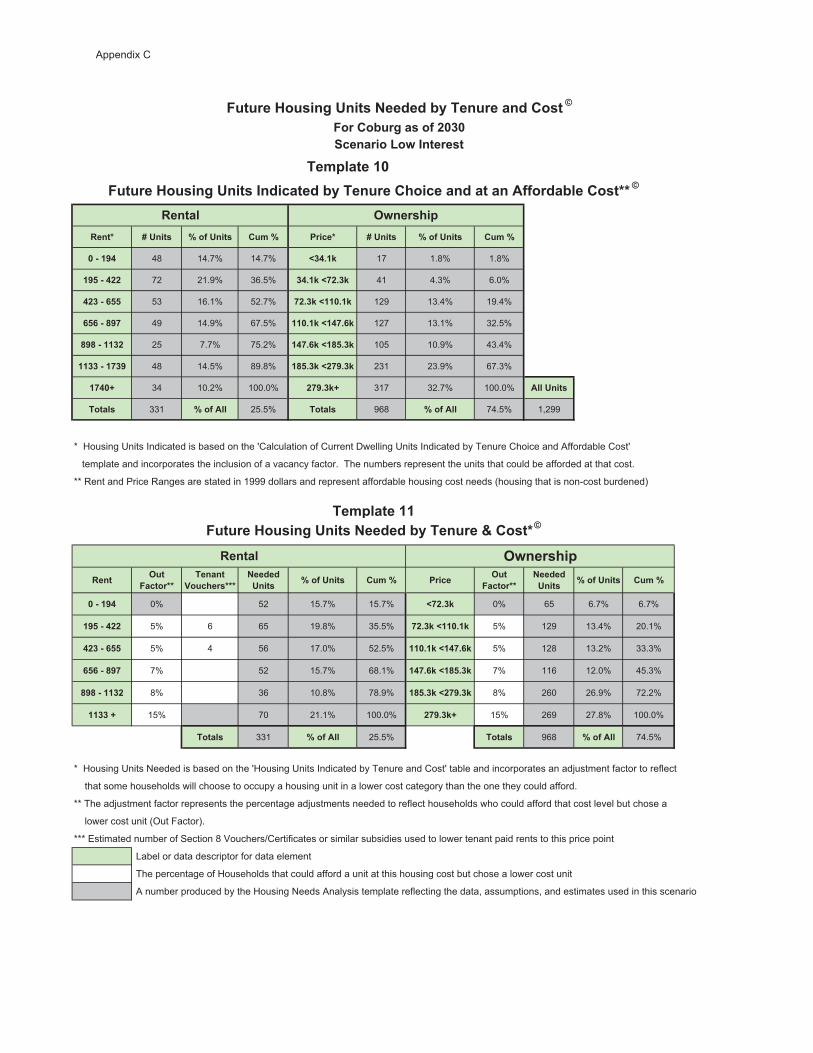
���C V�����# D��/�����# �� �D �����C V�����# D��/�����# �� �D
8�9��>( 48 14.7% 14.7% N$(��I 17 1.8% 1.8%
�>,�9�(�� 72 21.9% 36.5% $(��I�N1��$I 41 4.3% 6.0%
(�$�9�.,, 53 16.1% 52.7% 1��$I�N��8��I 129 13.4% 19.4%
.,.�9�4>1 49 14.9% 67.5% ��8��I�N�(1�.I 127 13.1% 32.5%
4>4�9���$� 25 7.7% 75.2% �(1�.I�N�4,�$I 105 10.9% 43.4%
��$$�9��1$> 48 14.5% 89.8% �4,�$I�N�1>�$I 231 23.9% 67.3%
�1(8B 34 10.2% 100.0% �1>�$IB 317 32.7% 100.0% ��������#
�����# 331 D��/���� 25.5% �����# 968 D��/���� 74.5% 1,299
* Housing Units Indicated is based on the 'Calculation of Current Dwelling Units Indicated by Tenure Choice and Affordable Cost'
template and incorporates the inclusion of a vacancy factor. The numbers represent the units that could be afforded at that cost.
** Rent and Price Ranges are stated in 1999 dollars and represent affordable housing cost needs (housing that is non-cost burdened)
��� -���"�����CC
�������������#CCC
+����������# D��/�����# �� �D ����� -���
"�����CC+����������# D��/�����# �� �D
8�9��>( 0% 52 15.7% 15.7% N1��$I 0% 65 6.7% 6.7%
�>,�9�(�� 5% 6 65 19.8% 35.5% 1��$I�N��8��I 5% 129 13.4% 20.1%
(�$�9�.,, 5% 4 56 17.0% 52.5% ��8��I�N�(1�.I 5% 128 13.2% 33.3%
.,.�9�4>1 7% 52 15.7% 68.1% �(1�.I�N�4,�$I 7% 116 12.0% 45.3%
4>4�9���$� 8% 36 10.8% 78.9% �4,�$I�N�1>�$I 8% 260 26.9% 72.2%
��$$�B 15% 70 21.1% 100.0% �1>�$IB 15% 269 27.8% 100.0%
�����# 331 D��/���� 25.5% �����# 968 D��/���� 74.5%
* Housing Units Needed is based on the 'Housing Units Indicated by Tenure and Cost' table and incorporates an adjustment factor to reflect
that some households will choose to occupy a housing unit in a lower cost category than the one they could afford.
** The adjustment factor represents the percentage adjustments needed to reflect households who could afford that cost level but chose a
lower cost unit (Out Factor).
*** Estimated number of Section 8 Vouchers/Certificates or similar subsidies used to lower tenant paid rents to this price point
Label or data descriptor for data element
The percentage of Households that could afford a unit at this housing cost but chose a lower cost unit
A number produced by the Housing Needs Analysis template reflecting the data, assumptions, and estimates used in this scenario
�� �������8"������)��#��*�����#�����������&!��������������������������//����&�����#�CC�T
"������)��#��*�����#�+������&!��������������#��T
"�����&��*��#��/��8$8��������'�?�������#�
�����
����� -?���#���
-?���#���
"������)��#��*�����#�+������&!��������M���#�C�T�� ��������
Appendix C
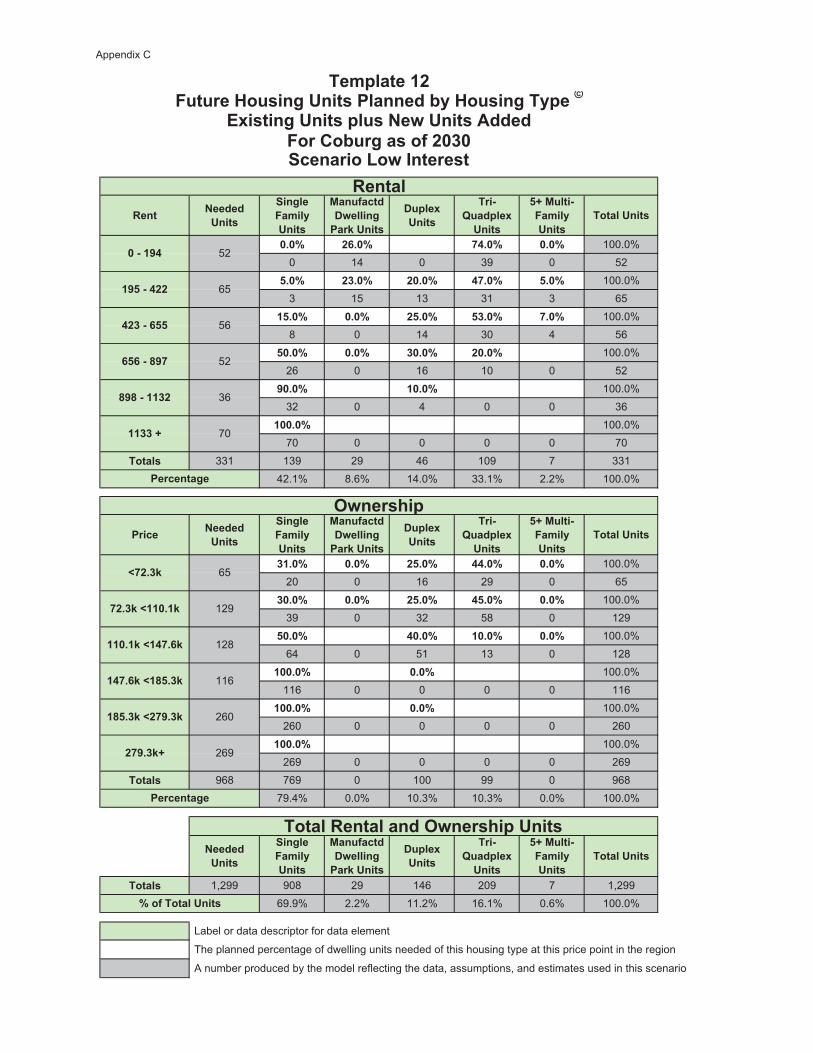
��� +����������#
��*���"� ��!�����#
����/�����0?�����*����I�����#
0����3�����#
���9E������3�����#
,B������9"� ��!�����#
����������#
8�8D �.�8D 1(�8D 8�8D 100.0%0 14 0 39 0 52
,�8D �$�8D �8�8D (1�8D ,�8D 100.0%3 15 13 31 3 65
�,�8D 8�8D �,�8D ,$�8D 1�8D 100.0%8 0 14 30 4 56
,8�8D 8�8D $8�8D �8�8D 100.0%26 0 16 10 0 52
>8�8D �8�8D 100.0%32 0 4 0 0 36
�88�8D 100.0%70 0 0 0 0 70
�����# 331 139 29 46 109 7 33142.1% 8.6% 14.0% 33.1% 2.2% 100.0%
����� +����������#
��*���"� ��!�����#
����/�����0?�����*����I�����#
0����3�����#
���9E������3�����#
,B������9"� ��!�����#
����������#
$��8D 8�8D �,�8D ((�8D 8�8D 100.0%20 0 16 29 0 65
$8�8D 8�8D �,�8D (,�8D 8�8D 100.0%39 0 32 58 0 129
,8�8D (8�8D �8�8D 8�8D 100.0%64 0 51 13 0 128
�88�8D 8�8D 100.0%116 0 0 0 0 116
�88�8D 8�8D 100.0%260 0 0 0 0 260
�88�8D 100.0%269 0 0 0 0 269
�����# 968 769 0 100 99 0 96879.4% 0.0% 10.3% 10.3% 0.0% 100.0%
+����������#
��*���"� ��!�����#
����/�����0?�����*����I�����#
0����3�����#
���9E������3�����#
,B������9"� ��!�����#
����������#
�����# 1,299 908 29 146 209 7 1,29969.9% 2.2% 11.2% 16.1% 0.6% 100.0%
Label or data descriptor for data element
The planned percentage of dwelling units needed of this housing type at this price point in the region
A number produced by the model reflecting the data, assumptions, and estimates used in this scenario
��������'�?�������#�
�(1�.I�N�4,�$I
�4,�$I�N�1>�$I
�1>�$IB
65
129
128
116
260
269
��8��I�N�(1�.I
1��$I�N��8��I
52
36
70
N1��$I
��$$�B
.,.�9�4>1
4>4�9���$�
8�9��>( 52
65
56
�>,�9�(��
(�$�9�.,,
�� ��������
������ ����������-?���#��������#
D��/�����������#
��������*�
��������*�
"������)��#��*�����#���������&!�)��#��*��!���T
"�����&��*��#��/��8$8
�����
-?���#���
�3�#���*�����#����#�+�?�����#������
Appendix C
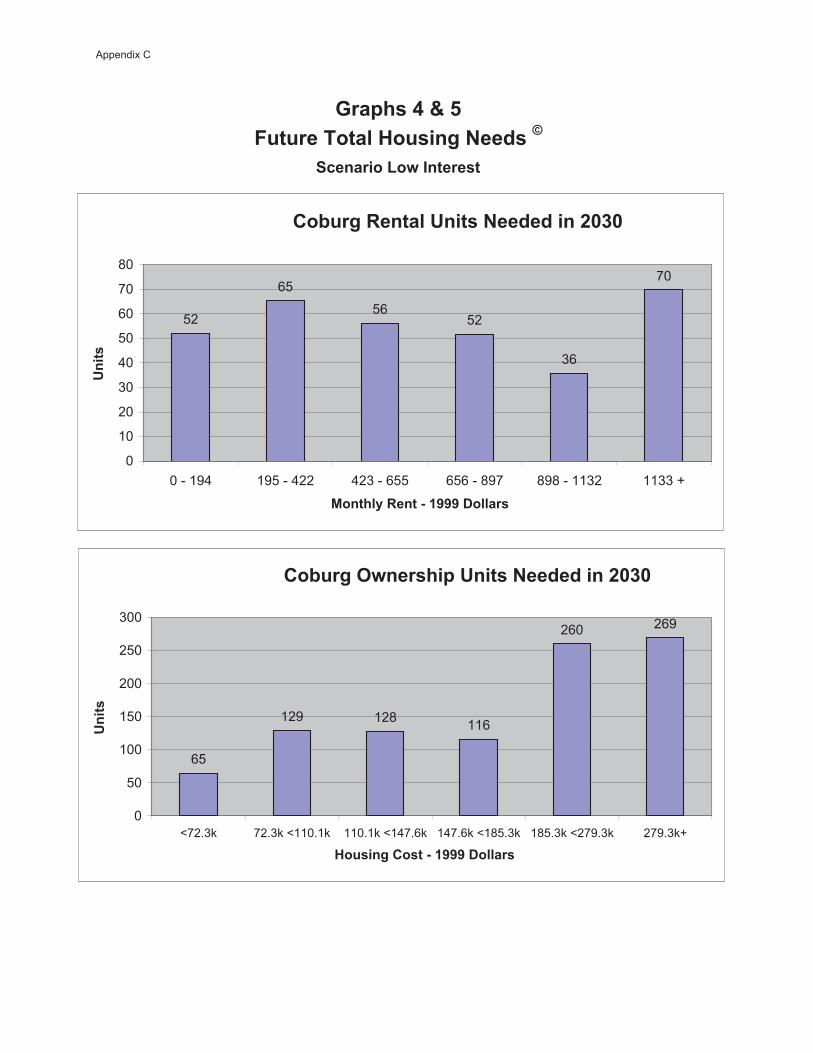
"������������)��#��*�+���#�T2����#�(�M�,
��������'�?�������#�
��&��*� ����������#�+����������8$8
52
6556
52
36
70
0
10
20
30
40
50
60
70
80
0 - 194 195 - 422 423 - 655 656 - 897 898 - 1132 1133 +
������!� ����9��>>>�0�����#
����#
��&��*�-?���#��������#�+����������8$8
65
129 128 116
260 269
0
50
100
150
200
250
300
<72.3k 72.3k <110.1k 110.1k <147.6k 147.6k <185.3k 185.3k <279.3k 279.3k+
)��#��*���#��9��>>>�0�����#
����#
Appendix C
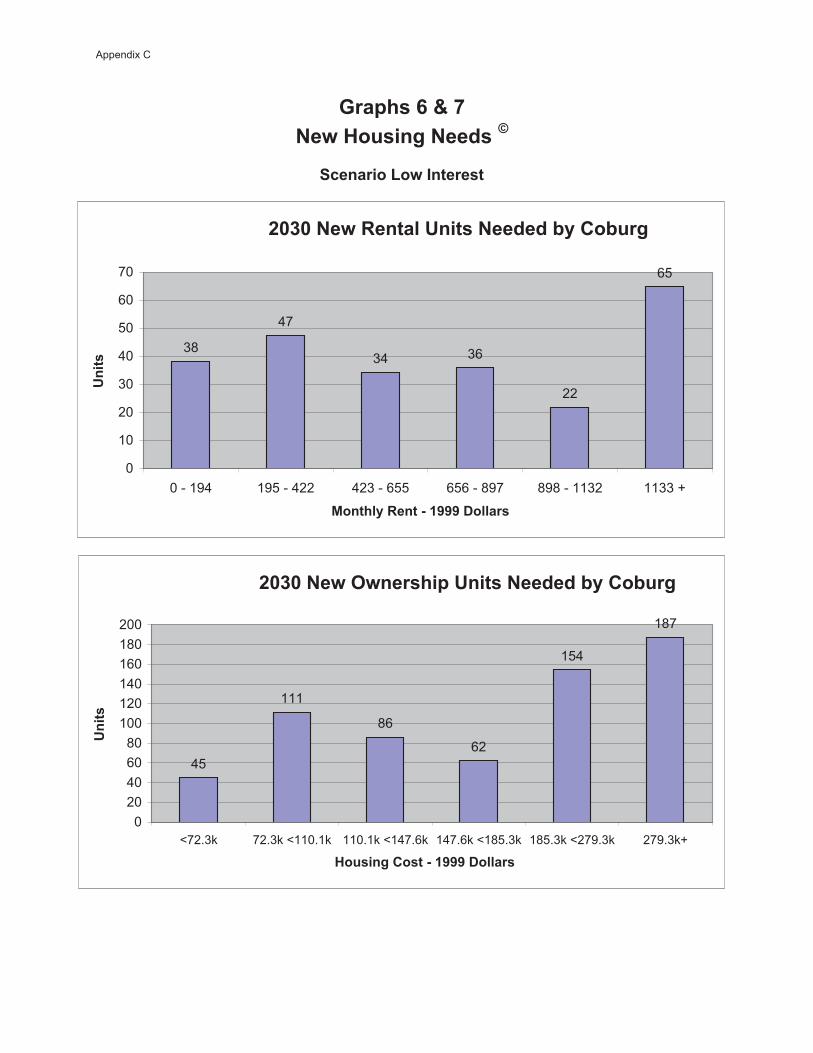
+�?�)��#��*�+���#�T2����#�.�M�1
��������'�?�������#�
�8$8�+�?� ����������#�+������&!���&��*
38
47
34 36
22
65
0
10
20
30
40
50
60
70
0 - 194 195 - 422 423 - 655 656 - 897 898 - 1132 1133 +
������!� ����9��>>>�0�����#
����#
�8$8�+�?�-?���#��������#�+������&!���&��*
45
111
86
62
154
187
020406080
100120140160180200
<72.3k 72.3k <110.1k 110.1k <147.6k 147.6k <185.3k 185.3k <279.3k 279.3k+
)��#��*���#��9��>>>�0�����#
����#
Appendix C
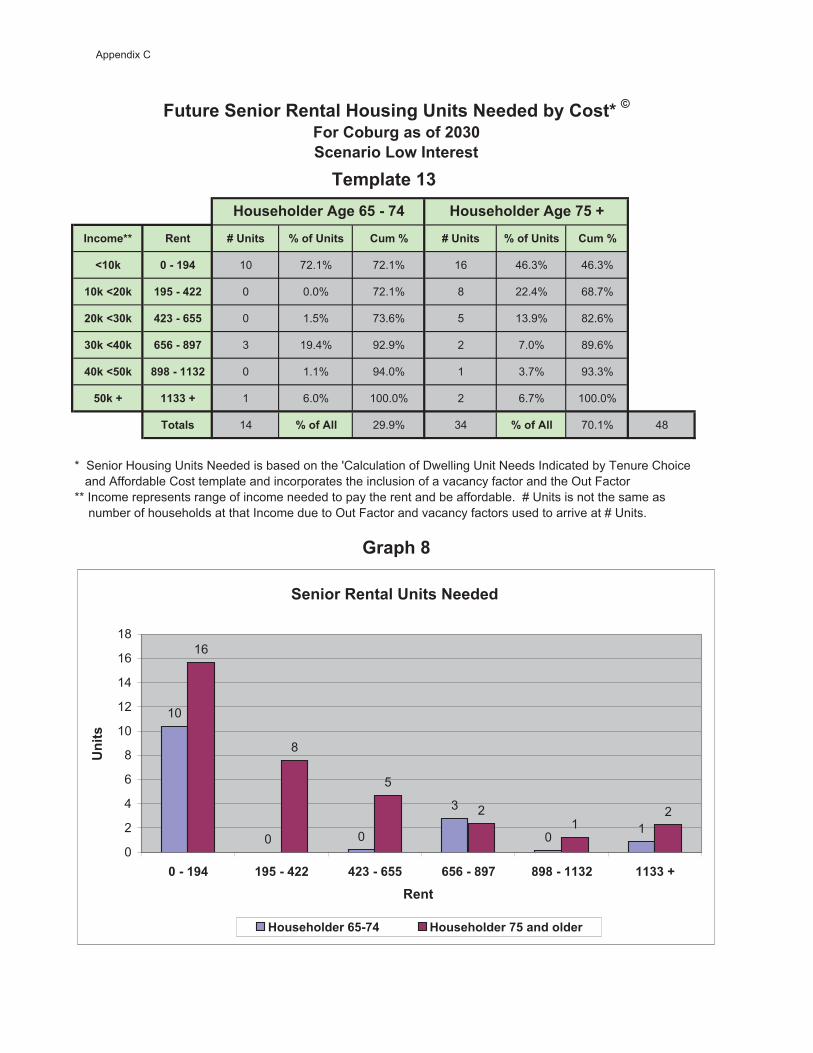
���� �CC ��� V�����# D��/�����# �� �D V�����# D��/�����# �� �D
N�8I 8�9��>( 10 72.1% 72.1% 16 46.3% 46.3%
�8I�N�8I �>,�9�(�� 0 0.0% 72.1% 8 22.4% 68.7%
�8I�N$8I (�$�9�.,, 0 1.5% 73.6% 5 13.9% 82.6%
$8I�N(8I .,.�9�4>1 3 19.4% 92.9% 2 7.0% 89.6%
(8I�N,8I 4>4�9���$� 0 1.1% 94.0% 1 3.7% 93.3%
,8I�B ��$$�B 1 6.0% 100.0% 2 6.7% 100.0%
�����# 14 D��/���� 29.9% 34 D��/���� 70.1% 48
* Senior Housing Units Needed is based on the 'Calculation of Dwelling Unit Needs Indicated by Tenure Choice and Affordable Cost template and incorporates the inclusion of a vacancy factor and the Out Factor** Income represents range of income needed to pay the rent and be affordable. # Units is not the same as number of households at that Income due to Out Factor and vacancy factors used to arrive at # Units.
"������������ ������)��#��*�����#�+������&!���#�C�T
2�����4
)��#���������*��1,�B
"�����&��*��#��/��8$8��������'�?�������#��� �������$
)��#���������*��.,�9�1(
������ ����������#�+�����
10
0 0
3
01
16
8
5
21
2
0
2
4
6
8
10
12
14
16
18
8�9��>( �>,�9�(�� (�$�9�.,, .,.�9�4>1 4>4�9���$� ��$$�B ���
����#
)��#��������.,91( )��#��������1,����������
Appendix C

��� +����������# ��*���"� ��!�����#
����/�����0?�����*����I�����#
0����3�����# ���9E������3�����#,B������9
"� ��!�����# ����������#
8�9��>( 38 0 (0) 0 39 0 38
�>,�9�(�� 47 3 0 13 31 0 47
(�$�9�.,, 34 8 0 14 12 (0) 34
.,.�9�4>1 36 19 0 12 5 0 36
4>4�9���$� 22 18 0 4 0 0 22
��$$�B 65 65 0 0 0 0 65
�����# 242 113 (0) 42 86 0 242
46.9% -0.2% 17.5% 35.7% 0.1% 100.0%
����� +����������# ��*���"� ��!�����#
����/�����0?�����*����I�����#
0����3�����# ���9E������3�����#,B������9
"� ��!�����# ����������#
N1��$I 45 0 0 16 29 0 45
1��$I�N��8��I 111 21 0 32 58 0 111
��8��I�N�(1�.I 86 22 0 51 13 0 86
�(1�.I�N�4,�$I 62 62 0 0 0 0 62
�4,�$I�N�1>�$I 154 154 0 0 0 0 154
�1>�$IB 187 187 0 0 0 0 187
�����# 646 447 0 100 99 0 646
69.1% 0.0% 15.4% 15.4% 0.0% 100.0%
+����������# ��*���"� ��!�����#
����/�����0?�����*����I�����#
0����3�����# ���9E������3�����#,B������9
"� ��!�����# ����������#
�����# 888 560 0 142 186 0 888
63.1% 0.0% 16.0% 20.9% 0.0% 100.0%
Label or data descriptor for data element
A number produced by the model reflecting the data, assumptions, and estimates used in this scenario
�� �������(+�?�)��#��*�����#�+������&!�)��#��*��!���T
"�����&��*��#��/��8$8
+�?� ����������#�+�����
��������'�?�������#�
+�?�-?���#��������#�+�����
������+�?� ����������-?���#��������#
D��/�����������#
��������*�
��������*�
Appendix C
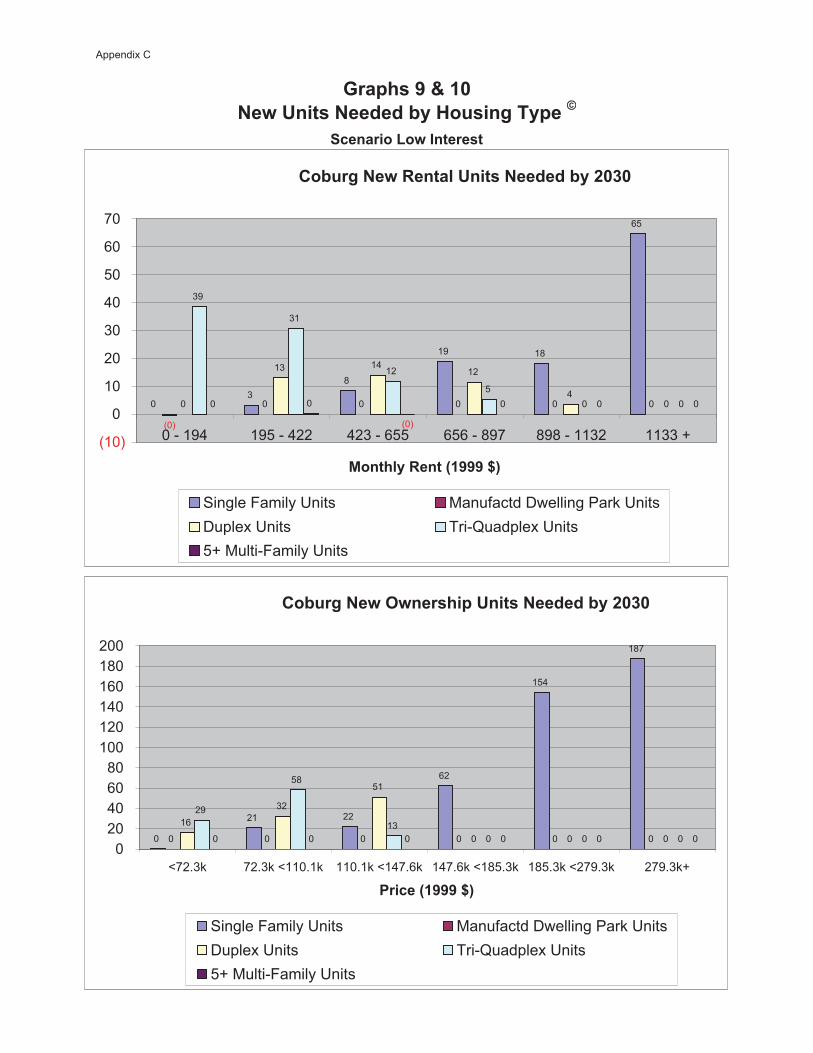
2����#�>�M��8+�?�����#�+������&!�)��#��*��!���T
��������'�?�������#�
��&��*�+�?� ����������#�+������&!��8$8
03
8
19 18
65
(0)
0 0 0 0 00
13 1412
40
39
31
12
50 00 0
(0)
0 0 0
(10)
0
10
20
30
40
50
60
70
0 - 194 195 - 422 423 - 655 656 - 897 898 - 1132 1133 +
������!� ����;�>>>�Q<
Single Family Units Manufactd Dwelling Park UnitsDuplex Units Tri-Quadplex Units5+ Multi-Family Units
��&��*�+�?�-?���#��������#�+������&!��8$8
0
21 22
62
154
187
0 0 0 0 0 0
16
32
51
0 0 0
29
58
130 0 00 0 0 0 0 0
020406080
100120140160180200
<72.3k 72.3k <110.1k 110.1k <147.6k 147.6k <185.3k 185.3k <279.3k 279.3k+
������;�>>>�Q<
Single Family Units Manufactd Dwelling Park UnitsDuplex Units Tri-Quadplex Units5+ Multi-Family Units
Appendix C
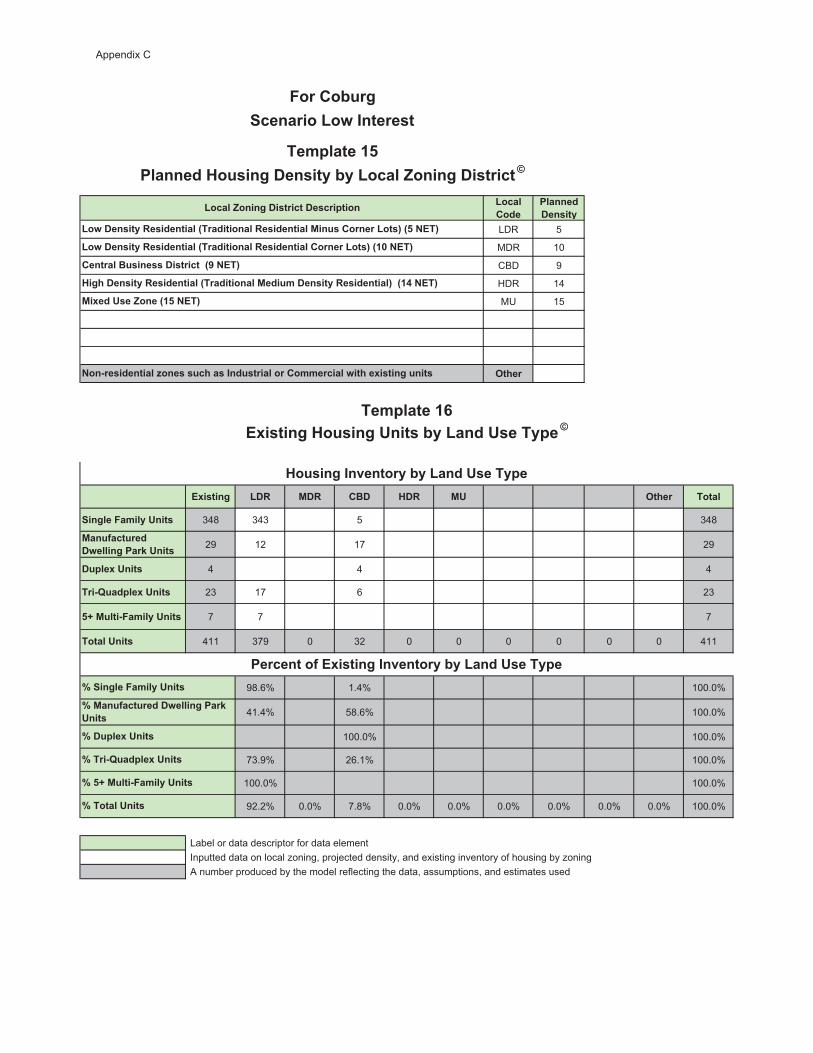
'���������
��������0��#��!
LDR 5
MDR 10
CBD 9
HDR 14
MU 15
-����
�3�#���* '0 �0 �%0 )0 �� -���� �����
��*���"� ��!�����# 348 343 5 348
����/��������0?�����*����I�����# 29 12 17 29
0����3�����# 4 4 4
���9E������3�����# 23 17 6 23
,B������9"� ��!�����# 7 7 7
����������# 411 379 0 32 0 0 0 0 0 0 411
98.6% 1.4% 100.0%
41.4% 58.6% 100.0%
100.0% 100.0%
73.9% 26.1% 100.0%
100.0% 100.0%
92.2% 0.0% 7.8% 0.0% 0.0% 0.0% 0.0% 0.0% 0.0% 100.0%
Label or data descriptor for data element Inputted data on local zoning, projected density, and existing inventory of housing by zoning A number produced by the model reflecting the data, assumptions, and estimates used
��������%�#���##�0�#�������;>�+��<
)�*��0��#��!� �#���������;����������������� �0��#��!� �#��������<��;�(�+��<
�3�#���*�)��#��*�����#�&!�'�����#���!���T�� �������.
"�����&��*
+��9��#���������J���#�#�����#�����#����������� �������?�����3�#���*�����#
��������)��#��*�0��#��!�&!�'�����@����*�0�#������T�� �������,
��������'�?�������#�
'�����@����*�0�#������0�#��������
'�?�0��#��!� �#���������;������������ �#�������������#��������'��#<�;,�+��<
'�?�0��#��!� �#���������;������������ �#����������������'��#<�;�8�+��<
��3����#��@����;�,�+��<
D����9E������3�����#
D�,B������9"� ��!�����#
)��#��*���=�����!�&!�'�����#���!��
D�����������#
���������/��3�#���*���=�����!�&!�'�����#���!��D���*���"� ��!�����#
D�����/��������0?�����*����I�����#
D�0����3�����#
Appendix C

��*���"� ��!�����# ��������# D����'0 D�����0 D�����%0 D����)0 D������ D���� D���� D���� -���� ������D
'�?���������� 33 80.0% 20.0% 0.0% 0.0% 0.0% 100.0%
����������� 121 85.0% 15.0% 0.0% 0.0% 0.0% 100.0%
)�*����������$ 406 100.0% 0.0% 0.0% 100.0%
����� 560 95.6% 4.4% 0.0% 0.0% 0.0% 0.0% 0.0% 0.0% 0.0% 100.0%
98.6% 1.4% 100.0%
�0������# ��������# D����'0 D�����0 D�����%0 D����)0 D������ D���� D���� D���� -���� ������D
'�?���������� 0 0% 100% 100.0%
����������� 0 0.0%
)�*����������$ 0 0.0%
����� 0 0.0% 0.0% 0.0% 100.0% 0.0% 0.0% 0.0% 0.0% 0.0% 100.0%
41.4% 58.6% 100.0%
0����3�����# ��������# D����'0 D�����0 D�����%0 D����)0 D������ D���� D���� D���� -���� ������D
'�?���������� 76 15% 60% 0% 5% 20% 100.0%
����������� 66 20% 65% 0% 7% 8% 100.0%
)�*����������$ 0 0.0%
����� 142 17.3% 62.3% 0.0% 5.9% 14.4% 0.0% 0.0% 0.0% 0.0% 100.0%
100.0% 100.0%
���9E������3�����# ��������# D����'0 D�����0 D�����%0 D����)0 D������ D���� D���� D���� -���� ������D
'�?���������� 168 0% 20% 0% 30% 50% 100.0%
����������� 18 0% 38% 23% 39% 100.0%
)�*����������$ 0 0.0%
����� 186 0.0% 21.8% 0.0% 29.3% 48.9% 0.0% 0.0% 0.0% 0.0% 100.0%
73.9% 26.1% 100.0%
,B������9"� ��!�����# ��������# D����'0 D�����0 D�����%0 D����)0 D������ D���� D���� D���� -���� ������D
'�?���������� 0 0% 0% 0% 0% 0.0%
����������� 0 0% 0% 0% 0.0%
)�*����������$ 0 0.0%
����� 0 0.0% 0.0% 0.0% 0.0% 0.0% 0.0% 0.0% 0.0% 0.0% 0.0%
100.0% 100.0%
1 - Lower Priced units are the rental or ownership units affordable at incomes less than $30,0002 - Mid Priced units are the rental or ownership units affordable at incomes between $30,000 and $50,0003 - Higher Priced units are the rental or ownership units affordable at incomes over $50,000
Label or data descriptor for data element
Projected percentage of new housing units that will be built in this land use type
A number produced by the model reflecting the data, assumptions, and estimates used
�3�#���*�0�#���&�����
�3�#���*�0�#���&�����
�3�#���*�0�#���&�����
�3�#���*�0�#���&�����
�� �������1
��������'�?�������#�
"�����&��*��#��/��8$8
�3�#���*�0�#���&�����
���H������0�#���&�������/�+�?�)��#��*�&!�'�����#���!���T
Appendix C
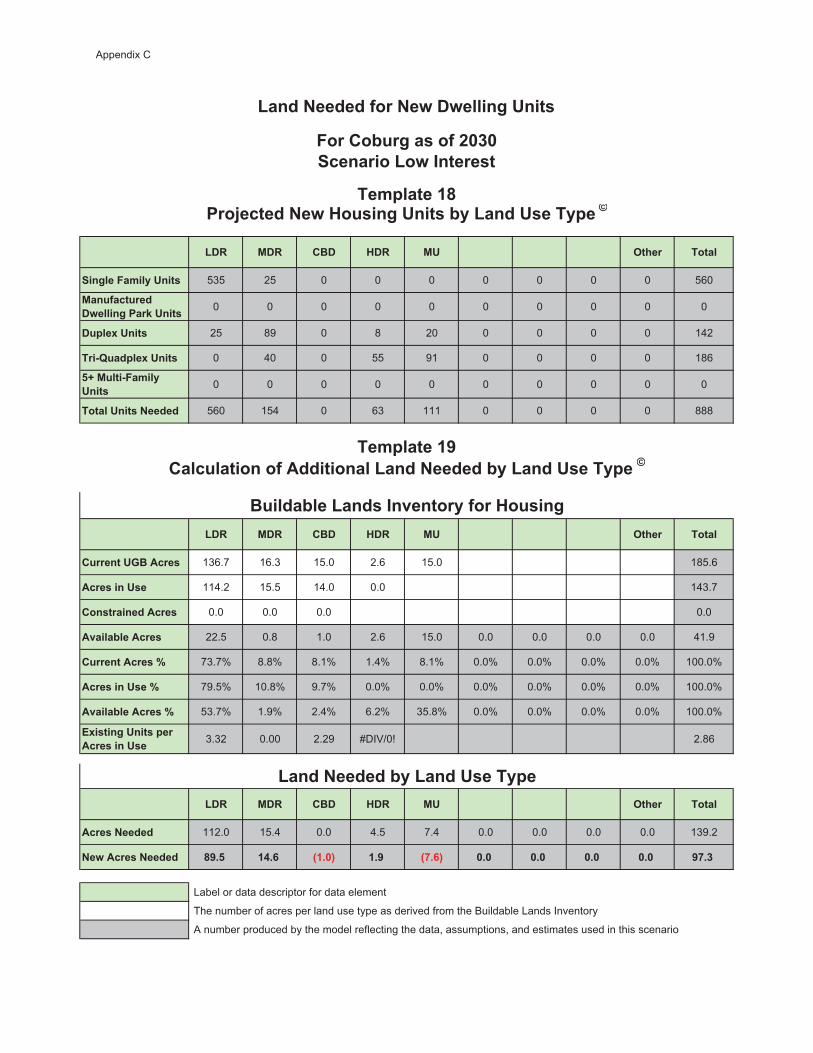
'0 �0 �%0 )0 �� -���� �����
��*���"� ��!�����# 535 25 0 0 0 0 0 0 0 560
����/��������0?�����*����I�����# 0 0 0 0 0 0 0 0 0 0
0����3�����# 25 89 0 8 20 0 0 0 0 142
���9E������3�����# 0 40 0 55 91 0 0 0 0 186
,B������9"� ��!�����# 0 0 0 0 0 0 0 0 0 0
����������#�+����� 560 154 0 63 111 0 0 0 0 888
'0 �0 �%0 )0 �� -���� �����
���������2%�����# 136.7 16.3 15.0 2.6 15.0 185.6
����#�����#� 114.2 15.5 14.0 0.0 143.7
���#������������# 0.0 0.0 0.0 0.0
�=����&�������# 22.5 0.8 1.0 2.6 15.0 0.0 0.0 0.0 0.0 41.9
������������#�D 73.7% 8.8% 8.1% 1.4% 8.1% 0.0% 0.0% 0.0% 0.0% 100.0%
����#�����#��D 79.5% 10.8% 9.7% 0.0% 0.0% 0.0% 0.0% 0.0% 0.0% 100.0%
�=����&�������#�D 53.7% 1.9% 2.4% 6.2% 35.8% 0.0% 0.0% 0.0% 0.0% 100.0%
�3�#���*�����#���������#�����#� 3.32 0.00 2.29 #DIV/0! 2.86
'0 �0 �%0 )0 �� -���� �����
����#�+����� 112.0 15.4 0.0 4.5 7.4 0.0 0.0 0.0 0.0 139.2
+�?�����#�+����� 4>�, �(�. ;��8< ��> ;1�.< 8�8 8�8 8�8 8�8 >1�$
Label or data descriptor for data element
The number of acres per land use type as derived from the Buildable Lands Inventory
A number produced by the model reflecting the data, assumptions, and estimates used in this scenario
'����+������&!�'�����#���!��
���H������+�?�)��#��*�����#�&!�'�����#���!���T
%�����&���'���#���=�����!�/���)��#��*
�� �������>�������������/������������'����+������&!�'�����#���!���T
'����+������/���+�?�0?�����*�����#
"�����&��*��#��/��8$8��������'�?�������#�
�� �������4
Appendix C
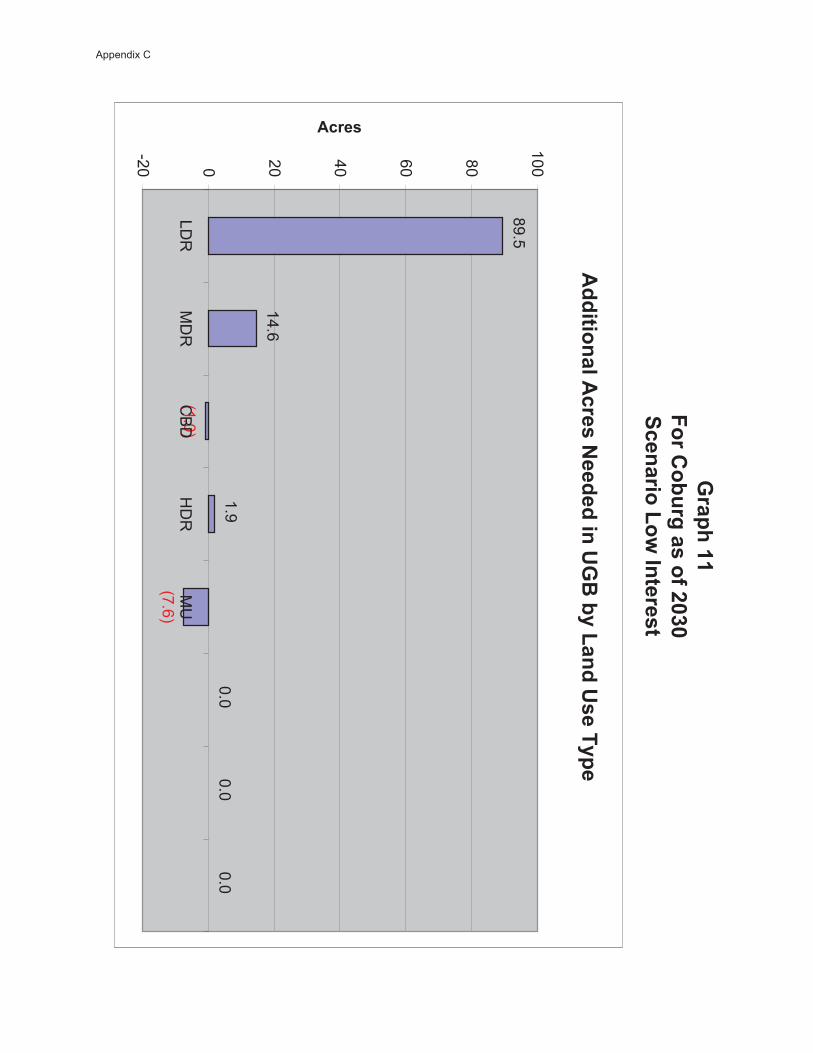
2�������
��������'�?�������#�
"�����&��*��#��/��8$8
������������
���#�+����������
2%�&!�'�����
#���!��
89.5
14.6
(1.0)
1.9
(7.6)
0.00.0
0.0
-20 0 20 40 60 80
100
LDR
MD
RC
BD
HD
RM
U
����#
Appendix C

0�9(
Less than $200
$200-399$400-449
$450-649$650-899
$900-999$1000-1249
$1250-1499
$1500-1999
$2000+N
o cash rent
Median
(dollars)67
05
037
155
30
20
0577
0�9(
0�9$
<$60k$60 <80k
$80 <100k$100<125k
$125<150k
$150<175k
$175k<200
$200k<250
$250k<300
$300k+M
edian(dollars)
MedianH
HI
29536
1123
2254
3629
3932
13165,600
47,5003.49
Rentals
0 - 194195 - 422
423 - 655656 - 897
898 - 11321133 +
Ow
ners<72.3k
72.3k<110.1k
110.1k<147.6k
147.6k<185.3k
185.3k<279.3k
279.3k+
670
537
157
3295
4335
6353
7626
Percent
0.0%7.5%
55.7%21.7%
10.1%5.0%
Percent
14.4%11.9%
21.3%18.0%
25.6%8.7%
10517
2018
1512
24298
2040
3836
8282
15.8%18.9%
17.5%13.8%
11.0%22.9%
6.8%13.4%
12.8%12.1%
27.4%27.5%
780
644
178
476
11376
30945
3766
5579
27300
Renters
0 - 194195 - 422
423 - 655656 - 897
898 - 11321133 +
Totalrental gap
Ow
ners<72.3k
72.3k<110.1k
110.1k<147.6k
147.6k<185.3k
185.3k<279.3k
279.3k+Total ow
ner gap
2000 Gap
1714
-25-2
420
272000 G
ap-24
3-28
-193
55-10
Future Need
5265
5652
3670
33165
129128
116260
269968
Future Gap
5260
1335
2866
25320
9362
61181
242659
Occupiedunits
Vacantunits
SR
Ovacantunits
Availableunits
Lackingplum
bingLackingkitchen
Net
availableunits
Ow
neroccupied
units
Renter
occupiedunits
Ow
nervacancy
rate
Renter
vacancyrate
36720
0387
00
387295
721.70%
5.30%D
P-1
DP
-1D
P-1
DP
-4D
P-4
DP
-1D
P-1
DP
-1D
P-1
�������
���#-?���#�����
���#
�**��*������
��#�#��������������������������#
�3��������������#�#����������#��
�����)��#��*����I
)��#��*��
�����"�������#�� ������
���#�+������;/��
��� ��������<
�888��#�� �����)
��#��*�+���#
)��#��*��
������#�� ������
���#�+�����
�� �������8
Rentals
Ow
ners ������/���������))�
2��##�
����;).������
��%�,8.$<
�����;)4(�����
��E�9)�(����%
�,81,<
)��#��*��
��I�������!#�#
"�����&��*��#��/�0
��� &����8�8
�#��*��
��#�#��888�� ��!�"���#�������$�����
��������
� ����!���=�!�0
����?����)
��#��*��������#��
�����+���#
��������'�?�������#�
Appendix C
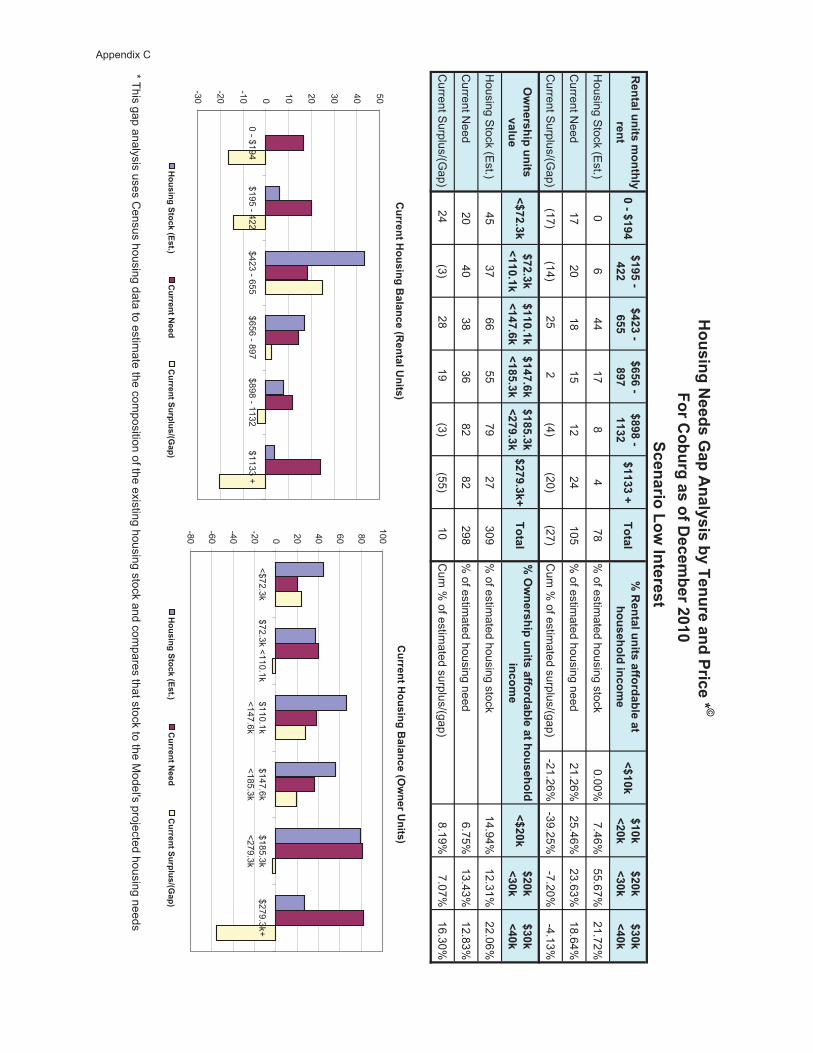
����������#�
�����!�����
8�9�Q�>(Q�>,�9�(��
Q(�$�9�.,,
Q.,.�9�4>1
Q4>4�9���$�
Q��$$�B�����
D� ����������#��//����&���������#����������
�NQ�8I
Q�8I�N�8I
Q�8I�N$8I
Q$8I�N(8I
Housing S
tock (Est.)
06
4417
84
78%
of estimated housing stock
0.00%7.46%
55.67%21.72%
Current N
eed17
2018
1512
24105
% of estim
ated housing need21.26%
25.46%23.63%
18.64%
Current S
urplus/(Gap)
(17)(14)
252
(4)(20)
(27)C
um %
of estimated surplus/(gap)
-21.26%-39.25%
-7.20%-4.13%
-?���#��������#�=����
NQ1��$IQ1��$I�N��8��I
Q��8��I�N�(1�.I
Q�(1�.I�N�4,�$I
Q�4,�$I�N�1>�$I
Q�1>�$IB�����
NQ�8IQ�8I�N$8I
Q$8I�N(8I
Housing S
tock (Est.)
4537
6655
7927
309%
of estimated housing stock
14.94%12.31%
22.06%
Current N
eed20
4038
3682
82298
% of estim
ated housing need6.75%
13.43%12.83%
Current S
urplus/(Gap)
24(3)
2819
(3)(55)
10C
um %
of estimated surplus/(gap)
8.19%7.07%
16.30%
* This gap analysis uses Census housing data to estim
ate the composition of the existing housing stock and com
pares that stock to the Model's projected housing needs
)��#��*�+
���#�2����
���!#�#�&!������������������C T
"�����&��*��#��/�0
��� &����8�8
D�-?���#��������#��//����&���������#������
���� �
��������'�?�������#�
��������)
��#��*�%�������;
����������#<
-30
-20
-10 0 10 20 30 40 50
0 - $194$195 - 422
$423 - 655$656 - 897
$898 - 1132$1133 +
)��#��*����I�;�#��<
��������+
����������������#A;2
��<
��������)
��#��*�%�������;-
?�����
���#<
-80
-60
-40
-20 0 20 40 60 80
100
<$72.3k$72.3k <110.1k
$110.1k<147.6k
$147.6k<185.3k
$185.3k<279.3k
$279.3k+
)��#��*����I�;�#��<
��������+
����������������#A;2
��<
Appendix C
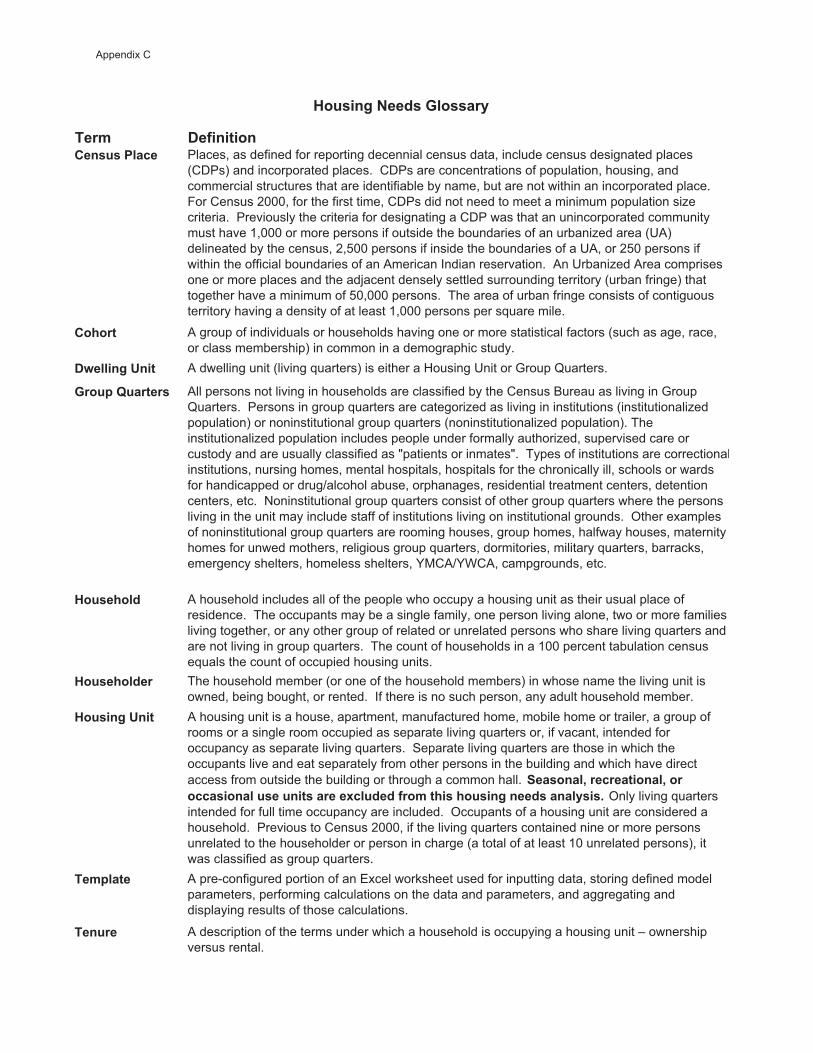
��� 0�/����������#�#������ Places, as defined for reporting decennial census data, include census designated places
(CDPs) and incorporated places. CDPs are concentrations of population, housing, and commercial structures that are identifiable by name, but are not within an incorporated place.For Census 2000, for the first time, CDPs did not need to meet a minimum population size criteria. Previously the criteria for designating a CDP was that an unincorporated community must have 1,000 or more persons if outside the boundaries of an urbanized area (UA) delineated by the census, 2,500 persons if inside the boundaries of a UA, or 250 persons if within the official boundaries of an American Indian reservation. An Urbanized Area comprises one or more places and the adjacent densely settled surrounding territory (urban fringe) that together have a minimum of 50,000 persons. The area of urban fringe consists of contiguous territory having a density of at least 1,000 persons per square mile.
������ A group of individuals or households having one or more statistical factors (such as age, race, or class membership) in common in a demographic study.
0?�����*����� A dwelling unit (living quarters) is either a Housing Unit or Group Quarters.
2�����E������# All persons not living in households are classified by the Census Bureau as living in Group Quarters. Persons in group quarters are categorized as living in institutions (institutionalized population) or noninstitutional group quarters (noninstitutionalized population). The institutionalized population includes people under formally authorized, supervised care or custody and are usually classified as "patients or inmates". Types of institutions are correctionalinstitutions, nursing homes, mental hospitals, hospitals for the chronically ill, schools or wards for handicapped or drug/alcohol abuse, orphanages, residential treatment centers, detention centers, etc. Noninstitutional group quarters consist of other group quarters where the persons living in the unit may include staff of institutions living on institutional grounds. Other examples of noninstitutional group quarters are rooming houses, group homes, halfway houses, maternity homes for unwed mothers, religious group quarters, dormitories, military quarters, barracks, emergency shelters, homeless shelters, YMCA/YWCA, campgrounds, etc.
)��#����� A household includes all of the people who occupy a housing unit as their usual place of residence. The occupants may be a single family, one person living alone, two or more families living together, or any other group of related or unrelated persons who share living quarters and are not living in group quarters. The count of households in a 100 percent tabulation census equals the count of occupied housing units.
)��#������� The household member (or one of the household members) in whose name the living unit is owned, being bought, or rented. If there is no such person, any adult household member.
)��#��*����� A housing unit is a house, apartment, manufactured home, mobile home or trailer, a group of rooms or a single room occupied as separate living quarters or, if vacant, intended for occupancy as separate living quarters. Separate living quarters are those in which the occupants live and eat separately from other persons in the building and which have direct access from outside the building or through a common hall. ��#����7�������������7��������#�������#������#������3�������/�� ����#����#��*�����#�����!#�#� Only living quarters intended for full time occupancy are included. Occupants of a housing unit are considered a household. Previous to Census 2000, if the living quarters contained nine or more persons unrelated to the householder or person in charge (a total of at least 10 unrelated persons), it was classified as group quarters.
�� ����� A pre-configured portion of an Excel worksheet used for inputting data, storing defined model parameters, performing calculations on the data and parameters, and aggregating and displaying results of those calculations.
������ A description of the terms under which a household is occupying a housing unit – ownership versus rental.
)��#��*�+���#�2��##��!
Appendix C
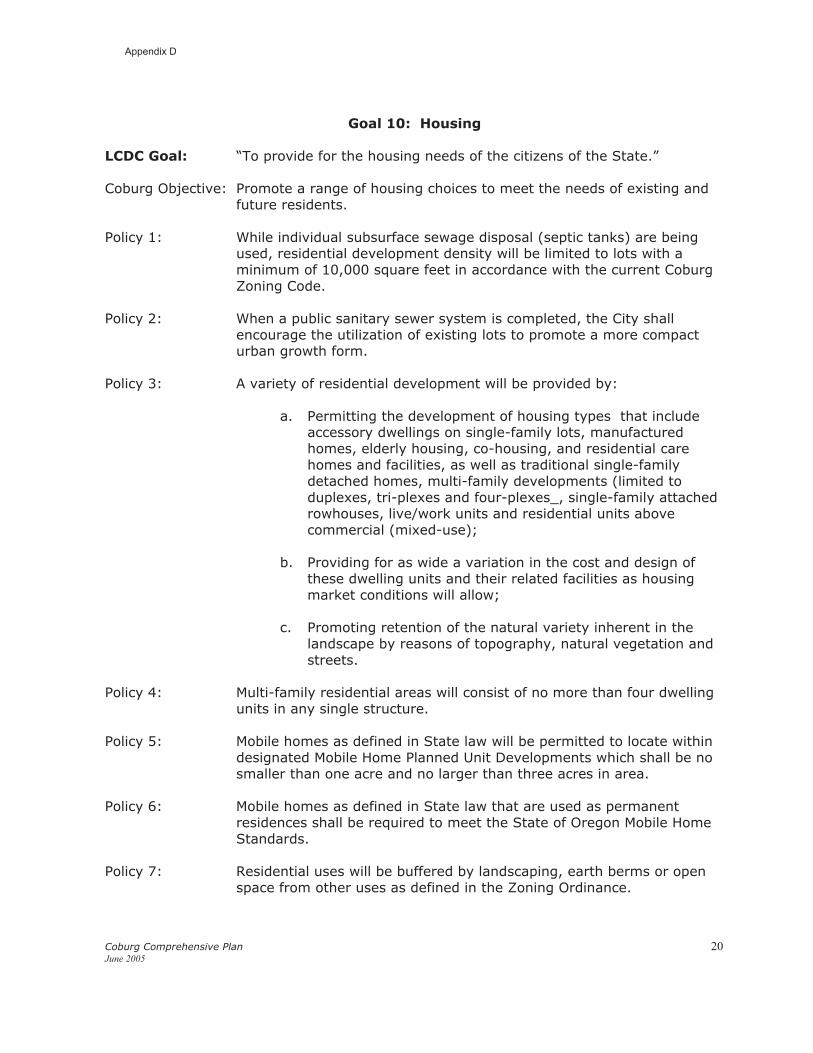
Coburg Comprehensive Plan 20June 2005
Goal 10: Housing
LCDC Goal: “To provide for the housing needs of the citizens of the State.”
Coburg Objective: Promote a range of housing choices to meet the needs of existing and future residents.
Policy 1: While individual subsurface sewage disposal (septic tanks) are being
used, residential development density will be limited to lots with a minimum of 10,000 square feet in accordance with the current Coburg Zoning Code.
Policy 2: When a public sanitary sewer system is completed, the City shall encourage the utilization of existing lots to promote a more compact urban growth form.
Policy 3: A variety of residential development will be provided by:
a. Permitting the development of housing types that include accessory dwellings on single-family lots, manufactured homes, elderly housing, co-housing, and residential care homes and facilities, as well as traditional single-family detached homes, multi-family developments (limited to duplexes, tri-plexes and four-plexes_, single-family attached rowhouses, live/work units and residential units above commercial (mixed-use);
b. Providing for as wide a variation in the cost and design of these dwelling units and their related facilities as housing market conditions will allow;
c. Promoting retention of the natural variety inherent in the landscape by reasons of topography, natural vegetation and streets.
Policy 4: Multi-family residential areas will consist of no more than four dwelling units in any single structure.
Policy 5: Mobile homes as defined in State law will be permitted to locate within designated Mobile Home Planned Unit Developments which shall be no smaller than one acre and no larger than three acres in area.
Policy 6: Mobile homes as defined in State law that are used as permanent residences shall be required to meet the State of Oregon Mobile Home Standards.
Policy 7: Residential uses will be buffered by landscaping, earth berms or open space from other uses as defined in the Zoning Ordinance.
Appendix D
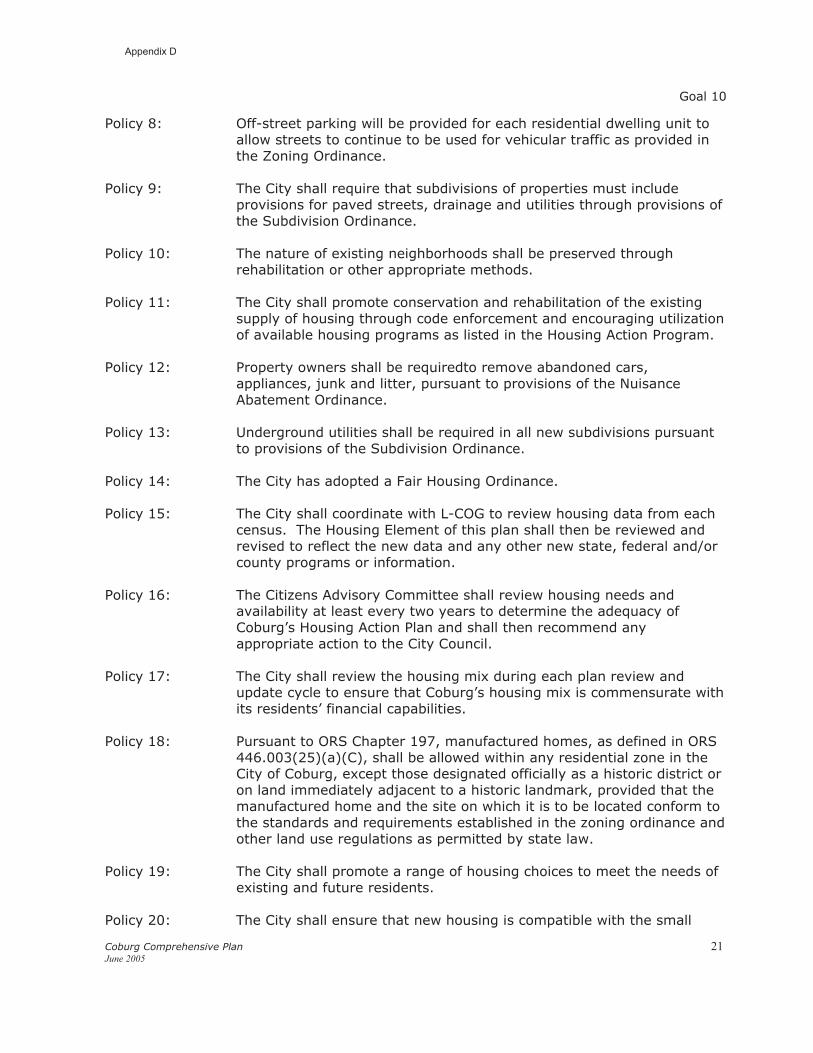
Goal 10
Coburg Comprehensive Plan 21June 2005
Policy 8: Off-street parking will be provided for each residential dwelling unit to allow streets to continue to be used for vehicular traffic as provided in the Zoning Ordinance.
Policy 9: The City shall require that subdivisions of properties must include provisions for paved streets, drainage and utilities through provisions of the Subdivision Ordinance.
Policy 10: The nature of existing neighborhoods shall be preserved through rehabilitation or other appropriate methods.
Policy 11: The City shall promote conservation and rehabilitation of the existing supply of housing through code enforcement and encouraging utilization of available housing programs as listed in the Housing Action Program.
Policy 12: Property owners shall be requiredto remove abandoned cars, appliances, junk and litter, pursuant to provisions of the Nuisance Abatement Ordinance.
Policy 13: Underground utilities shall be required in all new subdivisions pursuant to provisions of the Subdivision Ordinance.
Policy 14: The City has adopted a Fair Housing Ordinance.
Policy 15: The City shall coordinate with L-COG to review housing data from each census. The Housing Element of this plan shall then be reviewed and revised to reflect the new data and any other new state, federal and/or county programs or information.
Policy 16: The Citizens Advisory Committee shall review housing needs and availability at least every two years to determine the adequacy of Coburg’s Housing Action Plan and shall then recommend any appropriate action to the City Council.
Policy 17: The City shall review the housing mix during each plan review and update cycle to ensure that Coburg’s housing mix is commensurate with its residents’ financial capabilities.
Policy 18: Pursuant to ORS Chapter 197, manufactured homes, as defined in ORS 446.003(25)(a)(C), shall be allowed within any residential zone in the City of Coburg, except those designated officially as a historic district or on land immediately adjacent to a historic landmark, provided that the manufactured home and the site on which it is to be located conform to the standards and requirements established in the zoning ordinance and other land use regulations as permitted by state law.
Policy 19: The City shall promote a range of housing choices to meet the needs of existing and future residents.
Policy 20: The City shall ensure that new housing is compatible with the small
Appendix D

Goal 10
Coburg Comprehensive Plan 22June 2005
town, historic character of the community.
Policy 21: The City shall promote livability and community in existing and future neighborhoods.
Policy 22: The City shall promote the development of single-family housing that is affordable for families of elementary school children and compatible with the small town, historic character of the community in order to help retain an elementary school.
Policy 23: The City shall improve housing options for seniors, young adults, and people who work in the community by promoting a variety of multi-family housing types and levels of affordability that are compatible with the small town, historic character of the community.
Policy 24: The City shall encourage the preservation and incorporation of natural features and open space in new residential developments.
Policy 25: The City shall encourage the preservation of existing housing, particularly housing with historic value and features.
Policy 26: The City shall encourage the incorporation of energy and water efficiency standards in the existing housing stock.
Policy 27: The City shall encourage a compatible mix of housing types and services in residential areas.
Policy 28: The City shall encourage new housing to radiate out from the city center and discourage leapfrog development in order to promote connectivity and community interaction.
Policy 29: The City shall consider a range of tools to meet the housing needs of present and future residents, including (but not limited to) multiple residential zones, mixed-use zones, sufficient land to meet identified housing needs, appropriate minimum lot sizes, and accessory dwelling units.
Policy 30: The City shall adopt strategies to achieve a housing mix of single-family and multifamily dwellings. This mix, along with a range of minimum densities, will allow the City to meet an overall density of 6.5 dwelling units per net acre for new housing.
Policy 31: The City shall implement strategies to meet planned densities, while maintaining the City’s unique character through encouraging design that fits with Coburg’s existing neighborhoods.
Policy 32: New residential areas (outside the historic core) will be developed as complete, walkable neighborhoods.
Policy 33: Neighborhoods are the organizing form for residential use in Coburg.
Appendix D
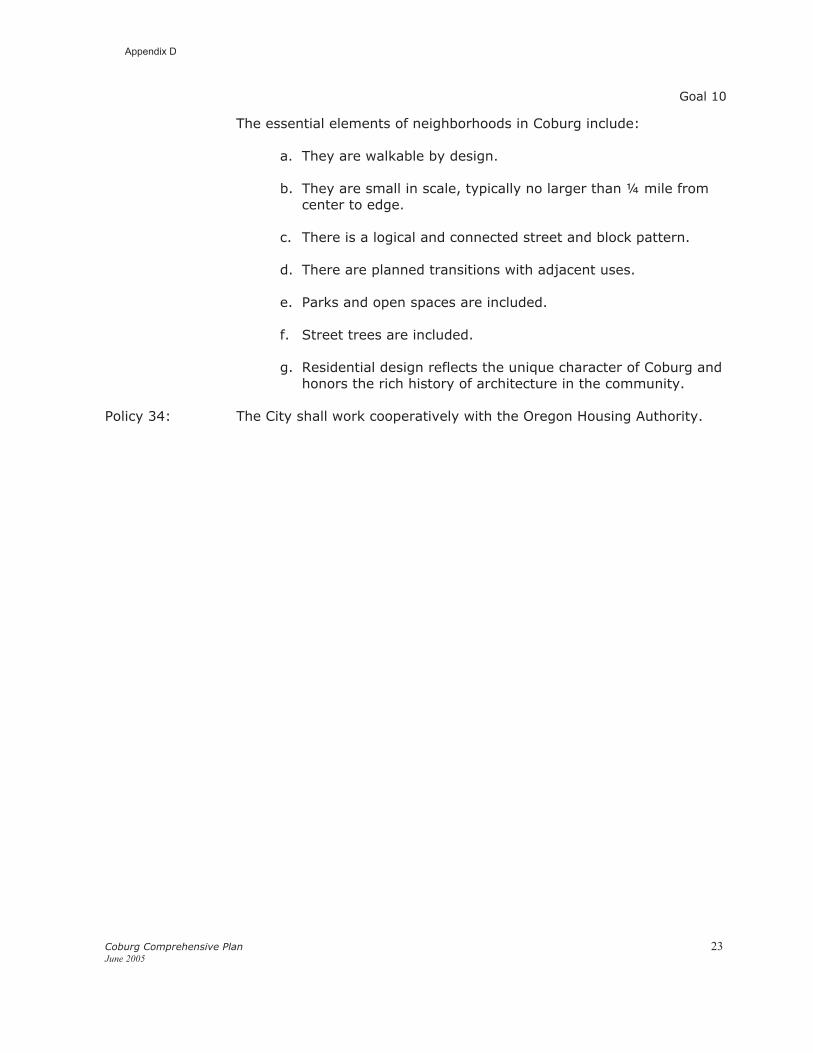
Goal 10
Coburg Comprehensive Plan 23June 2005
The essential elements of neighborhoods in Coburg include:
a. They are walkable by design.
b. They are small in scale, typically no larger than ¼ mile from center to edge.
c. There is a logical and connected street and block pattern.
d. There are planned transitions with adjacent uses.
e. Parks and open spaces are included.
f. Street trees are included.
g. Residential design reflects the unique character of Coburg and honors the rich history of architecture in the community.
Policy 34: The City shall work cooperatively with the Oregon Housing Authority.
Appendix D
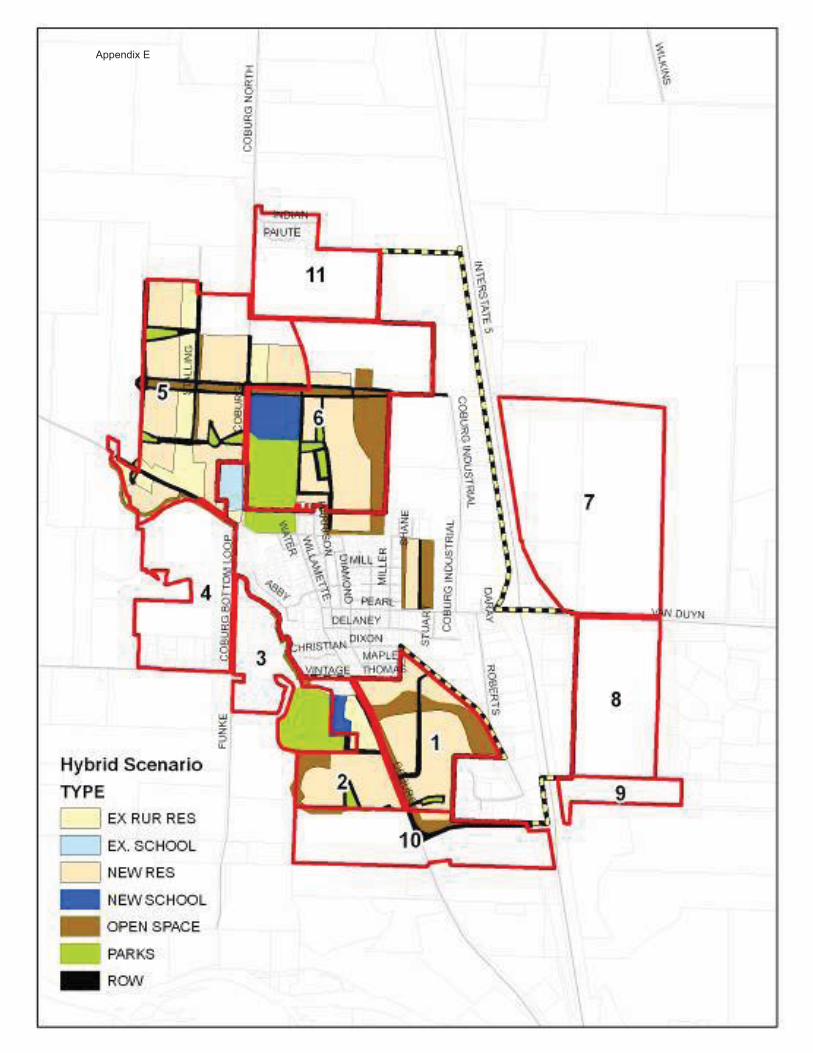
Appendix E

Appendix E
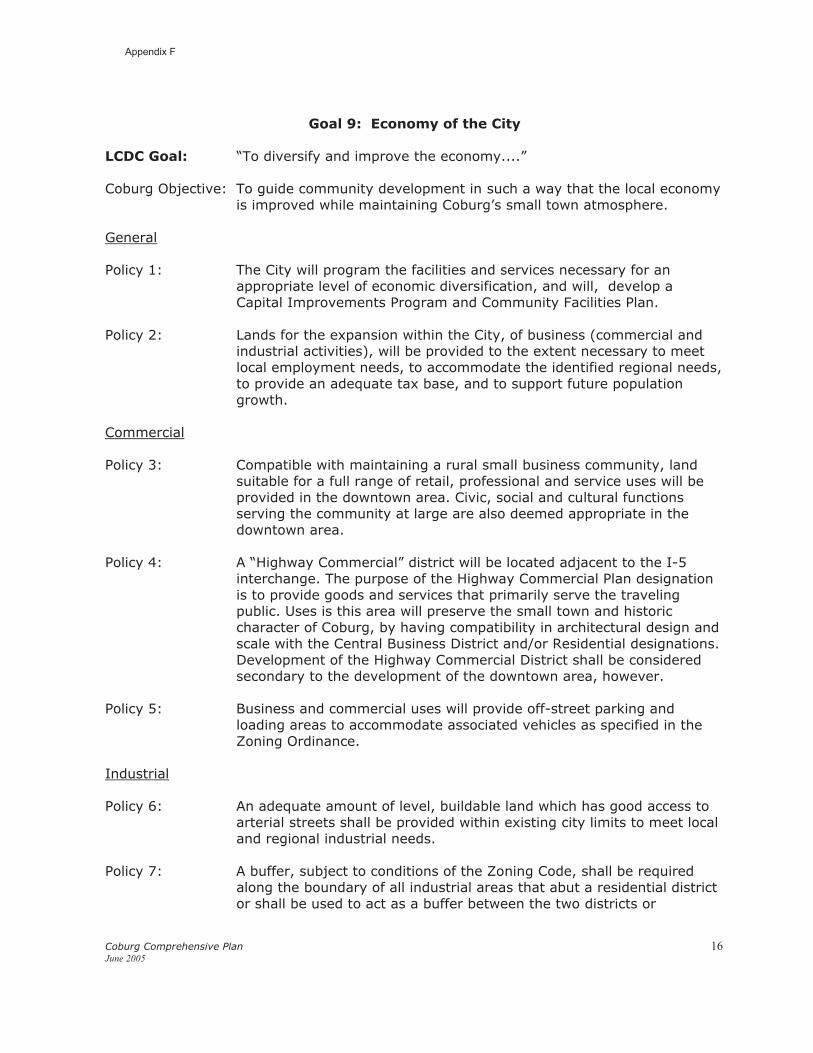
Coburg Comprehensive Plan 16June 2005
Goal 9: Economy of the City
LCDC Goal: “To diversify and improve the economy....”
Coburg Objective: To guide community development in such a way that the local economy is improved while maintaining Coburg’s small town atmosphere.
General
Policy 1: The City will program the facilities and services necessary for an appropriate level of economic diversification, and will, develop a Capital Improvements Program and Community Facilities Plan.
Policy 2: Lands for the expansion within the City, of business (commercial and industrial activities), will be provided to the extent necessary to meet local employment needs, to accommodate the identified regional needs, to provide an adequate tax base, and to support future population growth.
Commercial
Policy 3: Compatible with maintaining a rural small business community, land suitable for a full range of retail, professional and service uses will be provided in the downtown area. Civic, social and cultural functions serving the community at large are also deemed appropriate in the downtown area.
Policy 4: A “Highway Commercial” district will be located adjacent to the I-5 interchange. The purpose of the Highway Commercial Plan designation is to provide goods and services that primarily serve the traveling public. Uses is this area will preserve the small town and historic character of Coburg, by having compatibility in architectural design and scale with the Central Business District and/or Residential designations. Development of the Highway Commercial District shall be considered secondary to the development of the downtown area, however.
Policy 5: Business and commercial uses will provide off-street parking and loading areas to accommodate associated vehicles as specified in the Zoning Ordinance.
Industrial
Policy 6: An adequate amount of level, buildable land which has good access to arterial streets shall be provided within existing city limits to meet local and regional industrial needs.
Policy 7: A buffer, subject to conditions of the Zoning Code, shall be required along the boundary of all industrial areas that abut a residential district or shall be used to act as a buffer between the two districts or
Appendix F

Goal 9
Coburg Comprehensive Plan 17June 2005
conflicting uses. Setback requirements of the Zoning Code shall also reflect buffering needs.
Policy 8: Industrial uses shall be grouped together within well-designated industrial parks or subdivisions so as to promote:
� A pollution free environment; � The highest aesthetic standards possible; � Minimum impact on adjacent lands; � Development within the constraints of the natural environment; and � Compliance with LCDC Goals and Guidelines.
Policy 9: Public facilities, including water, streets and fire and police protection, already exist which are capable of meeting the needs of expanded commercial and industrial development within the Urban Growth Boundary.
Jobs and the Economy
Policy 10: The City shall promote a diverse economy that continues to support a strong tax base for the community.
Policy 11: The City shall promote quality of life and compatibility of commercial and industrial uses with the small town, historic character of the community.
Policy 12: The City shall coordinate with state and regional economic development organizations to ensure the City’s goal of economic diversity is considered in business recruitment strategies that affect Coburg.
Policy 13: The City shall foster a business environment and land use system that meet a variety of residents’ needs for goods and services, to reduce daily travel to Eugene, while maintaining Coburg’s small town character.
Policy 14: The City shall encourage environmentally friendly, low-polluting industries.
Policy 15: The City shall support existing businesses.
Policy 16: The City shall support efforts to create high-wage jobs in Coburg by the following:
a. Coordinate with other economic development organizations to develop a coherent and effective marketing program
b. Develop incentives to retain and expand existing firms
Appendix F
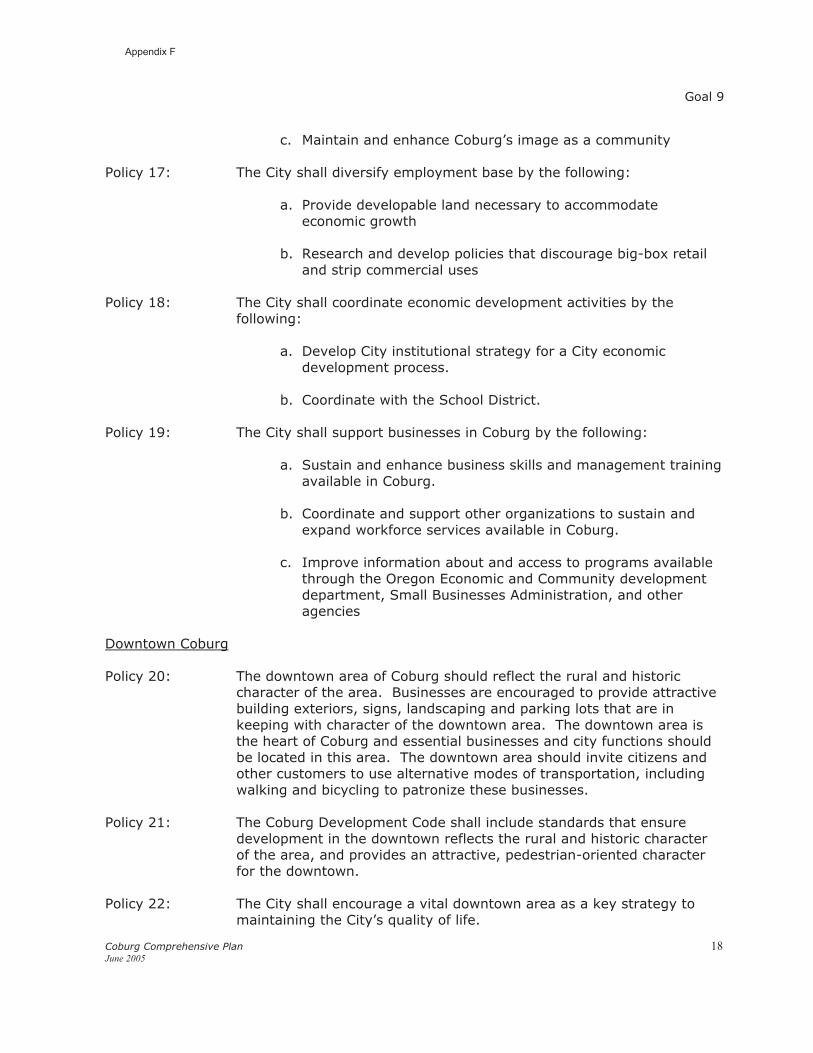
Goal 9
Coburg Comprehensive Plan 18June 2005
c. Maintain and enhance Coburg’s image as a community
Policy 17: The City shall diversify employment base by the following:
a. Provide developable land necessary to accommodate economic growth
b. Research and develop policies that discourage big-box retail and strip commercial uses
Policy 18: The City shall coordinate economic development activities by the following:
a. Develop City institutional strategy for a City economic development process.
b. Coordinate with the School District.
Policy 19: The City shall support businesses in Coburg by the following:
a. Sustain and enhance business skills and management training available in Coburg.
b. Coordinate and support other organizations to sustain and expand workforce services available in Coburg.
c. Improve information about and access to programs available through the Oregon Economic and Community development department, Small Businesses Administration, and otheragencies
Downtown Coburg
Policy 20: The downtown area of Coburg should reflect the rural and historiccharacter of the area. Businesses are encouraged to provide attractive building exteriors, signs, landscaping and parking lots that are in keeping with character of the downtown area. The downtown area is the heart of Coburg and essential businesses and city functions should be located in this area. The downtown area should invite citizens and other customers to use alternative modes of transportation, including walking and bicycling to patronize these businesses.
Policy 21: The Coburg Development Code shall include standards that ensure development in the downtown reflects the rural and historic character of the area, and provides an attractive, pedestrian-oriented character for the downtown.
Policy 22: The City shall encourage a vital downtown area as a key strategy to maintaining the City’s quality of life.
Appendix F
Goal 9
Coburg Comprehensive Plan 19June 2005
Policy 23: The City shall encourage mixed-use in the Central Business District, and where appropriate, in adjacent areas.
Policy 24: The City shall encourage small-scale downtown commercial uses that are pedestrian-friendly and compatible with the community’s small town, historic character.
Policy 25:
Other
Policy 26: The City shall utilize design standards for commercial and industrial development uses.
Policy 27: The City shall require screening, buffering and other measures to minimize visual nuisances and unsightly yards.
Appendix F
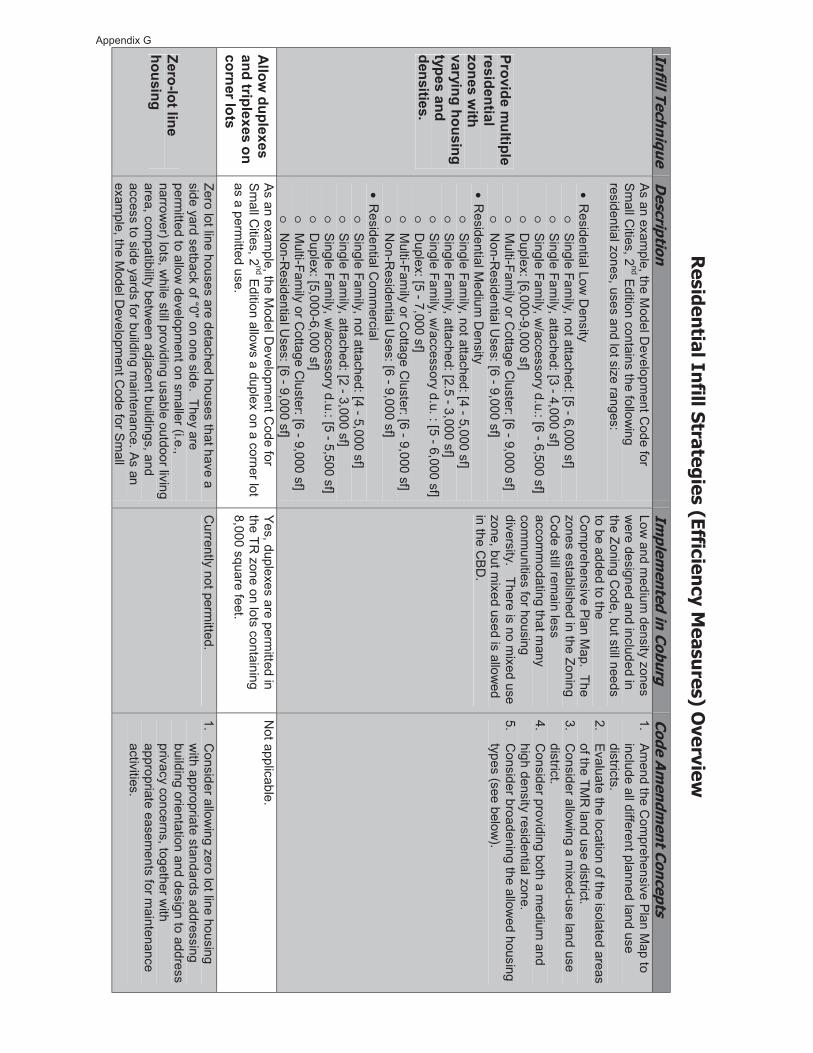
Residen
tial Infill Strategies (Efficiency M
easures) O
verview
Infill Technique
Description
Implem
ented in Coburg Code A
mendm
ent Concepts
Provide multiple
residential zones w
ith varying housing types and densities.
As an exam
ple, the Model D
evelopment C
ode for S
mall C
ities, 2nd Edition contains the follow
ing residential zones, uses and lot size ranges:
• Residential Low
Density
o S
ingle Family, not attached: [5 - 6,000 sf]
o S
ingle Family, attached: [3 - 4,000 sf]
o S
ingle Family, w
/accessory d.u.: [6 - 6,500 sf] o
Duplex: [6,000-9,000 sf]
o M
ulti-Family or C
ottage Cluster: [6 - 9,000 sf]
o N
on-Residential U
ses: [6 - 9,000 sf] • R
esidential Medium
Density
o S
ingle Family, not attached: [4 - 5,000 sf]
o S
ingle Family, attached: [2.5 - 3,000 sf]
o S
ingle Family, w
/accessory d.u. : [5 - 6,000 sf] o
Duplex: [5 - 7,000 sf]
o M
ulti-Family or C
ottage Cluster: [6 - 9,000 sf]
o N
on-Residential U
ses: [6 - 9,000 sf] • R
esidential Com
mercial
o S
ingle Family, not attached: [4 - 5,000 sf]
o S
ingle Family, attached: [2 - 3,000 sf]
o S
ingle Family, w
/accessory d.u.: [5 - 5,500 sf] o
Duplex: [5,000-6,000 sf]
o M
ulti-Family or C
ottage Cluster: [6 - 9,000 sf]
o N
on-Residential U
ses: [6 - 9,000 sf]
Low and m
edium density zones
were designed and included in
the Zoning Code, but still needs
to be added to the C
omprehensive Plan M
ap. The zones established in the Zoning C
ode still remain less
accomm
odating that many
comm
unities for housing diversity. There is no m
ixed use zone, but m
ixed used is allowed
in the CB
D.
1. Am
end the Com
prehensive Plan M
ap to include all different planned land use districts.
2. Evaluate the location of the isolated areas of the TM
R land use district.
3. C
onsider allowing a m
ixed-use land use district.
4. C
onsider providing both a medium
and high density residential zone.
5. C
onsider broadening the allowed housing
types (see below).
Allow
duplexes and triplexes on corner lots
As an exam
ple, the Model D
evelopment C
ode for S
mall C
ities, 2nd Edition allow
s a duplex on a corner lot as a perm
itted use.
Yes, duplexes are perm
itted in the TR
zone on lots containing 8,000 square feet.
Not applicable.
Zero-lot line housing
Zero lot line houses are detached houses that have a side yard setback of “0" on one side. They are perm
itted to allow developm
ent on smaller (i.e.,
narrower) lots, w
hile still providing usable outdoor living area, com
patibility between adjacent buildings, and
access to side yards for building maintenance. As an
example, the M
odel Developm
ent Code for S
mall
Currently not perm
itted. 1.
Consider allow
ing zero lot line housing w
ith appropriate standards addressing building orientation and design to address privacy concerns, together w
ith appropriate easem
ents for maintenance
activities.
Appendix G

Infill Technique D
escription Im
plemented in Coburg
Code Am
endment Concepts
Cities, 2
nd Edition allows zero lot line housing, together
with a site plan review
. Zero-lot line houses are subject to the sam
e standards as non- attached single family
housing, except that a side yard setback is not required on one side of the lot.
Attached single
family
(townhom
e) units that are sim
ilar to duplexes and triplexes in size and character
Single Fam
ily Attached (2 or m
ore comm
on-wall single
family dw
ellings), each on its own lot. This type of
provision would provide m
ore flexibility than the duplex provision by enabling the units to be located on individual lots, rather than held in com
mon. This could
be implem
ented in lower density zones through a
special permit review
process or, alternatively, allowed
outright in medium
or high density residential zones.
Single fam
ily attached units are perm
itted in the TMR
zone, provided they do not exceed four units per structure and are subject to design review
. A
ttached single family is not
permitted in the TR
zone.
1. C
onsider allowing attached single fam
ily of 2-3 units in existing residential areas. B
y allowing a m
ix of housing, Coburg can
help to ensure more efficient use of infill
lands with greater housing options.
Standards for building height, lot area, setbacks, and design can help to control the scale and com
patibility of new
housing with established single fam
ily residences.
Cottage H
ousing
Cottage housing is typically characterized as a cluster
of single family units contained on one lot oriented
around a central comm
on area such as a comm
on green, w
here the units are smaller in character
(typically limited to 1,000 to 1,200 square feet).
Density is typically higher in these com
munities than
would otherw
ise be achieved through standard detached dw
elling unit development. As a result, the
mass and scale of the buildings is lim
ited. These projects are typically subject to a design review
process.
Not specifically im
plemented in
Coburg.
1. C
onsider implem
enting provisions to allow
cottage housing projects in Coburg.
Include standards for building height, lot area, setbacks, and design to control the scale and com
patibility of new housing
with established single fam
ily residences
Small lot single
family
This provision would allow
reduced lot size beyond w
hat the underlying zoning allows, in order to provide
an incentive to retain or create smaller hom
es on sm
aller lots. This policy intends to encourage housing diversity by providing m
ore housing choice, and to offer a viable alternative if the m
arket trend in the comm
unity is tow
ard large homes m
aximizing the building
envelope and the comm
unity is concerned that such developm
ent is changing the character of the neighborhoods.
Not specifically im
plemented in
Coburg.
1. C
onsider implem
enting small lot single
family regulations.
Historic
Residence
If removal of historic residences is a concern in
Coburg, this provision could be im
plemented, allow
ing reduced lot size in order to provide an incentive to
Not specifically im
plemented in
Coburg.
1. C
onsider whether incentives to protect
historic residences are needed.
Appendix G

Infill Technique D
escription Im
plemented in Coburg
Code Am
endment Concepts
Preservation preserve historic residences. This policy intends to encourage voluntary retention of rem
aining historic hom
es that would otherw
ise be torn down, m
aking way
for larger homes on larger lots and changing the
character of the neighborhoods.
Allow
accessory dw
ellings
Secondary housing units located above a garage, in a
detached cottage, or attached to the primary residence.
Typically limited in size and m
ay be subject to other special standards. Typically not subject to density standards because of the sm
all size.
Accessory dw
ellings are allowed,
but do not “count” toward
density.
Not applicable.
Provide flexible lot coverage standards based on building type and lot size.
Lot coverages will vary considerably depending on the
building product. Generally, single fam
ily detached houses cover the low
est percentage of lot area (e.g., 30-40 %
typical), with the percentage increasing for lots
with accessory dw
ellings, townhom
es and multiple
family housing. For exam
ple,
a. Single Family D
etached Housing - 40 %
b. D
uplex and Triplex Buildings - [40-60] %
c. Single Fam
ily Attached Townhom
es - [60-70] %
d. Multiple Fam
ily Housing D
evelopments - [40-60] %
There is an increase in the allow
ed lot coverage for higher intensity projects, but the percentages indicated m
ay pose difficulties in developing the higher intensity product types, w
hich may serve to lim
it housing choice. The provisions provide the follow
ing: a. Single Fam
. Det. H
ousing: 30 %b. D
uplex: 35 %
c. Single Fam. A
tt. Townhom
es: 45 %
d. M
ulti-Fam H
ousing Dev.: 45
%
1. C
onsider increasing the allowed lot
coverage for duplex, single family
attached, and multiple fam
ily developm
ents. 2.
Provide better definition of what lot
coverage is addressing (e.g. building footprint or total im
pervious coverage). D
etermine w
hether regulations apply to building coverage only or w
hether they should also address total im
pervious area. If the latter, then standards w
ill need to be increased.
Lot Coverage
exemptions
Exem
pt some architectural features from
the lot coverage standards that contribute to streetscape character (e.g., front porches, overhangs, porticos, balconies, etc.) as w
ell as pedestrian-oriented elem
ents (e.g. pedestrian pathways, courtyards, etc. –
if the City decides to regulate im
pervious surface).
Not specifically im
plemented in
Coburg.
1. C
onsider exempting som
e architectural features and pedestrian-oriented features from
the lot coverage standards.
Allow
flag lots
Flag lots are one way to encourage infill developm
ent because they provide an alternative to public street frontage requirem
ents and therefore allow infill on
narrower lots or w
here the street system is incom
plete. A
s an example, the M
odel Developm
ent Code for
Sm
all Cities, 2
nd Edition allows flag lots and provides
special standards for how to m
easure front required
Flag lots are not allowed under
Coburg C
odes. 1.
Consider allow
ing flag lots, together with
special standards like those found in the M
odel Developm
ent Code.
Appendix G

Infill Technique D
escription Im
plemented in Coburg
Code Am
endment Concepts
yards. In addition, the following standards are
established for flag lots:
1. A
reas reserved for flag lot access (flag poles) are not counted for the purpose of calculating m
inimum
densities.
2. Flag lots m
ay be created only when a through
street or mid-block lanes cannot be extended to
serve abutting uses or future development.
3. A
flag lot driveway (“flag pole”) m
ay serve no more
than two (2) dw
elling units, including accessory dw
ellings and dwellings on individual lots, unless
Uniform
Fire Code (U
FC) standards are m
et for m
ore units. When U
FC standards are m
et, the m
aximum
number of dw
ellings shall be four (4).
Allow
mid-block
lanes
One of the difficulties w
ith infill development, and one
of the reasons that infill parcels exist, is that the street system
in these areas is often incomplete. C
ompleting
the street and sidewalk system
is one of the challenges to com
munities w
ho are trying to encourage infill and m
id-block lanes can be used to provide access to lots that otherw
ise cannot be served by public streets. Mid-
block lanes are generally narrower than public streets,
will not generally provide through access, and m
ay not contain the full com
pliment of public street
improvem
ents, such as public sidewalks.
Mid-block lanes are not allow
ed unless they m
eet the standards for a shared access drivew
ay.
1. C
onsider allowing m
id-block lanes, particularly in areas lacking street connectivity.
Allow
lot size averaging
Lot size averaging is one mechanism
to provide alternatives to rigid lot area and density standards that otherw
ise conform to the C
omprehensive P
lan. As an
example, the M
odel Developm
ent Code for S
mall
Cities, 2
nd Edition allows a [10%
] modification to the lot
areaand/or lot dim
ension (width/depth) standards, provided
that the overall density of the subdivision does not exceed the allow
able density of the district and the approval body finds that granting the m
odification allows for a greater
variety of housing types or it improves developm
ent
Flexible lot size is not allowed
unless determined as an
average within M
aster Planning.
1. C
onsider allowing lot size averaging as
part of a standard subdivision proposal.
Appendix G
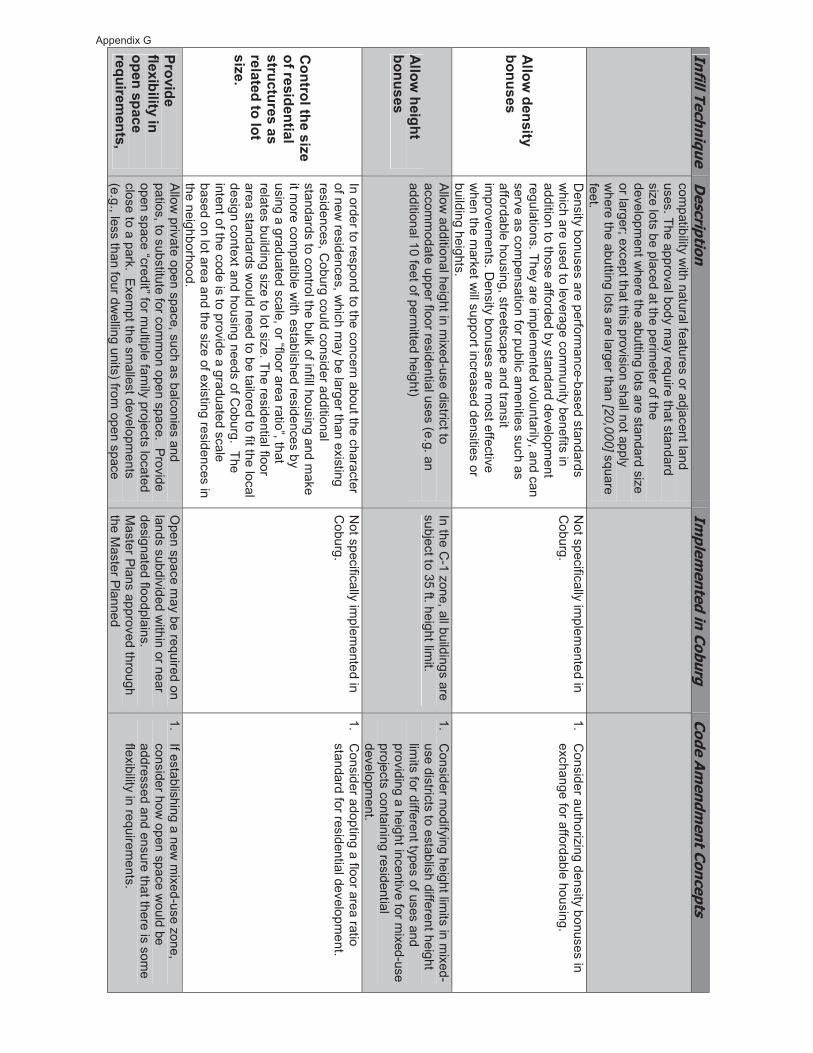
Infill Technique D
escription Im
plemented in Coburg
Code Am
endment Concepts
compatibility w
ith natural features or adjacent land uses. The approval body m
ay require that standard size lots be placed at the perim
eter of the developm
ent where the abutting lots are standard size
or larger; except that this provision shall not apply w
here the abutting lots are larger than [20,000] square feet.
Allow
density bonuses
Density bonuses are perform
ance-based standards w
hich are used to leverage comm
unity benefits in addition to those afforded by standard developm
ent regulations. They are im
plemented voluntarily, and can
serve as compensation for public am
enities such as affordable housing, streetscape and transit im
provements. D
ensity bonuses are most effective
when the m
arket will support increased densities or
building heights.
Not specifically im
plemented in
Coburg.
1. C
onsider authorizing density bonuses in exchange for affordable housing.
Allow
height bonuses
Allow
additional height in mixed-use district to
accomm
odate upper floor residential uses (e.g. an additional 10 feet of perm
itted height)
In the C-1 zone, all buildings are
subject to 35 ft. height limit.
1. C
onsider modifying height lim
its in mixed-
use districts to establish different height lim
its for different types of uses and providing a height incentive for m
ixed-use projects containing residential developm
ent.
Control the size
of residential structures as related to lot size.
In order to respond to the concern about the character of new
residences, which m
ay be larger than existing residences, C
oburg could consider additional standards to control the bulk of infill housing and m
ake it m
ore compatible w
ith established residences by using a graduated scale, or “floor area ratio”, that relates building size to lot size. The residential floor area standards w
ould need to be tailored to fit the local design context and housing needs of C
oburg. The intent of the code is to provide a graduated scale based on lot area and the size of existing residences in the neighborhood.
Not specifically im
plemented in
Coburg.
1. C
onsider adopting a floor area ratio standard for residential developm
ent.
Provide flexibility in open space requirem
ents,
Allow
private open space, such as balconies and patios, to substitute for com
mon open space. Provide
open space “credit” for multiple fam
ily projects located close to a park. Exem
pt the smallest developm
ents (e.g., less than four dw
elling units) from open space
Open space m
ay be required on lands subdivided w
ithin or near designated floodplains. M
aster Plans approved through the M
aster Planned
1. If establishing a new
mixed-use zone,
consider how open space w
ould be addressed and ensure that there is som
e flexibility in requirem
ents.
Appendix G
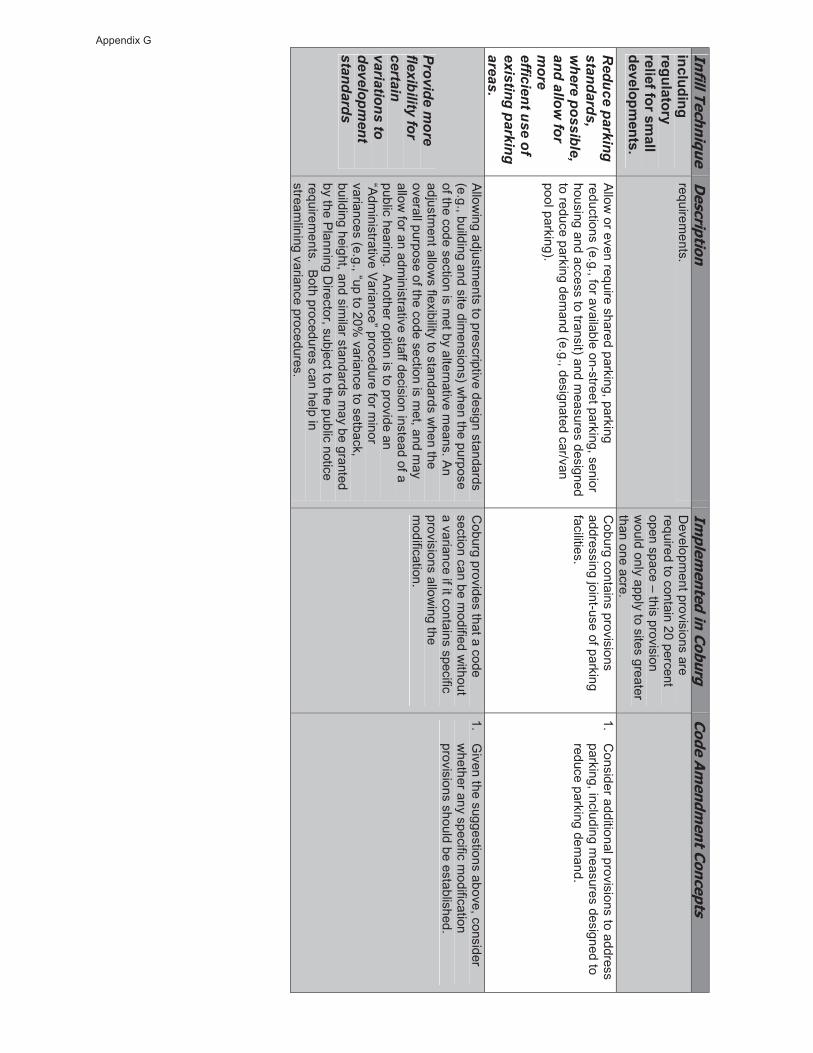
Infill Technique D
escription Im
plemented in Coburg
Code Am
endment Concepts
including regulatory relief for sm
all developm
ents.
requirements.
Developm
ent provisions are required to contain 20 percent open space – this provision w
ould only apply to sites greater than one acre.
Reduce parking
standards, w
here possible, and allow
for m
ore efficient use of existing parking areas.
Allow
or even require shared parking, parking reductions (e.g., for available on-street parking, senior housing and access to transit) and m
easures designed to reduce parking dem
and (e.g., designated car/van pool parking).
Coburg contains provisions
addressing joint-use of parking facilities.
1. C
onsider additional provisions to address parking, including m
easures designed to reduce parking dem
and.
Provide more
flexibility for certain variations to developm
ent standards
Allow
ing adjustments to prescriptive design standards
(e.g., building and site dimensions) w
hen the purpose of the code section is m
et by alternative means. A
n adjustm
ent allows flexibility to standards w
hen the overall purpose of the code section is m
et, and may
allow for an adm
inistrative staff decision instead of a public hearing. A
nother option is to provide an “A
dministrative Variance” procedure for m
inor variances (e.g., “up to 20%
variance to setback, building height, and sim
ilar standards may be granted
by the Planning D
irector, subject to the public notice requirem
ents. Both procedures can help in
streamlining variance procedures.
Coburg provides that a code
section can be modified w
ithout a variance if it contains specific provisions allow
ing the m
odification.
1. G
iven the suggestions above, consider w
hether any specific modification
provisions should be established.
Appendix G
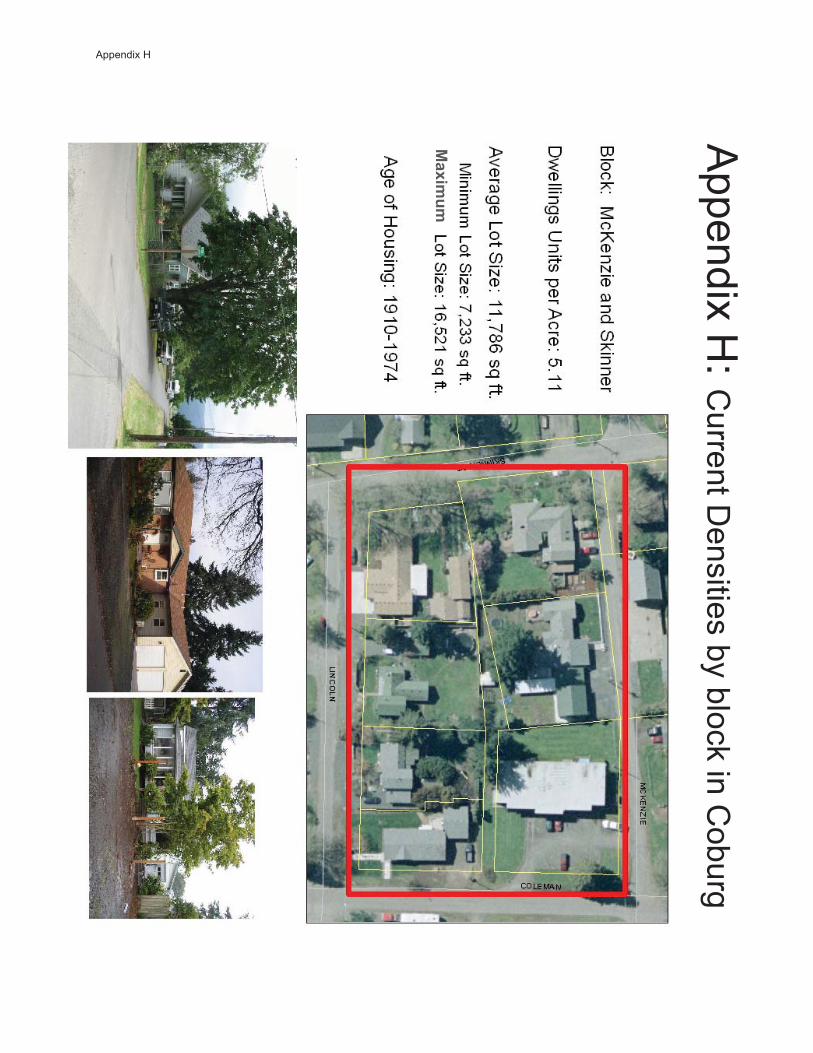
Appendix H
: Current D
ensities by block in Coburg
��3�
�
Appendix H

��3�
�
Appendix H

��3�
�
Appendix H
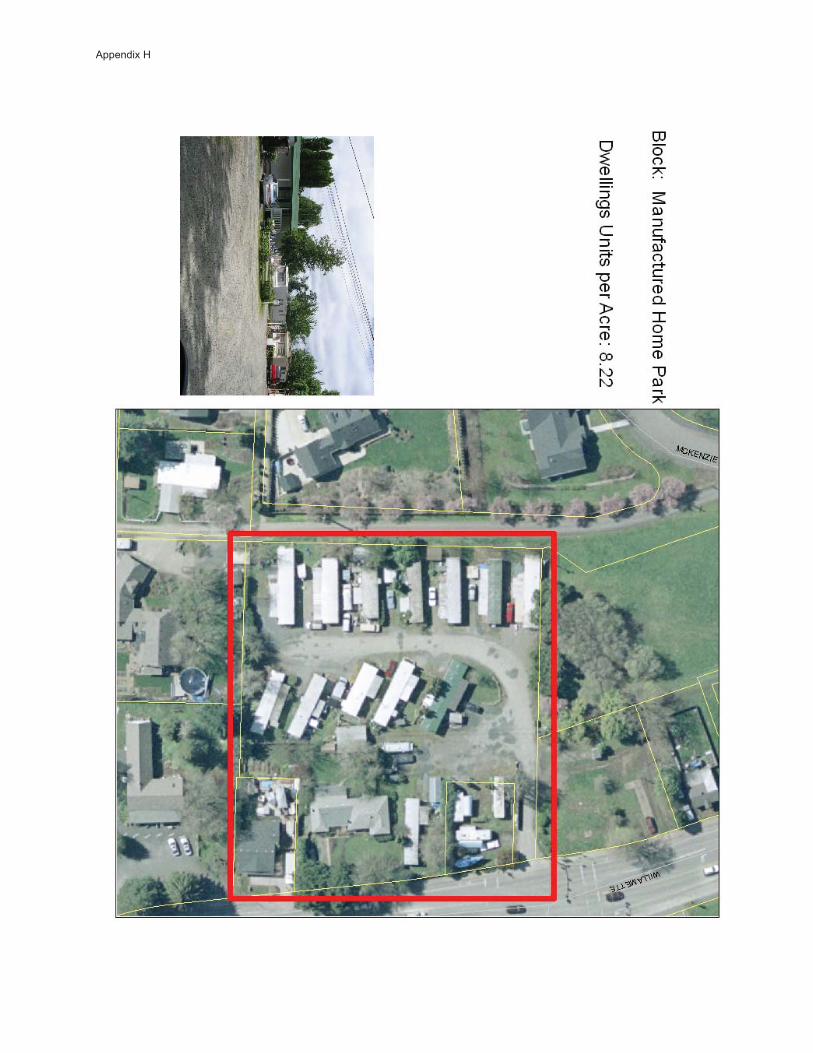
Appendix H

��3�
�
Appendix H
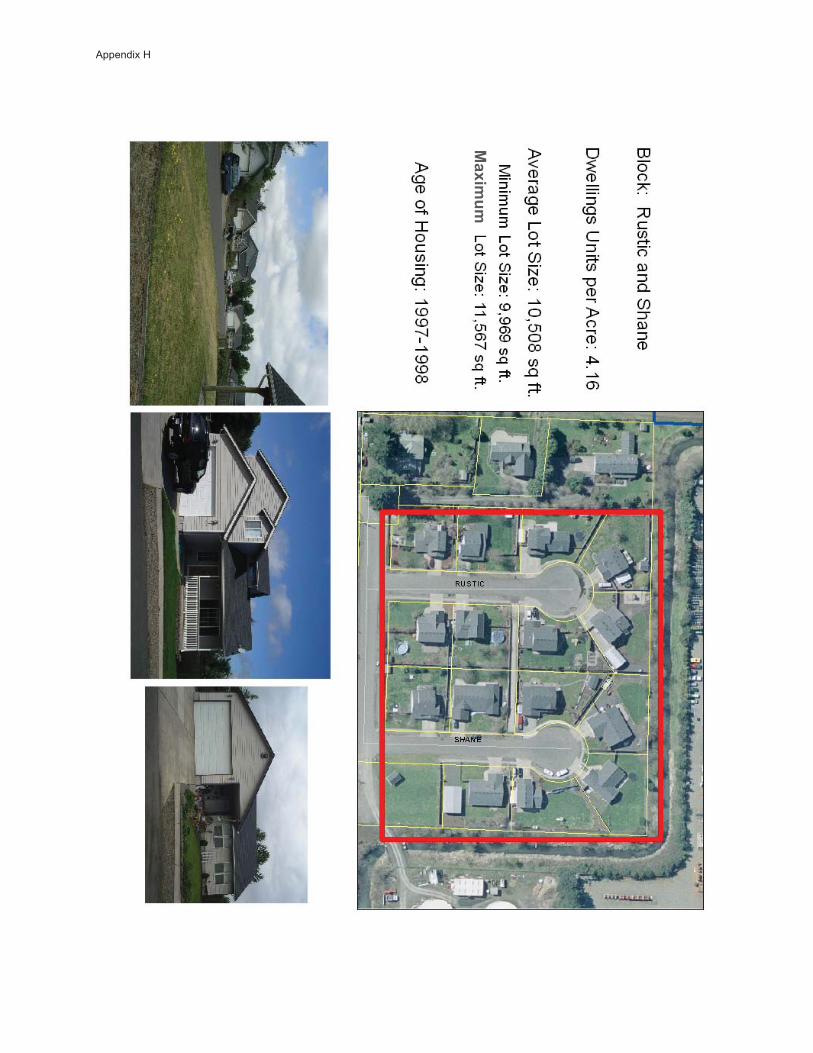
��3�
�
Appendix H

��3�
�
Appendix H
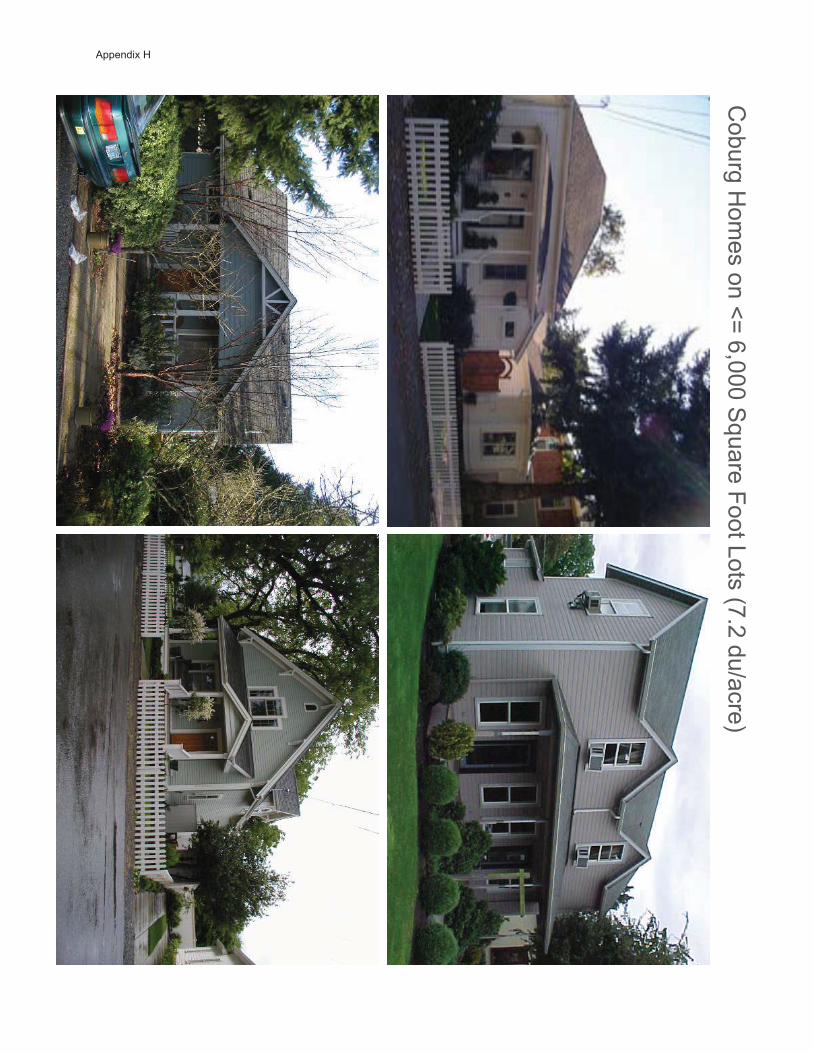
Coburg H
omes on <= 6,000 S
quare Foot Lots (7.2 du/acre)Appendix H
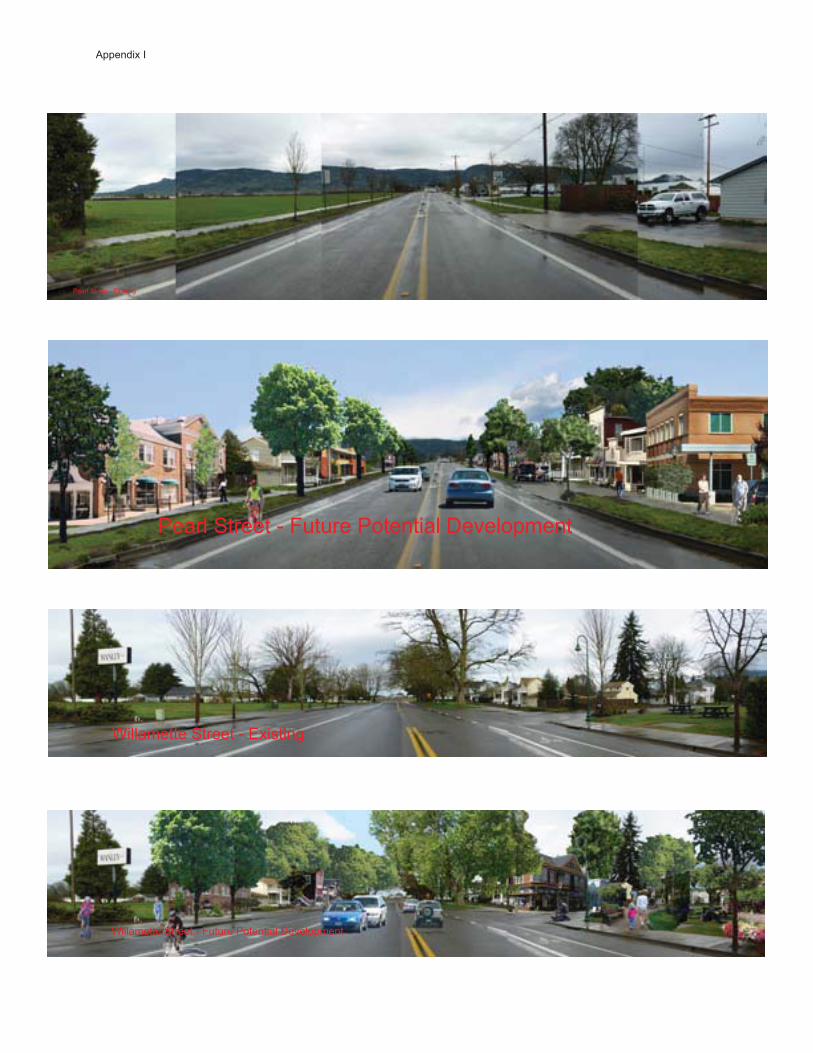
Pearl Street - Existing
Pearl Street - Future Potential Development
Willamette Street - Existing
Willamette Street - Future Potential Development
Appendix I
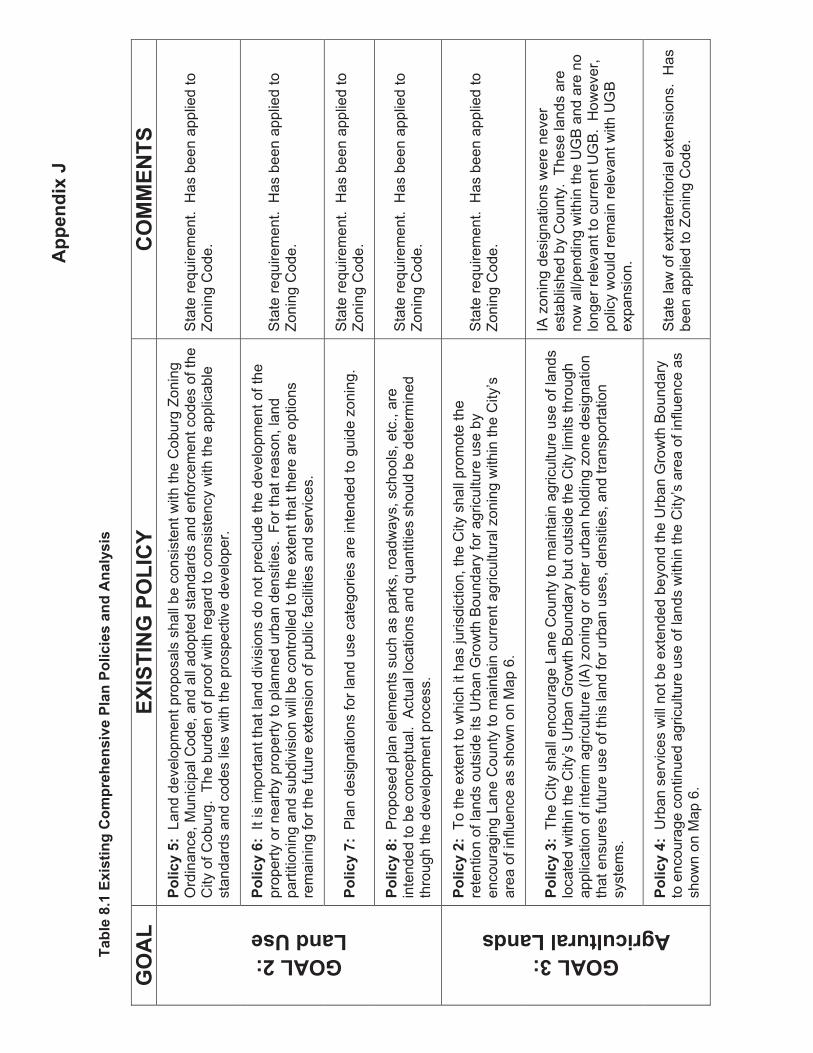
�������3�P�
��&���4����3�#���*��� ������#�=��������������#���������!#�#�
2-�'�
�����+2��-'����
�-���+��
�����!�,:
Lan
d de
velo
pmen
t pro
posa
ls s
hall
be c
onsi
sten
t with
the
Cob
urg
Zoni
ng
Ord
inan
ce, M
unic
ipal
Cod
e, a
nd a
ll ad
opte
d st
anda
rds
and
enfo
rcem
ent c
odes
of t
he
City
of C
obur
g. T
he b
urde
n of
pro
of w
ith re
gard
to c
onsi
sten
cy w
ith th
e ap
plic
able
st
anda
rds
and
code
s lie
s w
ith th
e pr
ospe
ctiv
e de
velo
per.
Sta
te re
quire
men
t. H
as b
een
appl
ied
to
Zoni
ng C
ode.
�����!�.:
It i
s im
porta
nt th
at la
nd d
ivis
ions
do
not p
recl
ude
the
deve
lopm
ent o
f the
pr
oper
ty o
r nea
rby
prop
erty
to p
lann
ed u
rban
den
sitie
s. F
or th
at re
ason
, lan
d pa
rtitio
ning
and
sub
divi
sion
will
be
cont
rolle
d to
the
exte
nt th
at th
ere
are
optio
ns
rem
aini
ng fo
r the
futu
re e
xten
sion
of p
ublic
faci
litie
s an
d se
rvic
es.
Sta
te re
quire
men
t. H
as b
een
appl
ied
to
Zoni
ng C
ode.
�����!�1:
Pla
n de
sign
atio
ns fo
r lan
d us
e ca
tego
ries
are
inte
nded
to g
uide
zon
ing.
S
tate
requ
irem
ent.
Has
bee
n ap
plie
d to
Zo
ning
Cod
e.
2-�'��:���'�����#��
�����!�4:
Pro
pose
d pl
an e
lem
ents
suc
h as
par
ks, r
oadw
ays,
sch
ools
, etc
., ar
e in
tend
ed to
be
conc
eptu
al.
Act
ual l
ocat
ions
and
qua
ntiti
es s
houl
d be
det
erm
ined
th
roug
h th
e de
velo
pmen
t pro
cess
.
Sta
te re
quire
men
t. H
as b
een
appl
ied
to
Zoni
ng C
ode.
�����!��:
To
the
exte
nt to
whi
ch it
has
juris
dict
ion,
the
City
sha
ll pr
omot
e th
e re
tent
ion
of la
nds
outs
ide
its U
rban
Gro
wth
Bou
ndar
y fo
r agr
icul
ture
use
by
enco
urag
ing
Lane
Cou
nty
to m
aint
ain
curr
ent a
gric
ultu
ral z
onin
g w
ithin
the
City
’s
area
of i
nflu
ence
as
show
n on
Map
6.
Sta
te re
quire
men
t. H
as b
een
appl
ied
to
Zoni
ng C
ode.
�����!�$:
The
City
sha
ll en
cour
age
Lane
Cou
nty
to m
aint
ain
agric
ultu
re u
se o
f lan
ds
loca
ted
with
in th
e C
ity’s
Urb
an G
row
th B
ound
ary
but o
utsi
de th
e C
ity li
mits
thro
ugh
appl
icat
ion
of in
terim
agr
icul
ture
(IA
) zon
ing
or o
ther
urb
an h
oldi
ng z
one
desi
gnat
ion
that
ens
ures
futu
re u
se o
f thi
s la
nd fo
r urb
an u
ses,
den
sitie
s, a
nd tr
ansp
orta
tion
syst
ems.
IA z
onin
g de
sign
atio
ns w
ere
neve
r es
tabl
ishe
d by
Cou
nty.
The
se la
nds
are
now
all/
pend
ing
with
in th
e U
GB
and
are
no
long
er re
leva
nt to
cur
rent
UG
B.
How
ever
, po
licy
wou
ld re
mai
n re
leva
nt w
ith U
GB
ex
pans
ion.
2-�'�$:���*�����������'���#
�����!�(:
Urb
an s
ervi
ces
will
not
be
exte
nded
bey
ond
the
Urb
an G
row
th B
ound
ary
to e
ncou
rage
con
tinue
d ag
ricul
ture
use
of l
ands
with
in th
e C
ity’s
are
a of
influ
ence
as
show
n on
Map
6.
Sta
te la
w o
f ext
rate
rrito
rial e
xten
sion
s. H
as
been
app
lied
to Z
onin
g C
ode.
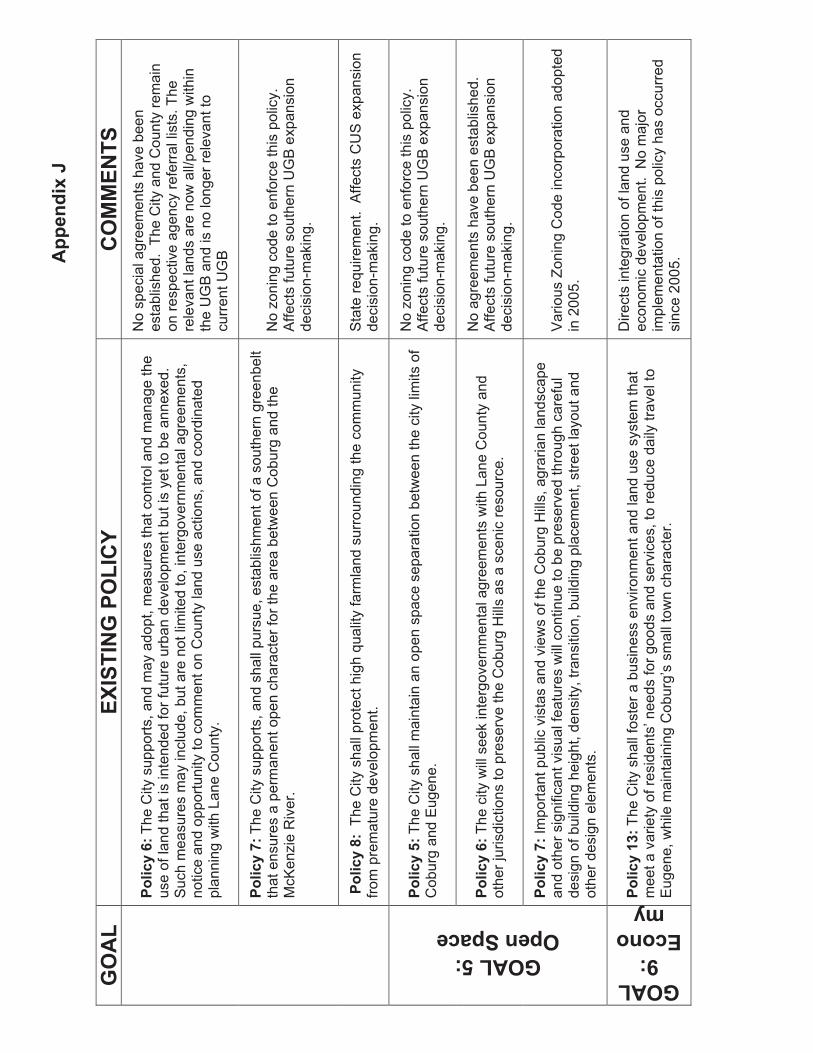
�������3�P�
2-�'�
�����+2��-'����
�-���+��
�����!�.:
The
City
sup
ports
, and
may
ado
pt, m
easu
res
that
con
trol a
nd m
anag
e th
e us
e of
land
that
is in
tend
ed fo
r fut
ure
urba
n de
velo
pmen
t but
is y
et to
be
anne
xed.
S
uch
mea
sure
s m
ay in
clud
e, b
ut a
re n
ot li
mite
d to
, int
ergo
vern
men
tal a
gree
men
ts,
notic
e an
d op
portu
nity
to c
omm
ent o
n C
ount
y la
nd u
se a
ctio
ns, a
nd c
oord
inat
ed
plan
ning
with
Lan
e C
ount
y.
No
spec
ial a
gree
men
ts h
ave
been
es
tabl
ishe
d. T
he C
ity a
nd C
ount
y re
mai
n on
resp
ectiv
e ag
ency
refe
rral
list
s. T
he
rele
vant
land
s ar
e no
w a
ll/pe
ndin
g w
ithin
th
e U
GB
and
is n
o lo
nger
rele
vant
to
curr
ent U
GB
�����!�1:
The
City
sup
ports
, and
sha
ll pu
rsue
, est
ablis
hmen
t of a
sou
ther
n gr
eenb
elt
that
ens
ures
a p
erm
anen
t ope
n ch
arac
ter f
or th
e ar
ea b
etw
een
Cob
urg
and
the
McK
enzi
e R
iver
. N
o zo
ning
cod
e to
enf
orce
this
pol
icy.
A
ffect
s fu
ture
sou
ther
n U
GB
exp
ansi
on
deci
sion
-mak
ing.
������!�4:
The
City
sha
ll pr
otec
t hig
h qu
ality
farm
land
sur
roun
ding
the
com
mun
ity
from
pre
mat
ure
deve
lopm
ent.
S
tate
requ
irem
ent.
Affe
cts
CU
S e
xpan
sion
de
cisi
on-m
akin
g.
�����!�,:
The
City
sha
ll m
aint
ain
an o
pen
spac
e se
para
tion
betw
een
the
city
lim
its o
f C
obur
g an
d E
ugen
e.
No
zoni
ng c
ode
to e
nfor
ce th
is p
olic
y.
Affe
cts
futu
re s
outh
ern
UG
B e
xpan
sion
de
cisi
on-m
akin
g.
�����!�.:
The
city
will
see
k in
terg
over
nmen
tal a
gree
men
ts w
ith L
ane
Cou
nty
and
othe
r jur
isdi
ctio
ns to
pre
serv
e th
e C
obur
g H
ills
as a
sce
nic
reso
urce
.
No
agre
emen
ts h
ave
been
est
ablis
hed.
A
ffect
s fu
ture
sou
ther
n U
GB
exp
ansi
on
deci
sion
-mak
ing.
2-�'�,:��-���������
�����!�1:
Impo
rtant
pub
lic v
ista
s an
d vi
ews
of th
e C
obur
g H
ills,
agr
aria
n la
ndsc
ape
and
othe
r sig
nific
ant v
isua
l fea
ture
s w
ill c
ontin
ue to
be
pres
erve
d th
roug
h ca
refu
l de
sign
of b
uild
ing
heig
ht, d
ensi
ty, t
rans
ition
, bui
ldin
g pl
acem
ent,
stre
et la
yout
and
ot
her d
esig
n el
emen
ts.
Var
ious
Zon
ing
Cod
e in
corp
orat
ion
adop
ted
in 2
005.
2-�'�>:��
����� !������!��$: T
he C
ity s
hall
fost
er a
bus
ines
s en
viro
nmen
t and
land
use
sys
tem
that
m
eet a
var
iety
of r
esid
ents
’ nee
ds fo
r goo
ds a
nd s
ervi
ces,
to re
duce
dai
ly tr
avel
to
Eug
ene,
whi
le m
aint
aini
ng C
obur
g’s
smal
l tow
n ch
arac
ter.
Dire
cts
inte
grat
ion
of la
nd u
se a
nd
econ
omic
dev
elop
men
t. N
o m
ajor
im
plem
enta
tion
of th
is p
olic
y ha
s oc
curr
ed
sinc
e 20
05.
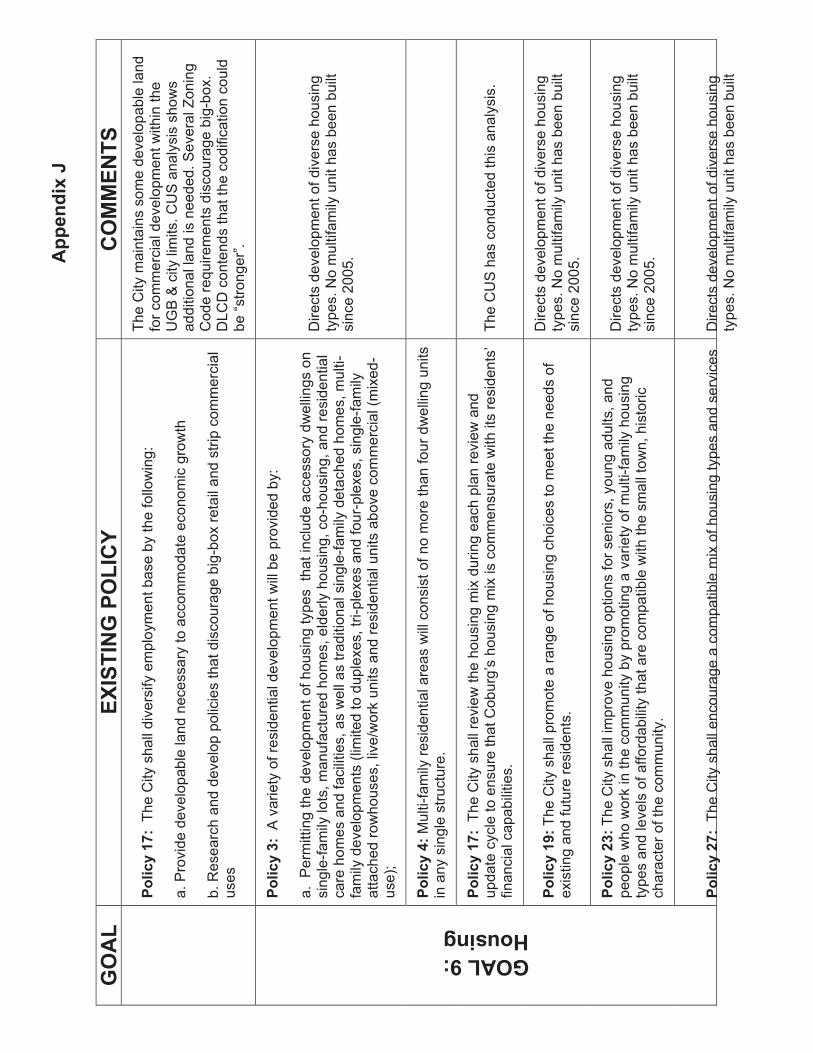
�������3�P�
2-�'�
�����+2��-'����
�-���+��
�����!��1:
The
City
sha
ll di
vers
ify e
mpl
oym
ent b
ase
by th
e fo
llow
ing:
a. P
rovi
de d
evel
opab
le la
nd n
eces
sary
to a
ccom
mod
ate
econ
omic
gro
wth
b. R
esea
rch
and
deve
lop
polic
ies
that
dis
cour
age
big-
box
reta
il an
d st
rip c
omm
erci
al
uses
The
City
mai
ntai
ns s
ome
deve
lopa
ble
land
fo
r com
mer
cial
dev
elop
men
t with
in th
e U
GB
& c
ity li
mits
. CU
S a
naly
sis
show
s ad
ditio
nal l
and
is n
eede
d. S
ever
al Z
onin
g C
ode
requ
irem
ents
dis
cour
age
big-
box.
D
LCD
con
tend
s th
at th
e co
dific
atio
n co
uld
be “s
trong
er”.
�����!�$:
A v
arie
ty o
f res
iden
tial d
evel
opm
ent w
ill b
e pr
ovid
ed b
y:
a. P
erm
ittin
g th
e de
velo
pmen
t of h
ousi
ng ty
pes
that
incl
ude
acce
ssor
y dw
ellin
gs o
n si
ngle
-fam
ily lo
ts, m
anuf
actu
red
hom
es, e
lder
ly h
ousi
ng, c
o-ho
usin
g, a
nd re
side
ntia
l ca
re h
omes
and
faci
litie
s, a
s w
ell a
s tra
ditio
nal s
ingl
e-fa
mily
det
ache
d ho
mes
, mul
ti-fa
mily
dev
elop
men
ts (l
imite
d to
dup
lexe
s, tr
i-ple
xes
and
four
-ple
xes,
sin
gle-
fam
ily
atta
ched
row
hous
es, l
ive/
wor
k un
its a
nd re
side
ntia
l uni
ts a
bove
com
mer
cial
(mix
ed-
use)
;
Dire
cts
deve
lopm
ent o
f div
erse
hou
sing
ty
pes.
No
mul
tifam
ily u
nit h
as b
een
built
si
nce
2005
.
�����!�(:
Mul
ti-fa
mily
resi
dent
ial a
reas
will
con
sist
of n
o m
ore
than
four
dw
ellin
g un
its
in a
ny s
ingl
e st
ruct
ure.
�����!��1:
The
City
sha
ll re
view
the
hous
ing
mix
dur
ing
each
pla
n re
view
and
up
date
cyc
le to
ens
ure
that
Cob
urg’
s ho
usin
g m
ix is
com
men
sura
te w
ith it
s re
side
nts’
fin
anci
al c
apab
ilitie
s.
The
CU
S h
as c
ondu
cted
this
ana
lysi
s.
�����!��>: T
he C
ity s
hall
prom
ote
a ra
nge
of h
ousi
ng c
hoic
es to
mee
t the
nee
ds o
f ex
istin
g an
d fu
ture
resi
dent
s.
Dire
cts
deve
lopm
ent o
f div
erse
hou
sing
ty
pes.
No
mul
tifam
ily u
nit h
as b
een
built
si
nce
2005
.
�����!��$: T
he C
ity s
hall
impr
ove
hous
ing
optio
ns fo
r sen
iors
, you
ng a
dults
, and
pe
ople
who
wor
k in
the
com
mun
ity b
y pr
omot
ing
a va
riety
of m
ulti-
fam
ily h
ousi
ng
type
s an
d le
vels
of a
fford
abili
ty th
at a
re c
ompa
tible
with
the
smal
l tow
n, h
isto
ric
char
acte
r of t
he c
omm
unity
.
Dire
cts
deve
lopm
ent o
f div
erse
hou
sing
ty
pes.
No
mul
tifam
ily u
nit h
as b
een
built
si
nce
2005
.
2-�'�>:��)��#��*
�����!��1:
The
City
sha
ll en
cour
age
a co
mpa
tible
mix
of h
ousi
ng ty
pes
and
serv
ices
D
irect
s de
velo
pmen
t of d
iver
se h
ousi
ng
type
s. N
o m
ultif
amily
uni
t has
bee
n bu
ilt
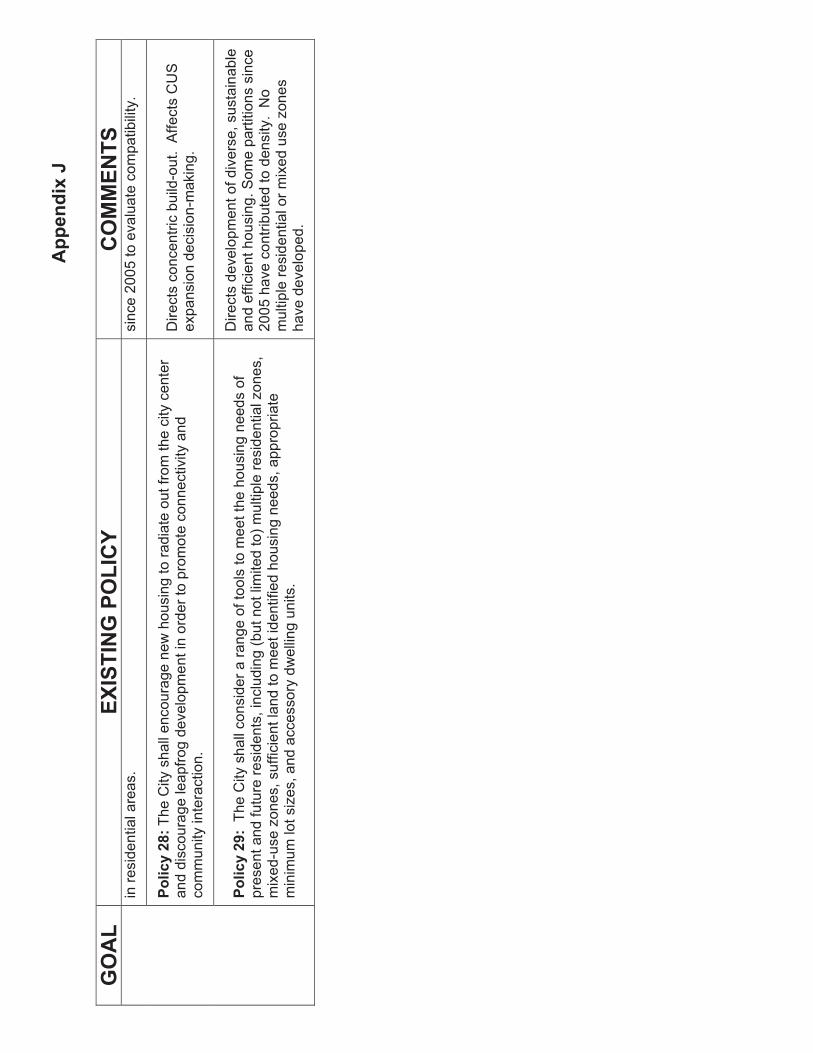
�������3�P�
2-�'�
�����+2��-'����
�-���+��
in re
side
ntia
l are
as.
si
nce
2005
to e
valu
ate
com
patib
ility
.
�����!��4: T
he C
ity s
hall
enco
urag
e ne
w h
ousi
ng to
radi
ate
out f
rom
the
city
cen
ter
and
disc
oura
ge le
apfro
g de
velo
pmen
t in
orde
r to
prom
ote
conn
ectiv
ity a
nd
com
mun
ity in
tera
ctio
n.
Dire
cts
conc
entri
c bu
ild-o
ut.
Affe
cts
CU
S
expa
nsio
n de
cisi
on-m
akin
g.
�����!��>:
The
City
sha
ll co
nsid
er a
rang
e of
tool
s to
mee
t the
hou
sing
nee
ds o
f pr
esen
t and
futu
re re
side
nts,
incl
udin
g (b
ut n
ot li
mite
d to
) mul
tiple
resi
dent
ial z
ones
, m
ixed
-use
zon
es, s
uffic
ient
land
to m
eet i
dent
ified
hou
sing
nee
ds, a
ppro
pria
te
min
imum
lot s
izes
, and
acc
esso
ry d
wel
ling
units
.
Dire
cts
deve
lopm
ent o
f div
erse
, sus
tain
able
an
d ef
ficie
nt h
ousi
ng. S
ome
parti
tions
sin
ce
2005
hav
e co
ntrib
uted
to d
ensi
ty.
No
mul
tiple
resi
dent
ial o
r mix
ed u
se z
ones
ha
ve d
evel
oped
.
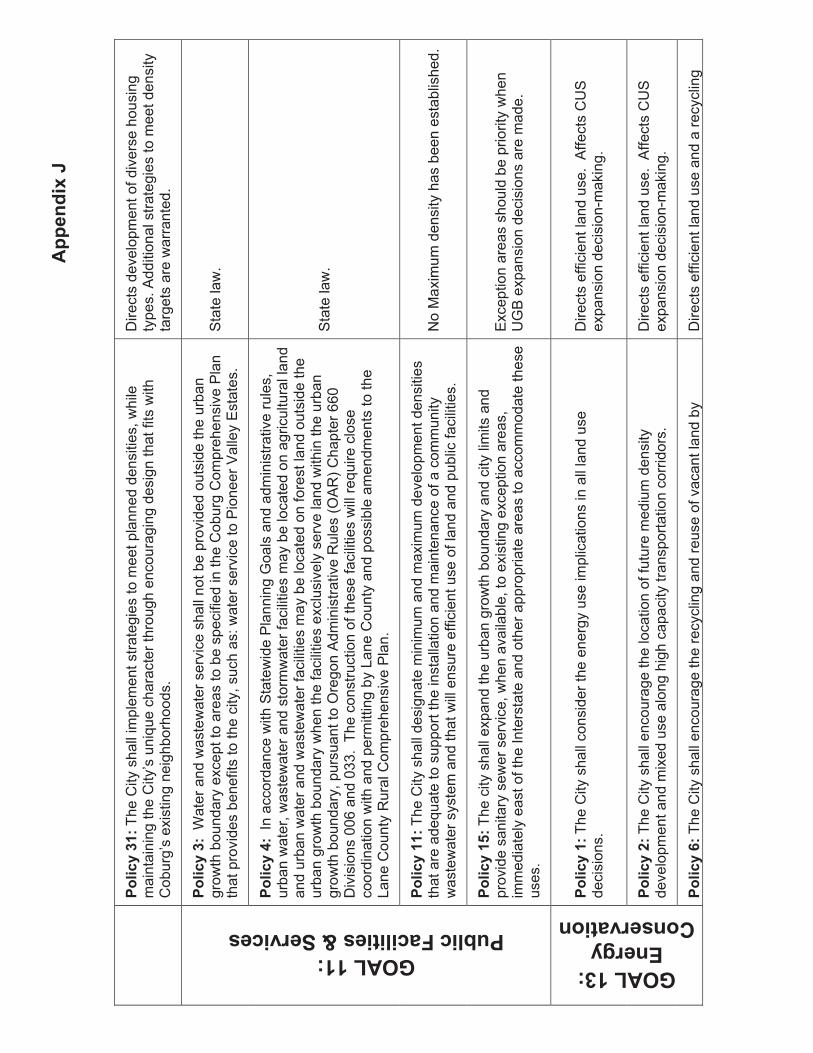
�������3�P�
�����!�$�: T
he C
ity s
hall
impl
emen
t stra
tegi
es to
mee
t pla
nned
den
sitie
s, w
hile
m
aint
aini
ng th
e C
ity’s
uni
que
char
acte
r thr
ough
enc
oura
ging
des
ign
that
fits
with
C
obur
g’s
exis
ting
neig
hbor
hood
s.
Dire
cts
deve
lopm
ent o
f div
erse
hou
sing
ty
pes.
Add
ition
al s
trate
gies
to m
eet d
ensi
ty
targ
ets
are
war
rant
ed.
�����!�$:
Wat
er a
nd w
aste
wat
er s
ervi
ce s
hall
not b
e pr
ovid
ed o
utsi
de th
e ur
ban
grow
th b
ound
ary
exce
pt to
are
as to
be
spec
ified
in th
e C
obur
g C
ompr
ehen
sive
Pla
n th
at p
rovi
des
bene
fits
to th
e ci
ty, s
uch
as: w
ater
ser
vice
to P
ione
er V
alle
y E
stat
es.
S
tate
law
.
�����!�(:
In
acco
rdan
ce w
ith S
tate
wid
e P
lann
ing
Goa
ls a
nd a
dmin
istra
tive
rule
s,
urba
n w
ater
, was
tew
ater
and
sto
rmw
ater
faci
litie
s m
ay b
e lo
cate
d on
agr
icul
tura
l lan
d an
d ur
ban
wat
er a
nd w
aste
wat
er fa
cilit
ies
may
be
loca
ted
on fo
rest
land
out
side
the
urba
n gr
owth
bou
ndar
y w
hen
the
faci
litie
s ex
clus
ivel
y se
rve
land
with
in th
e ur
ban
grow
th b
ound
ary,
pur
suan
t to
Ore
gon
Adm
inis
trativ
e R
ules
(OA
R) C
hapt
er 6
60
Div
isio
ns 0
06 a
nd 0
33.
The
cons
truct
ion
of th
ese
faci
litie
s w
ill re
quire
clo
se
coor
dina
tion
with
and
per
mitt
ing
by L
ane
Cou
nty
and
poss
ible
am
endm
ents
to th
e La
ne C
ount
y R
ural
Com
preh
ensi
ve P
lan.
Sta
te la
w.
�����!���: T
he C
ity s
hall
desi
gnat
e m
inim
um a
nd m
axim
um d
evel
opm
ent d
ensi
ties
that
are
ade
quat
e to
sup
port
the
inst
alla
tion
and
mai
nten
ance
of a
com
mun
ity
was
tew
ater
sys
tem
and
that
will
ens
ure
effic
ient
use
of l
and
and
publ
ic fa
cilit
ies.
N
o M
axim
um d
ensi
ty h
as b
een
esta
blis
hed.
2-�'���:����&����"��������#�M���=���#
�����!��,: T
he c
ity s
hall
expa
nd th
e ur
ban
grow
th b
ound
ary
and
city
lim
its a
nd
prov
ide
sani
tary
sew
er s
ervi
ce, w
hen
avai
labl
e, to
exi
stin
g ex
cept
ion
area
s,
imm
edia
tely
eas
t of t
he In
ters
tate
and
oth
er a
ppro
pria
te a
reas
to a
ccom
mod
ate
thes
e us
es.
Exc
eptio
n ar
eas
shou
ld b
e pr
iorit
y w
hen
UG
B e
xpan
sion
dec
isio
ns a
re m
ade.
�����!��:
The
City
sha
ll co
nsid
er th
e en
ergy
use
impl
icat
ions
in a
ll la
nd u
se
deci
sion
s.
Dire
cts
effic
ient
land
use
. A
ffect
s C
US
ex
pans
ion
deci
sion
-mak
ing.
�����!��:
The
City
sha
ll en
cour
age
the
loca
tion
of fu
ture
med
ium
den
sity
de
velo
pmen
t and
mix
ed u
se a
long
hig
h ca
paci
ty tr
ansp
orta
tion
corr
idor
s.
Dire
cts
effic
ient
land
use
. A
ffect
s C
US
ex
pans
ion
deci
sion
-mak
ing.
2-�'��$:������*!�
���#��=������
�����!�.:
The
City
sha
ll en
cour
age
the
recy
clin
g an
d re
use
of v
acan
t lan
d by
D
irect
s ef
ficie
nt la
nd u
se a
nd a
recy
clin
g

�������3�P�
allo
win
g in
fill o
f vac
ant l
ots
with
in th
e C
ity li
mits
whe
n sa
nita
ry c
ondi
tions
are
met
. pr
ogra
m. N
o co
mpr
ehen
sive
recy
clin
g pr
ogra
m e
xist
s. U
tiliz
atio
n of
vac
ant l
and
affe
cts
CU
S e
xpan
sion
dec
isio
n-m
akin
g.
�����!��:
The
City
sha
ll pr
eser
ve u
rban
izab
le la
nd a
nd p
rovi
de fo
r ord
erly
, effi
cien
t de
velo
pmen
t by
cont
rolli
ng d
ensi
ties
thro
ugh
prov
isio
n of
the
Zoni
ng a
nd S
ubdi
visi
on
Ord
inan
ces,
ther
eby
prev
entin
g th
e ne
ed fo
r ove
rly e
xten
sive
pub
lic s
ervi
ces
and
rest
rictin
g ur
bani
zatio
n to
that
com
men
sura
te w
ith th
e ca
rryi
ng c
apac
ity o
f the
land
.
Dire
cts
effic
ient
land
use
. A
ffect
s C
US
ex
pans
ion
deci
sion
-mak
ing.
�����!�$:
All
city
land
use
dec
isio
ns s
hall
be in
com
plia
nce
with
LC
DC
Goa
ls a
nd
Gui
delin
es.
Sta
te la
w.
�����!�,:
The
Urb
an G
row
th B
ound
ary
shal
l not
be
expa
nded
unl
ess
findi
ngs
of fa
ct
esta
blis
h th
at th
e pr
opos
ed e
xpan
sion
is in
com
plia
nce
with
all
7 fa
ctor
s of
LC
DC
G
oal 1
4.
Sta
te la
w.
�����!�1:
The
City
sha
ll, if
app
ropr
iate
, est
ablis
h st
anda
rds
in a
dditi
onal
to th
ose
enum
erat
ed in
Pol
icy
5 ab
ove
for c
hang
ing
the
UG
B.
�����!��8: T
he C
ity s
hall
enco
urag
e La
ne C
ount
y to
reta
in th
e cu
rren
t agr
icul
tura
l zo
ning
of l
ands
out
side
the
City
’s U
rban
Gro
wth
Bou
ndar
y bu
t with
in it
s A
rea
of
Influ
ence
to p
reve
nt c
ontin
uous
urb
aniz
atio
n of
land
s be
twee
n C
obur
g an
d E
ugen
e-S
prin
gfie
ld.
The
land
aro
und
Cob
urg
rem
ains
larg
ely
agric
ultu
ral a
nd is
zon
ed a
s su
ch.
�����!��,:
The
City
sha
ll en
cour
age
the
inte
grat
ion
of a
djac
ent l
and
uses
and
zo
ning
dis
trict
s th
roug
h de
nsity
tran
sitio
ning
, mid
-blo
ck z
onin
g lin
es, a
rea-
spec
ific
build
ing
heig
ht li
mits
, and
ble
ndin
g of
com
patib
le u
ses
as a
ppro
pria
te.
Are
a-sp
ecifi
c bu
ildin
g he
ight
lim
its a
nd
som
e bl
endi
ng o
f com
patib
le u
ses
has
been
cod
ified
sin
ce 2
005.
Den
sity
tra
nsiti
onin
g an
d m
id-b
lock
zon
ing
have
no
t.
�����!��1: T
he C
ity s
hall
prom
ote
the
effic
ient
use
of l
and
with
in th
e ur
ban
grow
th
boun
dary
and
seq
uent
ial d
evel
opm
ent t
hat e
xpan
ds in
an
orde
rly w
ay o
utw
ard
from
th
e ex
istin
g ci
ty c
ente
r.
Dire
cts
conc
entri
c bu
ild-o
ut.
Affe
cts
CU
S
expa
nsio
n de
cisi
on-m
akin
g.
2-�'��(:����&���J������
�����!��4: T
he C
ity s
hall
prov
ide
a su
ffici
ent s
uppl
y of
dev
elop
able
land
with
in th
e ur
ban
grow
th b
ound
ary
to m
eet t
he n
eeds
of t
he e
xist
ing
and
proj
ecte
d po
pula
tion
for
resi
dent
ial,
com
mer
cial
, ind
ustri
al, a
nd re
crea
tiona
l use
s ov
er th
e ne
xt 2
0 –
50 y
ears
,
The
CU
S a
naly
sis
and
reco
mm
enda
tions
ai
m to
com
preh
ensi
vely
add
ress
this
pol
icy.
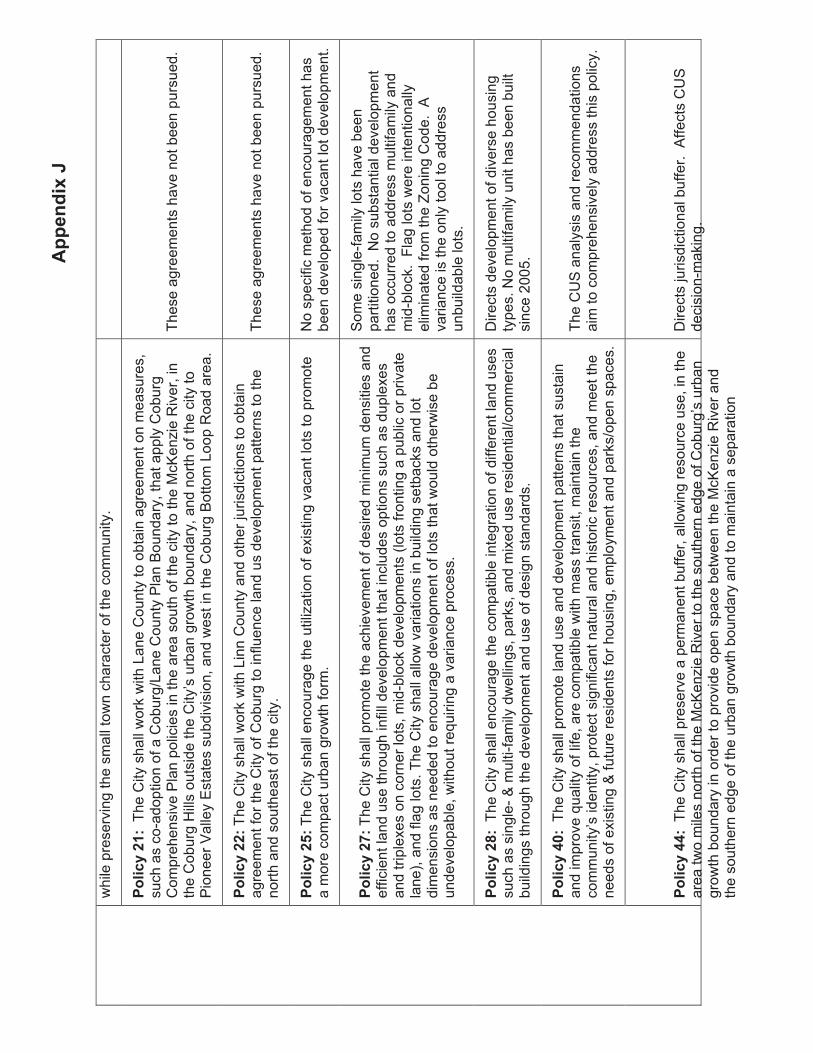
�������3�P�
whi
le p
rese
rvin
g th
e sm
all t
own
char
acte
r of t
he c
omm
unity
.
�����!���:
The
City
sha
ll w
ork
with
Lan
e C
ount
y to
obt
ain
agre
emen
t on
mea
sure
s,
such
as
co-a
dopt
ion
of a
Cob
urg/
Lane
Cou
nty
Pla
n B
ound
ary,
that
app
ly C
obur
g C
ompr
ehen
sive
Pla
n po
licie
s in
the
area
sou
th o
f the
city
to th
e M
cKen
zie
Riv
er, i
n th
e C
obur
g H
ills
outs
ide
the
City
’s u
rban
gro
wth
bou
ndar
y, a
nd n
orth
of t
he c
ity to
P
ione
er V
alle
y E
stat
es s
ubdi
visi
on, a
nd w
est i
n th
e C
obur
g B
otto
m L
oop
Roa
d ar
ea.
Thes
e ag
reem
ents
hav
e no
t bee
n pu
rsue
d.
�����!���: T
he C
ity s
hall
wor
k w
ith L
inn
Cou
nty
and
othe
r jur
isdi
ctio
ns to
obt
ain
agre
emen
t for
the
City
of C
obur
g to
influ
ence
land
us
deve
lopm
ent p
atte
rns
to th
e no
rth a
nd s
outh
east
of t
he c
ity.
Thes
e ag
reem
ents
hav
e no
t bee
n pu
rsue
d.
�����!��,: T
he C
ity s
hall
enco
urag
e th
e ut
iliza
tion
of e
xist
ing
vaca
nt lo
ts to
pro
mot
e a
mor
e co
mpa
ct u
rban
gro
wth
form
. N
o sp
ecifi
c m
etho
d of
enc
oura
gem
ent h
as
been
dev
elop
ed fo
r vac
ant l
ot d
evel
opm
ent.
�����!��1: T
he C
ity s
hall
prom
ote
the
achi
evem
ent o
f des
ired
min
imum
den
sitie
s an
d ef
ficie
nt la
nd u
se th
roug
h in
fill d
evel
opm
ent t
hat i
nclu
des
optio
ns s
uch
as d
uple
xes
and
tripl
exes
on
corn
er lo
ts, m
id-b
lock
dev
elop
men
ts (l
ots
front
ing
a pu
blic
or p
rivat
e la
ne),
and
flag
lots
. The
City
sha
ll al
low
var
iatio
ns in
bui
ldin
g se
tbac
ks a
nd lo
t di
men
sion
s as
nee
ded
to e
ncou
rage
dev
elop
men
t of l
ots
that
wou
ld o
ther
wis
e be
un
deve
lopa
ble,
with
out r
equi
ring
a va
rianc
e pr
oces
s.
Som
e si
ngle
-fam
ily lo
ts h
ave
been
pa
rtitio
ned.
No
subs
tant
ial d
evel
opm
ent
has
occu
rred
to a
ddre
ss m
ultif
amily
and
m
id-b
lock
. Fl
ag lo
ts w
ere
inte
ntio
nally
el
imin
ated
from
the
Zoni
ng C
ode.
A
varia
nce
is th
e on
ly to
ol to
add
ress
un
build
able
lots
.
�����!��4:
The
City
sha
ll en
cour
age
the
com
patib
le in
tegr
atio
n of
diff
eren
t lan
d us
es
such
as
sing
le- &
mul
ti-fa
mily
dw
ellin
gs, p
arks
, and
mix
ed u
se re
side
ntia
l/com
mer
cial
bu
ildin
gs th
roug
h th
e de
velo
pmen
t and
use
of d
esig
n st
anda
rds.
Dire
cts
deve
lopm
ent o
f div
erse
hou
sing
ty
pes.
No
mul
tifam
ily u
nit h
as b
een
built
si
nce
2005
.
�����!�(8:
The
City
sha
ll pr
omot
e la
nd u
se a
nd d
evel
opm
ent p
atte
rns
that
sus
tain
an
d im
prov
e qu
ality
of l
ife, a
re c
ompa
tible
with
mas
s tra
nsit,
mai
ntai
n th
e co
mm
unity
’s id
entit
y, p
rote
ct s
igni
fican
t nat
ural
and
his
toric
reso
urce
s, a
nd m
eet t
he
need
s of
exi
stin
g &
futu
re re
side
nts
for h
ousi
ng, e
mpl
oym
ent a
nd p
arks
/ope
n sp
aces
.
The
CU
S a
naly
sis
and
reco
mm
enda
tions
ai
m to
com
preh
ensi
vely
add
ress
this
pol
icy.
�����!�((:
The
City
sha
ll pr
eser
ve a
per
man
ent b
uffe
r, al
low
ing
reso
urce
use
, in
the
area
two
mile
s no
rth o
f the
McK
enzi
e R
iver
to th
e so
uthe
rn e
dge
of C
obur
g’s
urba
n gr
owth
bou
ndar
y in
ord
er to
pro
vide
ope
n sp
ace
betw
een
the
McK
enzi
e R
iver
and
th
e so
uthe
rn e
dge
of th
e ur
ban
grow
th b
ound
ary
and
to m
aint
ain
a se
para
tion
Dire
cts
juris
dict
iona
l buf
fer.
Affe
cts
CU
S
deci
sion
-mak
ing.

�������3�P�
betw
een
the
Citi
es o
f Cob
urg
and
Eug
ene.
�����!�(>: T
he C
ity s
houl
d de
velo
p a
syst
em o
f Urb
an R
eser
ve A
reas
. To
allo
w
plan
ning
for a
reas
out
side
urb
an g
row
th b
ound
arie
s fo
r eve
ntua
l inc
lusi
on in
an
urba
n gr
owth
bou
ndar
y an
d to
pro
tect
suc
h la
nds
from
pat
tern
s of
dev
elop
men
t tha
t w
ould
impe
de u
rban
izat
ion.
This
pol
icy
has
not b
een
purs
ued.
Affe
cts
CU
S p
roce
ss a
nd p
olic
y de
cisi
on-m
akin
g.
�����!�,8: T
he C
ity s
hall
deve
lop
stra
tegi
es fo
r inf
ill d
evel
opm
ent i
n re
side
ntia
l ar
eas.
Inf
ill te
chni
ques
incl
ude
desi
gn s
tand
ards
, dup
lexe
s an
d tri
plex
es in
sel
ecte
d ar
eas,
var
iatio
ns in
bui
ldin
g se
tbac
ks, m
id-b
lock
dev
elop
men
ts (l
ots
front
ing
a pr
ivat
e or
pub
lic m
id-b
lock
lane
), et
c.
Dire
cts
deve
lopm
ent o
f div
erse
hou
sing
ty
pes
and
desi
gn s
tand
ards
. No
mul
tifam
ily
unit
has
been
bui
lt si
nce
2005
, min
imal
de
sign
sta
ndar
ds w
ere
inco
rpor
ated
into
the
Zoni
ng C
ode
and
have
bee
n ap
plie
d.
Wed
nesd
ay, A
pril
07, 2
010
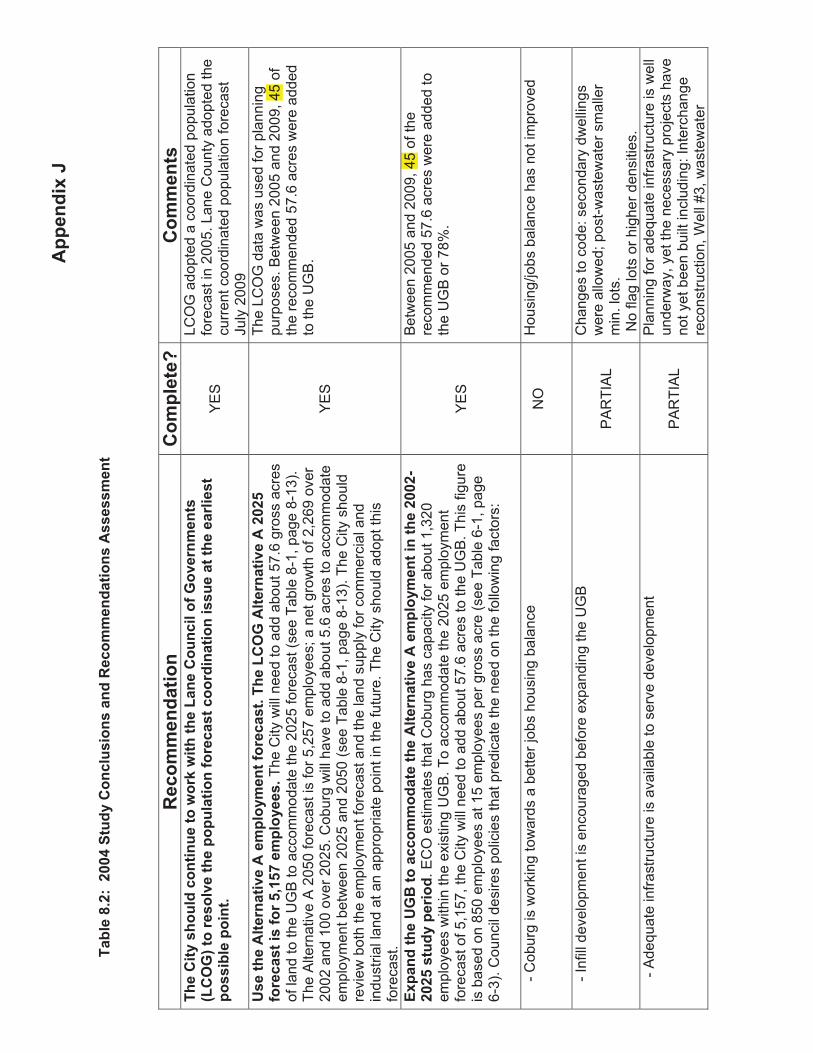
�������3�P�
��&���4��:���88(����!�������#���#����� ��� ��������#��##�## ����
� ��� ���������
�� �����6
�� ���#�
�������!�#������������������?��I�?��������'�������������/�2�=��� ���#�
;'�-2<������#��=�����������������/�����#����������������##����������������#��
��##�&����������
YE
S
LCO
G a
dopt
ed a
coo
rdin
ated
pop
ulat
ion
fore
cast
in 2
005.
Lan
e C
ount
y ad
opte
d th
e cu
rren
t coo
rdin
ated
pop
ulat
ion
fore
cast
Ju
ly 2
009
�#���������������=����� ���! ����/�����#�������'�-2����������=�����8�,�
/�����#���#�/���,7�,1�� ���!��#��T
he C
ity w
ill n
eed
to a
dd a
bout
57.
6 gr
oss
acre
s of
land
to th
e U
GB
to a
ccom
mod
ate
the
2025
fore
cast
(see
Tab
le 8
-1, p
age
8-13
). Th
e A
ltern
ativ
e A
205
0 fo
reca
st is
for 5
,257
em
ploy
ees;
a n
et g
row
th o
f 2,2
69 o
ver
2002
and
100
ove
r 202
5. C
obur
g w
ill h
ave
to a
dd a
bout
5.6
acr
es to
acc
omm
odat
e em
ploy
men
t bet
wee
n 20
25 a
nd 2
050
(see
Tab
le 8
-1, p
age
8-13
). Th
e C
ity s
houl
d re
view
bot
h th
e em
ploy
men
t for
ecas
t and
the
land
sup
ply
for c
omm
erci
al a
nd
indu
stria
l lan
d at
an
appr
opria
te p
oint
in th
e fu
ture
. The
City
sho
uld
adop
t thi
s fo
reca
st.�
YE
S
The
LCO
G d
ata
was
use
d fo
r pla
nnin
g pu
rpos
es. B
etw
een
2005
and
200
9, 4
5 of
th
e re
com
men
ded
57.6
acr
es w
ere
adde
d to
the
UG
B.
�3����������2%�������� �������������������=����� ���! ������������88�9
�8�,�#���!�������.
EC
O e
stim
ates�th
at C
obur
g ha
s ca
paci
ty fo
r abo
ut 1
,320
em
ploy
ees
with
in th
e ex
istin
g U
GB
. To
acco
mm
odat
e th
e 20
25 e
mpl
oym
ent
fore
cast�o
f 5,1
57, t
he C
ity w
ill n
eed
to a
dd a
bout
57.
6 ac
res
to th
e U
GB
.�Thi
s fig
ure
is b
ased
on
850
empl
oyee
s at
15
empl
oyee
s pe
r gro
ss a
cre
(see
Tab
le 6
-1, p
age
6-3)
. Cou
ncil
desi
res
polic
ies
that
pre
dica
te th
e ne
ed o
n th
e fo
llow
ing
fact
ors:�
YE
S
Bet
wee
n 20
05 a
nd 2
009,
45
of th
e re
com
men
ded
57.6
acr
es w
ere
adde
d to
th
e U
GB
or 7
8%.
-
Cob
urg
is w
orki
ng to
war
ds a
bet
ter j
obs
hous
ing
bala
nce
NO
Hou
sing
/jobs
bal
ance
has
not
impr
oved
-
Infil
l dev
elop
men
t is
enco
urag
ed b
efor
e ex
pand
ing
the
UG
B
PA
RTI
AL
Cha
nges
to c
ode:
sec
onda
ry d
wel
lings
w
ere
allo
wed
; pos
t-was
tew
ater
sm
alle
r m
in. l
ots.
N
o fla
g lo
ts o
r hig
her d
ensi
ties.
- A
dequ
ate
infra
stru
ctur
e is
ava
ilabl
e to
ser
ve d
evel
opm
ent
PA
RTI
AL
Pla
nnin
g fo
r ade
quat
e in
frast
ruct
ure
is w
ell
unde
rway
, yet
the
nece
ssar
y pr
ojec
ts h
ave
not y
et b
een
built
incl
udin
g: In
terc
hang
e re
cons
truct
ion,
Wel
l #3,
was
tew
ater
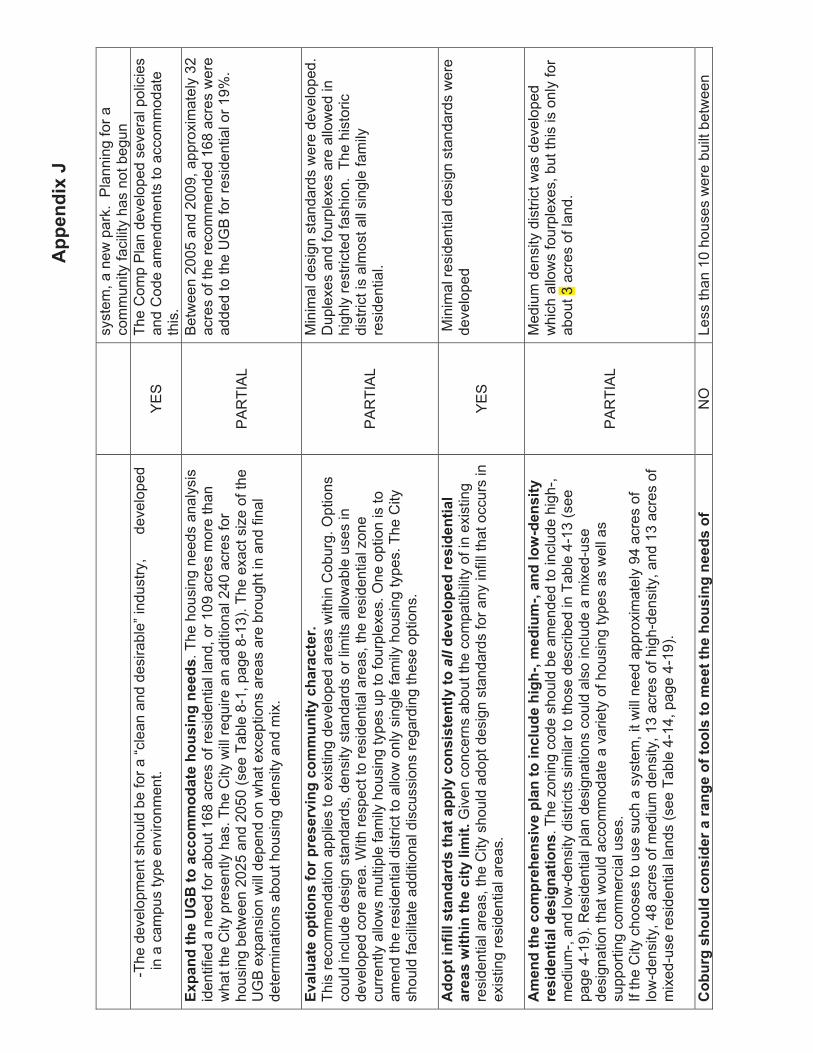
�������3�P�
syst
em, a
new
par
k. P
lann
ing
for a
co
mm
unity
faci
lity
has
not b
egun
-T
he d
evel
opm
ent s
houl
d be
for a
“cle
an a
nd d
esira
ble”
indu
stry
,
dev
elop
ed
in a
cam
pus
type
env
ironm
ent.
YE
S
The
Com
p P
lan
deve
lope
d se
vera
l pol
icie
s an
d C
ode
amen
dmen
ts to
acc
omm
odat
e th
is.
�3����������2%�������� ���������#��*�����#.
The
hou
sing
nee
ds a
naly
sis
iden
tifie
d a
need
for a
bout
168
acr
es o
f res
iden
tial l
and,
or 1
09 a
cres
mor
e th
an
wha
t the
City
pre
sent
ly h
as. T
he C
ity w
ill re
quire
an
addi
tiona
l 240
acr
es fo
r ho
usin
g be
twee
n 20
25 a
nd 2
050
(see
Tab
le 8
-1, p
age
8-13
). Th
e ex
act s
ize
of th
e U
GB
exp
ansi
on w
ill d
epen
d on
wha
t exc
eptio
ns a
reas
are
bro
ught
in a
nd fi
nal
dete
rmin
atio
ns a
bout
hou
sing
den
sity
and
mix
.
PA
RTI
AL
Bet
wee
n 20
05 a
nd 2
009,
app
roxi
mat
ely
32
acre
s of
the
reco
mm
ende
d 16
8 ac
res
wer
e ad
ded
to th
e U
GB
for r
esid
entia
l or 1
9%.
�=�������������#�/������#��=��*��� ����!������������
This
reco
mm
enda
tion
appl
ies
to e
xist
ing
deve
lope
d ar
eas
with
in C
obur
g. O
ptio
ns
coul
d in
clud
e de
sign
sta
ndar
ds, d
ensi
ty s
tand
ards
or l
imits
allo
wab
le u
ses
in
deve
lope
d co
re a
rea.
With
resp
ect t
o re
side
ntia
l are
as, t
he re
side
ntia
l zon
e cu
rren
tly a
llow
s m
ultip
le fa
mily
hou
sing
type
s up
to fo
urpl
exes
. One
opt
ion
is to
am
end
the
resi
dent
ial d
istri
ct to
allo
w o
nly
sing
le fa
mily
hou
sing
type
s. T
he C
ity
shou
ld fa
cilit
ate
addi
tiona
l dis
cuss
ions
rega
rdin
g th
ese
optio
ns.
PA
RTI
AL
Min
imal
des
ign
stan
dard
s w
ere
deve
lope
d.
Dup
lexe
s an
d fo
urpl
exes
are
allo
wed
in
high
ly re
stric
ted
fash
ion.
The
his
toric
di
stric
t is
alm
ost a
ll si
ngle
fam
ily
resi
dent
ial.
��������/����#�������#����������!����#�#�����!����a
ll��=���������#���������
����#�?�������������!��� ����G
iven
conc
erns
abo
ut th
e co
mpa
tibili
ty o
f in
exis
ting
resi
dent
iala
reas
, the
City
sho
uld
adop
t des
ign
stan
dard
s fo
r any
infil
l tha
t occ
urs
in
exis
ting
resi
dent
ial a
reas
.Y
ES
Min
imal
resi
dent
ial d
esig
n st
anda
rds
wer
e de
velo
ped
� ���������� ������#�=��������������������*�97� ���� 97�������?9���#��!�
��#�����������#�*������#
. The�z
onin
g co
de s
houl
d be
am
ende
d to
incl
ude
high
-, m
ediu
m-,
and�
low
-den
sity
dis
trict
s si
mila
r to
thos
e de
scrib
ed in
Tab
le 4
-13�
(see
page
4-1
9). R
esid
entia
l pla
n de
sign
atio
ns c
ould
als
o�in
clud
e a
mix
ed-u
se
desi
gnat
ion
that
wou
ld a
ccom
mod
ate
a�va
riety
of h
ousi
ng ty
pes
as w
ell a
s su
ppor
ting
com
mer
cial
use
s.�
If th
e C
ity c
hoos
es to
use
suc
h a
syst
em, i
t will
nee
d ap
prox
imat
ely
94 a
cres
of
low
-den
sity
, 48
acre
s of
med
ium
den
sity
, 13
acre
s of
hig
h-de
nsity
, and
13
acre
s of
m
ixed
-use
resi
dent
ial l
ands
(see
Tab
le 4
-14,
pag
e 4-
19).
PA
RTI
AL
Med
ium
den
sity
dis
trict
was
dev
elop
ed
whi
ch a
llow
s fo
urpl
exes
, but
this
is o
nly
for
abou
t 3 a
cres
of l
and.
��&��*�#���������#����������*���/�����#���� �����������#��*�����#��/�
NO
Less
than
10
hous
es w
ere
built
bet
wee
n
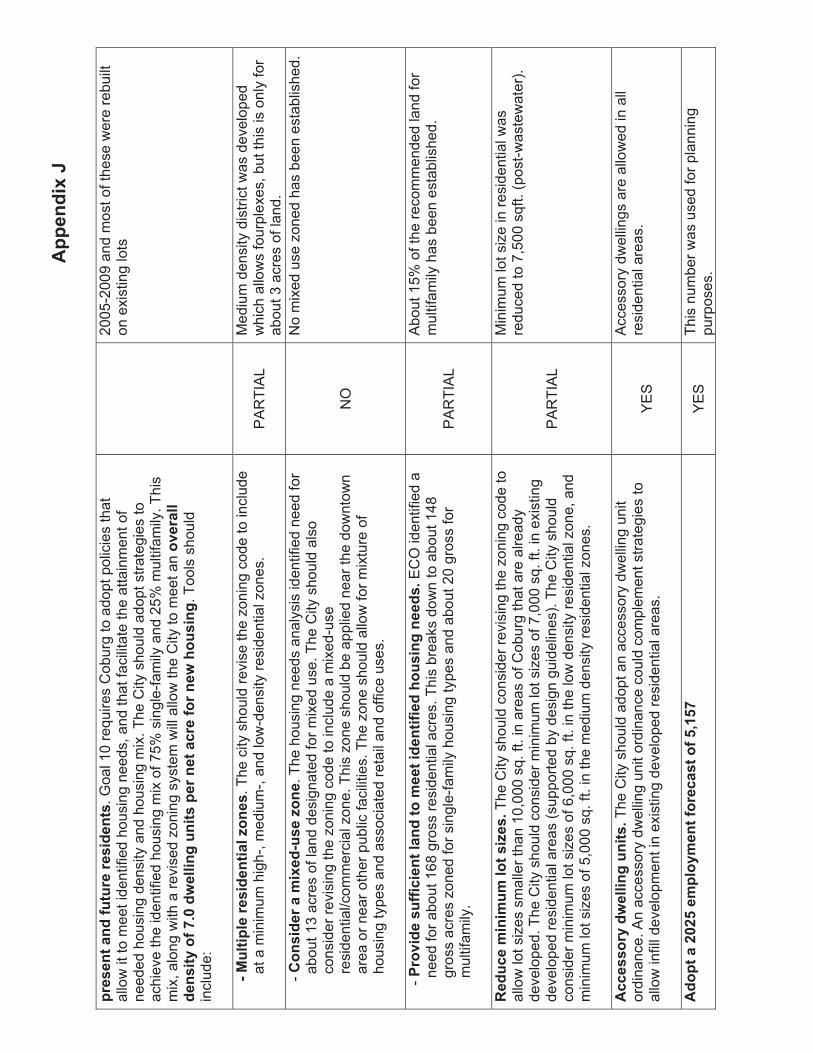
�������3�P�
���#��������/��������#�����#.
Goa
l 10�
requ
ires
Cob
urg
to a
dopt
pol
icie
s th
at
allo
w it
to m
eet�i
dent
ified
hou
sing
nee
ds, a
nd th
at fa
cilit
ate
the
atta
inm
ent o
f�ne
eded
hou
sing
den
sity
and
hou
sing
mix
. The
City
sho
uld�
adop
t stra
tegi
es to
ac
hiev
e th
e id
entif
ied
hous
ing
mix
of 7
5% s
ingl
e-fa
mily
and
25%
mul
tifam
ily. T
his
mix
, alo
ng w
ith a
revi
sed
zoni
ng s
yste
m w
ill a
llow
the
City
to m
eet a
n��=������
���#��!��/�1�8��?�����*�����#��������������/�����?����#��*
.�Too
ls s
houl
d in
clud
e:�
2005
-200
9 an
d m
ost o
f the
se w
ere
rebu
ilt
on e
xist
ing
lots
�����9������������#���������J���#
. The
city
sho
uld
revi
se th
e zo
ning
cod
e to
incl
ude
at a
min
imum
hig
h-, m
ediu
m-,
and
low
-den
sity
resi
dent
ial z
ones
. P
AR
TIA
LM
ediu
m d
ensi
ty d
istri
ct w
as d
evel
oped
w
hich
allo
ws
four
plex
es, b
ut th
is is
onl
y fo
r ab
out 3
acr
es o
f lan
d.
-
���#������� �3��9�#��J���.
The
hou
sing
nee
ds a
naly
sis
iden
tifie
d ne
ed fo
r ab
out 1
3 ac
res
of la
nd d
esig
nate
d fo
r mix
ed u
se. T
he C
ity s
houl
d al
so
cons
ider
revi
sing
the
zoni
ng c
ode
to in
clud
e a
mix
ed-u
se
resi
dent
ial/c
omm
erci
al z
one.
Thi
s zo
ne s
houl
d be
app
lied
near
the
dow
ntow
n ar
ea o
r nea
r oth
er p
ublic
faci
litie
s. T
he z
one
shou
ld a
llow
for m
ixtu
re o
f ho
usin
g ty
pes
and
asso
ciat
ed re
tail
and
offic
e us
es.
NO
No
mix
ed u
se z
oned
has
bee
n es
tabl
ishe
d.
- ���=����#�//��������������� ����������/�������#��*�����#��E
CO
iden
tifie
d a
need
for a
bout
168
gro
ss�re
side
ntia
l acr
es. T
his
brea
ks d
own
to a
bout
148
gr
oss
acre
s�zo
ned
for s
ingl
e-fa
mily
hou
sing
type
s an
d ab
out 2
0 gr
oss
for
mul
tifam
ily.�
PA
RTI
AL
Abo
ut 1
5% o
f the
reco
mm
ende
d la
nd fo
r m
ultif
amily
has
bee
n es
tabl
ishe
d.
������ ��� � �����#�J�#��T
he C
ity s
houl
d co
nsid
er re
visi
ng th
e zo
ning
cod
e to
al
low
lot s
izes
sm
alle
r tha
n 10
,000
sq.
ft. i
n ar
eas
of C
obur
g th
at a
re a
lread
y de
velo
ped.
The
City
sho
uld
cons
ider
min
imum
lot s
izes
of 7
,000
sq.
ft. i
n ex
istin
g de
velo
ped
resi
dent
ial a
reas
(sup
porte
d by
des
ign
guid
elin
es).
The
City
sho
uld
cons
ider
min
imum
lot s
izes
of 6
,000
sq.
ft. i
n th
e lo
w d
ensi
ty re
side
ntia
l zon
e, a
nd
min
imum
lot s
izes
of 5
,000
sq.
ft. i
n th
e m
ediu
m d
ensi
ty re
side
ntia
l zon
es.
PA
RTI
AL
Min
imum
lot s
ize
in re
side
ntia
l was
re
duce
d to
7,5
00 s
qft.
(pos
t-was
tew
ater
).
����##��!��?�����*�����#��T
he C
ity s
houl
d ad
opt a
n ac
cess
ory
dwel
ling
unit
ordi
nanc
e. A
n ac
cess
ory
dwel
ling
unit
ordi
nanc
e co
uld
com
plem
ent s
trate
gies
to
allo
w in
fill d
evel
opm
ent i
n ex
istin
g de
velo
ped
resi
dent
ial a
reas
. Y
ES
Acc
esso
ry d
wel
lings
are
allo
wed
in a
ll re
side
ntia
l are
as.
���������8�,�� ���! ����/�����#���/�,7�,1
YE
STh
is n
umbe
r was
use
d fo
r pla
nnin
g pu
rpos
es.
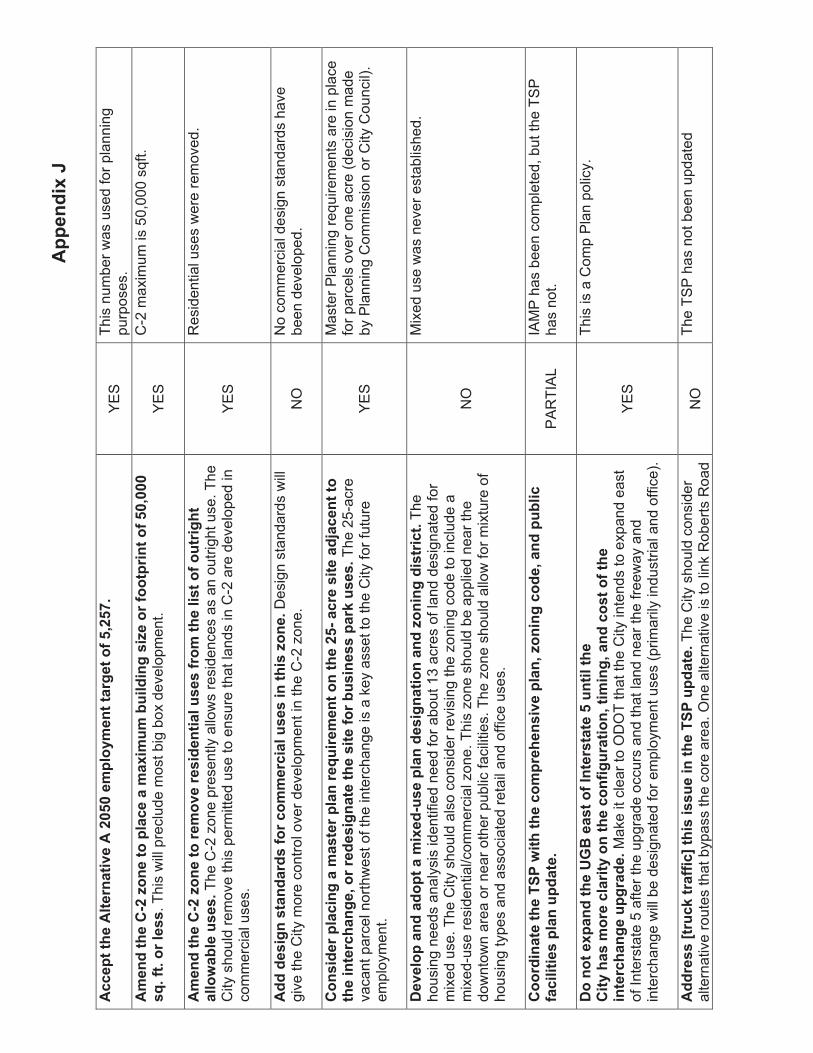
�������3�P�
��������������������=�����8,8�� ���! �������*����/�,7�,1��
YE
STh
is n
umbe
r was
use
d fo
r pla
nnin
g pu
rpos
es.
� ���������9��J��������������� �3� � �&������*�#�J�����/����������/�,87888�
#K��/��������##
. Thi
s w
ill p
recl
ude
mos
t big
box
dev
elop
men
t.�Y
ES
C-2
max
imum
is 5
0,00
0 sq
ft.
� ���������9��J��������� �=����#����������#�#�/�� �������#���/������*���
����?�&����#�#��T
he C
-2 z
one
pres
ently�a
llow
s re
side
nces
as
an o
utrig
ht u
se. T
he
City
sho
uld
rem
ove�
this
per
mitt
ed u
se to
ens
ure
that
land
s in
C-2
are
dev
elop
ed in�
com
mer
cial
use
s.�
YE
S
Res
iden
tial u
ses
wer
e re
mov
ed.
������#�*��#�������#�/����� ��������#�#�������#�J�����D
esig
n st
anda
rds
will
gi
ve th
e C
ity m
ore
cont
rol o
ver d
evel
opm
ent i
n th
e C
-2 z
one.�
�N
ON
o co
mm
erci
al d
esig
n st
anda
rds
have
be
en d
evel
oped
.
���#�����������*��� �#�����������K���� ������������,9������#������H���������
�������������*�7��������#�*���������#����/���&�#���##����I��#�#��T
he 2
5-ac
re
vaca
nt p
arce
l�nor
thw
est o
f the
inte
rcha
nge
is a
key
ass
et to
the
City
for�f
utur
eem
ploy
men
t.��
YE
S
Mas
ter P
lann
ing
requ
irem
ents
are
in p
lace
fo
r par
cels
ove
r one
acr
e (d
ecis
ion
mad
e by
Pla
nnin
g C
omm
issi
on o
r City
Cou
ncil)
.
0�=����������������� �3��9�#���������#�*�����������J����*���#�������
The
hous
ing
need
s an
alys
is id
entif
ied
need�fo
r abo
ut 1
3 ac
res
of la
nd d
esig
nate
d fo
r m
ixed
use
. The
City�s
houl
d al
so c
onsi
der r
evis
ing
the
zoni
ng c
ode
to in
clud
e a�
mix
ed-u
se re
side
ntia
l/com
mer
cial
zon
e. T
his
zone
sho
uld
be�a
pplie
d ne
ar th
e do
wnt
own
area
or n
ear o
ther
pub
lic fa
cilit
ies.�T
he z
one
shou
ld a
llow
for m
ixtu
re o
f ho
usin
g ty
pes
and�
asso
ciat
ed re
tail
and
offic
e us
es.�
�
NO
Mix
ed u
se w
as n
ever
est
ablis
hed.
������������������?���������� ������#�=������7�J����*�����7�������&����
/��������#��������������
�P
AR
TIA
LIA
MP
has
bee
n co
mpl
eted
, but
the
TSP
ha
s no
t.
0�������3����������2%���#���/������#�����,�����������
���!���#� ����������!�����������/�*�������7��� ��*7�������#���/�����
���������*����*������M
ake
it cl
ear t
o O
DO
T�th
at th
e C
ity in
tend
s to
exp
and
east
of
Inte
rsta
te 5
afte
r the�u
pgra
de o
ccur
s an
d th
at la
nd n
ear t
he fr
eew
ay a
nd�
inte
rcha
nge
will
be
desi
gnat
ed fo
r em
ploy
men
t use
s (p
rimar
ily�in
dust
rial a
nd o
ffice
).�
YE
S
This
is a
Com
p P
lan
polic
y.
�����##�W����I����//��X����#��##���������������������T
he C
ity s
houl
d co
nsid
er
alte
rnat
ive
rout
es th
at b
ypas
s th
e co
re a
rea.
One
alte
rnat
ive
is to
link
Rob
erts
Roa
d N
OTh
e TS
P h
as n
ot b
een
upda
ted
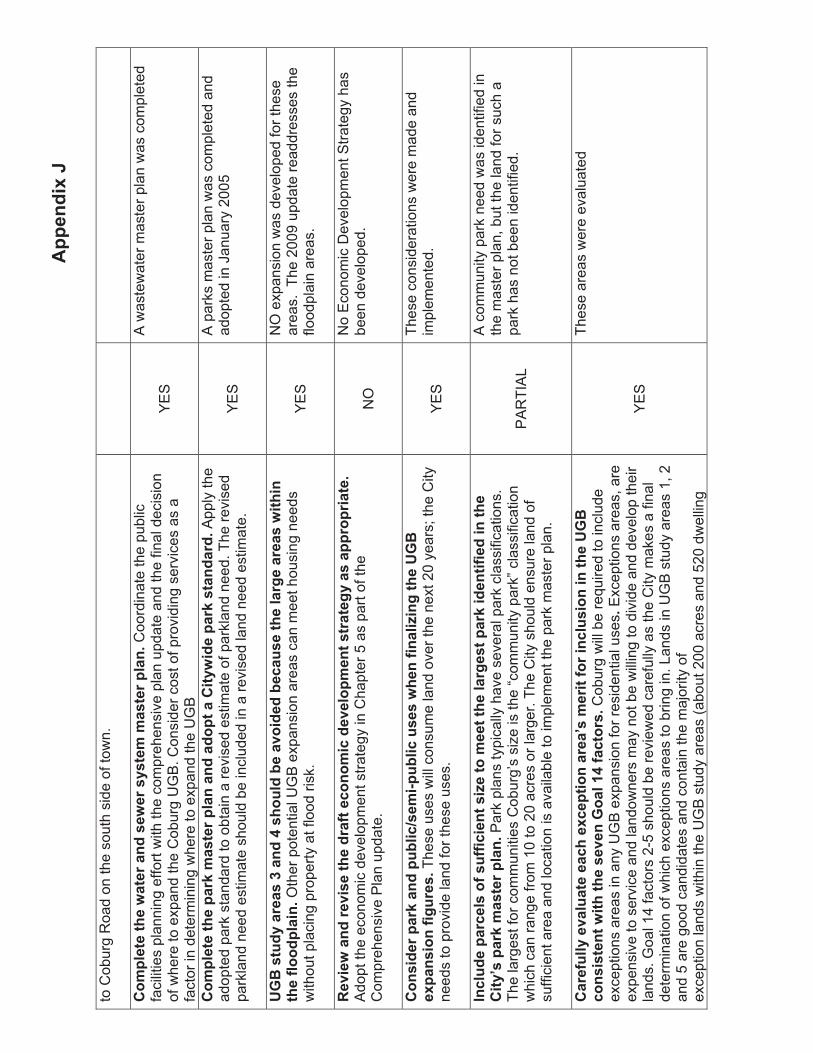
�������3�P�
to C
obur
g R
oad
on th
e so
uth
side
of t
own.
� �� ����������?���������#�?���#!#�� � �#����������C
oord
inat
e th
e pu
blic
fa
cilit
ies
plan
ning
effo
rt w
ith th
e�co
mpr
ehen
sive
pla
n up
date
and
the
final
dec
isio
n of
whe
re to�e
xpan
d th
e C
obur
g U
GB
. Con
side
r cos
t of p
rovi
ding
ser
vice
s as�a
fact
or in
det
erm
inin
g w
here
to e
xpan
d th
e U
GB�
YE
S
A w
aste
wat
er m
aste
r pla
n w
as c
ompl
eted
�� �������������I� �#������������������������!?�������I�#���������A
pply
the
adop
ted
park
sta
ndar
d to
obt
ain
a�re
vise
d es
timat
e of
par
klan
d ne
ed. T
he re
vise
d pa
rkla
nd n
eed�
estim
ate
shou
ld b
e in
clud
ed in
a re
vise
d la
nd n
eed
estim
ate.�
��
YE
S
A p
arks
mas
ter p
lan
was
com
plet
ed a
nd
adop
ted
in J
anua
ry 2
005
�2%�#���!�����#�$�����(�#������&���=������&����#���������*������#�?������
����/�����������O
ther
pot
entia
l UG
B�e
xpan
sion
are
as c
an m
eet h
ousi
ng n
eeds
w
ithou
t pla
cing�p
rope
rty a
t flo
od ri
sk.�
�Y
ES
NO
exp
ansi
on w
as d
evel
oped
for t
hese
ar
eas.
The
200
9 up
date
read
dres
ses
the
flood
plai
n ar
eas.
�=��?�������=�#���������/������� �����=���� ����#�����*!��#��������������
Ado
pt th
e ec
onom
ic d
evel
opm
ent�s
trate
gy in
Cha
pter
5 a
s pa
rt of
the
Com
preh
ensi
ve P
lan�
upda
te.�
�N
O
No
Eco
nom
ic D
evel
opm
ent S
trate
gy h
as
been
dev
elop
ed.
���#��������I�������&���A#� �9��&�����#�#�?����/�����J��*������2%�
�3���#����/�*���#��T
hese
use
s w
ill�c
onsu
me
land
ove
r the
nex
t 20
year
s; th
e C
ity
need
s to
pro
vide�la
nd fo
r the
se u
ses.�
�Y
ES
Thes
e co
nsid
erat
ions
wer
e m
ade
and
impl
emen
ted.
��������������#��/�#�//�������#�J����� �����������*�#�����I�������/�����������
���!F#����I� �#����������P
ark
plan
s�ty
pica
lly h
ave
seve
ral p
ark
clas
sific
atio
ns.
The
larg
est f
or�c
omm
uniti
es C
obur
g’s
size
is th
e “c
omm
unity
par
k”�c
lass
ifica
tion
whi
ch c
an ra
nge
from
10
to 2
0 ac
res
or la
rger
.�The
City
sho
uld
ensu
re la
nd o
f su
ffici
ent a
rea
and
loca
tion
is�a
vaila
ble
to im
plem
ent t
he p
ark
mas
ter p
lan.�
�
PA
RTI
AL
A c
omm
unity
par
k ne
ed w
as id
entif
ied
in
the
mas
ter p
lan,
but
the
land
for s
uch
a pa
rk h
as n
ot b
een
iden
tifie
d.
����/���!��=�������������3������������F#� �����/��������#������������2%�
���#�#�����?��������#�=���2�����(�/�����#��C
obur
g w
ill b
e re
quire
d to
incl
ude
exce
ptio
ns a
reas
in�a
ny U
GB
exp
ansi
on fo
r res
iden
tial u
ses��E
xcep
tions
are
as, a
re�
expe
nsiv
e to
ser
vice
and
land
owne
rs m
ay n
ot b
e w
illin
g to�d
ivid
e an
d de
velo
p th
eir
land
s. G
oal 1
4 fa
ctor
s 2-
5 sh
ould
be�
revi
ewed
car
eful
ly a
s th
e C
ity m
akes
a fi
nal
dete
rmin
atio
n of�w
hich
exc
eptio
ns a
reas
to b
ring
in. L
ands
in U
GB
stu
dy a
reas�1
, 2
and
5 ar
e go
od c
andi
date
s an
d co
ntai
n th
e m
ajor
ity o
f�ex
cept
ion
land
s w
ithin
the
UG
B s
tudy
are
as (a
bout
200
acr
es a
nd 5
20 d
wel
ling
YE
S
Thes
e ar
eas
wer
e ev
alua
ted
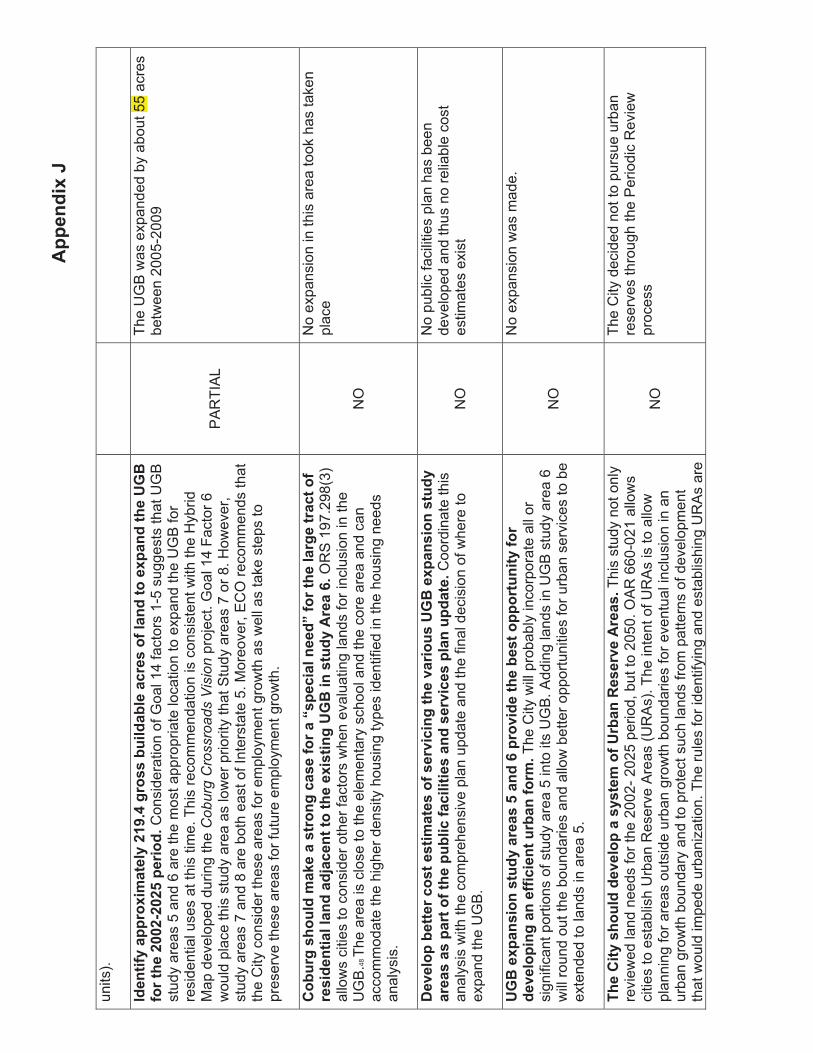
�������3�P�
units
).� ������/!������3� ����!���>�(�*��##�&�����&�������#��/����������3����������2%�
/��������88�9�8�,���������C
onsi
dera
tion
of G
oal 1
4 fa
ctor
s 1-
5 su
gges
ts th
at U
GB
st
udy�
area
s 5
and
6 ar
e th
e m
ost a
ppro
pria
te lo
catio
n to
exp
and
the�
UG
B fo
r re
side
ntia
l use
s at
this
tim
e. T
his
reco
mm
enda
tion
is�c
onsi
sten
t with
the
Hyb
rid
Map
dev
elop
ed d
urin
g th
e C
obur
g�C
ross
road
s V
isio
n pr
ojec
t. G
oal 1
4 Fa
ctor
6
wou
ld p
lace
this�s
tudy
are
a as
low
er p
riorit
y th
at S
tudy
are
as 7
or 8
. How
ever
,�st
udy
area
s 7
and
8 ar
e bo
th e
ast o
f Int
erst
ate
5. M
oreo
ver,�
EC
O re
com
men
ds th
at
the
City
con
side
r the
se a
reas
for e
mpl
oym
ent g
row
th a
s w
ell a
s ta
ke s
teps
to
pres
erve
thes
e ar
eas
for f
utur
e em
ploy
men
t gro
wth
.��
PA
RTI
AL
The
UG
B w
as e
xpan
ded
by a
bout
55
acre
s be
twee
n 20
05-2
009
��&��*�#������ �I����#����*���#��/�����Y#�����������Z�/����������*���������/�
��#����������������H��������������3�#���*��2%����#���!������.��O
RS
197
.298
(3)
allo
ws
citie
s�to
con
side
r oth
er fa
ctor
s w
hen
eval
uatin
g la
nds
for i
nclu
sion
in�th
eU
GB
. 48Th
e ar
ea is
clo
se to
the
elem
enta
ry s
choo
l and
the�
core
are
a an
d ca
n ac
com
mod
ate
the
high
er d
ensi
ty h
ousi
ng�ty
pes
iden
tifie
d in
the
hous
ing
need
s an
alys
is.�
�
NO
No
expa
nsio
n in
this
are
a to
ok h
as ta
ken
plac
e
0�=�����&��������#���#�� ���#��/�#��=����*�����=�����#��2%��3���#����#���!�
����#��#�������/�������&����/��������#�����#��=���#��������������C
oord
inat
e th
is�
anal
ysis
with
the
com
preh
ensi
ve p
lan
upda
te a
nd th
e fin
al�d
ecis
ion
of w
here
to
expa
nd th
e U
GB
.��
NO
No
publ
ic fa
cilit
ies
plan
has
bee
n de
velo
ped
and
thus
no
relia
ble
cost
es
timat
es e
xist
�2%��3���#����#���!�����#�,�����.����=��������&�#������������!�/���
��=������*�����//���������&���/�� ��T
he�C
ity w
ill p
roba
bly
inco
rpor
ate
all o
r si
gnifi
cant
por
tions
of s
tudy
are
a 5
into
its
UG
B. A
ddin
g la
nds
in U
GB
stu
dy a
rea
6 w
ill ro
und
out t
he b
ound
arie
s an
d al
low
bet
ter o
ppor
tuni
ties
for u
rban
ser
vice
s to
be
exte
nded
to la
nds
in a
rea
5.�
�
NO
No
expa
nsio
n w
as m
ade.
�������!�#��������=�������#!#�� ��/���&��� �#��=������#��T
his
stud
y no
t onl
y re
view
ed la
nd n
eeds
for t
he 2
002-
202
5 pe
riod,
but
to 2
050.
OA
R 6
60-0
21 a
llow
s ci
ties
to e
stab
lish�
Urb
an R
eser
ve A
reas
(UR
As)
. The
inte
nt o
f UR
As
is to
allo
w�
plan
ning
for a
reas
out
side
urb
an g
row
th b
ound
arie
s fo
r�eve
ntua
l inc
lusi
on in
an
urba
n gr
owth
bou
ndar
y an
d to
pro
tect�s
uch
land
s fro
m p
atte
rns
of d
evel
opm
ent
that
wou
ld im
pede
urb
aniz
atio
n. T
he ru
les
for i
dent
ifyin
g an
d es
tabl
ishi
ng U
RA
s ar
e
NO
The
City
dec
ided
not
to p
ursu
e ur
ban
rese
rves
thro
ugh
the
Per
iodi
c R
evie
w
proc
ess

�������3�P�
desc
ribed
in O
AR
660
-021
-003
0, a
nd g
ener
ally
follo
win
g th
e re
quire
men
ts o
f OR
S
197.
298
and
Goa
l 14.�
� ���#������ �#������/�#�����3�#���*���=���� �����������#��A
dd th
e re
mai
ning
12
5 ac
res
of U
GB
stu
dy a
rea
6�an
d th
e 28
-acr
e re
sour
ce la
nd a
rea
in U
GB
stu
dy
area
5.�C
onsi
der a
ddin
g th
e re
mai
ning
land
s in
UG
B s
tudy
are
a 1.
Add
land
s in
U
GB
stu
dy a
rea
7 or
8 fo
r the
em
ploy
men
t lan
d ne
ed fo
r the
202
5-20
50 p
lann
ing
perio
d.�
�
NO
No
expa
nsio
n w
as m
ade.
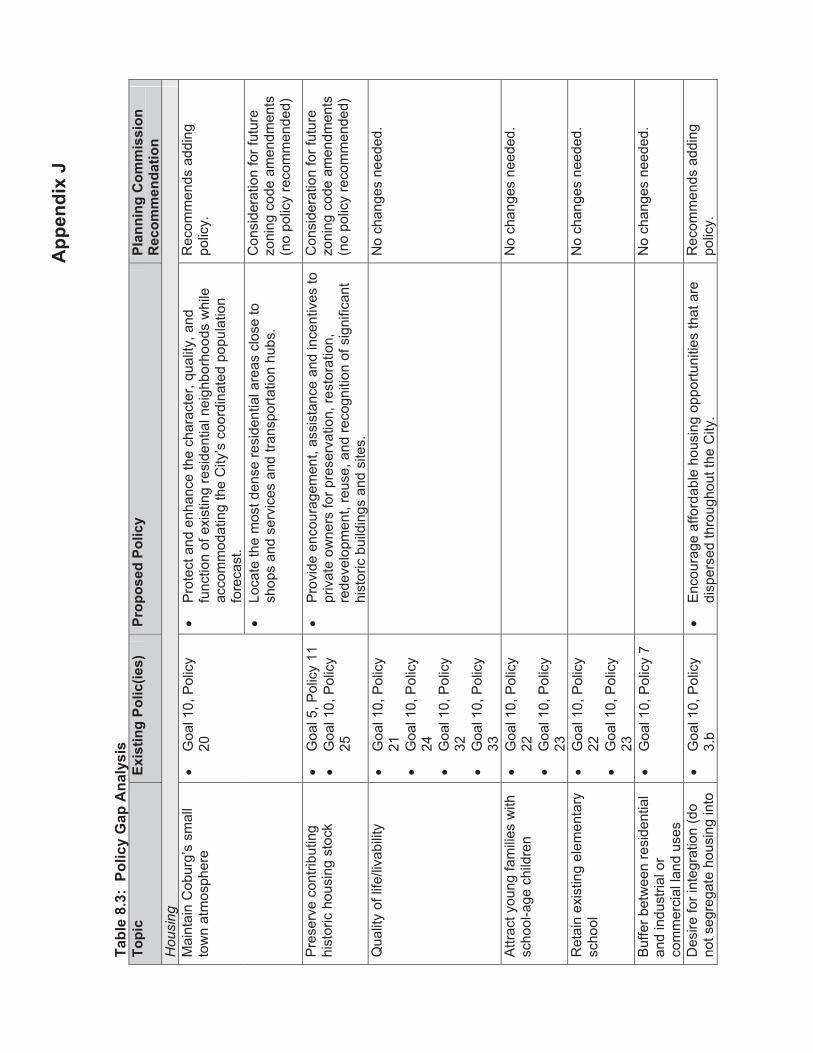
�������3�P�
��&���4�$:�������!�2�������!#�#�
������
�3�#���*������;��#<�
�����#��������!�
�������*��� �##����
��� ���������
Hou
sing
� P
rote
ct a
nd e
nhan
ce th
e ch
arac
ter,
qual
ity, a
nd
func
tion
of e
xist
ing
resi
dent
ial n
eigh
borh
oods
whi
le
acco
mm
odat
ing
the
City
’s c
oord
inat
ed p
opul
atio
n fo
reca
st.
Rec
omm
ends
add
ing
polic
y.M
aint
ain
Cob
urg’
s sm
all
tow
n at
mos
pher
e �
Goa
l 10,
Pol
icy
20
� Lo
cate
the
mos
t den
se re
side
ntia
l are
as c
lose
to
shop
s an
d se
rvic
es a
nd tr
ansp
orta
tion
hubs
. C
onsi
dera
tion
for f
utur
e zo
ning
cod
e am
endm
ents
(n
o po
licy
reco
mm
ende
d)
Pre
serv
e co
ntrib
utin
g hi
stor
ic h
ousi
ng s
tock
�
Goa
l 5, P
olic
y 11
�
Goa
l 10,
Pol
icy
25
� P
rovi
de e
ncou
rage
men
t, as
sist
ance
and
ince
ntiv
es to
pr
ivat
e ow
ners
for p
rese
rvat
ion,
rest
orat
ion,
re
deve
lopm
ent,
reus
e, a
nd re
cogn
ition
of s
igni
fican
t hi
stor
ic b
uild
ings
and
site
s.
Con
side
ratio
n fo
r fut
ure
zoni
ng c
ode
amen
dmen
ts
(no
polic
y re
com
men
ded)
Qua
lity
of li
fe/li
vabi
lity
� G
oal 1
0, P
olic
y 21
� G
oal 1
0, P
olic
y 24
� G
oal 1
0, P
olic
y 32
� G
oal 1
0, P
olic
y 33
No
chan
ges
need
ed.
Attr
act y
oung
fam
ilies
with
sc
hool
-age
chi
ldre
n �
Goa
l 10,
Pol
icy
22�
Goa
l 10,
Pol
icy
23
No
chan
ges
need
ed.
Ret
ain
exis
ting
elem
enta
ry
scho
ol�
Goa
l 10,
Pol
icy
22�
Goa
l 10,
Pol
icy
23
No
chan
ges
need
ed.
Buf
fer b
etw
een
resi
dent
ial
and
indu
stria
l or
com
mer
cial
land
use
s
� G
oal 1
0, P
olic
y 7
No
chan
ges
need
ed.
Des
ire fo
r int
egra
tion
(do
not s
egre
gate
hou
sing
into
�
Goa
l 10,
Pol
icy
3.b
� E
ncou
rage
affo
rdab
le h
ousi
ng o
ppor
tuni
ties
that
are
di
sper
sed
thro
ugho
ut th
e C
ity.
Rec
omm
ends
add
ing
polic
y.

�������3�P�
������
�3�#���*������;��#<�
�����#��������!�
�������*��� �##����
��� ���������
area
s of
diff
erin
g so
cioe
cono
mic
sta
tus)
�
Enc
oura
ge d
iver
sity
in s
ize
of d
wel
ling
units
by
pres
ervi
ng a
nd/o
r pro
mot
ing
smal
ler h
omes
on
smal
ler l
ots.
Con
side
ratio
n fo
r fut
ure
zoni
ng c
ode
amen
dmen
ts
(no
polic
y re
com
men
ded)
If co
ttage
hou
sing
or o
ther
al
tern
ativ
e pr
ovis
ions
are
pr
opos
ed
� A
llow
alte
rnat
ive
resi
dent
ial d
evel
opm
ent o
ptio
ns th
at
are
com
patib
le w
ith s
urro
undi
ng d
evel
opm
ent.
Rec
omm
ends
add
ing
polic
y. R
evis
e po
licy
lang
uage
to a
ddre
ss
conf
igur
ing
lots
in c
reat
ive
way
s to
add
ress
den
sity
. E
cono
my
Mai
ntai
n C
obur
g’s
smal
l to
wn
atm
osph
ere
(how
to
reta
in s
mal
l tow
n at
mos
pher
e w
ith e
xpec
ted
grow
th)
� G
oal 9
, Cob
urg
Obj
ectiv
e�
Goa
l 9, P
olic
y 11
�
Goa
l 9, P
olic
y 21
�
Goa
l 9, P
olic
y 24
No
chan
ges
need
ed.
Buf
fer b
etw
een
resi
dent
ial
and
indu
stria
l or
com
mer
cial
land
use
s
� G
oal 9
, Pol
icy
7 �
Goa
l 9, P
olic
y 27
N
och
ange
sne
eded
.
Des
ire fo
r mor
e of
fice/
med
ical
offi
ce
deve
lopm
ent
� E
mph
asiz
e ne
w o
ffice
and
med
ical
offi
ce
deve
lopm
ent w
ith a
com
plem
enta
ry m
ix o
f sup
porti
ng
uses
.
Con
side
ratio
n fo
r fut
ure
zoni
ng c
ode
amen
dmen
ts
(no
polic
y re
com
men
ded)
W
ant t
o se
e 'g
reen
in
dust
ries'
exp
lore
d (e
.g.
Cle
an T
echn
olog
y, e
tc.)
� G
oal 9
, Pol
icy
14
(add
ress
es to
pic
to s
ome
degr
ee)
� E
ncou
rage
bus
ines
ses
that
pro
mot
e en
viro
nmen
tally
su
stai
nabl
e te
chno
logi
es.
Rec
omm
end
alte
rnat
ive
lang
uage
: E
ncou
rage
bu
sine
sses
that
are
so
cial
ly a
nd
envi
ronm
enta
lly
sust
aina
ble.
Con
tinue
to s
uppo
rt do
wnt
own
as d
estin
atio
n ar
ea fo
r ant
iqui
ng (w
ith
sign
age,
etc
.)
� P
rom
ote
Cob
urg
as a
her
itage
, eco
-tour
ism
and
re
crea
tion
dest
inat
ion.
R
ecom
men
ds a
ddin
g po
licy.
Em
phas
ize
anch
or
busi
ness
es in
Cob
urg’
s do
wnt
own
(not
e: I
ssue
� E
mph
asiz
e “a
ncho
r” b
usin
esse
s in
Cob
urg’
s do
wnt
own
that
incl
udes
a m
ajor
ow
ner o
r les
see
that
in
crea
ses
traffi
c to
the
dow
ntow
n an
d pr
omis
es
Rec
omm
ends
add
ing
polic
y, m
ay n
eed
som
e la
ngua
ge re
visi
on.
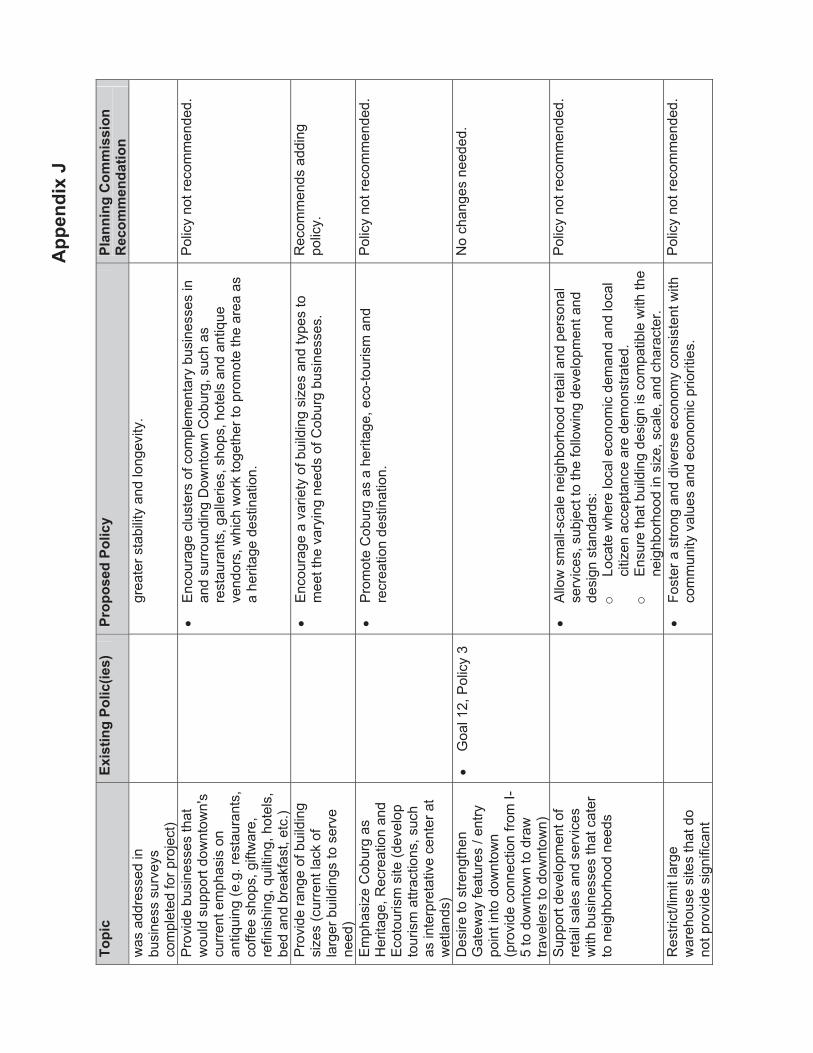
�������3�P�
������
�3�#���*������;��#<�
�����#��������!�
�������*��� �##����
��� ���������
was
add
ress
ed in
bu
sine
ss s
urve
ys
com
plet
ed fo
r pro
ject
)
grea
ter s
tabi
lity
and
long
evity
.
Pro
vide
bus
ines
ses
that
w
ould
sup
port
dow
ntow
n's
curr
ent e
mph
asis
on
antiq
uing
(e.g
. res
taur
ants
, co
ffee
shop
s, g
iftw
are,
re
finis
hing
, qui
lting
, hot
els,
be
d an
d br
eakf
ast,
etc.
)
� E
ncou
rage
clu
ster
s of
com
plem
enta
ry b
usin
esse
s in
an
d su
rrou
ndin
g D
ownt
own
Cob
urg,
suc
h as
re
stau
rant
s, g
alle
ries,
sho
ps, h
otel
s an
d an
tique
ve
ndor
s, w
hich
wor
k to
geth
er to
pro
mot
e th
e ar
ea a
s a
herit
age
dest
inat
ion.
Pol
icy
not r
ecom
men
ded.
Pro
vide
rang
e of
bui
ldin
g si
zes
(cur
rent
lack
of
larg
er b
uild
ings
to s
erve
ne
ed)
� E
ncou
rage
a v
arie
ty o
f bui
ldin
g si
zes
and
type
s to
m
eet t
he v
aryi
ng n
eeds
of C
obur
g bu
sine
sses
. R
ecom
men
ds a
ddin
g po
licy.
Em
phas
ize
Cob
urg
as
Her
itage
, Rec
reat
ion
and
Eco
tour
ism
site
(dev
elop
to
uris
m a
ttrac
tions
, suc
h as
inte
rpre
tativ
e ce
nter
at
wet
land
s)
� P
rom
ote
Cob
urg
as a
her
itage
, eco
-tour
ism
and
re
crea
tion
dest
inat
ion.
P
olic
y no
t rec
omm
ende
d.
Des
ire to
stre
ngth
en
Gat
eway
feat
ures
/ en
try
poin
t int
o do
wnt
own
(pro
vide
con
nect
ion
from
I-5
to d
ownt
own
to d
raw
tra
vele
rs to
dow
ntow
n)
� G
oal 1
2, P
olic
y 3
No
chan
ges
need
ed.
Sup
port
deve
lopm
ent o
f re
tail
sale
s an
d se
rvic
es
with
bus
ines
ses
that
cat
er
to n
eigh
borh
ood
need
s
� A
llow
sm
all-s
cale
nei
ghbo
rhoo
d re
tail
and
pers
onal
se
rvic
es, s
ubje
ct to
the
follo
win
g de
velo
pmen
t and
de
sign
sta
ndar
ds:
o Lo
cate
whe
re lo
cal e
cono
mic
dem
and
and
loca
l ci
tizen
acc
epta
nce
are
dem
onst
rate
d.
o E
nsur
e th
at b
uild
ing
desi
gn is
com
patib
le w
ith th
e ne
ighb
orho
od in
siz
e, s
cale
, and
cha
ract
er.
Pol
icy
not r
ecom
men
ded.
Res
trict
/lim
it la
rge
war
ehou
se s
ites
that
do
not p
rovi
de s
igni
fican
t
� Fo
ster
a s
trong
and
div
erse
eco
nom
y co
nsis
tent
with
co
mm
unity
val
ues
and
econ
omic
prio
ritie
s.
Pol
icy
not r
ecom
men
ded.

�������3�P�
������
�3�#���*������;��#<�
�����#��������!�
�������*��� �##����
��� ���������
bene
fits
to th
e co
mm
unity
(e
.g. i
n te
rms
of jo
bs,
chan
ge o
f cha
ract
er, e
tc.)
S
uppo
rt im
prov
emen
t of
inte
rcha
nge
� S
uppo
rt re
gion
al in
frast
ruct
ure
initi
ativ
es, s
uch
as th
e im
prov
emen
t of t
he C
obur
g/In
ters
tate
5 In
terc
hang
e th
at w
ill en
hanc
e ec
onom
ic d
evel
opm
ent
oppo
rtuni
ties.
Pol
icy
not r
ecom
men
ded.
Res
trict
/lim
it la
rge
regi
onal
sh
oppi
ng c
ente
rs
� G
oal 9
, Pol
icy
17
(add
ress
es to
pic
to s
ome
degr
ee)
� Fo
ster
a s
trong
and
div
erse
eco
nom
y co
nsis
tent
with
co
mm
unity
val
ues
and
econ
omic
prio
ritie
s.
Pol
icy
not r
ecom
men
ded.
Nee
d fo
r arc
hite
ctur
al a
nd
land
scap
ing
stan
dard
s �
Goa
l 9, P
olic
y 8
� G
oal 9
, Pol
icy
26
� G
oal 9
, Pol
icy
27
No
chan
ges
need
ed.
Con
tinue
d su
ppor
t for
ni
che
reta
il m
arke
t suc
h as
an
tique
sal
es
� S
uppo
rt st
reng
then
ing
Cob
urg’
s re
tail
shop
ping
ar
eas,
incl
udin
g sp
ecia
lty re
tail
in th
e D
ownt
own,
pr
ovid
ing
loca
l goo
ds a
nd s
ervi
ces
in n
ew
neig
hbor
hood
com
mer
cial
are
as a
nd e
ncou
ragi
ng
attra
ctiv
e co
mm
erci
al a
nd m
ixed
-use
dev
elop
men
t.
Pol
icy
not r
ecom
men
ded.
Ack
now
ledg
emen
t of n
eed
for s
torm
wat
er a
nd
was
tew
ater
sys
tem
s
� G
oal 9
, Pol
icy
9 (n
eeds
am
endm
ent)
� E
ncou
rage
infra
stru
ctur
e sy
stem
s fo
r util
ities
, tra
nspo
rtatio
n an
d te
leco
mm
unic
atio
ns to
opt
imiz
e se
rvic
e de
liver
y to
the
busi
ness
com
mun
ity.
Rec
omm
ends
add
ing
polic
y.
Pro
mot
e an
d ca
taly
ze
annu
al a
nd s
peci
al lo
cal
even
ts
� E
ncou
rage
and
dev
elop
eve
nts
thro
ugho
ut th
e co
mm
unity
whe
re p
eopl
e ca
n ga
ther
and
inte
ract
. �
Sup
port
busi
ness
es a
nd o
rgan
izat
ions
invo
lved
in th
e ar
ts, h
isto
ric p
rese
rvat
ion
and
civi
c ac
tiviti
es.
Rec
omm
ends
add
ing
polic
ies.
Incr
easi
ng ro
le o
f hom
e bu
sine
sses
� S
uppo
rt ho
me-
base
d bu
sine
sses
that
are
com
patib
le
with
nei
ghbo
rhoo
d ch
arac
ter.
Pol
icy
not r
ecom
men
ded.
Urb
aniz
atio
n P
rote
ct s
urro
undi
ng
agric
ultu
ral l
ands
�
Goa
l 14,
Pol
icy
19N
och
ange
sne
eded
.
Use
land
effi
cien
tly -
no
leap
frog
deve
lopm
ent
� G
oal 5
, Pol
icy
28
No
chan
ges
need
ed.
Pla
n fo
r seq
uent
ial,
conc
entri
c de
velo
pmen
t ou
twar
d fro
m e
xist
ing
city
� G
oal 1
4, P
olic
y 17
No
chan
ges
need
ed.
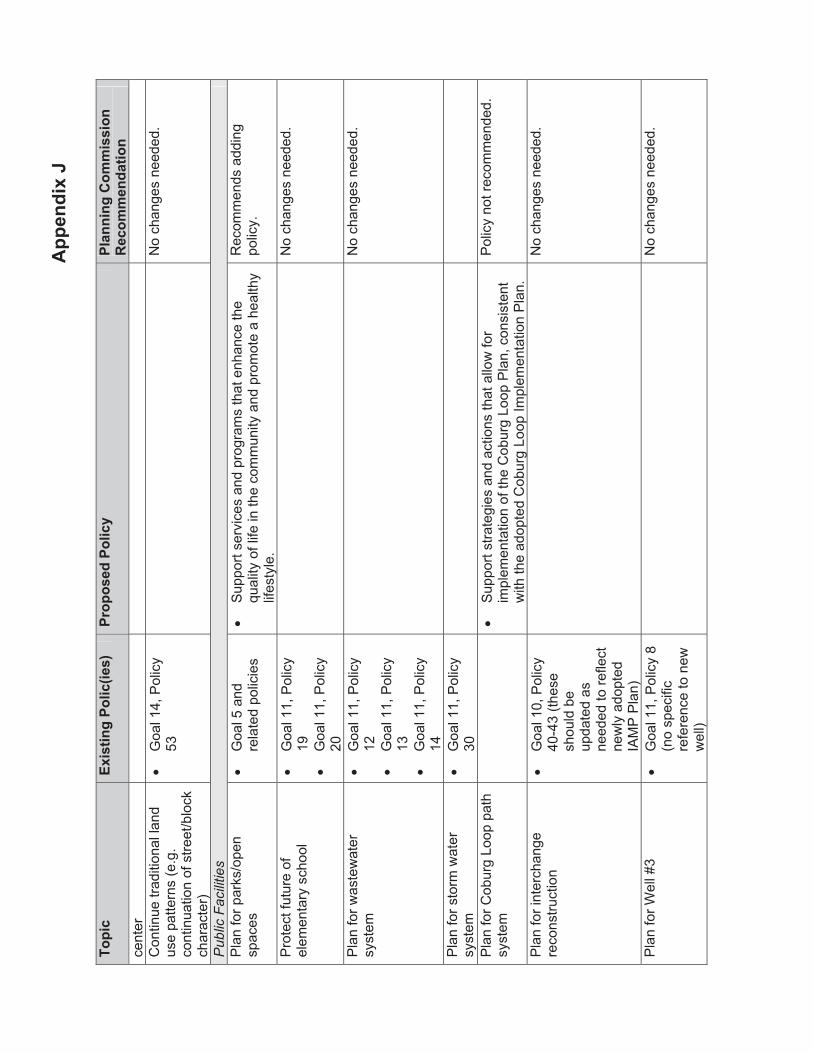
�������3�P�
������
�3#���*������;��#<�
������#��������!�
�������*��� �##����
��� ���������
cent
erC
ontin
ue tr
aditi
onal
land
us
e pa
ttern
s (e
.g.
cont
inua
tion
of s
treet
/blo
ck
char
acte
r)
� G
oal 1
4, P
olic
y 53
No
chan
ges
need
ed.
Pub
lic F
acili
ties
Pla
n fo
r par
ks/o
pen
spac
es�
Goa
l 5 a
nd
rela
ted
polic
ies
� S
uppo
rt se
rvic
es a
nd p
rogr
ams
that
enh
ance
the
qual
ity o
f life
in th
e co
mm
unity
and
pro
mot
e a
heal
thy
lifes
tyle
.
Rec
omm
ends
add
ing
polic
y.
Pro
tect
futu
re o
f el
emen
tary
sch
ool
� G
oal 1
1, P
olic
y 19
� G
oal 1
1, P
olic
y 20
No
chan
ges
need
ed.
Pla
n fo
r was
tew
ater
sy
stem
�
Goa
l 11,
Pol
icy
12�
Goa
l 11,
Pol
icy
13�
Goa
l 11,
Pol
icy
14
No
chan
ges
need
ed.
Pla
n fo
r sto
rm w
ater
sy
stem
�
Goa
l 11,
Pol
icy
30P
lan
for C
obur
g Lo
op p
ath
syst
em
� S
uppo
rt st
rate
gies
and
act
ions
that
allo
w fo
r im
plem
enta
tion
of th
e C
obur
g Lo
op P
lan,
con
sist
ent
with
the
adop
ted
Cob
urg
Loop
Impl
emen
tatio
n P
lan.
Pol
icy
not r
ecom
men
ded.
Pla
n fo
r int
erch
ange
re
cons
truct
ion
� G
oal 1
0, P
olic
y 40
-43
(thes
e sh
ould
be
upda
ted
as
need
ed to
refle
ct
new
ly a
dopt
ed
IAM
P P
lan)
No
chan
ges
need
ed.
Pla
n fo
r Wel
l #3
� G
oal 1
1, P
olic
y 8
(no
spec
ific
refe
renc
e to
new
w
ell)
No
chan
ges
need
ed.

�������3�P�
������
�3�#���*������;��#<�
����#��������!�
��������*��� �##����
��� ���������
Bet
ter m
aint
ain
exis
ting
park
s an
d op
en s
pace
�
Ens
ure
adeq
uate
mai
nten
ance
and
ope
ratio
n fu
ndin
g pr
ior t
o de
velo
pmen
t of p
arks
and
recr
eatio
nal
faci
litie
s.�
Pra
ctic
e pr
even
tativ
e m
aint
enan
ce a
nd im
prov
e pa
rks
and
faci
litie
s on
a s
ched
uled
bas
is in
ord
er to
m
aint
ain
user
sat
isfa
ctio
n, p
rote
ct th
e pu
blic
’s
inve
stm
ent,
and
mai
ntai
n th
e co
mm
unity
’s p
ositi
ve
imag
e.
Pol
icie
s no
t rec
omm
ende
d.
Lim
it tra
ffic
on lo
cal s
treet
sy
stem
�
Goa
l 12,
Pol
icy
1 �
Est
ablis
h a
stre
et s
yste
m th
at m
inim
izes
byp
ass
traffi
c an
d sa
fety
impa
cts
on n
eigh
borh
ood
stre
ets
and
prom
otes
and
mai
ntai
ns th
e in
tegr
ity o
f ne
ighb
orho
ods.
��
Rec
omm
ends
add
ing
polic
y.
Lim
it fre
ight
traf
fic th
roug
h do
wnt
own
� M
inim
ize
adve
rse
impa
cts
of tr
ansp
orta
tion
syst
ems
and
faci
litie
s on
nei
ghbo
rhoo
ds a
nd o
n th
e D
ownt
own.
Pot
entia
l iss
ues
of c
once
rn in
clud
e co
mm
erci
al a
nd in
dust
rial t
raffi
c on
loca
l stre
ets,
fre
ight
traf
fic th
roug
h D
ownt
own,
incr
easi
ng tr
affic
vo
lum
es; a
nd/o
r air
and
nois
e po
llutio
n. A
co
mbi
natio
n of
tech
niqu
es c
an b
e us
ed to
avo
id o
r m
itiga
te th
ese
impa
cts,
incl
udin
g: c
reat
ing
an
inte
rcon
nect
ed s
yste
m o
f stre
ets
to d
istri
bute
the
traffi
c lo
ad a
nd le
ssen
the
burd
en o
n an
y gi
ven
stre
et;
deve
lopi
ng a
nd im
plem
entin
g ne
ighb
orho
od
appr
opria
te s
treet
des
ign
stan
dard
s; o
r avo
idin
g co
nnec
tions
thro
ugh
resi
dent
ial n
eigh
borh
oods
whe
n th
ey w
ill c
reat
e ne
w ro
utes
for c
omm
erci
al/in
dust
rial
traffi
c or
by-
pass
rout
es.
Rec
omm
ends
add
ing
sim
plifi
ed p
olic
y.
�������������� ���������
���������� ���������������������������� ����������� !��"����#��$���� ��!"��!�#%�%����&��� !��"����#���!�
'#(�)*��+,����-�+,�������(�
'���(���+�.���)�/(����� ���0�
�
������������� ��������� ������
�������������������� ����� �������������������� ����������������!��"����<���>������?�@��X���� Y���"�[\�]^_`�
{��]^_^\����<������������� ����������������|��}��}����<�������>��"��<�>�������"�����~���>��������<��������������~>��������������"����������������������}}�����������!��"�������!��}�������������������<�}�}������������}��"��������|������������|��������������������]^�"���}�����������������
�����������������������}��"��������|���}�������������<���?�������|���@�����"��?�@����}�������������������������}��"������}}�����������<���|�����>�������������}��������������\�����?��������������"�����������}������"����������������<"�������������<�������������������>����������"\����� �������������������"�������}��}������������<���"������<"���������������������������<��������~���>����"��������������������������}����|�������������"�|������������"��<���������������������������������������������������"�����������������������������������������������������<���������������������������<�����������<�����>������?��������������"���
������������������������"�������������������� ����<����|������}����
�����"��<� �����������������������@���������<�������������������!��"����
X�����}������������� ������������������������� �������
�������{���������~���>��������}��"�������{������������������
��������}��
�|��}}��������������������|�����������}��������������������<�"�}��<��������X����������>��}�"\�~~>���}��}�����<��������"����������������}����������}}������������������
Clid1225
Typewritten Text
Appendix K

������������������������� ���!"������������#���$%�����������������!��"����<���>������?�@�� ����]�
� ������������������������������������
������������������������"�������������������������������}}��������������������<�����]^_^�>������?��������������"�����������������������}}�����������!��"�������!� � |�����������������������������<���?�@���}��������������]^�"������������������������<����|����������������������"��<���}�������������������<����������
���������������� ���!������� �����!"# #$�����]^_^�?��������������"��������������������"���������������������������������������������X~>X��<��������}�������������������������������"��������������������������}}�"����|����\�����]^_^���}��� ���������������>�������� �������}��������<������������}}�����������������������������<��������<���������������������������������"�����}�������������<��������������������������<�]^������������������|�������������������?�@��
�������%& ������#���������#'$�������>�����������������������"��}���"����|������������"\����|��������|�|��������|�<�����������������������������}�������������"��<���������������������������<�������}��������<���������������}�����������}�����������}������<���������������������\���}�����"�<���|����������}������������"���<���"������}��"������������������������� ���"�|�����}��"������}}����������������"����}��������������������������}�}����������|��������������������������"������
������ ������#���������#'$����������������������}����������"�����]^_^�?��������������"\���}��"��������>��������������������������<���������������������������]^_^\�����������������|��|������}������"�����������������������������������|����\�����}�������������"������������}|��������������<����������}��"�����X�}����������X��<��������<�����}��"��������|���<��������������~���>����"����������
��� ���!���#'� �!�(��#$�������}���������<������������������������������������<��������"�<����������������������������������������������������~���>����"������������������������<�����������}�������<��������������������������������}�����"�<���������������<�]^������������������}���������������<������~���>����"������������������������������������}�������"��������{�������}��������������������
��)�����%!�"���'�����#'� �!������� �#$�]^�"���<��������}�����������|��������
�� ������ �����������}�����������?��������������"������������}������<���}��"����������������������������������������"�|�����}�������X�}������������
�� ������ �#��*+,��������������}������<������}��������<�������������������������������������������������!�}����������\�}��������"�<���{�������������������
����������<��"��<����������������|���������������}�������<�>��������?�@�<�������������������<�������}��������"��������\�����"�!��������������������<����X�"�������_^���������������������"����������������<����������"�<�������������������}�������
��-'��'�%#$���������������<������������������|��������>��"��<�>�����\�~>������X~>X����<�����"��}��������?��������������"����������������������}�������������<�����������������|���������}��������������������������"�|��������������}}�������������
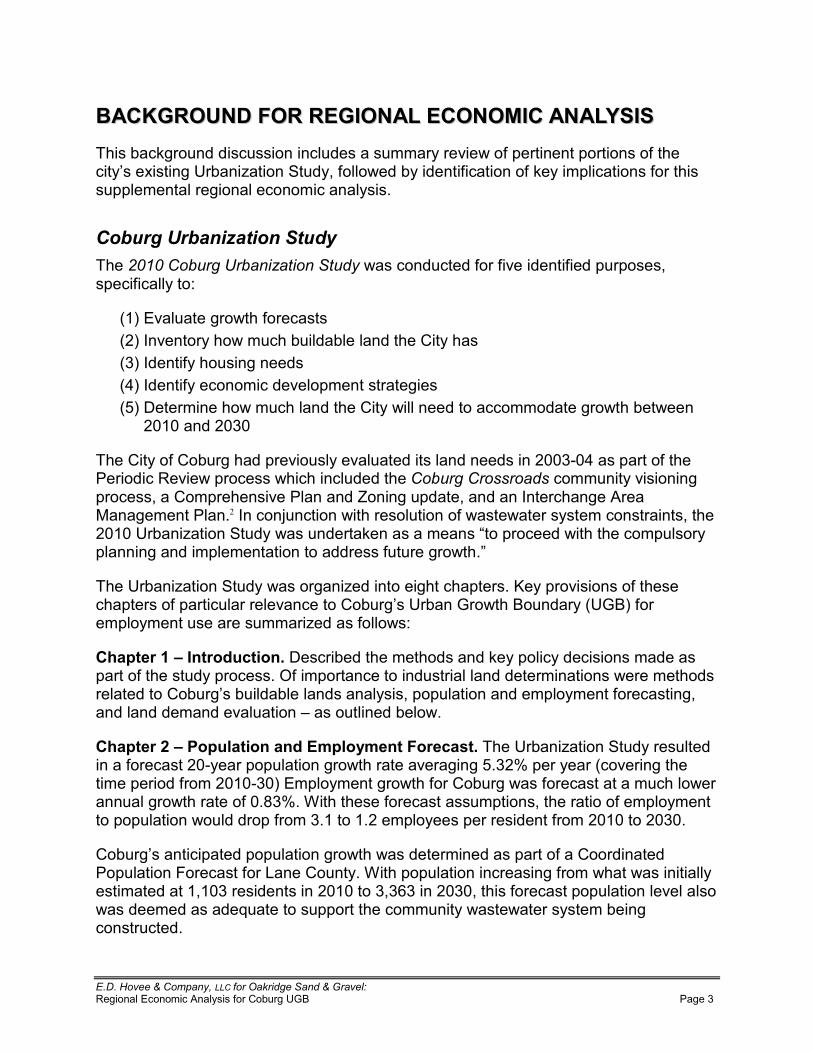
������������������������� ���!"������������#���$%�����������������!��"����<���>������?�@�� ������
������..������ ����������������������������((��������������������������((���������
�����������������������������������������"������|��<�}���������}���������<��������"������������?��������������"\�<����|����"�������<��������<���"���}���������<����������}}���������������������������"�����
����������� ������������������������������� �����������|������������<���<����������<����}��}����\��}���<����"�����
�_������������|���<���������]��{�������"���|�����������������������>��"��������{�����<"����������������`��{�����<"����������������}�������������������X�����������|��������������>��"�|�������������������������|������|����
]^_^����]^�^�
����>��"��<�>���������}��������"��������������������������]^^��^`���}����<������������������|�}�������|�������������������������������������������"�����������}������\��>��}�������������������������}���\������{����������!������������������{��������������|����������������<�|���|�����"���������������\�����]^_^�?��������������"�|������������������������}�������|�����������}�����"�}������������}���������������������<���������|�����
����?��������������"�|������������������������}��������"�}�����������<���������}������<�}��������������������>��������?�������|���@�����"��?�@��<�����}��"������������������������<����|���
�&��'���������'���'�����X��������������������������"�}����"�����������������}����<���������"�}���������<���}��������������������������������������|����������������������>������������������������"���\�}�}������������}��"�����<���������\����������������������������������������|��
�&��'���������� �'�������!�� �"���'�#�����$'������?��������������"��������������<�������]^�"���}�}����������|������������������]��}���"����������������������}������<����]^_^��^����}��"��������|���<���>������|��<�����������������|�����������|��������<�^�����������������<�����������}�����\�����������<���}��"��������}�}�������|��������}�<������_����_�]���}��"����}������������<����]^_^����]^�^��
>�������������}����}�}����������|���|���������������}����<��>������������}������� �������<���~���>����"�������}�}�����������������<����|���|���������"������������_\_^���������������]^_^�����\�������]^�^\������<�������}�}�����������������|�����������������������}}����������������"�|���|�����"�������������������������
%����&�'�������(���)�**�� ���!"������������#�'�$%�����������������!��"����<���>������?�@�� ����`�
��������������"��}������}�����������������<�~���>����"\�����?��������������"������������>��������}�������"����������������}����<����������}����������������������"�������������������<�}�}����������|�����{<��������\�}�}����������|��������<����������������������}������������������������������������������������������������������}��"�������������
@"����}�����\������������|������|�����������������|����������}��"�����<�������|�����������������������"�������������<��������}��������������!���^�^]`�����������������������"\�>����������}��"�����|���������������|���������������������<�~���>����"�|��������������������������]^^�������<���������}����������"��������������}��"�����X�}����������X����
~�����������������������������"�|�������|�������|��������<������������\�}��<������������������������������������������}�����"������������������������|���������������������}������������>����������"�����}������������������������"��������������}�������������������<�<����������|����������������������������}�������
���������������������"����������}�}������������}��"����������\�����?��������������"���}������������������<�������������������������������������������������������|�������<������������������>�������������}��������������������� ���>�����\�������������������<����}�����������������������������������&���������������<��������������������������������������������
�&��'���+����� �) ��(��$���� "$�$��!���<�]^_^\�>����������������^�������<��������|����������?�@\��<�|�������_������������|����������������!}}��������"�_[�������|����������<�������������������������<�����\�_��]����������|���������|�����������_]�]�������������������������}����<�����������������������������������"��<�]��`��������
!��������������"������}��������<����|����}��\��������������������������������������"�������������<���}��}��������������|����������<�����{���<���|"����������������������<�>��������<���|"������������������_[[��������������������������������������<�����<���|"�����������<�������������������
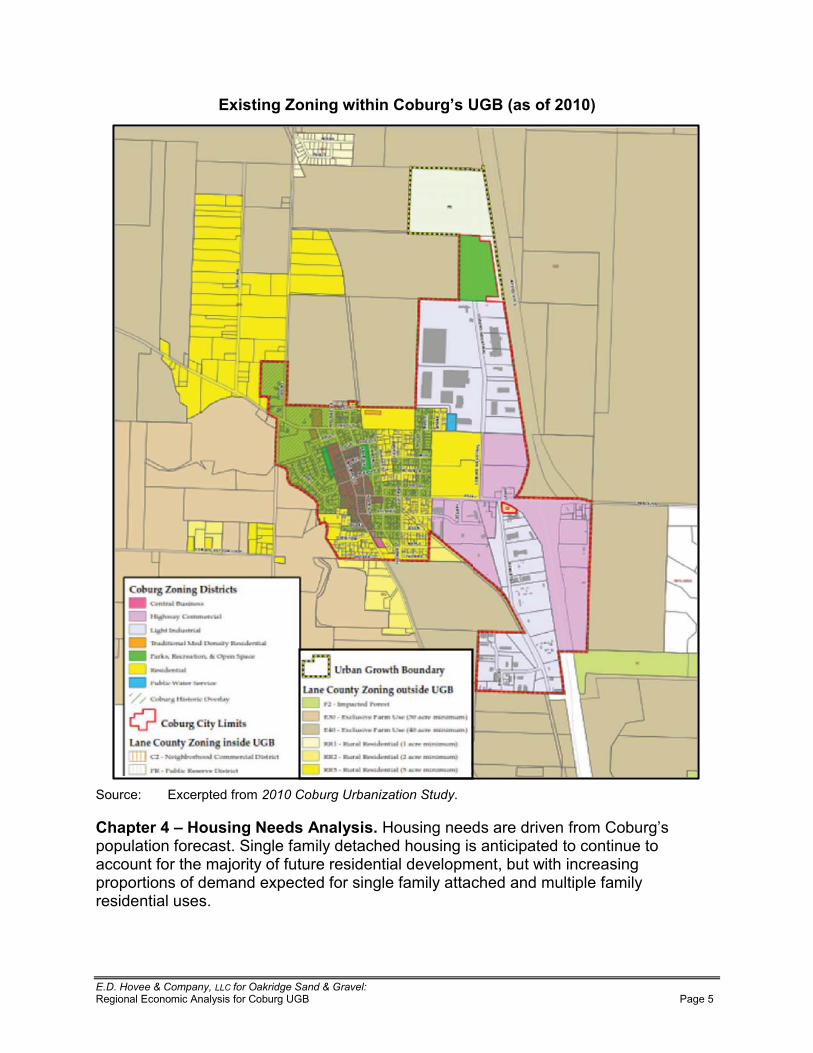
%����&�'�������(���)�**�� ���!"������������#�'�$%�����������������!��"����<���>������?�@�� ������
!,�$'����-������.�'&�����)��/$� 0��1�$�����2�23�
���������� �����}����<�������������������� �������������
�&��'���4���5�$����6��$���� "$�$��������������������������<����>��������}�}�������<���������������<���"�������������������������}��������������������������<�������������"��<�<�����������������������}����\�����|��������������}��}���������<���������}������<����������<���"����������������}���<���"������������������
%����&�'�������(���)�**�� ���!"������������#�'�$%�����������������!��"����<���>������?�@�� ������
����]^_^��������������}}�"��<�����|�����������������}}��������"�[��������������<�����������������\������������������������<�}������������<���?�@���}�������!����������|�����������<��������������"��^�������<�?�@�����������������}��������<������������������������������|����������}����������������"�<<����������"�����<���������������������������<<������������|���������������<�����������������������}��"���������|����}���}�������?�@���}�������|��������>�}��������"�������
�&��'���7���!�������������'��'��$���� "$�$��>����������!���}��������������
�� �&����'"/$�����������8� �����'�8�$����������������������"��<��������������������<�����������������������������������������}}���������������������������������}������������������<����������}��"�����
�� ���'�����'���������$'���$���$'� ��� "�'��)���''���'��'����)�����|�������������������������������������������<�������\�|��������|���������������������������������}����������{������������}�������"���
�� !$'���'���������$'��� � ���������<���]`���������������������������]^�"��������`^���<�>�������������}������������|����<��_������������\����������������������_��]_�������|������>�����������������������������������������}���"�|������������������������������������������������������]���������
�������������������������������������}}�����������������������"�������}}�"�|�������������������?�@\�����]^_^�?��������������"����������������|����"�������������|�"��������}}�"�������}���������<<���������������]^�"���}�������������� ����\���������"����������������>�������<<��������}�������������������������|�����"��������!!�����������������|��������}}��������~���>����"�<�����������������������������}�����\�}������������>�����������<<����������������������������������}�������|�������������<���|�����>����������������������������}������������������}�����������������<�����������������������������������������}���������������\�����������|���������\�������������\�|������������\�������<������������
������\�������!�����|��������������������������������<�������}}�"�����������������������������|�������������������������|������������������������������<���|���}��"��������|���������<�}�������������������������}�������������<��������������������������<�]^�������������������������|�������������������?�@���
�&��'���9����������$������(������ "����:����������}����"����������}����������"�����?��������������"����������!���}����|��|�����������������������"������"����������������������"������]^_^���!������������|������������>��"�|���������]����������<����������������������}��"������������������]^���������������������������������������|�������������������?�@���
�����������������"������<���\��������!�����������������<������"�|����}����������������<������������������������|��������������������"�|����������������>�����������������<��������{���}�������" ����������������}����������<����������������������<����������<�]^�������������������������|����>���������������������������������������"�������}��������������������������"����������������������}������"��������������������<"�������}�������������������������
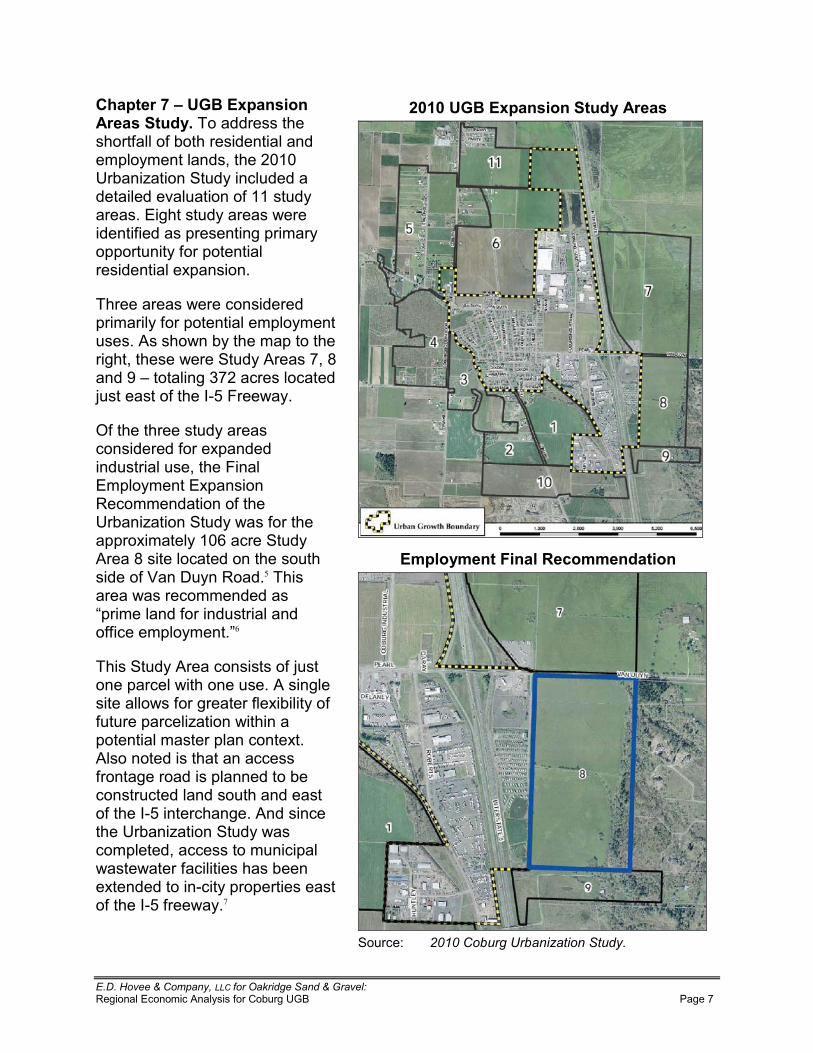
%����&�'�������(���)�**�� ���!"������������#�'�$%�����������������!��"����<���>������?�@�� ������
�&��'���;��� 0��!,���$��������$��'"���������������������<����<����������������������}��"���������\�����]^_^�?��������������"�����������������������������<�__�����"����������������"�����|����������<������}����������}����"��}}�������"�<���}���������������������}��������
����������|���������������}������"�<���}����������}��"�����������!�����|���"������}�������������\�������|��������"�!�����\������[�������������]�����������������������<�����{��� ���|"��
�<���������������"����������������<�����}������������������\����� ������}��"�������}��������������������<�����?��������������"�|��<�������}}��������"�_^����������"�!������������������������������������<����X�"���������������|�����������������}���������<�����������������<<������}��"������� �
���������"�!�������������<����������}�����|�������������!����������������|��<����������<���������"��<�<������}�����������|�������}��������������}������������!�������������������������<��������������}������������������������������������������<�����{���������������!�������������?��������������"�|�����}�����\����������������}��|���|����<�����������������������������������"�}��}������������<�����{���<���|"���
�2�2� 0��!,���$�����'"�����$�
�
!�� �"���'�#��� ����������'����
���������� ���������������� ���������������

%����&�'�������(���)�**�� ���!"������������#�'�$%�����������������!��"����<���>������?�@�� ������
����"�!���������������"������������������"�}���������<�>�����������������?�@�������������<�{���������������������?�@���}���������������������<������������|�����������������?�@�������������������"��������|������
!����������[�����<�����"�!��������������}������>����������{������\�������|����������������������<��������"}����"��}}������������<��������������������<��������������}������<��������"������������������������|��������}}���|�����������}���������������������{�������"�������}����<����������|�����������������<<�������"�<����}����������������X��������������������������������<����X�"��������}�������"������������������������}����\��������������<�|���}�����������<������|����������������������������������������������}�������������������������<����X�"����
�&��'���<����� ��"���� "$�$������]^_^�>������?��������������"�����������|�������������<�������������������������������������������}����\����������������������}����\�����}�������\����������\�������������������������������\����?�@���}��������<�}�������������������������}�����������������"����|���������=��$���'�� ��8� �����'���������������������}�������?�@���������������������}}�"��<�������������������������<<���������������"��������������}������|���}��"��������������}���<����"���<��������|�����������<����������������`^��^���������������������|������}���<�]^������}�����������������������}���<��������������������������
��������}������� 0���,���$���\���������������������������<�����?��������������"�|�����������}��"����������������?�@�����}}�������"���������"��������������"�����>��"�>����������������������������������<�����������������<������������<�]^��������������������������}}�������"�����>�}������?�@���}��������"������
���������� �� ������� ������ �������� ����������������<���������}������������|���������|����������<���}�������<����������������}����������}������������������������"������
�� ����|��������}�}����������|��������}���������������<<�������"���}}������}���������}������������������<�>��������|���|�����"�����
�� ��}����������|�������������������}�����������������������|�������"�����������"���}�����������������������"��<������������������������������������������|������|�����������������������������������}��"������������
�� !������|��������"�����]^_^�?��������������"\�>����������"���}������}�������������������}����������������<��������<�]^�������|����������������"������������������}��������|����?�@���}�������
�� �<����������������������|��������]^_^���"���\�����"�!������������<����X�"����������������������������������������}������"������<���}��������?�@���}�����������������������������������������������
���������������������������������� ����� <��������}����������}������������������������"����|�������|�<����|����
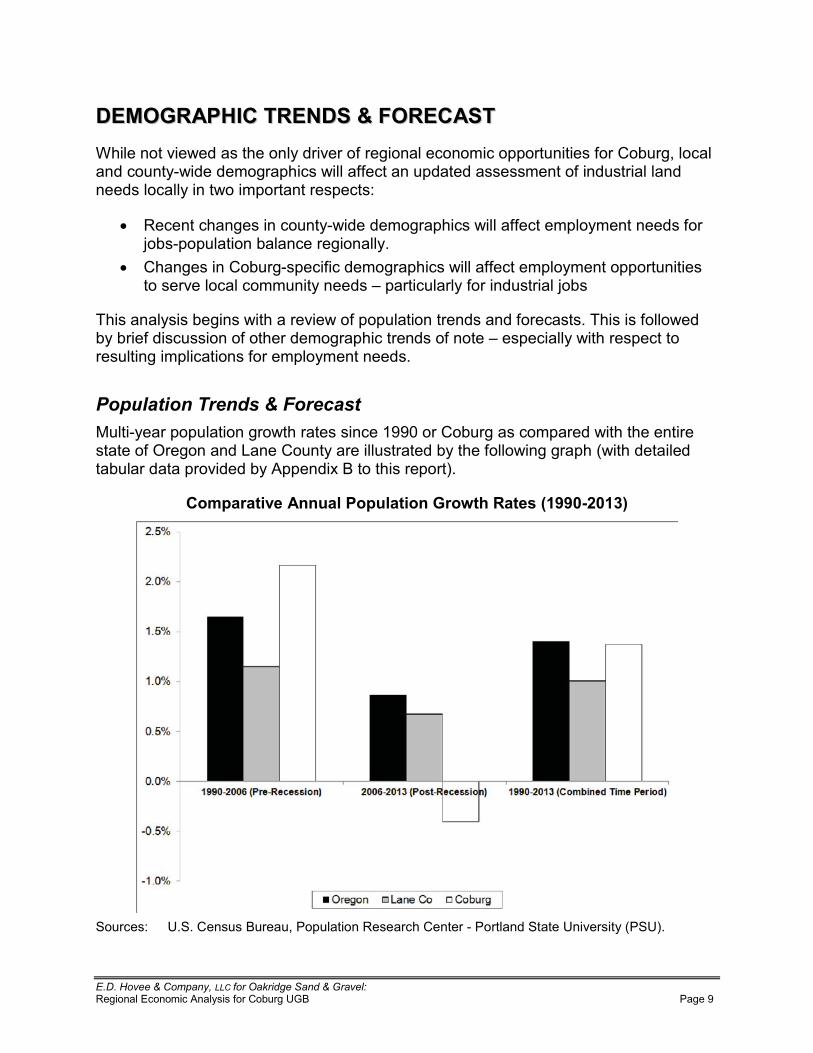
%��� &�'�� � ������� ��� ��� � ��!�� "�! � #�'�$% �����������������!��"����<���>������?�@�� ����[�
::!!����00����&&''����������!!66::��������##����!!����������
�������������|������������"���������<�������������������}}�����������<���>�����\��������������"�|����������}�����|����<<�������}����������������<��������������������������"�����|����}���������}�����
�� ����������������������"�|����������}�����|����<<������}��"�����������<��������}�}���������������������"��
�� >���������>�������}���<���������}�����|����<<������}��"������}}���������������������������������"���������}��������"�<������������������
�������"�����������|����������|��<�}�}�����������������<�����������������<����|����"�����<�������������<�������������}������������<����������}�����"�|�������}�������������������}���������<�����}��"�������������
���������� �������� ������������"���}�}����������|��������������_[[^����>�����������}����|���������������������<�����������~���>����"����������������"�����<����|������}���|���������������������}���������"�!}}������@�����������}������
����������������������������0������������ !""#$%#!&'��
����������� ?����>������@����\���}�������(�������>���������������������?��������"����?���
%)�)�&�*++�,�-��.�/����-������0��!�+�"�!�,�#�*+1%�(����������������!��"����<���>������?�@�� ����_^�
��"�������������������<������������}���������������������<����|����
�� ���$�����������<����_[[^�]^^��\�>��������}�}�������|���������������������������<�]�]��}���"�����|������������}��������|��������<����������������������~���>����"���
�� :�����������������������������<����]^^��]^_��\�>�����������}�����������������������������|����{���������|���}}�����������]^_^�?����>������������������\���}������}�}�����������������������������}�������������������}�������������}�}����������|�����������������"�|�������|�������������<�����������������\�>��������}�}����������|������|���������������������"�� ��������<�����������������������"�����<�]^__�_�\�>��������}�}���������������������_\^`�����������������������"���<�����������������}�������<�������|�����}���������
�� �������������!""#$%#!&�����������2�>��������}�}����������������������������������<�_�`��}���"���������������������"������������|���������|����}�������������|������������������_�^�������������~���>����"������<�}�}�����������������}�����������������������_[[^�]^_�������}��������
!�������\�����()3)�-����������4�����"��!/���<��������~���>����"���}����}�}����������|������������������]��}���"������������]^^����������}�������������������������<�������������"�}�}��������<��\���������������"�]^�^\�}}��������"�����������������}�}����������������<�_\_^�����������<���]^_^����������������}�}���������������|������}����������������<�]^_^�>������������������������������������]^_^�}�}�������<�������<�_\^��������������|�����}�������?������������
{���<<���\�>��������}�}�����������������}�����������������|��������������<��������|���������������<����|��������?��������������"����]^_^��{<������}�������<������������������|���|���������������\�������������"������}�������<�����������������������<�������|���|�����"�������}����������������������|������������}�����������������
������������<���"���������������������������|�������������}����������������"������������"\�������������������|������>�������������������"������}�������������"�����������|����\����}}�����������������|������������}�������]^_^\���������}}���������������"�����������"��!�����|�����}������������������<���"�|�����}��"�����������}������������������������<��<�������������������"���}�}����������|����������������
����������� �����������������������������}������������<��������������������������������������<�}�}������\������������������������"\�������������������\������|������}��\�����������������\������<�����}�����}������������}��"���������\�������������\������������������|�����������@������������}���������"�!}}������@\����}��������<�������}���������������������|����>�����\�~���>����"�����������������������������������<����|���
%)�)�&��++��������������� ����0��!�+�!�!���#��+1"�#����������������!��"����<���>������?�@�� ����__�
�� !���<�]^_^\����������������<�>����������������|����������"��������`_���"�����������������������������"�<����]^^^����������������������������<�����������<�~���>����"����������������������
�� >��������������|�������}��}���������<����$%&�'�����(�'���������'���������}�����"�|�������}����|�������������������������������������������������������������������������
�� ����"������<�����������%���$������\�|������������}���������������"����������|����������������|������}����������������"��������������|�����<����]^^^�_^���
�� ������&������)����������������"���������}�����������������<�~���>����"\����������<<�����������������������������|������
�� >������}�}������������������"�%�������'����|��������������������<���������������������������������������������������
�� (�*������������'�����'�������������������"�����������������������������������������������������������<�~���>����"���������������
�� +������"���'���'����������|������"���������|����������\����������������������������"�������������������
�� !������"�¡�[\^^^�}������������\������������������|��������������"���������|����<���������������������������}���"����>���������������"���������|�������������}�����������
�� �)������'��)���'����'��%�����������������_��������������<�����������������������������������������������~���>����"��������|�����~������������������������}}�������|�������������"������
�������������\�����������������}����"����������"����������������"��������������"�<<���������|�����������������}�����������������<�~���>����"��������������!��������������\�>��������}�}���������������������������������������}������������}��"������}}�������"�� ���������������������������������������������������������������������"��<�������������"�<�����������������������<�������������
{�}�����������}�������"������}������<��������������������������\���}�����"����������}������������"���<���"������}��"������������������������� ���"�|�����}��"������}}����������������"���������������}������������������������������|���}�}����������|��������������������������"������

%)�)�&��++��������������� ����0��!�+�!�!���#��+1"�#����������������!��"����<���>������?�@�� ����_]�
!!����66��������������!!66,,��������##����!!����������
������������}�������������������"�����������|����������|��<����������}��"������������<���>���������������<����|����"���������������<�������������������<���������|����������������}���������<���<�������������������>������� ?�@��
������� ���������������������������"����������}��"��������<���>���������<�����������������"�����}��"�������������\������}������"��������������}��"�����X�}����������X���!������������"����������������������\�>�������������������������_\�_^�������������������������"����<����]^^��]^_]��������������<��<�������}������]^^����}��"����������
�� ����������"����������}��\�>����������}��"�����������������}����������"�����������������������������������������"���������������\�������������\�|���������������}���������������
�� Y������������}���������<����]^^��_^�|����}������"�<�����������������������������\���}�����"�#�����<���������
�� ��|����\���������������������|��"���}������<����]^_^�_]\���������������<������������������������������"����������<����<���������"����}����<<��<<������<����������������������������������}}����������������������������������������������������������"���
�� @�����������������_`���<����>��������}��"��������]^^�����}������������������������"�����}��"�������������\��������}����<<��<<�������������<<�����������}��}�������������������������������������"��"���X���¢>�������
�<�����������������\�|��������<�������������������|��������"������|"\�����]^_^�?��������������"����<��������������������}��"����������������|����]^^��]^_^�������|������}������"��]^_^���}������������\�|�����������������<�������>���\�]^_^�<�������|�����������}�����������������\���������������������������|�������������������<�������|����}�������������������������������������"������"���������<������������������
��*�����)����!����"���'�!-���������./001$2/3�
/001 /020 /02/{���������������� ��� �`� ���>���������������� ]�� ��� �]�!���������� _^^� _^^� _^^�
������)����4�*� /5676�� 258//�� 25086��
9������'��
�
������� >�������������������<�������X�¢>����������}������<���>�������"�~>����{������������������������������������������"����X����������>��}�"\�~~>�<����¢>������������|����?����>���������������
���������� ��X�¢������"�>�������<���}��"��������"������¢>���\�~>��\�?����>������������X���������
�

%)�)�&��++��������������� ����0��!�+�!�!���#��+1"�#����������������!��"����<���>������?�@�� ����_��
�����]^_^��������}��"���������������|����|�\�������������}}���������������������������������������|��}��������"������}������|����������<�����������^���<�>������������������}��"�������������������������<����"����<����]^^��_^��
!����������}������������}���������<����������|�������������|��������������}����]^^�����������������������}��������|��}��������"��������|��������]^_^�?��������������"���������������������������������������������������������}����|������"�����<�>��������}��"�����������������������������
�����������������������������������������<���������������}����"����������<�>��������]^�"�����}��"�����<�������|��������]^_^�?��������������"��
�� ��������������<������"�����}��"�����������������<�]^^��\���<��������¢>�������������}��"����������������<�����������������}��"���������������<��������<��������?����@������<����������!��"�����@�!���!�������\�}}��������"������<���}��"��������>������|�����������������������<�����������}��"���\�|�����������������_`������������������}��"�����������<������������|���������}��}���������<�������������������
�� ?�����������<�����������������������_^�"���~���>����"���}��"�����<��������<���]^^��_��\���}��}�����"��������������}��"�����X�}����������X����
�� !}}���������<���<��������}��������\�������������>��������}��"�����|�����������������������}��������������������"�|�����������|������������_^�"�����X���}��"�����<�������}�������
������}����������}������������������������"�������������������������������|���������������������������"��<�������������<�����������������������]^^� �������|���������������}����������������������<�����������������������������}}��}�����"���������������������������������������|����������������������������
����]^_^�?��������������"�����������]^^���������������������}�����<�����������������<�<�������������������������������������������������������!�}���������������<���������}�����>������?�@������������"�������|����������}�����<���������������������������������|�������|��������������<���}��"�������\�����������"\��������������������������������}��������<���|���|������������������������<����|����"�<��������������|���|����<��������������������"���
������������ �����������!�������\����"���}����������>��������}��"�����<������������������������<�����~���>����"�|����}�������������}���������"��|��"�����"��������������}��"�����X�}����������X���!�����������"�����<����|��������\�����]^_^�?����������#�}���������������<��������������������]^^��_��}�������|���������������<���������>�������}���<�����������������������������]^_]���X���"��������������}�����<������������}����������������<����]^_^�]^����

%)�)�&��++��������������� ����0��!�+�!�!���#��+1"�#����������������!��"����<���>������?�@�� ����_`�
�������'�)��!����"���'�#������'�0��%'&���'���.�������)������0��%'&���'��:���0�3�
+��'������"���
!����"���'����'��(�������'"�
./001$213�;�'��
��*�����0�(�������'"�
./020$/03������#������������������ ^�^^� _�^_�>����������� _�`_� ]�`_����<������� ^��`� _�]`�������������� ^�[�� ]�^��#��������� _�_�� ]�^^� _��������}�������\�����������\�?�������� _�_�� _����{�<������� _�^�� _�`]� �������!��������� _�_`� _�][����<�����������@���������������� _��]� ]�]�� ]�`����������������������������� ]��_� ]����~�������������}�����" _��]� ]�]�� _�`���������������� _�_]� _��]����������� _�]^� ^�[��
��'���!����"���' 2�8<9 0�689 2�119
������'�
��X�_^�"���<�������<���
#����������~���>����"
#�������|����������}���������
�������\���������>�����������
������������_^�"�����X�#��������<�����������<�
]^_]�
/020�+�*���=�'�����'"
�
���������� ���������}��"�����X�}����������X�����()3)������������4�����!��!�)����X���������}�����������������|�������������<���������"�����������X�������\�]^^���
����������������������������<���������]^_]���X�<��������}�����
�� �����������~���>����"�*������+�5���+������������������<�����_��[����������������|��������!!�#��|��������]^_^�?��������������"�����_�����!!�#�|�����������������������������X���������}���������������}��������<������!!�#���������������"�|�����������|���|�����|����}������������������"��]�������]^�"����|�������|������}������������������"��[���
�� ��������������<��������>����<���}��"�������}����������������������������<����������<�������������������������������������������������������\�������������\����<�������\�|������������\��������}��������|���������������������@"����}�����\������"�|�����������|�����}��������������|�������<��������������������������������������������������\������������}�����"\����������������������������
�� @������>������������� �+��1���+�������������"��������������������������|������|����������\�����]^_^�?��������������"�������������������^�����!!�#�����<����������|���<�����������<�����}|��������������<�����������������}�����������}��"�����������������������������
%)�)�&��++��������������� ����0��!�+�!�!���#��+1"�#����������������!��"����<���>������?�@�� ����_��
�� {<�>���������������|�������|�������������}|���������<����������}���������������|�����}���������<���~���>����"��<��_�����!!�#\�������}��"���������|������>��������?�@�|������������<��������}��������}�����������<���������_����������_\][]���������������������]^�"���}����������������
� ���������������� ���������������<���������<<�����<����������!��"�������!��}���������������"��}������<�_^�"������������<���������������<������������������"�<��������������������������������������������������������\�����������������X��������]^_������|����<�������}������������<���}������<����}������|��������]^_]���X�����|����}�������������
���������������������!����������������������}�������<���!������X�<���������������<�������]^_^�]^������}���������}���������"�!}}������@�����������}�������"������������������������<����|���
�� ������\���!����������<����������������������}��"���������|�����"����������������|������|�������������������}����������"���X����|����\���!���������<�����"��������11�������}���}�����<���������������}��"�����������<������������������������������������X���
�� ��!�<�����������������������<����|���<�������������������\����<�������������?���������������X������������<�������\�<���������������"�������������������}|���<��������������������}��������������}�����"�<����}������������
�� X��}�������������<��|�\����������������������������������������"��������������������������������"�������\��������|�������������������������������|�<���������������������<����������������}��"�����������
� !<�����}�����������|�����\������������������������|�����������"�����������������������������|��������|�����}�������������}��������������������������������"��������|�����������<�����������<<��������"��������"������������"\��������������������}������������������������<��������"���������������������������������������������������������������������"����������
�� !������<��������������������<������������������������|���������!���}�����������������}��������������������������<�|����������|�����������������������������������|�������}}���������<�������������}����������!����������������������|��������}����������}��"�������
����������� ����"�!"��"�����!����������!����������}��������������������<�������\����������������������������}����������������������<�������������<�����}���}�����<��������|�������������������������<������������������������������������������������������"�� ���}��}������<���!�����"���\�������������������"�����������}������@�����\�~��\�~���\���������������>����������
��!�����������������������������"������������|���������������<�������\�|���������������������������"�������"�����������|��������������|�����������������������������������������"���������������������<��������������������}���������������������"��<������������������������}���������������|�����������}���������|����������������������
%#�#�&�������$��%��&�''$� ����0������(�����#���1"�)����������������!��"����<���>������?�@�� ����_��
������������������"���������������������"�������������������|��������������������������������������������������}�����������������<�������������������������"�������������������������������������������
�� !��������������<������"���}}������ >����������<���������� ����������������������� �����������<���������� >��}�}������������ �����}����������<����������� �������<���������� !}}�������<��������
�*+�����������������������������+�,����������������|��<��������������������������������������������������]^_^�?��������������"�|�������}��������������������<����|�����������������������������������
�_� ����������������<�)������}�����������������}��"��������������������������|������������������������}�����������������>��������������������������������������������������}�����������������}����������������<�����������������|�����
�]����������}��������<����������~���>����"������<��������<����|���|�������}�������]^_^\�|�������������������������}}�������"�����<<������������������� ��}�������� |������>���������������� ��}��"���������
���� �����������������}}�������"�<������������}������<�������<�������������������������������������������������<���|"������\��<<����������������������}���������������<���>�����������������������������������������������|��������~���>����"������������������������������������<�������������������������"�����
��!!00��!!66��--����66,,..����������--��--��66,,������
@�������������������������<����������"���\����������������}}�����������������\����}������������������"��<������������������������������������}��}����������~���>����"�������������|�������������������}����������������"��������<�����������������
��|����\���������������������������������������������������<���}��}���������������������<��������<�}��}���������|�����������������������|���������}����������������������������������"����������������������������<��������������������������������|���������}��������"������|���
�� ~��������<�������������������������"��������������\���}���������"�~���>����"���� ��������}����<������������������|�����\������������������]^^`��
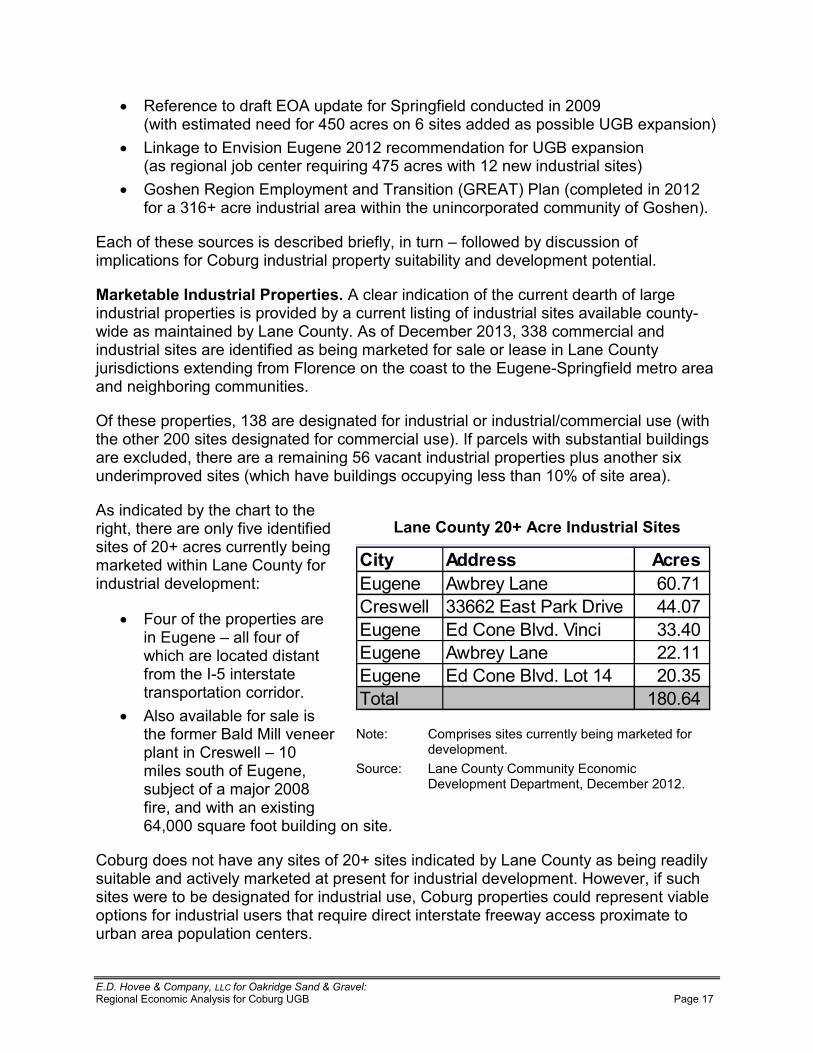
%#�#�&�������$��%��&�''$� ����0������(�����#���1"�)����������������!��"����<���>������?�@�� ����_��
�� )�<������������<����!��}����<����}����<������������������]^^[��|������������������<���`�^������������������������}��������?�@���}�������
�� ~�������������������������]^_]���������������<���?�@���}���������������������������� ����������`��������|����_]���|������������������
�� �������)��������}��"��������������������)�!�����������}���������]^_]�<�����_��������������������|�����������������}��������������"��<����������
�����<��������������������������������<�"\�����������<����|����"�������������<���}���������<���>����������������}��}���"����������"����������}�����}����������
�������*������������/�����������!�����������������<��������������������<����������������}��}����������}���������"�������������������<�����������������������������"�|����������������"�~���>����"��!���<�X��������]^_�\�������������������������������������������<��������������������<������������������~���>����"�������������������������<���� �����������������������������������}����<�������������������������������������������
�<�������}��}������\�_����������������<�����������������������������������������|��������������]^^�����������������<�������������������{<�}������|�����������������������������������\��������������������������������������}��}�������}����������������������}�������������|�����������������������}"�������������_^���<�������������
!������������"����������������������\�������������"�<����������<�����������<�]^���������������"���������������|������~���>����"�<�������������������}�������
�� �����<�����}��}�������������������������<�����<�|����������������������<��������{�����������������}������������������
�� !�����������<��������������<������@���������������}�������>���|����� _^��������������<�������\����������<�������]^^��<���\����|����������������`\^^^�������<������������������������
>��������������������"��������<�]^������������������"�~���>����"��������������"������������������"�����������}�������<�������������������}��������|����\��<������������|��������������������<����������������\�>������}��}���������������}��������������}������<������������������������������������������������<���|"�������}�������������������}�}�����������������
-��������"�012���������������������
���" ����� ����������� !|���"�~��� �^��_���>���|��� ����]���������X���� ``�^���������� ���>����@���������� ���`^��������� !|���"�~��� ]]�__��������� ���>����@�����~���_` ]^���������� _�^��`� �
������� >��}��������������������"���������������<���������}������
��������� ~���>����"�>�������"����������X�����}�����X�}������\�X��������]^_]����
�
%#�#�&�������$��%��&�''$� ����0������(�����#���1"�)����������������!��"����<���>������?�@�� ����_��
!����3�����������������/�����!���������}����<����������}������!���_[[^������������|���������"���}�������_[�]�������|����}������"����}�����_[�^�������������}�����"�����>�������<������������}����<���������|�������<<����������������"�~���>����"����_[�^������������������}���|�����}����������"��}��������]^^`�|����}�����}��������}�����}��������������"���]^_^���
��������������������������������������}���������}}�����������|����}�����������<���������������}����<����������}�����������������<�>�������|���������������������������&���%����&����������� �����������%�1�����4������5��1������4�������������������#��
{������������������������������\�����������������������<�������������������������������������<�<�������\�����������\����}��������������������������������������������������������������������"����|��������
�� ��}}�"�����������������<�����|����������?�@��<������<����������������������������������\�������������������������
�� )����������������������������}������<����}�����������}��������������������������
!������}�"����}����"�|�������{������������������<���������}�������������<�����������������������������������������������������<<���������}}�"�����������<����������"������������"�|��������}������������<�����������|����\���������������������]^^`������������}�����������������������������������������"�������<�����������������������������������������������������������}}�"����������������}����<���������
�����������"\����]^^�������������~����������}�����������@������������������������������}����<������� �����������}����?�@���!���������\�}�������<����������������}��������<�����������������<����<������������������������������}���<���}}�����<��������������}����<��������������������������!������|����������������}����"�<��������<������|�����������
�����������!!���!���<��$�����4�1����6�������1����1��1��'����6������������%4�����4��%%�������������1�����|�����}������<�������>��"��<��}����<��������]^^[��������!����������������}����<�����������<������<�`�^������<������������������������������|�������������������}�������}���<����"�������������|��������<����������^��������������_^^���������������
������!�������<����������<����}��������<�������������������������������������������{���������������~������������������������� ���������������������}����������������������������"�|�������������������������<�������\�����������������������<�������������������\�|����}�����������}}������<�������\�������������������|�����"���������
)��������<�������!�����������������������������(%���� ��1��(),)�?� ��������71��������}��������������������>��}������������������}��������<�]^_��|��}��������

%#�#�&�������$��%��&�''$� ����0������(�����#���1"�)����������������!��"����<���>������?�@�� ����_[�
��}�������<��}����<�������?�@�<�����������`^���������������<���}��"���������� �����������������}����_\�`����������������������}�����������������������������}�����������������<���?�@���}��������|������������}�������"��������{�����������������������|"���]]������������������������"�~��}���_�_���������
>�������"\������������}�������������}����<�����>��"�>����������~���>����"�@�����<�>�������������|�����������������������������������}��}�����]^�^�)�<���������������?�@�!���������������"�]^_`���
!�����!!���{��]^_^\�����!�|������������<�������>��"��<����������}����<��%������$��%����������'��������������#�!��|�����}����<����\�����������<������������������������������|��<�������������]^�"���}�������}��������������������!����������"�����������������������������������������}}������}��������"������"������������������������������������"\�����|����������<�����������
����>��"��<��������������������������������<������������������}�����������������<�������!�\�������������"���<<���������������<"��������������������<�������������������}��������������������������}�������������������������������������������������}����������������<����������������}���������������\�������"�����<�����������������������������������"������\�}������"�����������"\������}��������������������������}�����������������������}��������<������������������������
�������������!�������<�������<�������������������4���&�}��������������������������������"���}�������������������������������������"���}���<����"������������"�������!�|�����������������������������������<��������������������������������������������������������������"������������<����"�<������������������|���������������{������������|����������<�����������\�|������\����������<��������<<������}�������"��������{���<���|"��������������������������������<����������������������������������|"�[[�����������������|����������<����������
�����������!������������������<���<������������������������������<��}}����������������������|��������[��������|����������������%������1������������������������}�����}��������{���<<���\�����[��<<���������}}�������"�����������������������������"����|�������������������������������"������<�����������}��"����������������"}����<�<�������������������"��"�������������������������������"������������������������������<���������<��������
!�"������!����������]^_^����������!���������<����|����"�����������������"�}�������}����������|����%��������%�����#�!������������}�������<������}���������������"������|"������������<������������������<��������������������
���������������"��������������<������������"���������������|�����}����������������������%��������%�����������<���������������������|������������������"����"������������������<����<���������������������������"�����|���������"\����������������������\�|��������������\����������|�������\��}������������<�������\���<�|�����<�����������������"���������\������������\����<����}�������������
%#�#�&�������$��%��&�''$� ����0������(�����#���1"�)����������������!��"����<���>������?�@�� ����]^�
���<���������!�������������<�����%��������%������}�������������������<�������"�������������������������������������������������_^�������������\����������������\������������^�����\���}��������������������<����������������
!��]^_]���<�������������������������"�������������������������������}�����<��������<����������_^�����\��������<������"��<��������<�_^�����������������<�_`�������<����_^���������������"�|���\����"��|��}��}��������������������}�������"��������{���<���|"���������\���������<����@��������)�����������������}��}���"�����������������������}������������
)��������������%��������%�����������}�������<��������"���?�@������������������������������������������<����|�����������������
�� _^�]^���������������������������������� ]^��^�������_��������������]���������� �^��������������������������_�^��������� ���_^^�������]���������������_�^��������� ����+���� �����������+�� ������**��'��� +��-6.�������+ ����+���+ ���� ��
���������}�������}��}�����<���?�@���}�������������������������������������������������������������������������������������������������|��������|"�[[���������������!��}�������������!|���"�~�������������������}��|���������}�����������}������������������������}}����������\����"�����������"����}�������<<������������������������<����������<������|���������������������<��������������������������"�� �����"����������<�������������������������������"�<�����������{���������|�����������}����"�<�����������}���������������������
{��Y����]^_]\�%��������%�����&���$���������/������ ���(),(�|��������������"������������>��"�>���������������<����������<��|��������}�����������>��"�������������}����)�<��������������������<���?�@���}�����������������"���}������������}������������������������>�������������>��"�>����������]^_`��!�����������������>��}�������������\�������������������������������������������}�����������}�"�}�����}�������������
0��&����������!����"�������������������80�!��9�/�����{��]^_]\�~���>����"�}��}���������_`�����}������� ��������X�������������������������������������������"��<��_���_�������<��������� ����������������������������|����������������������}����������<��������������)�!��������"����!���������������������������������}����
_�� �����������_`����������������}���������|�����<���������������������<����|���������|������������������\�����������������������������}������<�������<�������\�������������<�����������������������������������|��������|�<����������������<���������������������|����������������������������������������������������}�����������������<����������"���|����"���������������}���������������������������������������}�����"��������
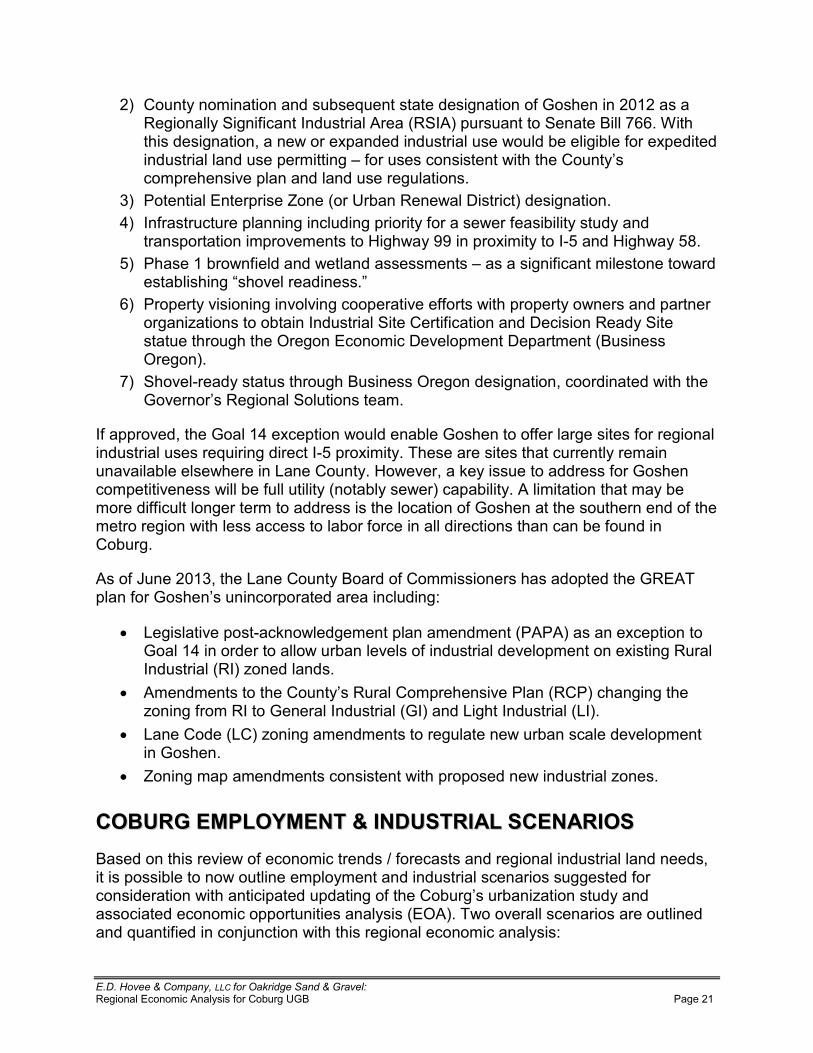
%#�#�&�������$��%��&�''$� ����0������(�����#���1"�)����������������!��"����<���>������?�@�� ����]_�
]�� >����"������������������������������������������<�����������]^_]����)�������"������<�����{���������!����)�{!��}����������������@�����������������������������\����|������}�������������������|�����������������<�����}�������������������������}������������<�������������������|��������>����"������}����������}���������������������������
��� ��������������}��������������?����)���|��X����������������������`�� {�<�����������}�����������������}������"�<������|���<��������"�����"����
����}����������}�����������������|"�[[����}�������"����{����������|"�������� �����_����|�<��������|���������������������������<�����������������|���
���������������������������������� ���}���"������������������������}��������<<�����|����}��}���"��|��������}������
���������������������{��������������>����<����������X��������)��"����������������������������������������X�����}�����X�}��������@������������������
��� ����������"���������������@�������������������������\������������|�������������������)����������������������
{<�}}�����\���������_`�����}�����|����������������������<<��������������<�������������������������������������������{���}�������"�����������������������������"��������������������|��������~���>����"����|����\����"�����������������<�������������}������������|�������<����������"�������"���|�����}�����"��!����������������"�����������<<��������������������������������������������<������� ��������������������<������������������|�����������������������<��������������������������������<��������>��������
!���<�Y����]^_�\�����~���>����"�@�����<�>������������������}���������)�!��}���<�������������������}��������������������
�� ~����������}��������|����������}��������������!�!����������}������������_`����������������|��������������<�����������������}�����������������)����{����������){��������������
� !�����������������>����"���)����>��}���������������)>����������������������<����){�����������{�����������{�����~�����{����������~{���
�� ~���>�����~>��������������������������������|�����������������}����������������
�� ��������}����������������������|����}��}�������|�����������������
��!!��..��00��!!��//--!!����!!66����������66,,..����������--������!!66������!!����
@�����������������|��<�������������������<��������������������������������������\�������}�������������|�����������}��"�������������������������������������<����������������|���������}�����}�������<�����>�����������������������"�����������������������}}�������������"�������!����|��������������������������������������<�������������������|����������������������������"�����
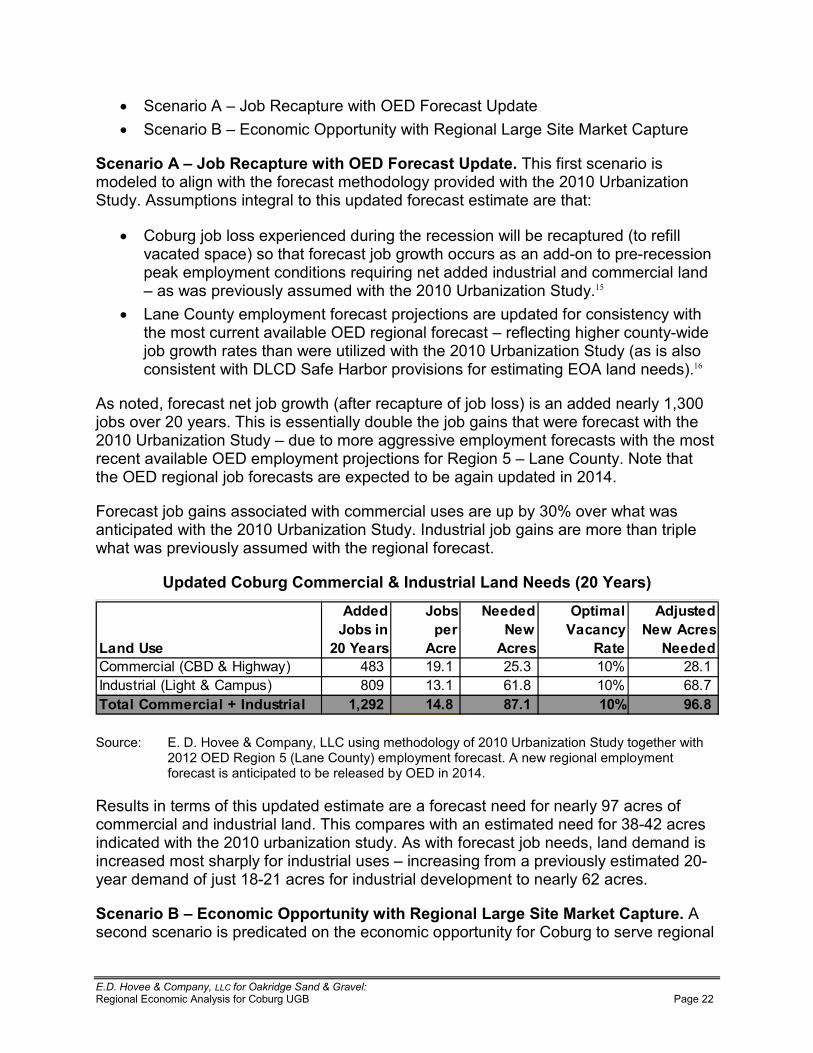
%#�#�&�������$��%��&�''$� ����0������(�����#���1"�)����������������!��"����<���>������?�@�� ����]]�
�� ��������!���Y���)��}�����|������X� �������?}������ ��������@�������������}}�������"�|����)�������~���������������>}�����
�����������:�:�*�������������&�!!,�#��������.�����������<��������������������������������|��������<�����������������"�}��������|��������]^_^�?��������������"��!����}�����������������������}�����<�����������������������
�� >�����������������}������������������������������|����������}������������<�����������}�����������<��������������|�����������������������}�������������}�����}��"������������������������������������������������������������������|��}��������"��������|��������]^_^�?��������������"�����
�� ~���>����"���}��"�����<�������}���������������}�����<�������������"�|������������������������������X���������<�����������<��������������������"�|�����������|������������|�������������|��������]^_^�?��������������"����������������������|����X~>X��<��������}����������<���������������!���������������
!�������\�<������������������|����<�������}������<�������������������������"�_\�^^�����������]^�"����������������������"�������������������������|����<�������|��������]^_^�?��������������"���������������������������}��"�����<��������|�����������������������������X���}��"�����}�����������<���)����������~���>����"�����������������X�������������<�������������}�����������������}��������]^_`���
�������������������������|�����������������������}��"��^�������|���|�������}����|��������]^_^�?��������������"��{���������������������������������}���|���|��}��������"��������|����������������<���������
.�������*�������������������������-���6����801������9�
-���.��
���:�*�����01������
:�*������
����
6����6���
�����
!������� �����"�
����
�;����6���������
6���>����������>@X�������|"� `���������� _[�_������� ]������������ _^� ]��_������������{����������~�������>�}��� �^[�������� _��_������� �_����������� _^� ���������������������������������2��������� 2<0=0����� 2>�?������� ?@�2��������� 21A =B�?������������ �
��������� ���X����������>��}�"\�~~>�����������������"��<�]^_^�?��������������"����������|����]^_]���X�)���������~���>����"����}��"�����<��������!���|�����������}��"�����<���������������}�������������������"���X����]^_`��
)�����������������<�������}�����������������<������������<�������"�[��������<�������������������������������������}����|��������������������<������`]���������������|��������]^_^����������������"��!��|����<������ ���������\�������������������������������}�"�<������������������������������<�����}��������"����������]^�"����������<������_��]_������<�������������������}������������"��]��������
�����������:�!��������!��������"����&����������-�������������������������!�������������������}��������������������������}}�������"�<���>�����������������������

%#�#�&�������$��%��&�''$� ����0������(�����#���1"�)����������������!��"����<���>������?�@�� ����]��
������<��������]^������������������������{���<���|"����������������������}������������<��������������<���������"�<��������������|����
�� �����������������������}}�������"���������������|��������<���������<�����]^_^�?��������������"�����>��������������������������������}��������<�����������<�����������������������������������������<����\�}��������"��<�]^������������|����������������������������<�������������������}��������
�� >�����������}���������}}�������"������������<�������"������������"�����������"�}��}����<��������������������������~���>����"�������<�|��������<�����������<����������������������<�]^���������������������������� }�������"��������{�������}�������������������
�������������������������������������������������������<����������������������������������}����������<��������]^������������������}����<�������!������}��������]^���������������������}���������������^���<����������<��������������������������������������������
���}��}������<����������������"���\�����������������������"�|���������������������"���}������������`^���<�����������������}���������������������������~���>����"���������������]^�"��������������������������������|�����������}���������<�������������������������������������������"�|��������������<���|"���}�������"������������������������������������ ��������������}������������}��������������������������������������{��������������������������
����<����|�����������}��������������<��������������������}��������������������������������������������<�����������]^������������������������������������������������������}��������"����������<��� �������!����������!������������������<���������������������|�������������}����������������}����|�������������������}}�"��<�����������������������������������]��`������|��������]^_^�?��������������"���
��*�������������������������&����������-��������������������������
��*���-��������������������������A���������"�����������C�!����� �� �2� �0� �8������������������������������� 1A 21A 01A 81A)�������~���������!������X���� `����������� `����������� `����������� `���������������>������)�������!������X����� ����������� `����������� []���������� _����������
>�����������!��������<���_^������" ����������� �_�`�������� _^]�������� _�`�]������71��� ~����{��������������� �������!� ������������ ������������ ������������ �����������������>������{���������X���� ������������ _]^�_������ _�_�������� ]]]�[������
'�������������>������{���������~��� �]��`�������� �]��`�������� �]��`�������� �]��`���������(��+��6��������������6�� >1�8�������� =2�@�������� 2>8�2������ 2=>�D������ �
��������� ���X����������>��}�"\�~~>�����������������"��<�]^_^�?��������������"����������|����]^_]���X�)���������~���>����"����}��"�����<������������!}}������@�<���������������
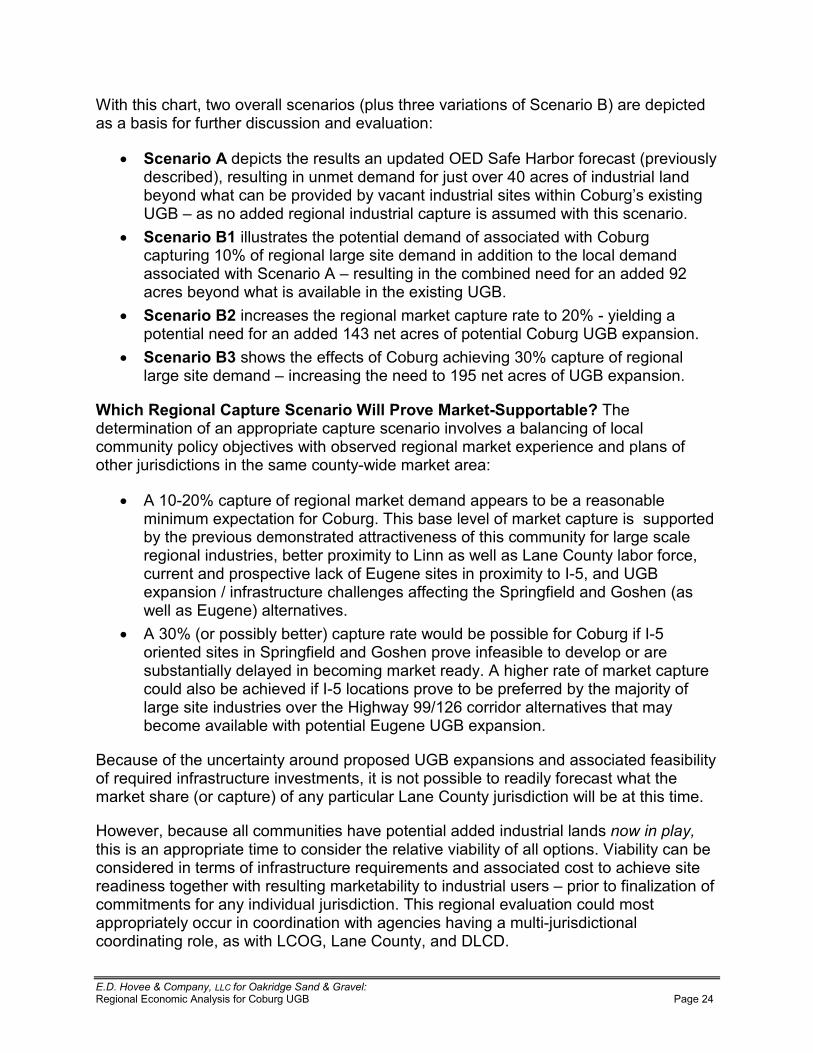
%#�#�&�������$��%��&�''$� ����0������(�����#���1"�)����������������!��"����<���>������?�@�� ����]`�
��������������\��|�������������������}��������������������<���������@�������}��������������<���<�������������������������������
�� �������������}��������������������}�������X��<��������<��������}��������"�����������\��������������������������<�������������`^�������<�����������������"����|���������}���������"����������������������|������>�����������������?�@��������������������������������}���������������|��������������������
�� ����������2����������������}���������������<����������|����>�������}�������_^���<���������������������������������������������������������������|������������!�� �������������������������������<����������[]�������"����|�����������������������������?�@���
�� ����������0�����������������������������}������������]^����"���������}�������������<����������_`������������<�}��������>������?�@���}��������
�� ����������8����|�������<<������<�>����������������^���}������<�������������������������������������������������_[������������<�?�@���}��������
�&��&�������������������������������/��"��������3�������*��E�������������������<���}}��}������}��������������������������������<��������������"�}����"������������|�����������������������������}�����������}�����<�������������������������������������"�|���������������
�� !�_^�]^���}������<���������������������}}������������������������������}��������<���>�����������������������<��������}�����������}}�������"�����}����������������������������������<��������������"�<�������������������������������\��������}�������"����~������|������~���>����"������<����\������������}���}������������<�����������������}�������"����{��\����?�@���}����������<���������������������<<������������}����<������������������|����������������������������
�� !��^������}������"����������}���������|��������}��������<���>�������<�{����������������������}����<���������������}�������<����������������}�����������������"����"������������������������"��!�������������<��������}���������������������������<�{������������}�����������}��<�������"�����������"��<�����������������������������������|"�[[�_]���������������������������"���������������|����}���������������?�@���}��������
@�������<��������������"�������}��}�����?�@���}�������������������<��������"��<������������<����������������������\�����������}����������������"�<�������|�����������������������}�������<��"�}��������~���>����"��������������|���������������������
��|����\���������������������������}������������������������������5����%1�&�����������}}��}�����������������������������������������"��<�����}��������������"����������������������������<���<��������������������������������������������������������������������������|������������������������"��������������������� }��������<�����������<�������������<����"����������������������������������������������������������}}��}�����"����������������������|�������������������������������������������������������\���|����~>��\�~���>����"\����X~>X���
%#�#�&�������$��%��&�''$� ����0������(�����#���1"�)����������������!��"����<���>������?�@�� ����]��
.0��!-����������������������!����<����������������������������������������<���?�@���}������������|�������������}������<������������������������\������}������<��������<����������������!����������������<��������`^�������<�?�@���}��������
������}������}��������������������}�����������������|��������]^_^�?��������������"�|������"�!�������������_^���������������<�|�����������|�����}��������"�������}�����!����������<��������������������<��������}��}���"�|������������������������������������������!���}�����������%1����"��������������������������������<���}��������<��������������|�����������������������
����"�!�����������������������������<����������}����������|������������@_��|�����"�>�������}������_^���<���������������������������{������������������|������������|������������������������"�����"�!����������|�������������@]����@���|����]^������^���������������������}�������{������������\������?�@���}�����������}�������������}���������<�����"�!������[�|�����������������������
)����������<�����<��������������}}�������"�}��������|����>������?�@���}������������<����������"�}�������<���������"��������������������������������<����������\���������������������������"���}}�������������"�}����������<����������}������}��������<�����������|��������}��������������������������������1F�������������������|����<��������������������"���������<�����������������<����������������"������������"����
66!!GG��������!!//����
������������������������"���������}�������������������}���������<���<������������������|���������������}�����������������������<�?�@���������������������������������������������������������������������}���������������"����������"���������������������<���
�� )����|��<������}��������"���"����|����~>����������>��"��<�>��������<�����������������<�|�������������|���<��������������}�������������������������"�������������������������������|�������}�����>������?��������������"��������������}}�����������!��"�����
�� ���������<���<���������"������<�������������}�����������������!�<�������������|�_^�"��������������������<��������<���)���������~���>����"��|������������"���X���}������"������"�������_�����������<�]^_`���
�� ��}�����������������������������}�������������<�X~>X����������|����~���>����"����}������"�����>�������<���������}����<���������������������������}����������<�}��}�����?�@���}������������<��������������������������������"�������������������������������������������������������<�������?�@���}�������|������������}������"��������������<���������������������}}������
���X����������>��}�"\�~~>���X���}}�������������}}�������"����������������������������������"������������<����������}����������������}}�������"�<���>���������<����������~���>����"�������������������
%#�#�&�������$��%��&�''$� ����0������(�����#���1"�)����������������!��"����<���>������?�@�� ����]��
��////!!66,,��GG��������//��!!//����!!����//��!!##��--!!��
������_[�`\����X����������>��}�"\�~~>���X������}��������������������������}��������������������������������<��<�}����������"\�����}��<������}��������������� ��������������������������<��������|�����������<����������������������>����������������������������������<���������������������}�������������\�����������}}�������"����!����������������[���"���\�������������������������������������\�������������������}�����}��������
)������}���������}�����������������������<����|����
�� �X�����������������������������������!���������������[��������"��<�������������"����������}������|���������X�}��������<�~���>��������������X�����}������X~>X���������������<�������������������������������>�������<��������\�@�������\� �����������\�������\������������\������������\�>�����~����\�!��������\����<�������!�����\����<��������)�����>����"���
�� �X������������������������������<��<�}����������������������>��}���������������������������������������������}������|��������[�����������������������������������������!���"\�@�������\������)����\�Y��������>��"\���|}�����������������
�� {������_[[^�\��X��|������|����)����X�����}�����{�����������)X{��|������������"���������������>�������������������
�� ����<����}��������������"��<�����������������������}�������������������������������������<�������������<���������<�������������|��������������������}����\�}�������������������}���������������\����}�����}�����������������}������������������<�������������|�������������������}����������������������������������������������{�������������������{�����
�� �X������������������������������<��������������������|�������������������}�������������������~���>����"���������������>�������<������������}����<����\������������������������@��������������X�}��������<�����}���������
�� >�������"\�����<���������������������������������<����|�<�������������}������}}�������������}����<�������������}����"�}�����������������<�������>��"��<���������
������������������������"����<�����������������<�>������?�@���}��������������}��}�����"������������� ������}�����!�����~������ )�������>�����������
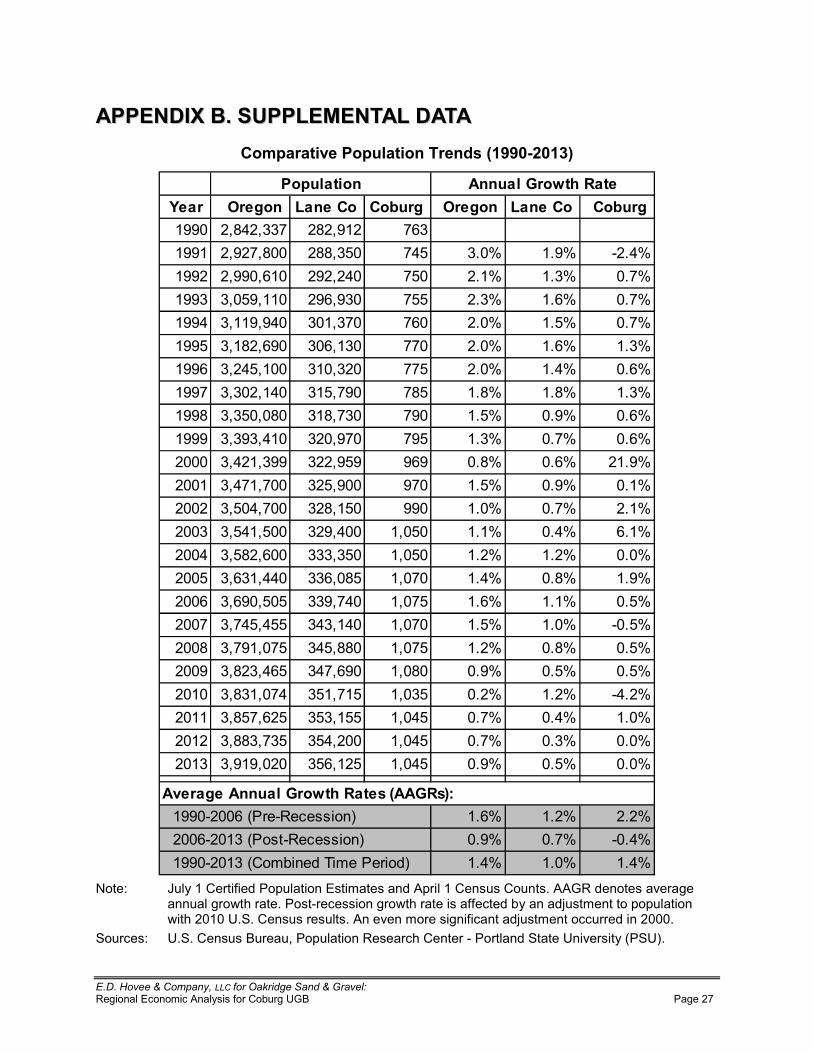
%#�#�&�������$��%��&�''$� ����0������(�����#���1"�)����������������!��"����<���>������?�@�� ����]��
��////!!66,,��GG����������..////--!!��!!66����--��,,��������
���������"��/���������������82==1301289�
����� !������ -������� ��*��� !������ -������� ��*���_[[^ ]\�`]\��� ]�]\[_] ���_[[_ ]\[]�\�^^ ]��\��^ �`� ��^� _�[� �]�`�_[[] ]\[[^\�_^ ][]\]`^ ��^ ]�_� _��� ^���_[[� �\^�[\__^ ][�\[�^ ��� ]��� _��� ^���_[[` �\__[\[`^ �^_\��^ ��^ ]�^� _��� ^���_[[� �\_�]\�[^ �^�\_�^ ��^ ]�^� _��� _���_[[� �\]`�\_^^ �_^\�]^ ��� ]�^� _�`� ^���_[[� �\�^]\_`^ �_�\�[^ ��� _��� _��� _���_[[� �\��^\^�^ �_�\��^ �[^ _��� ^�[� ^���_[[[ �\�[�\`_^ �]^\[�^ �[� _��� ^��� ^���]^^^ �\`]_\�[[ �]]\[�[ [�[ ^��� ^��� ]_�[�]^^_ �\`�_\�^^ �]�\[^^ [�^ _��� ^�[� ^�_�]^^] �\�^`\�^^ �]�\_�^ [[^ _�^� ^��� ]�_�]^^� �\�`_\�^^ �][\`^^ _\^�^ _�_� ^�`� ��_�]^^` �\��]\�^^ ���\��^ _\^�^ _�]� _�]� ^�^�]^^� �\��_\``^ ���\^�� _\^�^ _�`� ^��� _�[�]^^� �\�[^\�^� ��[\�`^ _\^�� _��� _�_� ^���]^^� �\�`�\`�� �`�\_`^ _\^�^ _��� _�^� �^���]^^� �\�[_\^�� �`�\��^ _\^�� _�]� ^��� ^���]^^[ �\�]�\`�� �`�\�[^ _\^�^ ^�[� ^��� ^���]^_^ �\��_\^�` ��_\�_� _\^�� ^�]� _�]� �`�]�]^__ �\���\�]� ���\_�� _\^`� ^��� ^�`� _�^�]^_] �\���\��� ��`\]^^ _\^`� ^��� ^��� ^�^�]^_� �\[_[\^]^ ���\_]� _\^`� ^�[� ^��� ^�^�
_��� _�]� ]�]�^�[� ^��� �^�`�_�`� _�^� _�`�_[[^�]^_���>��������������������
������0����&�����/��������
�"������������0����&�������8��0��9H_[[^�]^^�������)���������]^^��]^_��������)���������
�������� Y��"�_�>����<������}�������������������!}����_�>������>�������!!�)���������������
��������|��������������������������|����������<<�������"����������������}�}�������|����]^_^�?����>���������������!�����������������<���������������������������]^^^��
���������� ?����>������@����\���}�������)�������>���������������������?��������"����?���
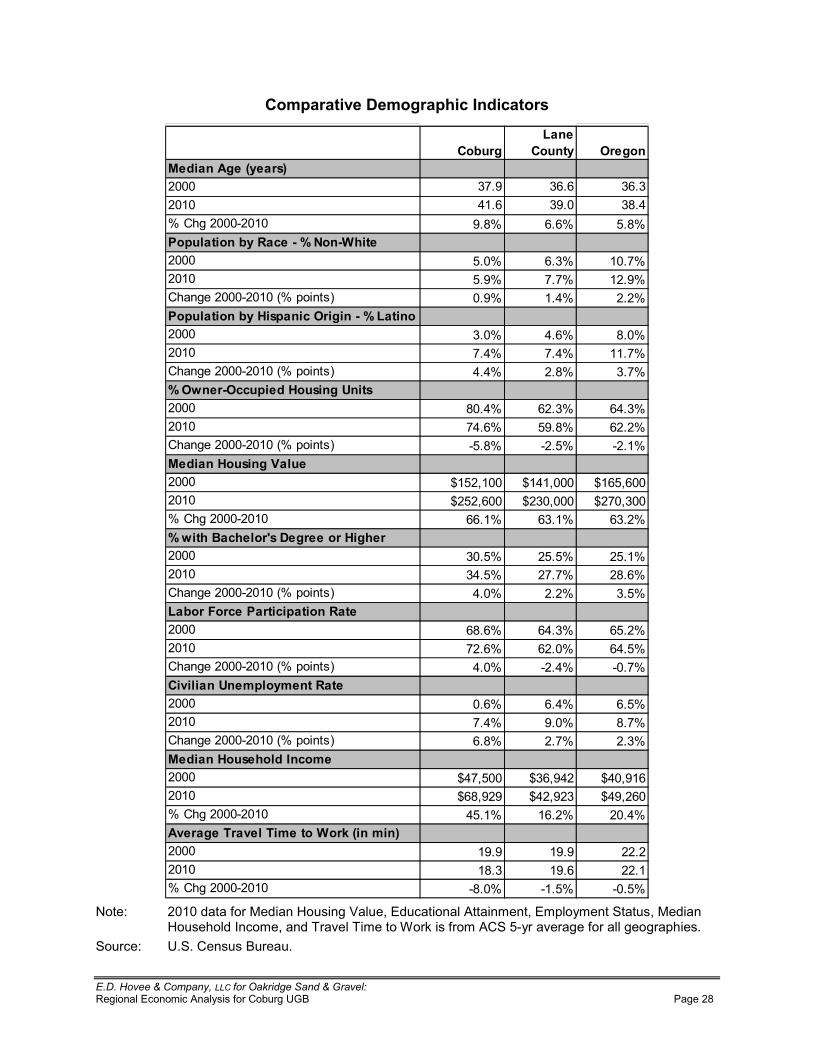
%#�#�&�������$��%��&�''$� ����0������(�����#���1"�)����������������!��"����<���>������?�@�� ����]��
���������"��,�������&�������������
��*��-����
����" !���������������8"����9]^^^ ���[ ���� ����]^_^ `_�� �[�^ ���`��>���]^^^�]^_^ [��� ���� ����/���������*"������3�A�6��3�&���]^^^ ��^� ���� _^���]^_^ ��[� ���� _]�[�>�����]^^^�]^_^����}������ ^�[� _�`� ]�]�/���������*"�I��������!������3�A�-�����]^^^ ��^� `��� ��^�]^_^ ��`� ��`� __���>�����]^^^�]^_^����}������ `�`� ]��� ����A�!����3!������I������.����]^^^ �^�`� �]��� �`���]^_^ �`��� �[��� �]�]�>�����]^^^�]^_^����}������ ����� �]��� �]�_�������I������ ���]^^^ ¡_�]\_^^ ¡_`_\^^^ ¡_��\�^^]^_^ ¡]�]\�^^ ¡]�^\^^^ ¡]�^\�^^��>���]^^^�]^_^ ���_� ���_� ���]�A����&����&����J��,���������I��&��]^^^ �^��� ]���� ]��_�]^_^ �`��� ]���� ]����>�����]^^^�]^_^����}������ `�^� ]�]� ����-�*���#�����/�����������������]^^^ ����� �`��� ���]�]^_^ �]��� �]�^� �`���>�����]^^^�]^_^����}������ `�^� �]�`� �^�����"������.������"���������]^^^ ^��� ��`� ����]^_^ ��`� [�^� ����>�����]^^^�]^_^����}������ ���� ]��� ]���������I���&���������]^^^ ¡`�\�^^ ¡��\[`] ¡`^\[_�]^_^ ¡��\[][ ¡`]\[]� ¡`[\]�^��>���]^^^�]^_^ `��_� _��]� ]^�`��"���������"����������������8������9]^^^ _[�[ _[�[ ]]�]]^_^ _��� _[�� ]]�_��>���]^^^�]^_^ ���^� �_��� �^��� �
������ ]^_^����<���������������������\�����������!��������\���}��"����������\�����������������{�����\��������������������������<����!>����"��������<�����������}������
��������� ?����>������@�������
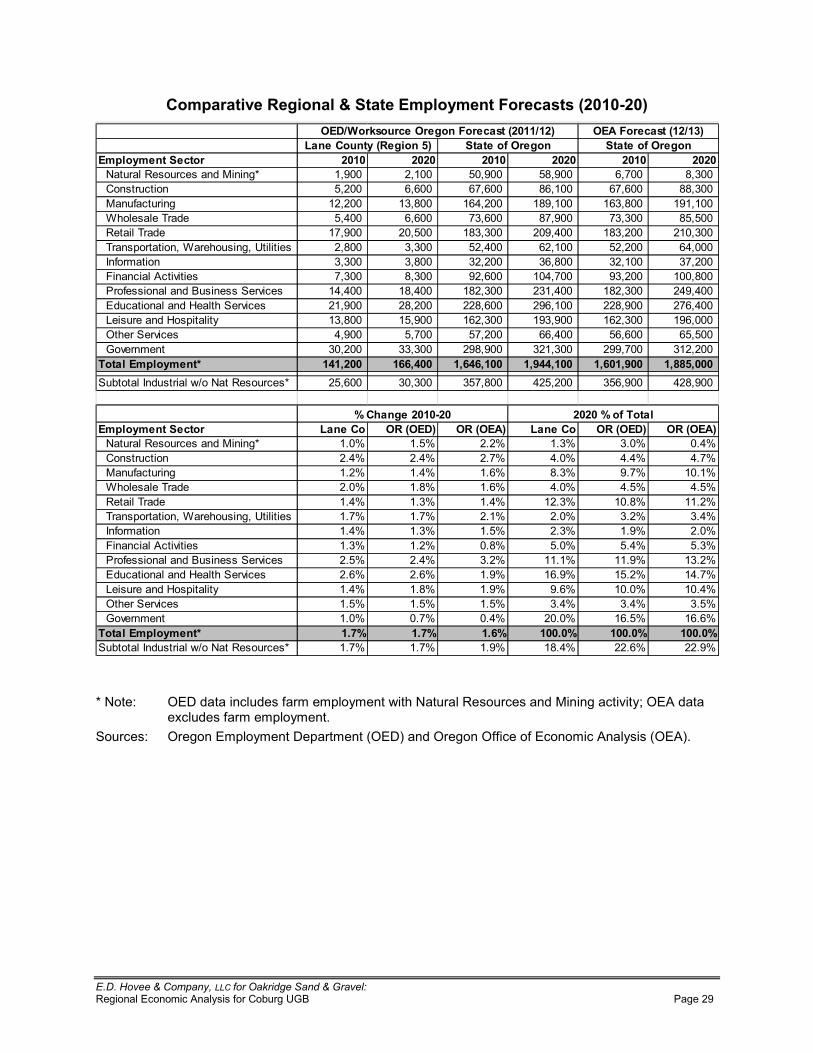
%#�#�&�������$��%��&�''$� ����0������(�����#���1"�)����������������!��"����<���>������?�@�� ����][�
���������"�������������������!����"�����#���������801213019�
!����"����������� 0121 0101 0121 0101 0121 0101������)������������������£ _\[^^���������� ]\_^^���������� �^\[^^�������� ��\[^^�������� �\�^^���������� �\�^^����������>����������� �\]^^���������� �\�^^���������� ��\�^^�������� ��\_^^�������� ��\�^^�������� ��\�^^�����������<������� _]\]^^�������� _�\�^^�������� _�`\]^^������ _�[\_^^������ _��\�^^������ _[_\_^^������������������� �\`^^���������� �\�^^���������� ��\�^^�������� ��\[^^�������� ��\�^^�������� ��\�^^��������)��������� _�\[^^�������� ]^\�^^�������� _��\�^^������ ]^[\`^^������ _��\]^^������ ]_^\�^^����������}�������\�����������\�?�������� ]\�^^���������� �\�^^���������� �]\`^^�������� �]\_^^�������� �]\]^^�������� �`\^^^��������{�<������� �\�^^���������� �\�^^���������� �]\]^^�������� ��\�^^�������� �]\_^^�������� ��\]^^�������� �������!��������� �\�^^���������� �\�^^���������� []\�^^�������� _^`\�^^������ [�\]^^�������� _^^\�^^���������<�����������@���������������� _`\`^^�������� _�\`^^�������� _�]\�^^������ ]�_\`^^������ _�]\�^^������ ]`[\`^^��������������������������������� ]_\[^^�������� ]�\]^^�������� ]]�\�^^������ ][�\_^^������ ]]�\[^^������ ]��\`^^������~�������������}�����" _�\�^^�������� _�\[^^�������� _�]\�^^������ _[�\[^^������ _�]\�^^������ _[�\^^^�������������������� `\[^^���������� �\�^^���������� ��\]^^�������� ��\`^^�������� ��\�^^�������� ��\�^^������������������ �^\]^^�������� ��\�^^�������� ][�\[^^������ �]_\�^^������ ][[\�^^������ �_]\]^^������
������!����"����K 2>2<011������ 2BB<>11������ 2<B>B<211���� 2<=>><211���� 2<B12<=11���� 2<??D<111������������{���������|������)��������£ ]�\�^^�������� �^\�^^�������� ���\�^^������ `]�\]^^������ ���\[^^������ `]�\[^^������
!����"����������� -������ !��8!!,9 !��8!!�9 -������ !��8!!,9 !��8!!�9������)������������������£ _�^� _��� ]�]� _��� ��^� ^�`�>����������� ]�`� ]�`� ]��� `�^� `�`� `������<������� _�]� _�`� _��� ���� [��� _^�_�������������� ]�^� _��� _��� `�^� `��� `���)��������� _�`� _��� _�`� _]��� _^��� __�]�����}�������\�����������\�?�������� _��� _��� ]�_� ]�^� ��]� ��`�{�<������� _�`� _��� _��� ]��� _�[� ]�^� �������!��������� _��� _�]� ^��� ��^� ��`� �������<�����������@���������������� ]��� ]�`� ��]� __�_� __�[� _��]���������������������������� ]��� ]��� _�[� _��[� _��]� _`���~�������������}�����" _�`� _��� _�[� [��� _^�^� _^�`��������������� _��� _��� _��� ��`� ��`� �������������� _�^� ^��� ^�`� ]^�^� _���� _����
������!����"����K 2�@A 2�@A 2�BA 211�1A 211�1A 211�1A��������{���������|������)��������£ _��� _��� _�[� _��`� ]]��� ]]�[�
!!��#��������820C289���������!����� ���������!�����-��������"�8�������D9
!!,C����������!������#��������80122C209
0101�A���������A��&�����0121301
�
£�������� ��X�������������<�����}��"�����|����������)�������������������������" ���!�������������<�����}��"������
���������� ���������}��"�����X�}����������X�������������<<�����<����������!��"�������!����

%#�#�&�������$��%��&�''$� ����0������(�����#���1"�)����������������!��"����<���>������?�@�� �����^�
��"����!����"�����!���������������*���80121<�01209�
6���� !����"����������� #���� :�*� #���� :�*�]� >����������� __����������� �[����������� _^����������� __����������
�����`] ���<����������������������� __����������� �^���������� _������������ ��^���������``���`� )��������� _^����������� _�_��������� [������������ _�^���������
`� ����}��������������������� `������������ ]^����������� ������������� ]������������
�]����� )������������)��������~�������� ���������{�������
_^����������� _`���������� ������������� [[�����������
�` ���<�������\��������<��\���������������������
������������� ]������������ ������������� ]������������
������]!������������������}}������������������������)���������������������������>������������!��������
������������� ������������� `������������ �������������
__\��_���[]
������������������\��������!������������\����!�\� ������"\� �����������������
������������� �]����������� `������������ �������������
�] !��������������� ������������ ������������� ]������������ ������������� ]^�����������
�_ ��������������������}���������!�������������
[������������ ������������� ������������� �_�����������
������!����"���� @>����������� 2<800������ B=����������� 2<18?������
0121�!������� 0121�!�������
��
£�������� ��}��"���������������������������\���������\��"�~>�����������������������<���<��������������������������������������������<�������
���������� ���������}��"�����X�}����������X��¢>������������������"�~���>��������<��������������~>������
.���������������������������-���6����801������9�
0121301�!����"����������� 0121 012> 018> A��0�� 6���6�� A�012���
������)������������������£ _\[^^������ _\[�������� ]\`_������� _�^� `���������� `^� _���������>����������� �\]^^������ �\�]^������ [\]_������� ]�`� �\`[������ `^� _\�[��������<������� _]\]^^���� _]\�_����� _�\�[[���� _�]� �\��]����� `^� _\`������������������� �\`^^������ �\��_������ �\�`_������ ]�^� ]\�[^����� `^� _\_������)��������� _�\[^^���� _�\�[����� ]`\������� _�`� �\��[����� ^� ������������}�������\�����������\�?�������� ]\�^^������ ]\[[^������ `\_�������� _��� _\_������� `^� `���������{�<������� �\�^^������ �\`[]������ `\��^������ _�`� _\_������� ^� �������� �������!��������� �\�^^������ �\��������� [\[�`������ _��� ]\]�^����� ^� �����������<�����������@���������������� _`\`^^���� _�\������� ]�\[������ ]��� _^\^�^���� ^� ����������������������������������� ]_\[^^���� ]`\]�_���� `^\_������ ]��� _�\[`����� ^� ��������~�������������}�����" _�\�^^���� _`\�^`���� _[\������� _�`� `\�������� ^� ���������������������� `\[^^������ �\]^������� �\^``������ _��� _\��[����� ^� ������������������ �^\]^^���� �_\`^`���� ��\_�]���� _�^� �\�������� ^� ��������
������!����"����K 2>2<011��� 2D1<@D?��� 021<==?��� 2�@A B1<0>1���� ?A ><B0@����!�������Y���X�����"����}��"����}���!���� _^�^������-�������������������-���,�����8�����9 >B8�������
-��������"�8�������D9 :�*�0����8012>38>9 :�*�����012��
�
��������� ���������}��"�����X�}�������������X����������>��}�"\�~~>����X��������|��������<���]^_^�]^����<������������"���������������}���������<��������<����"�]^_]��!���|�����������}��"�����<���������������}���������������������]^_`��{�����������}��"�����������������������������|��������}�����������|����%��������%����������<�����������
%#�#�&�������$��%��&�''$� ����0������(�����#���1"�)����������������!��"����<���>������?�@�� �����_�
!!66,,��66!!��!!���
���������������������������������������������� {�<�����������������|����������������������������"��������������������<�������������������"�
������������������������|����\��X����������������������������"��<���<��������<����������}��"����������!�����<����������������������������|����������������
� ����<���������������������������<��������}��������������<����������������"�����������������������������}���������������}�������<��"�������}��"�}����������������}������������\�|����������|��������}������
��� >��������]^^��^`�>��}��������������}�������������<�������������<���?�������|���@�����"��?�@����}������������������������������������}��"��������������|����\�<�����������^������<����������������\�<�������?�@���}��������}�����������|����������������������"������"����������}����>��������|���|�����"������
��� ¢�����������<��������()3)�$����������4�����(����&�}���_]����� ()3)�$����������4�����(����&�}����__�_]��������!�}��������<���������"��}���_�[������
��}�����������}����������������}}�"��<���������������������}����"�������������������<�������}��"��������|������>�����\������������"�������}��"������}���"��<������������������������}������}�����������������}�����������������������������������<���}��"��������|���>�����������}�������������<�������}��������
��� ����?��������������"��������"�������<�������������<�����"�!�����|����|���|����������������}��"�������}������!�����������������������������}��������<�����<����_^������}����������<������������������|����������<���������������"�!���������������������������`^���������������������"�}��������<�����}�����|����������|����|��������������}�����|���������������������}��������<����������������<�������������������
��� ()3)�$����������4�����(����&�}���]^������ ��������}��}��������������}������|�����"���� �����>��"�������<�������"������������}������
}�������������}��|������}�����������������}�|������}���������"���������������}�����?�����"�X�����������?X����
�� �}���<��������������}�"���������]����<�����]^_^�?��������������"�������������X�������������������<�������>���\�����]^_^����������<�������������}�������������������������������}�������������������\�����<���������������������������"�������������������������<������������}�������������������\���������<�������������������<���}��"�����������������������������<��������<��������>�������������������}��"������}���"�����������"������"��������<�������������������
��� @��������X��}���������������������<������������]�"����"���\�����������}�����}������������������}���������]^_`�����������]^_]�]]�<�����������������
���� ��!���X��������]^_���������%4�����4����?�������L���4������������������������]^^^\����������}�����������<������������<���������}��}����\�>�������\�������\����<���\��������\��������\�����������������}���������������������������������������!����������|��������������<�����?���\��������|��������|���������|������������������|����������������������������������|�|��������������]^^^���
���� {������"��������������������������"����������������������|���������������������������������}��������}��}��������<���}��"�����|�������}������������������������<�����������<������������������������������������"���������}��}��������<���}��"�����|���������������������|������
���� �����}����<�������!�����������<�������<������"��<������_[^����������������__�����������������������������������������������������������|�������������������?�@��
���� �>������|���\�����\�%������$��%����������'��������������"�7��F7�1�4����1����&�}��}����<�������>��"��<�������������������X�����}�����X�}������\�Y����]^_^���
%#�#�&�������$��%��&�''$� ����0������(�����#���1"�)����������������!��"����<���>������?�@�� �����]�
������������������������������������������������������������������������������������������������������������������������������������������������ �������������'��� ���6�������1�0���&�����������������������������������"\����}����
����������������������������������������������}}�"��<�_^�������������<����?�@���}�������|��������������������������������}}�"��!��������<���}�������<������������}�������������������}�����������������������������<�������<�����������������������"����{��\����������������"����������>�����>��}�����>�����\���_������������}����������������}���������������������������������)��"��{�������������������{��������������������\�����������������������>��<����\������>���������������������{����������������|"�]]��������������
� ����]^^[���������������!�}��}�����"��>������|������������������������������������������<��������������������������������������������<����{����������������<����>����~���)���������������������}������<����������}��}�����?�@���}�������������{������@��������)�������[���������������������|�����<����������������}��<������������<���"���������������������
���� ����������<����������)���������"������<����������������|����<�����������}�������������������������������������<�����������}����<�����]^^^�_^���������������"�<<�����������`�^��������������]^__�����������������������������<����������������|����������� ������}}�������������������������������������<����������<����<�����"�������������}��"�]`^���������������������X��������]^_���������}���������������<�����"�<���������
� �������������������|�������}�������������<�����>����������������}��}���"��"�������������<�������<�<���������<�����>��"�����|���|���������������������������"�������������}����\��������������������<������������¡]������������������}��������"���������<���<����}����������������������!����������������������<���|������}}�"������������}���"��}������<����<����}����������������<�������"}���!����}�������"�1���?��������#���&��!}}�������������������������|����\��X��������_[\�]^_����
� ����������������}�������������������������������������>�����\������������������������<���������}������}���������������������������������������<�����������<�������������������������������|����������}���������<����������������<��������������������"��<��������������
���� ����~���>����"�����<����������������������������<���<�����������������������������]^_`���X���}��"�����<����������������� ��������������������<�����!�����}���������<��������������������}��"�����������������}���������|������X�<�����������������
��� ����������������������!\������������������������}����������������������^���<����������������������"�`^���<�������������������������������������������������������"�<����������������������������������������������������������"��������{���<���|"�������������|������_����������<�����<���|"��


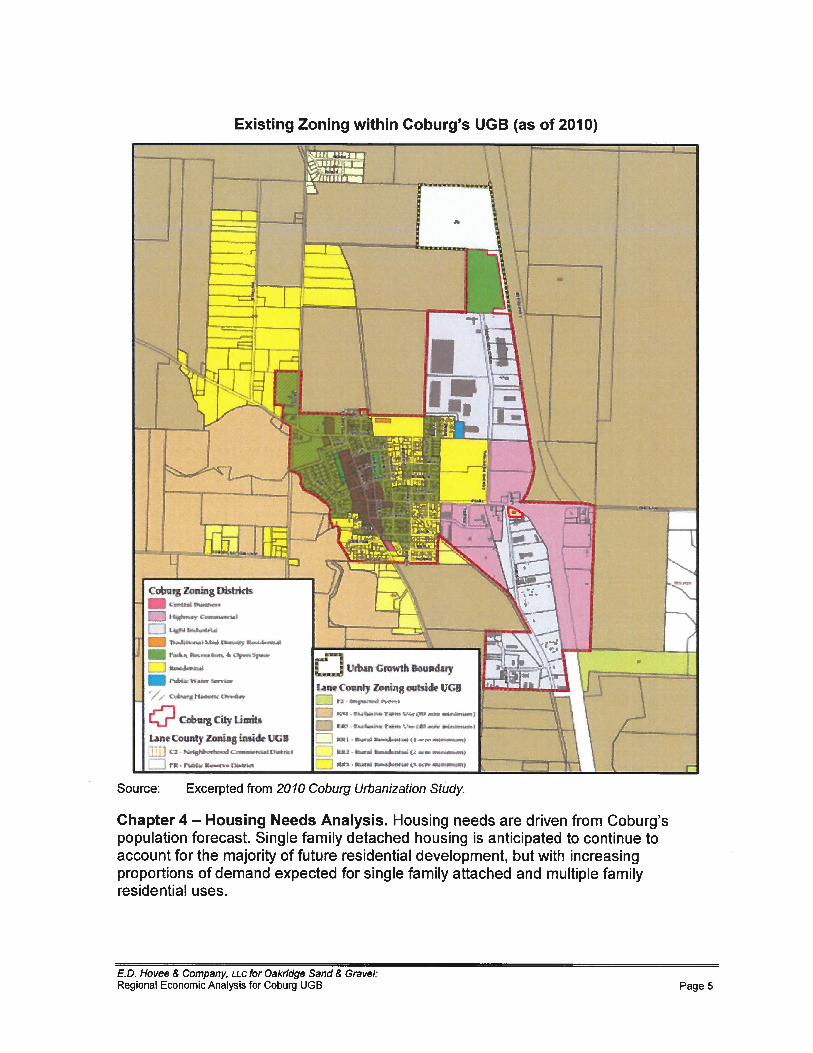
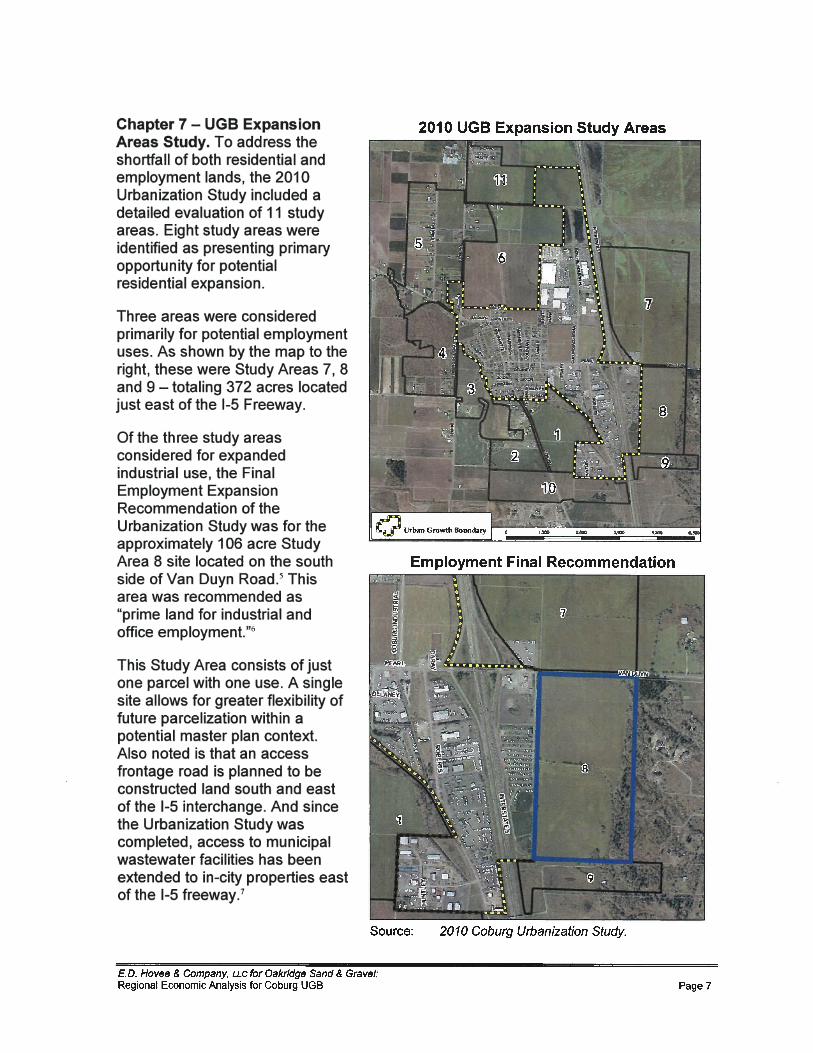
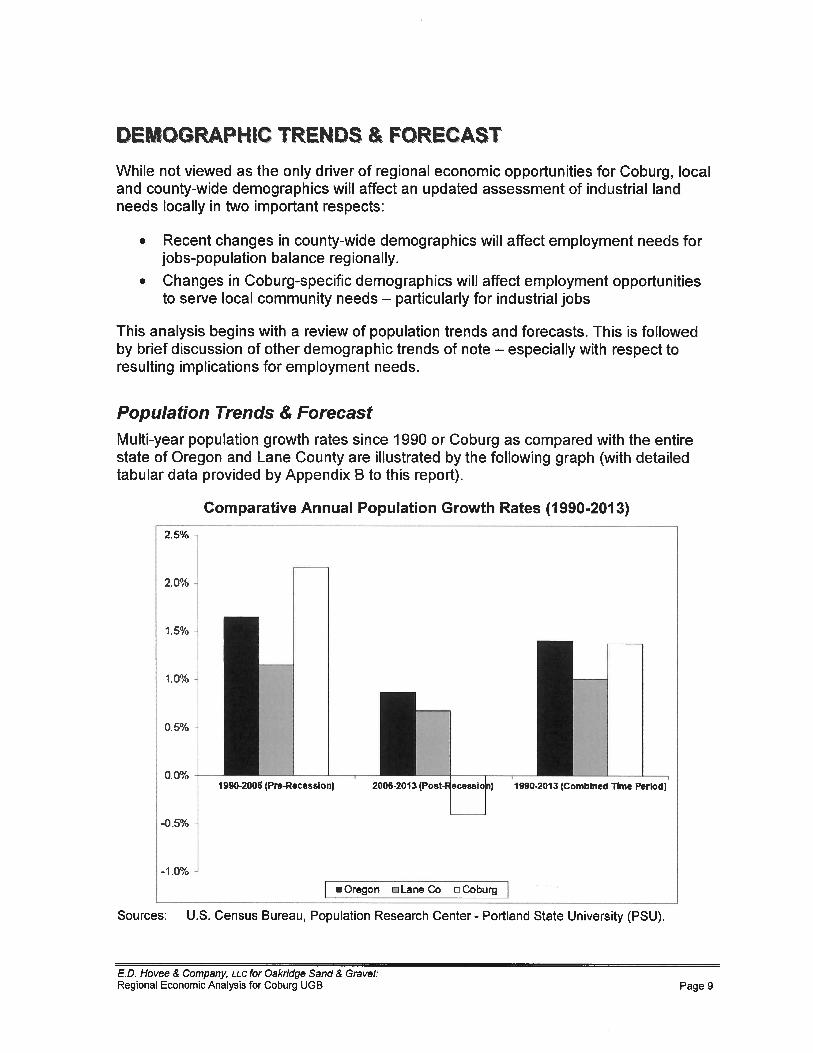

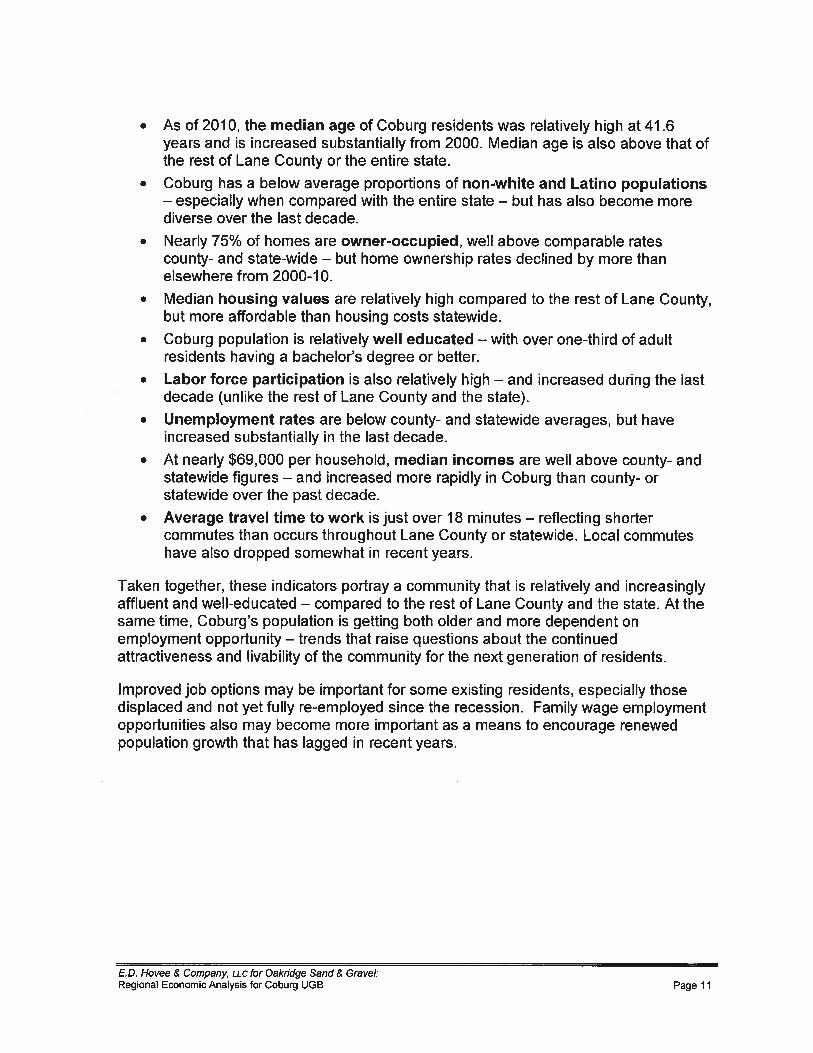
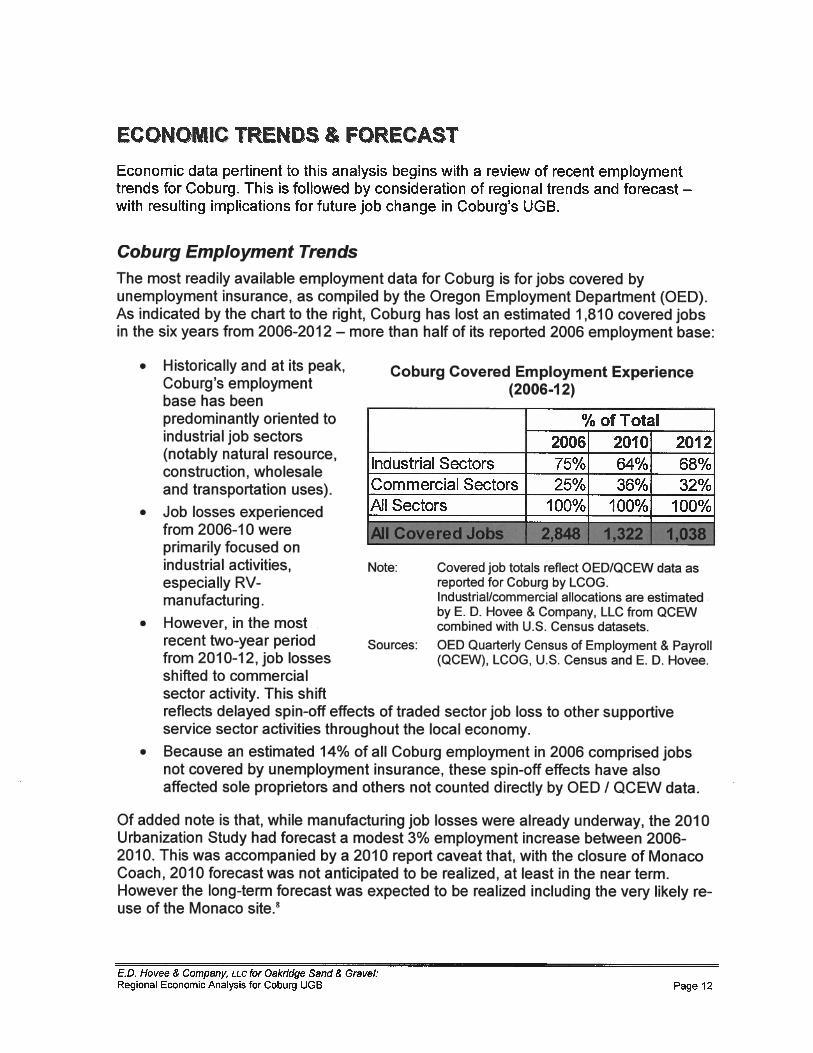

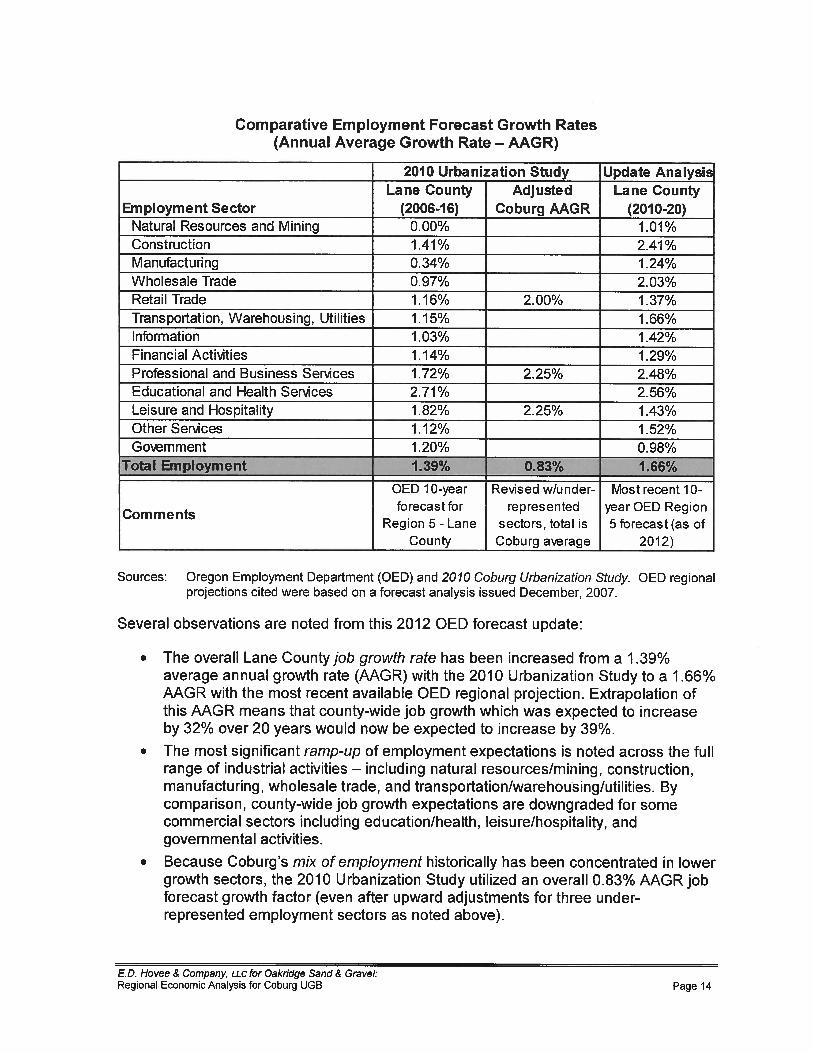

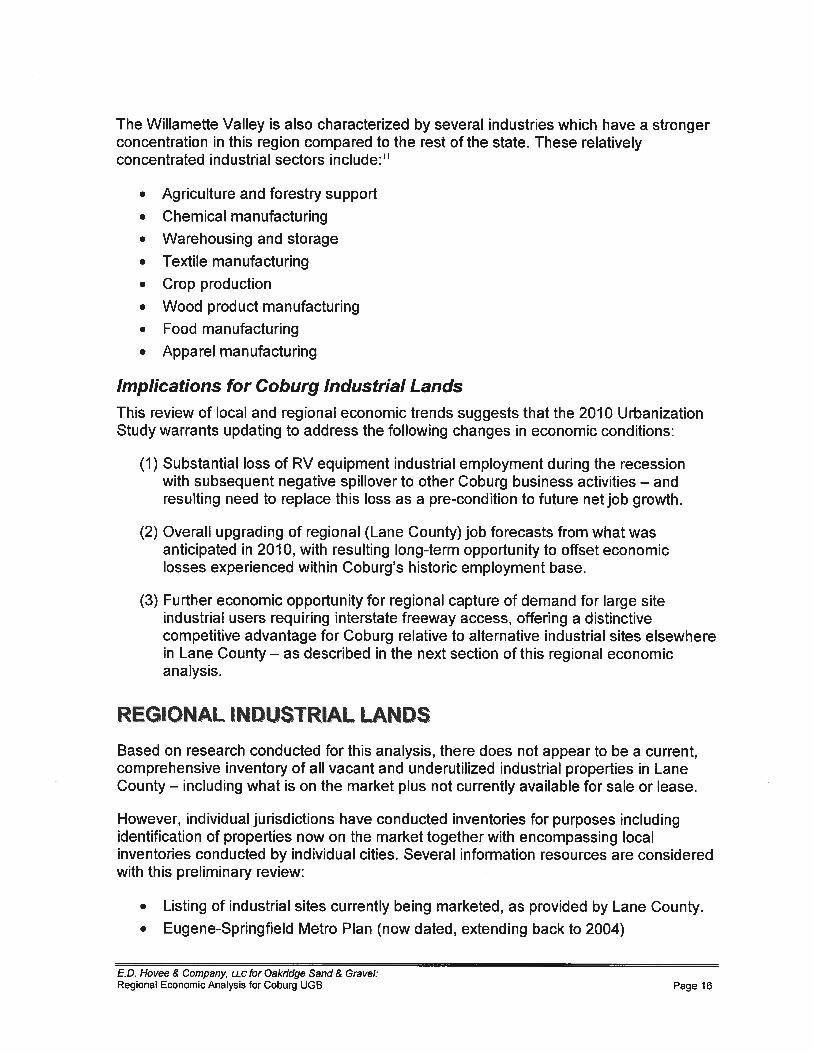
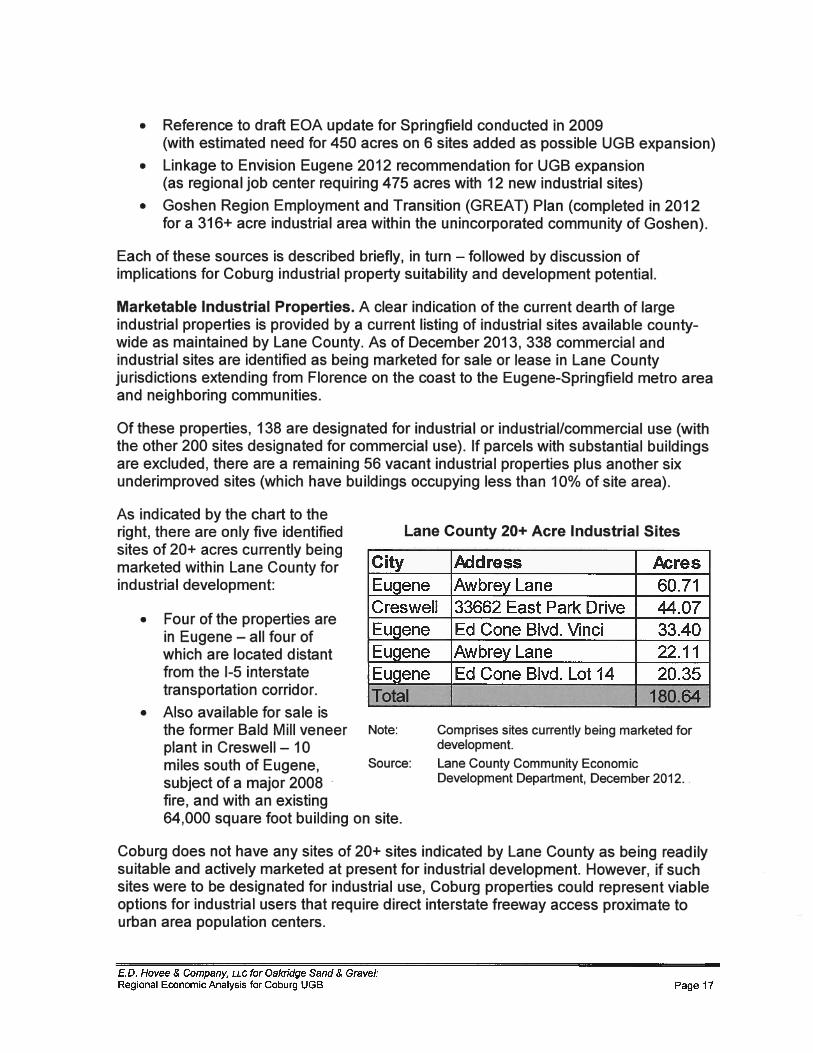

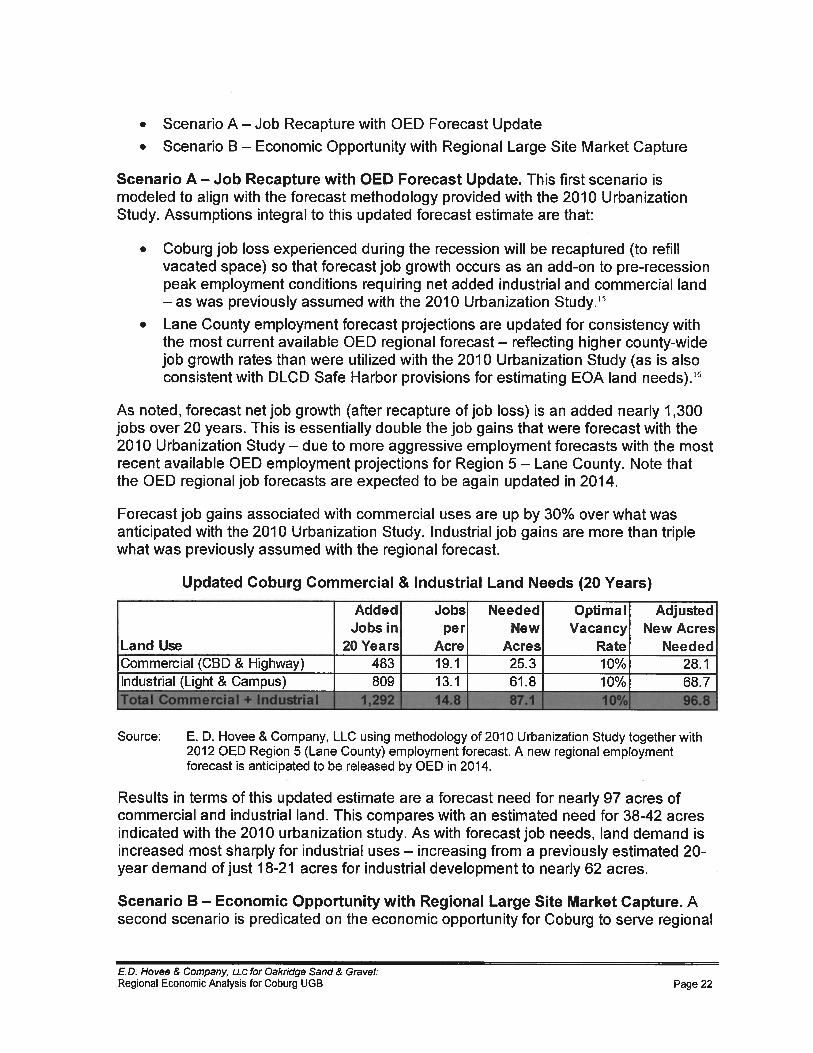
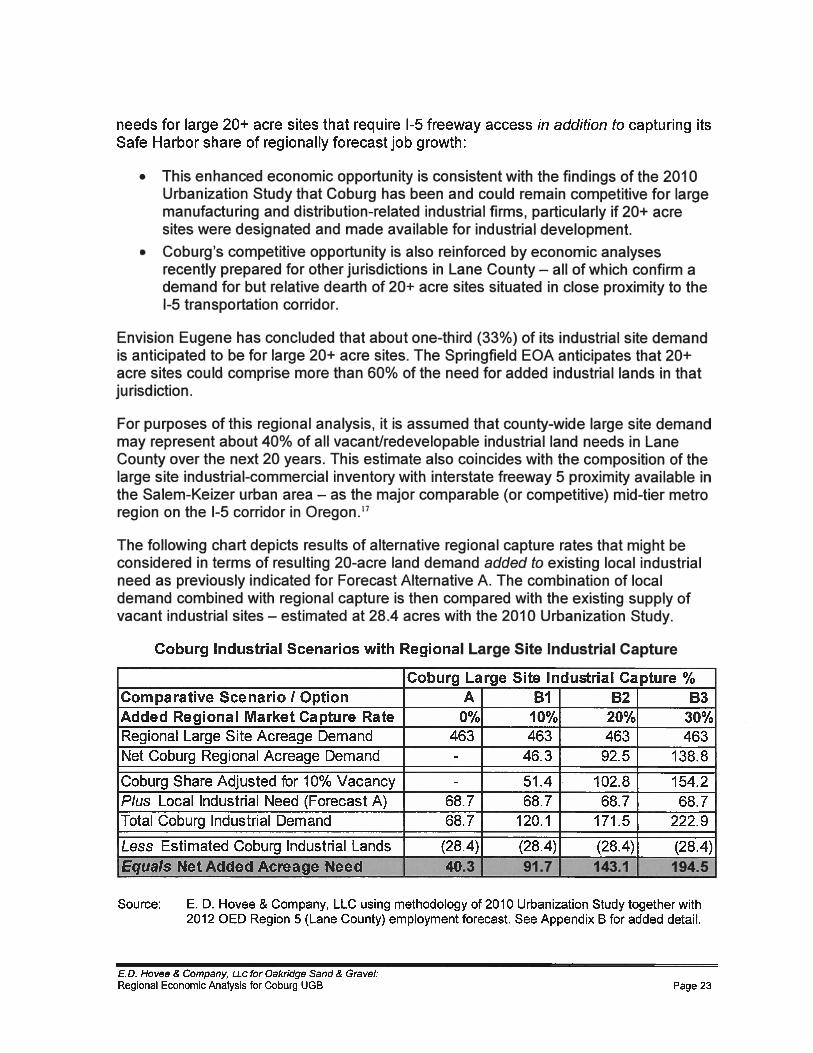
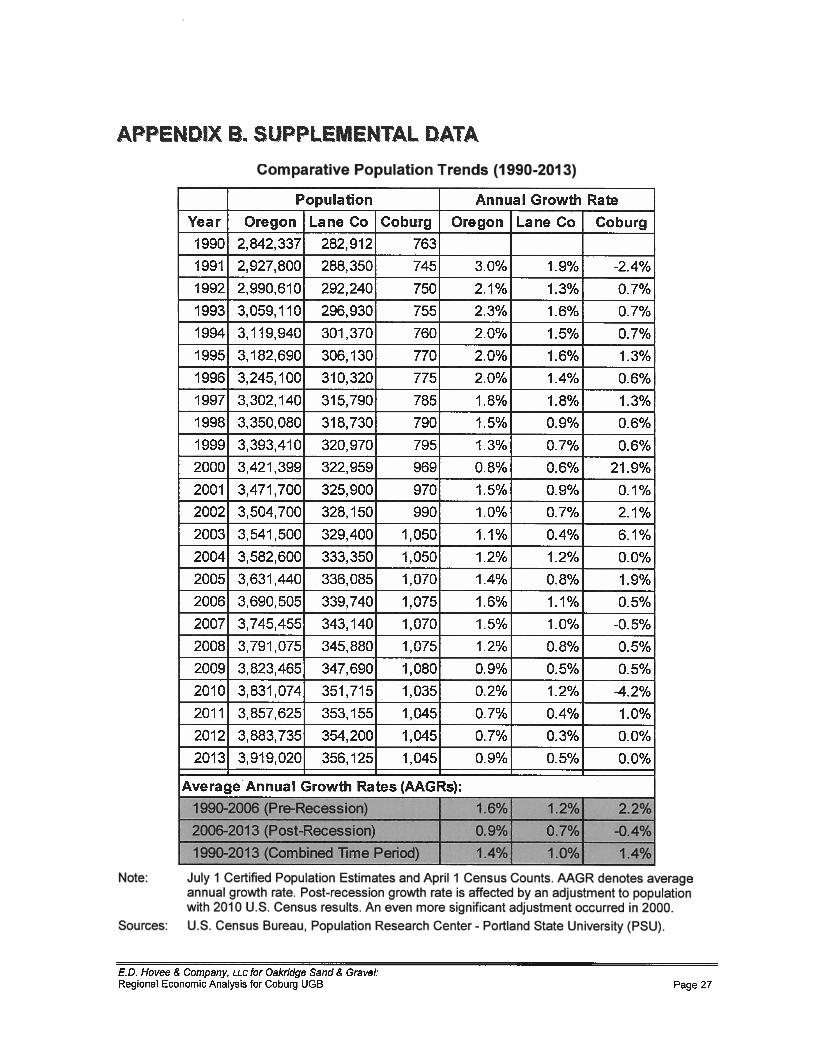
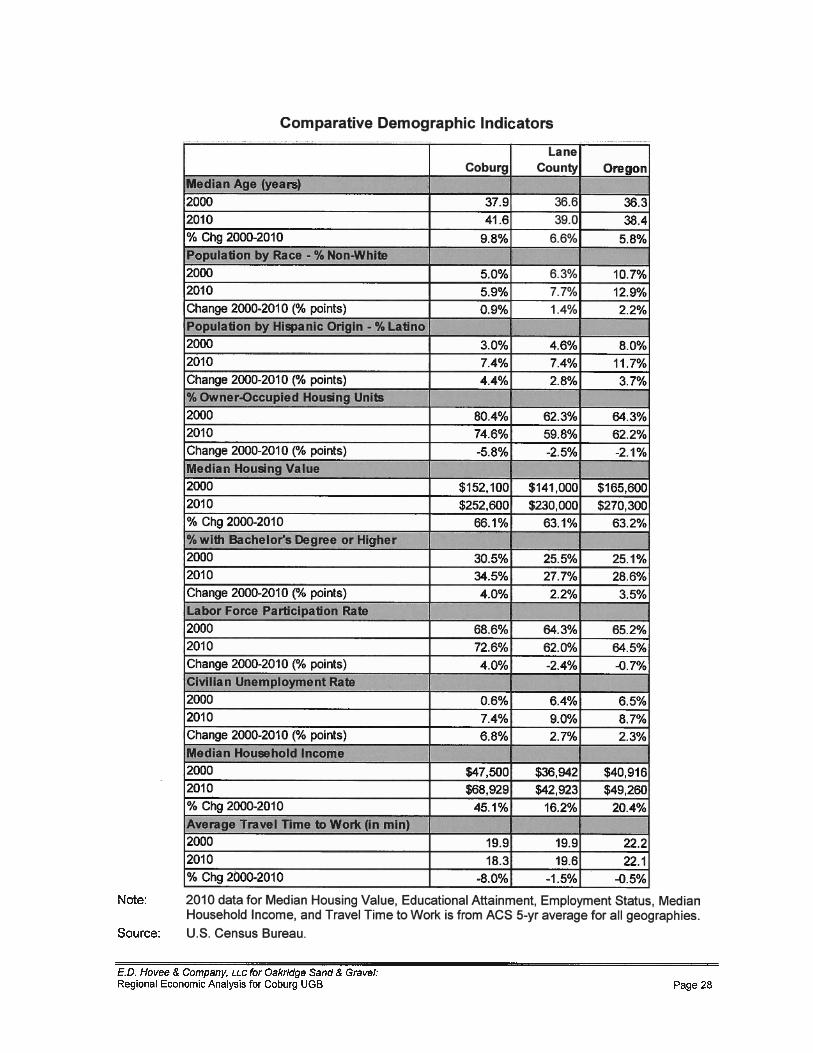
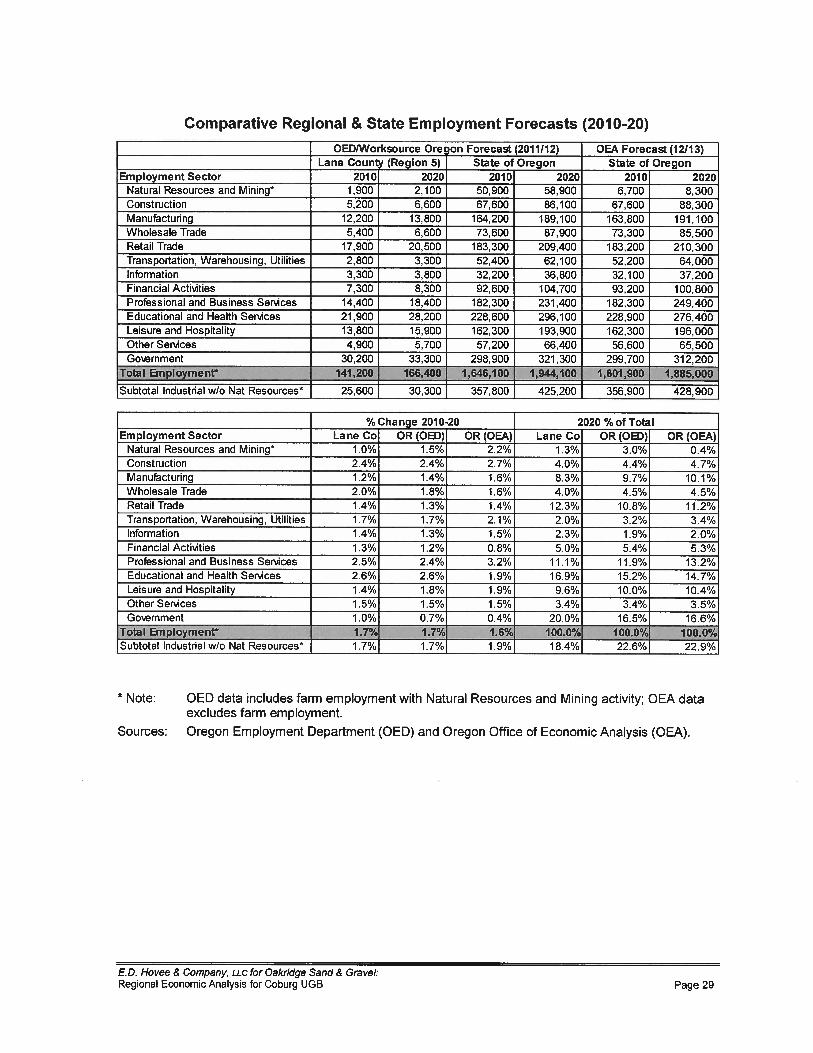
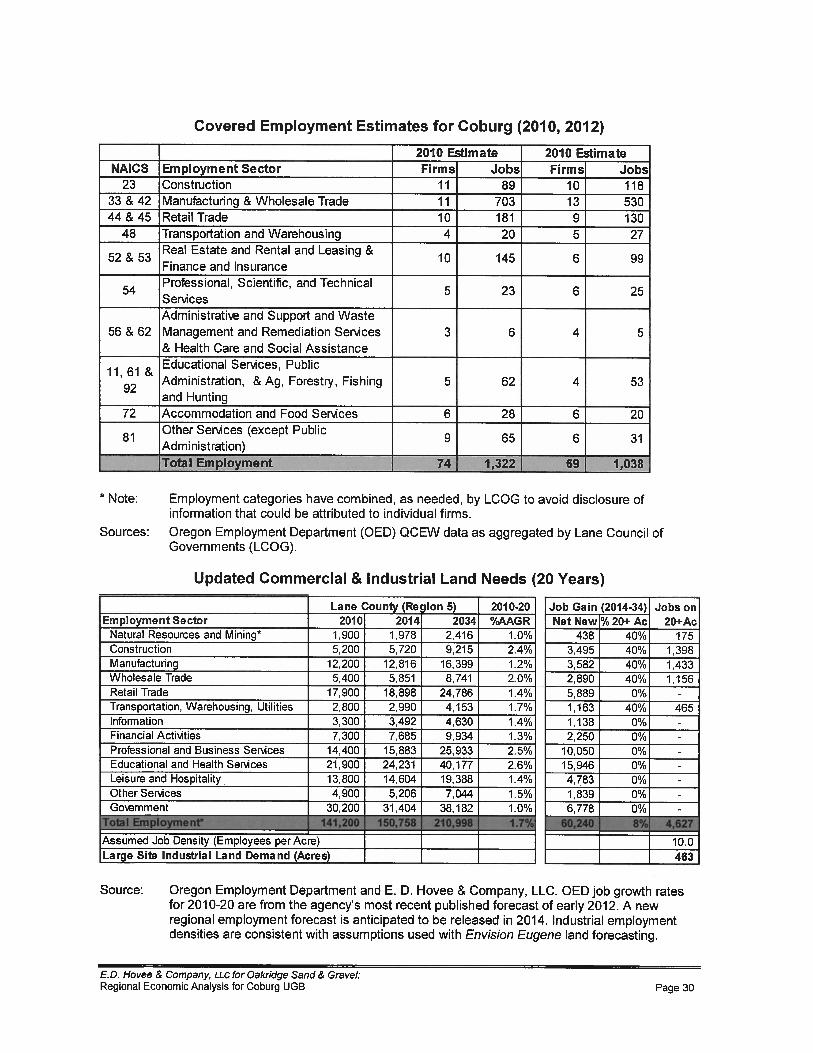

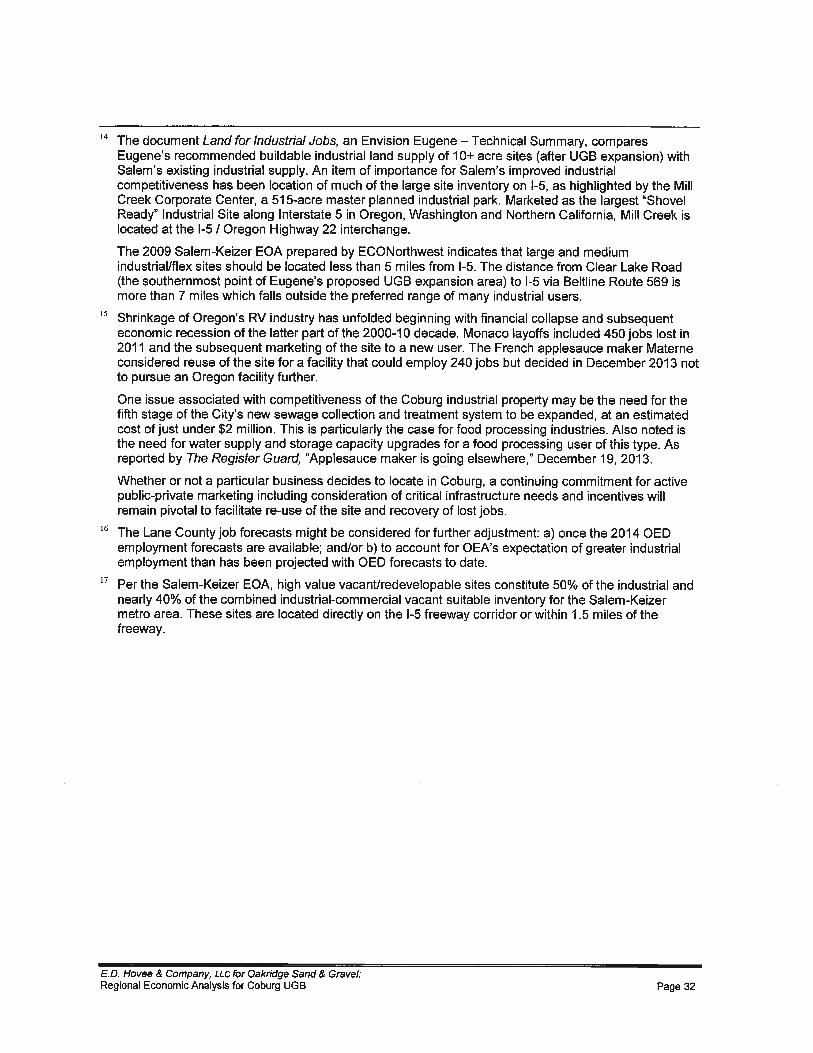
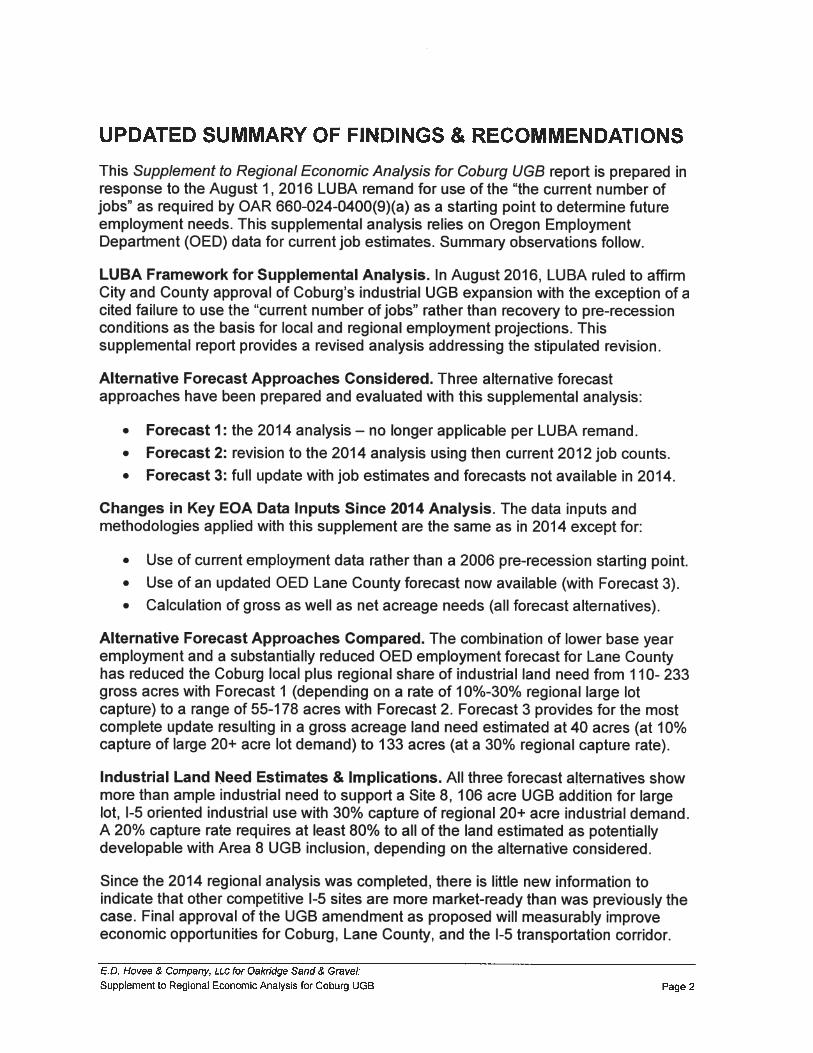
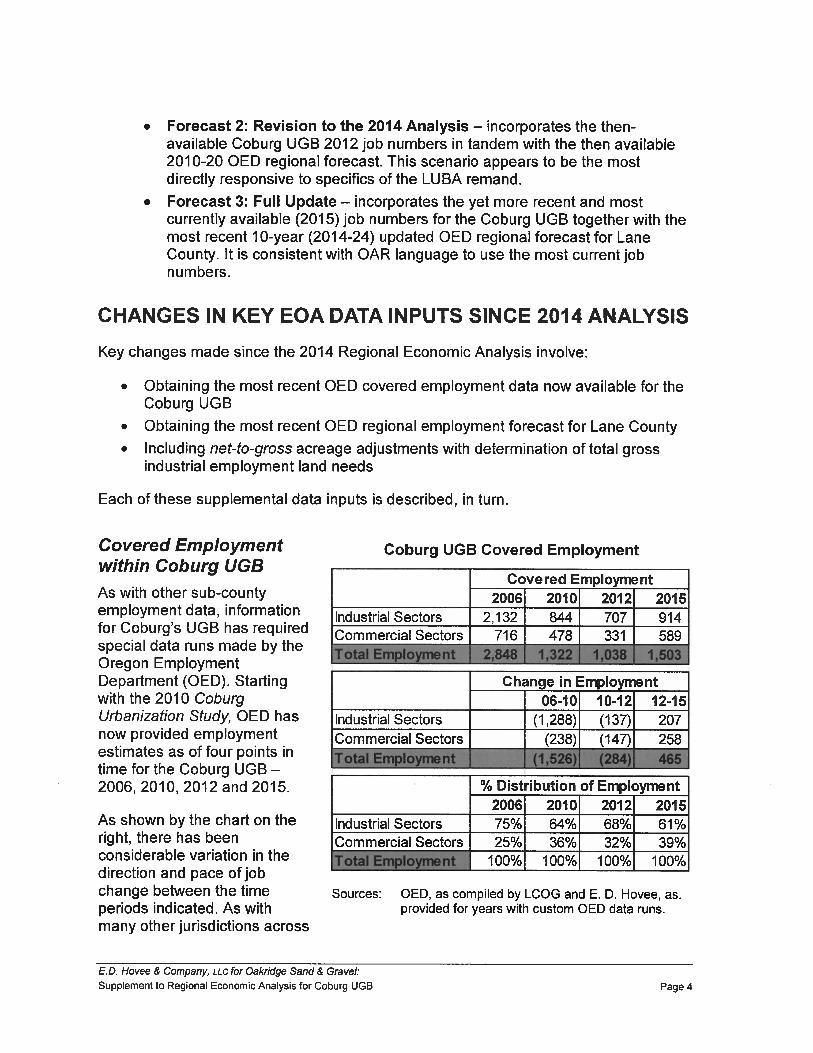
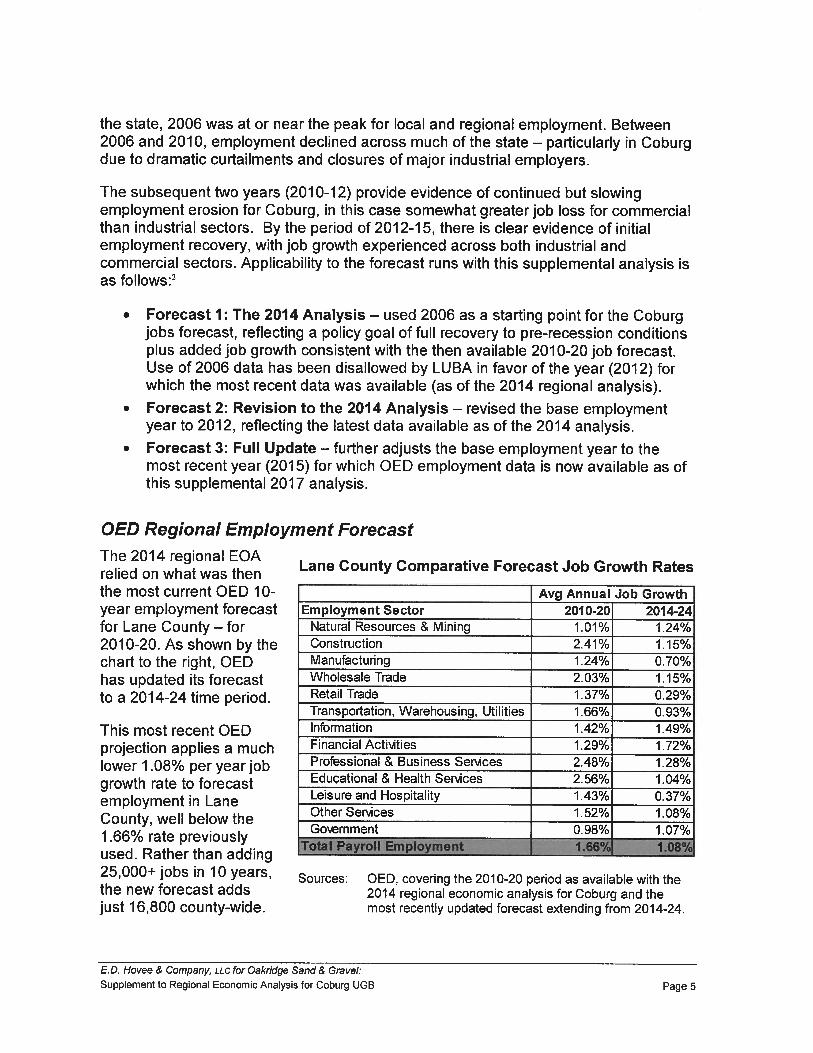
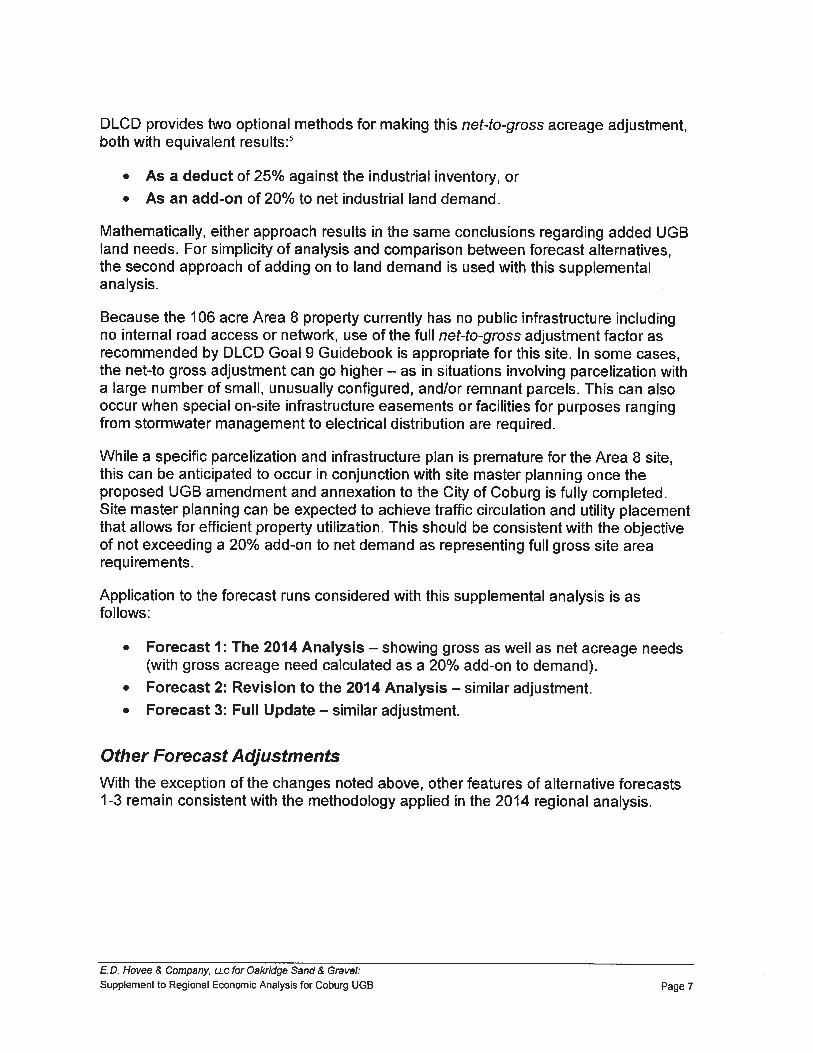
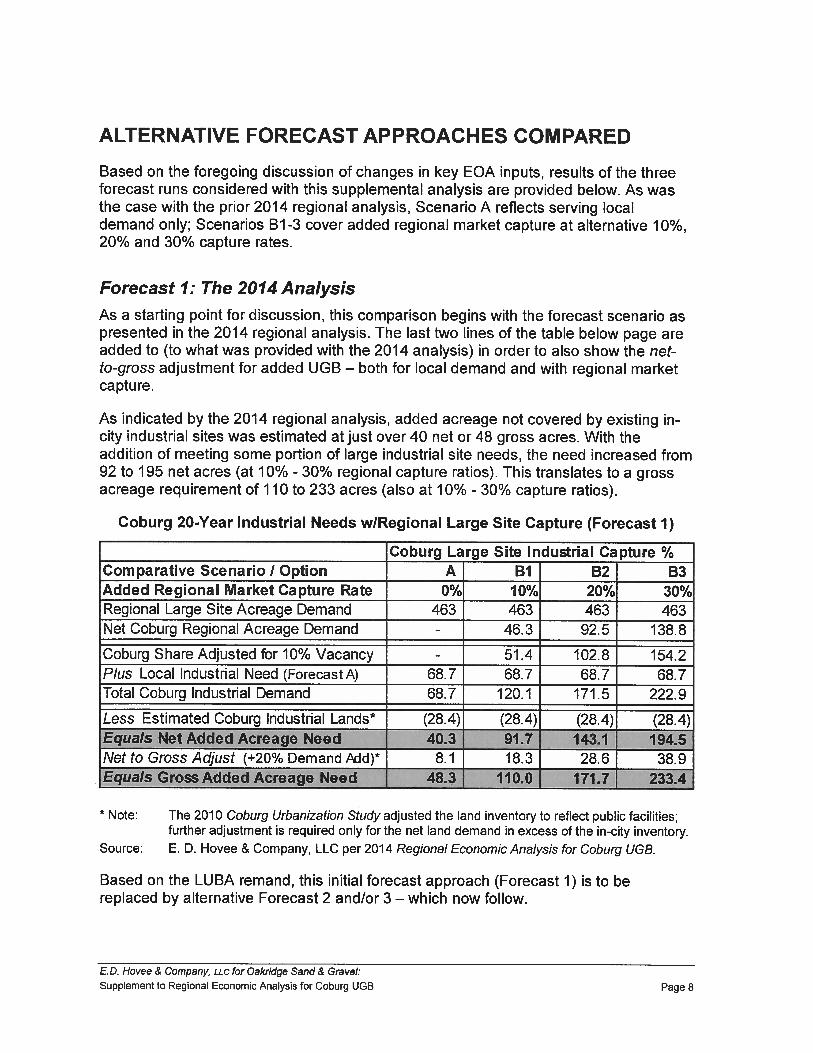
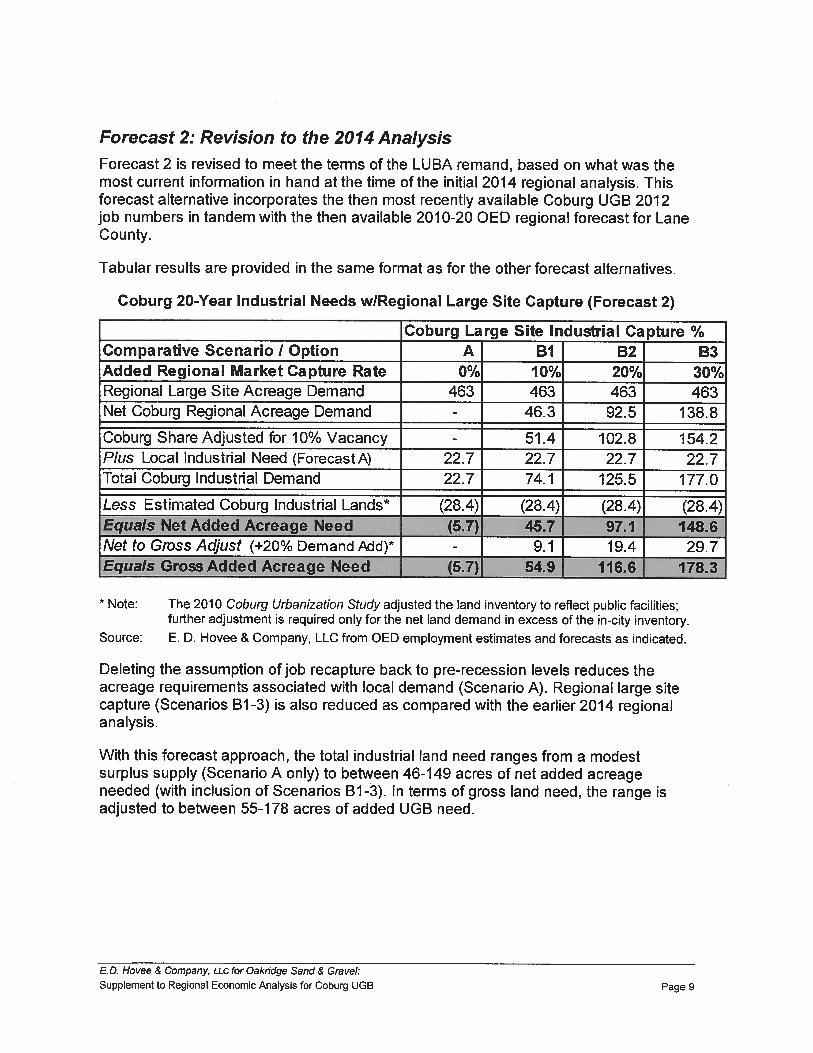
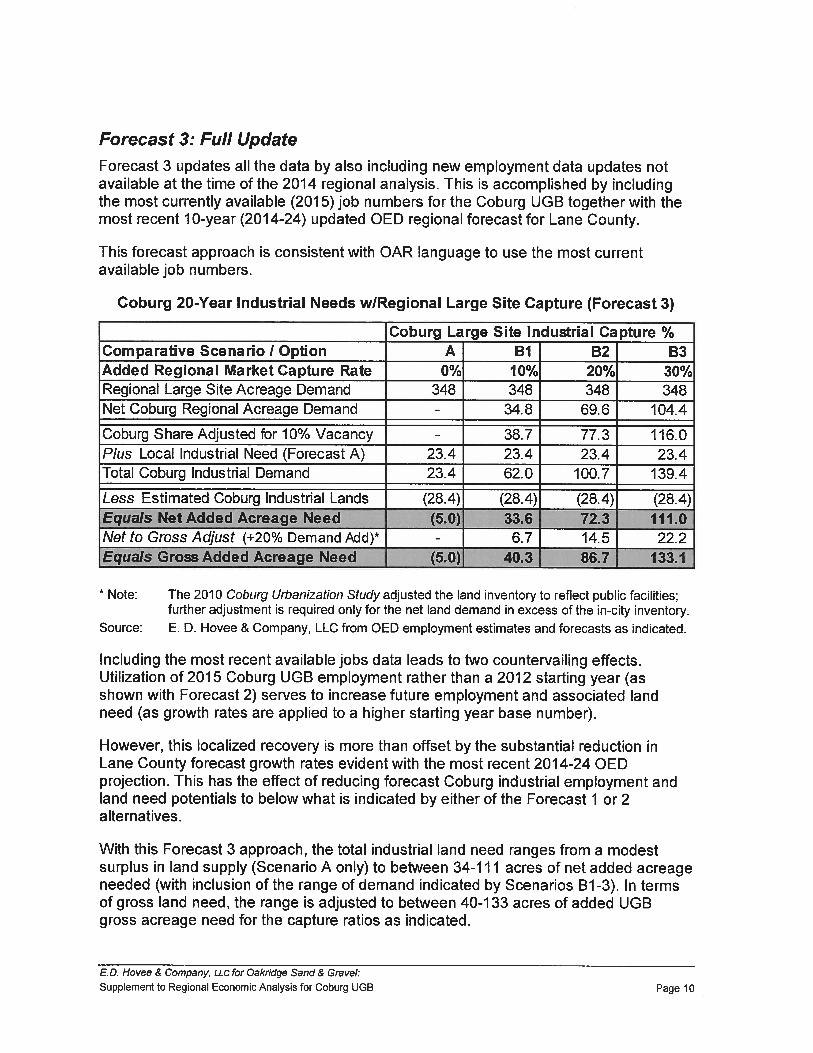


âââââââââââââââââââââââââââââââââââââââââââââââââââââââââââââââââââ
ââ â â âââââââââââââââââââââââââââââââ
ââââââââ
ââââââââââââââââââââââââ
ââââ
ââââ
ââââ
ââââââââââââââââââââââââââââââââââââââ
ââââââââââââââââââââ
ââââââââââââââââââââââ
âââ
ââââ
ââââââââââââââââââââââ
âââââââââââââââââââââââââââââââââââââââââââââââââ
ââââââââââ
â â â â â â â â â â
âââââââââââââââââââââ â â
âââââââââââââââââ
ââââââ
âââ
âââââââââââââââââââââââââââââ
ââââ
ââââ
âââââââââââ
â âââââââââââââââââââ
â ââ â
â â
âââââââââââââââââââââââ
ââââââââ
âââââ
ââ
âââââââââ
âââââââââââââ
ââââââââââââââââââ
âââââââââââââââ
â
âââ
âââââââââââ
âââââââââââââââââââ
ââââââââââââââââââ
ââââââââââââââââââââââââââââââââââââââââââââ
ââââââââ
âââââ
ââ
â
âââ
ââââ
ââââ
ââââ
ââââ
âââââââââââ
ââââ
ââââ
ââââ
ââââ
ââ
ââââ
âââââââââââââââââââââââââââââââ
âââââââââââââââââââââââââââââââââââ
ââââââââââââââââââââââââââââ
âââââââââââââââââââââââââââââââââââââââââââââââââââââââââââââââââââââââââââââââââââââââââââââââââââââââââââ
ââââââââââââââââââââââââââââââââââââââââââââââââââââââââââââââââââââââââââââââââââââââââââââââââââââââââââââââââââââââââââââââââââââ â â â â â â â
ââââââââ
ââââ
â
âââââââââââ
ââ
â â â â ââââââââââââââââââââââââââââââââââââââââââââââââââââââââââââââââââââââââââââââââââââââââââââââââââââââââââ â â â â â â â â â â â â â â â â â â â â â â â â â â â â â â â â â â â â â â â â â â â â â â â â â â â â â â â â â â â â â
ââââââââââââââââââââââââââââââââ â â â â â â â â â â â â â â â â â â â â â â â â â
âââââââââââââââââââââââââââââââ
â â â â â â â â â â â â â â â â â â â â â â â â â â â â â â â â â â â â â â â â â â
âââââââââââââââ â â â â â â â â â â â â â â â â â â â â â â â â â â â â â â â â â â â â â â â â â â â â â â â â â â â â â â â â â â
â
â â â â â â â â â â â â â â â â â â â â â â â â â â â â â â â â â â â â â â â â â â â â â â â â â â â â â â â â â â â â â â â â â â â
ââââââââ
â â â â â â â â â â â â â â â â â â â â â â â â â â â â â ââ â â â â â â â â â â â â â â â â â â
â âââ â â â â â â â â â â â â â â â â â
â â ââ â â
â â ââ â â â â â â â â â â â â â â
âââ
â â â â â â â â â â â â â â â â â â â â â â â â â â â â â â â â â â â â â â â â â â â â â â â ââââââââââââââââââââââââââââââââââââââââââââââââââ
7
1
8
6 5
2
9
34
18
11
19
17
30
31
29
10
35
28
32
21
26
33
27
20
3634
25
2223
1613
15
24
12
14
VAN DUYN RD
WILKINS RD
N MI
LLER
ST
I5 NB
PRIVA
TE R
D
FUNK
E RD
HERMAN RD
COLEMAN RD
ROBERTS RD
STAL
LINGS
LN
BLM 16 3 13 1
COBURG BOTTOM LOOP RD
E PEARL ST
SMITH LN
E CROSSROADS LN
OAK C
REST
RD
COBURGHILLS DR
COBURG INDUSTRIAL WAY
KNOX
RD
GREEN ISLAND RD
ABBY RD
DIAMOND RIDGE LP
E MILL ST
TRIPL
E OAK
S DR
BLM 16 2 21 4
E DIXON ST
N WILLAMETTE ST
I5 NB
OFF
RAMP
E MCKENZIE ST
E DELANEY ST
INDIAN DR
N SKINNER ST
ROBERTS CT
PAIUTE LN
SELBY WAY
S STU
ART W
AY
AUSTIN ST
BLACKBERRY LN
FREEDOM LN
N HA
RRISO
N ST
COUNTRY VIEW DR
W VAN DUYN ST
E MAPLE STVINTAGE WAY
MARQ
UISE
WAY
BRUCE WAY
WATER ST
PEPPERMINT LN CHRISTIAN WAY
E THOMAS ST
W DIXON ST
SHAN
E CT
RUST
IC C
T
RIDGEVIEW RD
DARA
Y ST
PRIVATE RD
I5 NB ONRAMP
BLM 16 3 13 1
PRIVATE RD
PRIVATE RD
PRIVA
TE R
D
PRIVATE RD
PRIVATE RD
I5 SB ONRAMP
PRIVATE
RD
PRIVA
TE R
D
PRIVATE RD
PRIVATE RD
PRIVATE RD
PRIVATE RD
I5 SB OFFRAMPPRIVATE RD
PRIVATE RD
PRIVATE RD
Linn County
22
22
66
77
77
77
77
77
77
77
77
77
77
77
77
88
88
88
88
77
77
77
22
22
77
88
77
22
77
77
22
22
88
22
77
77
77
77
77
77
77
77
77
77
77
77
77
77
77
77
77
77
77
100
800
900
1400
1600
100
200
201
202
301
303
304305 306 307
308
309
310311 312
313
314
315
316
317
318
319
320
321
322
323
326
327
400
500
600
700
800
100
101
102
103
105
106
107
108
200
400
500
600
100101102
103104
200201
300
301
302
304
305
306
306
307
307
400
500
501502
600
700
800
100200300
301302
400
100
101
200
300
100
100
200
100
200
300
400 500
100
200
300
100
101
200
201
202
203
204
300
100
101102
103
103
104
200
201
202
204
300
400
100200
300
400
401
402
500
600
601
602
200
300
400
500600
700
800
801
100
100
200
201
202
300
301
4300
4301
4401
100
200
301
400
401
402
403
500
600
700
800
900
1000
1100
101
102
102
200
300
400
101
300
301
302
303
100
101
100
300
400
500
100
200
201
202
203
204
205
206
207
300301
400
500
600
700
100
200
202
300
301
400
100
300
301302
400
401
406
407
408
500
500601
700
701
1000
1100
100
101 102
103
104
105
200
300301
400500
501502
600
601602
701
702
800
801
900
901
902
1000
1100
1200
13001400
1500
16001700
18001900
1901
2000 2100
2200
23002400
2401
25002600
2601
27012800
29003000
3100
3200
3300 3301
34003500
35013502
3600
37013702
3800
3801
38023803
3804
3805
3806
3807
3808
3809
3900
100300500600800
1000
11001200
13001500
1600 18002100 2200 2300
240029003000
33003400
36003700 3900 40004100
101200
300
400
500501
700
800801
801
803804
806
807
809810
811 812
900
902
903904
905
1000
10011002
100310041005
10091012
1013
1014 1015
1016
1017
1018
1020
1021
1022
1025
1026
1028
1029
1030
1031
1100
1200
1300
1301
1400
1500
1501
1600
1601
1700
600
602
700
701
703
704
705
706
707
707
709
801
900
901
101
102
200
300
400
500600
700800
900
10001100
12001300
1600 1700 1800
19002000
2100
2200
2300
2400
2500
2600
2700
100
200
300400
500
600
601
700800900
1000
1100 1200
1300
1400
1500 17011702
1703
1800
100100
200
200
300400500700800900
1800200022002400
2500
26002700
2800
2900
3000
600
700
701
800
900901
10001100
1200
1300
2000
20022003
2200
2300
2400
24012500
2700
2800
2900
100200
400
600700
8009001000
110012001300
14001500
1600
1700
1800
1900
100
1800
1900
2000
101
903
1301
1302
1400 14011402
1500 1501
300
1200
1300
1400
1500
22002500
26002700
2800
2900
3000
3100
3200
2300
101
102 103
104
105
109
109
111
112
113
114
115116
117
202
303304
400
500
600
700
800
900
1000
1100
1200
1300
1400
15001600
1700 1800
1900
20002100 2200
2300
2400
2500
2600
2700
2800
29003000
104
202
203 204
205
206 207
208 209
211
212
213214
215
216
217
218
219
220221
222
223224
225226
227
228229
230
231
232233
234
235 236
237
301
400500
700
800
100200
300
400
500
600
700
1000
1100
1200
100200500
600
700
800
100
200
300
401
1500
100
2001300
1401
1901
19021903
2100
2200
100
200
201
300
400401
600
700701
200
201
600
800
1100
100
100
1700
1700
1700
1701
200
300
100
300
200
102201
402
403404
405
405
601700
100100
200 201
300
900
901
1000
1100
1200
1201
1602
1700
1701
2101
2301
23022303
2400
2401
2402
2403
2404
1001
1002
1003
1004 1005
100
200
300
400400 600
700
800
1000
1000
1100
1100
110112001200 1200
13001301
100
101
400
500
500
500
500
600
600
600
600
701
701
800
800
800 800
1000
1000
1000
1000
100
400
6403
6600
66016601
68006800
7400
7600
Official Lane County Plan Map
Section Legend
¯0 1,000 2,000 3,000 4,000500
Feet
RCP Plan DesignationsF - Forest
A - Agricultural
ML - Marginal
C - Commercial
I - Industrial
R - Residential
NRES - Non Resource
P - Parks
AIR - Airport
NR:CA - Natural Resource Conservation Area
NR:M - Natural Resource : Mineral
NR:W - Natural Resource : Wildlife
E - Estuary
DR - Destination Resort
PF - Public Facility
2201
18551835 186518451825
2001
1805 18011804 181518021806
1605
17111705 1704
1901
1807
2005
2455
1601
1803
1703
2202
19031905
17011702
1902
1775
2101
1707 1706
1606
2004
1904
21152103
18081809
17551745
2415
2003
1607
1811
2102 2145
1710
2445
2002
1625
1935
2355
2155
2435
1906
1615
2045
1735 1765
1911
2345
1608
1955
2315
17151708
1875
2203
2025
1915
2055
1925
2135
1655
2335
2015
17091725
2245
1610
2225
1945
2215
1665
2425
1635
2125
2255
1810
1609
2035
2235
16451604
2325
19071965
1611
167516021603
2301
1511150115071509 1505
2303
1508 1506
21652159
2259
1959
2059 2065
1912
1510
2302
2006
1515
2265
1869
1812
1910
1769
1575
1712
1685
1975
15651555
1908
1612
1785
1504
2359
15791545
2007
1689
1512
2104
2204
1525 15851502
1909
1535
2011
2459
2365
20122068
1649
18851885
2559
1629 1545
2012
1885
Township South, Range 16 03 West
ORD.PA1246 July 11, 2008 NA Map Adopted
ORD.PA1246
UGB
City Limits
CommunitiesRuralUrban
Township Range
Sections
Metro Plan Boundary
Parcels
Roads
Surface Water
1703
1604
1602
Ordinance No. PA 1356 Exhibit B

Findings and Conclusions Ordinance No. PA 1356 Exhibit “C”
Page 1 of 7
Exhibit C of Ordinance No. PA 1356
FINDINGS AND CONCLUSIONS IN SUPPORT OF ORDINANCE No. PA 1356
(SUPPLEMENTAL FINDINGS FOR ORDINANCE No. PA 1315) The City of Coburg has prepared a revision to its Comprehensive Plan to be co-adopted by the Lane County Board of Commissioners (Board). The County Rural Comprehensive Plan includes all of the comprehensive plans adopted by the 12 cities within Lane County. When a city adopts a change to its comprehensive plan that affects property beyond the city limits, the County must co–adopt that change. In the present case, the City of Coburg has adopted an update to its urbanization study and, consistent with that study, is expanding its urban growth boundary outside its corporate limits. These changes must be co–adopted by the County because they remove certain property from the Rural Comprehensive Plan; however, that property will remain in the county and subject to the County’s jurisdiction until annexation. The process for co-adoption of the proposed changes is through a Lane County Rural Comprehensive Plan (RCP) amendment. Coburg’s 2010 Urbanization Study Update, as modified in 2014, (hereafter referenced as the”2010 Urbanization Study Update”) recommends that one or two 20–acre parcels of industrial land are necessary for economic opportunity needs. The Update proposes that this land be provided by the inclusion of Study Area 8, a 106-acre site east of I-5, into the Coburg Urban Growth Boundary. LANE CODE APPROVAL CRITERIA AND FINDINGS The relevant approval criteria for this action are provided below in bold with findings and conclusions provided in regular text. LC 12.005 Purpose.
(1) The board shall adopt a comprehensive plan. The general purpose of the comprehensive plan is the guiding of the social, economic, and physical development of the County to best promote public health, safety, order, convenience, prosperity and general welfare.
The proposed amendments do not impair the purpose of the Rural Comprehensive Plan as the guiding document for Lane County. Co-adoption of the proposed changes to the Coburg Comprehensive Plan and Plan Diagram is required by and consistent with the provisions of the RCP. LC 12.050 Method of Adoption and Amendment
(1) The adoption of the comprehensive plan or an amendment to such plan shall be by an ordinance.
The proposed amendments to the Rural Comprehensive Plan will be adopted by Ordinance when enacted by the Board.
(2) The Board may amend or supplement the comprehensive plan upon a finding of: (a) an error in the plan; or (b) changed circumstances affecting or pertaining to the plan; or (c) a change in public policy; or
Findings and Conclusions Ordinance No. PA 1356 Exhibit “C”
Page 2 of 7
Exhibit C of Ordinance No. PA 1356
(d) a change in public need based on a reevaluation of factors affecting the plan; provided, the amendment or supplement does not impair the purpose of the plan as established by LC 12.005 above.
Coburg is updating an urbanization study and expanding its urban growth boundary consistent with that study and therefore, this amendment to the comprehensive plan is being adopted due to changed circumstances affecting or pertaining to the plan, consistent with LC 12.050(2)(b). LC 16.252 Procedures for Zoning, Re-zoning, and Amendments to Requirements.
(2) Amendments shall comply with this section and shall achieve the general purpose of this chapter and shall not be contrary to the public interest.
The proposed amendments are necessary to co-adopt the updated Coburg Urbanization Study and proposed changes to the Coburg Urban Growth Boundary. Co-adoption of the Plan changes will provide consistency with state and local law. These amendments comply with this section and are not contrary to the public interest. No Zone Changes are proposed at this time. LC 16.400 Rural Comprehensive Plan Amendments.
(6) Plan Adoption or Amendment - General Procedures. The Rural Comprehensive Plan, or any component of such Plan, shall be adopted or amended in accordance with the following procedures:
(h) Method of Adoption and Amendment. (i) The adoption or amendment of a Rural Comprehensive Plan component shall be by Ordinance.
The proposed amendments shall be adopted by ordinance when enacted by the Board.
(iii) The Board may amend or supplement the Rural Comprehensive Plan upon making the following findings:
(aa) For Major and Minor Amendments as defined in LC 16.400(8)(a) below, the Plan component or amendment meets all applicable requirements of local and state law, including Statewide Planning Goals and Oregon Administrative Rules.
(bb) For Major and Minor Amendments as defined in LC16.400(8)(a) below, the Plan amendment or component is:
(i-i) necessary to correct an identified error in the application of the Plan; or (ii-ii) necessary to fulfill an identified public or community need for the intended result of the component or amendment; or (iii-iii) necessary to comply with the mandate of local, state or federal policy or law; or (iv-iv) necessary to provide for the implementation of adopted Plan policy or elements; or (v-v) otherwise deemed by the Board, for reasons briefly set forth in its decision, to be desirable, appropriate or proper.
Findings and Conclusions Ordinance No. PA 1356 Exhibit “C”
Page 3 of 7
Exhibit C of Ordinance No. PA 1356
The amendment is a major amendment because it is not limited to a Plan Diagram amendment. The amendment meets applicable requirements of local and state law in that it is being processed as a Plan Amendment pursuant to LC Chapter 14 requirements, and is subject to the approval criteria of LC Chapter 12 and 16, both of which chapters are in compliance with state law as outlined in the statewide planning Goal 2 findings, below. Findings of consistency with the approval criteria in LC 16 are contained herein as the property subject to the proposed expansion of the Coburg Urban Growth Boundary currently are subject to Chapter 16 land use regulation. Findings also address consistency with applicable Statewide Planning Goals and Oregon Administrative Rules:
Goal 1 - Citizen Involvement. To develop a citizen involvement program that insures the opportunity for citizens to be involved in all phases of the planning process.
The proposal is consistent with Statewide Planning Goal 1 because the process used to develop and adopt this amendment provided the opportunity for citizens to be involved in all phases of the planning process. The following processes were provided by the City of Coburg:
The citizen involvement program provides for widespread citizen involvement. The citizen
involvement program involves a cross-section of affected citizens in all phases of the planning process and includes the Planning Commission, the officially recognized committee for citizen involvement (CCI) that makes recommendations to the Coburg City Council.
Effective communication between citizens and elected and appointed officials in the project is
provided through open houses, work sessions, and public hearings, all open to the public, at which public input is sought and heard.
Citizens are provided the opportunity to be involved in all phases of the planning process,
including preparation of the proposed Comprehensive Plan and Code amendments. Technical information is explained in staff reports and PowerPoint presentations so that
information necessary reach policy decisions is available in a simplified, understandable form. City staff provided assistance to interpret and effectively use technical information. A copy of all technical information is available on the City and/or project web site as well as at City Hall offices.
Citizens receive a response from policy-makers in the form of written minutes of all public
hearings and meetings which are retained and made available for public assessment and include the rationale used to reach decisions on the proposal.
The City of Coburg provided legal notice for the Planning Commission proceedings conducted.
On March 27, 2012. The Coburg Planning Commission held a public hearing that was continued to April 10, 2012.
The City of Coburg provided legal notice for the City Council proceedings conducted.
The City Council held public hearings prior to adopting Ordinance No. A-199-D on September 12, 2014.
Findings and Conclusions Ordinance No. PA 1356 Exhibit “C”
Page 4 of 7
Exhibit C of Ordinance No. PA 1356
The City Council held public hearings prior to adopting Ordinance No. A-199-F on September
12, 2017.
On January 9, 2018, Coburg City Council held a public hearing adopting Ordinance A-199-G and repealing Ordinances A-199-E and A-199-F.
In addition, the following actions were taken by Lane County: On October 14, 2014, DLCD was notified of the proposed amendments.
On November 4, 2014, the Lane County Planning Commission (LCPC) conducted a work
session on the proposed amendments. On November 11, 2014, a legal ad was published in The Register Guard, providing notice of
the Lane County Planning Commission public hearing on December 2, 2014, at 7:00 P.M. On November 12, 2014 a Measure 56 noticed was mailed out to all property owners who were
included in proposed re-zoning actions. On the same day, notice of the December 2, 2014 public hearing was mailed to all property owners within the City of Coburg as well as all Interested Parties.
On December 2, 2014 the Lane County Planning Commission (LCPC) conducted a public
hearing on the proposed amendments. The hearing was continued and the Lane County Planning Commission requested additional information from the City.
Coburg City Council held three public hearings (March 3, 2015, April 4, 2014, and July 14, 2015) prior to adopting Ordinance No. A-199-E on July 14, 2015.
On August 22, 2015, notice was sent to DLCD regarding the new Ordinance No. A-199-E.
On August 25, notice of the Lane County Planning Commission public hearing on September 15, 2015, at 7:00 P.M., was mailed to all property owners within the proposed Urban Growth Boundary, current city limits, and all property owners within 750’ of the proposed boundary. Notice of hearing was also mailed to all interested parties on the same date.
On August 25, 2015, a legal ad was published in The Register Guard, providing notice of the Lane County Planning Commission public hearing on September 15, 2015, at 7:00 P.M.
On September 15, 2015, the Lane County Planning Commission conducted a second public hearing on the proposed amendments. The LCPC passed a motion to forward a positive recommendation to the Lane County Board of Commissioners on the proposed amendments.
On October 13, 2015, notice of the Lane County Board of Commissioners public hearing on November 3, 2015, at 1:30 P.M., was mailed to all property owners within the proposed Urban Growth Boundary, current city limits, and all property owners within 750’ of the proposed boundary. Notice of hearing was also mailed to all interested parties on the same date.
Findings and Conclusions Ordinance No. PA 1356 Exhibit “C”
Page 5 of 7
Exhibit C of Ordinance No. PA 1356
On October 13, 2015, a legal ad was published in The Register Guard, providing notice of the Lane County Board of Commissioners public hearing on November 3, 2015, at 1:30 P.M.
On November 3, 2015, the Lane County Board of Commissioners conducted a public hearing on the proposed amendments.
On May 15, 2018, the Lane County Board of Commissioners conducted an on the record public
hearing on the revised proposal. The adoption of the Coburg Urbanization Study Update and changes to the Coburg Comprehensive Plan constitutes a plan amendment that is subject to the public notification and hearing processes and provisions of LC Chapter 14 and 16. As described above, the public involvement requirements of these chapters have been met and opportunity for public involvement has been afforded at each phase of the process. The amendment is therefore consistent with statewide planning Goal 1.
Goal 2 - Land Use Planning: To establish a land use planning process and policy framework as a basis for all decisions and actions related to use of land and to assure an adequate factual base for such decisions and actions.
The Rural Comprehensive Plan was acknowledged by the Land Conservation and Development Commission (LCDC) as complying with state planning goals. LC 16.400, adopted and also acknowledged by LCDC, specifies the means by which the RCP may be amended. Notice of the public hearing and pending adoption of the Coburg Urbanization Study Update and changes to the Coburg Comprehensive Plan were mailed to the Oregon Department of Land Conservation and Development (DLCD) on October 14, 2014. The adoption process follows the procedures outlined in Lane Code and these findings provide an adequate factual basis for action. The amendment therefore conforms to the established land use planning process and framework consistent with Goal 2.
Goal 5 - Open Spaces, Scenic and Historic Areas, and Natural Resources: To conserve open space and protect natural and scenic resources.
The changes to the Coburg Comprehensive Plan are consistent with this goal because the Coburg Urbanization Study Update required a review of environmental impacts on the selected study areas as they impact Goal 5 resource sites.
Goal 6 - Air, Water and Land Resources Quality: To maintain and improve the quality of the air, water and land resources of the state.
The changes to the Coburg Comprehensive Plan are consistent with this goal because it supports a better mix of local housing opportunities to local jobs, thereby encouraging a more efficient transportation situation. Less reliance on the automobile results in lower levels of air and water pollution. Lane County’s Rural Comprehensive Plan findings and related policies also support this goal.
Goal 7 – Areas Subject to Natural Disasters and Hazards: Requires plans and policies that protect the public from natural disasters such as landslides, earthquakes and related hazards, tsunamis, coastal erosion, and wildfires.
Findings and Conclusions Ordinance No. PA 1356 Exhibit “C”
Page 6 of 7
Exhibit C of Ordinance No. PA 1356
The City of Coburg is located on flat ground surrounded by agricultural lands. The only applicable potential for natural disaster comes from flooding and this factor has been considered in weighing the inclusion of the different study areas into the expanded urban growth boundary. In addition, the City has land use regulations regarding development in the floodplain that have been acknowledged by LCDC. For these reasons, the changes to the Coburg Comprehensive Plan are consistent with this goal.
Goal 8 - Recreational Needs: To satisfy the recreational needs of the citizens of the state and visitors and, where appropriate, to provide for the siting of necessary recreational facilities including destination resorts.
The Urbanization Study Update did not identify an additional need for recreational land and therefore the proposed expansion of the urban growth boundary does not include land for this purpose. However, the updated TSP identifies the Coburg Loop Plan as a transportation facility designed to serve transportation and recreational purposes.
Goal 9 – Economic Development: Requires the provision of adequate opportunities for a variety of economic activities vital to public health, welfare and prosperity.
The changes to the Coburg Comprehensive Plan are consistent with this goal by recognizing a regional need for large–scale, light industrial land and by expanding the urban growth boundary to help satisfy a portion of this need. The adopting ordinance contains a provision that will ensure that the lot sizes in the newly included area will remain large enough to serve the identified regional need.
Goal 10- Housing: requires provision for the housing needs of citizens of the state. This proposal is not proposing any changes residential land. The need for residential land will be addressed in a future application.
Goal 11 - Public Facilities and Services: to plan and develop a timely, orderly and efficient arrangement of public facilities and services to serve as a framework for urban and rural development.
The proposal is consistent with Statewide Planning Goal 11 because the Urbanization Study Update specifically considered serviceability in determining which study areas were most appropriate to bring into the current urban growth boundary. Consistent with this goal and public sentiment, the proposed expansion of the urban growth boundary attempts to preserve a compact urban growth form, minimizing the expensive extension of urban services.
Goal 12 - Transportation: To provide and encourage a safe, convenient and economic transportation system.
The changes to the Coburg Comprehensive Plan are consistent with this goal and the Coburg Interchange Management Plan, by allowing additional frontage on Van Duyn Road. The additional frontage on Van Duyn Road within the UGB will allow a planned frontage road to be constructed to serve the properties along the eastern side of I-5, creating a safer intersection. The existing access location is expected to contribute to congestion.
Goal 13 - Energy: To conserve energy.
Findings and Conclusions Ordinance No. PA 1356 Exhibit “C”
Page 7 of 7
Exhibit C of Ordinance No. PA 1356
The changes to the Coburg Comprehensive Plan are consistent with this goal in that the proposed expansion of the urban growth boundary maintains the city’s compact urban growth form.
Goal 14 - Urbanization: To provide for an orderly and efficient transition from rural to urban land use.
The changes to the Coburg Comprehensive Plan are consistent with this goal as they implement a very thorough update to the Coburg Urbanization Study that updates the city’s buildable lands inventory and housing needs analysis and applies Goal 14, OAR Chapter 660, Division 24, and ORS 197.298. A more complete analysis follows under the City’s Goal 14 analysis. Conclusion
Based on the findings in the City of Coburg Ordinance A-199-G and these additional County findings and conclusions adopted in support of Ordinance No. PA 1356, the Board concludes approval of the proposed amendments complies with applicable statutes, Statewide Planning Goals, administrative rules, local plans, and local regulations.
Page 1
BEFORE THE LAND USE BOARD OF APPEALS 1
OF THE STATE OF OREGON 23
LAND WATCH OF LANE COUNTY 4 and LEE D. KERSTEN, 5
Petitioners, 6 7
vs. 89
LANE COUNTY and CITY OF COBURG, 10 Respondents. 11
12 and 13
14 INTERSTATE PROPERTIES, INC., 15
Intervenor-Respondent. 16 17
LUBA Nos. 2016-003/004 18 19
FINAL OPINION 20 AND ORDER 21
22 Appeal from Lane County and City of Coburg. 23
24 William K. Kabeiseman, Portland, filed the petition for review and 25 argued on behalf of petitioners. With him on the brief was Garvey Schubert 26 Barer. 27
28 H. Andrew Clark, County Counsel, Eugene, filed a joint response brief 29
and argued on behalf of respondent Lane County. 30 31
Milo R. Mecham, of Coburg. 32 33
Dan Terrell, Eugene, filed a response brief and argued on behalf of 34 intervenor-respondent. With him on the brief was the Law Office of Bill Kloos 35 PC. 36
37 HOLSTUN, Board Chair; BASSHAM, Board Member; RYAN, Board 38
BCC Packet for 5/1/2018Coburg UGB Expansion/RemandAttachment 2
Page 2
Member, participated in the decision. 1 2 REMANDED 08/01/2016 3 4 You are entitled to judicial review of this Order. Judicial review is 5 governed by the provisions of ORS 197.850. 6
Page 3
Opinion by Holstun 1
NATURE OF THE DECISION 2
Petitioners appeal two county ordinances that amend a county rural 3
comprehensive plan and co-adopt city comprehensive plan amendments to the 4
city’s transportation system plan and urban growth boundary. 5
MOTION TO FILE OVER-LENGTH BRIEF; MOTION TO STRIKE 6
Respondents Lane County and City of Coburg (county and city, 7
collectively respondents) filed a motion for an over-length response brief. 8
Petitioners Land Watch of Lane County and Lee Kersten (petitioners) filed a 9
motion to strike and a response to the motion. Because we have two 10
consolidated appeals, complex decisions and issues, and a large number of 11
parties, we consider all the parties’ filings, and petitioners’ motion to strike the 12
over-length response brief is denied. 13
FACTS 14
Respondents have an intergovernmental agreement regarding 15
coordinated planning and urban services pursuant to ORS 190.003 et seq. To 16
address projected population growth in the area, the county and city initiated an 17
urban growth boundary (UGB) expansion by passing ordinances to amend the 18
city’s UGB and revise the city’s transportation system plan (TSP) for the area, 19
based in part on the expanded UGB. The county ordinances that are before us 20
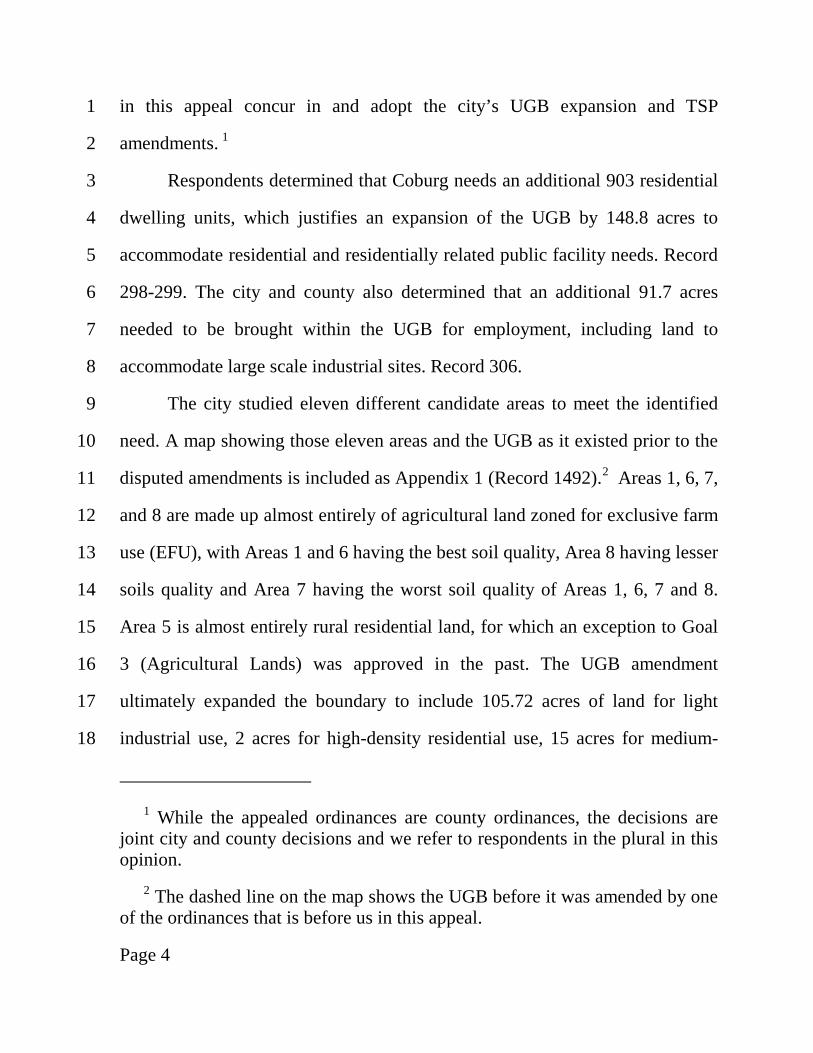
Page 4
in this appeal concur in and adopt the city’s UGB expansion and TSP 1
amendments. 1 2
Respondents determined that Coburg needs an additional 903 residential 3
dwelling units, which justifies an expansion of the UGB by 148.8 acres to 4
accommodate residential and residentially related public facility needs. Record 5
298-299. The city and county also determined that an additional 91.7 acres 6
needed to be brought within the UGB for employment, including land to 7
accommodate large scale industrial sites. Record 306. 8
The city studied eleven different candidate areas to meet the identified 9
need. A map showing those eleven areas and the UGB as it existed prior to the 10
disputed amendments is included as Appendix 1 (Record 1492).2 Areas 1, 6, 7, 11
and 8 are made up almost entirely of agricultural land zoned for exclusive farm 12
use (EFU), with Areas 1 and 6 having the best soil quality, Area 8 having lesser 13
soils quality and Area 7 having the worst soil quality of Areas 1, 6, 7 and 8. 14
Area 5 is almost entirely rural residential land, for which an exception to Goal 15
3 (Agricultural Lands) was approved in the past. The UGB amendment 16
ultimately expanded the boundary to include 105.72 acres of land for light 17
industrial use, 2 acres for high-density residential use, 15 acres for medium-18
1 While the appealed ordinances are county ordinances, the decisions are
joint city and county decisions and we refer to respondents in the plural in this opinion.
2 The dashed line on the map shows the UGB before it was amended by one of the ordinances that is before us in this appeal.
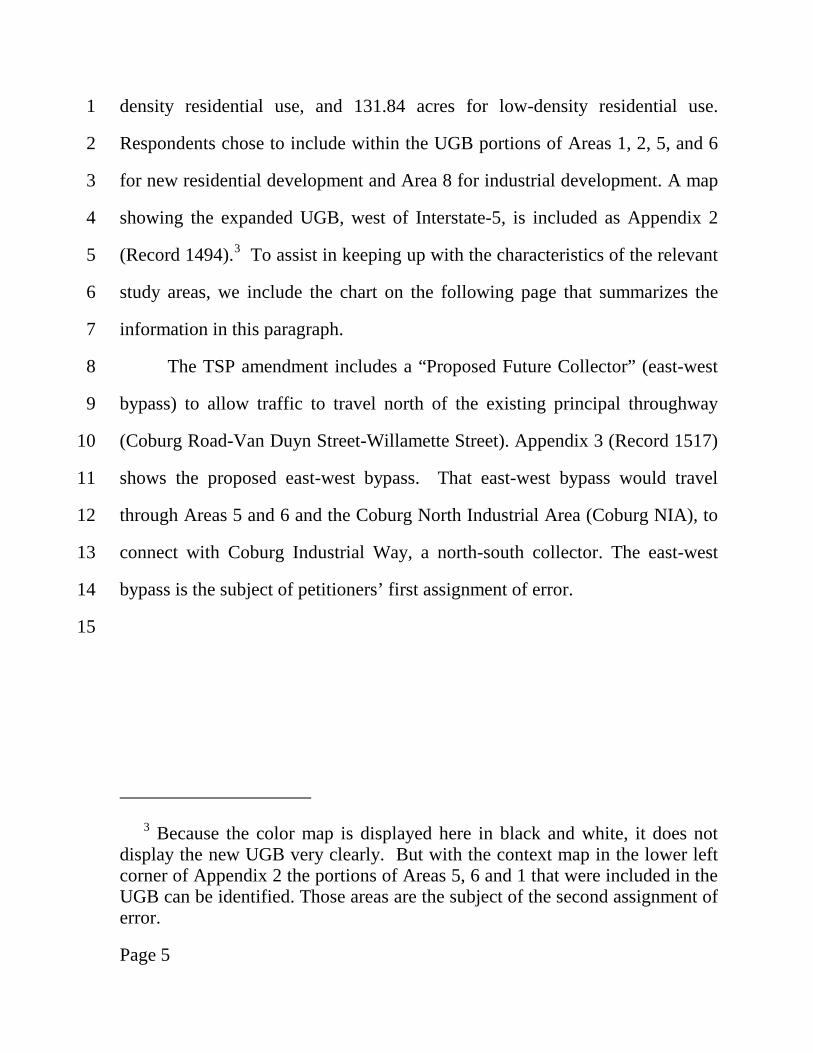
Page 5
density residential use, and 131.84 acres for low-density residential use. 1
Respondents chose to include within the UGB portions of Areas 1, 2, 5, and 6 2
for new residential development and Area 8 for industrial development. A map 3
showing the expanded UGB, west of Interstate-5, is included as Appendix 2 4
(Record 1494).3 To assist in keeping up with the characteristics of the relevant 5
study areas, we include the chart on the following page that summarizes the 6
information in this paragraph. 7
The TSP amendment includes a “Proposed Future Collector” (east-west 8
bypass) to allow traffic to travel north of the existing principal throughway 9
(Coburg Road-Van Duyn Street-Willamette Street). Appendix 3 (Record 1517) 10
shows the proposed east-west bypass. That east-west bypass would travel 11
through Areas 5 and 6 and the Coburg North Industrial Area (Coburg NIA), to 12
connect with Coburg Industrial Way, a north-south collector. The east-west 13
bypass is the subject of petitioners’ first assignment of error. 14
15
3 Because the color map is displayed here in black and white, it does not
display the new UGB very clearly. But with the context map in the lower left corner of Appendix 2 the portions of Areas 5, 6 and 1 that were included in the UGB can be identified. Those areas are the subject of the second assignment of error.
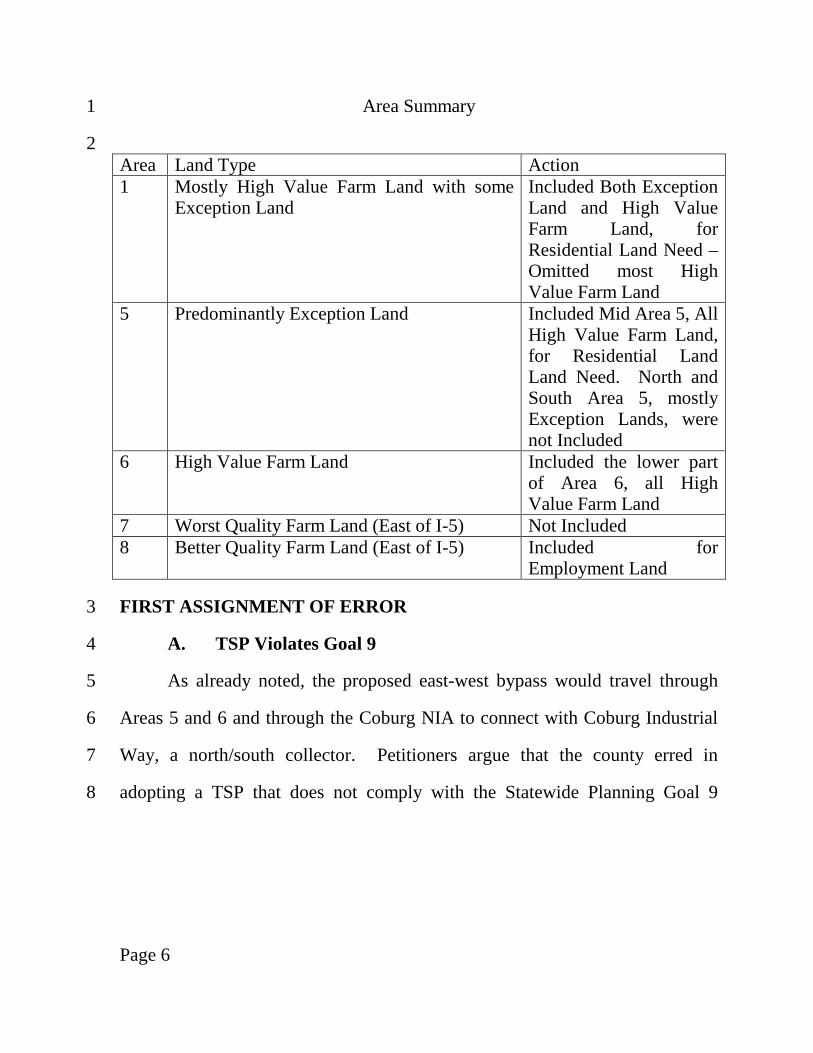
Page 6
Area Summary 1
2 Area Land Type Action 1 Mostly High Value Farm Land with some
Exception Land Included Both Exception Land and High Value Farm Land, for Residential Land Need – Omitted most High Value Farm Land
5 Predominantly Exception Land Included Mid Area 5, All High Value Farm Land, for Residential Land Land Need. North and South Area 5, mostly Exception Lands, were not Included
6 High Value Farm Land Included the lower part of Area 6, all High Value Farm Land
7 Worst Quality Farm Land (East of I-5) Not Included 8 Better Quality Farm Land (East of I-5) Included for
Employment Land
FIRST ASSIGNMENT OF ERROR 3
A. TSP Violates Goal 9 4
As already noted, the proposed east-west bypass would travel through 5
Areas 5 and 6 and through the Coburg NIA to connect with Coburg Industrial 6
Way, a north/south collector. Petitioners argue that the county erred in 7
adopting a TSP that does not comply with the Statewide Planning Goal 9 8

Page 7
(Economic Development) and is not supported by an adequate factual basis.4 1
Under this subassignment of error, petitioners advance two arguments. First, 2
citing Opus Development Corp v. City of Eugene, 28 Or LUBA 670, 691 3
(1995), petitioners contend that developing the east-west bypass will reduce the 4
amount of land now available for commercial and industrial uses in the Coburg 5
NIA, and the county’s decision fails to account for this loss or demonstrate that 6
there will remain a sufficient inventory of land for commercial and industrial 7
uses, as it is required to do under directive 3 of Goal 9.5 Id. Second, 8
petitioners assert that the TSP does not comply with directive 4 of Goal 9, 9
which requires that local governments “[l]imit uses on or near sites zoned for 10
4 Goal 2 requires that amendments to a comprehensive plan are supported by
a factual basis demonstrating compliance with applicable statewide planning goals. Goal 2 Guideline C.1.
5 Goal 9 provides that “[c]omprehensive plans for urban areas shall:
“1. Include an analysis of the community’s economic patterns, potentialities, strengths, and deficiencies as they relate to state and national trends;
“2. Contain policies concerning the economic development opportunities in the community;
“3. Provide for at least an adequate supply of sites of suitable sizes, types, locations, and service levels for a variety of industrial and commercial uses consistent with plan policies;
“4. Limit uses on or near sites zoned for specific industrial and commercial uses to those which are compatible with proposed uses.”
Page 8
specific industrial and commercial uses to those which are compatible with 1
proposed uses.” We turn to petitioners’ second argument first. 2
Petitioners argue that the proposed east-west bypass would cut directly 3
through the NIA and significantly interfere with the NIA’s ability to continue 4
to provide regional employment opportunities. Petitioners cite to the testimony 5
of Steve Lee to the board of commissioners, which alleged that the east-west 6
bypass would severely damage the ability of current NIA industrial users to 7
continue operations. Petitioners’ Appendix C 1-3. That testimony is further 8
supported by Kelly Sandow, a civil engineer who explained how the bypass 9
might damage industrial operations by rendering loading docks unusable and 10
impairing the use of a parking lot at two existing buildings. Record 851-856. 11
Petitioners note that the TSP findings do not address the east-west bypass 12
road’s impact on the NIA and the city’s Economic Opportunity Analysis did 13
not account for any loss of employment land capacity due to the east-west 14
bypass road’s impact. Petitioners assert that the city must explain how the NIA 15
will be able to retain existing jobs if it is disrupted by the new east-west 16
bypass.6 17
6 Pursuant to OAR 660-012-0025(1), the TSP “constitute[s] the land use
decision regarding the need for transportation facilities, services and major improvements and their function, mode, and general location.”
Page 9
Respondents offer a number of responses to petitioners’ arguments, but 1
cite only one relevant finding, which does not address the alleged impacts of 2
the proposed east-west bypass on the NIA.7 3
It is certainly possible that the east-west bypass envisioned by the TSP 4
amendment might negatively impact the loading docks and parking associated 5
with the two buildings the east-west bypass would pass between, if that 6
roadway is actually constructed in the location shown in the amended TSP.8 7
But the fourth paragraph of Goal 9 does not operate in the broad way that 8
petitioners argue. The “specific industrial and commercial uses” that the fourth 9
paragraph of Goal 9 refers to are limited to “specific commercial or industrial 10
uses with special site requirements.” Opus Development, 28 Or LUBA at 693. 11
We explained in Opus Development, 28 Or LUBA at 692, that OAR 660-009-12
7 The TSP Amendment’s brief finding on Goal 9 provides:
“The Coburg TSP is consistent with this goal because it reinforces the City’s freight network with transportation projects that will provide access to freight facilities and employment sites. Adopting the TSP will ensure that transportation improvements will be available to support the planned uses in the City’s employment areas, consistent with other local economic development goals that are consistent with Goal 9.” Record 790.
8 Respondents contend the TSP only displays the general location for the east-west bypass, and that when the specific location for the east-west collector is selected, appropriate measures can be imposed at that time to mitigate any impacts there might be to existing businesses in the Coburg NIA.
Page 10
0025 is relevant context for interpreting the goal, as it implements the fourth 1
paragraph of Goal 9. OAR 660-009-0025(8) explains what is required: 2
“Uses with Special Siting Characteristics. Cities and counties that 3 adopt objectives or policies providing for uses with special site 4 needs must adopt policies and land use regulations providing for 5 those special site needs. Special site needs include, but are not 6 limited to large acreage sites, special site configurations, direct 7 access to transportation facilities, prime industrial lands, 8 sensitivity to adjacent land uses, or coastal shoreland sites 9 designated as suited for water-dependent use under Goal 17. 10 Policies and land use regulations for these uses must: 11
“(a) Identify sites suitable for the proposed use; 12
“(b) Protect sites suitable for the proposed use by limiting land 13 divisions and permissible uses and activities that interfere 14 with development of the site for the intended use; and 15
“(c) Where necessary, protect a site for the intended use by 16 including measures that either prevent or appropriately 17 restrict incompatible uses on adjacent and nearby lands.”9 18
9 In 1995, this text was located at OAR 660-009-0025(4), but is now at
OAR 660-009-0025(8). The applicable version in 1995 quoted below had similar wording and any difference does not alter the analysis in Opus Development:
“Jurisdictions which adopt objectives or policies to provide for specific uses with special site requirements shall adopt policies and land use regulations to provide for the needs of those uses. * * * Plans and land use regulations for these uses shall:
“(a) Identify sites suitable for the proposed use;
“(b) Protect sites suitable for the proposed use by limiting land divisions and permissible uses and activities to those which
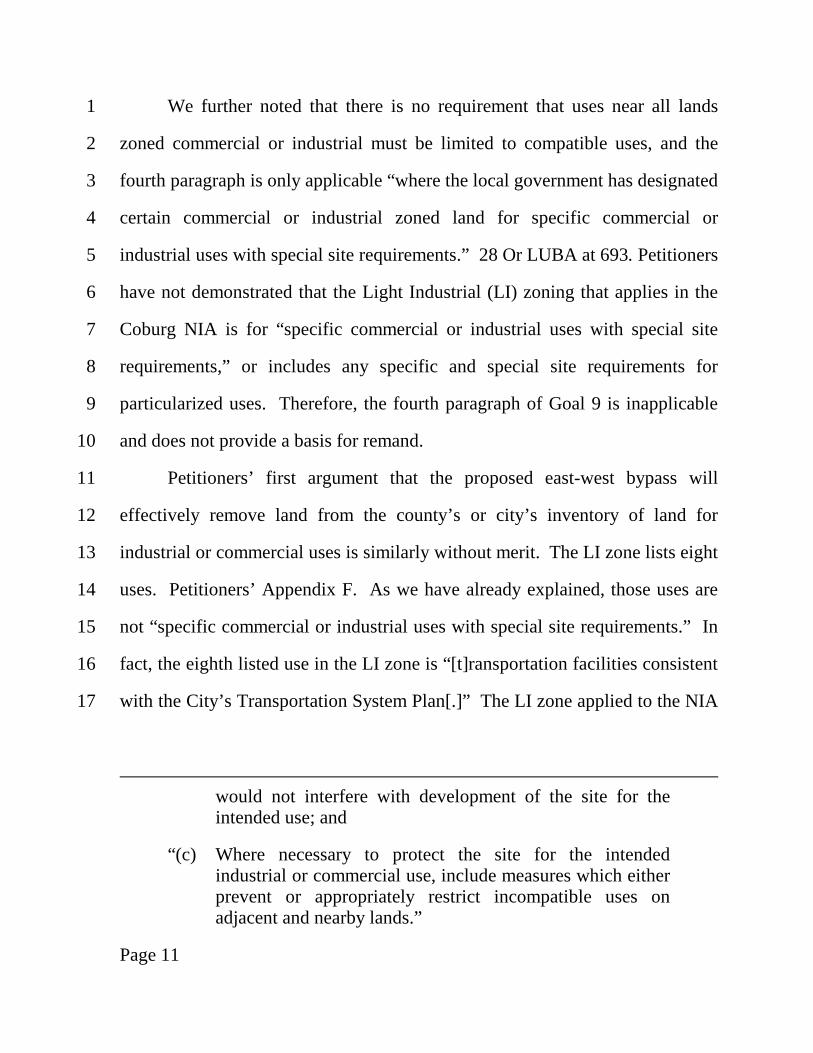
Page 11
We further noted that there is no requirement that uses near all lands 1
zoned commercial or industrial must be limited to compatible uses, and the 2
fourth paragraph is only applicable “where the local government has designated 3
certain commercial or industrial zoned land for specific commercial or 4
industrial uses with special site requirements.” 28 Or LUBA at 693. Petitioners 5
have not demonstrated that the Light Industrial (LI) zoning that applies in the 6
Coburg NIA is for “specific commercial or industrial uses with special site 7
requirements,” or includes any specific and special site requirements for 8
particularized uses. Therefore, the fourth paragraph of Goal 9 is inapplicable 9
and does not provide a basis for remand. 10
Petitioners’ first argument that the proposed east-west bypass will 11
effectively remove land from the county’s or city’s inventory of land for 12
industrial or commercial uses is similarly without merit. The LI zone lists eight 13
uses. Petitioners’ Appendix F. As we have already explained, those uses are 14
not “specific commercial or industrial uses with special site requirements.” In 15
fact, the eighth listed use in the LI zone is “[t]ransportation facilities consistent 16
with the City’s Transportation System Plan[.]” The LI zone applied to the NIA 17
would not interfere with development of the site for the intended use; and
“(c) Where necessary to protect the site for the intended industrial or commercial use, include measures which either prevent or appropriately restrict incompatible uses on adjacent and nearby lands.”
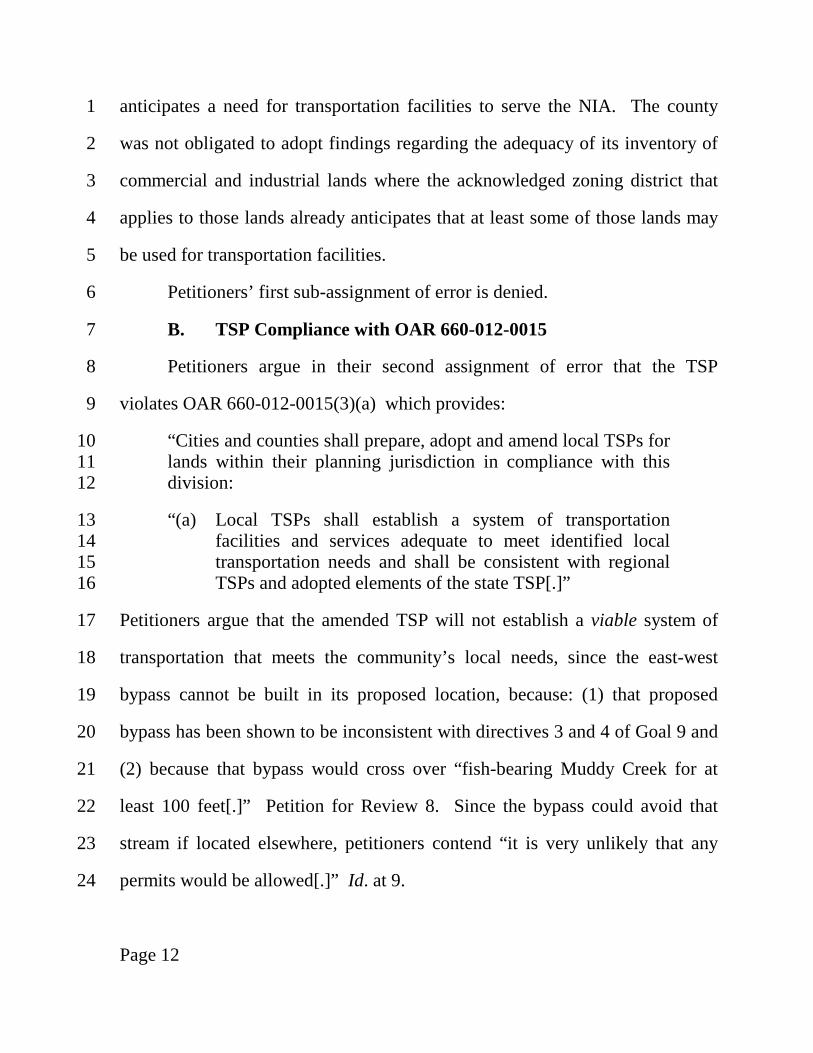
Page 12
anticipates a need for transportation facilities to serve the NIA. The county 1
was not obligated to adopt findings regarding the adequacy of its inventory of 2
commercial and industrial lands where the acknowledged zoning district that 3
applies to those lands already anticipates that at least some of those lands may 4
be used for transportation facilities. 5
Petitioners’ first sub-assignment of error is denied. 6
B. TSP Compliance with OAR 660-012-0015 7
Petitioners argue in their second assignment of error that the TSP 8
violates OAR 660-012-0015(3)(a) which provides: 9
“Cities and counties shall prepare, adopt and amend local TSPs for 10 lands within their planning jurisdiction in compliance with this 11 division: 12
“(a) Local TSPs shall establish a system of transportation 13 facilities and services adequate to meet identified local 14 transportation needs and shall be consistent with regional 15 TSPs and adopted elements of the state TSP[.]” 16
Petitioners argue that the amended TSP will not establish a viable system of 17
transportation that meets the community’s local needs, since the east-west 18
bypass cannot be built in its proposed location, because: (1) that proposed 19
bypass has been shown to be inconsistent with directives 3 and 4 of Goal 9 and 20
(2) because that bypass would cross over “fish-bearing Muddy Creek for at 21
least 100 feet[.]” Petition for Review 8. Since the bypass could avoid that 22
stream if located elsewhere, petitioners contend “it is very unlikely that any 23
permits would be allowed[.]” Id. at 9. 24

Page 13
Respondents reiterate their position that the east-west bypass complies 1
with all applicable transportation rules, and that the connector is not a new 2
addition to the Coburg TSP. Respondents assert that the general location has 3
not changed from the previously acknowledged TSP. In addition, respondents 4
argue that the fish-bearing stream petitioners identify, although in the vicinity 5
of Coburg, is not located within the area proposed for the bypass. 6
We turn first to respondents’ contention that the east-west bypass 7
location is unchanged from the prior TSP. If that were true, we would deny 8
this subassignment of error because the amended TSP could not be remanded 9
for re-adopting a general location for the east-west bypass that was previously 10
adopted. Respondents asked that we take official notice of a map from the 1999 11
TSP, and we do so. Comparing that map with the map from the amended TSP 12
that is attached to this opinion as Appendix 3, it is simply not accurate to say 13
that what we are referring to as the east-west bypass is depicted at the same 14
location on the two maps. 15
Turning to petitioners’ arguments, it requires a creative reading of OAR 16
660-012-0015(3)(a) to find the “demonstration of viability” requirement that 17
petitioners read into the rule. Even if there is such a requirement, we reject 18
petitioners’ suggestion that OAR 660-012-0015(3)(a) requires, at the time a 19
transportation facility is identified as needed in the TSP, that a local 20
government establish that such facilities are “viable,” in the sense that all 21
necessary siting permits will be issued in the future if that facility is sited in the 22
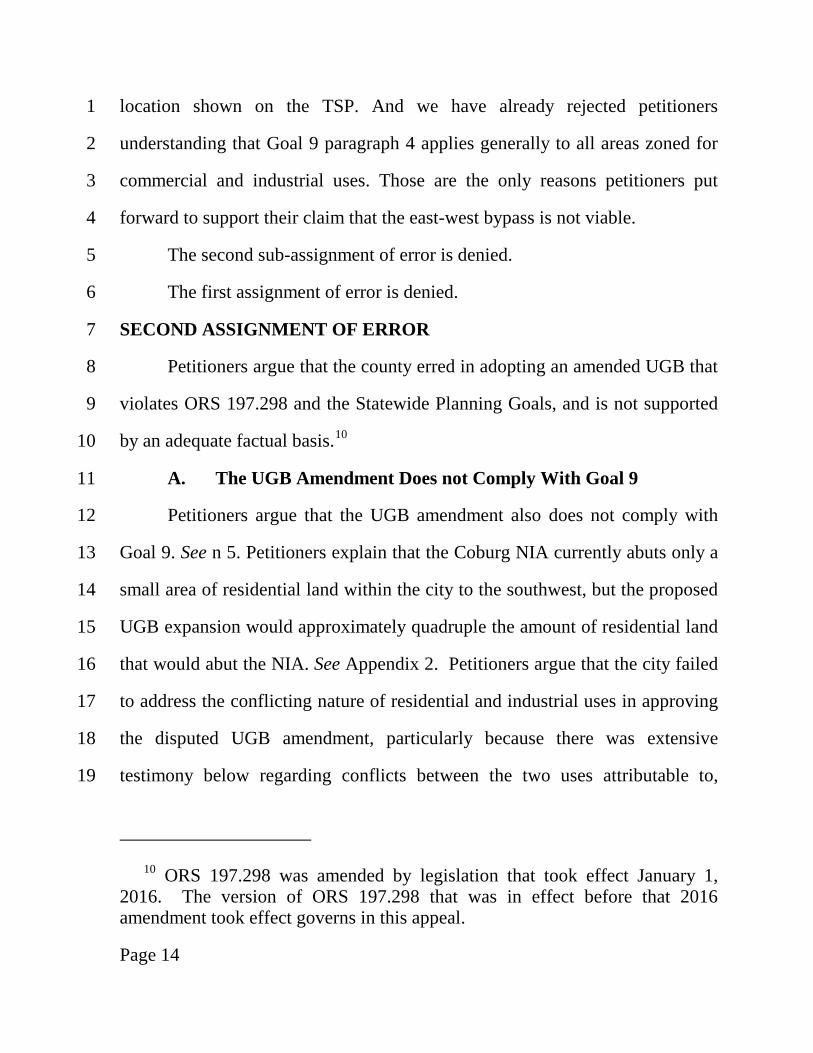
Page 14
location shown on the TSP. And we have already rejected petitioners 1
understanding that Goal 9 paragraph 4 applies generally to all areas zoned for 2
commercial and industrial uses. Those are the only reasons petitioners put 3
forward to support their claim that the east-west bypass is not viable. 4
The second sub-assignment of error is denied. 5
The first assignment of error is denied. 6
SECOND ASSIGNMENT OF ERROR 7
Petitioners argue that the county erred in adopting an amended UGB that 8
violates ORS 197.298 and the Statewide Planning Goals, and is not supported 9
by an adequate factual basis.10 10
A. The UGB Amendment Does not Comply With Goal 9 11
Petitioners argue that the UGB amendment also does not comply with 12
Goal 9. See n 5. Petitioners explain that the Coburg NIA currently abuts only a 13
small area of residential land within the city to the southwest, but the proposed 14
UGB expansion would approximately quadruple the amount of residential land 15
that would abut the NIA. See Appendix 2. Petitioners argue that the city failed 16
to address the conflicting nature of residential and industrial uses in approving 17
the disputed UGB amendment, particularly because there was extensive 18
testimony below regarding conflicts between the two uses attributable to, 19
10 ORS 197.298 was amended by legislation that took effect January 1,
2016. The version of ORS 197.298 that was in effect before that 2016 amendment took effect governs in this appeal.

Page 15
among other things, noise and smell from industrial operations. Petitioner also 1
cites to the Coburg zoning code setback provision for industrial sites abutting 2
residential districts, arguing that the new residential zone will result in 3
“existing, protected Goal 9 resources [having] to change to accommodate the 4
new residential development” due to the future imposition of a 25-foot setback 5
from residential parcels. Petition for Review 12. 6
Respondents consider petitioners’ argument to be that new residential 7
development would require the NIA to modify its operations and accommodate 8
residential development, resulting in a failure of a Goal 9 resource. 9
Respondents argue that the portion of the NIA that is adjacent to the UGB 10
residential expansion is already built out and “no growth is possible within the 11
area of alleged concern.” That appears to be the case. See Appendix 2. 12
In any event, based on our disposition of the first assignment of error, we 13
disagree with petitioners that paragraph 4 of Goal 9 applies to protect the 14
Coburg NIA in the manner petitioner argues. 15
This subassignment of error is denied. 16
B. The UGB Amendment Is Inconsistent With The ORS 197.298 17 Priority Scheme 18
As we explain in more detail below, ORS 197.298 establishes priorities 19
for the types of lands that may be included in the UGB. Under the priority 20
scheme, exception lands must generally be included in the UGB before 21
agricultural lands. Exception lands are lands outside the existing UGB, for 22
which a committed exception to Goal 3 has been approved, to permit those 23

Page 16
lands to be put to uses other than those allowed in exclusive farm use (EFU) 1
zones. Frequently, and in the present case, exception lands have been put to 2
low density rural residential uses. In addition, under the ORS 197.298 priority 3
scheme, where the local government must choose between agricultural lands, it 4
must generally include agricultural lands with worse productivity soils over 5
agricultural lands with soils of better productivity soils. 6
By selecting the alternative that they did, the city and county rejected 7
parts of Area 5 with higher priority exception land: North Area 5 (77 acres of 8
exception lands) and South Area 5 (20 acres of exception lands located south 9
of Coburg Road), in favor of high value agricultural land. Compare 10
Appendices 1 and 2.11 In selecting lands for the identified commercial and 11
industrial development (employment lands) needs, the city and county chose to 12
include Area 8. 13
Below, we first discuss how the ORS 197.298 priority scheme is 14
supposed to work, in conjunction with the Goal 14 (Urbanization). We then 15
turn to petitioners’ challenges to the findings the city and county adopted to 16
support their decision to include agricultural lands in Areas 1 and 6 instead of 17
11 Appendix 2 shows the middle portion of Area 5 that was included. The
roughly triangular southern portion of Area 5 below Coburg Road (which is Van Duyn extended west) was not included in the UGB.
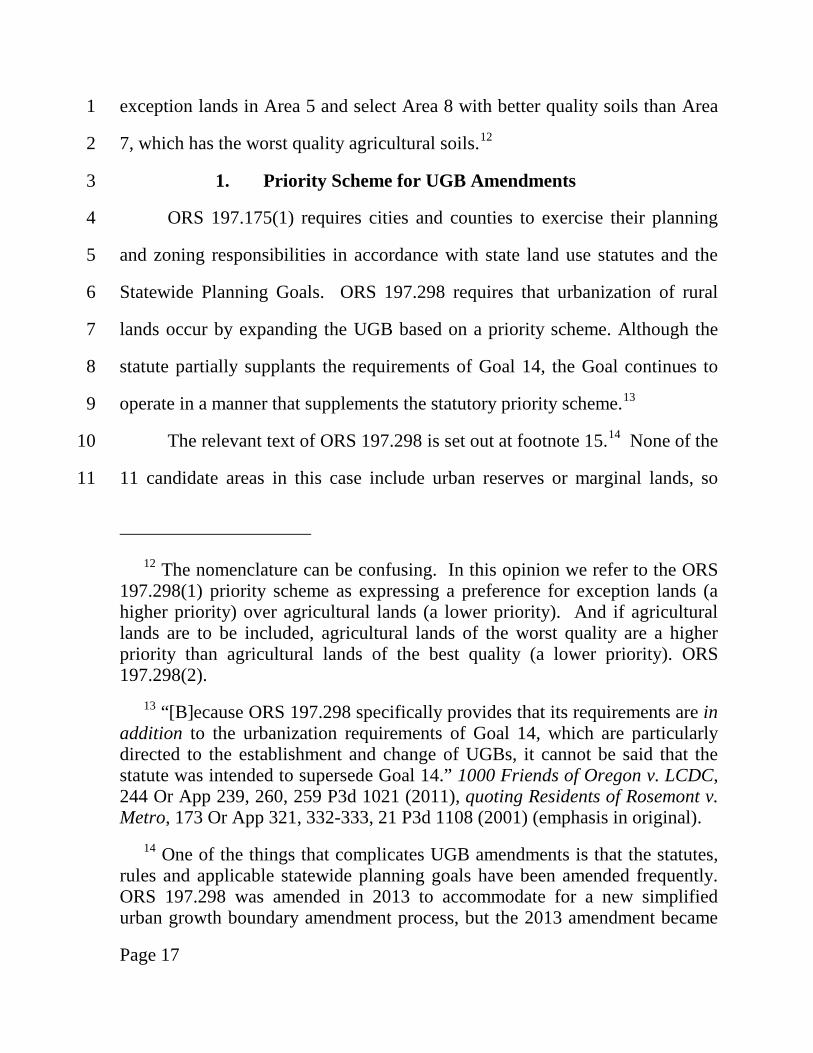
Page 17
exception lands in Area 5 and select Area 8 with better quality soils than Area 1
7, which has the worst quality agricultural soils.12 2
1. Priority Scheme for UGB Amendments 3
ORS 197.175(1) requires cities and counties to exercise their planning 4
and zoning responsibilities in accordance with state land use statutes and the 5
Statewide Planning Goals. ORS 197.298 requires that urbanization of rural 6
lands occur by expanding the UGB based on a priority scheme. Although the 7
statute partially supplants the requirements of Goal 14, the Goal continues to 8
operate in a manner that supplements the statutory priority scheme.13 9
The relevant text of ORS 197.298 is set out at footnote 15.14 None of the 10
11 candidate areas in this case include urban reserves or marginal lands, so 11
12 The nomenclature can be confusing. In this opinion we refer to the ORS
197.298(1) priority scheme as expressing a preference for exception lands (a higher priority) over agricultural lands (a lower priority). And if agricultural lands are to be included, agricultural lands of the worst quality are a higher priority than agricultural lands of the best quality (a lower priority). ORS 197.298(2).
13 “[B]ecause ORS 197.298 specifically provides that its requirements are in addition to the urbanization requirements of Goal 14, which are particularly directed to the establishment and change of UGBs, it cannot be said that the statute was intended to supersede Goal 14.” 1000 Friends of Oregon v. LCDC, 244 Or App 239, 260, 259 P3d 1021 (2011), quoting Residents of Rosemont v. Metro, 173 Or App 321, 332-333, 21 P3d 1108 (2001) (emphasis in original).
14 One of the things that complicates UGB amendments is that the statutes, rules and applicable statewide planning goals have been amended frequently. ORS 197.298 was amended in 2013 to accommodate for a new simplified urban growth boundary amendment process, but the 2013 amendment became
Page 18
relevant priorities are set out in ORS 197.298(1)(b) and (d), exception lands 1
have priority over agricultural lands, and lower quality agricultural lands have 2
priority over better quality agricultural lands.15 Under ORS 197.298(3), lower 3
effective on January 1, 2016, and is irrelevant to these proceedings. All references are to the version of ORS 197.298 that existed prior to 2013.
15 Prior to amendments that took effect on January 1, 2016, ORS 197.298 provided:
“(1) In addition to any requirements established by rule addressing urbanization, land may not be included within an urban growth boundary except under the following priorities:
“(a) First priority is land that is designated urban reserve land under ORS 195.145, rule or metropolitan service district action plan.
“(b) If land under paragraph (a) of this subsection is inadequate to accommodate the amount of land needed, second priority is land adjacent to an urban growth boundary that is identified in an acknowledged comprehensive plan as an exception area or nonresource land. Second priority may include resource land that is completely surrounded by exception areas unless such resource land is high-value farmland as described in ORS 215.710.
“(c) If land under paragraphs (a) and (b) of this subsection is inadequate to accommodate the amount of land needed, third priority is land designated as marginal land pursuant to ORS 197.247 (1991 Edition).
“(d) If land under paragraphs (a) to (c) of this subsection is inadequate to accommodate the amount of land needed, fourth priority is land designated in an
Page 19
priority land can be included in the UGB instead of higher priority land, where 1
the higher priority land “is found to be inadequate to accommodate the amount 2
of land” needed based on any of three reasons. See n 14. Those three reasons 3
are: (1) “specific types of identified land needs cannot be reasonably 4
accommodated on higher priority lands,” (2) “[f]uture urban services could not 5
reasonably be provided to higher priority land due to topographical or other 6
physical constraints,” or (3) “[m]aximum efficiencies of land uses within a 7
acknowledged comprehensive plan for agriculture or forestry, or both.
“(2) Higher priority shall be given to land of lower capability as measured by the capability classification system or by cubic foot site class, whichever is appropriate for the current use.
“(3) Land of lower priority under subsection (1) of this section may be included in an urban growth boundary if land of higher priority is found to be inadequate to accommodate the amount of land estimated in subsection (1) of this section for one or more of the following reasons:
“(a) Specific types of identified land needs cannot be reasonably accommodated on higher priority lands;
“(b) Future urban services could not reasonably be provided to the higher priority lands due to topographical or other physical constraints; or
“(c) Maximum efficiency of land uses within a proposed urban growth boundary requires inclusion of lower priority lands in order to include or to provide services to higher priority lands.” (Emphases added.)
Page 20
proposed [UGB] requires inclusion of lower priority land in order to include or 1
provide services to higher priority land.” 2
Because Goal 14 also plays a role in amending UGBs, and because there 3
is some tension or potential inconsistency between the Goal 14 Boundary 4
Location Factors and the ORS 197.298 priority scheme, in 1000 Friends of 5
Oregon v. LCDC, 244 Or App 239, 259 P3d 1021 (2011) (McMinnville), the 6
Court of Appeals went through a lengthy analysis of the interaction between 7
ORS 197.298 and Goal 14. In McMinnville, the Court of Appeals explained 8
that under ORS 197.298 and Goal 14, UGB amendments require a three-step 9
process. We summarize those three steps below, before turning to petitioners’ 10
challenges to respondents’ findings. 11
Under Step One, Goal 14 “Land Need” factors 1 and 2 are applied to 12
determine the amount of land needed: 13
“Establishment and change of urban growth boundaries shall be 14 based on the following: 15
“(1) Demonstrated need to accommodate long range urban 16 population, consistent with 20-year population forecast 17 coordinated with affected local governments; and 18
“(2) Demonstrated need for housing, employment opportunities, 19 livability or uses such as public facilities, streets and roads, 20 schools, parks or open space, or any combination of the 21 need categories in this subsection (2). In determining need, 22 local government may specify characteristics, such as parcel 23 size, topography or proximity, necessary for land to be 24 suitable for an identified need. Prior to expanding an urban 25 growth boundary, local governments shall demonstrate that 26

Page 21
needs cannot reasonably be accommodated on land already 1 inside the urban growth boundary.”16 2
The Court of Appeals explained that “Factors 1 and 2 necessarily require[] 3
differentiation of land use types according to their land consumption 4
attributes.” 244 Or App at 256. For example, high density residential land 5
uses consume less land per living unit than low density residential land uses. 6
After the amount of land needed is determined, Step Two requires a 7
determination whether higher priority candidate lands are adequate under ORS 8
197.298. Only if higher priority lands are “inadequate,” may lower priority 9
candidate lands be included in the UGB to meet identified land needs.17 The 10
adequacy inquiry under Step Two has both a straightforward quantitative part 11
(whether there are enough acres of the higher priority land to meet the 12
16 Goal 14 was amended in 2005 and 2006, and in McMinnville the Court of
Appeals was concerned with the pre-2005 version of Goal 14. 244 Or App at 243. The 2005 and 2006 amendments merely rearranged the substantive provisions for clarification, with some minor wording changes. No party argues the minor changes in wording are significant in this case, and for purposes of this opinion we assume that they are not. The Goal 14 Factors 1 and 2 in McMinnville are now Goal 14 Land Need Factors 1 and 2 quoted above. The Goal 14 Factors 3, 4, 5 and 7 discussed in McMinnville are now Goal 14 Boundary Location Factors 1, 2, 3 and 4 respectively. The Goal 14 Factor 6 identified in McMinnville has been eliminated in the current version of Goal 14. It is similar in substance to ORS 197.298(2). See n 15. All citations to Goal 14 Factors in this opinion are to the current Goal 14 Land Need and Boundary Location Factors.
17 ORS 197.298(1)(b), (c) and (d) all require a finding that higher priority lands in the previous subsections of ORS 197.298(1) are “inadequate.” See n 15.

Page 22
identified need) and a much less straightforward qualitative part. The 1
qualitative part of the inquiry is attributable first to ORS 197.298(3), which 2
allows including lower priority agricultural land in the UGB, instead of higher 3
priority exception land, if any of the ORS 197.298(3)(a)-(c) reasons make that 4
higher priority land “inadequate to accommodate the amount of land” needed. 5
Candidate lands that are not buildable may also be excluded as not adequate. 6
244 Or App at 262. 7
In addition to the ORS 197.298(3) reasons, Goal 14 “Boundary 8
Location” factors potentially may be applied in Step 2 to determine that higher 9
priority candidate land is “inadequate.” The Goal 14 “Boundary Location 10
Factors are set out below: 11
“The location of the urban growth boundary and changes to the 12 boundary shall be determined by evaluating alternative boundary 13 locations consistent with ORS 197.298 and with consideration of 14 the following factors: 15
“(1) Efficient accommodation of identified land needs [old 16 Factor 3]; 17
“(2) Orderly and economic provision of public facilities and 18 services [old Factor 4]; 19
“(3) Comparative environmental, energy, economic and social 20 consequences [old Factor 5]; and 21
“(4) Compatibility of the proposed urban uses with nearby 22 agricultural and forest activities occurring on farm and 23 forest land outside the UGB [old Factor 7].” 24
However, the Court of Appeals concluded in McMinnville that because Goal 14 25
Boundary Location Factors 1 and 2 have more specific and limited counterparts 26
Page 23
in ORS 197.298(3)(b) and (c), see n 15, the ORS 197.298(3)(b) and (c) bases 1
for a finding that higher priority lands are “inadequate” apply in place of 2
Factors 1 and 2. That leaves only the Factor 3 “[c]omparative environmental, 3
energy, economic, and social consequences” and Factor 4 “[c]ompatibility of 4
the proposed urban uses with nearby agricultural and forest activities occurring 5
on farm and forest land outside of the UGB” as relevant Goal 14 Boundary 6
Location Factors in determining whether higher priority candidate lands are 7
“inadequate to accommodate the amount of land” needed as determined by Step 8
One. 9
If highest priority lands are found to be “adequate to accommodate the 10
amount of land needed,” a local government moves to Step Three, where the 11
local government applies all of the Goal 14 “Boundary Location” factors to 12
choose the “best” land within those “available” high priority lands. If highest 13
priority lands are not adequate to accommodate the amount of land needed, the 14
next lowest priority lands are reviewed for adequacy under Step Two 15
(reviewing adequacy under ORS 197.298(3) and Goal 14’s consequence and 16
compatibility Factors 3 and 4). Then local government repeats the process 17
between Step Two and Step Three until the highest priority lands accommodate 18
the need in light of Goal 14 factors or until it is determined that a broader study 19
area is required to identify a sufficient number of adequate acres. 20
Page 24
2. Petitioners’ Findings Challenges 1
Respondents’ brief includes 35 pages in which respondents attempt to 2
explain why they believe the challenged decision properly applied the three-3
step analysis required under the Court of Appeals’ McMinnville decision. But 4
respondents’ brief makes almost no attempt to acknowledge and directly 5
address petitioners’ challenges to a number of respondent’s findings. Because 6
our task on review is to determine the merits of petitioners’ challenges to those 7
findings, that failure on respondents’ part complicates our resolution of this 8
part of petitioners’ second assignment of error. While the subassignments of 9
error that we discuss separately below are technically sub-subassignments of 10
error under petitioners’ second subassignment of error, we refer to them as 11
subassignments of error to avoid the awkward phrase sub-subassignment of 12
error. 13
a. Adjacent to the UGB (North Area 5; South Area 5) 14
Area 5 contains 97 acres of exception lands. As we have already 15
explained, the highest priority areas in candidate areas identified by the city are 16
exception lands. Under ORS 197.298 those exception lands must be “adjacent 17
to an urban growth boundary[.]” One of the reasons respondents gave for not 18
including North Area 5 and South Area 5 in the UGB is that North Area 5 and 19
South Area 5 are not “adjacent” to the urban growth boundary. Respondents 20
relied on a dictionary definition of “adjacent,” but petitioners argue that the 21
Page 25
decision should have applied the definition of “adjacent land” at OAR 660-1
024-0060(4), which provides: 2
“In determining alternative land for evaluation under ORS 3 197.298, ‘land adjacent to the UGB’ is not limited to those lots or 4 parcels that abut the UGB, but also includes land within the 5 vicinity of the UGB that has a reasonable potential to satisfy the 6 identified need deficiency.” 7
Respondents do not respond to the argument. The response brief merely 8
touches on adjacency as one of the reasons “one portion of study area 5” was 9
excluded, in part due to being “separated by approximately one half mile from 10
Coburg and only marginally connected to the rest of study area 5 across a 11
heavily traveled road.” Respondents’ Brief 38. Although respondents do not 12
cite to it, we understand the primary finding on adjacency to be at Record 747, 13
which appears to conclude that North Area 5 and South Area 5 are not adjacent 14
to the UGB, but does not address OAR 660-024-0060(4). 15
OAR Chapter 660, Division 24, is LCDC’s administrative rule 16
concerning urban growth boundaries and is, at the very least, relevant context 17
regarding the meaning of the word “adjacent” in ORS 197.298(1). More to the 18
point, in contrast to respondents’ argument that area 5 is not “adjacent” to the 19
existing UGB, the findings seem to indicate that all eleven study areas were 20
considered “adjacent” for purposes of the UGB amendment: “Map 11 of the 21
2010 Urbanization Study shows ‘built upon and developed’ exception areas * * 22
* and natural resource areas * * * located adjacent to the Coburg Urban 23
Growth Boundary.” Record 728 (emphasis added). See Record 1441 (showing 24

Page 26
Map 11 with all of the study areas including North and South Area 5). Absent a 1
better explanation from the city, we agree with petitioners that the city erred in 2
finding that North Area 5 and South Area 5 are not adjacent to the city’s 3
existing UGB. 4
This subassignment of error is sustained. 5
b. Access to Coburg Road (South Area 5) 6
Petitioners’ next subassignment of error challenges findings concerning 7
access to Coburg Road from South Area 5. Respondents apparently found that 8
South Area 5 could be eliminated as candidate exception land because Lane 9
County spacing standards for new access to minor arterials render it 10
unbuildable. Record 749. Petitioners argue that finding is not supported by the 11
record. Petitioners contend South Area 5 has considerable depth to develop an 12
internal road system with only a few access points on Coburg Road. 13
Petitioners attach Lane County Code sections addressing access to county 14
roads and contend they do not support respondents finding that additional 15
access for South Area 5 is not possible. 16
The response brief does not specifically acknowledge and address 17
petitioners’ argument. However, respondents do argue that South Area 5 18
“would not support any of the residential development * * *. Only 19 two parcels are large enough to contain any undeveloped area 20 suitable for development and they both have some floodplain areas 21 on them. * * * Most important are the transportation limitations on 22 these two parcels. Any development on them would require 23 additional access to busy Coburg Road where the layout of 24 existing driveways and Stallings Lane in the area would mean a 25
Page 27
violation of Coburg’s driveway and street spacing requirements.” 1 Respondents’ Brief 53. 2
If respondents’ rationale for excluding South Area 5 is that existing 3
driveways and county street spacing requirements make South Area 5 4
unbuildable, that rationale is not sufficiently explained with reference to the 5
city or county spacing standards respondents are relying on. In addition, as 6
discussed further below, absent an identified need for residential land with 7
particular parcel sizes, which the city did not justify under McMinnville Step 8
One for residential lands, respondents cannot exclude exception lands as 9
inadequate simply because they are parcelized. Parcel size is one of the factors 10
that can be relied on to justify an irrevocably committed exception in the first 11
place. 660-004-0028(6)(c). Disregarding exception lands simply because they 12
are parcelized, without more, is inconsistent with the ORS 197.298(1) priority 13
scheme. 14
This subassignment of error is sustained. 15
c. Conflicts with TSP (North Area 5) 16
The county adopted the following finding: 17
“Coburg is developing a multi modal path around the current UGB 18 to facilitate non-vehicular movement in Coburg. Inclusion of 19 Stallings Lane properties, especially those distant from the rest of 20 Coburg, would be directly contrary to the concept of the multi 21 modal path as a resource available for all Coburg residents, and 22 would negate the development work on the path that has already 23 been accomplished.” Record 750. 24
Petitioners argue: 25
Page 28
“There is no evidence for this assertion; nothing prevents the 1 residents of North Area 5 from accessing the multi-modal path. 2 The residents in North Area 5 are no more distant from the multi-3 modal path than downtown residents. In any event, the record 4 does not contain even a basic explanation of how the urbanization 5 of Area 5 could negatively impact the proposed path.” Petition for 6 Review 19. 7
We agree with petitioners. But more to the point, respondent may not 8
eliminate candidate exception lands, or in the words of ORS 197.298(1) decide 9
such lands are “inadequate,” simply because respondent believes development 10
of those exception lands is inconsistent with the “concept” of a planned 11
transportation facility. Exception land probably could be deemed “inadequate” 12
if, for example, a planned transportation facility would render the exception 13
land unbuildable. But respondent has not shown that to be the case. 14
d. Goal 14, Boundary Location Factor 3 15 Environmental Consequences (Area 7) 16
Assuming that exception lands are inadequate to accommodate identified 17
land needs, under ORS 197.298(1)(d) lower priority agricultural lands can be 18
included in the UGB. However, in that circumstance, ORS 197.298(2) makes 19
agricultural land with poorer soils a higher priority than agricultural lands with 20
better soils. 21
Portions of Areas 1 and 6 were included in the UGB. Areas 1 and 6 22
contain high quality Class I and II soils. Area 7, which was not included in the 23
UGB, has Class IV soils. Since Area 7 has poorer soils than Areas 1 and 6, 24
under ORS 197.298(2), Area 7 is a higher priority for a UGB expansion and 25
Page 29
absent a relevant consideration to the contrary should have been included 1
before Areas 1 and 6. 2
As part of McMinnville Step Two, a local government may consider Goal 3
14, Boundary Location Factor 3 “[c]omparative environmental, energy and 4
economic and social consequences” when determining if higher priority land 5
adequately accommodates identified land needs. Respondent relied in part on 6
Goal 14, Boundary Location Factor 3 to include portions of Areas 1 and 6, and 7
not include Area 7, based on “the environmental consequences of development 8
within the 100-year floodplain and impacts to mapped wetlands.” Record 736-9
37. 10
Petitioners argue: 11
“* * * There is no factual basis for this assertion. The findings 12 concede that, out of Area 7’s 240 acres, only 23 acres are either 13 floodplain or wetland, and inspection of the City’s mapping 14 reveals that area lies at the far north end, well away from the area 15 closest to the city center and most likely to be urbanized. 16 Furthermore, the findings do not explain why the consequences of 17 urbanizing Area 7 would be so severe that these areas would be 18 ‘inadequate’ under ORS 197.298(1).” Petition for Review 19 19 (record citations omitted). 20
We have not been able to locate a cognizable response to petitioners’ 21
arguments concerning respondent’s reliance on Goal 14, Boundary Location 22
Factor 3 environmental consequences to include portions of Areas 1 and 6 23
while not including Area 7. This subassignment of error is sustained. 24
Page 30
e. Goal 14, Boundary Location Factor 3 Social 1 Consequences (Areas 5 and 7) 2
Petitioners also assign error to respondent’s rejection of North Area 5 3
and Area 7 based on Goal 14, Factor 3 “[c]omparative * * * social 4
consequences[.]” The findings identified by petitioner concerning Area 5 are 5
as follows: 6
“* * * Existing residents of [Area 5] were split in terms of wishing 7 incorporation into the Coburg Urban Growth Boundary. 8 Therefore, inclusion of this exception land into the urban growth 9 boundary is inappropriate and would not accommodate the 10 residential land need pursuant to Factor 3 * * * social (resident 11 opposition) impacts * * *.”Record 735. 12
The findings identified by petitioners concerning Area 7 are as follows: 13
“[E]xtension of the urban growth boundary to the east side of 14 Interstate 5 has been a source of significant opposition from rural 15 property owners to the east.” Record 736. 16
Petitioners argue the record does not support respondent’s finding of 17
significant opposition to including North Area 5 in the UGB. Petitioners also 18
argue: 19
“Beyond the factual deficiencies, the Decision does not contain 20 any reasoning explaining why the disappointment of property 21 owners constitutes a valid basis for decision making, let alone a 22 bona-fide ‘social consequence’ contemplated by Goal 14 that 23 would be so severe that any part of Area 5 or Area 7 would be 24 rendered ‘inadequate’ under ORS 197.298(1). In addition, the 25 findings do not reconcile the obvious contradiction between the 26 exclusion of North Area 5 from [the] UGB and the simultaneous 27 inclusion of Mid Area 5 located just to the south. * * *” Petition 28 for Review 20-21. 29
Page 31
Once again, the response brief neither acknowledges nor directly 1
responds to this subassignment of error. The scope and nature of the inquiry 2
that is permissible under Goal 14, Factor 3 “[c]omparative environmental, 3
energy, economic and social consequences” and McMinnville Step Two to 4
conclude that higher priority land is “inadequate to accommodate” identified 5
land need is not entirely clear to us. We seriously doubt that property owner 6
opposition to having their property included in the UGB could ever be a social 7
consequence that might allow a local government to apply Goal 14, Factor 3 to 8
conclude that those property owners’ higher priority land under ORS 9
197.298(1) is inadequate to meet an identified land need. However, we are not 10
presented with a case where we need to definitively answer that question. 11
Based on this record, we conclude respondents have not even come close to 12
doing so here. 13
This subassignment of error is sustained. 14
f. Landowner Preference (North Area 5) 15
In addition to rejecting Area 5 based on the social consequences of 16
property owner opposition under Goal 14, Boundary Location Factor 3, 17
respondents speculated that property owner opposition might lead those 18
property owners to refuse to redevelop their lands for higher density residential 19
uses, with the result that North Area 5 should be viewed as “inadequate to 20
accommodate” identified residential land need for that reason as well: 21
“Coburg’s process included numerous opportunities for public 22 involvement and comment. Property owners from the Stallings 23
Page 32
Lane study area appeared at some of these events. The majority of 1 people from Stallings Lane who appeared expressed objections to 2 being included in the proposed UGB expansion. Coburg must plan 3 for properties becoming available on a regular basis over time. 4 The process will not work if the current property owners, or 5 replacement property owners who have purchased an operating 6 farm, do not wish to give up that lifestyle for urban residential 7 uses. If there is a significant delay in properties in the area 8 becoming available then Coburg will not be able to meet its need 9 over the next twenty years. If Coburg were to include only the 10 properties along Stallings Lane and these properties did not 11 become available for years, Coburg would have failed its 12 responsibilities to actually provide for reasonable residential 13 growth. Given the evidence in the record, Coburg had no choice 14 except to consider that these properties would not be available.” 15 Record 748 (footnote omitted). 16
Petitioners contend that if property owner opposition to urbanization is 17
sufficient to render candidate exception lands “inadequate” under ORS 18
197.298(1), the ORS 197.298 priority scheme will not work as the legislature 19
intended. Presumably that is because at least some of the residents of rural 20
exception lands will always prefer to retain the rural residential nature of their 21
properties. Moreover, petitioners argue, the record does not support 22
respondents’ speculation that property owner opposition will mean that land 23
will not be redeveloped to meet higher density residential land needs if the land 24
is brought into the UGB. Petitioners additionally dispute that the level of 25
opposition in Area 5 is as significant as respondents suggest and point out that 26
past failures to redevelop lands brought into the UGB are not predictive of the 27
future, since the city did not even have a sewer system until a few years ago. 28
Finally, the record includes a study that petitioners contend demonstrates that 29
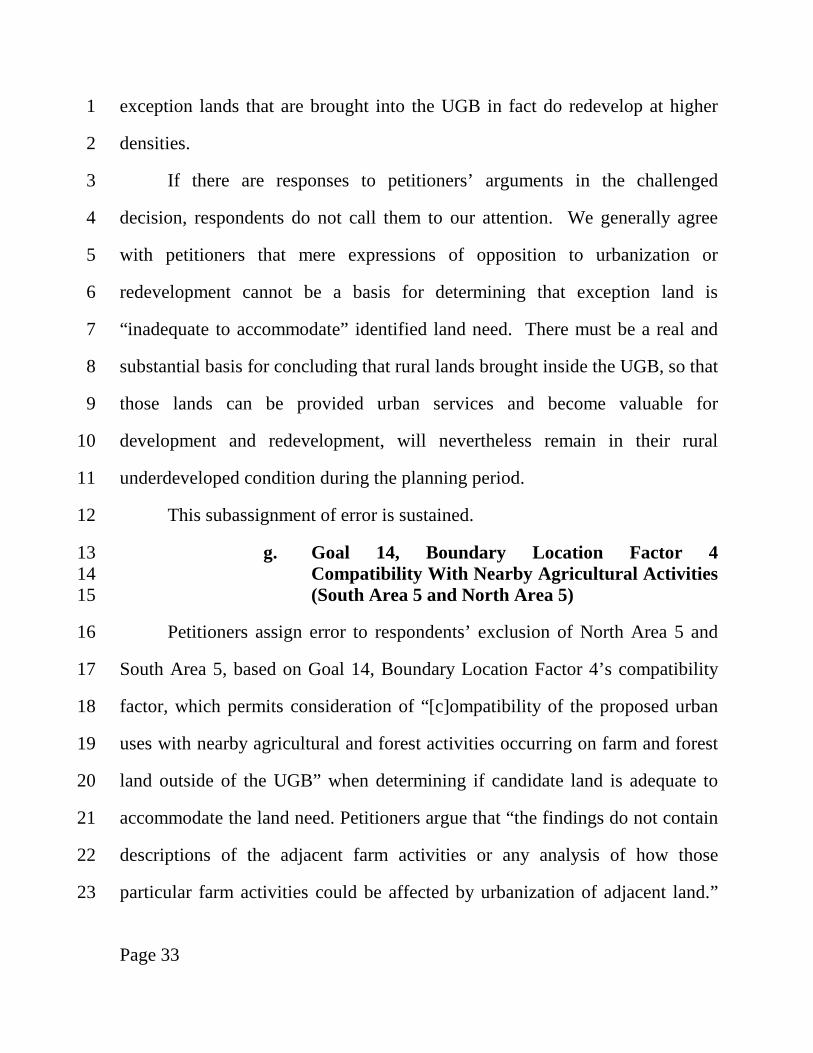
Page 33
exception lands that are brought into the UGB in fact do redevelop at higher 1
densities. 2
If there are responses to petitioners’ arguments in the challenged 3
decision, respondents do not call them to our attention. We generally agree 4
with petitioners that mere expressions of opposition to urbanization or 5
redevelopment cannot be a basis for determining that exception land is 6
“inadequate to accommodate” identified land need. There must be a real and 7
substantial basis for concluding that rural lands brought inside the UGB, so that 8
those lands can be provided urban services and become valuable for 9
development and redevelopment, will nevertheless remain in their rural 10
underdeveloped condition during the planning period. 11
This subassignment of error is sustained. 12
g. Goal 14, Boundary Location Factor 4 13 Compatibility With Nearby Agricultural Activities 14 (South Area 5 and North Area 5) 15
Petitioners assign error to respondents’ exclusion of North Area 5 and 16
South Area 5, based on Goal 14, Boundary Location Factor 4’s compatibility 17
factor, which permits consideration of “[c]ompatibility of the proposed urban 18
uses with nearby agricultural and forest activities occurring on farm and forest 19
land outside of the UGB” when determining if candidate land is adequate to 20
accommodate the land need. Petitioners argue that “the findings do not contain 21
descriptions of the adjacent farm activities or any analysis of how those 22
particular farm activities could be affected by urbanization of adjacent land.” 23

Page 34
Petition for Review 24. Petitioners argue remand is appropriate, because “the 1
findings are not sufficiently descriptive of nearby agricultural uses to allow 2
comparison among the candidate sites[,]” citing McMinnville, 244 Or App at 3
287. Petitioners also argue that respondent treated exception areas 4
inconsistently by including 13.6 acres in Area 1, with Class I and II soils, while 5
excluding 20-acre South Area 5, exception land, based on agricultural activity 6
conflicts, when those two areas appear to be very similarly situated. 7
Respondents do not clearly respond to petitioners’ arguments under this 8
subassignment of error. 9
We agree with petitioners. Exclusion of candidate land based on 10
incompatibility between existing agricultural operations and proposed 11
residential zoning must identify those agricultural practices and explain why 12
any incompatibility justifies deviating from the ORS 197.298(1) priority 13
scheme. Respondents also must address petitioners’ contention that for all 14
candidate land there is some level of agricultural conflict, because every study 15
area abuts farmland. Record 744 (“the compatibility impacts do not appear to 16
be much different between the UGB study areas.”) This sub-assignment of 17
error is sustained. 18
h. Traffic Impacts (North Area 5) 19
Petitioners argue that respondents erred in using the lack of an existing 20
east-west bypass to exclude portions of Area 5 as unavailable to meet identified 21
residential land needs. Respondents found: 22

Page 35
“The potential of a significant increase in traffic along Coburg 1 Road if the exception area of Stallings Lane is included in the 2 Coburg UGB significantly exacerbates the public safety issues that 3 Coburg now faces. * * * 4
“This public safety problem can only be alleviated if an East-West 5 connector[18] is constructed to give emergency services an 6 alternative means to access Coburg. Until that time, any residential 7 development along Stallings Lane will mean an unacceptable 8 increase in traffic, unacceptable because it would significantly 9 increase the risk of isolating parts of Coburg from emergency 10 services.” Record 750. 11
“Transportation and public safety issues serve as a limiting factor 12 for any of the exceptions areas of Stallings Lane being included in 13 the proposed Coburg UGB. If, however, a connector could be built 14 across the lower priority land adjacent to and just north of the 15 current Coburg UGB, the connector would provide an alternative 16 means to access the properties along Stallings Lane and reduce or 17 relieve the practical limitations on developing any part of Stallings 18 Lane.” Record 752. 19
Petitioners contend it is inconsistent for the city to (1) acknowledge that 20
any transportation impact problems that might be caused by included North 21
Area 5 would be solved by the east-west bypass, (2) include the east-west 22
bypass as a project in the updated TSP, and (3) nevertheless exclude North 23
Area 5 on the basis of adverse traffic impacts without the east-west bypass. 24
Respondents state that Area 5 was determined to be inappropriate for 25
residential development because: 26
18 The referenced East-West Connector is what we refer to as the east-west
bypass. In the record it is also sometimes referred to as the East-West Collector.
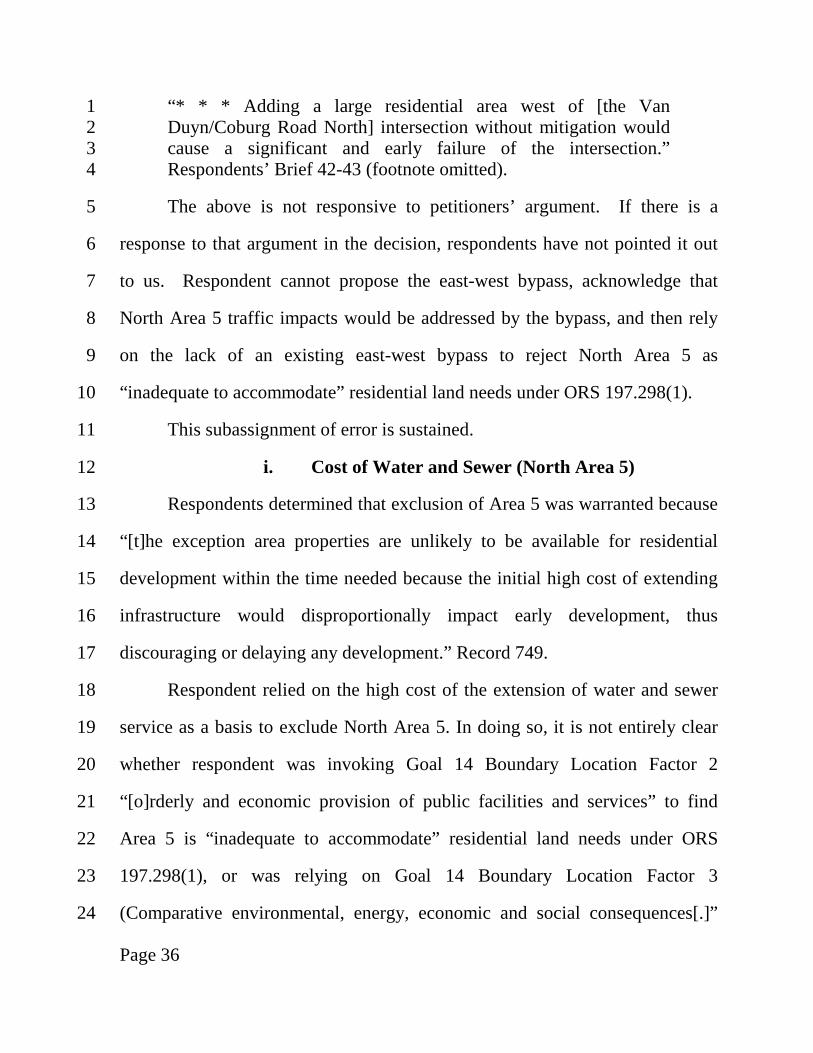
Page 36
“* * * Adding a large residential area west of [the Van 1 Duyn/Coburg Road North] intersection without mitigation would 2 cause a significant and early failure of the intersection.” 3 Respondents’ Brief 42-43 (footnote omitted). 4
The above is not responsive to petitioners’ argument. If there is a 5
response to that argument in the decision, respondents have not pointed it out 6
to us. Respondent cannot propose the east-west bypass, acknowledge that 7
North Area 5 traffic impacts would be addressed by the bypass, and then rely 8
on the lack of an existing east-west bypass to reject North Area 5 as 9
“inadequate to accommodate” residential land needs under ORS 197.298(1). 10
This subassignment of error is sustained. 11
i. Cost of Water and Sewer (North Area 5) 12
Respondents determined that exclusion of Area 5 was warranted because 13
“[t]he exception area properties are unlikely to be available for residential 14
development within the time needed because the initial high cost of extending 15
infrastructure would disproportionally impact early development, thus 16
discouraging or delaying any development.” Record 749. 17
Respondent relied on the high cost of the extension of water and sewer 18
service as a basis to exclude North Area 5. In doing so, it is not entirely clear 19
whether respondent was invoking Goal 14 Boundary Location Factor 2 20
“[o]rderly and economic provision of public facilities and services” to find 21
Area 5 is “inadequate to accommodate” residential land needs under ORS 22
197.298(1), or was relying on Goal 14 Boundary Location Factor 3 23
(Comparative environmental, energy, economic and social consequences[.]” 24
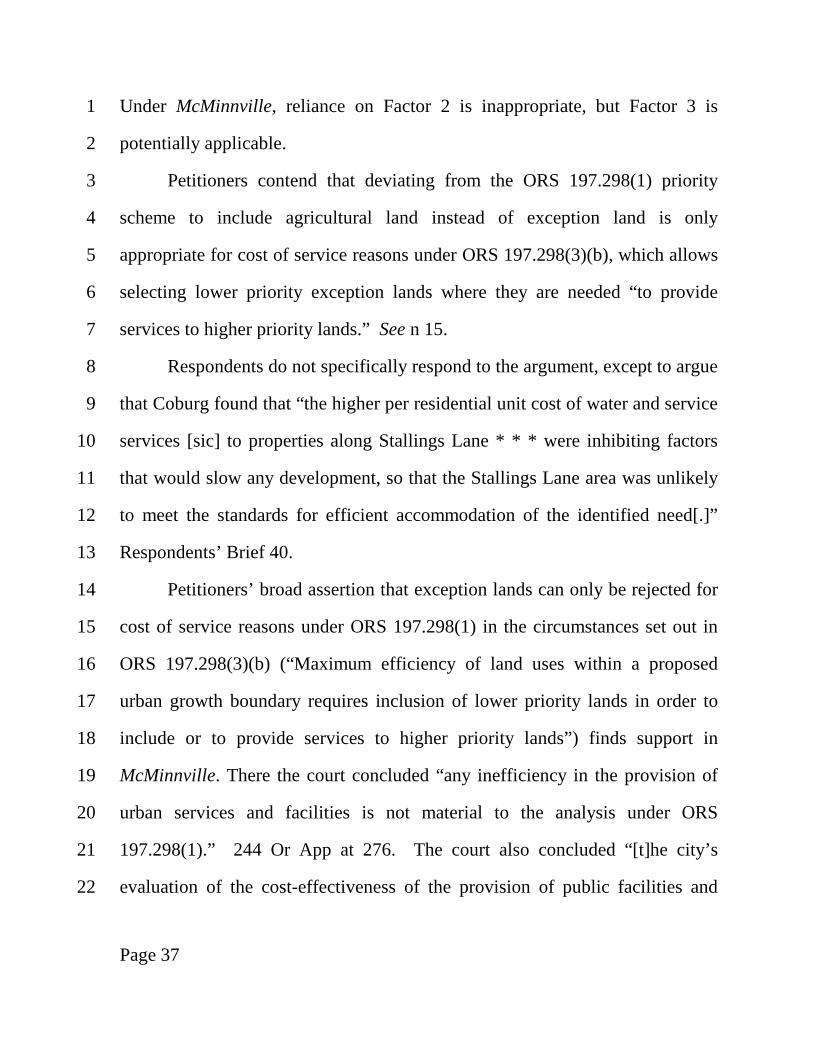
Page 37
Under McMinnville, reliance on Factor 2 is inappropriate, but Factor 3 is 1
potentially applicable. 2
Petitioners contend that deviating from the ORS 197.298(1) priority 3
scheme to include agricultural land instead of exception land is only 4
appropriate for cost of service reasons under ORS 197.298(3)(b), which allows 5
selecting lower priority exception lands where they are needed “to provide 6
services to higher priority lands.” See n 15. 7
Respondents do not specifically respond to the argument, except to argue 8
that Coburg found that “the higher per residential unit cost of water and service 9
services [sic] to properties along Stallings Lane * * * were inhibiting factors 10
that would slow any development, so that the Stallings Lane area was unlikely 11
to meet the standards for efficient accommodation of the identified need[.]” 12
Respondents’ Brief 40. 13
Petitioners’ broad assertion that exception lands can only be rejected for 14
cost of service reasons under ORS 197.298(1) in the circumstances set out in 15
ORS 197.298(3)(b) (“Maximum efficiency of land uses within a proposed 16
urban growth boundary requires inclusion of lower priority lands in order to 17
include or to provide services to higher priority lands”) finds support in 18
McMinnville. There the court concluded “any inefficiency in the provision of 19
urban services and facilities is not material to the analysis under ORS 20
197.298(1).” 244 Or App at 276. The court also concluded “[t]he city’s 21
evaluation of the cost-effectiveness of the provision of public facilities and 22
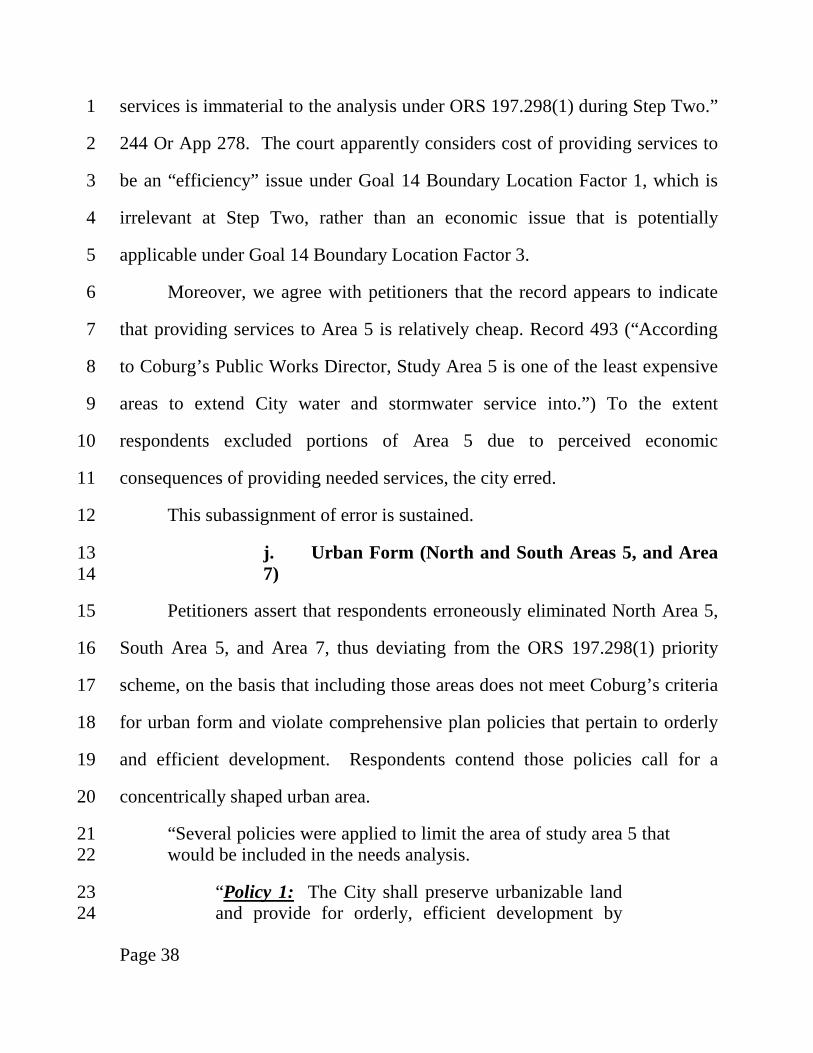
Page 38
services is immaterial to the analysis under ORS 197.298(1) during Step Two.” 1
244 Or App 278. The court apparently considers cost of providing services to 2
be an “efficiency” issue under Goal 14 Boundary Location Factor 1, which is 3
irrelevant at Step Two, rather than an economic issue that is potentially 4
applicable under Goal 14 Boundary Location Factor 3. 5
Moreover, we agree with petitioners that the record appears to indicate 6
that providing services to Area 5 is relatively cheap. Record 493 (“According 7
to Coburg’s Public Works Director, Study Area 5 is one of the least expensive 8
areas to extend City water and stormwater service into.”) To the extent 9
respondents excluded portions of Area 5 due to perceived economic 10
consequences of providing needed services, the city erred. 11
This subassignment of error is sustained. 12
j. Urban Form (North and South Areas 5, and Area 13 7) 14
Petitioners assert that respondents erroneously eliminated North Area 5, 15
South Area 5, and Area 7, thus deviating from the ORS 197.298(1) priority 16
scheme, on the basis that including those areas does not meet Coburg’s criteria 17
for urban form and violate comprehensive plan policies that pertain to orderly 18
and efficient development. Respondents contend those policies call for a 19
concentrically shaped urban area. 20
“Several policies were applied to limit the area of study area 5 that 21 would be included in the needs analysis. 22
“Policy 1: The City shall preserve urbanizable land 23 and provide for orderly, efficient development by 24
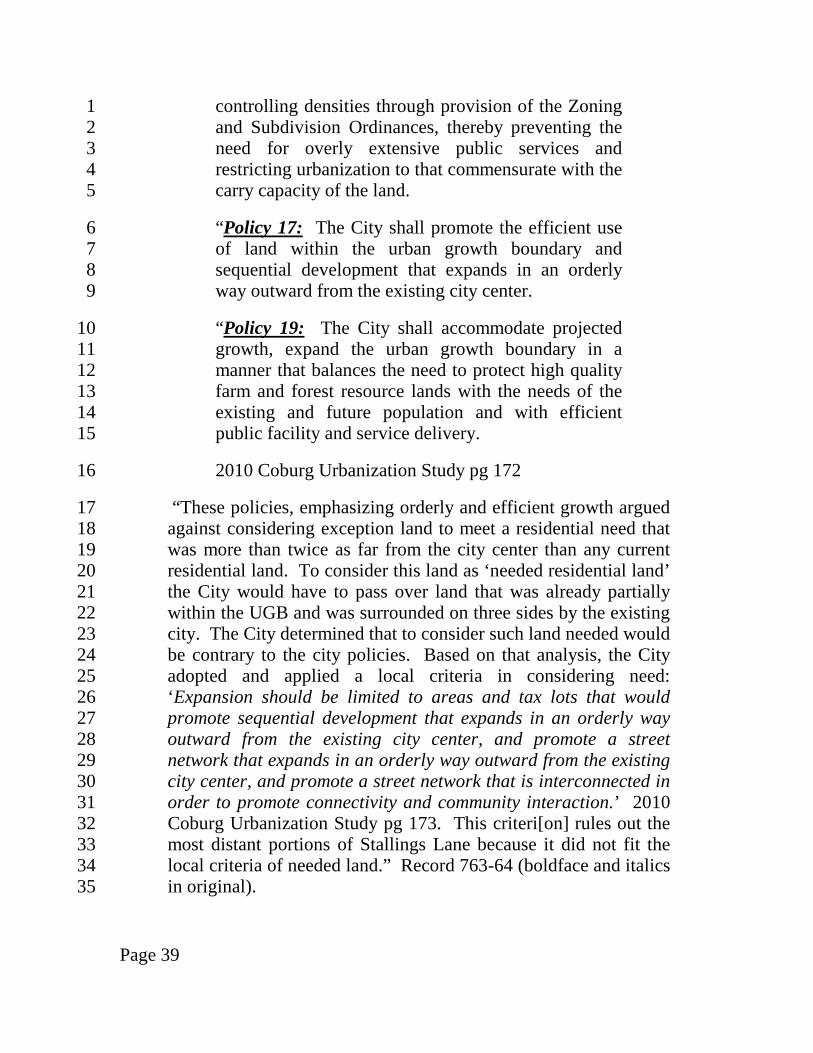
Page 39
controlling densities through provision of the Zoning 1 and Subdivision Ordinances, thereby preventing the 2 need for overly extensive public services and 3 restricting urbanization to that commensurate with the 4 carry capacity of the land. 5
“Policy 17: The City shall promote the efficient use 6 of land within the urban growth boundary and 7 sequential development that expands in an orderly 8 way outward from the existing city center. 9
“Policy 19: The City shall accommodate projected 10 growth, expand the urban growth boundary in a 11 manner that balances the need to protect high quality 12 farm and forest resource lands with the needs of the 13 existing and future population and with efficient 14 public facility and service delivery. 15
2010 Coburg Urbanization Study pg 172 16
“These policies, emphasizing orderly and efficient growth argued 17 against considering exception land to meet a residential need that 18 was more than twice as far from the city center than any current 19 residential land. To consider this land as ‘needed residential land’ 20 the City would have to pass over land that was already partially 21 within the UGB and was surrounded on three sides by the existing 22 city. The City determined that to consider such land needed would 23 be contrary to the city policies. Based on that analysis, the City 24 adopted and applied a local criteria in considering need: 25 ‘Expansion should be limited to areas and tax lots that would 26 promote sequential development that expands in an orderly way 27 outward from the existing city center, and promote a street 28 network that expands in an orderly way outward from the existing 29 city center, and promote a street network that is interconnected in 30 order to promote connectivity and community interaction.’ 2010 31 Coburg Urbanization Study pg 173. This criteri[on] rules out the 32 most distant portions of Stallings Lane because it did not fit the 33 local criteria of needed land.” Record 763-64 (boldface and italics 34 in original). 35
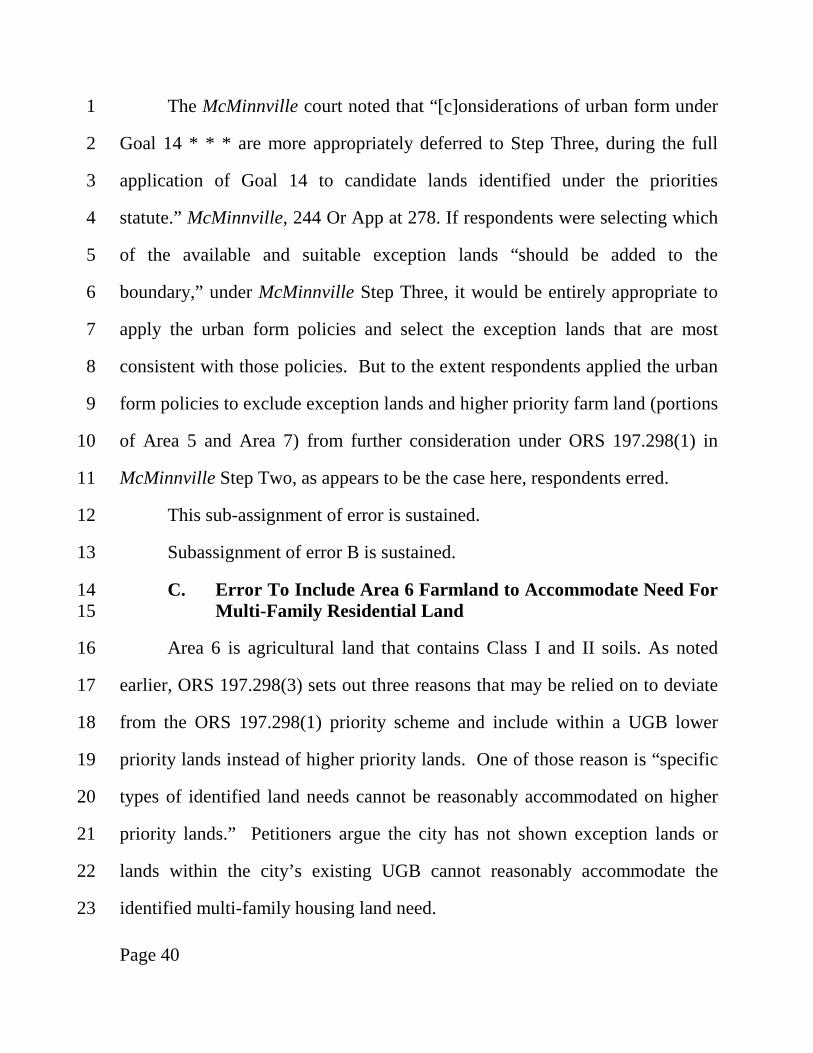
Page 40
The McMinnville court noted that “[c]onsiderations of urban form under 1
Goal 14 * * * are more appropriately deferred to Step Three, during the full 2
application of Goal 14 to candidate lands identified under the priorities 3
statute.” McMinnville, 244 Or App at 278. If respondents were selecting which 4
of the available and suitable exception lands “should be added to the 5
boundary,” under McMinnville Step Three, it would be entirely appropriate to 6
apply the urban form policies and select the exception lands that are most 7
consistent with those policies. But to the extent respondents applied the urban 8
form policies to exclude exception lands and higher priority farm land (portions 9
of Area 5 and Area 7) from further consideration under ORS 197.298(1) in 10
McMinnville Step Two, as appears to be the case here, respondents erred. 11
This sub-assignment of error is sustained. 12
Subassignment of error B is sustained. 13
C. Error To Include Area 6 Farmland to Accommodate Need For 14 Multi-Family Residential Land 15
Area 6 is agricultural land that contains Class I and II soils. As noted 16
earlier, ORS 197.298(3) sets out three reasons that may be relied on to deviate 17
from the ORS 197.298(1) priority scheme and include within a UGB lower 18
priority lands instead of higher priority lands. One of those reason is “specific 19
types of identified land needs cannot be reasonably accommodated on higher 20
priority lands.” Petitioners argue the city has not shown exception lands or 21
lands within the city’s existing UGB cannot reasonably accommodate the 22
identified multi-family housing land need. 23
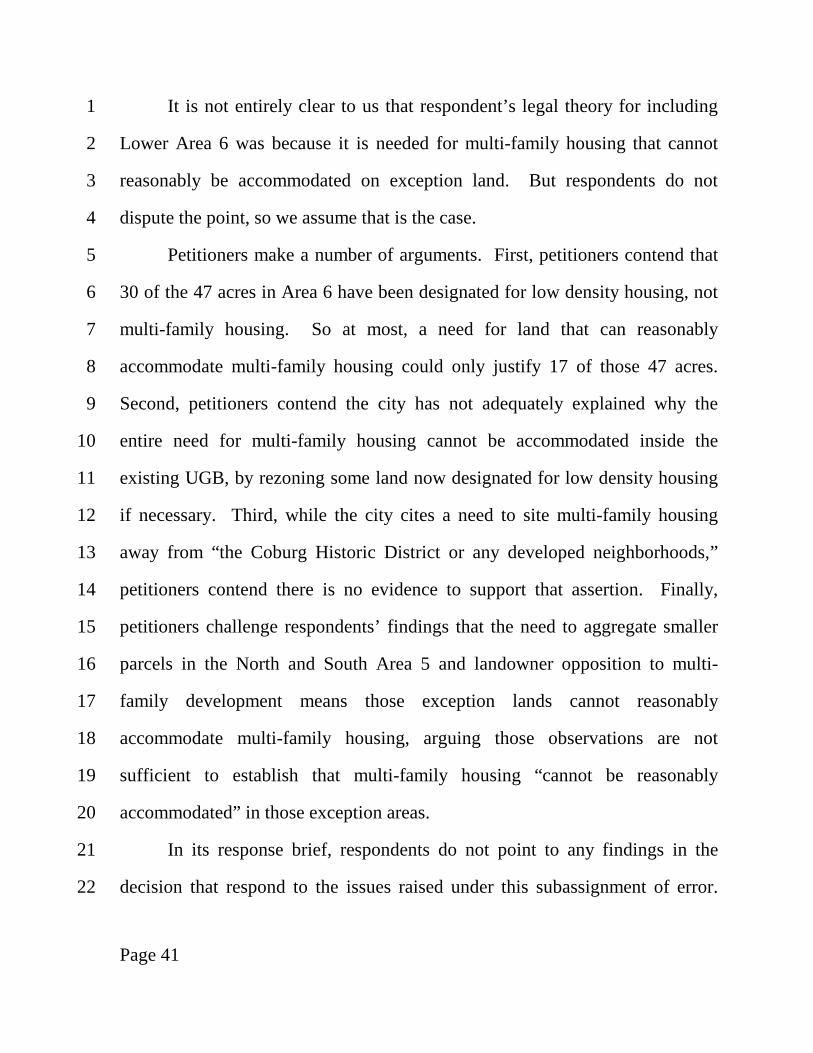
Page 41
It is not entirely clear to us that respondent’s legal theory for including 1
Lower Area 6 was because it is needed for multi-family housing that cannot 2
reasonably be accommodated on exception land. But respondents do not 3
dispute the point, so we assume that is the case. 4
Petitioners make a number of arguments. First, petitioners contend that 5
30 of the 47 acres in Area 6 have been designated for low density housing, not 6
multi-family housing. So at most, a need for land that can reasonably 7
accommodate multi-family housing could only justify 17 of those 47 acres. 8
Second, petitioners contend the city has not adequately explained why the 9
entire need for multi-family housing cannot be accommodated inside the 10
existing UGB, by rezoning some land now designated for low density housing 11
if necessary. Third, while the city cites a need to site multi-family housing 12
away from “the Coburg Historic District or any developed neighborhoods,” 13
petitioners contend there is no evidence to support that assertion. Finally, 14
petitioners challenge respondents’ findings that the need to aggregate smaller 15
parcels in the North and South Area 5 and landowner opposition to multi-16
family development means those exception lands cannot reasonably 17
accommodate multi-family housing, arguing those observations are not 18
sufficient to establish that multi-family housing “cannot be reasonably 19
accommodated” in those exception areas. 20
In its response brief, respondents do not point to any findings in the 21
decision that respond to the issues raised under this subassignment of error. 22

Page 42
We do not foreclose that possibility that circumstances in irrevocably 1
committed lands could pose such challenges to development of multi-family 2
housing that the city could find and justify a decision that multi-family housing 3
cannot “be reasonably accommodated” on such exception lands. But 4
generalized concerns about parcelization complicating site acquisition or 5
property owner opposition to multi-family housing fall far short of making the 6
demonstration required under ORS 197.298(3)(a) that “specific types of 7
identified land needs cannot be reasonably accommodated on higher priority 8
lands.” 9
This subassignment of error is sustained. 10
D. Error to Include Area 6 Farmland to Site East-West Bypass 11
Area 6 is exclusive farm use zoned land composed of Class I and II soils. 12
There is no dispute that Van Duyn Street, which provides access to downtown 13
Coburg, is experiencing congestion at two intersections west of the city. See 14
Appendix 3. Petitioners argue respondent improperly relied on ORS 15
197.298(3)(c) to include the lower part of Area 6 to allow construction of the 16
east-west bypass to resolve access problems associated with this traffic 17
congestion.19 Under ORS 197.298(3)(c), lower priority land may be included 18
within the UGB ahead of higher priority land if “[m]aximum efficiency of land 19
19 Respondents at one point proposed to include a larger part of Area 6, but
when faced with opposition settled on the smaller portion of Area 6, primarily to allow construction of the east-west bypass.

Page 43
uses within a proposed urban growth boundary requires inclusion of lower 1
priority lands in order to include or to provide services to higher priority 2
lands.” Respondents found: 3
“Transportation and public safety issues serve as a limiting factor 4 for any of the exceptions areas of Stallings Lane being included in 5 the proposed Coburg UGB. If, however, a connector could be built 6 across the lower priority land adjacent to and just north of the 7 current Coburg UGB, the connector would provide an alternative 8 means to access the properties along Stallings Lane and reduce or 9 relieve the practical limitations on developing any part of Stallings 10 Lane. 11
“The lower priority agricultural land must be included to provide 12 urban levels of service to the higher priority land along Stallings 13 Lane.” Record 752-53. 14
Petitioners first note in McMinnville, the Court of Appeals determined 15
that the scope of “services” in ORS 197.298(3)(c) does not include “roads.” 16
244 Or App at 275. Although petitioners recognize that respondent also cites 17
“public safety issues,” we understand petitioners to contend the public safety 18
issues are indistinguishable from the roads that would be used to provide them. 19
We reject petitioners’ argument that respondent is categorically 20
precluded from relying on ORS 197.298(3)(c) to include the lower part of Area 21
6 to provide needed police and other emergency services to Area 5. That those 22
services would be provided by using roads does not mean they are the same 23
thing as a road. Area 5 apparently does currently suffer from poor access for 24
police and other emergency services and would suffer even more if that Area 25
were developed more densely without transportation improvements of some 26
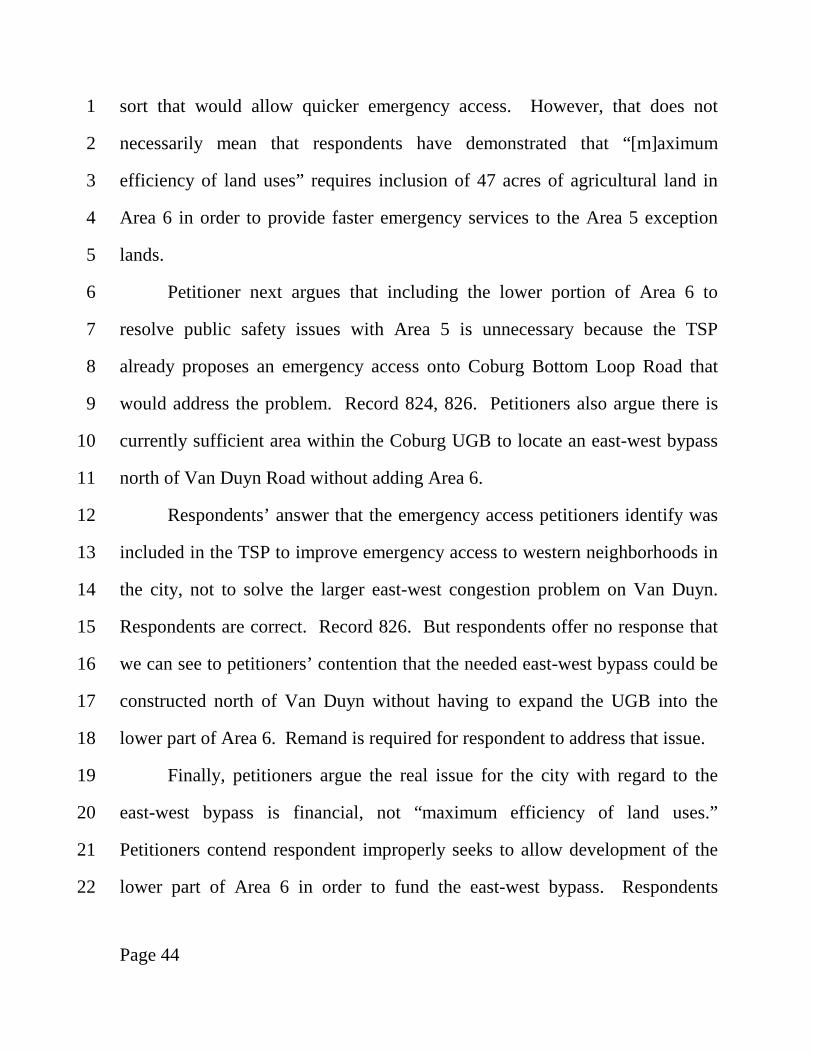
Page 44
sort that would allow quicker emergency access. However, that does not 1
necessarily mean that respondents have demonstrated that “[m]aximum 2
efficiency of land uses” requires inclusion of 47 acres of agricultural land in 3
Area 6 in order to provide faster emergency services to the Area 5 exception 4
lands. 5
Petitioner next argues that including the lower portion of Area 6 to 6
resolve public safety issues with Area 5 is unnecessary because the TSP 7
already proposes an emergency access onto Coburg Bottom Loop Road that 8
would address the problem. Record 824, 826. Petitioners also argue there is 9
currently sufficient area within the Coburg UGB to locate an east-west bypass 10
north of Van Duyn Road without adding Area 6. 11
Respondents’ answer that the emergency access petitioners identify was 12
included in the TSP to improve emergency access to western neighborhoods in 13
the city, not to solve the larger east-west congestion problem on Van Duyn. 14
Respondents are correct. Record 826. But respondents offer no response that 15
we can see to petitioners’ contention that the needed east-west bypass could be 16
constructed north of Van Duyn without having to expand the UGB into the 17
lower part of Area 6. Remand is required for respondent to address that issue. 18
Finally, petitioners argue the real issue for the city with regard to the 19
east-west bypass is financial, not “maximum efficiency of land uses.” 20
Petitioners contend respondent improperly seeks to allow development of the 21
lower part of Area 6 in order to fund the east-west bypass. Respondents 22
Page 45
respond that the city has traditionally relied on private development to finance 1
transportation infrastructure and that there is nothing improper about making 2
financing of the east-west bypass a factor under ORS 197.298(3)(c). 3
We agree with petitioners. As the Court of Appeals explained in 4
McMinnville, the scope of “services” in ORS 197.298(3)(c) does not include 5
“roads.” 244 Or App at 275. If the real reason respondents included the lower 6
part of Area 6 was to allow development that would generate the funding 7
necessary to build the east-west bypass (a road), respondents erred in relying 8
on ORS 197.298(3)(c) to include Area 6. 9
E. Error to Include Area 1 Farmland to Accommodate Need for 10 Multi-Modal Path 11
Area 1 is predominantly agricultural land composed of Class I and II 12
soils. One of the reasons given for including agricultural land in Area 1 into the 13
UGB was to “provide a means to complete a portion of the Coburg Loop Multi-14
Modal Path.” Record 751 15
Petitioners point out the proposed multi-modal path crosses agricultural 16
lands in other places that are not being included in the UGB and that under 17
OAR 660-012-0065(3)(h), “[b]ikeways, footpaths and recreation trails” are 18
specifically authorized transportation improvements on rural land, so there is 19
no need to include agricultural soils in Area 1 to develop the multi-modal path. 20
We agree with petitioners. This subassignment of error is sustained. 21
Page 46
F. Conclusion 1
Petitioners have successfully challenged a large number of the findings 2
that respondents adopted to exclude 97 acres of exception lands in North Area 3
5 and South Area 5 from consideration under ORS 197.298(1), and to include 4
prime agricultural lands in parts of Area 6 and Area 1, notwithstanding that 5
ORS 197.298(2) prioritizes exception lands. Petitioners have successfully 6
challenged findings respondent adopted to justify including land with better 7
quality agricultural soils in Areas 6 and 1, while not including land with poorer 8
quality agricultural soils in Area 7, whereas ORS 197.298(2) puts a higher 9
priority on including lands with poorer quality agricultural soils first. Finally, 10
we have sustained petitioners’ challenges to respondents’ reliance on ORS 11
197.298(3) to include lands with lower priority under ORS 197.298(1) in place 12
of lands with higher priority under ORS 197.298(1) to meet identified need for 13
multifamily housing, a multi-modal path and the east-west bypass. 14
Remand is therefore required under the second assignment of error for 15
respondents to correct those findings if they can, eliminate any findings that it 16
cannot correct, and adopt any supplemental findings they may wish to adopt to 17
support a UGB expansion that is consistent with ORS 197.298(1) and relevant 18
Goal 14 factors. To the extent our discussion above has not made this point 19
clearly enough, respondents appear to view Goal 14, Boundary Location Factor 20
3 “[c]omparative environmental, energy, economic and social consequences” 21
and Goal 14 Boundary Location Factor 4 “[c]ompatibility of the proposed 22
Page 47
urban uses with nearby agricultural and forest activities occurring on farm and 1
forest lands outside the UGB” and ORS 197.298(3) as a more available 2
vehicles for not following the ORS 197.298(1) priorities for including 3
exception lands first and including poorer agricultural lands before including 4
better agricultural lands than is actually the case. In applying the Goal 14 5
Boundary Location Factors, respondents must do more than identify possible 6
environmental, energy, economic or social consequences, and possible 7
incompatibilities with agricultural activities if exception lands or poorer quality 8
agricultural soils are included according to the ORS 197.298(1) priorities. 9
Respondents must establish that such considerations justify deviating from the 10
statutory priorities, notwithstanding the legislature’s expressed preference for 11
those priorities. Respondents should not underestimate the difficulty of making 12
such a demonstration. A similar caution is appropriate for attempts to use ORS 13
197.298(3) to avoid the ORS 197.298(1) priority scheme. 14
The second assignment of error is sustained in part. 15
THIRD ASSIGNMENT OF ERROR 16
Respondents included Area 8 in the UGB to meet the projected need for 17
land for commercial and industrial purposes (employment lands). Area 8 is 18
located east of Interstate 5 and includes 106 acres. In their third assignment of 19
Page 48
error, petitioners challenge the adequacy of the factual base for including Area 1
8 under Goals 9 and 14.20 2
As the Court of Appeals noted in Zimmerman v. LCDC, 274 Or App 512, 3
514, 361 P3d 619 (2015): 4
“* * * Goal 14 (Urbanization) requires a city to adopt and 5 maintain an urban growth boundary around its city limits “to 6 provide land for urban development needs and to identify and 7 separate urban and urbanizable land from rural land.” OAR 660–8 015–0000(14). Establishment and change of a UGB must be based 9 on a number of factors, including a “[d]emonstrated need for * * * 10 employment opportunities.” Id. Under OAR 660-024-0040(5), in 11 turn, the determination of that need “must comply with the 12 applicable requirements of Goal 9 and OAR chapter 660, division 13 9, and must include a determination of the need for a short-term 14 supply of land for employment uses consistent with [OAR] 660–15 009–0025.” 16
Accordingly, a city estimates future employment to determine the need for 17
employment lands in order to comply with the applicable Goal 14 and 9 18
requirements. 19
Here, respondents adopted a number of documents in support of their 20
decisions, including the economic lands component of the 2010 Coburg 21
Urbanization Study (2010 Study) (Record 308-634), the 2014 Regional 22
Economic Analysis (REA) (Record 635-666), and the 2014 Coburg 23
Urbanization Study Update (2014 Update) (Record 289-307). Respondents 24
explain that the 2010 Study documented the nature of industrial lands needed, 25
20 The ORS 197.298(1) priority scheme is not an issue under this assignment
of error.

Page 49
citing Record 467. While the 2010 Study identified a surplus of employment 1
land, it also noted the city’s employment lands might not be suitable for some 2
kinds of uses.21 Respondents also note that the 2014 Update took into account 3
changing economic conditions, with the assumption that Coburg would restore 4
a large number of jobs that were lost during the 2007 recession and projected 5
additional job growth based on Oregon Employment Department (OED) 6
projections for Lane County Job Growth. Record 305-306. The 2014 update 7
analyzes regional economic projections and provides: 8
21 Record 467 (part of the 2010 Study) includes the 2010 comparative
analysis for land supply and demand and long term projections for 2010-2030 and includes the following findings:
“The City of Coburg has a surplus of land within all employment categories, however the surplus for Industrial Uses is not seen as sufficient in size or characteristic to accommodate the City’s economic opportunities.
“The City should add approximately one lot or tract of land consisting of 20-70 acres of land to accommodate flexibility in responding to industry employment opportunities during the planning period (2010-2030).
“ * * * * *
“Long Term Supply/Demand Summary[:]The City of Coburg is currently faced with a supply of buildable land designated for commercial and office purposes that is insufficient to meet future long-term demand. The City is also faced with a limited supply of available and appropriate buildable land designated for industrial purposes.” (Emphasis added.)

Page 50
“The findings of the Regional Economic Analysis for Coburg 1 culminate in two recommended scenarios which are outlined as 2 follows: 3
“Scenario A – Job Recapture with OED Forecast Update. This first 4 scenario is modeled to align with the forecast methodology 5 provided with the 2010 Urbanization Study. Assumptions integral 6 to this updated forecast estimate are that: 7
“Coburg job loss experienced during the recession will be 8 recaptured (to refill vacated space) so that forecast job 9 growth occurs as an add-on to pre-recession peak 10 employment conditions requiring net added industrial and 11 commercial land as was previously assumed with the 2010 12 Urbanization Study. 13
“Lane County employment forecast projections are updated 14 for consistency with the most current available OED 15 regional forecast – reflecting higher county-wide job growth 16 rates than were utilized with the 2010 Urbanization Study 17 (as is also consistent with DLCD Safe Harbor provisions for 18 estimating EOA land needs). 19
“Scenario B – Economic Opportunity with Regional Large Site 20 Market Capture. A second scenario is predicated as an economic 21 opportunity for Coburg to serve regional needs for large 20+ acre 22 sites that require I-5 freeway access in addition to capturing its 23 Safe Harbor share of regionally forecast job growth: 24
“This enhanced economic opportunity is consistent with the 25 findings of the 2010 Urbanization Study that Coburg has 26 been, and could remain, competitive for large manufacturing 27 and distribution-related industrial firms, particularly if 20+ 28 acre sites were designated and made available for industrial 29 development. 30
“Coburg’s competitive opportunity is reinforced by 31 economic analyses recently prepared for other jurisdictions 32 in Lane County – all of which confirm a demand for but 33

Page 51
relative dearth of 20+ acre sites situated in close proximity 1 to the I-5 transportation corridor. 2
“Scenario B of the REA includes three sub-scenarios, one which 3 assumes 10% regional large site industrial capture, one which 4 assumes 20% regional large site industrial capture and one that 5 assumes a fairly aggressive 30% regional large site industrial 6 capture. 7
“Neither scenario presented in the Regional Economic Analysis is 8 expressly rejected by the City of Coburg in this addendum. At 9 their cores both scenarios are generally consistent with the primary 10 assumptions of the current Urbanization Study. Table A.17 11 outlines scenarios details, including total regional large site 12 acreage demand, an assumed vacancy percentage, and local 13 industrial land supply (from the buildable lands analysis). 14
“ * * * * * 15
“All of the scenarios evaluated support the continued need for a 16 UGB expansion of at least 40 acres to as much as 195 acres based 17 on forecast need for large industrial sites within Coburg and the 18 Central Lane County region.” Record 305-306 (footnotes omitted). 19
The 2010 study had predicted a total of 247 industrial jobs and 368 commercial 20
jobs, totaling 615 new jobs over twenty years. The 2014 Update includes the 21
following observation: 22
“If Coburg’s job growth rate were adjusted upwards to reflect the 23 updated overall growth expectations for Lane County * * *, the 24 employment gain within Coburg’s UGB would double from the 25 previous projection of an added 615 jobs to 1,292 net added jobs 26 over a 20-year planning horizon. It is noted by LCOG staff that a 27 truly sector specific forecast was not possible given the 28 information that economist Eric Hovee was provided. The figure 29 1,292 based on Lane County’s AAGR [average annual growth 30 rate] reflects an estimate assuming the highest realization of 31 Coburg matching Lane County growth rates. That number (1,292), 32
Page 52
in all likelihood would be smaller, and could potentially be 1 significantly smaller.” Record 303-304. 2
Intervenor and respondents (respondents) explain that the 2014 Update 3
confirmed the 2010 analysis, did not recommend any particular regional 4
scenario, but expressly stated that none were rejected and concluded that all of 5
the scenarios were generally consistent with the original assumptions regarding 6
employment land needs presented in 2010. 7
Petitioners’ third assignment of error is a series of loosely connected 8
challenges, focusing in large part on what petitioners contend are unresolved 9
inconsistencies in the 2010 Study, REA, and 2014 Update. Respondents answer 10
that petitioners’ confusion regarding the jobs forecasts is of petitioners’ own 11
making, and that the UGB decision is supported by an adequate factual basis. 12
Respondents contend that the economic land component of the decision and its 13
adopted findings are consistent with Goal 14 Urbanization and its 14
implementing administrative rules. Respondents quote OAR 660-024-0040 as 15
the governing rule for determining land need for industrial lands, emphasizing 16
that a local government is required to provide a reasonable justification for the 17
job growth estimate but Goal 14 does not require that job growth estimates 18
necessarily be proportional to population growth.22 Below we have attempted 19
22 OAR 660-024-0040(5) provides in relevant part:
“ * * * the determination of 20-year employment land need for an urban area must comply with applicable requirements of Goal 9 and OAR chapter 660, division 9, and must include a
Page 53
to identify each of petitioners’ separate arguments under this assignment of 1
error. 2
A. Adequacy of the Decision for Review (Petition for Review 39-3 43) 4
Petitioners argue that the 2014 Update reveals that only ranges of 5
forecasts and land needs were presented and none were actually selected 6
(“Neither scenario presented in the Regional Economic Analysis is expressly 7
rejected by the City of Coburg in this addendum. At their cores both scenarios 8
are generally consistent with the primary assumptions of the current 9
Urbanization Study. * * * All of the scenarios evaluated support the continued 10
need for a UGB expansion of at least 40 acres to as much as 195 acres based on 11
forecast need for large industrial sites within Coburg and the Central Lane 12
County region.”) Record 306. Therefore, petitioners argue, the decision is not 13
adequate for review. 14
Respondents answer that the city and intervenor submitted letters to 15
clarify the evidence in the record that supported the decision, and that those 16
letters were incorporated as findings. Those letters are at Record 757-782 and 17
determination of the need for a short-term supply of land for employment uses consistent with 660-009-0025. Employment land need may be based on an estimate of job growth over the planning period; local government must provide a reasonable justification for the job growth estimate but Goal 14 does not require that job growth estimates necessarily be proportional to population growth. * * *.” (Emphasis added.)
Page 54
further clarify the role of the 2010 study and the 2014 update as supporting the 1
decision. 2
We consider the decision and its supporting documentation adequate for 3
review. It is not unusual for decision makers to be presented documents that 4
present a range of possible options. Here the number of acres identified as 5
needed varies, because those documents were prepared at different times and 6
are based on different data and different assumptions. The fact that the 2014 7
update modifies the 2010 analysis and results in new projected figures does not 8
make those documents “internally inconsistent.” 9
Nonetheless, petitioners also argue that “it is not possible to tell which 10
jobs forecasts and land needs were ultimately selected to form the basis of the 11
decision and why.” Petition for Review 41. Respondents have not identified 12
any part of the challenged decision that clearly and expressly selects between 13
the different employment projections presented by the 2010 Study, REA and 14
2014 Update or the different estimates of the number of acres required to meet 15
projected employment needs. However, intervenor submitted a letter to the 16
board of commissioners, which it adopted as findings. A portion of that letter 17
is set out below: 18
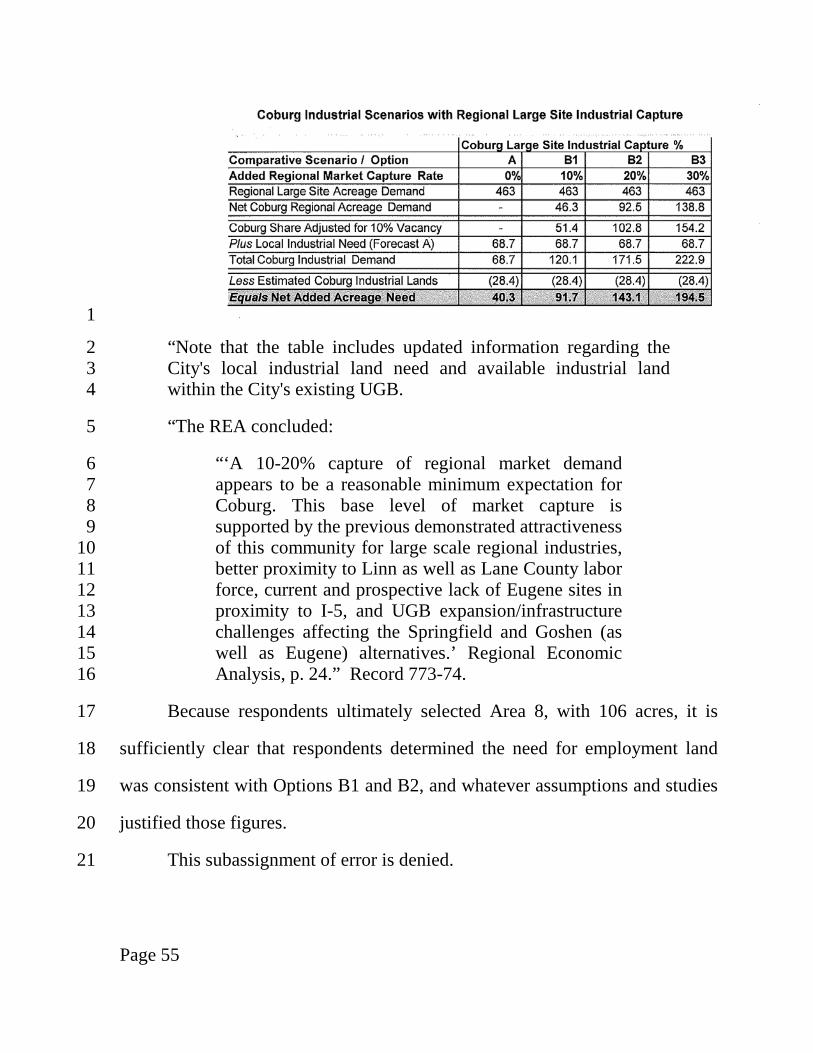
Page 55
1
“Note that the table includes updated information regarding the 2 City's local industrial land need and available industrial land 3 within the City's existing UGB. 4
“The REA concluded: 5
“‘A 10-20% capture of regional market demand 6 appears to be a reasonable minimum expectation for 7 Coburg. This base level of market capture is 8 supported by the previous demonstrated attractiveness 9 of this community for large scale regional industries, 10 better proximity to Linn as well as Lane County labor 11 force, current and prospective lack of Eugene sites in 12 proximity to I-5, and UGB expansion/infrastructure 13 challenges affecting the Springfield and Goshen (as 14 well as Eugene) alternatives.’ Regional Economic 15 Analysis, p. 24.” Record 773-74. 16
Because respondents ultimately selected Area 8, with 106 acres, it is 17
sufficiently clear that respondents determined the need for employment land 18
was consistent with Options B1 and B2, and whatever assumptions and studies 19
justified those figures. 20
This subassignment of error is denied. 21
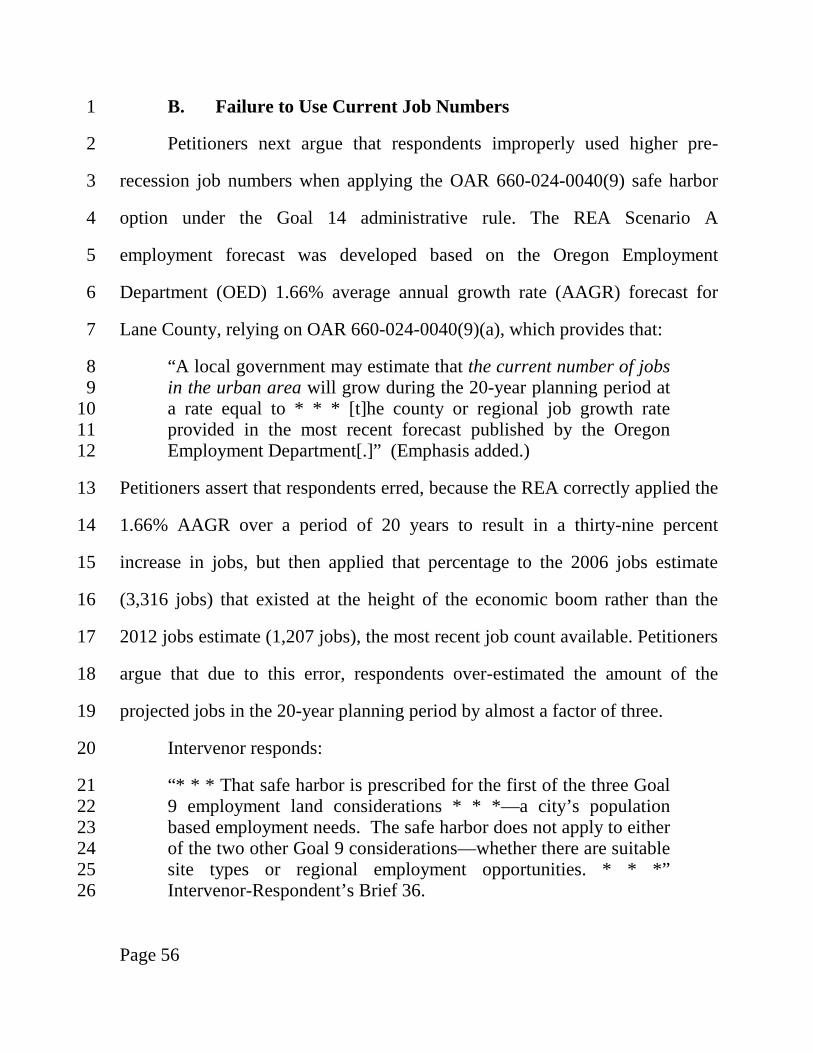
Page 56
B. Failure to Use Current Job Numbers 1
Petitioners next argue that respondents improperly used higher pre-2
recession job numbers when applying the OAR 660-024-0040(9) safe harbor 3
option under the Goal 14 administrative rule. The REA Scenario A 4
employment forecast was developed based on the Oregon Employment 5
Department (OED) 1.66% average annual growth rate (AAGR) forecast for 6
Lane County, relying on OAR 660-024-0040(9)(a), which provides that: 7
“A local government may estimate that the current number of jobs 8 in the urban area will grow during the 20-year planning period at 9 a rate equal to * * * [t]he county or regional job growth rate 10 provided in the most recent forecast published by the Oregon 11 Employment Department[.]” (Emphasis added.) 12
Petitioners assert that respondents erred, because the REA correctly applied the 13
1.66% AAGR over a period of 20 years to result in a thirty-nine percent 14
increase in jobs, but then applied that percentage to the 2006 jobs estimate 15
(3,316 jobs) that existed at the height of the economic boom rather than the 16
2012 jobs estimate (1,207 jobs), the most recent job count available. Petitioners 17
argue that due to this error, respondents over-estimated the amount of the 18
projected jobs in the 20-year planning period by almost a factor of three. 19
Intervenor responds: 20
“* * * That safe harbor is prescribed for the first of the three Goal 21 9 employment land considerations * * *—a city’s population 22 based employment needs. The safe harbor does not apply to either 23 of the two other Goal 9 considerations—whether there are suitable 24 site types or regional employment opportunities. * * *” 25 Intervenor-Respondent’s Brief 36. 26
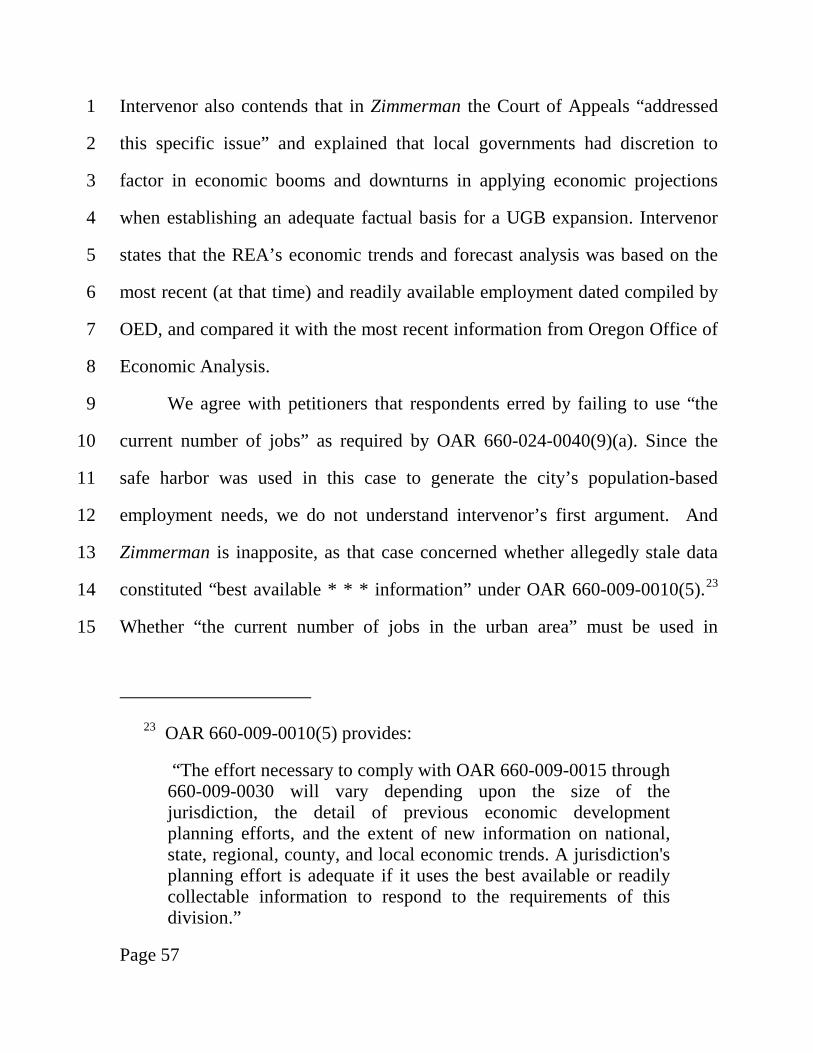
Page 57
Intervenor also contends that in Zimmerman the Court of Appeals “addressed 1
this specific issue” and explained that local governments had discretion to 2
factor in economic booms and downturns in applying economic projections 3
when establishing an adequate factual basis for a UGB expansion. Intervenor 4
states that the REA’s economic trends and forecast analysis was based on the 5
most recent (at that time) and readily available employment dated compiled by 6
OED, and compared it with the most recent information from Oregon Office of 7
Economic Analysis. 8
We agree with petitioners that respondents erred by failing to use “the 9
current number of jobs” as required by OAR 660-024-0040(9)(a). Since the 10
safe harbor was used in this case to generate the city’s population-based 11
employment needs, we do not understand intervenor’s first argument. And 12
Zimmerman is inapposite, as that case concerned whether allegedly stale data 13
constituted “best available * * * information” under OAR 660-009-0010(5).23 14
Whether “the current number of jobs in the urban area” must be used in 15
23 OAR 660-009-0010(5) provides:
“The effort necessary to comply with OAR 660-009-0015 through 660-009-0030 will vary depending upon the size of the jurisdiction, the detail of previous economic development planning efforts, and the extent of new information on national, state, regional, county, and local economic trends. A jurisdiction's planning effort is adequate if it uses the best available or readily collectable information to respond to the requirements of this division.”
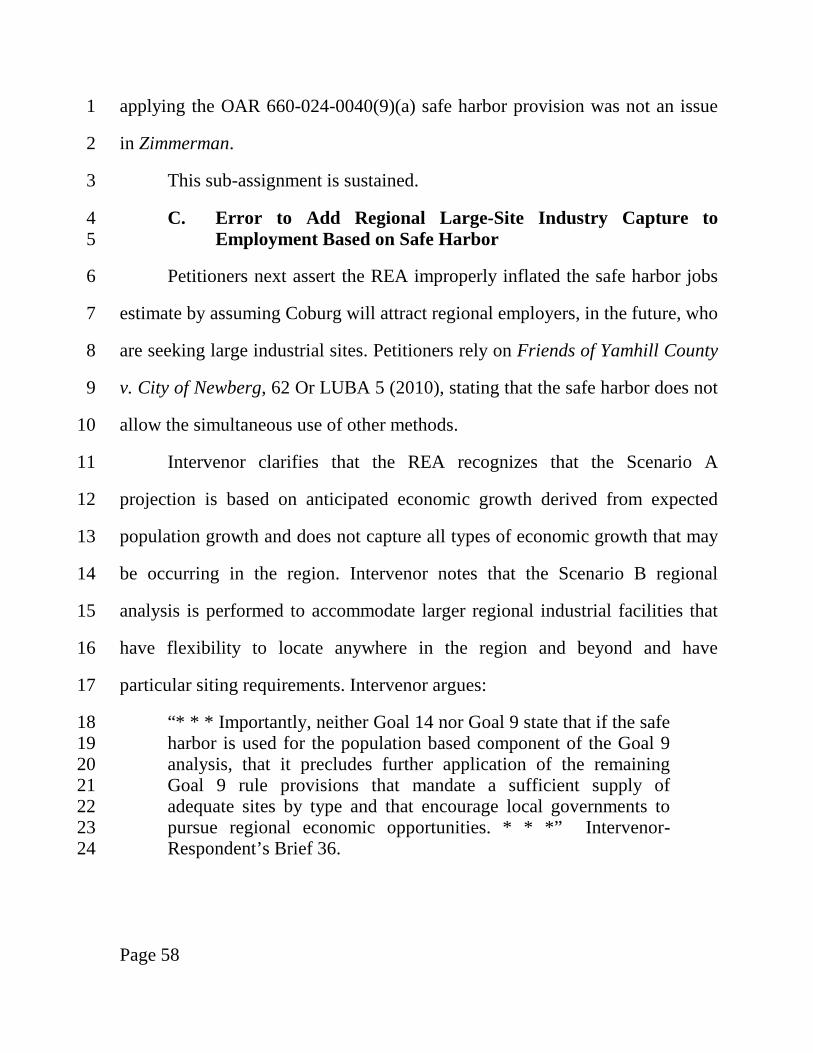
Page 58
applying the OAR 660-024-0040(9)(a) safe harbor provision was not an issue 1
in Zimmerman. 2
This sub-assignment is sustained. 3
C. Error to Add Regional Large-Site Industry Capture to 4 Employment Based on Safe Harbor 5
Petitioners next assert the REA improperly inflated the safe harbor jobs 6
estimate by assuming Coburg will attract regional employers, in the future, who 7
are seeking large industrial sites. Petitioners rely on Friends of Yamhill County 8
v. City of Newberg, 62 Or LUBA 5 (2010), stating that the safe harbor does not 9
allow the simultaneous use of other methods. 10
Intervenor clarifies that the REA recognizes that the Scenario A 11
projection is based on anticipated economic growth derived from expected 12
population growth and does not capture all types of economic growth that may 13
be occurring in the region. Intervenor notes that the Scenario B regional 14
analysis is performed to accommodate larger regional industrial facilities that 15
have flexibility to locate anywhere in the region and beyond and have 16
particular siting requirements. Intervenor argues: 17
“* * * Importantly, neither Goal 14 nor Goal 9 state that if the safe 18 harbor is used for the population based component of the Goal 9 19 analysis, that it precludes further application of the remaining 20 Goal 9 rule provisions that mandate a sufficient supply of 21 adequate sites by type and that encourage local governments to 22 pursue regional economic opportunities. * * *” Intervenor-23 Respondent’s Brief 36. 24
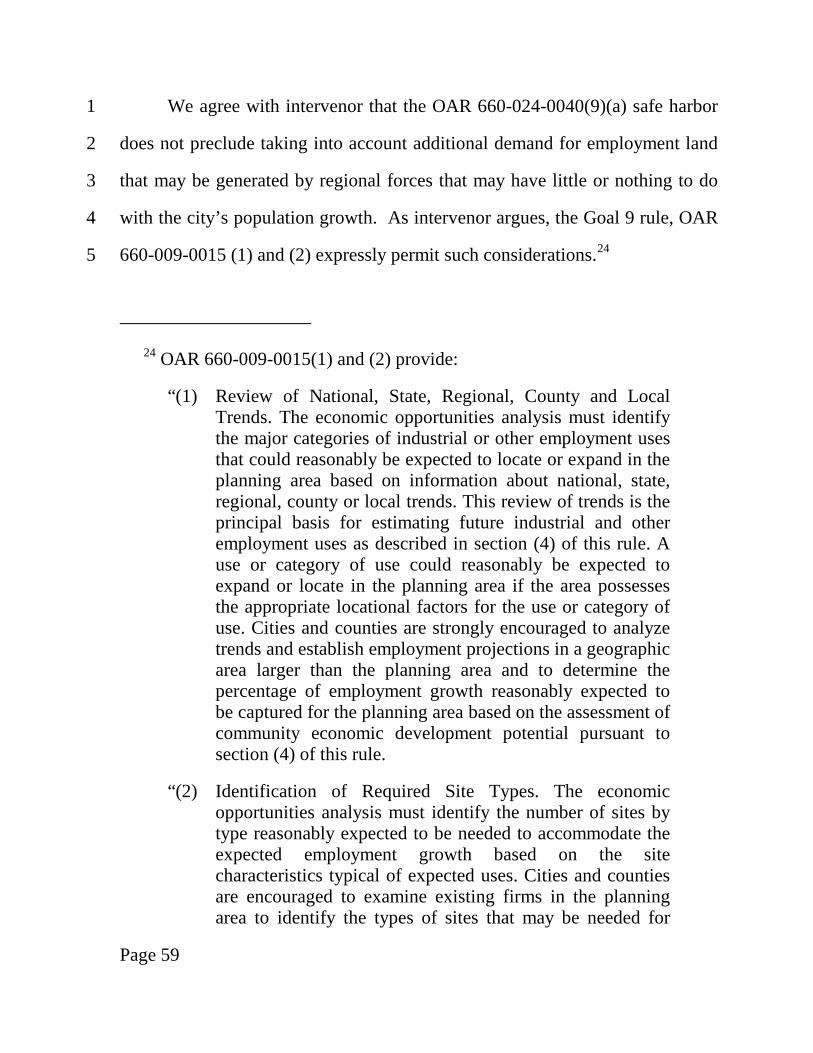
Page 59
We agree with intervenor that the OAR 660-024-0040(9)(a) safe harbor 1
does not preclude taking into account additional demand for employment land 2
that may be generated by regional forces that may have little or nothing to do 3
with the city’s population growth. As intervenor argues, the Goal 9 rule, OAR 4
660-009-0015 (1) and (2) expressly permit such considerations.24 5
24 OAR 660-009-0015(1) and (2) provide:
“(1) Review of National, State, Regional, County and Local Trends. The economic opportunities analysis must identify the major categories of industrial or other employment uses that could reasonably be expected to locate or expand in the planning area based on information about national, state, regional, county or local trends. This review of trends is the principal basis for estimating future industrial and other employment uses as described in section (4) of this rule. A use or category of use could reasonably be expected to expand or locate in the planning area if the area possesses the appropriate locational factors for the use or category of use. Cities and counties are strongly encouraged to analyze trends and establish employment projections in a geographic area larger than the planning area and to determine the percentage of employment growth reasonably expected to be captured for the planning area based on the assessment of community economic development potential pursuant to section (4) of this rule.
“(2) Identification of Required Site Types. The economic opportunities analysis must identify the number of sites by type reasonably expected to be needed to accommodate the expected employment growth based on the site characteristics typical of expected uses. Cities and counties are encouraged to examine existing firms in the planning area to identify the types of sites that may be needed for
Page 60
Petitioners’ reliance on Friends of Yamhill County is misplaced. LUBA 1
simply concluded in Friends of Yamhill County that “the Oregon Employment 2
Department job growth projection rate authorized by OAR 660-024-3
0040(9)(a)(A) and the coordinated population forecast projection rate 4
authorized by OAR 660-024-0040(9)(a)(B) are mutually exclusive 5
alternatives.” 62 Or LUBA at 30. We concluded the city could not switch 6
back and forth between those methodologies for different industries. Id. at 30-7
31. That is not what occurred here. We agree with intervenor on this point, and 8
also agree that Friends of Yamhill County does not support the proposition that 9
a government cannot use both the safe harbor provision to project the city’s 10
population growth based employment land needs and seek to capture additional 11
regional employment opportunities by allocating land to capture such regional 12
employment growth. 13
This subassignment of error is denied. 14
D. Double Counting Job Numbers for Large Lot Industrial 15
Petitioners also argue that the use of both the projected local 16
employment needs (Scenario A) in addition to regional needs (Scenario B) 17
double counts those large lot industrial jobs because large lot industrial jobs are 18
already a subset of Scenario A. 19
Intervenor-Respondent responds: 20
expansion. Industrial or other employment uses with compatible site characteristics may be grouped together into common site categories.”
Page 61
“Turning to Petitioners’ arguments here, the City’s original 1 demonstrated need for one or two 20-plus acre sites is a population 2 based industrial land need for target industrial uses that have 3 certain parcel size requirements. Its purpose is to replace the land 4 lost to local businesses use of those site types and to provide 5 similar types of sites to meet future local needs. However, REA is 6 looking at additional large site employers that might otherwise 7 locate somewhere else on the west coast but may locate in Coburg 8 if the conditions are right. In that respect, the regional opportunity 9 does not draw from the normal population growth within the cities 10 of Coburg, or even Eugene or Springfield. The regional need does 11 not already include the normal need for similar types of uses that 12 are based on population or employment projections as Petitioners’ 13 arguments contend; regional need is in addition to the local need. 14 Thus the number of jobs that may be created by a regional 15 opportunity are not already included in the initial EOA analysis – 16 there is no double counting.” Intervenor-Respondent’s Brief 40.25 17
We are not sure we fully understand either petitioners’ or intervenor’s 18
arguments on this point. Petitioners have the burden of demonstrating error. 19
We conclude petitioners have failed to demonstrate that respondents 20
improperly double-counted large-lot industrial jobs. 21
This subassignment of error is denied. 22
E. Failure to Consider Rezoning Surplus Commercial Land 23 Already Inside the UGB 24
Petitioners’ next subassignment of error is seven lines long, but bolstered 25
by additional arguments in a footnote. We reject the footnote arguments as 26
insufficiently developed to merit review. Petitioners’ complaint appears to be 27
25 Intervenor also points out that petitioners misread REA’s Scenario B1 to
assume Coburg “will capture 463 large-lot jobs,” whereas the REA actually indicates a regional need for 463 acres.
Page 62
that respondents did not adequately consider rezoning surplus commercially 1
designated lands to meet the identified need for employment lands. 2
Intervenor states that the 2010 Study concluded that the available 3
employment land inside the UGB will most likely be developed for smaller 4
businesses and would not be available for large lot industrial development. 5
Intervenor also argues the incorporated findings of the 2014 Update at Record 6
761-762 explain highway commercial lots identified by petitioners in the 7
proceeding totals only 22.5 acres and are insufficient to meet the need of a 8
minimum single 20 net buildable acre industrial site. 9
We conclude that petitioners have not established that respondents failed 10
to adequately consider rezoning existing commercially designated land to meet 11
some of the identified future need for employment land. 12
F. Failure to Account for Existing Regional Large Lot Supply 13
Petitioners finally argue that the challenged decision improperly ignores 14
that there are other communities in Lane County that can accommodate large 15
lot industrial sites, and that the findings fail to address this information and do 16
not explain how there can be an unmet regional need for 463 acres of large lot 17
industrial land when nearly that amount already exists within Lane County. 18
“[T]he record contains detailed evidence documenting that there 19 are already at least 450 acres of 20+ acre industrial sites presently 20 available in Lane County: a) 181 acres currently for sale in Eugene 21 and Creswell; b) 62 acres in Springfield; and c) 214 acres in 22 Goshen, most of it already served by I-5 and rail.” Petition for 23 Review 48 (original emphasis omitted). 24
Page 63
Intervenor contends that petitioners rely on an isolated table in the REA 1
and do not consider what follows. According to intervenor, the REA shows 2
that the City of Springfield has a deficit of 450 acres for large lot industrial 3
development, not 62 available acres. Intervenor contends the REA shows that 4
Eugene has determined it needs to expand its UGB to add 457 acres to meet its 5
needs and that the 181 acres petitioners identify are already needed to meet 6
Eugene’s needs. Finally, intervenor contends that the evidence petitioners rely 7
on to establish that that 214 acres of land is available in Goshen for large lot 8
employment development shows those acres are already developed. 9
We agree with intervenor that petitioners have not established that 10
respondents failed to adequately consider existing available land to meet 11
regional land for large lot employment land needs. 12
This subassignment of error is denied. 13
FOURTH ASSIGNMENT OF ERROR 14
ORS 197.732, Goal 2, Part II; and OAR Chapter 660, Division 4 all 15
authorize local governments to take “exceptions” to the statewide planning 16
goals. As defined by OAR 660-004-0005(1), 17
“An ‘Exception’ is a comprehensive plan provision, including an 18 amendment to an acknowledged comprehensive plan, that: 19
“(a) Is applicable to specific properties or situations and does not 20 establish a planning or zoning policy of general 21 applicability; 22
“(b) Does not comply with some or all goal requirements 23 applicable to the subject properties or situations; and 24
Page 64
“(c) Complies with ORS 197.732(2), the provisions of this 1 division and, if applicable, the provisions of OAR 660-011-2 0060, 660-012-0070, 660-014-0030 or 660-014-0040.” 3
Citing language in the decision that can be read to suggest respondents 4
attempted to take an exception to the ORS 197.298(1) priority scheme, 5
petitioners contend that while the exception process is a permissible vehicle for 6
attempting to avoid statewide planning goal requirements, there is simply no 7
authority for taking an exception to a statutory requirement, such as the ORS 8
197.298(1) priority requirement. 9
We understand respondents to take the position respondents were not 10
attempting to approve an exception to ORS 197.298, or any particular 11
statewide planning goal or administrative rule, but rather were simply 12
attempting to respond to the Court of Appeals decision in McMinnville “that 13
says clearly that there must be an exceptions analysis as a part of the UGB 14
expansion process.” Respondents’ Brief 68. Intervenor-Respondent takes a 15
different approach and argues that because the version of Goal 14 that applied 16
in this case required that respondents evaluate “alternative boundary locations 17
consistent with ORS 197.298,” it was entirely appropriate for respondents to 18
attempt to approve an exception. 19
The old version of Goal 14 that applied in McMinnville provided “a 20
governing body proposing [a] change in the boundary separating urbanizable 21
lands from rural land, shall follow the procedures and requirements as set forth 22
in the Land Use Planning goal (Goal 2) for goal exceptions.” That requirement 23

Page 65
complicated an already complicated process, and the version of Goal 14 that 1
applies in this case does not include that language or requirement. We agree 2
with respondents that it does not appear that respondents were attempting to 3
approve an exception to ORS 197.298, or any particular goal or rule, but rather 4
mistakenly believed they were required to follow exception procedures and 5
requirements under Goal 14, as analyzed in McMinnville. 6
We reject intervenor’s contention that because the applicable version of 7
Goal 14 states an UGB amendment must be consistent with the priority scheme 8
set out in ORS 197.298, the statute thereby becomes eligible for an exception. 9
A local government may not approve an exception to a statute. Because we 10
conclude respondents did not take an exception to the ORS 197.298 priority 11
scheme, which is the premise of petitioners’ fourth assignment of error, the 12
fourth assignment of error is denied. 13
CONCLUSION 14
Our resolution of petitioners’ assignments of error requires that we 15
remand Ordinance 1315, which among other things amends the UGB. Because 16
we reject petitioners’ challenges under Goal 9 to the TSP, it is less clear 17
whether Ordinance 1314, which adopts amendments to the TSP, must also be 18
remanded. But it is undisputed that, the east-west bypass could not be 19
constructed across rural agricultural land, and therefore depends on the UGB 20
amendment to include the lower part of Area 6. And as noted earlier, the 21
claimed need for the east-west bypass was one of the reasons respondents gave 22
Page 66
for including the lower part of Area 6 in the UGB. Given that interdependence 1
of the two ordinances, remand of both ordinances is required. 2
Ordinances 1314 and 1315 are remanded. 3
4
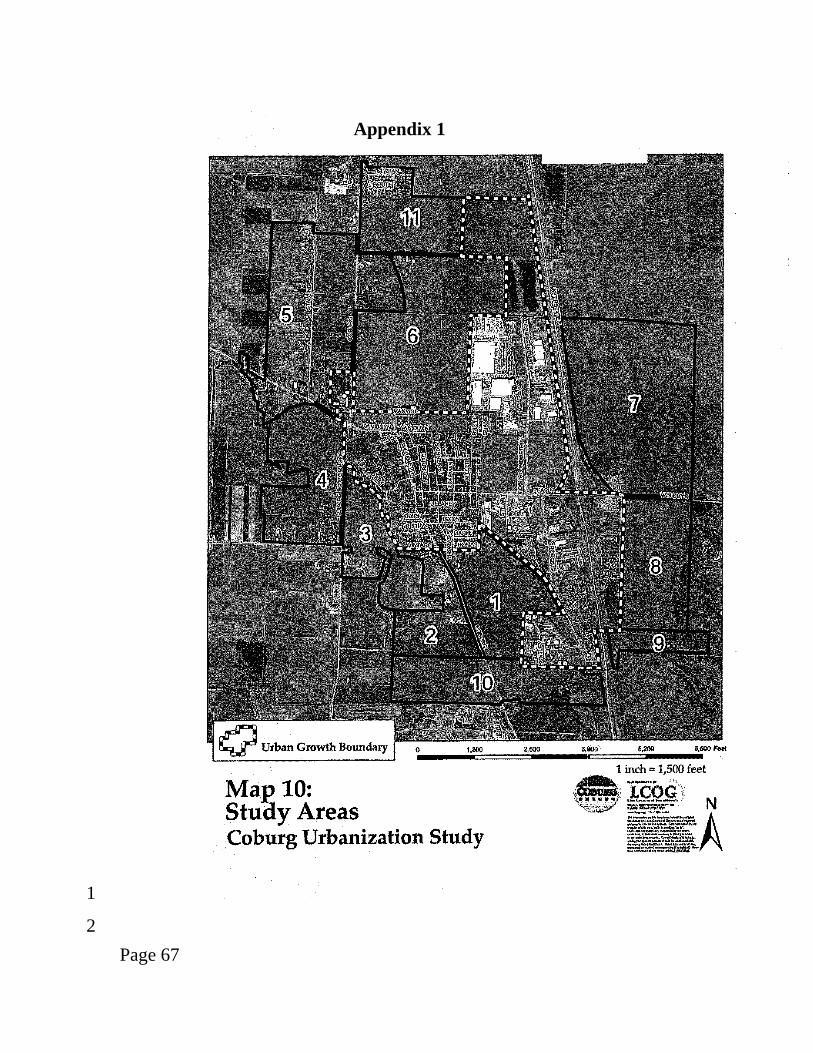
Page 67
1
2
Appendix 1

Page 68
1
2
3
Appendix 2
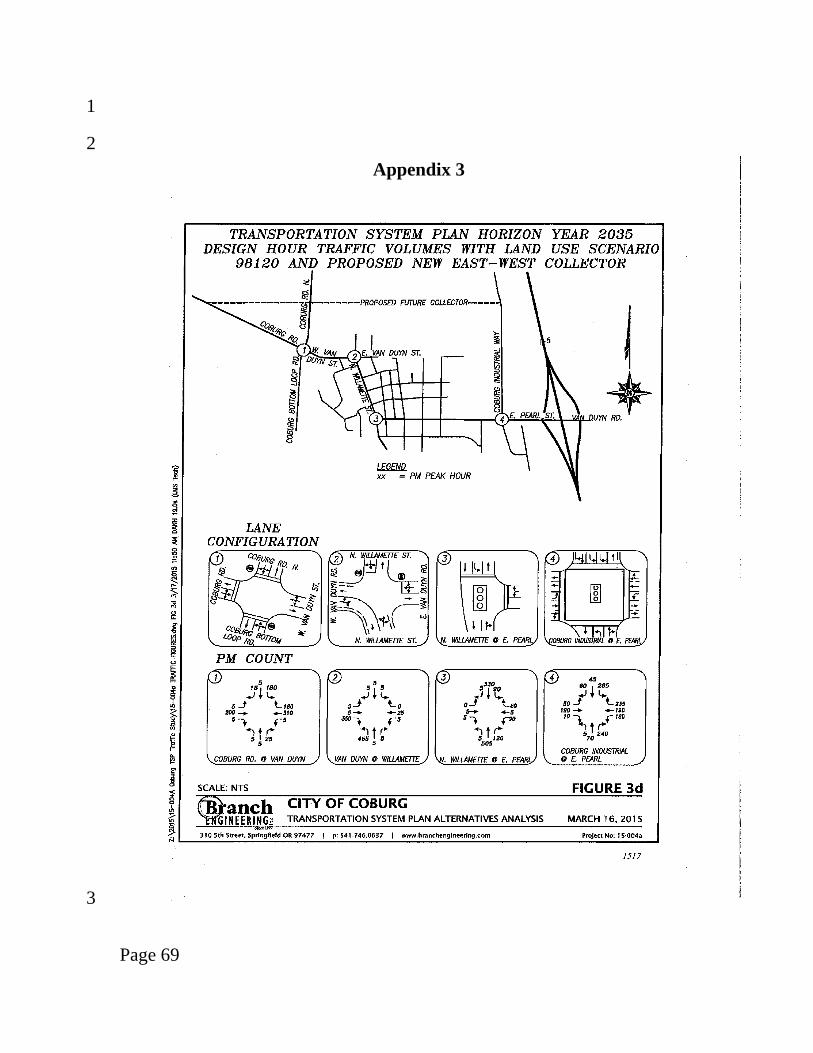
Page 69
1
2
3
Appendix 3
No. 664 December 29, 2016 217
IN THE COURT OF APPEALS OF THE STATE OF OREGON
LAND WATCH OF LANE COUNTY and Lee D. Kersten,
RespondentsCross-Petitioners,
v.LANE COUNTY,Respondent below,
andCITY OF COBURG
and Interstate Properties, Inc.,Petitioners
Cross-Respondents.Land Use Board of Appeals2016003, 2016004; A162909
Argued and submitted October 12, 2016.
Milo Mecham argued the cause for petitioners-cross-re-spondents. With him on the joint briefs were Daniel Terrell and Law Offices of Bill Kloos PC.
William K. Kabeiseman argued the cause for respon-dents-cross petitioners. With him on the brief were Carrie A. Richter and Bateman Seidel Miner Blomgren Chellis & Gram, P.C.
Before Duncan, Presiding Judge, and DeVore, Judge, and Garrett, Judge.
DEVORE, J.
Affirmed on petition and cross-petition.Case Summary: The City of Coburg and Lane County petition for review of
a decision of the Land Use Board of Appeals (LUBA), and Land Watch of Lane County cross-petitions. LUBA considered Land Watch’s appeal of two coadopted ordinances, amending the city’s urban grown boundary (UGB) and revising the city’s transportation system. LUBA remanded the city and county’s land use determination, because it determined that the city and county had not satis-fied the requirements under ORS 197.298 and the Goal 14 factors, as per the process outlined in 1000 Friends of Oregon v. LCDC, 244 Or App 239, 259 P3d 1021 (2011) (McMinnville), concerning use of higher-priority lands for inclusion
BCC Packet for 5/1/2018Coburg UGB Expansion/RemandAttachment 3

218 Land Watch of Lane County v. Lane County
in an expansion of an UGB. The city and county contend that LUBA erroneously determined that the city and county’s findings were insufficient to satisfy ORS 197.298 and that LUBA misapplied the analysis outlined in McMinnville. Land Watch cross-petitions, contending that LUBA’s order was unlawful in substance for two reasons. First, Land Watch contends that LUBA improperly interpreted the “safe harbor” rule of OAR 660-024-0040(9)(a) as not precluding a city, in its employment forecast, from considering certain employment-based needs for a UGB expansion. Second, Land Watch contends that there was not substan-tial evidence supporting the city’s employment forecast, as relied upon in the city’s urbanization study and land use determinations, because the employment forecast twice counted the same subset of employment-based growth calculation. Held: On petition, in light of the record, LUBA correctly ruled that the city and county failed to follow the McMinnville analysis. LUBA properly understood and applied its substantial evidence standard. On the cross-petition, LUBA’s order was not unlawful in substance; a city is not precluded from projecting an employ-ment need that considers employment opportunities from outside an urban area. LUBA did not misapply the substantial evidence standard in determining that Land Watch had failed to demonstrate a “double-counting of large-lot industrial jobs.”
Affirmed on petition and cross-petition.
Cite as 283 Or App 217 (2016) 219
DEVORE, J.
This case involves review of a decision of the Land Use Board of Appeals (LUBA). In 2015, following urban-ization studies and public hearings, the City of Coburg and Lane County coadopted two ordinances to amend the city’s urban growth boundary (UGB) and to revise the city’s transportation system plan. Respondents, Land Watch and Kersten, appealed to LUBA, contending that the amended UGB was not supported by an adequate factual basis and that the county did not comply with Oregon statutes, state-wide planning goals, and administrative rules.1 LUBA remanded both ordinances because the local findings were insufficient to satisfy ORS 197.298 and factors pertaining to Goals 9 and 14. The city and county seek review of LUBA’s order. Land Watch cross-petitions, contending that the city used two mutually exclusive ways of calculating its employ-ment-based land need and that the city had “double-counted” future employment growth. We affirm on the petition and cross-petition.
I. BACKGROUND
A. Local Government Proceedings
In 2010, the City of Coburg conducted an urbaniza-tion study, as part of a periodic review, to evaluate its land needs in light of future employment and residential growth over a period of 20 years. See ORS 197.628 - 197.644 (peri-odic review requirement). The study concluded that the city would need to expand its UGB to meet its projected growth.2
The urbanization study was updated in 2014 with an addendum, reflecting changes between 2010 and 2014. Generally, the addendum concluded that there was a “need for a UGB expansion * * * based on forecast need for large industrial sites within Coburg and the Central Lane County
1 Land Watch and Kersten are jointly represented by counsel and did not file separate briefing. For ease of reference, throughout the opinion we refer to the parties collectively as “Land Watch.” 2 “A UGB is the part of the land use map in a city’s comprehensive plan that demarcates the area around a city that is available for expansion and future urban uses.” 1000 Friends of Oregon v. LCDC, 244 Or App 239, 241, 259 P3d 1021 (2011) (McMinnville).
220 Land Watch of Lane County v. Lane County
region.” The addendum concluded that the “scenarios,” which the city council had selected in 2010, remained the recom-mended sites for expansion. In 2014, the city also conducted a Regional Economic Analysis (REA), prepared by an eco-nomic and development services company, E.D. Hovee. The REA considered “scenarios,” each of which would require expansion of Coburg’s UGB.3
“[W]hen a city amends its comprehensive plan, including any amendment to its UGB, the city must justify the change as being consistent with the [Land Conservation and Development Commission (LCDC)] goals, except to the extent that compliance with a goal is excused by an excep-tion to its application.” 1000 Friends of Oregon v. LCDC, 244 Or App 239, 243, 259 P3d 1021 (2011) (McMinnville); see also ORS 197.175 (requiring cities and counties to exercise land planning and zoning responsibilities in accordance with state land use statutes and goals approved by LCDC).
In this case, 11 discrete areas of land were consid-ered as sites for the UGB expansion. Of those areas, Areas 1, 6, 7, and 8 were predominantly agricultural land that had been zoned for exclusive farm use (EFU). Maps of the UGB were employed, illustrating alternative arrangements to address the city’s projected land needs. The city considered a map that illustrated growth using “exception lands.” They are lands outside the UGB in which the city or county can take an “exception” to the application of a goal to particular property that is regulated by LCDC substantive standards. See Waste Not of Yamhill County v. Yamhill County, 240 Or App 285, 287-89, 246 P3d 493 (2010), adh’d to as modified on recons, 241 Or App 199, 255 P3d 496 (2011) (explaining the relationship between goals and exception process). Other alternatives illustrated growth using EFU land.
3 Scenario A was “modeled to align with the forecast methodology provided with the 2010 Urbanization Study.” Scenario B was “predicated on the eco-nomic opportunity for Coburg to serve regional needs for large 20+ acre sites that require I-5 freeway access in addition to capturing its Safe Harbor share of regionally forecast job grown[.]” (Emphasis in original.) Three “variations” on Scenario B were included in the REA (B1, B2, and B3). Each variation illustrated a different “regional market capture rate”—10, 20, and 30 percent, respectively. In its order, LUBA determined that the city and county “determined the need for employment land * * * consistent with [Scenarios] B1 and B2, and whatever assumptions and studies justified those figures.”
Cite as 283 Or App 217 (2016) 221
The city considered alternatives that proposed using those 11 areas for residential and employment-based expan-sions. The urbanization study noted that “[a]ll employment land expansion alternatives show expansion occurring on the east side of I-5 in order to take advantage of the excel-lent transportation opportunities presented at this location.” The study recommended, for employment-related growth, an expansion of 106 acres using the entirety of “Study Area 8.” That area, comprised of EFU land, “would require the City to expand further across I-5 * * * as well as extend[ ] water and sewer services to the areas.” With regard to residentially- related growth, the study recommended an expansion that included “Study Areas 1, 2, 5 and 6.” The city, however, determined that Areas 5 and 7 were unavailable or unsuit-able for employment-based development, despite its recogni-tion that those areas were, in fact, “higher-priority” lands under the applicable land use standards for inclusion in an expansion of the UGB.
The study’s recommendations were based, in part, on an analysis of estimated future population and employ-ment growth (population and employment forecast). In 2010, the urbanization study had explained:
“Based upon State forecasted employment growth, employ-ment growth within Coburg’s UGB is anticipated to yield an additional 615 new jobs, for an employment total of 4,035 in 2030. This projection is based upon one of the Safe Harbor[s]. Safe Harbors were established in OAR 660-024-0040(8)(a), and adjusted based on local knowledge and/or community vision. As part of this process, the employment growth rates are based on the trends at the County level, which have been estimated by the Oregon Employment Department. As a result, Coburg’s employment is projected to grow at a rate equal to the County or Regional job growth rate provided in the most recent forecast published by the Oregon Employment Department. The employment growth rate has been evaluated by applying the annual average growth rate (AAGR) percentages from OED’s 10-year Lane County employment sector forecast (2006-2016) to Coburg’s industry sectors (2008-2030).”
(Emphasis added.) In the 2014 addendum, the city explained that it was relying on the 2010 data for its analysis “because the long-term forecast is expected to be realized, and
222 Land Watch of Lane County v. Lane County
therefore the calculation of employment change requires a starting figure reflecting Coburg’s existing employment capacity and redevelopment potential.” (Underscoring omit-ted.) The 2014 addendum added:
“If Coburg’s job growth rate were adjusted upwards to reflect the updated overall growth expectations for Lane County * * *, the employment gain within Coburg’s UGB would double from the previous projection of an added 615 jobs to 1,292 net added jobs over a 20-year planning horizon. It is noted * * * that a truly sector specific forecast was not possible given the information that economist Eric Hovee was provided [for the REA]. “
The projected employment-based land need, as determined by Hovee in the REA, would become a contested issue before LUBA and again before this court.
Coburg’s city council held public hearings and adopted the UGB expansion. The Lane County Planning Commission recommended to the Board of County Com-missioners that it approve an ordinance and coadopt the city’s plan. On December 8, 2015, the Board of County Commissioners coadopted two ordinances: (1) ordinance PA 1314, coadopted by the city, which permitted a city trans-portation system plan beyond the city limits, within the future growth areas, and (2) ordinance PA 1315 amending and coadopting the city’s plan to extend its UGB “by adding and redesignating 105.72 acres of land for Light Industrial use, 2.0 acres for High Density Residential use, 15.0 acres for Medium Density use, and 131.84 acres for Traditional Residential use.”4
B. LUBA Proceedings
Land Watch appealed both ordinances to LUBA, based on legal standards and the factual basis for the deci-sions. Before we address those arguments, we summarize
4 In its findings and conclusions supporting the ordinance, the county explained that changes to a city’s UGB must be coadopted by the county because the changes “remove certain property from the Rural Comprehensive Plan.” The county made a number of findings in support of its approval consistent with the criteria outlined in the Lane County Code (LC). See LC 12.050 (method of adop-tion and amendment); LC 16.400 (rural comprehensive plan amendments).
Cite as 283 Or App 217 (2016) 223
the legal framework which is applicable to this case, and which was described in McMinnville, 244 Or App at 242-45.
The priorities for the types of lands that may be included within a UGB are established in ORS 197.298. In relevant part, “exception lands” have higher priority for inclusion in the UGB than EFU lands. When a local gov-ernment must choose between agricultural lands, it must generally choose the agricultural lands with less productive soil. These priorities are reflected in ORS 197.298 which provides:
“(1) In addition to any requirements established by rule addressing urbanization, land may not be included within an urban growth boundary * * * except under the following priorities:
“(a) First priority is land that is designated urban reserve land under ORS 195.145, rule or metropolitan ser-vice district action plan.
“(b) If land under paragraph (a) of this subsection is inadequate to accommodate the amount of land needed, second priority is land adjacent to an urban growth bound-ary that is identified in an acknowledged comprehensive plan as an exception area or nonresource land. Second priority may include resource land that is completely sur-rounded by exception areas unless such resource land is high-value farmland as described in ORS 215.710.
“(c) If land under paragraphs (a) and (b) of this sub-section is inadequate to accommodate the amount of land needed, third priority is land designated as marginal land pursuant to ORS 197.247 (1991 Edition).
“(d) If land under paragraphs (a) to (c) of this sub-section is inadequate to accommodate the amount of land needed, fourth priority is land designated in an acknowl-edged comprehensive plan for agriculture or forestry, or both.
“(2) Higher priority shall be given to land of lower capability as measured by the capability classification sys-tem or by cubic foot site class, whichever is appropriate for the current use.
“(3) Land of lower priority under subsection (1) of this section may be included in an urban growth boundary if
224 Land Watch of Lane County v. Lane County
land of higher priority is found to be inadequate to accom-modate the amount of land estimated in subsection (1) of this section for one or more of the following reasons:
“(a) Specific types of identified land needs cannot be reasonably accommodated on higher priority lands;
“(b) Future urban services could not reasonably be provided to the higher priority lands due to topographical or other physical constraints; or
“(c) Maximum efficiency of land uses within a pro-posed urban growth boundary requires inclusion of lower priority lands in order to include or to provide services to higher priority lands.”5
Closely related, Goal 14, OAR 660-015-0000(14), establishes the goal for urbanization is:
“To provide for an orderly and efficient transition from rural to urban land use, to accommodate urban population and urban employment inside urban growth boundaries, to ensure efficient use of land, and to provide for livable communities.”
In addition, Goal 14 provides standards of “Land Need” that involve setting or changing a UGB:
“Establishment and change of urban growth boundar-ies shall be based on the following:
“(1) Demonstrated need to accommodate long range urban population, consistent with a 20-year population forecast coordinated with affected local governments, or for cities applying the simplified process under ORS chapter 197A, a 14-year forecast; and
“(2) Demonstrated need for housing, employment opportunities, livability or uses such as public facilities, streets and roads, schools, parks or open space, or any com-bination of the need categories in this subsection (2). * * *.”
Goal 14 describes factors for “Boundary Location” that involves changes to the UGB. Those factors are intro-duced by the statement that “[t]he location of the urban
5 ORS 197.298 (2013), which was operative at all relevant times in this case, has since been amended, but those amendments do not apply in this case and are immaterial. See Or Laws 2013, ch 575, § 12. References to ORS 197.298 through-out this opinion are to the current version of the statute.
Cite as 283 Or App 217 (2016) 225
growth boundary and changes to the boundary shall be determined by evaluating alternative boundary locations consistent with * * * ORS 197.298” as well as the factors related to Goal 14. OAR 660-015-0000(14).
As we explained in McMinnville, “ORS 197.298 sup-plements the Goal 14 criteria used to justify a UGB change. The statute requires that land be added to a UGB in a prior-ity sequence.” 244 Or App at 244. Therefore, ORS 197.298(1) “requires that the statutory priorities be applied to UGB amendments ‘[i]n addition to any requirements established by rule addressing urbanization,’ i.e., Goal 14 and its imple-menting administrative rules. The priority statute directs the application of different, but somewhat analogous, factors in approving UGB changes than those mandated by Goal 14.” Id. at 245.
We have interpreted ORS 197.298 and Goal 14 to work harmoniously, even if in tension. Id. at 260-65. Accordingly, we have outlined a three-step process “to jus-tify the inclusion or exclusion of the sorted lands and any remaining choices about what land to include [within an UGB].” Id. at 254. We need not revisit here the process out-lined in McMinnville.6 For this case, it suffices to say that the “application of all of the provisions in Goal 14 to the resulting UGB change is required * * *. The application of Goal 14 to the land that results from the prioritization of ORS 197.298 allows the separate and full use of both policies in justifying a UGB change that is contemplated by the pri-orities statute.” Id. at 266 (emphases added).
For our review, we summarize Land Watch’s two contentions before LUBA that are pertinent here. First, Land Watch contended that the city had impermissibly excluded higher-priority lands from inclusion in the UGB (exception lands and EFU land with Class 4 soils). Land Watch disputed the city’s conclusions that Areas 5 and 7 were “inadequate” or “unusable.” Second, Land Watch con-tended that the city had not properly based a UGB decision
6 Those three steps, in brief, are determining the land needed under ORS 197.298(1), determining the adequacy of candidate lands under ORS 197.298 and Goal 14, and determining which candidate lands should be included under Goal 14. McMinnville, 244 Or App at 255-66.
226 Land Watch of Lane County v. Lane County
on the 2010 urbanization study or 2014 addendum, because the study had impermissibly calculated its REA employ-ment forecasts. As its premise, Land Watch assumed that there are two, mutually exclusive options for calculating an employment projection—a safe harbor method and a stand-alone approach. Therefore, Land Watch contended that the city had used the safe harbor method but then impermissi-bly augmented that calculation.7 In a related subassignment of error, Land Watch contended that the city had “double- count[ed] large-lot industrial jobs.”8
In its order, LUBA agreed with some of Land Watch’s contentions. LUBA observed that the county’s brief “neither acknowledg[ed] nor directly respond[ed] to” Land Watch’s arguments on a number of issues. LUBA concluded, among other things, that there was no substantial evidence for the exclusion of Areas 5 and 7 because the city and county had not properly applied the three-step process outlined in McMinnville, 244 Or App at 239. LUBA ruled that the city and county had not satisfied the requirements under ORS 197.298 and under the Goal 14 factors. That is, the city and county did not properly justify their decision to exclude areas of inferior agricultural quality while including better agricultural lands within an expanded UGB.
With regard to Land Watch’s argument that the city had “double-counted” its employment-based fore-cast in the REA, LUBA concluded that the “OAR 660-024-0040(9)(a) safe harbor does not preclude taking into account additional demand for employment land that may be generated by regional forces that may have little or nothing to do with the city’s population growth. * * * [T]he Goal 9 rule, OAR 660-009-0015 (1) and (2) expressly per-mit such considerations.” LUBA also concluded that Land
7 In its petition to LUBA, Land Watch contended that “Scenario A” had been “improperly calculate[ed].” In its cross-petition to this court, however, Land Watch does not make a clear challenge involving the calculation of “Scenario A.” Land Watch states, for example, that the city “should have stopped * * * with its ‘Scenario A’ safe harbor jobs forecast and corresponding land need.” 8 That argument was based upon employment forecasts as presented in tables within the REA. Land Watch argued that the “324 jobs in Scenario A are an already-counted subset of Coburg’s large-lot job capture—and they cannot be counted a second time as part of Scenario B.” (Emphasis in original; boldface omitted.)
Cite as 283 Or App 217 (2016) 227
Watch had had “the burden of demonstrating error,” and that Land Watch had “failed to demonstrate that [the city and county] improperly double-counted large-lot indus-trial jobs.” LUBA issued a final order remanding the ordi-nances reflecting the proposed UGB expansion and trans-portation system plan.
II. ANALYSIS
A. Petition for Judicial Review
In its petition for judicial review, the city and county make three assignments of error. We reject, without discus-sion, the county’s second and third assignments. We write briefly to explain our rejection of the county’s first assign-ment. In the first assignment, the city and county assert that LUBA erred in concluding that the county had erro-neously construed ORS 197.298 and misapplied the analy-sis outlined in McMinnville. The city and county rejoin that “LUBA ignored the established standards of review and dis-missed substantiated local findings that supported Coburg’s conclusions regarding the inclusion of lower priority land pursuant to ORS 197.298.” The city and county stress that they had substantial evidence for their reasoning. The city and county posit that so long as a city “considers the actual appropriate factors as determined * * * [under McMinnville], and makes its decision based on how those permissible ele-ments work to form a decision set concerning the inclusion or exclusion of available land,” then a review of other applica-ble factors should not “invalidate” the city’s decision-making process.
We reject those arguments. Our task on judicial review is to determine whether LUBA’s order is “unlawful in substance.” ORS 197.850(9)(a). Initially, we are persuaded, on this record, that LUBA correctly ruled that the city and county failed to follow the McMinnville analysis. That is, the city and county failed to adhere to the priorities required by statute and goal. It does not suffice to say that the city and county merely considered them. McMinnville, 244 Or App at 266 (“[A]pplication of all of the provisions in Goal 14 to the resulting UGB change is required * * *.”). Moreover, to the extent that the parties argue about substantial evidence, we have reviewed the record and LUBA’s decision, and we

228 Land Watch of Lane County v. Lane County
are persuaded that LUBA properly understood and applied its substantial evidence standard. See Barkers Five, LLC v. LCDC, 261 Or App 259, 348, 323 P3d 368 (2014) (“[O]ur role is not to review * * * for evidentiary support. Instead, we determine whether [the board] understood and applied the substantial-evidence standard correctly.”). Therefore, we do not disturb LUBA’s determinations that the city and county had not satisfied the requirements under ORS 197.298 and under the Goal 14 factors.
B. Cross-Petition
We turn to Land Watch’s cross-petition and address LUBA’s rulings, both concerning the city’s REA and future employment projections or “forecasts.” Land Watch charac-terizes LUBA’s ruling as concluding that “Coburg could use two methods of calculating the city’s industrial land needs and add them together to determine its need for a UGB expansion for industrial land, when the methods are legally mutually exclusive.” We address the cross-petition in two parts, as LUBA did. First, we consider LUBA’s interpretation of OAR 660-024-0040(9)(a) to determine whether LUBA’s interpretation of that “safe harbor” rule was unlawful in substance. Second, we consider LUBA’s ruling that there was substantial evidence supporting the city’s employment forecast—that is, the issue of so-called “double-counting” of large-lot industrial jobs.
1. OAR 660-024-0040(9)(a)
LUBA ruled that the OAR 660-024-0040(9)(a) “safe harbor” does not preclude a city from considering additional demand for employment land, when completing an “employ-ment forecast.” As we will explain, we conclude that the rul-ing was not unlawful in substance.
Goal 9 provides that urban planning in comprehen-sive plans must “[i]nclude an analysis of the community’s economic patterns, potentialities, strengths, and deficien-cies as they relate to state and national trends.” OAR 660-015-0000(9); see also ORS 197.712(2) (codification of Goal 9 requirements for urban comprehensive plans). Several other administrative rules direct and focus the analysis under that Goal 9 requirement. At issue here is the city’s application of
Cite as 283 Or App 217 (2016) 229
the “safe harbor” provision, OAR 660-024-0040(9), which provides, in part:
“The following safe harbors may be applied by a local government to determine its employment needs for pur-poses of a UGB amendment under this rule, Goal 9, OAR chapter 660, division 9, Goal 14 and, if applicable, ORS 197.296.
“(a) A local government may estimate that the cur-rent number of jobs in the urban area will grow during the 20-year planning period at a rate equal to either:
“(A) The county or regional job growth rate pro-vided in the most recent forecast published by the Oregon Employment Department; or
“(B) The population growth rate for the urban area in the appropriate 20-year coordinated population forecast determined under Rules in OAR 660, div 32.”
(Emphasis added.)
That rule cannot be read in isolation. As LUBA explained, OAR 660-024-0040(9) finds context in rela-tion to another rule, OAR 660-009-0015, which addresses “economic opportunities analyses” (EOA). Cities and counties must engage in economic opportunities analyses, and those analyses must contain information required by that rule. The analyses should include the following information:
“(1) Review of National, State, Regional, County and Local Trends. The economic opportunities analysis must identify the major categories of industrial or other employ-ment uses that could reasonably be expected to locate or expand in the planning area based on information about national, state, regional, county or local trends. This review of trends is the principal basis for estimating future indus-trial and other employment uses as described in section (4) of this rule. A use or category of use could reasonably be expected to expand or locate in the planning area if the area possesses the appropriate locational factors for the use or category of use. Cities and counties are strongly encour-aged to analyze trends and establish employment projec-tions in a geographic area larger than the planning area and to determine the percentage of employment growth
230 Land Watch of Lane County v. Lane County
reasonably expected to be captured for the planning area based on the assessment of community economic develop-ment potential pursuant to section (4) of this rule.
“(2) Identification of Required Site Types. The eco-nomic opportunities analysis must identify the number of sites by type reasonably expected to be needed to accom-modate the expected employment growth based on the site characteristics typical of expected uses. Cities and counties are encouraged to examine existing firms in the planning area to identify the types of sites that may be needed for expansion. * * *.
“* * * * *
“(4) Assessment of Community Economic Development Potential. The economic opportunities analysis must estimate the types and amounts of industrial and other employment uses likely to occur in the planning area. The estimate must be based on information generated in response to sections (1) to (3) of this rule and must consider the planning area’s economic advantages and disadvan-tages. * * *.”
OAR 660-009-0015.
Read in that context, we agree with LUBA that the safe harbor set out under OAR 660-024-0040(9) does not preclude a city, in its EOA analysis or an “employment fore-cast,” from considering other employment-based needs for a UGB expansion. A city is not precluded from projecting a need that considers additional employment opportunities from outside the urban area. A city may have many relevant considerations when estimating employment-based growth needs and is not bound by the safe harbor of OAR 660-024-0040(9) to consider the prescribed growth rate in isolation. Rather, as noted in OAR 660-009-0015(1), for example, “[c]ities and counties are strongly encouraged to analyze trends and establish employment projections in a geographic area larger than the planning area and to determine the percentage of employment growth reasonably expected to be captured for the planning area based on the assessment of community economic development potential” outlined under that rule. (Emphases added.) Therefore, OAR 660-024-0040(9) may limit a calculation of the 20-year projected growth of the “current number of jobs in the urban area.”

Cite as 283 Or App 217 (2016) 231
(Emphasis added.) The rule, however, does not prohibit a city from considering, as part of its overall analysis, growth from larger projected employment trends outside that urban growth area.9
2. “Double-Counting” in REA Employment Forecasts
Before LUBA and now again before this court, the parties disputed how Hovee arrived at the particular calcu-lations in the REA for Scenarios B1, B2, and B3, and whether those projections were permissibly calculated. At the heart of this argument is a chart titled, “Coburg Industrial Scenarios with Regional Large Site Industrial Capture,” prepared by Hovee. That chart is described as “depict[ing] results of alternative regional capture rates that might be considered in terms of resulting 20-acre land demand added to existing local industrial need as previously indicated for [Scenario A].” (Emphasis in original.)
Land Watch challenges that, in determining a final employment-based land need, the city took a subset of the “Scenario A” calculation and reused it in calculating “Scenario B.” Relying on that understanding of the urban-ization study, Land Watch asserts that, because the analysis reused the same subset of projected employment-based need, the analysis impermissibly “resulted in a double-counting of employment need.”10 That is, Land Watch contends that the projected land need was inflated, because both “Scenario A safe harbor and the add-on ‘regional’ Scenario B1 land need determinations identified 20+ acre parcel sizes as a neces-sary special site characteristic for industrial land.”
In its response brief to LUBA, the city and county contended that Land Watch had misunderstood “the basis behind” the REA. They proposed a different understanding of the calculations:
9 The forecast must, of course, be supported by an adequate factual basis and may be challenged to demonstrate how its approach in creating its forecast is reliable. See, e.g., Meyer v. Douglas County, 61 Or LUBA 412, 416 (2010); Friends of Marion County v. City of Keizer, 45 Or LUBA 236, 248-50 (2003). 10 Specifically, Land Watch contends that the REA “added Scenario A’s 68.7 acres and Scenario B1’s 51.4 acres, resulting in a total industrial land need of 120.1 acres accommodating a total of 1,272 jobs (809 [industrial jobs] + 463 [industrial jobs]).” (Emphasis omitted.)

232 Land Watch of Lane County v. Lane County
“[T]he REA * * * recognizes that an EOA based simply on anticipated economic growth derived strictly from expected population growth does not capture all the types of eco-nomic growth that can and will normally occur in a region. A regional analysis is based on the fact that there are types of industries that will seek to locate substantial facilities in a region and that have a tremendous flexibility as to where they can locate. Once the decision is made to locate in a region, the employers are opportunistic shoppers, seeking immediately available properties and will turn their atten-tions elsewhere if, for example, assembly of smaller parcels or major land use procedures need to occur before develop-ment can happen. See, R.753 (discussing approach of large-site industrial regional employers).”
The city and county asserted that the REA did not dou-ble-count projected employment growth, because the REA considered “additional large site employers that might otherwise locate somewhere else on the west coast but may locate in Coburg if the conditions are right.” (Underscoring in original.) Therefore, they maintained, the REA did not reuse the same subset of employment-based need, but rather included additional regional need that had not already been included in the EOA calculation.
LUBA reviewed for substantial evidence and concluded that Land Watch failed to demonstrate that there had been a “double-counting of large-lot industrial jobs.” We reiterate that the scope of our review is not to reexamine evidence or the strength of that evidence but rather review to ensure that LUBA understood and applied the substantial evidence standard correctly. Here, LUBA understood the city to assert another explanation for its projected employment-based land need. The city responded that it was not “double-counting” employment needs or jobs that had already been accounted for in the REA. The city’s calculation anticipated a different source of jobs—jobs that had not already been included in the EOA. LUBA concluded that Land Watch did not demon-strate that the calculations reflected the error that Land Watch had asserted. Under our standard of review, we conclude that LUBA did not misapply the substantial evi-dence standard.

Cite as 283 Or App 217 (2016) 233
For all those reasons, we affirm as to the petition and cross-petition.
Affirmed on petition and cross-petition.