STAR FORMATION RELATIONS AND CO SPECTRAL LINE ENERGY DISTRIBUTIONS ACROSS THE J-LADDER AND REDSHIFT
18
Draft version July 17, 2014 Preprint typeset using L A T E X style emulateapj v. 5/2/11 STAR FORMATION RELATIONS AND CO SPECTRAL LINE ENERGY DISTRIBUTIONS ACROSS THE J -LADDER AND REDSHIFT T. R. Greve 1 , I. Leonidaki 2 , E. M. Xilouris 2 , A. Weiß 3 , Z.-Y. Zhang 4,5 , P. van der Werf 6 , S. Aalto 7 , L. Armus 8 , T. D´ ıaz-Santos 8 , A.S. Evans 9,10 , J. Fischer 11 , Y. Gao 12 , E. Gonz´ alez-Alfonso 13 , A. Harris 14 , C. Henkel 3 , R. Meijerink 6,15 , D. A. Naylor 16 H. A. Smith 17 M. Spaans 15 G. J. Stacey 18 S. Veilleux 14 F. Walter 19 Draft version July 17, 2014 ABSTRACT We present FIR[50 - 300 μm]-CO luminosity relations (i.e., log L FIR = α log L 0 CO + β) for the full CO rotational ladder from J =1 - 0 up to J = 13 - 12 for a sample of 62 local (z ≤ 0.1) (Ultra) Luminous Infrared Galaxies (LIRGs; L IR[8-1000 μm] > 10 11 L ) using data from Herschel SPIRE-FTS and ground-based telescopes. We extend our sample to high redshifts (z> 1) by including 35 (sub)- millimeter selected dusty star forming galaxies from the literature with robust CO observations, and sufficiently well-sampled FIR/sub-millimeter spectral energy distributions (SEDs) so that accurate FIR luminosities can be deduced. The addition of luminous starbursts at high redshifts enlarge the range of the FIR-CO luminosity relations towards the high-IR-luminosity end while also significantly increasing the small amount of mid-J /high-J CO line data (J =5 - 4 and higher) that was available prior to Herschel. This new data-set (both in terms of IR luminosity and J -ladder) reveals linear FIR-CO luminosity relations (i.e., α ’ 1) for J =1 - 0 up to J =5 - 4, with a nearly constant normalization (β ∼ 2). In the simplest physical scenario this is expected from the (also) linear FIR-(molecular line) relations recently found for the dense gas tracer lines (HCN and CS), as long as the dense gas mass fraction does not vary strongly within our (merger/starburst)-dominated sample. However from J =6 - 5 and up to the J = 13 - 12 transition we find an increasingly sub-linear slope and higher normalization constant with increasing J . We argue that these are caused by a warm (∼ 100 K) and dense (> 10 4 cm -3 ) gas component whose thermal state is unlikely to be maintained by star formation powered far-UV radiation fields (and thus is no longer directly tied to the star formation rate). We suggest that mechanical heating (e.g., supernova driven turbulence and shocks), and not cosmic rays, is the more likely source of energy for this component. The global CO spectral line energy distributions (SLEDs), which remain highly excited from J =6 - 5 up to J = 13 - 12, are found to be a generic feature of the (U)LIRGs in our sample, and further support the presence of this gas component. Subject headings: galaxies: low-redshift, high-redshift — galaxies: formation — galaxies: evolution — galaxies: starbursts — ISM: lines [email protected] 1 Department of Physics and Astronomy, University College London, Gower Street, London WC1E 6BT, UK 2 Institute for Astronomy, Astrophysics, Space Applications & Remote Sensing, National Observatory of Athens, GR-15236 Penteli, Greece 3 Max-Planck-Institut fur Radioastronomie, Auf dem H¨ ugel 69, D-53121 Bonn, Germany 4 UK Astronomy Technology Centre, Science and Technology Facilities Council, Royal Observatory, Blackford Hill, Edinburgh EH9 3HJ, UK 5 European Southern Observatory, Karl Schwarzschild Straße 2, 85748 Garching, Germany 6 Leiden Observatory, Leiden University, PO Box 9513, NL- 2300 RA Leiden, the Netherlands 7 Department of Earth and Space Sciences, Chalmers Univer- sity of Technology, Onsala Observatory, 43994 Onsala, Sweden 8 Spitzer Science Center, California Institute of Technology, MS 220-6, Pasadena, CA 91125, USA 9 Astronomy Department, University of Virginia Char- lottesville, VA 22904, USA 10 National Radio Astronomy Observatory, 520 Edgemont Road, Charlottesville, VA 22903, USA 11 Naval Research Laboratory, Remote Sensing Division, 4555 Overlook Ave SW, Washington, DC 20375, USA 12 Purple Mountain Observatory, Chinese Academy of Sci- ences, 2 West Beijing Road, Nanjing 210008, China 13 Universidad de Alcala de Henares, Departamento de F´sica, Campus Universitario, E-28871 Alcal´a de Henares, Madrid, Spain 14 Department of Astronomy, University of Maryland, College Park, MD 20742, USA 15 Kapteyn Astronomical Institute, University of Groningen, P.O. Box 800, 9700 AV Groningen, the Netherlands 16 Institute for Space Imaging Science, Department of Physics and Astronomy, University of Lethbridge, Lethbridge, AB T1K 3M4, Canada 17 HarvardSmithsonian Center for Astrophysics, 60 Garden Street, Cambridge, MA 02138, USA 18 Department of Astronomy, Cornell University, Ithaca, NY 1485, USA 19 Max-Planck-Institut fur Astronomie, K¨onigstuhl17, D- 691117 Heidelberg, Germany arXiv:1407.4400v1 [astro-ph.GA] 16 Jul 2014
Transcript of STAR FORMATION RELATIONS AND CO SPECTRAL LINE ENERGY DISTRIBUTIONS ACROSS THE J-LADDER AND REDSHIFT

Draft version July 17, 2014Preprint typeset using LATEX style emulateapj v. 5/2/11
STAR FORMATION RELATIONS AND CO SPECTRAL LINE ENERGY DISTRIBUTIONS ACROSS THEJ-LADDER AND REDSHIFT
T. R. Greve1, I. Leonidaki2, E. M. Xilouris2, A. Weiß3, Z.-Y. Zhang4,5, P. van der Werf6, S. Aalto7, L. Armus8,T. Dıaz-Santos8, A.S. Evans9,10, J. Fischer11, Y. Gao12, E. Gonzalez-Alfonso13, A. Harris14, C. Henkel3,
R. Meijerink6,15, D. A. Naylor16 H. A. Smith17 M. Spaans15 G. J. Stacey18 S. Veilleux14 F. Walter19
Draft version July 17, 2014
ABSTRACT
We present FIR[50− 300µm]−CO luminosity relations (i.e., logLFIR = α logL′CO + β) for the fullCO rotational ladder from J = 1 − 0 up to J = 13 − 12 for a sample of 62 local (z ≤ 0.1) (Ultra)Luminous Infrared Galaxies (LIRGs; LIR[8−1000µm] > 1011 L ) using data from Herschel SPIRE-FTSand ground-based telescopes. We extend our sample to high redshifts (z > 1) by including 35 (sub)-millimeter selected dusty star forming galaxies from the literature with robust CO observations, andsufficiently well-sampled FIR/sub-millimeter spectral energy distributions (SEDs) so that accurateFIR luminosities can be deduced. The addition of luminous starbursts at high redshifts enlarge therange of the FIR−CO luminosity relations towards the high-IR-luminosity end while also significantlyincreasing the small amount of mid-J/high-J CO line data (J = 5− 4 and higher) that was availableprior to Herschel. This new data-set (both in terms of IR luminosity and J-ladder) reveals linearFIR−CO luminosity relations (i.e., α ' 1) for J = 1 − 0 up to J = 5 − 4, with a nearly constantnormalization (β ∼ 2). In the simplest physical scenario this is expected from the (also) linearFIR−(molecular line) relations recently found for the dense gas tracer lines (HCN and CS), as long asthe dense gas mass fraction does not vary strongly within our (merger/starburst)-dominated sample.However from J = 6− 5 and up to the J = 13− 12 transition we find an increasingly sub-linear slopeand higher normalization constant with increasing J . We argue that these are caused by a warm(∼ 100 K) and dense (> 104 cm−3) gas component whose thermal state is unlikely to be maintainedby star formation powered far-UV radiation fields (and thus is no longer directly tied to the starformation rate). We suggest that mechanical heating (e.g., supernova driven turbulence and shocks),and not cosmic rays, is the more likely source of energy for this component. The global CO spectralline energy distributions (SLEDs), which remain highly excited from J = 6 − 5 up to J = 13 − 12,are found to be a generic feature of the (U)LIRGs in our sample, and further support the presence ofthis gas component.Subject headings: galaxies: low-redshift, high-redshift — galaxies: formation — galaxies: evolution —
galaxies: starbursts — ISM: lines
[email protected] Department of Physics and Astronomy, University College
London, Gower Street, London WC1E 6BT, UK2 Institute for Astronomy, Astrophysics, Space Applications
& Remote Sensing, National Observatory of Athens, GR-15236Penteli, Greece
3 Max-Planck-Institut fur Radioastronomie, Auf dem Hugel69, D-53121 Bonn, Germany
4 UK Astronomy Technology Centre, Science and TechnologyFacilities Council, Royal Observatory, Blackford Hill, EdinburghEH9 3HJ, UK
5 European Southern Observatory, Karl Schwarzschild Straße2, 85748 Garching, Germany
6 Leiden Observatory, Leiden University, PO Box 9513, NL-2300 RA Leiden, the Netherlands
7 Department of Earth and Space Sciences, Chalmers Univer-sity of Technology, Onsala Observatory, 43994 Onsala, Sweden
8 Spitzer Science Center, California Institute of Technology,MS 220-6, Pasadena, CA 91125, USA
9 Astronomy Department, University of Virginia Char-lottesville, VA 22904, USA
10 National Radio Astronomy Observatory, 520 EdgemontRoad, Charlottesville, VA 22903, USA
11 Naval Research Laboratory, Remote Sensing Division, 4555Overlook Ave SW, Washington, DC 20375, USA
12 Purple Mountain Observatory, Chinese Academy of Sci-ences, 2 West Beijing Road, Nanjing 210008, China
13 Universidad de Alcala de Henares, Departamento de F´sica,Campus Universitario, E-28871 Alcala de Henares, Madrid,Spain
14 Department of Astronomy, University of Maryland, CollegePark, MD 20742, USA
15 Kapteyn Astronomical Institute, University of Groningen,P.O. Box 800, 9700 AV Groningen, the Netherlands
16 Institute for Space Imaging Science, Department of Physicsand Astronomy, University of Lethbridge, Lethbridge, AB T1K3M4, Canada
17 HarvardSmithsonian Center for Astrophysics, 60 GardenStreet, Cambridge, MA 02138, USA
18 Department of Astronomy, Cornell University, Ithaca, NY1485, USA
19 Max-Planck-Institut fur Astronomie, Konigstuhl 17, D-691117 Heidelberg, Germany
arX
iv:1
407.
4400
v1 [
astr
o-ph
.GA
] 1
6 Ju
l 201
4

2 Greve et al.
1. INTRODUCTION
Early empirical correlations between the preponder-ance of young stars and gas in galaxies (e.g., Sanduleak(1969)) confirmed – in a qualitative sense – the simplepower-law dependence between star formation rate sur-face density (ΣSFR) and gas surface density (Σgas) firstsuggested by Schmidt (1959) who found ΣSFR ∝ Σ2
gas forHi gas. Once the H2 component as traced by CO lineswas identified in galaxies, the gas surface density couldbe related to both H i and H2, i.e., Σgas = ΣHI + ΣH2
(Kennicutt 1989). In a seminal paper, Kennicutt (1998)established this relation, hereafter called the Schmidt-Kennicutt (S-K) relation, to be: ΣSFR ∝ Σ1.4
gas, averagedover entire galaxy disks. Further studies by Wong & Blitz(2002) and Schruba et al. (2011) found a nearly linear S-K relation for the molecular gas on kpc scales (see alsoBigiel et al. (2008) and Leroy et al. (2008, 2013)), withthe SFR surface density having a much closer correspon-dence with the molecular gas surface density – reflectingthe well-established fact that stars form out of molec-ular rather than atomic gas. Much theoretical efforthas gone into obtaining the exponents and normaliza-tion of this relation as unique outcomes of various phys-ical processes occurring in star forming galaxies, withvarious models capable of yielding (S-K)-type relations(e.g., Dopita & Ryder (1994); Gerritsen (1997); Wong& Blitz (2002); Elmegreen (2002)). It became evidentthat, while no deterministic microphysics of the interstel-lar medium (ISM) and star formation (SF) can be linkedto a given S-K relation, the high-density gas component(n ≥ 104 cm−3) plays a crucial role in ultimately anchor-ing such relations to the star formation taking place deepinside supersonically turbulent molecular clouds in disks.
The S-K relations for high-density gas are particularlychallenging to establish since determining the dense gasmass fraction within a galaxy requires observations of COfrom J = 1− 0 (a total molecular gas mass tracer) up toat least J = 3−2 along with the much fainter lines of bonafide dense gas tracers like CS and heavy-rotor moleculessuch as HCN. A multi-component analysis of such CO,HCN, and CS spectral line energy distributions (SLEDs)can then yield dense gas masses, Mdense(n ≥ 104 cm−3)(e.g., Mao et al. (2000); Greve et al. (2009)). However,to do so for a large number of galaxies in order to obtaineven a surface-integrated SFR−Mdense S-K relation hasbeen prohibitively expensive in telescope time. At highredshifts the situation is made worse due to a lack insensitivity and angular resolution. Nonetheless, pioneer-ing efforts have been made at discerning ΣSFR = AΣNgas
at high redshifts using Hα maps obtained with integralfield unit cameras, and high-resolution interferometricCO (J = 1 − 0 to 3 − 2) observations of massive starforming galaxies at z ∼ 1 − 3 (Genzel et al. 2010; Tac-coni et al. 2013; Freundlich et al. 2013). Obviously, thissituation will now improve dramatically with the adventof the Atacama Large Millimeter/Sub-millimeter Array(ALMA).
With the dense gas mass fraction distribution currentlyinaccessible for any statistically significant number ofgalaxies one must fall back to the integrated (S-K)-proxyrelations: LIR − Lline (where Lline is the line luminosityof a dense gas tracer and LIR a linear proxy of SFR),and then invoke theoretically determined links to an
underlying S-K relation (Krumholz & Thompson 2007;Narayanan et al. 2008). HCN(1− 0) observations of sta-tistically significant samples of local IR luminous galax-ies (LIRGs) and normal spiral galaxies yielded the first ofsuch (S-K)-proxy relations using gas tracers other thanCO lines (Solomon et al. 1992), finding the IR−HCN re-lation to be linear and with much less scatter than thepreviously determined IR−CO low-J relations. This wasinterpreted as HCN(1− 0), with its high critical density(∼ 105 cm−3), being a more direct tracer of a dense, starforming gas component with a nearly constant under-lying star formation efficiency (SFE) (Gao & Solomon2004a,b). Furthermore, with the tight, linear IR−HCNrelation extending down to individual Galactic molec-ular clouds where LIR >∼ 104.5 L , thus covering over∼ 8 orders of magnitude in luminosity, its origin couldbe attributed to the existence of fundamental ‘units’ ofcluster star formation (Wu et al. 2005). This view isnow further supported by the linear LIR−Lline relationsfound also for the HCN(4−3) and CS(7−6) lines (Zhanget al. 2014), which for CS(7 − 6) also extends (linearly)down to Galactic cores (Wu et al. 2010). Some con-tentious points do remain however, especially towards thehigh-LIR end which is dominated by mergers/starburstswhere a slightly super-linear IR−HCN relation has beenclaimed and argued to be due mostly to an increase inthe dense gas SFE in such galaxies (Riechers, Walter &Carilli 2007; Gracia-Carpio et al. 2008b).
In this paper we present the first FIR−CO luminos-ity relations and the corresponding global CO SLEDsthat extend above Jup = 4 and up to Jup = 13 us-ing Herschel SPIRE-FTS data for local (U)LIRGs. TheFIR−CO relations and CO SLEDs presented in this work(from J = 1− 0 up to J = 13− 12), besides a significantextension of the J-ladder, benefit also from the inclu-sion of (U)LIRGs from the low- and the high-z Universe.This robustly extends the sample towards the importanthigh-LFIR end (as numerous galaxies with ULIRG-like,or higher, luminosities have been found in the high-zUniverse) where very different conditions may prevailfor the molecular gas, possibly leaving an imprint onthe FIR−CO relations and the CO SLEDs. Our newhigh-J CO line data-set is uniquely sensitive to suchan imprint since these lines need both high densities(ncrit ∼ (104−7×10⁵) cm−3) and (in most circumstances)high temperatures (EJ/kB ∼ (55− 500) K) to be signifi-cantly excited. The high-density and warm gas necessaryfor exciting them is the most difficult phase to maintainenergetically in appreciable quantities in galaxies. How-ever, it is one that would leave no easily discernible sig-nature in the low-J CO and low-/mid-J SLEDs of heavyrotor molecular lines (e.g., HCN, CS) that typically havebeen available for (U)LIRGs up to now. Throughout, weadopt a flat cosmology with ΩM = 0.315,ΩΛ = 0.685,and h = 0.67 (Planck 2013).
2. GALAXY SAMPLES AND DATA
For the purposes of this work we first compiled high-J(J = 4−3 up to J = 13−12 line data from the HerschelComprehensive (U)LIRG Emission Survey (HerCULES,van der Werf et al. (2010)) – an open time key program

Star formation relations and CO SLEDs across the J-ladder and redshift 3
on the ESA Herschel Space Observatory20 (Pilbratt et al.2010) which measured CO J = 4− 3 to J = 13− 12 for29 local (z < 0.1) (U)LIRGs using the Fourier Trans-form Spectrometer (FTS) of the SPIRE instrument21
(Griffin et al. 2010). The HerCULES sources were se-lected from the 60µm flux-limited IRAS Revised BrightGalaxy Sample (f60µm > 5.24 Jy; Sanders et al. (2003))with separate flux cuts applied to ULIRGs and LIRGs(f60µm > 11.65 Jy and > 16.4 Jy, respectively). A de-tailed description of the SPIRE-FTS observations, cal-ibration modes, extraction of CO line fluxes, and finalline luminosities, are given in a dedicated paper (Rosen-berg et al., in prep.). Briefly, the high spectral resolutionmode was used with a resolution of 1.2 GHz over bothobserving bands. A reference measurement was used tosubtract the emission from the sky, telescope, and instru-ment. The spectra were reduced using the Herschel Inter-active Processing Environment (HIPE), ver. 9.0. At thetime of writing, fully reduced SPIRE-FTS CO spectrawere available for only 26 sources, and of these three hadextended, multi-component morphologies and were dis-carded. Since the SPIRE-FTS beam ranges from ∼ 16′′
to ∼ 42′′ (FWHM) across the bandpass (Makiwa et al.2013), it is essential to perform a beam correction incases where the sources are extended with respect to thebeam. All spectra (and thus CO line fluxes) were scaledto a common spatial resolution of ∼ 42′′ using LABOCA870µm or SABOCA 350µm maps (see Rosenberg et al.,in prep. for details). Obviously, this assumes that thecorrections are perfectly mono-chromatic in the FIR andsub-millimeter (sub-mm) regime, which is a good as-sumption to within <∼ 20% (Galametz et al. 2013). Forthe HerCULES sources, which are all (U)LIRGs and thusnearly all relatively compact, and well within the beamsizes of the CO observations, this correction was minor.For very extended sources, however, this correction iscrucial, and failing to apply it can skew the observedFIR−CO relation (i.e., Bussmann et al. (2008), Juneauet al. (2009), and see discussion in Zhang et al. (2014)).
We also included ground-based CO line data presentedby Papadopoulos et al. (2012) for a sample of 45 local(U)LIRGs22 from the IRAS RBGS. These data consistedof low-J CO transitions, i.e., J = 1− 0 (all 45 sources),2−1 (17), 3−2 (44), as well as J = 4−3 (3) and 6−5 (12)observations. This allowed us to both fill-in the J = 1−0,2 − 1, 3 − 2 transitions for the 11 HerCULES sourcesthat overlapped with this sample (except for one sourcewhich did not have J = 2 − 1 measurement), and bringin additional CO low-J and J = 4 − 3/6 − 5 lines (theonly mid-/high-J CO lines accessible with the ground-
20 Herschel is an ESA space observatory with science instrumentsprovided by European-led Principal Investigator consortia and withimportant participation from NASA.
21 SPIRE has been developed by a consortium of institutes ledby Cardiff Univ. (UK) and including: Univ. Lethbridge (Canada);NAOC (China); CEA, LAM (France); IFSI, Univ. Padua (Italy);IAC (Spain); Stockholm Observatory (Sweden); Imperial CollegeLondon, RAL, UCL-MSSL, UKATC, Univ. Sussex (UK); andCaltech, JPL, NHSC, Univ. Colorado (USA). This developmenthas been supported by national funding agencies: CSA (Canada);NAOC (China); CEA, CNES, CNRS (France); ASI (Italy);MCINN(Spain); SNSB (Sweden); STFC, UKSA (UK); and NASA (USA).
22 The full sample in Papadopoulos et al. (2012) consisted of 70(U)LIRGs, but 25 of those lacked adequate continuum FIR and/orsub-mm data and were discarded.
z < 0.1 (U)LIRGs (HerCULES)z < 0.1 (U)LIRGsz > 1 DSFGs (unlensed)z > 1 DSFGs (lensed)
Fig. 1.— The logarithm of the FIR (50− 300µm) luminosity vs.redshift for the galaxy samples considered in this paper (after AGN-dominated systems have been removed), along with histogramsof the FIR luminosity and redshift distributions (top and rightinserts, respectively). The local (z < 0.1) sources include sub-setsof the (U)LIRG samples from HerCULES (20 sources, red symbols)and Papadopoulos et al. (2012) (42 sources, grey symbols) Thehigh-z (z > 1) sources are unlensed, or weakly lensed, DSFGs (16sources, green symbols) and strongly lensed DSFGs (19 sources,blue symbols) uncovered from various (sub)-mm surveys (see § 2).All FIR luminosities have been been corrected for lensing using themagnification factors in Table 2.
based telescopes used – see Papadopoulos et al. (2012)for details) to the sample. We stress that the CO linefluxes given in Papadopoulos et al. (2012) are total linefluxes, and so no additional beam correction is requiredfor these sources.
Of our sample of 68 local (U)LIRGs (listed in Table 1),30 sources (20+10 from HerCULES and Papadopouloset al. (2012) sub-samples, respectively) are also part ofThe Great Observatories All-Sky LIRG Survey (GOALS;Stierwalt et al. (2013)). To weed out active galacticnuclei (AGN), the sample was cross-correlated againstestimates of the AGN contribution to the bolometricluminosity based on several MIR diagnostics such asthe equivalent width of the 6.2µm PAH feature, the[Ne v]/[Ne ii] and [O iv]/[Ne ii] emission line ratios aswell as 30-to-15µm continuum flux ratios (Veilleux et al.2009; Petric et al. 2011). Only six sources (indicate by a∗ in Table 1) were found to have an AGN contribution> 30% and were omitted from our analysis (although,including them in our analysis did not alter the findingsof this paper).
The FIR/sub-mm continuum data were obtained froma number of studies (see Papadopoulos et al. (2012) andreferences therein) as well as from the NASA/IPAC Ex-tragalactic Database (NED). All the 850µm and 1.2 mmavailable fluxes were corrected for CO J = 3 − 2, and2 − 1 line contamination (< 20%), respectively. Wealso corrected for any non-thermal radio continuum con-tributions whenever radio data were available, allow-ing for a power-law extrapolation to the sub-mm wave-

4 Greve et al.
lengths. The FIR (50 − 300µm) luminosities derivedfrom the continuum data (see § 3 for details) span therange ∼ 1010−12 L (Fig. 1). The two samples are wellmatched in luminosity, although no HerCULES sourcesare found at <∼ 1010.8 L . The fact that the more lumi-nous sources tend to have higher redshifts merely reflectsthe flux-limited selection of the two samples.
High-redshift dusty star forming galaxies (DSFGs23)are thought to resemble the local (U)LIRG populationand most have LIR >∼ 1012 L . Moreover, typically mul-tiple high-J CO lines and FIR/(sub)-mm continuum ob-servations are available for them. These were the mainreasons for including them in our analysis. In order toachieve the best possible uniformity, a meticulous com-pilation of the aforementioned observations (CO line andcontinuum observations) for all published DSFGs was ex-tracted from the literature (guided by major review pa-pers by Solomon & Vanden Bout (2005) and Carilli &Walter (2013)). Sources with clear signs of AGN (e.g.,from optical spectroscopy showing strong Lyα, C iv, andC iii emission lines and a power-law continuum, or radio-loudness) were not included in our sample. In caseswhere multiple observations of the same CO transitionexisted, we adopted the weighted mean of the velocity-integrated line flux after discarding any outliers and mea-surements with low signal-to-noise. Many of the high-z
CO detections are of strongly lensed DSFGs, which wehere take to mean a gravitational magnification factor(µ) > 1, and in those cases we adopted the best esti-mates of µ available at the time of writing (e.g., Swin-bank et al. (2010); Aravena et al. (2013); Bussmann etal. (2013)). A total of 74 DSFGs constituted our initialhigh-z sample. For 39 (53%) of the DSFGs, however, wewere unable to put reliable constraints on their FIR lumi-nosities (see § 3), and these were therefore discarded forthe analysis presented in this paper. This left us witha final sample of 35 high-z sources (listed in Table 2),spanning the redshift range z = 1.0− 6.3 with a medianredshift of z ' 2.4 (see also Fig. 1). The lensed DSFGs(19 in total), after magnification correction, span a sim-ilar range in FIR luminosity as the non-lensed DSFGs(∼ 1012−14 L , see Fig. 1), which is about an order ofmagnitude higher than that of the local samples. Theonly exception is SMM J163555.2+661150 (z = 1.03),which has an intrinsic luminosity similar to that of localLIRGs (Knudsen et al. 2009). Within the high-z sam-ples, we see no strong dependence of FIR luminosity onredshift, which is due to the well-known flat selectionfunction at sub-mm wavelengths for z >∼ 1 (Blain & Lon-gair 1993). Finally, we stress that while the DSFGs, asa sample, cover all CO transitions from J = 1 − 0 toJ = 10−9, no individual galaxy has continuous coverageacross this transition range.
TABLE 1 The sample of 68 local (z < 0.1) (U)LIRGs used in this paper. The first 23 sources listedbelow (and not listed in italics) were observed by Herschel/SPIRE-FTS as part of the HerCULES
program (§ 2). Sources indicated by a ∗ were found to have significant AGN contribution (> 30% of thebolometric luminosity) and were not included in our final analysis.
ID z log(LFIR[50−300µm]/L ) log(LIR[8−1000µm]/L )
IRAS 00085−1223 (NGC 34) 0.0196 11.21 11.47IRAS 00506+7248 (MCG+12-02-001) 0.0157 11.26 11.53IRAS 01053−1746 (IC 1623) 0.0201 11.47 11.74IRAS 04315−0840 (NGC 1614) 0.0159 11.32 11.59IRAS 05189−2524∗ 0.0426 11.73 12.12IRAS 08354+2555 (NGC 2623) 0.0185 11.33 11.60IRAS 10257−4339 (NGC 3256) 0.0094 11.40 11.60IRAS 11506−3851 (ESO 320−G030) 0.0108 11.09 11.30IRAS 12540+5708 (Mrk 231)∗ 0.0422 12.14 12.56IRAS 13120−5453 (WKK 2031) 0.0308 12.07 12.34IRAS 13183+3423 (Arp 193) 0.0233 11.44 11.68IRAS 13229−2934 (NGC 5135) 0.0137 11.13 11.33IRAS 13242−5713 (ESO 173−G015) 0.0097 11.38 11.65IRAS 13428+5608 (Mrk 273)∗ 0.0378 11.91 12.17IRAS 16504+0228 (NGC 6240) 0.0245 11.61 11.87IRAS 15107+0724 (Zw 049.057) 0.0130 11.05 11.28IRAS 17208−0014 0.0428 12.20 12.47IRAS 18093−5744 (IC 4687) 0.0173 11.12 11.39IRAS 18293−3413 0.0182 11.62 11.84IRAS 23007+0836 (NGC 7469) 0.0163 11.32 11.60IRAS 23134−4251 (NGC 7552) 0.0054 10.84 11.05IRAS 23488+2018 (Mrk 331) 0.0185 11.26 11.53IRAS 23488+1949 (NGC 7771) 0.0143 11.26 11.43IRAS 00057+4021 0.0445 11.34 11.60IRAS 00509+1225 0.0611 11.40 11.67IRAS 01077−1707 0.0351 11.42 11.69IRAS 01418+1651 0.0274 11.29 11.56IRAS 02114+0456 0.0297 11.26 11.43IRAS 02401−0013 0.0037 10.96 11.23IRAS 02483+4302 0.0514 11.67 11.85IRAS 02512+1446 0.0312 11.43 11.70IRAS 03359+1523 0.0353 11.27 11.45IRAS 04232+1436 0.0795 11.81 12.08IRAS 05083+7936 0.0543 11.88 12.06IRAS 08572+3915∗ 0.0582 11.73 12.11
23 In this paper we take DSFGs to be synonymous with highlydust-enshrouded major merger starbursts selected at sub-mm/mm
wavelengths (also often referred to as (sub)-millimeter selectedgalaxies, i.e., SMGs)

Star formation relations and CO SLEDs across the J-ladder and redshift 5
IRAS 09126+4432 0.0398 11.48 11.65IRAS 09320+6134 0.0393 11.77 11.95IRAS 09586+1600 0.0080 10.37 10.64IRAS 10035−4852 0.0648 11.83 12.10IRAS 10039−3338∗ 0.0341 11.47 11.74IRAS 10173+0828 0.0489 11.53 11.80IRAS 10356+5345 0.0033 10.08 10.35IRAS 10565+2448 0.0428 11.75 12.01IRAS 11231+1456 0.0341 11.40 11.57IRAS 12001+0215 0.0066 10.11 10.29IRAS 12112+0305 0.0727 12.07 12.34IRAS 12224−0624 0.0263 11.05 11.23IRAS 12243−0036 0.0073 10.77 11.04IRAS 13001−2339 0.0215 11.24 11.41IRAS 13102+1251 0.0112 10.48 10.66IRAS 13188+0036 0.0186 11.00 11.17IRAS 13362+4831 0.0278 11.18 11.45IRAS 13470+3530 0.0168 10.96 11.10IRAS 13564+3741 0.0125 10.88 11.05IRAS 14003+3245 0.0145 10.77 10.95IRAS 14178+4927 0.0256 11.08 11.35IRAS 14348−1447 0.0825 12.08 12.42IRAS 15163+4255 0.0402 11.59 11.94IRAS 15243+4150 0.0089 10.38 10.65IRAS 15327+2340 0.0182 11.80 11.98IRAS 15437+0234∗ 0.0128 10.84 11.01IRAS 16104+5235 0.0292 11.37 11.63IRAS 16284+0411 0.0245 11.23 11.40IRAS 17132+5313 0.0507 11.62 11.89IRAS 19458+0944 0.1000 12.28 12.45IRAS 20550+1656 0.0363 11.63 11.97IRAS 22491−1808 0.0773 11.92 12.19IRAS 23365+3604 0.0644 11.88 12.15
3. ANALYSIS
3.1. SED fitting
The pan-chromatic (FUV/optical to radio) spectral en-ergy distributions (SEDs) of our sample galaxies weremodeled using CIGALE (Code Investigating GALaxyEmission – Burgarella et al. (2005); Noll et al. (2009)).CIGALE employs dust-attenuated stellar populationmodels to fit the FUV/optical SED, while at the sametime ensuring that the dust-absorbed UV photons arere-emitted in the FIR, thus maintaining energy-balancebetween the FUV and FIR. The FIR/sub-mm continuumis modeled using the templates by Dale & Helou (2002)and Chary & Elbaz (2001). For the stellar emission pop-ulation synthesis models from Maraston (2005) with aSalpeter initial mass function were used, and for the red-dening we used attenuation curves from Calzetti et al.(1994) with a wide range of V-band attenuation valuesfor young stellar populations. Despite having carefullychecked our samples against AGN, we allowed for thepossibility of additional dust emission from deeply buriedAGN by including in our SED fits the 32 AGN modelsfrom the Fritz, Franceschini & Hatziminaoglou (2006)library. Reassuringly, in no instances did the AGN frac-tion exceeded 20% of the total IR luminosity. Excel-lent fits were obtained for all of the local galaxies due totheir well-sampled SEDs. For the high-z galaxies, onlysources with data points longward and shortward of (ornear) the dust peak (λrest ∼ 100µm) were included inthe final analysis: a total of 35 out of the original 74DSFGs. All SED fits used in this paper can be found athttp://demogas.astro.noa.gr, and will also be pre-sented in a forthcoming paper (Xilouris et al., in prep.).
From the SED fits we derived the IR (LIR, from 8µm
to 1000µm rest-frame) and FIR (LFIR, from 50µm to300µm rest-frame) luminosities of our sample galaxies(Tables 1 and 2). We shall use the latter for our anal-ysis in order to minimize the effects of AGN, which arestrongest in the mid-IR regime (i.e., ∼ 8− 40µm). Also,the mid-IR is rich in PAH emission/absorption features,which could affect LIR estimates. For the uncertainty onour IR/FIR luminosity estimates we adopted the 1-σ dis-persion of the luminosity distributions obtained throughbootstrapping of the photometry errors 1000 times. Typ-ical uncertainties, δLFIR, were ∼ 20 and ∼ 40% for thelocal and high-z samples, respectively, and were adoptedacross the board for the two samples. We stress thatthe above FIR luminosities are total luminosities, i.e. de-rived from aperture fluxes that encompass the full extentof the galaxies, and thus match the CO measurements.
3.2. LFIR − L′CO relations
Fig. 2 shows the separate logLFIR − logL′CO relations(where log is for base 10) for each CO transition (fromCO J = 1−0 to J = 13−12) for the galaxy samples ana-lyzed here. Highly significant correlations are seen in alltransitions, as given by their near unity linear correlationcoefficients (r, see Fig. 2). Even for the highest transi-tion (J = 13− 12), where the dynamical range spannedin luminosities is relatively small, we see a statisticallysignificant correlation. To ensure that the observed cor-relations are not simply due to both LIR and L′CO being∝ D2
L (the luminosity distance squared), we calculatedfor each correlation the partial Kendall τ -statistic (Akri-tas & Siebert 1996) with D2
L as the test variable. In allcases (up to J = 13−12), we find probabilities P < 10−6
that the observed FIR−CO correlations are falsely in-

6 Greve et al.
TABLE 2The high-z DSFGs samples utilized in this paper, consisting of 35 sources in total of which 19 are strongly lensed, i.e.,gravitational magnification factor µ > 1 (bottom 19, shown in italics). The listed FIR (50− 300µm) and IR (8− 1000µm)
luminosities have not been corrected for gravitational lensing but we give the most up to date estimates of themagnification (µ) factor (from the literature) needed to perform this correction along with the appropriate references
for each source. For completeness and for cross-comparison, we also give alternative, but now most likely outdated,magnification estimates in parentheses.
ID z log(LFIR/L ) log(LIR/L ) µ ref.
SMM J021725−045934 (SXDF 11) 2.2920 12.30 12.51 1.0 [1,2]SMM J030227.73+000653.3 1.4060 12.45 12.72 1.0 [1]SMM J105151.69+572636.0 (Lock850.16) 1.5973 12.40 12.67 1.0 [1]SMM J105227.58+572512.4 (LE 1100.16) 2.4432 12.92 13.26 1.0 [1]SMM J105230.73+572209.5 (LE 1100.05) 2.6011 12.80 13.08 1.0 [1,3]SMM J105238.30+572435.8 (LE 1100.08) 3.0360 12.90 13.17 1.0 [3]SMM J123549.44+621536.8 (AzGN 15, HDF 76) 2.2020 12.62 12.89 1.0 [1,4]SMM J123600.16+621047.3 1.9941 12.36 12.53 1.0 [1,3]SMM J123606.85+621047.2 2.5054 12.66 12.83 1.0 [1]SMM J123634.51+621240.9 (GN 26, HDF 169) 1.2224 12.35 12.61 1.0 [5,6]SMM J123711.86+622212.6 (GN 20, AzGN 01) 4.0554 13.03 13.23 1.0 [7,8]SMM J131201.17+424208.1 3.4078 12.67 12.94 1.0 [3,6,9]SMM J163631.47+405546.9 (N2 850.13) 2.2767 12.69 12.96 1.0 [1,3]SMM J163658.19+410523.8 (N2 850.02) 2.4546 12.84 13.11 1.0 [3,4,10]SMM J163650.43+405734.5 (N2 850.04) 2.3853 12.83 13.10 1.0 [1,10,11]SMM J163706.51+405313.8 (N2 1200.17) 2.3774 12.77 12.96 1.0 [1,3]1HERMESS250 J022016.5060143 (HXMM01) 2.3074 13.17 13.37 1.5± 0.3 [12]SMMJ02399−0136 2.8076 13.08 13.43 2.38± 0.08 (2.45) [13,14]SPT-S J053816−5030.8 2.7818 12.49 12.69 20± 4 [15,16]HATLASJ084933.4+021443-T 2.4090 12.98 13.19 2.8± 0.2 (1.5± 0.2) [17,18]HATLASJ084933.4+021443-W 2.4068 13.24 13.51 1.0 [17]H-ATLASJ090302.9−014128-17b (SDP.17b) 2.3051 12.01 12.21 4.9± 0.7 (18± 8) [19,20,21]H-ATLASJ090311.6+003906 (SDP.81) 3.0425 12.15 12.35 11.1± 1.1 (14± 4, 18-31) [18,20,22]H-ATLASJ090740.0−004200 (SDP.9) 1.5770 13.47 13.67 8.8± 2.2 [18,20]H-ATLASJ091043.1−000322 (SDP.11) 1.7860 13.61 13.88 10.9± 1.3 [18,20]H-ATLASJ091305.0−005343 (SDP.130) 2.6256 12.46 12.66 2.1± 0.3 (5-7, 10± 4) [18,20,21,22]HERMESJ105751.1+573027 (HLSW−01) 2.9574 12.82 13.17 10.9± 0.7 (9.2± 0.4) [18,23,24]SMMJ12365+621226 (HDF850.1) 5.1830 12.43 12.65 1.4 [25]SMMJ14009+0252 2.9344 12.57 12.74 1.5 [14,26,27]SMMJ140104.96+025223.5 (SMMJ14011+0252) 2.5653 12.19 12.39 3.5± 0.5 (2.75± 0.25) [28,29,30]H-ATLASJ142413.9+023040 (ID141) 4.2430 13.82 14.09 4.6± 0.5 [31,32]SMMJ163555.2+661150 (ABELL2218 Arc L) 1.0313 11.16 11.34 7.1 [33]1HERMESS350 J170647.8+584623 (HFLS3) 6.3369 13.38 13.72 1.0 [33,34]SMMJ2135−0102 (Eyelash) 2.3259 12.26 12.36 32.5± 4.5 [35,36]SPT-S233227−5358.5 2.7256 12.77 13.04 15± 5 [15]
[1] Bothwell et al. (2013a); [2] Alaghband-Zadeh et al. (2013); [3] Greve et al. (2005); [4] Tacconi et al. (2006); [5] Frayer etal. (2008); [6] Engel et al. (2010); [7] Daddi et al. (2009); [8] Hodge et al. (2012); [9] Riechers et al. (2011a); [10] Ivison et al.(2011); [11] Neri et al. (2003); [12] Fu et al. (2013); [13] Ivison et al. (2010); [14] Thomson et al. (2012); [15] Aravena et al.(2013); [16] Bothwell et al. (2013b); [17] Ivison et al. (2013); [18] Bussmann et al. (2013); [19] Bussmann et al. (2013); [20] Lupuet al. (2012); [21] Harris et al. (2012); [22] Frayer et al. (2011); [23] Riechers et al. (2011b); [24] Conley et al. (2011); [25] Walteret al. (2012); [26] Weiß et al. (2009); [27] Harris et al. (2010); [28] Frayer et al. (1999); [29] Downes & Solomon (2003); [30]Sharon et al. (2013); [31] Cox et al. (2011); [32] Bussmann et al. (2012); [33] Riechers et al. (2013); [34] Robson et al. (2014);[35] Swinbank et al. (2010); [36] Danielson et al. (2011)
duced by the fact that luminosity ∝ D2L.
A function of the form logLFIR = α logL′CO + β wasadopted to model the correlations, and the optimal val-ues of the model parameters (α and β) were fitted (to thisend we used the IDL routine linmix err, Kelly (2007)).The slopes (α) and intersection points (β) inferred fromfits to the combined low- and high-z samples are givenin Table 3, along with the scatter (s) of the data-pointsaround the fitted relations. The fits are shown as dashedlines in Fig. 2. The best-fit (α, β)-values obtained by us-ing LIR instead of LFIR are also listed in Table 3. Withinthe errors, the fitted parameters are seen to be robustagainst the adopted choice of FIR or IR luminosity. Also,
our results did not change in any significant way whenomitting the lensed DSFGs from the analysis. Often lens-ing amplification factors are uncertain, and strong lens-ing can not only skew the selection of sources towardsmore compact (and thus more likely warm) sources, butfor a given source it may also boost the high-J CO linesrelative to to the lower lines (this is discussed further in§ 6.2).
Figs. 3 and 4 show the slopes and normalisations, re-spectively, of the logLFIR − logL′CO relations derivedabove as a function of the critical densities probed by thevarious CO transitions. The critical densities are calcu-lated as ncrit = Aul/
∑i 6=u Cui, where Aul is the Einstein

Star formation relations and CO SLEDs across the J-ladder and redshift 7
z < 0.1 (U)LIRGs (HerCULES)z < 0.1 (U)LIRGsz > 1 DSFGs (unlensed)z > 1 DSFGs (lensed)
Fig. 2.— logLFIR vs. logL′CO across the CO rotational ladder (from J = 1 − 0 to J = 13 − 12). The low-z (z < 0.1) data include the(U)LIRG sample from Papadopoulos et al. (2012) (grey symbols) with CO observations from J = 1− 0 to J = 6− 5, and (U)LIRGs fromHerCULES (red symbols) observed in CO J = 4− 3 to J = 13− 12 with Herschel SPIRE-FTS. Of the HerCULES sample, 11 sources haveCO J = 1 − 0 to J = 3 − 2 coverage from Papadopoulos et al. (2012) (see § 2). The high-z (z > 1) sources are unlensed DSFGs (greensymbols) and strongly lensed (µ > 1) DSFGs (blue symbols) uncovered by various (sub)-mm surveys (§ 2). The dashed lines show thebest fits of the function logLFIR = α logL′CO + β to the data (§ 3), with the optimum parameter (α, β) values and their errors indicatedin each panel. Also shown in each panel is the correlation coefficients (r) of the data and their scatter (s) around the best-fit line. TheLFIR-values used here were obtained by integrating the SEDs across the wavelength range 50 − 300µm (§ 3) but near-identical relationsare obtained if instead the full IR-luminosity from 8 − 1000µm is used (Table 3). Excluding the lensed DSFGs from the analysis did notalter the best-fit values of α and β significantly.

8 Greve et al.
TABLE 3Best-fit slopes (α) and intersection points (β), along with
the associated scatter of the data around the best-fitrelation, inferred from Fig. 2. The corresponding valuesusing LIR[8−1000µm] instead of LFIR[50−300µm] are given in
parentheses.
Transition α β s
CO(1− 0) 0.99± 0.04 1.9± 0.4 0.26(1.00± 0.05) (2.0± 0.5) (0.27)
CO(2− 1) 1.03± 0.09 1.6± 0.9 0.25(1.05± 0.10) (1.7± 0.9) (0.27)
CO(3− 2) 0.99± 0.04 2.1± 0.4 0.26(1.00± 0.05) (2.2± 0.5) (0.28)
CO(4− 3) 1.08± 0.09 1.2± 0.9 0.30(1.08± 0.09) (1.5± 0.9) (0.29)
CO(5− 4) 0.97± 0.06 2.5± 0.6 0.23(0.97± 0.06) (2.8± 0.6) (0.23)
CO(6− 5) 0.93± 0.05 3.1± 0.5 0.17(0.95± 0.06) (3.2± 0.5) (0.18)
CO(7− 6) 0.87± 0.05 3.9± 0.4 0.19(0.87± 0.05) (4.1± 0.4) (0.19)
CO(8− 7) 0.66± 0.07 5.8± 0.6 0.22(0.66± 0.07) (6.1± 0.6) (0.20)
CO(9− 8) 0.82± 0.07 4.6± 0.6 0.24(0.85± 0.07) (4.6± 0.6) (0.22)
CO(10− 9) 0.66± 0.07 6.1± 0.6 0.27(0.69± 0.08) (6.1± 0.6) (0.27)
CO(11− 10) 0.57± 0.09 6.8± 0.7 0.18(0.61± 0.09) (6.8± 0.7) (0.17)
CO(12− 11) 0.51± 0.11 7.5± 0.8 0.23(0.55± 0.11) (7.5± 0.8) (0.23)
CO(13− 12) 0.47± 0.20 7.9± 1.5 0.30(0.51± 0.21) (7.9± 1.6) (0.31)
coefficient for spontaneous decay, and∑i 6=u Cui is the
sum over all collisional coefficients (with H2 as the colli-sional partner) out of the level u, ‘upwards’ and ‘down-wards’ (see Table 4 where, as a reference, we also listncrit-values for a number of HCN and CS transitions).Although, it is the first three levels ‘up’ or ‘down’ fromthe u-level (i.e., |u − i| < 3) that dominate the sum, of-ten in the literature molecular line critical densities arecalculated for a two-level system only (i.e., |u − i| = 1),or for the downward transitions only – both practicesthat can significantly overestimate the true ncrit for agiven transition. The collision rates were adopted fromthe Leiden Atomic and Molecular Database (LAMDA;Schoier (2005)) for Tk = 40 K, which is within the rangeof typical dust and gas temperatures encountered in lo-cal (U)LIRGs and high-z DSFGs (e.g., Kovacs et al.(2006)). We do not correct for optical depth effects(i.e., line-trapping) as these are subject to the prevail-ing average ISM conditions, but we note that large op-tical depths (especially for low-J CO and HCN lines)can significantly lower the effective critical density to:
n(β)crit = βulncrit where βul is the average line escape prob-
ability (= [1 − exp(−τul)]/τul for spherical geometries).Of course, the collisional excitation of CO to higher ro-tational states (EJ) is set not only by the gas densitybut also by its kinetic temperature. The minimum tem-perature (Tmin) required for significant collisional excita-tion of a given rotational state is approximately given by:∼ EJ/kB = BrotJ(J+1)/kB, where Brot is the rotational
TABLE 4Critical densities (ncrit) and upper level energies (EJ/kB)of the rotational ladder of CO, and selected transitionsof HCN and CS, assuming H2 is the main collision partner.The ncrit-values are calculated for a kinetic temperature
of Tk = 40 K, and an ortho-H2 : para-H2 ratio of 3.
Transition ncrit EJ/kB[cm−3] [K]
CO(1− 0) 3.09× 10² 5.53CO(2− 1) 2.73× 10³ 16.60CO(3− 2) 9.51× 10³ 33.19CO(4− 3) 2.29× 10⁴ 55.32CO(5− 4) 4.48× 10⁴ 82.97CO(6− 5) 7.70× 10⁴ 116.16CO(7− 6) 1.21× 10⁵ 154.87CO(8− 7) 1.78× 10⁵ 199.11CO(9− 8) 2.50× 10⁵ 248.88CO(10− 9) 3.41× 10⁵ 304.16CO(11− 10) 4.63× 10⁵ 364.97CO(12− 11) 6.00× 10⁵ 431.29CO(13− 12) 7.55× 10⁵ 503.13
HCN(1− 0) 1.07× 10⁵ 4.25HCN(2− 1) 1.02× 10⁶ 12.76HCN(3− 2) 3.52× 10⁶ 25.52HCN(4− 3) 8.84× 10⁶ 42.53
CS(1− 0) 6.77× 10³ 2.35CS(2− 1) 6.50× 10⁴ 7.05CS(3− 2) 2.40× 10⁵ 14.11CS(5− 4) 1.34× 10⁶ 35.27CS(6− 5) 2.36× 10⁶ 49.37CS(7− 6) 3.76× 10⁶ 65.83
constant of CO, and kB is the Boltzmann constant. Asa rule of thumb, high kinetic temperatures are neededin order to excite the high-J CO lines (see Table 4), al-though due to the n − Tk degeneracy this can also beachieved for very dense, low-temperature gas.
Two trends regarding the LFIR−L′CO relations becomeapparent from Figs. 3 and 4 (see also Table 3). Firstly,the slopes are linear for J = 1 − 0 to J = 5 − 4 butthen start becoming increasingly sub-linear, the higherthe J level. Secondly, the normalization parameter βremains roughly constant (∼ 2) up to J = 4 − 3, 5 − 4,but then increases with higher J level, reaching β ∼ 8 forJ = 13− 12, which for a given CO luminosity translatesinto ∼ 6 orders of magnitude higher LFIR. We stressthat although the LFIR − L′CO relations are linear, andβ roughly constant, up to J = 5 − 4, it does not ingeneral imply that the CO lines are thermalized (i.e.,L′COJ,J−1
/L′CO1,0' 1) up to this transition. There is
significant scatter within the samples, and while a fewsources do have nearly-thermalized J = 2 − 1, 3 − 2,and/or 4 − 3 lines, in general, L′COJ,J−1
/L′CO1,0<∼ 1. In
fact, re-writing the LFIR − L′CO relations as:
L′COJ,J−1/L′CO1,0
= Lα−1
J,J−1−α−11,0
FIR × 10β1,0−βJ,J−1 , (1)
and inserting the fitted values from Table 3 yieldsL′COJ,J−1
/L′CO1,0< 1 over the range LFIR = 109−14 L .
In the following sections we discuss these empiricalrelations in the context of existing theoretical modelsand the new observational studies of such relations usingheavy rotor molecules like HCN, and CS.

Star formation relations and CO SLEDs across the J-ladder and redshift 9
4. THE SLOPE OF THE LFIR − L′CO RELATIONS
4.1. Comparison with previous studies
Before comparing our derived FIR−CO slopes withthose from the literature we must add two cautionarynotes, namely: a) many studies examine the L′CO−LFIR
relation, rather than LFIR − L′CO, and one cannot com-pare the two simply by inferring the inverse relation, b)often, only the errors in one variable (typically L′CO) aretaken into account when fitting such relations, when infact the uncertainties in both LFIR and L′CO must be con-sidered (see Mao et al. (2010) for a further discussion).Failing to do so can result in erroneous estimates of theslope.
For these reasons, we have re-fitted the data froma number of studies (see below) using the method de-scribed in § 3, i.e., with errors in both LFIR and L′CO
and including only sources with LFIR >∼ 1011 L in ouranalysis. Finally, not all studies use the FIR definitionused here to infer LFIR, while other studies use the full(8 − 1000µm) luminosity. These differences can resultin a different overall normalization (i.e., β), but are notexpected to affect the determination of α (see Table 3where there is little change in α when switching betweenLFIR[50−300µm] and LIR[8−1000µm]).
From Fig. 3 we note the overall good agreement be-tween the FIR−CO slopes derived here and values fromthe literature. For CO(1 − 0), however, one set of mea-surements found super-linear slopes (αCO1,0
∼ 1.3− 1.4;Juneau et al. (2009); Bayet et al. (2010)), while mostothers favor a slope of unity (Gao & Solomon 2004b;Mao et al. 2010; Ivison et al. 2011, this work). Note,our re-analysis of the Yao et al. (2003) and Baan et al.(2008) data revised their slopes from super-linear to lin-ear: αCO1,0 = 0.94 ± 0.07 and 1.08 ± 0.06, respectively(a similar result was found by Mao et al. (2010)). Gao& Solomon (2004b) finds a super-linear FIR−CO slope(α = 1.3 − 1.4) from their entire sample (combiningLIR ∼ 1010 L objects with LIRGs and ULIRGs), yetincluding only the LIRGs and ULIRGs in the analysis,we obtain a linear slope (αCO1,0 = 0.91±0.22). Re-fittingthe data presented in Juneau et al. (2009) and Bayet etal. (2010) we reproduce their super-linear slopes.
For CO(2−1) our slope of unity is consistent within theerrors with Bayet et al. (2010), who finds a slightly super-linear slope based on 17 sources. Our re-analysis of theCO(2− 1) data by Baan et al. (2008) yields a sub-linearslope of α = 0.82± 0.10. However, as pointed out by theauthors themselves, a non-negligible fraction of the totalCO(2− 1) emission is likely to have been missed due tothe smaller telescope beam at higher frequencies – thusbiasing the FIR−CO relation to a shallower value of α.
In the case of CO(3 − 2), the existing slope-determinations (Yao et al. 2003; Narayanan et al. 2005;Iono et al. 2009; Bayet et al. 2010; Mao et al. 2010), in-cluding our own, are all in agreement and favor a valueof unity within the errors. This includes a re-analysis ofthe Yao et al. (2003) data, which yielded α = 1.00 (seealso Mao et al. (2010)).
For CO(4− 3) to CO(7− 6) there is agreement withinthe errors between our results and the slopes found byBayet et al. (2010), which however were determined usingobserved as well as model-extrapolated CO luminosities
of 7 low-z and 10 high-z sources. A departure from lin-ear towards sub-linear is also found by the latter study,albeit we find this turn-over to occur at J = 6− 5 ratherthan at J = 4− 3 deduced by Bayet et al. (2010). Herewe must note, however, that the use of models to extrap-olate to high-J CO luminosities is not safe and artificialturnovers can be introduced because of the inability ofsuch models – in the absence of appropriate line data – toreliably account for the existence of warmer and densergas components. This further underscores the value ofour observed LFIR − L′CO relations from J = 1 − 0 toJ = 13 − 12 in safely determining such departures fromlinearity and/or in normalization before proceeding to-wards any interpretation based on ISM/SF physics.
4.2. Super-linear slopes: the simplest scenario
The few super-linear slopes of FIR−CO luminosity re-lations for low-J CO lines that survive careful re-analysis(Juneau et al. 2009; Bayet et al. 2010) could be a byprod-uct of dense molecular gas being the direct SF fuel inall galaxies (with a constant SFE) and a fdense,X =Mdense/MX (where X could be total H2 gas mass tracedby CO J = 1− 0, J = 2− 1 lines) that varies within thegalaxy sample with d(fdense)/dLFIR > 0. Variations ofthis simple scenario have been suggested throughout theliterature (Wong & Blitz 2002; Gao & Solomon 2004b),and unlike more sophisticated interpretations of suchsuper-linear slopes offered by the two theoretical treatisesavailable on this matter (Krumholz & Thompson 2007;Narayanan et al. 2008), the only assumption here is thatd(fdense)/dLFIR > 0. The latter is a well-documentedfact as starbursts/mergers, which dominate the high-LFIR end, are observed to have larger dense/total gasmass fractions than lower-LFIR isolated disks (e.g., Gao& Solomon (2004b); Garcıa-Burillo (2012)).
Within this scheme, the further the gas phase X isfrom the dense, star forming phase in terms of physi-cal conditions and relevance to the star formation, thehigher the d(fdense)/dLFIR value is and the deducedsuper-linear slope of the LFIR − L′X (or correspondingS-K) relation. On the other hand for galaxy sampleswith a smaller range of IR-luminosities that have a nearlyconstant fdense,X – such as the (U)LIRG+DSFG sampleconsidered in this paper (see § 5.2) – a linear slope ofan LFIR −L′X relation can still be recovered for e.g., COJ = 1 − 0 that traces all metal-rich molecular gas massrather than only the dense SF one. We return to thispoint later in our discussion.
5. CONFRONTING THEORETICAL MODELS
5.1. α versus ncrit
As already mentioned in the introduction, the S-K re-lation, and especially the important one involving thedense gas component in galaxies, is not easily accessibleobservationally. So one falls back to the much more ob-servationally accessible proxy LFIR−L′X relations. Theirindex can then be linked to that of an assumed un-derlying S-K relation in galaxies using two theoreticalmodels (Krumholz & Thompson 2007; Narayanan et al.2008). Both models posit the same intrinsic S-K rela-tion of ρSFR ∝ ρ1.5
gas (or ΣSFR ∝ Σ1.5gas (for disks of near-
constant scale-height), justified under the assumption ofa constant gas fraction transformed into stars per free

10 Greve et al.
Fig. 3.— A compilation of slope (α) determinations from the literature for CO (Yao et al. 2003; Gao & Solomon 2004b; Narayanan et al.2005; Baan et al. 2008; Juneau et al. 2009; Iono et al. 2009; Bayet et al. 2010; Genzel et al. 2010; Mao et al. 2010), HCO+ (Baan et al. 2008;Garcıa-Burillo 2012), HCN (Gao & Solomon 2004b; Wu et al. 2005, 2010; Bussmann et al. 2008; Gracia-Carpio et al. 2008b; Juneau et al.2009; Garcıa-Burillo 2012; Zhang et al. 2014), and CS (Wu et al. 2010; Wang, Zhang & Shi 2011; Zhang et al. 2014) (the CS J = 1 − 0,2−1, 3−2, and 5−4 results are from Zhang et al., in prep.). In some cases (Yao et al. 2003; Baan et al. 2008) we had to re-fit the FIR−COrelations as to facilitate a direct comparison with our findings (see § 4.1). The slopes derived in this paper are outlined by black squares.For the first three CO transitions, the different α-estimates have been slightly offset horizontally in order to ease the comparison. Thegrey-shaded regions show the CO (left) and HCN(right) slopes (within a 1-σ scatter) predicted by one of two theoretical models (Narayananet al. 2008). The LFIR − L′X relations for lines with high ncrit but low EJ/kB (X=HCN, CS) have slopes consistent with unity across the
critical density regime of ∼ 104−7 cm−3, and are inconsistent with the theoretical predictions. A statistically significant trend of α versusncrit is found for the LIR −L′CO relation with α ' 1 up to CO J = 5− 4 but then decreasing with higher J (and thus ncrit). However thehigh EJ/kB values of the CO J = 6− 5 to J = 13− 12 transitions (∼ 115− 500 K) place them well outside the applicability of both currenttheoretical models and thus this trend cannot be used to test them. Following the reasoning laid out by Krumholz & Thompson (2007),the sub-linear slopes of the LFIR − L′CO relations for such high-J CO lines are actually quite unexpected (see discussion). We ignore theFIR−HCN(3−2) slopes inferred by Bussmann et al. (2008) and Juneau et al. (2009) (shown as grey-hatched squares) since their data werenot appropriately beam-corrected (see § 5.1).
fall time (tff ∝ (Gρgas)−1/2). The same S-K relation
emerges also if the SF timescale is instead set by the dy-namical timescale of a marginally Toomre-stable galacticdisk with SF converting a fixed fraction of gas into starsover such a timescale (Elmegreen 2002).
Both models give expected values of α versus ncrit(X)for LFIR − L′X luminosity relations over a large rangeof line critical densities, but both models are applica-ble only for lines that require low temperatures to ex-cite EJ/kB . 30 K (for the Krumholz & Thompson(2007) model this limit is ∼ 10 K). The reasons behindthis limitation are explicit assumptions about isothermalgas states at a set temperature (Krumholz & Thompson2007), or the tracking of such states over a small rangeof Tk ∼ 10 − 30 K (Narayanan et al. 2008). The low-Jlines of heavy rotor molecular line data-sets found in theliterature and our low-J CO lines are certainly withinthe range of applicability of these models. The indicesof the corresponding LFIR − L′X power law relations can
thus be compared to these theoretical predictions.Gao & Solomon (2004a,b) found a linear FIR−HCN
correlation for the J = 1 − 0 transition (see also Baanet al. (2008)), which extends from local ULIRGs/LIRGs(LIR ∼ 1011−12 L ) to normal, star forming galaxies(LIR ∼ 109−10 L ), down to individual Galactic molec-ular clouds with LIR >∼ 104.5 L (Wu et al. 2005, 2010).A weakly super-linear FIR−HCN(1− 0) slope (α ' 1.2)was found by Gracia-Carpio, Garcıa-Burill & Planesas(2008a) and Garcıa-Burillo (2012) over a combined sam-ple of local normal galaxies and LIRG/ULIRGs. A care-ful analysis by Garcıa-Burillo (2012), however, demon-strated that a bimodal fit (i.e., a different normaliza-tion parameter β) is better, with each galaxy samplewell fit by a linear relation. Finally, a weakly super-linear LFIR −LHCN1,0
appears when high-z observationsof the most IR-luminous starburst galaxies and QSOsare included in the locally-established relation (Gao etal. 2007; Riechers, Walter & Carilli 2007). This could

Star formation relations and CO SLEDs across the J-ladder and redshift 11
Fig. 4.— The normalisations (β) of the FIR−CO relations presented in this paper (Fig. 2 and Table 3). For J = 1 − 0 to 5 − 4 thenormalisations are constant (within the errors), with values (β ∼ 1.2− 2.5) close to that expected from Eddington limited star formation(∼ 2.5 − 3.3, shown as grey shaded area), assuming a Rosseland-mean opacity in the range 5 − 30 cm2 g−1 and a CO-to-H2 conversionfactor of 0.8 K km s−1 pc2 (see also § 5.2). For J = 6−5 and higher, the β-values increase with J as the FIR−CO slopes become sub-linear.
also be bimodal instead, but with an otherwise linearLFIR−LHCN1,0
relation (and with insufficient high-LFIR
objects to decide the issue). A physical reason for suchbimodalities is discussed in § 5.2.
Extending HCN observations to include many moreobjects in the crucial LIR > 1012 L regime is nec-essary for deciding such issues. Even then one musteventually obtain the underlying SFR−Mdense relationbefore arriving at secure conclusions about a varyingSFE = SFR/Mdense of the dense gas in (U)LIRGs. Thelatter is the crucial physical quantity underlying the nor-malization of such LFIR−L′HCN relations and e.g., a ris-ing or bimodal XHCN = Mdense/LHCN1,0
factor towardshigh-LIR systems can easily erase purported SFE trendsobtained by using single-line proxies of dense gas.
A sub-linear FIR−HCN slope (∼ 0.7 − 0.8) for theJ = 3− 2 transition has been reported (Bussmann et al.2008; Juneau et al. 2009) but is very likely biased low dueto not having performed any beam correction (see § 2)for some of their very nearby extended objects, wherethe HCN beam does not cover the entire IR emitting re-gion. For these sources, the HCN measurements do notmatch the IR luminosities, and since they all reside atthe lower end of the HCN luminosity distribution, thenet effect will be to bias the relation towards shallowervalues. For this reason we have chosen to ignore the sub-linear FIR−HCN slopes from Bussmann et al. (2008) andJuneau et al. (2009). A recent survey of HCN J = 4− 3and CS J = 7−6 (Zhang et al. 2014), and CS J = 1−0,
2 − 1, 3 − 2, and 5 − 4 (Zhang et al., in prep.), towardsnearby star forming galaxies (LIR ∼ 109 − 1012 L ),where such effects have been adequately accounted for,establishes a slope α ∼ 1 for these transitions (see alsoWu et al. (2010) and Wang, Zhang & Shi (2011)). Manyof these CS transitions have higher critical densities thanHCN, and CS is furthermore less prone to IR pumpingeffects than HCN is (CS is pumped at 7.9µm comparedto 14µm for HCN). Pumping of HCN (and also HNC),however, typically only becomes important at dust tem-peratures >∼ 50 K (Aalto et al. 2007), and would typicallyrequire even higher temperatures for CS. This is impor-tant since pumping could affect the CS/HCN luminosi-ties (especially at high-J), and thus in principle resultin linear IR-CS/HCN relations. In Fig. 3 we summa-rize all the observationally determined LIR − L′HCN andLIR − L′CS slopes from the literature along with thosederived from our CO lines. Overall, the data suggestα ∼ 1 for our LFIR−L′CO relations from J = 1− 0 up toJ = 5− 4, 6− 5 and for the heavy-rotor molecular lines.The latter cover a range of ncrit ∼ 104 − 107 cm−3, i.e.,reaching up well into the high-density regime of the starforming gas phase.
From Fig. 3 it becomes clear that most observationsare incompatible with current model predictions (shownas the grey-shaded area) both for the heavy rotor and thelow-J CO lines (where such models remain applicable).Super-linear slopes do appear for some CO J = 1 − 0

12 Greve et al.
data-sets but then, unlike model predictions, the slopesremain linear for lines with much higher critical densities,including those of mid-J CO lines J = 3− 2, 4− 3, 5− 4(the FIR−CO luminosity relation for J = 6 − 5 is alsocompatible with a linear one).
In summary, we conclude that the global LFIR-L′X re-lations in (U)LIRGs and DSFGs, as parametrized bylogLFIR = α logL′X + β, are linear for heavy rotor lines,and our CO line data-set up to J = 6 − 5, at whichpoint the relations become increasingly sub-linear forhigher J . Moreover, the normalization factor β showsa similar behavior by being nearly constant β ∼ 2 up toJ = 5− 4/6− 5 but then starting to increase systemati-cally with increasing J , reaching β ∼ 8 for J = 13− 12.
5.2. More ISM physics in β rather than in α?
The simplest scenario outlined in § 4.2 seems to workboth for the low-J CO and the heavy rotor molecularlines with much higher critical densities. Given that oursample solely consists of (U)LIRGs (i.e., LIR[8−1000µm] ≥1011 L ) for which the dense gas fraction (i.e., fdense =L′HCNlow−J
/L′COlow−J) is nearly constant (see discussion
in § 6), linear slopes are to be expected for its low-JFIR−CO relations. For other samples in the literature(e.g., Bayet et al. (2010)) that reach lower IR luminosi-ties (∼ 1010 L ) and thus span a wider range in LIR
(over which fdense changes appreciably) the super-linearslopes of their low-J FIR−CO relations seen in Fig. 3are also expected. In this simple picture neither the occa-sional super-linear nor the linear slope of the LFIR−L′COlow-J relations carry any profound ISM physics otherthan more dense gas mass corresponds to proportionallyhigher SFRs (a picture also suggested by Gao & Solomon(2004b) and Wu et al. (2005)).
For dense gas tracer lines this shows itself directly withLIR−L′X relations that always have linear slopes. In thispicture there is actually more ISM physics to be foundin exploring what sets the value of the normalization pa-rameter β rather than the slope of LIR − L′X relations.
The low- and high-z (U)LIRGs studied here are highlydust-obscured galaxies, and radiation pressure exerted bythe strong absorption and scattering of FUV light by dustgrains could be an important feedback mechanism, possi-bly setting the value of the normalization (and ultimatelyregulating the SF). The maximum attainable LIR/Mdense
ratio of a star forming region before radiation pres-sure halts higher accretion rates is ultimately set by theEddington limit giving: LIR/Mdense ∼ 500L M
−1
(Scoville & Polletta 2001). Andrews & Thompson (2011)expressed the expected LIR − L′CO and LIR − L′HCN re-lations in the case of Eddington-limited SFRs and foundthat, for CO luminosity tracing only the actively starforming gas, the maximal possible luminosity is given byLEdd = 4πGcκ−1XCOL
′CO, where κ is the Rosseland-
mean opacity, and XCO is the L′CO-to-MH2conversion
factor. A similar expression holds for HCN, albeit withdifferent κ and X values (see Andrews & Thompson(2011) for details). Although the exact normalization ofthis relation for each molecular line depends on poorlyconstrained quantities like κ and X, the Eddington limitset by the strong FUV/optical radiation from embed-ded SF sites acting on the accreted dust and dense gascan naturally provide the normalization of the observed
LFIR−L′CO and LFIR−L′HCN relations. In fact, adoptingκ = 5 − 30 cm2 g−1 and XCO = 0.8 K km s−1 pc2, whichare perfectly reasonable values for (U)LIRGs (Thomp-son, Quataert & Murray 2005; Solomon et al. 1997),we find β = log(4πGcκ−1XCO) = 2.5 − 3.3. We notethat the high κ-value (30 cm2 g−1), which correspondsto a three-fold increase in the dust-to-gas mass ratio forthe Rosseland-mean opacity (see Andrews & Thompson(2011) for details), as might be expected in (U)LIRGs,yields β = 2.5, which is close to the observed normalisa-tion values obtained (β ' 2) for the low-J CO lines in§ 3 (Table 3; see also Fig. 4).
Given that the Eddington limit is ultimately set withinindividual SF sites embedded deep inside molecularclouds, it will operate on all galaxies, not just (U)LIRGs.For ordinary star forming spirals, the global β normal-ization value of the LFIR − L′CO relations for low-J COlines will be lower than its (Eddington limit)-set valueby a factor approximately equal to the logarithm of itsdense gas fraction, i.e., log(fdense) = log(Mdense/Mtot).By the same token, the offset in the log(LFIR)−log(L′CO)plane between two populations with significantly differ-ent dense gas fractions (fdense,1 and fdense,2, say) can beshown to be ∆β ∼ log(fdense,2/fdense,1). Thus, an in-creasing fdense(LIR) function can cause the super-linearFIR−CO(low-J) relations seen in some galaxy samples(which in reality is a varying β(LIR) rather than a su-perlinear α).
Local (U)LIRGs and high-z DSFGs on the other handform stars closer to the Eddington limit on a globalscale (Andrews & Thompson 2011). Thus, the lin-ear FIR−CO (low-J) and FIR−HCN/CS relations ob-served for local (U)LIRGs and high-z DSFGs is consis-tent with the notion that radiation pressure is an im-portant physical mechanism that underlies the observedstar formation laws in highly dust-obscured galaxies. Ineffect, the extreme merger/starbursts that dominate the(U)LIRGs and high-z DSFG population resemble dra-matically scaled-up versions of dense gas cores hostingSF deep inside Giant Molecular Clouds (GMCs), withthe balance between radiation pressure and self-gravitysetting their equilibrium during their IR-luminous phase.
In this framework the failure of the available theo-retical models to account for the observed LFIR − L′COrelations of low-J CO and heavy rotor molecular linesmight be attributed to the role radiation pressure feed-back plays in ultimately determining such relations. Thishas not be taken into account in all current theoreticalconsiderations that either seek to explain the S-K rela-tion in galaxies (e.g., Elmegreen (2002)), or use an (S-K)relation of ρSFR ∝ (ρgas)
1.5 to determine the emergentLFIR − L′line relations for molecular gas (Krumholz &Thompson 2007; Narayanan et al. 2008). These use self-gravity, the associated time-scale of free-fall time, alongwith models on how the SF efficiency (gas mass frac-tion converted into stars per free fall time) varies perphase in turbulent gas as the main ingredients towardsa complete understanding of SF, S-K relations, and theproxy LFIR−L′X relations. A non-gravitational force likethat exerted by radiation pressure on accreted gas anddust near SF sites can greatly modify such a picture byreducing or eliminating the dependence on the free falltime, especially for the high-density gas (which presum-
Star formation relations and CO SLEDs across the J-ladder and redshift 13
ably is the one closest to active SF sites). Alternatively,is has been suggested that in lower luminosity systemsthe star formation may be regulated by feedback-driventurbulence (kinetic momentum feedback) rather than byradiation pressure (Ostriker & Shetty 2011; Shetty &Ostriker 2012; Kim, Ostriker & Kim 2013). Assuminga continuum optical depth at FIR wavelengths (τFIR) oforder unity for our sample of starburst/merger (U)LIRGsand typical dust temperatures of ∼ 50 K, we can makea rough estimate of the expected radiation pressure,namely Prad ∼ τFIRσT
4d/c ∼ 1.2× 10⁻⁸ erg cm−3 (where
σ is Stefan-Boltzmann’s constant and c the speed oflight). This is comparable to the turbulent pressurePturb ∼ ρσ2
v/3 ∼ 1.4 × 10⁻⁸ erg cm−3, obtained assum-ing a turbulent velocity dispersion of σv ∼ 5 km s−1
and an average gas mass density of ρ ∼ 2µnH2corre-
sponding to nH2∼ 105cm−3. Both of these greatly ex-
ceed the expected thermal pressure Pth ∼ nH2kBTk ∼
1.4×10⁻⁹ erg cm−3 (for nH2∼ 105 cm−3 and Tk ∼ 100 K)
– thus highlighting the point made above that a completephysically model of the S-K relations has to incorporatethe effects of radiation pressure and/or turbulence.
6. THE α AND β TURNOVERS FOR HIGH-J CO LINES
Higher than J = 6 − 5 neither the slope, α, northe normalization, β, of the LFIR − L′CO relations re-main constant but α decreases while β increases to-wards higher J levels. This can be understood usinga simple argument first put forth (in a slightly differentform than here) by Wong & Blitz (2002). Consider thatαCOJ,J−1
= d logLFIR/d logL′COJ,J−1can be expressed
as:
αCOJ,J−1=
d logLFIR
d logL′HCN1,0
×d logL′HCN1,0
d logL′COJ,J−1
(2)
=αHCN1,0
(1 +
d log ldenseJ,J−1
d logL′COJ,J−1
), (3)
where αHCN1,0 is the slope of the FIR−HCN J = 1 − 0relation, which as mentioned previously, is near unity.The last term, ldenseJ,J−1
= L′HCN1,0/L′COJ,J−1
, is a con-
venient parametrization of deviations in αCOJ,J−1from
unity, and depends on both the dense gas content (astraced by HCN) and the global CO line excitation.
For CO J = 1 − 0, ldense1,0 is a linear proxy ofdense gas mass fraction. This is simply due to thelinearity of the L′HCN1,0
− L′CO1,0relation (a fit to the
LIR[8−1000µm] > 1011 L sources in the Gao & Solomon(2004b) sample yields logL′HCN1,0
' 0.9 logL′CO1,0−0.2),
and the fact that CO J = 1 − 0 provides a good lin-ear measure of Mtot(H2). The same applies also for theJ = 2− 1 line. For the higher J CO lines ncrit becomessimilar to that of HCN J = 1 − 0 (or only slightly sur-passes it) while their EJ/kB (∼ 115−500 K) significantlyexceed that of HCN J = 1−0 (∼ 4.3 K). The high-J COlines are significantly excited (see § 6.1) and, followingthe argument first made by Bradford et al. (2003), thisis unlikely to be a pure density effect, as this would implytoo large CO J = 1− 0 and 2− 1 optical depths and, inturn, 12CO/13CO line ratios well below the typical val-ues (∼ 10−30) observed for local (U)LIRGs (e.g., Casoliet al. (1992); Aalto et al. (1995)). Instead, we argue that
the high-J CO lines are produced by a dense and warm(Tk >∼ 100 K) phase. The ldenseJ,J−1
then becomes a mea-sure of the Rd,d−w = Mdense(H2)/Mdense−warm(H2) ≥ 1modulo gas excitation differences between the dense (d)and the dense and warm (d-w) molecular gas reservoirs.The derivative inside the parenthesis in eq. 3 will benearly zero for both low- and high-J CO lines as longas: a) the dense gas mass fraction remains nearly con-stant within our galaxy sample (i.e., the sample is ho-mogeneous in terms of fdense and its proxies ldense1,0 ,ldense2,1), and b) the Rd,d−w ratio also remains constant.The latter means that the relative excitation conditionsand mass between the dense gas component (d) and itssub-component of dense and warm gas (d-w) remain in-variant across the sample. The trend of LFIR − L′CO re-lations above J = 6− 5 towards increasing sub-linearityfor higher J levels is due to a decrease of ldenseJ,J−1
with increasing high-J CO luminosity, thus resulting inαCOJ,J−1
< 1. This behavior is indeed obvious in Fig.5, which shows ldenseJ,J−1
as a function of L′COJ,J−1for
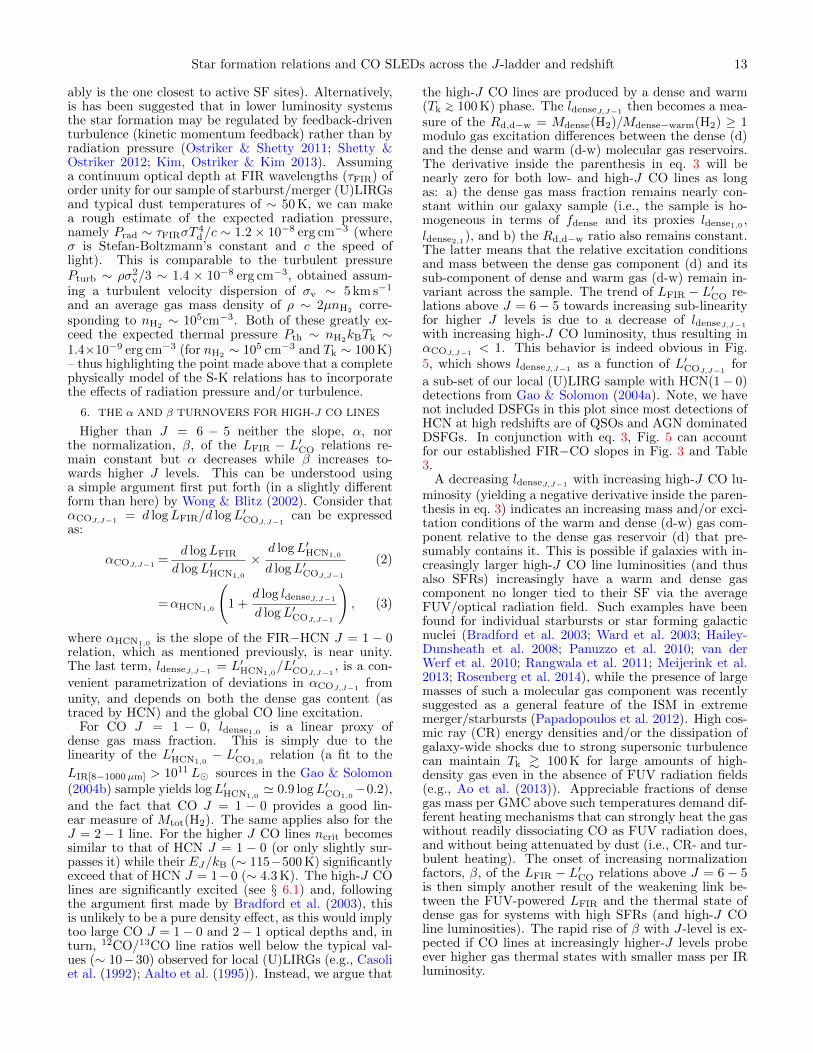
a sub-set of our local (U)LIRG sample with HCN(1− 0)detections from Gao & Solomon (2004a). Note, we havenot included DSFGs in this plot since most detections ofHCN at high redshifts are of QSOs and AGN dominatedDSFGs. In conjunction with eq. 3, Fig. 5 can accountfor our established FIR−CO slopes in Fig. 3 and Table3.
A decreasing ldenseJ,J−1with increasing high-J CO lu-
minosity (yielding a negative derivative inside the paren-thesis in eq. 3) indicates an increasing mass and/or exci-tation conditions of the warm and dense (d-w) gas com-ponent relative to the dense gas reservoir (d) that pre-sumably contains it. This is possible if galaxies with in-creasingly larger high-J CO line luminosities (and thusalso SFRs) increasingly have a warm and dense gascomponent no longer tied to their SF via the averageFUV/optical radiation field. Such examples have beenfound for individual starbursts or star forming galacticnuclei (Bradford et al. 2003; Ward et al. 2003; Hailey-Dunsheath et al. 2008; Panuzzo et al. 2010; van derWerf et al. 2010; Rangwala et al. 2011; Meijerink et al.2013; Rosenberg et al. 2014), while the presence of largemasses of such a molecular gas component was recentlysuggested as a general feature of the ISM in extrememerger/starbursts (Papadopoulos et al. 2012). High cos-mic ray (CR) energy densities and/or the dissipation ofgalaxy-wide shocks due to strong supersonic turbulencecan maintain Tk & 100 K for large amounts of high-density gas even in the absence of FUV radiation fields(e.g., Ao et al. (2013)). Appreciable fractions of densegas mass per GMC above such temperatures demand dif-ferent heating mechanisms that can strongly heat the gaswithout readily dissociating CO as FUV radiation does,and without being attenuated by dust (i.e., CR- and tur-bulent heating). The onset of increasing normalizationfactors, β, of the LFIR − L′CO relations above J = 6− 5is then simply another result of the weakening link be-tween the FUV-powered LFIR and the thermal state ofdense gas for systems with high SFRs (and high-J COline luminosities). The rapid rise of β with J-level is ex-pected if CO lines at increasingly higher-J levels probeever higher gas thermal states with smaller mass per IRluminosity.

14 Greve et al.
Fig. 5.— log ldenseJ,J−1vs. logL′COJ,J−1
for our local (U)LIRG
sample defined in § 2 (solid symbols), where ldenseJ,J−1=
L′HCN1,0/L′COJ,J−1
(see § 6). The different CO transitions are
color-coded (see insert). To highlight the trends, we show theaverage log ldenseJ,J−1
-values within suitable bins of L′COJ,J−1
(shown as open circles and connected with solid lines). Linearfits to these averages yield the slopes given in the insert. ForCO(1−0) to CO(6−5), we find d log ldenseJ,J−1
/d logL′COJ,J−1'
0, which when inserted in eq. 3 yields αCOJ,J−1' 1, in agree-
ment with our findings. For higher CO transitions, we haved log ldenseJ,J−1
/d logL′COJ,J−1< 0, which result in the sub-linear
αCOJ,J−1-values, which match our directly determined FIR−CO
slopes.
The above picture retains the simple explanation forthe observed α ' 1 for the LFIR − L′CO relations fromJ = 1 − 0 to J = 5 − 4, and for those found for severalheavy rotor molecular lines - as long as all these relationsrefer to a near fdense-homogeneous galaxy sample, withSF powering both the dust continuum and the molec-ular line luminosity via FUV radiation. Highly super-linear slopes can only occur for galaxy samples with sig-nificantly different dense gas fractions, or different starformation relation normalizations (e.g., Gao & Solomon(2004b)). Finally, in this overall scheme, and for good(i.e., linear) dense SF gas tracers such as HCN and CSlines it is rather hard to envisage how sub-linear slopescan come about (Juneau et al. 2009), since even the high-J transitions of these heavy-rotor molecules will trace thedense, cold star forming gas. Thus, the second term ineq. 3 will remain close to zero, leaving the FIR−HCN(or FIR−CS) relation linear. In fact, linear slopes areobserved for transitions as high as CS J = 7− 6 (Zhanget al. 2014).
6.1. The CO SLEDs and the thermal state of highdensity gas
A more direct indication of significant amounts ofwarm and dense gas in our (U)LIRG-dominated sam-ple, and to what extent its thermal state is likely to bemaintained by the SFR-powered average FUV radiationfields, is provided by the CO SLEDs. In Fig. 6 we showthe FIR- and CO(1−0)-normalised CO SLEDs (top andmiddle panels, respectively), as well as the ’raw’ CO lu-minosities (bottom panel). The first version allows foran assessment of the CO SLEDs for the full samples (not
all of our sources have CO J = 1−0 measurements), andshows the cooling power of the CO lines with respect tothe continuum. The CO J = 1− 0 normalized represen-tation of the CO SLEDs makes for a direct comparisonwith observed CO line ratios in the literature, and is fur-thermore what is usually used to constrain the excitationconditions of the gas.
A detailed analysis of the CO SLEDs, in conjunctionwith the multi-J HCN, CS and HCO+ line data-setsavailable for many of the (U)LIRGs in Fig. 6, is neededfor a full understanding of the heating and cooling mech-anisms of the molecular gas and for quantifying the rel-ative mass-fractions of the gas phases. Nevertheless, themarked contrast between their CO SLEDs and that ofthe Milky Way disk (where most of bulk of the molecu-lar gas is warmed by photoelectric heating induced by theambient FUV radiation field), already indicates the pres-ence of a different heating source. While intense X-rayradiation fields (1 − 5 keV) generated by AGN can pen-etrate and heat gas up to >∼ 100 K at column densitiesof 1022 − 1024 cm−2 (and without dissociating all of theCO), it is unlikely to be the case here since great care hasbeen taken in removing AGN from our sample. The inte-grated power emitted in the CO J = 7−6 to J = 13−12transitions for all the (U)LIRGs in our sample, consti-tutes the bulk (about 60 %) of the total energy outputof all the CO lines. Exploring the effects of different CRand mechanical heating rates on the thermal structureof clouds, Meijerink et al. (2011) found that even for ex-treme CR fluxes (∼ 102 − 104× the Milky Way value)it is difficult to maintain temperatures >∼ 100 K, and theeffect on the high-J CO lines appears to be minor. Me-chanical heating, such as supernova driven turbulenceand shocks, however, was found to heat the gas more ef-ficiently, and we favor this as the most likely explanationfor hot gas and the ‘boosted’ high-J CO lines observedin our (U)LIRGs.
Highly excited CO SLEDs have been found for themerger/starburst NGC 6240, where a recent analysisfound FUV photons (and the resulting photoelectricheating) to be inadequate as the main heating sourcefor the high temperatures of its dense gas (Meijerink etal. (2013); Papadopoulos et al. (2014)), and for Mrk 231where X-rays from the AGN are thought to heat thedense molecular gas reservoir (van der Werf et al. 2010)(although, Mrk 231 has recently been shown to be muchless X-ray luminous than previously though, see Tenget al. (2014)). While such CO SLEDs, and the needfor alternative heating mechanisms than FUV-photonsto explain them, might be linked to the unusually highCO line-to-continuum ratios of both of these two sources,a similar conclusion was reached for M 82 and NGC 253based on analyses of their full CO SLEDs (Panuzzo etal. 2010; Rosenberg et al. 2014). Our work is the firstto demonstrate such highly excited high-J CO SLEDs asa near generic characteristic of merger/starbursts (thegalaxies that dominate the sample shown in Fig. 6).
6.2. Some possible caveats
As mentioned in § 2 incorrect FIR−CO relations maybe inferred if the FIR and CO measurements cover dif-ferent regions within galaxies. This can be a seriousproblem for local extended sources where single-dish CObeams can be smaller than the extent of the IR emission

Star formation relations and CO SLEDs across the J-ladder and redshift 15
a)
b)
c)
Fig. 6.— The CO spectral energy distributions for the local (U)LIRG+HerCULES sample (red), the unlensed (green) and strongly lensed(blue) high-z DSFGs. The CO SLEDs are given both as the CO line luminosities, in L -units, normalized by the FIR luminosity (top),as brightness temperature ratios, i.e., L′COJ,J−1
/L′CO1,0(middle), and simply as LCOJ,J−1
(in L -units) versus J (bottom). The filled
bars indicate the full range of LCOJ,J−1/LFIR- and L′COJ,J−1
/L′CO1,0-values in the two panels, respectively, while the tick-marks indicate
the values of individual sources. For comparison we also show the CO SLEDs for the inner Galaxy (up to J = 7 − 6) as measured byFIRAS/COBE (Fixsen, Bennet & Mather 1999), normalised by LFIR = (1.8 ± 0.6) × 1010 L (also measured by FIRAS, Wright et al.(1991)) and for the proto-typical nearby starbust galaxy M 82 (Panuzzo et al. 2010).

16 Greve et al.
(see discussion in Zhang et al. (2014)). We are confi-dent that this is not an issue for our HerCULES sample,where all SPIRE-FTS CO line fluxes were scaled to acommon 42′′ angular resolution, which is beyond thenthe extent of the IR emission in these sources (as tracedby LABOCA 870µm maps). However, if this was notthe case, and the SPIRE-FTS measurements did not cap-ture all the CO emission, it would imply that the derivedFIR−CO slopes are biased high (since the CO luminositywill be underestimated relative to the total FIR luminos-ity, see Fig. 2). In short, the sub-linear FIR−CO slopesat high-J transition found here are robust against the(unlikely) possibility that some (small) fraction of theCO emission is unaccounted for.
The effects that the presence of strong AGNs wouldhave on the SF relations are two-sided. On the one handit could lead to an overestimate of the IR luminosityattributed to star formation, thus biasing the FIR−COslopes high. On the other hand, AGN-dominated en-vironments, where penetrating X-rays may be dominat-ing the gas heating, tend to have ‘boosted’ high-J COlines compared to star forming regions (e.g., Meijerink,Spaans & Israel (2007)). If the AGN was deeply buriedit would not be easily detectable in X-rays and wouldbe optically thick in the IR, possibly down to mm wave-lengths. The effect could be just what is observed here – achange of slope in the correlation and the high-J CO linesreflecting a hot, deeply embedded AGN. As mentionedin § 2, we used LFIR[50−300µm] instead of LIR[8−1000µm]
in the FIR−CO relations in order to minimize the ef-fects of AGN. More importantly, we only included local(U)LIRGs for which the bolometric AGN contributionwas deemed to be < 20%, as estimated from several MIRdiagnostics (§ 2). In the case of the high-z sample, ob-vious AGN-dominates systems were discarded from thesample to begin with (§ 2). Furthermore, we note thatdeep X-ray observations as well as MIR spectroscopyof millimeter and sub-millimeter selected DSFGs (whichshow no obvious signs of harboring an AGN) have shownthat any AGN that might be present typically contribute<∼ 20 % to the total IR luminosity (Alexander et al. 2005;Mendez-Delmestre et al. 2007). Based on the above, wefeel confident that neither the FIR nor the CO luminosi-ties are biased high due to AGN, and that therefore ourfindings are not systematically affected by AGN.
Galaxies that are gravitationally lensed are prone todifferential magnification, an effect in which regionswithin a galaxy are magnified by different amounts dueto variations in their location within the galaxy, and/orspatial extent (Blain 1999). This can significantly skewthe observed relative contributions from hot vs. cold dustto the IR luminosity, as well as low- vs. high-J CO lineluminosity ratios (Serjeant 2012). Furthermore, a flux-limited sample of strongly lensed sources will tend topreferentially select compact sources (Hezaveh, Marrone& Holder 2012), which may be more likely to have ex-treme CO excitation conditions. From Fig. 6a, however,there is nothing to suggest that the lensed DSFGs havemarkedly different L′COJ,J−1
/LFIR values than the non-
lensed and local (U)LIRGs. In Fig. 6b, however, we dosee a few lensed DSFGs which have markedly higherL′COJ,J−1
/L′CO1,0ratios at high-J than the other sam-
ples. This is exactly what we would expect to see if these
sources were differentially lensed, and the high-J linestracing more compact regions than the J = 1−0 line, or ifthe lensing preferentially selects compact sources (whichwould tend to have more extreme excitation conditions).The strongest argument against our analysis being af-fected by differential magnification effects is the fact thatthe lensed DSFGs make up only a minor fraction of ourtotal number of galaxies. To verify that this was indeedthe case we fitted the FIR−CO relations without thelensed DSFGs. This resulted in slopes nearly identicalto the ones given in Table 3, and fully consistent withinthe errors. Thus, we conclude that our findings are notaffected in any significant way by differential magnifica-tion effects.
7. SUMMARY
Utilizing Herschel/SPIRE-FTS observations of a sta-tistically significant sample of 23 local (U)LIRGs, simul-taneously covering the CO J = 5 − 4 to J = 13 − 12lines in one single spectrum, and combining these withCO J = 1 − 0, 2 − 1, 3 − 2 and 4 − 3, 6 − 5 data fromour comprehensive ground-based CO survey of the samesample, as well for an additional 44 local (U)LIRGs, wehave presented FIR−CO luminosity relations for the fullCO rotational ladder from J = 1 − 0 to J = 13 − 12.Included in our analysis is also a carefully groomed sam-ple of 35 high-z lensed and unlensed DSFGs (spanningthe redshift range z ∼ 1 − 6) with robust FIR and COluminosity measurements. Due to their high redshiftsmany of these sources have been observed in the mid-to high-J CO lines from the ground, thus allowing usto extend the mid- to high-J FIR−CO relations to thehighest redshifts.
For this data-set of low- and high-z merger/starburstdominated galaxies we find linear (α ' 1) FIR−CO re-lations for CO J = 1 − 0 up to J = 5 − 4, and withnearly constant normalization (β ∼ 2). In light of thelinear star formation relations found for HCN and CS(e.g., Gao & Solomon (2004b); Zhang et al. (2014), bothof which are bona fide tracers of dense star forming gas,we have shown that our results are to be expected pro-vided the dense gas mass fraction does not change sig-nificantly within the sample. Our findings are also qual-itatively consistent with models in which the star forma-tion in (U)LIRGs is regulated on a global scale by radi-ation pressure as these predict linear LFIR −Lmol slopesfor any molecule/transition that traces star forming gasin a ’homogeneous’ sample (i.e., constant normalization)(Andrews & Thompson 2011).
For CO J = 6 − 5 and up to J = 13 − 12 we findincreasingly sub-linear slopes and higher normalizationconstants, which we argue is due to these lines effectivelybeing detached from the star formation as they trace gasthat is dense (>∼ 104 cm−3) but also radically warmer(>∼ 100 K) than what is typical for star forming gas. Thisdense and warm ISM component is reflected in the globalCO SLEDs of the (U)LIRGs, and indeed of the high-zDSFGs, which remain highly excited from J = 6− 5 upto J = 13 − 12. This suggests that star formation pow-ered by FUV radiation fields is unlikely to be responsiblefor maintaining the gas temperature, but instead alter-native heating sources are required. Mechanical heatingvia shocks/turbulence seems to be the most plausible al-ternative given its effectiveness (compared to CRs) at

Star formation relations and CO SLEDs across the J-ladder and redshift 17
driving the temperatures in clouds to the required levels(∼ 100 K).
Finally, we note that our derived FIR−CO relationsare sufficiently tight, especially for the high-J lines,that they can predict the expected CO line brightnessof high-z DSFGs, which in turn might be useful forplanned observations with ALMA.
The authors gratefully acknowledge financial supportunder the ”DeMoGas” project. The project DeMoGasis implemented under the ”ARISTEIA” Action of the”Operational Programme Education and Lifelong Learn-ing”. The project is co-funded by the European SocialFund (ESF) and National Resources. TRG acknowl-edges support from an STFC Advanced Fellowship. TRG
was also supported by Chinese Academy of SciencesFellowship for Young International Scientists (grant no.2012y1ja0006). ZYZ acknowledges support from the Eu-ropean Research Council (ERC) in the form of AdvancedGrant,cosmicism. We are indebted to P.P. Papadopou-los for extensive discussions and comments on the pa-per (He ho’okele wa’a no ka la ’ino). Basic research ininfrared astronomy at the Naval Research Laboratoryis funded by the Office of Naval Research. JF also ac-knowledges support from the NHSC/JPL. The researchpresented here has made use of the NASA/IPAC Extra-galactic Database (NED) which is operated by the JetPropulsion Laboratory, California Institute of Technol-ogy, under contract with the National Aeronautics andSpace Administration. Finally, we would like to thankthe anonymous referee for a useful and constructive ref-eree report, which helped improve the paper.
REFERENCES
Aalto, S., Booth, R. S., Black, J. H., Johansson, L. E. B. 1995,A&A, 300, 369
Aalto, S., Spaans, M., Wiedner, M. C., Huttemeister, S. 2007,A&A, 464, 193
Ao, Y., Henkel, C., Menten, K. M., et al. 2013, A&A, 550, 135Alaghband-Zadeh, S., Chapman, S. C., Swinbank, A. M., et
al. 2013, MNRAS, 435, 1493Alexander, D. M., Bauer, F. E., Chapman, S. C., et al. 2005,
ApJ, 632, 736Akritas, M. G. & Siebert, J. 1996, MNRAS, 278, 919Andrews, B. H. & Thompson, T. A., ApJ, 727, 97Aravena, M., Murphy, E. J., Aguirre, J. E., et al. 2013, MNRAS,
433, 498Baan, W. A., Henkel, C., Loenen, A. F., Baudry, A., Wiklind,
T. 2008, A&A, 477, 747Bayet, E., Gerin, M., Phillips, T. G., Contoursi, A. 2009,
MNRAS, 399, 264Bigiel, F., Leroy, A., Walter, F., et al. 2008, AJ, 136, 2846Blain, A. W. & Longair, M. S. 1993, MNRAS, 264, 509Blain, A. W. 1999, MNRAS, 304, 669Bothwell, M. S., Smail, I., Chapman, S. C., et al. 2013a, MNRAS,
429, 3047Bothwell, M. S., Aquirre, M. S., Chapman, S. C., et al. 2013b,
ApJ, 779, 67Bradford, C. M., Nikola, T., Stacey, G. J., et al. 2003, ApJ, 586,
891Burgarella, D., Baut, V., Iglesias-Paramo, J. 2005, MNRAS, 360,
1413Bussmann, R. S., Narayanan, D., Shirley, Y. L., et al. 2008, ApJ,
681, L73Bussmann, R. S., Gurwell, M. A., Fu, H., et al. 2012, ApJ, 756,
134Bussmann, R. S., Perez-Fournon, I., Amber, S., et al. 2013, ApJ,
779, 25Calzetti, D., Kinney, A. L. & Storchi-Bergmann, T. 1994, ApJ,
429, 582Carilli, C. L. & Walter, F. 2013, ARA&A, 51, 105Chary, R. & Elbaz, D. 2001, ApJ, 556, 562Casoli, F., Dupraz, C. & Combes, F. 1992, A&A, 264, 55Conley, A., Cooray, A., Vieira, J. D., et al. 2011, ApJ, 732, L35Cox, P., Krips, M., Neri, R., et al. 2011, ApJ, 740, 63Daddi, E., Dannerbauer, H., Krips, M., et al. 2009, ApJ, 695,
L176Dale, D. A. & Helou, G. 2002, ApJ, 576, 159Danielson, A. L. R., Swinbank, A. M., Smail, I., et al. 2011,
MNRAS, 410, 1687Dopita, M. A. & Ryder, S. D. 1994, ApJ, 430, 163Downes, D. & Solomon, P. M. 2003, ApJ, 582, 37Elmegreen, B. G. 2002, ASPC, 285, 425Engel, H., Tacconi, L. J., Davies, R. I., et al. 2010, ApJ, 724, 233Fixsen, D. J., Bennett, C. L., Mather, J. C. 1999, ApJ, 526, 207
Frayer, D. T., Ivison, R. J., Scoville, N. Z., et al. 1999, ApJ, 514,13
Frayer, D. T., Koda, J., Pope, A., et al. 2008, ApJ, 680, L21Frayer, D. T., Harris, A. I., Baker, A. J., et al. 2011, ApJ, 726,
L22Freundlich, J., Combes, F., Tacconi, L. J., et al. 2013, A&A, 553,
A130Fritz, J., Franceschini, A., Hatziminaoglou, E. 2006, MNRAS,
366, 767Fu, H., Cooray, A., Feruglio, C., et al. 2013, Nature, 498, 338Galametz, M., Kennicutt, R. C., Calzetti, D., et al. 2013,
MNRAS, 431, 1956Gao, Y. & Solomon, P. M. 2004a, ApJS, 152, 63Gao, Y. & Solomon, P. M. 2004b, ApJS, 606, 271Gao, Y., Carilli, C. L., Solomon, P. M., Vanden Bout, P. A. 2007,
ApJ, 660, L93Genzel, R., Tacconi, L. J., Gracia-Carpio, J., et al. 2010,
MNRAS, 407, 2091Gerritsen, J. P. E. 1997, PhD thesis, Rijksuniversiteit GroningenGarcıa-Burillo, S., Usero, A., Alonso-Herrero, A., et al. 2012,
A&A, 539, A8Gracia-Carpio, J., Garcıa-Burillo, S. & Planesas, P. 2008a, APSS,
313, 331Gracia-Carpio, J., Garcıa-Burillo, S., Planesas, P., Fuente, A.,
Usero, A. 2008b, A&A, 479, 703Greve, T. R., Bertoldi, F., Smail, I., et al. 2005, MNRAS, 359,
1165Greve, T. R., Papadopoulos, P. P., Gao, Y., Radford,
S. J. E., 2009, ApJ, 692, 1432Griffin, M. J., Abergel, A., Abreu, A., et al. 2010, A&A, 518, L3Hailey-Dunsheath, S., Nikola, T., Stacey, G. J., et al. 2008, ApJ,
689, L109Harris, A. I., Baker, A. J., Zonak, S. G., et al., ApJ, 723, 1139Harris, A. I., Baker, A. J., Frayer, D. T., et al., 2012, ApJ, 752,
152Hezaveh, Y. D., Marrone, D. P. & Holder, G. P. 2012, ApJ, 761,
20Hodge, J. A., Carilli, C. L., Walter F., et al. 2012, ApJ, 760, 11Iono, D., Wilson, C. D., Yun, M. S., et al. 2009, ApJ, 695, 1537Ivison, R. J., Smail, I., Papadopoulos, P. P., et al. 2010, MNRAS,
404, 198Ivison, R. J., Papadopoulos, P. P., Smail, I., et al. 2011, MNRAS,
412, 1913Ivison, R. J., Swinbank, A. M., Smail, I., et al. 2013, ApJ, 722,
137Juneau, S., Narayanan, D. T., Moustakas, J., et al. 2009, ApJ,
707, 1217Kelly, B. C. 2007, ApJ, 665, 1489Kennicutt, Jr, R. C. 1989, ApJ, 344, 685Kennicutt, Jr, R. C. 1998, ApJ, 498, 541Kim, C. G., Ostriker, E. C. & Kim, W.-T. 2013, ApJ, 776, 1

18 Greve et al.
Knudsen, K. K., Neri, R., Kneib, J.-P., van der Werf, P. P. 2009,A&A, 496, 45
Kovacs, A., Chapman, S. C., Dowell, C. D., et al. 2006, ApJ, 650,592
Krumholz, M. & Thompson, T. A. 2007, ApJ, 669, 289Leroy, A., Walter, F., Brinks, E., et al. 2008, AJ, 136, 2782Leroy, A., Walter, F., Sandstrom, K., et al. 2013, AJ, 146, 19Lupu, R. E., Scott, K. S., Aretxaga, I., et al. 2012, ApJ, 757, 135Makiwa, G., Naylor, D. A., Ferlet, M., et al. 2013, Appl. Opt., 52,
3864Mao, R. Q., Henkel, C., Schulz, A., et al. 2000, A&A, 358, 433Mao, R. Q., Schulz, A., Henkel, C., et al. 2010, ApJ, 724, 1336Maraston, C. 2005, MNRAS, 362, 799Meijerink, R., Spaans, M. & Israel, F. P. 2007, A&A, 461, 793Meijerink, R., Spaans, M., Loenen, A. F., van der Werf,
P. P. 2011, A&A, 525, A119Meijerink, R., Kristensen, L. E., Weiß, A., et al. 2013, ApJ, 762,
L16Mendez-Delmestre, K., Blain, A. W., Alexander, D. M., et
al. 2007, ApJ, 655, L65Narayanan, D., Groppi, C. E., Kulesa, C. A., Walker, C. K. 2005,
ApJ, 630, 269Narayanan, D., Cox, T. J., Shirley, Y., et al. 2008, ApJ, 684, 996Neri, R., Genzel, R., Ivison, R. J., et al. 2003, ApJ, 597, L116Noll, S., Burgarella, D., Giovannoli, E., et al. 2009, A&A, 507,
1793Ostriker, E. C., Shetty, R. 2011, ApJ, 731, 41Panuzzo, P., Rangwala, N., Rykala, A., et al. 2010, A&A, 518, L37Papadopoulos, P. P., van der Werf, P. P., Isaak, K., Xilouris,
E. M. 2012, ApJ, 715, 775Papadopoulos, P. P., Zhang, Z.-Y., Xilouris, E. M, et al. 2014,
ApJ, 788, 153Petric, A. O., Armus, L., Howell, J., et al. 2011, ApJ, 730, 28Pilbratt, G. L., Riedinger, J. R., Passvogel, T. et al. 2010, A&A,
518, L1Planck Collaboration, Ade, P. A. R., Aghanim, N.,
Armitage-Caplan, C. et al. 2013, in press. (arXiv:1303.5076)Rangwala, N., Maloney, P. R., Glenn, J., et al. 2011, ApJ, 743, 94Riechers, D. A., Walter, F. & Carilli, C. L. 2007, ApJ, 671, L13Riechers, D. A., Hodge, J. A., Walter, F., Carilli, C. L., Bertoldi,
F. 2011a, ApJ, 739, L31Riechers, D. A., Cooray, A., Omont, A., et al. 2011b, ApJ, 733,
L12Riechers, D. A., Bradford, C. M., Clements, D. L., et al. 2013,
Nature, 496, 329Robson, E. I., Ivison, R. J., Smail, I., et al. 2014, ApJ, in pressRosenberg, M. J. F., Kazandjian, M. V., van der Werf, P. P.,
et al. 2014, A&A, 564, A126Sanders, D. B., Mazzarella, J. M., Kim, D.-C., et al. 2003, AJ,
126, 1607
Sanduleak, N. 1969, AJ, 74, 47Schmidt, M. 1959, ApJ, 129, 243Schoier, F. L., van der Tak, F. F. S., van Dishoeck, E. F., Black,
J. H. 2005, A&A, 432, 369Schruba, A., Leroy, A. K., Walter, F., et al. 2011, ApJ, 142, 37Scott, K. S., Lupu, R. E., Aguirre, J. E., et al. 2011, ApJ, 733, 29Scoville, N. Z. & Polletta, M. 2001, ASPC, 249, 591Serjeant, S. 2012, MNRAS, 424, 2429Sharon, C. E., Baker, A. J., Harris, A. I., Thomson, A. P. 2013,
ApJ, 765, 6Shetty, R. & Ostriker, E. C. 2012, ApJ, 754, 2Soifer, B. T., Sanders, D. B., Madore, B. F., et al. 1987, ApJ,
320, 238Solomon, P. M., Downes, D. & Radford, S. J. E., Barrett,
J. W. 1997, ApJ, 478, 144Solomon, P. M., Downes, D. & Radford, S. J. E., et al. 1992, ApJ,
387, L55Solomon, P. M. & Vanden Bout, P. A. 2005, ARA&A, 43, 677Stierwalt, S., Armus, L., Surace, J. A., et al. 2013, ApJS, 206, 1Swinbank, A. M., Smail, I., Longmore, S., et al. 2010, Nature,
464, 733Tacconi, L. J., Neri, R., Chapman, S. C., et al. 2006, ApJ, 640,
288Tacconi, L. J., Neri, R., Genzel, R., et al. 2013, ApJ, 768, 74Teng, S. H., Brandt, W. N., Harrison, F. A., et al. 2014, ApJ,
785, 19Thompson, T. A., Quataert, E. & Murray, N. 2005, ApJ, 630, 167
Thomson, A. P., Ivison, R. J., Smail, I., et al. 2012, MNRAS, 425,2203
van der Werf, P. P., Isaak, K. G., Meijerink, R., et al. 2010, A&A,518, L42
Veilleux, S., Rupke, D. S.N., Kim, D.-C., et al. 2009, ApJS, 182,628
Walter, F., Decarli, R., Carilli, C. L., et al. 2012, Nature, 486, 233Wang, J., Zhang, Z. & Shi, Y. 2011, MNRAS, 416, L21Ward, J. S., Zmuidzinas, J., Harris, A. I., Isaak, K. G. 2003, ApJ,
587, 171Weiß, A., Ivison, R. J., Downes, D., et al. 2009, ApJ, 705, L45Wong, M. & Blitz, L. 2002, ApJ, 569, 157Wright, E. L., Mather, J. C., Bennett, C. L., et al. 1991, ApJ,
381, 200Wu, J., Evans, II, N. J., Gao, Y., et al. 2005, ApJ, 635, L173Wu, J., Evans, II, N. J., Shirley, Y. L., Knez, C. 2010, ApJS, 188,
313Yao, L., Seaquist, E. R., Kuno, N., Dunne, L. 2003, ApJ, 588, 771Zhang, Z.-Y., Gao, Y., Henkel, C., et al. 2014, ApJ, 784, L31