The X‐Ray Spectral Variability of the Seyfert Galaxy NGC 3227
Upload
independentCategory
view
1download
0
THE ASTROPHYSICAL JOURNAL, 522 :921È934, 1999 September 101999. The American Astronomical Society. All rights reserved. Printed in U.S.A.(
THE HCO` MOLECULAR OUTFLOW IN NGC 2071
JOSE� M. GIRART,1,2,3 PAUL T. P. HO,1 ALEXANDER L. RUDOLPH,4,5 ROBERT ESTALELLA,1,2DAVID J. WILNER,1,6 AND LAWRENCE M. CHERNIN7
Received 1998 May 14; accepted 1999 April 23
ABSTRACTWe present high angular resolution and multitransition HCO` observations toward the NGC 2071
molecular outÑow. Comparison of the high-velocity (HV) HCO` and the near-IR in the molecularH2outÑow shows a clear correlation. At high HCO` Ñow velocities the spatial coincidence is especiallyremarkable. In addition, the HV HCO` presents clear morphological and kinematical di†erences withthe CO outÑow. These di†erences appear not only in the HV HCO` emission associated with the H2but in the overall outÑow. There is a clear HCO` emission enhancement, relative to CO, at increasingÑow velocities. This enhancement is probably due to an abundance enhancement produced by a velocity-dependent chemistry in the shocks. An overabundance of CH in low Mach shocks may cause the HCO`abundance enhancement. Because of the short cooling time for the correlation between the HCO`H2,and the implies that HCO` emission can provide a useful tool to study in detail the current inter-H2actions of protostellar winds with the dense ambient medium. At the position of the extremely highvelocity (EHV) CO component in the red lobe we detect HCO` (J \ 3 ] 2) emission within the velocityrange of the EHV CO gas. This emission is roughly compatible with the expected HCO` emissionassociated with EHV gas arising from behind dissociative shocks.Subject headings : ISM: individual (NGC 2071) È ISM: jets and outÑows È ISM: molecules È
radio lines : ISM È stars : formation
1. INTRODUCTION
HCO` emission has been associated with molecular out-Ñows in di†erent ways : as quiescent emission downstreamfrom some Herbig-Haro objects (HH 7-11 : Rudolph &Welch 1988 and Dent et al. 1993 ; HH 1-2 : Davis, Dent, &Burnell 1990 ; HH 34: Rudolph & Welch 1992 ; HH 80North : Girart, Estalella, & Ho 1998) and as high-velocity(HV) emission arising from molecular outÑows (OrionIRc2 : Vogel et al. 1984 ; Cep A: Loren et al. 1984 ; HH 7-11 :Lizano et al. 1988 ; L1287 : Yang et al. 1991 ; B335 : Hase-gawa, Rogers, & Hayashi 1991 ; DR 21 : Garden & Carls-trom 1992 ; L1157 : Umemoto et al. 1992 ; L1551 : Rudolph1992 ; S140 : Wilner & Welch 1994 ; NGC 7538 IRS 9 andGL 490 : Hasegawa & Mitchell 1995 ; R CrA: Anderson etal. 1997). In some cases (e.g., Orion IRc2 or DR 21), the HVHCO` emission seems to be enhanced and well correlatedspatially with the shock-excited line emission. TheH2enhanced fractional abundance of the HV HCO` mayresult from increased ionization following the passage of astrong shock (Garden & Carlstrom 1992). If the velocities ofthe shocks are fast enough to produce strong X-ray and UVradiation, then nonequilibrium ion chemistry, radiativeheating, and collisional excitation with electrons can alsoincrease the HCO` abundance and intensities (WolÐre &
1993). Alternatively, an overabundance of CH inKo� nigl
1 Harvard-Smithsonian Center for Astrophysics, 60 Garden Street,Cambridge, MA 02138.
2 Departament dÏAstronomia i Meteorologia, Universitat de Barcelona,Av. Diagonal 647, E-08028 Barcelona, Spain.
3 Present address : Department of Astronomy, University of Illinois,1002 West Green Street, Urbana, IL 61801.
4 Department of Physics, Harvey Mudd College, Claremont, CA 91711.5 NSF CAREER fellow.6 Hubble fellow.7 Present address : MIPS Technologies, Inc., Mountain View, CA
94043 ; chernin=mips.com.
molecular mixing layers also leads to an HCO` abundanceenhancement (Taylor & Raga 1995).
NGC 2071 is an optical reÑection nebula in the L1630molecular cloud, at a distance of 390 pc (Anthony-Twarog1982). A molecular outÑow is found D4@ north of theoptical nebula, within a dense and warm core (e.g., Woottenet al. 1984 ; Takano et al. 1986 ; Dent et al. 1989 ; Zhou,Evans II, & Mundy 1990) associated with a cluster of brightinfrared sources (e.g., Persson et al. 1981 ; Walther, Geballe,& Robson 1991 ; Walther et al. 1993) with a total luminosityof 520 (Butner et al. 1990). The Ðrst indication of strongL
_outÑow activity was OH and maser emissionH2O(Johansson et al. 1974 ; Schwartz & Buhl 1975) found to beassociated with some of the IR sources.
The CO molecular outÑow in NGC 2071 has beenstudied extensively (e.g., Lichten 1982 ; Bally 1982 ; Snell etal. 1984 ; Scoville et al. 1986 ; Moriarty-Schieven, Snell, &Hughes 1989). It exhibits an expanding, clumpy, hollow-shell structure in CO (e.g., Moriarty-Schieven et al. 1989) formoderate to high velocities km s~1, where(vflow \ 30
is the Ñow velocity, i.e., the relativevflow\ o vLSR [ v0 ovelocity of the outÑowing gas with respect to the ambientcloud velocity, km s~1). This clumpy shell structurev0\ 9.7can also be seen in CS and HCO` (Kitamura et al. 1990 ;Kitamura, Kawabe, & Ishiguro 1992). Extremely highvelocity (EHV, km s~1) material has also beenvflow [ 30observed in H I (Bally & Stark 1983) and in CO (Chernin &Masson 1992 ; Chernin & Welch 1995). The EHV com-ponent is not just an arbitrary deÐnition in the Ñow veloc-ity, but it appears as a separate feature in the CO line wings,especially for high-excitation transitions. In addition, theEHV CO is warmer and more collimated than the HV COmaterial. This suggests that the EHV CO may be arisingfrom working surfaces where the protostellar wind isdirectly interacting with the ambient material (Chernin &Masson 1992 ; Chernin & Welch 1995). Some molecules,such as CH (Sandell, Magnani, & Lada 1988), SiO, and SO
921

922 GIRART ET AL. Vol. 522
(Chernin & Masson 1993), appear to be enhanced in themolecular outÑow because of shock-induced chemical pro-cesses.
The near-IR emission associated with the NGC 2071H2molecular outÑow has a spatial extent similar to the COoutÑow, although there are signiÐcant morphological di†er-ences (Lane & Bally 1986 ; Burton, Geballe, & Brand 1989 ;Garden, Russell, & Burton 1990). The main feature of H2emission in the blueshifted lobe forms a well-collimated jetthat seems to start about 35A north of the infrared clusterand extends to the northeast. Toward the redshifted lobe,the emission only arises at the end of the lobe in theH2form of several distinct knots (Garden et al. 1990). The H2line ratios are typical of shock-excited emission, althoughUV-Ñuorescence excitation is not excluded (Burton et al.1989). Fabry-Perot imaging at high angular resolution ofthe near-IR emission toward the core region shows thatH2the strongest emission is probably powered by IRS1 andH2traces the inner part of the molecular outÑow seen on largerscales (Aspin, Sandell, & Walther 1992). Nevertheless, otherinfrared sources may be contributing to the excitation of the
emission in the core region (Aspin et al. 1992).H2In this paper we present interferometric HCO`(J \ 1 ] 0) observations of the NGC 2071 molecularoutÑow, as well as high angular resolution single-dishobservations of the higher transitions of HCO`, in order toelucidate the role of HCO` in tracing the molecularoutÑow.
2. OBSERVATIONS AND DATA REDUCTION
2.1. Hat Creek ObservationsInterferometric observations of the HCO` (J \ 1 ] 0)
transition were carried out with the Hat Creek millimeterinterferometer8 (see Table 1). The observations included atotal of 12 conÐgurations of the three 6.1 m antennas withprojected baselines ranging from 1.8 to 59 kj (D6È200 m).The digital correlator was conÐgured to observe simulta-neously the HCO` (J \ 1 ] 0) and the SO (J
K\ 22] 11)lines in the upper and lower sidebands, respectively. We
used two windows of 10 MHz bandwidth, each one with128 channels at 0.26 km s~1 velocity resolution. The twowindows were centered (with D4 km s~1 overlap) to obtaina total coverage from [22 to 41 km s~1. Because of thevLSR
8 The Hat Creek millimeter interferometer is operated by the Berkeley-Illinois-Maryland Association (BIMA) with support from the NationalScience Foundation.
size of the molecular outÑow (D6@), we made a three-pointmosaic, with an angular separation of 110A and P.A.\ 42¡.8,centered at d(J2000)\ ]00¡21@44@@.a(J2000)\ 05h47m04s.2 ;The phase calibrators used were 0605[085 and PK 0420,and the bandpass calibrator was 3C273. The Ñux scale wasestablished from observations of planets using the bright-ness temperatures of Ulich (1981), which should be accurateto D20%. The data were calibrated using the MIRIADsoftware, developed by BIMA. System temperatures rangedtypically between 300 and 700 K. Maps were thereforemade with the (u, v) data weighted by the associated systemtemperatures.
The SO line is only marginally detected at(JK
\ 22] 11)the 4 p level of 0.51 Jy beam~1 (0.46 K at 13A resolution) inthe the range of [11 to [3 km s~1 arising from thevLSRblue lobe. From this lower sideband, continuum emission(obtained using a 58 km s~1 window) was not detected atthe 0.19 Jy beam~1 (4 p) level, which is consistent withprevious detection of 0.17 Jy at 2.7 mm (Scoville et al. 1986).
2.2. FCRAO ObservationsIn order to recover the missing Ñux due to the lack of
short spacings in the interferometer data, we also observedthe HCO` (J \ 1 ] 0) transition with the 14 m FCRAO9telescope using the QUARRY 15 element receiver array (seeTable 1). At the frequency of this transition (89 GHz) themain-beam efficiency is D50%. We used an FAAS autocor-relation spectrometer with an e†ective bandwidth of 40MHz and a velocity resolution of 0.26 km s~1. The obser-vations were performed in the total power mode. Typicalsystem temperatures of 500È1000 K were obtained duringthe observations. Two Nyquist-sampled (25A spacings) foot-prints were made covering a total area of D10@] 4@ with aP.A.\ 45¡ centered at the same position as the interferome-ter phase center.
2.3. Data Combination ProcedureWe combined the interferometer and the single-dish data
in the MIRIAD software package, using a procedure similarto that given by Vogel et al. (1984) and Wilner & Welch(1994). We Ðrst used a direct deconvolution algorithm toremove the FCRAO beam pattern which is modeled as aGaussian with an FWHM of 58A. The deconvolved single-dish map was then multiplied by the interferometer
9 The Five College Radio Astronomy Observatory is supported by theNational Science Foundation and the Commonwealth of Massachusettsand is operated by permission of the Metropolitan District Commission.
TABLE 1
OBSERVATIONS
l haTelescope Epoch Transition (GHz) (arcsec) Observing Mode b
Hat Creek . . . . . . 1989 OctÈ1990 Sep HCO` (J \ 1 ] 0) 89.18852 15.5 MosaicSO (J
K\ 22] 11) 86.09395 Mosaic
FCRAO . . . . . . . . 1995 Apr HCO` (J \ 1 ] 0) 89.18852 58 MapCSO . . . . . . . . . . . . 1992 Jan HCO` (J \ 4 ] 3) 356.73425 20 Map
1997 Mar HCO` (J \ 3 ] 2) 267.55762 27 SpectraHaystack . . . . . . . 1997 Mar HCO` (J \ 1 ] 0) 89.18852 25 Spectra
H13CO` (J \ 1 ] 0) 86.75429 Spectra13CO (J \ 1 ] 0) 110.20138 SpectraC18O (J \ 1 ] 0) 109.78218 Spectra
a Angular resolution.b Type of observations carried out : mosaic \ interferometric mosaic, map \ single-dish mapping, spectra \ only a few
spectra taken. Mosaic and map modes were done covering almost all the molecular outÑow.

No. 2, 1999 HCO` MOLECULAR OUTFLOW IN NGC 2071 923
primary-beam response, taken to be three Gaussians withan FWHM of 135A (Wilner & Welch 1994), centered on thethree Ðelds of the mosaic (i.e., at []74@@,]81@@], [0@@, 0@@],[[74@@,[81@@]). To verify the cross calibration of the single-dish data and the interferometer data we generated visibil-ities from the deconvolved model of the single-dish data atthe same (u, v) points that were sampled by the interferome-ter. This was done in the region from 1.8 to 4.2 kj where thetwo instruments overlap. Maps from these generated visibil-ities as well as from the interferometric visibilities were thenmade in this region. Subtraction of the two resulting mapsshowed no signiÐcant signal above the noise level. In addi-tion, direct comparison of the visibilities from the two datasets was made in the (u, v)-plane by vector averaging overconcentric annuli. The values obtained from both instru-ments agreed to within 20%. Finally, we generated a ran-domly distributed sample of visibilities from thedeconvolved model of the single dish data in the (u, v) rangeof 0È3.2 kj. The number of visibilities generated was chosento have a visibility density similar to the interferometricdata for the inner part of the (u, v)-plane.
Maps were made with a velocity resolution of 2 km s~1using robust weighting (Briggs 1995) and applying a Gauss-ian taper to the (u, v) data. The resulting cleaned maps wereconvolved with a Gaussian in order to obtain a 15A.5 ] 15A.5synthesized beam.
2.4. Additional ObservationsThe HCO` (J \ 4 ] 3) transition was observed with the
Caltech Submillimeter Observatory (CSO)10 10.4 m tele-scope (see Table 1). At this frequency the main-beam effi-ciency was D0.60. The 345 GHz receiver was used inconjunction with a 50 and a 500 MHz acousto-opticalspectrometer. These provided coverages of 41 and 468 kms~1 and velocity resolutions of 0.04 and 0.46 km s~1,respectively, at 357 GHz. We mapped with the HCO`(J \ 4 ] 3) a region partially covering the molecularoutÑow using a 20A grid. The typical rms noise achievedT
A*
for the spectra was D0.3 K at a velocity resolution of 1.0km s~1. Further observations of the HCO` (J \ 3 ] 2)transition at the position of the redshifted EHV CO peakintensity d(J2000)\ ]00¡21@09@@][a(J2000)\ 05h47m02s.7 ;were made using the same backend, which provided veloc-ity coverages of 48 and 530 km s~1 and a velocity resolutionof 0.05 and 0.52 km s~1, respectively. The main-beam effi-ciency measured at 267 GHz was 0.51 (lower than the usualvalue because of a tent that covered the antenna). The rmsnoise achieved for the spectrum was D0.03 K at a velocityresolution of 1.0 km s~1.
In addition, we observed the HCO` (J \ 1 ] 0), 13CO(J \ 1 ] 0), and C18O (J \ 1 ] 0) transitions with the 37 mtelescope of the Haystack Observatory11 (see Table 1).
3. RESULTS
3.1. T he Molecular CoreThe molecular core, where the infrared cluster is embed-
ded, is better traced by the HCO` (J \ 4 ] 3) line than the(J \ 1 ] 0) line. This is due to the deep self-absorption
10 The Caltech Submillimeter Observatory is funded by the NationalScience Foundation under contract AST 96-15025.
11 Radio Astronomy at Haystack Observatory of the Northeast RadioObservatory Corporation is supported by the National Science Founda-tion.
feature of the (J \ 1 ] 0) line. In Figure 1 we show theintegrated emission of the HCO` (J \ 4 ] 3) for a velocityrange of 8È11 km s~1, in order to avoid any signiÐcantoutÑow contamination. The core is centered on the infraredcluster and has an FWHM of about 50@@] 50@@ (0.09] 0.09pc), without obvious elongation in any direction. This resultis similar to that obtained by Zhou et al. (1991) from multi-transition CS observations. Assuming a low optical depth,an excitation temperature of 80 K (Mangum & Wootten etal. 1993), and an HCO` fractional abundance of 2] 10~9(e.g., Hasegawa & Mitchell 1995), we obtain a mass of 5.4
This value is much lower than the values of 30È60M_
. M_obtained from previous observations (e.g., Wootten et al.
1984 ; Tauber, Goldsmith, & Snell 1988). The low valueobtained from the HCO` (J \ 4 ] 3) implies that at thecore velocities the HCO` (J \ 4 ] 3) is optically thick,q^ 10, or that the HCO` abundance is 10 times lower thanthe value assumed, i.e., X(HCO`) D 2 ] 10~10 (a valuesimilar to the ones found in L1551 and HH 34; Rudolph &Welch 1992 ; Rudolph 1992), or a combination of bothe†ects.
3.2. Morphology and Kinematics of the High-VelocityHCO`
The channel maps of the HCO` (J \ 1 ] 0) line emissionare shown in Figure 2a for the blueshifted lobe from(vLSR[19.75 to 7.25 km s~1) and in Figure 2b for the redshiftedlobe from 12.75 to 39.75 km s~1).(vLSRAt low-Ñow velocities (e.g., channel maps at andvLSR \ 515 km s~1), the overall morphology of the HCO` outÑowconsists of extended emission along a P.A.^ 40¡, each lobestretching However, the internal structure of [email protected] is di†erent. The brightest emission of the blue lobearises from the core roughly in the north direction, bifur-cating at a distance of D60A and changing the directionroughly toward the northeast. For the red lobe, the main
FIG. 1.ÈIntegrated emission of the HCO` (J \ 4 ] 3) for the vLSRrange of 8.0È11.0 km s~1. The velocity range was chosen to trace theambient gas avoiding any signiÐcant outÑow contamination. Contours are4, 6, 10, 15, 20, 25, 30, 40, 50, 60, 70, 90, 110, 140, and 170] 0.31 K km s~1(1 p). The thicker contour indicates the FWHM. The beam (20@@] 20@@) isshown in the bottom left-hand corner. The triangle indicates the positionof IRS1.

FIG
.2a
FIG
.2b
FIG
.2.
ÈC
onto
urm
aps
ofth
eve
loci
tych
anne
lsfo
rth
e(a
)bl
uesh
ifted
and
(b)re
dshi
fted
HC
O`
(J\
1]
0)em
ission
.The
ofea
chch
anne
lis
indi
cate
din
the
top
righ
t-ha
ndco
rner
ofea
chpa
nel.
v LSR
Con
tour
sle
vels
are
[4,
[2,
2,4,
6,9,
12,1
6,20
,25,
30,3
5,40
,45,
and
50]
0.16
Jybe
am~1
,the
rmsno
ise
ofth
em
aps.
The
synt
hesize
dbe
amis
show
nin
the
bottom
left-h
and
corn
erof
the
top
(15A.
5]
15A.5
)le
ft-h
and
pane
l.T
hetr
iang
lein
dica
testh
epo
sition
ofth
eIR
S1.
The
cros
sin
there
dshi
fted
chan
nels
indi
cate
sth
epo
sition
ofth
eE
HV
emission
(Che
rnin
&W
elch
1995
).

HCO` MOLECULAR OUTFLOW IN NGC 2071 925
FIG. 3.ÈIntegrated emission of the HCO` (J \ 4 ] 3) for the lower Ñow velocities. The of each channel is indicated in the top right of each panel.vLSRContours are 4, 6, 10, 15, 20, 25, 30, 40, 50, 60, 70, 90, 110, 140, and 170 ] 0.38 K km s~1 (1 p). The beam (20@@] 20@@) is shown in the bottom left-hand cornerof the top left-hand panel.
emission comes from an asymmetric shell-like structure,with the southern part of the shell being brighter. Someemission peaks, far from the core, appear both in the redand blue channel maps.
At moderate Ñow velocities (e.g., channel maps at vLSR \[4 and 24 km s~1), the blue lobe resembles a deÑectedjetlike structure, with an initial direction of P.A.^ 0¡ and aÐnal direction of P.A.^ 65¡. The red lobe presents a clumpystructure, tracing the southern part of the shell observed atthe km s~1 channel map.vLSR \ 15
The channel maps of the blue and redshifted HCO`(J \ 4 ] 3) emission are shown in Figure 3. The brightestemission comes from a compact structure centered on thecore. A weaker structure elongated to the north is observedin the blueshifted channel and matches the HCO`(J \ 1 ] 0) emission near the core. The overall J \ 4 ] 3structure is more compact than the J \ 1 ] 0 for the samevelocity channels.
In Figure 4 we show the position-velocity plot of theHCO` (J \ 1 ] 0) emission along the molecular outÑowdirection. The highest Ñow velocities are reached betweenD60A and D80A from the center. It can be seen that, for theblue lobe, the velocity window of our observations is notwide enough to cover the highest Ñow velocities. At the endof both lobes, there is a clump showing moderate blue andred Ñow velocities.
3.3. T he HCO` (J \ 3 ] 2) SpectrumFigure 5 shows the HCO` (J \ 3 ] 2) spectrum
obtained from deep observations at the position of the peakintensity of the redshifted EHV CO emission (Chernin &Masson 1992 ; Chernin & Welch 1995). The HCO`(J \ 3 ] 2) emission is detected at velocities up to vLSR \ 65km s~1 which coincides with the velocity range of the red-shifted CO emission (see, e.g., Fig. 2 of Chernin & Welch1995). However, the HCO` (J \ 4 ] 3) spectrum at this

926 GIRART ET AL. Vol. 522
FIG. 4.ÈPosition-velocity plot of the HCO` (J \ 1 ] 0) emission centered at the position of IRS 1 d(J2000)\ ]00¡21@44@@].[a(J2000)\ 05h47m04s.9,Because of the slightly di†erent orientation of the two lobes, we made the position-velocity cut along a P.A.\ 30¡ and 50¡ to the north and to the south,respectively, of IRS (the thick dashed line indicates the position of the P.A.Ïs change). In order to obtain a better signal-to-noise ratio, the beam has beenconvolved with a 20@@] 10@@ Gaussian with P.A.\ [50¡. Contours are [3, 3, 6, 10, 15, 20, 30, 40, 60, . . . ] 0.1 Jy beam~1.
FIG. 5.ÈSpectrum of the HCO` (J \ 3 ] 2) transition observed withthe CSO telescope toward the position where redshifted EHV CO isobserved (see Chernin & Masson 1992). The vertical axis is the main-beamtemperature.
position shows emission only up to km s~1,vLSR \ 20because of the signiÐcantly lower sensitivity.
3.4. Physical Parameters of the HCO` OutÑowFigure 6 shows the HCO` (J \ 1 ] 0) and the HCO`
(J \ 4 ] 3) spectral lines averaged over most of the red andblue lobes of the molecular outÑow (top and bottomspectra) and at the center of the map, within the core(central spectrum).
Qualitatively, a rough estimate of the physical conditionsof the HV HCO` can be obtained from the intensity lineratios of these two transitions. Assuming that they have thesame excitation temperature, the ratio of the brightnessTex,temperature and of the optical depths is given by
TJ1
TJ2
\ fJ1fJ2
Jl1(Tex) [ Jl1(Tbg)Jl2(Tex) [ Jl2(Tbg)
1 [ e~qJ11 [ e~qJ2
, (1)
qJ1
qJ2
\J1J2
eh2J1 B0@kTex [ 1eh2J2 B0@kTex [ 1
e~(hB0@kTex)*J1(J1`1)~J2(J2`1)+ , (2)
0 20 40 60 80 100Tex(1−0) (K)
0
2
4
6
8
10
T43
/T10
Tex(4−3)=1.0 Tex(1−0)Tex(4−3)=0.5 Tex(1−0)Tex(4−3)=0.3 Tex(1−0)
τ10=3
τ10=1
τ10=0.2
τ10=0.05
τ10<<1
No. 2, 1999 HCO` MOLECULAR OUTFLOW IN NGC 2071 927
FIG. 6.ÈSpectra of the HCO` (J \ 1 ] 0) (dashed line) and (J \ 4 ] 3)(solid line) transition from the red lobe (top), the center at (0A, 0A) positiono†set (center), and the blue lobe (bottom), obtained from the interferometricdata and with the CSO telescope, respectively. The HCO` (J \ 1 ] 0)data were convolved with a Gaussian curve in order to obtain a similarangular resolution as the HCO` (J \ 4 ] 3) (i.e., 20A). The red and bluelobe spectra were obtained by averaging several positions covering most ofeach lobe. The vertical axis is the main-beam brightness temperature.
where refers to the rotational transition,Ji
Ji] J
i[ 1 f
J1and are the Ðlling factors, is the Planck function infJ2
Jl(T )temperature units, is the rotational constant, and andB0 q
J1are the optical depths. For optically thin emission andqJ2 these two equations give a simple relationTex? Tbg,between the brightness temperature ratio and the excitation
temperature, that for the J \ 4 ] 3 and the J \ 1 ] 0 tran-sitions is
Tex\38.5
ln [(16T10/T43)( f43/f10)]. (3)
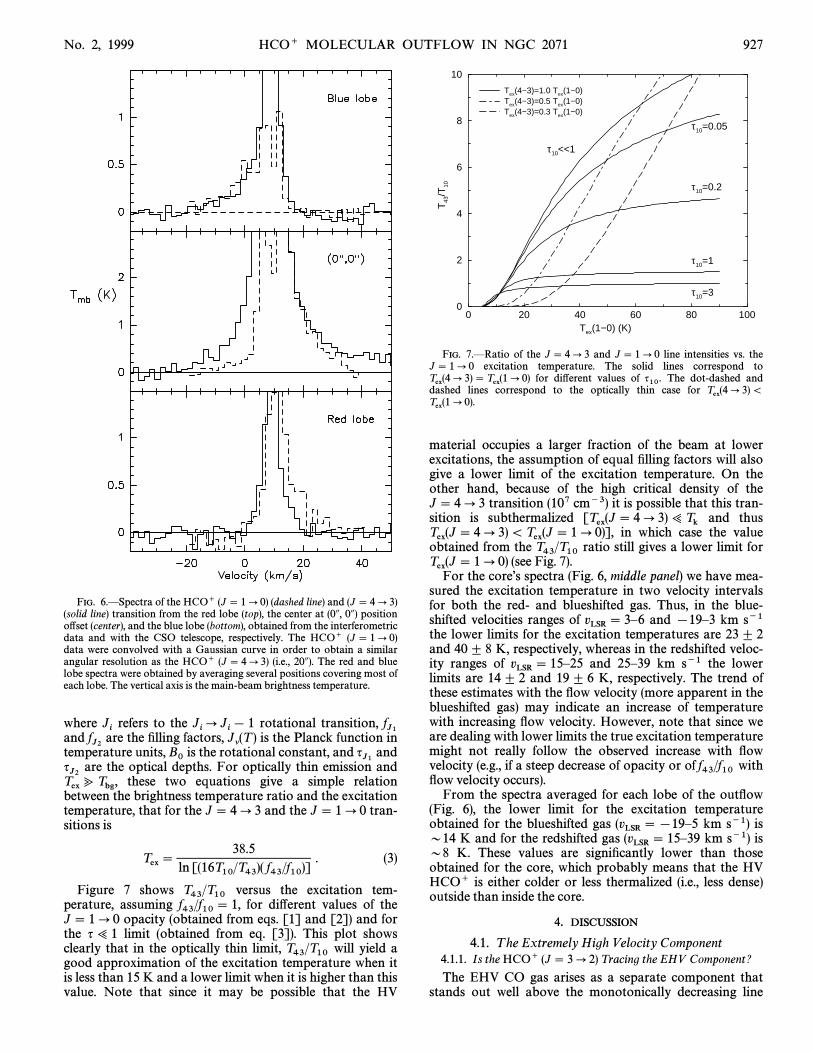
Figure 7 shows versus the excitation tem-T43/T10perature, assuming for di†erent values of thef43/f10\ 1,J \ 1 ] 0 opacity (obtained from eqs. [1] and [2]) and forthe q> 1 limit (obtained from eq. [3]). This plot showsclearly that in the optically thin limit, will yield aT43/T10good approximation of the excitation temperature when itis less than 15 K and a lower limit when it is higher than thisvalue. Note that since it may be possible that the HV
FIG. 7.ÈRatio of the J \ 4 ] 3 and J \ 1 ] 0 line intensities vs. theJ \ 1 ] 0 excitation temperature. The solid lines correspond to
for di†erent values of The dot-dashed andTex(4] 3)\Tex(1] 0) q10.dashed lines correspond to the optically thin case for Tex(4] 3)\Tex(1] 0).
material occupies a larger fraction of the beam at lowerexcitations, the assumption of equal Ðlling factors will alsogive a lower limit of the excitation temperature. On theother hand, because of the high critical density of theJ \ 4 ] 3 transition (107 cm~3) it is possible that this tran-sition is subthermalized and thus[Tex(J \ 4 ] 3)> Tkin which case the valueTex(J \ 4 ] 3)\ Tex(J \ 1 ] 0)],obtained from the ratio still gives a lower limit forT43/T10(see Fig. 7).Tex(J \ 1 ] 0)
For the coreÏs spectra (Fig. 6, middle panel) we have mea-sured the excitation temperature in two velocity intervalsfor both the red- and blueshifted gas. Thus, in the blue-shifted velocities ranges of and [19È3 km s~1vLSR \ 3È6the lower limits for the excitation temperatures are 23^ 2and 40 ^ 8 K, respectively, whereas in the redshifted veloc-ity ranges of and 25È39 km s~1 the lowervLSR \ 15È25limits are 14 ^ 2 and 19^ 6 K, respectively. The trend ofthese estimates with the Ñow velocity (more apparent in theblueshifted gas) may indicate an increase of temperaturewith increasing Ñow velocity. However, note that since weare dealing with lower limits the true excitation temperaturemight not really follow the observed increase with Ñowvelocity (e.g., if a steep decrease of opacity or of withf43/f10Ñow velocity occurs).
From the spectra averaged for each lobe of the outÑow(Fig. 6), the lower limit for the excitation temperatureobtained for the blueshifted gas km s~1) is(vLSR \[19È5D14 K and for the redshifted gas km s~1) is(vLSR \ 15È39D8 K. These values are signiÐcantly lower than thoseobtained for the core, which probably means that the HVHCO` is either colder or less thermalized (i.e., less dense)outside than inside the core.
4. DISCUSSION
4.1. T he Extremely High Velocity Component4.1.1. Is the HCO` (J \ 3 ] 2) Tracing the EHV Component?
The EHV CO gas arises as a separate component thatstands out well above the monotonically decreasing line

928 GIRART ET AL. Vol. 522
FIG. 8a FIG. 8b
FIG. 8.ÈSuperposition of the emission image by Curiel et al. (1999) and the contour map of the integrated (a) blueshifted and (b) redshifted HCO`H2(J \ 1 ] 0) emission for low- and high-Ñow velocities. The range of each map is indicated on the top left of each panel.vLSR
proÐle of the HV gas (Chernin & Masson 1992 ; Chernin &Welch 1995). In addition, the EHV gas comes from a muchmore compact and localized region, and it is signiÐcantlyhotter than the HV component. Chernin & Welch (1995)deduced for the EHV gas a density of D2 ] 105 cm~3 and akinetic temperature of D50 K. All these properties suggestthat the EHV material is likely to arise from a region withdi†erent physical properties than the HV component. Inparticular, one possibility that explains these properties wellis that the EHV gas arises from behind fast dissociative bowshocks (Chernin & Welch 1995), where molecules such asCO and HCO` are reformed after the passage of theshocks.
In order to elucidate if the highest redshifted velocities ofthe HCO` (J \ 3 ] 2) emission are tracing the EHV com-ponent (see ° 3.3 and Fig. 5), we assume that the EHV arisesfrom behind fast dissociative bow shocks. The chemicalprocesses involved in the reformation of molecules behindthis type of shocks have been modeled by Neufeld & Dal-garno (1989). For the preshock density estimated byChernin & Welch (1995), D104 cm~3, Neufeld & Dalgarno
(1989) predict an HCO` column density in the range of7È25 ] 1010 cm~2 for shock velocities of 60È100 km s~1. Ifthe rotational states of the HCO` are described by a singleexcitation temperature then the expected integratedTex,intensity will be
PT (HCO` 3 ] 2)dv^ 1.7f
e~25.7@TexTex ] 0.71
C1 [ Jl(Tbg)
Jl(Tex)D
]A N1010 cm~2
BK km s~1 , (4)
where f is the Ðlling factor and is the Planck functionJl(T )in temperature units. Because the density of the EHV gas(D2 ] 105 cm~3) is lower than the HCO` (J \ 3 ] 2) criti-cal density (D2 ] 106 cm~3), K. For anTex >Tkinetic^ 50HCO` (J \ 3 ] 2) excitation temperature in the range of5È20 K the expected integrated intensity will be (0.01È0.56)] f K km s~1. We note that these are rough estimatessince the preshock density estimate is not well constrained(Chernin & Welch 1995) and a slightly higher preshock

No. 2, 1999 HCO` MOLECULAR OUTFLOW IN NGC 2071 929
density [the presence of ambient HCO` (J \ 3 ] 2) and(J \ 4 ] 3) emission at the position of the EHV gas maysuggest it] will imply a much higher HCO` column density(see Table 3 of Neufeld & Dalgarno 1989). At the peakvelocity range of the EHV gas from 54 to 58 km s~1),(vLSRthe observed integrated HCO` (J \ 3 ] 2) emission is0.17^ 0.05 K km s~1. Therefore, it is possible that part (ifnot all) of the HCO` (J \ 3 ] 2) emission detected above
of 47 km s~1 is coming from the EHV component,vLSRalthough very sensitive and high angular resolution obser-vations will be required in order to conÐrm it.4.1.2. Comparison of the EHV Gas with the High-Velocity HCO`
It is also interesting to compare the EHV emission withthe HV emission. In Figure 2b the position of the EHVclump is marked with a cross. Only weak HV HCO` emis-sion arises at this position. This is especially signiÐcant forthe highest HV channels (i.e., km s~1), wherevLSR [ 18almost no emission is detected. In fact, for these channels,the emission has a well-collimated structure, starting at theposition of the infrared cluster and then disappearing beforereaching the EHV clump. About 15A southwest to the EHVclump (i.e., downstream of this clump) the emission reap-pears (see Fig. 2b). A possible interpretation for this appar-ent anticorrelation between the HV and EHV emission isthat a strong and fast shock is dissociating the molecular
gas, with molecules being formed again after the shock haspassed when the gas has cooled sufficiently but still atextremely high velocities.
4.2. High-Velocity HCO` : Comparison with Near-IR H24.2.1. Morphology and Kinematics
To compare the HV HCO` emission with the near-IRmaps of the high- and low-Ñow velocity componentsH2,were made at high angular resolution (synthesized beam of
P.A.\ [5¡). In Figure 8 we show these maps7A.5 ] 6A.4,overlain with the 1È0 S(1) ] continuum image obtainedH2by Curiel et al. (1999).
As can be seen in the Ðgure, both molecules show a clearspatial coincidence. This correlation is especially remark-able for the high-Ñow velocities. The emission appearsH2to have associated HV HCO` emission almost everywhere,although the reverse is not always true. This is the case forsome of the extended HCO` emission at low-Ñow veloci-ties, in particular for most of the redshifted HCO` east ofthe IR cluster and for the blueshifted clump B1 (the brightknot in the image is likely continuum emission from aH2Ðeld star).
It is also worth noting the di†erent morphological struc-tures of the HCO` emission associated with the di†erent
knots (see Fig. 8) :H2
FIG. 9a FIG. 9b
FIG. 9.ÈIntegrated emission over the blueshifted (top) and redshifted (bottom) line wings for the (a) HCO` (J \ 1 ] 0) and (b) CO (J \ 2 ] 1). The CO(J \ 2 ] 1) map is from Moriarty-Schieven et al. (1989) rotated 45¡. HCO` contours are [0.2, [0.1, 0.1, 0.2, 0.3, 0.4, 0.6, 0.8, 1.0, 1.2, 1.5, 1.8, . . . K km s~1.CO contours are at 10 K km s~1 intervals, starting at 10 K km s~1. The synthesized beam size of the HCO` map is displayed in the bottom left of the redmap, which is similar to the CO e†ective angular resolution (D14A ; Moriarty-Schieven et al. 1989).

vflow (km s−1
)
Rat
io H
CO
+ /CO
Blue HCO +/CORed HCO+/CO
2 104 6 8 20 40
0.06
0.10
0.04
0.60
0.40
0.20
0.08
1
10
100
Inte
grat
ed In
tens
ity (
103 K
arc
sec
2 )
Blue HV HCO + (1−0)Red HV HCO+ (1−0)HV CO (2−1)
930 GIRART ET AL. Vol. 522
1. The redshifted low-Ñow velocity HCO` emission inthe R2 clump has almost the same extent as the di†use H2emission. The redshifted high-Ñow velocity HCO` com-ponent in this clump surrounds the brightest knots.H2There is also some blueshifted low-Ñow velocity emissionassociated with this clump.
2. The redshifted high-Ñow velocity HCO` emission inthe R1 clump peaks at the position of a bright knot. TheH2redshifted low-Ñow velocity component surrounds thesouthern and west parts of the high-Ñow velocity com-ponent.
3. The jetlike structure observed at the blueshifted high-Ñow velocities follows perfectly the emission. However,H2despite this general correlation, the peak positions of theHCO` and are displaced a few arcseconds. The blue-H2shifted low-Ñow velocity component follows well both the
and the HV component, although the change in theH2direction of the jet is more abrupt and displaced toward thewest. At the northeastern end of the jet there is some red-shifted low-Ñow velocity emission.
4. The B2 clump shows blueshifted low-Ñow velocityemission, with marginal emission at blueshifted high andredshifted low-Ñow velocities. It is associated with a stringof knots.H2All these dissimilarities imply that the di†erent knotsH2have a signiÐcantly di†erent kinematic behavior. On theother hand, the comparison between the and the HCO`H2at the center of the molecular outÑow is difficult because ofthe number of IR sources and the continuum reÑectionemission present there.
4.2.2. T he Excitation Conditions
Line emission analysis shows that the near-IR emissionarises from shock-excited gas at temperatures of the orderof 1000È2000 K and that the preshock density is D105cm~3 (Burton et al. 1989). The high-Ñow velocity com-ponent of the HCO` shows a better correlation with the H2than the lower Ñow velocity component, suggesting that thehigher Ñow velocity HCO` should be hotter. However,there is not a clear trend of such a temperature increase withÑow velocity, except perhaps in the core (see ° 3.4). This islikely due to the fact that the of the HCO` (J \ 4 ] 3)Textransition does not follow the variations, because theT
kvolume density is less than the critical density of this tran-sition (D107 cm~3).
4.3. High-Velocity HCO` : Comparison with the CO4.3.1. Morphology and Kinematics
In Figure 9 we show the integrated emission of the blue-shifted and redshifted lobes of the molecular outÑow astraced by the HCO` (J \ 1 ] 0) and the CO (J \ 2 ] 1) ata similar angular resolution (the latter adapted from Fig. 3of Moriarty-Schieven et al. 1989). There are several impor-tant morphological di†erences between the two molecules.First, the overall morphology of the HV CO is moreextended than the HV HCO` in the two lobes, especially inthe width of the lobes. The primary beam attenuation forthe interferometric HCO` data can partially account forthis e†ect.
More important are the di†erences between the emissionpeaks of the HV CO and HCO`. Most of these di†erencesare expected because the HCO` emission is well correlatedwith the which Burton et al. (1989) and Garden et al.H2,
FIG. 10.ÈTop : Velocity proÐles for the spatially integrated intensityfrom CO (2È1) (taken from Moriarty-Schieven et al. 1989) and HCO`(1È0). The horizontal axis is Bottom : Plot of the spa-vflow \ o vLSR[ 9.7 o .tially integrated intensity ratio estimated from the HCO` (J \ 1 ] 0) (seeTable 1) and from the CO (J \ 2 ] 1) emission (Moriarty-Schieven et al.1989).
(1990) have shown to arise from distinctively di†erent partsof the molecular outÑow as compared with the CO. Wenote some of these di†erences : (1) The deÑected ““ jetlike ÏÏstructure in the blue lobe that seems to trace the strongestintegrated emission has a clearly di†erent shape for the twomolecules. The change in direction of this structure is muchmore abrupt in CO than in HCO`. (2) The blueshiftedHCO` clump B2 in Figure 9a, located at the end of the bluelobe, at is clearly displaced to the east of an([email protected],[email protected]), [email protected] peak at the end of the CO blue lobe. (3) The peakpositions of the two westernmost redshifted HCO` clumps,R1 and R2 (Fig. 9a), are displaced with respect to their COhomologs by about for R1 and for( [ [email protected], [email protected]) ( [ [email protected],[ [email protected])R2. This displacement is signiÐcant since the e†ectiveangular resolution of the CO map is ([email protected] et al. 1989) and that of the HCO` is Interestingly,[email protected] HCO` emission that is not associated with emissionH2also shows clear dissimilarities with the CO emission. Thetwo more clear examples are (1) the blueshifted HCO`clump B1 in Figure 9a, located at which has no([email protected], [email protected]),counterpart in the CO map. In fact, this position corre-sponds roughly to a ““ valley ÏÏ of CO emission. (2) Thenorthern part of the shell-like redshifted CO lobe, which isas bright as the southern part, whereas the HCO` is signiÐ-cantly dimmer.

No. 2, 1999 HCO` MOLECULAR OUTFLOW IN NGC 2071 931
The kinematical di†erences between the HCO` and theCO can be deduced from the position-velocity plots (seeFig. 4 of this paper and Fig. 4 of Moriarty-Schieven et al.1989, respectively). The main di†erence for the blueshiftedlobe is the location of the highest velocity gas, the CO beingcloser to the outÑow center than the HCO`([email protected]) ([email protected]).For the redshifted lobe, the CO velocity structure does notchange much with position, while the HCO` shows distinctHV clumps.
4.3.2. Integrated Emission Distribution
Table 2 shows the integrated emission of the HCO`(J \ 1 ] 0) (obtained spatially by integrating over theentire outÑowÏs lobes). The velocity intervals were chosen tomatch those in Table 1 of Moriarty-Schieven et al. (1989),which shows the mass of the molecular outÑow for eachvelocity interval [which is obtained from CO (J \ 2 ] 1)observations]. This mass is equivalent to the spatially inte-grated CO (J \ 2 ] 1) emission for each velocity interval,since it was computed assuming a constant excitation tem-perature and CO fractional abundance. The HCO` andCO integrated emission and their ratio with respect to theÑow velocity are shown in Figure 10. This Ðgure showsclearly that this ratio increases with the Ñow velocity (wenote that the uncertainty of the HCO` integrated emission,typically between 5% and 10%, is small compared with thisincrease). Globally, the ratio of integrated emission pervelocity interval increases between the lowest and highest
by roughly a factor of 10.vflowSince the HV HCO` emission associated with is theH2main contribution to the overall spatially integrated HCO`emission, it is tempting to attribute the HCO` emissionenhancement with increasing Ñow velocity only to thoseareas where it is associated with the emission. In orderH2to verify this, we obtained spectra of the HCO`, H13CO`,13CO, and C18O (J \ 1 ] 0) lines with the Haystack tele-scope at the position of clump B1, not associated with H2emission (see ° 4.2). Figure 11 shows that the shape of theHCO` and 13CO lines is clearly di†erent. Both the blue-shifted and redshifted 13CO emission becomes weak fasterthan the HCO` for increasing Ñow velocities. The H13CO`and C18O lines, which do not show signiÐcant HV wings,are centered at a velocity km s~1 and have linevLSR ^ 9.3widths *V ^ 1.6 km s~1, i.e., there is no signiÐcant ambient
FIG. 11.ÈSpectra of the HCO` (J \ 1 ] 0) (solid line), and 13CO(J \ 1 ] 0) (dashed line) lines obtained with the Haystack telescope fromthe B1 clump at an o†set position of (27A, 88A). Position o†sets are from thecenter of the map (i e., phase center). Vertical axis is in antenna tem-perature. The HCO` spectrum has been multiplied by 2.
gas emission at velocities lower than km s~1. InvLSR [ 7Table 3 we show the HCO` to 13CO integrated intensityratio for di†erent Ñow velocity intervals for the blueshiftedemission between and 7.2 km s~1. The increasevLSR\ [0.3in the relative intensity of HCO` to 13CO between thelowest Ñow velocity interval from 2.5 to 3.0 km s~1)(vflowand the highest from 4 to 10 km s~1) is a factor greater(vflowthan 9. Therefore, we suggest that the HCO` emissionenhancement with respect to the CO comes from the overallHV HCO` emission and not only from that associated withthe H2.
4.4. T he HCO` Emission Enhancement withRespect to the CO
In the previous sections we show the di†erences betweenthe HV CO and HCO` and, at the same time, the corre-lation between the HV HCO` and the near-IR H2.However, this by itself does not provide an explanation ofthe HCO` emission enhancement with respect to the COfor increasing Ñow velocities (see ° 4.3.2). In order to analyzethe cause of the enhancement, as a Ðrst approximation weassume that the two molecules have di†erent excitationtemperatures. Thus, for each velocity channel the integratedemission ratio between the HCO` (J \ 1 ] 0) and CO(J \ 2 ] 1) can be derived (for example, following theappendix by Scoville et al. 1986) as
/ *vT (HCO`)d)/ *vT (CO)d)
PTex(CO)e16.6@Tex(CO)
Tex(HCO`)e4.3@Tex(HCO`)
]*)(HCO`)
*)(CO)SN(HCO`)T
SN(CO)TCq(CO)
Cq(HCO`), (5)
where *) is the area of the emission, SNT is the averageover the area of emission of the beam-averaged columndensity, and Cq \SqT/1 [ e~WqX.
In order to elucidate which is the factor that is mainlyresponsible for the HCO` emission enhancement withrespect to the CO for increasing Ñow velocities, we canmake a rough analysis of how each of these factors maya†ect the HCO` to CO integrated emission ratio : (1) Since
K (see ° 3.4), the only possibility for theTex(HCO`) Z 8excitation temperatures to account for the HCO` emissionenhancement is that increases very fast for increas-Tex(CO)ing [e.g., a increase from 15 to 70 K wouldvflow Tex(CO)increase eq. (5) by just a factor ^2], an e†ect which is notobserved (see Chernin & Masson 1992). (2) For most of the
the sizes of the two tracers are roughly similar (see Fig.vflow,2 in this paper and Fig. 2 from Moriarty-Schieven et al.1989). The CO is more extended than the HCO` only at thelowest channels and in the direction perpendicular tovflowthe outÑow axis. However, this is a small e†ect and cannotaccount for the overall HCO` emission enhancement with
(3) Only high optical depths can signiÐcantly a†ectvflow.equation (5) (otherwise The HV HCO` emission isCq ^ 1).likely optically thin, since toward the core, where thehighest optical depths are expected, its optical depth is stilllow (Wootten et al. 1984). In addition, the HV CO(J \ 2 ] 1) has an appreciable optical depth at low-Ñowvelocities, becoming optically thin at higher Ñow velocities(Snell et al. 1984 ; Chernin & Masson 1992). So, this e†ectwould make equation (5) decrease with increasing (4)vflow.Finally, the column density ratio is the only factor left thatcan signiÐcantly contribute to the HCO` emission

932 GIRART ET AL. Vol. 522
TABLE 2
HCO` (J \ 1 ] 0) INTEGRATED EMISSION OF THE NGC 2071MOLECULAR OUTFLOWa
vLSR Interval Integrated Emission(km s~1) (103 K km s~1 arcsec2)
Blue Lobe
[20 to [13 . . . . . . . . . . . . . . . . . . . . . . . 5.40[13 to [6 . . . . . . . . . . . . . . . . . . . . . . . . 14.81[6 to 0 . . . . . . . . . . . . . . . . . . . . . . . . . . . . 20.840È2 . . . . . . . . . . . . . . . . . . . . . . . . . . . . . . . . . . 9.112È4 . . . . . . . . . . . . . . . . . . . . . . . . . . . . . . . . . . 12.134È6 . . . . . . . . . . . . . . . . . . . . . . . . . . . . . . . . . . 19.25
Subtotal . . . . . . . . . . . . . . . . . . . . . . . . . . 81.54
Red Lobe
13È14 . . . . . . . . . . . . . . . . . . . . . . . . . . . . . . . 15.8814È16 . . . . . . . . . . . . . . . . . . . . . . . . . . . . . . . 20.1716È18 . . . . . . . . . . . . . . . . . . . . . . . . . . . . . . . 14.8518È22 . . . . . . . . . . . . . . . . . . . . . . . . . . . . . . . 13.9222È28 . . . . . . . . . . . . . . . . . . . . . . . . . . . . . . . 12.9028È34 . . . . . . . . . . . . . . . . . . . . . . . . . . . . . . . 6.8534È40 . . . . . . . . . . . . . . . . . . . . . . . . . . . . . . . \2.10
Subtotal . . . . . . . . . . . . . . . . . . . . . . . . . . 84.57Blue and red lobe total . . . . . . 166.11
a Derived from the HCO` (J \ 1 ] 0) observations by inte-grating the emission from the corresponding lobe for each veloc-ity interval.
enhancement. Since these are beam-averaged column den-sities averaged over the area of emission, this ratio is equiv-alent to the abundance ratio. Therefore, we conclude thatthe HCO` emission enhancement with Ñow velocity ismainly due to an HCO` abundance enhancement relativeto the CO.
Observations of the extended outÑow associated withOrion IRc2, where an HCO` abundance enhancement of 2orders of magnitude was found, led Vogel et al. (1984) tosuggest that the HCO` abundance enhancement can bedue to the ionizing Ñux produced by X-rays generated bynearby stellar sources. The X-rays will increase the H3`,which will lead to the production of HCO` via H3`Garden & Carlstrom (1992) sug-] CO] HCO`] H2.gested that the HCO` enhancement may result fromincreased ionization following the passage of a strongshock. The time-dependent model of WolÐre & Ko� nigl(1993) shows that if the shock is strong enough to produce asigniÐcant FUV and X-ray Ðeld, then a combination ofHCO` abundance enhancement (via the aforementionedreaction) and an overabundance of electrons, resulting in anincrease of the collisional excitation rate of HCO`, can lead
TABLE 3
HCO` AND 13CO INTEGRATED
INTENSITY RATIOS FOR THE B1 CLUMP
vflow Intervala(km s~1) Ratio HCO`/13CO
4.0È10 . . . . . . . . [4.53.5È4.0 . . . . . . . 2.6 ^ 0.93.0È3.5 . . . . . . . 1.1 ^ 0.22.5È3.0 . . . . . . . 0.52 ^ 0.05
a DeÐned for the blueshifted gas askm s~1.vflow \ o vLSR [ 9.7 o
to an emission enhancement of HCO` of several orders ofmagnitude. Therefore, is there a signiÐcant X-ray and FUVÐeld arising from strong shocks along the NGC 2071 molec-ular outÑow? Shock velocities of at least 150 km s~1 arerequired to generate signiÐcant X-ray radiation (WolÐre &
1993) which are not observed in the H I emission inKo� niglNGC 2071 (Bally & Stark 1983), although the nondetectioncould result from inadequate sensitivity (CO will be com-pletely dissociated at such velocities). However, two piecesof observational evidence seem to rule out the UV andX-ray ion-chemistry contribution to the HCO` enhance-ment. First, the near-IR line ratios in NGC 2071H2 Burton et al. 1989) di†er(IH2*1~0S(1)+/IH2*2~1S(1)+\ 9È18 ;signiÐcantly from the values predicted by the WolÐre &
(1993) modelKo� nigl (IH2*1~0S(1)+/IH2*2~1S(1)+\ 2È3).Second, the HV HCO` does not show the predicted high-excitation conditions : for a preshock density in NGC 2071of 104È105 cm~3 (deduced observationally by Burton et al.1989 and Chernin & Welch 1995) ofIHCO`(1~0)/IHCO`(4~3)0.2È0.02 is expected for a shock velocity of D200 km s~1(WolÐre & 1993), much lower than 1È5, the typicalKo� niglvalues that can be derived from the averaged spectraoutside the core shown in Figure 6 (although we cannot ruleout that the di†erence between the predicted and theobserved values may be due to the Ðlling factor ratio
Toward the core the values observed are lower,f10/f43).0.2È1, but because of the higher density, the expected ratiowill also be lower.
Another possibility is that the overabundance of CHobserved in some outÑows, including NGC 2071 (Sandell etal. 1988) may lead to an HCO` abundance enhancement.Chemical modeling in a mixing layer shows that the HCO`abundance can be enhanced by about 2 orders of magni-tudes because of the reaction CH] O ] HCO`] e~(Taylor & Raga 1995). However, the excitation temperatureof the (1000È2000 K) suggests that the HCO` and theH2are tracing low Mach number C-shocks (e.g., Barsony,H2Scoville, & Chandler 1993), which is also in agreement withthe HCO` enhancement due to the aforementioned ion-chemistry reaction (Taylor & Raga 1995).
4.5. T he Role of the HCO` in the Molecular OutÑowThe analysis of the data shown in this paper strongly
suggests that the HCO` emission not associated with theis tracing the same type of gas as that associated with theH2 This conclusion is supported by the fact that the overallH2.HCO` emission (i.e., not only that associated with H2)shows morphological di†erences with the CO and that the
emission enhancement with respect to the CO comes fromthe overall HV HCO` emission and again not only fromthat associated with the H2.The emission is characterized by line widths and ÑowH2velocities comparable to the HV HCO` (Burton et al.1989). This, along with the spatial correlation of the overallstructure of the two molecules, especially for higher HCO`Ñow velocities, the displacement of their peak emission, thecompletely di†erent excitation conditions of both lines, andthe evidence that the is shock excited, all suggest thatH2the and HCO` are tracing di†erent parts of the sameH2gas : high-density shocked ambient gas, with the tracingH2the hottest and inner part and the HCO` tracing the colderand outer part or shell. Because of the short coolingH2time (of the order of 1 yr) it traces regions where inter-actions are currently taking place, in contrast with the CO

No. 2, 1999 HCO` MOLECULAR OUTFLOW IN NGC 2071 933
which shows the co-added history of the interactions1997). The remarkable correlation of the HCO`(Eislo� ffel
with the makes the HCO` a useful tool to study inH2detail at high angular and velocity resolution the currentinteractions of the stellar winds with the dense ambientmedium. On the other hand, the HCO` emission notassociated with but still signiÐcantly di†ering from theH2CO emission (e.g., clump B1) could trace recent interactionswhere the shocked gas has cooled enough to not excite thenear-IR transitions but still to excite the HCO`, orH2where the emission is not observable because of theH2extinction.
5. SUMMARY
We summarize the three di†erent phenomena studied inthis paper : the core, the EHV, and the HV components ofthe molecular outÑow.
T he core.ÈWe detect a compact HCO` (J \ 4 ] 3) corewith a size of 0.09] 0.09 pc in agreement with previousobservations. Our observations cannot account for all themass of the core as estimated in other studies, probablybecause of the HCO` opacity or abundance.
T he EHV component.ÈWe detect HCO` (J \ 3 ] 2)emission up to velocities of 66 km s~1 in the line at thevLSRposition of the EHV CO in the red lobe, i.e., in the samevelocity range as the EHV CO gas. The HCO` (J \ 3 ] 2)emission within the EHV velocity range is roughly compat-ible with the expected HCO` emission associated withEHV gas arising from behind dissociative shocks, althoughfurther observations will be needed to conÐrm this possi-bility.
T he HV HCO`.ÈWe detect HCO` emission overalmost the entire observed range (from [20 to 40 kmvLSRs~1). The combination of interferometric and single-dishdata, which allows us to recover all the HCO` (J \ 1 ] 0)Ñux, the high angular resolution achieved at this transition,and the lower angular resolution HCO` two-transitionanalysis, has allowed us to study in detail the properties ofthe HCO` emission from the molecular outÑow. The prin-cipal results and conclusions are the following :
1. Comparison of the HV HCO` and the near-IR H2shows a clear correlation. At high-Ñow HCO` velocities thespatial coincidence is especially remarkable. This alongwith the di†erent excitation conditions of the two moleculessuggests that they are tracing shocked ambient gas, with the
tracing the hottest and inner part, and the HCO` theH2colder and outer part or shell.2. The HV HCO` associated with the molecular core
presents an increase of the excitation temperature at higherÑow velocities, in agreement with the better correlation athigher HCO` Ñow velocities with the The emission ofH2.the HV component out from the molecular core is likelysubthermal for the HCO` (J \ 4 ] 3) transition.
3. The HV HCO` presents clear morphological andkinematical di†erences with the CO outÑow. These di†er-ences appear not only in the HV HCO` emission associ-ated with the but in the overall outÑow. In addition,H2there is a clear HCO` emission enhancement, relative toCO, at higher Ñow velocities.
4. The emission enhancement, relative to the CO, of theHV HCO` for increasing Ñow velocity is due to an abun-dance enhancement produced by a velocity-dependentchemistry in the shocks. The and HCO` propertiesH2seem to rule out the ion-chemistry produced by X-rays andUV Ðeld generated in the shocks. An overabundance of CHin low Mach shocks may cause the HCO` abundanceenhancement.
We thank S. Curiel for providing us the image ofH2NGC 2071. We would like to thank the anonymous refereefor the valuable comments. J. M. G. was supported by aSmithsonian predoctoral fellowship. J. M. G. also acknow-ledges support of the NSF grant AST 94-19227. R. E. ispartially supported by DGICYT grant PB95-0066 (Spain).A. L. R. wishes to acknowledge the support of the NSFYoung Faculty Career Development CAREER Programvia NSF grant 96-24924 and of a New Faculty ResearchGrant at Harvey Mudd College.
REFERENCES
Anderson, I. M., Harju, J., Knee, L. B. G., & Haikala, L. K. 1997, A&A,321, 575
Anthony-Twarog, B. J. 1982, AJ, 87, 1213Aspin, C., Sandell, G., & Walther, D. M. 1992, MNRAS, 258, 684Bally, J. 1982, ApJ, 261, 558Bally, J., & Stark, A. 1983, ApJ, 266, L61Barsony, M., Scoville, N. Z., & Chandler, C. J. 1993, ApJ, 409, 275Briggs, D. 1995, Ph.D. thesis, New Mexico Inst. Mining & Tech.Burton, M. G., Geballe, T. R., & Brand, P. W. J. L. 1989, MNRAS, 238,
1513Butner, H. M., Evans, N. J., II, Harvey, P. M., Mundy, L. G., Natta, A., &
Randich, M. S. 1990, ApJ, 364, 164Chernin, L. M., & Masson, C. R. 1992, ApJ, 396, L35ÈÈÈ. 1993, ApJ, 403, L21Chernin, L. M., & Welch, W. J. 1995, ApJ, 440, L21Curiel, S., et al. 1999, in preparationDavis, C. J., Dent, W. R. F., & Burnell, S. J. 1990, MNRAS, 244, 173Dent, W. R. F., Cunningham, R., Hayward, R., Davies, S. R., Wade,
D., Avery, L. W., Mayer, C. J., & Masuda, N. T. 1993, MNRAS, 262, L13Dent, W. R. F., Sandell, G., Duncan, W. D., & Robson, E. I. 1989,
MNRAS, 238, 1497J. 1997, in IAU Symp. 182, Herbig-Haro Flows and the Birth ofEislo� ffel,
Low Mass Stars, ed. B. Reipurth & C. Bertout (Dordrecht : Reidel), 93Garden, R. P., & Carlstrom, J. E. 1992, ApJ, 392, 602Garden, R. P., Russell, A. P. G., & Burton, M. G. 1990, ApJ, 354, 232Girart, J. M., Estalella, R., & Ho, P. T. P. 1998, ApJ, 495, L59Hasegawa, T. I., & Mitchell, G. F. 1995, ApJ, 441, 665Hasegawa, T. I., Rogers, C., & Hayashi, S. S. 1991, ApJ, 374, 177
Johansson, L. E. B., B., Winneberg, A., Nguyen-Q-Rieu, & Goss,Ho� glund,W. M. 1974, ApJ, 189, 455
Kitamura, Y., Kawabe, R., & Ishiguro, M. 1992, PASJ, 44, 407Kitamura, Y., Kawabe, R., Yamashita, T., & Hayashi, M. 1990, ApJ, 363,
180Lane, A. P., & Bally, J. 1986, ApJ, 310, 820Lichten, S. M. 1982, ApJ, 253, 593Lizano, S., Heiles, C., L. F., Koo, B., Shu, F. H., Hasegawa, T.,Rodr•� guez,
Hayashi, S., & Mirabel, I. F. 1988, ApJ, 328, 763Loren, R. B., Wootten, A., Sandqvist, Aa., Friberg, P., & Hjalmarson, A� .
1984, ApJ, 287, 707Mangum, J. G., & Wootten, A. 1993, ApJS, 89, 123Moriarty-Schieven, G. H., Snell, R. L., & Hughes, V. A. 1989, ApJ, 347, 358Neufeld, D. A., & Dalgarno, A. 1989, ApJ, 340, 869Persson, S. E., Geballe, T. R., Simon, T., Lonsdale, C., & Baas, F. 1981,
ApJ, 251, L81Rudolph, A. 1992, ApJ, 397, L111Rudolph, A., & Welch, W. J. 1988, ApJ, 326, L31ÈÈÈ. 1992, ApJ, 395, 488Sandell, G., Magnani, L., & Lada, E. A. 1988, ApJ, 329, 920Schwartz, P. R. & Buhl, D. 1975, ApJ, 201, L27Scoville, N. Z., Sargent, A. I., Sanders, D. B., Claussen, M. J., Masson,
C. R., Lo, K. Y., & Philips, T. G. 1986, ApJ, 303, 416Snell, R. L., Scoville, N. Z., Sanders, D. B., & Erickson, N. R. 1984, ApJ,
284, 176Takano, T., Stutzki, J., Fukui, Y., & Winnewisser, G. 1986, A&A, 167, 333Tauber, J. A., Goldsmith, P. F., & Snell, R. L. 1988, ApJ, 325, 846Taylor, S. D., & Raga, A. C. 1995, A&A, 296, 823

934 GIRART ET AL.
Ulich, B. L. 1981, AJ, 86, 1619Umemoto, T., Iwata, T., Fukui, Y., Mikami, H., Yamamoto, S., Kameya,
O., & Hirano, N. 1992, ApJ, 392, L83Vogel, S. N., Wright, M. C. H., Plambeck, R. L., & Welch, W. J. 1984, ApJ,
283, 655Walther, D. M., Geballe, T. R., & Robson, E. I. 1991, ApJ, 377, 246Walther, D. M., Robson, E. I., Aspin, C., & Dent, W. R. F. 1993, ApJ, 418,
310
Wilner, D. J., & Welch, W. J. 1994, ApJ, 427, 898Wootten, A., Loren, R. B., Sandqvist, A., Friberg, P., & Hjalmarson, A.
1984, ApJ, 279, 633WolÐre, M. G. & A. 1993, ApJ, 415, 204Ko� nigl,Yang, L., Umemoto, T., Iwata, T., & Fukui, Y. 1991, ApJ, 373, 137Zhou, S., Evans N. J., II, R., Mundy, L. G., & Kutner, M. L. 1991,Gu� sten,
ApJ, 372, 518Zhou, S., Evans N. J., II, & Mundy, L. G. 1990, ApJ, 355, 159
Copyright © 2022 FDOKUMEN