NGC 4993 and other short gamma-ray burst host galaxies
10
A&A 620, A37 (2018) https://doi.org/10.1051/0004-6361/201834040 c ESO 2018 Astronomy & Astrophysics NGC 4993 and other short gamma-ray burst host galaxies Modelling line and continuum spectra M. Contini 1,2 1 Dipartimento di Fisica e Astronomia “G. Galilei”, University of Padova, Vicolo dell’Osservatorio 3, 35122 Padova, Italy e-mail: [email protected] 2 School of Physics and Astronomy, Tel-Aviv University, Tel-Aviv 69978, Israel Received 8 August 2018 / Accepted 20 September 2018 ABSTRACT We present the spectral detailed modelling of NGC 4993 – the host galaxy of GW 170817 – and other short gamma-ray burst (SGRB) host galaxies. In order to determine their physical conditions and the element abundances, we have gathered spectroscopic and photometric data from the literature. The observation data are sometimes missing, preventing us from fully constraining the model. However, for most of the SGRB hosts the [OIII]5007/Hβ and [NII]6548/Hα line ratios are reported. The analysis of NGC 4993 by a composite model (photoionization+shock) confirms that an active galactic nucleus (AGN), most probably a low-ionization nuclear emission-line region (LINER) or a low-luminosity AGN (LLAGN) is the gas photoionization source. Shock velocities and preshock densities are similar to those found in the narrow line region of AGN. O/H and N/H have solar values. For the other SGRB of the sample, we found that O/H ratios are nearly solar, while N/H covers a much larger range of values at redshifts close to 0.4. In NGC4993, the relative contribution to the spectral energy distribution of an old stellar population, characterized by a black- body temperature of T bb = 4000 K, with respect to bremsstrahlung is higher by a factor of >100 than in most of the local AGN and starburst (SB) galaxies. For the other SGRB that compose the sample, T bb ranges between 2000 K for SGRB 100206A and 8000 K for SGRB 111117A. Key words. radiation mechanisms: general – shock waves – ISM: abundances – galaxies: high-redshift – gamma-ray burst: general – galaxies: active 1. Introduction Gamma-ray bursts (GRB) are short, intense, and isolated flashes (Berger 2013), peaking in the gamma-ray band and occurring at an average rate of one event per day over the whole sky (D’Avanzo 2015) with different spectral and temporal proper- ties. The current scenario in the observation frame distinguishes between GRBs in “short-hard and long-soft” (Berger 2013) bursts. Short duration GRB (SGRB) last less than 2 s, while long GRB (LGRB) have a longer duration (Kouvelioutou et al. 1993). Both the localization and detection of afterglows and hosts, and the evidence of lower energy and object number scale suggest (Fox et al. 2005; Barthelmy et al. 2005; Berger et al. 2005) that SGRB are cosmological in origin, with low energetic afterglow, and that their progenitors are not massive stars (Berger 2013). Berger (2009) claims that the association of some SGRB with elliptical galaxies shows that their progenitors belong to an old stellar population, unlike LGRB. However, SGRB hosts have also been found to be star-forming galaxies. The Niels Gehrels Swift observatory (hereafter Swift; Gehrels et al. 2004) greatly improved the understanding of SGRB progenitors by revealing their location. At present, the majority of SGRB events are typi- cally detected at low z, at ∼0.4–0.5 on average (Savaglio et al. 2009; Berger 2014) because of weaker emission at all wave- lengths. This is an important issue because it is related to the host galaxy stellar evolution (Contini 2017a). The host galaxy analysis shows that long GRB are found in star-forming galax- ies (Fruchter et al. 2006; Savaglio et al. 2009, etc.) while SGRB occur in both star-forming and early type galaxies (D’Avanzo 2015; Bloom et al. 2002; Berger et al. 2005; Fox et al. 2005; Savaglio et al. 2009; Fong et al. 2013). Star formation rates (SFR) in SGRB hosts are low and a broad range of stellar masses is found in agreement with a progenitor old enough to allow neu- tron star merging (Perley et al. 2012). The lack of an associated supernova in SGRB and the hetero- geneous sample of host galaxies (e.g. Kann 2011) is consistent with a compact binary merger origin (Rosswog & Ramirez-Ruiz 2003), such as neutron stars or black holes. The progenitors were related to an old star population compatible with NS (neu- tron star) -NS or NS-BH (black hole) encounters (Berger 2009; Eichler et al. 1989). The discovery of GW 170817, which is the neutron star merger directly measured in gravitational waves and associated with an SGRB, allows us to study neutron star mergers in general and to investigate, in particular, whether the gas within NGC 4993, the host galaxy of GW 170817, has particular characteristics (Levan et al. 2017; Villar et al. 2017). Wu et al. (2018) reported on the ensemble of data observed from NGC4993 from radio to X-ray, which lead to a valid modelling of the continuum spectral energy distribution (SED). Generally, most of the continuum data for GRB host galaxies are available in the infrared (IR) – near optical range. They are explained by models that account for the underlying stellar population flux or fluxes. The large frequency range covered by the dataset used by the aforementioned authors confirms that the photometric fluxes in the IR represent only one of the different contribu- tions to the continuum SED. The most evident ones over a large Article published by EDP Sciences A37, page 1 of 10
-
Upload
khangminh22 -
Category
Documents
-
view
2 -
download
0
Transcript of NGC 4993 and other short gamma-ray burst host galaxies
A&A 620, A37 (2018)https://doi.org/10.1051/0004-6361/201834040c© ESO 2018
Astronomy&Astrophysics
NGC 4993 and other short gamma-ray burst host galaxies
Modelling line and continuum spectra
M. Contini1,2
1 Dipartimento di Fisica e Astronomia “G. Galilei”, University of Padova, Vicolo dell’Osservatorio 3, 35122 Padova, Italye-mail: [email protected]
2 School of Physics and Astronomy, Tel-Aviv University, Tel-Aviv 69978, Israel
Received 8 August 2018 / Accepted 20 September 2018
ABSTRACT
We present the spectral detailed modelling of NGC 4993 – the host galaxy of GW 170817 – and other short gamma-ray burst (SGRB)host galaxies. In order to determine their physical conditions and the element abundances, we have gathered spectroscopic andphotometric data from the literature. The observation data are sometimes missing, preventing us from fully constraining the model.However, for most of the SGRB hosts the [OIII]5007/Hβ and [NII]6548/Hα line ratios are reported. The analysis of NGC 4993 bya composite model (photoionization+shock) confirms that an active galactic nucleus (AGN), most probably a low-ionization nuclearemission-line region (LINER) or a low-luminosity AGN (LLAGN) is the gas photoionization source. Shock velocities and preshockdensities are similar to those found in the narrow line region of AGN. O/H and N/H have solar values. For the other SGRB ofthe sample, we found that O/H ratios are nearly solar, while N/H covers a much larger range of values at redshifts close to 0.4.In NGC 4993, the relative contribution to the spectral energy distribution of an old stellar population, characterized by a black-body temperature of Tbb = 4000 K, with respect to bremsstrahlung is higher by a factor of >100 than in most of the local AGN andstarburst (SB) galaxies. For the other SGRB that compose the sample, Tbb ranges between 2000 K for SGRB 100206A and 8000 K forSGRB 111117A.
Key words. radiation mechanisms: general – shock waves – ISM: abundances – galaxies: high-redshift – gamma-ray burst: general –galaxies: active
1. Introduction
Gamma-ray bursts (GRB) are short, intense, and isolated flashes(Berger 2013), peaking in the gamma-ray band and occurringat an average rate of one event per day over the whole sky(D’Avanzo 2015) with different spectral and temporal proper-ties. The current scenario in the observation frame distinguishesbetween GRBs in “short-hard and long-soft” (Berger 2013)bursts. Short duration GRB (SGRB) last less than 2 s, while longGRB (LGRB) have a longer duration (Kouvelioutou et al. 1993).Both the localization and detection of afterglows and hosts, andthe evidence of lower energy and object number scale suggest(Fox et al. 2005; Barthelmy et al. 2005; Berger et al. 2005) thatSGRB are cosmological in origin, with low energetic afterglow,and that their progenitors are not massive stars (Berger 2013).Berger (2009) claims that the association of some SGRB withelliptical galaxies shows that their progenitors belong to an oldstellar population, unlike LGRB. However, SGRB hosts havealso been found to be star-forming galaxies. The Niels GehrelsSwift observatory (hereafter Swift; Gehrels et al. 2004) greatlyimproved the understanding of SGRB progenitors by revealingtheir location. At present, the majority of SGRB events are typi-cally detected at low z, at ∼0.4–0.5 on average (Savaglio et al.2009; Berger 2014) because of weaker emission at all wave-lengths. This is an important issue because it is related to thehost galaxy stellar evolution (Contini 2017a). The host galaxyanalysis shows that long GRB are found in star-forming galax-ies (Fruchter et al. 2006; Savaglio et al. 2009, etc.) while SGRB
occur in both star-forming and early type galaxies (D’Avanzo2015; Bloom et al. 2002; Berger et al. 2005; Fox et al. 2005;Savaglio et al. 2009; Fong et al. 2013). Star formation rates(SFR) in SGRB hosts are low and a broad range of stellar massesis found in agreement with a progenitor old enough to allow neu-tron star merging (Perley et al. 2012).
The lack of an associated supernova in SGRB and the hetero-geneous sample of host galaxies (e.g. Kann 2011) is consistentwith a compact binary merger origin (Rosswog & Ramirez-Ruiz2003), such as neutron stars or black holes. The progenitorswere related to an old star population compatible with NS (neu-tron star) -NS or NS-BH (black hole) encounters (Berger 2009;Eichler et al. 1989). The discovery of GW 170817, which is theneutron star merger directly measured in gravitational wavesand associated with an SGRB, allows us to study neutron starmergers in general and to investigate, in particular, whetherthe gas within NGC 4993, the host galaxy of GW 170817, hasparticular characteristics (Levan et al. 2017; Villar et al. 2017).Wu et al. (2018) reported on the ensemble of data observed fromNGC 4993 from radio to X-ray, which lead to a valid modellingof the continuum spectral energy distribution (SED). Generally,most of the continuum data for GRB host galaxies are availablein the infrared (IR) – near optical range. They are explained bymodels that account for the underlying stellar population flux orfluxes. The large frequency range covered by the dataset usedby the aforementioned authors confirms that the photometricfluxes in the IR represent only one of the different contribu-tions to the continuum SED. The most evident ones over a large
Article published by EDP Sciences A37, page 1 of 10
A&A 620, A37 (2018)
frequency range are the radio sources (thermal and synchrotron),dust reprocessed radiation, the underlying stellar emission, andthe direct flux from the active sources. They were recognisedin local as well as in high z galaxies (e.g. Contini & Contini2007). However, in some different ranges of the continuum, inparticular in the radio and ultraviolet (UV)–X-ray, data are bet-ter explained by the bremsstrahlung emitted from the gaseousclouds within the host galaxy, which also emit the spectral lines.The bremsstrahlung is seen over a large frequency range, in par-ticular when shocks are accounted for (Contini 2018). Besidesthe effect of merging, which affects both high redshift galaxiesas well as local ones, shock waves are created by winds, jets, andcollisions throughout the galaxies. Therefore shocks should beaccounted for by the calculation of line and continuum fluxes. Inparticular, shocks with velocities >300 km s−1 can heat the gas tohigh temperatures >106 K, which decrease following the coolingrate downstream. Consequently, the calculated bremsstrahlungcan be strong in the X-ray domain and beyond.
In previous papers (e.g. Contini 2016a) we have investigatedthe physical conditions and the element abundances of GRB hostgalaxies by the analysis of the observed line spectra at relativelyhigh z. We compared them, for example, with those of vari-ous supernova (SN) types, AGN, SB, and HII regions. In thispaper we investigate line ratios and continuum SED of SGRBhost galaxies. The model of the continuum is less constrain-ing than that of the line spectra, therefore we chose our sampleSGRB hosts that have reported emission-line fluxes. The sam-ple is somewhat poor in regard to the number of objects. Theline spectra suitable to constrain the models generally contain atleast Hβ, Hα, [OIII], [OII], and [NII]. The Hα/Hβ line ratios,which are used to correct for reddening the spectra, cannot beneglected.
Our aim is to determine the physical conditions, the elementabundances, and the radiation sources within the NGC 4993galaxy, which hosts a SGRB, and compare them with othergalaxies. Recently NGC 4993 was the site of a gravitationalwave (GW) event. NGC 4993 has enough published data toenable line and continuum modelling. For all other SGRBhosts presented in this paper, the continuum SED observationscover only the IR range that corresponds to emission fromthe underlying stellar population. However, for GRB 050709,GRB 100206A and GRB 130603B the data for the optical-near IR line ratios reported by Berger (2009), Perley et al.(2012), de Ugarte Postigo et al. (2014), Cucchiara et al. (2013),and Soderberg et al. (2006) are enough to constrain the mod-els. The code suma (Contini 2018 and references therein;Ferland et al. 1995) calculates the continuum as well as the linefluxes. We show the continuum SED in the diagrams over a largefrequency range (108–1019 Hz) even if we did not find any datain the radio, far-IR, optical-UV, and X-ray. The bremsstrahlungresults are presented as predictions. For GRB 111117A at z =2.21 no line fluxes are reported in the literature. Therefore onlythe old star contribution to the SED is investigated in order tocompare it to the SED of other SGRB hosts at lower z.
In Sect. 2 the modelling method is applied to NGC 4993and to other SGRB host galaxies. Discussion and concludingremarks follow in Sect. 3.
2. SGRB host spectra
2.1. Modelling approach
The code suma simulates the physical conditions of an emit-ting gaseous cloud under the coupled effect of photoionization
from a radiation source and shocks assuming a plane-parallelgeometry. Two cases are considered relative to cloud propaga-tion: infalling, in which photoionizing radiation reaches the gason the cloud edge corresponding to the shock front, and ejec-tion, in which the radiation reaches the gas on the edge oppositeto the shock front. Calculations and modelling are described indetail by Contini (2018). The main input parameters are thosereferring to the shock, which are the preshock density n0, theshock velocity Vs, the magnetic field B0 (for all galaxy modelsB0 = 10−4 Gauss is adopted), as well as the source ionizing radi-ation spectrum and the chemical abundances of He, C, N, O, Ne,Mg, Si, S, Ar, Cl, and Fe, relative to H. The photoionizing radia-tion adopted for the SB in the GRB host galaxies is a black body(bb). The input parameters are the effective temperature T∗ andthe ionization parameter U. For an AGN, the photoionizing radi-ation is the power-law radiation flux from the active centre F innumber of photons cm−2 s−1 eV−1 at the Lyman limit, and spectralindices αUV = −1.5 and αX = −0.7. Generally, Vs is constrainedby the full width half maximum (FWHM) of the line profiles andn0 is constrained by the ratio of the characteristic lines. The rela-tive abundances of the elements are constrained by the line ratios.In the case where shock and photoionization act on opposite sidesof a plan-parallel nebula, the geometrical width of the nebula, D,is an input parameter. The diffuse radiation bridges the two sides,and the smaller the value of D, the more entangled are the pho-toionized and the shocked regions on the opposite sides of thenebula. In this case, a few iterations are necessary to obtain thephysical conditions downstream. The effect of dust present in thegas, characterized by the dust-to-gas ratio d/g and the initial grainradius agr are also consistently taken into account.
The spectra observed from SGRB hosts are often lacking innumber of lines. Baldwin, Phillips & Terlevich (BPT) diagrams(Baldwin et al. 1981; Kauffmann 2003; Kewley et al. 2001) forthe [OIII]5007/Hβ and [NII]6583/Hα line ratios are generallyadopted by the community in order to identify the galaxy typein terms of the radiation source. However, extreme physicalconditions and relative abundances far from solar, in particu-lar for O/H and N/H, may shift the observed [OIII]/Hβ and[NII]/Hα line ratios throughout the BPT diagram towards sec-tors that were assigned to different galaxy types. For example,a low N/H relative abundance may shift the observed [NII]/Hαline ratio emitted from a galaxy towards the SB galaxy domain,although other features of the same object are characteristic ofan AGN. This may occur to GRB host galaxies that are locatedat redshifts higher than local. At high z, the over- and under-abundances of the heavy elements are important issues linkedwith merging, ages and evolution. Therefore, to constrain amodel when the line ratios are few we follow a different method.The line ratios of [OIII]5007/Hβ and [NII]6548/Hα are gener-ally observed because Hβ, Hα, [OIII], [OII], and [NII] are thestrongest lines in the optical range. A first hint towards the choiceof the model is obtained by comparing the observed line ratioswith the grids of composite models (photoionization+shock)previously calculated (e.g. Contini & Viegas 2001a,b). Thesemodels provide an approximate but rich indication of the gasphysical conditions calculated within the emitting clouds and ofthe line and the continuum radiation flux. The line ratios pre-sented by the grids are adapted to HII regions and AGN, respec-tively. The models (Contini & Viegas 2001a) corresponding to ablack-body photoionization flux can be applied to SB galaxies(see Sect. 2). The [OIII]/Hβ and [NII]/Hα line ratios alone can-not definitively constrain the model because we deal with twoline ratios related to two different elements. Ratios of [OIII] lineto Hb flux depend mostly on the ionization parameter and on Vs
A37, page 2 of 10
M. Contini: Modelling line and continuum spectra of SGRB hosts
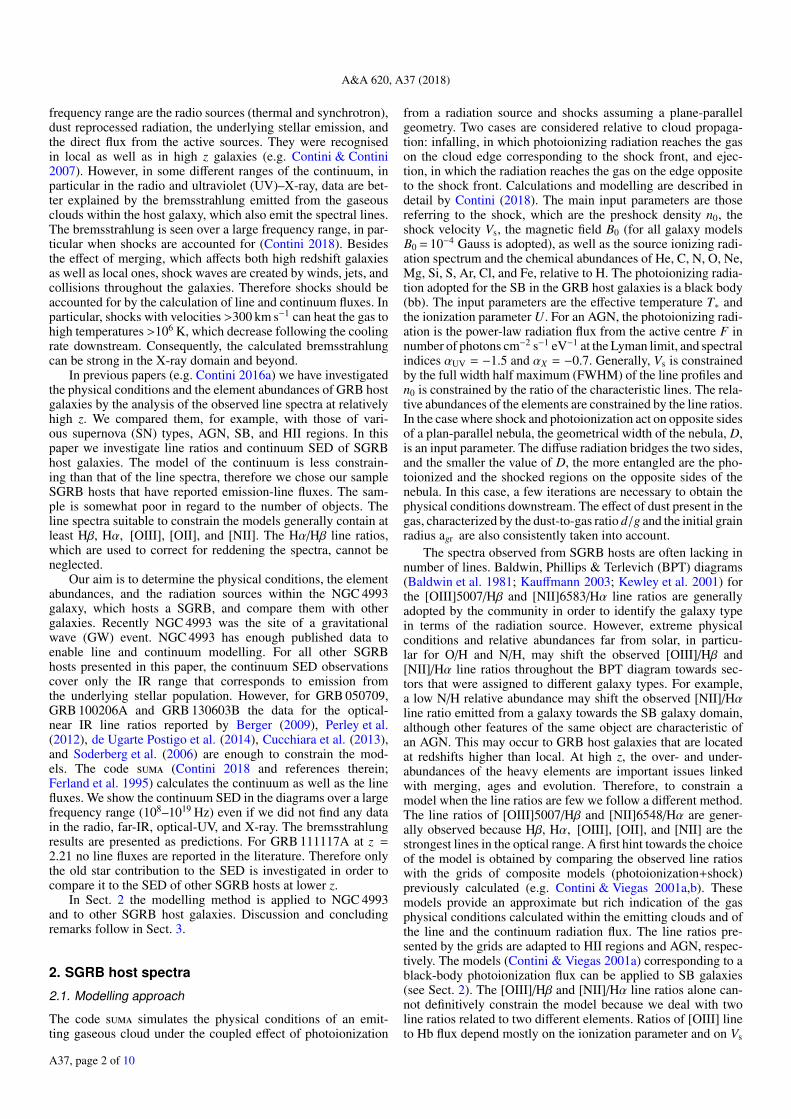
Table 1. Modelling NGC 4993 observed line ratios [OIII]/Hβ= 1.4 and [NII]/Hα= 1.26.
mod [OIII]/Hβ [NII]/Hα Hβ Vs n0 D T∗ U logF 12+log(O/H) 12+log(N/H)– – – a km s−1 cm−3 pc 104 K – b – –
modSB 1.41 0.13 37.7 300 300 1.67 5 1 – 8.82 8.0modSD 1.4 0.146 0.0009 100 100 1.9 – – – 8.82 8.0modAGN1 1.43 1.26 0.05 100 300 1 – – 9.55 8.82 8.0modAGN2 1.45 0.11 16.9 300 300 0.27 – – 9.48 8.82 8.0
Notes.(a)in erg cm−2 s−1 calculated at the nebula; (b)F is in photons cm−1 s−1 eV−1 at the Lyman limit.
but the [NII]/Hα ratios depend strongly on the N/H relative abun-dances. For example, SN and GRB host N/H ranges between∼0.1 solar and ∼5 solar (Contini 2017a). We cannot determinea priori whether the best fit to the observed [NII]/Hα line ratiocould be reached by changing one or more input parameters rep-resenting the physical conditions (Vs, n0, D, F for AGN, T∗ andU for SB) or by modifying the N/H relative abundance. TheN+ and H+ ions as well as O+ and H+ are correlated by chargeexchange reactions, therefore they have a similar trend through-out a cloud. When [OIII]/Hβ and [OII]/Hβ are well reproducedby modelling and solar N/H are adopted, the resulting N/H is cal-culated by ([NII]/Hβ)obs = ([NII]/Hβ)calc (N/H)/(N/H)�, where(N/H)� is the solar N/H relative abundance. The [OIII]/Hβ and[OII]/Hβ line ratios are more affected by the physical conditionsof the emitting gas than by O/H.
On this basis we calculated a grid of models. We selected theset of models (e.g. Table 1) which best reproduces the line ratios.We obtained the final model by comparing the calculated SEDwith the observed one. The calculated continuum SED is repre-sented in the diagrams by two lines, one for the bremsstrahlungthat covers frequencies from radio to X-ray, and the other forthe reprocessed radiation from dust in the IR range. They arecalculated by the same model that reproduces the line ratios. Inthe IR-optical range, the underlying stellar flux emerges frombremsstrahlung and can be blended with dust reradiation whenshock velocities are high. The errors in the observed photometricdata are <20 percent while the uncertainties in the calculationsare <10 percent.
2.2. NGC 4993. The host galaxy of GW 170817
We reproduced by detailed modelling the NGC 4993 observedline ratios and the continuum SED (Levan et al. 2017;Palmese et al. 2017; Wu et al. 2018). Observations by LazerInterferomer Gravitational-Wave Observatory (LIGO)/Virgo sci-entific collaboration reported gravitational waves that followedthe recent neutron star merger event GW 170817. In the frame ofour analysis of GRB host line and continuum SED, we calculatedthe characteristics of the emitting gas from NGC 4993, which isconsidered to be the host galaxy of GW 170817 at z = 0.009873.
Levan et al. (2017) in their Fig. 4 compared [OIII]/Hβand [NII]/Hα spectroscopic observations with BPT diagnos-tics. They found that the line ratios fitted the AGN domain.Spectroscopic observations by Palmese et al. (2017, in theirFig. 3 right panel) show [OIII]5007/Hβ and [OII]/Hα within theerror of Levan et al. (2017) observations. However, Palmese andcollaborators admitted that the [OIII]/Hβ line ratio is very uncer-tain. In Table 1 we report the calculated models that best repro-duce the spectroscopic data of Levan et al. (2017). For all ofthem, O/H solar (6.6× 10⁻⁴) and N/H solar (10−4) are adopted(Grevesse & Sauval 1998). Model modSB is characterized
by a bb photoionizing radiation (suitable to SB and HIIregions) and relatively high shock velocities (Vs = 300 km s−1),and modSD is a shock-dominated model (F = 0 and U = 0) withVs = 100 km s−1. Models modAGN1 and modAGN2 are calcu-lated by a power-law photoionizing flux and different shockvelocities, Vs =100 km s−1 and Vs = 300 km s−1, respectively.
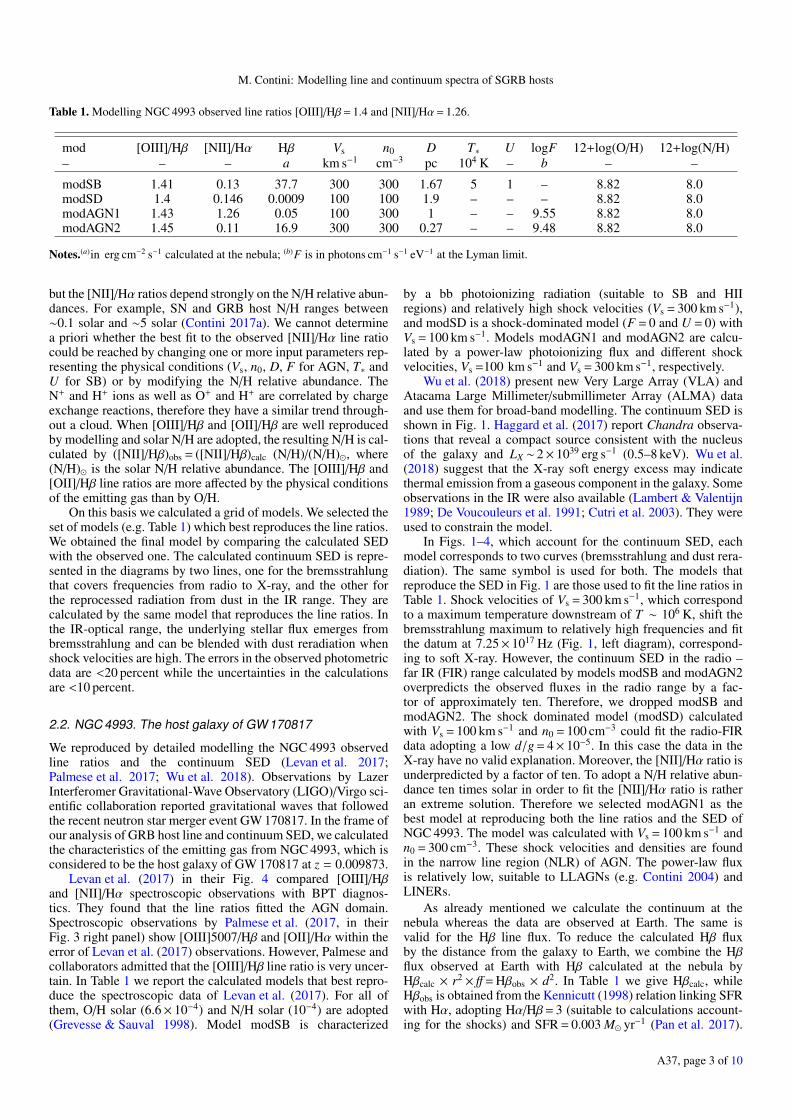
Wu et al. (2018) present new Very Large Array (VLA) andAtacama Large Millimeter/submillimeter Array (ALMA) dataand use them for broad-band modelling. The continuum SED isshown in Fig. 1. Haggard et al. (2017) report Chandra observa-tions that reveal a compact source consistent with the nucleusof the galaxy and LX ∼ 2× 1039 erg s−1 (0.5–8 keV). Wu et al.(2018) suggest that the X-ray soft energy excess may indicatethermal emission from a gaseous component in the galaxy. Someobservations in the IR were also available (Lambert & Valentijn1989; De Voucouleurs et al. 1991; Cutri et al. 2003). They wereused to constrain the model.
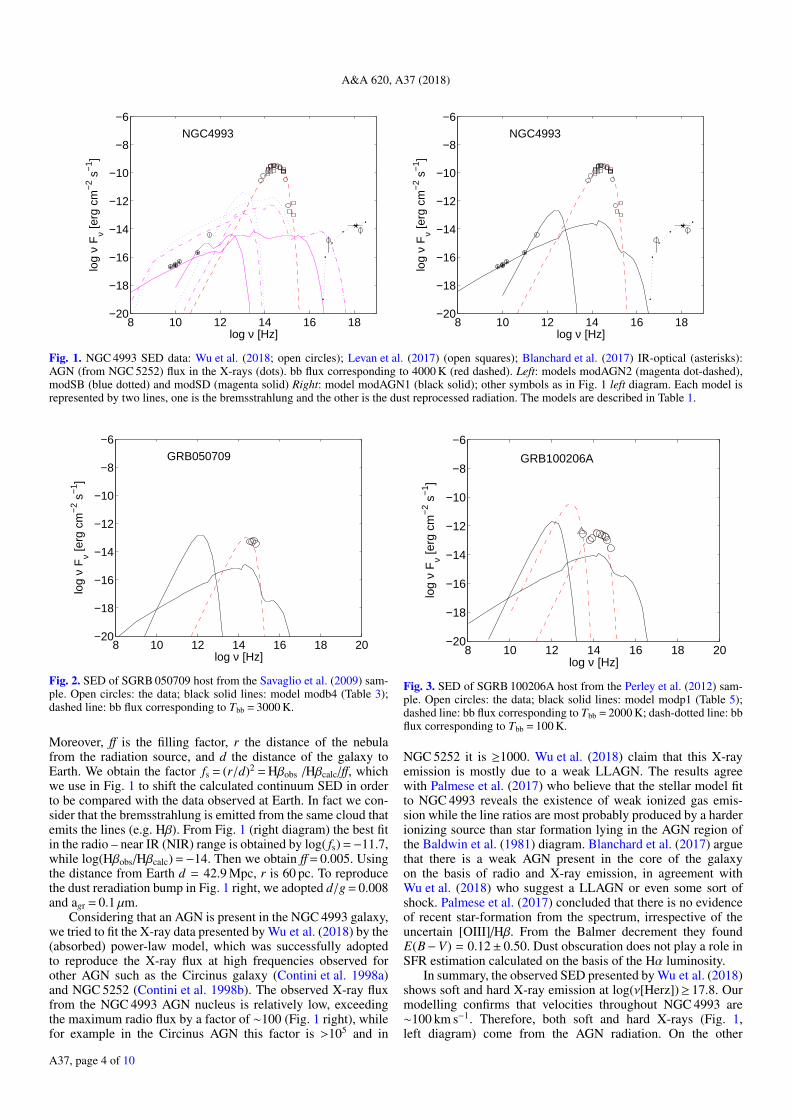
In Figs. 1–4, which account for the continuum SED, eachmodel corresponds to two curves (bremsstrahlung and dust rera-diation). The same symbol is used for both. The models thatreproduce the SED in Fig. 1 are those used to fit the line ratios inTable 1. Shock velocities of Vs = 300 km s−1, which correspondto a maximum temperature downstream of T ∼ 106 K, shift thebremsstrahlung maximum to relatively high frequencies and fitthe datum at 7.25× 10¹⁷ Hz (Fig. 1, left diagram), correspond-ing to soft X-ray. However, the continuum SED in the radio –far IR (FIR) range calculated by models modSB and modAGN2overpredicts the observed fluxes in the radio range by a fac-tor of approximately ten. Therefore, we dropped modSB andmodAGN2. The shock dominated model (modSD) calculatedwith Vs = 100 km s−1 and n0 = 100 cm−3 could fit the radio-FIRdata adopting a low d/g = 4× 10⁻⁵. In this case the data in theX-ray have no valid explanation. Moreover, the [NII]/Hα ratio isunderpredicted by a factor of ten. To adopt a N/H relative abun-dance ten times solar in order to fit the [NII]/Hα ratio is ratheran extreme solution. Therefore we selected modAGN1 as thebest model at reproducing both the line ratios and the SED ofNGC 4993. The model was calculated with Vs = 100 km s−1 andn0 = 300 cm−3. These shock velocities and densities are foundin the narrow line region (NLR) of AGN. The power-law fluxis relatively low, suitable to LLAGNs (e.g. Contini 2004) andLINERs.
As already mentioned we calculate the continuum at thenebula whereas the data are observed at Earth. The same isvalid for the Hβ line flux. To reduce the calculated Hβ fluxby the distance from the galaxy to Earth, we combine the Hβflux observed at Earth with Hβ calculated at the nebula byHβcalc × r2 × ff= Hβobs × d2. In Table 1 we give Hβcalc, whileHβobs is obtained from the Kennicutt (1998) relation linking SFRwith Hα, adopting Hα/Hβ= 3 (suitable to calculations account-ing for the shocks) and SFR = 0.003 M� yr−1 (Pan et al. 2017).
A37, page 3 of 10
A&A 620, A37 (2018)
8 10 12 14 16 18−20
−18
−16
−14
−12
−10
−8
−6
log ν [Hz]
log
ν F
ν [erg
cm
−2 s
−1 ]
NGC4993
8 10 12 14 16 18−20
−18
−16
−14
−12
−10
−8
−6
log ν [Hz]
log
ν F
ν [erg
cm
−2 s
−1 ]
NGC4993
Fig. 1. NGC 4993 SED data: Wu et al. (2018; open circles); Levan et al. (2017) (open squares); Blanchard et al. (2017) IR-optical (asterisks):AGN (from NGC 5252) flux in the X-rays (dots). bb flux corresponding to 4000 K (red dashed). Left: models modAGN2 (magenta dot-dashed),modSB (blue dotted) and modSD (magenta solid) Right: model modAGN1 (black solid); other symbols as in Fig. 1 left diagram. Each model isrepresented by two lines, one is the bremsstrahlung and the other is the dust reprocessed radiation. The models are described in Table 1.
8 10 12 14 16 18 20−20
−18
−16
−14
−12
−10
−8
−6
log ν [Hz]
log
ν F
ν [erg
cm
−2 s
−1 ]
GRB050709
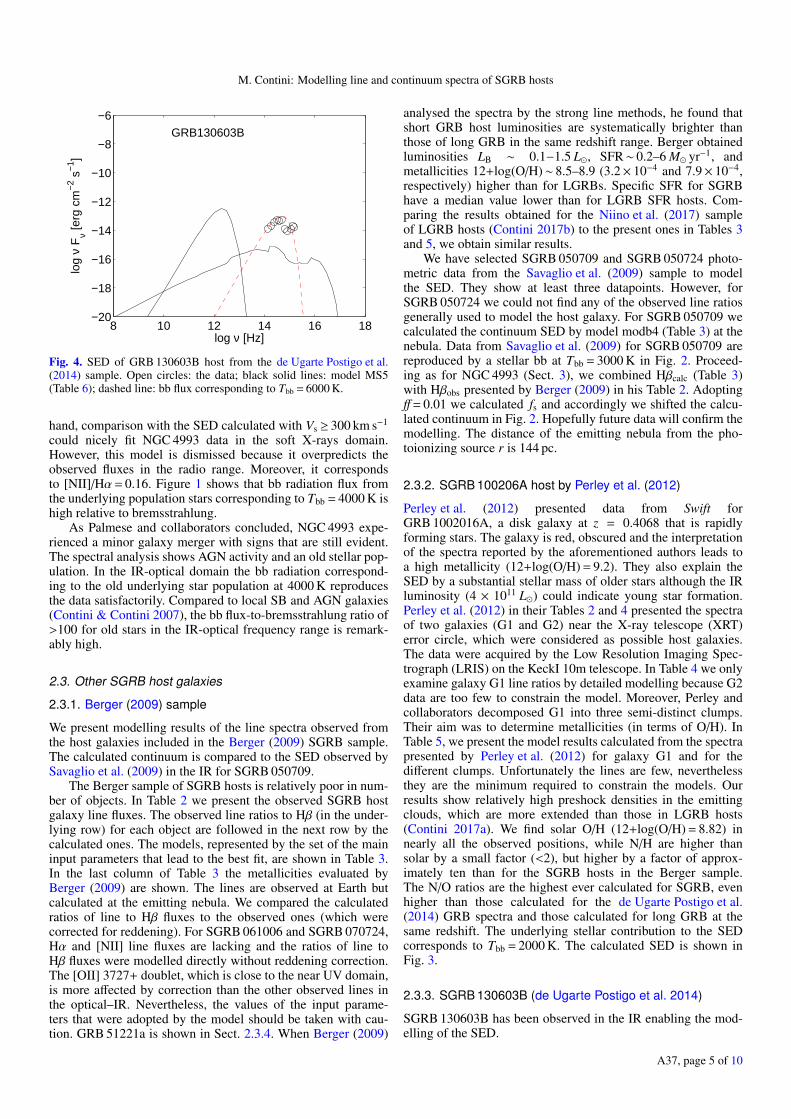
Fig. 2. SED of SGRB 050709 host from the Savaglio et al. (2009) sam-ple. Open circles: the data; black solid lines: model modb4 (Table 3);dashed line: bb flux corresponding to Tbb = 3000 K.
Moreover, ff is the filling factor, r the distance of the nebulafrom the radiation source, and d the distance of the galaxy toEarth. We obtain the factor fs = (r/d)2 = Hβobs /Hβcalc/ff, whichwe use in Fig. 1 to shift the calculated continuum SED in orderto be compared with the data observed at Earth. In fact we con-sider that the bremsstrahlung is emitted from the same cloud thatemits the lines (e.g. Hβ). From Fig. 1 (right diagram) the best fitin the radio – near IR (NIR) range is obtained by log( fs) =−11.7,while log(Hβobs/Hβcalc) =−14. Then we obtain ff= 0.005. Usingthe distance from Earth d = 42.9 Mpc, r is 60 pc. To reproducethe dust reradiation bump in Fig. 1 right, we adopted d/g = 0.008and agr = 0.1 µm.
Considering that an AGN is present in the NGC 4993 galaxy,we tried to fit the X-ray data presented by Wu et al. (2018) by the(absorbed) power-law model, which was successfully adoptedto reproduce the X-ray flux at high frequencies observed forother AGN such as the Circinus galaxy (Contini et al. 1998a)and NGC 5252 (Contini et al. 1998b). The observed X-ray fluxfrom the NGC 4993 AGN nucleus is relatively low, exceedingthe maximum radio flux by a factor of ∼100 (Fig. 1 right), whilefor example in the Circinus AGN this factor is >105 and in
8 10 12 14 16 18 20−20
−18
−16
−14
−12
−10
−8
−6
log ν [Hz]
log
ν F
ν [erg
cm
−2 s
−1 ]
GRB100206A
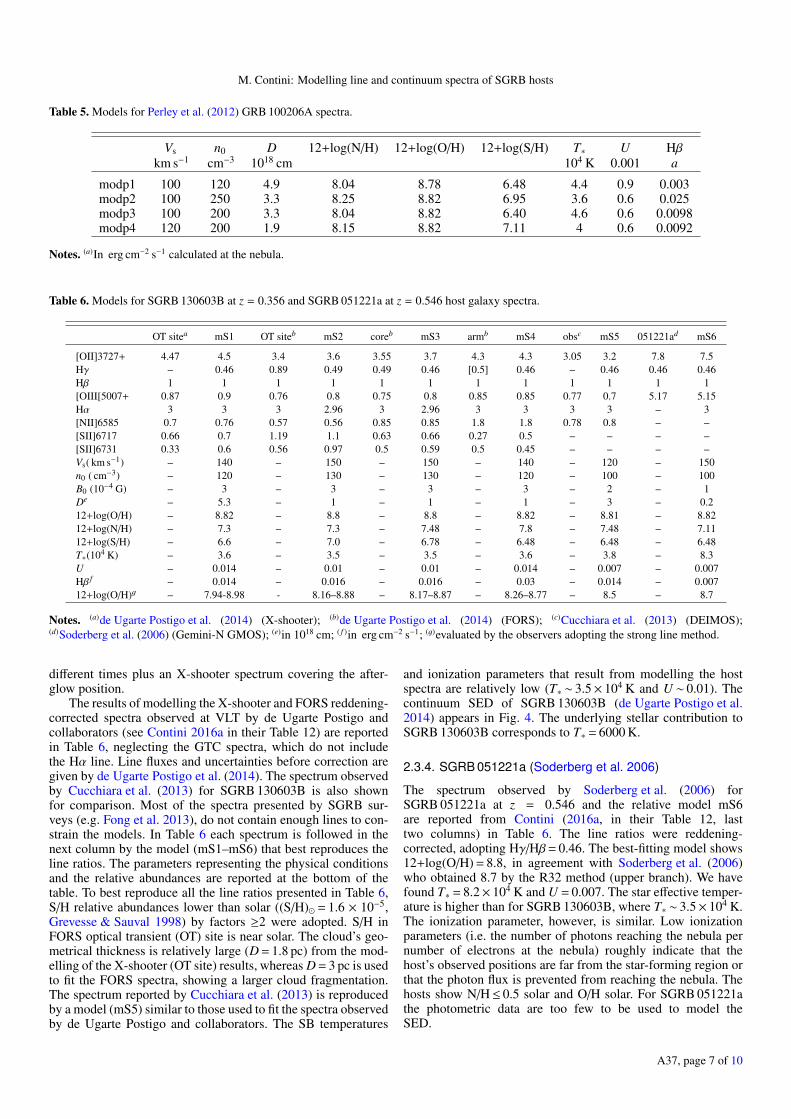
Fig. 3. SED of SGRB 100206A host from the Perley et al. (2012) sam-ple. Open circles: the data; black solid lines: model modp1 (Table 5);dashed line: bb flux corresponding to Tbb = 2000 K; dash-dotted line: bbflux corresponding to Tbb = 100 K.
NGC 5252 it is ≥1000. Wu et al. (2018) claim that this X-rayemission is mostly due to a weak LLAGN. The results agreewith Palmese et al. (2017) who believe that the stellar model fitto NGC 4993 reveals the existence of weak ionized gas emis-sion while the line ratios are most probably produced by a harderionizing source than star formation lying in the AGN region ofthe Baldwin et al. (1981) diagram. Blanchard et al. (2017) arguethat there is a weak AGN present in the core of the galaxyon the basis of radio and X-ray emission, in agreement withWu et al. (2018) who suggest a LLAGN or even some sort ofshock. Palmese et al. (2017) concluded that there is no evidenceof recent star-formation from the spectrum, irrespective of theuncertain [OIII]/Hβ. From the Balmer decrement they foundE(B−V) = 0.12± 0.50. Dust obscuration does not play a role inSFR estimation calculated on the basis of the Hα luminosity.
In summary, the observed SED presented by Wu et al. (2018)shows soft and hard X-ray emission at log(ν[Herz])≥ 17.8. Ourmodelling confirms that velocities throughout NGC 4993 are∼100 km s−1. Therefore, both soft and hard X-rays (Fig. 1,left diagram) come from the AGN radiation. On the other
A37, page 4 of 10
M. Contini: Modelling line and continuum spectra of SGRB hosts
8 10 12 14 16 18−20
−18
−16
−14
−12
−10
−8
−6
log ν [Hz]
log
ν F
ν [erg
cm
−2 s
−1 ]
GRB130603B
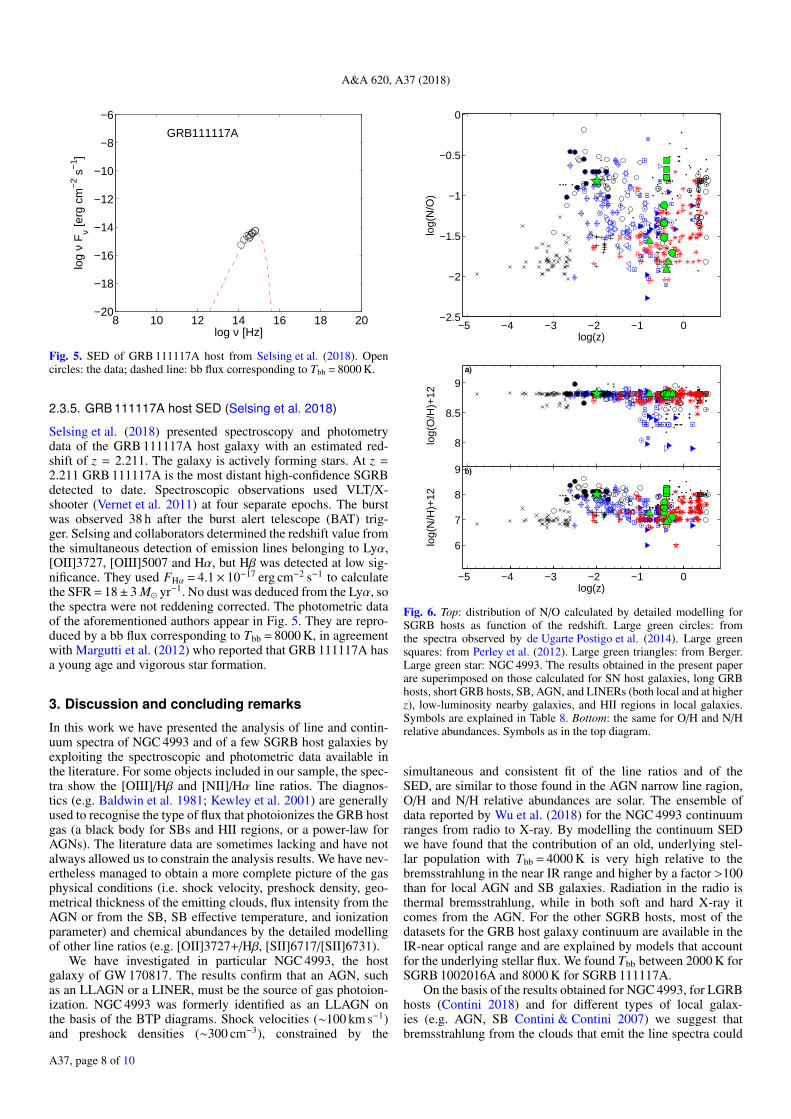
Fig. 4. SED of GRB 130603B host from the de Ugarte Postigo et al.(2014) sample. Open circles: the data; black solid lines: model MS5(Table 6); dashed line: bb flux corresponding to Tbb = 6000 K.
hand, comparison with the SED calculated with Vs ≥ 300 km s−1
could nicely fit NGC 4993 data in the soft X-rays domain.However, this model is dismissed because it overpredicts theobserved fluxes in the radio range. Moreover, it correspondsto [NII]/Hα= 0.16. Figure 1 shows that bb radiation flux fromthe underlying population stars corresponding to Tbb = 4000 K ishigh relative to bremsstrahlung.
As Palmese and collaborators concluded, NGC 4993 expe-rienced a minor galaxy merger with signs that are still evident.The spectral analysis shows AGN activity and an old stellar pop-ulation. In the IR-optical domain the bb radiation correspond-ing to the old underlying star population at 4000 K reproducesthe data satisfactorily. Compared to local SB and AGN galaxies(Contini & Contini 2007), the bb flux-to-bremsstrahlung ratio of>100 for old stars in the IR-optical frequency range is remark-ably high.
2.3. Other SGRB host galaxies
2.3.1. Berger (2009) sample
We present modelling results of the line spectra observed fromthe host galaxies included in the Berger (2009) SGRB sample.The calculated continuum is compared to the SED observed bySavaglio et al. (2009) in the IR for SGRB 050709.
The Berger sample of SGRB hosts is relatively poor in num-ber of objects. In Table 2 we present the observed SGRB hostgalaxy line fluxes. The observed line ratios to Hβ (in the under-lying row) for each object are followed in the next row by thecalculated ones. The models, represented by the set of the maininput parameters that lead to the best fit, are shown in Table 3.In the last column of Table 3 the metallicities evaluated byBerger (2009) are shown. The lines are observed at Earth butcalculated at the emitting nebula. We compared the calculatedratios of line to Hβ fluxes to the observed ones (which werecorrected for reddening). For SGRB 061006 and SGRB 070724,Hα and [NII] line fluxes are lacking and the ratios of line toHβ fluxes were modelled directly without reddening correction.The [OII] 3727+ doublet, which is close to the near UV domain,is more affected by correction than the other observed lines inthe optical–IR. Nevertheless, the values of the input parame-ters that were adopted by the model should be taken with cau-tion. GRB 51221a is shown in Sect. 2.3.4. When Berger (2009)
analysed the spectra by the strong line methods, he found thatshort GRB host luminosities are systematically brighter thanthose of long GRB in the same redshift range. Berger obtainedluminosities LB ∼ 0.1−1.5 L�, SFR∼ 0.2–6 M� yr−1, andmetallicities 12+log(O/H)∼ 8.5–8.9 (3.2× 10⁻⁴ and 7.9× 10⁻⁴,respectively) higher than for LGRBs. Specific SFR for SGRBhave a median value lower than for LGRB SFR hosts. Com-paring the results obtained for the Niino et al. (2017) sampleof LGRB hosts (Contini 2017b) to the present ones in Tables 3and 5, we obtain similar results.
We have selected SGRB 050709 and SGRB 050724 photo-metric data from the Savaglio et al. (2009) sample to modelthe SED. They show at least three datapoints. However, forSGRB 050724 we could not find any of the observed line ratiosgenerally used to model the host galaxy. For SGRB 050709 wecalculated the continuum SED by model modb4 (Table 3) at thenebula. Data from Savaglio et al. (2009) for SGRB 050709 arereproduced by a stellar bb at Tbb = 3000 K in Fig. 2. Proceed-ing as for NGC 4993 (Sect. 3), we combined Hβcalc (Table 3)with Hβobs presented by Berger (2009) in his Table 2. Adoptingff= 0.01 we calculated fs and accordingly we shifted the calcu-lated continuum in Fig. 2. Hopefully future data will confirm themodelling. The distance of the emitting nebula from the pho-toionizing source r is 144 pc.
2.3.2. SGRB 100206A host by Perley et al. (2012)
Perley et al. (2012) presented data from Swift forGRB 1002016A, a disk galaxy at z = 0.4068 that is rapidlyforming stars. The galaxy is red, obscured and the interpretationof the spectra reported by the aforementioned authors leads toa high metallicity (12+log(O/H) = 9.2). They also explain theSED by a substantial stellar mass of older stars although the IRluminosity (4 × 10¹¹ L�) could indicate young star formation.Perley et al. (2012) in their Tables 2 and 4 presented the spectraof two galaxies (G1 and G2) near the X-ray telescope (XRT)error circle, which were considered as possible host galaxies.The data were acquired by the Low Resolution Imaging Spec-trograph (LRIS) on the KeckI 10m telescope. In Table 4 we onlyexamine galaxy G1 line ratios by detailed modelling because G2data are too few to constrain the model. Moreover, Perley andcollaborators decomposed G1 into three semi-distinct clumps.Their aim was to determine metallicities (in terms of O/H). InTable 5, we present the model results calculated from the spectrapresented by Perley et al. (2012) for galaxy G1 and for thedifferent clumps. Unfortunately the lines are few, neverthelessthey are the minimum required to constrain the models. Ourresults show relatively high preshock densities in the emittingclouds, which are more extended than those in LGRB hosts(Contini 2017a). We find solar O/H (12+log(O/H) = 8.82) innearly all the observed positions, while N/H are higher thansolar by a small factor (<2), but higher by a factor of approx-imately ten than for the SGRB hosts in the Berger sample.The N/O ratios are the highest ever calculated for SGRB, evenhigher than those calculated for the de Ugarte Postigo et al.(2014) GRB spectra and those calculated for long GRB at thesame redshift. The underlying stellar contribution to the SEDcorresponds to Tbb = 2000 K. The calculated SED is shown inFig. 3.
2.3.3. SGRB 130603B (de Ugarte Postigo et al. 2014)
SGRB 130603B has been observed in the IR enabling the mod-elling of the SED.
A37, page 5 of 10

A&A 620, A37 (2018)
Table 2. Modelling Berger (2009) SGRB spectra.
GRB z [OII] Hβ [OIII] Hα [NII] Ref.3727 4865 5007+ 6563 6548+
061006a 0.4377 4.1 0.9 1.5 – – Berger (2009)061006b 4.24 1 1.89 – –modb1 4.5 1 1.86 – –061210a 0.4095 22. 7.6 10.5 11. 2.4 Berger (2009)061210c 1.71 1 1.6 3 0.15modb2 1.77 1 1.57 2.98 0.15070724a 0.4571 37. 15. 17. – – Berger (2009)070724b 2.47 1 1.13 – –modb3 2.54 1 1.18 – –050709a 0.1606 – 6.6 26 26 1.8 Fox et al. (2005)050709c – 1 3.7 3 0.29modb4 (1.69) 1 3.78 3 0.29
Notes. (a)Line flux in 10−17 erg cm−2 s−1 observed at Earth; (b)line ratios to Hβ; (c)corrected line ratios to Hβ.
Table 3. Models for Berger (2009) SGRB spectra.
mod Vs n0 D 12+log(N/H) 12+log(O/H) T∗ U Hβ 12+log(O/H)(Berger)km s−1 cm−3 1018 cm 104 K – a
modb1 100 100 0.8 7. 8.82 5.7 0.005 0.006 8.63modb2 100 300 2.8 6.9 8.8 4.3 0.03 0.167 8.82modb3 120 250 3 – 8.81 4.9 0.013 0.072 8.88modb4 120 250 3 7.25 8.81 4.8 0.06 0.19 8.50
Notes. (a)In erg cm−2 s−1 calculated at the nebula.
Table 4. Modelling Perley et al. (2012) short GRB 100206A host spectra at z = 0.4068.
[OII] Hβ [OIII] Hα [NII] [SII] [SII]3727 4865 5007+ 6563 6548+ 6716 6731
subtra 19.6± 2.1 21.8± 1.9 6.8± 1.6 112.8± 1.6 58.8± 2.5 20.4± 3.1 13.6± 1.7F/Hβ 0.9 1 0.31 5.17 2.7 0.93 0.62corr 1.34 1 0.23 3 1.58 0.53 0.35modp1 1.6 1 0.23 3 1.54 0.43 0.35North (subtr)a 7.91± 1.55 9.59± 1.35 1.22± 0.74 33.41± 1.08 16.98± 1.54 4.44± 1.73 4.0± 1.61F/Hβ 0.82 1 0.127 3.48 1.77 0.46 0.42modp2 0.82 1 0.127 3.12 1.6 0.4 0.42Center (subtr)a 5.69± 1.40 7.57± 1.24 3.5± 1.28 60.55± 1.32 33.9± 2 3.33± 2.50 3.24± 2.19F/Hβ 0.75 1 0.46 8. 4.47 0.44 0.43corr 1.57 1 0.27 3 1.67 0.15 0.149modp3 1.64 1 0.28 3.2 1.4 0.14 0.14South (subtr)a 4.02± 1.23 3.61± 1.02 1.68± 0.70 17.7± 0.83 10.54± 1.33 3.06± 1.09 4.94± 1.27F/Hβ 1.11 1 0.465 4.9 2.92 0.85 1.37corr 1.6 1 0.36 3 1.8 0.5 0.81modp4 1.57 1 0.367 3.2 1.8 0.51 0.61
Notes. (a)In 10−17 erg cm−2 s−1.
We report in the following the modelling of SGRB 130603Bline ratios (Table 6) by Contini (2016a) and in Fig. 4 the mod-elling of the SED. The spectra by FOcal Reducer and low disper-sion (FORS2) at the Very Large Telescope (VLT) and the OhioState InfraRed Imager/Spectrometer (OSIRIS) at Gran Telesco-pio Canarias (GTC) were observed by de Ugarte Postigo et al.(2014). They suggested that SGRB derive from the merger ofcompact objects, in particular SGRB 130603B, on the basisof the detection of “kilonova”-like signatures associated with
Swift. The host galaxy is a perturbed spiral due to interac-tion with another galaxy. In the spectrum taken by X-shooter,the afterglow dominates the continuum but the lines are emit-ted from the host, therefore they are used for modelling.FORS spectra show the core, the arm, and the opposite sideof the galaxy. The GRB is located on the outskirts of thegalaxy in a tidally disrupted arm at ∼5.4 kpc from the bright-est point of the host. The host was covered by two slit posi-tions along the major axis and two spectra were taken at
A37, page 6 of 10
M. Contini: Modelling line and continuum spectra of SGRB hosts
Table 5. Models for Perley et al. (2012) GRB 100206A spectra.
Vs n0 D 12+log(N/H) 12+log(O/H) 12+log(S/H) T∗ U Hβkm s−1 cm−3 1018 cm 104 K 0.001 a
modp1 100 120 4.9 8.04 8.78 6.48 4.4 0.9 0.003modp2 100 250 3.3 8.25 8.82 6.95 3.6 0.6 0.025modp3 100 200 3.3 8.04 8.82 6.40 4.6 0.6 0.0098modp4 120 200 1.9 8.15 8.82 7.11 4 0.6 0.0092
Notes. (a)In erg cm−2 s−1 calculated at the nebula.
Table 6. Models for SGRB 130603B at z = 0.356 and SGRB 051221a at z = 0.546 host galaxy spectra.
OT sitea mS1 OT siteb mS2 coreb mS3 armb mS4 obsc mS5 051221ad mS6
[OII]3727+ 4.47 4.5 3.4 3.6 3.55 3.7 4.3 4.3 3.05 3.2 7.8 7.5Hγ – 0.46 0.89 0.49 0.49 0.46 [0.5] 0.46 – 0.46 0.46 0.46Hβ 1 1 1 1 1 1 1 1 1 1 1 1[OIII[5007+ 0.87 0.9 0.76 0.8 0.75 0.8 0.85 0.85 0.77 0.7 5.17 5.15Hα 3 3 3 2.96 3 2.96 3 3 3 3 – 3[NII]6585 0.7 0.76 0.57 0.56 0.85 0.85 1.8 1.8 0.78 0.8 – –[SII]6717 0.66 0.7 1.19 1.1 0.63 0.66 0.27 0.5 – – – –[SII]6731 0.33 0.6 0.56 0.97 0.5 0.59 0.5 0.45 – – – –Vs( km s−1) – 140 – 150 – 150 – 140 – 120 – 150n0 ( cm−3) – 120 – 130 – 130 – 120 – 100 – 100B0 (10−4 G) – 3 – 3 – 3 – 3 – 2 – 1De – 5.3 – 1 – 1 – 1 – 3 – 0.212+log(O/H) – 8.82 – 8.8 – 8.8 – 8.82 – 8.81 – 8.8212+log(N/H) – 7.3 – 7.3 – 7.48 – 7.8 – 7.48 – 7.1112+log(S/H) – 6.6 – 7.0 – 6.78 – 6.48 – 6.48 – 6.48T∗(104 K) – 3.6 – 3.5 – 3.5 – 3.6 – 3.8 – 8.3U – 0.014 – 0.01 – 0.01 – 0.014 – 0.007 – 0.007Hβ f – 0.014 – 0.016 – 0.016 – 0.03 – 0.014 – 0.00712+log(O/H)g – 7.94-8.98 - 8.16–8.88 – 8.17–8.87 – 8.26–8.77 – 8.5 – 8.7
Notes. (a)de Ugarte Postigo et al. (2014) (X-shooter); (b)de Ugarte Postigo et al. (2014) (FORS); (c)Cucchiara et al. (2013) (DEIMOS);(d)Soderberg et al. (2006) (Gemini-N GMOS); (e)in 1018 cm; ( f )in erg cm−2 s−1; (g)evaluated by the observers adopting the strong line method.
different times plus an X-shooter spectrum covering the after-glow position.
The results of modelling the X-shooter and FORS reddening-corrected spectra observed at VLT by de Ugarte Postigo andcollaborators (see Contini 2016a in their Table 12) are reportedin Table 6, neglecting the GTC spectra, which do not includethe Hα line. Line fluxes and uncertainties before correction aregiven by de Ugarte Postigo et al. (2014). The spectrum observedby Cucchiara et al. (2013) for SGRB 130603B is also shownfor comparison. Most of the spectra presented by SGRB sur-veys (e.g. Fong et al. 2013), do not contain enough lines to con-strain the models. In Table 6 each spectrum is followed in thenext column by the model (mS1–mS6) that best reproduces theline ratios. The parameters representing the physical conditionsand the relative abundances are reported at the bottom of thetable. To best reproduce all the line ratios presented in Table 6,S/H relative abundances lower than solar ((S/H)� = 1.6 × 10⁻⁵,Grevesse & Sauval 1998) by factors ≥2 were adopted. S/H inFORS optical transient (OT) site is near solar. The cloud’s geo-metrical thickness is relatively large (D = 1.8 pc) from the mod-elling of the X-shooter (OT site) results, whereas D = 3 pc is usedto fit the FORS spectra, showing a larger cloud fragmentation.The spectrum reported by Cucchiara et al. (2013) is reproducedby a model (mS5) similar to those used to fit the spectra observedby de Ugarte Postigo and collaborators. The SB temperatures
and ionization parameters that result from modelling the hostspectra are relatively low (T∗ ∼ 3.5× 10⁴ K and U ∼ 0.01). Thecontinuum SED of SGRB 130603B (de Ugarte Postigo et al.2014) appears in Fig. 4. The underlying stellar contribution toSGRB 130603B corresponds to T∗ = 6000 K.
2.3.4. SGRB 051221a (Soderberg et al. 2006)
The spectrum observed by Soderberg et al. (2006) forSGRB 051221a at z = 0.546 and the relative model mS6are reported from Contini (2016a, in their Table 12, lasttwo columns) in Table 6. The line ratios were reddening-corrected, adopting Hγ/Hβ= 0.46. The best-fitting model shows12+log(O/H) = 8.8, in agreement with Soderberg et al. (2006)who obtained 8.7 by the R32 method (upper branch). We havefound T∗ = 8.2× 10⁴ K and U = 0.007. The star effective temper-ature is higher than for SGRB 130603B, where T∗ ∼ 3.5× 10⁴ K.The ionization parameter, however, is similar. Low ionizationparameters (i.e. the number of photons reaching the nebula pernumber of electrons at the nebula) roughly indicate that thehost’s observed positions are far from the star-forming region orthat the photon flux is prevented from reaching the nebula. Thehosts show N/H≤ 0.5 solar and O/H solar. For SGRB 051221athe photometric data are too few to be used to model theSED.
A37, page 7 of 10
A&A 620, A37 (2018)
8 10 12 14 16 18 20−20
−18
−16
−14
−12
−10
−8
−6
log ν [Hz]
log
ν F
ν [erg
cm
−2 s
−1 ]
GRB111117A
Fig. 5. SED of GRB 111117A host from Selsing et al. (2018). Opencircles: the data; dashed line: bb flux corresponding to Tbb = 8000 K.
2.3.5. GRB 111117A host SED (Selsing et al. 2018)
Selsing et al. (2018) presented spectroscopy and photometrydata of the GRB 111117A host galaxy with an estimated red-shift of z = 2.211. The galaxy is actively forming stars. At z =2.211 GRB 111117A is the most distant high-confidence SGRBdetected to date. Spectroscopic observations used VLT/X-shooter (Vernet et al. 2011) at four separate epochs. The burstwas observed 38 h after the burst alert telescope (BAT) trig-ger. Selsing and collaborators determined the redshift value fromthe simultaneous detection of emission lines belonging to Lyα,[OII]3727, [OIII]5007 and Hα, but Hβ was detected at low sig-nificance. They used FHα = 4.1× 10⁻¹⁷ erg cm−2 s−1 to calculatethe SFR = 18± 3 M� yr−1. No dust was deduced from the Lyα, sothe spectra were not reddening corrected. The photometric dataof the aforementioned authors appear in Fig. 5. They are repro-duced by a bb flux corresponding to Tbb = 8000 K, in agreementwith Margutti et al. (2012) who reported that GRB 111117A hasa young age and vigorous star formation.
3. Discussion and concluding remarks
In this work we have presented the analysis of line and contin-uum spectra of NGC 4993 and of a few SGRB host galaxies byexploiting the spectroscopic and photometric data available inthe literature. For some objects included in our sample, the spec-tra show the [OIII]/Hβ and [NII]/Hα line ratios. The diagnos-tics (e.g. Baldwin et al. 1981; Kewley et al. 2001) are generallyused to recognise the type of flux that photoionizes the GRB hostgas (a black body for SBs and HII regions, or a power-law forAGNs). The literature data are sometimes lacking and have notalways allowed us to constrain the analysis results. We have nev-ertheless managed to obtain a more complete picture of the gasphysical conditions (i.e. shock velocity, preshock density, geo-metrical thickness of the emitting clouds, flux intensity from theAGN or from the SB, SB effective temperature, and ionizationparameter) and chemical abundances by the detailed modellingof other line ratios (e.g. [OII]3727+/Hβ, [SII]6717/[SII]6731).
We have investigated in particular NGC 4993, the hostgalaxy of GW 170817. The results confirm that an AGN, suchas an LLAGN or a LINER, must be the source of gas photoion-ization. NGC 4993 was formerly identified as an LLAGN onthe basis of the BTP diagrams. Shock velocities (∼100 km s−1)and preshock densities (∼300 cm−3), constrained by the
−5 −4 −3 −2 −1 0−2.5
−2
−1.5
−1
−0.5
0
log(
N/O
)
log(z)
8
8.5
9
log(
O/H
)+12
log(z)
a) a)
−5 −4 −3 −2 −1 0
6
7
8
9
log(
N/H
)+12
log(z)
b) b)
Fig. 6. Top: distribution of N/O calculated by detailed modelling forSGRB hosts as function of the redshift. Large green circles: fromthe spectra observed by de Ugarte Postigo et al. (2014). Large greensquares: from Perley et al. (2012). Large green triangles: from Berger.Large green star: NGC 4993. The results obtained in the present paperare superimposed on those calculated for SN host galaxies, long GRBhosts, short GRB hosts, SB, AGN, and LINERs (both local and at higherz), low-luminosity nearby galaxies, and HII regions in local galaxies.Symbols are explained in Table 8. Bottom: the same for O/H and N/Hrelative abundances. Symbols as in the top diagram.
simultaneous and consistent fit of the line ratios and of theSED, are similar to those found in the AGN narrow line ragion,O/H and N/H relative abundances are solar. The ensemble ofdata reported by Wu et al. (2018) for the NGC 4993 continuumranges from radio to X-ray. By modelling the continuum SEDwe have found that the contribution of an old, underlying stel-lar population with Tbb = 4000 K is very high relative to thebremsstrahlung in the near IR range and higher by a factor >100than for local AGN and SB galaxies. Radiation in the radio isthermal bremsstrahlung, while in both soft and hard X-ray itcomes from the AGN. For the other SGRB hosts, most of thedatasets for the GRB host galaxy continuum are available in theIR-near optical range and are explained by models that accountfor the underlying stellar flux. We found Tbb between 2000 K forSGRB 1002016A and 8000 K for SGRB 111117A.
On the basis of the results obtained for NGC 4993, for LGRBhosts (Contini 2018) and for different types of local galax-ies (e.g. AGN, SB Contini & Contini 2007) we suggest thatbremsstrahlung from the clouds that emit the line spectra could
A37, page 8 of 10

M. Contini: Modelling line and continuum spectra of SGRB hosts
Table 7. Results of detailed modelling calculations.
SGRB Vs n0 D 12+log(N/H) 12+log(O/H) T∗ U log(F) Hβ Tbb zkm s−1 cm−3 pc – – 104 K – a b K
NGC 4993 100 300 0.3 8. 8.82 – – 9.55 0.05 4000 0.009873050709 120 250 1 7.25 8.81 4.8 0.06 – 0.19 3000 0.167051221a 150 100 0.07 7.11 8.82 8.3 0.007 – 0.007 – 0.546061006 100 100 0.27 7.0 8.82 5.7 0.05 – 0.006 – 0.4377061210 100 300 0.93 6.9 8.80 4.3 0.03 – 0.167 – 0.4095070724 120 250 1 7.25 8.81 4.9 0.013 – 0.072 – 0.4571100206A 100 120 1.7 8.04 8.78 4.4 0.9 – 0.003 2000 0.4068100206A N 100 250 1.1 8.25 8.82 3.6 0.6 – 0.025 –100206A C 100 200 1.1 8.04 8.82 4.6 0.6 – 0.0098 –100206A S 120 200 0.7 8.15 8.82 4 0.6 – 0.0092 –130603B OTc 140 120 1.8 7.30 8.82 3.6 0.014 – 0.014 6000 0.356130603B OTd 150 130 0.3 7.30 8.80 3.5 0.01 – 0.016 –130603B core 150 130 0.3 7.48 8.80 3.5 0.01 – 0.016 –130603B arm 140 120 0.3 7.7 8.82 3.6 0.014 – 0.03 –130603Be 120 100 1 7.47 8.813 3.8 0.007 – 0.014 –
Notes. (a)F is in photon cm−2 s−1 eV−1 at the Lyman limit; (b)in erg cm−2 s−1 calculated at the nebula; (c)X- shooter; (d)FORS; (e)DEIMOS.
Table 8. Symbols in Fig. 6.
Symbol Object Ref.
Encircled dot SLSNR hosts (1)Triangles at z ≥ 0.1 SLSNII hosts (2)Filled triangles SLSNI hosts (3)Square+dot SD models for SLSN hosts (4)Square+cross Type Ic host central (5)Circle+cross Type Ic host at SN positions (6)Triangles at z ≤ 0.1 SN Ib host (7)Encircled triangles SN IIb hosts (8)Opposite triangles SN Ic hosts (9)Double triangles SN IcBL hosts (10)Hexagrams SN Ibc (11)Asterisks GRB hosts (12)Triangle+cross LGRB hosts (13)Pentagrams LGRB different hosts (14)Triangle+plus LGRB hosts with WR stars (15)Encircled asterisks LGRB at lo z (16)Hexagrams (green) SGRB hosts (17)Diamonds Other galaxies (18)Dots Starburst galaxies (19,25)Circles AGN (20,21,25)Filled circles LINER (22)Plus Low-luminosity nearby galaxies (23)Cross HII regions in local galaxies (24)Diamonds+plus TypeI SN hosts (26)
References. (1), (2), (3), (4) (Leloudas et al. 2015); (5), (6)(Modjaz et al. 2008); (7), (8), (9), (10), (11) (Sanders et al. 2012);(12) (Krühler et al. 2015); (13) (Savaglio et al. 2009); (14) (Contini2016a, Table 8); (15) (Han et al. 2010); (16) (Niino et al. 2017); (17)(de Ugarte Postigo et al. 2014); (18), (19), (20) (Contini 2014; and ref-erences therein); (21) (Koski 1978; Cohen 1983; Kraemer et al. 1994;Dopita et al. 2015); (22) (Contini 1997); (23) (Marino et al. 2013); (24)(Berg et al. 2012); (25) (Contini 2016b); (26) (Gallagher et al. 2005).
also be the main contributor to the continuum in the radio, opti-cal, UV, and soft X-ray range of SGRB hosts, while the underly-ing stellar bb radiation in the IR-optical domain is constrained
by photometric observations in the infrared. Moreover, dust-reprocessed radiation in the IR range (consistently calculatedwith the gas bremsstrahlung) and the flux from the photoionisingsource in the X-ray also shape the continuum SED. The resultscalculated for the SGRB hosts are summarized in Table 7.
In the diagrams in Fig. 6 we have added the N/O relativeabundances calculated for the SGRB hosts as a function of theredshift to those presented for LGRB hosts, SN hosts of manytypes, HII regions, AGN, LINER, and SB galaxies (Contini2016a). Symbols are described in Table 8. The bottom diagramsshow the results for O/H and N/H relative abundances as a func-tion of z. It is evident that O/H is about constant at the solarvalue, while N/O covers a large range of values determined bythe N/H ratios (6.8≤ log(N/H)+12≤ 8.25) over a small redshiftrange centred around z ∼ 0.4. At present, only limited dataat other z are available. N/O abundance ratios calculated alongdifferent positions in GRB 100206B – observed by Perley et al.(2012) – reach the maximum values calculated for LGRB hostsat higher redshifts. In Fig. 6 most of the SGRB hosts are locatedat the confluence (at z close to 0.4) of the N/O decreasing slopewith decreasing z of GRB hosts and of the increasing N/O slopewith decreasing z of SN hosts at lower z. These trends can beexplained by considering that intermediate-mass stars between 4and 8 M�dominate nitrogen production, which is primary at lowmetallicities but when 12+log(O/H) exceeds 8.3, secondary Nproduction occurs, increasing at a faster rate than O (Henry et al.2000). The N/O ratios in the present SGRB sample span a factor≤30 at a nearly constant redshift z ∼ 0.4.
At present, NGC 4993 is the only SGRB located within theAGN-LINER region at a redshift close to local. We have foundthat – compared with LGRB and SGRB hosts (Contini 2016a) –the most significant characteristic of NGC 4993 is the power-law radiation source (AGN) and the abnormally high underlyingstellar radiation flux in the IR. The amount of data for SGRB hostgalaxies do not allow us to look on NGC 4993 as an isolated caseand to decide whether the AGN and the high N/O abundanceratios are related to the SGRB or to the high age of the galaxy.For the other SGRB host galaxies, we have used SB-dominatedmodels to reproduce the line ratios because they are well-fittingand generally suggested by the observers. However, the observed
A37, page 9 of 10

A&A 620, A37 (2018)
lines are few and the continuum SED is limited to the IR rangefor most of the objects. The fit of the SED leads to results similarto those obtained for active galaxies in general (AGN, SB, etc.).More data for both line and continuum spectra may reveal anAGN also within the other SGRB hosts.
Acknowledgements. I am very grateful to the referee for his or her comments,which substantially improved the presentation of the paper.
ReferencesBaldwin, J., Phillips, M., & Terlevich, R. 1981, PASP, 93, 5Barthelmy, S. D., Chincarini, G., Burrows, D. N., et al. 2005, Nature, 438,
994Bell, A. R. 1977, MNRAS, 179, 573Berg, D. A., Skillman, E. D., Croxall, K. V., et al. 2012, ApJ, 754, 98Berger, E. 2009, ApJ, 690, 231Berger, E. 2013, ApJ, 765, 121Berger, E. 2014, ARA&A, 52, 43Berger, E., Price, P. A., Cenko, S. B., et al. 2005, Nature, 438, 988Blanchard, P. K., Berger, E., Fong, W., et al. 2017, ApJ, 848, L22Bloom, J. S., Kulkarni, S. R., & Djorgavski, S. G. 2002, AJ, 123, 1111Cohen, R. D. 1983, ApJ, 273, 489Contini, M. 1997, A&A, 323, 71Contini, M. 2004, MNRAS, 675, 683Contini, M. 2014, A&A, 564, A19Contini, M. 2016a, MNRAS, 460, 3232Contini, M. 2016b, MNRAS, 461, 2374Contini, M. 2017a, MNRAS, 469, 3125Contini, M. 2017b, MNRAS, 466, 2787Contini, M. 2018, ArXiv e-prints [arXiv:1801.03312]Contini, M., & Aldrovandi, S. M. V. 1983, A&A, 127, 15Contini, M., & Viegas, S. M. 2001a, ApJS, 137, 75Contini, M., & Viegas, S. M. 2001b, ApJS, 132, 211Contini, M., & Contini, T. 2007, AN, 328, 953Contini, M., Prieto, M. A., & Viegas, S. M. 1998a, ApJ, 505, 621Contini, M., Prieto, M. A., & Viegas, S. M. 1998b, ApJ, 492, 511Cucchiara, A., Prochaska, J. X., Perley, D., et al. 2013, ApJ, 777, 94Cutri, R. M., Skrutskie, M. F.van Dyk, S., et al. 2003, 2MASS All Sky Catalog
of Point SourcesD’Avanzo, P. 2015, JHEAp, 7, 73de Ugarte Postigo, A., Thöne, C. C., Rowlinson, A., et al. 2014, A&A, 563, A62De Voucouleurs, G., De Voucouleurs, A., Corwin Jr., H. J., et al. 1991, Third
Reference Catalogue of Bright Galaxies, RC3.9 (New York: Springer)Dopita, M. M., Shastri, P., Davies, R., et al. 2015, ApJS, 217, 12Eichler, D., Livio, M., Piran, T., & Schramm, D. N. 1989, Nature, 340, 126
Ferland, G., Binette, L., Contini, M., et al. 1995, The Analysis of Emission Lines:A Meeting in Honor of the 70th Birthdays of D. E. Osterbrock and M. J.Seaton, Proceedings of the Space Telescope Science Institute Symposium,held in Baltimore, Maryland May 16–18, 1994, eds. R. Williams, & M. Livio(Cambridge University Press), 83
Fong, W., Berger, E., Chornock, R., et al. 2013, ApJ, 769, 56Fox, D. B., Frail, D. A., Hurley, K. C., et al. 2005, Nature, 437, 845Fruchter, A. S., Levan, A. J., Strolger, L., et al. 2006, Nature, 441, 463Gallagher, J. S., Garnavich, P. M., Berling, P., et al. 2005, ApJ, 634, 210Gehrels, N., White, N., Barthelmy, S., et al. 2004, ApJ, 611, 1005Grevesse, N., & Sauval, A. J. 1998, Space Sci. Rev., 85, 161Haggard, D., Nynka, M., Ruan, J. J., et al. 2017, ApJ, 848, L25Han, X. H., Hammer, F., Liang, Y. C., et al. 2010, A&A, 514, A24Henry, R. B. C., Edmund, M. G., Köppen, J. 2000, ApJ, 541, 660Hunt, L. K., Palazzi, E., Michałowski, M. J., et al. 2014, A&A, 565, A112Kann, D. A. 2011, ApJ, 734, 96Kauffmann, G., Heckman, T. M., Tremonti, C., et al. 2003, MNRAS, 346, 1055Kennicutt, R. C. 1998, ARA&A, 36, 189Kewley, L., Dopita, M. M., Sutherland, R., Heisler, C., & Trevena, J. 2001, ApJ,
556, 121Koski, A. 1978, ApJ, 223, 56Kouvelioutou, C., Meegan, C. A., Fishman, G. J., et al. 1993, ApJ, 413, L101Kraemer, S. B., Wu, C.-C., Crenshaw, D. M., & Harrington, J. P. 1994, ApJ, 435,
171Krühler, T., Malesani, D., Fynbo, J. P. U., et al. 2015, A&A, 581, A125Lambert, A., & Valentijn, E. A. 1989, The Surface Photometry Catalogue of the
ESO-Uppsala, 1989 (Garching bei Munchen: ESO)Leloudas, G., Hsiao, E. Y., Johansson, J., et al. 2015, MNRAS, 574, A61Levan, A.J., Lyman, J. D., Tanvir, N. R., et al. 2017, ApJ, 848, 28Maraston, C. 2005, MNRAS, 362, 799Margutti, R., Berger, E., Fong, W., et al. 2012, ApJ, 756, 63Marino, R. A., Rosales-Ortega, F. F., Sánchez, S. F., et al. 2013, A&A, 559, A114Modjaz, M., Kewley, L., Kirshner, R. P., et al. 2008, AJ, 135, 1136Niino, Y., Aoki, K., Hashimoto, T., et al. 2017, PASJ, 69, 27Osterbrock, D. E. 1974, Astrophysics of Gaseous Nebulae (San Francisco: W.H.
Freeman and Co.)Palmese, A., Hartley, W., Tarsitano, F., et al. 2017, ApJ, 849, L34Pan, Y.-C., Kilpatrick, C. D., Simon, J. D., et al. 2017, ApJ, 848, L30Perley, D. A., Modjaz, M., Morgan, A. N., et al. 2012, ApJ, 758, 122Rigby, J. R., & Rieke, G. H. 2004, ApJ, 606, 237Rosswog, S., & Ramirez-Ruiz, E. 2003, MNRAS, 345, 1077Sanders, N. E., Betancourt, M., Soderberg, A. M., et al. 2012, ApJ, 758, 132Savaglio, S., Glazerbrook, K., & Le Borgne, D. 2009, ApJ, 691, 182Selsing, J., Kröhler, T., Malesani, D., et al. 2018, A&A, 616, A48Soderberg, A. M., Berger, E., Kasliwal, M., et al. 2006, ApJ, 650, 261Vernet, J., Dekker, H., D’Odorico, S., et al. 2011, A&A, 536, A105Viegas, S. M., & Contini, M. 1994, ApJ, 428, 113Villar, V. A., Guillochon, J., Berger, E., et al. 2017, ApJ, 851, L21Wu, Q., Feng, J., & Fan, X. 2018, ApJ, 855, 46
A37, page 10 of 10