Chemical abundance analysis of the open clusters Cr 110, NGC 2099 (M 37), NGC 2420, NGC 7789, and M...
20
arXiv:0910.0723v1 [astro-ph.GA] 5 Oct 2009 ... DRAFT ... October 5, 2009 Astronomy & Astrophysics manuscript no. astro-ph c ESO 2009 October 5, 2009 Chemical abundance analysis of the Open Clusters Cr 110, NGC 2099 (M 37), NGC 2420, NGC 7789 and M 67 (NGC 2682) ⋆ E. Pancino 1 , R. Carrera 1,2 , E. Rossetti 1 , and C. Gallart 2 1 INAF – Osservatorio Astronomico di Bologna, via Ranzani 1, I-40127 Bologna, Italy e-mail: [email protected], [email protected], [email protected] 2 Instituto de Astrofisica de Canarias, via Lactea s/n, E-38200, La Laguna, Tenerife, Spain e-mail: [email protected],[email protected] Received July 24, 2009; accepted October 2, 2009 ABSTRACT Context. The present number of Galactic Open Clusters that have high resolution abundance determinations, not only of [Fe/H], but also of other key elements, is largely insufficient to enable a clear modeling of the Galactic Disk chemical evolution. Aims. To increase the number of Galactic Open Clusters with high quality measurements. Methods. We obtained high resolution (R∼30 000), high quality (S/N∼50-100 per pixel), echelle spectra with the fiber spectrograph FOCES, at Calar Alto, Spain, for three red clump stars in each of five Open Clusters. We used the classical Equivalent Width analysis method to obtain accurate abundances of sixteen elements: Al, Ba, Ca, Co, Cr, Fe, La, Mg, Na, Nd, Ni, Sc, Si, Ti, V, Y. We also derived the oxygen abundance through spectral synthesis of the 6300 Å forbidden line. Results. Three of the clusters were never studied previously with high resolution spectroscopy: we found [Fe/H]=+0.03±0.02 (±0.10) dex for Cr 110; [Fe/H]=+0.01±0.05 (±0.10) dex for NGC 2099 (M 37) and [Fe/H]=–0.05±0.03 (±0.10) dex for NGC 2420. This last finding is higher than typical recent literature estimates by 0.2–0.3 dex approximately and in better agreement with Galactic trends. For the remaining clusters, we find: [Fe/H]=+0.05±0.02 (±0.10) dex for M 67 and [Fe/H]=+0.04±0.07 (±0.10) dex for NGC 7789 . Accurate (to ∼0.5 km s −1 ) radial velocities were measured for all targets, and we provide the first high resolution based velocity estimate for Cr 110, <V r >=41.0±3.8 km s −1 . Conclusions. With our analysis of the new clusters Cr 110, NGC 2099 and NGC 2420, we increase the sample of clusters with high resolution based abundances by 5%. All our programme stars show abundance patterns which are typical of open clusters, very close to solar with few exceptions. This is true for all the iron-peak and s-process elements considered, and no significant α-enhancement is found. Also, no significant sign of (anti-)correlations for Na, Al, Mg and O abundances is found. If anticorrelations are present, the involved spreads must be <0.2 dex. We then compile high resolution data of 57 OC from the literature and we find a gradient of [Fe/H] with Galactocentric Radius of –0.06±0.02 dex kpc −1 , in agreement with past work and with Cepheids and B stars in the same range. A change of slope is seen outside R GC =12 kpc and [α/Fe] shows a tendency of increasing with R GC . We also confirm the absence of a significant Age-Metallicity relation, finding slopes of –2.6±1.1 10 −11 dex Gyr −1 and 1.1±5.0 10 −11 dex Gyr −1 for [Fe/H] and [α/Fe] respectively. Key words. Stars: abundances – Galaxy: disk – Galaxy: open clusters and associations: individual: Cr 110; NGC 2099; NGC 2420; M 67; NGC 7789 1. Introduction Open clusters (hereafter OC) are the ideal test particles in the study of the Galactic disk, providing chemical and kinemat- ical information in different locations and at different times. Compared to field stars, they have the obvious advantage of being coeval groups of stars, at the same distance and with a homogeneous composition. Therefore, their properties can be determined with smaller uncertainties. Several attempts have been done in the past to derive two fundamental relations us- ing OC: the metallicity gradient along the disk and the age- metallicity relation (hereafter AMR) of the disk (e.g. Janes, 1979; Panagia & Tosi, 1980; Twarog et al., 1997; Friel et al., 2002; Chen et al., 2003; Salaris et al., 2004), but they were Send offprint requests to: E. Pancino ⋆ Based on data collected with the fiber spectrograph FOCES at the 2.2m Calar Alto Telescope. Also based on data from the 2MASS survey and the WEBDA, VALD, NIST and GEISA online databases. hampered by the lack of large and homogeneous high quality datasets. In particular, the lack of a metallicity scale extending to so- lar metallicity with comparable precision to the lower metallic- ity regimes (i.e., Zinn & West, 1984; Carretta & Gratton, 1997) represents the main problem from the point of view of (i) the study of the Galactic disk; (ii) tests of stellar evolution models for younger and more metal-rich simple stellar populations and (iii) the use of those stellar populations as templates for extra- galactic studies of population synthesis. Of the ∼1700 known OC (Dias et al., 2002, and updates), only a subset of ∼140, i.e., 8% of the total, possesses some metallicity determination. Most of these have been obtained through different photomet- ric studies in the Washington (e.g. Geisler et al., 1991, 1992), DDO (e.g. Clari´ a et al., 1999), Str¨ omgren (e.g. Bruntt et al., 1999; Twarog et al., 2003), UBV (e.g. Cameron, 1985) and IR (e.g. Tiede et al., 1997) photometric systems and passbands, giv- ing often rise to considerable differences with those obtained from spectroscopy (see Gratton, 2000, and references therein).
-
Upload
independent -
Category
Documents
-
view
1 -
download
0
Transcript of Chemical abundance analysis of the open clusters Cr 110, NGC 2099 (M 37), NGC 2420, NGC 7789, and M...
arX
iv:0
910.
0723
v1 [
astr
o-ph
.GA
] 5
Oct
200
9... DRAFT ...
October 5, 2009
Astronomy & Astrophysicsmanuscript no. astro-ph c© ESO 2009October 5, 2009
Chemical abundance analysis of the Open Clusters Cr 110,NGC 2099 (M 37), NGC 2420, NGC 7789 and M 67 (NGC 2682) ⋆
E. Pancino1, R. Carrera1,2, E. Rossetti1, and C. Gallart2
1 INAF – Osservatorio Astronomico di Bologna, via Ranzani 1, I-40127 Bologna, Italye-mail:[email protected], [email protected], [email protected]
2 Instituto de Astrofisica de Canarias, via Lactea s/n, E-38200, La Laguna, Tenerife, Spaine-mail:[email protected],[email protected]
Received July 24, 2009; accepted October 2, 2009
ABSTRACT
Context. The present number of Galactic Open Clusters that have high resolution abundance determinations, not only of [Fe/H], butalso of other key elements, is largely insufficient to enable a clear modeling of the Galactic Disk chemical evolution.Aims. To increase the number of Galactic Open Clusters with high quality measurements.Methods. We obtained high resolution (R∼30 000), high quality (S/N∼50-100 per pixel), echelle spectra with the fiber spectrographFOCES, at Calar Alto, Spain, for three red clump stars in eachof five Open Clusters. We used the classical Equivalent Widthanalysismethod to obtain accurate abundances of sixteen elements: Al, Ba, Ca, Co, Cr, Fe, La, Mg, Na, Nd, Ni, Sc, Si, Ti, V, Y. We alsoderived the oxygen abundance through spectral synthesis ofthe 6300 Å forbidden line.Results. Three of the clusters were never studied previously with high resolution spectroscopy: we found [Fe/H]=+0.03±0.02(±0.10) dex for Cr 110; [Fe/H]=+0.01±0.05 (±0.10) dex for NGC 2099 (M 37) and [Fe/H]=–0.05±0.03 (±0.10) dex for NGC 2420.This last finding is higher than typical recent literature estimates by 0.2–0.3 dex approximately and in better agreement with Galactictrends. For the remaining clusters, we find: [Fe/H]=+0.05±0.02 (±0.10) dex for M 67 and [Fe/H]=+0.04±0.07 (±0.10) dex forNGC 7789 . Accurate (to∼0.5 km s−1) radial velocities were measured for all targets, and we provide the first high resolution basedvelocity estimate for Cr 110,<Vr>=41.0±3.8 km s−1.Conclusions. With our analysis of the new clusters Cr 110, NGC 2099 and NGC 2420, we increase the sample of clusters with highresolution based abundances by 5%. All our programme stars show abundance patterns which are typical of open clusters, very closeto solar with few exceptions. This is true for all the iron-peak and s-process elements considered, and no significantα-enhancementis found. Also, no significant sign of (anti-)correlations for Na, Al, Mg and O abundances is found. If anticorrelations are present,the involved spreads must be<0.2 dex. We then compile high resolution data of 57 OC from theliterature and we find a gradientof [Fe/H] with Galactocentric Radius of –0.06±0.02 dex kpc−1, in agreement with past work and with Cepheids and B stars in thesame range. A change of slope is seen outsideRGC=12 kpc and [α/Fe] shows a tendency of increasing withRGC. We also confirm theabsence of a significant Age-Metallicity relation, finding slopes of –2.6±1.1 10−11 dex Gyr−1 and 1.1±5.0 10−11 dex Gyr−1 for [Fe/H]and [α/Fe] respectively.
Key words. Stars: abundances – Galaxy: disk – Galaxy: open clusters andassociations: individual: Cr 110; NGC 2099; NGC 2420;M 67; NGC 7789
1. Introduction
Open clusters (hereafter OC) are the idealtest particlesin thestudy of the Galactic disk, providing chemical and kinemat-ical information in different locations and at different times.Compared to field stars, they have the obvious advantage ofbeing coeval groups of stars, at the same distance and with ahomogeneous composition. Therefore, their properties canbedetermined with smaller uncertainties. Several attempts havebeen done in the past to derive two fundamental relations us-ing OC: themetallicity gradientalong the disk and theage-metallicity relation (hereafter AMR) of the disk (e.g. Janes,1979; Panagia & Tosi, 1980; Twarog et al., 1997; Friel et al.,2002; Chen et al., 2003; Salaris et al., 2004), but they were
Send offprint requests to: E. Pancino⋆ Based on data collected with the fiber spectrograph FOCES at the
2.2m Calar Alto Telescope. Also based on data from the 2MASS surveyand the WEBDA, VALD, NIST and GEISA online databases.
hampered by the lack of large and homogeneous high qualitydatasets.
In particular, the lack of ametallicity scaleextending to so-lar metallicity with comparable precision to the lower metallic-ity regimes (i.e., Zinn & West, 1984; Carretta & Gratton, 1997)represents the main problem from the point of view of(i) thestudy of the Galactic disk;(ii) tests of stellar evolution modelsfor younger and more metal-richsimple stellar populationsand(iii) the use of those stellar populations as templates for extra-galactic studies of population synthesis. Of the∼1700 knownOC (Dias et al., 2002, and updates), only a subset of∼140,i.e., 8% of the total, possesses some metallicity determination.Most of these have been obtained through different photomet-ric studies in the Washington (e.g. Geisler et al., 1991, 1992),DDO (e.g. Claria et al., 1999), Stromgren (e.g. Bruntt et al.,1999; Twarog et al., 2003), UBV (e.g. Cameron, 1985) and IR(e.g. Tiede et al., 1997) photometric systems and passbands, giv-ing often rise to considerable differences with those obtainedfrom spectroscopy (see Gratton, 2000, and references therein).

... DRAFT ...
October 5, 2009
2 E. Pancino et al.: Abundances of five Open Clusters
Table 1.Observing Logs and Programme Stars Information.
Cluster Star αJ2000 δJ2000 B V IC R KS nexp t(tot)exp S/N(≃6000Å)
(hrs) (deg) (mag) (mag) (mag) (mag) (mag) (sec)Cr 110a 2108 06:38:52.5 +02:01:58.4 14.79 13.35 — — 9.76 6 16200 70
2129 06:38:41.1 +02:01:05.5 15.00 13.66 12.17 12.94 10.29 7 18900 703144 06:38:30.3 +02:03:03.0 14.80 13.49 12.04 12.72 10.19 6 16195 65
NGC 2099 (M 37)b 067 05:52:16.6 +32:34:45.6 12.38 11.12 9.87 — 8.17 3 3600 95148 05:52:08.1 +32:30:33.1 12.36 11.09 — — 8.05 3 3600 105508 05:52:33.2 +32:27:43.5 12.24 10.98 — — 7.92 3 3900 85
NGC 2420c 041 07:38:06.2 +21:36:54.7 13.75 12.67 11.61 12.13 10.13 5 9000 70076 07:38:15.5 +21:38:01.8 13.65 12.66 11.65 12.14 10.31 5 9000 75174 07:38:26.9 +21:38:24.8 13.41 12.40 — — 9.98 5 9000 60
NGC 2682 (M 67)d 0141 08:51:22.8 +11:48:01.7 11.59 10.48 9.40 9.92 7.92 3 2700 850223 08:51:43.9 +11:56:42.3 11.68 10.58 9.50 10.02 8.00 3 2700 850286 08:52:18.6 +11:44:26.3 11.53 10.47 9.43 9.93 7.92 3 2700 105
NGC 7789e 5237 23:56:50.6 +56:49:20.9 13.92 12.81 11.52 — 9.89 5 9000 707840 23:57:19.3 +56:40:51.5 14.03 12.82 11.49 — 9.83 6 9000 758556 23:57:27.6 +56:45:39.2 14.18 12.97 11.65 — 10.03 3 5400 45
a Star names and IC & R magnitudes from Dawson & Ianna (1998); coordinates and B &V magnitudes from Bragaglia & Tosi (2003);KS magnitudes from 2MASS
b Star names from van Zeipel & Lindgren (1921); coordinates from Kiss et al. (2001); B & V magnitudes from Kalirai et al. (2001); ICmagnitudes from Nilakshi & Sagar (2002); KS magnitudes from 2MASS
c Star names from Cannon & Lloyd (1970); coordinates from Stetson (2000) and Lasker et al. (1990); B & V magnitudes fromAnthony-Twarog et al. (1990); IC & R magnitudes from Stetson (2000); KS magnitudes from 2MASS
d Star names from Fagerholm (1906); coordinates from Fan et al. (1996); B, V & IC magnitudes from Sandquist (2004); B magnitude forstar 286 and R magnitudes from Janes & Smith (1984); KS magnitudes from 2MASS
e Star names and V & Ic magnitudes from Gim et al. (1998a); J1950 coordinates from Kustner (1923), precessed to J2000; B magnitudesfrom Mochejska & Kaluzny (1999); KS magnitudes from 2MASS
In a much smaller number of clusters, abundances have beenderived from low-resolution spectroscopy (e.g., Carrera et al.,2007; Warren & Cole, 2008), with admirable attempts to ob-tain large and homogeneous datasets (see Friel & Janes, 1993;Friel et al., 2002), in spite of the non-negligible uncertainties in-volved in the procedure.
A few research groups (see Section 6 for more details) arepresently obtaining high quality spectra and are producingmoreprecise abundance determinations. The study of elements otherthan the iron-peak ones (such asα, s- and r-process, light ele-ments), allows one to put more constraints on the sites of produc-tion of those elements (SNe Ia, SNe II, giants and supergiants,Wolf-Rayet stars), and therefore on their production timescales.These are fundamental ingredients for the chemical evolutionmodeling of the Galactic Disk (Tosi, 1982; Chiappini et al.,2001; Colavitti et al., 2009).
For these reasons, we obtained high resolution spectra for asample of poorly studied old OC. We present here the detailedabundance analysis of five clusters observed during our firstrunat Calar Alto. Observations and data reductions are described inSection 2; the linelist and equivalent width measurements aredetailed in Section 3 while the abundance analysis methods andresults are presented in Section 4; abundance results are then dis-cussed and compared with literature results in Sections 5, 6and7; finally, we summarize our results and draw our conclusionsinSection 8.
2. Observational Material
Three red clump stars1 were selected in each of the tar-get clusters using the WEBDA2 database (Mermilliod, 1995)and the 2MASS3 survey data for the infrared KS magnitudes(Skrutskie et al., 2006). More details on references for starnames, coordinates and magnitudes can be found in Table 1,while the position of our targets in the Color MagnitudeDiagrams (CMDs) obtained from WEBDA are shown inFigure 1.
Observations were done between the 1st and 10th of January2004 with the fiber echelle spectrograph FOCES at the 2.2 mCalar Alto Telescope, in Spain. The sky was generally clear,though a few nights had thin cirrus and sometimes clouds, forc-ing us to increase the exposure times considerably. All stars wereobserved in 3–16 exposures lasting 15–90 min each, dependingon the magnitude, until a global S/N ratio between 70 and 100(per pixel) was reached around 6000 Å (Table 1). Each night wetook a sky exposure lasting as the longest one of the night. Thesky level was negligible for all exposures with S/N>20, thereforeexposures with S/N<20 were neglected and we did not subtractthe sky, to avoid adding noise to the spectra. Sky emission lines,even in the red part of the spectrum, did only occasionally disturb
1 Though fainter than the brigthest giants, red clump stars have theadvantage of a higher gravity and temperature, that reducesconsider-ably line crowding. Also, clump stars are easy to identify even in thesparsest cluster, maximizing the chance of choosing cluster members.
2 http://www.univie.ac.at/webda3 http://www.ipac.caltech.edu/2mass. 2MASS (Two Micron
All Sky Survey) is a joint project of the University of Massachusettsand the Infrared Processing and Analysis Center/California Instituteof Technology, funded by the National Aeronautics and SpaceAdministration and the National Science Foundation.

... DRAFT ...
October 5, 2009
E. Pancino et al.: Abundances of five Open Clusters 3
Fig. 1.V, (B–V) Color Magnitude Diagrams of the programme clusters(from the WEBDA), with the location of our target stars.
the measurements of some absorption lines, that were discarded.The spectral resolution wasR≃ 30 000 for all spectra.
2.1. Data Reductions
Data reductions were done with IRAF4 within the imred andechellepackages. The following steps were performed: bias sub-traction, flatfielding, order tracing with optimal extraction, back-ground subtraction, wavelength calibration with the help of aThorium-Argon lamp, and final merging (and rebinning) of over-lapping orders. The one-dimensional spectra obtained fromdif-ferent exposures (with S/N>20) were median-averaged to pro-duce one single high S/N spectrum for each star, used for equiv-alent width measurements (Section 3.3). Finally, the noisyendsof each combined spectrum were cut, allowing for an effectivewavelength coverage from 5000 to 9000 Å.
Sky absorption lines (telluric bands of O2 and H2O) wereremoved using the IRAF tasktelluric with the help of two hot,rapidly rotating stars, HR 3982 and HR 8762, chosen from theBright Star Catalogue(Hoffleit & Jaschek, 1991). HR 3982 andHR 8762 were observed each night at an airmass not too dif-ferent from the scientific targets. Residuals of the correction inthe red part of the spectrum (for example from the strong O2
band around 7600 Å) prevented us from using most of the corre-sponding spectral regions for our abundance analysis. Also, af-ter 8400 Å, the echelle orders do not overlap anymore and smallgaps appear.
2.2. Radial Velocities
Radial velocities were measured with the help of DAOSPEC(Stetson & Pancino, 2008, see also Section 3.3). Measurementswere based on≃360 absorption lines of different elements (seeSection 3) with typical measurement errors on the mean of about
4 Image Reduction and Analysis Facility. IRAF is distributedby theNational Optical Astronomy Observatories, which is operated by theassociation of Universities for Research in Astronomy, Inc., under con-tract with the National Science Foundation
Table 2.Heliocentric radial velocities measurements and 1σ er-rors (Vr ± δVr)here for each programme star. Literature measure-ments, when available, are also reported with their uncertainties(Vr ± δVr )lit .
Cluster Star (Vr ± δVr)here (Vr ± σVr)lit
(km s−1) (km s−1)Cr 110 2108 44.47± 0.54 45± 8a
2129 38.74± 0.64 45± 8a
3144 37.81± 0.69 45± 8a
NGC 2099 (M 37) 067 8.79± 0.10 8.04± 0.19b
148 9.05± 0.36 8.73± 0.19b
508 9.40± 0.28 8.96± 0.19b
NGC 2420 041 74.23± 0.87 79.0± 4.2c
076 75.49± 0.41 75.7± 8.6c
174 73.66± 1.17 68.0± 0.9c
NGC 2682 (M 67) 141 35.23± 0.05 33.5± 2.3d
223 34.92± 0.31 33.0± 1.1d
286 38.90± 0.46 33.2± 2.0d
NGC 7789 5237 –51.06± 0.99 –57.17± 0.23e
7840 –49.06± 0.81 –49.21± 0.28e
8556 –53.37± 0.81 –54.10± 0.32e
a Cluster average by Carrera et al. (2007), based on 8 stars.b Mermilliod et al. (2008), superseding Mermilliod et al. (1996).c Average of measurements by Liu & Janes (1987), Friel et al. (1989)
and Scott et al. (1995).d Average of measurements by Mathieu et al. (1986),
Pilachowski et al. (1988), Friel et al. (1989), Friel & Janes(1993),Suntzeff et al. (1992), Scott et al. (1995), Melo et al. (2001), Yong etal.(2005), Yadav et al. (2008).
e Gim et al. (1998b).
0.1 km s−1. All measurements were performed separately on theone-dimensional spectra extracted from the single exposures foreach star, including those with S/N<20, that were not used forthe abundance analysis. In this way, we could check that no sig-nificant radial velocity variations were present.

... DRAFT ...
October 5, 2009
4 E. Pancino et al.: Abundances of five Open Clusters
Table 3.Stellar Parameters for the programme stars.
Cluster Star T(phot)eff T(spec)
eff logg(phot) logg(spec) v(phot)t v(spec)
t Mclump
(K) (K) (cgs) (cgs) (km s−1) (km s−1) (M⊙)Cr 110 2108 4914±111 4650 2.32±0.16 2.8 1.20±0.02/1.62±0.04 1.4 1.9±0.1
2129 5056±223 4950 2.53±0.19 2.7 1.17±0.02/1.52±0.06 1.4 1.9±0.13144 5112±258 4800 2.49±0.20 2.8 1.18±0.02/1.49±0.08 1.3 1.9±0.1
NGC 2099 (M 37) 067 4773±119 4550 2.15±0.32 2.7 1.22±0.03/1.68±0.05 1.5 2.7±0.2148 4708±116 4550 2.10±0.31 2.7 1.28±0.03/1.72±0.04 1.5 2.7±0.2508 4715±115 4500 2.05±0.32 2.8 1.23±0.03/1.72±0.04 1.5 2.7±0.2
NGC 2420 041 4616±77 4850 2.43±0.06 2.6 1.19±0.01/1.76±0.03 1.4 1.4±0.1076 4755±103 4800 2.51±0.06 2.6 1.18±0.01/1.69±0.03 1.6 1.4±0.1174 4730±77 4800 2.39±0.05 2.6 1.19±0.01/1.71±0.03 1.5 1.4±0.1
NGC 2682 (M 67) 141 4590±100 4650 2.42±0.04 2.8 1.19±0.01/1.78±0.04 1.3 1.3±0.1223 4594±100 4800 2.46±0.04 2.8 1.18±0.00/1.78±0.04 1.3 1.3±0.1286 4653±103 4850 2.45±0.04 2.8 1.18±0.01/1.75±0.04 1.4 1.3±0.1
NGC 7789 5237 4868±168 4900 2.53±0.15 2.8 1.17±0.02/1.63±0.04 1.2 1.8±0.17840 4759±131 4800 2.47±0.15 2.7 1.18±0.02/1.69±0.04 1.5 1.8±0.18556 4775±135 4900 2.54±0.15 2.9 1.17±0.02/1.68±0.04 1.4 1.8±0.1
Heliocentric corrections were computed with the IRAFtask rvcor, which bears a negligible uncertainty of less than0.005 km s−1. Since we did not observe any radial velocity stan-dard and our calibration lamps were not taken simultaneously,we used telluric absorption lines to find the absolute zero pointof our radial velocity measurements. In particular, laboratorywavelengths of the H2O absorption bands around 5800, 6500,7000, 7200, 8000 and 8900 Å and of the O2 absorption bandsaround 6300, 6900 and 7600 Å were obtained from the GEISA5
database (Jacquinet-Husson et al., 1999, 2005) and we measuredtheir radial velocity in our programme stars. The resultingzero-point corrections, based on 200–250 telluric lines, amountgen-erally to no more than±1 km s−1 with typical errors on the meanof about 0.5 km s−1, approximately five times larger than thoseon the radial velocity measurements.
After applying the above corrections, and propagating thecorresponding uncertainties, we computed a weighted averageof the heliocentric velocities estimates for each exposure(seeTable 2). All the programme stars appear to be radial velocitymembers of the observed clusters, with the possible exceptionof star 2108 in Cr 110, that has a slightly higher velocity than2129 and 3144. However, since the value for 2108 is within 3σfrom the mean value for the cluster, we decided not to reject thisstar. We can provide the first radial velocity estimate basedonhigh resolution for Cr 110:<Vr>=41.0±3.8 km s−1. Our deter-minations are generally in good agreement with literature val-ues within 3σ, except maybe for star 5237 in NGC 7789, whichis marginally dicrepant with the estimate by Gim et al. (1998b).However, there is perfect agreement between the two studiesforthe other two stars of NGC 7789, and our estimate appears morein line with a membership of 5237. In conclusion, we consid-ered all the programme stars as likely radial velocity membersof their respective clusters.
5 http://ara.lmd.polytechnique.fr/htdOC-public/pro
ducts/GEISA/HTML-GEISA/
2.3. Photometric Parameters
We first computed the dereddened colors6 (B–V)0, (V–IC)07
and (V–KTCS)08. The adopted E(B–V) values are indicated
in Table 4, where E(V–IC) was obtained with the red-dening laws by Dean et al. (1978), and E(V–KTCS) withCardelli et al. (1989). We were then able to obtain Teff andthe bolometric correction BCV for each programme star, us-ing both the Alonso et al. (1999) and the (theoretical andempyrical) Montegriffo et al. (1998) color-temperature rela-tions, taking into account the uncertainties on magnitudesand reddening estimates. The average difference between theAlonso et al. (1999) and the Montegriffo et al. (1998) temper-atures was∆Teff=178±66 K (for the empyrical calibration ofMontegriffo et al., 1998) and∆Teff=127±69 K (for the theoreti-cal calibration of Montegriffo et al., 1998). We averaged all theaboveTeff estimates to obtain our photometric reference valueswith their 1σ uncertainties (Table 3).
Gravities were obtained from Teff and BCV using the funda-mental relations
loggg⊙= log
MM⊙+ 2 log
R⊙R
0.4(Mbol − Mbol,⊙) = −4 logTeff
Teff,⊙+ 2 log
R⊙R
where red clump masses were derived using Table 1 ofGirardi & Salaris (2001), and are also shown in Table 3. We as-sumed logg⊙ = 4.437,Teff,⊙ = 5770 K andMbol,⊙ = 4.75, inconformity with the IAU recommendations (Andersen, 1999).The difference between the Alonso et al. (1999) and the (empyri-cal and theoretical, respectively) Montegriffo et al. (1998) esti-mates was∆ logg=0.20±0.13 and∆ logg=0.18±0.13. As above,we averaged all our estimats to obtain photometric gravitieslogg(phot) (Table 3) and their 1σ uncertainties.
Finally, a photometric estimate of the microturbulent ve-locities vt was obtained using both the prescriptions of
6 Since R magnitudes are available for less than half of our sample,we decided to ignore them in the following.
7 After dereddening, (V–IC) was also converted into (V–IJ) using theprescription by Bessell (1979), to be used with the color-temperaturerelations by Alonso et al. (1999).
8 We computed the KTCS magnitudes from the 2MASS TCS magni-tudes using the prescription by Kinman & Castelli (2002).

... DRAFT ...
October 5, 2009
E. Pancino et al.: Abundances of five Open Clusters 5
Table 4. Input cluster parameters.
Cluster E(B–V) (m-M)V log Age(mag) (mag) (dex)
Cr 110a 0.54±0.03 13.37±0.38 9.23±0.15NGC 2099 (M 37)b 0.27±0.04 11.53±0.19 8.61±0.16NGC 2420c 0.04±0.03 11.88±0.27 9.47±0.17NGC 2682 (M 67)d 0.04±0.02 9.67±0.11 9.64±0.05NGC 7789e 0.27±0.04 12.23±0.20 9.21±0.12
a Averages of measurements by Tsarevskii & Abakumov (1971),Dawson & Ianna (1998) and Bragaglia & Tosi (2006).
b Averages of measurements by West (1967a), Jennens & Helfer(1975), Lyngå (1987), Mermilliod et al. (1996), Twarog et al. (1997),Kiss et al. (2001), Kalirai et al. (2001), Nilakshi & Sagar (2002),Grocholski & Sarajedini (2003), Bragaglia & Tosi (2006) andHartman et al. (2008).
c Averages of measurements by McClure et al. (1974),Barbaro & Pigatto (1984), Vandenberg (1985), Lyngå (1987),Anthony-Twarog et al. (1990), Carraro & Chiosi (1994),Demarque et al. (1994), Twarog et al. (1997), Tadross et al. (2002) andGrocholski & Sarajedini (2003).
d Averages of measurements by Racine (1971), Barbaro & Pigatto(1984), Vandenberg (1985), Nissen et al. (1987), Hobbs & Thorburn(1991), Gilliland & Brown (1992), Demarque et al. (1992),Meynet et al. (1993), Montgomery et al. (1993), Carraro & Chiosi(1994), Dinescu et al. (1995), Fan et al. (1996), Twarog et al. (1997),Sarajedini (1999), Tadross et al. (2002), Grocholski & Sarajedini(2003), VandenBerg & Clem (2003), Laugalys et al. (2004) andSandquist (2004).
e Averages of measurements by Burbidge & Sandage (1958),Arp (1962), Strom & Strom (1970), Jennens & Helfer (1975), Janes(1977), Claria (1979), Twarog & Tyson (1985), Lyngå (1987),Mazzei & Pigatto (1988), Friel & Janes (1993), Martinez Roger et al.(1994), Janes & Phelps (1994), Twarog et al. (1997), Gim et al.(1998b), Sarajedini (1999), Vallenari et al. (2000), Tadross et al. (2002)and Bartasiute & Tautvaisiene (2004).
Ramırez & Cohen (2003),vt = 4.08 − 5.01 10−4 Teff, and ofCarretta et al. (2004),vt = 1.5− 0.13 logg. The latter takes intoaccount the systematic effect discussed by Magain (1984) andis on average lower by∆vt = 0.49± 0.08 km s−1 than the oneby Ramırez & Cohen (2003). However, the actual amount of thecorrection for the Magain (1984) effect depends heavily on thedata quality (i.e., resolution, S/N ratio, number of lines used,log g f values etc.). Therefore we chose not to average the twoestimates, but to use them as an indication of the (wide)vt rangeto explore in our abundance analysis (see Section 4.1).
3. Linelist, Atomic Data and Equivalent Widths
We created a masterlist of absorption lines by visually compar-ing our spectra with the the UVES solar spectrum9 in the range5000–9000 Å, and with the line lists extracted from the VALD10
database (Kupka et al., 1999) and the Moore11 (Moore et al.,1966) solar atlas. The masterlist was fed to DAOSPEC and EWwere measured for all our programme stars. A first selection wasapplied to reject all those lines that were measured in 10 starsor less (out of 15) and that had EW systematically larger than250 mÅ. Later, after performing a first crude abundance analy-sis (see Section 4.1), we rejected all the lines that gave sistemati-
9 http://www.eso.org/observing/dfo/quality/UVES/pipel
ine/solar spectrum.html10 http://www.astro.uu.se/∼vald/11 ftp://ftp.noao.edu/fts/linelist/Moore
cally discrepant abundances, especially if the formal DAOSPECrelative error (δEW/EW, Figure 2) was around 15% or more, andthe DAOSPEC quality parameter was above 1.5 (for more detailsabout DAOSPEC error and quality parameter, see Section 3.3).The final linelist, including atomic data and EW measurementsfor all programme stars, contains 358 absorption lines of 17species, and can be found in the electronic version of Table 5.Atomic data include laboratory wavelengths, excitation poten-tials and logg f values, which are always taken from the VALDdatabase, with the exceptions listed below.
3.1. α Elements Atomic Data
The onlyα-element for which we had clear problems with theatomic data was magnesium. The lines withχex=5.75 eV (7060and 7193Å) gave discrepant abundances by∼1.5 dex with re-spect to the average of all Mg lines. We compared our VALDlog g f with the NIST12 database of atomic data and noticed adifference of 1.4 dex for theχex=5.75 eV lines, while all theother Mg I had very similar logg f values in both databases. TheNIST log g f values abundances of theχex=5.75 eV lines gaveabundances in much better agreement with the other Mg I linesand with the literature Mg abundances for OC, therefore we usedthe NIST values for those lines, instead of the VALD ones.
Another element with uncertain logg f values is Calcium.As an example, for the 9 lines we use, there is an averagedifference of logg fNIS T–logg fVALD=–0.17±0.18 dex, which isnot statistically significant given the largeσ. Also, the NISTlogg f values for those 9 lines all range from D to E, whichmeans that they are largely uncertain. Finally, our solar abun-dance (Section 4.6) gives [Ca/H]=–0.09±0.03 (±0.03) dex if weuse the VALD logg f and [Ca/H]=+0.08±0.03 (±0.03) dex withthe NIST ones, which is equally compatible with zero within 3sigma. Summarizing, there is large uncertainty on the Calciumlogg f determinations, and we really should keep in mind thatthere is an additional∼0.2 dex uncertainty on all [Ca/Fe] deter-minations in the literature.
For the synthesis of the [O I]–Ni I blend at 6300Å, weused the VALD logg f for oxygen, but we chose to use theJohansson et al. (2003) logg f for Ni I at 6300.35Å, which islower (–2.11 dex instead of –1.74) and gives oxygen abundancesmore in line with the otherα-elements.
3.2. Heavy Elements Atomic Data
For neodymium, we could only find three reliable lines, whichapparently do not need any detailed HFS (hyper-fine splitting)analysis (Aoki et al., 2001), at 5092, 5249 and 5485 Å. However,the spread of their abundances was quite high (Table 7). The lab-oratory logg f published by Den Hartog et al. (2003) are verysimilar to the ones from VALD, except for the 5485 Å line,where they differ by 0.14 dex. Therefore, since the logg f valuesby Den Hartog et al. (2003) slightly reduced the spread in the[Nd/Fe], we used them instead of the VALD ones (see Table 5).
3.3. Equivalent Widths with DAOSPEC
The full description of how DAOSPEC works, including com-parisons with the literature and several experiments with ar-tificial and real spectra, can be found in Stetson & Pancino(2008). The instructions on how to install, configure and use
12 http://physics.nist.gov/PhysRefData/ASD/index.html

... DRAFT ...
October 5, 2009
6 E. Pancino et al.: Abundances of five Open Clusters
Table 5. Equivalent Widths and Atomic Data of the programme stars. The complete version of the Table is available at the CDS.Here we show a few lines for guidance about its contents.
Cluster Star λ Elem χex logg f EW δEW Q(Å) (eV) (dex) (mÅ) (mÅ)
Cr 110 2108 5055.99 Fe I 4.31 -2.01 41.2 3.3 0.371Cr 110 2108 5178.80 Fe I 4.39 -1.84 45.4 7.1 0.851Cr 110 2108 5294.55 Fe I 3.64 -2.86 – – –Cr 110 2108 5285.13 Fe I 4.43 -1.64 50.1 5.2 0.607Cr 110 2108 5295.31 Fe I 4.42 -1.69 38.3 9.5 1.958
Fig. 2. The behaviour of DAOSPEC relative errorsδEW/EWversus EW is shown (top panel) and the 15% error limit ismarked with a dotted line. The behaviour of the quality parame-ter Q is shown versus EW (middle panel) and wavelength (bot-tom panel) and the Q=1.5 limit is marked with a dotted line. SeeSection 3.3 for more details. In all panels, grey dots representall the lines measured by DAOSPEC, while black dots representlines cross-identified with our input linelist.
DAOSPEC can be found in“Cooking with DAOSPEC”13. Inshort, DAOSPEC is a Fortran program that automatically findsabsorption lines in a stellar spectrum, fits the continuum, mea-sures EW, and identifies lines with a laboratory linelist; italsoprovides a radial velocity estimate (Section 2.2).
As described in Section 3, we used the DAOSPEC errors andquality parameter, Q, to select good absorption lines in ourmas-
13 http://www3.cadc-ccda.hia-iha.nrc-cnrc.gc.ca/commun
ity/STETSON/daospec/ ; http://www.bo.astro.it/∼pancino/projects/daospec.html
ter line list. Since our spectra are rebinne linear in wavelength,we scaled the FWHM withλ. Figure 2 shows their behaviour.δEW is the formal error of the gaussian fit that DAOSPEC out-puts, andδEW/EW can be used to select good measurements,since smaller lines are noisier and tend to have higher relativeerrors. The quality parameter Q, instead, is the result of the com-parison of local residuals around each line with average residualson the whole spectrum. As a result Q tends to be worse for stronglines, because the Gaussian approximation does not hold so wellanymore. Also, Q gets worse at the blue side of the spectrum,where the S/N ratio is lower. In the region around 7700 Å, wherethe residuals of the prominent O2 telluric band disturb the mea-surements, Q reaches its maximum. The measured EW for ourprogramme stars are shown in the electronic version of Table5along with theδEW and Q parameter estimated by DAOSPEC.
3.4. EW uncertainties
We used the formal errors of the Gaussian fit computed byDAOSPEC only to reject bad measurements from our initialline list. The actual abundance errors due to the EW measure-ments process itself were instead computed later, as explained inSection 4.3.
To compute the EW uncertainty due to the continuum place-ment, we used Equation 7 from Stetson & Pancino (2008) toderive the effective uncertainty on the continuum placement(±∆C/C), which turned out to be significantly smaller than 1%.We first lowered the ”best” continuum by∆C/C and measuredEWs again, obtaining EW(−), then we increased it by the sameamount and measured EW(+). The differences with the “correct”EW measurements,∆EW(−) and∆EW(+) were averaged to pro-duce the actual∆EW for each line. The typical resulting uncer-tainty, due only to the continuum placement, was approximatelyconstant with EW and of∆EW≃1 mÅ approximately (see alsoFigure 2 by Stetson & Pancino, 2008). Such a small uncertaintywas neglected because it had a much smaller impact on the re-sulting abundances than other sources of uncertainty consideredin Sections 4.3 and 4.4.
3.5. Comparison with Literature EW
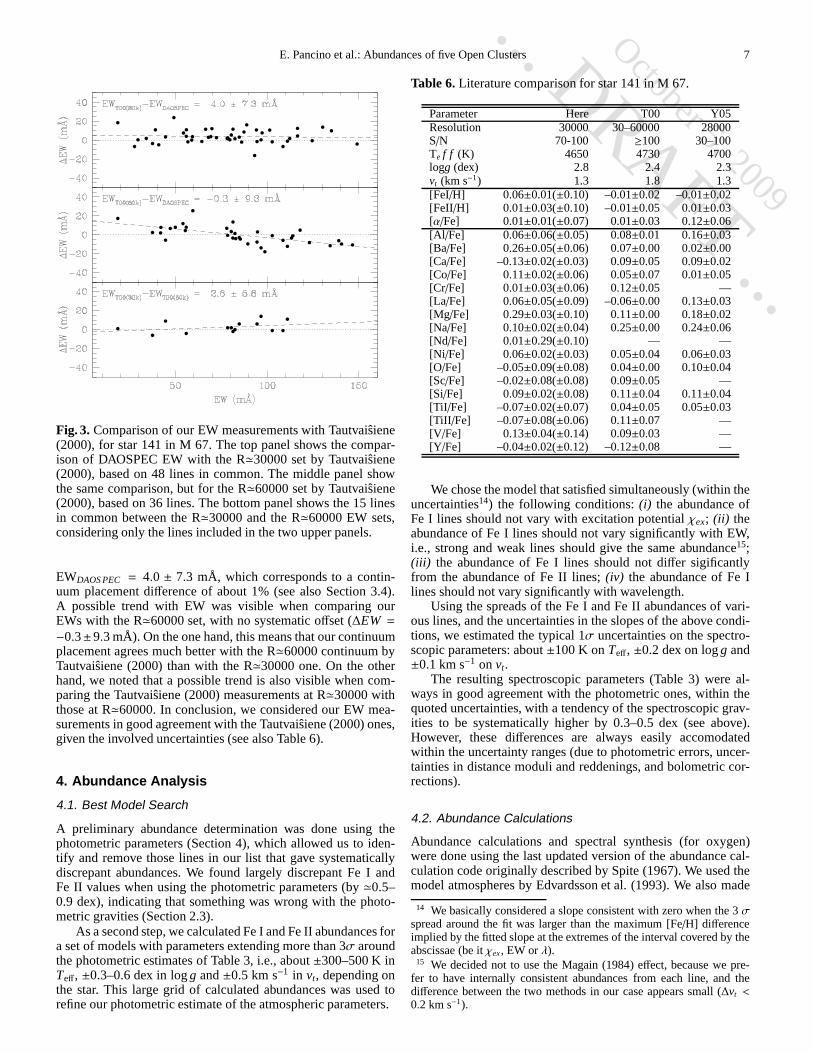
To our knowledge, only one of our target stars was studied beforeby Yong et al. (2005) and Tautvaisiene (2000), with a resolutionand S/N similar to ours, i.e. star 141 in M 67. While Yong et al.(2005) do not publish their EW measurements, we can comparewith the ones by Tautvaisiene (2000). The authors providedtwosets of EW, the former derived from a spectrum with R≃30000,and the latter from a spectrum with R≃60000. We have 48 linesin common with the R≃30000 set and 36 with the R≃60000 set.
Figure 3 shows good agreement between our EWs and theR≃30000 set. We found just a sistematic offset of EWT00-
... DRAFT ...
October 5, 2009
E. Pancino et al.: Abundances of five Open Clusters 7
Fig. 3. Comparison of our EW measurements with Tautvaisiene(2000), for star 141 in M 67. The top panel shows the compar-ison of DAOSPEC EW with the R≃30000 set by Tautvaisiene(2000), based on 48 lines in common. The middle panel showthe same comparison, but for the R≃60000 set by Tautvaisiene(2000), based on 36 lines. The bottom panel shows the 15 linesin common between the R≃30000 and the R≃60000 EW sets,considering only the lines included in the two upper panels.
EWDAOS PEC = 4.0 ± 7.3 mÅ, which corresponds to a contin-uum placement difference of about 1% (see also Section 3.4).A possible trend with EW was visible when comparing ourEWs with the R≃60000 set, with no systematic offset (∆EW =−0.3±9.3 mÅ). On the one hand, this means that our continuumplacement agrees much better with the R≃60000 continuum byTautvaisiene (2000) than with the R≃30000 one. On the otherhand, we noted that a possible trend is also visible when com-paring the Tautvaisiene (2000) measurements at R≃30000 withthose at R≃60000. In conclusion, we considered our EW mea-surements in good agreement with the Tautvaisiene (2000) ones,given the involved uncertainties (see also Table 6).
4. Abundance Analysis
4.1. Best Model Search
A preliminary abundance determination was done using thephotometric parameters (Section 4), which allowed us to iden-tify and remove those lines in our list that gave systematicallydiscrepant abundances. We found largely discrepant Fe I andFe II values when using the photometric parameters (by≃0.5–0.9 dex), indicating that something was wrong with the photo-metric gravities (Section 2.3).
As a second step, we calculated Fe I and Fe II abundances fora set of models with parameters extending more than 3σ aroundthe photometric estimates of Table 3, i.e., about±300–500 K inTeff, ±0.3–0.6 dex in logg and±0.5 km s−1 in vt, depending onthe star. This large grid of calculated abundances was used torefine our photometric estimate of the atmospheric parameters.
Table 6.Literature comparison for star 141 in M 67.
Parameter Here T00 Y05Resolution 30000 30–60000 28000S/N 70-100 ≥100 30–100Te f f (K) 4650 4730 4700logg (dex) 2.8 2.4 2.3vt (km s−1) 1.3 1.8 1.3[FeI/H] 0.06±0.01(±0.10) –0.01±0.02 –0.01±0.02[FeII/H] 0.01±0.03(±0.10) –0.01±0.05 0.01±0.03[α/Fe] 0.01±0.01(±0.07) 0.01±0.03 0.12±0.06[Al /Fe] 0.06±0.06(±0.05) 0.08±0.01 0.16±0.03[Ba/Fe] 0.26±0.05(±0.06) 0.07±0.00 0.02±0.00[Ca/Fe] –0.13±0.02(±0.03) 0.09±0.05 0.09±0.02[Co/Fe] 0.11±0.02(±0.06) 0.05±0.07 0.01±0.05[Cr/Fe] 0.01±0.03(±0.06) 0.12±0.05 —[La/Fe] 0.06±0.05(±0.09) –0.06±0.00 0.13±0.03[Mg/Fe] 0.29±0.03(±0.10) 0.11±0.00 0.18±0.02[Na/Fe] 0.10±0.02(±0.04) 0.25±0.00 0.24±0.06[Nd/Fe] 0.01±0.29(±0.10) — —[Ni /Fe] 0.06±0.02(±0.03) 0.05±0.04 0.06±0.03[O/Fe] –0.05±0.09(±0.08) 0.04±0.00 0.10±0.04[Sc/Fe] –0.02±0.08(±0.08) 0.09±0.05 —[Si/Fe] 0.09±0.02(±0.08) 0.11±0.04 0.11±0.04[TiI /Fe] –0.07±0.02(±0.07) 0.04±0.05 0.05±0.03[TiII /Fe] –0.07±0.08(±0.06) 0.11±0.07 —[V /Fe] 0.13±0.04(±0.14) 0.09±0.03 —[Y /Fe] –0.04±0.02(±0.12) –0.12±0.08 —
We chose the model that satisfied simultaneously (within theuncertainties14) the following conditions:(i) the abundance ofFe I lines should not vary with excitation potentialχex; (ii) theabundance of Fe I lines should not vary significantly with EW,i.e., strong and weak lines should give the same abundance15;(iii) the abundance of Fe I lines should not differ sigificantlyfrom the abundance of Fe II lines;(iv) the abundance of Fe Ilines should not vary significantly with wavelength.
Using the spreads of the Fe I and Fe II abundances of vari-ous lines, and the uncertainties in the slopes of the above condi-tions, we estimated the typical 1σ uncertainties on the spectro-scopic parameters: about±100 K onTeff, ±0.2 dex on logg and±0.1 km s−1 onvt.
The resulting spectroscopic parameters (Table 3) were al-ways in good agreement with the photometric ones, within thequoted uncertainties, with a tendency of the spectroscopicgrav-ities to be systematically higher by 0.3–0.5 dex (see above).However, these differences are always easily accomodatedwithin the uncertainty ranges (due to photometric errors, uncer-tainties in distance moduli and reddenings, and bolometriccor-rections).
4.2. Abundance Calculations
Abundance calculations and spectral synthesis (for oxygen)were done using the last updated version of the abundance cal-culation code originally described by Spite (1967). We usedthemodel atmospheres by Edvardsson et al. (1993). We also made
14 We basically considered a slope consistent with zero when the 3σspread around the fit was larger than the maximum [Fe/H] differenceimplied by the fitted slope at the extremes of the interval covered by theabscissae (be itχex, EW orλ).
15 We decided not to use the Magain (1984) effect, because we pre-fer to have internally consistent abundances from each line, and thedifference between the two methods in our case appears small (∆vt <
0.2 km s−1).

... DRAFT ...
October 5, 2009
8 E. Pancino et al.: Abundances of five Open Clusters
use of ABOMAN, a tool developed by E. Rossetti at the INAF,Bologna Observatory, Italy, that allows for the semi-automaticprocessing of several objects, using the above abundance cal-culation codes. ABOMAN performs automatically all the stepsneeded to choose the best model, and provides all the graphicaltools to analyze the results.
When the best model was found for each star, abundancesand abundance ratios of all the species of interest were cal-culated, by averaging the results for each line of that element(Table 7). Abundance ratios were always computed with respectto Fe I. Cluster averages were computed as weighted averagesof the results for each star in the cluster and, if necessary,of dif-ferent ionization stages of each element (Table 8). In all Tables,[α/Fe] is the weighted average of allα-elements abundances.
We can compare our results for star 141 in M 67 (see alsoSection 3.5) with the ones by Tautvaisiene (2000) and Yong et al.(2005). We find a general agreement for both atmospheric pa-rameter and abundance ratios, with the only significant excep-tion of barium (but see the discussion in Section 6.3), calcium(discussed in Section 6.2) and titanium. For all the discussed el-ements our results, as discussed in Section 6, are in broad agree-ment with the whole body of high resolution abundances for OC,so we consider our results sound.
4.3. Internal Abundance Uncertainties
Random uncertainties in the EW measurement process and in thelogg f determinations were taken into account by averaging theabundances determinations obtained for different lines and us-ing σ/
√(nlines) as the finalinternal error. These are reported in
Table 7, and they are of the order of∼0.01 dex for Fe I which hadthe highest number of lines, and could reach up to∼0.2–0.3 dexfor elements relying on a handful of lines such as Nd, for exam-ple. Additional systematic (from line to line) and random (fromstar to star) uncertainties in EW measurements, due to contin-uum placement, had a negligible impact on the final abundancesin our specific case (Section 3.4).
For the spectral synthesis of oxygen, the uncertainty of thefitwas computed by bracketing the best fitting synthetic spectrumwith two spectra with altered abundance. The bracketing spec-tra were chosen to overlap the 1σ poissonian uncertainty on theobserved spectrum. The abundance difference of the two brack-eting spectra with the best fit were averaged together to producethe estimated uncertainty, reported in Table 7 (and in our solaranalysis, Table 10).
4.4. Uncertainties due to the Choice of Stellar Parameters
The choice of stellar parameters implies systematic (from lineto line) and random (from star to star) uncertainties on the finalabundances. Usually, to estimate the impact of the stellar param-eter choice on the derived abundances, each parameter is alteredby its estimated uncertainty and the resulting abundance differ-ences with respect to the best model parameter abundance setaresummed in quadrature to obtain a global uncertainty. We appliedthis method to our coolest (508 in NGC 2099) and warmest star(2129 in Cr 110) and obtained for the various abundance ratiosuncertainties ranging from 0.05 to 0.45 dex, with a typical valuearound∼0.10 dex.
However, as noted by Cayrel et al. (2004), this method pro-duces a very conservative estimate of the uncertainty, because itneglects the natural correlation among stellar parametersoccur-ring when the so called ”spectroscopic method” (Section 4.1)
Table 9.Uncertanties due to the choice of stellar parameters.
Ratio NGC2099-508 Cr110-2129 Average(T=4500 K) (T=4950 K)
[Al /Fe] ±0.04 ±0.07 ±0.05[Ba/Fe] ±0.04 ±0.08 ±0.06[Ca/Fe] ±0.03 ±0.03 ±0.03[Co/Fe] ±0.07 ±0.05 ±0.06[Cr/Fe] ±0.09 ±0.03 ±0.06[Fe/H] ±0.16 ±0.04 ±0.10[La/Fe] ±0.10 ±0.07 ±0.09[Mg/Fe] ±0.11 ±0.09 ±0.10[Na/Fe] ±0.03 ±0.06 ±0.04[Nd/Fe] ±0.09 ±0.12 ±0.10[Ni /Fe] ±0.02 ±0.03 ±0.03[O/Fe] ±0.10 ±0.07 ±0.08[Sc/Fe] ±0.07 ±0.09 ±0.08[Si/Fe] ±0.12 ±0.03 ±0.07[Ti /Fe] ±0.07 ±0.06 ±0.06[V /Fe] ±0.21 ±0.07 ±0.14[Y /Fe] ±0.15 ±0.08 ±0.12
is adopted. Covariance terms should therefore be included toproperly take into account such dependencies among the pa-rameters (see McWilliam et al., 1995, for a detailed treatmentof the problem). The practical method proposed by Cayrel et al.(2004) assumes that Teff largely dominates the abundance resultsand, therefore, Teff has to be varied by its estimated uncertainty(≃100 K in our case, Section 4.1). A new ”second best” modelhas to be identified with the new value of Teff by varyingvt andlogg accordingly, to minimize as much as possible the slopesof the relations described in Section 4.1. This method naturallyand properly takes into account both the main terms of the errorbudgetandthe appropriate covariance terms.
We therefore altered the temperature of our hottest andcoolest stars (see above) by+100 K and by –100 K. We re-optimized all the parameters and re-calculated all the abundanceratios. The final uncertainties are the average of the uncertaintiescalculated with the higher and lower temperature and are shownin Table 9. The average between the uncertainties of these twocases is taken as a reliable estimate for the impact of the choiceof stellar parameters on our abundance ratios. We added theseexternaluncertainties between parenthesis after each abundanceratio and we summed them in quadrature with theinternalerrorsto produce the errobars in each Figure.
4.5. Other Sources of Uncertainty
The following additional sources of systematic uncertainties arenot explicitly discussed here, but should be taken into accountwhen comparing our abundance estimates with other works inthe literature:
– systematic uncertainties due to the choice of the solar ref-erence abundances, which are not discussed here. Our abun-dances can be reported to any solar reference abundance withthe information in Table 10;
– uncertainties due to the choice of logg f values, which canbe estimated by comparing our logg f values with other lit-erature values (see Section 3.1);
– uncertainties in the whole analysis due to more sophisticatedeffects such as, NLTE, HFS, isotope ratios, that are difficultto evaluate in some cases (these are mentioned wheneverknown or relevant in Sections 3 and 6;

... DRAFT ...
October 5, 2009
E. Pancino et al.: Abundances of five Open Clusters 9
Table 7. Abundance Ratios for sigle cluster stars, with theirinternal uncertainties (Section 4.3). Forexternaluncertainties seeTable 9
Cr 110 NGC 2099 (M 37) NGC 2420Ratio Star 2108 Star 2129 Star 3144 Star 067 Star 148 Star 508 Star 041 Star 076 Star 174[FeI/H] 0.02±0.01 0.05±0.01 0.02±0.01 0.01±0.01 –0.03±0.01 0.07±0.01 –0.07±0.01 –0.06±0.01 –0.03±0.01[FeII/H] 0.00±0.06 –0.04±0.08 0.00±0.06 –0.01±0.02 –0.07±0.04 0.05±0.06 –0.09±0.06 0.00±0.02 –0.07±0.04[α/Fe] –0.02±0.02 0.01±0.02 0.04±0.02 –0.04±0.01 0.00±0.01 0.03±0.01 –0.03±0.01 –0.03±0.01 0.03±0.02[Al /Fe] –0.02±0.04 –0.06±0.08 –0.03±0.06 –0.06±0.08 –0.10±0.07 –0.04±0.07 –0.10±0.04 –0.10±0.05 –0.09±0.05[Ba/Fe] 0.48±0.02 0.49±0.04 0.52±0.06 0.60±0.05 0.55±0.04 0.58±0.04 0.54±0.04 0.58±0.05 0.65±0.02[Ca/Fe] –0.08±0.04 –0.04±0.06 –0.09±0.07 –0.06±0.05 –0.08±0.04 –0.09±0.04 –0.08±0.03 –0.11±0.04 –0.08±0.05[Co/Fe] 0.13±0.05 –0.08±0.04 0.01±0.04 –0.04±0.02 –0.04±0.02 –0.05±0.02 0.10±0.05 –0.02±0.03 0.05±0.03[Cr/Fe] 0.00±0.04 0.06±0.06 0.03±0.08 –0.01±0.06 0.01±0.05 0.05±0.05 –0.02±0.03 –0.09±0.06 –0.02±0.05[La/Fe] 0.11±0.09 0.12±0.03 –0.15±0.04 0.08±0.02 0.16±0.08 0.13±0.08 0.23±0.01 0.12±0.09 0.07±0.13[Mg/Fe] 0.19±0.07 0.01±0.14 0.16±0.08 0.28±0.05 0.26±0.04 0.27±0.03 0.09±0.05 0.10±0.09 0.14±0.08[Na/Fe] –0.08±0.02 –0.06±0.08 0.00±0.03 0.08±0.05 0.10±0.04 0.05±0.08 –0.13±0.09 –0.04±0.06 0.02±0.07[Nd/Fe] 0.05±0.16 0.29±0.13 0.51±0.28 0.23±0.29 0.26±0.25 0.33±0.32 0.12±0.16 0.40±0.28 0.18±N.A.[Ni /Fe] –0.02±0.02 –0.01±0.02 –0.04±0.03 –0.04±0.03 –0.02±0.02 –0.01±0.02 0.03±0.02 –0.01±0.02 –0.01±0.02[O/Fe] 0.08±0.08 –0.07±0.12 0.02±0.14 0.12±0.07 0.25±0.15 0.22±0.13 –0.01±0.16 0.24±0.14 0.39±0.33[Sc/Fe] 0.11±0.05 –0.07±0.06 –0.14±0.10 –0.05±0.05 –0.01±0.07 –0.02±0.12 0.07±0.01 0.11±0.07 0.16±0.06[Si/Fe] 0.02±0.03 0.04±0.02 0.06±0.03 0.07±0.03 0.11±0.02 0.06±0.03 0.05±0.02 0.05±0.02 0.02±0.03[TiI /Fe] 0.01±0.03 0.00±0.03 0.01±0.04 –0.10±0.02 –0.10±0.02 –0.07±0.02 –0.06±0.02 –0.09±0.02 0.06±0.03[TiII /Fe] 0.01±0.13 –0.04±0.07 0.11±0.05 –0.01±0.06 0.00±0.05 0.05±0.08 –0.04±0.23 0.07±0.09 0.12±0.07[V /Fe] 0.28±0.06 –0.03±0.05 –0.09±0.07 –0.09±0.02 –0.08±0.04 –0.03±0.04 0.11±0.06 –0.08±0.05 0.13±0.04[Y /Fe] 0.02±0.12 –0.17±0.08 –0.03±0.18 –0.03±0.23 0.09±0.09 0.08±0.20 –0.14±0.14 0.06±0.02 0.02±0.09
NGC 2682 (M 67) NGC 7789Ratio Star 141 Star 223 Star 286 Star 5237 Star 7840 Star 8556[FeI/H] 0.06±0.01 0.04±0.01 0.06±0.01 –0.01±0.01 0.03±0.01 0.12±0.01[FeII/H] 0.01±0.03 0.02±0.05 –0.05±0.04 –0.06±0.05 –0.03±0.07 0.07±0.06[α/Fe] 0.01±0.01 –0.03±0.01 –0.05±0.01 –0.02±0.02 –0.02±0.02 –0.08±0.02[Al /Fe] 0.06±0.06 0.02±0.05 0.03±0.05 –0.01±0.10 0.05±0.11 –0.13±0.10[Ba/Fe] 0.26±0.05 0.27±0.05 0.23±0.05 0.49±0.06 0.36±0.07 0.46±0.03[Ca/Fe] –0.13±0.02 –0.20±0.03 –0.15±0.02 –0.10±0.04 –0.12±0.07 –0.24±0.03[Co/Fe] 0.11±0.02 0.05±0.04 0.17±0.04 –0.02±0.04 –0.03±0.02 –0.01±0.03[Cr/Fe] 0.01±0.03 –0.01±0.04 0.06±0.05 0.05±0.04 –0.02±0.03 0.16±0.45[La/Fe] 0.06±0.05 –0.06±0.06 0.07±0.03 0.14±0.06 0.06±0.07 0.14±0.15[Mg/Fe] 0.29±0.03 0.20±0.08 0.23±0.05 0.26±0.07 0.24±0.04 0.13±0.06[Na/Fe] 0.10±0.02 –0.02±0.04 0.22±0.08 0.04±0.01 0.09±0.08 –0.15±0.01[Nd/Fe] 0.01±0.29 0.10±0.25 0.10±0.21 0.21±0.38 –0.17±0.27 0.35±0.20[Ni /Fe] 0.06±0.02 0.04±0.02 0.04±0.02 –0.02±0.02 0.00±0.02 –0.02±0.03[O/Fe] –0.05±0.09 0.09±0.11 0.13±0.10 0.21±0.15 0.13±0.10 0.23±0.20[Sc/Fe] –0.02±0.08 –0.05±0.04 0.01±0.05 0.10±0.09 0.06±0.10 0.08±0.12[Si/Fe] 0.09±0.02 0.12±0.02 0.06±0.02 –0.01±0.02 –0.02±0.03 0.03±0.04[TiI /Fe] –0.07±0.02 –0.11±0.02 0.00±0.02 –0.02±0.03 –0.03±0.03 –0.14±0.04[TiII /Fe] –0.07±0.08 0.02±0.06 –0.06±0.13 –0.07±0.29 –0.19±0.17 0.14±0.05[V /Fe] 0.13±0.04 0.06±0.04 0.25±0.04 0.05±0.04 –0.01±0.04 –0.16±0.06[Y /Fe] –0.04±0.02 –0.06±0.05 0.00±0.03 0.22±N.A. –0.01±N.A. 0.07±0.18
– small additional uncertainties due to the particular choice ofatmospheric models and of the abundance calculation code.
4.6. The Sun
To test the whole abundance determination procedure, includingEW measurement, choice of lines and atomic parameters, andthe uncertainties determination criteria, we performed anabun-dance analysis of the Sun, and checked that we obtain solar val-ues for all elements, within the uncertainties. We used the so-lar spectrum from the ESO spectrograph HARPS, in La Silla,Chile, obtained by observing Ganymede16. The spectral reso-lution, R≃45000, is comparable to ours, while the S/N≃350 ismuch higher.
To measure EWs, we used DAOSPEC and the same linelistused for our programme stars. We then compared our solar
16 http://www.ls.eso.org/lasilla/sciops/3p6/harps/monitoring/sun.html
EWs with two different literature sets, the first by Moore et al.(1966) and the second by Rutten & van der Zalm (1984). Themedian difference between our EW and the ones by Mooreis EWDAO–EWMoore=0.9 mÅ (with an inter-quartile range of±2.7 mÅ), based on 225 lines in common, while the one withthe Rutten & van der Zalm (1984) measurements is EWDAO–EWRZ84=–0.5 mÅ (with an inter-quartile range of±2.1 mÅ),based on 112 lines in common. For completeness, we notethat EWMoore–EWRZ84=1.5 mÅ (with an inter-quartile range of±2.8 mÅ), based on 390 lines in common. We are therefore sat-isfied with our solar EW measurements.
We then performed our abundance analysis (as inSection 4.2) by exploring the following atmospheric parame-ters ranges:Teff,⊙=5700–5800, in steps of 50 K; logg⊙=4.3–4.5, in steps of 0.1 dex; andvt=0.5–1.5, in steps of 0.1 km s−1.The resulting best model hasTeff,⊙=5750 K; logg⊙=4.4 dex;and vt=0.8 km s−1, in good agreement with the accepted val-ues (Andersen, 1999). Our adopted reference solar abundances
... DRAFT ...
October 5, 2009
10 E. Pancino et al.: Abundances of five Open Clusters
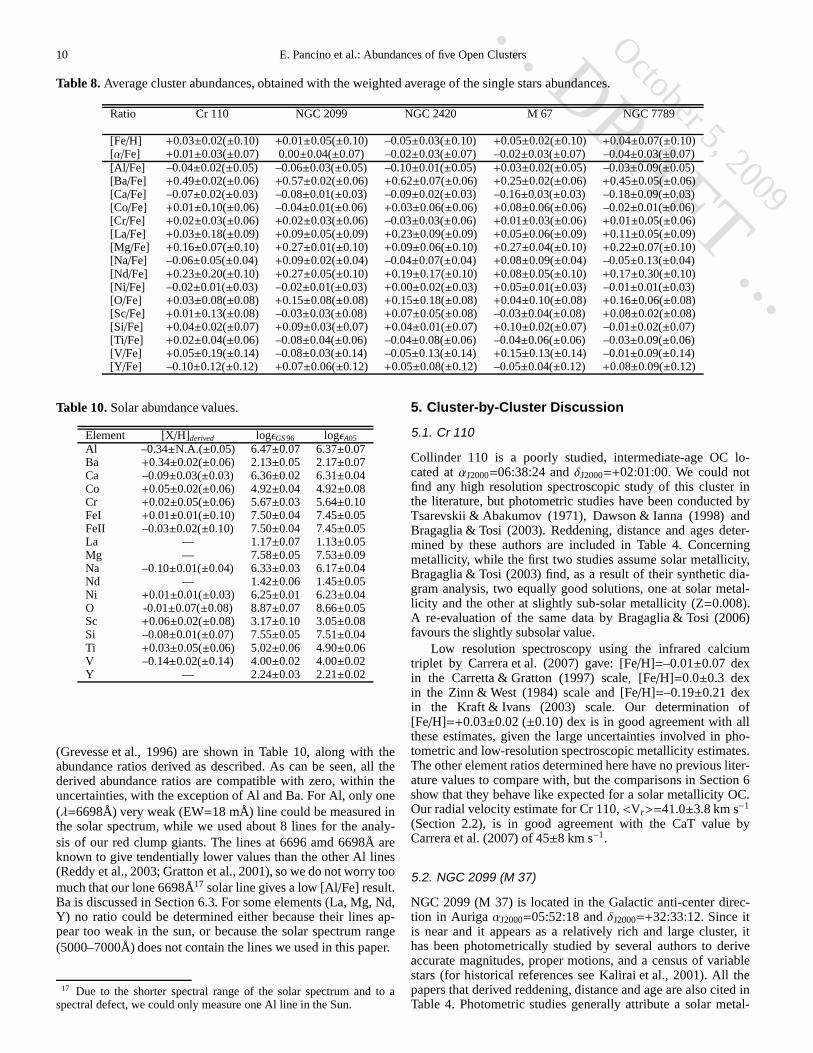
Table 8.Average cluster abundances, obtained with the weighted average of the single stars abundances.
Ratio Cr 110 NGC 2099 NGC 2420 M 67 NGC 7789
[Fe/H] +0.03±0.02(±0.10) +0.01±0.05(±0.10) –0.05±0.03(±0.10) +0.05±0.02(±0.10) +0.04±0.07(±0.10)[α/Fe] +0.01±0.03(±0.07) 0.00±0.04(±0.07) –0.02±0.03(±0.07) –0.02±0.03(±0.07) –0.04±0.03(±0.07)[Al /Fe] –0.04±0.02(±0.05) –0.06±0.03(±0.05) –0.10±0.01(±0.05) +0.03±0.02(±0.05) –0.03±0.09(±0.05)[Ba/Fe] +0.49±0.02(±0.06) +0.57±0.02(±0.06) +0.62±0.07(±0.06) +0.25±0.02(±0.06) +0.45±0.05(±0.06)[Ca/Fe] –0.07±0.02(±0.03) –0.08±0.01(±0.03) –0.09±0.02(±0.03) –0.16±0.03(±0.03) –0.18±0.09(±0.03)[Co/Fe] +0.01±0.10(±0.06) –0.04±0.01(±0.06) +0.03±0.06(±0.06) +0.08±0.06(±0.06) –0.02±0.01(±0.06)[Cr/Fe] +0.02±0.03(±0.06) +0.02±0.03(±0.06) –0.03±0.03(±0.06) +0.01±0.03(±0.06) +0.01±0.05(±0.06)[La/Fe] +0.03±0.18(±0.09) +0.09±0.05(±0.09) +0.23±0.09(±0.09) +0.05±0.06(±0.09) +0.11±0.05(±0.09)[Mg/Fe] +0.16±0.07(±0.10) +0.27±0.01(±0.10) +0.09±0.06(±0.10) +0.27±0.04(±0.10) +0.22±0.07(±0.10)[Na/Fe] –0.06±0.05(±0.04) +0.09±0.02(±0.04) –0.04±0.07(±0.04) +0.08±0.09(±0.04) –0.05±0.13(±0.04)[Nd/Fe] +0.23±0.20(±0.10) +0.27±0.05(±0.10) +0.19±0.17(±0.10) +0.08±0.05(±0.10) +0.17±0.30(±0.10)[Ni /Fe] –0.02±0.01(±0.03) –0.02±0.01(±0.03) +0.00±0.02(±0.03) +0.05±0.01(±0.03) –0.01±0.01(±0.03)[O/Fe] +0.03±0.08(±0.08) +0.15±0.08(±0.08) +0.15±0.18(±0.08) +0.04±0.10(±0.08) +0.16±0.06(±0.08)[Sc/Fe] +0.01±0.13(±0.08) –0.03±0.03(±0.08) +0.07±0.05(±0.08) –0.03±0.04(±0.08) +0.08±0.02(±0.08)[Si/Fe] +0.04±0.02(±0.07) +0.09±0.03(±0.07) +0.04±0.01(±0.07) +0.10±0.02(±0.07) –0.01±0.02(±0.07)[Ti /Fe] +0.02±0.04(±0.06) –0.08±0.04(±0.06) –0.04±0.08(±0.06) –0.04±0.06(±0.06) –0.03±0.09(±0.06)[V /Fe] +0.05±0.19(±0.14) –0.08±0.03(±0.14) –0.05±0.13(±0.14) +0.15±0.13(±0.14) –0.01±0.09(±0.14)[Y /Fe] –0.10±0.12(±0.12) +0.07±0.06(±0.12) +0.05±0.08(±0.12) –0.05±0.04(±0.12) +0.08±0.09(±0.12)
Table 10.Solar abundance values.
Element [X/H]derived logǫGS96 logǫA05
Al –0.34±N.A.(±0.05) 6.47±0.07 6.37±0.07Ba +0.34±0.02(±0.06) 2.13±0.05 2.17±0.07Ca –0.09±0.03(±0.03) 6.36±0.02 6.31±0.04Co +0.05±0.02(±0.06) 4.92±0.04 4.92±0.08Cr +0.02±0.05(±0.06) 5.67±0.03 5.64±0.10FeI +0.01±0.01(±0.10) 7.50±0.04 7.45±0.05FeII –0.03±0.02(±0.10) 7.50±0.04 7.45±0.05La — 1.17±0.07 1.13±0.05Mg — 7.58±0.05 7.53±0.09Na –0.10±0.01(±0.04) 6.33±0.03 6.17±0.04Nd — 1.42±0.06 1.45±0.05Ni +0.01±0.01(±0.03) 6.25±0.01 6.23±0.04O -0.01±0.07(±0.08) 8.87±0.07 8.66±0.05Sc +0.06±0.02(±0.08) 3.17±0.10 3.05±0.08Si –0.08±0.01(±0.07) 7.55±0.05 7.51±0.04Ti +0.03±0.05(±0.06) 5.02±0.06 4.90±0.06V –0.14±0.02(±0.14) 4.00±0.02 4.00±0.02Y — 2.24±0.03 2.21±0.02
(Grevesse et al., 1996) are shown in Table 10, along with theabundance ratios derived as described. As can be seen, all thederived abundance ratios are compatible with zero, within theuncertainties, with the exception of Al and Ba. For Al, only one(λ=6698Å) very weak (EW=18 mÅ) line could be measured inthe solar spectrum, while we used about 8 lines for the analy-sis of our red clump giants. The lines at 6696 amd 6698Å areknown to give tendentially lower values than the other Al lines(Reddy et al., 2003; Gratton et al., 2001), so we do not worry toomuch that our lone 6698Å17 solar line gives a low [Al/Fe] result.Ba is discussed in Section 6.3. For some elements (La, Mg, Nd,Y) no ratio could be determined either because their lines ap-pear too weak in the sun, or because the solar spectrum range(5000–7000Å) does not contain the lines we used in this paper.
17 Due to the shorter spectral range of the solar spectrum and toaspectral defect, we could only measure one Al line in the Sun.
5. Cluster-by-Cluster Discussion
5.1. Cr 110
Collinder 110 is a poorly studied, intermediate-age OC lo-cated atαJ2000=06:38:24 andδJ2000=+02:01:00. We could notfind any high resolution spectroscopic study of this clusterinthe literature, but photometric studies have been conducted byTsarevskii & Abakumov (1971), Dawson & Ianna (1998) andBragaglia & Tosi (2003). Reddening, distance and ages deter-mined by these authors are included in Table 4. Concerningmetallicity, while the first two studies assume solar metallicity,Bragaglia & Tosi (2003) find, as a result of their synthetic dia-gram analysis, two equally good solutions, one at solar metal-licity and the other at slightly sub-solar metallicity (Z=0.008).A re-evaluation of the same data by Bragaglia & Tosi (2006)favours the slightly subsolar value.
Low resolution spectroscopy using the infrared calciumtriplet by Carrera et al. (2007) gave: [Fe/H]=–0.01±0.07 dexin the Carretta & Gratton (1997) scale, [Fe/H]=0.0±0.3 dexin the Zinn & West (1984) scale and [Fe/H]=–0.19±0.21 dexin the Kraft & Ivans (2003) scale. Our determination of[Fe/H]=+0.03±0.02 (±0.10) dex is in good agreement with allthese estimates, given the large uncertainties involved inpho-tometric and low-resolution spectroscopic metallicity estimates.The other element ratios determined here have no previous liter-ature values to compare with, but the comparisons in Section6show that they behave like expected for a solar metallicity OC.Our radial velocity estimate for Cr 110,<Vr>=41.0±3.8 km s−1
(Section 2.2), is in good agreement with the CaT value byCarrera et al. (2007) of 45±8 km s−1.
5.2. NGC 2099 (M 37)
NGC 2099 (M 37) is located in the Galactic anti-center direc-tion in AurigaαJ2000=05:52:18 andδJ2000=+32:33:12. Since itis near and it appears as a relatively rich and large cluster,ithas been photometrically studied by several authors to deriveaccurate magnitudes, proper motions, and a census of variablestars (for historical references see Kalirai et al., 2001).All thepapers that derived reddening, distance and age are also cited inTable 4. Photometric studies generally attribute a solar metal-

... DRAFT ...
October 5, 2009
E. Pancino et al.: Abundances of five Open Clusters 11
Table 11.Literature abundance determinations for M 67 based on high resolution spectroscopy.
Here T00a S00b Y05c R06d P08e S09f
R=λ/δλ 30000 30–60000 30000 28000 45000 100000 50000S/N 50–100 ≥100 40–70 30–100 90–180 ≃80 100–300[Fe/H] +0.05±0.02(±0.10) –0.03±0.04 –0.05±0.01 +0.02±0.01 +0.03±0.01 +0.03±0.04 0.00±0.01[Al /Fe] +0.03±0.02(±0.05) +0.14±0.07 — +0.17±0.01 –0.06±0.04 –0.03±0.11 —[Ba/Fe] +0.25±0.02(±0.06) +0.07±0.12 +0.21±0.20 –0.02±0.03 — — —[Ca/Fe] –0.16±0.03(±0.03) +0.05±0.09 –0.02±0.03 +0.07±0.02 +0.05±0.04 +0.03±0.07 —[Co/Fe] +0.08±0.06(±0.06) +0.08±0.07 — — — — —[Cr/Fe] +0.01±0.03(±0.06) +0.10±0.09 — — –0.01±0.04 +0.03±0.09 —[La/Fe] +0.05±0.06(±0.09) +0.13±0.10 — +0.11±0.02 — — —[Mg/Fe] +0.27±0.04(±0.10) +0.10±0.06 –0.11±0.08 +0.16±0.02 –0.01±0.03 — —[Na/Fe] +0.08±0.09(±0.04) +0.19±0.08 –0.05±0.05 +0.30±0.03 +0.04±0.07 –0.02±0.07 —[Ni /Fe] +0.05±0.01(±0.10) +0.04±0.08 +0.04±0.06 +0.08±0.02 –0.01±0.04 –0.02±0.07 —[O/Fe] +0.04±0.10(±0.03) +0.02±0.06 –0.02±0.08 +0.07±0.02 –0.04±0.01 –0.07±0.09 —[Sc/Fe] –0.03±0.04(±0.08) +0.10±0.06 — — — — —[Si/Fe] +0.10±0.02(±0.07) +0.10±0.05 — +0.09±0.03 +0.03±0.04 –0.03±0.06 —[Ti /Fe] –0.04±0.06(±0.06) +0.04±0.13 — +0.12±0.02 –0.03±0.04 –0.02±0.11 —[V /Fe] +0.15±0.13(±0.14) +0.15±0.16 — — — — —[Y /Fe] –0.05±0.04(±0.12) +0.01±0.14 — — — — —
a Tautvaisiene (2000), from 6 red clump stars.b Shetrone & Sandquist (2000), from 4 turn-off stars (we ignored blue stragglers).c Yong et al. (2005), from 3 red clump stars.d Randich et al. (2006), from 8 dwarfs and 2 slightly evolved stars.e Pace et al. (2008), from 6 main sequence stars.f Santos et al. (2009), from 3 red clump giants and 6 dwarfs.
licity to NGC 2099 (e.g., Mermilliod et al., 1996). Metallicityestimates based on photometry can only be found in Janes et al.(1988), who give [Fe/H]=0.09 dex; Marshall et al. (2005), whogive [M/H]=+0.05±0.05 and Kalirai & Tosi (2004), who giveZ<0.02.
Surprisingly, when considering the wealth of photometricstudies, M 37 lacks any specific low or high resolution studyaimed at determining its chemical composition. Our valuestherefore fill this gap, and show that in all respects this clusterhas a typical solar metallicity, with all element ratios close tozero within the uncertainties. On the other hand, radial velocitydeterminations for this cluster are quite abundant (Section 2.2)and appear in good agreement with our determination.
5.3. NGC 2420
NGC 2420 (αJ2000=07:38:23 andδJ2000=+21:34:24) has alwaysbeen considered the definitive example of the older, mod-erately metal-deficient OC beyond the solar circle. Severalgood quality imaging studies appeared already in the 60s and70s (Sarma & Walker, 1962; West, 1967b; Cannon & Lloyd,1970; van Altena & Jones, 1970; McClure et al., 1974, 1978,to name a few), and more recent photometries appearedin a variety of photometric systems (the most cited be-ing Anthony-Twarog et al., 1990). Its intermediate status be-tween the solar-metallicity OC near the sun and the clearlymetal-deficient population of globular clusters tagged it earlyon as a potential transition object between the two popula-tions, with metallicity determinations — both photometricandspectroscopic — placing it at an [Fe/H] value around theone of 47 Tuc (e.g. Pilachowski et al., 1980; Cohen, 1980;Canterna et al., 1986; Smith & Suntzeff, 1987). More recentphotometric works give somewhat higher [Fe/H] values, rang-ing from –0.5 to –0.3 dex (e.g. Twarog et al., 1997; Friel et al.,
2002; Anthony-Twarog et al., 2006), but still significantlylowerthan the value of [Fe/H]=–0.05±0.03 (±0.10) dex we found here.
However, both Cohen (1980) and Pilachowski et al. (1980)noted that NGC 2420 should be significantly more metal richthan the Globular Clusters they analyzed, i.e., M 71 (Cohen,1980) and 47 Tuc (Pilachowski et al., 1980), by some≃0.5 dex.Since they placed M 71 and 47 Tuc around [Fe/H]=–1.3, theyconsequently placed NGC 2420 at [Fe/H]=–0.6. The resolu-tion of their spectra (R<10000) was much lower than ours,but if we trust their analysis in a relative sense, and considermore recent metallicity estimates for 47 Tuc and M 71 (–0.76and –0.73 respectively, Harris, 1996), we would then placeNGC 2420 around [Fe/H]≃–0.1 or –0.2. Having said that, itis surprising that there are no modern high resolution stud-ies of a cluster that was considered so important in the past.The highest spectral resolution employed to study NGC 2420is R≃15000 (Smith & Suntzeff, 1987), with a spectral coverageof only 200Å, giving [Fe/H]=–0.57. Only the preliminary workof Freeland et al. (2002) has suggested a higher, slightly subso-lar [Fe/H] value for NGC 2420. We also note that our [Fe/H]brings NGC 2420 more in line with other OC in the Galactictrends discussed in Section 7. Also, we cannot ignore the simi-larity with the case of NGC 7789 (Section 5.5), where high reso-lution spectroscopy by Tautvaisiene et al. (2005) and us providesa much higher abundance than the previous photometric andlow/medium-resolution studies. Clearly, further high resolutionspectroscopy with modern instruments, possibly with R≃50000and S/N≃100 is needed for this cluster.
5.4. NGC 2682 (M 67)
Among the old OC, M 67 (αJ2000=08:51:18,δJ2000=+11:48:00)is quite close to us, with low reddening (Table 4) and solarmetallicity, so it is one of the most studied open clusters, anda good target to look for solar twins and analogs (Pasquini etal.,

... DRAFT ...
October 5, 2009
12 E. Pancino et al.: Abundances of five Open Clusters
Table 12. Literature abundance determinations for NGC 7789based on high resolution spectroscopy.
Here T05a
R=λ/δλ 30000 30000S/N 50–100 ≥ 50[Fe/H] +0.04±0.07(±0.10) –0.04±0.05[Al /Fe] –0.03±0.09(±0.05) +0.18±0.08[Ca/Fe] –0.18±0.09(±0.03) +0.14±0.07[Co/Fe] –0.02±0.01(±0.06) +0.09±0.14[Cr/Fe] +0.01±0.05(±0.06) –0.05±0.09[Mg/Fe] +0.22±0.07(±0.10) +0.18±0.07[Na/Fe] –0.05±0.13(±0.04) +0.28±0.07[Ni /Fe] –0.01±0.01(±0.10) –0.02±0.05[O/Fe] +0.16±0.06(±0.03) –0.07±0.09[Sc/Fe] +0.08±0.02(±0.08) –0.02±0.07[Si/Fe] –0.01±0.02(±0.07) +0.14±0.05[Ti /Fe] –0.03±0.09(±0.06) –0.03±0.07[V /Fe] –0.01±0.09(±0.14) +0.09±0.12[Y /Fe] +0.08±0.09(±0.12) +0.13±0.13
a Tautvaisiene et al. (2005), from 6 giants and 3 red clump giants.
2008). Since the first pioneering studies at the beginning ofXXcentury, we have a few hundred papers published to date (seeBurstein et al., 1986; Carraro et al., 1996; Yadav et al., 2008, formore references). Therefore, we have included M 67 in our sam-ple because it acts as a fundamental comparison object, thaten-ables us to place our measurements in a more general frame-work.
Among the vast literature on M 67, there are sev-eral determinations of its metallicity, with various meth-ods (e.g. Demarque, 1980; Cohen, 1980; Foy & Proust,1981; Janes & Smith, 1984; Burstein et al., 1984, 1986;Brown, 1987; Garcia Lopez et al., 1988; Cayrel de Strobel,1990; Hobbs & Thorburn, 1991; Friel & Boesgaard, 1992;Friel & Janes, 1993; Janes & Phelps, 1994; Friel et al., 2002;Balaguer-Nunez et al., 2007; Marshall et al., 2005, to name afew), all typically converging to a solar value. high resolutionabundance determinations have been derived for both giantsanddwarfs, with many studies devoted to light elements such aslithium and beryllium and their implications for mixing theories(Pasquini et al., 1997; Jones et al., 1999; Randich et al., 2007).
Table 11 shows a comparison of our results withsome of the most recent high resolution (R≥20000) deter-minations (Tautvaisiene, 2000; Shetrone & Sandquist, 2000;Randich et al., 2006; Pace et al., 2008; Santos et al., 2009).Theoverall comparison is extremely satisfactory for all elements, ex-cept maybe for Mg, Na, Ba and Ca (see also Section 3.1). ForMg, Na and Ba the large spread in literature demonstrates thedifficulties in measuring these elements. For Ca we see that ourvalue is marginally lower than other literature deterrminations.As explained in Section 3.1, this is most probably due to thelarge uncertainties on the Calcium logg f values.
5.5. NGC 7789
NGC7789 (αJ2000=23:57:24 andδJ2000=+56:42:30, orl=115.53and b=–5.39) is a rich and intermediate-age OC, with awell defined giant branch, a well-populated main-sequenceturnoff, and a substantial population of blue stragglers(McNamara, 1980; Twarog & Tyson, 1985; Milone & Latham,1994). Several photometric studies have been carriedout (some examples are Kustner, 1923; Reddish, 1954;
Burbidge & Sandage, 1958; Janes, 1977; Martinez Roger et al.,1994; Jahn et al., 1995; Gim et al., 1998a; Vallenari et al., 2000;Bartasiute & Tautvaisiene, 2004; Bramich et al., 2005)and itsparameters are reasonably well known.
Abundance determinations through photometry andlow/medium-resolution spectroscopy all give sub-solar valuesaround [Fe/H]≃–0.2 (Pilachowski, 1985; Friel & Janes, 1993;Schonberner et al., 2001; Friel et al., 2002), i.e., much lowerthan our [Fe/H]=0.04±0.07 (±0.10) dex. However, a moreconforting comparison with Tautvaisiene et al. (2005) isshownin Table 12. Their spectra have resolution and S/N similar toours, and most abundance ratios in common show an excellentagreement. Minor discrepancies arise for some elements such asCa (but see the discussions in Sections 3.1 and 5.4), Al (but theyused only one doublet while we used four), Na and O. Sincethey do not list their logg f values, and other ingredients ofthe abundance analysis were similar to ours, we cannot explainthe Na-O discrepancies, but we suspect that they must be duelog g f differences.
6. Abundance Ratios Discussion
We compare our abundance ratios with data from the literature,assembled as follows. For the Milky Way field stars, we use theThick and Thin Disc measurements from Reddy et al. (2003)and Reddy et al. (2006), who performed homeogeneous abun-dance calculations of a few hundred F/G dwarfs selected fromthe Hipparcos catalogue. We added abundance ratios, based onhigh resolution spectroscopy, for 57 old OC from various litera-ture sources (Table 13). When more than one determination wasavailable for one cluster, we simply plotted them all to givearealistic idea of the uncertainties involved in the compilation.
6.1. Iron-peak Elements Ratios
When compared with literature (Figure 4), our iron-peak ele-ments appear all solar and in good agreement with the resultsforthe Disc and other OC. In particular, cobalt and chromium havethe best agreement and smallest spreads. Although Sc, V and Coare known to possess HFS that may lead to an increased scat-ter and an overestimated ratio, they do not appear significantlydifferent from solar for our target stars, so we did not attemptany detailed HFS analysis. Nevertheless, the effect of increasedscatter and overestimated abundance are visible, expecially forvanadium, both in our data and in the Discs stars, as well as inthe other clusters from the literature.
A puzzling effect is seen in Figure 4 in the [Ni/Fe]ratio. All the data from Disc stars are very close to so-lar (<[Ni /Fe]>=–0.02±0.02), and so are our determinations(<[Ni /Fe]>=0.00±0.03), but the other OC high resolution dataappear slightly enhanced (<[Ni /Fe]>=0.06±0.04), lying system-atically above the Disc ones. Such a≃0.05 dex offset is wellwithin the uncertainties of abundance determinations in gen-eral, but since it appears systematic in nature, we are stillleftwithout a clear explanation. Our [Ni/Fe] ratios anyway are a bitlower than the other OC determinations, although still compati-ble within the uncertainties.
6.2. α-elements Ratios
We obtained abundances of Ca, Mg, O, Si and Ti. As can beseen from Figure 5, Si and Ti appear practically solar, within therespective uncertainties, and in very good agreement with litera-

... DRAFT ...
October 5, 2009
E. Pancino et al.: Abundances of five Open Clusters 13
Table 13.Literature sources and [Fe/H] values for high resolution (R≥15000) based abundance ratios of old OC.
Cluster [Fe/H] Reference Cluster [Fe/H] ReferenceBe 17 –0.10 Friel et al. (2005) NGC 2141 –0.26 Yong et al. (2005)Be 20 –0.61 Yong et al. (2005) 0.00 Jacobson et al. (2009)
–0.30 Sestito et al. (2008) NGC 2158 –0.03 Jacobson et al. (2009)Be 22 –0.32 Villanova et al. (2005) NGC 2243 –0.48 Gratton & Contarini (1994)Be 25 –0.20 Carraro et al. (2007) NGC 2324 –0.17 Bragaglia et al. (2008)Be 29 –0.44 Carraro et al. (2004) NGC 2360+0.07 Hamdani et al. (2000)
–0.18 Yong et al. (2005) +0.04 Smiljanic et al. (2008)–0.31 Sestito et al. (2008) NGC 2420 –0.57 Smith & Suntzeff (1987)
Be 31 –0.40 Yong et al. (2005) NGC 2447 +0.03 Hamdani et al. (2000)Be 32 –0.29 Bragaglia et al. (2008) NGC 2477+0.07 Bragaglia et al. (2008)Be 66 –0.48 Villanova et al. (2005) –0.01 Smiljanic et al. (2008)Be73 –0.22 Carraro et al. (2007) NGC 2506 –0.20 Carretta et al. (2004)Be75 –0.22 Carraro et al. (2007) NGC 2660+0.04 Bragaglia et al. (2008)Blanco 1 +0.04 Ford et al. (2005) NGC 3532 +0.04 Smiljanic et al. (2008)Cr 261 –0.22 Friel et al. (2003) NGC 3680 –0.04 Pace et al. (2008)
–0.03 Carretta et al. (2005) +0.04 Smiljanic et al. (2008)–0.03 De Silva et al. (2007) NGC 3960 +0.02 Bragaglia et al. (2008)+0.13 Sestito et al. (2008) NGC 5822 +0.04 Smiljanic et al. (2008)
Hyades +0.13 Sestito et al. (2003) NGC 6134 +0.15 Carretta et al. (2004)+0.13 Paulson et al. (2003) +0.12 Smiljanic et al. (2008)+0.13 De Silva et al. (2006) NGC 6253 +0.46 Carretta et al. (2007)
IC 2391 –0.03 Randich et al. (2001) +0.36 Sestito et al. (2007)IC 2602 –0.05 Randich et al. (2001) NGC 6281+0.05 Smiljanic et al. (2008)IC 2714 +0.12 Smiljanic et al. (2008) NGC 6475 +0.14 Sestito et al. (2003)IC 4756 –0.15 Jacobson et al. (2007) NGC 6633+0.07 Smiljanic et al. (2008)
+0.04 Smiljanic et al. (2008) NGC 6791 +0.40 Peterson & Green (1998)IC 4651 +0.11 Carretta et al. (2004) +0.35 Origlia et al. (2006)
+0.10 Pasquini et al. (2004) +0.39 Carraro et al. (2006)+0.12 Pace et al. (2008) +0.47 Carretta et al. (2007)
M 11 +0.10 Gonzalez & Wallerstein (2000) +0.30 Boesgaard et al. (2009)M 34 +0.07 Schuler et al. (2003) NGC 6819 +0.09 Bragaglia et al. (2001)M 67 –0.03 Tautvaisiene (2000) NGC 6939 0.00 Jacobson et al.(2007)
–0.01 Yong et al. (2005) NGC 7142 +0.08 Jacobson et al. (2008)+0.03 Randich et al. (2006) NGC 7789 –0.04 Tautvaisiene et al. (2005)+0.03 Pace et al. (2008) Pleiades –0.03 Randich et al. (2001)
Mel 66 –0.38 Gratton & Contarini (1994) +0.06 Gebran & Monier (2008)–0.33 Sestito et al. (2008) Praesepe +0.04 Friel & Boesgaard (1992)
Mel 71 –0.30 Brown et al. (1996) +0.12 Pace et al. (2008)NGC 188 +0.01 Randich et al. (2003) Rup 4 –0.09 Carraro et al. (2007)NGC 1817 –0.07 Jacobson et al. (2009) Rup 7 –0.26 Carraro et al. (2007)NGC 1883 –0.20 Villanova et al. (2007) Saurer 1 –0.38 Carraroet al. (2004)
–0.01 Jacobson et al. (2009) Tom 2 –0.45 Brown et al. (1996)NGC 2112 –0.10 Brown et al. (1996) –0.28 Frinchaboy et al. (2008)
ture determinations for both the Discs stars and the other OC. O,Ca and Mg give instead marginally discrepant enhancements.
For O, we note that the spread both in our data and in theliterature is greater that in any otherα-element. This is partlydue to the well known problems of determining O from the6300Å lone line, or the 6363Å weak line, or from the IR tripletat 7770Å, that requires NLTE corrections. Moreover, some oldliterature work uses Solar reference abundances reaching as highas 8.93, which can explain some of the lowest [O/Fe] literatureestimates. Given the large spread, the tendency of our [O/Fe]measurements to lie on the upper envelope of the other OC highresolution data is probably irrelevant. Solar O enhancementswould probably be more in line with the otherα-elements, whilethe sub-solar values found generally in literature point towardsWolf-Rayet as additional contributors of O, with a strongermetallicity dependence of the O yields (McWilliam et al., 2008).
In the case of Ca, our values are marginally inconsistent withthe bulk of field and OC literature determinations. A few lit-erature measurements of OC ratios are however as low as our
values. These inconsistencies could be explained with the largeuncertainties in the literature logg f values for Calcium lines(∼0.2 dex, see discussion in Section 3.1). Given these large ad-ditional uncertainties, we finally concluded that [Ca/Fe] is basi-cally compatible with solar values in all the clusters examined.
Concerning Mg, we know already that the logg f values ofsome lines are still not very well determined (Section 3.1).Wealso know (Gratton et al., 1999) that some lines require NLTEcorrections. We could find no correction factors for the lines wewere able to measure in our spectra, but we noticed that thoselines examined by Gratton et al. (1999) which haveχex similar toour lines, require NLTE corrections of about+0.1–0.5 dex. Thiscorrection would make our [Mg/Fe] values even higher, reach-ing an enhancement of 0.2–0.6 dex with respect to solar. Anotherpossibility is that our lines have a non negligible HFS, becausethey are dominated by odd isotopes, but we could find no furtherinformation in the literature. We could only notice that other au-thors find such relatively high values of [Mg/Fe] in OC (such asBragaglia et al., 2008).

... DRAFT ...
October 5, 2009
14 E. Pancino et al.: Abundances of five Open Clusters
Fig. 4.Comparison between our iron-peak element results (largeblack dots), the high resolution measurements of other OC listedin Table 13 (large dark grey dots) and field stars belonging tothe Thin Disc (light grey dots, Reddy et al., 2003) and to theThick Disc (tiny light grey dots, Reddy et al., 2006). Errorbarson our results are the quadratic sum of internal uncertainties anduncertainties due to the choice of stellar parameters (Section 4).
When the average [α/Fe] values are calculated, however, allthe programme stars and the cluster averages appear perfectlycompatible with solar, within relatively small uncertainties, asexpected (see Tables 7 and 8). The [α/Fe] ratio is also discussedfurther in Section 7.
6.3. Heavy Elements Ratios
We measured the heavy s-process elements Ba, La and Nd andthe light s-process element Y. La does not require any synthesisto take into account HFS, since the three lines we used are al-ways in the linear part of the curve of growth, and in fact Figure 6shows good agreement with the sparse literature values. Yittriumand neodimium are also in agreement with the literature data, al-though the measurements of Nd in OC are scarce and scattered.Our values of [Nd/Fe] have a tendency of being towards the up-per envelope of the Dics stars, but this is not significant if weconsider the large uncertainties involved (see also the discussionin Section 3.2).
Concerning Ba, we find high values both in our programmestars and in the sun itself (Section 4.6). The same result hasbeenfound by other authors (e.g., Bragaglia et al., 2008). Whilea de-tailed study of the barium abundance is out of the scope of the
Fig. 5. Comparison between ourα-elements ratios and the liter-ature ones. Symbols are the same as in Figure 4.
present paper, we note that very recently D’Orazi et al. (2009)used a detailed HFS analysis of barium in OC and showed thatthe overabundance can be thus reduced roughly by∼0.2 dex.Looking at Figure 6, we see that in fact our [Ba/Fe] are on thehigh side of the OC data, which in turn have a huge spread. Datafrom D’Orazi et al. (2009), who revised the Ba abundances for20 OC using spectral synthesis to take HFS into account, are to-wards the lower envelope of the OC abundances (open stars inFigure 6). As can be seen, some [Ba/Fe] ehnancement remainsin their high quality data, that is apparently well correlated withthe cluster ages (see their Figure 1). Still no clear explanationis available, since the current evolution models and yieldsdonot reproduce the data correctly at young ages, where the en-hancement is higher and more uncertain (up to [Ba/Fe]≃0.6 dexfor ages around 108). In summary, most of the [Ba/Fe] enhance-ment we see in our measurements should be due to HFS effects,but some part of it could be real (up to 0.2 dex, see Fig. 2 byD’Orazi et al., 2009). A hint of a descending slope of [Ba/Fe]in OC appears, that is not appaerent among Disc stars. Furtherstudies such as D’Orazi et al. (2009) are necessary on large sam-ples of Disc and OC stars to get firmer constraint on the chemicalevolution of Ba in the Galactic Dics.
6.4. Ratios of Na and Al and Anticorrelations
We also derived Na and Al abundances, since these elements arequite easy to measure in OC and there is a vast body of liter-ature measurements to compare with. Figure 7 shows that for
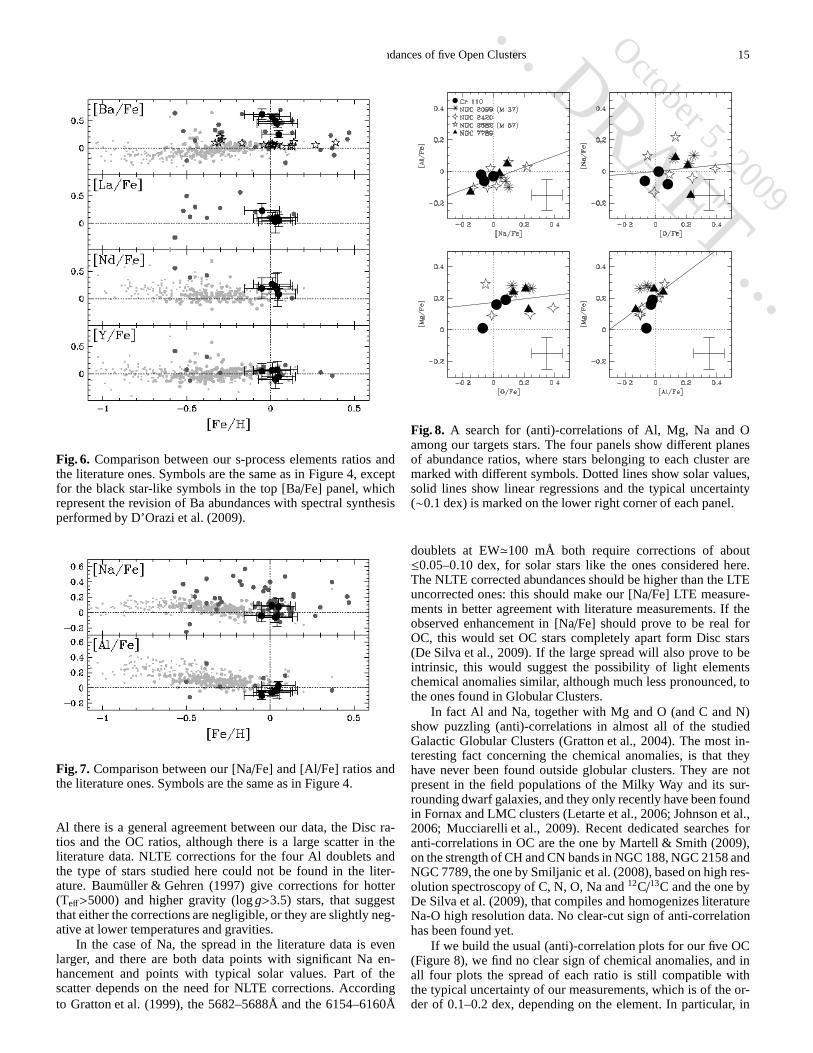
... DRAFT ...
October 5, 2009
E. Pancino et al.: Abundances of five Open Clusters 15
Fig. 6. Comparison between our s-process elements ratios andthe literature ones. Symbols are the same as in Figure 4, exceptfor the black star-like symbols in the top [Ba/Fe] panel, whichrepresent the revision of Ba abundances with spectral synthesisperformed by D’Orazi et al. (2009).
Fig. 7. Comparison between our [Na/Fe] and [Al/Fe] ratios andthe literature ones. Symbols are the same as in Figure 4.
Al there is a general agreement between our data, the Disc ra-tios and the OC ratios, although there is a large scatter in theliterature data. NLTE corrections for the four Al doublets andthe type of stars studied here could not be found in the liter-ature. Baumuller & Gehren (1997) give corrections for hotter(Teff>5000) and higher gravity (logg>3.5) stars, that suggestthat either the corrections are negligible, or they are slightly neg-ative at lower temperatures and gravities.
In the case of Na, the spread in the literature data is evenlarger, and there are both data points with significant Na en-hancement and points with typical solar values. Part of thescatter depends on the need for NLTE corrections. Accordingto Gratton et al. (1999), the 5682–5688Å and the 6154–6160Å
Fig. 8. A search for (anti)-correlations of Al, Mg, Na and Oamong our targets stars. The four panels show different planesof abundance ratios, where stars belonging to each cluster aremarked with different symbols. Dotted lines show solar values,solid lines show linear regressions and the typical uncertainty(∼0.1 dex) is marked on the lower right corner of each panel.
doublets at EW≃100 mÅ both require corrections of about≤0.05–0.10 dex, for solar stars like the ones considered here.The NLTE corrected abundances should be higher than the LTEuncorrected ones: this should make our [Na/Fe] LTE measure-ments in better agreement with literature measurements. Iftheobserved enhancement in [Na/Fe] should prove to be real forOC, this would set OC stars completely apart form Disc stars(De Silva et al., 2009). If the large spread will also prove tobeintrinsic, this would suggest the possibility of light elementschemical anomalies similar, although much less pronounced, tothe ones found in Globular Clusters.
In fact Al and Na, together with Mg and O (and C and N)show puzzling (anti)-correlations in almost all of the studiedGalactic Globular Clusters (Gratton et al., 2004). The mostin-teresting fact concerning the chemical anomalies, is that theyhave never been found outside globular clusters. They are notpresent in the field populations of the Milky Way and its sur-rounding dwarf galaxies, and they only recently have been foundin Fornax and LMC clusters (Letarte et al., 2006; Johnson et al.,2006; Mucciarelli et al., 2009). Recent dedicated searchesforanti-correlations in OC are the one by Martell & Smith (2009),on the strength of CH and CN bands in NGC 188, NGC 2158 andNGC 7789, the one by Smiljanic et al. (2008), based on high res-olution spectroscopy of C, N, O, Na and12C/13C and the one byDe Silva et al. (2009), that compiles and homogenizes literatureNa-O high resolution data. No clear-cut sign of anti-correlationhas been found yet.
If we build the usual (anti)-correlation plots for our five OC(Figure 8), we find no clear sign of chemical anomalies, and inall four plots the spread of each ratio is still compatible withthe typical uncertainty of our measurements, which is of theor-der of 0.1–0.2 dex, depending on the element. In particular,in

... DRAFT ...
October 5, 2009
16 E. Pancino et al.: Abundances of five Open Clusters
the [O/Fe]–[Na/Fe] plane, all 15 stars roughly occupy the solarregion around zero that in Figure 5 by Carretta et al. (2006) con-tains normal stars only (see also De Silva et al., 2009). A possi-ble exception to this total absence of correlations is the [Na/Fe]–[Al /Fe] plane, where a hint of a correlation can be noticed.Statistically, this is not significant and small variationsin Teffcould induce a similar weak correlation. For this reason, anti-correlations are usually a more robust sign of chemical anoma-lies. Still, in light of the discussion by Smiljanic et al. (2008)about the Na-O anti-correlation, our Na-Al results is suggestive.If further studies will show that some chemical anomalies ofthese elements are present in Galactic OC, our analysis (togetherwith that of Smiljanic et al., 2008) shows that they must be ofamuch smaller extent than in Globular Clusters: 0.2–0.3 dex atmost in the [Al/Fe], [Mg/Fe], [Na/Fe] and [O/Fe] for the kindof clusters studied here. In any case, the lack of relations in OCwould point towards one or more of the following environmentalcauses for the presence of anticorrelations in globular clusters:(i) relatively low metallicity (below solar);(ii) dense environ-ment; (iii) total cluster mass of the order of∼104M⊙ or more;(iv) undisturbed environment (e.g. away from the Disc, see alsoCarretta, 2006).
7. Galactic Trends
As said earlier, OC are the fundamental test particles for thestudy of the chemical evolution of the Galactic Disc, and assuch, they produce two of the strongest constraints on chemi-cal models: the Galactic radial trends and the Age-MetallicityRelation (AMR). Since a careful homogeneization of litera-ture data (including not only element ratios, but also ages andGalactocentric radii) is out of the scope of the present paper,we have used the literature data of Table 13, averaging all esti-mates for a single cluster together. We complemented with databy Friel et al. (2002) for those OC lacking high resolution mea-surements. Using 28 OC in common between the two datasets,we found an average offset of [Fe/H]=–0.16±0.13 dex, in thesense that the measurements by Friel et al. (2002) are on av-erage smaller than the ones based on high resolution. We cor-rected Friel et al. (2002) data by this amount before plottingthem. We extracted OC ages from the compilation of Dias et al.(2002)18, and for the Galactocentric Radii (RGC) we used pri-marily Friel et al. (2002), complemented by the WEBDA, andfilled in the few missing clusters with data from the papers ofTable 13. The resulting radial trends and AMR for [Fe/H] and[α/Fe] (computed as in Section 4.2) are plotted in Figures 9 and10 and discussed below.
7.1. Trends with Galactocentric Radius
The trend of abundances with Galactocentric radius RGC givesa strong constraint for the models of Galactic chemical evo-lution as far as the Disc formation mechanism is concerned19.It is now widely accepted (see for example Twarog et al.,1997; Friel et al., 2002; Yong et al., 2005; Sestito et al., 2008;
18 We are aware that at least in the case of NGC 6791, the age givenby Dias et al. (2002) is quite different from other literature estimates(citations in Tabls 13), being lower by at least 2 Gyr. However, buildinga homogeneous age scale is a non-trivial task, and it is beyond the scopeof the present paper.
19 A far stronger constraint would be the variation of this trend withage. Such a study is at the moment not possible, given the small numberof clusters studied with high resolution in a homogenous way.
Fig. 9. Trends of [Fe/H] (top panel) and [α/Fe] (bottom panel)with Galactocentric Radius. Light grey dots in the top panelareOC from Friel et al. (2002), grey dots are the OC compiled inTable 13 and black dots are our data. NGC 2420 estimates by usand Smith & Suntzeff (1987) are connected with a thick dottedline. A linear fits with uncertainty is drawn across all points inboth panels.
Magrini et al., 2009) that there is a clear trend of decreasingmetallicity, measured as [Fe/H], with increasing RGC. Such atrend is clearly detected not only in OC, but also in field stars(B-stars and Cepheids), H II regions and planetary nebulae20
(see Chiappini et al., 2001; Andrievsky et al., 2004; Yong etal.,2005; Lemasle et al., 2008, for some review of literature data).
The first large studies of homogeneous OC abundances(summarized in the review by Friel, 1995), found that old OC(older than the Hyades) were extending outwards in the Disc,much farther out than young OC, and they found a well definedslope out to RGC≃16 kpc. The spread around this slope was atthe time around∼0.2 dex, i.e., generally compatible with (or per-haps slightly larger than) the measurement uncertainties.Such aslope comes naturally in most Galactic chemical evolution mod-els (Tosi, 1982, 1988; Matteucci & Francois, 1989; Tosi, 1996;Chiappini et al., 2001; Andrievsky et al., 2004; Colavitti et al.,2009; Magrini et al., 2009), when different star formation andinfall rates are assumed for the inner and outer Disk. To repro-duce most of the observational constraints, a differential Discformation mechanism is often assumed, either with the innerDisk formed first and then growing in radius (inside-out forma-tion) or with the whole Disk evolving simultaneously, but witha much more intense (and sometimes fast) evolution in the cen-tral, denser parts. A prediction of all models is that the metallic-ity gradient should change with time (although different modelspredict very different time changes, Tosi, 1996) and some predictthat it should flatten out at large radii. Indeed, the first studies ofanticenter and distant clusters (Carraro et al., 2004; Yonget al.,
20 Although we know of at leas one dataset in which PNe show flattrends of oxygen and neon abundances with RGC (Stanghellini et al.,2006).

... DRAFT ...
October 5, 2009
E. Pancino et al.: Abundances of five Open Clusters 17
2005; Carraro et al., 2007; Sestito et al., 2008) showed thatafterRGC≃12 kpc, the relation flattens around a value of [Fe/H]≃–0.3 dex.
Not much can be said with the present data about the slopevariation with time, but the exact value of the slope has beenmat-ter of some debate. As said, earlier studies found a value around–0.09±0.01 dex kpc−1, or –0.07±0.01 dex kpc−1 with the strictlyhomogenous measurements by Friel et al. (2002). An alterna-tive interpretation of a different data compilation (Twarog et al.,1997), describes the trend as two disjoint plateaux, one aroundsolar metallicity and comprising OC within RGC ≃10 kpc,and a second one at an [Fe/H]≃–0.3 outside the solar cir-cle. More recent work based on high resolution compilationsof OC data (Sestito et al., 2008) find a steeper slope of –0.17±0.01 dex kpc−1 within RGC <14 kpc, which still holdswhen considering only the 10 clusters analyzed homogeneouslyby that group. A sort of bimodal distribution is observed in theirFigure 9, where between the very steep slope of the inner clus-ters and the plateau of the outer ones there is a small gap almostdevoid of OC (9<RGC<12 kpc).
Our results are plotted in Figure 9, where we consider thetrend of [Fe/H] and [α/Fe] with RGC. We do see a distinctslope in the inner clusters and a flattening out for the outerones. However, our sample contains∼15 more OC than theone of Sestito et al. (2008), and most of them (including ourfive determinations) fall in the gap around 9<RGC<12 kpc,discussed above. With the addition of these clusters we finda gentler slope of –0.05±0.01 dex kpc−1, in good agree-ment with previous works (Friel, 1995; Friel et al., 2002) andwith the Disk Cepheids within RGC≃11 kps (Andrievsky et al.,2004; Lemasle et al., 2008). If we exclude the clusters outsideRGC=12 kpc and remove the low resolution OC from Friel et al.(2002), the slope does not steepen significantly, becoming –0.06±0.02 dex kpc−1. Also, the flattening out does not seem soabrupt as in Figure 9 by Sestito et al. (2008). The paucity of OCin the flat part of the relation (we have only Be 20, Be 22, Be 29and Saurer 1 in our compilation) surely calls for more high reso-lution studies, since as the data stand now, they look compatiblewith both a plateau and a gradual change in slope. We would liketo note that NGC 2420 (already discussed in Section 5.3) wasplaced at [Fe/H]=–0.57 dex by Smith & Suntzeff (1987), basedon R≃16000 spectra, while we find –0.05, in much better agree-ment with the global Galactic trend. This goes in the direction offilling the gap in the Sestito et al. (2008) compilation, and also inthe Twarog et al. (1997) data-set, pointing more towards a gentleand continuous decrease of [Fe/H].
The trend ofα-enhancement with RGC is also of some impor-tance, since it unveils the role of SNe type Ia and II and theirrel-ative contributions. Yong et al. (2005) found a tendency of theα-enhancement to increase with RGC, as did Magrini et al. (2009),who found this tendency in good agreement with their chemicalevolution model. Also model A by Chiappini et al. (2001) pre-dicted an increase of [α/Fe] with RGC. In our compilation, thetrend appears as a weak slope, that is still perfectly compatiblewith a flat distribution at the 1σ level. This, together with thestudy of slope changes with time, is one typical case in whicha high quality, homogeneous analysis of∼100 OC could give aclear and definitive answer.
7.2. Trends with Age
In spite of the fact that all models predict an evolution of Diskmetallicity with time, albeit maybe only in the first Gyrs, and thefact that such a variation is observed in Disk stars (Reddy etal.,
Fig. 10.Trends of [Fe/H] (top panel) and [α/Fe] (bottom panel)with cluster ages. Symbols are the same as in Figure 9.
2003; Bensby et al., 2004), there appears to be no correlationat all between old OC abundances and ages (see the review byFriel, 1995). More recent results did not change this picture sub-stantially. If confirmed, the lack of an AMR in OC would pointtowards a different source of chemical enrichment for OC stars(Yong et al., 2005) with respect to the Disc stars. In substance,the metallicity of OC stars seems to be more determined by thelocation in which they formed, than by the time at which theyformed.
What we find here is quite encouraging, although still notstatistically significant. We recall that our compilation includes57 high resolution abundance determinations, plus a handful oflow resolution determinations by Friel et al. (2002). Althoughwe have made no attempt to homogeneize the data, except for a–0.16 dex correction to the low resolution abundances, thissam-ple is∼50% larger than any compilation presented before (seee.g., Sestito et al., 2008; De Silva et al., 2009; Magrini et al.,2009) and shows that the community is proceeding fast in fillingup the gaps of our knowledge of OC. Figure 10 shows indeed aweak trend of decreasing [Fe/H] and increasing [α/Fe] with in-creasing age. The slopes are very gentle at best and they are stillcompatible with no trends at all. Nevertheless, if such trends ex-ist, we can put some constraints on them: for [Fe/H], the gradientshould not be significantly larger than –2.6±1.1 10−11 dex Gyr−1
and for [α/Fe] no larger than 1.1±5.0 10−11 dex Gyr−1.
8. Summary and Conclusions
We have analyzed high resolution spectra of three red clump gi-ants in five OC, three of them lacking any previous high reso-lution based chemical analysis. Given the paucity of literaturedata, such a small sample is enough to increase the whole bodyof high resolution data for OC by≃5%. To compare our re-sults with the literature, we have compiled chemical abundancesbased on high resolution data of 57 clusters from the litera-ture. Given the recent and fast progress in the field, this sam-

... DRAFT ...
October 5, 2009
18 E. Pancino et al.: Abundances of five Open Clusters
ple is ∼50% larger than previous literature compilations (e.g.,Friel et al., 2002; Sestito et al., 2008; Magrini et al., 2009). Themain results drawn by the analysis of our five clusters are:
– We provide the first high resolution based abundance analy-sis of Cr 110 ([Fe/H]=+0.03±0.02 (±0.10) dex), NGC 2099([Fe/H]=+0.01±0.05 (±0.10) dex) and NGC 2420 ([Fe/H]=–0.05±0.03 (±0.10) dex), which only had low resolution de-terminations and the R≃16000 analysis by Smith & Suntzeff(1987); our new determination of the metallicity ofNGC 2420 puts this cluster in much better agreement withthe global Galactic trends;
– The abundances found for NGC 7789 ([Fe/H]= +0.04±0.07(±0.10) dex) and M 67 ([Fe/H]= +0.05±0.02 (±0.10) dex)are in good agreement with past high resolution studies;
– We provide the first high resolution based radial velocity de-termination for Cr 110 (< Vr >=41.0±3.8 km s−1);
– We found that all our abundance ratios, with few exceptionsgenerally explained with technical details of the analysispro-cedure, are near-solar, as is typical for OC with similar prop-erties; we found solar ratios also for Na, that is generallyfound overabundant, and for O, which is generally found un-derabundant;
– We do not find any significant sign of anti-correlation (orcorrelation) among Na, Al, Mg and O, in general agreementwith past and recent results, and we can say that if such cor-relations indeed are present in OC, they must be much lessextended than in Globular Clusters, amounting to no morethan 0.2–0.3 dex at most;
With our compilation of literature data, we also could ex-amine global Galactic trends, that are extremely useful to con-struct chemical evolution models for the Galaxy in general andthe Galactic Thin Disc in particular. For the metallicity gradientwe found a slope of –0.06±0.02 dex kpc−1 considering only thehigh resolution data withinRGC=12 kpc. Our compilation con-tains data, including our own determinations, that fill the smallgap around 9<RGC <12 and point towards a gentle and continu-ous decrease, rather than a two step drop such as in Twarog et al.(1997) or a steep slope such as in Sestito et al. (2008). We do finda flattening atRGC >12 kpc and a hint of an increasing [α/Fe] to-wards the outer Disk. Concerning the AMR, we do not find anystrong evidence for it, and we just note some very mild trends. Ifan AMR is indeed present among OC, it must be very weak andwe provide upper limits to its slope both in [Fe/H] and [α/Fe].
Acknowledgements.We warmly thank A. Bragaglia and A. Mucciarelli for theiruseful comments and suggestions.We thank M. Tosi and D. Romano for theirinsights on the chemical evolution modelling of the Milky Way and its Disks.We also warmly thank the Calar Alto Support staff for their hospitality anda good time together. RC, CG and EP acknowledge support by theSpanishMinistry of Science and Technology (Plan Nacional de Investigacion Cientıfica,Desarrollo, e Investigacion Tecnologica, AYA2004-06343). EP acknowledgessupport from the Italian MIUR (Ministero dell’Universitae della Ricerca) un-der PRIN 2003029437, ”Continuities and Discontinuites in the Formation ofthe Galaxy.” RC acknowledges funding by the Spanish Ministry of Science andInnovation under the MICINN/Fullbright post-doctoral fellowship program.
ReferencesAlonso, A., Arribas, S., & Martınez-Roger, C. 1999, A&AS, 140, 261Andrievsky, S. M., Luck, R. E., Martin, P., & Lepine, J. R. D.2004, A&A, 413,
159Arp, H. 1962, ApJ, 136, 66Andersen, J. 1999, Transactions of the IAU, Vol. XXIVA, p.36(1999) , 24, A36Anthony-Twarog B.J., Kaluzny J., Shara M.M., Twarog B.A. 1990, AJ, 99, 1504Anthony-Twarog, B. J., Tanner, D., Cracraft, M., & Twarog, B. A. 2006, AJ, 131,
461
Aoki, W., et al. 2001, ApJ, 561, 346Asplund, M., Grevesse, N., & Sauval, A. J. 2005, ASP Conf. Ser. 336: Cosmic
Abundances as Records of Stellar Evolution and Nucleosynthesis, 336, 25Balaguer-Nunez, L., Galadı-Enrıquez, D., & Jordi, C. 2007, A&A, 470, 585Barbaro, G., & Pigatto, L. 1984, A&A, 136, 355Bartasiute, S., & Tautvaisiene, G. 2004, Ap&SS, 294, 225Baumuller, D., & Gehren, T. 1997, A&A, 325, 1088Bensby, T., Feltzing, S., & Lundstrom, I. 2004, A&A, 421, 969Bessell, M. S. 1979, PASP, 91, 589Boesgaard, A. M., Jensen, E. E. C., & Deliyannis, C. P. 2009, AJ, 137, 4949Bragaglia, A., et al. 2001, AJ, 121, 327Bragaglia A., Tosi M. 2003, MNRAS, 343, 306Bragaglia, A., & Tosi, M. 2006, AJ, 131, 1544Bragaglia, A., Sestito, P., Villanova, S., Carretta, E., Randich, S., Tosi, M. 2008,
A&A, 480, 79Bramich, D. M., et al. 2005, MNRAS, 359, 1096Brown, J. A. 1987, ApJ, 317, 701Brown, J. A., Wallerstein, G., Geisler, D., & Oke, J. B. 1996,AJ, 112, 1551Bruntt, H., Frandsen, S., Kjeldsen, H., & Andersen, M. I. 1999, A&AS, 140, 135Burbidge, E. M., & Sandage, A. 1958, ApJ, 128, 174Burstein, D., Faber, S. M., Gonzalez, J. J., & Spaenhauer, A.1984, BAAS, 16,
968Burstein, D., Faber, S. M., & Gonzalez, J. J. 1986, AJ, 91, 1130Cameron, L. M. 1985, A&A, 147, 39Cannon R.D., Lloyd C. 1970, MNRAS, 150, 279Canterna, R., Geisler, D., Harris, H. C., Olszewski, E., & Schommer, R. 1986,
AJ, 92, 79Cardelli, J. A., Clayton, G. C., & Mathis, J. S. 1989, ApJ, 345, 245Carraro, G. & Chiosi, C. A&A 1994, 287, 761Carraro, G., Girardi, L., Bressan, A., & Chiosi, C. 1996, A&A, 305, 849Carraro, G., Bresolin, F., Villanova, S., Matteucci, F., Patat, F., & Romaniello,
M. 2004, AJ, 128, 1676Carraro, G., Villanova, S., Demarque, P., McSwain, M. V., Piotto, G., & Bedin,
L. R. 2006, ApJ, 643, 1151Carraro, G., Geisler, D., Villanova, S., Frinchaboy, P. M.,& Majewski, S. R.
2007, A&A, 476, 217Carrera, R., Gallart, C., Pancino, E., & Zinn, R. 2007, AJ, 134, 1298Carretta, E., & Gratton, R. G. 1997, A&AS, 121, 95Carretta, E., Bragaglia, A., Gratton, R. G., & Tosi, M. 2004,A&A, 422, 951Carretta, E., Bragaglia, A., Gratton, R. G., & Tosi, M. 2005,A&A, 441, 131Carretta, E., Bragaglia, A., Gratton, R. G., Leone, F., Recio-Blanco, A., &
Lucatello, S. 2006, A&A, 450, 523Carretta, E. 2006, AJ, 131, 1766Carretta, E., Bragaglia, A., & Gratton, R. G. 2007, A&A, 473,129Cayrel de Strobel, G. 1990, Memorie della Societa Astronomica Italiana, 61, 613Cayrel, R., et al. 2004, A&A, 416, 1117Chen , L., Hou, J. L. & Wang, J. J. 2003, AJ, 125, 1397Chiappini, C., Matteucci, F., & Romano, D. 2001, ApJ, 554, 1044Claria, J. J. 1979, Ap&SS, 66, 201Claria, J. J., Mermilliod, J.-C., & Piatti, A. E. 1999, A&AS, 134, 301Cohen, J. G. 1980, ApJ, 241, 981Colavitti, E., Cescutti, G., Matteucci, F., & Murante, G. 2009, A&A, 496, 429Dawson D.W., Ianna P.A. 1995, AJ, 115, 1076Demarque, P. 1980, Star Formation, 85, 281Den Hartog, E. A., Lawler, J. E., Sneden, C., Cowan, J. J. 2003ApJS..148..543De Silva, G. M., Sneden, C., Paulson, D. B., Asplund, M., Bland-Hawthorn, J.,
Bessell, M. S., & Freeman, K. C. 2006, AJ, 131, 455De Silva, G. M., Freeman, K. C., Asplund, M., Bland-Hawthorn, J., Bessell,
M. S., & Collet, R. 2007, AJ, 133, 1161De Silva, G. M., Gibson, B. K., Lattanzio, J., Asplund, M. 2009, accepted by
A&A Letters, preprint DOI: 10.1051/0004-6361/200912279Dias, W. S., Alessi, B. S., Moitinho, A., & Lepine, J. R. D. 2002, A&A, 389, 871Dinescu, D. I., Demarque, P., Guenther, D. B., & Pinsonneault, M. H. 1995, AJ,
109, 2090Dean, J. F., Warren, P. R., & Cousins, A. W. J. 1978, MNRAS, 183, 569Demarque, P., Guenther, D. B., & Green, E. M. 1992, AJ, 103, 151Demarque, P., Sarajedini, A., & Guo, X.-J. 1994, ApJ, 426, 165D’Orazi, V., Magrini, L., Randich, S., Galli, D., Busso, M.,& Sestito, P. 2009,
ApJ, 693, L31Edvardsson, B., Andersen, J., Gustafsson, B., Lambert, D. L., Nissen, P. E.,
Tomkin, J., 1993, A&A, 275, 101Fagerholm E. 1906, Uppsala dissertationFan X., Burstein D., Chen J.-S., Zhu J., Jlang Z., Wu H., et al.1996, AJ, 112,
628Ford, A., Jeffries, R. D., & Smalley, B. 2005, MNRAS, 364, 272Foy, R., & Proust, D. 1981, A&A, 99, 221Freeland, E., Deliyannis, C. P., Steinhauer, A., & Sarajedini, A. 2002, Bulletin
of the American Astronomical Society, 34, 655

... DRAFT ...
October 5, 2009
E. Pancino et al.: Abundances of five Open Clusters 19
Friel E.D., Janes K.A. 1993 A&A, 267, 75Friel, E. D. 1995, ARA&A, 33, 381Friel E.D., Liu T, Janes K.A. 1989 PASP 101, 1105Friel, E. D., & Boesgaard, A. M. 1992, ApJ, 387, 170Friel, E. D., Janes, K. A., Tavarez, M., Scott, J., Katsanis,R., Lotz, J., Hong, L.,
& Miller, N. 2002, AJ, 124, 2693Friel, E. D., Jacobson, H. R., Barrett, E., Fullton, L., Balachandran, S. C., &
Pilachowski, C. A. 2003, AJ, 126, 2372Friel, E. D., Jacobson, H. R., & Pilachowski, C. A. 2005, AJ, 129, 2725Frinchaboy, P. M., Marino, A. F., Villanova, S., Carraro, G., Majewski, S. R., &
Geisler, D. 2008, MNRAS, 391, 39Garcia Lopez, R. J., Rebolo, R., & Beckman, J. E. 1988, PASP, 100, 1489Gebran, M., & Monier, R. 2008, A&A, 483, 567Geisler, D., Claria, J. J., & Minniti, D. 1991, AJ, 102, 1836Geisler, D., Claria, J. J., & Minniti, D. 1992, AJ, 104, 1892Gilliland, R. L., & Brown, T. M. 1992, AJ, 103, 1945Gim M., Hesser J.E., McClure R.D., Stetson P.B. 1998 PASP, 110, 1172Gim M., Vandenberg D.A., Stetson P.B., Hesser J.E., Zurek D.R. 1998, PASP,
110, 1318Girardi, L., & Salaris, M. 2001, MNRAS, 323, 109Gonzalez, G., & Wallerstein, G. 2000, PASP, 112, 1081Gratton, R. G., & Contarini, G. 1994, A&A, 283, 911Gratton, R. G., Carretta, E., Eriksson, K., Gustafsson, B. 1999, A&A, 350, 955Gratton, R. G., et al. 2001, A&A, 369, 87Gratton, R. 2000, ASP Conf. Ser. 198: Stellar Clusters and Associations:
Convection, Rotation, and Dynamos, 198, 225Gratton, R., Sneden, C., & Carretta, E. 2004, ARA&A, 42, 385Grevesse, N., Noels, A., & Sauval, A. J. 1996, ASP Conf. Ser. 99: Cosmic
Abundances, 99, 117Grocholski A. J., & Sarajedini A. 2003, MNRAS, 345, 1015Hamdani, S., North, P., Mowlavi, N., Raboud, D., & Mermilliod, J.-C. 2000,
A&A, 360, 509Harris, W. E. 1996, AJ, 112, 1487Hartman, J. D., Gaudi, B. S., Holman, M. J., McLeod, B. A., Stanek, K. Z.,
Barranco, J. A., Pinsonneault, M. H., & Kalirai, J. S. 2008, ApJ, 675, 1254Hobbs, L. M., & Thorburn, J. A. 1991, AJ, 102, 1070Hoffleit, D. & Jaschek, C. —. 1991, New Haven, Conn.: Yale University
Observatory, —c1991, 5th rev.ed., edited by Hoffleit, Dorrit; Jaschek, Carlos—v(coll.),
Houdashelt M.L., Frogel J.A., Cohen J.G. 1992, AJ, 103, 163Jacobson, H. R., Friel, E. D., & Pilachowski, C. A. 2007, AJ, 134, 1216Jacobson, H. R., Friel, E. D., & Pilachowski, C. A. 2008, AJ, 135, 2341Jacobson, H. R., Friel, E. D., & Pilachowski, C. A. 2009, AJ, 137, 4753Jacquinet-Husson, N., Ari, E., Ballard, J., Barbe, A., Bjoraker, G. et al. 1999,
JQSRT, 62, 205Jacquinet-Husson, N., Scott, N. A., Garceran, K., Armante,R., Chedin, A. 2005,
JQSRT, 95, 429Jahn, K., Kaluzny, J., & Rucinski, S. M. 1995, A&A, 295, 101Janes, K. A. 1977, AJ, 82, 35Janes, K. A. 1979, ApJS, 39, 135Janes K.A., Smith G.H. 1984, AJ, 89, 487Janes, K. A., Tilley, C., & Lynga, G. 1988, AJ, 95, 771Janes, K. A., & Phelps, R. L. 1994, AJ, 108, 1773Jennens, P. A., & Helfer, H. L. 1975, MNRAS, 172, 681Johansson, S., Litzen, U., Lundberg, H., & Zhang, Z. 2003, ApJ, 584, L107Johnson, J. A., Ivans, I. I., & Stetson, P. B. 2006, ApJ, 640, 801Jones, B. F., Fischer, D., & Soderblom, D. R. 1999, AJ, 117, 330Kinman, T., & Castelli, F. 2002, A&A, 391, 1039Kalirai J.S., Ventura P., Richer H.B., Fahlman G.G., Durrell P.R., D’Antona F.,
Marconi G. 2001, AJ, 122, 3239Kalirai, J. S., & Tosi, M. 2004, MNRAS, 351, 649Kiss L.L., Szabo Gy., Sziladi K., Furesz G., Sarneczky K., Csak B. 2001, A&A,
376, 561Kraft, R. P., & Ivans, I. I. 2003, PASP, 115, 143Kupka, F., Piskunov, N., Ryabchikova, T. A., Stempels, H. C., & Weiss, W. W.
1999, A&AS, 138, 119Kustner K. 1923, Veroeff. Univ. Sternw., Bonn no 18Lasker B.M., Russel J.N., Jenkner H., Sturch C.R., McLean B.J., Shara M.M.
1990, AJ, 99, 2019Lattanzio, J. C. 1984, MNRAS, 207, 309Laugalys, V., Kazlauskas, A., Boyle, R. P., Vrba, F. J., Davis Philip, A. G. &
Straizys, V. 2004, Baltic Astronomy, 13, 1Lemasle, B., Francois, P., Piersimoni, A., Pedicelli, S.,Bono, G., Laney, C. D.,
Primas, F., & Romaniello, M. 2008, A&A, 490, 613Letarte, B., Hill, V., Jablonka, P., Tolstoy, E., Francois, P., & Meylan, G. 2006,
A&A, 453, 547Liu T., Janes K.A. 1987, PASP, 99, 1076
Lyngå, G. 1987, European Regional Astronomy Meeting of the IAU, Volume 4,4, 121
Magain, P. 1984, A&A, 134, 189Magrini, L., Sestito, P., Randich, S., & Galli, D. 2009, A&A,494, 95Marshall, J. L., Burke, C. J., DePoy, D. L., Gould, A., & Kollmeier, J. A. 2005,
AJ, 130, 1916Martell, S. L., & Smith, G. H. 2009, arXiv:0905.3175Martinez Roger, C., Paez, E., Castellani, V., & Straniero, O. 1994, A&A, 290,
62Mathieu R.D., Latham D.W., Griffin R.F., Gunn J.E. 1986, AJ, 92, 1100Matteucci, F., & Francois, P. 1989, MNRAS, 239, 885Mazzei, P., & Pigatto, L. 1988, A&A, 193, 148McClure, R. D., Forrester, W. T., & Gibson, J. 1974, ApJ, 189,409McClure, R. D., Newell, B., & Barnes, J. V. 1978, PASP, 90, 170McNamara, B. J. 1980, PASP, 92, 682McWilliam, A., Preston, G. W., Sneden, C., & Searle, L. 1995,AJ, 109, 2757McWilliam, A., Matteucci, F., Ballero, S., Rich, R. M., Fulbright, J. P., &
Cescutti, G. 2008, AJ, 136, 367Melo C.H.F., Pasquini L., De Medeiros J.R. 2001, A&A, 375, 851Mermilliod, J.-C. 1995, ASSL Vol. 203: Information & On-Line Data in
Astronomy, 127Mermilliod, J.-C., Huestamendia, G., del Rio, G., Mayor, M.1996, A&A, 307,
80Mermilliod, J. C., Mayor, M., & Udry, S. 2008, A&A, 485, 303Meynet, G., Mermilliod, J.-C., & Maeder, A. 1993, A&AS, 98, 477Milone, A. A. E., & Latham, D. W. 1994, AJ, 108, 1828Mochejska B.J., Kaluzny J. 1999, Acta Astron., 49, 351Montegriffo, P., Ferraro, F. R., Origlia, L., & Fusi Pecci, F. 1998, MNRAS, 297,
872Montgomery, K. A., Marschall, L. A., & Janes, K. A. 1993, AJ, 106, 181Moore, C. E., Minnaert, M. G. J., & Houtgast, J. 1966, National Bureau
of Standards Monograph, Washington: US Government Printing Office(USGPO)
Mucciarelli, A., Origlia, L., Ferraro, F. R., & Pancino, E. 2009, ApJ, 695, L134Nilakshi, Sagar R. 2002, A&A, 381, 65Nissen, P. E., Twarog, B. A., & Crawford, D. L. 1987, AJ, 93, 634Origlia, L., Valenti, E., Rich, R. M., & Ferraro, F. R. 2006, ApJ, 646, 499Pace, G., Pasquini, L., & Francois, P. 2008, A&A, 489, 403Panagia, N., & Tosi, M. 1980, A&A, 81, 375Pasquini, L., Randich, S., & Pallavicini, R. 1997, A&A, 325,535Pasquini, L., Randich, S., Zoccali, M., Hill, V., Charbonnel, C., & Nordstrom, B.
2004, A&A, 424, 951Pasquini, L., Biazzo, K., Bonifacio, P., Randich, S., & Bedin, L. R. 2008, A&A,
489, 677Paulson, D. B., Sneden, C., & Cochran, W. D. 2003, AJ, 125, 3185Pilachowski, C. A., Wallerstein, G., & Canterna, R. 1980, ApJ, 235, L21Pilachowski, A. A. 1985, PASP, 97, 801Peterson, R. C., & Green, E. M. 1998, ApJ, 502, L39Pilachowski, C. 1986, ApJ, 300, 289Pilachowski C.A., Saha A., Hobbs L.M. 1988, PASP, 100, 474Plez, B., Brett, J. M., & Nordlund, A. 1992, A&A, 256, 551Pols, O. R., Schroder, K.-P., Hurley, J. R., Tout, C. A., & Eggleton, P. P. 1998,
MNRAS, 298, 525Prochaska, J. X., & McWilliam, A. 2000, ApJ, 537, L57Racine, R. 1971, ApJ, 168, 393Ramırez, S. V., & Cohen, J. G. 2003, AJ, 125, 224Randich, S., Pallavicini, R., Meola, G., Stauffer, J. R., & Balachandran, S. C.
2001, A&A, 372, 862Randich, S., Sestito, P., & Pallavicini, R. 2003, A&A, 399, 133Randich, S., Sestito, P., Primas, F., Pallavicini, R., & Pasquini, L. 2006, A&A,
450, 557Randich, S., Primas, F., Pasquini, L., Sestito, P., & Pallavicini, R. 2007, A&A,
469, 163Reddish, V. C. 1954, MNRAS, 114, 583Reddy, B. E., Tomkin, J., Lambert, D. L., & Allende Prieto, C.2003, MNRAS,
340, 304Reddy, B. E., Lambert, D. L., & Allende Prieto, C. 2006, MNRAS, 367, 1329Rutten, R. J., van der Zalm, E. B. J. 1984, A&AS, 55, 171Salaris, M., Cassisi, S. 1998, MNRAS, 298, 166Salaris, M., Weiss, A., & Percival, S. M. 2004, A&A, 414, 163Sandquist E.L. 2004, MNRAS, 347, 101Santos, N. C., Lovis, C., Pace, G., Melendez, J., & Naef, D. 2009, A&A, 493,
309Sarajedini, A. 1999, AJ, 118, 2321Sarma, M. B. K., & Walker, M. F. 1962, ApJ, 135, 11Schonberner, D., Andrievsky, S. M., & Drilling, J. S. 2001,A&A, 366, 490Schuler, S. C., King, J. R., Fischer, D. A., Soderblom, D. R.,& Jones, B. F. 2003,
AJ, 125, 2085

... DRAFT ...
October 5, 2009
20 E. Pancino et al.: Abundances of five Open Clusters
Scott J.E., Friel E.D., Janes K.A. 1995, AJ, 109, 1706Sestito, P., Randich, S., Mermilliod, J.-C., & Pallavicini, R. 2003, A&A, 407,
289Sestito, P., Randich, S., & Bragaglia, A. 2007, A&A, 465, 185Sestito, P., Bragaglia, A., Randich, S., Pallavicini, R., Andrievsky, S. M., &
Korotin, S. A. 2008, A&A, 488, 943Shetrone, M. D., & Sandquist, E. L. 2000, AJ, 120, 1913Skrutskie, M. F., et al. 2006, AJ, 131, 1163Smiljanic, R., Gauderon, R., North, P., Barbuy, B., Charbonnel, C., & Mowlavi,
N. 2008, arXiv:0810.1701Spite, M. 1967, Annales d’Astrophysique, 30, 211Steffen, M. 1985, A&AS, 59, 403Smith, V. V., & Suntzeff, N. B. 1987, AJ, 93, 359Stanghellini, L., Guerrero, M. A., Cunha, K., Manchado, A.,& Villaver, E. 2006,
ApJ, 651, 898Stetson, P. B. 1987, PASP, 99, 191Stetson P.B. 2000, PASP, 112, 925Stetson, P. B., & Pancino, E. 2008, PASP, 120, 1332Strom, K. M., & Strom, S. E. 1970, ApJ, 162, 523Suntzeff N.B., Schommer R.A., Olzewski E.W., Walker A.R. 1992, AJ, 104,
1743Tadross, A. L., Werner, P., Osman, A., & Marie, M. 2002, New Astronomy, 7,
553Tautvaisiene, G., Edvardsson, B., Tuominen, I., Ilyin, I.2000, A&A, 360, 499Tautvaisiene, G., Edvardsson, B., Puzeras, E., & Ilyin, I. 2005, A&A, 431, 933Tiede, G. P., Martini, P., & Frogel, J. A. 1997, AJ, 114, 694Tosi, M. 1982, ApJ, 254, 699Tosi, M. 1988, A&A, 197, 47Tosi, M. 1996, From Stars to Galaxies: the Impact of Stellar Physics on Galaxy
Evolution, 98, 299Tsarevskii G. S., Abakumov I. E. 1971, Astron. Tsirk., 631, 6Twarog, B. A., & Tyson, N. 1985, AJ, 90, 1247Twarog, B. A., Ashman, K. M., & Anthony-Twarog, B. J. 1997, AJ, 114, 2556Twarog, B. A., Anthony-Twarog, B. J., & De Lee, N. 2003, AJ, 125, 1383Vallenari, A., Carraro, G., & Richichi, A. 2000, A&A, 353, 147van Altena, W. F., & Jones, B. F. 1970, A&A, 8, 112Vandenberg, D. A. 1985, ApJS, 58, 711VandenBerg, D. A., & Clem, J. L. 2003, AJ, 126, 778van Zeipel H., Lindgren J. 1921, Kungl. Sven. Vet. Handl. 61 no 15Villanova, S., Carraro, G., Bresolin, F., & Patat, F. 2005, AJ, 130, 652Villanova, S., Baume, G., & Carraro, G. 2007, MNRAS, 379, 1089Warren, S. R., & Cole, A. A. 2008, arXiv:0811.2925West, F. R. 1967, Publications of the Goethe Link Observatory, 75, 359West, F. R. 1967, ApJS, 14, 384Yadav, R. K. S., et al. 2008, A&A, 484, 609Yong D., Carney B.W., Texeira de Almeida M.L. 2005, AJ, 130, 597Zinn, R., & West, M. J. 1984, ApJS, 55, 45