Possible burst-like facet growth mode at high temperatures
7
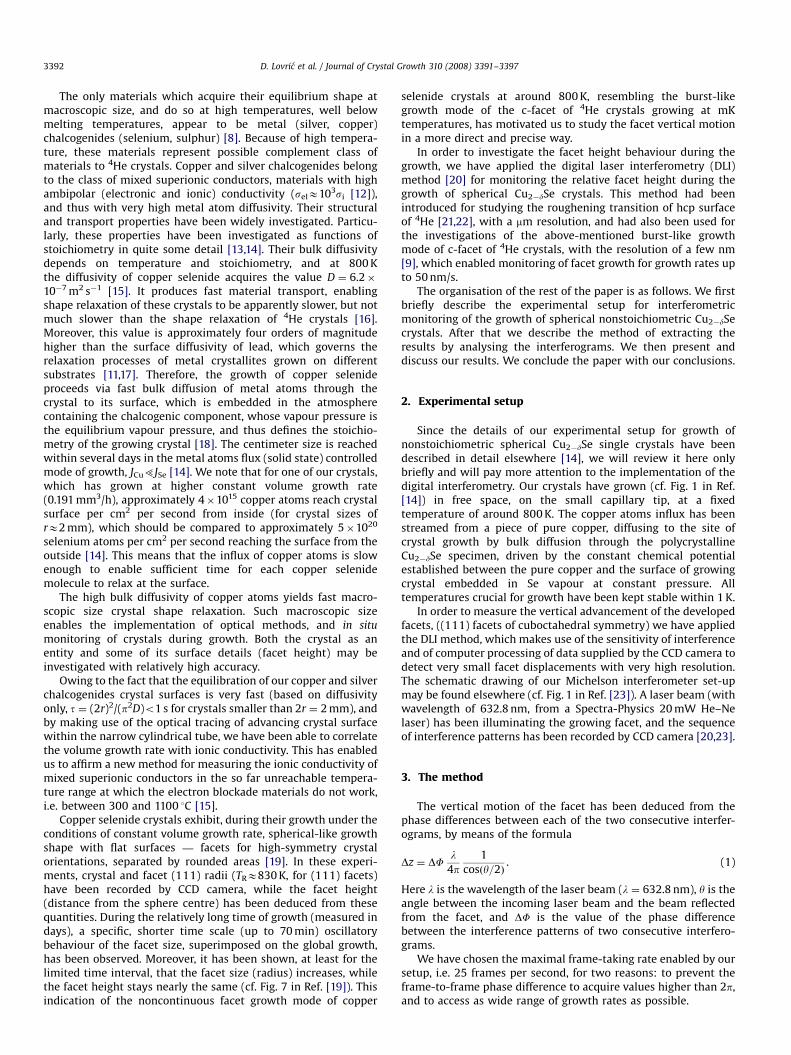
Possible burst-like facet growth mode at high temperatures Davorin Lovric ´ , Zlatko Vuc ˇic ´ , Jadranko Gladic ´ Institute of Physics, Bijenic ˇka cesta 46, P.O. Box 304, 10000 Zagreb, Croatia article info Article history: Received 3 March 2008 Received in revised form 11 April 2008 Accepted 19 April 2008 Communicated by Y. Furukawa Available online 3 May 2008 PACS: 81.10.h 81.10.Aj Keywords: A1. Diffusion A1. Growth models A1. Nucleation A1. Supersaturation A2. Single-crystal growth B2. Superionic conductors abstract A decade ago, a burst-like growth mode of c-facets of 4 He crystals growing at mK temperatures, characterized by the alternation of time intervals during which the facet does not advance with the intervals of its fast advancement, was found [J.P. Ruutu, P.J. Hakonen, A.V. Babkin, A.Y. Parshin, J.S. Penttila ¨, J.P. Sarama ¨ki, G. Tvalashvili, Phys. Rev. Lett. 76 (1996) 4187]. We investigate the possibility that a similar facet growth mode exists for facets at high growth temperatures. We have applied the digital laser interferometry for monitoring facet kinetics of spherical copper selenide single crystals during their growth at constant volume growth rate around 800 K. Our analysis of directly measured (111) facet advancement curves has revealed that they consist of time intervals during which the facet does not advance vertically alternating with the time intervals of enhanced growth, resembling the burst-like facet growth mode. The results are discussed in terms of the enhancement of the local supersaturation induced by the existence of nucleation barrier. & 2008 Elsevier B.V. All rights reserved. 1. Introduction Helium crystals have been established as model systems for studying crystal surfaces [2]. In contact with superfluid helium, 4 He crystals equilibrate their surface very rapidly, due to high thermal conductivity of both liquid and solid 4 He and low latent heat of crystallisation. Moreover, because of the dissipation-free flow in superfluid He phase, through which all mass transport takes place, these crystals evolve very quickly [2,3]. In fact, the processes of growing and melting of 4 He crystals on temperatures below 0.5 K develop so easily that the crystallisation waves may propagate on their surface [2]. The equilibrated macroscopic size of these crystals enables the classical optical methods to be used for study of their global growth and shape. The existence of such low temperature and quantum systems for studying crystal surfaces calls for some classical complement, that is, high- temperature system. The small group of materials which acquire their equilibrium form at macroscopic (up to 1 cm) size on an experimentally practical time scale of up to several days [4,5] also include ice single crystals [6], some organic crystals [7] and metal chalcogenides [8]. Below the (0 0 0 1) facet roughening temperature the surface of equilibrated 4 He single crystals exhibits smooth {0 0 0 1} facets coexisting with the surrounding rough, rounded areas [2,3]. For 4 He crystal facets, either without dislocations or having a very low density of them, a new growth mode of the c-facet, termed burst-like growth mode, has been detected [1,9]. The intervals of facet advancement (up to a few thousand layers per second, depending on the growth rate) alternate with intervals during which the facet does not grow, or grows very slowly. The facet growth event has been recorded by a sudden drop of overpressure (for growth rates higher than 50 nm/s), or by analysing the interference pattern for lower values of growth rate. For this burst-like facet growth mode of 4 He crystals, the interpretation based on quantum tunnelling has been suggested [2,9,10]. Among the materials whose equilibrium shape has been investigated at higher temperatures are small metal particles (Pb, Au, Sn, In) growing on various substrates (graphite, Ru) [10,11]. However, due to the long time duration needed for shape relaxation [4], their equilibrium size has been restricted to less than 10 mm, excluding the use of optical methods for quantitative monitoring of kinetics of their growth. Only recently, the step dynamics on small Pb crystallites grown on ruthenium substrate has been investigated in detail, using STM, at temperatures around 400 K [11]. ARTICLE IN PRESS Contents lists available at ScienceDirect journal homepage: www.elsevier.com/locate/jcrysgro Journal of Crystal Growth 0022-0248/$ - see front matter & 2008 Elsevier B.V. All rights reserved. doi:10.1016/j.jcrysgro.2008.04.030 Corresponding author. Tel.: +38514698864; fax: +38514898889. E-mail address: [email protected] (D. Lovric ´). Journal of Crystal Growth 310 (2008) 3391–3397
Transcript of Possible burst-like facet growth mode at high temperatures
ARTICLE IN PRESS
Journal of Crystal Growth 310 (2008) 3391– 3397
Contents lists available at ScienceDirect
Journal of Crystal Growth
0022-02
doi:10.1
� Corr
E-m
journal homepage: www.elsevier.com/locate/jcrysgro
Possible burst-like facet growth mode at high temperatures
Davorin Lovric �, Zlatko Vucic, Jadranko Gladic
Institute of Physics, Bijenicka cesta 46, P.O. Box 304, 10000 Zagreb, Croatia
a r t i c l e i n f o
Article history:
Received 3 March 2008
Received in revised form
11 April 2008
Accepted 19 April 2008
Communicated by Y. Furukawaa similar facet growth mode exists for facets at high growth temperatures. We have applied the digital
Available online 3 May 2008
PACS:
81.10.�h
81.10.Aj
Keywords:
A1. Diffusion
A1. Growth models
A1. Nucleation
A1. Supersaturation
A2. Single-crystal growth
B2. Superionic conductors
48/$ - see front matter & 2008 Elsevier B.V. A
016/j.jcrysgro.2008.04.030
esponding author. Tel.: +38514698864; fax:
ail address: [email protected] (D. Lovric).
a b s t r a c t
A decade ago, a burst-like growth mode of c-facets of 4He crystals growing at mK temperatures,
characterized by the alternation of time intervals during which the facet does not advance with the
intervals of its fast advancement, was found [J.P. Ruutu, P.J. Hakonen, A.V. Babkin, A.Y. Parshin, J.S.
Penttila, J.P. Saramaki, G. Tvalashvili, Phys. Rev. Lett. 76 (1996) 4187]. We investigate the possibility that
laser interferometry for monitoring facet kinetics of spherical copper selenide single crystals during
their growth at constant volume growth rate around 800 K. Our analysis of directly measured (111)
facet advancement curves has revealed that they consist of time intervals during which the facet does
not advance vertically alternating with the time intervals of enhanced growth, resembling the burst-like
facet growth mode. The results are discussed in terms of the enhancement of the local supersaturation
induced by the existence of nucleation barrier.
& 2008 Elsevier B.V. All rights reserved.
1. Introduction
Helium crystals have been established as model systems forstudying crystal surfaces [2]. In contact with superfluid helium,4He crystals equilibrate their surface very rapidly, due to highthermal conductivity of both liquid and solid 4He and low latentheat of crystallisation. Moreover, because of the dissipation-freeflow in superfluid He phase, through which all mass transporttakes place, these crystals evolve very quickly [2,3]. In fact, theprocesses of growing and melting of 4He crystals on temperaturesbelow 0.5 K develop so easily that the crystallisation waves maypropagate on their surface [2]. The equilibrated macroscopic sizeof these crystals enables the classical optical methods to be usedfor study of their global growth and shape. The existence of suchlow temperature and quantum systems for studying crystalsurfaces calls for some classical complement, that is, high-temperature system. The small group of materials which acquiretheir equilibrium form at macroscopic (up to 1 cm) size on anexperimentally practical time scale of up to several days [4,5] alsoinclude ice single crystals [6], some organic crystals [7] and metalchalcogenides [8].
ll rights reserved.
+38514898889.
Below the (0 0 0 1) facet roughening temperature the surface ofequilibrated 4He single crystals exhibits smooth {0 0 0 1} facetscoexisting with the surrounding rough, rounded areas [2,3].For 4He crystal facets, either without dislocations or having avery low density of them, a new growth mode of the c-facet,termed burst-like growth mode, has been detected [1,9]. Theintervals of facet advancement (up to a few thousand layers persecond, depending on the growth rate) alternate with intervalsduring which the facet does not grow, or grows very slowly. Thefacet growth event has been recorded by a sudden drop ofoverpressure (for growth rates higher than 50 nm/s), or byanalysing the interference pattern for lower values of growthrate. For this burst-like facet growth mode of 4He crystals, theinterpretation based on quantum tunnelling has been suggested[2,9,10].
Among the materials whose equilibrium shape has beeninvestigated at higher temperatures are small metal particles(Pb, Au, Sn, In) growing on various substrates (graphite, Ru)[10,11]. However, due to the long time duration needed for shaperelaxation [4], their equilibrium size has been restricted to lessthan 10 mm, excluding the use of optical methods for quantitativemonitoring of kinetics of their growth. Only recently, the stepdynamics on small Pb crystallites grown on ruthenium substratehas been investigated in detail, using STM, at temperaturesaround 400 K [11].
ARTICLE IN PRESS
D. Lovric et al. / Journal of Crystal Growth 310 (2008) 3391–33973392
The only materials which acquire their equilibrium shape atmacroscopic size, and do so at high temperatures, well belowmelting temperatures, appear to be metal (silver, copper)chalcogenides (selenium, sulphur) [8]. Because of high tempera-ture, these materials represent possible complement class ofmaterials to 4He crystals. Copper and silver chalcogenides belongto the class of mixed superionic conductors, materials with highambipolar (electronic and ionic) conductivity (selE103si [12]),and thus with very high metal atom diffusivity. Their structuraland transport properties have been widely investigated. Particu-larly, these properties have been investigated as functions ofstoichiometry in quite some detail [13,14]. Their bulk diffusivitydepends on temperature and stoichiometry, and at 800 Kthe diffusivity of copper selenide acquires the value D ¼ 6.2�10�7 m2 s�1 [15]. It produces fast material transport, enablingshape relaxation of these crystals to be apparently slower, but notmuch slower than the shape relaxation of 4He crystals [16].Moreover, this value is approximately four orders of magnitudehigher than the surface diffusivity of lead, which governs therelaxation processes of metal crystallites grown on differentsubstrates [11,17]. Therefore, the growth of copper selenideproceeds via fast bulk diffusion of metal atoms through thecrystal to its surface, which is embedded in the atmospherecontaining the chalcogenic component, whose vapour pressure isthe equilibrium vapour pressure, and thus defines the stoichio-metry of the growing crystal [18]. The centimeter size is reachedwithin several days in the metal atoms flux (solid state) controlledmode of growth, JCu5JSe [14]. We note that for one of our crystals,which has grown at higher constant volume growth rate(0.191 mm3/h), approximately 4�1015 copper atoms reach crystalsurface per cm2 per second from inside (for crystal sizes ofrE2 mm), which should be compared to approximately 5�1020
selenium atoms per cm2 per second reaching the surface from theoutside [14]. This means that the influx of copper atoms is slowenough to enable sufficient time for each copper selenidemolecule to relax at the surface.
The high bulk diffusivity of copper atoms yields fast macro-scopic size crystal shape relaxation. Such macroscopic sizeenables the implementation of optical methods, and in situ
monitoring of crystals during growth. Both the crystal as anentity and some of its surface details (facet height) may beinvestigated with relatively high accuracy.
Owing to the fact that the equilibration of our copper and silverchalcogenides crystal surfaces is very fast (based on diffusivityonly, t ¼ (2r)2/(p2D)o1 s for crystals smaller than 2r ¼ 2 mm), andby making use of the optical tracing of advancing crystal surfacewithin the narrow cylindrical tube, we have been able to correlatethe volume growth rate with ionic conductivity. This has enabledus to affirm a new method for measuring the ionic conductivity ofmixed superionic conductors in the so far unreachable tempera-ture range at which the electron blockade materials do not work,i.e. between 300 and 1100 1C [15].
Copper selenide crystals exhibit, during their growth under theconditions of constant volume growth rate, spherical-like growthshape with flat surfaces — facets for high-symmetry crystalorientations, separated by rounded areas [19]. In these experi-ments, crystal and facet (111) radii (TRE830 K, for (111) facets)have been recorded by CCD camera, while the facet height(distance from the sphere centre) has been deduced from thesequantities. During the relatively long time of growth (measured indays), a specific, shorter time scale (up to 70 min) oscillatorybehaviour of the facet size, superimposed on the global growth,has been observed. Moreover, it has been shown, at least for thelimited time interval, that the facet size (radius) increases, whilethe facet height stays nearly the same (cf. Fig. 7 in Ref. [19]). Thisindication of the noncontinuous facet growth mode of copper
selenide crystals at around 800 K, resembling the burst-likegrowth mode of the c-facet of 4He crystals growing at mKtemperatures, has motivated us to study the facet vertical motionin a more direct and precise way.
In order to investigate the facet height behaviour during thegrowth, we have applied the digital laser interferometry (DLI)method [20] for monitoring the relative facet height during thegrowth of spherical Cu2�dSe crystals. This method had beenintroduced for studying the roughening transition of hcp surfaceof 4He [21,22], with a mm resolution, and had also been used forthe investigations of the above-mentioned burst-like growthmode of c-facet of 4He crystals, with the resolution of a few nm[9], which enabled monitoring of facet growth for growth rates upto 50 nm/s.
The organisation of the rest of the paper is as follows. We firstbriefly describe the experimental setup for interferometricmonitoring of the growth of spherical nonstoichiometric Cu2�dSecrystals. After that we describe the method of extracting theresults by analysing the interferograms. We then present anddiscuss our results. We conclude the paper with our conclusions.
2. Experimental setup
Since the details of our experimental setup for growth ofnonstoichiometric spherical Cu2�dSe single crystals have beendescribed in detail elsewhere [14], we will review it here onlybriefly and will pay more attention to the implementation of thedigital interferometry. Our crystals have grown (cf. Fig. 1 in Ref.[14]) in free space, on the small capillary tip, at a fixedtemperature of around 800 K. The copper atoms influx has beenstreamed from a piece of pure copper, diffusing to the site ofcrystal growth by bulk diffusion through the polycrystallineCu2�dSe specimen, driven by the constant chemical potentialestablished between the pure copper and the surface of growingcrystal embedded in Se vapour at constant pressure. Alltemperatures crucial for growth have been kept stable within 1 K.
In order to measure the vertical advancement of the developedfacets, ((111) facets of cuboctahedral symmetry) we have appliedthe DLI method, which makes use of the sensitivity of interferenceand of computer processing of data supplied by the CCD camera todetect very small facet displacements with very high resolution.The schematic drawing of our Michelson interferometer set-upmay be found elsewhere (cf. Fig. 1 in Ref. [23]). A laser beam (withwavelength of 632.8 nm, from a Spectra-Physics 20 mW He–Nelaser) has been illuminating the growing facet, and the sequenceof interference patterns has been recorded by CCD camera [20,23].
3. The method
The vertical motion of the facet has been deduced from thephase differences between each of the two consecutive interfer-ograms, by means of the formula
Dz ¼ DFl
4p1
cosðy=2Þ. (1)
Here l is the wavelength of the laser beam (l ¼ 632.8 nm), y is theangle between the incoming laser beam and the beam reflectedfrom the facet, and DF is the value of the phase differencebetween the interference patterns of two consecutive interfero-grams.
We have chosen the maximal frame-taking rate enabled by oursetup, i.e. 25 frames per second, for two reasons: to prevent theframe-to-frame phase difference to acquire values higher than 2p,and to access as wide range of growth rates as possible.
ARTICLE IN PRESS
0
0.1
0.2
0.3
0.4
0.5 crA
crB
z -
z o (
mm
)
0 4 8 12 16 20 24t - to (hours)
0.1
0.2
0.3
0.4
0.5
z -
z o (
mm
)
D. Lovric et al. / Journal of Crystal Growth 310 (2008) 3391–3397 3393
We will describe our method of analysing two-dimensional(2D) digitised interferograms (256 grey levels, on a square grid of64�64 pixels) only briefly. The detailed discussion of this methodmay be found in Refs. [9,20]. We have used the refined Fourier-transform method for fringe-pattern analysis, which approxi-mates each interferogram by a function [24]
gðrÞ ¼ aðrÞ þ bðrÞ cos½2pq � rþ FðrÞ� (2)
in which the desired information is contained in the phase fieldF(r), while a(r) and b(r) are the functions whose spatialdependencies originate from experimental imperfections, andr ¼ (x, y). The method is based on the assumption that F(r), a(r)and b(r) are spatially slow-varying functions on the scaleestablished by the spatial-carrier frequency q ¼ (qx, qy), which isgiven by the number of pixels per interference line. Then, theFourier spectrum of each interferogram contains localisedfeatures separated by q. The standard procedure [24] includesthe extraction of one of the first-order maxima, centred either at qor at �q, and its shift to the origin of the inverse space. Then onedoes the inverse Fourier transform back to the real space, andextracts the phase field F(r). We have then unwrapped the phasefield by the procedure described in Ref. [25], and averaged it overthe grid to obtain the value F. The difference of averaged phasesbetween two consecutive interferograms F2 � F1 ¼ DF thengives, by means of Eq. (1), the vertical facet displacement Dz.
Our refinements of this method are related to the automatic,dynamic method of removal/subtraction of the background (i.e. ofa component of noise) from the interferograms, and to the use ofthe sampling theorem for determining the exact (subpixel)position of the first-order maxima, i.e. the exact value of q [20].These refinements have enabled us to achieve nanometreresolution in vertical facet displacement. We have recently madenew improvements to the method applied [26].
0 12 24 36 48 60 72t - to (hours)
0
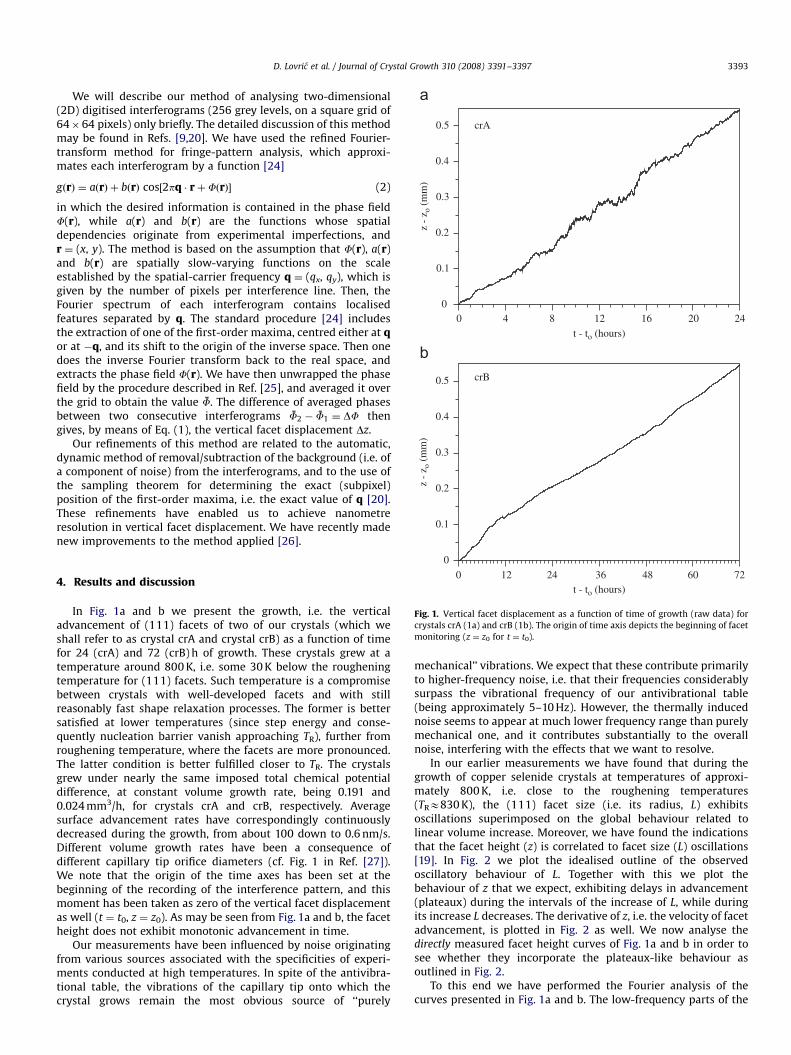
Fig. 1. Vertical facet displacement as a function of time of growth (raw data) for
crystals crA (1a) and crB (1b). The origin of time axis depicts the beginning of facet
monitoring (z ¼ z0 for t ¼ t0).
4. Results and discussion
In Fig. 1a and b we present the growth, i.e. the verticaladvancement of (111) facets of two of our crystals (which weshall refer to as crystal crA and crystal crB) as a function of timefor 24 (crA) and 72 (crB) h of growth. These crystals grew at atemperature around 800 K, i.e. some 30 K below the rougheningtemperature for (111) facets. Such temperature is a compromisebetween crystals with well-developed facets and with stillreasonably fast shape relaxation processes. The former is bettersatisfied at lower temperatures (since step energy and conse-quently nucleation barrier vanish approaching TR), further fromroughening temperature, where the facets are more pronounced.The latter condition is better fulfilled closer to TR. The crystalsgrew under nearly the same imposed total chemical potentialdifference, at constant volume growth rate, being 0.191 and0.024 mm3/h, for crystals crA and crB, respectively. Averagesurface advancement rates have correspondingly continuouslydecreased during the growth, from about 100 down to 0.6 nm/s.Different volume growth rates have been a consequence ofdifferent capillary tip orifice diameters (cf. Fig. 1 in Ref. [27]).We note that the origin of the time axes has been set at thebeginning of the recording of the interference pattern, and thismoment has been taken as zero of the vertical facet displacementas well (t ¼ t0, z ¼ z0). As may be seen from Fig. 1a and b, the facetheight does not exhibit monotonic advancement in time.
Our measurements have been influenced by noise originatingfrom various sources associated with the specificities of experi-ments conducted at high temperatures. In spite of the antivibra-tional table, the vibrations of the capillary tip onto which thecrystal grows remain the most obvious source of ‘‘purely
mechanical’’ vibrations. We expect that these contribute primarilyto higher-frequency noise, i.e. that their frequencies considerablysurpass the vibrational frequency of our antivibrational table(being approximately 5–10 Hz). However, the thermally inducednoise seems to appear at much lower frequency range than purelymechanical one, and it contributes substantially to the overallnoise, interfering with the effects that we want to resolve.
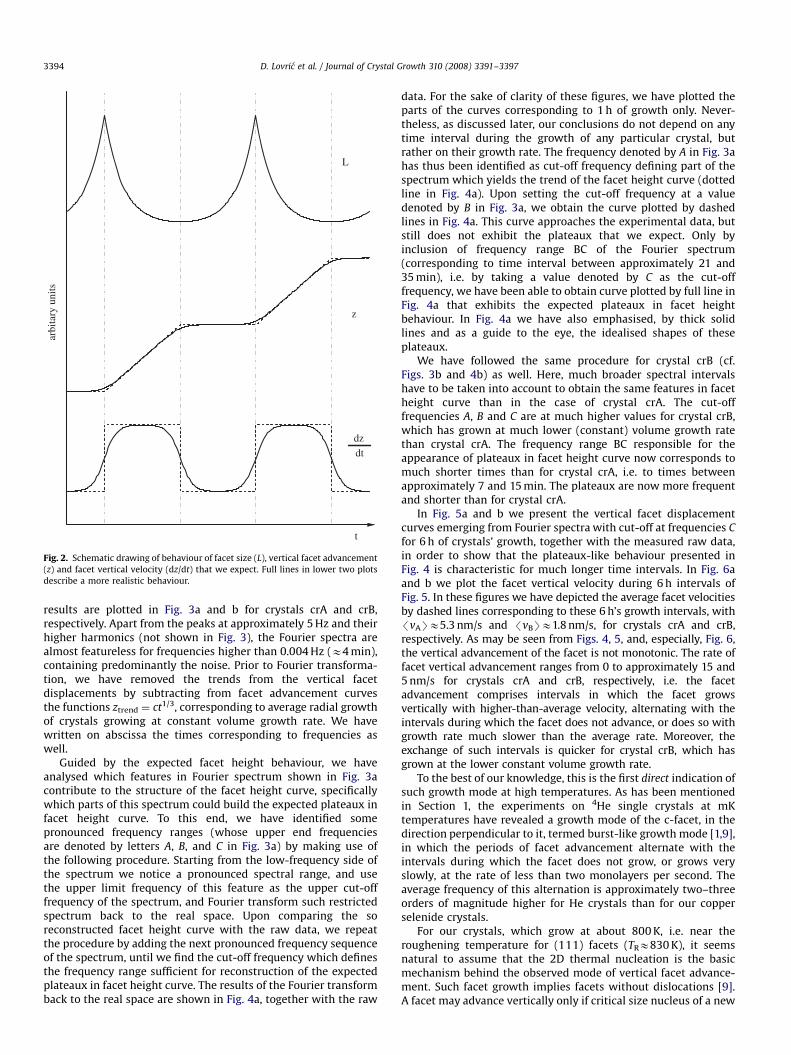
In our earlier measurements we have found that during thegrowth of copper selenide crystals at temperatures of approxi-mately 800 K, i.e. close to the roughening temperatures(TRE830 K), the (111) facet size (i.e. its radius, L) exhibitsoscillations superimposed on the global behaviour related tolinear volume increase. Moreover, we have found the indicationsthat the facet height (z) is correlated to facet size (L) oscillations[19]. In Fig. 2 we plot the idealised outline of the observedoscillatory behaviour of L. Together with this we plot thebehaviour of z that we expect, exhibiting delays in advancement(plateaux) during the intervals of the increase of L, while duringits increase L decreases. The derivative of z, i.e. the velocity of facetadvancement, is plotted in Fig. 2 as well. We now analyse thedirectly measured facet height curves of Fig. 1a and b in order tosee whether they incorporate the plateaux-like behaviour asoutlined in Fig. 2.
To this end we have performed the Fourier analysis of thecurves presented in Fig. 1a and b. The low-frequency parts of the
ARTICLE IN PRESS
L
z
dzdt
t
arbi
tary
uni
ts
Fig. 2. Schematic drawing of behaviour of facet size (L), vertical facet advancement
(z) and facet vertical velocity (dz/dt) that we expect. Full lines in lower two plots
describe a more realistic behaviour.
D. Lovric et al. / Journal of Crystal Growth 310 (2008) 3391–33973394
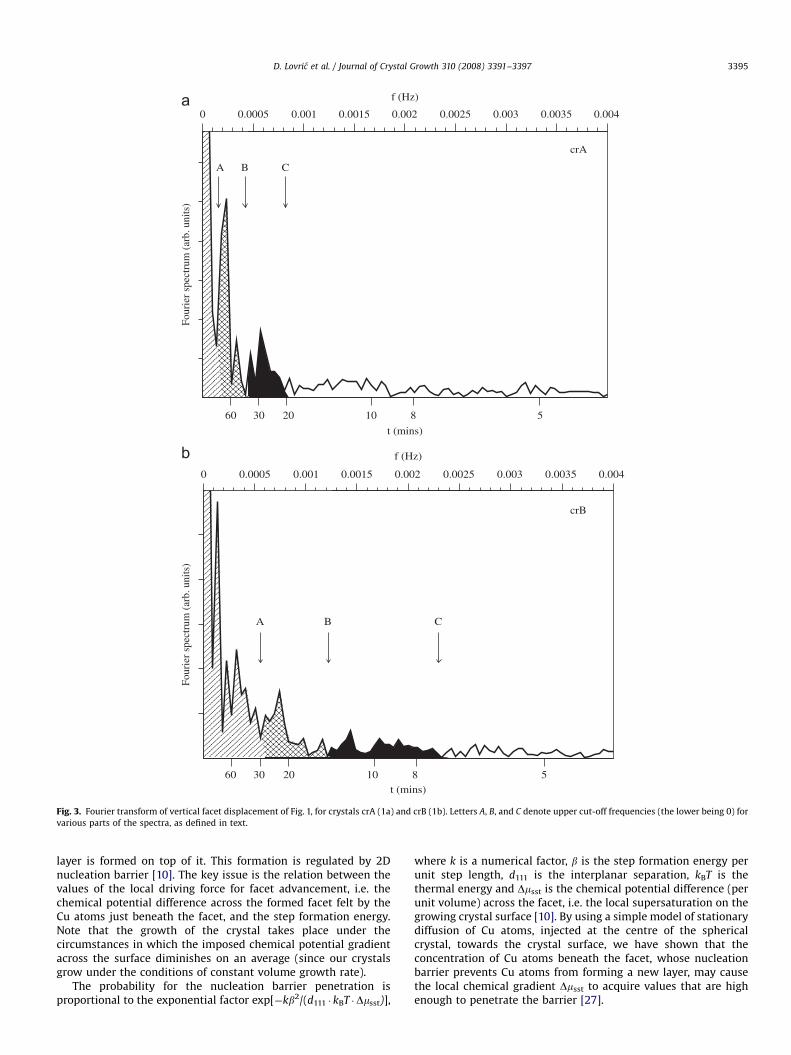
results are plotted in Fig. 3a and b for crystals crA and crB,respectively. Apart from the peaks at approximately 5 Hz and theirhigher harmonics (not shown in Fig. 3), the Fourier spectra arealmost featureless for frequencies higher than 0.004 Hz (E4 min),containing predominantly the noise. Prior to Fourier transforma-tion, we have removed the trends from the vertical facetdisplacements by subtracting from facet advancement curvesthe functions ztrend ¼ ct1/3, corresponding to average radial growthof crystals growing at constant volume growth rate. We havewritten on abscissa the times corresponding to frequencies aswell.
Guided by the expected facet height behaviour, we haveanalysed which features in Fourier spectrum shown in Fig. 3acontribute to the structure of the facet height curve, specificallywhich parts of this spectrum could build the expected plateaux infacet height curve. To this end, we have identified somepronounced frequency ranges (whose upper end frequenciesare denoted by letters A, B, and C in Fig. 3a) by making use ofthe following procedure. Starting from the low-frequency side ofthe spectrum we notice a pronounced spectral range, and usethe upper limit frequency of this feature as the upper cut-offfrequency of the spectrum, and Fourier transform such restrictedspectrum back to the real space. Upon comparing the soreconstructed facet height curve with the raw data, we repeatthe procedure by adding the next pronounced frequency sequenceof the spectrum, until we find the cut-off frequency which definesthe frequency range sufficient for reconstruction of the expectedplateaux in facet height curve. The results of the Fourier transformback to the real space are shown in Fig. 4a, together with the raw
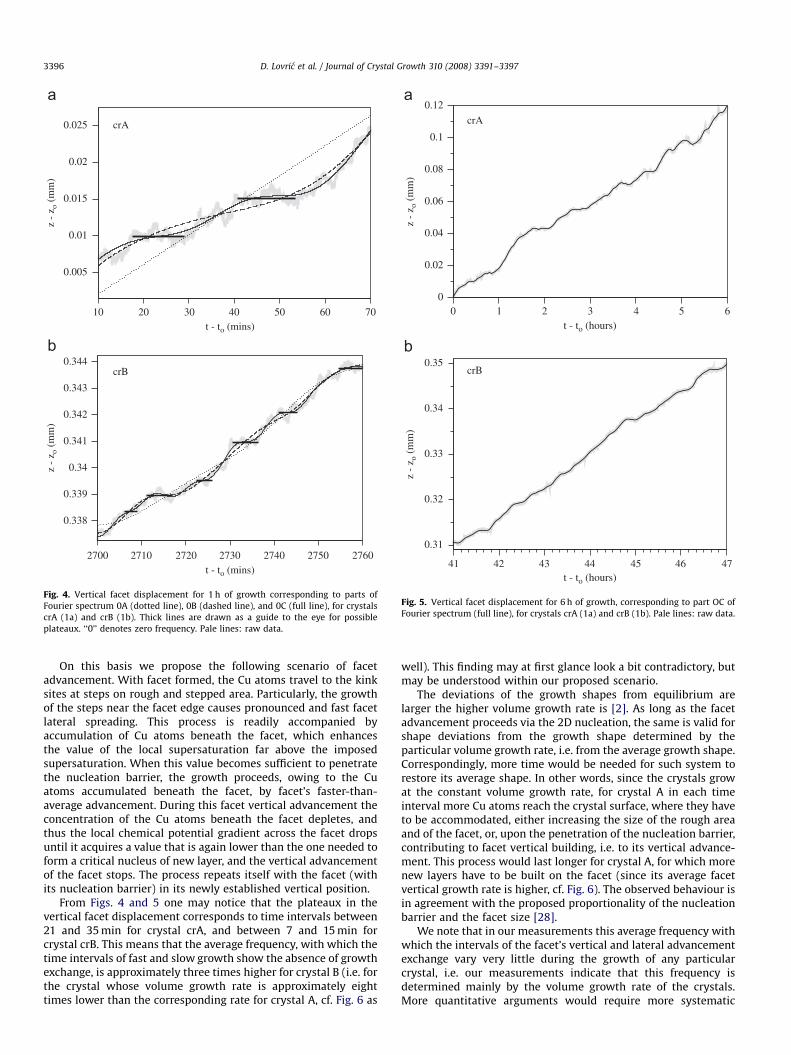
data. For the sake of clarity of these figures, we have plotted theparts of the curves corresponding to 1 h of growth only. Never-theless, as discussed later, our conclusions do not depend on anytime interval during the growth of any particular crystal, butrather on their growth rate. The frequency denoted by A in Fig. 3ahas thus been identified as cut-off frequency defining part of thespectrum which yields the trend of the facet height curve (dottedline in Fig. 4a). Upon setting the cut-off frequency at a valuedenoted by B in Fig. 3a, we obtain the curve plotted by dashedlines in Fig. 4a. This curve approaches the experimental data, butstill does not exhibit the plateaux that we expect. Only byinclusion of frequency range BC of the Fourier spectrum(corresponding to time interval between approximately 21 and35 min), i.e. by taking a value denoted by C as the cut-offfrequency, we have been able to obtain curve plotted by full line inFig. 4a that exhibits the expected plateaux in facet heightbehaviour. In Fig. 4a we have also emphasised, by thick solidlines and as a guide to the eye, the idealised shapes of theseplateaux.
We have followed the same procedure for crystal crB (cf.Figs. 3b and 4b) as well. Here, much broader spectral intervalshave to be taken into account to obtain the same features in facetheight curve than in the case of crystal crA. The cut-offfrequencies A, B and C are at much higher values for crystal crB,which has grown at much lower (constant) volume growth ratethan crystal crA. The frequency range BC responsible for theappearance of plateaux in facet height curve now corresponds tomuch shorter times than for crystal crA, i.e. to times betweenapproximately 7 and 15 min. The plateaux are now more frequentand shorter than for crystal crA.
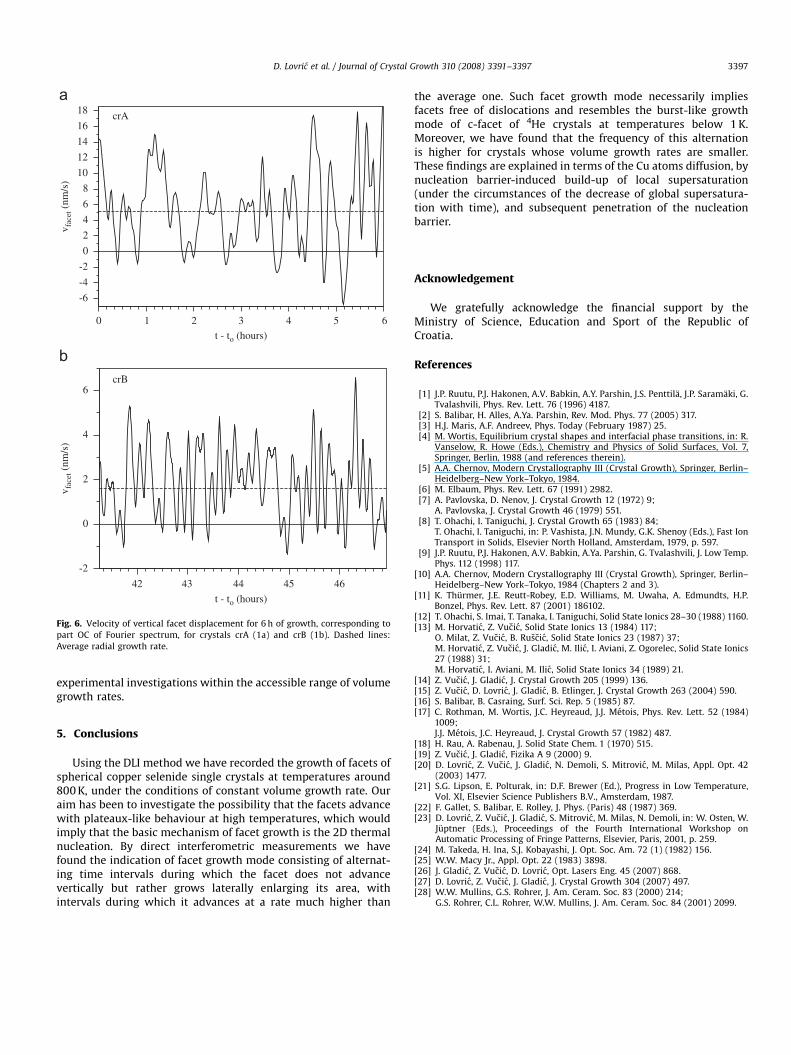
In Fig. 5a and b we present the vertical facet displacementcurves emerging from Fourier spectra with cut-off at frequencies C
for 6 h of crystals’ growth, together with the measured raw data,in order to show that the plateaux-like behaviour presented inFig. 4 is characteristic for much longer time intervals. In Fig. 6aand b we plot the facet vertical velocity during 6 h intervals ofFig. 5. In these figures we have depicted the average facet velocitiesby dashed lines corresponding to these 6 h’s growth intervals, with/vASE5.3 nm/s and /vBSE1.8 nm/s, for crystals crA and crB,respectively. As may be seen from Figs. 4, 5, and, especially, Fig. 6,the vertical advancement of the facet is not monotonic. The rate offacet vertical advancement ranges from 0 to approximately 15 and5 nm/s for crystals crA and crB, respectively, i.e. the facetadvancement comprises intervals in which the facet growsvertically with higher-than-average velocity, alternating with theintervals during which the facet does not advance, or does so withgrowth rate much slower than the average rate. Moreover, theexchange of such intervals is quicker for crystal crB, which hasgrown at the lower constant volume growth rate.
To the best of our knowledge, this is the first direct indication ofsuch growth mode at high temperatures. As has been mentionedin Section 1, the experiments on 4He single crystals at mKtemperatures have revealed a growth mode of the c-facet, in thedirection perpendicular to it, termed burst-like growth mode [1,9],in which the periods of facet advancement alternate with theintervals during which the facet does not grow, or grows veryslowly, at the rate of less than two monolayers per second. Theaverage frequency of this alternation is approximately two–threeorders of magnitude higher for He crystals than for our copperselenide crystals.
For our crystals, which grow at about 800 K, i.e. near theroughening temperature for (111) facets (TRE830 K), it seemsnatural to assume that the 2D thermal nucleation is the basicmechanism behind the observed mode of vertical facet advance-ment. Such facet growth implies facets without dislocations [9].A facet may advance vertically only if critical size nucleus of a new
ARTICLE IN PRESS
60 30 20 10 8 5
crA
crB
t (mins)
Four
ier
spec
trum
(ar
b. u
nits
)
0 0.0005 0.001 0.0015 0.002 0.0025 0.003 0.0035 0.004
C
f (Hz)
60 30 20 10 8 5t (mins)
Four
ier
spec
trum
(ar
b. u
nits
)
0 0.0005 0.001 0.0015 0.002 0.0025 0.003 0.0035 0.004
C
f (Hz)
A B
BA
Fig. 3. Fourier transform of vertical facet displacement of Fig. 1, for crystals crA (1a) and crB (1b). Letters A, B, and C denote upper cut-off frequencies (the lower being 0) for
various parts of the spectra, as defined in text.
D. Lovric et al. / Journal of Crystal Growth 310 (2008) 3391–3397 3395
layer is formed on top of it. This formation is regulated by 2Dnucleation barrier [10]. The key issue is the relation between thevalues of the local driving force for facet advancement, i.e. thechemical potential difference across the formed facet felt by theCu atoms just beneath the facet, and the step formation energy.Note that the growth of the crystal takes place under thecircumstances in which the imposed chemical potential gradientacross the surface diminishes on an average (since our crystalsgrow under the conditions of constant volume growth rate).
The probability for the nucleation barrier penetration isproportional to the exponential factor exp[�kb2/(d111 � kBT �Dmsst)],
where k is a numerical factor, b is the step formation energy perunit step length, d111 is the interplanar separation, kBT is thethermal energy and Dmsst is the chemical potential difference (perunit volume) across the facet, i.e. the local supersaturation on thegrowing crystal surface [10]. By using a simple model of stationarydiffusion of Cu atoms, injected at the centre of the sphericalcrystal, towards the crystal surface, we have shown that theconcentration of Cu atoms beneath the facet, whose nucleationbarrier prevents Cu atoms from forming a new layer, may causethe local chemical gradient Dmsst to acquire values that are highenough to penetrate the barrier [27].
ARTICLE IN PRESS
0.005
10 20 30 40 50 60 70
0.01
0.015
0.02
0.025 crA
crB
2700 2710 2720 275027402730 2760
0.338
0.339
0.34
0.341
0.342
0.343
0.344
z -
z o (
mm
)z
- z o
(m
m)
t - to (mins)
t - to (mins)
Fig. 4. Vertical facet displacement for 1 h of growth corresponding to parts of
Fourier spectrum 0A (dotted line), 0B (dashed line), and 0C (full line), for crystals
crA (1a) and crB (1b). Thick lines are drawn as a guide to the eye for possible
plateaux. ‘‘0’’ denotes zero frequency. Pale lines: raw data.
00 1 2 3 4 5 6
0.02
0.04
0.06
0.08
0.1
0.12
crA
crB
z -
z o (
mm
)
41 42 43 44 45 46 47
0.31
0.32
0.33
0.34
0.35
z -
z o (
mm
)
t - to (hours)
t - to (hours)
Fig. 5. Vertical facet displacement for 6 h of growth, corresponding to part OC of
Fourier spectrum (full line), for crystals crA (1a) and crB (1b). Pale lines: raw data.
D. Lovric et al. / Journal of Crystal Growth 310 (2008) 3391–33973396
On this basis we propose the following scenario of facetadvancement. With facet formed, the Cu atoms travel to the kinksites at steps on rough and stepped area. Particularly, the growthof the steps near the facet edge causes pronounced and fast facetlateral spreading. This process is readily accompanied byaccumulation of Cu atoms beneath the facet, which enhancesthe value of the local supersaturation far above the imposedsupersaturation. When this value becomes sufficient to penetratethe nucleation barrier, the growth proceeds, owing to the Cuatoms accumulated beneath the facet, by facet’s faster-than-average advancement. During this facet vertical advancement theconcentration of the Cu atoms beneath the facet depletes, andthus the local chemical potential gradient across the facet dropsuntil it acquires a value that is again lower than the one needed toform a critical nucleus of new layer, and the vertical advancementof the facet stops. The process repeats itself with the facet (withits nucleation barrier) in its newly established vertical position.
From Figs. 4 and 5 one may notice that the plateaux in thevertical facet displacement corresponds to time intervals between21 and 35 min for crystal crA, and between 7 and 15 min forcrystal crB. This means that the average frequency, with which thetime intervals of fast and slow growth show the absence of growthexchange, is approximately three times higher for crystal B (i.e. forthe crystal whose volume growth rate is approximately eighttimes lower than the corresponding rate for crystal A, cf. Fig. 6 as
well). This finding may at first glance look a bit contradictory, butmay be understood within our proposed scenario.
The deviations of the growth shapes from equilibrium arelarger the higher volume growth rate is [2]. As long as the facetadvancement proceeds via the 2D nucleation, the same is valid forshape deviations from the growth shape determined by theparticular volume growth rate, i.e. from the average growth shape.Correspondingly, more time would be needed for such system torestore its average shape. In other words, since the crystals growat the constant volume growth rate, for crystal A in each timeinterval more Cu atoms reach the crystal surface, where they haveto be accommodated, either increasing the size of the rough areaand of the facet, or, upon the penetration of the nucleation barrier,contributing to facet vertical building, i.e. to its vertical advance-ment. This process would last longer for crystal A, for which morenew layers have to be built on the facet (since its average facetvertical growth rate is higher, cf. Fig. 6). The observed behaviour isin agreement with the proposed proportionality of the nucleationbarrier and the facet size [28].
We note that in our measurements this average frequency withwhich the intervals of the facet’s vertical and lateral advancementexchange vary very little during the growth of any particularcrystal, i.e. our measurements indicate that this frequency isdetermined mainly by the volume growth rate of the crystals.More quantitative arguments would require more systematic
ARTICLE IN PRESS
-6
0 1 2 3 4 5 6
-4
-2
0
2
4
6
8
10
12
14
16
18 crA
crB
v fac
et (
nm/s
)
42 43 44 45 46
t - to (hours)
t - to (hours)
-2
0
2
4
6
v fac
et (
nm/s
)
Fig. 6. Velocity of vertical facet displacement for 6 h of growth, corresponding to
part OC of Fourier spectrum, for crystals crA (1a) and crB (1b). Dashed lines:
Average radial growth rate.
D. Lovric et al. / Journal of Crystal Growth 310 (2008) 3391–3397 3397
experimental investigations within the accessible range of volumegrowth rates.
5. Conclusions
Using the DLI method we have recorded the growth of facets ofspherical copper selenide single crystals at temperatures around800 K, under the conditions of constant volume growth rate. Ouraim has been to investigate the possibility that the facets advancewith plateaux-like behaviour at high temperatures, which wouldimply that the basic mechanism of facet growth is the 2D thermalnucleation. By direct interferometric measurements we havefound the indication of facet growth mode consisting of alternat-ing time intervals during which the facet does not advancevertically but rather grows laterally enlarging its area, withintervals during which it advances at a rate much higher than
the average one. Such facet growth mode necessarily impliesfacets free of dislocations and resembles the burst-like growthmode of c-facet of 4He crystals at temperatures below 1 K.Moreover, we have found that the frequency of this alternationis higher for crystals whose volume growth rates are smaller.These findings are explained in terms of the Cu atoms diffusion, bynucleation barrier-induced build-up of local supersaturation(under the circumstances of the decrease of global supersatura-tion with time), and subsequent penetration of the nucleationbarrier.
Acknowledgement
We gratefully acknowledge the financial support by theMinistry of Science, Education and Sport of the Republic ofCroatia.
References
[1] J.P. Ruutu, P.J. Hakonen, A.V. Babkin, A.Y. Parshin, J.S. Penttila, J.P. Saramaki, G.Tvalashvili, Phys. Rev. Lett. 76 (1996) 4187.
[2] S. Balibar, H. Alles, A.Ya. Parshin, Rev. Mod. Phys. 77 (2005) 317.[3] H.J. Maris, A.F. Andreev, Phys. Today (February 1987) 25.[4] M. Wortis, Equilibrium crystal shapes and interfacial phase transitions, in: R.
Vanselow, R. Howe (Eds.), Chemistry and Physics of Solid Surfaces, Vol. 7,Springer, Berlin, 1988 (and references therein).
[5] A.A. Chernov, Modern Crystallography III (Crystal Growth), Springer, Berlin–Heidelberg–New York–Tokyo, 1984.
[6] M. Elbaum, Phys. Rev. Lett. 67 (1991) 2982.[7] A. Pavlovska, D. Nenov, J. Crystal Growth 12 (1972) 9;
A. Pavlovska, J. Crystal Growth 46 (1979) 551.[8] T. Ohachi, I. Taniguchi, J. Crystal Growth 65 (1983) 84;
T. Ohachi, I. Taniguchi, in: P. Vashista, J.N. Mundy, G.K. Shenoy (Eds.), Fast IonTransport in Solids, Elsevier North Holland, Amsterdam, 1979, p. 597.
[9] J.P. Ruutu, P.J. Hakonen, A.V. Babkin, A.Ya. Parshin, G. Tvalashvili, J. Low Temp.Phys. 112 (1998) 117.
[10] A.A. Chernov, Modern Crystallography III (Crystal Growth), Springer, Berlin–Heidelberg–New York–Tokyo, 1984 (Chapters 2 and 3).
[11] K. Thurmer, J.E. Reutt-Robey, E.D. Williams, M. Uwaha, A. Edmundts, H.P.Bonzel, Phys. Rev. Lett. 87 (2001) 186102.
[12] T. Ohachi, S. Imai, T. Tanaka, I. Taniguchi, Solid State Ionics 28–30 (1988) 1160.[13] M. Horvatic, Z. Vucic, Solid State Ionics 13 (1984) 117;
O. Milat, Z. Vucic, B. Ruscic, Solid State Ionics 23 (1987) 37;M. Horvatic, Z. Vucic, J. Gladic, M. Ilic, I. Aviani, Z. Ogorelec, Solid State Ionics27 (1988) 31;M. Horvatic, I. Aviani, M. Ilic, Solid State Ionics 34 (1989) 21.
[14] Z. Vucic, J. Gladic, J. Crystal Growth 205 (1999) 136.[15] Z. Vucic, D. Lovric, J. Gladic, B. Etlinger, J. Crystal Growth 263 (2004) 590.[16] S. Balibar, B. Casraing, Surf. Sci. Rep. 5 (1985) 87.[17] C. Rothman, M. Wortis, J.C. Heyreaud, J.J. Metois, Phys. Rev. Lett. 52 (1984)
1009;J.J. Metois, J.C. Heyreaud, J. Crystal Growth 57 (1982) 487.
[18] H. Rau, A. Rabenau, J. Solid State Chem. 1 (1970) 515.[19] Z. Vucic, J. Gladic, Fizika A 9 (2000) 9.[20] D. Lovric, Z. Vucic, J. Gladic, N. Demoli, S. Mitrovic, M. Milas, Appl. Opt. 42
(2003) 1477.[21] S.G. Lipson, E. Polturak, in: D.F. Brewer (Ed.), Progress in Low Temperature,
Vol. XI, Elsevier Science Publishers B.V., Amsterdam, 1987.[22] F. Gallet, S. Balibar, E. Rolley, J. Phys. (Paris) 48 (1987) 369.[23] D. Lovric, Z. Vucic, J. Gladic, S. Mitrovic, M. Milas, N. Demoli, in: W. Osten, W.
Juptner (Eds.), Proceedings of the Fourth International Workshop onAutomatic Processing of Fringe Patterns, Elsevier, Paris, 2001, p. 259.
[24] M. Takeda, H. Ina, S.J. Kobayashi, J. Opt. Soc. Am. 72 (1) (1982) 156.[25] W.W. Macy Jr., Appl. Opt. 22 (1983) 3898.[26] J. Gladic, Z. Vucic, D. Lovric, Opt. Lasers Eng. 45 (2007) 868.[27] D. Lovric, Z. Vucic, J. Gladic, J. Crystal Growth 304 (2007) 497.[28] W.W. Mullins, G.S. Rohrer, J. Am. Ceram. Soc. 83 (2000) 214;
G.S. Rohrer, C.L. Rohrer, W.W. Mullins, J. Am. Ceram. Soc. 84 (2001) 2099.