
Tree-ring δ18O evidence for the drought history of eastern Tianshan Mountains, northwest China...
12
INTERNATIONAL JOURNAL OF CLIMATOLOGY Int. J. Climatol. (2013) Published online in Wiley Online Library (wileyonlinelibrary.com) DOI: 10.1002/joc.3911 Tree-ring δ 18 O evidence for the drought history of eastern Tianshan Mountains, northwest China since 1700 AD Guobao Xu, a,b Xiaohong Liu, a * Dahe Qin, a Tuo Chen, a Wenzhi Wang, a,b Guoju Wu, a,b Weizhen Sun, a Wenling An a,b and Xiaomin Zeng a,b a State Key Laboratory of Cryospheric Sciences, Cold and Arid Regions Environmental and Engineering Research Institute, Lanzhou, China b University of Chinese Academy of Sciences, Beijing, China ABSTRACT: We developed an annual tree-ring δ 18 O chronology from Larix sibirica in the eastern Tianshan Mountains of northwestern China. Climatic response revealed that tree-ring δ 18 O was significantly positively correlated with the mean and maximum July–August temperatures, whereas the July precipitation and relative humidity were significantly negatively correlated with tree-ring δ 18 O. The self-calibrating Palmer drought severity index (sc_PDSI) in July–August was significantly correlated with the tree-ring δ 18 O, which reflects the comprehensive effects of the three parameters on tree-ring δ 18 O fractionation. We established a robust reconstruction of July–August sc_PDSI that accounted for 38.4% of the total variance of sc_PDSI from 1959 to 2008. The sc_PDSI reconstruction yields new insights on past drought that were not previously realized in other PDSI reconstructions (e.g. Monsoon Asia Drought Atlas) from the region. The reconstruction revealed several wet and dry periods but no trend towards a wetter climate in the eastern Tianshan Mountains during the last two decades. It also detected synergistic effects of the North Atlantic Oscillation and the El Ni˜ no-Southern Oscillation on regional moisture conditions as a result of teleconnections between tropical oceans and mid-latitude circulation patterns. KEY WORDS tree-ring δ 18 O; self-calibrating PDSI; drought reconstruction; northwestern China; NAO; ENSO Received 19 April 2013; Revised 24 November 2013; Accepted 28 November 2013 1. Introduction In recent decades, drought events appear to be increasing in intensity and frequency in response to climate warming over Asia (Easterling et al., 2000), especially in semi- arid to arid regions such as northern China (Ma and Fu, 2006). It is thus important to understand drought patterns over long-time scale as well as the mechanisms responsible for these patterns. Understanding climate variability and long-term trends in moisture variability for periods before instrumental data is available is vital to regional hydrological management and agriculture. The Palmer drought severity index (PDSI) is often used as a drought metric because it can assess the severity of drought conditions (Palmer, 1965). PDSI has been used to study the drought variability over the Asia (Cook et al., 2010), northern China (Fang et al., 2012) and the central Tianshan Mountains of northwestern China (Li et al., 2006) in combination with tree-ring width. One of the most common problems of PDSI is that PDSI values are not comparable between diverse climatological regions (Wells et al., 2004). Efforts to address major problems of PDSI have led to a * Correspondence to: X. Liu, State Key Laboratory of Cryospheric Sciences, Cold and Arid Regions Environmental and Engineering Research Institute, Chinese Academy of Sciences, Donggang West Road No. 320, Lanzhou 730000, China. E-mail: [email protected] new variant of the PDSI, the self-calibrating PDSI (sc_PDSI) (Wells et al., 2004), which has been used to assess the drought (Dai, 2011). Tree-ring oxygen isotope ratio (δ 18 O) series have an advantage for PDSI reconstruction in that the physiological controls on the isotopic composition are well understood and relatively simple compared to many factors that control tree-ring growth (Roden and Ehleringer, 2000; Roden et al., 2000; Waterhouse et al., 2002; McCarroll and Loader, 2004; Treydte et al., 2006; Sano et al., 2012a). Tree-ring δ 18 O is primarily controlled by δ 18 O of source water and relative humidity (e.g. Roden et al., 2000, Robertson et al., 2001; McCarroll and Loader, 2004), both of which are directly related to the regional moisture conditions (wet–dry conditions). Tree-ring δ 18 O has been used successfully to reconstruct PDSI, which was used to assess aridity change and to detect possible linkage with atmospheric circulations (Xu et al., 2011; Sano et al., 2012a, 2012b). It has also been reported that tree-ring δ 18 O was much more sensitive to PDSI than tree-ring width (Xu et al., 2011). Another advantage of the tree-ring δ 18 O is that this parameter is weak or little affected by the tree’s age (Saurer et al., 2002; McCarroll and Loader, 2004; Anchukaitis and Evans, 2010; Daux et al., 2011; Shi et al., 2011; Young et al., 2011), except for a few studies (Treydte et al., 2006; Esper et al., 2010). Herein, we established a 309-year annual resolution tree-ring δ 18 O chronology using Siberian larch (Larix 2013 Royal Meteorological Society
Transcript of Tree-ring δ18O evidence for the drought history of eastern Tianshan Mountains, northwest China...

INTERNATIONAL JOURNAL OF CLIMATOLOGYInt. J. Climatol. (2013)Published online in Wiley Online Library(wileyonlinelibrary.com) DOI: 10.1002/joc.3911
Tree-ring δ18O evidence for the drought history of easternTianshan Mountains, northwest China since 1700 AD
Guobao Xu,a,b Xiaohong Liu,a* Dahe Qin,a Tuo Chen,a Wenzhi Wang,a,b Guoju Wu,a,b
Weizhen Sun,a Wenling Ana,b and Xiaomin Zenga,b
a State Key Laboratory of Cryospheric Sciences, Cold and Arid Regions Environmental and Engineering Research Institute, Lanzhou, Chinab University of Chinese Academy of Sciences, Beijing, China
ABSTRACT: We developed an annual tree-ring δ18O chronology from Larix sibirica in the eastern Tianshan Mountainsof northwestern China. Climatic response revealed that tree-ring δ18O was significantly positively correlated with themean and maximum July–August temperatures, whereas the July precipitation and relative humidity were significantlynegatively correlated with tree-ring δ18O. The self-calibrating Palmer drought severity index (sc_PDSI) in July–August wassignificantly correlated with the tree-ring δ18O, which reflects the comprehensive effects of the three parameters on tree-ringδ18O fractionation. We established a robust reconstruction of July–August sc_PDSI that accounted for 38.4% of the totalvariance of sc_PDSI from 1959 to 2008. The sc_PDSI reconstruction yields new insights on past drought that were notpreviously realized in other PDSI reconstructions (e.g. Monsoon Asia Drought Atlas) from the region. The reconstructionrevealed several wet and dry periods but no trend towards a wetter climate in the eastern Tianshan Mountains during thelast two decades. It also detected synergistic effects of the North Atlantic Oscillation and the El Nino-Southern Oscillationon regional moisture conditions as a result of teleconnections between tropical oceans and mid-latitude circulation patterns.
KEY WORDS tree-ring δ18O; self-calibrating PDSI; drought reconstruction; northwestern China; NAO; ENSO
Received 19 April 2013; Revised 24 November 2013; Accepted 28 November 2013
1. Introduction
In recent decades, drought events appear to be increasingin intensity and frequency in response to climate warmingover Asia (Easterling et al., 2000), especially in semi-arid to arid regions such as northern China (Ma andFu, 2006). It is thus important to understand droughtpatterns over long-time scale as well as the mechanismsresponsible for these patterns. Understanding climatevariability and long-term trends in moisture variabilityfor periods before instrumental data is available is vitalto regional hydrological management and agriculture.
The Palmer drought severity index (PDSI) is oftenused as a drought metric because it can assess theseverity of drought conditions (Palmer, 1965). PDSIhas been used to study the drought variability overthe Asia (Cook et al., 2010), northern China (Fanget al., 2012) and the central Tianshan Mountains ofnorthwestern China (Li et al., 2006) in combination withtree-ring width. One of the most common problems ofPDSI is that PDSI values are not comparable betweendiverse climatological regions (Wells et al., 2004). Effortsto address major problems of PDSI have led to a
* Correspondence to: X. Liu, State Key Laboratory of CryosphericSciences, Cold and Arid Regions Environmental and EngineeringResearch Institute, Chinese Academy of Sciences, Donggang WestRoad No. 320, Lanzhou 730000, China. E-mail: [email protected]
new variant of the PDSI, the self-calibrating PDSI(sc_PDSI) (Wells et al., 2004), which has been usedto assess the drought (Dai, 2011). Tree-ring oxygenisotope ratio (δ18O) series have an advantage for PDSIreconstruction in that the physiological controls on theisotopic composition are well understood and relativelysimple compared to many factors that control tree-ringgrowth (Roden and Ehleringer, 2000; Roden et al., 2000;Waterhouse et al., 2002; McCarroll and Loader, 2004;Treydte et al., 2006; Sano et al., 2012a). Tree-ring δ18O isprimarily controlled by δ18O of source water and relativehumidity (e.g. Roden et al., 2000, Robertson et al., 2001;McCarroll and Loader, 2004), both of which are directlyrelated to the regional moisture conditions (wet–dryconditions). Tree-ring δ18O has been used successfullyto reconstruct PDSI, which was used to assess ariditychange and to detect possible linkage with atmosphericcirculations (Xu et al., 2011; Sano et al., 2012a, 2012b).It has also been reported that tree-ring δ18O was muchmore sensitive to PDSI than tree-ring width (Xu et al.,2011). Another advantage of the tree-ring δ18O is thatthis parameter is weak or little affected by the tree’sage (Saurer et al., 2002; McCarroll and Loader, 2004;Anchukaitis and Evans, 2010; Daux et al., 2011; Shiet al., 2011; Young et al., 2011), except for a few studies(Treydte et al., 2006; Esper et al., 2010).
Herein, we established a 309-year annual resolutiontree-ring δ18O chronology using Siberian larch (Larix
2013 Royal Meteorological Society
G. XU et al.
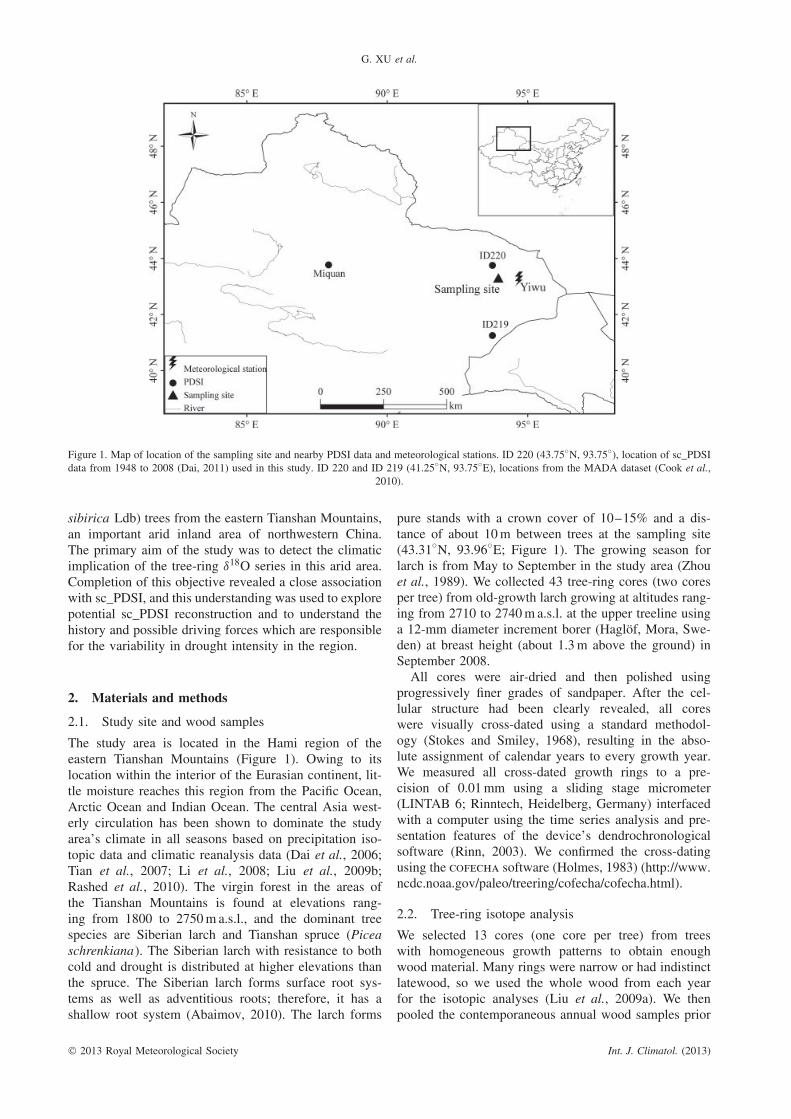
Figure 1. Map of location of the sampling site and nearby PDSI data and meteorological stations. ID 220 (43.75◦N, 93.75◦), location of sc_PDSIdata from 1948 to 2008 (Dai, 2011) used in this study. ID 220 and ID 219 (41.25◦N, 93.75◦E), locations from the MADA dataset (Cook et al.,
2010).
sibirica Ldb) trees from the eastern Tianshan Mountains,an important arid inland area of northwestern China.The primary aim of the study was to detect the climaticimplication of the tree-ring δ18O series in this arid area.Completion of this objective revealed a close associationwith sc_PDSI, and this understanding was used to explorepotential sc_PDSI reconstruction and to understand thehistory and possible driving forces which are responsiblefor the variability in drought intensity in the region.
2. Materials and methods
2.1. Study site and wood samples
The study area is located in the Hami region of theeastern Tianshan Mountains (Figure 1). Owing to itslocation within the interior of the Eurasian continent, lit-tle moisture reaches this region from the Pacific Ocean,Arctic Ocean and Indian Ocean. The central Asia west-erly circulation has been shown to dominate the studyarea’s climate in all seasons based on precipitation iso-topic data and climatic reanalysis data (Dai et al., 2006;Tian et al., 2007; Li et al., 2008; Liu et al., 2009b;Rashed et al., 2010). The virgin forest in the areas ofthe Tianshan Mountains is found at elevations rang-ing from 1800 to 2750 m a.s.l., and the dominant treespecies are Siberian larch and Tianshan spruce (Piceaschrenkiana). The Siberian larch with resistance to bothcold and drought is distributed at higher elevations thanthe spruce. The Siberian larch forms surface root sys-tems as well as adventitious roots; therefore, it has ashallow root system (Abaimov, 2010). The larch forms
pure stands with a crown cover of 10–15% and a dis-tance of about 10 m between trees at the sampling site(43.31◦N, 93.96◦E; Figure 1). The growing season forlarch is from May to September in the study area (Zhouet al., 1989). We collected 43 tree-ring cores (two coresper tree) from old-growth larch growing at altitudes rang-ing from 2710 to 2740 m a.s.l. at the upper treeline usinga 12-mm diameter increment borer (Haglof, Mora, Swe-den) at breast height (about 1.3 m above the ground) inSeptember 2008.
All cores were air-dried and then polished usingprogressively finer grades of sandpaper. After the cel-lular structure had been clearly revealed, all coreswere visually cross-dated using a standard methodol-ogy (Stokes and Smiley, 1968), resulting in the abso-lute assignment of calendar years to every growth year.We measured all cross-dated growth rings to a pre-cision of 0.01 mm using a sliding stage micrometer(LINTAB 6; Rinntech, Heidelberg, Germany) interfacedwith a computer using the time series analysis and pre-sentation features of the device’s dendrochronologicalsoftware (Rinn, 2003). We confirmed the cross-datingusing the cofecha software (Holmes, 1983) (http://www.ncdc.noaa.gov/paleo/treering/cofecha/cofecha.html).
2.2. Tree-ring isotope analysis
We selected 13 cores (one core per tree) from treeswith homogeneous growth patterns to obtain enoughwood material. Many rings were narrow or had indistinctlatewood, so we used the whole wood from each yearfor the isotopic analyses (Liu et al., 2009a). We thenpooled the contemporaneous annual wood samples prior
2013 Royal Meteorological Society Int. J. Climatol. (2013)
EASTERN TIANSHAN DROUGHT HISTORY BASED ON TREE-RING δ18O
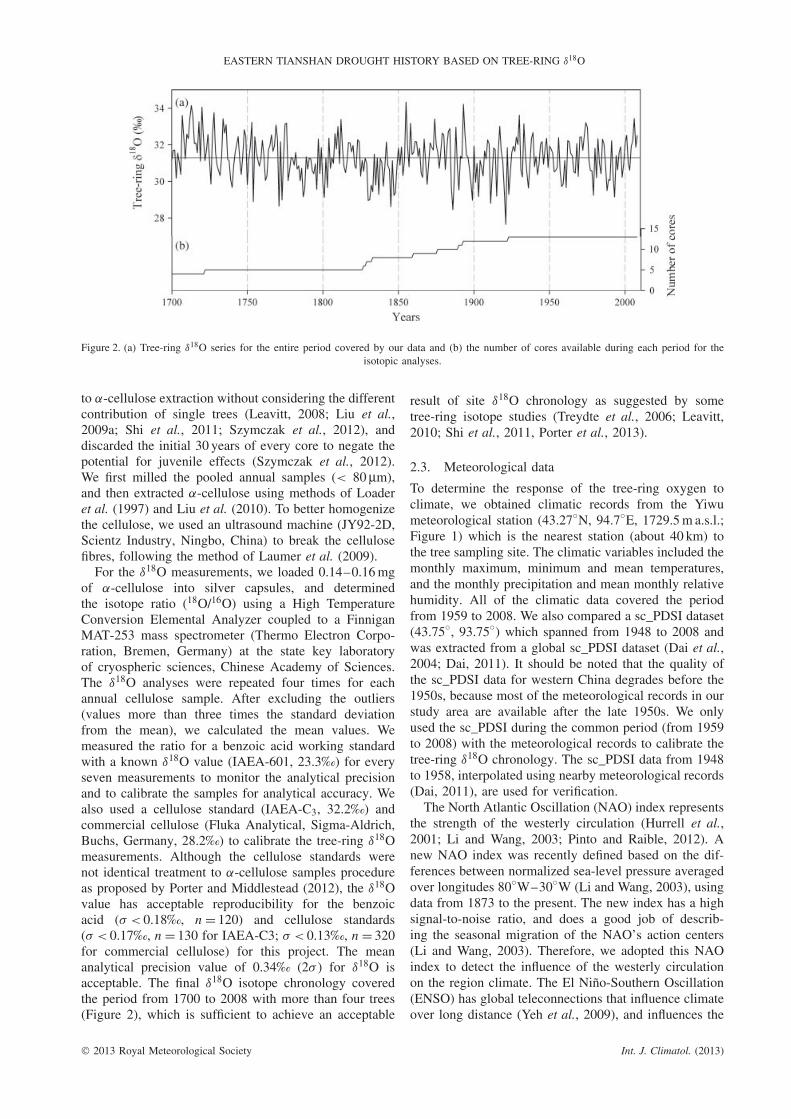
Figure 2. (a) Tree-ring δ18O series for the entire period covered by our data and (b) the number of cores available during each period for theisotopic analyses.
to α-cellulose extraction without considering the differentcontribution of single trees (Leavitt, 2008; Liu et al.,2009a; Shi et al., 2011; Szymczak et al., 2012), anddiscarded the initial 30 years of every core to negate thepotential for juvenile effects (Szymczak et al., 2012).We first milled the pooled annual samples (< 80 µm),and then extracted α-cellulose using methods of Loaderet al. (1997) and Liu et al. (2010). To better homogenizethe cellulose, we used an ultrasound machine (JY92-2D,Scientz Industry, Ningbo, China) to break the cellulosefibres, following the method of Laumer et al. (2009).
For the δ18O measurements, we loaded 0.14–0.16 mgof α-cellulose into silver capsules, and determinedthe isotope ratio (18O/16O) using a High TemperatureConversion Elemental Analyzer coupled to a FinniganMAT-253 mass spectrometer (Thermo Electron Corpo-ration, Bremen, Germany) at the state key laboratoryof cryospheric sciences, Chinese Academy of Sciences.The δ18O analyses were repeated four times for eachannual cellulose sample. After excluding the outliers(values more than three times the standard deviationfrom the mean), we calculated the mean values. Wemeasured the ratio for a benzoic acid working standardwith a known δ18O value (IAEA-601, 23.3‰) for everyseven measurements to monitor the analytical precisionand to calibrate the samples for analytical accuracy. Wealso used a cellulose standard (IAEA-C3, 32.2‰) andcommercial cellulose (Fluka Analytical, Sigma-Aldrich,Buchs, Germany, 28.2‰) to calibrate the tree-ring δ18Omeasurements. Although the cellulose standards werenot identical treatment to α-cellulose samples procedureas proposed by Porter and Middlestead (2012), the δ18Ovalue has acceptable reproducibility for the benzoicacid (σ < 0.18‰, n = 120) and cellulose standards(σ < 0.17‰, n = 130 for IAEA-C3; σ < 0.13‰, n = 320for commercial cellulose) for this project. The meananalytical precision value of 0.34‰ (2σ ) for δ18O isacceptable. The final δ18O isotope chronology coveredthe period from 1700 to 2008 with more than four trees(Figure 2), which is sufficient to achieve an acceptable
result of site δ18O chronology as suggested by sometree-ring isotope studies (Treydte et al., 2006; Leavitt,2010; Shi et al., 2011, Porter et al., 2013).
2.3. Meteorological data
To determine the response of the tree-ring oxygen toclimate, we obtained climatic records from the Yiwumeteorological station (43.27◦N, 94.7◦E, 1729.5 m a.s.l.;Figure 1) which is the nearest station (about 40 km) tothe tree sampling site. The climatic variables included themonthly maximum, minimum and mean temperatures,and the monthly precipitation and mean monthly relativehumidity. All of the climatic data covered the periodfrom 1959 to 2008. We also compared a sc_PDSI dataset(43.75◦, 93.75◦) which spanned from 1948 to 2008 andwas extracted from a global sc_PDSI dataset (Dai et al.,2004; Dai, 2011). It should be noted that the quality ofthe sc_PDSI data for western China degrades before the1950s, because most of the meteorological records in ourstudy area are available after the late 1950s. We onlyused the sc_PDSI during the common period (from 1959to 2008) with the meteorological records to calibrate thetree-ring δ18O chronology. The sc_PDSI data from 1948to 1958, interpolated using nearby meteorological records(Dai, 2011), are used for verification.
The North Atlantic Oscillation (NAO) index representsthe strength of the westerly circulation (Hurrell et al.,2001; Li and Wang, 2003; Pinto and Raible, 2012). Anew NAO index was recently defined based on the dif-ferences between normalized sea-level pressure averagedover longitudes 80◦W–30◦W (Li and Wang, 2003), usingdata from 1873 to the present. The new index has a highsignal-to-noise ratio, and does a good job of describ-ing the seasonal migration of the NAO’s action centers(Li and Wang, 2003). Therefore, we adopted this NAOindex to detect the influence of the westerly circulationon the region climate. The El Nino-Southern Oscillation(ENSO) has global teleconnections that influence climateover long distance (Yeh et al., 2009), and influences the
2013 Royal Meteorological Society Int. J. Climatol. (2013)
G. XU et al.
drought frequency and severity at mid-latitudes (Hoerlingand Kumar, 2003) such as those in central and south-western Asia (Barlow et al., 2002). We therefore alsoused the Nino 3.4 index from 1856 to 2008 (Kaplanet al., 1998) (http://www.cpc.ncep.noaa.gov) to investi-gate possible linkages with the regional climate of thestudy area.
2.4. Statistical and transfer function
To investigate the climate signals in tree-ring isotopeseries, we calculate its Pearson correlations with climatedata. We applied bootstrap resampling methods (Wigleyet al., 1984; Davison and Hinkley, 1997) to verify thereliability and stability of these correlations. The windowfor the response of tree-ring δ18O to climate spanned theperiod from August of the prior year to September of thecurrent year. We estimated a transfer function by meansof linear regression using the sc_PDSI in July–August(JA) (which had the strongest correlation with δ18O;see the results for details) as the dependent variableand the tree-ring δ18O as the independent variable. Thesc_PDSI data set from 1959 to 2008 was split into twosub-periods for separate calibration (30 year period) andverification (20 year period) of the dendroclimatic model(Fritts, 1976). We also used sc_PDSI data set from 1959to 2008 and leave-one-out validation method to verify ourreconstruction model. The sign test (ST), correlation coef-ficient (r), coefficient of efficiency (CE) and reduction oferror (RE) were used to validate the reconstruction (Cookand Kairiukstis 1990). The spatial correlation betweenthe reconstruction and the gridded University Corpora-tion for Atmospheric Research (UCAR) sc_PDSI (Daiet al., 2004) and standardized precipitation evapotranspi-ration index (SPEI) (Vicente-Serrano et al., 2010) datawas conducted to verify the reconstruction. In order tovalidate the reconstruction, it was compared with severalmoisture reconstructions. We also examined the possibil-ity of large-scale climate drivers (i.e. NAO and ENSO) ofmoisture conditions at decadal and multi-decadal scalesusing the fast Fourier transform (FFT) filters (Bergland,1969). To detect the decadal variation of ENSO and NAOand retain the cycle signals from NAO, we adopted aband-pass filter that preserved the signals at scales of10–60 years.
3. Results and discussions
3.1. Pooled method and tree-ring δ18O chronology
As suggested by Shi et al. (2011), the pooled mea-surement of tree-ring δ18O without regard to mass isconsistent with the mean values of several individualsmeasured separately. Several other researches have docu-mented the similar findings for carbon and oxygen in treerings (Leavitt, 2008; Kress et al., 2010; Leavitt, 2010;Linan et al., 2011; Szymczak et al., 2012). Herein, weconsider the pooling method without regard to mass tobe an acceptable method for producing a reliable δ18O
chronology, although we acknowledge its limitations withrespect to calculating signal strength and inter-tree vari-ability statistics.
The δ18O in tree rings averaged 31.3 ± 1.16‰(mean ± 1σ ; Figure 2) during the study period (1700–2008). The mean δ18O value of the tree-ring chronologyis in the range of the European tree-ring δ18O networkfor Pinus (from 26.37 to 33.58‰) (Treydte et al., 2007).The standard deviation (1.16) and the variance (1.35)of the series were low and the range of value in thechronology was 6.67‰. The maximum and minimumvalues occurred in 1855 (34.33‰) and 1921 (27.65‰),respectively.
3.2. Relationship between tree-ring δ18O and climate
Temperatures (maximum and mean), precipitation andrelative humidity in various months showed significantcorrelations with tree-ring δ18O (Figure 3(a) and (b)). Themaximum and mean temperatures from May to Augustwere significantly positively correlated with the tree-ringδ18O (Figure 3(a)). The correlation coefficient reached amaximum of 0.47 (p < 0.01) and 0.53 (p < 0.01), respec-tively, for mean temperature and maximum tempera-ture in July–August. Significant correlations were alsodetected between tree-ring δ18O and relative humidityin the previous December, in March, May and July,and precipitation in March and July (Figure 3(b)). Tree-ring δ18O was also significantly negatively correlatedwith the precipitation (r = −0.38, p < 0.01) and relativehumidity (r = −0.54, p < 0.001) in July–August. Therelative humidity and mean temperature in July–Augustexplained the variations of tree-ring δ18O about 29.5%(p < 0.001) and 21.8% (p < 0.001), respectively. Signif-icant negative correlations were also detected betweenthe sc_PDSI values from the previous December tothe current September and the tree-ring δ18O and thestrongest correlations were 0.71 in July (p < 0.01) and0.65 (p < 0.01) in July–August.
Tree-ring δ18O was significantly influenced by the rel-ative humidity (Figure 3(b)), and similar results wereobtained in previous studies (Roden et al., 2000; Robert-son et al., 2001; Waterhouse et al., 2002; Liu et al., 2012).As relative humidity controls evaporative enrichment ofthe δ18O of leaf water, lower relative humidity causes ahigher vapour-pressure gradient between the leaf’s inter-stitial spaces and the ambient atmosphere, resulting intranspiration enrichment in 18O of the δ18O of leaf water(Roden et al., 2000; Sano et al., 2012a). As a result, thetree-ring δ18O models (Roden et al., 2000; Waterhouseet al., 2002; McCarroll and Loader, 2004; Sternberg,2009) suggest that the variation of the relative humiditywill leave its fingerprints in the tree-ring δ18O. Precipi-tation and relative humidity are also closely associated,which in turn controls the degree of evaporative enrich-ment of leaf water δ18O (Roden et al., 2000), and there-fore controls tree-ring δ18O.
Temperature indirectly influences the tree-ring δ18Oby changing the ambient moisture conditions (e.g.
2013 Royal Meteorological Society Int. J. Climatol. (2013)

EASTERN TIANSHAN DROUGHT HISTORY BASED ON TREE-RING δ18O
Figure 3. (a, b) The values of Pearson’s correlation coefficient between the tree-ring δ18O and climatic variables at the Yiwu station and thesc_PDSI data from 1959 to 2008, (c) the relationship between tree-ring δ18O and corresponding July–August (JA) sc_PDSI data, and (d) therelationship between tree-ring δ18O and the residuals of the linear models in (c), (e) the relationship between reconstructed sc_PDSI from 1959to 2008 and the residuals of the linear models in (c), and (f) the gridded sc_PDSI data and the reconstructed sc_PDSI time series since 1959. Thegrey shaded area depicted the uncertainties of reconstruction (see text for details). (a, b) Months followed by ‘/p’ indicate values in the previousyear. JA represents the mean value July and August of the current growing season. The dashed lines indicate the 95% confidence intervals. Bars
that extend outside the confidence interval represent statistically significant results.
2013 Royal Meteorological Society Int. J. Climatol. (2013)
G. XU et al.
evaporation and transpiration), and this is particularlytrue in July and August, which are the warmest monthsin our study area. More specifically, the increasingtemperatures increase evaporation of soil water, resultingin a depletion of lighter isotopes from the soil water(Sano et al., 2012a), and this is reflected in the watertaken up by trees. In addition, δ18O of the source wateris also a primary factor affecting tree-ring δ18O (Rodenet al., 2000; McCarroll and Loader, 2004). δ18O ofprecipitation in the region is controlled by temperaturewith a positive effect (Liu et al., 2009b) because of theRayleigh distillation, which is named ‘temperature effect’(Dansgaard, 1964). As a shallow root system species, thesource water of the larch is primarily from the precipita-tion. As a consequence, tree-ring δ18O of larch recordedtemperature signal to some degree due to the linkagebetween precipitation δ18O and temperature. Our resultsindicated that tree-ring δ18O increases with increasingtemperature and with decreasing precipitation andrelative humidity (Figure 3(a) and (b)), and thus dependsstrongly on moisture conditions. The PDSI could describedrought events well because it is estimated througha water-balance model that accounts for temperature,precipitation and soil characteristic (Palmer, 1965; Daiet al., 2004; Dai, 2011). The sc_PDSI was strongly andsignificantly negatively correlated with the tree-ring δ18Oin July and August, which reflects the comprehensiveinfluence of the climatic factors embodied in sc_PDSIon tree-ring δ18O. The sc_PDSI in July and August wasthe most meaningful single variable that explained thevariation in our δ18O chronology based on its climateresponse.
3.3. Calibration and verification
On the basis of tree-ring δ18O-climate relationshipsdescribed in Section 3.2, we used tree-ring δ18O asindependent variable and sc_PDSI in July–August asthe dependent variable to establish a transfer function.The resulting reconstruction accounted for 38.4% (afteradjusted the degree of freedom) of the total variance dur-ing the validation period from 1959 to 2008 (Figure 3(c)).The transfer function was significant (F = 32.51,p < 0.001). The residuals of the regression model showednormal distribution with a Shapiro–Wilk value of 0.98(p = 0.55). Figure 3(d) showed that the residuals of thelinear model did not vary with the tree-ring δ18O values.This suggested that the residuals of the linear model had
homogeneity of variance. The residuals had no significanttrend with the predicted sc_PDSI (Figure 3(e)). The linearmodel had Durbin–Watson value of 1.55 and no signif-icant autocorrelation was detected in the residual series.All of above suggested that the regression was validto represent the relationship between the July–Augustsc_PDSI and the tree-ring δ18O. The uncertainty of thereconstructed sc_PDSI arises mainly from uncertainty ofthe model and the δ18O measurements (Figure 2). Weestimated the uncertainty associated with the linear modelusing bootstrap method. A calibration set (2/3 of the data)was sampled with replacement, the best linear model wasestimated on this data and the quality of the reconstruc-tion was assessed by the rest of the data (verificationsample). After 1000 iterations of this method, we esti-mated the uncertainty on the sc_PDSI as the mean stan-dard deviations of the verification residuals (2.19). Then,the uncertainties of the δ18O measurements were addedthrough multiplication by the constant coefficient in thelinear model.
The statistics of calibration and verification indicatedthat the model was applicable with positive RE and CE,and significant r and ST except for the verification periodfrom 1948 to 1958 (Table 1). The insignificant veri-fication statistics from 1948 to 1958 might arise fromthe degradation of the data of sc_PDSI due to the datainterpolated from the near meteorological stations. Theresults of the leave-one-out method also demonstratedthat the transfer function was valid, with a RE and CEboth of 0.35, a correlation coefficient of 0.63 and a signtest of 40+/10− (p < 0.01). The reconstruction of theJuly–August sc_PDSI was consistent with the griddedvalues from 1959 to 2008 (Figure 3(f)). Results of thespatial correlation analysis showed that the reconstruc-tion reflected a broad range of drought variability in thenorthwestern China, Western Mongolia and parts of cen-tral Asia. The strongest UCAR 1900–2008 correlationscoincided with the study region. The pattern of the spatialcorrelation between reconstruction and UCAR sc_PDSIwere similar for the two periods of from 1950 to 2008and from 1900 to 2008, but the strength was stronger forthe period of from 1950 to 2008 (Figure 4(a) and (b)).The spatial correlation pattern between reconstruction andSPEI was similar to the UCAR sc_PDSI (Figure 4(a)and (c)). These evidences further suggest that the recon-struction is robust, and agrees with reanalysis datasets(i.e. UCAR sc_PDSI and SPEI) that extend further backin time.
Table 1. Calibration/verification statistics for the reconstructed sc_PDSI in July and August; the calibration was performed overa 30-year interval. The results of the leave-one-out validation method.
Calibration r ST Verification r RE CE ST
1959–1988 0.60** 23/7* 1989–2008 0.69** 0.41 0.43 17/3*1989–2008 0.69** 17/3* 1959–1988 0.60** 0.28 0.32 23/7*1979–2008 0.70** 24/6* 1959–1978 0.52** 0.19 0.15 16/4*1959–2008 0.63** 40/10** 1948–1958 0.06ns −0.65 −0.4 6/5ns
Leave-one-out 1959–2008 0.63** 40/10** 0.35 0.35
ns, not significant. *p < 0.05. **p < 0.01.
2013 Royal Meteorological Society Int. J. Climatol. (2013)

EASTERN TIANSHAN DROUGHT HISTORY BASED ON TREE-RING δ18O
Figure 4. Spatial correlation (p < 0.1) pattern of the reconstruction with the sc_PDSI data from the regional grid (UCAR; Dai, 2011) from 1950to 2008 (a) and from 1900 to 2008 (b); and (c) with the SPEI data (Vicente-Serrano et al., 2010) from 1901 to 2008. The black dots represent
sampling site. The analyses were accomplished using the KNMI Climate Explorer software (http://climexp.knmi.nl).
3.4. Reconstruction and validation of July–Augustsc_PDSI
The past 309-year July–August sc_PDSI were recon-structed by applying the transfer function. The regionalmoisture conditions became wetter from 1700 to 1850(slope = 0.02, R2 = 0.13, p < 0.001) and drier from1993 to 2008 (slope = −0.25, R2 = 0.37, p = 0.008;Figure 5(a)). We conducted a regime shift analysis to testthe mean value shift of our reconstruction using softwareRegime Shift Detection v3.2 (Rodionov, 2006). Wefound six major regime shifts in years 1710, 1785, 1808,1830, 1855, 1898 and 2006. During the 19th century,the sc_PDSI showed three regime shift periods, whichindicated that the moisture conditions were not stable inthis period. The dry period (with sc_PDSI relative lowervalues) occurred from 1700 to the 1780s, from the 1810sto the 1820s, from the 1850s to the 1890s and the 2000s.The wet periods (with sc_PDSI relative higher value)occurred from 1780 to the 1800s, from the 1830s to 1850and the whole 20th century (Figure 5(a) and (b)). Theextreme years are defined as those reconstructed residualsc_PDSI values exceeding 1.5 standard deviation fromthe base level (thick solid lines in Figure 5(a)). In total,there was 35 extreme years (accounted for 11.3% of totalyears) during the past 309 years. The extreme dry years(downward bars) were concentrated in the period from1700 to 1730, whereas the extreme wet years (upwardbars) were concentrated in the period from the 1740s tothe 1770s and from the 1880s to the 1920s.
Several moisture-sensitive tree-ring records in the areasurrounding our study area provide evidence to validateour sc_PDSI reconstruction (Figure 5). Our reconstruc-tion showed a high correlation with the PDSI recon-struction in June–July–August (JJA) from the MonsoonAsia Drought Atlas (MADA) (Cook et al., 2010) at thegrid 220 (43.75◦93.75◦; Figures 1 and 5(c)) and grid219 (41◦25′N, 93.75◦E; Figures 1 and 5(d)) with cor-relation coefficients of 0.26 and 0.28 (p < 0.01, n = 306)covering the common period from 1700 to 2005, respec-tively. These correlation coefficients reached to 0.65 and0.56 during the instrumental period (1959–2005) for grid220 and 219, respectively. But the correlation betweenour reconstruction and MADA PDSI was relatively low(0.40 and 0.55) during the period of 1900–1958, espe-cially from 1920 to 1958 (r = 0.08 and r = 0.23, p > 0.1).This indicated that the coherence between reconstructed
sc_PDSI and MADA PDSI was not strong during theearly 20th century. The different signal window (i.e. JAvs JJA) and site-specific reconstruction may cause thisdiscrepancy. During the past century (1900–2005), thecorrelation between this reconstruction and the MADA(Cook et al., 2010) attained to 0.47 and 0.48 for grid220 and 219, respectively. In addition, the dry periodsoccurred from 1707 to the 1730s, and during the 1850s,the 1930s and the 1970s. The wet periods occurred dur-ing the 1780s, the 1800s, from 1950 to the 1960s andfrom 1980 to the 1990s, which agree with the resultsof the MADA results. The wetter 20th century agreedwith the results of MADA (Cook et al., 2010) in theMiquan, the central Tianshan Mountain (Li et al., 2006)(Figure 5(e)) and in northern Pakistan (Treydte et al.,2006) (Figure 5(f)). The wet period from 1780 to 1800also occurred in the Miquan results (Li et al., 2006), aperiod that corresponds to a strong advance of the GlacierNO.1 in the source area of the Urumqi River, in the cen-tral of the Tianshan Mountains, around 1770 ± 20 years(Chen, 1989). The dry period from 1700 to 1780s wasagreed with the less precipitation in northern Pakistan(Treydte et al., 2006).
However, some discrepancies also existed amongdifferent reconstructions during several periods. Thereconstructed sc_PDSI showed differing changes fromMADA PDSI, Miquan PDSI and precipitation in north-ern Pakistan from 1750 to 1780. During the period of1810–1870, sc_PDSI reconstruction was less coordinatedwith the Miquan PDSI and precipitation in northern Pak-istan. The sc_PDSI reconstruction was different fromthe Miquan PDSI from 1950 to 2002, but showed sim-ilar fluctuations with MADA PDSI during this period.Our reconstruction showed no significant correlation withthe patterns of PDSI in April to June from Miquan (Liet al., 2006) and annual precipitation in northern Pak-istan (Treydte et al., 2006). The discrepancies may haveresulted from the local setting and seasonal characteris-tics over the regions. The different signal window amongthe reconstruction may also cause the discrepancies. Forexample, the sc_PDSI reconstruction spanned from Julyto August, the MADA PDSI is from June to August,while the Miquan PDSI is from April to June.
The reconstruction showed a decreasing trend from the1990s to 2008, which was similar to the result of MADA(Cook et al., 2010). But this result differed from the result
2013 Royal Meteorological Society Int. J. Climatol. (2013)

G. XU et al.
Figure 5. (a) Reconstructed July–August sc_PDSI with its regime shift. The black line is the reconstructed sc_PDSI, with its uncertainty showedin grey shading (±1σ ), the thick solid line is the regime shifts (cutoff length =10 years, confident at 95%); the thick dashed lines represent theregression of sc_PDSI with the time, respectively, during 1700–1850 and 1993–2008; the upward and downward bars corresponded to extremewet/dry years (see text for details). Comparisons between (b) the present sc_PDSI reconstruction and (c, d) the gridded (ID 219 and ID 220)June to August (JJA) PDSI data from the MADA dataset (Cook et al., 2010), (e) the April to June (AMJ) PDSI in Miquan (Li et al., 2006); and(f) annual precipitation reconstruction in northern Pakistan (Treydte et al., 2006). The central line represents the long-term mean value. (b–f)
Smoothed results based on 10-year FFT.
of the Shi et al. (2007), who reported a warmer andwetter trend since 1987 in the northern part of Xinjiangregion. Our results demonstrated that the moisture levelshave not been increasing during last two decades in theeastern Tianshan Mountains, which is confirmed by theresults of other studies (Ma et al., 2005; Zou et al., 2005).As moisture levels are regionally variable, representationof many regions is needed to understand hydroclimaticchanges over long-time scales in China.
Over the long term, our sc_PDSI reconstructioncaptured more of the low-frequency of variationsthan in the MADA dataset (Cook et al., 2010) before1950 (Figure 5). One possible explanation arises fromdifferences in the calibration approaches and instru-mental ‘targets’ (Esper et al., 2005). In the MADAreconstruction, the calibration period for PDSI valueswas from 1951 to 1989, and the verification period wasfrom 1920 to 1950, and the series ended in 1989 (Cook
2013 Royal Meteorological Society Int. J. Climatol. (2013)
EASTERN TIANSHAN DROUGHT HISTORY BASED ON TREE-RING δ18O
et al., 2010). Instrumental data from 1990 to 2005 wereappended to the ends of the MADA datasets (NOAAPaleoclimatology, http://www.ncdc.noaa.gov/paleo).The sc_PDSI data before the instrument period wereinterpolated from meteorological records recorded insurrounding areas (Dai et al., 2004; Dai, 2011). Thus, thequality of that data for northwestern China is degradedbefore the instrument period. Our reconstruction usedthese relatively precise data as calibrate data, and therebyobtained robust results in the reconstruction. In addition,the PDSI in MADA (Cook et al., 2010) combined manyremote datasets based on a large search radius (e.g.1000 km) to locate the candidate tree-ring predictors,and thus lost some local information and bring someuncertainties. Our reconstruction contained more localdrought information about period of less intense drynessor wetness at local scales. Similar discrepancies betweenthe PDSI reconstruction from the MADA datasets andsite-based reconstructions were also founded in northernChina (Fang et al., 2012). Last but not least, the influenceof the detrending method used for the tree-ring widthdata may have caused some discrepancies. The standard-ization procedure that is used to remove any nonclimaticvariability retained in the ring-width measurements oftenresults in a loss of data on climate variations on centen-nial and longer time scales (Cook et al., 1995), althoughthis can be largely overcome by proper treatment usingmethods such as regional curve standardization byapplying a large number of ring-width series (Esperet al., 2002; Schweingruber, 2003). In contrast, tree-ringδ18O series are not processed by data-adaptive curvefitting, and so there is no potential loss of low-frequencyvariability in δ18O-based climate reconstructions.
3.5. Linkages to NAO and ENSO
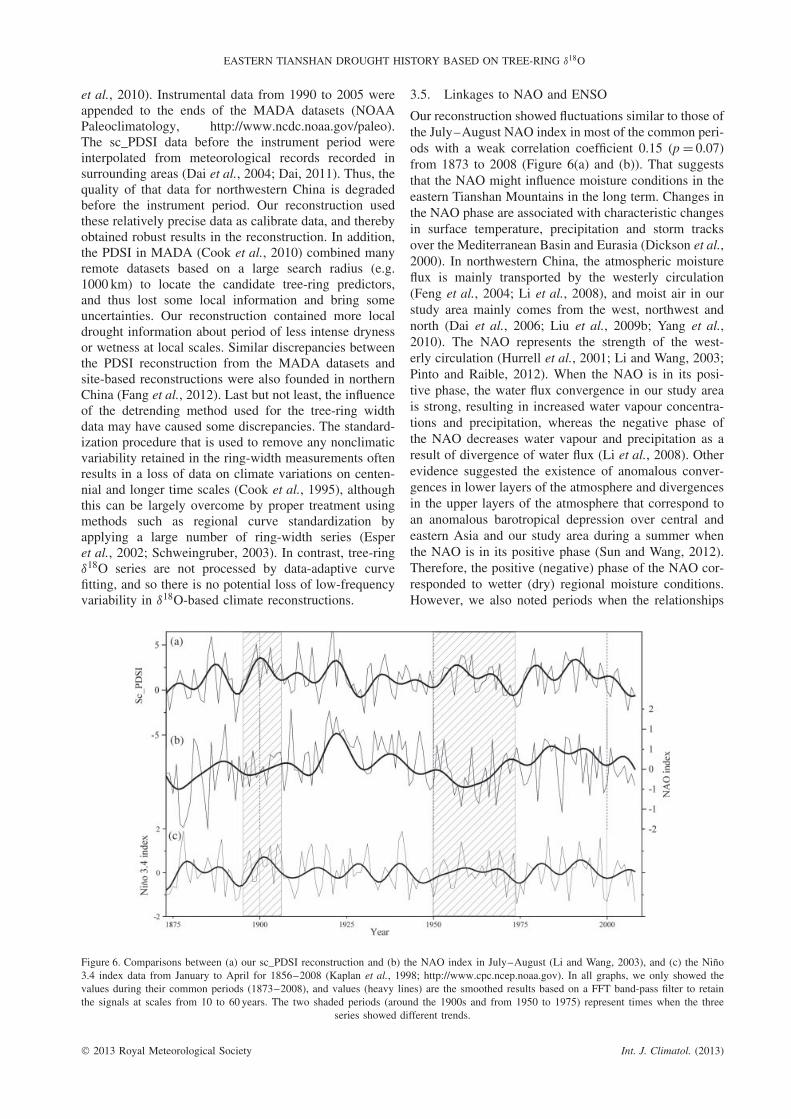
Our reconstruction showed fluctuations similar to those ofthe July–August NAO index in most of the common peri-ods with a weak correlation coefficient 0.15 (p = 0.07)from 1873 to 2008 (Figure 6(a) and (b)). That suggeststhat the NAO might influence moisture conditions in theeastern Tianshan Mountains in the long term. Changes inthe NAO phase are associated with characteristic changesin surface temperature, precipitation and storm tracksover the Mediterranean Basin and Eurasia (Dickson et al.,2000). In northwestern China, the atmospheric moistureflux is mainly transported by the westerly circulation(Feng et al., 2004; Li et al., 2008), and moist air in ourstudy area mainly comes from the west, northwest andnorth (Dai et al., 2006; Liu et al., 2009b; Yang et al.,2010). The NAO represents the strength of the west-erly circulation (Hurrell et al., 2001; Li and Wang, 2003;Pinto and Raible, 2012). When the NAO is in its posi-tive phase, the water flux convergence in our study areais strong, resulting in increased water vapour concentra-tions and precipitation, whereas the negative phase ofthe NAO decreases water vapour and precipitation as aresult of divergence of water flux (Li et al., 2008). Otherevidence suggested the existence of anomalous conver-gences in lower layers of the atmosphere and divergencesin the upper layers of the atmosphere that correspond toan anomalous barotropical depression over central andeastern Asia and our study area during a summer whenthe NAO is in its positive phase (Sun and Wang, 2012).Therefore, the positive (negative) phase of the NAO cor-responded to wetter (dry) regional moisture conditions.However, we also noted periods when the relationships
Figure 6. Comparisons between (a) our sc_PDSI reconstruction and (b) the NAO index in July–August (Li and Wang, 2003), and (c) the Nino3.4 index data from January to April for 1856–2008 (Kaplan et al., 1998; http://www.cpc.ncep.noaa.gov). In all graphs, we only showed thevalues during their common periods (1873–2008), and values (heavy lines) are the smoothed results based on a FFT band-pass filter to retainthe signals at scales from 10 to 60 years. The two shaded periods (around the 1900s and from 1950 to 1975) represent times when the three
series showed different trends.
2013 Royal Meteorological Society Int. J. Climatol. (2013)
G. XU et al.
between the NAO and sc_PDSI were disturbed, such asaround 1890 to 1910 and 1950 to 1975, suggesting thatother factors might affect the variation in moisture con-dition in our study area during certain periods.
The variations in NAO are associated with the ENSO(Melo-Goncalves et al., 2005). The NAO and ENSOphenomena both affect the precipitation in central andsouthwestern Asia (Syed et al., 2006; 2010). In this study,the sc_PDSI reconstruction was weakly but significantlycorrelated (r = 0.31, p = 0.0002, n = 136) with the Nino3.4 index from January to April for the period from 1856to 2008. The sc_PDSI reconstruction follows the Nino 3.4index at both annual and longer scales (Figure 6(a) and(c)). These results suggest that ENSO might also affectthe moisture conditions in the study area. Similar resultshave also been reported for the correlation with tree-ringwidth index from the middle of the Tianshan Mountains(Li et al., 2010).
On the basis of precipitation data in the northern Xin-jiang region, several studies have found that during thewarm phase of ENSO, El Nino, the 4-month-lagged pre-cipitation was greater than that in normal years, whereasprecipitation was lower during the cold phase, La Nina(Li, 1989; Ren, 1989; Zhang and Chen, 2001). The rela-tionship between sc_PDSI reconstruction and ENSO isin good agreement with recent studies that have sug-gested that the drought in central and southwestern Asiaresults from the cold phase of ENSO in the tropicaloceans (Barlow et al., 2002; Hoerling and Kumar, 2003).Climate models have consistently demonstrated that dry-ing over central Asia is linked with temperature varia-tions in the oceans (Hoerling and Kumar, 2003; Mariotti,2007). The interaction between the tropical and mid-latitude climates occurs when the warmer ENSO phaseinduces an anomalous southwesterly moisture flux (Mar-iotti, 2007). The increased southwesterly moisture fluxbrings abundant moisture into central and southwesternAsia, causing increased precipitation (Zhao et al., 2006;Mariotti, 2007). During the ENSO cold phase, southwest-erly moisture flux decreases, leading to decreased transferof moisture into central and southwestern Asian, leadingto drought (Hoerling and Kumar, 2003; Mariotti, 2007).Our result revealed that the linkages between drought andENSO were relatively stable in the long term.
The NAO and Nino3.4 index after band-pass filtercould explain 17.6% (r = 0.42, p < 0.01) of the total vari-ations of sc_PDSI by multiple regression analysis. Thismay suggest that synergy of the NAO and ENSO affectsthe regional drought at the decadal scales. The ENSO seasurface temperature affects the variation in NAO (Melo-Goncalves et al., 2005), and the interaction between thetwo phenomena can therefore influence the frequencyand severity of drought in our study area (Hoerling andKumar, 2003). These linkages could explain the relation-ships among the sc_PDSI reconstruction, the NAO indexand ENSO around the 1900s and from 1950 to 1975.However, the relationships between the NAO internalvariability and ENSO in different period should be furtherexplored by the atmospheric modelling.
4. Conclusion
The availability of moisture is the primary factor thatcontrols tree-ring δ18O in the east Tianshan Mountainsof northwestern China, which is indicated by signifi-cant positive correlations between tree-ring δ18O andtemperature (maximum and mean) and significant nega-tive correlations with precipitation and relative humidity.Sc_PDSI values in July–August, which integrate theseeffects, were significantly negatively correlated with thetree-ring δ18O, and we were able to establish a linearregression model that could reconstruct the July–Augustsc_PDSI series. The reconstruction showed similar trendsto those in the MADA PDSI dataset, but revealed pro-found information on low-frequency variations in thelocal moisture conditions, suggesting the need to developmore drought reconstructions with different proxy param-eters. Our reconstruction showed wet epochs from 1780to the 1800s, from the 1830s to 1850 and during the 20thcentury. Dry periods occurred from 1700 to the 1780s,from the 1810s to the 1820s, from the1850s to the 1890sand the 2000s. The variation in drought intensity waslikely linked with the NAO, but the relationship was alsodisturbed by ENSO around the 1900s and from 1950 to1975.
Acknowledgements
We are grateful for the editors and reviewers forvaluable comments and suggestions that substantiallyimproved the manuscript. This research was supportedby the Global Change Research Program of China(2010CB951401), by the National Natural Science Foun-dation of China (41171167 and 31200299), by the ChinaDesert Meteorological Science Research Foundation(Sqj2011013 and Sqj2009001), by Project for Incubationof Specialists in Glaciology and Geocryology of NationalNatural Science Foundation of China (J0930003/J0109),by a Chinese Academy of Sciences Special Grant forPostgraduate Research, Innovation and Practice and bythe Chinese Academy of Sciences Interdisciplinary Inno-vation Team project (29Y329B91). We thank Prof. Xiao-hua Gou for providing Miquan PDSI data used in ourcomparison.
References
Abaimov AP. 2010. Geographical distribution and genetics of Siberianlarch species. In Permafrost Ecosystems , Osawa A, Zyryanova OA,Matsuura Y, Kajimoto T, Wein RW. (eds). Springer: Dordrecht,Netherlands; 41–58.
Anchukaitis KJ, Evans MN. 2010. Tropical cloud forest climatevariability and the demise of the Monteverde golden toad. Proc.Natl. Acad. Sci. 107: 5036–5040, DOI: 10.1073/pnas.0908572107.
Barlow M, Cullen H, Lyon B. 2002. Drought in central and southwestAsia: La Nina, the warm pool, and Indian Ocean precipitation. J.Clim. 15: 697–700.
Bergland G. 1969. A guided tour of the fast Fourier transform. IEEESpectr. 6: 41–52.
Chen JY. 1989. Preliminary studies on using lichen dating to studyHolocene glacial changes in the source region of Urumqi River,Tianshan. Sci. China, Ser. B 32: 1487–1500.
2013 Royal Meteorological Society Int. J. Climatol. (2013)
EASTERN TIANSHAN DROUGHT HISTORY BASED ON TREE-RING δ18O
Cook ER, Kairiukstis LA. 1990. Methods of Dendrochronology: Appli-cations in the Environmental Sciences . Kluwer Academic Publishers:Boston, MA.
Cook ER, Briffa KR, Meko DM, Graybill DA, Funkhouser G. 1995.The ‘segment length curse in’ long tree-ring chronology developmentfor palaeoclimatic studies. The Holocene 5: 229–237.
Cook ER, Anchukaitis KJ, Buckley BM, D’Arrigo RD, JacobyGC, Wright WE. 2010. Asian monsoon failure and megadroughtduring the Last millennium. Science 328: 486–489, DOI: 10.1126/science.1185188.
Dai A. 2011. Characteristics and trends in various forms of the PalmerDrought Severity Index during 1900–2008. J. Geophys. Res. 116:D12115, DOI: 10.1029/2010JD015541.
Dai A, Trenberth KE, Qian T. 2004. A global dataset of palmer droughtseverity index for 1870–2002: relationship with soil moisture andeffects of surface warming. J. Hydrometeorol. 5: 1117–1130, DOI:10.1175/JHM-386.1.
Dai XG, Li WJ, Ma ZG. 2006. Variation characteristics of moisturesource of Xinjiang, China in recent decades (in Chinese). Prog. Nat.Sci. 16(12): 1651–1656.
Dansgaard W. 1964. Stable isotopes in precipitation. Tellus 16:436–468.
Daux V, Edouard JL, Masson-Delmotte V, Stievenard M, HoffmannG, Pierre M, Mestre O, Danis PA, Guibal F. 2011. Can climatevariations be inferred from tree-ring parameters and stable isotopesfrom Larix decidua? Juvenile effects, budmoth outbreaks, anddivergence issue. Earth Planet. Sci. Lett. 309: 221–233, DOI:10.1016/j.epsl.2011.07.003.
Davison AC, Hinkley DV. 1997. Bootstrap Methods and Their Applica-tion. Cambridge Series in Statistical and Probabilistic Mathematics .Cambridge University Press: Cambridge, UK.
Dickson R, Osborn T, Hurrell J, Meincke J, Blindheim J, AdlandsvikB, Vinje T, Alekseev G, Maslowski W. 2000. The Arctic Oceanresponse to the North Atlantic Oscillation. J. Clim. 13: 2671–2696.
Easterling D, Evans J, Groisman PY, Karl T, Kunkel K, Ambenje P.2000. Observed variability and trends in extreme climate events: abrief review. Bull. Am. Meteorol. Soc. 81: 417–426.
Esper J, Cook ER, Schweingruber FH. 2002. Low-frequency signalsin long tree-ring chronologies for reconstructing past temperaturevariability. Science 295: 2250–2253.
Esper J, Frank DC, Wilson RJ, Briffa KR. 2005. Effect of scal-ing and regression on reconstructed temperature amplitude forthe past millennium. Geophys. Res. Lett. 32: L07711, DOI:10.1029/2004GL021236.
Esper J, Frank DC, Battipaglia G, Buntgen U, Holert C, TreydteK, Siegwolf R, Saurer M. 2010. Low-frequency noise in δ13Cand δ18O tree ring data: a case study of Pinus uncinata in theSpanish Pyrenees. Glob. Biogeochem. Cycles 24: GB4018, DOI:10.1029/2010gb003772.
Fang KY, Gou XH, Chen FH, Liu CZ, Davi N, Li JB, ZhaoZQ, Li YJ. 2012. Tree-ring based reconstruction of droughtvariability (1615–2009) in the Kongtong Mountain area, north-ern China. Glob. Planet. Change 80–81: 190–197, DOI:10.1016/j.gloplacha.2011.10.009.
Feng W, Wang KL, Jiang H. 2004. Influences of westerly windinterannual change on water vapor transport over northwest Chinasummer (in Chinese). Plateau Meteorol. 23(02): 271–275.
Fritts HC. 1976. Tree Rings and Climate. Academic Press: London,UK.
Hoerling M, Kumar A. 2003. The perfect ocean for drought. Science299: 691–694.
Holmes RL. 1983. Computer-assisted quality control in tree-ring datingand measurement. Tree-Ring Bull. 43: 69–78.
Hurrell JW, Kushnir Y, Visbeck M. 2001. The North Atlantic Oscilla-tion. Science 291: 603–605.
Kaplan A, Cane M, Kushnir Y, Clement A, Blumenthal M, RajagopalanB. 1998. Analyses of global sea surface temperature 1856–1991. J.Geophys. Res. 103: 567–589.
Kress A, Saurer M, Siegwolf RTW, Frank DC, Esper J, BugmannH. 2010. A 350 year drought reconstruction from Alpine treering stable isotopes. Glob. Biogeochem. Cycles 24: GB2011, DOI:10.1029/2009gb003613.
Laumer W, Andreu L, Helle G, Schleser GH, Wieloch T, Wissel H.2009. A novel approach for the homogenization of cellulose to usemicro-amounts for stable isotope analyses. Rapid Commun. MassSpectrom. 23: 1934–1940, DOI: 10.1002/rcm.4105.
Leavitt SW. 2008. Tree-ring isotopic pooling without regard to mass:no difference from averaging δ13C values of each tree. Chem. Geol.252: 52–55, DOI: 10.1016/j.chemgeo.2008.01.014.
Leavitt SW. 2010. Tree-ring C-H-O isotope variability andsampling. Sci. Total Environ. 408: 5244–5253, DOI:10.1016/j.scitotenv.2010.07.057.
Li DC. 1989. Relationships between El Nino and the temperatureand precipitation in northwestern Xinjiang (in Chinese). XinjiangMeteorol. Z2: 1–5.
Li JP, Wang JXL. 2003. A new North Atlantic Oscillation index andits variability. Adv. Atmos. Sci. 20: 661–676.
Li JB, Gou X, Cook ER, Chen F. 2006. Tree-ring based droughtreconstruction for the central Tien Shan area in northwest China.Geophys. Res. Lett. 33: L07715, DOI: 10.1029/2006gl025803.
Li WL, Wang KL, Fu SM, Jiang H. 2008. The interrelationship betweenregional westerly index and the water vapor budget in NorthwestChina (in Chinese). J. Glaciol. Geocryol. 30: 28–34.
Li JB, Cook ER, Chen F, Gou X, D’Arrigo R, Yuan Y. 2010. Anextreme drought event in the central Tien Shan area in the year1945. J. Arid Environ. 74: 1225–1231.
Linan ID, Gutierrez E, Helle G, Heinrich I, Andreu-Hayles L,Planells O, Leuenberger M, Burger C, Schleser G. 2011. Pooledversus separate measurements of tree-ring stable isotopes. Sci. TotalEnviron. 409: 2244–2251, DOI: 10.1016/j.scitotenv.2011.02.010.
Liu JR, Song X, Sun X, Yuan G, Liu X, Wang S. 2009a. Isotopiccomposition of precipitation over Arid Northwestern China and itsimplications for the water vapor origin. J. Geogr. Sci. 19: 164–174,DOI: 10.1007/s11442-009-0164-3.
Liu X, Shao X, Liang E, Chen T, Qin D, An W, Xu G, SunW, Wang Y. 2009b. Climatic significance of tree-ring δ18O inthe Qilian Mountains, northwestern China and its relationship toatmospheric circulation patterns. Chem. Geol. 268: 147–154, DOI:10.1016/j.chemgeo.2009.08.005.
Liu XH, Liu Y, Xu GB, Cai QF, An WL, Wang WZ. 2010. Pretreatmentof the tree-ring samples for stable isotope analysis (in Chinese).J. Glaciol. Geocryol. 32: 1242–1250.
Liu X, An W, Treydte K, Shao X, Leavitt S, Hou S, Chen T, Sun W,Qin D. 2012. Tree-ring δ18O in southwestern China linked to vari-ations in regional cloud cover and tropical sea surface temperature.Chem. Geol. 291: 104–115, DOI: 10.1016/j.chemgeo.2011.10.001.
Loader NJ, Robertson I, Switsur VR, Waterhouse JS. 1997. Animproved technique for the batch processing of small whole woodsamples to α-cellulose. Chem. Geol. 136: 313–317.
Ma Z, Fu C. 2006. Some evidence of drying trend over northern Chinafrom 1951 to 2004. Chin. Sci. Bull. 51: 2913–2925.
Ma Z, Huang G, Gan W, Chen L. 2005. Multi scale temporalcharacteristics of the dryness/wetness over Northern China duringthe last century (in Chinese). Chin. J. Atmos. Sci. 29: 678–681.
Mariotti A. 2007. How ENSO impacts precipitation in south-west central Asia. Geophys. Res. Lett. 34: L16706, DOI:10.1029/2007GL030078.
McCarroll D, Loader NJ. 2004. Stable isotopes in tree rings. Quat. Sci.Rev. 23: 771–801, DOI: 10.1016/j.quascirev.2003.06.017.
Melo-Goncalves P, Rocha A, Castanheira J, Ferreira J. 2005. NorthAtlantic Oscillation sensitivity to the El Nino/Southern Oscillationpolarity in a large-ensemble simulation. Clim. Dyn. 24: 599–606,DOI: 10.1007/s00382-005-0001-z.
Palmer WC. 1965. Meteorological Drought. US Department of Com-merce, Weather Bureau: Washington, D.C.
Pinto JG, Raible CC. 2012. Past and recent changes in the NorthAtlantic oscillation. Wiley Interdiscip. Rev.: Clim.Change 3: 79–90,DOI: 10.1002/wcc.150.
Porter TJ, Middlestead P. 2012. On estimating the precision ofstable isotope ratios in processed tree-rings. Dendrochronologia 30:239–242, DOI: 10.1016/j.dendro.2012.02.001.
Porter TJ, Pisaric MF, Field RD, Kokelj SV, Edwards TW, Healy R,LeGrande AN. 2013. Spring-summer temperatures since AD 1780reconstructed from stable oxygen isotope ratios in white spruce tree-rings from the Mackenzie Delta, northwestern Canada. Clim. Dyn.1–15, DOI: 10.1007/s00382-013-1674-3.
Rashed M, Li S, Babar K. 2010. Causes of recurring droughtpatterns in Xinjiang, China. J. Arid Land 2: 279–285, DOI:10.3724/SP.J.1227.2010.00279.
Ren YY. 1989. The relationship between ENSO and Xinjiang weather(in Chinese). Xinjiang Meteorol. 12: 6–10.
Rinn F. 2003. TSAPWin: Time Series Analysis and Presentation forDendrochronology and Related Applications . Version 0.55 UserReference: Heidelberg, Germany.
Robertson I, Waterhouse JS, Barker AC, Carter AHC, Switsur VR.2001. Oxygen isotope ratios of oak in east England: implicationsfor reconstructing the isotopic composition of precipitation. EarthPlanet. Sci. Lett. 191: 21–31.
2013 Royal Meteorological Society Int. J. Climatol. (2013)

G. XU et al.
Roden JS, Ehleringer JR. 2000. Hydrogen and oxygen isotope ratiosof tree ring cellulose for field-grown riparian trees. Oecologia 123:481–489.
Roden JS, Lin G, Ehleringer JR. 2000. A mechanistic model forinterpretation of hydrogen and oxygen isotope ratios in tree-ringcellulose. Geochim. Cosmochim. Acta 64: 21–35.
Rodionov SN. 2006. The problem of red noise in climateregime shift detection. Geophys. Res. Lett. 31: L12707, DOI:10.1029/2004GL019448.
Sano M, Ramesh R, Sheshshayee M, Sukumar R. 2012a. Increasingaridity over the past 223 years in the Nepal Himalaya inferred froma tree-ring δ18O chronology. The Holocene 22: 809–817, DOI:10.1177/0959683611430338.
Sano M, Xu C, Nakatsuka T. 2012b. A 300-year Vietnam hydro-climate and ENSO variability record reconstructed from treering δ18O. J. Geophys. Res. 117: D12115, DOI: 10.1029/2012JD017749.
Saurer M, Schweingruber F, Vaganov EA, Shiyatov SG, SiegwolfR. 2002. Spatial and temporal oxygen isotope trends at the north-ern tree-line in Eurasia. Geophys. Res. Lett. 29: 1296, DOI:10.1029/2001gl013739.
Schweingruber FH. 2003. Tests of the RCS method for preserving low-frequency variability in long tree-ring chronologies. Tree-Ring Res.59: 81–98.
Shi Y, Shen Y, Kang E, Li D, Ding Y, Zhang G, Hu R. 2007. Recentand future climate change in northwest China. Clim. Change 80:379–393, DOI: 10.1007/s10584-006-9121-7.
Shi C, Masson-Delmotte V, Risi C, Eglin T, Stievenard M, Pierre M,Wang X, Gao J, Breon F-M, Zhang Q-B, Daux V. 2011. Samplingstrategy and climatic implications of tree-ring stable isotopes on thesoutheast Tibetan Plateau. Earth Planet. Sci. Lett. 301: 307–316,DOI: 10.1016/j.epsl.2010.11.014.
Sternberg LSL. 2009. Oxygen stable isotope ratios of tree-ring cellu-lose: the next phase of understanding. New Phytol. 181: 553–562,DOI: 10.1111/j.1469-8137.2008.02661.x.
Stokes MA, Smiley TL. 1968. An Introduction of Tree-ring Dating .The University of Chicago Press: Chicago, IL; 1–61.
Sun J, Wang H. 2012. Changes of the connection between the summerNorth Atlantic Oscillation and the East Asian summer rainfall. J.Geophys. Res. 117: D08110, DOI: 10.1029/2012jd017482.
Syed F, Giorgi F, Pal J, King M. 2006. Effect of remote forcings on thewinter precipitation of central southwest Asia part 1: observations.Theor. Appl. Climatol. 86: 147–160, DOI: 10.1007/s00704-005-0217-1.
Syed FS, Giorgi F, Pal J, Keay K. 2010. Regional climate modelsimulation of winter climate over Central–Southwest Asia, withemphasis on NAO and ENSO effects. Int. J. Climatol. 30: 220–235,DOI: 10.1002/joc.1887.
Szymczak S, Joachimski M, Brauning A, Hetzer T, Kuhlemann J. 2012.Are pooled tree ring δ13C and δ18O series reliable climate archives?-acase study of Pinus nigra spp. laricio (Corsica/France). Chem. Geol.308–309: 40–49.
Tian L, Yao T, MacClune K, White JWC, Schilla A, Vaughn B, VachonR, Ichiyanagi K. 2007. Stable isotopic variations in west China: aconsideration of moisture sources. J. Geophys. Res. 112: D10112,DOI: 10.1029/2006jd007718.
Treydte KS, Schleser GH, Helle G, Frank DC, Winiger M, Haug GH,Esper J. 2006. The twentieth century was the wettest period innorthern Pakistan over the past millennium. Nature 440: 1179–1182,DOI: 10.1038/nature04743.
Treydte K, Frank D, Esper J, Andreu L, Bednarz Z, BerningerF, Boettger T, D’Alessandro CM, Etien N, Filot M, GrabnerM, Guillemin MT, Gutierrez E, Haupt M, Helle G, HilasvuoriE, Jungner H, Kalela-Brundin M, Krapiec M, Leuenberger M,Loader NJ, Masson-Delmotte V, Pazdur A, Pawelczyk S, Pierre M,Planells O, Pukiene R, Reynolds-Henne CE, Rinne KT, Saracino A,Saurer M, Sonninen E, Stievenard M, Switsur VR, Szczepanek M,Szychowska-Krapiec E, Todaro L, Waterhouse JS, Weigl M, SchleserGH. 2007. Signal strength and climate calibration of a Europeantree-ring isotope network. Geophys. Res. Lett. 34: L24302, DOI:10.1029/2007gl031106.
Vicente-Serrano SM, Beguerıa S, Lopez-Moreno JI. 2010. A multi-scalar drought index sensitive to global warming: the standardizedprecipitation evapotranspiration index. J. Clim. 23: 1696–1718, DOI:10.1175/2009jcli2909.1.
Waterhouse JS, Switsur VR, Barker AC, Carter AHC, Robertson I.2002. Oxygen and hydrogen isotope ratios in tree rings: how welldo models predict observed values? Earth Planet. Sci. Lett. 201:421–430.
Wells N, Goddard S, Hayes MJ. 2004. A self-calibrating Palmerdrought severity index. J. Clim. 17: 2335–2351.
Wigley T, Briffa K, Jones P. 1984. On the average value of correlatedtime series, with applications in dendroclimatology and hydromete-orology. J. Clim. Appl. Meteorol. 23: 201–213.
Xu C, Sano M, Nakatsuka T. 2011. Tree ring cellulose δ18O of Fokieniahodginsii in northern Laos: a promising proxy to reconstruct ENSO?J. Geophys. Res. 116: D24109.
Yang Y, Chen Y, Li W, Wang M, Sun G. 2010. Impacts of climaticchange on river runoff in northern Xinjiang of China over last fiftyyears. Chin. Geogr. Sci. 20: 193–201, DOI: 10.1007/s11769-010-0193-y.
Yeh SW, Kug JS, Dewitte B, Kwon MH, Kirtman BP, Jin FF.2009. El Nino in a changing climate. Nature 461: 511–514, DOI:10.1038/nature08316.
Young GHF, Demmler JC, Gunnarson BE, Kirchhefer AJ, LoaderNJ, McCarroll D. 2011. Age trends in tree ring growth and iso-topic archives: a case study of Pinus sylvestris L. from north-western Norway. Glob. Biogeochem. Cycles 25: GB2020, DOI:10.1029/2010gb003913.
Zhang JB, Chen XM. 2001. Review the research of short-term climaticprediction in Xinjiang (in Chinese). Xinjiang Meteorol. 24(5): 1–6.
Zhao BK, Cai CX, Yang LM, Wang H. 2006. Atmospheric circulationanomalies during wetting summer over Xinjiang region (in Chinese).J. Glaciol. Geocryol. 28(3): 434–442.
Zhou WS, Li JF, Zhang JB. 1989. Some problems in developing thetree-ring chronologies in the south slope of the Altay mountain. InStudy of Tree-ring Climatology and Tree-ring Hydrology in Xinjiang ,Li JF, Zhang ZJ, Yuan YJ (eds). Meteorological Press: Beijing,China; 9–17.
Zou X, Zhai P, Zhang Q. 2005. Variations in droughts overChina: 1951–2003. Geophys. Res. Lett. 32: L04707, DOI:10.1029/2004GL021853.
2013 Royal Meteorological Society Int. J. Climatol. (2013)


![Fortified Palaces in Early Modern Europe, 1400-1700 [EAHN 2014]](https://static.fdokumen.com/doc/165x107/6332577f576b626f850d5fce/fortified-palaces-in-early-modern-europe-1400-1700-eahn-2014.jpg)