Effects of temperature on the specific dynamic action of the southern catfish, Silurus meridionalis
10
Effects of temperature on specific dynamic action in Atlantic cod Gadus morhua Bjørn Tirsgaard • Jon Christian Svendsen • John Fleng Steffensen Received: 1 June 2014 / Accepted: 18 October 2014 Ó Springer Science+Business Media Dordrecht 2014 Abstract Growth requires that energy is directed towards ingestion, digestion, absorption and assimila- tion of a meal; energy expenditures are often expressed as the specific dynamic action (SDA). While SDA is an important part of fish energy budgets and strongly affected by water temperature, temper- ature effects are not known across a wide temperature range in Atlantic cod Gadus morhua. The objective of this study was to examine effects of temperature (2, 5, 10, 15 or 20 °C) on the energetic cost and time used for SDA in juvenile G. morhua by intermittent flow respirometry. At each temperature, G. morhua were fed a meal of herring (Clupea harengus) correspond- ing to 5 % of the body mass. Standard metabolic rates measured pre-feeding and post-feeding metabolic rates were measured to determine SDA. The study showed that SDA coefficients (%, SDA energy divided by meal energy) were significantly lower at 2 and 10 °C (5.4–6.3 %) compared to 5, 15 and 20 °C (10.4–12.4 %), while SDA duration increased signif- icantly from 80 h at 10 °C to 130–160 h at 2, 15 and 20 °C and reached a maximum of 250 h at 5 °C. The significant decrease in SDA duration at 10 °C com- bined with a low SDA coefficient suggests that water temperatures close to 10 °C may represent the opti- mum temperatures for SDA in this population of G. morhua. Our results suggest that SDA is not a simple function of temperature, but may vary with tempera- ture in a more complex fashion. Keywords Digestion Gadus morhua Metabolic rate Respirometry SDA Temperature Introduction Atlantic cod (G. morhua) is distributed over a wide area and is known to inhabit a broad thermal niche (-1.5 to 19 °C) and because water temperature is known to affect enzymatic activity, basic body functions including growth typically change with the water temperature in ectothermic species. Mainte- nance and growth of fishes require that energy is directed to feeding and processing nutrients, often expressed as the specific dynamic action (SDA). SDA integrates energy expenditures associated with inges- tion, digestion, absorption, biosynthesis, nutrient turnover and assimilation of a meal (Jobling 1985, 1994) and is usually determined using respirometry as the excess post-feeding oxygen consumption (Jordan and Steffensen 2007). B. Tirsgaard (&) J. F. Steffensen Marine Biological Section, Biological Institute, University of Copenhagen, Strandpromenaden 5, 3000 Helsingør, Denmark e-mail: [email protected] J. C. Svendsen Interdisciplinary Centre of Marine and Environmental Research, University of Porto, Rua dos Bragas 289, 4050-123 Porto, Portugal 123 Fish Physiol Biochem DOI 10.1007/s10695-014-0004-y
-
Upload
independent -
Category
Documents
-
view
1 -
download
0
Transcript of Effects of temperature on the specific dynamic action of the southern catfish, Silurus meridionalis
Effects of temperature on specific dynamic action in Atlanticcod Gadus morhua
Bjørn Tirsgaard • Jon Christian Svendsen •
John Fleng Steffensen
Received: 1 June 2014 / Accepted: 18 October 2014
� Springer Science+Business Media Dordrecht 2014
Abstract Growth requires that energy is directed
towards ingestion, digestion, absorption and assimila-
tion of a meal; energy expenditures are often
expressed as the specific dynamic action (SDA).
While SDA is an important part of fish energy budgets
and strongly affected by water temperature, temper-
ature effects are not known across a wide temperature
range in Atlantic cod Gadus morhua. The objective of
this study was to examine effects of temperature (2, 5,
10, 15 or 20 �C) on the energetic cost and time used for
SDA in juvenile G. morhua by intermittent flow
respirometry. At each temperature, G. morhua were
fed a meal of herring (Clupea harengus) correspond-
ing to 5 % of the body mass. Standard metabolic rates
measured pre-feeding and post-feeding metabolic
rates were measured to determine SDA. The study
showed that SDA coefficients (%, SDA energy divided
by meal energy) were significantly lower at 2 and
10 �C (5.4–6.3 %) compared to 5, 15 and 20 �C
(10.4–12.4 %), while SDA duration increased signif-
icantly from 80 h at 10 �C to 130–160 h at 2, 15 and
20 �C and reached a maximum of 250 h at 5 �C. The
significant decrease in SDA duration at 10 �C com-
bined with a low SDA coefficient suggests that water
temperatures close to 10 �C may represent the opti-
mum temperatures for SDA in this population of G.
morhua. Our results suggest that SDA is not a simple
function of temperature, but may vary with tempera-
ture in a more complex fashion.
Keywords Digestion � Gadus morhua � Metabolic
rate � Respirometry � SDA � Temperature
Introduction
Atlantic cod (G. morhua) is distributed over a wide
area and is known to inhabit a broad thermal niche
(-1.5 to 19 �C) and because water temperature is
known to affect enzymatic activity, basic body
functions including growth typically change with the
water temperature in ectothermic species. Mainte-
nance and growth of fishes require that energy is
directed to feeding and processing nutrients, often
expressed as the specific dynamic action (SDA). SDA
integrates energy expenditures associated with inges-
tion, digestion, absorption, biosynthesis, nutrient
turnover and assimilation of a meal (Jobling 1985,
1994) and is usually determined using respirometry as
the excess post-feeding oxygen consumption (Jordan
and Steffensen 2007).
B. Tirsgaard (&) � J. F. Steffensen
Marine Biological Section, Biological Institute,
University of Copenhagen, Strandpromenaden 5,
3000 Helsingør, Denmark
e-mail: [email protected]
J. C. Svendsen
Interdisciplinary Centre of Marine and Environmental
Research, University of Porto, Rua dos Bragas 289,
4050-123 Porto, Portugal
123
Fish Physiol Biochem
DOI 10.1007/s10695-014-0004-y

SDA is important to study because the energy
allocated to SDA may constitute a significant fraction
of the energy uptake (Soofiani and Hawkins 1982;
Ware 1982; Castro-Santos and Haro 2005). Previous
studies have shown that the amount of energy
allocated to SDA (SDA cost; SDAcost) and the
duration of the SDA response (SDA duration; SDAdur)
vary with meal size (Fu et al. 2005a, b; Jordan and
Steffensen 2007), diet composition (Shi-Jian et al.
2005), feeding frequency (Fu et al. 2005a) and body
mass (Von Herbing and White 2002; Pirozzi and
Booth 2009). Moreover, SDAdur and the SDA coef-
ficient (SDAcoef; SDAcost divided by meal energy)
may vary with water oxygen tension (Jordan and
Steffensen 2007).
Several studies have investigated the influence of
temperature on SDA variables; the majority of the
studies has reported that SDAdur decreases with
temperature in ectotherms (Jobling and Davies 1980;
Wang et al. 2002; Secor and Boehm 2006; Luo and
Xie 2008). However, a few studies have not reported
this pattern. For example, an optimum temperature at
4 �C for the SDAdur was found in the teleost Patago-
notothen sima (Vanella et al. 2010), when tested at 2, 4
and 10 �C. In addition, an increasing SDAdur with
increasing temperature has been observed in two
species of killifish Aphyosemion cameronense and A.
exiguum (McKenzie et al. 2013). In contrast to the
effects of temperature on SDAdur, recent reviews have
considered temperature to have negligible effects on
the energetic cost of digesting a meal, measured as
either the SDAcost or the SDAcoef in ectotherms
(McCue 2006; Secor 2009). However, a small number
of studies have reported increasing SDAcoef with
increasing temperatures in Atlantic cod Gadus morhua
(Soofiani and Hawkins 1982), gilthead sea bream
Sparus aurata (Guinea and Fernandez 1997) and
southern catfish Silurus meridionalis (Luo and Xie
2008). In a leech species Nephelopsis obscura,
Kalarani and Davies (1994) found an optimum
temperature with the lowest SDAcost at 15 �C.
Numerous studies have linked the growth potential
of fish to their metabolic scope (MS) (Portner and
Knust 2007; Farrell et al. 2008; Neuheimer et al.
2011). MS is the difference between the standard
metabolic rate (SMR) and the maximal metabolic rate
(MMR) and reflects the energy available for all
activities beyond SMR including SDA (Fry 1971;
Portner and Farrell 2008; Portner 2010). At increasing
temperatures, both SMR and MMR increase but with
MMR increasing at the highest rate at low tempera-
tures thus resulting in an increasing MS. If the
temperature increases further, SMR continues to
increase, whereas MMR peaks and declines as MMR
approaches the upper thermal tolerance (Portner 2002;
Portner and Farrell 2008) resulting in MS being
maximized at an intermediate temperature with a
decline at temperatures above and below (Frederich
and Portner 2000; Portner 2001). Because oxygen is
used in most energy demanding processes, a reduction
in MS may affect all higher functions (muscular
activity, behaviour, growth and reproduction) and
might thereby shape the long-term fate of species
(Portner and Knust 2007).
Detailed knowledge about the effects of tempera-
ture on ectothermic animals is clearly important to
fully understand their physiological performance and
behaviour. The aim of the present study was to
improve the understanding of the effects of temper-
ature on different SDA variables in juvenile G.
morhua and to provide a better empirical basis for
bioenergetic models commonly used to estimate
growth and survival rates and stock dynamics in fish
(Hansson et al. 1996; Essington et al. 2001; Perez-
Rodrıguez and Saborido-Rey 2012). Specifically, we
used intermittent flow respirometry to measure oxygen
consumption rates (MO2) in G. morhua and test two
predictions: (1) SDAdur will decrease with tempera-
ture; (2) SDAcost and SDAcoef will not vary with
temperature. To this end, juvenile G. morhua were
captured in the wild and SDA variables were deter-
mined at 2, 5, 10, 15 and 20 �C.
Materials and methods
Experimental animals
A total of 33 G. morhua [173.9 ± 5.8 g (mean ± SE)]
were captured using fish traps in Øresund near
Helsingør in Denmark and held in 0.7 m3 flow-
through tanks (10 ± 1 �C; salinity: 31 ppt) at the
Marine Biological Section, University of Copenhagen,
Denmark. G. morhua were randomly divided into five
groups, and water temperature was modified by
1 �C day-1 to reach the five test temperatures of 2,
5, 10, 15 and 20 �C (±0.3 �C). G. morhua were then
acclimated to the stable test temperature for at least
Fish Physiol Biochem
123

2 weeks prior to experimentation. G. morhua were fed
herring Clupea harengus three times a week. The
average body mass and sample size for the experiment
were as follows: 2 (163.9 ± 16.4 g, N = 7), 5
(180 ± 9.5 g, N = 7), 10 (169.1 ± 4 g, N = 7), 15
(195.8 ± 18.7 g, N = 6) and 20 �C (162.2 ± 9.7 g,
N = 6).
Respirometry
The experimental set-up consisted of four static
respirometers (each 3.25 L) and a mixing pump,
submerged in a 100-L opaque tank, filled with salt
water (31 ppt) and maintained at the appropriate test
temperature (either 2, 5, 10, 15 or 20 ± 0.1 �C).
Normoxic conditions in the tank were secured using
air stones. To ensure water quality, water in the tank
was continuously replaced (2 % h-1) and simulta-
neously recirculated through a loop consisting of a
separate biofilter and a UV sterilizer (UV-10000;
Tetra Pond, Melle, Germany). Respirometers were
situated in a separate room with no other ongoing
experiments to minimize any disturbance of the fish.
Measurements of MO2 (mg O2 kg-1 h-1) were
taken every 10 min using computerized intermittent
flow respirometry allowing long-term ([48 h) repeated
measurements (Steffensen 1989). Each static respirom-
eter was fitted with two outlet and inlet ports at each end
as described previously (Svendsen et al. 2012) and a
vertical chimney allowed feeding within the respirom-
eter (Jordan and Steffensen 2007). The repeated
respirometric loops consisted of a 5-min flushing phase
during which a pump flushed the respirometer with
ambient water through one set of ports. The second set
of ports and a pump constituted a recirculating loop,
which secured re-circulation of water in the respirom-
eter in a closed circuit phase for 5 min, divided into a
waiting phase (1 min) and a measurement phase
(4 min). To secure water oxygen levels above 80 %
air saturation (O2sat) at all times, the measurement
phase was shortened to 3 min in the warmer treatments
(15 and 20 �C).
To determine MO2, water oxygen partial pressure
was measured in the re-circulated loop at 1 Hz using
fibre optic electrodes (PreSens, Regensburg, Germany
and Firesting, PyroScience, Aachen, Germany). The
pumps flushing the respirometers were controlled by
AutoResp software (version 2.1.3; Loligo Systems,
Tjele, Denmark) or AquaResp software (www.
aquaresp.com) that also calculated instantaneous
MO2, from the decrease in oxygen partial pressure
within the measurement phase using standard equa-
tions described by Schurmann and Steffensen (1997).
Preliminary testing demonstrated that the set-up
ensured that the coefficient of determination (r2)
associated with each MO2 measurement was always
[0.95, identical to previous studies (Svendsen et al.
2013). Corrections of background respiration (i.e.
microbial respiration) followed Capossela et al.
(2012).
Experimental Protocol
G. morhua used in the experiments were fasted for
5–10 days prior to respirometry to ensure a post-
absorptive state. The fasting period was 10 days for
the 2 and 5 �C treatments and shorter for the warmer
treatments. Before the experiment, G. morhua’s body
mass (to nearest 0.1 g) was determined, and individual
fish were transferred to the respirometers and left for
24 h to acclimate, while MO2 data were collected
continuously. Four fish were tested simultaneously in
the set-up with test temperatures modified randomly
between each trial. After acclimation, 24 h were used
to estimate SMR, as described below. Subsequently,
each G. morhua were fed a piece of C. harengus fillet
corresponding to 5 % (±0.1 %) of the body mass. C.
harengus used in the present study was from the same
season (autumn) as the C. harengus used by Jordan
and Steffensen (2007). The energetic value
(9.92 kJ g-1) reported by Jordan and Steffensen
(2007) was therefore used to estimate meal energy.
After ingestion, MO2 data were collected until post-
feeding MO2 converged with SMR ? 5 % as
described below. All experiments were carried out in
strict accordance with the 2010/63/EU directive of the
European Parliament concerning the protection of
animals used for scientific purposes.
Data acquisition
All measurements of MO2 were body mass adjusted
following previous studies (Steffensen et al. 1994;
Frisk et al. 2012). Specifically, measurements were
taken to a body mass of 174 g (average body mass)
using the equation:
Fish Physiol Biochem
123

MO2ð174Þ ¼ MO2 �M
174
� �ð1�AÞð1Þ
where MO2(174) = oxygen consumption rate of a
174 g fish, MO2 (mg O2 kg-1 h-1) = oxygen con-
sumption rate of a fish with body mass = M, and
A = the mass exponent describing the relationship
between metabolic rate and body mass. A mass
exponent of 0.87 was used based on a previous study
on G. morhua within the same temperature range
(2–20 �C) (Tirsgaard et al. 2014).
SMR and SDA were calculated using an algorithm
written in R (Team 2012) and the quantreg package
(Koenker 2005, 2011). Separate nonparametric quan-
tile regressions (function rqss) were fitted to the 24 h
pre-feeding MO2 data and the post-feeding MO2 data
to estimate SMR and SDA, respectively (Dorcas et al.
2004; Dupont-Prinet et al. 2010, 2013). SDA was
deemed terminated when the quantile fit reached
SMR ? 5 % (Fig. 1), similar to Jordan and Steffensen
(2007). The parameter s [tau, analogous to the quantile
(q)] was adjusted to 0.25 for SMR and SDA estimates
such that the same proportions of MO2 values were
below the fitted curve for the two different estimates.
G. morhua MMR was estimated for each fish at the
five test temperatures (2, 5, 10, 15 and 20 �C) based on
(Tirsgaard et al. 2014). The metabolic scope (MS) was
calculated as MMR–SMR (mg O2 kg-1 h-1). Five
SDA variables were calculated to describe the post-
feeding MO2 following Secor (2009):
1. SDAscope, i.e. the maximum value of MO2 above
SMR during the SDA course, assumed to occur
before 100 h post-feeding (Fig. 1);
2. tpeak, i.e. the time course from feeding to SDAscope
(Fig. 1);
3. SDAdur, i.e. the time from feeding until MO2
converged with SMR ? 5 % (Fig. 1);
4. SDAcost, i.e. the post-feeding integrated excess
oxygen consumption (mg O2 kg-1) above SMR;
5. SDAcoef (%) calculated as the SDAcost (mg O2
kg-1) converted to energy units using an oxycal-
orific coefficient of 14.06 kJ g O2-1 (Gnaiger
1983) and divided by the full energy content of
the meal.
Statistical analysis
The five SDA variables and body mass were grouped
according to temperature treatment and examined for
differences using a one-way ANOVA. The test was
followed by pairwise multiple comparison procedures
(Holm–Sidak) when appropriate. Data were log10-
transformed to meet assumptions of a normal distri-
bution of data and homogeneity of variance. Results
were considered significant at p \ 0.05. All values are
reported as mean ± SE unless otherwise noted. Data
analyses were carried out using SigmaPlot (version
11.0; Systat Software, Chicago, IL, USA). Correla-
tions between water temperature and SMR and
SMR ? SDAscope were fitted using exponential
regression lines, whereas linear lines were applied
between water temperatures and MS, MMR and the
remaining SDA variables.
Results
The average body mass for each temperature treatment
did not differ between the five temperature treatments
0 20 40 60 80
Time (hours)
SMR = 63.1
050
100
150
200
Duration = 75 h
SDAscope = 33.5 mg O2 kg−1 h−1
MO
2(m
gO
2kg
−1
h−1 )
−20
tpeak = 13 h
SDAcost = 1389 mg O2 kg−1
Fig. 1 An example of metabolic rates (mg O2 kg-1 h-1) in
Atlantic cod G. morhua (187 g) at 10 �C as a function of time
(h), prior to feeding (-24–0 h, black solid triangles) and after
feeding (0–95 h, black triangles). A quantile regression
(q = 0.25) is used to estimate the SMR from pre-feeding
MO2, indicated by the black horizontal line, whereas SDA
(specific dynamic action) is estimated from post-feeding MO2.
The fish is fed a C. harengus fillet corresponding to 5 % of the
wet body mass at 0 h (vertical dashed line) and then left
undisturbed while the metabolic rate is recorded continuously.
SDA is considered terminated when the regression converged
with the SMR ? 5 %. The corresponding duration is 75.5 h and
reflected SDAdur. SDAcost is estimated by integrating the area
between the curve and SMR (marked area). SDAscope (mg O2
kg-1 h-1) and tpeak (h) (see text for details) are indicated by the
arrow
Fish Physiol Biochem
123
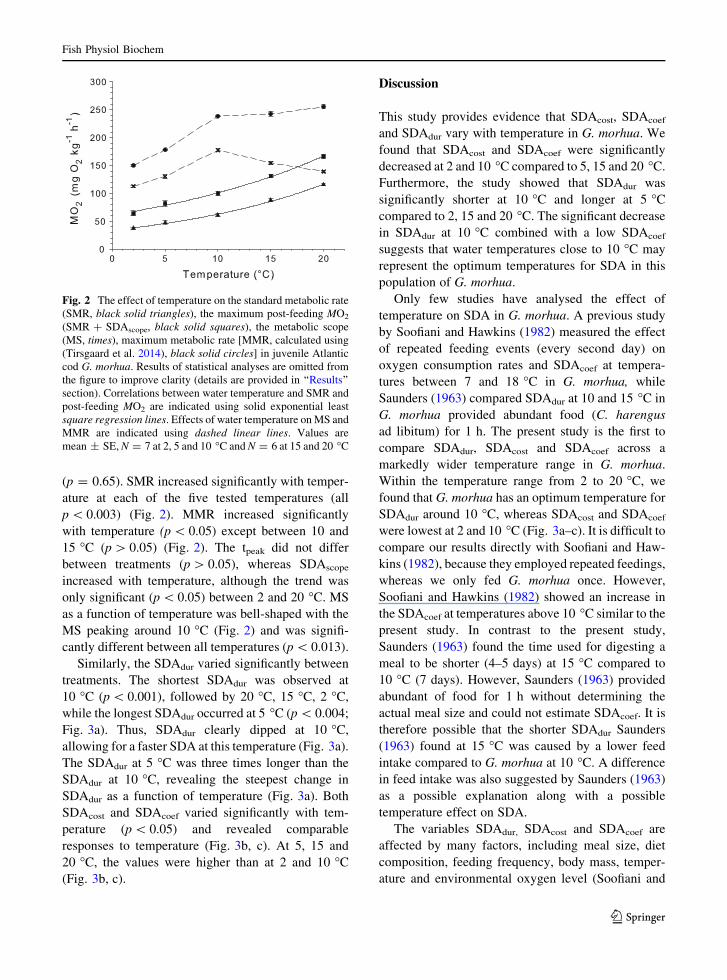
(p = 0.65). SMR increased significantly with temper-
ature at each of the five tested temperatures (all
p \ 0.003) (Fig. 2). MMR increased significantly
with temperature (p \ 0.05) except between 10 and
15 �C (p [ 0.05) (Fig. 2). The tpeak did not differ
between treatments (p [ 0.05), whereas SDAscope
increased with temperature, although the trend was
only significant (p \ 0.05) between 2 and 20 �C. MS
as a function of temperature was bell-shaped with the
MS peaking around 10 �C (Fig. 2) and was signifi-
cantly different between all temperatures (p \ 0.013).
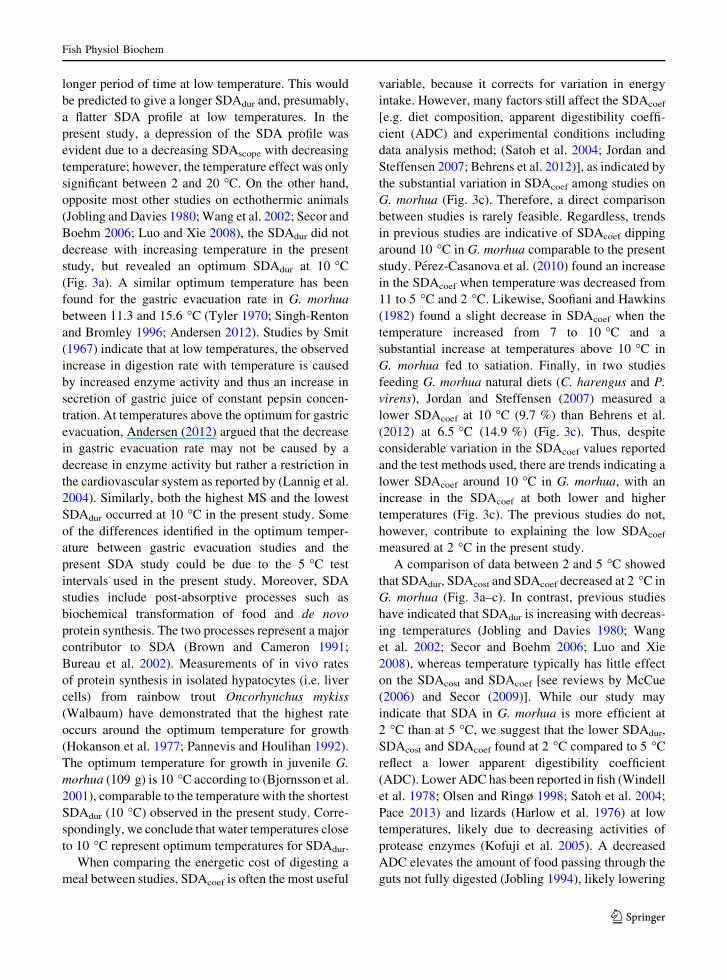
Similarly, the SDAdur varied significantly between
treatments. The shortest SDAdur was observed at
10 �C (p \ 0.001), followed by 20 �C, 15 �C, 2 �C,
while the longest SDAdur occurred at 5 �C (p \ 0.004;
Fig. 3a). Thus, SDAdur clearly dipped at 10 �C,
allowing for a faster SDA at this temperature (Fig. 3a).
The SDAdur at 5 �C was three times longer than the
SDAdur at 10 �C, revealing the steepest change in
SDAdur as a function of temperature (Fig. 3a). Both
SDAcost and SDAcoef varied significantly with tem-
perature (p \ 0.05) and revealed comparable
responses to temperature (Fig. 3b, c). At 5, 15 and
20 �C, the values were higher than at 2 and 10 �C
(Fig. 3b, c).
Discussion
This study provides evidence that SDAcost, SDAcoef
and SDAdur vary with temperature in G. morhua. We
found that SDAcost and SDAcoef were significantly
decreased at 2 and 10 �C compared to 5, 15 and 20 �C.
Furthermore, the study showed that SDAdur was
significantly shorter at 10 �C and longer at 5 �C
compared to 2, 15 and 20 �C. The significant decrease
in SDAdur at 10 �C combined with a low SDAcoef
suggests that water temperatures close to 10 �C may
represent the optimum temperatures for SDA in this
population of G. morhua.
Only few studies have analysed the effect of
temperature on SDA in G. morhua. A previous study
by Soofiani and Hawkins (1982) measured the effect
of repeated feeding events (every second day) on
oxygen consumption rates and SDAcoef at tempera-
tures between 7 and 18 �C in G. morhua, while
Saunders (1963) compared SDAdur at 10 and 15 �C in
G. morhua provided abundant food (C. harengus
ad libitum) for 1 h. The present study is the first to
compare SDAdur, SDAcost and SDAcoef across a
markedly wider temperature range in G. morhua.
Within the temperature range from 2 to 20 �C, we
found that G. morhua has an optimum temperature for
SDAdur around 10 �C, whereas SDAcost and SDAcoef
were lowest at 2 and 10 �C (Fig. 3a–c). It is difficult to
compare our results directly with Soofiani and Haw-
kins (1982), because they employed repeated feedings,
whereas we only fed G. morhua once. However,
Soofiani and Hawkins (1982) showed an increase in
the SDAcoef at temperatures above 10 �C similar to the
present study. In contrast to the present study,
Saunders (1963) found the time used for digesting a
meal to be shorter (4–5 days) at 15 �C compared to
10 �C (7 days). However, Saunders (1963) provided
abundant of food for 1 h without determining the
actual meal size and could not estimate SDAcoef. It is
therefore possible that the shorter SDAdur Saunders
(1963) found at 15 �C was caused by a lower feed
intake compared to G. morhua at 10 �C. A difference
in feed intake was also suggested by Saunders (1963)
as a possible explanation along with a possible
temperature effect on SDA.
The variables SDAdur, SDAcost and SDAcoef are
affected by many factors, including meal size, diet
composition, feeding frequency, body mass, temper-
ature and environmental oxygen level (Soofiani and
Fig. 2 The effect of temperature on the standard metabolic rate
(SMR, black solid triangles), the maximum post-feeding MO2
(SMR ? SDAscope, black solid squares), the metabolic scope
(MS, times), maximum metabolic rate [MMR, calculated using
(Tirsgaard et al. 2014), black solid circles] in juvenile Atlantic
cod G. morhua. Results of statistical analyses are omitted from
the figure to improve clarity (details are provided in ‘‘Results’’
section). Correlations between water temperature and SMR and
post-feeding MO2 are indicated using solid exponential least
square regression lines. Effects of water temperature on MS and
MMR are indicated using dashed linear lines. Values are
mean ± SE, N = 7 at 2, 5 and 10 �C and N = 6 at 15 and 20 �C
Fish Physiol Biochem
123

Hawkins 1982; Von Herbing and White 2002; Fu et al.
2005a, b; Shi-Jian et al. 2005; Jordan and Steffensen
2007; Pirozzi and Booth 2009), and a direct compar-
ison between studies is rarely feasible. This study
found that temperatures around 10 �C provide the
shortest SDAdur. Is this result supported by previous
studies? Among previous SDA studies on G. morhua,
the approach used by Jordan and Steffensen (2007)
resembles the present study the most. Feeding G.
morhua (150 g) with a fillet of C. harengus (5 % of
body mass) at 10 �C, Jordan and Steffensen (2007)
reported that SDAdur is 95 h, which is close to our 80 h
(Fig. 3a). Likewise, the study by Behrens et al. (2012)
used approaches similar to the present study. Behrens
et al. (2012) found that SDAdur is 65 h in G. morhua
fed a single meal of pollack Pollachius virens
corresponding to 2 % of the body mass at 6.5 �C.
According to Jordan and Steffensen (2007), increasing
meal size from 2.5 to 5 % doubles the SDAdur in G.
morhua. Hence, extrapolating the 2 % meal size used
by Behrens et al. (2012) to a 5 % meal size causes the
SDAdur to increase to 163 h at 6.5 �C (i.e. 65 h 9 5/
2 %). Using this extrapolated value (160 h) for a
comparison with the present study reveals a much
shorter SDAdur at 10 �C (95 h; (Jordan and Steffensen
2007) and 80 h; present study). Thus, Behrens et al.
(2012) provide indirect evidence that SDAdur at 6.5 �C
is substantially longer (C65 h) than at 10 �C.
Although a comparison using an extrapolated value
and a different diet (P. virens) should be performed
cautiously, the data are consistent with the observation
that SDAdur is substantially shorter at 10 �C than at
colder temperatures as found in the present study
(Fig. 3a).
It may be relevant to compare the present SDA
study with studies on gastric evacuation rates. Gastric
evacuation and intestinal transit normally take longer
at lower temperature so it would be expected that
nutrients from a given meal would be absorbed over a
b Fig. 3 Time (h) used for SDA (SDAdur) (a), cost (mg O2 kg-1)
of SDA (SDAcost) (b), and the percentage of ingested energy
used for SDA (SDAcoef) (c) in juvenile Atlantic cod G. morhua
fed a meal of C. harengus filet corresponding to 5 % of the wet
body mass at 2, 5, 10, 15 and 20 �C (black solid circles, the
present study). Values are mean ± SE; N = 7 at 2, 5 and 10 �C
and N = 6 at 15 and 20 �C. For the present study, different
letters indicate significant differences between temperatures
(p \ 0.05). For comparisons, data from related studies on G.
morhua are included [black solid triangles (Jordan and
Steffensen 2007), black solid squares (Behrens et al. 2012),
black squares (Soofiani and Hawkins 1982) and black circles
(Perez-Casanova et al. 2010)]. Across temperatures, multiple
data points are connected by linear lines, either solid (the present
study) or interrupted [(Soofiani and Hawkins 1982) and (Perez-
Casanova et al. 2010)]. Filled symbols (black solid circles, black
solid triangles and black solid squares) indicate that G. morhua
are fed with a natural diet (P. virens or C. harengus), whereas
open symbols (black squares and black circles) indicate that G.
morhua are fed artificial aquaculture pellets
(a)
(b)
(c)
Fish Physiol Biochem
123
longer period of time at low temperature. This would
be predicted to give a longer SDAdur and, presumably,
a flatter SDA profile at low temperatures. In the
present study, a depression of the SDA profile was
evident due to a decreasing SDAscope with decreasing
temperature; however, the temperature effect was only
significant between 2 and 20 �C. On the other hand,
opposite most other studies on ecthothermic animals
(Jobling and Davies 1980; Wang et al. 2002; Secor and
Boehm 2006; Luo and Xie 2008), the SDAdur did not
decrease with increasing temperature in the present
study, but revealed an optimum SDAdur at 10 �C
(Fig. 3a). A similar optimum temperature has been
found for the gastric evacuation rate in G. morhua
between 11.3 and 15.6 �C (Tyler 1970; Singh-Renton
and Bromley 1996; Andersen 2012). Studies by Smit
(1967) indicate that at low temperatures, the observed
increase in digestion rate with temperature is caused
by increased enzyme activity and thus an increase in
secretion of gastric juice of constant pepsin concen-
tration. At temperatures above the optimum for gastric
evacuation, Andersen (2012) argued that the decrease
in gastric evacuation rate may not be caused by a
decrease in enzyme activity but rather a restriction in
the cardiovascular system as reported by (Lannig et al.
2004). Similarly, both the highest MS and the lowest
SDAdur occurred at 10 �C in the present study. Some
of the differences identified in the optimum temper-
ature between gastric evacuation studies and the
present SDA study could be due to the 5 �C test
intervals used in the present study. Moreover, SDA
studies include post-absorptive processes such as
biochemical transformation of food and de novo
protein synthesis. The two processes represent a major
contributor to SDA (Brown and Cameron 1991;
Bureau et al. 2002). Measurements of in vivo rates
of protein synthesis in isolated hypatocytes (i.e. liver
cells) from rainbow trout Oncorhynchus mykiss
(Walbaum) have demonstrated that the highest rate
occurs around the optimum temperature for growth
(Hokanson et al. 1977; Pannevis and Houlihan 1992).
The optimum temperature for growth in juvenile G.
morhua (109 g) is 10 �C according to (Bjornsson et al.
2001), comparable to the temperature with the shortest
SDAdur (10 �C) observed in the present study. Corre-
spondingly, we conclude that water temperatures close
to 10 �C represent optimum temperatures for SDAdur.
When comparing the energetic cost of digesting a
meal between studies, SDAcoef is often the most useful
variable, because it corrects for variation in energy
intake. However, many factors still affect the SDAcoef
[e.g. diet composition, apparent digestibility coeffi-
cient (ADC) and experimental conditions including
data analysis method; (Satoh et al. 2004; Jordan and
Steffensen 2007; Behrens et al. 2012)], as indicated by
the substantial variation in SDAcoef among studies on
G. morhua (Fig. 3c). Therefore, a direct comparison
between studies is rarely feasible. Regardless, trends
in previous studies are indicative of SDAcoef dipping
around 10 �C in G. morhua comparable to the present
study. Perez-Casanova et al. (2010) found an increase
in the SDAcoef when temperature was decreased from
11 to 5 �C and 2 �C. Likewise, Soofiani and Hawkins
(1982) found a slight decrease in SDAcoef when the
temperature increased from 7 to 10 �C and a
substantial increase at temperatures above 10 �C in
G. morhua fed to satiation. Finally, in two studies
feeding G. morhua natural diets (C. harengus and P.
virens), Jordan and Steffensen (2007) measured a
lower SDAcoef at 10 �C (9.7 %) than Behrens et al.
(2012) at 6.5 �C (14.9 %) (Fig. 3c). Thus, despite
considerable variation in the SDAcoef values reported
and the test methods used, there are trends indicating a
lower SDAcoef around 10 �C in G. morhua, with an
increase in the SDAcoef at both lower and higher
temperatures (Fig. 3c). The previous studies do not,
however, contribute to explaining the low SDAcoef
measured at 2 �C in the present study.
A comparison of data between 2 and 5 �C showed
that SDAdur, SDAcost and SDAcoef decreased at 2 �C in
G. morhua (Fig. 3a–c). In contrast, previous studies
have indicated that SDAdur is increasing with decreas-
ing temperatures (Jobling and Davies 1980; Wang
et al. 2002; Secor and Boehm 2006; Luo and Xie
2008), whereas temperature typically has little effect
on the SDAcost and SDAcoef [see reviews by McCue
(2006) and Secor (2009)]. While our study may
indicate that SDA in G. morhua is more efficient at
2 �C than at 5 �C, we suggest that the lower SDAdur,
SDAcost and SDAcoef found at 2 �C compared to 5 �C
reflect a lower apparent digestibility coefficient
(ADC). Lower ADC has been reported in fish (Windell
et al. 1978; Olsen and Ringø 1998; Satoh et al. 2004;
Pace 2013) and lizards (Harlow et al. 1976) at low
temperatures, likely due to decreasing activities of
protease enzymes (Kofuji et al. 2005). A decreased
ADC elevates the amount of food passing through the
guts not fully digested (Jobling 1994), likely lowering
Fish Physiol Biochem
123
the amount of energy needed for nutrients reabsorption
and protein synthesis, resulting in the lower SDAdur,
SDAcost and SDAcoef observed at 2 �C in the present
study (Fig. 3a–c). Nevertheless, it remains a hypoth-
esis that low values of SDAdur, SDAcost and SDAcoef at
2 �C are explained by a drop in ADC and future studies
should address the potential influence of ADC varia-
tion, for example, by measuring energy intake, SDA
variables and energy content in faeces over the full
SDAdur covering a wide range of temperatures, in
particular at low temperatures. In this way, both the
cost and the duration of SDA may be estimated in
combination with accurate measurements of the actual
energy absorbtion, which will allow an assessment of
ADC variation in relation to temperature.
In summary, the present study indicates that SDA in
G. morhua may not be a simple function of temper-
ature within the temperature range of 2–20 �C. The
study showed that SDAscope increase with tempera-
ture, whereas SDAdur is shortest around 10 �C and
SDAcost and SDAcoef are lowest at 2 and 10 �C. We
suggest that the surprisingly low value of SDAcoef
found at 2 �C could be caused by a lower ADC, which
should be investigated in future studies. The signifi-
cant decrease in SDAdur at 10 �C combined with a low
SDAcoef suggests that water temperatures close to
10 �C may represent optimum temperatures for SDA
in this population of G. morhua.
Acknowledgments This study was part of the project
SUNFISH (sustainable fisheries, climate change and the North
Sea ecosystem), and financially supported by the Danish
Council for Strategic Research [Grant Number 09-063096]
and Department of Biology, University of Copenhagen [Grant
Number 102-0218/11-5550]. Jon Christian Svendsen was
supported by the Foundation for Science and Technology
(FCT) in Portugal (Grant Number SFRH/BPD/89473/2012). We
thank an anonymous reviewer for helpful and constructive
comments on an earlier version of the manuscript.
References
Andersen NG (2012) Influences of potential predictor variables
on gastric evacuation in Atlantic cod Gadus morhua
feeding on fish prey: parameterization of a generic model.
J Fish Biol 80(3):595–612. doi:10.1111/j.1095-8649.2011.
03195.x
Behrens JW, Axelsson M, Neuenfeldt S, Seth H (2012) Effects
of hypoxic exposure during feeding on SDA and post-
prandial cardiovascular physiology in the Atlantic cod,
Gadus morhua. PLoS One 7(9):e46227. doi:10.1371/
journal.pone.0046227
Bjornsson B, Steinarsson A, Oddgeirsson M (2001) Optimal
temperature for growth and feed conversion of immature
cod (Gadus morhua L.). ICES J Mar Sci 58(1):29–38.
doi:10.1006/jmsc.2000.0986
Brown CR, Cameron JN (1991) The relationship between spe-
cific dynamic action (SDA) and protein-synthesis rates in
the channel catfish. Physiol Zool 64(1):298–309
Bureau DP, Kaushik SJ, Cho CY (2002) Bioenergetics. In:
Halver JE, Hardy RW (eds) Fish nutrition, 3rd edn. Aca-
demic Press, London, pp 1–59
Capossela K, Brill R, Fabrizio M, Bushnell P (2012) Metabolic
and cardiorespiratory responses of summer flounder
Paralichthys dentatus to hypoxia at two temperatures.
J Fish Biol 81(3):1043–1058. doi:10.1111/j.1095-8649.
2012.03380.x
Castro-Santos T, Haro A (2005) Biomechanics and fisheries
conservation. Fish Physiol 23:469–523. doi:10.1016/
S1546-5098(05)23012-1
Dorcas ME, Hopkins WA, Roe JH (2004) Effects of body mass
and temperature on standard metabolic rate in the eastern
diamondback rattlesnake (Crotalus adamanteus). J Inf
1:145–151. doi:10.1643/CP-03-074R1
Dupont-Prinet A, Chatain B, Grima L, Vandeputte M, Claireaux
G, McKenzie D (2010) Physiological mechanisms underly-
ing a trade-off between growth rate and tolerance of feed
deprivation in the European sea bass (Dicentrarchus labrax).
J Exp Biol 213(7):1143–1152. doi:10.1242/jeb.037812
Dupont-Prinet A, Vagner M, Chabot D, Audet C, MacLatchey D
(2013) Impact of hypoxia on the metabolism of Greenland
halibut (Reinhardtius hippoglossoides). Can J Fish Aquat
Sci 70(3):461–469. doi:10.1139/cjfas-2012-0327
Essington TE, Kitchell JF, Walters CJ (2001) The von Berta-
lanffy growth function, bioenergetics, and the consumption
rates of fish. Can J Fish Aquat Sci 58(11):2129–2138.
doi:10.1139/f01-151
Farrell A, Hinch S, Cooke S, Patterson D, Crossin G, Lapointe
M, Mathes M (2008) Pacific salmon in hot water: applying
aerobic scope models and biotelemetry to predict the suc-
cess of spawning migrations. Physiol Biochem Zool
81(6):697–709. doi:10.1086/592057
Frederich M, Portner HO (2000) Oxygen limitation of thermal
tolerance defined by cardiac and ventilatory performance
in spider crab, Maja squinado. Am J Physiol Regul Integr
Comp Physiol 279(5):R1531–R1538
Frisk M, Skov PV, Steffensen JF (2012) Thermal optimum for
pikeperch (Sander lucioperca) and the use of ventilation
frequency as a predictor of metabolic rate. Aquaculture
324:151–157. doi:10.1016/j.aquaculture.2011.10.024
Fry F (1971) The effect of environmental factors on the physi-
ology of fish. Fish Physiol 6:1–98. doi:10.1016/S1546-
5098(08)60146-6
Fu SJ, Xie XJ, Cao ZD (2005a) Effect of feeding level and
feeding frequency on specific dynamic action in Silurus
meridionalis. J Fish Biol 67(1):171–181. doi:10.1111/j.
0022-1112.2005.00722.x
Fu SJ, Xie XJ, Cao ZD (2005b) Effect of meal size on post-
prandial metabolic response in southern catfish (Silurus
meridionalis). Comp Biochem Physiol A Mol Integr
Physiol 140(4):445–451. doi:10.1016/j.cbpb.2005.02.008
Gnaiger E (1983) Calculation of energetic and biochemical
equivalents of respiratory oxygen consumption. In:
Fish Physiol Biochem
123

Gnaiger E, Forstner H (eds) Polarographic oxygen sensors.
Springer, Berlin, pp 337–345. doi:10.1007/978-3-642-
81863-9_30
Guinea J, Fernandez F (1997) Effect of feeding frequency,
feeding level and temperature on energy metabolism in
Sparus aurata. Aquaculture 148(2–3):125–142. doi:10.
1016/S0044-8486(96)01424-X
Hansson S, Rudstam LG, Kitchell JF, Peppard P, Hilden M,
Johnson B (1996) Predation rates by North Sea cod (Gadus
morhua)—predictions from models on gastric evacuation
and bioenergetics. ICES J Mar Sci 53(1):107–114. doi:10.
1006/jmsc.1996.0010
Harlow HJ, Hillman SS, Hoffman M (1976) The effect of
temperature on digestive efficiency in the herbivorous
lizard, Dipsosaurus dorsalis. J Comp Physiol B Biochem
Syst Environ Physiol 111(1):1–6. doi:10.1007/
BF00691105
Hokanson KE, Kleiner CF, Thorslund TW (1977) Effects of
constant temperatures and diel temperature fluctuations on
specific growth and mortality rates and yield of juvenile
rainbow trout, Salmo gairdneri. J Fish Board Can
34(5):639–648. doi:10.1139/f77-100
Jobling M (1985) Growth. In: Wootton RJ, Tytler P, Calow P
(eds) Fish energetics: new perspectives. Croom Helm,
London, pp 213–230
Jobling M (1994) Fish bioenergetics. Chapman & Hall, London
Jobling M, Davies PS (1980) Effects of feeding on metabolic-
rate, and the specific dynamic action in plaice, Pleuro-
nectes-Platessa L. J Fish Biol 16(6):629–638. doi:10.1111/
j.1095-8649.1980.tb03742.x
Jordan AD, Steffensen JF (2007) Effects of ration size and
hypoxia on specific dynamic action in the cod. Physiol
Biochem Zool 80(2):178–185. doi:10.1086/510565
Kalarani V, Davies RW (1994) The bioenergetic costs of spe-
cific dynamic action and ammonia excretion in a fresh-
water predatory leech Nephelopsis obscura. Comp
Biochem Physiol Part A Physiol 108(4):523–531. doi:10.
1016/0300-9629(94)90336-0
Koenker R (2005) Quantile regression, vol 38. Cambridge
university press, Cambridge
Koenker R (2011) Additive models for quantile regression:
model selection and confidence bandaids. Braz J Probab
Stat 25(3):239–262. doi:10.1214/10-BJPS131
Kofuji PYM, Akimoto A, Hosokawa H, Masumoto T (2005)
Seasonal changes in proteolytic enzymes of yellowtail
Seriola quinqueradiata (Temminck & Schlegel; Carangi-
dae) fed extruded diets containing different protein and
energy levels. Aquac Res 36(7):696–703. doi:10.1111/j.
1365-2109.2005.01276.x
Lannig G, Bock C, Sartoris FJ, Portner HO (2004) Oxygen
limitation of thermal tolerance in cod, Gadus morhua L.,
studied by magnetic resonance imaging and on-line venous
oxygen monitoring. Am J Physiol Regul Integr Comp
Physiol 287(4):R902–R910
Luo Y, Xie X (2008) Effects of temperature on the specific
dynamic action of the southern catfish, Silurus meridio-
nalis. Comp Biochem Physiol A Mol Integr Physiol
149(2):150–156. doi:10.1016/j.cbpa.2007.11.003
McCue MD (2006) Specific dynamic action: a century of
investigation. Comp Biochem Physiol A Mol Integr
Physiol 144(4):381–394. doi:10.1016/j.cbpa.2006.03.011
McKenzie DJ, Estivales G, Svendsen JC, Steffensen JF, Agnese
J-F (2013) Local adaptation to altitude underlies divergent
thermal physiology in tropical killifishes of the genus
Aphyosemion. PLoS One 8(1):e54345. doi:10.1371/
journal.pone.0054345
Neuheimer A, Thresher R, Lyle J, Semmens J (2011) Tolerance
limit for fish growth exceeded by warming waters. Nat
Clim Chang 1(2):110–113. doi:10.1038/nclimate1084Olsen R, Ringø E (1998) The influence of temperature on the
apparent nutrient and fatty acid digestibility of Arctic
charr, Salvelinus alpinus L. Aquac Res 29(10):695–701.
doi:10.1046/j.1365-2109.1998.29100695.x
Pace SA (2013) Feeding frequency and water temperature impact
apparent digestibility coefficients of sablefish (Anoplopoma
fimbria). Dissertation, University of British Columbia
Pannevis MC, Houlihan DF (1992) The energetic cost of protein
synthesis in isolated hepatocytes of rainbow trout (On-
corhynchus mykiss). J Comp Physiol B 162(5):393–400
Perez-Casanova JC, Lall SP, Gamperl AK (2010) Effects of
dietary protein and lipid level, and water temperature, on
the post-feeding oxygen consumption of Atlantic cod and
haddock. Aquac Res 41(2):198–209. doi:10.1111/j.1365-
2109.2009.02318.x
Perez-Rodrıguez A, Saborido-Rey F (2012) Food consumption
of Flemish Cap cod Gadus morhua and redfish Sebastes sp.
using generic bioenergetic models. Northwest Atlantic
Fisheries Organization (NAFO) Document 12/68, Serial
No. N 6136
Pirozzi I, Booth MA (2009) The effect of temperature and body
weight on the routine metabolic rate and postprandial
metabolic response in mulloway, Argyrosomus japonicus.
Comp Biochem Physiol Part A Mol Integr Physiol
154(1):110–118. doi:10.1016/j.cbpa.2009.05.010
Portner HO (2001) Climate change and temperature-dependent
biogeography: oxygen limitation of thermal tolerance in
animals. Naturwissenschaften 88(4):137–146. doi:10.
1007/s001140100216
Portner HO (2002) Climate variations and the physiological
basis of temperature dependent biogeography: systemic to
molecular hierarchy of thermal tolerance in animals. Comp
Biochem Physiol A Mol Integr Physiol 132(4):739–761.
doi:10.1016/S1095-6433(02)00045-4
Portner HO (2010) Oxygen-and capacity-limitation of thermal
tolerance: a matrix for integrating climate-related stressor
effects in marine ecosystems. J Exp Biol 213(6):881–893.
doi:10.1242/jeb.037523
Portner HO, Farrell AP (2008) Physiology and Climate
Change. Science 322(5902):690–692. doi:10.1126/science.
1163156
Portner HO, Knust R (2007) Climate change affects marine
fishes through the oxygen limitation of thermal tolerance.
Science 315(5808):95–97. doi:10.1126/science.1135471
Satoh K, Kimoto K, Hitaka E (2004) Effect of water temperature
on the protein digestibility of extruded pellet, single moist
pellet and Oregon moist pellet in one-year-old yellowtail.
Nippon Suisan Gakk 70(5):758–763. doi:10.2331/suisan.
70.758
Saunders RL (1963) Respiration of the Atlantic cod. J Fish Res
Board Can 20(2):373–386. doi:10.1139/f63-031
Schurmann H, Steffensen JF (1997) Effects of temperature,
hypoxia and activity on the metabolism of juvenile Atlantic
Fish Physiol Biochem
123
cod. J Fish Biol 50(6):1166–1180. doi:10.1111/j.1095-
8649.1997.tb01645.x
Secor SM (2009) Specific dynamic action: a review of the
postprandial metabolic response. J Comp Physiol B Bio-
chem Syst Environ Physiol 179(1):1–56. doi:10.1007/
s00360-008-0283-7
Secor SM, Boehm M (2006) Specific dynamic action of am-
bystomatid salamanders and the effects of meal size, meal
type, and body temperature. Physiol Biochem Zool
79(4):720–735. doi:10.1086/505511
Shi-Jian F, Xiao-Jun X, Zhen-Dong C (2005) Effect of dietary
composition on specific dynamic action in southern catfish
Silurus meridionalis Chen. Aquac Res 36(14):1384–1390.
doi:10.1111/j.1365-2109.2005.01356.x
Singh-Renton S, Bromley P (1996) Effects of temperature, prey
type and prey size on gastric evacuation in small cod and
whiting. J Fish Biol 49(4):702–713. doi:10.1111/j.1095-
8649.1996.tb00066.x
Smit H (1967) Influence of temperature on the rate of gastric
juice secretion in the brown bullhead, Ictalurus nebolosus.
Comp Biochem Physiol 21(1):125–132
Soofiani NM, Hawkins AD (1982) Energetic costs at different
levels of feeding in juvenile cod, Gadus-morhua L. J Fish
Biol 21(5):577–592. doi:10.1111/j.1095-8649.1982.
tb02861.x
Steffensen JF (1989) Some errors in respirometry of aquatic
breathers—how to avoid and correct for them. Fish Physiol
Biochem 6(1t):49–59. doi:10.1007/BF02995809
Steffensen JF, Schurmann H, Bushnell PG (1994) Oxygen-
consumption in 4 species of teleosts from Greenland—no
evidence of metabolic cold adaptation. Polar Biol
14(1):49–54. doi:10.1007/BF00240272
Svendsen JC, Steffensen JF, Aarestrup K, Frisk M, Etzerodt A,
Jyde M (2012) Excess posthypoxic oxygen consumption in
rainbow trout (Oncorhynchus mykiss): recovery in nor-
moxia and hypoxia. Can J Zool 90(1):1–11. doi:10.1139/
z11-095
Svendsen JC, Banet AI, Christensen RH, Steffensen JF, Aa-
restrup K (2013) Effects of intraspecific variation in
reproductive traits, pectoral fin use and burst swimming on
metabolic rates and swimming performance in the Trin-
idadian guppy (Poecilia reticulata Peters). J Exp Biol
216:3564–3574. doi:10.1242/jeb.083089
Team RDC (2012) R: a language and environment for statistical
computing. R Foundation for Statistical Computing, Vienna
Tirsgaard B, Behrens JW, Steffensen JF (2014) The effect of
temperature and body size on metabolic scope of activity in
juvenile Atlantic cod. Comp Biochem Physiol Part A Mol
Integr Physiol, Gadus morhua L. doi:10.1016/j.cbpa.2014.09.
033
Tyler A (1970) Rates of gastric emptying in young cod. J Fish
Board Can 27(7):1177–1189. doi:10.1139/f70-140
Vanella FA, Boy CC, Lattuca ME, Calvo J (2010) Temperature
influence on post-prandial metabolic rate of sub-Antarctic
teleost fish. Comp Biochem Physiol A Mol Integr Physiol
156(2):247–254. doi:10.1016/j.cbpa.2010.02.006
Von Herbing IH, White L (2002) The effects of body mass and
feeding on metabolic rate in small juvenile Atlantic cod.
J Fish Biol 61(4):945–958. doi:10.1111/j.1095-8649.2002.
tb01854.x
Wang T, Zaar M, Arvedsen S, Vedel-Smith C, Overgaard J
(2002) Effects of temperature on the metabolic response to
feeding in Python molurus. Comp Biochem Physiol A Mol
Integr Physiol 133(3):519–527. doi:10.1016/S1095-
6433(02)00250-7
Ware D (1982) Power and evolutionary fitness of teleosts. Can J
Fish Aquat Sci 39(1):3–13. doi:10.1139/f82-002
Windell JT, Foltz JW, Sarokon JA (1978) Effect of fish size,
temperature, and amount fed on nutrient digestibility of a
pelleted diet by rainbow trout, Salmo gairdneri. Trans Am
Fish Soc 107(4):613–616. doi:10.1577/1548-
8659(1978)107\613:EOFSTA[2.0.CO;2
Fish Physiol Biochem
123