On the potential of δ18O and δ15N to assess N2O reduction to N2 in soil
11
European Journal of Soil Science, October 2013, 64, 610–620 doi: 10.1111/ejss.12068 On the potential of δ 18 O and δ 15 N to assess N 2 O reduction to N 2 in soil C. Decock ‡ & J. Six ‡ Department of Plant Sciences, University of California, Davis, CA 95616, USA Summary Enhancing microbial reduction of the potent greenhouse gas nitrous oxide (N 2 O) to N 2 could be a promising strategy to mitigate emissions from soils, but N 2 O reduction rates are currently neither well understood nor quantified. It has been suggested that the importance of N 2 O reduction to N 2 could be estimated from relationships between δ 18 O and δ 15 N when N 2 O production and reduction occur simultaneously. We assessed the robustness of such relationships by using simple simulation models and experimental data for various scenarios, including open versus closed system isotope dynamics and collection of N 2 O fluxes over time with and without refreshing the headspace between sampling. We found that relationships between δ 18 O and δ 15 N vary dramatically with experimental conditions (such as headspace gas concentration and sampling scheme) and open versus closed system isotope dynamics, irrespective of N 2 O reduction rate. Therefore, we conclude that the simple relationships between δ 18 O and δ 15 N currently used are not robust indicators of N 2 O reduction to N 2 and strongly discourage graphical interpretations of δ 18 O and δ 15 N to determine N 2 O reduction. We recommend the development of more advanced process-based isotope models that take into account open versus closed system isotope dynamics, experimental conditions, isotope values of precursors and other biogeochemical controls on δ 15 N and δ 18 O of N 2 O to estimate N 2 O reduction rates more reliably from natural abundance isotope values of N 2 O. Introduction Nitrous oxide (N 2 O) is a potent greenhouse gas and plays an important role in the destruction of stratospheric ozone (IPCC, 2007). Major sources of N 2 O emissions are natural and cultivated soils, together accounting for about 50% of the global N 2 O emissions (Denman et al., 2007). Microbial reduction of N 2 O to N 2 in soil could be enhanced to provide a key strategy to diminish N 2 O release to the atmosphere (Richardson et al., 2009). Furthermore, increased quantification of N loss under field conditions could greatly improve estimates of ecosystem N budgets (Houlton & Bai, 2009). However, poor understanding of N 2 O reduction to N 2 still forms one of the major bottlenecks for obtaining reliable predictions and consequently effective N-management strategies. Ratios of N 2 O to (N 2 O + N 2 ) observed for various ecosystems and soil types in the literature range between 0 and 1, and their predictability is very poor (Schlesinger, 2009). This large uncertainty of N 2 O ‡ Present address: Department of Environmental Systems Science, ETH- Zurich, Tannenstrasse 1, 8092 Zurich, Switzerland. Correspondence: C. Decock. E-mail: [email protected] Received 14 May 2013; revised version accepted 14 May 2013 reduction rates is mainly a result of the lack of adequate methods to estimate N 2 O reduction to N 2 in soils at relevant temporal and spatial scales, especially under field conditions (Groffman et al., 2006). It has been suggested that natural abundance stable isotopes of N 2 O(δ 15 N and δ 18 O) are promising tools to estimate N 2 O reduction rates in soils (Ostrom et al., 2007; Opdyke et al., 2009; Ostrom & Ostrom, 2011). A consistent slope of about 2.6 for linear regressions between δ 18 O and δ 15 N was observed when N 2 O reduction to N 2 was the sole process affecting the N 2 O pool (Menyailo & Hungate, 2006; Ostrom et al., 2007). In contrast, smaller slopes were observed in systems where N 2 O production and consumption occurred simultaneously (Mandernack et al., 2000; Ostrom et al., 2007). These observations have led to the suggestion that linear regressions between δ 18 O and δ 15 N in N 2 O with slopes larger than 1 are indicative of N 2 O reduction to N 2 (Ostrom et al., 2007; K¨ oster et al., 2011). In addition, it has been proposed that increasingly curvilinear relations between δ 18 O and δ 15 N indicate increasing rates of N 2 O reduction to N 2 (Ostrom et al., 2007; Opdyke et al., 2009; Toyoda et al., 2011), using the logarithmic function (Rayleigh equation) associated with isotope fractionation during N 2 O consumption in closed systems (Mariotti et al., 1981). 610 © 2013 British Society of Soil Science
Transcript of On the potential of δ18O and δ15N to assess N2O reduction to N2 in soil

European Journal of Soil Science, October 2013, 64, 610–620 doi: 10.1111/ejss.12068
On the potential of δ18O and δ15N to assess N2Oreduction to N2 in soil
C . D e c o c k‡ & J . S i x‡
Department of Plant Sciences, University of California, Davis, CA 95616, USA
Summary
Enhancing microbial reduction of the potent greenhouse gas nitrous oxide (N2O) to N2 could be a promisingstrategy to mitigate emissions from soils, but N2O reduction rates are currently neither well understoodnor quantified. It has been suggested that the importance of N2O reduction to N2 could be estimated fromrelationships between δ18O and δ15N when N2O production and reduction occur simultaneously. We assessedthe robustness of such relationships by using simple simulation models and experimental data for variousscenarios, including open versus closed system isotope dynamics and collection of N2O fluxes over timewith and without refreshing the headspace between sampling. We found that relationships between δ18Oand δ15N vary dramatically with experimental conditions (such as headspace gas concentration and samplingscheme) and open versus closed system isotope dynamics, irrespective of N2O reduction rate. Therefore, weconclude that the simple relationships between δ18O and δ15N currently used are not robust indicators ofN2O reduction to N2 and strongly discourage graphical interpretations of δ18O and δ15N to determine N2Oreduction. We recommend the development of more advanced process-based isotope models that take intoaccount open versus closed system isotope dynamics, experimental conditions, isotope values of precursorsand other biogeochemical controls on δ15N and δ18O of N2O to estimate N2O reduction rates more reliablyfrom natural abundance isotope values of N2O.
Introduction
Nitrous oxide (N2O) is a potent greenhouse gas and playsan important role in the destruction of stratospheric ozone(IPCC, 2007). Major sources of N2O emissions are naturaland cultivated soils, together accounting for about 50% ofthe global N2O emissions (Denman et al., 2007). Microbialreduction of N2O to N2 in soil could be enhanced to providea key strategy to diminish N2O release to the atmosphere(Richardson et al., 2009). Furthermore, increased quantificationof N loss under field conditions could greatly improve estimatesof ecosystem N budgets (Houlton & Bai, 2009). However,poor understanding of N2O reduction to N2 still forms oneof the major bottlenecks for obtaining reliable predictions andconsequently effective N-management strategies. Ratios of N2Oto (N2O + N2) observed for various ecosystems and soil typesin the literature range between 0 and 1, and their predictabilityis very poor (Schlesinger, 2009). This large uncertainty of N2O
‡Present address: Department of Environmental Systems Science, ETH-Zurich, Tannenstrasse 1, 8092 Zurich, Switzerland.
Correspondence: C. Decock. E-mail: [email protected]
Received 14 May 2013; revised version accepted 14 May 2013
reduction rates is mainly a result of the lack of adequatemethods to estimate N2O reduction to N2 in soils at relevanttemporal and spatial scales, especially under field conditions(Groffman et al., 2006).
It has been suggested that natural abundance stable isotopesof N2O (δ15 N and δ18O) are promising tools to estimate N2Oreduction rates in soils (Ostrom et al., 2007; Opdyke et al., 2009;Ostrom & Ostrom, 2011). A consistent slope of about 2.6 forlinear regressions between δ18O and δ15 N was observed whenN2O reduction to N2 was the sole process affecting the N2O pool(Menyailo & Hungate, 2006; Ostrom et al., 2007). In contrast,smaller slopes were observed in systems where N2O productionand consumption occurred simultaneously (Mandernack et al.,2000; Ostrom et al., 2007). These observations have led to thesuggestion that linear regressions between δ18O and δ15 N inN2O with slopes larger than 1 are indicative of N2O reductionto N2 (Ostrom et al., 2007; Koster et al., 2011). In addition, ithas been proposed that increasingly curvilinear relations betweenδ18O and δ15 N indicate increasing rates of N2O reduction to N2
(Ostrom et al., 2007; Opdyke et al., 2009; Toyoda et al., 2011),using the logarithmic function (Rayleigh equation) associated withisotope fractionation during N2O consumption in closed systems(Mariotti et al., 1981).
610 © 2013 British Society of Soil Science
N and O natural abundances and N2O reduction 611
It is well-established that factors other than N2O reduction to N2
may affect δ15 N and δ18O in N2O. For example, δ15 N and δ18O ofN2O are affected by the δ15 N and δ18O complement of precursors(NH4
+ and NO3−), as well as the contribution of different N2O-
producing processes to the total flux (Perez, 2005). The changein δ15 N and δ18O during N2O reduction to N2 also dependson whether N2O production and reduction adhered to open orclosed system isotope dynamics (Fry, 2006). Under open systemdynamics, the substrate is replenished and processes are at steady-state (Fry, 2006), whereas substrate is progressively consumed ina closed system (Mariotti et al., 1981). It should also be notedthat some of the proposed trends between δ15 N and δ18O arebased on plotted lines that describe the mixing of soil-emitted andtropospheric N2O (Ostrom et al., 2007), whereas many isotopevalues reported for soil-emitted N2O have already been correctedfor background (tropospheric or headspace) N2O (Park et al.,2011; Toyoda et al., 2011). Furthermore, when gas samples forN2O analyses are collected, the headspace of the flux chamber orincubation vessel may be closed and samples collected over time(Menyailo & Hungate, 2006; Ostrom et al., 2010). Alternatively,the headspace atmosphere can be refreshed regularly during thecourse of the experiment (Opdyke et al., 2009; Koster et al., 2011).Anomalous trends in isotope values of N2O can be observedwhen N2O production and consumption occur simultaneously inheterogeneous and isolated soil N pools (Bergstermann et al.,2011), when O-exchange between nitrate or nitrite and water takesplace (Kool et al., 2007; Snider et al., 2012), or when diffusionof N-species causes significant isotope effects (Well & Flessa,2008). It remains to be tested to what extent those factors confoundcorrelations between δ18O and δ15 N, and hence the interpretationof such correlations with respect to N2O reduction rates.
The objective of this paper is to assess and discuss therobustness and applicability of relations between δ18O and δ15 Nto estimate the extent of N2O reduction in soil. We hypothesizedthat relationships between δ18O and δ15 N of N2O are not solelydetermined by the N2O reduction rate, but also depend on theδ15 N and δ18O complement of precursors (NH4
+ and NO3−),
the experimental design and underlying isotope dynamics. Weprovide simulation exercises under a series of different scenariosto illustrate how factors, other than N2O reduction, controllingδ18O and δ15 N may affect relations between δ18O and δ15 N.Findings from our simulation exercises are used to help to inter-pret relationships between δ18O and δ15 N of N2O measured in awalnut orchard over 5 days after mowing a cover crop and irriga-tion. Finally, we provide suggestions for the future use of naturalabundance isotopes in predicting the extent of N2O reduction.
Materials and methods
Simulation exercises
Isotope mixing and fractionation models. The following isotopemixing models were used to simulate mixing of two sources of
N2O, or to simulate mixing of soil-produced N2O with headspaceor tropospheric N2O:
δmix = δ1 × m1 + δ2 × m2
m1 + m2, (1)
or
δmix = δ1 × f1 + δ2 × f2, (2)
with δmix equal to the isotope value of the mixture betweensource 1 and source 2, and δ1 and δ2 the isotope values ofsource 1 and source 2, respectively; m1 and m2 are the amountsof N2O from source 1 and source 2, respectively; f 1 and f 2
are the fractions of N2O derived from source 1 and source 2,respectively, where f 1 + f 2 = 1. Isotope ratios are expressed indelta (δ) notation (δ = (Rsample/Rstandard – 1) 1000), where the unitsare per mill (‰) and R = 15 N/14 N or 18O/16O. Standards areair N2 for δ15 N and Vienna Standard Mean Ocean Water forδ18O. For tropospheric N2O, we used the current concentration(320 nl l−1, data provided by ALE/GAGE/AGAGE investigators;see Prinn et al., 1990) and isotope values as determined by Kaiseret al. (2003), δ15 N = 6.72‰ and δ18O = 44.62‰.
When N is lost from a given pool, isotope fractionation takesplace. Isotope effects during fractionation are different for openand closed systems (Hayes, 2004; Fry, 2006). For open systemsthe substrate is replenished and fractionation during substrateconsumption was modelled as follows (Fry, 2006):
δt = δt−1 − ε × (1 − fR) , (3)
where δt and δt-1 are the isotope values at time t and t–1,f R is the fraction of remaining substrate (f R = C t/C t-1, withC = substrate concentration), and ε is the isotope effect duringsubstrate consumption; t–1 chronologically precedes t. If thesubstrate concentration is large and fractionations are small, ε
can be approximated by the difference in isotope values betweenthe product and the substrate, which has been defined as ‘del’(�) (Kendall & Caldwell, 1998). For processes described in oursimulations, ε is a normal isotope effect and consequently has anegative sign (ε = (α – 1)/1000 with α = Rproduct/Rsubstrate).
In closed systems, isotope values of the remaining substrate (δs),accumulated product (δp) and instantaneous product (δpi) increaseexponentially as more substrate is consumed in closed systems,and were modelled as follows (Mariotti et al., 1981):
δs = δs,0 + ε × ln (fR) , (4)
δp = δs,0 − ε × fR × ln (fR)
1 − fR, (5)
© 2013 British Society of Soil Science, European Journal of Soil Science, 64, 610–620

612 C. Decock & J. Six
δp,i = δs ×(
1 + ε
1000
)+ ε, (6)
with f R equal to the fraction of remaining substrate and δs,0 equalto the isotope value of the substrate at time 0 (f = 1). Substratesare NO3
− for N2O production by denitrification and N2O for N2Oreduction to N2. In this study, effects of fractionation on δ18Oand δ15 N during N2O production in closed systems are illustratedfor the denitrification pathway only. While known to play animportant role during N2O production (Kool et al., 2007; Snideret al., 2009), modelling of O-exchange was beyond the scope ofour current study.
Selected scenarios. S everal scenarios were selected to study theeffects of various confounding factors on correlations betweenδ18O and δ15 N during N2O production and consumption. In a firstset of simulations, we assessed relations between δ18O and δ15 Nduring N2O production in the absence of reduction (Simulations1.1–1.5). In a second set of simulations, we assessed relationshipsbetween δ18O and δ15 N when N2O production and consumptionoccur simultaneously (Simulations 2.1–2.5). In this study, wefocus on effects of open versus closed system isotope dynamics,the presence or absence of N2O in the headspace at the start ofthe experiment, refreshing the headspace between gas samplingand N2O production with, versus without, N2O reduction. Theselected scenarios and factors controlling δ18O and δ15 N of N2Oare far from exhaustive, but were intended to test how sensitiverelationships between δ18O and δ15 N are to factors other thanN2O reduction to N2.
Simulation 1.1
Equation (5) was used to simulate the change in δ18O and δ15 N ofN2O emitted into an N2O-free headspace during chamber closureas NO3
− is consumed in a closed system. We adopted isotopevalues for NO3
− and N2O observed in an experiment targetingN2O production by denitrification in an arable soil (Well & Flessa,2009). At time 0, δ15 N-NO3
− equalled 3.0‰ and δ18O-NO3−
equalled 13.7‰. The values for ε during N2O production bydenitrification observed in the same experiment were −52.4‰and −2.4‰ for 15 N and 18O, respectively.
Simulation 1.2
We assume the same initial conditions and N2O production rateby denitrification as for Simulation 1.1, but the headspace wasrefreshed after each gas collection. When chamber closure timesare short relative to the time needed to consume all availableNO3
−, the isotope values of NO3− at sampling time can be
approximated by Equation (4), while those for N2O in the gassample can be approximated by Equation (6).
Figure 1 Relationships between δ18O and δ15 N during N2O productionin the absence of N2O reduction when substrate is limiting (closed systemisotope dynamics). (a) N2O is produced under closed system isotopedynamics and emitted into a N2O-free headspace. Simulation 1.1 showsthe accumulated product and Simulation 1.2 shows the product in thesituation that the headspace is refreshed between sample collections. (b)N2O is produced as in Simulation 1.1, but produced N2O mixes withheadspace N2O (Simulation 1.3). ‘δp initial’ represents the isotope valuesof the product at the start of the experiment; ‘δp end’ represents the isotopevalues of the accumulated product when all substrate is consumed; δs,0
represents the isotope values of the substrate at the start of the experiment;‘δp initial’, ‘δp end’ and δs,0 are shown by grey triangles; δp,i representsthe isotope value of the instantaneous product; f R is the fraction ofremaining substrate; ε15 N and δ18O are the isotope effects for 15 N and18O, respectively, during N2O production; δt represents the isotope valuesof tropospheric N2O; and δmix represents the isotope values of the mixtureof headspace and soil-emitted N2O.
Simulation 1.3
Simulation 1.3 illustrates relations between δ18O and δ15 Nwhen N2O is produced as in Simulation 1.1, but N2O mixeswith headspace N2O after it is produced. This can be modelledby applying Equation (1) to results from Equation (5) at eachtime-step.
© 2013 British Society of Soil Science, European Journal of Soil Science, 64, 610–620
N and O natural abundances and N2O reduction 613
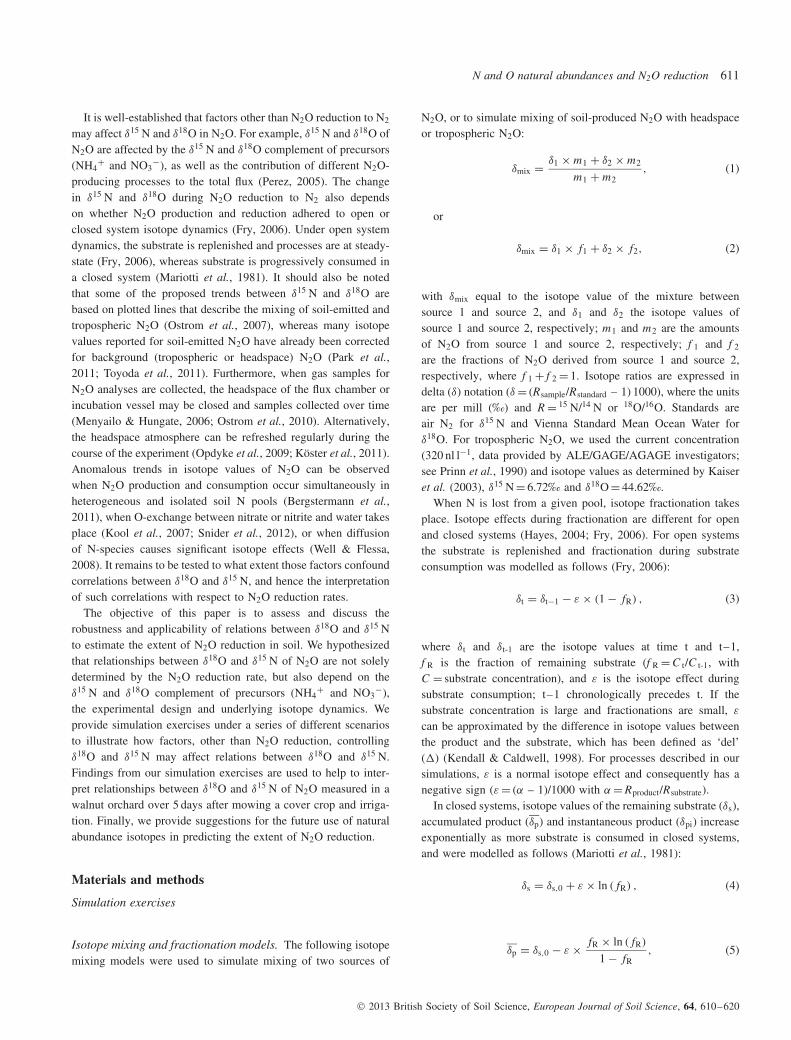
Figure 2 Illustration of the position of δ18O and δ15 N values of N2Oproduced by nitrifiers or denitrifiers in the absence of N2O reduction,relative to a simulated mixing line with a slope of 1 between troposphericN2O (grey triangle; Kaiser et al., 2003) and soil-emitted N2O under opensystem isotope dynamics (Simulation 1.4). Note that observations belowthe hypothetical mixing line with slope = 1 would result in mixing lineswith slopes greater than 1. Data from pure cultures are adopted from Sutkaet al. (2004, 2006) and Toyoda et al. (2005). Data for soil-emitted N2Oare adopted from Perez et al. (2006), Well et al. (2008) and Well & Flessa(2009).
Simulation 1.4
Simulation 1.4 illustrates relations between δ18O and δ15 N asN2O produced under open system dynamics mixes with headspaceN2O, following Equation (1). Simulations are performed usingisotope values observed for N2O produced by ammonia-oxidizingbacteria and denitrifying bacteria in pure cultures (Sutka et al.,2004, 2006; Toyoda et al., 2005), and for N2O from nitrificationand denitrification in soil incubation studies (Perez et al., 2006;Well et al., 2008; Well & Flessa, 2009).
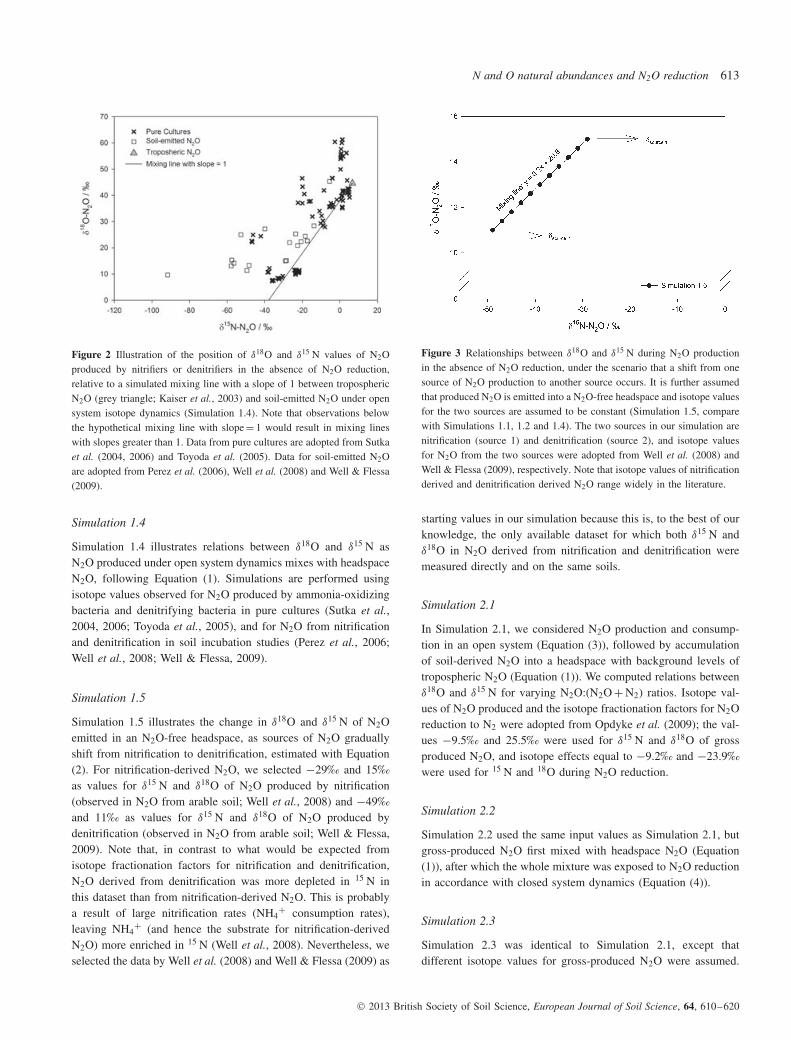
Simulation 1.5
Simulation 1.5 illustrates the change in δ18O and δ15 N of N2Oemitted in an N2O-free headspace, as sources of N2O graduallyshift from nitrification to denitrification, estimated with Equation(2). For nitrification-derived N2O, we selected −29‰ and 15‰as values for δ15 N and δ18O of N2O produced by nitrification(observed in N2O from arable soil; Well et al., 2008) and −49‰and 11‰ as values for δ15 N and δ18O of N2O produced bydenitrification (observed in N2O from arable soil; Well & Flessa,2009). Note that, in contrast to what would be expected fromisotope fractionation factors for nitrification and denitrification,N2O derived from denitrification was more depleted in 15 N inthis dataset than from nitrification-derived N2O. This is probablya result of large nitrification rates (NH4
+ consumption rates),leaving NH4
+ (and hence the substrate for nitrification-derivedN2O) more enriched in 15 N (Well et al., 2008). Nevertheless, weselected the data by Well et al. (2008) and Well & Flessa (2009) as
Figure 3 Relationships between δ18O and δ15 N during N2O productionin the absence of N2O reduction, under the scenario that a shift from onesource of N2O production to another source occurs. It is further assumedthat produced N2O is emitted into a N2O-free headspace and isotope valuesfor the two sources are assumed to be constant (Simulation 1.5, comparewith Simulations 1.1, 1.2 and 1.4). The two sources in our simulation arenitrification (source 1) and denitrification (source 2), and isotope valuesfor N2O from the two sources were adopted from Well et al. (2008) andWell & Flessa (2009), respectively. Note that isotope values of nitrificationderived and denitrification derived N2O range widely in the literature.
starting values in our simulation because this is, to the best of ourknowledge, the only available dataset for which both δ15 N andδ18O in N2O derived from nitrification and denitrification weremeasured directly and on the same soils.
Simulation 2.1
In Simulation 2.1, we considered N2O production and consump-tion in an open system (Equation (3)), followed by accumulationof soil-derived N2O into a headspace with background levels oftropospheric N2O (Equation (1)). We computed relations betweenδ18O and δ15 N for varying N2O:(N2O + N2) ratios. Isotope val-ues of N2O produced and the isotope fractionation factors for N2Oreduction to N2 were adopted from Opdyke et al. (2009); the val-ues −9.5‰ and 25.5‰ were used for δ15 N and δ18O of grossproduced N2O, and isotope effects equal to −9.2‰ and −23.9‰were used for 15 N and 18O during N2O reduction.
Simulation 2.2
Simulation 2.2 used the same input values as Simulation 2.1, butgross-produced N2O first mixed with headspace N2O (Equation(1)), after which the whole mixture was exposed to N2O reductionin accordance with closed system dynamics (Equation (4)).
Simulation 2.3
Simulation 2.3 was identical to Simulation 2.1, except thatdifferent isotope values for gross-produced N2O were assumed.
© 2013 British Society of Soil Science, European Journal of Soil Science, 64, 610–620

614 C. Decock & J. Six
Figure 4 Relationships between δ18O and δ15 N when N2O productionand consumption occur simultaneously. (a) Both N2O production andreduction adhere to open system dynamics, and a fraction of producedN2O is reduced to N2 before it mixes with headspace N2O (Simulation2.1). Solid black lines represent mixing of accumulated soil-emitted N2Owith headspace N2O. The grey dashed lines represent mixing of soil-emitted N2O with headspace N2O at increasing rates of N2O reduction,when the headspace is refreshed between sampling. (b) N2O productionfollows open system isotope dynamics, while N2O reduction followsclosed system isotope dynamics. N2O only becomes subject to reductionafter produced N2O mixes with headspace N2O (Simulation 2.2). Solidblack lines represent mixing followed by reduction of soil-emitted andheadspace N2O. In (a) and (b), black dotted lines are reduction lines(slope = 2.6); N2Ot is tropospheric N2O; N2Os is soil-emitted N2O;fN2O = N2O/(N2O + N2).
In experiments with pure cultures and soil incubation studiestargeting N2O-producing processes, isotope values as small as−57.8‰ for δ15 N-N2O and 13.1‰ for δ18O-N2O (Well & Flessa,2009) and as large as 1.4‰ for δ15 N-N2O and 61.2‰ for δ18O-N2O (Sutka et al., 2004) have been measured. Those values wereused in Simulation 2.3 to assess the effect of isotope values ofproduced N2O on relationships between δ18O and δ15 N of N2Owhen N2O production and consumption occur simultaneously.
Figure 5 Effect of isotope values of produced N2O on relations betweenδ18O and δ15 N when N2O production and reduction occur simultaneouslyunder open system dynamics with N2O reduction occurring before mixinginto the atmosphere. Black solid lines: δ15 N and δ18O of producedN2O are −57.8‰ and 13.1‰, respectively. Grey solid lines: δ15 N andδ18O of produced N2O are 1.1‰ and 60‰, respectively. Different blackand grey curves indicate different N2O/(N2O + N2) ratios. Dotted linesrepresent the reduction lines (slope = 2.6). Solid lines are mixing lines.fN2O = N2O/(N2O + N2); N2Ot is tropospheric N2O; N2Os is soil-emittedN2O.
Simulation 2.4
In Simulation 2.4, we assessed the effect of gradual changes inthe isotope values of gross-produced N2O caused by substratelimitation, in the scenario that N2O production and consumptionoccur simultaneously. Gross-produced N2O was simulated withEquation (6) in each time-step, with initial isotope values asin Simulation 1.1. This gross-produced N2O was subjected toreduction with Equation (3), after which the remaining N2O mixedwith background N2O (Equation (1)). The mixing model used theisotope value and N2O concentration of the mixture of producedand background N2O at time t–1 for source 1, and the isotopevalue and amount of N2O produced between t–1 and t as source 2.
Simulation 2.5
Simulation 2.5 was similar to Simulation 2.4, but the headspacewas refreshed between subsequent sample collections. For themixing model, source 1 constituted isotope values and concen-tration of tropospheric N2O, while source 2 was the same as inSimulation 2.4.
Field data
Field data were collected to assess if and how results from thesimulations can be used to interpret relationships between δ18Oand δ15 N of N2O in environmental samples. The experimental sitewas an organically managed walnut orchard in Winters, California.We targeted the anticipated N2O peak after mowing a cover
© 2013 British Society of Soil Science, European Journal of Soil Science, 64, 610–620

N and O natural abundances and N2O reduction 615
crop and irrigation. Nitrous oxide fluxes and δ15 N and δ18O ofN2O were determined for two functional locations: the tree rowand the tractor row. Irrigation water from the overhead micro-jet sprinkler system directly targeted the tree row, but the soilmoisture content was similar between the two locations at thetime of sampling. The cover crop covered the entire orchard floor.There were three replicate chambers per functional location. Gassamples were collected from non-flow-through, non-steady-statevented chambers (surface area of 319 cm2 and a height of 12 cm)at 0, 30, 60, 90 and 120 minutes after chamber closure, afterwhich the chambers were opened and headspace air was refreshed.This procedure was repeated each day starting at 11.00 for fiveconsecutive days. Headspace gas samples (20 ml) were collectedwith a needle and syringe and transferred into 12-ml exetainers.N2O concentrations were determined on a Hewlett Packard6890 Series Gas Chromatograph, equipped with a micro-electroncapture detector (ECD) (Hewlet Packard, Palo Alto, CA, USA),and the 15 N and 18O enrichment of N2O were determined with aThermoFinnigan GasBench with a PreCon trace gas concentrationsystem interfaced to a ThermoScientific Delta V Plus isotope-ratio mass spectrometer (Bremen, Germany), at the Stable IsotopeFacility of the University of California, Davis. Keeling plotswere used to determine the isotope values of soil-emitted N2Ofor each day of data collection. Following this approach, theisotope value of emitted N2O was calculated as the intercept ofthe regression between δ15 N or δ18O and the inverse of the N2Oconcentration. The soil moisture content and the NH4
+ and NO3−
concentrations were determined for the topsoil (0–10 cm). Thesoil moisture content was determined gravimetrically. Soil NH4
+
and NO3− were extracted with 0.5 m K2SO4 and the NH4
+ andNO3
− concentrations were determined colorimetrically followingthe Berthelot reaction (Forster, 1995) and vanadium(III) chloridereduction (Doane & Horwath, 2003), respectively. We performeda repeated measures analysis of variance in the R 2.15.3 packagefor statistical computing, to assess differences in N2O fluxes andancillary variables between functional locations.
Results and discussion
Relationships between δ18O and δ15N during N2O productionin the absence of reduction
Under the scenario that N2O was produced in a closed system(where NO3
− is limiting and progressively consumed) and emittedin a N2O-free headspace (or after background correction), therelationship between δ18O and δ15 N of produced N2O waslinear (Figure 1a, Simulations 1.1 and 1.2). This is in agreementwith Menyailo & Hungate (2006), who determined isotopefractionation factors for N2O production during denitrificationby incubating soil under an anaerobic (helium) atmosphere withNO3
− as the sole electron acceptor in a closed system. Notethat the linear relationship between δ18O and δ15 N duringN2O production with limiting substrate in our study merelyreflects the ratio of isotope effects for 18O and 15 N (Figure 1a,Simulation 1.1). In fact, isotope values for the cumulative product
fall between the isotope value of the initial product and that of theinitial substrate. This complies with the Rayleigh equation, wherethe accumulated product reaches the isotope value of the initialsubstrate once all substrate is consumed (Equation (6)). Isotopevalues for the product when the headspace was refreshed followedthe same line, but much larger values than the initial substrate wereobserved as the fraction of remaining substrate became smaller(Figure 1a, Simulation 1.2). The net 18O isotope effects for N2Oproduction by denitrification can vary widely through the varyingextents of O-exchange, resulting in δ18O-N2O that is largelydictated by δ18O-H2O values and subsequent fractionation (Snideret al., 2009). This further complicates relationships between δ18Oand δ15 N during N2O production.
Using the same initial isotope values and isotope effectsduring N2O production as in Simulation 1.1, we computed therelationship between δ18O and δ15 N when the N2O producedcould mix with tropospheric N2O (Figure 1b, Simulation 1.3). Inthis case, the relationship between δ18O and δ15 N was curvilinear,even though no N2O reduction to N2 took place. Hence, thesuggestion that simultaneous N2O production and reduction couldbe identified by a curvilinear relationship between δ18O and δ15 N(Ostrom et al., 2007) should be taken with caution.
When soil-derived and tropospheric N2O are mixed, it hasbeen suggested that mixing lines with a slope smaller than 1would indicate N2O production in the absence of reduction,because soil-derived N2O is commonly depleted in δ18O andδ15 N relative to tropospheric N2O (Ostrom et al., 2007).However, a slope smaller than 1 would effectively indicate that(δ18Ot – δ18Os)/(δ15Nt – δ15Ns) is smaller than 1, where δt andδs represent isotope values of tropospheric and soil-derived N2O.When isotope values observed in the literature for N2O producedin the absence of N2O reduction are plotted against the isotopemixing line with a slope equalling 1, it appears that the majority,but not all, of the observations would result in mixing lines withslopes less than 1 (Simulation 1.4, Figure 2).
In addition to N2O production when NO3− is limiting
(Simulations 1.1 and 1.2) and mixing of tropospheric N2O withN2O produced in an open system (Simulation 1.4), a linearrelationship between δ18O and δ15 N in soil-emitted N2O (emittedin N2O-free headspace or background-corrected) in the absence ofN2O reduction could occur when a gradual shift from one sourceof N2O production (such as nitrification) to another source (suchas denitrification) occurs, while isotope values of N2O from eachof the sources remain constant (Figure 3, Simulation 1.5). Hence,comparisons of Simulations 1.1, 1.2, 1.4 and 1.5 demonstratethat linear relationships between δ18O and δ15 N can havemultiple causes and can therefore lead to incorrect conclusions.Furthermore, when N2O produced during denitrification is emittedin a N2O-free atmosphere (or when isotope values are background-corrected) under open system dynamics with constant precursorisotope values, the isotope value of N2O in the headspace wouldbe constant over time. In this scenario, all processes that controlN2O emissions, including rates of N2O production, consumptionand diffusion, must be at steady state.
© 2013 British Society of Soil Science, European Journal of Soil Science, 64, 610–620

616 C. Decock & J. Six
Figure 6 Relationships between δ18O and δ15 N during simultaneousN2O production and consumption followed by mixing with troposphericN2O. Substrate for N2O production was assumed to be limiting. (a) Theheadspace remains closed during the experimental period (Simulation2.4). (b) The headspace is refreshed between gas samplings (Simulation2.5). Different curves within each graph reflect different N2O/(N2O + N2)ratios. The dotted line represents the reduction line (slope = 2.6).fN2O = N2O/(N2O + N2); fNO3- is the fraction of remaining nitrate; N2Ot
is tropospheric N2O.
Relationships between δ18O and δ15N during simultaneousN2O production and reduction
Of major interest is the evaluation of relationships betweenδ18O and δ15 N when N2O production and consumption occursimultaneously. We found that slopes of linear regressions betweenδ18O and δ15 N decreased as N2O reduction to N2 increasedwhen N2O was produced and reduced in the soil under opensystem dynamics, after which N2O mixes with tropospheric N2O(Figure 4a, Simulation 2.1). As isotope values of N2O producedwere more depleted than tropospheric N2O in our example, theslope of the mixing line of produced and tropospheric N2O waspositive (Figure 4a: N2O/(N2O + N2) = 1). As N2O reduction toN2 increases, δ15 N and δ18O in the remaining soil-derived N2Obecome more enriched, resulting in mixing lines with smaller
Figure 7 Relationships between δ18O and δ15 N during mixing ofproduced N2O with atmospheric N2O in static flux chambers at a walnutorchard in the California central valley. Samples were collected at 0, 30,60, 90 and 120 minutes after chamber closure from chambers located inthe (a) tree row and (b) tractor row, 1 day after mowing of the cover cropand irrigation. Different symbols are used for replicate chambers.
slopes. Results from this simulation indicate that the suggestionthat slopes of regressions between δ18O and δ15 N greater than 1are indicative of N2O reduction to N2 (Ostrom et al., 2007) is notrobust.
When gross-produced N2O mixed with tropospheric N2O andthe mixture was subjected to N2O reduction in accordance withclosed-system dynamics, the relationships between δ18O and δ15 Nwere curvilinear (Figure 4b, Simulation 2.2). Curves increasinglydeviated from the mixing line of gross produced and troposphericN2O as more N2O was reduced to N2. Note that the results fromthis simulation are remarkably similar to the graphical approachof Opdyke et al. (2009) to estimate N2O reduction rates andexplained in more detail in Ostrom & Ostrom (2011). Differencesbetween results observed for Simulation 2.1 and 2.2 in our study(Figure 4) illustrate how substrate availability (open or closedsystem) and the timing of mixing with tropospheric N2O relative
© 2013 British Society of Soil Science, European Journal of Soil Science, 64, 610–620

N and O natural abundances and N2O reduction 617
to N2O reduction affect relationships between δ18O and δ15 N ofN2O. Both open and closed system dynamics may apply duringN2O reduction in soils (Fry, 2006). An open system would occurwhen N2O production takes place in immediate proximity to sitesof N2O reduction. In contrast, N2O reduction may follow closed-system dynamics when the N2O produced diffuses to isolatedmicrosites where it is gradually reduced to N2. When N2Oemissions are large, consumption of tropospheric N2O by N2Oreduction is unlikely. However, the observation of net negativeN2O fluxes in various ecosystems suggests that there may besituations where a mixture of newly produced and troposphericN2O is consumed (Chapuis-Lardy et al., 2007). Therefore, theavailability of N2O for reduction and the potential for consumptionof tropospheric N2O should be considered when interpretingrelationships between δ18O-N2O and δ15 N-N2O in gas samplescollected from the soil surface.
It is noteworthy that the relationship between δ18O and δ15 N,when N2O production and reduction occur simultaneously, isdependent on the isotopic values of the N2O produced. InSimulation 2.3, we simulated the relationship between δ18O andδ15 N for the scenario in which N2O production and reductionoccur simultaneously under open system isotope dynamics withN2O reduction occurring before mixing in the headspace, withsmall and large values for δ15 N and δ18O of produced N2O(Figure 5). The distinctly different patterns from the differentisotope values of produced N2O demonstrate that N2O reductionto N2 cannot be assessed in the absence of knowledge of isotopevalues of the produced N2O, which in turn depends on isotopevalues of the precursors for nitrification and denitrification (NH4
+,NO3
−, O2, H2O).The mixing lines for simultaneous N2O production and
reduction under open system dynamics as discussed (Figure 4a)are only relevant if the accumulating product is sampled overtime without refreshing the air in the headspace. However, N2Ocould be sampled after, for example, 1 hour of chamber closurefollowed by refreshment of the flux chamber’s headspace. Duringchamber closure, the isotope values of N2O in the headspacewould reach certain δ18O and δ15 N values. After flushing theheadspace, the isotope values of N2O would be ‘reset’ to thoseof tropospheric N2O. If no changes in process rates and isotope
Table 1 Summary results for the effect of functional location (tree ortractor rows) on N2O fluxes, water-filled pore space (WFPS), NH4
+
concentrations and NO3− concentrations from repeated measures anova.
Variable
N2O flux /g N2O-N ha−1
day−1
WFPS/ %
NH4+
concentration/ μg N g−1
soil
NO3−
concentration/ μg N g−1
soil
Degrees of freedom 1 1 1 1Mean square 3.14 48.80 0.70 8.50F ratio 0.27 36.60 4.98 2.74P 0.63 0.10 0.27 0.35
Table 2 Mean values and standard errors for N2O fluxes, water-filled porespace (WFPS), NH4
+ concentrations and NO3− concentrations for the tree
and the tractor rows
Tree rows Tractor rows
N2O fluxes / g N2O-N ha−1 day−1 5.1 ± 0.9 4.5 ± 1.7WFPS / % 51.1 ± 4.6 47.1 ± 4.6NH4
+ concentration / μg N g−1 soil 2.8 ± 0.4 2.3 ± 0.2NO3
− concentration / μg N g−1 soil 5.5 ± 1.4 7.2 ± 1.6
values of precursors occur (steady-state conditions), the sameisotope values as those of the first sample would be obtained forthe second sample during the next chamber closure. Therefore,linear or non-linear relationships in δ18O and δ15 N in caseswhere the headspace is refreshed between sampling events indicatenon-steady-state conditions. Various reasons for this are possible,including substrate limitation, or shifts in the contribution ofvarious N2O-producing and consuming processes to the net N2Oflux. In this context, the grey dashed lines in Figure 4(a) illustratehow δ18O and δ15 N would change over a gradient of N2Oreduction rates, assuming that other variables remain constant,when the headspace is refreshed between gas samplings.
Simulations 2.4 and 2.5 further demonstrate the effects ofclosing or refreshing the headspace between gas sampling times,in this case when the substrate for N2O production is limited (N2Oproduction follows closed system dynamics, Figure 6). The isotopevalues of N2O accumulated in the headspace follow curvilinearrelationships and different amounts of N2O reduction to N2
are clearly distinguishable (Figure 6a). When the headspace isrefreshed between sampling times, relationships between δ18O andδ15 N are linear and only the intercepts of the linear regressionsincrease as N2O:(N2O + N2) decreases. It should further be notedthat in all simulations where simultaneous N2O production andreduction was considered and all other processes were assumedto be at steady-state (black dotted lines, Figures 4, 5 and 6),increasing or decreasing N2O:(N2O + N2) resulted in a linearregression between δ18O and δ15 N with a slope of 2.6. Thisimplies that regressions between δ18O and δ15 N with slopesdifferent from 2.6 most probably indicate that N2O productionis not at steady-state.
It should further be noted, however, that the narrow rangeof ratios of fractionation factors for δ18O to δ15 N during N2Oreduction (2.4–2.6), as observed by Menyailo & Hungate (2006),Ostrom et al. (2007), Vieten et al. (2007) and Jinuntuya-Nortmanet al. (2008), indicates mass dependence of fractionation of Oand N during N2O reduction (Ostrom & Ostrom, 2011). Inprocess-based isotope models that simulate N2O production andconsumption, Monte Carlo simulation can be used to account forthe uncertainty around fractionation factors (Snider et al., 2012). Ifa known relationship between fractionation of O and N exists, thenumber of combinations of randomly chosen fractionation factorsfor 15 N and 18O can be drastically reduced, thereby significantlyreducing uncertainty around the model outcomes.
© 2013 British Society of Soil Science, European Journal of Soil Science, 64, 610–620

618 C. Decock & J. Six
Figure 8 Relationships between δ18O and δ15 N for produced N2Omeasured on five consecutive days following mowing of a cover crop andirrigation in an organic walnut orchard in the California central valley. (a)Tree row. (b) Tractor row.
Example with field isotope measurements
Within one chamber-closure period of 2 hours, mixing of producedN2O with atmospheric N2O resulted in a linear relationshipbetween δ18O and δ15 N (Figure 7). This relationship is consistentwith simulations for mixing of produced N2O and atmosphericN2O when the product accumulates under open system isotopedynamics, while the isotope value of the precursors and processesunderlying N2O emissions remains constant. In other words,N2O-producing and consuming processes were at steady-stateduring chamber closure. Such conditions can be expected for a2-hour period. During the 5 days after mowing the cover crop andirrigation, fluxes ranged between 0 and 14.4 g N2O-N ha−1 day−1.Fluxes were greatest on the first day after mowing and irrigation,after which they gradually decreased. There were no significantdifferences in N2O fluxes between the tree and the tractor rows(Tables 1 and 2). The soil moisture content ranged between31 and 65% water-filled pore space and was not significantlyaffected by functional location (Tables 1 and 2). Similarly, mineral
N concentrations ranged between 1.7 and 4.2 μg N g−1 soil forNH4
+ and between 1.8 and 12.7 μg N g−1 soil for NO3−, with
no significant differences between the tree and the tractor rows(Tables 1 and 2).
In contrast, the changes in δ18O in relation to δ15 N were verydifferent for the tree row to those in the tractor row (Figure 8). Thisindicates that different mechanisms were acting to produce N2Oin the different locations. In the tree row, δ15 N and δ18O valueswere fairly constant, suggesting that processes underlying N2Oproduction and consumption probably remained mostly unalteredduring the five sampling days. δ15 N and δ18O values increasedfrom the first to the second day after mowing and irrigating inthe tractor row, followed by a decrease in the isotope values onsubsequent days. Hence, increased N2O reduction to N2 probablytook place between the first and the second day (upon theflush of available C from the mowed cover crop), after whichN2O reduction to N2 could have decreased on days 3 and 4.Nevertheless, isotope values of N2O on days 3 and 4 do not fall onthe line between days 1 and 2. Therefore, changes in processes ormechanisms other than a decrease in the rate of N2O reduction toN2 are needed to explain the observed trends. Shifts in nitrificationor denitrification as a source of N2O or changes in the isotopevalues of the precursors for N2O production potentially tookplace. Our observations clearly demonstrate that the relationshipsbetween δ18O and δ15 N alone were not sufficient to demonstrateN2O reduction to N2. However, the distinct differences inisotope values between the tree and the tractor rows suggest thatnatural abundance stable isotopes of N2O have the potential toconstrain N2O production and consumption mechanisms in soilsif information on isotope values of the precursors was availableand more advanced models were employed.
Conclusions and suggestions for future research
Our simulation exercises illustrate how relationships between δ18Oand δ15 N during N2O production and simultaneous N2O produc-tion and reduction depend on experimental design (backgroundN2O, refreshing of the headspace between sampling) and biogeo-chemical controls (open or closed system dynamics as dictatedby substrate availability, the relative flux and isotope values ofthe source processes and isotope values of precursors). In orderto account for this complexity, we suggest that the interpretationof natural abundance isotope values of N2O should be guided byisotope mixing and fractionation models that take into accountexperimental design and biogeochemical controls on N2O emis-sion. In addition to examples of biogeochemical controls illus-trated in this paper, effects of other known controls such as soilheterogeneity, O-exchange and diffusion should be considered(Snider et al., 2012; Well et al., 2012). Furthermore, it is stronglyrecommended that reported isotope values of N2O emitted fromsoil are accompanied by data on soil moisture content and mineralN concentration, as those variables are relatively straightforwardto measure and remain important and well-recognized controls onthe various processes underlying N2O emissions.
© 2013 British Society of Soil Science, European Journal of Soil Science, 64, 610–620

N and O natural abundances and N2O reduction 619
Acknowledgements
We are grateful for financial support from the United StatesNational Science Foundation (NSF-DEB 0543218), IPNI and theDavid and Lucile Packard Foundation. We also thank Engil Pereiraand Emma Spencer for assistance with providing the field data.
References
Bergstermann, A., Cardenas, L., Bol, R., Gilliam, L., Goulding, K.,Meijide, A., et al. 2011. Effect of antecedent soil moisture conditions onemissions and isotopologue distribution of N2O during denitrification.Soil Biology & Biochemistry , 43, 240–250.
Chapuis-Lardy, L., Wrage, N., Metay, A., Chotte, J.L. & Bernoux, M.2007. Soils, a sink for N2O? A review. Global Change Biology , 13,1–17.
Denman, K.L., Brasseur, G., Chidthaisong, A., Ciais, P., Cox, P.M.,Dickinson, R.E., et al. 2007. Couplings between changes in theclimate system and biogeochemistry. In: Climate Change 2007 : The
Physical Science Basis . Contribution of Working Group I to the Fourth
Assessment Report of the Intergovernmental Panel on Climate Change
(eds S. Solomon, D. Qin, M. Manning, Z. Chen, M. Marquis, K.B.Averyt, et al.) pp. 501–587. Cambridge University Press, Cambridge,New York.
Doane, T.A. & Horwath, W.R. 2003. Spectrophotometric determinationof nitrate with a single reagent. Analytical Letters , 36, 2713–2722.
Forster, J.C. 1995. Soil nitrogen. In: Methods in Applied Soil Microbi-ology and Biochemistry (eds A. Alef & P. Nannipieri), pp. 79–87.Academic Press, San Diego, CA.
Fry, B.B. 2006. Stable Isotope Ecology. Springer Science + BusinessMedia, LLC, New York.
Groffman, P.M., Altabet, M.A., Bohlke, J.K., Butterbach-Bahl, K.,David, M.B., Firestone, M.K., et al. 2006. Methods for measuringdenitrification: diverse approaches to a difficult problem. Ecological
Applications , 16, 2091–2122.Hayes, H. 2004. An Introduction to Isotopic Calculations. Woods Hole
Oceanographic Institution, Woods Hole, MA.Houlton, B. & Bai, E. 2009. Imprint of denitrifying bacteria on the global
terrestrial biosphere. Proceedings of the National Academy of Sciences ,106, 21713–21716.
IPCC 2007. Climate change 2007: synthesis report. In: Contribution of
Working Groups I , II and III to the Fourth Assessment Report of the
Intergovernmental Panel on Climate Change (eds R.K. Pachauri & A.Reisinger), p. 104. IPCC, Geneva.
Jinuntuya-Nortman, M., Sutka, R.L., Ostrom, P.H., Gandhi, H. & Ostrom,N.E. 2008. Isotopologue fractionation during microbial reduction ofN2O within soil mesocosms as a function of water-filled pore space.Soil Biology & Biochemistry , 40, 2273–2280.
Kaiser, J., Rockmann, T. & Brenninkmeijer, C.A.M. 2003. Complete andaccurate mass spectrometric isotope analysis of tropospheric nitrousoxide. Journal of Geophysical Research , 108, 4476–4493.
Kendall, C. & Caldwell, E. 1998. Fundamentals of isotope geochemistry.In: Isotope Tracers in Catchment Hydrology (eds C. Kendall & J.McDonnell), pp. 51–86. Elsevier Science B.V., Amsterdam.
Kool, D.M., Wrage, N., Oenema, O., Dolfing, J. & Van Groenigen, J.W.2007. Oxygen exchange between (de)nitrification intermediates andH2O and its implications for source determination of NO3
− and N2O: areview. Rapid Communications in Mass Spectrometry , 21, 3569–3578.
Koster, J.R., Cardenas, L., Senbayram, M., Bol, R., Well, R., Butler, M.,et al. 2011. Rapid shift from denitrification to nitrification in soil afterbiogas residue application as indicated by nitrous oxide isotopomers.Soil Biology & Biochemistry , 43, 1671–1677.
Mandernack, K.W., Rahn, T., Kinney, C. & Wahlen, M. 2000. The bio-geochemical controls of the δ15N and δ18O of N2O produced in landfillcover soils. Journal of Geophysical Research , 105, 17709–17720.
Mariotti, A., Germon, J.C., Hubert, P., Kaiser, P., Letolle, R., Tardieux,A., et al. 1981. Experimental determination of nitrogen kinetic isotopefractionation – some principles – illustration for the denitrification andnitrification processes. Plant & Soil , 62, 413–430.
Menyailo, O.V. & Hungate, B.A. 2006. Stable isotope discriminationduring soil denitrification: production and consumption of nitrous oxide.Global Biogeochemical Cycles , 20, GB3025, 1–10.
Opdyke, M., Ostrom, N. & Ostrom, P. 2009. Evidence for the predomi-nance of denitrification as a source of N2O in temperate agricultural soilsbased on isotopologue measurements. Global Biogeochemical Cycles ,23, GB4018, 1–10.
Ostrom, N.E. & Ostrom, G.P. 2011. The isotopomers of nitrousoxide: analytical considerations and application to resolution ofmicrobial production pathways. In: Handbook of Environmental IsotopeGeochemistry. Advances in Isotope Geochemistry (ed M. Baskaran)pp. 453–476. Springer-Verlag, Berlin, Heidelberg.
Ostrom, N.E., Pitt, A., Sutka, R., Ostrom, P.H., Grandy, A.S., Huizinga,K.M., et al. 2007. Isotopologue effects during N2O reduction in soilsand in pure cultures of denitrifiers. Journal of Geophysical Research ,112, G02005, 1–12.
Ostrom, N., Sutka, R., Ostrom, P., Grandy, P., Huizinga, K., Gandhi,H., et al. 2010. Isotopologue data reveal bacterial denitrification as theprimary source of N2O during a high flux event following cultivationof a native temperate grassland. Soil Biology & Biochemistry , 42,499–506.
Park, S., Perez, T., Boering, K., Trumbore, S., Gil, J., Marquina, S.,et al. 2011. Can N2O stable isotopes and isotopomers be useful toolsto characterize sources and microbial pathways of N2O productionand consumption in tropical soils? Global Biogeochemical Cycles , 25,GB1001, 1–16.
Perez, T. 2005. Factors that control the isotopic composition of N2Ofrom soil emissions. In: Stable Isotopes and Biosphere-AtmosphereInteractions (eds L.B. Flanagan, J.R. Ehleringer & D.E. Pataki), pp.69–84. Elsevier Academic Press, Oxford.
Perez, T., Garcia-Montiel, D., Trumbore, S., Tyler, S., De Camargo, P.,Moreira, M., et al. 2006. Nitrous oxide nitrification and denitrificationN-15 enrichment factors from Amazon forest soils. Ecological Applica-tions , 16, 2153–2167.
Prinn, R., Cunnold, R., Rasmussen, R., Simmonds, P., Alyea, F., Crawford,A., et al. 1990. Atmospheric emissions and trends of nitrous oxidededuced from 10 years of ALE–GAGE data. Journal of GeophysicalResearch , 95, 18369–18385.
Richardson, D., Felgate, H., Watmough, N., Thomson, A. & Baggs,E. 2009. Mitigating release of the potent greenhouse gas N2O fromthe nitrogen cycle–could enzymic regulation hold the key? Trends inBiotechnology , 27, 388–397.
Schlesinger, W.H. 2009. On the fate of anthropogenic nitrogen. Proceed-ings of the National Academy of Sciences , 106, 203–208.
Snider, D.M., Schiff, S.L. & Spoelstra, J. 2009. 15 N/14 N and 18O/16Ostable isotope ratios of nitrous oxide produced during denitrificationin temperate forest soils. Geochimica et Cosmochimica Acta , 73,877–888.
© 2013 British Society of Soil Science, European Journal of Soil Science, 64, 610–620

620 C. Decock & J. Six
Snider, D.M., Venkiteswaran, J.J., Schiff, S.L. & Spoelstra, J. 2012.Deciphering the oxygen isotope composition of nitrous oxide producedby nitrification. Global Change Biology , 18, 356–370.
Sutka, R.L., Ostrom, N.E., Ostrom, P.H., Gandhi, H. & Breznak, J.H. 2004.Nitrogen isotopomer site preference of N2O produced by Nitrosomonaseuropaea and Methylococcus capsulatus Bath. Rapid Communications
in Mass Spectrometry , 18, 1411–1412.Sutka, R.L., Ostrom, N.E., Ostrom, P.H., Breznak, J.A., Gandhi,
H., Pitt, A.J., et al. 2006. Distinguishing nitrous oxide produc-tion from nitrification and denitrification on the basis of iso-topomer abundances. Applied & Environmental Microbiology , 72,638–644.
Toyoda, S., Mutobe, H., Yamagishi, H., Yoshida, N. & Tanji, Y. 2005.Fractionation of N2O isotopomers during production by denitrifier. Soil
Biology & Biochemistry , 37, 1535–1545.Toyoda, S., Yano, M., Nishimura, S., Akiyama, H., Hayakawa, A., Koba,
K., et al. 2011. Characterization and production and consumptionprocesses of N2O emitted from temperate agricultural soils determinedvia isotopomer ratio analysis. Global Biogeochemical Cycles , 25,GB2008, 1–17.
Vieten, B., Blunier, T., Neftel, A., Alewell, C. & Conen, F. 2007. Frac-tionation factors for stable isotopes of N and O during N2O reduction insoil depend on reaction rate constant. Rapid Communications in Mass
Spectrometry , 21, 846–850.Well, R. & Flessa, H. 2008. Isotope fractionation factors of N2O diffusion.
Rapid Communications in Mass Spectrometry , 22, 2621–2628.Well, R. & Flessa, H. 2009. Isotopologue signatures of N2O produced by
denitrification in soils. Journal of Geophysical Research , 114, G02020,1–11.
Well, R., Flessa, H., Xing, L., Ju, X.T. & Romheld, V. 2008.Isotopologue ratios of N2O emitted from microcosms with NH4
+
fertilized arable soils under conditions favoring nitrification. Soil
Biology & Biochemistry , 40, 2416–2426.Well, R., Eschenbach, W., Flessa, H., von der Heide, C. & Weymann, D.
2012. Are dual isotope and isotopomer ratios of N2O useful indicatorsfor N2O turnover during denitrification in nitrate-contaminated aquifers?Geochimica et Cosmochimica Acta , 90, 265–282.
© 2013 British Society of Soil Science, European Journal of Soil Science, 64, 610–620