N2O and NO emissions during wastewater denitrification step: Influence of temperature on the...
8
International Chemical Engineering Congress 2013 N 2 O and NO emissions during wastewater denitrification step: Influence of temperature on the biological process E ´ missions de NO et de N 2 O lors de l’e ´tape de de ´nitrification : e ´tude de l’influence de la tempe ´rature sur le processus biologique Nouceiba Adouani a, *, Lionel Limousy b , Thomas Lendormi c , Olivier Sire c a Laboratoire Re ´actions et Ge ´nie des proce ´de ´s, LRGP, Nancy, France b Institut de science des mate ´riaux de Mulhouse, CNRS,UMR-7361, 3 bis, rue Alfred-Werner, 68093 Mulhouse, France c Universite ´ europe ´enne de Bretagne, LimatB, Pontivy, France C. R. Chimie 18 (2015) 15–22 A R T I C L E I N F O Article history: Received 15 March 2014 Accepted after revision 18 November 2014 Available online 24 December 2014 Keywords: Denitrification Temperature Nitrous oxide Nitric oxide Wastewater Enzymatic kinetics Mots cle ´s : De ´ nitrification Tempe ´ rature Protoxyde d’azote Oxyde nitrique Eaux use ´es Cine ´ tiques enzymatiques A B S T R A C T The denitrification process occurring in wastewater treatment plants (WWTPs) is responsible for nitrous oxide (N 2 O) and nitric oxide (NO) emissions. These compounds indirectly lead to the global warming. In this study, we investigated the impact of the temperature on N 2 O and NO emissions. Experiments were achieved at PH 7 in a batch reactor with acetate as the carbon source. The nitrogen source was nitrates (NO 3 ) and the COD/N ratio was set to three. Results showed that NO and N 2 O emissions increased when the temperature decreased. NO emissions appeared only at 10 8C and 5 8C, with respectively 8% and 18% of the total denitrified nitrogen. N 2 O emissions increased from 13 to 40 then 82% of the total denitrified nitrogen, respectively at 20, 10 and 5 8C. Several hypotheses were suggested to explain these results: a general enzymatic slow down, enzymatic inhibitions, electron donor competition between the different enzymes and metabolic pathway alterations. ß 2014 Acade ´ mie des sciences. Published by Elsevier Masson SAS. All rights reserved. R E ´ S U M E ´ L’e ´ tape de de ´ nitrification re ´ alise ´e en station d’e ´ puration peut e ˆtre a ` l’origine d’e ´ missions de NO et de N 2 O, compose ´s implique ´s dans le re ´ chauffement climatique. Cette e ´ tude porte sur l’influence de la tempe ´ rature sur l’e ´ mission de ces compose ´ s, en utilisant l’ace ´ tate de sodium comme source de carbone, les nitrates comme source d’azote et en travaillant en re ´ acteur batch. Le rapport DCO/N a e ´ te ´ fixe ´a ` 3. Les re ´ sultats obtenus montrent qu’une baisse de la tempe ´ rature entraı ˆne une augmentation importante des e ´ missions d’oxyde d’azote, et que NO est e ´ mis de `s que la tempe ´ rature est infe ´ rieure ou e ´ gale a ` 10 8C. Les e ´ missions de N 2 O passent de 13 % (20 8C) a ` 82 % (5 8C), 100 % de l’azote de ´ nitrifie ´ est strippe ´ sous la forme de NO (18 %) et de N 2 O (82 %) a `5 8C. Ces re ´ sultats peuvent e ˆtre explique ´s par un ralentissement ge ´ ne ´ ral de l’activite ´ enzymatique de la biomasse de ´ nitrifiante, voire l’inhibition partielle ou totale de certaines bacte ´ ries. ß 2014 Acade ´ mie des sciences. Publie ´ par Elsevier Masson SAS. Tous droits re ´ serve ´s. * Corresponding author. E-mail addresses: [email protected] (N. Adouani), [email protected] (L. Limousy), [email protected] (T. Lendormi), [email protected] (O. Sire). Contents lists available at ScienceDirect Comptes Rendus Chimie ww w.s cien c edir ec t.c om http://dx.doi.org/10.1016/j.crci.2014.11.005 1631-0748/ß 2014 Acade ´ mie des sciences. Published by Elsevier Masson SAS. All rights reserved.
-
Upload
independent -
Category
Documents
-
view
0 -
download
0
Transcript of N2O and NO emissions during wastewater denitrification step: Influence of temperature on the...
Int
N2
st
Em
etu
Noa Labb Insc Un
C. R. Chimie 18 (2015) 15–22
A R
Artic
Rece
Acce
Avai
Keyw
Den
Tem
Nitr
Nitr
Was
Enzy
Mot
Den
Tem
Prot
Oxy
Eau
Cine
*
oliv
http
163
ernational Chemical Engineering Congress 2013
O and NO emissions during wastewater denitrificationep: Influence of temperature on the biological process
issions de NO et de N2O lors de l’etape de denitrification :
de de l’influence de la temperature sur le processus biologique
uceiba Adouani a,*, Lionel Limousy b, Thomas Lendormi c, Olivier Sire c
oratoire Reactions et Genie des procedes, LRGP, Nancy, France
titut de science des materiaux de Mulhouse, CNRS,UMR-7361, 3 bis, rue Alfred-Werner, 68093 Mulhouse, France
iversite europeenne de Bretagne, LimatB, Pontivy, France
T I C L E I N F O
le history:
ived 15 March 2014
pted after revision 18 November 2014
lable online 24 December 2014
ords:
itrification
perature
ous oxide
ic oxide
tewater
matic kinetics
s cles :
itrification
perature
oxyde d’azote
de nitrique
x usees
tiques enzymatiques
A B S T R A C T
The denitrification process occurring in wastewater treatment plants (WWTPs) is
responsible for nitrous oxide (N2O) and nitric oxide (NO) emissions. These compounds
indirectly lead to the global warming. In this study, we investigated the impact of the
temperature on N2O and NO emissions. Experiments were achieved at PH 7 in a batch
reactor with acetate as the carbon source. The nitrogen source was nitrates (NO3�) and the
COD/N ratio was set to three. Results showed that NO and N2O emissions increased when
the temperature decreased. NO emissions appeared only at 10 8C and 5 8C, with
respectively 8% and 18% of the total denitrified nitrogen. N2O emissions increased from
13 to 40 then 82% of the total denitrified nitrogen, respectively at 20, 10 and 5 8C. Several
hypotheses were suggested to explain these results: a general enzymatic slow down,
enzymatic inhibitions, electron donor competition between the different enzymes and
metabolic pathway alterations.
� 2014 Academie des sciences. Published by Elsevier Masson SAS. All rights reserved.
R E S U M E
L’etape de denitrification realisee en station d’epuration peut etre a l’origine d’emissions
de NO et de N2O, composes impliques dans le rechauffement climatique. Cette etude porte
sur l’influence de la temperature sur l’emission de ces composes, en utilisant l’acetate de
sodium comme source de carbone, les nitrates comme source d’azote et en travaillant en
reacteur batch. Le rapport DCO/N a ete fixe a 3. Les resultats obtenus montrent qu’une
baisse de la temperature entraıne une augmentation importante des emissions d’oxyde
d’azote, et que NO est emis des que la temperature est inferieure ou egale a 10 8C. Les
emissions de N2O passent de 13 % (20 8C) a 82 % (5 8C), 100 % de l’azote denitrifie est strippe
sous la forme de NO (18 %) et de N2O (82 %) a 5 8C. Ces resultats peuvent etre expliques par
un ralentissement general de l’activite enzymatique de la biomasse denitrifiante, voire
l’inhibition partielle ou totale de certaines bacteries.
� 2014 Academie des sciences. Publie par Elsevier Masson SAS. Tous droits reserves.
Corresponding author.
E-mail addresses: [email protected] (N. Adouani), [email protected] (L. Limousy), [email protected] (T. Lendormi),
[email protected] (O. Sire).
Contents lists available at ScienceDirect
Comptes Rendus Chimie
ww w.s c ien c edi r ec t . c om
://dx.doi.org/10.1016/j.crci.2014.11.005
1-0748/� 2014 Academie des sciences. Published by Elsevier Masson SAS. All rights reserved.
N. Adouani et al. / C. R. Chimie 18 (2015) 15–2216
1. Introduction
N2O ranks third in greenhouse gases after carbondioxide (CO2) and methane (CH4) and before hydrofluor-ocarbons (HFC), perfluorocarbons (PFC) and sulphurhexafluoride (SF6). N2O only accounts for around 0.03%of the total greenhouse gas emissions, but when expressedaccording to the Intergovernmental Panel on ClimateChange (IPCC) in approved unit of CO2 equivalent, itaccounts for 10% of the total emissions [1]. N2O is apowerful greenhouse gas with a very long lifetime of150 years and a 320-fold stronger effect thanCO2. Nowadays, the atmospheric concentration of N2O isabout 324 ppbv and is still increasing at an alarming rate of0.3% per year [2,3]. It is therefore of great need tounderstand and control the anthropogenic emissions ofN2O [4]. Actually, anthropogenic N2O emissions comemainly from energy processes, chemical industries andagriculture and waste treatments. Wastewater treatmentis responsible for 3.2–10% of the total N2O emissions [5],which corresponds globally to about 94% of the wastesector (Kyoto Protocol: the Kyoto Protocol to the UnitedNations Framework Convention on Climate Change(UNFCCC) is an international treaty that sets bindingobligations on industrialized countries to reduce emissionsof greenhouse gases. It was adopted by Parties to theUNFCCC in 1997, and entered into force in 2005).
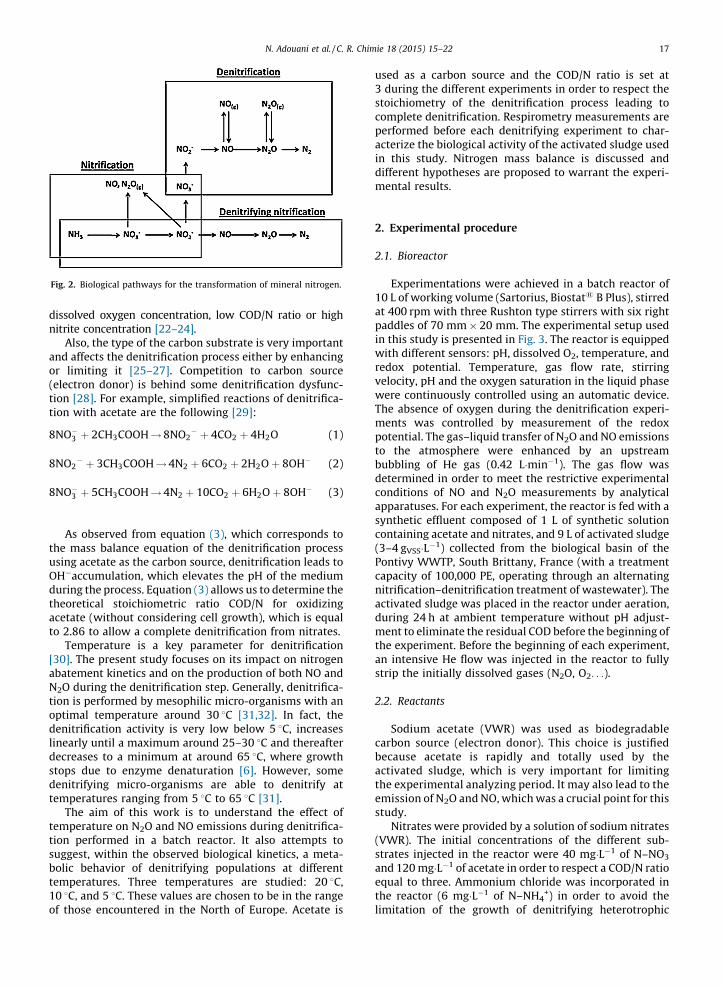
N2O is mostly produced during biological nitrogenremoval by nitrification and denitrification either in soil orin water [6–9]. These two processes are the main redoxreactions in the N cycle, as shown in Fig. 1 below.
Fig. 1 shows also the production of the nitrous oxide(NO) during the N cycle and particularly during denitri-fication processes. While researches on N2O emissions areabundant, only few studies address NO emissions duringwastewater treatment, even though NO has an indirecteffect on global warming [10–12]. When emitted into theair, it counts among the atmospheric pollutants. Byreacting with O2, it transforms into NO2, which yieldsphotochemical oxidants responsible for increasing the
greenhouse effect [1]. Also, it has been shown that N2Oreacts with oxygen radicals in the stratosphere to form NO,which is involved in the depletion in stratospheric ozone[13]. NO is a potent cytotoxin, and bacteria deficient innitric oxide reductase cannot grow through denitrificationbecause they are killed by this toxic intermediate[14,15]. The NO production source can be either denitrify-ing bacteria or ammonia-oxidizing bacteria.
Nitrogen abatement in wastewater treatment startsfirst by a nitrification process. It consists in a succession ofoxidation reactions transforming ammonia (NH4
+) intonitrates (NO3
�) under aerobic conditions by autotrophicbacteria transforming mineral substances into organicsubstances. Autotrophic nitrifying bacteria take theirenergy from ammonia or nitrites (NO2
�) and their carbonsource from CO2. First, NH4
+ is transformed into hydro-xylamine (NH2OH) by ammonia mono-oxygenase enzyme.Then, NH2OH is transformed into NO2
� by hydroxylamineoxydoreductase enzyme, which is finally oxidized intoNO3
� by nitrite oxydoreductase [16–18]. Hence startsdenitrification, which reduces nitrates into molecular N2
under anoxic conditions and by heterotrophic bacteria. Thereductions are catalyzed successively by NO3
� reductase,NO2
� reductase, NO reductase, and N2O reductase. A largerange of heterotrophic micro-organisms is able to deni-trify. The growth of heterotrophs requires organic carbonsupply [19].
Most denitrifiers are actually facultative aerobes, whichmeans that they gain energy using O2 as the electronacceptor, but are able to switch to anoxic respiration anduse NO3
� as an electron acceptor when O2 is missing inorder to survive environmental changes. The enzymesrequired for denitrification are activated by low oxygenpartial pressure. The final product of denitrification is notalways N2, but could be N2O and sometimes even NO,depending on the organisms involved and on theenvironmental conditions. Equally, NO3
� does not needto be the terminal electron acceptor; instead, otherintermediates may be used. For example, Alcaligenes
faecalis and Pseudomonas perfectomarinus bacteria wereshown to grow in the laboratory using N2O as an electronacceptor [19].
Another biological way of denitrifying is called ‘‘deni-trifying nitrification’’. It is a pathway carried out by thegroup of nitrifiers that perform the first step of nitrificationand named the ammonium oxidizers, which oxidize NH4
+
to NH2OH and then to NO2�. Under O2 stress, these
organisms then reduce NO2� to gaseous forms of N (NO,
N2O, N2) [20–22]. All these biological pathways of N2
abatement are presented in Fig. 2.It appears from this figure that N2O and NO are always
present in the N2 cycle. They are co-products duringnitrification and their production is not necessary, whilein denitrification, they are obligatory intermediates. Thisis the reason why this study focused on denitrification.During the denitrification step, NO and N2O intermedi-ates may be present in both the aqueous and gas phases[4].
The denitrification process in WWTPs depends on severalfactors: biological kinetics and physicochemical parametersas pH, temperature, viscosity, substrate concentrations,Fig. 1. Schematic representation of the N cycle [6].
dissnitr
andor
(eletiontion
8NO
8NO
8NO
theusiOHdurtheaceto 2
[30abaN2Otionoptdenlinedecstodentem
temtionsugboltem10
of t
Fig.
N. Adouani et al. / C. R. Chimie 18 (2015) 15–22 17
olved oxygen concentration, low COD/N ratio or highite concentration [22–24].Also, the type of the carbon substrate is very important
affects the denitrification process either by enhancinglimiting it [25–27]. Competition to carbon sourcectron donor) is behind some denitrification dysfunc-
[28]. For example, simplified reactions of denitrifica- with acetate are the following [29]:
�3 þ 2CH3COOH ! 8NO2
� þ 4CO2 þ 4H2O (1)
2� þ 3CH3COOH ! 4N2 þ 6CO2 þ 2H2O þ 8OH� (2)
�3 þ 5CH3COOH ! 4N2 þ 10CO2 þ 6H2O þ 8OH� (3)
As observed from equation (3), which corresponds to mass balance equation of the denitrification processng acetate as the carbon source, denitrification leads to�accumulation, which elevates the pH of the mediuming the process. Equation (3) allows us to determine theoretical stoichiometric ratio COD/N for oxidizingtate (without considering cell growth), which is equal.86 to allow a complete denitrification from nitrates.
Temperature is a key parameter for denitrification]. The present study focuses on its impact on nitrogentement kinetics and on the production of both NO and
during the denitrification step. Generally, denitrifica- is performed by mesophilic micro-organisms with an
imal temperature around 30 8C [31,32]. In fact, theitrification activity is very low below 5 8C, increasesarly until a maximum around 25–30 8C and thereafterreases to a minimum at around 65 8C, where growthps due to enzyme denaturation [6]. However, someitrifying micro-organisms are able to denitrify atperatures ranging from 5 8C to 65 8C [31].
The aim of this work is to understand the effect ofperature on N2O and NO emissions during denitrifica- performed in a batch reactor. It also attempts to
gest, within the observed biological kinetics, a meta-ic behavior of denitrifying populations at differentperatures. Three temperatures are studied: 20 8C,8C, and 5 8C. These values are chosen to be in the rangehose encountered in the North of Europe. Acetate is
used as a carbon source and the COD/N ratio is set at3 during the different experiments in order to respect thestoichiometry of the denitrification process leading tocomplete denitrification. Respirometry measurements areperformed before each denitrifying experiment to char-acterize the biological activity of the activated sludge usedin this study. Nitrogen mass balance is discussed anddifferent hypotheses are proposed to warrant the experi-mental results.
2. Experimental procedure
2.1. Bioreactor
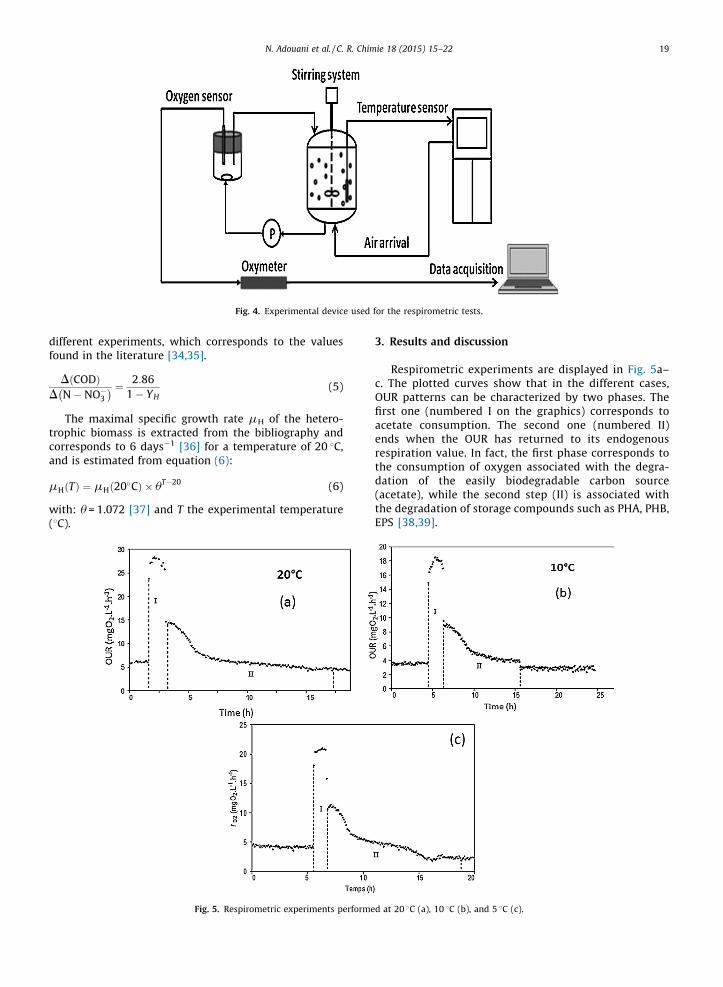
Experimentations were achieved in a batch reactor of10 L of working volume (Sartorius, Biostat1 B Plus), stirredat 400 rpm with three Rushton type stirrers with six rightpaddles of 70 mm � 20 mm. The experimental setup usedin this study is presented in Fig. 3. The reactor is equippedwith different sensors: pH, dissolved O2, temperature, andredox potential. Temperature, gas flow rate, stirringvelocity, pH and the oxygen saturation in the liquid phasewere continuously controlled using an automatic device.The absence of oxygen during the denitrification experi-ments was controlled by measurement of the redoxpotential. The gas–liquid transfer of N2O and NO emissionsto the atmosphere were enhanced by an upstreambubbling of He gas (0.42 L�min�1). The gas flow wasdetermined in order to meet the restrictive experimentalconditions of NO and N2O measurements by analyticalapparatuses. For each experiment, the reactor is fed with asynthetic effluent composed of 1 L of synthetic solutioncontaining acetate and nitrates, and 9 L of activated sludge(3–4 gVSS�L�1) collected from the biological basin of thePontivy WWTP, South Brittany, France (with a treatmentcapacity of 100,000 PE, operating through an alternatingnitrification–denitrification treatment of wastewater). Theactivated sludge was placed in the reactor under aeration,during 24 h at ambient temperature without pH adjust-ment to eliminate the residual COD before the beginning ofthe experiment. Before the beginning of each experiment,an intensive He flow was injected in the reactor to fullystrip the initially dissolved gases (N2O, O2. . .).
2.2. Reactants
Sodium acetate (VWR) was used as biodegradablecarbon source (electron donor). This choice is justifiedbecause acetate is rapidly and totally used by theactivated sludge, which is very important for limitingthe experimental analyzing period. It may also lead to theemission of N2O and NO, which was a crucial point for thisstudy.
Nitrates were provided by a solution of sodium nitrates(VWR). The initial concentrations of the different sub-strates injected in the reactor were 40 mg�L�1 of N–NO3
and 120 mg�L�1 of acetate in order to respect a COD/N ratioequal to three. Ammonium chloride was incorporated inthe reactor (6 mg�L�1 of N–NH4
+) in order to avoid thelimitation of the growth of denitrifying heterotrophic
2. Biological pathways for the transformation of mineral nitrogen.

N. Adouani et al. / C. R. Chimie 18 (2015) 15–2218
bacteria. The pH was continuously and automaticallyadjusted to 7 with HCl (1N) or NaOH (1N) solutions.
2.3. Analyses
Nitrates, nitrites, and COD concentrations in the liquidphase were determined by colorimetric methods accord-ing to French normalized standards NFT 90-101 for COD,NFT 90-012 for NO3
�and NFT 90-013 for NO2�. The volatile
suspended solids (VSS) were also measured at thebeginning of each experimentation according to NFT(90-029).
The reactor headspace was periodically analyzed byusing an online gas chromatograph (GC Varian CP-4900) tomeasure N2O emissions. A PoraPLOT U 10 M Backflushcolumn and a Thermal Conductivity Detector (TCD) wereused for the separation and the detection of N2O,respectively. NO emissions were also continuously ana-lyzed thanks to a non-destructive ultraviolet analyzer(NGA 2000, Emerson analytical).
2.4. Respirometry
In addition to analyses performed on the gas and theliquid phases, respirometric assays were performedbefore each denitrifying experiment in order to char-acterize the biological activity of the sludge by estimatingthe heterotrophic population (XBH) responsible fordenitrification. The XBH parameter was calculated accord-ing to equation (4) valid when exponential growth isassumed:
XBH ¼OURexo max
mH
� �� YH
1 � YH(4)
where OURexomax ¼ rO2 max � rO2 endogenous. It features themaximal exogenic oxygen consumption rate (mgO2�L�1�h�1), with:
mH the maximal specific growth rate (h�1),YH the growth yield of sludge.Respirometry consists in measuring the uptake rate of
the dissolved oxygen present in the sludge before its use inthe 10-L denitrification reactor. It is a rapid and efficientmethod to characterize the biological activity of theheterotrophic biomass as well as its behavior in thepresence of a synthetic influent at different temperatures[32]. Fig. 4 displays the experimental device for respiro-metric assays.
A reactor of 3 L of working volume (Bioflo 3000, NewBruswick) was connected to a small OUR measurement cellof 0.25 L. The sludge was warmed up during a starvationperiod (24 h). Then, 40 mg�L�1 ATU (allylthiourea) wereadded in the reactor to inhibit the nitrification since ATUinhibits autotrophic bacteria [33]. Thereafter, when thesecond respirometric endogenous threshold was observed,corresponding to the respiration of the heterotrophicdenitrifying bacteria, acetate was injected in the reactor inaerobic conditions, and OUR was measured. It can bepointed out that no significant initial ammonia or nitrateswere present in the tested sludge.
Three respirometric assays were performed at thedifferent experimental temperatures: 20, 10 and 5 8C.
OUR is directly extracted from the respirometric curves,while the growth yield of sludge is estimated byintegration of the oxygen uptake corresponding to thedifference between the experimental and the endogenousrespirometry curves. The oxygen uptake is proportional tothe organic substrate consumption, as described inequation (5), and then to the yield of substrate assimilation(corresponding to YH). The YH value is close to 0.63 for the
Fig. 3. Experimental device used for the biological denitrification process.
difffou
D
D N�
tropcorand
mH
wit(8C
N. Adouani et al. / C. R. Chimie 18 (2015) 15–22 19
erent experiments, which corresponds to the valuesnd in the literature [34,35].
CODð Þ � NO�3
� ¼ 2:86
1 � YH(5)
The maximal specific growth rate mH of the hetero-hic biomass is extracted from the bibliography and
responds to 6 days�1 [36] for a temperature of 20 8C, is estimated from equation (6):
Tð Þ ¼ mHð20�CÞ � uT�20 (6)
h: u = 1.072 [37] and T the experimental temperature).
3. Results and discussion
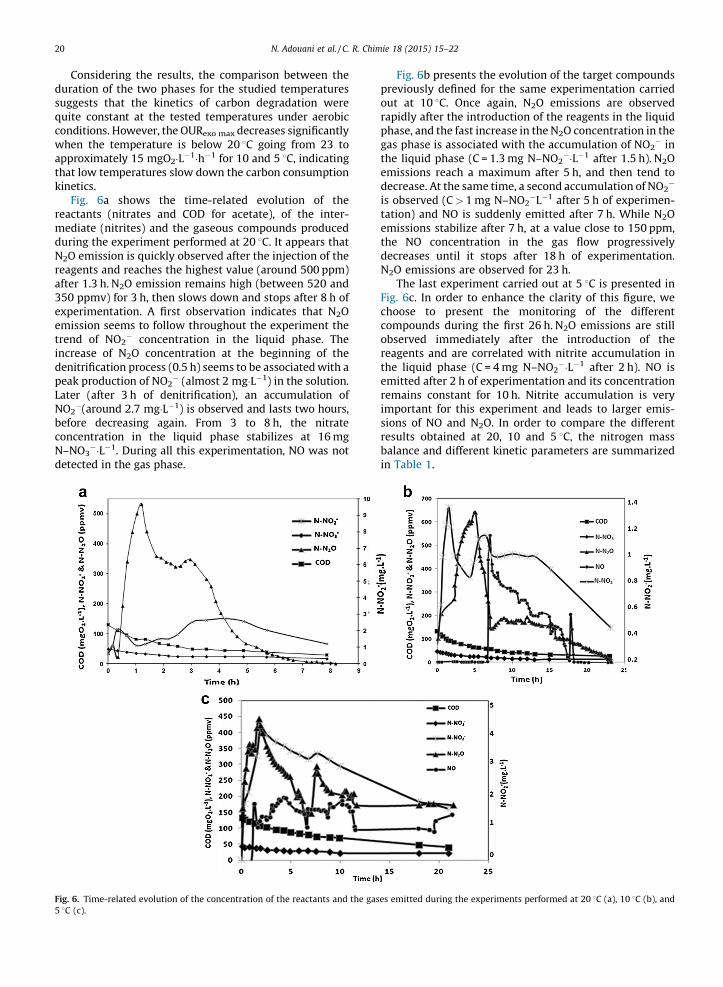
Respirometric experiments are displayed in Fig. 5a–c. The plotted curves show that in the different cases,OUR patterns can be characterized by two phases. Thefirst one (numbered I on the graphics) corresponds toacetate consumption. The second one (numbered II)ends when the OUR has returned to its endogenousrespiration value. In fact, the first phase corresponds tothe consumption of oxygen associated with the degra-dation of the easily biodegradable carbon source(acetate), while the second step (II) is associated withthe degradation of storage compounds such as PHA, PHB,EPS [38,39].
Fig. 4. Experimental device used for the respirometric tests.
Fig. 5. Respirometric experiments performed at 20 8C (a), 10 8C (b), and 5 8C (c).
N. Adouani et al. / C. R. Chimie 18 (2015) 15–2220
Considering the results, the comparison between theduration of the two phases for the studied temperaturessuggests that the kinetics of carbon degradation werequite constant at the tested temperatures under aerobicconditions. However, the OURexo max decreases significantlywhen the temperature is below 20 8C going from 23 toapproximately 15 mgO2�L�1�h�1 for 10 and 5 8C, indicatingthat low temperatures slow down the carbon consumptionkinetics.
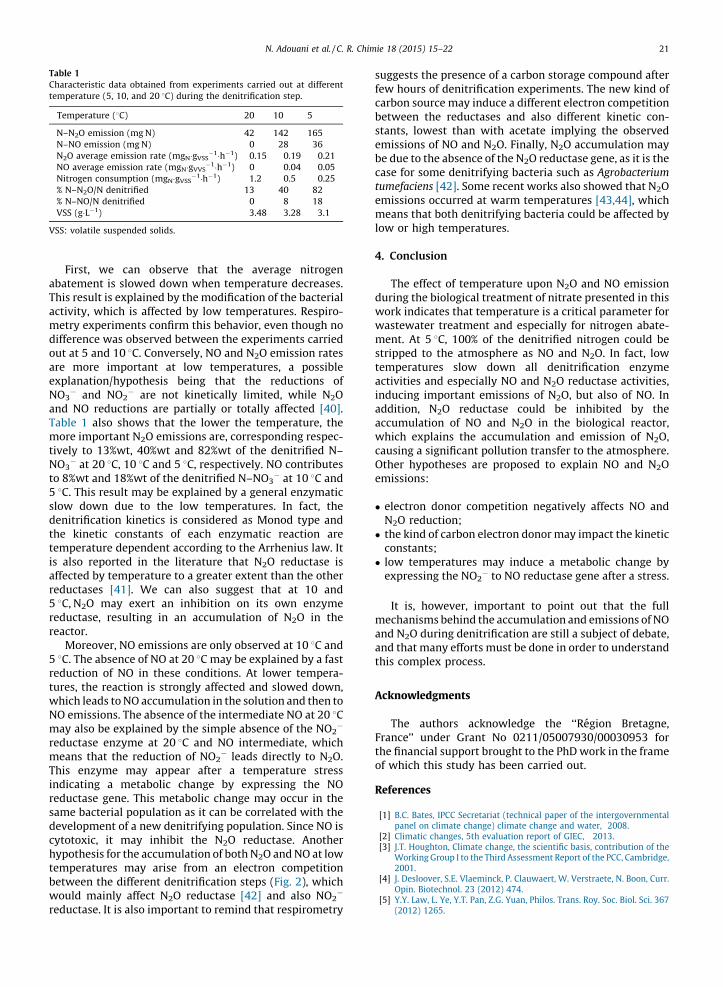
Fig. 6a shows the time-related evolution of thereactants (nitrates and COD for acetate), of the inter-mediate (nitrites) and the gaseous compounds producedduring the experiment performed at 20 8C. It appears thatN2O emission is quickly observed after the injection of thereagents and reaches the highest value (around 500 ppm)after 1.3 h. N2O emission remains high (between 520 and350 ppmv) for 3 h, then slows down and stops after 8 h ofexperimentation. A first observation indicates that N2Oemission seems to follow throughout the experiment thetrend of NO2
� concentration in the liquid phase. Theincrease of N2O concentration at the beginning of thedenitrification process (0.5 h) seems to be associated with apeak production of NO2
� (almost 2 mg�L�1) in the solution.Later (after 3 h of denitrification), an accumulation ofNO2
�(around 2.7 mg�L�1) is observed and lasts two hours,before decreasing again. From 3 to 8 h, the nitrateconcentration in the liquid phase stabilizes at 16 mgN–NO3
��L�1. During all this experimentation, NO was notdetected in the gas phase.
Fig. 6b presents the evolution of the target compoundspreviously defined for the same experimentation carriedout at 10 8C. Once again, N2O emissions are observedrapidly after the introduction of the reagents in the liquidphase, and the fast increase in the N2O concentration in thegas phase is associated with the accumulation of NO2
� inthe liquid phase (C = 1.3 mg N–NO2
��L�1 after 1.5 h). N2Oemissions reach a maximum after 5 h, and then tend todecrease. At the same time, a second accumulation of NO2
�
is observed (C > 1 mg N–NO2�L�1 after 5 h of experimen-
tation) and NO is suddenly emitted after 7 h. While N2Oemissions stabilize after 7 h, at a value close to 150 ppm,the NO concentration in the gas flow progressivelydecreases until it stops after 18 h of experimentation.N2O emissions are observed for 23 h.
The last experiment carried out at 5 8C is presented inFig. 6c. In order to enhance the clarity of this figure, wechoose to present the monitoring of the differentcompounds during the first 26 h. N2O emissions are stillobserved immediately after the introduction of thereagents and are correlated with nitrite accumulation inthe liquid phase (C = 4 mg N–NO2
��L�1 after 2 h). NO isemitted after 2 h of experimentation and its concentrationremains constant for 10 h. Nitrite accumulation is veryimportant for this experiment and leads to larger emis-sions of NO and N2O. In order to compare the differentresults obtained at 20, 10 and 5 8C, the nitrogen massbalance and different kinetic parameters are summarizedin Table 1.
Fig. 6. Time-related evolution of the concentration of the reactants and the gases emitted during the experiments performed at 20 8C (a), 10 8C (b), and
5 8C (c).
abaThiactmediffoutareexpNOandTabmotiveNOto 85 8Cslowdenthetemis aaffered5 8Credrea
5 8CredturwhNOmaredmeThiindredsamdevcythyptembetwored
Tab
Cha
tem
Te
N–
N–
N2
NO
Ni
%
%
VS
VSS
N. Adouani et al. / C. R. Chimie 18 (2015) 15–22 21
First, we can observe that the average nitrogentement is slowed down when temperature decreases.s result is explained by the modification of the bacterialivity, which is affected by low temperatures. Respiro-try experiments confirm this behavior, even though noerence was observed between the experiments carried
at 5 and 10 8C. Conversely, NO and N2O emission rates more important at low temperatures, a possiblelanation/hypothesis being that the reductions of
3� and NO2
� are not kinetically limited, while N2O NO reductions are partially or totally affected [40].le 1 also shows that the lower the temperature, there important N2O emissions are, corresponding respec-ly to 13%wt, 40%wt and 82%wt of the denitrified N–
3� at 20 8C, 10 8C and 5 8C, respectively. NO contributes%wt and 18%wt of the denitrified N–NO3
� at 10 8C and. This result may be explained by a general enzymatic
down due to the low temperatures. In fact, theitrification kinetics is considered as Monod type and
kinetic constants of each enzymatic reaction areperature dependent according to the Arrhenius law. Itlso reported in the literature that N2O reductase iscted by temperature to a greater extent than the otheructases [41]. We can also suggest that at 10 and, N2O may exert an inhibition on its own enzymeuctase, resulting in an accumulation of N2O in thector.Moreover, NO emissions are only observed at 10 8C and. The absence of NO at 20 8C may be explained by a fastuction of NO in these conditions. At lower tempera-es, the reaction is strongly affected and slowed down,ich leads to NO accumulation in the solution and then to emissions. The absence of the intermediate NO at 20 8Cy also be explained by the simple absence of the NO2
�
uctase enzyme at 20 8C and NO intermediate, whichans that the reduction of NO2
� leads directly to N2O.s enzyme may appear after a temperature stressicating a metabolic change by expressing the NOuctase gene. This metabolic change may occur in thee bacterial population as it can be correlated with theelopment of a new denitrifying population. Since NO isotoxic, it may inhibit the N2O reductase. Anotherothesis for the accumulation of both N2O and NO at lowperatures may arise from an electron competition
ween the different denitrification steps (Fig. 2), whichuld mainly affect N2O reductase [42] and also NO2
�
suggests the presence of a carbon storage compound afterfew hours of denitrification experiments. The new kind ofcarbon source may induce a different electron competitionbetween the reductases and also different kinetic con-stants, lowest than with acetate implying the observedemissions of NO and N2O. Finally, N2O accumulation maybe due to the absence of the N2O reductase gene, as it is thecase for some denitrifying bacteria such as Agrobacterium
tumefaciens [42]. Some recent works also showed that N2Oemissions occurred at warm temperatures [43,44], whichmeans that both denitrifying bacteria could be affected bylow or high temperatures.
4. Conclusion
The effect of temperature upon N2O and NO emissionduring the biological treatment of nitrate presented in thiswork indicates that temperature is a critical parameter forwastewater treatment and especially for nitrogen abate-ment. At 5 8C, 100% of the denitrified nitrogen could bestripped to the atmosphere as NO and N2O. In fact, lowtemperatures slow down all denitrification enzymeactivities and especially NO and N2O reductase activities,inducing important emissions of N2O, but also of NO. Inaddition, N2O reductase could be inhibited by theaccumulation of NO and N2O in the biological reactor,which explains the accumulation and emission of N2O,causing a significant pollution transfer to the atmosphere.Other hypotheses are proposed to explain NO and N2Oemissions:
� electron donor competition negatively affects NO andN2O reduction;� the kind of carbon electron donor may impact the kinetic
constants;� low temperatures may induce a metabolic change by
expressing the NO2� to NO reductase gene after a stress.
It is, however, important to point out that the fullmechanisms behind the accumulation and emissions of NOand N2O during denitrification are still a subject of debate,and that many efforts must be done in order to understandthis complex process.
Acknowledgments
The authors acknowledge the ‘‘Region Bretagne,France’’ under Grant No 0211/05007930/00030953 forthe financial support brought to the PhD work in the frameof which this study has been carried out.
References
[1] B.C. Bates, IPCC Secretariat (technical paper of the intergovernmentalpanel on climate change) climate change and water, 2008.
[2] Climatic changes, 5th evaluation report of GIEC, 2013.[3] J.T. Houghton, Climate change, the scientific basis, contribution of the
Working Group I to the Third Assessment Report of the PCC, Cambridge,2001.
[4] J. Desloover, S.E. Vlaeminck, P. Clauwaert, W. Verstraete, N. Boon, Curr.Opin. Biotechnol. 23 (2012) 474.
[5] Y.Y. Law, L. Ye, Y.T. Pan, Z.G. Yuan, Philos. Trans. Roy. Soc. Biol. Sci. 367
le 1
racteristic data obtained from experiments carried out at different
perature (5, 10, and 20 8C) during the denitrification step.
mperature (8C) 20 10 5
N2O emission (mg N) 42 142 165
NO emission (mg N) 0 28 36
O average emission rate (mgN�gVSS�1�h�1) 0.15 0.19 0.21
average emission rate (mgN�gVVS�1�h�1) 0 0.04 0.05
trogen consumption (mgN�gVSS�1�h�1) 1.2 0.5 0.25
N–N2O/N denitrified 13 40 82
N–NO/N denitrified 0 8 18
S (g�L�1) 3.48 3.28 3.1
: volatile suspended solids.
(2012) 1265.
uctase. It is also important to remind that respirometry
N. Adouani et al. / C. R. Chimie 18 (2015) 15–2222
[6] D. Richardson, H. Felgate, N. Watmmough, A. Thomson, E. Baggs, TrendsBiotechnol. 27 (2009) 388.
[7] H. Itokawa, K. Hanaki, T. Matsuo, Water Res. 35 (2001) 657.[8] G. Tallec, J. Garnier, G. Billen, M. Gousailles, Water Res. 40 (2006) 2972.[9] USEPA, Inventory of U.S. greenhouse gas emissions and sinks: 1990–
2010, U.S. Environmental Protection Agency, Washington DC, USA,2012.
[10] J. Sommer, A. Ciplak, E. Sumer, G. Benckiser, J.C.G. Ottow, Agrobiol. Res.51 (1998) 59.
[11] M. Fuerhacker, H. Bauer, R. Ellinger, U. Sree, H. Schmid, F. Zibuschka, H.Puxbaum, Chemosphere 44 (2001) 1213.
[12] M.J. Kampschreur, W.R.L. van der Star, H.A. Wielders, J.W. Mulder,S.M.M. Jetten, M.C.M. van, Loosdrecht, Water Res. 42 (2008) 812.
[13] P.J. Crutzen, Atmospheric chemical processes of the oxides of nitrogenincluding nitrous oxide, in: C.C. Delwiche (Ed.), Denitrification, nitrifi-cation and atmospheric N2O, Wiley, Chichester, 1981, p. 17.
[14] A.P. de Boer, J. Van der Oost, H.V. Westerhoff, A.H. Stouthamer, R.J. VanSpanning, Eur. J. Biochem. 242 (1996) 592.
[15] G. Butland, S. Spiro, N.J. Watmough, D.J. Richardson, J. Bacteriol. 183(2001) 189.
[16] P.M. Wood, Nitrification as a bacterial energy source, in: P.M. Wood, J.I.Prosser (Eds.), Nitrification, IRL Press, Oxford, UK, 1986, pp. 39–62.
[17] H. Mc Tavish, J.A. Fuchs, A.B. Hooper, J. Bacteriol. 175 (1993) 2436.[18] L.A. Sayavedra-Soto, N.G. Hommes, D.J. Arp, J. Bacteriol. 176 (1994) 504.[19] U. Skiba, Denitrification, reference module in earth systems and envi-
ronmental sciences, encyclopedia of ecology, Elsevier, 2008, p. 866.[20] N. Wrage, G.L. Velthof, M.L. van Beusichem, O. Oenema, Soil Boil.
Biochem. 133 (2001) 1723.[21] B.B. Colliver, T. Stephenson, Biotechnol. Adv. 18 (2000) 219.[22] F. Beline, J. Martinez, D. Chadwick, F. Guiziou, C.M. Coste, J. Agric. Eng.
Res. 73 (1999) 235.[23] K. Young, I. Yuhei, M. Motoyuki, H. Ahn Kyu, J. Biosci. Bioeng. 90 (2000)
247.[24] A. Alinsafi, N. Adouani, F. Beline, T. Lendormi, L. Limousy, O. Sire,
Process Biochem. 43 (2008) 683.[25] L. Foglar, F. Briski, Process Biochem. 39 (2003) 95.
[26] P. Elefsiniotis, D.G. Wareham, M.O. Smith, J. Biotechnol. 114 (2004) 289.[27] N. Adouani, T. Lendormi, L. Limousy, O. Sire, Resour. Conserv. Recy. 54
(2010) 299.[28] Y. Pan, B.J. Ni, P.L. Bond, L. Ye, Z. Yuan, Water Res. 47 (10) (2013) 3273.[29] W. Verstraete, S. Philips, Environ. Pollut. 102 (1998) 717.[30] J. Carrera, T. Vicent, F.J. Lafuente, Water SA 29 (1) (2003) 11–16.[31] J.M. Bremmer, Role of organic matter in volatilisation of sulphur and
nitrogen from soils, Soil organic matter studies, vol. 2, InternationalAtomic Energy Agency, Vienna, 1977, pp. 229–240.
[32] M. Sperandio, Developpement d’une procedure de compartimentationd’une eau residuaire urbaine et application a la modelisation dynami-que de procedes a boues activees, Insa, Toulouse, 1998, [PhD Thesis].
[33] P. Ginestet, J.M. Audic, V. Urbain, J.C. Block, Appl. Environ. Microbiol. 64(1998) 2266.
[34] M. Henze, C.P.L. Grady, W. Gujer, G.V.R. Marais, T. Matsuo, Activatedsludge model No. 1. Scientific and technical report no. 1, IAWPRC,London, 1987.
[35] J. Sollfrank, PhD Thesis, Frankfurt am Main, Germany, 1991.[36] M. Henze, P. Harremoes, J. La Cour Jansen, E. Arvin, Wastewater
treatment – Biological and chemical processes, 2nd edition, Spring-er-Verlag, Berlin, 1997.
[37] M. Sperandio, M. Heran, S. Gillot, Modelisation dynamique des pro-cedes biologiques de traitement des eaux, techniques de l’ingenieur,W 6 500, 2007 [18 p.].
[38] J.J. Beun, K. Dircks, M.C.M. Van Loosdrecht, J.J. Heijnen, Water Res. 36(2002) 1167.
[39] A. Carucci, D. Dionusi, M. Majone, E. Rolle, P. Smurra, Water Res. 35(2001) 3833.
[40] N. Adouani, L. Limousy, T. Lendormi, E.O. Voit, O. Sire, Int. J. Chem. Eng.Reactor (2014), http://dx.doi.org/10.1515/ijcre.2014.0050 [in press].
[41] L. Holtan-Hartwig, P. Dorsch, L.R. Bakken, Soil Biol. Biochem. 34 (2002)1797.
[42] S.H. Baek, A. Hartsock, J.P. Shapleigh, J. Bacteriol. 190 (2008) 78.[43] J. Wu, J.J.W.L. Zhang, H.J. Xie, R.R. Gu, Environ. Sci. 30 (2009) 3146.[44] X. Wang, X. Yang, Z. Zhang, X. Ye, C.M. Kao, S. Chen, J. Biosci. Bioeng. 117
(2014) 298.