Cereal grain, rachis and pulse seed amino acid δ15N values as indicators of plant nitrogen...
10
Cereal grain, rachis and pulse seed amino acid d 15 N values as indicators of plant nitrogen metabolism q Amy K. Styring a , Rebecca A. Fraser b , Amy Bogaard b , Richard P. Evershed a,⇑ a Organic Geochemistry Unit, Biogeochemistry Research Centre, School of Chemistry, University of Bristol, Bristol, UK b School of Archaeology, University of Oxford, 36 Beaumont Street, Oxford, UK article info Article history: Received 12 April 2012 Received in revised form 16 May 2013 Available online 20 June 2013 Keywords: Hordeum vulgare Triticum aestivum Vicia faba Pisum sativum Amino acids Nitrogen d 15 N values abstract Natural abundance d 15 N values of plant tissue amino acids (AAs) reflect the cycling of N into and within plants, providing an opportunity to better understand environmental and anthropogenic effects on plant metabolism. In this study, the AA d 15 N values of barley (Hordeum vulgare) and bread wheat (Triticum aes- tivum) grains and rachis and broad bean (Vicia faba) and pea (Pisum sativum) seeds, grown at the exper- imental farm stations of Rothamsted, UK and Bad Lauchstädt, Germany, were determined by GC–C–IRMS. It was found that the d 15 N values of cereal grain and rachis AAs could be largely attributed to metabolic pathways involved in their biosynthesis and catabolism. The relative 15 N-enrichment of phenylalanine can be attributed to its involvement in the phenylpropanoid pathway and glutamate has a d 15 N value which is an average of the other AAs due to its central role in AA–N cycling. The relative AA d 15 N values of broad bean and pea seeds were very different from one another, providing evidence for differences in the metabolic routing of AAs to the developing seeds in these leguminous plants. This study has shown that AA d 15 N values relate to known AA biosynthetic pathways in plants and thus have the potential to aid understanding of how various external factors, such as source of assimilated N, influence metabolic cycling of N within plants. Ó 2013 The Authors. Published by Elsevier Ltd. All rights reserved. 1. Introduction Natural abundance d 15 N values of bulk plant material reflect the net effect of a range of biochemical and environmental processes, which are difficult to disentangle from one another. These include the source of assimilated N, mycorrhizal associations, temporal and spatial variation in N availability, and changes in plant N de- mand (Robinson, 2001; Evans, 2001). Plants can be defined as N 2 -fixing (leguminous) and non N 2 -fixing. N 2 -fixing plants can ob- tain their N from the atmosphere, whereas non N 2 -fixing plants take up N from the soil. Since the d 15 N value of air is defined as 0‰,N 2 -fixing plants tend to have d 15 N values close to 0‰ (van Klinken et al., 2000). Non N 2 -fixing plants assimilate N from the soil in a variety of forms, primarily as inorganic NH 4 + or NO 3 - . The d 15 N values of non N 2 -fixing plants are generally assumed to be between 3‰ and 5‰, but studies of higher plants have shown that they can vary widely in their d 15 N values, from À8‰ to +18‰ (Kelly, 2000). Such variation can be due to a number of factors, namely: (i) the inherent variation in soil d 15 N values (Shearer et al., 1978), (ii) soil N availability (Mariotti et al., 1982; Evans, 2001), (iii) environmental factors, such as aridity (Heaton, 1987), (iv) anthropogenic addition of N to the soil through use of manure or artificial fertilisers (Choi et al., 2002), and (v) transpira- tion efficiency of net N uptake (Cernusak et al., 2009). The N absorbed by plants must be converted into a form that can be used in protein biosynthesis. The NH 3 produced in the N 2 fixation reaction in legumes is retained by N-fixing cells in the symbiotic bacteria and reacts with glutamate to form glutamine, which can be absorbed by the plant (Schulten and Schnitzer, 1998). Leguminous plants can also absorb the NH 3 directly, via their root hairs, in the form of NH 4 + ions and use the N to biosyn- thesise amino acids (AAs) and proteins. In non N 2 -fixing plants, N is generally assimilated as NO 3 À or NH 4 + , but in ecosystems which are strongly N limited, it has been found that plants can also assim- ilate organic forms of N; primarily AAs (e.g. Näsholm et al., 1998; Weigelt et al., 2005). It seems, however, that the uptake of organ- ic-N is of limited importance in agricultural situations, because plants compete poorly with microbes for AAs (Bardgett et al., 2003). NO 3 À taken up from the soil is reduced to NH 3 and this is then assimilated into glutamine by glutamine synthetase. NH 4 + is incorporated directly into glutamine, using glutamate as a sub- strate. The amide-N of glutamine is transferred to a-ketogluturate by glutamate synthase and this forms glutamate (Forde and Woodall, 1995). The amide-N in glutamine is therefore the primary 0031-9422/$ - see front matter Ó 2013 The Authors. Published by Elsevier Ltd. All rights reserved. http://dx.doi.org/10.1016/j.phytochem.2013.05.009 q This is an open-access article distributed under the terms of the Creative Commons Attribution-NonCommercial-No Derivative Works License, which permits non-commercial use, distribution, and reproduction in any medium, provided the original author and source are credited. ⇑ Corresponding author. Address: Organic Geochemistry Unit, School of Chem- istry, Cantock’s Close, University of Bristol, Bristol BS8 1TS, UK. Tel.: +44 (0) 1179 287671; fax: +44 1179 251295. E-mail address: [email protected] (R.P. Evershed). Phytochemistry 97 (2014) 20–29 Contents lists available at SciVerse ScienceDirect Phytochemistry journal homepage: www.elsevier.com/locate/phytochem
-
Upload
uni-frankfurt -
Category
Documents
-
view
1 -
download
0
Transcript of Cereal grain, rachis and pulse seed amino acid δ15N values as indicators of plant nitrogen...

Phytochemistry 97 (2014) 20–29
Contents lists available at SciVerse ScienceDirect
Phytochemistry
journal homepage: www.elsevier .com/locate /phytochem
Cereal grain, rachis and pulse seed amino acid d15N values as indicatorsof plant nitrogen metabolism q
0031-9422/$ - see front matter � 2013 The Authors. Published by Elsevier Ltd. All rights reserved.http://dx.doi.org/10.1016/j.phytochem.2013.05.009
q This is an open-access article distributed under the terms of the CreativeCommons Attribution-NonCommercial-No Derivative Works License, whichpermits non-commercial use, distribution, and reproduction in any medium,provided the original author and source are credited.⇑ Corresponding author. Address: Organic Geochemistry Unit, School of Chem-
istry, Cantock’s Close, University of Bristol, Bristol BS8 1TS, UK. Tel.: +44 (0) 1179287671; fax: +44 1179 251295.
E-mail address: [email protected] (R.P. Evershed).
Amy K. Styring a, Rebecca A. Fraser b, Amy Bogaard b, Richard P. Evershed a,⇑a Organic Geochemistry Unit, Biogeochemistry Research Centre, School of Chemistry, University of Bristol, Bristol, UKb School of Archaeology, University of Oxford, 36 Beaumont Street, Oxford, UK
a r t i c l e i n f o a b s t r a c t
Article history:Received 12 April 2012Received in revised form 16 May 2013Available online 20 June 2013
Keywords:Hordeum vulgareTriticum aestivumVicia fabaPisum sativumAmino acidsNitrogend15N values
Natural abundance d15N values of plant tissue amino acids (AAs) reflect the cycling of N into and withinplants, providing an opportunity to better understand environmental and anthropogenic effects on plantmetabolism. In this study, the AA d15N values of barley (Hordeum vulgare) and bread wheat (Triticum aes-tivum) grains and rachis and broad bean (Vicia faba) and pea (Pisum sativum) seeds, grown at the exper-imental farm stations of Rothamsted, UK and Bad Lauchstädt, Germany, were determined by GC–C–IRMS.It was found that the d15N values of cereal grain and rachis AAs could be largely attributed to metabolicpathways involved in their biosynthesis and catabolism. The relative 15N-enrichment of phenylalaninecan be attributed to its involvement in the phenylpropanoid pathway and glutamate has a d15N valuewhich is an average of the other AAs due to its central role in AA–N cycling. The relative AA d15N valuesof broad bean and pea seeds were very different from one another, providing evidence for differences inthe metabolic routing of AAs to the developing seeds in these leguminous plants. This study has shownthat AA d15N values relate to known AA biosynthetic pathways in plants and thus have the potential toaid understanding of how various external factors, such as source of assimilated N, influence metaboliccycling of N within plants.
� 2013 The Authors. Published by Elsevier Ltd. All rights reserved.
1. Introduction factors, namely: (i) the inherent variation in soil d15N values
Natural abundance d15N values of bulk plant material reflect thenet effect of a range of biochemical and environmental processes,which are difficult to disentangle from one another. These includethe source of assimilated N, mycorrhizal associations, temporaland spatial variation in N availability, and changes in plant N de-mand (Robinson, 2001; Evans, 2001). Plants can be defined asN2-fixing (leguminous) and non N2-fixing. N2-fixing plants can ob-tain their N from the atmosphere, whereas non N2-fixing plantstake up N from the soil. Since the d15N value of air is defined as0‰, N2-fixing plants tend to have d15N values close to 0‰ (vanKlinken et al., 2000). Non N2-fixing plants assimilate N from thesoil in a variety of forms, primarily as inorganic NH4
+ or NO3-.
The d15N values of non N2-fixing plants are generally assumed tobe between 3‰ and 5‰, but studies of higher plants have shownthat they can vary widely in their d15N values, from �8‰ to+18‰ (Kelly, 2000). Such variation can be due to a number of
(Shearer et al., 1978), (ii) soil N availability (Mariotti et al., 1982;Evans, 2001), (iii) environmental factors, such as aridity (Heaton,1987), (iv) anthropogenic addition of N to the soil through use ofmanure or artificial fertilisers (Choi et al., 2002), and (v) transpira-tion efficiency of net N uptake (Cernusak et al., 2009).
The N absorbed by plants must be converted into a form thatcan be used in protein biosynthesis. The NH3 produced in the N2
fixation reaction in legumes is retained by N-fixing cells in thesymbiotic bacteria and reacts with glutamate to form glutamine,which can be absorbed by the plant (Schulten and Schnitzer,1998). Leguminous plants can also absorb the NH3 directly, viatheir root hairs, in the form of NH4
+ ions and use the N to biosyn-thesise amino acids (AAs) and proteins. In non N2-fixing plants, N isgenerally assimilated as NO3
� or NH4+, but in ecosystems which
are strongly N limited, it has been found that plants can also assim-ilate organic forms of N; primarily AAs (e.g. Näsholm et al., 1998;Weigelt et al., 2005). It seems, however, that the uptake of organ-ic-N is of limited importance in agricultural situations, becauseplants compete poorly with microbes for AAs (Bardgett et al.,2003). NO3
� taken up from the soil is reduced to NH3 and this isthen assimilated into glutamine by glutamine synthetase. NH4
+ isincorporated directly into glutamine, using glutamate as a sub-strate. The amide-N of glutamine is transferred to a-ketogluturateby glutamate synthase and this forms glutamate (Forde andWoodall, 1995). The amide-N in glutamine is therefore the primary

Tabl
e1
Crop
AA
com
posi
tion
of(i
)ba
rley
grai
nsan
dra
chis
from
the
expe
rim
enta
lfar
min
gst
atio
nsof
Roth
amst
ed(R
OT)
and
Bad
Lauc
hstä
dt(B
AD
),(i
i)br
ead
whe
atgr
ains
and
rach
isfr
omRo
tham
sted
and
Bad
Lauc
hstä
dt,a
nd(i
ii)br
oad
bean
san
dpe
asfr
omBa
dLa
uchs
tädt
.
Cro
psp
ecie
sSi
teY
ear
Cro
ppa
rtM
anur
etr
eatm
ent
Cro
pam
ino
acid
con
cen
trat
ion
(mg
g�1)
Phe
Glx
Pro
Ala
Asx
Val
Leu
Gly
Ser
Tota
l
Bar
ley
RO
T19
62G
rain
Man
ure
35t/
ha
4.6
24.9
11.2
3.5
6.1
3.2
6.1
3.5
3.5
66.6
NIL
3.6
19.0
9.2
3.9
5.4
2.6
5.5
3.8
3.8
56.7
Rac
his
Man
ure
35t/
ha
1.2
4.3
2.3
2.1
3.3
1.0
1.8
1.8
1.4
19.7
NIL
0.9
2.6
1.4
1.5
2.2
1.2
1.4
1.4
1.1
14.0
BA
D20
08G
rain
Man
ure
30t/
ha
1.8
9.7
3.8
1.9
4.0
1.9
3.0
2.0
1.5
29.6
NIL
1.4
7.1
2.9
2.0
3.4
1.6
2.5
2.0
1.6
24.5
Rac
his
Man
ure
30t/
ha
0.8
3.4
1.6
1.0
1.5
0.7
1.2
0.9
0.9
12.2
NIL
0.3
1.1
0.7
0.7
1.1
0.5
0.6
0.6
0.6
6.6
Bre
adw
hea
tR
OT
1965
Gra
inM
anur
e35
t/h
a4.
936
.812
.33.
85.
53.
46.
84.
33.
080
.7N
IL4.
632
.410
.73.
25.
53.
16.
33.
73.
973
.4R
ach
isM
anur
e35
t/h
a1.
02.
61.
51.
62.
31.
21.
61.
51.
314
.9N
IL0.
80.
91.
20.
80.
70.
81.
40.
70.
47.
7B
AD
2008
Gra
inM
anur
e30
t/h
a2.
215
.34.
61.
53.
11.
13.
11.
81.
434
.2N
IL1.
913
.94.
51.
63.
01.
22.
81.
91.
732
.4R
ach
isM
anur
e30
t/h
a0.
41.
40.
70.
81.
10.
40.
70.
70.
67.
0N
IL0.
31.
10.
70.
70.
80.
20.
60.
70.
55.
9
Bro
adbe
ans
BA
D20
08Pu
lse
Man
ure
30t/
ha
5.8
26.0
6.5
6.0
17.8
5.0
10.3
6.0
7.6
91.0
NIL
6.1
27.2
6.8
5.8
23.0
4.8
10.8
6.0
7.7
98.3
Peas
BA
D20
08Pu
lse
Man
ure
30t/
ha
6.2
26.1
5.6
4.8
17.0
4.5
9.0
4.6
5.3
83.1
NIL
5.4
23.3
5.4
5.3
14.6
3.4
8.6
5.0
6.0
77.0
A.K. Styring et al. / Phytochemistry 97 (2014) 20–29 21
source of N for the amino groups of all of the other AAs found inplants, via transamination reactions between glutamate and corre-sponding a-keto acids. Any deviation observed in the d15N valuesof other AAs from the d15N value of glutamate can therefore beattributed to isotopic fractionation occurring during subsequentprimary and secondary N metabolism within the plant. Such reac-tions include reductions, amidations, transaminations, hydrolysesand lyase reactions; all of which have the potential for N kineticand/or thermodynamic isotope effects.
Individual AA d15N values in plant protein will reflect the cy-cling of N into and within plants and could thus aid understandingof environmental and anthropogenic effects on plant metabolism.Natural abundance AA d15N values have been determined previ-ously in only a handful of plants. These studies include the deter-mination of AA d15N values in: (i) roots and shoots of grasslandperennials to examine the effects of land use and fertiliser prac-tices (Bol et al., 2002; Ostle et al., 1999); (ii) whole wheat proteinhydrolysates to investigate the ecotoxicological effects of ozone ata molecular level (Hofmann et al., 1995); (iii) spinach, komatsunaand soybean leaves and roots (Yoneyama and Tanaka, 1999); (iv)mangrove leaves to understand more about ecosystem dynamicsand nutrient availability in past stands (Smallwood et al., 2003);and (v) rapeseed leaves to understand leaf metabolic fluxes(Gauthier et al., 2013). The lack of replicates in most of these studiesand the low number of plant species sampled means that they areof limited use for interpretation of plant N cycling. Nonetheless,although these studies do not provide a comprehensive set of plantAA d15N values, they do indicate the extent of variation in plant AAd15N values, which have the potential to be linked with metabolicpathways within the plant. The study by Gauthier et al. (2013)compared modelled d15N values of free AAs in leaves with mea-sured values, to explain isotopic fractionation due to the dynamicsof N metabolism. Gauthier et al. (2013) followed the metabolicmodel developed by Tcherkez (2011), which uses steady-stateequations to predict AA d15N values. The AA d15N values deter-mined in previous studies and those modelled by Tcherkez(2011) are discussed below in more detail, in relation to the resultsfrom this study.
In this study, the proteinaceous AA d15N values of barley (Hord-eum vulgare) and bread wheat (Triticum aestivum) grains and rachisand broad bean (Vicia faba) and pea (Pisum sativum) seeds, grownat the experimental farm stations of Rothamsted, UK and BadLauchstädt, Germany, were determined by gas chromatography–combustion–isotope ratio mass spectrometry (GC–C–IRMS). Eachsample represents the combined cereal grains, rachis or pulseseeds from 10 plants randomly sampled along a central transectof each farming plot (for cereals ca. 200–300 grains and for pulsesca. 30–50 seeds). Table 1 gives details of the plant tissues. Detailsof the climate and soil types of the experimental plots are givenin Fraser et al. (2011, Table 1). Determination of cereal grain, rachisand pulse AA d15N values will aid our understanding of plant N cy-cling in: (i) different crop species; (ii) in different parts of the sameplant, and (iii) will also allow comparison of N cycling within cere-als and legumes. The results obtained are interpreted in terms of aknown metabolic framework of plant protein biosynthesis.
2. Results and discussion
The d15N values of nine AAs: alanine (Ala), aspartate (Asx),glutamate (Glx), glycine (Gly), leucine (Leu), phenylalanine (Phe),proline (Pro), serine (Ser) and valine (Val), were determined byGC–C–IRMS. These AAs account for 65% of the total AA–N in hulledbarley grains (H. vulgare), 67% of the total AA–N in whole breadwheat grain (Triticum spp.), 53% of the total AA–N in broad beans(V. faba) and 51% of the total AA–N in peas (P. sativum; calculatedfrom data from the FAO; see Table 1 for AA concentrations). During

Tabl
e2
Crop
AA
d15N
valu
esfo
r:(i
)ba
rley
grai
nsan
dra
chis
from
the
expe
rim
enta
lfar
min
gst
atio
nsof
Roth
amst
edan
dBa
dLa
uchs
tädt
,(ii)
brea
dw
heat
grai
nsan
dra
chis
from
Roth
amst
edan
dBa
dLa
uchs
tädt
,and
(iii)
broa
dbe
ans
and
peas
from
Bad
Lauc
hstä
dt.N
umbe
rsin
brac
kets
are
the
stan
dard
devi
atio
nsas
soci
ated
wit
htr
iplic
ate
isot
ope
dete
rmin
atio
ns.
Cro
psp
ecie
sSi
teY
ear
Cro
ppa
rtM
anu
retr
eatm
ent
Cro
pam
ino
acid
d15N
valu
es(‰
)
Phe
Glx
Pro
Ala
Asx
Val
Leu
Gly
Ser
Bu
lk
Bar
ley
RO
T19
62G
rain
Man
ure
35t/
ha
16.7
(0.3
)10
.1(0
.1)
11.4
(0.2
)9.
6(0
.2)
10.9
(0.2
)9.
4(0
.8)
6.8
(0.4
)8.
4(0
.3)
6.2
(0.2
)9.
19N
IL10
.7(0
.5)
3.6
(0.2
)4.
9(0
.1)
3.2
(0.6
)4.
4(0
.3)
3.9
(0.5
)0.
7(0
.4)
0.7
(0.6
)�
1.1
(0.2
)1.
64R
ach
isM
anu
re35
t/h
a14
.3(0
.7)
5.6
(0.0
)7.
6(0
.1)
6.0
(0.4
)6.
8(0
.1)
6.0
(0.4
)3.
7(0
.2)
5.1
(0.3
)2.
7(0
.1)
4.32
NIL
10.6
(0.4
)1.
3(0
.1)
3.4
(0.1
)1.
6(0
.2)
2.8
(0.1
)2.
6(0
.3)
�0.
7(0
.2)
0.3
(0.1
)�
1.5
(0.1
)�
0.26
BA
D20
08G
rain
Man
ure
30t/
ha
14.6
(0.2
)7.
5(0
.1)
9.1
(0.3
)8.
2(0
.2)
9.0
(0.2
)7.
9(0
.3)
5.3
(0.6
)5.
5(0
.4)
3.7
(0.3
)7.
32N
IL10
.6(0
.4)
1.3
(0.1
)3.
4(0
.1)
1.6
(0.2
)2.
8(0
.1)
2.6
(0.3
)�
0.7
(0.2
)0.
3(0
.1)
�1.
5(0
.1)
�0.
26R
ach
isM
anu
re30
t/h
a14
.6(0
.2)
5.8
(0.1
)7.
9(0
.4)
4.3
(0.3
)6.
9(0
.2)
6.0
(0.3
)2.
7(0
.4)
2.3
(0.4
)0.
3(0
.7)
3.08
NIL
11.8
(0.8
)�
0.3
(0.3
)3.
8(0
.2)
�2.
1(0
.4)
0.6
(0.1
)3.
7(0
.0)
�3.
1(0
.3)
�6.
6(0
.4)
�6.
0(0
.4)
�1.
80
Bre
adw
hea
tR
OT
1965
Gra
inM
anu
re35
t/h
a14
.6(0
.2)
7.5
(0.1
)9.
1(0
.3)
8.2
(0.2
)9.
0(0
.2)
7.9
(0.3
)5.
3(0
.6)
5.5
(0.4
)3.
7(0
.3)
7.36
NIL
7.3
(0.4
)0.
5(0
.2)
2.2
(0.2
)0.
8(0
.4)
2.4
(0.4
)2.
2(0
.3)
�2.
1(0
.2)
�2.
7(0
.2)
�3.
0(0
.2)
0.74
Rac
his
Man
ure
35t/
ha
15.7
(1.5
)9.
1(0
.9)
10.6
(0.5
)7.
4(0
.2)
9.2
(0.2
)8.
8(0
.1)
5.9
(0.4
)3.
4(0
.2)
2.1
(0.2
)5.
30N
IL10
.4(0
.9)
2.4
(1.4
)4.
9(0
.4)
3.1
(0.2
)3.
5(0
.9)
4.3
(0.3
)0.
1(0
.7)
�1.
0(0
.2)
�3.
6(1
.2)
�2.
50B
AD
2008
Gra
inM
anu
re30
t/h
a12
.8(0
.8)
4.0
(0.1
)6.
7(0
.3)
5.8
(0.2
)5.
4(0
.4)
6.1
(0.2
)3.
0(0
.4)
3.6
(0.7
)2.
9(0
.3)
4.91
NIL
10.3
(0.4
)1.
0(0
.2)
3.9
(0.2
)2.
7(0
.3)
2.5
(0.1
)3.
0(0
.2)
�0.
3(0
.1)
0.7
(0.2
)�
0.7
(0.5
)1.
87R
ach
isM
anu
re30
t/h
a13
.7(0
.2)
7.0
(0.2
)9.
0(0
.2)
8.2
(0.2
)5.
6(0
.2)
7.4
(0.4
)7.
2(0
.1)
5.0
(0.6
)2.
8(0
.2)
3.01
NIL
11.9
(0.6
)3.
3(0
.4)
6.1
(0.2
)5.
2(0
.6)
1.7
(0.2
)3.
6(0
.1)
5.0
(0.2
)1.
2(0
.4)
�1.
0(0
.3)
0.01
Bro
adbe
ans
BA
D20
08Pu
lse
Man
ure
30t/
ha
2.1
(0.3
)0.
9(0
.2)
4.3
(0.1
)�
0.9
(0.3
)2.
4(0
.1)
0.3
(0.2
)�
2.4
(0.2
)2.
2(0
.2)
�2.
5(0
.0)
�0.
02N
IL1.
3(0
.8)
1.2
(0.5
)3.
1(0
.4)
0.1
(0.5
)1.
9(0
.5)
�0.
1(0
.4)
�4.
4(0
.1)
1.7
(0.1
)�
2.8
(0.5
)�
0.7
Peas
BA
D20
08Pu
lse
Man
ure
30t/
ha
�0.
5(0
.7)
0.7
(0.3
)3.
6(0
.3)
�0.
4(0
.3)
1.0
(0.1
)0.
4(0
.7)
�4.
8(0
.6)
6.5
(0.6
)0.
5(0
.4)
0.84
NIL
0.3
(0.4
)0.
9(0
.3)
3.8
(0.1
)0.
2(0
.2)
2.3
(0.2
)0.
6(0
.5)
�2.
8(0
.1)
7.3
(0.2
)0.
8(0
.4)
0.03
22 A.K. Styring et al. / Phytochemistry 97 (2014) 20–29
hydrolysis, asparagine (Asn) and glutamine (Gln) are deamidatedto form aspartate (Asp) and glutamate (Glu), respectively (Hill,1965). This deamidation proceeds quantitatively and thereforethe d15N value of Asx represents the amino-N of both Asp andAsn and the d15N value of Glx represent the amino-N of Glu and Gln.
In the following graphs, AA d15N values are normalised to Glx,to negate any differences in AA d15N values due to a difference inbulk plant tissue d15N value. The AAs are grouped according tometabolic relationships (explained in more detail below), in orderof decreasing d15N value. Phe has a distinct metabolic pathwayfrom the other AAs; Glx and Pro are closely related since the ami-no group of Pro comes from Glu; the amino group of Ala can comefrom Glu and also from c-aminobutyric acid; the N from Asx isexchanged with many AAs, including Glu and Ala; Val and Leuare both branched-chain AAs; and Gly and Ser are both involvedin photorespiration and can be biosynthesised from one another.The determined AA d15N values are summarised in Table 2.
2.1. Cereal grain amino acid d15N values
Fig. 1 shows the d15N values of barley and bread wheat grainAAs, normalised to Glx, from experimental farming plots atRothamsted and Bad Lauchstädt. The d15N values of Phe(+8.0 ± 1.2‰), Pro (+2.0 ± 0.6‰) and Asx (+1.3 ± 0.4‰) are higherthan the d15NGlx value, whereas the d15N values of Leu(�2.2 ± 0.8‰), Gly (�1.5 ± 1.1‰) and Ser (�3.1 ± 1.2‰) are lower.Ala and Val have d15N values similar to that of d15NGlx
(within ± 1.3‰).In cereals, most of the N stored in the grain comes from the
senescing leaves, either derived from: (i) the proteolysis of leafproteins, such as Rubisco (which contributes up to 50% of the to-tal leaf protein and 30% of total leaf N), or (ii) the incorporation offoliar NH4
+ into the amide group of Gln, using Glu as a substrate(John, 1992). N from AAs is transaminated onto Glu, which thenprovides the amide-N of Asn, since Asn is synthesised from Glnby asparagine synthetase. Thus, N arriving in the seeds in thephloem is predominantly in the form of Gln and Asn, however,the contribution of other imported AA to the total grain AA poolis difficult to quantify (Miflin and Lea, 1977). In the developingseed, the amide-N of Gln and Asn is released for incorporationinto other AAs, generally through a transamination reaction viaGlu (Pate, 1980). It can be assumed that the d15N value of the Nsource (in the case of in situ biosynthesis, the amide-N of Gln orAsn) and any isotopic fractionation associated with the biosyn-thetic pathway will determine the d15N value of the newly bio-synthesised AAs in cereal grains.
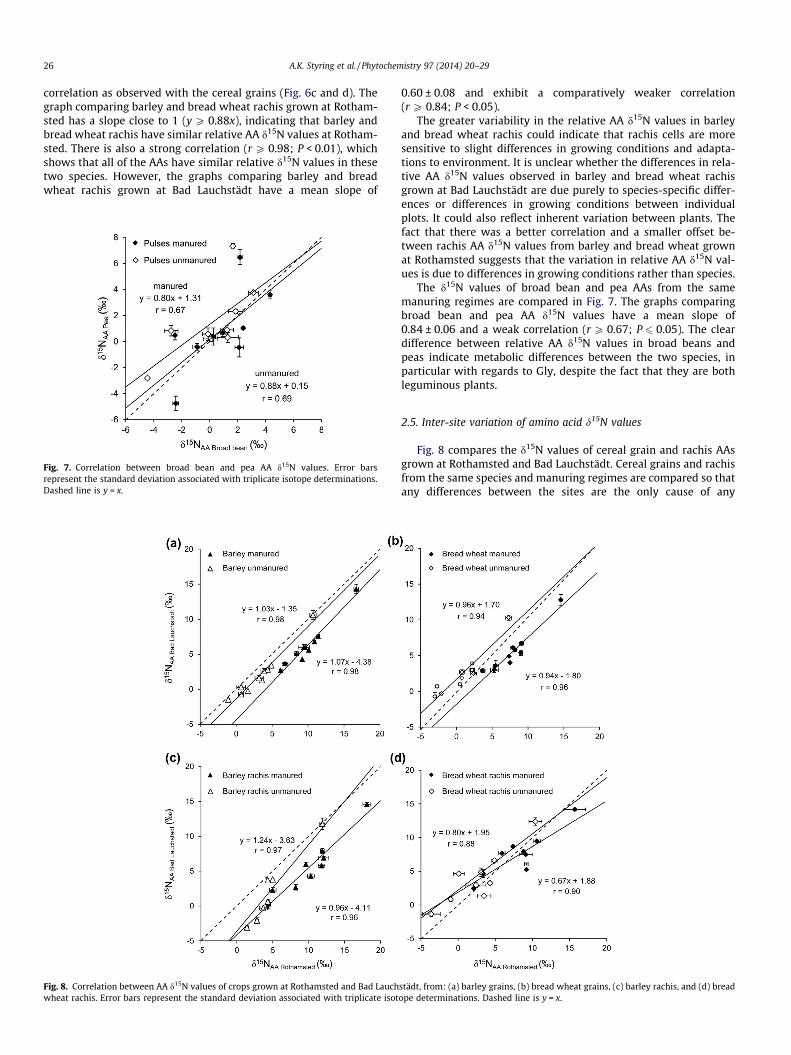
Fig. 2 relates determined grain AA d15N values to known path-ways of AA metabolism in cereal grains. Greater understanding ofenzyme N fractionation and catabolic pathways is needed in or-der to fully explain the relative AA d15N values expressed indeveloping cereal grains, but the main differences can be ration-alised based on known biosynthetic and metabolic pathways.
The significant role of Phe in the phenylpropanoid pathway,involved in the synthesis of a wide range of phenolic compounds(including lignin), can explain the relative 15N-enrichment of Phecompared to the other AAs in cereal grains. The enzyme PAL,which catalyses the deamination of Phe in the first step of thisphenylpropanoid pathway, is a branch-point enzyme and there-fore the kinetic isotope effect associated with this deamination(Hermes et al., 1985) is likely to be expressed, leaving the residualPhe relatively enriched in 15N. Such a significant 15N-enrichment(average +8.0‰), compared to the d15N value of Glx in cereal grainprotein, indicates the importance of the phenylpropanoid path-way in the biosynthesis of plant tissue (c.f. Cantón et al., 2005).Similarly high d15N values of Phe compared to other AAs havebeen observed by Hofmann et al. (1995) in whole wheat protein
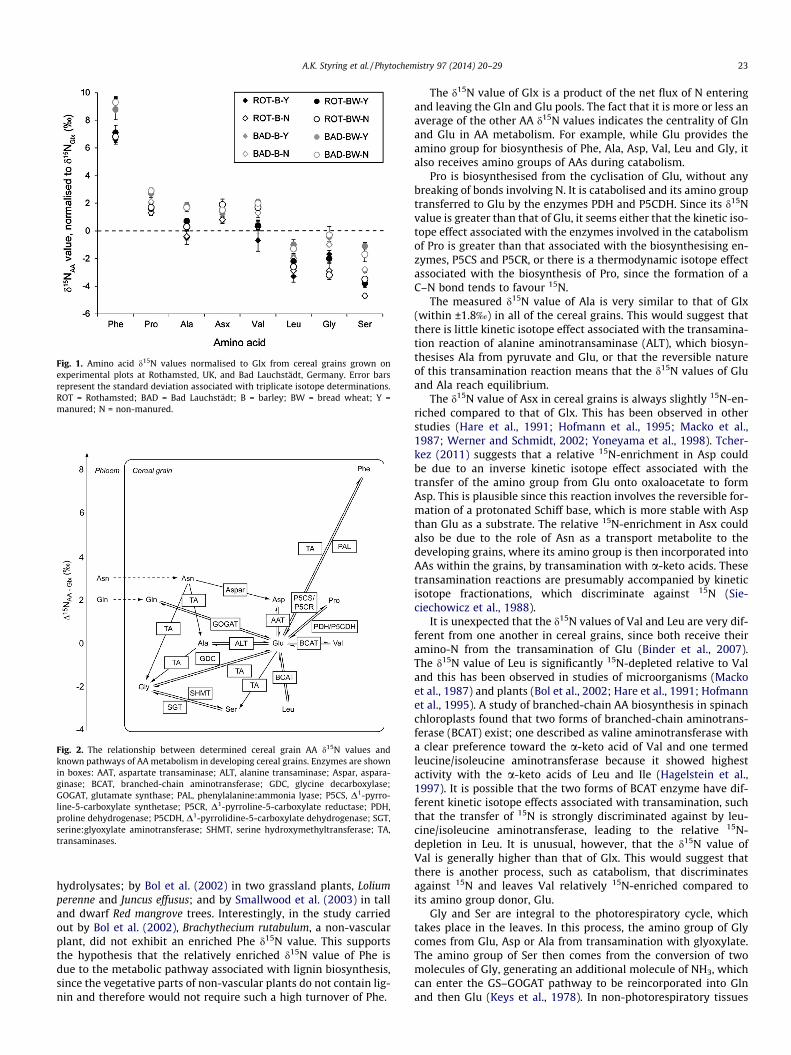
Fig. 1. Amino acid d15N values normalised to Glx from cereal grains grown onexperimental plots at Rothamsted, UK, and Bad Lauchstädt, Germany. Error barsrepresent the standard deviation associated with triplicate isotope determinations.ROT = Rothamsted; BAD = Bad Lauchstädt; B = barley; BW = bread wheat; Y =manured; N = non-manured.
Fig. 2. The relationship between determined cereal grain AA d15N values andknown pathways of AA metabolism in developing cereal grains. Enzymes are shownin boxes: AAT, aspartate transaminase; ALT, alanine transaminase; Aspar, aspara-ginase; BCAT, branched-chain aminotransferase; GDC, glycine decarboxylase;GOGAT, glutamate synthase; PAL, phenylalanine:ammonia lyase; P5CS, D1-pyrro-line-5-carboxylate synthetase; P5CR, D1-pyrroline-5-carboxylate reductase; PDH,proline dehydrogenase; P5CDH, D1-pyrrolidine-5-carboxylate dehydrogenase; SGT,serine:glyoxylate aminotransferase; SHMT, serine hydroxymethyltransferase; TA,transaminases.
A.K. Styring et al. / Phytochemistry 97 (2014) 20–29 23
hydrolysates; by Bol et al. (2002) in two grassland plants, Loliumperenne and Juncus effusus; and by Smallwood et al. (2003) in talland dwarf Red mangrove trees. Interestingly, in the study carriedout by Bol et al. (2002), Brachythecium rutabulum, a non-vascularplant, did not exhibit an enriched Phe d15N value. This supportsthe hypothesis that the relatively enriched d15N value of Phe isdue to the metabolic pathway associated with lignin biosynthesis,since the vegetative parts of non-vascular plants do not contain lig-nin and therefore would not require such a high turnover of Phe.
The d15N value of Glx is a product of the net flux of N enteringand leaving the Gln and Glu pools. The fact that it is more or less anaverage of the other AA d15N values indicates the centrality of Glnand Glu in AA metabolism. For example, while Glu provides theamino group for biosynthesis of Phe, Ala, Asp, Val, Leu and Gly, italso receives amino groups of AAs during catabolism.
Pro is biosynthesised from the cyclisation of Glu, without anybreaking of bonds involving N. It is catabolised and its amino grouptransferred to Glu by the enzymes PDH and P5CDH. Since its d15Nvalue is greater than that of Glu, it seems either that the kinetic iso-tope effect associated with the enzymes involved in the catabolismof Pro is greater than that associated with the biosynthesising en-zymes, P5CS and P5CR, or there is a thermodynamic isotope effectassociated with the biosynthesis of Pro, since the formation of aC–N bond tends to favour 15N.
The measured d15N value of Ala is very similar to that of Glx(within ±1.8‰) in all of the cereal grains. This would suggest thatthere is little kinetic isotope effect associated with the transamina-tion reaction of alanine aminotransaminase (ALT), which biosyn-thesises Ala from pyruvate and Glu, or that the reversible natureof this transamination reaction means that the d15N values of Gluand Ala reach equilibrium.
The d15N value of Asx in cereal grains is always slightly 15N-en-riched compared to that of Glx. This has been observed in otherstudies (Hare et al., 1991; Hofmann et al., 1995; Macko et al.,1987; Werner and Schmidt, 2002; Yoneyama et al., 1998). Tcher-kez (2011) suggests that a relative 15N-enrichment in Asp couldbe due to an inverse kinetic isotope effect associated with thetransfer of the amino group from Glu onto oxaloacetate to formAsp. This is plausible since this reaction involves the reversible for-mation of a protonated Schiff base, which is more stable with Aspthan Glu as a substrate. The relative 15N-enrichment in Asx couldalso be due to the role of Asn as a transport metabolite to thedeveloping grains, where its amino group is then incorporated intoAAs within the grains, by transamination with a-keto acids. Thesetransamination reactions are presumably accompanied by kineticisotope fractionations, which discriminate against 15N (Sie-ciechowicz et al., 1988).
It is unexpected that the d15N values of Val and Leu are very dif-ferent from one another in cereal grains, since both receive theiramino-N from the transamination of Glu (Binder et al., 2007).The d15N value of Leu is significantly 15N-depleted relative to Valand this has been observed in studies of microorganisms (Mackoet al., 1987) and plants (Bol et al., 2002; Hare et al., 1991; Hofmannet al., 1995). A study of branched-chain AA biosynthesis in spinachchloroplasts found that two forms of branched-chain aminotrans-ferase (BCAT) exist; one described as valine aminotransferase witha clear preference toward the a-keto acid of Val and one termedleucine/isoleucine aminotransferase because it showed highestactivity with the a-keto acids of Leu and Ile (Hagelstein et al.,1997). It is possible that the two forms of BCAT enzyme have dif-ferent kinetic isotope effects associated with transamination, suchthat the transfer of 15N is strongly discriminated against by leu-cine/isoleucine aminotransferase, leading to the relative 15N-depletion in Leu. It is unusual, however, that the d15N value ofVal is generally higher than that of Glx. This would suggest thatthere is another process, such as catabolism, that discriminatesagainst 15N and leaves Val relatively 15N-enriched compared toits amino group donor, Glu.
Gly and Ser are integral to the photorespiratory cycle, whichtakes place in the leaves. In this process, the amino group of Glycomes from Glu, Asp or Ala from transamination with glyoxylate.The amino group of Ser then comes from the conversion of twomolecules of Gly, generating an additional molecule of NH3, whichcan enter the GS–GOGAT pathway to be reincorporated into Glnand then Glu (Keys et al., 1978). In non-photorespiratory tissues

24 A.K. Styring et al. / Phytochemistry 97 (2014) 20–29
(i.e. in situ synthesis in the grains), Gly is formed from Ser by theaction of the enzyme SHMT. Ser is formed via the phosphorylationpathway, via transamination of 3-phosphohydroxypyruvate withGlu to form 3-phosphoserine, which is then converted into Ser (Ire-land and Hiltz, 1995). The 15N-depletion in Gly and Ser relative tothe d15N value of Glx could be due either to: (i) 15N-depletion inGly formed during photorespiration and then imported into thegrains, or (ii) a kinetic isotope effect associated with the in situ syn-thesis of Ser in the grains, involving transamination of Glu. Thed15N value of Ser is always lower than that of Gly, which couldbe due to a thermodynamic isotope effect associated with thereversible reaction converting Ser to Gly. All other studies whichhave determined the AA d15N values of primary producers (algaeand terrestrial plants) found that the d15N values of Gly and Serwere also 15N-depleted relative to Glx (Bol et al., 2002; Chikaraishiet al., 2007; Gauthier et al., 2013; Hare et al., 1991; Hofmann et al.,1995; McClelland and Montoya, 2002; Ostle et al., 1999;Smallwood et al., 2003).
Fig. 4. The relationship between determined cereal rachis AA d15N values andknown pathways of AA metabolism in whole cereal plants. Variation in AA d15Nvalues is indicated by grey bars. Enzymes are shown in boxes: AAT, aspartatetransaminase; ALT, alanine transaminase; AS, asparagine synthetase; Aspar, aspar-aginase; BCAT, branched-chain aminotransferase; GDC, glycine decarboxylase;GOGAT, glutamate synthase; GS, glutamine synthetase; PAL, phenylalanine:ammo-nia lyase; P5CS, D1-pyrroline-5-carboxylate synthetase; P5CR, D1-pyrroline-5-carboxylate reductase; PDH proline dehydrogenase; P5CDH, D1-pyrrolidine-5-carboxylate dehydrogenase; SGT, serine:glyoxylate aminotransferase; SHMT, serinehydroxymethyltransferase; TA, transaminases.
2.2. Cereal rachis amino acid d15N values
Fig. 3 shows the d15N values of cereal rachis AAs, normalised toGlx, from experimental farming plots at Rothamsted and Bad Lau-chstädt. The d15N values of Phe (+8.2 ± 1.9‰) and Pro(+2.1 ± 1.2‰), are higher than the d15NGlx value. The d15N valuesof Leu (�1.9 ± 1.9‰), Gly (�4.5 ± 2.0‰) and Ser (�5.9 ± 1.2‰) arelower. Ala, Asx and Val have d15N values within ±0.6‰ of the d15-
NGlx value. The variation in relative AA d15N values of cereal rachisis much greater than that of cereal grains.
Fig. 4 relates determined rachis AA d15N values to known path-ways of AA metabolism in whole cereal plants. This indicates thesimilarity in AA biosynthetic relationships between whole plantsand developing cereal grains (see Fig. 2). The relative AA d15N val-ues in cereal rachis vary considerably more than those in cerealgrains. This could reflect the greater potential for input of pre-bio-synthesised AAs with different d15N values to the rachis cells,whereas in developing grains, Gln and Asn are the main sourceof imported N, which is then used to feed the biosynthesis of otherAAs. The d15N value of Phe in cereal rachis is on average+1.4 ± 0.8‰ greater than that of the Phe in its corresponding cerealgrains. This 15N-enrichment could indicate the greater significance
Fig. 3. Amino acid d15N values normalised to Glx from cereal rachis grown onexperimental plots at Rothamsted, UK, and Bad Lauchstädt, Germany. Error barsrepresent the standard deviation associated with triplicate isotope determinations.Br = barley rachis; BWr = bread wheat rachis.
of the phenylpropanoid pathway in the metabolism of Phe in rachiscells compared to cereal grains, since rachis is comprised of cellsthat fulfill a predominantly structural role and are therefore likelyto be highly lignified. Thus, it is expected that rachis cells willexperience a high turnover of Phe as a substrate in the phenylprop-anoid pathway, which leads to the formation of lignin.
2.3. Pulse amino acid d15N values
Fig. 5 shows the d15N values of AAs, normalised to Glx, frombroad beans and peas grown on plots at Bad Lauchstädt. In broadbeans, the d15N values of Pro (+2.6 ± 1.1‰) and Asx (+1.0 ± 0.6‰)are higher than the d15NGlx value, whereas the d15N values of Ala(�1.5 ± 0.5‰), Leu (�4.5 ± 1.6‰) and Ser (�3.7 ± 0.4‰) are lower.The d15N values of Phe, Val and Gly are within ±1.4‰ of the d15NGlx
value. In peas, the d15N values of Pro (+2.9 ± 0.0‰) and Gly(+6.1 ± 0.4‰) are higher than the d15NGlx value, whereas the d15Nvalue of Leu (�4.6 ± 1.2‰) is lower. The d15N values of the otherAAs, Phe, Ala, Asx, Val and Ser, are within ±1.4‰ of the d15NGlx va-lue. The most striking difference between the AA d15N values ofbroad beans and peas is the higher d15N value of Gly observed inpeas.
N remobilised from senescing leaves is also the main contribu-tor to legume seed (pulse) N (Murray and Cordova-Edwards, 1984).In legumes, Asn is the major form of translocated N (Miflin and Lea,1977). N also reaches the seeds in the form of ureides: allantoinand allantoic acid (Peoples et al., 1985). These nitrogenous com-pounds enter the seed coat and are transformed, since Ala andGln are the principal nitrogenous solutes released by the emptyseed coats of pea and broad bean (Wolswinkel and De Ruiter,

Fig. 5. Amino acid d15N values normalised to Glx of broad beans and peas grown onexperimental plots at Bad Lauchstädt, Germany. Error bars represent the standarddeviation associated with triplicate isotope determinations.
A.K. Styring et al. / Phytochemistry 97 (2014) 20–29 25
1985). The enzyme asparaginase has been found at high concentra-tions in the seed coats of peas (Murray and Kennedy, 1980), sug-gesting Asn that reaches the seed coats is converted to Ala andGln. The relative 15N-enrichment of Asx compared to the majorityof the other AAs in pulses would indicate that deamidation of Asnand transamination of Asp, with associated kinetic isotope effectsdiscriminating against 15N, play a significant role in the biosynthe-sis of the other AAs in pulses. Pro in broad beans and Pro and Gly inpeas are the only AAs 15N-enriched compared to Asx. This is of
Fig. 6. Correlation between barley and bread wheat AA d15N values from: (a) RothamsteLauchstädt rachis. Error bars represent the standard deviation associated with triplicate
note, since Pro is not detected in pea or broad bean seed coat exu-date, which means it needs to be biosynthesised in situ in the seeds(Wolswinkel and De Ruiter, 1985). Gly is not detected in the seedcoat exudate of broad bean, but is in peas. The difference betweenthe relative d15N values of Gly in peas and broad beans could bedue to differences in the proportion of its in situ biosynthesis. Withthe lack of comparable studies citing pulse AA d15N values, it isvery difficult to explain the observed AA d15N values.
2.4. Effect of species on amino acid d15N values
Fig. 6 compares the d15N values of barley and bread wheat grain,barley and bread wheat rachis and broad bean and pea AAs fromthe same manuring regimes and the same sites. This allows identi-fication of species-specific differences, eliminating other possiblecauses of variation. The slope is close to 1 (y P 0.94x) for all ofthe barley–bread wheat grain pairs, indicating that barley andbread wheat grains have similar relative AA d15N values. There isexcellent correlation (r P 0.98; P < 0.01) between barley and breadwheat grain AA d15N values from the same sites and manuringregimes.
The similarity in the relative AA d15N values of bread wheat andbarley grains (Fig. 6a and b), indicating their similarity in N routing,is expected since both are cereals and would be anticipated to havesimilar metabolic pathways and uptake mechanisms. These speciesare closely related – both belonging to the tribe Triticeae – and bar-ley is considered a good genomic model for bread wheat (Schulteet al., 2009). Barley and bread wheat can therefore be expectedto have the same enzymes and similar isotopic fractionations asso-ciated with their AA metabolism in grains.
The d15N values of barley and bread wheat rachis AAs from thesame manuring regimes and the same sites do not show as strong a
d cereal grains, (b) Bad Lauchstädt cereal grains, (c) Rothamsted rachis, and (d) Badisotope determinations. Dashed line is y = x.
26 A.K. Styring et al. / Phytochemistry 97 (2014) 20–29
correlation as observed with the cereal grains (Fig. 6c and d). Thegraph comparing barley and bread wheat rachis grown at Rotham-sted has a slope close to 1 (y P 0.88x), indicating that barley andbread wheat rachis have similar relative AA d15N values at Rotham-sted. There is also a strong correlation (r P 0.98; P < 0.01), whichshows that all of the AAs have similar relative d15N values in thesetwo species. However, the graphs comparing barley and breadwheat rachis grown at Bad Lauchstädt have a mean slope of
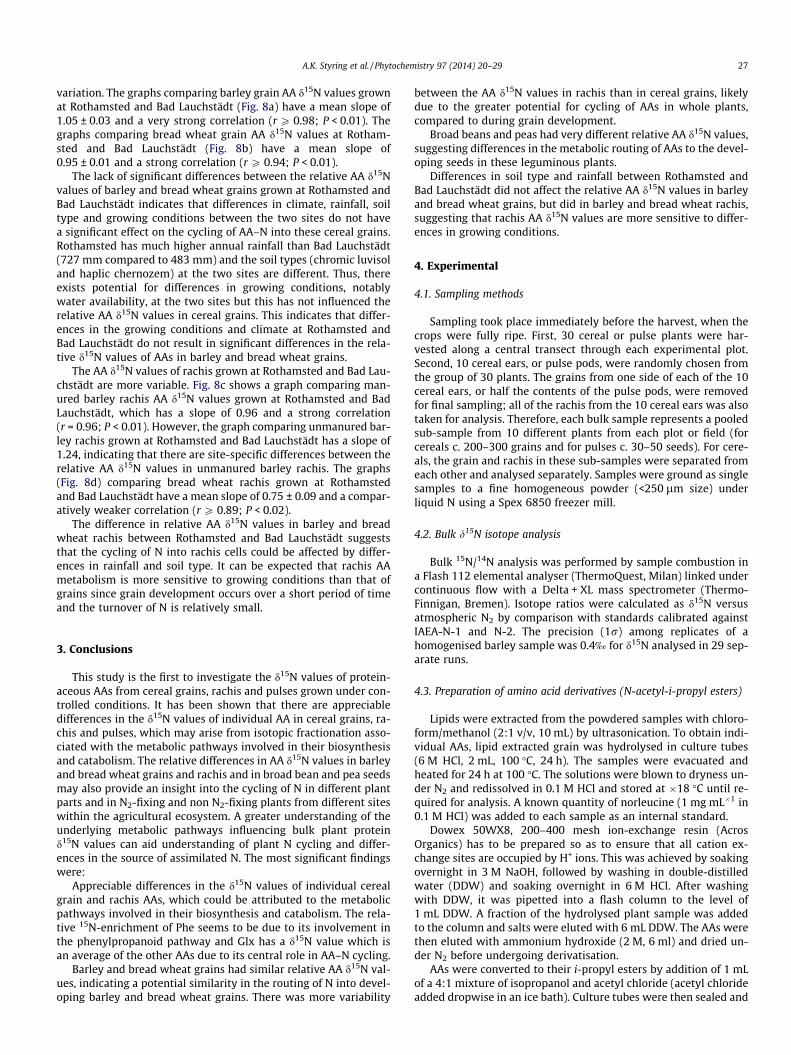
Fig. 7. Correlation between broad bean and pea AA d15N values. Error barsrepresent the standard deviation associated with triplicate isotope determinations.Dashed line is y = x.
Fig. 8. Correlation between AA d15N values of crops grown at Rothamsted and Bad Lauchwheat rachis. Error bars represent the standard deviation associated with triplicate isot
0.60 ± 0.08 and exhibit a comparatively weaker correlation(r P 0.84; P < 0.05).
The greater variability in the relative AA d15N values in barleyand bread wheat rachis could indicate that rachis cells are moresensitive to slight differences in growing conditions and adapta-tions to environment. It is unclear whether the differences in rela-tive AA d15N values observed in barley and bread wheat rachisgrown at Bad Lauchstädt are due purely to species-specific differ-ences or differences in growing conditions between individualplots. It could also reflect inherent variation between plants. Thefact that there was a better correlation and a smaller offset be-tween rachis AA d15N values from barley and bread wheat grownat Rothamsted suggests that the variation in relative AA d15N val-ues is due to differences in growing conditions rather than species.
The d15N values of broad bean and pea AAs from the samemanuring regimes are compared in Fig. 7. The graphs comparingbroad bean and pea AA d15N values have a mean slope of0.84 ± 0.06 and a weak correlation (r P 0.67; P 6 0.05). The cleardifference between relative AA d15N values in broad beans andpeas indicate metabolic differences between the two species, inparticular with regards to Gly, despite the fact that they are bothleguminous plants.
2.5. Inter-site variation of amino acid d15N values
Fig. 8 compares the d15N values of cereal grain and rachis AAsgrown at Rothamsted and Bad Lauchstädt. Cereal grains and rachisfrom the same species and manuring regimes are compared so thatany differences between the sites are the only cause of any
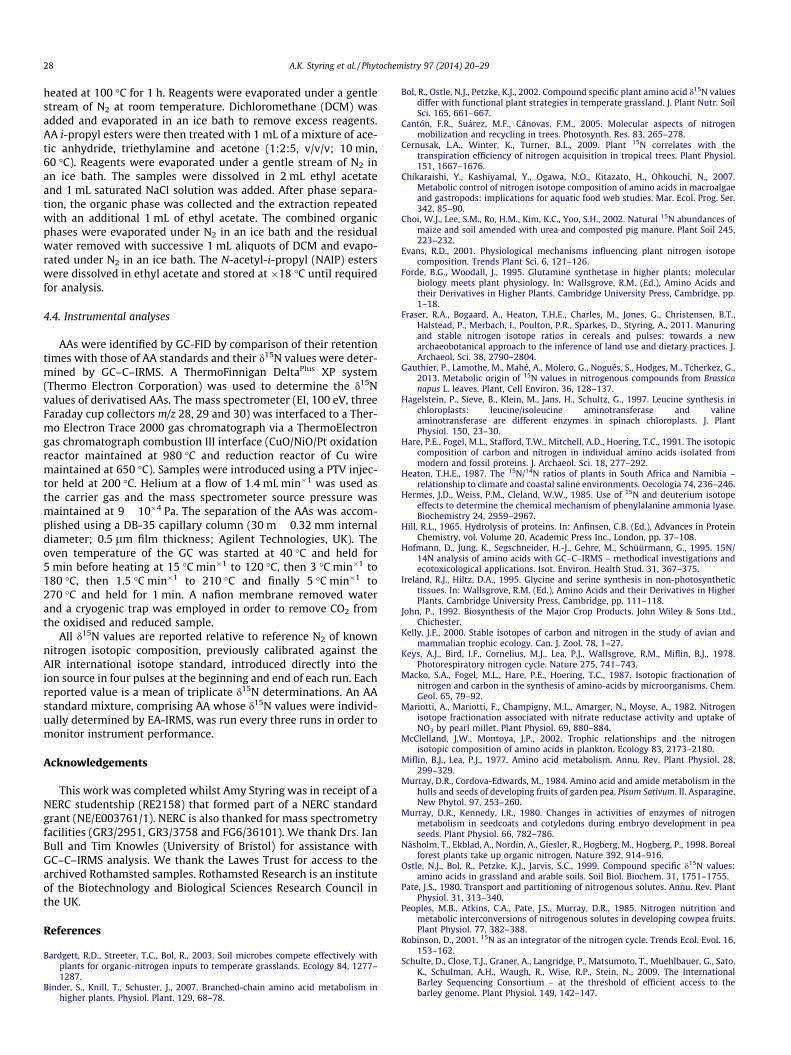
städt, from: (a) barley grains, (b) bread wheat grains, (c) barley rachis, and (d) breadope determinations. Dashed line is y = x.
A.K. Styring et al. / Phytochemistry 97 (2014) 20–29 27
variation. The graphs comparing barley grain AA d15N values grownat Rothamsted and Bad Lauchstädt (Fig. 8a) have a mean slope of1.05 ± 0.03 and a very strong correlation (r P 0.98; P < 0.01). Thegraphs comparing bread wheat grain AA d15N values at Rotham-sted and Bad Lauchstädt (Fig. 8b) have a mean slope of0.95 ± 0.01 and a strong correlation (r P 0.94; P < 0.01).
The lack of significant differences between the relative AA d15Nvalues of barley and bread wheat grains grown at Rothamsted andBad Lauchstädt indicates that differences in climate, rainfall, soiltype and growing conditions between the two sites do not havea significant effect on the cycling of AA–N into these cereal grains.Rothamsted has much higher annual rainfall than Bad Lauchstädt(727 mm compared to 483 mm) and the soil types (chromic luvisoland haplic chernozem) at the two sites are different. Thus, thereexists potential for differences in growing conditions, notablywater availability, at the two sites but this has not influenced therelative AA d15N values in cereal grains. This indicates that differ-ences in the growing conditions and climate at Rothamsted andBad Lauchstädt do not result in significant differences in the rela-tive d15N values of AAs in barley and bread wheat grains.
The AA d15N values of rachis grown at Rothamsted and Bad Lau-chstädt are more variable. Fig. 8c shows a graph comparing man-ured barley rachis AA d15N values grown at Rothamsted and BadLauchstädt, which has a slope of 0.96 and a strong correlation(r = 0.96; P < 0.01). However, the graph comparing unmanured bar-ley rachis grown at Rothamsted and Bad Lauchstädt has a slope of1.24, indicating that there are site-specific differences between therelative AA d15N values in unmanured barley rachis. The graphs(Fig. 8d) comparing bread wheat rachis grown at Rothamstedand Bad Lauchstädt have a mean slope of 0.75 ± 0.09 and a compar-atively weaker correlation (r P 0.89; P < 0.02).
The difference in relative AA d15N values in barley and breadwheat rachis between Rothamsted and Bad Lauchstädt suggeststhat the cycling of N into rachis cells could be affected by differ-ences in rainfall and soil type. It can be expected that rachis AAmetabolism is more sensitive to growing conditions than that ofgrains since grain development occurs over a short period of timeand the turnover of N is relatively small.
3. Conclusions
This study is the first to investigate the d15N values of protein-aceous AAs from cereal grains, rachis and pulses grown under con-trolled conditions. It has been shown that there are appreciabledifferences in the d15N values of individual AA in cereal grains, ra-chis and pulses, which may arise from isotopic fractionation asso-ciated with the metabolic pathways involved in their biosynthesisand catabolism. The relative differences in AA d15N values in barleyand bread wheat grains and rachis and in broad bean and pea seedsmay also provide an insight into the cycling of N in different plantparts and in N2-fixing and non N2-fixing plants from different siteswithin the agricultural ecosystem. A greater understanding of theunderlying metabolic pathways influencing bulk plant proteind15N values can aid understanding of plant N cycling and differ-ences in the source of assimilated N. The most significant findingswere:
Appreciable differences in the d15N values of individual cerealgrain and rachis AAs, which could be attributed to the metabolicpathways involved in their biosynthesis and catabolism. The rela-tive 15N-enrichment of Phe seems to be due to its involvement inthe phenylpropanoid pathway and Glx has a d15N value which isan average of the other AAs due to its central role in AA–N cycling.
Barley and bread wheat grains had similar relative AA d15N val-ues, indicating a potential similarity in the routing of N into devel-oping barley and bread wheat grains. There was more variability
between the AA d15N values in rachis than in cereal grains, likelydue to the greater potential for cycling of AAs in whole plants,compared to during grain development.
Broad beans and peas had very different relative AA d15N values,suggesting differences in the metabolic routing of AAs to the devel-oping seeds in these leguminous plants.
Differences in soil type and rainfall between Rothamsted andBad Lauchstädt did not affect the relative AA d15N values in barleyand bread wheat grains, but did in barley and bread wheat rachis,suggesting that rachis AA d15N values are more sensitive to differ-ences in growing conditions.
4. Experimental
4.1. Sampling methods
Sampling took place immediately before the harvest, when thecrops were fully ripe. First, 30 cereal or pulse plants were har-vested along a central transect through each experimental plot.Second, 10 cereal ears, or pulse pods, were randomly chosen fromthe group of 30 plants. The grains from one side of each of the 10cereal ears, or half the contents of the pulse pods, were removedfor final sampling; all of the rachis from the 10 cereal ears was alsotaken for analysis. Therefore, each bulk sample represents a pooledsub-sample from 10 different plants from each plot or field (forcereals c. 200–300 grains and for pulses c. 30–50 seeds). For cere-als, the grain and rachis in these sub-samples were separated fromeach other and analysed separately. Samples were ground as singlesamples to a fine homogeneous powder (<250 lm size) underliquid N using a Spex 6850 freezer mill.
4.2. Bulk d15N isotope analysis
Bulk 15N/14N analysis was performed by sample combustion ina Flash 112 elemental analyser (ThermoQuest, Milan) linked undercontinuous flow with a Delta + XL mass spectrometer (Thermo-Finnigan, Bremen). Isotope ratios were calculated as d15N versusatmospheric N2 by comparison with standards calibrated againstIAEA-N-1 and N-2. The precision (1r) among replicates of ahomogenised barley sample was 0.4‰ for d15N analysed in 29 sep-arate runs.
4.3. Preparation of amino acid derivatives (N-acetyl-i-propyl esters)
Lipids were extracted from the powdered samples with chloro-form/methanol (2:1 v/v, 10 mL) by ultrasonication. To obtain indi-vidual AAs, lipid extracted grain was hydrolysed in culture tubes(6 M HCl, 2 mL, 100 �C, 24 h). The samples were evacuated andheated for 24 h at 100 �C. The solutions were blown to dryness un-der N2 and redissolved in 0.1 M HCl and stored at �18 �C until re-quired for analysis. A known quantity of norleucine (1 mg mL�1 in0.1 M HCl) was added to each sample as an internal standard.
Dowex 50WX8, 200–400 mesh ion-exchange resin (AcrosOrganics) has to be prepared so as to ensure that all cation ex-change sites are occupied by H+ ions. This was achieved by soakingovernight in 3 M NaOH, followed by washing in double-distilledwater (DDW) and soaking overnight in 6 M HCl. After washingwith DDW, it was pipetted into a flash column to the level of1 mL DDW. A fraction of the hydrolysed plant sample was addedto the column and salts were eluted with 6 mL DDW. The AAs werethen eluted with ammonium hydroxide (2 M, 6 ml) and dried un-der N2 before undergoing derivatisation.
AAs were converted to their i-propyl esters by addition of 1 mLof a 4:1 mixture of isopropanol and acetyl chloride (acetyl chlorideadded dropwise in an ice bath). Culture tubes were then sealed and
28 A.K. Styring et al. / Phytochemistry 97 (2014) 20–29
heated at 100 �C for 1 h. Reagents were evaporated under a gentlestream of N2 at room temperature. Dichloromethane (DCM) wasadded and evaporated in an ice bath to remove excess reagents.AA i-propyl esters were then treated with 1 mL of a mixture of ace-tic anhydride, triethylamine and acetone (1:2:5, v/v/v; 10 min,60 �C). Reagents were evaporated under a gentle stream of N2 inan ice bath. The samples were dissolved in 2 mL ethyl acetateand 1 mL saturated NaCl solution was added. After phase separa-tion, the organic phase was collected and the extraction repeatedwith an additional 1 mL of ethyl acetate. The combined organicphases were evaporated under N2 in an ice bath and the residualwater removed with successive 1 mL aliquots of DCM and evapo-rated under N2 in an ice bath. The N-acetyl-i-propyl (NAIP) esterswere dissolved in ethyl acetate and stored at �18 �C until requiredfor analysis.
4.4. Instrumental analyses
AAs were identified by GC-FID by comparison of their retentiontimes with those of AA standards and their d15N values were deter-mined by GC–C–IRMS. A ThermoFinnigan DeltaPlus XP system(Thermo Electron Corporation) was used to determine the d15Nvalues of derivatised AAs. The mass spectrometer (EI, 100 eV, threeFaraday cup collectors m/z 28, 29 and 30) was interfaced to a Ther-mo Electron Trace 2000 gas chromatograph via a ThermoElectrongas chromatograph combustion III interface (CuO/NiO/Pt oxidationreactor maintained at 980 �C and reduction reactor of Cu wiremaintained at 650 �C). Samples were introduced using a PTV injec-tor held at 200 �C. Helium at a flow of 1.4 mL min�1 was used asthe carrier gas and the mass spectrometer source pressure wasmaintained at 9 � 10�4 Pa. The separation of the AAs was accom-plished using a DB-35 capillary column (30 m � 0.32 mm internaldiameter; 0.5 lm film thickness; Agilent Technologies, UK). Theoven temperature of the GC was started at 40 �C and held for5 min before heating at 15 �C min�1 to 120 �C, then 3 �C min�1 to180 �C, then 1.5 �C min�1 to 210 �C and finally 5 �C min�1 to270 �C and held for 1 min. A nafion membrane removed waterand a cryogenic trap was employed in order to remove CO2 fromthe oxidised and reduced sample.
All d15N values are reported relative to reference N2 of knownnitrogen isotopic composition, previously calibrated against theAIR international isotope standard, introduced directly into theion source in four pulses at the beginning and end of each run. Eachreported value is a mean of triplicate d15N determinations. An AAstandard mixture, comprising AA whose d15N values were individ-ually determined by EA-IRMS, was run every three runs in order tomonitor instrument performance.
Acknowledgements
This work was completed whilst Amy Styring was in receipt of aNERC studentship (RE2158) that formed part of a NERC standardgrant (NE/E003761/1). NERC is also thanked for mass spectrometryfacilities (GR3/2951, GR3/3758 and FG6/36101). We thank Drs. IanBull and Tim Knowles (University of Bristol) for assistance withGC–C–IRMS analysis. We thank the Lawes Trust for access to thearchived Rothamsted samples. Rothamsted Research is an instituteof the Biotechnology and Biological Sciences Research Council inthe UK.
References
Bardgett, R.D., Streeter, T.C., Bol, R., 2003. Soil microbes compete effectively withplants for organic-nitrogen inputs to temperate grasslands. Ecology 84, 1277–1287.
Binder, S., Knill, T., Schuster, J., 2007. Branched-chain amino acid metabolism inhigher plants. Physiol. Plant. 129, 68–78.
Bol, R., Ostle, N.J., Petzke, K.J., 2002. Compound specific plant amino acid d15N valuesdiffer with functional plant strategies in temperate grassland. J. Plant Nutr. SoilSci. 165, 661–667.
Cantón, F.R., Suárez, M.F., Cánovas, F.M., 2005. Molecular aspects of nitrogenmobilization and recycling in trees. Photosynth. Res. 83, 265–278.
Cernusak, L.A., Winter, K., Turner, B.L., 2009. Plant 15N correlates with thetranspiration efficiency of nitrogen acquisition in tropical trees. Plant Physiol.151, 1667–1676.
Chikaraishi, Y., Kashiyamal, Y., Ogawa, N.O., Kitazato, H., Ohkouchi, N., 2007.Metabolic control of nitrogen isotope composition of amino acids in macroalgaeand gastropods: implications for aquatic food web studies. Mar. Ecol. Prog. Ser.342, 85–90.
Choi, W.J., Lee, S.M., Ro, H.M., Kim, K.C., Yoo, S.H., 2002. Natural 15N abundances ofmaize and soil amended with urea and composted pig manure. Plant Soil 245,223–232.
Evans, R.D., 2001. Physiological mechanisms influencing plant nitrogen isotopecomposition. Trends Plant Sci. 6, 121–126.
Forde, B.G., Woodall, J., 1995. Glutamine synthetase in higher plants: molecularbiology meets plant physiology. In: Wallsgrove, R.M. (Ed.), Amino Acids andtheir Derivatives in Higher Plants. Cambridge University Press, Cambridge, pp.1–18.
Fraser, R.A., Bogaard, A., Heaton, T.H.E., Charles, M., Jones, G., Christensen, B.T.,Halstead, P., Merbach, I., Poulton, P.R., Sparkes, D., Styring, A., 2011. Manuringand stable nitrogen isotope ratios in cereals and pulses: towards a newarchaeobotanical approach to the inference of land use and dietary practices. J.Archaeol. Sci. 38, 2790–2804.
Gauthier, P., Lamothe, M., Mahé, A., Molero, G., Nogués, S., Hodges, M., Tcherkez, G.,2013. Metabolic origin of 15N values in nitrogenous compounds from Brassicanapus L. leaves. Plant, Cell Environ. 36, 128–137.
Hagelstein, P., Sieve, B., Klein, M., Jans, H., Schultz, G., 1997. Leucine synthesis inchloroplasts: leucine/isoleucine aminotransferase and valineaminotransferase are different enzymes in spinach chloroplasts. J. PlantPhysiol. 150, 23–30.
Hare, P.E., Fogel, M.L., Stafford, T.W., Mitchell, A.D., Hoering, T.C., 1991. The isotopiccomposition of carbon and nitrogen in individual amino acids isolated frommodern and fossil proteins. J. Archaeol. Sci. 18, 277–292.
Heaton, T.H.E., 1987. The 15N/14N ratios of plants in South Africa and Namibia –relationship to climate and coastal saline environments. Oecologia 74, 236–246.
Hermes, J.D., Weiss, P.M., Cleland, W.W., 1985. Use of 15N and deuterium isotopeeffects to determine the chemical mechanism of phenylalanine ammonia lyase.Biochemistry 24, 2959–2967.
Hill, R.L., 1965. Hydrolysis of proteins. In: Anfinsen, C.B. (Ed.), Advances in ProteinChemistry, vol. Volume 20. Academic Press Inc., London, pp. 37–108.
Hofmann, D., Jung, K., Segschneider, H.-J., Gehre, M., Schüürmann, G., 1995. 15N/14N analysis of amino acids with GC–C–IRMS – methodical investigations andecotoxicological applications. Isot. Environ. Health Stud. 31, 367–375.
Ireland, R.J., Hiltz, D.A., 1995. Glycine and serine synthesis in non-photosynthetictissues. In: Wallsgrove, R.M. (Ed.), Amino Acids and their Derivatives in HigherPlants. Cambridge University Press, Cambridge, pp. 111–118.
John, P., 1992. Biosynthesis of the Major Crop Products. John Wiley & Sons Ltd.,Chichester.
Kelly, J.F., 2000. Stable isotopes of carbon and nitrogen in the study of avian andmammalian trophic ecology. Can. J. Zool. 78, 1–27.
Keys, A.J., Bird, I.F., Cornelius, M.J., Lea, P.J., Wallsgrove, R.M., Miflin, B.J., 1978.Photorespiratory nitrogen cycle. Nature 275, 741–743.
Macko, S.A., Fogel, M.L., Hare, P.E., Hoering, T.C., 1987. Isotopic fractionation ofnitrogen and carbon in the synthesis of amino-acids by microorganisms. Chem.Geol. 65, 79–92.
Mariotti, A., Mariotti, F., Champigny, M.L., Amarger, N., Moyse, A., 1982. Nitrogenisotope fractionation associated with nitrate reductase activity and uptake ofNO3 by pearl millet. Plant Physiol. 69, 880–884.
McClelland, J.W., Montoya, J.P., 2002. Trophic relationships and the nitrogenisotopic composition of amino acids in plankton. Ecology 83, 2173–2180.
Miflin, B.J., Lea, P.J., 1977. Amino acid metabolism. Annu. Rev. Plant Physiol. 28,299–329.
Murray, D.R., Cordova-Edwards, M., 1984. Amino acid and amide metabolism in thehulls and seeds of developing fruits of garden pea, Pisum Sativum. II. Asparagine.New Phytol. 97, 253–260.
Murray, D.R., Kennedy, I.R., 1980. Changes in activities of enzymes of nitrogenmetabolism in seedcoats and cotyledons during embryo development in peaseeds. Plant Physiol. 66, 782–786.
Näsholm, T., Ekblad, A., Nordin, A., Giesler, R., Hogberg, M., Hogberg, P., 1998. Borealforest plants take up organic nitrogen. Nature 392, 914–916.
Ostle, N.J., Bol, R., Petzke, K.J., Jarvis, S.C., 1999. Compound specific d15N values:amino acids in grassland and arable soils. Soil Biol. Biochem. 31, 1751–1755.
Pate, J.S., 1980. Transport and partitioning of nitrogenous solutes. Annu. Rev. PlantPhysiol. 31, 313–340.
Peoples, M.B., Atkins, C.A., Pate, J.S., Murray, D.R., 1985. Nitrogen nutrition andmetabolic interconversions of nitrogenous solutes in developing cowpea fruits.Plant Physiol. 77, 382–388.
Robinson, D., 2001. 15N as an integrator of the nitrogen cycle. Trends Ecol. Evol. 16,153–162.
Schulte, D., Close, T.J., Graner, A., Langridge, P., Matsumoto, T., Muehlbauer, G., Sato,K., Schulman, A.H., Waugh, R., Wise, R.P., Stein, N., 2009. The InternationalBarley Sequencing Consortium – at the threshold of efficient access to thebarley genome. Plant Physiol. 149, 142–147.

A.K. Styring et al. / Phytochemistry 97 (2014) 20–29 29
Schulten, H.R., Schnitzer, M., 1998. The chemistry of soil nitrogen: a review. Biol.Fertil. Soils 26, 1–15.
Shearer, G., Kohl, D.H., Chien, S.H., 1978. 15N abundance in a wide variety of soils.Soil Sci. Soc. Am. J. 42, 899–902.
Sieciechowicz, K.A., Joy, K.W., Ireland, R.J., 1988. The metabolism of asparagine inplants. Phytochemistry 27, 663–671.
Smallwood, B.J., Wooller, M.J., Jacobson, M.E., Fogel, M.L., 2003. Isotopic andmolecular distributions of biochemicals from fresh and buried Rhizophoramangle leaves. Geochem. Trans. 4, 38–46.
Tcherkez, G., 2011. Natural 15N/14N isotope composition in C3 leaves: are enzymaticisotope effects informative for predicting the 15N-abundance in keymetabolites? Funct. Plant Biol. 38, 1–12.
van Klinken, G.J., Richards, M.P., Hedges, R.E.M., 2000. An overview of causes forstable isotopic variations in past European human populations: environmental,
ecophysiological, and cultural effects. In: Ambrose, S.H., Katzenburg, M. (Eds.),Biogeochemical Approaches to Paleodietary Analysis. Kluwer Academic, NewYork, pp. 39–63.
Weigelt, A., Bol, R., Bardgett, R.D., 2005. Preferential uptake of soil nitrogen forms bygrassland plant species. Oecologia 142, 627–635.
Werner, R.A., Schmidt, H.L., 2002. The in vivo nitrogen isotope discriminationamong organic plant compounds. Phytochemistry 61, 465–484.
Wolswinkel, P., De Ruiter, H., 1985. Amino acid release from the seed coat ofdeveloping seeds of Vicia faba and Pisum sativum. Ann. Bot. 55, 283–287.
Yoneyama, T., Tanaka, F., 1999. Natural abundance of 15N in nitrate, ureides, andamino acids from plant tissues. Soil Sci. Plant Nutr. 45, 751–755.
Yoneyama, T., Fujihara, S., Yagi, K., 1998. Natural abundance of 15N in amino acidsand polyamines from leguminous nodules: unique 15N enrichment inhomospermidine. J. Exp. Bot. 49, 521–526.