Adsorption and reactivity of nitrogen oxides (NO2, NO, N2O) on Fe–zeolites
13
Adsorption and reactivity of nitrogen oxides (NO 2 , NO, N 2 O) on Fe–zeolites Mickaël Rivallan a,b,c, * , Gabriele Ricchiardi a,b , Silvia Bordiga a,b , Adriano Zecchina a,b, * a Università di Torino, Dipartimento di Chimica Inorganica, Chimica Fisica e Chimica dei Materiali, Via P. Giuria 7, 10125 Torino, Italy b NIS Centre of Excellence, University of Torino, Italy c Laboratoire Catalyse et Spectrochimie, ENSICAEN, Université de Caen, CNRS, 6 Bd Maréchal Juin, F-14050 Caen, France article info Article history: Received 29 November 2008 Revised 11 March 2009 Accepted 19 March 2009 Available online 26 April 2009 Keywords: N 2 O decomposition Fe–zeolite MFI N 2 O, NO, and NO 2 probe molecules Fe(II) active sites abstract Nitrous oxide decomposition and temperature programmed desorption tests on Fe–ZSM-5 and Fe–silica- lite show that the catalytic conversion mechanism of N 2 O into N 2 and O 2 over Fe–zeolites is more com- plex than expected. Nitrogen oxides are formed as byproducts of the catalytic process with the major part consisting in NO 2 species adsorbed on the iron sites. FTIR spectroscopy of adsorbed N 2 O, NO, and NO 2 has been used to investigate the structure and environment of the iron active species of the Fe–MFI catalysts before and after atomic oxygen deposition. The interactions of NO and N 2 O probes on activated Fe–ZSM-5 have evidenced two families of mononuclear Fe(II) centers (Fe A and Fe B ) differing in the coordination state of Fe. N 2 O also interacts with Brønsted sites of Fe–ZSM-5 via hydrogen bonding. This type of inter- action is nearly absent in Fe–silicalite. Polynuclear species (clusters) and iron oxide particles, whose con- centrations are strongly influenced by the iron content and by the preparation methods are also present. When oxidized samples (by N 2 O) are considered, the ability of Fe A and Fe B centers to adsorb N 2 O and NO is strongly depressed. On the contrary, the surface chemistry of iron particles is not appreciably influ- enced. These results represent an indirect proof of the preferential presence of adsorbed oxygen on iso- lated Fe centers. NO titration of oxidized Fe–ZSM-5 results in the formation of a complex network of interplaying neutral (NO, NO 2 ,N 2 O 4 ) and ionic species (NO + , NO 2 , NO 3 ). The cooperation of sites between Brønsted and iron active sites is demonstrated. The last observation is fully confirmed by the experiments performed using NO 2 probe that titrates both Brønsted and iron sites. On the basis of the comparison of catalytic results of N 2 O decomposition and of spectroscopic results concerning the titration of surface sites with N 2 O, NO, and NO 2 obtained on the same samples (which form the main scope of the paper), it clearly emerges that mononuclear sites characterized by lowest coordination are the most active in N 2 O decomposition. Under the adopted conditions, low or negligible activity is shown by Fe x O y clusters and Fe 2 O 3 particles. Ó 2009 Elsevier Inc. All rights reserved. 1. Introduction The control of N 2 O emissions is part of the efforts taken to limit greenhouse gas emissions [1], as dictated by the Kyoto Protocol. In fact despite its relatively small concentration in the atmosphere, nitrous oxide is the third largest greenhouse gas contributor to overall global warming, behind carbon dioxide and methane and attacks ozone in the stratosphere, aggravating the excess amount of UV light striking the Earth’s surface. N 2 O is mainly emitted by agriculture (65%) [2], while industrial sources, including the pro- duction of nylon [3] and nitric acid [4], and the burning of fossil fuel in internal combustion engines [5,6] are responsible for about 20% of total N 2 O emissions. All these detrimental effects have led to the research on the development of efficient and stable de-N 2 O cat- alysts. Among the many different de-N 2 O catalysts proposed so far (mainly M–zeolites (M = Cu, Co, Fe, etc. [7]), perovskite-like mixed oxides [8] and precious metals supported (Pd, Rh, etc. [9]), we re- port here on Fe–MFI. This reaction first reported by Panov et al. [10,11] has also been proposed for the titration of surface active sites [12–26]. It is generally accepted that surface iron species form the core of the catalytic site, and that the mechanisms of N 2 O decomposition likely pass through an adsorbed oxygen intermedi- ate called ‘‘a-oxygen” [10]. The most frequently proposed mecha- nisms in direct N 2 O decomposition are (a) N 2 O+( * ) ? N 2 + * O N 2 O+ * O ? N 2 +O * O O * O ? O 2 +( * ) see [17] (b) 2N 2 O + 2( * ) ? 2N 2 +2 * O 2 * O ? O 2 + 2( * ) see [15,22] (c) N 2 O+( * ) ? N 2 + * O 0021-9517/$ - see front matter Ó 2009 Elsevier Inc. All rights reserved. doi:10.1016/j.jcat.2009.03.012 * Corresponding authors. Address: Università di Torino, Dipartimento di Chimica Inorganica, Chimica Fisica e Chimica dei Materiali, Via P. Giuria 7, 10125 Torino, Italy. E-mail addresses: [email protected] (M. Rivallan), Adriano.zecchina@ unito.it (A. Zecchina). Journal of Catalysis 264 (2009) 104–116 Contents lists available at ScienceDirect Journal of Catalysis journal homepage: www.elsevier.com/locate/jcat
Transcript of Adsorption and reactivity of nitrogen oxides (NO2, NO, N2O) on Fe–zeolites
Journal of Catalysis 264 (2009) 104–116
Contents lists available at ScienceDirect
Journal of Catalysis
journal homepage: www.elsevier .com/locate / jcat
Adsorption and reactivity of nitrogen oxides (NO2, NO, N2O) on Fe–zeolites
Mickaël Rivallan a,b,c,*, Gabriele Ricchiardi a,b, Silvia Bordiga a,b, Adriano Zecchina a,b,*
a Università di Torino, Dipartimento di Chimica Inorganica, Chimica Fisica e Chimica dei Materiali, Via P. Giuria 7, 10125 Torino, Italyb NIS Centre of Excellence, University of Torino, Italyc Laboratoire Catalyse et Spectrochimie, ENSICAEN, Université de Caen, CNRS, 6 Bd Maréchal Juin, F-14050 Caen, France
a r t i c l e i n f o
Article history:Received 29 November 2008Revised 11 March 2009Accepted 19 March 2009Available online 26 April 2009
Keywords:N2O decompositionFe–zeoliteMFIN2O, NO, and NO2 probe moleculesFe(II) active sites
0021-9517/$ - see front matter � 2009 Elsevier Inc. Adoi:10.1016/j.jcat.2009.03.012
* Corresponding authors. Address: Università di TorInorganica, Chimica Fisica e Chimica dei Materiali, VItaly.
E-mail addresses: [email protected] (M.unito.it (A. Zecchina).
a b s t r a c t
Nitrous oxide decomposition and temperature programmed desorption tests on Fe–ZSM-5 and Fe–silica-lite show that the catalytic conversion mechanism of N2O into N2 and O2 over Fe–zeolites is more com-plex than expected. Nitrogen oxides are formed as byproducts of the catalytic process with the major partconsisting in NO2 species adsorbed on the iron sites. FTIR spectroscopy of adsorbed N2O, NO, and NO2 hasbeen used to investigate the structure and environment of the iron active species of the Fe–MFI catalystsbefore and after atomic oxygen deposition. The interactions of NO and N2O probes on activated Fe–ZSM-5have evidenced two families of mononuclear Fe(II) centers (FeA and FeB) differing in the coordinationstate of Fe. N2O also interacts with Brønsted sites of Fe–ZSM-5 via hydrogen bonding. This type of inter-action is nearly absent in Fe–silicalite. Polynuclear species (clusters) and iron oxide particles, whose con-centrations are strongly influenced by the iron content and by the preparation methods are also present.When oxidized samples (by N2O) are considered, the ability of FeA and FeB centers to adsorb N2O and NOis strongly depressed. On the contrary, the surface chemistry of iron particles is not appreciably influ-enced. These results represent an indirect proof of the preferential presence of adsorbed oxygen on iso-lated Fe centers. NO titration of oxidized Fe–ZSM-5 results in the formation of a complex network ofinterplaying neutral (NO, NO2, N2O4) and ionic species (NO+, NO�2 , NO�3 ). The cooperation of sites betweenBrønsted and iron active sites is demonstrated. The last observation is fully confirmed by the experimentsperformed using NO2 probe that titrates both Brønsted and iron sites.
On the basis of the comparison of catalytic results of N2O decomposition and of spectroscopic resultsconcerning the titration of surface sites with N2O, NO, and NO2 obtained on the same samples (whichform the main scope of the paper), it clearly emerges that mononuclear sites characterized by lowestcoordination are the most active in N2O decomposition. Under the adopted conditions, low or negligibleactivity is shown by FexOy clusters and Fe2O3 particles.
� 2009 Elsevier Inc. All rights reserved.
1. Introduction
The control of N2O emissions is part of the efforts taken to limitgreenhouse gas emissions [1], as dictated by the Kyoto Protocol. Infact despite its relatively small concentration in the atmosphere,nitrous oxide is the third largest greenhouse gas contributor tooverall global warming, behind carbon dioxide and methane andattacks ozone in the stratosphere, aggravating the excess amountof UV light striking the Earth’s surface. N2O is mainly emitted byagriculture (65%) [2], while industrial sources, including the pro-duction of nylon [3] and nitric acid [4], and the burning of fossilfuel in internal combustion engines [5,6] are responsible for about20% of total N2O emissions. All these detrimental effects have led to
ll rights reserved.
ino, Dipartimento di Chimicaia P. Giuria 7, 10125 Torino,
Rivallan), Adriano.zecchina@
the research on the development of efficient and stable de-N2O cat-alysts. Among the many different de-N2O catalysts proposed so far(mainly M–zeolites (M = Cu, Co, Fe, etc. [7]), perovskite-like mixedoxides [8] and precious metals supported (Pd, Rh, etc. [9]), we re-port here on Fe–MFI. This reaction first reported by Panov et al.[10,11] has also been proposed for the titration of surface activesites [12–26]. It is generally accepted that surface iron species formthe core of the catalytic site, and that the mechanisms of N2Odecomposition likely pass through an adsorbed oxygen intermedi-ate called ‘‘a-oxygen” [10]. The most frequently proposed mecha-nisms in direct N2O decomposition are
(a) N2O + (*) ? N2 + *ON2O + *O ? N2 + O*OO*O ? O2 + (*) see [17]
(b) 2N2O + 2(*) ? 2N2 + 2*O2*O ? O2 + 2(*) see [15,22](c) N2O + (*) ? N2 + *O

M. Rivallan et al. / Journal of Catalysis 264 (2009) 104–116 105
N2O + *O ? N2 + *O2
N2O + *O2 ? N2 + *O3
*O3 ? *O + O2 see [27]
In mechanism (b) (Langmuir–Hinshelwood mechanism), themigration of oxygen from one active site (*) followed by recombi-nation with another oxidized site is the rate-determining step[15,22]. This reaction mechanism needs the active participationof at least two iron centers that are not necessarily located in adja-cent positions. In mechanisms (a) [17] and (c) [27] (Eley–Ridealmechanisms), N2O decomposition and oxygen evolution occur atthe same isolated sites (*) after successive collisions betweenN2O with (*) and *O for (a), and with (*), *O, and *O2 for (c). Theabove described mechanisms are all in agreement with transientresponse experiments, showing that N2 appears before O2 upon di-rect N2O decomposition pulses in the 773 to 848 K interval. This isbecause in all cases the global decomposition reaction is limited bythe reactions steps leading to O2 gas phase. More recent accuratetemporal analysis of products [17] strongly suggests that mecha-nism (a) is the most likely. From the point of view of the oxygenspecies formed on iron active sites (*), the three mechanisms areassociated with increasingly complex oxygen species: *O, O*O,and *O2 for (a); *O for (b); and *O, *O2, and *O3 for (c). Other very rel-evant results resulting from these catalytic experiments are
(a) Fe–ZSM-5 is always more active than Fe–silicalite containingthe same amount of Fe [17,22–24]; from this importantpoint, the role of Al in catalytic process is inferred. Someauthors have proposed interesting Fe–Al configurations onthe basis of theoretical models [28], or contributions of Alin N2O interaction [29,30];
(b) The active sites are formed during activation in inert atmo-sphere or in vacuo [17,22–24]. There is a widespread agree-ment that after this treatment a large fraction of iron is inextra-framework position and in the divalent state;
(c) The fraction of active sites present depends upon many fac-tors (impregnation methods, Fe concentration, and H2Oresidual pressure). An analysis of the data published so farsuggests that the samples can be quite heterogeneous [31];
(d) The fraction of clusters FexOy and the Fe2+/Fe3+ ratio after acti-vation are also very much influenced by the sample history;
(e) The activity augments with increasing activation tempera-ture in inert gas; the same implies for the number of activesites [17,22–24];
(f) At low Fe content, the number of Fe sites where adsorbedoxygen species are formed is roughly identical in Fe–ZSM-5 and Fe–silicalite [17,22–24];
(g) The activity (calculated per Fe center) increases with dilu-tion [22]. The fraction of active sites (calculated with respectto the total amount of introduced iron) can reach about 35%for the most diluted samples (<1000 ppm). It can be so con-cluded that the active sites contain a very small number ofFe atoms or, more likely, a single atom. From the above con-siderations it is also inferred that clustered species, becom-ing relevant at the highest Fe contents, are characterizedby lower or negligible catalytic activity in N2O decomposi-tion. The debate concerning the nuclearity of the catalyticsites (mono or di-nuclear) continues.
(h) The number of ‘‘a-sites” (i.e. the Fe sites where atomic oxy-gen can be deposited during N2O decomposition) grows withthe Fe concentration, this growth being, however, definitelysmaller than that of clustered species as expected by consid-ering the atomic dispersion of the active sites [32].
(i) All other factors being equal, the number of active sites ismaximum on catalysts formed by high temperature activa-tion of isomorphously substituted zeolites [22], as com-
pared, for example, with catalysts obtained with post-synthesis impregnation.
An interesting point concerning the mechanism of N2Odecomposition reaction is the positive effect of NO [33–39],which enhances the decomposition rate of N2O. The last observa-tion has relevant mechanistic implications and has recently ani-mated the debate since recent papers have reported on thepresence of NOy species presumably formed on the Fe–ZSM-5during the first catalytic steps [33,38,40,41]. This problem willbe specifically addressed in the discussion of the results obtainedusing NO2 probe.
As for the structure of active sites, the crystalline character ofthe hosting matrix (MFI framework) has spread the conviction thatthe structure is characterized not only by extremely low nuclearitybut also by well-defined geometry. This conviction, which at firstsight establishes an analogy with iron-based homogeneous cata-lysts and enzymes, has conferred a unique model character to thiscatalyst and has stimulated a great deal of investigations based onaccurate catalytic measurements and on physical characterizationmethods. The results of this intensive research work have been re-cently reviewed [31]. From the comparison of whole set of exper-imental and theoretical results, it has been concluded that despitethe crystalline character of the hosting matrix, the structure of ironsites of Fe–MFI systems is less defined than initially hypothesizedand that the analogies with Fe-based enzymatic systems must becut down to size.
As for the characterization with physical methods, the wholeset of spectroscopic techniques has been used including FTIR of ad-sorbed molecules, UV–Vis-NIR, XANES, and EXAFS. In particular,the following facts have been firmly established:
(a) After severe thermal treatment, the Fe3+ originally located inthe framework position (isomorphously substituted Fe–ZSM-5 and Fe–silicalite) migrates in extra-framework posi-tions (isolated and/or clusters) and undergoes reduction toFe(II). These sites are highly coordinatively unsaturatedand are able to interact with many adsorbates. To a firstapproximation the isolated sites can be considered as Fe(II)ions linked to the framework via two strong bonds asreported for Co2+ ions in Co–ZSM-5 [42] and for Cr supportedon silica [43,44]. In the first coordination sphere of Fe(II)ions, a variable number of weaker ligands (oxygen of adja-cent SiOSi groups) can be present whose number dependsupon the location of Fe(II) ions on the surface of the MFIstructure. A representation of the structure of isolated spe-cies sites is illustrated in Scheme 1.In the model structurereported in Scheme 1 (valid only for Fe–ZSM-5), Fe2+ substi-tutes two cationic sites (like in b sites of Ref. [42]). The scopeof this picture is simply to show that in the coordinationsphere of Fe2+, strong and weak coordination ligands areclearly present. This model has only qualitative characterand cannot be extended to Fe–silicalite, because in this caseno trivalent ions are present in the structure after the ther-mal treatments. In this case the Fe2+ ions are really graftedto the siliceous framework via two strong FeOSi bonds (likein the Cr/SiO2 system). Considering the first coordinationsphere, the structure of all iron centers (either on Fe–ZSM-5 or on Fe–silicalite) can be schematized with a common for-mula FeLnXm (where n P 2, m P 2).
(b) The spectra of adsorbed NO on isomorphously substitutedFe–ZSM-5 and Fe–silicalite treated at 773 K are very similar:NO interacts with isolated Fe2+ centers with the formation oftri-nitrosylic and di-nitrosylic complexes whose frequenciesare slightly higher for Al-containing samples (suggesting thepresence of Al close to Fe site) [31]. Furthermore, the inten-

Scheme 1. FeLnXm (with n P 2, m P 2), where L is an O atom in SiOAl, whereas Xcorresponds to an O atom in SiOSi.
300
400
500
600
700
800
0 200 400 600 800 1000
Tem
pera
ture
(K)
2
Time (min)
N2O
Flo
w (c
m3 .m
in-1)
5
0
Activation N2O (1st) React. N2O (2nd)
1 3
Fig. 1. Scheme of the whole catalytic test done over Fe–MFI. Temperature (blackline) and N2O flow (dotted line) are plotted as a function of time.
106 M. Rivallan et al. / Journal of Catalysis 264 (2009) 104–116
sity of the NO peaks is higher on Al-containing samples. Itmeans that Al helps in Fe dispersion and hence increasesthe abundance of mononuclear or low nuclearity Fe species.
(c) The predominance of extra-framework species is a fortioriverified in samples prepared by wet or gas phase impregna-tion, because in these cases Fe is in extra-framework posi-tion already obtained from the preparation step. From theconcise description illustrated above, few well-ascertainedfacts and few remaining problems are emerging. Amongthe ascertained facts, the extra-framework character andthe reduced valence state of isolated iron centers must bementioned. Among the problems, the exact nuclearity, thedetailed structure of the active sites, the role of Al, and thepotential role of NOx intermediates in N2O decomposition,and their location must be recalled. In the present work,the N2O decomposition on Fe–ZSM-5 and Fe–silicalite is dis-cussed and compared. This comparison is necessary in orderto investigate the role of Al on the catalytic activity. N2OTemperature Programmed Reaction (TPR) and TemperatureProgrammed Desorption (TPD) experiments form the coreof the catalytic tests section. A second section devoted toFTIR characterization consists in the use of N2O, NO, andNO2 probes, with the scope to investigate the structureand nuclearity of the iron active centers. The NO2 probehas also been used to probe pure H–ZSM-5 and silicalite.
2. Experimental
2.1. Sample preparation
Fe-exchanged ZSM-5 zeolites were prepared using aqueous ion-exchange [45]. The parent zeolite, NH4-ZSM-5 (nominally Si/Al = 15, 40, 140; Na2O = 0.05 wt.%), was supplied by Zeolyst Inter-national. For the aqueous ion-exchange, 0.3 g of NH4-ZSM-5 wasadded under stirring in two recipients, each one containing a 5-ml 0.01 M iron(III) oxalate solution. The solution of iron(III) oxalatewas prepared using Fe2(C2O4)3 � 6 H2O (99%, Aldrich) and deionizedwater. After 24 h the mixtures were filtered, washed with deion-ized water, dried in atmosphere, and used for further investiga-tions. During the impregnation, the ferric oxalate solution andthe zeolite slurries were carefully kept away from light. Here, the
sample prepared by the oxalate method will be referred to as Fe–Z-x, where x corresponds to Si/Al ratio. The Fe–silicalite catalyst(Fe–S) was prepared following the hydrothermal method describedin detail by Ratnasamy and Kumar [46]. Briefly, the Fe–silicalitecatalyst was obtained by mixing solutions of oxalic acid, ferric ni-trate, sodium silicate, and tetrapropyl-ammonium bromide. Theso-obtained gel was crystallized in a tumbling autoclave at 440 Kfor 4 days. The so-obtained solid was separated, washed, dried,and calcined in air at 823 K. With the aim of removing any unde-sired extra-framework cations coming from the reagents, the solidwas then ion-exchanged with 1 M NH4NO3 solution and dried. Theestimated Fe content is approximately 1.0 wt.%. Pure silicalite wasfurnished by ENI Tecnologie Laboratories (S. Donato Milanese).Chemical composition was determined by elemental analysis, bymeans of a Varian Vista Pro Axial ICP spectrometer. Fe-standardsolutions were made from Spectrascan-standard (1000 ppm) deliv-ered by Teknolab.
2.2. Catalytic activity tests
Catalyst activity tests were performed using an integratedquartz micro-reactor and mass spectrometer system (CATLAB fromHiden). The system features a fast-response, low thermal mass fur-nace with integrated air-cooling, a precision Quadrupole MassSpectrometer, and a quartz inert capillary with ‘‘hot zone” inletfor continuous close-coupled catalyst sampling with minimal deadvolume and memory effects. The in-bed thermocouple ensuresoptimal measurement of catalyst temperature. The reactant gasesare supplied through electronic mass flow controllers. An amountof 200 mg pelletized catalyst (particles size 250 to 500 lm) dilutedin the same volume of mesh size of a-Alumina (Talum) is heldbetween plugs of quartz wool in a quartz tubular vertical flowreactor (Ø = 5 mm). The pre-treatment of the catalyst is realizedat 773 K (ramp temperature of 5 K min�1) under He:Ar mixture(99:1 vol.%) with a flow of 100 cm3 min�1. After 2 h the reactor iscooled down to 300 K in He:Ar. Then the N2O decomposition test(TPR) is performed from 300 K to 773 K (5 K min�1), with a gasmixture of He: N2O:Ar (94:5:1 vol.%) kept at a constant flow of100 cm3 min�1. Fig. 1 shows the typical catalytic test done overFe–MFI samples. The whole catalytic test starts with a 2-h activa-tion treatment at 773 K followed by a first TPR from RT to 773 K.Afterwards the sample is reactivated up to 773 K in He and a sec-ond TPR is performed.
Temperature Programmed Desorption (TPD) has been per-formed between the two TPR cycles (time range 550 to 650 min(Fig. 1)) under inert He:Ar (99:1 vol.%) atmosphere (100cm3 min�1) over Fe–MFI previously N2O treated from RT to 773 K(5 K min�1). Isotherm tests have also been performed at T = 623,673, and 723 K over Fe–Z-40 freshly activated at 773 K for 2 h.The reactant gas was composed of N2O (5 vol.%) in a constant flowof 100 cm3 min�1 completed by He:Ar (99:1 vol.%). During thesecatalytic and desorption tests, the following AMU: 28 (N2), 30
500 550 600 650 700 7500.00
0.25
0.50
0.75
1.00
-r N2O
Temperature K
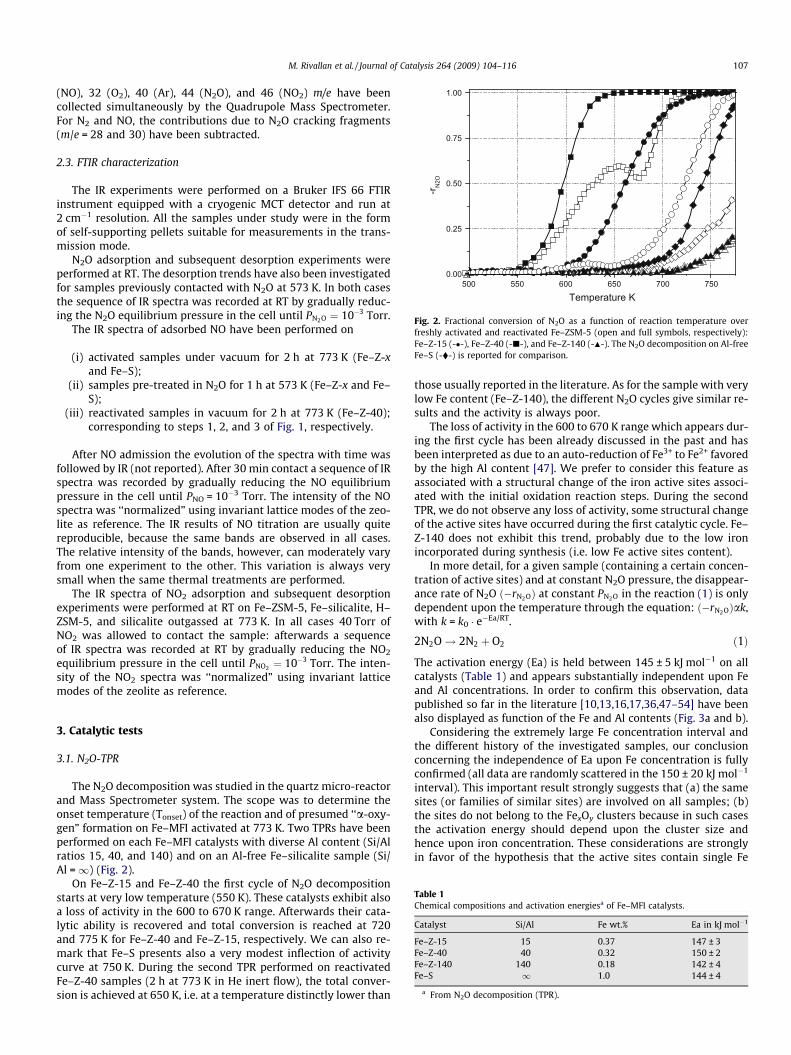
Fig. 2. Fractional conversion of N2O as a function of reaction temperature overfreshly activated and reactivated Fe–ZSM-5 (open and full symbols, respectively):Fe–Z-15 (-�-), Fe–Z-40 (-j-), and Fe–Z-140 (-N-). The N2O decomposition on Al-freeFe–S (-�-) is reported for comparison.
M. Rivallan et al. / Journal of Catalysis 264 (2009) 104–116 107
(NO), 32 (O2), 40 (Ar), 44 (N2O), and 46 (NO2) m/e have beencollected simultaneously by the Quadrupole Mass Spectrometer.For N2 and NO, the contributions due to N2O cracking fragments(m/e = 28 and 30) have been subtracted.
2.3. FTIR characterization
The IR experiments were performed on a Bruker IFS 66 FTIRinstrument equipped with a cryogenic MCT detector and run at2 cm�1 resolution. All the samples under study were in the formof self-supporting pellets suitable for measurements in the trans-mission mode.
N2O adsorption and subsequent desorption experiments wereperformed at RT. The desorption trends have also been investigatedfor samples previously contacted with N2O at 573 K. In both casesthe sequence of IR spectra was recorded at RT by gradually reduc-ing the N2O equilibrium pressure in the cell until PN2O ¼ 10�3 Torr.
The IR spectra of adsorbed NO have been performed on
(i) activated samples under vacuum for 2 h at 773 K (Fe–Z-xand Fe–S);
(ii) samples pre-treated in N2O for 1 h at 573 K (Fe–Z-x and Fe–S);
(iii) reactivated samples in vacuum for 2 h at 773 K (Fe–Z-40);corresponding to steps 1, 2, and 3 of Fig. 1, respectively.
After NO admission the evolution of the spectra with time wasfollowed by IR (not reported). After 30 min contact a sequence of IRspectra was recorded by gradually reducing the NO equilibriumpressure in the cell until PNO = 10�3 Torr. The intensity of the NOspectra was ‘‘normalized” using invariant lattice modes of the zeo-lite as reference. The IR results of NO titration are usually quitereproducible, because the same bands are observed in all cases.The relative intensity of the bands, however, can moderately varyfrom one experiment to the other. This variation is always verysmall when the same thermal treatments are performed.
The IR spectra of NO2 adsorption and subsequent desorptionexperiments were performed at RT on Fe–ZSM-5, Fe–silicalite, H–ZSM-5, and silicalite outgassed at 773 K. In all cases 40 Torr ofNO2 was allowed to contact the sample: afterwards a sequenceof IR spectra was recorded at RT by gradually reducing the NO2
equilibrium pressure in the cell until PNO2 ¼ 10�3 Torr. The inten-sity of the NO2 spectra was ‘‘normalized” using invariant latticemodes of the zeolite as reference.
Table 1Chemical compositions and activation energiesa of Fe–MFI catalysts.
Catalyst Si/Al Fe wt.% Ea in kJ mol�1
Fe–Z-15 15 0.37 147 ± 3Fe–Z-40 40 0.32 150 ± 2Fe–Z-140 140 0.18 142 ± 4Fe–S 1 1.0 144 ± 4
a From N2O decomposition (TPR).
3. Catalytic tests
3.1. N2O-TPR
The N2O decomposition was studied in the quartz micro-reactorand Mass Spectrometer system. The scope was to determine theonset temperature (Tonset) of the reaction and of presumed ‘‘a-oxy-gen” formation on Fe–MFI activated at 773 K. Two TPRs have beenperformed on each Fe–MFI catalysts with diverse Al content (Si/Alratios 15, 40, and 140) and on an Al-free Fe–silicalite sample (Si/Al =1) (Fig. 2).
On Fe–Z-15 and Fe–Z-40 the first cycle of N2O decompositionstarts at very low temperature (550 K). These catalysts exhibit alsoa loss of activity in the 600 to 670 K range. Afterwards their cata-lytic ability is recovered and total conversion is reached at 720and 775 K for Fe–Z-40 and Fe–Z-15, respectively. We can also re-mark that Fe–S presents also a very modest inflection of activitycurve at 750 K. During the second TPR performed on reactivatedFe–Z-40 samples (2 h at 773 K in He inert flow), the total conver-sion is achieved at 650 K, i.e. at a temperature distinctly lower than
those usually reported in the literature. As for the sample with verylow Fe content (Fe–Z-140), the different N2O cycles give similar re-sults and the activity is always poor.
The loss of activity in the 600 to 670 K range which appears dur-ing the first cycle has been already discussed in the past and hasbeen interpreted as due to an auto-reduction of Fe3+ to Fe2+ favoredby the high Al content [47]. We prefer to consider this feature asassociated with a structural change of the iron active sites associ-ated with the initial oxidation reaction steps. During the secondTPR, we do not observe any loss of activity, some structural changeof the active sites have occurred during the first catalytic cycle. Fe–Z-140 does not exhibit this trend, probably due to the low ironincorporated during synthesis (i.e. low Fe active sites content).
In more detail, for a given sample (containing a certain concen-tration of active sites) and at constant N2O pressure, the disappear-ance rate of N2O ð�rN2OÞ at constant PN2O in the reaction (1) is onlydependent upon the temperature through the equation: ð�rN2OÞak,with k = k0 � e�Ea/RT.
2N2O! 2N2 þ O2 ð1Þ
The activation energy (Ea) is held between 145 ± 5 kJ mol�1 on allcatalysts (Table 1) and appears substantially independent upon Feand Al concentrations. In order to confirm this observation, datapublished so far in the literature [10,13,16,17,36,47–54] have beenalso displayed as function of the Fe and Al contents (Fig. 3a and b).
Considering the extremely large Fe concentration interval andthe different history of the investigated samples, our conclusionconcerning the independence of Ea upon Fe concentration is fullyconfirmed (all data are randomly scattered in the 150 ± 20 kJ mol�1
interval). This important result strongly suggests that (a) the samesites (or families of similar sites) are involved on all samples; (b)the sites do not belong to the FexOy clusters because in such casesthe activation energy should depend upon the cluster size andhence upon iron concentration. These considerations are stronglyin favor of the hypothesis that the active sites contain single Fe

10 20 30 40 50 100 15050
100
150
200
250
0.0 0.5 1.0 1.5 2.0 2.5 3.0 3.5 4.0 4.5 5.050
100
150
200
250
Ea k
J/m
ol
Si/Al ratio
Ea k
J/m
ol
Fe wt. %
a
b
Fig. 3. (a) Influences of Fe content (0.03 < Fe wt.% < 5.0); and (b) Al (10 < Si/Al < 140) content, respectively, on Ea reported from Refs. [10,13,16,17,35,43–50].
108 M. Rivallan et al. / Journal of Catalysis 264 (2009) 104–116
centers implanted on the MFI matrix. Extremely small clusters (forinstance dimers) are, however, not completely ruled out.
The Ea is also not appreciably influenced by Al concentration.This result is even more surprising, because Fe–ZSM-5 samplesare known to be more active than Al-free Fe–silicalite samples.From this result it is evident that the higher activity derived fromthe presence of Al is not due to a substantial decrement of the Ea ofthe rate-determining step (which can be either the reactive N2Ocollision with adsorbed *O or atomic oxygen *O recombination toform O2).
3.2. Isotherms at 623, 673, and 723 K
In order to limit the parameters which must be considered dur-ing N2O abatement, isotherm tests have been performed over Fe–Z-40 (Fe 0.32 wt.%) at 623 K (decomposition starts); 673 K (lossof activity) and 723 K (total decomposition) (Fig. 4).
Upon flowing N2O (5 vol.%) on freshly activated Fe–Z-40 at623 K, NO and N2 traces appear first at the outlet of the reactor.
0 50 100 150 200 2500
1
2
3
4
5
6
0 50 100
Con
cent
ratio
n, V
ol. %
Time min
At T = 723 K At T = 6
Tim
Fig. 4. Response curves of N2, NO, O2, and N2O obtained at 723, 673, and 623 K after switmixture over Fe–Z-40 previously activated.
After 10 min, NO starts to decrease while O2 emerges. All these sig-nals vanish after 1 h interaction. It implies that at this temperature,the catalytic products are covering (poisoning) the sites and thatthe decomposition does not proceed until O2 desorption.
At 673 K, about 40% of N2O is directly converted and only N2
and O2 products are detected. As the isotherm at 673 K proceeds,the activity of the catalyst decreases, because the N2O decomposi-tion products still accumulate (as before). The probable accumula-tion may consist of strongly adsorbed NOy species. As after 10 h thecatalyst loses about 80% of its initial activity (not shown), we mayso conclude that the reaction (1) needs higher temperature to besustained. This phenomenon can also explain the loss of activityobserved during the first N2O-TPR (Fig. 2). The full and stable con-version is reached at high temperature (T = 723 K), in fact after 20 hcontact with N2O (5 vol.%) the conversion remains unchanged, soconfirming the high ability of Fe–Z-40 in direct N2Odecomposition.
The volumes of N2, O2, and NO detected in outlet reactor and theN2O consumption during the first hour of isotherm at 623 K cangive some clues about the species adsorbed on the catalysts. Theratio V(Nat)/V(Oat) coming from the decomposition of native N2O(V(Nat)/V(Oat) = 2) is larger than that expected on the basis of thestoichiometry of reaction (1). This suggests that N atoms are re-leased in higher quantity than O atoms and that oxygen is ad-sorbed on Fe–MFI catalyst. Whether this oxygen is an atomicspecies (a-oxygen) or a NOy-like species (or both) is difficult toestablish. The presence of NO in the outlet gas phase suggests thatbesides reaction (2) and dominant paths (a, b, and c) also the con-secutive reaction (3) must be considered [40,41]:
N2Oþ ð�Þ ! N2 þ O� ð2ÞN2Oþ O� ! 2ðNOÞ� ! 2NOþ ð�Þ ð3Þ
In fact at 623 K, NO can also react with adsorbed oxygen, the forma-tion of NO2 (N2O4) and hence of surface nitrites and nitrates mustbe taken into consideration.
3.3. Temperature Programmed Desorption (TPD)
In order to shed light on the possible NOy ad-species, TPD testwas done. Fig. 5 displays the results obtained over Fe–Z-15 andFe–Z-40 previously oxidized until 773 K and cooled down to RT un-der N2O (5 vol.%).
150 200 2500 50 100 150 200 250
N2
NO O2
N2O
73 K
e min
At T = 623 K
Time min
x 20
ching at t = 0 min from inert atmosphere (1% Ar, 99% He) to (5% N2O, 1% Ar, 94% He)

0.000
0.015
0.030
350 400 450 500 550 600 6500.00
0.03
O2
Sign
al (a
.u)
NO
Temperature K
Fig. 5. Response curves of O2 and NO obtained during Temperature ProgrammedDesorption (TPD) performed over Fe–Z-15 (-�-), Fe–Z-40 (-j-) previously N2O-oxidized at 773 K.
2350 2300 2250 2200 2150 2100
Wavenumbers cm-1
2282
2248
2226
2219
2350 2300 2250 2200 2150 2100
Wavenumbers cm-1
2248
2226
2219
a b
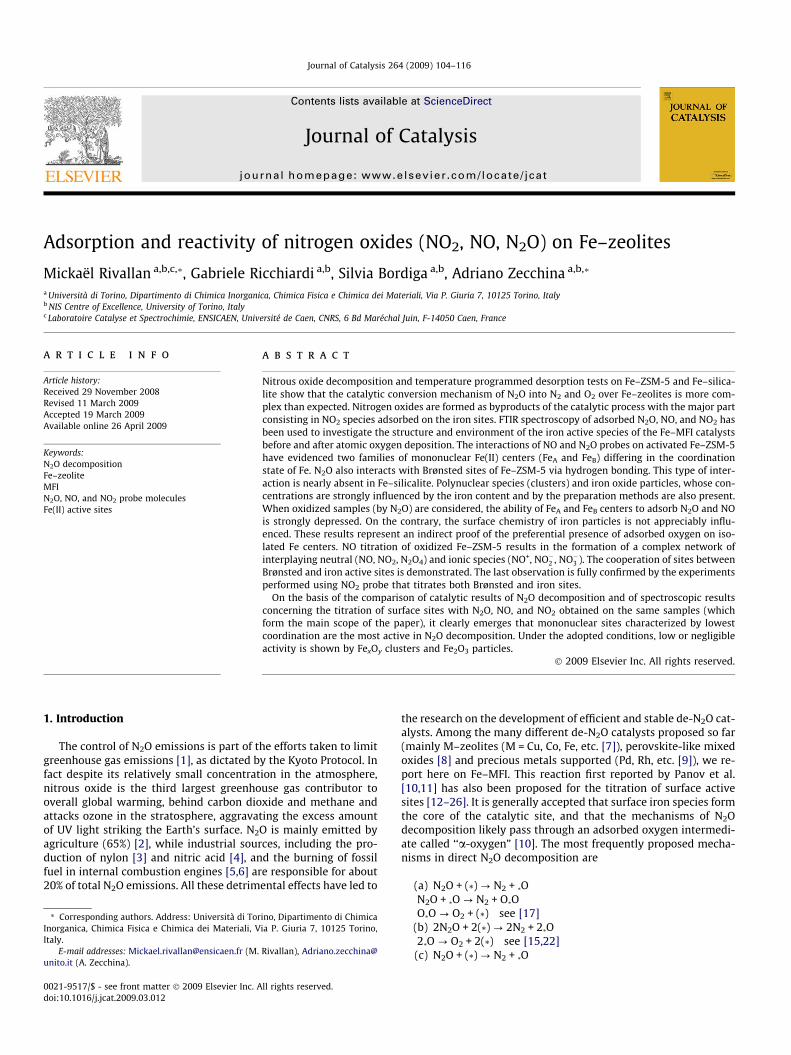
Fig. 6. FTIR spectra (background subtracted) of Fe–Z-40 freshly activated at 773 Kin contact with N2O at RT (a) and at 573 K (b) and following desorption at RT fromPN2 O ¼ 20 Torr (bold line) to PN2 O ¼ 10�3 Torr (dotted line).
M. Rivallan et al. / Journal of Catalysis 264 (2009) 104–116 109
Unlike Fe–silicalite and Fe–Z-140 (not shown), Fe–Z-15 and Fe–Z-40 exhibit two distinct TPD signals of O2 and NO. The TPD of Fe–Z-15 shows two oxygen maxima as a result of the presence of twodifferent families of iron adsorbing sites. The first oxygen releasecould come from recombination of species adsorbed on highly ac-tive sites (Langmuir–Hinshelwood), because it occurs at lowertemperature (4). The second oxygen desorption occurring on bothsamples (Fe–Z-15 and Fe–Z-40) is probably the result of thedecomposition of NOx species (5) because it is coupled (and pro-portional) to NO signal:
2FeðO�Þ ! 2Feð�Þ þ O2 ð4Þ2FeðNO2Þ ! 2Feð�Þ þ 2NOþ O2 ð5Þ
The fact that Fe–Z-40 sample does not display the second O2 signalat �550 K is quite difficult to explain. We may tentatively suggestthat on this catalyst characterized by highest activity reaction (3)is not occurring. In conclusion TPD test reveals the presence ofNOx products on the catalyst’s surface after N2O interaction (at773 K) and that NO can be evolved in the gas phase. We have clearevidence that NO can participate as reactant in the complex net-work of reactions associated with the N2O decomposition.
4. FTIR characterization using N2O, NO, and NO2 as probemolecules
4.1. Nitrous oxide
The IR spectra of N2O adsorbed at RT on Fe–Z-40 freshly acti-vated and pre-treated in N2O at 573 K (oxygen deposition) areshown in Fig. 6a and b.
Upon adsorption of N2O (20 Torr) on the sample activated at773 K (under vacuum condition) a fraction of Brønsted acid Si(O-H)Al groups are shifted from 3610 to 3470 cm�1 (not shown) be-cause of the weak hydrogen-bonding interaction reported below
SiðOHÞAlþ N2O! SiðOH � � �N2OÞAl ð6Þ
The silanols groups (peak at 3750 cm�1) are not perturbed by N2Oadsorption at RT. The N2O species weakly adsorbed on strongBrønsted sites is associated with an intense band with maximumat 2226 cm�1 due to the m(N–N) stretching vibration. The m(N–O)stretching vibration occurs at lower frequencies [55,56] and hencecannot be observed. The 2226 cm�1 band, also present on pure H–
ZSM-5, quickly disappears upon outgassing at RT. N2O interactionwith pure silicalite (not shown), where only silanols are present,do not show formation of these weakly adsorbed precursor species.The additional band at 2282 cm�1 and the shoulder at 2248 cm�1
are less reversible upon outgassing and are ascribed to N2O ad-sorbed on Fe sites [47].
Fexþ þ N2O! Fexþ � � �N2O ð7Þ
Two different families of sites (FeA and FeB) are involved likely char-acterized by different coordinative situations (lower and higher,respectively). N2O interaction on pre-oxidized catalyst (Fig. 6b) re-sults in FeA and FeB sites behaving differently toward oxidation. Infact A sites are no more detected while B sites population appearsonly substantially weakened. This behavior can be explained as fol-lows: (i) upon oxidation with N2O at 573 K, A sites (2282 cm�1)which are the most active become fully covered by oxygen species.Consequently they do not interact with N2O probe; (ii) FeB sites,belonging to a less active family, are less affected. Formation ofNOx species could also partially deactivate FeA and FeB sites. The lat-ter hypothesis cannot be discarded because the results of the cata-lytic tests obtained previously have shown that formation andsubsequent decomposition of surface NO�2 occur (5). It must be re-called that, if present, nitrites species are not detectable by FTIR be-cause their characteristic spectral region falls in the 1440 to1100 cm�1 range [57,58], where intense modes of the siliceousMFI matrix occur.
In conclusion the special character of the N2O probe is not onlyassociated to its ability to titrate different families of unsaturatedFe2+ sites, but also to its character of reactant in the investigateddecomposition. It is quite conceivable that (Fe2+� � �ON2) are the firstintermediates in the oxidation step of the decomposition:
Fe2þ þ N2O$ Fe2þ � � �ONN! ðFeOÞ2þ þ N2 ð8Þ
The higher concentration of adsorbed (hydrogen bonded) N2O onAl-containing samples could partially contribute to explain thehigher reactivity of these samples with respect to Al-free zeolites.
4.2. Nitric oxide
FTIR spectroscopy of adsorbed NO has been used by manyauthors in the past to explore iron sites dispersed in inorganicmatrices, as testified by the rich literature reporting IR spectra ofFe-nitrosyl complexes in zeolites [35,59–62]. This method is basedon the use of NO as a titrant of the exposed sites and is made pos-
110 M. Rivallan et al. / Journal of Catalysis 264 (2009) 104–116
sible by the well-known exceptional affinity of NO toward Fe2+ andFe3+ centers, leading to a formation of Fex+(NO)n nitrosyls (n = 1, 2,3) characterized by extremely intense IR bands. The high extinc-tion coefficient of nitrosylic bands allows to probe samples con-taining very low concentration of Fe centers [31]. A usefulfeature of this method is also related to the fact that upon changingthe NO equilibrium pressure, the full range of coverage can be ex-plored. Under these conditions all surface centers are titrated.
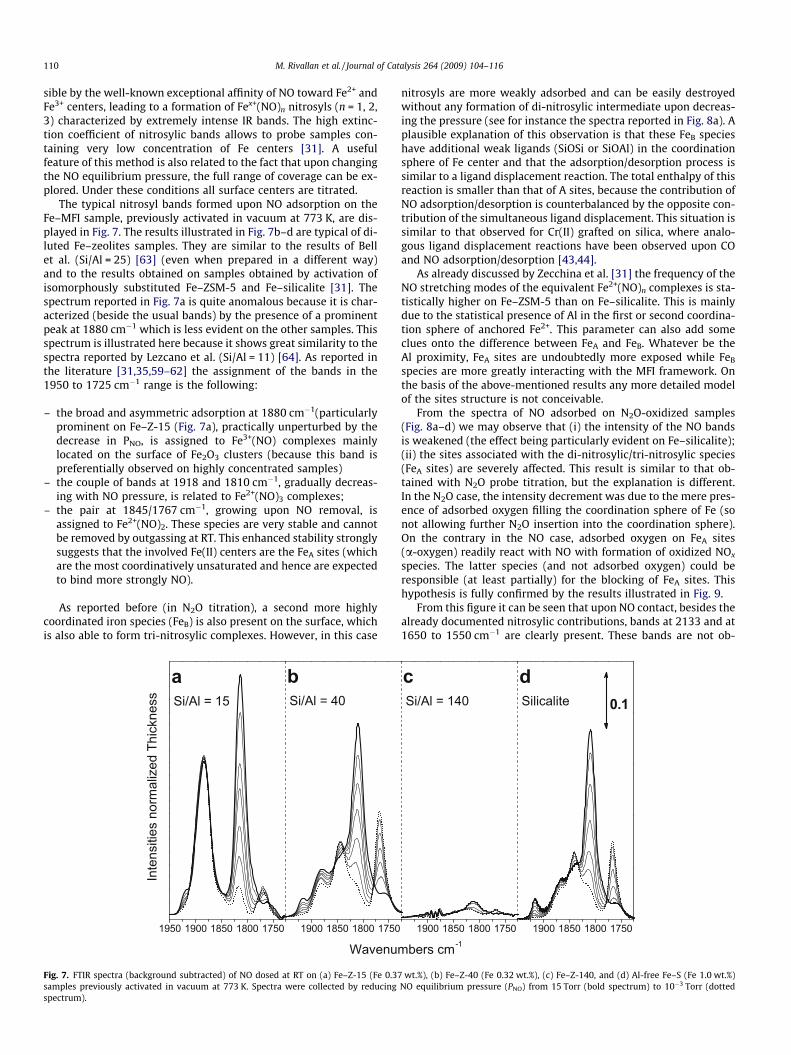
The typical nitrosyl bands formed upon NO adsorption on theFe–MFI sample, previously activated in vacuum at 773 K, are dis-played in Fig. 7. The results illustrated in Fig. 7b–d are typical of di-luted Fe–zeolites samples. They are similar to the results of Bellet al. (Si/Al = 25) [63] (even when prepared in a different way)and to the results obtained on samples obtained by activation ofisomorphously substituted Fe–ZSM-5 and Fe–silicalite [31]. Thespectrum reported in Fig. 7a is quite anomalous because it is char-acterized (beside the usual bands) by the presence of a prominentpeak at 1880 cm�1 which is less evident on the other samples. Thisspectrum is illustrated here because it shows great similarity to thespectra reported by Lezcano et al. (Si/Al = 11) [64]. As reported inthe literature [31,35,59–62] the assignment of the bands in the1950 to 1725 cm�1 range is the following:
– the broad and asymmetric adsorption at 1880 cm�1(particularlyprominent on Fe–Z-15 (Fig. 7a), practically unperturbed by thedecrease in PNO, is assigned to Fe3+(NO) complexes mainlylocated on the surface of Fe2O3 clusters (because this band ispreferentially observed on highly concentrated samples)
– the couple of bands at 1918 and 1810 cm�1, gradually decreas-ing with NO pressure, is related to Fe2+(NO)3 complexes;
– the pair at 1845/1767 cm�1, growing upon NO removal, isassigned to Fe2+(NO)2. These species are very stable and cannotbe removed by outgassing at RT. This enhanced stability stronglysuggests that the involved Fe(II) centers are the FeA sites (whichare the most coordinatively unsaturated and hence are expectedto bind more strongly NO).
As reported before (in N2O titration), a second more highlycoordinated iron species (FeB) is also present on the surface, whichis also able to form tri-nitrosylic complexes. However, in this case
Inte
nsiti
es n
orm
aliz
edTh
ickn
ess
1950 1900 1850 1800 1750
Si/Al = 15
Wavenum
a
1900 1850 1800 1750
bSi/Al = 40
Fig. 7. FTIR spectra (background subtracted) of NO dosed at RT on (a) Fe–Z-15 (Fe 0.37samples previously activated in vacuum at 773 K. Spectra were collected by reducingspectrum).
nitrosyls are more weakly adsorbed and can be easily destroyedwithout any formation of di-nitrosylic intermediate upon decreas-ing the pressure (see for instance the spectra reported in Fig. 8a). Aplausible explanation of this observation is that these FeB specieshave additional weak ligands (SiOSi or SiOAl) in the coordinationsphere of Fe center and that the adsorption/desorption process issimilar to a ligand displacement reaction. The total enthalpy of thisreaction is smaller than that of A sites, because the contribution ofNO adsorption/desorption is counterbalanced by the opposite con-tribution of the simultaneous ligand displacement. This situation issimilar to that observed for Cr(II) grafted on silica, where analo-gous ligand displacement reactions have been observed upon COand NO adsorption/desorption [43,44].
As already discussed by Zecchina et al. [31] the frequency of theNO stretching modes of the equivalent Fe2+(NO)n complexes is sta-tistically higher on Fe–ZSM-5 than on Fe–silicalite. This is mainlydue to the statistical presence of Al in the first or second coordina-tion sphere of anchored Fe2+. This parameter can also add someclues onto the difference between FeA and FeB. Whatever be theAl proximity, FeA sites are undoubtedly more exposed while FeB
species are more greatly interacting with the MFI framework. Onthe basis of the above-mentioned results any more detailed modelof the sites structure is not conceivable.
From the spectra of NO adsorbed on N2O-oxidized samples(Fig. 8a–d) we may observe that (i) the intensity of the NO bandsis weakened (the effect being particularly evident on Fe–silicalite);(ii) the sites associated with the di-nitrosylic/tri-nitrosylic species(FeA sites) are severely affected. This result is similar to that ob-tained with N2O probe titration, but the explanation is different.In the N2O case, the intensity decrement was due to the mere pres-ence of adsorbed oxygen filling the coordination sphere of Fe (sonot allowing further N2O insertion into the coordination sphere).On the contrary in the NO case, adsorbed oxygen on FeA sites(a-oxygen) readily react with NO with formation of oxidized NOx
species. The latter species (and not adsorbed oxygen) could beresponsible (at least partially) for the blocking of FeA sites. Thishypothesis is fully confirmed by the results illustrated in Fig. 9.
From this figure it can be seen that upon NO contact, besides thealready documented nitrosylic contributions, bands at 2133 and at1650 to 1550 cm�1 are clearly present. These bands are not ob-
1900 1850 1800 1750
cSi/Al = 140 0.1
bers cm-1
1900 1850 1800 1750
dSilicalite
wt.%), (b) Fe–Z-40 (Fe 0.32 wt.%), (c) Fe–Z-140, and (d) Al-free Fe–S (Fe 1.0 wt.%)NO equilibrium pressure (PNO) from 15 Torr (bold spectrum) to 10�3 Torr (dotted

1900 1850 1800 17501950 1900 1850 1800 1750
cSi/Al = 140
Inte
nsiti
es n
orm
aliz
edTh
ickn
ess 0.1Si/Al = 15
Wavenumbers cm-1
a bSi/Al = 40
dSilicalite
1900 1850 1800 1750 1900 1850 1800 1750
Fig. 8. FTIR spectra (background subtracted) of NO dosed at RT on (a) Fe–Z-15 (Fe 0.37 wt.%), (b) Fe–Z-40 (Fe 0.32 wt.%), (c) Fe–Z-140, and (d) Al-free Fe–S (Fe 1.0 wt.%)samples previously activated and then oxidized in N2O atmosphere (15 Torr at 573 K). Spectra were collected by reducing NO equilibrium pressure (PNO) from 15 Torr (boldspectrum) to 10�3 Torr (dotted spectrum).
M. Rivallan et al. / Journal of Catalysis 264 (2009) 104–116 111
served when a similar experiment is performed on Al-free Fe–sili-calite (not shown). We hypothesize that the appearance of thesebands is due to NO interaction with oxygen adsorbed on FeA sites(at RT) with formation of NO2. This molecule can be directlyadsorbed on iron centers with formation of Fe3+(NO2)� or, in thedimeric form (N2O4), disproportionate into NO+ and NO3
�.This hypothesis is especially consistent with the presence of the2133 cm�1 band. In fact Hadjiivanov et al. [58,65,66] have ob-served the same band on the H–ZSM-5/NO2 system which has beenassigned (after isotopic tests) to NO+ species. The formation of NO+
species can be justified as follows: N2O4 (which is in equilibriumwith NO2) originates first NO+ and NO�3 [67–69] and then NO+ read-ily exchanges with H+ of H–ZSM-5 Brønsted sites with formation ofadsorbed NO+. The overall reaction scheme is
2200 2100 2000 1900 1800 1700 1600 1500
b) Fe-Z-40 N2O-oxidized
Abso
rban
ce u
.a.
Wavenumbers cm-1
a) Fe-Z-40 activated
Fig. 9. FTIR spectra (background subtracted) of 15 Torr NO dosed at RT on Fe–Z-40after activation at 773 K in He (a) and after N2O contact at 573 K (b).
2NO2 $ N2O4 $ NOþ � � �NO�3 ð9ÞNOþ � � �NO�3 þHþ $ NOþ þHNO3 ð10Þ
Of course a similar reaction sequence can occur if NO2 is generatedon Fe–ZSM-5 by reaction on NO with preadsorbed oxygen. In con-clusion, the formation of NO+ species (at 2133 cm�1) at RT afterNO contact with the previously oxidized Fe–ZSM-5 (by N2O) givesindirect and convincing evidence of the presence of adsorbed oxy-gen and of its reactivity. From this, it also emerges that NO cannot only probe Fex+ sites, but also react with adsorbed species(*O). This reactivity could help to understand the promoting effectof NO in N2O decomposition. Notice that the interaction betweenNO and deposited Oat has been clearly evidenced in catalysis test,where NO promotes N2O decomposition reaction. The presence ofFe3+(NO2)� species cannot be detected by IR because the bands of(NO2)� occur usually in a region where the skeletal modes of thematrix absorb strongly. However, the formation of new Fe3+ speciesupon NO contact is indirectly proved by the increase of the band at1870 cm�1 which is known to belong to Fe3+(NO) species.
About the destiny of NO�3 , we remark that weak bands are ob-served in the 1650 to 1600 cm�1 range, which can be assigned toadsorbed nitrate species (NO3)�. These species could be locatedeither on iron centers or on the matrix (vide infra).
On the basis of the above points, we shall compare and discusson the spectroscopy of adsorbed NO2 on Fe–ZSM-5, Fe–silicalite,H–ZSM-5 and silicalite.
4.3. Relation between activity in N2O abatement and active sitestitration with NO and N2O
The connection between catalysis and active sites characteriza-tion is generally not straightforward. In the present case this con-nection is made difficult by the heterogeneity of Fe sites on thesurface and by the fact that only a fraction of them is really active.On the basis of the comparison of catalytic results of N2O decom-position and of spectroscopic results concerning the surface sitestitration with N2O and NO obtained on the same samples (whichform the main scope of the paper) it clearly emerges that low coor-
112 M. Rivallan et al. / Journal of Catalysis 264 (2009) 104–116
dinated FeA mononuclear sites are the most active in N2O decom-position. FeB mononuclear sites, being characterized by a morecomplete coordination sphere, are less active. The same can beconcluded about iron sites on FexOy clusters and Fe2O3 particles be-cause the activity (calculated per Fe center) increases with dilution.The abundant presence of clustered species explains the anoma-lous activity and NO spectra of Fe–Z-15 sample.
4.4. Nitrogen dioxide
The spectra illustrated in Fig. 9 have shown that NO can reactwith adsorbed oxygen with formation of adsorbed NOx species.To give a fully convincing assignment of the bands illustrated inFig. 9 we have planned to investigate the spectroscopy of adsorbedNOx species formed by direct adsorption of NO2. This study is notonly useful for the above-mentioned scope but has also generalvalidity. In fact, the dual character of NO2 (N2O4) which can gener-ate NOþ=NO�3 pairs allows to simultaneously probe the acid andbasic sites present on the surface. In Figs. 10 and 11 the spectraof adsorbed NO2 on silicalite, H–Z-40 (H–ZSM-5; Si/Al = 40), Fe–S,and Fe–Z-40 are illustrated.
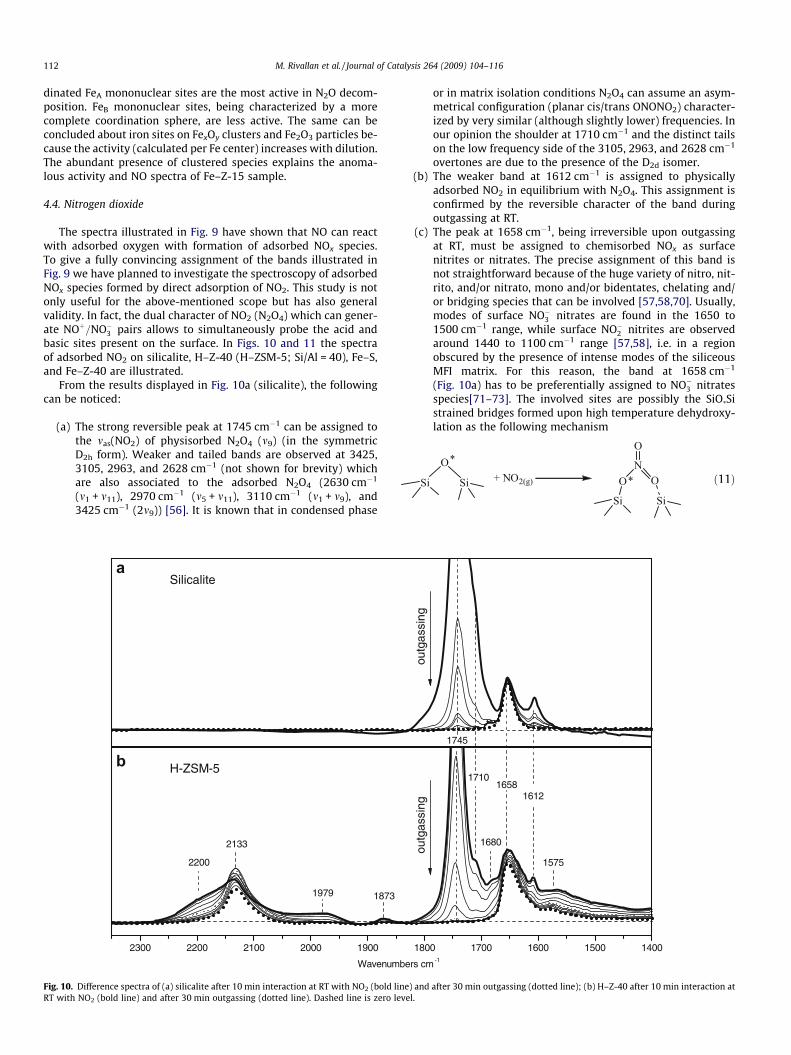
From the results displayed in Fig. 10a (silicalite), the followingcan be noticed:
(a) The strong reversible peak at 1745 cm�1 can be assigned tothe mas(NO2) of physisorbed N2O4 (m9) (in the symmetricD2h form). Weaker and tailed bands are observed at 3425,3105, 2963, and 2628 cm�1 (not shown for brevity) whichare also associated to the adsorbed N2O4 (2630 cm�1
(m1 + m11), 2970 cm�1 (m5 + m11), 3110 cm�1 (m1 + m9), and3425 cm�1 (2m9)) [56]. It is known that in condensed phase
Silicalite
2300 2200 2100 2000 1900
H-ZSM-5
Wavenum
2133
2200
1979 1873
a
b
Fig. 10. Difference spectra of (a) silicalite after 10 min interaction at RT with NO2 (bold liRT with NO2 (bold line) and after 30 min outgassing (dotted line). Dashed line is zero le
or in matrix isolation conditions N2O4 can assume an asym-metrical configuration (planar cis/trans ONONO2) character-ized by very similar (although slightly lower) frequencies. Inour opinion the shoulder at 1710 cm�1 and the distinct tailson the low frequency side of the 3105, 2963, and 2628 cm�1
overtones are due to the presence of the D2d isomer.(b) The weaker band at 1612 cm�1 is assigned to physically
adsorbed NO2 in equilibrium with N2O4. This assignment isconfirmed by the reversible character of the band duringoutgassing at RT.
(c) The peak at 1658 cm�1, being irreversible upon outgassingat RT, must be assigned to chemisorbed NOx as surfacenitrites or nitrates. The precise assignment of this band isnot straightforward because of the huge variety of nitro, nit-rito, and/or nitrato, mono and/or bidentates, chelating and/or bridging species that can be involved [57,58,70]. Usually,modes of surface NO�3 nitrates are found in the 1650 to1500 cm�1 range, while surface NO�2 nitrites are observedaround 1440 to 1100 cm�1 range [57,58], i.e. in a regionobscured by the presence of intense modes of the siliceousMFI matrix. For this reason, the band at 1658 cm�1
(Fig. 10a) has to be preferentially assigned to NO�3 nitratesspecies[71–73]. The involved sites are possibly the SiO*Sistrained bridges formed upon high temperature dehydroxy-lation as the following mechanism
ð11Þ
1710
outg
assi
ng
1800 1700 1600 1500 1400
outg
assi
ng
16581612
1745
bers cm-1
1575
1680
ne) and after 30 min outgassing (dotted line); (b) H–Z-40 after 10 min interaction atvel.
2079
outg
assi
ng
2300 2200 2100 2000 1900 1800 1700 1600 1500 1400
outg
assi
ng
1658
1612
1580
21332200
1979
1873 1680
1710
Wavenumbers cm-1
1635
1620
Fe-silicalite
Fe-ZSM-5
a
b
Fig. 11. Difference spectra of (a) Fe–S after 10 min interaction at RT with NO2 (bold line) and after 30 min outgassing (dotted line); (b) Fe–Z-40 after 10 min interaction at RTwith NO2 (bold line) and after 30 min outgassing (dotted line). Dashed line is zero level.
M. Rivallan et al. / Journal of Catalysis 264 (2009) 104–116 113
It is a matter of fact that upon NO2 dosage a shoulder at 910 and apeak at 896 cm�1 (attributed to distorted SiO*Si bridges) arestrongly weakened (results not shown for brevity). It is so con-cluded that the pure siliceous part of the framework clearly partic-ipates in the adsorption and stabilization of NO2. From this pointand from Fig. 10b the following emerges:
(a) A band at 2133 cm�1 and a broad shoulder at 2200 cm�1
which can be attributed to the m(NO) of NO+ species areclearly observed (not present on silicalite). The shoulder at2200 cm�1 is progressively weakened by decreasing thepressure of NO2 (N2O4). This decrement is accompanied bythe simultaneous increase of the peak at 2133 cm�1. Thiseffect is attributed to the destruction of a weak complex(SiO�Al)NO+� � �N2O4 [58,74,75] responsible for the shoulderat 2200 cm�1. This is in agreement with the observation thatthe band at 2200 cm�1 increases proportionally with thegrowth of the ‘‘N2O4 band” at 1745 cm�1 and disappearsupon outgassing.
(b) With respect to silicalite/NO2 system (Fig. 10a), additionalbands appear at 1620 (shoulder) and 1575 cm�1 which canalso be assigned to nitrates species. The 1620 and1575 cm�1 bands are located on the top of a broad absorp-tion band that covers the whole 1650 to 1450 cm�1 region.This broad feature is drastically weakened upon outgassingat RT and hence is due to neutral weakly adsorbed speciessuch as HNO3. The presence of weakly adsorbed HNO3 is alsodemonstrated by the band at around 3400 cm�1 (notreported) which can be assigned to OH stretching modesof HNO3 [55,57,76,77].
(c) Two new weak bands occur at 1979 and 1873 cm�1 (notobserved on silicalite), these bands are not due to vibrationalmodes of new adsorbed species, but due to slight modifica-tion of the skeletal modes disturbed by the presence ofstrong adsorbates (a fact that is reflected in difference spec-tra) [78].
(d) Upon outgassing, molecular N2O4 and unreacted HNO3 aredirectly desorbed, while nitrate species remains. The behav-ior of the NO+ species (band at 2133 cm�1) upon outgassingis quite interesting also because a fraction of these species isremoved by outgassing. This decrement is associated with aproportional recover of the band due to Brønsted sites at3610 cm�1 (Si(OH)Al) (not shown). The explanation of theremoval of an ionic species by outgassing at RT is notstraightforward. In the present case, this phenomenon canonly be explained if NO+ is replaced by H+, following a shiftto the left of the equilibrium in reaction (10), thanks to thepresence of adsorbed HNO3 in the cavities (band in 3430to 3400 cm�1range). A cooperation effect between two sep-arate species (NO+ and HNO3) is here evidenced. The elimi-nation of NO+ is not complete because the outgassingprocedure also directly removes HNO3, a fact that does notallow the full reversibility of the process.
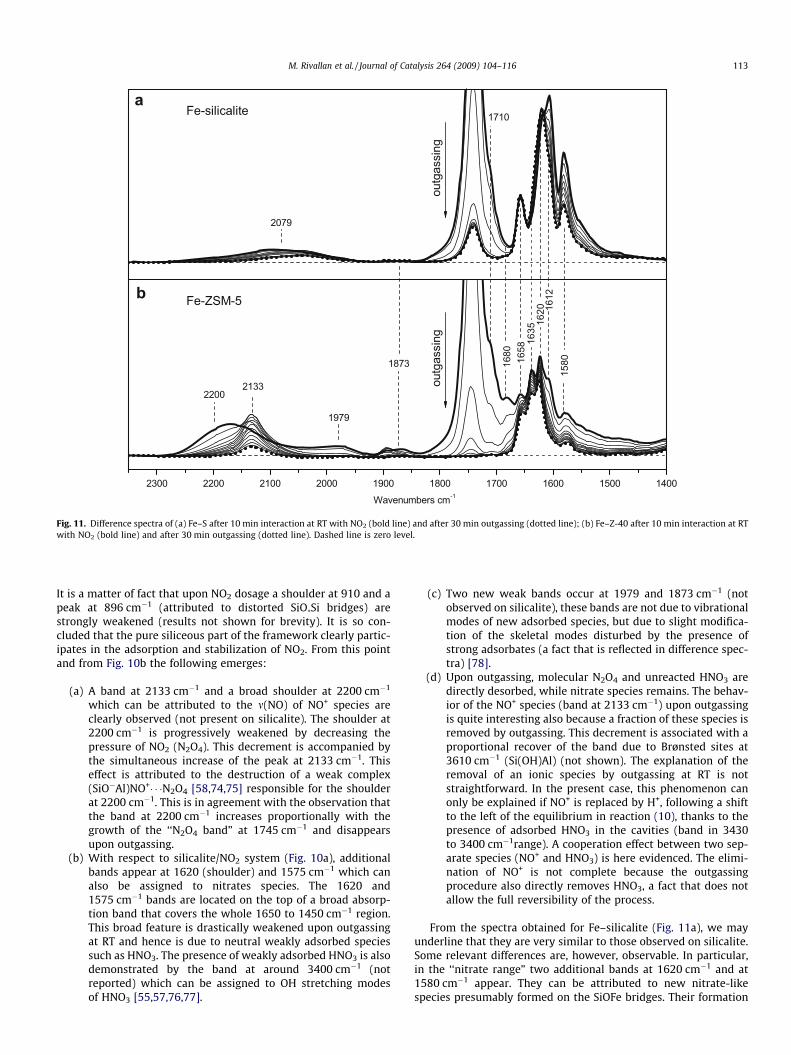
From the spectra obtained for Fe–silicalite (Fig. 11a), we mayunderline that they are very similar to those observed on silicalite.Some relevant differences are, however, observable. In particular,in the ‘‘nitrate range” two additional bands at 1620 cm�1 and at1580 cm�1 appear. They can be attributed to new nitrate-likespecies presumably formed on the SiOFe bridges. Their formation
3
n
2 2 4
n
2-
+
n
2-
a
b
c
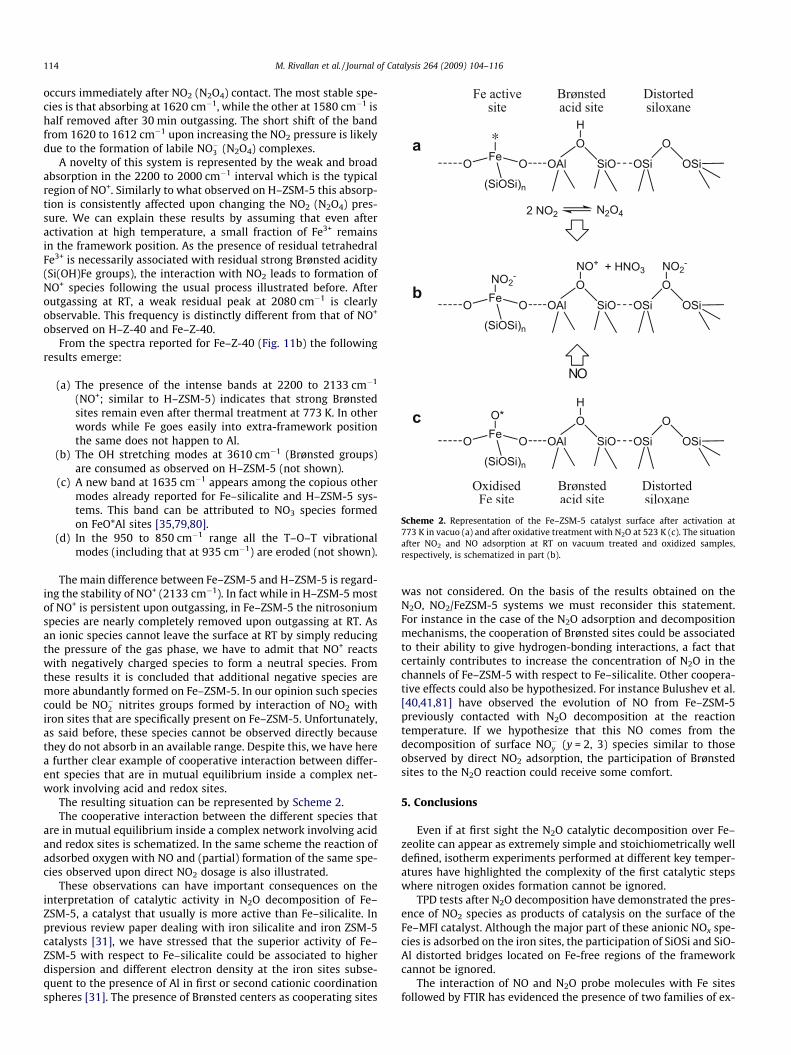
Scheme 2. Representation of the Fe–ZSM-5 catalyst surface after activation at773 K in vacuo (a) and after oxidative treatment with N2O at 523 K (c). The situationafter NO2 and NO adsorption at RT on vacuum treated and oxidized samples,respectively, is schematized in part (b).
114 M. Rivallan et al. / Journal of Catalysis 264 (2009) 104–116
occurs immediately after NO2 (N2O4) contact. The most stable spe-cies is that absorbing at 1620 cm�1, while the other at 1580 cm�1 ishalf removed after 30 min outgassing. The short shift of the bandfrom 1620 to 1612 cm�1 upon increasing the NO2 pressure is likelydue to the formation of labile NO�3 (N2O4) complexes.
A novelty of this system is represented by the weak and broadabsorption in the 2200 to 2000 cm�1 interval which is the typicalregion of NO+. Similarly to what observed on H–ZSM-5 this absorp-tion is consistently affected upon changing the NO2 (N2O4) pres-sure. We can explain these results by assuming that even afteractivation at high temperature, a small fraction of Fe3+ remainsin the framework position. As the presence of residual tetrahedralFe3+ is necessarily associated with residual strong Brønsted acidity(Si(OH)Fe groups), the interaction with NO2 leads to formation ofNO+ species following the usual process illustrated before. Afteroutgassing at RT, a weak residual peak at 2080 cm�1 is clearlyobservable. This frequency is distinctly different from that of NO+
observed on H–Z-40 and Fe–Z-40.From the spectra reported for Fe–Z-40 (Fig. 11b) the following
results emerge:
(a) The presence of the intense bands at 2200 to 2133 cm�1
(NO+; similar to H–ZSM-5) indicates that strong Brønstedsites remain even after thermal treatment at 773 K. In otherwords while Fe goes easily into extra-framework positionthe same does not happen to Al.
(b) The OH stretching modes at 3610 cm�1 (Brønsted groups)are consumed as observed on H–ZSM-5 (not shown).
(c) A new band at 1635 cm�1 appears among the copious othermodes already reported for Fe–silicalite and H–ZSM-5 sys-tems. This band can be attributed to NO3 species formedon FeO*Al sites [35,79,80].
(d) In the 950 to 850 cm�1 range all the T–O–T vibrationalmodes (including that at 935 cm�1) are eroded (not shown).
The main difference between Fe–ZSM-5 and H–ZSM-5 is regard-ing the stability of NO+ (2133 cm�1). In fact while in H–ZSM-5 mostof NO+ is persistent upon outgassing, in Fe–ZSM-5 the nitrosoniumspecies are nearly completely removed upon outgassing at RT. Asan ionic species cannot leave the surface at RT by simply reducingthe pressure of the gas phase, we have to admit that NO+ reactswith negatively charged species to form a neutral species. Fromthese results it is concluded that additional negative species aremore abundantly formed on Fe–ZSM-5. In our opinion such speciescould be NO�2 nitrites groups formed by interaction of NO2 withiron sites that are specifically present on Fe–ZSM-5. Unfortunately,as said before, these species cannot be observed directly becausethey do not absorb in an available range. Despite this, we have herea further clear example of cooperative interaction between differ-ent species that are in mutual equilibrium inside a complex net-work involving acid and redox sites.
The resulting situation can be represented by Scheme 2.The cooperative interaction between the different species that
are in mutual equilibrium inside a complex network involving acidand redox sites is schematized. In the same scheme the reaction ofadsorbed oxygen with NO and (partial) formation of the same spe-cies observed upon direct NO2 dosage is also illustrated.
These observations can have important consequences on theinterpretation of catalytic activity in N2O decomposition of Fe–ZSM-5, a catalyst that usually is more active than Fe–silicalite. Inprevious review paper dealing with iron silicalite and iron ZSM-5catalysts [31], we have stressed that the superior activity of Fe–ZSM-5 with respect to Fe–silicalite could be associated to higherdispersion and different electron density at the iron sites subse-quent to the presence of Al in first or second cationic coordinationspheres [31]. The presence of Brønsted centers as cooperating sites
was not considered. On the basis of the results obtained on theN2O, NO2/FeZSM-5 systems we must reconsider this statement.For instance in the case of the N2O adsorption and decompositionmechanisms, the cooperation of Brønsted sites could be associatedto their ability to give hydrogen-bonding interactions, a fact thatcertainly contributes to increase the concentration of N2O in thechannels of Fe–ZSM-5 with respect to Fe–silicalite. Other coopera-tive effects could also be hypothesized. For instance Bulushev et al.[40,41,81] have observed the evolution of NO from Fe–ZSM-5previously contacted with N2O decomposition at the reactiontemperature. If we hypothesize that this NO comes from thedecomposition of surface NO�y (y = 2, 3) species similar to thoseobserved by direct NO2 adsorption, the participation of Brønstedsites to the N2O reaction could receive some comfort.
5. Conclusions
Even if at first sight the N2O catalytic decomposition over Fe–zeolite can appear as extremely simple and stoichiometrically welldefined, isotherm experiments performed at different key temper-atures have highlighted the complexity of the first catalytic stepswhere nitrogen oxides formation cannot be ignored.
TPD tests after N2O decomposition have demonstrated the pres-ence of NO2 species as products of catalysis on the surface of theFe–MFI catalyst. Although the major part of these anionic NOx spe-cies is adsorbed on the iron sites, the participation of SiOSi and SiO-Al distorted bridges located on Fe-free regions of the frameworkcannot be ignored.
The interaction of NO and N2O probe molecules with Fe sitesfollowed by FTIR has evidenced the presence of two families of ex-
M. Rivallan et al. / Journal of Catalysis 264 (2009) 104–116 115
tra-framework iron mononuclear species FeA and FeB. The differ-ence between these two iron sites is likely due to the number ofSiOSi and SiOAl ligands present in the coordination sphere of Fe(II).The FeA site, less coordinated to MFI zeolitic framework, appearsmore active and can be associated with the classical a-sites. Alvicinity is another parameter to be considered because it favorsiron dispersion. Clustered species and Fe2O3 particles do notemerge as active participants to the N2O decomposition reaction(under the investigated temperature conditions). Brønsted sitespresent in Fe–ZSM-5 interact with N2O via hydrogen bonding withformation of stabilized complexes. These complexes are not ob-served on Fe–silicalite. This difference could partially explain thedifferent activity of the two samples in the N2O decompositionreaction.
Sites cooperation between Brønsted and iron active sites is evi-denced when Fe–ZSM-5 previously oxidized with N2O is probedwith NO. In this case NO interacts directly with active oxygen spe-cies previously adsorbed (‘‘alpha-oxygen”) on FeA sites with forma-tion of NO2 and of the associated NO+ and NO�3 species. The sitescooperation is also clearly demonstrated when NO2 is directly usedas a probe molecule to titrate surface sites of H–ZSM-5 and Fe–ZSM-5 zeolites.
References
[1] J. Perez-Ramirez, F. Kapteijn, K. Schoffel, J.A. Moulijn, Applied Catalysis B –Environmental 44 (2003) 117–151.
[2] P.M. Vitousek, J.D. Aber, R.W. Howarth, G.E. Likens, P.A. Matson, D.W.Schindler, W.H. Schlesinger, D.G. Tilman, Ecological Applications 7 (1997)737–750.
[3] M.H. Thiemens, W.C. Trogler, Science 251 (1991) 932–934.[4] R.W. van den Brink, S. Booneveld, M. Verhaak, F.A. de Bruijn, Catalysis Today 75
(2002) 227–232.[5] A.N. Hayhurst, A.D. Lawrence, Progress in Energy and Combustion Science 18
(1992) 529–552.[6] M.A. Wojtowicz, J.R. Pels, J.A. Moulijn, Fuel Processing Technology 34 (1993) 1–
71.[7] Y.J. Li, J.N. Armor, Applied Catalysis B – Environmental 1 (1992) L21–L29.[8] M.A. Pena, J.L.G. Fierro, Chemical Reviews 101 (2001) 1981–2017.[9] K. Yuzaki, T. Yarimizu, K. Aoyagi, S. Ito, K. Kunimori, Catalysis Today 45 (1998)
129–134.[10] G.I. Panov, V.I. Sobolev, A.S. Kharitonov, Journal of Molecular Catalysis 61
(1990) 85–97.[11] G.I. Panov, G.A. Sheveleva, A.S. Kharitonov, V.N. Romannikov, L.A. Vostrikova,
Applied Catalysis A – General 82 (1992) 31–36.[12] E. Hensen, Q.J. Zhu, P.H. Liu, K.J. Chao, R. van Santen, Journal of Catalysis 226
(2004) 466–470.[13] K.Q. Sun, H. Xia, E. Hensen, R. van Santen, C. Li, Journal of Catalysis 238 (2006)
186–195.[14] Y. Li, Z.C. Feng, H.C. Xin, F.T. Fan, J. Zhang, P. Magusin, E.J.M. Hensen, R.A. van
Santen, Q.H. Yang, C. Li, Journal of Physical Chemistry B 110 (2006) 26114–26121.
[15] G.D. Pirngruber, M. Luechinger, P.K. Roy, A. Cecchetto, P. Smirniotis, Journal ofCatalysis 224 (2004) 429–440.
[16] J. Perez-Ramirez, F. Kapteijn, A. Bruckner, Journal of Catalysis 218 (2003) 234–238.
[17] E.V. Kondratenko, J. Perez-Ramirez, Journal of Physical Chemistry B 110 (2006)22586–22595.
[18] A. Heyden, N. Hansen, A.T. Bell, F.J. Keil, Journal of Physical Chemistry B 110(2006) 17096–17114.
[19] I. Melian-Cabrera, S. Espinosa, J.C. Groen, B. van de Linden, F. Kapteijn, J.A.Moulijn, Journal of Catalysis 238 (2006) 250–259.
[20] G.D. Pirngruber, P.K. Roy, Catalysis Today 110 (2005) 199–210.[21] A. Heyden, B. Peters, A.T. Bell, F.J. Keil, Journal of Physical Chemistry B 109
(2005) 4801–4804.[22] I. Yuranov, D.A. Bulushev, A. Renken, L. Kiwi-Minsker, Journal of Catalysis 227
(2004) 138–147.[23] G. Berlier, C. Prestipino, M. Rivallan, S. Bordiga, C. Lamberti, A. Zecchina,
Journal of Physical Chemistry B 109 (2005).[24] E.V. Kondratenko, J. Perez-Ramirez, Applied Catalysis B – Environmental 64
(2006) 35–41.[25] L. Kiwi-Minsker, D.A. Bulushev, A. Renken, Journal of Catalysis 219 (2003)
273–285.[26] A. Ates, A. Reitzmann, Chemical Engineering Journal 134 (2007) 218–227.[27] A. Heyden, B. Peters, A.T. Bell, F.J. Keil, Journal of Physical Chemistry B 109
(2005) 1857–1873.[28] G. Yang, D. Zhou, X. Liu, X. Han, X. Bao, Journal of Molecular Structure 797
(2006) 131–139.
[29] P.M. Esteves, B. Louis, Journal of Physical Chemistry B 110 (2006) 16793–16800.
[30] S. Perathoner, F. Pino, G. Centi, G. Giordano, A. Katovic, J.B. Nagy, K. Lazar, P.Fejes, Impact of Zeolites and Other Porous Materials on the New Technologiesat the Beginning of the New Millennium, Pts. A and B, Elsevier Science Bv.,Amsterdam, 2002, pp. 503–510.
[31] A. Zecchina, M. Rivallan, G. Berlier, C. Lamberti, G. Ricchiardi, Phys. Chem.Chem. Phys. 9 (2007) 3483–3499.
[32] N. Hansen, A. Heyden, A.T. Bell, F.J. Keil, Journal of Physical Chemistry C 111(2007) 2092–2101.
[33] G. Grubert, M.J. Hudson, R.W. Joyner, M. Stockenhuber, Journal of Catalysis 196(2000) 126–133.
[34] G. Mul, J. Perez-Ramirez, F. Kapteijn, J.A. Moulijn, Catalysis Letters 77 (2001) 7–13.
[35] G. Mul, J. Perez-Ramirez, F. Kapteijn, J.A. Moulijn, Catalysis Letters 80 (2002)129–138.
[36] J. Perez-Ramirez, F. Kapteijn, G. Mul, J.A. Moulijn, Journal of Catalysis 208(2002) 211–223.
[37] C.M. Sang, B.H. Kim, C.R.F. Lund, Journal of Physical Chemistry B 109 (2005)2295–2301.
[38] J. Novakova, Z. Sobalik, Catalysis Letters 105 (2005) 169–177.[39] J. Novakova, Z. Sobalik, Catalysis Letters 111 (2006) 195–202.[40] D.A. Bulushev, A. Renken, L. Kiwi-Minsker, Journal of Physical Chemistry B 110
(2006) 305–312.[41] D.A. Bulushev, A. Renken, L. Kiwi-Minsker, Journal of Physical Chemistry B 110
(2006) 10691–10700.[42] B. Wichterlova, Z. Sobalik, J. Dedecek, Applied Catalysis B – Environmental 41
(2003) 97–114.[43] E. Groppo, C. Lamberti, S. Bordiga, G. Spoto, A. Zecchina, Chemical Reviews 105
(2005) 115–183.[44] E. Groppo, C. Lamberti, G. Spoto, S. Bordiga, G. Magnacca, A. Zecchina, Journal
of Catalysis 236 (2005) 233–244.[45] M.T. Nechita, G. Berlier, G. Ricchiardi, S. Bordiga, A. Zecchina, Catalysis Letters
103 (2005) 33–41.[46] P. Ratnasamy, R. Kumar, Catalysis Today 9 (1991) 329–416.[47] B.R. Wood, J.A. Reimer, A.G. Bell, Journal of Catalysis 209 (2002) 151–158.[48] J.F. Jia, Q. Sun, B. Wen, L.X. Chen, W.M.H. Sachtler, Catalysis Letters 82 (2002)
7–11.[49] Q. Zhu, B.L. Mojet, R.A.J. Janssen, E.J.M. Hensen, J. van Grondelle, P. Magusin,
R.A. van Santen, Catalysis Letters 81 (2002) 205–212.[50] P.K. Roy, G.D. Pirngruber, Journal of Catalysis 227 (2004) 164–174.[51] M.N. Debbagh, A. Bueno-Lopez, C.S.M. de Lecea, J. Perez-Ramirez, Applied
Catalysis A – General 327 (2007) 66–72.[52] J. Perez-Ramirez, F. Kapteijn, J.C. Groen, A. Domenech, G. Mul, J.A. Moulijn,
Journal of Catalysis 214 (2003) 33–45.[53] F. Kapteijn, G. Marban, J. RodriguezMirasol, J.A. Moulijn, Journal of Catalysis
167 (1997) 256–265.[54] L. Kiwi-Minsker, D.A. Bulushev, A. Renken, Catalysis Today 110 (2005) 191–
198.[55] J. Laane, J.R. Ohlsen, Progress in Inorganic Chemistry 28 (1986) 465.[56] G. Herzberg, 2: Infrared and Raman Spectra of Polyatomic Molecules, D. Van
Nostrand Reinhold, Inc., New York, 1945.[57] K. Nakamoto, Infrared and Raman Spectra of Inorganic and Coordination
Compounds, Wiley and Sons, New York, 1970.[58] K.I. Hadjiivanov, Catalysis Reviews – Science and Engineering 42 (2000) 71–
144.[59] L.J. Lobree, I.C. Hwang, J.A. Reimer, A.T. Bell, Catalysis Letters 63 (1999) 233–
240.[60] G. Spoto, A. Zecchina, G. Berlier, S. Bordiga, M.G. Clerici, L. Basini, Journal of
Molecular Catalysis A – Chemical 158 (2000) 107–114.[61] G. Berlier, G. Ricchiardi, S. Bordiga, A. Zecchina, Journal of Catalysis 229 (2005)
127–135.[62] G. Berlier, G. Spoto, G. Ricchiardi, S. Bordiga, C. Lamberti, A. Zecchina, Journal of
Molecular Catalysis A – Chemical 182 (2002) 359–366.[63] L.J. Lobree, I.C. Hwang, J.A. Reimer, A.T. Bell, Journal of Catalysis 186 (1999)
242–253.[64] M. Lezcano, V.I. Kovalchuk, J.L. d’Itri, Kinetics and Catalysis 42 (2001) 104–111.[65] K. Hadjiivanov, J. Saussey, J.L. Freysz, J.C. Lavalley, Catalysis Letters 52 (1998)
103–108.[66] A. Penkova, K. Hadjiivanov, M. Mihaylov, M. Daturi, J. Saussey, J.C. Lavalley,
Langmuir 20 (2004) 5425–5431.[67] A.M. Vos, P. Mignon, P. Geerlings, F. Thibault-Starzyk, R.A. Schoonheydt,
Microporous and Mesoporous Materials 90 (2006) 370–376.[68] J. Szanyi, J.H. Kwak, R.A. Moline, C.H.F. Peden, Physical Chemistry Chemical
Physics 5 (2003) 4045–4051.[69] I. Perdana, D. Creaser, O. Ohrman, J. Hedlund, Applied Catalysis B –
Environmental 72 (2007) 82–91.[70] V.H. Grassian, International Reviews in Physical Chemistry 20 (2001) 467–548.[71] T. Venkov, K. Hadjiivanov, D. Klissurski, Physical Chemistry Chemical Physics 4
(2002) 2443–2448.[72] J. Szanyi, J.H. Kwak, R.J. Chimentao, C.H.F. Peden, Journal of Physical Chemistry
C 111 (2007) 2661–2669.[73] C. Paze, G. Gubitosa, S.O. Giacone, G. Spoto, F. Xamena, A. Zecchina, Topics in
Catalysis 30–31 (2004) 169–175.[74] Q. Sun, Z.X. Gao, H.Y. Chen, W.M.H. Sachtler, Journal of Catalysis 201 (2001)
89–99.

116 M. Rivallan et al. / Journal of Catalysis 264 (2009) 104–116
[75] Z.X. Gao, S. Qi, W.M.H. Sachtler, Applied Catalysis B – Environmental 33 (2001)9–23.
[76] C. Borensen, U. Kirchner, V. Scheer, R. Vogt, R. Zellner, Journal of PhysicalChemistry A 104 (2000) 5036–5045.
[77] K. Hadjiivanov, Catalysis Letters 68 (2000) 157–161.[78] A. Zecchina, F. Geobaldo, G. Spoto, S. Bordiga, G. Ricchiardi, R. Buzzoni, G.
Petrini, Journal of Physical Chemistry 100 (1996) 16584–16599.
[79] E.J.M. Hensen, Q. Zhu, R.A.J. Janssen, P. Magusin, P.J. Kooyman, R.A. van Santen,Journal of Catalysis 233 (2005) 123–135.
[80] Q. Yu, X.P. Wang, N. Xing, H.L. Yang, S.X. Zhang, Journal of Catalysis 245 (2007)124–132.
[81] E.M. El-Malki, R.A. van Santen, W.M.H. Sachtler, Journal of Catalysis 196 (2000)212–223.