U591663.pdf - UCL Discovery
468
FACTORS INFLUENCING THE SUCCESSFUL PRODUCTION OF LARGE PLASMIDS FOR USE IN GENE THERAPY AND DNA VACCINATION A THESIS SUMITTED FOR THE DEGREE OF ENGINEERING DOCTORATE BY THOMAS HENRY BURT DEPARTMENT OF BIOCHEMICAL ENGINEERING UNIVERSITY COLLEGE LONDON SEPTEMBER 2006
-
Upload
khangminh22 -
Category
Documents
-
view
0 -
download
0
Transcript of U591663.pdf - UCL Discovery

FACTORS INFLUENCING THE
SUCCESSFUL PRODUCTION OF
LARGE PLASMIDS FOR USE IN GENE
THERAPY AND DNA VACCINATION
A THESIS SUMITTED FOR THE DEGREE OF
ENGINEERING DOCTORATE
BY
THOMAS HENRY BURT
DEPARTMENT OF BIOCHEMICAL ENGINEERING
UNIVERSITY COLLEGE LONDON
SEPTEMBER 2006

UMI Number: U591663
All rights reserved
INFORMATION TO ALL USERS The quality of this reproduction is dependent upon the quality of the copy submitted.
In the unlikely event that the author did not send a complete manuscript and there are missing pages, these will be noted. Also, if material had to be removed,
a note will indicate the deletion.
Dissertation Publishing
UMI U591663Published by ProQuest LLC 2013. Copyright in the Dissertation held by the Author.
Microform Edition © ProQuest LLC.All rights reserved. This work is protected against
unauthorized copying under Title 17, United States Code.
ProQuest LLC 789 East Eisenhower Parkway
P.O. Box 1346 Ann Arbor, Ml 48106-1346

TABLE OF CONTENTS
1 Literature review....................................................................................31.1 C hapter Aims............................................... 31.2 Gene Therapy........................................................................................................ 31.3 The Potential of Gene Therapy.........................................................................5
1.3.1 Publication Analysis.................................................................................. 61.3.2 Potential Targets for Gene Therapy.......................................................... 8
1.3.2.1 Cancer............................................................................................91.3.2.2 HIV/AIDS and related Conditions................................................ 91.3.2.3 Blood, Cardiovascular and Heart Disorders...............................101.3.2.4 Monogenic Disorders...................................................................10
1.4 Vaccines...............................................................................................................111.4.1 Traditional Vaccines................................................................................ 111.4.2 Novel Vaccine Classes.............................................................................12
1.4.2.1 Recombinant Viruses...................................................................121.4.2.2 Subunit Vaccines......................................................................... 121.4.2.3 Passive Immunisation.................................................................. 121.4.2.4 Idiotypic Antibodies.................................................................... 121.4.2.5 Peptide Vaccines......................................................................... 12
1.4.3 DNA Vaccines..........................................................................................131.4.4 Advantages of DNA Vaccines.................................................................13
1.5 Gene Delivery.....................................................................................................161.5.1 Ex vivo Gene Delivery............................................................................. 161.5.2 In vivo Gene Delivery.............................................................................. 17
1.6 Gene Therapy Vectors..................................................................................... 171.6.1 Viral Vectors............................................................................................. 171.6.2 Non-viral Vectors......................................................................................181.6.3 Naked DNA....................................................................... 201.6.4 Needle-free Injection................................................................................201.6.5 Condensed DNA Particles...................................................................... 201.6.6 Cationic Lipids......................................................................................... 21
1.7 Plasmid DNA Properties................................................................................. 211.8 Plasmid DNA M anufacture.............................................................................23
1.8.1 Fermentation.............................................................................................231.8.2 Downstream Processing...........................................................................24
1.9 The Requirement for Large Plasmids...........................................................241.10 Conclusions.........................................................................................................25
2 Materials and methods............................................................ 262.1 Cultures............................................................................................................... 26
2.1.1 Escherichia coli bacterial strain genotypes............................................ 262.1.2 Preparation of cell stocks........................................................................ 262.1.3 Growth of bacterial strains...................................................................... 27
2.2 Plasmid Constructs..............................................................................................272.2.1 Oxford Series of large plasmids..............................................................27

2.2.2 Control plasmid pSVp (6.9kb).................................................................282.2.3 pGEM® constructed plasmid models......................................................28
2.3 Bacterial Growth Media......................................................................................292.3.1 Growth M edia........................................................................................... 29
2.3.1.1 Nutrient agar........................................................................................ 292.3.1.2 SOC media............................................................................................292.3.1.3 SuperBroth m edia................................................................................ 292.3.1.4 SDCAS media...................................................................................... 292.3.1.5 Seed Media............................................................... 31
2.3.2 Antibiotic solutions...................................................................................312.4 Buffers and other solutions..................................................................................32
2.4.1.1 TE buffer...............................................................................................322.4.1.2 Phosphate buffered saline buffer (PBS)..............................................322.4.1.3 Qiagen® buffers for small-scale plasmid DNA preparation.............. 322.4.1.4 3 M Sodium acetate............................................................................... 322.4.1.5 0.5x Tris-Borate-EDTA (TBE) buffer for electrophoresis............... 332.4.1.6 SYBR Gold Staining buffer................................................................ 332.4.1.7 Loading buffer...................................................................................... 332.4.1.8 LMP Agarose....................................................................................... 332.4.1.9 TBE/ Ethidium bromide staining buffer.............................................332.4.1.10 HPLC buffers....................................................................................332.4.1.11 PicoGreen Working Solution...........................................................342.4.1.12 Bicinchoninic acid (BCA) assay reagents.......................................342.4.1.13 Quant-IT™ Working Solution......................................................... 342.4.1.14 Restriction Enzyme buffers..............................................................342.4.1.15 1 OOmM ATP solution....................................................................... 342.4.1.16 P-Agarase buffer.............................................................................. 352.4.1.17 Phenol/Chloroform........................................................................... 352.4.1.18 1 x T4 DNA ligase buffer..................................................................352.4.1.19 MagNA Pure LC DNA Isolation Kit 1 ...........................................352.4.1.20 TaqMan 2xUniversal MasterMix Buffer .......................................352.4.1.21 Primer-Probe M ix ............................................................................ 352.4.1.22 Resuspension Buffer........................................................................352.4.1.23 0.96% (w/v) Sodium hydroxide (Lysis buffer 1)..........................362.4.1.24 6% (w/v) Sodium dodecylsulphate solution (Lysis buffer 2 ) .......362.4.1.25 Neutralisation buffer (3M Potassium acetate)................................ 362.4.1.26 RNA precipitation solution (5M Calcium chloride)......................362.4.1.27 Diafiltration buffer 1 (lOmM Tris).................................................362.4.1.28 Diafiltration buffer 2 (lOmM Tris+0.54M NaCl)..........................36
2.5 Analytical methods.............................................................................................. 372.5.1 Optical density measurement.................................................................. 372.5.2 Wet Cell Weight (WCW) determination.................................................372.5.3 Dry Cell Weight (DCW) determination..................................................372.5.4 Replica plating assay for determination of plasmid retention............... 372.5.5 Sample preparation for quantification by HPLC and gel analysis 392.5.6 Preparation of samples for quantification by PicoGreen assay............392.5.7 Preparation of samples by Qiagen spin-prep..........................................392.5.8 Preparation of plasmid material by Qiagen kits......................................40

2.5.8.1 Qiagen Maxi-preps (Refer to Figure 2-2)...........................................402.5.8.2 Qiagen Very Low-copy number preps (Refer to Figure 2-2)........... 412.5.8.3 Qiagen Large construct preps (Refer to Figure 2-2).........................41
2.5.9 Concentration of plasmid DNA by UV absorbance..............................422.5.9.1 Standard spectrophotometric measurement...................................... 432.5.9.2 NanoDrop spectrophotometric measurement..................................... 43
2.5.10 PicoGreen quantification of plasmid.......................................................442.5.10.1 Sample preparation and measurement............................................44
2.5.11 Concentration of plasmid by HPLC........................................................462.5.11.1 Calibration of HPLC....................................................................... 472.5.11.2 Determining specific yield progression during fermentation........482.5.11.3 Monitoring plasmid mass through downstream operations..........49
2.5.12 Desalting samples for assays using PD-10 columns..............................492.5.13 BCA Protein assay...................................................................................502.5.14 Purifying DNA from DSP samples for using MagNA Pure system ....56
2.5.14.1 Preparing E.coli Genomic DNA standard curve............................562.5.15 Quantitative Polymerase Chain Reaction (qPCR).................................. 582.5.16 Quant-IT RNA assay................................................................................612.5.17 Conventional Agarose gel electrophoresis............................................. 632.5.18 Pulsed Field Electrophoresis (PFGE)......................................................632.5.19 Field Inversion Gel Electrophoresis........................................................642.5.20 Staining with SYBR Gold....................................................................... 652.5.21 Quantitative Gel analysis........................................................................ 65
2.6 Cloning and cell line development methods.......................................................662.6.1 Enzymatic manipulation...........................................................................662.6.2 Insert preparation.....................................................................................662.6.3 Ligations....................................................................................................672.6.4 Electroporation......................................................................................... 672.6.5 Recombinant selection and sizing...........................................................682.6.6 Preparing electrocompetent cells............................................................692.6.7 Cell Banking............................................................................................ 692.6.8 Plasmid stability assay.............................................................................69
2.7 Upstream processing methods............................................................................ 712.7.1 Shake-flask fermentations....................................................................... 712.7.2 Inoculum preparation...............................................................................712.7.3 Fermentation............................................................................................ 712.7.4 Calculation of specific growth rate (p ) .................................................. 722.7.5 Samples for specific plasmid yield progression.....................................722.7.6 Oxygen Uptake Rate (OUR) determination........................................... 732.7.7 Online parameter logging........................................................................ 73
2.8 Downstream purification methods..................................................................... 742.8.1 Cell Resuspension....................................................................................742.8.2 Cell Lysis................................................................................................. 742.8.3 RNA removal........................................................................................... 752.8.4 Clarification............................................................................................. 752.8.5 Ultrafiltration operation.......................................................................... 76
2.8.5.1 Ultrafiltration preparation................................................................... 762.8.5.2 Recirculation........................................................................................ 77

2.8.5.3 Permeation.............................................................................................772.8.5.4 Diafiltration............................................................................................772.8.5.5 Retentate collection...............................................................................77
2.8.6 Determining Mass-Volume coefficients of anion-exchange resins 782.8.7 Binding Studies.........................................................................................78
3 Initial studies: results and discussion.............................................. 793.1 Chapter Aims.......................................................................................................793.2 Investigating the effect of plasmid size on culture growth rates....................... 80
3.2.1 Introduction............................................................................................... 803.2.2 Characterising the growth rates of the Oxford series.............................843.2.3 Control studies using parental and high-copy number strains.............. 883.2.4 Conclusions............................................................................................... 91
33 Progression of p5176 (116kb) yield during 2L SF fermentations...................... 923.3.1 Introduction............................................................................................... 923.3.2 Genetic-led Strategies.............................................................................. 923.3.3 Process-led strategies............................................................................... 93
3.3.3.1 Media effects......................................................................................... 933.3.3.2 Mode of cultivation...............................................................................93
3.3.4 Conclusions............................................................................................... 953.3.5 Results of investigations into the yield progression of Oxford series..96
3.4 7L Fermentation of E.coli DHlOp p5176 (116kb)...............................................983.4.1 Fermentation Growth analysis................................................................ 983.4.2 Fermentation yield analysis.................................................................... 1003.4.3 Qiagen Column chromatography studies.............................................. 1013.4.4 Topology of Fermentation samples........................................................1043.4.5 Conclusions............................................................................................. 104
3.5 Electroporation of the large series of plasmids into E.coli DH1....................... 1063.5.1 Introduction............................................................................................. 1063.5.2 Effect of host-strain on fermentation growth profiles.......................... 1063.5.3 Effect of host-strain on biomass yields................................................. 1083.5.4 Conclusions............................................................................................. 109
3.6 Triplicate 4L working vol. fermentations of E.coli DH1 p5176 (116kb)........ 1103.6.1 Introduction..............................................................................................1103.6.2 Results...................................................................................................... 110
3.7 Progression of plasmid yield during 4L fermentations.....................................1133.7.1 Introduction..............................................................................................1133.7.2 Results......................................................................................................1133.7.3 Conclusions..............................................................................................115
3.8 Downstream processing of the large plasmid p5176 (116kb)...........................1163.8.1 Introduction..............................................................................................1163.8.2 Brief Methodology.................................................................................. 1163.8.3 Plasmid DNA primary' purification........................................................1183.8.4 Plasmid DNA purification.......................................................................1203.8.5 Results of investigations into purification of the Oxford series...........1213.8.6 Conclusions..............................................................................................123
3.9 Initial Studies Conclusions................................................................................. 1243.10 Discussion........................................................................................................... 126

4 Analytical development: results and discussion...........................1284.1 Chapter Aims.................................................................................................... 1284.2 Techniques Used for Plasmid Quantification................................................... 129
4.2.1 Introduction............................................................................................. 1294.2.2 UV absorbance........................................................................................1314.2.3 Fluorescent Dye Quantification.............................................................1334.2.4 Plasmid quantification by qPCR............................................................1384.2.5 Conclusions............................................................................................. 141
43 PicoGreen quantification of IP A precipitated lysates & spin-prep eluents.... 1424.3.1 Outline..................................................................................................... 1424.3.2 Comparing specific yield curves............................................................1424.3.3 Control studies using DH 10p.................................................................1454.3.4 Calculating the clearance of gDNA by the two extraction regimes... 1464.3.5 Validation of the PicoGreen assay for use on spin-prep eluents..........148
4.3.5.1 Plasmid recovery over a spin-prep column...................................... 1494.3.5.2 Standard curve for PicoGreen analysis of spin-prep eluents........... 149
4.3.6 Conclusions.............................................................................................1514.4 Comparing Plasmid Quantification by Absorbance and PicoGreen............... 151
4.4.1 Outline..................................................................................................... 1514.4.2 Methodology...........................................................................................1524.4.3 Comparing the results of PicoGreen and Absorbance for pSV p......... 1544.4.4 Comparing the results of PicoGreen and Absorbance for p5176..........1584.4.5 Quantification of spin-prep purified p5176 (116kb) by A260.............1584.4.6 PicoGreen quantification on clarified lysates.......................................1604.4.7 Conclusions.............................................................................................163
4.5 Plasmid quantification by HPLC...................................................................... 1634.5.1 Introduction............................................................................................. 163
4.5.1.1 Hydrophobic Interaction HPLC........................................................1634.5.1.2 Size Exclusion HPLC.........................................................................1644.5.1.3 Reverse Phase HPLC.........................................................................1644.5.1.4 Anion Exchange HPLC..................................................................... 165
4.5.2 Use of Anion-Exchange HPLC............................................................. 1684.5.2.1 HPLC for plasmid quantification of Fermentation Samples............ 1704.5.2.2 HPLC for plasmid quantification for DSP operations.................... 173
4.5.3 Conclusions.............................................................................................1764.6 Gel Electrophoresis........................................................................................... 178
4.6.1 Conventional Gel Electrophoresis........................................................ 1784.6.2 Pulsed-Field Electrophoresis..................................................................180
4.6.2.1 CHEF Pulsed Field Electrophoresis................................................. 1814.6.2.2 Field Inversion Gel Electrophoresis................................................. 184
4.6.3 Conclusions.............................................................................................1864.7 Determining Genomic DNA contamination by quantitative PCR...................188
4.7.1 Introduction.............................................................................................1884.7.2 Purification and preparation of samples for analysis by qPCR........... 1884.7.3 Background of the qPCR assay............................................................. 1904.7.4 Determining the accuracy and precision of the qPCR assay.............1944.7.5 Conclusions.............................................................................................198
4.8 RNA quantification by Quant-IT assay............................................................1994.8.1 RN A assay background..........................................................................199

4.8.2 Determining the accuracy of the Quant-IT RNA assay...................... 2014.8.3 Determining the assay precision........................................................... 2034.8.4 Conclusions............................................................................................. 205
4.9 Protein quantification by BCA assay.................................................................2064.9.1 Background of BCA assay................................................................... 2064.9.2 Determining the accuracy of the BCA assay....................................... 2074.9.3 Determining the precision of the BCA assay....................................... 2084.9.4 Conclusions............................................................................................. 209
4.10 Sonication procedure..........................................................................................2104.10.1 Assay Background................................................................................. 2104.10.2 Determination of sonication conditions to ensure full cell lysis.......... 211
4.10.2.1 Determining the optimum cell concentration............................... 2114.10.2.2 Determining the optimum number of sonication cycles............. 213
4.10.3 Conclusions............................................................................................. 2134.11 Conclusions........................................................................................................ 214
5 Cloning and cell-line development: results and discussion 2165.1 Chapter Aims..................................................................................................... 2165.2 Decision to construct a new series of large plasmids........................................ 2175.3 Attempts to create large constructs with a relaxed origin of replication 223
5.3.1 Retrofitting BAC constructs with relaxed origin of replication...........2235.3.2 Sub-cloning of BAC inserts into relaxed plasmid vectors................... 225
5.3.2.1 Preparing linear vector.......................................................................2265.3.2.2 Preparing insert DNA.........................................................................2265.3.2.3 Ligations..............................................................................................2285.3.2.4 Transformation................................................................................. 2305.3.2.5 Selection..............................................................................................2315.3.2.6 Recombinant Screening.....................................................................231
5.3.3 Shotgun cloning......................................................................................2345.3.3.1 Vector Preparation.............................................................................2345.3.3.2 Insert Preparation...............................................................................235
5.3.4 Ligations.................................................................................................. 2395.3.4.1 Transformation................................................................................. 2405.3.4.2 Selection..............................................................................................2405.3.4.3 Screening.............................................................................................2415.3.4.4 Cell Banking...................................................................................... 242
5.3.5 Conclusions.............................................................................................2455.4 Factorial design experiments to determine fermentation conditions..............247
5.4.1 Design of Experiments (DOE).............................................................. 2475.4.2 Experimental setup................................................................................. 2495.4.3 Data Analysis..........................................................................................2525.4.4 Conclusions.............................................................................................254
5.5 Pilot-scale Fermentations of the large plasmid series...................................... 2555.6 Stability studies of large constructs..................................................................256
5.6.1 Segregational Plasmid Instability.......................................................... 2565.6.2 Assessing the stability of the pGEM series of large plasmids............ 2605.6.3 Attempts to improve segregational stability of pGEM series............. 2645.6.4 Improving plasmid stability by cultivation at lower temperatures 2675.6.5 Clone Selection...................................................................................... 271

5.6.6 Conclusions............................................................................................. 2735.7 Conclusions........................................................................................................ 274
6 Upstream processing: results and discussion............................... 2756.1 Chapter Aims..................................................................................................... 2756.2 Fermentation Calibration..................................................................................2766.3 Duplicate 4L fermentations at 37°C...................................................................279
6.3.1 Introduction............................................................................................. 2796.3.2 Results and discussion........................................................................... 2796.3.3 Conclusions............................................................................................. 281
6.4 Fermentations at 25°C.......................................................................................2836.4.1 Introduction............................................................................................. 2836.4.2 Results and Discussion........................................................................... 2856.4.3 Stability profiles......................................................................................2876.4.4 Conclusions.............................................................................................289
6.5 Analysis into the plasmid yields of the duplicate 25°C fermentations..............2906.5.1 Introduction............................................................................................. 2906.5.2 Analysis of the specific yield profiles................................................... 2926.5.3 Specific Yields by HPLC on Qiagen prepped harvest pastel..............2956.5.4 Investigations into the levels of contaminating gDNA........................2986.5.5 Conclusions............................................................................................. 300
6.6 Plasmid Topology through the fermentations...................................................3016.6.1 DNA Supercoiling.................................................................................. 3016.6.2 Introduction............................................................................................. 3016.6.3 Results of the Topology Analysis......................................................... 303
6.7 Upstream Processing Conclusions.................................................................... 305
7 Downstream processing: results and discussion..........................3077.1 Chapter Aims..................................................................................................... 3077.2 Introduction....................................................................................................... 307
7.2.1 Primary isolation.....................................................................................3107.2.2 Intermediate purification........................................................................312
7.2.2.1 Precipitation....................................................................................... 3121 2 2 .2 Ultrafiltration.....................................................................................3137.2.2.3 Aqueous two-phase systems (ATPS)............................................... 3137.2.2.4 Expanded Bed Chromatography.......................................................3147.2.2.5 Membrane Adsorption/Chromatography......................................... 314
7.2.3 Purification..............................................................................................3157.2.3.1 Anion-exchange chromatography (AEX)........................................3151 2 3 2 Size-exclusion chromatography (SEC)............................................ 3161 2 3 3 Hydrophobic Interaction chromatography (HIC)............................ 3167.2.3.4 Affinity chromatography...................................................................317
7.2.4 Process schematic................................................................................... 3177.3 Process Outline..................................................................................................3177.4 Process Analytics...............................................................................................3207.5 Experimental order........................................................................................... 3227.6 Plasmid recovery and topology........................................................................ 323
7.6.1 Plasmid Yields following alkaline lysis................................................3237.6.2 Plasmid Recoveries from the UF rig.....................................................325

7.6.3 Plasmid Topology changes witnessed during processing................... 3277.6.4 Plasmid topology changes over the lysis step...................................... 331
7.7 Characterising the mixing in the lysis vessel......................................................3337.7.1 Analysis of the Macromixing conditions in the lysis vessel............... 333
7.7.1.1 Conclusions........................................................................................3377.7.2 Analysis of the Micromixing conditions in the lysis vessel................ 338
7.7.2.1 Micromixing environment during lysis............................................3397.7.2.2 Micromixing environment during neutralisation............................ 3417.7.2.3 Conclusions........................................................................................342
7.7.3 Characterising the possibility for plasmid shear during lysis............. 3427.7.3.1 Estimating the size of the plasmid molecules................................. 342
7.7.4 Conclusions............................................................................................ 3467.8 Balances of the major contaminants.................................................................348
7.8.1 Genomic DN A ....................................................................................... 3497.8.2 Ribonucleic acid (RNA)........................................................................ 3567.8.3 Protein.....................................................................................................3597.8.4 Conclusions............................................................................................ 361
7.9 Binding studies.................................................................................................. 3637.9.1 Introduction............................................................................................ 3637.9.2 Chromatographic matrices for plasmid purification............................3637.9.3 Experimental setup.................................................................................3647.9.4 Binding kinetics of plasmids on to two commercial AEX resins 3657.9.5 Specific Binding Capacities.................................................................. 3677.9.6 Conclusions............................................................................................ 370
7.10 Conclusions....................................................................................................... 3717.10.1 Plasmid Purification...............................................................................3717.10.2 Analysis of the Lysis step ..................................................................... 3737.10.3 Contaminant Profiles..............................................................................3747.10.4 Chromatographic studies....................................................................... 374
8 Conclusions and future work.......................................................... 3768.1 Introduction...................................................................................................... 376
8.1.1 Construct design.....................................................................................3768.1.2 Upstream Processing..............................................................................3788.1.3 Intermediate purification....................................................................... 3798.1.4 Contaminant profiles............................................................................. 3828.1.5 Chromatographic Separations...............................................................3838.1.6 Analytical............................................................................................... 3848.1.7 Future work............................................................................................ 385
9 Appendices......................................................................................... 387
10 References 433

LIST OF FIGURES
Figure Page Figure Page Figure Page Figure PageFig 1-1 5 Fig 4-1 129 Fig 4-34 196 Fig 6-1 277Fig 1-2 6 Fig 4-2 132 Fig 4-35 197 Fig 6-2 280Fig 1-3 8 Fig 4-3 134 Fig 4-36 202 Fig 6-3 284Fig 1-4 15 Fig 4-4 136 Fig 4-37 203 Fig 6-4 288Fig 1-5 22 Fig 4-5 139 Fig 4-38 204 Fig 6-5 291
Fig 4-6 143 Fig 4-39 204 Fig 6-6 296Fig 2-1 28 Fig 4-7 144 Fig 4-40 207 Fig 6-7 298Fig 2-2 42 Fig 4-8 146 Fig 4-41 209 Fig 6-8 303Fig 2-3 52 Fig 4-9 147 Fig 4-42 212 Fig 6-9 303Fig 2-4 54 Fig 4-10 149Fig 2-5 55 Fig 4-11 150 Fig 5-1 224 Fig 7-1 317Fig 2-6 62 Fig 4-12 153 Fig 5-2 226 Fig 7-2 323Fig 2-7 76 Fig 4-13 155 Fig 5-3 227 Fig 7-3 325
Fig 4-14 157 Fig 5-4 232 Fig 7-4 328Fig 3-1 85 Fig 4-15 159 Fig 5-5 234 Fig 7-5 331Fig 3-2 89 Fig 4-16 165 Fig 5-6 235 Fig 7-6 333
Fig 3-3 97 Fig 4-17 166 Fig 5-7 236 Fig 7-7 337Fig 3-4 99 Fig 4-18 167 Fig 5-8 237 Fig 7-8 341
Fig 3-5 100 Fig 4-19 168 Fig 5-9 241 Fig 7-9 342
Fig 3-6 102 Fig 4-20 169 Fig 5-10 242 Fig 7-10 343Fig 3-7 107 Fig 4-21 170 Fig 5-11 246 Fig 7-11 350
Fig 3-8 111 Fig 4-22 172 Fig 5-12 252 Fig 7-12 354
Fig 3-9 114 Fig 4-23 175 Fig 5-13 253 Fig 7-13 357
Fig 3-10 115 Fig 4-24 179 Fig 5-14 255 Fig 7-14 359
Fig 3-11 117 Fig 4-25 180 Fig 5-15 258 Fig 7-15 366
Fig 3-12 117 Fig 4-26 182 Fig 5-16 262 Fig 7-16 368
Fig 3-13 121 Fig 4-27 184 Fig 5-17 263 Fig 7-17 369
Fig 3-14 126 Fig 4-28 185 Fig 5-18 265
Fig 4-29 186 Fig 5-19 266
Fig 4-30 192 Fig 5-20 268
Fig 4-31 193 Fig 5-21 269
Fig 4-32 194 Fig 5-22 272
Fig 4-33 195

LIST OF TABLES
able Page Table Page Table Page Table Page
Table 1-1 8 Table 3-1 97 Table 4-11 192 Table 7-1 309Table 1-2 10 Table 3-2 99 Table 4-12 200 Table 7-2 310Table 1-3 15 Table 3-3 101 Table 4-13 202 Table 7-3 319
Table 3-4 107 Table 7-4 321Table 2-1 30 Table 3-5 111 Table 5-1 218 Table 7-5 322Table 2-2 30 Table 3-6 119 Table 5-2 219 Table 7-6 324Table 2-3 38 Table 3-7 122 Table 5-3 221 Table 7-7 336Table 2-4 45 Table 5-4 228 Table 7-8 338Table 2-5 45 Table 4-1 131 Table 5-5 238 Table 7-9 344Table 2-6 46 Table 4-2 137 Table 5-6 239 Table 7-10 348Table 2-7 51 Table 4-3 143 Table 5-7 244 Table 7-11 351Table 2-8 55 Table 4-4 152 Table 5-8 250 Table 7-12 362Table 2-9 56 Table 4-5 161 Table 5-9 251 Table 7-13 357Table 2-10 59 Table 4-6 166 Table 5-10 259 Table 7-14 359Table 2-11 60 Table 4-7 171Table 2-12 60 Table 4-8 185 Table 6-1 277Table 2-13 62 Table 4-9 190 Table 6-2 280Table 2-14 75 Table 4-10 191 Table 6-3 285
Table 6-4 292

LIST OF FIGURES (APPENDIX)
Figure Page Figure Page Figure Page Figure Page
Fig 9-1 387 Fig 9-17 396 Fig 9-33 412 Fig 9-49 42S
Fig 9-2 387 Fig 9-18 397 Fig 9-34 413 Fig 9-50 429Fig 9-3 387 Fig 9-19 398 Fig 9-35 414 Fig 9-51 430Fig 9-4 388 Fig 9-20 399 Fig 9-36 415
Fig 9-5 388 Fig 9-21 400 Fig 9-37 416Fig 9-6 389 Fig 9-22 401 Fig 9-38 417Fig 9-7 389 Fig 9-23 402 Fig 9-39 418Fig 9-8 389 Fig 9-24 403 Fig 9-40 419Fig 9-9 390 Fig 9-25 404 Fig 9-41 420Fig 9-10 390 Fig 9-26 405 Fig 9-42 421Fig 9-11 390 Fig 9-27 406 Fig 9-43 422Fig 9-12 391 Fig 9-28 407 Fig 9-44 423Fig 9-13 392 Fig 9-29 408 Fig 9-45 424Fig 9-14 393 Fig 9-30 409 Fig 9-46 425Fig 9-15 394 Fig 9-31 410 Fig 9-47 426Fig 9-16 395 Fig 9-32 411 Fig 9-48 427

ACKNOWLEDGMENTS
This degree has represented the single hardest challenge in my life so far. Its
completion is greatly down to the support and encouragement of many people whose
help I would like to acknowledge.
Firstly, I would like to thank Claire, without whom I certainly would never have
finished this project. Your help and support, not to mention the example you set when
completing your own PhD, was inspirational. You are such an example to me and I
just hope you realise how incredible you are. I promise never to forget the patience and
kindness you showed to me through many tough years. Thank you.
I would also like to thank my family and friends who showed me so much kindness
and put up with my ‘Pretty horrible Disposition’. Mum & John, the support you gave
me was well beyond any son’s expectations and I apologise for the sleepless nights I
may have caused you. To my brothers, James and Joseph, thank you for your help and
empathy. You both are such remarkable people that my efforts were merely inspired
by your own impressive achievements. To Dad & Laura, thank you for your helpful
words of advice and encouragement. I would also like to thank my friends for putting
up with me and keeping me sane through this time.
To Prof. Titchener-Hooker many thanks for the patience you showed in reading my
work and the helpful, insightful corrections you suggested.
Crucially, I must acknowledge the generous help given to me by the staff at GSK,
Beckenham. Their prudent advice and guidance was continually helpful and I was
inspired to progress with the project by the passion they showed for their work.
Specifically, I would like to thank Cora Henwood and Ronan O’Kennedy. There were
times when nothing made sense and somehow you could always help. Thank you.
Thomas Burt

ABSTRACT
A thesis is presented which outlines investigations conducted to determine issues
which may be faced should attempts be made to produce large plasmids (>3-10kb) for
use in areas such as DNA vaccination and gene therapy.
Initial studies attempted to manufacture a series of large Bacterial Artificial
Chromosomes (116kb - 242kb) and centered on the fermentation and downstream
purification steps required to produce the plasmid material. It was determined that
these constructs were not suitable models due to the low yields at which they were
propagated. Additionally, many of the analytical protocols employed were found to be
inadequate for monitoring the concentration and form of large plasmids.
In response to these issues large plasmids were constructed by the insertion of large
fragments of S.cerevisiae DNA in to the relaxed, high-copy number vector; pGEMl 1.
Plasmids ranging from 3kb to 50kb were created and used to probe the upstream and
downstream steps of a plasmid production process. Efforts were also made to develop
more suitable analytical methods.
The production of these plasmids was studied during pilot-scale fermentations at 37°C
where it was discovered that the plasmids demonstrated a poor stability profile. In an
attempt to improve plasmid stability, reduced temperature (25°C) fermentations were
conducted which increased the stability and yields obtained from fermentations of
these constructs.
Cell paste from the fermentations was subject to a purification process involving
alkaline lysis and ultrafiltration steps. Described are balances of plasmid DNA,
genomic DNA, RNA and contaminating protein. The topology changes displayed by
the plasmids are also described. Finally, studies are outlined describing the binding
behaviour of the large plasmids to chromatographic resins used for plasmid
purification.
Thomas Burt 2

1. Literature Survey
1 LITERATURE REVIEW
1.1 Chapter Aims
The aims of this section are as follows
1. Provide a brief summary to the field of gene therapy and the progression of
the technology to date together with postulating about future developments
in the field.
2. Describe some of the disease targets against which gene therapy treatments
are being tested and the methods and means by which the treatments are
delivered.
3. Describe the use of gene therapy in the field of vaccination and advantages
offered by this mechanism of immunisation.
4. Outline the properties of plasmid DNA and briefly discuss the current
processes used for its manufacture.
5. Highlight the importance of being able to reliably manufacture large
plasmid DNA molecules.
1.2 Gene Therapy
Gene therapy is defined as the ‘use of nucleic acid transfer, either RNA or DNA, to
treat or prevent a disease’(Mountain, 2000). Generally, the nucleic acid is dsDNA
encoding a therapeutic, destructive or marker protein but the above definition
encompasses antisense therapy which uses ssDNA and RNA to prevent expression of a
specific gene, by blocking mRNA expression or promoter activation. Gene therapy is
regarded as potentially the fourth revolution in medicine, (the others being sanitation,
antiseptics, antibiotics/vaccines) as it seeks to eliminate the cause of disease rather than
just treat the symptoms.
The first gene therapy trial was initiated in 1990, on two girls with Severe Combined
Immunodeficiency Disorder (SCID) resulting from the absence of the enzyme
adenosine deaminase (ADA). In the protocol, T-lymphocytes were removed from each
Thomas Burt 3

1. Literature Survey
patient and cDNA coding for the ADA gene introduced. After culturing, each patient
received transfusions of their own genetically modified lymphocytes regularly for two
years. Four years from the start, integrated vector and ADA expression (25% of normal
levels) was still detectable in the girls’ T-cells. SCID symptoms were alleviated.
(Anderson, 1998; Crystal, 1995; Davis, 2002)
However, the initial excitement this technology generated was ill-founded as there are
still only a handful of cases where gene therapy has proven efficacious. Even the trial
described above was by no means conclusive, as it is uncertain whether the therapeutic
advantage was provided by the replacement therapy, or the direct infusions of ADA
the patients received. Reasons for this failure mainly lie with the fact that because gene
therapy is so new and the number of diseases that could be treated by this broad-
platform technology so diverse, a huge number of different strategies have been
researched. Consequently, the past decade has been dedicated to developing the
technology without any product successes. The most important development required
for gene therapy is a clear demonstration of efficacy in clinical trials, which will lead
to restoration of public and investor confidence. This development hopefully will be
complemented by the completion of the Human Genome Project and the revolution in
the field of genomics. It is becoming much more apparent that many diseases have a
genetic component. Currently, pharmaceutical researchers have about 500 targets
(genes) for intervention (Anderson, 1984; Edelstein et al., 2004; Mhashilkar et a l ,
2001). It is expected when mapping is completed this figure will be about 10,000,
leaving a great scope for gene-based intervention.
Presently, fifteen years after the initial attempts, the first gene-therapy treatments are
expected to gain market approval this year, and the predicted market for these kinds of
product by 2010, exceeds $45billion (£27billion). However, with recent
disappointments surrounding the safety of gene therapy (Fox, 1999) and the
excitement generated by RNAi approaches, the acceptance of ‘traditional’ gene
therapy remains as unsure as ever.
Thomas Burt 4

1. Literature Survey
Figure 1-1 Figure displaying the num ber of biotech derived therapeu tics cu rren tly in developm ent. H ighlighted in d a rk grey are classes for which plasmid DNA could be employed.
The figure above displays that at present gene/ antisense treatments only represent a
small proportion o f biotech-derived medicines in development. This is because the
majority o f drugs in development are still 1st generation biotech medicines, being
recombinant human proteins and vaccines. Also, arriving after twenty years of
development, are monoclonal antibodies. As with gene therapy, the therapeutic
promise o f monoclonal antibodies was hyped when first discovered in 1975. It has
taken twenty years o f development to overcome the problem of immune rejection but
now the figures prove the technology is viable.
That there are gene therapy products in clinical trials is still an achievement after only
fifteen-years. It is envisioned that the proportion will continue to increase as this
technology supersedes and makes redundant existing treatments. For example, gene
therapy could potentially replace many of the 1st generation o f biotech compounds.
Already this is being witnessed with gene therapy products in development for
Heamophilia A, B and anaemia to replace the conventional recombinant protein
treatments. As Professor W. French Anderson, director o f the Gene Therapy
Laboratories at the University of Southern California School of Medicine, and leader
of the first gene therapy trial says “Thirty years from now, essentially every disease
will have a gene-based therapy as a treatment option" (Anderson, 1984; Anderson,
1998).
1.3 The Potential of Gene Therapy0 10 20 30 40 50 60 70 80 90 100J
VaccinesOthers ........ !
Monoclonal AntibodesGene Therapy
Growth FactorsCellular Therapy
RecomtMnant Human Proteins ■ q - • ■iInterferons 5 T y - JAntisense ■ 1
InterleukinsAnfpogenesa Inhibitors ■Immune-based Therapy □
Human Groerth Hormones □ -Signalling 1
Recombinant Soluble Receptors 2Erlhropoietlns Z
Colony Sbmulaang Factors ...... rn t ■ . ■ ■ , i . i . .... .0 10 20 30 40 50 60 70 80 90 100
Number of Compounds in Development
Thomas Burt 5

1. Literature Survey
1.3.1 Publication Analysis
Metaanalysis can be used to provide an objective opinion about the relative importance
and development o f a particular area. This can be achieved by searching terms in
PubMed and recording the number of publications. This was performed to try and give
an idea as to the relative importance of gene therapy compared to other technologies
which show similar levels of promise.
Figure 1-2 summarises the results of this analysis. From Figure 1-2A, it can be
appreciated that the number o f gene therapy publications published per year increased
dramatically over the 1990-2000 period when a high-level of spending, both public
and private, was dedicated to the area. However, in 2000, the yearly increase of
publications came to a halt and last year (2005) fewer publications were returned than
the previous year. The reason for the slow-down is thought to be due to the death of a
teenager which was directly attributed to a gene therapy protocol he was involved in
(Fox, 1999).
60006000
Gene Therapy (AH fields] RNAi [All fields]Stem Cells (AS fields)5000 5000
4000 4000
30003000
2000 2000
1000 1000
% Publications referencing plasnrad Publications refumed
S w itn a m n e IA Iis .id .jj [All S.ld.1 »w »py AND [All f l«ds) cUnmid
1 0 -
Year of Pub lical ion
10000Monoclonal AND Antibody [All fields] Recombinant AND DNA [All fields] p Gene Therapy [All fields] /
-35009000
30008000
7000 2500
60002000
5000
15004000
3000 1000
2000500
1000
Year of Publication
Year of Publication
Figure 1-2 analysis conducted into the num ber of jou rna l entries recorded when term were searched in PubM ed.
I
3500
3000
2500
2000
1500
1000
500
0
Thomas Burt 6

1. Literature Survey
As a result of the negative publicity generated by this event a number of gene therapy
trials were halted. The research dollars went elsewhere and to an extent could explain
the rapid increase in publications witnessed in the fields of stem cell therapy and
RNAi. Where does this leave the field of gene therapy? On the face of it the numbers
appear bleak but a similar situation has been seen previously with the more advanced
fields of monoclonal antibodies and recombinant DNA technology.
Looking at Figure 1-2C demonstrates how both these fields displayed an exponential
increase in publications followed by a subsequent decline. The comparision of the field
of monoclonal antibodies to gene therapy is particularly apt. Monoclonal antibodies
were hyped as the ‘magic bullets’ soon after their discovery, but the hype was
unfounded as the delivery of commercial products was hampered for many years by
problems of immune rejection. Figure C shows how the rise in publications reached a
peak in 1990 from when on the number decreased year-on-year. It is important to
remember that the first monoclonal antibody therapeutic (Rituxari®) did not receive
approval until 1997. Therefore, if parallels are to be drawn to gene therapy, the decline
in publications should not be seen as a wholly negative indication.
A more appropriate explanation for the decreasing attention dedicated to the field can
be explained by the manner in which scientific advancements are made. (Popper,
1975) describes how scientific advancements occur in paradigm shifts, which manifest
as an initial breakthrough followed by a period of intense activity. Following the initial
rapid progress the rate of advancement slows as the initial impetus dissipates and
newer competing technologies are discovered. It could be argued that this is what is
occurring in the field of gene therapy at present. Research has reached a stage where a
further breakthrough is required prior to a reinvigoration of the area. This could come
in the form of a successful form of gene delivery. Again, using MAbs as an example, it
could be foolish to abandon the field, as many companies have done, as the potential
for success still remains.
Thomas Burt 7

1. Literature Survey
1.3.2 Potential Targets for Gene Therapy
0 50 IX 150 200
Figure 1-3 Number of genetherapy protocols by therapeutic application. From the grah the roughly equal number of ex vivo to in vivo procedures can be seen
0 50 100 150 200Number of Gene Therapy protocol*
Approximately 300 clinical protocols involving gene transfer have been conducted,
involving some 3500 patients (Edelstein et al., 2004). The majority have been small
Phase 1/ II trials mainly to assess safety before efficacy trials. Media speculation on
these trials has been harsh, criticizing gene therapy for not living up to the hype the
press created. It soon became apparent that gene therapies are technically more
demanding than previously thought. However, progress has been made and shown
below are some of the trials which have entered phase II and III trials.
Table 1-1 Table describing current gene therapy compounds in late-stage development
Name Disease Vector Gene Strategy Company Phase
LeuvectinProstate cancer/
renal cell carcinoma
Cationic lipid Tumour cells
in vivoIL-2 Immunogenicity
Enhancement Vical II
E1A lipid complexBreast/ head/ neck/ ovarian
cancers
Cationic lipid Tumour cells
in vivoAdElA Apotosis induction
TargetedGenetics
II
ING N201Head and neck
cancer
Adenovirus Tumour cells
in vivoP53 Apoptosis induction
IntrogenTherap. III
ONYX-015P53 deficient
cancers
Adenovirus Tumour cells
in vivo
Addeathgenes
Killing by lytic virusOnyx
Pharm.. II
N/A Ovarian cancerRetrovirus.
Fibroblasts exvivo
IL-12 Immunogenicityenhancement
National Cancer Ins. III
BioByPassLimb ischaemia/
cardiac artery disease.
N aked D N A Muscle cells
in vivoVEGF Angiogenesis
stimulationGenVec/Valentis II
AAV( F I R Cystic fibrosis
AAV Airway cells in vivo CFTR Provision of
functional proteinTargettedGenetics II
TCR HIVRetrovirus T- cells ex vivo TCR Retargeting killer T-
cellsN/a II
Infectious Disesses
Thomas Burt 8

1. Literature Survey
At present only one gene therapy is licensed which is Vitravene®, an antisense
treatment for cytomegalovirus retinitis in AIDS patients, produced by Isis
Pharmaceuticals.
1.3.2.1 Cancer
Figure 1-3 shows that the majority of gene therapy trials are for treatment of cancers.
This is because cancer is a genetic disease, caused by mutations in any one of the
multitude of genes involved in cell cycle regulation. Main treatments at present for the
majority of cancers involve surgical removal of the primary tumour, which is often
ineffective if the cancer is malignant. Radio and chemotherapy do show success but
which exhibit appalling side effects, meaning treatment is essentially a race to kill the
tumour before the treatment kills the patient.
Gene therapy offers a rational treatment that could complement existing methods and
make treatable presently unbeatable cancers. New approaches are desperately needed.
The five-year survival rates of patients diagnosed with any one of a number of
different cancers remain static. Existing gene therapy strategies include:-
(i) Gene Directed Enzyme Prodrug Therapy (GDEPT).
(ii) Immunogenicity enhancement e.g. by vaccination.
(iii) Oncolytic viral therapy.
(iv) Transfer of therapeutic genes-tumour suppressor/ apoptosis inducing.
(v) Antisense e.g ISIS 2503/ 3521/ 5132.
1.3.2.2 HIV/ AIDS and related conditions
Referring to (Figure 1-3) it can be seen that there are approximately 25 gene therapy
protocols being developed for infectious diseases, of which the vast majority are
targeting HIV. Development has been spurred in this area because of the lack of
effective antivirals, the main one being AZT, but resistance to present drugs is
spreading. Antisense prevails for HIV treatment aimed at blocking the expression of
several key genes namely gag, pol and env.
Thomas Burt 9

1. Literature Survey
1.3.2.3 Blood\ Cardiovascular and Heart disorders
Figure 1-3 also highlights the importance this technology has in the development of
treatments for blood, heart and cardiovascular disorders. Gene therapy treatments for
Haemophilia A and B are in phase I trials. Within the past year, clinical benefit has
been demonstrated by the administration of naked DNA encoding the angiogenic
protein VEGF. Injections into the skeletal muscles o f patients with critical limb
ischaemia, resulting from inadequate blood supply has resulted in dramatic long-term
benefit in a large proportion of patients. The treatment is now completing phase II
trials and is showing success in the alleviation of coronary artery blockage, a major
symptom of heart disease. In addition to HIV, cancer and cardiovascular disorders
infectious diseases, skin disorders and transplant rejection are also being targetted.
1.3.2.4 Monogenic Disorders
Perhaps one o f the most media attentive areas has been the potential of gene therapy to
alleviate genetic disorders that afflict people from birth and at present are incurable.
Appendix 1 details two treatments, which are in clinical trials for the treatment of
cystic fibrosis, using gene replacement to provide patients with the transmembrane
regulator they lack. It is expected that this area will be one of intense research, because
of the lack of cures or effective treatments Table 1-2 shows a selection o f monogenic
disorders which could benefit. As the technology is developed, it may be possible to
treat more complex genetic disorders.
Table 1-2 Table listing a number of monogenic disorders which may benefit from gene therapy
Gene Product Disease Frequency Current Therapy Prognosis
Adenosinedeaminase
SCID Loss of T and B cells 1:1,000,000 Bone marrow transplant
Without therapy fatal by 2yrs. With therapy limited
improvement
LDL receptor
Familial hypercholesterolemia Elevated cholesterol
leading to heart disease
1:500 Diet, drugs. Liver transplant Some improvement
Glucocerebrosidase
Gaucher disease Accumulation of glucocerebroside
causing liver, spleen, bone damage
1:2,500Removal of spleen,
antibiotics,bone marrow transplant
Some improvement
Blood clotting factor VIII
Haemophilia A Defective blood clotting, chronic internal bleeding
1:10,000(males)
Transfusions of recombinant factor VIII
Extended life expectancy requiring continual treatment
Phenylalaninehydroxylase
Phenylketonuria Can cause retardation 1:10,000 Control of dietary
phenylalanine Good if treatment started early
Thomas Burt 10

1. Literature Survey
ai-AntitrypsinEmphysema
Damage to lungs Cirrhosis of liver
1:3,500Replacement therapy Reduce environmental
risksProgression is slowed but not
stopped.
Cystic fibrosis transmembrane
regulator
Cystic fibrosis Blocked airways
Intestinal blockage Damaged pancreas
1:2,500(Caucasians)
Antibiotics, physical clearing of lungs, diet
controlFatal by late twenties
Orthinine trans- carbamylase 1:40,000 Restricted protein diet,
Drugs, liver transplant Symptoms diminished
Dystrophin
Duchenne muscular dystrophy
Progressive muscular wasting
1:7,500(males)
Only supportive treatments: -wheel chair,
breathing aidsFatal by early twenties
f)-Globin
Sickle-cell anemia Damage to spleen,
heart, kidneys, liver and brain
1:500Blood transfusions,
drugs, analgesics, bone marrow
Symptoms diminished but treatments suboptimal
1.4 Vaccines
1.4.1 Traditional Vaccination
Vaccination protects a recipient from pathogenic agents by establishing an
immunological resistance to infection. Present day vaccines consist of either
inactivated, attenuated or components o f the infectious agent. Notwithstanding the
considerable success vaccines have had in combating diseases such as poliomyelitis,
smallpox and diptheria etc, there are a number of limitations to the current mode of
vaccination
(i) Not all infectious agents can be cultured meaning no vaccines have been
developed for many diseases.
(ii) Production o f human/ animal vaccines by animal cell culture is expensive but
often necessary to produce correct form of vaccine.
(iii) Batches o f vaccine may not be killed/ attenuated (or may revert) sufficiently
leading to the recipient contracting the disease, they pose severe safety
problems
(iv) Extensive safety precautions are necessary to protect production personnel.
(v) Not all diseases (e.g AIDS, malaria and tuberculosis) are preventable through
the use o f present day vaccines
(vi) Most current vaccines have a shelf-life and require refrigeration which limits
their usage in third world countries.
Thomas Burt 11

1. Literature Survey
1.4.2 Novel Vaccine classes
The advent of recombinant DNA technology has provided a means of creating new
generations of vaccines that overcome the above drawbacks
1.4.2.1 Recombinant viruses
(i) Removal of virulence genes enables the pathogen to be used as a live
vaccine as it is impossible for a whole gene to be reacquired spontaneously.
(ii) Live non-pathogenic virus (e.g vaccinia virus) could have antigenic genes
inserted into its genome. Vaccinia virus is harmless and inserted antigen
gene would be expressed using viral machinery in the cytoplasm.
(iii) Virus like particles.
1.4.2.2 Subunit vaccines
Genes for immunologically active proteins of a dangerous pathogen are cloned into a
host such as E.coli. These subunit vaccines can be produced safely, purified and
administered. It is a safe option and allows vaccines to be made against pathogens,
which cannot be maintained in culture. Although the preparation is ensured to be safe
and defined, isolated, subunit proteins may not have the same conformation and thus
not the same antigenicity. Also, the host used to make the subunit may not correctly
post-translationally modify and glycosylate.
1.4.2.3 Passive Immunisation
Using monoclonal antibody technology it is possible to create a specific, murine mAbs
against a pathogen. Using humanization the monoclonal antibody can be administered
to patients, providing them with antibodies to a pathogen they have yet to encounter,
therefore immunising them.
1.4.2.4 A nti-idiotypic A ntibodies
Antibodies raised against the variable domains of antibodies generated against an
original antigen can be used to mimic the original antigen and can be used as a
‘surrogate antigen’ to generate an immune response targeting the original antigen.
Thomas Burt 12

1. Literature Survey
1.4.2.5 Peptide Vaccines
These new classes of vaccines do have benefits over traditional vaccines, but are still
not ideal. Recombinant vaccines are expensive to develop and produce, are unstable
and can only be produced for pathogens able to be cultured. Subunit, passive and
idiotypic vaccines suffer the same problems of instability and do not elicit as strong an
immune response or memory as traditional vaccines. Fortunatelty there are another
class of vaccines on the horizon which show considerable promise; DNA vaccines.
1.4.3 DNA Vaccines
DNA vaccines represent an exiting area of gene therapy. They employ plasmid DNA,
encoding proteins of pathogens or tumours, directly transfected in to animals to elicit
an immune response. They consist of a bacterial plasmid with a strong, viral promoter
(CMV/ SV40), the gene of interest and a polyadenylation/ transcription termination
sequence. They must have a bacterial origin of replication (ori) but a eukaryotic ori is
omitted so the plasmid does not persist in the vaccinee’s cells. They are delivered to
cells, usually muscle cells, by microinjection or using compressed gas to fire DNA
coated gold particles.
1.4.4 Advantages of DNA vaccines
(i) One major reason that DNA vaccines are considered so important is the way by
which they are able to stimulate the immune system. The immune system is composed
of two arms. The humoral arm consists of B-lymphocytes, which detect antigens on
the surface of pathogens and produce antibodies, molecules that bind the antigen and
alert other immune cells to destroy the pathogen. The cellular arm is carried out
primarily by cytotoxic T-lymphocytes (CTL). These cells have the ability to detect
antigens expressed on the surface of cells infected by a pathogen and destroy any
infected cells. Once an antigen has been encountered by the immune system, some B-
lymphocytes differentiate into ‘memory’ cells, which rapidly divide if the antigen is
detected again, making the second response quicker and more effective.
Vaccination is far more efficient if both arms of the immune system are alerted. For
this to occur the proteins of the pathogen must be expressed in the cells of the patient.
When this occurs these foreign proteins are then automatically presented on the surface
Thomas Burt 13

1. Literature Survey
of the cells where they are recognized by CTL, initiating the cellular arm and the
humoral arm of the immune system. Heat killed, subunit, idiotypic, peptide and
passive vaccines cannot induce cellular arm and are thus less effective vaccines.
Attenuated and recombinant vaccines are able to but they have other disadvantages.
(ii) A second major advantage is the simplicity of this form of vaccination. The
only steps required are construction of the plasmid and its purification. There are more
issues involved in the scale-up and manufacture of these pharmaceuticals but less so
than involved with subunit vaccines. Development of subunit vaccines requires the
plasmid to be constructed, expression must be assured to be correct and at high-titres
in a suitable host (usually animal cell culture, which is expensive) followed by
purification through a multitude of different steps. With DNA vaccines, the antigen is
expressed in vivo guaranteeing correct processing for viral proteins and more often
than not for bacterial and parasitic antigens. This helps generate antibodies of optimal
specificity.
(iii) Traditional vaccines (excluding attenuated types) only stimulate the humoral
response, producing antibodies that bind proteins on the surface of the pathogen. To
escape antibody detection, pathogens (especially viruses) mutate their surface proteins
often to escape recognition. Functional proteins that require a specific sequence
function are conserved and protected from attack by these surface proteins (Rossman’s
Canyon hypothesis). DNA vaccines can be produced encoding these conserved
proteins so when they are exposed to function the immune system can rapidly respond.
(iv) Certain motifs of bacterial DNA, notably Cytidine-Phosphate-Guanosine
(CpG) are known to be immunostimulatory. Studies have revealed these motifs,
(present twenty times more commonly in bacterial DNA than eukaryotic DNA)
activate T-helper-1 and T-helper-2 cells (Thl/ Th2). These cells produce cytokines
such as y-interferon and interleukin 4,5,12 and 13. Such T-cell and cytokine activation
appears to augment antibody and CTL responses to the antigen encoded by the
plasmid. Essentially, the construct has in-built adjuvants.
(v) Pre-clinical efficacy/ immune response has been clearly demonstrated for a
wide range of disease models, including viral, bacterial, parasitic diseases together
Thomas Burt 14

1. Literature Survey
with allergies and tumours. Table 1 Ogives examples of disease models against which
DNA vaccination has shown positive responses.
(vi) Many DNA vaccines protocols followed thus far have demonstrated positive,
long-lasting responses from even small doses. Figure 1-4 demonstrates the survival of
mice immunized with 200pg of plasmid DNA encoding NP from influenza against
100 100
60
* 40
20 - 2 0
0 355 10 15 20 25 30 40 45
Figure 1-4 Demonstrates the survival of mice immunized with 200pg of plasmid DNA encoding NP from influenza against control DNA (plasmid without the coding region) or not injected. Groups of 10 mice were injected three times at three-week intervals and then challenged intranasally with LD90 o f influenza A/HK /68 (H3N2) three weeks after the third injection.
Number of Days post-infection
control DNA (plasmid without the coding region) or not injected. Groups of 10 mice
were injected three times at three week intervals and then challenged intranasally with
LD% of influenza A/HK/68 (H3N2) three weeks after the third injection.
Table 1-3 Table detailing the disease models against which DNA vaccination has proved effective
D isord er V accin e T yp e
Viral
Influenza Nucleoprotein / Haemagglutinin. HIV envelope protein / Bovine herpes virus glycoprotein / Rabies virus glycoprotein / Hep B surface antigen / HSV glycoproteins B and D / Papillomavirus LI / Hep C virus nucleocapsid / Hep B core protein / HIV gp!20 and gpl60 /HIV N ef protein
Bacterial B.thuringensis delta-toxin / Mycobacterium tuberculosis antigen 85 and hsp65 / Mycobacterium pulmonis Tetanus toxin C I Salmonella OmpC protein.
Parasitic Schistosoma japonicum Leishmania major Plasmodium yoelli Plasmodium falciparum
Tumour Human carcinoembryonic antigen / Polymorphic epithelial mucin (MUC-1)Idiotypic antibody o f a B-cell lymphoma / Human IgV region / MHC class 1 molecules
(vii) DNA vaccines could facilitate the combination of diverse immunogens into a
single preparation to facilitate the immunisation of several disorders. Indeed for
viruses that undergo antigenic variation, such as HIV and influenza it may be
necessary to include DNA constructs encoding surface proteins from several distinct
stains to provide protection against strains which may be circulating.
Thomas Burt 15

1. Literature Survey
1.5 Gene Delivery
At the heart of any gene therapy procedure is the delivery of a corrective gene,
together with the appropriate regulatory machinery into the cells of the designated
tissue and the subsequent expression of the gene. Two methods have been developed
to that end
1.5.1 Ex vivo gene delivery
Ex vivo gene delivery was the first method to be developed and usually involves the
following procedure;
1. Collecting the appropriate cells from affected individual.
2. Growing isolated cells in culture.
3. Correct the genetic defect by transferring appropriate gene into the isolated
cells.
4. Select and culture the corrected cells.
5. Either infuse or transplant the corrected cell back into the patient.
The advantages of this technique are that it uses the patient’s own cells, ensuring no
adverse immunological response occurs after infusion of the corrected cells.
Additionally, this technique of gene delivery has a high transfer efficiency ensuring
multiple copies of the corrective genes are delivered to the cells. Furthermore, only
transfected cells are selected for and delivered back to the patient. These transfected
cells tend to have numerous copies of the gene stably inserted into the genome of the
cell, meaning the construct persists in the cells for reasonably long periods of time
(-18 months). However, it is by no means a cure as ultimately the expression of the
gene is transient and the procedure will need to be repeated.
Unfortunately, this technique is only applicable to a small number of cell types;
endothelial, haematopoeitic and skin. A preferred method of ex vivo delivery would
use totipotent stem cells. These cells have the ability to develop into any differentiated
tissue once exposed to the correct growth factors. Unfortunately, at present it is very
hard to isolate stem cells from a patient, being present in only very small numbers in
bone marrow, blood and adipose tissue and the ethical debate surrounding the use of
Thomas Burt 16

1. Literature Survey
embryonic stem cells, remains sadly unresolved. Furthermore, this method is very time
consuming taking months to generate sufficient number of cells, and highly labour
intensive.
1.5.2 In vivo gene delivery
In vivo gene transfer would be the preferred technique of introducing a corrective gene
into the required cells, once the many technical hurdles have been overcome. It
requires the direct introduction of the gene construct in to the patient. This form of
delivery would mean gene therapy would become as simple as administering a
traditional pharmaceutical, thus allowing the huge number of people in need of some
possible form of gene therapy to benefit.
If gene therapy is to become a viable treatment option able to compete with traditional,
small-molecule pharmaceuticals, in vivo transfer is the only way it will succeed. There
simply are not the medical or economic resources to treat the huge number of people
who could benefit from gene therapy by the ex vivo transfer procedure. Unfortunately,
the hurdles in terms of producing a suitable in vivo vector, which can be targetted to
the correct cells, enter those cells in sufficient numbers and in many cases stably
integrate in to the host chromosome and be expressed for long periods of time, are
huge. At present in vivo methods produce low transfection efficiency and non-stable
integration. In many cases, namely tumour therapy and vaccination, transient
expression is favourable but high rates of targetted transfer are still required.
1.6 Gene Therapy Vectors
In order to deliver the corrective gene to the correct cells and to ensure its expression,
the gene is inserted in to a vector. An ideal vector should be efficient in delivering the
gene, target the correct cells, protect the gene from degradation, allow for control of
expression aswell as being non-toxic or immunogenic. There exist two broad
categories of vector; viral and non-viral vectors.
1.6.1 Viral Vectors
Viruses have evolved specifically for hijacking cellular machinery of the cell to
express the nucleic acid it carries. Consequently, they became an obvious choice as a
Thomas Burt 17

1. Literature Survey
vector, by removing the virulence/replication genes and replacing them with the gene
for transfer. The most commonly used viral vectors are; Adenovirus, Retrovirus and
Adeno-assocoiated virus. Viral vectors have a high transfection efficiency, meaning
the majority of viral particles deliver the gene into the cells. Because of the nature of
viruses, these vectors can be targetted very specifically to certain cells. Additionally,
some virus are lysogenic meaning they insert into the genome of the cell allowing
prolonged expression of the construct. Transient expression is also possible with other
viral species.
Disadvantages with the viral method centre around the highly immunogenic nature of
the viral particle. Continual administration of the viral vector leads to a strengthening
immune response by the patient, meaning greater and greater doses need to be given,
which in one case has proved fatal. Because the virus exists as a self-assembling,
precise, geometric particle the cavity where the genetic material is encased, limits the
size of the insert allowed to usually less than 8kb. A further drawback, which applies
not just to the viral delivery method, but any method which leads to integration of the
construct into the host genome, is the possible deactivation of important genes, namely
those which control cell proliferation. The chances of insertional deactivation are
slight, due to the small amount of coding DNA within the genome and are considered
to be a necessaiy evil. However, one trial in France has already had to be ceased since
the patient contracted leukemia, due to the insertion of a lysogenic virus.
Other problems encountered include the potential risk of recombination between
vector and viral DNA resulting in the generation of wild-type, infectious particles. This
vector class also have to be produced by contained, animal cell culture leading to high
cost of manufacture.
Retroviral vectors (MMLV/ HIV):- the advantage of this vector class are their ability
to efficiently and stably integrate nucleic acids into the host chromosome. The
integrated DNA is expressed throughout the life of the cell and passed on to daughter
cells. Retroviral vectors require mitosis for integration so subsequently can only be
used to infect rapidly dividing cells.
Adenoviral vectors are used due to their ability to carry large inserts ~10kb. They are
also able to infect non-dividing cells. Their chromosome remains episomal, leading to
Thomas Burt 18

1. Literature Survey
transient expression, useful in tumour therapy. However, this vector class is highly
immunogenic and was the one used in the trial which resulted in the death of one
volunteer.
Adeno-associated vectors have recently been used as vectors. They are a small, ssDNA
virus carrying an insert of ~5kb. It is their absence of pathogenicity which makes this
vector class so attractive. They also have the ability to integrate into a specific site on
chromosome 19. Injection of this virus into brain and muscle tissue has produced
stable and long-term expression.
1.6.2 Non-viral vectors
Increasingly, the emphasis for gene delivery method is shifting from viral to non-viral
means. In non-viral delivery, genes are carried on plasmids, produced most commonly
in E. coli. The advantages of using non-viral delivery systems are that it eliminates the
concerns relating to the transfer of unwanted viral sequences, together with reduced
immunogenicity. The reduced immunogenicity allows greater potential for serial in
vivo administrations than viral vectors (Davis, 2002).
Additionally, this method allows for larger expression cassettes to be used. At present
trials have used constructs of less than lOkb, but this is expected to increase. Larger
constructs allow for multiple expression cassettes, meaning several corrective genes
can be expressed together or the inclusion of cell signaling molecules, cytokines
allowing greater control over cellular processes. Thus, treatment of multigene and
metabolic disorders becomes a possibility. There is even talk about the possible
transfer of artificial chromosomes.
The main disadvantages of this method are the relatively low levels of delivery. It is
estimated that for every 1000 plasmid molecules only one reaches the cell and is
expressed. Another drawback is the very transient nature of expression demonstrated
by these vectors. Although generally regarded as being safer than the viral alternative,
there still remain some safety concerns with this delivery method. DNA itself is
immunogenic (specifically unmethylated CpG sequences) this can be advantageous if
the purpose of transfer is for vaccination. However, a severe immune response could
possibly cause patients to develop systemic autoimmune disease, triggered by
activation of auto-reactive B-cells.
Thomas Burt 19

1. Literature Survey
1.6.3 Naked DNA
Administration of naked DNA gives a surprising level of gene transfer following local
injection into skin/muscle. Reports have described transgene expression lasting several
months for intramuscular injection, but only a few days for intradermal. The
mechanism of DNA uptake into muscle/skin cells is unclear, but the fact that this
delivery method does lead to the priming of both the humoral and cellular arms of the
immune system has led to enormous interest in this method for DNA vaccination.
Success has been demonstrated by this method for stimulating immune responses
against the protein product of a gene from Plasmodium falciparum (the malaria
parasite). The other important application is the injection of naked DNA encoding
VEGF into the muscles of patients with critical limb ischaemia, now in Phase II trials.
The advantage of this method is that naked DNA can be manufactured and
administered simply. However, gene delivery efficiency is still poor, very brief
expression is seen and the method is only an option for a few tissues as targeting is not
an option. As detailed earlier naked DNA is a powerful adjuvant, an advantage when
used to administer a one-off vaccine but becoming a serious problem if the therapy
requires multiple injections as it could lead to the development of autoimmune
diseases.
1.6.4 Needle-free injection
Two ‘biolistic’ devices have been developed as an alternative to the injection of naked
DNA. The ‘gene gun’ uses high-pressure helium to deliver DNA coated gold particles
directly into the cytoplasm of cells, and can be used for both in vivo and ex vivo
transfer procedures. The ‘Intraject’ device uses liquid under high pressure to force the
DNA into interstitial spaces. Both methods report higher immune responses than naked
DNA injection, but again suffer from the same drawbacks, namely that they can only
be applied to a few tissue types (Yoshida et al., 2000; Zagon et al., 2005)
1.6.5 Condensed DNA particles
This method uses cationic polymers to condense DNA by electrostatic interaction into
small particles. The hope is to protect the DNA from degradation and enhance its
uptake by endocytosis. The most important polymers continue to be polylysine and
Thomas Burt 20

1. Literature Survey
polyethyleneimine (PEI). There are a number of examples, which suggest that these
formulations give reasonably efficient transfection ex vivo but very few reports to
suggest any improvement over naked DNA transfer for in vivo protocols. Indeed, the
polymers seem to cause aggregation of the particles in physiological conditions,
resulting in entities too large to effectively penetrate tissue. The main advantage of this
approach are that it offers a way of improving specificity by the attachment of ligands
or antibody to the condensing polymer.
1.6.6 Cationic Lipids
Cationic lipids bind DNA tightly by electrostatic interaction. Like cationic polymers,
lipids offer some protection to the DNA aswell as neutralizing the anionic charge of
the DNA so condensing its structure. Cationic lipid-DNA complexes have been
extensively tested for delivery of the cystic fibrosis transmembrane receptor gene.
Unfortunately, the level and duration of expression was too low for clinical benefit. As
with cationic polymers the main drawbacks with this method are the low transfection
efficiency, poor targeting and formulation instability. Two therapeutic strategies
involving cationic lipids for the treatment of cancer have reached Phase II trials.
However, the investigation of the efficacy of cationic lipids has led to the development
of cationic liposomes, which are the most widely used non-viral vector.
1.7 Plasmid DNA Properties
The plasmid DNA used in non-viral gene delivery applications is required to possess
certain qualities in terms of size, gene sequences and conformation. Plasmids, the
workhorse of the biotechnology revolution, are naturally occurring entities of bacterial
origin. These DNA units are found as extra chromosomal DNA within bacterial
species such as E.coli (Caldwell, 1997; Feigner, 1997; Middaugh et al., 1997).
Plasmids are usually isolated as covalently closed circular DNA in a negative
supercoiled form (i.e. the DNA is interwound, containing fewer helical turns,
compared to relaxed forms, resulting in torsional tension in the plasmid loop). The
conformation of the plasmid is important and for gene delivery purposes it is
preferable to keep the plasmid DNA in its native conformation of negative super coiled
(SC) conformation. This conformation is known to produce the highest transfection
Thomas Burt 21

1. Literature Survey
efficiency as it dissociates from and complexes with the greatest ease aiding uptake of
the DNA to the cell nucleus (Adami et al., 1998; Even-Chen and Barenholz, 1999).
Conversion of the SC DNA to a circular conformation has only a minor effect but
conversion to a linear state reduces the efficiency of gene expression by 90% (Adami
et al., 1998). The natural sequence of these plasmids does not however contain all the
genes required for effective gene delivery and further manipulation is required to
produce a sequence suitable for effective gene delivery.CCC monomer OC monomer
OC dimer
CCC dimer
OC monomer
CCC dimer OC dimer
Figure 1-5 Electronmicrograph displying the different forms that plasmid DNA molecules can exist and how they are represented by electrophoresis
There is a limit to the size of the construct that can be packaged into the delivery
system and easily inserted into the target cells. DNA macromolecules are relatively
large, for example, DNA of seven kilo bases (kb) has a theoretical hydrodynamic
diameter of 300nm and the upper limit for packaging is at present 30kb (Tsai et a l,
1998). The sequences contained in the plasmid are therefore important and only
essential genetic information can be included. Essential information includes the
therapeutic gene, which must be identified and cloned into the appropriate expression
vector, the signal sequences for gene expression such as promoters and enhancers and
in some cases genes that aid integration into the genome of the diseased cell
(Mhashilkar et a l , 2001).
Ideally the vector should also contain an on/off switch to provide a level of control,
however, currently available switches need further development (Prud'homme et a l ,
Thomas Burt 22

1. Literature Survey
2000). To limit the possibility for chromosomal integration during the delivery of
genes to a patient the homology of the pDNA sequences to known sequences in the
human genome should be examined and described and strong homology avoided if
possible (Zoon, 1996). To tailor plasmids to contain the essential gene sequence for
production of the desired protein a recombinant DNA technology process is employed
(Caldwell, 1997). The tailoring process begins with cleaving the plasmid and
therapeutic genes at precise locations, using restriction enzymes, in order to produce
compatible DNA ends and the therapeutic genes, along with the appropriate promoter
and enhancer sequences, can then be ligated into the plasmid via their compatible end
(Stribley et al., 2002). The result of this manipulation is the production of a small, well
designed, custom-built expression vector, aiding therapeutic delivery and expression,
which can then be produced in significant quantities relatively easily in a bacterial
fermentation.
1.8 Plasmid DNA manufacture
In this section a brief overview of the methods commonly employed to produce
plasmids for therapy will be outlined. The description will purposely be kept brief as to
avoid repeating subject matter encountered later.
1.8.1 Fermentation
Escherichia coli is by far the most common choice as the host for the production of
plasmid DNA. The organism is well characterised and there exists a multitude of
strains with various characteristics which may be desirable. The choice of fermentation
strategy is designed to achieve high cell densities under conditions which allow for
high plasmid specific yields. Although plasmid copy number is primarily a function of
the control mechnisms coded on the molecule it can be strongly influenced by growth
conditions, including growth rate. Further discussion concerning the impact of
manipulating the upstream conditions in order to maximise plasmid yield is discussed
in 3.1. Such manipulation can take the form of media adaptation and the use of fed-
batch operation.
Thomas Burt 23

1. Literature Survey
1.8.2 Downstream processing
Following the fermentation step a sequence of unit operations must be set up with the
combined task of purifying the plasmid, commonly achieved by the removal of
impurities away from the product, as well as concentrating the plasmid product. Due to
the variety of unit operations on offer many different process flow sheets have been
described. Generally, the downstream operations can be divided in to four distinct
phases: Cell harvest, Cell Lysis, Clarification and concentration and Purification. More
detail concerning these operations can be found in Chapter 7
1.9 The requirement for large plasmids
There are many processes described in the literature capable of producing plasmid
DNA (Table 7-1), but the overwhelmingly majority describe the production of
plasmids up to lOkb in size. Plasmids of this size range can comfortably accommodate
all the necessary coding sequences for the own plasmid’s replication, whilst in the
bacterial host, with sufficient capacity remaining to accomodate the necessary
sequence information for the protein of interest. As such, what are the drivers for the
larger plasmid manufacture? It is envisioned that there are several reasons why larger
plasmids could be required, all of which are linked to the increase in coding capacity
available.
Increased coding capacity promises to allow for the expression of multiple proteins of
interest, enable more sophisticated control of gene expression and also allow for the
delivery of whole gene sequences, inclusive of introns and other regulatory factors.
In the shorter term more coding capacity is envisioned to be critical to the further
development of DNA vaccines. At present, it is believed that to become a truly
functional technology the immune response generated by such vaccines needs to be
strengthened. One proposed stategy is to include sequences coding for
immunomodulatory proteins, such as cytokines and interleukins, to be expressed in
conjunction with the antigen and so boost the resulting immune reaction. In addition, it
is hoped that constructs could be produced which express multiple antigens
simultaneously. This would be useful for strengthening the response against one
target/pathogen or would allow the immunisation against multiple targets/pathogens
Thomas Burt 24

1. Literature Survey
using one construct. Obviously, both of these strategies would require either an
increase in coding capacity or could be achieved through the administration of multiple
invidual constructs. However, the manufacturing, formulation and logistical issues
associated with such the administration of multiple constructs would be complicated.
Furthermore, current targets for gene replacement technology are mainly directed
against monogenic disorders. It is hypothesised that future targets may be more
complicated involving the correction of entire biochemical pathways and, as such,
multigenic in nature. Larger coding capacity would be essential to achieve correction
of such disorders.
1.10 Conclusions
A brief background to the field of gene therapy has been outlined. Details have been
given about current progress and the potential future developments of this technology,
and specifically DNA vaccination. Limited detail was given surrounding to the
properties of plasmid DNA and the current methods on manufacture as these subjects
will be dealt with in more detail in later sections. Finally, reasons were outlined as to
the requirement of being able to manufacture large plasmids.
Thomas Burt 25

2. Materials and Methods
2 MATERIALS AND METHODS
2.1 Cultures
2.1.1 Escherichia coli bacterial strain genotypes
E.coli K-12 strains used as plasmids hosts were:
PHI TF~ rec A l endA\ gyrA96(Nalr) thi-1 hsdRll supEAA re/Al].
PH I06 TF' mcrA A(mrr-hsdRMS-mcrBC) O80/tfcZAM15 AlacXIA deoR recAl endAl ara A139 A{ara,leu)l691 galU galKX rpsL nupG].
DH5a [F7 end A l hsdRll (rK‘ itik+) supEAA thi-1 rec A l gyrA (Nalr) relAl A(lacZYA-
argF) U169 (O80dlac A(/acZ)M15] (Woodcock et al., 1989; Blattner et al., 1997).
2.1.2 Preparation of cell stocks
E.coli strains were maintained in 20% glycerol and stored at -70°C. Glycerol stocks were
prepared by plating out cells from a master cell bank on to selective agar plates using a
sterile inoculation loop. Plates were incubated at either 37°C or 25°C depending on the
fermentation regime. Single colonies were picked off and used to inoculate 5mL of media
in a sterile universal.
Bacteria were grown at either 37°C or 25°C on LB media in rotary shaker at 230rpm (New
Brunswick Scientific). Plasmid harbouring strains were maintained by supplementing the
liquid/solid media with selective antibiotics as appropriate, depending on plasmid
phenotype; ampicillin sodium salt (lOOpgmL"1 to lOOOpgmL*1) for ampicillin resistance
(pSVp and pGEM® series), kanamycin sulphate (SOpgmL*1) for kanamycin resistance and
chloramphenicol powder (25pgmL1) for chloramphenicol resistance (Oxford series). All
selective agents were provided by Sigma-Aldrich, Dorset, UK and were added to the
media after it had been sterilised and cooled so as to prevent degradation.
The seed culture was used to inoculate 50mL of sterile media, containing the appropriate
antibiotic in a 1L baffled shake-flask, to 0.1 OD. Shake-flasks were incubated until the
optical density fell between 2.5-3.0 (early log phase). The flasks were removed from the
incubator and 12.5mL of sterile 100%(v/v) glycerol was added. The cell suspension was
Thomas Burt 26

2. Materials and Methods
then aliquoted in 1.8mL volumes into 2mL Nunc cryovials and stored at -70°C. These
formed the working cell bank.
2.1.3 Growth of bacterial strains.
In order to produce plasmid for cloning and gel studies, cultures were grown in 1L baffled
shake-flasks. A cryovial from the working cell bank was removed from cold storage,
defrosted and used inoculate 50mL of sterile, selective nutrient-broth in the shake-flask.
Because the working cell bank was banked at an OD of -2.5, inoculating 50mL of media
with a 1.8mL cryovial of cell suspension led to a starting OD of 0.1. Shake-flasks were
incubated overnight and the cell paste harvested by centrifugation.
To produce larger amounts of cell paste for the downstream operations bacteria were
grown in a 5L (4L working volume) Applikon bioreactor. The sterile media in the
fermenter was inoculated from Shake-flasks prepared as above to a starting OD of 0.1.
2.2 Plasmid Constructs
2.2.1 Oxford Series of large plasmids
The Oxford series of plasmids were provided by the The Wellcome Trust Centre for
Human Genetics. Their construction and use is described by (Wade-Martins et al., 1999;
White et al.. 2003). Three constructs were provided: p5176 (116kb), p5206 (172kb) and
p5204 (242kb). All the constructs were Bacterial Artificial Chromosome (BAC) based
plasmids, constructed by the insertion of human genomic DNA segments into p5170
(12kb). The vector p5170 is based on the Notl-Xhol fragment of the BAC vector
pBAC108L. This vector carries par A. parB, parC, repE and oriS which are F factor
regulatory genes controlling BAC replication and copy number. These genes encourage
stable propagation of the constructs and maintain copy number at -2 copies/cell. The
vector also carries Cmr providing resistance to chloramphenicol.
The p5170 vector was developed as an episomal shuttle vector and as such was designed
to be constructed and produced in bacterial cells for subsequent transfection into
mammalian cells so as to investigate the effect of the inserted sequences on mammalian
cell physiology. This trait means the vector also carries several genes enabling it to express
sequences in mammalian cells. These include green-fluorescent protein (GFP) open-
reading frame under the control of cytomegalovirus promoter {Pern) for visualisation
Thomas Burt 27

2. Materials and Methods
studies. The hygromycin-B phosphotransferase (HPH) gene under the control of the Rous
sarcoma virus promoter (FW) is included in order to allow selection in mammalian cells
and the Epstein-Barr virus FR region is present to provide nuclear retention of the
construct in cells expressing EBNA-1 (Figure 2-1).
2 .2.2 Control plasmid pSVp (6.9kb)
The plasmid pSVp was used as a control in many experiments. It is a high-copy number
pUC-based plasmid which confers ampicillin resistance and expresses p-galactosidase
under the control of SV40 promoter (Figure 2-1).
2.2.3 pGEM® constructed plasmid models
(Tao and Zhang, 1998) describe the propagation of large DNA fragments using
conventional vectors, specifically pGEM ll. This vector was employed to create a
series of larger constructs under the control of a high-copy number replicon using the
method outlined in their report.
230l*fr5204)
\ / \ /
\ /
\ MUftfrMM) /\ /
\ /
\ 105kkfc3176) /K >
\ / \ /
Nor I
parC
parB
par A
P ksv
rrpEoriS
Xho I
T7 1
t SP6
Figure 2-1 Maps of the plasmid vectors employed throughout this study. P5170 is the BAC vector in to which had been cloned several large fragments of human genomic DNA form the Oxford series of 116kb, 172kb and 242kb in size. Note the presence of active partition elements {par A,B,C) to ensure stable propagation. These combined with Ori S form the F-replicon. Also shown is the pSV0 construct which was a small, high-copy number plasmid often employed as a positive control plasmid. The pGEMll vector is also detailed. Into this vector was cloned a series of large fragments of S.cerevisiae DNA to create large plasmid models using a method based on that of Tao and Zhang, (1998).
Thomas Burt 28

2. Materials and Methods
2.3 Bacterial Growth Media
2.3.1 Growth Media
Unless otherwise stated, chemicals and media components were supplied by BDH
Laboratory Suppliers, Dorset, UK. Deionised water was drawn from a Milli-Q system
(Millipore, Billerica, Massachusetts, USA) and used for media preparation. Media
sterilisation was performed by autoclaving except additions which were heat labile.
Autoclaving was peformed in either a PAC Autoclave set on Media cycle (121°C /
30mins/ 15psi) or for smaller items a benchtop autoclave was used.
23.1.1 Nutrient agar
Plate media was Luria-Bertani (LB) medium agar. LB agar consisted of per litre,
mycological peptone (lOg; Oxoid, Hampshire, UK), Yeast Extract (5g; Oxoid), NaCl
(lOg) and Agar Technical (15g; Oxoid, Hampshire, UK). The pH was adjusted to 7.5 with
4M NaOH prior to sterilisation by autoclaving.
2.3.1.2 SOC Media
This complex media was used in the revival of cells following electroporation. It consisted
of per litre; Tryptone (20g; Oxoid), Yeast extract (5.0g; Oxoid), NaCl (lOmL of 1M soln)
and KC1 (2.5mL of 1M soln). These components were mixed and the pH brought to 7.0
with 4M NaOH before adjusting the volume to 960mL and autoclaving. Following
sterilisation additions of separately sterilised components were added. These were
MgCl2.6H20 (lOmL of 1M soln), MgS04.7H20 (lOmL of 1M soln) and D-Glucose (20mL
of 1M soln). (Sambrook et a l 1989)
2.3.1.3 Super Broth mediaSuperBroth media is a complex media. It consisted of, per litre; Yeast Extract (20g; Oxoid,
Hampshire, UK), NaCl (5.0g) and Tryptone (32.0g; Oxoid, Hampshire, UK). The pH was
adjusted to 7.5 with 4M NaOH prior to sterilisation.
2.3.1.4 SDCAS media
SDCAS media is semi-defined. Its preparation is slightly more involved than that of
SuperBroth. The basal media was prepared as outlined in Table 2-1 and autoclaved to
sterilise. The additions outlined in the same table were all sterilised separately either by
autoclaving or filter sterilising and recombined aseptically once sterile in order to avoid
Thomas Burt 29

2. Materials and Methods
browning. Table 2-2outlines the constituents of the stock solutions used to prepare SDCAS
media, together with the method of their sterilisation and storage.(0'Kennedy et a l, 2000)
T ablej^jT able^etailing the constituents o f SDCAS mediaSDCAS MEDIA (PH 6.3) COMPONENT AMOUNT PER LITRE
Base Media
(N H ^ SO , 4.0g
k h 2p o 4 13.3g
Citric acid l-7g
Trace element soln. (TES) lmL
4M NaOH to pH6.3 ~10mL
dH.O To 920mL
Additions
Iron (III) citrate stock lmL
Thiamine stock lmL
M gS0 4 .7H20 2mL
Glucose stock 25mL
Casamino acids stock 50mL
Selective agent Chloroamphenicol stock 0.74mL
Table 2-2 Table detailing the constituents o f the stock solutions used to make SD CA S media
I I SOLUTION COMPONENTS G PER 100ML STOCK STERILISATION STORAGE
TraceElementSolution
(TES)
Na2 EDTA.2H20 0.84
A/C RT
CoCl2 .2H20 0.25
M nS04 .4H20 1.5
C uS0 4 .2H20 0.15
H3BO3 0.3
N aM o04 .2H20 0.25
ZnCl 1.3
Iron (III) citrate 1 0 A/C RT
M gS0 4 .7H20 60 A/C RT
D-Glucose 40 A/C RT
Casamino acids 2 0 A/C RT
Thiamine 0.45 F/S -206C
Chloramphenicol 3.4 N/A -20°C
Thomas Burt 30

2. Materials and Methods
2.3.1.5 Seed Media
Used for shake-flask studies and inoculum preparation. A complex media prepared
from yeast extract and tryptone, supplemented with glycerol as an additional carbon
source. The media was sterilised prior to use. The precise contents remain proprietary.
2.3.1.6 Fermentation media
Used for 4L fermentations. A complex media prepared by dissolution of yeast extract,
tryptone and mineral ion supplements in deionised water. Glycerol was added as an
additional carbon source. Polypropylene glycol (PPG) was added on a fixed volumetric
basis to control foaming. The media was sterilised in situ prior to use. The exact contents
remain proprietary.
2.3.2 Antibiotic solutions
Both ampicillin and kanamycin were produced at stock concentrations of SOmgmL"1 by
dissolving in sterile-filtered, cell-culture tested water. The stocks solutions were filter
sterilised through 0.22pm filters (Acrodisc, Gelman Sciences, Ann Arbor, USA) before
being aliquoted in lmL fractions into sterile Sarstedt tubes and stored at -20°C.
Chloramphenicol was prepared as a 34mgmL'1 solution in HPLC grade ethanol. With no
need to filter sterilise the stock was aliquoted as above and also stored at -20°C.
(Sambrook et al., 1989)
Thomas Burt 31

2. Materials and Methods
2.4 Buffers and other solutions
2.4.1.1 TE buffer
lOmM Tris-HCl (pH 8.0); ImM Na2EDTA (Sambrook et al., 1989)
2.4.1.2 Phosphate buffered saline buffer (PBS)
A lOx stock of PBS was prepared by dissolving NaCl (80.0g), KC1 (2.0g), Na2HPC>4
(14.4g) and KH2PO4 (2.4g) in 800mL of dH20. The pH was adjusted to 7.4 through
dropwise addition of 1M HC1. The solution was then made up to 1L and autoclaved. A lOx
dilution using dH20 was made when required and the solution re-sterilised (Sambrook et al, 1989).
2.4.1.3 Qiagen® buffers for small-scale plasmid DNA preparation
All buffers for small scale preparations of plasmid were provided by Qiagen, Crawley,
Sussex, UK. The buffer contents listed below are taken from (Qiagen, 2005).
PI (Resuspension buffer) 50mM Tris-HCl (pH8.0); lOmM Na2EDTA; lOOpgmL'1
RNase A. Stored at 4°C.
P2 (Lysis buffer) 200mM NaOH; 1 % (w/v) SDS. Stored at RT
P3 (Neutralisation buffer) 3.0M Potassium acetate (pH 5.5). Stored at 4°C
N3 (Neutralisation buf.-spin) Proprietary composition similar to P3 but also
containing guanidine hydrochloride. Stored at RT.
QBT (Equilibration buffer) 750mM NaCl; 50mM MOPS, pH 7.0; 15%(v/v) IPA;
0.15%(v/v) Triton® X-100.
QC (Wash buffer) 1M NaCl; 50mM MOPS; pH 7.0; 15%(v/v) IPA
QF (Elution buffer) 1.25M NaCl; 50mM Tris.Cl; pH 8.5; 15%(v/v) IPA.
EB (Elution buffer-spin) lOmM Tris-HCl; pH8.5
QS (Adjustment buffer) 1.5M NaCl; lOOmM KH 2 PO4 ; pH 7.5
EX (Reaction buffer) 50mM Tris-HCl; lOmM MgCl2; pH8.5
2.4.1.4 3M Sodium acetate
Sodium acetate (24.6g) was dissolved in 80mL of dH20. The solution was made up to
lOOmL and sterilised by filter sterilising through a 0.22pm filter (Acrodisc, Gelman
Sciences, Ann Arbor, USA). It was stored at 4°C (Ausubel, 1987).
Thomas Burt 32

2. Materials and Methods
2.4.J.5 0.5x Tris-Borate-EDTA (TBE) buffer for electrophoresis
A lOx stock of TBE (0.45M Tris-Borate; 0.1M EDTA) was produced by dissolving
Trizma base (54.0g) and Orthoboric acid (27.5g) in 0.8L of dH20. 20mL of 0.5M
Na2EDTA (pH8.0) was added to the solution which was then made up to a final volume of
1L. The buffer was autoclaved and subsequently diluted 1:20 with distilled water prior to
use.(Sambrook et al., 1989)
2.4.1.6 SYBR Gold Staining buffer
30pL of 10,000x concentrate of SYBR Gold (Molecular Probes, Leiden, NL) was added to
300mL of 0.5xTBE. (Molecular Probes Inc, 2003)
2.4.1.7 Loading buffer
0.25% (v/v) bromophenol blue; 0.25% (v/v) xylene cyanol; 30% (v/v) glycerol; 0.1M
Na2EDTA
2.4.1.8 LMP Agarose
Low-melting point agarose was prepared by dissolving 0.8g of LMP agarose (Sigma,
Dorset, UK) in 0.5xTBE. The solution was autoclaved to dissolve.
2.4.1.9 TBE7 Ethidium bromide staining buffer
lOmgmL'1 EtBr (Sigma, Dorset, UK) was added to 0.5xTBE to a final concentration of
0.2pgmL'\
2.4.1.10 HPLC buffers
(i) Buffer A (20mM Tris; pH7.5).
9.69g of Trizma base (Sigma, Dorset, UK) was dissolved in 1.5L of dH20 in a 2L
volumetric flask. The pH was adjusted to 7.5 through dropwise addition of 1M HC1 before
being made up to 2L. The solution was filtered through a Millipore Type HA 0.45pm filter
(Millipore. Billerica, Mass. USA) to degas.
(ii) Buffer B (20mM Tris+IM KC1; pH7.5)
9.69g of Trizma base (Sigma, Dorset, UK) and 149.0g of KC1 was dissolved in 1.5L of
dH20 in a 2L volumetric flask. The pH was adjusted to 7.5 through dropwise addition of
1M HC1 before being made up to 2L. The solution was filtered through a Millipore Type
HA 0.45pm filter (Millipore, Billerica, Mass. USA) to degas.
Thomas Burt 33

2. Materials and Methods
(iii) Cleaning solution (20% (v/v) Methanol)
To 500mL of CIH2O 200mL of HPLC grade methanol was added. The solution was
allowed to cool before being made up to 1L.
2.4.1.11 PicoGreen Working Solution
lOOpL of PicoGreen stock solution (Molecular Probes, Leiden, Netherlands) was diluted
1:200 in 19.9mL of TE buffer in an opaque universal immediately prior to use(Molecular
Probes Product Information, 2003).
2.4.1.12 Bicinchoninic acid (BCA) assay reagents
All reagents were supplied by Pierce Scientific BCA Protein Assay kit (Perbio Science,
Northumberland, UK) and as such the exact contents were proprietary (Pierce Scientific,
2006).
Reagent A: Contained Sodium carbonate; Sodium bicarbonate; bicinchoninic acid; Sodium
tartrate in 0.1 M Sodium hydroxide.
Reagent B: Contained 4% cupric sulphate (CuS04)
Working reagent: 50:1 dilution of Reagent A to B.
2.4.1.13 Quant-IT™ Working Solution.
lOOpL of Quant-IT™ RNA reagent (Molecular Probes, Leiden, Netherlands) was diluted
1:200 in 19.9mL of Quant-IT RNA buffer in an opaque universal immediately prior to use
(Molecular Probes Inc, 2006).
2.4.1.14 Restriction Enzyme buffers
All restriction enzymes were purchased from Promega, Madison, USA and the buffers
supplied were used. Bovine serum albumin (BSA) was added to restriction digests from a
stock solution provided (lOmgmL'1) to form a lOOpgmL"1 solution in the reaction mixture.
2.4.1.15 1 OOmMATP solution
Adenosine 5’-triphosphate disodium salt (2.75g; Sigma, Dorset, UK) was dissolved in
40mL of dfUO. The pH was adjusted to 7.5 using 4M NaOH and the volume corrected to
50mL. The solution was sterilised through a 0.22pm filter before being aliquoted in 300pL
volumes and stored at -20°C (Qiagen, 2005).
Thomas Burt 34

2. Materials and Methods
2.4.1.16 fi-Agarase buffer
lOmM Bis Tris-HCl; ImM EDTA; pH 6.5 (Promega, Madison, USA)
2.4.1.17 Phenol/Chloroform
Phenol:Chloroform:Isoamyl alcohol (25:24:1), saturated with lOmM Tris-HCl (pH 8.0);
ImM Na2EDTA (Sigma, Dorset, UK). The phenolic phase was pH 6.7±0.2
2.4.1.18 lx T4 DNA ligase buffer
50mM Tris-HCl (pH 7.5); lOmM MgCl2; lOmM dithiothreitol; ImM ATP; 25pgmL1
BSA(Promega, Madison, USA).
2.4.1.19 MagNA Pure LC DNA Isolation Kit 1
Contents of the buffers provided for use in the kit remain proprietary (Roche Diagnostics,
Indianapolis, USA). The MSDS provides indications to some of their contents but not as to
their proportions (Roche Diagnostics, 2004).
Lysis/ Binding buffer 20% Triton^ X-100; 25%Guanidinium isothiocyanateProteinase K solution 2% Proteinase K; 50% Glycerol
Magnetic Glass Particle soln l-Methyl-2-pyrrolideWash Buffer 1 38% Ethanol; Guanidine hydrochlorideWash Buffer 2 Not known
Elution Buffer lOmM Tris-HCl (pH8.0)
2.4.1.20 TaqMan 2xUniversal MasterMix Buffer (Applied Biosystems, CA, USA)
Exact contents remain proprietary but the mix is known to contain AmpliTaqGold® DNA
polymerase (a heat activated enzyme designed to reduce background signal), ROX™
passive reference dye, dNTP's at 200pM each in lOOmM Tris-HCl, lOOmM KC1 (pH8.3).
The remaining buffer components including Mg2+ concentration are optimised for high-
performance. with total MgCl2 being 1.5mM; 0.7mM of which remains unbound.
2.4.1.21 Primer-Probe Mix
Supplied as 500nM primer and 250nM probe solution in 25mM Tris-HCl; O.lmM
Na2EDTA; 0.15%(v/v) Tween-20; 0.15% (v/v) NP-40 (pH8.3).
2.4.1.22 Resuspension Buffer
25mM Tris+lOmM EDTA+55mM Dextrose. Stored and used at room temperature.
Thomas Burt 35

2. Materials and Methods
2.4.1.23 0.96% (w/v) Sodium hydroxide (Lysis buffer 1)
2.4.1.24 6% (w/v) Sodium dodecylsulphate solution (Lysis buffer 2)
2.4.1.25 Neutralisation buffer (3M Potassium acetate)
3M Potasium acetate pH to 5.5 using glacial aceitic acid. Stored and used at 4°C.
2.4.1.26 RNA precipitation solution (5M Calcium chloride)
5M Calcium chloride stored and use at room temperature.
2.4.1.27 Diaflltration buffer 1 (lOmMTris)
lOmM Tris buffer (pH 7.1) stored and used at room temperature.
2.4.1.28 Diaflltration buffer 2 (1 OmM Tris+0.54MNaCl)
lOmM Tris + 0.54M NaCl (pH 7.1) stored and used at room temperature.
Thomas Burt 36

2. Materials and Methods
2.5 Analytical methods
2.5.1 Optical density measurement
Optical density was used as the primary measure of bacterial cell growth in liquid culture.
All recordings were taken using the same spectrophotometer; Shimadzu UV-1700
(Shimadzu Corp, Duisburg, Germany) set to 600nm. Measurements were taken by diluting
culture broths, using blank media being used for cultivation, until the reading fell within
the linear range of the assay 0.1-0.6OD units.
2.5.2 Wet Cell Weight (WCW) determination
Wet cell weight measurements were taken in duplicate per sample point. All mass
measurements were carried out using a Sartorius MasterPro five-point balance (Sartorius
AG, Surrey, UK). lmL of culture broth was pipetted into a pre-weighed sarstedt tube and
centrifuged for 5 minutes at 13,000rpm in a benchtop centrifuge. The supernatant was
carefully decanted off and any remnants of media removed using a cotton swab. The tube
was then reweighed and the cell weight calculated from the difference.
2.5.3 Dry Cell Weight (DCW) determination
Dry cell weight measurements were taken in duplicate per sample point. All mass
measurements were carried out using a Sartorius MasterPro five-point balance (Sartorius
AG. Surrey, UK). 5mL of culture broth was pipetted into pre-weighed, glass universal
bottles. These were placed in a vacuum oven at 80°C and left for ~24hours before being
reweighed and the cell weight calculated from the difference.
2.5.4 Replica plating assay for determination of plasmid retention
Broth samples for analysis needed to produce between 50-200 colonies per 100mm
diameter plate to produce a significant result. Each sample for analysis was processed in
triplicate by loading each of the dilutions on to three plates. The optical density of the
broth was determined and the level of dilution required chosen from Table 2-3 which lists
the dilutions used (figures decided upon assuming 10D unit~2.5xl08 cellsmL"1 (Figure
6-1). The broth was diluted using sterile PBS buffer by serial log]0 dilution in sterile
universal bottles by adding lmL of culture broth to 9mL of PBS. IOOjiL of the correct
dilution was then pipetted on to the centre of a non-selective TSA 100mm plate.
Thomas Burt 37

2. Materials and Methods
The plates were then incubated at whatever temperature the culture was being cultivated at
(25°C, 30°C or 37°C) for 18-24hrs in a benchtop incubator. The dilution plates with the
most applicable number of colonies were chosen as the master plates.
Table 2-3 Table outlining the tw o dilutions w hich w ere plated out on to separate 100mm TSA plates. The table dem onstrates the increase in dilution required with OD progression, calculated by assum ing IOD^k, unit ~ 2 .5 x l0 8cellsmL"1. D ilutions w ere perform ed by log10 dilution in sterile PBS buffer.
ODjoo Cells per lOOpL Dilutions required
0 - 0.04 0 - 1 x 1 0 * 1 0 ’5 and 1 0 4
0.04 - 0.4 IxlO6- lxlO7 1 0 " and 1 0 * 5
© 1 © lxlO7 - 2.5xl07 1 0 * and 1 0 " 6
©TT1©
2 .5xl07- 1x10* 1 0 ' 5 and 1 0 " 6
4 .0 -1 0 .0 Ix l0 * -2 .5 x l0 8 1 0 -* and 1 0 ‘7
10.0-50.0 2.5xl08- 1.25x10⁹ 1 0 "* and 1 0 ‘7
The master plates were marked on the base as a reference point. In a hood, the replica-
plating block was disinfected by spraying with 70% (v/v) ethanol. A sterile, velveteen
square was then placed on the block and locked in place by a locking ring. Aligning the
mark on the master plate with the mark on the plating block, the master plate was inverted
and the colonies transferred to the cloth by applying gentle pressure to the back of the
plate. A marked, non-selective TSA plate was then placed on the plating block and gently
pressured to ensure colonies are transferred. A selective TSA plate was then placed on the
block and the process repeated. The plates were incubated at the cultivation temperature
for 18-24 hours to allow colony formation after which the colonies were counted using a
colony counter. The colonies on the three selective and three non-selective plates for each
sample point were counted and totalled. The proportion of plasmid bearing cells was
calculated using the binomial equation shown in Equation 2-1.
Proportion o f plasmid bearing cells = IEquation 2-1 Binom ial equation w hich w as used to calculate the proportion o f plasmid bearing cells from data gathered by replica plating. It was used to im prove the accuracy o f the result, since the equation used the sum o f the colonies from all the triplicate plates. This produces a more precise result than calculating the proportion o f plasm id bearing cells from each o f the triplicate plates and then averaging the resu lts.(0 'K en nedy and Patching, 1999)
Colonies on selective Colonies on non-selective
\ ( (X M/ V
Colonies on selective ^Colonieson non-selective,
Colonies on non - selective
Thomas Burt 38

2. Materials and Methods
2.5.5 Sample preparation for plasmid quantification by HPLC and gel analysis
Bacterial pellets of 50D units, equivalent to approximately 2.5x10⁹ cells were resuspended
to homogeneity in 250pL of buffer P I(2.4.1.3) by pipetting. 250pL of buffer P2 was then
added and the solution gently mixed by inverting 4-6 times. The lysis reaction was left to
proceed for no longer than 5 minutes before 250pL of 4°C buffer P3 was added and the
solution mixed as before. The tubes were then left on ice for 30minutes to complete the
precipitation reaction. The lysate was cleared by centrifugation in a benchtop centrifuge
(Eppendorf, Cambridge, UK) at 13,000rpm for lOminutes. The clarified lysate was
decanted off into fresh Sarstedt tubes.
To the 0.75mL of lysate, 0.53mL (0.7vols) of isopropyl alcohol (IPA) was added together
with 0.1 volumes (75pL) of 3M sodium acetate. The tubes were gently mixed by
inversion. The plasmid DNA was recovered by centrifugation at 13,000rpm for 25mins.
The liquor was decanted off and the pellet washed with lmL of 70%(v/v) ethanol before
being centrifuged again for 10 minutes at 13,000rpm. The ethanol fraction was discarded
and the tubes air-dried. The plasmid DNA pellet was then resuspended in 100pL of TE
buffer. (Sambrook et al., 1989)
2.5.6 Preparation of samples for plasmid quantification by PicoGreen assay
Bacterial pellet samples were prepared in an identical fashion to above (2.5.4) except that
the procedure was halted once the clarified lysate was decanted into fresh sarstedt tubes.
The PicoGreen assay was conducted directly on clarified lysates or spin-prep eluents
where specified. (Noites et al., 1999)
2.5.7 Preparation of samples by Qiagen spin-prep
Bacterial pellets of 50D units, equivalent to approximately 2.5x10⁹ cells, were
resuspended in 250pL of buffer P I(2.4.1.3) by pipetting. 250pL of buffer P2 was then
added and the solution gently mixed by inverting 4-6 times. The lysis reaction was left to
proceed for no longer than 5 minutes before 350pL of buffer N3 (2.4.1.3) was added to
neutralise and the solution mixed as before. The lysate was cleared by centrifugation in a
benchtop centrifuge (13,000rpm lOminutes) and the clarified lysate instantly applied to the
anion-exchange resin of a QIAprep spin-column (Qiagen, Crawley, UK), which was
centrifuged for 1 minute. The flow-through was discarded and 0.75mL of the wash buffer
PE was applied to the column before being centrifuged for 1 minute. The column was then
Thomas Burt 39

2. Materials and Methods
re-centrifuged to remove any residual enthanolic wash buffer. Finally, the plasmid DNA
was eluted from the column into a fresh eppendorf tube by applying 50pL of EB buffer
directly to the surface of the resin. The columns were left to incubate for 5 minutes to
encourage maximum recovery before eluting the plasmid solution by centrifugation. (Qiagen, 2005; Pederson, 1996)
2.5.8 Preparation of plasmid material by Qiagen kits
When larger quantities of plasmid were required for standard curve preparation, for use as
markers or in binding studies, commercially available Qiagen kits were utilised (Qiagen,
Crawley, UK). Three different methodologies were used depending on the quantity and
purity of the desired plasmid. Each of the methodologies were as outlined in Qiagen
technical literature (Qiagen, 2005) and all were based upon the use of Qiagen Tip-500
columns capable of binding a maximum 500pg of pDNA product.
2.5.8.1 Qiagen Maxi-preps (Refer to Figure 2-2)
2.0g of frozen cell paste was resuspended to homogeneity in lOmL of buffer PI (2.4.1.3)
in a Sorvall centrifuge pot by vortexing, forming a cell suspension of-ISOgL'1. The cells
were lysed through the addition of lOmL of buffer P2 and the solution mixed by inverting
the bottle 4-6 times. The lysis reaction was allowed to proceed for 5 minutes before
neutralising through the addition of lOmL of 4°C buffer P3. The centrifuge pot was then
incubated on ice for 30minutes to maximise precipitation, before clarifying the solution by
centrifugation in a Sorvall centrifuge (SLA-1500 rotor) at 12,000rpm for 30minutes. The
lysate was further clarified by filtration through a double-layer of Kimwipe® tissue into a
clean, sterile Nalgene flask.
A Tip-500 column was equilibrated by applying lOmL of the buffer QBT, which passed
through the resin by gravity flow, before the clarified lysate was introduced to the column.
Once the clarified lysate had passed through the column, 2x30mL volumes of the wash
buffer QC were applied. The plasmid DNA was eluted from the column using 15mL of
buffer QF heated to ~60°C.
The eluant was collected in a clean SS-34 centrifuge tube, to which was added 10.5mL
(0.7vols) of IPA and 1.5mL (0.1 vols) of 3M sodium acetate to precipitate the pDNA. This
step was followed by centrifugation using a Sorvall SS-34 rotor at 12,000rpm for 30mins.
The IPA liquor was decanted off, being careful not to disturb the pellet and lOmL of 70%
Thomas Burt 40

2. Materials and Methods
(v/v) ethanol was added before re-centrifuging the tube for 15minutes at 12,000rpm. The
ethanol liquor was decanted off and the tube allowed to air-dry before the plasmid DNA
was resuspended in 0.5mL of TE buffer.
2.5.8.2 Qiagen Very Low-copy number preps (Refer to Figure 2-2)
This protocol was identical to the Maxi-prep method (2.5.8.1) except that it used more
starting material and required an additional IPA precipitation step. It was employed
because many of the plasmids studied existed at very low copy numbers making them hard
to isolate using a traditional maxi-prep approach. Consequently, this protocol used 4.0g of
starting material resuspended in 20mL of buffer PI so forming a cell suspension of
identical concentration as above. The lysis and neutralisation buffers were added in the
same ratio as before (1:1:1) equating to 20mL each. Consequently, 60mL of clarified
lysate was produced as opposed to 30mL.
The second difference with this protocol is that the clarified lysate was not applied directly
to the Tip-500 column as was the case with the maxi-preps. Instead, the lysate was
precipitated in order to concentrate through the direct addition of 42mL (0.7vols) of IPA
and 6mL (O.lvols) of 3M sodium acetate. The DNA was recovered by centrifugation in a
Sorvall centrifuge (SLA-1500 rotor) at 12,000rpm for 30minutes. The waste liquor was
discarded and the pellet resuspended in lmL of TE buffer to which was added 12mL of
equilibration buffer QBT. This plasmid containing solution was then applied to the
equilibrated Tip-500 column and the remainder of the protocol matched that of the Maxi-
prep method.
2.5.8.3 Qiagen Large construct preps (Refer to Figure 2-2)
This protocol mirrored that of the Very Low-copy number prep (2.5.8.2) except for two
key differences. Because many of the plasmids being studied were low-copy number they
were very difficult to obtain in sufficient quantities. That issue was addressed by the Low-
copy number prep by doubling the starting quantities used. However, because of the low-
copy number and low yields the ratio of plasmid DNA to contaminating genomic DNA at
the end of the purification regime was often unacceptably low, especially when preparing
the plasmids to form a standard curve for PicoGreen or HPLC. This is because the level of
contaminating gDNA would give a false overestimation of plasmid yield when measured
spectrophotometrically at 260nm. In attempt to remedy the problem this prep was used
when preparing large plasmids for use as standards. The key difference of this prep was
Thomas Burt 41

2. Materials and Methods
that it employed an exonuclease to degrade the genomic DNA so as to increase the ratio of plasmid DNA to genomic DNA achieved.
The beginning of the protocol was identical to the Very low-copy number prep in that 4.0g of cell paste was resuspended, lysed and neutralised using 20mL of the various buffers. Again the clarified lysate was precipitated in the same fashion as before but after centrifugation the pellet was washed with 70% (v/v) ethanol and recentrifuged using a Sorvall centrifuge (SLA-1500 rotor) at 12,000rpm for 15minutes. Once the ethanol liquor had been discarded and the tube air-dried, the pellet was dissolved in 9.5mL of buffer EX. To this was added 300|iL of lOOmM ATP solution (2.4.1.15) together with 200pL of ATP-Dependent exonuclease (supplied in kit) and the tube incubated in a water bath for 60 minutes at 37°C. Following incubation, lOmL of buffer QS was added to the mixture,
which was then applied to an equilibrated Tip-500 column. The remainder of the protocol was as outlined in the Maxi-prep method (2.5.8.1).
A B1 1
□
0 i*}**■*-T1
1"1 -
1
! 'T
I ) - ■
I
C Figure 2-2 Schematic outlining the three differentmethods of Qiagen column chromatography employed throughout this project. All methods employed Tip-500 packed bed columns containing Qiagen's proprietary anion exchange resin. There are subtle differences in the operation of the protocols. A; Standard maxi-prep
gfr . B; Low-copy number protocol C; Large construct kit protocol.
i
1Jrl
2.5.9 Concentration of plasmid DNA by UV absorbance
This method quantified plasmid preparations through their absorbance at 260nm. The extinction coefficient (s) of dsDNA at this wavelength is 20gL lcm '. According to Beer’s law, absorbance is the product of the path length, concentration and the extinction coefficient. Using a path length of 1cm means absorbance is equal to optical density, which itself is the product of the concentration and the extinction coefficient. This means that an optical density of 1.0 equates to a DNA concentration of O.OSgL'1 or 50pg mL '(Ausubel. 1987). This method of quantification formed the bench mark against which all the other methods of plasmid quantification (HPLC/ PicoGreen) were calibrated. Due
Thomas Burt 42

2. Materials and Methods
to the nature of the assay, absorbance could only be used on pure, concentrated solutions
of plasmid DNA and so was mostly employed to quantify material for calibrating the other
methods of plasmid quantification, which could be performed on less pure and more dilute
plasmid solutions. Two different spectrophotometers were used during the course of the
investigations.
2.5.9.1 Standard spectrophotometric measurement
Absorbance was measured by diluting the plasmid solution so that the A26o reading fell
into the linear range of 0.2-0.8, using the buffer in which the plasmid was contained. Most
commonly this was TE buffer except when measuring spin-prep eluents when buffer EB
was used. A Uvikon XL double-beam scanning spectrophotometer (North Star Scientific,
Bedford, UK), blanked against the correct buffer, was used to measure the absorbance of
the plasmid solution in a lOOpL quartz cuvette. The purity of samples was checked by the
ratio of absorbance at 260nm to 280nm, a ratio below 1.8 being indicative of protein
contamination.
2.5.9.2 Nano Drop spectrophotometric measurement
When investigating the binding of plasmids to chromatographic matrices, A26o absorption
was measured using a ND-1000 spectrophotometer (NanoDrop Technologies,
Wilmington, USA). The mechanism of this spectrophotometer differed considerably to the
Uvikon device but studies demonstrated a high level of comparability between the two
spectrophotometers.
A 2pL drop of sample was placed on the sample pedestal and the automated, magnetic
cantilever of the device used surface tension to pull the drop into a column of liquid of
known path length. The sample pedestal was the end of an optical fibre down which the
light from a xenon flash lamp was directed. The device consisted of a 2048-element linear
silicon CCD array detector, enabling the absorption measurement of a continuous
spectrum. The machine was blanked against the sample buffer but dilution was not
required as the spectrophotometer was capable of quantifying DNA solutions up to
3700pgmL"'. The attached software produced a continuous spectrum trace but quantified
the solution by using the absorbance reading as found at 260nm and the dsDNA extinction
coefficient of 20gL'cm'’. The device also reported the A 26o/A28o and A 26o/A230 ratios as
measures of plasmid purity (NanoDrop Tech.Lit, 2005).
Thomas Burt 43

2. Materials and Methods
2.5.10 PicoGreen quantification of plasmid
PicoGreen (Molecular Probes, Leiden, NL) was used in the quantification of plasmid DNA
solutions including both clarified lysates and spin-prep eluents. PicoGreen has been
demonstrated to be a sensitive dye that can be used to detect dsDNA in the presence of
ssDNA, RNA and other compounds which commonly contaminate nucleic acid
preparations. The dye becomes intensely fluorescent upon binding dsDNA due to its high
quantum yield (~0.5) and large, molar extinction coefficient (-TO^OOcm^M*1) (Singer et
al., 1997). The lower detection limit of the assay has been determined to be 25pgmL'1 and
the linear range found to extend over four-orders of magnitude; 25pgmL'1 to lpgm L1.
However, investigations did reveal that the linearity of the assay was sensitive to salt
contamination. Also, the signal emitted from linear dsDNA was greater than that of an
equivalent concentration of CCC plasmid DNA, due to the capability of linear dsDNA to
bind more flurophore molecules per mole.
2.5.10.1 Sample preparation and measurement
All assays were performed in BD-Falcon™ 96-well polystyrene plates (clear/ flat-
bottomed/ 370|iL volume) and based on the method of (Noites et al., 1999). The
fluorescence of the unknowns was calculated by calibrating against a standard curve of
solutions of known plasmid DNA concentration, determined by A260 (Refer to 2.5.9.1).
Duplicate samples for analysis were prepared as described in 2.5.4 for clarified lysates and
2.5.7 for spin-prep eluents. In both cases the final dilution of the samples (unless stated
otherwise) and PicoGreen stock was 1:400.
In sterile sarstedt tubes, 20pL of each sample was diluted with 180pL of TE buffer,
representing a 1:10 dilution. Triplicate 5pL volumes of the diluted sample were loaded
into separate wells of a 96-well plate. To each well was added 95pL of TE buffer. A
standard curve was constructed by preparing a 2pgmL'1 stock of the plasmid being
quantified. The material for the standards was prepared by Qiagen kit (2.5.8.1) except in
the case of linear DNA which used X DNA (Sigma, Dorset, UK). This stock was diluted by
serial dilution, using TE buffer to create three other standard solutions of concentration;
0.2pgmL''; SOngmL"1; SngmL'1. The standard curve was then prepared as outlined in
Table 2-4.
Immediately before use, lOOpL of PicoGreen stock (200x concentrate in DMSO) was
added to 19.9mL of TE buffer in an opaque universal and inverted to mix, representing a
Thomas Burt 44

2. Materials and Methods
1:200 dilution. Using a multiwell Gilson® 200pL pipette. lOOpL of the diluted PicoGreen reagent was added to each well. The plate was wrapped in aluminium foil and incubated in the dark for 5 minutes prior to reading.
Table 2-4 Table outlining the volumes of the standard curves added to a 96-well plate to form the standard curves for the PicoGreen assay. Rows A-D represent the concentrated standard curve and E- H formed the dilute standard curve. Typical R2 values were 0.99. Wells A4-A12 were blank and recorded background fluorescence. The mean value of the background was subtracted from each sample and standard value before calculation of the concentration.
Well
TotalDNA(ng)
DNACone.
pgmL'1
Vol(pL)o f
2jigmL'1
Vol (pL) of
O^pgm'1
Vol (pL) o f
SOngm'1
Vol(pL)o f
5ngmr'
Vol o f Te(pL)
Vol (pL) o f
PicoGreen
A 1-3 40 8 20 0 0 0 80 100Bl-3 20 4 10 0 0 90 100C l-3 2 0.4 0 10 0 0 90 100D l-3 0.2 0.04 0 1 0 0 99 100El-3 5 1 0 0 100 0 0 100FI-3 0.5 0.1 0 0 10 0 90 100G l-3 0.05 0.01 0 0 0 10 90 100HI-3 0.005 0.001 0 0 0 1 99 100A4-12 0 0 0 0 0 0 100 100
The plate was read using a Gemini EM Microplate Spectrofluorometer (MolecularDevices, Wokingham, UK). Readings were taken using Excitation filter EX 480/20 (470- 490nm) and Emission filter EM 520/10 (505-515nm). Gain was set to 80 and each well was automatically read six times and the average value taken. The data was analysed using SoftMax Pro® software. The software plotted the standard curve using a Quadratic fit, subtracted the background, calculated the DNA concentration and corrected for dilution and so returned the value of DNA concentration in the starting sample.
Table 2-5 Table depicting the concentrations of components in the samples tested by the PicoGreen assay and their tolerable limits as reported by (Singer et aL, 1997). * refers to average levels of contaminants determined in the clarified lysate from the DSP operations and assumed to be at similar levels for the analytical preparations used here.
Feed Stream Component Concentration In Undiluted Stream Acceptable Limit Concentration Post
400x Dilution (mM)
Potassium acetate lOOOmM 30mM 2.5mMSDS 11.5mM 3.5mM 0.03mM
Clarified lysate Protein* 0.1% 2% <0.1%ssDNA* 33.6pgmL-l 0.13pgmL-l 0.08pgmL-lRNA* 112pgmL-l 0.13pgmL-l 0.28pgmL-l
Spin-prep eluant TrisEDTA
lOmMImM
No reported effect Blanked against TE
Thomas Burt 45

2. Materials and Methods
2.5.11 Concentration of plasmid by HPLC
Plasmid concentration was determined by anion-exchange high performance liquid chromatography (IE-HPLC) using a Dionex DNAPac PA-100 column (4mm x 250mm) (Dionex, Camberley, UK). The DNAPac PA-100 packing material is composed of 100- nm, quaternary-ammonium functionalized MicroBeads™ bound to a 13pm diameter, solvent-compatible, nonporous substrate. The HPLC system was a Waters Alliance 2690/5 Separations module coupled to a 996 Photodiode Array Detector recording absorbance at 260nm (Waters. Elstree. UK). Injection of a sample was followed by a linear gradient of 20mM Tris + 0.7M KC1 (pH 7.5) to 20mM Tris + 0.9M KC1 (pH 7.5) over a 9.5minute period (Refer to 2.4.1.10). The column was then requilibrated with Buffer A for 4.5minutes. The exact programmed flow gradient is detailed in Table 2-6. Buffer flowrate was maintained constant at around 1 .OmLmin'1 producing a pressure drop during normal operation of ~1500psi. Samples for analysis were maintained at 4°C ± 0.5C in the
refrigerated carousel whilst the column was operated at 40°C. (Stowers et al., 1988; Strege
and Lagu, 1991; Eon-Duval and Burke, 2004)
Table 2-6 Table detailing the programmed flow for a HPLC run
TIME(MINS)
FLOWRATE(M Lm in1)
% BUFFER A % BUFFER B
0 to 5 1.0 30.0 70.05.0 1.0 18.0 82.05.5 1.0 10.0 90.09.5 1.0 10.0 90.01 0 . 1.0 30.0 70.0
14.0 1.0 30.0 70.014.99 1.0 30.0 70.015.0 0.0 30.0 70.0
HPLC trace data was logged by the attached PC and Empower 2 Chromatography Data Software (Waters. Elstree. UK) was used for its manipulation and interpretation. The software was instructed to integrate peaks between the time points 4.59mins and 8.118mins, the time region in which plasmid DNA was found to elute.
Plasmid streams quantified using HPLC included fermentation time-point samples together with samples recovered during the various steps of the downstream process. These samples were run in an identical fashion on the same column but their method of preparation, volume loaded and calibration curve differed, the reasons for these differences
are outlined in (4.5.2).
Thomas Burt 46

2. Materials and Methods
2.5.11.1 Calibration o f HPLC
During the course of investigations it was necessary to calibrate the HPLC column on
numerous occasions. It was observed that plasmid quantification by HPLC was, to a much
lesser extent than the PicoGreen assay, affected by the form and purity of the plasmid
sample being analysed. As such, it was necessary to use three standard curves during the
course of process. For more on the development on this assay refer to (4.5.2). The standard
curve used depended on the stage of the process from which the sample was generated.
Each standard curve set was comprised of a calibration curve for each construct under investigation.
(a) Standard Curve Set for Specific Yield progression during fermentation (Upstream)
This standard curve was generated through the loading of 10pL volumes of plasmid
standard in TE buffer. The plasmid standard was produced using Qiagen Large construct
kit*. The plasmid stock was quantified by absorbance at 260nm (2.5.8.1) and serially
diluted to create standard solutions of concentration; 0/ 1/ 2.5/ 5/ 7.5/ 12.5/ 25/ 50/ 75/
100/ 150/ 200/ 250pgmL'1. The standard solutions were run on HPLC in triplicate in
increasing concentration order, with buffer blank runs between each sample to prevent
carryover. The resulting areas were used to construct the calibration curve shown in Figure
9-26
(b) Standard Curve for Pre-Ultrafiltration samples (Downstream)
This standard curve was created using Qiagen Large construct kit* as above but instead
serially diluted in parental clarified lysate. The parental clarified lysate would remove the
small but observable distortion produced by the presence of genomic DNA fragments in
the lysate. The parental clarified lysate was prepared by conducting a 50g prep (2.8) on
parental cell paste. The plasmid stock was quantified by absorbance using the NanoDrop
spectrophotometer and serially diluted using clarified lysate to the following
concentrations; 0/ 0.1/ 0.25/ 0.5/ 0.75/ 1.25/ 2.5/ 5/ 7.5/ 10/ 15/ 20 and 25pgmL"1
Triplicate 100pL samples of the standard solutions were run in ascending concentration
order separated by buffer blanks. The resulting areas were used to construct the calibration
curve shown in Figure 9-27
* The Qiagen Large construct kit was employed on all plasmid constructs since it was necessary to use it for the BAC p5176, so for reasons of consistency the kit was used to prepare all plasmid stock solutions. It was preferential because for BAC preparations contaminating chromosomal DNA could represent -30-50% of recovered DNA. as assayed by A260. Looking at the standard curves for some constructs it was not possible to recover sufficient plasmid to prepare standards above 50|igmL''.
Thomas Burt 47

2. Materials and Methods
(c) Standard Curve for Post-Ultrafiltration samples (Downstream)
This standard curve was generated from each of the plasmids recovered from the
Ultrafiltration rig. Recovered plasmid solutions were concentrated by IPA precipitation
and ethanol wash and resuspended in 20mM Tris/0.54M NaCl (the buffer used to recover
plasmid from the UF rig). The plasmid stocks were quantified using the NanoDrop
spectrophotometer and serially diluted to create the standard solutions. Triplicate lOOpL
samples of the stock solution were run in ascending concentration order separated by
buffer blanks. The resulting areas were used to construct the calibration curve shown in
Figure 9-27.
2.5.11.2 Determining specific yield progression during fermentation by HPLC
To measure specific yield progression during fermentation, hourly cell pellet samples were
obtained as outlined in 2.7.5 and prepared as in 2.5.4. Duplicate 50D samples from each
time point were prepared and 50pL of the final plasmid containing solution was added to
polypropylene HPLC vials. lOpL of this solution was run on the HPLC column for
analysis. The area values reported from the HPLC were converted to plasmid
concentrations using the calibration curves shown in Figure 9-26. The values of
concentration of the purified plasmid samples were used to determine the plasmid specific
yield, volumetric yield and copy number as shown in Figure 9-26 using the equations
detailed in Equation 2-2 and Equation 2-3
Plasmid Mass (ppg)= 0.1 x Plasmid Concentration(pgml 1)
Pellet Mass (g) =' Wet Cell Weight
Optical Density 1000
Specific Yield (ppg 1) =r Plasmid Mass(jug)^
Pellet Mass(g)
Volumetric Yield (mgL 1) = Specific Yield(pgg 1) x WCWEquation 2-2 Equations used to calculate the specific and volumetric yield from the value of plasmid concentration obtained from inputting the HPLC peaks areas into the respective calibration curves.
Thomas Burt 48

2. Materials and Methods
n7 ~ XT , Copies o f Plasmid Plasmid Copy Number = — -------------------Number o f Cells
5 Optical Density Units = 2.5x10⁹ cells_ . . 7 . Plasmid MassCopiesimoles) of Plasmid -------------------
RMM\bp = 660Da
W a = \. 66x1 O'24
Plasmid RMM (gmol~x) = (Plasmid Size(bp) x 660) x 1.66x10”24f Plasmid mass(pg)^Moles o f Plasmid =
Plasmid Copy Number -
V RMM Moles o f Plasmid
2.5x10⁹
/lxlO
Equation 2-3 Equations used to calculate the plasmid copy number progression during the fermentations from the plasmid concentration information.
2.5.11.3 Monitoring plasmid mass through downstream operations
Plasmid DNA progression was monitored through the downstream operations using the
same HPLC assay. Samples were obtained from the streams outlined in Table 7-4. The
peak areas produced were converted to plasmid concentrations using the calibration curves
shown in Figure 9-27. Once the plasmid concentration had been determined a mass
balance for plasmid could be constructed across the process using the volumes of the
various streams. From each downstream run, duplicate samples were analysed for each
stream.
2.5.12 Desalting samples for assays using PD-10 columns
During the downstream procedure, RNA removal was achieved through precipitation by
the addition of 5M CaCh. This resulted in the final clarified lysate having a salt
concentration of 1M. a salt level which was found to interfere with all the assays for
plasmid, protein, RNA and gDNA quantification. To overcome this, Post-CaCL and
Permeate samples were desalted using PD-10 desalting columns (Amersham Biosciences,
Buckinghamshire, UK). PD-10 columns are pre-packed, disposable columns containing
Sephadex™ G-25 Medium for group separation of high (M,> 5000) from low molecular
weight substances (M,< 1000) by desalting and buffer exchange.
Thomas Burt 49

2. Materials and Methods
A column was equilibrated by applying 25mL of TE buffer. To the equilibrated column,
2.5mL of either Post-CaCL or Permeate sample was added and allowed to run-through by
gravity feed. The large molecular weight compounds were then eluted by the addition of
3.5mL of TE buffer. The literature supplied with the columns claims that 95% recovery of
large molecular weight species is achieved, with only 4% of the salt remaining. Because
the compounds are loaded in 2.5mL and eluted in 3.5mL of volume, there is a dilution of
1.4 fold which was accounted for when mass balancing. The final salt concentration of the
eluted material was ~28.5mmols a level in the acceptable range of all the assays.
2.5.13 BCA Protein assay
To quantify protein levels through the downstream process the BCA assay was performed
on all the streams. Assay materials were all contained within the Pierce Scientific BCA
Protein Assay kit (Perbio Science, Northumberland, UK). The BCA assay, as opposed to
the Lowry method, is a detergent compatible formulation based on bicinchoninic acid
(BCA) for the colourimetric detection and quantification of total protein. The method
combines the reduction of Cu2+ to Cu+ by protein, which occurs in an alkali environment
(the biuret assay), with the selective and sensitive colourimetric detection of Cu+ using a
proprietary reagent containing BCA (Smith et al., 1985). The reaction produces a purple
colouration being the result of a Cu+ cation chelating with two molecules of BCA. This
complex exhibits strong absorbance at 562nm which is linear over a working range of 20
to 20,000|igmL'1. The absorbance of the unknown samples was determined by calculation
from a calibration curve prepared from supplied Bovine Serum Albumin (BSA).
Samples from the downstream operations were removed from -70°C cold storage and
defrosted. A fresh vial of BSA solution (2mgmL-l) was opened and diluted by serial log2
dilution in sterile sarstedt tubes using sterile PBS, in order to form a standard curve; 2/ 1/
0.5/ 0.25/ 0.125/ 0.0625/ 0.03125/ OmgmL*1. To a 96-well plate1 (Fisher Scientific,
Loughborough, UK) triplicate 25pL volumes of each of the standards was pipetted. In a
sterile Falcon tube, 50mL of the supplied Regent A was mixed with lmL of Reagent B to
form the working solution (2.4.1.12). Each of the unknowns was diluted to form three
different dilutions all within the acceptable linear range of 20-20,OOOpgmL1. Three
dilutions were used to improve assay accuracy and the specific dilutions chosen depended
on the level of contaminating compounds present in the different streams. Table 2-7 details
1 Coming® 96 Well Clear/ Flat Bottom/ Polystyrene/ TC-Treated Microplate/ Individually Wrapped/ Sterile/ with Lid
Thomas Burt 50

2. Materials and Methods
the dilutions chosen for each feed stream and the reasons why whilst Figure 2-2 shows the
plate template used. (Pierce Scientific, 2006; Brown et al., 1989)
Table 2-7 Table depicting the concentrations of components reported to effect the BCA assay. The concentrations were determined by calculating the dilutions of the components that occurs when the lysis buffers were combined, knowing their original concentrations. Concentrations of components in desalted samples were calculated by assuming 4% of original component remained from the original solution and accounting for 1.4x dilution achieved by desalting. The dilutions chosen had to decrease the level of the contaminating component to below the acceptable limit whilst maintaining the protein concentration within the linear range of 20-20,000pg/mL. All dilutions used lxPBS (0.1 M Phosphate; 0.15M NaCI levels which are perfectly compatible with the assay). Figures in bold highlight contaminant levels in the feedstream which were above the acceptable limit. The dilutions employed removed this contaminant levels to below the limit.
Feed Stream Component Concentration In Undiluted Feed
(mM)
Acceptable Limit (mM) In
Final Assay Solution
DilutionsEmployed*
PRE-LYSIS TrisEDTA
101
1004 lx 2x 5x
Tris 6.5 100EDTA 2.6 4
p r e -c a c l 2 Dextrose 14.3 4 2x 5x lOxSodium hydroxide 100 40Potassium acetate 730 160
SDS 17 68Tris 6.5 100
PD-10 POST- EDTA 2.6 4c a c l 2 Dextrose 0.41 4(samples desalted Sodium hydroxide 2.9 40 lx 2x 5xby PD-10 column) Potassium acetate 20.9 160
SDS 0.49 68Calcium chloride 28.5 4
PD-10PERMEATE (samples desalted Equivalent to Post-
CaCl2 See above See above 1 x 2x 5xby PD-10 column)
Tris 10 100
DIAFILTRATE 1 (represents a 1:20 dilution of Post- CaCI2)
EDTA Dextrose
Sodium hydroxide Potassium acetate
SDS
0.10.75
36.50.85
44
4016068
5x 8x lOx
Calcium chloride 50 4
DIAFILTRATE 2 TrisSodium chloride
10540
2501000 lx 2x 5x
RECOVERED Tris 10 250 lx 2x 5xFRACTIONS Sodium chloride 540 1000
All unknowns were diluted with PBS and 25pL of each of the dilutions was added in
triplicate to the 96-well plate. To each well was added 200pL of the working reagent and
* Dilutions em ployed m ust be m ultiplied by factor eight to reach the final dilution factor since 25pl o f diluted unknown w as added to 200pl o f w orking reagent.
Thomas Burt 51

2. Materials and Methods
the plate was covered with an adhesive plate cover and incubated at 37°C for 30mins. The
plate was removed from the incubator and left to stand for 5 minutes to cool to room
temperature. The plate was read at 562nm using a SpectraMax 190 Microplate reader
(Molecular Devices, Wokingham, UK) using the attached SoftMax Pro software. The
software was instructed as to the layout and dilutions of the samples on the plate and so
automatically plotted the standard curve using Quadratic fit, calculated the mean value of
the triplicate wells and corrected for the dilutions and so returned the value of the protein
in the original solution. The software also calculated the %CV and standard deviation
enabling quantification of assay precision and accuracy.
S tan d a rd s Dilution A Dilution B Dilution C
2mg/mly i[ • • • • « • • • • $ # $ Rim 1
ling ini Run 20.5mg ml 9 § ® 0 0 0 $ « $ i i i Rim 3
0.25mg/ml @ @ ® O Q O ® ® ® ® ® ® Run 40.125mg ml o o o @ ® @ # ® « « # ® Run 50.063mg ml o o o @ Q i i « » » « ® Run 60.031 mg ml 0 0 0 © ® 9 M 9 9 « ® Run 7
BLANK O O O Q O O I t ® « « ® Run 8
Figure 2-3 Schematic displaying the plate template used to assay the same one process stage sample (e.g.pre-CaCI2) from 8 runs for total protein concentration, using the BCA assay. Each process stage sample (pre-lysis, pre-CaCI2, post-CaCI2, permeate, diafiltrate 1, diafiltrate 2, retentate, wash 1, wash 2) from each of the 24 runs was diluted to form three differing dilutions, each of which was assayed in triplicate. The average of each triplicate was returned as a separate concentration value and the average of each of these values, from each dilution set, was taken as the final value.
In order to track the removal of contaminating E.coli genomic DNA through the
downstream process, it was necessary to purify the total genomic DNA from samples
taken at stages during the process, allowing for their quantification by quantitative PCR.
This was achieved using a MagNA Pure LC system (Roche Diagnostics, East Sussex,
UK). More detail into the background of the assay is provided in 4.7 .
The MagNA pure system is robotically automated and capable of isolating the total DNA
from 32 samples simultaneously (equating to 16 duplicate samples). The system was used
in conjunction with Roche’s proprietary extraction technology, which binds the DNA to
glass-magnetic particles, from which contaminants (proteins/ RNA/ salts etc) could be
washed and then from which the nucleic acids could be eluted. The operation followed
pre-programmed actions throughout to isolate the DNA, then loaded the purified DNA on
Thomas Burt 52

2. Materials and Methods
to a PCR plate with all the necessary components (primer/probes/dNTPs/polymerase)
ready to insert into a ABI Prism 7700 PCR cycler (Applied Biosystems, CA, USA) as 30pL
reaction volumes. The minimal manual involvement and the physical enclosure of all the
samples for preparation, massively reduced the potential of any contamination of the
samples for analysis by free DNA, together with increasing the assay reproducibility.
(Roche Diagnostics, 2006; Roche Diagnostics, 2004)
Samples analysed by qPCR were taken from Pre-lysis, Pre-CaCh, Retentate, Wash 1 and
Wash 2 streams. Analysis of these samples would allow the construction of a partial mass
balance for gDNA across the plasmid recovery process. Although not a full mass balance
the information provided would be useful in describing the main steps where gDNA is
removed and give values as to the final levels of contamination. The MagNA pure system
was operated using DNA Isolation Kit 1 (Roche Diagnostics, East Sussex, UK). The exact
contents of the buffer preparations are proprietary but some indications are outlined in
2.4.1.19.
The MagNA Pure system was switched on an hour before use to allow the cooling and
heating blocks to reach temperature. Before use the internal surfaces were wiped down
with RNA/DNAzap®(Ambion Ltd., Huntingdon, UK) and following use the UV lamp was
left turned on to degrade any contaminating DNA. The machine was instructed that total
DNA was to be extracted from the samples using the Total DNA Kit 1 (Roche Diagnostics,
2004) and that the purified DNA should be eluted in lOOpL volumes of the elution buffer.
Because lOOpL volume of sample was purified and eluted in lOOpL of elution buffer,
meant no dilution occurred. The program used for extraction was DNA I Blood Cells
Fast.blk. This program uses the minimum lysis time. Since all the DNA in the samples was
free in solution no lysis was really required but the lysis operation also places the samples
in the correct buffer for binding to the MGPs.
For each extraction, 15 samples were processed in duplicate, meaning samples (Pre-lysis/
pre-CaCh/ retentate/ wash 1 and wash 2) from three 50g preps could be processed
simultaneously. Samples were removed from cold storage and defrosted. In a DNA-free
hood, duplicate lOOpL volumes of sample were pipetted into separate wells of a 32-well
sample cartridge, which was then covered with an adhesive plastic cover and placed in the
cooling block of the MagNA pure machine ready for processing (1). The identity of the
samples in each of the wells was entered into the PC. From Figure 2-5 it is possible to see
the arrangement of samples as they were when loaded into the MagNA pure in a 32-well
Thomas Burt 53

2. Materials and Methods
sample cartridge. Following processing the eluted samples were arranged in the same
pattern, in a 32-well sample cartridge placed in cooling block (9), as they were when
loaded. From here 3pL volumes were pipetted into separate wells of a PCR, also shown.
The master mix buffer and primer/probe mix (2.4.1.20) were combined in a DNA-free
facility to prevent any background contamination. 1450pL of 2x Master Mix buffer
(Applied Biosystems, CA, USA) was mixed with 1160pL of Primer/Probe mix in a
sterile bijou and vortexed. This solution was aliquoted in 1300pL volumes into two
sterile sarstedt tubes and placed in the cooling block of the MagNA pure system.
Figure 2-4 Picture (overleaf) displaying the setup and arrangement of the MagNA Pure LC system. All is enclosed in a DNA-free hood to reduce contamination. Duplicate lOOpI volumes of 15 raw process samples and 1 duplicate sample of sterile water are loaded in a 32-well sample cartridge and placed in the cooling block (1). All buffers for purification and the magnetic-glass beads are placed in separate buffer cartridges and correctly positioned in their racks (2). The robotic arm (5) uses disposable pipette tips of two sizes; blue > 200pl (3) and yellow <200pl (4) for the processing. Tips are rested between different functions in tip-rests (6). Washing steps occur in the four 64-well processing cartridges (7). Heating is used to promote elution of DNA from the magnetic-glass particles in a sample cartridge contained in a heating block (8). Once eluted the DNA is transferred to a cooling block (9). The purified DNA is now ready to be loaded on to the PCR plate positioned in a cooling block (11). Duplicate 3pl volumes of each of the DNA samples in the 32-well elution cartridge, in cooling block (9) are transferred to known positions on the PCR plate (11). The sarstedt tubes containing six known concentrations of E.coli gDNA (106-l0 1 copies/3pl), which form the standard curve, are positioned in the cooling block (10). Triplicate 3pl volumes of each of these are then pipetted into precise wells on the PCR plate (11). As a control, triplicate 3pl volumes of sterile water from a sarstedt tube in cooling block (10) are also added to the plate. Finally, the MagNA pure aliquots 27pl volumes of the pre-combined master mix buffer/primer+probe mixture (located in 2 sarstedt tubes positioned in cooling block (10)) into each well of the PCR plate. The process is now complete and the plate placed into the cycler.
Thomas Burt 54

2. Materials and Methods
1 2 3 4 5 6 7 8 9 10 11 12
»•••••••••tto ■•••••••••ttoc • • • • • • • • • • • 0» • • • • • • • • • • • 0* • • O O O M O ^ O F 0W K )0 # H H # 0 ••••••©©##••0- • • • • • © © • • • • 0
Sterile water
Pre-lysis samples
Pre-CaCl samples
Retentate samples
Wash 1 samples
Wash 2 sanf Its
32-weD sample cartridge 96 well optical PCRplate
Figure 2-5 Schematic displaying the arrangement of samples on the MagNA Pure plates. Samples from three 50g runs were processed simultaneously. The colours represent the different sample types and the horizontal/vertical lines represent the three different runs. lOOpl volumes of duplicate raw samples from each run were loaded into the sample cartridge. These were processed by the MagNA pure system and eluted in lOOpI volume so no dilution occurred. Duplicate 3pl volumes of each of the processed samples was loaded into a separate well of a 96-well PCR plate together with all the components required for the PCR reaction. The standard curve is also shown in the diagram; A1-A3 represents 106 genome copies per well down to F1-F3 representing 101 copies per well. Sterile water was included as a control. Well G&H1-3 represent the value 0 copies/well on the standard curve, whilst A&B4-5 were actually processed by the machine and included to record ant contamination during processing
In a separate facility the E.coli gDNA standard curve was aliquoted. The standard curve
was pre-prepared so that the same batch of standard material was used for every PCR run
(er to 2.5.14.1). 15pL volumes of each of the standard curve samples were aliquoted into
separate, sterile 1.5mL sarstedt tubes and placed in the cooling block (10).
An ABI P r i s m optical 96-well reaction plate (Applied Biosystems, CA, USA) was placed
into cooling block (11). In separate, disposable reagent tubs the volumes of each of the
buffers required for purification were aliquoted and placed in the proper rack (2). The
details of these buffers are outlined in Table 2-8.
Table 2-8 Table detailing the volumes of the various buffers used by the MagNA Pure LC system during processing and their functions. The buffers are described in the order in which they are used and the volume of each which was aliquoted into individual disposable reagent tubs.
BUFFER VOLUME (ML) FUNCTION
Lysis/ Binding Buffer 12Lyses cells/ denatures proteins and promotes
binding of DNAProteinase K Lyophilised powder; dissolved
by vortexing in 4mL o f Elution buffer
Digests proteins
Magnetic Glass Particle Suspension
Provided in bottle as 5mL. Vortexed to resuspend
Solid Phase Matrix for binding DNA
Wash Buffer 1 40Removes unbound substances; proteins
(nucleases)/ membranes/ inhibitors (heparin)Wash Buffer 2 40 Removes chaotropic salts and some proteins
Elution Buffer 20Elution o f DNA/ resuspending Proteinase K and
tip washing
Thomas Burt 55

2. Materials and Methods
Once all the reagents were in place the door to the MagNA pure LC system was locked
and through the attached software, the run was initiated. The sequential actions performed
by the system to purify samples are detailed in Table 2-9. Completion of the operation
took three hours, after which the prepared PCR plate was held at 4°C in the cooling block
(10). The PCR plate was then removed from the machine and in a DNA-free hood, the
wells of the plate were sealed with ABI P r i s m optical strip caps (Applied Biosystems, CA,
USA). The plate was then spun for 1 minute at lOOOrpm in a benchtop centrifuge, using a
96-well plate rotor, to ensure all liquid was at the bottom of the wells. The plate was now
loaded into the PCR cycler (2.5.15)
Table 2-9 Table outlining the sequence of actions carried out by the MagNA Pure LC system. This sequence of events occurs after the machine has been initiated. More details of the exact program the MagNA pure system follows are outlined in the program supplied with the software; DNA I Blood Cells Fast.blk
STEP A CTIO NS PERFO RM ED BY THE M AGNA PURE LC INSTRUM ENT(0) Dispensation o f all necessary reagents into the processing cartridges (7)(0) Dispensation of the Elution Buffer into the heated Elution Cartridge (8) to equilibrate1 Mixing of 300jiL o f Lysis/Binding buffer with the samples (1)2 Addition of lOOpL o f Proteinase K to each sample, mixing and incubation (1)3 Addition of 150|iL o f MGP suspension/ mixing/ incubation and separation (1)4 Transfer o f MGPs to 850pL o f Wash buffer 1, mixing and separation (7)5 Transfer o f MGPs to 450pL o f Wash buffer 2, mixing and separation (7)6 Transfer of MGPs to 450pL o f Wash buffer 2, mixing and separation (7)
7 Transfer of MGPs into heated Elution Buffer (Heating block)(8) mixing, incubation, elution of DNA in lOOpL
8 Transfer of lOOpL eluate to the Storage cartridge (Cooling Block) (9)
9Transfer of duplicate 3pL volumes of each processed sample to an individual well on the PCR plate (11)
10Transfer o f triplicate 3(iL volumes of each standard curve sample to a individual wells on PCR plate (11)
11 Addition of 27pL o f Primer/ Probe mix to each well on the PCR plate. Cooled. (11)
2.5.14.1 Preparing E.coli Genomic DNA standard curve
Due to the nature of the software used by the PCR cycler (Applied Biosystems, CA, USA)
the standard curve for the measurement of contaminating genomic E.coli DNA used
copies/well as the unit. The standard curve employed, consisted of six-points; lxlO6
genome copies/well down to lxlO1 genome copies/well, created by logio dilution of the
starting material in water (Figure 4-31). Conversion of the copies/well into a mass based
concentration figure used the equations shown in Equation 2-5. From the calculation it can
be seen that the highest standard point used of lxlO6 copies/ well required an E.coli
genomic DNA stock of 1.7pgmL '.
Thomas Burt 56

2. Materials and Methods
Size o f Ejcoli genome = 4.64x10⁶ bp \bp = 660Da
\Da = 1.6605^1 O'24 g®
dsDNA = 1.096x1 O'2’ gbp~'
Mass o f Ejcoli genome = 4.64x106 x 1.096x10"21
= S.087xl0"15 g copy"'
1 st s tan dard curve pi = lxl O6 copies / wellv 3pl o f s tan dard / sample injected per PCR well
s tan dard = 0.33x10⁶ copies / pi
= 0.33xl06 x5.087xl0-|S
= I.696xI0"9g/t/-'
= 1.696pgml~'
Equation 2-4 Calculation demonstrating the conversion of the values of genome copies to a mass based concentration value. PCR reactions commonly use copies as their basal unit and conversion to more applicable units uses commonly trusted values for E.coli genome size and base pair mass. (Blattner et aL, 1997) e Value obtained from National Physical Laboratory.
To prepare gDNA stocks, cultures of E.coli DH1 [F' recA\ endAl g>rA96(Nalr) thi-1
hsdRM swpE44 relA\] were grown on 50mL of seed media (2.3.1.5) contained in a 1L
baffled Shake-flasks according to 2.1.3. The Shake-flasks were incubated overnight at
37°C and 230rpm in a shaking incubator (New Brunswick Scientific, NJ, USA).
ImL volumes of the cell suspension were transferred to sterile sarstedt tubes and
centrifuged for 5 minutes at 13,000rpm. The supernatant was decanted and the pellet
resuspended in ImL of TE buffer by pipetting. The suspension was again centrifuged as
before to pellet. The wash buffer was discarded and the pellet resuspended in 0.5mL of TE
buffer.
To the suspensions were added 30pL of 10% SDS and 3pL of 20mgmL"1 Proteinase K.
The tubes were mixed and incubated in a 37°C water bath for 1 hour. To the tubes was
added 1 volume of 25°C phenol:chloroform (2.4.1.17) and the tubes gently agitated until
an emulsion formed. The tubes were then centrifuged at 13,000rpm for 15 minutes in a
benchtop centrifuge. The aqueous, top-layer was gently removed using a wide-bore Gilson
to a fresh sarstedt tube and the process repeated two more times, until no interfacial layer
could be seen. To the aqueous fraction, 1 volume of chloroform was added to remove any
Thomas Burt 57

2. Materials and Methods
phenolic traces and the tube re-centrifuged. Once more, the aqueous layer was removed to
a clean tube and to it added 0.1 volumes of 3M sodium acetate and 2 volumes of -20°C
100% ethanol. The tube was mixed and left at -70°C for 1 hour. The tubes were then spun
down at 13,000rpm for 15minutes. The supernatant was discarded and the pellets washed
in ImL of -20°C 70% ethanol. The tubes were then re-centrifuged as before and the
supernatant discarded and the pellet left to air-dry for 10 minutes before being resuspended
in 200pL of sterile water (Sigma, Dorset, UK) (Ausubel, 1987).
The stock solution was pipetted to shear the gDNA into smaller fragments before being
quantified using the NanoDrop spectrophotometer. This stock solution was then diluted
down with water to a concentration of UpgmL"1 to form the first calibration. The
remaining standards were created by logio dilution of the top standard in water. The
standards were then frozen at -70°C. To demonstrate the consistency of the new standard
curve, samples were run in the PCR cycler against an existing standard curve and the Ct
values produced compared 4.7.4
2.5.15 Quantitative Polymerase Chain Reaction (qPCR)
The technology described here is an automated kinetic PCR, which allows for real time
quantification of target nucleic acids. More in depth information into the mechanism of the
qPCR reaction can be found in 4.7. In brief, the approach involved the binding of a
forward and reverse primer to the DNA sequence of interest as with traditional PCR (Saiki
et al., 1985a). Additionally included was a probe sequence specific to a region within the
boundaries of the sequence set by the primers. Attached to the 5’end of the probe sequence 'T 'K / l T \ v lwas reporter dye (in this case FAM ) and to the 3’end a quencher dye (TAMRA ). The
approach utilised the 5' exonuclease activity of Taq DNA polymerase to digest the probe
region and so release the reporter dye away from the quencher dye so increasing its
fluorescence. Accumulation of PCR products could then be monitored in real time by
scanning the increase in fluorescence in the PCR wells using a PCR cycler coupled with a
fluorescent plate reader; ABI P r i s m 7700. (Fykse et al., 2003; Heid et al., 1996;
Weissensteiner and Lanchbury, 1996)
The system was used quantitatively by using standards of known DNA concentration and
recording the number of PCR cycles required to raise the fluorescence reading above a
threshold value. The number of PCR cycles required to cross the threshold value is directly
proportional to the starting concentration of DNA. The threshold cycle values (Ct) of the
Thomas Burt 58

2. Materials and Methods
standards were used to construct a calibration curve against which the unknowns could be plotted.(Holland et al., 1991; Gelfand et al., 1993) From Table 2-10 it can be seen that the total mass of E.coli gDNA in each of the standard wells starts from 5xl0'9g/well down to 50x10 1 g/well. Such a broad standard curve allowed the assaying of all the samples from the downstream process on an identical standard curve.
The PCR plate as prepared by the MagNA Pure LC instrument was inserted in the carousel of an ABI P r i s m 7700 PCR cycler (Applied Biosystems, CA, USA). The reaction volume of each of the wells totalled 30pL. Table 2-10 details the breakdown of the final components in the PCR wells and Table 2-11 details the components of the Master Mix buffer and their individual functions.
Both primer and probe sequences were directed at a region of the single copy E.coli
DNA polymerase gene. The primer sequences were about 20bp in length and probe
sequence was a 27bp sequence covalently coupled to the two dyes; FAM™ and
TAMRA™. Further details about the primer and probe sequences are recorded in
Table2-12.
Table 2-10 Table describing the concentrations of the various components used in the PCR before they were diluted by the MagNA Pure during plate preparation and the final concentrations they existed in the PCR wells.
COMPONENT INITIALCONCENTRATION
COMPOUNDDILUTION2
FINALCONCENTRATION
Master Mix Buffer 2x 2 lxPrimers (Fwd and Rev) 500nM each 2.5 200nMProbe 250nM 2.5 lOOnMGenomic DNA Standards 1.7pgmL'' to 17pgmL'' 10 5ng to 50fg per well (106 to
101 copies/well)
: Compound dilutions calculated from reagent mixing. Since 1450pl of 2xMaster Mix added to 1160jil of primer+probe mix. Represents a 1.8x dilution for the master mix and a 2.25x dilution for primer probe mix. Both are then further diluted by the addition of 27pl of the mix to 3pl of sample/standard representing a 1.1 lx dilution. Samples and standards are diluted by a factor 10.
Thomas Burt 59

2. Materials and Methods
Table 2-11 Table detailing the components of the master mix buffer and their importance to the functioning of the quantitative polymerase chain reaction.
COMPONENT FUNCTION
AmpliTaq Gold DNA Polymerase
Possesses 5’-3’ nuclease activity but lacks 3 ’-5’ exonuclease activity. It is a thermostable enzyme allowing hot start PCR, which reduced background signals normally created by amplification o f non-target sequences before thermal cycling had begun.
AmpErase* uracil-N-glycosylase
Due to the enormous amplification possible, false positives can be created caused by amplicon carryover. This enzyme removes incorporated uracil bases reducing contamination
Deoxynucleosidetriphosphates (dNTPs) dTTP/dGTP/dCTP/dATP/ dUTP at 200pM
Passive Reference Dye (ROXTM)Does not interfere with reporter dye. Present to normalise fluorescence signals to correct for buffer or volume deviations.
Mg2+ 1.5mM; optimised for highest specific yield of target PVR product.
Table 2-12 (ov erleaf) Describes key features of the primers (forw ard and reverse) and the probe used to bind complementary regions of the E.coli DNA polymerase gene. The shortest amplicons are the most effective and 20bp-45bp is optimum. The GC content of the amplicons should be in the 40-80% range to avoid formation of internal structures. The melting temperature of the primers should be between 58 ’ C to 60 ’ C and the probes >68 * C. The 5’end of the probe should not end in G. The probe strand sequence chosen should be the one with the hihest number of C residues and for all amplicons less than 2 G or C bases should comprise the last 5 bases of the 3’end. Information calculated by Primer Express software vl.5a (Dieffenbach C W e! al., 1995)
CRITERION FWDPRIMER REV PRIMER PROBE
Length (bp) 20 19 27GC content (%) 60 47 48Melting Temp (°C) (50mM salt) 61.47 61.65 71.47Molecular weight (fwd) Da 6118 5751 8188Molecular weigh (rev) Da 6118 5863 8370G on 5’ end N/A N/A NOStrand with more C than G N/A N/A YESLess than 2 G or C bases in last 5 bases of 3 ’ end
NO YES YES
The thermal cycler conditions were Stage 1: 50C for 2:00mins, Stage 2: 95°C for
10:00mins, Stage 3: 95°C for 0.15secs and then 60°C for l:00mins. repeated 40 times. The
software of the ABI P r i s m was instructed as to the identity of the wells on the plate, since
the plate outline was always as shown in Figure 2-5 a template was used. The threshold
value was set at 0.04ARn and the baseline to be taken as the average fluorescence of all
wells between cycles 3-13. The software then plotted the standard curve of starting DNA quantity against threshold cycle as shown in Figure 4-31, against which it calculated the
Thomas Burt 60

2. Materials and Methods
starting quantities of all the unknowns. The software took the average figure of the
quadruplicate samples and returned the data as genome copies/well as shown in (Figure
9-28). To convert the copies per well value into pgmL'1 of the initial sample material the
data was pasted into Excel and the following formula applied.
DNA mass (agm/-1 ) = ^ ^ 2E les 1 j x (5 .087x10-9) x Correction Factor
Equation 2-5 Relationship used to convert the values of DNA mass presented by the software interms of copies per well into the more standard mass-based figures.
2.5.16 Quant-IT RNA assay
The progression of RNA removal was tracked through the downstream process using the
Quant-IT™ RNA assay kit (Molecular Probes, Leiden, Netherlands). More background
into the nature and development of the assay is given in 4.8. This assay was very similar to
the PicoGreen assay in its design and operation. The RNA specific dye becomes intensely
fluorescent upon binding RNA. The assay has been demonstrated to be highly selective
toward RNA over dsDNA (Molecular Probes Inc, 2006) and the fluorescence signal
produced is linear with RNA over a range of 5ng to lOOng per well (0.5-lOpgmL*1 starting
material).
All assays were performed in BD-Falcon™ 96-well polystyrene plates (clear/flat-bottomed/
370pL total vol.) and based upon the method as described by the enclosed literature
(Molecular Probes Inc, 2006). The fluorescence was calculated by calibrating against a
standard curve of solutions of known RNA concentration. The E.coli rRNA standards
were provided in the kit. Samples from each stage of the DSP were removed from -70°C
cold storage and defrosted. Each sample was diluted to form three different dilutions.
Dilutions were chosen to ensure the signal produced fell within the range of the standard
curve and also to remove the possibility of any contaminating substances interfering with
the signal (Table 2-13). Triplicate lOpL volumes of each of the three dilutions made from
each process sample were loaded into separate wells of the 96-well plate as shown in
Figure 2-6. Triplicate lOpL volumes of the 8 provided standards (0, 0.5, 1, 2, 4, 6, 8 and
lOpgmL'1) were also included on the plate.
Thomas Burt 61

2. Materials and Methods
10pg ml 8pg ml
6pg ml 4pg ml 2pg ml
1pg ml 0.5pg ml
BLANK
Standards Dilution A Dilution B Dilution C/
• • • • • • • • • • • • • • • • • • • • • • • •
000@i§99#99< 000999999991 <-000999999991 000999999991
Run 1
Run 2
Run 3
Run 4
Run 5 Run 6
Run 7 Run 8
Figure 2-6 Schematic displaying the plate template used to assay the same one process stage sample (e.g.pre-CaCI2) from 8 runs for RNA concentration, using the Quant-IT RNA assay. Each process stage sample (pre-lysis, pre- CaCl2, post-CaCI2, permeate, diafiltrate 1, diafiltrate 2, retentate, wash 1, wash 2) from each of the 24 runs was diluted to form three differing dilutions, each of which was assayed in triplicate. The average of each triplicates was returned as a concentration value and the average of each of these values, from each dilution set, was taken as the final value.
Immediately prior to use, the Quant-IT ™ working solution was prepared as outlined in
2.4.1.13. Using a multiwell Gilson® pipette 200pL of the working solution was added
to each well of the plate. The plate was then wrapped in aluminium foil and incubated
in the dark for 5 minutes.
Table 2-13 RNA concentration of diluted sample must fall between 1 and lOpgmL'1. Table shows the components and their concentrations in the different streams which underwent analysis. The table also shows the dilution used to dilute away any interfering effects these components mat have had.
FEED STREAM COMPONENT CONCENTRATION IN UNDILUTED
FEED (mM)
ACCEPTABLE LIMIT (mM)
IN lOpL SAMPLE
DILUTIONSEMPLOYED
PRE-LYSIS TrisEDTA
101
N.SN.S 4x lOx 20x
PRE-CACL2 Potassium acetate 730 200 lOOx 200xSDS 17 6.9 400x
PD-10 POST-CACL2 Potassium acetate 20.9 200(samples desalted SDS 0.49 6.9 5x 1 Ox 20xby PD-10 column) Calcium chloride 28.5 40
PD-10PERMEATE (samples desalted Equivalent to Post-
CaCl2See above See above 5x 10x20x
by PD-10 column)
DIAFILTRATE 1(represents a 1:20 dilution of Post- CaCI2)
Potassium acetate SDSCalcium chloride
36.50.8550
2006.940
4x 5x lOx
DIAFILTRATE 2 Sodium chloride 540 200 4x 5x lOxRECOVEREDFRACTIONS
Sodium chloride 540 200 4x 5x 8x
Thomas Burt 62

2. Materials and Methods
The plate was read using a Gemini EM Microplate SpectroFlurometer (Molecular Devices,
Wokingham, UK). Readings were taken using a Excitation wavelength of 644nm and
fluorescence was recorded at a wavelength of 673nm with a cut-off of 665nm. Each well
of the plate was read six times and the average taken. The data analysis was processed
automatically using SoftMax Pro® software. The software plotted the standard curve,
subtracted the background, calculated the RNA concentration of the unknowns and
corrected for the dilutions used and so returned the value for RNA concentration of the
nascent sample. The software also gave the standard deviations and %CV values of the
recordings made.
2.5.17 Conventional Agarose gel electrophoresis
In some applications, typically cloning procedures, it was necessary to run plasmid
samples by conventional agarose gel electrophoresis, even though this technique was not
suitable for visualising and sizing large constructs. Depending on the separation required
the agarose concentration used varied between 0.6-1.0% (w/v). For cloning purposes
lxTAE buffer was used, otherwise lxTBE was standard. Between 0.6g and l.Og of
agarose (Sigma, Dorset, UK) was added to the selected buffer in a conical flask and
dissolved by boiling. After cooling to around 60°C, agarose was poured into casting trays
and the wells formed using combs containing the appropriate number of teeth. Once set,
the casting blocks were removed and the gel placed in the electrophoresis chamber. The
gel was then submerged in the appropriate buffer and the electrodes connected. Samples
for analysis were prepared as described in 2.5.5. 0.6-0.8pg of plasmid was loaded into
each well in loading buffer. Electrophoresis conditions varied depending on the level of
separation required but fell between 100V running for 2 hours down to 15V running
overnight. (Sambrook et al., 1989; Ausubel, 1987)
2.5.18 Pulsed Field Electrophoresis (PFGE)
This technique is capable of separating megabase sized DNA molecules and as such had a
slightly more complex methodology. More detail on the nature of this assay can be found
in 4.6.2. PFGE was carried out in a CHEF-DR II system (Bio-Rad Laboratories, Herts,
UK). Gels were cast as 1.0% (w/v) solutions of Pulsed-Field certified agarose (Bio-Rad
Laboratories, Herts, UK) by dissolving 3.5g of agarose in 350mL of 0.5xTBE. The
agarose was dissolved by boiling and allowed to cool prior to pouring the solution into the
Thomas Burt 63

2. Materials and Methods
supplied gel frame. Once the gel had solidified, 0.8-1.0pg samples of plasmid for analysis
(2.5.5) were loaded onto the gel in 0.8% (w/v) low-melting point (LMP) agarose. Size
standards used were Mid-Range I and II PFG markers (New England Biolabs, Herts, UK).
A fresh 2L volume of pre-chilled 0.5xTBE was added to the electrophoresis chamber and
the loaded gel submerged in the chamber. The buffer was circulated at speed 70 on the
supplied pump and the temperature of the buffer maintained at 14°C by the chiller.
Running conditions varied depending on the operation but typically were; Run time: 22hrs,
Initial switch time of 50s, Final switch time of 90s, Fixed angle of 120° using a 6Vcm'1
gradient. After running the gel was removed to stain. (Barton et al., 1995; Carle et al,
1986; Clark et al., 1988; Fangman, 1978; Hightower et al., 1987; Levene and Zimm, 1987;
Olson, 1989; Wang and Lai, 1995)
2.5.19 Field Inversion Gel Electrophoresis
This technique is a derivative of PFGE with the only exception being the angle of field
inversion. In PFGE, separation of larger DNA species is possible because the electric field
can switch at 120° intervals, with FIGE the angle of inversion is fixed at 180°. More detail
into the background of this assay is provided in 4.6.2.2. A FIGE Mapper Electrophoresis
System (Bio-Rad Laboratories, Herts, UK) was used. The agarose gel was prepared in an
identical fashion as described in 2.5.18. Also as above, 0.8-1.0pg of plasmid samples were
loaded into the gel in 0.8%(w/v) LMP agarose. Size standards employed included; 2.5kb
ladder, 5kb ladder, 8-48kb ladder and Lambda DNA standard (Bio-Rad Laboratories,
Herts. UK).
2L of fresh, chilled 0.5xTBE buffer was added to the electrophoresis chamber and
circulated at ~750mLmin'1 (-70 on supplied pump). Electrophoresis was carried out in a
4°C cold-room to improve resolution of the separated bands. Running conditions again
varied but typically were; Run time 40hrs, Forward Voltage 180V, Reverse Voltage 120V,
Switch time 0.1-3.5secs increasingly linearly over run time. After running the gel was
removed to stain. (Carle et a l 1986)
Thomas Burt 64

2. Materials and Methods
2.5.20 Staining with SYBR Gold
All gels were stained with SYBR-Gold (Molecular Probes, Leiden, Netherlands). There
are a number of advantages in the use of SYBR-Gold over traditional Ethidium bromide
for gel staining (4.2.3). Unlike EtBr it does not bind plasmid isoforms differently. (Even-
Chen and Barenholz, 2000). Also, it is considerably more sensitive having a much lower
limit of detection. This is because it exhibits a 10,000 fold increase in fluorescence upon
binding nucleic acids, rather than a corresponding 30-fold increase witnessed with
EtBr.(Tuma et al., 1999; Le Pecq and Paoletti, 1966)
The gel was placed in a foil covered Tupperware box to which was added 300mL of
0.5xTBE and 30pL of SYBR-Gold Reagent (1:10,000 dilution). The gel was left to stain
for ~24hours on a platform shaker in a 4°C cold-room. Following staining the gel was
destained in an equivalent volume of distilled water for 1 hour, to improve contrast.
2.5.21 Quantitative Gel analysis
Gels were scanned using a GelDoc-It Imaging system (Ultraviolet Products, Cambridge,
UK). Excitation at 480nm and emission of 530nm were used with an exposure time of 10-
30s, depending on detection level. Band quantification was performed using LabWorks 3.0
software.
Thomas Burt 65

2. Materials and Methods
2.6 Cloning and cell line development methods
2.6.1 Enzymatic manipulation
Restriction digests and other DNA modifications were carried out using the conditions
recommended and buffers supplied by the enzyme manufacturers; Promega, Madison,
USA, New England Biolabs, Herts, UK. Typical plasmid digests were performed using
lpg of DNA, using lOunits of restriction enzyme, in a total volume of 20pL with 2pL of
lOx buffer, as supplied with each enzyme. Reaction mixtures were incubated at 37°C for 2
hours in a waterbath. Dephosphorylation of linearised vectors was achieved by the
addition of 0.1 Units of Shrimp Alkaline Phosphatase (New England Biolabs, Herts, UK)
per pmol of DNA and incubation at 37°C for 30 minutes.(Sambrook et al., 1989; Ausubel,
1987)
2.6.2 Insert preparation
Large DNA fragments for insertion into pGEMl 1 were prepared in three ways, either by
partial digestion of Saccharomyces cerevisiae DNA (Promega, Madison, USA) by Hindlll
or complete digestion by Not lor by digestion of the BAC p5176 by Notl to release the
112kb fragment. (Tao and Zhang, 1998; Hong-Bin Zhang et al., 1995). More information
on the precise procedure is outlined in 5.3.2. Duplicate samples of the digested fragments
were then run on a 0.8%(w/v) Low-melting point agarose gel using conditions outlined in
2.5.19. Following electrophoresis, the marker lane (MidRange PFG marker 1, New
England Biolabs, Herts, UK) was cut from the gel and stained using SYBR Gold. The
marker lane was then visualised under an UV transilluminator and the migration distances
of the various size fragments recorded.
The areas of the gel lanes containing the digested DNA fragments of interest were excised
using a scalpel, placed in separate eppendorf tubes and dialysed overnight at 4°C in
lxTE+30mM NaCl. The gel slices excised ranged from 30-85kb in 5kb increments for the
Notl digestions, 15-65kb in 5kb increments for the Hindlll digestions and 112kb for the
p5176 digestions. The dialysis buffer was removed and replaced with 2 x gel volume
(~100pL) of lxP-agarase buffer and left on ice for 30 minutes. This step was repeated
twice more. Each of the gel slices was then melted by heating to 65°C in a heating block
and then transferred to a 42°C waterbath to equilibrate before 3 units of p-agarase (New
England Biolabs, Herts, UK) was added to each eppendorf. The slices were left at 42°C for
Thomas Burt 66

2. Materials and Methods
2 hours for the LMP agarose to be completely digested. On removal from the waterbath
the tubes were incubated on ice for 15 minutes to coagulate any carbohydrate fragments
remaining and spun at 13,000rpm for 2 minutes in a benchtop centrifuge.
The solutions of large DNA fragments were then quantified by running 20pL of each on a
conventional 0.6% gel at 6Vcm'1 for 2 hours. The gel was stained in SYBR Gold overnight
and destained for 1 hour in 0.5xTBE. The gel was scanned and the software calculated the
mass of DNA in each of the wells by comparing the image intensity to bands contained in
three standard lanes. From the mass calculations the concentrations could be determined.
2.6.3 Ligations
Ligations were prepared using a 5:1 molar ratio of vector DNA to insert DNA. The
ligations were all based upon 50ng of insert DNA. More detail on the ligation preparations
is shown in 5.3.4. Ligation controls were also prepared using linearised, phosphorlylated (-
ve control) and dephosphorylated (+ve control). The prepared ligation mixtures were then
heated to 56°C for 10 minutes to encourage ligation. The reaction mixtures were cooled to
room temperature when 0.1 volumes of lOx ligation buffer and 2Units of T4 Ligase (New
England Biolabs, Herts, UK) were added to each. The ligation mixtures were then
incubated at 4°C overnight. The lowered ligation temperature having been shown to aid
ligation of large fragments (Promega, 2005).
2.6.4 Electroporation
Ligation products were electroporated into ElectroMAX DH5a-E cells (Invitrogen,
Paisley. UK) to increase the chance of successful transformation and capture of any large
plasmids created. Cells were removed from -70°C storage and defrosted on ice. IpL of
ligation mixture was added to an ice-cold, sterile sarstedt tube and mixed with 20fiL of
cells using a cold Gilson pipette tip and left on ice for 1 minute. The mixture was then
pipetted into a chilled 0.1cm electroporation cuvette (Bio-Rad Laboratories, Herts, UK)
making sure both electrode plates were contacted. Electroporation was achieved using a
MicroPulser™ (Bio-Rad Laboratories, Herts, UK). Electroporation conditions adopted
were as described by (Sheng et al., 1995) and were BkVcnf’OJkV across 0.1cm) using a
lOpF capacitor, which decayed with an exponential waveform time constant of 5ms.(Bio-
Rad Labs., 2003)
Thomas Burt 67

2. Materials and Methods
Immediately following pulsing, 0.9mL of pre-warmed SOC media was added to the
cuvette. The contents were then transferred to a sterile sarstedt tube and incubated at 37°C
for 2 hours and 230rpm in a shaking incubator (New Brunswick Scientific).
2.6.5 Recombinant selection and sizing
The SOC broth containing the transformants was serially diluted by log]0 dilution in sterile
PBS buffer. lOOpL of neat broth and on separate plates, lOOpL of 1:10 diluted broth was
plated out on to selective, lOOpgmL'1 ampicillin plates. On each 100mm diameter TSA
plate, had been spread 40pL of SOmgmL'1 5-bromo-4-chloro-3-indoyl-p-
galactopyranoside (X-Gal) and 4pL of 200pgmL‘1 isopropyl-B-D-thiogalactopyranoside
(IPTG) to allow blue/white colony screening. When recording transformation efficiency,
lOOpL volumes of 1:105 and 1:106 diluted broth samples were plated onto non-selective
TSA plates. All plates were incubated at 30°C in a benchtop incubator for over 24 hours,
after which time the recombinants were counted and efficiencies of transformation were
calculated using the equations described in Equation 2-6.
_ . ( (CFU on selective p la te )x dil.factor ^Transformant Ratio = r----------------
I (CFU on non - selective plate) x dil.factor* 100%
T.efficiency (CFU / pg) =f CFU on selective plate ( 1x10⁶ p g \ (vo l. o f transformants(pl)^
M ass(pg) o f pDNA used J ( pg J { vol. platedx dil. factor
Equation 2-6 Different equations used to determine the transformation efficiency of electroporation procedures
White colonies from the selective plates were picked off using a sterile inoculum loop
and streaked on to separate, selective TSA plates. These were incubated for over 24
hours at 30°C. From these plates colonies were picked and used to inoculate 5mL of
sterile, seed media containing lOOpgmL’1 ampicillin in universal bottles. These were
incubated at 30°C and 230rpm in a shaking incubator for 16 hours. Duplicate lmL
samples of each of the cultures were spun down in a benchtop centrifuge and the
plasmid extracted as described in 2.5.5. The plasmid samples were then run by FIGE
to size the constructs.
Thomas Burt 68

2. Materials and Methods
2.6.6 Preparing electrocompetent cells
All large constructs created were transformed by electroporation into GSK’s host cell line
E.coli DH1. Electrocompetent cells were produced by inoculating lOOmL of seed medium,
in a 1L baffled Shake-flask, with 1 vial of DH1 working cell bank stock. The flask was
incubated at 37°C for ~4hrs and harvested when the optical density reached 1.5. The
resulting broth was recovered into a 250mL sterile Falcon tube and incubated on ice for 1
hour. The cells were then spun down at 4°C in a Sorvall Legend RT Tabletop centrifuge at
20,000g for 20 minutes. The supernatant was poured off and as much of the media
remnants removed using a tissue swab. The cells were then washed by resuspending in
lOOmL of ice-cold 10%(v/v) glycerol. The cells were then re-centrifuged. The washing
process was repeated twice more. Finally, the cells were resuspended in 500pL of
10%(v/v) glycerol and aliquoted into an ice-cold cryovial and stored at -70°C. Throughout
the entire process the cells were constantly maintained at a temperature as close to freezing
as possible by incubation on ice. (Sheng et al., 1995; Siguret et al., 1994). The cells were
then electroporated together with the large constructs isolated from the previous step.
2.6.7 Cell Banking
Cells having undergone electroporation and so contained a known large plasmid were
isolated on selective TSA plates (lOOpgmL' 1 ampicillin). These colonies were then used to
create a working cell bank. Single colonies were picked off and used to inoculate 5mL of
media in a sterile universal. Cells were incubated at 30°C, 230rpm overnight and used as a
seed culture to inoculate 50mL of sterile selective media in a 1L baffled Shake-flask to
0.1 OD. Shake-flasks were incubated until the optical density fell between 2.5-3.0 (early
log-phase). The flasks were removed from the incubator and 12.5mL of sterile 100% (v/v)
glycerol was added to each. The cell suspension was then aliquoted in 1.8 mL volumes into
2mL Nunc cryovials and stored at -70°C.
2.6.8 Plasmid stability assay
Following duplicate 4L fermentations of the selected large constructs, from which no
plasmid could be isolated, stability studies were conducted on the large plasmid bearing
strains. These consisted of cultivating the plasmid-bearing cells in 50mL of selective
medium in 1 L baffled shake-flasks over a 60 hour period, which required four passages of
the cells to fresh, selective media. The conditions employed during the stability trials
Thomas Burt 69

2. Materials and Methods
(temperature, selective agent, concentration of selective agent and host cell line) varied in
attempt to improve plasmid retention but the general methodology remained fixed. Refer to 5.6.1.
Two working cell vials of cells bearing each construct were removed from -70°C storage
and defrosted. These were used to inoculate duplicate 50mL volumes of sterile, selective
media to a starting OD ~0.1. The flasks were incubated at 230rpm and either 37°C, 30°C
or 25°C in a shaking incubator. In a hood, samples of culture broth were removed at
regular intervals over an eight hour period. The samples were used to determine optical
density progression to measure growth rate and were also used to determine plasmid
retention using the replica plate assay as outlined in 2.5.5. At the end of the eight-hour
period, sufficient inoculum was drawn from each Shake-flask to inoculate a corresponding
flask containing fresh, sterile, selective media to 0.05OD. (the lower initial starting OD
was used due to a longer incubation period). The passaged flasks were incubated in an
identical fashion overnight, after which the process was repeated for a total of four
passages.
Thomas Burt 70

2. Materials and Methods
2.7 Upstream processing methods
2.7.1 Shake-flask fermentations
Shake-flask fermentations were conducted to produce sufficient plasmid material for
purification by Qiagen kits, to investigate plasmid stability and as scale-down mimics of
larger scale fermentations or to prepare inoculum for such fermentations. Two methods of
Shake-flask fermentation were conducted throughout this project.
Early work utilised 2L total volume baffled shake-flasks in which 500mL of sterile media
was cultured. Later 1L total volume shake-flasks were employed in which 50mL of sterile
culture media was added. The smaller volume Shake-flasks enabled a larger number of
runs to be conducted. Shake-flask cultures were all inoculated to 0.1 OD by inoculating
from a seed culture in a glass universal bottle, in the case of the larger shake-flasks or
directly from the working cell bank for the smaller volume flasks.
2.7.2 Inoculum preparation
The inoculum with which to seed the vessels was prepared by shake-flask
fermentations. 50mL of fresh, sterile seed media supplemented with the appropriate
antibiotic was inoculated to 0.05OD from a lmL cryovial. The shake-flasks were then
incubated at either 37°C or 25°C for 10-12hours or 20-24 hours depending on the
regime in a shaking incubator at 230rpm. If multiple fermentations were being
conducted the inoculum would be pooled to ensure for each vessel the inoculum was
uniform.
2.7.3 Fermentation
Batch fermentations were performed in 5L total volume, jacketed, autoclavable, glass
bioreactors (Applikon, Worcs., UK) containing 4L of sterile media. The shake-flask
inoculum was pooled, the optical density determined and the volume of inoculum required
to produce a starting OD of 0.1 was asepetically transferred into each vessel. Dissolved
oxygen tension (DOT) was monitored using an Ingold polarographic probe (Mettler-
Toledo Ltd., Leics., UK) (Buhler and Ingold, 1976). DOT was maintained at 30%
saturation initially by cascade control of impeller speed from 600rpm to lOOOrpm and
adjustment of sparging rate from 0.5vvm to lvvm. When action on the DOT control loop
had been >90% for a period of 1 0 minutes the control algorithm switched the sparger from
Thomas Burt 71

2. Materials and Methods
compressed air to enriched air (40% O2). Again the DOT was maintained at 30% by
cascade control of the impeller speed and adjustment of sparging rate from lw m to 2 vvm.
Fermentations were deemed complete when the DOT spiked and the progression of OD had stopped.
pH was maintained at 7.00±0.1 through the automatic additions of 1M NaOH and 1M
H2 SO4 under proportional control. Temperature was maintained at either 37°C or 25°C,
depending on the cultivation regime, by proportional and integral control of water
temperature flowing through the vessel jacket. Antifoam addition was controlled by the
timed addition of 10%(v/v) polypropylene glycol at 5secs/hour. Both optical density
(2.5.1) and wet cell weight (2.5.2) were used to monitor culture growth and samples were
also taken to determine plasmid retention (2.5.4). Exit gas analysis of O2 and CO2 levels
was carried out by mass spectrometry (VG Gas Analysis Systems Ltd., Cheshire, UK).
Culture broth was centrifuged immediately following the end of the fermentation by
aliquoting 4L of broth into centrifuge pots and centrifuging at 20,000g for 20 minutes at
4°C. (Heraeus centrifuge). The supernatant was discarded and the cell paste collected and
frozen at -70°C.
2.7.4 Calculation of specific growth rate (p)
A standard method of calculating specific growth rate was used. From the growth curve
the period of exponential growth was identified covering at least four data-points. A plot
of the natural log of these points was constructed and linear regression performed. The
result was only accepted if the R2 value returned exceeded 0.96.
2.7.5 Samples for specific plasmid yield progression
Using the correlation that 50D units at 600nm is equal to 2.5x10⁹ cells (Figure 6-1 A), the
volume of culture required to produce samples was calculated3. For each fermentation, per
time point (-hourly), 50D equivalent volumes of broth were aliquoted into 10 separate
sartstedt tubes and centrifuged at 13,000rpm for 5 minutes. The supernatant was decanted
3 Using a constant mass unit (50D ) rather than a constant volume unit when sampling meant that when thesamples were analysed, the cell mass being lysed would be constant (~120gL'') irrespective of culture celldensity when the sample was taken. This meant the lysis conditions would remain the same for each sample,which is critical when trying to accurately determine plasmid specific yield progression and would not be thecase if samples were taken on a fixed volume basis. The mass of the sample pellet was easily calculated byrecording the volume of the sample taken and also recording the WCW of the culture at the time o f sampling.
Thomas Burt 72

2. Materials and Methods
off and any media remnants removed using a cotton bud. Cell pellets were then frozen at -
20°C for retrospective analysis.
2.7.6 Oxygen Uptake Rate (OUR) determination
OUR and Carbon dioxide evolution rate were calculated by mass balancing the proportion
of both compounds entering and leaving the fermentation vessel. A macro was used for the
calculation, using the values for oxygen and carbon dioxide entering the vessel (obtained
by directing a proportion of the entry gas to the mass spectrometer) and subtracting the
masses of both the compounds detected in the exit gas. The mass spectrometer (VG Gas
Analysis Systems Ltd., Cheshire, UK) returned the values of each of the components as %
of total, therefore the basic equation for OUR and CER calculation used by the macro was
as described in Equation 2-7.
r-i i... -iOxygen Uptake Rate (mmolsL hr~ ) = - o20UT))
22.4 x Fermentation Vol I
Equation 2-7 Basic equation used by OUR macro to calculate oxygen uptake rate. Theequation uses gas flow rate as Lmin'1 and assumes lm ole of gas occupies 22.4L at standard temperature and pressure.
2.7.7 Online parameter logging
Fermentation conditions and variables were constantly logged using BioXpert software
(Applikon, Worcs., UK). Progression of pH, temperature, DOT, impeller speed and the %
action on each of these control loops was used in combination with OUR/CER progression
and the discrete variables recorded (WCW/OD/Specific Yield) in the multivariate analysis
of each of the fermentations.
Thomas Burt 73

2. Materials and Methods
2.8 Downstream purification methods
2.8.1 Cell Resuspension
50g of cell paste was removed from the freezer, broken into pieces and resuspended in
250mL of resuspension buffer in a glass vessel equipped with an overhead magnetic
stirrer. The solution was left mixing for 1 hour to allow complete resuspension of the cell
paste, after which the solution was incubated on ice for 10 minutes to chill. The wet cell
weight of the solution was then determined using the assay described in 2 .5 . 2
2.8.2 Cell Lysis
Cell lysis was achieved in a 1.5L total volume, round-bottomed, glass vessel equipped
with a 4-blade, 45° pitched blade impeller. The dimensions of the vessel are recorded in
Figure 7-6. At all times during the lysis and neutralisation operations the vessel was
surrounded by ice. 395mL of cold 0.96%(w/v) NaOH was added to the lysis vessel along
with 78mL of 6 %(w/v) sodium dodecylsulphate (SDS) solution to form the lysis buffer.
The impeller was switched to lOOrpm and after a short time a white precipitate could be
seen as the temperature of the SDS dropped. After the precipitate had formed the cell
suspension was removed from the ice and poured into the lysis vessel, which continued to
be agitated at lOOrpm. Immediately upon addition of the cells the sudden increase in
viscosity could be seen, typical of the cell lysis operation.
The vessel was left agitating for 30 minutes to allow for complete lysis4 at which time
236mL of ice-cold 3M Potassium acetate was added to the vessel to neutralise the solution.
The neutralisation reaction was allowed to proceed for a further 30 minutes to reach
completion. At the end of the neutralisation reaction a lOmL sample was taken
representing the Pre-CaCL sample point. The sample was aliquoted in lmL volumes into
sterile sarstedt tubes which were centrifuged for 5 minutes at 13,000rpm to clarify. The
clarified lysates were poured into fresh tubes, labelled and frozen at -70°C for
retrospective analysis. The total volume of the lysate in the vessel at this point was 959mL
and the component concentrations were as shown in Table 2-14 .
4 Although lysis would be complete much quicker in a vessel o f the size used, a 30-minute mixing time was used to mimic the likely mixing time that would be normal for a production (500L) operation. Refer to section for the calculation.
Thomas Burt 74

2. Materials and Methods
Table 2-14 Table detailing the concentrations of the various constituents used in the lysis procedure. Also showb are the concentrations following combination. In bold are recorded the concentrations after the addition of the 5M CaCl2.
COMPONENT VOLUME ADDED . . . . . . | m M ...............
CONC.(mM)
DILUTIONFACTOR
RESULTANT CONC. (mM)
Tris 250 25 3.84 (4.82) 6.5 (5.19)EDTA 44 10 3.84 (4.82) 2.6 (2.07)Dextrose 44 55 3.84 (4.82) 14.32(11.41)Sodiumhydroxide 395 240 2.43 (3.05) 98.8 (78.7)
SDS 78 210 12.29(15.45) 17.1 (13.6)Potassiumacetate 236 3000 4.06 (5.11) 738.9(587.1)
Calcium chloride 246 5000 4.9 1020
2.8.3 RNA removal
The ice-surrounding the vessel was removed and 246mL of room temperature 5M CaC^ was added to the unclarified lysate in the reaction vessel. Agitation of the vessel was continued for a further 5 minutes, to ensure adequate mixing of the components, after which the impeller was turned off and the mixture incubated at room temperature for 10 minutes.
2.8.4 Clarification
The unclarified lysate was distributed equally into six centrifuge pots and centrifuged in a Sorval-1500 rotor for 30 minutes at 12,000rpm/ 4°C to clarify. The supernatant was poured off into a clean, sterile 2L Duran bottle through a double-layer of Kimwipe tissue (Merck KGaA, Darmstadt. Germany) to remove any large particulates. Further clarification was achieved by pumping the clarified lysate through a 5pm PTFE depth filter in series with a 0.45pm/0.22pm PTFE depth filter (Sartorius, Surrey, UK) using a Watson-Marlow peristaltic pump set to SOmLmin'1. This step ensured the removal of micron and sub-micron size particulates which would block the UF membrane. The filters were primed before use by passing through 1L of TE buffer. A clean 2L Duran was used to collect the clarified lysate which had a volume of 1205mL. The concentrations of the various components of the clarified lysate are shown emboldened in Table 2-14.
Thomas Burt 75

2. Materials and Methods
2.8.5 Ultrafiltration operation
Inlet lineRetentate collection
FW1 Certramate UF lOQkDaNMWL
membraneBtfFetf SaitfJe f
Valve B Permeate line
HxHxj III
Reseivar Valve A
PessuK GaugeWatson- Marlow w505
penstaltic pump Permeate/ Diafiltatecollection
Figure 2-7 Schematic showing the setup of the ultrafiltration rig. The clarified lysate was added to the reservoir and sealed such that capillary action could be used to draw more fluid into the system from the inlet line. The fluid was pumped around the system in an anti-clockwise direction with the plasmid remaining in the retentate side of the membrane. Permeate and diafiltrate was collected for analysis. The TIMP was regulated by the back-pressure valve (B) and the retentate collected from valve (A).
The setup of the Ultra filtration system is outlined in Figure 2-7. The system used a O.lsqft, lOOkDa NMCO, Omega open-channel5, Pall Filtron Centramate membrane (Pall Corporation, Portsmouth. UK). Liquid was passed around the system through 7.5mm ID tubing, the lengths of which were kept to minimum to reduce liquid hold-up volume. A Watson-Marlow 505 peristaltic pump was used for operation, set to either 500mLmin'' or 250mLmin'1.
2.8.5.1 Ultrafiltration preparation
After each use the membrane was cleaned by circulating with 500mL of 0.5M NaOH for 5 minutes. This was drained and replaced with a fresh volume which was circulated for 30minutes. This was drained off and the membrane stored in 500mL of 0.1M NaOH. Before use the alkali had to be drained and the system equilibrated. The system was equilibrated by passing 2L of Milli-Q water through the membrane followed by circulation of 1L of lOmM Tris (pH 8.0) for 30 minutes. This was drained and the membrane ready
for use.
5 Open channel meant there were no spacers between the outer wall of the membrane and the membrane itself. This resulted in less turbulent flow being created and so less shear at the membrane surface.
Thomas Burt 76

2. Materials and Methods
2.8.5.2 Recirculation
Approximately, 400mL of clarified lysate was loaded into the reservoir, the lid sealed and
the tube leading into the reservoir placed in the Duran bottle containing the remainder of
the clarified lysate. The permeate line was opened and placed in the Duran bottle
containing the remainder of the clarified lysate so that any permeate would return to the
system. The pump was turned on and the back pressure adjusted to 5psi by closing valve
B. The system was operated like this for 30 minutes, this was the time required for the
permeate flux rate to reach equilibrium, indicating the maximum gel layer formation.
2.8.5.3 Permeation
Immediately following the 30 minutes recirculation period, the permeate line was removed
from the bottle containing the clarified lysate and placed in a clean, sterile Duran. The
clarified lysate was allowed to concentrate from 1200mL to lOOmL, representing a 12-fold
concentration step.
2.8.5.4 Diafiltration
Once the clarified lysate had been concentrated to lOOmL the inlet line was transferred to a
bottle containing 3L of sterile-filtered lOmM Tris (pH7.5) DF1 buffer. The diafiltration
was allowed to continue until all the volume had passed through the membrane. The
filtrate was collected for analysis. Immeadiately, following the use of all DF1 buffer the
inlet line was transferred to 2L of lOmM Tris+50mlVrNaCl. This was allowed to penetrate
the membrane and the filtrate collected for analysis.
2.8.5.5 Retentate collection
Following both diafiltration steps there remained lOOmL of clear fluid in the UF
system. In order to recover the plasmid from the gel layer, the TMP was removed and
the Retentate recirculated at the set crossflow velocity for 20minutes. The pump was
then stopped and the fluid collected from the system. To fully recover the plasmid
from the membrane two more sequential wash steps were employed, both using
~80mL of DF2 buffer which was circulated for 20 minute periods. The washes were
drained from the system and the volume determined by weight
Thomas Burt 77

2. Materials and Methods
2.8.6 Determining Mass-Volume coefficients of anion-exchange resins
To separate, pre-weighed (5d.p) glass McCartney bottles were added 7mL, 5mL,
2.5mL and lmL volumes of each anion-exchange resin under study (TMAE Fractogel
and DEAE Fractogel). For each volume triplicates were prepared. These were left in a
vacuum oven (80°C) for 24 hours. The bottles were reweighed and the mass of the
residue calculated. Taking the average of the triplicate measurements and of each
volume repeat, the mass-volume coefficient of the resins was calculated.
2.8.7 Binding Studies
The TMAE and DEAE Fractogel (Merck, USA) resins to be used were mixed well to
resuspend. Multiple 20pL volumes of each were pipetted in to separate, autoclaved
eppendorf tubes. To each was added 2mL of sterile lOmM Tris+0.54M NaCl
(Diafiltration buffer 2). This was done to equilibrate the resin into the buffer used for
loading in the normal course of the process. The tubes were then left overnight at 4°C
to allow the resin to settle.
To perform the binding studies the equilibration buffer was drained away. To the
sedimented resin was added lmL of a SOpgmL'1 solution of the plasmid under study.
The plasmids were purified by Qiagen Large Construct kit (2.5.8.3) which employs an
exonuclease to digest any genomic DNA. Immediately following addition a 2pL
volume of the solution was extracted and the plasmid concentration measured using
the NanoDrop spectrophotometer (2.5.9.2). The tubes were then attached to an
inversion mixer to agitate and promote effective mixing. At regular intervals the tubes
were assayed for the presence of free, unbound plasmid by removing 2pL volumes and
assaying by NanoDrop. The binding was monitored for 90 minutes. In total about 15
measurements were recorded over this period, equating to 30pL. This represented 3%
of the total volume of the mixture under study. Following the 90 minute period the
tubes were left to agitate at room temperature for a total of 24 hours. At this point the
agitation was halted and the final measurements of free, unbound plasmid recorded. It
was maintained that equilibrium would have been reached by this point and as such
this measurement formed the value for maximum specific binding capacity.
Thomas Burt 78

3. Initial Studies
3 INITIAL STUDIES: RESULTS AND DISCUSSION
3.1 Chapter Aims
This chapter concentrates on the initial studies conducted on the series of large, BAC
based, Oxford plasmids (Wade-Martins et al., 1999). At the outset of this EngD no data
existed as for the potential for these constructs to be produced or purified and previously
their production had been purely laboratory scale, utilising caesium chloride gradient
purification. A number of preliminary experiments were designed to assess the feasibility
of manufacturing these plasmids at a larger scale.
The main questions to be answered by these studies were;
1. Whether the host-cells were able to grow sufficiently when bearing constructs of this
size and whether the plasmid size had any deleterious effect on the growth rate of the
culture. If the growth rate was severely impinged by the propagation of such large
macromolecules, their large-scale manufacture may not be feasible due to the excessively
long time scales predicted for the fermentations.
2. Investigations would be done to determine the plasmid yields, which could be expected
from fermentations of these constructs. It was known in advance that these plasmids
existed at a very low copy number (1-2 copies/ cell) (Frame and Bishop, 1971). However,
due to the much greater linear DNA length it remained to be seen whether a similar mass
of plasmid DNA existed for purification, as compared to that of a smaller, high-copy
number plasmids, by balance of the sheer plasmid size. Experiments would also be done to
determine whether it was possible to increase the productivity of the strains producing
these plasmids by altering the medium used for their cultivation.
3. By completing pilot-scale (4L) batch fermentations of these large constructs, sufficient
cell material could be produced to conduct purification trials upon these plasmids.
Additionally, it would be possible to monitor the growth and productivity of cells bearing
these constructs in a system which would closer mimic their manufacture, should attempts
ever be made.
4. Using the cell material produced from pilot-scale fermentations, downstream
purification trials could be conducted to investigate if it was possible to purify these large
Thomas Burt 79

3. Initial Studies
constructs and in what amounts, together with identifying the steps in the downstream
process, which were the most problematic.
5. In the process of monitoring plasmid yields though the fermentation and downstream
operations it would be possible to determine whether the current analytical techniques,
used for plasmid quantification and visualisation, were applicable and whether
developments or new assay techniques were required.
The following sections detail the attempts made to answer these unknowns.
3.2 Investigating the effect of plasmid size on culture growth rates
3.2.1 Introduction
It has been recognised for some time that strong, constitutive promoters severely limit the
growth of bacterial cells by forcing the cell to generate large amounts of the desired
protein (Glick, 1995; Dong et al., 1995). Essentially a significant amount of the host cell’s
resources, either in the form of energy such as ATP or raw materials such as nucleotides
and amino acids, are diverted to maintain or express foreign DNA. This metabolic burden
can cause a variety of changes to the physiology and functioning of the host cell. One of
the most commonly observed changes is a decrease in the rate of cell growth but a
reduction in final cell yield has also been reported (Summers, 1991). Attempts have been
made to quantify the level of metabolic burden placed upon cultures expressing
recombinant proteins by measuring the level of the starvation signal molecule ppGpp
(Andersson et al., 1996; Cserjan-Puschmann et al., 1999).
With burdened cells having a slower growth rate, in the absence of selective pressure, this
can lead to complete plasmid loss from the culture, as the plasmid-free cells soon come to
dominate the population. Due to the industry focus being mainly upon recombinant protein
production, several strategies have been developed to try and overcome the problem of
excessive expression leading to an unsustainable metabolic burden. One of the most
common is to employ an inducible promoter to ensure protein expression occurs only at
high cell densities, thereby reducing the metabolic burden on the dividing cells leading to a
higher proportion of cells maintaining the plasmid up until they are induced. (Grabherr and
Bayer, 2002) reported that expression vectors should be carefully designed to ensure a
balance exists between expression rate of the plasmid-encoded protein and the plasmid
copy number (and hence the resultant metabolic burden placed upon the cell). The desired
Thomas Burt 80

3. Initial Studies
result is the maximisation of protein yield, with the minimal burden placed upon the cells,
so that fast growth rates and high cell densities can be achieved.
The obvious difference with the strategies employed for processes aimed at producing
recombinant proteins and those for the manufacture of plasmid DNA, are that for the latter
no expression of the plasmid DNA is strictly required. The reason for this being that
excluding the necessary control machinery the plasmid genes remained unexpressed in the
bacterial cell since it is the genes themselves that are the product, as such metabolic
burden should be less of a problem. It has become clear that the metabolic burden
associated with the propagation of a plasmid is small compared to the effect of expression
of recombinant protein (Bentley W.E., 1990; Jones and Keasling, 1998). (Andersson et al.,
1996) demonstrated that inducing expression of a plasmid-bearing culture led to 23% drop
in the biomass produced as compared to the plasmid-free culture of the host. The result for
the non-induced plasmid-bearing culture was a reduction in final biomass, which fell
between the other two. Indeed several studies have identified the fact that when
propagating non-coding sequences in bacteria the extra metabolic burden is the result of
the cells expressing the selective agent employed to maintain the plasmid and not the
plasmid itself (Rozkov et al., 2004; Lee and Edlin, 1985). Attempts have been made to
remove the selective resistance gene from plasmid constructs and maintain plasmid
presence by novel section techniques such as repressor-titration (Cranenburgh et al., 2001;
Williams et al., 1998b).
It appears to be the case that it is protein expression which leads to the higher metabolic
burden rather that the propagation of the plasmid itself. The extent to which this idea can
be applied when the cells are being asked to propagate large plasmids such as in this study
is, however, unknown. (Stouthamer A.H., 1973) calculated that to synthesize lg of
plasmid-free cells requires 34.7mmoles of ATP. Of that total, 20.5mmoles is required for
protein synthesis and only 1.1 mmoles is needed for DNA synthesis. These figures mask
the fact that the constituent mass breakdown of a log-phase E.coli cell (Bailey and Ollis,
1986) includes 15% protein and 1% DNA. Proportionally, this means that the energy
required for the synthesis a unit mass of protein is highly comparable to the identical mass
of DNA. This analysis is relevant, since the figure of 1% DNA represents 4.7Mbp of DNA
(i.e 1 bacterial genome) (Blattner et al., 1997). Hypothetically, the propagation of a
plasmid may cause a significant metabolic burden when the plasmid exists at levels where
the amount of extrachromosomal plasmid DNA is equal to, or at least approaching, the
Thomas Burt 81

3. Initial Studies
amount of DNA in the genome. With large plasmids, it becomes feasible that this limit
could be reached, such that the host cell’s resources for synthesising genomic DNA may
become strained by the burden of having to maintain and replicate the plasmid DNA. The
only unknown is by how much the task of replicating such quantities of DNA would effect
the cell’s normal functioning and the resultant metabolic burden and whether the demands
are at all comparable to the high metabolic burden caused by the constitutive expression
of proteins.
Certainly there are some reports that plasmid size does result in additional metabolic
burden. In one study, the behaviour of four different pUC8-based plasmids was compared,
with each plasmid carrying different amounts of unexpressed Drosophilia melanogaster
chromosomal DNA (2.7-8.7kb). Although the growth rates in rich medium of E.coli cells
transformed with one of these four plasmids were identical, as plasmid size increased,
maximum cell density decreased, and with the largest plasmid, cell death was accelerated
once the stationary phase of cell growth was reached (Cheah et al., 1987). Similarly, report
that inserting non-coding sequences from Metarhizium anisopiliae of sizes 3-9kb into
pBluescript caused a reduction in growth rate by increasing the length of the lag phase
period of growth (Smith and Bidochka, 1998).
The other factor observed during these preliminary studies was whether the use of semi-
defined media (SDCAS) provided any benefit over complex SuperBroth media. E.coli is a
non-fastidious microorganism and as such is capable of growing both on rich, complex
media as well as in salt-based, chemically defined media, provided a source of organic
carbon is provided. Though the type and concentration of the components used, growth
medium composition directly dictates the amount of biomass produced, and therefore
directly dictates the plasmid volumetric yield (mg plasmid/L). In addition, the medium
composition directly affects the host-cell physiology and metabolism and therefore
influences plasmid copy number or specific yield (pgmL1) (Prather et al., 2003). Once
again a balance must be met. A high specific yield is critical so that for the downstream
processing stages the plasmid exists in high amounts relative to other cellular components,
which exist as contaminants in the purification process. However, the high specific yield
should not impact too negatively on the final biomass yields or the maximum specific
growth rate, by applying excess metabolic burden, as this reduces the overall efficiency of
the fermentation process.
Thomas Burt 82

3. Initial Studies
The advantages of using either defined media over complex media remains disputable.
(Shoham and Demain, 1990; O'Kennedy and Patching, 1997; Kim et al., 1987) report that
defined media can support higher plasmid copy numbers than complex media by reducing
segregation-rate associated plasmid instability and the maximum specific growth rate. It is
generally accepted that plasmid copy-number varies inversely with growth rate in batch
culture. Indeed, this has been mathematically established by (Vasuki, 1989) in the form of
an unstructured model based upon Michaelis-Menton type kinetics to derive the
relationship outlined in Equation 3-1.
Ps ~ -r Kp P + &H
Equation 3-1 Relationship derived from a model for plasmid replication (p—>2p) using Michaelis- Menton kinetics, demonstrating an inverse relationship between plasmid copy number and specific growth rate. Ps is the intracellular plasmid copy number or concentration, p is the specific growth rate. KH is the host-cell saturation constant and as such is effectively a measure of the dependence of the plasmid on the host cell machinery for replication. KP is the plasmid saturation constant and represents the level of all the host components involved in plasmid replication exist at 0.5Vp°. V0P represents the maximal rate of plasmid synthesis, whilst VH° represents the maximal rate of hostcell activities required for plasmid synthesis such as RNA synthesis.
A proposed basis for this response is a negative control system, which suggests that the
activities of the RNAI and RNAII promoters, and the efficiency with which RNAI inhibits
plasmid replication, are controlled by the growth rate. Reducing the culture growth rate
from 1.7h_1 to 0.41V1 led to an increase in copy number from 15-23 plasmids per genome
(Lin-Chao and Bremer, 1986). Similarly, the use of a stoichiometrically designed, defined
medium produced plasmid yields of 60±5.0mgL‘' as compared to 4.0±0.4mgL‘1 for LB
medium by reducing the growth rate from 0.611V1 with complex LB to 0.331V1 with the
defined media (Wang et al., 2001). For complex media, opposite results have been seen
(O'Kennedy et al., 2000). They describe how semi-defined SDCAS media was capable of
producing lower growth rates, higher cell densities and improved plasmid stability than LB
media. However, these studies made use of LB media for comparison, which is quite a
simple, complex media formulation (O'Kennedy and Patching, 1997; Wang et al., 2001).
Increasing complex medium strength by employing richer formulations, such as
SuperBroth, supports higher volumetric yields without compromising specific yields, and
this solely attributable to increased biomass levels at harvest.
Thomas Burt 83

3. Initial Studies
3.2.2 Characterising the growth rates of the Oxford series in Shake-flasks
The main difference between previous studies and this study is down to the nature of the
plasmids employed. All studies referenced thus far made use of ColEl based, reasonably
small, high-copy number plasmids whose replication was relaxed. In this study the
plasmids are derived from the pBAC108L vector and so the replication is stringently
controlled at l-2copies per cell by the F-factor (Frame and Bishop, 1971). However, the
plasmid sizes are considerably larger than previously encountered at 116kb, 172kb and
242kb. It was unknown when embarking on these studies whether the low-copy, large size
would place a similar level of burden upon the cells as high-copy, small plasmids.
Additionally, due to the nature of stringent replication control demonstrated by these
plasmids, the use of semi-defined media may have little impact on yields since the RNA
promoter control system is not in effect and so reducing the growth rate may only serve to
reduce the efficiency of the fermentation.
Figure 3-1A and B display the results of shake-flask experiments conducted on the large
plasmid series. Each large construct; p5176 (116kb), p5206 (172kb) and p5204 (242kb)
was grown in triplicate in 2L shake-flasks containing 500mL of either complex
(SuperBroth) media or semi-defined (SDCAS) media. Referring to Figure 3-1A and B, it
can be appreciated that the cultures grown on SuperBroth displayed shorter lag-phases
than the same cultures grown on SDCAS media. The lag-phase was deemed complete
when the optical density of the culture had increased from its 0.1 starting figure to over
0.5OD. The lag phase for the complex media had a three hour duration, whilst the figure
for the semi-defined media was four hours. A possible explanation for this difference
could be catabolic repression. The main carbon source in SDCAS media is glucose, which
E.coli will metabolise preferentially over any other carbon source. Because of this fact it is
unlikely that any glucose remained in the starter culture used to inoculate the SDCAS
shake-flasks, since they had been growing for over 12 hours. This would have meant that
when the culture was passaged into fresh media containing glucose, the cells would have
responded by synthesising the required enzymes to metabolise the glucose, as this would
take preference over any other carbon source, a course of action which would have
Thomas Burt 84

3. Initial Studies
6
64
321
00 7 0 9 101 2 9 5 64
Time (hr*)
654
3
2
10
0 1 2 3 5 6 74 6 9 10
B Time (hr*)
2
1
0•1
-30 1 2 3 5 6 7 6 9 10A 4
2
1
0
A
-2
-3
0 1 2 3 5 6 7 9 10A 4 8
D5 5 0 -
5 2 5 -
5up«rtiroth(oomp(«x) SDCAS (••nn-d*fir»d)
100-i complexV .x.. ■nc'T,'*:
p5176(110»cb P52O0 ■ P2Mp 5 2 0 * ” 2 kfc ■ 204 242M
r.-or ir.Tf uc!
Figure 3-1 Results of Shake-flask studies designed to determine whether the size of the large Oxford series of constructs had any effect on the growth characteristics of the plasmid bearing cells. Plasmids were propagated in E.coli DHlOfl and grown on 500mL of either complex SuperBroth media or semi-defined SDCAS media in 2L baffled shake-flasks supplemented with 25jigmL'‘ chloramphenicol. Each construct on each media variety was studied in triplicate by inoculating each flask to 0.1 OD starting density though the use of a starting culture grown on the appropriate media. Flasks were incubated at 37°C and 230rpm in a shaking incubator. Hourly samples of broth were extracted and diluted to within the linear range (0.1-0.6) using the appropriate blank media and analysed using a Novaspec spectrophotometer set to 600nm, blanked against media. Specific growth rates were determined by linear regression of natural log of optical density though the time period, which displayed maximum growth.
|A; growth profiles of the constructs on SuperBroth / B; Growth profiles of the constructs on SDCAS media. / C; Growth rates on SuperBroth. / D; Growth rates on SDCAS. / E; Final biomass levels at harvest. / F; Maximum specific growth rates]
Thomas Burt 85

3. Initial Studies
delayed culture growth. The same effect would not appear in SuperBroth since all the
components are complex and as such no catabolite takes preference.
Another point to make about the growth profiles concerns their variability. The
SuperBroth cultures displayed more uniformity in their optical density progression than
did the SDCAS cultures. This is unusual since typically complex media results in the
variation of growth behaviour due to fluctuations in the components used to formulate the
media (Stanbury and Whitaker, 1984). With defined media the fluctuations are less
common since the media is prepared exactly to recipe. However, these fluctuations relate
to batch-to-batch variation. In this study all the media was prepared in one batch, such that
all the triplicate cultures were cultivated on identical media solutions. This means that the
greater variation in optical density progression witnessed in the SDCAS fermentations
must be a result of the way in which the inoculum responds to the media rather than the
media itself. This implies that cultures have to undergo more complex physiological
changes when being passaged in semi-defined media than they do when growing on
complex formulations, a fact that than can increase variation between cultures.
Because of the extended lag-phase it was deemed that the SDCAS cultures’ period of most
rapid growth occurred during the 4-7 time points and as such the maximum specific
growth rate of the cultures was determined between these points by linear regression of the
natural log of optical density. The same procedure was conducted on the data for the
SuperBroth cultures except the period of most rapid growth was deemed to be between the
3-6 hour time points. The software used for growth rate analysis calculated the gradient
together with the error associated with the linear regression. Figure 3-1C and D display the
linear regression of the optical density progression together with the values for growth rate
and their associated error.
Several points can be raised from Figure 3-IF, which plots the mean specific growth rates
of the triplicate cultures. The most apparent observation is the effect that semi-defined
media had on growth rate, as it can clearly be seen that the use of this media resulted in a
-25-30% decrease in the growth rate for each construct. Highlighting one example is the
drop from 0.631V1 to 0.481V1 displayed by p5176 culture. This is very similar to other
reports (O'Kennedy et al., 2000). In their report they described a decreasing growth rate of
0.631V1 to 0.421V1 when growing E.coli DH5a [pSVP] on LB and SDCAS media
respectively.
Thomas Burt 86

3. Initial Studies
Alongside the decrease in growth rate due to the media change, plasmid size also has a
suppressing effect on growth rate. From Figure 3-IF it can be seen that growth rate on
SuperBroth drops from 0.63h] for 116kb to 0.59h'] for 172kb plasmid and 0.57h‘] for
242kb. Overall this accounts for a 10% drop in growth rate upon doubling the plasmid size
from 116kb to 242kb. Similarly with the SDCAS cultures, growth rate drops from 0.48h']
for 116kb to 0.421T1 for 242kb plasmid, representing a 12.5% drop. Since the plasmid
backbone of the constructs is identical, such that the expression rate of the
chloramphenicol resistance gene is the same, the decreasing growth rate has to be due to
the increase in non-coding DNA the cells are required to maintain and replicate.
Figure 3-IE throws up some disparities as it plots the final biomass yield attained
(determined from optical density) of cultures carrying the different constructs on the
different media types. Increasing plasmid size reduces the final biomass attained by
fermentations (Cheah et al., 1987). The same effect is seen here with optical density
dropping from a 5.15 OD units for the 116kb plasmid down to 4.690D units for the largest
242kb plasmid, when cultivated on SuperBroth media. This represents a 10% decrease in
final biomass yields. This effect is understandable, once again by assuming the effect of
metabolic burden placed upon the cells by increasing plasmid size.
r s = r s i x ) + r s i p)
1 1 - r s' + ^ r ~ rr
1 X / .S’ 1 P / s
Equation 3-2 Equations describing the relationships between substrate utlisation and product formation. Rs is rate of substrate utilisation; r ^ describes the rate of substrate utilisation for biomass production; r$(p) is rate of substrate utilisation for product formation. Rx is rate of biomass accumulation; rP is rate of product formation; Yx/s and YP/S are the yield coefficients for biomass and product synthesis
The relationships between substrate utilisation and product formation are outlined in
Equation 3-2 (Luedeking et al., 1957). Since plasmid is the product, as plasmid size
increased the product yield coefficient (Yp/s) would decrease since more substrate is
required to make one mass unit of product. This would increase the rate of substrate
utilisation for product formation and since the amount of substrate would be fixed would
mean less would be available for biomass synthesis.
A potential disparity is seen in the results for the SDCAS fermentations, whereby biomass
accumulation appears to increase with plasmid size. The only possible way for this to
occur would be for the product yield coefficient (YP/S) to increase with increasing plasmid
Thomas Burt 87

3. Initial Studies
size, such that product formation consumes less substrate material as size increases.
However, this suggestion does not have a rational explanation as to why this would be the
case, so the only possible explanation is that the result for the biomass accumulation on
SDCAS media is an anomaly. Despite this it could be claimed that the SDCAS media does
reduce the maximum cell mass attainable, since all the biomass levels produced are lower
than when SuperBroth media was used. A possible explanation for this is that cells
growing on semi-defined media have a lower biomass yield coefficient (Y x/s), such that
per unit mass of substrate consumed less biomass is produced. The remainder of substrate
utilised could have been taken up with a higher amount of endogenous respiration which
occurs due to the increased number of metabolic actions the cells must perform on the
substrate to produce useful cell metabolites.
So far it has been demonstrated that the Oxford series of large plasmids do exert an
increasing metabolic load with increasing size on the cells employed to replicate them and
also that using SDCAS media reduced the growth rate and final cell density reached.
However, the magnitude of this load compared to that from a plasmid-free culture has not
been established nor whether the metabolic load is as great as in a culture propagating a
relaxed, high-copy number plasmid, the type of which is normally used for plasmid
production.
3.2.3 Comparative control studies using parental and high-copy number strains
Further shake-flask trials were performed which characterised the variation in growth of
one of the large plasmids; DHlOp p5176 (116kb) against a negative control in the form of
wild-type, parental DHlOp and a positive control in the form of a small, high-copy number
construct; DHlOp pSVp (6.9kb). As before, all constructs were grown in triplicate in
500mL of SuperBroth media in 2L Shake-flasks at 230rpm and 37°C in a shaking
incubator. Again, growth was monitored by recording optical density progression at hourly
intervals.
Figure 3-2 displays the results from these shake-flask experiments. Figure 3-2A plots the
mean growth profiles of the triplicate cultures of each construct. Again it can be seen that
the short lag-phase which occurs with complex media, but also how the parental culture
soon overtakes the other two cultures and does so for the remainder of the fermentation.
Indeed, it appears that p5176 and pSVp display remarkably similar growth profiles.
Thomas Burt 88

3. Initial Studies
CHIOt'lpSVU] OHlOt-[Parerraf] DHIOn [p617S
i - O flQ -lpaw rtalJ 11 (156346+/-002417
DK1Q' [PSWl li 0.4929 +/- 003825
G^CLlpSiTg II 053096+/- QQB464
T»rB(hrs)Time Ot s ;
£ 0450
p617BConstruct
Figure 3-2 Results from shake-flask trials designed to determine the extent of metabolic load on the propagation of the large 116kb plasmid exerted upon the host-cells as compared to a parental plasmid -free culture and a culture bearing the small, high-copy number plasmid pSV0. All cultures were E.coli DHlOp grown in triplicate on SOOmL of SuperBroth media, supplemented with either 25pgmL'1 chloroamphenicol or lOOpgmL'1 ampicillin where appropriate, in 2L baffled shake- (lasks. Each flask as inoculated to 0.1 starting OD from an inoculum culture. Flasks were incubated at 37°C and 230rpm in a shaking incubator. Hourly samples of broth were extracted and diluted to within the linear range (0.1-0.6) using blank SuperBroth media and analysed using a Novaspec spectrophotometer set to 600nm and blanked against the media. Maximum specific growth rates were determine by linear regression of the natural log of optical density though the time period which displayed maximum growth. |A; growth profile on SuperBroth/ B; growth rate determination/ C; Maximum specific growth rates/ D; final optical densities
One difference between the two constructs becomes apparent once the stationary phase is
reached. In the pSVp cultures the stationary' phase is very abrupt and as such the cell
concentration soon goes into decline.
It was decided that the maximum specific growth rate should be calculated over the 2-6
time points during which maximum growth was occurring. Figure 3-2B shows the linear
regression used to determine the growth rates. The first thing to notice from the growth
rates is the difference they display to the previous shake-flask cultures, as outlined in
Figure 3-1. The growth rate recorded previously for DHlOp [p5176] on SuperBroth, using
the same growth conditions and flask geometry, was 0.63h_l whereas in this series for the
same culture the figure was 0.53h '. This represents a 15% drop-off. the only explanation
Thomas Burt 89

3. Initial Studies
of which can be down to growth conditions and media preparation. As described earlier,
complex media can vary significantly between batches, as can the inoculum used. All this
goes to signify how critical it is to employ controls and to maintain the conditions and
media components as consistently as possible. However, although it becomes hard to
compare the two shake-flask studies directly, it is still possible to draw conclusions from
the independent studies.
From the previous studies it can be appreciated that increasing plasmid size does increase
the metabolic load upon the cells, an effect noticeable by the reduction in both growth rate
and biomass yields. Comparing the culture growth rates outlined in Figure 3-2C shows
that the effect of the metabolic burden of both p5176 and pSVp compared to the wild-type.
It can be seen that the propagation of the large 116kb plasmid does reduce the mean
maximum growth rate slightly from 0.56IT1 -0.5311'1. However, the error associated with
this decrease is large and as such the significance of this result is questionable. Despite
this, it can be said that the growth rate of the BAC-bearing culture falls in between that of
the parental and of the high copy number plasmid.
The propagation of the small, high-copy number plasmid pSVp does reduce growth rate
significantly, in this study by roughly 15%. This amount is half of that described by others
when comparing the growth rates of DH5a parental and DH5a [pSVP], where they
describe a 30% reduction in growth rate (O'Kennedy et al, 2000). However, this earlier
result is due to the more rapid growth of DH5a parental cell-line in their study. Indeed,
this is a reason the large constructs are propagated in the DHlOp strain, since the slower
growth characteristics of this cell line are meant to promote plasmid retention. In line with
the reduction in growth rates witnessed, there also occurs a significant reduction in
biomass levels attained by the cultures. As shown in Figure 3-2 there was a roughly 10%
reduction in biomass yield when propagating the 116kb plasmid but a 30% reduction with
pSVp cultures. The large difference in the biomass yields attained from the pSVp cultures
was described by the rapid decline in optical density that these cultures displayed upon
reaching stationary phase.
Thomas Burt 90

3. Initial Studies
3.2.4 Conclusions
It has been found that the propagation of the Oxford series of large plasmids is not too
problematic. They do contribute a metabolic burden on the growing cells but not to the
extent that small, high-copy number plasmids do. Growth rates are suppressed and reduce
further with increasing plasmid size, but by small margins. The biomass levels reached by
the end of the fermentations, were found to be reduced but again by a small degree. It has
also been determined that the use of semi-defined SDCAS media lowers the growth rate
and final biomass levels of the cultures. It has been described elsewhere that reducing
growth rate can be beneficial to increasing plasmid specific yield, a fact that remains to be
determined with these plasmids. Lowered biomass levels would certainly reduce plasmid
volumetric yield (O'Kennedy et al, 2000; Wang et al, 2001). The propagation of these
plasmids is no different to any other plasmid and indeed there propagation does not place
much additional burden on the host cell.
It is thought appropriate to highlight an error with the experimental setup, which was not
appreciated until later. In the past experiment references were made to how negative
controls, in the form of plasmid-free, wild-type E.coli were used to allow comparison to
cultures bearing large plasmids. From these studies conclusions were drawn about the
effects propagation of these large plasmids had on the cell growth and biomass yields.
However, it was realised that the studies were not strictly equivalent due to the fact that
plasmid-free fermentations were conducted in the absence of chloroamphenicol, whilst the
plasmid-bearing cultures were supplemented with this antibiotic up to 25pgmL'1. It is not
known the effect of inclusion of this antibiotic may have had on the results. Perhaps it may
have been more scientifically correct to perform the shake-flask studies of the cultures
bearing the plasmids in the absence of the antibiotic. The problem with this strategy would
have been the potential for plasmid loss from the culture and the resultant inaccuracies
such an event would cause. As a result of this oversight it, it should be considered that the
inclusion of the antibiotic may have an impact on the reduced growth witnessed for the
larger plasmids (as compared to the plasmid-free wild-type) especially when it is
appreciated that the mode of action of the antibiotic involves the disruption of protein
synthesis.
Thomas Burt 91

3. Initial Studies
3.3 Progression of p5176 (116kb) yield during 2L Shake-flask fermentations
3.3.1 Introduction
It has been established that the propagation of the series of large plasmids does not pose a
significant challenge and that indeed they demonstrate faster growth rates and higher
biomass yields than cell lines propagating small, high-copy number plasmids. What needs
to be determined is whether the mass of plasmid DNA carried by the cells bearing these
plasmids is sufficient to enable purification.
As described previously a high specific plasmid yield is very desirable, since it
immediately increases the efficiency of the fermentation stage, whilst also facilitating
downstream processing by decreasing the ratio between contaminants and plasmid product
in the initial starting material (Prather et al., 2003). As such many strategies have been
employed to increase the plasmid specific yield. Briefly, these fall into two groupings;
genetic and process strategies.
3.3.2 Genetic-led Strategies
The genetic strategies employed centre on the choice of replicon chosen for the plasmid.
pMBl replicons, as used in pBR322 based plasmids, are traditionally chosen since they
have successfully been modified to replicate at high copy numbers of -50 per cell
(Bolivar et al., 1977). pBR322 was modified to exclude the Rop/Rom protein that controls
its replication and as such copy number increased three fold to ~150cpc (Baibas et al.,
1986). Further modification by a single G—>A point created the pUC series of vectors
which demonstrated a further increase in copy number to -500-700 copies per cell. The
point mutation lies within the region coding for the RNAII sequence and impacts upon the
binding of the RNATRNAII complex in a temperature sensitive manner. The effect of the
mutation is suppressed at 30°C but becomes elevated at 42°C, a technique employed to
produce yields of 10.3pgmg''DCW (Lahijani et al., 1996). Additional to a high-copy
replicon, vectors engineered for production have also included short cer sequences, which
occur naturally in E.coli ColEl. This sequence enhances the resolution of concatomeric
DNA and the distribution of plasmids among daughter cells. Inclusion of this sequence
assists plasmid maintenance and stability and therefore maintains a high specific yield. It
should be noted that despite the choice of replicons, the size and sequence of the DNA
being propagated in the plasmid also has an effect on the growth rate and copy number of
Thomas Burt 92

3. Initial Studies
the plasmid (Summers, 1991). For instance some cloned, non-coding sequences are found
to be toxic to the host cells.
3.3.3 Process-led strategies
Process driven strategies of improving specific yield focus on the fermentation media
employed together with the mode of cultivation.
3.3.3.1 Media effects
As described earlier in this section, both specific and volumetric yield are affected by the
media used for cultivation. In general, rich complex-media leads to faster growth rates and
higher biomass and therefore volumetric yields. Plasmid specific yields attained
propagating high-copy plasmids on complex LB media, have been shown to display
remarkable similarity, all reaching yields of 4-6pgmg'1 DCW (Prather et al., 2003).
Utilising defined media can slow the growth rate which leads to higher specific yields
(O'Kennedy and Patching, 1997; Wang et al., 2001; Kim et al., 1987). Additionally,
defined media can reduce the growth rate differential that exists between plasmid-free and
plasmid-bearing cells thereby reducing plasmid instability and so positively influencing
specific yield. Defined media can also be improved by rational design of required
metabolites. In one study, stoichiometric analysis of fermentation media led to the
identification of six amino acids found to be key to the successful propagation of plasmid
DNA. Supplementing a basal salt-glucose media with these amino acids led to a 50%
increase in specific yield, as compared to LB media. Further enhancement of the defined
media though the inclusion of ribonucleosides (adenosine, guanosine, cytidine, thymidine)
led to an additional 250% increase in specific yield, up to 17.1pgmg'1DCW (Wang et al.,
2001). Similarly, the carbon to nitrogen ratio of the fermentation media has been found to
have a strong influence on plasmid specific yield (O'Kennedy et al., 2000). Traditional
media formulations typically possess a C:N ratio of 12:1, lowering the ratio to 2.78:1 led
to a 600% increase in specific yield to Hpgmg^DCW.
3.3.3.2 Mode o f cultivation
Both batch and fed-batch cultivation strategies have been used for the manufacture of
plasmid DNA (Riesenberg et al., 1991; Knorre et al., 1991; Lee, 1996). Batch
fermentations used for pDNA production are associated with technological and economic
drawbacks. For batch fermentations, complex or semi-defined media are most commonly
Thomas Burt 93

3. Initial Studies
used and result in a pDNA yield that ranges between 3.5 and 68 mgL'1 (Huber and et al.,
2005a). With batch culture, oxygen transfer capacity becomes limiting sooner and as such
the culture anaerobically respires producing toxic by-products such as acetic acid, which
limits growth and ultimately leads to cell death. Typically, biomass yields at the end of
batch fermentations are between 5-15gL_1 DCW. Conversely, fed-batch culture supplies
nutrients over an extended period of time and so controls the nutrient availability to a level
compatible with the oxygen transfer capacity of the bioreactor. This management enables
the attainment of high cell densities in the range of SO-lOOgL^DCW. Batch cultivation can
be improved by reducing oxygen limitation though the use of enriched air, enabling higher
biomass yields up to 25gL']DCW (as shown in this report) but still failing to reach the
levels achievable using fed-batch strategies.
Perhaps more important is that fed-batch techniques allow control over cell growth rate,
which just like reducing growth rate by changing medium composition, leads to higher
plasmid copy numbers. A feeding strategy designed to maintain slow growth at around
0.15h'J for the majority of the fermentation, resulted in a final biomass yield of 50g
L ’DCW and a specific yield of 4.1pgmg'1DCW (Schmidt et al., 1997). Fed-batch feeding
strategies are becoming increasingly sophisticated. A process using an automated, feed
back control nutrient-feeding strategy, based on dissolved oxygen tension (DOT) and pH
has been described (Chen et al., 1997). The process was automated though a computer-
aided data processing system to regulate the cell growth rate by controlling interactively
both the nutrient feed rate and agitation speed based on DOT. The control increased the
total yield of the plasmid DNA by approximately 10-fold as compared to a manual fed-
batch culture but to only 1.7pgmg_1DCW. With such feed-back algorithms, plasmid yields
between 100 and 230 mgL'1 have been obtained, mostly due to increasing biomass yields
(Prather et al., 2003). However, the application of feed-back algorithms is accompanied
with a number of disadvantages. One is that the feeding rate depends on current
measurable process parameters such as the DOT. Fluctuations in the process for whatever
reason may influence the control parameter and therefore impact on the feeding rate and
consequently on growth and plasmid yield. Another disadvantage of feed-back control is
that the specific growth rate cannot be exactly predefined or controlled.
Precise control of the specific growth rate can be achieved by another fundamental feeding
mode based on the supply of feed medium using an exponential function. Exponential
feeding of glucose to control growth at 0.05h'1 resulted in an 800% increase in plasmid
Thomas Burt 94

3. Initial Studies
specific yield to T^pgmg^DCW (O'Kennedy et al, 2003). This technique is effective as it
controls growth at a low-rate, a fact known to increase yield of pUC based plasmids. Also,
by culturing cells in a carbon-limited environment, the cellular machinery responds by
down-regulating other metabolic pathways, thus inadvertently providing more nutrients for
plasmid replication. One possible drawback with fed-batch strategies have centered on
concerns over the resultant plasmid quality. Reports have shown how fed-batch process
result in low plasmid quality, (Schleef, 2001) however, this conflicts with others who
maintain that percentage supercoiling decreases over the course of a batch fermentation,
but remains fairly constant at 50-70% during fed-batch operations (O'Kennedy et al, 2003).
3.3.4 Conclusions
The importance of obtaining a high plasmid specific yield is critical to the efficiency of the
fermentation but also to the success and ease of the downstream processing stages. Many
strategies have been tested and refined. However, it is clear that the best routes to a high
specific yield are to employ relaxed plasmid replicons, which generate high-copy numbers.
Ideally, they should not express any protein including for selection as this adds additional
metabolic burden. Traditional batch techniques are increasingly being replaced by fed-
batch strategies, most employing exponential feed, as this can positively affect plasmid
specific and volumetric yields. Also, although at present complex media is common, the
use of fully defined media offers greater advantages in terms of reproducibility and higher
specific yields. These advantages are coupled with better approval ratings by the
regulatory authorities and so easier and quicker process validation.
Once again the problem with comparing the findings of current literature concern
differences in the plasmids being studied here. It is already understood that the large
constructs are present at very low copy numbers of 1-2 per cell. This figure is so precise
because it is known that the replication of these plasmids is stringently maintained at this
level by host-cell control. This difference makes redundant any of the techniques used to
influence plasmid specific yield since copy number regulation is outside the control of the
environmental factors of growth rate and medium design. What was hoped for was that by
virtue of the large plasmid size, sufficient plasmid mass would be present to make
purification applicable. However, simple arithmetic shows that for these constructs the
total cellular plasmid mass of two copies of a 116kb plasmid would be far less than that for
a 6kb plasmid maintained at 500 copies per cell. The picture becomes bleaker when it is
Thomas Burt 95

3. Initial Studies
appreciated that even high copy number plasmids form only 1-3% by mass of the total
material to be purified (Shamlou, 2003). Having understood the potential drawbacks the
results of the yield studies were not too surprising.
3.3.5 Results of investigations into the yield progression of the Oxford series
Figure 3-3 displays the results of triplicate shake-flask studies where progression of p5176
(116kb) yield was measured though the course of the fermentations. The shake-flask
fermentations were carried out in an identical manner to be before by inoculating 500mL
of either SDCAS or SuperBroth media, supplemented with 25pgmL'1 chloramphenicol, to
a starting optical density of 0.1. The shake-flasks were incubated at 37°C and 230rpm in a
shaking incubator. Wet cell weight and optical density progression were measured though
out the fermentations. Duplicate lmL samples of broth were taken hourly from each of the
shake-flasks, centrifuged, the liquor discarded and the pellets frozen at -20°C. The pellets
from both culture sets were processed by Qiagen spin-prep. The plasmid containing
streams from the spin-preps were then quantified by PicoGreen, calibrating against a
linear, lambda DNA standard curve. These studies were part of a larger investigation
performed to identify suitable methods of quantifying BAC DNA containing streams. In
this section are reported the results which were found to be the most accurate. Details of
the remaining investigations determined to validate the different quantitative methods can
be found in Analytical development: results and discussion.
Cultures grown on SDCAS media demonstrated longer lag-phases as the cells adapted to
the fresh media. Additionally, as previous studies highlighted, Table 3-1 shows that
cultivation on SuperBroth produced a faster growth rate, with SDCAS media showing a
20% relative reduction, comparable to the result described earlier. In line with a reduction
in growth rate, SDCAS cultures also demonstrate a reduction in final biomass yields
obtained, averaging 9.2gL'’ as opposed to 11.3gL_1 demonstrated by SuperBroth. Again in
line with earlier results.
Considering the plasmid yields produced by these fermentations shows a high degree of
comparability between the two media types and fairly constant yields. Considering Table
3-1 highlights how plasmid yields in both fermentations remained quite constant at
-SOpggWCW'1 equating to 1-2 copies per cell. This result fits well with the yields
predicted according to the copy number of these constructs. It will be outlined in Chapter 4
about how the validity of these yield results was confirmed
Thomas Burt 96

3. Initial Studies
SDCAS
SPIN-PREP
Superbroth
SPtN-PREP
Time (hre)
Specitc plasmid Yield (ugpDNA / gWCW)Time (hre)
Figure 3-3 Chart depicting the progression of wet cell weight (gL-1) and specific plasmid yield (pg pDNA/ gWCW) though triplicate shake-flask fermentations of DHlOp [p5176 (116kb>] on two media types; complex SuperBroth and semi-defined SDCAS media.
2L shake-flasks (500mL media) were inoculated with 50 OD units and incubated in a shaking incubator (230rpm) at 37 * C. Hourly lmL samples of broth were taken, centrifuged and the plasmid extracted from the cell pellets using Qiagen spin-prep® extraction. The plasmid containing streams were then quantified by PicoGreen against a >.DNA standard curve.|A; SuperBroth media - Qiagen spin-prep / B; SDCAS media - Qiagen spin-prepj
Table 3-1 Summarising the yield data produced by p5176 cultures grown on both SDCAS and SuperBroth media by Qiagen spin-prep. The plasmid containing streams were quantified by PicoGreen calibrating against a linear >DNA standard curve.
Sam ple Spin-Prep Eluent
^Measure
Media
1c,28rs.
Final Specific Yield (p.g/ gWCW)
Final Volumetric Yield
(mgL-')
Final Copy No. (Copies/cell)
SDCAS 11 0.56 34.8 ±8.2 0.32 ±0.08 1.14 ±0.27
SuperBroth 0.69 54.8 ±8.46 0.62 ±0.1 1.80 ±0.28
Thomas Burt 97

3. Initial Studies
3.4 7L Fermentation of E.coli DHlOp p5176 (116kb)
A fermentation was carried out in a 7L (5.5L working volume) LH210 series bioreactor, to
determine whether the yields of the p5176 (116kb) plasmid were improved by cultivation
in a more controlled environment. The fermentation was performed in batch mode at 37°C
on complex SuperBroth media. A seed culture was prepared by inoculation of an overnight
streak into lOmL of SuperBroth, which was incubated for 12h in a shaking incubator. The
seed culture was used to inoculate 500mL of SuperBroth in a 2L shake-flask which was
incubated for a further 12 hours. The 5.5L of SuperBroth media in the vessel was
sterilised-in-place and prior to inoculation was supplemented with sufficient
chloramphenicol to produce a 25pgmL'1 concentration in the media. The broth was then
inoculated to a starting optical density of 0.5 and aeration maintained at S.SLmin'1 (lvvm).
During the fermentation optical density, wet cell weight and plasmid retention were
monitored using the techniques outlined in 2.5.1, 2.5.2 and 2.5.4.
3.4.1 Fermentation Growth analysis .
Figure 3-4 and Table 3-2 details the information obtained from the fermentation. From
the growth profile it can be seen how quickly the culture adapted in larger scale
culture, since the lag-phase is almost non-existent. This is confirmed by the OUR
profile which shows a rapid drop-off from saturation to the 30% control level within
one hour. Maximum oxygen uptake rate of 34.5mmolsL'1h-1 was reached at 6.33h
coinciding with the point of highest biomass concentration. Between this point and
harvest, biomass concentration dropped slightly. The fermentation was harvested at the
DOT spike, occurring at 7.92h, an identifying signal that the culture was limited and as
such was respiring anaerobically. However, it is believed that the culture was not 02
limited as the maximum impeller speed used was 692rpm, with lOOOrpm being the
maximum capable using the algorithm. The culture most likely became substrate
limited. Biomass levels at harvest are improved on shake-flask studies by roughly 25-
30% indicating improved oxygen supply. The harvest cell concentration of 15gL_1
(~4gL'1DCW) matches well with similar studies reported in the literature,(Wang et a l ,
2001; Lahijani et al., 1996; Horn et al., 1995) who all report harvest yields of 4-5gL_1
DCW, when cultivating plasmid-bearing E.coli in batch on complex media
Thomas Burt 98

3. Initial Studies
1 6 -
<Do
71 2 3 4 5 6 6 9- W*t C*« Weight (gl1)- OiMolved Oxygen Tension (%)
Oxygon uptake Rate (mmol»L V t)
Time (hrs)
120 O100 ® g
C §• ■£ |
80 » O
~ 5 4 0 I -5
20 ?
reu zI s
.-3
100
90
80
- 0 .970
6 0
50
0 540
30
20
10
02 3 5 74 6 8 9
- Specific Yield u>g pDN/U gWCW)- Volumetric Yield (mgL'1)
Time (hrs)
Figure 3-4 Chart A: Profile of DHlOp [p5176 (116kb)j during a 7L (5.5L working volume) fermentation at 37°C on SuperBroth supplemented with 25pgmLl chloramphenicol. The vessel was inoculated to 0.5OD a from shake-flask culture of the same media. Oxygen saturation was maintained at 30% by cascade control of impeller speed. The impeller speed response time was set 10-fold faster than the Ingold polarographic probe response time in order to maintain stable control. Optical density and wet cell weight were followed throughout the fermentation. Multiple ImL samples of broth were extracted hourly, spun down to remove broth and frozen for retrospective analysis of plasmid specific yield. At harvest the broth was aliquoted into 0.5L centrifuge pots and centrifuged. The cell paste was frozen at -80°C for later analysis.
Chart B: Graph charting the progression of plasmid yield during a 5.5L working volume, batch fermentation of DHlOp p5176 (116kb) on complex, SuperBroth media. Hourly, triplicate ImL broth samples were centrifuged, the supernatant discarded and the pellets stored at -20°C for retrospective analysis. The cell pellets were processed using Qiagen spin-preps and the plasmid in the eluents quantified by PicoGreen against a X DNA standard curve. The specific yield was calculated by dividing the total mass of plasmid DNA in the sample by the mass of cell paste processed in ImL sample, calculated from the wet cell weight at the time of sampling. Volumetric plasmid yield was calculated by multiplying the specific yield by the wet cell weight at the appropriate time point
Table 3-2 Table highlighting the key measurable values from a 5.5L working volume fermentation of DHlOp p5176 conducted in batch mode on SuperBroth media. Growth rate was calculated by linear regression of the natural log of wet cell weight progression between the 1-4 time points. OUR was calculated using the exit gas data recorded by the mass spectrometer. Total oxygen demand was calculated by integration of OUR curve and accounting for total volume of 5.5L.
Measure
Strain
FinalOD
(A600)
Final WCW
(g L ‘)
Max. OUR (m m olsL 'h1)
Total 0 2 Demand (mmols) ( h ‘)
Plasmid retention at harvest (%)
D IllO p[p5176 (1 16kb>]
7.4 14.9 34.5 352.1 0.475 100
Thomas Burt 99

3. Initial Studies
The plasmid stability profile was 100% at each assay point during the fermentation,
indicating that plasmid retention was not problematic. This result was expected due to the
construction of the BAC backbone, which includes the parA,B,C loci responsible for
enforcing plasmid separation between daughter cells (Monaco and Larin, 1994).
3.4.2 Fermentation yield analysis
As with previous shake-flask studies, hourly samples of broth were taken for analysis.
ImL samples were spun-down, the liquor removed and cell pellets processed by both spin-
prep and IPA precipitation. The plasmid containing streams from both preparations were
then quantified using PicoGreen, calibrating against a linear standard curve.
The results from the yield analysis by spin-prep are plotted in Figure 3-4B. From the
figure it can be seen that specific plasmid yield at harvest was 60±1.6 pgg^WCW,
resulting in a final volumetric yield of 0.9±0.02 mgL'1. The specific yield value is within
10% of that achieved in the shake-flask studies outlined in Table 3-1. The average specific
yield over the course of the entire fermentation was 51.4±12.5 pgg^WCW, a figure very
much in line with that shown in.
The specific yield does display a rise (-70%) during the log-phase of growth, specifically
between the 3-5h time-points. As postulated earlier, this coincides with the period of
maximum cell growth when any cell will likely have greater than 1 genome equivalent of
DNA.
Figure 3-5 Graph outlining the progression of plasmid copy number during a 5.5L batch fermentation of DHlOp p5176 on complex SuperBroth media. Copy number was calculated from the specific plasmid yield figures obtained by PicoGreen on spin-prep purified hourly samples.
The same logic can be applied to these plasmid molecules, whose replication is controlled
in-line with genome replication. It is highly likely that the individual cell would posses a
greater number of plasmid molecules during periods of rapid cell growth. Copy number
analysis confirms this suspicion. Figure 3-5 plots the copy number progression calculated
24
22
2 0
1 8
1 61 4
121.0
5 7 80 1 2 3 A 6Time (hrs)
Thomas Burt 100

3. Initial Studies
from the yield data. The rise during the log period of growth is from an average of
~1.2copies to over 2.0 copies per cell. During periods of slow growth the copy number
hovers between 1.2-1.4. In this respect these plasmid molecules are produced in a growth
associated manner, meaning the optimum harvest point is at the end of the log-phase.
Continuing fermentation could result in 50% lower yields as the plasmid copy number
would return to its low growth copy number, which seems to be occurring 6-8 hours from
the onset of cultivation.
3.4.3 Qiagen Column chromatography studies
Further studies into the plasmid yield from the 5.5L fermentation of p5176 were conducted
by Targer-scale* Qiagen-prep analysis on the harvested cell paste. Three methods of
extraction were employed, all utilising the Qiagen anion-exchange columns but using three
distinct protocols. The eluents from all three preps were quantified by absorbance at
260nm. The A260/A280 ratio was used to determine the relative purity of the samples and
approximately lpg of each of the purified samples was run by conventional
electrophoresis to enable comparison of the purity and relative form of the various plasmid
samples. The gel was also useful for comparing the plasmid streams obtained from the
samples taken during the fermentation and extracted by both spin-prep and I PA
precipitation.
Table 3-3 Table detailing the total masses of plasmid obtained from three protocols based around the Qiagen Maxi-prep methodology and the resultant specific yields.
Measurement
Extraction protocolA260 280
Cone.(pgm L1)
Total mass (Mg)
Specific Yield (Mgg )
A26(/A 2$o
Maxi-prep (2.0g) 0.306 0.188 153.0 76.5 38.3 1.63
Low-copy number prep (4.0g) 0.603 0.467 301.5 150.8 37.7 1.29
Large construct prep (4.0g) 0.440 0.227 110 55.0 13.8 1.94
Table 3-3 details the results of the three extraction methods employed and Figure 3-6.
shows the result of the electrophoresis. Specific plasmid yield varies considerably from
13.8-38.3 pgg''WCW. The simplest extraction technique was the Qiagen® Maxi-prep
where 2.0g of cell paste was lysed and the clarified lysate purified using a Tip-500
column.
Thomas Burt 101

3. Initial Studies
M 1 2 3 4 5 6 7 8 9 10 11 12 13* 14 15 16 17 18 M
Figure 3-6 Conventional gel electrophoresis of samples prepared from hourly cell collections from the 5.5L fermentation of DH10P |p5176 (U6kb)|. Approximately Ipg samples of plasmid were loaded into each well of a 0.8% agarose gel and run for 4 hours at 6Vcm'1 in O.SxTBE. The gel was then stained in a 1:10,000 dilution of EtBr before being photographed using a UY transilluminator.M ... Hindi 11 digest 10 .... Qiagen spin-prep (Time-point 3)1 ... Qiagen Maxi-Prep 11..... ... Qiagen spin-prep (Time-point 4)2 ....... ... Qiagen Large Construct prep 12..... .... Qiagen spin-prep (Time-point 5)3 ........... ... IPA precipitated lysate (Time-point 3) 13.... .... Qiagen spin-prep (Time-point 6)4 ... IPA precipitated Ivsate (Time-point 4) 14..... ... Qiagen spin-prep (Time-point 7)5 ........... ... IPA precipitated Ivsate (Time-point 5) 15..... .... Qiagen spin-prep (Time-point 8)6 ... IPA precipitated lysate (Time-point 6) 16..... .... Qiagen spin-prep (Time-point 9)7...... ... IPA precipitated lysate (Time-point 7) 17..... .... Qiagen Large Construct prep8 ...... ... IPA precipitated lysate (Time-point 8) 18............. Qiagen Low copy number Maxi-prep9 . . . IPA precipitated lysate (Time-point 9) M ......... Ufindlll digest
The yield produced was -35% below that obtained by PicoGreen on spin-prep purified
samples. Also, the low A260/A280 ratio points to contamination by protein, meaning the
specific yield could be even lower. Analysis by electrophoresis indicates that the sample
was heavily contaminated by genomic DNA. Genomic DNA contamination can be
identified by a continuous smear of DNA extending down the lane in which the sample
was loaded. By comparing the spin-prep purified samples with the maxi-prep eluents
suggests that the spin-prep matrices are far more efficient at removing genomic DNA.
However, this cannot be definitively stated since the concentrations of cell material in all
the Qiagen large-scale preps at 200gL'1WCW was 3-fold greater than that of the samples
taken during the fermentation (OOgL’WCW), resulting in a higher amount of
contaminating gDNA in the starting material. Despite this unequivalence, the gel shows
roughly equal masses of plasmid loaded and there is no doubt that the eluent from the
gravity fed. maxi-prep column has a far higher ratio of genomic to plasmid DNA. This
Thomas Burt 102

3. Initial Studies
ratio analysis is important as it suggests that the maxi-prep is either less capable of
purifying the large construct or not as efficient at removing genomic DNA as the spin-
preps.
The low-copy number Qiagen protocol was used to improve the yield of the large
construct. Its operation differed little from the maxi-prep protocol, except it employed
double the mass of cell paste, in twice the volume of buffer, with an additional IPA
precipitation step to concentrate the feed material prior to column loading. The philosophy
of the protocol is simple. By doubling the mass of the starting material the amount of
plasmid available for purification is doubled, but the same applies to the masses of
contaminants. From Table 3-3 it can be seen that double the amount of DNA is purified
and as such gives a very similar specific yield to the maxi-prep. However, as before the
specific yield could be misleading as the A260/A280 ratio is even poorer indicating the
greater mass of starting protein is not removed as effectively. Also, from the gel profile,
shown in lane 18, it becomes clear that the prep merely succeeds in purifying a higher
amount of genomic DNA than the maxi-prep, such that the plasmid to genomic DNA ratio
is worse than when using the maxi-prep.
This highlights how critical the harvest specific yield is to the plasmid purification
process. If the plasmid specific yield is low, simply increasing the mass of cell paste
processed will do nothing to solve the problem as it only serves to increase concomitantly
the mass of contaminants. The key factor is the initial starting ratio of plasmid DNA to
genomic DNA. Although other contaminants like protein and RNA are present, their
removal is less of an issue than that of genomic DNA, the physicochemical similarities of
which being so close to that of the plasmid product that separation becomes difficult.
Looking at lanes 2 and 17 it can be seen that the gDNA contamination problem is
improved by the use of the Qiagen Large construct kit. The operation of this kit was
similar to the low-construct prep except that it employed an exonuclease digestion step to
enzymatically clear gDNA contamination. The yield results from this prep were very low
at n .S pgg’WCW. From PicoGreen quantification on spin-prep eluents it is known that
the specific yield at harvest was ~60pgg'1WCW, which means that the Tip-500 columns
used in these protocols are capable of recovering only -25% of the plasmid that is present
in the sample. Therefore, large plasmids do elute better from spin-preps, where 70-80%
recovery has been established (Figure 4-10), than from gravity-fed Qiagen columns. What
is believed to occur in the maxi-prep column is that the small, contaminating genomic
Thomas Burt 103

3. Initial Studies
DNA fragments are not cleared as efficiently by the wash steps but are eluted at a higher
rate than the plasmid during the elution step, even more so since the elution buffer was
heated in these investigations. However, the large plasmid size means their elution or even
their binding is problematic. Later studies using PD-10 desalting columns and Qiagen
columns (6.5.3)showed that the large constructs were eluted poorly from the columns and
it is possible that a similar effect occurred here.
3.4.4 Topology of Fermentation samples
The gel also displays interesting differences in plasmid topology resulting from
processing. Although the samples were only run by conventional gel electrophoresis it is
understood and corroborated by later studies (4.6.1) that the linear/ open-circular forms of
the large plasmid are incapable of penetrating into the gel and remain trapped in the wells.
However, it is believed that the smaller diameter SCC form of the plasmid and indeed
smaller fragments created by shear degradation of the plasmid are capable of running into
the gel. Comparing the spin-prep processed samples to the IPA precipitated samples
highlights how damaging the spin-prep methodology is to the plasmid topology. From the
gel it can be seen that in the IPA samples the supercoiled plasmids runs slightly behind a
similar species found in the lanes of the spin-prep purified samples. It is believed that for
IPA this band represents supercoiled BAC DNA. For the spin-prep purified samples this is
believed to be sheared plasmid DNA, because it runs slightly ahead. The sheared
fragments are believed to be large, and as such are not well resolved by conventional gel
electrophoresis, but there is also evidence of smaller sheared fragments since a slight
smear continues down the lanes of the spin-prep purified samples. It is thought that since
the spin-preps force the plasmid through the column matrix explains the higher levels of
recovery but also the damage caused to the plasmid topology.
3.4.5 Conclusions
The 5.5L fermentation study confirmed that large-scale cultivation of cells bearing large
constructs remains unproblematic. Specific growth rate is adequate and the final biomass
yield is within the range reported by authors adopting similar media and cultivation
conditions. There was nothing observed that would suggest that the plasmids cause oxygen
limitation in the growing cells, indeed substrate limitation was believed to be the limiting
factor. Further evidence was provided as to the very low specific yields at which these
plasmids exist. Additionally, it was determined that cultivation of these plasmids in a more
Thomas Burt 104

3. Initial Studies
controlled environment does little to improve the specific yield. Important conclusions can
also be drawn about approaches to downstream processing and how the specific yield is
the root problem for effective genomic DNA clearance. Simply increasing the mass of
cells for processing does not alleviate the problem. Direct visual evidence was also
provided for the damaging effects of spin-prep processing on plasmid topology.
Thomas Burt 105

3. Initial Studies
3.5 Electroporation of the large series of plasmids into E.coli DH1.
3.5.1 Introduction
The series of large plasmids was transformed into GSK’s host strain, E.coli DH1, by
electroporation using the methodology outlined in (2.6.4). This was performed to enable
studies of the large plasmid series to begin, using the process for manufacturing plasmid
DNA employed by GSK. Following cell banking, shake-flask studies were performed on
the plasmids in the new host to determine any influence on growth the host change may
have had. The studies compared the large plasmid series in DH1 to the same plasmids
propagated in DHlOp. The cells were cultivated on GSK’s complex media recipe, which
was compared to historical shake-flask studies performed using SuperBroth.
Shake-flask studies were performed by inoculating 50mL of sterile seed media, containing
25pgmL'1 chloramphenicol, in 1L baffled shake-flasks. Inoculation of each flask was
achieved by the addition of one vial of defrosted cell stock (1.8mL), which was banked at
-2.50D and so gave a starting OD of 0.1 when added to 50mL. The flasks were all
incubated at 37°C, 230rpm in a shaking incubator. Samples were taken hourly to
determine optical density.
3.5.2 Effect of host-strain on fermentation growth profiles
Figure 3-7 and Table 3-4 detail the results of the shake-flask studies. From Figure 3-7A
the optical density progression of the shake-flasks is shown. It is immediately apparent
that the host-cell line does effect the growth of the cultures. The E.coli DH1 strain
demonstrated a much shorter lag phase than the DHlOp cultures, which remained l-1.5h
behind the DH1 cultures. The reason for this is postulated to be due to the complex media
having been specifically optimised for propagation of DH1 cells. One of the key factors in
medium development is to reduce the period of lag-phase of growth (Stanbury and
Whitaker, 1984). Media optimisation would have been achieved using either Plackett-
Burman or factorial design studies to determine the optimum concentrations of the media
components that produced the best growth and yield characteristics. Since these
optimisation studies would have been performed using the DH1 strain, the media would be
specifically adapted for its cultivation.
Thomas Burt 106

3. Initial Studies
3» DHlOp - GSK media * DH1 - Superbroth2
1
Q* 0o5
-1
-2
■3 0 2 4 6 8 10
—O -0H 1 ( p 5 1 7 6 ] ___DH1 (p5206)
-O -0H1[p5204)—• - DH10p [p5176]
DH100lp5206]— DH100lpS204]
1 2 - -12
2
gI
2-- -2
0 1 2 3 5 6 7 8 0 10 114
Time (hrs) Time (hrs)
Figure 3-7Chart A displays the progression of optical density of cultures of E.coli DH1 and DHlOp propagating each of the plasmids from the Oxford series. The fermentations were carried out in 1L shake- flasks, using 50mL of GSK proprietary media supplemented with 25pgmL"‘ chloramphenicol, from a starting OD of 0.1. The flasks were incubated at 37 * C / 230rpm in a shaking incubator with hourly samples removed from each, diluted appropriately and optical density determined at 600nm using a Shimadzu spectrophotometer. The arrows mark the period of logarithmic growth over which linear regression was performed. Chart B plots the natural log of the mean optical density for the fermentations of the large plasmid series in DH10P in this study and compares the maximum specific growth rate to the same strains grown on SuperBroth in (Figure 3-1)
Table 3-4 Table compiling the growth and final optical densities reached during shake-flask fermentations of the large plasmid series in the original host strain, DH10P and in the GSK host strain, DH1. The data obtained in this study was compared and normalised to the figures obtained in the first shake-flask studies with the cultures grown on SuperBroth.
Strain/media DHlOp - SuperBroth DH10P-GSK media DH1 - GSK media
Construct p5176 p5206 p5204 P5176 p5206 p5204 p5176 p5206 p5204
0.63 0.60 0.58 0.45 0.41 0.40 0.44 0.43 0.44
% 100 100 100 70.2 72.3 75.8 70.7 69.1 68.7
Final OD 5.15 4.81 4.69 9.94 9.66 9.22 11.8 11.6 11.38
% 100 100 100 193 200.8 196.6 229.1 241.1 242.6
However, when both DH1 and DH10(3 cultures enter logarithmic growth the difference in
specific growth rate is quite minimal, even from the optical density progression it can be
seen that the profiles run roughly parallel. Table 3-4 details the specific growth rate for
each fermentation. The GSK media provided an average specific growth rate in all the
cultures is 0.43±0.02 h '1. There is a decrease in growth rate with increasing plasmid size
from 0.451T1 to 0.401T1 in the DHlOp cultures, representing an 11% decrease.
Thomas Burt 107

3. Initial Studies
This is a similar decrease as described in previous shake-flask studies (Figure 3-1) of the
large plasmid series grown on SuperBroth, where growth rate dropped from 0.631T1 to
0.5811'1, (a 10% decrease). The relation between specific growth rate and plasmid size is
not really apparent with the new host DHL
From Table 3-4, the striking difference is between the specific growth rates witnessed in
this study and those reported previously by shake-flask studies on the complex media
SuperBroth. From the table it can be appreciated that cultivation on GSK complex media
resulted in a -30% decrease in growth rate, irrespective of the host strain. Figure 3-7B
displays growth profiles for shake-flask fermentations of DHlOp conducted on SuperBroth
and GSK media and shows the reduced gradient of the fermentation on GSK media. The
geometry of the shake-flasks used in the two different studies did differ, but it is unlikely
that such a significant decrease in growth rate can be solely due to flask geometry and as
such the media employed must be affecting the change.
3.5.3 Effect of host-strain on biomass yields
The second striking difference is the improvement in harvest biomass yields as a result of
cultivation on GSK media. The final biomass yields for the large plasmid series
propagated in DHlOp are double that for the same strains cultivated on SuperBroth. In
both DH1 and DHlOp cultivations the final biomass yields decrease slightly with
increasing plasmid size. This effect was reported earlier where the final biomass yield
dropped about 10% when plasmid size increased from 116kb to 242kb. In this study the
biomass reduction attestable to increasing plasmid size is between 5-7%. The DH1 strains
consistently produced the highest biomass yields at harvest, more than 2.3-fold higher than
the same strains cultivated on SuperBroth and -20% higher than DH1 Op cultures grown on
the same GSK media. This increase over DH10P is believed to be attributable again to
either the media optimisation having been specific to DH 1 or the fact that this strain is a
relA mutant. Such mutants are unable to produce ribosome-dependent ppGpp synthetases.
These are activated during amino-acid starvation and produce the signalling molecule
ppGpp, which induces the stringent response in bacteria. The stringent response causes the
down-regulation, of among other things, protein synthesis, cell division and genome
replication. This response in DHlOp could explain the decreased biomass produced as the
cells effectively enter hibernation as they become starved whilst the DH1 strain carries on
dividing (Baracchini and Bremer, 1988; Hecker et al., 1983).
Thomas Burt 108

3. Initial Studies
3.5.4 Conclusions
From the growth profile of the large plasmid series propagated in DHlOp on SuperBroth,
shown in Figure (Figure 3-1), the extent of the difference in growth profiles can be seen.
Cultivation on GSK media extends the logarithmic growth period by approximately three
hours. It is believed that the reduced growth rate and extended log-phase is a characteristic
of the media, which is enhanced by media optimisation. As explained earlier a reduced
growth rate is preferable when culturing cells containing relaxed plasmids, as evidence
suggests this increases specific plasmid yield (Lin-Chao and Bremer, 1986; Byung Gee
Kim, 2006).
The GSK media differed from SuperBroth in several ways. Firstly, GSK media employed
glycerol as a carbon source. The use of this more complex carbohydrate has been shown to
reduce the maximum specific growth rate and also allow the attainment of higher biomass
yields (Thatcher , 1997). Also, glycerol can be used at much higher concentrations than
glucose without suffering the inhibitions of growth caused by acetate accumulation.
Secondly, the GSK media was richer in the concentration of yeast extract together with the
inclusion of additional minerals providing extra sources of potassium, phosphorus and an
inorganic nitrogen source. This richer medium formulation supplemented with more
minerals necessary for bacterial growth and metabolism are believed to be the reason for
the GSK media consistently producing higher biomass yields.
These studies demonstrate that the DH1 host-strain is capable of increasing biomass
yields, possibly due to an improved genotype. Additionally, the use of GSK’s richer media
formulation reduces specific growth rate, extends logarithmic growth phase and so doubles
the final biomass yield. If this media were to be used for production of a relaxed plasmid
species, a simultaneous increase in specific and volumetric yields could be expected.
Consequently, further pilot-scale fermentations were conducted to determine whether this
improved media and host-cell combination could generate any improvements in the
specific yields of the Oxford series of plasmids despite previous studies having confirmed
the vector architecture makes this outcome unlikely.
Thomas Burt 109

3. Initial Studies
3.6 Triplicate 4L working vol. fermentations of K coli DH1 p5176 (116kb)
3.6.1 Introduction
Pilot scale fermentations were run to investigate the growth and yield characteristics of the
large plasmids propagated in the DH1 cell line further.
Triplicate fermentations of the large plasmid [p5176] were conducted along with triplicate
fermentations of DHl[pSVp] and DH1 [parental]. The pSVp and parental fermentations
were conducted to form positive and negative controls respectively. Fermentations were
carried out at 37°C in 7L total volume, water-jacketed fermenters using 4L of sterile media
supplemented with the appropriate antibiotic where required. DOT was maintained at 30%
saturation by cascade control of impeller speed. Aeration was achieved by sparging at
lvvm until the DOT fell below 30% and the impeller speed was at the maximal lOOOrpm,
when the airflow was switched to enriched air, initially at lvvm and later 2vvm. The
fermentations were deemed complete when DOT spiked. Optical density and wet cell
weight progression were monitored throughout the runs. Multiple broth samples, equal to
50D unit volumes, were taken at each time-point, centrifuged, the liquor discarded and the
pellets stored at -80°C for retrospective analysis of plasmid specific yield progression.
3.6.2 Results
Figure 3-8 and Table 3-5 detail the mean results of the triplicate fermentations. The
specific growth rates (p) calculated by linear regression of the OD and WCW progression
were very comparable, differing only by an average 5%. Both sets of specific growth rates
display a decrease in growth rate for plasmid bearing cells, as compared to the parental
strain. This decrease in growth rate has been reported previously (3.2) and the decline
comparable to before, with the high-copy number strain displaying a -10% decrease and
the large plasmid; p5176 displaying a -5-10% decrease.
The impact of the improved media recipe and aeration regime, achieved by sparging
enriched air, can be seen in the large increase in final biomass yields as compared to
previous fermentations. Comparing the data for DHl[p5176] in Table 3-5 with the data for
the same strain, cultivated on SuperBroth without enriched air aeration (Table 3-2) it can
be seen that the harvest OD in these fermentations displayed a 7-fold increase and the
WCW increased 6-fold.
Thomas Burt 110

3. Initial Studies
I
100 100
90 90
8070 70
60 60
50 50
40. 40
30 X20
10 10
00 2 3 71 4 5 6 e 9 0 2 3 5 7 8 91 4 6
Time (hrs) Time (hrs)
543
1
5 o
-2 0 2 3 5 6 7 91 4
Time (hrs)8
DH1 parental
£&5I5
0 2 3 7 9* 5 6 6-DH1 pSVp - DH1 p5176
Time (hrs)
Figure 3-8 Chart outlining the mean progression of optical density and wet cell weight of triplicate 4L working volume fermentations of E.coli DH1 parental, pSVp (6.9kb) and p5176 (116kb). Wet cell weights from each vessel at each time-point were determined by spinning down duplicate ImL broth samples in preweighed Sarstedt tubes. The supernatant was decanted off and any liquid traces removed using a cotton bud, these tubes were then re-weighed on a five-point balance. Optical density measurements were taken by diluting samples of the broth with blank media to a level consistent with the region of linearity (0.1-0.60D) and measuring absorbance in a Shimadzu spectrophotometer at 600nm. 50D unit equivalent volumes of broth from each vessel were aliquoted into sterile Sarstedt tubes at hourly intervals. These were prepared in a similar fashion to the WCW samples except were frozen at -80°C for retrospective determination of plasmid yield.|A; Wet cell weight progression / B; Optical density (A600 progression / C; pmax determination for WCW / D; pmax determination from OD)
Table 3-5 Table outlining the mean maximum growth rates of the cultures grown at 4L scale, as measured by two methods, together with the average final biomass yields. The table shows the percentage difference between the results normalised against that recorded for the parental fermentations
Parameter -__=======s==s===s= Strain DH1PARENTAL DH1 |p5176] DH1 IpSVpj
p OD (h 1) 0.5618 ±0.0439 0.5360 ±0.0178 0.4952 ± 0.059% 100 95.4 88.14
M WCW (If1) 0.5380 ± 0.049 0.4958 ± 0.036 0.4865 ± 0.044% 100 92.2 90.4
Final OD 42.9 ± 3.0 52.2 ± 1.11 40.2 ± 0.85% 100 121.7 93.7
Final WCW (gL l) 78.1 ±0.99 87.9 ± 2.4 80.15 ±0.59% 100 112.5 102.6
Thomas Burt 111

3. Initial Studies
The corresponding volumetric plasmid yield would rise proportionately, making this
fermentation regime far more efficient. This highlights the importance of fermentation
optimisation for process efficiency, though these final biomass yields must be put in
context to those reported in the literature. (VoB et al., 2003; Huber and et al., 2005a) both
employed fed-batch cultivation to reach final biomass yields of 50gL_1 DCW (~200gL1
WCW) whilst (Riesenberg et al., 1991) used a similar methodology to achieve final
biomass yields of llOgL'1 DCW (~440gL WCW). These yields suggest that further
fermentation optimisation could increase the biomass yields witnessed here by -2-4 fold.
However, again it must be emphasised that whilst essential to process efficiency,
volumetric yield is not nearly as important as the final specific plasmid yield obtained,
since it is this factor which determines the performance of the downstream stages.
The comparable final biomass yields between the strains cultivated was not expected.
Previous studies suggested that the plasmid-bearing cells reach lower final biomass yields
than parental strains, due to the metabolic burden of plasmid propagation. In these
fermentations this did not occur. Whilst the DHl[pSVp] cultures did display a slight
decrease in final biomass yield as compared to the wild type, the large plasmid p5176 gave
a relative increase in final biomass yield. A possible explanation for this lies in the media
formulation. The triplicate fermentations of each strain were performed simultaneously,
16L of cultivation media was prepared in bulk, so that the same cultures were grown on
batch-identical media. Differences could have occurred during the media preparation
between the different sets of triplicate fermentations and this may account for growth
disparities. A possible improvement would have been to perform triplicate fermentations
simultaneously but with each fermentation running a different strain. This would not have
removed any differences caused by variation in the inoculum used, but an understanding
of this effect would have been useful.
Thomas Burt 112

3. Initial Studies
3.7 Progression of plasmid yield during 4L fermentations
3.7.1 Introduction
It was hoped by conducting these fermentation trials of the large construct in the new host;
DH1 and on media specifically adapted for its cultivation that an increase in plasmid yield
may be recorded. So, together with monitoring the fermentation growth, broth samples
were taken during the runs and used to determine plasmid yield through the course of the
process.
The samples taken for yield analysis were processed by a variety of methods since at this
stage in the project a suitable method of accurately recording the yield of these constructs
had yet to have been found and validated. More details into the background of the
investigations concerned with determining the suitability of the various analytical
techniques can be found in the Analytical development chapter. The method that will be
reported here was the method found to describe the situation most accurately for this
particular investigation. However, the samples obtained during these fermentations were
used to validate the different analytical techniques so the yield curves presented here will
be encountered again in later sections (4.3 and 4.4).
3.7.2 Results
The yield profiles from the 4L fermentations are described by Figure 3-9. Graph A plots
the specific yield profile for the small, high-copy number plasmid pSVp (6.9kb) whilst B
describes the same for the large construct p5176 (116kb). The plots were generated from
data obtained from A260 analysis of Qiagen spin-prep purified cell pellets. The method of
quantification is a very common one for determining yield progression of small, high-copy
number plasmids, since the spin-prep can be relied upon to remove the majority of
contaminants, whilst absorbance on pure DNA samples can be regarded as a highly
accurate, and indeed is the method employed to calibrate other methods of plasmid
quantification.
Considering the smaller plasmid pSVp first. It can be seen that plasmid specific yield
begins at ~175pg gWCW'1 and rises to ~320|nggWCW'1 by the end of the fermentations.
The results for the three vessels show a high degree of comparibility.
Thomas Burt 113

3. Initial Studies
600 600 -y-600
-550
s00!#-450 O Q
550-Sg 550y uj soo
550 gD H 1[p5176]500500450-— ID 450
< a
400350
-450
-400
- 350
-150 2150-300
250
-1 0 0 S ' S
TJ >100 -- 200
- 150
50- - 50100 - 100<*<- 50
00 2 3 5 71 4 6 8 9 0 1 2 3 5 6 7 8 94
Time (hrs) Time (hrs)
Figure 3-9Chart describing the progression of specific plasmid yield (ng pDNA/ gWCW) throughout triplicate 4L 37°C of E.coli DH1 pSVP (6.9kb) and p5176 (116kb). Duplicate 50D-unit equivalent volumes of broth were taken at each time point for each fermentation and centrifuged. The resultant cell pellets were then processed using using Qiagen spin-preps. The plasmid recovered from the spin-preps was then quantified by absorbance. The specific yield could be then calculated from the mass of plasmid recovered and the size of the pellet from which the plasmid was extracted
The increase in plasmid yield with the progression of the fermentation was postulated
to be due to relative decreases of the specific growth rate with time. As outlined in
earlier sections plasmid copy number and hence specific yield vary inversely with
growth rate. In order to test this, the mean specific yield of the pSVp was plotted
against the culture growth rate recorded at the time of sampling. This was performed
by linear regression between the natural log of the OD at the time prior and after the
sample was taken. It is appreciated that the use of only three data points will lead to
inaccuracies in the returned value but the aim was only the illusatration of connection
between plasmid yield and growth rate for relaxed plasmid. The result of the analysis
is detailed in Figure 3-10. From the graph it can be seen that the relationship described
by (Vasuki, 1989) is in action for these fermentations. The importance of such a
relationship is that it means that a degree of control can be exerted over the specific
yield of the fermentation by manipulation of the environmental parameters which
influence growth rate.
Turning attention to the yield profile of the larger p5176 construct (116kb) shows that
no predictable increase was witnessed during the fermentations. Again as was
witnessed during the fermentation of this construct reported in 3.4 the increase in
Thomas Burt 114

3. Initial Studies
400 400□ Absorbance [pSVp]
Pi cogreen [pSVp]350 - -350
3> 250
-300
-250
5 200 -200
150 -150co1 0 0 - -100
0.0 0.5 1.0 1.5 2.0 2.5M ean Specific Growth Rate (hr*'1)
Figure 3-10 Graph plotting the mean specific plasmid yield recorded for pSVp from triplicate fermentations plotted against the mean specific growth rate calculated at the time of sampling. The mean specific growth rate was calculated by linear regression of the natural log of optical density between the hour points when the sample was taken. A line of best fit is drawn between the average values. The relationship shown is that adapted from (Vasuki, 1989)
yield is reported during the exponential phase of growth. This was outlined before as
being due to the replication of this construct being growth-linked since its replication
is coupled to that of the host genome. As such unlike the relaxed plasmid pSV|3 the
specific yield of this construct cannot be increased by growth rate manipulation. Not
much more can be said about the yield curve presented for the p5176 fermentations as
later studies will call into question the accuracy of the data presented. One final point
should be made about the specific yield at harvest. A figure of -SOpggWCW'1 is
reported, very much in-line with previous estimates.
3.7.3 Conclusions
The yields of the fermentations demonstrate an increase of pSVp yield upto
~300pggWCW'1. It was demonstrated that the production of this plasmid is related to
the culture specific growth rate. Profiles of the yield progression of the p5176 plasmid
were also recorded and a harvest yield of ~50pggWCW' reported.
One of the aims of this series of fermentation was the creation of cell paste with which
to conduct downstream purification trials on. This will be the subject of the next
section.
Thomas Burt 115

3. Initial Studies
3.8 Downstream processing of the large plasmid p5176 (116kb)
3.8.1 Introduction
After completing the pilot-scale fermentations of the large construct p5176, the high-copy
control plasmid pSVp and the wild-type parental strain, cell paste from the fermentation
was collected by centrifugation and stored at -80°C for retrospective analysis. The analysis
consisted of triplicate runs for each construct, involving purifying the plasmid using a
scaled-down process mimicking the large-scale operation employed for plasmid
manufacture. The process methodology is outlined in 2.8 and 7.3 and is based upon a
method described elsewhere (Eon-Duval etal., 2003a; Eon-Duval et al., 2003b).
3.8.2 Brief Methodology
Briefly 50g of frozen cell paste was resuspended in a Tris-based buffer to a
concentration of 200gL"\ To resuspend fully, the cells were agitated by a
magnetically-driven overhead impeller. During resuspension, the lysis buffer,
consisting of sodium hydroxide and SDS, was prepared in the lysis tank. The lysis tank
was a round bottomed CSTR, surrounded by ice and equipped with a 4-blade, 45° up-
pumping pitched-blade impeller agitated at 1 OOrpm. The resuspended cells were added
to the lysis buffer and the lysis operation was allowed to proceed for 30 minutes before
the solution was neutralised using 4°C potassium acetate (A and B). The process was
designed such that RNA removal was achieved by precipitation using a divalent cation
as the precipitation agent. Calcium chloride was the agent used, by addition of 250mL
of 5M solution to the neutralised lysate, which was then incubated for 10 minutes with
agitation and 10 minutes without. The precipitated lysis mixture was clarified by
centrifugation, a step replacing the traditional 200pm sieve filter used for clarification
on the large scale for purposes of ease of operation. The clarified lysate was depth
filtered to remove sub-micron particulates prior to loading on to the UF membrane
(Figure 3-12C). The UF step achieved concentration and purification by trapping the
plasmid on the membrane surface and allowing the lysis solution, containing salts,
proteins and small molecular weight RNA and genomic DNA through (Figure 3-11)
Thomas Burt 116

3. Initial Studies
Figure 3-12 Images displaying some of the key steps in the downstream process. A; Lysis operation; the addition of the cell suspension to the NaOH/SDS lysis buffer was accompanied by a dramatic increase in viscosity and the occurrence of the Weissenberg effect indicative of laminar/ transition phase mixing B: Neutralisation operation: the neutralisation of the lysis mixture was achieved though the addition of Potassium acetate, leading to precipitation of the majority of cellular contaminants. C; Microfiltration (5 im followed by 0.45pm/0.2nm depth filters), clarified lysate was filtered to remove sub-micron sized particulates prior to loading the ultrafiltration rig.
PlasmidEndotoxingDNA
TANGENTIAL FLOW
PLASMID GEL LAYER
RETENTATE
Lmwt RNA Protein Lmwt gDNA Medium components
A)♦ rs
PERMEATE 9 0 • A •
0
C3
Figure 3-11 Schematic displaying the operation of the ultrafiltration membrane. Fluid flow is adjacent to the membrane surface (SOOmLmin'1) and pressure is applied across the membrane (5- lOpsi). The result is an equilibrium between the rate of build-up of plasmid on the membrane surface with the TMP forcing membrane accumulation and the fluid-flow removing membrane accumulation. This equilibrium enables the formation of a plasmid gel-layer thick enough to act as a secondary membrane layer and prevents plasmid loss though the membrane but allowing penetration of small M.Wt solutes including proteins, salts. Ultimately, the plasmid is concentrated and purified.
Thomas Burt 117

3. Initial Studies
Further purification was achieved by two diafiltration steps employing 3L of a Tris-
based buffer for washing and 2L of a Tris-based salt buffer for buffer exchange.
Finally, the plasmid solution was recovered from the membrane by three consecutive
wash steps
3.8.3 Plasmid DNA primary purification
On the laboratory scale plasmid purification can be accomplished by either column
purification of the clarified lysate using supplied kits such as Qiagen or though intensive
methods such as caesium chloride centrifugation. However, these techniques do not lend
themselves to scale-up due to the relatively dilute concentration of the starting material,
the use of large amounts of organic solvents or unachievable equipment specifications i.e.
ultracentrifugation (Feliciello and Chinali, 1993). There are some similarities in the
processes used at bench scale and the processes employed on the larger scale, the most
notable being the lysis operation.
As with vector design, the most common bacterial cell lysis operations, including
homogenisation, freeze-thaw and detergent lysis, have been optimised for recombinant
protein extraction. By far the most common lysis method encountered for plasmid
purification is alkaline lysis (Bimboim and Doly, 1979). This procedure uses sodium
hydroxide and sodium dodecylsulphate to disrupt the cell membrane and cause the release
of intracellular components. Subsequent neutralisation with potassium/sodium acetate
leads to the precipitation of protein and genomic DNA. Plasmid DNA, due to its enclosed
conformation, is able to re-circularise into its native form, whilst the large genomic DNA
cannot diffuse and reform properly such that it is precipitated. In addition, a large amount
of dissolved protein is precipitated and at high pH’s RNA degradation occurs. Both effects
being beneficial to the downstream processing steps.
A disadvantage of this lysis method is the large increase in viscosity encountered, in the
35-200mPas range, which makes mixing difficult (Levy et al., 1999a; Ciccolini et al.,
1999). This can lead to areas of extreme pH within the lysis vessel leading to irreversible
plasmid denaturation and the creation of multimeric and open-circular forms. The high pH
and agitation-induced shear has also been shown to lead to plasmid degradation and
fragmentation of genomic DNA into smaller sizes which are harder to purify in later stages
due to their physicochemical similarities to the plasmid product (Chamsart et al., 2001).
Thomas Burt 118

3. Initial Studies
Several studies have been performed to optimise the lysis step in terms of plasmid yield
and gDNA contamination by alteration of the agitation rate, exposure time to high pH,
sodium hydroxide concentration and impeller type (Meacle et al., 2004; Clemson and
Kelly, 2003). Table 3-6 summarises some of the key findings of the optimisation studies.
Table 3-6 Table sum m arising the findings o f several authors and the resulting conclusions which can be drawn about optim ising the shear rates and m ixing tim es used in the lysis operation.
Shear rate Plasmid gDNA Comments
Low(<600s’)
• Lower plasmid release as lysis operation is inefficient. (Clemson and Kelly, 2003)
• gDNA fragments larger (300-1 OOOkb) (Meacle et a l, 2004)
• Poor macro and micromixing resulting in poorer cell lysis as a result lysis operation may be extended.
• Possibly the plasmid associates with floe during neutralisation
Moderate(600- 10V!)
• More plasmid released more quickly (Clemson and Kelly, 2003)
• No shear of plasmid molecule (Levy et al., 1999b)
• Higher shear does not appear to increase gDNA contamination (Meacle et a l, 2004; Chamsart et a l, 2001)• Decreased size of gDNA fragments (Meacle et a l, 2004)50-200kb
• Better micromixing means lysis operation is more rapid and effective. Less time required for lysis operation.
• gDNA fragments released are slightly smaller due to shear
High(> 10V )
• Shear of plasmid molecule (Levy et al., 1999b)
• Slight increase in gDNA contamination (Meacle et a l, 2004)• Fragments smaller size (10-100kb)
• High shear rates physically damage plasmid molecule and reduce size of gDNA fragments which hinders DSP.
• Only at this rate are there reports of increase in gDNA in lysate
LYSIS MIXING TIME -scale dependent
SHORT• If lysis time too short complete lysis does not occur and poor plasmid yields obtained (Clemson and Kelly, 2003)
LONG
• Longer lysis periods increase plasmid yields by ensuring complete lysis (Ciccolini et al., 1999)• More gDNA present in lysate but by virtue of more complete lysis (Ciccolini et al., 1999)• Too long lysis periods lead to decrease in plasmid supercoiling. (Meacle et al., 2004; Clemson and Kelly, 2003; Sayers et al., 1996)• Suggested that longer lysis times required for larger plasmids (Clemson and Kelly, 2003)
To achieve maximum yield and purity of plasmid from the lysis operation several points
must be considered when deciding on mixing conditions and the lysis time-scales.
(a) That high final NaOH concentrations (>0.1 M) are required in order to convert all
gDNA to single-stranded form so that maximum precipitation occurs in the
neutralisation stage.
(b) Exposure of plasmids to NaOH concentrations >0.15M (pH 12.9) leads to
irreversible plasmid denaturation.
Thomas Burt 119

3. Initial Studies
(c) Extended lysis periods lead to a rapid decrease in plasmid supercoiling.
(d) Sufficient time is required to complete lysis otherwise yields will be low.
(e) Moderate to high shear rates are required to encourage good macro and
micromixing and thus ensuring complete lysis and plasmid release and to
discourage areas of high pH/molarity in the vessel.
(f) Shear rates in the order of 1OV1 can cause plasmid damage and increase the level
of contaminating gDNA.
Whether these conditions were optimal during the lysis regime employed in this protocol
is subject to later analysis in the Downstream processing chapter (7.7).
3.8.4 Plasmid DNA purification
Tangential flow ultrafiltration is one potential method for intermediate purification of
plasmid-containing lysates. This step enables simultaneous concentration, purification and
buffer exchange. The use of this technique has been demonstrated to remove >99% of
RNA and >95% of protein from clarified lysate (Kahn et al., 2000). The mechanism of
action involves trapping the plasmid molecules, the diameters of which exceed the 160nm
pore size of the 0.1m2 (1ft2) membrane used in this study (Millipore, USA), on the surface
of the membrane whilst allowing the passage of smaller sized contaminants (Figure 3-11).
The retention of the plasmid on the surface allows washing of the plasmid to facilitate the
removal of maximum amounts of contaminants and also buffer exchange to place the
plasmid in the correct buffer for later chromatographic steps. The build-up of plasmid on
the surface of the membrane forms a boundary or gel layer which inhibits permeate flux.
This gel layer is kept at an acceptable thickness by employing a crossflow of fluid. The gel
layer is functional, since plasmid molecules are potentially able to cross the membrane
depending on their size distribution, this is rendered much harder by the creation of the gel
layer. The disadvantage of maintaining a crossflow is, as with any fluid in motion that the
shear forces created may be of a magnitude sufficient to damage the plasmid molecule, a
problem which could become more apparent when processing larger plasmids. So far
tangential flow ultrafiltration has been demonstrated to be an acceptable method of
intermediate purification and concentration of plasmids up to 1 Okb.
Thomas Burt 120

3. Initial Studies
Use of UF is the subject of a patent claim (Butler et a l 2000) which covers this
technique up to a plasmid size of 50kb, though only data for a maximum plasmid size of
lOkb is reported (Kahn et a l 2000).
3.8.5 Results of preliminary investigations into purification of the Oxford series
The overall aim of this study was to investigate the possibility of purifying the large
construct p5176 (116kb) using the established plasmid purification protocol. The results of
the study are outlined in Figure 3-13.
r ~ ^ DH1 [p5176] (116kb) DH1 [parental)
■ ■ ■ DH1 [pSVp)
pSV|i(6.9kb) p5176 (116kb)
Retentate Vash 1 Wash 2
Recovered Fraction Time from start (mins)
Figure 3-13 Graph displaying the results of preliminary investigations into the possible purification of the large construct p5176 using the small, high copy number plasmid pSVp and DH1 parental as positive and negative controls. Figure A shows the plasmid masses recovered from the ultrafilter by the three consecutive wash steps which follow the permeation and diafiltration steps. Figure B tracks the changes in permeate flux as the ultrafiltration step progressed.
Figure 3-13 shows that large differences exist in the recovered masses of pSVp and p5176.
The recovered yields of p5176 mirror that of gDNA from the parental controls indicating
that little plasmid was actually recovered. Comparison of the flux profiles between two of
the runs highlights the problems with ultrafiltration of the large construct; p5176. Permeate
flux drops much more rapidly and to a greater extent for the pSVp runs than for the p5176
runs, indicating greater membrane loading. During the first diafiltration period the flux of
the p5176 run increases sharply suggesting that the majority of the material on the
membrane, thoughout the permeation stage, may be washed though the membrane; it was
evidently not plasmid.
Thomas Burt 121

3. Initial Studies
Several factors may account for the low yields of p5176;
(a) That the large construct was sheared by fluid forces in the UF rig, degrading it sufficiently such that the fragments permeated the membrane
(b) That there exists only trace amounts of plasmid to begin with because of degradation in the lysis step.
(c) That there exists only trace amounts in the lysate by virtue of the low copy number of the plasmid.
(d) That the absence of a sufficient gel layer enabled permeation of the plasmid molecule.
To identify the most likely cause for the yield loss, the process data was compared to the hypothetical yields expected as predicted from the plasmid specific yields determined at harvest
Table 3-7Table displaying the average yields of plasmid DNA from triplicate 50g purifications conducted on cell paste from 4L fermentations. The masses were quantified by A260 on the recovered fractions from the ultrafilter. The % recovery values are estimates determined from the harvest specific yields._______________
Total DNA recovery (mg)
Harvest specific yield (pgg'WCW)
Maximum plasmid recovery (mg)
%Recovery A260/A280
DM I |pSVp] 15.96 ± 4.57 351 ± 39.5 17.55 ± 1.98 90.9 1.86 ± 0.26
DH1[p51761 0.94 ± 0.06 44.7 ± 6.8 2.2 ± 0.34 42.7 1.78 ±
0.31
DH1|parental| 0.246 ± 0.97
1,410610.000212,1403
70.5500607*3
0.350.050.04
1.74 ± 0.25
From Table 3-7 it can be seen that the from the harvest yields the total mass of p5176 present at the start of the DSP process is 2.2mg, meaning that if the contamination by
gDNA is ignored around 40% of the plasmid was recovered. The same result for pSVp suggests that 90% of the plasmid is recovered.
6 Assum es that E.coli genom e is 4.7M bp and is present at lcopy per cell at h arv es t.2 A ssum es DNA present at l% (w /w ) W CW (Bailey and Ollis, 1 9 8 6 ).3 V alue placed upon specific gDNA yield by sonication and qPCR in later Chapters.
Thomas Burt 122

3. Initial Studies
3.8.6 Conclusions
It was not possible to determine which factors led to the low plasmid yields as there
remain too many unknowns. The low yields meant further analysis was difficult as
insufficient plasmid could be concentrated to analyse by electrophoresis. The only
conclusion which could be confidently stated is that the low p5176 recoveries are a direct
result of either the low starting yields or the large size of the construct. Shear forces are
certainly likely to impact on the recoveries, due to the large diameter of the plasmid
molecule, ~lpm (7.7.3.1). This large size also means that the plasmid molecules are
unlikely to have penetrated the 0.16pm pores of the membrane, at least not in their native
form. An additional fact is that this process was designed to operate at a loading value of
500-700mg of plasmid per m2 of membrane and the loading values used here were far
below that level. Smaller sized membranes (0.01m2) were used to increase the plasmid
load but this led to rapid fouling and ultimately complete blockage of the membrane. The
problem faced in resolving these questions is that the low yield and large size are
inextricably linked making resolution of the problem difficult.
As the process stands it was unable to effectively purify the large construct p5176 (116kb)
a fact attributable to either the large plasmid size or low initial yields. An interesting
analysis of the results concerns the contamination by genomic DNA. The total recovery of
genomic DNA from the process was low at ~250pg, representing a clearance of gDNA in
excess of 99.5%. This level of clearance compares well to that reported elsewhere for
similar purification strategies (Kahn et al., 2000). Although the level of gDNA is
acceptable the ratio of plasmid DNA to gDNA at the end of the process are not. The
regulatory authorities have been demanding for some time that the level of genomic DNA
contamination in plasmid vaccine preparations should not exceed 0.05pg gDNA /pg
plasmid (5% w/w) (WHO, 1997) and indeed industry standards are beginning to accept an
even lower level of <0.01 pg gDNA/pg plasmid (<1% w/w) (Zoon, 1996). In the studies
reported here the level of genomic DNA contamination represents 1.5% (w/w) of the total
plasmid DNA when considering pSVp but 26% (w/w) when considering p5176. Even if
the p5176 demonstrated 100% recovery the genomic DNA would still account for 11%
(w/w). These figures are difficult to improve upon further downstream in the
chomatography and polishing stages and as such the only effective method of ensuring the
ratio is maintained <1% is to achieve high plasmid yields from the fermentation.
Thomas Burt 123

3. Initial Studies
3.9 Initial Studies Conclusions
To conclude this chapter involves confirming whether the questions posed at the start have
been satisfactorily answered. The first query posed was whether cultures harbouring these
large plasmids were able to grow sufficiently well when bearing constructs of this size.
Both shake-flask investigations and pilot-scale fermentations have confirmed that the
growth rates of these cultures are not severely impinged by the propagation of these
constructs. Decreases in maximum growth rate and final biomass yields were reported, as
compared to parental strains, but were to a lesser degree than cultures bearing small, high-
copy number plasmids and as such would not cause problems in their larger scale
manufacture.
In regards to the yields of these plasmids the view is less optimistic. It seems by virtue of
the low-copy number at which these plasmids are maintained (1-2 copies/cell) the yields,
as determined during various studies, were very low (-O^pgmg^DCW). This yield figure
compares poorly to small, high-copy number plasmids reported in the literature as
commonly being 4-6pgmg'1DCW, resulting in 25-fold less material for purification. If
compared to the yields of more optimised productions systems, the large plasmid yields
are almost 100-fold lower. It was also established that due to the vector architecture of
these plasmids, strategies often employed to improve specific yield by reducing specific
growth rate, could not be used with these plasmids as different control mechanisms are in
action. Boosting volumetric plasmid yield was achieved by improving aeration during
fermentation but this yield measure is of less critical importance.
The low specific yield also impacted negatively on the downstream processing of these
molecules. Lab-scale purifications involving gravity-fed, anion-exchange resins were
judged to be poor at purifying these constructs. It was found that the expected yields from
such protocols were not obtained. Variations in the operations of these lab-scale protocols
by doubling the starting cell mass, achieved little except to increase the level of
contaminants. The use of a lab-scale purification technique employing an exonuclease to
digest the contaminating gDNA succeeded in its aim but the resulting yields suggested that
only -25% of the expected plasmid was recovered by these columns, implying that the
binding or elution of these plasmid to the resins was problematic. Purification of these
plasmids on a larger scale employing ultrafiltration was also found to be far from optimal.
The % recoveries of the large construct was found to be -40% compared to -90% with a
Thomas Burt 124

3. Initial Studies
small, high-copy number plasmid. The low % recoveries were accompanied by low mass
yields. At this stage it was impossible to determine whether the low recoveries produced
by the DSP runs was symptomatic of the large size of the constructs or the fact that
purification was being attempted on lysate containing little plasmid. A recurring problem
though out the purification of these large plasmids was the co-purification of
contaminants. It was found that with both lab-scale and pilot-scale purification runs, the
ratio of plasmid to contaminants was high, not due in fact to poor processing techniques
but attributable to the low initial yields. The low-level of starting material also made
determination of the most troublesome DSP stages hard, due to the difficulty faced in
quantifying changes in low amounts.
Accurate and precise quantification of the large plasmids was also found to be fraught with
problems, mostly due to the high ratio of contaminants to plasmid in the purified streams
used for analysis. Spin-prep purification results were found to be heavily influenced by the
residual levels of co-purified protein, levels of which have little impact when the
recovered plasmid yields are high. PicoGreen analysis on both clarified lysates and spin-
prep purified samples was also troublesome. When PicoGreen was conducted on clarified
lysates, the resulting yields were misleading by virtue of contaminating gDNA, which due
to its relatively high concentration and linear topology gave stronger signals than the
supercoiled plasmid. When conducting PicoGreen on spin-prep purified eluents the
problem lay with the standard curve employed. It was determined that the process of spin-
prepping destroyed any topology possessed by the plasmid molecules reducing them
entirely to linear form. As such, PicoGreen calibration against a standard composed of the
plasmid under analysis, as is traditional with the protocol, led to misleading over
estimations of plasmid yield. An alternative method was devised, involving calibration of
spin-prep purified samples against a linear XDNA standard curve. This method by-passed
the problem of residual protein contamination in the eluents and the linear standard
represented the plasmid DNA in the correct form it demonstrated after processing.
However, since this assay relies on exacting a physical change upon the plasmid under
investigation it becomes more likely for errors to creep in and as such the assay would
never be acceptable from a validation perspective. As a result of these conclusions new
methods of large plasmid quantification are required. It was possible to visualise the
plasmids using PFGE but separation of the plasmid topologies proved difficult. Further
optimisation of the assay for plasmid visualisation is required.
Thomas Burt 125

3. Initial Studies
3.10 Discussion
The findings of these initial studies makes determining the problems faced when
manufacturing large plasmids difficult. The reason being that the problems faced thus far
are intrinsically linked to the low plasmid yields and not to the size of the plasmids per se.
Indeed, the most pressing problems encountered during fermentation, downstream and
analytical protocols remains their low yield a fact which makes determining the other
challenges impossible. If the other problems faced when manufacturing large plasmids are
to be determined, the impact of the large size has to be decoupled from the impact of the
low plasmid yield
Figure 3-14 Schematic displaying the expected plasmid copy number of various sized plasmids when cells are producing 1800kb of extrachomosomal DNA and when the medium and processing conditions have been optimised for production of 18Mb of extrachomosomal DNA
This conclusion contradicts the accepted belief that large plasmids have to be present in
low yields. The plasmids employed in this study are at low yields due to the nature of their
origin of replication and not due to their large size. Ultimately, they remain tools for
molecular biology and genome mapping and as such were not intended for production.
Conceptually, if the cell is regarded as a manufacturing unit, it is being persuaded to under
perform when synthesising these constructs. Literature evidence confirms that when
bacterial cells record yields of 4-6pgmg'1DCW, as they commonly do when maintaining
high-copy number replicons, each cell is in effect synthesising ~1.8Mbp of
extrachomosomal DNA. When the medium and process conditions are optimised this
value has been found to rise to a maximum recorded level of 18Mbp per cell (Adapted
from (Wang et al., 2001)). Using these figures the expected copy numbers of plasmids of
various sizes can be estimated as shown in Figure 3-14. From the graph it can be reasoned
Present 1 situation
i — i— i— ■— i— i— i— i— i— i— i— i— i— i— i— i— r
1 8Mbp extrachromosomal DNA (SugpDNA m g’DCW) 18Mbp extrachromosomal DNA (Wang et al. 2001)
Plasmid size (Kb)
Thomas Burt 126

3. Initial Studies
that the yields of large plasmids could be much improved though the use of a more
suitable origin of replication.
Another major consideration is the size of the plasmid molecules under investigation, the
smallest of which being 116kb. At present manufacture of plasmids has been focused on
constructs 3-1 Okb. To attempt to monitor plasmid processing with constructs ranging from
116kb to 242kb represents quite a dramatic leap in size. A more reasoned approach would
make use of more incrementally increasing plasmid sizes. It was for these reasons that the
decision was taken to attempt to clone a series of large plasmids making use of a high-
copy number replicon.
Thomas Burt 127

4. Analytical Development
4 ANALYTICAL DEVELOPMENT: RESULTS AND
DISCUSSION
4.1 Chapter Aims
The main aims of this chapter are to describe the analytical techniques which were
developed and used for quantifying the concentrations and analysing the topology of large
plasmids. Also, the techniques used to determine the masses of other constituents
encountered during plasmid processing, will be outlined. Additionally in this section,
information will be given on why the techniques required development, as well as details
about their operation and accuracy.
The main issues which will be answered by this chapter are;
1. Whether the techniques commonly employed for plasmid quantification are
applicable to larger constructs. By virtue of the large size of the plasmids being
studied and the low-copy numbers they exist at (as determined by previous
studies), exact quantification may result in difficulties when using techniques
developed for small, high-copy number plasmids. Several methods for plasmid
quantification including absorbance, PicoGreen and HPLC were studied.
2. Together with plasmid quantification, useful information about the process and the
plasmid product are provided by gel electrophoresis analysis. This chapter will
describe the efforts which went into developing suitable techniques for
visualisation of large plasmids.
3. The most important contaminant to consider when manufacturing plasmid DNA is
contaminating bacterial genomic DNA (gDNA). The reason for its importance is
due to the physicochemical similarities of gDNA to the plasmid product, which
makes removal of this contaminant critical to ensuring a production process is
feasible. Due to the similarities, presence of this contaminant can also lead to
significant errors in the accuracy of analytical techniques used for quantifying
plasmid. Consequently, this chapter will describe the development of techniques
aimed at accurately quantifying genomic DNA.
Thomas Burt 128

4. Analytical Development
4. In order to assess the removal of protein and RNA by the process, suitable
methods of determining their concentration, in all streams of the process, were
required. The development of assays to achieve this will be outlined.
5. Finally, the development of the sonication assay will be described. This technique
was employed to determine the initial masses of the contaminants such that their
emoval could be balanced over the lysis step.
4.2 Techniques Used for Plasmid Quantification
plasmid in either clarified lysates obtained from either bacterial cell pellets or from process streams of the downstream process. The analytical techniques are italicised.
4.2.1 Introduction
The plasmid quantification techniques employed during this project were developed
concurrently as the project progressed. At the outset, it was unknown whether the
commonly applied techniques for plasmid quantification could be employed with these
large, low-copy plasmids. Consequently, many of the studies employed during the early
stages of the project were as much about investigating the analytical techniques, as they
were about investigating the production issues associated with the manufacture of large
plasmids.
In this project, plasmid concentration was a measured variable in two situations;
Fermentation and Downstream Processing. During the fermentations, plasmid progression
was monitored to record the efficiency of the fermentation and to determine the relative
I Bacterial Cell Pellet I
(B) jP C R ok ClarifiedLtfamte < |rn,Ainnm ai. akai.in f t .y sa teOR PROCESS STREAM SAMPLE
(A) Pico& eat on Clarified Lysate
(QHPLCoa O arifiU Lyomta jlPA Pircyjtatieii j 1 Qiage« ► (G)Ahsor*a*c* 26 # h m
(D) PtcoGrom on ronttpiadai procipttttMt
(F) PicoGraau om spix-prep »huut
(E) HPLCox raaxspaxiad praciptiaxt
Figure 4-1 Schematic describing the analytical techniques which can be employed to quantify
Thomas Burt 129

4. Analytical Development
productivity of the large plasmid constructs. During downstream processing, measurement
of plasmid concentration in the different process streams was essential for mass balancing,
in order to determine the feasibility of processing large constructs using the adopted
process. These two scenarios describe the situations where plasmid concentration was
measured as a process variable, but alongside these investigations there were other
instances where plasmid quantity needed to be determined, for instance when cloning or
preparing standard curves. On these occasions plasmid was not being recorded as a
variable, however, it was important to be confident that the analytical technique being
employed was accurate and precise. Figure 4-1 outlines the different techniques that can
be employed to determine plasmid concentration. All methods shown in the diagram,
except qPCR, were scrutinised as to their accuracy and precision in determining the
correct plasmid yield, and as such will be described in this chapter. From the schematic it
can be appreciated that the analytical technique employed depended on what processing
method was used to purify samples for analysis. Since plasmids are intracellular products,
all techniques required a lysis step to release the molecules enabling their analysis
(excluding process samples in which plasmid, after the lysis step, existed free in solution).
Conceptually, the most accurate techniques promised to be those where processing was
kept to a minimum (i.e. A, B and C) as the introduction of further processing steps (D, E, F
and G) could be expected to lead to greater losses and make the sample less representative.
Table 4-1 describes the numerous methods available for quantifying plasmid DNA in
solution. The analytical techniques can be categorised as one of three methods: ultraviolet
absorbance, fluorescent dyes or quantitative PCR. Historically, quantification of DNA was
often achieved by measurement of deoxyribose or phosphate groups following hydrolysis,
but these techniques have largely been superseded due to their high error and labour-
intensive nature, and so are not considered here.
Thomas Burt 130

4. Analytical Development
Table 4-1 Table outlining the various methods available for the determination of DNA concentration. The three major techniques detection by are Absorbance, Fluorescent dyes, and qPCR. The other two, involve hydrolysis reactions which are laborious and less accurate.___________________________________________ANALYTICALTECHNIQUE USES REFERENCE
Absorbance 260nm Direct measurement/ HPLC (Sambrook et al., 1989)
Fluorescent dye Hoechst 33258/ PicoGreen/ AGE (Singer et al., 1997)
Quantitative PCR Most specific and accurate technique (Lee et al. , )
Quantification of deoxyribose Superseded due to high errors introduced by hydrolysis and the labour intensive nature of the assays.
Quantification of phosphate
4.2.2 UV absorbance
Ultraviolet absorbance quantification of plasmid solutions is the most simple and widely
applied method, and is the technique used by direct absorbance as well as HPLC (which
uses an in-line UV spectrophotometer). Indeed, the use of this technique forms the basis
for all the other techniques, since they all rely on standard curves calibrated from
absorbance readings. The rationale for the method is that the presence of conjugated
heterocycles (the purine and pyrimidine bases) in DNA gives rise to strong electronic
transitions upon absorption of light at 260nm in wavelength, the near-UV region
(Middaugh et a l 1998). Consequently, DNA absorbs maximally around 260nm.
However, the absorbance method is incapable of distinguishing dsDNA plasmid from
ssDNA and RNA, which due to their highly comparable chemical make-up, also absorb
strongly in this region. And, although proteins absorb maximally near 280nm, they do
display absorbance at 260nm. This means that for a plasmid sample to be accurately
quantified it must be very pure and free of contaminating RNA and protein.
Spin-prep processed samples are assumed to have had the majority of protein
contaminants removed by processing, whilst HPLC purifies the plasmid DNA away from
protein, prior to quantification by absorbance. In all techniques used, the resuspension
buffer was supplemented with RNase. This highly efficient enzyme is able to quickly
degrade all of the RNA in a lysed sample, such that none can be detected by gel
electrophoresis. As such, RNA contamination of analytical samples rarely occurs.
An estimate of sample purity can be achieved from absorbance readings by calculating the
ratio between the absorbance value of the sample at 260nm and 280nm. If the ratio is
Thomas Burt 131

4. Analytical Development
found to be lower than 1.8 then the sample is contaminated by protein and as such the
260nm reading used to calculate plasmid concentration would be erroneous. The impact of
contaminating protein on the absorbance result is displayed in Figure 4-2.
3.5 3.5
BSA (3.2mgmr1)Plasmid DNA (80mgml ’) BSA (1.2mgmr')
3.0 3.0
25 2.5
$ 2.0 2.08c
1.5
n< 1.0 A 280/A 2 » = 1 8 1.0
0.5 0.5
0.0 0.0250240 260 270 280 290
Wavelength (nm)
Figure 4-2 Schematic adapted from (Davidson, 1972) displaying the absorbance profiles of solutions of plasmid DNA and comparing to those of the protein BSA. From the schematic it can be appreciated that for an accurate estimate of plasmid concentration the plasmid concentration must be more than 60-fold higher than the contaminating protein.
The figure demonstrates the absorbance profile a plasmid DNA solution, which produces a
maximum absorbance reading of 1.6,* which when multiplied by 50 (since the extinction
coefficient of dsDNA is 20gL'1cm'1, and the path length used here is 1cm then 1AU =
50pgmL'1DNA) the concentration is found to be SOmgmL'1. The traces of two BSA
solutions are also shown. Although the peak of these solutions is at 277nm, the 280nm
reading is taken as the maximal due to the sensitivity of the majority of spectrometers not
being greater than ±5nm. The problem arises due to the lower extinction coefficient of
proteins. The value for this parameter varies depending on the specific protein, but using
BSA as an example highlights the problem. The extinction coefficient of BSA is 0.66gL'
'em '1 (See figure and (Pierce Scientific, 2006)) meaning that 1AU = l^OOpgmL'1. From
Figure 4-2, this means that the higher protein peak is produced by a BSA solution of
S^mgmL'1 (AU 2.1 *1.5). Recording the A260/ A280 ratio, between the absorbance peak
produced by plasmid DNA (260nm) and the absorbance peak produced by protein
(280nm), produces a value of 0.7. This indicates that an SOmgmL'1 solution containing
B^mgmL'1 of protein would be out of spec, and as such the value produced for the
concentration of plasmid would be erroneous, since the impact of protein absorbing at
260nm would corrupt the true result. Therefore, to have confidence in the reading
produced by absorbance, a plasmid solution of SOmgmL'1 could contain no more than
* In this study the range o f linearity o f absorbance was taken to be 0.2-0.8 where % Coefficient o f variation (% CV) between assays is <2% . Dilution w as used to achieve this. A bsorbance readings >1.0 are accom panied by increases in %CV to around 2-5% . (Q iagen, 2005).
Thomas Burt 132

4. Analytical Development
1 mgmL'1 protein, as shown by the figure, as at this point the impact of the protein on
absorbance is deemed to be minimal. Ultimately, due to the differences in the extinction
coefficient of protein and DNA, to correctly record the concentration of a plasmid solution
it must exist in a ratio > 60:1 plasmid mass to protein mass.
Another interesting point which can be gleaned from this analysis are the assay limits. The
majority of spectrophotometers can record to 2d.p resulting in the lowest value being 0.01,
equating to a dsDNA concentration of O.SpgmL'1. However, using such low values would
be fraught with inaccuracies, so in this project 0.05 was taken as the lower range of the
assay. This limits the lower range of the absorbance assay to 2.5pgmL‘1.
To summarise, when applying the absorbance technique consideration of the drawbacks of
this method must be appreciated. The technique can only be applied on very pure solutions
such that absorbance effects of proteins are minimised and it must be acknowledged that
this technique is incapable of distinguishing small traces of ssDNA remaining from the
bacterial genome and that the lower limit of application of this assay is ~2.5pgmL'1.
4.2.3 Fluorescent Dye Quantification
Quantification of plasmids using fluorescent dyes offers two important advantages over
absorbance.
(a) Their use can extend the lower limit of detection below the O.S^.SpgmL’1 limit
reached by absorbance.
(b) They can be selective for plasmid molecules and so reduce the over- estimation
of plasmid concentration caused by the contributory effects on absorbance
readings produced by the contaminants; RNA, protein, ssDNA.
The mechanism of action of all fluorescent dyes is comparable, but their individual uses
and application can differ. The most common dyes used for DNA quantification in
solution are Ethidium bromide, Hoechst 33258 and PicoGreen, whilst for gel visualisation
Ethidium bromide and SYBR-Gold are used. The structures of fluorophore molecules used
for plasmid quantification are all similar in that they are all heterocyclic compounds. As
such, the molecules possess the dispersed electron clouds necessary to display fluorescent
behaviour. The core structure of the monomeric cyanine dyes, of which PicoGreen,
SYBR-Gold and YO-YO are included, is shown in Figure 4-3C.
Thomas Burt 133

4. Analytical Development
A B
Stokes shift
i.>01og Excitation Emission
400 450 500
Wavelength (nm)
Figure 4-3 Schematic displaying the process of fluorescence. The flurophore molecule, such as monomeric cyanine dye base (C), is excited by radiation of wavelength which most excites the electrons in the dispersed electron cloud of the molecule (its excitation maximum). The excitation wavelength is set by the filter used on the fluorometer. The absorption of energy raises the molecule from its ground state to its excited state (1). Whilst in the excited state, (an unstable state which is extremely short ~10'9-10‘15s) collisions with solvent molecules leads to dissipation of some of the energy as heat. Following such energy loss, the molecule is in its semi-excited state (2) and returns to its ground state by emission of the excess energy as light (3). Due to the energy lost during the excited to semi-excited transition, the wavelength of the light emitted is of lower frequency than it absorbed.The molecule is now free to repeat the process
Improvements to the binding behaviour of these molecules, depending on desired function,
can be achieved by alteration o f the two R groups. PicoGreen and SYBR-Gold have
almost homologous R groups, accounting for the similarities between the two fluorophores
(Zipper, 2004). In both cases the Ri is a phenyl group, but PicoGreen carries an additional
positive charge on its R2 group. The planar, hydrophobic structure and positive charge at
the appropriate position, facilitates binding of these molecules to DNA. It is known that
PicoGreen and SYBR-Gold display biphasic binding, such that they intercalate into the
DNA superstructure, as well as binding the minor groove of DNA molecule.
Contrastingly, Hoechst 33258 does not intercalate and only displays minor groove binding.
The mechanism of action of these molecules, as with any fluorophore, is that binding to
the target compound increases the molecule’s fluorescence, as compared to unbound
molecules, due to minor structural or electrochemical changes induced by binding.
Figure 4-3 A and B displays the progression of a fluorescent transition. Upon irradiation of
the fluorophore molecule, photons of the correct wavelength excite the electrons of the
distributed electron cloud, resulting in them occupying a higher energy state (B). During
the period of this excited state, a proportion of energy is dissipated as heat through
collision with solvent molecules.
C
Heat
Thomas Burt 134

4. Analytical Development
Ultimately, when the molecule returns to the ground state, due to the energy loss, the
radiation emitted is of a longer wavelength/ lower frequency. The shift in the excitation
and emission wavelength is known as Stoke’s shift (A).
The technique can be used quantitatively by recording the intensity of the emission
radiation. The fluorometer is set to record the intensity of radiation produced at the
emission maximum, the wavelength at which the majority of the fluorophore’s energy is
emitted. Subtracting the emission produced by unbound molecules, determined by
blanking against negative controls, enables calculation of the fluorescence increase
attributable to binding. By plotting the fluorescence produced by standards of known
concentration, this increase in fluorescence due to binding can be linearly correlated to
DNA mass. The nature of the fluorescence transition dictates certain criteria required by
the fluorophore molecule for it to be functional for assay purposes.
A main criterion for efficacy is a large increase in fluorescence upon binding. Ethidium
bromide has long been used for quantification of DNA in solution, as well as gel
visualisation. A drawback with this molecule is that the unbound form displays a high
degree of intrinsic fluorescence, such that the increase upon binding is relatively low (-20-
fold). This makes the background fluorescence of the molecule hard to eliminate, reducing
the sensitivity of the assay. Hoechst 33258 is an improvement as it displays a ~95-fold
increase in fluorescence upon binding. However, the new generation of monomeric
cyanine dyes are reported to display a -2000-fold enhancement of fluorescence upon
binding, and as such the background intrinsic fluorescence is less of a problem (Singer et
a l , 1997). See Figure 4-4.
A second criterion is the specificity of the fluorophore molecule. The use of dyes in this
project requires the fluorophore to report the concentration of dsDNA plasmid molecules.
Reporting the presence of contaminating ssDNA, RNA and protein leads to inaccuracy.
Again, ethidium bromide is not optimal as it displays strong specificity for all nucleic
acids including ssDNA and RNA. Hoechst 33258 does display specificity for dsDNA, but
requires high salt conditions to detect dsDNA in the presence of RNA and low salt
conditions to enable dsDNA detection in the presence of ssDNA, meaning two assay
conditions must be run to achieve adequate selectivity.
Thomas Burt 135

4. Analytical Development
PicoGreen - 1xTE Hoechst 33258 -1xTE
dsDNAdsDNA ~n
RNA
.ssDNAssDNA RNA Free Dye
Free Dye500 550 600 360 400 500 600 650
Wavelength (nm) Wavelength (nm)
Figure 4-4 Fluorescence spectra of PicoGreen and Hoechst 33258 dyes when free dye or bound to dsDNA, ssDNA and RNA. The PicoGreen trace shows minimal background fluorescence due to the contaminants. The Hoescht profile shows the large contributory effect of RNA in a low-salt buffer. Should any RNA be remaining in the sample then the result would be affected by its presence. From (Singer et aL, 1997)
Figure 4-4 shows the emission spectra of assays employing both PicoGreen and the
competing dye Hoechst 33258, when unbound and when bound to contaminating ssDNA,
RNA and dsDNA. From the figure it can be appreciated the increase in fluorescence
displayed by PicoGreen upon binding dsDNA. as compared to the presence of free dye.
What is also apparent from the figure is the specificity the molecule displays for dsDNA
over contaminating RNA and ssDNA.
The fluorescence quantum yield of the fluorophore is the ratio of photons absorbed to
photons emitted through fluorescence (ranging from 0.1-1.0). Therefore, the quantum
yield gives the probability of the excited state being deactivated by fluorescence rather
than by another, non-fluorescent mechanism. From Table 4-2 it can be seen that the
quantum yield results for PicoGreen, upon binding various types of polynucleotide, are
relatively comparable. However, the values for RNA and ssDNA are lower than the same
for dsDNA. This means that the specificity of PicoGreen is partly down to the reduction in
fluorescence displayed when the molecule binds either ssDNA or RNA, since the quantum
yields of these complexes are lower, such that less of the energy of the excited state is
released by fluorescence.
However, the main reason for PicoGreen’s specificity for dsDNA over ssDNA and RNA is
due to the red-shift phenomenon. At the concentrations suggested for its use, PicoGreen
molecules bind ssDNA/RNA at high dye molecule: base pair ratios. The overall effect of
this is that the emission maximum of the complex is shifted to longer wavelengths, such
that the effect is not recorded at the wavelength used to record the emission of dsDNA.
Thomas Burt 136

4. Analytical Development
Table 4-2 Table contrasting the properties of the fluorescent dyes PicoGreen and Hoechst 33258. The table describes the molar extinction coefficient (e) (M 'cm 1) of the two stains, essentially a measure of how efficiently the molecule absorbs the applied radiation. The table also details the quantum yields of the fluorophore molecules when bound to dsDNA/ RNA and ssDNA together with polynucleotides of AT and GC bases. The quantum yield describes the efficiency of fluorescence as it measures the probability of the excited state being deactivated by fluorescence rather than by a non-fluorescent mechanism. Obtained from (Singer et aL, 1997)
Quantum yield
Dye e dsDNA RNA dA-dT dG*dC ssDNA
PicoGreen 70,000 0.53 0.42 0.53 0.53 0.34Hoechst 33258 40,000 0.59 0.03 0.52 0.05 0.40
A final criterion for the fluorophore molecule concerns the limit of its range. With low
quantities of material available to bind, the efficiency at which the fluorophore absorbs
radiation combined with the intensity of the fluorescence produced by the molecule upon
binding, must be maximal. Absorption and emission efficiencies are quantified by the
molar extinction coefficient (s) for absorption and the quantum yield for fluorescence. The
fluorescence intensity per dye molecule is proportional to the product of both these value.
As can be seen from Table 4-2 the extinction coefficient of PicoGreen is high at 70,000M'
’em'1, compared to ~5500M'1cm'1 for EtBr. Also, the quantum yield of PicoGreen when
bound to dsDNA is higher at 0.53, compared to <0.3 for EtBr. As a result PicoGreen can
quantify solutions of dsDNA down to 25pgmL'1, representing a 104 fold lower limit than
achievable by absorbance, and -20 fold that achievable by EtBr.
The advantages of PicoGreen and SYBR-Gold, as outlined above, mean they have been
applied to plasmid quantification for several years. (Singh et al., 2005; Thwaites et al.,
2002; Molecular Probes Product Information, 2003; Rengarajan et al., 2002; Kay et a l ,
2003). SYBR-Gold is used for plasmid quantification by densitometric gel scanning, as the
use of this fluorophore improves contrast and a lower detection limit of plasmid DNA as
compared to EtBr. However, determination of plasmid concentration by gel scanning is
not a particularly robust assay, due to inter-assay fluctuations and the inaccuracy
associated with calibration from a marker (Friehs, 2004). As such, DNA binding dyes are
more commonly used for quantifying plasmid in solution, through the use of a
fluorometer. A drawback of this is that due to the error associated with the more complex
nature of the fluorescence assay, PicoGreen quantification has been found to be less
accurate than absorbance, when analysing pure solutions of dsDNA (Rengarajan et al.
Thomas Burt 137

4. Analytical Development
(2002a)) compared the accuracy of quantification of solutions of dsDNA by PCR,
PicoGreen and Absorbance against a reference standard. The absorbance method was
found to be the DNA quantification method most concordant with the reference sample
among the three methods evaluated (Rengarajan et a l , 2002). However, the advantage of
PicoGreen is its capacity to determine dsDNA concentration in the presence of
contaminants, in which case the use of this assay has clearly demonstrated its credentials
(Noites et al., 1999).
Despite the advantages of PicoGreen its use has two drawbacks, the extent of which will
be explained in the results section. PicoGreen has been demonstrated to display impressive
sensitivity toward dsDNA. Obviously though, it is incapable of differentiating genomic
dsDNA from plasmid dsDNA, as for all intent and purposes they are identical molecules.
This is not a pressing problem when the sample being quantified has a high plasmid to
genomic dsDNA ratio, since the contributory effect of genomic dsDNA will be minimal.
The problem arises when the plasmid DNA mass approaches the mass of contaminating
genomic dsDNA. Secondly, the fluorescence reading has been reported to vary according
to the topology of the DNA (Singer et a l , 1997). The authors describe how linear dsDNA
produced a higher fluorescence reading than the same mass of supercoiled DNA, which
they attribute to the high rate of intercalation of the PicoGreen molecule into linear DNA.
Ultimately, this means that the topology of the sample used for calibration must be highly
representative of the topology of the plasmids under analysis.
4.2.4 Plasmid quantification by qPCR
Plasmid quantification by quantitative PCR is more an enabling technology than an
analytical technique per se. It facilitates extremely accurate and specific quantification of
plasmid molecules (or indeed any RNA/DNA), but the actual detection method employs
fluorescent dyes as described above. The use of qPCR is largely replacing historical
methods of quantifying specific gene sequences based around radio-labelling of nucleic
acids and quantifying their hybridisation. Such methods present safety problems in
handling radioactively labelled probes, and the procedure is laborious and time-
consuming. Additionally, the radioactive probe used for hybridization can also cause
inaccuracy due to its short life span (Pushnova et al., 2000). One of the main advantages of
qPCR is the assay’s specificity. The technique is capable of quantifying dsDNA specific to
the plasmid under investigation, even in the presence of other forms of dsDNA, ssDNA,
protein and RNA.
Thomas Burt 138

4. Analytical Development
It achieves this through the use of sequence specific primers, which bind only to the plasmid molecule and so initiate only its replication.
End-point qPCR was the traditional mode of operation of this assay. In essence, the PCR reaction would be used to amplify the sequence of interest, be it part of a plasmid or genomic fragment, alongside control fragments of known concentration. At the end of the reaction the amplified DNA and controls would be analysed by agarose gel electrophoresis, followed by densitometric scanning of the bands. The problem with this method included poor sensitivity and precision combined with long running times. The technique at best was semi-quantitative and hardly an improvement on Southern blot. The insensitivity of gel scanning was combined with the fact that when using end-point PCR reaction, identical masses of DNA at the start could differ significantly by the finish, due
to chaotic and unpredictable events (rector-Myska et al., 2001; Mallet, 2000). Figure 4-5
attempts to display how random events during a PCR reaction can lead to differences in the final DNA mass despite the starting mass being identical. It can be appreciated that during the exponential part of the PCR reaction replicate samples are in concordance. However, due to random events this synchronicity deviates during the linear phase of the reaction.
Development of real-time PCR massively improved the sensitivity and accuracy of qPCR. There are two methods of real-time PCR but they both rely on the same principle to improve accuracy. Real-time PCR tracks the difference in DNA mass produced during PCR, but only during the exponential phase of the reaction, where no significant deviation between replicate samples will have occurred. The technique exploits the fact that there will be a quantitative relationship between the amount of starting target sample and the amount of PCR product at any given cycle number. To do this requires in situ and continuous monitoring of the PCR products during the reaction.
E xponen tia lL inearPlateau
Figure 4-5 Schematic demonstrating the progression of two PCR reactions on two replicate samples. The same starting yield means that progression of the reaction is highly comparable during the exponential phase. However, slight differences and random events cause the deviation of the two reactions such that by the end-point large deviations can be created. Real-time PCR exploits the concordance between individual PCR reactions demonstrated in the exponential phase.
Cycle (Ct)
Thomas Burt 139

4. Analytical Development
This is achieved in one of two ways, but both rely on the use of fluorescent dyes. The
constant monitoring of the DNA mass allows determination of the number of reaction
cycles required to raise the starting mass of DNA above a threshold value. By calibrating
against a standard curve, the cycle number at which the threshold value is crossed, can be
linearly related to the mass of starting DNA material (Wang et al., 2005). The two
methods of real-time PCR are described below.
The SYBR-Green method traces the progression of the PCR reaction through the
fluorescence of this fluorophore, an analogue of PicoGreen. As new PCR products are
formed, fluorophore molecules intercalate into the newly formed DNA whereupon the
fluorescence enables real-time detection of the DNA mass increase. The only drawback of
this method is that the molecule will detect all dsDNA formed, including any unexpected
PCR products. Although the probability of a defined probe binding to an unintentional
sequence is low, it can occur. For example, a probe sequence 20bp length will occur every
160kb (204). The situation can be worse if the probe contains repetitive sequence (Lee et
al., Providenti et al.).
An improvement on the SYBR-Green method is the fluorescent primer-probe method.
This technique employs a sequence-specific probe which binds to a sequence on the DNA
molecule downstream from the sequence where the primer binds. Attached to the probe
molecule at the 5’ and 3’ ends respectively are two molecules; a fluorescent reporter dye
(e.g.FAM) and a quencher dye (e.g. TAMRA). The reaction relies on the 5’ exonuclease
ability of DNA polymerase, such that when the PCR reaction is initiated the primer is
extended. The reaction continues until the probe sequence is reached, slightly downstream
of the primer. The exonuclease action of DNA polymerase causes the release of the
fluorescent reporter dye away from the quencher dye. The quencher dye works by
stabilising the excited state of the fluorescent molecule such that it does not fluoresce.
Upon release of the reporter dye, the molecule is able to fluoresce enabling real-time
monitoring of the PCR reaction. Due to the proximity of the primer and probe sequence
the probability of both binding to a sequence, except the one of interest, is highly unlikely.
Ultimately, this technique is more precise than the SYBR-Green method as rogue PCR
products will not be reported.
It is evident that qPCR is the most sensitive and accurate method of monitoring DNA
concentration, be it plasmid or genomic DNA (Gibson et al., 1996; Heid et al., 1996). At
the time of writing there existed no published data for the use of the primer-probe method
Thomas Burt 140

4. Analytical Development
for quantifying plasmid DNA. The use of the SYBR-Green technique for plasmid
quantification has been reported and its precision determined to be high at %CV of 2.8-
3.9% (Lee et al, ). The use of the primer-probe method has displayed its sensitivity in
being able to enable detection down to the single-copy number level (Lockey et al., 1998).
The application of this technique to allow precise determination of the contamination of
plasmid preparations by gDNA has also been reported by (Vilalta et al, 2002; Smith, III et
al, 1999). On the basis of the reported accuracy and precision it is believed that qPCR will
be adopted further. At present it is the method of choice for quantifying gDNA
contamination in plasmid preparations and is believed it will become more widely adopted
for plasmid quantification.
4.2.5 Conclusions
The different methods of plasmid quantification have been outlined. Essentially, all the
analytical technique make use of either absorbance or fluorescence for plasmid detection.
However, how these two techniques are deployed depends on the method used to prepare
the sample for analysis. As outlined in Figure 4-1, a number of methods were tried and
analysed as to their efficacy. The philosophy behind this is that no evidence existed that
the large plasmids used in this project could be reliably monitored using conventional
techniques. The following results sections highlight the problems identified with
commonly used plasmid quantification techniques and the improvement of such
techniques required to allow quantification of large constructs.
Thomas Burt 141

4. Analytical Development
4.3 PicoGreen quantification of IPA precipitated lysates and spin-prep eluents
4.3.1 Outline
The first analytical methods used for quantification of large constructs were performed on
the Oxford series of plasmids grown in shake-flasks. Hourly samples of broth were
analysed for the presence of plasmid by PicoGreen on samples purified by both Qiagen
spin-prep and IPA precipitated clarified lysate. The streams were calibrated against a
standard curve prepared from linear ADNA. Referring to Figure 4-1 this represents streams
D and F.
Figure 4-6 displays the results of triplicate shake-flask studies where progression of p5176
(116kb) yield was measured through the course of the fermentations. The shake-flask
fermentations were carried out by inoculating 500mL of either SDCAS or SuperBroth
media, supplemented with 25pgmL'1 chloramphenicol, to a starting optical density of 0.1.
The shake-flasks were incubated at 37°C and 230rpm in a shaking incubator. Wet cell
weight and optical density progression were measured throughout the fermentations.
Duplicate lmL samples of broth were taken hourly from each of the shake-flasks,
centrifuged, the liquor discarded and the pellets frozen at -20°C. The pellets from both
culture sets were processed by two means; Qiagen spin-prep and IPA precipitation of
clarified lysate. The plasmid containing streams were then quantified by PicoGreen
calibrating against a linear, lambda DNA standard curve.
4.3.2 Comparing specific yield curves
The differences between the yield curves are quite apparent, the most apparent being
between the different processing techniques employed. Yield progression shows a much
higher variation when analyzing IPA precipitated clarified lysate. For example, the
standard error on the harvest point of SuperBroth media, using IPA precipitation, is 34%.
Comparing that error to the same result obtained by spin-prep extraction is 15%. It is clear
then that PicoGreen quantification on spin-prep clarified lysates is a much less error prone
technique.
Thomas Burt 142

4. Analytical Development
Figure 4-6 Chart depicting the progression of wet cell weight (gL'1) and specific plasmid yield (pg pDNA/ gWCW) through triplicate shake-flask fermentations of DHlOp |p5176 (116kb)] on two media types; complex SuperBroth and semi-defined SDCAS media.
2L shake-flasks (500mL media) were inoculated with 50 OD units and incubated in a shaking incubator (230rpm) at 37 * C. Hourly lmL samples of broth were taken, centrifuged and the plasmid extracted from the cell pellets using both Qiagen spin-prep® extraction and IPA precipitation of clarified lysate. The plasmid containing streams from both procedures were then quantified by PicoGreen against a XDNA standard curve.|A; SDCAS media - IPA precipitation of lysate / B; SDCAS media - Qiagen spin-prep / C; SuperBroth media - IPA precipitation of lysate / D; SuperBroth media - Qiagen spin-prep|
SDCAS
IPA PPTN
SuperbrothSPIN-PREP
Time (hrs)
cSuperbroth
IPA PPTN
SDCAS
SPIN-PREP
180 #
160 | i
1<°t 120 §; -< 100 • Q-
« I" 80 |
40 -<o_2° § 0 ^
- Wet Cell Weight (gL ') Tjme (hr#)
- Specific plasmid Yield (ugpDNA / gWCW)
Table 4-3 Summarising the yield data produced by p5176 cultures grown on both SDCAS and SuperBroth media by two extraction methods IPA precipitation of clarified lysate and Qiagenspin-prep. The plasmid containing streams from both extraction methods were quantified by PicoGreen calibrating against a linear XDNA standard curve.
Sample IPA precipitated C larified Lysate Spin-Prep Eluent
s*Jeasure
Media
‘e
FinalSpecific
Yield(ng/
gWCW)
FinalVolumetric
Yield(mgL*1)
Final Copy No.
(Copies/cell)
FinalSpecific
Yield(ng/
gWCW)
FinalVolumetric
Yield(m g L 1)
Final Copy No.
(Copies/cell)
SDCAS 0.56104±29.4
0.96 ±0.27 3.42 ± 0.97 34.8 ±8.2 0.32 ±0.08 1.14 ± 0.27
SuperBroth 0.69124.4±42.5
1.41 ±0.48 4.08 ± 1.454.8±8.46
0.62 ± 0 .1 1.80 ± 0 .2 8
Thomas Burt 143

4. Analytical Development
However, the difference in error between the two techniques is not the most striking
observation. The most striking is the difference the two techniques place on specific
plasmid yield at any point. Yield curves determined by PicoGreen on IPA clarified lysates
demonstrate much greater values for plasmid yield, which also increase with wet cell
weight. Conflictingly, yield curves for specific yield determined by PicoGreen on spin-
preps suggest lower values for plasmid specific yield, but which are must more consistent
throughout the course of the fermentations.
It is not until the results are scrutinised that a clearer picture emerges. Table 4-3
summarises the key yield data produced by the triplicate fermentations. Looking at the
SuperBroth data, for example, shows that the final volumetric yield predicted by the IPA
clarified lysate results is more than double the value identified for identical samples
processed by spin-prep. A rough indication of the accuracy of the results was determined
using copy number analysis. Figure 4-7 shows how copy number was calculated using
data from the SuperBroth/Spin-prep trials shown in Table 4-3.
Final volumetric yield = 0.62mgL1 Final optical density = 5.420D units
10D unit = 5x10⁸ cells/ml lml of sample processed = 0.62//g
= 0.114//g / OD unit
Plasmid RMM(gmol'1) = (plasmid size x 660)x 1.66x10'24]
= (ll6x l03 x660)xl.66xl0-24]
= 1.2709x1 O'16 gmor'
Figure 4-7 Calculation used to estim ate the copy number of p5176 at harvest using the yield data provided by PicoGreen analysis on Qiagen spin-prep eluents from SuperBroth Shake-flask fermentations.
Moles of plasmid = f Plasmid mass 6RMM J X
1.2709x10
Plasmid Copy Number =
= 8.97x10⁸ mols Moles of plasmidNumber of cells
8.97x10s 5xl08
= 1.79 copies/cell
Thomas Burt 144

4. Analytical Development
The other results from the copy number analysis are shown in Table 4-3. From them, it
appears that the values placed on copy number by spin-prep extraction are the most
trustworthy. The reason being that the figures calculated for the mean copy number at
harvest for samples extracted by IPA precipitation; 3.42 and 4.08, are much higher than
could be physically achieved. More likely are the numbers calculated for copy number by
samples extracted by spin-prep; 1.14 and 1.8, as these place the result within the l-2copies
per cell range, known to be the copy number of plasmids possessing the F-factor replicon
(Frame and Bishop, 1971; Burke et al., 1987; Monaco and Larin, 1994; Sinnett et al.,
1998). Although not conclusive proof of the accuracy of certain techniques, copy number
analysis can provide a good estimate of whether the result is likely or not. Further
evidence supporting the inaccuracy of the IPA technique, and relative accuracy of the
spin-prep technique, was provided by control studies.
4.3.3 Control studies using DH1 Op
The assumption that the spin-prep processing technique produces the most likely result of
plasmid specific yield was backed up by control studies. Figure 4-8 details the results of
yield traces, produced using an identical methodology and extraction regime as before, but
on triplicate cultures of DH10P parental strain grown on SuperBroth. From Figure 4-8A, it
can be appreciated that the specific yield of genomic DNA over the course of the
fermentations, shows a remarkably similar trace to that presented by the yield curves for
the IPA precipitated clarified lysates of samples extracted from the 116kb fermentations. It
would seem that the results presented as plasmid specific yields in Figure 4-6A and C are
heavily contaminated by residual genomic DNA, meaning that the traces are not at all
indicative of the actual plasmid yields. The contamination also goes someway to explain
the variation in IPA results as being due to fluctuations in the mass of genomic DNA
removed by the individual lysis operations conducted on the samples. It is not known what
form the contamination takes, it is either ssDNA or dsDNA. What can be said is that
PicoGreen is unable to differentiate between the plasmid p5176 and this contaminant.
Contamination is somewhat expected, due to the crude nature of the IPA processing
technique. Although alkaline lysis will result in the removal of large amounts of genomic
DNA, some small fragments obviously remain in the clarified lysate and are co
precipitated together with the plasmid in the IPA precipitation step.
Thomas Burt 145

4. Analytical Development
2002001 2 -12 R Superbroth -spii
180 -160-spin-prep16010 -120140
8 120II%O
-201006
-154 60I -10
402
0-1 0 1 2 3 4 5 6 7 8 9 10 11 120 1 2 3 4 5 6 7 8 9 10 11 12
Time (hrs) T,rne 0 * 4
Figure 4-8 Chart depicting the progression of wet cell weight (gL-1) and specific gDNA yield (pg gDNA/ gWCW) through triplicate shake-flask fermentations of DHlOp (parental] on complex SuperBroth.2L shake-flasks (500mL media) were inoculated with 50 OD units and incubated in a shaking incubator (230rpm) at 37 * C. Hourly lmL samples of broth were taken, centrifuged and the DNA extracted from the cell pellets using both Qiagen spin-prep extraction and IPA precipitation of clarified lysate. The DNA containing streams from both procedures were then quantified by PicoGreen against a >.DNA standard curve in order to provide a measure of the background reading produced by the co-purification of gDNA.[A; SuperBroth - IPA precipitation / B; SuperBroth - Qiagen spin-prep]
Figure 4-8B displays the results of background genomic DNA as measured by PicoGreen
on spin-preps eluents of DHlOp parental fermentation samples. The background level of
genomic DNA contamination is far reduced compared to IPA precipitation. Indeed at
harvest the spin-prep samples recorded an average of ~5pgg_1 WCW as opposed to the
same figure for the IPA clarified lysates being ~60pgg'WCW genomic DNA. This is
confirmed by the manufacturer’s literature (Qiagen, 2005) which claims the protocol is
able to promote the elution of small dsDNA fragments over plasmid DNA by the salt
content and pH of the wash buffers employed during the washing stages of the column
(Qiagen, 2005).
4.3.4 Calculating the clearance of genomic DNA by the two extraction regimes
The profiles of the progression of genomic DNA during the fermentations are quite
illuminating. The genomic DNA yield trace shown in Figure 4-8B describes a reduction in
genomic DNA specific yield as the course of the fermentation progresses. This should be
the case, since a typical cell during early log phase of growth will be doubling at a
maximum rate, and so will most probably have greater than 1 genome copy of DNA,
meaning specific yield would be at a maximum. As growth slows, in late log phase and
early stationary phase, less of the cell population will be doubling and so DNA specific
yield begins to decrease. Eventually, at stationary phase, growth stops and the specific
Thomas Burt 146

4. Analytical Development
yield would become constant, because the amount of genomic DNA in each cell would
stand at 1 copy per cell. This means using similar copy number analysis to as used earlier,
it is possible to estimate the clearance of genomic DNA by the two extraction techniques
by calculating the clearance supposing cells at harvest possessed 1 genome copy. The
estimation is shown in Figure 4-9.
The result described in the calculation below is that the majority of genomic DNA is
removed by both techniques. However, the spin-prep methodology is capable of clearing
an additional -4% of gDNA mass. Nominally, this figure seems small but when put in
context by outlining that the total plasmid DNA for purification consists of ~2 copies of a
116kb plasmid (232kb), an amount equal to -5% of the genome mass. Consequently, in a
typical IPA processed sample it can be expected that there was a 1:1 ratio of plasmid mass
to contaminating genomic DNA mass, meaning the results obtained for pDNA yield are
approximately double the actual amount.
Volumetric gDNA yield ( / ig L 1) at harvest =48.1 [spin - prep]= 575.1 [IPA pptn]
OD at harvest =5.2
= 2.6x10 9 cells
1 genome copy mass (g) = 4.669Mbp
= [(4.7x10 6 x 660 )x 1.66x10 24 ]
= 5.15x10 '15 g / copy
Mass of genomic DNA in 1ml at harvest( f i g ) =(2.6x10 9)x (5.15x10 15)= 13.4 f i g
Mass of gDNA recovered from 1ml by spin -prep ( f i g) = 0.048 f i g
Mass of gDNA recovered from 1ml by IPA pptn ( j u g ) = 0.575 f i g
. u f 13-4 -0.048 1AA% rem oval by spin - prep =1 — — ------- 1x100
= 99.64%
% rem oval by IPA pptn = f ^ jxlOO
= 95.7%
Figure 4-9 Calculation to determine the mass of genomic DNA cleared by IPA precipitation and spin-prep assuming each cell has 1 genome equivalent at harvest.
Thomas Burt 147

4. Analytical Development
4.3.5 Validation of the PicoGreen assay for use on spin-prep eluents
One conclusion for the yield analysis is that the results for plasmid yield progression are
more precisely described by the spin-prep results. However, although precise, it is not
known definitively how accurate the results are. Copy-number analysis suggests that the
figures are accurate but two unknowns remain. For the figures to be accurate, it has been
assumed all the plasmid is recovered by spin-prep processing. Secondly, there is a
disparity over the calibration standard employed. Typically, when using PicoGreen the
unknown fluorescence is calibrated against a signal of known concentration. The
calibration curve is made up from the DNA species being quantified, such that when
measuring the concentration of p5176 plasmid in samples, the standard curve should be
composed of known concentrations of the same plasmid. In this study, the calibration
standard was composed of known concentration of lambda DNA, differing from plasmid
DNA in that it is linear and so displays no supercoiling. This fact could result in the yield
data plotted in Figure 4-6B and D being inaccurate.
4.3.5.1 Plasmid recovery over a spin-prep column
The effect of the first unknown; the efficiency by which large plasmids could be purified
by spin-preps, was quantified by recording the percentage recovery of various plasmid
solutions across the column step of a Qiagen spin-prep. Figure 4-10 displays the results of
the recovery trials. The irregularity with this study was that spin-preps are designed to
recover plasmid from clarified lysate and not TE buffer. However, this effect was decided
to be minimal and the results back this up. The graph displays the percentage recovery of
the small plasmid pSVp against the same for the large construct, p5176. Although
recovery for both plasmids is quite poor at low concentrations, (deemed mainly to be due
to assay error) the recoveries of the two constructs display a similar profile of between 75-
90%. The pSVp solutions demonstrate only a slightly higher level of recovery. In
conclusion, using spin-prep purification recovers the majority of large plasmid DNA
present in the samples, and hence the results presented in Figure 4-6 B and D can be taken
as being an accurate reflection of the process output.
Thomas Burt 148

% R
ecov
ery
4. Analytical Development
100 100
p5176 (116kb) pSVp (6.9kb)
9 0 - - 9 0
8 0 - - 8 0
7 0 - - 7 0
6 0 - - 6 0
0 .0 0.5 1.0 1.5 2.0 2.5 3.0 3 .5 4.0 4 .5 5.0 5.5
Figure 4-10 Figure displaying the recovery of two plasmid varieties over triplicate spin-prep column purification. lmL volumes of known plasmid concentration (quantified by NanoDrop) in TE buffer were loaded on to the matrix of a spin-prep column and incubated at room temperature for five mins. The columns were then washed with the requisite buffers as described by the spin-prep protocol. The eluted plasmid was then quantified by NanoDrop absorbance and the percentage recovery calculated.
DNA mass loaded (jig)
4.3.5.2 Standard curve fo r PicoGreen analysis o f spin-prep eluents
The second unknown about the accuracy of PicoGreen analysis on spin-prep purified
samples, concerns the disparity between the standard curve material and the samples being
analysed. In this study the samples were calibrated against a linear DNA standard curve.
As explained earlier, it had been reported that the fluorescence signal produced by
PicoGreen is dependent upon the topology of the DNA. At the stage of conducting these
investigations, it was believed that the plasmids in the p5176 samples were supercoiled
and as such would not be well represented by a linear DNA standard curve. It was
perceived that further studies were needed to confirm the accuracy of PicoGreen on spin-
prep purified samples, by calibration against a standard curve composed of p5176 plasmid.
4.3.6 Conclusions
It has to be concluded that PicoGreen quantification of IPA clarified lysates is not an
accurate method of determining the concentration of large plasmid in the sample. The
reason determined for this is that the signal produced by the plasmid is heavily corrupted
by the presence of contaminating DNA of either single-stranded of double-stranded form.
This technique can and does form the basis for reliable quantification when the
concentration of the plasmid in the sample is high, as with high-copy number plasmids,
but due to the similar quantities of plasmid to contaminant gDNA in the samples of large
plasmids, the results cannot be trusted. It is not an issue with the PicoGreen either, as the
Thomas Burt 149

4. Analytical Development
fluorophore does demonstrate a high specificity for dsDNA over contaminants. The issue
remains that since the level of contaminants is at a comparable concentration to the
plasmid product, the results will be misleading. Figure 4-11 attempts to highlight the
problem.
dsDNA
ssDNAdsDNA
Wavelength (nm)500 550 600
Wavelength (nm)
Figure 4-11 Figure attempting to illustrate how contamination issues can corrupt the signal produced when assaying large, low-copy number plasmids. Figure A demonstrates a hypothetical fluorescence trace when assaying a high-copy number plasmid. The result of the combined fluorescence result can be trusted since the effect of the contaminants on the overall result is small. However, when the ratio of contaminants to plasmid is high as in B. the contributory effect of the contaminants cannot be ignored since it forms a large part of the overall signal.
PicoGreen analysis of spin-prep purified samples did show a higher degree of precision. It
was determined that the spin-prep process removed a higher quantity of contaminating
genomic DNA (99.64%), sufficient to believe that only small traces of contaminants
remain. However, issues still surround the accuracy of this technique. Studies revealed that
the majority of plasmid is purified when using spin-prep processing. The problem lay in
the standard used for PicoGreen analysis and more specifically the topology it displayed.
Thomas Burt 150

4. Analytical Development
4.4 Comparing Plasmid Quantification by Absorbance and PicoGreen
4.4.1 Outline
This section compares two methods of quantifying plasmid samples extracted as time-
points during 4L fermentations. Fermentations of the small, high-copy plasmid pSVp and
the large plasmid p5176 were conducted. Duplicate hourly broth samples were taken
during triplicate 4L fermentations and were processed by Qiagen spin-prep. From previous
studies it had been established that Qiagen spin-preps are the most reliable way of
removing the majority of the contaminants found in the clarified lysate and that they
recover the majority of plasmid.
These experiments were designed to determine the best method of determining the plasmid
yields of the of the spin-prep eluents. These would be quantified by simple absorbance and
by PicoGreen. The difference in this study to the last, would be that the standard used for
the PicoGreen assay would be composed of the plasmid under investigation, purified by
Qiagen maxi-prep. As such, the topology of the plasmid standard should be identical to
that of the native plasmid. Referring to Figure 4-1 this study will compare quantification of
streams G and F.
4.4.2 Methodology
Samples taken during the 4L fermentations were processed by Qiagen spin-prep. Duplicate
samples from each fermentation at each time-point were processed. The eluted plasmid
containing streams were quantified by two means; Absorbance (A260) and PicoGreen.
Absorbance measurements were recorded using the method explained in (2.5.9) and the
PicoGreen method followed that described in (2.5.10). There was one key difference with
this set of studies. Up until this point, PicoGreen measurements on spin-prep eluents, had
been made by calibrating against a linear ADNA standard curve. It was understood at the
time that this could lead to discrepancies in the returned values, due to differences in the
topology of plasmid and linear DNA. Consequently, in these studies, the plasmid
containing streams were calibrated against known concentrations of the same plasmid
purified by maxi-prep (i.e. p5176 standards for p5176 samples). The gentler processing
regime of maxi-preps ensured that the plasmid standards existed in a form closely
matching their native topology. Samples purified from the parental fermentations
Thomas Burt 151

4. Analytical Development
continued to be calibrated against XDNA. Figure 4-12 and Table 4-4 detail the results of
the yield investigations.
Table 4-4 Table detailing the key measurables taken from investigations into the plasmid yields of triplicate fermentations of DHl|pSVpj and DHl|p5176J. The yield results were obtained by PicoGreen and absorbance (A260) readings recorded from duplicate samples through the course of the fermentations and processed byy i a g v u a p u i - p i c p
StrainQuantificationmethod
3 •
Mean% CV
Coefficient of correlation
Final mean specific yield (Mgg’WCW)
% Average deviation
from mean
Final mean volumetric
j ie ld (m gL!)
Final copy number
DH1 IpSVpl Absorbance 16.14
0.883
320±35.7 31.6 25.65±2.86 168±18.8
DH1 IpSVP) PicoGreen 12.06 351±39.5 24.3 28.1±3.17 185±20.9
DH1 |p5176] Absorbance 17.72
0.572
44.7±6.8 23.6 3.93±0.6 1.2±0.18
DH1 [p5176] PicoGreen 16.06 205.3±49.8 24.2 18.05±4.38 5.4±1.3
4.4.3 Comparing the results of PicoGreen and Absorbance for pSVp
The results from the pSVp fermentations in Figure 4-12A and B, demonstrate a high
degree of comparability between the yield profiles from both methods of quantification.
The mean %CV records the average % coefficient of variation between each duplicate
sample, from each time-point, from each of the three fermentations. The values produced
suggest that the PicoGreen method, with a lower value of 12% is the more precise of the
two assaying methods. This contradicts (Haque et al., 2003) who maintained that due to
the higher complexity of the PicoGreen assay, the %CV was higher than for absorbance.
Figure 4-12F correlates the mean values for specific yield determined by each method for
each time point. For the pSVp results, the coefficient of correlation is high at 0.883,
suggesting good correlation between the results produced by absorbance and those of
PicoGreen. The results of linear regression through the axis, reveals that quantification by
absorbance places the value for specific yield roughly 6% higher than PicoGreen. Because
absorbance has been demonstrated to be the more error-prone technique, it is assumed that
PicoGreen quantification is also more accurate.
It is believed that PicoGreen would be more likely to record a more accurate value, since
the absorbance readings would be affected by contaminating protein in the recovered
Thomas Burt 152

4. Analytical Development
< a
550
500
450
400
350
3X
£ ° 250I O* Z 200
£ f t 150
» W inn10050
600 600
550- -550
- 500ZUJ3-I
450- -450
400UJa.uj
-150
zoUJa2
- 100
-50
5 7 80 1 2 3 4 6 9
Time (hrs)
300
t a
Time (hrs)
580
Time (hrs)
600 600
■ pSVp O p5176
550 550
500 500
450 450
400 400
350 350m» 3.64 ±0.299
300
250 250m • 0.9461 0.046200
150 150
100
0 50 100 150 200 250 300 350 400
Mean Specific Plasmid Yield (Absorbance)
Z 3 O a z -<V) 5 2 a
-550
Figure 4-12 : Chart describing the progression of specific plasmid yield (pg pDNA/ gWCW) throughout triplicate 4L 37°C fermentations of E.coli DH1 parental, IpSVp (6.9kb)] and [p5176 (116kb)|. Duplicate 50D-unit equivalent volumes of broth were taken at each time point and centrifuged. The resultant cell pellets from each of the fermentations were then processed using Qiagen spin-preps. The plasmid recovered from the spin-preps was then quantified by both absorbance and PicoGreen. For PicoGreen the appropriate standard was employed, either; maxi-prep purified pSVp (6.9kb)/ p5176 (116kb) respectively or XDNA for parental extracts. [A; pSVp (6.9kb)-Absorbance / B; pSVp (6.9kb)-PicoGreen / C; p5176 (116kb)- Absorbance / D; p5176 (116kb)- PicoGreen /E; Parental-PicoGreen (Background) / F; Correlating PicoGreen and absorbance methods for the two plasmid constructs).
Thomas Burt 153

4. Analytical Development
samples, whereas the PicoGreen would not. (Haque et al, 2003) report that absorbance for
plasmid quantification is more accurate than PicoGreen, due to the increased complexity
of the fluorescence assay. However, in their study absorbance was conducted on ultra-pure
samples of plasmid and so contaminating protein would not be present. In this study, it is
believed that while the vast majority of protein is removed by spin-prep processing, some
trace amounts do remain. The levels of protein remaining would vary between individual
spin-preps, explaining why absorbance readings taken in this study had a higher %CV than
PicoGreen, which would be unaffected by residual protein. Ultimately, due to the
relatively high concentration of pSVp plasmid in the eluents, the estimated 6% increase
due to protein reported by absorbance, is acceptably small. Both PicoGreen and
Absorbance methods would be affected by trace amounts of genomic DNA but as Figure
4-12E shows the level of host genomic DNA contamination at harvest represents -1% of
total DNA under analysis.
4.4.4 Comparing the results of PicoGreen and Absorbance for p5176
Turning attention to the specific yield progression of the large plasmid; p5176, plotted in
Figure 4-12C and D, shows how the values placed on specific yield progression by the
PicoGreen and Absorbance differ widely. Quantification by absorbance produced a
specific yield progression which varied between SO-lOOpgg^WCW over the course of the
fermentation. This result for p5176 was in the range of previous studies, using PicoGreen
on spin-prep eluents, which placed the specific yield at ~50pgg'1WCW, but the results in
this study show a lot more intra-assay variation. Contrastingly, samples quantified by
PicoGreen display much higher specific yields, ranging between lSO^Opgg^WCW,
roughly a 3-3.5 fold increase on the absorbance figures. The figures for mean %CV place
the PicoGreen results as the more precise, recording a value of 16%. This value for %CV
is higher than the same value for PicoGreen on pSVp eluents, but it is lower than the mean
%CV recorded for absorbance on p5176 eluents. Strangely, it seemed that the more precise
technique was recording values for plasmid yield three times higher than had been
previously encountered.
The striking difference between the values estimated for specific yield by the two methods
is shown in Figure 4-12F, which plots the values produced for each time point by the two
methods against each other. The correlation between the two sets is low at 0.572 making
linear regression uneasy. However, the value produced suggests that indeed PicoGreen
quantification produced a value for specific yield on average 3.6 fold higher than
Thomas Burt 154

4. Analytical Development
absorbance. Copy number analysis was performed to give an estimate about which
technique was producing a value closest to that assumed to be the case. i.e. 1-2 copies per
cell. Shown in Table 4-4 are the values for harvest copy number estimated by the two
techniques. The analysis suggests that the absorbance method is the more accurate since it
places copy number in the 1-2 copy range, whereas PicoGreen places the figure much
higher at 5-6 copies per cell.
The situation was clarified when the standard curves used for PicoGreen were analysed, as
plotted in Figure 4-13A. From the graph, the difference in the fluorescence produced per
unit mass of DNA can be seen to vary depending on the DNA used. Comparing the linear
aDNA standard curve to the other two curves demonstrates that linear DNA produces a
6.5-fold stronger fluorescence signal than pSVp and a 2.6-fold stronger signal than p5176.
(Singer et a l, 1997) reported similar differences when studying the fluorescence of
supercoiled and linear DNA species and reasoned it was due to conformational differences
in the DNA. Essentially, the increased supercoiling of DNA makes it increasingly difficult
for the PicoGreen fluorophore to intercalate into the DNA. The results above suggest that
linear DNA is capable of binding over 6-fold more molecules of PicoGreen per kilobase of
DNA than the same length of supercoiled pSVp DNA. Interestingly, p5176 DNA is able to
70-
60-
50-
sr-O 40xDw 30 u.
20 -
1 0 -
0 -
0 10 20 30 40
DNA m a ss in well (ng)□ Maxi-prep purified pSVp [R^-0.968]O Linear IDNA [R2-0.998]A Maxi-prep purified p5176 [FT-0.996]
------- 1------
A-------i--------1--------i------- 1--------i--------1-------
1XDNA m=3230 (100%)
B 'p5176 DNA m «1223 (38%)
I t
pSVp DNA m=502 (15%)
•4 .................... } '
__ - r ' " -
t --------1-------- 1-------- "1-----------------r
600
550
500
450
400
-150 C 2 S
oSo C 4J z
-100 > m c %
150
100
50
070 2 3 5 6 81 4 9
Figure 4-13 Chart A shows the calibration curves used in PicoGreen quantification. Fluorescence was recorded for each DNA species in triplicate at concentrations of 10.005/0.05/0.2/0.5/2/5/20/40 ng per well]. The gradients produced by linear regression are shown on the graph. Chart B records the values produced for mean specific plasmid yield for the p5176 fermentations when the linear XDNA standard curve was used for calibration.
Thomas Burt 155

4. Analytical Development
bind 2.5 fold more DNA than the same mass of pSVp, suggesting p5176 samples
displayed less supercoiling than pSVp, a fact supported by the increased plasmid size
causing an increased probability of plasmid shear during standard preparation.
This analysis suggests that for accurate estimation of plasmid yield using the PicoGreen
assay, requires that the standard employed must be highly representative, in terms of
topology, of the samples under analysis. By such logic, it was reasoned that the standard
curve used in this study was representative for the pSVp cultures and so reliable specific
yields, which correlated well with the absorbance readings, were produced. However, the
same could not be said for the p5176 fermentations, where it was believed the standard
curve did not closely mimic the samples being analysed.
This belief was evidenced by earlier studies, as shown in (Figure 3-6), where the
differences between the relative topologies displayed by the IP A/maxi-prep and the spin-
prep purified samples were striking. The effect of the shear induced by spin-prepping and
the resultant over-estimation by PicoGreen was only appreciated at this stage.
Consequently, it was realised that purifying p5176 samples by spin-prep and then
assuming that their topology matched that of its native state was wrong. This error only
seemed to apply to the large constructs, since the PicoGreen values for the pSVp did show
good comparability. The smaller size of pSVp molecule suggests that it is minimally
affected by spin-prep processing. Figure 4-14 shows how the absorbance and PicoGreen
measurements align for pSVp but not p5176 when the volumetric yields of the triplicate
fermentations are plotted.
Thomas Burt 156

4. Analytical Development
35' 35
30 • 30
25 25
20
15 15
10 10
So.
0 1 6 7 82 3 4 5 9 0 1 2 3 4 5 6 7 8 9
rII
3530-
25-
20 .
15-
10.
50
0 1 2 3 4 5 6 7 8 9
353025
20
10S.
o.
35
3025
2015
10 -
5.
0.
2 3 4 5 6 7 6 90
10 s
I5 *J-
35
30.
25
2016
10-
5-
0.
3 4 5 6 7 6 90 1 2
Quantification by PtcoGraan — Quantification by Absorbance
Figure 4-14 Figure contrasting the differing estimations of volumetric yield produced by quantifying plasmid by PicoGreen and Absorbance (A260). Figures A/B/C compare the values for volumetric yields produced during 4L fermentations of DH1 pSVp (6.9kb) determined by both PicoGreen (using maxi-prep purified pSV'P for the standard) and Absorbance on Qiagen spin-prep eluents. Figures D/E/F contrast the volumetric yields determined by absorbance and PicoGreen (using maxi-prep purified p5176 (116kb) for the standard) for the 4L fermentations of DH1 p5176 (116kb). In all cases plasmid quantification (either by absorbance or PicoGreen) was conducted on Qiagen spin-prep purified material generated from (5 OD unit volume equivalent) cell pellets collected during 4L fermentations
As an estimate, the fluorescence values produced by the spin-prep eluents of the p5176
plasmid were calibrated against the standard curve for A.DNA. and the results plotted in
Figure 4-13B. This analysis is not entirely accurate, since for PicoGreen to be accurate a
standard curve is included on each assay plate as the level of fluorescence will vary
between plates. However, despite the associated error, the yield profile produced suggests
that the X.DNA curve does form a more representative standard, since the yield profile
more closely resembles the values estimated by absorbance. This realisation, that using a
>T)NA standard curve with spin-prep purified p5176, produced a more accurate estimation
of yield validated previous studies which employed the same standard for quantification.
Thomas Burt 157

4. Analytical Development
4.4.5 Quantification of Qiagen spin-prep purified p5176 (116kb) by Absorbance
This study has shown that quantification by PicoGreen is complicated by the fact that the
yield returned is highly dependent on the standard employed and the topology displayed
by the plasmid molecule. However, absorbance quantification of p5176 is also fraught
with problems, as in this study the A260/A280 ratios were often below 1.8, indicating
contamination by residual protein in the Qiagen eluted fractions. This is despite the spin-
prep method using an extra washing step to remove protein. On average, with the pSV{3
samples, absorbance produced an acceptable 6% increase in absorbance which could be
attributed to protein. Unfortunately, due to the lower specific yields, when eluted from the
spin-prep column the p5176 plasmid would have been at 6-7fold lower concentration than
pSVp. If a linear relationship is assumed between the protein concentration and the effect
it has on absorbance readings, then the effect of residual protein on the absorbance
readings obtained for p5176, when assaying the Qiagen eluted fractions, would be 30-
40%. This error would explain the high deviation from the average recorded by the
absorbance readings and the high mean %CV. As seen before with the PicoGreen on IPA
precipitated samples, the inaccuracy is a result of high contaminant to plasmid ratio.
Unfortunately, background residual contamination will always be present in the spin-prep
purified samples, making the situation difficult to improve upon.
4.4.6 PicoGreen quantification on clarified lysates
As described previously, absorbance on spin-prep purified samples has been shown to be
an accurate and precise method of quantifying high-copy number, small plasmids.
However, its employment for use with large, low-copy number plasmids was found to be
hampered by the corrupting influence of trace amounts of residual protein. Additionally,
using PicoGreen quantification on spin-prep eluents has been shown to be highly
dependent on the topology of the plasmid used for calibration. It was found that the
topology of the small plasmid pSV(3, in the spin-prep eluent, did not differ widely from the
maxi-prep standard, the same could not be said for the large plasmid.
In response to these issues, samples taken from both the pSV(3 and p5176 fermentations
were lysed in the normal fashion and attempts made to determine the plasmid
concentration directly in the clarified lysate. This technique, it was hoped, would describe
the plasmid in a more native state. Referring to Figure 4-1 this corresponds to stream A.
Thomas Burt 158

4. Analytical Development
The plasmid samples were calibrated against a standard curve composed of maxi-prep purified plasmid. The results are outlined in Figure 4-15.
From the graph it can be appreciated that the results for pSVp, as determined by spin-prep on clarified lysate and directly on clarified lysate, correlate well. Linear regression through the origin reveals that PicoGreen directly on clarified lysate produced -60% higher reading than on spin-prep eluents. The reason for this increase will be down to two reasons. Firstly, there will have existed higher levels of bacterial genomic DNA in the clarified lysate, the presence of this linear dsDNA contamination would be expected to produce an increased fluorescence signal, the effect of which would have been exacerbated by the calibration against a pure, supercoiled standard. Secondly, as shown in, spin- prepping does result in 10-15% loss of plasmid. This plasmid would still be present in the clarified lysate, partly explaining the increased specific yield. As a result of this analysis, it has to be assumed that PicoGreen on clarified lysate places an upper limit on pSVp yield with PicoGreen on spin-prep eluents placing a lower limit on the yield.
Turning attention to the progression of specific yield of the culture bearing the large construct p5176 as shown in Figure 4-15B. The results of PicoGreen quantification on the clarified lysate of hourly cell pellets taken from the p5176 fermentations revealed a great
700 700 400
pSVp P5176350 -350-600600
-300-500500
-250400 400
200 200■B. i 300 ? ° 150150
-200200100100
-100100
0500 600 700100 200 300 0 2 3 5 7 8 91 4 6
Specific Plasmid Yield Time (hrs)by PicoGreen on Spin-prep eluents
Figure 4-15 Graph A correlates the mean specific yield calculated by PicoGreen on spin-prep purified pSVp against the values produced from the same time-point in the fermentation determined by PicoGreen on clarified lysates. A point has been masked to improve the correlation. Graph B shows the calculated specific yields of the p5176 fermentations as determined by PicoGreen on clarified lysates.
Thomas Burt 159

4. Analytical Development
deal of variation, with the average %CV recorded at 38%. Such lack of precision of the
results is mirrored by the assay’s poor accuracy. The results from the fermentation
recorded by absorbance (Figure 4-12C) are taken as the most accurate in explaining the
progression of p5176 yield during the fermentations. The absorbance values, although
probably adversely affected by residual protein, place the plasmid yield at 50-
lOOpgg^WCW. Using PicoGreen quantification on clarified lysates it can be seen that the
values ranged from 100-250pgg'1WCW. As such, it is believed that these results do not
accurately describe the yield progression.
Referring back to the results of PicoGreen on IPA precipitated clarified lysates shown in
Figure 4-6 suggests that similar contamination effects are being witnessed by performing
PicoGreen on clarified lysates. As reported with quantification of IPA lysates the results
were heavily contaminated by residual bacterial genomic DNA. The situation is made
worse in this scenario since in this study the lysates were calibrated against a standard
curve composed of supercoiled p5176. The net result of this is that the residual linear
DNA will bind more fluorophore molecules giving a higher estimate of plasmid DNA.
Whilst the residual DNA effect impacts on all quantification of plasmids by this method,
partly explaining the increase witnessed for the pSVp fermentations, the effect becomes
more noticeable when the plasmid yield is low, as with p5176. The results are
overestimated by such a large extent that the contributory effect of contamination cannot
be ignored. The large impact of the contaminants on the final result also explains the low
precision of this assay (%CV =38%), a fact attributable to variations in the amount of
bacterial genomic DNA remaining following lysis which would show large sample
variation.
4.4.7 Conclusions
These investigations were important not only in gaining information regarding the
progression of plasmid yield during fermentations, but also in discerning the accuracy of
the various methods employed to quantify plasmids. It has been demonstrated that many of
the techniques employed to quantify small, high-copy plasmids are not applicable for
quantifying large, low-copy number plasmids. The main cause of the problems is the
contaminant to plasmid ratio. High-copy plasmids exist at high enough concentration in
the streams used for analysis that the impact of background signals produced by
contaminants has little impact on the accuracy of the results. However, with the drop in
Thomas Burt 160

4. Analytical Development
plasmid concentration witnessed when using low-copy number plasmids, the impact of the contaminants on the overall value becomes too large to be ignored.
Table 4-5 highlights the problems associated with the application of various quantification methods for determination of plasmid concentration when low-copy plasmids are being assayed. The asterisked methods can and have been applied for the accurate quantification of small, high-copy number plasmids.
Table 4-5 Table displaying the extraction and quantification combinations used so far and their relative suitability for monitoring yield progression of the large plasmid series. Asterisks denominate methods which would be suitable for small, high-cops number plasmids._____________________________________________QUANTIFICATIONMETHOD ABSORBANCE PICOGREEN
IUSING LINEAR XDNA STANDARD]
PICOGREEN [USING MAXI-PREP
PLASMID STANDARD]EXTRACTIONMETHOD
IA26o!
IPA precipitated clarified lysate OR directly on Clarified Lysate
Not Possible: sample heavily contaminated by protein and gDNA
Inaccurate and imprecise:BAC remains supercoiled meaning plasmid yield would be underestimated. However, reading masked by residual gDNA contamination
Inaccurate and imprecise:overestimation of plasmid yield due to background gDNA fluorescence. *
Qiagen spin-prep
Roughly accurate: most plasmid eluted but due to the low elution concentration, small traces o f protein can lead to large errors in absorbance readings.*
Accurate and precise;spin-prep removes the most contaminants and majority o f plasmid eluted. Shear forces remove all supercoiling meaning standard and sample share the same topology.
Inaccurate; large difference between plasmid and standard topology means plasmid yield is overestimated.*
From the table it can be appreciated that absorbance on either clarified lysate or IPA
precipitated lysates is not a feasible technique, in any case, due to the solvent and high contaminant levels. PicoGreen quantification can be employed to quantify all of the aforementioned streams when high-copy number plasmids are being quantified, since the overall level of the contaminants is not sufficient to corrupt the final reading. However, this is not the case with low-copy number plasmids.
Again, spin-prep purification of plasmids followed by absorbance quantification, is a perfectly acceptable technique for quantification of high-copy number plasmids. In this study it was established that the trace levels of protein would lead to an acceptable 6% overestimation of plasmid yield. However, due to the lower plasmid concentration in the spin-prep eluents of low-copy plasmids, the residual levels of protein were found to
produce A260/A280 ratios below the acceptable margin of 1.8. As a result, the use of this
Thomas Burt 161

4. Analytical Development
technique for quantifying low-copy plasmids was accompanied by a high error level and
the certain possibility that the residual protein increased the final estimate placed upon
plasmid yield.
An interesting effect was reported for the quantification of spin-prep eluents using
PicoGreen. From standard curve data, it was shown that the topology of the DNA affected
the fluorescence signal produced, and as such it was deemed that the topology of the
standard had to mimic the sample under investigation very closely, in order to be confident
about the accuracy of the result. For small plasmids, the action of spin-prepping did not
have a detrimental effect on the plasmid topology, meaning that spin-prep purified samples
could be accurately calibrated against a standard curve composed of maxi-prep material.
However, it was deemed that the action of spin-prepping on the large plasmid; p5176, did
cause the loss of supercoiling such that calibrating the samples against the supercoiled
maxi-prep standard led to an overestimation of plasmid yield. It was determined that the
spin-prep samples could be accurately quantified by calibrating the samples against a
standard curve composed of linear XDNA. This method overcame the problem with
residual protein in the eluents and also accurately mimicked the DNA topology of the
plasmid in the eluent.
The final technique of accurately quantifying large plasmids by spin-prepping to remove
the majority of contaminants, followed by PicoGreen detection and calibration against a
linear standard curve could be employed. The drawback with this technique is that the
spin-prepping technique involves exacting a physical change upon the plasmid molecule
and assumes that the spin-prep does this reliably and completely. To make this assumption
makes it likely for errors to be overlooked and from an industrial perspective, such an
assay would be unlikely to be validated. A second consideration concerns one of the main
aims of this project, which is the creation of descriptive plasmid balance over the process.
This will involve quantifying the plasmid through fermentation and all streams of the
purification process. During this it is expected that the topology of the plasmid, and the
contaminant profile of the solution it is in, will vary a great deal. As such, it is important
that an analytical technique be found that is not affected by alterations in plasmid
topology, contaminant concentration or the buffer environment. With this in mind it was
decided to investigate the use of HPLC for plasmid quantification.
Thomas Burt 162

4. Analytical Development
4.5 Plasmid quantification by HPLC
4.5.1 Introduction
Separation of biological molecules by High Performance Liquid Chromatography (HPLC)
is long established. Commonly used for analytical studies on biological compounds, it
enables effective separation of different molecular species in a sample by one
chromatographic step, so allowing their analysis and quantification. The high degree of
separation and high purity that can be achieved is produced due to the high theoretical
plate number of HPLC columns which, depending on column length, is in the order of 105.
This high plate number is created by virtue of the small particle size used for the stationary
phase (which is commonly between 3-5Opm) combined with the large aspect ratio of
HPLC columns. As with traditional column chromatography, HPLC can be operated in
different modes i.e. hydrophobic interaction, gel filtration and ion-exchange, by employing
specific column matrices which enable its use for separating a wide variety of compounds.
The small particle size is the cause of the large pressure drops encountered during HPLC
operation, which again depend on column length, but are often over lOOOpsi.
The use of HPLC for plasmid analysis has been reported in the literature. The advantages
of using this analytical technique for quantifying plasmid in clarified lysate is that it many
cases it can allow separation of plasmid DNA from contaminating protein, RNA and linear
DNA such that only the plasmid is quantified. Indeed, the technique has even been
reported to enable separation of the different topoisomers of plasmid DNA, allowing the
obtainment of detailed information on the plasmid quantity and quality (Kapp and
Langowski, 1992). It is this ability to separate the plasmids away from the contaminants
that led to the adoption of this technique for use in this project, as previous investigations
had been hampered by misleading quantification due to the high ratio of contaminants to
plasmid in the streams used for analysis. Four modes of operation have been reported for
plasmid separation, as well as mixed mode.
4.5.1.1 Hydrophobic Interaction HPLC
Hydrophobic Interaction HPLC (HIC-HPLC) has been applied successfully for
quantifying total plasmid in clarified lysates. The technique takes advantage of the more
hydrophobic character of nucleic acid impurities (RNA, denatured genomic DNA,
oligonucleotides and denatured plasmid forms) when compared with double-stranded
Thomas Burt 163

4. Analytical Development
plasmid DNA. The advantage of this technique is that no prior removal of RNA is
required. Diogo et al. (2003) employed HIC, using Sepharose CL-6B gel derivatized with
1,4-butanediol diglycidyl ether, to achieve base-line separation of plasmid DNA. The
precision of the technique was reported to be 2%, and it was found capable of accurately
quantifying pDNA in heavily contaminated samples, where plasmid was <5% w/w and at
concentration levels down to lpgmL'1 (Diogo et al., 2003). The technique is also reported
to be capable of separating of open-circular and supercoiled plasmid forms (Diogo et al.,
1999; Iuliano et al., 2002; Onishi et al., 1993). However, this degree of selectivity can
only be achieved with longer running times of about 40 minutes.
4.5.1.2 Size Exclusion HPLC
Size-exclusion HPLC has also been demonstrated to separate plasmid molecules from
clarified lysate. It is capable of separating large Mr molecules (plasmid isoforms/ gDNA)
away from smaller Mr species (oligonucleotides/ RNA/ Proteins). The plasmid containing
peak is Gaussian in form, with the leading edge containing the OC/multimers/ large
gDNA, whilst the smaller size CCC form is found in the trailing edge. Traditional
matrices were not effective since the small pore sizes did not allow the penetration of the
large plasmid molecules. Introduction of rigid and highly porous composite
polyacrylamide/dextran stationary phases has alleviated the problem. Despite the
drawback, plasmid isolation has been reported using TSK-Gel G6000PW which separated
plasmid from clarified lysate by size exclusion alone. However, there are no reports of this
method being able to resolve the different topoisomers. The majority of methods using
size exclusion HPLC do so in mixed mode.
4.5.1.3 Reverse Phase HPLC
The use of this HPLC method has been reported to separate different plasmid topoisomers.
The retention of nucleic acids on the column is attributed to hydrophobic interactions
between the aromatic hydrophobic bases and the hydrophobic ligands of the matrix. Bound
molecules are eluted in order of increasing hydrophobicity, a property which is defined by
characteristics such as base composition, chain length and secondary structure.
Consequently, nucleic acids of increasing size will be retained longer, also AT-rich
sequences leads to an increase in interaction strength, suggesting that separation can be
sequence dependent. (Kapp and Langowski, 1992; Weiner et al, 1988)
Thomas Burt 164

4. Analytical Development
2 0 -
nicktd
nicked
33 0 10 1 22min min
nicked tupercoiled
u u ES
1 0 06
Im p u r i t i e s
t T O f m m )
I
190
Figure 4-16 Figure displaying reported HPLC traces of plasmid samples separated by different forms of HPLC. A shows the profile generated by anion exchange HPLC using DEAE-PS-DVB matrix. Reasonable separation of plasmid isoforms is witnessed (Huber, 1998). B shoes the trace following Reverse Phase HPLC using copolymer beads with attached Hexyl residues (Kapp and Langowski, 1992). C shows the results of HIC-HPLC using TSKgel Butyl-NPR column and effective baseline line separation is achieved (Iuliano et al., 2002). D shows the results of size-exclusion HPLC using TSKgel G6000PW, showing the separation of plasmid from smaller size contaminants. E shows the profile of 3kb plasmid run in this project on anion-exchange column DNA-Pac PA-100, which allowed separation of topoisomers of small plasmids. F displays the trace of another anion exchange matrix; Nucleogen 4000 with effective separation of a small plasmid pBR322 (4.3kb) produced.
4.5.1.4 Anion Exchange HPLC
Anion exchange HPLC is the most common form of HPLC used for plasmid
quantification, and is the type employed in this project. It relies on the interaction between
the negatively charged phosphate groups in the DNA backbone and positively
Thomas Burt 165

4. Analytical Development
Table 4-6 Table outlining a selection of ion-exchange HPLC columns used for plasmid separation. Details are given into the nature of the stationary phase, the manufacturers and any associated publications.
Stationary Phase Manufacturer References
Nucleogen-DMA-4000 Macherey-Nagel (Coppella et a l, 1987; Chen et a l, 1997)
DEAE-NPR Tosoh (Onishi et a l , 1993)
DEAE-5PW Tosoh (Onishi et a l, 1993)
DEAEGen-Pak Waters (Lahijani et a l, 1996; Stowers et a l, 1988)
DEAEPS-DVB N/A
DMAE-LiChrospher Merck (Horn etal., 1995)
Poros HQ. QE, PI PerSeptive Biosystems(Diogo et a l, 2001b; Prazeres et a l , 1998; Meacle et a l, 2004; Ferreira et a l, 1999; Monteiro et a l, 1999)
DNAPac PA-100 Dionex (Eon-Duval and Burke, 2004; Eon-Duval et a l, 2003b)
charged ligands on the stationary phase (Prazeres et al., 1998). A salt gradient is employed
to displace the different nucleic acids, which elute in order of increasing charge density,
which is a function of chain length and conformation (Diogo et al., 2005). A disadvantage
of all anion-exchange assays is that the technique is unable to resolve plasmid from RNA,
and as such the sample must be pre-treated with RNase to allow quantification of plasmid.
However, this is not a significant issue. See Figure 4-17.
The use of anion-exchange HPLC for plasmid quantification has been described in
numerous publications, as outlined in Table 4-6. Total pDNA analysis and quantification,
for use as a process analytical tool has been described using Poros HQ, Poros PI and
DMAE-LiChrospher (Table 4-6). None of these methods were capable of resolving the
different plasmid forms, but were used for accurate assessment of the purity and pDNA
quantification in process solutions.
However, the separation of different plasmid isoforms by AE-HPLC has been reported.
Figure 4-17 Impact of RNA in the HPLC sample when run on Dionex DNAPaclOO column. While a degree of separation is achieved the contaminating presence of RNA makes accurate quantification of plasmid difficult. Consequently, samples treated with RNAse.
(Colpan, 1999) used macroporous Nucleogen-DMA-4000 to separate gDNA and RNA
Plasmid
Thomas Burt 166

4. Analytical Development
from pDNA, and achieve separation of isoforms (Figure 4-16F). Similarly, (Onishi et al, 1993) achieved the same objective using DEAE-NPR and DEAE-5PW columns. Both these reports could be referred to as mixed-mode HPLC as the columns separated using both AE and SE principles. Consequently, the run times of these columns were ~30mins.
A much more rapid method, allowing the resolution of pDNA isoforms was obtained using a non-porous, micropellicular DEAE anion-exchanger, based upon highly crosslinked PS- DVB particles. The favourable mass transfer properties of this type of support allowed the resolution of different pDNA isoforms within 3 minutes (Liu et al., 2004). It is this type of matrix that is employed in this project, as found in DNAPac PA-100 columns (Dionex). The Nucleopac PA-100 stationary phase of the column consists of lOOnm quaternary - ammonium functionalised Microbeads, bound to a 13pm non-porous core. The solid core allows steeper gradients to be applied allowing more rapid elution, and the microbeads ensure good mass-transfer. Furthermore, the material is more stable and pressure resistant, and due to its configuration, the area available for binding is not much lower than totally porous substrates.
The micropellicular nature of the substrate used in the HPLC column, along with its high aspect ratio (250mm x 4mm) allows for excellent separation and resolution of plasmid samples. Consequently, as shown in Figure 4-16E the column is capable of resolving the
nicked and supercoiled plasmid forms.
100nm Microbeads Figure 4-18 Figure displaying the physical make-up of the beads which form the stationary phase of the DNA Pac PA-100 column. The functional groups of crosslinked quaternary ammonium form lOOnm microbeads, attached to a 13pm solid core of fused silica. The design enables good mass transfer and pressure resistance.
Thomas Burt 167

4. Analytical Development
4.5.2 Use of Anion-Exchange HPLC
The use of HPLC in this project was pervasive, as it was the main analytical tool for
plasmid quantification in both upstream and downstream studies. Test runs carried out
established the feasibility of using this technique for quantifying plasmids up to 116kb.
From the HPLC traces produced for the smallest plasmid analysed (3.2kb), it was
estimated that the HPLC column possessed ~103 theoretical plates. A figure not as great as
reached by some preparative columns, but still outperforming other HPLC systems, as
evidenced by the shape of the peaks as compared to competing methods shown in Figure
4-16. It was noted however, that the degree of resolution was better for small plasmids,
and as such plasmid isoforms could be resolved. Unfortunately, it was found that
resolution decreased with increasing plasmid size, such that it was not possible to resolve
the topologies of the larger plasmids. This was not a major problem as other techniques
were developed for analysing plasmid topology. The main use for HPLC was for a
technique that could reliably and accurately determine plasmid yield. The precision of the
HPLC assay was determined by running replicate samples and was determined to be
~4%CV.
I6kb3.2kb 33kb
i
'1; 1*1
49kb 116kb
3
Figure 4-19 Figure displaying the decrease in resolution achieved with increasing plasmid size. Traces of equal concentrations of the various plasmids shows that as size increased the ability to resolve isoforms could not be achieved. Also, as plasmid size increased the width of the peaks increased indicating the greater number of plasmid conformations that were in existence.
Thomas Burt 168

Log
10Pe
ak
Area
x1
0
4. Analytical Development
Details about the operation of the HPLC system can be found in (2.5.11). In all cases the
operation remained the same in terms of flow rate, buffers used and the method of
detection. Detection was achieved by absorbance at 260nm and the traces recorded by the
software. Integration of the peaks from the HPLC traces was also automated by the
software. The algorithm controlling the integration was instructed to ignore peaks before
4.5mins and after 8.2mins, as all the plasmids investigated were found to elute between
these time points. The peak areas were calibrated against standard curves prepared for
each plasmid.
All the standard curves used, were plots of the concentration of the plasmid solution
loaded (determined by A26o of ultra-pure samples) against the resultant HPLC peak area.
The application of the standard curve depended on the HPLC area value returned. If the
peak area of the unknown was found to be >400,000 then a different standard curve would
be employed to when the peak area was <400,000. The reason for this was to improve
accuracy of the standard curve and is explained by recording a semi-log plot of a typical
standard curve (Figure 4-20). Because the standard curve describes an area term, the
increase in area obeys a square relationship. Consequently, for more dilute plasmid
solutions, the standard curve was found to be more representative if the linear fit was
performed over the points describing the dilute solutions. Similarly, for the more
concentrated solutions accuracy was improved if the linear fit was achieved over the more
concentrated solutions. For this reason each standard curve shown, even though they are
seen to be perfectly linear, will be accompanied by two linear regression plots and
relationships.
400,000
0.1250 3002000 50 100 150
pDNA Cone. (pgm L1)
Figure 4-20 Semi-log plot of a calibration curves used for quantifying upstream process samples. From the plot the square relationship is apparent. Linear regression through the concentrated points crosses the linear regression through the more dilute samples at 400,000. For that reason the exact equation used to calculate plasmid concentration depended on whether the value was less or more than 400,000.
Thomas Burt 169

4. Analytical Development
2.5 2.5Mean Average %CV « 3.*%
2.0 - 2.0
1.5 .5
1.0 .0 o 20
0.5 I-0.5
. V %•.o.o - 0.0
0.1 1 10
Plasmid Concentration in sample (MOml'1)1000.0 0.5 1.0 1.5
Back-calculated Peak Area x10e2.0 2.5
Figure 4-21 Figure A displays a check made to confirm the accuracy of the HPLC system. The figure correlates the areas produced from running solutions of known plasmid concentration against the values predicted for the area terms from the current standard curve. Performing this check regularly allowed detection of any drift in the calibration. Figure B plots figures the results of investigations into precision of the HPLC system. The %CV produced by running replicate samples on the HPLC equipment is plotted against the resultant concentration of the plasmid sample.
The accuracy of the HPLC assay was regularly checked by running plasmid standards of
known concentration. The results were then correlated against the expected peak area, as
determined from the current standard curve. Figure 4-21A shows the result of such an
investigation, using a 16kb plasmid. From the figure it can be appreciated that the
accuracy of the HPLC assay was never in doubt. Figure 4-2IB also plots the results of
investigations into the assay's precision.
Despite the similarities in the operation of the HPLC assay for its use in upstream and
downstream studies, there remained some subtle differences between the two, in terms of
the standard curves employed and the volumes injected. These differences shall be
outlined in the following sections.
4.5.2.1 HPLC fo r plasmid quantification o f Fermentation Samples
HPLC was used to quantify plasmid containing streams from samples taken during the
fermentations of large plasmids. 50D unit cell pellets were prepared as outlined in (2.5.5).
From each time point of each fermentation, duplicate samples were prepared and lOpL of
the IPA concentrated solution was analysed by HPLC (Referring to Figure 4-1, this
represents stream (E). The HPLC system was calibrated using material prepared by Qiagen
Large Construct kit, which employed an exonuclease to digest any residual genomic DNA.
A standard curve was prepared for each construct under investigation.
Thomas Burt 170

4. Analytical Development
Table 4-7 Table outlining the calculations performed to determine plasmid specific yield from the HPLC peak areas. Peak areas were calibrated from the standard curves enabling the plasmid mass produced from a 50D cell pellet sample to be found. The specific yield was calculated from this value and the mass of the cell pellet analysed determined from the optical density and wet cell weight. The table also shows the calculation of volumetric yield and plasmid copy number.
Elaps'dTtnw(hrs) zs H ^LC1 Mean
Are. C o n c e r n .)PM Mass w cw
ton.)w cw
PMD.V]Optical
Density (A600)w cw Penal H
y*eW|m*L)Mote* o' PU -nidCopyN.
(coptesfc'H)Copy No is* D*V}
c c 618827 578373.5 66 56 696 06178 40.7 0141 125 0.0158964 437 54 38.857 0.14 0.012 317.46 28.199 234731 241807 238266 2814 2.81 14 55 0.601 2 885 0.0252166 111.59 2.417 1 62 0.035 1.60525E-11 128.42 278
» 10 201841 219921 210931 2451 2 48 C 1548 17 4 0 849 46 0.0189130 131.18 8 187 238 0 142 1 41531E-11 11322 7.074 11 5 208172 186872 196522 2305 231 0 1662 25 55 0.318 74 0.0172635 13355 9628 3 41 0246 1 3152E-11 105.22 7.895 12.5 239007 258302 248654 5 29 40 2 94 C 1662 28 45 0 177 8.12 0.0175185 167 85 9 485 478 C270 1.6774E-11 134.19 758« . 133 247865 260599 254232 30.08 3.01 0 1097 37.25 0 601 13.12 00141959 21152 7.725 7 89 0288 1.71616E+11 13729 540* 15 240875 249219 245047 28.96 2.90 0.0719 51 15 0 530 i e i 0.0141298 204 96 5 086 1046 C.260 1.65234E-11 132.19 328
— \--- 16 241862 257447 249654 5 2953 296 0.1342 656 0.071 22.7 0.0144493 20434 9389 1340 0 609 1.68435E-11 134.75 6.13
« 18 273429 275481 274455 32.55 3.25 0.0177 95 1 2 051 387 00122868 264 89 1 438 25 19 0.137 1 85666E-»11 148 53 0.8118 5 293636 264448 279042 3311 3.31 0.2514 92 45 0.601 395 0.0117025 28259 21 480 2616 1.906 1 88853E-11 151.08 11.47
The standard curves are shown in Figure 9-26 and from which it can be appreciated that the curves align well, no matter the plasmid size, indicating that although the resolution decreased as plasmid size increased, the area under the curve remained for an equal plasmid mass. This indicated that the recovery of the plasmid from the column was comparable no matter the size of the plasmid loaded.
Following the analysis of the cell pellet sample by HPLC, the trace was analysed the peak area recorded and converted to a concentration using the standard curve (Figure 9-26). Once the plasmid concentration of the plasmid stream was known, the total plasmid mass could easily be determined. The specific yield of the fermentation at the particular time point could then be calculated. Details of the calculation process for one vessel is shown in Table 4-7, the other vessel records can be found in Figure 9-29. The volume of the broth samples taken during the fermentation were all 50D unit volume equivalent. The reason to assay on the constant mass basis was that as the wet cell weight of the fermentation increased, sampling on a constant volume basis would lead to increased masses of the cell pellets. This would cause inaccuracies in the analysis when the cell pellets were lysed. For instance, sampling on a constant volume basis would lead to inefficient cell lysis of samples taken toward the end of the fermentation. Since the wet cell weight and optical density of the fermentations were known at the point of sampling the pellet mass could be calculated and the specific yield was the plasmid mass determined by HPLC divided by
the mass of the cell pellet.
The precision of IPA precipitation of clarified lysate and subsequent plasmid quantification by HPLC was determined to be 7%CV. As such, this assay was deemed more precise than both absorbance and PicoGreen on spin-prep eluents which recorded
%CV values between 12-16%.
Thomas Burt 171

Spec
ific
Plas
mid
Yi
eld
(jigp
DN
A/g
WC
W)
4. Analytical Development
As outlined earlier the accuracy of the HPLC system for quantifying plasmids was never in doubt. However, the checks described earlier were performed on ultra-pure plasmid standards. In this scenario, IPA precipitated samples were being run on the system. As such, the assumption was being made that the peaks recorded only contained plasmid. It was known that HPLC has the ability to separate pDNA away from protein and low mol.weight gDNA, and that the RNA was removed by RNase. However, it was discovered that the system did co-elute some large gDNA fragments, which remained in the IPA precipitated sample along with the plasmid. There was little that could be done to improve this, as there would always be some degree of contamination. It was reasoned that a size exclusion column could be placed in-line with the anion-exchange column to remove the effect. However, it was believed that since the impact of the contamination was small, the potential plasmid loss which could be incurred by including an additional column would negate the point of its inclusion.
It was important to quantify the level of this residual contamination. As such, when the upstream studies were conducted, negative controls were also carried out in the form of DH1 parental fermentations. Samples were taken during the fermentations and processed in the same fashion as the plasmid bearing samples. These were run on HPLC to provide information on the background signal. The resulting contaminant profile is not a measure of the amount of gDNA in the sample, since the vast majority would be removed by IPA
100 100
Parental Form A Parental Perm B P5176 (116kb) A P5176 (116kb) B
90- 90
8080-
70- 70
60- 60 Total Area ■ 76373
50- -50
4040-
30- 30
202 0 -
101 0 -
Total Area- 171510 9 10 11 12 13 14 15 16 17 18 19 201
Time from Inoculation (hrs) •*—
Figure 4-22 Graph showing the yield profiles of the large plasmid p5176 (116kb) through duplicate fermentations as determined by HPLC on IPA precipitated clarified lysates. The graph also charts the progression of the contaminants detected by HPLC by loading IPA precipitated samples obtained during fermentations of wild-type parental fermentations. The HPLC traces compare that produced from loading lOpL of IPA precipitated sample from a p5176 time-point (A) and the same time-point from a parental time- point
Thomas Burt 172

4. Analytical Development
precipitation, as later studies demonstrate (6.5.4). Additionally, it was not considered
accurate to subtract the reported gDNA contaminant profile from the plasmid yield
profiles, since this would make the assumption that the contamination in all the samples is
equivalent. Consequently, the contaminant profile is reported alongside the plasmid yield
data. For this reason, when looking at the yield curves for the plasmid fermentations, it is
important to note that a proportion of the signal is due to contamination (Figure 6-5).
However, the overall level of contamination detected by this assay should be put in
context. Overall, the level was small and it did not have nearly the same impact on the
plasmid yields, as was witnessed when attempting to quantify similar samples with
PicoGreen. Figure 4-22 compares the yield profiles of the plasmid whose quantification
was most affected by the residual contamination: p5176 (116kb). This construct was the
most affected, since it was found to exist at the lowest concentrations. On average, the co
elution of residual gDNA accounted for -20% of the returned value. Contrast this situation
with the PicoGreen studies on IPA precipitated clarified lysates and the improvement
delivered by the HPLC assay becomes clear. With PicoGreen analysis the residual, linear
gDNA bound proportionally more fluorophore molecules than the plasmid molecule and
so the estimated plasmid yield was often over twice the expected.
The development of the HPLC assay produced a method of plasmid quantification more
accurate and precise than any previously used. Other assays were affected far worse by the
trace level of contaminants remaining in the streams used for analysis. Whilst not
impervious to such contamination, the HPLC assay succeeded in removing the vast
majority of contaminants and the level of the remaining contaminants could be
acknowledged and reported. Also, the trace data allowed for visual inspection of the assay
results. Due to the development, confidence was placed in this assay as being accurate,
reliable and reproducible, consequently, it became the assay used for monitoring plasmid
specific yield during fermentations.
4.5.2.2 HPLC for plasmid quantification for Downstream Process operations
The use of HPLC in downstream processing studies was as important as for the upstream
investigations. The technique was used to determine plasmid concentration at several
stages during the downstream process, and on streams leaving the process, in order to
devise a full plasmid balance. As outlined previously, the operation of the HPLC remained
constant no matter whether analysing upstream or downstream samples. However, the
Thomas Burt 173

4 . Analytical Development
samples injected, the volumes injected and the calibration curves used did differ when
analysing downstream samples as from when running upstream samples. There were several reasons for this.
Firstly, it was noted from the results of the upstream samples that the sample
concentrations never exceeded 20pgmL'1, even for the most concentrated samples. As a
result of the narrow concentration range encountered, calibration of values on a standard
curve ranging from 0-250pgmL'1 reduced the sensitivity of the assay. Also, for the
downstream process assay, it was hoped to perform HPLC directly on samples so
removing the need for IPA precipitation. Without the IPA precipitation step, the samples
for analysis would be ~7.5x more dilute, since the IPA step achieved that level of
concentration. With these considerations in mind, the HPLC standard curves prepared for
downstream process samples were prepared over a narrower range of 0-25pgmL'\ Since
no IPA concentration step would be performed, to ensure sufficient plasmid material was
injected to generate large enough peak areas to allow accurate quantification, 10-fold more
volume would be loaded. Consequently, all DSP analyses involved loading lOOpL
volumes of sample. The net effect of loading higher volumes of more dilute streams, was
that the peak areas produced were comparable to those produced by the upstream analysis.
The second difference in the HPLC assay for DSP samples also involved the standard
curve and the impact of gDNA contamination. As described previously, the small effect of
gDNA could not be eliminated from the analysis of the upstream samples and as a result
its presence was reported alongside the results for plasmid yield. With DSP analysis the
potential existed to ‘calibrate out’ the impact of the small amount of contamination. In the
process runs, identical masses of cell paste were lysed and as such the concentration of the
contaminants in the clarified lysate would be comparable. To ‘calibrate out’ the gDNA
contamination, the DSP standard curve material was prepared by serial dilution of known concentrations of the individual plasmids, using clarified lysate prepared from parental
wild-type cell paste. By performing the dilutions with the blank lysate, the peak areas
returned for the standard curve would be the concentration of the plasmid, plus the small
contamination. In this way when lysate samples were run, the peak area of the
contaminants would be effectively ‘blanked out’. These standard curves were used to
quantify plasmid in the clarified lysate before the UF step.
Thomas Burt 174

4. Analytical Development
The final difference with the HPLC assay, as it was used for the mass balancing of plasmid through the downstream process, was a correction to an issue which had not been envisaged. Having performed several of the DSP runs, it was noted that the plasmid concentration value, as determined by HPLC on the material recovered from the ultrafilter, was less than the value placed upon the same solution by direct absorbance. It was also noted that this issue did not occur with the smaller plasmids, indicating that the problem was a result of plasmid size. Repeated calibration of the HPLC did not resolve the issue. The reason was only determined when the HPLC profiles were compared.
Figure 4-23 compares the HPLC profiles of Qiagen purified 49kb plasmid against the same plasmid recovered after ultrafiltration. The plasmids are both at -lOOpgmL'1. The difference between the two profiles is the bulge seen on the post-UF profile (Figure 4-23B) between the column run-through peak and the plasmid peak. This ‘peak' was present on all traces of the large plasmid samples following ultrafiltration, and as such was reasoned to be small dsDNA fragments generated by shear during UF operation. These
smaller sized DNA fragments were later sized by electrophoresis at being between 10- 25kb. Due to their smaller size and linear conformation, their charge density would be lower than an intact plasmid molecule, so explaining their elution before the plasmid. The ill-defined nature of the peak made it impossible to integrate accurately, complicating the quantification of the plasmid in the UF streams.
However, for correct mass balancing of pDNA, it was essential that the sheared plasmid be accurately quantified. Although no longer plasmid molecules, the sheared fragments represented a proportion of the plasmid stream and as such was required to be quantified.
Shearedplasmid3i
SampteName 40KB 100UGML CLARLYS. Vial 61; Infection 1; Channel 486
Figure 4-23 Figure comparing the HPLC profiles of similar concentrations of a large 49kb plasmid. Figure A shows the HPLC trace of a plasmid in clarified lysate. Figure B shows the same plasmid following ultrafiltration.
Thomas Burt 175

4. Analytical Development
The solution required the preparation of post-UF standard curves for each construct, which
took account of the sheared portion of plasmid in the samples.
The standard curves for the post-UF samples were prepared from plasmid recovered from
the UF step and suspended in Tris + 0.54M NaCl buffer. The stock plasmid was serially
diluted to the desired concentrations, and to improve accuracy the precise concentration of
all the standards was determined using the NanoDrop spectrophotometer. From Figure
9-27 it can be appreciated how the peak area produced from the same quantity of plasmid
material differed between the curves of intact plasmid and sheared plasmid. The curves
can be used as an indication of the susceptibility of the constructs to shear. Looking at
Figure 9-27 it can be seen how the standard curves for the 3kb and 16kb plasmids align
well. It is the increase in size to 33kb, 49kb and 116kb where the differences manifest
themselves with increasing magnitude. This observation confirms that shear damage is
size dependent.
4.5.3 Conclusions
Following the problems identified with the application of PicoGreen and direct
Absorbance to the quantification of large, low-copy plasmids, it was decided to investigate
the use of HPLC. It was found that anion exchange offered an effective means of
quantifying the concentration of large plasmids in solution. Plasmids up to 116kb in size
were found to be separated and eluted from the chosen column, however, the broadening
of the peaks produced was observed with increasing plasmid size. Furthermore, the
accuracy and precision of the technique was found to be very favourable.
The HPLC assay was applied to the quantification of plasmid streams encountered in both
upstream and downstream investigations. However, slight changes were required to enable
the application of the assay in both areas. Additionally, three sets of standard curves were
required for each construct under investigation.
The first set was used for IPA concentrated plasmid streams generated by the purification
of plasmids from cell pellets obtained during fermentations. The second and third sets of
standard curves were used for plasmid quantification during the DSP studies. These sets
were prepared over a more dilute range (0-25pgmL'1) to allow running of neat process
samples, consequently more sample volume was loaded. The second set was used to
quantify plasmids in the clarified lysate following lysis and as such the standards were
prepared using blank parental lysate to ‘calibrate out’ the impact of small traces of gDNA
Thomas Burt 176

4. Analytical Development
contamination. The third set was prepared upon discovering that shear effects on the larger
plasmids was generating linear dsDNA fragments, which were not being integrated by the
HPLC and leading to errors in the plasmid balancing. To correct the third standard curve
was prepared from plasmid material recovered from the UF, suspended in the buffer used
in the recovery steps from the membrane.
Thomas Burt 177

4. Analytical Development
4.6 Gel Electrophoresis
Direct visualisation of plasmids by electrophoresis is a useful method of investigating the
relative purity of a plasmid sample, giving information on contamination by gDNA and
more importantly the ratios of supercoiled to other plasmid topologies. It use is mandatory
for the analysis of plasmid batches for bulk release (Zoon, 1996), although its use may
become superseded by more quantitative techniques of assessing plasmid topology, such as capillary electrophoresis.
The principle behind electrophoresis centres around the force exerted on a charged particle
in an electric field; the Lorentz force. The force induced is dependent on both the electric
properties of the body under study and the magnitude of the electric field. The migration
of the body by the force is countered by the resultant frictional force, such that the
migration of the charged body in a constant, homogeneous electric field is steady. There
are relationships which can predict and describe the movement of bodies in electric fields
i.e Smoluchowski equation, but due to the number of potential variables, precise prediction
is complicated. However, some fundamental parameters affecting migration rate have been
identified:
Particle properties: Charge density/ SizeSolution properties: Ionic strength/ Electrical permivitty/ pH/ Temperature Matrix properties: Gel cone./ Gel type; Crosslinking and Electroendosmosis (EEO)Electric field properties: Magnitude/ Field arrangement
4.6.1 Conventional Gel Electrophoresis
Conventional gel electrophoresis is the most common form of electrophoresis encountered
for plasmid DNA analysis. The technique employs a constant, homogeneous electric field
and separates different plasmid molecules and topologies on the basis of their charge
density and size. The application of conventional electrophoresis in this project was
hampered by the fact that the distance migrated by the DNA molecules becomes
independent of their size at around 20kb, such that molecules exceeding that size all co-
migrate.
However, conventional gel electrophoresis was attempted on the Oxford series of
plasmids, the results of which are displayed in Figure 4-24. To improve the separation
several parameters were altered by trial and error. Firstly, the running time was extended
Thomas Burt 178

4. Analytical Development
to ~15hrs, with smaller plasmids separation can be achieved using run times of l-4hrs. Secondly, the gel concentration was lowered to 0.8%, any lower and the gels tended to melt due to the long running times. To abate the temperature increases encountered during the extended running times, the gel-case was surrounded by ice.
From the images it can be appreciated that whilst the plasmid molecules can be visualised, the level of information provided by such analysis is poor. The gels resolve the supercoiled plasmid form but there is no evidence of the other plasmid forms. It is believed that due to the outstretched size of the open-circular/ linear forms they remain trapped in the wells. Increasing the running time did little to improve the resolution, as shown in Figure A. The band running ahead of the supercoiled form in the wells containing the large plasmids is contaminating linear, gDNA remaining in the preparations, the size range of which is between 15-30kb. By comparison when running a smaller plasmid by traditional electrophoresis, all the topologies which were present can be elucidated, as shown by pSVp; Lane 1/Fig. B
LINEAR/ gDNA
23130
I
23222027
Figure 4-24 Two conventional gel electrophoresis gels displaying the running characteristics of the large constructs. Figure A shows a 0.8% gel run in 2xTBE for 15 hours at a current strength of ~80mA generated from a fixed field strength of l.SVcm1. To prevent the overheating of the system due to the extended running period the gel case was surrounded by ice. Figure B shows the result of an identical operation except the plasmids were run at higher field strength of 4.2Vcm'1 for a period of 6 hours.M ; Mid-range PFGE marker M; >JDNA Hindlll digest1; p5176 (116kb) 1; pSVp (6.9kb)2; p5204(242kb) 2; p5176(116kb)3; p5206(172kb) 3; p5204(242kb)4; 86kb plug 4; p5206 (172kb)5; k DNA Hindlll digest M; LDNA Hindlll digest6; k DNA ladder
Thomas Burt 179

4. Analytical Development
It was realised that useful information regarding the topology of large plasmids was not going to be achieved by conventional electrophoresis.
4.6.2 Pulsed-Field Electrophoresis
Pulsed field electrophoresis was developed to allow resolution of large DNA molecules which could not be separated by normal electrophoresis. The technique was developed by (Schwartz and Cantor, 1984) and originally intended for whole genome mapping, electrophoretic karyotyping and for discerning strain homogeneity. The crucial difference between PFGE and conventional electrophoresis is that during operation, the polarity of the electrodes is switched at defined and variable intervals, causing the re-orientation of the electric field and so the molecules in the field. The rate of switching can alter during the run period and is essential to effective resolution. There are several different arrangements of PFGE, but the ones considered in this project are Field Inversion Gel electrophoresis (FIGE) and Contour clamped Homogeneous Electric field (CHEF).
CHEF• • • •
A- <» «• •-• •
• •• •• \ •
• > •• a*
• • • • 1
FIGECGE
Figure 4-25 Figure displaying the orientation of electric fields of three types of electrophoresis employed in this project. Conventional gel electrophoresis (CGE) employs a constant, unidirectional homogeneous electric field and the DNA molecules are separated by virtue of their size and charge density. Field inversion (FIGE) is a type of pulsed field electrophoresis where the electric field is inverted casing periodic 180° reorientation. Contour clamped homogeneous electric field (CHEF) is a more complicated form of pulsed field electrophoresis whereby the DNA is reorientated at oblique angle of 120° causing the molecules to follow a zig-zag pattern through the gel.
Currently, there are three models that attempt to describe the behaviour of DNA during PFGE ; the biased reptation model, the chain model, and the bag model (Chu, 1990), but these focus on linear DNA molecules. Although the exact theory of pulsed field electrophoresis is still a matter of debate, qualitative statements can be made about the movement of DNA during PFGE. As outlined earlier, during conventional electrophoresis, DNA above 20kb migrates with the same mobility regardless of size producing a single large diffuse band (Figure 4-24). However, if the DNA is forced to change direction
Thomas Burt 180

4. Analytical Development
during electrophoresis, different sized fragments within this diffuse band begin to separate
from each other. With each reorientation of the electric field relative to the gel, smaller
sized DNA molecules are capable of switching direction more easily and begin moving in
the new direction more quickly than the larger DNA molecules. Thus, the larger DNA lags
behind, providing a mechanism for separation from the smaller DNA. The rate of re
orientation combined with the extended running times and longer running distances (the
reorientation means the path followed by the molecules is far longer) account for the
technique’s ability to resolve DNA molecules of megabase size. Of note, is that fact that
the constant field re-orientation can also lead to changes in the order in which the plasmid
topologies are resolved, again because the separation is dependent on the rate at which the
molecules are able to change direction.
Although PFGE was developed in the 1980s, its use has mainly been for linear DNA and
genome analysis, but there are reports of the technique’s use for plasmid analysis. (Levene
and Zimm, 1987) reported the differences in migration rates seen for supercoiled, linear
and open-circular plasmid forms for plasmids extending from 3-56kb. (Wang and Lai,
1995) compared CHEF, FIGE and conventional agarose gel electrophoresis. They report
how SCC forms of large constructs can be separated by CGE, stating that the mobility of
SCC forms is independent of size. However, the report also describes the difficulties
experienced in resolving OC forms of large plasmids, maintaining that the OC
configuration results in the molecules being trapped in the wells.(Barton et al., 1995)
report a method for detecting and sizing BACs which are traditionally hard to isolate from
bacterial preparations. Despite the several reported methods, the specifics of their
individual operation did not translate well to the situation of this project. For that reason,
the development of the PFGE assay was very much a trial and error affair.
4.6.2.1 CHEF Pulsed Field Electrophoresis
The CHEF system was the first of the Pulsed Field variety that was used to determine the
topology of constructs studied in this project. Exact details of the system, its configuration
and operation are outlined in 2.5.18. It was the most sophisticated of the systems
employed, and is reportedly capable of resolving chromosome-sized DNA molecules (Bio-
Rad Labs., 2000).
Thomas Burt 181

4. Analytical Development
D
Figure 4-26 Results o f Pulsed-Field Gel E lectrophoresis on the large plasm ids as the conditions for use were determ ined. The pictures are segm ented because the large size o f the gel meant that to fully photograph usng the gel im ager, several pictures had to be taken and reassem bled.
A: |0 .5xT B E/ 16hrs/ 125m A / 6.0Vcm'V 14°C /1% agarose/ Initial switch time 0.1s/ Final switch time 0.1s (Ratio 1:1)
1/4 : p5176 (U 6 k b ) Lane order applies to B also.2/5 : p5204 (242kb)3 /6 : p5206(172kb)
B: | 0.5xTBE/ 16hrs/ 125m A / 6.0V cm V 1 4 ° C /1% agarose/ Initial s.t 5s/ Final s.t 120s] (1:24)
C: | 0 .5xTBE/20hrs/ 125m A / 6.0V cm '/ 14°C / 0.8% agarose/ Initial st 1.4s/ Final st 21.6s] (1:15)
Lane 1 /1 2 : M id-R ange m arker I 5 /8 : M axi-prep p5176 (116kb)2 /1 1 : M id-Range m arker II 9: M axi-prep pM T103 (29kb)3 / 6: M axi-prep p5206 (172kb) 10: M axi-prep pQ R l 50 (20kb)4/ 7: M axi-prep p5204 (242kb)
D : |0.5xT B E/ 16hrs/ 125m A / 6.0Vcm'V 14°C / 1% A garose/ Initial s.t 100s/ Final s.tlOOOs] (1:10)
1: pQR186 (13kb) 6 : X D N A2: pQR150 (20kb) 7: >J)NA H in d lll digest4: pSVp (6.9kb) 8: Supercoiled ladder.3/5: pM T103 (29kb)
Thomas Burt 182

4. Analytical Development
Figure 4-26 displays the results of four runs using the CHEF system. Because of the
number of combinations feasible, in the development of this is assay it was decided to
keep a number of possible variables constant and concentrate on optimising the switch
times. (Levene and Zimm, 1987; Wang and Lai, 1995) both report the large impact the
choice of suitable switch times have on effective separation of plasmid moieties by PFGE.
Whilst gel concentration, run-time and field strength also have an impact on the degree of
separation achieved, their value affects the separation in a reasonably predictable and
linear fashion. Consequently, it was important to firstly to ensure the plasmid topologies
could be reliably separated, by determining the optimum switch time ratio, prior to optimising the other variables.
The first attempt (A) displays the results using the variables listed but with equal forward
and reverse switch times, the duration of which were very short (0.1s). The overall effect
of this was that the operation of the PFGE was effectively in conventional mode, since the
rapidly fluctuating field would have little impact on the separation as no re-orientation
would have been induced. From the figure, it can be seen that plasmid could be identified,
suggesting that the gel concentration and running time were suitable. Looking at the
marker lanes (10-200kb) it can be seen that they are not resolved, since no banding is
evident. Also, from the figure, the contaminating gDNA remaining in the preparation can
be seen as it forms a smear towards the base of the plasmid containing lanes. The aim was
to optimise the switch times such that the marker bands are effectively resolved.
Repeating the above run using identical parameters but with a switch time ratio of 1:24
achieved a degree of separation of the marker lanes (Figure 4-26B). However, the
separation was not optimal and still only one plasmid topology, most likely supercoiled,
was seen on the gel. The gel in Figure 4-26C shows an improvement on the previous trials,
as the marker lanes are quite effectively separated. However, once more, the plasmids only
display one topology. Looking at Lane 10 in Figure C shows the results of the pQR150
(20kb) the profile seems to suggest the presence of another topology. Indeed as shown in
Figure D the topologies of a selection of smaller plasmids could be resolved. It was
disappointing that despite the separation of the marker lanes, which indicated workable
parameters, the plasmid topologies were not resolved. It was surmised that the OC form of
the large BACs were being trapped in the wells of the gel as reported by (Wang and Lai,
1995).
Thomas Burt 183

4. Analytical Development
4.6.2.2 Field Inversion Gel Electrophoresis
FIGE is a simpler form of Pulsed field electrophoresis. As the name suggests the field is inverted around 180°, causing the DNA molecules to constantly switch their direction of movement back and forth. The technique was found to be more applicable for the plasmids under study, as although the system doesn’t enable separation over the size range achievable with the CHEF system, it is extremely useful for separating smaller DNA of the order 4-1 OOOkb (Carle et al., 1986).
1 2 3 4 5 6 7
B \Supercoiled
gDIS'A contamination
Figure 4-27 Figure showing the separation of the Oxford series of BAC by FIGE.
Lane 1 rmarkerLane 2: 172kb maxi-prep Lane 5: 172kb Large construct kitLane 3: 242kb maxi-prep Lane 6: 242kb Large construct kitLane 4: 116kb maxi-prep Lane 7: 116kb Large construct kit|lxTBE/ 0.8%/ 30hrs/ Forward voltage 180V/ Reverse Voltage 120V/ Initial st 0.3/Final st 5.5/ Linear ramp]
Figure 4-27 displays the results of a preliminary run using the FIGE system. Each of the Oxford series of plasmids was analysed. Two different methods were employed for their purification; conventional Qiagen maxi-prep and Qiagen Large construct kit. As described in 2.5.8.3 the large construct kit employs an exonuclease to digest any linear DNA. Fromthe figure the importance of this step can be seen in the level of contamination removed.The normal maxi-prep samples display a large degree of contamination which is almost all
removed by treatment with the exonuclease.
Thomas Burt 184

4. Analytical Development
However, the important factor was that both plasmid topologies could be resolved. It was determined that the supercoiled plasmid topology runs behind the open-circular form. The reason for this is due to the smaller diameter/ size of the supercoiled form enables it to switch direction more easily than the open-circular form, as a result it is able to travel further in the reverse direction. The system was checked as to the linearity in which it resolved linear markers and as shown in Figure 4-27, the distance migrated was found to be proportional to the size of the fragments above lOkb. Below lOkb the linearity ended.
Further development of the FIGE assay led to incremental improvements in the quality of the gels produced. Figure 4-29 shows the result of a sizing FIGE using the final adopted
Table 4-8 Table showing the results of the gel-scan taken from the gel image captured in Figure 4-29. The relative amounts of each species were used to calculate the % topologies.
Sizing Gel " 3 . 2 k b 16kb 33kb 49kb 116kbLane (am oun t) % T o p o lo g y (am o u n t) % T o p o lo g y (am o u n t) % T o p o lo g y (am oun t) % T o p o lo g y (am ount) % T opo logySUPERCOILED 46.974 100 64.954 90.66 48.002 84.51 41.813 83.62 14.432 46.40OPEN-CIRCULAR 0 0 6.6926 9 34 8.7969 15.49 8.1884 16.38 16.672 53.60Sum 46.974 71.647 56.799 50.001 31.104
280Figure 4-28 Figure displaying the results of a
240 gel-scan of a lane on which the pGEM49kb 2 2 0 construct had been analysed. The scan also ^ records the fluorescence produced as
background.180
180
140
120
100 80
80•10 0 10 20 30 40 50 80 70 80 00 100 110 120
Gal scan Molecular '/.'eight (kb) Background
conditions. The small improvements were to use 1% PFGE agarose and run at 4°C for longer running periods. Previously, using shorter run-times, 0.8% gels at room temperature had resulted in good separation but more diffuse bands. Also, the gels were stained for >24hrs at 4°C using SYBR-Gold and destained for ~4hrs to improve contrast. These conditions led to effective separation of the various topologies and discrete bands which could be accurately quantified by gel scanning. The results of the gel scan of the gel shown
in Figure 4-29 can be seen in Table 4-8.
260 WELLOCC [50 4%]
240
220
200
180
£ 160
- 140
120
100
Thomas Burt 185

4. Analytical Development
SUPERCOILED
OPEN-CIRCULAR22.6
■4 9.4
DIMER
Figure 4-29 FIGE of the plasmid series employed in this project. The plasmids are run in the linear form and native form, the supercoiled and open-circular forms clearly visible.
[Forward voltage 180V/ Reverse voltage 120V/ Initial switch time 0.4s/ Final switch time 3.5s/ Linear ramping/ 40hr run-time/1% PFGE agarose/ 4°C]
Figure 4-28 displays a plot of a typical gel scan produce by the UVP software. The
software was instructed to scan the gel, the bands were fitted manually and the peaks
automatically integrated, so determining the relative proportions of the various topologies.
The topology proportions could then be used to convert the plasmid masses, as determined
by HPLC, into the masses of the various topologies. It would be feasible to determine
masses of the topologies directly from the gel, by loading samples of known mass on the
gel and calibrating from the signal produced. However, there are several inaccuracies
involved in such a method, especially gel to gel variation, so it was decided to use the
FIGE to determine the proportions of the topologies, and then calculate the masses of the
various topologies from the HPLC data.
4.6.3 Conclusions
An effective assay for plasmid topology was fundamental for the analysis of the plasmid
containing streams from both the fermentation and the downstream stages, since topology
Thomas Burt 186

4. Analytical Development
is a critical process variable and one which grows in importance when considering larger
constructs, which by their nature were expected to be more shear sensitive. Additionally,
the use of FIGE was essential for the successful construction of large plasmids using high- copy vectors as described in 5.3.2.2.
After considerable development, with too many individual results to report, a method has
been established which resulted in effective separation of large plasmid topologies. The
bands produced were discrete and could be accurately quantified by gel scanning software.
The drawback with the assay was the long run-times with a single assay taking a few days
to produce results. It would have been optimal had the HPLC system been capable of
resolving the different plasmid forms, since measuring plasmid concentration and topology
in a single assay would have been more convenient and more rapid. However, it is
believed that the information provided about plasmid topology by gel based assay is as
accurate as HPLC and certainly provides a higher degree of qualitative data. For instance,
the use of this assay for topology analysis in later studies clearly evidenced the
vulnerability to shear the large constructs demonstrate during DSP stages, it is unlikely
that HPLC would have been able to as neatly describe the situation.
Thomas Burt 187

4. Analytical Development
4.7 Determining Genomic DNA contamination by quantitative PCR
4.7.1 Introduction
Accurate and precise determination of the level of bacterial genomic DNA contamination
is important in any plasmid manufacturing process. However, its description became even
more critical in this project as many of the plasmids under study were present in low
quantities. As a result of the lower plasmid masses, the ratio of genomic DNA to plasmid
DNA was often high. The persistence of relatively high levels of gDNA has been
responsible for many of the issues surrounding the development of accurate analytical
techniques for plasmid quantification, since it became more important to distinguish the
contributory signal produced due to the gDNA contamination from the signal produced by
the plasmid DNA. Looking at Figure 4-27, showing the level of gDNA contamination
detected by gel analysis, and it can be appreciated the importance of not mis-representing
plasmid yield by assuming that gDNA is plasmid. Because of this pressure, a HPLC assay
was utilised which went a long way to removing the contributory effect of gDNA from the
overall signal, allowing accurate plasmid quantification.
Thus far the methods used to quantify plasmid and plasmid topology through the process
have been outlined. Knowing the impact that gDNA contamination had wrought in the
development of suitable analytical techniques, it was expected that its persistence in the
downstream processing steps was likely to be as important to describe. Consequently, a
specific method of quantifying the level of gDNA in samples obtained during DSP was
required. Fortunately, qPCR offered the potential of precise detection and measurement
specifically of genomic DNA.
4.7.2 Purification and preparation of samples for analysis by qPCR
The genomic DNA from samples obtained throughout the downstream process needed to
be purified prior to analysis by quantitative PCR. This was achieved using the automated
MagNA pure system, the operation of which is outlined in (2.5.14). The robotic system
was able to purify the total DNA from 32 samples simultaneously, equating to 16 duplicate
samples. This meant that 5 duplicate samples from 3 different DSP runs could be analysed
simultaneously. The samples were taken from the Pre-lysis, Pre-CaCh, Retentate, Wash 1
and Wash 2 stages of the process. As a result, the gDNA assay could not produce a full
mass balance, but could demonstrate clearance of gDNA through the process.
Thomas Burt 188

4. Analytical Development
The MagNA pure system employed Roche’s proprietary extraction technology, which
binds the DNA to glass particles, from which contaminants can be washed prior to eluting
the DNA. The advantage of the technique was its ease of operation, combined with its
reproducibility, and the fact that purification was performed in a DNA-free hood, so
reducing the potential for contamination. The same could not be said had the samples been
purified by conventional spin-prep.
Following purification, the system loaded the purified DNA into the wells of a PCR plate
in a programmed order, with all the necessary reagents required for the PCR reaction.
1 OOpL of each of the duplicate DSP samples was loaded into the sample cartridge and the
machine purified the DNA and eluted it in lOOpL of buffer, meaning no dilution occurred.
3pL volumes of the eluted material was then loaded into a well of the PCR plate with the
necessary primers, probes and materials for the PCR reaction, with the volume in each
well totalling 30pL. After loading, the plate could be removed from the machine and
placed in the PCR cycler for analysis. Since duplicate samples from each step in the
process were run, and duplicate volumes of each purified sample were loaded on to the
reaction plate, the net result was four values for gDNA concentration for each sample
point (Figure 4-33). The mean of the four values was taken as the concentration. It should
be noted that because the mean of the four samples was taken, the coefficient of variation
recorded is a measure of the combined differences encountered during both the processing
of the duplicate samples and the measurement of the four samples.
Calculating the precise amount of DNA present in the initial DSP sample from the data
produced by the PCR, the proportion of DNA purified by the MagNA pure system was
required. Recording the concentration of DNA in the PCR well as being the concentration
of DNA in the initial sample would be false, as it would make the incorrect assumption
that all DNA from the sample was purified and eluted. As a result, the MagNA pure
system was calibrated in order to account for the DNA that is lost during the purification
process. Fortunately, the MagNA pure instrument employed in this project had been
calibrated prior to its use for this assay. The calibration of the machine took account of the
different buffer make-up of the samples being purified, as this was a major factor in
influencing the binding of the DNA to the glass particles. Additionally, samples of varying
concentration were run and the average taken. The calibration was represented by a
correction factor (Table 4-9) which when multiplied by the result obtained from the PCR
Thomas Burt 189

4. Analytical Development
reaction would describe the DNA concentration in the original sample 2.5.15/ Equation 2-5. The requirement for calibration was not really a drawback to the procedure, since the same action would have to be conducted had the purification been carried out by conventional spin-prep. Furthermore, the reproducibility of the MagNA pure system improved the confidence that the correction factor would be consistently applicable.
Table 4-9 Table describing the different streams of the process which were purified by MagNA Pure and then quantified by qPCR. The MagNA pure was capable of purifying small amounts of DNA but could not be relied upon to extract all the gDNA fragments from a sample. The reason had a great deal to do with the ionic env ironment of the buffer affecting binding of the gDNA to the glass particles. From the table it can be appreciated that in low-salt buffer (TE) the equipment was capable of extracting -15% of the gDNA. However, as the salt content of the buffer was increased the recoveries decreased. No analysis was performedon samples from the Post-CaCI2 stage of the process but its inclusion in the calibration table was to demonstrate the inverse relationship of increasing the ionic strength of the buffer on the recoveries.
Sample stream Buffer ConstituentsCorrection Factor
(% Recovery of DNA)
PRE-LYSIS lO m M T ris / Im M E D T A 7.05 (14.2% )
PRE-CACL2
6 .5m M T ris / 2 .6m M E D T A / 14.3m M D ex tro se / lOOmM N aO H / 730m M Potassium
a c e t a te /17m M SD S
8.93 (11 .2% )
RETENTATE/ WASH 1/ WASH 2 lO m M T ris / 540m M N aC l 13.61 (7 .3% )
POST-CACL2
|No samples from this stream were run but the MagNA pure system had been calibrated for them to be analysed]
Roughly equal to Pre-CaCl2 but with lOOOmM CaCl2 43.47 (2.3%)
4.7.3 Background of the qPCR assay
The different modes of PCR are outlined in 4.2.4 and the operation of the PCR is described in (2.5.15). In this project, kinetic qPCR, employing primer-probe system was the type used for real-time quantification of gDNA at various points of the process. The technique followed a similar method to that described by (Smith, III et al., 1999). The samples removed from the process were purified using the automated MagNA pure system described in (2.5.14). The MagNA pure system purified the DNA from the samples and prepared the qPCR plate containing all the necessary reagents, primers, probes and
standards
Thomas Burt 190

4. Analytical Development
Table 4-10 Table detailing the components of the master mix buffer and their importance to the functioning of the quantitative polymerase chain reaction.______________________________________________________
Component Function
AmpliTaq Gold DNA Polymerase
Possesses 5 ’-3 ’ nuclease activity but lacks 3 ’-5 ’ exonuclease activity. It is a therm ostable enzyme allow ing hot start PCR, which reduced background signals norm ally created by am plification o f nontarget sequences before thermal cycling had begun.
AmpErase® uracil-N-glycosylase
D ue to the enorm ous am plification possible, false positives can be created caused by amplicon carryover. This enzyme rem oves incorporated uracil bases reducing contam ination
Deoxynucleosidetriphosphates (dNTPs) dTTP/dG TP/dCTP/dA TP/ dUTP at 200pM
Passive Reference Dye (ROX™)D oes not interfere with reporter dye. Present to norm alise fluorescence signals to correct for buffer or volum e deviations.
Mg1* 1.5mM; optim ised for highest specific yield o f target PVR product.
PCR wells. The mechanism of the qPCR reaction involved the binding of a forward and reverse primer to the DNA sequence of interest as with traditional PCR (Saiki et al, 1985b). However, additionally included in the reaction mixture was a probe-sequence, specific to a region within the boundaries of the sequence set by the primers. Attached to the 5’end of this probe sequence was reporter dye (in this case FAM™) and to the 3'end a quencher dye (TAMRA™). Whilst the reporter dye was in proximity to the quencher dye. the molecule did not fluoresce. The approach utilised the 5’ exonuclease activity of Taq DNA polymerase to digest the probe region, releasing the reporter dye away from the quencher dye, so enabling it to fluoresce. Accumulation of PCR products could then be monitored in real time by scanning the increase in fluorescence in the PCR wells using a PCR cycler coupled with a fluorescent plate reader; ABI PRISM 7700. (Fykse et al., 2003; Heid et al., 1996; Weissensteiner and Lanchbury, 1996). Figure 4-30 describes the progression of a primer-probe PCR reaction.
Thomas Burt 191

4. Analytical Development
Both primer and probe sequences were directed at a region of the single genome copy
E.coli DNA polymerase gene. The primer sequences were about 20bp in length and probe
sequence was a 27bp sequence covalently coupled to the two fluorescent dyes; FAM™
and TAMRA™. Further details about the primer and probe sequences are recorded in
Table 2-12.
(i) Binding and Polymerisation
® 9
(M) Strand Displacement (*
<») Cleavage
j>.
(iv) Polymerisation complete
*_St® .Reporter (3) -Ouenctwr
Figure 4-30 Figure describing the progression of the PCR reaction, (i) the forward and reverse primers bind to their complementary regions on DNA pol and the probe binds to the site between the two. The polymerisation reaction begins, (ii) the Taq DNA polymerase extends the 5’ strand of DNA until the probe region is reached, (iii) the exonuclease activity of Taq polymerase causes the release of the fluorophore away from the quencher molecule, the fluorophore can now fluoresce, (iv) polymerisation complete.
Table 4-10 Describes key features of the primers (forward and reverse) and the probe used to bind complementary regions of the E.coli DNA polymerase gene. The shortest amplicons are the most effective and 20bp-45bp is optimum. The GC content of the amplicons should be in the 40-80% range to avoid formation of internal structures. The melting temperature of the primers should be between 58°C to 60°C and the probes >68°C. The 5’end of the probe should not end in G. The probe strand sequence chosen should be the one with the highest number of C residues and for all amplicons less than 2 G or C bases should comprise the last 5 bases of the 3’end. Information calculated by Primer Express software vl.5a
I, - ■ ■ ■CRITERION Fwd Primer Rev primer ProbeLength (bp) 20 19 27GC content (%) 60 47 48Melting Temp (°C) (50mM salt) 61.47 61.65 71.47Molecular weight (fwd) Da 6118 5751 8188Molecular weigh (rev) Da 6118 5863 8370G on 5’ end N /A N /A NOStrand with more C than G N/A N/A YESLess than 2 G or C bases in last 5 bases of 3’ end
N O YES YES
Thomas Burt 192

4. Analytical Development
-4 286
42 7*1
0 BM
Anp art cation - untttios 2
iS m iim iii « ! ! / ' ' 1JfffTfi
„ . anV. f l . . : . s i / H d l H U M U IIIII• 1 4 • I 12 I I U II It 21 21 24 I t 2t St S2 34 38 38 <
CfClt
U * TW— r W 1 Cl U toIftC • S M B ) 10 0 )• | M l 1O H i r w i w f ~ : o 1
FAU - Al FAN - A*
DO17.213
U.W10001
[ * • " 1 3 1 — » l n l l F AS - M 36.7470.0010001
FAN - AS 36.637 0.001
B
Figure 4-31 Figure A displays a typical standard curve used by the ABI Prism software. It plots the number of PCR cycles required to raise the fluorescence above the threshold value (0.04) against the number of genome copies in each well. The black points show the standards used to create the curve, so it is possible to see the inverse linear relationship existing between the mass of DNA to begin with and the number of PCR cycles required to raise the fluorescence above the threshold value. Figure B shows the trace of a PCR plate. The blackline marks the threshold value. Each of the coloured lines represents a set of wells. Wells containing the highest amounts of DNA cross the threshold at ~16,h cycle whilst the most dilute cross the threshold value at ~30th cycle. The picture is for demonstration purposes only, the software recorded the data for each well, plotted the standard curve and calculated the concentrations automatically.
The system was used quantitatively by using standards of known DNA concentration and recording the number of PCR cycles required to raise the fluorescence reading above a threshold value. The number of PCR cycles required to cross the threshold value is directly proportional to the starting concentration of DNA. The threshold cycle values (Ct) of the standards were used to construct a calibration curve against which the unknowns could be plotted.(Holland et al., 1991; Gelfand et al., 1993). A standard curve was included on each PCR plate and was prepared from the same batch of standard genomic DNA stored at - 80°C. The standard curve extends from 102copies/well to 106copies/well as shown in Figure 4-31 A. Such a broad standard curve allowed the assaying of all the samples from the downstream process on an identical standard curve.
The ABI Prism software recorded the progression of the PCR reaction, constantly monitoring the fluorescence increases in each well, and the cycle number at which the threshold value was exceeded. Following completion of the reaction, the software plotted the standard curve and automatically calculated the gDNA concentration in each well, averaging the four values representing identical sample points and returning the mean value and error. The results of each qPCR plate were given by the software in PDF form as shown in Figure 9-28. The values for gDNA concentration were given in copies per well.
Since the target sequence of the primers/probe was present at
Urfcrwn*
3»na*rm
Slop*
Y -ln tarcap t:
CorrelationCaaff:
Thomas Burt 193

4. Analytical Development
only one copy per genome, recording its frequency meant probability dictated that the remaining gDNA (comprising an entire genome) would also be present in the sample. Consequently, the calculation (Equation 2-5) used to determine the gDNA mass of the
nascent sample converted the genome copy number to mass, since the mass of the E.coli genome is known. The result is then multiplied by the correction factor, determined for the MagNA Pure instrument for that particular sample stage, to obtain the value of gDNA concentration in the initial DSP sample.
4.7.4 Determining the accuracy and precision of the qPCR assay
Compared to other methods of DNA quantification, such as PicoGreen and absorbance, the qPCR assay employed during this project was fairly complex. However, the far greater sensitivity and specificity of the assay was sufficient justification for the additional complexity. As the results will demonstrate, the assay was capable of accurately and specifically quantifying gDNA concentrations over 3000-fold more dilute than the lower
limit of the absorbance assay. Automation of sample purification simplified the operation tremendously and enabled far more replicates to be processed and so improving the accuracy obtained. However, the accuracy and precision of the assay needed to be quantified to be sure of the assay’s usefulness, as increased complexity can often lead to reductions in accuracy.
120
100
-"1------' 1 ■ ■ " ■ T
Average Mean %CV - 6.9%
10’ 10J 10s 10* 10* 10* (0.0172J l0172I 1112] I17*] I17*]
Genome copies per well(gD N A concentra tion in P C R w e ll (ngArtl)]
Mean Average %CV > 27.1%
23 4pgmTu
1 OOtgmr'
wmPRE-LYSIS PRE-CACL RETENTATE WASH 1
Process Stream• A verage gD N A concentration in sa m p le
0 1 3 ig m T '
-100
-90
-80
■70
-60
-50
-40
-30
-20
-10
-0
Figure 4-32 Graph A plots the coefficient of variation recorded for every pair of PCR wells against the mean concentration determined for the wells, and as such records the intra-assay variation introduced by the PCR reaction. Note that the average %CV is 6.9%. Plot B records the total variation between the two independently purified samples as a function of the stream under analysis. It also displays the average concentration of the streams analysed. Note that the average total variation (%CV) of the entire qPCR operation is 27.1%
Thomas Burt 194

4. Analytical Development
Figure 4-32 shows the results of studies completed to quantify the assay’s precision. The precision was recorded by % Coefficient of variation in two ways. Figure 4-32A records the intra-assay variation whilst Figure 4-32B records the total assay variation as a function of the process stream assayed. It can be stated that the total assay variation is the sum of
the variation introduced by the variation encountered during the PCR reaction and the variation introduced by the sample’s purification.
Looking first at the intra-assay variation shown in Figure 4-32A. It demonstrates that the variation introduced by the measurement of the PCR plate is very consistent never mind the concentration of the sample under analysis. There are a few anomalies but the average variation introduced to the total variation by the PCR reaction is 6.9%CV. This compares well to the precision of PCR reactions in the literature, where precision levels of 2.8-3.9%
have been demonstrated (Lee et al.,). Regarding Figure 4-32B shows that the total variation of the qPCR operation is on average 27.1%, which is much higher than the 6.9% due to the intra-assay variation. Consequently, it can be confidently stated that the decrease in precision is due to the purification of the samples by the MagNA pure machine. What is interesting to note is that the total variation is dependent on the stream under analysis, and as such the concentration of the gDNA in the stream. It appears that
the MagNA pure machine is capable of very consistent purification of relatively concentrated samples, but that this consistency is reduced with more dilute samples. However, it is to be expected that the precision would drop when purifying more dilute samples, as small fluctuations in the operation would have a much greater proportional
effect.
Overall, the assay precision (27.1%CV) is very acceptable and it is highly unlikely that performing the purifications manually, through the use of spin-preps, would be able to match that level of precision, especially with the dilute samples.
MagNA Pure V olu m e 1 / MEAN
DSPSAMPLE
MagNA P u ie V olu m e 2 © 0 > MEAN
PCR w e lls
Figure 4-33 Schematic explaining the method of determining variation encountered during the qPCR operation. Two volumes of a DSP sample were independently purified by the MagNA pure machine. Two volumes of each of these samples were loaded on to the PCR plate, giving a total number of 4 wells per sample. X records the intra-assay variation and as such is a measure of the variation introduced by the PCR reaction. Y records the variation between the independently purified samples and as such is the total variation encountered during the assay
X
Thomas Burt 195

4. Analytical Development
105
10*
103
10J
10’
10°
.......... ■ . . . ) ........-I ■ ■■,..■ . . 10'’10' ’ 10° 10’ 105 103 10" 105
Concentration of DNA sample loaded in to MagNA pure (ng/ml)
Figure 4-34 Figure shows the results of the experiment run to determine the accuracy of the qPCR assay. Triplicate samples of known concentrations of gDNA standard material (lOpgmL 1 to O.OOlpgmL'1) prepared by serial dilution in TE buffer, were purified by the MagNA pure system and loaded on to the PCR plate as would occur in a normal operation. The results from the PCR plate were then back- calculated using the correction factor and correlated against the values of their known concentration. The concentration of the top standard was determined by NanoDrop spectrophotometer.
Studies to record the accuracy of the qPCR assay are displayed in Figure 4-34. Duplicate volumes of standard gDNA material of known concentrations dissolved in TE buffer were processed by the MagNA pure equipment and loaded on to a PCR plate, as would be the case for normal operation. The results from the qPCR plate were then used to calculate the DNA concentration of the original solutions using the equation (Equation 2-5). The quadruplicate results were then correlated against their known values as shown in the graph. From the figure the coefficient of correlation was found to be high at 0.987. The gradient of the linear regression was determined to be 1.07, indicating that the qPCR had the tendency to overestimate gDNA yield by ~7%. This deviation is acceptable and probably attributable to a combination of error in the calibration of the MagNA pure, and the possible detection of contaminating sequences in the preparations. From the figure the increase in variation is seen toward the lower concentrations which are predicted by the reduction in precision at low gDNA concentrations.
The final action to be performed to ensure the accuracy of the qPCR was to ensure that the standard curve employed was accurate. The standard curve was prepared as described in (2.5.14.1). The highest concentration standard was 106 genome copies per well, equivalent to UpgmL'1 gDNA. This was prepared and the concentration validated by the NanoDrop
10*
103
103
10’
10°
Param eter Value Error
-0.01021 0 059241 06958 0.01542
0 96765 0 19944 15 <0.0001
Thomas Burt 196

4. Analytical Development
40-
35-
30-
25-
2 0 -
15-
10 -
5-
0-
I R eference S tandard New Standard Curve A New Standard Curve B
40
35
30
25
20
15
10
5
. 0100 1000 10000 100000 1000000
Genome Copies per Well
40
35
30
25
20
15
10
5
00 5 10 15 20 25 30 35 40Threshold Cycle Values (Reference Standard)
Figure 4-35 Graphs plotting the results of the standard curve validation experiments. Figure A plots the threshold values of each standard curve point at each gDNA concentration. The threshold value is the cycle number at which the fluorescence in the PCR well exceeds the pre-defined boundary of 0.04, a value in the middle of the exponential part of the PCR reaction. From the figure it can be appreciated that the different standard curves are in alignment and that the inverse relationship between threshold cycle number and DNA concentration is in effect. The anomalous result for 10 copies/well is ignored to improve fit.
Figure B correlates the threshold values produced for the prepared standard curve points against those of the reference standard. The coefficient of correlation for each standard curve is high and the average deviation from the reference standard is ~5%.
spectrophotometer. The remaining points on the standard curve were prepared by serial logio dilution, and were beyond the capacity of the spectrophotometer to validate. Consequently, the validity of the standard curve was checked against the reference- standard gDNA standard material. Triplicate volumes of each standard curve point were loaded on to a PCR plate, with all the necessary reagents. Similarly, equal volumes of the reference standard material were loaded on and the plate analysed by the ABI Prism PCR cycler. From Figure 4-35A it can be appreciated that the freshly prepared standard curve aligned well with the reference standard. Each PCR reaction which was run in this project carried a standard curve on the plate ranging from 101 — 106 copies/ well. However, as can be appreciated from Figure 4-35A the points for 101 copies were ignored in order to improve fit. It seems that the limit of sensitivity for the qPCR reaction is around lOcopies per well, equating to a gDNA concentration of ~1.72pgmL'].
Correlating the threshold values produced for the new standard material against the reference standard, as shown in Figure 4-35B demonstrated good correlation (-0.98) and suggested that the new standard curve values lay on average -5% within the figure for the reference standard. The acceptable degree of variation from the reference standard was 10%, meaning that the freshly prepared standard was acceptable.
Thomas Burt 197

4. Analytical Development
4.7.5 Conclusions
The importance of developing an assay to measure the clearance of gDNA during the
downstream processing stages cannot be overstated. This is because of the necessity that
the process demonstrates effective gDNA clearance. What is key about the qPCR assay
was that it enabled accurate measurement of gDNA to levels unachievable by absorbance.
Additionally, it allowed the specific monitoring of gDNA, despite the presence of plasmid
DNA in the samples, something beyond the capability of PicoGreen. Although more
convoluted in nature than the mentioned alternatives, the precision of the PCR reaction
was found to be 6.9%CV, a very acceptable level. However, the necessity to purify the
gDNA prior to quantification meant that the overall assay precision dropped to 27%CV.
However, the necessity to purify the sample would be required whatever the analytical
method employed, and the automation of the assay meant that reproducibility would be
better than manual purification, aswell as allowing more replicates to be processed.
The accuracy of the assay was also something important to demonstrate. Overall, the assay
was found to overestimate the gDNA present by -7%. This was surmised to be due to
residual contamination, although that remains conjecture. The entire operation was
performed in a DNA-free hood ensuring contamination was minimised. However, due to
the impressive sensitivity of the PCR reaction (found to be sensitive to ~1.72pgmL'1)
extremely slight contamination would contribute. In short the assay’s impressive
capabilities made it such an important assay to use and demonstrated why it is becoming
the recognised industry standard method of quantifying gDNA in process streams.
Furthermore, the capabilities of this assay make it an ideal candidate for plasmid
quantification, and it is believed that it will be employed for such in an increasing way.
Thomas Burt 198

4. Analytical Development
4.8 RNA quantification by Quant-IT assay
4.8.1 RNA assay background
One of the desired achievements of this project was the construction of a mass balance for
plasmid and contaminants over the main steps of the downstream process. A great amount
of process information can be gleaned from a descriptive mass balance and although the
plasmid is the product, and therefore the most important species to track, a fundamental
concern in process development is tracking the progression of the contaminants, of which
RNA is a major one. Indeed, in the order of contaminant mass following the lysis
procedure, RNA represents the second most prevalent contaminant, second only to
dissolved protein (Ciccolini et al., 2002). To construct such an RNA balance would
require an accurate and precise assay for quantifying RNA from process streams, which
had to be robust enough to do so in samples which contain other nucleotides, proteins and
salts.
During the preparation of samples for plasmid analysis, RNA is typically removed through
the inclusion of RNase in the resuspension buffer. This highly efficient enzyme is capable
of clearing all of the RNA contamination in a short period. However, from a process
validation perspective the use of bovine material in plasmid production processes is
disallowed. Consequently, the main RNA removal step employed in this process was the
addition of 5M Calcium chloride to the bulk lysate, immediately following completion of
the neutralisation step. The addition of this divalent salt, forming a final 1M solution,
causes the precipitation of the vast majority of the RNA in the lysate. It was important to
describe the level of this removal achieved over this step, together with characterising the
removal of RNA by the other steps known to facilitate RNA clearance, namely UF.
Unfortunately, there is not an abundance of suitable analytical techniques capable of
quantifying RNA. From an historical perspective, the number and sophistication of
techniques for assaying and quantifying DNA far exceed those available for RNA
measurement, by virtue of DNA’s greater importance in a larger number of fields. Table
4-11 details a number of available techniques used for RNA quantification and their
associated drawbacks.
Thomas Burt 199

4. Analytical Development
Table 4-11 Table describing competing methods for quantification of RNA in process streams and their associated drawbacks.
Technique Analytical method Drawbacks
Gel detection
Run sam ple on gel, stain and scan.
- Can and is used to prove RNA removal but not II particularly quantitative- Tim e-consum ing- High inter-assay variability
Hydrolysis and dephosphorylation of RNA in sample (Gehrke and Kuo, 1989)
G uanosine residues in hydrolysate quantified by R everse-phase H PLC.
- Hydrolysis reaction takes >24hrs.- Each H PLC run takes ~30 mins, reducing the num ber o f sam ples which can be screened.- Contam ination by residual guanosine residues on glassw are etc.
Direct HPLC (Eon-Duval et aLy 2003a)
Sam ple analysed by HPLC using an A nion exchange and Size exclusion colum n in series.
- Cannot give a definitive measure o f RNA, but a ratio o f plasmid: RNA- Each sam ple takes -30 mins, reducing the num ber o f sam ples which can be screened.
MagNA Pure Total RNA isolation (Roche Diagnostics, 2006)
Total RNA from sam ples purified by glass beads and DNA digested enzym atically. D etection by absorbance at 260nm
- A dditional processing decreases accuracy- Detection by absorbance requires samples to be >6pgm L '1 for accurate quantification- Tim e consum ing
Qiagen RNA purification kits
Q iagen kits used to purify RNA in sam ple. D etection by absorbance at 260nm
- Cannot purify total RNA, species <200bp lost- Additional processing decreases accuracy- Detection by absorbance requires samples to be >6pgm L '' for accurate quantification- Tim e consum ing-Cannot guarantee full clearance o f DNA.
RT-qPCR(Roche Diagnostics, 2006)
RNA purified by one o f the above tw o m ethods. RNA detection by RT-qPCR
- Cannot m easure total RNA only quantity o f RNA species targeted by the primers. Therefore m ust know the proportion the target RNA represents o f total RNA. This value is variable and hard to determine.
Fortunately, Molecular Probes had just produced the Quant-IT RNA assay kit, which
promised to make the construction of an RNA balance a possibility. It also promised to be
a lot simpler and less complex assay than those detailed in Table 4-11. Due to the relative
novelty of the assay no reported results of the use of this assay, except the manufacturer’s
guidelines, were available (Molecular Probes Inc, 2006). More detail about the assay
methodology can be found in 2.5.16. In brief, the assay follows a similar format to the
PicoGreen assay, in that it employs an RNA specific fluorophore and is conducted in a 96-
well plate format. The advantages of this technique become obvious in that no purification
of samples is required and that due to the high-throughput nature many samples and
sample replicates can be read, improving ease and precision.
Although many problems were encountered with the PicoGreen assay, it was envisaged
that these problems would not be a hindrance to this assay. The PicoGreen assay is a rapid
and accurate method of plasmid quantification, the problems with the assay found in this
Thomas Burt 200

4. Analytical Development
project were the direct result of the plasmids under investigation and not the assay itself.
As outlined earlier, the relatively high abundance of gDNA corrupted the results for the
plasmid quantification, which was confounded by the wide-range in signal variation
produced by linear and supercoiled DNA. For the Quant-IT RNA assay, the
manufacturer’s outline claimed the fluorophore to be highly specific for RNA, even in the
presence of DNA. Additionally, the handbook goes on to state that the fluorophore is
specific for all types of RNA (mRNA/ tRNA/ rRNA) no matter the molecules’
conformation (Molecular Probes Inc, 2006).
As with the PicoGreen assay, the sample for analysis is diluted to lie within the assay
range (0-10pgRNA mL'1) and lOpL loaded on to a 96-well plate. The fluorophore
concentrate is then mixed, in a 1:200 ratio, with the proprietary dilution buffer, 200pL of
which is then added to each well of the plate. Included on each plate was an RNA 8-point
RNA standard curve using material provided by the manufacturer, which ranged from 0-
lOpgmL'1. After a 5 minute incubation period the plate can be read using a fluorescent
plate-reader.
4.8.2 Determining the accuracy of the Quant-IT RNA assay
Since the assay involved no purification of RNA in the streams used for analysis, the
potential for contaminants in the samples to corrupt the result was a real possibility. To
determine whether this was the case, standard curve material was used to create solutions
of known RNA concentration using mimics of the solutions found in the downstream
process. These solutions were then read and the results correlated against the solutions of
the RNA in TE buffer. Table 4-12 displays the results of the correlation experiments. It
can be seen that RNA solutions in the DF1 and DF2 buffers demonstrated good
comparability to the standard curve indicating the contents of those streams would not
affect the results. However, the correlations for the Pre-CaCE and Post-CaCE streams did
not show good comparability, indicating that components of those streams had the
potential to heavily influence the assay results.
Thomas Burt 201

4. Analytical Development
Table 4-12 Table detailing the results of experiments into the effect of buffer components on the Quant-IT assay. Known concentrations of RNA were prepared using solutions found at various stages of the downstream process. The Pre-CaCl2 and Post-CaCI2 solutions were prepared from a blank lysis run using E.coli parental cell paste. The Diafiltrate 1 buffer was prepared by a 1:20 dilution of the Post-CaCI2 buffer, mimicking the dilution achieved in the process. The prepared standards were run in triplicate against a reference standard consisting of RNA of known concentration in TE buffer. The results were correlated
STREAM GRADIENT % OFFSET CORRELATIONPRE-CACL, 0.546 -45.4 0.924POST-CACL,/ PERMEATE 0.263 -73.7 0.877DIAFILTRATE 1 0.948 -5.2 0.989DIAFILTRATE 2/ RECOVERY STREAMS 0.976 -2.4 0.982
Knowing that the Pre-CaCl2 and Post-CaCl2 streams contained species which would
corrupt the results, further correlation experiments were performed by preparing fresh
standards of known RNA concentration prepared in the buffers, which had been diluted by
several degrees. Figure 4-36 plots the results of these investigations. From the figures it
can be seen that sample material from the Pre-CaCl2 stream required dilution by 100-fold
to remove the corrupting effects of the buffer. However, the same results for the Post-
CaCl2 stream suggested that even dilutions of sample material by 200-fold were
insufficient to remove the salt effects. The high-salt environment of the Post-CaCl2
solution meant that removing the inhibitory effects would be impossible by dilution alone.
Further dilutions could not be attempted as they would take the concentration of the RNA
3
PRE-CACL BUFFER EFFECTSGfpdient Correlation 0.836 0.914 0.978
30 - 3 0Buffer Dilution * 50-fold ■ 100-fold
-2525 0.98
-2020
-1515
-10
5
03010 15 20 250 5
POST-CACL BUFFER EFFECTSBuffer Dilution* 50-fold ■ 100-fold• 200-fold
30 -30G radien t
0.3510.6600.686
0.9925 -25
20 -20
15 -15
10 -10
5
05 15 250 10 20 30
RFU Reference Standard RFU Reference Standard
Figure 4-36 Figure A plots the correlation experiments of the RNA standards prepared using Pre- CaCI2 solution of three dilutions against the reference standard. It can be seen that above 100-fold dilution of the solution the corrupting influence of the contaminants is sufficient to reduce the effect to within the 10% acceptable limit. Figure B plots the same results using various dilutions of the Post- CaCI2 buffer to form the standards. The results suggest that even dilutions of 200-fold is insufficient to remove the corrupting effects of the contaminants
Thomas Burt 202

4. Analytical Development
in the sample stream out of the linear range o f the assay.
For this reason the high-salt streams (Post-CaCl2/ Permeate) would have to be de-salted,
prior to analysis, through the use o f PD-10 columns. Although this would represent a
further processing step, the recoveries of macromolecules from these columns is claimed
by the manufacturer to be >95%, meaning that de-salting should not be detrimental to the
accuracy (GE Healthcare, 2005). The final dilutions employed for each process stream can
be seen in Table 2-13. These experiments gave the confidence that the dilutions were
sufficient to remove the effect o f any contaminating species in the buffers and that the
assay accuracy lay within 10%.
The final consideration concerning the accuracy of this assay lay with the standard curve.
The manufacturers claim that the fluorescence signal from RNA was linearly related to
the RNA concentration. However, it was found more accurate to fit a polynomial curve to
the data, as shown by Figure 4-37.
4.8.3 Determining the assay precision
As with the other assays, o f which the development has been described in this chapter,
determining the precision of the Quant-IT RNA assay is central to having confidence in
the results it returned. The determination of the assay precision follows the same
procedure as outlined for qPCR. with a small difference. The manufacturer's guidelines
specify the need to repeat each measurement in triplicate, advice which was followed.
Additionally, each DSP sample analysed was on three dilutions of the sample (all within
the linear range of the assay) to improve accuracy. Once again this experimental setup
allowed measurement of the intra-assay variation, which is inherent in the assay and the
determination of the inter-assay variation which is caused by dilutional and liquid handling
45
40
35
30
15
10
5
0100 6 82 4
RNA concentration (|jgm! ’)
Figure 4-37 Figure showing a typical standard curve. The standard curve and data analysis was automatically performed by the SoftMax Pro software. However, it was found more accurate to employ polynomial regression rather than linear on the standard curve
Thomas Burt 203

4. Analytical Development
differences. It was a definite possibility that the inclusion of three dilutions would increase
assay variation, which is why it was important to quantify, however doing so would
benefit the assay accuracy.
The results of the assay variation are displayed in Figure 4-38. Graph A shows the intra
assay variation encountered between triplicate wells of the same sample, plotted against
the concentration of RNA in the well. It can be appreciated that the assay precision
decreases as the sample becomes more dilute. For this reason it was decided to ignore the
results of triplicate wells where the %CV exceeded 50%.From Figure 4-3 8 A it can be seen
that the average %CV of the triplicate samples was 18.6%. This is a high value for intra
assay variation, when compared to the same value for the HPLC, gDNA and BCA assays.
WELLSDILUTION 1 ^ ^ « _ MEAN
DSP x * SAMPLE
X
• • • — MEAN -
' 0 0 0 , - MEAN -
— Y
Figure 4-39 Schematic describing the measurement of variation in the Quant-IT assay. Three dilutions of the DSP sample were created, each of which was measured three times on a 96-well plate. The intra-assay variation (X) records the variation inherent in the assay technique, whilst inter-assay variation records the variation between replicate dilutions (Y).
A verage %CV • 18 6%
m no]Mean RNA concentration (pgml1)
[Mean RNA m ass in wall mg)]
50
45
8 40ec 35
1 30> 25
1 20
I 15o£c
10
1 5
Combined A vef ag* %CV* 20.6*
all II
• Mean Average RNAconcentration in stream
B Process Stream
Figure 4-38 Graph A plots the coefficient of variation recorded for every triplicate set of wells recorded in the RNA assay against the concentration determined for the wells. Note that %CV increases as the RNA concentration decreases and that the average %CV for the assay is 18.6%. The grey points represent sample sets which were ignored due to displaying a %CV >50%. Graph B plots the total variation recorded between triplicate dilutions o f the same samples as a function o f the stream analysed. The average concentration of the sample under study is recorded and is thought to effect the %CV achieved. Note the average assay variation was 20.6%CV
Thomas Burt 204

4. Analytical Development
However, little can be done to improve upon this value as it represents the inherent
variation within the assay. Figure 4-38B plots the total variation witnessed between the
triplicate dilutions. The average value stands at 20.6%, meaning that the vast majority of
the variation is a direct result of the assay rather than any liquid handling or dilution
effects. It can also be appreciated from that plot that the variation is not fixed but varies
between the samples under analysis of the assay variation are displayed in Figure 4-38.
Figure 4-38A shows the intra-assay variation encountered between triplicate wells of the
same sample plotted against As a general rule, the streams containing the least RNA
possessed the greater %CV, something which is a direct result of the assay. It seems that
although the assay can quantify RNA solutions less than lpgmL'1 the precision of the
assay becomes less at those concentrations. Although it has been demonstrated that the
assay variation increases with sample concentration, the maximum overall variation
(~30% for dilute samples) was not deemed high enough not to include the results in the
mass balance.
4.8.4 Conclusions
The development of a suitable assay for monitoring the progression of RNA removal
throughout the downstream process has been reported. The assay employed had the
advantage of ease of operation and the potential to allow the screening of multiple
replicates with ease, something not available with alternative methods. It was expected and
determined that contaminating species could cause corruption of the results returned.
However, suitable dilutions were found that could eliminate these effects, and where it was
deemed not possible to do so, the samples were de-salted through the use of PD-10
columns. Overall, the assay accuracy was predicted to be within 10% no matter the sample
stream under analysis.
It was also determined that although the assay provided many benefits, its variation was
higher than witnessed with other assays. The average variation between replicate wells
containing identical samples was found to be 18.9%CV. The variation was found to
increase with decreasing sample concentration such that it is expected for precise results
the concentration of RNA in the sample wells should not be below O.lpgmL*1 and ideally
lpgmL"1. Despite this drawback the assay promised to be very suitable for the creation of
an RNA balance for the downstream process.
Thomas Burt 205

4. Analytical Development
4.9 Protein quantification by BCA assay
4.9.1 Background of BCA assay
Despite the large removal of protein that is achieved over the precipitation step, sufficient
mass remains for dissolved protein to form the most abundant contaminant in the
downstream process stages. For that reason it is critical that the removal of this
contaminant be described by a mass balance. Despite its prevalence, protein represents the
least troublesome contaminant to remove during the downstream stages, mainly due to the
large physico-chemical differences which exist between proteinaceous molecules and
polynucleotides. The same cannot be said for RNA and gDNA, since they share a great
deal of similarity to the target plasmid molecule. In order to construct a protein mass
balance a suitable assay, capable of monitoring protein concentration through the process
was required.
The BCA (Bicinchoninic acid) assay was chosen over competing total protein assays
(Modified Lowry and Biuret) namely for ease and accuracy, since the BCA assays was
available in 96-well format and the other two were not. The advantage of analysing samples in the plate-based format is that far more samples and sample replicates can be
screened more quickly and through the use of less material. The BCA assay was chosen
over the Bradford assay, which is available in a 96-well format, because the BCA has a
higher sensitivity (-O.SpgmL'1), shows less protein-protein variation and, unlike the
Bradford assay, is not strongly affected by trace amounts of SDS (Smith et al., 1985;
Brown etal., 1989).
The operation of the BCA assay surrounds the reduction of copper(II) ions by proteins in
an alkali environment (Biuret assay). The concentration of copper(I) ions is then
determined colourimetrically using the BCA reagent. The reaction produces a purple
colour which exhibits strong absorbance at 562nm. More detail concerning the operation
of the BCA assay can be found in (2.5.13). In this project the assay was used to determine
the protein concentration of all streams of the downstream process enabling the
construction of a full mass balance. However, prior to its use, the accuracy of the BCA
assay needed to be validated and following the assay’s deployment the precision of the
assay could be found, so as to give confidence in the results produced.
Thomas Burt 206

4. Analytical Development
4.9.2 Determining the accuracy of the BCA assay
As with the RNA assay, the BCA assay required no prior purification of the samples used for analysis. Once again the potential for contaminants in the process samples to effect the BCA reaction and cause misleading results was a distinct possibility, such effects had been reported by (Brown et al., 1989). To determine whether this was the case similar experiments were performed as were described in the RNA assay section. Standard curve material (BSA) of known concentration was prepared using neat solutions of the various solutions encountered during the DSP operations. These samples were run in triplicate against reference standard, consisting of identical concentrations of BSA prepared in PBS buffer. The absorbance results of the buffer standards were then correlated against the same for the reference standards, as shown in Figure 4-40.
From the results of these preliminary experiments it can be seen that the Diafiltrate 1 (DF1) and DF2 buffers did have a small increasing effect (8-10%) on the absorbencies, however, they lay within the 10% acceptable margin, meaning that no dilutions of these
solutions would be required. The Pre-CaCk and Post-CaCk solutions were found to have
0.8PRE-CACL BUFFER EFFECTS
Gradient CorrelationDilution0 .7 - -0 .7
p0 .5 - -0 .5
CO0 .4 - - 0 4
CO0 .3 -as 0J2 - - 0.2
- 0.1
0.0 0.00.2 0.3 0.4 0.5 0.6 0.70.0 0.1 0.8
BUFFER EFFECTS'Stream
1 .2 - - 1.2
1.0 2.06
1 0 9
0.8
- 0.6▼ DF2- 0.8
*>°-7!2 06 o 0.5 -0 .5
0. 4 -0 .4
-0 .30.3
0.2 - 0.2
- 0.00.0
-0.10.0 0 1 0.2 0.3 0.4 0.5 0.6
Absorbance of PBS Standard Absorbance Reference Standard
Figure 4-40 Figure A plots the results of correlation experiments performed to determine whether the contents of the solutions of the process stream affected the result obtained by the BCA assay. Known concentration of standard BSA protein were prepared in Pre-CaCI/ Post-CaCl/ DF1 and DF2 buffers. Triplicate volumes of these were loaded onto a plate and read against a reference standard of the same protein solutions made in PBS buffer. The absorbances produced by the buffer standards were then correlated against the reference standard. Note that the gradient produced for the DF1 and DF2 buffers were within the accepted range of accuracy (i.e.10%) but that the same was not true for the solutions made with the Pre-CaCI and Post-CaCl buffers. Figure B shows repeat experiments, using known concentrations of protein made up in Pre-CaCI solution of varying degrees of dilution. Correlating the results against the reference standards demonstrates that dilutions of 2-fold is sufficient to remove the corrupting effects of the contaminants in the Pre-CaCI buffer
Thomas Burt 207

4. Analytical Development
more of an impact on the results. The gradient of the Pre-CaCU standards suggested that
the buffer caused a -13% increase in the absorbance signal. Further experiments were
carried out using various dilutions of this buffer and it was deemed that this effect could be
reduced to lie within the acceptable margin (±10%) by a 2-fold dilution of the sample
material. The buffer effects demonstrated by the Post-CaCU solution (known to be at least
a 1M salt-solution) were more dramatic, suggesting that assaying samples in this buffer
would cause a >100% deviation from the actual value. It was attempted to remove the
effect of this contaminant by dilution, but it was found that even dilutions as 1:100 still
produced an effect. Any higher dilutions would take the protein concentration beyond the
linear range of the assay. Consequently, for the same reason as described in the RNA
assay, high-salt containing streams (Post-CaC^ and Permeate) would require de-salting
prior to assaying. Again, PD-10 columns would be used, which claim to recover >95% of
the macromolecules and retain <4% of the salt (GE Healthcare, 2005).
4.9.3 Determining the precision of the BCA assay
The operation of the BCA assay was the same as described for the RNA assay, in that
triplicate measurements of three different dilutions of the DSP sample were performed.
For that reason determination of the assay precision was carried out in the same fashion,
by placing a value on the intra-assay and total variation of the assay. As before the intra
assay variation is inherent in the assay, whilst the total variation is due to the intra-assay
variation combined with the dilutional and liquid handling effects. The results of assay
variation are detailed in Figure 4-41. From Figure 4-41A it can be appreciated that intra
assay does increase with decreasing sample concentration. A similar effect to that reported
by the RNA assay. However, the extent of this variation is far less than that reported by the
RNA assay, meaning that fewer sample sets were ignored for exceeding 50%CV. Indeed,
the average variation due to the assay alone is less than 10% compared for -18% for the
RNA assay, meaning that the BCA assay is by its nature a more precise assay.
Unfortunately, the advantages of this improved assay precision are lost due to dilutional
and liquid handling differences as the total variation of the assay was deemed to be 17.8%
(Figure 4 4IB). As with the gDNA and RNA assays the streams demonstrating the greatest
variability are those containing the least amount of protein
Thomas Burt 208

4. Analytical Development
130- 120 110
g lO O £. 90I 80i 70
f 60 i 50I 40-S 3 ° - i
» 2 0 -
10 0
Mean Average %CV* 9.4S%
10 100
Protein Concentration in \wll (ngml ’)
130 - 120
50 -i
45--110- 100 «> 40-
-90 35-- 80 S—-70
(0X>
30-
-60 25--50 1-40 1 20-
-30 8 15--20 *
10--10 S
2-0 5-
Combined Average %CV - 17.8S
BIS IS 5
Process Stream
Figure 4-41 Figure A plots the coefficient of variation recorded for every triplicate set of wells run in the BCA assay, against the concentration of protein in the well. Note that %CV does show an increase as protein concentration decreases, but to a lesser extent than for the RNA assay and that the average %CV is 9.45%. The grey points were sample sets that exceeded 50%CV and so where ignored to improve precision. Graph B plots the total variation recorded between triplicate dilutions of the same sample as a function of the stream analysed. Note that the average %CV id 17.8%
The results of the precision analysis suggest that the BCA assay is more precise than the RNA assay. However, it seems to be affected more by dilutional effects between samples, possibly suggesting that the chosen dilutions were not ideal. However, the overall assay precision of 17.8% made it more precise than the RNA assay and was deemed acceptable.
4.9.4 Conclusions
An accurate and precise method of determining protein concentration in all streams of the downstream process has been described. No dilution was required for UF recovered fractions, but a 2-fold dilution of the clarified lysate was deemed required to ensure accuracy. Furthermore, the Post-CaCh required de-salting prior to measurement. The intra-assay precision was found to be much improved compared to the RNA assay at 9.45%CV, but that the overall assay variation determined at 17.8%.
Thomas Burt 209

4. Analytical Development
4.10 Sonication procedure
4.10.1 Assay Background
One of the final actions in the construction of the mass balances for protein, RNA and
gDNA was to determine the mass of each of these contaminants in the initial cell paste
used in the process, enabling the balancing of these contaminants over the lysis step. To do
so would require a lysis procedure that would not lead to any removal of these
contaminants. For example, alkaline lysis would not be suitable as it achieves lysis but
also contaminant removal during the precipitation step. Enzymatic lysis was not thought to
be an improvement, since the addition of lysozyme would corrupt the protein results.
Consequently, it was decided to achieve lysis by a physical mechanism; through the use of
ultrasonication.
Ultrasonication of microbial cells in suspension with inaudible ultrasound, results in their
physical disruption. The technique utilises the rapid sinusoidal movement of a probe
within the suspension. The high frequency (>18 kHz), small displacements (<50 pm) of
the probe generate moderate fluid velocities (~l-2ms'1) but cause high shear rates
(-4,000s'1) and high acceleration rates (~80,000g). These effects induce cavitation, such
that acoustic power is sufficiently high to produce micro-bubbles at nucleation sites in the
fluid. The bubbles grow during the rarefying phase of the sound wave but are collapsed
during the compression phase. Overall, the collapse of the bubbles converts sonic energy
into mechanical energy, in the form of shock waves equivalent to several thousand
atmospheres pressure (~300MPa). This energy imparts motion onto cells, which
disintegrate when the kinetic energy content exceeds the wall strength. Also, the shear
rates produced are enough alone to cause significant damage to the cells (Bailey and Ollis,
1986; Fykse et al., 2003)
This technique would be employed to lyse the cell suspension and the various assays
(gDNA/ BCA and Quant-IT RNA) could then be performed on the lysate to determine the
concentrations and masses of the contaminants at the beginning of the process. However,
to have confidence in the results conditions needed to be isolated that guaranteed that full
lysis was being achieved, otherwise not all of the contaminant mass would be accounted
for.
Thomas Burt 210

4. Analytical Development
4.10.2 Determination of suitable sonication conditions to ensure full cell lysis.
The determination of suitable conditions for the sonication procedure was essential to give
confidence that all the intra-cellular contents were released into solution where they could
be assayed. Since the achievement of full lysis is dependant on so many factors, varying
from the cell strain employed to the shape of the vessel in which the cell suspension is
contained, no definitive conditions could be obtained from the literature which would
guarantee full lysis. Consequently, studies were required to decide upon the best
conditions. It was decided that the lysis would be conducted on lOmL of cell suspension in
a 50mL Falcon tube. The ultrasonicator (Braun Labsonic), equipped with a needle-
titanium probe of 4-mm diameter and 127-mm length, was kept immersed about 5 mm into
the fluid. Sonication experiments were done at 20 kHz meaning that the acoustic power
ranged from 35-95W. At all times the cell suspension was kept at ~4°C by incubation in an
ice-bath. Determining the extent of cell lysis would employ the BCA assay to record the
concentration of dissolved protein in the sonicated lysate.
The two conditions which were thought most likely to impact upon lysis efficiency were
the cell concentration of the suspension and the period of time that the cells were
sonicated.
4.10.2.1 Determining the optimum cell concentration
From the manufacturer’s guidelines a sonication regime was obtained which involved a
10s sonication event followed by a 30s break (the break period prevented sample over
heating). This 40s cycle was repeated 10-times for each sample. Cell material extracted
from E.coli DH1 fermentations was used in the optimisation studies. A series of cell
suspensions of varying concentrations (190gL‘1-0.39gL"1) were prepared by dissolving lOg
of frozen parental cell paste in 50mL of TE buffer. The WCW of the solution was
determined to be 190gL_1. The remaining cell suspensions were prepared by log2 dilutions
of this starting material in TE buffer. The cell suspensions were then subject to the
sonication regime in Falcon tubes. Following sonication, the cell lysate was recovered by
centrifugation and the dissolved protein concentration of the supernatant found using the
BCA assay. A negative control was also assayed, which involved spinning down an
identical cell suspension which had not been subject to sonication. This would account for
the protein present due to background cell lysis.
Thomas Burt 211

4. Analytical Development
250 250
—o— Sonicated o Unsonicated Control
225-
200 - -200
175 - -175
2 150 - -150
125- -125
g 100- -1 0 0
-75
-50
25- -25
0.25 0.5 1 2 8 16 32 64 1284
160- 160
^ 140-
S 120 - 120
100
2 0 -
0 2 8 10 12 14 16 18 204 6Log. Cell Concentration (gL1) Cycle Number
Figure 4-42 Figure A plots the results of investigations to find the optimum cell concentration at which lysis, by sonication, is the most efficient. lOmL solutions of different cell concentration of E.coli in TE buffer were subject to a 40s sonication cycle, repeated 10-times. The lysate was centrifuged down and the supernatant assayed to determine total protein concentration. The specific protein yield could then be determined. It was found that lysis at l.SbgL'1 gave the highest and most reproducible degree of lysis. Figure B plots the results of investigations to determine the optimum number of sonication cycles required to achieve full lysis of a 1.56gL"’ cell solution. It was determined that beyond 8-cycles the increase in lysis achieved was minimal. Additionally, extending lysis longer than this could cause damage to the molecules which were to be assayed, not by shear but by exposure to elevated temperatures.
Figure 4-42A plots the results of these investigations to determine optimum cell concentration. The semi-log plot details the small extent at which lysis occurs at the higher cell concentrations. The efficiency of lysis shows an almost linear increase as the cell concentration is reduced. However, past 1.56gL'’ the precision of the assay becomes problematic and as the unlysed control records higher specific protein yield than the lysed value, also the error at that level is high. Consequently, it is decided that a cell concentration of 1.56gL_1 (prepared by serial dilution) offers the optimum cell concentration. Visual observations of sonication also recorded the efficiency of lysis, because at the lower cell concentrations the opaque, cloudy suspension became clear following sonication. This was taken as visual evidence of effective lysis. Additionally, the value recorded for specific protein yield at this concentration was ~1 ^mgg’1 WCW, representing -11% WCW. The value for total protein in an E.coli cell is -15% (Bailey and Ollis, 1986) indicating that the lysis was effective. The slightly strange effect noted, was that merely preparing the cell suspension, which does involve pipetting, centrifugation etc. seemed to account for -50% of the reported lysis. Whether the cells at the end of the fermentation were weakened or that the cells were exposed to osmotic lysis is unsure, but
the figure seems high.
Thomas Burt 212

4. Analytical Development
4.10.2.2 Determining the optimum number o f sonication cycles
It had been decided to lyse cells using sonication at cell concentrations of 1.56gL']. In the
determination of that figure a sonication regime had been employed which involved a 10s
burst followed by a 30s break period. This had been repeated for a total of 10 cycles. What
needed to be determined was whether this regime was sufficient to allow complete cell
lysis, or indeed whether full cell lysis was achieved in fewer cycle times. The
investigations were performed in an identical manner to as described previously. Cell
suspensions of E.coli DH1 parental at 1.56gL_1 were prepared by serial dilution. These
were then subject to sonication regime of 40s, but the number of cycles was varied from 2-
18. Following sonication the lysate was centrifuged and the protein content of the
supernatant recorded using the BCA assay.
Figure 4-42B plots the results of the investigations. From the plot it can be appreciated that
lysis efficiency rises with the number of sonication cycles, but that a maximum efficiency
is recorded at about 8 cycles. Continuing with the sonication past this cycle number did
not appear to achieve any higher degree of lysis. Furthermore, it was felt that although the
lysis was performed on ice, continuation of sonication for longer than the maximum
needed could only lead to damage/denaturation of the contaminants to be assayed.
4.10.3 Conclusions
It had been decided to employ ultrasonication to induce lysis in cells so that the starting
amounts of the contaminants could be found. It was believed that this technique was better
than alternatives (detergent/ enzymatic lysis) as it efficiently achieved its objective, but
with the minimal impact on the concentrations of the contaminants to be assayed.
Optimisation studies were performed and it was decided that efficient cell lysis could be
achieved at cell concentrations of l.SbgL'1 using a sonication regime involving 8-cycles.
Now that these conditions were known, the cell material used for the downstream
processing studies could be subject to the same regime and the lysate assayed for the
concentration of gDNA, RNA and protein. This would allow the specific yield of each of
these contaminants to be determined for every cell mass processed. Ultimately, this would
enable the starting masses of each of the contaminants at the process start to be calculated.
Thomas Burt 213

4. Analytical Development
4.11 Conclusions
The importance of accurate analytical techniques was crucial in the development of this
project. However, it was understood at the outset that techniques commonly used for
plasmid quantification, when recording the concentration of solutions containing small,
high-copy number plasmids may not be applicable for quantification of large, low-copy
number plasmids. Studies confirmed this. Problems were encountered with the use of
PicoGreen, due to the presence of contaminating gDNA. Although this contaminant
existed at identical levels whether assaying a high or low copy number plasmid, the ratio
of the level of contaminant to plasmid was found to be of key importance. For high-copy
number plasmids the small, corrupting influence of background gDNA did not influence
results significantly. However, at the low plasmid concentrations encountered with the
low-copy plasmids this background signal was found to equal that due to the plasmid,
meaning the actual yield results were far more corrupted.
Issues were also identified with processing of these plasmids using Qiagen spin-preps and
attempting to quantify the pDNA in the eluents. Due to the low plasmid yields, the
presence of protein in the eluent stream had an impact on the accuracy of using A260 to
quantify large plasmid eluents. Again, this problem was not be encountered when
processing small, high-copy plasmids due to that fact that the higher pDNA yields in the
eluent were less affected by these trace contaminants. Furthermore, attempting to use
PicoGreen to quantify the plasmid in the spin-prep eluents also posed more questions. It
was found that to obtain an accurate result the standard curve employed has to mimic
closely the topology of the plasmid in the eluent. It was soon realised that the large
plasmids in the eluent displayed very little supercoiling and as such assaying against a
standard curve composed of native plasmid produced erroneous results. Again, this effect
was not witnessed with the smaller plasmids, since the action of spin-prepping did not
have the same effect on their level of supercoiling. A method was determined which
provides a reasonably accurate method of quantifying large, low-copy number plasmids.
Alternative methods of plasmid quantification were investigated. Development of a HPLC
technique led to a very effective assay for the analysis of plasmid (of all sizes) in all
elements of the plasmid production process.
Thomas Burt 214

4. Analytical Development
Development of an assay for visualising plasmid topology was difficult. The use of Field
Inversion Gel electrophoresis (FIGE) was found to reliably separate the isoforms of large plasmids.
Further details are given into the development of the other assays required to construct a
mass balance for the key contaminants in the plasmid production process. These included
assays for protein, RNA and genomic DNA. Suitable investigation was required to
determine the limits of the individual assays, their accuracy and their precision.
Assay development formed a key part of this project and ran concurrently with the
progress of the project. All of the assays employed were suitably tested and verified so that
confidence can be had in the results these techniques returned.
Thomas Burt 215

5. Cloning and Cell-line development
5 CLONING AND CELL-LINE DEVELOPMENT:
RESULTS AND DISCUSSION
5.1 Chapter Aims
From the initial studies it had been determined that the large plasmids of the Oxford series
were not particularly useful for investigating the plasmid process. Since the constructs
were Bacterial Artificial Chromosomes, their copy number was found to be very low, at
about 1-2 copies per cell. The resultant low yields created a multitude of problems,
including difficulties in analytical procedures, but also in the investigations performed to
study their behaviour when processed. Essentially, it became impossible to differentiate
effects recorded when these molecules were processed as being due to the large construct
size or the low yields at which they existed. This realisation resulted in a difficult decision
as to the direction of the project. The project could continue to investigate the production
of the large series of BACs or attempts could be made to construct a series of large
plasmids employing origins of replication found in plasmids used for production. As a
result, this chapter attempts to cover the following areas;
1. Logical and intuitive reasons why the decision was made to construct large
plasmids using conventional plasmid backbones.
2. The chapter will describe the broad methods which were attempted but which
failed to produce large constructs.
3. The chapter will describe in more detail the shotgun-cloning method which was
successful in producing a series of large constructs.
4. How techniques of statistical design of experiments were adopted to determine
optimum conditions at which to produce the large constructs by batch
fermentation.
5. Investigations into the stability of the newly constructed plasmids to determine the
extent to which losses were accrued by plasmid instability.
Thomas Burt 216

5. Cloning and Cell-line development
5.2 Decision to construct a new series of large plasmids
The Oxford series of plasmids used in the initial investigations were Bacterial Artificial
Chromosomes (BACs). As such the constructs’ replication was controlled by the F-factor,
which stringently maintains plasmid copy number at 1-2 copies per cell, depending on the
stage of growth of the culture. This value of 1-2 copies was reported by (Frame and
Bishop, 1971) but was also determined by studies into plasmid yield found in Chapter 3.
At the outset of this project it was hoped that the large plasmid size would go someway to
alleviate the low-copy number by ensuring that there still existed a high amount of pDNA
for purification. However, it was soon determined that the yields produced from
fermentations of these constructs were very low (~50pgg'1WCW) approximating to about
10-fold less material that un-optimised production systems using high-copy plasmids, and
up to 100-fold less than that of optimised production systems. The low yields made it hard
to draw any concrete conclusions from investigations into the processing of these
macromolecules. The situation was made increasingly difficult by inaccuracies in the
analytical procedures, mis-representing plasmid yields because of the relatively high
impact of other contaminants on the signal used for quantification. Additionally, it was
found that operation of the plasmid production protocol being studied was not feasible
using lysate streams containing these plasmids. The reason for this was that the current
process employed a UF step which required a certain quantity of plasmid to be present so
as to generate an effective gel layer. Attempts to increase the loaded plasmid mass, by
either reducing membrane area or increasing the volume of lysate loaded, were tried but
found not to be applicable as it led to the rapid and complete blockage of the membrane.
As a result of these issues it was believed that in order to generate meaningful data the
specific yield of plasmid to be purified would need to be increased, at least to within
comparable yields generated by small, high-copy number constructs. It is important to
remember that the cells were not close to the estimated maximum limit of
extrachromosomal DNA when they were propagating the BAC series of plasmids (Figure
3-14), meaning there existed a large scope to improve on the pDNA specific yield. With
most commercial processes increasing plasmids can be achieved by one of two methods;
genetic and process strategies.
These are outlined in 3.3 and either involve increasing the plasmid copy number (and
hence specific yield) by employing replicons which ensure high copy numbers or by
Thomas Burt 217

5. Cloning and Cell-line development
adjusting fermentation conditions (media recipe, fermentation strategy, growth rate) to amplify plasmid copy number.
Table 5-1 Decision matrix used in an attempt to objectify the decision making process. The pros and cons of the two courses of action s were summarised. Each pro and con was then rated numerically, a pro given a positive score and a con a negative. The magnitude of the score varied from -5-+5 with each judged on the criteria of relevancy and likelihood. The net score is the sum of the values for pros and cons.
ACTION PROS CONS
Continue with the use of the Oxford Series
Net result (-10)
- Could continue without taking time out to construct new plasmids (+5)
- Unable to differentiate the effect of low yields or large size (-3)
- Unsure if meaningful results could be obtained (-2)
- Would not be possible to study the whole process, only unit operations (-3)
- A commercial process would never make use o f these constructs (-1)
- Had obtained data relating the difficulty of purifying these constructs using the conventional process(-4)
- Constructs’ copy number stringently controlled, and as such no methods available to increase copy number. (-2)
Alter replicon of large plasmids
Net result (0)
- If created high-copy number large plasmids the resultant information would be more relevant to existing processes. (+2)
- Creation o f a series o f plasmids with more realistic sizes. (+4)
- Could allow the studying of the whole process- enabling construction o f a mass balance. (+3)
- Would make use o f plasmid backbones used in current production processes. (+3)
- Make use o f relaxed plasmid backbones which would allow a degree o f control over plasmid yields during fermentation (+2)
- Time required to construct/alter the plasmids (-5)
- Unsure whether the constructs could be produced. (-5)
- New constructs may not improve situation (-4)
Unfortunately, it has been shown in Chapter 1 that none of the process strategies described in the literature can be used with stringently controlled plasmids. In short the only viable
Thomas Burt 218

5. Cloning and Cell-line development
option of increasing plasmid specific yield was to employ a genetic strategy. This would involve replacement of the F-replicon with a relaxed origin of replication which would increase the plasmid copy number. Table 5-2 details the origins of replication and copy number of various plasmids.
Table 5-2 Table describing the replication and copy number of various plasmids. The origin of replication determines whether the plasmid is under relaxed or stringent control. Plasmids such as pUC/pTZ have mutations which allow them to reach very high copy numbers. The copy number of relaxed plasmids is not fixed and can vary depending on the nature and size of the insert. Table adapted from (Sambrook et aL, 1989) and (Qiagen, 2005).
PLASMID CONSTRUCT ORIGIN OF REPLICATION (OR1)
COPYNUMBER CLASSIFICATION
pTZ vectors pMBl >1000 High copy
pUC vectors pMBl 500-700 High copy
pBluescript vectors ColEl 300-500 High copy
pGEM vectors pMBl 300-400 High copy
pBR322 and derivatives pMBl 15-20 Low copy
pSClOl p!5A ~5 Low copy
pML31 F-factor 1-2 Very Low copy
pBAC108L (Oxford series) F-factor 1-2 Very Low copy
However, it was realised that this strategy would be technically difficult and there would be no guarantee of a successful outcome. On the other hand, the alternative of continuing to use the Oxford series was not attractive either. In order to choose the best strategic course of action a decision matrix was drawn as shown in Table 5-1. The decision matrix was used in an attempt to objectify the decision process by rating the reasons for pursuing
the two different strategies.
The main pro towards continuing use of the Oxford series was that no time would be required to develop more suitable constructs. However, a number of disadvantages were identified with continuing with this course of action. From the initial studies it had been shown impossible to determine whether the low mass recoveries produced at the end of the process were a result of the low starting yields or the large size of the constructs.
Additionally, with such low starting yields it was unsure whether meaningful results, in the form of a plasmid mass balance, could be obtained using these constructs. The low initial
Thomas Burt 219

5. Cloning and Cell-line development
yields would make detection and mass balancing difficult, and as such it would be hard to
determine which steps in the process were the most problematic, since only trace amounts of plasmid were present to begin with.
Furthermore, from the initial studies it had been found that insufficient plasmid mass was
present in the lysate to build up an effective gel-layer on the membrane surface. As a
result, it probably would not be possible to study the downstream process in its entirety.
This would require the application of scale-down studies to mimic each process step, using
pre-concentrated plasmid stock as the feedstream. However, investigation of the plasmid
process, by studying each unit operation using scaled-down mimics and concentrated
feedstock, would not represent the process as accurately and holistically as actually
performing pilot-scale downstream runs. Also, generating sufficient material to perform
these studies promised to be problematic.
Further reasoning led to the belief that a sea-change in the operation of the plasmid
production process would be required to produce such low-copy vectors. Traditional
plasmid processes operate by removing the contaminants away from the plasmid product.
This strategy works by ensuring that each unit operation delivers a large clearance of the
major contaminants, which as a side-effect also leads to the loss of a small proportion of
the plasmid product. The losses accrued are generally accepted since the initial plasmid
mass would be sufficiently high. With BACs, the mass of plasmid is so small to begin with
that it is believed that conventional methods of processing would not be applicable.
Instead, the purification strategy would need to focus around selectively purifying the
BAC away from the other contaminants. Investigating the potential to do so would be well
beyond the scope and capability of this project. Evidence for this opinion is provided by
the contaminant ratios shown in Table 5-3, which detail that the low plasmid yields found
with BACs are very detrimental to ratios achieved.
Thomas Burt 220

5. Cloning and Cell-line development
Table 5-3 Table detailing the ratio plasmid mass to the contaminant masses in typical clarified lysates of a 50g prep prior to any RNA removal step. The masses of the contaminants are the average of the values determined from later sections for each as they exist in the clarified lysates. The plasmid masses are calculated from specific yield data taken by experiment (50pgg'*WCW for BAC and HOOpgg 'WCW for a
Plasmid construct
ContaminantBacterial Artificial
Chromosome (2.5mg)High-copy optimised plasmid
system (70mg)
Protein [~865mg] 1:346 1:12
Genomic DNA [~32mg] 1:13 1:0.5
RNA |~1100mg] 1:440 1:15
It was also supposed that the practical application of BAC constructs in a commercial process was highly unlikely. It was reasoned that a commercial process, no matter the plasmid size, would at the outset optimise the copy number to be as high as possible, together with making use of relaxed plasmid replicons which allow for a degree of control over copy number during the fermentation.
In contrast to the strategy of continuing with the Oxford series, several advantages were identified with altering the plasmid replicon to increase plasmid specific yield. It was reasoned that the use of large plasmids constructed using a high-copy replicon would be more representative of the course of action which would be taken should large plasmids needed to be produced commercially. It was hoped that the high-copy number replicon would increase the plasmid specific yield to levels that would enable accurate and precise detection and as such allow for the construction of a more representative plasmid mass balance. The reasoning behind this being that if more plasmid is present in the initial streams used for processing, the effect on yield by processing can be more confidently
described.
An added advantage of pursuing this strategy, was that constructs could be generated which had more realistic sizes. Historically, the plasmid process being investigated, and indeed the overwhelming majority of alternative processes reported, had been used for the production of plasmid molecules less than lOkb in size. To immediately attempt to process plasmid constructs with size ranges in the order of 116kb - 242kb seemed too large an increment to increase the plasmid size by, without first having described the effects of
processing on plasmids ranging from KMOOkb.
Thomas Burt 221

5. Cloning and Cell-line development
The advantages of probing the production process with plasmids constructed using relaxed
replicons would not only be beneficial to the downstream stages but also to the upstream
steps, since they provide scope for further increases in plasmid specific yield through alteration of process conditions.
The disadvantages of this strategy centred on the time required to create the new
constructs and whether it was technically achievable. However, several reports have been
published citing the creation of large plasmids under the control of relaxed replicons. Most
notable and certainly influential in the decision to clone were (Wild et al, 2002; Wild et
al, 1998) and (Tao and Zhang, 1998). Wild et a l , (1998/2002) reported a strategy solely
based around correcting the problem of low yields produced from cultures bearing BACs.
The principle involves retrofitting BAC plasmids with an inducible origin of replication
(oriV). When the culture is induced using L-arabinose the BAC copy number is reported to
increase from l-2copies/cell to ~10-20copies/cell. Tao et al, (1998) report the creation
and stable maintenance of constructs over 300kb using conventional, relaxed plasmid
vectors. Thus, it seemed that the strategy was indeed achievable.
To conclude this section involves summarising why the decision was taken to improve the
specific yield of large plasmids using genetic based strategies. Although the decision
matrix retains a degree of subjectivity, it was the most objective method which could be
used to help in making the decision. It clarified the situation by highlighting the intuitive
belief that continuing to use the Oxford series of plasmids was not a strategy which would
capable of generating useful data. The problems surrounding the processing of these
vectors had been demonstrated and it was judged that the issues remain pretty
insurmountable. The fact that techniques as described by Wild et al., (1998/2002) had
been developed specifically to increase the yield of BACs when they were being used for
small-scale, lab-based studies crystallised the notion that the troubles of making BACs on
the lab-scale would be magnified if attempts were made to produced these constructs on a
pilot-scale.
Consequently, although the cloning strategy was risky and unknown in its outcome, it was
favoured as at least it promised to go to someway to alleviate the issues. Additionally, it
was felt that it would be the strategy employed if this project were to be attempted
commercially.
Thomas Burt 222

5. Cloning and Cell-line development
5.3 Attempts to create large constructs with a relaxed origin of replication
The methods attempted to create large plasmid constructs with relaxed replication controlcan be divided into three broad techniques.
1. Retrofitting of BACs with relaxed origin of replications
2. Sub-cloning of BAC inserts into relaxed plasmid backbones.
3. Shotgun cloning of large DNA fragments into relaxed plasmid backbones.
Of these three broad strategies only the last two were practically attempted but the first
strategy was considered and as a result it is important to describe why it was not
attempted. In the following sections details about the three strategies will be outlined.
5.3.1 Retrofitting BAC constructs with relaxed origin of replication
BAC vectors were developed by (Shizuya et al., 1992) for use in genome research mainly
for genome mapping and DNA sequencing. The main advantage of these constructs were
that they enabled the stable propagation of large DNA fragments, but the main
disadvantage was the low-yields at which they were propagated. It should be noted that
this drawback was reported even on the laboratory scale where more intensive methods of
preparation (not applicable to larger scale processes), such as caesium gradient
centrifugation, could be pursued. In an attempt to alleviate this disadvantage Wild et al,
(1998, 2002) developed a method to retrofit the control elements of BACs such that copy
number could be increased through an inducible origin of replication. (Wild et al., 2002;
Wild et al., 1998).
The method involves an in vitro transposition reaction based on bacteriophage Mu, to
insert a transposon sequence into the target BAC (Figure 5-1). The transposon, derived
from bacteriophage Mu, is a linear, non-replicating dsDNA sequence containing MuA
Transposase binding sites (R1 and R2) which flank an inducible origin of replication
(oriV). It also contains a marker (KanR) for selection of recombinants in E. coli. In the
method, MuA Transposase brings the ends of the transposon into close proximity to an
homologous sequence in the BAC, forming a loop structure. The enzyme then cleaves the
target BAC and covalently joins it to the transposon ends.
Thomas Burt 223

5. Cloning and Cell-line development
Seq B-
- R2 oriV 1 r ei- ■ “ i------- 5'
Seq A
Figure 5-1 Schematic detailing the transposon used to increase the BAC copy number. The 690bp sequence contains the inducible origin (oriV) which initiates BAC replication upon binding to the TrfA protein. The sequence codes for Kan resistance allowing selection of recombinants. The flanking R1/R2 sequences are recognised by the MuA Transposase protein and used to insert the sequence into the BAC.
The recombinant BAC is then inserted into an engineered cell line and the transformants selected by kanamycin resistance. The cell line is engineered to express the replication initiation protein, TrfA under the control of an L-arabinose regulated promoter. When induced, by the addition of L-arabinose to the culture medium, the genome-based trfA gene is expressed and the resultant protein initiates the replication of the BAC through its action on the inserted oriV sequence. The inducible replication step is reported to raise the copy number of the BAC from 1-2 copies per cell to ~10-20copies per cell. The method was developed by Wild et al., (1998) but the technology and materials sold under licence by Invitrogen (Invitrogen, 2006). An addition to this system was made in 2004 by the marketing of a BAC vector which already possessed the F-factor and oriV combination into which sequences could be cloned, thus removing the need to retrofit.
This method offered several advantages over competing methods. The product information (Invitrogen, 2006) states that the in vitro retrofitting reaction is relatively simple and short. Additionally, the technique effects no change upon the actual BAC molecule, except the transposon insertion, which would allow for the comparison of the original BAC vectors to the improved constructs. However, the method was accompanied by several disadvantages which resulted in this method not being attempted. The primary reason was that the system was designed for lab-scale systems, essentially the technique was developed to overcome the problem of low-yields faced by researchers attempting to purify sufficient BAC to sequence or to conduct gene-function studies. There existed, at the time of writing, no reports of the use of this technology at any scale larger than shake-flask. Furthermore, the materials are all supplied by the manufacturers, including the L-arabinose solution used to induce the culture, and sufficient provided to accommodate only small-scale reactions. Since no information was accessible as to the make-up of the L-arabinose solution used for inducement, it would be difficult to produce sufficient quantities to enable induction of
pilot-scale fermentations.
Thomas Burt 224

5. Cloning and Cell-line development
An added problem was that the technology only promised to increase copy number up to
10-20 copies per cell. Comparing this to the 500-1000 copy number achievable with high- copy replicons it was felt that more gains could be made.
Furthermore it was felt that there remained several unknowns as to the feasibility of
adopting this technique to the larger scale. A major consideration was the requirement to
culture the plasmids in an engineered cell line of which little was known and which would
be unlikely to be as adapted to the culture media as the in-house E.coli strain.
Additionally, this protocol involved the expression of further sequences (kanamycin
resistance and TrfA) which most likely would have a detrimental effect on the growth rates and productivity of the fermentation step.
As a result of the unknowns it was decided not to pursue this strategy. However, the
technology should not be dismissed and it is suggested that this strategy could be
investigated should serious attempts be made to manufacture Bacterial Artificial
Chromosomes on the large scale. The strategy shares many of the advantages to those of
inducible expression systems developed for recombinant protein production in that during
the growth and exponential phase the copy number, and thus metabolic burden, can be
minimised and that inducement towards the end of the fermentation leads to large
increases in yield (Grabherr and Bayer, 2002).
5.3.2 Sub-cloning of BAC inserts into relaxed plasmid vectors
The first strategy attempted to create large plasmids under the control of a relaxed plasmid
replicon, was to sub-clone the DNA inserts of the BAC Oxford series into a vector with a
high-copy replicon. It was hoped by following this strategy that high copy number
constructs could be generated which possessed the same insert as the original plasmids. In
this way the direct effect of the replicon could be compared, by investigating the
difference in yields between the original BACs and the high-copy derivatives. Figure 5-2
displays the principle behind the sub-cloning strategy.
Multiple rounds of cloning were attempted using this strategy. Three cloning vectors were
employed; pBluescript, pUC4K and p7313-mi (a GSK DNA vaccine cloning vector). The
methodology attempted was that commonly encountered during cloning regimes.
Thomas Burt 225

5. Cloning and Cell-line development
230 » 05204)v ■
\ / \ /\ /\ 160kb (p5206) /
Sot I MCSparC P Lac£ F P FI an
parB
parA p5170 11.9 kb
pB lnesaipt II SK 3.0kb
P k sv pUCanrepE
oriSXho I
Figure 5-2 Schematic displaying the principle of the sub-cloning strategy. The large DNA inserts from the BAC vectors were excised by digestion with Notl. The fragments were then purified by gel electrophoresis and cloned into a Notl linearised high-copy vector. In the figure pBluescript is shown but other vectors were employed, including p7313-mi and pUC4K.
5.3.2.1 Preparing linear vector
Sufficient vector DNA was produced from a 5mL overnight culture of the E.coli strain bearing the relevant vector and purified using a Qiagen spin-prep. The vector was linearised at the multiple cloning site (MCS) using Notl and dephosphorylated to prevent vector religation using Shrimp Alkaline Phosphatase (SAP). The linear plasmid was then purified away from any remaining intact plasmid and restriction enzyme by gel electrophoresis. After staining, the linear vector was excised from the gel and purified using Qiagen gel extraction kit (Promega, 2004; Sambrook et al., 1989)
5.3.2.2 Preparing insert DNA
The insert DNA was prepared from the BAC vectors of the Oxford series; p5176 (105kb), p5206 (160kb) and p5204 (230kb). Purified constructs were digested with Notl which released the insert DNA and left the insert fragments with complementary ‘sticky ends’ to
those of the linearised cloning vector.
Thomas Burt 226

5. Cloning and Cell-line development
A major problem encountered with this cloning regime was obtaining sufficiently pure insert DNA at high concentrations. The situation was exacerbated because the large size of the insert DNA, meant creating a sufficient molar ratio of vector to insert DNA (e.g. 1:1) for the ligation reactions required relatively large mass quantities of insert DNA. Figure5-3 highlights the problem. Using maxi-prep purified constructs led to the insert mixture being highly contaminated with genomic DNA resulting in the likelihood of genomic DNA being inserted into the vector rather than the plasmid insert. In an attempt to
overcome this drawback the Oxford series were purified using the Qiagen Large construct kit (2.5.8.3) utilising an exonuclease to degrade any residual bacterial DNA. Figure 5-3B shows a FIGE gel picture of the Oxford series purified using this methodology. The purified plasmids were then digested with Notl to release the large inserts. To ensure complete purity of the insert DNA, the digested BAC vectors were run by FIGE in low melting point (LMP) agarose. Gel slices containing the insert DNA were then excised and the gel melted by heating in a water bath at 45°C, the insert DNA could then be purified from this mixture by IPA precipitation.
8Figure 5-3 Figure highlighting the problem faced in obtaining sufficient amounts of pure insert DNA from the BAC series of vectors. Figure A shows a FIGE gel of all three large constructs purified by Qiagen maxi-prep. The bands indicating plasmid are clear but it can be appreciated the level of contamination with bacterial genomic DNA is high. Figure B displays Qiagen large construct kit purified material. Lanes 1-3 are the undigested plasmids, whilst lanes 4-6 were run the linear inserts prepared by digestion with Notl.
Thomas Burt 227

5. Cloning and Cell-line development
5.3.2.3 Ligations
During the ligation reactions the linearised cloning vector was mixed with the insert DNA. Because the vector had been dephosphorylated, it was prevented from religating
spontaneously and since the insert DNA has complementary cohesive termini to the linear vector, there was a high probability of the insert and vector annealing. To maximise the chance of this occurrence the molar ratio of vector DNA to insert DNA was paramount. Included in the ligation mixture was T4 DNA Ligase (and ATP), added to promote the formation of phosphodiester bonds between the annealed insert and vector DNA, so as to create a stable recombinant DNA molecule (Sambrook et al., 1989). Although the optimum activation temperature of this enzyme is 25°C, the ligation reactions were carried out, as is the norm, at 4°C. The lowered temperature would facilitate the formation of hydrogen bonds between the cohesive termini, which would be less likely to form at higher temperatures due to the greater molecular motion. In order to compensate for the low temperature causing low activity of the ligase enzyme, the reactions were allowed to proceed for ~24hrs.
Theoretically, the higher the ratio of insert DNA to vector DNA, the greater the probability of generating a recombinant molecule, however, this is not always the case so several ratios were attempted. The mass of insert DNA required for the individual ligation reactions was calculated using the relationship detailed in Equation 5-1
w , . f Mass of Vector DNA (ng) x Size of Insert DNA (kb) ( Insert Ratio ^Mass of insert DNA (ng) = --------------------------2--------------------------- - \x \------------- Size of Vector DNA (kb) J V Vector Ratio J
Equation 5-1 Relationship used to determine the mass amount of insert DNA required when preparing a ligation reaction.
Table 5-4 Table detailing the mass of insert DNA required for ligation reactions when using three different insertrvector ratios. The mass of insert DNA was calculated using the above equation for ligation reactions using pBluescript (3.0kb). From the table it can be appreciated that due to the large differences in sire between the insert DNA and vector DNA obtaining the molar ratios requires large mass quantities of insert DNA.
Insert DNA Vector: Insert Ratio M ass of vector DNA(ng) Mass of Insert DNA (ng)p5176 insert 1:1 20 693(104kb) 1:3 20 2080
3:1 20 231p5206 insert 1:1 20 1067(160kb) 1:3 20 3200
3:1 20 355p5204 insert 1:1 20 1533(230kb) 1:3 20 4600
3:1 20 511
Thomas Burt 228

5. Cloning and Cell-line development
Table 5-4 highlights the main problem encountered with this sub-cloning strategy, which
was obtaining sufficient amounts of insert DNA to prepare the ligation reactions. The
simple reason for this was that the large size of the DNA inserts required a far greater
DNA mass to obtain the desired molar ratios. It should be noted that in traditional ligation
reactions the mass of vector DNA typically used is 100-200ng (Promega, 2004). Using
such a mass of vector DNA is achievable, for example, when cloning an insert fragment of
0.5kb (typical gene size) into pBluescript (3kb), as this would require only ~17ng of insert
DNA to achieve a 1:1 ratio. However, using lOOng of vector was not applicable in this
scenario, as to do so, each ligation reaction would require 10-20pg of pure insert DNA.
Since restriction enzyme reactions are typically conducted on lpg of plasmid, trying to
generate such large quantities of insert DNA for a single ligation reaction would have been
impractical, especially when considering the fact that multiple ligation reactions are
commonly prepared in a single protocol. As a result, the starting mass of vector DNA had
to be reduced to 20ng per reaction, such that the masses of insert DNA required were not
as great. Although necessary, lowering the mass of vector DNA in a ligation reaction by
4/5ths would have reduced the probability of a successful annealing event by the same
proportion.
A second consideration concerns the concentration of the DNA segments used in the
ligation mixture. As outlined before, the annealing of vector to insert DNA is a diffusion
driven process. The low temperature incubation would have reduced the molecular motion
of the ligation components, in order to allow formation of hydrogen bonds between
cohesive termini when they come into contact. However, the reduced molecular motion
would also reduce the occurrence of successful ‘collisions’, as predicted by the Arrhenius
equation. Therefore, it is important that the insert and vector DNA are in high
concentrations to improve the probability of successful ‘collisions’. The problem in this
protocol was that despite the insert DNA required being as concentrated as possible, the
large masses required resulted in greater reaction volumes. For example, in a typical
ligation reaction the total reaction volume is lOpL. In this protocol the lowest volume
employed was 20pL, with the highest being 40pL. The larger volumes meant that the
probability of successful collisions was further reduced. It was for this reason that in every
ligation protocol carried out, a 3:1 ratio of vector to insert was prepared as this preparation
requires less insert DNA and so the total ligation volume is reduced.
Thomas Burt 229

5. Cloning and Cell-line development
5.3.2.4 Transformation
The ligation mixtures were left for 24 hours in a 4°C water-bath, after which it was hoped
that recombinant DNA molecules would have formed from the large insert DNA annealing
with a linear, vector molecule. In order to clone this recombinant molecule it would need
to be propagated in cells. In this project, in all but a few instances, it was decided to
introduce DNA into cells using electroporation rather than chemical transformation. There
are several reasons for this. The main one being that the electroporation has been
demonstrated to be up to 10-fold more efficient than chemical transformation, with one
study reporting 80% of cells receiving the foreign DNA (Miller and Nickoloff, 1995). It
was hoped that this would go some way to alleviate the expected reduced efficiency of the
ligation reactions by ensuring that any large recombinant molecules created would be
transformed. Also, it had been demonstrated that this method is more applicable to the
transformation of large DNA molecules (Sheng et al., 1995; Siguret et al., 1994).
Electroporation involves subjecting bacterial cells to high-voltage pulses, which are
thought to lead to the transient formation of pores in the cell wall, through which DNA is
driven by the electric field. The electric field is produced by the exponential discharge of a
capacitor. Two parameters are key in determining the efficiency of electroporation; the
field strength and the duration of the pulse. The field strength is determined by the
potential applied as well as the width of separation of the plates found in the
electroporation cuvette. In this project, the conditions employed were taken directly from
Sheng et al., (1995) using a voltage of 1.3kV across a plate separation of 0.1cm, meaning a
field strength of nkVcm'1. The second factor concerns the rate at which the potential is
discharged. Again, using the parameters from Sheng et al., (1995) the lOpF capacitor was
set to discharge with an exponential waveform constant lasting 5ms.
Triplicate rounds of electroporation were conducted using lpL samples from the same
ligation mixture to maximise the chance of capturing any large recombinant plasmids. The
electro-competent E.coli DH1 cells were prepared as outlined in (2.6.6) being careful to
always maintain them at ~0°C. 24pL of electro-competent cells (~109 cellsmL'1) were
gently pipetted with the 1 pL ligation mixture and placed between the conducting plates of
a chilled 0.1cm width electroporation cuvette. Following pulsing, the cells were
respuspended in pre-warmed SOC media and revived for two hours. The extended
recovery period was used to increase the concentration of transformed cells prior to
selective plating.
Thomas Burt 230

5. Cloning and Cell-line development
53.2.5 Selection
Selection of transformants was straight-forward since the revived cells could be plated out
on LB agar plates containing ampicillin. Any cells capable of growing on the substrate
must posses the vector-encoded Ampr gene. Additional to this form of selection, in most
cases blue-white screening could be employed (where the vector permitted it) to
differentiate which of the transformants contained constructs where the insert had
successfully ligated into the vector. Specifically, when attempting to clone into pUC4K
and pBluescript vectors, the surface of the ampicillin selective plate could be spread with
the chromogenic substrate (X-gal) and the lacZ inducer (IPTG) since these vectors carried
the lacZ gene enabling blue-white selection. This technique exploited the fact that the
MCS site, where the vector was linearised, falls in the open-reading frame (ORF) of the
lacZ gene. If the vector was linearised and then re-ligated to itself, the ORF would have
remained intact allowing full expression of the lacZ protein product; P-galactosidase.
However, should the insert DNA have ligated into the vector, the ORF would be displaced
meaning that no p-galactosidase would be produced. No expression of the p-galactosidase
means that the chromogenic X-gal remains unhydrolysed and colourless. Hence, whilst the
blue colonies could be ignored the white colonies contained possible constructs of interest
(Ullmann et al., 1967). It should be mentioned that in every cloning protocol controls were
employed. The control ligations consisted of vector DNA ligation mixtures containing no
insert DNA. From the colonies produced it was possible to record the efficiency of the
ligation reaction.
5.3.2.6 Recombinant Screening
Colonies growing on the selective plates were sure to have contained vector DNA, and
where blue-white screening had been employed, white colonies suggested the propagation
of plasmids containing large, insert DNA. However, this was not a certainty since the
vector could have re-ligated improperly causing incorrect expression of p-galactosidase, or
the inserted fragment could be small, contaminating DNA. To identify large recombinant
plasmids, sufficient material was purified and sized by gel electrophoresis. To do so
involved picking off multiple colonies and inoculating 5mL of sterile, selective media in
Universal bottles. Incubating these overnight generated sufficient cell material from which
plasmid could be isolated by IPA precipitation of the clarified lysate. These were then be
analysed by gel electrophoresis.
Thomas Burt 231

5. Cloning and Cell-line development
The colonies which were picked off were marked and the plates returned to the incubator to allow them to regenerate.
It was decided to attempt to identify colonies bearing large constructs by conventional gel electrophoresis. The simple reason for this being the large number of colonies which needed to be screened. To do this using FIGE would have been impractical since the system can run only 12 samples at a time with a run-time of ~20hrs. Using conventional gel electrophoresis the number of samples which could be processed concurrently was -25, but also there was more than one gel tank enabling up to 70 colonies to be screened at the same time. Additionally, the run-time was ~2-3hrs. Although conventional gel electrophoresis could not determine the size of any large constructs, as it is only capable of resolving plasmids <20kb, it could be used to determine which clones were large, since they would run far behind the vector standards. Those that did so could be further characterised by FIGE.
Unfortunately, there were no instances where a large construct was identified using this sub-cloning protocol. Despite multiple rounds of cloning using different vectors and all three insert DNA fragments (104kb, 160kb and 230kb). In all cases, although white colonies were generated on the selective plates, when the constructs propagated by these colonies were screened they invariably consisted of re-ligated vector molecules which had incorrectly re-ligated causing improper expression of the p-galactosidase.
In a few cases, plasmids were seen which were larger than the original vector (e.g. Figure 5-4 Lane 8) but by only a small amount indicating the insertion of rogue DNA fragments.
5.3.2.7 Conclusions
The repeated failures of this sub-cloning protocol led to its abandonment after many
Figure 5-4 Example of a conventional gel run to identify whether any of the colonies transformed and selected contained large constructs. It was hoped that running conventional gels, any large constructs could be identified by moving far behind the vector marker (VM). However, apart from a few cases where small DNA fragments had ligated into the vector (e.g lane 8), no large constructs were identified. The colonies were found to be propagating re-ligated vector constructs since their size matched that of the vector standard on the gels.
Thomas Burt 232

5. Cloning and Cell-line development
attempts. It was reasoned that the failures could be due to a number of possibilities. Much
was learnt from the failed attempts which led to alterations of later protocols used to
generate large, high-copy plasmids. The reasons for failure could have included many of the following;
1. Difficulty of obtaining sufficient insert material. As with many issues faced so far
with the Oxford series plasmids, obtaining sufficient amounts to prepare insert
DNA was troublesome. Additionally, measures were needed to reduce the
presence of contaminating gDNA in the preparations. All these factors led to great
difficulty in preparing sufficient insert DNA. On top of this was the fact that to
prepare ligation reactions using suitable vectorrinsert molar ratios required far
more insert DNA, due to the large size of the insert DNA.
2. Reduction in the amount of vector material used to clone. To create the correct
ratios of vector to insert DNA, the amount of vector DNA used in each ligation
reaction was reduced so that the masses of insert DNA required were realistically
obtainable. Doing so also reduced the chance of creating recombinant molecules.
3. Large ligation reaction volumes. The molar ratios employed dictated the use of set
masses of insert DNA. Although the insert solutions were made as concentrated as
possible (-lOOngpL'1), the large masses required led to larger ligation volumes.
The final ligation mixture would be more dilute and so would have reduced the
possibility of successful annealing.
4. Reduced probability of such large fragments ligating into the vector. The ligation
reaction is essentially a stochastic process. The probability of fragments, over 30-
fold larger than the vector, successfully ligating would be much lower than a
conventional sub-cloning regime. However, it certainly must be possible since the
original BAC constructs would have been created by the same techniques, but is
believed to be more random and tricky procedure.
5. Use of ‘home-made’ electrocompetent cells. When attempting a standard sub
cloning regime, self-prepared electro-competent cells are normally adequate.
However, it could be the case that for such large constructs the cells used were not
that efficient at accepting foreign DNA. For this reason it may be useful to use
commercially supplied electro-competent cells.
Thomas Burt 233

5. Cloning and Cell-line development
6. Use of E.coli DH1 cells. The electrocompetent cells were prepared from cultures
of E.coli DH1 cells, since this was the host cell line most commonly used in this
project and the one for which the media had been adapted. However, it may not be
the most suitable cell line for accepting large, foreign DNA. Evidence from
manufacturers suggests that DHlOp is a better host-cell line for propagating large
plasmids. Indeed, this was the cell line originally used for the propagation of the Oxford series.
5.3.3 Shotgun cloning
Having tried and failed several times to clone the inserts from the Oxford series into high-
copy number vectors, a new strategy was attempted. The protocol for this was taken
directly from (Tao and Zhang, 1998) who describe the ‘cloning and stable maintenance of
DNA fragments over 300kb in Escherichia coli with conventional plasmid based vectors’.
In the report the authors cloned large fragments of eukaryotic DNA into several
conventional plasmid vectors, notably the conventional plasmid vector (pGEMll), the
binary plasmid vector (pSLJ1711) and the binary cosmid vector (pCLD04541). Contact
was initiated with the group, but unfortunately they were unable to provide the clones created in the work. Consequently, it was decided to replicate their work using the
pGEMl 1 vector from Promega, in which they managed to generate constructs ranging
Aat II 2284 Nda 12533
Figure 5-5 Map of the pGEMl 1 vector employed by (Tao and Zhang, 1998) to
1 clone large segments of eukaryotic DNA.2 7 The vector is reported to have a copy 29 number of 300-400 copies per cell, with 4 1 the replication under control of the *7 pMBl replicon. Resistance is conferred 5 9 by the beta-lactamase gene and it ^ contains the lacZ gene allowing for blue- 78 white screening.93
from 40-100kb (Tao and Zhang, 1998). This vector is a high-copy number reported to
have a copy number of 300-400 (Qiagen, 2005) under the control of the pMBl replicon.
pGEMMIZfWVictor
(3221bp)
Thomas Burt 234

5. Cloning and Cell-line development
The precise cloning method used by (Tao and Zhang, 1998) was taken from (Hong-Bin Zhang et al., 1995) who describe the technique of shotgun cloning. The technique is traditionally employed for the sequencing of entire genomes. The principle is simple and involves digesting genomic DNA using a restriction enzyme, followed by random ligation
of the fragments into vectors. In this project that would be the main aim, whereas when sequencing the recombinant vectors would be sequenced and the sequence data patched together, from the linkage of overlapping sequences, to generate the sequence of the entire genome. The crucial end-point in this project was the generation of large, high-copy number vectors and as a result the actual content and make-up of the insert DNA was rather immaterial.
5.3.3.1 Vector Preparation
Vector DNA was prepared in an identical fashion to before. Sufficient pGEMll was purified from an overnight culture, lpg of plasmid was linearised by either Notl or Hindlll, before being dephosphorylated by the addition of Shrimp Alkaline Phosphatase. The linear DNA species was purified away from the other contaminants in the mixture by gel electrophoresis. Following electrophoresis the marker lanes were cut away and stained in SYBR-Gold and the distances travelled used to identify the region on the gel where the linear plasmid would be. These regions were excised from the gel and the linear vector purified from the gel slices by Qiagen gel extraction kit.
Figure 5-6 Figure displaying the preparation of linear vector DNA for cloning. The vector was linearised with either N otl or H indlll and dephosphorylated with SAP. The linear vector was purified away from the reaction components and other plasmid forms by electrophoresis. The marker lanes were cut-out and stained and used to mark the position of the desired fragments.
5.3.3.2 Insert Preparation
Insert DNA was prepared by the digestion of Saccharomyces cerevisiae gDNA with a single restriction enzyme. The main advantages of this method over the sub-cloning
strategy were;
Thomas Burt 235

5. Cloning and Cell-line development
(i) The DNA used to generate the insert fragments could be obtained and digested in large amounts and was of high purity, since it was manufacturer supplied.
(ii) The large masses of DNA which could be used to create the insert DNA meant that the concentration of the insert DNA, following its purification from the gel, was far higher than could be obtained using the sub-cloning strategy.
(iii) The DNA could be digested into a range of fragments sizes, which meant that a series of plasmids could be produced and also allowed multiple ligations to be prepared for each cloning round, increasing the chances of success.
Two restriction enzymes were employed, in separate digestions, to create fragments of suitable length. These fragments were separated on a size basis by electrophoresis and then ligated into the linear pGEMl 1 vector.
The sizes of the fragments generated by digesting genomic DNA are dependent on the restriction enzyme employed and the extent to which digestion is allowed to run to completion. Figure 5-7 shows the extent of this variation, as it displays a gel on which samples of genomic S.cerevisiae DNA have been digested using three different restrictions enzymes. The three restriction enzymes recognise different sequences of DNA at which they cut the DNA. Naturally, the fewer bases the enzyme recognises, the more frequently
it will cut the DNA molecule.
For example, Hindlll recognises a 6bp sequence, so should cut the DNA every 46
9 / 1 0 11 12
145.5kb —S
97.0kb
I
48.5kb
Figure 5-7 Figure displaying the effect of the restriction enzyme and the extent of digestion has on the size of the DNA fragments produced when digesting genomic DNA.
Lane 1-3: Notl (8bp cutter) [full digest]
Lane 4-6: H indlll (6bp cutter) (full digest]
Lane 7-9: Notl (8bp cutter) [partial digest]
Lane 10-12: H indlll (6bp cutter) [partial digest]
The three lanes for each are for digests on 2pg, lpg and 0.5pg
Thomas Burt 236

5. Cloning and Cell-line development
(~4,000bp), whereas Notl is an 8bp cutter so should the cut the DNA only every 48 (~65,000bp). This frequency driven process dictates that the range of fragment sizes produced will be spread over a large range, but that that most occurrent would be fragments of the predicted size order. From Figure 5-7 it can be seen that the sizes of the fragments are smaller when exposed to Hindlll than when using Notl.
The effect of incomplete digestion is also shown by the gel. Three different masses of DNA (2pg, lpg, 0.5pg) were exposed to the same quantity of restriction enzyme and the effect of the extra substrate can be seen by the fact that the fragment sizes extend over a larger range. Control over the level of digestion can also be achieved by alteration of the temperature of the digestions. Shown in Figure 5-7 (Lanes 10-12) are partial digestions of DNA using Hindlll, where the samples were kept on ice. The overall effect of this was to reduce the activity of the enzyme and so reduce the efficiency of the digestion step and hence increase the sizes of the DNA fragments produced.
During this cloning protocol two digestions were prepared; complete digestion of the
gDNA using Notl and partial digestion of the gDNA using Hindlll. The digests were prepared as outlined in Table 5-5, using the exact method of (Hong-Bin Zhang et al 1995).
A large amount of DNA (10pg) was prepared for Digestion 2, since Hindlll is such a frequent cutter that providing excess substrate increased the size range of the fragments. Furthermore, the digests were incubated on ice for 2 hours and then at 37°C for 30 minutes
to promote incomplete digestion.
Figure 5-8 FIGE gel marker lanes. The digested Saccharomyces DNA was run by FIGE in 0.8% LMP agarose. The marker lanes were cut from the gel, stained and used to determine the position of the DNA fragments in the unstained section of the gel. Digestions of p5176 (116kb) are also shown to demonstrate the difficulty of obtaining sufficient DNA by the sub-cloning method compared to the shotgun cloning method.
Lane 1: Mid-range markerLane 2: H indlll digested gDNA (10pg)Lane 3: N otl digested gDNA (lOpg)Lane 4: Undigested p5176 (3pg)Lane 5: Notl digested p5176 (3pg)Lane 6: Undigested S.cerevisiae gDNA
Thomas Burt 237

5. Cloning and Cell-line development
Table 5-5 Table displaying the digestions prepared to generate large fragment insert DNA. Two digestions were prepared one using N otl which was carried out to completion and once using H indlll which was only setup to partially digest the genomic DNA.
DIGEST REACTIONgDNA
VOLUME[MASS]
BSAVOLUME
BUFFERVOLUME
NOT1VOLUME[UNITS]
Digestion 1 Complete gDNA digestion {Notl) 11.8pL[2pg] 0.2 pL 1.4pL 2pL [2U]
Digestion 2 Partial gDNA digestion (Hindlll) 60gL [10ms] lpL 6.3pL lpL [10U]
Five sets of Digestion 1 were prepared separately, and the digests pooled afterwards, in order to prevent excessive substrate causing partial digestion. The reason being that Notl is an infrequent cutter, so as the preliminary gel shows, is capable of generating fragments in the right size order without enforcing partial digestion. These digestions were incubated at 37°C for 3 hours to promote complete digestion. All digestions were terminated by incubating at 65°C for 20 minutes.
The digested samples were run on a 0.8% Low Melting Point Agarose gel using the FIGE system, as shown by Figure 5-8. The digestions were run in duplicate, lOpg in each well, such that one half of the finished gel could be cut away, stained and used for determining the position of the fragments. The sections of gel lanes containing large fragments of interest were excised using a scalpel, placed in individual eppendorf tubes and dialysed in lxTE+30mM NaCl overnight at 4°C. The gel slices excised contained fragments ranging from 30-85kb, in approximately 5kb increments.
Following dialysis, the TE buffer was replaced with twice the gel-slice volume (~100pL) of P-agarase buffer and left on ice for 30 minutes. This step was repeated twice. The gel slices were than melted by heating to 65°C for 10 minutes before being transferred to a 42°C waterbath to equilibrate. To each tube was added 3 units of P-agarase, an enzyme which facilitates the digestion of the carbohydrate in the agarose, which after 2 hours was almost fully digested. The tubes were then placed on ice for 30 minutes to coagulate any remaining agarose moieties, before they were sedimented away by centrifugation at 13,000rpm for 5 minutes. The DNA fragments in the liquour were then purified by IPA precipitation before being resuspended in 1 OOpL of TE buffer. These solutions were then
quantified by absorbance.
Thomas Burt 238

5. Cloning and Cell-line development
5.3.4 Ligations
Ligations were prepared as described by (Hong-Bin Zhang et al., 1995) by using a 5:1 ratio of vector DNA to genomic insert DNA. In contrast to the sub-cloning strategy, the ligations were prepared using a constant mass (50ng) of insert. The ligations were prepared as detailed in (2.6.3). The mass of vector required was calculated using the relationship shown in Equation 5-2.
Equation 5-2 Relationship employed to calculate the mass of linearised vector required to form a 5:1 molar ratio of vector to insert DNA in the ligation mixtures.
mass of insert (ng)Mass of pGEMl 1 vector required (ng) = size of vector (kb) xmolar ratio x insert size (kb)
The size of the insert was an estimation based upon the region of the gel from which the slice was extracted. Ligation controls were also prepared to determine the efficiency of the ligation and transformation steps. The negative control consisted of linearised pGEMll vector, which had not been dephosphorylated, whilst the positive control consisted of linearised vector which had been dephosphorylated. Once the insert and vector DNA solutions had been mixed together, but prior to the addition of the T4 ligase and ligase
Table 5-6 Table outlining the makeup of the ligations. Ligation reactions were prepared using a constant mass of purified insert DNA (50ng). The mass and volume of the vector required was then calculated on the basis of a 5:1 vector to insert molar ratio. The sizes of the insert DNA was estimated from the region of the gel the slice was extracted as measured against the linear DNA marker. T4 DNA ligase was added at volume rate of 0.02U/pL together with the ligase buffer in 0.1 vol proportion.
Insert S ize (kb)
Insert C one, (ng/pl)
Insert V olu m e (ill)
M a ss o f V ector (ng)
V ector V olu m e (pi)
U nits o f L ig a se (U)
L igase V olu m e (pi)
L igase 10x Buffer Vol (pi)
Total V olum e (pi)
A 30 1 .3 8 3 6 .2 2 7 2 .7 0 .8 0 .3 3 .9 4 3T3 B 50 1 .4 5 3 4 .5 16 1 .6 0 .7 0 .2 3 .6 4 0<L>
C 55 1 .5 4 3 2 .5 15 1 .5 0 .7 0 .2 3 .4 38wD) D 6 0 1 .9 9 2 5 .1 13 1.3 0 .5 0 .2 2 .7 29O
E 6 5 2 .0 9 2 3 .9 12 1 .2 0 .5 0 .2 2 .5 2 8O F 7 0 2 .5 2 0 .0 11 1.1 0 .4 0.1 2.1 2 3
G 7 5 2 .8 9 1 7 .3 11 1.1 0 .4 0.1 1 .8 2 0
H 8 0 2 .4 4 2 0 .5 10 1.0 0 .4 0.1 2 .2 24
1 8 5 1 .5 7 3 1 .8 9 0 .9 0 .7 0 .2 3 .3 36
A 2 0 0 .4 8 1 0 4 .2 4 0 4 .0 2 .2 0 .7 10 .9 1 20
B 2 5 0 .7 3 6 8 .5 3 2 3 .2 1 .4 0 .5 7 .2 79© C 3 0 0 .8 2 6 1 .0 2 7 2 .7 1 .3 0 .4 6 .4 7 0i/io05 D 3 5 0 .2 7 1 8 5 .2 2 3 2 .3 3 .7 1 .2 1 8 .9 2 0 8O E 4 0 0 .3 8 1 3 1 .6 2 0 2 .0 2 .7 0 .9 1 3 .4 148
•w F 4 5 0 .6 2 8 0 .6 18 1.8 1 .6 0 .5 8 .3 91ac G 5 0 0 .5 8 8 6 .2 16 1 .6 1 .8 0 .6
0000 9 7i
H 5 5 0 .31 1 6 1 .3 15 1 .5 3 .3 1.1 1 6 .4 1 80
1 6 0 0 .4 2 1 1 9 .0 13 1 .3 2 .4 0 .8 12.1 133
J 6 5 0 .3 7 135 .1 12 1 .2 2 .7 0 .9 1 3 .7 151
Thomas Burt 239

5. Cloning and Cell-line development
buffer, the solution was incubated at 56°C for 10 minutes to promote molecular motion
and annealing. The solutions were left to cool to room temperature before addition of the
T4 ligase. Ligase was added at a volume of 0.02 units per pL ligation volume. All the
ligation reactions were then incubated overnight (~16hrs) at 4°C as described by
(Promega, 2005). The setup of the ligation reactions is detailed in Table 5-6.
5.3.4.1 Transformation
Following overnight incubation, lpL of each ligation reaction was transformed into E.coli
by electroporation using the same methodology and parameters as detailed before in
5.3.2.4. One adaptation was made to the protocol in order to improve the success rate,
which was to use commercially supplied electrocompetent cells. It was reasoned, after the
failures of the sub-cloning strategy, that one possible cause of no large constructs being
isolated was that there could have been problems in the electroporation step. The sub
cloning strategy employed self-prepared electrocompetent cells which had been washed
several times with a 10%(v/v) glycerol solution to remove any media components, namely
salts and other electrolytes. The presence of these lead to conductance when
electroporation is attempted and so reduce the step’s efficiency. However, it was felt that
self-prepared cells would still contain some of these contaminants. Secondly, the sub
cloning strategy used E.coli strain DH1, which is believed to be not the most suitable
strain for accommodating large constructs. There is data to suggest that DHlOp is a more
suitable strain for cloning and transforming of large constructs (Hanahan et al., 1991;
Donahue, 1998; Eastman and Durland, 1998) due to mutation in the deoR gene. In
response to these issues it was decided to use the ligation mixtures to transform
commercially obtained ElectroMAX DHlOp cells (Invitrogen).
5.3.4.2 Selection
Following electroporation the transformed cells were revived and selected as outlined
before in 5.3.2.5. Blue-white screening was used since the vector did contain the lacZ
gene. The results of the screening were mixed. Cells transformed using DNA inserts
prepared using Notl digestion of genomic DNA were few and not really above the
background level of ligation, as determined by comparison to the negative control plates.
As a result no colonies were picked from these plates as it was reasoned that there would
not be a great possibility that they contained large constructs.
Thomas Burt 240

5. Cloning and Cell-line development
The results from the ligations using Hindlll digestion of genomic DNA were more successful. Many more white colonies were present than on the control plates, suggesting that ligations had been successful. Consequently, ten colonies from every insert size ligation plate (Table 5-6 Hindlll A-J) were picked off and transferred to fresh, selective plates (25|igmL'1 ampicillin) which were incubated at 30°C overnight. This was done to prevent the selection of satellite colonies. All of the selected colonies grew on the plates indicating that they were not satellite colonies and did posses the (3-lactamase gene encoded on the pGEMll plasmid. These strains were then used to inoculate 5mL of sterile, selective media in Universal bottles and incubated overnight to generate sufficient cell mass from which to extract plasmid for screening.
53.4.3 Screening
Since 10 colonies were selected from each of the ten plates, 100 colonies were passed to the screening stage. As described before this involved culturing sufficient cell mass from which to purify plasmid, which could then be analysed by electrophoresis to identify
colonies bearing large constructs. Several rounds of electrophoresis were required to
M4 M3 M2
4 8 .5 k b
1 2 k b
G 2
5 0 k b4 5 k b40kb3 5 k b3 0 k b
2 5 k b|
1 5 k b
1 0 k b
Figure 5-9 FIGE gel image of four large constructs isolated from the screening stage. Several rounds of screening were required to identify large constructs from the 100 colonies selected for scrutiny. The plasmids were run in their native state and also linearised using ISotl.
Ml: L DNA Lane 1: Clone 3 (linearised) Lane 5: Clone 52(Iinearised)
M2: lkb ladder Lane 2: Clone 3 (native) Lane 6: Clone 52 (native)
M3: 2.5kb ladder Lane 3: Clone 31 (linearised) Lane 7:Clone 74 (linearised)
M4: 5kb ladder Lane 4: Clone 31 (native) Lane 8: Clone 74 (native)
Gel was run for 20hrs/ 0.8% PFGE agarose/ Fwrd 180V/ Reverse 120V/ 0.1s-ls/ 0.5xTBE
Thomas Burt 241

5. Cloning and Cell-line development
55 - 49KB
33KB
27KB16KB
10 300 20 40 50 60
Figure 5-10 Results of a gel scan on the lanes carrying the linearised forms of the newly created plasmids (Lanes 1, 3, 5, 8). After staining the gel was visualised under a UV transilluminator. The image was analysed using LVP software and the positions of the marker bands marked and the software plotted the fluorescence levels recorded down the lanes and subtracted the background noise. The results of this indicates the size of the constructs.
identify large constructs using FIGE system. Fortunately, the presence of large constructs was confirmed, meaning that this method of cloning had been successful. However, it had been hoped to obtain a range of plasmids ranging between HMOOkb. Unfortunately, the approximate size of the largest construct isolated was ~50kb. The final four constructs were identified in the gel shown in Figure 5-9 and the results of the gel scan shown in Figure 5-10.
From the FIGE gel and the associated scan it can be appreciated that this shotgun cloning strategy had been more successful than the sub-cloning attempts. Four constructs had been isolated with sizes greater than lOkb. These constructs all possessed the same pGEMll backbone, the replication of which is high-copy. It was hoped that these plasmids would be more conducive to investigation as they should exist at higher copy numbers, and hence
yield, than the BACs.
5.3.4.4 Cell Banking
The clones selected by the initial screening procedure were transferred to E.coli strain DH1. The ligation mixtures were initially transformed into DHlOp cells to improve the chances of isolating large constructs. Since colonies bearing large constructs had been identified, these could be transformed into prepared electrocompetent DH1 cells. It was important for reasons of consistency to use the same cell line and also since the DH1 strain is the strain to which the media, fermentations and downstream operations had been
optimised for.
This step allowed the investigation into the efficiency by which large plasmids are
transformed. Both (Siguret et al., 1994; Sheng et al., 1995) report the decreasing efficiency by which cells are transformed as plasmid size increases. The electroporation was carried out, as detailed earlier, using 200ng of each purified construct, and after revival, dilutions of the broth were plated out on to both selective and non-selective plates,
Thomas Burt 242

5. Cloning and Cell-line development
which were incubated overnight at 30°C. By counting the colonies produced on both the
selective and non-selective plates the concentration of cells in the broth and the
concentration of the transformants could be found. The ratio between these is a measure of
transformation efficiency. For comparison to published data the molar efficiency of the
transformation step needed to be found. This requires the number of transformant colonies
counted on the selective plates and the measures efficiency on the basis of the number of
Colony Forming Units (CFU) produced per unit mass of DNA used. The details of how
these measures of efficiency were calculated are detailed in Equation 5-3.
/AXrr, . . Concentration of transformed cells(A) Transformant Ratio = ------------------------------------------Concentration of cells
(B) Molar Transformation Efficiency (CFU///g) =
CFU on selective plate \xlxlO x ^Volume of Transformants^
Mass of DNA used (ng) ) y Volume platedx Dilution Factor
Equation 5-3 Equations used to calculate the efficiency of the electroporation event. Published data has described how increasing plasmid size reduces the efficiency of the electroporation. These relationships were used to determine whether a drop in transformation efficiency could be seen when electroporating the large constructs generated into E.coli DH1. The transformation efficiency measure shown in A records the proportion of cells transformed by the electroporation step, whilst equation B was used calculate the efficiency of the transformation in terms of the number of transformants generated per unit mass of DNA used.
The results of this investigation into plasmid transformation can be seen in Table 5-7. As a
control, the investigation employed a commercially supplied pUC plasmid (2.8kb). The
table lists the colony number from which the construct was isolated which are listed in the
order of increasing size. The figures in the ratio column displays the ratio of transformed
cells to cell non-transformed cells. A slight decrease in transformation efficiency with
increasing plasmid size was witnessed, but not in any large amount.
For instance, (Sheng et al., 1995) described a 20-fold drop in transformation efficiency
when the plasmid size increased from 150kb to 240kb. In this study the level of
transformation stood at one cell in every 2,000-3,000.
Thomas Burt 243

5. Cloning and Cell-line development
Table 5-7 Table describing the two measures used to record transformation efficiency (emboldened) . The first method calculates the proportion of cells transformed, whilst the second method records the efficiency of transformation on the basis of the number of cells transformed per unit mass of DNA.
ColonyNo.
CFU (NonSelectivePlate)
Cell Cone. (Cells/Ml)
Cfu(SelectivePlate)
Transformed Cell Cone. (Cells/Ml
TransformRatio
Mass Of DNA Used (ng)
Transform Efficiency (CFU/mg DNA)
pUC(2.8kb) 130 1.30xl09 26 5.20x10³ 250,000 0.2 2.6x10s
3(16kb) 115 1.15xl09 509 5.09x10s 2,260 200 2.55xl06
31(27kb) 120 1.20xl09 108 1.08x10s 11,100 200 5.40xl03
52(33kb) 81 8.10x10s 244 2.44x10s 3,319 200 1.22xl06
74(49kb) 77 7.70x10s 197 1.97x10s 3,908 200 9.85x10s
This ignores the result obtained for the construct obtained from colony 31, which has the poorest level of transformation at one cell in every 11,000. This result is reasoned to be anomalous and thought to be due to poor electroporation conditions rather than the actual construct. The apparent poor transformation efficiency of the pUC plasmid is explainable due to the reduced amount of DNA which was used in the electroporation. The reason for the difference was that the instructions supplied by the vendor were being followed, which outlined the use of 200pg of vector per transformation. Since the control reaction used a 1000-fold less DNA, the corrected transformation ratio would stand at 1 cell transformed in every 250 cells, roughly a 10-fold improvement on the other constructs.
This requirement for correction is removed when the compared efficiencies are those determined on a unit mass of DNA transformed, as shown in the last column of Table 5-7. From these figures it can be appreciated that the average transformation efficiency for the pGEM series is ~1.5xl06 CFUs/pgDNA. These values are far below comparable figures reported by (Sheng et al., 1995) where efficiencies in the order of 4.4xl08CFUs/pgDNA were reported for electroporation of 80kb BAC using identical conditions as used in this study. The value for the efficiency of the pUC transformation is very comparable to those reported in the cited report. It is believed that poor preparation of the DNA used for transformation must be the reason for the reduced efficiency. Overall, there is a -60% reduction in transformation efficiency between the transformation of the construct isolated from colony 3 (16kb) to the construct isolated from colony 74 (49kb).
Thomas Burt 244

5. Cloning and Cell-line development
However, as evidence by the pUC control and the poor result of the transformation for
colony 31, it is thought that the overriding factor influencing transformation efficiency is
the quality of the DNA used for the electroporation and not the size of the constructs per se.
One colony from each of the construct transformations was picked from the selective
plates and transferred to 5mL of sterile media in Universal bottles. These were incubated
overnight and used to seed 50mL of selective media in shake-flasks. These were incubated
in a shaking incubator until the optical density reached 2-30D, when they were aliquoted
into cryovials as 20%(v/v) solutions of glycerol and stored at -80°C. These represented the master cell bank.
5.3.5 Conclusions
After numerous cloning attempts large constructs had been isolated by employing a
shotgun cloning strategy. The main aim of the cloning effort had been to create a series of
large plasmids under the control of a high-copy number replicon. In that sense the
operation had been a success. It had also been hoped that the series of plasmids produced
would be in the size order of KMOOkb. It was felt that since the vast majority of published
data, and current production systems, were concerned with the manufacture of plasmids in
the 3-1 Okb size range a jump to plasmids of 116-242kb in size was too large an increment.
Consequently, by obtaining plasmid constructs in this size order should allow a more
reasoned approach to determining potential problems with large-plasmid manufacture.
It was decided to drop the 27kb pGEM construct from further investigation. It was felt that
the size increment between 27kb and 33kb was not great enough to justify the additional
investigation of this construct. As a control, the pGEMll (3.2kb) would be studied, as
would the smallest of the Oxford series used so far; p5176 (116kb). Although this BAC
was under the control of a completely different replicon, its inclusion was warranted since
it represented the alternative strategy of producing large plasmids i.e. through the use of
large, low copy constructs. Figure 5-11 displays a FIGE gel of the five constructs taken on
to further study.
Thomas Burt 245

5. Cloning and Cell-line development
VCLUQQ
VCUJ
VC1_1VC
z3m
QQ<
2_J
Oo_ ) 00 CO
00 m *T * CN CM00 ID CO CO
_ l —1 __lVC VC vc VC VC VC< E < \ - < \ -LU 2 LU 2 LU 22 O 2 o 2 O_ l o _J o _ i oCO CO CO 00 CO 00
X. * * *CD CD CO CO 05 05T— T_ CO CO •M-
COCD
VC
SUPERCOILED
|-OPEN-CIRCULAR1 - 22.6■ 9.4■ -47.1■ H5.0 1 - 12.2■ '10.0 | ^ 8.6 1 - 8 .3
- BACVECTOR (12kb)
DIMER
Figure 5-11 FIGE gel of the plasmid constructs which were taken on to further study. The constructs were analysed in both their native and linearised form. Five constructs were taken on to further study; pGEM ll (3.2kb), pGEM16 (16kb), pGEM33 (33kb), pGEM49 (49kb) and p5176 (116kb).
Thomas Burt 246

5. Cloning and Cell-line development
5.4 Factorial design experiments to determine optimum fermentation conditions
Having isolated suitable constructs with which to probe the plasmid production and
purification operations, it was reasoned that the most important issue was to determine
optimum conditions by which to produce the constructs by fermentation. Fermentation
optimisation is of critical importance to the efficient and economical production of any
biologic, and is key in deciding whether a process is permissible. Much of the focus, when
optimising a fermentation step, concerns the mode of the fermentation and the media
employed. However, for the production system under study, these parameters had already
been optimised. The process would utilise a glycerol supplemented, complex media
adapted to the DH1 cell line, and the fermentation would be conducted in batch mode
using enriched air toward the finish to improve harvest biomass (volumetric) yield. It was
believed that the more important aspects to ascertain were whether the plasmid size had
any deleterious effect on the fermentation progression; much like had been investigated
with the Oxford series at the outset of this project. Additional to this, would be
determining whether the temperature of the fermentation was important and if the
concentration of the antibiotic employed had any effect. Reports into these factors
suggested that they were important when propagating large plasmids (Promega, 2005).
Due to the number of continuous variables which were to be investigated it was felt that
the most efficient method of achieving the aims was to conduct the optimisation studies in
shake-flasks, where more replicates could be analysed. Furthermore, as is common when
optimising media for fermentations, the investigations would employ techniques of
experimental design to improve the results obtained, as well as reducing the number of
runs required.
5.4.1 Design of Experiments (DOE)
Conventional experimental methods are based upon the “one factor at a time” (OFaT)
methodology, involving the manipulation of one variable, while keeping the remaining
factors constant. The drawback with this methodology is that it is very inefficient, a fact
that becomes apparent when the studies require the investigation into the effects of
multiple continuous variables. In addition, traditional OFaT methods of experimentation
provide an estimate of the effect of a single variable at a selected, fixed set of conditions of
all other variables.
Thomas Burt 247

5. Cloning and Cell-line development
For such an estimate to have a general relevance, it is necessary to assume that the effect
would be the same at other settings of the other variables, that is, over the ranges of current
interest the variables are said to act on the response additively (Box et al., 1978). Because
of this, OFaT experiments can only provide information on the main effect that is being
varied and give no indication of any interactions which may exist between the factors.
The application of statistical design techniques, such as factorial design and response
surface methodology (RSM), to process optimisation offers numerous advantages when
compared to traditional experimental techniques including;
(i) Greater efficiency and less time consuming than OFaT techniques, allowing the
determination of optimum conditions through a relatively smaller number of
systematic experiments (Box et al., 1978; Ficarra et al., 2002).
(ii) Generation of equivalent data to traditional techniques but with additional
precision.
(iii) If the variables do not act additively, statistical design techniques, unlike the OFaT
design, can also detect and estimate interactions that measure the non-additive
effects and gives an accurate description of an experimental region around a centre
of interest with validity of interpolation (Box et al., 1978).
(iv) Experimental measurements are performed by varying all the factors
simultaneously, providing the ability to estimate the effect of a factor at several
levels of other factors and thereby allowing the conclusions made to be valid over
a much wider range of experimental conditions (Ficarra et al., 2002).
(v) Compared to empirical methods, statistical design can greatly simplify
optimisation. When the concern is which combination of two independent
variables will produce a maximum or minimum response the factorial will give a
combination near the maximum, whereas OFaT would not (Hicks and Turner,
1999).
(vi) In cases where maximum or minimum has not been reached, factorial techniques
will indicate the direction to be followed in the next experiment to get closer to
such a maximum (Hicks and Turner, 1999).
Thomas Burt 248

5. Cloning and Cell-line development
With these advantages, statistical design techniques, coupled with an appropriate
knowledge of the subject matter, can provide the most effective means of analysing a
process. Techniques such as response surface methodology have been successfully used
since the 1950s on a wide range of investigations in numerous disciplines. (Chakravarti,
2002; Arroyo et al., 2005; Garcia-Arrazola et al., 2005; He et al, 2004) applied the
methodology to establish the optimum operational conditions, including pH, temperature,
aeration rate, feed rate and media composition to maximise the performance of a
fermentation operation in terms of product yield. The motivation for the use of these
techniques in this project was to identify optimum conditions for the fermentations of large
plasmids. A full description of factorial design and RSM techniques may be found elsewhere (Montgomery, 2001).
5.4.2 Experimental setup
Response surface methodology (RSM) can be used to map the effect on a measured
(response) parameter made by manipulation of a set of defined variables (factors). The
methodology which is described in greater detail in (Montgomery, 2001) consists of a
number of steps including;
1) Recognition o f the problem and development o f all the ideas about the objective of
the experiment that is to be designed.
2) Establish the factors and the levels and range at which they are to be varied.
3) Selection o f response variable(s).
4) The choice o f experimental design involves the consideration o f the sample size (i.e.
the number o f replicates), selection o f a suitable run order for the experimental trials and establishment o f any blocking, other randomisation restrictions or
identification o f any additional design features to be applied.
5) Set up o f a mathematical model to describe the experiment (Use o f Stat-Ease)
6) Experimental data collection can begin with the investigations performed in run and
block order.
The identification of each factor and the range over which it will be allowed to change in
the investigations requires prior knowledge of the process under study. The factors
believed to be the most influential are used in the response surface design.
Thomas Burt 249

5. Cloning and Cell-line development
In all statistical designs, presented in this investigation, three levels were assigned to each
variable and represent the allowable limit, which are the maximum and minimum and an
intermediate value. The final relationship determined would hold within these limits.
Additionally, in all the designs the centre repetitions were carried out in order, as this
allowed the derivation of the experimental error variance and to test the predictive validity
of the model (Ficarra et al., 2002). In this case, three response parameters were to be
mapped by experimental design investigations, using a mathematical model which was
created using Design-Expert 5® Software and which analysed the results.
As described earlier the chosen factors were temperature, ampicillin concentration and
plasmid size. The chosen responses which would be recorded were those felt to be the
most important to optimise and were; culture growth rate, final plasmid specific yield and
final volumetric yield (a response dependent on the final biomass and specific yield). The
required factors and responses were inputted into Design Expert and a D-optimal design
was chosen. It was decided to conduct all the runs in parallel, as this would require only
one experimental block, and so reduce the possibility of intra-block experimental
variation.
Table 5-8 Table outlining the creation of the D-optimal model used to monitor the effect that manipulating the three factors (Temperature, Ampicillin concentration and Plasmid size) had on three recorded responses (Growth rate, Final specific yield and Final volumetric yield) in 50mL cultures in shake-flasks. The model predicted that 18 shake-flask runs would be required to gather the information and gave the model a very acceptable G-efficiency of 74.3%
Design SummaryStudy Type Response Surface Experiments 18Initial Design D-optimal Blocks No BlocksDesign Model QuadraticResponse Name Units Obs Minimum Maximum Trans ModelY1 Growth rate hrs-1 18 0.3698 0.8798 None RQuadraticY2 Final specific yield mg/L 18 6.63317 290.594 None RQuadraticY3 Final Volumetic Yield g/L 18 27.15 51.55 None Linear
Factor Name Units Type Low Actual High Actual Low Coded High CodedA Temperature C Numeric 25 37 -1 1B Ampiciliin cone ug/mL Numeric 0 200 -1 1C Plasmid size kb Numeric 16 49 -1 1
Maximum Prediction Variance = 0.748 Average Prediction Variance = 0.556 Condition Number of Coefficient Matrix = 4.07325 G Efficiency = 74.3%Scaled D-optimality Criterion = 2.247
Thomas Burt 250

5. Cloning and Cell-line development
Table 5-9 Table describing the experimental setup of the D-optimal design. The model predicted that 18 shake-flask runs would be sufficient to gather the required information. The experiments allow the detailed prediction of the effect of manipulating each of the factors together with recording effects produced by interaction which may occur between the manipulated variables. The table also shows the measured responses produced after the experimentation, which were inputted into the model and used to create the response curves.__________________________________________________________
F A C T O R S R E S P O N S E S
R U N Temperature(°C)
Ampicillin(pgmL'1)
Plasmid size (kb)
Growth Rate (hrs’!)
Final Specific Yield (p gg1)
Final Vol. Yield (mgL*1)
1 25 0 49 0.404 7.25 0.3392 25 200 49 0.445 8.62 0.3993 37 200 49 0.774 12.69 0.4644 31 100 16 0.709 177.8 8.2745 25 0 16 0.374 106.8 4.06 31 0 33 0.788 8.76 0.3377 37 0 16 0.723 246.5 6.978 31 100 16 0.725 219.5 11.329 37 0 49 0.815 6.63 0.19410 37 200 16 0.723 235.3 9.02211 25 0 33 0.417 11.63 0.45612 37 0 49 0.880 6.75 0.22713 37 100 33 0.860 8.91 0.30814 25 200 33 0.424 10.17 0.40115 31 200 49 0.698 10.10 0.38916 37 0 16 0.810 290.59 8.71817 25 200 16 0.370 107.9 4.85118 37 200 16 0.705 279.7 7.594
As a result, the chosen model possessed a G-efficiency (a measure of accuracy) of 74.3%.
Model efficiency between 70-80% is highly desirable when designing the experimental
setup. The software determined that a series o f 18 shake-flask runs were required to be run
in parallel.
The 1L Shake-flasks were prepared as outlined in Table 5-9 using 50mL of sterile media,
and the desired volume o f selective agent to produce the required concentration. One vial
of working cell bank, o f the appropriate construct, was used to inoculate the media to a
starting optical density o f 0.2. The shake-flasks were then placed one of the corresponding
shaking incubators, which had been temperature mapped to ensure each was at the desired
temperature of either 25°C, 31°C or 37°C.
Growth of the cultures was monitored on an hourly basis by recording optical density
progression. These points were used to calculate the growth rate. When the cultures were
deemed to have reached stationary growth phase their incubation was stopped. Samples
were extracted and used to determine the final biomass yield.
Thomas Burt 251

5. Cloning and Cell-line development
Additionally, triplicate 50D volumes o f broth were taken from each shake-flask, spun-
down and the plasmid extracted by Qiagen spin-prep and used to calculate the plasmid
specific yield at harvest. Once the data had been collated, as demonstrated in Table 5-9, it
was inputted into the Stat-Ease model which generated the response curves.
5.4.3 Data Analysis
The results from the factorial design experiments were inputted into the D-optimal model
and used to create response curves. It was found that altering the ampicillin concentration
had minimal effect on any of the responses measured. The response curve where changing
the ampicillin concentration had the greatest demonstrable effect is shown in Figure 5-12.
The profile shows a slight downwards skew, but less than a 5% decrease in growth rate, as
the ampicillin concentration was increased from 0 to 200pgmL'1. For that reason, the
response curves shown in Figure 5-13 are normalised with respect to ampicillin
concentration, which is fixed at lOOpgmL'1. What is important to note from the response
curve, shown in Figure 5-12, is the effect that plasmid size has on growth rate. The
response is not linear, rather the fastest growth rates are witnessed for the intermediate
sized construct, with the maximum and minimum sized plasmids causing a reduction from
this maximum rate.
Figure 5-12 Response curve generated for the combined effect of ampicillin concentration and plasmid size on culture growth rate, normalised at 37°C . The small contributory effect of altering the antibiotic concentrations is evidenced by the downward skew in growth rate produced by increasing the antibiotic concentration from 0- 200pgmL'1. The graph also shows the effect of the construct size on the growth rate, which was found to be the greatest for the intermediate sized construct, with propagation of the 16kb and 49kb constructs reducing growth rate.
The curves generated for the effect o f the other two factors (temperature/ plasmid size) on
the three responses are shown overleaf in Figure 5-13. Figure A plots how the temperature
and size of the plasmid combine to affect the growth rate of the cultures.
Thomas Burt 252

5. Cloning and Cell-line development
0.72£ , 5.4
0.60
0.37
37.0^ ^ 3 4 . 0 r s
16 25280
Pl“*™sia(kb)16 25.0
UL
Plasmid size (kb)
Figure 5-13 R esponse curves show ing the com bined effects o f m anipulating the tem perature of incubation and plasmid size on the three m easured responses; growth rate (A ) , volum etric yield at harvest (B) and specific yield at harvest (C ).
From the plot it can be seen the temperature is the overriding variable of the two in its effect on culture growth rate. The profile plots a predictable curved increase with temperature. This is the expected case, since growth can be assumed to a collection of enzyme catalysed reactions, and the profile mimics well what occurs with increasing temperature on the rate of enzyme catalysis. It can be seen that the peak rate is reached at 37°C, the optimum temperature for enzymic reactions, with a maximum recorded growth rate of 0.88hrs''. Closer inspection reveals the contributory effect of the plasmid size on the growth rate and explains the curves contour lines. As highlighted in Figure 5-12 the fastest growth rates were encountered with the intermediate sized construct and this effect is evidenced by the curvature of the profile in Figure 5-13 A.
Figure 5-13B displays the response curve which characterises the effect of temperature and plasmid size on the final volumetric plasmid yield. The graph shows an almost linear decrease in volumetric yield with plasmid size, the variable which has the strongest effect of the two. The temperature of cultivation does appear to have a slight effect on volumetric yield, with slightly lower recorded yields at the reduced temperatures.
Figure 5-13C shows the impact of the two factors on specific plasmid yield at harvest. The reported responses show a higher degree of interaction between the two variables as the response curve is heavily skewed. It is very apparent that the plasmid specific yield decreases with increasing plasmid size to disappointingly low levels. The decrease is not linear as the smallest plasmid size (16kb) reports reasonably high specific yields
(~220|iigmL‘1), unlike the two larger constructs.
Thomas Burt 253

5. Cloning and Cell-line development
The impact of the temperature is also apparent in the skew of the profile, with the result
suggesting that lower temperatures produce lower specific yields, or at least do nothing to improve the yields.
5.4.4 Conclusions
It had been observed that the large plasmids produced extremely poor specific yields
during these investigations. At the time of study the reason for this was not fully
understood. It was perceived that the low yields could be symptomatic of running the
investigations in shake-flasks. One possibility was that the cells were not receiving
sufficient oxygen and that running the fermentations in the stirred tanks would alleviate
the issue. For that reason it was decided to press ahead with the pilot-scale fermentations.
Consequently, to conclude this section involves deciding upon the optimum conditions at
which to run the fermentations. The factorial design of experiments had provided good
data by which to judge the best conditions at which to operate.
Firstly, the concentration of ampicillin was found to have a minimal effect on any of the
responses, so it was decided to maintain its concentration at lOOpgmL'1 during the pilot-
scale fermentations. The effect of temperature on growth rate was predictable and as
expected. Higher temperatures resulted in faster growth, with growth rates at 37°C being
up to 100% greater than at 25°C (Figure 5-13A). So in terms of fermentation productivity
(yield per unit time), the best option would be to culture at 37°C, providing that this did not impact negatively on the yield responses considered. In both the case of volumetric
and specific yields, cultivation temperature was found to have a distinguishable impact,
but in both cases the higher yields were generated at the elevated temperature of 37°C
(Refer to Figure 5-13B and C). This is also displayed by the response curves shown in
Figure 5-14, which plot the effect of temperature and ampicillin concentration on the
harvest specific yields, standardised for each of the three constructs under investigation.
Again, the effect of the ampicillin concentration is shown to be minimal. In the cases of
the 16kb and 33kb constructs, there is an interpolated, linear increase of specific yield with
temperature. In the case of the 49kb construct, increasing temperature seems to decrease
harvest specific yield but by negligible amounts
Thomas Burt 254

5. Cloning and Cell-line development
92 17
Z 200"2, 200 <Z- 150Os- 150
% 1002 8 31 Temperature
ii 34 28 31 Temperature
261
■O226S’>» 191o
! 156
U5 12175
28 *i 34Temperature
Figure 5-14 Response curves modelling the effect of temperature and ampicillin concentration on plasmid specific yield at harvest. The graphs are normalised with respect to plasmid size, such that Figure A plots the response for the 16kb plasmid, figure B for the 33kb construct and figure C for the 49kb. From the plots it can be seen that temperature is the most influential of the two factors with ampicillin concentration barely registering any impact on the response. For the 16kb and 33kb plasmids temperature clearly effects harvest specific yield with an interpolated relationship between temperature and specific yield which is linear.
As a result of these conclusions duplicate 4L fermentations of each of the large pGEM plasmid series (3kb, 16kb, 33kb and 49kb) were conducted at 37°C in media supplemented with lOOjigmL'1 ampicillin. As described previously, the mode and media of the fermentation had already been optimised to the DH1 strain, and consisted of a glycerol supplemented complex media with the fermentations conducted in batch mode with enriched air aeration toward the end of cultivation.
5.5 Pilot-scale Fermentations of the large plasmid series
Having pursued optimisation studies it was decided to complete duplicate 4L fermentations of the large constructs. Details of these investigations are outlined in the Upstream processing chapter of this report (6.3). Unfortunately, the problem, as flagged by the optimisation studies, was that the plasmid yields from the fermentations of the large constructs were extremely poor. The low yields warranted further studies to identify the nature of the problem as it was believed to be related to the stability of the large plasmid
series.
Thomas Burt 255

5. Cloning and Cell-line development
5.6 Stability studies of large constructs
It was clear from the results of the optimisation studies, and the pilot-scale fermentations,
that the plasmids created by the insertion of large DNA fragments of DNA into the pGEM
vector, were not producing the high plasmid yields which were hoped for and somewhat
expected. It was deduced that the reason for the disappointing yields was due to plasmid
instability. It had been postulated that the low yields encountered during the optimisation
studies were due to plasmid instability, but it had been hoped, possibly somewhat naively,
that the cause may be due to poor oxygen transfer in shake-flasks. However, with the poor
yield results from the fermentation, this notion had to be abandoned. The reason for the
misplaced optimism was due to the stability studies conducted by (Tao and Zhang, 1998)
who concluded that the large pGEM constructs created in their own study were stably
maintained, a claim even summarised in the publication title. However, it is this author’s
belief that their investigation into the stability of the large pGEM plasmid was flawed and
as such the claim of stable maintenance was misleading. In their report, the stability of the
constructs was assessed by passaging a culture, bearing the large constructs, into fresh
medium for a total of five days. Because the cells continued to grow on the selective media
it was deduced that the cells must be plasmid bearing, however, no details were given into
the proportions of cells bearing plasmids and therein lies the flaw in the claim of stable
maintenance.
5.6.1 Segregational Plasmid Instability
The type of instability reasoned to be the cause of the poor plasmid yields was
segregational stability. The successful partitioning of plasmids to the daughter cells is a
central problem in any system utilising plasmids as vectors. Plasmids are always a
metabolic burden on the cells, which leads to preference of plasmid-free cells during
cultivation, since they are able to replicate at faster rates and so come to dominate the cell
population. The probability of plasmid loss during cell division becomes more problematic
as plasmid size increases, for the simple reason that the copy number decreases and as a
result the likelihood of a daughter cell not receiving a copy of a plasmid increases (Wames
and Stephenson, 1986; Wojcik et al., 1993; Smith and Bidochka, 1998). Bacterial
Artificial Chromosomes (BACs), of which the Oxford series are a variety, are very large
plasmids but avoid segregational instability by employing active partitioning mechanisms.
Thomas Burt 256

5. Cloning and Cell-line development
Modelling segregational plasmid stability is complex since the phenomenon is influenced
by a variety of different factors, including plasmid type and biological properties, culture
conditions and host-strain. Non-segregated models only distinguish between cells bearing
plasmids and those without, whilst segregated models take more differences into account,
namely the difference in plasmid copy numbers in cells. (Imanaka and Aiba, 1981)
developed a simple, non-segregated model to describe plasmid loss in batch culture taking
into account the probability of plasmid loss per generation of cells and the difference
between the growth rates of the plasmid-bearing and plasmid-free cells, assuming
exponential growth. This is shown in Equation 5-4. The model itself makes many
assumptions and is of limited practical application, as placing a value of the probability of plasmid loss could be somewhat qualitative.
More complicated segregated models attempt to take into account the metabolic burden of
plasmids, their copy number, the presence of multimers and the timing of their replication.
These models are beyond the scope of this report but examples can be found in (Summers,
Growth Rate (Plasmid - bearing) rx + - (l - p ) p +x +
Growth Rate (Plasmid - free) rx = [p/u
Pr oportion of Plasmid - bearing cells Fx + x
(0(ii)
(iii)
n ( a + p - 1F = Where: a - n =In 2
(IV)
Equation 5-4 A brief description of the non-segregated model developed by (Imanaka and Aiba, 1981) to describe the kinetics of plasmid loss during batch cultivation. The important parameters considered in the model are the probability of plasmid loss per generation (p) and the difference between the growth-rate of the plasmid bearing cells (p+) and the plasmid-free cells (ft). The non- segregated nature of the model means that it assumes exponential growth, that all plasmid containing cells have an identical growth rate and that the copy number is the same. Although not particularly helpful in predicting the actual proportions of cells bearing plasmid at any point is does serve to highlight the important issues affecting plasmid stability.
1991; Chatwin and Summers, 2001; Paulsson and Ehrenberg, 1998; O'Kennedy et al, 1995; Summers et al., 1993; Ataai and Shuler, 1986; Leipold et al, 1994; Ganusov et al,
2000; Ridha Mosrati, 1993).
The sheer number of publications in this field goes someway to highlight the industrial
implications of plasmid instability and its effect on heterologous protein production and
indeed, but to a lesser extent, plasmids themselves. As a direct result of the importance of
Thomas Burt 257

5. Cloning and Cell-line development
this issue to the application of recombinant DNA technology, numerous strategies have been devised, many utilising stabilisation systems employed naturally, to reduce plasmid segregational instability. Some of the strategies developed are detailed in Table 5-10. One of the simplest methods for enhancing segregational plasmid stability, widely used in laboratories and up to pilot-scale, is to add an antibiotic to the medium against which plasmid-bearing cells are resistant. This strategy can be effective in reducing instability, as evidence by Figure 5-15A, and is employed with the pGEM series of large constructs which carry the bla gene encoding (3-lactamase, an enzyme capable of degrading ampicillin. For historical reasons, this resistance gene has been included on cloning vectors in an almost de facto fashion. However, the strategy is not entirely effective due to the nature of the encoded resistance. Once synthesised, J3-lactamase is transported into the periplasm and over-expression leads to secretion of the enzyme into the culture medium (Georgiou, 1988). As a result, ampicillin may have a stabilising effect during the lag phase of growth, but is completely degraded by the exponential phase (Korpimaki et al., 2003). Furthermore, the inoculum used in the seeding of the fermentation may have such a high- level of {3-lactamase already present that the ampicillin is degraded so rapidly that no overall stabilising effect is witnessed.
An example of the rapidity of ampicillin degradation is shown in Figure 5-15B. This graph is extracted from (Kim et al., 1998) and demonstrates the dramatic rise in the activity of {3- lactamse during a fermentation of E.coli carrying pAA 182.
35100 1001600
* ■f"' 1400 9 CI 1200
• w ithout Ampicillin ▲ with Ampicillin
308080
25
60 100060
15a. 40 40 600 10
40020200
070 2 4 5 8 9 9 110 80 10020 40 60
Tim* of continuous cultivation (h)
Figure 5-15 Figures highlighting the use of ampicillin as a selective agent to reduce segregational instability. Figure A highlights how the use of ampicillin in continuous cultures does improve plasmid retention compared to a negative control. However, figure B shows how the use of ampicillin in batch culture can be ineffective due to the accumulation of p-lactamase in the culture medium and the associated rapid degradation of the selective agent. Adapted from (Friehs, 2004)
Thomas Burt 258

5. Cloning and Cell-line development
Table 5-10 Table detailing a selection of the numerous mechanisms employed to enhance the stability of plasmids. Many utilise techniques encountered naturally. The vast number of techniques relate the importance of this issue to the application of rDNA technology.
TECHNIQUE OUTLINE OF MECHANISM
Resistance against toxic substances
Simplest method involves adding a selective antibiotic to the media, against which cells develop resistance due to plasmid encoded genes. Impractical on the large-scale.
RepressorTitration
Again, utilises antibiotic but the resistance gene is encoded in the bacterial genome under the regulation o f the lac operon. Expression o f this resistance gene requires the presence of the lac promoter encoded on the plasmid. (Williams et al.. 1998a)
Complementation of chromosomal mutations
Propagation o f the plasmid in a host-cell line incapable o f synthesising an essential metabolite/protein. The required gene is expressed on the plasmid, ensuring only plasmid bearing cells could survive.(Skogman and Nilsson, 1984; Curtiss, III et al.. 1989)
Post-segregational killing of plasmid- free cells
Found on natural plasmids. Based upon intracellular mechanisms which kill plasmid-free cells. Mechanism consists o f a genome based gene for a toxic substance and a plasmid located antidote which neutralises the lethal toxin i.e. CcdB/ CcdA from F-factor and hok/sok.(Jensen et al.. 1995: Jensen and Gerdes. 1995)
Stabilisation of plasmid forms
The size o f plasmids leads to increased probability o f segregational instability. Multimerisation can be a cause o f segregational instability'. Inclusion of genes leading to the monomerisation o f multimers can lead to enhanced plasmid stability'. Gene for resolvase in the parCBA system is an example. (Gerlitz et al.. 1990)
Active plasmid partitioning
Par genes can be used to ensure correct segregation o f plasmids to daughter cells. Employed by BACs. The mechanism o f action o f these genes can be either attachment o f the plasmid to specific places on the cell membrane or active movement o f plasmid to younger zones(Bignell et al.. 1999: Lemonnier et al.. 2000)
High-copynumberprobability
Simple, non-segregated models predict that plasmid copy numbers >20 per cell lead to 100% segregational stability (Bentley et al.). High plasmid copy numbers increase the probability of successful partitioning. Also important is the variance o f copy number, such that the distribution o f plasmid copy number is narrow so that the population does not display high and low copy numbers. Inclusion o f the Rom protein can reduce copy number variance.
Lowering the difference in specific growth rates
The major disadvantage once plasmid-free cells appear is that they are able to replicate at faster rates that plasmid-bearing cells. Decreasing the difference between the growth rates can increase segregational stability. Industrially inducement o f cultures at high biomass reduces the occurrence o f plasmid loss during the growth phase. Alternative strategies utilise lowering the temperature o f cultivation or by ensuring that plasmid-free cells a forced to express a certain proteinto increase the burden placed upon the cells (Corchero and Villaverde, 1998; Glick. 1995)
Modifying culture conditions
Many culture conditions have been observed to improve plasmid stability'. Often these are just observations without full explanations into why they occur. Too many effects observed to comment upon but examples include: low dissolved oxygen lead to decreased plasmid stability a similar effect was seen with a lowered pH. The choice o f media can also impact stability with defined glucose media displaying higher stability that complex media. Additionally, induction o f plasmid -based genes has been associated with a decrease in stability.
Clone selection Suitable clone selection techniques (i.e. continuous culture) can be employed to isolate highly stable plasmid-bearing strains without full appreciation o f the reasons for the enhanced stability (Vyas et al.. 1994).
Separation of plasmid-free and bearing cells
Plasmid bearing and plasmid-free cells can have different flocculation characteristics. Could be employed as part o f a purification regime but not ideal when considering fermentation economics (Henry et al.. 1990)
Integration into chromosome
Impractical if the aim is to produce plasmid DNA. Can be used if only low gene dosage is required. Integration can lad to negative changes on the host-cell.
Thomas Burt 259

5. Cloning and Cell-line development
From the graph, the harvest point activity of p-lactamase in the broth is ~23mmols/s
(1400mmols/min). Considering that the 4L fermentations conducted with the pGEM series
were supplemented with lOOmgL'1 ampicillin, it can be estimated that the total 400mg of
ampicillin used (-l.lmmols) could be degraded in within Is of the addition of the
inoculum to the fermenter. This realisation is important as it demonstrates the flaw in the
claim made by (Tao and Zhang, 1998) when they specificied that large (up to lOOkb)
pGEM constructs created in their study were stably maintained. By simply passaging a
sample of culture into fresh selective media, a great deal of p-lactamase activity would
also have been transferred, most probably sufficient to degrade all of the ampicillin present
very quicky. Providing a small proportion of the cells retained the plasmid, sufficient |3-
lactamase could be generated to do the same when passaged again. Consequently, only a
minute proportion of cells need be plasmid bearing for the assumption to be made that the
plasmid is maintained, but by not detailing the proportion of cells actually bearing the plasmid, then the claim of stable maintenance is unsubtantiated.
With these considerations in mind it was decided that the stability of the large constructs
needed to be investigated by describing the actual proportion of plasmid bearing cells.
5.6.2 Assessing the stability of the pGEM series of large plasmids
Assessment of the stability of the series of large pGEM plasmids was conducted in shake-
flasks. The selective media in the first shake-flask was inoculated from an appropriate cell-
bank vial and incubated. The growth was monitored by following OD progression and
samples taken hourly for the analysis of plasmid stability. At the end of the growth period,
sufficient culture broth was passaged and used to inoculate a shake-flask containing fresh
selective media to 0.1 OD. The whole trial was conducted over a sixty hour period
involving four passages of the culture broth into fresh media. Designing the stability trials
in this fashion mimicked a fermentation train which would take the culture from the initial
master cell vial through to the end of a large-scale fermentation.
The method chosen for monitoring plasmid segregational stability was replica plating.
More detail into the assay is provided in (2.6.8). The method involved the appropriately
diluted samples of broth being plated out on to non-selective agar plates, which were
incubated to allow colony formation. These represented the master plates. The colonies
from the master plates were then imprinted on to separate, sterile velveteen cloths and used
to inoculate fresh non-selective plates as well as selective plates, in that order.
Thomas Burt 260

5. Cloning and Cell-line development
The plates were then incubated to allow colony formation. The broth was diluted to ensure
-100-200 colonies would form on the master plate; the dilution factor required being
determined from the OD at the time of sampling. The ratio of the colonies on the selective
plate to the non-selective plate is the ratio of plasmid bearing cells. Each time point for
each stability trial was assessed using triplicate plates. To improve accuracy the number of
colonies on both the selective and non-selective plates were totalled, and the proportion of
plasmid bearing cells calculated using a binomial distribution equation show in (Equation2-1).
The results of the first stability trials can be seen in Figure 5-16. This stability trial was
designed to monitor the likely changes which would have occurred to the proportion of
plasmid bearing cells during the pilot-scale 4L fermentations (including the inoculum
development period) of the pGEM series of large constructs. To ensure comparability to
the fermentations the same media formulation, including an identical concentration of
ampicillin (lOOpgmL'1) was used for the stability trials. Additionally, all the shake-flasks
were incubated at 37°C.
As can be appreciated from the figure, the loss of plasmid was a likely occurrence during
the pilot-scale fermentations of the larger constructs. The figures demonstrate that
ampicillin selection is not as effective as hoped. Only the pGEMll culture displayed
100% stability at these conditions and as a direct result of this also recorded the slowest
growth rates of all the constructs, at 0.7hrs‘] on the first day, rising to 0.74hrs_1 on the final
day. It could be postulated that the increase in growth rate witnessed demonstrated some
form of adaptation of the culture. The results for the pGEM16 were less successful as even
this sized plasmid displayed instability. On the first day of the trial, stability was around 100%, but instability became apparent during the end of the first day and during the
overnight passage. By the second day, the 16kb demonstrated a large drop-off in the
proportion of plasmid-bearing cells. The drop off in stability followed the roughly
sigmoidal curve reported by others investigating segregational plasmid instability and
likely caused by the growth-rate differential between plasmid-bearing and plasmid-free
cells (Smith and Bidochka, 1998; Wames and Stephenson, 1986).
It is believed that the loss of plasmid from the cells also accounts for the increase in
specific growth rate, which was found to rise from -0.71hrs‘], when stability was at is
highest, to -O.SOhrs'1 when the proportion of plasmid bearing cells was at its lowest.
Thomas Burt 261

5. Cloning and Cell-line development
Time (hrs)Time (hrs)Proportion of plssmid bearing cells
Figure 5-16 Stability studies of the pGEM series of plasmids propagated in DH1, displaying the change in the proportion of plasmid bearing cells through the course of a 60-hour passaging run. In each case, 50mL of sterile media (in 1L baffled shake-flasks) supplemented with lOOpgmL'1 ampicillin was inoculated from a banked vial of cells to a starting OD of 0.1. For each construct duplicate shake-flasks were incubated at 37°C/ 230rpm in a shaking incubator. In a hood, samples of broth from each flask were removed at regular intervals over an eight-hour period. Optical density measurements were recorded to measure growth rate and samples of the broth were diluted appropriately in sterile PBS. lOOpl of the diluted broth was plated on to non-selective TSA plates which were incubated for 20hrs at 37 * C in a benchtop incubator. At the end of the eight-hour time- point sufficient inoculum was drawn from each shake-flask to inoculate a corresponding flask containing fresh sterile, selective media to 0.1 OD. The passaged flasks were incubated in an identical fashion overnight, after which the process was repeated for a total of four passages.
The proportion of plasmid bearing cells was determined for each time point from each flask in duplicate by replica plating. The colonies on each of the master plates were transferred on to a sterile velveteen cloth which was then used to inoculate another non-selective TSA plate followed by a selective plate (TSA+lOOpg,!'1 Amp). The replica plates were then incubated for ~20hrs at 37°C. The proportion of plasmid bearing cells was determined by counting the number of colonies present on the selective plate in comparison to the non-selective control plate.
|A: pGEM ll (3.2kb) B: pGEM16 (16kb) C: pGEM33 (33kb) D: pGEM49 (49kb)|
Thomas Burt 262

5. Cloning and Cell-line development
This outcome meant that the plasmid-free cells had a growth rate -15% greater than the
cells bearing the 16kb plasmid. It is the result of this differential that accounted for the
population of plasmid-free cells becoming the dominant cell population. From the stability
trial of pGEM16 it was possible to estimate the growth rates of the culture at -0% and
100% stability. These growth rates were used in the non-segregated model, developed by
(Imanaka and Aiba, 1981) (Equation 5-4) in an attempt to place a value on the probability
of loss of the 16kb per generation. The result of the predictions is shown in Figure 5-17.
An unsubstantiated observation from the figure is the difference between the shapes of the
curves predicted and those actually observed. This highlights the difficulty in using non
segregated models to predict the rate of plasmid loss.
.0=0.0010.9 0.9
0.8 0.8
= 0.7 0.7
5 0.6 0.6p=0.050.5
t 0.4
! 0.301 0.2
0.4
0.3p=0 1 0.2
0.00.00 10 40 50 60 7020 30
Figure 5-17 Graph showing the predicted rates of plasmid loss of the pGEM16 plasmid using the non-segregated model shown in Equation 5-4. The growth rates of the plasmid-bearing and plasmid-free cells were determined by experiment. Differing values were placed upon the probability of plasmid loss per generation ranging from 0.1% (1:1000) probability to 20% probability (1:5). The predicted rates could be compared to those derived from observation.
Time from inoculation (hrs)
Segregational instability is a complex process, dependent on the magnitude of numerous
variables, so simple non-segregated models cannot be relied on to accurately predict the
event. However, from the predictions it could be estimated that the generational
probability of a daughter cell being created which was plasmid-free was -15%. This
probability was estimated as by the end of the 60 hour period it leads to a predicted
population of plasmid-bearing cells to be -5% , in-line with the observed proportion. It can
only be assumed that the probability of loss for the 33kb and 49kb constructs would be
greater.
The stability profiles of the 33kb and 49kb constructs demonstrate that at no point during
the trial did they display 100% stability, suggesting that even the master cell bank used to
inoculate was prepared from a culture of cells with reduced stability. In both cases the
proportion was reduced, rising only temporarily when the culture was passaged into fresh,
selective media, but soon dropping. As a result the growth rates of the cultures were found
Thomas Burt 263

5. Cloning and Cell-line development
to be higher than those reported for the stably maintained 3kb construct ~ 0.75-0.8
hrs'1. One interesting occurrence was seen during the second day of the pGEM49 stability
trial, where elevated stability caused a dramatic drop-off in growth rate, or indeed, vice- versa.
To summarise the results of the first stability trial involves confirming that the large
pGEM constructs do display reduced segregational stability. More than likely this reduced
stability was the reason for the poor plasmid yields obtained during the pilot-scale
fermentations. It had been hoped that because stable maintenance was reported by Tao et al. (1998), when they created large plasmids using the same vector backbone, that this
would be achievable with these constructs. However, in hindsight more care should have
been taken over the selection of a suitable cloning vector. Ideally, the vector would not
have utilised ampicillin resistance as the selective agent but kanamycin resistance instead.
The advantage of this selective gene is that the encoded protein does not confer resistance
by degrading the antibiotic, but by active transport of the kanamycin out of the cells. As a
result the selective pressure is not lost. It had been thought to use a range of cloning vectors developed by Lucigen Corp. (pSMART vectors) which claim to be capable of
accommodating larger than normal DNA fragments and which use Kan resistance.
However, the vectors could only be used via ‘blunt-end’ cloning strategy which was felt to
be more prone to failure than traditional ‘sticky-end’ cloning protocols. Consequently, the
pGEM vector was favoured.
The main focus of the stability studies now became trying to improve the stability
characteristics of the pGEM large constructs, as in doing so would improve plasmid yield.
5.6.3 Attempts to improve segregational stability of pGEM series
The first attempts to improve the stability profile of the pGEM series of plasmids involved
determining whether propagation of the plasmids in an alternative host-cell line or
selection with an improved antibiotic, increased plasmid stability. The stability trial was
conducted in an identical fashion to before, using shake-flasks and replica plating. The
changes included propagation of the plasmids in E.coli DH10P and the use of carbenicillin
as the selective agent. It was felt that propagation of large plasmids in the DH10|3 cell line,
as reported previously, may aid large plasmid propagation and stability (Hanahan et al, 1991; Donahue, 1998; Eastman and Durland, 1998). Carbenicillin is an analogue of
ampicillin, as shown by Figure 5-18.
Thomas Burt 264

5. Cloning and Cell-line development
Its use is recommended over ampicillin since the modifications to the groups surrounding
the (3-lactam ring mean that it is hydrolysed at a far slower rate by (3-lactamase than
ampicillin (Sambrook e t a l ., 1989). As such, the selective pressure should be maintained
for longer periods.
Figure 5-18 Figure showing the structural similarities between ampicillin (A) and carbenicillin (B). Both possess the p-lactam ring (highlighted in red). This is the target for ^-lactamase which hydrolyses the ring to break up the molecule. Due to slight differences in the R-groups this process of hydrolysis is slower with carbenicillin than with ampicillin.
The combined results of the use of DH 10(3 host-cell and carbenicillin are shown in Figure
5-19. Once again, the smallest plasmid; pG E M ll (3.2kb) is the only construct which
displays 100% stability. pGEM16 (16kb) shows a very similar pattern in stability to as
before when using carbenicillin. However, overall the results do not show any real
improvement in the stability profile o f the large constructs.
Simple cost-benefit analysis suggested that pursuing the use of either carbenicillin or
DHlOp as the host is not particularly useful. The benefit o f either strategy on the stability
characteristics of the large constructs was found to be minimal. Furthermore, the use of
DHlOp would involve the use of an unoptimised strain which has been found before to
demonstrate slower growth rates and biomass yields on the DH1 optimised media (3.5.2).
As for carbenicillin, the cost multiple is a big disadvantage. It may be found advantageous
to increase the concentration of selective agent in the media or even to add it in fed-batch
mode. Doing so would require more quantities of antibiotic, however, carbenicillin is -20-
fold more expensive per gram than ampicillin, which reduces the feasibility of using more
selective agent. (Ampicillin; £4.20/g Carbenicillin; £76.40/g) (Sigma-Aldrich). As a result
of these findings it was decided not to employ either of these techniques.
Na+Cr O
Thomas Burt 265

5. Cloning and Cell-line development
Passage 1 2 Passage 3
1.0
0.9
080 7
0.6
0.5
0.4
0 3
0.2
0 10.0 0 10 20 30 40 SO 60
1.0
0.9
0.8
0.7
0.6
0.5
0.4
0.3
0.2
0.1
0.0 0 10 20 30 40 6050
0 10 20 30 40 50 60
E.coliE.coli
DH1O0DH1
Time (hrs)
1.0
0.9
0.8
0.7
0.6
0.5
0.4
0.3
0.2
0.1
0.0 0 10 20 30 40 50 60Time (hrs)
Figure 5-19 Stability studies of the pGEM series of plasmids propagated in DH1 and DHlOp, displaying the change in the proportion of plasmid bearing cells through the course of a 60-hour passaging run. In each case, 50mL of sterile media (in 1L baffled shake-flasks) supplemented with lOOpgmLf1 Carbenicillin was inoculated from a banked vial of cells to a starting OD of 0.1. For each construct duplicate shake-flasks were incubated at 37°C/ 230rpm in a shaking incubator. In a hood, samples of broth from each flask were removed at regular intervals over an eight-hour period. Optical density measurements were recorded and samples of the broth were diluted appropriately in sterile PBS. lOOpI of the diluted broth was plated on to non-selective TSA plates which were incubated for 20hrs at 37 * C in a benchtop incubator. At the end of the eight-hour time-point sufficient inoculum was drawn from each shake-flask to inoculate a corresponding flask containing fresh sterile, selective media to 0.1 OD. The passaged flasks were incubated in an identical fashion overnight, after which the process was repeated for a total of four passages.
The proportion of plasmid bearing cells was determined for each time point from each flask in duplicate by replica plating. The colonies on each of the master plates were transferred on to a sterile velveteen cloth which was then used to inoculate another non-selective TSA plate followed by a selective plate (TSA+lOOpg,!'1 Carbenicillin). The replica plates were then incubated for ~20hrs at 37°C. The proportion of plasmid bearing cells was determined by counting the number of colonies present on the selective plate in comparison to the non-selective control plate.
[A: pGEM ll (3.2kb) B: pGEM16 (16kb) C: pGEM33 (33kb) D: pGEM49 (49kb)]
Thomas Burt 266

5. Cloning and Cell-line development
5.6.4 Improving plasmid segregational stability by cultivation at lower temperatures
Referring to Table 5-10 details the numerous techniques developed to improve the
segregational stability of plasmids. Unfortunately, the majority of techniques are only
applicable to plasmids which have been constructed with the particular stabilisation
technique in mind (e.g. active partitioning) and as such there are few generic strategies.
The strategies which are generic tend to be related to alterations which can be made to the
cultivation conditions. Consequently, these strategies were chosen in an attempt to improve the stability profile.
The strategy thought best to improve the situation was the reduction of the specific growth
rate, which has been reported to have favourable effects on the stability and plasmid yield
(in relaxed plasmid systems) and can be achieved in a number of ways; including media
adaptation, fermentation mode and cultivation temperature. It was decided that reducing
the temperature of cultivation would be the simplest strategy to employ in order to verify
whether stability was improved. This approach was thought likely to be successful for two
reasons, both of which are highlighted in the non-segregated model shown in Equation
5-4. It was reasoned that reducing growth rate would reduce the growth rate differential
(a) and the probability of plasmid-free cell generation (p), both should have a positive
impact on stability.
The first mechanism exploits the fact that reducing the cultivation temperature would
reduce the growth rate differential between the plasmid-free and plasmid-bearing cells.
The result is that when/if plasmid-free cells appear their rate of replication should be not
much faster than the plasmid-bearing cells. As such, the plasmid-free cells would require
far longer periods to become the dominant cell population. Secondly, it is postulated that
decreasing the incubation temperature should reduce the probability of plasmid-free cells
appearing. The reason behind this is that slower growth rates have been shown to have a
positive effect on plasmid copy numbers (Seo, 1986; Bailey and Seo, 1985; Kim et al., 1998; Reinikainen and Virkajaervi, 1989; Reinikainen et al., 1989). Therefore, it was
envisioned that incubation at a lower temperature would decrease growth-rate, which
would up-regulate the plasmid copy number, which in turn would decrease the probability
of plasmid loss (Bentley, 1989). The stability trials were conducted in an identical fashion
to before, using shake-flasks and replica plating, the only difference being the temperature
at which the shake-flasks were incubated at which were both 30°C and 25°C.
Thomas Burt 267

5. Cloning and Cell-line development
1.00.9
0.80.7
o.e
0.5
0 40.3
0.20.10.0 100 20 30 40 50 60
B
0.4 6
1.00.9
0 80.7
06
0.5
0 40.3
0.20 10.0
06 i0.5 I
- 1
1.00.9
0.8
0.7
0.6
0.5
0.4
0.3
0.2
0.1
0.0 0 10 20 30 40 50 60
0.7
0.6 J
%0.5 a:
10.4 O
0.3
Time (hr*)
30°C
Figure 5-20 Stability' studies of the pGEM series of plasmids propagated in DH1, displaying the change in the proportion of plasmid bearing cells through the course of a 60-hour passaging run. In each case, 50mL of sterile media (in 1L baffled shake-flasks) supplemented with lOOpgmL'1 ampicillin was inoculated from a banked vial of cells to a starting OD of 0.1. For each construct duplicate shake-flasks were incubated at 30°C/ 230rpm in a shaking incubator. In a hood, samples of broth from each flask were removed at regular intervals over an eight-hour period. Optical density measurements were recorded to measure growth rate and samples of the broth were diluted appropriately in sterile PBS. lOOpI of the diluted broth was plated on to non-selective TSA plates which were incubated for 20hrs at 30 ’ C in a benchtop incubator. At the end of the eight-hour time-point sufficient inoculum was drawn from each shake-flask to inoculate a corresponding flask containing fresh sterile, selective media to 0.1 OD. The passaged flasks were incubated in an identical fashion overnight, after w hich the process was repeated for a total of four passages.
The proportion of plasmid bearing cells was determined for each time point from each flask in duplicate by replica plating. The colonies on each of the master plates were transferred on to a sterile velveteen cloth which was then used to inoculate another non-selective TSA plate followed by a selective plate (TSA+lOOpg,!'1 Amp). The replica plates were then incubated for ~20hrs at 30°C. The proportion of plasmid bearing cells was determined by counting the number of colonies present on the selective plate in comparison to the non-selective control plate.
[A: pGEMll (3.2kb) B: pGEM16 (16kb) C: pGEM33 (33kb) D: pGEM49 (49kb)J
Thomas Burt 268

5. Cloning and Cell-line development
g1 0.3 -I
V/
Time (hrs) • Proportion of plasmid bearing cells
i/s a Growth rate (hrs*1) over measured penod
1.00 90 607
0.6
0.5
0 40.3
0.2
010 0 10 20 40 500 30 60
25°C
1-■E.?I 0.6 \
I£
■a.?i
ciiio 10 20 30 40 50 60
Time (hrs)
Figure 5-21 Stability studies of the pGEM series of plasmids propagated in DH1, displaying the change in the proportion of plasmid bearing cells through the course of a 60-hour passaging run. In each case, 50mL of sterile media (in 1L baffled shake-flasks) supplemented with lOOpgmL'1 ampicillin was inoculated from a banked vial of cells to a starting OD of 0.1. For each construct duplicate shake-flasks were incubated at 25°C/ 230rpm in a shaking incubator. In a hood, samples of broth from each flask were removed at regular intervals over an eight-hour period. Optical density measurements were recorded to measure growth rate and samples of the broth were diluted appropriately in sterile PBS. lOOpl of the diluted broth was plated on to non-selective TSA plates which were incubated for 20hrs at 25 * C in a benchtop incubator. At the end of the eight-hour time-point sufficient inoculum was drawn from each shake-flask to inoculate a corresponding flask containing fresh sterile, selective media to 0.1 OD. The passaged flasks were incubated in an identical fashion overnight, after which the process was repeated for a total of four passages.
The proportion of plasmid bearing cells was determined for each time point from each flask in duplicate by replica plating. The colonies on each of the master plates were transferred on to a sterile velveteen cloth which was then used to inoculate another non-selective TSA plate followed by a selective plate (TSA+100pg,l-l Amp). The replica plates were then incubated for ~20hrs at 25°C. The proportion of plasmid bearing cells was determined by counting the number of colonies present on the selective plate in comparison to the non-selective control plate.
|A: pGEM ll (3.2kb) B: pGEM 16 (16kb) C: pGEM33 (33kb) D: pGEM49 (49kb)]
Thomas Burt 269

5. Cloning and Cell-line development
Figure 5-20 details the results of the stability study at 30°C whilst Figure 5-21 displays
those of the 25°C study. The most interesting fact about both of the stability studies is that
reducing the cultivation temperature entirely corrects the instability of the pGEM16
construct. The results from the 37°C trial suggested that the stability of this construct was
correctable. In both previous trials the construct maintained 100% stability for the initial
period of the trial, but toward the end of the first day would begin to display instability. By
that point the generation of plasmid-free cells and the large growth differential meant it
was inevitable that the proportion of plasmid-free cells would increase and become
dominant. The reduction in cultivation temperature seemed to sufficiently decrease the
probability of plasmid-loss such that it does not occur, or at least not as often. Referring to
Figure 5-17 shows the positive effect that reducing the probability of plasmid loss had on
the predicted stability of the 16kb construct.
The results of reducing the cultivation temperature on the stability of the larger pGEM
constructs were more mixed. At both temperatures the constructs still displayed instability.
This indicates that the plasmid-free cells were still being generated and that their growth
persisted in being faster than the plasmid-bearing cells. On the positive side, the
equilibrium proportion of plasmid-bearing cells was higher. This is directly attributable to
the lowered temperature, as although plasmid-loss is still occurring, it must have been
reduced by some degree. Similarly, the growth-rate differential between the plasmid-free
and plasmid-bearing cells must have been reduced since the proportion of plasmid-free
cells does not come to dominate the cell population as quickly. However, it establishes the
fact that, unlike the pGEM16 construct, the instability of these constructs cannot be
entirely rectified by simply reducing the temperature.
The stability profile of the 30°C trials of the pGEM33 and 49 constructs displays
predictable sawtooth kinetics, as the proportion of plasmid-bearing cells is highest just
following passaging. This is to be expected since the presence of ampicillin would
neutralise the plasmid-free cells, but due to the rapid action of f3-lactamase the selection
pressure is soon lost and the proportion of plasmid-bearing cells begins to fall as growth-
rate differential becomes noticeable. Although it is difficult to exactly quantify, it was felt
that the stabilising effect was greatest at the lower temperature of 25°C. Theoretically, this
would be expected as the growth rate and plasmid copy number would be lower and as
such the growth-rate differential and probability of plasmid loss would be reduced.
Thomas Burt 270

5. Cloning and Cell-line development
Observations from the stability profiles back up this belief with the proportion of plasmid
bearing cells being higher during the 25°C stability trials than in any previous trial. In the
hope that this cultivation temperature did promise the best conditions for improving stability it was chosen.
5.6.5 Clone Selection
Results from the stability trials suggested that cultivation at 25°C would improve the
stability profile of the large plasmids. Therefore, pilot-scale fermentations would be
carried out using the lower temperature conditions. Before doing so it was felt applicable
to attempt a further level of optimisation. Table 5-10 details a generic strategy of
improving stability by the selection of more stable clones. Traditionally this would be
achieved through the use of continuous culture. For example, (Vyas et al., 1994) employed
72hr continuous culture to select clones which displayed more favourable stability (+60%)
profiles during batch culture. The exact mechanism of why the stability improved is
unknown, and is likely due to a combination of factors. However, the fact remains that the
forced evolution environment of continuous culture enables the generation and selection of
clones with improved stability phenotypes.
Unfortunately, it was reasoned that the design and setup of continuous culture systems for
clone selection was out of the capability of this investigation. However, it is maintained that the use of this technique as a means of generating and selecting favourable clones,
capable of bearing large, high-copy plasmids, could be a successful strategy and would be
recommended should further attempts be made at producing these constructs.
Although continuous culture would have been the optimal method of clone selection a less
sophisticated method was attempted to identify and select suitable clones. Streaks of the
master cell bank of each large construct were made on to selective plates and incubated at
25°C to allow colony formation. Five colonies from each construct plate were inoculated
into sterile, selective media and incubated overnight at 25°C. These cultures were then
used to inoculate five shake-flasks. In an identical fashion to the stability studies, the
cultures were grown in shake-flasks and passaged at 12 hour periods into fresh, selective
media. This selection regime was continued for a 60 hour period. At the end of the 60 hour
period, samples of the culture broth were streaked on to selective plates and 50D volume
samples of culture broth taken and spun down.
Thomas Burt 271

5. Cloning and Cell-line development
Mean Copy Number = 159.3 3.2kb
I I I I IA B C D E
Mean Copy Number = 89.3 ' — 16kBf■1 160 3 140
Mean Copy Number =16.6 3 3 k t.£ 180
120 • 120
Mean Copy Number = 13.1 49kb
I f 1 11 11111Figure 5-22 Figure displaying the specific yields of each of the five clones, bearing each of the pGEM series of plasmids, at the end of the 60 hour selection period. The asterisk marks the clone which was selected and banked.
The plasmid specific yield of each of the clones was then determined by HPLC on IPA precipitated samples. The results are detailed in Figure 5-22.
The results show that there was a level of variation in the yields of each clone. The clones which produced the highest yield at the end of the selection procedure were selected. The results also gave the first indications of expected yields from this series of large plasmids and their associated copy number. The most noticeable are the poor yields of the pGEMl 1 construct, which were below lOOpg/gWCW. This was surprising since in the product literature it is claimed that this construct has a copy number of 300-400, but the estimates from this study placed the value at -150 (Qiagen, 2005). The yields for the pGEMl6 were far greater due to the greater quantity of cloned DNA, but as the estimates show, the value for copy number is reduced by -50% due to the increased plasmid size. The yields of the two larger constructs would be expected to be even greater than the 16kb construct, due to the increased cloned DNA mass, but the instability issue brought the overall yields down. However, the clones selected both returned yields above 100pg/gWCW.
Thomas Burt 272

5. Cloning and Cell-line development
It may be coincidental, but the estimates placed on the copy number of both the larger
constructs was below 20 copies/cell. It was calculated by (Bentley, 1989) that above 20
copies/cell 100% stability is guaranteed by improved probability of successful partitioning.
5.6.6 Conclusions
The cause for the low plasmid yields during the pilot-scale fermentations has been
determined to be due to segregational instability. Stability studies mimicking the pilot-
scale fermentations identified that only the smallest of the constructs (pGEMl l[3.2kb])
displayed 100% stability. In hindsight, the choice of vector in which to clone large
segments of DNA was far from optimal. In defence, the vector (pGEMl 1) was chosen due
to published data, which claimed stable maintenance of up to lOOkb was achievable using
this construct (Tao and Zhang, 1998). However, a more reasoned approach to the cloning
could have anticipated the occurrence of instability problems as there was published data concerning the action of ampicillin selection.
Attempts at further cloning using a more optimal vector were ruled out due to time
constraints and the potential for the same problem occurring. As a result attempts were
made to improve the stability of the plasmid using generic techniques. Initially, these
attempts included changing the host cell line and the use of a more degradation resistant
antibiotic. Unfortunately, these efforts did not yield significant improvements in stability
and it was deduced that the cons from utilising these approaches outweighed their minimal
benefits. As a result, the final strategy employed was to reduce the temperature of cultivation from 37°C to 25°C. Shake-flask evidence suggested that this had the action of
reducing the probability of plasmid loss as well as reducing the growth-rate differential
between the plasmid-free and plasmid-bearing cells. Clone selection was also conducted to
try and select more stable clones.
Although a major disappointment, the stability issues serve as a reminder of a technical
hurdle which must be overcome in the production of large constructs. However, it is
believed it is a hurdle which could be overcome. In contrast, the low-yields presented by
the stringently controlled Oxford series have no margin for improvement. Described in this
chapter (Table 5-10) are mechanisms which could be employed to optimise the stability of
the large plasmids. It is believed that rational design of large constructs with plasmid
stabilisation in mind could generate suitable candidates for large-scale production.
Thomas Burt 273

5. Cloning and Cell-line development
Unfortunately, due to the highly technical nature of many of these approaches it was not
possible to attempt them in this project. As a result only the simplest strategies were
attempted, but some improvement in stabilisation can be reported. Consequently, pilot-
scale fermentations using these improved conditions could now be conducted to determine
the plasmid yields resulting from growth in a more controlled environment.
5.7 Conclusions
Attempts to produce the Oxford series of Bacterial Artificial Chromosomes were described
in Chapter 3. From these studies it was reasoned that the low yields produced from the
fermentations of these constructs did not allow effective study of their processing.
Problems with analytical procedures and the setup of the downstream processing steps,
highlighted that these constructs were not really applicable to large-scale manufacture.
With little that could be done to improve the yields of these constructs, the decision was
taken to produce large plasmids under the control of a high-copy number replicon, with the
intention that they would improve the yields achievable and so allow further study into
their processing.
Initial attempts at sub-cloning the insert DNA from the Oxford series constructs into high-
copy number vectors were not successful. As a result, a new strategy was attempted that
involved the cloning of large fragments of S.cerevisiae genomic DNA into pGEM vectors,
as first reported by (Tao and Zhang, 1998). These efforts were more successful in
generating large constructs. However, optimisation studies, designed to identify suitable
conditions at which to produce these constructs, reported low yields of these constructs, as
did further pilot-scale fermentations. Investigations into the cause of the low-yields
determined that the problem lay with the unstable nature at which these construct were
propagated. In response to this, attempts were made at trying to identify suitable
conditions which would increase the stability of the plasmids. Following these
investigations, higher-producing clones were isolated and it was decided that reducing the
temperature of cultivation to 25°C improved the stability by a significant degree.
Consequently, attempts could now be made to produce these constructs on the pilot-scale
using these conditions. The results of these efforts will be outlined in the next section of
this report which deals with the upstream processing of these constructs.
Thomas Burt 274

6. Upstream Processing
6 UPSTREAM PROCESSING: RESULTS AND
DISCUSSION
6.1 Chapter Aims
The aims of this chapter are to outline the results of pilot-scale fermentations conducted
on strains bearing the large plasmid series created in the previous chapter. The
fermentations were studied as a separate unit operation since their importance to any
process cannot be easily estimated. Too often upstream and downstream processes are
considered as completely separate, unconnected unit operations; when in reality
fermentations have a huge impact on the proceeding steps. Attempts have been made to
avoid such an approach since previous studies have demonstrated the impact that
fermentation-driven factors, namely specific yield, can have on the performance of
downstream operations. Despite this, the fact remains that the main aim of the
fermentations was to produce sufficient cell material with which to attempt purification
of the large plasmids. It was fully understood that far longer could have been spent
investigating and optimising this section of the overall process so as to further increase
productivity, but due to time pressures, many of the more elegant strategies which could
have been applied were not attempted. More detail into the background of fermentations
for plasmid production is described in Chapter 3.
The main issues which will be investigated by this chapter include the following;
1. At the outset of this project fermentation calibration was identified to be of
critical importance. Many calculations required the understanding of how
factors such as cell concentration and optical density relate to one another.
Detailed in this section will be the results of runs performed to prepare
calibration curves for such purposes.
2. Prior to the realisation of the stability issues plaguing the propagation of these
large plasmids, ‘conventional’ 37°C fermentations were carried out in an
attempt to produce the constructs. The results from these fermentations will be
outlined.
Thomas Burt 275

6. Upstream Processing
3. Following poor yields from the 37°C fermentations, the stability studies
detailed in 5.6 were carried out. From these investigations it was decided to
proceed with fermentations at 25°C. The results of these fermentations will be
outlined.
4. Together with assessment of the fermentation characteristics such as growth
and final biomass levels, perhaps the most important measurable are the actual
plasmid yields. As such details will be given in to the plasmid yields of the
fermentations.
5. Finally, high plasmid yields are only desirable if the plasmid is produced in
supercoiled form. Since supercoiling is a driven by an energy requiring process
the level of supercoiling can vary throughout the course of a fermentation. The
results from gel analysis will be outlined to describe the observed flux in
plasmid supercoiling during the fermentations.
6.2 Fermentation Calibration
In many instances throughout this project it has been necessary to perform calculations
which required the conversion of values such as optical density into figures such as cell concentration, so enabling the determination, of amongst other things, plasmid copy
number. In order to have confidence in the values returned by these calculations, an
accurate and precise description of how these factors relate to one another was required.
To this end quadruplicate fermentations of E.coli DH1 [parental] were carried out in
which all possible measurements were recorded allowing the construction of calibration
curves*.
* It should be emphasised that the creation of these calibration curves did not replace direct measurement where
possible and the curves were never created with this aim in mind. In every fermentation conducted WCW and
optical density were measured as standard.
Thomas Burt 276

Wet
Cel
l W
eigh
t (g
L'1)
Log
10 Ce
ll C
once
ntra
tion
(cel
ls m
l"1)
6. Upstream Processing
l optical density unit » 5 x 10* cellsmr'
10*
10"
101 100
r 10e
Log Optical Density (A
100
90
80
70
60
so40
30
20
10
0
c0
°
%
o S
8 °
B ° Parameter Value Error
" °A 6.11696 0.87719 B 2.04056 0.06406
R SO N P
0.97532 4.01479 54 <0.0001
-9 0
- 80
-7 0
-6 0
-5 0
- 4 0
-3 0
- 20
- 10 -0
100100
9 0 -
8 0 -
DCW = (WCW -0.22)/4.017 0 -
ea 6 0 - 60
5 0 - 50
40
<5 30: | 20-
10-0-21971 0.782
0 2 6 8 10 12 14 16 18 20 22 244
Dry Cell W eight (gL‘1)
100
15 20 25 30 35
Optical D ensity (A
45 50 55 60
100
8 0 -
!_iCI 6 0 - 30 OEB0>O
20-
0 2 5 6 7 8 9 101 3 4 11Time (hrs)
Figure 6-1 Results from quadruplicate fermentations of DH1 parental were used to prepare the calibration curves shown. During the runs wet cell weight (WCW), dry cell weight (DCW), optical density and cell concentration measurements were taken. Figure A correlates cell concentration against optical density and establishes that lOD unit ~5xlO*cellmL*1. Figure B correlates dry cell weight against wet cell weight and shows that DCW is roughly Vi of WCW. Figure C attempts to correlate optical density against wet cell weight Figure D plots the WCW and DCW progression of the parental fermentations
Table 6-1 Table summarising the key growth data extracted from quadruplicate 4L pilot-scale fermentations of DH1 Parental at 37°C.
Vessel 1 Vessel 2 Vessel 3 Vessel 4 Average
Specific Growth Rate 0.359 0.408 0.410 0.399 0.394Final WCW (gL *) 87.2 76.1 79.9 79.2 80.6Final DCW (gL !) 17.6 20.9 19.3 20.0 19.5Final optical density 40.1 32.4 57.7 48.4 44.7
The results of the fermentations also provide a useful benckmark, representing a negative control against which to compare the other fermentations. Four-litre working volume fermentations were conducted as outlined in 2.7.3. Optical density, wet-cell weight (WCW), dry cell weight were calculated as described in 2.5.1, 2.5.2, 2.5.3. Cell concentration was determined using a method similar to that used for replica plating (2.5.4).
Thomas Burt 277

6. Upstream Processing
Broth was diluted by serial dilution using sterile PBS and the dilutant plated on non-
selective TSA plates which were incubated at 37°C. The resultant colonies were counted
and converted to cellsmL'1
The results of these fermentations are outlined in Figure 6-1 and Table 6-1. The value
recorded for growth rate was 0.39h']. This value is lower than many values previously
placed upon p for plasmid bearing strains shown in 3.2 and 3.4. It is reasoned this is due
to a combination of the fermentations being conducted in the more controlled
environment of a bioreactor, as compared to shake-flasks, and to the use of an adapted
media formulation optimised to minimise p and a different host cell-line. Comparison to
values placed on p recorded in Table 3-4, for the Oxford series propagated in DH1 and
grown on the same media but in shake-flasks, show a high degree of comparability. The
figures recorded are slightly higher (-10%) a fact presumed to be accountable to shake-
flask propagation. The values calculated for specific growth do not compare well to the
same figures for parental fermentations grown in bioreactors on the same media (Table
3-5). However, the other measurables; OD, WCW and DCW do compare favourably. The
data portrayed in (Table 6-1) will be used to benchmark against proceeding runs as a
negative control.
The main point to this exercise was to use the data produced by these fermentations to
construct calibration curves. From Figure 6-1A it can be appreciated that 10D unit was
found to be equivalent to a cell concentration of 5x10⁸ cellsmL'1.
The second calibration curve Figure 6-1B correlates wet cell weight (WCW) against dry
cell weight (DCW). This curve was used since recording DCW progression for each
fermentation would have been laborious and quite variable. However, on many occasions
in the literature plasmid yields are recorded as a proportion of DCW. In order to allow
direct comparison of the figures determined for yield in these studies to those reported in
the literature, this calibration curve allowed conversion.
Thomas Burt 278

6. Upstream Processing
The final calibration curve confirms the accuracy of the optical density assay. Good
linearity exists between OD and WCW until high optical densities are reached. As
reported in 2.5.1 the linear range of the OD assay is 0.1-0.6OD. Consequently, the higher
the broth OD e.g. >45 the more extreme the dilution required (i.e.90-100-fold), the larger
the dilution the greater the likelihood of dilutional errors and liquid handling differences.
However, in the batch fermentations described here the OD did not often exceed 45 so
the accuracy of the measurements was never in doubt, however, this limitation should be
acknowledged if utilising more intensive modes of operation i.e. fed-batch.
6.3 Duplicate 4L fermentations at 37°C
6.3.1 Introduction
Following the successful creation of large constructs using the pGEMl 1 vector and their
successful transformation into E.coli DH1, statistical design studies were performed to
identify optimum cultivation conditions (5.4) with which to produce the large constructs.
The results of those investigations were ambiguous because poor yields were returned.
However, without knowledge of the stability problems it was decided to progress to pilot-
scale (4L) fermentations using the conditions chosen as being the most optimal; 37°C,
lOOpgmL'1 Ampicillin. This section details the results of these duplicate fermentations
and how it came to be realised that the plasmids were being plagued by instability issues.
6.3.2 Results and discussion
The results of the fermentations are detailed in Figure 6-2 and the results summarised in
(Table 6-2). The first noticeable fact are the differences in the growth profiles between
the smaller constructs (pGEMl 1 [3.2kb]/ pGEMl6) and the larger pGEM33 and
pGEM49. The two larger constructs displayed much longer lag-phase periods of about
4.5 hours compared to 3 hours for the smaller constructs. The explanation for this was only realised after appreciation of the stability issues with the larger series. According to
the stability profiles of these larger constructs at 37°C (Figure 5-19) at this stage of the
fermentation train it is predicted that only a small proportion of the cells used to inoculate
the fermenters
Thomas Burt 279

Wet
Cell
Wei
ght
(gL
’)
6. Upstream Processing
100- * pGEM11 [3.2kb]—O— pGEM 16kb
90 - —A— pGEM 33kb▼ pGEM 49kb
■ pGEM11 [3.2kb] —O - pGEM 16kb - A - pGEM 33kb
T pGEM 49kb
100
90
80-70
60 30-50
40
-30
-2 0
-1 0
0 -0
0 1 2 3 4 5 6 7 8 9 10 11 12Time (hrs)
o 2 3 4 5 6 7 8 9 10 11 121
Figure 6-2 Results from duplicate 4L pilot-scale batch fermentations of the large pGEM series of plasmids created by shotgun cloning. Fermentations were conducted at 37°C on complex media supplemented with lOOpgmL'1 Ampicillin. Figure A plots the progression of wet cell weight and B plots OD progression.
Table 6-2 Table summarising the key growth measurables obtained from 4L pilot-scale fermentations of the pGEM series of plasmids at 37°C.
Final WCW (gL *) Final OD (A600) Growth Rate (If1) Growth Rate % of parental rate
pGEMl 1 (3.2kb) 81.4 45.9 0.367 93.1%
pGEM16 (16kb) 85.6 45.9 0.372 94.3%
pGEM33 (33kb) 88.7 38.9 0.35 88.8%
pGEM 49 (49kb) 84.3 40.1 0.351 89.0%
Average 85 42.7 0.36 91.3%
would have been plasmid-bearing. Throughout inoculum preparation the plasmids would have been lost and with them the resistance to ampicillin. Consequently, when the cells were passaged into the fermenter containing fresh selective agent the growth of the vast majority of cells would have been inhibited. As such when it was thought the fermenters were being inoculated to a starting OD of 0.1, in reality the figure would have been lower. The lower value would have represented the small portion of plasmid bearing cells capable of resisting the ampicillin and any cells remaining which were not destroyed by the ampicillin before it was degraded. The lower starting optical density explains the extended lag-phase demonstrated by the most unstable plasmids.
Thomas Burt 280

6. Upstream Processing
Samples extracted from the fermentations were analysed for the presence of plasmid
using HPLC (2.5.5 and 2.5.11). Presence of pGEMl 1 (3.2kb) plasmid was confirmed as
having a specific yield in the range of 90-1 lOpggWCW'1. It was not possible to detect the
presence of any of the larger constructs. For these samples the HPLC results just recorded
the residual gDNA remaining in the preps analysed. In hindsight this occurrence can be
explained but at the time it was a disappointment. The absence of plasmid was due to the
mechanism of action of ampicillin. As explained in 5.6.1, resistance to this selective
agent is conferred by the expression of an enzyme (fi-lactamase) capable of degrading the
molecule to an inactive form (Georgiou, 1988). The enzyme then persists in the culture
broth. Consequently, when the small volume of inoculum (~30mL) from the shake-flasks
was added to the fresh media in the bioreactor there already existed a significant level of
fi-lactamase activity. Estimates place the activity of the enzyme at such a magnitude that
all the selective agent in the bioreactors could have been degraded in less than 10s
(5.6.1). With such rapid degradation of the selective agent the pressure for the bacterial
cell to maintain and propagate these plasmids was lost. Due to the large size the
metabolic burden meant propagation of these constructs was unfavourable and as such the plasmid-bearing population was soon outgrown by the plasmid-free population. This
did not occur with the smaller pGEMl 1 construct since its propagation was perhaps not
as disadvantageous but certainly the probability of loss was much less. More information
concerning the stability issues faced by these plasmids is outlined in 5.6.
6.3.3 Conclusions
The results of these fermentations were disappointing. The likelihood of instability issues
was thought likely after the results from the optimisation experiments failed to
demonstrate significant plasmid yields. It was hoped that the situation may improve in
the more controlled environment of the bioreactors. This was not found to be the case.
In light of these results, investigations were performed to confirm that plasmid instability
was the cause of the absence of plasmid DNA. The results of these runs were outlined in
5.6 confirming the hypothesis. With limited options available the few methods which
could be employed to discourage the loss of plasmids were attempted. These included the
use of the more degradation resistant antibiotic (carbenicillin), a different host-strain
(DHlOp) and reduced temperature of incubation (25°C). It was decided that the most
applicable method was to reduce the temperature of cultivation in order to reduce the
growth differential between plasmid-free and plasmid bearing cells. Additionally, more
Thomas Burt 281

6. Upstream Processing
stable clones were selected. After conducting these optimisation studies, repeat pilot-
scale 25°C fermentations were conducted as described in the next section.
Thomas Burt 282

6. Upstream Processing
6.4 Fermentations at 25°C
6.4.1 Introduction
Duplicate pilot-scale 4L working volume fermentations of each of the constructs were
conducted in an identical fashion to as outlined in 2.7.3, except that the cultivation
temperature was adjusted to 25 °C, including for the inoculum development steps prior to
the fermentations. As described in the stability studies the aim was to reduce the specific growth rate of the culture with the hope that plasmid copy number would be up-regulated
and that the growth rate differential between the plasmid-free and plasmid-bearing cells
would be minimised. It was outlined in 3.3 how judicious control of the culture growth rate can have a positive impact on plasmid specific yield and this was demonstrated for
fermentations of relaxed plasmids as shown in Figure 3-10 (Vasuki, 1989). In addition,
there are reports that reducing growth rate increases plasmid stability by reducing the
differential between plasmid-free and plasmid-bearing cells (O'Kennedy et a l , 1995).
It was appreciated that reducing the incubation temperature by such a degree would
massively extend the periods required for growth. To assess the extent of this change
preliminary fermentations were conducted and it was discovered that fermentations at
this temperature required -20-24 hours from inoculation to harvest* (with the additional
24 hours required to prepare sufficient inoculum by shake-flask fermentation). At 37°C
batch fermentations using the conditions outlined in 2.7.3 could be completed within 12 hours. Due to the extended operation monitoring the entire fermentation in terms of
recording WCW and OD would not be possible. To overcome this the reactors were
inoculated in the evening and the initial lag-phase period of growth (0.1—>~60D) was left
to proceed unmonitored. As a result no growth or yield data was obtained for the first 8- 9hrs of growth. However, it was felt that this was not a major limitation since not much
could be gleaned from this initial period.
* Fermentations were harvested, as before, following the spike in DOT indicative o f the culture being 0 2 limited and repiring anaerobically. Often accompanied by a decrease in pH as the catabolites o f anaerobic respiration are released into the media. (Figure 9-14 to Figure 9-25)
Thomas Burt 283

6. Upstream Processing
DH1 [PARENTAL] DH1 [p5176]
DH1 [pGEM 16]DH1 [pGEM 11]
Time (hrs)Time (hrs)
DH1 [pGEM 49]DH1 [pGEM 33]
Time (hrs)Time (hrs)
Wet cell weight Dry cell weight Optical density
Figure 6-3 Chart displaying the mean progression of optical density, wet and dry cell weight through the course of 4L duplicate fermentations on GSK proprietary media at 25°C [lOOpgmL1 ampicillin]. [A; DH1 parental / B; DH1 p5176 / C; pGEM 3.2kb / D; DH1 pGEM 16kb / E; pGEM 33kb / F; pGEM 49kb]
Thomas Burt 284

6. Upstream Processing
Table 6-3 Table summarising the average key measurables extracted from 25°C 4L pilot-scale fermentations of E.coli propagating the large plasmid series. Where percentages are Shown they are relative to the parental value_________________ ________________________________________________________
Strain
Parameter
DH1 parental P5176
n i6 k b i
pG EM l 1
(3.2klb
pGEM16
(16kb)
pGEM33
(33kb)
pGEM49
(49kbl
Final Growth Rate ( h 1) 0.266 ±0.019 (100%)
0.215 ±0.002 (-18.8%)
0.220 ± 0.006 (-17.3%)
0.215 ±0.004 (-19.0%)
0.25 ±0.008 (-5.8%)
0.225 ±0.03 (-15.3%)
Final WCW (g L 1)91.88 ±2.16
(100%)90.55 ± 1.48
(-1.5%)87.33 ± 0.74
(-5.0%)91.85 ±0.85
(0.0%)96.78 ±3.57
(5.3%)99.1 ±4.88
(7.9%)
Final DCW (g L 1) 22.10 ±0.54 22.56 ± 0.41 21.55 ±0.43 22.85 ±0.212 24.08 ± 0.89 24.65 ± 1.22
Final OD 38.15 ±4.17 38.25 ±0.35 45.45 ±2.47 40.55 ±1.48 40.2 ±0.14 40.5 ±0.71
Max OUR (mmolsL'1h'))17.89 ± 0.19
(100%)14.98 ±0.088
(-16.3%)16.94 ±0.29
(-5.3%)14.46 ±0.97
(-19.2%)15.51 ±0.88
(-13.3%)11.37 ±0.61
(-36.4%)
Total O2 Demand (mmols) 219.3 ± 8.84 187.85 ±2 .6 194.34 ±6.14 146.98 ±0.14 205.54 ± 0.544 169.74 ±12.6
Final Plasmid Stability N/A 1.0 1.0 1.0 0.22 ± 0.042 0.12 ±0.017
Excepting the changes in the inoculation regime the fermentations and analytical procedures were carried out in an identical fashion to before. In addition to the traditional measurements of OD, WCW and 50D yield samples, the fermentations were sampled at regular intervals to record the proportion of plasmid-bearing cells by replica plating (2 .6 .8).
6.4.2 Results and Discussion
The average results of the duplicate fermentations are outlined in Figure 6-3 and key
measurables are summarised in (Table 6-3). The complete profiles of the individual
fermentations are displayed in Figure 9-14 to Figure 9-25. These graphs display the plots of the online logged data; pH, temperature, DOT, agitation rate and the associated actions on the loops. Whilst supplemental, this data can be used to give a more in-depth appreciation of the fermentations and certain items will be referred to.
The first observation to make from this series of fermentations is the reduction in growth
rate as compared to those recorded at 37°C.
Thomas Burt 285

6. Upstream Processing
For example, the parental negative control fermentations recorded an average of growth
rate of 0.394h'] at 37°C (Table 6-1) whilst at 25°C the same figure had dropped to
0.266h'1 representing a 33% decrease. Similar decreases were recorded for the other
fermentations. The aim of cultivation at 25°C was to reduce the growth rate, so in that
sense the fermentations had been successful.
More information about the growth rates is provided by the relative performance of the
plasmid bearing strains to the parental negative control. From Table 6-3 it can
appreciated that culture growth rate did decrease for strains bearing plasmids. However,
there did not appear to be any logical trend in the reported growth reductions, with all
(except pGEM 33) recording ~15-20% relative reductions. It is postulated that a more
linear decrease would have been witnessed had each of the constructs been propagated at
the same copy number, since as plasmid size increased the amount of extrachromosomal
DNA propagated by the strains would have increased proportionately and so placed more
pressure on the host cell replication. As it was, stability issues meant that direct
comparison on this front was not possible.
The table also details the mean maximum oxygen uptake rates and the total oxygen
demand required over the course of the fermentations. Maximum oxygen uptake rates
(OUR) were obtained from mass spectroscopy of the fermentation exit gas plotted in
Figure 9-14 to Figure 9-25 and calculated using the method described in (2.7.6). Values
for total oxygen demand were obtained by integration of the curves describing oxygen uptake rate. The figures for plasmid-bearing strains all describe a similar relative
decrease in the relative oxygen uptake rates and total oxygen demands. This suggests that
there is no significant relationship between increasing construct size and increased
oxygen requirement. This is in agreement with other authors who described no significant impact on OUR by increasing plasmid size (Kay et al., 2003). The fact that all the
constructs reported a decrease in relative oxygen uptake rate/demand may also be
significant. It suggests that the demand for oxygen is more related to the culture growth
rate than the actual plasmid size, consequently, the parental strain records the highest
value.
The fermentations all recorded similar biomass yields in the order of 40-45OD and WCW
in the order of SS-OOgL'1.
Thomas Burt 286

6. Upstream Processing
More information on the fermentations is provided by the graphs plotting the online data
which was continually logged (Figure 9-14 to Figure 9-25). Of interest are the plots of
pH and temperature. Although these variables were maintained constant by the action of
the control, the % action plots are interesting. The % action on the heating loop
demonstrated a smooth decrease with time displaying the decreased action (heating)
required on the temperature loop with time. It is believed that this mirrors very precisely
the growth of the cultures for as the cell density increased the heat produced by the
culture increases proportionately and the control moves from needing gentle heating to an
increasing level of cooling. Similarly for pH, as the fermentation progressed the action on
the pH loop increased with more base required to neutralise the acidic metabolites created by respiration.
6.4.3 Stability profiles
Having identified plasmid instability as the cause of the absence of plasmid when
fermentations were conducted at 37°C, it was felt essential to monitor plasmid stability
during this series of fermentations. The results are detailed in Figure 6-4. Figure B
details the proportion of plasmid-bearing cells during the fermentations. From the profiles
it can be appreciated that pGEMl 1, as has always been the case, was maintained at 100%
stability. The reduction in cultivation temperature also corrected the instability
demonstrated by the 16kb plasmid at 37°C. Unfortunately, the temperature reduction was
not sufficient to eliminate the problems with instability found in the larger two constructs
of 33kb and 49kb.
Considering pGEM 33kb first. The profile demonstrates the increase in plasmid-bearing
cells following inoculation. This has been seen before (Figure 5-21) and is due to most
plasmid-free cells being destroyed upon passage of the inoculum to broth containing
fresh selective agent and so increasing the relative proportion of plasmid-bearing cells.
However, after this initial peak the stability decreased over the course of the
fermentation, but an equilibrium was reached toward the end of the fermentation. It is
also proposed that there was an increase (at least a stabilisation) of plasmid stability in
the last couple of hours of the fermentation.
Thomas Burt 287

6. Upstream Processing
- 1.0
-0 .9
- 0.8
-0 .7
- 0.6
-0 .5
-0 .4
-0 .3
- 0.2
- 0.1
- 0.00 2 8 10 12 14 16 18 20 22
Time (hrs)
Figure 6-4 Figures profiling the plasmid stability during the course of the 25°C fermentations. Figure B plots the mean proportion of plasmid bearing cells recorded during the duplicate fermentations for each of the plasmid bearing strains. pGEM 11 (3.2kb) recorded 100% stability throughout the fermentation. The graph also shows that the reduced temperature did lead to stabilisation of the pGEM16 construct as predicted by stability studies. Unfortunately, the reduced temperature was not sufficient to correct the stability profiles of the larger constructs. It can be seen that pGEM 33 showed a dramatic increase in the proportion of plasmid bearing cells shortly following inoculation. This is simply due to the ampicillin causing a reduction in the number of plasmid-free cells. The stability does decrease following this event. For the pGEM49 constructs no dramatic rise was witnessed possibly suggesting even more rapid loss of plasmid in that the majority of plasmid-free cells were inhibited following inoculation but that the loss of plasmid was so rapid that this was not recorded. It is expected that at the point of the first sample (T+l) the ampicillin had largely been degraded. However, both strains did record presence of plasmid-bearing cells through the course of the fermentation albeit -10-20% but that suggests an equilibrium was reached.Figure A plots the mean OUR profiles of fermentations 1-10 compared against the same for the pGEM 49kb plasmids. The delay hints at a phenomenon previously witnessed in that the poor stability profile lead to an extension of the lag-phase and hence an extension of the fermentation.
This would be expected as toward the end of the fermentation a combination of the
competition for nutrients and the increasing presence of toxins leads to the wholly
expected drop-off in culture growth rate. Again, any reduction in growth rate is
advantageous as it leads to a reduction in the relative growth rates between plasmid-free
and plasmid-bearing cells. Additionally, as is outlined in the next section this decrease in
growth also leads to an up-regulation o f plasmid copy number. By harvest, the proportion
of cells bearing the 33kb plasmid was found to be - 2 2 % .
The profile of the 49kb plasmid differs to that o f the 33kb construct. It did not
demonstrate the same increase one hour following inoculation. This could be due to the
increased instability shown by this construct. However, the culture did seem to reach
equilibrium again as the fermentation progressed and again showed an increase/
stabilisation toward the end o f its growth. At harvest the proportion of cells bearing the
49kb was determined to be -12% . The fact that both cultures reached a detectable
equilibrium, demonstrates the effectiveness o f reducing the growth rate and hence the
Mean OUR [Perm 1-10) Mean OUR [Fenm 11/12] (pGEM49kb) -12
- 1 0
01Ea>&crVaS.3c0iIO
Time (hrs)
u> 0 .9 - ai!>0-8:re 0 .7 - a>
S 06 -| 05: B°- .2 0 .3 -
|° . 2 : £ 0.1 -
0.0
BpGEM 3.2kb p5176(116kb) pGEM 33kb pGEM 49kt> pGEM 16kb
Thomas Burt 288

6. Upstream Processing
growth differential that persists between plasmid-free and plasmid-bearing cells. At 37°C
the equilibrium figure of plasmid-bearing to plasmid-free cells would have been so low
as to be indistinguishable from zero. Hypothetically, if the growth rate were to be reduced
further it is expected that the proportion of cells at which equilibrium is reached would be
higher (Imanaka and Aiba, 1981) (Refer to Equation 5-4). It will be suggested later that
this could be a viable strategy to increase plasmid stability and hence yields.
Figure 6-4A clearly demonstrates the problematic effect of inoculating using a seed
culture with low plasmid stability. The plot shows the mean OUR profiles detected for
fermentations 1-10 against the mean recorded for pGEM49kb. Despite inoculation to the
same final OD of 0.1 it is clear that the lag-phase of the 49kb is extended by the inhibitory effect of the selective agent on the plasmid-free cells.
6.4.4 Conclusions
This series of fermentations has demonstrated that cultivation of strains bearing large
constructs at the reduced temperature of 25°C is feasible. The results suggested that
growth rate was reduced by -30% relative to 37°C incubation. Also, it was suggested that
increasing construct size did reduce growth rate but not in any linear fashion. It was also
shown that oxygen uptake rate was not related to the size of the construct. The
conclusions being drawn cannot be relied upon to be definitive since despite the reduced
temperature, the stability of the larger 33kb and 49kb plasmids remained troublesome.
Despite this, significant improvements were made in improving the overall stability of
the plasmids in that at least plasmid-bearing cells could be detected at the harvest of the
fermentation. A slight increase in plasmid stability was recorded toward the end of the
fermentations, which provides further evidence of the advantages offered by operating at
a reduced growth rate.
Thomas Burt 289

6. Upstream Processing
6.5 Analysis into the plasmid yields of the duplicate 25°C fermentations
6.5.1 Introduction
Results from the fermentation growth analysis suggested that the reduced temperature
fermentations had been a success in that the aim of lowering specific growth rate had
been achieved. Additionally, the stability profiles suggested that a proportion of cells
propagating the larger 33kb and 49kb constructs were plasmid-bearing at harvest.
Therefore, unlike the 37°C runs, plasmid was expected from these fermentations. As with
all other fermentations, multiple 50D volume-equivalent samples were taken throughout
the duplicate fermentations and prepared as described in 2.7.5. To record specific yield progression the 50D cell pellets were lysed in a typical fashion and the clarified lysate
concentrated by precipitation using 0.7 volumes of IPA (2.5.5). The plasmid pellet was
then resuspended in lOOpL of TE buffer and the concentration of the solution quantified by HPLC (2.5.11).
Knowing the concentration of the plasmid solution allowed simple calculation of the
plasmid mass. Since both the volume of broth processed to obtain a 50D sample and the
wet cell weight at the time of sampling were known, calculation of the mass of the cell
pellet was a simple manipulation. From both the mass of plasmid and cell pellet it was
extracted from, the plasmid specific yield could be found simply by division of one by
the other. Duplicate 50D samples were processed for each time point of each
fermentation. (For more information concerning the calculation of specific yield refer to
Figure 9-29). From plasmid specific yields simple manipulations could be used to
calculate plasmid volumetric yield and plasmid copy number (Equation 2-2 and Equation
2-3). For each fermentation a sample of the inoculum was processed as described above
to calculate the specific yield of the culture from time 0. This value was the same for both
duplicates as both vessels were seeded from the same inoculum. At the end of the
fermentation the cell paste was recovered by batch centrifugation and frozen at -80°C for
later use in DSP studies.
Thomas Burt 290

6. Upstream Processing
50
DH1 [PARENTAL]45
40
35 -3 5
30
25 -2 5
20
15 -1 5
10
5 -5Fermentation 1 Fermentation 20 0 8 10 12 14 16 18 20 22
100
p5176 (116kb)
-70 <7 0 -
50- -50 1
40-
1 0 -Fermentation 3 Fermentation 4
0 8 10 12 1614 18 20 22
140- pGEM11 (3.2kb)§0§a><zQClCT>321 >- ■g EtoBQ.o
- 120
Fermentation 6
10 12 18 20 220 8 1614
500
450
400.
350
300
250
200
150
100
50
0
pGEM16 (16kb)
- Fermentation 7- Fermentation 8
-400 § o>- 350 ^ Q
250 •§ >-200 1
c7) TO150 q:
00 oQ.C/3
\-50
010 12 14 16 18 20 22
300
275
o 250£O) 225<zn 200Q.CT> 175
■00) 150>■O 125F00 100Q_o 75
n 50C/3
25
0
-/I—■—i—■—i—'—i—■—i—»—i—1—i—1—r
- Fermentation 9- F e rm e n ta ty 10
pGEM33 (33kb)
j- 300
-275
250 -r
225-
-250200-
-225
-200175-
-175 150-
- 150 125-
-125 100-
- 1007 5 -
-7 5
-5 050 -
-25 2 5 -
-0 0 -10 12 14
Time (hrs)
16 18 20 22
pGEM49 (49kb) O(-200 ^
- 150
125 2
100 P
Fermentation 11 Fermentapon 12
10 12 14 16 18 20 22
Time (hrs)
Figure 6-5 Plots displaying the specific yield progression of the fermentations carried out at 25°C. It should be appreciated that whilst the majority of the gDNA contamination was removed when the 50D sample pellets were lysed and purified by IPA some remained in the samples for analysis by HPLC. The overwhelming majority of gDNA remaining was sufficiently small to avoid co-elution with the plasmid DNA, however some large fragments did persist. The full background into the HPLC assay is outlined in (REF). When analysing the plasmid specific yield curves it must understood that the small amount of contamination shown in Figure A will contribute to the above profiles. In the majority of cases this is not that important but it is for lower copy constructs i.e. (p5176).
Thomas Burt 291

6. Upstream Processing
6.5.2 Analysis o f the specific yield profiles
Figure 6-5 plots the specific yield profiles whilst (Table 6-4) summarises the key data
concerning harvest specific yields. For reference, the plots o f the volumetric yield can be
found in Figure 9-13.
Table 6-4 Table sum marising the key yield data recorded from the analysis of samples extracted from the 25°C fermentations. Sam ples were purified by IPA on clarified lysates and the streams quantified by HPLC.
Strain
Parameter
DH1 parental P5176
(1 16kb)
p G E M ll
(3.2k)b
pGEM 16
(16kb)
pGEM 33
(33kb)
pGEM 49
(49 kb)
Final Specific Yield
(usdDNA/ eWCW)12.5111.29 4 8 .1312 .53 77.53 15.79 289.4819.33 190.07136.19 150.06122.01
Inoculum Spec. Yield
(pgpDNA/gW CW )9 .6 5 1 1.51 32 .8 1 3 .1 119.414.4 437.5 138.8 261 .416 .2 204.1 1 11.7
Final Spec. Yield
(pgpD N A /gD C W )50.19 193.01 310.89 1160.83 762.2 601.74
Final Spec. Yield from
Maxi-preps(pg/gWCW)7.11 1 2 .06 5.7710.08 86.5818 .78 272.021 13.94 144.881 1.06 64.0817.35
Final Volumetric Yield
(me pDNA L'1)1 .1510.09 4 .3 6 1 0 .3 6 .7710 .45 26 .591 0.61 18.331 2.82 14.8211.45
Final Copy Number
(copies/cell)N /A 3.59 270.1 149.6 50.4 27.29
Specific Yield assuming
100% stability (WCW)N/A N/A N/A" N/A 863.9 682.1
Copy Number assuming
100% stabilityN/A N /A N/A N/A 229.4 227.4
Considering the plots o f specific yield first. From Figure 6-5A it can be seen that
although there remained some degree o f gDNA contamination with the HPLC assay, it
had far less of a corrupting effect on the plasmid signal than with PicoGreen. Also, it was
directly quantifiable. From the plot it can be seen that residual, contaminating gDNA
eluting from the HPLC at a comparable time to plasmids represented ~10-15figgWCW~’
of the specific yields. This level o f background contamination should be kept in mind
when analysing the other profiles. More detail about the residual genomic DNA data is
given later (6.5.4) where it is demonstrated the effective clearance achieved by HPLC.
(Also refer to Figure 4-22).
Turning attention to the specific yield plot o f the BAC p5176 (1 16kb). From the graph
the increase in specific yield can be seen to coincide with the period of maximum growth.
This has been reported previously (Figure 3-5) and is because the replication of this BAC
is maintained in-line with host genome replication. As such, it is a growth-linked product,
such that during periods o f high growth there are more copies in existence. When
Thomas Burt 292

6. Upstream Processing
analysing Figure 6-5B it should be appreciated that its high-point, in mid-point of the
exponential phase, is also when the genomic DNA contamination will be at the greatest
(Figure 6-7). A point worth noting concerns the inoculum specific yield. In contrast to
the other strains it can be seen that the specific yield of the inoculum is not significantly
higher than the specific yields reported throughout the course of the fermentations. Again
this is because this plasmid is growth-linked, which is in direct contrast to the other
constructs where higher yields are associated with periods of slower growth. From Figure
6-5 the final specific yield of this construct was placed at -SOpggWCW*1, a value
consistently reported throughout this project due to the very controlled nature of its
replication. However, a fraction of the specific yield can be attributed to gDNA contamination (-25%) which would bring the actual figure down. This would also mean
that the specific yield reported in the table would be more like 2.5 copies per cell, more in
line with predicted values (Frame and Bishop, 1971). As outlined several times
previously, improvement on this yield is impossible by manipulation of environmental
parameters due to the nature of the plasmid’s replication.
Considering the 3.2kb plasmid (Figure C), the yield profile shows a gradual increase in
specific yield over the course of the fermentation from -60 to SOpggWCW'1. However,
overall the yields of this construct were disappointing. In the product information the
copy number of this plasmid was reported to be between 400-600 copies per cell. Such a
copy number would only be recorded if the specific yield was double those reported at
harvest in these fermentations (Promega, 2004). It is assumed that the figure for 400-600
may have been reported following a period of slow growth. For example, consider the value for the specific yield for the inoculum (-^OpggWCW1). The increased yield is a
result of period of sustained low-growth, since the culture used for inoculation had been
in the stationary phase of growth for some time. As outlined before slow growth is very
beneficial to plasmid copy number. It will be discussed later whether the fermentations
were harvested too early when on fact the cultures should have been cultured past the
DOT spike.
The pGEM16kb showed a similar increase in specific yield over the course of the
fermentation to as witnessed before with another relaxed plasmid model; pSVp (Figure
4-12). Once again the cultures did demonstrate a steep increase in the yield toward the
end of the fermentations. This increase, toward the end of the fermentation is well
documented and the reason is as discussed earlier (Prather et ai, 2003; Reinikainen et al.,
Thomas Burt 293

6. Upstream Processing
1989). Once more it must be suggested that the fermentation was harvested too early, as
judging from the inoculum results it could be predicted that the increase in plasmid
specific yield could have continued and taken the specific yield to ~450pggWCW‘1. The
harvest specific yield was found to average ~300pggWCW'1 meaning an extra 50%
increase in yield could have been attained. The increase in harvest yield relative to
pGEMl 1 is wholly attributable to the extra 13kb of DNA being propagated per plasmid.
However, as can be seen from the table, the predicted copy number actually fell from 270
to 150 upon the insertion of the 13kb DNA fragment into pGEMl 1 to create pGEMl6.
This is to be expected and is reported that copy number is related to plasmid size (Sambrook et al, 1989; Qiagen, 2005). Overall the yields of this plasmid are poor being
at a similar level to that of pSVp (6.9kb) a plasmid Vi its size (Figure 4-12). The reason
for the low yields are due to the lower copy number. It had been expected that copy
number may have decreased upon insertion of large fragments but that it was hoped since the copy number of the original vector was 400-600 meant that high copy numbers would
still be obtained. However, it has to be stated that compared to the 50pggWCW_1 harvest
yield of p5176, yields of 300pggWCW'1 (with the potential for 450pggWCW'1) is an
improvement.
The specific yield profiles of the two larger pGEM constructs (33kb and 49kb) do show a
higher degree of variation between vessels. A rise of specific yield was recorded over the
course of the fermentations with yield increasing from -75 to 200pggWCW'1. Again, the
increase toward the end of the fermentation was more pronounced. It is suggested that the increase in specific yields toward the end of the fermentations for both 33kb and 49kb is
more dramatic than for the other pGEM models. This is believed to be due to the slow
down on growth recorded during these periods as impacting positively on both plasmid
copy number (copy number is inversely related to specific growth (Vasuki, 1989)) and
plasmid stability (stability is inversely related to specific growth (Imanaka and Aiba,
1981)). As a result for one vessel culturing pGEM33 the specific yield recorded an
increase from 125pggWCW_1 to 225pggWCW_1 over the last two hours of cultivation.
From Table 6-4 it can be seen that the average harvest value for this construct was a
specific yield of ^OpggWCW’1 and so a copy number of -50 per cell. This yield is
recorded with only -20% of the cells bearing plasmid (Table 6-3). If the diluting effect
of the non-plasmid bearing cells is ignored the copy number of the plasmid-bearing cells
in the vessel is closer -230 copies per cell. This can only be an estimate since it relies on
Thomas Burt 294

6. Upstream Processing
the value placed on the culture stability being accurate. However, it means that the cells
actually bearing plasmid are propagating a massive ~7,500kb of extrachromosomal DNA
(~1.7 genome equivalents). This analysis is essential to the conclusions of this project for
it means that if the problems with stability were overcome, then large yields from fermentations of large plasmids could be expected.
Finally considering the largest pGEM construct pGEM 49kb. Once more the extreme
increase in yield toward the end of the fementation can be seen. The harvest specific
yields were placed at -ISOpggWCW'1, meaning the potential existed for a maximum
specific yield of ~700pggWCW'1 should 100% stability be attained. The result is that each cell would be propagating 11,000kb of plasmid DNA
6.5.3 Specific Yields determined by HPLC on Qiagen maxi-prepped harvest paste
Following the 25°C fermentations the samples taken during the fementation were
analysed for the presence of plasmid and the specific yields reported as detailed in the
preceeding section. To allow comparision it was decided to determine the specific yield
of the constructs by Qiagen max-prep studies. As such, duplicate 2.0g masses of frozen
cell paste were processed by this technique* (2.5.8.1) and the eluents quantified by
HPLC. The results are detailed in Figure 6-6.
When the calculated specific yields from the Qiagen studies were compared to those
recorded by HPLC on harvest IPA samples, the results were mixed. From Figure 6-6A it
can be seen that the values for specific yield align vey well when comparing the smaller
pGEM 3kb arid 16kb constructs but that the yields reported for the larger 33kb, 49kb and
116kb were increasingly reduced as compared to harvest IPA values.
* It was decided to perform the extractions using standard Qiagen maxi-preps. It was felt that the additional time and variation involved in pursuing Qiagen Large construct kit purification was not justified. In the technique an exonuclease is employed to degrade any gDNA. It was the technique used to generate the material used for HPLC calibration.
Thomas Burt 295

6. Upstream Processing
350 ...................I DH1 PARENTAL
1 p5176 (116kb) 300 J pGEM11 (3.2kb)
pGEM16 (16kb)- pGEM33 (33kb)
2S0 I pGEM49 (49kb)
[FERMS 1 & 2][FERMS 3 & 4)[FERMS 5 * 61 - 300[FERMS 7 & 8][FERMS 9 S 10][FERMS 11 & 12)
ISO
100
1 2 3 4I HPLC/ Qiagen Maxi-prep I HPLC/ IPA precipitated I HPLC/ Qiagen Maxi-prep eluted at 60“C
5 6 7 8 9 10Ferm entation Num ber
120 120
100 - 100
80-
£■<LO40- -40
2 0 - 20
400 20 60 80 100 120
Plasmid size (kb)
Figure 6-6 Figures plotting the results of investigations into the specific yields of the plasmid as determined by HPLC on harvest material purified using Qiagen Maxi-prep columns. Figure A compares the values for specific yields obtained from the harvest samples taken at the end of the fermentations and determined by HPLC on IPA precipitated clarified lysates to those produced by Qiagen maxi-prep. Two different protocols were employed for the maxi-prep with duplicates run for both. In one the plasmid was eluted using room-temperature buffer and for the other the plasmid was eluted from the columns using buffer at 60°C. Figure B plots the specific yield recorded for Qiagen maxi-prep (60°C elution) as a percentage of that recorded for the harvest specific yields determined by HPLC on IPA precipitated lysates.
A similar issue was encountered in the early stages of this project (3.4.3) when investigating the yields of p5176 from fermentation cell paste. It was suspected that the larger constructs were not eluting effectively from the anion-exchange resin of the Qiagen Tip-500 columns. To investigate this further, repeat Qiagen maxi-preps were conducted on the same batches of cell paste but the elution buffer temperature was heated to 60°C prior to use. This technique is suggested by the manufacturers when dealing with
larger constructs (Qiagen, 2005). Referring back to Figure 6-6A it can be appreciated
that increasing the elution buffer temperature did have a positive effect on the resultant
specific yields. However, as demonstrated by Figure 6-6B the yields produced by
increased temperature elution were still below those identified by HPLC, directly on IPA precipitated harvest samples, for the larger constructs. The plot of the recovered yields as a percentage of IPA harvest yields clearly shows a decrease in recovery with increasing
plasmid size.
There could be several reasons for this. Due to the increasing sizes of the plasmids each plasmid molecule would bind the matrix at more points and so increase the strength of the overall interaction. Due to the operation of the Qiagen protocol there is no increase in
salt gradient, rather the level of salt in the the buffer is fixed at 1.25M
Thomas Burt 296

6. Upstream Processing
NaCl (2.4.1.3). It is postulated that at this level an increasingly reduced proportion of the
larger plasmids is eluted. Circumstantial evidence for this is provided by HPLC elution
profiles of these constructs (Figure 4-19). From these figures it can be seen that the
resolution of the curves decreases with increasing plasmid size. Whereas the 16kb
construct displayed at very uniform elution profile at ~7minutes, the peak for the 116kb
plasmid was much broader and spread over the 6.0-8.0 minute period. In conjunction
with the increased strength of interaction predicted by the larger constructs to the matrix,
it is felt that the elution of the larger constructs will be hampered by the number of
conformations larger molecules can exist in, and as such the broader range of charge densities displayed by a population of larger plasmids.
Despite the high temperature elution not all of the specific yield was accounted for,
suggesting that this was not sufficient to achieve total elution of the larger molecules.
Although it is incorrect to state defintively (since no experiements were conducted
employing increasing salt gradients), this fact leads to the conclusion that maybe other
factors, other than the strength of the interaction, may be responsible. Increasing the size of the plasmid molecules may mean that they are incapable of penetrating the column
effectively. Such an issue was at the heart of a problem with another analytical coumn
step employed in this project. As will be outlined later in section 7.4 it was not possible
to balance plasmid over the CaCh step of the downstream process, because attempts to desalt larger plasmid samples for analysis using gel-base (SEC) PD-10 coulumns resulted
in limited plasmid being eluted. It is believed that the larger plasmids were incapable of penetrating the gel matrix. Whilst no direct comparison can be made between the AEX
resin and the gel-based columns it remains a possibility.
If studies confirm that larger plasmids are incapable of effective prentration in to Qiagen
AEX resins then it does not bode well for AEX column stages in this process, where
resins of comparable dimensions are employed. It was found that the plasmids did
penetrate the HPLC columns effectively but that could be by virtue of the large pressures
employed.
Thomas Burt 297

6. Upstream Processing
6.5.4 Investigations into the levels o f contaminating gDNA
The main flaw determined in the PicoGreen assay, as applied to plasmid samples of low
concentration, was the large contributory effect that contaminating gDNA had on the
signals used for plasmid DNA quantification. From this realisation every effort has been
made to confirm that the signals used for plasmid quantification were produced from the
plasmid and not gDNA. For this reason HPLC was employed as studies confirmed that
the signal it produced was not affected strongly by residual gDNA contamination
(4.5.2.1). However, the studies did demonstrate some carryover of residual gDNA,
assumed to be large fragments. In this section the contamination will be investigated
further.
Figure 6-7 plots the results o f gDNA quantification o f samples taken from the DH1
Parental fermentations. In the yield profiles shown in Figure 6-5 the figures for gDNA
contamination are those derived from HPLC analysis of IPA precipitated clarified lysates,
since this was the method used to quantify the plasmid-containing samples. The intent of
these studies was to compare the values o f gDNA contamination produced by this
measure against other methods. It was realised that during DSP studies plasmid was to be
balanced by HPLC and the hope was to do so directly on samples.
160 900-xJS 800-° UJ S-
S 3 700-
24-Ui%5i f a .Q 5* 20 -UJ o>
700
u.32 a- 2 500
Di S’ 12- 300■J2
mO2Oo 1 0 -
^ U) >ClI 100Hm
18 200 8 10 12 1614 120 8 10 14 16 18 20D— HPLC on IPA clarified lysate (Left-hand axis) j j me (hrs) qPCR on clarified lysate Time (hrs)
— HPLC on Clarified lysate (Right-hand axis)
Figure 6-7 Studies conducted to assess the progression of gDNA contamination in fermentation samples used for analysis. The studies were performed to place a definitive value on the level of background detectable gDNA in the samples used for plasmid analysis during the fermentations. Secondly it was decided to perform preliminary runs to assess whether gDNA in process streams could be reliably monitored using HPLC or whether qPCR was needed to track the progression of this contaminant in downstream studies. Both figures pit the specific yield of gDNA from samples taken during a DH1 Parental fermentation but quantified by three different methods. HPLC on IPA clarified lysates (as was used for the plasmid samples), HPLC directly on clarified lysate samples and qPCR directly on clarified lysate
Thomas Burt 298

6. Upstream Processing
From Figure 6-7 A it can be seen that gDNA quantification on IPA precipitated samples
produced the lowest values for contamination at harvest, -BpggWCW'1, in-line with the
values reported alongside the plasmid yield curves. This value is much lower than for the
direct clarified lysate where values placed upon gDNA contamination at harvest were
bOfiggWCW’1 and demonstrates the removal of gDNA achieved by IPA precipitation. It is belived that the technique is capable of removing much of the small molecular weigtht gDNA contamination since it does not precipitate with the larger (plasmid) species.
The gDNA value of bOpggWCW^when analysing clarified lysate samples directly meant
that a great deal of gDNA contamination would be present if clarified lysate samples taken during the DSP runs were run directly. As such it would be hard to trust HPLC
results conducted in clarified lysate without some accommodation being made for this
contamination. Again this is due to the relative plasmid concentrations. For high-copy (therefore high-concentration) plasmids, gDNA contamination of -bOpggWCW'1 could
be ignored if the plasmid existed at -SOOpggWCW'1, however, with lower-copy plasmids
doing so would be inaccurate. Therefore, the HPLC assay for the plasmid quantification
from DSP clarified lysate had to be adjusted. As described in 4.5.2.2 for the analysis of
plasmid quantification during clarified lysate a separate HPLC standard curve was
developed. The standard curve was prepared by spiking blank, parental clarified lysate
with known masses of plasmid. As such, when using the curve to quantify plasmid in
clarified lysate samples the presence of gDNA would be “calibrated out”. This could only
be performed for DSP runs as the amount of gDNA present would be fixed.
Another point of these investigations was to investigate whether gDNA could be
monitored through the process by HPLC analysis, or whether qPCR needed to be used.
Comparing the yield curves for gDNA progression determined by HPLC to those
produced by qPCR answers the question.The values placed upon harvest specific yield of genomic DNA was determined to be ~280pggWCW'1some -5-fold higher than the same
value placed upon the figure by HPLC of clarified lysate. Ultimately, it is believed that
HPLC is unable to resolve the small genomic fragments which form the bulk of the
gDNA contamination, only the larger species are retained detected by the column. This
means that HPLC could not effectively be used to monitor gDNA progression through
the DSP process and that qPCR should be used.
A final point to be taken from all of the curves shown in Figure 6-7 concerns their
profile. An interesting insight can be gleaned into the progression of genomic DNA
Thomas Burt 299

6. Upstream Processing
throughout the course of a bacterial fermentation. As described before the p5176 was
found to be growth linked since its replication was coupled to that of the bacterial
genome. From the curves it can be seen that during the exponential phase cells are
propagating double the amount of DNA as to when the cells are in the quiescent stages of growth, indicative of the additional genome copies.
6.5.5 Conclusions
It has been demonstrated that the problems with the instability of the larger pGEM series
were alleviated slightly by cultivation at reduced temperatures. Plasmid DNA arising
from the propagation of large plasmids under the control of relaxed replicons could be
detected. However, the yields were not spectacular even for the strains demonstrating
100% stability. The reported copy numbers of the pGEMl 1 vector were not achieved.
For the larger constructs correcting for the instability, revealed that large yields of
plasmid DNA could be expected by virtue of the increased DNA propagated by the
plasmids. Analysis of the yield profiles indicated the substantial impact of stabilisation
and up-regulation of copy number toward the end of the fermentations. Knowledge of
this could allow for improved design of the fermentation process, such that with
improved construct design and optimised fermentations 100% stability could be possible.
Also outlined were the problems faced with purification of these large constructs using
Qiagen packed bed columns. The poor yields warrant futher investigation since it could
suggest potential problems with larger constructs penetrating chromatographic matrices
commonly used for plasmid purification.
Further work was conducted concerning the contamination of plasmid samples by
residual gDNA. The likely contamination from the HPLC analysis was reported
alongside the plasmid yield curves. It was determined that HPLC was not a viable
technique for gDNA quantification and that a qPCR assay should be developed.
Thomas Burt 300

6. Upstream Processing
6.6 Plasmid Topology through the fermentations
6.6.1 DNA Supercoiling
With an average molecular weight of 660Da per base pair, even small pDNA constructs
can be considered large, heavy molecules. Thus, in order to fit into the bacterial cell (or
ultimately a eukaryotic nucleus) DNA molecules must be condensed. This is achieved by
plasmid supercoiling. Supercoilinng in plasmids is achieved by the over/under winding of
the plasmid molecule. In addition to reducing the molecule’s size, supercoiled plasmids
contain a large amount of free energy (AG) that can be used to drive biological reactions
such as replication and transcription. More details in to the thermodynamics of
supercoiling can be found in (Bonilla et al., 1991; Pavlicek et al., 2004). Supercoiling is
characterised by the linking number (Lk) which is the number of times the two DNA
strands interwind when the molecule is laid on a flat plane. A molecule with no
supercoiling has a linking number of (Lko) equal to the number of base pairs divided by
the helical repeat. Most plasmid molecules display negative supercoiling such that Lk <Lko and the supercoiling is in the opposition rotation to the right-handed DNA helix
DNA topoisomerases catalyse the supercoiling and relaxation of plasmid DNA. These
nuclease-active enzymes are divided into two groups. Type I topoisomerases introduce
temporary single-strand breaks in DNA. This relaxes the supercoiled molecule into open-
circular (OC) form allowing transcription and replication. DNA gyrases introduce
supercoiling into plasmid molecules by an ATP-driven process. The degree of
supercoiling is regulated by the opposing activities of both types of enzyme, such that the
balance of these activities keeps the plasmid DNA at a precisely tuned level of
supercoiling. It also suggests that achieving 100% supercoiling during fermentation is an
impossibility.
6.6.2 Introduction
Having established that large plasmids had been produced by the reduced temperature
fermentations it remained to be confirmed that the plasmids existed in an acceptable
form. In an industrial setting, tests for structural homogeneity are required to be
performed to characterise plasmid DNA prior to its release. In addition to the strict
requirements on the levels of the contaminants it is specified that the plasmid DNA must
exhibit >95% supercoiling (Zoon, 1996). There is no accepted reason why supercoiling is
Thomas Burt 301

6. Upstream Processing
desired. It is commonly argued that eukaryotic cells are more likely to accept SCC pDNA
upon administration of a plasmid as a therapeutic agent, however, studies have not
confirmed this (Bergan et a l , 2000). More likely is that the attainment of 95% SCC is indicative of an acceptable and reproducible process.
Despite the dubious reasoning, it is important to track the supercoiling of the plasmid
molecules for other reasons. As is shown in the Chapter 7, a clear understanding of the
topology changes which occur during processing can reveal a great deal about the
process. Admittedly tracking the changes of topology during downstream processing is
probably more critical since the plasmid molecules are free of the protective environment
of the cell wall and as such subject to the full impact of physical forces. However, since
supercoiling is a biologically driven process, dependent on the relative activities of
gyrases and topoisomerases, fluctuations can occur during fermentation which must be
understood. Several authors have reported changes in plasmid topology with the progression of fermentation. (O’Kennedy et al., 2003) reported that % supercoiling
decreased with progression of batch fermentation but that the same effect was not
demonstrated during fed-bacth operation. However, (Schleef, 2001) maintains that fed-
batch processing does have a detrimental effect on plasmid quality.
Topology changes were recorded by performing field inversion gel electrophoresis
(2.5.19) on IPA precipitated lysates obtained from samples taken during the
fermentations. The gels are shown in Figure 9-1 to Figure 9-5. The gels were run for a
period of 40 hours at 4°C in attempt to improve resolution. After which time the gels
were stained with SYBR-Gold for 24 hours and destained followed by gel densitometry
using UVP software (2.5.20 and 2.5.21). Due to the long period require for separation,
only single sample sets could be analysed.
Thomas Burt 302

6. Upstream Processing
100 100
95
90
85
80
75
70
65- pGEM11 (3.2kb) -pGEM16(16kt»- pGEM33 (33kb)- pGEM49 (49kb)
Figure 6-8 Plot displaying the changes in % supercoiling observed during the 25°C temperature fermentations of the large pGEM series of plasmids. It is clear that despite the more pronounced fluctutations displayed by the pGEM33 construct the results for the other plasmids show no major changes in %SCC with the values consistently being between 90-100%. Despite this the smaller two plasmids (3kb and 16kb) did record slightly higher %SCC at harvest.
Time-point
250 250 250 250pGEM 11 (3.2kb) pGEM 16 (16kb)
225 225 225 -225SUPERCOILED SUPERCOILED
200 200 200
175 175 175
150 150
125 125-cD£*%I£
-125occ
100 100 -100OCC
75SC DIMER
50
25
0
2 5 0 ------- ,---------------- r—^ pG E M 33(33kb)
n175- ,
250pGEM 49 (49kb)
SUPERCOILED-200
SUPERCOILED-175
•I 150 OCC
2 125 -125
100 100e 100
OCC 75DIMER
50 -50
25 -25
0
Figure 6-9 Figure displaying the gel scan profiles of the four pGEM constructs normalised against the baseline determined for the lanes. The profiles are those taken from the harvest point of each fermentation and show the relative proportions of the different isomeric plasmid forms.
6.6.3 Results of the Topology Analysis
The changes observed in plasmid supercoiling during fermentation are tracked in Figure
6-8, whilst examples of the gel scan produced by which the relative proportions are
shown in Figure 6-9. From the first graph it can be seen that, with the exception of
pGEM33, no large variations in plasmid supercoiling were witnessed
Thomas Burt 303

6. Upstream Processing
during the fermentations. This is encouraging since it was a possibility that due to the
large sizes of the plasmids being propagated the resultant toplogy may have been
negatively affected. However, it is reasoned that in order to propagate these plasmids (in
the cells which actually propagated them) then a high degree of supercoiling would be
required, to reduce the volume of the molecules such they would be capable of packing
inside the cells. (Analysis carried out in 7.7.3.1 suggests that due to the large size of some
of these plasmid molecules, that physical volume of a bacterial cell may become
limitational). From Figure 6-8 it becomes apparent that the 3kb, 16kb and 49kb plasmid
molecules all recorded % supercoiling within 90-100%. The smaller constructs did record
higher degrees of supercoiling upon harvest but it remains debatable whether that was
due to the biological environment during the fermentation or the less susceptibility to
physical/chemical shear during sample preparation demonstrated by these constructs. It is
the susceptibility of the larger constructs to physical/chemical degradation which is
believed to explain the more fluctuating results demonstrated by pGEM33kb, since the
gels display the presence of linear forms, not associated with a change in the biological parameters, but more so with the period of time the samples are exposed to harsh
chemical lysis regimes (7.7.2.3). This conclusion is justified by the fact that the FIGE gel
shown in Figure 5-11 was run using material harvested from these fermentations prepared
by Qiagen Maxi-prep. It returns a more favourable value for the level of supercoiling for
the pGEM33 construct. It is believed the samples used for analysis of the fermentation
topology changes of the pGEM33kb plasmid were not prepared with sufficient care.
To reiterate, whilst a demonstration of plasmid topology flux during fermentation is
warranted, its importance to the overall process is limited, providing the plasmids display
a significantly high level of supercoiling at harvest. This is because supercoiling cannot
be improved upon downstream and as such the proportion of SCC plasmid at harvest
represents the total product available for purification. However, as will be demonstrated
in the proceeding chapter, topology fluctuations are much more likely when the plasmid
is free of the protection provided by the bacterial cell wall.
Thomas Burt 304

6. Upstream Processing
6.7 Upstream Processing Conclusions
Work in this chapter has described how large plasmids, created by cloning fragments of
DNA into pGEM series of vectors, are hampered by instability issues. This was
unexpected since others describe stable maintenance of such constructs as an attribute
(Tao and Zhang, 1998). Had it been realised that instability would have been an issue,
vectors employing a more optimal form of selection (i.e.kanamycin) would have been used.
Despite the disappointment it was found that reducing the growth rate of cultivation had a
positive impact on both plasmid stability and yield. The importance of this technique was
made clear in these studies. It is concluded that if attempts were made to produce large
plasmids, employing a reduced growth rate would be a good strategy to follow because of
the positive effect it has on both copy number and stability. However, it is envisioned that
a more elegant and reproducible strategy could be tried than simple temperature
reduction, namely exponential fed-batch fermentation. This method of cultivation allows
direct control over the culture growth rate meaning that stability and copy number could
be positively influenced. Additionally, higher biomass yields could be attained. It would
mean an extension in the period required for fermentation but this is not too harmful a
drawback. It is plausible to entertain the notion that if this fementation regime was used in conjunction with a more judicious method of selection (kanamycin or repressor
titration) then stabilities of 100% could be attained.
Although the yields of the large plasmids were not in the ranges hoped for, an insight into the possible yields was provided by adjustment of the final yields accounting for the
levels of stability. The values achieved are due entirely to the increased DNA being
propagated per plasmid, since a reduction in the copy number with increasing plasmid
size was seen. However, if the stability were improved, the main problem faced this far in
the processing of large plasmids; low yields, could be alleviated. As such, although the
decision to clone large constructs under the control of high-copy number replicons
represented a fundamental change of direction for this project, the strategy has been
partially validated.
Evidence was also provided that the propogation of these large constructs was not
accompanied by any significant decrease in plasmid topology. This was important to
Thomas Burt 305
6. Upstream Processing
ascertain since there would be little to be gained from designing processes to accomodate the production of large plasmids if the resultant plasmid quality was poor.
A rather unfortunate aspect of large plasmid purification was identified in that recoveries
of the large plasmids from packed-bed chromatographic matrices were poor. It was not
possible to state whether this was due to unoptimised elution conditions or the more
troublesome possibility that the larger sizes means that the plasmids were incapable of penetrating the resin.
Overall through the use of an understanding of the potential that manipulation of
environmental conditions can have on relaxed plasmid yields it was possible to obtain
cell material containing large plasmids. It was realised that the yield increases were not
by the large increment desired but it was hoped that sufficient plasmid mass existed to
perform meaningful analyses into the purification of such constructs. With this aim the
purification of these molecules forms the subject of the next chapter.
Thomas Burt 306

7. Downstream Processing
7 DOWNSTREAM PROCESSING: RESULTS AND
DISCUSSION
7.1 Chapter Aims
The aims of this chapter are to describe the attempts made at purifying the large constructs
produced from the pilot-scale fermentations. The process for the purification of the
plasmid DNA was already in place and had previously been demonstrated to be effective
for the purification of small plasmid DNA (Eon-Duval and Burke, 2004; Eon-Duval et al., 2003b). The investigations described in this section would help to decide the feasibility of applying the process to the purification of larger plasmid DNA molecules and to determine
any potential problems which could be encountered, should further attempts be made to
manufacture larger plasmid constructs.
As such the main questions which hope to be answered in this section are;
1. Whether the process was capable of purifying larger constructs with the same
degree of efficiency as attained with smaller constructs. This would be determined
from a plasmid mass balance enabling the calculation of percentage recovery
levels of larger constructs over the process. However, an additional consideration
with any plasmid process are any changes to the form of the plasmid during its
processing, an issue of increasing importance when processing larger, and
therefore, more shear sensitive plasmids. As such, a further question to be
answered was whether the act of processing had a more detrimental effect on the
topology of the larger constructs.
2. The mixing conditions employed during these investigations will be subject to
scrutiny in order to decide whether improvements could be made.
3. Of key importance in any plasmid process is the removal of contaminants. Of the
contaminants, the most critical is reasoned to be the bacterial genomic DNA, with
the regulators requiring increasingly strict levels of clearance (Zoon, 1996).
Consequently, this section will describe the clearance levels achieved of genomic
DNA.
Thomas Burt 307

7. Downstream Processing
4 Together with genomic DNA, any plasmid production process must demonstrate
effective clearance of other contaminants. Consequently, this chapter will outline the mass balances constructed of the two other contaminants; protein and RNA.
4. Finally, this section will consider the impact of the plasmid size on any
chromatographic procedures which would need to conducted in a plasmid process.
This would be achieved by investigating the binding kinetics and maximum
binding capacities of the large constructs to two commercially supplied anion- exchange resins.
7.2 Introduction
There are several strategies which can be employed to improve the “manufacture” of
plasmid DNA by fermentation. As explained in 3.3.1, the methods centre on genetic
strategies and process strategies (medium and mode of operation). Consequently, when
optimising the fermentation step the choice of strategy is somewhat constrained. The same
cannot be said for the design of processes for the purification of the plasmid DNA once
synthesised. There are innumerable publications which describe the different strategies,
techniques and technologies which have been investigated for plasmid DNA purification
(Table 7-1). The aim of this introduction is not to attempt to cover them all but to get an
overview of some of main processes employed in this area.
Downstream processing consists of a sequence of unit operations designed to release the
plasmid DNA molecules from the host cells and to remove impurities and contaminants until the desired level of purity and other specifications are reached. The major
components of the starting mass of cell paste are detailed in Table 7-2 and the
specifications for release shown in Table 7-10. The plasmid will, even when considering a
high-copy plasmid, account for less than l%(w/w) and as reiterated through out this
project, many of the contaminants have very similar physico-chemical profile to that of the
plasmid product (Ciccolini et al., 2002; Shamlou, 2003).
Thomas Burt 308

7. Downstream Processing
i
S ^ SI 5 S 5 !
3
£ O O !B O W<w< 6 S. S
I
I S
Table 7-1 Table detailing the possible methods which could be used for the manufacture of plasmid DNA. From the table it can be seen that alkaline lysis is the most obvious choice for the initial step, due the capacity of the step to release the plasmid together with achieving a large degree of purification. Following lysis the number of process options are increased. More traditional approaches would employ a form of intermediate purification such as precipitation / ultrafiltration to concentrate the plasmid solution prior to a chromatographic step. However, more recently process options are appearing which like intermediate steps accept clarified lysate but achieve more concentration and purification in a single step. These process options include membrane chromatography,. ATPS and expanded bed adsorption.
Thomas Burt 309

7. Downstream Processing
7.2.1 Primary isolation
Table 7-2 Composition of a rapidly growing E.coli cell. A Assumes the total nucleic acid complement excluding plasmid DNA. B Assumes that a rapidly growing cell can have more than 1 genome copy. c Assumes a plasmid molecule of 5kb in size.
Species Amount(% w/w)
No of different kinds Average MW (kDa)
Water 70 1 18Nucleic Acids 6.5 a
gDNA 0.5 l b 2.8 xlO6Transfer RNA 4.8 40 28Ribosomal RNA 0.9 3 500-1,000Messenger RNA 0.3 400-800 660-990Plasmid DNA
pGEM 3.2kb 1 2,100pGEM 16kb 1 10,500pGEM 33kb 1 21,800
P5176116kb 1 76,600Proteins 15 1,100 8-200Endotoxins 5 10Small molecules/ ionsd 3 800-2,000 <1
Downstream processing begins with the recovery of cells from the fermentation broth. In this project this was achieved by batch centrifugation but on the larger scale microfiltration or continuous centrifugation are employed (Stanbury and Whitaker. 1984). The cell paste is then resuspended in a buffer which contains agents capable of disrupting the ionic and hydrogen bonds which lend strength to the outer wall of the bacterial cell. Commonly the chelating agent EDTA is used which binds divalent cations from the cell wall destabilising the overall structure and so facilitating lysis (Feliciello and Chinali, 1993). The chelation of Mg2+ ions has the added advantage of inhibiting endonucleases which can degrade the released plasmid. In these investigations the resuspension buffer also contained dextrose in order to increase the solution viscosity in an attempt to minimise any shear damage to the
plasmid.
Cell disruption can be achieved by mechanical methods such as sonication or homogenisation but they are not commonly employed as the shear damage to the plasmid is too great (Carlson et al., 1995). Heat based techniques have also been studied as a potential ways of lysing bacterial cells (Zhu et al., 2005) however for this method to be effective requires pre-treatment of the cells with agents such as lysozyme.
Variations on the alkaline lysis procedure described by Bimboim and Doly remain the method of choice (Bimboim and Doly, 1979). This operation disrupts the cells to release
Thomas Burt 310

7. Downstream Processing
plasmid and at the same time removes a large amount of the genomic DNA and protein,
which are precipitated together with the cell debris and other impurities. More information
on the lysis step is provided in 2.8.2 and 3.8.3. The lysis step is the most crucial step in the
downstream process and the one where most problems arise (Ciccolini et al., 1999). Lysis
is initiated by the addition of the lysis reagent to the E.coli cell suspension. The reagent
contains the alkali solution (-0.2M NaOH) and a detergent (-1% SDS). The detergent
solubilises cell membranes by eliminating interfacial van der Waals interactions between
proteins and phospholipids. The actual lysis reaction is rapid and only 30-40s are required to reach completion (Ciccolini et al., 1999).
The alkali in the solution raises the pH and so promotes the irreversible denaturation of the
gDNA, whilst keeping plasmid denaturation reversible. The complementary strands of
gDNA are completely separated and the hydrophobic bases exposed. This denaturation of
the genomic DNA leads to an associated increase in fluid viscosity peaking at 35-160mPas
(shear rate dependent) 120-140s after the addition of the lysis reagent (Ciccolini et al., 1999). Although plasmid is denatured during this operation the circular conformation of
the molecule mean sufficient bases remain in register to act as nuclei for the renaturation
of the molecule, provided that the solution pH does not exceed 12.5.
Mixing during lysis is extremely important. The lysis must be added and mixed rapidly so
as to avoid localised regions of high pH which could lead to irreversible plasmid
denaturation (Prazeres et al., 1998). This is made more difficult by the increase in viscosity of the lysate which makes the flow and handling of the material very difficult
(Stephenson et al, 1992). In addition, following the release of plasmid the agitation
intensity should not be too great as to cause the shearing of plasmid DNA or genomic DNA into small fragments which do not precipitate out and so remain as contamination.
However, gentle mixing leads to shear thickening of the lysate and so the deterioration of
mixing conditions. Refer to Table 3-6.
The following step in the lysis procedure is the addition of a chilled high salt neutralisation
buffer (3M Potassium acetate pH 5.5) which causes the renaturation of the plasmid
molecules and the precipitation of the gDNA and protein. Genomic DNA precipitates
whilst the SDS-protein complexes to form a buoyant, shear sensitive matrix which entraps
the cell debris, RNA and gDNA (Theodossiou et al., 1999).
Thomas Burt 311

7. Downstream Processing
Alkaline lysis and neutralisation are typically carried out sequentially in the same tank
with each operation taking 5-10 minutes. In these investigations the lysis and neutralisation operations were conducted for 30 minutes each.
This fact will prove controversial but was found to be required due to the gentler agitation
conditions employed in this protocol. Following neutralisation a solid-liquid separation
step is used to remove the contaminant floe. This is either centrifugation or filtration with
the latter becoming more common due to improved performance. Flotation can be
employed to remove the bulk of the floe material prior to loading on to filter.
Often overlooked, but of equal importance to the shear sensitivity of the plasmid
molecules, is their chemical stability during the lysis/ neutralisation stage (Monteiro et al., 1999). In spite of the harsh alkali treatment endogenous nucleases (DNases/RNases) may
persist in the process streams. If adequate measures are not taken, such as not extending
lysis or by failing to lower the temperature of the solutions, damage to the supercoiled
molecules can result (Monteiro et al., 1999). Attempts have been made to exploit the
persistence of the RNases to degrade the RNA remaining, by incubating the lysate.
However, on the larger scale the technique has been plagued by damage to the plasmid
caused by exposure to endogenous DNases.
7.2.2 Intermediate purification
The main aim of intermediate processing steps is to decrease the volume of the plasmid
containing stream prior to chromatography. However, increases in purity can be obtained in parallel. As shown by Table 7-1, traditional intermediate purification steps such as
ultrafiltration and precipitation produce a cleaner and smaller process streams. However,
there is evidence that they can be by-passed all together by the use of expanded-bed chromatography, membrane chromatography or aqueous-two phase systems (ATPS).
These techniques are grouped with the other intermediate techniques by virtue of the fact
that all can accept clarified lysate directly; generally traditional packed-bed
chromatography is unable to do so. In contrast to the UF/precipitation these techniques are
capable of achieving remarkable levels of purification in one step. It is these impressive
clearances combined with ease of use which are driving the uptake of these technologies.
7.2.2.1 Precipitation
Precipitation can be used to either precipitate the plasmid or contaminants. Precipitation of
plasmid from clarified lysate with ethanol/isopropanol can recover >95% of plasmid
Thomas Burt 312

7. Downstream Processing
(Diogo et al, 2000). This technique is common on the laboratory scale and indeed was
utilised in this project in analytical studies 2.5.6 but the technique is not feasible to the larger scale.
Another method of precipitation of plasmid utilises polyethylene glycol (PEG). In this
technique the size of the DNA molecules precipitated depends on the concentration and molecular weight of the PEG. As such the technique can be used to fractionate DNA
according to its MWt or to precipitate the total DNA content (Horn et al, 1995; Marquet,
1996). Whilst the technique is applicable to lager scale operation there remain inconsistencies and a degree of empiricism in its application.
Small cationic molecules, known as compaction agents have also been used to selectively
precipitate plasmid DNA. These molecules (spermidine/spermine) bind into the grooves of
the DNA neutralising the charge and compacting the molecule’s size (Plum et al., 1990).
When considering the use of precipitation it has to understood that the operation entails a
solid-liquid step which may be deleterious to the resultant plasmid quality. Precipitation
can be used to remove contaminants including proteins, gDNA, LPS and RNA. In these
studies Calcium chloride is used to precipitate out the RNA.
7.2.2.2 Ultrafiltration
UF can achieve good levels of concentration and purification in one unit operation as well
as buffer exchange. The use of tangential flow filtration with UF polyethersulfone
membranes (MWCO 500-l,000kDa) has been claimed to remove 99% of RNA and 95%
of protein from clarified lysates, with the plasmid being retained on the membrane side
and the protein/RNA passing through (Butler et al., 2000; Kahn et al., 2000). It is this
technique which forms the basis of these investigations and with which similar levels of
clearance are achieved as described by (Eon-Duval and Burke, 2004).
7.2.23 Aqueous two-phase systems (ATPS)
Clarified lysates can be concentrated and purified by liquid-liquid extraction using
aqueous two-phase systems. ATPS consist of a PEG enriched top-phase and a salt
enriched bottom phase. Partition of nucleic acids depends on many factors such as the size/chemistry of the macromolecule and the ionic composition of the buffer which can be
manipulated to achieve the desired partitioning (Cole, 1991; Frerix et al., 2005; Kepka et al., 2004a; Trindade et al., 2005). Promising results have been reported and the technology
Thomas Burt 313

7. Downstream Processing
is becoming a more fashionable area of development for plasmid manufacture. Plasmid
recoveries of 100% were reported using a PEG1,000/ K2HP04 [15%/13% (w/w)] with no
protein detected in the purified stream and the gDNA content reduced 60-fold (Ribeiro et
al., 2002). There are several advantages to ATPS. It can achieve impressive concentrations
and purifications in one low-shear, low-cost unit operation using non-hazardous reagents.
7.2.2.4 Expanded Bed Chromatography
Expanded bed chromatography is being finally being accepted on an industrial scale in a
variety of processes due to its significant advantages over standard packed bed-
chromatography. Indeed, it can even supersede unit operation upstream of chromatographic steps. The technology exploits the fluidisation of adsorbent particles by
up-pumping flow. This increases the voidage between particles, something not achievable
by standard packed-bed techniques. This increased voidage enables the passage of
unclarified feedstocks which would block traditional packed-bed columns in a matter of
seconds. This capacity to handle unclarified feed stocks minimises the number of unit
operations (solid-liquid separation/ UF/Precipitation) which in turn results in higher yields,
lower processing times and running costs. Overall significant improvements in process
economic can be achieved. The investigation of the technology to plasmid purification is
described by (Ferreira et al., 2000b; Theodossiou et al., 2001; Theodossiou and Thomas,
2002; Theodossiou et al., 2002; Varley et al., 1999).
7.2.2.5 Membrane Adsorption/Chromatography
As will be outlined in the following section the major limitation of porous particles for
chromatographic separations of plasmid DNA is the low binding capacity of the resins due
to inability of plasmid to diffuse into the pores of the matrix particles. Developments in
this field are led by the aim to reduce the limitations posed by intra-particle binding. One
approach is to use a continuous stationary phase, where the internal surface area is
completely accessible by convective flow and thus reducing the need for diffusive intra
particle transport. This strategy forms the basis for membrane chromatography. Membrane
chromatography systems consist of multiple microporous membranes in series onto which
adsorptive ligands have been attached. The technology is receiving increased attention due
to several advantages. Convective binding means shorter residence times, diffusional
limitations are overcome by having mainly through pores and thus higher binding
capacities can be attained. Additionally, any problems with column packing and uneven
Thomas Burt 314

7. Downstream Processing
flow are eliminated. The strategy has also has the capacity to accept quite impure
feedstocks (Giovannini et al, 1998; Grunwald and Shields, 2001; Teeters et al, 2003; van et a l , 1993; Zhang et a l , 2003).
7.2.3 Purification
Chromatography is typically the last step in the downstream processing of plasmid DNA.
The role of chromatography is to remove impurities such as RNA, gDNA, endotoxins and
plasmid variants. To achieve these wide-ranging aims several varieties of chromatography
are available. In this section the different types of chromatography will be outlined.
However, it should be understood that the achievement of process objectives is dependent
on both the adsorbent phase used and how they are deployed i.e. the nature of the support
material/ chromatography system used. For instance, anion-exchange resins have been
utilised for expanded-bed chromatography but have achieved different process objectives
due to the different setup*.
This section assumes that the chromatography being employed is standard packed-bed
mode. This is important because historically the majority of chromatographic matrices
have been designed for the purification of proteins and due to their massive size plasmids
cannot penetrate the pores of the majority of commercial chromatographic matrices. This
means that only the outer surface of the matrix is available for binding, a fact that
constitutes an important capacity limitation (Ljunglof et al, 1999);(Ferreira et al, 2000a).
For example, 2.5mg plasmid are obtained as opposed to 1 lOmg of protein per mL of the
anion-exchanger Streamline QXL (Ferreira et al, 2000a).
7.2.3.1 A nion-exchange chromatography (AEX)
Purification of plasmid DNA by anion exchange chromatography utilises the interaction
between negatively charged phosphate groups on the DNA backbone and positively
charged ligands on the stationary phase. Suitable ligands include the weak exchangers
such as DEAE and DMA coupled to silica, polymeric or composite matrices or strong
exchangers such as quaternary amines coupled to polymeric matrices (Diogo et al, 2005).
A salt gradient is used to displace the different nucleic acid species.
The order in which the species elute should be in order of charge density, a factor
governed by the DNA molecule’s chain length and conformation. However, variations in
* For example elution profiles of the different chromatographic techniques refer to Figure 4-16. Although they are HPLC traces the principle mechanism of the chromatography remains the same.
Thomas Burt 315

7. Downstream Processing
the base sequence, size and conformation impact to affect the elution order. However,
anion exchangers can and have been employed to remove OC plasmid from SCC plasmid (Prazeres et al., 1998).
Anion exchange is also useful for ensuring the removal of RNA, oligoribonucleotides and
some proteins. However, the technique should not be relied upon to clear other
polyanionic molecules such as short gDNA fragments and endotoxins due to their similar binding affinities (Wicks et al., 1995).
7.2.3.2 Size-exclusion chromatography (SEC)
Size exclusion chromatography (SEC) or gel filtration chromatography has been used to
fractionate and purify plasmid molecules on the basis of their relative size. SEC can be
used alone but more often is used sequentially to other chromatographic steps such as
anion exchange (as is the case in the process under study)(Ferreira et al., 1999; Varley et al, 1999). It constitutes an ideal polishing step enabling the removal of trace gDNA and
RNA, partial separation of OC from SCC forms, reduction of endotoxin loads and the
transferral of the plasmid product into a suitable storage buffer. DNA exits the column as a broad non-Gaussian peaks (Figure 4-16), gDNA elutes first as the leading edge followed
by the open-circular and then supercoiled forms. Smaller solutes such as salts and RNA
are eluted behind the larger DNA species and can easily be separated. A judicious choice of the fractions collected enables recovery of almost pure SCC pDNA. The disadvantages
with this technology are associated with its limited capacity and the fact that there are few
gels which have the adequate selectivity to be used for plasmid purification.
7.2.3.3 Hydrophobic Interaction chromatography (HIC)
Hydrophobic interaction chromatography has been described for the purification of
plasmid DNA (Diogo et al., 2003; Diogo et al, 2001a; Diogo et al., 2000; Yuan Li, 2005).
The technology uses matrices derivatised with mildly, hydrophobic ligands (e.g.PEG) to
separate relaxed and supercoiled plasmids from RNA, gDNA, endotoxins and denatured
pDNA on the basis of differences in surface hydrophobicity. HIC takes advantage of the
higher hydrophobicity of single-stranded nucleic acids, a characteristic resulting from the
exposure of the organic bases. With dsDNA molecules the bases are shielded inside the
helical structure by the phosphate background and so there is little scope for interaction
with the hydrophobic stationary phase. However, the high quantity of single-stranded
nucleic acid forms which compose the gDNA/RNA contamination bind strongly as do
Thomas Burt 316

7. Downstream Processing
endotoxins by virtue of the lipdic moiety. It has been reported that HIC is straight-forward
to scale-up with no losses in purity and only marginal losses in yield, additionally, run-to-
run consistency is high even after sanitation and cleaning cycles of caustic washing (Diogo
e t a l . , 2005).
7.2 . 3 . 4 A f f i n i t y c h r o m a t o g r a p h y
Affinity chromatography is based upon the recognition o f a very precise structure in the
target plasmid molecule by the immobilised ligand. Triplex-affmity chromatography
utilises the formation of triple helices between plasmid molecules and sequence-specific
immobilised oligonucleotides. Proponents claim that the technique can purify pDNA in
one-step whilst significantly reducing the levels of impurities. This specificity makes it an
attractive option but the same sequence specificity could potentially limit its adoption
since the ligand is base specific. Similar to the deployment o f this technique for the
purification of proteins the associated costs are high (Ito e t a l , 1992a; Schluep and
Cooney, 1998). Other forms of affinity chromatography for the purification of plasmids
have been investigated (Table 7-1) but overall the use o f this technology for pDNA
purification remains lab-based at present.
7.2.4 Process schematic
Figure 7-1 Schematic of the process studied in this project in its entirety. The steps which were studied in detail are highlighted by the blue arrows. The fermentation broth is centrifuged and the cell paste resuspended in the lysis vessel. Following lysis, neutralisation and RNA removal by CaCI2 addition the lysate is clarified by a series of filtration steps. The first filtration step is a coarse, mesh filter which removes the majority of the large floe material. To achieve clearance of remaining micron/sub-micron particulates, which could block the UF membrane, the lysate is further clarified by two depth filtration steps in series. The clarified lysate is then subject to ultrafiltration. During the 1°UF step the clarified lysate is first concentrated by 10-fold. This removes the majority of protein and RNA. The concentrated solution is then purified further by a diafiltration step which removes small MWt RNA. A second diafiltration step is then used for buffer exchange to transfer the plasmid into a buffer suitable for loading on to an anion exchange column. The AEX column facilitates the removal any traces RNA but can also be used to purify SCC topology and achieve some removal of gDNA. The remaining steps are designed to ensure clearance of any trace endotoxin/ gDNA material and so use size-based approaches.
7.3 Process Outline
A process developed for pilot-scale purification of plasmid DNA was utilised for these
studies. The procedure was conducted on 50g of frozen cell paste from the fermentations.
Thomas Burt 317

7. Downstream Processing
It involved the resuspension of the cell paste in a Tris-based resuspension buffer.
Concurrently, the lysis buffer was prepared in a 1.5L round-bottomed vessel fitted with a
45° pitched-blade impeller and surrounded by ice. Lysis was achieved by addition of the
cell suspension to the alkaline lysis buffer, a method similar to that described by
(Bimboim and Doly, 1979). The removal of RNA from the lysate was achieved through the addition of the divalent salt calcium chloride, first demonstrated by (Mukhopadhyay
and Mandal, 1983) and further improved by (Eon-Duval et a l, 2003a; Eon-Duval et al,
2003b). Clarification was performed by batch ultracentrifugation. This step replaced a
course filter train typically employed on the larger scale for ease and simplicity and due to
the fact that the course clarification has little, if any, effect on final plasmid recoveries.
Small particulates were removed from the liquor, to prevent any blockage of the UF
membrane, by depth microfiltration.
The central concentration and purification step of this downstream process utilised
ultrafiltration. Primary concentration of the clarified lysate involved reducing its volume
from 1205mL to lOOmL and was achieved by permeation. The plasmid remained on the
Retentate side of the membrane. Removal of protein and remaining small molecular
weight RNA was achieved by diafiltration using 30 volumes of a Tris-based buffer.
Further purification and buffer exchange (placing the plasmid in a suitable buffer for
anion-exchange chromatography) was enabled by a second diafiltration step, after which
the plasmid containing retentate could be recovered from the membrane.
The recovery step involved the removal of the transmembrane pressure (TMP) and
circulation of the retentate for 20 minutes. This facilitated the suspension of the plasmid
molecules away from the membrane gel layer. The retentate wash step was followed by
two further wash steps, involving the addition of 80mL of the second diafiltration buffer to
the membrane and the subsequent recirculation and collection.
Thomas Burt 318

7. Downstream Processing
Table 7-3 Table outlining the sequential steps of the downstream processing steps. Brief details are given into the actions performed in each step as well as the samples taken and the name assigned to the samples stage.STEP ACTION SAMPLING
Cell Resuspension 50g o f frozen cell paste resuspended to homogeneity in 250m L o f Tris based buffer.
Samples taken to determine WCW of suspension. Sonication to reveal starting amounts o f RNA, Protein and gDNA. [Pre-Lysis samples!
Cell Lysis Lysis achieved by addition o f cell suspension to 395mL ice-cold 0.96 %(w/v) NaOH and 78mL 6% (w/v) SDS in lysis vessel. M ixed at lOOrpm for 30 minutes.
N o samples taken
Neutralisation Lysis mixture neutralised by addition o f 246mL ice-cold Potassium acetate. M ixing continued for 30 minutes
lm L samples taken, centrifuged and frozen for retrospective analysis o f pDNA, RNA, gDNA and Protein. [Pre-CaCI2 samples]
RNA Removal RNA removal achieved by addition o f 246mL o f r.tp 5M CaCl2. Mixing continued for 10 minutes
No samples taken.
Clarification Lysate aliquoted into centrifuge pots and centrifuged for 30 mins at 20,000g. Small particulates removed from liquor by depth microfiltration.
lm L samples taken, centrifuged and frozen for retrospective analysis o f RNA and Protein. lPost-CaCl2 samples]
UF Concentration Clarified lysate concentrated from 1205mL to lOOmL by permeation. Crossflow at either 250 or SOOmLmin'1. Permeate collected. Flux rate recorded.
lm L samples o f permeate taken and frozen for retrospective analysis o f pDNA, RNA and Protein. [Permeate samples]
UF Diafiltration 1 Protein and small mol.wt. RNA removed from retentate by diafiltration with 20 volumes (2L) o f a Tris-based buffer. Flux rate recorded.
Diafiltrate collected and samples taken and frozen for retrospective analysis o f pDNA, RNA and Protein. |Diafiltrate 1 samples!
UF Diafiltration 2 Further purification and buffer exchange achieved by diafiltration with 30 volumes (3L) o f DF2 buffer. Flux rate recorded.
Diafiltrate collected and samples taken and frozen for retrospective analysis o f pDNA, RNA and Protein. Diafiltrate 2 samples]
RetentateRecovery
TMP removed and Retentate allowed to circulate for 20 mins prior to collection in a pre-weighed Nalgene bottle.
Retentate collected and samples taken and frozen for retrospective analysis o f pDNA, gDNA, RNA and Protein. Volume determined by weight. [Retentate samples]
Wash 1 Recovery 80mL o f DF2 buffer added to the membrane and allowed to circulate for 20 minutes prior to collection in a preweighed Nalgene bottle.
Retentate collected and samples taken and frozen for retrospective analysis o f pDNA, gDNA, RNA and Protein. Volume determined by weight [Wash 1 samples]
Wash 2 Recovery 80mL o f DF2 buffer added to the membrane and allowed to circulate for 20 minutes prior to collection in a preweighed Nalgene bottle.
Retentate collected and samples taken and frozen for retrospective analysis o f pDNA, gDNA, RNA and Protein. [Wash 2 samples!
Thomas Burt 319

7. Downstream Processing
7.4 Process Analytics
One of the main objectives of these investigations was the construction of mass balances
for the plasmid and the key contaminants. To do so required accurate determination of the
concentration of each at various stages of the process. Once the concentration was
determined the masses could easily be calculated from knowing the volume of the
different streams. The development of the assays employed is outlined in the analytical development chapter. There remain a few points to explain here though.
Table 7-4 outlines the assays employed to determine the concentration of the various
constituents and where sampling was recorded. Of note was the fact that measurements
could not be made of plasmid mass before the lysis stage. Essentially, alkaline lysis is a
lysis procedure that also enables removal of a majority of protein and genomic DNA.
Feasibly it could also lead to losses of plasmid. Determination of the plasmid mass in the
cells before lysis would have enabled a more complete plasmid balance. However,
sonication could not be employed, as was used for the other contaminants, because the act
of sonication shears the plasmid to the extent that it could not be recorded. Alternative
methods of determining the plasmid mass at outset, through the use of different lysis
regimes (e.g. enzymatic and detergent based lysis) were attempted but no sensible results,
from the analysis of the samples by HPLC, were forthcoming.
Furthermore, it was not found possible to record the plasmid concentration of streams
containing high-levels of the calcium chloride salt. The high-salt content of the streams
meant that the samples did not run well on HPLC. Estimates could be placed upon the
concentration by applying samples diluted 10-fold with TE buffer. This was done for
permeate samples to check that the permeate did not contain high-levels of plasmid.
However, the results returned, when using this method for the Post-CaC12 samples, were
too variable to be included and so were discarded. As with the other constituents, it was
hoped that desalting the Post-CaC12 samples would alleviate the issue. However, when the
desalted samples were analysed by HPLC no plasmid could be detected. It is believed that
the plasmid did not run well through the gel matrix of PD-10 columns.
Thomas Burt 320

7. Downstream Processing
Table 7-4 Table outlining the assays used to determine the concentrations of the various constituents. The table also shows the streams on which these assays were used on.
CONSTITUENT ASSAY DETAILS SAMPLING STAGES
PlasmidQuantification HPLC Directly on samples Pre-CaCy Permeate / DF1 / DF2 / Retentate
/ Wash 1 / Wash 2.
PlasmidQuantification A-260
On UF recovered material Retentate / Wash 1 / Wash 2
Plasmid Topology FIGE On IPA purified samples
Pre-CaCl2 / Post-CaCl2 / Retentate / Wash 1 /W ash 2
Protein BCA In triplicate on 3 appropriate dilutions
Pre-Lysis / Pre-CaCl2/ Post-CaCl2 / Permeate / DF1 / DF2 / Retentate / Wash 1 / Wash 2.
RNA Quant-IT In triplicate on 3 appropriate dilutions
Pre-Lysis / Pre-CaCl2/ Post-CaCl2 Permeate / DF1 / DF2 / Retentate / Wash 1 / Wash 2.
Genomic DNA qPCR Purified robotically by MagNA-Pure.
Pre-Lysis / Pre-CaCl2 / Retentate / Wash 1 / Wash 2
Flux Rate Manually Measuring cylinder and stopwatch Permeation / Diafiltration 1 & 2
The plasmid topology assay could only be performed on streams containing sufficient
plasmid material to enable concentration. As a result, only the streams shown in the table
were analysed by FIGE. However, this was not a major problem since the streams with
low plasmid masses were the exit streams which were less critical.
The concentration of plasmid solutions recovered from the UF step were concentrated by
both HPLC and checked against those returned by A26o. This could be done since the
plasmids were sufficiently pure by the end of the UF step to allow for A26o quantification.
However, in all the balances the HPLC results were used for reasons of consistency. It was
this double-check that highlighted the issue found with the HPLC concerning the detection
of sheared plasmid DNA, when the results from A26o did not match those from the HPLC.
Thomas Burt 321

7. Downstream Processing
7.5 Experimental order
Having outlined the way in which the DSP operations were conducted and the various
analytical techniques employed to determine the concentration of the different
constituents, the run order in which these investigations were performed can now be
outlined.
Twenty-four individual DSP runs were completed, the details of which are outlined in
Table 7-5. From the table it can be seen that each of the five plasmid constructs was
processed in duplicate runs. Also the investigations were designed to determine whether
the cross-flow velocity had any impact on the recovery and topology of the plasmid
product. This was done as it was reasoned that the high shear environment of the UF rig
may lead to severe damage to the larger constructs. Normally the UF process is operated at
a cross-flow velocity of SOOmLmin'1, so performing investigations at 250mLmiiT1 should
provide data to make useful comparisons.
Furthermore, HPLC determination of the pDNA concentration in the samples taken from
the Post-CaCL stream of the process was found to be unachievable. As a result it was not
possible to balance pDNA mass across this step. In order to determine whether the
addition of CaCb resulted in any plasmid loss control runs were performed. In these
control runs RNA removal was achieved through the action of RNase by replacing the
Table 7-5 Table describing the twenty-four separate DSP operations conducted on 50g of cell paste obtained from the fermentations. All five constructs were analysed in duplicate. Two cross-flow velocities were also used; 250mLmin'' and SOOmLmin'1. Determination of the plasmid concentration in the streams immediately following the addition of calcium chloride was found unachievable. Consequently control runs were performed to determine whether the addition of this salt had any impact on the plasmid yields. In these controls the addition of 246mL of 5M CaCl2 was replaced by the addition of the same volume of IxTE buffer containing SOOpgmL'1 RNase. This produced a solution of RNase of lOOpgmL'1 in the lysate. The remainder of the procedure was conducted in the same fashion as the other runs.
C o n s tru c t C ro ssf lo w RNA
size (kb) v e lo c ity (m l/m in) rem oval
RUN 1 3.2 500 CACL
RUN 2 3.2 500 CACL
RUN 3 16 500 CACL
RUN 4 16 500 CACL
RUN 5 33 500 CACL
RUN 6 33 500 CACL
RUN 7 49 r 500 CACL
RUN 8 49 500 CACL
RUN 9 116 500 CACL
RUN 10 116 500 CACL
RUN 11 3.2 250 CACL
RUN 12 3.2 250 CACL
RUN 13 16 250 CACL
RUN 14 16 250 CACL
RUN 15 33 250 CACL
RUN 16 33 250 CACL
RUN 17 49 250 CACL
RUN 18 49 250 CACL
RUN 19 116 250 CACL
RUN 20 116 250 CACL
RUN 21 33 500 RNASE
RUN 22 49 500 RNASE
RUN 23 33 250 RNASE
RUN 24 49 250 RNASE
Thomas Burt 322

Plas
mid
M
ass
(mg)
7. Downstream Processing
addition of 246mL of 5M CaCh with the same volume of lxTE buffer supplemented with
500pgmL 1 RNase. This solution formed an RNase concentration of lOOpgmL*1 in the
lysate. The remainder of the process was performed in an identical fashion to the other
runs.
7.6 Plasmid recovery and topology
7.6.1 Plasmid Yields following alkaline lysis
The plasmid balances of the different runs are show in the individual mass balance
breakdowns shown in (Figure 9-31 to Figure 9-49). The figures used in this analysis are
the averages of the quadruplicate runs performed.
---------1------- 1------- 1--------'--------1--------'--------1--------1--------1---------
I AX
— t—
T -y rr
“
3.2kb 16kb 33kb 49kb 116kb
C onstruct
450 450
400 -400
350 -350
300 -3 0 0
250 -250
200 -200
150 -150
100 - 100
50 -5 0
03.2kb 16kb 33kb 49kb 116kb
Construct
Figure 7-2 Figures detailing the masses of the different constructs at the Pre-CaCl2 stage of the process. This step is directly after the completion of neutralisation and before the addition of the Calcium chloride. The figures record the average of four runs for each construct. This was allowable, since there was no difference between the different runs at this stage, the different processing technique (crossflow velocity) appear later in the UF step. Figure A shows the total plasmid masses determined by HPLC directly on clarified lysate. These mass values represent the starting masses of plasmid DNA. Figure B shows the plasmid specific yields determined from the mass quantities and the WCW of the individual cell suspensions. It was not possible to plot the graphs on the same graph because although they appear equivalent small differences in the WCW between runs mean they are not quite equivalent. The dashed line represents the lower limit of starting yields determined to be acceptable by this process.
Figure 7-2 details the initial starting masses of plasmid DNA for each construct. These
were determined following the neutralisation stage of the process by HPLC on the clarified
lysate. The average of the four runs is displayed in the graph.
Thomas Burt 323
Specific Plasm
id Yield
(pg gW
CW
1)

7. Downstream Processing
This could be done since up until the UF stage the operation of all the processes was
equivalent. The WCW of each suspension was determined prior to lysis. This value could
be used to determine the specific yields of the constructs and see how close they compared
to the values reported at the end of the fermentations since they should be equivalent. It
was noted that although 50g of frozen cell paste was lysed in these reactions the actual
WCW of the solutions deemed that there was only on average ~42g of cell mass present.
The reason for this disparity was reasoned to be due to the relative dewatering capabilities
of the centrifuge used to recover the cell paste from the fermentations. It seems from the
results that it was only capable of achieving 80-90% dewatering. This meant assuming that
the 50g used was all cell paste would have been wrong and as such would have under
represented the specific plasmid yields at this point. Determination of the WCW of the cell
suspension highlighted the issue and as such allowed for direct comparison of the specific
yields recorded here to those reported at the end of the fermentations.
The comparison is shown in Table 7-6. The values placed on the specific yields are pretty
comparable although they do differ. There could be several reasons for this. A main one
could be that although the fermentation yields were determined at harvest, there remained
the period of time when the cells were collected, spun-down and frozen.
Table 7-6 T able com paring the values place upon the specific plasm id yields. Specific plasmid yields determ ined on the clarified lysate during the dow nstream process w ere com pared to the specific yields determ ined at the harvest o f the ferm entation the cell paste processed w as taken from. The values taken for the ferm entations y ields w ere those o f the duplicate ferm entation which recorded the highest yield since it was the cell paste from these ferm entation which w as selected to be processed.
Fermentation Specific Plasmid Yield
(pg pDNA/ gWCW)
DSP Specific Plasmid Yield
(pg pDNA/ gWCW)% Difference
pGEM 11 |3.2kb| 81.6 70.4 -16.0pGEM 16 fl6kbl 296.1 396.2 + 25.3pGEM 33 |33kb| 215.7 289.0 + 25.4pGEM 49 |49kb| 165.6 180.0 + 7.97P 5 1 7 6 |116kb| 49.9 47.2 -6 .2
Before the cells were frozen there remains the distinct possibility that specific yield could
have increased, especially considering how rapidly the specific yields were increasing
toward the end of the fermentations. Additionally, there would have been variations in the
assay. Although in both scenarios the yield values were determined by HPLC, the sample
for the fermentations was performed on IPA precipitated clarified lysate, whilst the DSP
samples were run directly (Refer to 4.5.2.2 for the reason). However, it was felt that the
values aligned sufficiently to give confidence.
Thomas Burt 324

% R
ecov
ery
7. Downstream Processing
7.6.2 Plasmid Recoveries from the UF rig
The plasmid recoveries of the individual runs were calculated from the total masses
recovered from the Retentate and wash fractions of the UF stage, and the starting masses
determined by HPLC on the clarified lysate prior to CaCL addition. The full breakdown of
the individual runs can be seen in the mass balances (Figure 9-31-Figure 9-49).
Figure 7-3 A plots the calculated % recoveries of every run against the size of the plasmids
processed. From the graph it can be appreciated that there is a roughly linear drop-off in
the percentage of plasmid recovered with increasing plasmid size.
The poor results for the smallest construct (pGEM ll) seem to break the trend, but are
explainable. Details from the mass balances show that the low recoveries of this construct
are due to its appearance in the permeate streams, and as a result, the vast majority of this
plasmid can be accounted for. Unfortunately, it seems that by virtue of the small size of
this construct, it was capable of penetrating the membrane. From the full plasmid balances
shown in (Figure 9-31 to 9-49) it seems that a great deal of this plasmid appears
specifically in the Diafiltrate 2 stream, exiting the membrane. The most likely cause of this
is that since the DF2 buffer is relatively high-salt (0.54M NaCl), the high ionic
100
90
80
70
60
50
40
30
20
10
0
1 I ■ I ' I 1 '• r
□
, . . . . —
250mlmin'1/ CaCI2
..........O 500m lm in'/ CaCI2▲ 250mlmin‘1/ R N ase Control
□ 500mlmin’1/ R N ase Control
.©................o ..............□p a
0
▲V
e ...... .....................................-O_______
A
•a-□ o
........................ -.................................................................... o□
100
- 9 0
-8 0
- 7 0
60
-5 0
-4 0
-3 0
-20
-10
0
100
90
80
70
60
50
4 0 -|
30
20
10
0
100250m Lm in
500m Lm in
0 10 20 30 40 50 60 70 80 90 100 110 120 130
P lasm id S ize (kb)
3.2k b 16kb 33kb
Construct
49kb
Figure 7-3 Figures detailing the recovery o f plasm id DNA from the process and the proportion of supercoiling d isplayed. F igure A records the % plasm id recovery as a function of plasmid size at the different cross-flow rates. T his w as calculated from the am ount o f plasmid mass determined to be present in the clarified lysate at the Pre-Lysis stage (Figure 7-2) and the total mass of pDNA recovered from the process in the R etentate and wash fractions. Figure B shows the % supercoiling displayed by the different constructs at the end o f the process in the recovered stream. This was calculated on a m ass basis from determ ination o f the plasmid topology by densitom etric scanning the process gels.
Thomas Burt 325
% Plasm
id R
ecovered in
SCC form

7. Downstream Processing
environment would have caused greater compaction of the plasmid molecule, reducing its
size sufficiently to allow it to permeate the membrane. It is well documented how high-
ionic environments induce better packing in supercoiled plasmid molecules as cations
reduce electrostatic repulsion between phosphate groups in the DNA backbone (Schlick,
1994). Unfortunately, this meant that only small amounts of this plasmid could be
recovered from the UF rig at the end of the operation. In some ways it highlights the importance of pursuing pilot-scale process runs.
Turning attention to the other constructs, the recoveries of the different sized plasmids did
demonstrate intra-run variation, which would be expected due to the multi-step nature of
the downstream process. Despite the variation it is clear that decreasing levels of recovery
were evident with increasing plasmid size. The question which was asked was where was
the plasmid mass disappearing to? Evidence from the plasmid balances suggested that,
unlike the smaller construct, the larger plasmids were not penetrating the membrane an
outcome that would not be expected anyhow, due to the increased size. Additionally, the
poor recoveries were only seen with the larger constructs and not with the 16kb plasmid
which displayed highly acceptable -80% recoveries. The determination of where the
plasmid mass was escaping to requires the analysis of plasmid topology and will be
discussed in the next section.
Some final points need to mentioned about Figure 7-3A. The first is that control runs
displayed similar levels of plasmid recovery to the experimental runs. From this evidence
it was concluded that the addition of CaCE was not detrimental to large plasmid recovery.
It had been speculated that since this salt is added to precipitate the large molecular weight
RNA that it was feasible that it may lead to precipitation of larger plasmid molecules. The
controls utilised RNase as the RNA removal tool and seem to confirm that this was not the
case, since the level of recoveries recorded in the control runs was highly comparable to
those reported by the experimental runs. This is in agreement with (Eon-Duval et al., 2003a; Eon-Duval and Burke, 2004) who reported 94% plasmid recovery over this same
CaCE step when investigating production of a 5.5kb plasmid.
Thomas Burt 326

7. Downstream Processing
They concluded that the less hydrophobic nature of SCC pDNA meant that it was less
likely to precipitate than ssRNA molecules, which are more hydrophobic by virtue of their exposed base sequences.
The second point about Figure 7-3A is that the different cross-flow velocities had no
discemable effect on the % recoveries. Accepting that reasonable levels of variation would
be encountered due to the complex, multi-step nature of the procedure there appears no
real evidence that the cross-flow velocity had a large impact on recovery levels.
7.6.3 Plasmid Topology changes witnessed during processing
Explanation of the poor recoveries of the larger plasmids only came following analysis of
the topology changes of the constructs during their processing. IPA precipitated samples
from five points during the process for each plasmid run were analysed by gel
electrophoresis. The gel images are shown in (Figure 9-6-Figure 9-11). The gels were
scanned as described in (2.5.21). The data describing the proportional breakdown of the
isomeric forms is described in graphical form in this section. The five sampling points
were; Pre-CaCL (following neutralisation), Post-CaCL addition, Retentate, Wash 1 and
Wash 2 fractions. Also described are the proportions of isomer forms taken as being the
case at the Pre-Lysis stage. These values were obtained from the gel shown in (Figure
5-11). These were taken as the Pre-Lysis form of the plasmids because the samples
analysed were prepared by maxi-prep (large construct kit) on cell paste recovered from the
fermentations. It was assumed that the gentle processing regime of these preparations
meant that the plasmid forms would have remained unchanged to as they were at the end
of the fermentations.
Figure 7-4 plots the topology proportions of the constructs pGEMl 1, pGEM16, pGEM33
and pGEM49 at the different stages. As shown by Figure 9-9 it was not possible to extract
sufficient information from the gel of the p5176 (116kb) plasmid to be of use. Numerous
attempts were made at trying to prepare sufficient p5176 material, from the different
streams, with which to prepare a useful gel. However, on each occasion visualisation of
the actual plasmid, not to mention the different topologies, remained elusive.
Thomas Burt 327

250m
lmln
'i SO
Om
lmln
"’ 25
0mlm
in'
500m
lmin
7. Downstream Processing
pGEM11 [3.2kb]
WASH 2
WASH 1
RETENTATE
POST-CACL
PRE-CACL
PRE-LYSIS
I OC pDNA I SCC pDNA
WASH 2
W A S H 1
P R E - L Y S I S
40 50 60 70. TOPOLOGY
90 100
pGEM16 [16kb]
WASH 2
WASH 11
RETENTATE1
POST-CACL
PRE-CACL
PRE-LYSIS 1 jWASH 21
WASH 11
r e t e n t a t e ]
POST-CACL |
PRE-CACL ]
PRE-LYSIS 1
I SCC pDNA lOCpDNA LINEAR pDNA
0 10 20 30 40 50 60 70 80 90 100% TOPOLOGY
pGEM33 [33kb] LINEAR pDNA SHEARED pDNA
SCC pDNAOC pDNA
WASH 2
W A S H 1
POST-CACL
PRE-LYSIS
pGEM49 [49kb]
WASH 2
WASH 1
RETENTATE
POST-CACL
PRE-CACL
PRE-LYSIS
90 100% TOPOLOGY
SCCpDNAOCpDNA
LINEAR pDNASHEARED pDNA
WASH 2
- RETENTATE
P O S T - C A C L
W A S H 2
J= WASH 1
• I RETENTATE
g POST-CACL
PRE-LYSIS
10 20 30 40 50 60 70 80 90 100TOPOLOGY
Figure 7-4 Bar charts describing the proportions of the different plasmid forms at various stages during the downstream process. The data was obtained from densitometric scanning of the gel images shown in Figure 9-6 to Figure 9-11.
Close inspection of the topology graphs, and indeed the gels themselves, clarifies the issue surrounding the poor plasmid recoveries. On a general level it can be seen that before lysis all the plasmid display a high level of supercoiling. The actual levels vary slightly between constructs but it can be said that they all display between 85-95% supercoiling. What becomes apparent with every construct is that this level of supercoiling drops over the lysis step. The level of the reduction of the supercoiling is very much related to the
plasmid size and is discussed separately in the following section. What also should be noted is how linear plasmid form is generated over the lysis stage for the two largest
constructs; pGEM33 and pGEM49.
So, at the end of the lysis stage a large amount of both linear and open-circular forms of plasmid had been generated. For the larger constructs the levels of these isomeric forms were greater than the level of supercoiling. However, after the ultrafiltration steps the
Thomas Burt 328

7. Downstream Processing
topology breakdown of the plasmids had changed significantly, something which can be appreciated by visual inspection of the gel images.
ki k2SCC----------------- ► OC/LIN ------------------- ► Sheared pDNA
When describing the events, which it is believed explain both the changes in plasmid
topology and decreases in % recoveries, it helps to consider the kinetics of the mechanisms
which are central to the issue. These are shown above. Also, it is important to differentiate
between the different stages of UF step. Permeation and Diafiltration are conducted when
a TMP is applied across the membrane, whilst during the recovery stages the TMP is
removed. At all times a crossflow is in operation.
It has been outlined how increasing the size of the plasmid causes more OC form to be
generated during the lysis regime, such that for increasing plasmid size kj is greater.
During the lysis regime there was no evidence of k2 being in effect, since none of the gels
show the presence of sheared pDNA at this stage.
During the UF operation stage (permeation/ diafiltration) a TMP was applied across the
membrane. It is reasoned at this stage k2 was rapid at both crossflow velocities due to the
action of hydrodynamic shear. Consequently, the OC/Linear forms were sheared to
fragments ~15kb in size (Figure 9-10 and Figure 9-11). Due to the TMP these fragments
were able to penetrate the membrane and escape the process. However, it is also believed
that during this stage k} was low, due to the smaller hydrodynamic diameter of the SCC
form and the relative protective environment of the gel layer. The high rate of k2 and low
rate of kj would explain why %SCC would increase. This also means that the recovery of
plasmid from the membrane becomes a function of the proportion of the plasmid loaded
on in OC form. Since a higher proportion of the larger constructs were converted from
SCC to OC form during the lysis step meant that the yields of these constructs would be
correspondingly lower, a fact reported in Figure 7-3A. The OC form having been sheared
would have passed through the membrane as short dsDNA fragments and so would not be
accounted.
Thomas Burt 329

7. Downstream Processing
Similarly, it is reasoned that the rate of k2 was high enough at both crossflow velocities to
shear OC plasmid forms, explaining why at both velocities the % plasmid recoveries were similar.
It is believed that this rate differential explains the similar recoveries reported for the
different crossflow velocities and why % recovery decreased with plasmid size, but this is
not a complete explanation. As can be seen from Figure 7-3A and Figure 7-4, although the
% recoveries were similar at both crossflow rates, the resultant topology breakdowns
differ, with the slower crossflow rate reporting higher %SCC form and less sheared plasmid. This again can be logically explained.
At the end of the UF operation stage (by DF2) it is deduced that selective degradation of
the OC/Lin form had occurred at both crossflow velocities. This was sufficient to account
for the similar recovery levels and it is reasoned that the majority of plasmid form in the
plasmid gel-layer, at this stage, for both scenarios would have been SCC. However, the UF
operation stages (Permeation and Diafiltration) were followed by the UF recovery stages
(Retentate, Washes 1 and 2). During these periods the TMP was removed from the
membrane, such that no flow occurred across the membrane, but the same crossflow rates
were in effect. The objective of these steps is to scour the membrane to recover the
plasmid from the gel layer. It is believed that these steps account for the difference in
plasmid topologies witnessed between the two crossflows for every construct. It is
reasoned that during these recovery phases both kj and k2 are in action. Kj would have
been higher because the protective environment of the gel-layer, a result of the applied
TMP, would have been absent. Additionally, it is believed that the magnitude of kj would
have been greater at the faster crossflow velocity of SOOmLmin"1 than 250mLmin'1.
Consequently, more SCC plasmid would have been converted into OC/Lin form during the
investigations employing higher crossflow rates. For the larger constructs, this form would
have been rapidly converted to sheared plasmid form (k2), but because no flow existed
across the membrane these fragments were unable to escape and so were detected.
It is believed that the sequence of events just described occurred with all the plasmids
investigated from the smallest to the largest, the only difference being the rates of the two
processes described. It is therefore maintained that to improve the recovery of plasmid
from a UF membrane, whatever its size, it is important that little plasmid is converted to
OC form during the lysis step. Had this been the case for the larger plasmids it is believed
Thomas Burt 330

7. Downstream Processing
that their recoveries would have been greater. Additionally, it was found that recovery at
slower cross-flow rates would be advantageous to plasmid topology.
7.6.4 Plasmid topology changes over the lysis step
The recovery and topology results from the DSP investigations suggested that the action of
ultrafiltration on OC/Linear plasmid form was particularly damaging. From those results it
was postulated that the majority o f plasmid loaded on to the membrane in OC/Linear form
was degraded to small DNA fragments capable o f penetrating the membrane. This meant
that the recoveiy levels from the UF step were heavily influenced by the amount of OC
form generated during the lysis stage o f the process. Information from the gels suggested
that as plasmid size increased the amount o f plasmid degraded to OC/Linear form
increased. (Figure 9-6 to Figure 9-11)
In this section this degradation o f plasmid form from SCC to OC/Linear during the lysis
step will be investigated.
Figure 7-5A displays the supercoiled proportion of the four plasmids, capable of being
analysed by FIGE, at the end o f the lysis stage o f the investigations. The samples scanned
were those at the Pre-CaCb stage but identical levels of supercoiling were apparent at the
Post-CaCh stage o f the process (Refer to gels Figure 9-6 to Figure 9-11). The plot shows a
very linear decrease in supercoiling with increasing plasmid size. For the smaller
construct, roughly 70% supercoiling was witnessed by the end of the lysis step, compared
1 0 0 -
90
80Ma■2- 70<31C
I 60S 50
1 40o 8 30 * 20
10
0-
% S C C = -1 .1 3 [P la sm id s iz e ] + 7 1 .6
100
90
80
70
60
50
40
30
20
10
010 15 20 25 30 35 40 45 50
Plasmid S ize (kb)
55
5.0x10'3 - - 5.0x10"
4.5x10" -4.5x1 O'k = -dfSCCl [sccy4.0x10"
<29 3.5x10"
-4.0x10
- 3.5x10:
- 3.0x1033.0x10"
g 2.5x10³
g 2.0x10'3O£ 1.5x10³
-2.5x10"
2.0x1 O'3
1.5x10³
1.0x10³
5.0x10"
0.00 5 10 15 20 25 30 35 40 45 50 55
Plasmid Size (kb)
Figure 7-5 Figures describing the degradation of SCC plasmid form during the lysis stages of the DSP operations. Figure A shows the proportion of the different sized plasmids determined to be in supercoiled form at the end of neutralisation reaction (Pre-CaCl2 stage) as determined by densitometric scanning of the gels shown in Figure 9-6 to Figure 9-11. Figure B plots the estimated rate constants for the degradation of SCC topology over the lysis steps for the different sized constructs.
Thomas Burt 331

7. Downstream Processing
to only 15% with the larger 49kb construct. The linearity suggested the action of a first-
order reaction rate with respect to plasmid size. Using the values for plasmid concentration
and the pre-lysis levels of supercoiling, the rate constants could be determined. Figure
7-5 B plots the calculated reaction rate constants for the degradation of supercoiling over
the entire lysis procedure. From the plot it can be seen how the rate constant of
degradation increased from -l^xlO^mmolsL'V 1 for the smallest construct to -4.5x10'
3mmolsL'1s' 1 for the largest construct. This threefold increase in reaction rate explains the
prevalence of OC form for the larger constructs at the end of the process and the subsequent effect on the recovered plasmid yields.
It was known that the increased presence of OC form post-lysis was directly related to the
increased plasmid size. The unknown remained of what caused the increased degradation
of SCC form during the lysis period. It was reasoned that the degradation of supercoiled
form could be caused by two mechanisms; physical shear or chemical degradation since,
both of these could be increasingly likely with increased plasmid size.
Physical shear could be expected to increase with plasmid size since the plasmid molecule
would be larger and hence more susceptible to hydrodynamic shear forces. The causes of
fluid stresses sufficient to degrade plasmid molecules could be found to be due to either
the action of turbulent eddies on the surface of the particle or the deforming effects of
elongational flows. Similarly, chemical degradation could be expected to increase with
plasmid size due to the increased sites for action. One mechanism of DNA chain breakage
in fluid flows has been shown to be a base-catalysed hydrolysis of the phosphate-ester
linkage, where it has been shown that the reaction rate is enhanced by hydroxyl ions
(Adam and Zimm, 1977). In these studies, hydroxyl radicals were found to react readily
with both DNA bases and deoxyribose sugar to generate many different compounds
(Evans et al., 2000). An additional factor which must be considered, is the action of
endogenous endonucleases which could degrade plasmids (Monteiro et al., 1999). It would
be expected that increasing size of plasmid molecules could lead to more sites for their
action. In order to determine which mechanism for SCC plasmid DNA degradation was
the more likely, a more thorough understanding of the mixing conditions in the lysis vessel
was required. This will be the subject of the next section.
Thomas Burt 332

7. Downstream Processing
7.7 Characterising the mixing in the lysis vessel
During the DSP investigations the lysis procedure was carried out in an agitated vessel, a
schematic of which is shown in Figure 7-6. In this section attempts will be made at
describing the mixing conditions encountered during the scaled-down process and what
effects would be predicted to plasmid form. As described in (3.8.3) efficient mixing is a
key parameter in successful lysis. Shear rates must be large enough to promote good
macro and micromixing patterns to ensure rapid blending and dissolution of the NaOH
solution. However, high shear forces may impact negatively on the plasmid structure but
also lead to fragmentation o f genomic DNA creating hard-to-remove gDNA fragments.
Figure 7-6 Schematic of the lysis vessel in which the lysis, neutralisation and CaCl2 operations were conducted.
Ht = Vessel height = 0.19m
Ht Dt = Vessel width = 0.12m
D, = Impeller width = 0.065m
Hj = Height from base = 0.04m
Bh = Blade height = 0.045m
jl, By* = Blade width = 0.014m
Lh = Neutralisation liquid height = 0.128m
7.7.1 Analysis of the Macromixing conditions in the lysis vessel
The lysis operation can be divided into two distinct phases; lysis and neutralisation.
During the first phase the cell membranes are solubilised by the SDS, and the DNA and
protein denatured by the sodium hydroxide. The release of the intracellular contents causes
a dramatic increase in the fluid viscosity and the fluid assumes non-Newtonian,
pseudoplastic behaviour, which makes describing the mixing conditions complicated. The
addition of the potassium acetate neutralises the solution and causes the precipitation of
the majority of the intracellular contaminants. This precipitation leads to a dramatic
decrease in the fluid viscosity as it returns to a value close to that of water and displays
highly Newtonian behaviour.
Thomas Burt 333

7. Downstream Processing
When characterising mixing in stirred tanks it is common to describe the efficacy of the
operation by calculating the mixing time. Mixing time is defined as the time required to
achieve a prescribed degree of homogeneity of the vessel contents, and is dependent on the
level of macromixing or distribution of fluid in the vessel. However, the objective of this
lysis operation was the blending of two miscible fluids {cell suspension + lysis buffer and
cell lysate + neutralisation buffer) and as such the measure of mixing time is less useful in
describing the operation. More useful is the blend time or macroscale mixing time, which
is a measure of the time taken to blend two fluids to a predetermined degree of
homogeneity, in this case set to 95%. Blend time (0) in turbulent regimes is a constant,
independent of Reynolds and Froude numbers, and dependent only on vessel and impeller
geometry. In the transitional regime, where Reynolds value lies between 10 and 20,000,
the local blend time in the impeller region is the same as the vessel blend time for the
turbulent regime, but becomes extended when recording local blend time at the vessel
wall. Ultimately though, the local blend time at the wall controls the blend time for the
entire vessel (Paul et al., 2004).
Additional to this, blend time is viscosity (p) dependent, a factor which is constant in
Newtonian fluids but shear rate dependent in viscoelastic fluids of the type encountered
during the lysis operation. Consequently, since viscosity is a function of the shear rate,
slower blending will occur in the regions of low shear typically found furthest from the
impeller, such as the vessel wall. Ultimately, this means that the overall blend time of this
operation was dictated by the viscosity and macromixing conditions at the less well
agitated regions of the vessel wall. Therefore, to estimate the blend time for a non-
Newtonian fluid, the appropriate shear rate at the vessel wall must be identified and the
blend time can then be estimated using Newtonian correlations.
In order to estimate the blend time, the rheological properties of the lysate needed to be
understood. This was achieved using data from (Ciccolini et al, 1999) where they listed
the steady-state viscosity of lysate fluid, prepared from E.coli C600/pR26 suspension, at
various shear rates. A plot of these results (Figure 9-12) suggests a power law relationship
between the viscosity and shear rate. From the curve, the values for K (consistency index)
and n (flow-behaviour index) could be extracted. (Metzner A.B and Otto R.E., 1957)
described how shear rate is directly proportional to agitator speed using an impeller
dependent constant k.
Thomas Burt 334

7. Downstream Processing
Using the obtained values and relationships it was possible to estimate the blend time in
the vessel used for lysis in both the lysis period of operation (cell suspension + lysis buffer) and the neutralisation period of operation {cell lysate + potassium acetate). The
calculations performed are detailed in Table 1-5. The calculation for the blend time in
these stages used derivations described by (Grenville, 1992; Paul et a l, 2004). Estimating
the blend time taken to reach 95% homogeneity during the lysis step was based upon the
premise that the blend time for viscoelastic fluid mixing is governed by the rate limiting
point furthest from the impeller region, where mixing and so shear rates are at the lowest.
The calculation makes use of a correlation for estimating shear rate at the vessel wall
derived for the agitation of shear-thinning fluids in torispherical bottomed, baffled vessels
as described by (Grenville, 1992). The blend time was then calculated using equations
derived for Newtonian fluids in transitional regimes (Paul et al., 2004). The calculation for
blend time for the neutralisation step was more straight-forward, since Newtonian
behaviour was assumed and hence constant viscosity. A value was placed upon the
viscosity of the neutralised lysate at 1 0 -fold greater than water, in order to place an upper
value on blend time.
Considering the lysis stage first, it can be seen that the time estimated to blend the two
fluids to 95% homogeneity is 24.5 minutes. This value is close to the 30 minutes actually
employed for the mixing during the experimental protocol. However, the estimation placed
upon blend time is probably an underestimate since it uses historical data from (Ciccolini
et al, 1999) for the rheological properties of cell lysate. In that study the cells were
resuspended to ^gL^W C W , whereas in these studies the value was 162gL‘1WCW. The
higher cell concentration would tend to increase the overall blend time. Certainly, the
blend time was observationally verified, as even late into the lysis operation (~2 0 mins)
distinct ‘sections’ of the bulk fluid could be seen to be poorly mixed. Similar blend time
analysis during the neutralisation stage estimated the required period to reach 95%
homogeneity to be just 1.3 minutes. The difference at this stage of the process was that the
viscosity of the fluid was assumed to drop to O.OlmPas, since the majority of the
macromolecular species responsible for the viscoelastic behaviour during the lysis stage
were precipitated out. Additionally, the fluid was assumed to be Newtonian in behaviour.
However, the predicted rate of operation is much quicker than measured experimentally
and may be due to the fact that the calculation assumes the viscosity of the
Thomas Burt 335

7. Downstream Processing
Table 7-7 Table outlining the calculation of the blend time of the two steps of the lysis procedure. For the lysis stage the calculation involved determination of the shear rate at the vessel wall and so the apparent viscosity. From this value the blend time could be calculated using traditional Newtonian correlations. Because during the neutralisation procedure the fluid was assumed to display Newtonian behaviour and constant value for viscosity could be used. This constant value was assumed to be 10-fold greater than water to place an upper value on the blend-time for the neutralisation operation. Furthermore, the value for density of the lysate solution was taken as being llOOkgm’3. All equations used are described in (Paul et aL, 2004; Grenville, 1992)._________________________TERM EQUATION LYSIS NEUTRALISATION ||Reynolds (pseudoplastic fluid) at impeller
R e,= rp N ™ D * )k in~') K
124.1
--------------------------------
N/a
Reynolds(Newtonian) Re = p N ,
)N/a 774.6
Torque on shaft (A) A = f P , p N ) D )
v 2* .)1.13xlO‘3Nm 0.72x1 O'3 Nm
Shear stress at vessel wall (tw) Tw = 1 A 1 0.403 Pa N/a
1 .622
Shear rate at vessel wall (yw) Yw =
f i r )1.54 s ] N/a
Apparent viscosity at wall (pw) / v = ( * r ‘r 1>) 262 mPas N/a
P0 1/3 x Reynolds number at vessel wall
Re„. = P '" 3( p N , D f '|< Mw j
37.1(transition) 838.8 (transition)
Fourier number at wall (Fow)
1 f / T R e ^0.203 4.58
jF o w 183 JFourier number at wall (F0w)
1
Fow( p * \\.Mw 9 )
0.0411 2 1 . 0
Blend-time (0)f
e =V
pD } 1 Pw {VFo,
24.5 mins 1.3 mins
solution dropped immediately upon addition of the neutralising agent. In practice this was
not the case since the final viscosity of the solution would only be reached upon homogeneity. It was also noted that once the potassium acetate solution was added a distinct, clear layer at the base of the vessel, with the lysate solution above, was formed by virtue of the higher density of the neutralisation buffer (1143kgm'3 at 25°C). The compartmentalisation of the lysate and neutralisation buffer meant blending took much longer, despite the use of an up-pumping, mixed-flow impeller which transported material
across the interface.
Thomas Burt 336

7. Downstream Processing
7.7.1.1 Conclusions
To conclude the macromixing analysis requires assessment of the efficacy of each of die
steps. The long blend time for the lysis was verified observationally and the blend-time for
the neutralisation reaction was found to be far longer than predicted. Predicting bulk
mixing during cell lysis and neutralisation is known to be difficult because of the large
viscosity changes and density differentials causing compartmentalisation during the
neutralisation reaction. By way of a comparison, the calculated blend-time for two
solutions with similar p and p to water, in the same vessel, was determined to be 8.5s. This
value was found to be comparable to the experimental result using coloured, aqueous
solutions.
In all, the long periods required for bulk mixing can only be assumed to be detrimental to
plasmid quality. Several reports link extended lysis periods to decreases in plasmid
supercoiling (Clemson and Kelly, 2003; Meacle et al., 2004; Sayers et al., 1996).
However, analysis of the bulk mixing conditions does not help in determining whether the
decrease in supercoiling witnessed is a result of a physical or chemical mechanism, just
that the extended periods of operation required make more likely the effect of either to
occur and to increase their impact. Further analysis of the micromixing conditions and
shear forces in the vessel are required and are the subject of the next sections. In all it has
to be reasoned that if this lysis vessel were to be scaled-up, on a constant power to unit
volume ratio, the blend time estimations suggest that the mixing regime and parameters
employed would be far from optimal.
'- J U N1 \ —1
Figure 7-7 Schematic demonstrating the improved flow characteristics of a larger diameter pitched blade turbine (PBT) impeller. Better flow and higher shear rates at the vessel wall would improve the overall blend time (Paul et a l , 2004).
PBTLarge D
However, it is envisioned that two approaches could be employed to reduce the blend
times in the vessel. Increasing the swept diameter of the impeller would improve mixing
by increasing the bulk flow and thus raise the shear rates around the vessel wall.
Thomas Burt 337

7. Downstream Processing
Figure 7-7 sketches out improved flow characteristics expected from the use of a larger
pitched-blade turbine (PBT). A second approach would increase the agitation rate of the
impeller
7.7.2 Analysis of the Micromixing conditions in the lysis vessel
Both the lysis and neutralisation stages involve chemical reactions between two fluids,
which means that it is important to consider the level of micromixing occurring in the
vessel. Micromixing is the mixing encountered on the smallest scales of motion
(Kolmogorov scale, % ) and at the final scales of molecular diffusivity (Batchelor scale,
X,b). Micromixing can be the limiting step in the progress of reactions because effective
micromixing dramatically accelerates the rate of production of interfacial area available
for diffusion. Additionally, analysing the micromixing environment provides information
on the hydrodynamic forces likely to be impacting on particles (i.e. plasmid DNA) at this
scale. This is important since during the lysis and neutralisation operations, the plasmid
product is in the bulk solution and no longer protected from hydrodynamic forces by the
bacterial cell wall.
Table 7-8 details some of the key parameters which impact upon the vessel micromixing
during the lysis and neutralisation reactions. All the values listed describe the situation in
the impeller region, where the shear and energy dissipation rates are at their highest, and as
such represent the most efficacious micromixing conditions likely to be encountered in the
vessel. At the less well agitated areas of the vessel, lower shear rates would mean higher
viscosities, lower energy dissipation rates and so poorer micromixing conditions.
Table 7-8 Table describing the key parameters which influence mixing and reaction on the microscale. The values were all determined for the impeller region of the vessel where the energy dissipation and shear rates are at their greatest. The smaller the turbulent length scales, the finer the scale of micromixing, and the faster the rate of mixing at the smallest scales of motion.
NOTATION MEANINGLYSISSTAGE(100RPM)
NEUTRALISATION STAGE (100RPM)
r?K =<€ t ,
1/4 Kolmogorov's length scale
Eddy size at which viscous forces equal inertial forces
288pm 38pm
t K =' 2 N
Vk
<e T J
1/3Kolmogorov’s time scale
Time taken to dissipate the energy contained in the smallest eddies
4.8ms 1.6ms
Thomas Burt 338

7. Downstream Processing
4==(f Batchelor ’s length scale
Size of a pure ‘drop’ that will diffuse into bulk fluid in time tB
2.7pm 1 .2 pm
.
\ '■ >
' 0 .5 7 * )
, 4 D
Batchelor’s time scale
Time required for pure ‘drop’ of size Lb to diffuse into the bulk fluid. (Micromixing Time imm)
6.9s 0 .2 1 s
Reaction rate (kr)(mols L 'V 1)
(a) HCl+NaOH(b) CH3COOH + NaOH
(a) 1.4x10" (b) 4.7x101
Da = krC0tK
Damkoehler number (Da)
Ratio of mixing rate to reaction rate. Values <0.02 imply reaction is limiting.
1 .6 x l0 8 0.0144
7.7.2.1 Micromixing environment during lysis
During the lysis step the maximum shear rate at the impeller was calculated using an empirical correlation (Paul et al., 2004) that suggests the maximum shear experienced at the impeller is roughly equal to 150N, giving a value of 2.5x10²s'1. This rate is -1000-fold lower than the shear rates at which plasmid supercoiling is damaged (Levy et al., 1999b). Indeed others report that shear rates of this magnitude have no adverse effects on plasmid supercoiling and do not cause further fragmentation of the genomic DNA (Meacle et al.,
2004; Chamsart et al., 2001).
Using the maximum shear rate the apparent viscosity of the lysate fluid at the impeller region was estimated at 19mPas. Ultimately, this meant that the Kolmogorov microscale of turbulence, and therefore the size of the smallest eddies, was ~300pm. Such relatively large sizes are a direct result of the high viscosity of the system causing viscous damping, such that the inertial forces of the fluid in motion would have been quickly dissipated in
the fluid.
During the lysis procedure the cell suspension was mixed with the sodium hydroxide/ SDS solution with the aim of solubilising the cell membranes and raising the pH of the solution, in order to denature macromolecules. The pH and molarity of the neutralisation solution was 14 and 0.24M respectively, decreasing to -12 and 0.13M upon reaching full homogeneity with the cell suspension. It has been demonstrated that during lysis,
Thomas Burt 339

7. Downstream Processing
irreversible denaturation of plasmid molecules occurs if they are exposed to pH’s >12.5 and molarities >0.15M (Meacle et al., 2004; Thatcher, 1997).
This means that a key process objective is the rate at which the sodium hydroxide enters
the bulk solution; a faster rate being desired to avoid creating localised regions of high pH
in the vessel, where plasmid molecules could be denatured.
Using the value for the diffusion coefficient of sodium hydroxide in water at room
temperature of 1.51xl0'9m2s‘1 (Coulson et al., 1996), the size of the Batchelor length scale
could be estimated. Below this size ‘drops’ of sodium hydroxide are small enough such
that diffusion becomes the driving force for mass transfer. Because of the relatively high
diffusivity of sodium hydroxide in water, the Batchelor length scale is larger than the same
value for acetic acid in water (Coulson et al., 1996). However, the time taken for a ‘drop’
of this size to diffuse into the bulk fluid, the Batchelor time-scale (ts) (or micromixing
time) is much longer than for the neutralisation reaction. The reason for this being that the
Batchelor length scale is proportional to the square of the size of the smallest eddy, so as
t]k increases the time taken for the NaOH to diffuse into the bulk solution increases
rapidly. Ultimately, the viscous damping occurring during lysis results in rapid dissipation
of the fluid energy, increasing the size of t|k and so extending the diffusion time for
NaOH. The resulting micromixing time scale is reliably assumed to be longer than the
reaction rate, so as the Damkoehler number suggests, micromixing is the limiting factor in
the lysis reaction. The estimation of the Damkoehler number assumed that the lysis
reaction is rapid once the NaOH is in the solution, the figure of 1.4xlOnmolsL'1s' 1 being
typical value for a neutralisation reaction (Paul et al., 2004). With such a fast reaction rate,
micromixing will always be limiting irrelevant of the mixing conditions as for the reaction
rate to become limiting r|K would need to be ~ 1 0 ‘19m, which would be impossible.
Even though the micromixing would always be the limiting factor in the lysis reaction,
reduction of the Batchelor time scale would be an effective way of lessening the
heterogeneity of the NaOH and so reduce the exposure time of plasmid molecules to high
NaOH molarities and pH’s. Because of the square relationship between the r}K and the time
taken for a drop of size XB to diffuse into the bulk fluid, reducing the size of r|K would have
a large impact on the diffusion rates. Figure 7-8 describes the estimated impact of
increasing the agitation (shear) rate on some of the key parameters influencing macro and
micromixing during lysis. The graph shows the dramatic improvements expected in blend
Thomas Burt 340

7. Downstream Processing
300- Calculated Blend time (mins) A pparent viscosity at impeller (mPas) Batchelors time sca le (s)
Kolmogorov length sca le (>im)- 250 -
2 0 0 -
150 -
100 -
5 0 -
- 0
100 [250s-1]
Current Operation
200 300
Agitation rate (rpm) [maximum shear rate]
400 500[1250s’]
Figure 7-8 Schematic displaying thecalculated impact that increasing the agitation rate would have on some of the key parameters affecting macro- andmicromixing during the lysis operation. A constant power number was assumed during the regime since the Reynolds number at impeller did not exceed 103.
time, Kolmogorov’s length and micromixing time scale, which can be attributed to the simultaneous increase in 8 j and decrease in apparent viscosity of the lysate.
7.7.2.2 Micromixing environment during neutralisation
Referring to Table 7-8 shows that by virtue of the viscosity drop (assumed to be lxlO‘2Pas) the size of the Kolmogorov length and time scales are much reduced than those estimated for the lysis stage. However, because of the slower rate of diffusivity of acetic acid in water (0.88x1 O^mV1 (Coulson et al., 1996)) the size of the ‘drop’ at which diffusion becomes the driving force for mass transfer (Batchelor length scale) is smaller than for NaOH. But, due to the smaller values for r|K the time taken for mass transfer is much reduced. Similar to the situation for the lysis procedure, rapid micromixing is desired in the neutralisation stage as the longer the plasmid molecules are exposed to high pH’s the more chance of irreversible plasmid denaturation. The production of OC pDNA under strongly alkaline conditions due to the alkaline-scission of the phosphodiester bonds in DNA has been reported (Uhlenhopp et al., 1974; Sayers et al., 1996). However, the reported reaction rate of the NaOH-CHsCOOH neutralisation reaction at 4.7x10’molsL'V1
(Paul et al., 2004) is far slower than those seen for strong acid-strong base neutralisation. Because of this, the calculated Damkoehler number for the neutralisation step suggests that the reaction rate and not the level of the micromixing represents the limiting step in the reaction. Because of this increasing the level of micromixing would not improve the
efficacy of the neutralisation step.
Thomas Burt 341

7. Downstream Processing
7.7.2.3 Conclusions
To conclude requires judging the efficacy of the micromixing encountered during the lysis
operation. The micromxing environment is deemed to be poor. The low shear rate results
in a high apparent viscosity leading rapid viscous damping of the inertial forces of the
fluid. This results in large estimated sizes for the microscale of turbulence which in
ensures long periods are required to achieve transport of the NaOH into bulk solution. The
situation is not as problematic during the neutralisation stage since it is suspected that the
slow rate of the neutralisation reaction is the limiting step. The use of low shear rates is
believed to be favoured during this protocol in order to reduce the possibility of both
damaging plasmid and inducing fragmentation of genomic DNA. However, it is believed
that the low shear rates adopted have a more damaging effect by virtue of creating poor
conditions for mass transfer.
7.7.3 Characterising the possibility for shear induced plasmid damage during lysis
When considering shear damage to biological particles it is commonly accepted that if the
particle is smaller than the Kolmogorov length scale then shear damage is unlikely, since
under these conditions eddies will be larger than the particles and so would be entrained
within the eddy. If the eddies are smaller than the particle then they would act on the
particle surface and induce relative motion, possibly resulting in damage. This reasoning
does not include the possibility of elongational flows, present in all fluid in motion,
causing shear damage, but these are rarely studied.
To understand whether the size of the smallest eddies induced by mixing in the impeller
region were small enough to inflict damage on the plasmid DNA, the hydrodynamic
diameter of the supercoiled plasmid molecules needs to be known. It is quite hard to place
an exact figure on this value.
the size o f the plasmid moleculesFigure 7-9 Electronmicrograph of a supercoiled 6kb plasmid molecule represented on a 2D surface from (Levy et a l 2000b) with a measured hydrodynamic diameter ~500nm. Length of plasmid DNA is (6000x 3.4A) is 2pm, meaning thehydrodynamic diameter is roughly 3/4 plasmid diameter.
Figure 7-9 shows an electronmicrograph of a 6kb plasmid with a measured hydrodynamic
diameter of 500nm. It is known that B-DNA rises 3.4A with each base pair (Voet and
7.7.3.1 Estimating
Thomas Burt 342

7. Downstream Processing
Voet, 1995), giving this plasmid a total linear length of 2pm. If this represents the plasmid
circumference then the outstretched diameter would be 636nm. and as such means the
hydrodynamic diameter is —3/4 the total plasmid diameter. However, this assumes a
maximum value, since the plasmid molecule is splayed out on a 2D surface. In solution, it
could be expected to be a more tightly coiled three dimensional structure.
To estimate the approximate dimensions of the plasmid when in solution, it could be
assumed it behaves like a globular protein and adopts a spherical morphology. By such
logic and knowing the density of supercoiled DNA to be 1.709gcm'3 (Davidson, 1972) and
the molecular weight of the plasmid, the particle diameter can be calculated. The
calculated diameter for the 6kb plasmid becomes 19.4nm. Obviously, the difference
between the calculated value and the value obtained from the electronmicrograph is very
large.
The problem with both measures is that each makes assumptions about the state of the
plasmid in solution. The maximum measure assumes that the diameter is that of the
plasmid molecule when splayed out on a 2D surface, whilst the calculation method
assumes that the topology of the plasmid molecule is such that it forms a tightly coiled
ball. However, the chemical composition of DNA makes the thermodynamics of this
assumption unlikely. The phosphate groups forming the backbone of the DNA are charged
molecules and as such will be hydrophilic.
350 -|
300 - y = 16.017x°'7489 R2 = 0.9895250 -
» 200
• 150 -
100 -
P la sm id size (kb)
Figure 7-10 Schematic of the different radii used to describe the size of a globular protein; lysozyme. RG is the radius of gyration (root mean square radius) and is a measure of the mass distribution of a molecule around its centre of mass. RM is the particle radius calculated from knowing the density of the molecule. RH is the hydrodynamic radius and represents the full radius of the particle including the solvation shell. Rr is the radius of rotation and describes the maximum radius of the particle when rotated. Figure B shows the linear fit of the three data points produced for the Rc of three plasmids of different sizes from FFF.
Thomas Burt 343

7. Downstream Processing
For the molecule to assume its lowest energy state these groups would need to be solvated and as such be exposed to the bulk solution. This situation differs from globular proteins, which contain hydrophobic amino acids, and so the thermodynamics of the system force the protein molecule to assume a tightly coiled configuration. Structural analysis of plasmids is complicated by the conceptual belief that the plasmid molecule would assume a more tightly coiled formation with associated water molecules trapped within the supercoiled structure.
An estimate can be placed on plasmid size using information gained from field-flow fractionation (FFF). Three large plasmids of size 16kb, 33kb and 49kb were run once on such a system. It should be mentioned that the data is very limited.
Field-flow fractionation outputs the root-mean square radius of the particles under study. This is a size value weighted by the mass distribution about the centre of mass of the molecule, also known as the radius of gyration. The root mean square radius is not necessarily representative of globular protein size, though for a plasmid since its tertiary structure will not be as compact as a globular protein, it may provide a more useful measure. Ultimately, what has to be considered when estimating the size of plasmids using the various methods is that it cannot exceed the size of the bacterial cell it as synthesised in
i.e l-2 pm.
Table 7-9 Predicted plasmid diameters calculated by three different means. The linear length of the plasmids was calculated knowing that B-DNA increases by 3.4x10'10m per base pair. The maximum diameter was calculated by assuming that it was 0.75 that of the plasmid diameter as suggested by electronmicrograph data. The minimum diameter was calculated from the density of supercoiled DNA and assuming it coiled similarly to a globular protein. The root mean square diameter was calculated from a standard curve generated by analysing samples by field-flow fractionation. The shaded areas display predicted sizes which would not be feasible since the size of a bacterial cell is known to be 1- 2pm.
Plasmid length (kb)
Linear length (pm)
Max. supercoiled diameter (nm)
Min. supercoiled diameter (nm)
Root mean square diameter (nm)
2 0.68 166.5 13.5 53.8
6 2.0 500 19.4 122.6
10 3.4 832.5 23.1 179.7
20 6.8 1,665.0 29.0 302.0
40 13.6 3,330.0 36.6 507.5
80 27.2 6,660.0 46.0 852.8
100 34 8,325.0 49.7 1,007.9
116 39.4 9,657.0 52.2 1,126.4
Thomas Burt 344

7. Downstream Processing
Table 7-9 details the diameters of various sized plasmids estimated by the three methods.
The maximum measure assumes that the plasmid diameter is 0.75 its outstretched diameter
but the values estimated soon reach levels unsustainable by the bacterial cell. The
minimum values predicted for plasmid size, by calculating the particle radius from
supercoiled DNA density, are deemed to be too small as the method overestimates
supercoiling by assuming the same level of coiling seen in globular proteins.
The most plausible estimates of plasmid diameter are those provided by FFF. From these
estimates the predicted plasmid diameters reach a level of just over 1 pm for the largest
constructs. These values will be taken as the closest estimates but are themselves subject to
large variations depending on the system in which the plasmids are in, for instance
changes in the ionic strength of the buffers are known to have large effects on the plasmid
diameters (Schlick, 1994). An interesting analysis produced from these size assumptions is
that for a 116kb plasmid (i.e. p5176) there exists only enough physical volume in a 1 pm
radius bacterial cell to accommodate 6 constructs, which could give an indication of the
maximum level of copy number.
Having estimated the plasmid sizes being investigated to be ~lpm, it can be stated that
they are smaller than the Kolmogorov length scales witnessed in the impeller region
during the lysis and neutralisation stages (Table 7-8) and as such would be unlikely to be
sheared by these forces. However, it must be expected that if the plasmid molecules were
to lose a degree of supercoiling when released into solution, a possibility due to changes in
the ionic/biological environment, then it does not take much to extend the diameters of
these molecules to very large sizes, in the order of 1 0 pm, such that shear forces would be
effective. This acknowledgment has ramifications for the UF step where selective
degradation of the OC plasmids form was witnessed. It is hypothesised from these size
estimations that the size difference between the SCC and OC plasmid forms becomes
greater with the increased linear length of the pDNA molecule. As such in the higher shear
environment of the UF membrane the outstretched OC plasmid forms were within the size
ranges of hydrodynamic shear but that the compacted nature of the SCC forms meant that
these particles were below the size range of hydrodynamic shear and thus were relatively
unscathed.
Thomas Burt 345

7. Downstream Processing
7.7.4 Conclusions
To conclude this section requires assessment of the mixing conditions created in the vessel
and deciding on whether the degradation of SCC—>00 plasmid form, witnessed during the
lysis procedure, was the result of a physical or chemical action. It has to be reiterated at
this point that whilst a decrease in SCC plasmid topology was witnessed for the smaller
plasmid (3.2kb) the issue only became more apparent for the larger constructs. As such, it
must be appreciated when assessing the conditions used for this lysis procedure, that they
were deemed to be sufficient for plasmids in that size order (3-1 Dkb). It is only during
these recent investigations, utilising larger plasmids that the efficacy of this lysis
procedure needed to be questioned. Analysis of the macromixing found blend time to be
extensively long in both the lysis and neutralisation steps. The long periods estimated to
achieve 95% homogeneity, at the conditions employed, were found to be required in
practice. The blending of viscoelastic fluids will continue to be a difficult problem due to
the large increases in fluid viscosity. Again, despite evidence showing that extended
exposure to alkaline environments can lead to OC generation, the magnitude of the
problem may not have been apparent with smaller plasmids. However, it is believed that
the extended periods required to reach homogeneity have a more detrimental effect when
processing larger constructs.
Similarly, the micromixing conditions were found to be far from ideal during the lysis
period of the process. It was estimated that due to viscous damping, sizes of the smallest
eddies were ~300pm. Due to the square relationship which exists between the sizes of
these eddies and the resultant micromixing time, the time required for the NaOH to diffuse
into the bulk solution was extended. The only result of this is that at the microscale,
plasmid molecules would have been exposed to regions of high pH and NaOH for longer
periods, a detrimental occurrence. During the neutralisation reaction the situation with the
micromixing environment was deemed to be less of a problem as it was suggested that the
actual reaction rate rather than the micromixing was the limiting step.
Overall it is felt that the mixing conditions employed during the lysis procedure are sub-
optimal. The low shear rate is at the heart of the poor macro and micromixing. It is
suspected that the protocol is too cautious in the belief that the lower the shear-rate, the
less likelihood of fragmentation of gDNA and plasmid shearing. However, it is believed
that the shear rates required to cause those problems are far above those employed in this
protocol (Chamsart et al., 2001; Meacle et al., 2004).
Thomas Burt 346

7. Downstream Processing
Characterising the potential for physical damage to the plasmid molecules by
hydrodynamic shear, required estimation of the plasmid diameter of the constructs under
investigation. The values thought best to represent the sizes were determined by FFF and
suggested that the supercoiled plasmid form of all the constructs were < 1pm. At such
sizes the plasmids were deemed to be out of the size range of the smallest eddies (~40pm)
calculated to be generated during the neutralisation. It was also established by these
analyses that as linear plasmid DNA length increased the estimated sizes for OC plasmid
form could be expected to become very large indeed ~10pm. It is reasoned that these large
size increases lie at the heart of the issue surrounding selective OC degradation during UF.
In all, it is believed that the SCC to OC degradation witnessed during lysis was largely the
result of chemical action rather than a physical mechanism. Both the macro and
micromixing analysis suggested poor mixing conditions were generated, meaning that the
plasmid molecules would have been exposed to high molarities and pHs for the long
periods required to blend. This would not necessarily been apparent when processing
smaller plasmids but certainly became more so with the larger constructs. Secondly, the
impact of hydrodynamic shear was estimated not to be in the region to cause damage to
the plasmid molecules. These suspicions are backed up by visual inspection of the gels of
the lysate samples. The gels describe an accumulation of OC and in the cases of the larger
plasmids linear plasmid form during lysis. Conceptually had this been caused by physical
shear then it is reasoned that the process would not stop there, but the OC/ Linear forms to
would have been further sheared to fragments, as occurred during the UF step. This would
be expected since the hydrodynamic diameters of the OC/Lin forms would be larger than
the same plasmid in SCC form and so more prone to shear degradation. The fact that this
degree of shearing was not witnessed suggests the action of more precise degradation of
the type expected from chemical degradation. The reason that the extent of degradation
would increase with plasmid size, is thought to be unrelated to the actual physical size of
the plasmids and more to do with the increased linear length of DNA providing an
proportional increase in the number of sites for degradative action.
So in short, poor mixing conditions leading to extended mixing operations and poor mass
transfer led to the plasmid damage by a chemical mechanism. The exact mechanism is
unknown but likely to be due to the combination of alkaline-scission of phosphodiester
bonds (Adam and Zimm, 1977) and the endonucleases actions of endogeneous DNases
(Monteiro et al., 1999).
Thomas Burt 347

7. Downstream Processing
7.8 Balances of the major contaminants
The main aim of this downstream process is the recovery and concentration of the desired plasmid product, but of equal importance is the purification of the product away from any
contaminants. One of the main aims of conducting these downstream investigations was to monitor the clearance levels of the major contaminants encountered when processing plasmids. As such samples taken during each of the 24 runs were analysed by BCA, Quant-IT and qPCR in order to quantify the levels of dissolved protein, RNA and genomic DNA. In this section the levels of removal exacted by the process will be presented and judged. Judgement will be made against the criteria required for plasmid release as shown in Table 7-10.
Table 7-10Specifications required for release of plasmid DNA (Ferreira et a l, 2000c; Zoon, 1996)
Specification Acceptance criteria Analytical methodPlasmid
Appearance Clear, colourless solution Visual inspectionIdentity of
plasmidRestriction map, sequence homology
Restriction mapping, PCR
Plasmidhomogeneity
>90% supercoiled (SCC) form Agarose gel + densitometry
Plasmid According to application A260, HPLC, Fluorescenceconcentration
Potency According to application Cell transfection studiesImpurities
Protein Not detectable, <0.0 lpg/ dose BCA assay, SDS-PAGERNA Not detectable 0.8% Agarose gelgDNA <0.05 pg/ jig plasmid,
<0.01pg/doseSouthern blot, qPCR,
Endotoxins 0.1 EU/ pg plasmid, <5EU/kg body weight
Limus ameobocyte lysate (LAL)
It should be noted that the results displayed in this section are the averages of the runs conducted, the full breakdowns for each run can be seen in the respective mass balance (Figure 9-31 to Figure 9-49). Averages were taken for the masses of the contaminants at the respective points of the process for all runs excluding the controls. The controls were excluded since they utilised a different mechanism of RNA removal, involving the addition of RNase (a protein), and as such were thought to be unequivalent. It was deemed that the other runs were equivalent since they made use of identical batches of cell paste. Taking averages in this way allowed for comparison between the different crossflow rates
Thomas Burt 348

7. Downstream Processing
on contaminant clearance. As such, each point recorded is the average of 10 individual
runs, and the value for each of those points is the average of multiple assay results.
7.8.1 Genomic DNA
It has been reiterated several times in this report about the importance of demonstrating
clearance of genomic DNA during plasmid production, as well as highlighting the unique
difficulties presented by this contaminant (Ferreira et al., 1999). The philosophy of any
downstream process is to employ appropriate techniques which enable separation by
exploiting any differences either physical (e.g. size, charge) or chemical (e.g. solubility,
binding) between the desired product and the contaminants (Bailey and Ollis, 1986). As was demonstrated in the analytical section of the report, in this project recording the
relative amounts of plasmid DNA and genomic DNA was troublesome. With high-copy
number plasmids the importance of this was reduced, since the plasmid DNA was
commonly far in abundance of gDNA in the samples used for analysis, and so the presence
of gDNA could be ignored. However, with low-copy plasmids this was not the case.
Fluorescence and absorbance techniques were found not capable of distinguishing between
pDNA and gDNA. Similarly, with HPLC, although the impact of gDNA was reduced,
small amounts were still found to co-purify with the plasmid DNA. In all, this anecdotal
evidence displays the problems faced in removing this contaminant, in that for most
criteria, gDNA and pDNA are essentially identical molecules, making separation
troublesome.
The greatest selective removal of gDNA is achieved across the alkaline lysis step, which
exploits a differences connected to the relative size and form of pDNA and gDNA. Due to
the larger size of gDNA, when denatured during the lysis step, it is unable to re-anneal
properly when the solution is neutralised. However, due to the smaller size of pDNA and
its circular conformation, it is capable of re-annealing properly. Due to this behaviour
pDNA returns to soluble form upon neutralisation, whilst the amorphous mass of
mismatched gDNA does not and so is precipitated out (Bimboim and Doly, 1979; Ferreira
et al, 2000c). However, this removal is not complete as small fragments of gDNA can be
found dissolved in the neutralised solution. It is these fragments that present the problem
to the steps downstream of lysis. The creation of these fragments is an inherent drawback
with the alkaline lysis procedure, however, there are no alternative methods which have
been shown to outperform this step, which is why it is the industry standard..
Thomas Burt 349

gDNA
m
ass
(mg)
7. Downstream Processing
1000
100
10
1
0.1
0.01
0.001
.o 'Figure 7-11 Figures outlining the step removal of gDNA during these investigations. The results represent the averages of the 10 individual runs for each crossflow rate (Table 7-5). The results for the individual runs are shown in the mass balances and each point in those was determined by quadruplicate analysis of samples by qPCR. The pre-lysis values were obtained by sonication of a 1.56gL_1 sonication of the relevant cell paste and subsequent qPCR of the lysate. The starting masses were then calculated by knowing the WCW of each of the individual DSP runs.
However, one of the most important considerations when optimising the alkaline lysis stepis that the shear rates employed do not lead to fragmentation of the precipitated floe andthe associated increase in gDNA fragments such an event would cause.
Figure 7-11 details the results of the investigations into the removal of gDNA through the downstream process. Whilst not a full mass balance, the data is useful in describing the clearances produced by the process. At the outset, the total mass of genomic DNA was determined to range between 500-700mg. The large difference between the two starting masses for the different investigations is reasoned to be due to variations produced by the analytical procedures, since the cell paste in which the investigations were conducted upon were deemed equivalent. The difference is not too problematic since the different investigations are also compared on a proportionate basis taking the initial value as 100%. Taking the average value of 607mg and knowing that the average mass of cells lysed was
42g4 produces a value of 1.44% (w/w). This is larger than the value listed in Figure 7-2,
taken from (Ferreira et al., 2000c), but values do vary. (Bailey and Ollis, 1986) place the value at 1% (w/w). In all, the figure was deemed acceptable since variation in cell line,
* As outlined earlier, even though the procedure was conducted on 50g o f frozen cell paste, determination of the WCW o f the cell suspension recorded the average cell concentration o f 168gL ! equating to 42g of cells lysed. The difference was reasoned to be due to differences in the dewatering capabilities of the batch centrifuges used for fermentation harvest.
250mLmin*1500m L m in 1
1000
100
- r 0 .0 1
0.001
M A SS(M G ) %PRE-LYSIS 7 0 9 .0 6 1 0 0 .0 0PRE-CACL 3 9 .6 4 5 .5 9
RETENTATE 0 .1 7 9 7 0 .0 2 5 3WASH 1 0 .0 4 8 4 0 .0 0 6 8WASH 2 0 .0 1 4 9 0 .0 0 2 1
TOTAL RECOVERY 0 .2 4 3 1 0 .0 3 4 3CLEARANCE 7 0 8 .8 2 9 9 .9 6 6
500ml/min MASS(MG) %
PRE-LYSIS 5 0 4 .9 3 1 0 0 .0 0PRE-CACL 2 4 .8 6 4 .9 2
RETENTATE 0 .0 6 0 8 0 .0 1 2 0WASH 1 0 .0 2 5 2 0 .0 0 5 0WASH 2 0 .0 1 0 3 0 .0 0 2 0
TOTAL RECOVERY 0 .0 9 6 4 0 .0 1 9 1CLEARANCE 5 0 4 .8 3 9 9 .9 8 1
Thomas Burt 350

7. Downstream Processing
extraction methodology and analytical technique could all combine to account for the difference.
It can be appreciated the large removal produced by the alkaline lysis procedure, as the starting ~607mg was found to be reduced to ~32mg in the neutralised lysate. Overall, the
alkaline lysis procedure was demonstrated to remove 94.5-95% of the total genomic DNA. It is reasoned that the remaining gDNA consisted of small dsDNA fragments capable of re-anealing and returning to solution. Whilst this level of removal is impressive the situation is effected by the ratio of genomic DNA to plasmid DNA. As shown by Table 7-11, for all the plasmids under investigation the final specific yields meant that even the large removal was insufficient to take the mass of the genomic DNA below that of plasmid DNA, such that it every case the mass of gDNA exceeded that of pDNA in the neutralised lysate. The factor by which this occurred being dependent on the mass of pDNA in the lysate and so the final specific yield of the fermentations.
Table 7-11 Table showing the mass levels of each of the plasmids at the pre-CaCl2 stage of the process, as described in Figure 7-2. The table also shows the ratio of genomic DNA to plasmid DNA at this stage. Also, detailed is the expected mass of a hypothetical high-copy number construct of 5kb with a copy number of 1000 per cell. The mass value was calculated by determining the mass of plasmid DNA produced from each cell (5.48 xlO*15 g pDNA/cell) and using the calibration curves shown in the fermentation chapter to determine the level of mass expected from a cell suspension containing 42g of cells (2.5xl09cellsmL 1 ~ 16.32gL'! WCW).
Construct Mass of pDNA (mg) in clarified lysate
Ratio of gDNA to pDNA at lysate stage
Genomic DNA 32.25 1pGEM 11 [3.2kbl 3.04 10.6pGEM 16 |16kb] 15.62 2.06pGEM 33 |33kbl 11.87 2.72pGEM 49 [49kb| 7.10 4.54P5176 |116kb| 1.73 18.6pUC [5kb] 35 0.92
By way of analysis the table describes the hypothetical situation for a high-copy number 5kb plasmid existing at a copy number of 1000 at the end of the fermentation. Calculations estimate that the mass of pDNA present in the lysate at the pre-CaCl2 stage for this construct would be ~35mg. As a result of these higher masses it could be expected that for such a plasmid it would exist in excess of the genomic DNA. Obviously, this would be a more favourable position to be in. This analysis goes someway to highlighting the importance of specific plasmid yields to the downstream process. Had the large plasmids demonstrated 100% stability the situation would have been much improved.
Thomas Burt 351

7. Downstream Processing
Indeed higher masses, in the order of 100-200mg of plasmid in the lysate at this stage
could be obtainable, depending on the construct and the fermentation strategy employed
(Chen et al., 1997). The result of obtaining these higher masses would mean that plasmid
DNA was far more in excess of gDNA than the situation encountered with these constructs.
Further processing led to reductions in genomic DNA. It has been reported that some
gDNA removal (especially denatured gDNA) would be likely over CaCh addition step,
but no data is available to state this definitively for these investigations (Eon-Duval et al., 2003a). Certainly, the UF step removes a large proportion of the remaining gDNA
fragments. The logic behind this step being that the smaller, linear form of the gDNA
fragments allows them to pass through the membrane and so exit the process. The DNA
would have been cleared either during the permeation or diafiltration procedures and as
can be seen by the clearance data the removal is almost total. The permeation of these
fragments is perceived to be comparable to what occurred to the sheared plasmid
fragments during the same operation. The losses described in the plasmid section were
reasoned to be due to the small, sheared pDNA fragments being small enough to pass through the membrane when a TMP was applied.
The clearance of gDNA by this process is deemed to be good, in that both situations
>99.9% of the gDNA is removed. As can be seen from the gDNA clearance data and as
will be described with the other contaminants, higher proportionate clearances were
achieved during using the higher crossflow velocity of SOOmLmin'1. It is reasoned that due
to the greater scouring effect of the faster crossflow rate, the resultant equilibrium
thickness of the gel layer would have been smaller (Damon et al., 2003; Butler et al., 2000). A direct result of a thinner boundary layer would be improved transport of material
across it. Since at the boundary layer mass transfer becomes a diffusion driven process, the
narrower layer produced during faster crossflow operation, would allow more material to
cross and be cleared from the process.
A final level of information to be extracted from the clearance data is the final co-recovery
levels of gDNA. Although both procedures resulted in >99.9% clearance, the amount of
gDNA co-recovered from the UF step with the plasmid product has very important
implications. It is important that the UF stages of this process remove the majority of
gDNA, since following the UF step the plasmid recovery fractions are subjected to anion-
exchange chromatographic purification. Although there are more sophisticated
Thomas Burt 352

7. Downstream Processing
chromatography systems being developed for plasmid purification (Diogo et al., 2005), the one utilised in this process is a packed bed TMAE resin. It is accepted, that due to the
relatively unsophisticated nature of anion-exchange chromatography and the
physicochemical similarities of gDNA and pDNA, that no great clearances of gDNA can
be expected from this step. By personal communication (Cora Henwood, GSK) it has been determined that 0.5log clearances are the best that can be achieved.
For argument’s sake it will be assumed that the levels of gDNA recorded to be co-purified
along with the plasmid at the end of the UF step, represent the final situation. Regarding
Table 7-10 shows that the specifications for plasmid release require the gDNA
contamination to be below 0.05 pg gDNA/ pg pDNA. However, industry pressure is
leading to further stringency, such that processes should be able to demonstrate clearances
down to 0.0lpg gDNA/ pg pDNA (personal communication). These clearances have implications to this process as the data suggests that the average co-recovery of gDNA was 96.4pg gDNA for the 500mLmin"1 operation but 243.lpg gDNA for the 250mLmm1
procedure. These results can be used to estimate the limits of this process. Using the lower value (96.4pg) means that to be acceptable the total plasmid recovered must be 9.6mg. If
80%* recovery of plasmid is assumed across the process then this requires a starting mass
of pDNA in the lysate to be 12.05mg, which assuming 42g of cells are lysed, equates to a
specific yield of 287pg pDNA / gWCW. From the calibration curves outlined in the
fermentation chapter, it was found that lg WCW ~ 1.5xlOn cells. As such, the specific
yield equates to 1.9lx l0 ' 15 g pDNA/ cell, a mass equivalent to 1.15xl09Da of
extrachromosomal DNA. Since lbp ~ 660Da, the total amount of extrachromosomal DNA
required, per cell, is 1.75xl06bp. This value represents the lower acceptable limit of this
process, if each of the cells produces pDNA at values below this level, then the clearance
of gDNA exacted by this process will be insufficient for the plasmid to pass the acceptance
criteria.
The value of 1.75x10⁶bp has important implications in judging whether this process can be
employed to process large constructs. The results from previous sections have highlighted
problems faced with plasmid recoveries and topology changes encountered during
operation of this process for the purification of large plasmids. This result demonstrates a
* 80% recovery was found to be achievable with the 16kb construct and would be expected for constructs smaller than this, as shown by Figure 7-3. However, the recoveries of the larger constructs was found to fall below this level due to the greater abundance of OC plasmid form being created during lysis and subsequently sheared during UF operation. As such, when assuming 80% recovery this should be appreciated and that poorer recoveries would lead to the levels of gDNA clearances being unacceptable
Thomas Burt 353

7. Downstream Processing
physical cut-off point, dictated by the clearance of gDNA, below which the process cannot be operated since the contamination remaining at the end would be too high to pass the acceptance criterion of 0.01 pg gDNA/ pg pDNA.
Figure 7-12 shows the minimum copy number required by plasmids of different sizes such that sufficient pDNA is present at the end of the process such that ratio of plasmid DNA to genomic DNA is above the acceptance criterion for this contaminant. From the graph it can be appreciated that under no circumstances could this process be used to effectively purify the Oxford series of BAC plasmids. Considering the construct p5176 (116kb), for sufficient plasmid material to be present to meet the acceptance criteria (even assuming 80% recovery, which as the process stands is unlikely) the copy number of this construct would have to be ~ 15 per cell. At present the copy number of this construct is deemed to be 1-2 copies per cell and as such way below the minimum acceptable limit. Indeed the situation is not much improved for the other constructs. Referring back to Figure 7-2, the point at which the lower limit of acceptability is demarcated by dashed lines on the graphs plotting plasmid mass and specific yields of the constructs employed in these investigations. It can be seen that only pGEM16 and pGEM33 have specific yields high enough to expect that this process would be capable of their purification. The other constructs fall too low. However, even though the two constructs have specific yields within the acceptable range they are too close to the cut-off point to be likely to be trusted in practice. Consequently, for such a process, specific yields double the limit would probably be required for the process to be deemed operational i.e. ~600pg pDNA/ gWCW.
Figure 7-12 Plot showing the lower level at which this process is capable of operating.
1 0 0 The graph plots plasmid size against the required copy number which must be ensured such that the total mass of extrachromosomal pDNA available for purification exceeds 1.75x10⁶bp per cell. This amount of pDNA is estimated to be
10 required such that the ratio of plasmid DNA to genomic DNA at the end of the process is high enough to pass the acceptance criterion of 0.01 pg gDNA/ pg pDNA.
15 6 7 8 9 10 2 0 30 4 0 50 6 0 70 80 100 200
Log10 Plasm id S iz e (kb)
100
Limiting copy number = 1750*[1/plasmid size]
Thomas Burt 354

7. Downstream Processing
The importance of acknowledging this process constraint cannot be understated for the
production of large plasmids using this or similar processes. The process can only be relied upon to clear a certain majority of the gDNA present, which is reasonably fixed by the
process design. Whether the process is acceptable is reliant on the mass of plasmid
purified from it and as such the mass of plasmid present initially i.e. the harvest specific
yield. If that yield is not high enough, the process, as it stands, would not be capable of
producing a sufficiently pure plasmid fraction. With small plasmids this has been
reasonably unproblematic since the constructs and production strategies have been
designed and optimised to ensure plasmid DNA is maintained at high enough levels, such
that the mass of extrachromosomal DNA exceeds the minimum level. With larger
constructs, such as BACs, the unoptimised nature of their replication elements and their
stringent control means that the levels of pDNA remain below the level acceptable by this process.
Similarly, had the cloned large constructs been maintained at 100% stability, sufficient
pDNA would have been present to reach the minimum requirements. Extrapolation of the
yield and stability data of the larger pGEM33kb and 49kb in Table 6-4 demonstrated that
the specific yields of these constructs if stability were 1 0 0 % specific would have been in
the range of 700-SOOpggWCW'1, and as such above the bOOpggWCW' 1 limit. However,
with the poor stability profile the plasmids it was found that sufficient pDNA was not
being produced per unit mass of cells.
A final caveat must also be outlined. The specifications for use of plasmid DNA in
therapeutic applications has been assumed to be 0.01 pg gDNA/pg pDNA. However,
when dosing plasmid DNA it is assumed that for the protocol to be effective the gene
dosing must be conducted on a molar basis. For instance, should 10,000 copies of a
3 kb plasmid be required for efficacy then it can be assumed that the same number of
copies be required for the efficacy of a 33kb plasmid. However, to achieve that level
requires 11-fold more plasmid mass and in conjunction 11-fold more gDNA
contamination will be delivered. Therefore it is fully expected that as the mass required
for dosing increases the demonstrated clearance must also be shown to increase. Such
a fact, more so than any other, could make the therapeutic application of large
plasmids an impossibility.
Thomas Burt 355

7. Downstream Processing
7.8.2 Ribonucleic acid (RNA)
An additional nucleic acid which any plasmid process needs to demonstrate clearance of is
RNA, for exactly the same reasons as gDNA, the fear being that these fragments may
contain oncogenes or cause activation of oncogenes once delivered (Schleef, 2001). Again,
RNA is physically and chemically similar to the plasmid DNA being produced.
Historically, this contaminant was removed using RNase and indeed this approach is still
commonly employed on the analytical scale. However, there are concerns regarding
RNase because it is purified from bovine pancreas and regulatory authorities recommend
that bovine-derived material should be avoided in the production of biopharmaceuticals, following the outbreak of new-variant CJD.
Precipitation techniques are a convenient way of separating pDNA from RNA and can be
divided into two categories. First, plasmid precipitation can be employed, using either
isopropanol (IPA) (Chakrabarti et a l , 1992), spermine (Murphy et al., 1999), polyethylene
glycol (PEG) (Lis and Schleif, 1975) or cetyltrimethylammonium bromide (CTAB) (Ishaq
et al., 1990). However, the scaling up of plasmid precipitation is troublesome since the
delicate plasmid needs to be centrifuged out and resuspended for further processing.
Consequently, selective precipitation of the RNA impurity with the plasmid remaining in
solution is deemed preferable. High-salt is the main RNA precipitant. Lithium chloride is
most commonly used on the analytical scale (Chakrabarti et al, 1992) but its adverse toxicological effects prevent its use on a commercial scale, as such sodium acetate,
ammonium acetate, ammonium sulphate, magnesium chloride and calcium chloride have
all been studied.
In these investigations RNA precipitation was achieved through the addition of Calcium
chloride (Eon-Duval et al., 2003a; Eon-Duval and Burke, 2004). The high modal surface
tension of this salt means it is anti-chaotropic and so reduces the solubility of molecules.
Its mechanism of action has been linked to the presence of divalent cation binding sites
within RNA structures (Bukhman and Draper, 1997). However, (Semancik and
Szychowski, 1983) found RNA precipitation by divalent salts to be reversible and as such
more likely to be caused by the ‘salting-out’ effect described by (Wu and Karger, 1996),
an occurrence commonly seen with proteins, rather than metal-ion mediated cleavage. The
selective nature of the nucleic acid precipitation may be explained by the flexible single
stranded structure of the RNA molecule. This form results in more hydrophobic bases
being exposed, which leads to increased aggregation and precipitation. By contrast, SCC
Thomas Burt 356

RNA
mas
s (m
g)7. Downstream Processing
plasmid DNA is less hydrophobic since the bases are sheltered within the compact double helix structure. This may also explain why denatured gDNA has been found to coprecipitate with RNA (Eon-Duval et al., 2003a). In all these studies the concentration of RNA at the various sample points was determined using the Quant-IT RNA assay, the background of which is explained in (2.5.16 and 4.8)
Figure 7-13 details the results of the investigations into the clearance of RNA from the process. From the figures the starting RNA mass was deemed to be ~1384mg, which
equates to -3.3% (w/w). Both (Bailey and Ollis, 1986) and Table 7-2 estimate the actual figure to be 6%(w/w). The difference is perceived to be down to preparatory and analytical differences centred on the action of endogenous RNases. If the action of these is not blocked then they can quickly degrade the RNA present. A blocking agent was employed when the samples were sonicated, but how effective it was remains questionable, since the result produced is -50% that reported in the literature.
As a result of the difference between the published value for RNA mass and the figure
reported in these studies, background RNA removal over the lysis and neutralisation step differs. If the value of 6%(w/w) is assumed then RNA removal over lysis is -55%,
1000250m lm in'500m lm in'
250m l/m in MASS (MG) %PRE-LYSIS 1373.983 100.000PRE-CACL 1071.026 77.950
P O ST -CACL 32.887 2.394PERMEATE 13.640 0.993
DIAFILTRATE 1 17.464 1.271DIAFILTRATE 2 7.136 0.519
RETENTATE 0.683 0.050WASH 1 0.371 0.027WASH 2 0.263 0.019
TOTAL RECOVERY 1.315 0.096CLEARANCE 1372.668 99.904
500m l/m in MASS (MG) %PRE-LYSIS 1395.661 100.000PRE-CACL 1129.634 80.939
PO ST -CACL 55.635 3.986PERMEATE 14.056 1.007
DIAFILTRATE 1 17.918 1.284DIAFILTRATE 2 8.203 0.588
RETENTATE 0.426 0.031WASH 1 0.280 0.020WASH 2 0.282 0.020
TOTAL RECOVERY 0.988 0.071CLEARANCE 1394.673 99.929
Figure 7-13 Figures outlining the removal of RNA during these investigations. The results represent the averages of the 10 individual runs for each crossflow rate (Table 7-5). The results for the individual runs are shown in the mass balances and each point in those was determined by quadruplicate analysis of samples by Quant-IT RNA. The pre-lysis values were obtained by sonication of a 1.56gL'’ sonication of the relevant cell paste and subsequent analysis of the lysate. The starting masses were then calculated by knowing the WCW of each of the individual DSP runs.
Thomas Burt 357

7. Downstream Processing
whereas if the reported figure of 3.3%(w/w ) is taken then removal is -23%. Background
RNA removal over this step would be expected through both the precipitation of larger
RNA species combined with the action of endogenous RNases, however, it is felt that the level of removal would fall in between the range of 23%-55%.
The mass value of the RNA following the lysis stage is not in doubt and at 1.0-1.lg still
represents a large mass of contaminant. Compared to the level of gDNA, which was
determined to be in excess of pDNA at this stage, the mass of RNA is -34-fold higher,
making it by far the most abundant nucleic acid. The large step removal produced by the
addition of CaCl2 can be seen in that the mass of RNA falls from an average of 1 lOOmg to
44.2mg representing a 96% step clearance. This figure is very much in line with those
reported by (Eon-Duval et al., 2003a) using the same reaction conditions. It is accepted
that RNA precipitation cannot lead to 100% clearance and that the action of CaCE is more
effective at precipitating larger MWt RNA molecules than the smaller species (Semancik
and Szychowski, 1983). As such, a further step is required to ensure full removal of RNA.
In this process that step is ultrafiltration.
With the high MWt RNA molecules removed by precipitation the UF step removes the
smaller Mwt RNA molecules in the same fashion as small gDNA fragments. Their smaller
size allows them to penetrate the UF membrane and be cleared from the process. From the
clearance breakdown shown in Figure 7-13 the vast majority of the remaining RNA is
cleared in the permeate and DF1 streams, with a smaller proportion cleared by the DF2
buffer.
The final recoveries of the RNA contaminant from the system estimate that for both
crossflow velocities >99.9% RNA is removed from the process, most of which can be
accounted for. As reported with gDNA, recoveries of RNA were found to be slightly
reduced at the higher crossflow rate, an effect reasoned to be due to the same reason of the
narrower boundary layer resulting from the higher fluid velocity. What is also noticeable is
that in both instances -lm g of RNA was co-purified along with the plasmid product,
roughly 10-fold the amount co-purified as gDNA (Figure 7-11). This high figure is not
deemed to be as problematic as for the gDNA since there exists sufficient size and charge
differences between RNA and the plasmid product that more effective clearance of this
contaminant can be expected over the chromatographic steps.
Thomas Burt 358

7. Downstream Processing
7.8.3 Protein
The final contaminant important to demonstrate clearance of was dissolved protein. On a mass basis this species represents the most abundant contaminant, but it is fair to say it is the least problematic one to reduce. The reason for this being that there exists many more differences between proteins and nucleic acids, than between different types of nucleic acids, which a purification strategy can exploit for the removal of this contaminant.
Figure 7-14 describes the average clearances of protein at the two crossflow velocities employed. The data suggests that the starting mass of dissolved protein to be ~3000mg representing 7.2% (w/w). Again this figure represents 50% of the value described by (Bailey and Ollis, 1986) and Table 7-2 which both place the starting mass of protein at 15%(w/w). The reason again for this anomaly is deduced to be due to preparatory and analytical differences. It is believed that the figure in this report accurately represents the total soluble protein but it is believed that the other 50% of the protein may have been membrane-bound protein. It is believed that these were not recorded by the sonication
250m L m in '1I ■ 500m L m in 1
5 0 0 m lm in M A SS (MG) %PR E -L Y S IS 3058 .9 8 3 100 .000PR E -C A C L 837 .0 4 7 27 .364
P O S T -C A C L 3 3 6 .5 5 7 11.002PER M EA TE 158 .573 5 .184
D IAFILTRATE 1 2 4 6 .2 6 7 8.051DIAFILTRATE 2 3 8 .100 1.246
R ET EN TA TE 0.931 0 .030W A SH 1 1.252 0.041W A SH 2 1 .105 0 .036
TO TA L R EC O V ER Y 3.288 0 .107C LE A R A N C E 3055 .6 9 5 99 .893
P R E -L Y S ISM A SS (MG)
3 0 1 5 .6 8 7%
100 .000P R E -C A C L 8 9 4 .7 1 6 2 9 .669
PO S T -C A C L 343 .3 2 5 11 .385PE R M E A T E 198 .658 6 .587
D IAFILTRATE 1 163 .237 5 .413DIAFILTRATE 2 60 .9 3 2 2.021
R E T EN TA TE 2 .7 0 8 0 .090W A SH 1 1 .609 0 .053W A SH 2 1 .475 0 .049
TO TA L R EC O V ER Y 5.792 0 .1 9 2CLE A R A N C E 3 0 0 9 .8 9 5 9 9 .808
Figure 7-14 Figures outlining the removal of dissolved protein during these DSP investigations. The results represent the averages of the 10 individual runs for each crossflow rate (Table 7-5). The results for the individual runs are shown in the mass balances and each point in those was determined by multiple analysis of samples using the BCA assay. The pre-lysis values were obtained by sonication of a 1.56gLf' sonication of the relevant cell paste and subsequent analysis of the lysate. The starting masses were then calculated by knowing the WCW of each of the individual DSP runs. Post-CaCl2 samples were desalted prior to analysis.
Thomas Burt 359

7. Downstream Processing
method employed in these investigations, since after sonication and prior to analysis, the
lysate was clarified by centrifugation to remove cellular debris. The cellular debris must
have contained the other 50% of the total protein mass.
Due to the differences in the starting mass of protein, the value placed upon protein
removal over the lysis step can be taken as either of two values. If total protein is recorded
then the lysis and neutralisation step removed - 8 6 % of the total protein. If the soluble
protein is recorded then the value is -72% removal. Despite the differences it can be
appreciated that the lysis step is effective at bulk removal of this contaminant.
Total dissolved protein at the pre-CaC^ stage was determined to be ~865mg and the data
suggests that a considerable amount of protein removal occurs over the CaCb precipitation
step, for which the step was not strictly designed. Approximately 60% of the protein
remaining in the neutralised lysate is precipitated by the addition of CaC^. The
mechanism behind this is believed to be identical to that employed by ammonium sulphate
precipitation of proteins. In brief, protein folding is a thermodynamic driven process which
results in the hydrophobic amino acids regions of proteins being contained within the
interior of the protein molecule, with the charged, hydrophilic amino acids exposed to the
bulk solution and so interacting with the molecules of solvation. This interaction with
surrounding water molecules is essential for the protein molecule to be stable. However,
when the CaCb is added, a proportion of water molecules are attracted by the Ca2+ and Cf
ions, which decrease the number of water molecules interacting with the charged part of
protein molecules. As a result of this competition between the salt ions and the other
dissolved solutes for water molecules, the solute-solute interactions become stronger than
the solvent-solute interaction. As such, the protein molecules coagulate by forming
hydrophobic interactions with each other in order to stabilise themselves. This leads to
their aggregation and precipitation (Wu and Karger, 1996; Doran, 1995)
Despite further precipitation of the protein by the addition of CaCk, ~340mg of protein
was found remaining in the clarified lysate prior to the ultrafiltration step. The very small
size of proteins means that they were able to pass through the membrane quite easily. The
breakdown shows that the majority of protein was removed during the permeation and
diafiltration stages.
Despite quite effective clearances, on a mass basis, protein represents the most abundant
contaminant co-recovered along with the plasmid product. At the faster crossflow ~3.3mg
Thomas Burt 360

7. Downstream Processing
was remaining compared to ~5.8mg for the slower crossflow velocity*. Again, on average,
higher co-recovery was reported with the slower crossflow velocity rates. Also, despite the
higher mass recoveries of this contaminant the clearance levels of >9 9 .8 % were deemed
acceptable in the knowledge that further clearances of this contaminant would be achieved
by following chromatographic procedures.
7.8.4 Conclusions
To conclude this section requires summarising the clearances of the major contaminants
achieved by this process. This is shown in Table 7-12. From the table it can be appreciated
that the process is effective at clearing the three contaminants. If the starting masses of
each contaminant are assumed to be those listed in (Bailey and Ollis, 1986) then the
process achieves >99.9% clearance of every contaminant at both crossflow rates.
It has been noted from these studies that % clearances were found to be higher for the
faster crossflow velocity. This may be an important factor to bear in mind when adapting
such a process for the manufacture of large plasmids. This is because lower crossflow rates
were found to be beneficial to plasmid form recovered from the membrane, with higher
%SCC recovered at the slower crossflow rates.
If the decision was made to operate at a slower velocity for the sake of improved topology
then the increased contamination may become an issue. It could be possible to conduct the
UF operation stages (permeation/ diafiltration) at the faster crossflow velocity and the
recovery phases at the lower speed. This would mean that higher contaminant clearances
would be achieved with no negative outcomes on plasmid topology, since it is believed
that SCC pDNA is protected when TMP is applied by the plasmid gel-layer.
* It should be mentioned that detection o f both RNA and protein in the Retentate and wash fractions was almost out o f the linear range o f both assays, since the concentrations were so low. However, as mentioned in the analytical section it was found more accurate to fit a polynomial curve to the standard curves, doing so also extended the range o f the assays to these lower levels. Calibration on a standard linear fit resulted in negative values. In a way this validates the process for the clearance of these contaminants in that they were at such low concentrations that the assays employed were at their very limit o f detection.
Thomas Burt 361

7. Downstream Processing
Table 7-12 Table detailing the average co-recovered masses of the major contaminants for the two different crossflow rates. The table also describes the % clearances of these contaminants over the process. The non-italicised values represent the % clearances calculated using the starting masses of the different species determined by assays performed on sonicated cell samples. The italicised % clearances are calculated using the %(w/w) starting masses described by (Bailey and Ollis, 1986) on 42g of cells.
Mass corecovered (mg)
500m Lm in'1% Clearance
Mass corecovered (mg)
250mLmin'1% Clearance
Genomic DNA |1% (w/w)| 0.0964 99.981 [99.977] 0.243 99.966 [99.942]
RNA|6% (w/w)| 0.988 99.929 [99.961] 1.315 99.904 [99.948]
Protein |15% (w/w)l 3.288 99.893 [99.948] 5.792 99.808 [99.908]
It was determined that severe damage to the SCC plasmid form was found to occur during the recovery operations especially at the higher crossflow rate. If the crossflow rate was reduced for the recovery stage the result would combine the better clearances with improved plasmid topology. However, the logistics of such an operation remains unknown since a variable speed pump would be required.
Clearance of protein and RNA by this process was deemed acceptable. The concentration of these contaminants in the membrane recovery fractions was lower enough such that they were at the very limit of assay detection. Additionally, it was reasoned that further clearance of these species would be achieved over the chromatographic steps which follow the membrane. The most important issue determined by these investigations into contaminant clearance was the impact of residual gDNA contamination.
The mass of 0.0964mg gDNA co-recovered from the membrane was used to set the limit of operation of this process. It was reasoned that unlike protein and RNA, assuming further clearance of this molecule over the chromatography steps could not be guaranteed. Using the acceptance criteria of 0.0lpg gDNA/ pg pDNA it was determined that for the process to be effective an initial starting mass of pDNA of 12.05mg was required. Back- calculation set the required mass of extrachromosomal DNA per cell to be 1.75xl06bp. If the total amount of pDNA per cell falls shy of this limit then the process will not be
capable of producing an acceptably pure product.
Thomas Burt 362

7. Downstream Processing
7.9 Binding studies
7.9.1 Introduction
During regular operation of this pilot-scale process the retentate and wash fractions,
collected from the UF membrane, are pooled and further purified by an anion-exchange
chromatography step (Figure 7-1). However, due to the low mass yields (and hence low
concentrations) of plasmid recovered from the membrane using these large constructs, it
was deemed that there was insufficient material to load on to the column and as such little
could be determined by carrying out investigations with this aim in mind. Additionally,
much of the larger plasmid mass recovered from the membrane existed in sheared form,
meaning limited data could be extracted about the binding behaviour of intact large
plasmid molecules. It was reasoned that more useful information would be provided by the
determination of whether the large size of these plasmids would pose any problems to the
actual level of binding and associated kinetics when using the anion-exchange resins
employed in the process. As such, it was decided to investigate the binding behaviour of
these large constructs through batch adsorption studies.
7.9.2 Chromatographic matrices for plasmid purification
The separation and purification of pDNA by chromatography is associated with two
significant limitations (Diogo et al., 2005)
1. Physical and chemical similarities between impurities and pDNA. The most
problematic contaminant being gDNA but RNA and protein can also be
troublesome. The result of the contamination can be poor selectivity due to
competition and the co-elution of impurities. Reduction of the impurities prior to
chromatography is one strategy to overcome this limitation and has already been
covered in the earlier sections of this chapter.
2. The large size of pDNA molecules combined with the small pore sizes of
chromatographic matrices. This limitation causes a number of problems when
separating plasmids by chromatography;
i. Low diffusion coefficients and poor internal mass transfer
ii. Broad peaks and low recovery
iii. Small flow-rates and long separation times
Thomas Burt 363

7. Downstream Processing
iv. Poor capacity for pDNA due to lack of accessibility.
Importantly, the diffusion coefficients of pDNA in solution are significantly lower than
those of proteins. This is a result of the greater mass of plasmids and also their size and
structure. Most proteins are small (2-10nm) and globular whilst plasmids are micron size
(0 .2 - 1 pm) with a structure intermediate between a flexible coil and a rigid interwound
superhelix. A typical diffusion coefficient for a plasmid is 10'8cm2s‘1, whilst proteins can
be expected to display a coefficient over 1 0 -fold greater.
The larger size and reduced diffusion coefficients are associated with poor internal mass
transfer leading to long binding times and therefore long-separation times, poor flow rates
and low binding capacities. These drawbacks are reported for plasmids of the size range
3kb-10kb. The point of these investigations was to determine whether these issues worsen
when the plasmids being purified are larger still.
7.9.3 Experimental setup
Much of the design and setup of these experiments was a direct repeat of published
studies, which investigated the batch binding behaviour of smaller plasmids on to anion
exchange resins (Ferreira et al., 2000a). The main difference exploited the advantages
offered by the NanoDrop spectrophotometer. As outlined in (2.5.9.2) this device enables
direct absorbance measurement on plasmid solutions using only 2pL of solution. More
detail into the methodology of the studies can be found in (2.8.7).
Briefly, the studies employed the matrix from 20pL volumes of two common anion-
exchange resins; DEAE-Fractogel and TMAE-Fractogel to which were added lmL
volumes of 50pgmL'' solutions of the different constructs (Qiagen Large Construct kit
purified 2.5.8 .3). These were combined in sterilised eppendorf tubes and agitated on an
inversion mixer. At periodic intervals, 2pL samples of the solution were extracted and the
level of unbound plasmid measured by direct A2eo absorbance using the NanoDrop
spectrophotometer. Each binding study for each plasmid on each resin was performed in
triplicate. The concentration of the free, unbound plasmid was recorded over a 90 minute
period. For examples of the NanoDrop recordings refer to Figure 9-49 and Figure 9-50. At
the end of this period the tubes were left to agitate at room temperature
Thomas Burt 364

7. Downstream Processing
for a total of 24 hours, after which a final absorbance measurement was taken. It is
reported that the level of binding would have reached equilibrium by this point, such that
the value represents the maximum-binding capacity of the resin (Ferreira et al., 2000a).
In order to perform studies into the binding behaviour of the large plasmids on to anion-
exchange resins certain information was required about the resins themselves. Specifically,
when reporting the binding capacity of the resins it is standard to report the level on a
specific, mass-basis so as to eliminate differences in the relative density differences
between different resins. To do so required determination of the mass-volume coefficients
of the resins being studied. This was achieved by evaporation of the suspending fluid as
described in 2.8.6. The values from this analysis are recorded in Table 7-13.
7.9.4 Binding kinetics of plasmids on to two commercially available AEX resins
Figure 7-15 plots the adsorption isotherms from the studies into the binding kinetics of the
different constructs on to TMAE Fractogel and DEAE Fractogel. There are several points
to be extracted from these two figures. Primarily, it can be appreciated that plasmid
binding rates are very much dependent on plasmid size. This is to be expected since
binding is a diffusion driven process requiring the transport of plasmid molecules from the
bulk-solution to binding sites on the matrix particles4. Rates of diffusion can be described
by Fick’s Law which uses a value for diffusivity coefficient to determine diffusion rates.
As shown by Equation 7-1 a particle’s diffusivity coefficient is directly related to its size.
r - v kT . . - f f . n kTD = ---- . f - bnrjr D = -------/ 67ti jr
Equation 7-1 R elationship describing the link between a particle’s diffusivity and its size. Einstein proposed that diffusivity (D) is governed by a particle’s kinetic energy (k-Boltzman constant and T- tem perature) and the frictional coefficient o f the solute molecule (f). The frictional coefficient is a direct result o f the solution viscosity (q) and particle radius (r).
* Plasmids are known only to bind to shallow depths within the chromatographic matrices. Intra-particle binding is severely reduced because the plasmid molecules are too large to penetrate deeply in to the pores in the Fractogel matrix particles (Ljunglof et al., 1999).
Thomas Burt 365

7. Downstream Processing
1.1
1 .0 1.0
0 .9 0 .90 .9
0.81 1 6 k b
0 .7 0 .7 0 .7 0.7
0 6 0.6 0.6 0.6
4 9 k b0 5 0 5 0 .5 0 .5
0 4 0 .4 0 .4 0 4~ 3 3 k b
0 .3 0 .3 0 .3 0 3
0.2 0.2 - 1 6 k b
t. 3 2k b
0.2 0.23 .2 k b
0.1 0.1
00 0 0 0.0 0.00 1 0 2 0 3 0 4 0 5 0 6 0 7 0 8 0 9 0 1 0 0 110 0 10 2 0 3 0 4 0 5 0 6 0 7 0 8 0 9 0 10 0 11 0J 5 0 6 0 7 0 8 0 9 0 1 0 0 1 1 0 0 1 0 2 0 3 0 4 0 5 0 6 0 7 0 8 0 9 0 1 0 0 11 0
Time (mins) , . .Time (mins)
Figure 7-15 The results of the NanoDrop binding studies were converted into mass values describing the levels of plasmid remaining unbound in solution. These values were then described as a proportion o f the amount of mass (50pg) originally present in the solution under study. Plotted in A are the results for TMAE Fractogel and in B are the results for DEAE Fractogel. Each o f the points represent the average of triplicate runs.
Additional to the lower rates of diffusion it is postulated that steric hindrances between larger plasmid molecules may extend the time required for binding. From the figures it can be seen that by the end of the recorded period an in both examples -85% of the small plasmid pGEM 11 had been removed from bulk solution by binding to the matrix particles.In contrast binding levels of the larger pGEM49kb and p5175 <50% of the free plasmid had bound by the end of the same period.
The pattern of the isotherms are also interesting since they suggest that plasmid adsorption on to these anion-exchangers can be modelled by Langmuir-type isotherms (Ferreira et al.,
2000a).
f « C * 9l + ( c r C * ) (1
Equation 7-2 Expressions used to describe the Langmuir isotherm. © is the equilibrium concentration or coverage o f the adsorbent by the adsorbed particle. C* is the equilibrium concentration of the solute in the fluid phase and a is a constant. K describes the equilibrium constant determined by ratio of bound to unbound substrate.
It is appreciated that assuming a Langmuir adsorption makes several assumptions about the system including that there are no interactions between bound molecules and that each
site for adsorption is equivalent.
A final point concerns the relative performance of the two different resins. The data suggests that TMAE Fractogel produced superior binding rates especially for larger
Thomas Burt 366

7. Downstream Processing
constructs. Despite similar binding rates for the smaller constructs, rates for the larger
constructs, noticeably pGEM49 and p5176, are improved for this resin. Because the
particles used in both cases were equivalent (i.e. Fractogel) the improved binding
characteristics must be due to the derivatized group. The difference between the two
ligands is that DEAE is a weak exchanger whilst TMAE is a strong exchanger. This is a
result of the higher charge density associated with the latter. Although pure conjecture it is
suggested that the number of interactions required between the charged groups and a
plasmid molecule in order to bind the molecule is less for TMAE than DEAE due to the
increased strength of the individual TMAE-plasmid interactions. Because fewer
interactions are required means that there are a greater number of binding sites available
per unit mass of TMAE resin. For smaller constructs this lower number of binding sites is
not immediately noticeable since fewer interactions «re required. However, for the larger
molecules more interactions will be required and is such the rate of binding will be
effected by the number of sites available. More binding sites are required for larger
molecules by virtue of their larger size and the fact that steric hindrances may appear
between competing plasmid molecules.
7.9.5 Specific Binding Capacities
The results of the binding capacities highlight other potential issues with the attachment of
these plasmids to the available resins. The results arc reported in Table 7-13 and Figure
7-16. As outlined before these resins are not specifically designed for plasmids and this
fact is reflected in the binding capacities of the plasmids compared to proteins. Even for
the smallest construct; [pGEMll] the maximum binding capacity is ~2.3mgmL'1. This
capacity is 40-fold lower than that reported for proteins. This effect has been described by
several authors and the reason determined to be due to plasmids only binding to the outer
surface of the matrix particles (Ljunglof et al., 1999; Lyddiatt and O'Sullivan, 1998). The
large size of plasmids prevents them from accessing the full complement of potential
binding sites which lie inside the pores of the particles.
Table 7-9 displays the results of attempts to place figures on plasmid diameters of the
constructs under study. The most reliable estimate was determined to be provided by field-
flow fractionation which sized the diameter of
Thomas Burt 367

t. Bi
ndin
g Ca
paci
ty
[Q^l
(mg
mL
'm
atrix
)7. Downstream Processing
Table 7-13 Table highlighting the differences between the two anion exchange resins studied in these investigations. Shown are the mass-volume coefficients determined by evaporation of the suspending fluid. The maximum specific binding capacities were obtained by calculating the level of plasmid bound to the matrix following 24 hours of incubation. They are reported on both a volumetric and specific basis. The % difference described the relative improvement offered by TMAE Fractogel.
D E A E -F ractogel T M A E -F ractogel % D ifferenceP artic le d ia m eter (pm ) 40-90 40-90 0
A v era g e p ore 0 (nm ) 800 800M a ss-V o lu m e coeffic ien t
0.133 ±0.0036 0.125 ±0.0053(g d ry m a tr ix / m L ) -6%
M ax. B in d in g cap acity (m g p ro te in / m L resin )
100
M axim u m . B ind in g capacity (m g pD N A m L ’resin)3 .2 k b 2.27 ± 0.028 (100%) 2.34 ± 0.007 (100%) + 3.116kb 2.35 ±0.011 (104%) 2.24 ± 0.007 (96%) -4 .73 3 k b 2.05 ±0 .014 (90%) 2.23 ± 0.035 (95%) + 8.849k b 1.74 ± 0.074 (77%) 2.07 ± 0.028 (88%) + 19.0
116k b 1 .56 ± 0.046 (69%) 1.96 ±0.039 (84%) + 25.6S p ec ific M axim u m . B in d ing (m g pD N A / g dry m atrix)
3 .2 k b 17.03 ±0.21 18.72 ±0.056 + 9.916kb 17.69 ±0.08 17.88 ±0.042 + 1.133 k b 15.38 ±0.106 17.84 ±0.28 + 16.049k b 13.10 ± 0.56 16.52 ±0.23 + 26.1
1 16kb 11.75 ± 0 .35 15.70 ±0.31 + 33.6
2 5 0
2 .2 5 -
1 .7 5 -
1 2 5
1.00
TMAE F ractogel DEAE Fractogel
P /■»!"»«♦« iH
116kb
- 2.00
1.75
TMAE Fractogel DEAE Fractogel
- 1 7 <Q
- 16 w
P r v n c t n i/~+
Figure 7-16 Plots of the maximum and specific maximum binding capacities of the two resins. From the graphs it can be seen that for both measures the binding capacity decreases with plasmid size an interesting occurrence was that the maximum specific binding capacities for the 3kb and 16kb plasmids were quite equivalent and that the decrease in capacity only became apparent for the larger constructs. This suggests that with plasmid sizes over 16kb the drop in binding capacities is due to steric hindrance. Again TMAE displayed superior binding performance
Thomas Burt 368
Specific M
ax. Binding C
apacity

7. Downstream Processing
a 3.2kb plasmid at ~77nm.and the largest plasmid (116kb) at -llOOnm. The figure of 77nm is much larger than the average protein size of 2-10nm but is still smaller than the 800nm pore size of the matrix particles of the resins under study. The results of this analysis suggests that a plasmid of 3.2kb would be capable of penetrating the 800nm pores on the Fractogel particle. It is believed that some intra-particle penetration does occur and that the limited intra-particle diffusion accounts for the decrease in the specific maximum binding capacity with increasing plasmid size.
Referring to Figure 7-16 and Table 7-13 there are two main observations to explain.
Firstly that maximum binding capacity does decrease with plasmid size, for example in the case of DEAE a 30% decrease is witnessed between 3.2kb and 116kb binding capacities. The decrease is not linear with plasmid size. Secondly the binding capacities of TMAE resin is greater than that for DEAE for all plasmid sizes.
In order to explain these results requires consideration of what is occurring on the micron- scale. Again this is pure conjecture, but it is reasoned that a 3kb plasmid molecule is capable of penetrating the pores on the particle surface but that the intra-particle diffusion is limited to a very shallow penetration due to the plasmid size. This limitation increases with plasmid size such that less and less penetration is possible with the result in their being fewer accessible binding sites and hence less binding capacity for larger constructs.
Figure 7-17
Figure 7-17 A schematic of the cross-section of a resin particle. It is known that intra-particle delivery is dependent on particle size. This schematic attempts to explain the witnessed results and is by no means to scale. It is reasoned that proteins are capable of full penetration (blue-layer) and hence maximum binding capacity. The smaller plasmids can penetrate further into the surface layer than the larger plasmids (red-layer) and so have access to more binding sites than the larger plasmids which are capable of only surface binding (green layer).
The explanation for the improved binding capacity demonstrated by TMAE resin has quite a simple explanation. TMAE, by virtue of its higher charge density, is considered a strong exchanger. Since the results for maximum binding capacity were obtained after 24 hrs incubation it is safe to assume that equilibrium had been reached.
Thomas Burt 369

7. Downstream Processing
r d _ p ik = - [5] = Binding sites [P] = Plasmid
Due to the stronger interaction between plasmid and binding site which would occur in
TMAE resins the rate of dissociation would be lower and so the equilibrium concentration
of bound [B-P] plasmid would be greater than for DEAE. Additionally, as described
previously the stronger interactions provided by TMAE groups mean that more sites are
available since fewer sites will be required per plasmid. An interesting point is raised by
Table 7-13 which demonstrates that the percentage improvement offered by TMAE
increases with plasmid size. The reason for this is a more rapid decrease in binding
capacity with plasmid size offered by DEAE resin. Overall this suggests that the rate of
dissociation found in DEAE resins increases more rapidly with increasing plasmid size.
Therefore as plasmid size increases it becomes more likely for a plasmid to dissociate
from DEAE resins. Perhaps the weaker exchange characteristics limit the ability of this
resin to bind increasingly large plasmids as strongly such that they are more likely to
dissociate.
It is appreciated that the extent of the analysis into the results of the maximum binding
capacities is likely to be an over-simplification of what is occurring. No explanation can be
offered for why the results suggest the binding capacities for the 16kb and 3kb should be
equivalent. It could be anomalous but the studies were conducted in triplicate and the
effect is witnessed for both resins. It is likely that the binding capacities are dictated by
more than size limitations. Possibly steric hindrances could be playing a part in reducing
the binding capacities witnessed for larger constructs.
7.9.6 Conclusions
The purpose of these investigations was to identify any limitations in the binding
behaviour of larger constructs on anion-exchange resins commonly used for plasmid
purification. The data can now be used to predict any problems which could be expected
should plasmids of this size order be subject to anion-exchange chromatography on a
larger scale. Overall, the results have suggested that limitations currently witnessed with
chromatographic separation of plasmids are exacerbated by the increased size of the
constructs. The adsorption isotherms suggest that binding rates decrease with increasing
plasmid size due in part to the reduced diffusivity of the plasmid molecules and the
associated reduction in the number of accessible binding sites. The reduction in the
Thomas Burt 370

7. Downstream Processing
number of available binding sites also reduces the maximum binding capacities. Although
TMAE Fractogel offered an improvement, the difference was not great. The results of
these limitations will be as described earlier in that broad peaks and low recoveries could
be expected. Additionally, the chromatography step would require slower flowrates
resulting in longer separation times.
The limitations posed by the increasing size may never be completely eliminated but
improvements could be achieved. The sizes of the plasmid DNA could be reduced prior to
loading with compaction agents (e.g.spermine) but that may be unfavourable since it
represents an addition of an added impurity. The bead size of the matrix particles could be
reduced to improve mass transfer, but this strategy would introduce new challenges caused
by the expected increased pressure drops over the column. Certainly worth investigating
would be “superporous” stationary phases designed with plasmid purification in mind.
These are reported to improve intra-particle mass transfer with the introduction of much
more rapid convective pore flow to take place. Reports suggest these matrices allow the
attainment of binding capacities in the range of lOmgmL'1 (Diogo et al., 2005).
One strategy thought very worthy of investigating for such large constructs would be the
use of membrane chromatography (7.2.2.5). In these systems (e.g.Pall Mustang Q
columns) diffusional limitations are overcome by having through-pores rather than dead
end pores associated with particle based stationary phases. The pores could be engineered
to accommodate larger constructs and the more rapid adsorption would allow for faster
mobile phase flow rates.
7.10 Conclusions
The conclusion to this section requires summarising the key observations and whether the
questions posed at the section beginning have been satisfactorily answered.
7.10.1 Plasmid Purification
The key point from the analysis of large plasmid purification by this process was that %
recoveries of plasmid (% of plasmid in clarified lysate recovered from the UF membrane)
decreased with increasing plasmid size (Figure 7-3A). The smaller 3.2kb plasmid was
found to be capable of penetrating the membrane but the 16kb plasmid recorded -80%
recovery levels. The loss of the other plasmids was determined by careful analysis of the
gels tracking the change in plasmid topology levels (Figure 9-6 to Figure 9-11). It was
Thomas Burt 371

7. Downstream Processing
noted that the level of supercoiling increased for all the plasmids, including the 3 .2 kb
(Figure 9-6), over the course of the ultrafiltration step. Such an unlikely occurrence was
not envisioned since supercoiling is an energy intensive process. The only explanation
which could be offered was that the % supercoiling increased due to selective reduction in
the proportion of the open-circular and linear fractions. The gels suggested that increased
degradation of supercoiling occurred with increasing plasmid size over the course of the
lysis operation (Figure 7-4). As such plasmid recovery became a function of the amount of
plasmid loaded on to the membrane in supercoiled form. The more plasmid loaded in SCC
form, the higher the recovery. Since the %SCC at the end of the lysis period was found to
be directly related to the size of the plasmid there was a comparable decrease in plasmid
recoveries from the membrane.
Experiments were conducted which compared the effect of the cross-flow rates on
recovery levels. It was found that the crossflow rate had no real effect on recovery levels
(Figure 7-3A). Essentially at both rates the shear forces were of sufficient magnitude to
exact the degradation of OC/Linear form to sheared fragments, which when a TMP was
applied, were capable of penetrating the membrane. The effect of the cross flow rate only
manifested itself during the recovery steps of the operation. At the outset of this stage it
was envisioned that the overriding plasmid form was SCC, due to the selective
degradation of OC/ linear forms. However, with the removal of the TMP and the
purposeful disruption of the plasmid gel layer, the SCC form was damaged by the shear
forces. It was found that the plasmid degradation was not specific and that the plasmid was
sheared randomly into fragments ~15kb in size. Had a TMP in place these fragments
would have penetrated the membrane but due to the system being closed they were
recovered. It is believed that this sequence of events accurately explains the recovery
levels.
Overall, the results of this section suggests that ultrafiltration of plasmid containing lysates
remains a reasonably viable technique for the purification of constructs up to 50kb and
plausibly larger. However, two caveats must be acknowledged. Firstly, that the recovery
levels are directly effected by the form of the plasmid loaded on to the membrane.
Secondly, the recovery of the plasmid from the membrane following processing promises
to be difficult since this step was found to cause shear damage. Evidence was provided
that shearing was reduced by operating the recovery steps at a low cross-flow but that a
degree of shearing was still in effect.
Thomas Burt 372

7. Downstream Processing
7.10.2 Analysis of the Lysis step
Having demonstrated that the % recovery of plasmid from the UF membrane was a
function of its supercoiling it was decided to investigate the lysis step utilised in this
protocol. It had been shown that the rate of loss of supercoiling during this step was
linearly relate to the plasmid’s size (Figure 7-5). What remained to be determined was
whether this was the result of the action of a physical or chemical process.
Reasonable estimates were placed upon the size of the plasmid molecules from the results
of field-flow fractionation (Table 7-9). Analysis of the macromixing conditions in the
vessel suggested that the loss of supercoiling was not due to physical shear, since the size
of the eddies produced were determined to be too large to impact upon a particle of the
size of the plasmids being studied. Additionally evidence from the gels suggested that the
conversion of SCC form to OC/Linear form was unlikely to be the result of random
physical shear. Further analysis of the mixing conditions produced in the lysis vessel,
suggested that both the macro and micromixing conditions were poor. This was a direct
result of the low shear rate utilised. In the belief that the low shear environment would
minimise damage to the plasmid and precipitated gDNA, the low shear rates actually led to
an extension of the period required for both bulk mixing and mass transfer. It was
suggested that the effect of the extended lysis period may have escaped notice when
processing plasmids of the size order 3-1 Okb. However, with increasing plasmid size there
is a linear increase in the number of sites for action and as such a linear decrease in
plasmid supercoiling displayed by the end of the lysis period.
In effect this lysis procedure requires optimisation. Even when considering smaller
plasmids where 70-80% SCC is displayed following lysis, it is believed that judicious
optimisation could lead to increase in %SCC displayed by the end of the lysis period, and
hence better recoveries from the UF rig. It is suggested that the agitation rate be increased
to improve both bulk mixing and mass transfer. This will decrease the amount of time
required for lysis, improve mass transfer and so reduce the occurrence of regions of
heterogeneity in the vessel. For the processing of these larger constructs it may not be
enough to increase agitation rate. As such, it is felt that the adoption of a continuous lysis
protocol could be highly beneficial to recoveries and topologies.
Thomas Burt 373

7. Downstream Processing
7.10.3 Contaminant Profiles
Mainly performed to complement the results for the plasmid recoveries, it was possible to
describe in some detail the removal of key contaminants exacted by this process. Of key
importance were the results describing the removal of genomic DNA from the process.
Effective clearance was demonstrated (Figure 7-11) but the remaining trace amounts
served as a reminder of optimising the specific yields of large plasmids from the
fermentation. It was found that the process could remove >99.9% of the starting mass.
Using the best case scenario it was found that ~100pg of gDNA could be expected to be
co-purified by this process. Using the latest purity requirements this co-purification means
that for the process to be validated (assuming an optimistic 80% recovery of plasmid from
the system) the minimum specific yield that is capable of being handled by this process is
~280pg pDNA gWCW'1. For plasmid specific yields lower than this the ratio of
contaminating gDNA to pDNA at the end of the process will be too high as to be
approvable. Such a figure for specific yield equates to 1.75xl06bp of extrachromosomal
pDNA per cell. This means that a plasmid of size 116kb must be present at 15 copies per
cell to be even close to being acceptable.
This analysis also suggests that the 33kb and 49kb series of plasmids created by cloning
were present at too low a yield to process effectively. However, for these constructs the
problems of instability led to reduced yields. As predicted by (Table 6-4) the predicted
yields of these constructs (assuming 100%) are 600-800pggWCW] and should be able to
be purified effectively. However, again this assumes 80% recovery which as was seen with
larger constructs was not achieved due to extensive damage in the lysis step.
Further contaminant profiles were generate for RNA and protein. The description of the
RNA removal was achieved through the use of a novel assay, which although not
applicable for QA/QC purposes would be suggested for process optimisation studies. A
final point was found concerning the relative clearances achieved at the different cross-
flow velocities. It was found that more co-purification of all the contaminants occurred at
the slower crossflow rate.
7.10.4 Chromatographic studies
Batch binding studies in to the adsorption of these larger constructs on to commercially
available resins suggests that problems could be expected to arise during the
chromatographic separation of these macromolecules. Binding rates and binding capacities
Thomas Burt 374

7. Downstream Processing
were found to be reduced with increasing plasmid size. It is suggested that should attempts
be made to produce constructs of this size order on a commercial scale that investigations
should be made in to the application of membrane chromatography systems or at least
“superporous” stationary phases. The necessity for such studies is even more justified
when the results from the poor binding are considered in light of the possibility that large
plasmids may face problems in penetrating packed-bed columns of such resins (6 .5 .3 ).
Thomas Burt 375

8. Conclusions and Future Work
8 CONCLUSIONS AND FUTURE WORK
8.1 Introduction
To conclude this thesis first involves reiteration of the objective of the investigations
which was; to identify any problems which may be encountered should attempts be made
to produce large plasmids using currently adopted techniques. As such, the project had
quite a broad remit since the current processes for the manufacture of these
macromolecules involves numerous steps. Rather than concentrate on specific operations
the aim was to observe, through experimentation, where the potential bottlenecks were
likely to be encountered. This required taking a holistic view of the process, since each
section of the process impacts on the next. However, in concluding it is felt more
digestible to divide the process up into sections and describe the main observations.
8.1.1 Construct design
The start of any plasmid production process begins with the design of the construct to be
produced. In a commercial setting the design of the construct will be mainly dictated by
the condition to which the therapeutic plasmid is being targeted. However, since within the
plasmid sequence are contained the instructions for its propagation and replication, its
design becomes of fundamental importance to the parties involved in its manufacture. This
fact cannot be overstated.
At the outset of this project, the constructs with which investigations were begun had not
been designed with any form of manufacture in mind. The Oxford series of plasmids were
Bacterial Artificial Chromosomes, designed for shuttling DNA between eukaryotic and
prokaryotic cells, so as to investigate the functionality of proteins encoded on the huge
sections of DNA it was capable of propagating. The desire for high plasmid yields was not
a key driver in the design of these plasmids, since only small masses were required with
which to perform such studies. Sufficient mass with which to conduct such functional
studies could be obtained by lab-based procedures. What was deemed important when
these constructs were being designed, was stable propagation of the plasmid, such that
strains could be maintained and banked. Consequently, the plasmids were built around F-
factor replicons. This naturally occurring plasmid replicon maintains a very low plasmid
copy number by coupling the replication of the plasmid to the replication of the host
Thomas Burt 376

8. Conclusions and Future Work
genome, as such only 1-2 copies persist within any given cell. Consequently, when initial
yield investigations into fermentations of strains bearing this plasmid were performed it
was found that little pDNA could be recovered (3.3). Also, downstream purification
investigations were conducted but little useful information could gathered concerning
issues faced with the purification of large plasmid, since the initial plasmid masses were too low (3.8).
This forms the first conclusion. If large plasmids are to be manufactured the use of low-
copy number replicons should be avoided simply because insufficient plasmid mass is
produced with which to enable purification. It was detailed in the downstream processing
chapter that even had 1 0 0 % of the large construct p5176 been purified the initial starting
mass still would not be sufficient to produce a validatable contaminant profile (7.8.1). It is
speculated that to produce such plasmids would require a fundamental overhaul in the
currently adopted techniques for plasmid purification. Rather than the aim of the
purification train being the bulk removal of contaminants from the plasmid, as is the
current philosophy, the selective removal of the plasmid from the contaminants would
need to be attempted. The feasibility of such a course of action remains debatable. Should
there be a strong desire to make BACs (>100kb) then there is a potential strategy which
may be worth investigating, which involves the propagation of inducible BACs. However,
these only promise to increase the copy number to the 1 0 - 2 0 copies per cell level.
Estimates show that even this may be insufficient. (5.3.1).
A final note on BACs must include the correction to a belief that due to the massive size of
the average BAC (>100kb) compared to a regular plasmid (3-10kb) is that it needs to be
maintained at 1 - 2 copies per cell in order to avoid over-burdening the host-cell machinery.
With commercially designed vectors of 3-1 Okb being reliably propagated at 1000 copies
per cell, the notion that 2 copies of a plasmid lOOkb in size would cause an excessive
burden is a misnomer (Figure 3-14).
In a change of course of this project, it was decided to attempt the creation of large
plasmids under the control of relaxed, high-copy number replicons. It is concluded that
this strategy is the only reasonable course of action were attempts be made at large
plasmid manufacture. It was demonstrated (from extrapolation (Table 6-4)) that the yields
which could be expected from the fermentations of such constructs could allow
purification. However, a few considerations need to be taken in the choice of vector. It is
recommended that the vector employed should use an alternative selection method than
Thomas Burt 377

8. Conclusions and Future Work
that of ampicillin. It is reasoned that kanamycin may be a more judicious choice due to the
mode of action of this agent. However, in a more commercial setting, where the use of
antibiotics is discouraged, then design of the construct should employ a system such as
repressor titration. What has to be concluded from the investigations conducted in the
course of this project is that a form of selective pressure is definitely required since the
probability of loss of larger constructs is increased (Table 5-10).
8.1.2 Upstream Processing
Following construct design the next step of a plasmid production process involves
optimisation and characterisation of the fermentation step. Initial studies concluded that
the propagation of the large BACs did not pose a significant burden to the growing cells
(3.2). Indeed the results confirmed previous reports suggesting that any metabolic burden
suffered by cells, and manifested by reduced growth rates and biomass yields, were more
likely to be the result of proteins expressed by the construct rather than the construct itself.
Furthermore, it is concluded that the small amount of extrachrmomosomal DNA being
propagated by cells bearing BACs is unlikely to present a significant burden to any
growing cell.
Another unfortunate consequence of the design of the Oxford series concerned the
limitation that the stringent nature of their replication eliminated any prospect of
increasing plasmid yields by manipulation of the environmental parameters influencing
culture growth rate. Had this been a possibility then the feat of cloning large constructs
could have been avoided by employing sophisticated cultivation techniques to amplify the
BAC copy number.
Upstream investigations revealed the true extent by which manipulation of the
fermentation growth conditions could positively influence specific yields. Having
determined that the series of pGEM plasmid were plagued by instability issues, after 37°C
pilot-scale fermentations failed to generate plasmids (6.3), it was decided to culture the
plasmids at reduced temperatures (6.4). The more optimal control mechanism of the
pGEM plasmids meant that their replication was relaxed. As such the copy number was
not linked to host-genome replication but more connected to the growth rate of the cells
bearing the constructs. Had it been realised, prior to conducting the pilot-scale
fermentations, the extent to which the plasmid specific yield would increase toward the
end of the fermentations (Figure 6-5), then fermentation time would have been extended
Thomas Burt 378

8. Conclusions and Future Work
to exploit the full magnitude of this effect. As it were, it was only realised following the
completion of the fermentations. It is concluded that the large increases seen in plasmid
specific yields toward the end of the fermentation were feasibly larger than those described
by other researchers. The reason being that the increase was being fuelled by not only the
up-regulation of plasmid replication, but also by the increase in the relative proportions of
plasmid-bearing cells, caused as a result of the reduction in the growth differential existing
between plasmid-free and plasmid bearing cells. It was this observation that leads to the
conclusion that should fermentations of high-copy number, large plasmids, be conducted
that problems of instability should be expected, which will push down plasmid yields.
However, unlike stringent plasmids, there are strategies which could be employed to
counteract this issue so as to correct the problem and restore high yields. One has already
been mentioned; the judicious choice of the selection system. However, the second
concerns the choice of the mode of operation of the fermentation. It is suggested that
exponential fed-batch control of culture growth at a levels <0.2h_1 would be very effective
in increasing the yields of large plasmids by exploiting the two outcomes previously
mentioned.
Overall the extrachromosomal DNA yields which could be expected from a fermentation
of a large, high-copy plasmid in which stability was maintained at 100%, are predicted to
reach levels several multiples that of the genome of the host cell (Table 6-4). However, it
must be concluded that this increase is in the large part driven by the proportionate
increase in plasmid size, as a decrease in plasmid copy number with increasing plasmid
size was recorded. Whilst not a critical issue, if the plasmid product is considered on a
molar basis, as must be considered when dosing, then the fermentations do become less
efficient with increasing plasmid size, since fewer copies are being propagated.
Finally it can be concluded that propagation of larger constructs was not hampered by any
reduction in supercoiling. Indeed it has been shown that the larger plasmids recovered
from the fermentations did show a favourable level of supercoiling (Figure 6-8/Figure
5-11).
8.1.3 Intermediate purification
The conclusions to be drawn from the studies in to the downstream purification steps are
considered quite profound. It is concluded that the potential exists for constructs up to
Thomas Burt 379

8. Conclusions and Future Work
50kb to be purified by the currently adopted process. However, it must be stated that for
the manufacture of large plasmids, the current process is far from optimal.
It was demonstrated that recovery levels of increasingly sized plasmids from the UF
demonstrated a reasonably linear decrease (Figure 7-3). It was only from detailed
investigations into the topology changes (Figure 7-4) occurring to the plasmid molecules
that a mechanism for the losses was elucidated. It is believed that the lysis operation is the
real culprit in reducing plasmid yields. It was found that increasingly severe damage to
plasmid topology was enacted upon plasmids as the size of the constructs increased, such
that by the end of the lysis period an increasing proportion of the larger plasmid molecules
existed in open-circular form (Figure 9-10). Analysis into the macro and micromixing
environments achieved in the vessel suggested that the damage was not inflicted by a
physical process but rather a chemical one (7.7). It can only be concluded that the precise
nature of the chemical process responsible was either base-catalysed hydrolysis of the
phosphodiester bonds in the pDNA backbone or the action of endogenous nucleases, or a
combination of the two. It can be quite reliably concluded that the effect was not produced
by physical forces, since the loss of topology was a clean one, involving the uniform
conversion of SCC form to OC form, this would not be typically expected by a random
physical process (Figure 9-10).
It is concluded that the mixing condition employed in the lysis vessel are far from ideal. In
the mistaken belief that a low-agitation/shear environment would be beneficial to both
plasmid and contaminating gDNA form, the result is in reality the creation of poor mixing
conditions. The poor mixing conditions in turn lead to an extension of the time required
for the lysis and neutralisation steps to be completed (Table 7-7). It is the extended
periods required for these unit operations which are responsible for the damage to the
plasmids, since they prolong the period for the action of either of the two chemical
mechanisms outlined. It is concluded that the chemical damage is in action for plasmids of
all sizes, but that with increasing plasmid size the effect became more noticeable since
more sites were available for action.
Whilst it is concluded that the lysis operation lies at the root of the losses of plasmid from
the system, it is not the direct cause of the plasmid losses. From the plasmid balances
(Figure 9-31), all the plasmid expected from harvest sample comparison was still
detectable following lysis, it is just that the gels recorded that the larger plasmid were
Thomas Burt 380

8. Conclusions and Future Work
increasingly detected in OC form. The actual loss of plasmid mass was believed to occur during the ultrafiltration operation.
During the operation stages of the UF step a crossflow was in action and a transmembrane
pressure applied. It is concluded that during this period the crossflow quickly degraded the
open-circular pDNA leading to a relative increase in the proportion of supercoiled
plasmid, an occurrence which can be appreciated by direct visualisation of the gels (Figure
9-10). It is maintained that the supercoiled form was relatively unaffected during this
period of operation being quite protected from the physical forces by the action of the
plasmid-gel layer. The losses of the plasmid were accrued since the shearing of the OC
plasmid forms was believed to create small linear fragments capable of penetrating the
membrane. It is believed that the shearing of the OC plasmid form with the effect of
increasing % supercoiling to be an occurrence which is independent of plasmid size. This
can be concluded since the effect was witnessed even with the smallest construct (Figure
9-6). As a result of the selective degradation of the OC form, the recovery levels of
plasmid from the UF membrane became a function of the proportion of plasmid loaded in
OC form. Since the proportion of OC form generated by the lysis step was found to be
linearly related to plasmid size (Figure 7-5), by virtue of an increased likelihood of
chemical degradation, the larger plasmids recorded the most severe losses.
Following the period of UF operation follows the recovery of the plasmid from the UF
membrane. During this operation the TMP is removed from the membrane and the
crossflow allowed to scour the membrane so as to recover the plasmid on the surface. It is
this scouring of the membrane which is thought to explain the difference in the final
topologies between runs performed on the same plasmids at crossflows 250mLmin‘1 and
500mLmin'] (Figure 7-3). It is also this period of operation which creates the sheared
pDNA which can be observed on the gel scans of many of the larger constructs (Figure
9-10). From the results it is concluded, as would be expected, that operation of the
membrane at 250mLmin‘1 rather than SOOmLmin'1 is more beneficial to final plasmid
quality. However, it must also be concluded that the final form of the larger plasmid
recovered from the membrane would not pass the >95% supercoiling criterion (Figure
7-3).
From these conclusions it was speculated that the operation of this process could be
applied to the purification of larger constructs since it was found that the reported losses
were due to the high proportions of OC pDNA in the clarified lysate at the time of
Thomas Burt 381

8. Conclusions and Future Work
ultrafiltration. It will be suggested that should a process for the manufacture of larger
plasmid DNA be attempted, intermediate purification by UF could work as a viable
strategy, providing attempts were made to ensure that the plasmid loaded on to the
membrane was primarily supercoiled. As such, when commenting on this process it is
recommended that the lysis step be optimised since, even for smaller constructs, its
operation is concluded to be far from optimal. It is suggested that lysis needs to be
achieved more rapidly and increasingly so for larger constructs. The employment of a
continuous lysis and neutralisation procedure should be considered. The fact also remains
that recovery of plasmid from the membrane promises to be problematic in terms of the
quality of the pDNA recovered as plasmid size increases.
8.1.4 Contaminant profiles
The level of clearance achieved of the major contaminants achieved by the process was
detailed and deemed to be very effective (7.8). A large swathe of contaminants was found
to be removed by precipitation during the lysis regime and another large majority removed
by the proceeding diafiltration steps. Incidentally, it was determined that a slightly more
effective clearance of all the contaminants was realised using the faster (SOOmLmin'1)
crossflow rate. This is believed to be due to the greater scouring action, resulting from the
faster velocity, reducing the thickness of the gel-layer which inhibits the transit of the
contaminant moieties across the membrane. A drawback with this is that were large
plasmids to be produced a trade-off would need to be established between the faster
crossflow velocity, at which greater contaminant clearances are demonstrated, and the
slower velocities at which damage to plasmid topology is less pronounced. It was
suggested that the use of a faster crossflow could be employed during the membrane
operation stages, with a slower velocity used for the recovery stages. However, the
demands for a variable speed pump might prevent the application of such a proposal.
The level of gDNA was deemed the most critical contaminant to track (7.8.1). The
resultant profiles produced by monitoring the clearance of this contaminant are concluded
to have important implication to the manufacture of large plasmids. It was found that this
process is capable of achieving a set level of clearance of this contaminant. Although the
process was only studied up to the anion-exchange column stage, due to the similar
physico-chemical properties of pDNA and gDNA it was deemed that the ratio between the
two at the end of the UF step could be used to assess the likelihood of the process being
accepted. Strict requirements surrounding the ratio of gDNA to pDNA demanded by the
Thomas Burt 382

8. Conclusions and Future Work
regulators, combined with the fixed level of clearance achieved by the plasmid process
means that the final plasmid mass obtained comes to influence whether a process would be acceptable or not.
Employing such as process as the one outlined here, with a plasmid maintained at high-
copy numbers will almost always ensure that there is sufficient plasmid mass at the end of
the process such that the small amount of gDNA co-purified is massively exceeded by the
mass of plasmid purified. However, the situation for large plasmids may not be as simple.
If the specific yields of large plasmids from the fermentations are low then the poor yield
of pDNA purified by the end means that the ratio of gDNA to pDNA may be too high as to
be acceptable. This was found to be the case in these investigations. This provides a
definitive reason why high plasmid yields from the fermentation are a necessity and not
just a matter of process efficiency. It can be concluded that for this process to be accepted,
in that the ratio of pDNA to gDNA by the process end meets the acceptance criteria, then a
minimum specific yield of ~290pgpDNA gWCW’must be obtained. If not then the level
of clearance of gDNA will be insufficient. This specific yield figure was obtained
assuming an 80% recovery of plasmid across the UF steps. As has been demonstrated, as
the process stands this level of recovery remains unachievable for larger constructs.
8.1.5 Chromatographic Separations
The use of chromatography in processes for the manufacture of plasmid DNA is essential,
despite the matrices not being particularly well adapted for the purpose. From these
investigations it can be concluded that the purification of larger plasmids can be expected
to be increasingly troublesome (7.9). It was demonstrated that the binding kinetics of
larger constructs were reduced as compared to the smaller plasmid controls (Figure 7-15).
This would mean that slower flow rates would be required and less well defined elution
peaks could be expected. Additional studies demonstrated the decreasing maximum
binding capacities displayed by the resins under study with increasing plasmid size
(Figure 7-16), the result of which could be poorer recoveries from column steps.
Another observation made through the course of the project were the poor recoveries
produced from Qiagen resins when purifying larger constructs. Investigations concluded
that whilst heating the elution buffer alleviated the problem it was not completely resolved
(6.5.3). As such it was proposed that the plasmids may have had difficulty entering the
resins and as such poor recoveries were recorded. It is recommended that further studies be
Thomas Burt 383

8. Conclusions and Future Work
conducted to confirm whether this is the case. It was certainly established that the larger
plasmids were not capable of effectively penetrating PD-10 gel columns used for de
salting. The results from the chromatographic investigations suggest that should attempts
be made to produce large plasmids alternative chromatographic strategies are worth
pursuing, namely membrane chromatography.
8.1.6 Analytical
Effective analytical techniques are essential if confidence is to be had in the results
returned since it from these that conclusions will be drawn. In these investigations the two
assays for which a great deal of development was required were the plasmid quantification
assay and the plasmid topology assay.
Studies found that the accurate quantification of large plasmids was hampered by their size
and their yield. Low yields often meant that contributory signals produced as a result of
the relatively high levels of contaminants lead to misleading results regarding plasmid
yield (4.3). For instance, the presence of contaminating gDNA was found to completely
distort the reading produced by PicoGreen. In the end a suitable HPLC assay was
developed. It has to be concluded that HPLC remains a valid technique for large plasmid
quantification but the caveat must be applied that plasmid resolution decreases with
plasmid size. However, it must be outlined that if this project were to be repeated then
time spent developing a qPCR based assay for plasmid quantification would be well spent.
Results from qPCR for gDNA contamination were impressive in the level of sensitivity
and specificity displayed. It can only be expected that the same could be said of a qPCR
assay for plasmid quantification.
The second assay regards the plasmid topology. Due to the larger size of these constructs
the use of conventional gel electrophoresis was prevented since DNA molecules >20kb are
not effectively resolved (4.6.1). As such a great deal of trial and error was spent
developing a FIGE based assay. Although useful results were eventually forthcoming the
turn around of the assay was incredibly slow. It was found that 40 hours was required for
the running of the gel followed by another 24 hours for effective staining to be achieved.
Therefore it was far from being a user-friendly assay. As with a plasmid qPCR assay, if
this project were to be started from the outset then it would be considered a good move to
investigate the use of capillary electrophoresis for the analysis of plasmid topology. The
Thomas Burt 384

8. Conclusions and Future Work
turnaround time for this assay is a matter of minutes, meaning that many more replicatescould be processed.
8.1.7 Future Work
(i) There is a pressing need to further investigate the lysis step of the current process.
It was postulated that the lysis step was the real cause of plasmid topology damage,
and as such the root cause of plasmid loss. Investigations are required to further
quantify the damage to plasmid molecules by this lysis regime. If the plasmid
topology changes are reduced, through the use of more suitable conditions, it may
be found that the remainder of the current process could be applicable to the
manufacture of larger constructs.
(ii) Further work needs to be conducted into optimising large plasmid’s replication
machinery in order to improve plasmid yield and stability. Whilst it was found
favourable to use a high-copy number replicon to improve plasmid copy-number,
the consequences this had on the plasmid stability were disappointing. As such it is
thought that large yield gains could be found by optimising the plasmid’s
machinery such that high-copy numbers were obtained in conjunction with high
stability. Several approaches would be required including the choice of a more
effective selection mechanism which could be as simple as kanamycin or more
complicated such as post-segregational killing.
(iii)It would be worth investigating the use of inducible BACs. Whilst it is maintained
that standard vectors e.g. pGEM ll are capable of maintaining up to lOOkb of
DNA, for larger amounts BACs remain the only option. However, as described in
Chapter 3, it is believed that at copy numbers of 1-2 per cell, they would never
represent a feasible strategy. The arrival of inducible BACs, whose copy number
can be amplified upon the addition of IPTG may promise to rectify the issue of low
copy number.
(iv)Further investigations need to focus on the chromatographic steps to be used in any
process for the manufacture of large plasmids. It was highlighted during these
studies how the specific binding capacity decreased with increasing plasmid size.
Thomas Burt 385

8. Conclusions and Future Work
Such a phenomenon would reduce the overall efficiency of any chromatography
step. More explanation is needed into why this is the case. It was hypothesised to
be due to the lack of binding sites created by hindrances resulting from the
molecules’ size. It would be useful investigating the use of more porous supports.
Furthermore, no studies were conducted into the use of expanded bed strategies.
The low shear environment of this option may be found to be favourable.
(v) One recurring problem throughout this project was the corruption of plasmid
quantification by changes in plasmid topology. Whilst minimal effect is noticeable
when assaying smaller plasmids, with larger constructs the distorting effect became
increasingly apparent when using many of the analytical procedures. It is believed
that for large plasmid studies it would be worth investing time in creating a qPCR
based assay for the highly accurate quantification of plasmid in all process streams.
Thomas Burt 386

9. Appendices
9. APPENDICES
OC Dimer
SC Dimer
Figure 9-1 Conventional AGE of the smallest construct (pG E M ll [3.2kb]> used to determine the topology changes of the construct through the fermentation. The gel was scanned and the proportions used to plot the change in supercoiling with time.
M M 1 2 3 4 5 6 7 8 9 10 11 M
SCC3 0 k b —25kb----
Figure 9-3 FIGE of the construct (pGEM16 [16kb]) used to determine the topology changes o f the construct through the fermentation. The gel was scanned and the proportions used to plot the change in supercoiling with time.
5kb----
M M 1 2 3 4 5 6 7 8 9 10 M M
35kb30kb25kb20kb15kb
Linear
Figure 9-2 FIGE of the construct (pGEM33 [33kb]) used to determine the topology changes of the construct through the fermentation. The gel was scanned and the proportions used to plot the change in supercoiling with time.
Thomas Burt 387

9. Appendices
10 11 MV. ® v-i ^ c § i . ,g R | is &,
35kb
2 0 k b
15kb
— SCC
OC
Figure 9-5 FIGE of the construct (pGEM49 |49kb]) used to determine the topology changes of the construct through the fermentation. The gel was scanned and the proportions used to plot the change in supercoiling with time. The right- hand marker consisted of the 49kb which had been subjected to vigourous pipetting to attempt to damage the plasmid. Some shearing is evident.
1 2 3 4 5Figure 9-4 FIGE of the construct (p5176 |U 6kb ]) used to determine the topology changes of the construct through the fermentation. The gel was scanned and the proportions used to plot the change in supercoiling with time.
SCC
OC
Thomas Burt 388

9. Appendices
SIZING GEL £
(maxi-prep)
65.060.0 550 50 045.0 40035.030.025.020.015.0
10.0
g
—J CO CD* s2 o_l oCD COE E m® <o CD
— a* s & B u «
- n
i =9 = w
SUPERCOILED
48.538.4
OPEN-CIRCULAR22.619.4
-17.115.0 12.210.0 8.6 8.3
Figure 9-7 FIG E gel of maxi-prep (large construct kit) purified constructs. This gel was scanned and the topology inform ation taken to be the proportions a t the s ta rt of the process (Pre-Lysis), since the gentle processing regime of the m axi-preps should not have caused significant changes to the topology.
3.2kb
CF =500MLMINCF=250MLMIN
OPEN-CIRCULAR
SUPERCOILED
Figure 9-6 Conventional AGE of the sm allest construct (pG E M lI [3.2kb]) used to determ ine the topology changes of the construct through the production process. Samples were taken from five points during the process and from runs a t both crossflow velocities; 250 and 500m Lm in'1.
: 6VcrrrV 2hrs/ 1xTBE/ 0.8%/25‘C
pGEM1 1
SUPERCOILED
OPEN-CIRCULARLINEAR
F igu re 9-8 F IG E o f the pG EM 16kb co n stru c t used to de te rm in e th e topology changes o f the co n stru c t th ro u g h the p roduc tion process. Sam ples w ere tak en a t five points d u rin g the process and from runs at both crossflow velocities; 250 and SOOmLmin'1.
| CF =250MLMIN-’---- 1 |--------CF =500MLNIINI------1
Field Inversion GE: Forward Voltage 180V/ Reverse Voltage 120V/ Linear switch ramp/ 40hrs/1%/ 4*C
Thomas Burt 389

9. Appendices
PGEM11
3 3 kb
50.045 .040 .0 35 0 3 0 025 .020.0 150 10.0
5.0
5 iLm cc.
5 w fS wSUPERCOILED
LINEAR
OPEN-CIRCULAR
SHEARED pDNA
| CF =250MLMIN ’ --------- | |---------CF =500MLMIN-’ --------1
Field Inversion GE: Forward Voltage 180V/ R everse Voltage 120V/ Unear switch ramp/ 40hrs/ 1% /4'C
Figure 9-11 F IG E of the pG EM 33kb construct used to determ ine the topology changes of the construct through the production process. Samples were taken a t five points during the process and from runs a t both crossflow velocities; 250 and 500m Lm in '1
PGEM11
49k b mSUPERCOILED
LINEAR
OPEN-CIRCULAR
SHEARED pDNA
Figure 9-10 FIG E of the pGEM 49kb construct used to determ ine the topology changes of the construct through the production process. Samples were taken a t five points du ring the process and from runs at both crossflow velocities; 250 and 500m Lm in '1
|------- CF =250MLMIN-’ --------- 1 | CF =500MLMIN ’ -
Field Inversion GE: Forward Voltage 180V/ R everse Voltage 120V/ Linear switch ramp/ 40hrs/ 1% /4‘C
P5176 1 16kb
Figure 9-9 F IG E o f BAC p5176. N um erous a ttem p ts w ere m ade to ex trac t suffic ien t p lasm id m ate ria l w ith w hich to ru n a re liab le gel bu t to no avail. T he p lasm id existed in such sm all am o u n ts th a t insufficient could be co n cen tra ted and purified w ithou t the m ask ing effect o f th e genom ic DNA sm ear ap p ea rin g
\~ CF =250MLMIN-1 CF =500MLMIN-' -
Forward Voltage 180V/ R everse Voltage 120V/ L inear switch ram p/ 4 0 h r s /1%/ 4 ‘C
Thomas Burt 390

Stea
dy-s
tate
ap
pare
nt v
isco
sity
pa
(Pas
)
9. Appendices
D.D5 0.05
0.045 0.045y = 0.327X -0-5145
0.04 0.04, ( 0 . 4 8 5 5 - 1 )
0.035 0.035
0.03 - 0 0 3
0 .025 -
0.02 - 0.02
0.015 - 0.015
0.01 - -- 0.01
0.005 - -■ 0.005
0 100 200 300 400 500 BOO
Shear rate y ( s '1)
F ig u re 9-12 G ra p h p lo ttin g a line o f best fit th ro u g h th e d a ta fo r a p p a re n t v iscosity o f ly sa te flu id a t v a rio u s sh e a r ra te s as de te rm in ed from (C iccolini et a/.. 1999) T a b le 7-7. F ro m th e d a ta the values fo r K (consistency index) an d n (f lo w -b eh av io u r index) have been ex trac ted .
Thomas Burt 391

Figure 9-13
Volum
etric Yield
profiles from
the 25°C
4L ferm
entations
Volumetric Plasmid Yield (mg plasmid L'1)O o
o
00
O
to
o>
00
O l O - ^ O O O O t O A O l O O O
o
o
o>
o to o> a>o
Volumetric Plasmid Yield (mg plasmid L"1)
Volumetric Plasmid Yield (mg plasmid L'1) Volumetric Background gDNA Yield (mg gDNA L‘1)
Volumetric Plasmid Yield (mg plasmid L'1)Volumetric Plasmid Yield (mg plasmid L'1)
9. Appendices

9. Appendices
FERMENTATION 1 DATA: DH1 fparentall80
WM C«M WSI0M ) Dry CM wtght (at*)
70
0090
40
30
20to
00 8 10 18 20 22
- iX> “
30 |
Dssotwd Oxfl)«n T ention (%) Agitation rate (rpm)
too o
I1
0 2 6 8 10 12 18 20 22FIGURE FIGURE Timt (hrs)
20
-16 15
.1410
• 12 I• 10 1 5-8 a 0
! --4 I - i°
:-15
-0
- 2 -20
FIGURE Tim» (hrs) Time (hrs)FIGURE
26 5
260
29 5
29 0
24 9-90 g.
24.0
■Temperature (°C)Action on temperature loop (%)
23 0-2 6 8 10 12 14 16 18 20 220
15
10
•10 105
00
Action on pH loop (%)
o 2 6 8 10 12 18 20 22
FIGURE: Time (hrs) FIGURE: Time (hrs)
500 = 0 271hrs
3210A
•2
-3102 8 12 20 220
$
0 2 6 10 12 14 16 18 20 22
FIGURE FIGURE:
Figure 9-14 Online data for 4L working volume 25°C fermentation of DH1 parental. 4L of sterile media (GSK proprietary media) was inoculated to a starting OD of 0.1 using a starter culture grown at 25°C. Oxygen saturation was maintained at 30% by cascade control of impeller speed and maintained through the sparging o f enriched air. Online data was logged using BioXpert
Thomas Burt 393

9. Appendices
FERMENTATION 2 DATA: DH1 fparentall80’
Wtf Cm* w ight 1.9L *) Dry CmU wmtgr* iflLl)
70
40
2 0 -
1 0 -
0.0 8 10 12 14 18 18 20 22
4I 113 I££ 1I
FIGURE Time (hrs)
1050
Ossotved Oxygen Tension (%) Agrtabon rate (rpm)10 0 0 .
950
900
850.
800.
750-
700
860
800 0 2 84 I 10 12 14 16 18 20 22
FIGURE Time (In)
I
18
Ms* OUR (18 4 2 ta ) • 18 02mmo*sL V Total Oaygsn Oamand * 225 5mmois16
14.
1210
64 .
2-
0.
-2 0 2 164 6 6 10 12 14 16 20 22
FIGURE Time (hrs) FIGURE10 12 14 16 16
Time (hrs)
ec*II w
Temper aUre (^C)Acton on temperature loop (%)
2 3 5 .
0 2 6 16 18 20 226 10 12 144
I-10 8
-50 £
iriuT n r i
------PH-------Acton on pH loop (%)
FIGURE Time (hrs) FIGURE10 12
Time (hrs)16 18 20 22
54 .
21
0>1
-2
Time (hrs)FIGURE
5 .
WCW « 0252hre4 .
3210-1
-2-3
120 2 6 e 10 14 16 16 20 22
FIGURE Time (hrs)
Figure 9-15 O nline data for 4L w ork ing volum e 25°C ferm entation o f DH1 parental. 4L o f sterile media (G SK proprietary m edia) w as inoculated to a starting OD o f 0.1 using a starter culture grown at 25*C. O xygen saturation w as m aintained at 30% by cascade control o f impeller speed and m aintained through the sparging o f enriched air. O nline data was logged using BioXpert
Thomas Burt 394

9. Appendices
FERMENTATION 3 DATA: DH1 fp51761 (116kb)
- W*t C*H w ttght (OL )- Dry C#W w g f * t g i ')- Opdc«[ DtraMty
10
:Z i:<0 £- 3 0 “
- I
FIGURE
1050Dissolved Oxygen T ension (%) Agitation rate (rpm)1000
950
750.
700
550
6000 3
FIGURE6 5 10
Time (hrs)14 16 20 22
Maa OU* (16 67Hr») • 15 O tm m M l W Total O ^por Domarxi • 166mmoto
FIGURE Time (hrs)
2015
5
0
■10
-15
-200 2 6 12 2210 16 20
FIGURE: Time (hrs)
2 7 5
2 6 5 -
26 0 -
2 6 5 -
2 5 0 -
2 4 5 -
245 -
2 3 5 -
2 3 0 -
FIGURE
- Temperalure (°C)Acton on temperature loop (%)
Time (hrs)
-io §
•30
-40
-50 s.
*-70
-60
15
10
-10 105
00
95
Acton on pH loop (%)
0 2 4 6 6 10 12 16 16 20 22
FIGURE Time (hrs)
5OD * 02SShrs
32
0-1
-2
20 2212 16 160 2 6 10
FIGURE Time (lw»)
5WCW*0217hrs
4
32
0•1
-2
220 2 6 6 10 12 14 16 20
FIGURE Time (hrs)
Figure 9-16 O nline data for 4L w orking volum e 25°C ferm entation o f DH1 p5176. 4L o f sterile media (G SK proprietary m edia) w as inoculated to a starting OD o f 0.1 using a starter culture grown at 25°C. Oxygen saturation was m aintained at 30% by cascade control o f im peller speed and maintained through the sparging o f enriched air. O nline data was logged using BioXpert
Thomas Burt 395

9. Appendices
FERMENTATION 4 DATA: DH1 fp51761 (116kblBO
700050
40
50201 0 -
00 10 >f»me(tH) IB IB 20 22
FIGURE
MU* OUR (17 Itirm) - 14 82mmp«L V ToUM Otygw CUmano - 100 7mmo*
>
I
0 2 6 a 10 2212 IB IB 20
1050
Dissolved Oxygen T enswn (%) Agitation rate (rpm)1000
950
900
650
000750
700
650
BOO
FIGURE:10 12 14 16 18 20 22
Time (hrs)
20
15
10
S
0-5
-10
-15
•20 0 2 6 6 10 12 16 16 20 22
FIGURE Time (hrs) FIGURE: Time (hrs)
M0
\ A
Temperature (°C)Acton on temperature loop (%)
222 8 12 16 200 10
-io 8
-2° ^
s-40 O
-50 a .
- I-00
FIGURE Time (hrs)
5
*
5
2
0-
-2
-3
Time (hrs)FIGURE
20
15
10-1 0 ?
06
00
96
Action on pH loop (%)
6 10 12 16 18 20 220 2 4 6FIGURE Time (hrs)
5
n^WCW«0.214hrs63
2
0-1
-2
-32 6 10 12 16 18 200 8 22
FIGURE:
Figure 9-17
Thomas Burt 396

9. Appendices
FERMENTATION 5 DATA: DH1 PGEM11 (3.2kb)
0 * 18 ’time pH) »• u 20 aaFIGURE
H u o v a n r I M I • it.TSm m olu. 1h f1 ToUl Cuyfa* Demand • leOvnmda
5
ft r
o 2 6 10e 14 16 18 20 22
20
-200 2 6 8 10 12 16 18 20 22
FIGURE Time (hr*) FIGURE Time (hrs)
27 0 -
264
260
€ « c3 2 9 0
f 2442 4 0 *
2 3 9
2 3 0 -
FIGURE
- Temperature PC)Acton on temperature loop (%)
Time (hrs)
- io §
-50 S.
16 16 20 22
.20
15
10
•'0?OS
00
06 Acton on pH loop (%)
0 2 6 8 10 12 14 18 18 20 22
FIGURE Time (hrs)
»•
u ^ O D * 0-261 hrs4
210
•1
•2-3
20 222 10 12 14 180 6 8
FIGURE Time (hrs)
5M^WCW-0219hrs
4
3
2
0*
-2
•310 16 18 20 220 2 4 6 14
FIGURE Time (hrs)
Figure 9-18
0 2 4 6 S 10 12 14 16 I t 20 22
FIGURE: Time (hre)
Diasolved Oxygen T ension (%) Agitation rate (rpm)
Thomas Burt 397

9. Appendices
FERMENTATION 6 DATA: DH1 PGEM11 (3.2kb)
1000
950
900
850 DOT PROBE FAILURE800 AERATION MAINTAINED EQUAL TO OTHER VESSEL
750
700
650
600 -0 2 4 S a 10 12 14 1B IB 20 22
FIGURE Time (In)
10 . 1U L
: I•: -
41 -
> ! 3
FIGURE10 12
Time (hr*)16 18 20 220 2 4 § 8 10 12 14 16 18 20 22
FIGURE Tim. (In)
l. K"2 0 -
10 .
0 -
FlGURE# 10 'font (IH) 10 1# 20 22
260
246
240
- T emper ature (X )Act) or on temper ature loop (%)
0 10 12 16 18 20 222 6 8 14
FIGURE Time(hr»)
50 0 « 0272hr»
210
•1
-2
4 2210 16 18 200 2 6 12 14
FIGURE Time (two)
20
15.
10.
•10 305
7 00
95Action on pH loop (%)
2 10 16 16 220 4 6 6 12 14 20
FIGURE: Time (hr»)
WCW « 0224hrs
35
o 2 4 6 8 10 16 20 22FIGURE: Time (hn)
F igu re 9-19
Thomas Burt 398

9. Appendices
FERMENTATION 7 DATA: DH1 p GEM 16kb80
Wa< Om» w t g h t ( g i ) Dry Cad w t g n t ig t A
70 i l6C
5040.
»•
2 0 .
to.
0.
0 If 20 22
“ I40 BX “ X
20 5
Dissolved Oxygen Tension (%) Agitation rate (rpm)
I
FIGURE Time (hrs)18 20 22
FIGURE:
Mai OUR (17.27m ) - 13 77mmo*L W Total OKyean Oama«o • 147 06mm© to
•IaI5
0 2 6 8 2210 12 18 18 20
FIGURE
20
-20 0 2 4 6 8 10 12 16 18 20 22
FIGURE: Time (hrs)
Temperature fa )Acfon on temperature loop (%) Action on pH loop (%)
FIGURE Time (hrs) FIGURE: Tune (hrs)
5
3
05
-2
-318 20 220 6 12 I4 182
FIGURE Time (hrs)
5MFl t W CW -0212hrs
3
2
0
-2
-316 20 220 2 4 6 6 10 12
FIGURE: Time (hrs)
F igu re 9-20
Thomas Burt 399

9. Appendices
FERMENTATION 8 DATA: DH1 p GEM 16kb80
Wat Call watgftt (gi/S 6ry Cali weight yji i Optical Oanaty
70
40
30-
20100
0 0 10 10 10
FIGURE Time (hrs)
1 “
Dissolved Oxygen Tension (%)^tat)on rate (rpm)
FIGURE Tune (hrs)
10
OU« (17 42nr»> . 15 tSmmolal V
1210
4 •
2
0-2
20 0 0 10 12 10 10 20 22
20
IS
105
0
-s
•10 "
-15
-20 -200 2 0 0 10 12 14 10 10 20 22
FIGURE Time (hrs) FIGURE Time (hrs)
270 -
TemperatureAcSon on temperature loop (%)
2300 2 0 12 10 10 20 224 10
OS
00
AcSon on pH loop (%)•30
0 200 2 0 10 14 10 22
FIGURE Time (hrs) FIGURE Time (hrs)
5-
4 ■
3
2
1
0
•3222 0 10 12 14 10 10 200 4 0
5^ W CW -0215hrs
3
2
1
0
•1
-2
-30 2 0 e 14 10 20 22
FIGURE FIGURE
F igu re 9-21
Thomas Burt 400
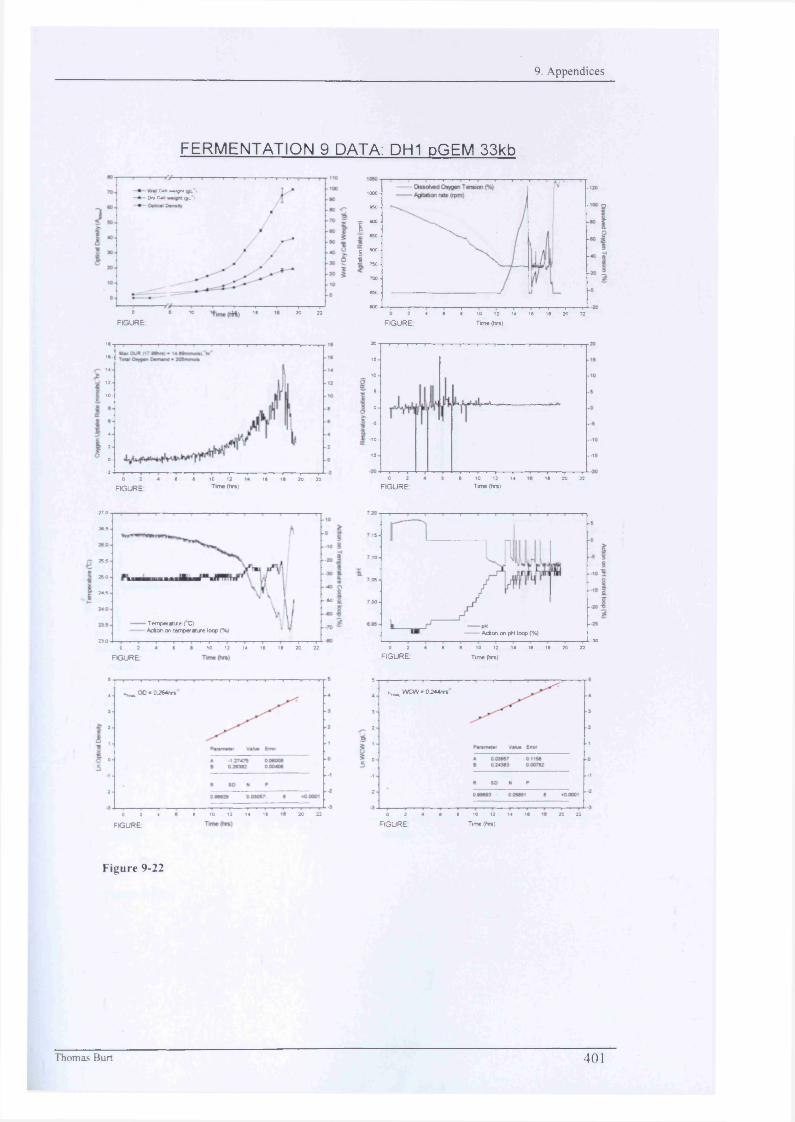
9. Appendices
FERMENTATION 9 DATA: DH1 p GEM 33kb
C«H weight 'j0»y CmK tflL'1)
0 10 16 20 22FIGURE
16
16-
14
1210-
4 ■
20-
-2 0 2 126 6 10 16 16 20 22
2015
105-
0-6-
-10-
-15
0 2 6 6 10 12 14 18 20 22FIGURE Time (hrs) FIGURE Time (hr*)
270
26 5
255
25 0
24 5-50
Temperatu’e (~C)Acton on temperature loop (%)
230 0 2 6 10 12 16 18 20 2214
15
10
05
00
Act) on on pH loop (%)•30
2 6 10 12 16 18 20 220 6 14
FIGURE FIGURE Time (hrs)
5
v 0 0 ■ 0264hrs ’4
S
2
10
-2
12 16 20 220 2 4 8 10 14
5-
u^WCW«0244hrs'
3
2
0-1
•2
10 12 16 20 220 2 6 6 14
FIGURE FIGURE Time (hrs)
F igu re 9-22
Thomas Burt 4 0 1
1000 •
650
600I 850
8 8008 750
700-
65C
apt0 2 4 6 6 10 12 14 16 16 20 22
FIGURE: Time (hrs)

9. Appendices
FIGURE Time (hrs)FIGURE
FERMENTATION 10 DATA: DH1 p GEM 33kb
- VWat Ca0 ta t ')- Dry Call w ttgm (gt*1)- Optical Density
0 # 10 't.m edH )FIGURE
0 2 4 • • 10 12 14 16 10 20 22
FIGURE: Time (hrs)
- T emper ature (°C)Acs on on temperature loop (%)
FIGURE10 12 14 16 16 20
Time (hrs)
Aden on pH loop (%)
2 4 6 6 10 12
FIGURE Time (hrs)
i^OO-O^lhrs
5
16 20 220 2 6 6 10 12 16
WCW - 0 256hrs
5
o 6 8 12 222 10 20FIGURE Time (hrs) FIGURE: Time (hrs)
F ig u re 9-23
Thomas Burt 402

9. Appendices
FERMENTATION 11 DATA: DH1 p GEM 49kb90 '
70
40
90
2010 ■
0-
0 10 If 19 20 22
20 £
1090
Dissolved Oxygen Tension (%) Agitation rate (rpm)1000
990
900'
950
900
790
700
990
600 0 2 4 6 9 10 12 16 19 20 22FIGURE FIGURE Time (hrs)
ifU*> OOf (21 70»w») • 11 OOmmotel W Tow Oiypoo Daman* • 179 ffm moio
If
14
109
20
20 6 9 10 12 14 16 19 20 22
2019
109
0
-5
-10
-19
•200 2 106 6 12 14 16 16 20 22
FIGURE Tune (hrs) FIGURE: Time (hrs)
- T empersture C*C)- Acton on temperMure loop (%)
*Un
-ro S
•20 I 1‘"I-40 O
-90 2 .
- !-20 i16 1 f 20 22
.20
19
10
05
00
96
Acton on pH loop (%)
o 2 6 8 10 12 14 16 20 22FIGURE FIGURE Time (hrs)
M»^OD»0247hre
5
10 16 20 220 2 6 12
m W C W - 0226hrs
5
2 6 10 12 16 16 20 220 6FIGURE Time (hrs) FIGURE Time (hrs)
Figure 9-24
Thomas Burt 403

9. Appendices
F E R M E N T A T I O N 1 2 D A T A : D H 1 p G E M 4 9 kb
80
Wat Call w*iflht c g l ') Dry Call wa*gnt Wl ')
70«C
90
40
9020100
0 10 18 18 20 22
Dissolved Oxygen T ension (%) Agrtaton rate (rpm)
II
0 2 4 6 8 10 12 20 2218
FIGURE FIGURE Time (hrs)
Ma> 0 0 8 Q i 09hra) • 10 SSmmo*!. W Total Oxygon Do mono • 180 84mmo*»
1210
8-
20
0 2 4 8 8 10 12 18 20 2218
IIDC
0 2 4 6 8 10 12 14 18 18 20 22FIGURE Time (hrs) FIGURE Time (hrs)
2 70
285
280
250
Temperature (°C)Acton on temperature loop (%)
0 2 8 10 14 18 20 224
--io 3
-40 O
£-so *
20
10
10 106
00
96
Acton on pH loop (%)
o 2 8 8 10 12 14 20 2218
FIGURE Time (hrs) FIGURE Time (hrs)
i1*^^00*0-250*54
2
I
0
-1
-2-
22200 2 8 10 18
5
9
210
■1
-2
-3 2 8 8 10 12 16 20 220 18
FIGURE Time (hrs) FIGURE Time (hrs)
F ig u re 9-25
Thomas Burt 404

9. Appendices
(vi) Upstream HPLC curves
3kb standard curve 10ul loaded 16kb standard curve 10ul loaded
2 5 - (Peak Area - 2774 09) -25< 400*.. .[pDNA] (pgmP*)9446.3*
20- -20
■fe 15-Xc0 £< 10- OCm4)a
- 15
-10
0 50 100 150 200 250 300
25- (Peak Area - 7224.99)£ 400*...[pDNA] (p g m r')
*210.7](Peak Area + 27840.42]> 400k...[pDNA\ (pgml'') =20- 9260.79
x 1 5 -
10-
0 50 100 150 200 250 300
pDNA Concentration (ngmr1) pDNA Concentration (ngm!-1)
33kb standard curye 10nl toaded 49kb standard curve 10ul loaded
(Peak Area - 4499.56)25 . < 400*.. \pDNA] (p g m r ' ) -257501.03 (Peak Area + 13*63 99)2. 400* \pDNA\ (pgmP') =
20- -20■b5 15- £<w 10- ■0-
-15
- 10
0 50 100 150 200 250 300
(Peak Area - 16502.16)'s4m..\pDm)(pgmr')25- -257*99 49 (Peak Area-1- 179 51)
2 400*.. [pDNA] IpgmP') =*179.3320-
■fex 15-ro£<"fo 10-a>a
-15
0 25050 100 150 200 300
pDNA Concentration (ngml1) pDNA Concentration (ngmr')
1 16kb standard curve 1 0 u l loaded Combined Standard Curves
-2525- (Peak Area - 5250.20)<, 400*... [pDNA] (pgmr') = 8264.40-2020-
COo>< 10-
- 15
- 10aerea;O-
200 250 300100 1500 50
25- -25
i
I-2020-
15- - 15
2-1010-
pDNA Concentration (ngmf1)
50 100 150 200 250 300
pDNA Concentration (ngmf1)
Figure 9-26 H PL C calibration curves used determ ination of plasmid concentration in samples taken during the ferm entations. A stan d a rd curve was prepared for each construct under investigation ranging between O ^SO pgm L 1 in concentration . As can be seen from the figures it was not always possible to purify some of the constructs to the high concentrations so only the more dilute points were used in the standard curves.
Thomas Burt 405

9. Appendices
3kb standard curve 10Oul loaded
Pre-UF >400k [pDNAJ« (Area -2475864)/93275 46 PreA* <4008 IpDNA] - (Area -99003.54)/a0265.0
Post-UF >4008 (pDNAj - (Area +145602.22)/10501052 Post-UF <400k [pDNA] = (Area +5806 63)/88106 0
"5------------- TO------------ T5------------20“
pDNA concentration (ugmf1)
16kb standard curve IQOul loaded
I<* 10
Pre-UF <4008 [pDNAj« (Area ♦ 466.03)/81635 10 Pre^lF >4008 [pDNAj • (Area ♦ 21756.7)/887D7.5
Posl-UF <4008 (pDNA] - (Area -6473 59)168703.58 Post-UF >4008 |pDNA| - (Area +61959 42V80833 41
“To re to js r
pDNA concentration (pgml'1)
33kb standard curve 1 0 0 u l loaded
- (Area -2774.09K94463.80 « (Area +25435.74V96157 44
“oxcoe<9IQ_
Post-UF <4008 |pDNA) * (Area -6020.22)/66218.52 Poat-UF >400 (pDNA) - (Area +77795.69)72883 57
pDNA concentration (pgmr1)
49kb standard curve 10Oul loaded
Pre-UF <400k [pDNAj = (Area -3814,50)/83409.22 Pre-UF >4008 [pDNA] = (Area -5252.28)/81539.21
Post-UF <4008 IpDNA) - (Area -12110.05)/48736 4 Post-UF >400 IpDNA)» (Area -78711)/44253 06
pDNA concentration (pgml'')
11SK1? ?la.n<jars!..g,grvgj^9ial Ipafled
Pre-UF <400 |pDNA) • (Area 3814 501/83409 22 Pre-UF >4008 [pDNAj - (Area -9472 53V81295.94
Post-UF <4008 (pDNAj - (Area -18140V24334.16 Post-UF >4008 IpDNA) = (Area -44647 08V23184 1
■5------------- T tr 15- “zcr
pDNA concentration (pgml'’)Pre-UF material In blan8 clarified lysate Post-UF material in 20mM Trts/0.54M NaO
gDNA standard curve 100pl loaded
Pre/Post UF <4008 |pDNAj « (Area -21216.63V39634.83 Pre/Post UF >4008 |pDNA) ■ (Area +11102 63)/43698 65
S------------TO-----------TO-----------2D-----------25"
pDNA concentration (pgml'1)
Figure 9-27 The stan d ard curves employed for the D ownstream processing steps. As can be seen two curves are detailed for each construct. This was due to the effect of shear. It was found necessary to develop two s tandard curves for plasmid m aterial p re and post-UF. As can be seen the Post-U F calib ration curves run lower th a t the pre-UF, this was due to the presence of sheared pDNA being unaccounted for du ring peak integration
Thomas Burt 406

9. Appendices
PE Applied Biosystems Sequence Detection Systems 1.6.3
File Name: untried 2 U s e r .D»te:Thu, Ses 15. 2005
C om m ents:
P la ts Type: 7703 Single Reporter PCR volume: 30
ThermalC yclsHOG
Cycle Conditions
T em perature50 00
Tim e2:00
Repent & Tuns Auto incrementAUtO
hoa 95.00 10:00 Auto
Cycle 95 00 60 00
0:151:00
40 AutoAuto
s tan d ard Curve
S lo p s : -4 .05 In te rc e p t : 42 16
Fit R: 0.99
T h resh o ld : 0.04 Baseline Range: ;3 . 13)
Sample inform ationw e n Type Sample Nam* R e p l ic a te £ 1 Q u a n ti ty Xtd Dev M eanA1 STND 17.69 1.0e+06 0 .00 1000000.A2 STM) 17.61 1.3*+06 0 .00 1000000.A3 STND 18.34 1.0e+06 0 .00 100000D.B1 STND 21 .5 7 1.0*+Q5 0 .00 100000.0B2 STND 21 .49 1.Qe+05 0 .00 :B3 STND 21 .47 1.0*+05 0 .00 100000.0C1 STND 26.31 1.3«+34 0 .00 10000.00C2 STND 26.41 1.04+04 0 .00 10000.00C3 STND 26 .6 3 1.04+04 0 .00 10000.0001 STND 30.04 1.04+03 0.00 1000 00D2 STND 29 .7 5 1.04+03 0 .00 1000 00D3 STND 3 0 .t5 1.04+03 0 .00 1000 00Cl STND 3 4 .03 1.04+02 0 .00 100.00E2 STND 3 3 .1 7 1.04+02 0 .00 100.00E3 STND 34.65 1.04+02 0 .00 1 : 3 . 3 3
A4 UMOT NIC 01 35.38 4.84+01 6 .60 50 16A5 UhKN NIC 01 35 .17 5.44+01 6.60 50 16B4 UFKN NTC 01 35.61 4-24+01 6 .60 50 .18B5 UKKS NTC 01 35.08 5.7e+01 6 .60 50.16C4 UFKN RUN 1 PRE-LYSIS 02 16.66 2.04+06 74605 9 1955786.C5 UN<N RUN 1 PRE-LYSIS 02 16.67 2.04+06 746D5.9 1955786D4 iJMOs RUN 1 PRE-LYSIS 02 16.75 1.94+06 74605 .9 1955786.05 UNO* RUN 1 PRE-.YSIS 02 16.60 1.94+06 74605.9 1955786.E4 JNOs RUN 1 PRE-CACL 03 16.28 2.54+06 47657 .2 2544000.EE UNO* RUN 1 PRE-CACL 03 16.21 2.64+06 47657 .2 2544000.F4 UNO* RUN 1 PRE-CACL 03 16.28 2 54+06 4 7657 .2 2544000.
F5 UNO* RUN 1 PRE-CACL 03 16.27 2.54+06 4 7657 .2 2544000.G4 UNO* RUN 1 RETENTATE 04 25 .77 1 14+04 4 942 .09 7732 .46G5 UNO* RUN 1 RETENTATE 04 25 .59 1.34+04 4942 09 7732 .48H4 UNO* RUN 1 RETENTATE 04 27.78 3.64+03 4942 .09 7732 46H5 UNO* RUN 1 RETENTATE 04 2 7 .92 3.34+03 4 942 .09 7732 46A6 UNO* RUN 1 WASH 1 05 26 .40 7.94+03 3725 .44 4 793 .79
A7 UNO* RUN 1 WASH 1 05 26 .37 8 .ie + 0 3 3725.44 4 793 .79
Bo UNO* RUN 1 WASH 1 05 29.21 1.64+03 3725.44 4793 .79B7 UNO* RUN 1 WASH 1 05 29 .29 1.54+03 3725.44 4793 .79
Figure 9-28 An exam ple o f the PDF report generated by the MagNA Pure m achine as p a rt o f the gDNA assay. Note th a t four independent samples are com bined into 1 result. The results were reported in copies per well, figures which w ere then converted into mass based units.
Thomas Burt 407

Thom
as Burt
408
Yield calculations for Fermentation 1: DH1 Parental AP*rV1
Tim« pointElapsed
Time (hrs)HPLC
Area AHPLC Area B
MeanArea
Plasmid Cone. (pg/ml)
Plasmid Mass (pg)
Pld Mass [St Dev] [St Dev]
Optical Density (A600) Mass (g) Yield (pg/gWCW) [St Dev]
Volumetric Yield (mg/L) [St dev]
0 0 16103 18806 17454.5 1.48 0.15 0.0231 36.8 2.121 12.02 0.0153078 9.65 1.511 0.0030 0.0562 10.25 30000 31000 30500 3.06 0.31 0.0086 15.85 2.616 5.8 0.0136638 22.36 0.626 0.35 0.0103 11.5 33663 30751 32207 3.26 0.33 0.0249 24.3 5.233 8.3 0.0146386 22.28 1.702 0.54 0.0414 12.5 27341 24598 25969.5 2.51 0.25 0.0235 32.4 1.131 12.2 0.0132787 18.88 1.767 0.61 0.0575 13.5 21285 23426 22355.5 2.07 0.21 0.0183 45.1 0.636 14.5 0.0155517 13.31 1.178 0.60 0.0536 14.5 22210 24013 23111.5 2.16 0,22 0.0154 51.7 0.212 17.8 0.0145225 14.88 1.062 0.77 0.0557 16.25 18894 19711 19302.5 1.70 0.17 0.0070 87.7 2.192 30.9 0.0141909 11.98 0.493 1.05 0.0438 17 17260 17260 1.45 0.15 0.0000 95.3 0.071 34.8 0.0136925 10 61 0 000 1.01 0.0009 18 15633 17151 16392 1.35 0 13 0.0130 93.4 0.000 40.2 0.0116169 11.61 1.118 1.08 0.104
Yield calculations for Fermentation 2: DH1 Parental BPAR V2
Time pointElapsed
Time (hrs)HPLC
Area AHPLC Area B
MeanArea
Plasmid Cone, (pg/ml)
Plasmid Mass (Mg)
Pld Mas.[St Dev] (ba.) [St Dev] Density (A600) Mass (g) Yield (pg/gWCW) [St Dev]
Volumetric Yield (mg/L)
Vol Yield [St dev]
0 0 16103 18806 17454.5 1.48 0.15 0.0231 36.8 2.121 12.02 0.0153078 9.65 1.511 0.0030 0.0562 10.25 18806 24701 21753.5 2.00 0.20 0.0504 16.5 0.283 6.13 0.0134584 14.84 3.748 0.24 0.0623 11.5 22688 24593 23640.5 2.23 0.22 0.0163 27.05 0.495 8.6 0.0157267 14.15 1.036 0.38 0.0284 12.5 25585 25480 25532.5 2.45 0 25 0.0009 31.95 1.061 10.84 0.0147371 16.65 0.061 0.53 0.0025 13.5 26812 23187 24999.5 2.39 0.24 0.0310 41.15 0.354 14.12 0.0145715 16.40 2.129 0.67 0.088e 14.5 30824 30519 30671.5 3.08 0.31 0.0026 48.65 0.212 19.08 0.0127490 24.13 0.205 1.17 0.0107 16.25 28744 30358 29551 2.94 0.29 0.0138 82.15 4.344 29.8 0.0137836 21.33 1.002 1.75 0.0828 17 16850 16850 1.40 0.14 0.0000 93.3 2.404 34.8 0.0134052 10.47 0.000 0.98 0.0009 18 23026 19193 21109.5 1.92 0.19 0.0328 92.1 0.849 39.1 0.0117775 16.29 2.785 1.50 0.256
10 18.5 16514 18376 17445 1.48 0.15 0.0159 90.35 0.354 41.1 0.0109915 13.42 1.449 1.21 0.131
so>
Yield calculations for Fermentation 3: DH1 p5176 (116kb) Ap817t11tkbV1
Time pointElapsed
Time (hrs)HPLC HPLC Mean Plasmid Plasmid Pld Mass WCW WCW
Density (AMO)Plasmid Specific Yield (pgfgWCW) [31 Dev]
Volumetric Moles of Plasmid Copy No. Copy No [St Dev]Area A AreaB Area Cone, (pg/ml) Mass (pg) [St Dev] (9A-) [St Dev] Mass(g) Yield (mg/L) [St dev] Plasmid (oopies/oell)
« 0 46328 52232 49280 5.33 0.53 0.0505 36.55 1.344 11.24 0.0162589 32.77 3.107 0.011 0.001 4192039545 3.35 0.322 10.25 49088 50600 49844 5.40 0.54 0.0129 19.5 0.354 5.66 0.0172261 31.32 0.751 0.61 0.015 4245737502 3.40 0.083 11.5 61496 54598 58047 6.39 0.64 0.0590 25.1 0.354 7.84 0.0160077 39.91 3.687 1.00 0.093 5026738106 4.02 0.374 12.5 46773 62022 54397.5 5.95 0.59 0.1305 28.5 0.071 10.12 0.0140810 42.23 9.266 1.20 0.264 4679272337 3.74 0.825 13.5 65945 94679 80312 9.08 0.91 0.2458 36.7 0.212 14.44 0.0127078 71.47 19.346 2.62 0.710 7146569686 5.72 1.55t 14.5 76638 53328 64983 7.23 0.72 0.1994 45.35 0.318 17.72 0.0127963 56.48 15.586 2.56 0.707 5687108725 4.55 1.267 16.25 65387 70468 67927.5 7.58 0.76 0.0435 69.06 0.369 26.4 0.0130795 57.98 3.324 4.00 0.230 5967452048 4.77 0.271 17 57265 76373 66819 7.45 0.74 0.1635 84.4 0.424 31.4 0.0134395 55.43 12.165 4.68 1.027 5861912713 4.69 1.031 18 42973 51644 47308.5 5.09 0.51 0.0742 89 0.141 39.5 0.0112658 45.17 6.585 4.02 0.586 4004334719 3.20 0.4710 18.5 49036 50503 49769.5 5.39 0.54 0.0126 89.5 0.636 38.5 0.0116234 46.35 1.080 4.15 0.097 4238644421 3.39 0.08
3 << »r - — • V>
I 9r *Q . IT ” —n xr a a. u
■o_asM3a.n©•a ■<
o «« -•> TJ nr>
n “S.as
< s* i .O g CL
=3 » n S. 5‘ °-3. 3 On v>
v>
» _ _cr o ora« 3VI —.
3C CTQ
re
M -
(D ft M
Calculation
of specific
yields

9. Appendices
(v ii) T o p o lo g y B a la n ce
Mass-T opolPflY Balance [?.?Kb / 250ml mm"] Mass-Tcpoloav Balance [32Kb < 500ml rmrrl
MMS:TaBoiagyMantt I1SH; ' ZSBntntn Mass-Topology Balance [16kb / 500mlminJ1
. Nf M i
* /Mass-Topoloav Balance 133Kb / SOOmlmirrh
LINEAR SHEARED pDNA
LINEAR SHEARED pDNA
M a ss-T ooo ipqv B a la n ce 149tt> /. 25Qm.irn.in- j
LINEAR Q SHEARED pDNA
LINEAR SHEARED pDNA
/
Figure 9-30 Figures applying the percentage toplogy results produced by gel analysis of the different streams to the plasmid mass balance data so as to indicate the proportion of plasmid mass in each form. Avergaes from each of the two runs were taken.
Thomas Burt 4 0 9

9. Appendices
RUN 1 IpGEMHI
P lasm id B alan ce de te rm ined bv HPLC Flux R ate18
16
14
123E.
10SI2 8!2F 6E
CL 4
2
0
TOTAL PLASMID RECOVERED = 1 75MG YIELD = 59 9%
350 350
Recirculation300 300
250 250
20010 200
f j 150 150
100 100
-10 0 10 50 6020 30 40 70 80
FINAL FLUX RATE = 276.5LMH PROCESSING TIME = 54 73MINS
Tim e (mins)
Protein B a lan ce de te rm ined bv BCA a s sa y RNA b alan ce determ ined bv f luo rescence b a sed a ssa y
to 100
* * / / y v ^
Genomic DNA m ass determined bv qPCR assay1000 4.0
3.5100
3.0
10 o>E 2.5
81 2 2.022S 1.5
0.1 reQ. 1.0
0.010.5
1E-3 0.0
M ass-Topoloav B alance determ ined bv Gel E lectrophoresis-4 .0
LINEAR SHEARED pDNA
Figure 9-31 Run 1 Data from a single DSP operation. Shown is the plasmid mass balance, the flux recorded during the UF operation, the soluble protein, RNA and gDNA masses recorded at each stage and the plasmid toplogy balance.
Thomas Burt 4 1 0

9. Appendices
RUN 2 IpGEMHI
Plasmid Balance determined bv HPLC
TOTAL PLASMID RECOVERED = 1 51 MG YIELD = 49-5%
350 350Diafiltration
300 300
250 250
200 200
3 150 150
100 100
-10 0 10 20 30 7040 50 60 80FINAL FLUX RATE = 297 8LMH PROCESSING TIME = 57 7MINS
Time (mins)
Protein Balance determined bv BCA assay RNA balance determined bv fluorescence based assay
m 100
/ / / / / / / s s /
Genomic DNA m ass determined bv qPCR assay
0.001
1000 4.0
3.5100
3.0
10 CDE 2.5v>
1 I 2.02
1.50.1 £7
2Q. 1.0
0.010.5
1E-3 00
Mass-Topoloov Balance determined bv Gel Electrophoresis-4.0
LINEARSHEARED pDNA
Figure 9-32 Data from a single DSP operation. Shown is the plasmid mass balance, the flux recorded during the UF operation, the soluble protein, RNA and gDNA masses recorded at each stage and the plasmid toplogy balance.
Thomas Burt 411

Thomas Burt 412
gD N A m a s s (m g) S o lu b le Protein M a ss (m g)P lasm id M a ss (m g)
R N A m a s s (m g)P lasm id M a ss (m g)

9. Appendices
RUN 4 IdGEM1 6 I
Plasmid Balance determined by HPLC Flux Rate
TOTAL PLASMID RECOVERED = 14 1MG YIELD *87.7%
- V / / /
350 350
300 300
250 250
200 200I
150 150
100 100
-10 0 10 20 30 40 7050 60 80FINAL FLUX RATE = 198 5LMH PROCESSING TIME = 61 3MINS
Time (mins)
Protein Balance determined bv BCA assay RNA balance determined by fluorescence based assay
m 100« 10
Genomic DNA m ass determined bv qPCR assay
0.001
Mass-Topology Balance determined bv Gel Electrophoresis18 -|------ .-------1-------.-------1------------------ 1-.-- 1------ r 18
BHEARE0 PONA
Figure 9-34
Thomas Burt 413

9. Appendices
RUN 5 IpGEM3 3 1
Plasmid Balance determined bv HPLC
TOTAL PLASMID RECOVERED = 6 17MG YIELD = 48 3%
Flux Rate
/ / / / / " / /
350 350
300 300
250 250
200 200I5—i 150 150
100 100
-10 0 10 20 30 40 50 60 70 80FINAL FLUX RATE = 209LMH PROCESSING TIME = 68.8MINS
Time (mins)
Protein Balance determined bv BCA assay RNA balance determined bv fluorescence based assay
Genomic DNA m ass determined bv oPCR assay Mass-Topplofly Balance determined by Gel Electrophoresis
Figure 9-35
Thomas Burt 4 1 4

Thomas Burt 415
gDNA m ass (mg) Soluble Protein Mass (mg) Plasmid Mass (mg)
RNA m ass (mg)Plasmid Mass (mg)

9. Appendices
RUN 7 IpGEM4 9 I
Plasmid Balance determined bv HPLC18
TOTAL PLASMID RECOVERED « 1 97MG YIELD * 25.6%
16
14
12
864
20
Flux Rate350 350
300 300
250 250
200 200
150
100 100
-10 0 10 20 30 40 50 60 70 80FINAL FLUX RATE = 234 6LMH PROCESSING TIME ■ 60 3MINS
Time (mins)
Protein Balance determined bv BCA assay RNA balance determined bv fluorescence based assay
m 100
f ■ / / / / / / '/ i f j ’y / /
f / / / / / / * ' S
Genomic DNA m ass determined bv aPC R assay I by Qel Electrophoresis
/
88
7SHEARED pDNA
6
5
4
3
2
1
0
Figure 9-37
Thomas Burt 4 1 6

9. Appendices
RUN 8 IdGEM49 1
Plasmid Balance determined bv HPLC18
TOTAL PLASMID RECOVERED = 1.83MG YIELD « 24 9%
16
14
1210864
20
Flux Rale350 350
Permeate Dialiltration300 300
250 250
200 200
150 150
100 100
F*IAL FLUX RATE = 258 06LMH PROCESSING TIME = 67 75MINS
10 20 30 40 50 60 70
Time (mins)
Protein Balance determined, by..B£A assay RNA balance determined bv fluorescence based assay
1____ j r ____ --------- 1— :---- 1— :— i— :— i---- 1— j - ■— a. -.1—. ■J.—i ■■ j
/ / / / / / / s s / / / / / / / / s * /
1000
to 100
Genomic DNA m ass determined by qPQR assay
gM(053£■1
Mass-Topology Balance determined by Gel Electrophoresis88
7
6
5
3
2
10
/
Figure 9-38
Thomas Burt 4 1 7
13

9. Appendices
RUN 9 IP5 1 7 6 I
Plasmid Balance determined bv HPLC18
TOTAL PLASMID RECOVERED = 0 39MG YIELD = 21 1%
16
14
1210864
20
Flux Rate350 350
300 300
250 250
200 200
150
100 100
-10 0 10 20 30 40 50 60 70 80FINAL FLUX RATE = 193 6LMH PROCESSING TIME = S2MINS
Time (mins)
Protein Balance determined bv BCA assay RNA balance determined by fluorescence based assay
<c 100
z z z z / Z Z ^ 'Z
Genomic DNA m ass determined by qP gR assay
Figure 9-39
Thomas Burt 4 18

gDNA m ass (mg) Soluble Protein Mass (mg)
RNA m ass (mg)
Protein B
alance determ
ined bv
BCA assay
RNA balance
determined
bv fluorescence
based assay
Plasmid Mass (mg)
O) 09 O K>
V\ :\
\
\ S
m Q
o K> o> 00 00o>O ro
LMH
o
o
o
Ao
S
8
g
a( j t
ON
9. Appendices

9. Appendices
RUN 11 IdGEMHI 2 5 0 mLmin-
P lasm id B a lan ce d e te rm ined bv HPLC Flux R ate
DiafiltrationRecirculationTOTAL PLASMID RECOVERED = 1 70MG YIELD = 55 7%
FINAL FLUX RATE = 154.84LMH PROCESSING TIME = 54 9MINS
Tim e (mins)
P rotein B a lan ce d e te rm in ed by BCA a s s a y RNA b a lan ce determ ined bv f lu o rescen ce b a sed a s sa y
G enom ic DNA m a s s d e te rm in ed bv qP C R a s sa y M ass-Topolo.qy B alance determ ined by Gel E lectrophoresis
seeocLINEARSHEARED pDNA
Figure 9-41
Thomas Burt 4 2 0

9. Appendices
RUN 1 2 IpGEMIII ISOmLmiir1
Plasmid Balance determined bv HPLC Flux Rate
DiafiltrationRecirculationTOTAL PLASMID RECOVERED = 1 63MG YIELD = 52%
FINAL FLUX RATE = 161 3LMH PROCESSING TIME = 53 4MINS
Time (mins)
Protein Balance determined bv BCA assay RNA balance determined bv fluorescence based assay
Genomic DNA m ass determined bv oPCR assay Mass-Topology Balance determined bv Gel Electrophoresis
seeocLINEARSHEARED pDNA
Figure 9-42
Thomas Burt 421

Thomas Burt 422
gDNA m ass (mg) Soluble Protein Mass (mg) Plasmid Mass (mg)
RNA m ass (mg)Plasmid Mass (mg)

9. Appendices
RUN 1 4 IdGEM161 2 5 0 mLmin-
Plasmid Balance determined bv HPLC Flux Rate
TOTAL PLASMID RECOVERED = 13 84MG YIELD = 85 3%
/ / / / / " / /
350 350Diafiltration Diafiltration.Recirculation Permeate
300 300
250 250
200 200
3 150 150
100 100
-10 0 2010 30 40 50 60 70 80FINAL FLUX RATE * 146 07LMH PROCESSING TIME = 76 44MINS
Time (mins)
Prptein gglaq£g_(jetermine(j by BQA flSSOY RNA balance determined bv fluorescence based assay
ra 100
/ S / / s Y / s s /
i s i i s s i i
i I i I i i i i
Genomic DNA m ass determined bv aPCR assay Mass-Topology Balance determined by Gel Electrophoresis1000 18
16100
14
10 3 12EV) 10
1 ro2 82E0.1 8
i s6
Q.4
0.012
1E-3 0
LINEAR SHEARED dDNA
Figure 9-44
Thomas Burt 423
13

Thom
as Burt
424
gDNA m ass (mg) Soluble Protein Mass (mg) Plasmid Mass (mg)
RNA m ass (mg)Plasmid Mass (mg)

9. Appendices
RUN 1 6 IpGEM 3 3 1 2 5 0 mLmin-
Plasmid Balance determined bv HPLC18
TOTAL PLASMID RECOVERED = 5 690MG YELD * 48 6%
16
14
1210864
20
Flux Rate350 350
Permeate Diafiltration DiafiltratiorRecirculation
300 300
250 250
200 200
5 150 150
100 100
-10 0 10 20 30 40 50 60 70 80FINAL FLUX RATE = 154 8LMH PROCESSING TIME = 67 4MINS
Time (mins)
Protein Balance determined by BCA assay“■—i—
RNA balance determined bv fluorescence based assay
</> 10
f / / / / / / / S S / / / / S S / * *
Mass-Topology g ajanoe determined &y g e l Electrophoresis— ,--------- . t . , . 1 . , ,--------- P 14
Genomic DNA m ass determined bv aPCR assay
seeocLINEARSHEARED pDNA
Thomas Burt 4 25

9. Appendices
RUN 1 7 IpGEM 4 9 1 2 5 0 mLmind
Plasmid Balance determined bv HPLC Flux Rate18
TOTAL PLASM© RECOVERED = 1 29MG YIELD = 19.2%
16
14
1210864
20
* ' S .
350 350
300 300
250 250
200 200
□ 150 150
100 100
-10 0 20 4010 30 50 60 70 80FINAL FLUX RATE = 161 3LMH PROCESSING TIME = 63 9MINS
Time (mins)
Protein Balance determined bv BCA assay1 i ■:
RNA balance determined bv fluorescence based assay
Genomic DNA m ass determined bv aPCR assay Mass-Topoloav Balance determined bv Gel Electrophoresis8
7SHEARED pONA
6
5
4
3
2
1
0
/ • s
Figure 9-47
Thomas Burt 4 2 6

9. Appendices
RUN 1 8 IpGEM 491 2 5 0 mLmin -l
Plasmid Balance determined bv HPLC Flux Rate
TOTAL PLASMID RECOVERED = 1.052MG YIELD * 15-3%
/ / / / /
350 350
300 300
250 250
200 200
j 150 150
100 100
50
-10 0 10 20 30 40 50 60 70 80FINAL FLUX RATE = 154 84LMH PROCESSING TIME = 65 42MINS
Time (mins)
Protein Balance determined by BQA assay~1-----’ i T
RNA balance determined bv fluorescence based assay
/ / / / / / / s s /
Genomic DNA m ass determined bv aPCR assay Mass-Topoioov Balance determined bv Gel Electrophoresis
LINEAR SHEARED pDNA
✓ S
Figure 9-48
Thomas Burt 4 2 7

9. Appendices
RUN 1 9 I d5 1 761 SOOmLmiir1
P lasm id B a la n c e d eterm in ed bv HPLC Flux R ate18
TOTAL PLASMID RECOVERED = 0.255MG YIELD = 16 7%
16
14
1210864
20
350 350
300 300
250
200 200I—i 150 150
100 100
FINAL FLUX RATE = 158LMH PROCESSING TIME = 56 41MINS
20 30 40 50
T im e (m ins)
P rotein B a la n c e d ete rm in ed bv BC A a s s a y R N A b a la n c e d eterm in ed bv f lu o r e sc e n c e b a se d a s s a y
G e n o m ic D N A m a s s d e te r m ined by q P C R a s s a y
Figure 9-49 Run 19
Thomas Burt 4 2 8

9. Appendices
m™ s = = “ "l-l, -- *««•> tuu »
\ / \ r : I
A - iv\ ------------
49 9m * - * * *
pGEM 49kb TMAE Omins pGEM 49kb TMAE 14.0mins
pGEM 49kb TMAE 2.5mins pGEM 49kb TMAE 17.0mins
pGEM 49kb TMAE 5.0mins pGEM 49kb TMAE 20.0mins
pGEM 49kb TMAE 8.5mins pGEM 49kb TMAE 23.0mins
pGEM 49kb TMAE 11.5mins pGEM 49kb TMAE 30.0mins
Figure 9-50 Images recorded from the binding studies which show the proportion of plasmid remaining in solution at v arious points from the addition of the plasmid solution to the chromatographic matrix - pGEM49kb
Thomas Burt 4 2 9

9. Appendices
"O'* 23.8
pGEM 3.2kb TMAE 14.0minsa mm mm.l
* r r
= ^ \x , ; ; r 4*.
iMni n«M- 2 2 ? "
pGEM 3.2kb TMAE 17.0mins
pGEM 3.2kb TMAE 20.0mins<Wmtrnmv -Me "ST
i l l1.Tr« a*-
-
"**■ 179k * ■' * T » ’
pGEM 3.2kb TMAE 23.0mins
" * mmmmmmm ■ ■ ■ ■ now. 162
pGEM 3.2kb TMAE 30.0mins
Figure 9-51 Images recorded from the binding studies which show the proportion of plasmid remaining in solution at various points from the addition of the plasmid solution to the chromatographic matrix - pGEM 11 3.2kb
496
dGEM 3.2kb TMAE Omins
pGEM 3.2kb TMAE 2.5mins
pGEM 3.2kb TMAE S.Omins
pGEM 3.2kb TMAE 8.5mins
pGEM 3.2kb TMAE 11.5mins
Thomas Burt 4 3 0

9. Appendices
S A M P L E I N F O R M A T I O NSnm|)lfrName: V1T11A Acquired By: thb30228Sample- Type: Unknown Date Acquired: 08-Apr-2005 04 25:23Vint: 41 Acq Method Set: Dionex BAD 2 MethInjection 1 Dale Processed: 09-Apr-2005 11 04:511 njection Volume . 10.00 ul Processing Melhol Dionex BAD PRun Time 14 0 Minutes Channel Name: 480Sample Set Name: DtO TB 07APR05 Proc. Chnl Descr.:
A u to -S ca led C hrom atogram
S A M P L E I N F O R M A T I O N
Sample Name: Sample Type Vial:Injection - Injection Volume: Run Time:Sample Set Name:
V2T11AUnknown19110.00 ul14 O MinutesDIO TB 07APR05
Acquired By:Date Acquired: Acq. Method Set: Date Processed: Processing Method Channel Nome: Proc. Chnl. Descr.:
Ihb302280 7-Apt-2005 22:52:10 Dionex BAD 2 Men08-Apr-2005 10:59:53 Dionex BAD P486
Auto-Scaled Chromatogram
Thomas Burt 431

Thomas Burt
9. Appendices
4 3 2

10. References
REFERENCES
1. Adam ,R.E. and Zimm,B.H. (1977) Shear degradation o f DNA1. Nucleic Acids Res., 4, 1513-1537.
2. Anderson, W.F. (1998) Human gene therapy1. Nature, 392, 25-30.
3. Anderson, W .F. (1984) Prospects for human gene therapy1. Science, 226, 401-409.
4. Andersson,L., Yang,S., Neubauer,P. and Enfors,S.O. (1996) Impact ofplasmid presence and induction on cellular responses in fed batch cultures o f Escherichia coli2. J. Biotechnol., 46, 255-263.
5. Arroyo,F.N., Duran Quintana,M .C. and Garrido,F.A. (2005) Evaluation o f primary models to describe the growth o f Pichia anomala and study o f temperature, NaCl, and pH effects on its biological parameters by response surface methodology. J. Food Prot., 68, 562-570.
6. Ataai,M .M . and Shuler, M.L. (1986) Mathematical model for the control o f ColEl type plasmid replication. Plasmid, 16,204-212.
7. Ausubel,F.M . (1987) Current protocols in molecular biology.
8. Bachvarov,D.R. and Ivanov,I.G. (1983) Large scale purification o f plasmid DNA1. Prep. Biochem., 13, 161-166.
9. Bailey ,J.E. and Seo,J.H. (1985) Effects o f recombinant plasmid content on growth properties and cloned gene product formation in Escherichia co li. Biotechnol. Bioeng., 27, 1668-1674.
10. Bailey,J.E. and OIlis,D.F. (1986) Biochemical engineering fundamentals. McGraw-Hill, New York.
11. Baibas,P., Soberon,X., M erino,E., Zurita,M ., Lomeli,H., Valle,F., Flores,N. and Bolivar,F.(1986) Plasmid vector pBR322 and its special-purpose derivatives—a review 1. Gene, 50, 3-40.
12. Baracchini,E. and Bremer,H. (1988) Stringent and growth control o f rRNA synthesis in Escherichia coli are both mediated by ppGpp. J. Biol. Chem., 263, 2597-2602.
13 . Barton,B.M ., Harding,G.P. and Zuccarelli,A.J. (1995) A general method for detecting and sizing large plasmids1. Anal. Biochem., 226, 235-240.
Thomas Burt 4 3 3

References
14. Bentley W .E.,M .N.A.D.C.D.R.H.K.D.S. (1990) Plasmid-encoded protein: The principal factor in the ?metabolic burden? associated with recombinant bacteria. BIOTECHNOLOGY AND BIOENGINEERING, 35, 668-681.
15. Bentley ,W.E.K.D.S. (1989) A novel structured kinetic modeling approach for the analysis of plasmid instability in recombinant bacterial cultures. Biotechnol. Bioeng., 33,49-61.
16. Bergan,D., Galbraith,T. and Sloane,D.L. (2000) Gene transfer in vitro and in vivo by cationic lipids is not significantly affected by levels o f supercoiling o f a reporter plasmid. Pharm.Res., 17,967-973.
17. Best,A.N., Allison,D.P. and Novelli,G.D. (1981) Purification o f super coiled DNA o f plasmid col E l by RPC-5 chromatography2. Anal. Biochem., 114, 235-243.
18. Bignell,C.R., Haines, A.S., Khare,D. and Thomas,C.M. (1999) Effect o f growth rate and incC mutation on symmetric plasmid distribution by the IncP-1 partitioning apparatus. Mol. Microbiol., 34, 205-216.
19. Bio-Rad Labs. (2000) CHEF-DR® III Pulsed Field Electrophoresis Systems Instruction Manual and Applications Guide.
20. Bio-Rad Labs. (2003) MicroPulser Electroporation Apparatus; Operating Instructions and Applications guide 165-2100.
21. Birnboim,H.C. and Doly,J. (1979) A rapid alkaline extraction procedure for screening recombinant plasmid DNA. Nucleic Acids Res., 7, 1513-1523.
22. BIattner,F.R., Plunkett,G., III, Bloch,C.A., Perna,N.T., Burland,V., Riley,M., Collado- Vides,J., Glasner,J.D., Rode,C.K., Mayhew,G.F., Gregor,J., Davis,N.W .,Kirkpatrick,H.A., Goeden,M .A., Rose,D.J., Mau,B. and Shao,Y. (1997) The complete genome sequence o f Escherichia coli K-121. Science, 277, 1453-1474.
23. Bolivar,F., Rodriguez,R.L., Greene,P.J., Betlach,M.C., Heyneker,H.L. and Boyer,H.W.(1977) Construction and characterization o f new cloning vehicles. II. A multipurpose cloning system1. Gene, 2, 95-113.
24. Bonilla,P. J., Freytag,S.O. and Lutter,L.C. (1991) Enhancer-activated plasmid transcription complexes contain constrained supercoiling. Nucleic Acids Res., 19, 3965-3971.
25. Box,G.E.P., Hunter,J.S. and Hunter,W .G. (1978) Statistics for experimenters an introduction to design, data analysis, and model building. Wiley, New York.
26. Brown,R.E., Jarvis,K.L. and Hyland,K.J. (1989) Protein measurement using bicinchoninic acid: elimination o f interfering substances3 . Anal. Biochem., 180, 136-139.
27. BuhIer,H. and Ingold,W . (1976) Measuring pH and oxygen in fermenters. Proc. Biochem, 11,19-22.
Thomas Burt 4 3 4

References
28. Bukhman,Y.V. and Draper,D.E. (1997) Affinities and selectivities o f divalent cation binding sites within an RNA tertiary structure. J. Mol. Biol., 273, 1020-1031.
29. Burke, D.T., Carle,G.F. and Olson, M.V. (1987) Cloning o f large segments o f exogenous DNA into yeast by means o f artificial chromosome vectors2. Science, 236, 806-812.
30. Bussey ,L.B. (1998) Methods fo r purifying nucleic acids.
31. Butler ,e.al., Kahn, Cohen and W inkler (2000) Purification o f plasm id DNA.
32. Byung G ee Kim,M.L.S. (2006) Analysis o f pBR322 replication kinetics and its dependency ongrowth rate. BIOTECHNOLOGY AND BIOENGINEERING, 36, 233-242.
33. Bywater,M ., Bywater,R. and Heilman,L. (1983) A novel chromatographic procedure fo r purification o f bacterial plasmids1. Anal. Biochem., 132, 219-224.
34. Carle,G .F., Frank,M . and Olson,M.V. (1986) Electrophoretic separations o f large DNA molecules by periodic inversion o f the electric fie ld1. Science, 232, 65-68.
35. Carlson,A., Signs,M ., Liermann,L. and Boor,R. (1995) Mechanical Disruption o f Escherichia coli fo r Plasm id Recovery. BIOTECHNOLOGY AND BIOENGINEERING, VOL 48; NUMBER 4, -303.
36. Chakrabarti,A., Sitaric,S. and Ohi,S. (1992) A procedure fo r large-scale plasm id isolation without using ultracentrifugation1. Biotechnol. Appl. Biochem., 16, 211-215.
37. Chakravarti,R.a.S.V. (2002) Optimisation o f compactinproduction in chemically defined production medium by Penicillin citrinum using statistical methods. Proc. Biochem.
38. Cham sart,S., Patel,H., Hanak,J.A., Hitchcock,A.G. and Nienow,A.W . (2001) The impact o f fluid-dynamic-generated stresses on chDNA and pDNA stability during alkaline cell lysis fo r gene therapy products1. Biotechnol. Bioeng., 75, 387-392.
39. Chandra,G., Patel,P., Kost,T.A. and Gray,J.G. (1992) Large-scale purification o f plasmid DNA by fa s t protein liquid chromatography using a Hi-Load Q Sepharose column/ . Anal. Biochem., 203, 169-172.
40. Chaszczewska-M arkowska,M ., Ugorski,M. and Langner,M. (2004) Plasmid condensation induced by cationic compounds: hydrophilic polylysine and amphiphilic cationic lipid. Cell Mol. Biol. Lett., 9 ,3-13.
41. Chatwin,H.M . and Summers,D.K. (2001) Monomer-dimer control o f the ColEl P(cer) prom oter1. Microbiology, 147, 3071-3081.
Thomas Burt 4 3 5

References
42. Cheah,U.E., W eigand,W .A. and Stark, B.C. (1987) Effects o f recombinant plasmid size on cellular processes in Escherichia coli. Plasmid, 18, 127-134.
43. Chen,W ., Graham,C. and Ciccarelli,R.B. (1997) Automatedfed-batchfermentation with feed-back controls based on dissolved oxygen (DO) and pH for production o f DNA vaccines. J. Ind. Microbiol. Biotechnol., 18,43-48.
44. Chu,G. (1990) Pulsed-field electrophoresis: theory and practice. In Birren,B. and Lai,E.(eds.), Methods: A Companion to Methods o f Enzymology. Pulsed-Field Electrophoresis. Academic Press, San Diego.
45. Ciccolini,L.A., Shamlou,P.A. and Titchener-Hooker,N. (2002) A mass balance study to assess the extent o f contaminant removal achieved in the operations for the primary recovery o f plasmid DNA from Escherichia coli cells. Biotechnol. Bioeng., 77, 796-805.
46. Ciccolini,L.A.S., yazi Shamlou,P., Titchener-Hooker,N.J., W ard,J.M . and DunnilI,P.(1999) Rheological properties o f chromosomal and plasmid DNA during alkaline lysis reaction. Bioprocess and Biosystems Engineering, 21, 231-237.
47. Clark,S.M ., Lai,E., Birren,B.W . and Hood,L. (1988) A novel instrument for separating large DNA molecules with pulsed homogeneous electric fields3. Science, 241, 1203-1205.
48. Clemson,M . and Kelly,W .J. (2003) Optimizing alkaline lysis for DNA plasmid recovery 1. Biotechnol. Appl. Biochem., 37, 235-244.
49. Cole,K.D. (1991) Purification o f plasmid and high molecular mass DNA using PEG-salt two- phase extraction. Biotechniques, 11, 18, 20, 22-18, 20, 24.
50. Colm an,A., Byers,M .J., Primrose,S.B. and Lyons,A. (1978) Rapid purification ofplasmid DNAs by hydroxyapatite chromatography1. Eur. J. Biochem., 91, 303-310.
51. Colote,S., Ferraz,C. and Liautard,J.P. (1986) Analysis and purification ofplasmid DNA by reversed-phase high-performance liquid chromatography1. Anal. Biochem., 154, 15-20.
52. Colpan ,e.al. (1999) Process for the separation and purification o f nucleic acids from biological sources.
53. Coppella,S.J., Acheson,C.M . and Dhurjati,P. (1987) Isolation o f high-molecular-weight nucleic acids for copy number analysis using high-performance liquid chromatography1. J. Chromatogr., 402, 189-199.
54. Corchero,J.L. and Villaverde,A. (1998) Plasmid maintenance in Escherichia coli recombinant cultures is dramatically, steadily, and specifically influenced by features o f the encoded proteins. Biotechnol. Bioeng., 58, 625-632.
55. Cornelis,P., Digneffe,C., W illemot,K. and Colson,C. (1981) Purification o f Escherichia coli amplifiable plasmids by high-salt sepharose chromatography1. Plasmid, 5, 221-223.
Thomas Burt 4 3 6

References
56. Costioli,M .D., Fisch,I., Garret-Flaudy,F., Hilbrig,F. and Freitag,R. (2003) DNA purification by triple-helix affinity precipitation. Biotechnol. Bioeng., 81, 535-545.
57. Coulson,J.M ., Richardson,J.F., Backhurst,J.R. and Harker,J.H. (1996) Chemical engineering. Butterworth-Heinemann, Oxford, U.K.
58. Cranenburgh,R.M ., Hanak,J.A., Williams,S.G. and Sherratt,D.J. (2001) Escherichia coli strains that allow antibiotic-free plasmid selection and maintenance by repressor titration24. Nucleic Acids Res., 29, E26.
59. Crystal,R.G. (1995) The gene as the drug. Nat. Med., 1, 15-17.
60. Cserjan-Puschmann,M ., Kramer,W ., Duerrschmid,E., Striedner,G. and Bayer,K. (1999) Metabolic approaches for the optimisation o f recombinant fermentation processes. Appl. Microbiol. Biotechnol., 53,43-50.
61. Curtiss,R., I l l , Nakayama,K. and Kelly,S.M. (1989) Recombinant avirulent Salmonella vaccine strains with stable maintenance and high level expression o f cloned genes in vivo. Immunol. Invest, 18,583-596.
62. Darnon,E., M orin,E., Belleville,M .P. and Rios,G.M. (2003) Ultrafiltration within downstream processing: some process design considerations. Chemical Engineering and Processing, 42, 299-309.
63. Davidson,J.N. (1972) The biochemistry of the nucleic acids. Chapman and Hall, London.
64. Davies,M .J., Smethurst,D.E., Howard,K.M., Todd,M., Higgins,L.M. and Bruce,I.J. (1997) Improved manufacture and application o f an agarose magnetizable solid-phase support11. Appl. Biochem. Biotechnol., 68, 95-112.
65. Davis,M .E. (2002) Non-viral gene delivery systems1. Curr. Opin. Biotechnol., 13, 128-131.
66. Deshmukh,N.R. and Lali,A.M. (2005) Adsorptive purification o f pDNA on superporous rigid cross-linked cellulose matrix. J. Chromatogr. B Analyt. Technol. Biomed. Life Sci., 818, 5-10.
67. Dieffenbach C W, Lowe TMK and Dveksler (1995) General concepts for primer design. Cold Spring Harbour Laboratory Press, New York.
68. Diogo,M .M ., Queiroz,J.A., Monteiro,G.A., Martins,S.A., Ferreira,G.N. and Prazeres,D.M . (2000) Purification o f a cystic fibrosis plasmid vector for gene therapy using hydrophobic interaction chromatography. Biotechnol. Bioeng., 68, 576-583.
69. Diogo,M .M ., Queiroz,J.A., Monteiro,G.A. and Prazeres,D.M. (1999) Separation and analysis o f plasmid denaturedforms using hydrophobic interaction chromatography. Anal. Biochem., 275, 122-124.
70. Diogo,M .M ., Queiroz,J.A. and Prazeres,D.M. (2005) Chromatography o f plasmid DNA. J. Chromatogr. A, 1069,3-22.
Thomas Burt 4 3 7

References
71. Diogo,M .M ., Queiroz,J.A. and Prazeres,D.M . (2001a) Studies on the retention o f plasmid DNA and Escherichia coli nucleic acids by hydrophobic interaction chromatography. Bioseparation., 10, 211-220.
72. Diogo,M .M ., Queiroz,J.A. and Prazeres,D.M. (2003) Assessment o f purity and quantification o f plasm id DNA in process solutions using high-performance hydrophobic interaction chromatography. J. Chromatogr. A, 998, 109-117.
73. Diogo,M .M ., Ribeiro,S.C., Queiroz,J.A., Monteiro,G.A., Tordo,N., Perrin,P. and Prazeres,D.M . (2001b) Production, purification and analysis o f an experimental DNA vaccine against rabies. J. Gene Med., 3, 577-584.
74. Donahue,R.B.F.R. (1998) Transformation Efficiency o f E. coli Electroporated with Large Plasm id DNA.
75. Dong,H., Nilsson,L. and Kurland,C.G. (1995) Gratuitous overexpression o f genes in Escherichia coli leads to growth inhibition and ribosome destruction1. J. Bacteriol., 177, 1497-1504.
76. Doran,P.M . (1995) Bioprocess engineering principles. Academic Press, London.
77. Drager,R.R. and Regnier,F.E. (1985) High-performance anion-exchange chromatography o f oligonucleotides1. Anal. Biochem., 145, 47-56.
78. Eastman,E.M . and Durland,R.H. (1998) Manufacturing and quality control o f plasmid-based gene expression systems1. Adv. Drug Deliv. Rev., 30, 33-48.
79. Edelstein,M .L., Abedi,M .R., W ixon,J. and EdeIstein,R.M. (2004) Gene therapy clinical trials worldwide 1989-2004-an overview130. J. Gene Med., 6, 597-602.
80. Eon-Duval,A. and Burke,G. (2004) Purification o f pharmaceutical-grade plasm id DNA by anion-exchange chromatography in an RNase-free process. J. Chromatogr. B Analyt. Technol. Biomed. Life Sci., 804, 327-335.
81. Eon-Duval,A., Gumbs,K. and Ellett,C. (2003a) Precipitation o f RNA impurities with high salt in a plasm id DNA purification process: use o f experimental design to determine reaction conditions2. Biotechnol. Bioeng., 83, 544-553.
82. Eon-Duval,A., M acDuff,R.H., Fisher,C.A., Harris,M.J. and Brook,C. (2003b) Removal o f RNA impurities by tangential flow filtration in an RNase-free plasm id DNA purification process3. Anal. Biochem., 316, 66-73.
83. Evans,R.K., Xu,Z., Bohannon,K.E., W ang,B., Bruner,M.W. and VoIkin,D.B. (2000) Evaluation o f degradation pathways fo r plasm id DNA in pharmaceutical formulations via accelerated stability studies1. J. Pharm. Sci., 89, 76-87.
Thomas Burt 438

References
84. Even-Chen,S. and Barenholz,Y. (2000) DOTAP cationic liposomes prefer relaxed over supercoiled plasmids1. Biochim. Biophys. Acta, 1509, 176-188.
85. Fangman,W .L. (1978) Separation o f very large DNA molecules by gel electrophoresis 1. Nucleic Acids Res., 5, 653-665.
8 6 . Feliciello,I. and Chinali,G. (1993) A modified alkaline lysis method fo r the preparation o f highly purified plasm id DNA from Escherichia coli1. Anal. Biochem., 212, 394-401.
87. Ferreira,G.N., Cabral,J.M. and Prazeres,D.M. (2000a) Studies on the batch adsorption o f plasm id DNA onto anion-exchange chromatographic supports. Biotechnol. Prog., 16,416-424.
8 8 . Ferreira,G.N., Cabral,J.M. and Prazeres,D.M. (1999) Development ofprocess flow sheets fo r the purification o f supercoiled plasmids fo r gene therapy applications. Biotechnol. Prog., 15, 725-731.
89. Ferreira,G.N., Cabral,J.M. and Prazeres,D.M. (2000b) Anion exchange purification o f plasm id DNA using expanded bed adsorption. Bioseparation., 9, 1-6.
90. Ferreira,G.N., M onteiro,G.A., Prazeres,D.M. and Cabral,J.M. (2000c) Downstream processing o f plasm id DNA for gene therapy and DNA vaccine applications. Trends Biotechnol., 18,380-388.
91. Ficarra,R., Calabro,M .L., Cutroneo,P., Tommasini,S., Melardi,S., Semreen,M., Furlanetto,S., Ficarra,P. and Altavilla,G. (2002) Validation o f a LC method fo r the analysis o f oxaliplatin in a pharmaceutical formulation using an experimental design. J. Pharm. Biomed. Anal., 29, 1097-1103.
92. Fox,J.L. (1999) Gene therapy safety issues come to fore. Nat. Biotechnol., 17, 1153.
93. Frame,R. and Bishop,J.O. (1971) The number o f sex-factors per chromosome in Escherichia coli1. Biochem. J., 121, 93-103.
94. Frerix,A., Muller,M ., Kula,M.R. and Hubbuch,J. (2005) Scalable recovery o f plasmid DNA based on aqueous two-phase separation. Biotechnol. Appl. Biochem., 42, 57-66.
95. Friehs,K. (2004) Plasmid copy number and plasm id stability 1. Adv. Biochem Eng Biotechnol., 8 6 , 47-82.
96. Fykse,E.M ., Olsen,J.S. and Skogan,G. (2003) Application o f sonication to release DNA from Bacillus cereus fo r quantitative detection by real-time PCR32. J. Microbiol. Methods, 55, 1-10.
97. Ganusov,V.V., Bril’kov,A.V. and Pechurkin,N.S. (2000) [Mathematical modeling o f population dynamics o f unstable plasmid-containing bacteria during continuous cultivation in a chemostat]. Biofizika, 45, 908-914.
Thomas Burt 43 9

References
98. Garcia-Arrazola,R., Dawson,P., Buchanan,I., Doyle,B., Fearn,T., Titchener-Hooker,N. and Baganz,F. (2005) Evaluation o f the effects and interactions o f mixing and oxygen transfer on the production o f Fab' antibody fragments in Escherichia coli fermentation with gas blending. Bioprocess. Biosyst. Eng, 27, 365-374.
99. Garon,C.F. and Petersen,L.L. (1987) An improved m ethodfor the isolation o f supercoiled DNA molecules using ion-exchange column chromatography1. Gene Anal. Tech., 4, 5-8.
100. GE Healthcare (2005) PD-10 Desalting Columns [Instructions 52-1308-00 AP].
101. Gehrke,C.W . and Kuo,ICC. (1989) Ribonucleoside analysis by reversed-phase high- performance liquid chromatography. J. Chromatogr., 471, 3-36.
102. Gelfand, David H., Holland, Pamela M., Saiki, Randall K., Watson and Robert M. (1993) Homogeneous assay system using the nuclease activity o f a nucleic 5,210,015.
103. Georgiou,G.S.M .L.W .D.B. (1988) Release o f periplasmic enzymes and other physiological effects o f B-lactamase overproduction in Escherichia coli. BIOTECHNOLOGY AND BIOENGINEERING, 32, 741-748.
104. Gerlitz,M ., H rabak,0 . and Schwab,H. (1990) Partitioning o f broad-host-range plasm id RP4 is a complex system involving site-specific recombination. J. Bacteriol., 172, 6194-6203.
105. Gibson,U.E., Heid,C.A. and Williams,P.M. (1996) A novel method fo r real time quantitative RT-PCR. Genome Res., 6, 995-1001.
106. Giovannini,R. and Freitag,R. (2002) Continuous isolation o f plasm id DNA by annular chromatography. Biotechnol. Bioeng., 77, 445-454.
107. Giovannini,R., Freitag,R. and Tennikova,T.B. (1998) High-performance membrane chromatography o f supercoiled plasm id DNA. Anal. Chem., 70, 3348-3354.
108. Glick,B.R. (1995) Metabolic load and heterologous gene expression. Biotechnology Advances, 13,247-261.
109. Gomez-M arquez,J., Freire,M. and Segade,F. (1987) A simple procedure fo r large-scale purification o f plasm id DNA1. Gene, 54, 255-259.
110. Grabherr,R. and Bayer,K. (2002) Impact o f targeted vector design on ColEl plasm id replication. Trends in Biotechnology, 20, 257-260.
111. Grenville,R.K. (1992) Blending o f viscous and pseudo-plastic fluids. Cranfield Institute of Technology, Bedfordshire, UK.
112. Grunwald,A.G. and Shields,M .S. (2001) Plasmid purification using membrane-based anion- exchange chromatography1. Anal. Biochem., 296, 138-141.
Thomas Burt 4 4 0

References
113. Hanahan,D., Jessee^J. and Bloom,F.R. (1991) Plasmid transformation o f Escherichia coli and other bacteria. Methods Enzymol., 204, 63-113.
114. Haque,K.A., Pfeiffer,R.M ., Beerman,M .B., Struewing,J.P., Chanock,S.J. and Bergen,A. W. (2003) Performance o f high-throughput DNA quantification methods. BMC. Biotechnol., 3, 20.
115. He,G.Q., Kong,Q. and Ding,L.X. (2004) Response surface methodology fo r optimizing the fermentation medium o f Clostridium butyricum. Lett. Appl. Microbiol., 39, 363-368.
116. Hecker,M ., Schroeter,A. and Mach,F. (1983) Replication o f pBR322 DNA in stringent and relaxed strains o f Escherichia coli. Mol. Gen. Genet., 190, 355-357.
117. Heid,C.A., Stevens,J., Livak,K.J. and Williams,P.M. (1996) Real time quantitative PCR6. Genome Res., 6, 986-994.
118. Henry,K.L., Davis,R.H. and Taylor,A.L. (1990) Continuous recombinant bacterial fermentations utilizing selective flocculation and recycle. Biotechnol. Prog., 6, 7-12.
119. Hicks,C.R. and Turner,K.V. (1999) Fundamental concepts in the design o f experiments. Oxford University Press, New York.
120. Hightower,R.C., Metge,D.W . and Santi,D.V. (1987) Plasmid migration using orthogonal- field-alternation gel electrophoresis. Nucleic Acids Res., 15, 8387-8398.
121. Hines,R.N., O ’Connor,K.C., Vella,G. and Warren,W. (1992) Large-scale purification o f plasm id DNA by anion-exchange high-performance liquid chromatography1. Biotechniques, 12, 430-434.
122. Holland,P.M ., Abramson, R.D., Watson,R. and Gelfand,D.H. (1991) Detection o f specific polym erase chain reaction product by utilizing the 5'— 3' exonuclease activity ofThermus aquaticus DNA polymerase1. Proc. Natl. Acad. Sci. U. S. A, 88, 7276-7280.
123. Holmes, D.S. and Quigley ,M. (1981) A rapid boiling m ethodfor the preparation o f bacterial plasm ids3. Anal. Biochem., 114, 193-197.
124. Hong-Bin Zhang, Sangdun Choi, Sung-Sick Woo, Zhikang li and Rod A.W ing (1995) Construction and characterization o f two rice bacterial artificial chromosome libraries from the parents o f a permanent recombinant inbred mapping population. Molecular Breeding, 2, 11-24.
125. Horn ,e.al. (1998) Purification o f plasm id DNA during column chromatography.
126. Horn,N. A., Meek,J.A., Budahazi,G. and Marquet,M. (1995) Cancer gene therapy using plasm id DNA: purification o f DNA fo r human clinical trials. Hum. Gene Ther., 6 , 565-573.
Thomas Burt 441

References
127. Huber,C.G. (1998) Micropellicular stationary phases fo r high-performance liquid chromatography o f double-stranded DNA3. J. Chromatogr. A, 806, 3-30.
128. Huber ,H. and et al. (2005b) Method fo r producing plasm id DNA on a manufacturing scale.
129. Huber,H. and et al. (2005a) Fed-batch fermentation process and culture medium fo r the production o f plasm id DNA in E. coli on a manufacturing scale.
130. Humphreys,G.O., WilIshaw,G.A. and Anderson,E.S. (1975) A simple method fo r the preparation o f large quantities ofpure plasm id DNA1. Biochim. Biophys. Acta, 383,457-463.
131. Imanaka,T. and Aiba,S. (1981) A perspective on the application o f genetic engineering: stability o f recombinant plasmid. Ann. N. Y. Acad. Sci., 369, 1-14.
132. Invitrogen (2006) The GeneJumper oriVKit.
133. Ishaq,M ., W olf,B. and Ritter,C. (1990) Large-scale isolation o f plasmid DNA using cetyltrimethylammonium bromide1. Biotechniques, 9, 19-20, 22, 24.
134. Ito,T., Smith, C.L. and Cantor,C.R. (1992b) Triplex affinity capture o f a single copy clone from a yeast genomic library1. Nucleic Acids Res., 20, 3524.
135. Ito,T., Smith,C.L. and Cantor,C.R. (1992a) Sequence-specific DNA purification by triplex affinity capture2. Proc. Natl. Acad. Sci. U. S. A, 89, 495-498.
136. Iuliano,S., Fisher,J.R., Chen,M. and Kelly ,W.J. (2002) Rapid analysis o f a plasm id by hydrophobic-interaction chromatography with a non-porous resin. J. Chromatogr. A, 972, 77- 86 .
137. Jensen,R.B. and Gerdes,K. (1995) Programmed cell death in bacteria: proteicplasm id stabilization systems. Mol. Microbiol., 17, 205-210.
138. Jensen,R.B., Grohmann,E., Schwab,H., az-Orejas,R. and Gerdes,K. (1995) Comparison o f ccd o f F, parD E o f RP4, andparD o f RJ using a novel conditional replication control system o f p la sm id R l. Mol. Microbiol., 17, 211-220.
139. Johnson,T.R. and Ilan,J. (1983) Large-scale isolation ofplasm id DNA and purification o f lambda phage DNA using hydroxylapatite chromatography3. Anal. Biochem., 132, 20-25.
140. Jones,K.L. and Keasling,J.D. (1998) Construction and characterization o f Fplasm id-based expression vectors4. Biotechnol. Bioeng., 59, 659-665.
Thomas Burt 442
References
141. Kahn,D.W ., Butler,M.D., Cohen,D.L., Gordon,M., Kahn,J.W . and Winkler,M.E. (2000) Purification ofplasm id DNA by tangential flow filtration. Biotechnol. Bioeng., 69, 101-106.
142. Kapp,U. and Langowski^J. (1992) Preparation o f DNA topoisomers by RP-18 high- performance liquid chromatography1. Anal. Biochem., 206, 293-299.
143. Kay,A., 0'K ennedy,R ., Ward,J. and Keshavarz-Moore,E. (2003) Impact o f plasmid size on cellular oxygen demand in Escherichia coli. Biotechnol. Appl. Biochem., 38, 1-7.
144. Kendall,D., Lye,G.J. and Levy,M.S. (2002) Purification o f plasm id DNA by an integrated operation comprising tangential flow filtration and nitrocellulose adsorption. Biotechnol. Bioeng., 79, 816-822.
145. Kepka,C., Lemmens,R., Vasi,J., Nyhammar,T. and Gustavsson,P.E. (2004a) Integrated process fo r purification o f plasm id DNA using aqueous two-phase systems combined with membrane filtration and lid bead chromatography. J. Chromatogr. A, 1057, 115-124.
146. Kepka,C., Rhodin,J., Lemmens,R., Tjerneld,F. and Gustavsson,P.E. (2004b) Extraction o f plasm id DNA from Escherichia coli cell lysate in a thermoseparating aqueous two-phase system. J. Chromatogr. A, 1024, 95-104.
147. Kim,B.G., Good,T.A., Ataai,M.M. and Shuler, M.L. (1987) Growth behavior and prediction o f copy number and retention o f ColEl-type plasmids in E. coli under slow growth conditions. Ann. N. Y. Acad. Sci., 506, 384-395.
148. Kim,C.H., Lee,J.Y., Kim,M .G., Song,K.B., Seo,J.W., Chung,B.H., Chang,S.J. and Rhee,S.K. (1998) Fermentation strategy to enhance plasm id stability during the cultivation o f Escherichia coli fo r the production o f recombinant levansucrase. Journal o f Fermentation and Bioengineering, 86, 391-394.
149. Knorre,W .A., Deckwer,W .D., Korz,D., Pohl,H.D., Riesenberg,D., Ross,A., Sanders,E. and Schulz,V. (1991) High cell density fermentation o f recombinant Escherichia coli with computer-controlled optimal growth rate1. Ann. N. Y. Acad. Sci., 646, 300-306.
150. Korpimaki,T., Kurittu,J. and Karp,M. (2003) Surprisingly fa st disappearance o f beta- lactam selection pressure in cultivation as detected with novel biosensing approaches. J. Microbiol. Methods, 53, 37-42.
151. Kostal,J., M ulchandani,A. and Chen,W. (2004) Affinity purification o f plasmid DNA by temperature-triggered precipitation. Biotechnol. Bioeng., 85, 293-297.
152. Lahijani,R., Hulley,G., Soriano,G., Horn,N.A. and Marquet,M. (1996) High-yield production ofpBR322-derived plasmids intended for human gene therapy by employing a temperature-controllable point mutation. Hum. Gene Ther., 7, 1971-1980.
153. Lander,R.J., W inters,M .A., Meacle,F.J., Buckland,B.C. and Lee,A.L. (2002) Fractional precipitation o f plasm id DNA from lysate by CTAB1. Biotechnol. Bioeng., 79, 776-784.
Thomas Burt 4 4 3

References
154. Larson,J.E., Hardies,S.C., Patient,R.K. and W ells,R.D. (1979) Factors influencing fractionation o f DNA restriction fragments by RPC-5 column chromatography3. J. Biol. Chem., 254, 5535-5541.
155. Le Pecq,J.B. and Paoletti,C. (1966) A new fluorometric m ethodfor RNA and DNA determination11. Anal. Biochem., 17, 100-107.
156. Lee ,e.al. (1996) M ethodfor large scale plasm id purification.
157. Lee,C., Kim,J., Shin,S.G. and Hwang,S. Absolute and relative QPCR quantification o f plasm id copy number in Escherichia coli. Journal o f Biotechnology, In Press, Corrected Proof.
158. Lee,S.W . and Edlin,G. (1985) Expression o f tetracycline resistance in pBR322 derivatives reduces the reproductive fitness o f plasmid-containing Escherichia coli. Gene, 39, 173-180.
159. Lee,S.Y. (1996) High cell-density culture o f Escherichia coli15. Trends Biotechnol., 14, 98-105.
160. Leipold,R.J., Krewson,C.E. and Dhurjati,P. (1994) Mathematical model o f temperature- sensitive plasm id replication/.Plasm id, 32, 131-167.
161. Lemmens,R., 01sson,U., Nyhammar,T. and Stadler,J. (2003) Supercoiled plasm id DNA: selective purification by thiophilic/aromatic adsorption. J. Chromatogr. B Analyt. Technol. Biomed. Life Sci., 784,291-300.
162. Lem onnier,M ., Bouet,J.Y., Libante,V. and Lane,D. (2000) Disruption o f the F plasm id partition complex in vivo by partition protein SopA. Mol. Microbiol., 38, 493-505.
163. Levene,S.D. and Zimm,B.H. (1987) Separations o f open-circular DNA using pulsed-field electrophoresis1. Proc. Natl. Acad. Sci. U. S. A, 84, 4054-4057.
164. Levison,P.R., Badger,S.E., Dennis,J., Hathi,P., Davies,M.J., Bruce,I.J. and Schimkat,D.(1998a) Recent developments o f magnetic beads fo r use in nucleic acid purification. J. Chromatogr. A, 816, 107-111.
165. Levison,P.R., Badger,S.E., Hathi,P., Davies,M.J., Bruce,I.J. and Grimm,V. (1998b) New approaches to the isolation o f DNA by ion-exchange chromatography. J. Chromatogr. A, 827, 337-344.
166. Levy,M.S., Ciccolini,L.A.S., Yim,S.S.S., Tsai,J.T., Titchener-Hooker,N., yazi Shamlou,P. and Dunnill,P. (1999a) The effects o f material properties andfluidflow intensity on plasm id DNA recovery during cell lysis. Chemical Engineering Science, 54, 3171-3178.
167. Levy,M.S., Collins,I.J., Tsai,J.T., yazi Shamlou,P., Ward,J.M. and DunnilI,P. (2000a) Removal o f contaminant nucleic acids by nitrocellulose filtration during pharmaceutical-grade plasm id DNA processing. Journal o f Biotechnology, 76, 197-205.
Thomas Burt 4 4 4

References
168. Levy,M .S., Collins,I.J., Yim,S.S., W ard,J.M ., Titchener-Hooker,N., yazi Shamlou,P. and Dunnill,P. (1999b) Effect o f shear on plasm id DNA in solution. Bioprocess and Biosystems Engineering, 20, 7-13.
169. Levy,M .S., Kennedy,R.D., yazi-Shamlou,P. and Dunnill,P. (2000b) Biochemical engineering approaches to the challenges ofproducing pure plasm id DNA. Trends in Biotechnology, 18,296-305.
170. Lin-Chao,S. and Bremer,H. (1986) Effect o f the bacterial growth rate on replication control o f plasm idpBR322 in Escherichia coli2. Mol. Gen. Genet., 203, 143-149.
171. Lis,J.T. and Schleif,R. (1975) Size fractionation o f double-stranded DNA by precipitation with polyethylene glycol1. Nucleic Acids Res., 02, 383-389.
172. Liu,J., Zhang,Q., Bi,J., W ang,X., Gong,P., Ha,X., Wang,Z. and Wu,Z. (2004) [Analysis o f plasm idpU D K H by anion-exchange high performance liquid chromatogaphy]16. Se. Pu„ 22, 65-67.
173. Ljunglof,A., Bergvall,P., Bhikhabhai,R. and Hjorth,R. (1999) Direct visualisation o f plasm id DNA in individual chromatography adsorbent particles by confocal scanning laser microscopy1. J. Chromatogr. A, 844, 129-135.
174. Lockey,C., Otto,E. and Long,Z. (1998) Real-time fluorescence detection o f a single DNA molecule. Biotechniques, 24, 744-746.
175. Lyddiatt,A. and O'Sullivan,D. A. (1998) Biochemical recovery and purification o f gene therapy vectors1. Curr. Opin. Biotechnol., 9, 177-185.
176. M allet,F. (2000) Comparison o f competitive and positive control-based PCR quantitative procedures coupled with end point detection. Mol. Biotechnol., 14, 205-214.
177. M arquet ,e.a. (1996) Production o f pharmaceutical-grade plasm id DNA.
178. M arquet,R., W yart,A. and Houssier,C. (1987) Influence o f DNA length on spermine-induced condensation. Importance o f the bending and stiffening o f DNA12. Biochim. Biophys. Acta, 909, 165-172.
179. M cClung,J.K. and Gonzales,R. A. (1989) Purification ofplasm id DNA by fa st protein liquid chromatography on superose 6 preparative grade7. Anal. Biochem., 177,378-382.
180. M eacle,F.J., Lander,R., Ayazi,S.P. and Titchener-Hooker,N.J. (2004) Impact o f engineering flow conditions on plasm id DNA y ie ld and purity in chemical cell lysis operations1. Biotechnol. Bioeng., 87, 293-302.
181. Metzner A.B and Otto R.E. (1957) Agitation o f non-Newtonian fluids. AIChEJ, 3.
Thomas Burt 4 4 5

References
182. M hashilkar,A., Chada,S., Roth,J.A. and Ramesh,R. (2001) Gene therapy. Therapeutic approaches and implications1. Biotechnol. Adv., 19, 279-297.
183. Micard,D., Sobrier,M.L., Couderc,J.L. and Dastugue,B. (1985) Purification ofRNA-free plasm id DNA using alkaline extraction follow ed by Ultrogel A2 column chromatography1. Anal. Biochem., 148, 121-126.
184. M iddaugh,C.R., Evans,R.K., Montgomery,D.L. and Casimiro,D.R. (1998) Analysis o f plasm id DNA from a pharmaceutical perspective15. J. Pharm. Sci., 87, 130-146.
185. M iller,E.M . and NickoIoff,J.A. (1995) Escherichia coli electrotransformation. Methods Mol. Biol., 47, 105-113.
186. M olecular Probes Inc (2006) Quant-iT ™ RNA Assay Kit http: //probes, invitrosen. com/media/pis/mp33140. pdf.
187. M olecular Probes Inc (2003) SYBR G old Nucleic Acid Gel Stain http://probes, invitrogen. com/media/pis/mpl 1494.pdf.
188. M olecular Probes Product Information (2003) PicoGreen dsDNA Quantitation Reagent and Kits.
189. M onaco,A.P. and Larin,Z. (1994) YACs, BACs, PACs and MACs: artificial chromosomes as research tools1. Trends Biotechnol., 12,280-286.
190. M onteiro,G.A., Ferreira,G.N., Cabral,J.M. and Prazeres,D.M. (1999) Analysis and use o fendogenous nuclease activities in Escherichia coli lysates during the primary isolation o f plasmids fo r gene therapy. Biotechnol. Bioeng., 66, 189-194.
191. M ontgomery,D.C. (2001) Design and analysis o f experiments. Wiley, New York.
192. M ountain,A. (2000) Gene therapy: the first decade9. Trends Biotechnol., 18, 119-128.
193. M ukhopadhyay,M. and M andal,N.C. (1983) A simple procedure fo r large-scale preparation ofpure plasm id DNA free from chromosomal DNA from bacteriaI. Anal. Biochem., 133, 265-270.
194. Murphy,J.C., Jewell,D.L., W hite,K.I., Fox,G.E. and Willson,R.C. (2003) Nucleic acid separations utilizing immobilized metal affinity chromatographyII. Biotechnol. Prog., 19, 982-986.
195. Murphy,J.C., W ibbenmeyer,J.A., Fox,G.E. and W illson,R.C. (1999) Purification o f plasm id DNA using selective precipitation by compaction agents7. Nat. Biotechnol., 17, 822-823.
Thomas Burt 4 4 6

References
196. NanoDrop Tech.Lit (2005) NanoDrop Users Manual httpJ/www. nanodr op. com/pdf/nd-1000- users-manual. pdf.
197. Nicoletti,V.G. and Condorelli,D.F. (1993) Optimized PEG method fo r rapid plasm id DNA purification: high y ie ld from "midi-prep"1. Biotechniques, 14, 532-4, 536.
198. Noites,I.S., 0'K ennedy,R .D ., Levy,M.S., Abidi,N. and Keshavarz-Moore,E. (1999) Rapid quantitation and monitoring o f plasmid DNA using an ultrasensitive DNA-binding dye. Biotechnol. Bioeng., 66, 195-201.
199. O fKennedy,R., Houghton, C.J. and Patching,J.W. (1995) Effects o f growth environment on recombinant plasm id stability in Saccharomyces cerevisiae grown in continuous culture. Appl. Microbiol. Biotechnol., 44, 126-132.
200. 0'K ennedy,R .D ., Baldwin,C. and Keshavarz-Moore,E. (2000) Effects o f growth medium selection on plasm id DNA production and initial processing steps. J. Biotechnol., 76, 175-183.
201. 0'K ennedy,R .D . and Patching, J.W. (1997) Effects o f medium composition and nutrient limitation on loss o f the recombinant plasm id pLG669-z and beta-galactosidase expression by Saccharomyces cerevisiae. J. Ind. Microbiol. Biotechnol., 18, 319-325.
202. 0'K ennedy,R .D . and Patching,J.W . (1999) The isolation o f strains o f Saccharomyces cerevisiae showing altered plasm id stability characteristics by means o f selective continuous culture. J. Biotechnol., 69, 203-214.
203. 0 ’Kennedy,R.D., W ard,J.M . and Keshavarz-Moore,E. (2003) Effects o f fermentation strategy on the characteristics o f plasm id DNA production. Biotechnol. Appl. Biochem., 37, 83-90.
204. Olson, M.V. (1989) Separation o f large DNA molecules by pulsed-field gel electrophoresis. A review o f the basic phenomenology5. J. Chromatogr., 470, 377-383.
205. Onishi,Y., Azuma,Y. and Kizaki,H. (1993) An assay method for DNA topoisomerase activity based on separation o f relaxed DNA from supercoiled DNA using high-performance liquid chromatography. Anal. Biochem., 210, 63-68.
206. Paul,E.L., Kresta,S.M ., tiemo-Obeng,V.A. and North American,M.F. (2004) Handbook o f industrial mixingscience and practice. Wiley-Interscience, Hoboken, N.J.
207. Paulsson,J. and Ehrenberg,M . (1998) Trade-off between segregational stability and metabolic burden: a mathematical model o f plasm id ColEl replication control. J. Mol. Biol., 279, 73-88.
208. Pavlicek,J.W ., Oussatcheva,E.A., Sinden,R.R., Potaman,V.N., Sankey,O.F. and Lyubchenko,Y.L. (2004) Super coil ing-induced DNA bending6. Biochemistry, 43, 10664-10668.
Thomas Burt 447

References
209. Pederson,N.E. (1996) Spin-column chromatography fo r DNA purification 7. Anal. Biochem., 239, 117-118.
210. Pierce Scientific (2006) BCA Protein Assay Kit Technical Literature httpJ/www. piercenet. com/files/1296dh4.pdf.
211. Plum,G.E., Arscott,P.G. and Bloomfield,V.A. (1990) Condensation o f DNA by trivalent cations. 2. Effects o f cation structure3. Biopolymers, 30, 631-643.
212. Popper,K.R. (1975) Objective knowledge: an evolutionary approach 19. Oxford University Press, Oxford.
213. Prather,K.J., Sagar,S., Murphy,J. and Chartrain,M. (2003) Industrial scale production o f plasm id DNA fo r vaccine and gene therapy: plasm id design, production, and purification. Enzyme and Microbial Technology, 33, 865-883.
214. Prazeres,D.M ., Schluep,T. and Cooney ,C. (1998) Preparative purification o f supercoiled plasm id DNA using anion-exchange chromatography. J. Chromatogr. A, 806, 31-45.
215. Promega (2004) Promega Subcloning Notebook.
216. Promega (2005) FAQ: What is the largest insert a Prom egaplasm id vector will accept?
217. Providenti,M .A., O'Brien^J.M., Ewing,R.J., Paterson,E.S. and Smith,M.L. The copy- number o f plasmids and other genetic elements can be determined by SYBR-Green-based quantitative real-time PCR. Journal o f Microbiological Methods, In Press, Corrected Proof.
218. Qiagen (2005) QIAGEN Plasmid Purification Handbook.
219. Raymond,G.J., Bryant,P.K., I l l , Nelson,A. and Johnson,J.D. (1988) Large-scale isolation o f covalently closed circular DNA using gel filtration chromatography. Anal. Biochem., 173, 125-133.
220. rector-M yska,A.E., PogozeIski,W .K., Lofts,R.S., Prasanna,P.G., Hamel,C.J. and Blakely,W .F. (2001) Quantitative plasm id mixture analysis using the fluorogenic 5'-nuclease polym erase chain reaction assay. Environ. Mol. Mutagen., 37, 147-154.
221. Reinikainen,P., Korpela,K., Nissinen,V., 01kku,J., Soederlund,H. and Markkanen,P.(1989) Escherichia coli plasm id production in fermenter. Biotechnol. Bioeng., 33, 386-393.
222. Reinikainen,P. and Virkajaervi,I. (1989) Escherichia coli growth and plasm id copy numbers in continuous cultivations. Biotechnol. Lett., 11, 225-230.
223. Rembhotkar,G.W . and Khatri,G.S. (1989) Large scale preparation o f bacteriophage lambda by tangential flow ultrafiltration fo r isolation o f lambda DNA7. Anal. Biochem., 176,373-374.
Thomas Burt 448

References
224. Rengarajan,K., Cristol,S.M ., Mehta,M. and Nickerson,J.M. (2002) Quantifying DNA concentrations using fluorometry: a comparison o f fluorophores. Mol. Vis., 8,416-421.
225. Ribeiro,S.C., Monteiro,G.A., Cabral,J.M. and Prazeres,D.M. (2002) Isolation o f plasmid DNA from cell lysates by aqueous two-phase systems4. Biotechnol. Bioeng., 78, 376-384.
226. Ridha M osrati,N.N.J.B. (1993) Variation and modeling o f the probability ofplasm id loss as a function o f growth rate o f plasmid-bearing cells o f <I> Escherichia coli</I> during continuous cultures. BIOTECHNOLOGY AND BIOENGINEERING, 41, 395-404.
227. Riesenberg,D., Schulz,V., Knorre,W .A., Pohl,H.D., Korz,D., Sanders,E.A., Ross,A. and Deckwer,W .D. (1991) High cell density cultivation o f Escherichia coli at controlled specific growth rate2. J. Biotechnol., 20, 17-27.
228. Roche Diagnostics (2004) MagNA Pure LC DNA Isolation Kit I http://www.roche-applied- science.com/pack-insert/30Q3990a.pdf.
229. Roche Diagnostics (2006) MagNA Pure LC Tech. Lit http://www. roche-applied- science. com/sis/automated/magna lc/.
230. Rozkov,A., vignone-Rossa,C.A., Ertl,P.F., Jones,P., 0'K ennedy,R .D ., Smith,J.J.,Dale,J.W. and Bushell,M.E. (2004) Characterization o f the metabolic burden on Escherichia coli DH1 cells imposed by the presence o f a plasm id containing a gene therapy sequence. Biotechnol. Bioeng., 88, 909-915.
231. Saiki,R.K., Scharf,S., Faloona,F., M ullis,K.B., Horn,G.T., Erlich,H.A. and Arnheim,N.(1985b) Enzymatic amplification o f beta-globin genomic sequences and restriction site analysis fo r diagnosis o f sickle cell anemia. Science, 230, 1350-1354.
232. Saiki,R.K., Scharf,S., Faloona,F., Mullis,K.B., Horn,G.T., Erlich,H.A. and Arnheim,N.(1985a) Enzymatic amplification o f beta-globin genomic sequences and restriction site analysis fo r diagnosis o f sickle cell anemia. Science, 230, 1350-1354.
233. Sambrook,J., Russell,D.W . and Cold Spring,H.L. (1989) Molecular cloning: a laboratory manual. Cold Spring Harbor Laboratory, Cold Spring Harbor, N.Y.
234. Sandberg,L.M., BjurIing,A., Busson,P., Vasi,J. and Lemmens,R. (2004) Thiophilic interaction chromatography fo r supercoiled plasm id DNA purification. J. Biotechnol., 109, 193-199.
235. Sayers,J.R., Evans,D. and Thomson,J.B. (1996) Identification and eradication o f a denatured DNA isolated during alkaline lysis-based plasm id purification procedures2. Anal. Biochem., 241, 186-189.
236. Schleef,M. (2001) Plasmids for therapy and vaccination 1. Weinheim ; Chichester : Wiley-VCH.
237. Schlick,T.L.B.O.W .K. (1994) The influence o f salt on the structure and energetics o f super coiled DNA. Biophys. J., 67, 2146-2166.
Thomas Burt 44 9

References
238. SchIuep,T. and Cooney,C.L. (1998) Purification o f plasmids by triplex affinity interaction. Nucleic Acids Res., 26, 4524-4528.
239. Schwartz,D.C. and Cantor,C.R. (1984) Separation o f yeast chromosome-sized DNAs by pulsed fie ld gradient gel electrophoresis. Cell, 37, 67-75.
240. Semancik^J.S. and Szychowski,J. (1983) Enhanced detection o f viroid-RNA after selective divalent cation fractionation. Anal. Biochem, 135, 275-279.
241. Seo,J.H.B.J.E. (1986) Continuous cultivation o f recombinant Escherichia coli: Existence o f an optimum dilution rate fo r maximum plasm id and gene product concentration. Biotechnok Bioeng., 28, 1590-1594.
242. Shamlou,P.A. (2003) Scaleable processes fo r the manufacture o f therapeutic quantities o f plasm id DNA3. Biotechnol. Appl. Biochem., 37, 207-218.
243. Sheng,Y., Mancino,V. and Birren,B. (1995) Transformation o f Escherichia coli with large DNA molecules by electroporation1. Nucleic Acids Res., 23, 1990-1996.
244. Shizuya,H., Birren,B., Kim,U.J., Mancino,V., Slepak,T., Tachiiri,Y. and Simon,M. (1992) Cloning and stable maintenance of300-kilobase-pair fragments o f human DNA in Escherichia coli using an F-factor-based vector1. Proc. Natl. Acad. Sci. U. S. A, 89, 8794-8797.
245. Shoham,Y. and Demain,A.L. (1990) Effect o f medium composition on the maintenance o f a recombinant plasm id in Bacillus subtilis1. Enzyme Microb. Technol., 12, 330-336.
246. Siguret,V., Ribba,A.S., ChereI,G., Meyer,D. and Pietu,G. (1994) Effect o f plasmid size on transformation efficiency by electroporation o f Escherichia coli DH5 alpha1. Biotechniques, 16, 422-426.
247. Singer,V.L., Jones,L.J., Yue,S.T. and Haugland,R.P. (1997) Characterization ofPicoGreen reagent and development o f a fluorescence-based solution assay fo r double-stranded DNA quantitation6. Anal. Biochem., 249, 228-238.
248. Singh,R., Pantarotto,D., M cCarthy,D., C haloin,0., Hoebeke,J., Partidos,C.D., Briand,J.P., Prato,M., Bianco,A. and Kostarelos,K. (2005) Binding and condensation o f plasm id DNA onto functionalized carbon nanotubes: toward the construction o f nanotube- based gene delivery vectors14. J. Am. Chem. Soc., 127, 4388-4396.
249. Sinnett,D., Richer,C. and Baccichet,A. (1998) Isolation o f stable bacterial artificial chromosome DNA using a modified alkaline lysis method1. Biotechniques, 24, 752-754.
250. Skogman,S.G. and Nilsson, J. (1984) Temperature-dependent retention o f a tryptophan- operon-bearing plasm id in Escherichia coli. Gene, 31, 117-122.
Thomas Burt 4 5 0

References
251. Smith,G.J., III, HeIf,M., Nesbet,C., Betita,H.A., Meek,J. and Ferre,F. (1999) Fast and accurate methodfor quantitating E. coli host-cell DNA contamination in plasm id DNA preparations3. Biotechniques, 26, 518-22, 524, 526.
252. Smith, M. A. and Bidochka,M.J. (1998) Bacterial fitness and plasm id loss: the importance o f culture conditions and plasm id size. Can. J. Microbiol., 44, 351-355.
253. Smith,P.K., Krohn,R.I., Hermanson,G.T., Mallia,A.K., Gartner,F.H., Provenzano,M.D., Fujimoto,E.K., Goeke,N.M ., Olson,B.J. and Klenk,D.C. (1985) Measurement o f protein using bicinchoninic acid1. Anal. Biochem., 150, 76-85.
254. Sparks, R.B. and Elder,J.H. (1983) A simple and rapid procedure fo r the purification o f plasm id DNA using reverse-phase C l8 silica beads7. Anal. Biochem., 135,345-348.
255. Stanbury,P.F. and W hitaker,A. (1984) Principles o f fermentation technology. Pergamon Press, Oxford.
256. Stephenson,D., Norman,F. and Cumming,R.H. (1992) Shear thickening o f DNA in SDSlysates1. Bioseparation., 3, 285-289.
257. Stouthamer A.H. (1973) A theoretical study on the amount o f ATP requiredfor synthesis o f microbial cell material. Antonie Van Leeuwenhoek, 39, 545-565.
258. Stowers,D.J., Keim,J.M., Paul,P.S., Lyoo,Y.S., Merion,M. and Benbow,R.M. (1988) High- resolution chromatography o f nucleic acids on the Gen-Pak FAX column1. J. Chromatogr., 444, 47-65.
259. Strege,M.A. and Lagu,A.L. (1991) Anion-exchange chromatography o f DNA restriction fragments. J. Chromatogr., 555, 109-124.
260. Summers,D.K. (1991) The kinetics o f plasm id loss 1. Trends Biotechnol., 9, 273-278.
261. Summers,D.K., Beton,C.W . and W ithers,H.L. (1993) Multicopy plasm id instability: the dimer catastrophe hypothesis. Mol. Microbiol., 8 , 1031-1038.
262. Tao,Q. and Zhang, H.B. (1998) Cloning and stable maintenance o f DNA fragments over 300 kb in Escherichia coli with conventional plasm id-based vectors1. Nucleic Acids Res., 26, 4901-4909.
263. Teeters,M.A., Conrardy,S.E., Thomas,B.L., Root,T.W. and Lightfoot,E.N. (2003) Adsorptive membrane chromatography fo r purification ofplasm id DNA. J. Chromatogr. A,989, 165-173.
264. Thatcher ,e.al. (1997) M ethod ofplasm id DNA production and purification.
Thomas Burt 451

References
265. Theodossiou,I., Eisner,H.D., Thomas,O.R. and Hobley,T.J. (2002) Fluidisation and dispersion behaviour o f small high density pellicular expanded bed adsorbents10. J. Chromatogr. A, 964, 77-89.
266. Theodossiou,I., Sondergaard,M. and Thomas,O.R. (2001) Design o f expanded bed supports fo r the recovery o f plasmid DNA by anion exchange adsorption/.Bioseparation., 10,31-44.
267. Theodossiou,I. and Thomas,O.R. (2002) DNA-induced inter-particle cross-linking during expanded bed adsorption chromatography. Impact on future support design9. J. Chromatogr. A, 971, 73-86.
268. Theodossiou,I., Thomas,O.R.T. and Dunnill,P. (1999) Methods o f enhancing the recovery o f plasm id genes from neutralised cell lysate. Bioprocess and Biosystems Engineering, 20, 147-156.
269. Thwaites,E., Burton,S.C. and Lyddiatt,A. (2002) Impact o f the physical and topographical characteristics o f adsorbent solid-phases upon the fluidised bed recovery ofplasm id DNA from Escherichia coli lysates1. J. Chromatogr. A, 943, 77-90.
270. Trindade,I.P., Diogo,M.M., Prazeres,D.M . and Marcos,J.C. (2005) Purification o f plasmid DNA vectors by aqueous two-phase extraction and hydrophobic interaction chromatography. J. Chromatogr. A, 1082, 176-184.
271. Tuma,R.S., Beaudet,M.P., Jin,X., Jones,L.J., Cheung,C.Y., Yue,S. and Singer,V.L. (1999) Characterization ofSYBR G old nucleic acid gel stain: a dye optim izedfor use with 300-nm ultraviolet transilluminators3. Anal. Biochem., 268, 278-288.
272. Uhlenhopp,E.L., Zimm,B.H. and Cummings,D.J. (1974) Structural aberrations in T-even bacteriophage : VI. Molecular weight o f DNA from giant heads. Journal o f Molecular Biology, 89, 689-690.
273. Ulimann,A., Jacob,F. and Monod,J. (1967) Characterization by in vitro complementation o f a peptide corresponding to an operator-proximal segment o f the beta-galactosidase structural gene o f Escherichia coli. J. Mol. Biol., 24, 339-343.
274. Urthaler,J., Schlegl,R., Podgornik,A., Strancar,A., Jungbauer,A. and Necina,R. (2005) Application o f monoliths fo r plasm id DNA purification development and transfer to production. J. Chromatogr. A, 1065, 93-106.
275. van,H.N., M otte,J.C., Pilette,J.F., Decleire,M . and Colson,C. (1993) Sequential elution o f denatured proteins, hydrolyzed RNA, and plasm id DNA o f bacterial lysates adsorbed onto stacked DEAE-cellulose membranes1. Anal. Biochem., 211, 61-65.
276. VarIey,D.L., Hitchcock,A.G., W eiss,A.M ., Horler,W.A., Cowell,R., Peddie,L.,Sharpe,G.S., Thatcher,D.R. and Hanak,J.A. (1999) Production o f plasm id DNA fo r human gene therapy using modified alkaline cell lysis and expanded bed anion exchange chromatography. Bioseparation., 8 , 209-217.
Thomas Burt 4 5 2

References
277. Vasuki,N.S. (1989) A generalized model o f plasmid replication. BIOTECHNOLOGY AND BIOENGINEERING, 33, 1135-1144.
278. Vilalta,A., W hitlow,V. and Martin,T. (2002) Real-time PCR determination o f Escherichia coli genomic DNA contamination in plasm id preparations. Anal. Biochem., 301, 151-153.
279. Vincent, W .S., III and Goldstein, E.S. (1981) Rapid preparation o f covalently closed circular DNA by acridine yellow affinity chromatography1. Anal. Biochem., 110, 123-127.
280. Voet,D. and Voet,J.G. (1995) Biochemistry. J. Wiley & Sons, New York.
281. VoB,C., Schmidt,T., Schleef,M ., Friehs,K. and Flaschel,E. (2003) Production o f supercoiled multimeric plasm id DNA fo r biopharmaceutical application46. J. Biotechnol., 105, 205-213.
282. Vyas,V.V., Gupta,S. and Sharma,P. (1994) Stability o f a recombinant shuttle plasm id in Bacillus subtilis and Escherichia coli. Enzyme Microb. Technol., 16, 240-246.
283. W ade-Martins,R., Frampton,J. and James, M.R. (1999) Long-term stability o f large insert genomic DNA episomal shuttle vectors in human cells1. Nucleic Acids Res., 27, 1674-1682.
284. Wahlund,P.O., Gustavsson,P.E., Izumrudov,V.A., Larsson,P.O. and Galaev,I.Y. (2004) Precipitation by polycation as capture step in purification o f plasm id DNA from a clarified lysate69. Biotechnol. Bioeng., 87, 675-684.
285. Wang,L., Blasic,J.R., Jr., Holden, M.J. and Pires,R. (2005) Sensitivity comparison o f realtime PCR probe designs on a model DNA plasmid. Anal. Biochem., 344, 257-265.
286. Wang,M. and Lai,E. (1995) Pulsedfield separation o f large supercoiled and open-circular DNAs and its application to bacterial artificial chromosome cloning6. Electrophoresis, 16, 1-7.
287. Wang,Z., Le,G., Shi,Y. and W egrzyn,G. (2001) Medium design fo r plasm id DNA production based on stoichiometric model. Process Biochemistry, 36, 1085-1093.
288. Wang,Z., Le,G., Shi,Y. and W egrzyn,G. (2002) Studies on recovery plasm id DNA from Echerichia coli by heat treatment. Process Biochemistry, 38, 199-206.
289. Warnes,A. and Stephenson, J.R. (1986) The insertion o f large pieces offoreign genetic material reduces the stability o f bacterial plasmids7. Plasmid, 16, 116-123.
290. W einer,M.P., Thannhauser,J.H., L a i t y B e n n i n g , D . P . and Lee,H.A. (1988)P l a s m i d p u r i f i c a t i o n u s i n g r e v e r s e - p h a s e h i g h p e r f o r m a n c e l i q u i d c h r o m a t o g r a p h y r e s i n P R P - i n f i n i t y . Nucleic Acids Res., 16, 8183.
Thomas Burt 4 5 3

References
291. W eissensteiner,T. and Lanchbury,J.S. (1996) Strategy fo r controlling preferential amplification and avoiding false negatives in PCR typing1. Biotechniques, 21, 1102-1108.
292. W hite,R E ., W ade-M artins,R , Hart,S.L., Frampton,J., Huey,B., sai-Mehta,A., Cerosaletti,K.M ., Concannon,P. and James, M .R (2003) Functional delivery o f large genomic DNA to human cells with apeptide-lipid vector. J. Gene Med., 5, 883-892.
293. W HO,G. (1997) WHO Expert Committee on Biological Standardisation. WHO Technical Report Series No 878.
294. W icks,I.P., Howell,M .L., Hancock,T., Kohsaka,H., 01ee,T. and Carson,D.A. (1995) Bacterial lipopolysaccharide copurifies with plasm id DNA: implications fo r animal models and human gene therapy1. Hum. Gene Ther., 6, 317-323.
295. W ild,J., Hradecna,Z. and Szybalski,W. (2002) Conditionally amplifiable BACs: switching from single-copy to high-copy vectors and genomic clones7. Genome Res., 12, 1434-1444.
296. Wild^J., Sektas,M., Hradecna,Z. and Szybalski,W . (1998) Targeting and retrofitting preexisting libraries o f transposon insertions with FRT and oriV elements fo r in-vivo generation o f large quantities o f any genomic fragment. Gene, 223, 55-66.
297. Williams,S.G., Cranenburgh,RM ., W eiss,A.M., W righton,C.J., Sherratt,D.J. and Hanak,J.A. (1998a) Repressor titration: a novel system fo r selection and stable maintenance o f recombinant plasm ids. Nucleic Acids Res., 26, 2120-2124.
298. W illiams,S.G., Cranenburgh,RM ., W eiss,A.M ., W righton,C.J., Sherratt,D.J. and Hanak,J.A. (1998b) Repressor titration: a novel system fo r selection and stable maintenance o f recombinant plasmids5. Nucleic Acids Res., 26, 2120-2124.
299. Wils,P., Escriou,V., Warnery,A., Lacroix,F., Lagneaux,D., OHivier,M., Crouzet,J., Mayaux,J.F. and Scherman,D. (1997) Efficient purification o f plasm id DNA fo r gene transfer using triple-helix affinity chromatography. Gene Ther., 4, 323-330.
300. Winters,M.A., Richter,J.D., Sagar,S.L., Lee,A.L. and Lander,R.J. (2003) Plasmid DNA purification by selective calcium silicate adsorption o f closely related impurities1. Biotechnol. Prog., 19, 440-447.
301. W ojcik,K., W ieckiewicz,J., Kuczma,M. and Porwit-Bobr,Z. (1993) Instability o f hybrid plasmids in Bacillus subtilis. Acta Microbiol. Pol., 42, 127-136.
302. W oodcock,D.M., Crowther,P.J., Doherty,J., Jefferson,S., DeCruz,E., Noyer-Weidner,M., Smith,S.S., Michael, M.Z. and Graham, M.W. (1989) Quantitative evaluation o f Escherichia coli host strains fo r tolerance to cytosine methylation in plasm id and phage recombinants2. Nucleic Acids Res., 17, 3469-3478.
303. Wu,S.L. and Karger,B.L. (1996) Hydrophobic interaction chromatography o f proteins. Methods Enzymol., 270, 27-47.
Thomas Burt 4 5 4

References
304. Yoshida,A., Nagata,T., Uchijima,M., Higashi,T. and Koide,Y. (2000) Advantage o f gene gun-mediated over intramuscular inoculation o f plasm id DNA vaccine in reproducible induction o f specific immune responses. Vaccine, 18, 1725-1729.
305. Yuan Li,X.-Y.D.a.Y.S. (2005) High-speed chromatographic purification o f plasmid DNA with a customized biporous hydrophobic adsorbent. Biochemical Engineering Journal, 27, 33-39.
306. Zagon,I.S., Sassani,J.W ., Verderame,M.F. and McLaughlin,P.J. (2005) Particle-mediated gene transfer o f opioid growth factor receptor cDNA regulates cell proliferation o f the corneal epithelium. Cornea, 24, 614-619.
307. Zhang,S., Krivosheyeva,A. and Nochumson,S. (2003) Large-scale capture and partial purification o f plasmid DNA using anion-exchange membrane capsules. Biotechnol. Appl. Biochem., 37,245-249.
308. Zhu,K., Jin,H., Ma,Y., Ren,Z., Xiao,C., He,Z., Zhang,F., Zhu,Q. and Wang,B. (2005) A continuous thermal lysis procedure fo r the large-scale preparation ofplasm id DNA. J. Biotechnol., 118,257-264.
309. Zipper,H.B.H.B.J.V.F. (2004) Investigations on DNA intercalation and surface binding by SYBR Green /, its structure determination and methodological implications. Nucleic Acids Res., 32.
310. Zoon,K.C. (1996) Points to Consider on Plasmid DNA Vaccines fo r Preventive Infectious Disease Indications [Food and DrugA dministration1 (http://www. fda. 2 0 v/cber/gdlns/plasm id. pdf).
Thomas Burt 4 5 5