
Endovascular_repair_of_abdomin.pdf - UCL Discovery
256
ENDOVASCULAR REPAIR OF ABDOMINAL AORTIC ANEURYSM; A MORPHOLOGICAL STUDY Ravinder Singh-Ranger BSc FRCS (Gen. Surg) A thesis submitted in partial flalfiUment of the requirements for the degree of Master of Surgery University of London Under the supervision of Mr. M Adiseshiah MS FRCP FRCS Department of Vascular Surgery 1998-2000
-
Upload
khangminh22 -
Category
Documents
-
view
1 -
download
0
Transcript of Endovascular_repair_of_abdomin.pdf - UCL Discovery
ENDOVASCULAR REPAIR OF
ABDOMINAL AORTIC
ANEURYSM; A
MORPHOLOGICAL STUDY
Ravinder Singh-Ranger BSc FRCS (Gen. Surg)
A thesis submitted in partial
flalfiUment of the requirements for the
degree of
Master of Surgery
University of London
Under the supervision of Mr. M Adiseshiah MS FRCP FRCS
Department of Vascular Surgery
1998-2000

ProQuest Number: U642534
All rights reserved
INFORMATION TO ALL USERS The quality of this reproduction is dependent upon the quality of the copy submitted.
In the unlikely event that the author did not send a complete manuscript and there are missing pages, these will be noted. Also, if material had to be removed,
a note will indicate the deletion.
uest.
ProQuest U642534
Published by ProQuest LLC(2015). Copyright of the Dissertation is held by the Author.
All rights reserved.This work is protected against unauthorized copying under Title 17, United States Code.
Microform Edition © ProQuest LLC.
ProQuest LLC 789 East Eisenhower Parkway
P.O. Box 1346 Ann Arbor, Ml 48106-1346
University of London
Abstract
ENDOVASCULAR REPAIR
OF ABDOMINAL AORTIC
ANEURYSM; A
MORPHOLOGICAL STUDY
Ravinder Singh-Ranger MBBS BSc FRCS
The longer-term efficacy and durability of endovascular repair (ER) are
unknown. Preliminary, non-validated data suggest progressive shrinkage of
the aneurysm sac and length follows successful ER. These alterations are also
blamed for producing forces that disrupt device integrity.
This study uses validated methods to document the morphological and
dynamic changes affecting the aneurysm sac and neck after ER.
'Laboratory section: Six glass aneurysms with varying neck angulation and sac size
were filled with known proportions of iodinated contrast media and deionized
water. Volumes and linear dimensions were pre-determined with pyknometry
and electronic callipers. Scanning with three-dimensional spiral CT
angiography (3D SCTA) patient protocol produced near perfect correlation
and agreement between true and scanned volumes and diameters. Inter- and
intra-observer errors associated with clinical estimation of these parameters
were also within acceptable range (<5% error). Volume appeared a more
complete measure of sac morphology than diameter alone.
Satellite technology for imaging arterial motion was validated by describing a
glass aneurysm in terms of its volume. Acceptable reproduction was obtained
combining multi-camera imaging with photogrammetric analysis.
Clinical section: 88 patients treated with balloon-expanding PTFE or Talent self
expanding endografts, were prospectively followed for 1-4 years post—ER.
SCTA performed at day 5 and at 6 monthly intervals was used to record
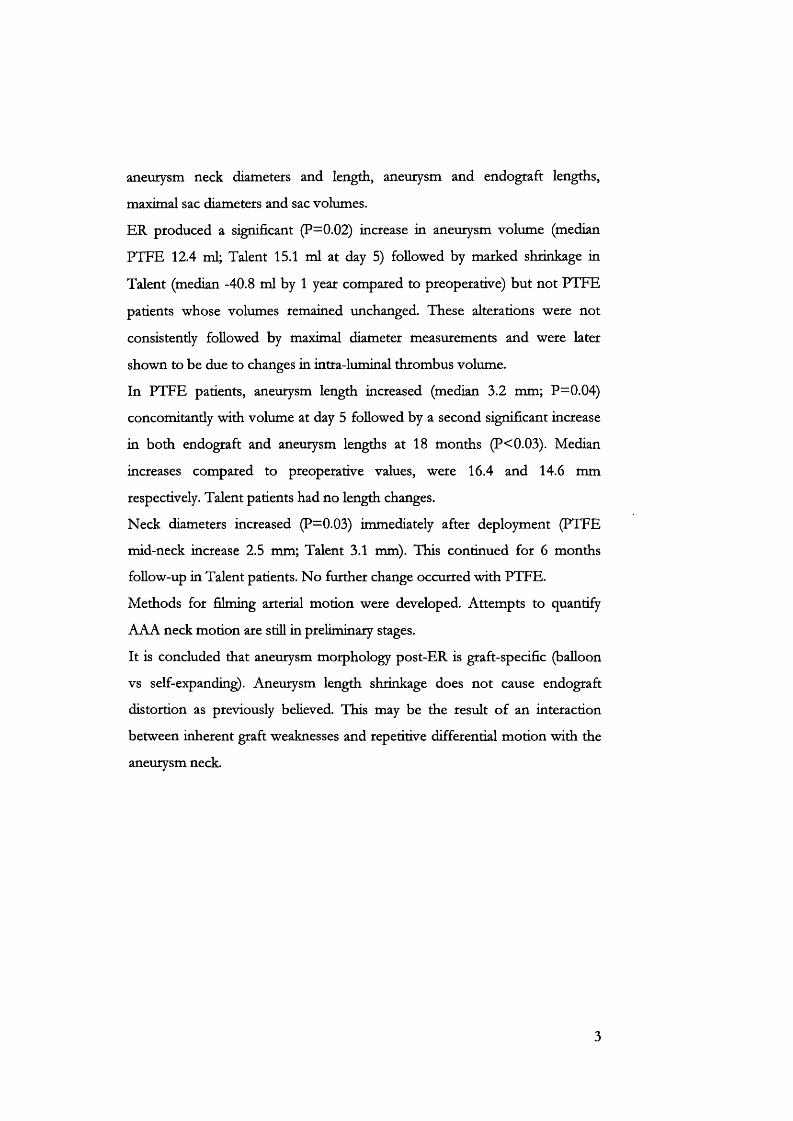
aneurysm neck diameters and length, aneurysm and endograft lengths,
maximal sac diameters and sac volumes.
ER produced a significant (P=0,02) increase in aneurysm volume (median
PTFE 12.4 ml; Talent 15.1 ml at day 5) followed by marked shrinkage in
Talent (median -40.8 ml by 1 year compared to preoperative) but not PTFE
patients whose volumes remained unchanged. These alterations were not
consistently followed by maximal diameter measurements and were later
shown to be due to changes in intra-luminal thrombus volume.
In PTFE patients, aneurysm length increased (median 3.2 mm; P=0.04)
concomitantly with volume at day 5 followed by a second significant increase
in both endograft and aneurysm lengths at 18 months (P<0.03). Median
increases compared to preoperative values, were 16.4 and 14.6 mm
respectively. Talent patients had no length changes.
Neck diameters increased (P=0.03) immediately after deployment (PTFE
mid-neck increase 2.5 mm; Talent 3.1 mm). This continued for 6 months
follow-up in Talent patients. No further change occurred with PTFE.
Methods for filming arterial motion were developed. Attempts to quantify
AAA neck motion are still in preliminary stages.
It is concluded that aneurysm morphology post-ER is graft-specific (balloon
vs self-expanding). Aneurysm length shrinkage does not cause endograft
distortion as previously believed. This may be the result of an interaction
between inherent graft weaknesses and repetitive differential motion with the
aneurysm neck.
TABLE OF C O N TEN TS
C h a p t e r 1: The history of aneurysm surgery.....................................................8
C h a p t e r 2: Is a new aneurysm treatment necessary?..............................................17
C h a p t e r 3: Surgery for abdominal aortic aneurysm.........................................23
C h a p t e r 4: Pathogenesis of abdominal aortic aneurysm................................ 37
C h a p t e r 5: Aims and objectives.......................................................................43
C h a p t e r 6: Imaging techniques used in this study...........................................49
C h a p t e r 7 : Experiments I: Spiral CT and MRA............................................. 67
7.1: Validation of spiral CT volume and linear measurements using
glass phantom aneurysms....................................................................................................68
7.2: Validation of a method used to determine intra-aneurysmal
flow channel and intra-luminal thrombus volum es..................................................... 79
7.3: A comparison of the intra-observer and inter-observer errors
in the measurement of AAA sac volume and maximal diameters...................... 88
7.4: Comparison of spiral CT angiography and graduated sizing
catheter in the geometric sizing of AAA for endoluminal repair........................92
7.5: The natural history of AAA after endoluminal repair. A
comparative study of balloon and self-expanding endograft systems
using Spiral CT angiography............................................................................... 100
7.6: Changes in intraluminal thrombus (ILT) after endovascular
repair of abdominal aortic aneurysm.................................................................. 114
7.7: Changes in aneurysm and graft length after endovascular
exclusion of AAA using balloon and self-expanding endograft
systems.................................................................................................................118
7.8: Natural history of the aneurysm neck after endoluminal repair
using balloon and self-expanding endograft systems.........................................125
7.9: The intra- and inter-observer differences in aneurysm neck
length and diameters found during measurement with spiral CT
angiography........................................................................................................ 132
7.10: Measurement of distance and volume with MRI: An in vitro
feasibility study.................................................................................................... 136
7.11: A comparison of gadolinium-enhanced MR angiography
versus spiral CT angiography in the evaluation of patients for
endovascular repair............................................................................................. 143
C h a p t e r 8: Photogrammetry.......................................................................... 150
C h a p t e r 9: Experiments II: Dynamic arterial imaging.................................. 161
9.1: Laboratory validation of a digital photogrammetric technique
used to measure arterial dimensions................................................................... 162
9.2: Measurement of aneurysm neck and arterial motion during
open surgical repair............................................................................................. 172
9.3: Measurement of arterial motion during open surgery using
digital photography: a feasibility study................................................................183
C h a p t e r 10: Discussion............................................................................................... 188
C h a p t e r 11: Synopsis.....................................................................................212
C h a p t e r 12: References................................................................................. 214
A p p e n d i x I: List of Figures........................................................................... 244
A p p e n d i x I I : List of Tables........................................................................... 250
A p p e n d i x I I I : Critical values for Z ................................................................ 254
ACKNOWLEDGMENTS
This thesis would not have been possible without Mr. Mohan
Adiseshiah. This work is a product of his help, encouragement and
selfless support.
The experimental work was nurtured from its embryonic beginnings
with the help of many colleagues including Leoni Blank and Stuart
Robson (Photogrammetry). Professor Tony Grass and his team were
also invaluable in helping me to understand the importance of pure
science and the techniques of precise measurement.
Professor Michael Hobsley gave up much of his time to discuss
statistical methods and theory for which I am immensely grateful.
Tony McArthur and Professor William Lees were instrumental in
teaching a novice the basics of spiral CT imaging. I am very grateful
for the trust and open policy towards research held in our radiology
department.
Finally, I would like to thank my fiancée Helen Lewis for her support
during the many anti-social experimental hours spent on this project
and her saintly patience while enduring the umpteenth practice run
before a major presentation.
PUBLICATIONS
It is a requirement of the University of London that the work
presented here is original and carried out by the named author. These
conditions have been fulfilled. Work from this thesis has been
presented in abstract form and published within the following
journals:
1. Singh-Ranger R, Adiseshiah M, Endovascular repair of
abdominal aortic aneurysms. Hosp Med. 1998; 59(10); 788-92.
Review.
2. Singh-Ranger R, McArthur T, Dellacorte M, Lees W, Adiseshiah
M. The abdominal aortic aneurysm (AAA) sac after endoluminal
exclusion: a medium-term morphological follow up based on
volumetric technology. J. Vase Surg 2000; 31(4): 490-500.
3. Singh-Ranger R, McArthur T, Lees W, Adiseshiah M. A
prospective study of changes in aneurysm and graft length after
endovascular exclusion of AAA using balloon and self-expanding
endograft systems. Eur J Vase Endovasc Surg 2000; 20(1): 90-5.
4. Singh-Ranger R, Adiseshiah M. Differing morphological changes
following endovascular AAA repair using balloon-expandable or
self-expanding endografts. J Endovasc Ther. 2000; 7: 479-85.

C h a p t e r 1
The history of aneurysm surgei
1.1 D e f i n i t i o n o f a n a b d o m i n a l a o r t i c a n e u r y s m
The first record of peripheral arterial aneurysms is attributed to Antyllus who Hved in the 2nd
century AD (fi AD 250)b He described two types caused either by spontaneous dilatation ( 'when the
artery has been ruptured’) or following trauma. Although Antyllus described a method for the
treatment of smaller aneurysms using ligation and incision, it was not until 1804, that an attempt
was made to describe the formation of aneurysms. J H Wishart’s translation of Antonio Scarpa’s
book “A Treatise on the Anatomy, Pathology and Surgical Treatment of Aneurysms.” outlined the
gradual dilatation of the arterial wall leading to eventual rupture.
The modem definition^ of an aneurysm is “A localised and irreversible dilatation of an artery.”
However, this statement ignores size, a sine qua non for clinical management of asymptomatic
aneurysms.
Although most surgeons would accept the presence of an abdominal aortic aneurysm (AAA) in an
aorta with a diameter of 30 mm or more, there is argument over the precise clinical definition. This
is because aortic diameter is a continuous variable and the exact point at which a normal vessel
becomes aneurysmal cannot be easily defined. Normal arterial diameter depends on several factors,
including age, gender and blood pressure. Standardised data show the normal external diameters of
the inffarenal abdominal aorta to be 16.6-21.6 mm in females and 19.9-23.9 mm in males / .
Some investigators define an aneurysmal segment as having an internal diameter at least 5 mm
greater than the proximal aorta, while others suggest that the ratio of the inffarenal to the
suprarenal diameter must be greater than 1.5 . AAA has also been defined by a mean aortic
diameter greater than 2 standard deviations above normal* .
The committees on reporting standards of The Society of Vascular Surgery and the North
American Chapter of the International Society for Cardiovascular Surgery^ have suggested a
consensus definition for an abdominal aortic aneurysm. This is an aortic “diameter greater than
30mm in the infira-renal portion of the aorta, or a diameter of 50% greater than the normal artery
above it.” The definition excludes arteriomegaly where there is a generalised dilatation of the aorta.
1.2 C o n v e n t i o n a l a b d o m i n a l a o r t i c a n e u r y s m s u r g e r y
Although recognised for many years, aneurysms were usually untreated apart from some ill-judged
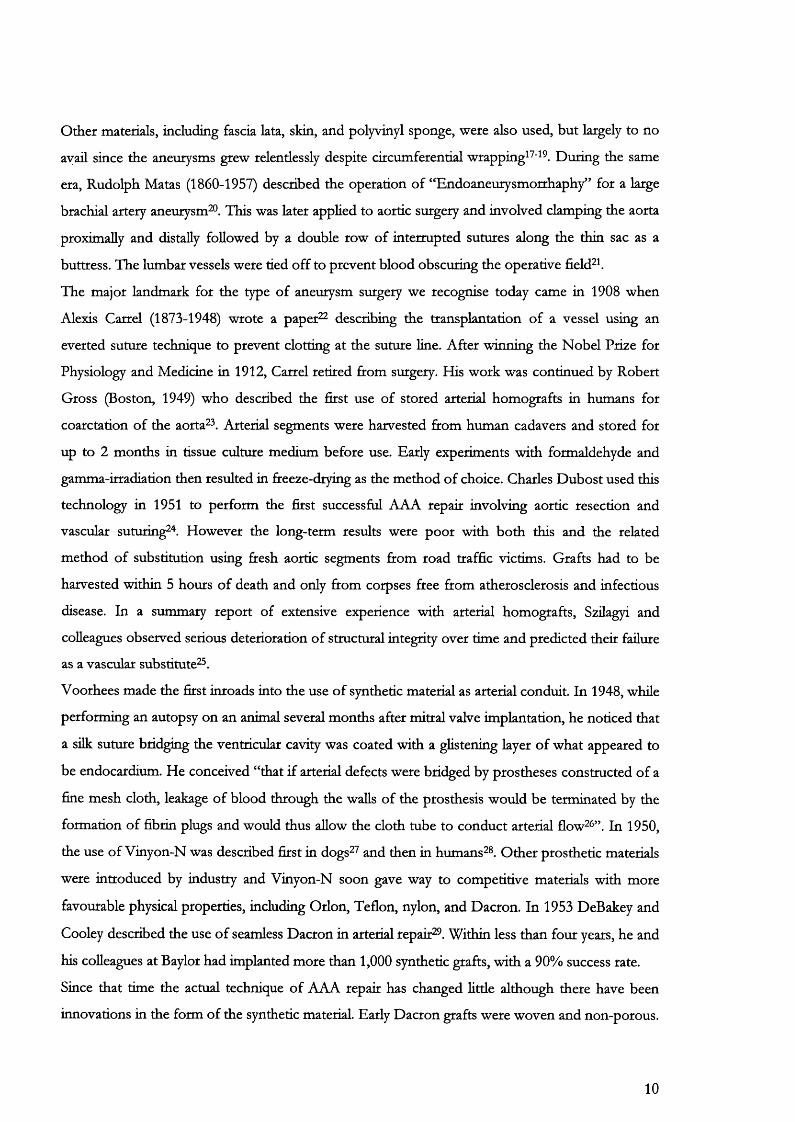
attempts at lancing with sharp probes. In the Papyrus Ebers (Figure 1), one of the earliest medical
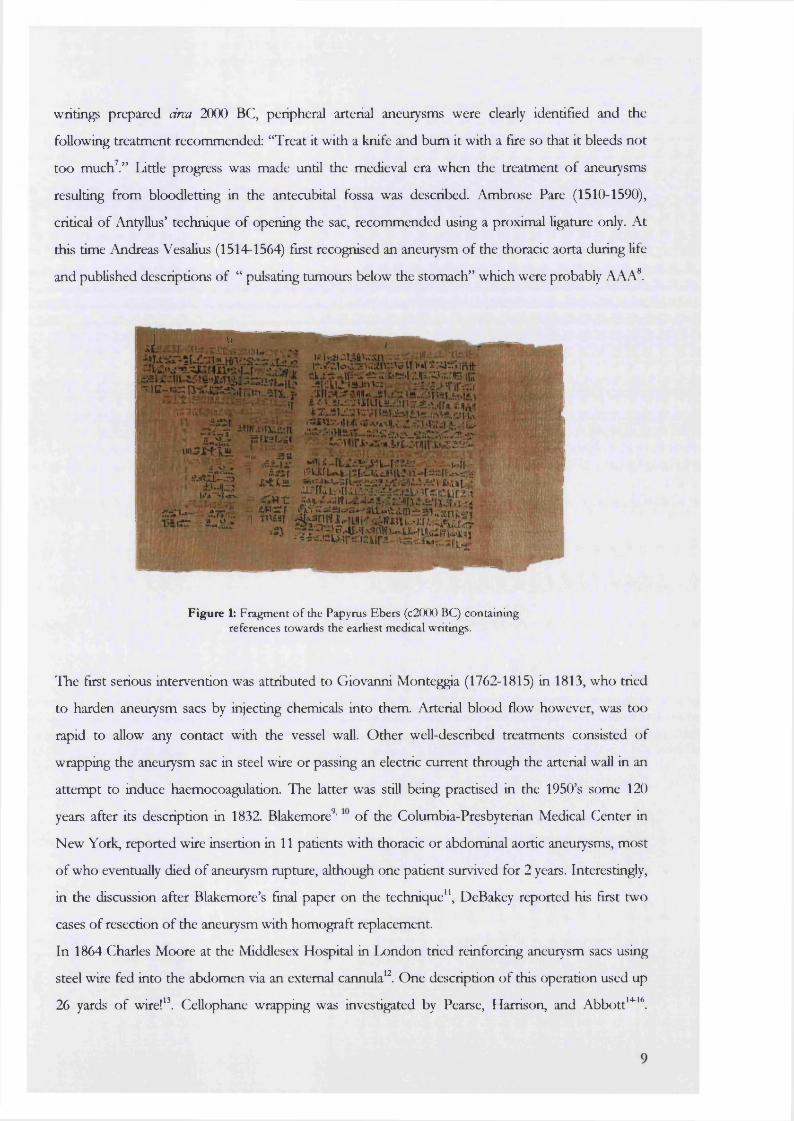
writings prepared circa 2000 BC, peripheral arterial aneurysms were clearly identified and the
following treatment recommended: “Treat it with a knife and bum it with a fire so that it bleeds not
too muchV' Little progress was made until the medieval era when the treatment of aneurysms
resulting from bloodletting in the antecubital fossa was described. Ambrose Pare (1510-1590),
critical of Antyllus’ technique of opening the sac, recommended using a proximal Hgature only. At
this time Andreas Vesalius (1514-1564) first recognised an aneurysm of the thoracic aorta during life
and published descriptions of “ pulsating tumours below the stomach” which were probably AAA*.
j u
Figure 1: Fragment o f the Papyrus Ebers (c2(XX) BC) containing references towards the earliest medical writings.
The first serious intervention was attributed to Giovanni Monteggia (1762-1815) in 1813, who tried
to harden aneurysm sacs by injecting chemicals into them Arterial blood flow however, was too
rapid to allow any contact with the vessel wall. Other well-described treatments consisted of
wrapping the aneurysm sac in steel wire or passing an electric current through the arterial wall in an
attempt to induce haemocoagulation. The latter was still being practised in the 1950’s some 120
years after its description in 1832. Blakemore’’ of the Columbia-Presbyterian Medical Center in
New York, reported wire insertion in 11 patients with thoracic or abdominal aortic aneurysms, most
of who eventually died of aneurysm rupture, although one patient survived for 2 years. Interestingly,
in the discussion after Blakemore’s final paper on the technique”, DeBakey reported his first two
cases of resection of the aneurysm with homograft replacement.
In 1864 Charles Moore at the Middlesex Hospital in London tried reinforcing aneurysm sacs using
steel wire fed into the abdomen via an external cannula'^. One description of this operation used up
26 yards of wire!”. Cellophane wrapping was investigated by Pearse, Harrison, and Abbott*'^* .
Other materials, including fascia lata, skin, and polyvinyl sponge, were also used, but largely to no
avail since the aneurysms grew relentlessly despite circumferential wrapping^ '^^. During the same
era, Rudolph Matas (1860-1957) described the operation of “Endoaneurysmorrhaphy^’ for a large
brachial artery aneurysm^o. This was later applied, to aortic surgery and involved clamping the aorta
proximaUy and dis tally followed by a double row of intermpted sutures along the thin sac as a
buttress. The lumbar vessels were tied off to prevent blood obscuring the operative field^h
The major landmark for the type of aneurysm surgery we recognise today came in 1908 when
Alexis Carrel (1873-1948) wrote a paper^ describing the transplantation of a vessel using an
everted suture technique to prevent clotting at the suture Hne. After winning the Nobel Prize for
Physiology and Medicine in 1912, Carrel retited from surgery. His work was continued by Robert
Gross (Boston, 1949) who described the first use of stored arterial homografts in humans for
coarctation of the aorta^ . Arterial segments were harvested from human cadavers and stored for
up to 2 months in tissue culture medium before use. Early experiments with formaldehyde and
gamma-irradiation then resulted in ffeeze-drying as the method of choice. Charles Dubost used this
technology in 1951 to perform the first successful AAA repair involving aortic resection and
vascular sutufing " . However the long-term results were poor with both this and the related
method of substitution using fresh aortic segments from road traffic victims. Grafts had to be
harvested within 5 hours of death and only from corpses free from atherosclerosis and infectious
disease. In a summary report of extensive experience with arterial homografts, Szdagyi and
colleagues observed serious deterioration of stmctural integrity over time and predicted their failure
as a vascular substitute^.
Voorhees made the first inroads into the use of synthetic material as arterial conduit. In 1948, while
performing an autopsy on an animal several months after mitral valve implantation, he noticed that
a silk suture bridging the ventricular cavity was coated with a glistening layer of what appeared to
be endocardium. He conceived “that if arterial defects were bridged by prostheses constructed of a
fine mesh cloth, leakage of blood through the walls of the prosthesis would be terminated by the
formation of fibrin plugs and would thus allow the cloth tube to conduct arterial flow^^”. In 1950,
the use of Vinyon-N was described first in dogs^ and then in hum ans^® . Other prosthetic materials
were introduced by industry and Vinyon-N soon gave way to competitive materials with more
favourable physical properties, including Orion, Teflon, nylon, and Dacron. In 1953 DeBakey and
Cooley described the use of seamless Dacron in arterial repair^ . Within less than four years, he and
his colleagues at Baylor had implanted more than 1,000 synthetic grafts, with a 90% success rate.
Since that time the actual technique of AAA repair has changed little although there have been
innovations in the form of the synthetic material. Early Dacron grafts were woven and non-porous.
10
They were rigid and difficult to handle with a tendency to fray at the edges. Modem fabrics employ
a warp or lock-knit pattern. The material is softer and suturing is easier with lesser tendency to
cause fraying. However, unsealed grafts are highly permeable and require pre-clotting with
autologous blood to prevent percolation during implantation. This serious disadvantage during
emergency repair was addressed to a large extent by the introduction of gelatin-bonded grafts.
1.3 E n d o l u m i n a l e x c l u s i o n o f a n e u r y s m s
Attempts to simplify the abdominal approach were made in the 1980’s when a vascular graft with a
rigid ring at each end was described^®. This was placed within the lumen of the aorta and held in situ
with external ligatures. The prosthesis, originally indicated for aortic dissections, was successfully
used in the management of an AAA^h However, it had no particular advantage over conventional
repair, also requiring a laparotomy and cross-clamping of the aorta.
Several groups were also beginning to explore the idea of placing a graft within the aorta using the
transfemoral approach. In 1983 Kreamer, a year medical student, devised the concept of
transfemoral endovascular repair of AAA by insertion of a prosthetic graft held to the aortic wall
with adhesives^^. When the Food and Drug Administration (FDA) ruled that adhesives could not
be used in humans, he used stents to fix his graft to the aortic wall. He later received the first patent
for a stent-graft awarded in 1987^ .
Cragg et al reported on a small series using nitinol wire prostheses in 1983^t Nitinol wire coil grafts
straightened in ice water were passed into the canine aorta via catheter, where they reformed into
their original shapes. Follow-up aortograms demonstrated long-term patency with minimal
thrombus formation. It was concluded that these coü grafts might eventually be used in the
nonsurgical treatment of several forms of vascular disease.
Balko et aP used a polyurethane and nitinol graft to treat aneurysms created in three adult sheep.
Endografts were deployed via the femoral artery. Post mortem examination later demonstrated
successful endovascular exclusion of these aneurysms.
In 1991 Parodi and Paknaz^^ described the first series of endoluminal repairs in humans. This
seminal paper described six cases: five abdominal aortic aneurysms, and one abdominal aortic
dissection.
In each case, a Pahnaz stent (Johnson and Johnson) was used to attach a Dacron graft immediately
below the renal arteries. The lower end of the prosthesis was left free and it was hoped that the
blood pressure would allow patency and simultaneous sealing against the aortic wall. This proved
untrue, and continued leakage into the sac from below required deployment of a second Palmaz
stent to fix the lower end of the graft. These tubular grafts required a proximal and distal neck of
11
normal aorta superior and inferior to the aneurysm to enable a satisfactory seal to occur between
the stent, graft and aortic wall.
The tube graft has now become unpopular due to high rates of endoleakage^^ from the distal
ftxation site. Further, only 5-10% of all AAA have the anatomical configuration required for its
deployments^. Recently, it has been argued that tube endografts may still retain a place in selected
cases. In a review of 158 patients treated with tubular (n = 57), aorto-ibac/femoral (n = 24) and
bifurcated (n = 77) grafts, tubular prostheses had the highest rate of endoleak (21/57 compared to
16/101 patients). Analysis of the cause of tube graft failure revealed a distal neck of inadequate
length (<1.5 cm) as the most common culprit. When the length of the distal neck was 2.5 cm or
greater, endoleak was much less likelyS .
Current therapeutic options for endoluminal treatment of AAA lie between aorto-uni-diac and
bifurcated endografts. The major difference between these two systems is the ability to deal with
common iliac artery anatomy.
Bifurcated endoluminal grafts
The design of bifurcated endovascular grafts for the treatment of AAA emerged directly from the
experience of conventional aorto-iliac reconstructive surgery. The first experimental use of a
bifurcated graft by Chuter et was followed in 1993 by Scott's" description of the first clinical
experience. This system delivered a preformed graft with three orifices, each of which was attached
to non-dilated artery by a Gianturco Z-stent. The Y-shaped prosthesis was introduced through one
femoral artery and manipulated into position, using a system of connected catheters. An alternative
method of bifurcated endograft insertion involves assembling several stent-graft components to
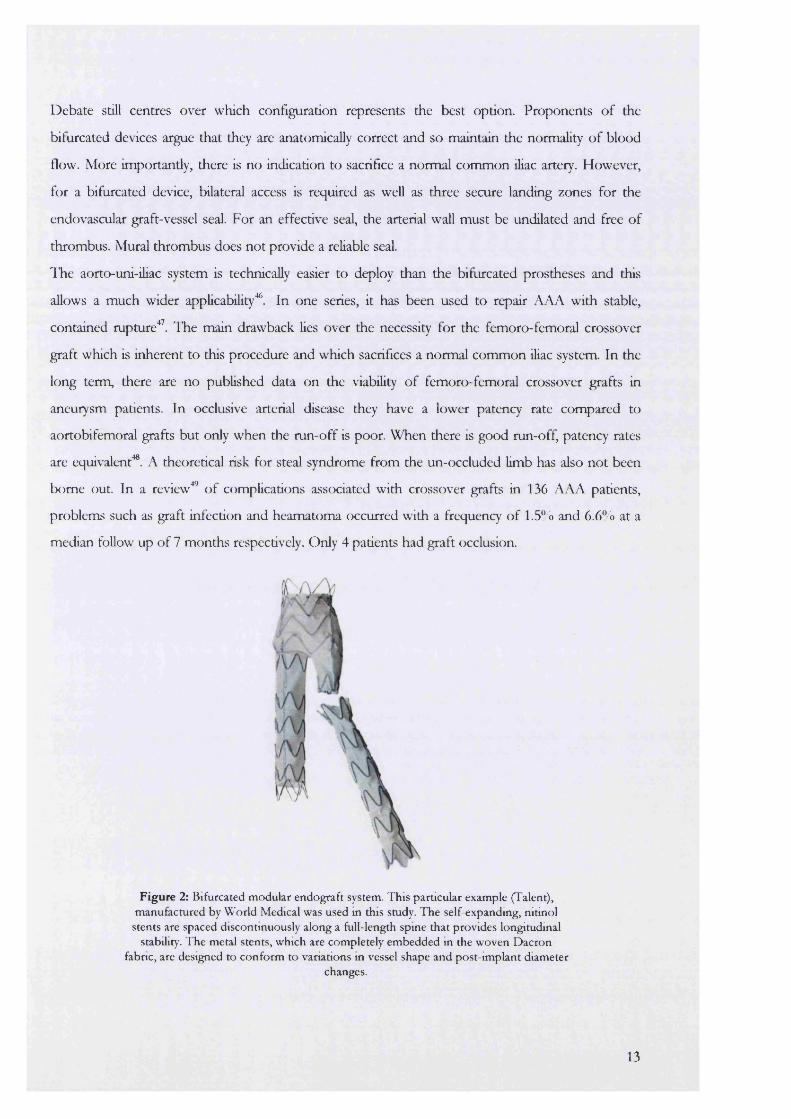
create the bifurcated prosthesis in situ (Figure 2) referred to as the "modular" approach'^^.
Aorto-uni-iliac grafts
Following Parodi’s initial description, the aorto-uni-üiac system was pioneered and utilised in many
of the early endovascular series' "' . It’s simplicity lay in the fact that it could be assembled using
easily accessible components (a length of pre-expanded PTFE, two balloon-expandable stents and a
balloon catheter) literally at the time of repair.
The graft is deployed below the renal arteries and then brought down through one of the common-
iliac arteries to be fixed either there or within the external iliac artery. The contralateral common
ihac artery is occluded either surgically by ‘T>lind-stenting” or with embolisation coils to prevent
retrograde filling of the AAA sac. A femoro-femoral bypass restores blood to the occluded side.
12
Debate still centres over which configuration represents the best option. Proponents of the
bifurcated devices argue that they are anatomically correct and so maintain the normality of blood
flow. More importantly, there is no indication to sacrifice a normal common iliac artery. However,
for a bifurcated device, bilateral access is required as well as three secure landing zones for the
endovascular graft-vessel seal. For an effective seal, the arterial wall must be undilated and free of
thrombus. Mural thrombus does not provide a reliable seal.
The aorto-uni-iliac system is technically easier to deploy than the bifurcated prostheses and this
allows a much wider applicability^. In one series, it has been used to repair AAA with stable,
contained mpture'^ . The main drawback lies over the necessity for the femoro-femoral crossover
graft which is inherent to this procedure and which sacrifices a normal common iliac system. In the
long term, there are no published data on the viability of femoro-femoral crossover grafts in
aneurysm patients. In occlusive arterial disease they have a lower patency rate compared to
aortobifemoral grafts but only when the run-off is poor. When there is good run-off, patency rates
are equivalent^. A theoretical risk for steal syndrome from the un-occluded limb has also not been
borne out. In a review^ of complications associated with crossover grafts in 136 AAA patients,
problems such as graft infection and heamatoma occurred with a frequency of 1.5% and 6.6% at a
median follow up of 7 months respectively. Only 4 patients had graft occlusion.
Figure 2: Bifurcated modular endograft system. This particular example (Talent), manufactured by World Medical was used m this study. The self-expanding, nitinol
stents are spaced discontinuously along a full-length spine that provides longitudinal stability. The metal stents, which are completely embedded m the woven Dacron
fabric, are designed to conform to variations in vessel shape and post-implant diameterchanges.
13
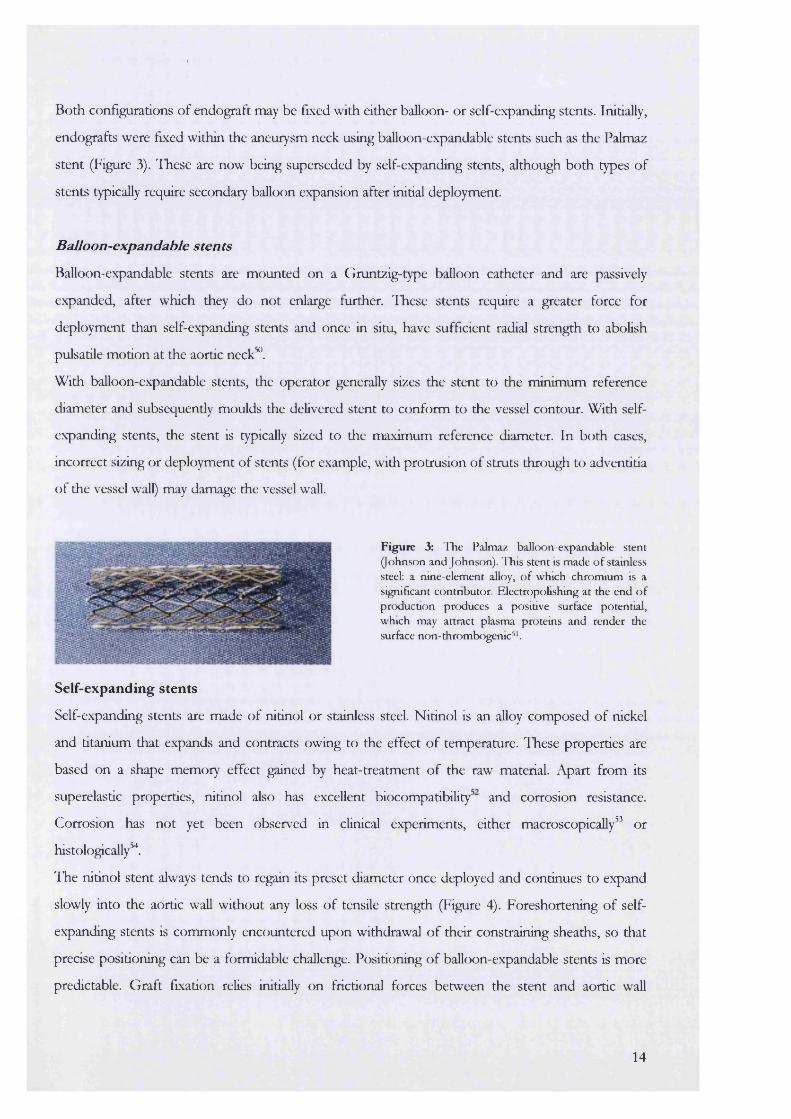
Both configurations of endograft may be fixed with either balloon- or self-expanding stents. Initially,
endografts were fixed within the aneurysm neck using balloon-expandable stents such as the Palmaz
stent (Figure 3). These are now being superseded by self-expanding stents, although both types of
stents typically require secondary balloon expansion after initial deployment.
Balloon-expandable stents
Balloon-expandable stents are mounted on a Gruntzig-type balloon catheter and are passively
expanded, after which they do not enlarge further. These stents require a greater force for
deployment than self-expanding stents and once in situ, have sufficient radial strength to abolish
pulsatile motion at the aortic neck“ .
With balloon-expandable stents, the operator generally sizes the stent to the minimum reference
diameter and subsequently moulds the delivered stent to conform to the vessel contour. With self
expanding stents, the stent is typically sized to the maximum reference diameter. In both cases,
incorrect sizing or deployment of stents (for example, with protrusion of struts through to adventitia
of the vessel wall) may damage the vessel wall.
Figure 3: The Palmaz balloon-expandable stent (Johnson and Johnson). This stent is made of stainless steel: a nine-element alloy, o f which chromium is a significant contnbutor. FJectropolishing at the end o f production produces a positive surface potential, which may attract plasma proteins and render the surfece non- thrombogenic^ .
Self-expanding stents
Self-expanding stents are made of nitinol or stainless steel. Nitinol is an alloy composed of nickel
and titanium that expands and contracts owing to the effect of temperature. These properties are
based on a shape memory effect gained by heat-treatment of the raw material. Apart from its
superelastic properties, nitinol also has excellent biocompatibilityand corrosion resistance.
Corrosion has not yet been observed in clinical experiments, either macroscopically” or
histologically^.
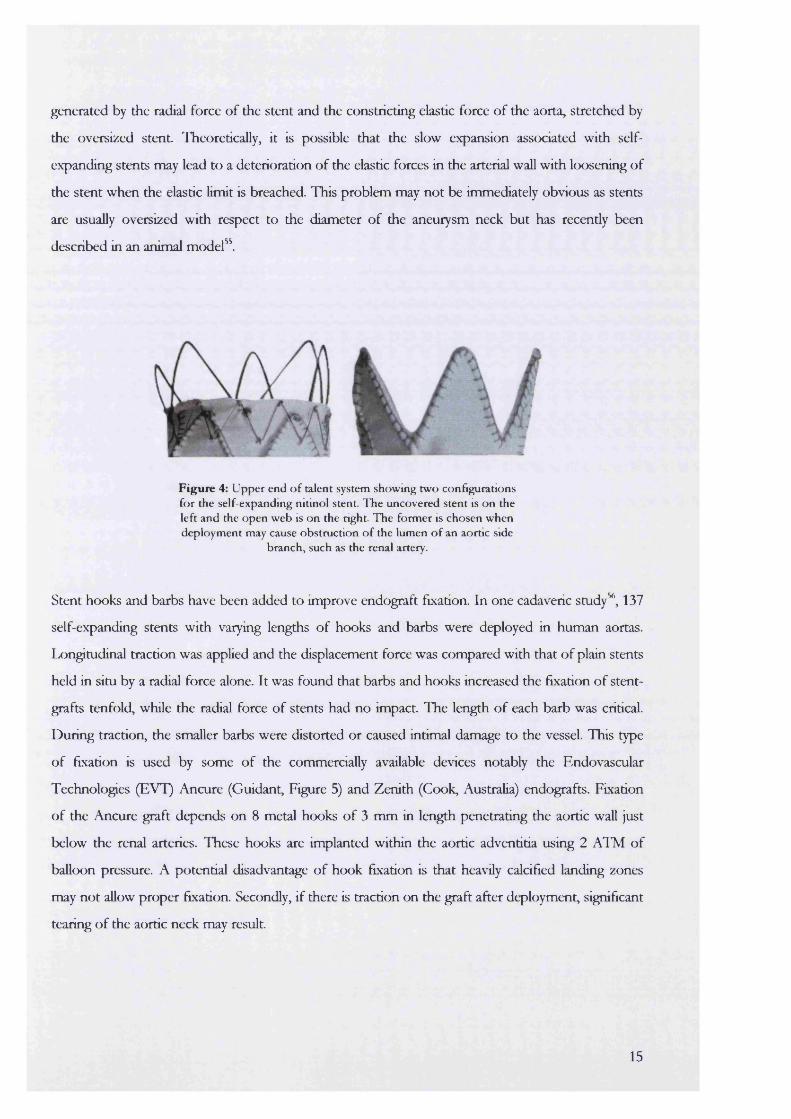
The nitinol stent always tends to regain its preset diameter once deployed and continues to expand
slowly into the aortic wall without any loss of tensüe strength (Figure 4). Foreshortening of self
expanding stents is commonly encountered upon withdrawal of their constraining sheaths, so that
precise positioning can be a formidable challenge. Positioning of balloon-expandable stents is more
predictable. Graft fixation relies initially on frictional forces between the stent and aortic wall
14
generated by the radial force of the stent and the constricting elastic force of the aorta, stretched by
the oversized stent. Theoretically, it is possible that the slow expansion associated with self
expanding stents may lead to a deterioration of the elastic forces in the arterial wall with loosening of
the stent when the elastic limit is breached. This problem may not be immediately obvious as stents
are usually oversized with respect to the diameter of the aneurysm neck but has recently been
described in an animal modeP^.
Figure 4: Upper end o f talent system showing two configurations for the self-expanding nitinol stent. The uncovered stent is on the left and the open web is on the right. The former is chosen when deployment may cause obstruction o f the lumen o f an aortic side
branch, such as the renal artery.
Stent hooks and barbs have been added to improve endograft fixation. In one cadaveric study^, 137
self-expanding stents with varying lengths of hooks and barbs were deployed in human aortas.
Ivongitudinal traction was applied and the displacement force was compared with that of plain stents
held in situ by a radial force alone. It was found that barbs and hooks increased the fixation of stent-
grafts tenfold, while the radial force of stents had no impact. The length of each barb was critical.
During traction, the smaller barbs were distorted or caused intimai damage to the vessel. This type
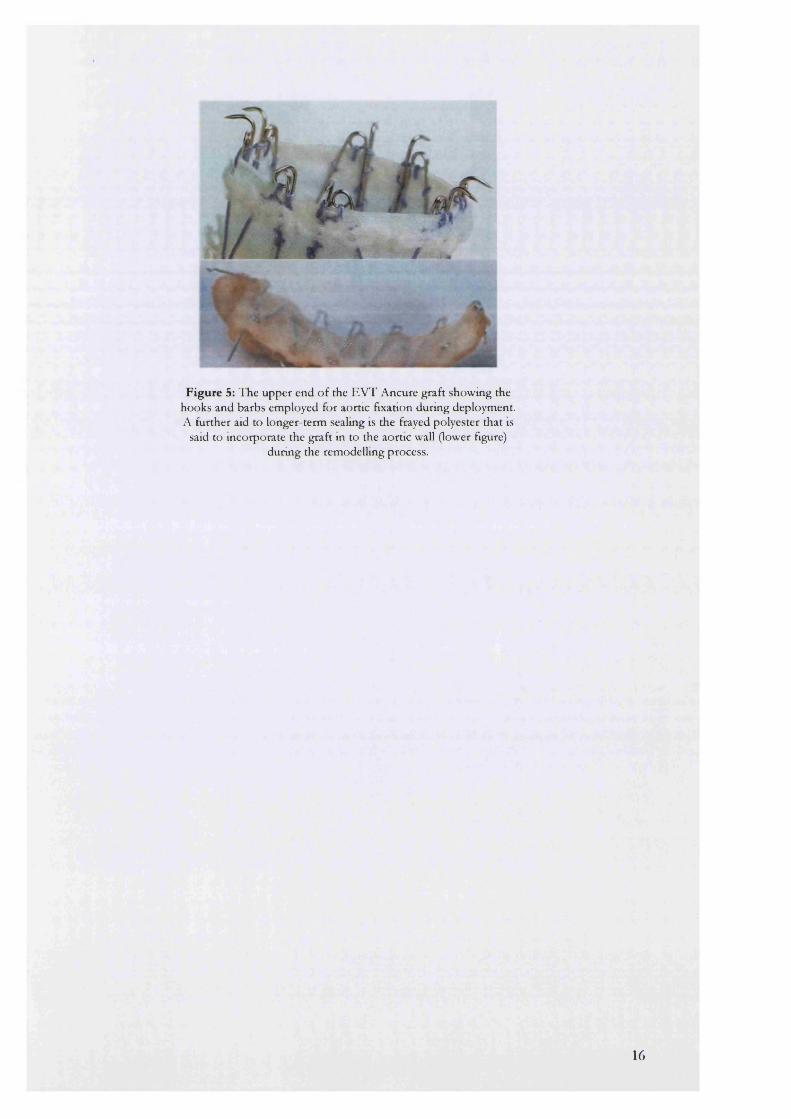
of fixation is used by some of the commercially available devices notably the Endovascular
Technologies (EVT) Ancure (Guidant, Figure 5) and Zenith (Cook, Australia) endografts. Fixation
of the Ancure graft depends on 8 metal hooks of 3 mm in length penetrating the aortic wall just
below the renal arteries. These hooks are implanted within the aortic adventitia using 2 Al’M of
balloon pressure. A potential disadvantage of hook fixation is that heavily calcified landing zones
may not allow proper fixation. Secondly, if there is traction on the graft after deployment, significant
tearing of the aortic neck may result.
15
% W
Figure 5: The upper end o f the EVT Ancure graft showing the hooks and barbs employed for aortic fixation during deployment. A further aid to longer-term sealmg is the frayed polyester that is
said to incorporate the graft in to the aortic wall (lower figure) durmg the remodelling process.
16
C h a p t e r 2
Is a new aneurysm treatment necessa
Before a new treatment is adopted in favour of the old three requirements should be considered:
• A continuing increase in the disease load and hence demand for a less invasive and less costly
treatment may be called for. For example, if the incidence of AAA begins to markedly decrease
over the next few years then, in fiscal terms, preparations for the introduction of a new
treatment would not be economical.
• The adequacy of the current treatment, in this case open repair, has to be re-examined. If the
present treatment is safe with litde morbidity and mortality, then the introduction of a new
regimen will not have any perceived benefit.
• The efficacy of the new treatment needs to be established. Open repair, the current gold
standard, eradicates the threat of death from aneurysm rupture as the sac is physically disrupted
and then (usually) oversewn. In contrast endovascular approaches do not disturb the anatomy
of the aneurysm sac and the threat of rupture may still be present.
In this section the epidemiology of aneurysms will be reviewed to try and determine whether there
is likely to be a sufficient increase in the number of aneurysm cases in the future to merit the need
for a new treatment.
2 .1 A n e u r y s m a l d i s e a s e i n p e r s p e c t i v e
Abdominal aortic aneurysms have posed a significant challenge to the healthcare system. The
number of new aneurysms seen by vascular surgeons in 1980 was 7 times higher than that seen in
1951 * when the first inlay repair was described. In the United states, AAA is now ranked as the
13th leading cause of death and is responsible for about 15,000 deaths per year while in the United
Kingdom (UK) it is responsible for 10,000 deaths per year. The incidence of AAA has been
estimated at 52 per 100,000 per annum in men aged 55-64 years^ and 499 per 100,000 per annum
in men over 80 years ®.
However, since the first open AAA repair only took place 48 years ago " , it is possible that these
trends are simply a reflection of improvements in diagnosis and hence better case definitions^.
17
It could therefore be argued that, while the incidence of AAA continues to increase, its prevalence,
or the total number of cases in the population at any point in time, remains constant. Eventually,
there wiU come a point at which the increasing incidence will begin to level off.
Furthermore, since AAA is a degenerative disease it will be more common in an ageing population.
An average life expectancy of 85 years has been predicted in the year 2000* ®. If the increased life
expectancy of earlier generations is added to this, a substantial rise in the numbers of aneurysms
and demand for their treatment must be expected regardless of a true increase in the disease itself.
Incidence of Aneurysms
In both the United States and the United Kingdom the annual incidence of abdominal aortic
aneurysm (AAA) has shown a substantial increase fcom 1950 to 1980. 8.7 new AAA were
diagnosed per 100,000 person-years from 1950-1960 compared with 36.5 new aneurysms per
100,000 person-years from 1971-1980 in the USA^h
In England and Wales, the number of AAA deaths in men over the age of 40 increased steadily
from 202 in 1950 to 4668 in 1984. In women, during the same time period, the increase was from
201 to 259U^. Neither group had any significant increase during the 1970’s when diagnostic
ultrasound became widely available* . Further, the corresponding age-standardised mortalities were
widely different for the sexes, increasing 20-fold for men and only 11-fold for women during this
time period^ .
These observations suggest that the rising incidence of aneurysms is real and not based on
improved case ascertainment or an ageing population; if these were the main or only influences on
increasing incidence, then men and women would have been expected to have been equally
affected.
A further illustration comes from an increase in the incidence of ruptured AAA. One study in
Goteborg, Sweden found a sevenfold increase over a period of 36 years* " unaltered by any
improvements in diagnostic techniques. It has been suggested that these figures represent the tip of
a very large iceberg^^. Only 20% of patients with mptured aneurysms actually reach hospital alive
with an operative mortality of 78-94%. Free intraperitoneal mpture, which is rapidly followed by
cardiovascular collapse and death, is probably underreported in mortality statistics. The tme
incidence of ruptured AAA is hidden amongst such patients who die suddenly without medical
input and without a correct diagnosis.
18
Ptevalence of Aneurysms
The prevalence of AAA (>30 mm) increases with age. The number of AAA, estimated using
ultrasound-based screening in a sample of 12,203 Australian men^^, increased from 4.8% in men
aged 65-69 years to 10.8% in those aged 80-83 years. The overall prevalence of large (> 50 mm)
aneurysms was 0.69%. Existing estimates of point prevalence can be grouped according to whether
they have been obtained from post mortem or population screening studies.
Posf mortem studies
As sources of prevalence 02X2i, post mortem studies are flawed because definitions for aneurysms may
not always be quoted or be as strict as those used in population screening surveys. Significant
difficulty is also presented by the postmortem rate. If this is less than 100%, patients with sudden and
unexpected deaths may be over represented^^ and the frequency of ruptured AAA may then appear
falsely high.
In one series of post mortem’s carried out over a 28-year period in Makno^®, the annual prevalence
showed a significant increase in both sexes. In men, the annual increase was 4.7% (95% confidence
interval 3.6-9) compared to women where it was 3.0% (1.8-4.3). The advantages of this study were
based on the well-defined and stable population who were all served by one hospital. The post
mortem rate was also very high.
Screening studies
Recent studies, based on screening of General practice populations, may provide a more accurate
insight into the prevalence of AAA. In UK males, this varies between 1.3 and 12.7% depending on
the age group and criteria used for the definition of AAA^ . The latter is critical as differences in
prevalence data can often be explained by differences in the definition of an aneurysm. For
example, the point prevalence for AAA in males over 55 years was estimated as 4.1% in a Dutch
study ® compared to 8.2% in Norwegian study^h These would seem unusual, as both countries are
geographically comparable with similar population origins. Closer comparison however, shows that
the Dutch used a cut-off value of 35 mm for the presence of an AAA while the Norwegian series
was based on a value of 29 mm or an infira-renal diameter 50% greater than the supra-renal aorta.
Repeated comparisons of prevalence within a single location over a period of time, may provide a
better idea of trends due to consistency, but screening for AAA is new and programmes have not
been in evidence long enough for these to be visible.
In summary, there is a true increase in the incidence of patients with AAA that is independent of
changes in diagnostic technology and ageing within a population. The prevalence of AAA is still
19

unknown although the data obtained from post mortem studies seem to agree quite well with the
screening studies when adjusted for population demography^^. This suggests that there is likely to
be a continuing need for aneurysm surgery, as the number of afflicted patients will continue to
increase.
2.2. S c r e e n i n g f o r AAA
Screening for aneurysms may be an important way to eliminate a preventable cause of mortaHty^ .
AAA are asymptomatic, life threatening, treatable and amenable to detection by noninvasive tests.
In addition, the incidence increases in the presence of known risk factors such as smoking,
presence of first-degree relatives with an AAA or peripheral vascular disease, carotid artery disease
or hypertension^^’ Smoking is associated with a 5.6-fold increase in the risk of finding an
abdominal aortic aneurysm (more than 4 cm in size), but even among smokers the prevalence of
large abdominal aortic aneurysms is low in the absence of other risk factors^ . Patients with
aneurysms have a 20 percent chance of having a first-degree relative with the same condition. Male
siblings are at particular risk. The exact genetic pattern of inheritance has not been elucidated but
may involve both X chromosome-linked and autosomal dominant patterns of inheritance^^’
From this discussion, it would seem reasonable to speculate that widespread screening could
significantly increase the workload for aneurysm repaie. The majority of screen-detected AAA are
however 5 cm or less in diameter. In one report, the results from 5 large European screening
programmes found only 9 (0.18%) AAA greater than 6 cm in diameter among a total of 5005
subjects (Table 1) ®. Operative treatment of smaU aneurysms is controversial because of the
following:
• The natural history of small aneurysms is unknown. It is believed that aneurysms smaller than
5.5 cm diameter (so called “small aneurysms”) may expand at a rate of 0.18 cm per year
compared to larger aneurysms which expand at 0.28 cm/year^^. While the risk of rupture is
thought to be low, this is by no means certain, and estimates vary from 1% upwards. In Scott’s
series® , only 1 out of 8820 screened patients who did not fulfil the criteria deemed necessary for
surgery (mde injrd), mptured his aneurysm. In contrast. Darling and Brewster® showed that 18%
of 182 AAA that mptured were less than 5 cm in diameter while Szilagyi et aP- had a mpture
rate of 29.5% for small aneurysms in their series.
The risk of mpture may increase with co-morbidity. Patients with hypertension, significant
pulmonary disease and an AAA of 3 cm have a 54% risk of mpture within 3 years of
20
diagnosis® . In comparison, the annual risk of mpture ftom an AAA of 5.0-5.7cm is 6.6% and
that fcom an aneurysm of 7cm is
Open AAA repair has a significant mortality and morbidity and it would be inappropriate to
offer surgery to patients with small AAA if the risk of mpture is less than the risk of death from
conventional operation. The mortality fiom open AAA repair is currendy 3-4% in specialist
units® but may exceed 40% in patients with concomitant renal, cardiac and pulmonary
disease® . Operative complications are due mainly to the extensive dissection and aortic cross
clamping inherent to this operation. A positive risk-benefit ratio for these patients has been
demonstrated provided the mortality of surgery can be reduced below 5%®>®®.
• Patients with AAA have significandy higher risk of death from cardiovascular causes compared
to age and sex matched populations and many with small aneurysms are likely to die from
unrelated events. Only about 15% of aU AAA’s mpture. The remaining 85% of patients die
from causes unrelated to the aneurysm® . This suggests that most small aneurysms could safely
be observed until they reach a size where the risk of death from open surgery is less than the
risk of death from mpture.
The interval between observations is unclear, as aneurysm expansion may not be linear and does
not depend upon starting diameters. One smdy^° demonstrated that exponential growth was
more common: larger aneurysms exhibited faster rates of enlargement implying that more
frequent observation of these patients was necessary. This was not confirmed in a smdy of 302
screen-detected aneurysms^^, where it was found that aU sizes of aneurysm showed similar rates
of growth.
The uncertainty is increased by smdies that show no significant differences in mortality between
emergency repair of mptured small and larger aneurysms^^. It has been suggested that these small
aneurysms should be treated early while the patient is fit. Proponents of this philosophy argue that
as enlargement continues during a patients lifetime, there should be no need to expose an
individual to the continued risk of mpture while waiting for the AAA to reach a size acceptable for
open repair. Further, although not proven, it is argued that as aneurysms continue to enlarge,
patients will be older and less fit at the time of surgery^ .
In view of this, there have been moves by some to offer open surgery to all individuals with
asymptomatic AAA. Ramo et aP operated on aU small AAA detected within a ten year period in
Finland. Their results showed that while small AAA’s could be electively repaired with low
21
mortality and morbidity, such a strategy still did not affect the ratio of ruptured and elective
aneurysms that presented to their establishment.
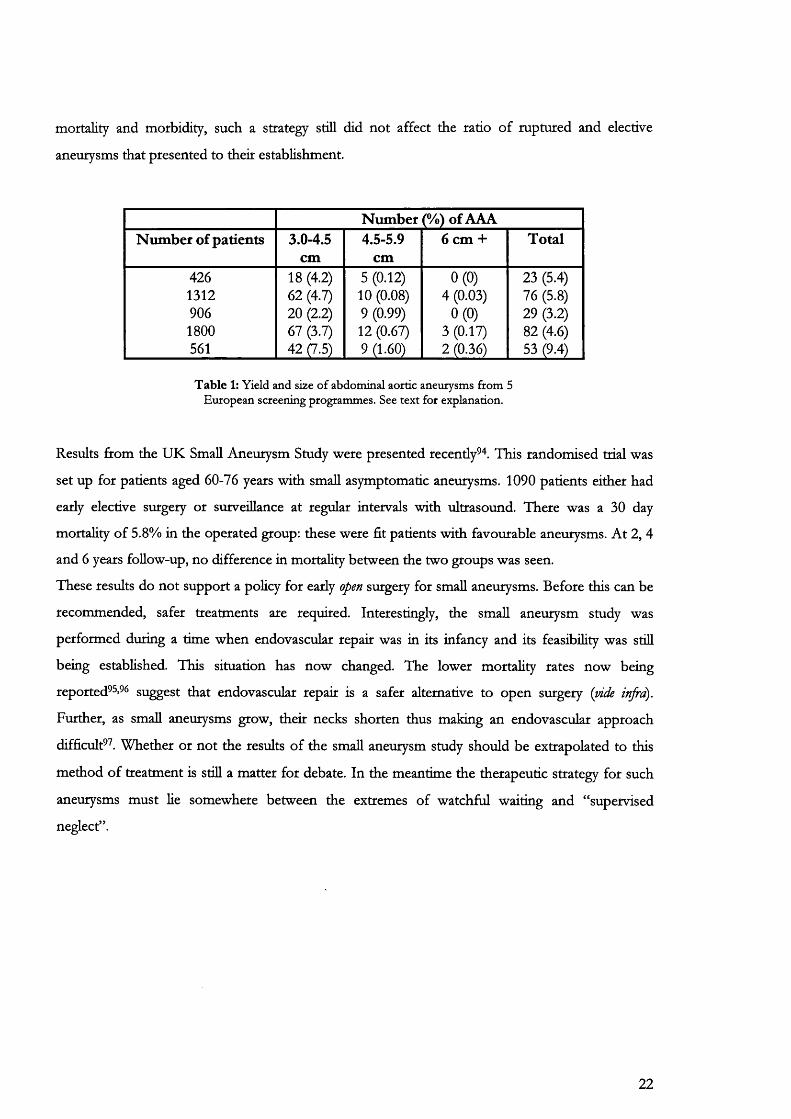
Number (%) of AAANumber of patients 3.0-4.5
cm4.5-S.9
cm6 cm + Total
426 18 (4.2) 5 (0.12) 0(0) 23 (5.4)1312 62 (4.7) 10 (0.08) 4 (0.03) 76 (5.8)906 20 (2.2) 9 (0.99) 0(0) 29 (3.2)1800 67 (3.7) 12 (0.67) 3 (0.17) 82 (4.6)561 42 (7.5) 9 (1.60) 2 (0.36) 53 (9.4)
T ab le 1: Yield and size o f abdominal aortic aneurysms from 5 European screening programmes. See text for explanation.
Results from the UK Small Aneurysm Study were presented recendy " . This randomised trial was
set up for patients aged 60-76 years with small asymptomatic aneurysms. 1090 patients either had
early elective surgery or surveillance at regular intervals with ultrasound. There was a 30 day
mortality of 5.8% in the operated group: these were fit patients with favourable aneurysms. At 2, 4
and 6 years follow-up, no difference in mortality between the two groups was seen.
These results do not support a policy for early open surgery for small aneurysms. Before this can be
recommended, safer treatments are required. Interestingly, the small aneurysm study was
performed during a time when endovascular repair was in its infancy and its feasibility was stiU
being established. This situation has now changed. The lower mortality rates now being
reported^^’* suggest that endovascular repair is a safer alternative to open surgery {mde injrd).
Further, as small aneurysms grow, their necks shorten thus making an endovascular approach
difficult^ . Whether or not the results of the small aneurysm study should be extrapolated to this
method of treatment is still a matter for debate. In the meantime the therapeutic strategy for such
aneurysms must lie somewhere between the extremes of watchful waiting and “supervised
neglect”.
22
C h a p t e r 3
Surgery fot abdominal aortic aneurysm
3 .1 I n d i c a t i o n s f o r s u r g i c a l r e p a i r o f a n e u r y s m s
The current indications^^ for elective repair of AAA are:
• a symptomatic or rapidly expanding aneurysm (annual increase in diameter of more than 5 mm)
• a large aneurysm (diameter greater than 5.5 cm)
• a complicated aneurysm (i.e. one with thrombosis, embolism, or hstulization).
3 .2 H o w SAFE IS CONVENTIONAL ANEURYSM SURGERY?
In major centres the elective mortality of aneurysm repair is quoted as 3-4%. This understates the
tme risk. Community-based studies reveal a much higher mortality. In New York, a survey of 3570
patients undergoing conventional aneurysm surgery, found that the mortality of open AAA repair
was as high as 10-14%® . These differences are closely allied to operator experience: there was a
striking difference in the mortality obtained by surgeons treating more than 25 aneurysms per year
compared to those treating fewer. In a second study from the UK, the results of aneurysmal
surgery over a 13 year period^^, produced an overall mortality of 6.7% for elective surgery, 16% for
urgent cases and 53% for emergency repair.
Cross clamping of the aorta produces a major insult to the heart that has to pump against a
significandy greater resistance. There may also be a profound reduction in renal and splanchnic
blood flow associated with an increase in the base deficit after clamp removal^*^. This, allied with
the presence of cardiac morbidity in up to 60% of patients presenting for AAA repair ® ’ ®, is
responsible for most of the mortality and morbidity of open repair. Between 60 and 70% of in-
hospital and late mortality is due to cardiac causes This increases even further in the presence
of poor left ventricular function. When the ejection fraction is less than 35%, up to 80% of patients
may suffer from myocardial infarction with 20% eventually dying^^ .
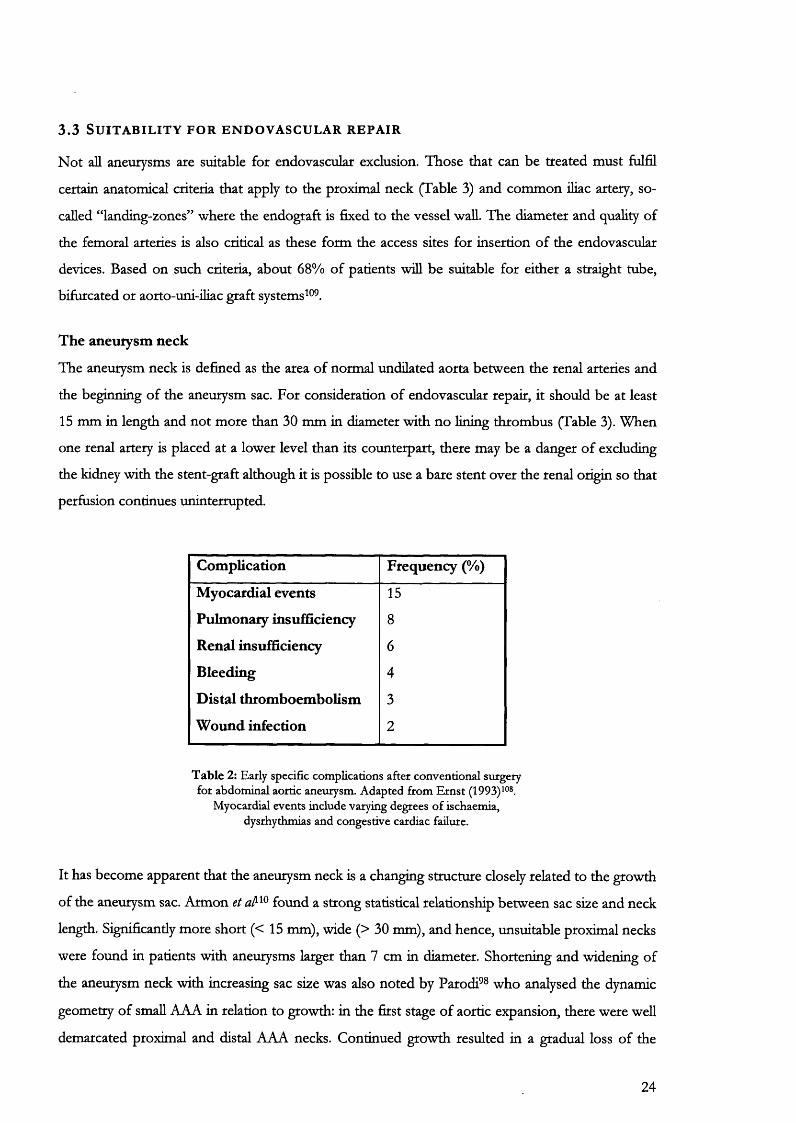
26% of patients may experience complications after conventional repair^^ . A detailed analysis of
reports (Table 2) from the USA, dating from 198U®® showed early complications after elective
operations were common. Late complications, such as aortoenteric fistula, occurred 3-5 years after
surgery and were responsible for an additional 2% mortality.
23
3.3 S u i t a b i l i t y f o r e n d o v a s c u l a r r e p a i r
Not all aneurysms are suitable for endovascular exclusion. Those that can be treated must fulfil
certain anatomical criteria that apply to the proximal neck (Table 3) and common ihac artery, so-
called “landing-zones” where the endograft is fixed to the vessel wall. The diameter and quahty of
the femoral arteries is also critical as these form the access sites for insertion of the endovascular
devices. Based on such criteria, about 68% of patients will be suitable for either a straight tube,
bifurcated or aorto-uni-iliac graft systems ® .
The aneurysm neck
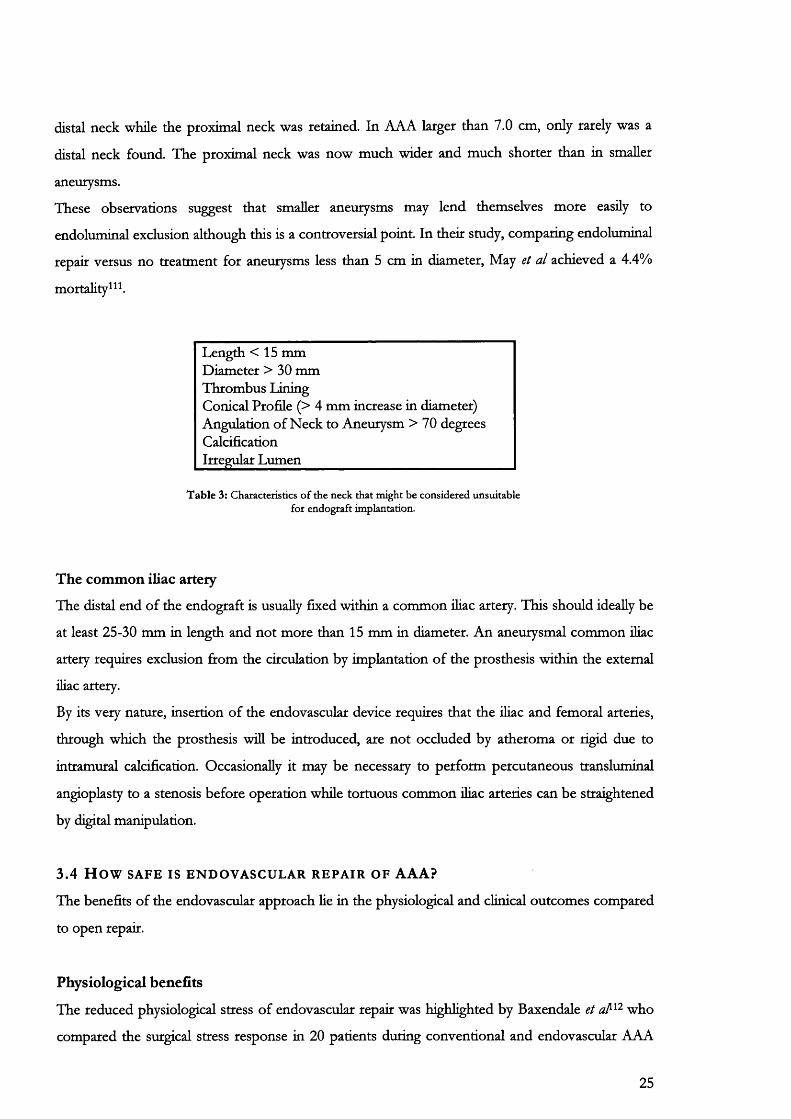
The aneurysm neck is defined as the area of normal undilated aorta between the renal arteries and
the beginning of the aneurysm sac. For consideration of endovascular repair, it should be at least
15 mm in length and not more than 30 mm in diameter with no lining thrombus (Table 3). When
one renal artery is placed at a lower level than its counterpart, there may be a danger of excluding
the kidney with the stent-graft although it is possible to use a bare stent over the renal origin so that
perfusion continues uninterrupted.
Complication Frequency (%)
Myocardial events 15
Pulmonary insufficiency 8
Renal insufficiency 6
Bleeding 4
Distal thromboembolism 3
Wound infection 2
T ab le 2: Early specific complications after conventional surgery for abdominal aortic aneurysm. Adapted from Ernst (1993)^°®.
Myocardial events include varying degrees o f ischaemia, dysrhythmias and congestive cardiac failure.
It has become apparent that the aneurysm neck is a changing structure closely related to the growth
of the aneurysm sac. Armon et found a strong statistical relationship between sac size and neck
length. Significantly more short (<15 mm), wide (> 30 mm), and hence, unsuitable proximal necks
were found in patients with aneurysms larger than 7 cm in diameter. Shortening and widening of
the aneurysm neck with increasing sac size was also noted by Parodi^® who analysed the dynamic
geometry of small AAA in relation to growth: in the first stage of aortic expansion, there were well
demarcated proximal and distal AAA necks. Continued growth resulted in a gradual loss of the
24
distal neck while the proximal neck was retained. In AAA larger than 7.0 cm, only rarely was a
distal neck found. The proximal neck was now much wider and much shorter than in smaller
aneurysms.
These observations suggest that smaller aneurysms may lend themselves more easily to
endoluminal exclusion although this is a controversial point. In their study, comparing endoluminal
repair versus no treatment for aneurysms less than 5 cm in diameter. May et al achieved a 4.4%
mortality^
Length < 15 mm Diameter > 30 mm Thrombus LiningConical Profile (> 4 mm increase in diameter) Angulation of Neck to Aneurysm > 70 degrees CalcificationIrregular Lumen_________________________
Table 3: Characteristics of the neck that might be considered unsuitable for endograft implantation.
The common iliac artery
The distal end of the endograft is usually fixed within a common iliac artery. This should ideally be
at least 25-30 mm in length and not more than 15 mm in diameter. An aneurysmal common iliac
artery requires exclusion from the circulation by implantation of the prosthesis within the external
iliac artery.
By its very nature, insertion of the endovascular device requires that the iHac and femoral arteries,
through which the prosthesis wiU be introduced, are not occluded by atheroma or rigid due to
intramural calcification. Occasionally it may be necessary to perform percutaneous transluminal
angioplasty to a stenosis before operation while tortuous common iliac arteries can be straightened
by digital manipulation.
3.4 H ow SAFE IS ENDOVASCULAR REPAIR OF AAA?
The benefits of the endovascular approach He in the physiological and clinical outcomes compared
to open repair.
Physiological benefits
The reduced physiological stress of endovascular repair was highlighted by Baxendale et who
compared the surgical stress response in 20 patients during conventional and endovascular AAA
25
surgery. Parameters used to record stress consisted of mean arterial pressure, cardiac output, total
peripheral resistance and serum lactic acid levels. It was found that endovascular repair imposed
significandy less perioperative haemodynamic and metabolic stress on the patient compared with
conventional open surgery. This was supported in a second larger study, where the morbidity and
mortality rates following conventional and endovascular AAA repair were compared in 153
individuals using physiological s c o r i n g ^ T h e operative severity score P-POSSUM, was
significandy greater in the conventional group (26.3 versus 19.7; P < 0.001).
Endovascular repair thus has the potential to be a safer procedure than open surgery, especially in a
population of patients characterised by a high prevalence of cardiovascular pathology.
Clinical benefits
Clinical comparisons of the outcomes between open and endovascular repair are complex.
Conventional aneurysm surgery is the established gold standard and has been in existence for the
past 50 years. In contrast, endovascular techniques and technology are continuously improving.
The longest reported follow-up of endovascular aneurysm repair would now be just over 5 years "
whereas follow-up for conventional repair extends well beyond 10 years ®> ^ .
Comparisons are further complicated by the inclusion of early endovascular series containing
patients deemed unfit for conventional repair. If emergency conversion was necessary, the
mortality and morbidity were high. In their study of 113 patients undergoing endoluminal repair.
May et al found that conversion to open repair entailed a 43% mortality for patients who had
previously been rejected for open repair. In this series, which also included patients fit for open
repair, all deaths occurred in the unfit patients^
Results from endovascular series have been presented in dual format. Firstly, there are individual
reports that concentrate on the outcomes from a single unit. These suffer from the drawbacks of
smaller patient numbers and the heterogeneity of endoprostheses implanted. In addition, early
results may be little more than a reflection of the surgeons’ learning curve making comparisons
between units difficult. A further problem is the “intention to treat” principle. To avoid later
selection bias, this entails the registration of all patients selected for endovascular repair before the
operation takes place. Subsequent details of the operative procedure, the early outcome and follow-
up information are then compared for everyone. Within individual series, this precaution is rarely
followed.
Such difficulties may be avoided by collecting endovascular data within a single registry. This would
allow larger numbers of patients to be included as well as the possibility of comparisons between
the different graft designs. Analysis of aggregated data has the potential to identify problems at an
26
early stage and to establish whether any adverse outcomes observed are a result of sporadic
random events or due to recurring systematic failure.
A further advantage of registration is the greater patient heterogeneity than exits within a single
centre. For example although the anatomical criteria involved in the selection of suitable aneurysms
for endovascular repair are similar in most units, patient co-morbidities may differ. Some units may
bias their endovascular practice to individuals who are rejected for open repaie, whilst others may
offer this as a first line treatment to all. Results from the former may include a higher mortality due
to the higher risks involved with conversion and will therefore provide a prejudiced conclusion.
The strength of a registry lies in its ability to provide better case definition and individual patient
information. In this respect it is limited by the quality and completeness of the data return.
Prerequisite for a successful registry is primarily the willingness to participate in a project that has
no immediate benefit for each unit. In addition, a common basis of definitions and classifications
of complications is essential. Incomplete reporting and incorrect information can significandy
restrict the usefulness of the exercise. As submission is voluntary, there is still a risk of bias in the
data collected by each individual centre. This can be overcome to some degree by selecting centres
at random for auditing purposes. This would involve verifying patient details on the registration
forms and numbers treated by cross-checking radiology, theatre and endograft company records.
Individual series
Results from some of the larger single series are presented in Table 4. The study by Blum et is
the most homogenous containing the largest number of patients (154 recruited firom 3 different
centres) treated with the same endograft (Stentor). In this report the primary success rate (defined
as aneurysm exclusion without conversion or endoleak), was 86% with a conversion rate of 1.9%.
During a mean follow-up period of 13 months, 10-14% of patients developed endoleaks. Similar
figures are obtained from the other reports with primary success rates varying from 73% (Chuter et
to 83% (Mialhe et Early conversions to open repair, which vary from 0 to 10%, were
inevitably due to technical failures such as iHac artery stenoses which could not be crossed, diiac
ruptures and malpositioninig of the endograft causing uncontrollable Type I endoleakage.
Mortality rates are separated into procedure-related deaths and those relative to pre-existing co
morbidity. Procedure-related mortality was commonly due to arterial ruptures, conversion to open
repair, arterial thromboemboHsm^^® and colonic ischaemia due to exclusion of the common iHac
arteries^This varied from 0% to 8%. MortaHty related to co-morbidity varied from 0.6% to 8%.
The Chuter study ^® is of particular interest because it demonstrates the learning curve effect over
two time intervals between 1993-1995. A total of 40 patients spHt into two equal groups were
followed for a mean of 18.8 and 10.9 months respectively. Patients in the second half of the study
27
had a lower overall combined morbidity/mortality rate (15% vs 50%) and higher overall success
rate (85% versus 65%). The mortality rate for the series as a whole was 7.5%.
Late follow up to 1 year was available for the Parodi series. This demonstrated 4 further Type I
endoleaks and a further procedure-unrelated death ^®.
Outcomes in endovascular registries
Registries for endovascular patients have been set up on both sides of the Atlantic. These relate
either to single graft types such as the EVT study, or to collections of patients from a particular
country or continent.
Reference Number of patients
Mean follow up
(months)
Endograftused
Primary success rate
Conversionrate Endoleak
rate
Procediue-related
mortality
Mortality due to
comorbidity
Blum 1997 (117)
154 12.5 Stentor 86% 1.9% 10-14% 0% 0.6%
Chuter 1996 (118)
Gianturco41 10.9-18.8 and
Dacron65%-85% 5% -l0% 20%-25% 5% 7%
Mialhe 1997 (119) 79 6 Stentor 83% 0% 17% 2.4% 2.4%
Parodi 1996 (120)
50 17Palmaz
andDacron
80% 6% 12.5% 8% 8%
T ab le 4: Clinical outcomes after endovascular repair in some o f the major series reported within the last 2 years
The United Kingdom Registry for Endovascular Treatment of Aneurysms (RETA),^^! recorded
473 endovascular procedures between January 1996 and January 1999. 88% of these patients were
American Society of Anaesthesiology (ASA) grade I-III and 12% were classed as grades IV-V.
Primary success was seen in 75.7% (358 patients) with a conversion rate of 5.5% (26 patients).
There was a 30-day mortality of 6.3% (30 patients) with a variation of 6.6% (17 out of 409
individuals) in fit patients and 23.2% (13 out of 56) in unfit patients. The mortality in cases that
underwent conversion to open repair was even higher at 30.8%. Persistent primary endoleaks
remained in 6.6% of patients at discharge.
The RETA data has now progressed to include 1 year follow-up data for 173 of the original group.
This demonstrates a further mortality of 10.4% (16 patients); although most deaths were related to
pre-existing cardiac morbidity in patients classed as ASA IV-V, two cases of delayed AAA rupture
were seen. One of these could be directly attributed to persisting endoleakage. Data for persisting
28
endoleaks were available in 5 other patients, only one of whom did not require any form of
intervention. The complication rate was relatively high, with 12.5% of patients having a problem
with the endograft or aneurysm requiring treatment or close monitoring.
The Endovascular Technologies (EVT) phase 1 trial conducted under the Food and Drug
Administration (FDA) in the USA^^, had much stricter physiological and anatomical criteria for
selection. This was reflected in the improved survival for patients requiring conversion. From a
total of 46 treated patients, there were 39 (85%) successful deployments with only 7 conversions.
There were no complications in the latter group. The 30 day mortality was 0%. Patients with
complications had mainly technical reasons for their morbidity such as iliofemoral injury (8
patients) or postoperative wound infection (7 patients). Hospital stay ranged from 1 to 13 days.
There were 8 (21%) persistent cases of endoleak and of great concern was implant failure due to
attachment system fractures seen in 9 patients (23%). This halted the further progress until graft
modifications had taken place.
The phase 2 trial results were recently presented^^3 recruited patients had to be acceptable
candidates for open surgery and results were analysed at an independent radiology centre. A total
of 526 patients underwent treatment with tube, bifurcation or aorto-uni-ihac grafts. I l l patients,
unfit for open repair, were chosen as controls. Despite the rigorous selection however, the
mortahty (5.6%) in converted patients was still double that in the endovascular group. Patients with
aorto-aortic tube endografts had the lowest mortality (0%) followed by the bifurcated (2.6%) and
then the aorto-uni-ihac (4.6%) groups. The mortahty in untreated controls was 2.7%.
The Eurostar Registry was estabhshed in February 1996 to gather data on the results of
endovascular repair from 43 European centres. Registered patients are followed up at regular
intervals for 5 to 10 years.
Of the 1138 patients consecutively registered on the Eurostar database^ " , the procedure was
completed successfully in 98%. Minor technical problems were encountered during deployment in
17%, but with few exceptions these were resolved by appropriate additional endovascular
manipulations undertaken at the time. Only one patient died during the course of the operative
procedure, although another 25 patients died within 30 days, giving an in-hospital mortahty rate of
2.3%. Nearly ah of the patients who died had severe co-morbidity. The Eurostar data was also
useful because it clearly showed that the majority of registered patients had a very satisfactory
outcome from their operation. The cumulative survival rate at 18 months was 85%, with the
majority of patients dying from causes unrelated to their aneurysm.
29
specific complications associated with endovascular repair
Specific complications with the endovascular approach have been well descnbed ^> ^* . A major
drawback is the risk of distal embolism of thrombus and dislodged particles from the irregular
friable intraluminal surface. Continued aneurysmal expansion firom an incomplete graft-vessel wall
seal may result in rupture. Occlusion of the renal arteries may occur as a result of improper
placement of the proximal end of the graft, and failure to restore flow to a patent mesenteric artery
may lead to colonic ischaemia. Other obstacles have been tortuosity of the access arteries and
dislodgement with migration of the graft.
Distal thromhoemholism
Aneurysms are usually lined with incompletely organised thrombus. Manipulation of catheters and
wires may result in distal embolism. Peripheral embolization is relatively rare after open repair and
may be avoided by distal iliac clamping before placing the proximal aortic clamp. In contrast,
clinical experience of endovascular deployment suggests that it may be a significant complication of
this technique with a high mortality and an incidence that varies between 4-17% in some reports^^ .
In Parodi’s series^^ of 87 patients, distal thromboembolism resulted in 3 deaths (75%) out of the
four occurrences recorded. Large, tortuous aneurysms with a substantial amount of intraluminal
thrombus may pose an increased potential for peripheral embolization.
Endoleak
Endoleak is a term that describes "The inability to obtain or maintain a secure seal between the
aortic wall and a transluminaUy implanted intra-aneurysmal graft ^®". Endoleaks can be classified in
the following ways:
• Chronologically endoleaks can be described according to the time of onset after implantation
of the endovascular device: endoleaks are immediate or primary when detected within 30 days
of repair and delayed or secondary when discovered afterwards. They are recurrent when they
reappear following apparently successful initial sealing.
• Physiological criteria describe endoleaks according to their source of inflow: directly from the
aorta or from collateral channels.
• Anatomical criteria describe the site of origin of the endoleak. Proposals for an anatomical
classification of endoleak have been made by White et al (Table 5) 128-130
30
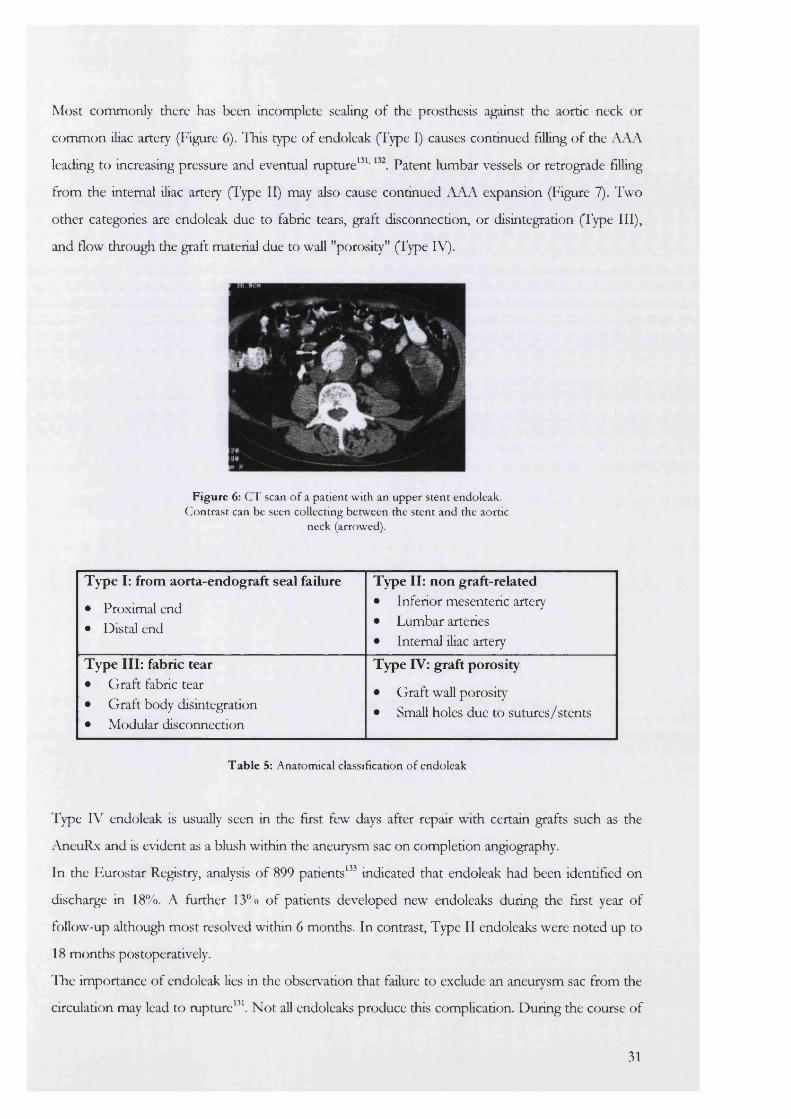
Most commonly there has been incomplete sealing of the prosthesis against the aortic neck or
common iliac artery (Figure 6). This type of endoleak (Type I) causes continued filling of the AAA
leading to increasing pressure and eventual rupture^^ ' Patent lumbar vessels or retrograde filling
from the intemal iliac artery (Type II) may also cause continued AAA expansion (Figure 7). Two
other categories are endoleak due to fabric tears, graft disconnection, or disintegration (Type III),
and flow through the graft material due to wall "porosity" (Type IV).
Figure 6: CT scan o f a patient w ith an upper stent endoleak. C ontrast can be seen collecting betw een the stent and the aortic
neck (arrowed).
Type I: from aorta-endograft seal failure
• Proximal end• Distal end
Type II: non graft-related• Inferior mesenteric artery• Lumbar arteries• Intemal iliac artery
Type III: fabric tear• Graft fabric tear• Graft body disintegration• Modular disconnection
Type IV: graft porosity
• Graft wall porosity• Small holes due to sutures/stents
Table 5: Anatomical classification o f endoleak
Type IV endoleak is usually seen in the first few days after repair with certain grafts such as the
AneuRx and is evident as a blush within the aneurysm sac on completion angiography.
In the Eurostar Registry, analysis of 899 patients^" indicated that endoleak had been identified on
discharge in 18“ o. A further 13% of patients developed new endoleaks during the first year of
follow-up although most resolved within 6 months. In contrast. Type II endoleaks were noted up to
18 months postoperatively.
The importance of endoleak lies in the observation that failure to exclude an aneurysm sac from the
circulation may lead to rupture^^\ Not all endoleaks produce this complication. During the course of
31
follow-up examination, up to 50% of early leaks may seal spontaneously^^^’ Consequently, there
is debate about the management of these patients. While it is agreed that Type I endoleaks should
be corrected, usually with additional endovascular manipulations, the timing of this intervention is
not always certain. This may relate to difficulty in the grading of endoleaks. Small or minor
endoleaks may conceivably seal spontaneously by thrombosis whereas larger leaks could necessitate
earlier intervention. One way of distinguishing objectively between endoleaks is to measure thek
pressure effects within the sac.
The importance of Type II endoleaks is as yet undetermined. In contrast to Type I endoleak, it has
been demonstrated that aneurysms with collateral patency do not show an increase in diameter at
least up to 18 months follow up ^ . However, some have taken the view that a large calibre patent
inferior mesenteric artery or large lumbar arteries (particularly the 4* lumbar pait) should be
embolized as soon as they are detected. Some evidence for this approach has been obtained from
studies of aneurysms treated by surgical ligation and extra-anatomic bypass^^ . Shah^^ reported two
patients who had persistent perfusion and enlargement of aortic aneurysms after open exclusion
and bypass. Lumbar artery collateral vessels and coagulopathy led to aneurysm rupture in one case,
and the collateral iliac flow was ligated with subsequent diminution of the aneurysm in the other. A
large patent channel may maintain aneurysm pressurization analogous to a pseudoaneurysm.
In animal models, spontaneous thrombosis of patent lumbar and other branches has been
demonstrated after deployments^®. In humans, however, Matsumara and Moore found no
difference in spontaneous closure between proximal and other endoleaks^^^ Large type II
endoleaks have been managed successfully by radiological embolization of the patent vessels using
steel coilsS 9 ot gelfoam sponges^^ despite reservations that this may increase the risk of paraplegia.
Finally, some workers have suggested that even if an endoleak seals spontaneously, the patient
remains at risk for continued enlargement of the aneurysm and subsequent rupture^^®. Others
however, argue that if a leak seals, the clinical behaviour of the aneurysm sac is similar to that after
endovascular repair in the absence of a leak ^ k
In a recent presentation comparing open (n = 253 patients) and endoluminal repair (n = 181), it
was found that when patients with endoleak (n=4) had rupture, major haemodynamic changes and
a high mortality rate were not always evident as rupture occurring de novo in an untreated AAA
(P<0.05). It was concluded that although failed endoluminal repair did not prevent rupture it
enhanced survival following open surgery for rupture, possibly by ameliorating the haemodynamic
changes associated with the rupture process " .
32
Postoperative pyrexia
A significant majority of patients have a sterile pyrexia commencing 24-36 h post-stenting and
lasting up to 3 days " . This is associated with a leucocytosis and elevation of non-specific serum
inflammatory markers such as C-reactive protein^"^. The aetiology of these observations is still
unknown although treatment is not necessarily indicated or provided.
It has been suggested that the cause may be related to bowel ischaemia caused by exclusion of the
inferior mesenteric and one or both intemal iHac arteries during graft deployment. In agreement
with this, colonic mucosal pH has been shown to decrease both during endovascular deployment
and afterwards " .
It is now known that the mural thrombus of an aortic aneurysm contains high amounts of
Interleukin 6 (IL-6)^" . Manipulation with introducers and catheters inside the mural thrombus
might cause direct release of this cytokine to stimulate leucocyte activation and the production of
tumour Necrosis Factor alpha (TNF-OC), which is able to mediate a systemic inflammatory
response. Levels of TNF-OC have been shown to increase after endovascular repair and can be
correlated to decreases in blood pressure " . These inflammatory responses could also be related to
endothelial cell damage by similar graft-related manipulations.
Another possibiHty is that manipulations inside the aortic aneurysm may cause release of various
toxic products from colonising micro-organisms. It is known that bacteria, mainly Staphylococcus
epidermidis, contaminate a proportion of aortic aneurysm thrombi, reported at 5% to 25%. It is still
argued whether this represents contamination or true colonisation '^ '^^ . There is no good evidence
to impHcate this as the mechanism causing endovascular pyrexia.
Vertebral body infarction has been recognised on MRI scans following successful exclusion of the
aneurysm sac ^ . This could also be responsible for a rise in body temperature although at present,
there are no studies examining this hypothesis.
Renal failure
Endovascular repair potentially carries its own renal morbidity compared to open repair. This
relates to radiographic contrast media and their reno-toxic effects, intravascular catheter and graft
manipulations and the risk of obstmcting the renal arteries with the prosthesis.
The adverse effect of iodonated contrast on renal function is recognised although the pathogenesis
of this compHcation is unclear^^ . Patients with pre-existing renal deficit and dehydration are at
particular risk^^t In addition to more general causes of renal disease, patients with aneurysms are at
greater risk of significant renal artery atheroma and nephropathy secondary to hypertension. It is
33

not uncommon to use 300-500 ml of contrast in difficult manipulations despite a conscious effort
to limit the volume injected.
Embolic occlusion of renal vessels is possible but usually where there is thrombus lining the aorta
above the renal arteries or where there is distal aortic occlusion just below the neck so that the
dislodged material travels preferentially into the kidneys.
Stent-grafts may be placed over the renal artery origins accidentally or deliberately where the
anatomy does not allow other options. When bare stents cross the renal ostia, intravascular
haemolysis and platelet microemboHsation into the renal vessels may occur leading to a long-term
decline in function. Antiplatelet agents may reduce the risk of this complication.
Superior s ten t leak
IMA leak
Inferior s ten t lea Lumbar artery leak
Figure 7: Sites o f endoleak after endovascular repair o f abdom inal aortic aneurysms
Graft distortion
Recent reports^ - ^ have identified a new cause of concern. Following implantation, it is apparent
that all endografts are subject to considerable physical stresses over time. These can result m
distortion of the prosthesis that may in turn be associated with new endoleaks and other clinical
complications such as graft limb thrombosis. There have also been reports of tears occurring in the
fabric of some grafts^^ , but there is as yet insufficient data available to draw any conclusions as to
whether this is a sporadic or regularly occurring phenomenon.
34
Delayed aneurysm rupture
Rupture of the aneurysm following endovascular repair has been described in individual reports
as well as in the larger registries. 6 of the patients registered with Eurostar had delayed rupture of
their aneurysms post-exclusion, three of which died^^ . These ruptures occurred in patients
exhibiting no signs of obvious endoleak, graft migration or suspected graft failure. It is possible that
minor fabric tears or holes (Type III/IV endoleaks) may be responsible for this problem if
undetected over a period of time thus causing a slow and delayed rise in sac pressure.
3.5 F U T U R E T R E A T M E N T F O R AAA
While endoluminal repair has obvious benefits for treatment of AAA, it is a procedure with a
number of unanswered questions:
Firsdy, it is difficult to predict, for individual patients, when the risk-benefit analysis favours a
choice of endovascular treatment over conventional treatment or no treatment at all. Different
kinds of patients present different problems. Patients with large aneurysms and poor health are
clearly at high risk of mortality if they under go either observation or conventional treatment, but
they are also at high risk if they undergo endovascular treatment as failed repair and conversion to
open operation may well be fatal.
Conversely, patients who are good risk for conventional operations will derive little benefit (in
terms of mortality rate) ftom the endovascular alternative, but they are also at a relatively low risk,
since a failed endovascular repair can always be rescued by open surgery.
Two prospective randomized trials of open versus endoluminal surgery in patients with large
aneurysms (>55 mm) have been initiated in the United Kingdom. The EVAR (Endovascular
aneurysm repair) 1 trial compares the outcome for fit patients undergoing endovascular versus
open repair. The EVAR 2 trial examines the outcome of endoluminal repair versus best medical
treatment in patients with large aneurysms rejected ftom open surgery on the grounds of high risk.
It is expected that these studies will provide answers to the above questions that can presently only
be partly answered with case control studies ^®.
Emergency repair of AAA
Endovascular graft repair of ruptured aortic aneurysms has been sporadically reported^^ ' '^h There
are inherent limitations in this type of procedure, including the need for preoperative
measurements of the aneurysmal and adjacent arterial anatomy to determine the appropriate size
and type of graft and the delay required to obtain proximal occlusion. The endograft system with
broadest versatility in this respect consists of the generation PTFE graft fixed with Palmaz
35
stents. The value of this graft lies in the ability to construct it at the time of surgery using readily
available components.
Emergency endovascular repair of leaking AAA has produced mixed results^^ '^^ , probably
because many of these patients have already sustained life-threatening hemodynamic insults by the
time they are treated. In theory, endovascular repair has the advantage of being able to exclude the
aneurysm from the circulation without destabilising the retroperitoneal heamatoma. However, the
main problem lies in rapid and accurate sizing of the neck, which has to be perfect to prevent
endoleak or later graft migration. Many of these patients can become rapidly shocked without
warning and the decision to await the results of a CT scan may mean the difference between life
and death.
Because of these constraints, it must be accepted that endovascular repair is not yet ready for
adoption as the standard treatment for the majority of patients with abdominal aortic aneurysms.
The most important message that can be drawn at this time is that the technology of endovascular
repair is still evolving. Newer endografts are constantly appearing and inevitably there is a
significant time lag before their clinical effectiveness of can be properly evaluated. Current data
relates mainly to the first three generations of device. It is impossible to state whether or not the
newer devices have addressed effectively the problems identified with previous generations of
endograft. This means that patients having endovascular repair of their aneurysm must be followed
up carefully according to a properly structured surveillance programme.
36

C h a p t e r 4
Pathogenesis of abdominal aortic aneurysm
As the biology of the arterial wall has unfolded with time, it becomes obvious that the aorta is not
an inert and passive conduit but a complex and metabolically active organ. In concert, a change in
the simplistic mechanical views that govern the behaviour and pathology of this region should
follow. In particular, aneurysms are not simple bulges in attenuated areas of aorta, but are the
summation of a complicated process of remodelling within that vessel. Even cursory histological
examination will show marked and obvious changes in tissue architecture during aneurysm
formation.
4 .1 T h e a o r t i c w a l l
In the 18th Century, Robert Hook (1635-1703) observed that the deformation an elastic body
underwent in response to an applied force was directly proportional to that force within a certain
point called the elastic limit. Once this was breached, the body retained a permanent deformation.
This law cannot be easily applied to aortic tissue as the human aorta is not a homogenous tube of
constant proportions. There are macroscopic and microscopic constraints that limit the
applicability of physical laws to living tissue.
Macroscopic constraints
Blood vessels in vivo are at a different length to their in vitro preparations. For example, when the
upper thoracic aorta is removed at post mortem from subjects less than 35 years of age, it undergoes
an immediate retraction of at least 22% of its original length. This retraction lessens with age but
may still lie within 10-15% of the in vivo length^^ . The main reason for this phenomenon is
vascular tethering. It is believed that the aorta grows at a much slower rate than the vertebral
column to which it is tethered, so that a considerable stretch is set up during growth. As the
individual begins to age and lose the elastin and collagen in this vessel, the tethering effect is
reduced manifest by the reduction in its retraction.
It has been well documented that the majority of aneurysms occur in the inffarenal segment of the
abdominal aorta * . The aorta becomes stiffer and thinner as it progresses distaUy. This may be
because the constituents of the aorta are not uniformly distributed along its length. The loss of
elasticity is due to an increase in collagen and decrease in elastin fibers in this segment " . This has
important implications for the transmission of a pulse wave and for the change in diameter of this
segment during the passage of the arterial pulse.
37
Microscopic constraints
Histologically the aortic wall is composed of three main layers incorporating three main
components (Figures 8 and 9).
The three layers described ftom the lumen outward consist of the tunica intima, the tunica media
and the adventitia. They are separated by condensations of elastin, which form the intemal and
external elastic laminae respectively.
The intima is formed by a layer of endothelial cells supported by a thin rim of connective tissue.
The media is the functional layer in the context of aortic biomechanics and consists of collagen,
elastin and smooth muscle cells. The smooth muscle cells are called myofibroblasts because their
synthetic properties closely resemble those of true fibroblasts. The constituent elements are held in
a semiliquid matrix composed of mucopeptides and water which makes up more than 70% of the
aortic wall.
The outermost adventitia is formed by connective tissue that surrounds the vasa vasorum and
merges in with the loose areolar tissue of the retroperitoneum. The abdominal aorta has a sparse
vasa vasorum and it is believed that this segment of artery obtains its nutrition mainly from the
luminal blood flow.
Elastin
Elastin is a 70,000 dalton protein which is unusually rich in proline and glycine. The details of
elastin synthesis and secretion are not fully understood but we do know that extracellular elastin
molecules are arranged in a folded mesh-like structure within the aortic wall (Figure 8), believed to
unravel as the aorta pulsates^^ .
Elastin is synthesised early in life and has a long biological half-life of at least 70 years. The amount
of functional elastin within the aorta is finite. Experiments have shown that elastin may be
synthesised by myofibroblasts in later life but is non-functional and does not contribute to vessel
strength^^ . Elastic fibres are not composed solely of elastin, but also contain a surface glycoprotein
that forms microfibrils within the meshwork. These microfibrils appear before elastin in
development and may serve to organise the secreted elastin molecules into the mesh arrangement.
Mutations in fibrillin, one of these fibrillar proteins, have recently been described in Mar fan's
syndrome where AAA forms part of the clinical picture^^ .
Individual elastin fibres are 5-10 times more easily stretched than rubber and closely follow the
principle of Hooke’s Law up to the yield point. This point is only reached when an elastin fibre has
approached more than(60470% of its original length ^®.
Changes in elastin
Destruction of elastin in the infrarenal aorta precedes the formation of an aneurysm. Histological
examination of AAA walls reveals a deficiency of elastin fibres with a reduction from the normal
elastin concentration of 12% to
The pathogenesis of this elastin degradation is unknown. Since elastin is synthesized and deposited
during early life with a long half-Hfe, it is unlikely that aneurysms develop as a result of inadequate
synthesis. If this were the case AAA would be seen at a much earlier age.
One promising lead has been in the direction of elastase activation. Elastin is a protein that is
extremely stable and highly specific elastases are required for proteolysis. Two types of elastase
have been isolated from the walls of AAA^^ . Although these are also found in normal aorta, the
quantities are significantly less. These elastase enzymes can be derived from macrophages,
endothelium, myofibroblasts and platelets. This is interesting as this group of cells is found in large
numbers within intra-aneurysmal thrombus and has also been implicated in the genesis of
atheromatous plaques.
Excessive protease activity may not be the only cause for elastin degradation. Decreased levels of
protease inhibitors within the aneurysm wall have also been identified^Dim inished levels of
alpha-1-antiprotease have been found in the walls of AAA, especially in ruptured aortas^^b There is
also an association between Chronic Obstructive Lung Disease, a risk factor for aneurysm rupture,
and alpha-1-antiprotease deficiency^^ . In a small study, the MZ variant of alpha-1-antiprotease has
been linked with an increased frequency of ruptured AAA^^ .
Decrease in elastin may also be due to dilution, as discordant synthesis of other matrix proteins
during dilatation, causes a relative decline in elastin levels " .
Collagen
Collagen is not a single protein but a family of characteristic molecules that constitute 25% of the
total mammalian protein. It is synthesised throughout Hfe. The central feature of all collagen
molecules is their stiff, triple-stranded helical structure. Three (%-helical peptide chains are wound
around each other to create a rope-like structure about 300 nm long and 1.5 nm in diameter. There
are at least seven different forms of collagen tt-helical chain and theoretically this could give rise to
more than 100 different forms of triple helix. In practice, fewer than 12 forms are known, the
major types described by the numerals I-V. Types I and III are the main arterial form and
molecules assemble to form long collagen fibrils within the tunica media (Figure 9). The structure
is strengthened by the formation of unique covalent cross-links within and between the constituent
39

collagen molecules. The extent and type of cross-linking varies between tissues and where tensile
strength is crucial, as in the Achilles tendon, the linkage is especially dense.
Collagen has significantly lower extensibility compared with elastin and does not obey Hooke’s
Law. The yield point is reached at a maximum extension of only 10-50% of the original length.
Collagen however is very strong^^ with a tensile strength reported as 5 x 10^ to 5 x 10^ dynes/cm^
compared with elastin which has a tensile strength of 3.6 x 10^ to 4.4 x 10^ dynes/cm^
Changes in collagen
Although elastin bears most of the tensile load within the vessel wall at physiological pressures,
collagen fibres are increasingly recruited as the pressure rises^^ . For an aneurysm to form therefore,
collagen must fail.
However, no qualitative changes in collagen or gene mutations have been demonstrated in patients’
with AAA. In fact, the total protein content of aneurysms is actually 8.4 fold greater than normal
aorta^^ . Whether this can be attributed to increased synthesis of collagen is arguable. Studies of
collagen messenger RNA (mRNA) in myofibroblasts, have shown raised levels of both type I and
IIT^ . The increased synthesis may be balanced by increased degradation. Increased coUagenase
activity in tissue from AAA has been reported although this may only occur in ruptured aneurysms.
The source may be the smooth muscle cells in the media as shown by immunoreactive studies ^®.
In the Ehlers-Danlos syndrome, a deficiency of type III collagen causes spontaneous aortic rupture
with little preceding dilatation^This reinforces its important role in the pathology of the aortic
wall.
Myofibroblasts
The myofibroblast is the sole cell type normally found in the arterial media. It is a terminally
differentiated cell that expresses cytoskeletal marker proteins Hke OC-actin and myosin heavy chains.
These enable it to contract in response to chemical and mechanical stimuli. Uniquely it is able to
revert to a proliferative and secretory state equivalent to that seen in vasculogenesis^®®. These two
phenotypes are influenced by a variety of growth factors, cytokines and other molecules. Smooth
muscle cells in culture wiU produce extracellular matrix proteins such as collagen, elastin and
proteoglycans.
The role of smooth muscle in arterial mechanics is controversial^ This is pardy due to the
difficulty in elucidating a mechanical relationship for a structure capable of existing in two different
phenotypes. Smooth muscle contraction results from the formation and breaking of protein links
involving actin and myosin chains. Thus shortening and lengthening is not a simple elastic
40

phenomenon. This may not be appreciated in vitro where there has been rigor mortis or in vivo where
general anaesthesia is known to cause paralysis of vascular smooth muscle.
Further, smooth muscle in the aorta is actually orientated in a circumferential manner and it is now
clear that its contractile tension is capable of decreasing the diameter of even large arteries although
individual cells do not appear to shorten more than 25-30% of their resting lengths^® .
41
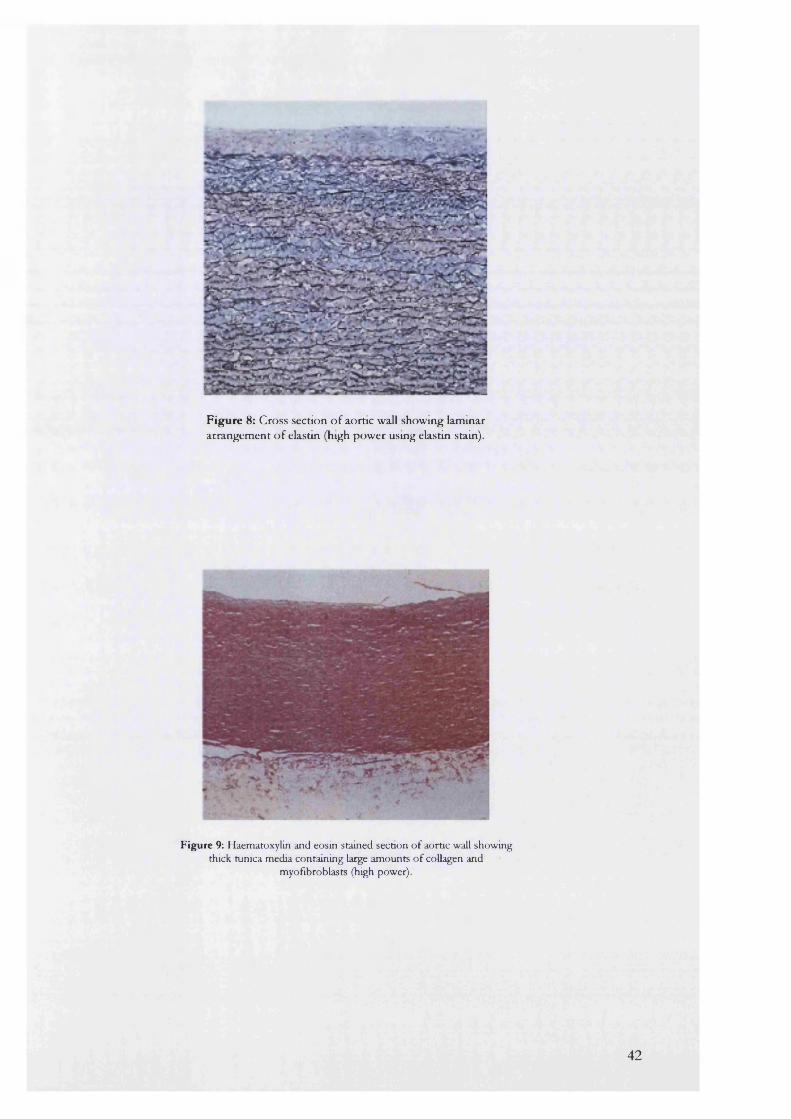
Figure 8: Cross section o f aortic wall showing laminar arrangement o f elastin (high power usmg elastin stain).
Figure 9: Haematoxylin and eosin stained section of aortic wall showing thick tunica media containing large amounts o f collagen and
myofibroblasts (high power).
42
C h a p t e r 5
Aims and objectives
This thesis will investigate 2 areas of endovascular repair. These are the morphological changes
affecting aneurysms after treatment and the dynamic nature of the interaction between the stent-
graft and aortic wall.
5 .1 M o r p h o l o g i c a l c h a n g e s
Endovascular repair involves the placement of an endograft within an aneurysm with the aim of
completely excluding the sac from the circulation. It differs from conventional repair because the
anatomy of the AAA remains intact. Currentiy, much uncertainty surrounds exacdy how the
natural history of the aneurysmal process is modified after endovascular repair.
Charting sac morphology accurately and reliably provides a valuable method of establishing the
efficacy and durability of the repair. It is particularly of value in the detection of changes in the
neck and sac of the aneurysm post-exclusion.
The aneurysm sac
It has been shown in animal m o d e l s a n d in humans^® that aneurysmal sac pressure and wall
stress are sharply reduced on completion of successful deployment thus reducing the risk of
rupture. Analysis of aneurysm size ® and pulsatile wall motion using indirect measures, such as
echo-tracking ultrasound, also confirm reduced sac pressure on deployment^ ®.
Unfortunately, it is not currendy possible to continue pressure measurement in vivo much beyond
the point of deployment. Further, there is no evidence that the pressure reduction is maintained
long-term. It has been argued that patent lumbar arteries may continue to perfuse the aneurysm
sac thus delaying the risk of rupture rather than preventing it permanendy^® . In one series of 1103
patients with AAA, after open proximal and distal ligation of the sac combined with an aorto-
aortic bypass, 17 (2%) continued to have enlarging sacs despite complete anatomical discontinuity
from the abdominal aorta and common ihac arteries ®®.
Shrinkage of aneurysm sacs after exclusion is a second end-point measure of successful
endovascular repair ' » 189-192 diameters of successfully excluded aneurysms are said to
decrease, except in cases of endoleakage or retro-perfusion. Mahna and colleagues described a
decrease of up to 6 mm in the maximal sac diameter of successfully excluded aneurysms in 35
patients. Patients with endoleak also had a decrease in diameter but only after further
endovascular intervention was performed!® .
43
Shfinkage however, is by no means absolute. In one group of 7 patients followed for 15 months
with spiral CT, there was continuing shrinkage of the sac in only 2 (29%) patients. In the
remainder the AAA either remained stable (43%) or increased in size due to endoleaks (29%)^^ .
One reason for such discrepancies may be related to the use of imaging software that has not
been validated for aneurysm measurements. This was originally recognised for measurements of
aneurysm diameter made with ultrasound that were shown to be highly operator dependent: the
coefficients of repeatability vary as much as 3.0-7.5 for AP diameter and 10.2-15.4 for transverse
diameter^ " . Similar studies have rarely been performed with any of the common imaging
modalities presently used for endovascular repair.
The use of maximal diameter measurements as indicators of postoperative aneurysm morphology
suffers from a number of disadvantages. Firstly, axial slices from conventional CT are not always
perpendicular to the vessel lumen. Secondly, one cannot be certain that the same maximal
diameter is measured on every occasion that a patient is scanned. An aneurysm sac may change its
shape but still retain the same value for its maximal diameter (Figure 68). Measuring more than
one diameter within the sac is likely to increase the accuracy of measurement. If all these
diameters could be described with a single numerator, this would then increase the convenience
of this measure still further. It is proposed here that aneurysm volume may be a better indicator of
aneurysm sac morphology. The volume of a sphere is proportional to the cube of its radius and so
only a small change in the latter will lead to a much larger change in volume. The small change in
diameter may not always be reliably measurable.
The fate of the aneurysm sac will be recorded in a prospective study using 3D volumetric spiral
CT angiography after the completion of adequate validation studies. An introduction to the basic
principles of the imaging techniques used in this study is provided as a prelude to these
experiments.
Intra-luminal thrombus
Related to the anatomy of the sac post-exclusion, is the fate of intra-luminal thrombus (ILT).
Thrombus is a dual-edged sword. It may have an important role in the pathogenesis of AAA. A
potential interaction may be to cause wall anoxia by acting as a diffusion barrier to oxygen passage
into the tunicae intima and media^^ .
Histological studies have demonstrated that a complex and self-sustaining “ecosystem” exists
within the structure of ILT * . Immunocompetent cells that are capable of antigen presentation
and cytokine production are found in greater numbers within AAA thrombus compared to non-
aneurysmal atherosclerotic tissue^^ . It has been suggested that these cells contribute to the
44
pathogenesis of aneurysm formation by cytokine secretion altering the biological turnover of the
constituents of the aortic waU ®.
Thrombus may also have a protective role to delay aneurysm rupture. Segments of ILT have a
unique elastic modulus and follow simple elastic theory in vitrxP' . This has been confirmed
mathematically with finite-element models of aneurysms. Finite element analysis allows the
computation of mechanical stress distribution on a body subjected to known forces or
deformations. Using this technique it can be shown that thrombus reduces the stress on the
aneurysm wall in proportion to its thickness^oo. When the thrombus is placed eccentrically within
the AAA lumen, the greatest points of stress are found in the thinnest regions of wall.
More recently, it has been suggested that ILT may protect against Type II endoleaks by plugging
the orifices of patent arteries. Broeders et al demonstrated that the incidence of persistent
backflow from sac branches was dependent on both the number of patent lumbar vessels as well
as the presence of thrombus and its localisation: the presence of posterior wall thrombus was
associated with a lower incidence of back-flow^^h
During conventional AAA repair thrombus is removed but endovascular repair leaves it intact.
To date, there has been no attempted study to elucidate the fate of ILT after endoluminal
exclusion of AAA. This study will set out to prospectively record the fate of ILT, using
volumetric technology, after endoluminal exclusion.
The aneurysm neck
The long-term success of endovascular repair is dependent on the secure fixation of the stent-
graft at the proximal and distal attachment sites. Progressive dilatation of the inffarenal neck may
jeopardize this success.
Conflicting views exist in relation to the fate of the neck and data on changes after endovascular
exclusion are sparse. On the one hand, it is thought that this part of the aneurysm is fairly stable
and unlikely to dilate over time. Histological studies demonstrate crossing fibres in the adventitia
that enter the neck from the renal arteries. These may make it more resistant to dilatation. The
pressure required to balloon dilate this region of the aorta is also much higher than the pressure
needed to dilate the lower inffarenal aorta^^. This is in direct contrast to experimental results
suggesting, both in vitro and in vivo, that a generalised metabolic dilatory diathesis may affect all
arteries in individuals with aneurysms. Sonesson showed a significant increase in the stiffness of
the aorta in patients with AAA compared to unaffected controls, confirrning the altered
mechanical properties of the aneurysmal wall. When the same index was calculated for the
common carotid arteries of both groups, similar differences were found suggesting a generalized
process of the vasculature with focal manifestation in the abdominal aorta.^^
45
The long-term fate of the infrarenal neck has been studied after open aneurysm surgery. Hallet^^
et al demonstrated, in a population-based study, that neck enlargement occurred in 13% of
patients after open repair. Illig and colleagues^os found an average growth of nearly 10 mm over
10 years in necks initially measuring more than 27 mm in diameter. Similar results were obtained
using trans-lumbar aortography as the imaging method in a retrospective study of 800 patients.
There was a mean dilatation of the aortic neck of up to 5 mm and an elongation of up to 10 mm
at 42 months^^^. This type of change would be more than sufficient to cause loss of the endograft-
vessel wall seal despite the routine graft oversizing of 2-4 mm. However, it could equally be
argued that conventional repair, which results in surgical disruption of the aorta, alters arterial
biology and that neck dilatation is simply a reflection of this interference.
Reviews of neck diameter post-endovascular repair also suggest that this region may continue to
dilate. Malina ® reported on proximal neck dilatation of 2 mm in the first postoperative year using
self-expanding stents for fixation. Matsumura and Chaikof, using the self-expanding EVT graft,
also observed continuing dilatation of up to 3 mm for at least 2 years in their 59 subjects * . In
contrast. Walker et al found no significant change in the proximal neck diameters in their 4 year
follow-up of 112 patients after endovascular repair. Tlie.^thors^did-not unfortunately specifyihe'*
nature of stent used in their grafts ®®.
Aneurysm neck dilatation can be difficult to separate ftom the physical effect of the endo
prosthesis. It is as yet unclear whether neck enlargement is limited to the size of the prosthesis or
whether it continues on unabated with time. Some authors have suggested that dilatation is more
likely to occur with balloon-expandable rather than self-expanding endografts^o^. The sequel to
this, late perigraft flow or endoleakage, has recently been reported in older patients^^®.
One aspect of this study was to record the changes in aneurysm neck diameter occurring after the
deployment of endografts fixed with balloon- and self-expanding stents.
5.2 D y n a m i c s t u d i e s o f t h e a n e u r y s m n e c k
Endovascular repair involves the insertion of a semi-rigid graft into a dynamic arterial system. The
aneurysm is never static and there is always movement between the neck, sac and the üiac arteries.
These graft-vessel wall interactions may be important in long-term graft stability. Attaining a
blood-tight seal between the graft and underlying aortic neck has as much to do with the nature
and quality of the aortic tissue as it does with the construction and function of the device itself.
The individual components that form the aortic wall and their mechanics will influence the extent
of arterial motion and hence the amount of stress experienced by the prosthesis over its lifetime.
It is proposed here that the effects of aU these different motions may summate over a period of
g )

time to result in a physical alteration of the endograft. The dilemma lies in defining and
quantifying the extent of differential movement.
Filming and measurement of instantaneous changes in arterial diameter presents the first hurdle.
Arterial walls change their radius by less than 10% in response to a pressure change of almost
50% during the cardiac cycle ^ .
Further complexity is added by the changes occurring during diseased states. The changes from
normal to aneurysmal aorta involve considerable remodelling of the arterial wall accompanied by
an increase in the elastic modulus or stiffness index " . This in turn is likely to alter the dynamic
behaviour of the aortic neck. This area has never been imaged before in its normal let alone
pathological state.
Previous investigators have focused on the dynamic measurement of arterial diameter to calculate
its elasticity in health and disease. The major categories for the instruments that have been used
are electrical, radiological and optical.
Electrical methods usually incorporate some form of strain gauge calliper and produce results
dependent on the constraint introduced by the device^^ - 216. xhe technology can however, be
rniniaturised to such an extent, that it can be used on blood vessels as small as 10mm indiameter^^^
A major problem is the invasive nature of the electrical methods precluding safe use in humans.
Furthermore, the study of diameter changes over a long period of time requires implantation of
the device, which was difficult even in animal subjects.
Ultrasound has been the most popular method used to date for measuring arterial diameters.
MacSweeney et aP- used M-mode ultrasonography to calculate the elastic modulus of the
aneurysmal aorta which was correlated with a decreasing elastin content in the tunica media. The
regional elastic properties of the aorta have also been examined using transoesophageal
echocardiography220 and by an echo-tracking and phase-locking device^^i. 214 hig method, two
electronic markers are placed on the signals corresponding to the vessel wall on a real-time
display. An echo-tracking phase loop then restores the position of an electronic gate relative to the
moving echo-signal returning from the vessel wall. The output signal from the echo-tracking
circuits represents the distance between the vessel walls. This method produces very accurate
measurements of aortic diameter and can detect a change as small as 8 m m ^. However it is
difficult to position the electronic markers accurately as distinguishing where the vessel wall ends
and the lumen starts is a problem. Furthermore, images can only be obtained in 2 dimensions due
to the constraints of the display. Although this does not hinder the measurement of diameter, it
prevents visualisation of the whole artery and 3 dimensional motion studies are not possible.
47
optical methods to record diameter changes have been used on isolated arterial segments, passing
a coUimated light beam across the vessel onto a photoelectric light tube ^ - Changes in vessel
diameter cause variations in the amount of light falling on the tube and diameter changes of up to
6 mm may be detected. This method requires the arterial specimens to soak in an oxygenated
solution and cannot be applied in vivo. Values for the elastic modulus obtained using this method
are very high and it is now clear that this is due to an absence of vasa vasorum around the
specimens^.
Filrning of the pulsatile change in arterial diameter was attempted by Hiramatsu et al who
described a needle-probe videomicroscope used to film subendocardial vessels in a beating
heart^^. They found in anaesthetised pigs, that there was a total ratio of change in diameter of
24% of these vessels during the cardiac cycle. The same experiment was repeated a year later in
canine subjects to measure diameter changes during prolonged diastole^^ .
The aim of this study was to identify and measure arterial motion during open repair of aneurysms
and other vascular procedures using conventional and digital cameras to record changes. These
data were analysed using photogrammetric principles novel to this field. A working knowledge of
these principles is presented in Chapter 8 so that the reader may follow the reasoning behind each
experiment.
48

C h a p t e r 6
Imaging techniques used in tliis study
The fundamental difference in requirements for execution of repait between conventional and
endovascular grafting for aortic aneurysm is the role of imaging. Endovascular repair is heavily
reliant on comprehensive imaging techniques. Preoperatively this must be capable of providing
accurate and reliable measurements of the aorta, iliac vessels and demonstrate anatomical features
that may complicate the procedure.
For a typical bifurcated graft, measurements of the length and diameter of the proximal aortic
neck, the length of the vascular channel and the üiac arteries are essential (Figure 10).
Undersizing the endograft diameter can cause an inadequate seal between the graft and the
aneurysm wall resulting in endoleak or perigraft flow that has been associated with AAA
mpture^^h Similarly, oversizing of the graft and crimping of the excess material also produce
endoleak or rupture of the aortic wall. Insecure attachment also results in graft migration and
occlusion of major visceral arteries.
C u r r e n t i m a g i n g t e c h n i q u e s
There are several available methods for imaging the abdominal aorta prior to endoluminal surgery.
Most centres use a combination of arteriography and conventional or spiral CT as part of the
endovascular-imaging algorithm. Magnetic resonance imaging (MRI) has recently been advocated
in view of the relatively lower toxicity of the contrast agents utilised and the ability to image in all
planes^®. However, it is an evolving technology with many ongoing improvements and changes
still occurring at the time of writing.
6.1 Contrast angiography
Preoperative angiography offers an excellent representation of the anatomy of the contrast filled
aortic lumen and its branches, but it fails to give an adequate measurement of the dilated sac in
cases where the aneurysm is partially filled with an adherent mass of thrombus (Figure 11). It is
performed using either conventional x-ray film or digital subtraction technology^^. The
advantages of digital subtraction include the fact that it uses less contrast media, multiple views
can be rapidly obtained and images can be observed in rapid sequence so that flow can be
assessed. Since the degree of magnification cannot be ascertained when using digital subtraction
angiography (DSA), a catheter with radio-opaque markers must be used when providing
49
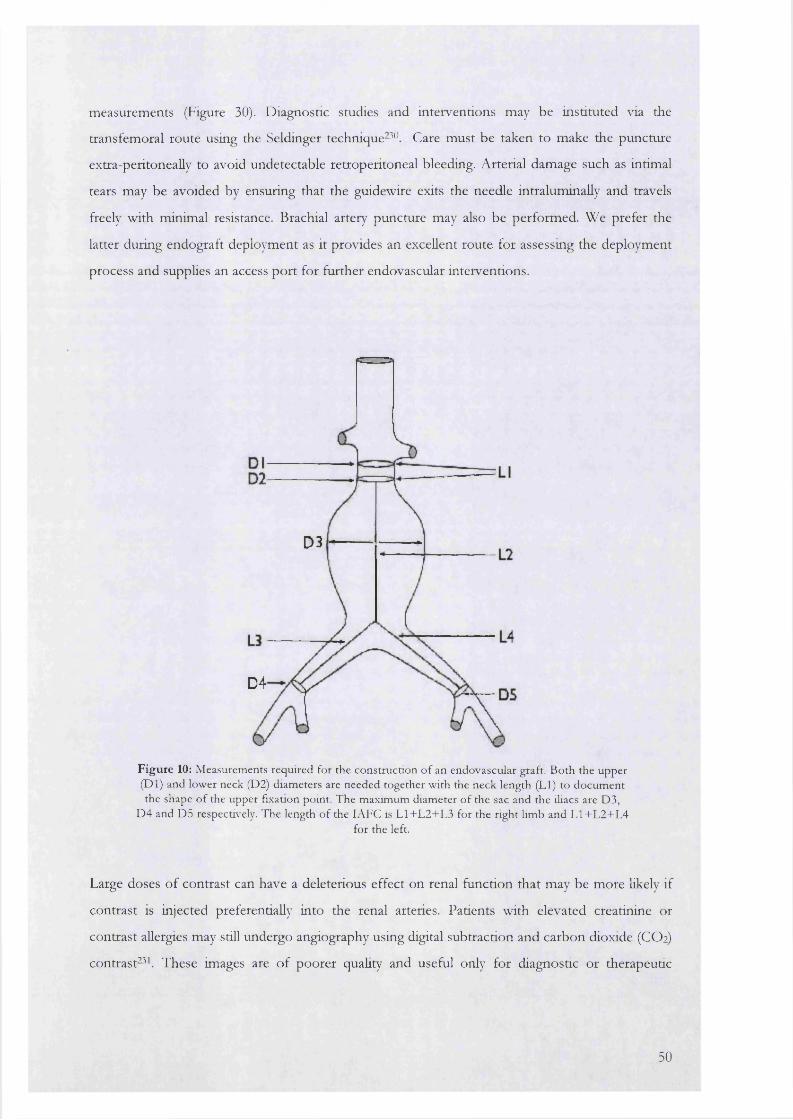
measurements (Figure 30). Diagnostic studies and interventions may be instituted via the
transfemoral route using the Seldinger technique-^^\ Care must be taken to make the puncture
extra-peritoneally to avoid undetectable retroperitoneal bleeding. Arterial damage such as intimai
tears may be avoided by ensuring that the guidewire exits the needle intraluminaUy and travels
freely with minimal resistance. Brachial artery puncture may also be performed. We prefer the
latter during endograft deployment as it provides an excellent route for assessing the deployment
process and supplies an access port for further endovascular interventions.
D3
D4
F ig u re 10: M easurements required for the construction o f an endovascular graft. B oth the upper (D l) and lower neck (D2) diam eters are needed together w ith the neck length (LI) to docum ent the shape o f the upper fixation point. T he maxim um diam eter o f the sac and the iliacs are D3,
D 4 and D5 respectively. The length o f the lA FC is L 1+L 2+L 3 for the right limb and L 1+L 2+L 4for the left.
Large doses of contrast can have a deleterious effect on renal function that may be more likely if
contrast is injected preferentially into the renal arteries. Patients with elevated creatinine or
contrast allergies may still undergo angiography using digital subtraction and carbon dioxide (CO2)
contrast^^k These images are of poorer quality and useful only for diagnostic or therapeutic
50
manoeuvres such as positioning of the stent-graft before deployment. The quality does not
support the accurate measurements detailed above.
In addition to assessing preoperative aneurysm dimensions, DSA can also be used as a therapeutic
aid to manage co-existing problems prior to endografting. Access vessel stenoses can be treated
by angioplasty at the time of the diagnostic arteriogram, facilitating the introduction of a large
delivery device. If an aorto-uni-ihac device is being considered, coil embolization of the
contralateral common or internal iliac artery can be carried out. Similar embolization techniques
may also be used intra-operatively to prevent retrograde sac perfusion via small pelvic and lumbar
collaterals^^®’
Intra-procedure angiography during endograft deployment is almost a sine qua non. Angiography
provides excellent views of the renal vessels and aneurysm neck during deployment and gives
early warning of renal arterial occlusion.
A completion angiogram should be performed to search for proximal/distal endoleak, graft kinks
or significant graft compression and altered vascular flow. Additional endovascular techniques can
then be instituted during the same session and their success or failure confirmed with further
injections.
Post-procedure follow-up angiography is only really useful in confirming the presence of an
endoleak or detecting endograft disruption. It cannot be used to demonstrate the continuing
enlargement or shrinkage of the aneurysm sac, measurements that are important in determining
the success of the procedure.
6.2 Principles of conventional and spiral CT (SCT) scanning
A plain radiograph is simply a map of the attenuation coefficients of the various tissues being
imaged for the energy spectrum of a typical x-ray beam. Radiographs usually allow contrasts of
the order of 2% to be seen easily so that a 1 cm thick rib or a 1 cm air-filled trachea can be readily
distinguished. However, blood vessels and other soft tissue details, such as the cardiac anatomy,
cannot be conventionally visualised. A second problem is the loss of depth information caused by
the projection of a 3-dimensional structure onto 2-dimensional film. This can be overcome to
some extent with conventional tomography or viewing stereo-pairs of film (Chapter 8).
A CT scan differs from a radiograph because it provides two-dimensional information concerning
a three-dimensional slice of the patient without any superimposition from other regions (Figure
12). The x-ray beam does not interrogate parts of the body outside the sHce, thus eliminating the
problem of "depth scrambling". The resulting sequence of images (axial scans) show the sectional
51

anatomy with a spatial resolution of about 1 mm and linear attenuation coefficient (density)
of better than 1%.
Figure 11: A ortogram o f the abdom inal aorta in a patien t w ith an abdom inal aortic aneurysm sac m easuring 6.5 cm. N either the
an teroposte rio r (left) n o r lateral (right) view o f the abdom inal aorta dem onstrates the size o f the aneurysm because o f the lam inated throm bus filling the vascular channel o f the aneurysm , allowing
b lood (and contrast) to flow through a m uch reduced lum en size.
Conventional C T
Conventional (slice-by-slice) C l’ is performed by sequential scanning at multiple pre
determined levels. Ih e incremental data are collected with the patient stationary and
suspending respiration at each level. This often results in stepping or misregistration related
to the difference in the position of the diaphragm and other organs during multiple breath-
holds. These artefacts produce poor quality images particularly if intravenous contrast agents
are given as with aortic images. The scan times are lengthy (1-3 seconds per slice) and
because of the interscan delay (typically 1-5 seconds between slices), the number of slices
with optimal contrast enhancement are limited. Consequently, large amounts of contrast
medium may be necessary with resulting renal complications.
Spiral C T
Spiral CT is based on the continuous acquisition of data from an entire anatomic volume
and differs from conventional CT because a whole volume can be scanned within a short
time interval. An entire CT examination of the head, chest or abdomen may be performed
within 90 seconds, often with only a single breath hold required by the patient. With
52

shortened acquisition, only brief contrast injection times are needed for optimal vascular
opacification. Moreover, a bolus of injected contrast can be captured with the peak aortic
concentration, thus simulating angiography^^.
Spiral scanners are based on a slip-ring gantry system, which does not have any electrical wire
contact, and the X-ray tube can therefore rotate a full 360 degrees around the patient without
entanglement.
The spiral CT scanner table also moves relative to the tube at predetermined speeds: in this way a
helix of raw data can be acquired. Axial scans within the scanned volume can then be
reconstructed at any level giving the possibility of overlap and hence improving anatomical
accuracy.
It is essential to recognise that spiral CT data does not represent any single section of tissue but
the entire 3-dimensional scanned volume. This data is reformatted into axial planar images, similar
to those of conventional scanners, using special mathematical algorithms'^. The initial scan data,
stored in the form of small units of volume known as voxels, is reformatted on 2-dimensional
scans as pixels. Each voxel has its own specific density, proportional to the linear attenuation
coefficient of the tissue. This is rescaled in terms of a CT or Hounsfield (HU) number defined as:
CT îlUtllbcr jdtissue" jdwater / jd-water X 1000
where |I refers to the linear attenuation coefficient. By convention, water is given a Hounsfield
value of 0 while air is -1024 HU. The HU of different tissues are relatively close to each other and
relatively close to 0. However, provided the projection data are recorded with sufficient accuracy,
differences between soft tissues can be displayed with a high degree of statistical confidence.
Changing the contrast of the display can further enhance visualisation of small differences. This is
related to the HU number by means of a level and width control allowing the small range of
numbers corresponding to the soft tissues in question to drive the screen from black to white.
Visually, HU are represented by a different shade of grey for each pixel on the 2D film. Since the
human retina does not have the ability to distinguish between all the different grey-scale
resolutions, the amount of available data within scans is not always appreciated.
Reconstruction's of |4 are made on rectangular arrays that define the resolution of the CT scanner.
The scanner used in this project was a Siemens Somatom plus 4 with a rectangular array
resolution of 512 x 512 pixels.
53

Partial volume artefact
CT slices do not usually intersect anatomical structures at right angles. A long, thin voxel could
well have one end in soft tissue and the other end in bone. The value of |X for these longitudinally
arranged voxels spanning between the two ends of a segment of anatomy (Figure 13) are simply
averaged to give a single grey-scale value for one pixel. For tissues where there is not much
change in density, this is not a significant problem. However, where there are sharp changes in
density, averaging can produce values that do not correspond with any real tissue at all.
The partial volume artefact wiH exist for aU situations where the resolution of the scanner is
insufficient. For example, CT resolution is about 1 mm x 1 mm x 1 mm whereas a typical cell is of
the order 10 |lm x 10 jim x 10 |lm. This results in a blurting of the intensity distinction between
tissue classes at the border of two tissues.
54
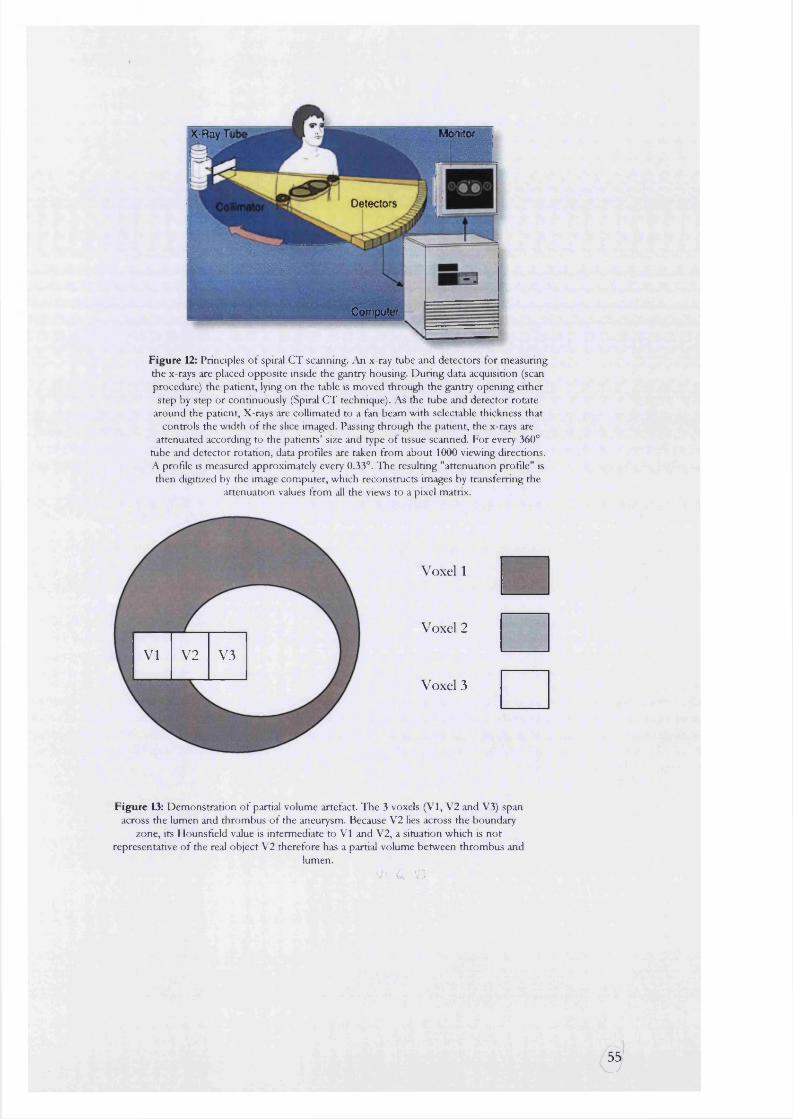
Monitor: X-Ray T|
Detectors
Computer
Figure 12: Principles o f spinil CT scanning. An x-ray tube and detectors for measuring the x-rays are placed opposite inside the gantry housing. Dunng data acquisition (scan procedure) the patient, lying on the table is moved through the gantry opening either step by step or continuously (Spiral CT technique). As the tube and detector rotate
around the patient. X-rays are collimated to a fan beam with selectable thickness that controls the width of the slice imaged. Passing through the patient, the x-rays are
attenuated according to the patients’ size and type o f tissue scanned. For every 360° tube and detector rotation, data profiles are taken from about 1000 viewing directions. A profile is measured approximately every 0.33°. The resulting "attenuation profile" is then digitized by the image computer, which reconstructs images by transferring the
attenuation values from all the views to a pixel matrix.
VI V2 V3
Voxel 1
Voxel 2
Voxel 3
Figure 13: Demonstration o f partial volume artefact. The 3 voxels (VI, V2 and V3) span across the lumen and thrombus o f the aneurysm. Because V2 lies across the boundary
zone, its Hounsfield value is intermediate to VI and V2, a situation which is not representative o f the real object V2 therefore has a partial volume between thrombus and
lumen.V' C V:
3'
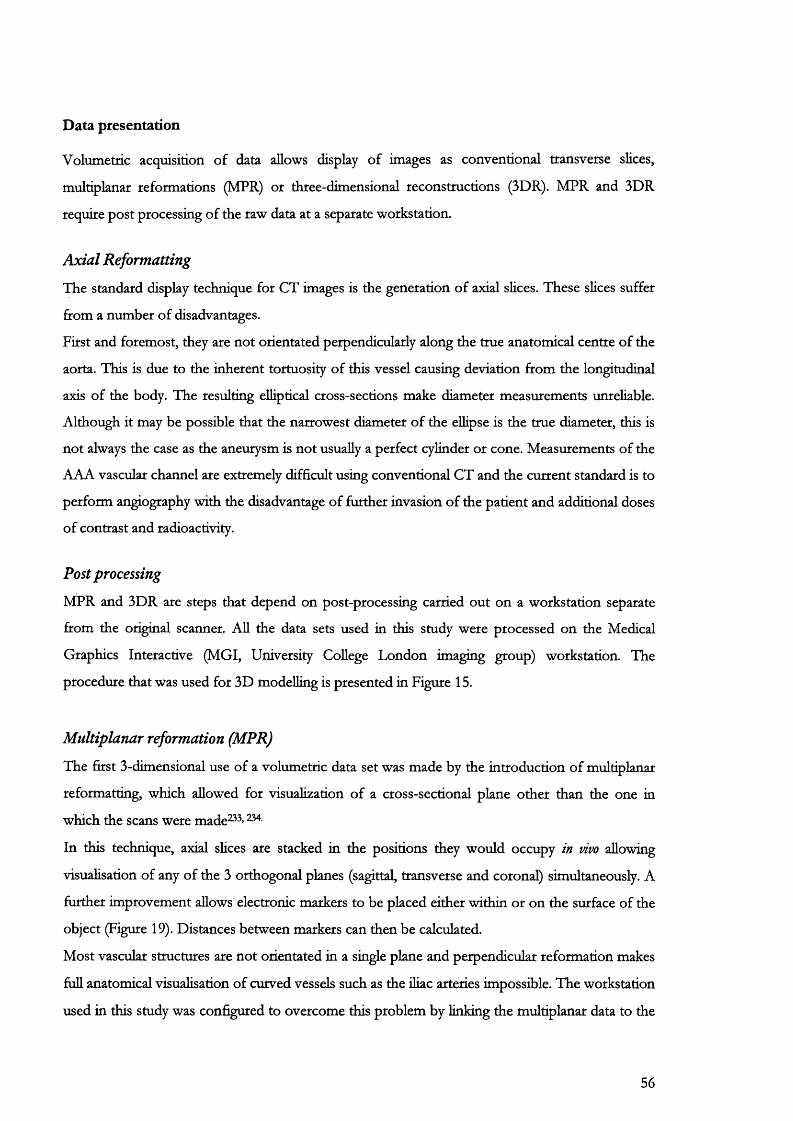
Data presentation
Volumetric acquisition of data allows display of images as conventional transverse slices,
multiplanar reformations (MPR) or three-dimensional reconstructions (3DR). MPR and 3DR
require post processing of the raw data at a separate workstation.
Axial Reformatting
The standard display technique for CT images is the generation of axial sHces. These sHces suffer
from a number of disadvantages.
First and foremost, they are not orientated perpendicularly along the true anatomical centre of the
aorta. This is due to the inherent tortuosity of this vessel causing deviation from the longitudinal
axis of the body. The resulting elliptical cross-sections make diameter measurements unreliable.
Although it may be possible that the narrowest diameter of the ellipse is the true diameter, this is
not always the case as the aneurysm is not usually a perfect cylinder or cone. Measurements of the
AAA vascular channel are extremely difficult using conventional CT and the current standard is to
perform angiography with the disadvantage of further invasion of the patient and additional doses
of contrast and radioactivity.
Post processing
MPR and 3DR are steps that depend on post-processing carried out on a workstation separate
from the original scanner. All the data sets used in this study were processed on the Medical
Graphics Interactive (MGI, University College London imaging group) workstation. The
procedure that was used for 3D modelling is presented in Figure 15.
Multiplanar reformation (MPR)
The first 3-dimensional use of a volumetric data set was made by the introduction of multiplanar
reformatting, which allowed for visualization of a cross-sectional plane other than the one in
which the scans were made^^>
In this technique, axial slices are stacked in the positions they would occupy in vivo allowing
visualisation of any of the 3 orthogonal planes (sagittal, transverse and coronal) simultaneously. A
further improvement allows electronic markers to be placed either within or on the surface of the
object (Figure 19). Distances between markers can then be calculated.
Most vascular structures are not orientated in a single plane and perpendicular reformation makes
full anatomical visualisation of curved vessels such as the diac arteries impossible. The workstation
used in this study was configured to overcome this problem by linking the multiplanar data to the
56

orientation of the 3-dimensional image. When the 3D image was manipulated through 360
degrees the MPR revolved by exactly similar amounts in all 3 planes.
One disadvantage of MPR is that the longitudinal resolution is generally inferior to the transverse
resolution. This is due to the table speed, which may generate a streak artefact. The image quality
of vessels located perpendicular to the scanning axis such as the aorta, is hence inferior to the
quality of vessels parallel to the axis. For large structures such as aneurysms however, this is of
little consequence during measurement.
3-dimensional reconstruction
Early 3-dimensional images were simply wire-riame images (Figure 15: stage 3) of high-contrast
tissue interface surfaces such as bone,^^» 36 skin^^ and lung^®. Connecting tissue contours with
perpendicular line segments^^ or subdividing the strips between contours into triangles^'^ is called
"tiling" and creates a covering composed of elements that can subsequently be used for shading of
that surface. Modem techniques for surface rendering require that the structure to be imaged is
first isolated or segmented from the total data volume. This takes place in two stages.
For highly contrasting tissues, such as bone versus air, the segmentation process makes use of the
Hounsfield number or magnetic resonance-number threshold. Volumes of interest are simply
extracted from the CT images by setting windows based on Hounsfield units. For example, a
value of 0 HU will display everything with a density greater than water while 100 HU or higher
will only display voxels with a density greater than that of a mixture of blood and iodinated
contrast.
For interfaces with little contrast (eg, aortic wall versus surrounding soft tissues) segmentation
may become impossible without manual interaction with the image. The area of interest is picked
out manually with the aid of a painting/editing tool (Figure 14). The post-processing computer
then extracts this new data set from each slice, keeping images in the correct sequence and
orientation by aligning individual pixels to a reference grid. A superficial wire-mesh constructed by
joining corresponding pixels. Generating a shaded surface on the selected object creates the
illusion of depth. This is referred to as the surface shaded display (SSD).
57
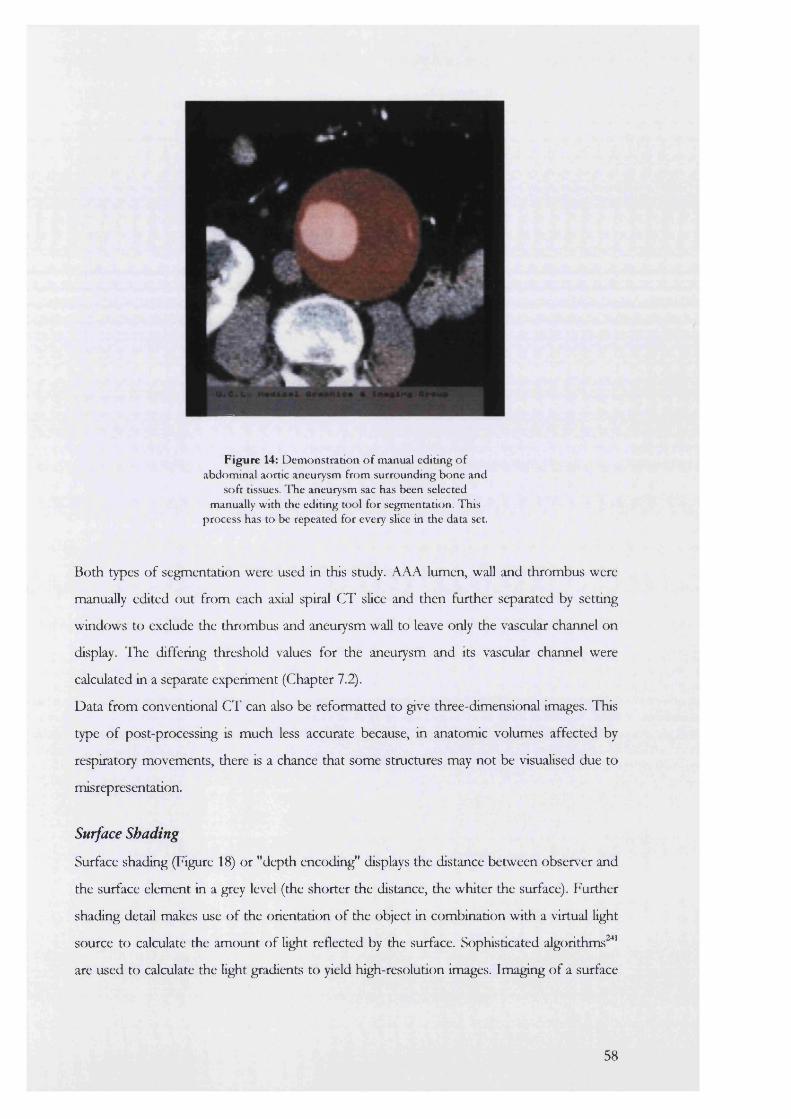
Figure 14: Demonstration o f manual editing o f abdominal aortic aneurysm from surrounding bone and
soft tissues. I he aneurysm sac has been selected manually with the editing tool for segmentation. This
process has to be repeated for every slice in the data set.
Both types of segmentation were used in this study. AAA lumen, wall and thrombus were
manually edited out from each axial spiral CT slice and then further separated by setting
windows to exclude the thrombus and aneurysm wall to leave only the vascular channel on
display. The differing threshold values for the aneurysm and its vascular channel were
calculated in a separate experiment (Chapter 7.2).
Data from conventional CT can also be reformatted to give three-dimensional images. This
type of post-processing is much less accurate because, in anatomic volumes affected by
respiratory movements, there is a chance that some structures may not be visualised due to
misrepresentation.
Surface Shading
Surface shading (Figure 18) or "depth encoding" displays the distance between observer and
the surface element in a grey level (the shorter the distance, the whiter the surface). Further
shading detail makes use of the orientation of the object in combination with a virtual light
source to calculate the amount of light reflected by the surface. Sophisticated algorithms '**
are used to calculate the light gradients to yield high-resolution images. Imaging of a surface
58
using illumination derived with virtual light source(s) is referred to as "surface rendering^^^ "
Software tools have been developed to make this process less labour intensive '^ ,
6.3 Principles of Magnetic Resonance Imaging (MRI)
This section describes the physics of MRI and the related phenomena of relaxation times. These
basic methods are used to derive images that are a function of proton density, the freedom of
hydrogen ions to rotate and the amount of water contained within the scanned object.
Components of an MRI imaging system
The main components of the MRI hardware system are far more complex than spiral CT and
incorporate:
• The main magnet
• Gradient systems
• Radiofrequency (RF) Cods
• Transmitters
• Receivers
• Computer
The main magnetic field, within which the patient lies, is kept constant. Its strength is measured in
units called Tesla (1) and typically ranges from 0.08 T to 2 T.
The gradient system consists of three electromagnets that can be turned on and off rapidly. They
are arranged along the x, j and directions in three-dimensional space. These electromagnets
generate a weaker and spatially dependant magnetic field that, when applied appropriately, wiU
encode spatial information in to the MRI signal.
RF coils are antennae that transmit and receive radio waves. These consist of large volume cods
that surround the body part being imaged or smaller surface cods, which are placed directly under
the area of interest and provide finer anatomical detad.
Ad of the hardware except for the main magnet is under the control of a highly sophisticated
computer and associated software. This is used to construct the relevant image sequence and
process the signals obtained from the imaging protocol.
Proton spin
The nucleus of an atom must contain an uneven number of protons in order to be affected by a
magnetic field. The hydrogen nucleus contains a single proton, which has a positive charge. This
charge is distributed and rotates about a central axis to create a magnetic field (Mp).
59
The multiple protons located within human tissue all generate magnetic fluxes. Under normal
conditions these cancel each other out.
However, when a patient is placed in a magnetic field, the proton becomes orientated either
parallel or anti-parallel to the magnetic field. Parallel alignment creates a low energy state whereas
an anti-parallel array results in a high-energy state. At room temperature and equilibrium in a
magnetic field of flux density IT, protons are usually aligned in the lower energy state by an excess
of approximately 3 x 10'* .
The measurement of Mp requires it to be physically tilted away fcom its original direction (Bo or
to produce a measurable signal.
The Latmor frequency
When energy in the form of radio waves is added to the patient, the low energy parallel direction
of the protons can change to high-energy anti-parallel arrangement. The angle of displacement is a
function related to the amount of energy added to the system.
A radio frequency (RF) pulse of an amount that displaces the net magnetic field 90 degrees from
its original position (Bo or 0 into the X)i plane is called a "90 degree pulse".
The radio frequency used here is very specific and is called the Larmor Frequency. It gives rise to
a typical signal known as a Free Induction Decay.
Precession and resonance
Protons spin about their own axis, but in addition, they also rotate around the axis of the MRI
system. This second type of spin is called precession. An analogy would be to visualise the
spinning of a child's top.
After revolving about its own axis, it wiU begin to wobble as the speed slows. This second type of
spin or wobble is similar to precession. The frequency of precession is related to the Larmor
Frequency and the strength of the external magnetic field.
Resonance occurs when the patient is exposed to a RF pulse identical to the Larmor Frequency. A
specific resonance then occurs as the protons absorb that quantum of energy. This is released as
the system returns to equilibrium.
Gradient fields
In order to form an image, the source and strength of the signal must be determined. This is
achieved by the use of a gradient field, which is a weaker magnetic field superimposed on the
main magnetic field. The gradient adds to the main magnetic field on one side and subtracts from
the other. Therefore, each distant point in the patient is in a slightly different magnetic field from
60
all of the others. Since protons will precess at a rate proportional to their particular magnetic field,
those at different points along the gradient wiU precess at different frequencies depending on the
site. The resulting signals, when encoded, wiU determine the point of origin.
Frequency encoding or read gradient
A great advantage of MRI over CT is that imaging in any plane is possible. The planes used are
defined by the three-dimensional Cartesian co-ordinate system.
The axis lies parallel to the long axis of the MRI magnet. The x axis goes from side to side and
the j/ axis is vertical. The x and Y axis define the transaxial plane, the ^ and x axis define the
coronal plane.
The x , j and ^ axes also correspond with the three sets of magnetic field gradients. When switched
off and on, protons at different points in the body experience their own specific combination of
gradients and these emit a unique signal.
A fixed gradient is applied along the plane that is to be imaged. This is called the frequency
encoding or read gradient.
Phase encoding gradient
Once the fixed or read gradient is selected, the other two gradient fields can be manipulated iu
order to separate the signal from different points along the slice. Phase differences are created
along one dimension of the selected slice by increasing the strength of the gradient perpendicular
to the read gradient during the scan.
This gradient is termed the phase encoding gradient.
Two dimensional Fourier transformation
The result of these various manipulations with the gradient result in a highly complex signal which
can be simplified using a mathematical manipulation known as two-dimensional Fourier
Transformation. The MRI computer changes the signal parameters from amplitude versus time to
signal strength versus position.
This now indicates the signal intensity associated with each different point along the selected axis
allowing transformation into the corresponding image.
Basic Image Interpretation
In order for pathology or tissue to be visible in a magnetic resonance image there must be
contrast or a difference in signal intensity between it and the adjacent tissue.
61
Depending on which pulse sequence is used, tissues will show up as either dark, bright or a shade
of grey. For example, collection of water such as CSF or urine will appear dark on a T1 image and
bright on a T2 image. T1 and T2 contrast, and proton density and flow are the basic MR image
variables and will be briefly considered here.
T1 weighting
A radio ftequency pulse is used to displace the longitudinally aligned protons by 90 degrees in the
transverse plane. When the RF pulse is turned off, the protons will begin to realign themselves in
their original longitudinal direction. The velocity of this return to the original position is direcdy
related to the brighmess of the visualised structure.
It is cmcial to measure the emitted signal early so as to differentiate the structure of interest from
signals sent out by surrounding tissues as eventually aU the protons will realign and show no
visible image differentiation.
This sampling time is known as TR and to maximise T1 contrast one must use a short TR
sampling time.
T2 weighting
T2 contrast relates to the transverse magnetisation. During T1 contrast imaging, a 90 degree RF
signal is used to realign protons in the transverse or plane. Turning off the RF signal then
results not only in longitudinal realignment, but also in what is called a dephasing in the transverse
plane.
To explain this further, while in the transverse plane when the RF pulse was on, the protons were
aU precessing in phase. When the RF pulse was turned off they started to dephase at different
rates. At this moment, a foUow-up 180 degree RF pulse is given which puts the dephasing protons
back in phase. This signal is now measured in the transverse plane. As time passes, these protons
again become out-of-phase and the signal decreases.
Tissues with a long T2 remain in phase for long periods of time and emit a stronger signal. Since
all tissues are initially in phase, maximum T2 contrast can be obtained by delaying the sampling
time in the transverse plane. This time is referred to as TE. Therefore for maximum T2 contrast, a
long TE is desirable.
T1 contrast is thus essentially controlled by TR, and a short TR is necessary to achieve maximum
T1 contrast. Conversely, T2 contrast is controlled by TE and for maximum results, a long TE is
desirable. If we negate the T1 contrast by using a long TR and then use a short TE to negate the
62
T2 contrast, we will be left with an image that derives its contrast only from a difference in proton
density. This is called the proton, or spin, density image.
Magnetic resonance imaging has two typical advantages in vascular imaging:
• The flow-void phenomenon provides excellent contrast between the vessel lumen and the
vessel waU "*
• It is possible to obtain information regarding flow " ^
Magnetic resonance angiography has been used as a basis for the three-dimensional
reconstruction of vascular trees^" , but the small vessel branches still present segmentation
problems and require both noise reduction^^^ as well as contrast restoration^^s.
Segmentation of small vessels can be avoided by the use of a Maximal Intensity Projection (MIP)
technique. Mathematical rays are cast through the data volume and the MIP technique is then
used to select the maximal intensity encountered along each ray path to construct an image. When
surrounding tissues are removed, this can result in detailed images of the vasculature. However, as
these vessels tend to be lost in three-dimensional images (partial volume effect) and low contrast
vessels tend to be lost in MlP’s, these techniques are of complementary value.
MRI contrast agents
Magnetic resonance contrast agents are unique in radiology because it is not the chemical that is
detected, but rather the effect that the chemical has on surrounding molecules. MR imaging relies
on signal originating from hydrogen nuclei in water and fat. The reason that different anatomic
structures can be seen on an MRI image is largely due to differences in T1 and T2 between
different tissues. Gadolinium is an intravenously injected heavy metal MR contrast agent that
improves image quality by facilitating Ti relaxation wherever it is concentrated. It shortens the T1
of surrounding protons, making them appear brighter. Because gadolinium normally stays in
blood vessels it has the effect of making vessels, highly vascular tissues, and areas of blood leakage
appear brighter.
Gadolinium is manufactured chelated to diethylenetriamine penta-acetic acid, as are other heavy
metals used for imaging, such as technetium. In its chelated form, gadolinium is excreted by the
kidneys with a serum half-Hfe of approximately 1.5 hours.
63

Gadolinium has no known significant side effects and no nephrotoxicity has been recorded to
date. For these reasons it is safe for use in patients with renal insufficiency '* ' The Magnevist
injection used in this project was the N-methylglucamine salt of the gadolinium complex of
diethylenetriamine penta-acetic acid.
64
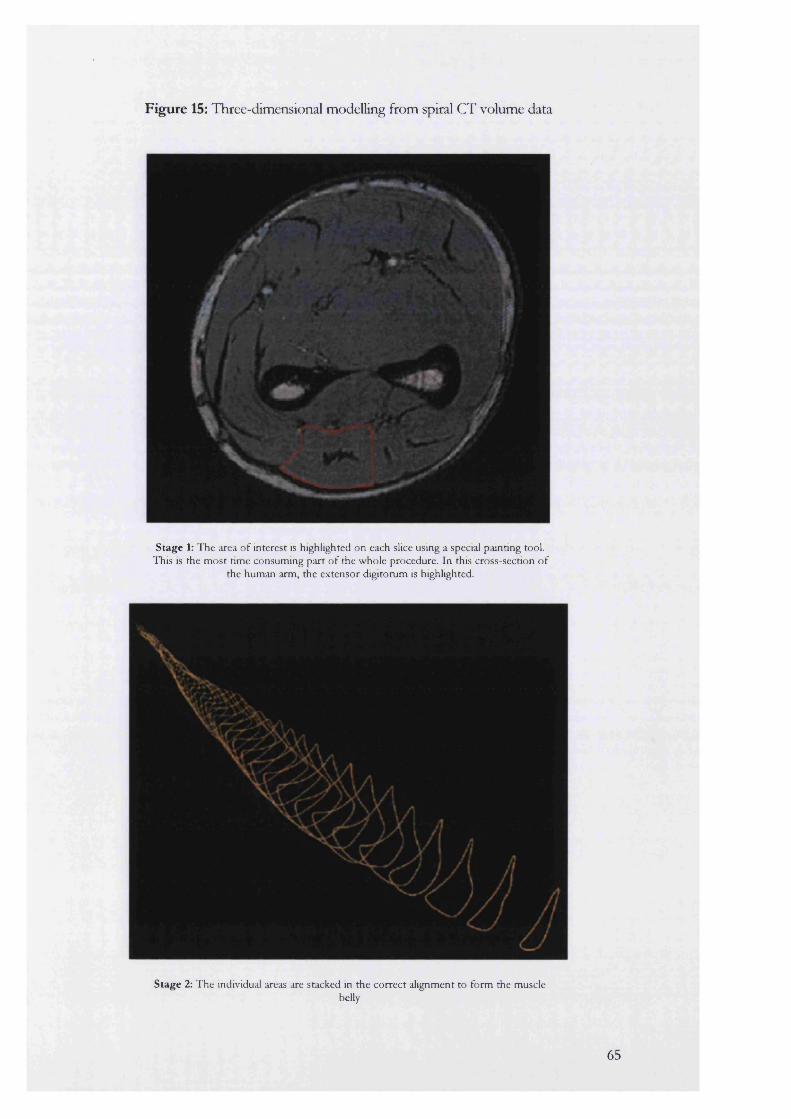
Figure 15: Three-dimensional modelling from spiral CT volume data
Stage 1: The area o f interest is highlighted on each slice using a special painting tool. This is the most time consuming part o f the whole procedure. In this cross-section of
the human arm, the extensor digitorum is highlighted.
Stage 2: The individual areas are stacked in the correct alignment to form the musclebelly
65
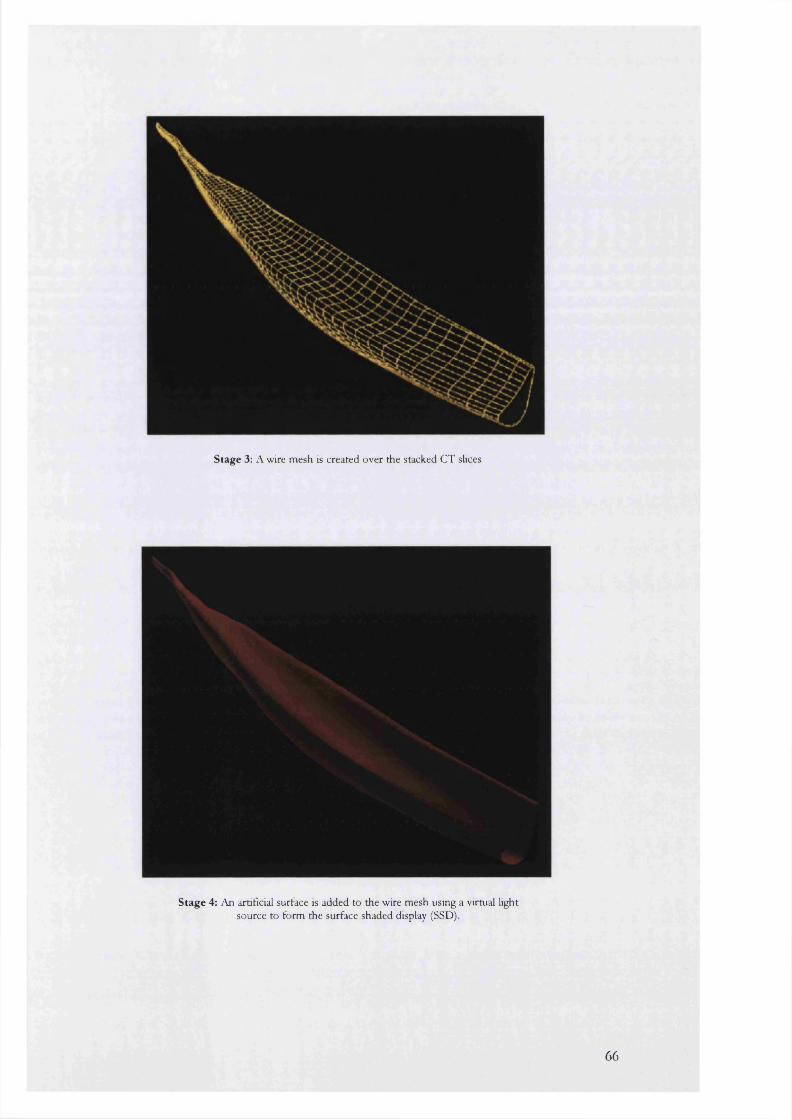
Stage 3: A wire mesh is created over the stacked CT slices
Stage 4: An artificial surface is added to the wire mesh using a virtual light source to form the surface shaded display (SSD).
66
CHAPTER 7
EXPERIMENTS I
SPIRAL CT ANGIOGRAPHY AND MAGNETIC RESONANCE ANGIOGRAPHY
7.1: Validation of spiral CT volume and linear measurements using glass phantom aneurysms
7.2: Validation of a method used to determine intra-aneurysmal flow channel and intra-luminal thrombus volumes
7.3: A comparison of the intra-observer and inter-observer errors in the measurement of AAA sac volume and maximal diameters
7.4: Comparison of spiral CT angiography and graduated sizing catheter in the geometric sizing of AAA for endoluminal repair
7.5: The natural history of AAA after endoluminal repair. A comparative study of balloon and self-expanding endograft systems using Spiral CT angiography.
7.6: Changes in intraluminal thrombus (ILl) after endovascular repair of abdominal aortic aneurysm.
7.7: Changes in aneurysm and graft length after endovascular exclusion of AAA using balloon and self-expanding endograft systems.
7.8: Natural history of the aneurysm neck after endoluminal repair using balloon and selfexpanding endograft systems.
7.9: The intra- and inter-observer differences in aneurysm neck length and diameters found during measurement with spiral CT angiography
7.10: Measurement of distance and volume with MRI: An in vitro feasibility study
7.11: A comparison of gadolinium-enhanced MR angiography versus spiral CT angiography in the evaluation of patients for endovascular repair
67
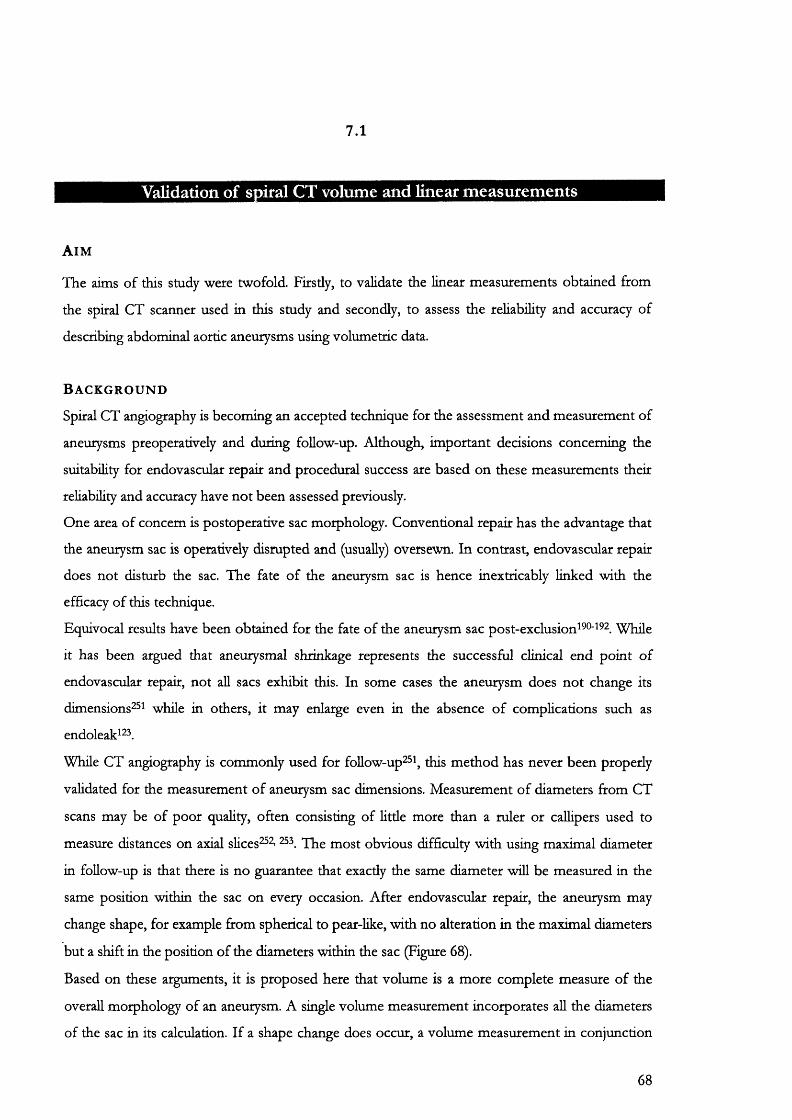
7.1
Validation of spiral CT volume and linear measurements
A i m
The aims of this study were twofold. Firstly, to validate the linear measurements obtained from
the spiral CT scanner used in this study and secondly, to assess the reliability and accuracy of
describing abdominal aortic aneurysms using volumetric data.
B a c k g r o u n d
Spiral CT angiography is becoming an accepted technique for the assessment and measurement of
aneurysms preoperatively and during follow-up. Although, important decisions concerning the
suitability for endovascular repair and procedural success are based on these measurements their
reliability and accuracy have not been assessed previously.
One area of concern is postoperative sac morphology. Conventional repair has the advantage that
the aneurysm sac is operatively disrupted and (usually) oversewn. In contrast, endovascular repair
does not disturb the sac. The fate of the aneurysm sac is hence inextricably linked with the
efficacy of this technique.
Equivocal results have been obtained for the fate of the aneurysm sac post-exclusion^^®'^^ . While
it has been argued that aneurysmal shrinkage represents the successful clinical end point of
endovascular repair, not all sacs exhibit this. In some cases the aneurysm does not change its
dimensions'^ while in others, it may enlarge even in the absence of complications such as
endoleak^^ .
While CT angiography is commonly used for fbllow-up^\ this method has never been properly
validated for the measurement of aneurysm sac dimensions. Measurement of diameters from CT
scans may be of poor quality, often consisting of little more than a ruler or callipers used to
measure distances on axial slices^^ 53 most obvious difficulty with using maximal diameter
in follow-up is that there is no guarantee that exactly the same diameter will be measured in the
same position within the sac on every occasion. After endovascular repair, the aneurysm may
change shape, for example from spherical to pear-like, with no alteration in the maximal diameters
but a shift in the position of the diameters within the sac (Figure 68).
Based on these arguments, it is proposed here that volume is a more complete measure of the
overall morphology of an aneurysm. A single volume measurement incorporates all the diameters
of the sac in its calculation. If a shape change does occur, a volume measurement in conjunction
68

with the 3D surface-shaded display is more likely to indicate this than a single maximal diameter
measurement. Finally, since the volume of a sphere is proportional to the cube of its maximal
diameter, only a small (and sometimes un-measurable) change in diameter can cause a much larger
(and measurable) simultaneous change volume.
M a t e r i a l s a n d m e t h o d
Phantom aneurysms were hand blown using glass tubing of similar dimensions to the human
adult aorta: 25 mm in outer diameter and 2 mm wall thickness. To produce tortuosity, aneurysms
were allowed to bend randomly during heating. Eccentric rather than a concentric sac shapes were
fashioned (Figure 16). Only one aneurysm (F) was blown as a perfect spherical shape with no
angulation between the stems and the “sac.” The phantom aneurysms were shut off with leak
proof graduated (19/26) glass corks.
All the phantom aneurysms were measured with electronic callipers (Mitutoyo absolute digimatic,
Japan). The maximal AP and transverse diameters were averaged over eight observations to
obtain the mean and standard deviation.
Phantoms were filled with a mixture of de-ionised water and iodinated contrast media
(Omnipaque 350 mg Iodine/ml) in proportions similar to those found in vivo, after bolus
tracking, during SCTA of an adult with an average intravascular volume of 5 L. In this situation,
the administration of 150 ml of intravenous contrast would result in an increase of the
intravascular volume to 5150 ml. Assuming negligible homeostatic volume correction, the ratio of
contrast medium to blood would then be 1:34.33 ml.
The density of this solution was calculated using a pyknometer (Figure 17), applying Archimedes
principle, in the laboratory at 21.9°C.
The volumes of the phantom aneurysms were then measured in the laboratory in three stages:
1. The total volume of the contrast-water mix was calculated by weighing the empty and then
the full phantom after scanning. The difference in weight divided by the density of the
mixture was the volume of the solution used.
2. The volume of the glass comprising the aneurysm was calculated separately by dividing the
density of the glass used by the dry weight of each phantom. The density of the
69
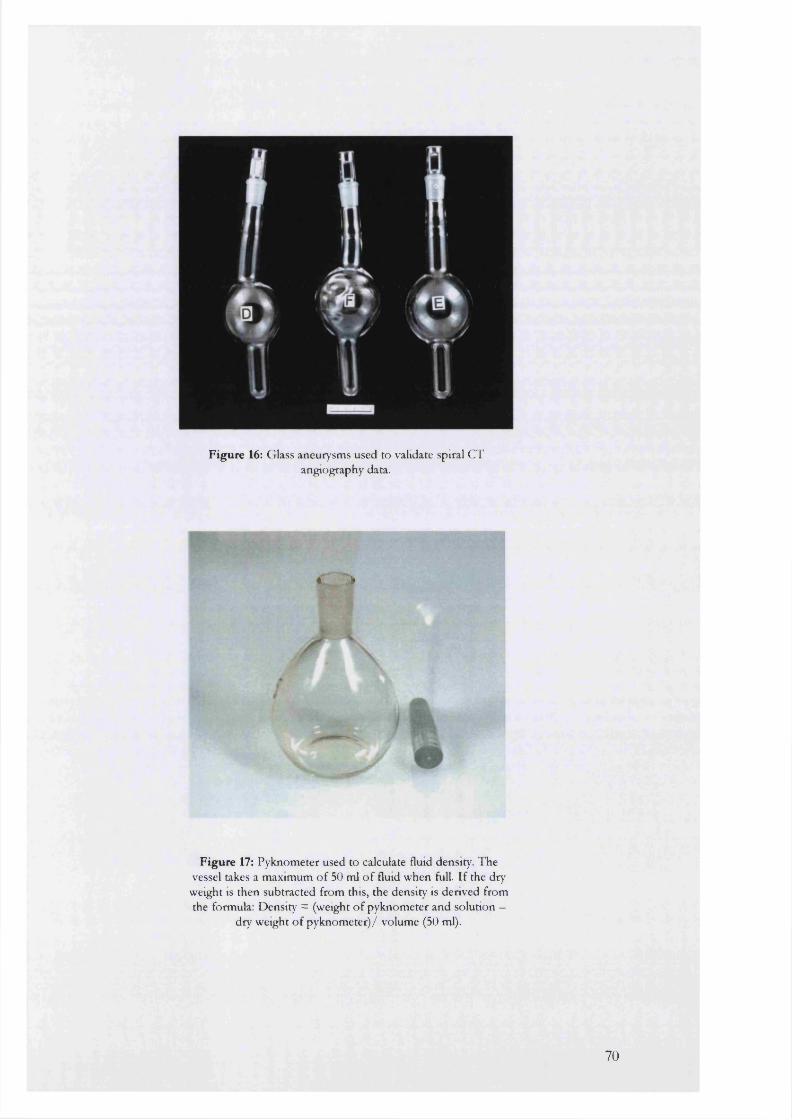
f %
Figure 16: Glass aneurysms used to validate spiral CT angiography data.
« *
I
Figure 17: Pyknometer used to calculate fluid density. The vessel takes a maximum o f 50 ml o f fluid when full. If the dry
weight IS then subtracted from this, the density is derived from the formula: Density = (weight o f pyknometer and solution —
dry weight o f pyknometer)/ volume (50 ml).
70
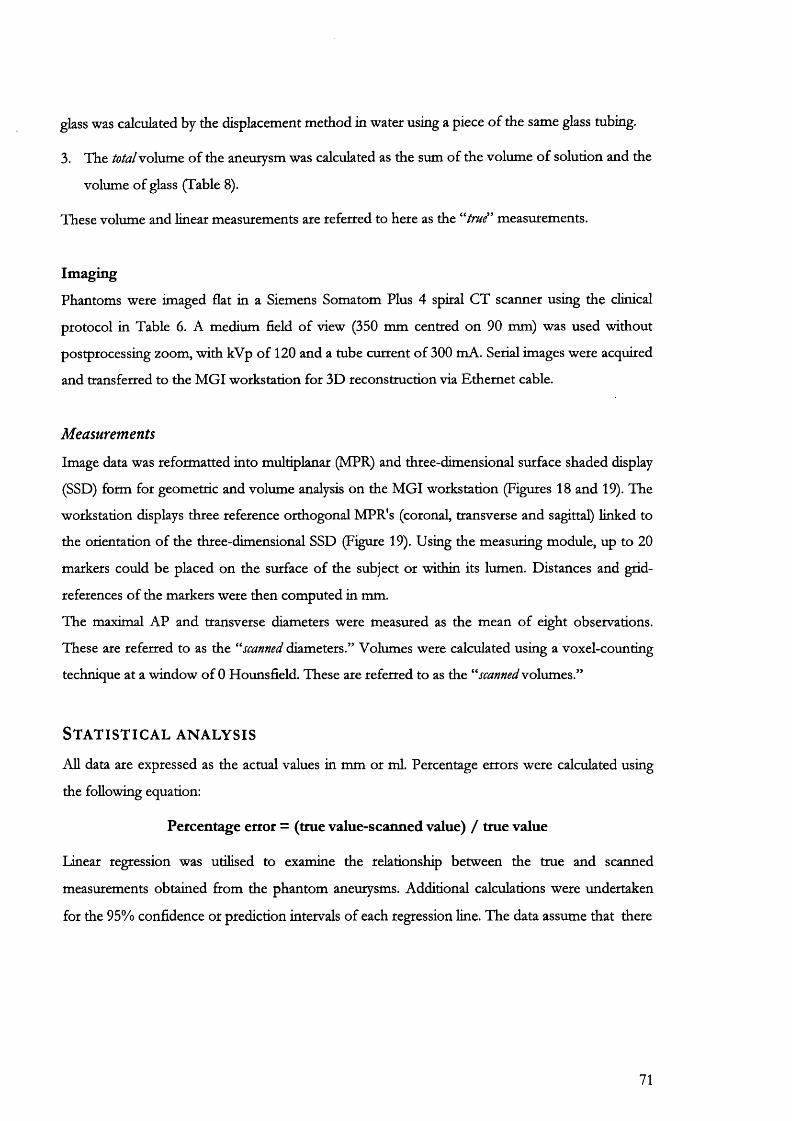
glass was calculated by the displacement method in water using a piece of the same glass tubing.
3. The total Yohmie. of the aneurysm was calculated as the sum of the volume of solution and the
volume of glass (Table 8).
These volume and linear measurements are referred to here as the measurements.
Imaging
Phantoms were imaged flat in a Siemens Somatom Plus 4 spiral CT scanner using the clinical
protocol in Table 6. A medium field of view (350 mm centred on 90 mm) was used without
postprocessing zoom, with kVp of 120 and a tube current of 300 mA. Serial images were acquired
and transferred to the MGI workstation for 3D reconstruction via Ethernet cable.
Measurements
Image data was reformatted into multiplanar (MPR) and three-dimensional surface shaded display
(SSD) form for geometric and volume analysis on the MGI workstation (Figures 18 and 19). The
workstation displays three reference orthogonal MPR's (coronal, transverse and sagittal) linked to
the orientation of the three-dimensional SSD (Figure 19). Using the measuring module, up to 20
markers could be placed on the surface of the subject or within its lumen. Distances and grid-
references of the markers were then computed in mm.
The maximal AP and transverse diameters were measured as the mean of eight observations.
These are referred to as the scanned diameters.” Volumes were calculated using a voxel-counting
technique at a window of 0 Hounsfield. These are referred to as the ''''scanned volumes.”
S t a t i s t i c a l a n a l y s i s
All data are expressed as the actual values in mm or ml. Percentage errors were calculated using
the following equation:
Percentage error = (true value-scanned value) / true value
Linear regression was utilised to examine the relationship between the tme and scanned
measurements obtained from the phantom aneurysms. Additional calculations were undertaken
for the 95% confidence or prediction intervals of each regression line. The data assume that there
71

is 95% chance that the two confidence bands enclose the tme best-fit linear regression line,
leaving a 5% chance that the tme line is outside those boundaries (Figures 20 to 22).
l a . e . t . . n e t - M u d io m l 4 rm (k n jic a
Figure 18: A surface shaded display o f an abdominal aortic aneurysm produced using the MGI workstation
(UCL imaging group).
L . M C I -
Figure 19: A multiplanar reformation (MPR) display linked to the 3 dimensional orientation o f the abdominal aortic aneurysm
at the top left. The coronal display is at the top right. The transverse and sagittal displays are bottom left and right
respectively.
72

The slope of the regression line may be used to assess the degree of agreement between individual
values. The closer this approximates to unity, the better the agreement between the scanned and
true values ' .
Collimation 5 mmTable speed 7.5 mm/secondPitch (scanner rotation 1 per 1.5second)Contrast Omnipaque 350 (120-150 ml)Contrast injection rate (pump injection) 5 ml/second
Delay to start of scan 21 secondsStart level coeliac axisFinish level external iliac arteriesReconstruction interval 2.5 mm
T able 6: Spiral CT angiography protocol used for the imaging of patients and glass phantom aneurysms in this study
R e s u l t s
Values obtained for the density of the glass tubing used and the iodinated contrast-deionized water to mixture were 2.24 g/cm^ and 1.01 g/cm^.
1. Geometric measurements
Maximum transverse and anteroposterior (AP) diameters of phantom aneurysms were averaged
over 8 observations using electronic callipers and the measuring tool on the post-processing
workstation. The average of the true maximal diameters (± standard deviation) compared to their
scanned counterparts are shown in Table 7.
For both dimensions, near perfect correlation and agreement was obtained between the true and
scanned AP (Figure 20) and transverse diameters (Figure 21). The slope of the regression line for
AP diameter was 0.97 ± 0.03 and for transverse diameter was 1.0 ± 0.01.
Table 7 also shows that the standard deviations for measurements made using SCTA, with only
three exceptions, are an order of magnitude larger than those obtained with electronic calipers.
This illustrates that the variability of diameter measurement with spiral CT, while clinically
acceptable, is sldll almost 10 fold greater than measuring the object directly.
2. Volume Measurements
Scanned volumes were compared with the true values as shown in Table 8. The median
percentage error was 1.1 (range 0.36-2.72).
73

Tm e diameters (mm) Scanned diameters (mm)Aneuiysm
anteroposterior transverse anteroposterior transverse
A 43.33±0.1 48.83+0.07 44.50+0.46 49.18±0.64
B 55.44±0.06 54.81+0.05 56.75+0.05 55.34±0.46
C 60.51±0.07 60.47±0.1 61.19±0.71 60.69±0.63
D 69.81+0.07 69.84±0.06 70.08±0.50 70.08±0.50
E 76.54±0.05 78.92±0.03 75.83±0.47 79.41±0.48
F 79.74±0.03 79.80±0.03 80.70±0 80.01+0.66
T ab le 7: A Comparison o f true and scanned diameters o f glass phantom aneurysms. The regression plots and equations for this
comparison are shown in Figures 20 and 21.
ANEURYSM
TR UEVOLUMfmlat21.9°q
[ES SCANNEDVOLUMES
PERCENTERROR
volume of glass
volume of solution
totalvolume 0 Hounsfield
A 39.78 133.96 173.74 178.06 2.72
B 40.13 180.59 220.72 224.86 1.88
C 39.06 216.44 255.50 256.43 0.36
D 47.28 233.66 280.94 284.92 1.42
E 46.83 274.36 321.19 323.06 0.58
F 49.78 308.71 358.49 360.99 0.7
Table 8; Comparison of true and scanned volumes of glass phantom aneurysms
74

The accuracy of the volume data obtained using the spiral CT scanner was reflected by near
perfect correlation between the scanned and true volumes (Figure 22). The gradient of the
regression line (0.99) did not deviate significantly from the ideal line at 45° demonstrating near
perfect agreement also between true and scanned volumes.
At a true volume of 0, the calculated intercept (5.9 ml) was not significant at the 5% level
(P=0.08), suggesting random as opposed to systematic error (Chapter 10). This was further
reflected by a wide confidence interval that included zero: -0.92 to 13 ml (95% confidence limits).
C o n c l u s i o n
Both linear and volume data obtained with spiral CT show near-perfect correlation and agreement
with the true dimensions of the phantom aneurysms scanned. linear dimensions had greater
variability expressed by larger standard deviations compared with the true measurements. This
may have been due to the subjectivity involved in placing electronic markers over what was
perceived to be the edge of the maximum diameter of an aneurysm on screen. In contrast, within
the laboratory, electronic calipers could easily be slipped up and down the phantom in 3
dimensions to locate this parameter.
Volume analysis involves a mathematical calculation of the number of volume units (voxels)
within the object. This was done entirely by the post-processing software using edge detection and
voxel-counting algorithms. Because of the reduced subjectivity involved with this measurement it
may be a more accurate method of describing tubular structures with complex three-dimensional
morphology such as aneurysms. The volumetric approach may be particularly valuable in the
presence of a changing sac shape. This is because volume provides a mathematical snapshot of
the overall morphology of an aneurysm not available from two-dimensional parameters such as
the maximal sac diameters.
75
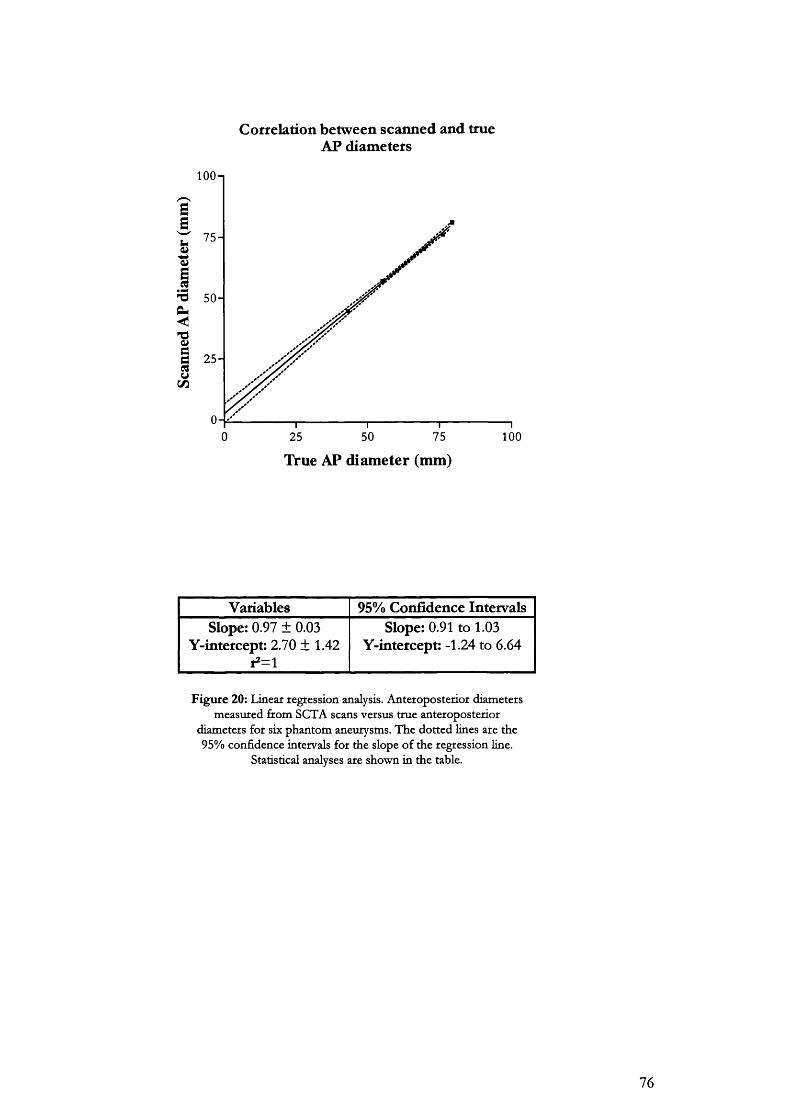
Correlation between scanned and trueAP diameters
100-1
GG
75-
-d 50-
<
ÏG 25 -S(/J
750 25 50 100
True AP diameter (mm)
Variables 95% Confidence IntervalsSlope: 0.97 ± 0.03
Y-intetcept: 2.70 ± 1.42 ,2=1
Slope: 0.91 to 1.03 Y-intercept: -1.24 to 6.64
F igu re 20: Linear regression analysis. Anteroposterior diameters measured from SCTA scans versus true anteroposterior
diameters for six phantom aneurysms. The dotted lines are the 95% confidence intervals for the slope o f the regression hne.
Statistical analyses are shown in the table.
76
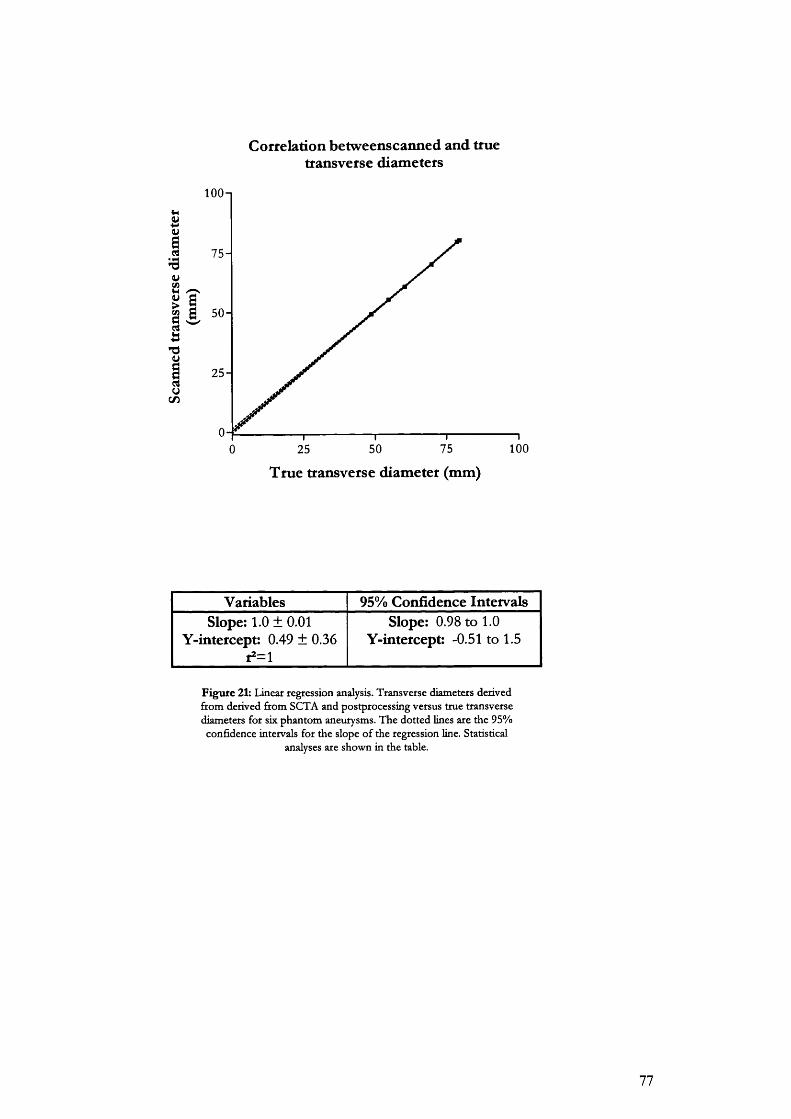
Correlation betweenscanned and truetransverse diameters
s
I9uCO
uC / D
lOOn
7 5 -
i 5 0 -
2 5 -
O-f0 100755025
True transverse diameter (mm)
Variables 95% Confidence IntervalsSlope: 1.0 ± 0.01
Y-intercept: 0.49 ± 0.36r2=l
Slope: 0.98 to 1.0 Y-intercept: -0.51 to 1.5
Figure 21: Linear regression analysis. Transverse diameters derived from derived from SCTA and postprocessing versus true transverse diameters for six phantom aneurysms. The dotted lines are the 95% confidence intervals for the slope of the regression line. Statistical
analyses are shown in the table.
77
Cottelation between scanned and true volumes
400n
g 300-
200 -
^ 100 -
. 200 300 4000 100
True volumes (ml)
Variables 95% Confidence IntervalsSlope: 0.99 ± 0.01
Y-intercept: 5.9 ± 2.5r2=i
Slope: +0.96 to 1.0 Y-intercept: -0.92 to 13
Figure 22: Linear regression analysis. Volumes derived from SCTA and post-processing versus the true volumes of six phantom aneurysms. The
dotted lines are the 95% confidence intervals for the slope o f the regression line. Statistical analyses are shown in the table.
78

7.2
Validation of a method used to determine intra-aneurysmal flow channel and intra-luminal thrombus volumes
A i m
The aim s of this study were to define objective criteria to calculate a tissue segmentation threshold
for shaded surface display (SSD) rendering of the intra-aneurysmal vascular channel with SCTA,
and to validate a subtraction method used to derive intraluminal thrombus volume.
B a c k g r o u n d
For this study, aneurysms were divided into 2 anatomical volumes (Figure 23). These were the
intra-aneurysmal flow channel (lAFC) and the total aneurysm volume. In patients, both volumes
were calculated between the level of the lowest renal artery to the aortic bifurcation. The lAFC is
surrounded by the intraluminal thrombus (ILT). This tissue relationship was simulated with
phantoms as described below.
Calculation of total aneurysm volume at segmentation 0 HU has been previously validated using
glass phantom aneurysms. In contrast, the lAFC cannot be scanned separately from the whole
aneurysm. Its volume can only be displayed by editing it out on each axial slice, by hand, using the
painting tool on the workstation (Figure 14). This is a time consuming and laborious method
especially when the lAFC is anatomically tortuous.
There is a sharp change in density from the mixture of iodinated contrast and blood in the lAFC
to the surrounding ILT. If the Hounsfield value for this interface was known, it could theoretically
be used to segment out the lAFC from the rest of the aneurysm. An important assumption of this
method, is that for the short period of time over which scan data is acquired, the density of the
thrombus-blood interface must not alter significantly due to permeability of the ILT.
As a separate but related step, subtraction of the flow channel volume from the total aneurysm
volume will give the volume of intraluminal thrombus (Figure 23).
M e t h o d a n d m a t e r i a l s
A single glass phantom aneurysm (Aneurysm F) was prepared for scanning. This phantom was
constructed as a perfect sphere with no sac eccentricity or neck-to-sac angulation. A latex
79
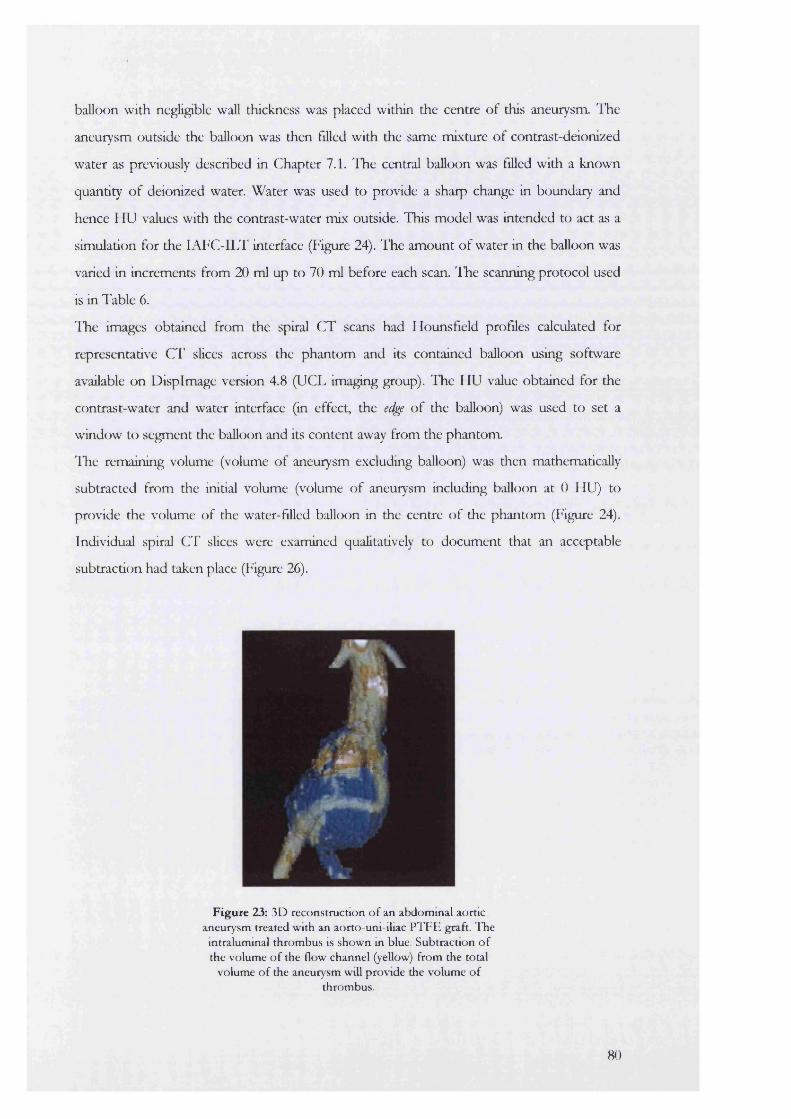
balloon with negligible wall thickness was placed within the centre of this aneurysm. The
aneurysm outside the balloon was then filled with the same mixture of contrast-deionized
water as previously described in Chapter 7.1. The central balloon was filled with a known
quantity of deionized water. Water was used to provide a sharp change in boundary and
hence HU values with the contrast-water mix outside. This model was intended to act as a
simulation for the lAFC-ILT interface (Figure 24). The amount of water in the balloon was
varied in increments from 20 ml up to 70 ml before each scan. The scanning protocol used
is in Table 6.
The images obtained from the spiral CT scans had Hounsfield profiles calculated for
representative CT slices across the phantom and its contained balloon using software
available on Displmage version 4.8 (UCL imaging group). The HU value obtained for the
contrast-water and water interface (in effect, the edge of the balloon) was used to set a
window to segment the balloon and its content away from the phantom
ITe remaining volume (volume of aneurysm excluding balloon) was then mathematically
subtracted from the initial volume (volume of aneurysm including balloon at 0 HU) to
provide the volume of the water-filled balloon in the centre of the phantom (Figure 24).
Individual spiral C l’ slices were examined qualitatively to document that an acceptable
subtraction had taken place (Figure 26).
i n ’
Figure 23: 3D reconstruction o f an abdom inal aortic aneurysm treated with an aorto-uni-iliac P T F E graft. I h e
intralum inal th rom bus is show n m blue. Subtraction o f the volum e o f the flow channel (yellow) from the total
volum e o f the aneurysm will p rovide the volum e o f throm bus.
80
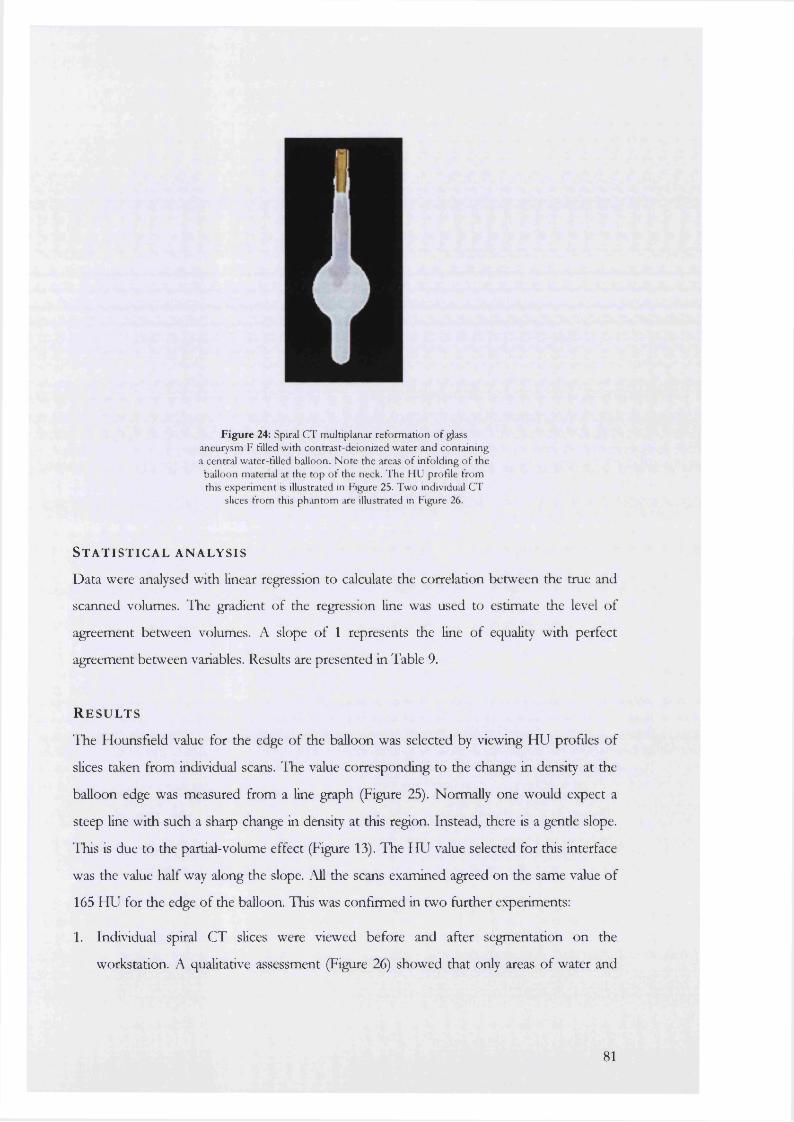
Figure 24: Spiral CT multiplanar reformation of glass aneurysm F filled with contrast-deionized water and containing a central water-filled balloon. Note the areas of infolding o f the
balloon material at the top o f the neck. The HU profile from this experiment is illustrated in Figure 25. Two individual CT
slices from this phantom are illustrated in Figure 26.
S t a t i s t i c a l a n a l y s i s
Data were analysed with linear regression to calculate the correlation between the true and
scanned volumes. The gradient of the regression line was used to estimate the level of
agreement between volumes. A slope of 1 represents the line of equality with perfect
agreement between variables. Results are presented in Table 9.
R e s u l t s
The Hounsfield value for the edge of the balloon was selected by viewing HU profiles of
slices taken from individual scans. The value corresponding to the change in density at the
balloon edge was measured from a line graph (Figure 25). Normally one would expect a
steep line with such a sharp change in density at this region. Instead, there is a gentle slope.
This is due to the partial-volume effect (Figure 13). The HU value selected for this interface
was the value half way along the slope. All the scans examined agreed on the same value of
165 HU for the edge of the balloon. This was confirmed in two further experiments:
1. Individual spiral CT slices were viewed before and after segmentation on the
workstation. A qualitative assessment (Figure 26) showed that only areas of water and
81
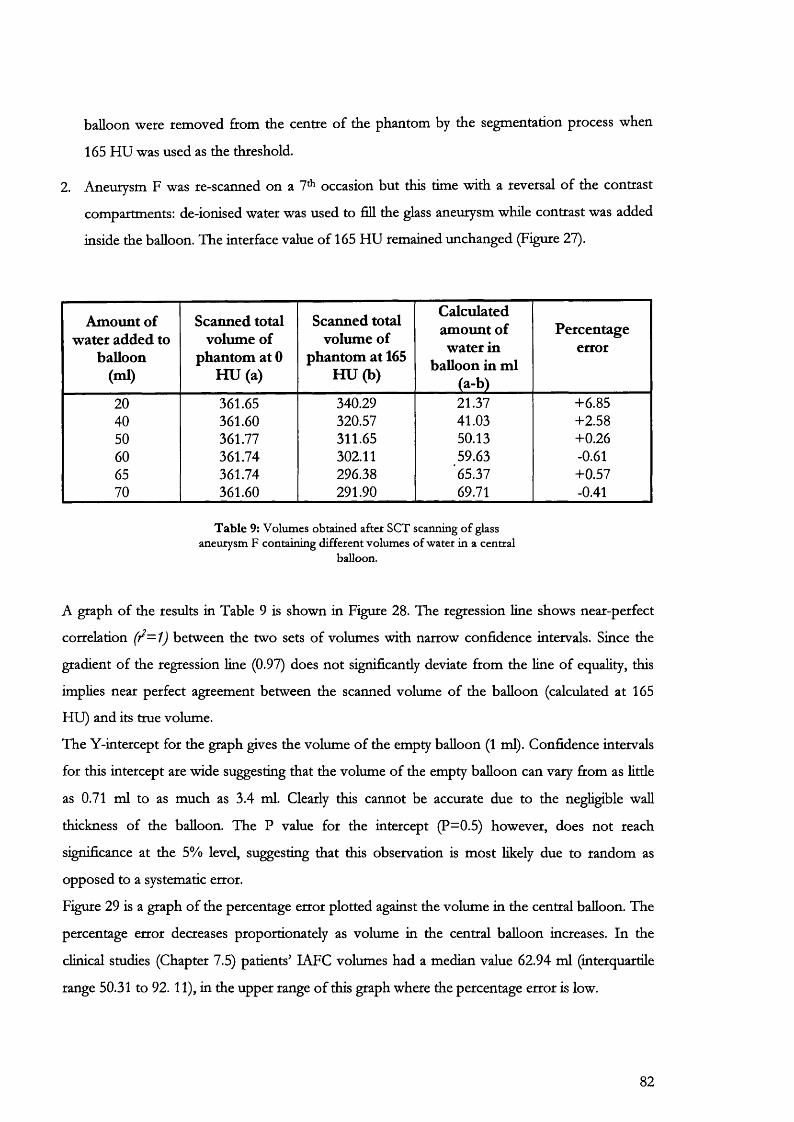
balloon were removed from the centre of the phantom by the segmentation process when
165 HU was used as the threshold.
2. Aneurysm F was re-scanned on a 7* occasion but this time with a reversal of the contrast
compartments: de-ionised water was used to fill the glass aneurysm while contrast was added
inside the balloon. The interface value of 165 HU remained unchanged (Figure 27).
Amount of water added to
balloon (ml)
Scanned total volume of
phantom at 0 HU (a)
Scanned total volume of
phantom at 165 H U (b)
Calculated amount of water in
balloon in ml (a-b)
Percentageerror
20 361.65 340.29 21.37 +6.8540 361.60 320.57 41.03 +2.5850 361.77 311.65 50.13 +0.2660 361.74 302.11 59.63 -0.6165 361.74 296.38 65.37 +0.5770 361.60 291.90 69.71 -0.41
T ab le 9: Volumes obtained after SCT scanning o f glass aneurysm F containing different volumes of water in a central
balloon.
A graph of the results in Table 9 is shown in Figure 28. The regression line shows near-perfect
correlation between the two sets of volumes with narrow confidence intervals. Since the
gradient of the regression line (0.97) does not significantly deviate from the line of equality, this
implies near perfect agreement between the scanned volume of the balloon (calculated at 165
HU) and its true volume.
The Y-intercept for the graph gives the volume of the empty balloon (1 ml). Confidence intervals
for this intercept are wide suggesting that the volume of the empty balloon can vary from as little
as 0.71 ml to as much as 3.4 ml. Clearly this cannot be accurate due to the negligible wall
thickness of the balloon. The P value for the intercept (P=0.5) however, does not reach
significance at the 5% level, suggesting that this observation is most likely due to random as
opposed to a systematic error.
Figure 29 is a graph of the percentage error plotted against the volume in the central balloon. The
percentage error decreases proportionately as volume in the central balloon increases. In the
clinical studies (Chapter 7.5) patients’ LAFC volumes had a median value 62.94 ml (interquartile
range 50.31 to 92. 11), in the upper range of this graph where the percentage error is low.
82
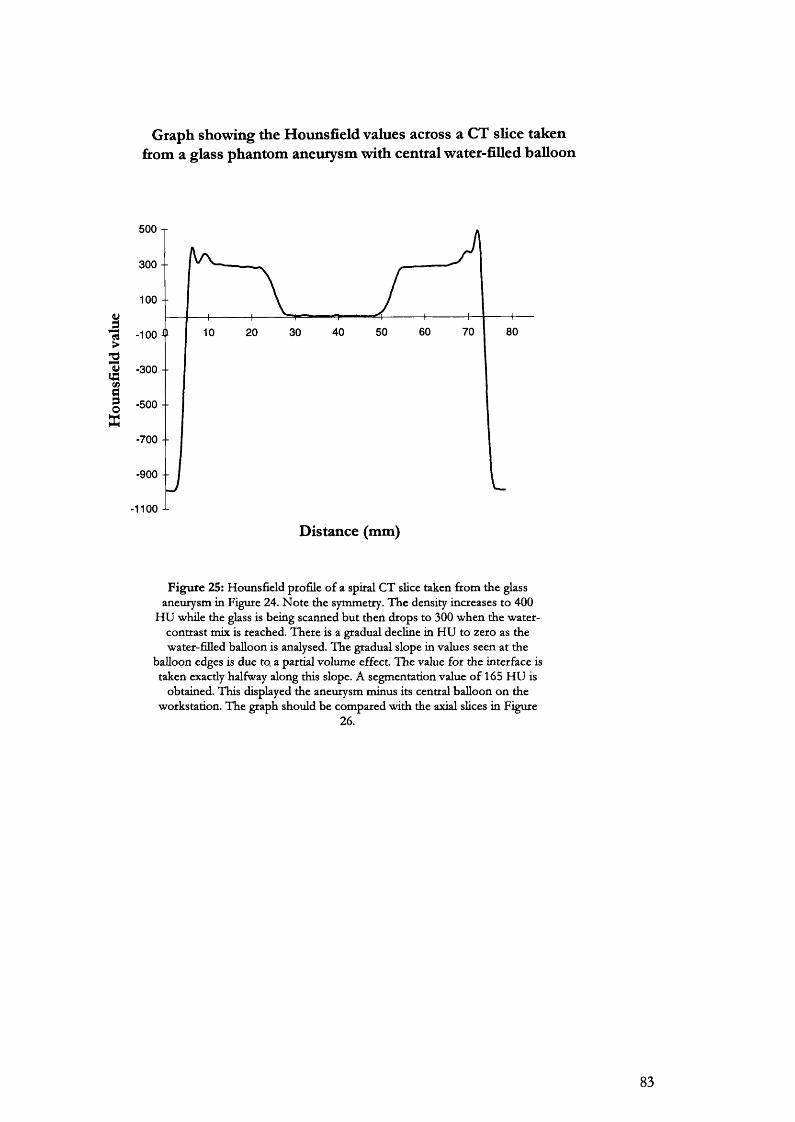
Graph showing the Hounsfield values across a CT slice takenfirom a glass phantom aneurysm with central water-filled balloon
500 T
300 -
100 -
3 -100
w -300 + IQ
-500 --
-700 -
-900 --
1100 ^
Distance (mm)
Figure 25: Hounsfield profile o f a spiral CT slice taken from the glass aneurysm in Figure 24. N ote the symmetry. The density increases to 400
HU while the glass is being scanned but then drops to 300 when the water- contrast mix is reached. There is a gradual decline in HU to zero as the water-filled balloon is analysed. The gradual slope in values seen at the
balloon edges is due to a partial volume effect. The value for the interface is taken exactly halfway along this slope. A segmentation value o f 165 HU is
obtained. This displayed the aneurysm minus its central balloon on the workstation. The graph should be compared with the axial slices in Figure
26.
83
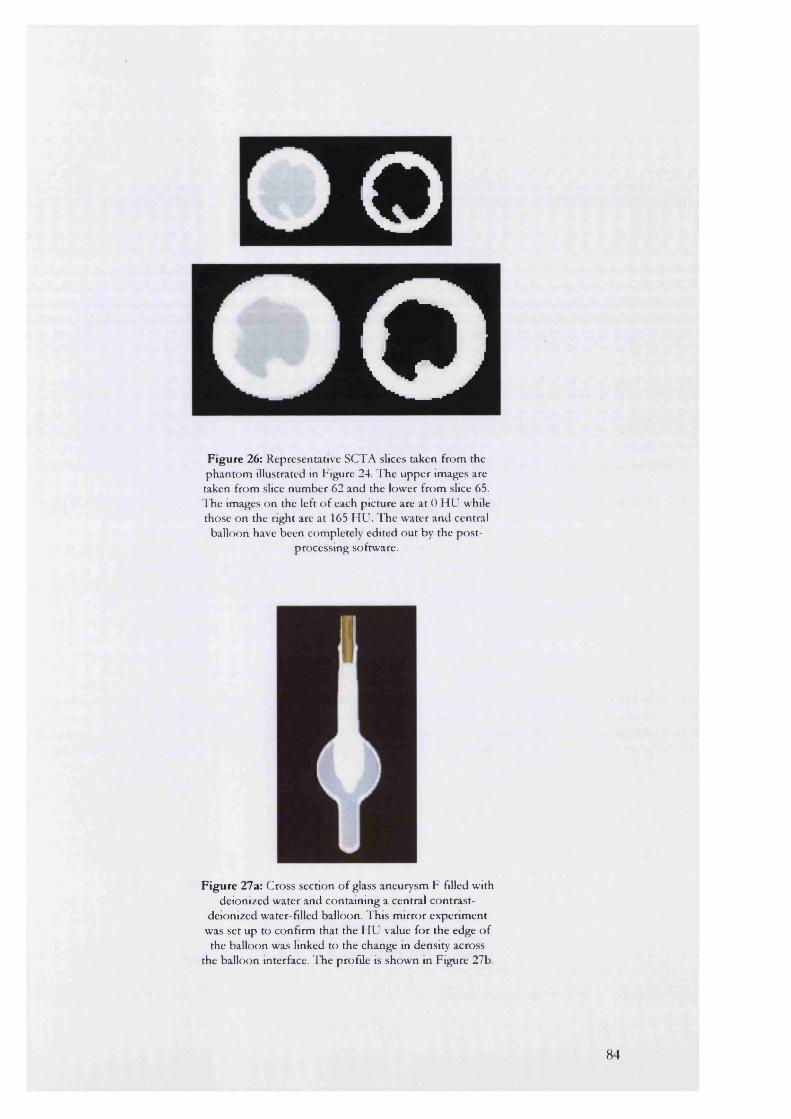
oO
F ig u re 26: Representative SCTA slices taken from the p h an to m illustrated in Figure 24. T he upper images are taken from slice num ber 62 and the low er from slice 65. ITie images on the left o f each p icture are a t 0 H U while those on the right are at 165 H U . T he w ater and central
balloon have been com pletely edited o u t by the p o s tprocessing software.
F ig u re 27a: C ross section o f glass aneurysm F filled with deionized w ater and contain ing a central contrast-
deionized water-filled balloon. T his m irro r experim ent was set up to confirm that the H U value fo r the edge o f
the balloon was linked to the change in density across the balloon interface. T he profile is show n in Figure 27b.
84
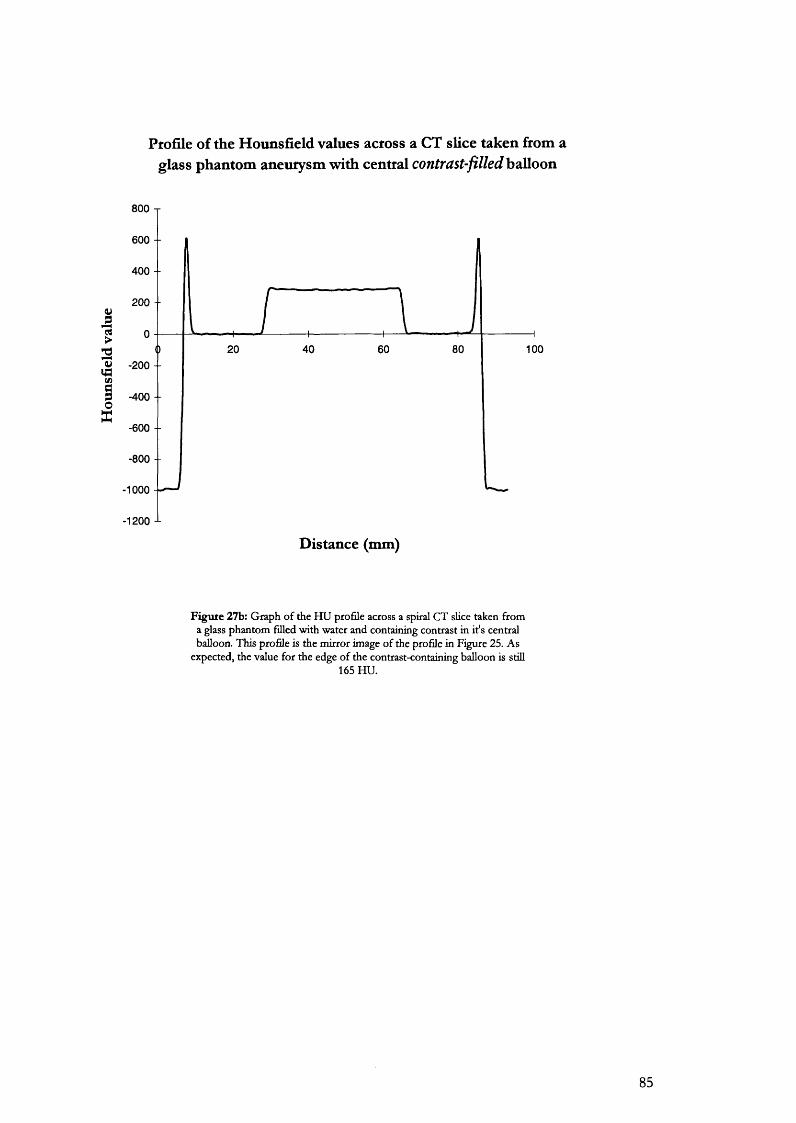
Ptofile of the Hounsfield values across a CT slice taken from aglass phantom aneurysm with central contrast-filled balloon
800 T
600 --
400 -
200 - -
3>
2 40 100W -200 -
IOX
-600 --
-800 --
-1000
-1200 J-
Distance (mm)
Figute 27b: Graph of the HU profile across a spiral CT slice taken from a glass phantom filled with water and containing contrast in it's central balloon. This profile is the mirror image of the profile in Figure 25. As
expected, the value for the edge of the contrast-containing balloon is still165 HU.
85
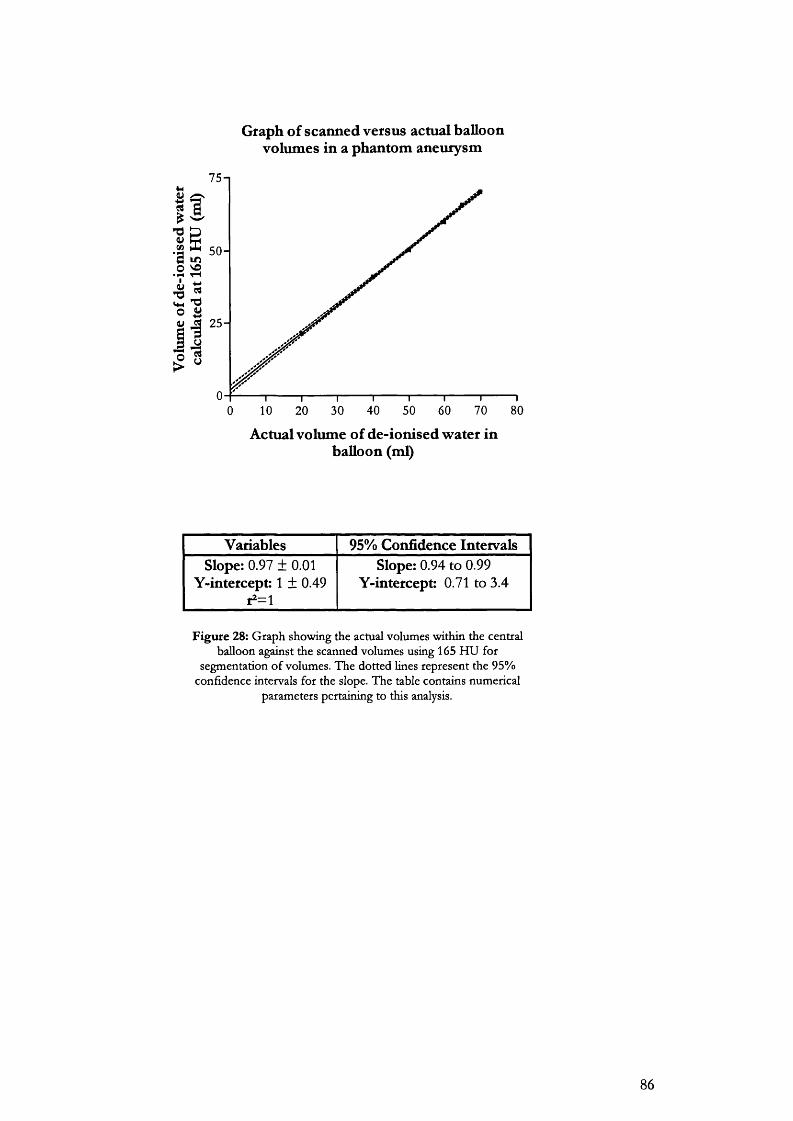
Graph of scanned versus actual balloon volumes in a phantom aneurysm
75-1
II
I 2 5 -
us10 20 30 40 50 60 70 800
Actual volume of de-ionised water in balloon (ml)
Variables 95% Confidence IntervalsSlope: 0.97 ± 0.01
Y-intercept: 1 ± 0.49r2=l
Slope: 0.94 to 0.99 Y-intercept: 0.71 to 3.4
F igu re 28: G raph show ing the actual volum es w ithin the central balloon against the scanned volum es using 165 H U for
segm entation o f volum es. T he do tted lines represen t the 95% confidence intervals for the slope. T he table contains num erical
param eters pertaining to this analysis.
86
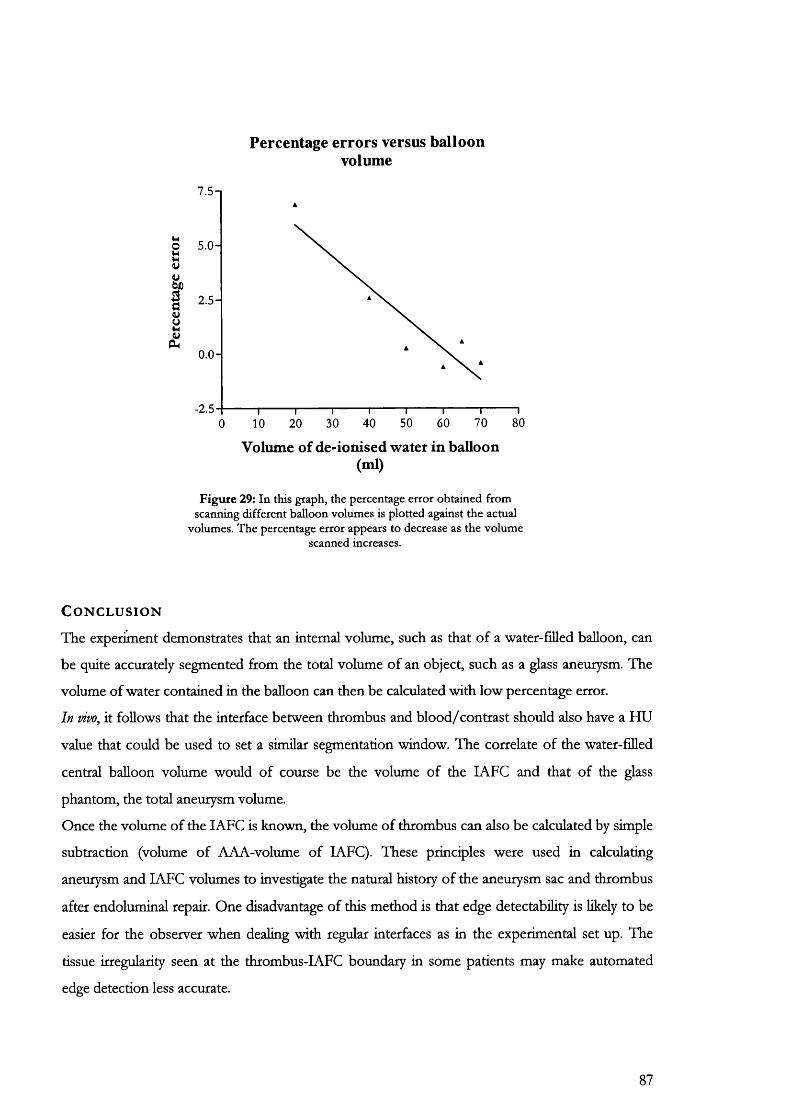
Percentage errors versus balloon volume
7.5-1
I ” ■I ».I
0 .0 -
-2.550 60 70 8030 40200 10
Volume of de-ionised water in balloon (ml)
Figure 29: In this graph, the percentage error obtained from scanning different balloon volumes is plotted against the actual
volumes. The percentage error appears to decrease as the volume scanned increases.
C o n c l u s i o n
The experiment demonstrates that an internal volume, such as that of a water-filled balloon, can
be quite accurately segmented from the total volume of an object, such as a glass aneurysm. The
volume of water contained in the balloon can then be calculated with low percentage error.
In vivo, it follows that the interface between thrombus and blood/contrast should also have a HU
value that could be used to set a similar segmentation window. The correlate of the water-filled
central balloon volume would of course be the volume of the lAFC and that of the glass
phantom, the total aneurysm volume.
Once the volume of the lAFC is known, the volume of thrombus can also be calculated by simple
subtraction (volume of AAA-volume of lAFC). These principles were used in calculating
aneurysm and LAFC volumes to investigate the natural history of the aneurysm sac and thrombus
after endoluminal repair. One disadvantage of this method is that edge detectability is likely to be
easier for the observer when dealing with regular interfaces as in the experimental set up. The
tissue irregularity seen at the thrombus-IAFC boundary in some patients may make automated
edge detection less accurate.
87
7.3
A comparison of the intra-observer and inter-observer errors in the measurement of AAA sac volume and maximal diameters
A i m
This study was designed to determine intra-observer and inter-observer errors in the assessment
of abdominal aortic aneurysm maximal diameters and sac volume using SCTA.
B a c k g r o u n d
For traditional reasons measurements of aneurysm sac diameter have been chosen as the method
of follow-up post-endovascular repair. However, their accuracy is questionable. This becomes
particularly important as they are often used to describe the efficacy and durability of this new
technique.
One disadvantage is that a single diameter may not be recorded at the same level on each occasion
of follow-up, so an aneurysm shape change may be missed. It is hence possible for an aneurysm
to shrink post-exclusion in volume terms, but because of a concurrent change in shape, with no
alteration in its maximal diameters. Furthermore, it is impossible to guarantee that linear
measurements are always taken at the same angle with respect to the long-axis of the aneurysm
even if the level is correct. This introduces a second variable that can confound the results from
this source even further.
The measurement of aneurysm volume may be a more accurate tool to follow the natural history
after endovascular repair. Mathematically a volume measurement is no more than the summation
of an infinite series of cross-sectional slices across the aneurysm sac. This would suggest that it
might describe the morphology of an aneurysm more completely than a measurement taken from
one cross-section.
For a volume measurement to be clinically useful, its reliability and repeatability need to be
known. The British Standards Institution (BSI) definition of reproducibility^^, states that 95% of
the differences obtained with repeated use of the test should lie within 2 standard deviations (BS
5497,1979). This is the working definition that wiU be adopted for this study.
In this report, linear and volume measurements taken from randomly chosen spiral CT data sets
were used to calculate the coefficient of repeatability.

P a t i e n t s a n d m e t h o d
From a total of 120 spiral CT scans initially analysed at least 6 months prior to this study, 10% (12
scans) were randomly chosen for repeat analysis. This was carried out by numbering the scans in
chronological order and then selecting them out by using a series of 12 random numbers
generated by a Geiger-MuUer tube measuring background radioactive decay and interfaced to a
computer.
Spiral CT scans, originally stored on optical disk (3M, Imation Enterprises Corp. Oakdale, Minn)
in compressed format, were re-loaded on to the MGI workstation for repeat analysis. For the
intra-observer study, the spiral CT scans were re-examined after the delay of at least 6 months
following the first analysis. A different investigator re-analysed these 12 scans for the inter
observer part of the study. Both investigators were judged to be of equivalent experience in using
the post-processing software for measurement of aneurysm parameters and were blinded to each
other's results. Only the patients original data file number with no measurement data, stored on
optical disk, was made available to the investigators. Thus both observers were blinded to the first
set of data in each analysis.
The following parameters were recorded:
1. Total aneurysm volume between the lowest renal artery and the aortic bifurcation
2. Volume of the intra-aneurysmal flow channel (lAFC)
3. Maximum aneurysm anteroposterior (AP) diameter
4. Maximum aneurysm transverse diameter
In addition both investigators were asked to comment on the level of difficulty encountered in
reading each scan.
Total aneurysm volume was calculated at a segmentation window of 0 Hounsfield (HU). The
window used to calculate the volume of the intra-aneurysmal flow channel was set up separately
for every patient from the HU profiles of representative SCTA slices taken from each scan
(Figure 32).
S t a t i s t i c a l a n a l y s i s
AH readings were expressed as the actual values in mm (linear measurements) or ml (volumes).
Intra-observer and inter-observer differences were assessed using the method described by Bland
and Altmann254. The observer errors were calculated using the coefficient of reproducibility as
defined by the British Standards Institution. This figure was derived by first calculating the
differences in readings between the observers. These differences were squared and their sum was
divided by the number of observations. The square root of this value was used as the standard
89
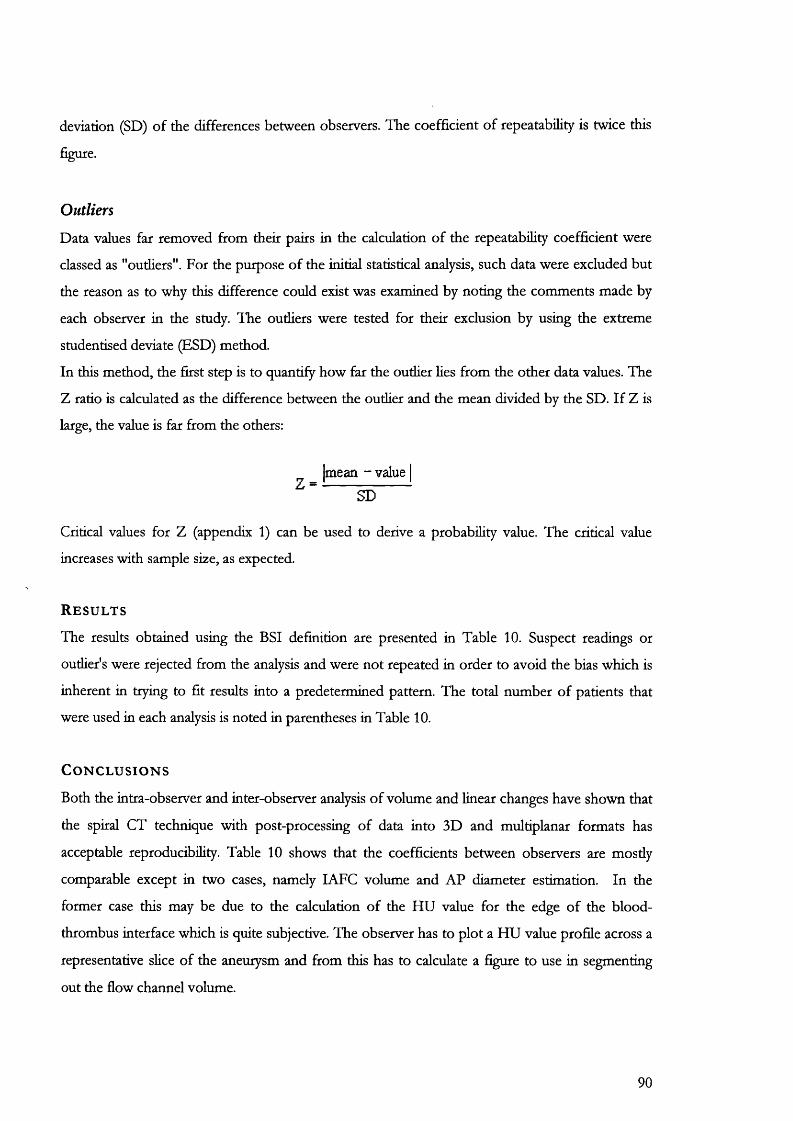
deviation (SD) of the differences between observers. The coefficient of repeatability is twice this
figure.
Outliers
Data values far removed from their pairs in the calculation of the repeatability coefficient were
classed as "outliers". For the purpose of the initial statistical analysis, such data were excluded but
the reason as to why this difference could exist was examined by noting the comments made by
each observer in the study. The outliers were tested for their exclusion by using the extreme
studentised deviate (BSD) method.
In this method, the first step is to quantify how far the outlier lies from the other data values. The
Z ratio is calculated as the difference between the outlier and the mean divided by the SD. If Z is
large, the value is far from the others:
Imean - value I Z = -
SD
Critical values for Z (appendix 1) can be used to derive a probability value. The critical value
increases with sample size, as expected.
R e s u l t s
The results obtained using the BSI definition are presented in Table 10. Suspect readings or
oudier's were rejected from the analysis and were not repeated in order to avoid the bias which is
inherent in trying to fit results into a predetermined pattern. The total number of patients that
were used in each analysis is noted in parentheses in Table 10.
C o n c l u s i o n s
Both the intra-observer and inter-observer analysis of volume and linear changes have shown that
the spiral CT technique with post-processing of data into 3D and multiplanar formats has
acceptable reproducibility. Table 10 shows that the coefficients between observers are mostly
comparable except in two cases, namely lAFC volume and AP diameter estimation. In the
former case this may be due to the calculation of the HU value for the edge of the blood-
thrombus interface which is quite subjective. The observer has to plot a HU value profile across a
representative slice of the aneurysm and from this has to calculate a figure to use in segmenting
out the flow channel volume.
90
In the case of the AP diameter, estimation of the posterior limit of the aneurysm was found to be
quite difficult due to the impingement of the vertebral column that sometimes obscured the
aneurysm sac greatly. In some patients the aneurysm had actually eroded backwards into the
intervertébral disc space. In addition, soft tissues such as pancreas and renal veins sometimes were
difficult to distinguish from the boundaries of the aneurysm sac. Both observers noted these
points.
Parameter measuredIntra-observer coefficient of
reproducibility
Inter-observer coefficient of
reproducibilityTotal AAA volume
LAFC volume Maximum AP diameter
Maximum transverse diameter
5.70 ml (11) 4.38 ml (11)
3.40 mm (11)
2.31 mm (11)
4.39 ml (10) 6.49 ml (10)
4.42 mm (11)
2.46 mm (11)
Table 10: Intra-observer and inter-observer coefficient o f repeatability in the measurement o f aneurysm parameters. The figures in parentheses indicate the number o f patients used in each analysis after the
omission o f outiying points. The range o f total aneurysm volumes surveyed was 99.75-402.66 ml; The range o f lAFC volumes was 44.10-319.63 and maximal diameters ranged 33.9-82.4 mm (AP); 39.2-85.9
(transverse).
A further detail to note are the units used in Table 10. Adthough the magnitude of the volumes
and linear measurements appear to be similar, it should be remembered that volume is actually
proportional to the cube of the diameter. Hence an intra-observer coefficient of 2.31 mm for
difference in transverse diameter translates to a volume change of at least 12.33 ml. In this respect,
the actual coefficient of 5.7 ml represents excellent volume reproducibility.
Based on these results, it would be reasonable to conclude that 3D spiral CT linear and volumetric
analysis of aneurysms post-exclusion is a reproducible technique with clinically acceptable
variability between different observer readings. The variability for total aneurysm volume is
mathematically much lower than that for maximal diameters suggesting that volume may be a
more useful clinical measure for following changes in aneurysm morphology.
91

7.4
Comparison of spiral CT angiography and graduated sizing catheter in the geometric sizing of AAA for endoluminal repair
A i m
To compare the agreement between SCTA and sizing catheter angiography in the assessment of
patients for endoluminal repair.
B a c k g r o u n d
Measurements of aneurysm morphology for endovascular assessment are commonly made using
intra-operative angiography with a graduated catheter. This method suffers from a number of
disadvantages. It requires a femoral puncture with recognised complications such as haemorrhage,
intimai dissection and distal embolisation. Angiography can only provide a two-dimensional
projection of the aorta and often only two orthogonal views are available, making interpretation
of the true anatomical dimensions difficult. There is also a magnification error, which may be
reduced but not eliminated, by imaging as close to the patients’ abdomen as possible. Narrowing
the field of view can similarly reduce parallax. Further errors due to radial distortion and camera
tilt (described in Chapter 8) also apply to imaging using fluoroscopy.
In an effort to improve the accuracy of these measurements, graduated marker catheters
(radiodense markers at 1 cm intervals) may be employed (Figure 30) but are stiU not ideal. Such
markers facilitate only longitudinal measurements parallel to the angiocatheter. Measurements
made perpendicular to the graduations still necessitate a degree of observer estimation (“eye-
baUing”). This method does nothing to reduce the danger from repeated and cumulative exposure
to higher levels of background radiation.
Spiral CT is a minimally invasive imaging technique that can also be used to provide geometric
distance measurements from 3D reconstructions. It combines all the advantages of conventional
CT scanners together with the benefits of angiography. This study compares measurements of
AAA made with SCTA and then graduated angiocatheter in the same group of patients.
92
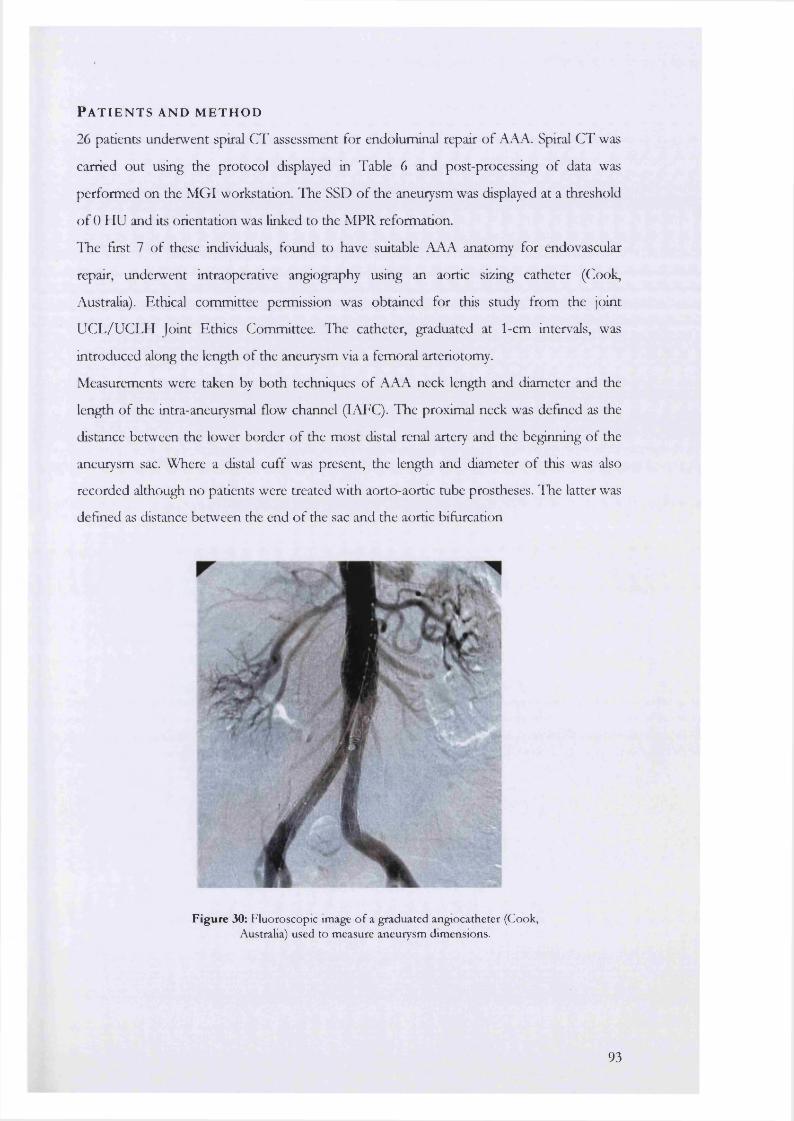
P a t i e n t s a n d m e t h o d
26 patients underwent spiral CT assessment for endoluminal repair of AAA. Spiral CT was
carried out using the protocol displayed in Table 6 and post-processing of data was
performed on the MGI workstation. The SSD of the aneurysm was displayed at a threshold
of 0 HU and its orientation was linked to the MPR reformation.
ITie first 7 of these individuals, found to have suitable AAA anatomy for endovascular
repair, underwent intraoperative angiography using an aortic sizing catheter (Cook,
Australia). Ethical committee permission was obtained for this study from the joint
UCL/UCLH Joint Ethics Committee. The catheter, graduated at 1-cm intervals, was
introduced along the length of the aneurysm via a femoral arteriotomy.
Measurements were taken by both techniques of AAA neck length and diameter and the
length of the intra-aneurysmal flow channel (IAFC). The proximal neck was defined as the
distance between the lower border of the most distal renal artery and the beginning of the
aneurysm sac. Where a distal cuff was present, the length and diameter of this was also
recorded although no patients were treated with aorto-aortic tube prostheses. The latter was
defined as distance between the end of the sac and the aortic bifurcation
Figure 30: Fluoroscopic image o f a graduated angiocatheter (Cook, Australia) used to measure aneurysm dimensions.
93
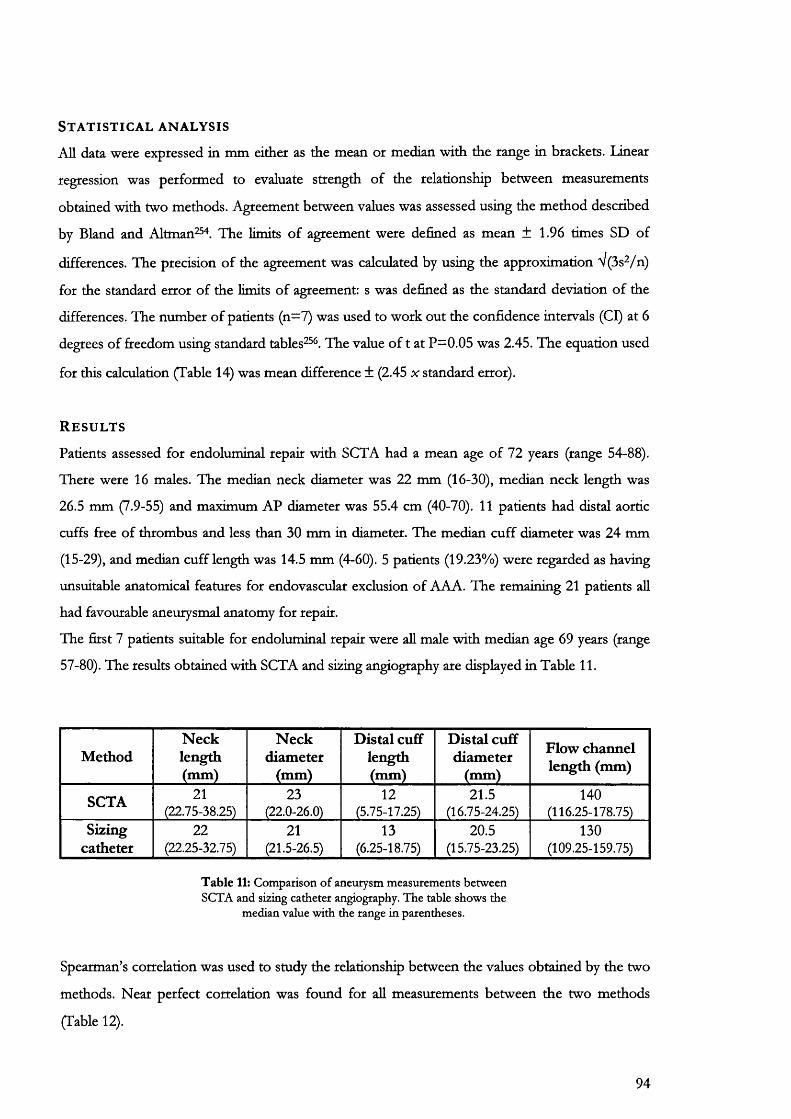
S t a t i s t i c a l a n a l y s i s
All data were expressed in mm either as the mean or median with the range in brackets. Linear
regression was performed to evaluate strength of the relationship between measurements
obtained with two methods. Agreement between values was assessed using the method described
by Bland and Altman^. The limits of agreement were defined as mean ± 1.96 times SD of
differences. The precision of the agreement was calculated by using the approximation V(3s2/n)
for the standard error of the limits of agreement: s was defined as the standard deviation of the
differences. The number of patients (n=7) was used to work out the confidence intervals (Cl) at 6
degrees of freedom using standard tables^^. The value of t at P=0.05 was 2.45. The equation used
for this calculation (Table 14) was mean difference ± (2.45 x standard error).
R e s u l t s
Patients assessed for endoluminal repair with SCTA had a mean age of 72 years (range 54-88).
There were 16 males. The median neck diameter was 22 mm (16-30), median neck length was
26.5 mm (7.9-55) and maximum AP diameter was 55.4 cm (40-70). 11 patients had distal aortic
cuffs free of thrombus and less than 30 mm in diameter. The median cuff diameter was 24 mm
(15-29), and median cuff length was 14.5 mm (4-60). 5 patients (19.23%) were regarded as having
unsuitable anatomical features for endovascular exclusion of AAA. The remaining 21 patients all
had favourable aneurysmal anatomy for repair.
The first 7 patients suitable for endoluminal repair were all male with median age 69 years (range
57-80). The results obtained with SCTA and sizing angiography are displayed in Table 11.
MethodNecklength(mm)
N eckdiameter
(mm)
Distal cuff length (mm)
Distal cuff diameter
(mm)
Flow channel length (mm)
SCTA 21(22.75-38.25)
23(22.0-26.0)
12(5.75-17.25)
21.5(16.75-24.25)
140(116.25-178.75)
Sizingcatheter
22(22.25-32.75)
21(21.5-26.5)
13(6.25-18.75)
20.5(15.75-23.25)
130(109.25-159.75)
Table 11: Comparison o f aneurysm measurements between SCTA and sizing catheter angiography. The table shows the
median value with the range in parentheses.
Spearman’s correlation was used to study the relationship between the values obtained by the two
methods. Near perfect correlation was found for all measurements between the two methods
(Table 12).
94
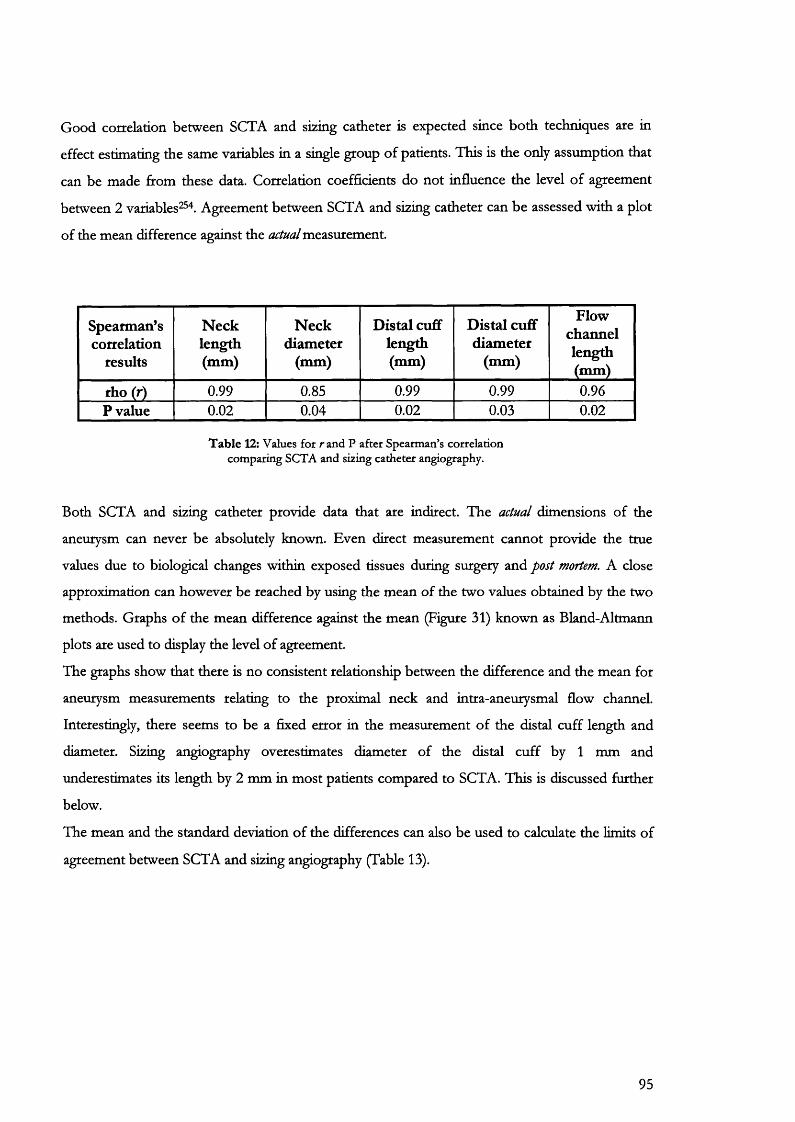
Good correlation between SCTA and sizing catheter is expected since both techniques are in
effect estimating the same variables in a single group of patients. This is the only assumption that
can be made from these data. Correlation coefficients do not influence the level of agreement
between 2 variables^" . Agreement between SCTA and sizing catheter can be assessed with a plot
of the mean difference against the actual measurement.
Spearman’scorrelation
results
Necklength(mm)
Neckdiameter
(mm)
Distal cuff length (mm)
Distal cuff diameter
(mm)
Flowchannellength(mm)
rho (r) 0.99 0.85 0.99 0.99 0.96P value 0.02 0.04 0.02 0.03 0.02
Table 12: Values fo t ran d P after Spearman’s correlation comparing SCTA and sizing catheter angiography.
Both SCTA and sizing catheter provide data that are indirect. The actual dimensions of the
aneurysm can never be absolutely known. Even direct measurement cannot provide the true
values due to biological changes within exposed tissues during surgery and post mortem. A close
approximation can however be reached by using the mean of the two values obtained by the two
methods. Graphs of the mean difference against the mean (Figure 31) known as Bland-Altmann
plots are used to display the level of agreement.
The graphs show that there is no consistent relationship between the difference and the mean for
aneurysm measurements relating to the proximal neck and intra-aneurysmal flow channel.
Interestingly, there seems to be a fixed error in the measurement of the distal cuff length and
diameter. Sizing angiography overestimates diameter of the distal cuff by 1 mm and
underestimates its length by 2 mm in most patients compared to SCTA. This is discussed further
below.
The mean and the standard deviation of the differences can also be used to calculate the limits of
agreement between SCTA and sizing angiography (Table 13).
95
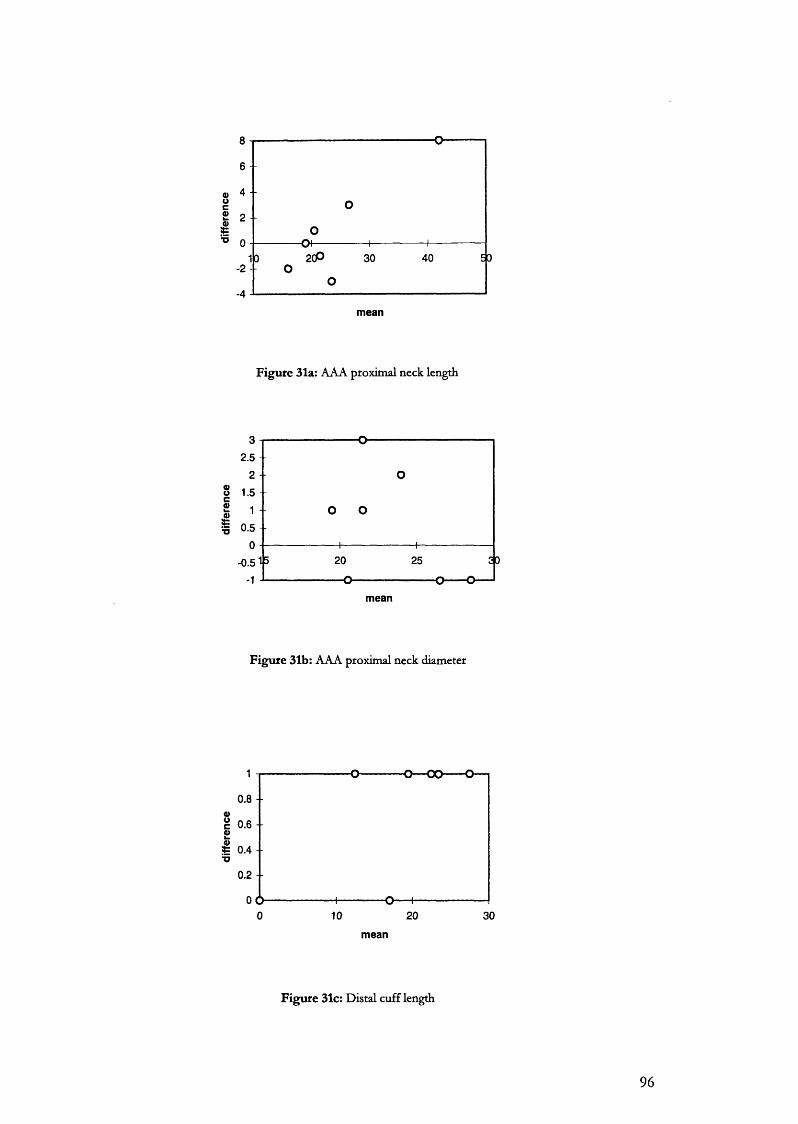
mean
F igure 31a: AAA proximal neck length
mean
F igu re 31b: AAA proximal neck diameter
0.8 - -
%c 0 . 6 - - 0)
0.4 --
0.2 - -
OCX0 10 20 30
mean
F igu re 31c: Distal cuff length
96
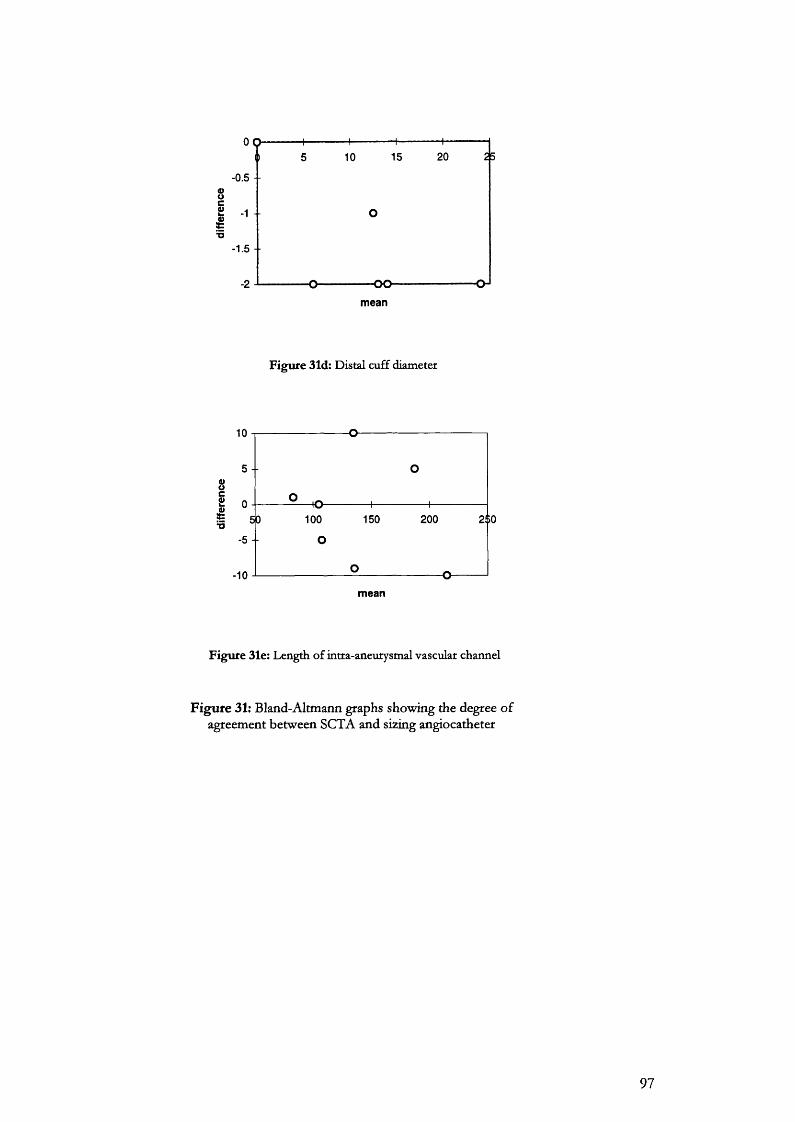
-0.5 - -
mean
Figure 31d: Distal cuff diameter
mean
Figure 31e: Length o f intra-aneurysmal vascular channel
Figure 31: Bland-Altmann graphs showing the degree of agreement between SCTA and sizing angiocatheter
97

Region of aneurysm Mean difference(d)
Standard deviation (SD)
Limits of agreement
(d±1.96 SD)neck length 0.86 3.72 -6.43 to 8.15
neck diameter 0.57 1.62 -2.67 to 3.81cuff length -1.29 0.95 -3.19 to 0.61
cuff diameter 0.71 0.49 -0.27 to 1.69flow channel -1.14 7.34 -15.82 to 13.54
T ab le 13; Summary o f the lack o f agreement (bias) between SCTA and sizing angiography.
Table 13 demonstrates that the use of angiography to measure aortic aneurysm parameters is
subject to clinically unacceptable measurement errors. For example, estimation of aneurysm neck
length using an angiocatheter may undersize by up to 7 mm or oversize by up to 8 mm. These
values could mean the difference between the selection and rejection of patients for endovascular
repair. Similarly the errors inherent in the estimation of aneurysm neck diameter could increase the
risk of postoperative complications such as endoleakage.
Precision of estimated limits of agreement and bias
So far estimates of the lack of agreement between SCTA and sizing catheter have been obtained
only for this particular series of patients. It could be argued that a different sample might give
different values^^ possibly showing better agreement. The confidence intervals (Cl) for the limits
of agreement in Table 13 have been calculated in Table 14 to investigate the precision of these
estimates.
region Cl lower limit of agreement Cl upper limit of agreementneck length -12.41 to -0.45 2.17 to 14.13
neck diameter -5.27 to -0.07 1.21 to 6.41cuff length -4.71 to -1.67 -0.91 to 2.13
cuff diameter -1.06 to 0.52 0.90 to 2.48flow chaimel -27.58 to -4.06 1.78 to 25.30
T ab le 14: Precision o f lack o f agreement between SCTA and sizing catheter angiography. This table shows the confidence intervals for the bias (which refers to the overall lack o f
agreement between the two methods) and the limits o f agreement. The intervals are calculated for each limit using the equation in the text.
98
The confidence intervals in Table 14 show a wide range of values about those seen in Table 13.
This confirms the considerable discrepancies between the 2 methods of measurement particularly
when measuring the length of the vascular channel.
C o n c l u s i o n
The study shows that the agreement between SCTA and calibrated angiocatheter is poor. There are
large disparities between the two techniques with a wide scattering of differences about the mean.
The discrepancies are much larger for neck and flow channel lengths than for diameters. For
example in the case of flow channel length, angiocatheter may undersize by 16 mm or oversize by
14 mm compared to the gold standard of SCTA. This effect is emphasized further by the results in
Table 14. Here it can be seen that the confidence intervals for these disagreements are even wider
and in the very worst situation angiocatheter may under- or oversize SCTA measurements by as
much as 28 mm and 25 mm respectively. One reason for this may be related to the physical nature
of the angiocatheter (Figure 67a).
Angiocatheter diameter measurements differed from SCTA by —3 to +4 mm in this experiment.
The sequelae of poor sizing in this region are significant. Graft migration due to undersizing is just
as important as endoleakage due to the crimping of excess graft material in oversizing.
The best agreement was obtained for sizing of the distal cuff parameters. These limits were narrow,
compared to the other regions and their confidence intervals were relatively tight. Unfortunately,
this observation has almost no clinical relevance as aorto-aortic tube grafts are now seldom
deployed.
The use of sizing angiography to measure aortic aneurysm parameters is therefore subject to
clinically unacceptable limits of under or over-estimation. In the worst scenario, this could result in
life-threatening complications.
99

7.5
The natural history of AAA after endoluminal repair. A comparative study of balloon and self-expanding endograft systems using Spiral CT angiography
A i m
The aim of this study was to document the natural history of AAA after endovascular repair using
spiral CT angiography (SCTA). This method was used to follow changes occurring after
endovascular repair utilising two separate endografting systems.
B a c k g r o u n d
It is now recognised that changes in sac morphology post-endovascular repair of AAA, are not
only indicators of the efficacy of this technique, but are also inextricably linked with endograft
durability " .
Efficacy of endovascular repair is presently judged using sac maximal diameters. It is assumed that
successful repair results initially in a reduction in sac pressure followed by later sac shrinkage. The
latter part of this statement may be incorrect for the following reasons:
Firstly, as has previously been suggested and confirmed by other investigators^^®, maximal diameter
measurements may be an inaccurate method for following sac change. They have poor
reproducibility and may miss changes in sac shape occurring in parts of the aneurysm above and
below the region of interest. In various series ^ ^ ^ , the sac as judged by AP diameter, shrinks,
remains unaltered, or increases in size. Although an increase in sac size is most commonly due to
endoleakage this cannot always be demonstrated using currently available imaging technology.
Volume measurement may provide more accurate information concerning the natural history after
endoluminal exclusion^^k Volume is a composite measure of all the cross-sectional diameters of an
aneurysm and is relatively easily estimated either commercially or using the post-processing
software available with aU spiral CT scanning equipment.
P a t i e n t s a n d m e t h o d s
During the interval April 1995-November 1999,194 patients were assessed for endovascular repair
of their AAA using spiral CT angiography (SCTA). O f this group 88 patients were selected for
endovascular repair based on standard anatomical and physiological criteria. 27 patients were
treated with home-made, 1® generation PTFE devices fixed with Palmaz stents Johnson and
Johnson), while the remainder had custom tailored Talent (World Medical, Florida) endografts. 12
100
PTFE and 18 Talent patients, who had reached follow up for 2 years or more, were chosen for
further study. There were 24 males and 6 females.
Techniques used to manufacture and deploy our PTFE system have been previously described"^ . A
length of PTFE (Impra, USA) was selected according to dimensions obtained from SCTA, and
pre-expanded to 3 times its original diameter. A Palmaz stent (Johnson and Johnson) was sutured
to the upper end of the graft (Figure 41). The stent-graft was then mounted on a Gruntzig balloon
catheter (15-30mm diameter according to the AAA neck diameter). This was introduced into a
covering sheath of 20-24 French. Once the upper stent had been deployed within the aneurysm
neck, the graft was held within the chosen common iliac artery by a nylon suture^^ whilst a second
Palmaz stent was placed to anchor its lower end. The contralateral common iliac artery was
occluded with Tungsten coils and an 8 or 10mm Dacron femoro-femoral crossover graft was
performed.
Talent grafts were custom-tailored, also according to specifications obtained from SCTA, using a
thin-walled Dacron fabric supported by a series of interlinked nitinol stents. Two configurations
were used: aorto-uni-üiac (4 patients) and bifurcated modular (57 patients).
Patients were foUowed-up with SCTA at day 5 post-exclusion and at 6-monthly intervals thereafter.
Spiral CT angiography was performed with a Siemens Somatom plus 4 scanner using the protocol
described in Table 6 for aU subjects. Patients were asked to remain still, without breathing,
throughout the scan process. Scout images were obtained, and the table was then positioned so
that scanning would begin at the coeliac axis and end a short distance below the bifurcation of the
common iliac arteries (sacroiliac joints). lodinated contrast material (Omnipaque 350 mg
Iodine/ml) was injected via a peripheral vein at a rate of 5 ml/s with bolus tracking (the total
volume administered was approximately 120 to 150 ml). After a 21 second delay, spiral scans were
performed using a pitch of 1.5 mm/s and a 5 mm beam collimation. An index of 2.5 mm was used
for the reconstructed images with a pixel resolution grid of 512x512. The entire scan time lasted
30 to 40 seconds, and approximately 100 axial images were obtained from each patient. Data were
then transferred to a workstation, where the pixel grid size was reduced to 128 x 128. Bone and
soft tissues other than the AAA were manually removed from axial images using the programme-
editing tool (Figure 14).
Data obtained fcom SCTA were transferred to a post-processing workstation (UGL-imaging group)
via Ethernet cable for reformatting into 3-dimensional and multi-planar display.
Patients with complications requiring conversion to open repair, or those with a follow-up of less
than 2 years were excluded from the study.
Using the SCTA data sets, the following linear dimensions and volumes were recorded (Table 15):
101

1. Sac maximal AP and transverse diameters
Maximal AP and transverse diameters were recorded at the widest point of the sac as judged using
the 3D SSD and multiplanar reformation. These were measured using the electronic markers and
calliper system built into the software.
2. Shortest longitudinal distance from the lowermost renal artery to the maximal AP or
transverse diameters
The distance from the beginning of the proximal neck of the aneurysm to each maximal sac
diameter was also measured. The proximal neck of the aneurysm was defined as starting just below
the level of the lowest renal artery. These measurements were made to investigate the possibility
that the maximal diameters may have altered in position within the sac after endovascular repair.
Measurements of aneurysm sac1. Maximal AP diameter
2. Distance from lowest renal artery to maximal AP diameter
1. Maximal transverse diameter2. Distance from lowest renal artery to maximal
transverse diameter
T ab le 15: Measurements carried out on the aneurysm sac (mm) after endovascular repair
In addition to the linear measurements shown in Table 15, all patients had an aneurysm volume
calculated on each occasion, from the level of the lowest renal artery (or beginning of the proximal
neck) to the aortic bifurcation. The method used to calculate these volumes was based on a voxel
density calculation and summation (Chapter 6).
Two anatomical volumes were calculated:
1. The total aneurysm volume
2. The volume of the intra-aneurysmal flow channel (lAFC).
A window of 0 HU was used to calculate the total aneurysm volume. The Hounsfield value used to
calculate lAFC volume was derived from HU profiles obtained from separate CT slices taken from
individual patients after scanning. A typical plot of this type is shown in Figure 32 and the method
used to calculate the segmentation window is also explained.
102

S t a t i s t i c a l a n a l y s i s
Measurements are displayed as the median (mm or ml) followed by the 25th and 75* percentiles
respectively.
Comparisons of results between the two groups were performed with a Mann-Whitney U test.
Comparison of patient outcomes within the two groups was performed using the Wilcoxon sum of
ranks test. In both cases P less than or equal to 0.05 was regarded as attaining significance.
R e s u l t s
4 patients in the PTFE group developed complications. One patient, in atrial fibrillation, had a
saddle embolus with contiguous thrombosis of his aortic graft to the level of the renal arteries.
After failed thrombolysis, this was treated with an axülo-bi-femoral graft. A second patient
developed graft infection at 8 months requiring open repair (Figure 33). Two patients with Type I
endoleak detected by SCTA and confirmed by DSA, were excluded from further analysis at 8 and
15 months respectively. The former patient had successful endovascular therapy to stem an upper
stent leak and was re-entered into the study at 12 months from the original repair. In all the
remaining patients we were unable to demonstrate endoleakage or slippage or migration of the
stent graft. Lumbar and/or mesenteric artery filling was observed in 7 patients but this was absent
after 6 months.
30 patients selected for this study had reached a minimum of 2 or more years follow up. 12 of
these patients had PTFE balloon-expandable, aorto-uni-iliac grafts and 18 had Talent, self
expanding, fuUy supported Dacron grafts. There were 24 males and 6 females with a mean age of
72.9 years (range 55-93).
Pre-treatment linear dimensions and volumes for the whole group are illustrated in Table 16 below.
There were no significant differences (Mann-Whitney U test) in these starting values between the
two patient groups.
AP diameter (mm)
Transverse diameter (mm)
Total aneurysm Volume (ml)
Flow Channel volume (ml)
Median 52.40 53.35 157.47 96.61
25% percentile 45.20 48.45 122.32 72.90
75% percentile 59.90 62.15 209.32 113.28
Table 16: Starting sac diameters and aneurysm volumes for patients in this study.
103
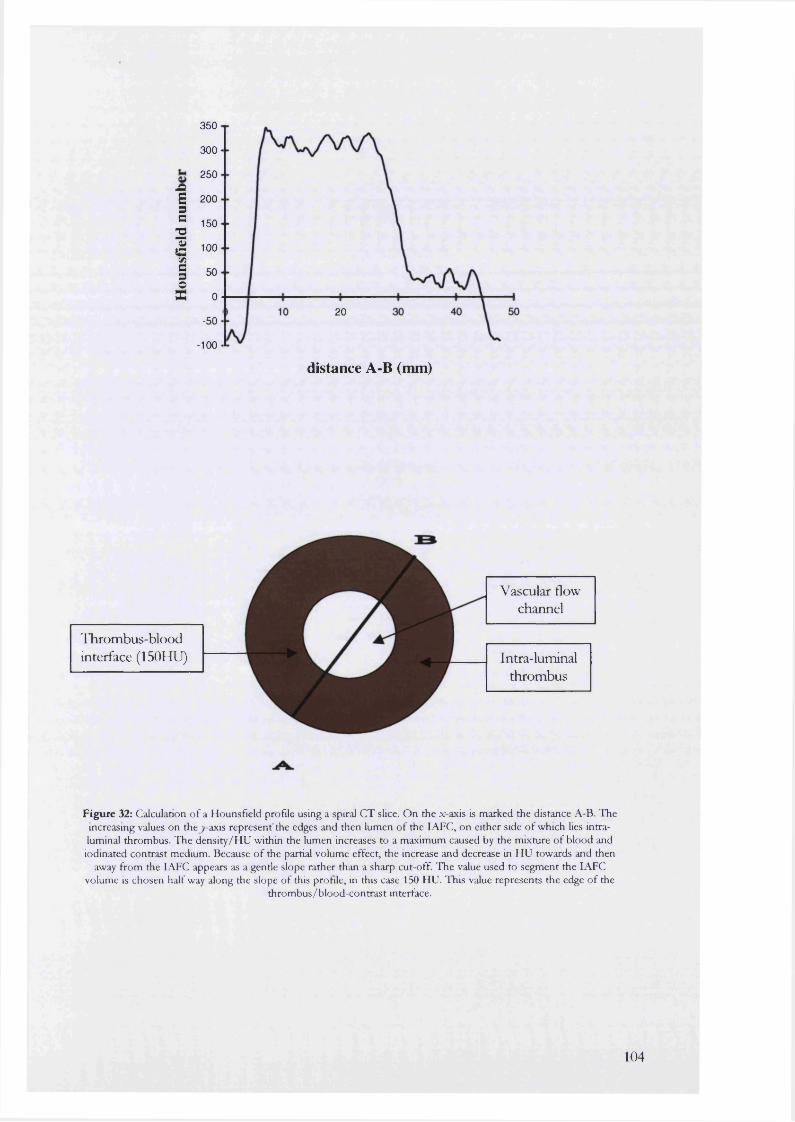
IiI
350
300
250
200
150
100
50
020
-50
-100
distance A-B (mm)
'ITirombus-blood interface (150HU)
Vascular flow channel
Intra-luminalthrombus
Figure 32: Calculation o f a Hounsfield profile using a spiral CT slice. On the x-axis is marked the distance A-B. The increasing values on thej-axis represent'the edges and then lumen of the lAFC, on either side o f which lies intraluminal thrombus. The density/HU within the lumen increases to a maximum caused by the mixture of blood and iodinated contrast medium. Because o f the partial volume effect, the increase and decrease in HU towards and then
away from the lAFC appears as a gentle slope rather than a sharp cut-off. The value used to segment the lAFC volume is chosen half way along the slope of this profile, in this case 150 HU. This value represents the edge o f the
thrombus/blood-contrast interface.
104

The different numbers of patients followed up at each time interval are presented in Table 17.
Length of follow-up Preoperative 5
days6
months1
year1.5
years 2 years 2.5years
3years
PTFE 12 12 10 9 7 5 4 2Talent 18 18 11 10 7 3 - -
T ab le 17: N um ber o f patients foUowed-up at each time interval
within the 2 groups selected for this smdy
1. Changes in total aneurysm volume
For the whole group, 5 days after endoluminal exclusion, there was a significant (P=0.02) increase
in total aneurysm volume (25 of the original 30 patients: 10 PTFE and 15 Talent). For the PTFE
group, the median volume increased from 128.54 ml to 140.93 ml.
Corresponding volumes for the Talent group increased from 179.27 ml to 194.37 during the same
period. The actual volumes for both groups are recorded in Table 18 and illustrated in Figure 34.
For the PTFE group, only patients with complications had any further significant changes in total
aneurysm volume (Figure 35). The rest of the group showed no further significant change in
volume to the conclusion of the study.
The patient with a PTFE graft blocked by saddle embolus and contiguous thrombosis had sac
shrinkage, from a preoperative volume of 109.31 ml to 53.17 ml at 1 year. The 2 patients with
endoleakage continued to have an increase in their total aneurysm volume until further treatment.
Only one of these patients had any demonstrable concomitant increase in AP or transverse
diameter.
In the Talent group there was a significant (P=0.01) decrease in total aneurysm volume to a median
143.84 ml over the next 6 months of follow up. At 1 year a further significant (P=0.03) decrease in
volume was observed to a new median of 138.8 ml. Further significant changes in volume could
not be demonstrated to the conclusion of the study (Table 18).
2. Changes in the volume of the intra-aneurysmal flow channel
For both groups, immediately after treatment, there was a significant (P<0.005) decrease in the
volume of the lAFC which then remained stable for the duration of follow up (Table 18). The
initial decrease in flow channel volume was demonstrated for 22 out of the 30 patients.
3. Changes in maximal diameters and their levels
The maximal AP and transverse diameters and their shortest distances from the lowest renal artery
are recorded in Table 19a and 19b.
105
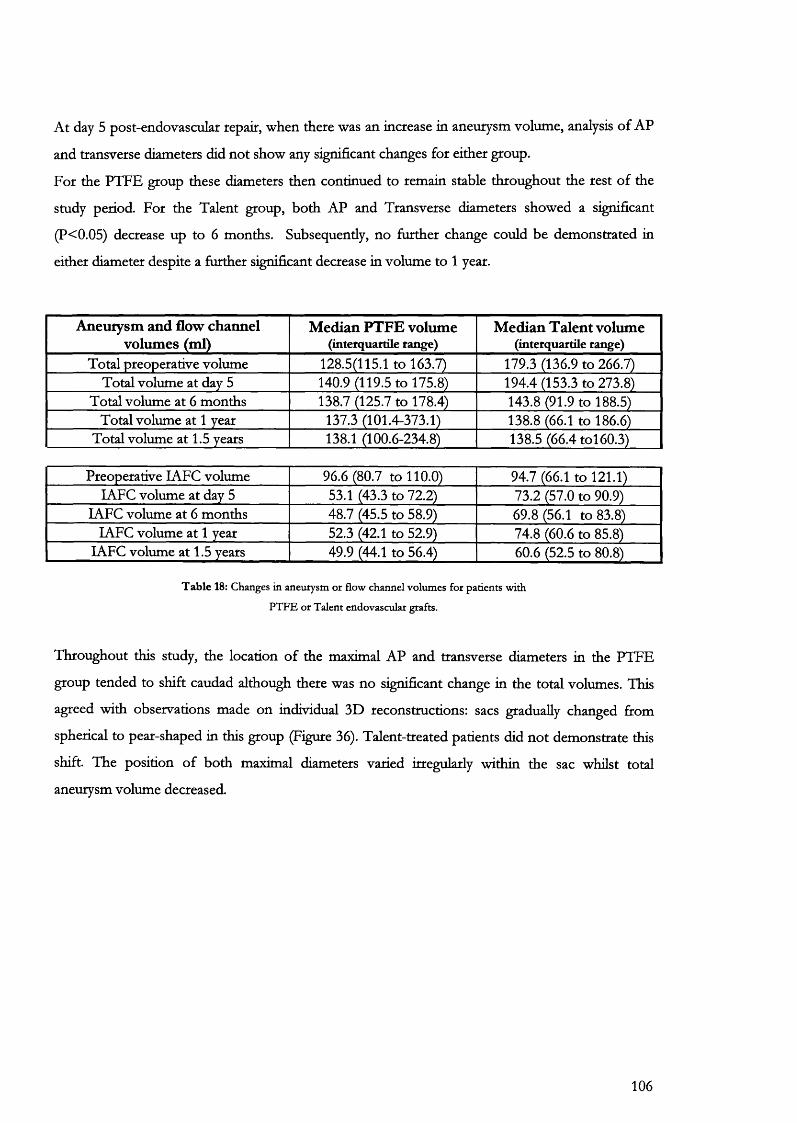
At day 5 post-endovascular repair, when there was an increase in aneurysm volume, analysis of AP
and transverse diameters did not show any significant changes for either group.
For the PTFE group these diameters then continued to remain stable throughout the rest of the
study period. For the Talent group, both AP and Transverse diameters showed a significant
(P<0.05) decrease up to 6 months. Subsequently, no further change could be demonstrated in
either diameter despite a further significant decrease in volume to 1 year.
Aneurysm and flow channel volumes (ml)
Median PTFE volume (interquartile range)
M edian Talent volume (interquartile range)
Total preoperative volume 128.5(115.1 to 163.7) 179.3 (136.9 to 266.7)Total volume at day 5 140.9 (119.5 to 175.8) 194.4 (153.3 to 273.8)
Total volume at 6 months 138.7 (125.7 to 178.4) 143.8 (91.9 to 188.5)Total volume at 1 year 137.3 (101.4-373.1) 138.8 (66.1 to 186.6)
Total volume at 1.5 years 138.1 (100.6-234.8) 138.5 (66.4 toi 60.3)
Preoperative LAFC volume 96.6 (80.7 to 110.0) 94.7 (66.1 to 121.1)lAFC volume at day 5 53.1 (43.3 to 72.2) 73.2 (57.0 to 90.9)
lAFC volume at 6 months 48.7 (45.5 to 58.9) 69.8 (56.1 to 83.8)lAFC volume at 1 year 52.3 (42.1 to 52.9) 74.8 (60.6 to 85.8)
lAFC volume at 1.5 years 49.9 (44.1 to 56.4) 60.6 (52.5 to 80.8)
T able 18: Changes in aneurysm or flow channel volumes for patients with
PTFE or Talent endovascular grafts.
Throughout this study, the location of the maximal AP and transverse diameters in the PTFE
group tended to shift caudad although there was no significant change in the total volumes. This
agreed with observations made on individual 3D reconstructions: sacs gradually changed from
spherical to pear-shaped in this group (Figure 36). Talent-treated patients did not demonstrate this
shift. The position of both maximal diameters varied irregularly within the sac whilst total
aneurysm volume decreased.
106

Figure 33: PTFE graft infection requiring removal and open repair. This patient presented with a 4-month history o f backache,
low-grade pyrexia and leucocytosis.
107
Change in total aneurysm volume after endograftingwith PTFE
4 0 0 -1
BB
I'o
200 -
1□□
oH 100 -
183 365 548 730 91350Time (days)
Figure 34a: Column scatter graph showing the change in aneurysm volume after endografting with PTFE. The median volume has been
indicated by the line at each interval.
Change in flow channel volume after endografting with PTFE
4001
2 0 0 -
100 -
Time (days)
F igu re 34b: Coltiinn scatter graph showing the change in intra- aneurysmal flow channel volume after endografting with PTFE.
The median volume has been indicated by the line at each interval.
108
Change in total aneurysm volume afterendografting with Talent
750 1îI 500- §
250-
H
730183 365Time (days)
548
F ig u re 34c: Column scatter graph showing the change in total aneurysm volume after endografting with Talent. The median
volume has been indicated by the line at each interval.
Change in flow channel volume after endografting with Talent
300 1
&
3 200-O
I*0
100 - ♦ ♦
183 365Time (days)
548 730
Figure 34d: Column scatter graph showing the change in intra- aneurysmal flow channel volume after endografting with Talent. The
median volume has been indicated by the line at each interval.
109
500-1
1 endoleakage at 1 year400-II 300-
endoleakage at 6 months200 -
normal median volume(9
100-
postoperative saddle embolism
7505002500
Time (days)
F ig u re 35: G raph show ing changes in total aneurysm volum e following the onset o f com plications in patients w ith P T F E endografts. T h e m edian volum e curve for patients w ithou t
com plications is included for reference.
Maximal diameters (mm) Median PTFE diameters ( in te rq u a rtile ran g e )
Median Talent diameters (in te rq u a rtile ran g e)
Preoperative AP diameter 52.2 (49.1 to 56.1) 55.3 (44.6 to 61.0)AP diameter at day 5 51.3 (48.5 to 57.0) 54.6 (46.1 to 64.2)
AP diameter at 6 months 53.5 (50.6 to 56.4) 44.1 (40.9 to 53.5)AP diameter at 1 year 55.0 (50.1 to 55.2) 47.6 (41.9 to 50.1)
AP diameter at 1.5 years 53.7 (47.9 to 60.1) 30.1 (28.7 to 45.7)
Preoperative transverse diameter 50.7 (46.1 to 58.9) 53.9 (49.4 to 66.3)Transverse diameter at day 5 52.3 (45.5 to 60.6) 55.5 (53.2 to 67.6)
Transverse diameter at 6 months 53.9 (48.2 to 59.6) 50.3 (40.7 to 59.1)Transverse diameter at 1 year 53.2 (48.4 to 60.6) 52.5 (46.6 to 64.0)
Transverse diameter at 1.5 years 57.1 (49.2 to 61.8) 32.0 (26.4 to 50.1)
T a b le 19a: Changes in aneurysm m axim al diam eters fo r patients w ith P T F E o r T alen t endovascular grafts
110
Level of maximal diameter (mm) Median PTFE levels (interquartile range)
Median Talent levels (interquartile range)
Preoperative AP level 70.1 (65.2 to 85.0) 72.5 (60.1 to 88.0)AP level at day 5 70.0 (66.3 to 88.2) 78.8 (66.9 to 97.3)
AP level at 6 months 80.6 (66.2 to 86.2) 76.7 (57.6 to 90.2)AP level at 1 year 81.1 (71.4 to 88.4) 74.6 (64.3 to 85.0)
AP level at 1.5 years 87.8 (67.6 to 93.2) 57.7 (44.6 to 76.6)
Preoperative transverse level 76.5 (62.9 to 91.9) 75.3 (64.1 to 86.4)Transverse level at day 5 78.0 (66.3 to 87.2) 81.4 (67.7 to 93.1)
Transverse level at 6 months 77.9 (72.3 to 88.1) 75.6 (59.9 to 93.3)Transverse level at 1 year 82.7 (69.6 to 90.5) 74.0 (69.2 to 80.4)
Transverse level at 1.5 years 78.6 (72.9 to 91.9) 73.7(55.7 to 91.0)
T a b le 19b: This table shows the distance from the low est renal artery (a fixed anatom ical point) to the level, w ithin the aneurysm , a t w hich each m axim al diam eter was m easured. A ll m easurem ents
represen t the shortest distance along a straight line betw een the tw o points.
C o n c l u s i o n
The study demonstrates differing effects of balloon and self-expanding endograft systems on
aneurysm morphology. These changes, described using volume measurements, are incompletely
followed by changes in the maximal diameters.
Both endografts caused an initial significant increase in total aneurysm volume and a decrease in
lAFC volume. The decrease in flow channel volume resulted from the exclusion of part of the
blood-flow channel in the aneurysm sac (Figure 36) and its replacement with a narrower
endovascular graft. The increase in aneurysm volume was not accompanied by any significant
change in the maximal diameters.
Follow up based on measurement of maximal sac diameters may also miss a change in sac shape
after endovascular repair. Although, a change in sac shape could lead to an alteration in sac linear
dimensions, maximal diameters may not necessarily change (Figure 68). One way of recording an
alteration in the location of the maximal diameters within the aneurysm sac is by measuring the
level at which each maximal diameter is recorded with respect to a fixed point such as the lowest
renal artery. In this study, the level did not vary consistently for the Talent group, confirmed by an
analysis of the individual 3D reconstructions. The changes in position of maximal diameter were
irregular reflecting asymmetrical sac shrinkage.
In the PTFE group, although total aneurysm volume remained stable, sac shape and position of
maximal diameters did change. There was a tendency for the sac to become pear-shaped with time
as the maximal diameters moved in a caudad direction. A change in sac shape seems to have taken
111

place without any change in magnitude of maximal diameters. Although the clinical significance of
this observation is as yet unclear, it does demonstrate that the value of diameter measurements in
follow-up may be of limited use thus providing further support to the idea that aneurysm volume is
a more complete measure of sac morphology.
112

F ig u re 36: T his sequence o f 3D reconstructions show the effects o f endografting w ith P T F E (top) and Talent (below) o n aneurysm sac m orphology. T he first reconstruction is preoperative followed by the sac at day 5.
Subsequent reconstructions at 6-m onthly intervals clearly show the PT F E -trea ted sac becom ing m ore pear-shaped w ith time while the T alent sac show s m arked and irregular shrinkage over its length. T hese pictures are reproduced
for qualitative exam ination only and the images betw een the two patients are n o t draw n to the sam e scale.
?/ V
t
1*'—à %
113
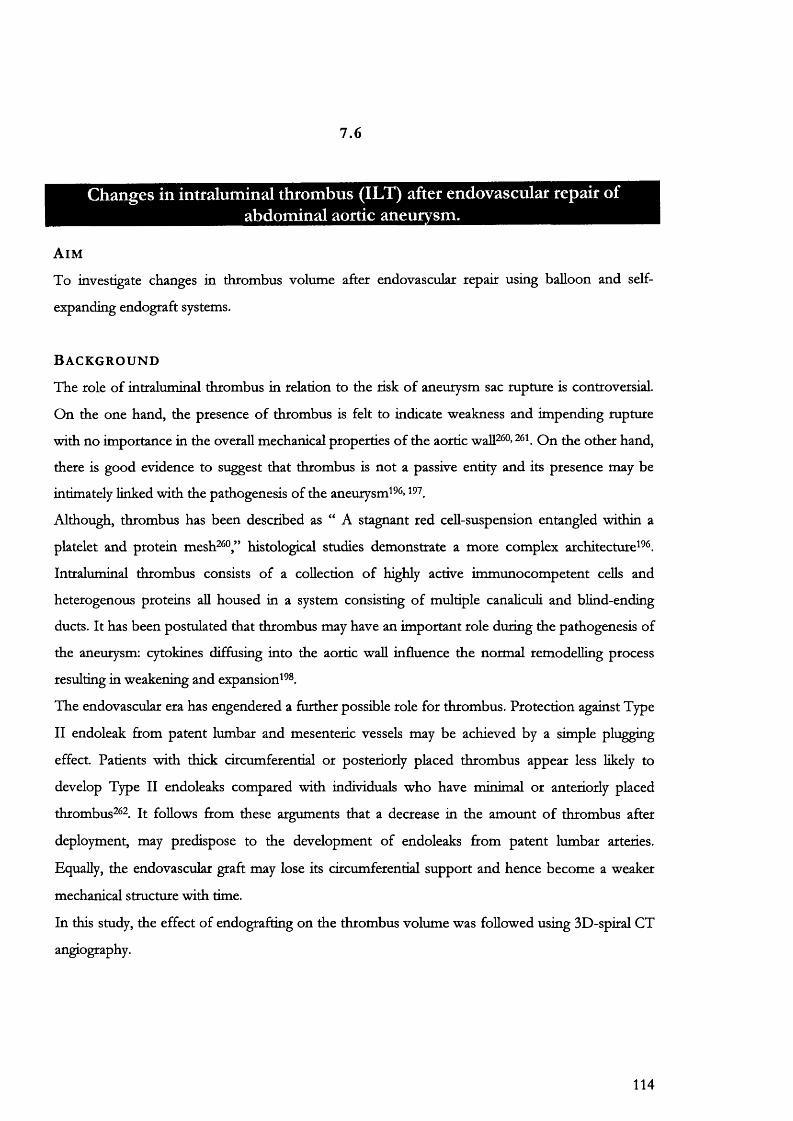
7.6
Changes in intraluminal thrombus (ILT) after endovascular repair of abdominal aortic aneurysm.
A i m
To investigate changes in thrombus volume after endovascular repair using balloon and self
expanding endograft systems.
B a c k g r o u n d
The role of intraluminal thrombus in relation to the risk of aneurysm sac rupture is controversial.
On the one hand, the presence of thrombus is felt to indicate weakness and impending rupture
with no importance in the overall mechanical properties of the aortic waU ®» On the other hand,
there is good evidence to suggest that thrombus is not a passive entity and its presence may be
intimately linked with the pathogenesis of the aneurysm^^^»
Although, thrombus has been described as “ A stagnant red cell-suspension entangled within a
platelet and protein mesh ^ ®,” histological studies demonstrate a more complex architecture^^< .
Intraluminal thrombus consists of a collection of highly active immunocompetent cells and
heterogenous proteins all housed in a system consisting of multiple canaliculi and blind-ending
ducts. It has been postulated that thrombus may have an important role during the pathogenesis of
the aneurysm: cytokines diffusing into the aortic wall influence the normal remodelling process
resulting in weakening and expansion^^®.
The endovascular era has engendered a further possible role for thrombus. Protection against Type
II endoleak from patent lumbar and mesenteric vessels may be achieved by a simple plugging
effect. Patients with thick circumferential or posteriorly placed thrombus appear less likely to
develop Type II endoleaks compared with individuals who have minimal or anteriorly placed
thrombus^‘2. It follows from these arguments that a decrease in the amount of thrombus after
deployment, may predispose to the development of endoleaks from patent lumbar arteries.
Equally, the endovascular graft may lose its circumferential support and hence become a weaker
mechanical structure with time.
In this study, the effect of endografting on the thrombus volume was followed using 3D-spiral CT
angiography.
114
P a t i e n t s a n d m e t h o d
From a total experience of 88 patients undergoing endovascular repair of their abdominal aortic
aneurysms, 30 individuals, who had reached follow up for 2 or more years, were chosen for further
study. 12 patients were treated with pre-expanded PTFE aorto-uni-iliac grafts and 18 had Talent,
supported Dacron grafts (World Medical). There were 24 males and 6 females with a mean age of
72.9 years (range 55-93).
Spiral CT angiography was performed with a Siemens Somatom plus 4 scanner using the protocol
described in Table 6 for all subjects. Volumetric data was transferred to a workstation, where bone
and soft tissues other than the AAA were manually removed from axial images using the
programme-editing tool (Figure 14). Volumes were calculated, using a voxel-summing technique,
for the whole aneurysm and for the intra-aneurysmal flow channel. These volumes were then
subtracted, using a previously validated technique (Chapter 7.2), to provide the volume of intra
luminal thrombus (ILT).
S t a t i s t i c a l a n a l y s i s
Individual values are presented as the median volume (ml) with the interquartile range in brackets.
Results were analysed within groups using the Wilcoxon matched paies test. Between groups
analysis was performed with a Mann-Whimey U test. A P value less than or equal to 0.05 was
regarded as attaining significance.
R e s u l t s
Before endovascular repair, the median volume of ILT for PTFE patients was 33.47 ml (percentiles
22.41 to 55.98 ml). For Talent patients’ equivalent volumes were 79.85 ml (38.41 to 152.30 ml).
There was a significant difference between these two groups at the 5% level (Mann-Whitney U test;
P=0.01) suggesting that the Talent patients did contain more aneurysm thrombus preoperatively
than the PTFE group (Figure 37).
115
Preoperative intra-luminal throm bus volumes
500 -1
400
Ii
300 -
200 -
100 -
PTFE TalentPatient group
F igure 37: This graph shows the differences in preoperative intraluminal thrombus volume for the two populations used in this study. The box-whisker plot illustrates the 25*'’ (upper line o f box) and 75* (lower line o f box) percentiles. The median value for each
group is the centre line. The bars above and below each box indicate the maximum and minimum values respectively.
1. Outcome for PTFE-treated patients
After endovascular exclusion, the median PTFE ILT volume significantly (P=0.002) increased to
87.67 ml (67.76 to 120.80 ml). No further significant changes in volume were seen to the
conclusion of the study at 2.5 years (Table 20).
7 Type II endoleaks, noted immediately after endografting with a combination of spiral CT and
contrast angiography, had aU disappeared without any intervention by 6 months.
Time (days) Median thrombus volume (ml) Interquartile range P value*0 33.47 22.41 - 55.98 -
5 87.67 67.76 -120.8 0.002183 92.90 80.49 - 122.8 0.85365 97.98 77.95 - 99.22 0.91548 91.63 76.54 -120.7 0.12730 87.42 74.65 -104.4 1.00913 107.0 78.00 -174.60 0.50
*Wilcoxon signed rank test
T ab le 20: The effects o f endografting with PTFE on volume o f intraluminal thrombus. After an initial increase in thrombus volume, there is no further significant change up to 2.5 years (913 days) follow-up.
116
2. Outcome for Talent-treated patients
For Talent-treated patients there was also an initial significant (P=0.004) increase in thrombus
volume at day 5 after endovascular repair. The median thrombus volume increased by 34.15 ml
during this interval (Table 21).
At 6 months, there was a drop in thrombus volume (P=0.01) of 41.63 ml. The new median volume
(72.37 ml) was now less than the preoperative median thrombus volume. No further significant
change in ILT volume was observed to the conclusion of the smdy. 5 cases of Type II
endoleakage, observed at day 5, had all resolved by 6 months without further intervention.
Time (days) Median thrombus volume (ml) Interquartile rangée (ml) P value*
0 79.85 38.41 -152.3 -
5 114.0 87.09 -186.5 0.004183 72.37 41.56-105.9 0.01365 84.40 51.90 -109.5 0.19548 24.25 9.39-79.55 0.25
*Wilcoxon signed rank test
T ab le 21: The effects o f endografting with Talent on volume o f intra-aneurysmal thrombus. After an initial increase in thrombus volume, there is a continuing loss to
1-year follow-up.
C o n c l u s i o n
The significance of the larger amount of ILT in the Talent group preoperatively, is unclear (Figure
37) but is probably a reflection of the slightly larger aneurysms treated later on in our learning
curve. The median preoperative AP diameter for the PTFE group was 52.2 mm, transverse was
50.7 mm and preoperative volume was 128.5 ml. For the Talent group, the equivalent figures were
55.3 mm, 53.9 mm and 179.3 ml respectively.
Post endovascular repair, there is an increase in the amount of ILT which then alters depending on
the endografting system used. In patients treated with PTFE balloon-expandable endografts, the
ILT remains constant in volume.
In contrast, the amount of ILT with the Talent self-expanding system decreases almost to its
preoperative level after which no further significant change is noted.
Although patients in both groups experienced endoleaks, these resolved without further
intervention. Talent patients had no particular propensity to suffer from further type II leaks as a
result of the loss of thrombus. These results suggest that apart from the possible plugging of
lumbar artery ostia by thrombus preoperatively, there appears to be little relationship between the
amount of sac thrombus and type II endoleakage.
117
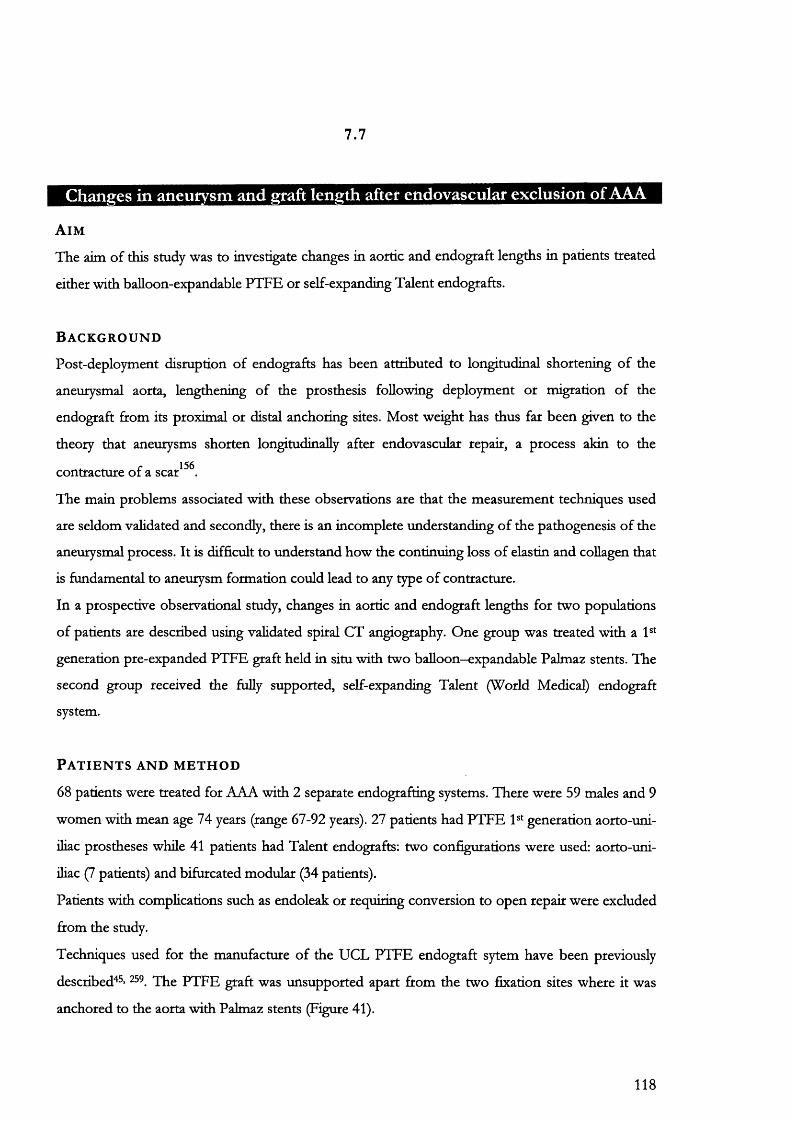
7.7
Changes in aneurysm and graft length after endovascular exclusion of AAA
A i m
The aim of this study was to investigate changes in aortic and endograft lengths in patients treated
either with balloon-expandable PTFE or self-expanding Talent endografts.
B a c k g r o u n d
Post-deployment disruption of endografts has been attributed to longitudinal shortening of the
aneurysmal aorta, lengthening of the prosthesis following deployment or migration of the
endograft from its proximal or distal anchoring sites. Most weight has thus far been given to the
theory that aneurysms shorten longitudinally after endovascular repair, a process akin to the
contracture of a scar*^ .
The main problems associated with these observations are that the measurement techniques used
are seldom validated and secondly, there is an incomplete understanding of the pathogenesis of the
aneurysmal process. It is difficult to understand how the continuing loss of elastin and collagen that
is fundamental to aneurysm formation could lead to any type of contracture.
In a prospective observational study, changes in aortic and endograft lengths for two populations
of patients are described using validated spiral CT angiography. One group was treated with a 1®
generation pre-expanded PTFE graft held in situ with two balloon—expandable Palmaz stents. The
second group received the fiilly supported, self-expanding Talent (World Medical) endograft
system.
P a t i e n t s a n d m e t h o d
68 patients were treated for AAA with 2 separate endografting systems. There were 59 males and 9
women with mean age 74 years (range 67-92 years). 27 patients had PTFE 1®* generation aorto-uni-
iliac prostheses while 41 patients had Talent endografts: two configurations were used: aorto-uni-
iliac (7 patients) and bifurcated modular (34 patients).
Patients with complications such as endoleak or requiring conversion to open repair were excluded
from the study.
Techniques used for the manufacture of the UGL PTFE endograft sytem have been previously
described'^^’ The PTFE graft was unsupported apart from the two fixation sites where it was
anchored to the aorta with Palmaz stents (Figure 41).
118
Patients had SCTA on the 5’ postoperative day and 6 monthly intervals thereafter using the
protocol already described (Table 6). Two longitudinal distances were measured and compared for
each patient (Figure 38):
• The shortest distance between the two points joining the lowermost renal artery and the aortic
bifurcation (the vertical bociy length)
• The length of the intra-aneurysmal flow channel (luminal centre line). This was calculated by
placing markers in the centre of the aneurysm or graft blood flow channel, perpendicular to it’s
waU and then measuring the distances between these markers starting at the upper margin of
the stent and finishing at the aortic bifurcation. These, landmarks were relatively easily
identified using a combination of 3-dimensional reconstruction and multiplanar reformation.
S t a t i s t i c a l a n a l y s i s
All results are displayed in mm as the median with the interquartile range in parentheses.
Comparison of patient outcomes within groups was performed using a Wücoxon sum of ranks
test. A Mann-Whimey U test was used to compare preoperative differences between the PTFE and
Talent group. P less than 0.05 was regarded as attaining significance.
R e s u l t s
Data fcom 12 PTFE and 30 Talent patients was available for analysis up to 3 and 2 years follow up
respectively. These patients showed no Type I endoleaks or evidence of late rupture. There were 7
cases of Type II endoleak in the PTFE group and 5 cases in the Talent group but all resolved
spontaneously within 6 months without intervention.
1. Changes in vertical body length for PTFE-treated patients
There was a significant (P=0.04) median increase in vertical body length from an initial 111.5 mm
(percentiles 103.7 to 125.9 mm) to 114.7 mm at day 5 (106.3 to 125.4 mm). The increase was seen
for 10 out of 12 patients, of which six had a difference greater than 2.5 mm, ie beyond the range of
observer error (Table 10).
The gradual increase in length continued, becoming significant (P= 0.03) when there was a further
median increase from 119.7 mm (109.1 to 125.8mm) at 12 months to 126.1 mm (111.9 to 135.7
mm) at 18 months. This occurred in 6 out of 7 patients. Further significant change was not seen up
to 3 years follow up (Figure 39).
119
2. Changes in luminal centre line length (LCL) for PTFE-treated patients
In contrast to vertical body length, there was no significant change in luminal centre line length
from the initial median value of 116.6 mm percentiles 111.1 to 131.8 mm) until 18 months. At this
time, median length had increased by 16.4 mm to 133.0 mm (127.8 to 158.9 mm; P=0.01). The
new graft length subsequently remained unchanged. The distance between the lowest renal artery
and the top of the stent was also measured. This did not show any significant change excluding
graft migration from this site as a cause.
3. Changes in vertical body length for Talent-treated patients
The initial median length for Talent-treated patients was 123 mm percentiles 104.5 to 133.2 mm).
This did not significandy differ firom the PTFE group preoperative lengths (Mann-Whitney U test).
Although, there was an apparent decrease in aneurysm length at 1 year, this failed to reach
significance (Figure 40). When Talent patients with the aorto-uni-iliac configuration were analysed
as a separate group, the results remained unaltered.
4. Changes in luminal centre line length for Talent-treated patients
The initial length in the Talent group was 130.6 mm percentiles 113.4 to 139.7 mm). This also did
not differ significandy from the PTFE-treated initial length (Mann-Whitney U test). There was no
significant change in graft length after treatment (Figure 40) for the study period (2 years).
120
V e r t i c a l b o d y l e n g t h
Figure 38: Length measurements made on aneurysms. The vertical body length was the shortest linear distance between the lowest renal artery and the aortic bifurcation. The luminal centre line length was measured in 3- dimensional space using electronic markers (black circles) placed in the center o f the flow channel from the
beginning of the top stent to the aortic bifurcation. The distance between each marker was calculated and summedto give this length
121
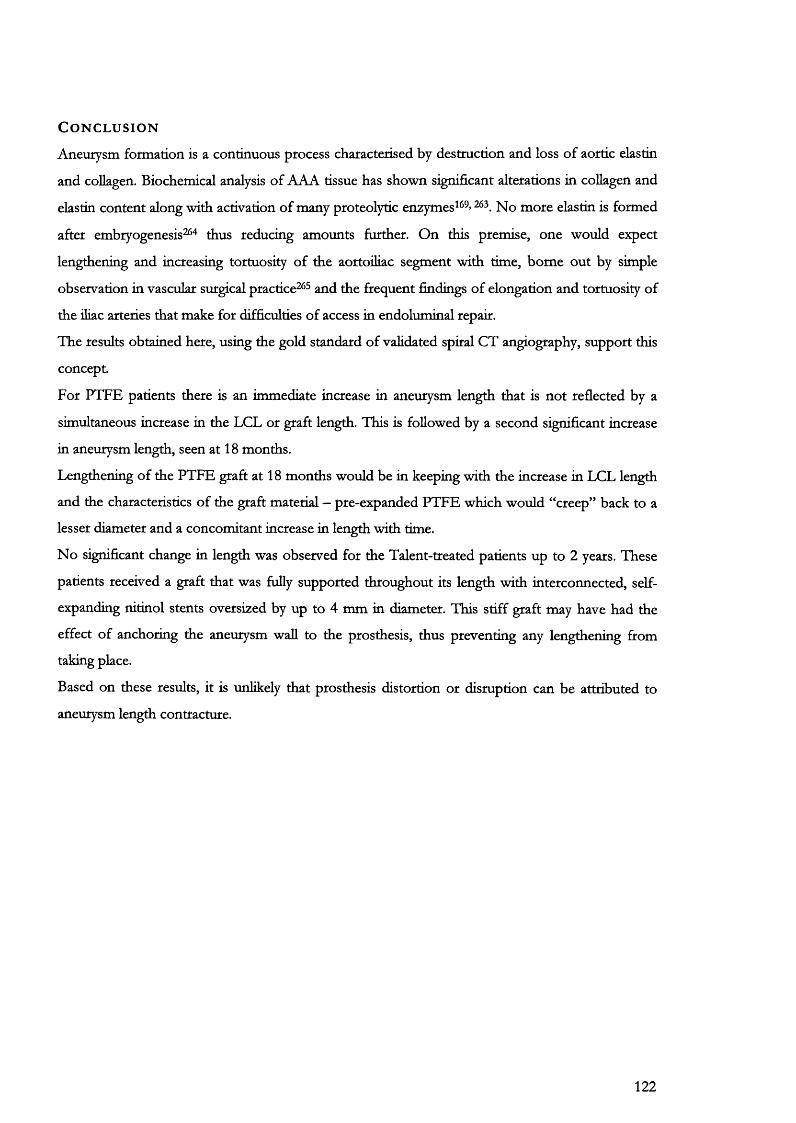
C o n c l u s i o n
Aneurysm formation is a continuous process characterised by destruction and loss of aortic elastin
and collagen. Biochemical analysis of AAA tissue has shown significant alterations in collagen and
elastin content along with activation of many proteolytic enzymes^^^» No more elastin is formed
after embryogenesis^^" thus reducing amounts further. On this premise, one would expect
lengthening and increasing tortuosity of the aortoüiac segment with time, borne out by simple
observation in vascular surgical practice^^ and the frequent findings of elongation and tortuosity of
the ihac arteries that make for difficulties of access in endoluminal repair.
The results obtained here, using the gold standard of validated spiral CT angiography, support this
concept.
For PTFE patients there is an immediate increase in aneurysm length that is not reflected by a
simultaneous increase in the LCL or graft length. This is followed by a second significant increase
in aneurysm length, seen at 18 months.
Lengthening of the PTFE graft at 18 months would be in keeping with the increase in LCL length
and the characteristics of the graft material — pre-expanded PTFE which would “creep” back to a
lesser diameter and a concomitant increase in length with time.
No significant change in length was observed for the Talent-treated patients up to 2 years. These
patients received a graft that was fully supported throughout its length with interconnected, self
expanding nitinol stents oversized by up to 4 mm in diameter. This stiff graft may have had the
effect of anchoring the aneurysm wall to the prosthesis, thus preventing any lengthening fcom
taking place.
Based on these results, it is unlikely that prosthesis distortion or disruption can be attributed to
aneurysm length contracture.
122
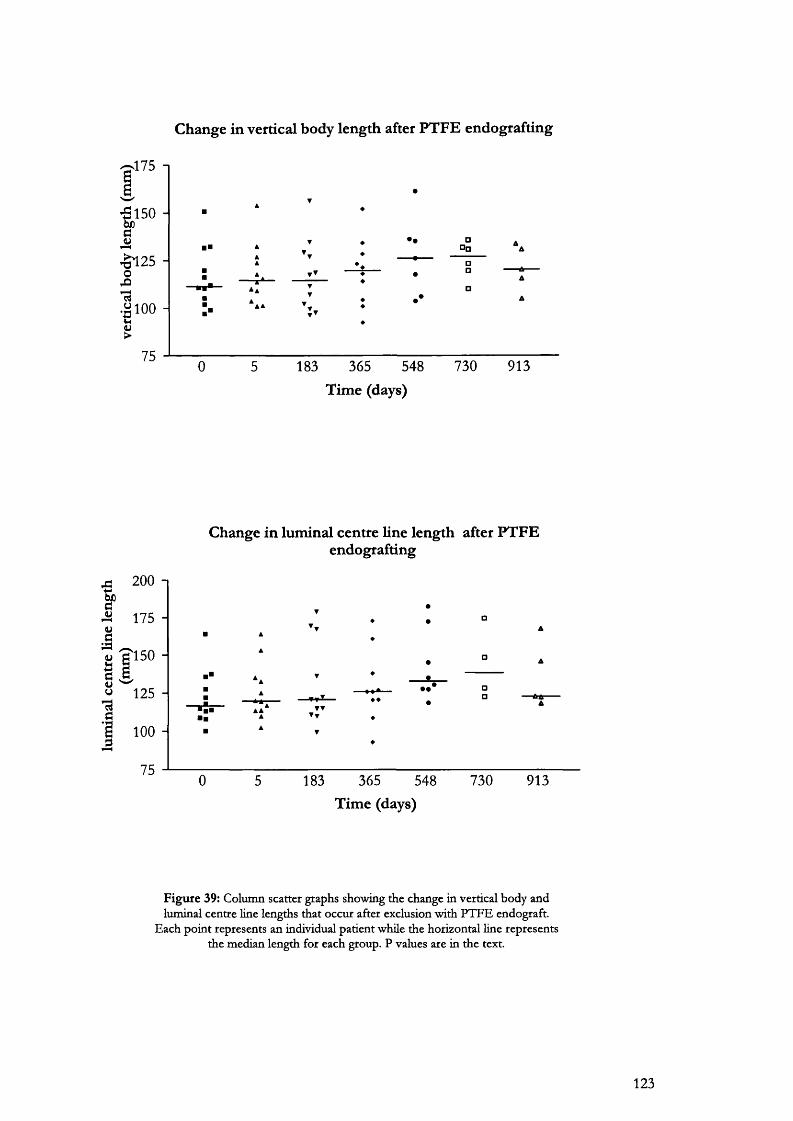
Change in vertical body length after PTFE endografting
175 1
-5150
f2 5
oS i
1 100
;75
□□□
0 5 183 365 548 730 913
Time (days)
Change in luminal centre line length after PTFE endografting
200 -I
f 175
125 -
100 -
75
T T▼▼
183 365 548Time (days)
730 913
F igu re 39: Column scatter graphs showing the change in vertical body and luminal centre line lengths that occur after exclusion with P T F E endograft.
Each point represents an individual patient whüe the horizontal line represents the median length for each group. P values are in the text.
123
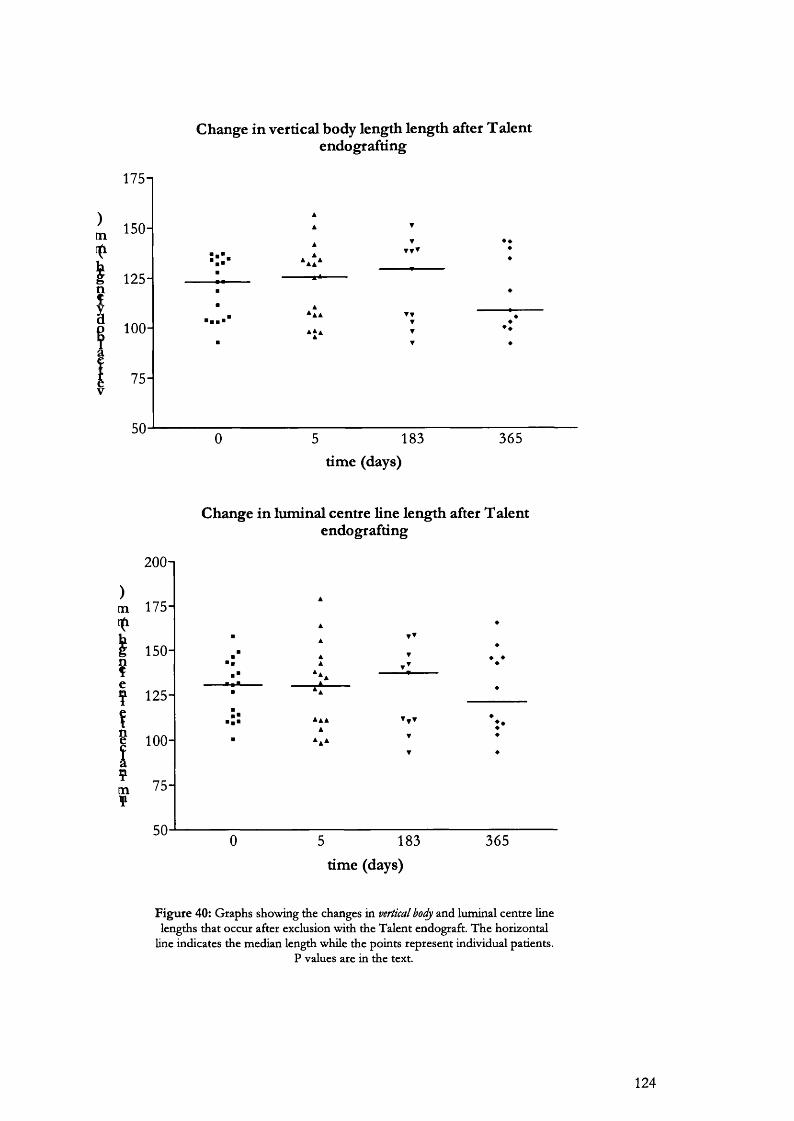
Change in vertical body length length after Talentendografting
175n
g 125-Io 100- !
75-V
183 365time (days)
)m
g
tn?
200n
175-
150-
125-
100 -
75-
50
Change in luminal centre line length after T aient endografting
5 183time (days)
365
F ig u re 40: G raphs show ing the changes in vertical bocfy and lum inal cen tre line lengths tha t occur after exclusion w ith the T alen t endograft. T h e horizontal
Hne indicates the m edian length while the points rep resen t individual patients. P values are in the text.
124

7.8
Natural history of the aneurysm neck after endoluminal repair using balloon and self-exnanding endoeraft systems.
A i m
To determine the natural history of the proximal aneurysm neck after endovascular repair
deploying balloon and self-expanding endografts.
B a c k g r o u n d
The durability of endovascular repair is still unknown. One concern is expansion of the aortic neck
at the site of endograft attachment. Studies of inffa-renal aortic diameter in healthy individuals have
shown a gradual dilatati.on '^ of this segment with age (Table 22). The magnitude of the increase is
dependent on both the body surface area and the sex of the patient. The inffarenal diameter
increases 26% in males compared to 24% in females between the ages of 25 and 70 years * .
Patients with aneurysms demonstrate an even greater dilatation of this region over time with
significant implications for the longer-term integrity of the graft-vessel wall seal^^. In contrast to
studies of neck dilatation after open repair, only a few studies have looked specifically at neck
changes post-endovascular repair. Many of these have either short term follow up (1 year or less) or
are performed using axial CT slices and non-calibrated measurement techniques.
Neck measurements performed using 3D reconstruction and MPR have the advantage of
recording dimensions that are perpendicular to the central lumen (or flow line) of the aneurysm.
These are more accurate as plain slices may capture the aorta in an elliptical section and provide
erroneous results.
Aortic region Expansion (m m /year)Thoracic 0.14Coeliac 0.11Renal 0.08
Inffa-renal 0.07
T a b le 22: C hanges in aortic d iam eter at d ifferent levels w ith time.
P a t i e n t s a n d m e t h o d s
From a total experience of 88 patients undergoing endovascular repair of their abdominal aortic
aneurysms, 30 were chosen for this study. All patients reached a minimum of 2 or more years
follow up. 12 patients had pre-expanded PTFE balloon-expandable, aorto-uni-iliac grafts (Figure
125
41) and 18 had Talent, self-expanding, fully supported Dacron grafts (World Medical). There were
24 males and 6 females with a mean age of 72.9 years (range 55-93).
Spiral CT angiography was performed with a Siemens Somatom plus 4 scanner using the protocol
in Table 6 for all subjects.
Neck diameter and length measurements were carried out on all patients using 3D reformatting
and MPR respectively (Table 23). The neck of the aneurysm was defined as starting at the level of
the lowest renal artery and ending at the beginning of the aneurysm chamber, usually identifiable by
the presence of a gradual dilatation containing intra-luminal thrombus. This length is referred to
here as the 'neck length. ”
Neck diameters were recorded perpendicular to the true centre or flow-line of the vascular channel
within the aneurysm. Diameters were recorded at 3 levels (Figure 42):
• At the level just below the lowest renal artery
• The mid-neck diameter was calculated at the halfway point once the neck length was known.
• At the level just above the beginning of the aneurysm chamber
The aorta is never a perfect circle in cross-section. In some instances a true ellipse may be present.
In such a case an over or underestimation of diameter is easily made. To avoid this type of
assumption, two diameters perpendicular to each other were measured. The average of these was
used to represent the diameter at that level.
Measurements of aneurysm neck
proximal neck length
maximal proximal neck diameter maximal mid neck diameter
maximal distal neck diameter
T a b le 23: M easurem ents carried o u t on aneurysm patients (mm)
S t a t i s t i c a l a n a l y s i s
All values were recorded in mm with the median followed by the interquartile range in parentheses.
Comparison of patient outcomes within the two groups was performed using a Wücoxon sum of
ranks test. Median neck lengths and diameters were compared to the previous values with P less
than 0.05 regarded as attaining significance.
126
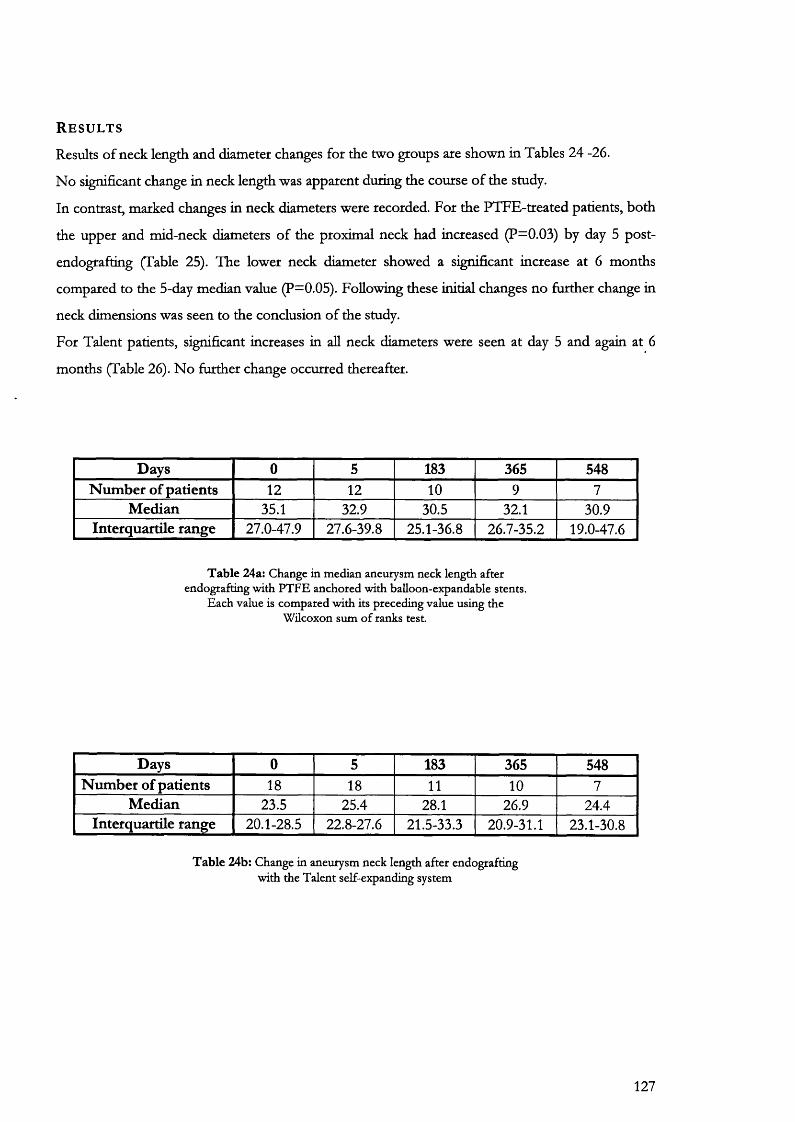
R e s u l t s
Results of neck length and diameter changes for the two groups are shown in Tables 24 -26.
No significant change in neck length was apparent during the course of the study.
In contrast, marked changes in neck diameters were recorded. For the PTFE-treated patients, both
the upper and mid-neck diameters of the proximal neck had increased (P=0.03) by day 5 post-
endografting (Table 25). The lower neck diameter showed a significant increase at 6 months
compared to the 5-day median value (P=0.05). Following these initial changes no further change in
neck dimensions was seen to the conclusion of the study.
For Talent patients, significant increases in all neck diameters were seen at day 5 and again at 6
months (Table 26). No further change occurred thereafter.
Days 0 5 183 365 548N um ber of patients 12 12 10 9 7
M edian 35.1 32.9 30.5 32.1 30.9Interquartile range 27.0-47.9 27.6-39.8 25.1-36.8 26.7-35.2 19.0-47.6
T a b le 24a: Change in m edian aneurysm neck length after endografdng w ith P T F E anchored w ith balloon-expandable stents.
E ach value is com pared w ith its preceding value using the W ilcoxon sum o f ranks test.
Days 0 5 183 365 548Num ber of patients 18 18 11 10 7
M edian 23.5 25.4 28.1 26.9 24.4Interquartile range 20.1-28.5 22.8-27.6 21.5-33.3 20.9-31.1 23.1-30.8
T a b le 24b: Change in aneurysm neck length after endografdng w ith the T alent self-expanding system
127

Figure 41: P T F E endograft. M ade w ith a standard length o f P T F E pre-expanded to three times its ongm al diam eter, two
Palm az balloon-expandable stents (S) are sutured w ith prolene stitch to each end o f the endograft (G). This is deployed w ithin
the aneurysm as described. T he contralateral com m on iliac artery was occluded with tungsten em bolisation coils.
Upperdiameter
Middiameter
Neck length
Lowerdiameter
Diameter=A+B/2Diameter A
Diameter B
Figure 42: Method o f calculation of neck, diameters at three levels within the neck o f the aneurysm. The mid-neck diameter was recorded at the
point hallway along the neck length.
128
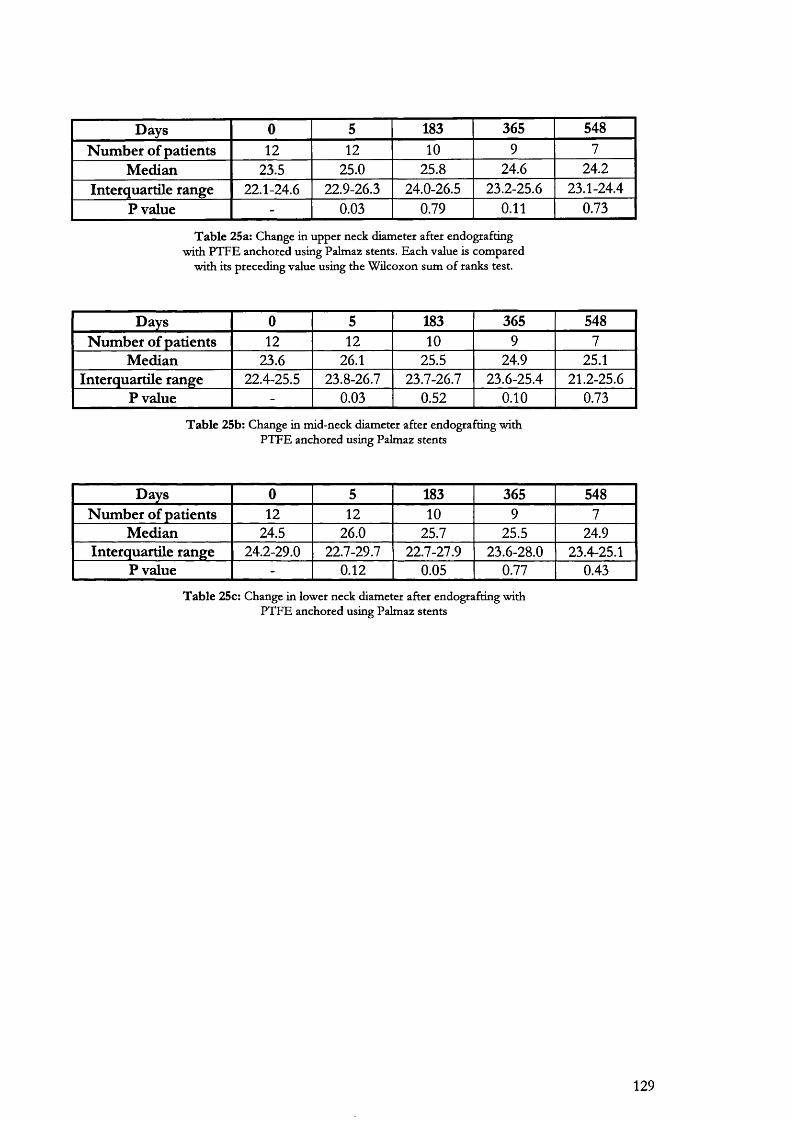
Days 0 5 183 365 548N um ber of patients 12 12 10 9 7
M edian 23.5 25.0 25.8 24.6 24.2Interquartile range 22.1-24.6 22.9-26.3 24.0-26.5 23.2-25.6 23.1-24.4
P value - 0.03 0.79 0.11 0.73
T a b le 25a: Change in upper neck diam eter after endografting w ith P T F E anchored using Palm az stents. E ach value is com pared
w ith its preceding value using the W ilcoxon sum o f ranks test.
Days 0 5 183 365 548N um ber of patients 12 12 10 9 7
Median 23.6 26.1 25.5 24.9 25.1Interquartile range 22.4-25.5 23.8-26.7 23.7-26.7 23.6-25.4 21.2-25.6
P value - 0.03 0.52 0.10 0.73
T a b le 25b: C hange in m id-neck diam eter after endografting w ith P T F E anchored using Palm az stents
Days 0 5 183 365 548Num ber of patients 12 12 10 9 7
Median 24.5 26.0 25.7 25.5 24.9Interquartile range 24.2-29.0 22.7-29.7 22.7-27.9 23.6-28.0 23.4-25.1
P value - 0.12 0.05 0.77 0.43
T a b le 25c: Change in low er neck diam eter after endografting w ith P T F E anchored using Palm az stents
129
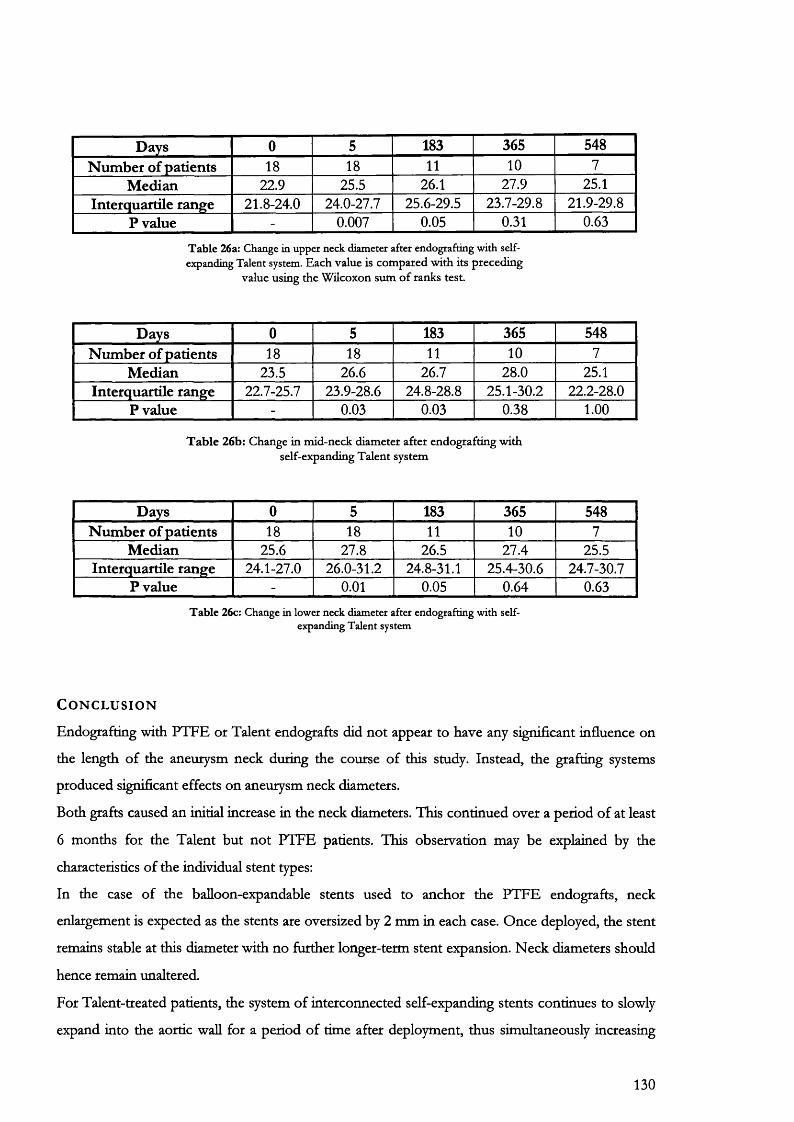
Days 0 5 183 365 548N um ber of patients 18 18 11 10 7
Median 22.9 25.5 26.1 27.9 25.1Interquartile range 21.8-24.0 24.0-27.7 25.6-29.5 23.7-29.8 21.9-29.8
P value - 0.007 0.05 0.31 0.63
T able 26a: Change in upper neck diameter after endografting with selfexpanding Talent system. E ach value is com pared w ith its preceding
value using the W ilcoxon sum o f ranks test.
Days 0 5 183 365 548N um ber of patients 18 18 11 10 7
Median 23.5 26.6 26.7 28.0 25.1Interquartile range 22.7-25.7 23.9-28.6 24.8-28.8 25.1-30.2 22.2-28.0
P value - 0.03 0.03 0.38 1.00
T a b le 26b: Change in m id-neck diam eter after endografting w ith self-expanding T alent system
Days 0 5 183 365 548Num ber of patients 18 18 11 10 7
Median 25.6 27.8 26.5 27.4 25.5Interquartile range 24.1-27.0 26.0-31.2 24.8-31.1 25.4-30.6 24.7-30.7
P value - 0.01 0.05 0.64 0.63T able 26c: Change in lower neck diameter after endografting with self
expanding Talent system
C o n c l u s i o n
Endografting with PTFE or Talent endografts did not appear to have any significant influence on
the length of the aneurysm neck during the course of this study. Instead, the grafting systems
produced significant effects on aneurysm neck diameters.
Both grafts caused an initial increase in the neck diameters. This continued over a period of at least
6 months for the Talent but not PTFE patients. This observation may be explained by the
characteristics of the individual stent types:
In the case of the balloon-expandable stents used to anchor the PTFE endografts, neck
enlargement is expected as the stents are oversized by 2 mm in each case. Once deployed, the stent
remains stable at this diameter with no further longer-term stent expansion. Neck diameters should
hence remain unaltered.
For Talent-treated patients, the system of interconnected self-expanding stents continues to slowly
expand into the aortic wall for a period of time after deployment, thus simultaneously increasing
130

the neck diameters. It is possible that if the elastic recoil of the aortic wall is eventually exceeded,
this could lead to loosening of the graft causing endoleak, graft migration or both. It is important to
note that the results described here are recorded within the medium-term of 1.5 to 2 years.
Whether these trends continue in the longer-term remains to be determined.
131

7.9
The intra- and inter-observef differences in aneurysm neck length and diameters found during measurement with spiral CT angiography
A i m
This study determines the inter-observer and intra-observer variability in the assessment of
abdominal aortic aneurysm neck dimensions.
B a c k g r o u n d
The selection of patients for endovascular repair of AAA relies on critical anatomical features such
as the proximal neck dimensions and the tortuosity of the diac arteries. These dimensions are
currently measured using a combination of calibrated angiocatheter and spiral CT angiography.
Both methods have inherent errors resulting from the nature of the imaging technology and the
operator who has to interpret the end result. For example, with calibrated angiography system-
related errors due to magnification and the penumbra effect (Figure 66) may result in
overestimation of neck diameters. Operator error from parallax may also produce similar
measurement problems.
Because of the recognised disadvantages associated with calibrated angiography, 3D-spiral CT
angiography is increasingly beginning to play an important preoperative role in measuring
aneurysm dimensions prior to patient selection. It is still possible however, that a certain
proportion of patients may be denied the procedure on the basis of incorrect interpretation of
measurements or worse, may undergo the procedure with incorrect anatomy. This study
documents the magnitude of error, involved in patient selection for endovascular repair in our unit,
using spiral CT angiography.
M e t h o d
120 consecutive patients were assessed for endovascular repair of AAA between January 1996 and
January 1998. From these preoperative spiral CT scans, 12 data sets were chosen for repeat
analysis. Random selection was carried out by numbering each scan and then generating a string of
12 random numbers by measuring background radioactive decay with a Geiger counter interfaced
to a computer. Scans were reanalysed by two individuals judged to be of equivalent experience in
utilizing this technology.
132

For the intra-observer part of the study, the original investigator (RSR) repeated his analysis 6
months after the first measurements. A second investigator, judged to be of equivalent experience,
also re-analysed the same scans at this time. Scans were stored on optical disc (3M Imation
Enterprises Corp. Oakdale, Minn) and only the data file was made available to both investigators.
Repeat measurements were performed without any knowledge of the previous values.
The following parameters were measured:
1. Aneurysm neck length
2. Aneurysm neck diameter at the level of lowermost renal artery
3. Aneurysm neck diameter at the start of the aneurysm sac
S t a t i s t i c a l a n a l y s i s
The difference of means analysis described by Bland and Altman^ " was used to compare values.
The difference between each pair of measurements was plotted against their mean. By analysing
the differences between paired measurements, the only source of variability is the measurement
error and this should follow a Gaussian distribution. The standard deviation of the differences was
also calculated to work out a coefficient of repeatability, which was defined as equivalent to 1.96
times the standard deviation.
R e s u l t s
The intra- and inter-observer variations for neck length are listed in Table 27. Proximal neck length
could be measured with an accuracy of ±5 mm both within and between observers. Observer
errors for the neck diameters were much lower (Tables 28 and 29). The upper neck diameter could
be measured with an accuracy of ±2 mm on repeated occasions compared with an accuracy of ±3
mm for the lower neck diameter.
Study Mean of differences SD Coefficient of repeatabilityIntra-observer 5.09 2.26 4.51Inter-observer 7.01 2.50 4.99
T a b le 27: T he in tta-observer and in ter-observer differences obtained in m easurem ent o f aneurysm neck length.
133
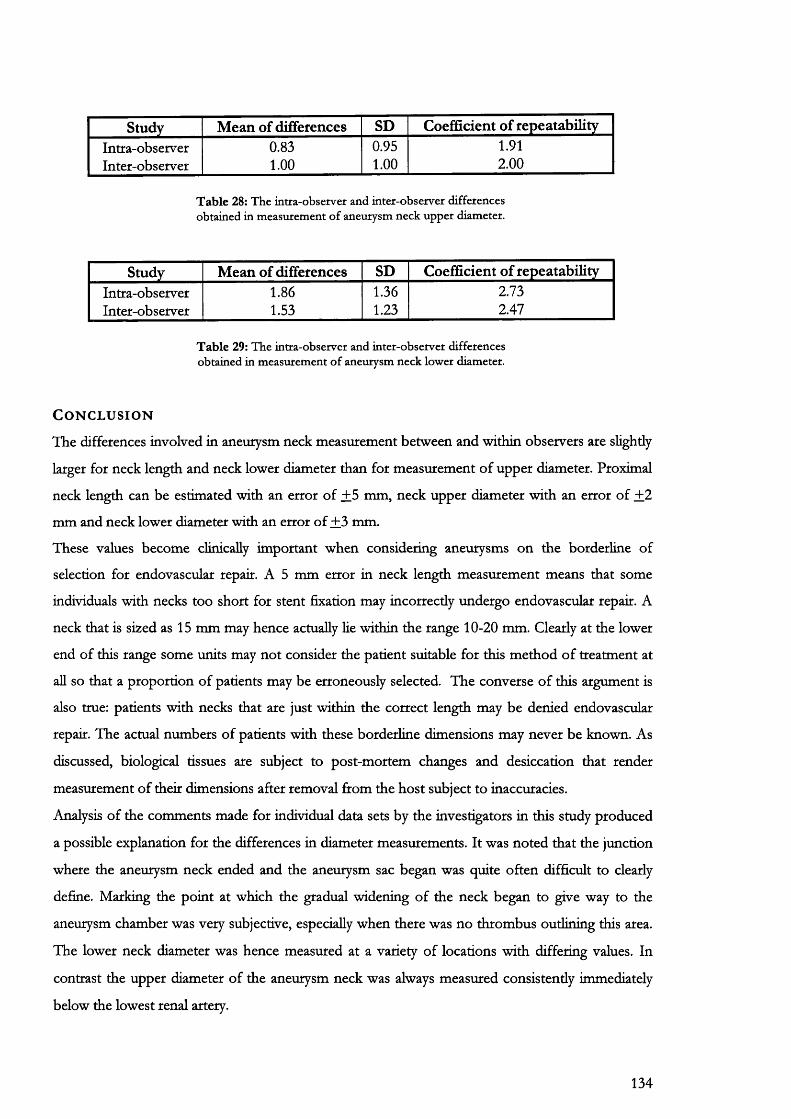
Study Mean of differences SD Coefficient of repeatabilityIntra-observer 0.83 0.95 1.91Inter-observer 1.00 1.00 2.00
T a b le 28: T he intra-observer and in ter-observer differences obtained in m easurem ent o f aneurysm neck up p er diam eter.
Study Mean of differences SD Coefficient of repeatabilityIntra-observer 1.86 1.36 2.73Inter-observer 1.53 1.23 2.47
T a b le 29: T he in tra-observer and in ter-observer differences obtained in m easurem ent o f aneurysm neck low er diam eter.
C o n c l u s i o n
The differences involved in aneurysm neck measurement between and within observers are slightly
larger for neck length and neck lower diameter than for measurement of upper diameter. Proximal
neck length can be estimated with an error of +5 mm, neck upper diameter with an error of +2
mm and neck lower diameter with an error of +3 mm.
These values become clinically important when considering aneurysms on the borderline of
selection for endovascular repair. A 5 mm error in neck length measurement means that some
individuals with necks too short for stent fixation may incorrectly undergo endovascular repair. A
neck that is sized as 15 mm may hence actually lie within the range 10-20 mm. Clearly at the lower
end of this range some units may not consider the patient suitable for this method of treatment at
all so that a proportion of patients may be erroneously selected. The converse of this argument is
also true: patients with necks that are just within the correct length may be denied endovascular
repair. The actual numbers of patients with these borderline dimensions may never be known. As
discussed, biological tissues are subject to post-mortem changes and desiccation that render
measurement of their dimensions after removal ftom the host subject to inaccuracies.
Analysis of the comments made for individual data sets by the investigators in this study produced
a possible explanation for the differences in diameter measurements. It was noted that the junction
where the aneurysm neck ended and the aneurysm sac began was quite often difficult to clearly
define. Marking the point at which the gradual widening of the neck began to give way to the
aneurysm chamber was very subjective, especially when there was no thrombus outlining this area.
The lower neck diameter was hence measured at a variety of locations with differing values. In
contrast the upper diameter of the aneurysm neck was always measured consistently immediately
below the lowest renal artery.
134

An alternative explanation is based on aortic wall thickness. Measurements of neck diameter
differed by 2-3 mm, a value similar in magnitude to the thickness of the aortic wall. It is equally
possible that the diameters may not have been consistently measured from external wall—to-
extemal wall or internal wall-to-intemal wall by the investigators thus further accounting for these
differences.
135

7.10
Measurement of distance and volume with MRI: An in vitro feasibility stud
A i m
The aim of this study was to assess the feasibility of aneurysm volume measurement using
gadolinium-enhanced Magnetic Resonance Angiography (gMRA).
B a c k g r o u n d
Breath-hold gadolinium-enhanced three-dimensional (3D) magnetic resonance imaging (MRI) has
been developed in the past few years as an alternative technique to conventional angiography,
primarily in the evaluation of arterial disease. The rapid acquisition times possible with high-
performance gradient systems allow 3D imaging of large volumes of anatomy during the arterial
and later phases of contrast material distribution through the body, similar to that in SCTA. This
technique is versatile and in many clinical settings, 3D gadolinium-enhanced MR imaging is being
used in lieu of computed tomography and conventional angiography.
In addition to the diagnostic information regarding arterial anatomy that this technique can
provide, additional quantitative information helpful in patient selection and follow up post-
endovascular repak can be obtained from a multiphasic examination. This includes measurement
of linear and volume data. Volume may be more accurate than single maximal diameters in
describing the morphology of AAA after endovascular repair. The feasibility of aneurysm volume
follow-up with MRA remains to be demonstrated.
In this study the volumes and linear dimensions of six phantom aneurysms were calculated
following imaging with gMRA. These data were compared with the known values to calculate the
accuracy of this technique.
M a t e r i a l s a n d m e t h o d
Six glass phantom aneurysms were hand blown using tubing 2 mm in wall thickness and 25 mm in
diameter. The physical dimensions (volume and maximal diameters) of these phantoms were
recorded in the laboratory using pyknometry (Figure 17) and electronic callipers (Mitutoyo absolute
digimatic, Japan). These dimensions were referred to as the true diameters and volumes.
Phantoms were then filled with a mixture of Gadopentetate dimeglurnine (Magnevist; Berlex
Laboratories, Wayne, NJ) and de-ionised water in proportions similar to those found in vivo during
gMRA (20 ml of Magnevist in 5 L of deionized water). Scanning was performed with a Siemens
Magnetom vision 1.5T scanner using the same MRA protocol as in clinical practice (Chapter 7.11).
136

Scanned data were transferred to our post-processing workstation for the calculation of scanned
diameters and volumes using the same techniques as previously described (Chapter 7.1).
S t a t i s t i c a l a n a l y s i s
All linear data are given as the mean of eight observations together with the standard deviation.
Volumes are given as the value in ml calculated using 3D gMRA data. The true and scanned
dimensions were compared using regression analysis. P less than or equal to 0.05 was regarded as
attaining significance.
R e s u l t s
The results obtained for diameter are presented in Table 30. These values are comparable to the
SCTA validation study (Table 7). In particular, the standard deviations are again at least 10 fold
higher for the scanned diameters compared to the true diameters.
The regression graphs (Figures 44 and 45) for this data have a slope of 1.01 for both diameter
calculations. This suggests that the agreement between true and scanned values is near perfect.
The results for volume are presented in Table 31. Similar values were again obtained as for the
SCTA validation study (Table 8). Two further points should however be noted:
Firsdy, MRA is not based on the principle of Hounsfield number and doe not define objects as
maps of their tissue attenuation profiles. In MRA images the signal intensity is proportional to the
proton density of the target tissue with enhanced signal from tissues containing gadolinium
contrast. MRA raw data consists of voxels that are converted to 2-dimensional pixels in the
corresponding image. The signal intensity of each pixel equates to the contents of the
corresponding voxel so that to calculate the volume of an object a pixel histogram is generated
(Figure 43).
The number of pixels that are contained within the volume of interest can be calculated to allow
estimation of volume on the available software. The procedure takes somewhat longer than SCTA
volume estimation by an additional 10-15 minutes on the total estimation time.
137

AneurysmTrue diameters (mm) Scanned diameters (mm)
anteroposterior transverse anteroposterior transverse
A 43.33±0.10 48.83±0.07 42.84±0.80 47.3510.46
B 55.44+0.06 54.81±0.05 55.49+0.63 53.7410.39
C 60.51+0.07 60.47±0.10 58.5010.56 59.7010.56
D 69.81±0.07 69.84±0.06 68.7110.04 68.7310.05
E 76.54±0.05 78.92+0.03 77.3410.92 77.2010
F 79.74+0.03 79.80±0.03 78.8510.48 79.2910.32
T a b le 30: A C om parison o f true and scanned diam eters o f glass p h an tom aneurysm s. T he regression plots and equations for this com parison are show n in Figures 44 and 45.
138
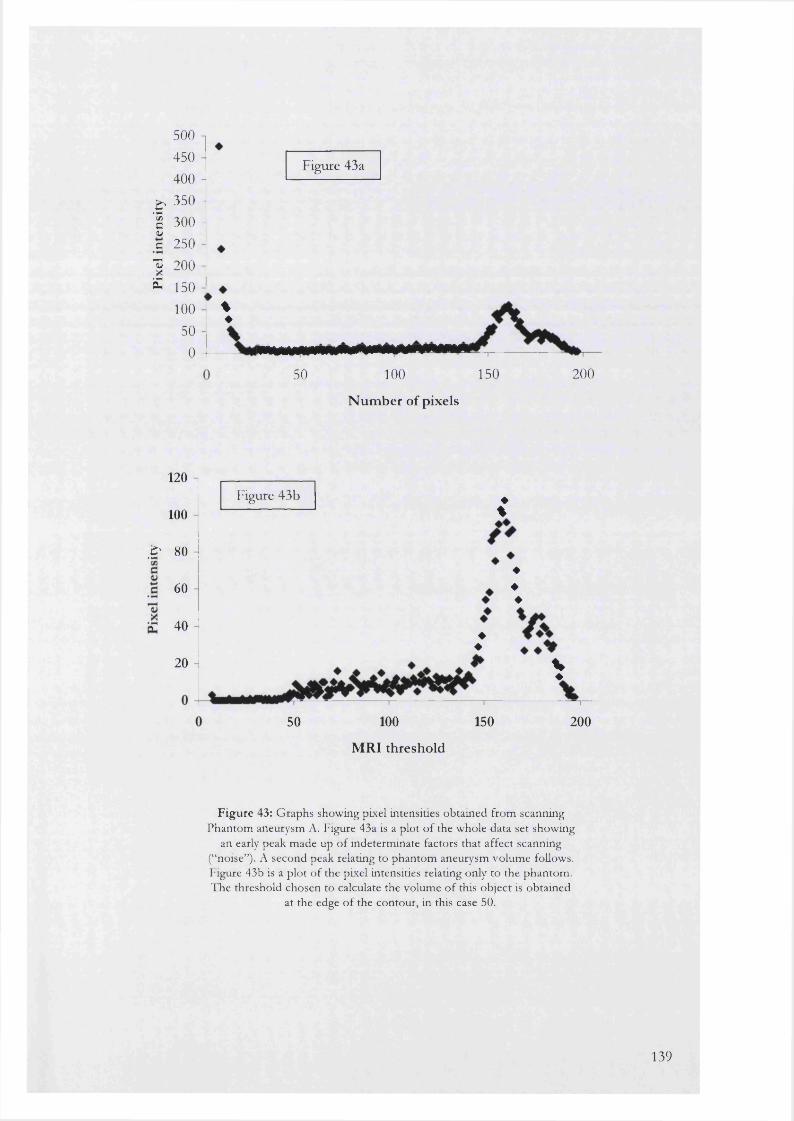
500 450 400
^ 350 - I 300 -wc 250 I 200 S 150
100 50
0
Figure 43a
%♦
50 100 150
Number of pixels
200
120
100Figure 43b ♦
%
■S' 80
60
r 40
20
♦♦
♦♦♦
%♦
50 100
MRI threshold
150 200
F ig u re 43: G raphs showing pixel intensities obtained from scanning Phantom aneurysm A. Figure 43a is a plot o f the whole data set showing
an early peak m ade up o f indeterm inate factors that affect scanning (“noise”). A second peak relating to phantom aneurysm volum e follows. Figure 43b is a p lo t o f the pixel intensities relating only to the phantom . The threshold chosen to calculate the volum e o f this object is obtained
at the edge o f the contour, in this case 50.
139
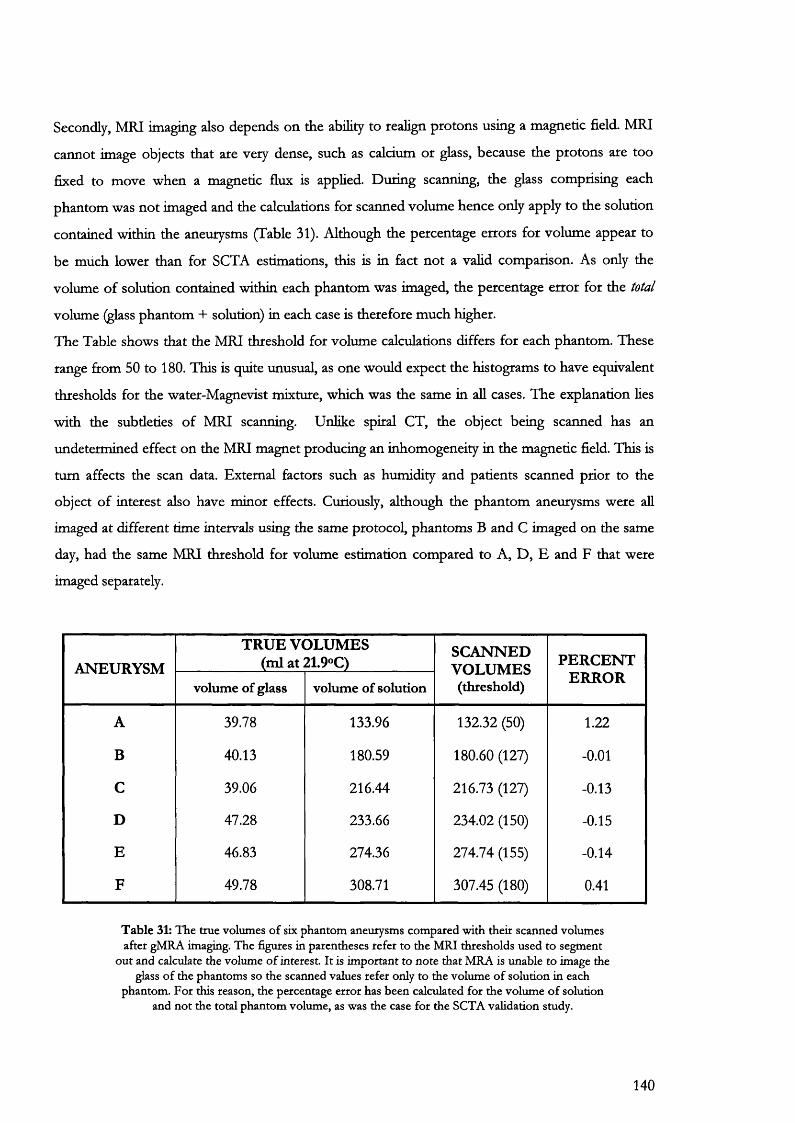
Secondly, MRI imaging also depends on the ability to realign protons using a magnetic field. MRI
cannot image objects that are very dense, such as calcium or glass, because the protons are too
fixed to move when a magnetic flux is applied. During scanning, the glass comprising each
phantom was not imaged and the calculations for scanned volume hence only apply to the solution
contained within the aneurysms (Table 31). Although the percentage errors for volume appear to
be much lower than for SCTA estimations, this is in fact not a valid comparison. As only the
volume of solution contained within each phantom was imaged, the percentage error for the total
volume (glass phantom + solution) in each case is therefore much higher.
The Table shows that the MRI threshold for volume calculations differs for each phantom. These
range from 50 to 180. This is quite unusual, as one would expect the histograms to have equivalent
thresholds for the water-Magnevist mixture, which was the same in aU cases. The explanation lies
with the subtleties of MRI scanning. Unlike spiral CT, the object being scanned has an
undetermined effect on the MRI magnet producing an inhomogeneity in the magnetic field. This is
turn affects the scan data. External factors such as humidity and patients scanned prior to the
object of interest also have minor effects. Curiously, although the phantom aneurysms were all
imaged at different time intervals using the same protocol, phantoms B and C imaged on the same
day, had the same MRI threshold for volume estimation compared to A, D, E and F that were
imaged separately.
ANEURYSMTRU E VOLUMES
(ml at 21.9°C)SCANNEDVOLUMES(threshold)
PERCEN TERRORvolume of glass volume of solution
A 39.78 133.96 132.32 (50) 1.22
B 40.13 180.59 180.60 (127) -0.01
C 39.06 216.44 216.73 (127) -0.13
D 47.28 233.66 234.02 (150) -0.15
E 46.83 274.36 274.74 (155) -0.14
F 49.78 308.71 307.45 (180) 0.41
T a b le 31: T he true volum es o f six phan tom aneurysm s com pared w ith their scanned volum es after gM RA imaging. T he figures in parentheses refer to the M RJ thresho lds used to segm ent
o u t and calculate the volum e o f interest. I t is im portan t to n o te tha t M RA is unable to im age the glass o f the phantom s so the scanned values refer only to the vo lum e o f so lu tion in each
phantom . F o r this reason, the percentage e rro r has been calculated fo r the volum e o f solution and n o t the total phan tom volum e, as was the case fo r the SCTA validation study.
140

R egression graph o f scan nedversus true AP diam eters
<uu
I’3( U
ccu(/)
lOOn
7 5 -
5 0 -
2 5 -
100T ru e A P d ia m e te r (m m )
Variables ValuesSlope
Y-interceptr2
1.01 ± 0.04 -1.09 ±2.30
0.99
F ig u re 44: G raph and Table showing the results obtained w ith linear regression analysis o f true and scanned AP diam eters after
gMRA. The dotted lines on the graph are the 95% confidence intervals for the slope.
141
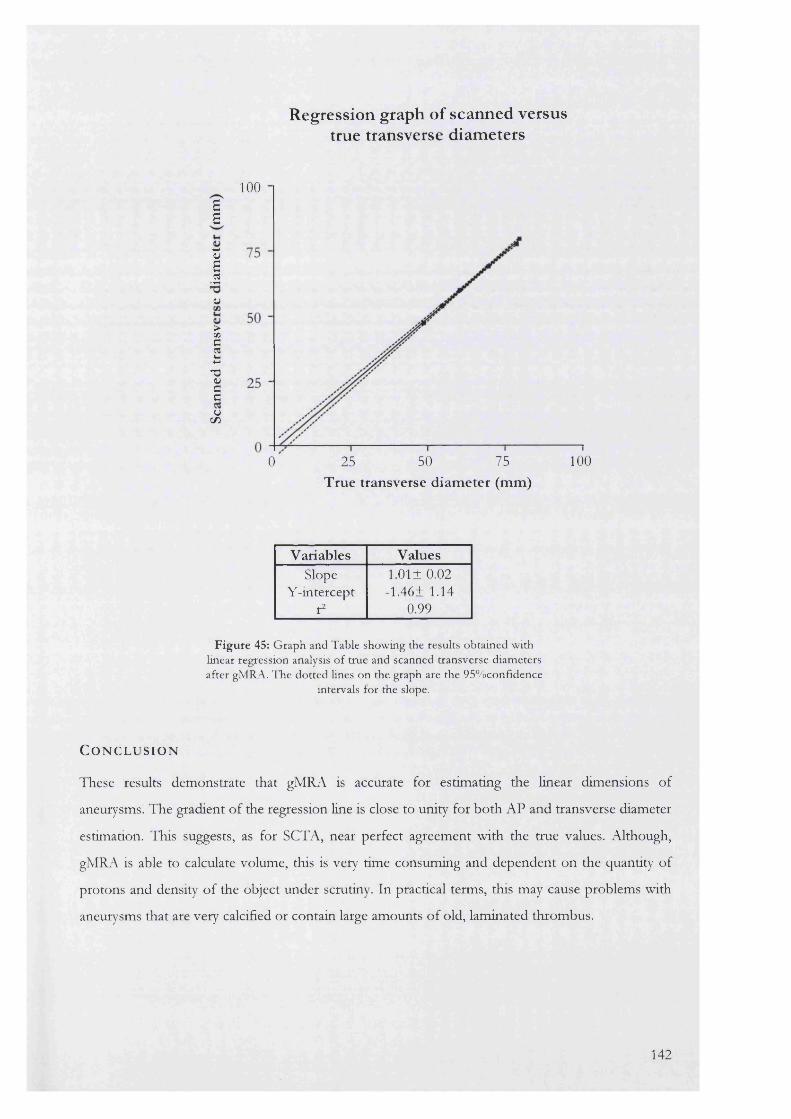
Regression graph o f scanned versustrue transverse diameters
100aa
I(U
>CAC§13<uCCu
C / )
10025 50 750True transverse diameter (mm)
Variables ValuesSlope
Y-interceptr2
1.01 ±0.02 -1.46± 1.14
0.99
F ig u re 45: G raph and Table showing the results obtained w ith linear regression analysis o f true and scanned transverse diam eters after gMRA. The dotted lines on the graph are the 95% confidence
intervals for the slope.
C o n c l u s i o n
These results demonstrate that gMRA is accurate for estimating the linear dimensions of
aneurysms. The gradient of the regression Hne is close to unity for both AP and transverse diameter
estimation. This suggests, as for SCTA, near perfect agreement with the true values. Although,
gMRA is able to calculate volume, this is very time consuming and dependent on the quantity of
protons and density of the object under scrutiny. In practical terms, this may cause problems with
aneurysms that are very calcified or contain large amounts of old, laminated thrombus.
142
7 .1 1
A comparison of gadolinium-enhanced MR angiography versus spiral CT angiography in the evaluation of patients for endovascular repair
A i m
The aim of this study was to assess the accuracy of gadolinium-enhanced 3D MR angiography
(gMRA) in comparison with 3D spiral computed tomographic angiography (SCTA) in a clinical
setting.
B a c k g r o u n d
Accurate preoperative imaging of AAA is an absolute prerequisite in determining patient suitability
for endovascular exclusion. It is vital for stent construction, to demonstrate aneurysm morphology
and dimensions accurately, as well as identifying the possible complications that may be
encountered during repair. 3D spiral computed tomographic angiography (SCTA) has previously
been validated as the gold standard for aneurysm assessment in both these situations. The main
disadvantage of SCTA is that intravenous iodinated contrast may be a source of nephrotoxicity in
patients with renal compromise^^^> This is potentiated if intravenous iodinated contrast agents
are also used in preoperative and per-operative angiography.
Magnetic Resonance Angiography (MRA) has shown varied success in the evaluation of
aneurysms. Difficulties in imaging the slow, swirling flow within aneurysms, turbulent flow in
stenoses, and tortuous iliac arteries ^® previously limited its usefulness in providing the detailed
information necessary for preoperative planning.
Recent developments using gadolinium-enhanced MRA have overcome some of these
problems^^^. Gadolinium, a paramagnetic contrast agent, shortens the Ti (spin-lattice) relaxation
time of blood, making blood distinct from surrounding tissues regardless of its flow rate or
direction. The technique provides true anatomic images that have an appearance similar to
conventional or digital subtraction contrast arteriograms. Furthermore gMRA offers the potential
of an imaging modality that uses non-nephrotoxic contrast and provides both anatomical and
physiological information about renal function.
This study will assess the accuracy of gMRA in comparison with SCTA in the preoperative
evaluation of abdominal aortic aneurysms for endovascular repair.
143
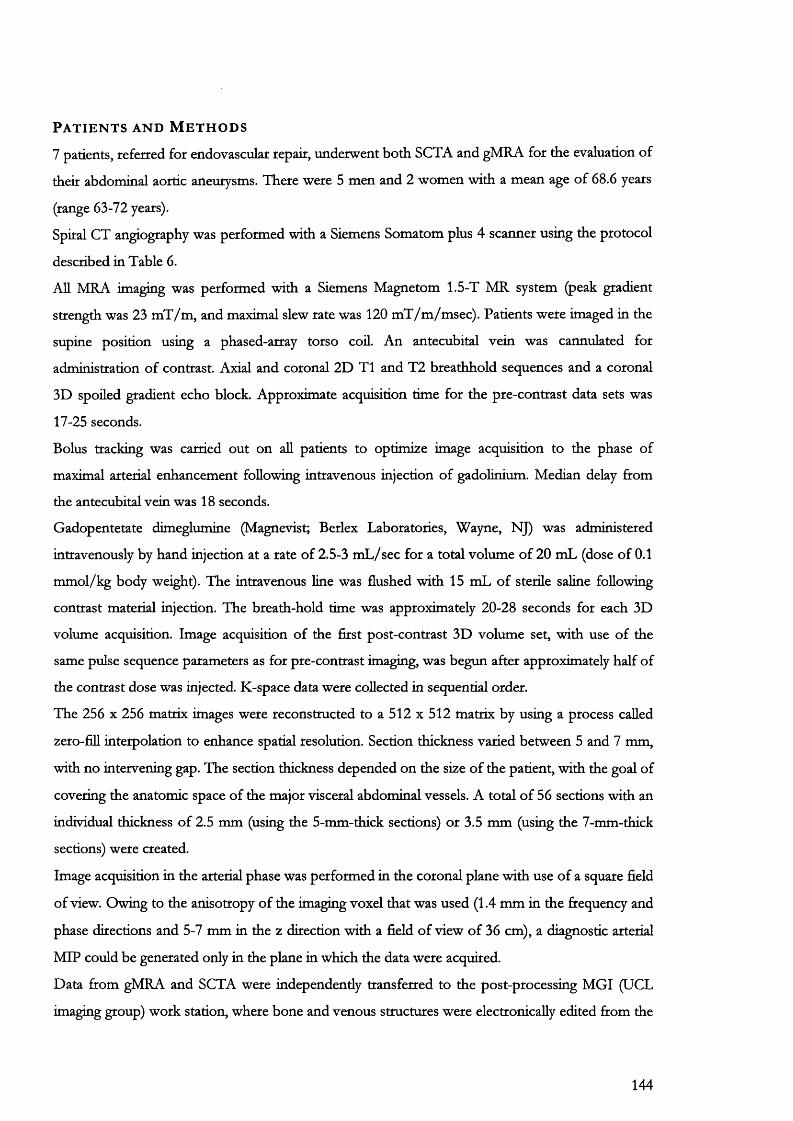
P a t i e n t s a n d M e t h o d s
7 patients, refeired for endovascular repair, underwent both SCTA and gMRA for the evaluation of
their abdominal aortic aneurysms. There were 5 men and 2 women with a mean age of 68.6 years
(range 63-72 years).
Spiral CT angiography was performed with a Siemens Somatom plus 4 scanner using the protocol
described in Table 6.
All MRA imaging was performed with a Siemens Magnetom 1.5-T MR system (peak gradient
strength was 23 mT/m, and maximal slew rate was 120 mT/m/msec). Patients were imaged in the
supine position using a phased-array torso coil. An antecubital vein was cannulated for
administration of contrast. Axial and coronal 2D T l and T2 breathhold sequences and a coronal
3D spoiled gradient echo block. Approximate acquisition time for the pre-contrast data sets was
17-25 seconds.
Bolus tracking was carried out on all patients to optimize image acquisition to the phase of
maximal arterial enhancement following intravenous injection of gadolinium. Median delay from
the antecubital vein was 18 seconds.
Gadopentetate dimeglurnine (Magnevist; Berlex Laboratories, Wayne, NJ) was administered
intravenously by hand injection at a rate of 2.5-3 mL/sec for a total volume of 20 mL (dose of 0.1
mmol/kg body weight). The intravenous line was flushed with 15 mL of sterile saline following
contrast material injection. The breath-hold time was approximately 20-28 seconds for each 3D
volume acquisition. Image acquisition of the first post-contrast 3D volume set, with use of the
same pulse sequence parameters as for pre-contrast imaging, was begun after approximately half of
the contrast dose was injected. K-space data were collected in sequential order.
The 256 x 256 matrix images were reconstructed to a 512 x 512 matrix by using a process called
zero-fill interpolation to enhance spatial resolution. Section thickness varied between 5 and 7 mm,
with no intervening gap. The section thickness depended on the size of the patient, with the goal of
covering the anatomic space of the major visceral abdominal vessels. A total of 56 sections with an
individual thickness of 2.5 mm (using the 5-mm-thick sections) or 3.5 mm (using the 7-mm-thick
sections) were created.
Image acquisition in the arterial phase was performed in the coronal plane with use of a square field
of view. Owing to the anisotropy of the imaging voxel that was used (1.4 mm in the frequency and
phase directions and 5-7 mm in the z direction with a field of view of 36 cm), a diagnostic arterial
MIP could be generated only in the plane in which the data were acquired.
Data from gMRA and SCTA were independendy transferred to the post-processing MGI (UCL
imaging group) work station, where bone and venous structures were electronically edited from the
144

coronal and axial images respectively. Maximum intensity projection (MIP) technique was used to
reconstruct the gMRA coronal images into an arteriogram that could be projected from any angle
(Figure 46). Using the measuring tool within the software, markers were placed as for the spiral CT
reconstruction to measure distances between points.
gMRA images were analyzed separately to the SCTA scans with the reader blinded to the SCTA
findings. There was a gap of 2-3 weeks between analyses of data from the same patient. The
following parameters were recorded:
1. Aneurysm neck measurement
Aneurysm neck length (from the lowest renal artery to the beginning of the aneurysm sac) and
diameter at 3 levels was measured. The upper neck diameter was measured at the level of the
lowest renal artery; the lower neck diameter was measured at the level of the start of the aneurysm
sac; the mid-neck diameter was measured at the middle of the neck once the length was known.
Two measurements of the greatest and least diameters were made to avoid bias if the aortic neck
was not a perfect circle (Figure 42).
2. Aneurysm flow channel measurement
The blood flow channel was measured in true 3 dimensional space using multiplanar reformation
linked to a 3 dimensional surface shaded display of the aneurysm. Electronic markers were placed
in the centre of the flow channel perpendicular to its walls. The distance between these markers
was summed for the total length (Figure 38).
3. Common iliac artery measurement
Measurement of the common iliac arteries was carried out in a similar fashion to the flow channel.
The maximal diameter perpendicular to the vessel lumen at that point was also measured.
145
I U . C M O I - M a O l e a l O r m * « T l = # W o r k a c a t l o n
Figure 46: G adolinium -enhanced MRA o f an abdom inal aortic aneurysm. T he left picture shows the M IP view while the right figure shows the 3D reconstruction.
4. A n e u r y s m v o l u m e m e a s r e m e n t
Volumetric assessment of AAA did not prove successful in any of the patients chosen for this study.
ITie main difficulties arose because of data collection in coronal as opposed to axial slices due to the
anisotropy of the imaging voxel required for volumetric study, lliere was particular difficulty in
finding and manually delineating small segments of sac that had just been sliced off at their tip in
some sections. ITiis type of difficulty would not exist had slices been axial.
Further explanation is given below and in Chapter 10.
S t a t i s t i c s
Data are expressed as the median in mm with the interquartile range in parentheses. The Wilcoxon
paired test was used to evaluate the significance of the differences between measurements obtained
with two methods, and Bland-Altman analysis was performed for agreement assessment^. limits
of agreement were defined as mean ±1.96 times SD of differences. A value of P less than or equal
to 0.05 was considered to be statistically significant.
R e s u l t s
The mean aneurysm AP and transverse diameters for the whole group, measured using SCTA, were
57.74 (interquartile range 47.80 to 62.40) mm and 48.84 (33.60 to 76.40) mm respectively.
One of the main differences between SCI A and gMRA was the poor resolution, in the case of
gMRA, for the 3D data sets. Although the gMRA flow channel was very clearly delineated, the
transition between the outer edge of the sac and surrounding soft tissues was sometimes difficult to
distinguish at the resolution available (256 x 256 pixels). This was further confounded by the
146
difference in voxel shape between SCTA and gMRA. As described, the 3D-gMRA voxels were
rectangular with the long axis of each rectangle stacked vertically so that longitudinal resolution was
lower than transverse definition. In contrast SCTA voxels were cuboid with the same resolution in
aU visual planes.
1. Aneurysm neck measurement
The median upper neck diameter measured using SCTA was 19.48 (interquartile range 18.78 to
21.75) mm. The median mid-neck diameter values were 22.43 (21.90 to 23.25) mm. The equivalent
lower neck values were 24.00 (23.10 to 25.03) mm.
The limits of agreement for neck diameter measurements between the two techniques were similar
for all three levels measured (Table 32). There was a disagreement of approximately -4 to +1 mm
using gMRA compared with SCTA. This was higher than the disagreement for neck length
measurement (-2 to +1 mm).
Apart from one case (mid-neck diameter, P=0.03), the measurement differences between gMRA
and CT were not statistically significant. The reason for this particular discrepancy was not
apparent and may have been due to statistical artefact.
2. Aneurysm flow channel (lAFC) measurement
The median lAFC length measured using SCTA was 119.7 (115.8 to 124.3) mm. The agreement
for this region approximated to ±3 mm between the methods. The greatest differences in length
estimation, between the two methods, were found to occur in situations where the flow channel
was very tortuous and a larger number of markers therefore had to be placed within the lumen for
an accurate assessment. There was no significant difference between the actual values obtained
using either SCTA or gMRA.
3. Common iliac artery measurement
The median right common iliac artery length and diameter measured with SCTA were 52.55 (46.90
to 76.85) mm and 14.75 (14.35 to 18.65) mm respectively. The equivalent left common iliac
dimensions were 51.70 (46.70 to 69.20) mm and 14.20 (13.70 to 15.85) mm respectively.
Results contrasted with the neck measurement data. In this case, limits of agreement comparing
gMRA to SCTA, were better for diameters (-3 to +2 mm) than for length (-3 to +7 mm). Again,
there was no significant difference between the data obtained with the two methods.
147
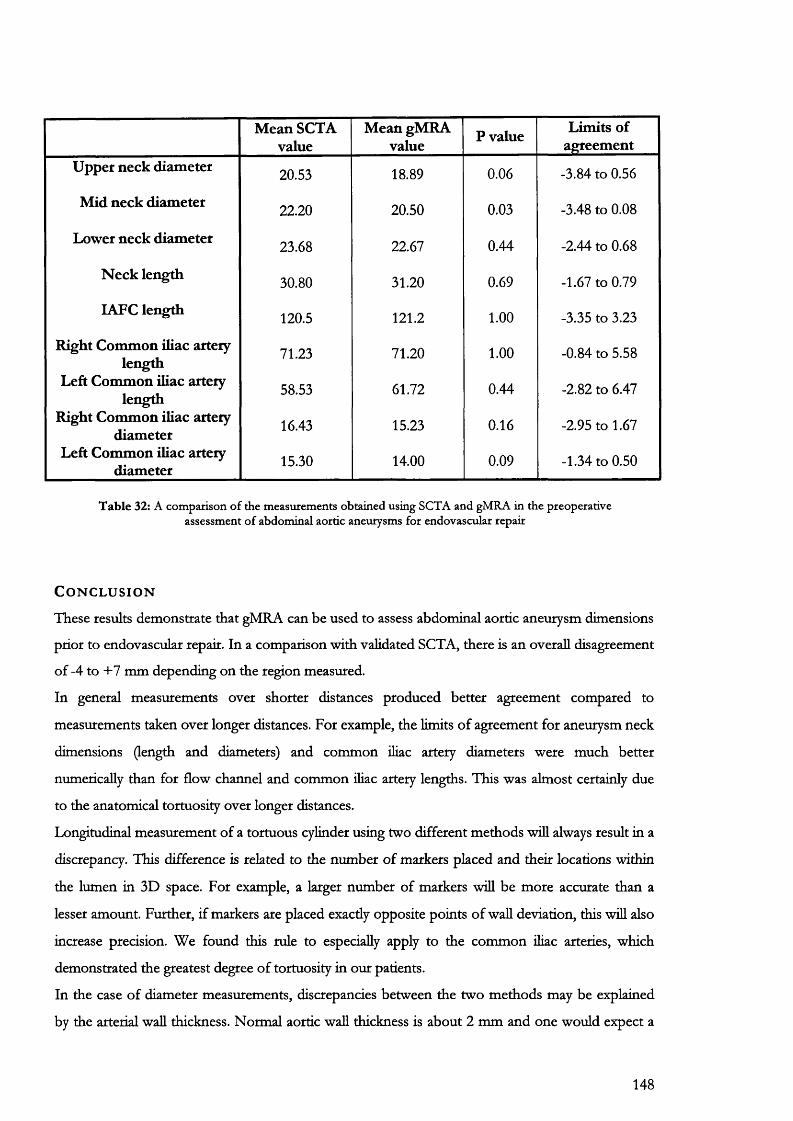
Mean SCTA value
Mean gMRA value P value Limits of
agreementUpper neck diameter 20.53 18.89 0.06 -3.84 to 0.56
Mid neck diameter 22.20 20.50 0.03 -3.48 to 0.08
Lower neck diameter 23.68 22.67 0.44 -2.44 to 0.68
N eck length 30.80 31.20 0.69 -1.67 to 0.79
lAFC length 120.5 121.2 1.00 -3.35 to 3.23
Right Common iliac artery length
Left Common iliac artery length
Right Common iliac artery diameter
71.23 71.20 1.00 -0.84 to 5.58
58.53 61.72 0.44 -2.82 to 6.47
16.43 15.23 0.16 -2.95 to 1.67
Left Common iliac artery diameter 15.30 14.00 0.09 -1.34 to 0.50
T ab le 32: A com parison o f the m easurem ents obtained using SCTA and gM RA in the preoperative assessm ent o f abdom inal aortic aneurysm s for endovascular repair
C o n c l u s i o n
These results demonstrate that gMRA can be used to assess abdominal aortic aneurysm dimensions
prior to endovascular repair. In a comparison with validated SCTA, there is an overall disagreement
of -4 to +7 mm depending on the region measured.
In general measurements over shorter distances produced better agreement compared to
measurements taken over longer distances. For example, the limits of agreement for aneurysm neck
dimensions (length and diameters) and common iliac artery diameters were much better
numerically than for flow channel and common iliac artery lengths. This was almost certainly due
to the anatomical tortuosity over longer distances.
Longitudinal measurement of a tortuous cylinder using two different methods will always result in a
discrepancy. This difference is related to the number of markers placed and their locations within
the lumen in 3D space. For example, a larger number of markers will be more accurate than a
lesser amount. Further, if markers are placed exacdy opposite points of wall deviation, this wül also
increase precision. We found this rule to especially apply to the common ihac arteries, which
demonstrated the greatest degree of tortuosity in our patients.
In the case of diameter measurements, discrepancies between the two methods may be explained
by the arterial wall thickness. Normal aortic wall thickness is about 2 mm and one would expect a
148
difference of about 4 mm in favour of SCTA if the gMRA scans did not display wall thickness. In
most subjects where this discrepancy was evident, subsequent simultaneous review of the gMRA
and SCTA scans showed the former to be simple “lumenograms” compared to their SCTA
counterparts. Wall thickness was more clearly defined with SCTA especially where MIP’s were
analysed for gMRA. Certainly, agreement between methods for diameter estimation was much
closer for the common iliac arteries compared to the aneurysm neck. It could be argued that the
arterial wall thickness at the level of the external iliac arteries is much thinner than in the main aorta
thus producing much less diameter disagreement between the two methods in this region.
In conclusion, we found gMRA to be a useful means of assessing aneurysm dimensions prior to
endovascular repair. Further discussion on this point is provided in Chapter 10.
149
C h a p t e r 8
Photogfammet
Endograft durability may be linked to motion occurring at the aneurysm neck. The endograft is a
rigid mechanical device that is placed within a moving biological system. A differential motion
between aneurysm neck and stent-graft may result in long-term strain on the weakest points of the
endograft with eventual distortion and/or disintegration.
To examine this hypothesis further, it is necessary to document and quantify the extent of
movement taking place at the aneurysm neck. At first glance, this concept would seem relatively
simple. Filming an aneurysm and measuring the direction and extent of displacement could be
quite easily performed using simple linear measurements calculating displacement from sequential
images of a moving object.
However, this reasoning is somewhat flawed. To explain further, it is necessary to summarize some
of the basic principles of photogrammetry.
8.1. B a s i c p h o t o g r a m m e t r y
Photogrammetry is the science of remote measurement. Its value stems from the fact that for
practical reasons it may not be possible to study the subject direcdy. For example, the
reconstruction of an archaeological site from available historical evidence cannot be brought
indoors into any sort of laboratory. The alternative is to use a series of images that can be
mathematically analysed to construct an accurate model remote from the original site.
Consequentiy, any sort of image that can be scanned into a computer is suitable for analysis. Some
of the sources that are commonly used include Polaroid's, 35 mm prints, radiographs and selected
frames from videotape.
Photogrammetry can be divided into two main fields, namely aerial photogrammetry and close-
range or terrestrial photogrammetry.
In aerial experiments, a special camera mounted on an aircraft takes photographs. The information
is used for topographical reconstructions such as the production of accurate terrain maps.
In close-range photogrammetry, the type of camera used can vary from the simplest 35-mm
pictorial model to highly specialised configurations. The resulting images are converted to 3D
format and are often input to a Computer Aided Design (CAD) system for further processing or
visualisation.
150
Today, a dominating part of photogrammetric research is focused on digital photogrammetry. The
appearance of powerful computers has opened new possibilities for automatic recognition and
description alongside the established measurement process.
Terminology for the single photograph
Although both maps and aerial photos present a "bird's-eye" view of the earth, aerial photographs
are not maps. Maps are orthogonal representations of the earth's surface, meaning that they are
directionally and geometrically accurate (within the limitations imposed by projecting a 3-
dimensional object onto 2 dimensions). Aerial photographs, on the other hand, display a high degree
of radial distortion. ITieir topography is distorted (Figure 47), and until corrections are made for this
distortion, measurements made from a photograph are not accurate. This concept also applies to the
use of single images in close-range photogrammetry.
Only light rays that pass directly through the centre of the lens without distortion (along the
principal axis) are a true representation of the external scale of the object (Figure 48). lliese light
rays are incident at a point called the principal point o f autocollimation on the photographic
frame. Around the rest of the image there will be distortion, the degree of which depends on the
radial distance from the principal point and the height of the object.
Î)«
Figure 47: T he perspective view. In this pho tograph , the edges o f the road, which are actually parallel lines in 3D space, appear to converge as they recede tow ards the horizon. T he trees also get smaller tow ards the horizon form ed by the "infinitely d istant points" o r
vanishm g directions o f the ground plane. In reality the edges o f the road should never m eet and the trees do n o t get physically smaller. T his simple example show s how a perspective
view greatly differs from the true situation.
The centre of the photograph does not usually coincide with the principal point. The photographic
centre can be easily found by determining the intersection of imaginary lines drawn from opposite
pairs of fiducial marks in the sides or comers of the image plane. These marks are usually etched
151
onto the photographic plate and in an ideal camera their intersection is referred to as the fiducial
centre.
The principal point is decentered from the fiducial centre by an increment referred to as xi, yi. This
is the most important part of the photograph as it is taken as the origin for calculations of radial
distortion.
Radial distortion
Distortion of images at the edges of photographs is now not as easily seen with the naked eye due
to vast improvements in lens manufacturing technology. Nevertheless, even with modem cameras
there is still a deviation from the true position of the object externally. This distortion depends on
the radial distance from the principal point and the height of the object. The edges of a photograph
therefore will contain the greatest distortion relative to the principal point and objects that lie above
the horizontal plane of reference (the datum plane) will exhibit varying degrees of distortion
depending on their height (Figure 49a and 49b).
Tangential/Tilt displacement
A third type of image distortion, due to internal camera geometry, results from two factors:
• The misalignment of individual lens elements in the camera during construction.
• The position of the camera during imaging which is seldom truly vertical and causes
displacement in addition to the radial deviation already described.
Tüt displacement is radial from the isocenter, a point midway between the principal point and the
nadir point. The nadir point is the line that is direcdy perpendicular to the image plane. The
different types of tilt are annotated in each dimension using the Greek expressions phi, kappa and
omega. Each describes tilt about a different axis: phi is tilt about j/, omega is tilt about x and kappa is
tilt about These parameters are always considered in the calibration of the internal geometry of
any camera used in the photogrammetric process.
8 .2 . C a m e r a c a l i b r a t i o n
Camera calibration is the process of determining the internal camera geometric and optical
characteristics (intrinsic parameters) and the 3D position and orientation of the camera frame
relative to a certain world coordinate system (extrinsic parameters).
Camera calibration provides the analytical software with critical information such as the focal
length of the camera, the size of the image, and distortion parameters of the lens.
152
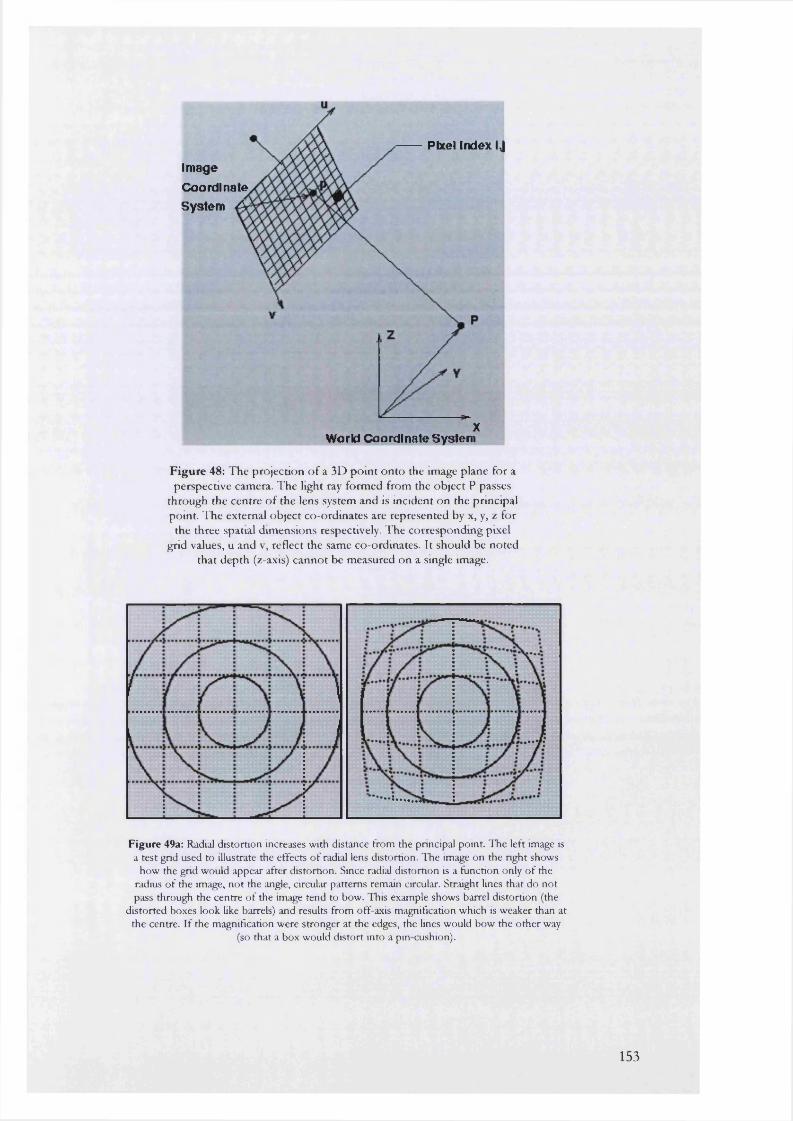
Pixel Index IJImage Coordinate System A
XWo rid Coo rdl nate System
Figure 48: T he projection o f a 3D p o in t o n to the image plane for a perspective camera. T he light ray form ed from the object P passes
through the centre o f the lens system and is incident on the principal point. T he external object co-ordinates are represented by x, y, z for
the three spatial dim ensions respectively. T he correspondm g pixel grid values, u and v, reflect the same co-ordinates. It should be no ted
that dep th (z-axis) canno t be m easured on a single image.
Figure 49a: Radial distortion increases with distance from the principal point. The left image is a test grid used to illustrate the effects o f radial lens distortion. The image on the right shows
how the grid would appear after distortion. Since radial distortion is a function only of the radius o f the image, not the angle, circular patterns remain circular. Straight lines that do not pass through the centre of the image tend to bow. This example shows barrel distortion (the
distorted boxes look like barrels) and results from off-axis magnification which is weaker than at the centre. If the magnification were stronger at the edges, the lines would bow the other way
(so that a box would distort into a pin cushion).
153

Calibration is performed by photographing a series of known targets using the camera on a test rig
built specifically for the purpose (Figure 59). The co-ordinates of each target in 3D space are
known precisely and are then used to determine the events that alter the bundle of light rays
passing through the camera lens. Once the behaviour of the light bundle is known, mathematical
transformations can be used to derive the proportions of the object under study.
A second type of calibration, known as self-calibration, is used after completion of the
experiments. The camera is calibrated using only the data obtained from the new observations and
these values are then compared to the original calibration. The differences or residual values
between the two sets of data then act as a type of internal quality control.
Methods of camera calibration
To determine the six exterior orientation parameters defining the spatial location and orientation of
a camera, a minimum of 50-100 targets of known 3D location are required. The mathematics used
are quite complex but are based on a least squares solution where the different types of distortion
(radial and decentering) are represented by matrix transformations of the original point (x, y, z) and
used to derive the image co-ordinates. The system of equations that is used for this calibration is
referred to as a %undle adjustmenV\
Self-calibration uses discrete target points on the image as data required for both object point
determination and for the determination of the parameters of camera calibration. All other points
have to be defined relative to these co-ordinates. At the conclusion of the imaging, a scale is
entered and these control points then act as the parameters for calibration.
In this series of experimental observations, image analysis and bundle adjustment was carried out
using software available on The Vision Management System version 7 (VMS written by Dr. S.
Robson and Dr. M. Shortis, Department of Photogrammetry, UCL).
8 . 3 . T h e s t e r e o s c o p i c m o d e l
A single photograph only gives a 2-dimensional representation of an object, and consequently any
measurements made from this image are limited to these 2 dimensions (x and y co-ordinates).
Nevertheless, it is still possible to gauge depth using visual clues. Such clues are based on the
relative sizes of objects, hidden objects, shadows and differences in focusing the eye required for
viewing objects at varying distances. This type of depth estimation, known as monoscopic, only
enables rough estimations of distances to objects. For example the perspective view in Figure 47
implies correcdy, that the house is at the front of the horizon while the road continues on into the
154
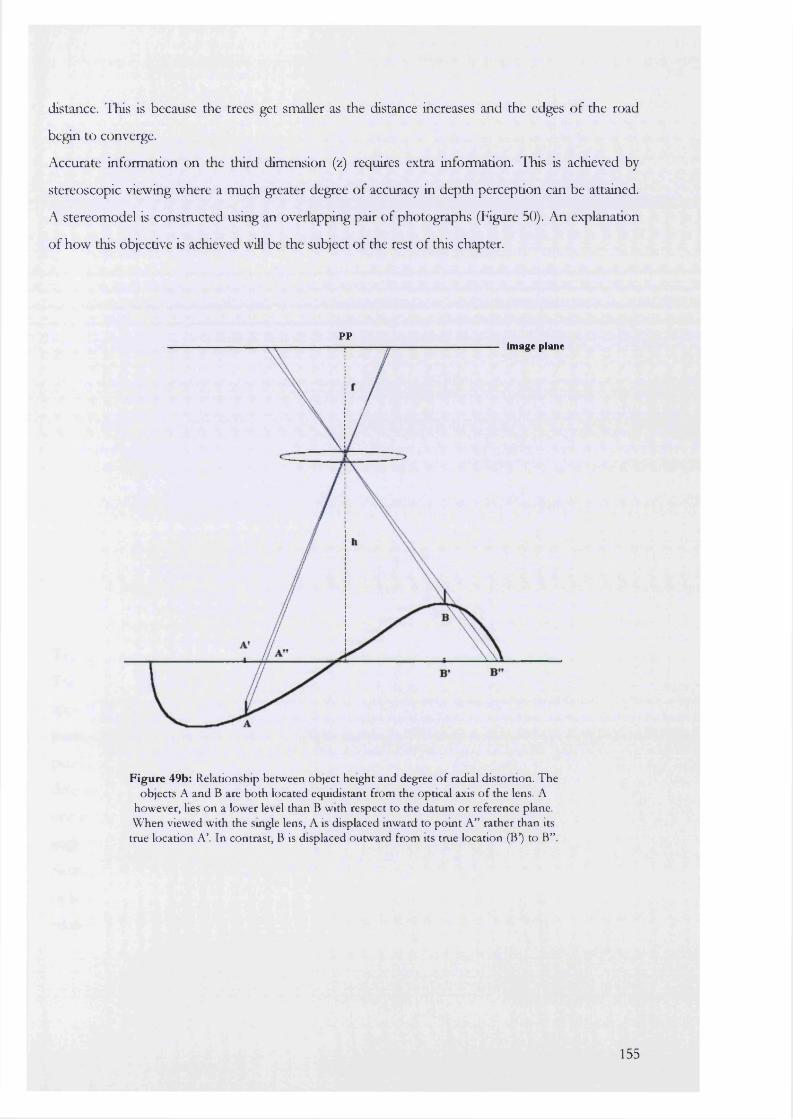
distance. ITiis is because the trees get smaller as the distance increases and the edges of the road
begin to converge.
Accurate information on the third dimension (z) requires extra information. This is achieved by
stereoscopic viewing where a much greater degree of accuracy in depth perception can be attained.
A stereomodel is constructed using an overlapping pair of photographs (Figure 50). An explanation
of how this objective is achieved will be the subject of the rest of this chapter.
ppimage plane
Figure 49b: Relationship betw een object height and degree o f radial distortion. T he objects A and B are b o th located equidistant from the optical axis o f the lens. A
how ever, lies o n a lower level than B w ith respect to the datum o r reference plane. WTien viewed w ith the smgle lens, A is displaced inward to p o m t A” rather than its
true location A ’. In contrast, B is displaced outw ard from its true location (B*) to B” .
155
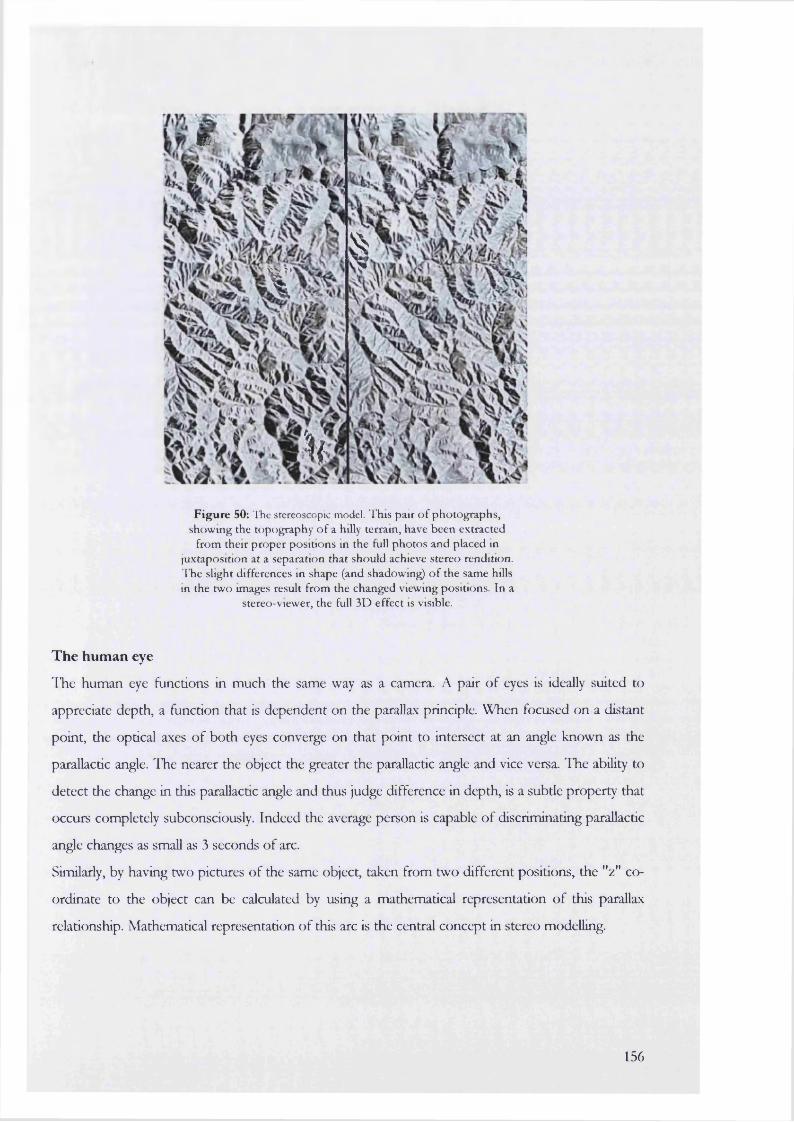
M :
§I
M
Figure 50: The stereoscopic model. This pair o f pho tographs, show ing the topography o f a hilly terrain, have been extracted
from their p roper positions in the full pho tos and placed in juxtaposition at a separation that should achieve stereo rendition. T he slight differences in shape (and shadowmg) o f the same hills in the tw o images result from the changed viewing positions. In a
stereo-viewer, the full 3D effect is visible.
The human eye
ITie human eye functions in much the same way as a camera. A pair of eyes is ideally suited to
appreciate depth, a function that is dependent on the parallax principle. When focused on a distant
point, the optical axes of both eyes converge on that point to intersect at an angle known as the
parallactic angle. The nearer the object the greater the parallactic angle and vice versa. The ability to
detect the change in this parallactic angle and thus judge difference in depth, is a subtle property that
occurs completely subconsciously. Indeed the average person is capable of discriminating parallactic
angle changes as small as 3 seconds of arc.
Similarly, by having two pictures of the same object, taken from two different positions, the "2 " co
ordinate to the object can be calculated by using a mathematical representation of this parallax
relationship. Mathematical representation of this arc is the central concept in stereo modelling.
156
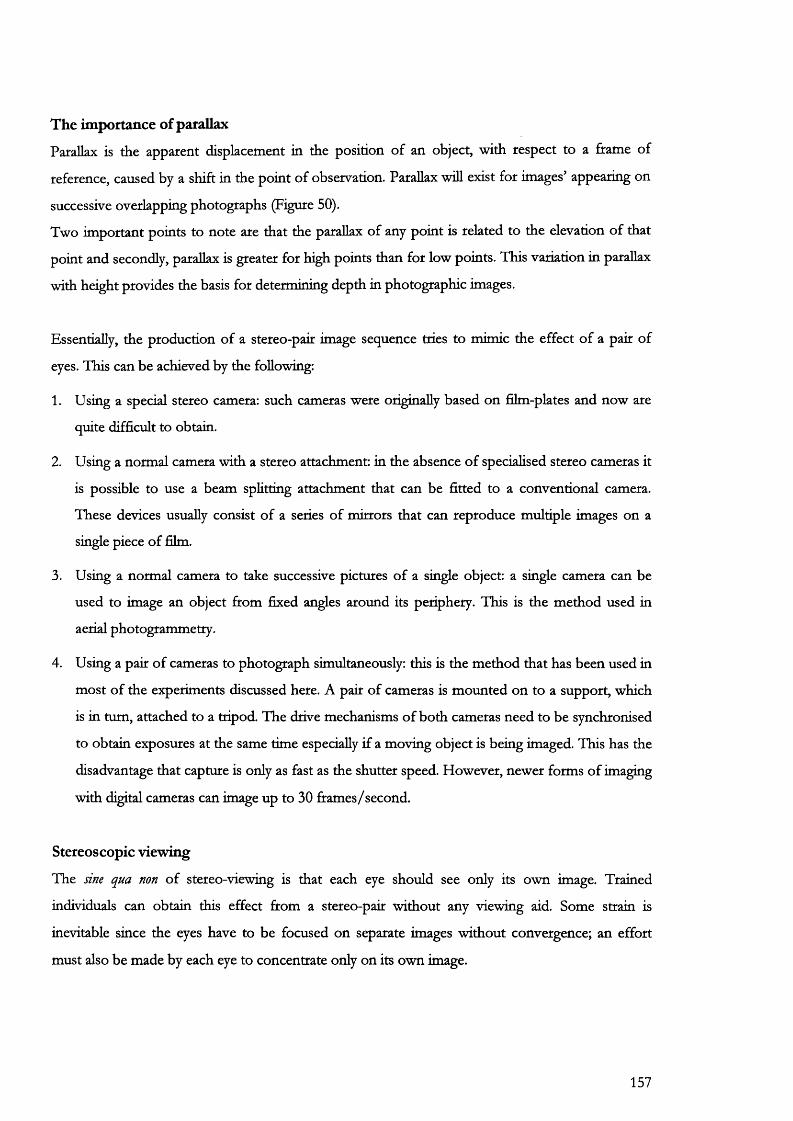
The importance of parallax
Parallax is the apparent displacement in the position of an object, with respect to a frame of
reference, caused by a shift in the point of observation. Parallax wiU exist for images’ appearing on
successive overlapping photographs (Figure 50).
Two important points to note are that the parallax of any point is related to the elevation of that
point and secondly, parallax is greater for high points than for low points. This variation in parallax
with height provides the basis for determining depth in photographic images.
Essentially, the production of a stereo-pair image sequence tries to mimic the effect of a pair of
eyes. This can be achieved by the following:
1. Using a special stereo camera: such cameras were originally based on fihn-pktes and now are
quite difficult to obtain.
2. Using a normal camera with a stereo attachment: in the absence of specialised stereo cameras it
is possible to use a beam splitting attachment that can be fitted to a conventional camera.
These devices usually consist of a series of mirrors that can reproduce multiple images on a
single piece of film.
3. Using a normal camera to take successive pictures of a single object: a single camera can be
used to image an object firom fixed angles around its periphery. This is the method used in
aerial photogrammetry.
4. Using a pair of cameras to photograph simultaneously: this is the method that has been used in
most of the experiments discussed here. A pair of cameras is mounted on to a support, which
is in turn, attached to a tripod. The drive mechanisms of both cameras need to be synchronised
to obtain exposures at the same time especially if a moving object is being imaged. This has the
disadvantage that capture is only as fast as the shutter speed. However, newer forms of imaging
with digital cameras can image up to 30 frames/second.
Stereoscopic viewing
The sine qua non of stereo-viewing is that each eye should see only its own image. Trained
individuals can obtain this effect from a stereo-pair without any viewing aid. Some strain is
inevitable since the eyes have to be focused on separate images without convergence; an effort
must also be made by each eye to concentrate only on its own image.
157
When the stereo pair is properly positioned left-right and then viewed through a stereoscope, the
eye-brain reaction is an impression of surface curvature or relief as though looking down ftom an
aeroplane at the ground.
Most commonly stereo-pairs are analysed in a purpose-built device known as a stereo- viewer. The
procedure requires that the stereo-pair are placed side-by-side at the principal focus of the viewing
lenses. The emergent beam is then parallel and the eye accepts it as originating ftom an infinitely
distant subject, allowing a relaxation of focusing and improved viewing comfort. The simplest type
of viewer is the pocket stereo-viewer. This consists of two lenses that can be expanded or
contracted along a slide bar to be as far apart as the distance between the observers eyes, placed in
a mount that is raised (on collapsible legs) approximately 6 inches above the central region of the
stereo pair. The stereo-viewer is able to measure the height of objects directly as well as differences
in height between two or more objects (relief).
Consider for example the determination of the height h of a tall building that lies near the edge of a
single aerial photograph (Figure 51a). If that photograph were taken as truly vertical, ie looking
straight down, then its center would lie at the nadir (the vertical line ftom camera perpendicular to
a surface point directly beneath). In this instance, the nadir would also coincide with the principal
point (pp) in the photograph, (the intersection of the lens' optical axis and the ground), so that the
pp would also be the true center of the photo. This point becomes off-center if the photograph
(and optical axis) is non-vertical.
If the building were to lie close to the pp, its top and bottom would appear to coincide in the
photo. If it were well away from pp at some radial distance r towards the edge, it would appear as
slanted with the top displaced further away ftom the pp than the bottom. This amount is
measurable in the photo as d. For an aircraft height H (calculable ftom the scale if a ground
distance is known), the value of h is:
h = (d /r )x (H ).
In Figure 51a, the lateral tilt of the tall buildings at the edges is obvious; d and r have been drawn
between the pp and one of the buildings near the edge:
158
«
I I I !
Figure 51a: D em onstration o f the calculation o f absolute height o f a building w ith photogram m etry. T he principal point, distance to base o f
building (r) and height o f buildm g (d) are all marked. O nce the height o f the plane is know n, the calculation o f absolute height can be perform ed
as detailed in the text.
Height differences (Figure 51b) between points of different elevation along surfaces can be
calculated from stereo pairs using the formula, h = (H) dP/(P + dP).
P is the absolute stereo parallax. For any standing object or separated points on a slope whose
height or relief is to be determined, the distance (in the direction parallel to the flight line) on one
photo between the base (here: point b) of that feature and the principal point (PPl) or nadir is
measured. The same is then done for that conjugate feature as it appears in some different position
in the other photograph. Note that the principal point of the first image PPl now lies off-center (at
PPl") in the second photograph whose equivalent is PP2. The average of the two distances (d +
d j/2) is the absolute stereo parallax.
dP is the differential parallax. It is determined by measuring the distance between the base and the
top of the feature or between two proximate terrain points at different elevations on a slope as
located in each of the two photos when the pair is in optimum alignment for stereo viewing. dP is
then the numerical difference between the two distance values (x - x j which will be different in
each of the photo pair.
159

The value of dP is established optically through use of special devices built into the stereo-viewer,
commonly referred to as a parallax bar. Each uses a variant of the "floating point" method in which
reference marks (dot or cross) are visible when the aligned photos are viewed under a mirror
stereoscope.
The parallax bar is placed on the image plane so that a fixed mark over one photograph is made to
coincide with a movable mark on the other by turning a screw drive. The value of dP is then read
from a graduated scale. When this is done for a number of points, heights and relief values for
parts of the map can be calculated; these become absolute values (elevations) if points are
referenced to benchmarks.
PPlPPi
Flight Line
F ig u re 51b: Calculation o f relief o r difference in height using a stereo-viewer. T h e object is labelled as a-b in b o th photographs w here b is the base and a is the
top o f the object. A calculation o f the absolute and differential parallax values (see text) are required in o rder to determ ine the height o f the object.
Use of the manual stereoplotter to specify a large enough number of elevation points in stereo
photos to permit contouring is difficult and tedious. This process can be automated using digital
photography and newer optical-mechanical stereoplotters. These are capable of semi-automating
the contouring process through computer processing of mathematically transformed data.
Both types of stereo-plotter were used in this study. The Kem analytical stereo-plotter was used for
the manual analysis of image pairs obtained firom filming an aneurysm neck. These pairs were
further analysed by scanning into digital format and transfer to a digital workstation (Figure 60).
The digital workstation allows contouring or formation of terrain maps used to study natural land
shifts due to erosion or earthquakes.
160

CHAPTER 9
EXPERIM ENTS II
DYNAMIC ARTERIAL IMAGING
9.2: Laboratory validation of a digital photogrammetric technique used to measure arterial dimensions.
9.1: Measurement of aneurysm neck and arterial motion during open surgical repair.
9.3: Measurement of arterial motion during open surgery using digital photography; a feasibility study
161
9.1
Laboratory validation of a digital photogrammetric technique used to measure arterial dimensions
A i m
The aim of this experiment was, using digital photogrammetry, to describe a complex 3D shape
such as a glass aneurysm solely in terms of its volume.
M e t h o d :
A single glass aneurysm, forming a perfect sphere of measured diameter 79.8 mm and volume
358.49 ml, was imaged around its circumference using a digital camera. The steps involved in
imaging and subsequent photgrammetric analysis were as follows:
1. Image Acquisition
Using a Kodak Megaplus ES 1.6i digital camera, 42 images were acquired of glass phantom F
around its circumference and two stems. Image resolution was 1536 x 1024 pixels. The phantom
was imaged on a background grid marked with points that had known co-ordinates in 3D space. 8
of these were used as the initial control points. The phantom itself was covered with 13 rows of
403 retroreflective targets to delineate its shape. The co-ordinates of these targets were unknown.
2. Establishing ground control points
Reference points needed to calculate the location and orientation of the network of photographs in
3D space were established in the project area prior to photography. They consisted of clearly
labelled self-adhesive retroreflective targets that could easily be identified in the photographs.
A minimum of 4 (range 2 to 50) control points are usually required in every group of photographs,
although the control points need not be visible in each and every photograph. The first set of
images used 8 points on a special background grid as initial controls to establish the location of
points on the glass phantom. Once these locations on the phantom were known {with reference to the
initial controls points), they were then used to replace the existing control points which were deleted
from the file. The x, y and z co-ordinates of each target in the reference co-ordinate system was
calculated within the software (VMS) by simply measuring the distances between the various
control points and establishing an arbitrary, but correctly scaled co-ordinate system. This procedure
is called cantilevering.
162
To permit 3D co-ordination each target measured from the photography had to be visible in two
or more images taken from different perspectives. Hence, each photograph taken had to contain a
fair amount of overlap with some of the other images. This overlap was used in the analytical
phase. This set of linked photographs is called a network. Networks consist of a group of images
that cover a certain area such as a single piece of equipment (Figure 52). In general, network sizes
range from 2 to 50 images. This grouping greatly reduces control requirements, and increases the
accuracy of the measurements.
3. Image Processing
A digital camera (Kodak Megaplus ES 1.6i) was used to streamline the image processing. Further
digital scanning or réseau measurement as is the case with traditional photogrammetry techniques
(Chapter 8) could hence be avoided. Images could be measured as soon as they had been acquired.
Camera Calibration
Camera calibration was accomplished prior to this experiment by using a number of test
photographs of a specially designed calibration field (Figure 59). The data obtained from this
calibration are shown in Table 33.
Camera calibration parameters Initial values from test grid (mm)
Focal len 15.68Principal point Px 0.09
offsets Py -0.03Radial lens K1 -1.55x10⁻³distortion K2 4.83 X 10⁻⁶
parameters K3 -1.86x10-"Tangential lens PI -0.002
distortion parameters P2 0.07
T a b le 33: D ata obtained from calibration o f K odak ES 1.6i digital cam era using a specially designed
test field (Figure 59). T h e term s relating to cam era calibration are explained in C hapter 8.
Data obtained from self-calibration are shown in Table 34. A comparison of Tables 33 and 34
shows similar calibration parameters for both experiments. Only the focal length differs by a
negligible amount.
Image location and orientation at the time of exposure were then calculated as discussed below.
163
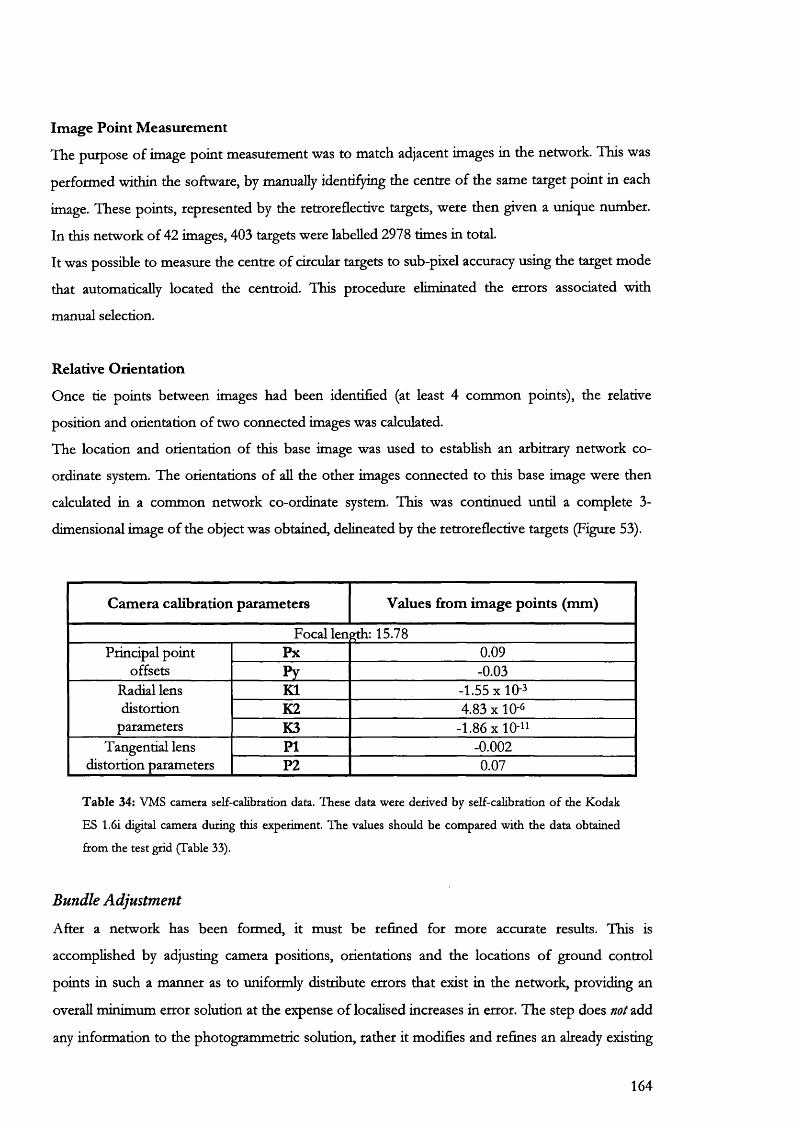
Image Point Measurement
The purpose of image point measurement was to match adjacent images in the network. This was
performed within the software, by manually identifying the centre of the same target point in each
image. These points, represented by the retroreflective targets, were then given a unique number.
In this network of 42 images, 403 targets were labelled 2978 times in total.
It was possible to measure the centre of circular targets to sub-pixel accuracy using the target mode
that automatically located the centroid. This procedure eliminated the errors associated with
manual selection.
Relative Orientation
Once tie points between images had been identified (at least 4 common points), the relative
position and orientation of two connected images was calculated.
The location and orientation of this base image was used to establish an arbitrary network co
ordinate system. The orientations of all the other images connected to this base image were then
calculated in a common network co-ordinate system. This was continued until a complete 3-
dimensional image of the object was obtained, delineated by the retroreflective targets (Figure 53).
Camera calibration parameters Values from image points (mm)
Focal leneth: 15.78Principal point Px 0.09
offsets Py -0.03Radial lens K1 -1.55x10⁻³distortion K2 4.83 X 10⁻⁶
parameters K3 -1.86x10-"Tangential lens PI -0.002
distortion parameters P2 0.07
T a b le 34: VMS cam era self-calibration data. These data w ere derived by self-calibration o f the K odak
ES 1.6i digital cam era during this experim ent. T he values should be com pared w ith the data obtained
from the test grid (Table 33).
Bundle Adjustment
After a network has been formed, it must be refined for more accurate results. This is
accomplished by adjusting camera positions, orientations and the locations of ground control
points in such a manner as to uniformly distribute errors that exist in the network, providing an
overall minimum error solution at the expense of localised increases in error. The step does not add
any information to the photogrammetric solution, rather it modifies and refines an already existing
164
solution. It is very important to note that the bundle adjustment method does not reduce or
eliminate error but only redistributes it in a more statistically rigorous way.
The bundle adjustment technique employed here was a weighted, simultaneous, least-squares
solution to the photogrammetric equations relating image co-ordinates and control measurements.
Thus the solution transformed measurements into a mathematical description of the
photogrammetric network. Since there were many more measurements than required and each
measurement contained some measurement error, the software computed a “best fit” solution. The
inconsistency or residuals generated were the difference between the measured value and the value
predicted by the solution.
4. Measurement and 3D Modelling
Using the measurements determined firom the image network, A 3D solid model of the original
glass phantom was created using two further analytical software programmes. These packages
applied a solid surface over the original image (Figure 53), thus allowing estimation of volume and
maximal diameter of the original glass aneurysm. Both the software packages used. Microstation
and Surfer, are recognized for their universal photogrammetric applicability.
Microstation
Data regarding image point co-ordinates was transferred intact to a Computer Aided Design
package called Microstation. Here the aneurysm image was edited in two stages before
measurements were made.
In the first stage, a profile was defined along one-half of the phantom (Figure 54). This was then
rotated by 360° around a labelled axis of rotation that had been placed through the geometric
centre of the glass aneurysm. Rotation produced a series of different sized circles that were used to
generate the 3D-aneurysm shape. The volume of this shape (Figure 55) was then estimated by
integration.
165
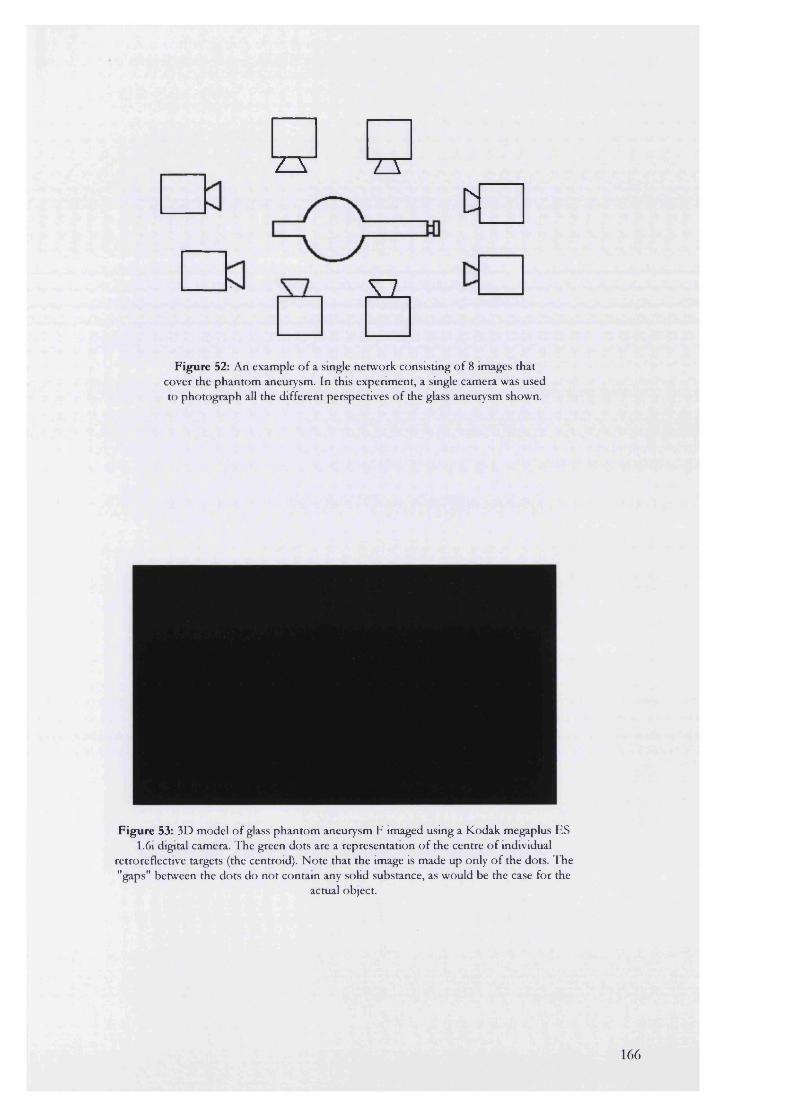
a ZTDf
a
Figure 52: An example o f a single netw ork consisting o f 8 images that cover the p h an to m aneurysm. In this experim ent, a smgle cam era was used to pho tog raph all the d ifferent perspectives o f the glass aneurysm shown.
Figure 53: 3D m odel o f glass p h an to m aneurysm F im aged using a K odak m egaplus ES 1.6i digital camera. T he green do ts are a representation o f the centre o f individual
retroreflective targets (the centroid). N ote tha t the image is m ade up only o f the dots. T he "gaps" betw een the dots do n o t contain any solid substance, as w ould be the case for the
actual object.
166
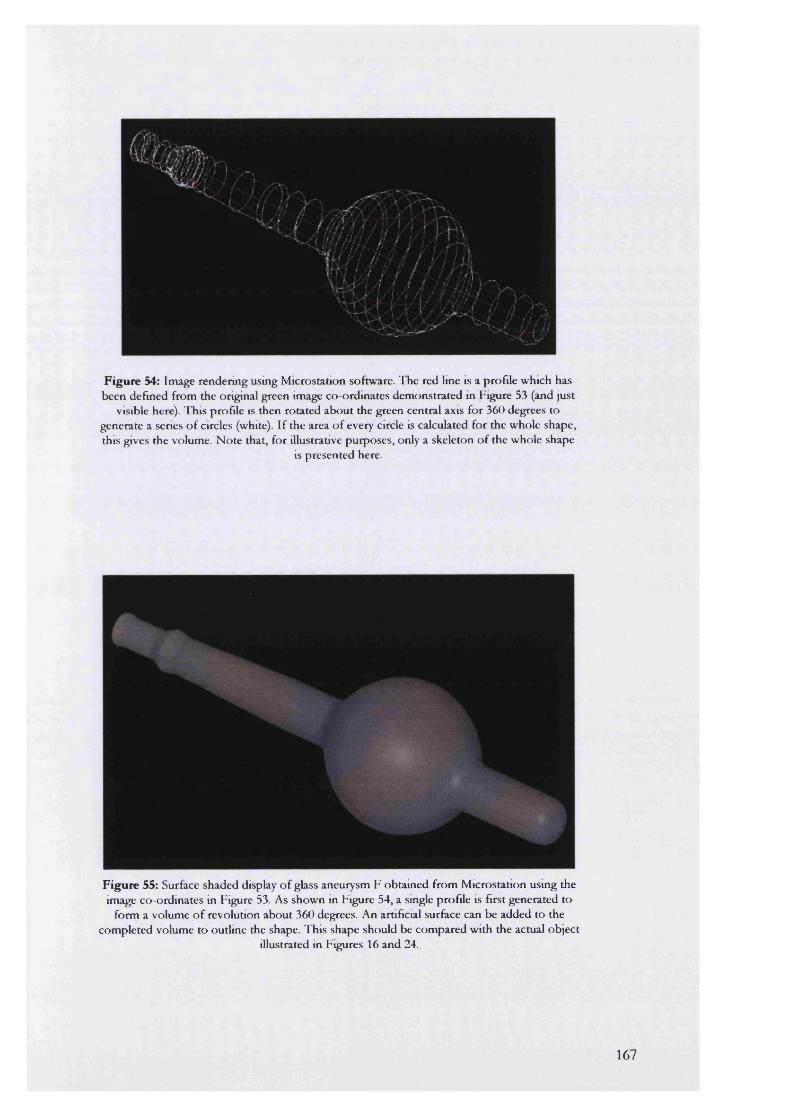
Figure 54: Image rendering using M icrostation software. T he red line is a profile w hich has been defined from the original green image co-ordinates dem onstrated in Figure 53 (and just
visible here). T his profile is then ro tated abou t the green central axis for 360 degrees to generate a series o f circles (white). I f the area o f every circle is calculated for the w hole shape, this gives the volume. N o te that, fo r illustrative purposes, only a skeleton o f the w hole shape
is p resented here.
Figure 55: Surface shaded display o f glass aneurysm F obtained from M icrostation using the image co-ordinates in Figure 53. As show n in Figure 54, a single profile is first generated to
form a volum e o f revolution about 360 degrees. A n artificial surface can be added to the com pleted volum e to outline the shape. T his shape should be com pared w ith the actual object
illustrated in Figures 16 and 24.
167
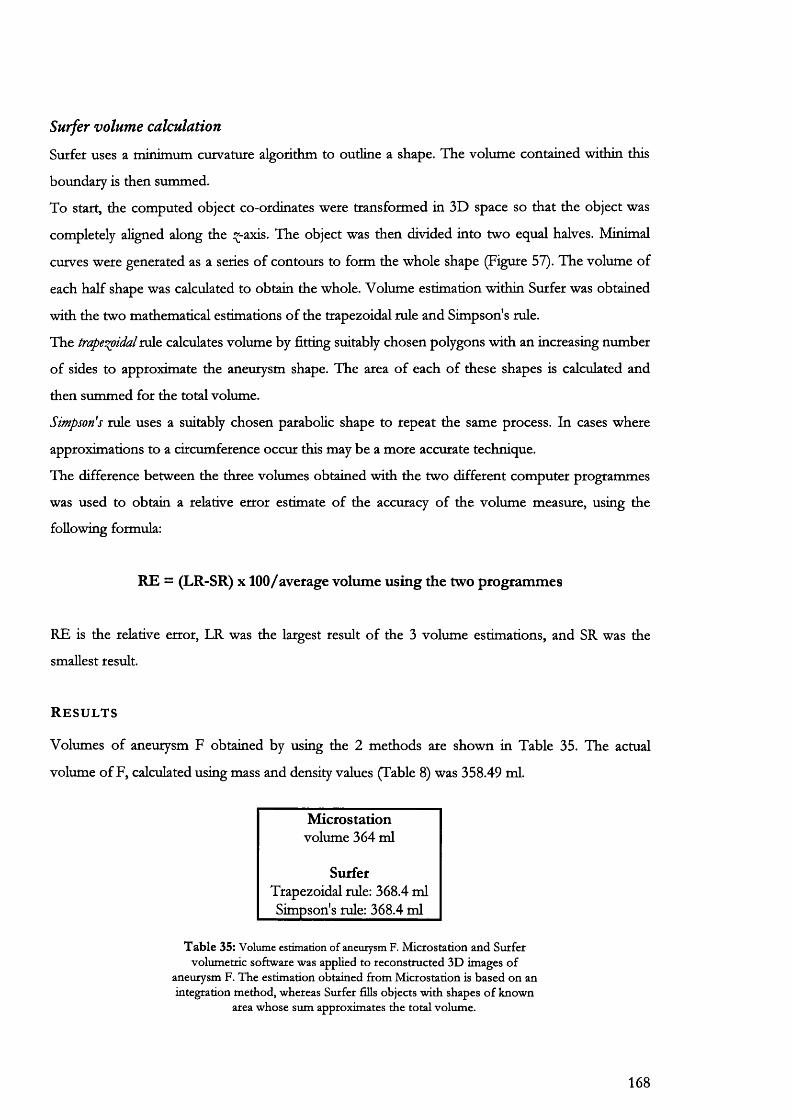
Surfer volume calculation
Surfer uses a rninirnurn curvature algorithm to outline a shape. The volume contained within this
boundary is then summed.
To start, the computed object co-ordinates were transformed in 3D space so that the object was
completely aligned along the î -axis. The object was then divided into two equal halves. Minimal
curves were generated as a series of contours to form the whole shape (Figure 57). The volume of
each half shape was calculated to obtain the whole. Volume estimation within Surfer was obtained
with the two mathematical estimations of the trapezoidal rule and Simpson's rule.
The traper^idal rule calculates volume by fitting suitably chosen polygons with an increasing number
of sides to approximate the aneurysm shape. The area of each of these shapes is calculated and
then summed for the total volume.
Simpson's rule uses a suitably chosen parabolic shape to repeat the same process. In cases where
approximations to a circumference occur this may be a more accurate technique.
The difference between the three volumes obtained with the two different computer programmes
was used to obtain a relative error estimate of the accuracy of the volume measure, using the
following formula:
RE = (LR-SR) X100/average volume using the two programmes
RE is the relative error, LR was the largest result of the 3 volume estimations, and SR was the
smallest result.
R e s u l t s
Volumes of aneurysm F obtained by using the 2 methods are shown in Table 35. The actual
volume of F, calculated using mass and density values (Table 8) was 358.49 ml.
Microstationvolume 364 ml
SurferTrapezoidal rule: 368.4 ml Simpson's rule: 368.4 ml
T a b le 35: Volume estimation of aneurysm F. M icfostation and Surfer volum etric softw are was applied to reconstructed 3D im ages o f
aneurysm F. T he estim ation obtained from M icrostation is based on an integration m ethod, w hereas Surfer fills objects w ith shapes o f know n
area w hose sum approxim ates the to tal volum e.
168
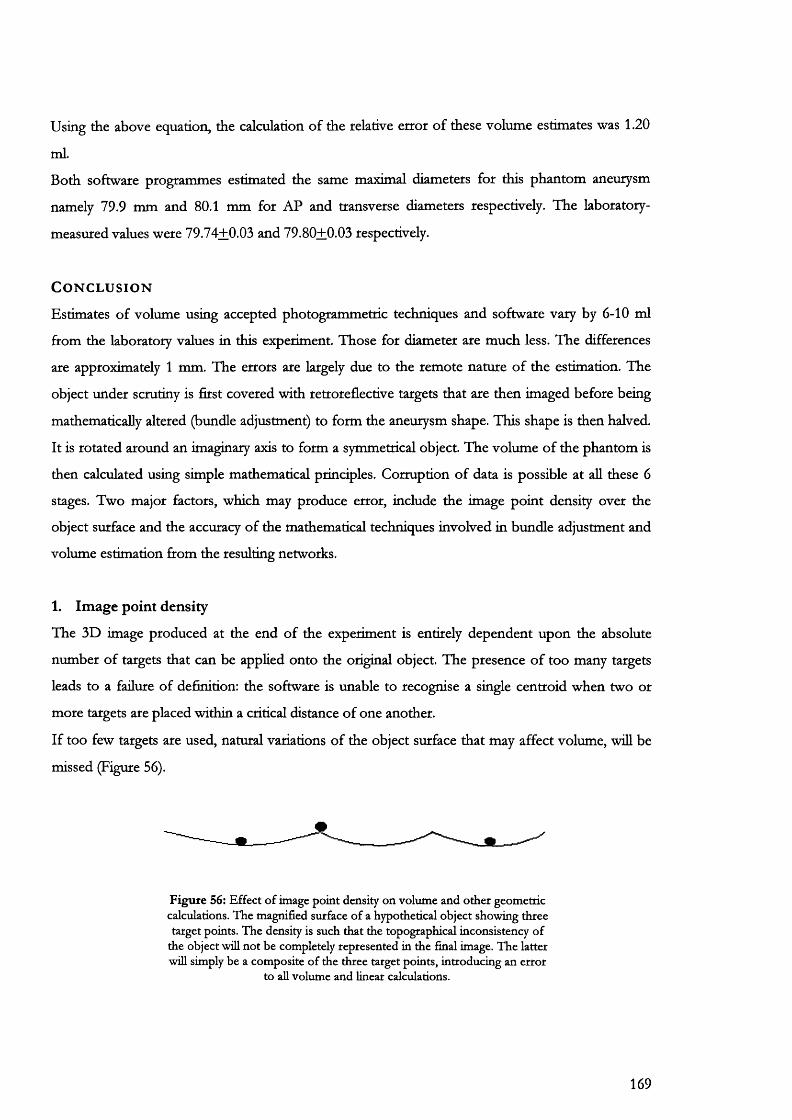
Using the above equation, the calculation of the relative error of these volume estimates was 1.20
ml.
Both software programmes estimated the same maximal diameters for this phantom aneurysm
namely 79.9 mm and 80.1 mm for AP and transverse diameters respectively. The laboratory-
measured values were 79.74+0.03 and 79.80+0.03 respectively.
C o n c l u s i o n
Estimates of volume using accepted photogrammetric techniques and software vary by 6-10 ml
from the laboratory values in this experiment. Those for diameter are much less. The differences
are approximately 1 mm. The errors are largely due to the remote nature of the estimation. The
object under scrutiny is first covered with retroreflective targets that are then imaged before being
mathematically altered (bundle adjustment) to form the aneurysm shape. This shape is then halved.
It is rotated around an imaginary axis to form a symmetrical object. The volume of the phantom is
then calculated using simple mathematical principles. Corruption of data is possible at all these 6
stages. Two major factors, which may produce error, include the image point density over the
object surface and the accuracy of the mathematical techniques involved in bundle adjustment and
volume estimation from the resulting networks.
1. Image point density
The 3D image produced at the end of the experiment is entirely dependent upon the absolute
number of targets that can be applied onto the original object. The presence of too many targets
leads to a failure of definition: the software is unable to recognise a single centroid when two or
more targets are placed within a critical distance of one another.
If too few targets are used, natural variations of the object surface that may affect volume, wiU be
missed (Figure 56).
F ig u re 56: E ffec t o f im age po in t density on volum e and o th e r geom etric calculations. T he m agnified surface o f a hypothetical object show ing th ree target points. T he density is such tha t the topographical inconsistency o f
the object will n o t be com pletely represen ted in the final image. T h e latter will simply be a com posite o f the three target points, in troducing an erro r
to all volum e and linear calculations.
169
2. Mathematical estimates of volume
The bundle adjustment equation tends to redistribute the errors associated with each image point
measurement across the whole network in a more statistically acceptable fashion. In some cases
this may corrupt the original object shape by further removing the data obtained from the actual
object parameters. The remoteness can be judged by comparing the residual values obtained. These
were aU less than 0.1 mm suggesting only slight if any deviation from the original image point
measurements.
Both software packages estimated volume by adding artificial surfaces within the object under
study. In this case, the object used was symmetrical and a good volume of revolution estimate was
obtained from Microstation. This would have been subject to a greater error if a non-symmetrical
shape were used.
Surfer uses a different technique for volumes involving a basic shape-fitting exercise. In this
respect, although the volume estimate is slightly less accurate than for Microstation, this error may
be reduced when a non-uniform object, that cannot be successfully rotated around an axis, is
studied.
It is of interest to note that small errors of measurement distributed across the whole object surface
can become magnified to produce a much greater volume as opposed to diameter error. The
diameter is measured at a single point whereas volume is really a composite measure of all the given
diameters forming a spherical object.
170
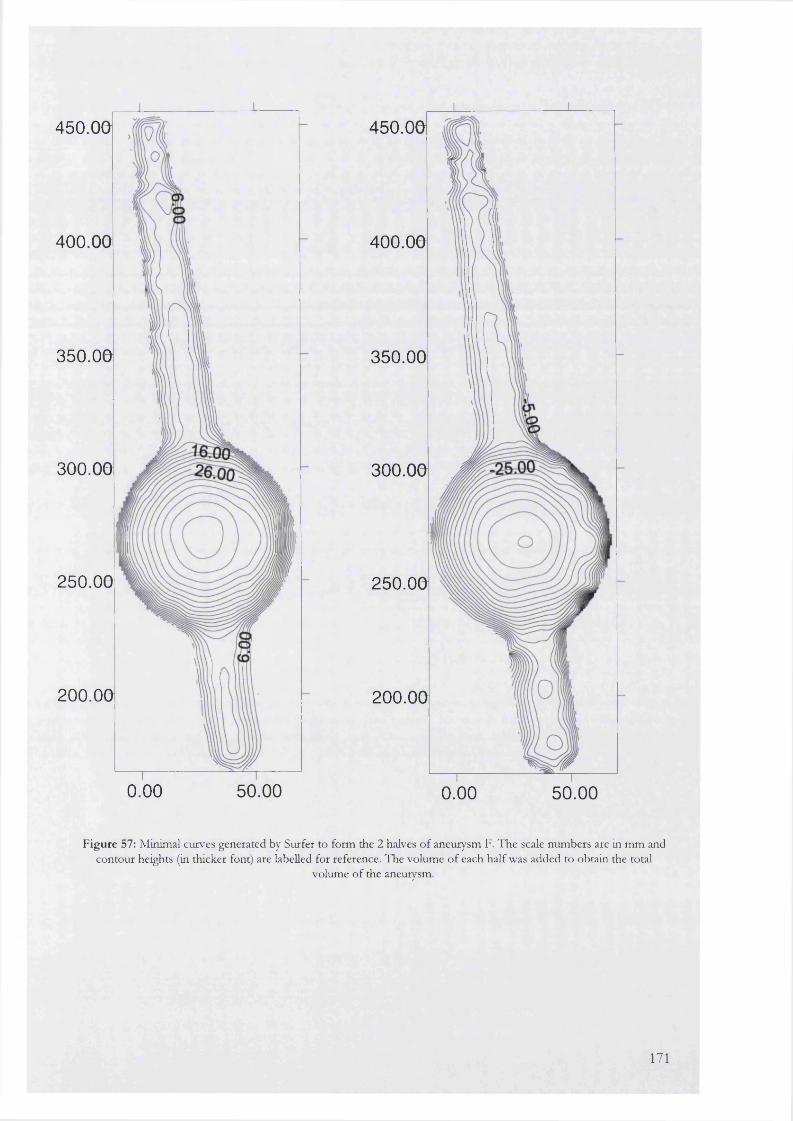
450.00
400.00
350.00
300.00
250.00
200.00
0.00 50.00
450.00
400.00
350.00
300.00
250.00
200.00
0.00 50.00
F igu re 57: Minimal curves generated by Surfer to form the 2 halves o f aneurysm F. T he scale num bers are in m m and contour heights (in thicker font) are labelled for reference. The volum e o f each half was added to obtain the total
volume o f the aneurysm.
171
9.2
Measurement of aneurysm neck and arterial motion during open surgicalrepair
A i m
The aim of this expenment was to define and quantify the types of motion exhibited by the neck of
an AAA and other smaller arteries during open vascular surgery.
B a c k g r o u n d
Endovascular treatment of aneurysms essentially results in the deployment of a rigid endograft
within a moving biological system. The extent and type of motion that occurs within this system
has never been quantified particularly with reference to the neck of the aneurysm, which is the
landing zone for graft fixation. Continuous differential motion, between the aneurysm neck and the
endograft has important implications for the graft-vessel seal. Loss of this seal may lead to
endoleak with catastrophic consequences.
Previous pilot experiments had identified that three types of motion may be occurring at the
aneurysm neck (Figure 58). These were not quantified due to an inability to gauge depth and the
inaccuracies inherent in direct measurements firom video-film. To overcome these difficulties,
calibrated cameras and 3-dimensional film stereo-pair modelling were used in this series of
experiments. The techniques were first tried on smaller arteries during vascular procedures
followed by actual filming of aneurysms during conventional repair. Ethical permission for these
studies was obtained from the UCL/UCLH Joint Ethics Committee.
P a t i e n t s a n d m e t h o d
Informed consent for filming was obtained from 9 patients scheduled for major vascular
procedures. The first group of 3 patients was used in a pilot study to confirm the presence and
nature of aneurysm neck motion. This experimental work was carried out with a co-worker in the
laboratory. During these patients’ operations with respiratory effort halted, aneurysm necks were
filmed using a high-speed video camera (NAC high speed HSV 400, NAC inc. Japan). Two
standard arterial clips (Ethicon proximate) were placed at two points on the anterior surface of the
aneurysm. These clips served as markers for measurement of longitudinal displacement and twist.
Results were analysed using the graphics tablet supplied with the video camera. We were unable to
determine a scale for the tablet and displacement was hence measured in arbitrary units.
172

In the second group of patients, more sophisticated technology was used to estimate these
movements. There were 3 patients undergoing open aneurysm repair, 2 patients undergoing a
femoro-popliteal vein bypass and one patient undergoing carotid endarterectomy.
All patients had a general anaesthetic and respiration was suspended for the short interval over
which filming occurred.
Arteries were surgically exposed with care taken not to traumatise the vessels by direct handling,
application of vascular clamps or the passage of surgical sloops before photography had taken
place. During the course of this study, it was found that to enable recognition of identical points
during data analysis, the surface of each vessel filmed had to be gently marked with a regular array
of small dots made with a sterile spirit-based pen (vide injra).
All photography was performed with a pair of RoUei 6006 single reflex lens cameras containing
120-mm roll film. Cameras were electronically synchronized so that the triggering of one led to the
simultaneous firing of the other. The cameras were mounted on a steel bar, 1 metre apart and
angled inwards at 45 degrees. This bar was in turn fixed to a wheeled tripod that could be easily
manoeuvred over the patient when required.
2 types of film were used to test the quality of images obtained for measurement. Ilford PAN F
(Panchromatic) black and white film was used for half the exposures while Kodak Ektachrome was
used for the rest.
A strobe light was mounted in the centre of the bar between the two cameras and its flash
sequence was varied from 1 per second to 4 per second. The cameras had a 1-second exposure
time so each film had either 1 or 4 flashes per print. The idea was to capture movement as a series
of overlapping stills on the same photograph. However, it soon became apparent that the films
used were not sensitive enough to detect these subtle displacements. Instead, a series of image pairs
were obtained at recurrent 1-second intervals in time. These were analysed as described below:
173
Figure 58: Graphs showing the three types of motion identified at the neck of an aneurysm using high-speed
video filming.
Longitudinal motion
9.85 -
9.75 -
I 9.7 -
Q 9.55 -
9.45 -
9.48 8 8 8
Time (ms)
Transverse m otion
3.75 T
3.7 --
1Î
3.55
3.5
8 i i 8 i i i i8 8T im e (m s)
174
Torque
33 T
32 --
1«
30 --
^ 28 --5
26 --
ii Îi i 8 ni8 isT im e (m s)
T hese experim ents w ere perfo rm ed w ith 3 patients undergo ing open aneurysm surgery. A fter filming, the d isplacem ent o f tw o
m arked points from one ano ther in differing directions was recorded using a graphics tablet. T here are 3 d ifferen t cyclical
m otions seen on the graphs. T orque was m easured by calculating the arctan o f the angle betw een the u pper and low er
m ark e rs / clips.
M e t h o d o f i m a g e a n a l y s i s
1. Camera calibration
The internal geometry of both cameras was elucidated in a separate experiment using a wall with a
non-uniform surface and targets placed at known ordinates in the x , j and planes (Figure 59).
Exactly the same photographic protocol was used with the cameras mounted on a rigid support
and tripod.
The cameras were randomly tilted in the omega, phi and kappa angular directions and multiple
exposures were taken. The data from these pictures was used to model camera geometry using
VMS bundle adjustment software. This provided precise information about the principal point for
each camera as well as the amount of radial distortion expected on each photograph of a stereo-
pair.
2. Ground control point matching for stereo-model reconstruction
The paired images of arteries and the aneurysm neck were arranged in the analytical stereoplotter
(DSR, Kem, Switzerland) for initial viewing and marking. To facilitate stereo matching, 13 ground
175
control points were marked on each photograph over common stationary points on both images.
The true co-ordinates of these points in 3D space were calculated using the calibration parameters
obtained for each camera from VMS as described above. Using the calibration parameters and
working backwards, it was possible to assign the true 3D co-ordinates to these 13 points.
3. Scanning of images and analysis using digital photogrammetric workstation
For digital terrain modelling (DTM), image pairs were first scanned into digital format using a Leica
scanner (Leica Technology B.V. Rijswijk Netherlands) to a resolution of 512 x 512 pixels.
This data was then analysed using the Phodis photogrammetric workstation (Zeiss, Germany), a
unique application for a system normally used in DTM from aerial photographs (Figure 60).
Post-scanning, the 13 ground control points were re-identified manually and their co-ordinates
were re-assigned. The residuals between the 2 sets of values (manually marked ground points
versus the points marked in digital format) were less than 1 mm in aU 13 cases. This represented
only a very minor loss of information judged as acceptable for further analysis.
To further improve the quality of the 3D digital models, 12 extra points were then placed over
other corresponding features in both images. The software used these tie points to match images
one stage further.
Final adjustments to improve the stereo matching were achieved automatically within the software
using a pixel intensity recognition sequence. Briefly, individual pixels from the pen marks on each
photo pair (Figure 61) were identified and matched with their pair with further continuous
mapping until the full image had been captured in 3D.
Two series of DTM were built over the 3D-aneurysm shape using a wire grid with intersections at
every 1 mm and 0.5 mm respectively. Each intersection had known x , j and ^ co-ordinate values.
One problem became apparent in the change in depth from the edge of the aneurysm to the
laparotomy wound. This was too subtie for the software to recognise and the area had to be
manually marked on screen with a break-line. This loss of recognition was most likely due to the
original function of the workstation software as a geographical mapping tool usually dealing with
large variations in depth (such as would occur between a mountain peak and its corresponding
valley).
The whole of the above procedure was then repeated for two more pairs of images. These depicted
the filmed arteries at 1 second and then 2 seconds later in time.
The software was able to subtract these images from one-another (Figure 62) expressing only the
differences between image pairs. In the case of the AAA neck, this difference was taken to imply
176
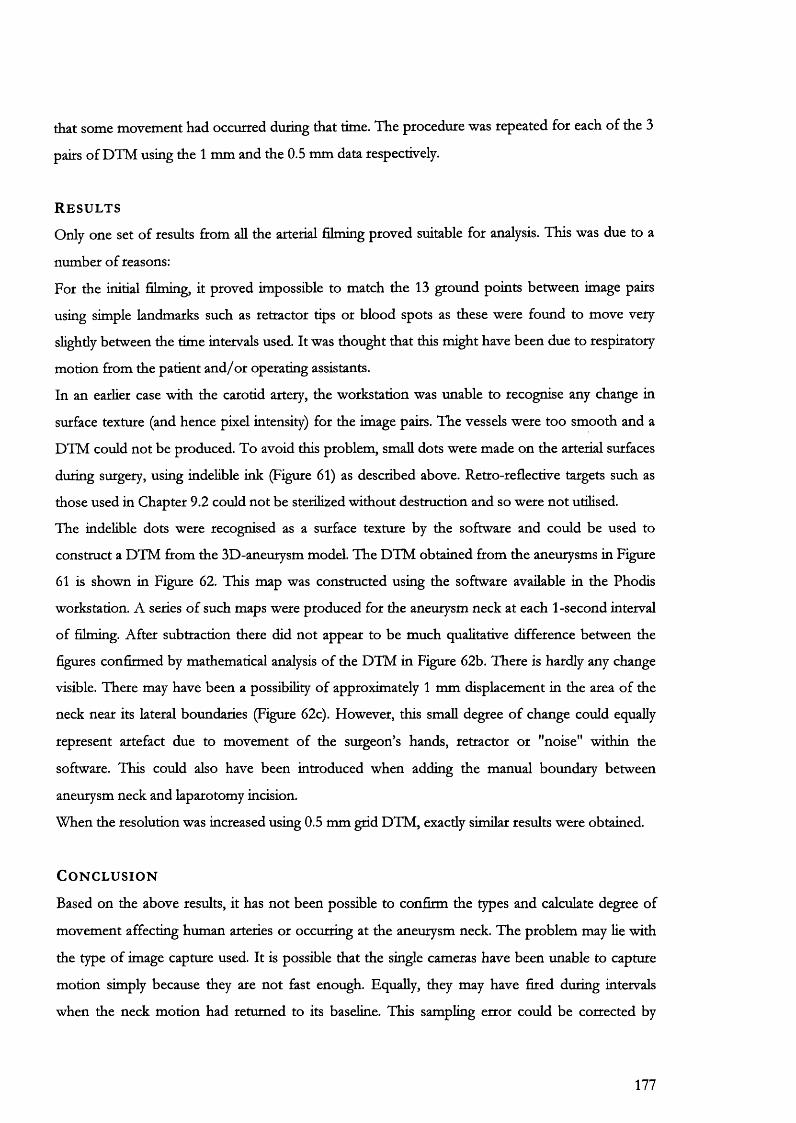
that some movement had occurred during that time. The procedure was repeated for each of the 3
pairs of DTM using the 1 mm and the 0.5 mm data respectively.
R e s u l t s
Only one set of results from all the arterial filming proved suitable for analysis. This was due to a
number of reasons:
For the initial filming, it proved impossible to match the 13 ground points between image pairs
using simple landmarks such as retractor tips or blood spots as these were found to move very
slightly between the time intervals used. It was thought that this might have been due to respiratory
motion from the patient and/or operating assistants.
In an earlier case with the carotid artery, the workstation was unable to recognise any change in
surface texture (and hence pixel intensity) for the image pairs. The vessels were too smooth and a
DTM could not be produced. To avoid this problem, small dots were made on the arterial surfaces
during surgery, using mdehble ink (Figure 61) as described above. Retro-reflective targets such as
those used in Chapter 9.2 could not be sterilized without destruction and so were not utilised.
The indelible dots were recognised as a surface texture by the software and could be used to
construct a DTM from the 3D-aneurysm model. The DTM obtained from the aneurysms in Figure
61 is shown in Figure 62. This map was constructed using the software available in the Phodis
workstation. A series of such maps were produced for the aneurysm neck at each 1-second interval
of filming. After subtraction there did not appear to be much qualitative difference between the
figures confirmed by mathematical analysis of the DTM in Figure 62b. There is hardly any change
visible. There may have been a possibility of approximately 1 mm displacement in the area of the
neck near its lateral boundaries (Figure 62c). However, this small degree of change could equally
represent artefact due to movement of the surgeon’s hands, retractor or "noise" within the
software. This could also have been introduced when adding the manual boundary between
aneurysm neck and laparotomy incision.
When the resolution was increased using 0.5 mm grid DTM, exactly similar results were obtained.
C o n c l u s i o n
Based on the above results, it has not been possible to confirm the types and calculate degree of
movement affecting human arteries or occurring at the aneurysm neck. The problem may lie with
the type of image capture used. It is possible that the single cameras have been unable to capture
motion simply because they are not fast enough. Equally, they may have fired during intervals
when the neck motion had returned to its baseline. This sampling error could be corrected by
177

taking larger numbers of photographs but the analysis stage, which was already very time
consuming (1-2 weeks), would be considerably lengthened.
The experiment has been useful in the sense that it has illustrated the feasibility of using stereo
filming in theatre and subsequently analysing results using photogrammetric software. A further
advancement on the present technique would be to improve the speed of image capture while
preserving the resolution of the images obtained.
178
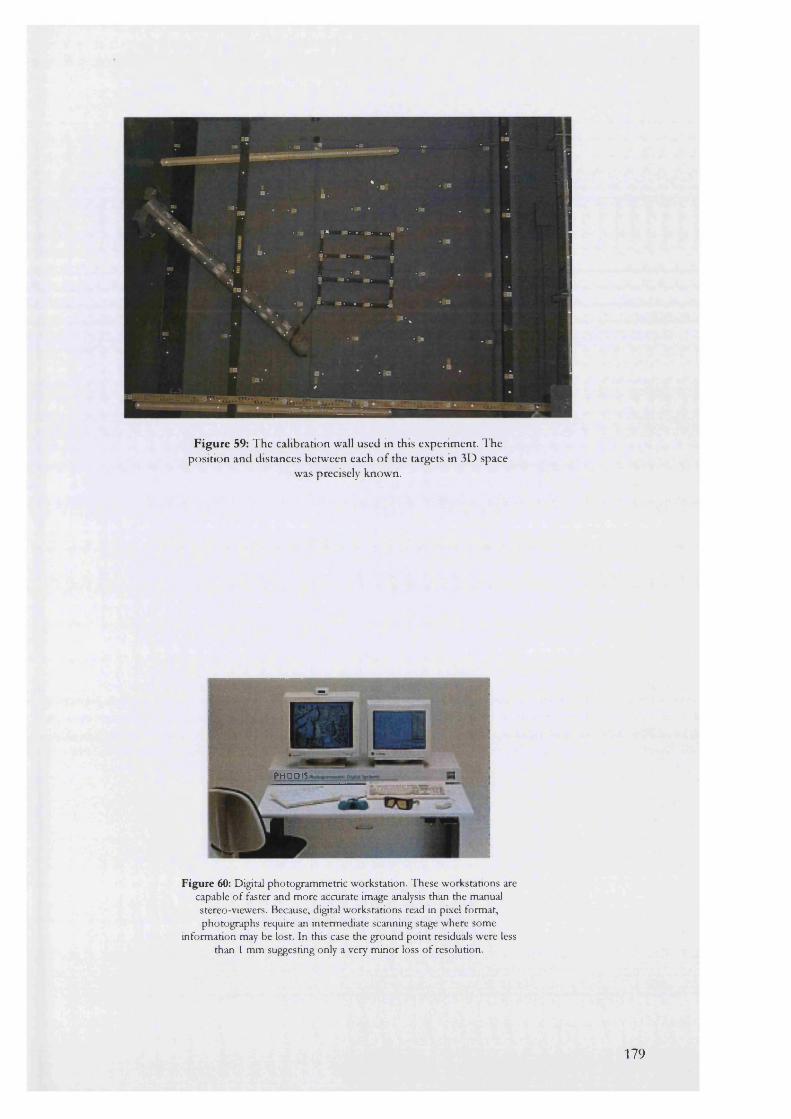
F ig u re 59: T he calibration wall used in this experim ent. The position and distances betw een each o f the targets in 3D space
was precisely known.
PHO D IS
Figure 60: Digital photogrammetric workstation. These workstations are capable o f faster and more accurate image analysis than the manual stereo-viewers. Because, digital workstations read in pixel format, photographs require an intermediate scanning stage where some
information may be lost. In this case the ground point residuals were less than 1 mm suggesting only a very minor loss o f resolution.
179
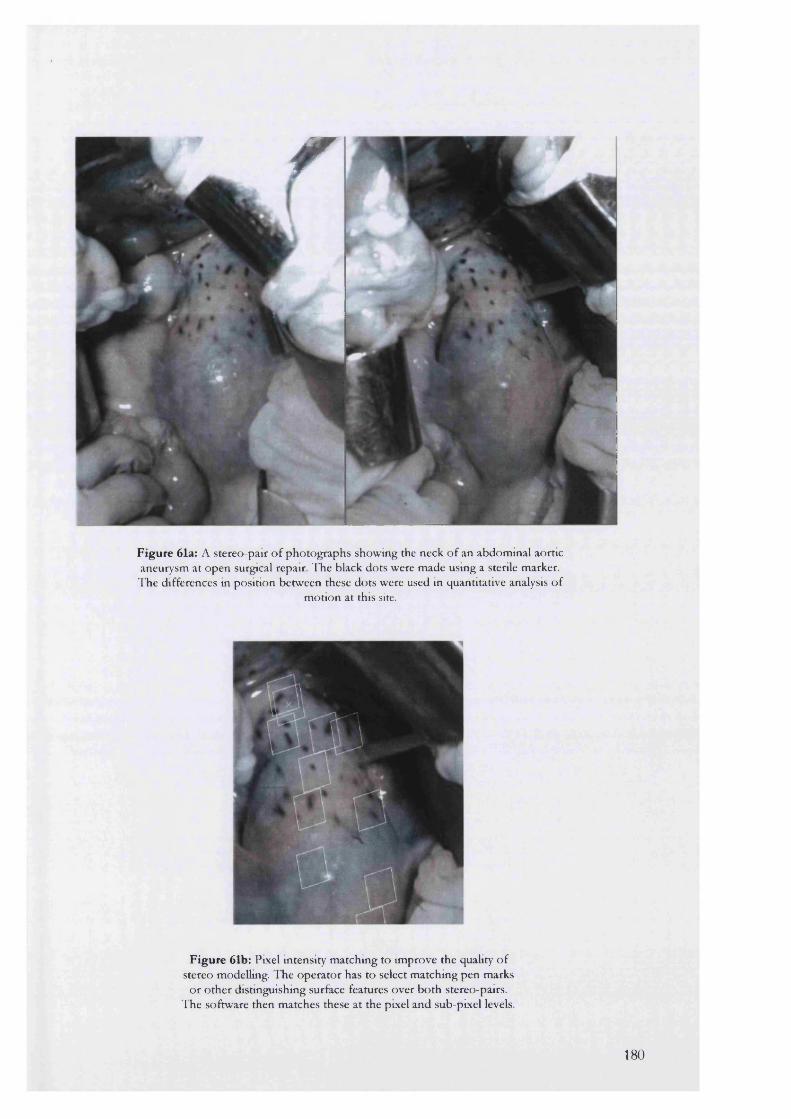
r
Figure 61a: A stereo-pair o f pho tographs show ing the neck o f an abdom inal aortic aneurysm at open surgical repair. T he black dots were m ade using a sterile marker. T he differences in position betw een these dots were used in quantitative analysis o f
m otion at this site.
Figure 61b: Pixel intensity m atching to im prove the quality o f stereo modelling. T he opera to r has to select m atching pen marks
o r o th e r distinguishing surface features over b o th stereo-pairs. T he softw are then m atches these a t the pixel and sub-pixel levels.
180
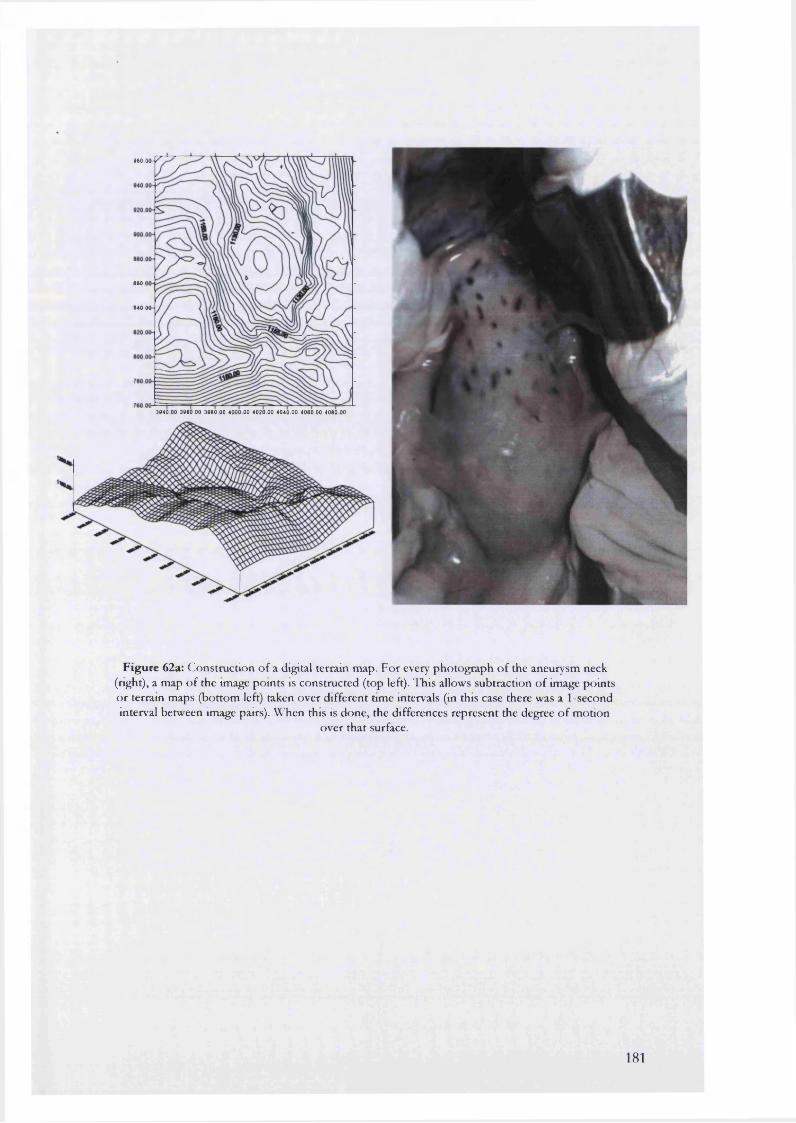
M O . O O - p ^
8 M . I
• 40.00-
3840 00 3860.00 3880.00 4000.00 4020.00 4040.00 4060.00 4060 00
Figure 62a: C onstruction o f a digital terrain m ap. F o r every pho tog raph o f the aneurysm neck (right), a m ap o f the image po in ts is constructed (top left). This allows subtraction o f image points o r terrain m aps (bo ttom left) taken over d ifferent time intervals (in this case there was a 1-second interval betw een image pairs). VCTien this is done, the differences represent the degree o f m otion
over tha t surface.
181
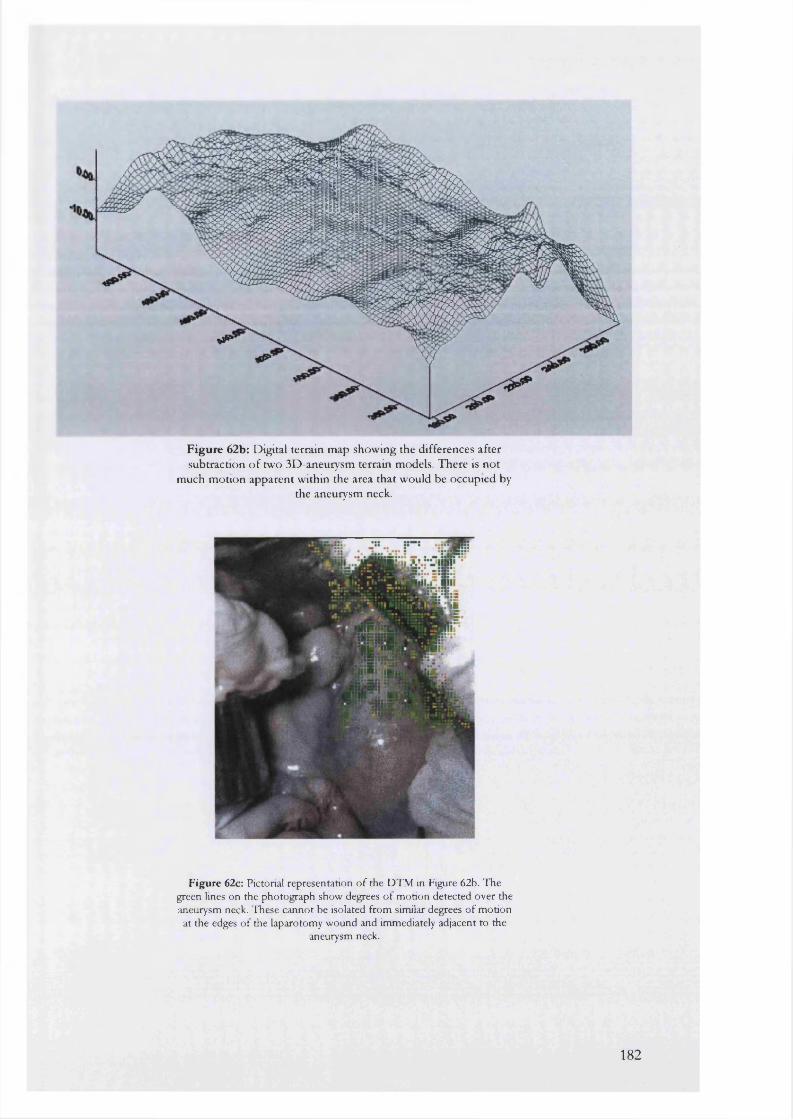
F ig u re 62b: Digital terrain map showing the differences after subtraction o f two 3D-aneurysm terrain models. There is not
much motion apparent within the area that would be occupied by the aneurysm neck.
Figure 62c: Pictorial representation o f the DTM in Figure 62b. The green lines on the photograph show degrees of motion detected over the aneurysm neck. These cannot be isolated from similar degrees o f motion at the edges of the laparotomy wound and immediately adjacent to the
aneurysm neck.
182
9.3
Measurement of arterial motion during open surgery using digital hotography: a feasibility study_______________
A i m
The aim of this expemnent was, using digital photography, to define and quantify the types of
motion exhibited by a femoral artery.
I n t r o d u c t i o n
Conventional still photography is not able to capture arterial or indeed aneurysm motion with any
degree of accuracy. The problems have been outlined in previous experiments. The advantages of
digital capture are firstly, that the camera shutter speed can be increased with the possibility of real
time imaging and secondly, elimination of the stage of digital scanning necessary with conventional
photographic film.
This experiment was designed to evaluate the feasibility of arterial motion capture using a pair of
Kodak Megaplus ES 1.6i high-resolution, high-speed digital cameras. The capture rate was up to 30
images per second with a spatial resolution of over one million pixels. Each pixel measured 9-
microns square with a 60% fill factor. The digital images obtained had up to 1024 gray levels per
pixel providing an excellent contrast detail. The built-in electronic shutter produced exposure times
as short as 127 microseconds, ideal for imaging moving blood vessels.
M a t e r i a l s a n d m e t h o d
Two patients, undergoing endovascular repair of their aneurysms, had both their femoral arteries
exposed with standard surgical technique. This dissection was limited to simple exposure and the
vessels were not traumatised any further with the passage of control sloops or endovascular wices
until the conclusion of filming.
A series of small dots were made over the arteries and skin edges in regular arrays to act as
recognition points for the software during manual measurement (Figure 63). The method used for
filming motion was exactly as described for experiment 9.2 with one exception: instead of the
conventional RoUei cameras, a pair of Kodak Megaplus ES 1.6i digital cameras was used.
These cameras were mounted onto the same iron bar, which was then fixed onto the tripod as
described. A photographic circular fluorescent light was placed around the lens of each camera,
which were simultaneously fired using an electronic triggering device. The tripod with cameras was
183

moved over the patients’ groin wound for filming of exposed femoral arteries at the appropriate
point.
A sequence of 40 photographs was taken at a rate of 15 frames per second. The image data, stored
in the camera memory, were downloaded onto computer for later analysis using the Vision
Management System (VMS) version 7 software.
Using the VMS software, four control points were chosen using the pen marks on the skin edges
together with 5 more points over the arteries themselves. These were manually identified and
marked on all 40 pairs of photographs, A 3-dimensional vector map was then constructed to
demonstrate the location of each of these points at every 1/15* of a second. From these maps, the
direction and magnitude of movement was calculated.
R e s u l t s
From the complete animation sequence of 2,7 seconds, 2 cycles of pulsation could be detected in
all 4 films. The skin edges appeared stationary. Subtracting the image pairs from one another and
constructing a simple vector diagram from the results was used to confirm this motion:
Figure 63 below, demonstrates the presence of arterial motion in 2-dimensions, The digital images
of the femoral artery taken 1 second apart have been subtracted to show any differences. The
subtraction photo demonstrates motion-related differences between the two images as a white
mottling. Most of this motion has taken place in the lower part of the femoral artery. The vector
diagram (Figure 64) shows the motion is taking place mainly over the center of the vessel and not
the skin edges where the control points were placed.
After image point identification and measurement (Figure 65a), a 3D-displacement diagram was
constructed as shown in Figure 65b, For all the arteries filmed in this experiment, the control
points at the wound edges were found to vary in an inconsistent fashion despite re-measurement
on three occasions. This measurement noise was not related to arterial movement but more likely
the control points. At least two points of difficulty were encountered during analysis:
• The camera focal length was not adequate for closer filming of the femoral arteries. Because of
this limitation, the cameras could not be brought closer to the wound hence allowing better
definition of each artery,
• The pen-marks used were too large occupying 5 to 6 pixel spaces. This made it difficult to
identify the same pixel point on each successive frame of measurement.
The displacement diagram (Figure 65b) shows that the control point measurement noise is of
similar magnitude to the presumed arterial motion. This artefact prevents accurate determination of
the magnitude and direction of motion.
184

C o n c l u s i o n
The experiments conducted are useful in the sense that the presence of arterial motion was
captured over the filming interval of 2.7 seconds. Although qualitative evidence of motion was
present in the animated sequences and in the simple subtraction diagrams (Figures 63 and 64), the
measurement noise was too great for quantitative analysis of motion over the femoral arteries.
185
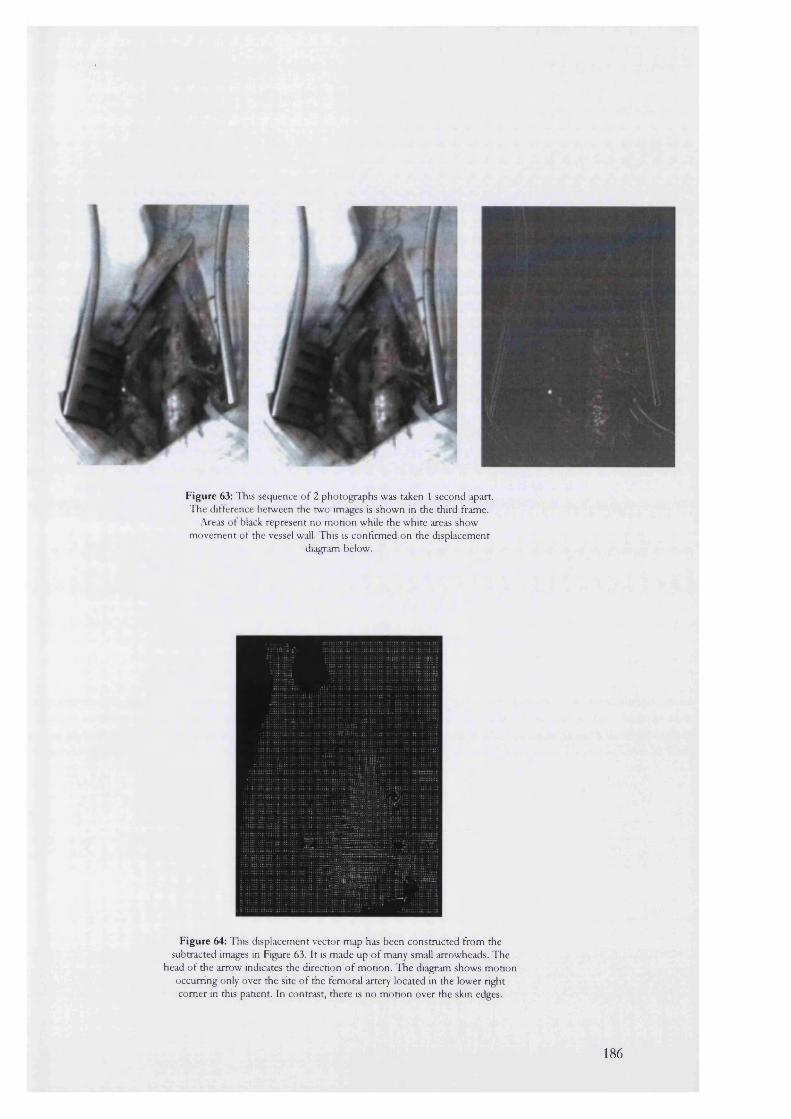
Figure 63: This sequence of 2 photographs was taken 1 second apart. The difference between the two images is shown in the third frame.
Areas of black represent no motion while the white areas show movement of the vessel wall. This is confirmed on the displacement
diagram below.
Figure 64: This displacement vector map has been constructed from the subtracted images in Figure 63. It is made up of many small arrowheads. The
head of the arrow indicates the direction of motion. The diagram shows motion occurring only over the site of the femoral artery located in the lower tight comer in this patient. In contrast, there is no motion over the skin edges.
186
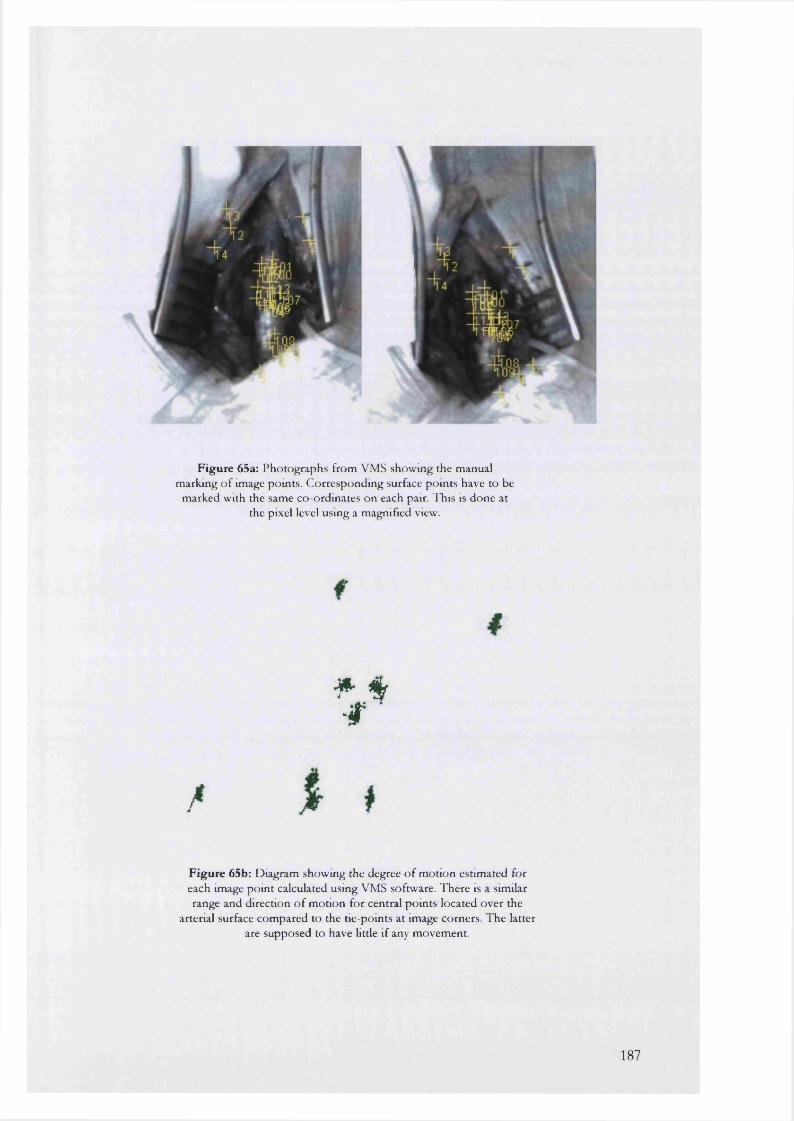
F ig u re 65a: P hotographs from VMS show ing the m anual m arking o f image points. C orresponding surface pom ts have to be
m arked with the same co-ordinates on each pair. T his is done at the pixel level using a m agnified view.
# f ■ f
F ig u re 65b: D iagram show ing the degree o f m otion estim ated for each image pom t calculated using VMS software. T here is a similar range and direction o f m otion for central po in ts located over the
arterial surface com pared to the tie-points at image corners. T he latter are supposed to have little if any m ovem ent.
187
C h a p t e r 10
Discussion
Considerable progress has been made into the endovascular method of repairing aortic aneurysms,
avoiding the need for a major open abdominal operation. The procedure involves passing a graft
into the aneurysm through the femoral artery in the groin. The graft is then fixed in place to normal
calibre aorta, above and below the aneurysm, by expandable metal stents.
Endovascular repair is heavily dependent on reliable and accurate imaging in the preoperative,
perioperative and postoperative periods.
Preoperative imaging is necessary to ensure that the endograft is accurately constructed to fit the
diameter and length of the aneurysmal aorta. Qualitative information about the arterial “landing
zones,” or site of endograft-vessel wall seal is also important to exclude heavy calcification or lining
thrombus. Finally, the tortuosity and diameters of the access vessels must be assessed to make
certain the introducer sytem can be passed up into the aneurysm sac and neck.
Postoperative imaging is required to assess complications, the efficacy of treatment and durability
of the endograft. It is recognised that the efficacy of therapy and the durability of the endograft are
inextricably linked to the morphology of the aneurysm and its sac after endovascular repair. This
may in turn be affected both by the endograft itself as well as the continuing pathology of
aneurysm formation.
There is currently, no universally accepted imaging method in assessment of patients before and
after endoluminal repair of AAA. It is not clear what morphological changes should be expected
after endovascular repair or indeed whether any of these alterations are graft-specific.
CT is used in the preliminary evaluation of candidates for endovascular repair, in order to screen
patients and for diameter measurements. Standard CT, although costly, is accurate and
reproducible in documenting aneurysm size and has the additional advantages of delineating
suprarenal extension and other abnormalities that may influence endovascular repair, such as heavy
calcification or neck lining thrombus. For a high-quality study, large doses of iodinated contrast
may be required to provide visualisation of the distal iliac vessels, at considerable risk of renal
compromise in susceptible individuals. Coronal reconstructions, useful in these instances, are often
of low resolution and do not display the arterial anatomy in an angiographic format.
Axial CT slices often do not cut through planes perpendicular to the vessel lumen. The resulting
elliptical cross-sections make diameter measurements difficult. Although it is often assumed that
the narrowest diameter of the ellipse is the true diameter, this is not always the case, as an aneurysm
188
does not have a simple cylindrical or conical shape. Simply using sagittal or coronal reconstructions
does not reduce this error, because these sections may also not be perpendicular to the vessel (thus
overestimating vessel diameter) or may not pass through the exact centre of the vessel (thus
underestimating diameter).
While diameter measurements with conventional CT may be difficult, estimating the length of a
proposed endograft is even more inaccurate. The current standard is to perform Digital Subtraction
Angiography (DSA) for length measurements and evaluation of occlusive disease prior to
endovascular repair.
Angiography provides a 2-dimensional image of a 3-dimensional structure. Often only two
orthogonal views are available, making interpretation of the true anatomical dimensions difficult.
To improve the accuracy of measurement, angiograms are performed with graduated marker
catheters (usually at 1 cm intervals). The measuring catheter seldom follows the proposed path of
the endograft. The prosthesis, equal in diameter to the aneurysm lumen, tends to follow the centre
line of the blood-fiow channel, whereas the much narrower and more rigid angiocatheter will
follow the shortest intra-luminal path (Figure 67a).
SCTA with 3-dimensional reconstruction and postprocessing offers unique benefits. It can acquire
volumes of data within very short scan times: for routine studies a single 32-second exposure with
conventional 1 cm coUimation will cover 32 cm of tissue. The use of finer collimation, such as 5
mm, reduces the longitudinal coverage to 16 cm, but allows the aorta and its branches to be
reconstructed from the celiac axis to the iliac arteries. The location and spacing of the slice
reconstruction can be varied before or even after data acquisition up to that of the slice coUimation.
Overlapping sections wiU result if the reconstruction interval is less than the coUimation. These
slices are used for generation of the 3-dimensional model. Overlap is also necessary to create
smooth 3-dimensional models without artifacts and jagged edges. AU this is performed without the
need for additional radiation exposure. Spiral CT aUows the flexibUity to view image data as both
conventional axial slices and three-dimensional models.
Multiplanar reformatting allows the accurate measurement of intraluminal diameters and
longitudinal distances. Rather than measuring the length of a line drawn in a 2D projection, the
computer makes length measurements fcom actual 3D data sets along a centre-Une defined by the
user. Similarly, for diameter measurements, the MPR technique enables the display of axial slices
perpendicular to the vessel lumen.
This thesis was designed to evaluate the effects of endografting on the morphology of abdominal
aortic aneurysms. As part of this project an evaluation of our current imaging modalities for
189
suitable aneurysms was undertaken. In both laboratory and clinical studies, SCTA, graduated
angiocatheter and gadolinium-enhanced MRA were compared. The objective was to select a gold
standard, accurate as the sole imaging modality for both pre and postoperative assessment of
patients.
M e a s u r e m e n t t h e o r y
Two essential components of a measurement are its reliability and its validity.
Reliability is concerned with the consistency or repeatability of each measurement made. Validity
reflects the accuracy of measurement. For example, it is possible for a measuring tool to provide
the same value for a specific dimension on repeated occasions although the actual figure provided
in this case may be incorrect. The measure is hence reliable but not valid (that is it is consistent but
wrong).
The definition of reliability is based on the true score theoiy of measurement, which postulates that
every measurement consists of two components, the true ability (or true score) of the respondent on
that measure and random error.
The disadvantage of the true score theory is its simplistic approach to random error. It ignores the
possibility of a systematic component that may be an inherent part of the measuring device and
which may be repeated consistently across aU of the members of a group. True random error is
caused by factors which affect measurement and which vary in an indeterminate way. For example,
the measurement of aneurysm maximal AP diameter using ultrasound is known to be strongly
operator dependenfl*^. The same operator may produce different values for this dimension on the
same patient measured repeatedly. Part of this variability may depend on factors such as
interruptions and distractions from the screen or the amount of operator fatigue. This type of
indeterminate error is also referred to as “noise.”
Systematic error is caused by factors that consistently affect measurement of a variable across the
whole sample. In the case of an ultrasound scanner, this may occur because of incorrect calibration
of the machine.
In the first stage of this thesis, the quality of measurements obtained from two preoperative
imaging systems in our department, calibrated angiography and spiral CT angiography, was
investigated.
E v a l u a t i o n o f t h e q u a l i t y o f m e a s u r e m e n t s m a d e w i t h s c t a
The quality of the measurements obtained with SCTA depend on three factors:
190
• SCANNER: extremes of temperature or power failures/surges may influence electrical
circuitry.
• PATIENT: Obesity, motion within the scanner and respiration may all introduce artefact.
• OBSERVER: errors in implementing the clinical protocol or poor technique for
measurements made from scans.
Scanner and observer-related factors were assessed with six glass phantom aneurysms that were
hand blown using tubes with similar internal dimensions to the human aorta. Linear dimensions
(maximal AP and transverse diameters) and volumes of these phantoms were recorded before
scanning using the accepted physical techniques of pyknometry and electronic callipers.
Data obtained from scanning aneurysms with the patient clinical protocol were transferred to a
post-processing station for volume and linear estimations. AP and transverse diameters were
calculated using the MPR facility that measured the distances between electronic markers placed on
the phantoms. Volume was estimated using a voxel summation technique at a segmentation
threshold of 0 HU.
Comparison of the true values with their scanned counterparts, revealed near perfect correlation. In
addition the gradients for the three correlation lines (AP diameter, transverse diameter and volume)
were close to unity, implying near perfect agreement with the true values.
Observer-related factors were calculated using an intra- and inter-observer analysis of linear and
volume data obtained from a series of randomly chosen SCTA scans stored on optical disc. The
results demonstrated that the spiral CT technique, with post-processing of data into 3D and
multiplanar formats, had acceptable reproducibility. For example, in terms of transverse diameter,
95% of the differences within and between observers were in the range 2.3 to 2.5 mm, for a
median diameter of 52.6 mm (range 39.2-85.9). This compared favourably with the results from a
similar study where a difference of 4 mm was obtained looking at the same parameters with spiral CT270.
H o w A C C U R A T E IS C A L IB R A T E D A N G IO G R A P H Y F O R A S S E S S M E N T O F AAA?
Calibrated angiography is currently used in conjunction with conventional or spiral CT for imaging
the abdominal aorta and its branches prior to selection for endovascular repair. Previous studies
have found a high level of agreement between length measurements made using calibrated
angiocatheter and SCTA^7 many centres, angiography is deemed sufficiendy accurate enough
to be used as the sole basis for the construction of endovascular grafts.
191
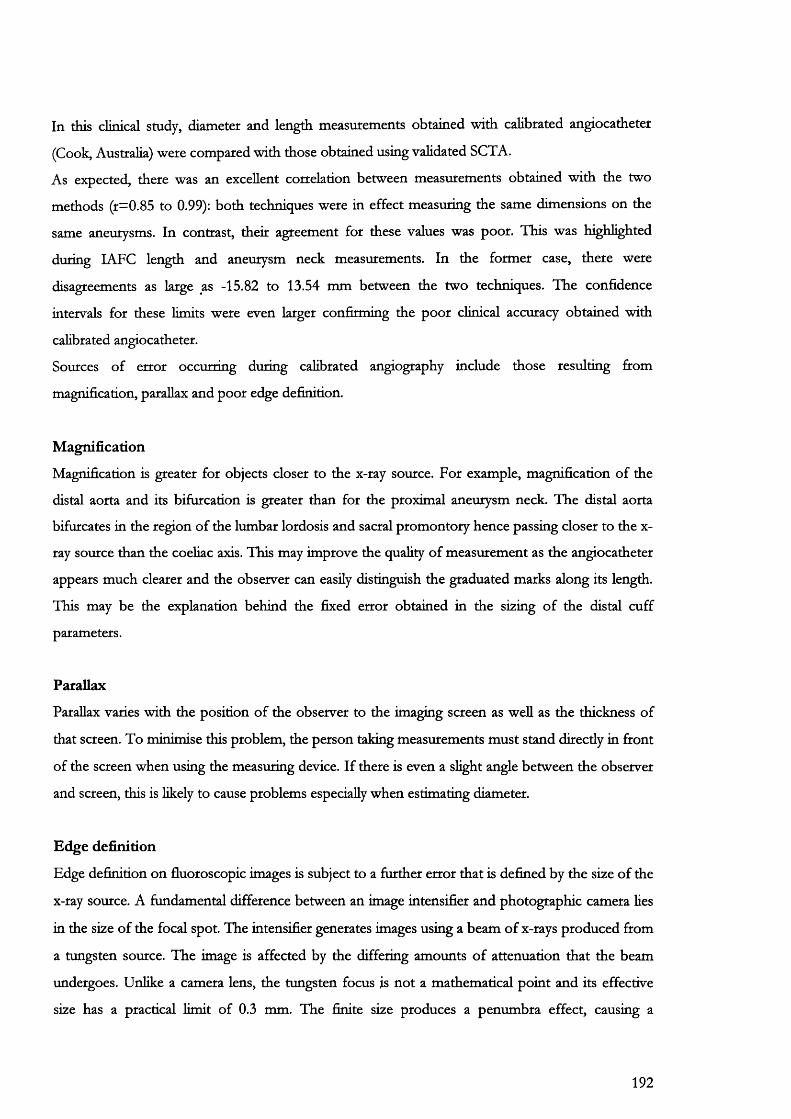
In this clinical study, diameter and length measurements obtained with calibrated angiocatheter
(Cook, Australia) were compared with those obtained using validated SCTA.
As expected, there was an excellent correlation between measurements obtained with the two
methods (r=0.85 to 0.99): both techniques were in effect measuring the same dimensions on the
same aneurysms. In contrast, there agreement for these values was poor. This was highlighted
during lAFC length and aneurysm neck measurements. In the former case, there were
disagreements as large as -15.82 to 13.54 mm between the two techniques. The confidence
intervals for these limits were even larger confirming the poor clinical accuracy obtained with
calibrated angiocatheter.
Sources of error occurring during calibrated angiography include those resulting from
magnification, parallax and poor edge definition.
Magnification
Magnification is greater for objects closer to the x-ray source. For example, magnification of the
distal aorta and its bifurcation is greater than for the proximal aneurysm neck. The distal aorta
bifurcates in the region of the lumbar lordosis and sacral promontory hence passing closer to the x-
ray source than the coeliac axis. This may improve the quality of measurement as the angiocatheter
appears much clearer and the observer can easily distinguish the graduated marks along its length.
This may be the explanation behind the fixed error obtained in the sizing of the distal cuff
parameters.
Parallax
Parallax varies with the position of the observer to the imaging screen as weU as the thickness of
that screen. To minimise this problem, the person taking measurements must stand directly in front
of the screen when using the measuring device. If there is even a slight angle between the observer
and screen, this is likely to cause problems especially when estimating diameter.
Edge definition
Edge definition on fluoroscopic images is subject to a further error that is defined by the size of the
x-ray source. A fundamental difference between an image intensifier and photographic camera lies
in the size of the focal spot. The intensifier generates images using a beam of x-rays produced from
a tungsten source. The image is affected by the differing amounts of attenuation that the beam
undergoes. Unlike a camera lens, the tungsten focus is not a mathematical point and its effective
size has a practical limit of 0.3 mm. The finite size produces a penumbra effect, causing a
192
degradation of the object edges (Figure 66). This tends to spread out the edge gradients resulting in
a softer on screen image. The effect is greater for objects closer to the source. In experiment 7.4,
the distal cuff, which was closest to the screen, had its diameter oversized by 2 mm in most
patients. This may have been due to the penumbra effect causing thicker edge lines.
Discrepancies between measurements may also occur due to the physical nature of the measuring
device. In the situation of vascular channel measurement, the sizing pigtail catheter wiU always take
the shortest intra-luminal route whereas an endoluminal graft, equal in size to the vessel diameter, is
likely to follow the centre-Hne of the vascular channel (Figure 67a). Only spiral CT can mimic this
effect by "dropping" markers within the true luminal centre in 3D space (Figure 67b). This is
dependent on the MPR facility that allows 3 simultaneous orthogonal views. These views
themselves are linked to a 3D SSD that can be manipulated to ensure the true aortic lumen is
always sectioned perpendicular to its long axis. The rigid angiography catheter may hence undersize
the tme length of the vascular channel. Conversely, when the aneurysm contains litde in the way of
thrombus, oversizing may occur due to bowing of the catheter. This is probably because the sizing
catheter can bend in the aneurysm sac thus increasing the apparent length of the vascular channel.
This effect may remain unnoticed, especially if it occurs in the AP plane.
The fixed errors in sizing distal cuff diameter and length with angio-catheter may also be explained,
in this way. There is less chance for the catheter to bend or bow near the aortic bifurcation as this
represents the entrance into the aneurysm sac from below. Magnification is also likely to provide
improved visualisation in this area generally. Unfortunately the clinical applicability of these
observations is limited as aorto-aortic tube grafts are now seldom deployed.
These experiments demonstrate that even with the most optimistic interpretation, the quality of
measurements obtained using sizing catheter angiography is not clinically acceptable. Incorrect
measurements may have serious clinical repercussions. The limits of agreement and their
confidence intervals were potentially bad enough to result either in the erroneous rejection (due to
undersizing of neck length) or selection (due to overestimation of neck length) of patients for
endoluminal repair. If a patient with an aneurysm neck that is too short for endoluminal repair is
selected, the risks of postoperative endoleakage or graft migration are then high. Similarly, incorrect
estimation of aneurysm neck diameter is likely to result in a poor graft-vessel wall seal with
resulting endoleak and chance of aneurysm rupture.
Patients undergoing sizing angiography are also exposed to larger cumulative doses of intravenous
iodinated contrast with the potential of renal impairment, especially with pre-existing renal disease
or diabetes mellitus. Spiral CT angiography should hence be regarded as the method of choice for
measurement of aneurysms prior to endoluminal repair.
193
Tungstensource
X-ray beamsObject
Figure 66: The penumbra effect leads to blurring and overestimation of the image diameter
T h e l i m i t a t i o n s o f p r e o p e r a t i v e a s s e s s m e n t u s i n g SCTA
Although SCTA has now been fully validated both in the laboratory and clinically, one source of
error stems from the observer who makes necessary measurements from scans using the post
processing technology.
In Chapter 7.9, 12 preoperative scans were re-examined at 6 months after the first reading, by the
original and a separate observer of equal experience. Proximal neck length (Table 27) could be
measured with an accuracy of ±5 mm both within and between observers. Observer errors for the
neck diameters were much lower (Tables 28 and 29). ITie upper neck diameter could be measured
with an accuracy of ±2 mm on repeated occasions compared with an accuracy of ±3 mm for the
lower neck diameter.
These results demonstrate one limitation of SCTA. In the case of neck length, 15 mm is currently
accepted as the minimum for selection for endovascular repair. It is easy to see how a patient with a
borderline neck of 10 mm may be over- or under-measured (producing values of 15 mm and 5 mm)
respectively with possible sequelae such as endograft migration in the former case.
In the case of oversizing neck diameter, the endograft may initially appear mechanically sound with
no post-deployment endoleak. However, if the frictional forces between the stent and aortic wall are
at their limit, longer-term loss of wall elasticity and recoil is likely to result in disruption of the blood-
tight seal and produce endoleakage or graft slippage.
When neck diameter is undersized, the endograft will sit loosely and endoleak or slippage will be
immediately apparent. In more insidious situations, where the endograft just contacts the aortic wall,
further expansion of the aortic neck as may occur with a continuation of the aneurysmal diathesis
likely to results in long-term loosening with complications.
This experiment also serves to highlight the importance of standardising measurement techniques to
reduce error where more than one clinician is employed to measure and select patients for
194

endovascular repair. At one level this would involve measuring aneurysm neck diameter from
internal wall to internal wall or reviewing scans, in difficult cases, with other members of the
endovascular team to decide on where the neck ends and aneurysm chamber begins.
195
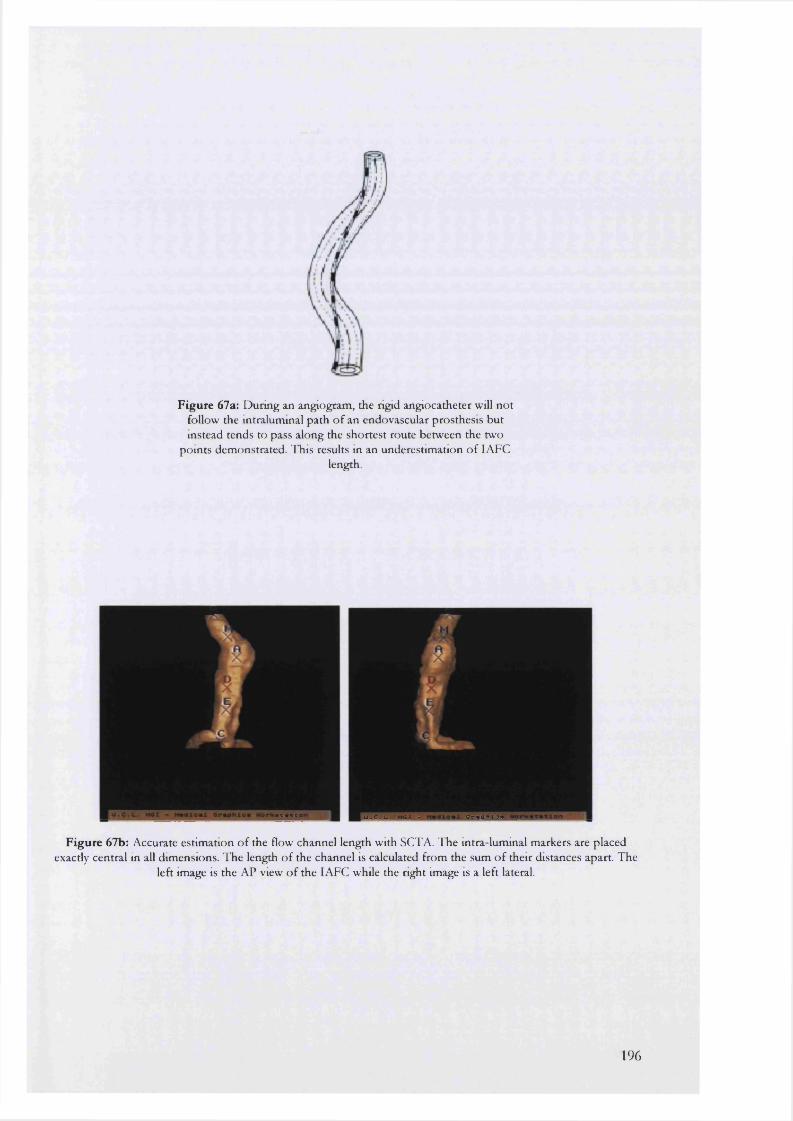
F ig u re 67a: D uring an angiogram , the rigid angiocatheter will n o t follow the intralumm al path o f an endovascular prosthesis bu t instead tends to pass along the shortest route betw een the two
poin ts dem onstrated. This results m an underestim ation o f I AFClength.
U . C . L . H C X - O r a p H l o *
F ig u re 67b: Accurate estim ation o f the flow channel length w ith SCTA. T he intra lum inal m arkers are placed exactly central in all dim ensions. T he length o f the channel is calculated from the sum o f their distances apart. The
left image is the AP view o f the lA FC while the right image is a left lateral.
196
A n e u r y s m v o l u m e : a m o r e u s e f u l i n d i c a t o r o f s a c m o r p h o l o g y t h a n
M A X IM A L D I A M E T E R S ?
Successful endovascular deployment is followed by an immediate reduction in aneurysm sac
pressure. With the present limitations however, intra-sac pressure, cannot be continuously
measured after this point. Instead sac shrinkage, measured using maximal sac diameters, takes over
as the morphological representation of a successful procedure. Diameters are relatively easy to
measure and have traditionally been used to describe aneurysms in follow-up prior to conventional
repair. The enigma for endovascular repair lies with the equivocal results for sac morphology
obtained from postoperative follow-up. In some reports, successful endovascular repair may be
followed by no change in sac diameter while in others there may even be enlargement in the
absence of endoleak. Explanations for such discrepancies include the following:
• The point at which the diameter measurement is made may be too soon in the natural history
of the sac to detect any change.
• The aneurysm sac may really remain unchanged or increase slightly in size after successful
repair in certain patients.
• The parameter being measured (usually the maximal AP diameter) may be impossible to
measure accurately or may vary inconsistently with time.
• The measuring tool may be inaccurate and unable to detect small differences in diameter.
Volume, an alternative means of describing aneurysm sac morphology, has a number of advantages
over diameter measurements.
Firstly, volume is inherently a more accurate descriptor of aneurysm morphology than a single
maximal diameter. This is because volume is a composite measure of all the cross-sectional
diameters within the aneurysm sac whereas a single diameter measurement can interrogate only one
cross-section of the sac at a time.
The volume of a sphere is proportional to the cube of its radius. This means that a small but not
necessarily measurable change in diameter will lead to a magnified and, by implication, more easily
measurable change in aneurysm volume.
A further problem arises when the same diameter is not quoted at each follow up interval. Every
diameter occupies a unique location in 3D space within the aneurysm sac. It is hence possible for a
change in sac shape to occur, without any change in the magnitude of the maximal diameter (Figure
68).
197
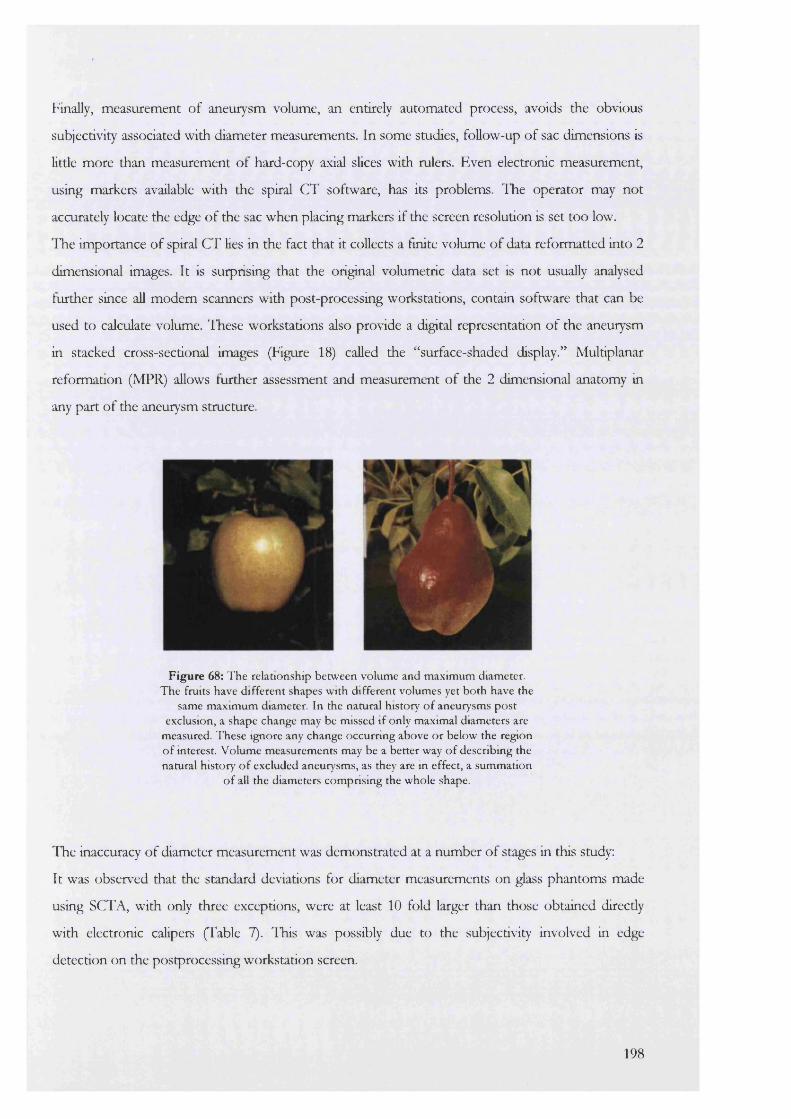
Finally, measurement of aneurysm volume, an entirely automated process, avoids the obvious
subjectivity associated with diameter measurements. In some studies, follow-up of sac dimensions is
litde more than measurement of hard-copy axial slices with rulers. Even electronic measurement,
using markers available with the spiral CT software, has its problems. ITie operator may not
accurately locate the edge of the sac when placing markers if the screen resolution is set too low.
ITe importance of spiral CT lies in the fact that it collects a finite volume of data reformatted into 2
dimensional images. It is surprising that the original volumetric data set is not usually analysed
further since all modem scanners with post-processing workstations, contain software that can be
used to calculate volume. These workstations also provide a digital representation of the aneurysm
in stacked cross-sectional images (Figure 18) called the “surface-shaded display.” Multiplanar
reformation (MPR) allows further assessment and measurement of the 2 dimensional anatomy in
any part of the aneurysm structure.
F ig u re 68: T he relationship betw een volum e and m axim um diam eter. The fruits have d ifferent shapes w ith d ifferent volum es yet bo th have the
same m axim um diameter. In the natural history o f aneurysm s post exclusion, a shape change may be missed if only maximal diam eters are
measured. T hese ignore any change occurring above o r below the region o f interest. V olum e m easurem ents may be a better way o f describm g the natural history o f excluded aneurysm s, as they are in effect, a sum m ation
o f all the diam eters com prising the whole shape.
The inaccuracy of diameter measurement was demonstrated at a number of stages in this study:
It was observed that the standard deviations for diameter measurements on glass phantoms made
using SCTA, with only three exceptions, were at least 10 fold larger than those obtained direcdy
with electronic calipers (Table 7). liais was possibly due to the subjectivity involved in edge
detection on the postprocessing workstation screen.
198
A second, subtier example was demonstrated in the intra/inter-observer studies (Table 10). The
important point to note are the units used in this table. Although the actual values assigned to the
errors for volume and linear measurements appear to be similar in magnitude, volume is actually
proportional to the cube of the diameter. Hence an intra-observer coefficient of ±2.31 mm for
transverse diameter translates to a volume difference of ±12.33 ml. With this in mind, the actual
coefficient of ±5.7 ml (46% less than 12.33 ml) demonstrates an excellent reproducibility of
volume estimation.
Other workers in this field have obtained similar results. The Utrecht group^^ analysed a series of
35 patients to find that a decrease in volume post-endovascular repair was missed in 14% of their
cohort with diameter measurements alone, while an increase in sac volume was missed in 19%.
More importantly, there were 4 patients with major endoleak of which two had an increase in sac
volume but no change in diameter. In a second smdy with nine patients, Baku et aP- found again
that aneurysm sac diameters did not always reflect the volume changes after endoluminal grafting.
Calculations of thrombus or lAFC volumes were also necessary to discriminate successful from
failed exclusion.
In this series of 88 patients, there were 2 cases of Type I endoleak and one case of late graft
migration (a Talent-treated patient) all of which continued to have an increase in their total
aneurysm volume (Figure 35) until treatment. Only two of these had an increase in one or both
maximal diameters.
Recording change in the morphology of the intra-aneurysmal flow channel after exclusion is also
important. Endoleak or graft migration may lead to an increase in the volume of this entity. A
possible disadvantage of this method is the amount of work involved in initially editing out the
flow-channel by hand on each axial slice. This was even more time consuming than for total
aneurysm volume {vide infra). To overcome this, a new method based on HU segmentation was
designed.
Due to the sharp change in density at the boundary between the lining thrombus and the blood-
contrast mix, the LAFC should have its own unique Hounsfield value. Calculation of this value
should display only the LAFC volume allowing its estimation on a post-processing work-station.
The change in HU/density at the thrombus-flow channel edge was calculated using Disp Image,
software that is available with aU modem spiral CT equipment. In the case of the glass validation
model this value was 165 HU. The percentage error for calculating the volume of the balloons used
was dependent on their true volumes. This decreased as the true volume increased and approached
a value similar to that found for the LAFC in vivo.
199
Although the same technique was employed in the clinical studies, differences between the glass
model and patients’ aneurysms were evident. The main difference was the sharp contrast to water
boundary in the phantom (Figure 25) compared to the somewhat less well-defined boundary in
patients. Biologically the intra-luminal thrombus was far more irregular at its boundary with the
flowing blood raising the possibility that an automated segmentation technique could have
problems in defining this zone accurately. In the representative axial slices that were individually
examined before and after segmentation however, this problem was not immediately apparent.
A second difficulty occurred while plotting the HU values comprising thrombus and the blood-
contrast interface. Due the partial volume effect of spiral CT, the HU values did not demonstrate a
sharp numerical change at this site, but instead a gentle slope across the region (Figures 25 and 32).
The point hahway along this slope is conventionally chosen as the segmentation Houns field value
for the interface both in vitro and in vivo. The somewhat greater subjectivity of this technique was
demonstrated in the intra/inter-observer comparisons. It was found that the inter-observer
comparison for total aneurysm volume (4.39 ml) was less than its counterpart for lAFC volume
(6.49 ml). Fortunately, the difference involved (2.1 ml) would probably not be of much significance
clinically.
In this study, the main disadvantage of volume estimation was the time taken to edit out the AAA
by hand, from the surrounding soft-tissues and bone. The sac and lumen had to be painted out on
every axial slice (95-110 slices) using a special editing tool available within the software (Figure 14)
taking an average of about 30-45 minutes per patient before the total aneurysm volume was then
segmented at 0 HU. Van Hoe et examined the effect of manual editing on the accuracy of
volume estimation using a series of ellipsoid and irregular phantoms. They found that this was
likely to produce poor volume estimation only for smaller objects (they used ginger roots)
compared to larger regular shaped phantoms (such as aneurysms). Other factors that may
potentially influence the accuracy of volume estimation with spiral CT include increasing axial slice
thickness^^ and inappropriate window center selection^^^ both of which may cause overestimation
of volume.
A n e u r y s m m o r p h o l o g y a f t e r e n d o v a s c u l a r e x c l u s i o n
Two groups of patients were studied over two generations of endografting experience. The first
group (27 patients) was treated with an in-house generation F IF E endograft fixed with balloon-
expandable Palmaz stents as previously described (Figure 41). The second group (61 patients)
received the custom tailored talent (World Medical) device.
200

In the absence of complications there was a small but significant increase in total aneurysm volume
and decrease in flow channel volume at day 5 after endografting. The median increases were 12.39
± 5.70 ml for the PTFE group and 15.1 ± 5.70 ml for the Talent group. It should be recognised
that the actual values obtained may have been up to 6 ml higher or lower according to the estimate
for intra-observer error (Table 10).
In their study of nine patients, Balm and coHeagues^^ found a postoperative increase of 17 ml in
median total aneurysm volume for patients treated with the EVT endograft. In contrast with the
findings here however, the volume change occurred concomitanfly with an increase of 0.9 mm in
the median maximal aneurysm diameter. An increase in maximal diameter of this small magnitude
is difficult to accept with confidence as it could quite easily He within the ranges of intra- and inter
observer error in diameter measurements, between ±3.40 mm and ±4.42 mm respectively (Table
10).
Following this early increase, the subsequent sac morphology was entirely dependent on the
endografting system used. In the case of the PTFE group, no further significant change in volume
was seen to the conclusion of the study at 3 years. For Talent-treated patients, marked and obvious
shrinkage took place up to 1.5 years. The impHcations of these findings are not clear, and although
the PTFE group did not exhibit sac shrinkage, no ruptures have so far been noted up to 3.5 years
following implantation.
In this study, had diameter measurements alone been used in follow up, the initial increase in
volume would not have been discovered and sac shrinkage in the Talent group would only have
been detected up to 1 year. Significant decreases in maximal AP or transverse diameter could not
be detected at or beyond this point.
Hypotheses for volume changes
The increase in total aneurysm volume at day 5 was accompanied by a simultaneous decrease in
lAFC volume, indicating a true increase in the volume of the perigraft space. Investigation for the
cause of this increase was beyond the remit of this work.
It was evident from an examination of individual scans however, that the increase resulted firom an
accumulation of new clot and inflammatory oedema, formed firom the pool of blood excluded by
the endograft during deployment. A semi-Hquid pool of blood and contrast collected outside the
prosthesis wall and was later incorporated into the intra-luminal thrombus. The contrast may have
resulted in hyperosmolarity of this region with the accumulation of more tissue fluid over time.
The nature of the graft material is another important consideration. An initial inflammatory
reaction may result in the accumulation of an exudate in the perigraft area that is later resorbed in
201

Talent but not PTFE patients. There is evidence that both PTFE and Dacron can initiate
inflammatory reactions within surrounding tissues " - It is possible that a similar reaction in the
sac causing an inflammatory collection may have added to the increase in the perigraft space. A
further hypothesis is based on the semi-permeable characteristics of the graft materials^^^. The
normal hydrophobic quality of the PTFE may be lost when the material is structurally altered by
pre-expansion during the in-house technique of graft manufacture, and both grafts may then allow
ultrafiltration of the flowing blood to occur after implantation. This may later be resorbed in the
Talent but not PTFE group.
Later follow up demonstrated a divergence in the morphology of aneurysms treated with the two
endografts. PTFE-treated sacs remained static whilst Talent-treated sacs demonstrated marked
shrinkage. A second structural difference between the Talent and PTFE systems, apart from the
graft material, is the self-expanding nature of the Talent system and the balloon-expandable Palmaz
stents used in the unsupported PTFE group. Balloon-expandable devices abolish the pulsatile
motion of the aneurysm neck whereas this is not seen with the self-expandable devices^®. It is
possible that the aboHtion of pulsatile motion at this site may favour the maintenance of intra
luminal thrombus in the PTFE group. This would explain the decrease in volume for Talent-
treated sacs. However, the PTFE patient with a saddle embolus and no intra-aortic flow below the
renal arteries, also had marked sac shrinkage. This introduces a further possibility. The PTFE
device was free and unsupported in its central segment where the transmission of intra-luminal
pressure waves into the sac may have also had some effect on maintaining the intra-luminal
thrombus.
C h a n g e s i n i n t r a l u m i n a l t h r o m b u s a f t e r e n d o v a s c u l a r r e p a i r
Thrombus is formed within the lumen of an AAA due to the presence of turbulence and pockets
of stasis in the flow of blood. Platelets and activated clotting factors are deposited in layers adjacent
to the aortic wall. The centre of the sac maintains its patency and blood can pass through this
vascular channel into the lower Hmbs.
Various roles have been attributed to the presence of ILT. Originally, it was believed that thrombus
had no function in the aneurysm sac and its presence offered no protection from rupture ' >
Thrombus allowed the direct undamped transmission of the blood pressure through to the
weakened aortic wall.
Evidence suggests that thrombus may act as a double-edged sword during aneurysm formation. On
the one hand, it could be involved in the formation of aneurysms by acting either as a physical
barrier to diffusion of nutrients causing aortic wall anoxia, or as a source of inflammatory cells and
202

cytokines causing aortic wall destruction and weakening. On the other, a demonstration of its’
elastic behaviour in vitro and a protective effect against rupture in fine element models of AAA
implies it may delay the onset of rupture. When models of the aneurysm are lined with varying
thickness of lAT, the mechanical strength of the whole unit increases in direct proportion to the
thickness of this lining^^.
With the advent of endovascular repair, these theories have now become even more important. In
contrast to open repaie of abdominal aortic aneurysm, endovascular repair leaves ILT undisturbed.
A further role, for which there is no evidence as yet, may be for thrombus to act as a type of
buttress around the stent-graft forming a thrombus-endograft unit. Clearly, it is important to be
aware of changes in the amount of ILT with time if it has an influence on the aortic wall.
In this study, the preservation of ILT was dependent on the prosthesis used. In the case of the
balloon-expanding PTFE grafts, thrombus was conserved whereas for the Talent patients, its
volume was markedly reduced with time. In this case, although further significant resorption could
not be demonstrated after 6 months, for some patients thrombus was completely reabsorbed
(Tables 20 and 21). The explanations for these differences are at present uncertain, although any
ideas must run on similar lines to the hypotheses presented above.
The suggestion that ILT may protect against type II endoleakage is based on a qualitative analysis
of its location within the aneurysm sac^^h This has been mimicked by some investigators who have
plugged lumbar and mesenteric arterial orifices with gelatin sponges and coded sprtngs ^ »
Although the sequelae of type II endoleakage are still debated, its presence may nevertheless
become significant^^ . If thrombus does have a protective role, then it follows that aneurysms with
complete resorption may be at greater risk of complications with time.
A n e u r y s m l e n g t h a f t e r e n d o v a s c u l a r r e p a i r
Endovascular repair of abdominal aortic aneurysm has focused attention to the morphological
changes of the aorta and iliac arteries that accompany aneurysm growth. Because of the destruction
and loss of aortic elastin and collagen, aneurysms undergo both longitudinal and transverse
expansion. Lengthening results in increasing tortuosity of the aortodiac segment with important
implications in obtaining access to the aorta for endoluminal repair. Tortuosity in the proximal
aneurysm neck may lead to migration and endoleak if the neck is short as wed as angulated.
Prosthetic Distortion
Investigators have recently drawn attention to the distortion of aortic stent-grafts in the medium to
long-term after implantation. These shape changes commonly affect bifurcated endografts and
203
include kinking of their limbs at the junction with the trunk. Three proposals have been put
forward to explain these findings ^®:
• Shortening or shrinkage of aneurysms along their longitudinal axes results in endograft
buckling and disruption.
• Shortening of the prosthesis following deployment results in infolding and disruption of the
endograft
• Migration of the endograft from its proximal or distal anchoring sites results in endograft
distortion
Distortion is a serious problem that may ultimately lead to graft Hmb thrombosis, separation of
modular components, or migration of the limbs from the common ikac arteries. The latter two
sequelae inevitably result in endoleak.
Shortening or contracture of aneurysms along their longitudinal axes has been held as the cause for
the majority of endograft failures post-exclusion. Harris et described shortening of the aorta by
as much as 3.1-6.2 mm occurring up to 1 year after implantation. A further complicating feature in
this study was concomitant shortening of the endograft after deployment, by as much as 2.4 to 67.6
mm, which was seen in 94% of their cohort.
Shrinkage of endografts, measured immediately after deployment, has been described by White et
aP^. This study, using the AneuRx and Vanguard devices, found shortening up to 30 and 40 mm
respectively. Varying degrees of graft component separation, angulation and distal stent migration
were observed and ascribed to this shortening process.
In both these studies, the techniques for graft and aneurysm measurements were not validated. The
Liverpool group measured aneurysm lengths directly from the CT scans while the Sydney group
recorded graft length pre- and post-deployment by fluoroscopic comparison to a graduated
marking catheter. The problems involved with both these techniques have been highlighted above.
When validated SCTA is used to examine aneurysm lengths with time, neither of these hypotheses
can be supported. Instead, the sequence of changes that is observed is related to the type of
endograft deployed and the changing volume of the aneurysm sac with time.
When balloon expandable PTFE is used, both the aneurysm and endograft undergo a gradual
lengthening. In the case of the aneurysm, the first significant lengthening is seen almost
immediately at day 5 post-repair. It is unlikely that enough collagen/elastin remodeling would have
occurred within this short interval to produce this change. Another explanation may relate to the
concomitant changes in volume and AP/transverse diameter.
204
At day 5 there is a significant increase in total aneurysm volume in PTFE treated aneurysms, but no
change in diameter. In keeping with the law of mass conservation, an increase in length might be
required to accommodate an increase in volume. This would result in “unfolding” of the aneurysm
thus apparently increasing its length.
A second significant increase in aneurysm vertical body length was seen at 18 months. This
probably does reflect the gradual and continuing loss of collagen and elastin occurring within the
aneurysm wall. Lengthening of the PTFE graft also at 18 months would be in keeping with the
increase in luminal centre line length and the characteristics of the graft material — pre-expanded
PTFE which would “creep” back to a lesser diameter and greater length with time.
Of interest was the PTFE patient with a saddle embolus resulting in endograft thrombosis and
necessitating an axülo-bifemoral graft after failed thrombolysis. Although this was the only PTFE
patient who had marked and obvious shrinkage in total aneurysm volume (50% reduction at 1
year), the vertical body length continued to increase as described.
No significant change in length was observed for the Talent-treated patients up to 2 years. These
patients received a graft that was fuUy supported throughout its length with interconnected, self
expanding nitinol stents oversized by up to 4 mm in diameter. This stiff graft may have had the
effect of anchoring the aneurysm wall to the prosthesis, thus preventing lengthening. With the
marked and obvious shrinkage in sac volume of Talent-treated aneurysms, more of the aortic wall
itself would come in to direct contact with the prosthesis improving the anchoring effect with time.
Graft lengthening was not observed. This is again not surprising given the robust nature of the
graft construction. In one study of 290 patients treated with Stentor, AneuRx and Talent
endoprostheses, only Talent grafts remained relatively unaltered at 1 year post-implantation^®^.
The results described here are also supported in part by investigations looking at changes in neck
length after both endovascular^®^’ ® and open repair ® . These show significant increases in neck
length firom 2 to 10 mm over follow up intervals extending between 1 and 10 years respectively.
Based on these results and explanations therefore, it is unlikely that prosthesis distortion or
disruption can be attributed to aneurysm length contracture. The destructive changes described for
some types of endograft ®®' ® may be due to the physical properties of the graft structure itself and
not due to changes in the aortic wall and sac. An alternative explanation is to consider the
possibility that differential motion between the aneurysm wall and the endograft may be
responsible for some of these developments. The aorta is not an inert conduit for carrying blood to
organs and limbs, but a complex and moving biological structure whose function may interfere
with the long-term integrity of an implanted prosthesis in ways that are as yet only poorly
understood.
205
N a t u r a l h i s t o r y o f t h e a n e u r y s m n e c k a f t e r e n d o l u m i n a l r e p a i r
Long-term success after endovascular repair depends on durable fixation at the aneurysm neck and
distal landing-zone. It is believed that gradual dilatation of the aorta at these locations may cause
leakage and graft migration. Some units have begun to try and bypass these potential problems by
deploying grafts in the inter- and supra-renal positions. In two separate series of 25 ^ and 32^^2
patients, there were no reported renal occlusions during this procedure or postoperatively. A
second advantage of the technique is a potential use in the treatment of aneurysms with very short
necks although this has yet to be formally assessed.
Many studies that measure aortic neck diameters in patients after open and endovascular repair
have now been published. Methodological differences must be carefully noted when comparing
their results because different measurement techniques, aortic regions and time periods are
described. For instance studies have assessed the aortic neck at various levels: halfway in the
neck/attachment system^^i, proximal neck suitable for “proximal stent implantation^®^, 1 cm below
the lowest renal artery and 1 cm above the aortic bifurcation^^®, the juxtarenal aorta ® , and at
multiple 5 mm intervals^®®. Time intervals are often short (less than 1 year for the majority of
patients) and the actual changes in size are often smaller than the sensitivity of the methods used.
Further complexity is added by the physical properties of the stents (balloon- versus self
expanding) whose effects are seldom individually analysed.
In this study, the natural history of the aneurysm neck was recorded for up to 2 years using
validated SCTA. In the case of the balloon-expandable Palmaz stents used to anchor the PTFE
system, there was a significant increase in neck diameter at day 5 for the upper and mid-neck levels.
This was followed by a slower increase affecting the distal part of the neck at 6 months. The neck
diameters were then stable. An opposite situation was observed with the self-expanding Talent
endograft. Again there was an immediate increase in diameter for aU 3 neck levels but this was
followed by further gradual increases over the next six months.
The most likely explanation for these results is that they reflect the outward force generated by the
endovascular stents onto the aortic wall. The balloon-expandable stent reaches its’ maximal
diameter soon after deployment whereas the self-expanding nitinol stent continues to dilate for
some time after the procedure accounting for the differing patterns of neck enlargement described.
In the case of the self-expanding system, this poses an interesting dilemma. As the stent gradually
approaches its maximal size, the elastic recoil of the aortic wall may begin to deteriorate with time.
Frictional forces between the stent and aortic wall will then become dangerously low with possible
endograft migration as a result. The preferred stent type from this perspective would consist of a
206
stent with a low outward force after deployment and a fixation mechanism independent of friction
between stent and neck. This would imply a reversion back to the 1®* generation balloon-expanding
stents perhaps with hooks/barbs used as part of the fixation.
In this study, although further progressive enlargement of the neck diameters, a consequence of the
underlying aneurysmal disease, was not demonstrated, this may have been too insidious to have
been statistically significant or possibly even overshadowed by the effect of over sizing the stent-
graft relative to aneurysm neck diameter. Because of these uncertainties longer-term follow up
(greater than 5 years) is required to confirm this change.
In contrast to changes affecting neck diameters, no change in aneurysm neck length was observed
in either group of patients during this smdy.
C a n M R I b e u s e d f o r p r e o p e r a t i v e e n d o v a s c u l a r i m a g i n g ?
MRJ has already been used in the evaluation of aortic aneurysms prior to conventional and
endovascular repair. The main advantages are the use of non-nephrotoxic contrast and the absence
of ionising radiation during the imaging process. MRA may be the technique of choice in young
patients or those with real impairment. However, even MRI is not completely safe as use is limited
by the presence of ferromagnetic materials in the patient, such as pacemakers and metallic fixation
devices, and by artifacts created by surgical clips or the endografts themselves. Some patients
cannot tolerate the noise and confinement of the MRI scanner. Motion artifacts and spatial
resolution limit imaging of nonaxial vessels and, as in conventional CT, precise delineation of
relevant aortic branches is suboptimal. Further, MRA examination times are longer than those
typically required for SCTA, and therefore MRA is not suited to examinations of acute conditions
such as rupture.
MRI may also be used in the assessment of tissue volume although this application has so far been
limited to the brain. Absolute volumes of brain tumours have been followed to reflect the effect of
treatment^® . Conditions in which the encephalic ventricles become enlarged such as Alzheimer's
disease and hydrocephalus, also require accurate measurement of the ventricles to provide a safe
means of aiding the diagnosis and provide follow-up information in affected patients. In one study
measuring the volume of simulated ventricles (water-filled cavities in gelatin phantoms), the results
obtained using MRI were better than those obtained with CT ® . The average percent difference
between volumes obtained by CT or MRI compared to the actual volume determined by water
displacement was 15.8% and 8.3% respectively.
207
Laboratoty studies
The use of gMRA in the assessment of aneurysm volume and linear dimensions was examined in
the laboratory and in a sample of 7 patients prior to endovascular repair. The main laboratory
findings were that gMRA produced linear and volume data comparable to spkal CT angiography.
One problem with volume estimation however, was the inability of MRA to detect glass due to the
nature of the imaging mechanism. If this effect was ignored however, gMRA estimation of solution
volume only was highly accurate with percentage errors in the range -0.01 to 1.22. In clinical
practice possible volume errors could arise if the aneurysm walls were heavily calcified or contained
large amounts of old laminated and calcified thrombus.
Clinical studies
In the clinical section, the feasibility of gMRA for assessment of linear abdominal aortic aneurysm
dimensions prior to endovascular repair was investigated. In a comparison with validated SCTA,
there was an overall disagreement of -4 to +7 mm depending on the region of the aneurysm under
consideration. The disagreement was much higher for length measurement than for diameters
particularly in the presence of tortuosity. This was especially true for LAFC and common ihac
lengths. However, the results are not a reflection of the inability of MRA to measure these regions
accurately, but more a consequence of the complex 3D anatomy in the area. Any two imaging
methods would have discrepancies in this situation.
Compared to SCTA, two further disadvantages became apparent:
Firstly there was an inability to clinically estimate aneurysm volumes due to the form of data
acquisition. The software collected volumetric data in coronal slices compared to the axial slices of
SCTA. This was because the 3D volumetric MRA had different voxel geometry (rectangular)
compared to SCTA (cuboid).
Secondly, aneurysm neck wall thickness was a problem during diameter measurements. This was
especially true with the maximum intensity projections (MIP) that tended to improve luminal
resolution at the expense of wall thickness thus causing underestimation of the aortic neck
diameter.
These results suggest that the role of MRA in the endovascular field is evolving. While MR
angiography compares favourably with SCTA in the estimation of linear distances, volume
calculations are disadvantaged by the nature of imaging mechanism. Although it can be argued that
aneurysm volumes are not essential when measuring patients for endovascular grafts, theic
importance in follow-up after endovascular repair renders MRA less useful. Accordingly, it is
208

recommended that this technique be presently reserved for patients with contraindications for
SCTA such as contrast allergy or renal compromise.
M o t i o n a t t h e a n e u r y s m n e c k
In addition to distortion and changes in position, endoluminal stent-grafts are at risk of structural
deterioration. This may involve fatigue fracture in the metal frame, disruption of sutures between
the metal frame components or covering, and fabric deterioration ranging from small defects to
disintegration of the graft. For example, the Stentor (MinTec, Freeport) graft is composed of a
series of nitinol zigzag stents interconnected with a 7-0 polypropylene suture. Breakage of these
ligatures and dislocation of the frames has been shown to occur between 5 and 41 months after
deployment^^^. Suture breakage and stent separations have also been noted in its successor, the
Vanguard (Boston Scientific) device on plain radiographs of the abdomen^^^. These structural
alterations may lead to graft distortion. Umscheid and Stelter^^o provide the most comprehensive
report of these changes to date and emphasize that their incidence increases with time.
As demonstrated, longitudinal shrinkage of aneurysms is unlikely to be responsible for these
changes. An alternative is to consider that the damage may be device specific and/or related to
some other source of trauma. One possibility that incorporates both these suggestions is related to
the physical forces acting within the aortic lumen and the nature of the motion occurring at the
aneurysm neck.
The endograft, a rigid device, is inserted into a continuously mobile aneurysm. If the endograft
construction is not robust as was the case with original Vanguard, the repeated minor trauma
expected with a continuous low-grade motion could be responsible for some of the types of
endograft loosening and damage seen after deployment.
Malina and colleagues have identified two basic motions affecting the aneurysmal aorta. There is a
longitudinal pulsatile motion in the range 1.5 mm and a radial component estimated at Imm ®" .
These motions are altered by endograft deployment (the radial component is reduced to
approximately 0.2 mm) and by the shape of the endograft. Wider endografts pulsate more and
transmit a greater pulsation to the aneurysm sac.
A second force generated by the column of flowing blood above the endograft creates a
longitudinal force within the aortic lumen. Data based on mathematical calculations and
experimental perfusion models suggest that a longitudinal force of approximately 10 Newton acts
on the proximal stent of an implanted endograft ®" . This force is proportional to the blood pressure
but independent of the flow rate. The force of 10 Newton has been shown to be sufficient to
dislodge stent-grafts in cadaveric models. The risk of stent dislodgement is reduced with bifurcated
209
as opposed to aorto-uni-iliac endografts. Within the bifurcated design, the effects of the
longitudinal force on the proximal stent can be further abated by using a longer column for the
endograft body so that its component limbs separate as close as possible to the native aortic
bifurcation. Short graft Hmbs inside the aneurysm sac are less likely to buckle or twist.
In this study, a method was developed to record and accurately measure the types of motion taking
place at the aneurysm neck. A pilot study, utdHsing high-speed video camera had previously
confirmed the presence of the described aneurysm neck motions.
The method eventually chosen to record and measure neck movement accurately was based on the
same techniques employed by surveyors to record land shifts. Measurement of linear distances
from photographs is not as simple as it may first appear. As described in Chapter 8, the distortions
inherent in all camera lenses translate onto photographic images making measurements in two
dimensions inaccurate. Further problems occur in trying to measure depth from a perspective view.
To reproduce depth requires a 3-dimensional reconstruction.
AU of these difficulties can be overcome with the use of multi-camera imaging and analytical
mathematical techniques based on the least-squares method. These correct the measurements
made direcdy from photographic images either manuaUy in stereoplotters or with the use of
speciaHsed software, both of which predict the distortion a bundle of Hght undergoes as it passes
through the internal geometry of a camera (bundle-adjustment software).
Because this software was originaUy designed for geographical land mapping on a much larger
scale, its use for measurement of the much smaUer aneurysm was uncertain. A simple vaHdation
experiment was hence designed to measure the volume of a glass aneurysm using this technology.
Aneurysm F was coated with a series of retro-reflective targets and photographed around its
complete circumference. The images were then Hnked to form a 3D image on screen used to
measure diameter and volume. The values obtained were very similar to the known parameters of
this phantom with minimal error.
Still multi-camera photography was used to capture aneurysm neck and other arterial motion
during conventional vascular surgical procedures. Dual cameras were set to fire synchronously at 1-
second intervals. With this technique, although the presence of movement was confirmed, it
proved impossible to quantify its direction and magnitude. This was due to a number of problems.
It was beHeved that the shutter-speed of the cameras used was too slow. The cameras were fixed to
a simultaneous shutter speed of 1-second that could not be varied and it may have been possible
that aneurysm neck movement was either much faster than this or was cycHcal within the 1 second
intervals. To test this hypothesis, a strobe Hght was mounted on the camera bar and programmed
to produce 4 flashes per second. This would therefore result in 4 exposures during the time the
210
camera shutter was open. If there were any movement in this time, overlapping images of the
aneurysm would be seen. Unfortunately this did not prove possible probably due to the sensitivity
of the photographic film s used. Although a selection of films was tried within the budget allowed,
none were sensitive enough to record more than one exposure.
A further loss of data may have occurred in the analysis stage. Image data had to be labeled by
hand in the Kem stereo-plotter and then converted into digital format with a scanner. These steps
may have resulted in the loss of some information. Against this hypothesis were the figures for the
residual values of the ground point co-ordinates measured in the manual and digital stereo-plotters.
All were less than 1 mm.
Digital photography
Digital photography was used to increase the camera shutter speed and also to avoid the manual
analytical stage. Two pairs of femoral arteries were filmed in a preliminary experiment. The results
showed that while a degree of motion was present, its magnitude was again difficult to determine.
This time however, the problem was due to the measurement error or “noise” associated with the
tie points. The most likely explanation lies in the nature of these points. Individual points were
made with indelible ink on the surface of the native artery. These were then converted into pixel
format by the digital cameras. The accuracy of image point identification of the software used
(VMS) was at the pixel level. Hence larger points generated more inconsistency due to the errors
involved in recognising and marking the same pixel by hand on each photograph. This problem
could have been overcome by improving the marking process with smaller points or use of
photoreflective targets that could be sterilised without damage. This has to be contrasted against
the critical diameter of each point that makes it easily visible in every photograph. At the time of
writing, the VMS software was being altered to allow automated recognition of the same point at
the sub-pixel level in different image sequences.
In this series of experiments therefore, although aneurysm neck motion was observed, its capture
and accurate measurement proved difficult in the time allowed for this work. However, from these
preliminary results and discussion, it is apparent that a complex pattern of physical forces and
arterial movements must co-exist within the aorta. Future research will be directed towards
measuring and elucidating interactions between the continuous longitudinal force within the vessel
and the pulsatile wall motions to understand how these influence endograft durability.
211
C h a p t e r 11
S y n o p s i s
This thesis validates a new gold standard, 3D-spiral CT angiography with post-processing, for the
assessment and follow-up patients suitable for endovascular repair of their AAA. The difficulties
encountered with measurement of maximal diameter alone, suggest that volume measurements
should also become part of the routine assessment when describing aneurysms after endoluminal
repair. Using this technology, the intricate geometrical changes that affect aneurysm morphology
post-stenting can be shown to depend solely on the physical nature of the endograft (balloon
versus self-expanding/PTFE versus Dacron), a point that has previously not been recognised.
These observations may be used as a baseline in actual clinical practice and may also form the basis
for the timing of postoperative imaging. For example, the significant increase in sac volume to day
5 post-deployment would suggest that patients should have their first spiral CT scan at this time to
act as the baseline for comparisons with other scans during follow-up.
It is essential to state that these results do not commit to a relationship that may exist between a
critical volume and the risk of sac rupture. Volume has been examined purely in the context of
follow-up after endovascular repaie. This serves to demonstrate that the aim of aortic endografting,
which is to eliminate the threat of aneurysm rupture, is not necessarily synonymous with
aneurysmal shrinkage. PTFE-treated sacs appear ftozen in their natural history up to the medium-
term.
Previous work has suggested that aneurysms shrink along their longitudinal axes causing endograft
damage. From the results presented here, it can now be seen that aneurysm and graft lengths do
not shrink after endovascular repair, but instead may increase if unsupported grafts are deployed.
One consequence of this statement is that observations of medium to long-term endograft
buckling in situ must be due to reasons other than aneurysm contracture.
One possibility is the repeated minor trauma that must occur at the aneurysm neck due to
differential motion between the endograft and aortic wall. Over a period of time, this may result in
the disintegration of less robust constructions such as the Stentor endograft. This thesis has
identified aa accurate photographic method that may be used to investigate this hypothesis further.
Finally, there has been a clear demonstration of MRA as an alternative in the assessment of patients
for endovascular repair. Unfortunately, because of problems with volume rendering and loss of
wall definition with MIP images, the methodology is limited to cases where iodinated-contrast
injection is unsafe. For the time being, patients presenting for endovascular repair should be
212

assessed using SCTA as the sole imaging modality thus avoiding the complications of direct arterial
puncture seen with sizing-catheter angiography and intra-vascular ultrasound.
213

C h a p t e r 12
References
1. Crowe SJ. Halsted of Johns Hopkins: the man and his men. Springfield: Charles C. Thomas,
1957: 210-218.
2. Cotran RS, Kumar V, Robbins SL. Robbins (eds). Pathologic Basis of Disease. 5th Edition.
Philadelphia, W.B. Saunders, 1994: 500-501.
3. Johnston KW, Rutherford RB, Tilson MD, Shah DM, HoUier L, Stanley JC. Suggested
standards for reporting on arterial aneurysms. Subcommittee on Reporting Standards for
Arterial Aneurysms, Ad Hoc Committee on Reporting Standards, Society for Vascular
Surgery and North American Chapter, International Society for Cardiovascular Surgery. J
Vase Surg, 1991; 13(3): 452-458.
4. Steinberg CR, Morton A, Steinberg I. Measurement of the abdominal aortic after
intravenous aortography in health and arteriosclerotic peripheral vascular disease. AJR 1965;
95: 703-8.
5. Collin J. A proposal for a precise definition of abdominal aortic aneurysm. A personal view.
J Cardiovasc Surg. 1990; 31(2): 168-169.
6. Moher D, Cole CW, Hdl GB. Epidemiology of abdominal aortic aneurysm: the effect of
differing definitions. Eur J Vase Surg. 1992; 6(6): 647-650.
7. Barker WF. Clio Chirurgical: The arteries. Austin (TX): RG Landers; 1992: 2-502.
8. Osier W. Aneurysm of the abdominal aorta. Lancet. 1905; 2: 1089-1096.
9. Blakemore AH. Progressive constrictive occlusion of abdominal aorta with wiring and
electrothermic coagulation: A one-stage operation for arteriosclerotic aneurysm of the
abdominal aorta. Ann Surg. 1951; 133: 447-462.
214

10. Blakemore AH, King BG. Electrothermic coagulation of aortic aneurysms. JAMA 1938;
111:1821-1827.
11. Blakemore AH. Progressive constrictive occlusion of the aorta with wiring and
electrothermic coagulation for the treatment of arteriosclerotic aneurysms of the abdominal
aorta. Transactions of the Southern Surgical Association 1952; 64: 202-219.
12. Osier W. The principles and practice of medicine. 7th edition. New York. D. Appleton;
1909: 862-863.
13. Haeger K. The illustrated history of surgery. New York: Bell Publishing; 1988
14. Pearse HE. Experimental studies of the gradual occlusion of large arteries. Ann Surg 1940;
112: 923-937.
15. Harrison PW, Chandy J. A subclavian aneurysm cured by cellophane fibrosis. Ann Surg
1943; 118:478-481.
16. Abbott OA. Clinical experiences with the application of polythene cellophane upon
aneurysms of the thoracic vessels. J Thorac Surg 1949; 18: 435-461.
17. Lowenberg EL. Aneurysms of the abdominal aorta; report of two cases treated by "cutis
grafting." Angiology 1950; 1: 396-404.
18. de Takats G, Marshall MR. Surgical treatment of arteriosclerotic aneurysms of the
abdominal aorta. Arch Surg 1952; 64: 307-319.
19. Wylie EJ, Kerr E, Davies O. Experimental and clinical experiences with the use of fascia
lata applied as a graft about major arteries after thrombo-endarterectomy and
aneurysmorrhapy. Surg Gyn Obst. 1951; 93: 257-272.
20. Matas R. Traumatic aneurysm of the left brachial artery. Incision and partial excision of the
sac-recovery. Medical News of New York 1888; 53: 462-466.
215
21. Matas R. Aneurysm of the abdominal aorta at its bifurcation into the common iliac arteries.
Ann Surg 1940; 112; 909-922.
22. Carrel A. Results of the transplantation of blood vessels, organs and hmbs. JAMA 1908; LI:
1662-1667.
23. Gross RE, Bih AH Jr., Peirce EC II. Methods for preservation and transplantation of
arterial grafts; observations on arterial grafts in dogs. Report of transplantation of preserved
arterial grafts in 9 human cases. Surg Gynecol Obstet 1949; 88: 689-701.
24. Dubost C, Allary M, Oeconomos N. Resection of an aneurysm of the abdominal aorta.
Reestabhshment of the continuity by a preserved human arterial graft, with result after five
months. Arch Surg 1952; 64: 405-408.
25. Szilagyi E, McDonald RT, Smith RF, Whitcomb JG. Biologic fate of human arterial
homografts. Arch Surg 1957; 75: 506-529.
26. Voorhees AB Jr. The origin of the permeable arterial prosthesis: A personal reminiscence.
Surg Rounds 1988; 2: 79-84.
27. Voorhees AB Jr., Jaretzki A III, Blakemore AH. The use of tubes constructed from Vinyon
*'N" cloth in bridging arterial defects. Ann Surg 1952; 135: 332-336.
28. Blakemore AH, Voorhees AB Jr. The use of tubes constructed from Vinyon "N" cloth in
bridging arterial defects - experimental and clinical. Ann Surg 1954; 140: 324-334.
29. DeBakey ME, Cooley DA, Crawford ES, Morris GC Jr. Clinical apphcation of a new
flexible knitted Dacron arterial substitute. Amer Surg 1958; 24: 862-869.
30. Lemole GM, Spagna BM, Strong MD. Rigid intraluminal prosthesis for replacement of
thoracic and abdominal aorta. J Vase Surg 1984; 1: 22.
31. Goddard MD, Lucas AR, Curletti EL, Cohn MS, Sadighi PJ. Sutureless intraluminal grafts
for repair of abdominal aortic aneurysms. Arch. Surg. 1985; 120: 791.
216

32. Kreamer JW. Intiraluminal graft using adhesives. US Patent No. 4, 577, 631 1986.
33. Kreamer JW. Intraluminal sleeve graft. US Patent No. 4, 740, 207 1987.
34. Cragg A; Lund G; Rysavy J; Castaneda F; Castaneda-Zuniga W; Amplatz K. Nonsurgical
placement of arterial endoprostheses: a new technique using nitinol wire. Radiology 1983;
147(1): 261-263.
35. Balko A, Piasecki GJ, Shah DM, Carney WI, Hopkins RW, Jackson BT. Transfemoral
placement of intraluminal polyurethane prosthesis for abdominal aortic aneurysm. J Surg
Res 1986; 40(4): 305-309.
36. Parodi JC, Palmaz JC, Barone HD. Transfemoral intraluminal graft implantation for
abdominal aortic aneurysms. Ann Vase Surg 1991; 5(6): 491-499.
37. White GH, Yu W, May J. Endoleak-a proposed new terminology to describe incomplete
aneurysm exclusion by an endoluminal graft (letter). J Endovasc Surg, 1996; 3(1): 124-125.
38. Moore WS, Vescera CL. Repair of abdominal aortic aneurysm by transfemoral endovascular
graft placement. Ann Surg 1994; 220: 331-341.
39. May J. Tube grafts for AAA endovascular repair. Is there a continuing role?
http://www.cvi-online.com/page/site/aneurys/baseaneu/mainanevry.html
40. Chuter TA, Green RM, Ouriel K, Fiore WM, DeWeese JA. Transfemoral endovascular
aortic graft placement. J Vase Surg 1993; 18(2): 185-195.
41. Scott RA, Chuter TA. Clinical endovascular placement of bifurcated graft in abdominal
aortic aneurysm without laparotomy. Lancet 1994; 343(8894): 413.
42. Blum U, Langer M, Spillner G, Mialhe C, Beyersdorf F, Buitrago-TeUez C, Voshage G,
Duber C, Schlosser V, Cragg AH. Abdominal aortic aneurysms: preliminary technical and
clinical results with transfemoral placement of endovascular self-expanding stent-grafts.
Radiology 1996; 198(1): 25-31.
217
43. May J, White G, Waugh R, Yu W, Hams J. Treatment of complex abdominal aortic
aneurysms by a combination of endoluminal and extraluminal aortofemoral grafts. J Vase
Surg 1994; 19(5): 924-933.
44. Yusuf SW, Wenham PW, Hopkinson BR. The Nottingham experience. In: Hopkinson B,
Yusuf W, Whitaker S, Veith F (eds). Endovascular Surgery for Aortic Aneurysms. London,
W.B. Saunders. 1997; 221-229.
45. Adiseshiah M, Bray AJ, Bergeron P, Raphael MJ. Endoluminal repair of large abdominal
aortic aneurysms using PTFE: a feasibility study. J Endovasc Surg, 1997; 4(3): 286-289.
46. Yusuf SW, Whitaker SC, Chuter TA, Ivancev K, Baker DM, Gregson RH, Tennant WG,
Wenham PW, Hopkinson BR. Early results of endovascular abdominal aortic aneurysm
repair with aorto uni-iliac graft and femoro-femoral bypass. J Vase Surg 1997; 25: 165-172.
47. Yusuf SW, Whitaker SC, Chuter TA, Wenham PW, Hopkinson BR. Emergency
endovascular repair of leaking aortic aneurysm. Lancet 1994; 344(8937): 1645
48. Piotrowski J, Jones DN, Whithill T, Bell R, Patt A, Rutherford RB . Aortobimeforal bypass:
the operation of choice for unilateral iliac occlusion. J Vase Surg. 1988; 8: 211-216.
49. Walker SR, Braithwaite B, Tennant WG, MacSweeney ST, Wenham PW, Hopkinson BR.
Early complications of femorofemoral crossover bypass grafts after aorto uni-iliac
endovascular repair of abdominal aortic aneurysms. J Vase surg 1998; 28: 647-650.
50. Mangell P, Malina M, Vogt K, Lindh M, Schroeder T, Risberg B, BrunkwaU J, Lanne T. Are
self-expanding stents superior to balloon-expanded in dilating aortas? An experimental
study in pigs. Eur J Vase Endovasc Surg. 1996; 12(3): 287-294.
51. Siegerstetter V, Krause T, Rossle M, Haag K, Ochs A, Hauenstein KH, Moser HE.
Transjugular intrahepatic portosystemic shunt (TIPS). Thrombogenicity in stents and its
effect on shunt patency. Acta Radiol. 1997; 38(4 Pt 1): 558-564.
218
52. Buhler Wang FE. A summary of recent research in the nitinol alloys and their potential
application in ocean engineering. Ocean Eng. 1968; 1: 105-120.
53. Edie JW, Andreasen GF, Zaytoun MP. Surface corrosion of nitinol and stainless steel under
clinical conditions. Angle Orthod. 1981; 51; 319-324.
54. Grewe P, Krampe K, Muller KM. Macroscopic and histopatholgic alterations of the
bronchial wall after implantation of nitinol stents. In: Liermann D (ed). Stents-state of the
art and future developments. Morin Heights, Canada. Polyscience Publications Inc. 1995;
256-259.
55. Grégoire J, Jeong MH, Camrud AR, Lerman A, Holmes DR, Schwartz RS. The self
expanding coronary stent: how much force is safe in the normal coronary artery [abstract]?}
Am CoU Cardiol 1997; 29(A): 313A.
56. Malina M; lindblad B; Ivancev K; Lindh M; Malina J; BrunkwaU J. Endovascular AAA
exclusion: wiU stents with hooks and barbs prevent stent-graft migration? J Endovasc Surg.
1998; 5(4): 310-317.
57. Melton LJ 3rd, Bickerstaff LK, HoHer LH, Van Peenen HJ, Lie JT, Pairolero PC, Cherry
KJ, O’FaUon WM. Changing incidence of abdominal aortic aneurysm: a population-based
study. Am J Epidemiol. 1984; 120: 379.
58. Casdeden WM, Mercer JC. Abdominal aortic aneurysm in western Australia: descriptive
epidemiology and patterns .of rupture. Br J Surg. 1985; 72:109-112.
59. Santilli JD, SantiUi SM. Diagnosis and treatment of abdominal aortic aneurysms. Am Fam
Physician 1998; 56(4): 1081-1090.
60. Lehnert T, Roberts PJ. Editorial. Eur J Surg Oncol. 1998; 24(5): 361
61. Bickerstaff LK, HoUier LH, Van Peenen HJ, Melton LJ 3d, Pairolero PC, Cherry KJ.
Abdominal aortic aneurysms: the changing natural history. J Vase Surg. 1984; 1: 6-12.
219
62. Fowkes FGC, MacIntyreCCA, Ruckley CV. Increasing incience of aortic aneurysms in
England and Wales. Br Med J. 1989; 298: 33-35.
63. Norman PE, Casdeden WM, Hockey RL. Prevalence of abdominal aortic aneurysm in
Western Australia. Br J Surg 1991; 78:1118-1121.
64. Drott C, Arfvidsson B, OrtenwaUP, Lundhokn K. Age-standardized incidence of ruptured
aortic aneurysm in a Swedish population between 1952 and 1958: mortality rate and
operative results. Br J Surg 1992; 79: 175-179.
65. Armour RH. Survivors of ruptured abdominal aortic aneurysm: the iceberg's tip. Br Med J.
1977; 2(6094): 1055-1057.
66. Jamrozik K, Norman PE, Spencer CA, Parsons RW, Tuohy R, Lawrence-Brown MM,
Dickinson JA. Screening for abdominal aortic aneurysm: lessons from a population-based
study. Med J Aust. 2000; 173(7): 345-350.
67. McFarlane MJ. The epidemiologic necropsy for abdominal aortic aneurysm. JAMA. 1991;
265(16): 2085-2088.
68. Bergqvist D, Bengtsson H, Svenjso S. Prevalence of abdominal aortic aneurysm: Experience
from Mahno, Sweden. In Yao JS, Pearce WH. (eds). Aneurysms: new findings and
treatments. New York. Appleton and Lange 1994; 49-61.
69. Wümink AB, Quick CR. Epidemiology and potential for prevention of abdominal aortic
aneurysm. Br J Surg 1998; 85(2): 155-162.
70. Pleumeekers HJ, Hoes AW, van der Does E, van Urk H, Hofman A, de Jong PT, Grobbee
DE. Aneurysms of the abdominal aorta in older adults. The Rotterdam Study. Am J
Epidemiol. 1995; 142 (12): 1291-1299.
71. Krohn CD, KuUmann G, Kvemebo K, Rosen L, Kroese A. Ultrasonographic screening for
abdominal aortic aneurysm. Eur J Surg 1992; 158 (10): 527-530.
220
72. Scott RA, Wilson NM, Ashton HA, Kay DN. Influence of screening on the incidence of
ruptured abdominal aortic aneurysm: 5-year results of a randomized controlled study. Br J
Surg 1995; 82:1066-1070.
73. Frame PS, Fryback DG, Patterson C. Screening for abdominal aortic aneurysm in men ages
60 to 80 years. A cost-effectiveness analysis. Ann Intern Med 1993; 119:411-416.
74. Norman PE, Castleden WM, Lawrence-Brown MM. Screening for abdominal aortic
aneurysms. Aust N Z J Surg 1992; 62: 333-337.
75. Lederle FA, Johnson OR, Wilson SE, Chute EP, Littooy FN, Bandyk D, Krupski WG,
Barone GW, Acher CW, Ballard DJ. Prevalence and associations of abdominal aortic
aneurysm detected through screening. Aneurysm Detection and Management (ADAM)
Veterans Affairs Cooperative Study Group. Ann Intern Med 1997; 126: 441-449.
76. Johansen K, Koepsell T. Familial tendency for abdominal aortic aneurysms. JAMA 1986;
256:1934-1936.
77. Tilson MD, Dang C. Generalized arteriomegaly. A possible predisposition to the formation
of abdominal aortic aneurysms. Arch Surg 1981; 116:1030-1032.
78. Powell JT, MacSweeney STR, Greenhalgh RM. The spontaneous course of small aortic
aneurysm. In: Aneurysms: New findings and treatment. Yao JST, Pearce WH (eds). New
York. Appleton and Lange 1994.
79. ZoUner N, ZoUer WG, Spengel F, Weigold B, Schewe CK The spontaneous course of small
abdominal aortic aneurysms. Aneurysmal growth rates and life expectancy. Khn
Wochenschr 1991; 69(14):633-639
80. Scott RAP, Wilson NM, Ashton HA, Kay DN. Is surgery necessary for abdominal aortic
aneurysm less than 6 cm in diameter? Lancet 1993; 342:1395-1396.
81. Darling RC, Brewster DC. Elective treatment of abdominal aortic aneurysms. World J Surg,
1980; 4(6): 661-667.
221
82. Szilagyi DE, Smith RF, DeRusso FJ, Elliott JP, Shemn FW. Contribution of abdominal
aortic aneurysmectomy to prolongation of life. Ann Surg 1966; 164(4): 678-699.
83. Cronenwett JL, Murphy TF, Zelenock GB, Whitehouse WM Jr, Lindenauer SM, Graham
LM, Quint LE, Silver TM, Stanley JC. Actuarial analysis of variables associated with rupture
of small abdominal aortic aneurysms. Surgery. 1985; 98(3): 472-483.
84. Darling RC; Messina CR; Brewster DC; Ottinger LW. Autopsy study of unoperated
abdominal aortic aneurysms. The case for early resection. Circulation, 1977; 56(3): II 161-
164.
85. Szilagyi DE; Elliott JP; Smith RF. Clinical fate of the patient with asymptomatic abdominal
aortic aneurysm and unfit for surgical treatment. Arch Surg. 1972; 104(4): 600-606.
86. Veith FJ, Goldsmith J, Leather RP, Hannan EL. The need for quality assurance in vascular
surgery. J Vase Surg. 1991; 13(4): 523-526.
87. Katz DJ, Stanley JC, Zelenock GB. Operative mortality rates for intact and ruptured
abdominal aortic aneurysms in Michigan: an eleven year statewide experience. J Vase Surg.
1994; 19: 804-815.
88. Katz DA, Cronenwett JL. The cost-effectiveness of early surgery versus watchful waiting in
the management of small abdominal aortic aneurysms. J Vase Surg 1994; 19(6): 980-990.
89. Bengtsson H, Bergqvist D. Ruptured abdominal aortic aneurysm. A population based study.
J Vase Surg. 1993; 18: 74-80.
90. Glimaker H, Hohnberg L, Elvin A, Nybacka O, AJmgren B, Bjorck CG, Eriksson I. Natural
history of patients with abdominal aortic aneurysm. Eur J Vase Surg. 1991; 5: 125-130.
91. Gtimshaw GM, Thompson JM, Hamer JD. A statistical analysis of the growth of small
abdominal aortic aneurysms. Eur J Vase Surg. 1994; 8: 741-746.
222
92. Raithel D, Heilberger P, Schiinn C. Does size of aneurysm affect our choice of management
of abdominal aortic aneurysm? In Indications in vascular and endovascular surgery.
Greenhalgh RM (ed). London, WB Saunders 1998; 241-249.
93. Ramo OJ, Gronlund S, Toivio I, Mokka RE. Can we achieve better results by operating
on smaller abdominal aortic aneurysms? Vasa 1995; 24(3): 270-274.
94. The UK Small aneurysm trial participants. Mortality results for randomised controlled trial
of early elective surgery or ultrasonographic surveillance for small abdominal aortic
aneurysms. Lancet 1998; 352:1649-1655.
95. Blum U, Voshage G, Lammer J, Beyersdorf F, ToUner D, Kretschmer G, Spillner G,
Polterauer P, Nagel G, Holzenbein T. Endoluminal stent-grafts for inftarenal abdominal
aortic aneurysms. N EnglJ Med 1997; 336:13-20.
96. Goldstone J, Brewster DC, Chaikof EL. Endoluminal repair versus standard open repair of
abdominal aortic aneurysm: early results of a prospective clinical comparison trial.
Proceedings of the 46th Scientific Meeting of The International Society for Cardiovascular
Surgery; 1998 Jun 7—8; San Diego, California.
97. Parodi JC. Should size of aneurysm determine procedure type for endovascular stent-
grafting for aortic aneurysm? In Indications in vascular and endovascular surgery.
Greenhalgh RM (ed). London, WB Saunders 1998; 199-209.
98. HoUier LH, Taylor LM, Ochsner J. Recommended indications for operative treatment of
abdominal aortic aneurysms. Report of a subcommittee of the Joint Council of the Society
for Vascular Surgery and the North American Chapter of the International Society for
Cardiovascular Surgery. J Vase Surg. 1992; 15(6): 1046-1056.
99. Berridge DC, Chamberlain J, Guy AJ, Lambert D. Prospective audit of abdominal aortic
aneurysm surgery in the northern region from 1988 to 1992. Northern Vascular Surgeons
Group.Br J Surg. 1995; 82(7): 906-910
223
100. Whalley DG, Salevsky FC, Ryckman JV. Haemodynamic and metabolic consequences of
aortic occlusion during abdominal aortic aneurysm surgery. Br J Anaesth. 1993; 70 (1): 96-
98.
101. Hertzer NR. Basic data concerning associated coronary disease in peripheral vascular
patients. Ann Vase Surg. 1987; 1(5): 616-620.
102. Bayazit M, Gol MK, Battaloglu B, Tokmakoglu H, Tasdemir O, Bayazit K. Routine
coronary arteriography before abdominal aortic aneurysm repair. Am J Surg. 1995; 170(3);
246-250.
103. Hertzer NR. Fatal myocardial infarction following abdominal aortic aneurysm resection:
Two hundred and seventy-three patients followed 6 to 11 prospective years. Ann Surg 1990;
192: 667-673.
104. Galland RB Mortality following elective infrarenal aortic reconstruction: a Joint Vascular
Research Group study. Br J Surg. 1998; 85(5): 633-636
105. Hertzer NR. Bevan EG, Young JR. Coronary artery disease in peripheral vascular patients -
a classification of 1000 coronary angiograms and results of surgical management. Ann Surg.
1984; 199: 223-233.
106. Kazmers A; Cerqueira MD; Zierler RE. Perioperative and late outcome in patients with left
ventricular ejection fraction of 35% or less who require major vascular surgery. J Vase Surg.
1988; 8(3): 307-315.
107. Akkersdijk GJ, van der Graaf Y, Moll FL, de Vries AC, Kitslaar PJ, van Bockel JH, Hak E,
Eikelboom BC. Complications of Standard Elective Abdominal Aortic Aneurysm Repair.
Eur J Vase Endovasc Surg 1998; 15(6): 505-510.
108. Ernst CB. Abdominal aortic aneurysm. N EnglJ Med 1993; 328:1167-1172.
224
109. Arnion MP, Yusuf SW, Latief K, Whitaker SC, Gregson RH, Wenham PW, Hopldnson BR
Anatomical suitability of abdominal aortic aneurysms for endovascular repair. Br J Surg.
1997; 84(2): 178-180.
110. Armon MP, Yusuf SW, Whitaker SC, Gregson RH, Wenham PW, Hopldnson BR.
Influence of abdominal aortic aneurysm size on the feasibility of endovascular repair. J
Endovasc Surg. 1997; 4(3): 279-83.
111. May J, White GH, Yu W, Waugh R, Stephen M, Harris JP. Concurrent comparison of
endoluminal repair vs. no treatment for small abdominal aortic aneurysms. Eur J Vase
Endovasc Surg. 1997; 13(5): 472-476.
112. Baxendale BR, Baker DM, Hutchinson A, Chuter TA, Wenham PW, Hopkinson BR.
Haemodynamic and metabolic response to endovascular repair of inffa-renal aortic
aneurysms. Br J Anaesth. 1996; 77(5): 581-5.
113. Trehame GD, Thompson MM, Whiteley MS, Bell PR. Physiological comparison of open
and endovascular aneurysm repair. Br J Surg. 1999; 86(6): 760-764.
114. Parodi JC. The Parodi system. In: Hopkinson B, Yusuf W, Whitaker S, Veith F (eds).
Endovascular surgery for aortic aneurysms. London. WB Saunders. 1997; 164-179.
115. Bradbury AW, Adam DJ, Makhdoomi KR, Stuart WP, Murie JA, Jenkins AM, Ruckley CV.
A 21-year Experience of Abdominal Aortic Aneurysm Operations in Edinburgh. Br J Surg
1998; 85(5): 645-647.
116. May J, White GH, Yu W, Waugh R, Stephen M, Sieunarine K, Harris JP. Conversion from
endoluminal to open repair of abdominal aortic aneurysms: a hazardous procedure. Eur J
Vase Endovasc Surg. 1997; 14(1): 4-11.
117. Blum U, Voshage G, Lammer J, Beyersdorf F, T oUner D, Kretschmer G, Spillner G,
Polterauer P, Nagel G, H olzenbein T. Endoluminal stent-grafts for inffarenal abdominal
aortic aneurysms. N EnglJ Med 1997; 336: 13-20.
225
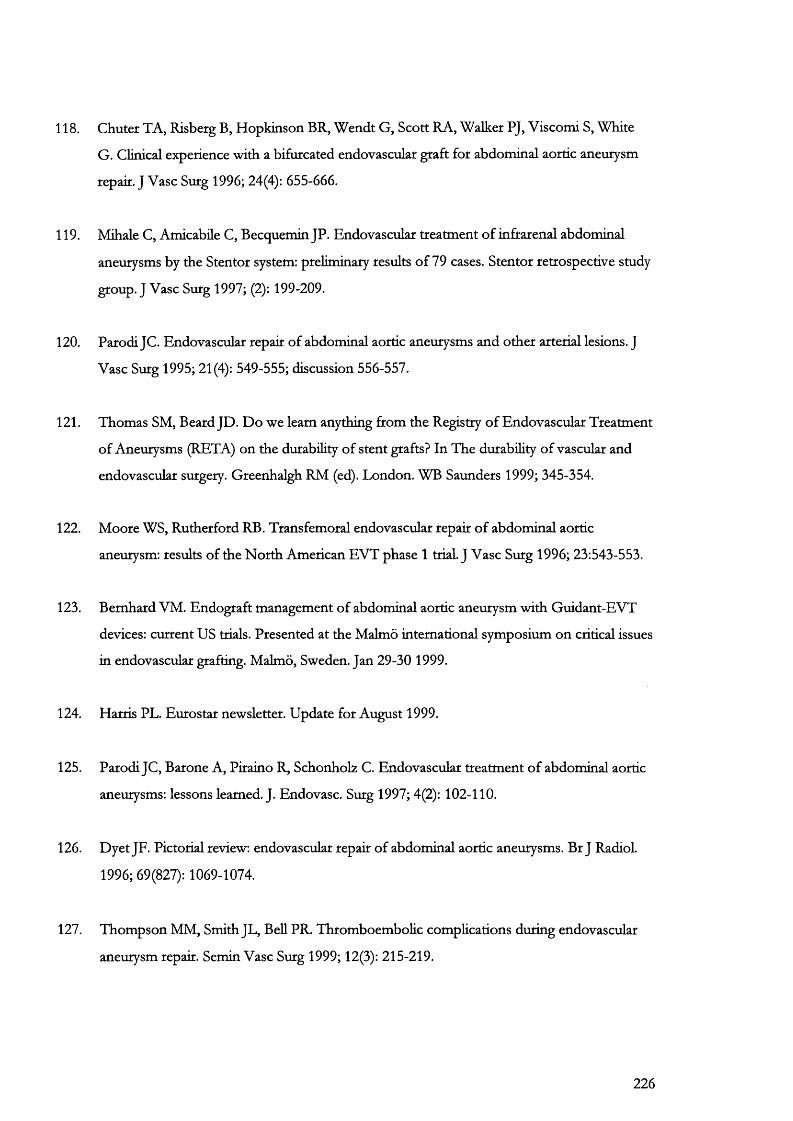
118. Chuter TA, Risberg B, Hopkinson BR, Wendt G, Scott RA, Walker PJ, Viscomi S, White
G. Clinical experience with a bifurcated endovascular graft for abdominal aortic aneurysm
repair. J Vase Surg 1996; 24(4): 655-666.
119. Mihale C, Amicabile C, Becquemin JP. Endovascular treatment of inffarenal abdominal
aneurysms by the Stentor system: preliminary results of 79 cases. Stentor retrospective study
group. J Vase Surg 1997; (2): 199-209.
120. Parodi JC. Endovascular repair of abdominal aortic aneurysms and other arterial lesions. J
Vase Surg 1995; 21(4): 549-555; discussion 556-557.
121. Thomas SM, Beard JD. Do we learn anything from the Registry of Endovascular Treatment
of Aneurysms (RETA) on the durability of stent grafts? In The durability of vascular and
endovascular surgery. Greenhalgh RM (ed). London. WB Saunders 1999; 345-354.
122. Moore WS, Rutherford RB. Transfemoral endovascular repair of abdominal aortic
aneurysm: results of the North American EVT phase 1 trial. J Vase Surg 1996; 23:543-553.
123. Bernhard VM. Endograft management of abdominal aortic aneurysm with Guidant-EVT
devices: current US trials. Presented at the Mahno international symposium on critical issues
in endovascular grafting. Malmo, Sweden. Jan 29-30 1999.
124. Harris PL. Eurostar newsletter. Update for August 1999.
125. Parodi JC, Barone A, Piraino R, Schonholz C. Endovascular treatment of abdominal aortic
aneurysms: lessons learned. J. Endovasc. Surg 1997; 4(2): 102-110.
126. Dyet JF. Pictorial review: endovascular repair of abdominal aortic aneurysms. Br J Radiol.
1996; 69(827): 1069-1074.
127. Thompson MM, Smith JL, Bell PR. Thromboembolic complications during endovascular
aneurysm repair. Semin Vase Surg 1999; 12(3): 215-219.
226
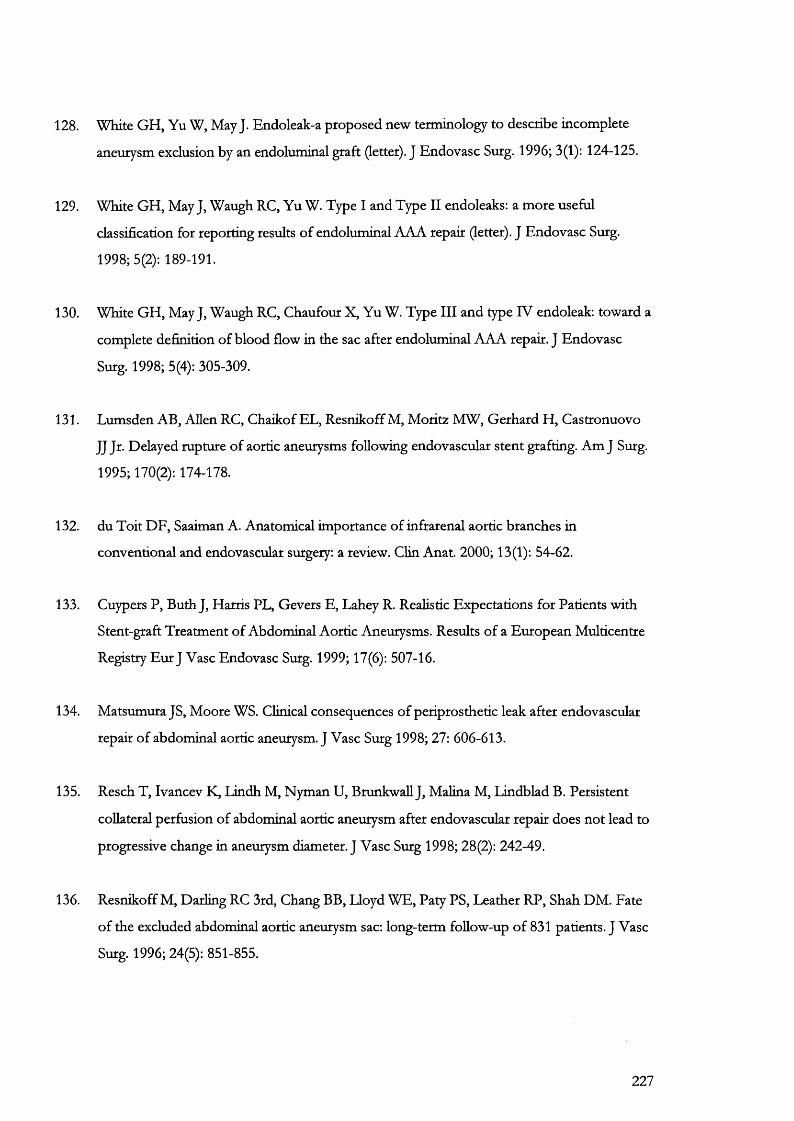
128. White GH, Yu W, May J. Endoleak-a proposed new terminology to describe incomplete
aneurysm exclusion by an endoluminal graft (letter). J Endovasc Surg. 1996; 3(1): 124-125.
129. White GH, May J, Waugh RC, Yu W. Type I and Type II endoleaks: a more useful
classification for reporting results of endoluminal AAA repair (letter). J Endovasc Surg.
1998; 5(2): 189-191.
130. White GH, May J, Waugh RC, Chaufour X, Yu W. Type III and type IV endoleak: toward a
complete definition of blood flow in the sac after endoluminal AAA repair. J Endovasc
Surg. 1998; 5(4): 305-309.
131. Lumsden AB, Allen RC, Chaikof EL, Resnikoff M, Moritz MW, Gerhard H, Castronuovo
JJ Jr. Delayed rupture of aortic aneurysms following endovascular stent grafting. Am J Surg.
1995; 170(2): 174-178.
132. du Toit DP, Saaiman A. Anatomical importance of infrarenal aortic branches in
conventional and endovascular surgery: a review. Clin Anat. 2000; 13(1): 54-62.
133. Cuypers P, Buth J, Harris PL, Gevers E, Lahey R. Realistic Expectations for Patients with
Stent-graft Treatment of Abdominal Aortic Aneurysms. Results of a European Multicentre
Registry Eur J Vase Endovasc Surg. 1999; 17(6): 507-16.
134. Matsumura JS, Moore WS. Clinical consequences of periprosthetic leak after endovascular
repair of abdominal aortic aneurysm. J Vase Surg 1998; 27: 606-613.
135. Resch T, Ivancev K, Lindh M, Nyman U, BrunkwaU J, Mahna M, Lindblad B. Persistent
collateral perfusion of abdominal aortic aneurysm after endovascular repair does not lead to
progressive change in aneurysm diameter. J Vase Surg 1998; 28(2): 242-49.
136. Resnikoff M, Darling RC 3rd, Chang BB, Lloyd WE, Paty PS, Leather RP, Shah DM. Fate
of the excluded abdominal aortic aneurysm sac: long-term follow-up of 831 patients. J Vase
Surg. 1996; 24(5): 851-855.
227
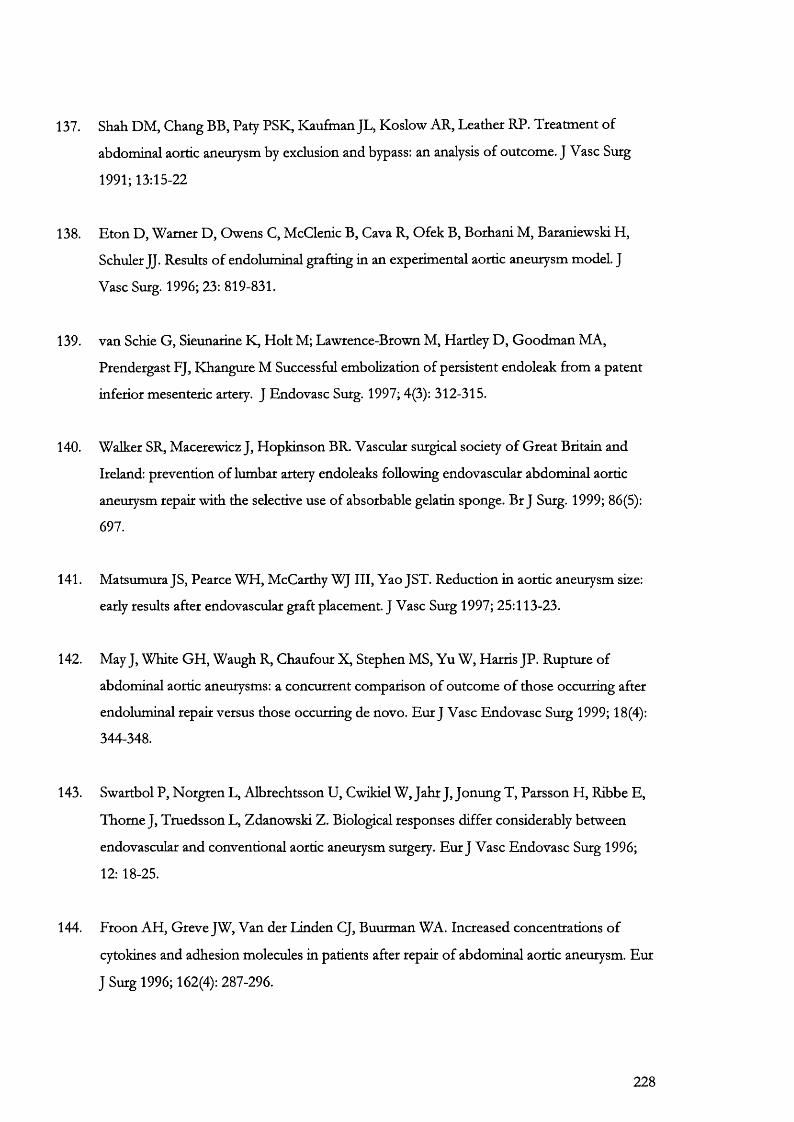
137. Shah DM, Chang BB, Paty PSK, Kaufinan JL, Koslow AR, Leather RP. Treatment of
abdominal aortic aneurysm by exclusion and bypass: an analysis of outcome. J Vase Surg
1991; 13:15-22
138. Eton D, Warner D, Owens C, McClenic B, Cava R, Ofek B, Borhani M, Baraniewski H,
Schuler JJ. Results of endoluminal grafting in an experimental aortic aneurysm model. J
Vase Surg. 1996; 23: 819-831.
139. van Schie G, Sieunarine K, Holt M; Lawrence-Brown M, Hartley D, Goodman MA,
Prendergast FJ, Khangure M Successful embolization of persistent endoleak from a patent
inferior mesenteric artery. J Endovasc Surg. 1997; 4(3): 312-315.
140. Walker SR, Macerewicz J, Hopkinson BR. Vascular surgical society of Great Britain and
Ireland: prevention of lumbar artery endoleaks following endovascular abdominal aortic
aneurysm repair with the selective use of absorbable gelatin sponge. Br J Surg. 1999; 86(5):
697.
141. Matsumura JS, Pearce WH, McCarthy WJ III, Yao JST. Reduction in aortic aneurysm size:
early results after endovascular graft placement. J Vase Surg 1997; 25:113-23.
142. May J, White GH, Waugh R, Chaufour X, Stephen MS, Yu W, Harris JP. Rupture of
abdominal aortic aneurysms: a concurrent comparison of outcome of those occurring after
endoluminal repair versus those occurring de novo. Eur J Vase Endovasc Surg 1999; 18(4):
344-348.
143. Swartbol P, Norgren L, Albrechtsson U, Cwikiel W, Jahr J, Jonung T, Parsson H, Ribbe E,
Thome J, Truedsson L, Zdanowski Z. Biological responses differ considerably between
endovascular and conventional aortic aneurysm surgery. Eur J Vase Endovasc Surg 1996;
12:18-25.
144. Froon AH, Greve JW, Van der Linden CJ, Buurman WA. Increased concentrations of
cytokines and adhesion molecules in patients after repair of abdominal aortic aneurysm. Eur
J Surg 1996; 162(4): 287-296.
228
145. Weitz J, Schumacher H, Kienle P, Koch M, Allenberg J. Measurement of sigmoid
intramucosal pH (pHi) during endovascular treatment of AAA. Presented at the
international endovascular symposium. Sydney, Australia. Dec 13-15 1998.
146. Swartbol P, Truedsson L, Norgren L. Adverse reactions during endovascular treatment of
aortic aneurysms may be triggered by interleukin 6 release from the thrombotic content. J
Vase Surg 1998; 28:664-668.
147. Steed DL, Higgings RS, PascuUe A, Webster MW. Culture of intraluminal thrombus during
abdominal aortic aneurysm resection: Significant contamination is rare. Cardiovasc Surg
1993; 1: 494-498.
148. Schwartz JA, Powell TW, Burnham SJ, Johnson G Jr. Culture of abdominal aortic aneurysm
contents. An additional series. Arch Surg. 1987; 122: 777-80.
149. McAuley CE, Steed DL, Webster MW. Bacterial presence in aortic thrombus at elective
aneurysm resection: Is it clinically significant? Am J Surg. 1984; 147: 322-4.
150. Raso AM, MuncineUi M, Serra R, Sisto G, Castagano PL, Rispoli P, Trogolo M, Maggio D.
Intraoperative microbiological monitoring in abdominal aortic aneurysms in elective
surgery. A review of the literature and the authors' personal experience. Minerva
Cardioangiology. 1992; 40: 375-81.
151. Van der Vliet JA, Kouwenberg PP, Muytjens HL, Barendregt WB, Boll AP, Buskens FG.
Relevance of bacterial cultures of abdominal aortic aneurysm contents. Surgery. 1996; 119:
129-32.
152. Engellau L, Larsson EM, Albrechtsson U, Jonung T, Ribbe E, Thome J, Zdanowski Z,
Norgren L. Magnetic resonance imaging and MR angiography of endoluminally treated
abdominal aortic aneurysms. Eur J Vase Endovasc Surg. 1998; 15(3): 212-219.
153. Miller DC, Myers BD. Pathophysiology and prevention of acute renal failure associated with
thoracoabdominal or abdominal aortic surgery. J Vase Surg. 1987; 5(3): 518-523.
229
154. McCord JM. Oxygen-derived free-radicals in post-ischaemic tissue injury. N EnglJ Med.
1985; 312: 159-163.
155. Riepe G, Heilberger P, Umscheid T, Chakfe N, Raithel D, Stelter W, Morlock M, Kretz JG,
Schroder A, Imig H. Frame dislocation of body middle rings in endovascular stent tube
grafts. Eur J Vase Endovasc Surg. 1999; 17 (1); 28-34.
156. Harris P, Brennan J, Martin J, Gould D, Bakran A, GiUing-Smith G, Buth J, Gevers E,
White D. Longitudinal aneurysm shrinkage following endovascular aortic aneurysm repair: a
source of intermediate and late complications.} Endovasc Surg. 1999; 6 (1): 11-16.
157. Stelter W, Umscheid T, Ziegler P. Three year experience with modular stent-graft devices
for endovascular AAA treatment. J Endovasc Surg. 1997; 4: 362-369.
158. Zarins CK, White RA, Schwarten D, Kinney E, Diethrich EB, Hodgson KJ, Fogarty TJ.
AneuRx stent graft versus open surgical repair of abdominal aortic aneurysms: multicenter
prospective clinical trial. J Vase Surg. 1999; 29(2); 292-305.
159. Yusuf SW, Whitaker SC, Chuter TA, Wenham PW, Hopkinson BR. Emergency
endovascular repair of leaking aortic aneurysm. Lancet 1994; 344(8937): 1645.
160. Yusuf SW, Baker DM, Hind RE, Chuter TA, Whitaker SC, Wenham PW, Gregson RH,
Hopkinson BR. Endoluminal transfemoral abdominal aortic aneurysm repair with aorto-
uni-üiac graft and femorofemoral bypass. Br J Surg. 1995; 82(7): 916
161. Ohki T, Veith FJ, Sanchez LA, Cynamon J, Lipsitz EC, Wain RA, Morgan JA, Zhen L,
Suggs WD, Lyon RT Endovascular graft repair of ruptured aortoihac aneurysms. J Am CoU
Surg 1999; 189(1): 102-112; discussion 112-113.
162. Learoyd BM, Taylor MG. Alterations with age in the visco-elastic properties of human
arterial walls. Circulation Res. 1966; 18; 278-292.
230

163. Feibleib B, Thom T, Havlik RJ. Decline in coronary heart disease mortality in the United
States. Atherosclerosis Rev. 1982; 9: 29-41.
164. Patel MI, Hardman DT, Fisher CM. Current views on the pathogenesis of abdominal aortic
aneurysms. J Am CoU Surg. 1995; 181: 371-382.
165. The extraceUular matrix. In Molecular biology of the ceU. Eds Alberts B, Bray D, Lewis J,
Raff M, Roberts K, Watson JD. Garland Publishing. 1983; 701-702.
166. McMahon MP, Paris B, Wolfe BL. Aging effects on the elastin composition in the
extraceUular matrix of cultured rat aortic smooth muscle ceUs. In vitro CeU Div Biol. 1985;
21: 674-680.
167. Kim TF. Marian's syndrome. Starting to yield secrets. JAMA. 1988; 260: 3108.
168. Hass GM. Elastic tissue III. Relations between the structure of the ageing aorta and the
properties of isolated elastic tissue. Arch Pathol. 1943; 35: 29.
169. Campa JS, Greenhalgh RM, PoweU JT. Elastin degradation in abdominal aortic aneurysms.
Atherosclerosis. 1987; 65: 13-21.
170. Brophy CM, Marks WH, ReiUy JM, TUson MD. Decrease tissue inhibitor of
metaUoproteinases (TIMP) in abdominal aortic aneurysm tissue: a preliminary report. J Surg
Res. 1991; 50; 653-657.
171. Cohen JR, MandeU C, MargoHs I, Chang J, Wise L. Altered aortic protease and antiprotease
activity in patients with ruptured abdominal aortic aneurysm. Surg Gynecol Obstet. 1987;
164: 355-358.
172. Cronenwett JL, Murphy TF, Zelencock G. Actiirial analysis of variables associated with
rupture of smaU abdominal aortic aneurysms. Surgery. 1985; 98: 472-83.
173. Cohen JR, Sarfati I, Ramer L, TUson MD. Alpha 1 antitrypsin phenotypes in patients with
abdominal aortic aneurysms. J Surg Res. 1990; 49: 319-321.
231
174. Baxter TB, Halloran BG. Matrix protein metabolism in abdominal aortic aneurysms. In:
Aneurysms New findings and treatments. Ed Yao JST, Pearce WH. Appleton and Lange
1998; 25-34.
175. Mechanical properties of the blood vessel wall. In: Hemodynamics for surgeons. Strandness
DE, Sumner DS. Grune and Stratton 1975; 161-172.
176. Dobrin PB. Pathophysiology and pathogenesis of aortic aneurysms. Current concepts. Surg
Clin North Am 1989; 69(4): 687-703.
177. Mesh CL, Baxter BT, Pearce WH, Chisholm RL, McGee GS, Yao JS. Collagen and elastin
gene expression in aortic aneurysms. Surgery. 1992; 112: 256-261.
178. Mao D, Lee JK, VanVickle SJ, Thompson RW. Expression of collagenase-3 (MMP-13) in
human abdominal aortic aneurysms and vascular smooth muscle cells in culture. Btochem
Biophys Res Commun. 1999; 261(3): 904-910.
179. Burrows NP. The molecular genetics of the Ehlers-Danlos syndrome. Clin Exp Dermatol
1999; 24(2): 99-106.
180. Serim G, Gabbiani G. Mechanisms of myofibroblast activity and phenotypic modulation. :
Exp Cell Res 1999; 250(2): 273-283.
181. Nichols WW, O’Rourke MF. Properties of the arterial wall: practice. In. McDonald’s blood
flow in arteries. Theoretical, experimental and clinical principles. 4^ Ed. Arnold 1998; 85-87.
182. Bank AJ; Wang H; Holte JE; Mullen K; Shammas R; Kubo SH. Contribution of collagen,
elastin, and smooth muscle to in vivo human brachial artery wall stress and elastic modulus.
Circulation 1996; 94(12): 3263-3270.
183. Marston WA, Criado E, Baird CA, Keagy BA. Reduction of aneurysm pressure and wall
stress after endovascular repair of abdominal aortic aneurysm in a canine model. Ann Vase
Surg. 1996; 10(2): 166-173.
232
184. Fanes PL, Sanchez LA, Mann ML, Parsons RE, Lyon RT, Oliven S, Veith FJ. An
experimental model for the acute and chronic evaluation of intra-aneurysmal pressure. J
Endovasc Surg. 1997; 4(3): 290-297.
185. Chuter T, Ivancev K, Malina M, Resch T, BrunkwaU J, Lindblad B, Risberg B. Aneurysm
pressure foUowing endovascular exclusion. Eur J Vase Endovasc Surg. 1997; 13(1): 85-87.
186. Novak P, Glikstein R, Mohr G. Pulsation-pressure relationship in experimental aneurysms:
observation of aneurysmal hysteresis. Neurol Res. 1996; 18(4): 377-382.
187. M alina M, L 'anne T, Ivancev K, Lindblad B, BrunkwaU J. Reduced pulsatUe waU motion of
abdominal aortic aneurysms after endovascular repair. J Vase Surg. 1998; 27(4): 624-631.
188. Resnikoff M, Darling RC 3rd, Chang BB, Lloyd WE, Paty PS, Leather RP, Shah DM. Fate
of the excluded abdominal aortic aneurysm sac: long-term foUow-up of 831 patients. J Vase
Surg. 1996; 24(5): 851-855.
189. MaUna M, Ivancev K, Chuter TA, Lindh M, Lanne T, Lindblad B, BrunkwaU J, Risberg B.
Changing aneurysmal morphology after endovascular grafting: relation to leakage or
persistent perfusion. J Endovasc Surg. 1997; 4(1): 23-30.
190. May J, White G, Yu W, Waugh R, Stephen M, Harris J. A prospective study of anatomico-
pathological changes in abdominal aortic aneurysms foUowing endoluminal repair: is the
aneurysmal process reversed? Eur J Vase Endovasc Surg. 1996; 12(1): 11-17.
191. Broeders lA, Blankensteijn JD, Gvakharia A, May J, BeU PR, Swedenborg J, CoUin J,
Eikelboom BC. The efficacy of transfemoral endovascular aneurysm management: a study
on size changes of the abdominal aorta during mid-term foUow-up. Eur J Vase Endovasc
Surg. 1997; 14(2): 84-90.
192. May J. The ins and outs of the excluded abdominal aortic aneurysm: decreasing diameters
and dilating necks. J Endovasc Surg 1997; 4: 31-22.
233
193. Rozenblit A, Marin ML, Veith FJ, Cynamon J, Wahl SI, Bakal CW. Endovascular repair of
abdominal aortic aneurysm: value of postoperative foUow-up with helical CT AJR Am J
Roentgenol. 1995; 165:1473-1479.
194. Ellis M, Powell JP, Greenhalgh RM. The limitations of ultrasound for the surveillance of
abdominal aortic aneurysm. Br J Surg. 1991; 78: 614-616.
195. Vorp DA, Federspiel Webster MW. Does laminated intraluminal thrombus within
abdominal aortic aneurysm cause anoxia of the aortic wall? J Vase Surg. 1996; 23: 3; 540-
541.
196. Adolph R, Vorp DA, Steed DL, Webster MW, Kameneva MV, Watkins SC Cellular content
and permeability of intraluminal thrombus in abdominal aortic aneurysm. J Vase Surg 1997;
25(5): 916-926.
197. Szekanecz Z, Shah MR, Pearce WH, Koch AE. Human atherosclerotic abdominal aortic
aneurysms produce interleukin (IL)-6 and interferon-gamma but not IL-2 and IL-4: the
possible role for IL-6 and interferon-gamma in vascular inflammation. Agents Actions.
1994; 42(3-4): 159-162.
198. Newman KM; Jean-Claude J; Li H; Ramey WG; Tilson MD. Cytokines that activate
proteolysis are increased in abdominal aortic aneurysms. Circulation 1994; 90(5 Pt 2): II
224-227.
199. Di Martino E, Mantero S, Inzoli F, Melissano G, Astore D, Chiesa R, Fumero R.
Biomechanics of abdominal aortic aneurysm in the presence of endoluminal thrombus:
experimental characterisation and structural static computational analysis. Eur J Vase
Endovasc Surg 1998; 15(4): 290-299.
200. Mower WR, Quinones WJ, Gambhir SS. Effect of intraluminal thrombus on abdominal
aortic aneurysm wall stress. J Vase Surg 1997; 26(4): 602-608.
234
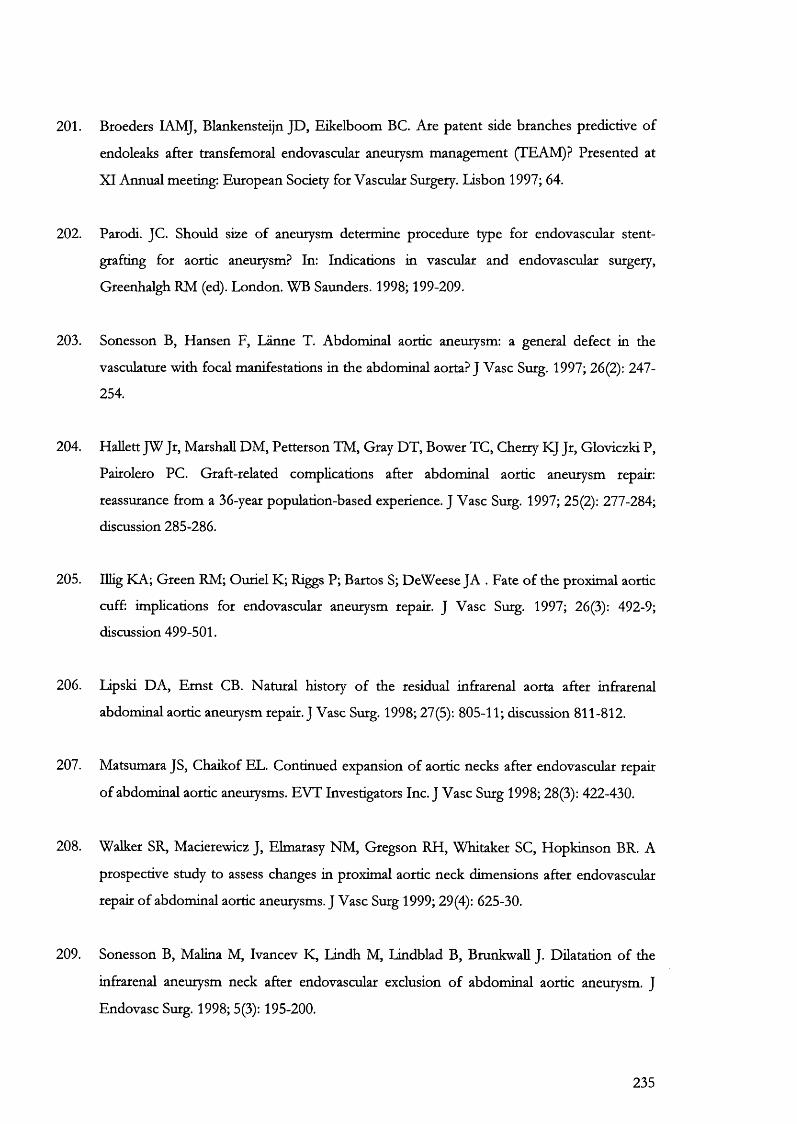
201. Broeders lAMJ, Blankensteijn JD, Eikelboom BC. Are patent side branches predictive of
endoleaks after transfemoral endovascular aneurysm management (TEAM)? Presented at
XI Annual meeting: European Society for Vascular Surgery. Lisbon 1997; 64.
202. Parodi. JC. Should size of aneurysm determine procedure type for endovascular stent-
grafring for aortic aneurysm? In: Indications in vascular and endovascular surgery,
Greenhalgh RM (ed). London. WB Saunders. 1998; 199-209.
203. Sonesson B, Hansen F, Lanne T. Abdominal aortic aneurysm: a general defect in the
vasculature with focal manifestations in the abdominal aorta? J Vase Surg. 1997; 26(2): 247-
254.
204. Hallett JW Jr, Marshall DM, Petterson TM, Gray DT, Bower TC, Cherry KJ Jr, Gloviczki P,
Pairolero PC. Graft-related complications after abdominal aortic aneurysm repair:
reassurance from a 36-year population-based experience. J Vase Surg. 1997; 25(2): 277-284;
discussion 285-286.
205. lUig KA; Green RM; Ouriel K; Riggs P; Bartos S; DeWeese JA . Fate of the proximal aortic
cuff: implications for endovascular aneurysm repair. J Vase Surg. 1997; 26(3): 492-9;
discussion 499-501.
206. Lipski DA, Emst CB. Natural history of the residual infrarenal aorta after infrarenal
abdominal aortic aneurysm repair. J Vase Surg. 1998; 27(5): 805-11; discussion 811-812.
207. Matsumara JS, Chaikof EL. Continued expansion of aortic necks after endovascular repair
of abdominal aortic aneurysms. EVT Investigators Inc. J Vase Surg 1998; 28(3): 422-430.
208. Walker SR, Macierewicz J, Elmarasy NM, Gregson RH, Whitaker SC, Hopkinson BR. A
prospective study to assess changes in proximal aortic neck dimensions after endovascular
repair of abdominal aortic aneurysms. J Vase Surg 1999; 29(4): 625-30.
209. Sonesson B, Malina M, Ivancev K, Lindh M, Lindblad B, BrunkwaU J. Dilatation of the
infrarenal aneurysm neck after endovascular exclusion of abdominal aortic aneurysm. J
Endovasc Surg. 1998; 5(3): 195-200.
235
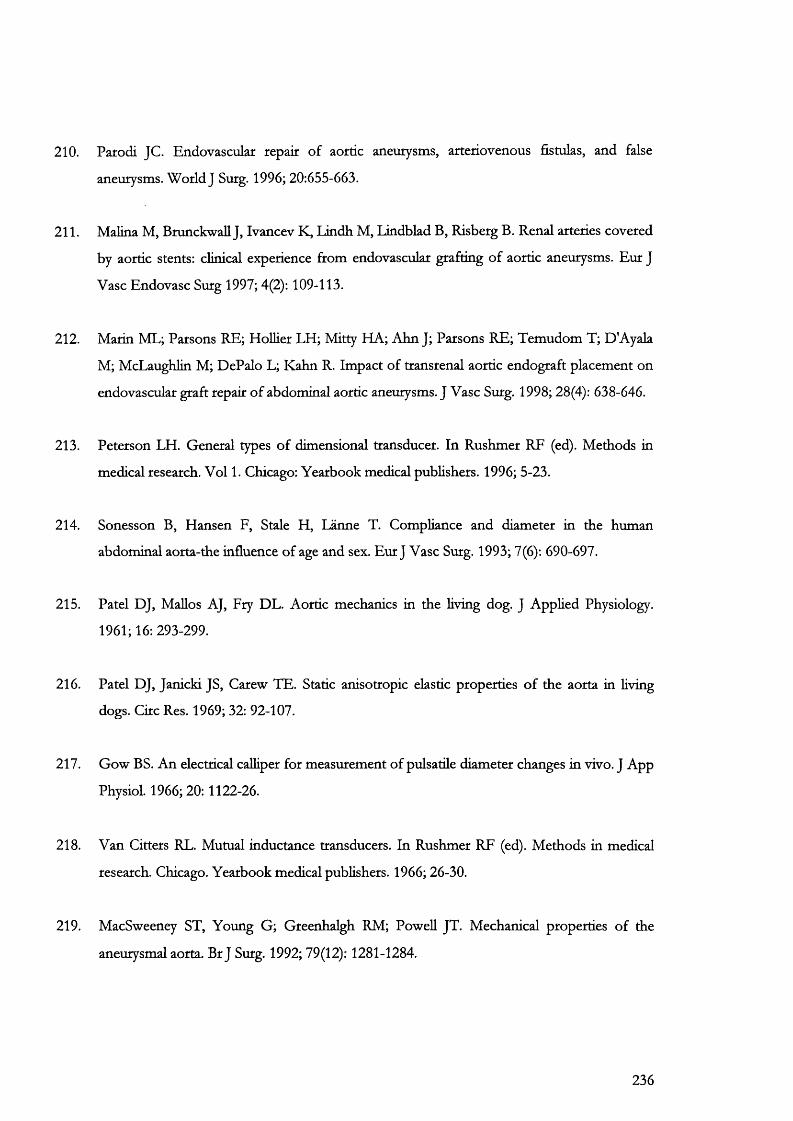
210. Parodi JC. Endovascular repair of aortic aneurysms, arteriovenous fistulas, and false
aneurysms. World J Surg. 1996; 20:655-663.
211. Malina M, Brunckwall J, Ivancev K, Lindh M, Lindblad B, Risberg B. Renal arteries covered
by aortic stents: clinical experience fiom endovascular grafting of aortic aneurysms. Eur J
Vase Endovasc Surg 1997; 4(2): 109-113.
212. Marin ML; Parsons RE; HoUier LH; Mitty HA; Ahn J; Parsons RE; Temudom T; D'Ayala
M; McLaughlin M; DePalo L; Kahn R. Impact of transrenal aortic endograft placement on
endovascular graft repair of abdominal aortic aneurysms. J Vase Surg. 1998; 28(4): 638-646.
213. Peterson LH. General types of dimensional transducer. In Rushmer RF (ed). Methods in
medical research. Vol 1. Chicago: Yearbook medical publishers. 1996; 5-23.
214. Sonesson B, Hansen F, Stale H, Lanne T. Compliance and diameter in the human
abdominal aorta-the influence of age and sex. Eur J Vase Surg. 1993; 7(6): 690-697.
215. Patel DJ, Mallos AJ, Fry DL. Aortic mechanics in the living dog. J Applied Physiology.
1961; 16: 293-299.
216. Patel DJ, Janicki JS, Carew TE. Static anisotropic elastic properties of the aorta in living
dogs. Circ Res. 1969; 32: 92-107.
217. Gow BS. An electrical calliper for measurement of pulsatile diameter changes in vivo. J App
Physiol. 1966; 20:1122-26.
218. Van Citters RL. Mutual inductance transducers. In Rushmer RF (ed). Methods in medical
research. Chicago. Yearbook medical publishers. 1966; 26-30.
219. MacSweeney ST, Young G; Greenhalgh RM; PoweU JT. Mechanical properties of the
aneurysmal aorta. Br J Surg. 1992; 79(12): 1281-1284.
236

220. Lang RM; ChoUey BP; Korcarz C; Marcus RH; Shroff SG. Measurement of regional elastic
properties of the human aorta. A new application of transesophageal echocardiography with
automated border detection and calibrated subclavian pulse tracings. Circulation. 1994;
90(4): 1875-1882.
221. Imura T, Yamamoto K, Kanamori K, Mikami T, Yasuda H. Non-invasive ultrasonic
measurement of the elastic properties of the human abdominal aorta. Cardiovasc Res 1986;
20(3) 208-214.
222. Benthin M, Dahl P, Ruzicka R, Lindstrom K. Calculation of pulse-wave velocity using cross
correlation-effects of reflexes in the arterial tree. Ultrasound Med Biol 1991; 17(5): 461-469.
223. Bergel DH. The static elastic properties of the arterial wall. J Physiol. 1961; 156: 445-457.
224. Bergel DH. The dynamic elastic properties of the arterial wall. J Physiol. 1961; 156; 458-469.
225. Megermann J, Hasson JE, Wamock DF. Noninvasive measurements of nonlinear arterial
elasticity. Am J Physiol. 1986; 250: 181-188.
226. Yada T, Hiramatsu O, Kimura A, Goto M, Ogasawara Y, Tsujioka K, Yamamori S, Ohno
K, Hosaka H, Kajiya F. In vivo observation of subendocardial microvessels of the beating
porcine heart using a needle-probe videomicroscope with a CCD camera. Circ Res. 1993;
72(5): 939-946.
227. Hiramatsu O; Goto M; Yada T; Kimura A; Tachibana H; Ogasawara Y; Tsujioka K; Kajiya
F. Diameters of subendocardial arterioles and venules during prolonged diastole in canine
left ventricles. Circ Res. 1994; 75(2): 393-397.
228. Prince MR, Narasimham DL, Stanley JC, Wakefield TW, Messina LM, Zelenock GB,
Jacoby WT, Marx MV, Williams DM, Cho KJ. Gadolinium-enhanced magnetic resonance
angiography of abdominal aortic aneurysms. J Vase Surg. 1995; 21(4): 656-669.
229. Malden E, Picus D, Vesely T. Peripheral vascular disease: Evaluation with stepping DSA
and conventional screen-film angiography. Radiology 1994; 191:149-152.
237
230. Lang EK. A survey of the complications of percutaneous retrograde angiography: Seldinger
technique. Radiology 1963; 81: 257-260.
231. Oliva VL, Denbow N, Therasse E, Common AA, Harel C, Giroux MF, Soulez G. Digital
subtraction angiography of the abdominal aorta and lower extremities: carbon dioxide
versus iodinated contrast material. J Vase Interv Radiol 1999; 10(6):723-731.
232. Kalender WA, Seissler W, Klotz E, Vock P. Spiral volumetric CT single-breath-hold
technique, continuous transport and continuous scanner rotation. Radiology. 1990; 176:
181-190.
233. Rubin GD. Three-dimensional helical CT angiography. RadioGraphics 1994; 14: 905-912.
234. Huang HK, Ledley RS. Three-dimensional image reconstruction from in vivo consecutive
transverse axial sections. Comput Biol Med. 1975; 5: 165-170.
235. Vannier MW, Marsh JL, Warren JO. Three dimensional computer graphics for craniofacial
surgical planning and evaluation. Computer Graphics. 1983; 17: 263-273.
236. Verbout AJ, Falke THM, Tinkelenberg J. A three-dimensional graphic reconstruction
method of the vertebral column from CT scans. Eur J Radiol 1983; 3: 95-172.
237. Vannier MW, Marsh JL. 3D imaging aids skull surgeons: adding depth to CAT scans
clarifies diagnoses. Comp Graph World. 1985; 8: 49-52.
238. Fram EK, Godwin JD, Putman CE. Three-dimensional display of the heart, aorta, lungs,
and airway using CT. Am J Roentgenol. 1982; 139:1171-1176.
239. Richard MJ, Allard J, Ghosh SK, Bougouss M. Three- dimensional reconstruction of human
Hmbs from tomographic views. Comp Biomed Res. 1989; 22: 26-35.
238
240. Englmeier KH, Wieber A, Milachowski, Hamburger C, Mittlmeier T. Methods and
applications of three- dimensional imaging in orthopedics. Arch Orthop Trauma Surg. 1990;
109: 186-190.
241. Tan AC, Richards R. Pseudo-shading technique in the two- dimensional domain: a post
processing algorithm for enhancing the Z-buffer of a three-dimensional binary image. Med
Inf. 1989; 14:149-156.
242. Tiede U, Hohne KH, Romans M, Pommert A, Riemer M, Wiebecke G. Surface rendering.
Investigation of medical 3D- rendering algorithms. IEEE Comput Graph & Appl. 1990; 10:
41-53.
243. Fan RT, Zinreich SJ, Quinn CB, FeUingham LL. Minimally interactive soft tissue
segmentation for 3-D display from tomographic images. Proceedings of SPIE. 1989; 1091:
279- 286.
244. Gehl H-B, Bohndorf K, Gladziwa U, Handt S, Gunther RW. Imaging of hemodialysis
fistulas: limitations of MR angiography. J Comput Assist Tomogr. 1991; 15: 271-275.
245. Hale JD, Valk PE, Watts JC, Kaufman L, Crooks LE, Higgins CB, Deconinck F. MR
imaging of blood vessels using three dimensional reconstruction: methodology. Radiology.
1985; 157: 727-733.
246. Pommert A, Romans M, Hohne K-H. Volume visualization in magnetic resonance
angiography. IEEE Comput Graph & Appl. 1992; 12(5): 12-13.
247. Gerig G, Kikinis R, Jolesz FA. Image processing of routine spin-echo MR images to
enhance vascular structures: comparison with MR angiography. In: Hohne K-H, Fuchs H,
Pizer SM (eds). 3D imaging in medicine. Berlin, Springer-Verlag 1990: 121-132.
248. Vandermeulen D, Delaere D, Suetens P, Bosmans H, Marchai G. Local filtering and global
optimisation methods for 3D magnetic resonance angiography (MRA) image enhancement.
Visualization in Biomedical Computing 1992. Proc SPIE. 1992; 1808: 274-288.
239

249. Haustein J, Niendorf HP, Krestin G, Louton T, Schuhmann-Giampieri G, Clauss W, Junge
W. Renal tolerance of gadoliniuni-DTPA/diniegliimine in patients with chronic renal
failure. Invest Radiol 1992; 27:153-156.
250. Rofsky NM, Weinreb JC, Bosniak MA, Libes RB, Bimbaum BA. Renal lesion
characterization with gadolinium-enhanced MR imaging: efficacy and safety in patients with
renal insufficiency. Radiology. 1991; 180: 85-89.
251. Balm R, Kaatee R, Blankensteijn JD, Mali WP, Eikelboom BC. CT -angiography of
abdominal aortic aneurysms after transfemoral endovascular aneurysm management. Eur J
Vase Endovasc Surg. 1996; 12(2): 182-188.
252. Resch T, Ivancev K, Lindh M, Nirhov N, Nyman U, lindblad B. Abdominal aortic
aneurysm morphology in candidates for endovascular repair evaluated with spiral computed
tomography and digital subtraction angiography. J Endovasc Surg. 1999; 6(3): 227-232.
253. Aarts NJ, Schurink GW, Schultze Kool LJ, Bode PJ, van Baalen JM, Hermans J, van Bockel
JH. Abdominal aortic aneurysm measurements for endovascular repair: intra- and
interobserver variability of CT measurements. Eur J Vase Endovasc Surg. 1999; 18(6): 475-
480.
254. Bland JM, Altman DG. Statistical methods for assessing agreement between two methods
of clinical measurement. Lancet. 1986; 1(8476): 307-310.
255. British standards Institution. Precision of test methods I: Guide for the determination and
reproducibility for a standard test method (BS 5497 part 1). London BSI 1979.
256. Swinscow TDV, Campbell MJ. Statistics at square one. Distribution of t (two-tailed). BMJ
Publishing. 9* Edition. 1997; 134.
257. Armon MP, Whitaker SC, Gregson RH, Wenham PW, Hopkinson BR. Spiral CT
angiography versus aortography in the assessment of aortoiliac length in patients
undergoing endovascular abdominal aortic aneurysm repair. J Endovasc Surg. 1998; 5(3):
222-227.
240
258. Wever JJ, Blankensteijn JD, Broeders lAMJ, Eikelboom BC. CTA measurements after
abdominal aortic aneurysm repair; what to measure? Presented at The international congress
XII on endovascular interventions Phoenix, Arizona 1999.
259. Jenkins M, Adiseshiah M “Aortomonoiliac Endografring: it does not have to be that
difficult" J Endovasc Surg. 1997; 4: 425-426.
260. Schurink GW, van Baalen JM, Visser MJ, van Bockel JH Thrombus within an aortic
aneurysm does not reduce pressure on the aneurysmal wall. J Vase Surg. 2000; 31(3): 501-
506.
261. Mechanical properties of the blood vessel wall. In: Hemodynamics for surgeons. Strandness
DE, Sumner DS. Grune and Stratton. 1975; 180-185.
262. Armon MP, Yusuf SW, Whitaker RHS, Gregson PW, Wenham PW, Hopkinson BR.
Thrombus distribution and changes in aneurysm size following endovascular aortic
aneurysm repair. Eur J Vase Endovasc Surg. 1998; 16(6): 472-476.
263. Busuttil RW, Abou-Zamzam AM, Machleder HI: CoUagenase activity of human aorta. Arch
Surg. 1980; 115:1373.
264. Rucker RB, Tinker D. Structure and metabolism of arterial elastin. Int Rev Exp Patholol.
1977; 17: 1-47.
265. Dobrin PB, Schwarcz TH, Baker WH. Mechanisms of arterial and aneurysmal tortuosity.
Surgery 1988; 104: 568-571.
266. Pearce WH, Slaughter MS, Le Maire S, Salyapongse AN, Feinglass J, McCarthy W}, Yao JS.
Aortic diameter as a function of age, gender and body surface area. Surgery 1993; 114: 691-
697.
267. Sonesson B, Lanne T, Hansen F, Sandgren T. Inffarenal aortic diameter in the healthy
person. Eur J Vase Surg. 1994; 8(1): 89-95.
241
268. Kaufinan JA, Yucel EK, Waltman AC, Geller SC, Prince MR, Cambria RP, Brewster DC,
Abbott WM. MR angiography in the preoperative evaluation of abdominal aortic
aneurysms: a preliminary study. J Vase Interv Radiol 1994; 5: 489-96.
269. Prince MR. Gadolinium-enhanced MR aortography. Radiology 1994; 191: 155-164.
270. Wever JJ, Blankensteijn JD, Broeders LAMJ, Eikelboom BC. Inter and intraobserver
variability of CTA measurements in endovascular repair of abdominal aortic aneurysms.
Abstract, presented at the International Congress for endovascular Interventions. Phoenix,
Arizona 1999.
271. Wever JJ, Blankensteijn JD, Mali WPThM, Eikelboom BC. Maximal aneurysm diameter
foUow-up is inadequate after endovascular abdominal aortic aneurysm repair. Submitted for
publication and abstract, presented at the International Congress for endovascular
Interventions. Phoenix, Arizona 1999.
272. Van Hoe L, Haven F, Bellon E, Baert AL, Bosmans H, Feron M, Suetens P, Marchai G.
Factors influencing the accuracy of volume measurements in spiral CT: a phantom study. J
Comput Assist Tomogr. 1997; 21(2): 332-338.
273. Disler DG, Mart DS, Rosenthal DI. Accuracy of volume measurements of computed
tomography and magnetic resonance imaging phantoms by three-dimensional
reconstruction and preliminary clinical application. Invest Radiol. 1994; 29(8): 739-745.
274. Utoh J, Goto H, Hirata T, Hara M, Kitamura N. Postoperative inflammatory reactions to
sealed Dacron prostheses: a comparison of Gelseal and Hemashield. J Cardiovasc Surg.
1997; 38(3): 287-290.
275. Blumenberg RM, Gelfand ML, Dale WA Perigraft seromas complicating arterial grafts.
Surgery. 1985; 97(2): 194-204.
242
276. G. Melville Williams, MD. The management of massive ultrafiltration distending the
aneurysm sac after abdominal aortic aneurysm repair with a polytetrafluoroethylene
aortobiiliac graft. J Vase Surg. 1998; 28 (3); 551-555.
277. Wever JJ, Blankensteijn JD, Eikelboom BC. Secondary endoleak or missed endoleak? Eur J
Vase Endovasc Surg. 1999; 18(5): 458-460.
278. Harris PL. The durability of the Vanguard® system. In: The durability of vascular and
endovascular surgery. Greenhalgh RM (ed). London. WB Saunders 1999; 397-405.
279. White GH, May J, Waugh R, Harris JP, Chaufour X, Yu W, Stephen MS. Shortening of
endografts during deployment in endovascular AAA repair. J Endovasc Surg. 1999; 6(1): 4-
10 .
280. Umscheid T, Stelter Time-related alterations in shape, position, and structure of self
expanding, modular aortic stent-grafts: a 4-year single-center follow-up. J Endovasc Surg.
1999; 6(1): 17-32.
281. Thompson MM, Boyle JR, Hartshorn T, Maltezos C, Nasim A, Sayers RD, Fishwick G, Bell
PR. Comparison of computed tomography and duplex imaging in assessing aortic
morphology following endovascular aneurysm repaie. Br J Surg. 1998; 85(3): 346-350.
282. Shi WM, Wildrick DM, Sawaya R. Volumetric measurement of brain tumors from MR
imaging. J Neurooncol 1998; 37(1): 87-93.
283. Cramer GD, Allen DI, D D io LJ. Volume determinations of the encephalic ventricles with
CT and MRI. Surg Radiol Anat. 1990; 12(1): 59-64.
284. Malina M, Ivancev K. What are the chronic forces applied to a graft after endovascular
AAA repair: what harm can they cause and how can they be offset? Presented at the 27*
Global Vascular endovascular issues techniques horizons symposium. 2000; V5.1-5.2.
243
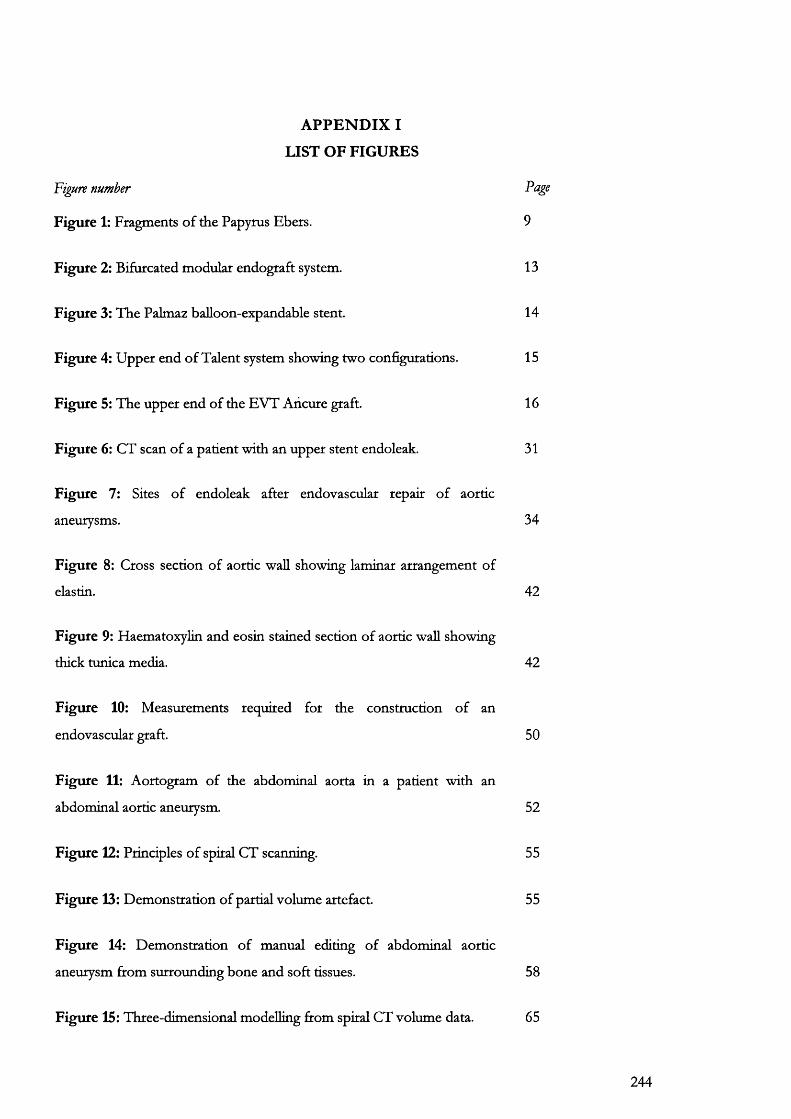
A PPEN D IX I
LIST OF FIGURES
Viÿire number
Figure 1: Fragments of the Papyrus Ebers.
Figure 2: Bifurcated modular endograft system.
Figure 3: The Palmaz baUoon-expandable stent.
Figure 4: Upper end of Talent system showing two configurations.
Figure 5: The upper end of the EVT Aiicure graft.
Figure 6: CT scan of a patient with an upper stent endoleak.
Vage
9
13
14
15
16
31
Figure 7: Sites of endoleak after endovascular repair of aortic
aneurysms. 34
Figure 8: Cross section of aortic wall showing laminar arrangement of
elastin. 42
Figure 9: Haematoxylin and eosin stained section of aortic wall showing
thick tunica media. 42
Figure 10: Measurements required for the construction of an
endovascular graft. 50
Figure 11: Aortogram of the abdominal aorta in a patient with an
abdominal aortic aneurysm. 52
Figure 12: Principles of spiral CT scanning. 55
Figure 13: Demonstration of partial volume artefact. 55
Figure 14: Demonstration of manual editing of abdominal aortic
aneurysm from surrounding bone and soft tissues. 58
Figure 15: Three-dimensional modelling from spiral CT volume data. 65
244
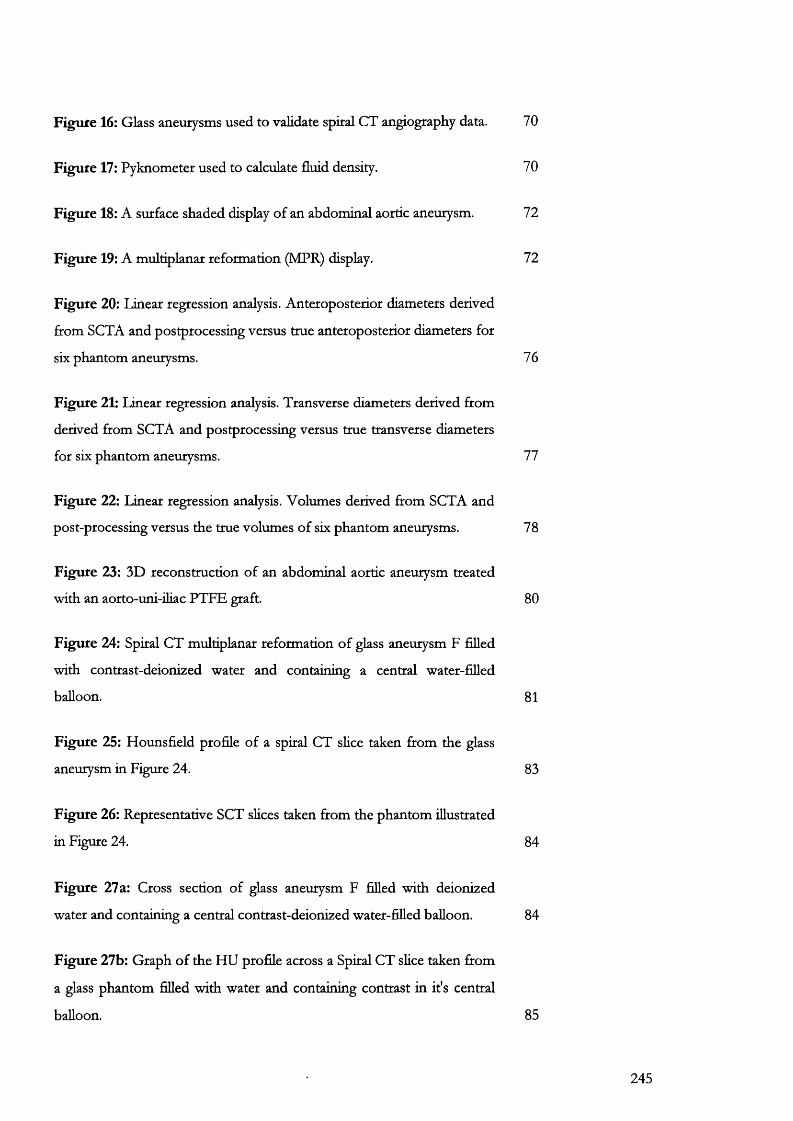
Figure 16: Glass aneurysms used to validate spiral CT angiography data. 70
Figure 17: Pyknometer used to calculate fluid density. 70
Figure 18: A surface shaded display of an abdominal aortic aneurysm. 72
Figure 19: A multiplanar reformation (MPR) display. 72
Figure 20: Linear regression analysis. Anteroposterior diameters derived
from SCTA and postprocessing versus true anteroposterior diameters for
six phantom aneurysms. 76
Figure 21: Linear regression analysis. Transverse diameters derived ftom
derived from SCTA and postprocessing versus true transverse diameters
for six phantom aneurysms. 77
Figure 22: Linear regression analysis. Volumes derived from SCTA and
post-processing versus the true volumes of six phantom aneurysms. 78
Figure 23: 3D reconstruction of an abdominal aortic aneurysm treated
with an aorto-uni-iliac PTFE graft. 80
Figure 24: Spiral CT multiplanar reformation of glass aneurysm F filled
with contrast-deionized water and containing a central water-filled
balloon. 81
Figure 25: Hounsfield profile of a spiral CT slice taken from the glass
aneurysm in Figure 24. 83
Figure 26: Representative SCT slices taken from the phantom illustrated
in Figure 24. 84
Figure 27 a: Cross section of glass aneurysm F filled with deionized
water and containing a central contrast-deionized water-filled balloon. 84
Figure 27b: Graph of the HU profile across a Spical CT slice taken from
a glass phantom filled with water and containing contrast in it's central
balloon. 85
245
Figure 28: Graph showing the actual volumes within the central balloon
against the calculated volumes 86
Figure 29: In this graph, the percentage error obtained from scanning
different balloon volumes is plotted against the actual volumes. 87
Figure 30: Fluoroscopic image of a graduated angiocatheter. 93
Figure 31: Bland-Altmann graphs showing the degree of agreement
between SCTA and sizing angiocatheter. 97
Figure 32: Calculation of a Hounsfield profile using a spiral CT slice. 104
Figure 33: PTFE graft infection requiring removal and open repair. 107
Figure 34a: Column scatter graph showing the change in aneurysm
volume after endografring with PTFE. 108
Figure 34b: Column scatter graph showing the change in intra-
aneurysmal flow channel volume after endografring with PTFE. 108
Figure 34c: Column scatter graph showing the change in total aneurysm
volume after endografring with Talent. 109
Figure 34d: Column scatter graph showing the change in intra-
aneurysmal flow channel volume after endografring with Talent. 109
Figure 35: Graph showing changes in total aneurysm volume following
the onset of complications in patients with PTFE endografts. 110
Figure 36: This sequence of 3D reconstructions show the effects of
endografring with PTFE (top) and Talent (below) on aneurysm sac
morphology. 112
Figure 37: This graph shows the differences in preoperarive intraluminal
thrombus volume for the two populations used in this study. 116
Figure 38: Length measurements made on aneurysms. 121
246
Figure 39: Column scatter graphs showing the change in vertical body
and luminal centre line lengths that occur after exclusion with PTFE
endograft. 123
Figure 40: Graphs showing the changes in vertical body and luminal
centre line lengths that occur after exclusion with the Talent endograft, 124
Figure 41: PTFE endograft. 128
Figure 42: Method of calculation of neck diameters at three levels within
the neck of the aneurysm. 128
Figure 43: Graphs showing pixel intensities obtained from scanning
Phantom aneurysm A. 139
Figure 44: Graph and Table showing the results obtained with linear
regression analysis of true and scanned AP diameters obtained with
gMRA. 141
Figure 45: Graph and Table showing the results obtained with linear
regression analysis of true and scanned transverse diameters obtained
with gMRA. 142
Figure 46: Gadolinium-enhanced MRA of an abdominal aortic
aneurysm. 146
Figure 47 : The perspective view. 151
Figure 48: The projection of a 3D point onto the image plane for a
perspective camera. 153
Figure 49a: Radial distortion increases with distance from the principal
point. 153
Figure 49b: Relationship between object height and degree of radial
distortion. 155
Figure 50: The stereoscopic model. 156
247
Figure 51a: Demonstration of the calculation of absolute height of a
building with photogrammetry. 159
Figure 51b: Calculation of relief or difference in height using a stereo-
viewer. 160
Figure 52: An example of a single network consisting of 8 images that
cover the phantom aneurysm. 166
Figure 53: 3D model of glass phantom aneurysm F imaged using a
Kodak megaplus ES 1.6i digital camera. 166
Figure 54: Image rendering using Microstation software. 167
Figure 55: Surface shaded display of glass aneurysm F obtained from
Microstation using the image co-ordinates in Figure 53. 167
Figure 56: Effect of image point density on volume and other geometric
calculations. 169
Figure 57: Minimal curves generated by Surfer to form the 2 halves of
aneurysm F. 171
Figure 58: Graphs showing the three types of motion identified at the
neck of an aneurysm using high-speed video filming. 175
Figure 59: The calibration wall used in this experiment. 179
Figure 60: Digital photogrammetric workstation. 179
Figure 61a: A stereo-pair of photographs showing the neck of an
abdominal aortic aneurysm at open surgical repair. 180
Figure 61b: Pixel intensity matching to improve the quality of stereo
modelling 180
Figure 62a: Construction of a digital terrain map 181
248

Figure 62b: Digital terrain map showing the differences after subtraction
of two 3D-aneurysm terrain models 182
Figure 62c: Pictorial representation of the DTM in Figure 62b 182
Figure 63: This sequence of 2 photographs was taken 1 second apart.
The difference between the two images is shown in the third frame. 186
Figure 64: This vector map has been constructed from the subtracted
images in Figure 63. 186
Figure 65 a: Photographs from VMS showing the manual marking of
image points. 187
Figure 65b: Diagram showing the degree of motion estimated for each
image point calculated using VMS software. 187
Figure 66: The penumbra effect leads to blurring and overestimation of
the image diameter. 194
Figure 67a: During an angiogram, the rigid angiocatheter will not follow
the intraluminal path of an endovascular prosthesis. 196
Figure 67b: Accurate estimation of the flow channel length with SCTA. 196
Figure 68: The relationship between volume and maximum diameter. 198
249
A PPEN D IX II
LIST OF TABLES
Table number Page
Table 1; Yield and size of abdominal aortic aneurysms from 5 European
screening programmes. 22
Table 2: Early specific complications after conventional surgery for
abdominal aortic aneurysm. 24
Table 3: Characteristics of the neck that might be considered unsuitable
for endograft implantation. 25
Table 4: Clinical outcomes after endovascular repair in some of the
major series reported within the last 2 years. 28
Table 5: Anatomical classification of endoleak. 31
Table 6: Spiral CT angiography protocol used for the imaging of
patients and glass phantom aneurysms in this study. 73
Table 7: A Comparison of true and scanned diameters of glass phantom
aneurysms. 74
Table 8: Comparison of tme and scanned volumes of glass phantom
aneurysms. 74
Table 9: Volumes obtained after SCT scanning of glass aneurysm F
containing different volumes of water in a central balloon. 82
Table 10: Intra-observer and inter-observer coefficient of repeatability in
the measurement of aneurysm parameters. 91
Table 11: Comparison of aneurysm measurements between SCTA and
sizing catheter angiography. 94
Table 12: Values for r and P after Spearman’s correlation comparing
SCTA and sizing catheter angiography. 95
250
Table 13: Summary of the lack of agreement (bias) between SCTA and
sizing angiography. 98
Table 14: Precision of lack of agreement between SCTA and sizing
catheter angiography. 98
Table 15: Measurements carried out on the aneurysm sac (mm) after
endovascular repair. 102
Table 16: Starting sac diameters and aneurysm volumes for patients in
this study. 103
Table 17: Number of patients foUowed-up at each time interval within
the 2 groups selected for this study. 105
Table 18: Changes in aneurysm or flow channel volumes for patients
with PTFE or Talent endovascular grafts. 106
Table 19a: Changes in aneurysm maximal diameters for patients with
PTFE or Taient endovascular grafts. 110
Table 19b: This table shows the distance from the lowest renal artery (a
fixed anatomical point) to the level, within the aneurysm, at which each
maximal diameter was measured. I l l
Table 20: The effects of endografting with PTFE on volume of
intraluminal thrombus. 116
Table 21: The effects of endografting with Talent on volume of intra-
aneurysmal thrombus. 117
Table 22: Changes in aortic diameter at different levels with time. 125
Table 23: Measurements carried out on aneurysm patients (mm) 126
Table 24a: Change in median aneurysm neck length after endografting
with PTFE anchored with balloon-expandable stents. 127
251

Table 24b: Change in aneurysm neck length after endografting with the
Talent self-expanding system. 127
Table 25a: Change in upper neck diameter after endografting with
PTFE anchored using Palmaz stents. 129
Table 25b: Change in mid-neck diameter after endografting with PTFE
anchored using Palmaz stents. 129
Table 25c: Change in lower neck diameter after endografting with
PTFE anchored using Palmaz stents. 129
Table 26a: Change in upper neck diameter after endografting with self
expanding Talent system. 130
Table 26b: Change in mid-neck diameter after endografting with self-
expanding Talent system. 130
Table 26c: Change in lower neck diameter after endografting with self
expanding Talent system. 130
Table 27: The intra-observer and inter-observer differences obtained in
measurement of aneurysm neck length. 133
Table 28: The intra-observer and inter-observer differences obtained in
measurement of aneurysm neck upper diameter. 134
Table 29: The intra-observer and inter-observer differences obtained in
measurement of aneurysm neck lower diameter. 134
Table 30: A Comparison of true and scanned diameters of glass
phantom aneurysms. 138
Table 31: The true volumes of six phantom aneurysms compared with
their scanned volumes after gMRA. 140
252

Table 32: A comparison of the measurements obtained using SCTA and
gMRA in the preoperative assessment of abdominal aortic aneurysms for
endovascular repair. 148
Table 33: Data obtained from calibration of Kodak ES 1.6i digital
camera using a specially designed test field (Figure 59). 163
Table 34: VMS camera self-calibration data. 164
Table 35: Volume estimation of aneurysm F 168
253
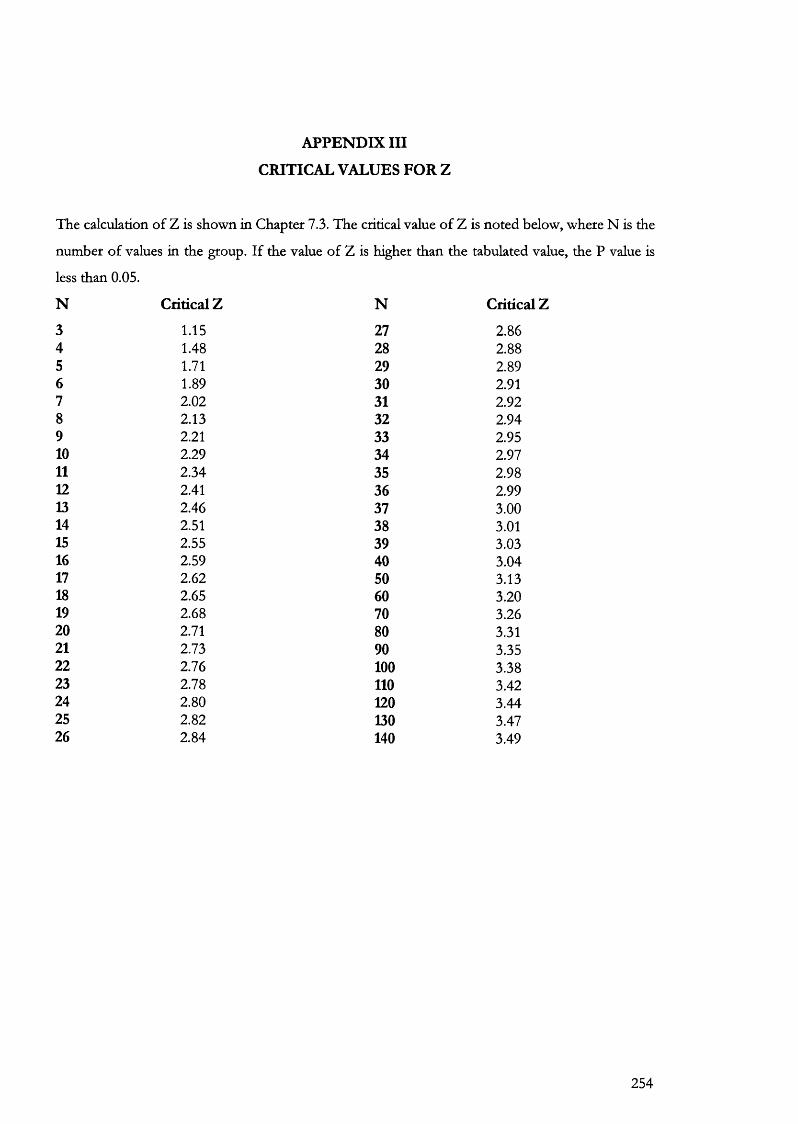
APPENDIX III
CRITICAL VALUES FOR Z
The calculation of Z is shown in Chapter 7.3. The critical value of Z is noted below, where N is the
number of values in the group. If the value of Z is higher than the tabulated value, the P value is
less than 0.05.
N Critical Z N Critic
3 1.15 27 2.864 1.48 28 2.885 1.71 29 2.896 1.89 30 2.917 2.02 31 2.928 2.13 32 2.949 2.21 33 2.9510 2.29 34 2.9711 2.34 35 2.9812 2.41 36 2.9913 2.46 37 3.0014 2.51 38 3.0115 2.55 39 3.0316 2.59 40 3.0417 2.62 50 3.1318 2.65 60 3.2019 2.68 70 3.2620 2.71 80 3.3121 2.73 90 3.3522 2.76 100 3.3823 2.78 110 3.4224 2.80 120 3.4425 2.82 130 3.4726 2.84 140 3.49
254

255