10104735.pdf - UCL Discovery
270
Investigation of the effect of preparation methods on the surface properties, dissolution rate and stability of solid dispersions Peng KE A thesis submitted for the degree of Doctor of Philosophy The School of Pharmacy, University of London 29-39 Brunswick Square, London, WCIN lAX 2010
-
Upload
khangminh22 -
Category
Documents
-
view
0 -
download
0
Transcript of 10104735.pdf - UCL Discovery

Investigation of the effect of preparation methods on the surface properties, dissolution
rate and stability of solid dispersions
Peng KE
A thesis submitted for the degree of Doctor of Philosophy
The School of Pharmacy, University of London
29-39 Brunswick Square, London,
WCIN lAX
2010
ProQuest Number: 10104735
All rights reserved
INFORMATION TO ALL USERS The quality of this reproduction is dependent upon the quality of the copy submitted.
In the unlikely event that the author did not send a complete manuscript and there are missing pages, these will be noted. Also, if material had to be removed,
a note will indicate the deletion.
uest.
ProQuest 10104735
Published by ProQuest LLC(2016). Copyright of the Dissertation is held by the Author.
All rights reserved.This work is protected against unauthorized copying under Title 17, United States Code.
Microform Edition © ProQuest LLC.
ProQuest LLC 789 East Eisenhower Parkway
P.O. Box 1346 Ann Arbor, Ml 48106-1346

Plagiarism Statement
This thesis describes research conducted in the School of Pharmacy, University of London between 2005 and 2009 under the supervision of Professor G. Buckton and Dr. S. Gaisford. I certify that the research described is original and that any parts of the work that have been conducted by collaboration are clearly indicated. I also certify that I have written all the text herein and have clearly indicated by suitable citation any part of this dissertation that has already appeared in publication.
0 ^ I ü ' 2 1 I V
Signature " Date
AbstractFormation of solid dispersions is frequently used as an important strategy to improve the dissolution properties of poorly water-soluble drugs. In addition, the carriers used to prepare solid dispersions can help stabilise the drugs if they appear in the amorphous form. Preparation method is a key factor affecting both dissolution and stability of a solid dispersion due to difference in dispersivity and molecular arrangement of the drug and carrier. The objectives of this work were to study the effect of preparation method on the physical properties, stability and dissolution of solid dispersions containing indometacin as the model drug. The surface energy state of the solid dispersions during aging was studied. Molecular mobility at the surface and in the bulk of the solid dispersions was determined and correlated to the stability and dissolution properties. Solid dispersions with different carriers were prepared using different methods and their stability and dissolution profiles were investigated.
Solid dispersions of polyvinylpyrrolidone (PVP) and indometacin (30%: 70%) were prepared using melt quenching or ball milling and subjected to physical aging. It was found that the surface energy state of the samples decreased as a function of time and this energy reduction was temperature dependent, as determined using inverse gas chromatography (IGC). A novel method which utilises the retention volume of decane (f max) to measure surface relaxation by IGC was developed. The surface relaxation of PVP and indometacin solid dispersions prepared by ball milling, spray drying, and melt quenching were measured using the V ax method and compared to their bulk relaxation measured using step-scan differential scanning calorimetry. The surface appeared to have higher molecular mobility than the bulk irrelevant of which preparation method was used. However, preparation method appeared to have an impact on both surface and bulk molecular mobility. Relaxed samples sorbed less moisture and dissolved slower than the initial ones as determined by dynamic vapor sorption and dissolution experiments, and a faster bulk relaxation rate led to a more significant reduction in the dissolution rate of the solid dispersions after aging. The glass fragilities of the systems were obtained using the heating rate dependence of the glass transition method. The values were found to be preparation method specific. The zero mobility temperatures (To), of the systems were calculated using the fragility parameter. With a similar glass transition temperature (Tg) at c.a. 64 to 67 °C, the To of the ball milled, spray dried and melt quenched samples were -4.2, 16.7, and 21.6 °C, respectively. Physical stability test showed that the ball milled sample was the least stable while the melt quenched one was the most, which correlated well with their revalues. It is suggested that To might be a better indicator of stability than Tg. Carriers which were miscible or immiscible with indometacin were used to form solid dispersions with the drug prepared by ball milling and spray drying. Improved stability and dissolution rate of indometacin were noticed. Intermolecular interactions between the drug and carrier were found to be crucial to the stability of the amorphous drug no matter whether the carrier was miscible or not. The effect of preparation methods on the dissolution rate of the sample was found to be carrier dependent.

To my grandma
To my dearest parents and wife
III

Acknowledgements
Firstly, I would like to express my sincere gratitude to Professor Graham Buckton for his supervision. He has always provided me support when I needed it. His advice and guidance has been very important to me throughout my PhD. I would also like to acknowledge Dr. Simon Gaisford for his help, and encouragement.
I am grateful to Ms Isabel Goncalves for all her technical support and help.
Thanks must also go to the various members in the research group that I have been so lucky to work with during my PhD - Hisham, Cyrus, Naziha, Ana Caterina, Karolina, Meena, Liang, Luis, Rita and Viraj. I would also like to thank my other friends and colleagues in the School of Pharmacy: Adeline, Boom, Enosh, Fang, Felipe, Gabby, Hala, Hamid, Hanene, Jon, Ketan, Nui, Qian, Sami, Suchada and Winnie. Without their support and company, the time in the school will be inevitably less joyful. Thanks are also due to Mr Owen Shephard. The demonstration work for his practical was very enjoyable.
Special thanks to Dr. Susumu Hasegawa for his help and support on the IGC experiments. Thanks also go to Dr. Hasegawa for all the invaluable knowledge and experience that he shared with me when we worked together. I would also like to thank Dr. Hardyal Gill for his help on IGC and Mr David McCarthy for helping me taking the SEM images.
Last but most importantly, I would like to dedicate this thesis to my parents, my wife and my late grandma whom I owe so much. Without all your love, encouragement, and selfless giving, I would never have been able to come this far. I love you all forever.
IV

Table of contents
Abstract........................................................................................................................... IIAcknowledgements....................................................................................................... IVTable of contents.............................................................................................................VList of figures................................................................................................................ IXList of tables.............................................................................................................XVIIIList of abbreviations................................................................................................. XXI
Chapter 1 Introduction__________________________________________________ _
1.1 Introduction.................................................................................................................21.2 Permeability-solubility drug classification.................................................................41.3 Drug absorption...........................................................................................................5
1.3.1 Bringing the drug to its site of absorption..........................................................51.3.2 Getting the drug into solution............................................................................7
1.3.2.1 Effective surface area of the drug particles...............................................81.3.2.2 Solubility of the drug................................................................................9
1.3.3 Gastrointestinal membrane transport of drugs................................................. 121.3.4 Movement of the drug into the general circulation..........................................13
1.4 Solids in the amorphous state....................................................................................141.4.1 The formation of amorphous solids.................................................................141.4.2 Physical properties of the amorphous state...................................................... 171.4.3 Molecular mobility and relaxation of the amorphous solids............................181.4.4 Plasticisation effect of amorphous solids.........................................................231.4.5 Crystal nucléation and growth.........................................................................251.4.6 Characterisation techniques for amorphous solids...........................................26
1.5 Solid dispersions for drug delivery...........................................................................291.5.1 Classifications of solid dispersions..................................................................301.5.2 Preparation methods for solid dispersions.......................................................32
1.5.2.1 Melting method.......................................................................................321.5.2.2 Solvent method.......................................................................................331.5.2.3 Ball milling method................................................................................34
1.5.3 Stability of solid dispersions............................................................................341.6 Surface properties of solids............................................................................... 371.7 Aims of thesis............................................................................................................38
Chapter 2 Materials and methods____________________________________________
2.1 Materials..................................................................................................................402.1.1 Model drug: indometacin.................................................................................412.1.2 Carriers.............................................................................................................42

2.1.2.1 Polyvinylpyrrolidone (PVP) ...............................................................422.1.2.2 Magnesium aluminum silicate (Neusilin)...............................................432.1.2.3 Hydroxypropyl methylcellulose acetate succinate (HPMCAS)..............442.1.2.4 Other carriers.......................................................................................... 44
2.2 Methods...................................................................................................................452.2.1 Preparation of amorphous indometacin...........................................................452.2.2 Preparation of solid dispersions using ball milling..........................................45
2.2.2.1 Introduction............................................................................................ 451 2 2 2 Experimental.......................................................................................... 49
2.2.3 Preparation of solid dispersions using melt quenching....................................492.2.3.1 Introduction............................................................................................ 492.2.3.2 Experimental...........................................................................................51
2.2.4 Preparation of solid dispersions using spray drying........................................522.2.4.1 Introduction.............................................................................................522.2.4.2 Experimental...........................................................................................56
2.2.5 Inverse gas chromatography (IGC)..................................................................562.2.5.1 Introduction.............................................................................................562.2.5.2 Experimental...........................................................................................59
2.2.6 Differential scanning calorimetry (DSC).........................................................602.2.6.1 Conventional DSC..................................................................................602.2.6.2 Modulated temperature differential scanning calorimetry (MTDSC) ....622.2.6.3 Hyper differential scanning calorimetry (Hyper DSC)...........................622.2.6.4 Experimental.......................................................................................... 62
2.2.7 X-ray powder diffraction (XRPD)...................................................................632.2.7.1 Introduction............................................................................................ 6322.12 Experimental........................................................................................ 64
2.2.8 Fourier transform infrared spectroscopy (FTIR)..............................................642.2.8.1 Introduction.............................................................................................642.2.8.2 Experimental.......................................................................................... 65
2.2.9 Other methods................................................................................................. 652.2.9.1 Thermal gravimetric analysis (TGA)......................................................652.2.9.2 Scanning electron microscopy (SEM)....................................................65
Chapter 3 Investigation of surface properties of solid solutions during relaxation
using inverse gas chromatography___________________________________________
3.1 Introduction...............................................................................................................673.2 Chapter outline......................................................................................................... 683.3 Methods.....................................................................................................................69
3.3.1 Preparation of physical mixtures......................................................................693.3.2 Ball milling..................................................................................................... 693.3.3 Melt quenching.................................................................................................69
VI
3.3.4 Inverse gas chromatography (IGC)..................................................................693.3.5 Differential scanning calorimetry (DSC).........................................................703.3.6 X-ray Powder Diffraction (XRPD)..................................................................703.3.7 Fourier transform infrared spectroscopy (FTIR)..............................................703.3.8 Scanning electron microscopy (SEM).............................................................70
3.4 Results and discussion..............................................................................................713.4.1 Physical properties of the solid solutions.........................................................71
3.4.1.1 Melt quenched solid solutions.................................................................713.4.1.2 Ball milled solid solutions.......................................................................723.4.1.3 Hydrogen bonding between indometacin and PVP................................75
3.4.2 Changes of surface free energy of the solid solutions during physical aging..783.4.2.1 Dispersive surface free energy of melt quenched solid solutions...........823.4.2.2 Dispersive surface free energy of ball milled solid solutions.................963.4.2.3 The acid-base contributions to the surface free energy during aging 99
3.4.3 Detecting surface relaxation using the retention volume of decane..............1023.5 Conclusion.............................................................................................................. 113
Chapter 4 Influence of preparation methods on surface and bulk structural
relaxation of solid solutions_________________________________________________
4.1 Introduction............................................................................................................. 1164.2 Chapter outline........................................................................................................ 1184.3 Methods................................................................................................................... 119
4.3.1 Spray drying................................................................................................... 1194.3.2 Ball milling....................................................................................................1194.3.3 Melt quenching............................................................................................... 1194.3.4 Differential scanning calorimetry (DSC) for enthalpy recovery study.......... 1194.3.6 Inverse gas chromatography (IGC) for surface relaxation study...................1204.3.7 Isothermal microcalorimetry (IMC)............................................................... 1214.3.8 X-ray Powder Diffraction (XRPD)................................................................1214.3.9 Scanning electron microscopy (SEM)........................................................... 1214.3.10 Atomic force microscopy (AFM).................................................................1214.3.11 Dynamic vapour sorption (DVS).................................................................1214.3.12 Dissolution test.............................................................................................1224.3.13 Evaluation of the physical stability of the solid solutions.......................... 122
4.4 Results and discussion............................................................................................1234.4.1 Physical properties of the solid solutions....................................................... 1234.4.2 Relaxation evaluation using Step-scan DSC.................................................. 1264.4.3 Relaxation evaluation using the retention volume of decane.........................1334.4.4 Relaxation evaluation using isothermal microcalorimetry............................1404.4.5 Correlation of fragility, zero mobility temperature and physical stability 1464.4.6 Effect of relaxation on the dissolution behaviour of the solid solutions 154
VII
4.5 Conclusion..............................................................................................................162
Chapter 5 Effect of preparation methods and formulations on the dissolution rate
and stability of solid dispersion/solutions____________________________________
5.1 Introduction.............................................................................................................1655.2 Chapter outline........................................................................................................1665.3 Methods...................................................................................................................167
5.3.1 Spray drying...................................................................................................1675.3.2 Ball milling....................................................................................................1675.3.3 Thermal gravimetric analysis (TGA)............................................................. 1685.3.4 Differential scanning calorimetry (DSC).......................................................1685.3.5 X-ray Powder Diffraction (XRPD)................................................................1685.3.6 Fourier transform infrared spectroscopy (FTIR)............................................1685.3.7 Scanning electron microscopy (SEM)........................................................... 1685.3.8 Dissolution test...............................................................................................1685.3.9 Contact angle measurement...........................................................................1695.3.10 Physical stability studies of the solid dispersion/solutions..........................169
5.4 Results and discussion............................................................................................1705.4.1 Effect of milling conditions on the amorphisation rate of indometacin.........1705.4.2 Carriers which are immiscible with the model drug......................................173
5.4.2.1 Physical properties of the solid dispersions.......................................... 1735.4.2.2 Drug-carrier interaction determined by FTIR....................................... 1815.4.2.3 Physical stability studies of the solid dispersions................................. 186
5.4.2.3.1 Effect of silica content on the physical stability.......................... 1865.4.2.3.2 Effect of milling duration on the physical stability...................... 190
5.4.2.4 Dissolution properties of the solid dispersions..................................... 1935.4.2.5 Preparing the solid dispersions by spray drying................................... 198
5.4.3 Carriers which are miscible with the model drug..........................................1995.4.3.1 Preparation of the solid solutions by spray drying................................2005.4.3.2 Preparation of the solid solutions by ball milling.................................2055.4.3.3 Hydrogen bonding between the drug and the carriers..........................2075.4.3.4 Physical stability of the solid solutions.................................................2095.4.3.5 Dissolution properties of the solid solutions.........................................211
5.5 General discussion................................................................................................. 2145.6 Conclusion............................................................................................................. 219
Chapter 6 Conclusions and future work..................................................................... 221
Bibliography......................................................................................................................228
VIII
List of figures
Chapter 1____________________________________
Figure 1.1: Diagram o f the gastrointestinal tract (divided into esophagus, stomach,
small intestine, colon and rectum).....................................................................................5
Figure 1.2: Schematic diagram o f the dissolution process...............................................7
Figure 1.3: A scheme o f membrane transport o f drugs...................................................13
Figure 1.4: Schematic representation o f the structure o f an amorphous solid (adapted
from Yu, 2001)..................................................................................................................14
Figure 1.5: A scheme representing the change o f enthalpy and volume during cooling o f
a material from its gas or liquid form which can either crystallise (route a) or form a
glass (route b). The thermodynamic and dynamic properties o f a glass depend on the
cooling rate. Tb is the boiling point, Tm is the melting point, Tg is the glass transition
temperature. Ta is the aging temperature, Tk is the Kauzmann (or zero mobility)
temperature and x is the relaxation time..........................................................................15
Figure 1.6: Relaxation time and viscosity o f fragile or strong glasses as a function o f
temperature relative to Tg (adapted from van Drooge, 2006)......................................... 22
Figure 1.7: Tg o f mixtures o f two components (M) in different weight percentages: a)
the Tg o f amorphous indometacin as a function o f the percentage o f water (Andronis et
al, 1997); b) the Tg o f amorphous sucrose as a function o f the percentage o f PVP
(Taylor and Zografi, 1998). The solid lines represent the theoretical prediction o f Tg
based on the Gordon-Taylor equation.............................................................................23
Figure 1.8: Schematic o f the relationship between xj and X2 a) system not taken into
account o f viscous effects and b) realistic system with the effects o f viscosity (adapted
fromAngell, 1988)...........................................................................................................26
Figure 1.9: Classification o f three generations o f solid dispersions (adapted from
Vasconcelos e ta l, 2007)................................................................................................. 30
Figure 1.10: Different stages o f drug molecules in the carrier matrix o f solid
dispersions during crystallisation................................................................................... 35
IX

Chapter 2
Figure 2,1: Chemical structure o f indometacin............................................................41
Figure 2.2: Chemical structure o f PVP........................................................................ 42
Figure 2.3: Chemical structure o f Neusilin.................................................................. 43
Figure 2.4: Chemical structure o f HPMCAS................................................................44
Figure 2.5: Principal o f a planetary mill (adapted from manual o f Pulverisette 5,
Fritsch)............................................................................................................................ 46
Figure 2.6: Ball motions during milling at different speed ratios (adapted from Mio et
a/., 2002;................................................................................................................................ 48
Figure 2.7: Time-temperature-transformation (TTT) diagram (adaptedfrom Willart and
De scamps, 2008)............................................................................................................. 50
Figure 2.8: Different process stages included in a spray drying operation................... 53
Figure 2.9: A picture o f the Niro SD MICRO™ spray drying unit which includes a) air
compressor, b) nitrogen generator, c) operating control panel and d) spray dryer. 55
Figure 2.10: A schematic diagram o f an IGC instrument (adapted from Thielmann,
2004)................................................................................................................................57
Figure 2.11: Schematic diagrams o f a power-compensated DSC (a) and a heat flux
DSC (b) (adaptedfrom Clas et al, 1999)........................................................................61
Figure 2.12: Schematic diagram o f an XRPD (adapted from PANalytical manual) 64
Chapter 3
Figure 3.1: SEM images o f melt quenched indometacin: PVP (lOYoïlOYo) solid solution
(a, 20 pm and b, 5 pm).................................................................................................... 71
Figure 3.2: XRPD pattern o f melt quenched indometacin:PVP (70%:30%) solid
solution............................................................................................................................ 72
Figure 3.3: Conventional DSC scan o f melt quenched indometacin:PVP (70%:30%)
solid solution................................................................................................................... 72
Figure 3.4: XRPD patterns o f a) y-indometacin, b) melt quenched (amorphous)
indometacin and c) y-indometacin milled continuously for 48 hours............................. 73
X

Figure 3.5: Hyper-DSC traces o f indometacin and PVP (70%:30%) physical mixture
milled for 0.5 (a), 1.5 (b), 3 (c), 6 (d), 9 (e), 12 (f), and 18 (g) hours.............................74
Figure 3.6: Conventional DSC scan o f ball milled indometacin: PVP (70%:30%) solid
solution (18 hours o f milling)..........................................................................................74
Figure 3.7: XRPD pattern o f ball milled indometacin:PVP (70%:30%) solid solution
(18 hours o f milling)........................................................................................................75
Figure 3.8: SEM images o f ball milled indometacin: PVP (70%:30yo) solid solution (a,
20 jum and b, 5 pm)..........................................................................................................75
Figure 3.9: Hydrogen bonding between PVP and indometacin..................................... 76
Figure 3.10: FTIR spectra o f indometacin and PVP (70%:30%): a) ball milled solid
solution, b) melt quenched solid solution and c) physical mixture................................. 77
Figure 3.11: An example o f a plot o f RTlnV„ versus af y f Ÿ ' ^ for alkanes: decane,
nonane, octane, heptane and hexane...............................................................................81
Figure 3.12: FTIR spectra o f crystalline indometacin (a), physical mixture (b), and melt
quenched solid solution o f indometacin and PVP (70%:30%) aged for 0 (c), 6 (d), 12 (e)
and 18 (f) days at 60 °C...................................................................................................83
Figure 3.13: XRPD patterns o f the melt quenched indometacin:PVP (70%:30%) aged
at 40, 50 and 60 °C for 0 (a), 2 (b), 4 (c), 6 (d), 9 (e), 12 (f) and 18 (g) days.................84
Figure 3.14: Conventional DSC scans o f the melt quenched indometacin:PVP
(70%:30%) solid solutions aged at 40, 50 and 60 °C for 0 (a), 2 (b), 4 (c), 6 (d), 9 (e),
12 (f) and 18 (g) days...................................................................................................... 85
Figure 3.15: Changes o f dispersive surface free energy o f the melt quenched solid
solution (an indometacin to PVP ratio o f 70%:30%) aged at 40 ^C..............................87
Figure 3.16: Changes o f dispersive surface free energy o f the melt quenched solid
solution (an indometacin to PVP ratio of70%).30%}) aged at 50 °C..............................88
Figure 3.17: Changes o f dispersive surface free energy o f the melt quenched solid
solution (an indometacin to PVP ratio of70%>:30%) aged at 60 °C..............................88
Figure 3.18: Structural relaxation decay function determined from IGC data (n=4). The
aging temperatures are: 40 °C (^),50 °C (M) and 60 ^C (A) with KWWfitting (—). .91
XI

Figure 3.19: A plot o f dispersive surface free energy changes o f melt quenched solid
solutions (an indometacin to PVP ratio o f 50%:50%) stored at 40 (^ ) , 60 (M) and 70
(m )°C (n^4)................................................................................................................... 93
Figure 3.20: Structural relaxation decay function determined from IGC data (n=4). The
aging temperatures are: 60 °C ( ^ ) and 70 °C(M) with KWWfitting (—) .....................94
Figure 3.21: A plot o f dispersive surface free energy changes o f ball milled solid
solutions (an indometacin to PVP ratio o f 70%:30%) stored at 50 ‘'C (M), and 60 °C
(4 ; (»=<;.......................................................................................... 97
Figure 3.22: A plot o f decane retention volume changing as a function o f time (M, 50
T ; and ♦ , 60 T , n=4)..................................................................................................98
Figure 3.23: Ka, Kd and Kd/Ka values o f amorphous and crystalline indometacin, PVP
and the ball milled solid solution (an indometacin to PVP ratio o f 70%). 30%))............100
Figure 3.24: Gutmann Ke/Ka ratio o f the ball milled solid solution o f indometacin and
PVP (70%: 30%) as a function o f time at 60 °C............................................................ 101
Figure 3.25: Decrease o f decane Vmax on three different batches o f melt quenched
indometacin and PVP (70%:30%) solid solution as a function o f aging time at 50 °C. a)
traces o f measurements on three different batches and b) trace o f the mean o f three
measurements ± s. d.)......................................................................................................103
Figure 3.26: The FID responses showing the decane peaks at different time point
during measurement for the melt quenched solid solution containing indometacin and
PVP with a ratio of70%o:30%o (a, 0 min; b, 90 min; c, 180 min and d, 270 min) 104
Figure 3.27: The net retention volume o f indometacin:PVP (70% : 30%) physical
mixtures at 50 °C (Vcom, net retention volume calculated using the time point at centre o f
mass o f the peak and Vmax, the one calculated using the time point at the maximum o f
the peak).........................................................................................................................105
Figure 3.28: Time course o f Vmax cind Vcom o f decane kept at 50 °C during measurement
for the indometacin-PVP (70%:30%) solid solution..................................................... 107
Figure 3.29: Plots o f dispersive surface energy and Vmax (decane) as a function o f aging
time for the melt quenched indometacin and PVP (70%:30%) solid solution at 50 °C. a)
dispersive surface energy calculated using three probes, decane, nonane and octane;
XII

and b) Vmax o f decane.....................................................................................................109
Figure 3,30: Decay function o f the retention volume o f decane o f the melt quenched
solid solution (an indometacin to PVP ratio o f 70%: 30%) aged at 50 °C (n=3) I l l
Chapter 4_________________________________________________________________
Figure 4,1: XRPD pattern o f spray dried indometacin: PVP (70%:30%) solid solution.
.............................................................................................................................................. 123
Figure 4,2: SEM images o f spray dired indometacin: PVP (70%: 30%) solid solution (a,
20 pm and b, 5 pm)........................................................................................................123
Figure 4,3: Step-scan DSC traces o f the spray dried (a), melt quenched (b) and ball
milled (c) solid solutions (an indometacin to PVP ratio of70%o:30%)......................... 125
Figure 4,4: Changes o f the endothermie peaks o f ball milled solid solution (an
indometacin to PVP ratio o f 70%).30%>) aged at 50 °C for 0, 2, 4, 8, 24 and 48 hours.
....................................................................................................................................... 127
Figure 4,5: Changes o f the endothermie peaks o f melt quenched solid solution (an
indometacin to PVP ratio o f 70%:30%) aged at 50 °C for 0, 2, 4, 8, 16 and 48 hours.
....................................................................................................................................... 127
Figure 4,6: Changes o f the endothermie peaks o f spray dried solid solution ( an
indometacin to PVP ratio o f 70%:30%) aged at 50 °C for 0, 2, 4, 8, 24 and 48 hours.
128
Figure 4,7: Enthalpy recovery o f ball milled solid solution (an indometacin to PVP
ratio o f 70%). 30%) aged at 50 °C as a function o f time, determined by SSDSC (n=3). 128
Figure 4,8: Enthalpy recovery o f melt quenched solid solution (an indometacin to PVP
ratio of70%:30%) aged at 50 °C as a function o f time, determined by SSDSC (n=3).\29
Figure 4,9: Enthalpy recovery o f melt quenched solid solution (an indometacin to PVP
ratio o f 70%: 30%) aged at 50 °C as a function o f time, determined by SSDSC (n=3). 129
Figure 4,10: Structural relaxation decay function o f ball milled (M), spray dried (A )
and melt quenched (A ) solid solutions(an indometacin to PVP ratio o f 70%:30%)
determined by enthalpy recovery method, with KWW fitting shown as solid lines (n=3).
XIII

.............................................................................................................................................. 131
Figure 4.11: Decrease o f decane Vmax on four different batches o f ball milled solid
solution (an indometacin to PVP ratio o f 70%: 30%) as a function o f time at 50 °C. .. 134
Figure 4.12: Decrease o f decane Vmax on three different batches o f spray dried solid
solution (an indometacin to PVP ratio o f 70%: 30%) as a function o f time at 50 "C. ..134
Figure 4.13: KWW fitting o f the IGC and DSC data o f the melt quenched solid solution
(an indometacin to PVP ratio o f 70%:30%) aged at 50 °C..........................................135
Figure 4.14: KWWfitting o f the IGC and DSC data o f the ball milled solid solution (an
indometacin to PVP ratio o f 70%:30%) aged at 50 °C................................................. 136
Figure 4.15: KWWfitting o f the IGC and DSC data o f the spray dried solid solution (an
indometacin to PVP ratio of70%>:30%>) aged at 50 ^C................................................. 136
Figure 4.16: Tapping-mode AFM images: a) initial sample and b) sample aged at 50 °C
for 48 hours (left, amplitude image; right, phase image)..............................................139
Figure 4.17: Power time response o f the ball milled solid solution (an indometacin to
PVP ratio o f 70%:30%) measured by IMC at 50 °C..................................................... 142
Figure 4.18: Power time response o f the melt quenched solid solution (an indometacin
to PVP ratio o f 70%:30%) measured by IMC at 50 °C................................................. 142
Figure 4.19: Power time response o f the spray dried solid solution (an indometacin to
PVP ratio o f 70%:30%) measured by IMC at 50 °C..................................................... 143
Figure 4.20: DSC traces (each trace is a representative o f three measurements) o f the
ball milled (I), melt quenched (2) and spray dried (3) samples (an indometacin to PVP
ratio o f 70%:30%) scanned at 40 (a), 20 (b), 10 (c) and 5 (d) °C/min......................... 147
Figure 4.21: Plot logarithm o f heating rate as a function o f I/Tgo„ o f the ball milled (M ),
spray dried (%) and melt quenched ( ^ ) solid solutions (an indometacin to PVP ratio o f
70%:30%). The regression straight lines and coefficients o f determination are shown
........................................................................................................................................................149
Figure 4.22: XRPD patterns o f the ball milled (BM), melt quenched (MQ) and spray
dried (SD) solid solutions (an indometacin to PVP ratio o f 70%:30%) stored at room
temperature and 75% RHfor 0, 70 and 188 days......................................................... 153
Figure 4.23: Water vapour sorption isotherms for the unaged and aged (15 days at 50
X IV

) melt quenched and hall milled solid solutions o f indometacin and PVP (70%:30%).
....................................................................................................................................... 154
Figure 4,24: Water sorption profiles o f the unaged melt quenched solid solution o f
indometacin and PVP (70%:30%), the one aged for 15 days at 50 °C and the second
cycle o f the aged sample................................................................................................ 156
Figure 4.25: Dynamic vapour sorption traces o f the ball milled solid solutions: a)
unaged sample and b) sample aged for 15 days at 50 °C.............................................157
Figure 4.26: Dynamic vapour sorption traces o f the melt quenched solid solutions: a)
unaged sample and b) sample aged for 15 days at 50 °C............................................. 158
Figure 4.27: The dissolution profiles o f the unaged and aged solid solutions (an
indometacin to PVP ratio o f 70%:30%) prepared by ball milling and melt quenching
.....................................................................................................................................159
Chapter 5_________________________________________________________________
Figure 5.1: DSC scans o f indometacin:PVP (90%: 10%) physical mixture (1), the
mixture that milled for 1 hour at 200 rpm (2), 2 hours at 200 rpm (3), and 2 hours at
300 rpm (4).................................................................................................................... 170
Figure 5.2: Effect o f milling time on the crystalline indometacin content o f the ball
milled product at two rotation speed: 300 rpm and 200 rpm........................................171
Figure 5.3: Effect o f rotation speed on the crystalline indometacin content o f the ball
milled product. Milling duration was fixed at 2 hours.................................................. 173
Figure 5.4: SEM images o f a) crystalline indometacin; b) pure Neusilin; c) pure SMCC
2%>; and d) pure MCC...................................................................................................175
Figure 5.5: XRPD patterns o f indometacin milled with different carriers (durg:carrier,
25%:75%) for 5 (a), 15 (b), 30 (c), 60 (d), 120 (e), 240 (f), and 360 (g) minutes 176
Figure 5.6: SEM images o f indometacin milled with a) MCC, b) SMCC, and c) Neusilin
for 6 hours with a drug to carrier ratio o f 25%o:75%o....................................................177
Figure 5.7: FTIR spectra o f (1) crystalline and (2) amorphous indometacin.............. 182
Figure 5.8: FTIR spectra o f physical mixtures o f 1) MCC-indometacin, 2) SMCC
X V

2%-îndometacin, and solid dispersions o f 3) MCC-indometacin, 4) SMCC
2%-indometacin, 5) SMCC 5%-indometacin and 6) SMCC 10%-indometacin 184
Figure 5.9: FTIR spectra o f Neusilin-indometacin physical mixture (1) and solid
dispersion (2).................................................................................................................184
Figure 5.10: XRPD o f a) melt-quenched indometacin and b) melt-quenched
indometacin, stored for 2 days at 30 °C 11% RH..........................................................187
Figure 5.11: XRPD o f solid dispersions o f indometacin with MCC (a), SMCC 2% (b),
SMCC 5% (c), SMCC 10% (d) or Neusilin (e) after storage at 30 11% RH for 6
months (a drug to carrier ratio o f 25%:75%)............................................................... 188
Figure 5.12: XRPD o f solid dispersions o f indometacin with MCC (a), SMCC 2% (b),
SMCC 5%) (c), SMCC 10% (d) or Neusilin (e) after storage at 40 °C 75%) RH (a drug to
carrier ratio of25%:75%>)........................................................................................... 180
Figure 5.13: Indometacin-SMCC (25%:75%>) milled for 2 hours and stored at 30 °C,
11%) RHfor a) 0 day, b) 1 week, c) 2 weeks and d) 4 weeks......................................... 190
Figure 5.14: Indometacin-SMCC (25%o:75%o) milled for 4 hours and stored at 30 °C,
11% RHfor a) 0 day, b) 1 week, c) 2 weeks and d) 4 weeks..........................................191
Figure 5.15: Indometacin-SMCC (25%:75%o) milled for 6 hours and stored at 30 C,
11% RHfor a) 0 day, b) 1 week, c) 2 weeks and d) 4 weeks......................................... 191
Figure 5.16: SMCC Indometacin-SMCC (25%: 75%) milled for 24 hours and stored at
30 °C, 11% RHfor a) 0 day, b) 4 weeks, c) 2 months and d) 4 months.........................192
Figure 5.17: Dissolution profiles o f crystalline, amorphous indometacin (IM) and the
SMCC and MCC solid dispersions (with a drug to carrier ratio o f 25%: 75%) at pH 6.8
phosphate buffer (37 °C)................................................................................................194
Figure 5.18: Dissolution profiles o f crystalline, amorphous indometacin and
indometacin-Neusilin (25%:75%o) solid dispersion at pH 6.8 phosphate buffer (37 °C).
.......................................................................................................................................195
Figure 5.19: Dissolution profiles o f Neusilin-indometacin solid dispersions with
different carrier to drug ratios and the samples were introduced to the pH 6.8 phosphate
buffer (37 °C) via different ways....................................................................................196
Figure 5.20: Contact angle o f crystalline indometacin and the solid dispersions o f
X V I

indometacin with Neusilin, SMCC or MCC (a drug to carrier ratio o f 25%: 75%)......197
Figure 5,21: SEM images o f spray dried indometacin with Neusilin (a) or MCC (b) with
a drug to carrier ratio of25%:75%>.............................................................................. 199
Figure 5.22: SEM images o f spray dried indometacin with PVP (a) or HPMCAS (b),
with a drug to carrier ratio o f 25%: 75%...................................................................... 204
Figure 5.23: XRPD patterns o f spray dried indometacin with PVP (a) or HPMCAS (b),
with a drug to carrier ratio o f 25%: 75%...................................................................... 204
Figure 5.24: DSC scans o f spray dried indometacin with HPMCAS (a) or PVP (b), with
a drug to carrier ratio of25%o:75%).............................................................................. 205
Figure 5.25: XRPD patterns o f indometacin milled with PVP (1) or HPMCAS (2) for 5
(a), 15 (b), 30 (c), 60 (d), 120 (e), 240 (f), and 360 (g) minutes................................... 206
Figure 5.26: SEM images o f ball milled indometacin with PVP (a) or HPMCAS (b),
with a drug to carrier ratio o f 25%: 75%...................................................................... 206
Figure 5.27: DSC scans o f ball milled indometacin with HPMCAS (a) or PVP (b), with
a drug to carrier ratio o f 25%>:75%>.............................................................................. 207
Figure 5.28: FTIR spectra o f indometacin and PVP physical mixture (1) and their spray
dried (2) and ball milled (3) samples............................................................................ 208
Figure 5.29: FTIR spectra o f indometacin and HPMCAS physical mixture (1) and their
spray dried (2) and ball milled (3) samples.................................................................. 208
Figure 5.30: Dissolution profiles o f crystalline, amorphous indometacin and
indometacin-PVP (25%:75%) solid solutions prepared by ball milling and spray drying,
studied at pH 6.8 phosphate buffer (37 °C)...................................................................212
Figure 5.31: Dissolution profiles o f crystalline, amorphous indometacin and
indometacin-HPMCAS (25%:75%) solid solutions prepared by ball milling and spray
drying, studied at pH 6.8 phosphate buffer (37 °C).......................................................212
Figure 5.32: Dissolution profiles o f the solid dispersions o f PHPMA-MCC-indometacin,
PHPMA-indometacin and MCC-indometacin...............................................................217
Figure 5.33: XRPD patterns o f solid dispersions o f a) PHPMA-MCC-indometacin
(1.5:15:1), b) PHPMA-indometacin (3:1) and c) MCC-indometacin (3:1) stored at 30
‘'C 75% for 4 weeks....................................................................................................... 218
X V II

List of tables
Chapter 1___________________________________
Table 1.1: The Biopharmaceutical Classification system o f drugs (adapted from Amidon eta l, 1995)........................................................................................................................4
Chapter 2
Table 2.1: List o f the materials used with grade and supplier....................................... 40
Table 2.2: Parameters related to a milling process........................................................ 47
Chapter 3
Table 3.1: Dispersive surface free energy o f the pure components and the melt quenched
solid solution (indometacin:PVP, 70%:30%) measured by IGC (values are mean ± s.d.,
n = 4) ............................................................................................................................................ 86
Table 3.2: Relaxation parameters obtained from IGC data for the indometacin:PVP
(70%: 30%) melt quenched sample after KWW fitting (R?, coefficient o f determination,
and Chf/DoF, reduced Chi^ value).................................................................................92
Table 3.3: Relaxation parameters obtained from IGC data for the indometacin:PVP
(50%:50%) melt quenched sample after KWW fitting (R , coefficient o f determination,
and Chi^/DoF, reduced C hf value)................................................................................. 95
Table 3.4: Structural relaxation parameters o f the melt quenched solid solution (an
indometacin to PVP ratio o f 70%: 30%) obtained from decane Vmax-........................... I l l
Chapter 4
Table 4.1: Glass transition temperature and heat capacity o f the solid solutions
determined by Step-scan DSC and the loss on drying determined by TGA (n=3).........124
Table 4.2: Relaxation parameters obtained from DSC data for different solid solutions
X V III

containing indometacin:PVP o f 70%:30% (R , coefficient o f determination, and
Chf/DoF, reduced C hf value)...................................................................................... 131
Table 4.3: A comparison o f the surface (IGC) and bulk (DSC) relaxation (R , coefficient
o f determination, and Chf/DoF, reduced C hf value)................................................... 137
Table 4.4: Root-mean-square roughness o f the initial and aged solid solution measured
from the amplitude images.............................................................................................139
Table 4.5: Comparison o f infinite relaxation enthalpy o f the solid solutions (an
indometacin to PVP ratio o f 70%:30%) determined by IMC and calculated according to
the Tg value obtained by SSDSC...................................................................................143
Table 4.6: Comparison o f relaxation parameters o f the solid solutions (an indometacin
to PVP ratio o f 70%: 30%) evaluated using both KWW and MSE equations in IMC study
and the ones determined in DSC study (n=3)................................................................144
Table 4.7: A table o f fragility and other related values o f the solid solutions (an
indometacin to PVP ratio o f 70%:30%) prepared by different methods (Tg values are
mean ± s.d., n=3)........................................................................................................... 150
Table 4.8: Percentage release o f indometacin from the solid solutions (an indometacin
to PVP ratio of70%:30%) at 20 min (t2o) and 120 min (tj2o) (n=3)............................. 161
Chapter 5_______________________________________________________________
Table 5.1: Glass transition temperature and moisture content o f the solid dispersions o f
indometacin and Neusilin, SMCC (contain different amount o f silica) or MCC 179
Table 5.2: Hansan solubility parameters o f indometacin, MCC and silica..................180
Table 5.3: Percentage crystallinities o f SMCC, MCC and MCC-silica mixtures (adapted
from Tobyn et al, 1998).................................................................................................181
Table 5.4: Effect o f carrier species on the apparent solubility o f indometacin compared
with that o f indometacin along (pH 6.8 phosphate buffer at 37 °C) in 24 hours 198
Table 5.5: Hansan solubility parameters o f the drugs and carriers............................. 200
Table 5.6: List o f the spray drying parameters used for different batches o f operations
and their final yields......................................................................................................202
X IX

Table 5,7: Physical stability o f the solid solutions (a drug to carrier ratio o f 25%: 75%)
stored for 2 months in different conditions as determined by XRPD or DSC...............210
Table 5.8: Release percentage o f indometacin-HPMCAS (25%: 75%) solid solutions,
and crystalline and amorphous indometacin at 10 minutes (tjo) and 60 minutes (t^o)- 213
X X

List of abbreviations
A Surface areaa Interaction surface areaAFM Atomic force microscopyAN* Acid (electron acceptor) numberP Distribution of the relaxation time constantB A material parameter related to its fragilityBET Brunauer-Emmett-Teller equationC ConcentrationCh Saturation solubility of the drug in the boundary layerCp Heat capacityCs Saturation solubility of the drug in the stationary layerÔ Solubility parameterAEfg Activation enthalpy of structural relaxation at glass transition
temperature AGads Free energy of sorptionzf//oo Maximum enthalpy of relaxationAHm Fusion of meltingD Strength parameterDd Diffusion coefficient of the drug in the solubulising fluids of the
gastrointerstinal tract DN Base (electron donor) numberDSC Differential scanning calorimetryDVS Dynamic vapour sorptiong Constant regarding acceleration due to gravityrj ViscosityF Exit flow rate of the carrier gasFID Flame ionised detectorFTIR Fourier transform infraredy Surface free energy
Dispersive component of surface free energy / Polar component of surface free energyGIT Gastrointestinal tracth Boundary layerH EnthalpyHPMCAS Hydroxypropyl methylcellulose acetate succinateIGC Inverse gas chromatographyIM IndometacinIMC Isothermal microcalorimetryj The James-Martin compressibility correction factorKa Acidic (electron accepting) parameterKd Basic (electron donating) parameter
X X I

L Stationary layerm Fragility parameterM Sample massMCC Microcrystalline celluloseMMP Molecular Modeling Pro softwareMSE Modified stretched exponential functionNSAID Non-steroidal anti-inflammatory drug9 Volume fractionP PowerPVP PolyvinylpyrrolidonePHPMA Poly[N-(2-hydroxypropyl)methacrylate]q Heating/cooling rateqc Critical cooling ratep DensityR Gas constantRH Relative humidity& Root-mean-square roughnesss EntropySEM Scanning electron microscopySMCC Silicified microcrystalline celluloseT Relaxation timero The shortest possible relaxation timeTin Induction time needed to form a nucleust TimeT TemperatureTo zero mobility temperatureTa. The temperature of infinite relaxation timeTa aging temperatureTAM Thermal Activity MonitorTb boiling pointTCD Thermal conductivity detectorT, Glass transition temperatureTk Kauzmann temperatureTm Melting pointV VolumeVcom Retention volume measured using the center mass point of the peakVmax Retention volume measured using the maximum point of peakVn Retention volumeVTF Vogel-Tammann-Fulcher equationWads Work of adsorptionWLF William-Landel-Ferry equationPi Distance of point i from the centre line
X X II

Cfiapterl
Introduction

Chapter 1 Introduction
1.1 Introduction
Oral drug delivery is the most convenient route for drug administrations with the solid
oral dosage forms being preferred over other types of dosage forms because of their
smaller bulk size, better stability, accurate dose, and ease of preparation (Vasconcelos et
al, 2007). Drugs used in solid oral dosage forms need to have good solubility in order
to result in good bioavailability. However, based on some recent estimates, about 40%
of present drugs are poorly soluble in water, and even up to 60% of compounds coming
directly from synthesis encounter the same problem (Merisko-Liversidge, 2002).
Therefore, finding an efficient approach to increase the dissolution and solubility of the
drugs is a major challenge for pharmaceutical researchers.
Formation of solid dispersions is an efficient strategy for dissolution rate improvement
(Sekiguchi and Obi, 1961; Chiou and Riegelman, 1971; Serajuddin, 1999). The particle
size of the drugs in a solid dispersion can reach as low as molecular level which helps to
improve the dissolution rate (Vasconcelos et a l, 2007). In addition, the drugs can exist
in the amorphous forms which in theory represent the most energetic solid state of a
material, and hence they should have the biggest advantage in terms of apparent
solubility (Hancock and Zografi, 1997). However, a potential risk of solid dispersions is
recrystallisation of the amorphous drug resulting in an alteration of the dissolution
properties of the products upon storage. Molecular mobility is considered to be the
governing factor affecting the crystallisation rate of the drug from the carrier matrix;
therefore, in this thesis, studies were conducted to understand molecular mobility and
some other relevant properties in relation to the physical stability and dissolution
properties of solid dispersions. Since crystallisation is surface initiated in many cases
(Wu and Yu, 2006), focus was also placed on the study of surface molecular mobility.
An efficient method for probing the surface molecular mobility is needed in the
pharmaceutical research field: hence a new method regarding the use of inverse gas
chromatography (IGC) was developed for this purpose. The surface molecular mobility
detected using this method was compared to the bulk molecular mobility measured
using differential scanning calorimetry (DSC).
2

Chapter 1 Introduction
Previous studies have shown that the physical properties of an amorphous material
could be greatly affected by the way it is prepared (Surana et a l, 2004), but the
understanding of the effect of preparation methods on solid dispersions is limited
(Patterson et a l, 2007). In this thesis, emphasis was also placed on the influence of
preparation methods on the physical properties, stability and dissolution of the solid
dispersions. Thus studies were undertaken to prepare stable solid dispersions with rapid
dissolution rate using a variety of methods and the effect of carrier type was studied.
The interaction between the drug and carrier in relation to the physical stability of the
solid dispersions was also investigated.

C hapter I Introduction
1.2 Permeability-solubility drug classifîcation
In order for solid state drugs which are administrated orally to elicit an efficient
therapeutic effect, they have to be absorbed into the systemic circulation first so as to
reach the site of action. The effect of absorption is usually determined by two factors:
the dissolution and solubility of the drug, and its permeability through the intestinal
membrane. According to the solubility and permeability levels, drugs can be divided
into four different classes (Amidon et al, 1995).
Class I Class II Class III Class IV
Permeability High High Low Low
Solubility High Low High Low
Table 1.1: The Biopharmaceutical Classification system o f drugs (adapted from Amidon
et al, 1995).
According to the classification (Table 1.1), the strategies needed for different classes of
drugs for absorption improvement become clear: 1) class 1 drugs have both high
permeability and solubility, hence no special treatment is required; 2) for class 11 drugs,
the limiting step is the dissolution and solubility of the drugs, therefore, the most
effective strategy is to increase the amount of drug dissolved at the absorption site; 3)
for class 111 drugs, permeability is the limiting step which is opposite to the class 11
drugs, and increasing membrane permeability of the drugs will be crucial; 4) for class
IV drugs, both dissolution and permeability needed to be improved. It should be noted
that for class IV drugs, improving dissolution and solubility is more efficient than
improving the permeability. The drug dissolved at the absorption site can range over six
orders of magnitude while permeability ranges only 50 fold (Curatolo, 1998). Therefore
the potential for absorption improvement of the class IV drugs will be larger by
improving their dissolution and apparent solubility.

Chapter I Introduction
1.3 Drug absorption
Drug absorption is closely related to bioavailability, but they are not exactly the same.
Absorption is related to the movement of a drug into the bloodstream whereas
bioavailability is related to drug concentration in the blood circulation. Since drug
absorption is the prerequisite of bioavailability, it is necessary to briefly explain how
drugs are absorbed. There is a four-step process for the successful transport of a drug
from an oral dosage form into the general circulation. These are: 1) bringing the drug to
its absorption site; 2) releasing the drug into the aqueous liquid in the gastrointestinal
tract (GIT); 3) transport of the dissolved drug through the membranes of the GIT; and 4)
movement of the drug into the general circulation from the site of absorption. The order
of the first two steps is interchangeable, which means that the drug may dissolve either
before or after getting to its absorption position.
1.3.1 Bringing the drug to its site of absorption
Stomach
Smallintestine
Ascendingcolon
Rectum
Figure 1.1: Diagram of the gastrointestinal tract (divided into esophagus, stomach,
small intestine, colon and rectum).

Chapter 1 Introduction
The gastrointestinal tract (Figure 1.1) is the place where an oral dosage form can be
absorbed after swallowing. During this passage the dosage form will encounter great
anatomical and physiological variations. Among these variables, the two most important
ones affecting the delivery of the drug from its oral dosage form are: 1) hydrogen ion
concentration, which exhibits a 10 fold difference between the mucosal fluids of the
stomach and the intestine (pH 1 to 3 in the stomach, pH 5 to 7 in the duodenum, and pH
7 to 8 in the jejunum and ileum); and 2) available surface area for absorption, which
changes dramatically at different regions of the GIT.
The stomach acts as a barrier for protecting the intestine from extreme conditions, such
as the small difference in pH, temperature, osmolarity, or viscosity from the normal
conditions of the intestine. Thus, the stomach will delay emptying until these conditions
become normal. Due to factors such as increased membrane surface area and decreased
thickness, the intestine is a more preferable site for drug absorption than the stomach.
The rate at which the drug gets to the small intestine can significantly affect its rate of
absorption. Therefore, gastric-emptying rate may be one of the important factors
determining the absorption rate of a drug. Factors like light physical activity will/
stimulate stomach emptying, but strenuous exercise will delay emptying (Bachrach,
1959; Davenport, 1971). Posture, emotional state, and numerous pathological conditions
of a patient can all alter the gastric-emptying rate and hence the absorption rate of a
drug in the body. Other drugs taken together may also affect the gastric-emptying rate
by influencing gastrointestinal motility.
Absorption is not the only process that occurs along the GIT. The aqueous fluids of the
GIT can degrade and different enzymes can metabolise a drug before it reaches the
absorption site. This is especially the case for drugs that structurally resemble nutrients,
such as polypeptides, nucleotides, or fatty acids which are liable to undergo enzymatic
degradation. Conversely, the metabolic and degradative processes can also help to
increase the bioavailability of drugs in some cases. These degradative processes play an
important role for some prodrugs in aiding them to achieve their bioavailability. Hence
6
Chapter 1 Introduction
the metabolism and degradation of a drug can either reduce or enhance its extent of
availability.
1.3.2 Getting the drug into solution
In order to be absorbed, the drug has to be in solution following release from its dosage
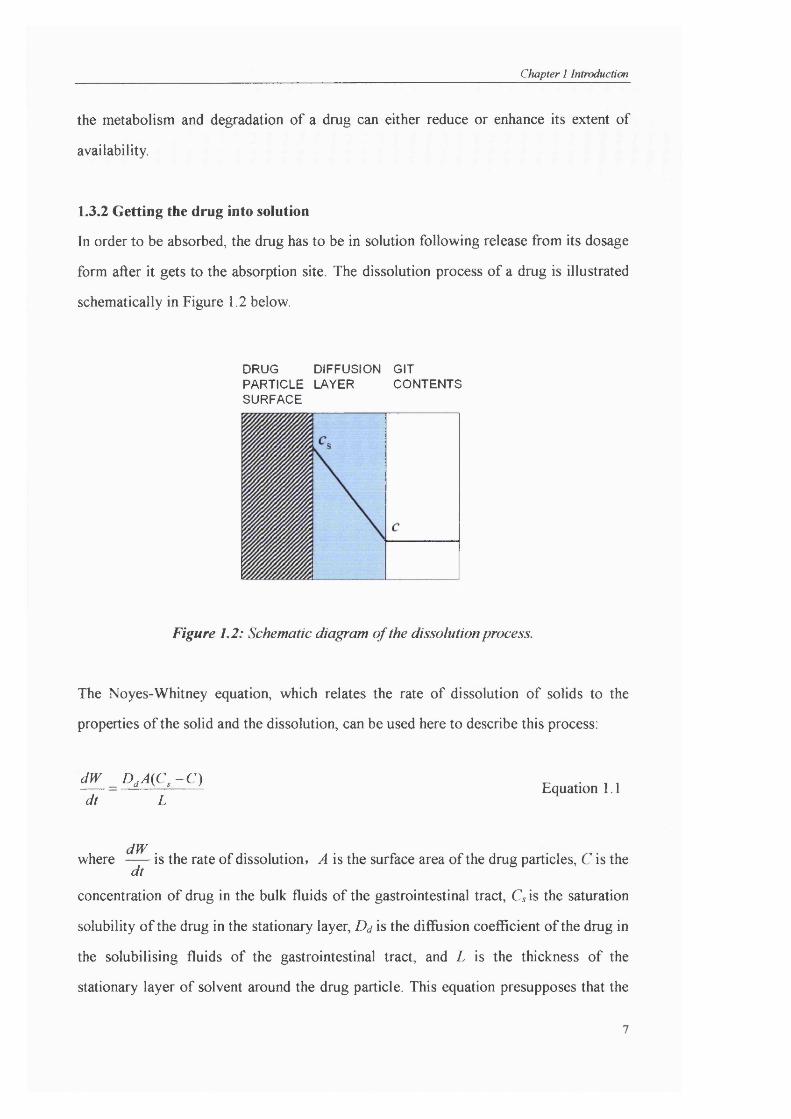
form after it gets to the absorption site. The dissolution process of a drug is illustrated
schematically in Figure 1.2 below.
DRUG DIFFUSION GIT PARTICLE LAYER CONTENTS SURFACE
Figure 1,2: Schematic diagram of the dissolution process.
The Noyes-Whitney equation, which relates the rate of dissolution of solids to the
properties of the solid and the dissolution, can be used here to describe this process:
dW D ,A (C ,-C ) dt L
Equation 1.1
dWwhere is the rate of dissolution, A is the surface area of the drug particles, C is thedt
concentration of drug in the bulk fluids of the gastrointestinal tract, G is the saturation
solubility of the drug in the stationary layer, Dd is the diffusion coefficient of the drug in
the solubilising fluids of the gastrointestinal tract, and L is the thickness of the
stationary layer of solvent around the drug particle. This equation presupposes that the

Chapter 1 Introduction
drug dissolved uniformly from all surfaces of the particles, which are assumed to be
spherical and having the same size. Additionally, L is assumed to be constant while both
L and Q are taken to be independent of particle size. Based on the equation, it is
indicated that the possibilities for improving dissolution rate are to increase the surface
area available for dissolution by decreasing the particle size of the solid compound
and/or by optimising the wetting characteristics of the compound surface, to decrease
the boundary layer thickness, to ensure sink conditions for dissolution and to improve
the solubility of the drug in the gastrointestinal tract (Leuner and Dressman, 2000).
Among the methods stated above, there are two which have been widely applied to
improve the bioavailability of poorly soluble drugs: increasing the surface area, and
increasing the solubility. These approaches will be discussed in the following section.
1.3.2.1 Effective surface area of the drug particles
It is generally accepted that the smaller the drug particles, the greater will be the surface
area for a given amount of drug (i.e. a greater specific surface area). Therefore, based on
the Noyes-Whitney equation, the dissolution rate will increase as particle size decreases.
This is commonly applied for drugs with poor water solubility. For example, the
therapeutic dose of griseofulvin was reduced to 50% by micronisation and it was also
found that a more constant and reliable blood level was produced (Atkinson et al,
1962). The commercial dose of spironolactone was also decreased to half by just a
slight reduction of particle size (Levy et al, 1963). It is shown that in many cases,
enhancement of drug absorption can be increased several fold if the particle size of the
drug is reduced (Bauer et a l, 1962).
Particle-size reduction is usually achieved by: conventional grinding, ball milling, fluid
energy micronisation, controlled precipitation by change of solvents or temperature,
application of ultrasonic waves and spray drying. It should be emphasised that not all
the resultant fine particles can have faster dissolution and absorption behaviors. This is
due to the possible aggregation and agglomeration of the particles caused by their
increased surface energy and the subsequent stronger van der Waal’s attraction between

Chapter 1 Introduction
nonpolar molecules. This was first demonstrated by Lin et al (1968), who showed that
the in vitro dissolution rates of micronised griseofulvin and glutethimide were slower
than those of their coarser particles.
1.3.2.2 Solubility of the drug
The physical and chemical properties of a drug can be modified to increase its saturation
or apparent solubility. Therefore, according to the Noyes-Whitney equation,
improvement in dissolution rate of the drug can be achieved. Some examples are
described as follow:
Salt form of drugs
In the majority of cases, the dissolution rate and solubility of the salt form of a drug is
greater than that of its nonionised form. Hence the formation of the salt form of a drug
is one of the alternatives to improve its dissolution, solubility and bioavailability. Indeed,
many studies have been done regarding this area. For example, a weakly acidic drug
p-aminosalicylic acid, having three salt forms (potassium, calcium, and sodium), was
found to exhibit much higher dissolution rates in the salt forms compared to the
nonionised drug. The bioavailability of the acid form was only about 77% of that of the
salt forms (Pentikaninen et a l, 1974). In general, the solubility of the salt is related on
the counterion, and the smaller the counterion, the more soluble the salt is.
Drugs in ionised forms
The ionised form of a drug is expected to be more soluble than the nonionised form in
the aqueous fluids of the GIT. Since the pH of the gastrointestinal fluids will determine
the ionised or nonionised state of a drug, pH should be considered as a factor for
influencing the solubility of a drug. Equation 1.1 can be rewritten here as:
Equation 1.2dt L

Chapter 1 Introduction
All the terms are described as before, excluding Ch which is the saturation solubility of
the drug in the boundary layer, h, at any pH. When C/,=Q, the drug exists as its
nonionised form after it dissolves in the aqueous fluids. In this case, for a weak acid:
Ch = [HA] + [A-] = Cs 1 + Equation 1.3
dW DA L (dt
1 + -C Equation 1.4
Similarly, for a weak base:
Ch = [HB ] + {E\ = Cs Equation 1.5
f i + H Udt l \ \ k , ,
-c Equation 1.6
Therefore, the dissolution rate of weak acid increases as pH increases, while that of
weak base decreases as the pH decreases.
Solvate formation
The solvate of a drug is another variable which will affect its saturation solubility. It is
known that the anhydrous, hydrated and alcoholated forms of a drug have different
solubility and dissolution rates.
Polymorphism and amorphous state of drugs
Many materials are able to exist in different crystalline forms and this is known as
polymorphism (Yu, 2001). Generally, the dissolution rate and apparent solubility of
different polymorphs are different. For example, indometacin has three different
10

Chapter 1 Introduction
crystalline forms (y, a, and P) and each of them exhibits different dissolution behavior,
while a has the fastest dissolution rate and best apparent solubility, P is the next and y is
the worst. Polymorphism can cause variations in melting point, stability, density and
other properties depending on the escaping tendency of the molecules from a particular
crystalline structure. The amorphous form is the least stable form of a material and it
has the highest internal energy; therefore, amorphous drug tends to exhibit better
dissolution rate compared to its corresponding crystalline forms. Detailed discussion
about the amorphous form will be given in the next section. Suffice to say, in most cases,
the more apparently soluble form has the least thermodynamical stability. Hence, the
balance between the stability and solubility of a drug is an important consideration for
pharmaceutical researchers.
Complex formation
Drug-cyclodextrin complexes can be prepared by adding the drug and excipient together,
and as a result solubility of a drug can be increased. Cyclodextrins, which exist in y, a,
and P forms, are a group of structurally-related cyclic oligosaccharides that have an
apolar cavity and hydrophilic external surface. Complexation of a drug with
cyclodextrin is purely noncovalent and occurs due to physical forces such as
electrostatic interactions, van der Waals forces, hydrophobic interactions, hydrogen
bonding and release of enthalpy rich water molecules (Loftsson and Brewster, 1996).
The complex structure protects the drug molecule from unfavorable environments in
some respects.
Solid dispersions
Preparation of solid dispersions is also a useful approach to increase the dissolution rate
and apparent solubility of poorly soluble drugs (Serajuddin, 1999). More discussion
about the use of solid dispersions for bioavailability improvement will be given in
section 1.5.
11

Chapter 1 Introduction
1.3.3 Gastrointestinal membrane transport of drugs
Once a drug gets into the aqueous liquids at the absorption site in the GIT, it must cross
the membrane (Figure 1.3) to reach into the general circulation. It is the membrane that
keeps all of the cell contents securely inside, but which allows some materials to pass in
and out the cell via several different mechanisms. One of the main mechanisms by
which drugs are transported through the cell membrane is passive diffusion. This is
based on the difference in the concentration of the drug outside and inside of the cell.
The greater the difference is, the greater the diffusion of the drug from outside to the
inside of the cell. Since the membrane is highly lipidic in structure, the partitioning
ability of the drug is dependent on its lipophilic properties. Thus, the oil-water partition
coefficient of the drug can be used to test whether it can move through the membrane.
As mentioned above, the pH of the aqueous fluids will determine the ionised and
unionised state of the drug. Since unionised molecules are more lipid-soluble and can
diffuse across membranes more easily, the pH of the fluids will play an important role
during passive diffusion. Besides passive diffusion, facilitated diffusion is another
mechanism for transport of drugs, whereby carrier proteins will transport water soluble
drugs through the membrane. The drugs are transported from a higher concentration to a
lower one. The third mechanism is the one involving the transport of inorganic ions
such as sodium and potassium and many drugs, which are moved through the cell
membrane by active transport. In this process, a membrane pump such as
sodium/potassium ATPase pump plays a role to transport chemicals against a
concentration gradient into the cell. Unlike diffusion, this is an energy demanding
process. The fourth mechanism involves drugs crossing the membrane via pores. This
mechanism is dependent on the size of the pore and the molecular weight of the drug.
Finally, the membrane can also engulf the drug, forming a vesicle and then transport it
across the membrane into the cell. This process is called pinocytosis.
12

Chapter 1 Introduction
êMêê'ê
Figure 1.3: A scheme o f membrane transport o f drugs.
1.3.4 Movement of the drug into the general circulation
Moving the drug away from the site of absorption is also an important process. Drugs
that have crossed the gastrointestinal membrane are primarily removed as a function of
blood flow (Benet et al, 1976). If there is no blood flow, the passage of a drug across
the membrane will cease. If the blood flow decreases, it might decrease the rate or
removal of passively absorbed drugs and also interfere with active transport systems
owing to the reduction of the supply of oxygen to the tissues. Thus, the possible effect
of blood flow rate (especially alterations in the flow rate) on the availability of drugs is
an important factor for considerations in pharmaceutical research.
13

Chapter 1 Introduction
1.4 Solids in the amorphous state
Unlike crystalline solids which have three-dimensional long range order, amorphous
solids exhibit short range order and the arrangement of molecules is more random
(Figure 1.4). Amorphous solids can be treated as a supercooled liquid in which the
molecules can vibrate and rotate as those in liquid, while in the case of crystalline solids
these movements appear to a lesser extent or are even absent due to their rigid
arrangement. Therefore, the molecules in amorphous solids have a higher internal
energy than those in the crystal forms (Imaizumi et a l, 1980). In pharmaceutical
research and development, the amorphous state is commonly used to improve the
solubility and bioavailability of poorly soluble drugs because it is more energetic
compared to the corresponding crystalline forms (Hancock and Parks, 2000).
▲ A A A A A A . y ^
AVAVA V. f T▲ ▲ ▲ ▲ ▲ ▲ ▲ ▲ k ▲ ▲ A ▲ ▲ ▲
crystalline solid amorphous solid gas
Figure 1.4: Schematic representation o f the structure o f an amorphous solid (adapted
from Yu, 2001).
1.4.1 The formation of amorphous solids
In the past, the term "''glass'' has been used to refer to an amorphous solid produced by
rapid quenching of a melt. In recent times, the definition for glass has been broadened
(Zallen, 1983). A glass is now defined as an amorphous solid which displays a
short-range order and exhibits a glass transition. An amorphous solid exists in the glassy
state when below the glass transition temperature (Tg).
14

Chapter 1 Introduction
Gas10 sec 10 sec
Liquid
Supercooled Liquid /1
2 o >k.oQ.(0£C
Glass 2
(b) Glass L
lU Equilibrium^ Glass /
Crystal
T.a m
Temperature
Figure 1.5: A scheme representing the change o f enthalpy and volume during cooling of
a material from its gas or liquidform which can either crystallise (route a) or form a
glass (route b). The thermodynamic and dynamic properties o f a glass depend on the
cooling rate. Tb is the boiling point, In, is the melting point, Tg is the glass transition
temperature. Ta is the aging temperature, Tk is the Kauzmann (or zero mobility)
temperature and r is the relaxation time.
In Figure 1.5 the change of enthalpy (//) and volume (V) during the formation of a glass
(or a crystal) by cooling a gas (or liquid) is shown. A sharp break or bend in N and V
indicates a change of phase during the decrease of temperature. The first change of
phase happens at 7* where the gas turns into liquid and abrupt changes of H and V are
accompanied. Continuous cooling of the liquid decreases the H and F in a continuous
way, until eventually Tm is reached. At this point, if the cooling rate is sufficiently low,
the liquid would take route (a) and crystallise into a solid in a discontinuous way.
Crystallisation is a first-order phase transition, and as shown in the figure, an abrupt
15

Chapter 1 Introduction
change in H and V is noticed. Meanwhile, if the cooling rate is sufficiently high, Tm is
bypassed without incident and route (b) is taken to the solid state. The liquid that
manages to get below Tm without crystallisation is called a supercooled liquid (or an
amorphous solid in the rubbery state). As the liquid is further cooled, its viscosity
increases and the molecules eventually rearrange so slowly that molecular
configurations can not happen in the allowed timescale depending on the cooling rate.
The H and V will begin to deviate abruptly (but continuously) from the equilibrium
value at a certain temperature and the structure of the liquid appears ‘frozen’ resulting a
glass. The temperature at which deviation happens is called the glass transition
temperature. Below Tg, H and V of the glass continue to decrease but in a lower
temperature dependence similar to the crystal state. It should be noted that the slower
the liquid is cooled, the longer the time available for molecular configurations at each
temperature, and hence the lower it can get before deviation from the equilibrium
(Debenedetti and Stillinger, 2001). In another words, Tg increases as the cooling rate
increases (Bruning and Samwer, 1992).
The critical cooling rate {qc) for glass formation from the melt to prohibit crystallisation
can be defined using the following equation (Hilden and Morris, 2004):
~ — — Equation 1.7
where is the induction time needed to form a nucleus at temperature, T„. Therefore, a
sufficiently fast cooling rate is needed to make sure the time spent to cool from Tm to T„
is shorter than the induction time at T„ in order to avoid crystallisation. The fastest
cooling rate for cooling a bulk sample or micronised droplets in quench cooling or spray
freeze drying is about 10 Ks'\ If the sample can be made into thin film with a thickness
of less than 100 nm, the cooling rate can reach as fast as 10*" Ks'* (Debenedetti, 1996).
Turnbull (1987) has used a three-step process to describe the general procedure for
16

Chapter 1 Introduction
preparing amorphous solids from a crystalline material, namely: 1) energising the
material (such as melting, milling, etc.); 2) de-energising of the material, for example,
quench cooling; and 3) kinetically trapping the amorphous form which often continues
from step two. Melt quenching is a commonly used technique for the preparation of
amorphous solids. This technique involves melting of a solid material into liquid
followed by rapid cooling using liquid nitrogen. Other techniques for amorphous state
formation include mechanical activation of a crystalline mass (such as milling),
precipitation from solution and solvent evaporation (such as spray drying and
lyophilisation (Hancock and Zografi, 1997; Craig et a l, 1999). All these techniques fall
into the three-step procedure described by Turnbull (1987).
1.4.2 Physical properties of the amorphous state
The crystalline state and the liquid state above the melting temperature of a material are
thermodynamically stable, but the amorphous state of the material is not. Since the
amorphous solid has a higher free energy compared to its crystalline state, it will tend to
crystallise into the stable form. However, the amorphous solid can be kinetically stable
if the time needed for the solid to crystallise or reach an equilibrium state is
significantly longer than the timeframe of the experiment or shelf life of the product.
Separated by the glass transition temperature, an amorphous solid can exist in two
different physical states: the glassy state and the rubbery state. The kinetic stability of
the physical states is different. During the glass transition, properties such as modulus of
elasticity, specific volume, enthalpy, heat capacity, viscosity and thermal expansion
coefficient change dramatically. In the rubbery state, these properties exhibit high
temperature dependence. The molecular mobility in the rubbery state is very high,
which helps crystallisation and hastens chemical reactions, hence it is very likely that
the amorphous solid is kinetically unstable. In contrast, in the glassy state, the
temperature dependence of the properties stated above is less extreme and the molecular
mobility of the amorphous solid is much reduced. At a sufficiently low temperature, the
crystallisation and chemical reactions would be extremely slow or sometimes absent.
Thus, under these conditions, the amorphous solid is kinetically stable.
17
Chapter 1 Introduction
1.4.3 Molecular mobility and relaxation of the amorphous solids
Molecular mobility of amorphous solids can be linked with their physical instability or
crystallisation rate from the amorphous state. The temperature dependence of molecular
mobility has been found to be similar to that of the degradation rate for some
amorphous drugs (Shamblin et al, 1999; Guo et a l, 2000), therefore it could be used to
predict the onset of crystallisation of amorphous products (Aso et al, 2000, 2004). On
the other hand, in a recent study, researchers suggested a method to establish coupling
between reaction rate (i.e., crystallisation onset or growth rates) and relaxation time of
an amorphous solid at higher temperatures and extrapolate such correlations to lower
temperatures (Bhugra et a l , 2006). Based on these correlations, reasonable predictions
can be made for a pharmaceutical product at temperatures where reaction rates are
greatly reduced, without actually running a long term stability experiment. A good
correlation was found between the molecular mobility measured above and below Tg
using different techniques (Bhugra et a l, 2006). In another study, the same group of
researchers have further confirmed the coupling between crystallisation onset times and
molecular mobility above Tg and it is possible to exploit the correlation to below Tg for
prediction of a crystallisation onset time of the amorphous product. The predictions
were found to be in good agreement with the experimental data (Bhugra et al, 2008b).
These examples demonstrate perfectly the important meaning of molecular mobility in
relation to the stability of an amorphous solid.
Although molecular mobility can be studied according to the viscosity of an amorphous
solid, it is usually quantified in terms of molecular relaxation time r. The relaxation time
is defined as the time taken for a particular motion to take place (Angell, 1995).
Molecular relaxation may be classified as structural relaxation (a-relaxation) and
Johari-Goldstein relaxation (^-relaxation) according to the relaxation modes (Kawakami
and Pikal, 2005). Structural relaxation corresponds to the motion of the whole molecule
such as diffusional motion and viscous flow, while y^-relaxation is related to the
intramolecular motion such as rotation of a side chain on a polymer or motion of a small
group of atoms on a large molecule that is not coupled or correlated with motion of the
18

Chapter 1 Introduction
whole molecule (Kawakami and Pikal, 2005).
Since the relaxation time can be used to represent the rate at which the molecular
configuration of the amorphous solid adapts during changes of temperature, the risk of
crystallisation during glass formation is reduced if the relaxation time is longer or at
least similar to the experimental timeframe (for example, in the case of spray drying and
melt quenching). Also, relaxation times at the storage conditions can be used to predict
the shelf life (Andronis and Zografi, 1997; Bhugra et a l, 2007). As discussed above in
section 1.4.1, the molecular configuration of amorphous solids changes dramatically
during the cooling process. On the top of Figure 1.5, an indication of this change is
given separately at the 7^, Tg and a temperature well below the Tg (7^-50 °C). The
relaxation time can vary from the order of 10" seconds at Tm, 10 seconds at Tg to 10
years at 7^-50 °C.
Relaxation time can be characterised according to many properties which include
macrostructural, or bulk properties such as free volume, enthalpy, mechanical and
dielectric response, as well as microstructural or molecular scale properties that can be
measured using spectroscopic and scattering techniques (Hutchinson, 1995). There are
many techniques available for measuring these properties for the determination of the
molecular mobility below the Tg. They include enthalpy recovery experiments, which
are determined by differential scanning calorimetry (Hancock et a l, 1995; Matsumoto
and Zografi, 1999), isothermal microcalorimatry (Liu et a l, 2002), thermally stimulated
depolarisation current spectroscopy (Shmeis et a l , 2004), dielectric relaxation (Bhugra
et a l, 2008a), nuclear magnetic resonance (Aso and Yoshioka, 2006), and dynamic
mechanical analysis (Andronis and Zografi, 1997). Some surface properties can be used
to reflect the surface molecular mobility, such as the surface roughness and deformation
which can be probed by atomic force microscopy (AFM) (Kerle et a l, 2001). Apart
from AFM, in polymer science, some other probing techniques which focus on the
surface properties can be used to detect the surface molecular mobility as well. For
instance, friction force microscopy can be used to study surface viscoelastic relaxation
19

Chapter 1 Introduction
(Hammerschmidt et al, 1999) and near-edge X-ray absorption fine structure
spectroscopy can also be applied (Liu et al, 1997). Relaxation is always accompanied
with the loss of energy, it will be interesting to study the change of surface free energy
in order to acquire molecular mobility information on the surface. The use of inverse
gas chromatography to study the surface energy change during relaxation is shown and
discussed in the result chapters.
A commonly used approach for the study of relaxation is through physical aging of the
amorphous solids. During physical aging, the properties of an amorphous solid can
change as a function of storage time. The degree and rate of the property change can be
measured to obtain information on molecular mobility. An example was shown in
Figure 1.5, which provides a representative scheme of the change of specific volume
and enthalpy stored at an aging temperature Ta below Tg. When the glass is stored at Ta,
there will be a driving force for the excess thermodynamic quantities (i.e. specific
volume and enthalpy) to reduce towards equilibrium as shown by arrow A. By
measuring the decreasing rate of the specific volume or enthalpy, the molecular mobility
of the glass at Ta can be estimated. As the aging temperature is reduced, a longer
time-scale would be needed for the glass to reach the equilibrium state. After reheating
the aged glassy solid, the volume or enthalpy losses can be recovered at or near Tg
(Petrie, 1972). DSC is a useful technique for the measurement of the relaxation enthalpy.
The relaxation enthalpy of the glass measured after aging for different period of time
can be fitted to the Kohlraush-Williams-Watts (KWW) equation to obtain the relaxation
time T and the distribution of the relaxation time constant p (the use of KWW equation
for fitting of the DSC data will be explained in Chapter 3) The enthalpy recovery
experiment by DSC is one of the most commonly used methods for detecting the
molecular mobility of an amorphous solid in the non-equilibrium state (Six et a l, 2001).
Based on the behaviour of the molecular relaxation time and the viscosity above the
glass transition temperature, Angell (1991) classified the amorphous solids into two
types: strong glasses and fragile glasses. The strong glasses show Arrhenius behaviour
20

Chapter 1 Introduction
while the fragile ones exhibit significant deviation from the exponential Arrhenius
relaxation in the viscosity/relaxation versus temperature plot. A study has shown that the
fragile amorphous solid at temperature just above Tg would have a relaxation time
decrease by one magnitude for every 3 °C temperature rise while for strong amorphous
solid, 33 °C temperature rise is needed to achieve the same kind of effect (Slade and
Levine, 1991). It is worth pointing out that most pharmaceutical amorphous compounds
exhibit moderately fragile to fragile behaviour (Crowley and Zografi, 2001).
The non-Arrhenius temperature dependence of properties of the fragile glasses above Tg
can be described by the Vogel-Tammann-Fulcher (VTF) equation:
r = Tq exp(— —— ) Equation 1.8T — 7L
where relaxation time t can also be replaced by viscosity rj, tq represent the shortest
possible relaxation time, 5 is a material parameter related to its fragility, and 7^ is the
temperature of infinite relaxation time. The empirical William-Landel-Ferry (WLF)
equation is usually used to describe relaxation times or viscosity in polymers and it is
mathematically equivalent to the VTF equation:
log(— ) = -----— ------ — Equation 1.9Q + ( T - T )
where r/t and t/(g are related to the viscosity of the glass at the experimental and glass
transition temperatures. For polymers with TJTg ~ 3/2, the constants Cj and Q are
17.44 and 51.6 respectively, which are usually referred to as “universal” constants
(Slade and Levine, 1991).
A representative scheme indicating the relaxation time and viscosity for the strong and
fragile glasses is shown in Figure 1.6. It shows the significant meaning of Tg to the
21

Chapter 1 Introduction
molecular mobility of a glass solid because it acts as a dividing line for high and low
mobility of the glass. According to this, some studies proposed that a temperature at
7^-50 °C would be an ideal storage condition for most fragile glasses because their
molecular mobility will be greatly reduce at this point. Therefore, a high Tg will be
always preferred for the stability of an amorphous solid. Another thermodynamic
temperature for the storage of an amorphous solid is the Kauzmann temperature which
is also defined as the zero mobility temperature T q. At this temperature, the
configurational entropy of the amorphous solid would reach zero and its total entropy
would approach that of a crystal. Theoretically, it should be the most ideal storage
temperature for amorphous solids.
strong glass
: .fragile glass j
T=T, 10
I‘■Cd
IÎb£o
Figure 1.6: Relaxation time and viscosity o f fragile or strong glasses as a function o f
temperature relative to Tg (adapted from van Drooge, 2006).
22

Chapter 1 Introduction
1.4.4 Plasticisation effect of amorphous solids
J20
3 I«
280
0 1 2 3
455
445
435
425gH415
38520 40 60 80 100
W e ig h t •/. w a te r W e ig h t V .PV P
Figure 1.7: Tg of mixtures o f two components (M) in different weight percentages: a)
the Tg of amorphous indometacin as a function of the percentage o f water (Andronis et
ai, 1997); b) the Tg of amorphous sucrose as a function of the percentage o f PVP
(Taylor and Zografi, 1998). The solid lines represent the theoretical prediction of Tg
based on the Gordon-Taylor equation.
Amorphous solids, in most cases, would not appear alone; they always exist together
with other components. The simplest example is that after an amorphous solid is stored
in a humidified condition, the water sorbed to the solid would make the system become
a multi-component system. Therefore, a question frequently asked in pharmaceutical
research is whether the additional components affect the structures and thermodynamics,
and if they cause any other unpredicted changes to an amorphous solid (Craig et al.,
1999; Yu, 2001). The glass transition temperature, as the most important characteristic
parameter for amorphous solids, would be the main concern in this question. Small
molecules such as water, methanol, ethanol can increase the molecular mobility (or
viscosity) of an amorphous solid (like the effect of a lubricant) when they are mixed
together, and as a result, the Tg of the solid would be lowered. The extent of the lowered
Tg would depend on the concentration of the components. Figure 1.7a shows a very
good example of the Tg of amorphous indometacin with different amount of water
23

Chapter 1 Introduction
(w/w). In contrast, if the amorphous solid is mixed with another component which has a
higher Tg (usually a polymer with high molecular weight), the Tg of the solid is
increased and this phenomenon is called anti-plasticisation. Figure 1.7b shows the effect
of high molecular weight polymer, polyvinylpyrrolidone (PVP), on the Tg of a
disaccharide, trehalose (Taylor and Zografi, 1998).
The Gordon-Taylor equation, which is based on free volume theory, was proposed to
predict the value of a binary mixture (Gordon and Taylor, 1952):
Equation 1.10
where Tgi and Tg2 are the glass transition of the two components individually (pi and (p2
are their volume fractions. The Gordon-Taylor equation is based on the assumption that
no interaction between the two components exists and it can be modified into the
following equation:
+ Equation 1.11
where:
K = ■ Equation 1.12
The constant K is related to the free volume of the two components, which can be
calculated basing on the Simha Boyer rule (Simha and Boyer, 1962). The parameter p is
the density of each component and it is in the unit of kg/m^. It is deemed that any
deviation of the experimental data from the line predicted by the Gordon-Taylor
equation is a sign of non-ideal mixing between the two components (Craig et al, 1999).
24

Chapter 1 Introduction
In a study conducted by Taylor and Zografi (1998), it was found that a negative
deviation in Tg occurred because the intramolecular hydrogen bond among the
individual component was more favoured than the intermolecular one between the two
components. In another study (Patterson et al, 2007), a positive deviation of Tg was
observed when two components form strong intermolecular hydrogen bonding, while
the individual component did not have enough intramolecular interaction tendency.
1.4.5 Crystal nucléation and growth
As long as stable crystalline forms exist, all amorphous solids would eventually
crystallise when cooled below the melting temperature because of the thermodynamic
metastability of the amorphous state. The first step in crystallisation involves nucléation.
The formation of nuclei is not well understood but could be related to dust, impurities or
small agglomerates of molecules of the compound normally a few nanometers in size
(Bym et a l, 1999). The onset of crystallisation is governed by the formation of nuclei
and once the nucléation barrier is crossed, the amorphous system is physically unstable
since the system is on its direction to the more stable crystalline state, which is
recognised as crystal growth. During crystal growth, small crystals are formed followed
by gradual incorporation of nuclei to form larger crystals. Both nucléation and crystal
growth together govern the physical stability of the amorphous solids (Bhugra and Pikal,
2008).
The tendency for an amorphous solid to crystallise in an experimental time scale is
determined by the characteristic time t/ which is related to the time required for a given
volume fraction of amorphous state to crystallise at a constant temperature after a rapid
cooling. If the effect of viscosity is neglected, when t; increases, the probability of a
critical nucleus formation decreases, and t/ decreases exponentially with decreasing
temperature. However, in reality, viscosity would slow down nucléation because high
viscosity would make the aggregation of nuclei become difficult. Hence, Ty is also
dependant on T2, the average time needed for molecules to rearrange in the glass state
and it is a representative of the molecular mobility. The schematic relationship between
25

Chapter 1 Introduction
T} and T2 is shown in Figure 1.8. A faster nucléation rate happens at lower temperature
while high molecular mobility is achieved at elevated temperatures. Therefore, the
maximum crystallisation rate lies between Tg and Tm, at a point where the nucléation
rate equals the molecular mobility rate (Salekigerhardt and Zografi, 1994). This is why
normally in a DSC scan, the crystallisation exotherm happens between the Tg and Tm.
1(H
-
T.B
1
T T.8
Figure 1,8: Schematic o f the relationship between tj and T2 a) system not taken into
account o f viscous effects and b) realistic system with the effects of viscosity (adapted
from Angell, 1988).
1.4.6 Characterisation techniques for amorphous solids
When a liquid is cooled into the rubbery or glassy state, a multitude of physical
properties of the material change including viscosity, density, heat capacity. X-ray
diffraction and diffusion behaviour (Hancock and Zografi, 1997). Therefore, techniques
which can measure these property changes are capable of detecting the presence of the
amorphous state. Some of the most commonly used techniques are:
1. Diffraction techniques are probably the most commonly used techniques for
amorphous state determination. Because the lack of long-range three-dimensional
molecular order of the amorphous state, its irregular diffraction of electromagnetic
radiation can be compared to that of the crystalline state which usually show sharp
26

Chapter 1 Introduction
diffraction peaks. There are conventional, small-angle and wide angle X-ray
powder diffraction (XRPD) techniques available depending on the purpose of the
measurements (Hancock and Zografi, 1997).
2. Spectroscopic techniques such as nuclear magnetic resonance, Raman, infrared,
near infrared and electron spin resonance are useful for the characterisation of
amorphous systems because of their high structural resolution.
3. Differential scanning calorimetry is a very powerful technique for amorphous state
characterisation (Kerc and Srcic, 1995). During a DSC measurement, samples are
heated using a constant heating rate, and thermal events can be detected. These
thermal events include glass to rubber transition, crystallisation, melting or
degradation. In recent years, the development of Hyper-DSC (Saunders et al., 2004)
and modulated-temperature DSC (Craig et a l, 2000) have helped to make the
determination and quantification of amorphous contents more sensitive and
accurate.
4. Isothermal microcalorimetry is useful to measure the crystallisation energy of
amorphous materials as well as some other phase transitions and thermal
decompositions. In an isothermal microcalorimetry experiment, samples are held at
a constant temperature and any heat produced or absorbed by them is measured as a
function of time (Gaisford and Buckton, 2001). It is different to the other
calorimetry method, DSC, which measures the heat-flow as a function of
temperature
5. Solution calorimetry works on the basis that the heat of solution is different for the
crystalline and the amorphous states of a sample (Buckton and Darcy, 1999). The
dissolution of crystalline materials is usually endothermie while that of the
amorphous ones is exothermic.
6. Water vapour sorption is also a useful technique for amorphous content
determination. The amorphous and crystalline materials usually have different
water uptake patterns. Many amorphous materials are able to crystallise after
sorbing a criticial amount of water because the sorbed water can help to lower their
Tg and facilitate the crystallisation (Buckton and Darcy, 1999). If it is necessary,
27

Chapter 1 Introduction
organic solvents such as methanol, ethanol etc. can be used instead of water to
trigger the crystallisation.
7. Specific volumes of the rubber and glass states are different, which could be
reflected by the density values. Though accurate measurements of volume or
density are difficult, gas or liquid displacement pycnometry can be used to measure
the density of materials and quantify the amorphous contents (Salekigerhardt et a l ,
1994).
In some cases, bulk analytical techniques such as DSC, XRPD or Isothermal
microcalorimetry might not be useful if the amorphous content is mainly located at the
surface of a solid. Therefore, techniques such as inverse gas chromatography (Newell et
al, 2001), microthermal anaylsis (Craig et al, 2002), atomic force microscopy (Ward et
al, 2005) and Raman mapping (Patterson et al, 2007) are all very useful for surface
amorphous contents qualification or quantification.
28

Chapter 1 Introduction
1.5 Solid dispersions for drug delivery
As mentioned previously in section 1.3, formation of salts, particle size reduction and
other methods are able to improve the bioavailability of poorly soluble drugs, but there
are practical limitations for these techniques. Salt formation is only possible for some
weakly acidic or weakly basic drugs (Serajuddin, 1999; Karavas et a l, 2006). In some
cases, the salts can not increase the dissolution rate because of the reconversion into the
respective acid or base forms due to hydrolysis. A major disadvantage of the salt
formation method is that the newly formed salt might represent a new chemical entity
which requires additional clinical trials. As far as particle size reduction is concerned,
there is a practical limit to the size that can be achieved. Moreover, if the particle size is
too small, the powders might become tacky and form agglomerates, which might
jeopardise the dissolution property of the drug in some cases.
Solid dispersions, first developed and prepared by Sekiguchi and Obi (1961), are a
useful method which can overcome the above-mentioned limitations, they are currently
one of the most promising strategies for the enhancement of the oral bioavailability of
poorly water-soluble drugs. Chiou and Riegelman (1971) defined a solid dispersion as a
solid matrix consisting of at least two components: generally a hydrophilic carrier and a
hydrophobic drug. The carrier can be either crystalline or amorphous and the drug can
be dispersed molecularly, in amorphous particles (clusters) or in crystalline particles.
The dissolution advantages of solid dispersions include: 1) reduced particle size which
could be as small as molecular level giving rise to a high surface area; 2) improved
wettability by the use of a hydrophilic carrier; 3) higher porosity which favours a rapid
drug release; and 4) drugs in amorphous state which have a higher apparent solubility
compared to their crystalline forms. Moreover, the use of solid dispersions can help to
prevent recrystallisation of the amorphous drugs. The stability advantages of solid
dispersions will be explained in section 1.5.3.
29

Chapter 1 Introduction
1.5.1 Classifications of solid dispersions
After nearly 50 years of continuing research and development, many solid dispersion
formulations have been prepared. According to the type of the carriers used, molecular
arrangements and addition of surfactants or not, there are three generations of solid
dispersions classified (Figure 1.9).
Solid dispersions
First generation Second generation Third generation
lixture of surfactants and polymers .
Crystalline carriers SurfactantsPolymeric carriers
Mixture of polymers
Figure 1,9: Classification o f three generations o f solid dispersions (adapted from
Vasconcelos et al, 2007).
The first generation of solid dispersions is the ones prepared using crystalline carriers,
and in the solid dispersions, at least one of the components (drug and carrier) exists in
crystalline form. The crystalline carriers used here include urea (Sekiguchi et al, 1964)
and sugars (Kanig, 1964). The best example of the first generation solid dispersion is
the eutectic mixture prepared by Sekiguchi and Obi (1961), the first solid dispersion
prepared in the literature. In the study, sulphathiazole and urea were melted together at a
temperature above the eutectic point and then cooled in an ice bath. The dispersed drugs
were trapped within the carrier matrix in the resultant solid eutectic, which was then
milled to reduce the particle size. A eutectic mixture usually contains two crystalline
materials and it has a melting point lower than that for any other ratio of mixtures of the
30

Chapter 1 Introduction
same materials. Later, some other solid dispersion systems were developed by preparing
solid solutions through molecular dispersions instead of eutectic mixtures (Kanig, 1964;
Chiou and Riegelman, 1969). These solid dispersions also fall into the first generation
category because they appeared in crystalline states.
The disadvantage of forming crystalline solid dispersions is that it makes the dissolution
of drug slower than when in the amorphous state. Therefore, the second generation of
solid dispersions appeared, which contain amorphous drugs and carriers. These kinds of
solid dispersions are the most commonly used nowadays. The carriers used here are
mostly polymeric, such as ethyl cellulose, polyvinylpyrrolidone, polyethyleneglycols,
hydroxypropylmethyl cellulose and so forth. Depending on the molecular arrangement
between the drug and carriers, the second generation solid dispersions could be divided
into solid solution, solid suspension or a mixture of both. The differences among the
three sub-groups are detailed here below:
1. In a solid solution, the drug and carrier are totally miscible (soluble) resulting as a
homogeneous one phase system, which means that the crystalline drug is
completely dissolved into the carriers.
2. In a solid suspension, the carrier and drug have very limited solubility. The system
is still amorphous but the drug and carrier do not form a homogeneous structure,
which means it is a two-phase system.
3. The third type system is a mixture of solid solution and solid suspension. A
heterogeneous structure occurs as the drug is both dissolved and suspended in the
carrier.
Compared to the first generation of solid dispersion, the second generation provides a
better dissolution of drug since the drug particle size can be reduced to nearly a
molecular level and the drug can exist in its amorphous form.
Recently, a third generation of solid dispersions has been developed by using a carrier
31

Chapter 1 Introduction
which has surface activity or self-emulsifying properties. The solid dispersions contain
either a surfactant carrier or both polymeric and surfactant carriers. It was found that
these types of systems could help to improve the bioavailability of poorly-soluble drug
significantly and at the same time help to improve the stability of the drug for a long
period of time (Dannenfelser et al, 2004).
There is also another way to classify solid dispersions based on the miscibility between
the drug and carrier. Accordingly, Augsburger and Hoag (2008) have broadly divided
solid dispersions into two categories: solid dispersion and solid solution. Despite the
general meaning of solid dispersion described above, herein, solid dispersion also refers
to the system that amorphous drug is dispersed (immiscible) in the carrier matrix and
the system is usually distinguished by two separate Tg values of the drug and the carrier
respectively. Meanwhile, solid solution refers to the system that the amorphous drug is
miscible with the carrier and only one Tg exists for the system. Hence forth, this
classification of solid dispersions is applied in order to better distinguish the
molecularly dispersed solid dispersions to the others.
1.5.2 Preparation methods for solid dispersions
There are generally two main methods for the preparation of solid dispersions, one is
through the use of liquid phase such as melting and solvent methods (Serajuddin, 1999)
and the other one is through the solid phase such as milling (Patterson et a l , 2007).
1.5.2.1 Melting method
The melting method is widely used for preparing solid dispersions and some of the first
developed solid dispersions for pharmaceutical applications were prepared by this
method. Generally, in a melting process, drug and carrier are melted together and the
high molecular mobility of the components allows them to be incorporated into each
other. Cooling is usually followed to solidify the melted mixtures and the processes
include ice bath agitation, immersion in liquid nitrogen, stainless steel thin layer
spreading followed by a cold draught, spreading on plates with dry ice and so forth.
32

Chapter 1 Introduction
Pulverisation is often needed to break down the cake into small particles after cooling.
However, there are some significant drawbacks which might limit the application of the
melting method. Firstly, degradation can happen to some drugs and carriers during
heating to temperatures needed to melt them. Secondly, incomplete miscibility between
drug and carrier may occur because of the high viscosity of some carriers in the molten
state. Therefore, some modified melting methods such as hot-stage extrusion, have been
developed in order to avoid these problems (Chokshi et a l, 2005). In this approach, the
carrier and drug used are firstly heated together to the melting temperature or a
temperature lower than that for a short period of time, and then extrusion at high
rotational speed is followed. Finally, the resulting materials are cooled at room
temperature and milled. In some cases, the use of carbon dioxide as a plasticiser can
greatly reduce the heating temperature which makes this method even more useful to
thermosensitive compounds.
1.5.2.2 Solvent method
In the solvent method, drug and carrier are dissolved in a solvent (usually volatile
organic solvents) and then the solvent is removed leading to the production of solid
dispersions. Solvent methods are very useful for thermosensitive compounds because
the solvent evaporation usually occurs at a low temperature. There are many different
types of solvent methods which are determined by the solvent removal process, such as
vacuum drying, heating on a hot plate, slow evaporation of the solvent at low
temperature, the use of a rotary evaporator, use of nitrogen, spray drying, freeze drying
and the use of supercritical fluids. Among these methods, spray drying and freeze
drying are probably the most commonly used. In a spray drying process, the carrier and
drug are dissolved or suspended in a certain solvent and then through an atomiser, the
solution is sprayed into very small droplets which can be dried easily using a stream of
heated air flow (van Drooge et al, 2006). During freeze drying, the drug and carrier are
dissolved in a common solvent followed by immersion in liquid nitrogen for freezing.
Then the frozen samples are lyophilised. Vacuum drying is normally needed in order to
33

Chapter 1 Introduction
remove the solvent thoroughly. The use of super critical fluids, usually carbon dioxide,
has been receiving more and more attention recently (Won et a l , 2005). Its advantages
include reduced particle size and residual solvent content, disappearance of any
degradation and high product yield (Majerik et a l, 2007). The co-precipitation method
(Huang et a l , 2006) and spin-coated films (Konno and Taylor, 2006) are also two very
useful solvent methods for preparation of solid dispersions. The limitation regarding the
solvent methods is the use of organic solvents which increases the preparation cost and
leads to great risk to the environment.
1.5.2.3 Ball milling method
Ball milling differs to the melting and solvent methods in that solid dispersions of drug
and carrier are prepared in the solid state. This method has been widely used to make
the amorphous phase (Willart and Descamps, 2008). During milling, strong mechanical
forces occur which can help to facilitate the incorporation of drug and carrier (Gupta et
al, 2003). Heat might be generated in the local collision region between the balls and
the wall of the pot, which could help to dissolve the drug into a carrier with good
miscibility (Patterson et a l, 2007). Studies have shown that solid solutions can be made
by using high energy milling approaches such as planetary ball milling (Patterson et a l ,
2007). Advantages of ball milling to prepare solid dispersions include its suitability for
thermosensitive materials and its ease in handling avoiding the use of large amount of
solvents. However, compared to melting and solvent methods, ball milling might be
difficult to scale up. Prolonged milling might also lead to potential degradation of the
materials.
1.5.3 Stability of solid dispersions
A critical factor to maintaining the dissolution properties of a solid dispersion after
storage is to prevent the recrystallisation of the amorphous drug. As explained above,
the amorphous drug is thermodynamically unstable and it has the tendency to
recrystallise into the stable form. One important reason for the preparation of a solid
dispersion is to reduce the crystallisation rate of the amorphous drug by compounding it
34

Chapter 1 Introduction
with a carrier. However, forming a solid dispersion does not mean that the drug will
inevitably stay amorphous forever. The drug in the carrier matrix may still have the
tendency to recrystallise if it is stored for a certain period of time. Figure 1.10 shows the
physical changes during crystallisation of a solid dispersion in which the drug is
molecularly dispersed. Molecular mobility is the governing factor that influences the
rate that the crystals form in the solid dispersion. If the molecular mobility is lowered,
the time needed for the drug molecules to diffuse back together and start to form
crystals is shortened. A useful way to reduce the molecular mobility of the drug is to
increase its Tg by compounding it with a high Tg carrier through the anti-plasticisation
approach.
O _
C/ U ^
drug molecularly dispersed in carrier matrix
drug partially crystallised in the carrier matrix
diffusion
>
amorphous state of drug in carrier matrix
crystallisation
drug completely crystallised in carrier matrix
Figure 1.10: Different stages of drug molecules in the carrier matrix of solid
dispersions during crystallisation.
There are some other issues which are important for reducing the molecular mobility or
keeping the drug molecules separate. A high molecular weight carrier can help to restrict
35
Chapter 1 Introduction
the molecular motions of the drug because the free volume of the solid dispersion is
smaller (Kaushal et al, 2004). Also, a high carrier ratio is important because the
diffusion distance for separate drug molecules getting back together is larger.
Furthermore, when the Tg of the carrier is higher than that of the drug, a higher carrier
content can help to increase the Tg of the solid dispersion further according to the
Gordon-Taylor equation. Higher carrier content increases the chance of interaction
between the drug and carrier molecules and also minimise the risk of the drug exceeding
the solid solubility (Vasanthavada et al, 2004). Carriers which can help to reduce the
water uptake are also favored because plasticisation of Tg by water can be avoided or at
least minimised (Augsburger and Hoag, 2008).
Compared to other types of solid dispersions in which clusters of drug molecules exist,
solid solutions can be considered superior in terms of stability. This is because for this
type of solid dispersions, an extra step of diffusion is needed before nucléation happens
(Figure 1.10). Therefore, a good miscibility between a drug and a carrier can, in many
respects, help to increase the stability of the solid dispersion. However, sometimes, high
Tg and good miscibility might not be enough to guarantee a good stability (Al-Obaidi,
2007). A strong drug-carrier intermolecular interaction is also needed (Matsumoto and
Zografi, 1999). There are many examples relating the drug-carrier interaction to the
stability of a solid dispersion (Broman et a l, 2001; Forster et a l, 2001). The extent and
type of interactions can control the dissolution, phase separation and miscibility of the
solid dispersion. Furthermore, strong interactions can help to increase the Tg of the solid
dispersion (Khougaz and Clas, 2000), which as a result leads to an increased stability.
36

Chapter 1 Introduction
1.6 Surface properties of solids
The surface properties of solids can be affected by a consequence of physical
manipulation as well as the chemical structure (Buckton, 1995). The change of size,
crystal habit, polymorphic form, hydrate or solvate form, degree of crystallinity and
introduction of impurities can all alter the surface of a solid. The extent of crystallinity
at the surface of a solid is probably the most important factor as far as variability in
solid surface properties is concerned.
When the surface of a solid changes, the way the solid interacts with other phases
(mostly liquid or solid phase in pharmaceutical areas) changes as a result. These
interactions include sorption of moisture, wetting and spreading of a liquid over the
solids, dissolution, film coating, suspension formation, tabletting, flowability,
solid-solid blending, and so forth. For example, by changing the surface of the materials
used in a dry powder inhaler system, the inter-particulate interactions (both cohesion
and adhesion) of the materials can be altered and, thus, the performance of the system
can be adjusted (Tong et a l, 2006). In another example, since the cohesive strength of
interaction of colloidal silicon dioxide (silica, 311.5 MPa) is lower than that of
microcrystalline cellulose (MCC, 386.1 MPa), the surface of MCC can be manipulated
by adding silica on it to obstruct MCC-MCC bonding and lower the tablet strength
during compaction (van Veen et a l, 2005). The dissolution improvement of many
poorly soluble drugs in solid dispersions can be partly attributed to the increase of
surface area after size reduction and increase of wettability on the surface after
compounding with a hydrophilic carrier. Therefore, in many cases, the study of the
surface behaviour of a solid is important for pharmaceutical scientists to produce an
efficient formulation.
37

Chapter 1 Introduction
1.7 Aims of thesis
The main aim of this thesis was to study the effect of different preparation methods on
the physical properties, stability and dissolution of solid dispersions. The specific
objectives were to investigate: 1) the effect of aging on the surface energy of the solid
dispersions; 2 ) differences between the surface and bulk molecular mobility of the solid
dispersions; 3) correlating physical stability of the solid dispersions and their molecular
mobility, fragility and zero mobility temperature; 4) the effect of aging on the water
sorption and dissolution characteristics of solid dispersions; 5) approaches to prepare
stable solid dispersions with rapid dissolution rate and finding the most suitable
preparation method depending on the miscibility of carriers used.
The following hypotheses were established and tested:
1. Relaxation is usually accompanied by a decrease of energy; therefore, the surface
energy of the solid dispersions decreases during physical aging. Furthermore, solid
dispersions prepared by different methods exhibit differences in surface energy
relaxation because the solid dispersions have different surface morphologies.
2. Since crystallisation is often initiated at the surface, the molecular mobility at the
surface of the solid dispersions is greater than that of the bulk.
3. Crystallisation rates below Tg are orders of magnitude lower than those found above,
but still very significant over the time scales employed during storage. Therefore,
zero mobility temperature. To can be a better indicator for prediction of the physical
stability compared to Tg. When the Tg are similar, the solid dispersion with a lower
To tends to crystallise first.
4. Interaction between the drug and carrier is vital for the physical stability of a solid
dispersion. The drug and carrier interaction happens more easily in the liquid state
than the solid state. The drug and carrier of the solid dispersions which prepared
through liquid state have a better interaction tendency than the ones prepared in the
solid state.
38

Cftapter2
Materials and metkods

Chapter 2 Materials and methods
In this chapter, the materials and methods used for the study and the instruments used
for characterisation of the samples will be explained in detail.
2.1 Materials
All materials were used as received, unless otherwise stated.
Material Grade and supplier
Indometacin Tokyo Kasei
Polyvinylpyrrolidone (PVP) K30, BSFE
Hydroxypropyl methylcellulose acetate
succinate (HPMCAS)AS-LG, Shin-etsu
Poly[N-(2-hydroxypropyl)methacrylate]
(PHPMA)Acros Organics
Microcrystalline cellulose (MCC) EMCOCEL® 50M, Mendell UK
Silicified microcrystalline cellulose
(SMCC )Prosolv® 50, JRS Pharma
Magnesium aluminum silicate (Neusilin) Neusilin® US2, Fuji Chemical
Liquid Nitrogen BOC
Lithium Chloride (LiCl) Analytical grade, Acros Organics
Sodium Chloride (NaCl) AnalaR®, BDH
Ethanol AnalaR®, BDH
AcetoneLaboratory reagent grade, Fisher
Scientific
Decane GPR™, BDH
non-hermetically sealed aluminum pans PerkinElmer
Table 2.1: List o f the materials used with grade and supplier.
40

Chapter 2 Materials and methods
2.1.1 Model drug: indometacin
OH
CH.
Cl
0
Figure 2,1: Chemical structure o f indometacin.
Indometacin (Figure 2.1) belongs to the non-steroidal anti-inflammatory drug (NSAIDs)
family which can be used to reduce inflammation, pain, and temperature. Indometacin is
usually applied in the treatment of osteoarthritis, acute gouty arthritis, rheumatoid
arthritis, and ankylosing spondylitis. Because of its action as a prostaglandin synthase
inhibitor, indometacin has also been used to delay premature labor. Indometacin is
classified as a class II drug because of its poor solubility (a water solubility of ~5 pg/L,
Hancock and Parks, 2000) and high permeability. Due to these characteristics, the
bioavailability of a class II drug can be improved by increasing its solubility or
dissolution rate using many formulation approaches such as: co-grinding with fine
porous silica particles (Watanabe et al, 2001); preparation of solid dispersion with PVP
by spray drying (Matsumoto and Zografi, 1999); mechanical mixing with crospovidone
followed by heating to temperatures below the melting point to form a solid dispersion
(Fujii et a l, 2005); and coprecipitating with PVP by solvent-free supercritical fluid
processing (Gong et a l, 2005).
Indometacin was chosen as a model drug for these studies because of its excellent glass
forming ability with a relatively low Tg and its well characterised crystallisation
tendency above or below its Tg (Telang et a l , 2009). Indometacin can exist in different
41
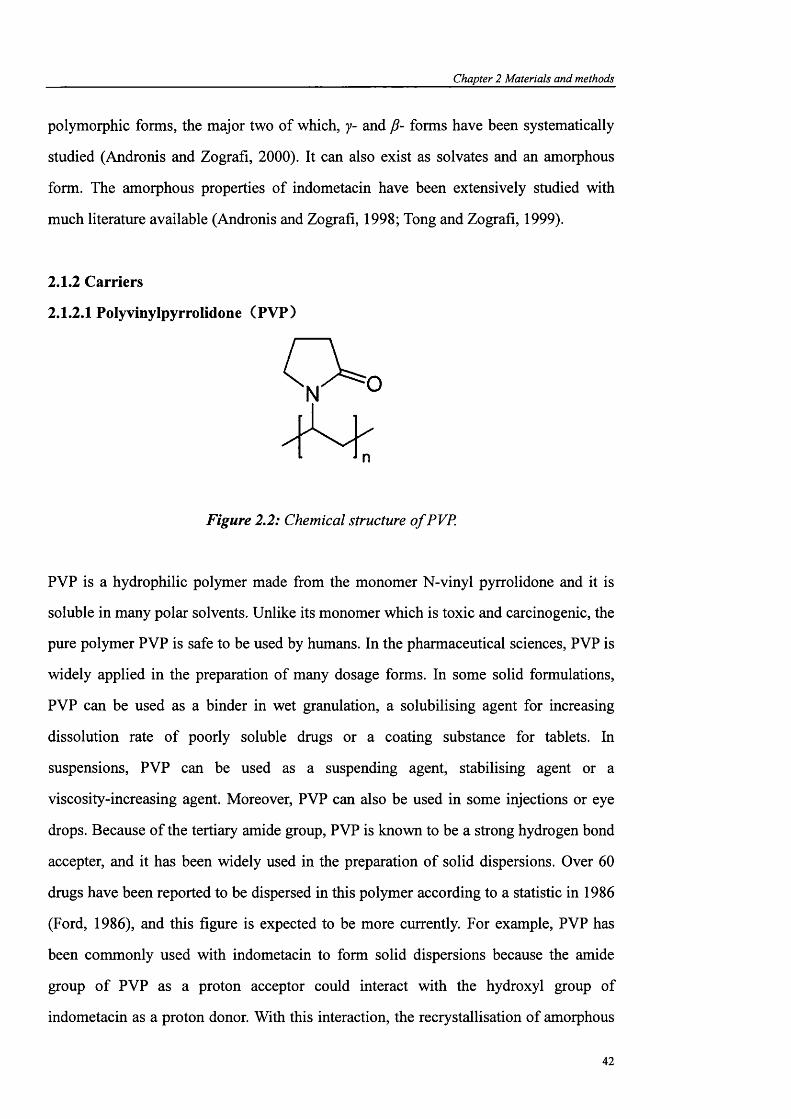
Chapter 2 Materials and methods
polymorphic forms, the major two of which, y- and P- forms have been systematically
studied (Andronis and Zografi, 2000). It can also exist as solvates and an amorphous
form. The amorphous properties of indometacin have been extensively studied with
much literature available (Andronis and Zografi, 1998; Tong and Zografi, 1999).
2.1.2 Carriers
2.1.2.1 Polyvinylpyrrolidone (PVP)
Figure 2.2: Chemical structure o f PVP.
PVP is a hydrophilic polymer made from the monomer N-vinyl pyrrolidone and it is
soluble in many polar solvents. Unlike its monomer which is toxic and carcinogenic, the
pure polymer PVP is safe to be used by humans. In the pharmaceutical sciences, PVP is
widely applied in the preparation of many dosage forms. In some solid formulations,
PVP can be used as a binder in wet granulation, a solubilising agent for increasing
dissolution rate of poorly soluble drugs or a coating substance for tablets. In
suspensions, PVP can be used as a suspending agent, stabilising agent or a
viscosity-increasing agent. Moreover, PVP can also be used in some injections or eye
drops. Because of the tertiary amide group, PVP is known to be a strong hydrogen bond
accepter, and it has been widely used in the preparation of solid dispersions. Over 60
drugs have been reported to be dispersed in this polymer according to a statistic in 1986
(Ford, 1986), and this figure is expected to be more currently. For example, PVP has
been commonly used with indometacin to form solid dispersions because the amide
group of PVP as a proton acceptor could interact with the hydroxyl group of
indometacin as a proton donor. With this interaction, the recrystallisation of amorphous
42

Chapter 2 Materials and methods
indometacin could be inhibited. Sekikawa et al (1978) have shown that the
crystallisation inhibition mechanism is related to the drug and polymer interaction level.
Because of its relative high Tg, PVP can act as an anti-plasticiser when compounding
with many compounds with a low Tg. In the case of indometacin which has a Tg at 42 °C,
its Tg can be greatly increased when compounded with PVP, hence reducing its
molecular mobility as well as the tendency to crystallise. The hydrophilic nature of the
polymer could also help to increase the wettability of a poorly soluble drug in a solid
dispersion.
2.1.2.2 Magnesium aluminum silicate (Neusilin)
O’\ / O ’
S i M g 2 + A P +
-Q \0 ’
Figure 2.3: Chemical structure o f Neusilin.
Magnesium aluminum silicate has a commercial name Neusilin and it is derived from
refined and purified natural clay. In the pharmaceutical area, Neusilin is used in tablets,
ointments and creams. When used alone or with other materials, Neusilin can act as a
suspending agent or stabiliser in some oral or external dosage forms. In cosmetics,
Neusilin can be used to thicken, emulsify and color cosmetics. Gupta et al (2002) have
tried to use three-component solid dispersion granules prepared by hot-melt granulation
including Neusilin as a surface adsorbent to enhance drug dissolution. It was found that
the drug dissolution rate of these solid dispersions increased on storage, accompanied
by evidence of hydrogen bonding between the drug and the surface of Neusilin, which
could act as a proton donor as well as an acceptor because of the surface silanol groups.
A later study has shown that after compounding with Neusilin, the conversion from
crystalline to amorphous states of four drugs was greatly reduced (Gupta et al, 2003).
43

Chapter 2 Materials and methods
2.1.2.3 Hydroxypropyl methylcellulose acetate succinate (HPMCAS)
Ok
— <>
OK
R II CHC(X:H>c c x :n .c H .c o o nC liX lK O lD C IU
CH.CHCH
O C (X lh
CH.-CHCH»
oc(xn.cn.C(X)H
Figure 2.4: Chemical structure o f HPMCAS.
HPMCAS is manufactured by introducing acetyl and succinoyl groups to the hydroxyl
groups of HPMC which comes from highly-purified pulp from natural trees. By
controlling the ratio of acetyl and succinoyl moieties, the dissolution behavior of
HPMCAS in buffers with different pH values could be manipulated. Because of this
special characteristic, HPMCAS can be used as an aqueous enteric coating material.
Tanno et al. (2004) have studied the application o f HPMCAS in a solid dispersion with
nifedipine, a poorly soluble drug. It was shown that HPMCAS was able to inerease the
dissolution rate of nifedipine while preventing its recrystallisation from a supersaturated
solution.
2.1.2.4 Other carriers
Silicified microcrystalline cellulose (SMCC), Poly [N-(2-hydroxypropyl)methacrylate]
(PHPMA) were also used in this study in the preparation of solid dispersions because of
their different charaeteristies. The dissolution and stability behaviour of drugs
compounding with these carrierss were studied and compared.
44

Chapter 2 Materials and methods
2.2 Methods
2.2.1 Preparation of amorphous indometacin
About 3 g of crystalline indometacin was evenly distributed into 10 pieces of aluminum
foil and then placed on a hot plate kept at 165 °C. Indometacin melted completely
within about 10-20 seconds. By visual observation, once indometacin was all melted
(this process was accompanied by a colour and phase change of the white powder to a
yellow clear liquid), the foils were placed on the surface of liquid N% for quench cooling.
Direct contact between the liquid and the melted liquid was always avoided in order
to reduce the moisture content in the final product. Once the liquid turned into a glassy
state, this sample was kept in a vacuumed desiccator over phosphorus pentoxide (P2O5)
at room temperature for moisture removal. The glassy sample was firstly dried in the
desiccator for one hour to allow the sample to return to room temperature (the sample
would tend to sorb more moisture at a lower temperature) and then taken out and
ground gently using a mortar and pestle. Ground powders were passed through a sieve
with different mesh sizes as required by the experiments and kept in the desiccator
drying for another one hour (the drying time was always fixed to control the thermal
history). The final product would be used directly or stored at -80 °C sealed with
parafilm until required.
2.2.2 Preparation of solid dispersions using ball milling
2.2.2.1 Introduction
For practical formulation purposes, milling has been frequently applied by
pharmaceutical manufacturers as an important method for reducing particle sizes. For
increasing the dissolution rate of a poorly soluble drug, milling can be used to decrease
the crystallinity of compound until amorphisation or formation of metastable
polymorphic forms occurs, which provide a higher energy for the drug to dissolve and
hence increasing its bioavailability (Hancock and Zografi, 1997). Some recent studies
have applied milling as a preparation method to form co-crystals (Chadwick et a l, 2007;
Karki et a l, 2007). Moreover, milling a drug with some carriers such as silicates could
help to enhance its physical properties and keep it stable during storage.
45

Chapter 2 Materials and methods
Ball milling is a milling method which has been used for over one hundred years.
Depending on the purpose of the milling, different scales of ball mills could be used; a
tumbler mill can be used for primarily large-scale industrial manufacturing with high
milling energy; an attrition mill can be used for small-industry scale size reduction
purpose (<100 kg); a shaker mill would be used for research-scale experiments which
require a relatively high milling energy and a planetary mill is the one used during this
study and it can provide medium to high milling energy for a sample size lower than
250 g.
Figure 2.5: Principal of a planetary mill (adaptedfrom manual of Pulverisette 5,
Fritsch).
The principal of a planetary mill is to generate maximum energy impact together with
friction between the balls and the wall by cascading the milling balls across the milling
pot and colliding to the opposite wall. To achieve this, the milling pots with materials
and balls inside rotate in one direction and the supporting disc which the pots are sitting
on would rotate in the opposite direction around its central axis mimicking the
revolution and rotation of the earth around the sun. A strong centrifugal force can be
produced allowing the milling materials and balls rotating inside the wall of the pot
46

Chapter 2 Materials and methods
(friction force is generated) until a certain point that they start to separate from the wall
and cascade across the pot at a high speed generating a huge impact force. Figure 2.5
shows a diagram of how a planetary mill works and the movement of the balls.
The milling effect could be greatly affected by many milling parameters (Table 2.2). For
a planetary mill, the milling speed which means the relative speeds of pot rotation to
disk revolution is a major concern for many scientific researchers (Watanabe, 1999; Mio
g/ a/., 2 0 0 2 ).
PotMilling
balls
Milling
samples
Milling
temperatureOthers
Affecting
parameters
Composition,
size, shape,
and surface
Number,
size,
material
(density
and
elasticity)
and surface
Weight,
shape, size
and
composition
Type of
Temperatures mill, speed
of pot, ball, of mill,
sample and amount of
collision filling, and
point milling
duration
Table 2.2: Parameters related to a milling process.
Rose (1957) have summarised the different stages of ball milling as the rotation speed
increases: distinct avalanche, continuous avalanche, cascading motion, cataracting
motion and centrifugal motion which happen in a sequence. The rotation speed that is
required to achieve the final stage, i.e. centrifugal motion, is called critical rotation
speed Ac which could be calculated using Equation 2.1 :
A,. =1
2/r ]l D — 2rEquation 2.1
47

Chapter 2 Materials and methods
where r is the radius of the balls, D is the inner diameter of the milling pot and g is a
constant related to gravity with an average magnitude of 9.81 m/s . Therefore, by
understanding the critical rotation speed, a suitable speed could be decided based on the
purpose of an experiment. For example, avalanche motion and centrifugal motion gives
more friction force while cascading motion and cataracting motion give more impact
force. Figure 2.6 shows how the balls behave in a milling pot depending on r, values
which represents the ratio of rotation-to-revolution speed.
f s ~ 2 .4
i%=2.6
r,=2.8
Figure 2,6: Ball motions during milling at different speed ratios (adapted from Mio et
a/., 2002/
The ball motions change from cascading (r, =2.4), into cataracting =2.6) then to
“slipping” (/-j =2.6) at the end. The specific impact energy changes following the change
of the ball motions with the cataracting motion giving the highest value. The specific
impact energy of balls, can be calculated using Equation 2.2:
48

Chapter 2 Materials and methods
n j=y^ — mv]. Equation 2.2
where Vy is the relative velocity between two colliding balls or a ball colliding against
the wall, m is a. ball’s mass, n is the number of collisions between a ball and other balls
or the wall per second, and W is the weight of the filling sample. could be related
with the size reduction and the rates of conversion to amorphous state.
During milling, the temperature and the atmosphere inside the pot can be controlled.
While 100% of conversion of indometacin into the amorphous state could not be
achieved at room temperature, indometacin became completely amorphous when being
milled at 4 °C in 4 hours (Otsuka et al, 1986) or cryogenic impact milling for 1 hour
(Crowley and Zografi, 2002). Adding some solvents to the powders during milling
might be able to make the size reduction more efficient due to the decrease of particles’
surface energy (Oguchi et al, 1995).
2.2.2.2 Experimental
A Fritsch pulverisette 5 planetary mill was used for preparing ball milled solid
dispersions. 5 g of powders with different drug to carrier ratios (by mass) were weighed
and loaded into a 250 mL ZrOz jar. The sample was then milled under different milling
conditions. Depending on the purpose of different experiments, the milling conditions
were altered by adjusting the milling time, the number of milling balls and/or the
rotation speed of the pot. These conditions including the sample compositions used will
be listed in the following relevant chapters.
2.2.3 Preparation of solid dispersions using melt quenching
2.2.3.1 Introduction
Melt quenching is one of the most widely used methods for the preparation of glassy
materials (Hancock and Zografi, 1997; Yu, 2001). When a crystalline material is heated,
the energy given by the heat will make the solid melt into liquid (if it doesn’t degrade)
49
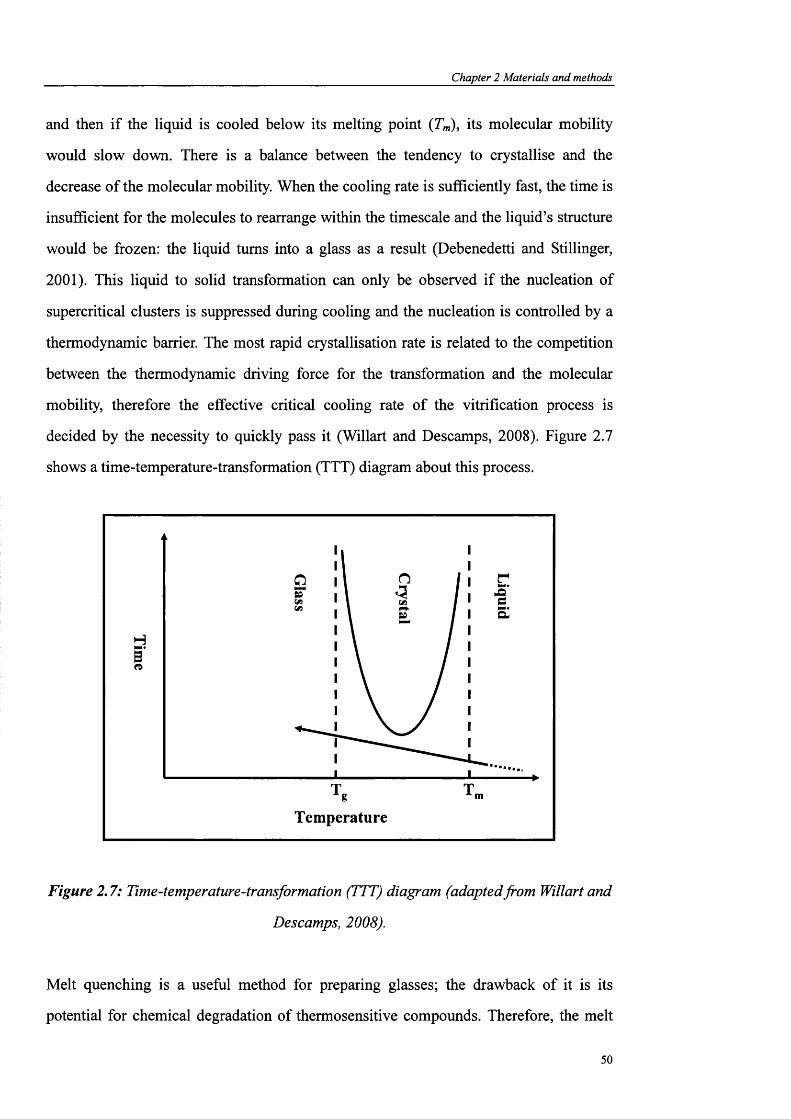
Chapter 2 Materials and methods
and then if the liquid is cooled below its melting point (7^), its molecular mobility
would slow down. There is a balance between the tendency to crystallise and the
decrease of the molecular mobility. When the cooling rate is sufficiently fast, the time is
insufficient for the molecules to rearrange within the timescale and the liquid’s structure
would be frozen: the liquid turns into a glass as a result (Debenedetti and Stillinger,
2001). This liquid to solid transformation can only be observed if the nucléation of
supercritical clusters is suppressed during cooling and the nucléation is controlled by a
thermodynamic barrier. The most rapid crystallisation rate is related to the competition
between the thermodynamic driving force for the transformation and the molecular
mobility, therefore the effective critical cooling rate of the vitrification process is
decided by the necessity to quickly pass it (Willart and Descamps, 2008). Figure 2.7
shows a time-temperature-transformation (TTT) diagram about this process.
T,Tg m
Temperature
Figure 2.7: Time-temperature-transformation (TTT) diagram (adapted from Willart and
Descamps, 2008).
Melt quenching is a useful method for preparing glasses; the drawback of it is its
potential for chemical degradation of thermosensitive compounds. Therefore, the melt
50

Chapter 2 Materials and methods
quenching conditions need to be carefully considered, because the longer the duration of
heating or the higher the heating temperature the greater the risk for a material to
degrade. There are only a few limited ways to prevent degradation happen such as:
introducing an inert gas to the heating process; the use of a twin-screw extruder to lower
the heating temperature because the shear force applied could make a drug and carrier to
form a solid dispersion at a lower temperature than the drug’s melting point (Nakamichi
et a l, 2002); Hasegawa et al (2005) used a closed melting method for the preparation
of a troglitazone and PVP solid dispersion by adding a plasticiser (water) to the physical
mixture, the Tg of PVP can be lowered and the solid dispersion can be prepared without
heating the sample over the melting point of the drug (Hasegawa et a l, 2005).
2.2.3.2 Experimental
For melt quenching, 3 g of indometacin and PVP (70%: 30%) physical mixtures were
weighed into a crucible and then placed in an oven which was preheated to 175 °C and
stabilised. The physical mixtures were heated for 15 minutes to allow complete melting
of the ingredients. In the time points of 5 and 10 minutes, the crucible was taken out and
the melted liquid was stirred using a small spatula. This was to help the components to
mix well and prevent phase separation. After heating, the crucible was immediately
placed on liquid N% for quench cooling. Direct contact between liquid N2 and the sample
was avoided to reduce the possibility of moisture sorption. A glassy amorphous solid
(appeared as a hard cake) was formed and it was kept in a vacuumed desiccator over
P 2 O 5 at room temperature for one hour for drying and to allow the cooled sample to
recover to room temperature (samples would tend to sorb more moisture at a lower
temperature). Grinding of the sample was followed using a pestle and mortar. The
ground powders were sieved through a 90 micron sieve and the powders was dried in
the desiccator (0% RH and room temperature) for another one hour to allow the same
total drying time as the ball milled and spray dried sample to ensure that thermal history
were the same.
51

Chapter 2 Materials and methods
2.2.4 Preparation of solid dispersions using spray drying
2.2.4.1 Introduction
Spray drying has been a commonly used technique in many industrial and laboratory
applications since the late 19»* century (Marshall and Seltzer, 1950). By definition,
spray drying is a process of drying a liquid feed by a hot drying medium, which is a one
step rapid process for the production of a dried product. The product can be powder,
granules or agglomerates depending on the physical and chemical properties of the feed
and the design of the spray dryer. The feed here can be a solution, colloid or suspension
(Masters, 1972).
Figure 2.8 shows a scheme of four different steps included in a spray drying operation: a)
atomisation of feed into a spray; b) spray-drying medium contact; c) drying of the spray
and d) removal of the dried product from the drying medium (Masters, 1972). Firstly,
the suitable feed (sludge, slurries or clear liquids with different viscosity) was prepared
by mixing and agitation, and then pumped through an atomiser device for atomisation
into a spray. The atomisers can be a rotary, single fluid, two-fluid or ultrasonic nozzle
design. Secondly, the spray and hot drying air make contact which includes mixing the
flow depending on the designs of the chamber. The spray and hot air can enter the
chamber in a co-current or counter-current flow: a co-current flow enables a lower
residence time of the particles and higher particle separation efficiency in the cyclone; a
counter-current flow enables a longer residence time of the particles in the chamber
giving them a better drying effect. Thirdly, drying of droplets happens immediately after
the contact of spray and dry medium. It contains two periods: in the first period of
drying, evaporation of moisture is at a constant rate because of diffusion of moisture
from the core of the droplet maintaining surface saturation; in the second period of
drying, critical point is reached when there is insufficient moisture to maintain saturated
conditions, hence a dried shell starts to form at the surface of the droplet. The
evaporation rate decreases because diffusion slows down caused by the increased
thickness of the surface dried shell. Finally, dried particles are removed from the drying
medium. There are two systems for this purpose. In system one, primary separation of
52

Chapter 2 Materials and methods
particles takes place at the base of the drying chamber (usually the coarser particles) and
then the residual particles (the finer particles) are collected in a separation equipment,
sometimes with bag filters. In system two, total removal of dried particles happens in
the separation equipment (Masters, 1972).
Feed Powder
Atomization Separation of dried product from air
rotary atomizer pressure nozzle design
product collected product collected from the chamber from a separation unit
Spray-air contact
Drying of spraycounter-current
CO- .current mixed
Figure 2.8: Different process stages included in a spray drying operation.
Spray drying is a complicated process in that there are many variables that need to be
carefully considered. A higher atomiser speed and nozzle pressure usually produce a
smaller spray droplet size; a higher feed viscosity and feeding rate produce a coarser
spray at fixed atomisation conditions; the drying rate and different feed properties
exhibit different final products, some will expand, some will collapse, fracture or
disintegrate while others retain a spherical shape or contract leading to denser particles
(Chidavaenzi et a l, 1997). The yield of spray drying increases with higher inlet
temperature, and as the inlet temperature increases, a maximum powder yield is reached
followed by a sharp decrease as the temperature of the chamber, or cyclone wall, go
over the sticky point causing powder to deposit on it. Decreasing the liquid pumping
53

Chapter 2 Materials and methods
rate, increasing the atomising air flow rate and the dry air flow rate can all help to
increase the yield (Maury et a l, 2005).
The spray drying technique can be utilised in food productions (such as instant coffee,
milk, and soups), household commodities and pharmaceuticals. The advantages of spray
drying are the effective control of certain product properties and quality values,
suitability for drying of some thermosensitive materials, capability of large-scale
production in a relatively economic cost and higher efficiency over other types of dryers.
While at the same time, there are some drawbacks of spray drying which need to be
borne in mind: products with low bulk densities are frequently obtained while often the
opposite property is required; a coarse product is required while the spray dryer is
designed for producing fine particles; and the materials to be spray dried need to be in a
form that can be pumped to the atomiser (Marshall and Seltzer, 1950).
Figure 2.9 shows the Niro SD MICRO™ spray drying unit that was used in this work.
The spray drying unit comprises of an air compressor, a nitrogen generator, an operating
control panel and a spray dryer. The nitrogen generator connected to the spray dryer can
provide nitrogen flow as the drying medium which allows the use of flammable feeds
for spray drying and this is an important feature of this system. Another advantage of
the spray dryer is that the fluid dynamics of the system mimics those of an industrial
scale plant; therefore it makes scale-up studies easier. Furthermore, the spray dryer
contains a two-fluid nozzle atomiser (pneumatic nozzle) which can be used for
production of fine particles with a size of 5-20 pm. This pneumatic nozzle can also
produce a liquid film of spray with a high velocity gas (Khalid, 2006).
54

Chapter 2 Materials and methods
i
Figure 2,9: A picture o f the Niro SD M ICRO^ spray drying unit which includes a) air
compressor, b) nitrogen generator, c) operating control panel and d) spray dryer.
55
Chapter 2 Materials and methods
2.2.4.2 Experimental
The GEA Niro SD MICRO™ was used for spray drying purpose. A Maxigas Nitrogen
generator was attached to the spray dryer which can provide dry nitrogen flow through
the spray dryer. 200 mL of different solvents were used to prepare drug and carrier
solutions. The feed concentration in the solution was 1.5 % or 2.0 % w/v and 30
minutes were allowed for the materials to dissolve completely into the solvent. The
solution was then spray dried using following parameters:
atomiser gas flow: 2.5 kg/h
chamber inlet flow: 30.0 kg/h
inlet temperature: 80 °C
feeding rate: 20%
Spray dried samples were collected from the collection bottle and cyclone and then
stored in a vacuumed desiccator over P2O5 at room temperature before further use. The
drug and carrier compositions, types of solvents and feed concentrations for different
experiments will be listed in the following relevant chapters.
2.2.5 Inverse gas chromatography (IGC)
2.2.5.1 Introduction
Inverse gas chromatography (IGC) is an inverted version of the gas chromatography
technique which was developed in the 1950s for the purpose of characterisation of
catalyst support materials such as activated carbon, silica or alumina (Kiselev and
Yashin, 1969). In contrast to the conventional analytical GC in which the solid phase is
the material with known physicochemical properties and the vapour phase is the sample
to be investigated, the roles of the phases in IGC are inverted.
IGC measurements can be conducted in two different techniques, pulse and frontal. In a
pulse measurement, a certain amount of probe molecules are injected to a carrier gas
(usually helium) and delivered to the powder sample in the column, then adsorption and
56

Chapter 2 Materials and methods
desorption occurs and the detector shows a peak indicating the clearance of the probe.
In a frontal method, continuous injection of probe molecular is made and the detector
would display a breakthrough curve instead of a single peak. A fast equilibration of
probe molecule adsorption is required for pulse technique while the frontal technique
can always achieve equilibration because of the continuous probe injection (Thielmann,
2004). Because the frontal method is independent of the retention, it is not discussed as
an IGC approach (Thielmann, 2004). The pulse method is the method used for this
study.
Column
LoopVapourGeneration
Oven
Detector
Hood
Cartier Gas
Figure 2.10: A schematic diagram o f an IGC instrument (adapted from Thielmann,
2004/
In an IGC pulse measurement, powder samples under investigation are loaded in an
empty column with glass wools on either end, followed by tapping of the column gently
for a certain period of time in order to eliminate unwanted hollows or cracks in the
powder body. The column is then conditioned in a column oven under a certain
temperature as requested (15-120 °C) and the relative humidity (0-90%) inside the
column is adjusted by a carrier gas which constantly flows through the column. A single
pulse of a polar (acetone, ethanol, chloroform etc.) or non-polar (decane, nonane, octane
etc.) vapour would be injected as a probe molecule and brought into the column by
57

Chapter 2 Materials and methods
helium to interact with the powders. The signal of the vapour can be detected by a flame
ionised detector (FID) and a thermal conductivity detector (TCD) would be used to
monitor the RH. Figure 2.10 shows a simple schematic of an IGC instrument.
It needs to be borne in mind that for the measurement of thermodynamic parameters, an
infinite dilution condition must be achieved. When the probe injected is in a very low
concentration, the uptake of the probe is independent of the surface coverage, and the
isotherm in this range is linear. This range is called the Henry region and it is also the
infinite dilution range. In this range, the interaction between the vapour phase molecule
and the solid phase predominantly happens on the solid’s high energy site. Therefore,
the retention volume of the probes would not be affected by the size and mass of the
samples.
Since the early 1990s, IGC has received more and more attention in the pharmaceutical
field and the numbers of publications are increasing in recent years (Buckton and Gill,
2007). In general, IGC can be applied in pharmaceutical science to measure isotherms,
surface free energy (the calculation process is discussed in Chapter 3), heat of sorption
and surface heterogeneity (Newell et al, 2001; Roubani-Kalantzopoulou, 2004). IGC
could also be used for some specific applications: IGC was proved to be capable to
study samples that contain small but differing levels of amorphous content and
differentiate them (Newell and Buckton, 2004). Therefore, IGC is a very suitable
technique for batch variability and routine materials characterisation. The surface
dispersive energy calculated using dispersive probes can be used as an index to predict
the batch and batch difference or stability on the surface of powders while the bulk
techniques could not show any change. On the other hand, some materials for which
surface dispersive energies show very similar values for different samples while with
known differences in functionality, their polar data are often different (Ticehurst et a l ,
1996). A very important advantage of IGC is controlling of the temperature and relative
humidity. For example, Surana et al (2003) studied the Tg of an amorphous
sucrose-PVP mixture by increasing the oven temperature. The retention volume of
58

Chapter 2 Materials and methods
decane deviated from linear when the sample was approaching its glass transition and
another deviation happened when it passed through the rubbery phase. IGC also enables
the study of plasticised Tg under a certain RH. In another case, for the first time,
Buckton et al. (2004) used a RH method to study the surface Tg of indometacin based
on the retention volume calculated by the center of decane peak and the center of the
peak mass. Because of the ability to detect the free energy level of a material based on
the interaction between a probe and the material’s surface, IGC could be used to study
the surface relaxation of amorphous materials. In Chapter 3, a novel method will be
developed to investigate the surface relaxation of amorphous solid dispersions by
detecting the decrease of free energy during relaxation measured by the drop of
retention volume of decane as a function of time.
2.2.S.2 Experimental
The IGC instrument used for this study was made by Surface Measurement Systems
(London, UK). 500-800 mg of powder samples were weighted accurately and loaded
into a pre-silanised glass column (internal diameter 3 mm, column length 30 cm)
followed by 15 minutes of tapping. Samples with this amount of mass were able to
reach infinite dilution condition. The packed column was placed in the column oven and
conditioned for 4 (for surface energy measurement and the oven temperature was 30 °C)
or 10 (for decane retention method and the oven temperature was 25 °C) hours in order
to eliminate any moisture depending on the samples under study. Then the non-polar or
polar probes with a concentration of 0.03 p/p® (p® is the saturated vapour pressure of the
liquid probe at the experimental temperature) was injected to the column. For the
measurement of surface dispersive energy, the non-polar probes decane, nonane, octane,
heptane, and hexane were used and for the measurement of KJKd values (A , acidic
parameter and Kd, basic parameter), the polar probes acetone, chloroform, ethanol and
ethyl acetate were used. For both of these experiments, the column over temperature
was set at 30 °C during probe injections. On the other hand, for the measurement of
surface relaxation by retention volume method, decane was continuously injected for up
to 24 or 48 hours and the column oven temperature was set as 50 °C. In all cases,
59

Chapter 2 Materials and methods
methane was used as an internal reference. All solvents used were of HPLC grade. The
IGC experiment was controlled by software SMS IGC controller VI.5 and data were
analysed using a SMS IGC analysis macros VI.2 (Surface Measurement Systems,
London, UK).
2.2.6 Differential scanning calorimetry (DSC)
2.2.6.1 Conventional DSC
Differential scanning calorimetry (DSC) is commonly used in the pharmaceutical field
for the characterisation of the physical and energetic properties of a compound, because
of its ability to provide an accurate, easy and quick measurement compared to other
techniques. Some examples of DSC application are detection of polymorphism,
characterisation of amorphous or crystalline materials, investigation of compatibility
between different components in a formulation, measurement of solid-solid solubility,
and investigation of reaction and decomposition kinetics. Basically, nearly all DSC
measurement involves the introduction of a temperature scan in a linear way or an
isothermal temperature programme and the detection of the change of heat flow (usually
presented in the unit of watt) as a function of time or temperature (Coleman and Craig,
1996).
There are two main kinds of differential thermal instruments, differential thermal
analysis which measures temperature difference between reference and sample pans,
and differential scanning calorimetry which measures the energy difference (Clas et al,
1999). Depending on the data acquisition method, DSC can be divided into two types:
heat flux DSC and power-compensated DSC.
In a heat flux DSC, there is only one furnace where both the sample and reference pans
are heated by the same source (a constantan thermoelectric) and the signal of
temperature change is converted to heat flow using Equation 2.3:
60

Chapter 2 Materials and methods
Ag =(T ,-T ,)
R.Equation: 2.3
where Q is heat, Ts is the sample temperature, Tr is the reference temperature and Rt is
the cell’s resistance.
In a power-compensated DSC, there are two individual furnaces for the sample and
reference pans and the temperature between them is always kept the same by
compensating the heat gain or lost during an exothermic or endothermie event to the
pans. The power used for compensation can be calculated using Equation 2.4:
dtEquation: 2.4
where P is power, R is the resistance of the heater, t is time and I is current used by the
heater. Figure 2.11 shows the schematic diagram of these two types of DSC.
Pt sensors
Dual heaters
a
Lid
Thermoelectric disc (constantan)
" Chromel disc
Alumel wire
Heating block
Chromel wire
Figure 2,11: Schematic diagrams o f a power-compensated DSC (a) and a heat flux
DSC (b) (adaptedfrom Clas et al, 1999).
61

Chapter 2 Materials and methods
2.2.6.2 Modulated temperature differential scanning calorimetry (MTDSC)
MTDSC is an extension of conventional DSC. In MTDSC, a modulation of temperature
is superimposed over the underlying linear heating or cooling temperature programme
to enable the separation of the total heat flow signal into the heat capacity component
and the kinetic component. The kinetic component can be obtained by the difference
between the total heat flow and the heat capacity component. This feature gives many
advantages to MTDSC such as: a higher resolution and sensitivity, an easier way to
detect a sample’s heat capacity, detection of some hidden phenomena, investigation of
initial crystallinity, and better discrimination of glass transitions or melting covered by
moisture evaporation or other event (Coleman and Craig, 1996). For example, Royall et
al. (1998) studied the Tg of saquinavir by MTDSC which is able to separate out the Tg
appearing in the reversing signal from enthalpy elaxation endotherm appeared in the
non-reversing signal providing a clear detection of Tg.
2.2.63 Hyper differential scanning calorimetry (Hyper DSC)
One drawback of the conventional DSC or MTDSC is their relatively slow heating rate
(usually 2, 5, 10, 20 °C/min) during a measurement and this is not desirable for
detecting polymorph behaviour of some substances. A slow heating rate might allow the
polymorphic to recrystallise to another polymorphic form (McGregor et al, 2004).
Therefore, a Hyper-DSC which usually scans a sample at 100-500 °C/min (some newer
models can even reach 1500 °C/min) is needed for this issue. The scanning rate is so
quick that any small change of sample can be inhibited. Another advantage of
Hyper-DSC is its higher detection sensitivity because of a larger heat flow per unit of
time due to its fast scanning rate. This feature can help the detection of small changes in
minor contents in a mixture such as a formulation easier and more accurate (Buckton et
al, 2006).
2.2.Ô.4 Experimental
A Pyris 1 DSC (PerkinElmer Instruments, Beaconsfield, UK) was used for the study,
which is connected to a cooling unit (Intracooler IIP, PerkinElmer Instruments) allowing
62

Chapter 2 Materials and methods
the sample conditioned at minimum -55 °C. Measurements were performed under a N2
gas purge at a flow rate of 20 mL/min (except for the fragility study, where a flow rate
of 40 mL/min was used). Calibration was carried out using pure indium, or indium and
decane together in the case of fragility study at the heating rate required by the studies.
Samples (around 5 mg) were accurately weighed into non-hermetically sealed pans. In a
conventional DSC study, a heating rate of 20 °C/min was used in the scan range from
-20-220 °C. In a Hyper-DSC measurement, 200 °C/min was used in the scan range from
-20-250 °C. Temperature modulated scans were also performed and the conditions were:
starting temperature: 0 °C, heating rate: 10 °C/min, step: 2 °C, isothermal time per step:
1 min and repeats: 50-100 times. Different DSC modes were used depending on the
purpose of the studies: detection of relaxation enthalpy, characterisation of samples,
detecting the Tg or measuring the fragility of amorphous samples.
2.2.7 X-ray powder diffraction (XRPD)
2.2.7.1 Introduction
X-ray powder diffraction can be efficiently used for determining the degree of
crystallinity of powders. The principle behind X-ray diffraction is that when an X-ray
beam is applied to the sample, interference bands can be detected. The angle at which
the interference bands can be detected depends on the wavelength used and the
geometry of the sample with respect to periodicities in the structure (Leuner and
Dressman, 2000). Figure 2.12 shows a simple diagram of an XRPD instrument. Every
crystalline substance has a unique pattern which is like a fingerprint. Therefore, XRPD
is very useful to detect a substance in a mixture in which the pattern is the overlap of the
individual pattern of each component.
63
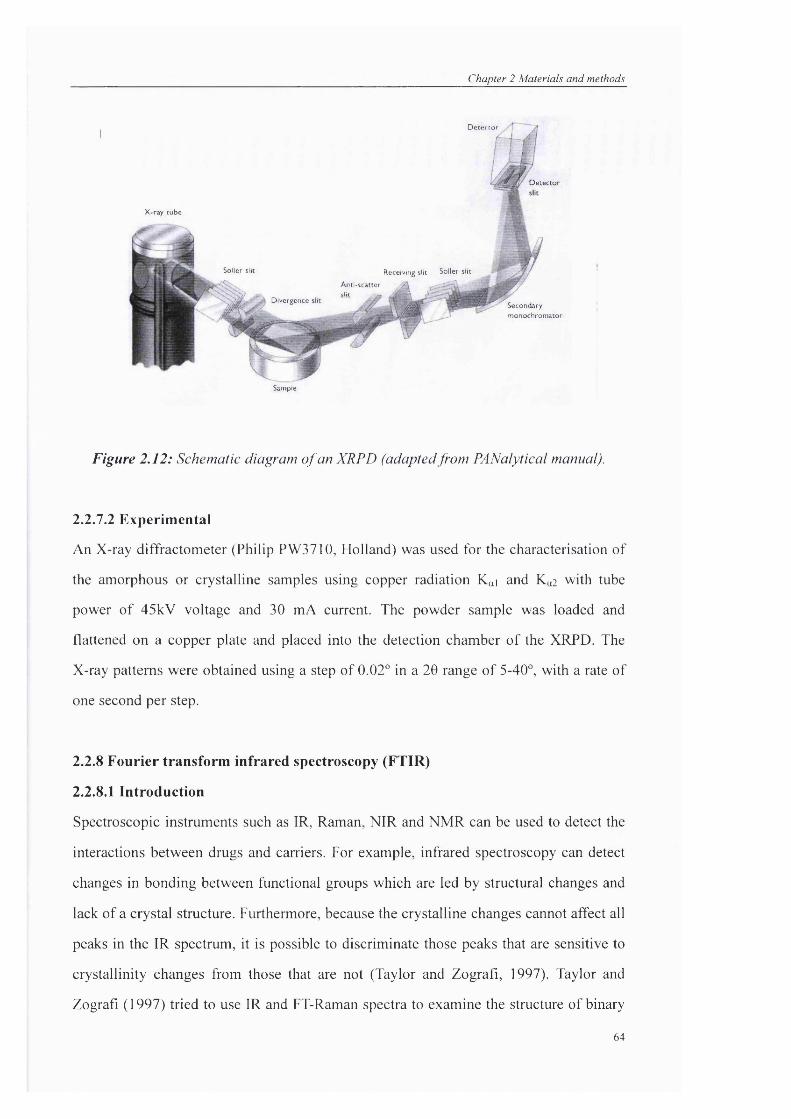
Chapter 2 Materials and methods
X -ray tu b e
Receiving slit Soller slit
A n ti-sca tte r«lif .. ^ z^.
Soller slit
D ivergence
D e te c to r
D e te c to
S econdarym o n o c h ro m a to r
Sample
Figure 2.12: Schematic diagram o f an XRPD (adapted from PANalytical manual).
1.1.1.1 Experimental
An X-ray diffractometer (Philip PW3710, Holland) was used for the characterisation of
the amorphous or crystalline samples using copper radiation Kai and K„2 with tube
power of 45kV voltage and 30 mA current. The powder sample was loaded and
flattened on a copper plate and placed into the detection chamber of the XRPD. The
X-ray patterns were obtained using a step of 0.02° in a 20 range of 5-40°, with a rate of
one second per step.
2.2.8 Fourier transform infrared spectroscopy (FTIR)
2.2.8.1 Introduction
Spectroscopic instruments such as IR, Raman, NIR and NMR can be used to detect the
interactions between drugs and carriers. For example, infrared spectroscopy can detect
changes in bonding between functional groups which are led by structural changes and
lack of a crystal structure. Furthermore, because the crystalline changes cannot affect all
peaks in the IR spectrum, it is possible to discriminate those peaks that are sensitive to
crystallinity changes from those that are not (Taylor and Zografi, 1997). Taylor and
Zografi ( 1997) tried to use IR and FT-Raman spectra to examine the structure of binary
64

Chapter 2 Materials and methods
amorphous mixtures of indometacin and PVP at the molecular level and it was found
that indometacin interacted with PVP in their solid dispersions through hydrogen bonds
formed between the drug hydroxyl and carrier carbonyl resulting in disruption of
indometacin dimers.
2.2.S.2 Experimental
FTIR was utilised in this study to investigate the interaction between the drug and
different carriers, and the amorphous state of the drug in the solid dispersions was also
confirmed by the spectra of FTIR. A FTIR (Avatar 360, Nicolet) was used and the
spectra were obtained over a spectral region from 4000 to 400 cm' with a resolution of
4 cm' for 32 scans. Each sample was examined in triplicate.
2.2.9 Other methods
2.2.9.1 Thermal gravimetric analysis (TGA)
A TGA (Perkin Elmer Instruments, Beaconfield, UK) was used to detect the moisture
level of the samples. About 10-20 mg of sample was used and scanned from 30-200 °C
at a heating rate of 20 °C/min. Nitrogen purge was applied at a flow rate of 20 mL/min.
2.2.9.2 Scanning electron microscopy (SEM)
All samples tested were manually dispersed onto a carbon tab adhered to an aluminum
stub using a micro-brush. Samples were gold-coated prior to viewing using a sputter
coater (Emitech K550X, Texas, USA) and scanned using a Phillips SEM (XL30,
Cambridge, UK) to study their morphology, Avith magnifications of 5 and 10 pm.The
acceleration voltage was 10-12kV.
65

CUdpter 3
Investigation of surface properties of soM soCutions during relwçation using inverse gas cfiromatograpfiy
Chapter 3 Investigation o f surface properties.
3.1 Introduction
The importance of the amorphous form in pharmaceutical products has been rapidly
gaining interest (Hancock and Zografi, 1997). Amorphous material can be produced by
many different ways such as milling, spray drying, freeze drying, and melt quenching.
The presence of an amorphous phase in a product can be expected or unexpected. If the
amorphous phase is unexpected (during preparation such as size reduction, granulation,
compression and so forth) the surface properties of the product might be significantly
altered leading to an undesirable performance. Newell et al. (2001a) have studied the
surface energy difference of 100% crystalline/amorphous lactose, physical mixture of
crystalline lactose (99%) and amorphous lactose (1%), and milled lactose with around
1% (w/w) of amorphous content. It was found that the milled lactose has a surface
energy close to the 100% amorphous lactose. According to the authors, this
phenomenon was due to the fact that amorphous content of the milled lactose is mainly
located at the surface. The surface of the milled lactose might cause difficulties in wet
granulation of micronised drugs and performance variability in micronised inhalation
products (Newell et a l, 2001a). This study demonstrates clearly how the unexpected
formation of an amorphous phase could sometimes be detrimental.
In many other cases amorphous content is generated deliberately. For example,
amorphous solid dispersions are prepared in order to achieve improved apparent
solubility and rapid dissolution rate of poorly soluble drugs. It is known that the surface
energy can greatly influence some fundamental issues of a system, such as dissolution
(Rowe, 1988, 1989). If the surface energy of a solid dispersion changes during storage,
the dissolution properties of the solid dispersion could be affected. Furthermore, a solid
dispersion can be applied in many administration routes and dosage forms. As such, it
has to be mixed with other excipients. For example, during capsule filling, tabletting
and preparation of dry powder inhalation, the solid dispersion might be mixed with
some other relevant compounds and excipients. Whenever a solid gets in contact with
another substance irrespective whether it is a solid or liquid, the surface energy of the
system immediately starts to affect the interaction. Therefore, it is very important to
67

Chapter 3 Investigation o f surface properties ...
study the surface energy of solid dispersions, especially during storage. It is known that
the amorphous state would have a different surface energy if it crystallised, but
understanding of the surface energy behaviour during relaxation (where the sample is
still amorphous) is limited. Hence further studies are necessary to understand this issue.
The hypothesis based in this chapter is: since relaxation is accompanied by a reduction
in energy, it is very likely that the surface energy of the solid dispersion would decrease
as a consequence of relaxation. On the other hand, it will also be interesting to
investigate if the change of surface energy could provide any information about the
molecular mobility at the surface, since molecular mobility is highly related to the
stability of an amorphous material. Herein, solid solutions of polyvinylpyrrolidone
(PVP) and indometacin were prepared using melt quenching and ball milling and
subjected to physical aging. The surface properties change during aging was monitored
using inverse gas chromatography (IGC). The use of IGC has been rapidly growing in
the pharmaceutical field. Its advantages over some other surface measuring methods
have been discussed in Chapter 2. Basically, IGC is a versatile technique for studying
influence of mechanical treatment on the surface of solid samples (York et al, 1998),
determination of surface (Buckton et a l, 2004) and bulk glass transition temperature
(Surana et a l, 2003), effect of relative humidity (RH) on the solid surface (Newell et al,
2001b), batch to batch surface variations (Ticehurst et a l, 1994) and so forth. IGC will
be used in this study to help better understand the surface properties of solid
dispersions.
3.2 Chapter outline
The outline of this chapter is 1) to prepare amorphous solid solutions of PVP and
indometacin by melt quenching and ball milling and characterise them using X-ray
powder diffraction (XRPD), differential scanning calorimetry (DSC) and Fourier
transform infrared (FTIR); 2) to study the change of dispersive surface free energy of
the solid solutions during aging; 3) to study the acid and base parameters of the solid
solution; and 4) to develop an efficient and convenient method for detecting the
molecular mobility at the surface of amorphous materials.
68

Chapter 3 Investigation o f surface properties...
3.3 Methods
3.3.1 Preparation of physical mixtures
20 g of powders with a ratio of 30% (PVP) to 70% (indometacin) were weighed
carefully into a glass bottle and mixed using a Turbula mixer for 15 min. These physical
mixtures were kept at room temperature in a desiccator together with silica gel until
further use for the preparation of solid dispersions.
3.3.2 Ball milling
5 g of indometacin and PVP powders with a ratio of 70%:30% was weighed carefully
into a milling pot. The weighing process was conducted in a glove bag with N] flowing
through to keep the relative humidity lower than 10% RH and the pot was wrapped with
parafilm before moving out from the glove bag to prevent moisture getting inside during
milling. The powders were then milled for 18 hours at 300 rpm to achieve complete
amorphous state conversion as described in Section 2.2.2. Afterward, the milled
powders were collected from the pot and passed through a 90 micron sieve to break
down any lumps in the glove bag and then kept in a vacuumed desiccator over
phosphorus pentoxide ( P 2 O 5 ) at room temperature for 2 hours to allow efficient drying.
The use of a glove bag through out the experiment was intending to lower the
potentiality of moisture sorption.
3.3.3 Melt quenching
Indometacin and PVP with a ratio of 70% and 30% were melt quenched using the
method described in Section 2.2.3.
3.3.4 Inverse gas chromatography (IGC)
IGC measurements were performed on the ball milled and melt quenched products
using the methods described in Section 2.2.5. These measurements were conducted to
study the dispersive surface energy, the acidic parameter Ka and basic parameter Kd,
and the decane retention volume change during aging of the products.
69

Chapter 3 Investigation o f surface properties...
3.3.5 Differential scanning calorimetry (DSC)
Differential scanning calorimetry was applied to confirm the amorphous state of the ball
milled and melt quenched products using the method described in Section 2.2.6
Calibration of DSC was conducted by measuring the melting temperature and heat of
fusion of pure indium. After calibration, around 5 mg of samples was weighed carefully
into a non-hermetically sealed pan. The sample was then heated at a heating rate of 20
°C from -20 to 220 °C under a N2 gas purge at a flow rate of 20 mL/min.
3.3.6 X-ray Powder Diffraction (XRPD)
X-ray powder diffractions were also performed according to the method described in
Section 2.2.7 in order to confirm the amorphous state of the products after ball milling
and melt quenching. Also, XRPD was used to monitor the amorphicity of the samples
after physical aging.
3.3.7 Fourier transform infrared spectroscopy (FTIR)
Fourier transform infrared spectroscopy was used to study the intermolecular
interactions between indometacin and PVP. The experimental condition used was
described in Section 2.2.8. Each sample was measured in triplicate.
3.3.8 Scanning electron microscopy (SEM)
The morphology of the samples was studied using scanning electron microscopy as
described in Section 2.2.9.
70

C h apter 3 Investigation o f surface p roperties ..
3.4 Results and discussion
3.4.1 Physical properties of the solid solutions
3.4.1.1 Melt quenched solid solutions
Indometacin is a white powder when it is in the crystalline form. After melt quenching
with PVP, indometacin turned into yellow indicating the presence of the amorphous
state. The change of color during crystalline-amorphous transition could be attributed to
the rearrangement of molecules in different forms. The drug to carrier ratio chosen here
is 70% to 30%. In this ratio the dimer form of indometacin is completely eliminated by
PVP and the molar ratio of indometacin to the monomer unit of PVP is close to 1:1,
which means the hydrogen bonding between the indometacin carboxyl and the PVP
carbonyl group is substantial (Matsumoto and Zografi, 1999). The surface morphology
of the solid solution was characterised by scanning electron microscopy (SEM) which
showed that the melt quenched particles have irregular shapes with a size around 10-20
pm (Figure 3.1). Complete formation of amorphous indometacin was achieved
according to the XRPD result, as the XRPD pattern (Figure 3.2) showed a halo shape
(which is typical for an amorphous material) and lack of any characteristic peak of
crystalline indometacin. Moreover, the DSC study has confirmed that indometacin was
in the amorphous form since no melting peak was observed during a conventional scan
of the sample (Figure 3.3).
a b
Figure 3.1: SEM images o f melt quenched indometacin: PVP (70%: 30%) solid solution
(a, 20 jum and b, 5 fim).
71

Chapter 3 Investigation o f surface properties.
4 0 0
3 5 0
3 0 0
. 2 5 0
I 2005
1 5 0
100
3 0 3 5 4 05 10 15 20 2 5P o s i t i o n [ ° 2 T h e t a ]
Figure 3,2: XRPD pattern o f melt quenched indometacin: PVP (70%: 30%) solid
solution.
S 7 0 ^ 6 5
-otS 5 0 > 4 5
Z 4 0 3 5
= 3 0
0 5 0 100 1 5 0 200T e m p e r a t u r e °C
Figure 3,3: Conventional DSC scan o f melt quenched indometacin: PVP (70%:30%)
solid solution.
3.4.1.2 Ball milled solid solutions
Ball milling is one of the commonly used methods for the preparation of amorphous
forms. However, some previous reports showed that it is difficult to achieve complete
crystalline to amorphous transition in the absence of any excipient (Patterson et al,
2007). Indometacin on its own is very difficult to be milled into a completely
amorphous form at room temperature. Figure 3.4 shows that after being milled
72

Chapter 3 Investigation o f surface properties...
continuously for 48 hours without any additive, indometacin still exhibited
characteristic peaks of its y-form, albeit with reduced peak intensities.
Position [°2 Theta]
Figure 3.4: XRPD patterns o f a) y-indometacin, b) melt quenched (amorphous)
indometacin and c) y-indometacin milled continuously for 48 hours.
Some studies have shown that high-energy milling is capable of producing solid
solutions (Boldyrev et a l, 1994) or form miscible drug-excipient regions (Friedrich et
al, 2005). The same ratio of indometacin and PVP as the melt quenched sample was
milled here in order to achieve complete amorphous form. In order to decide a suitable
milling time, the physical mixture was milled by a planetary mill and at the time points
of 0.5, 1.5, 3, 6, 12, 18 hours a small amount of sample was collected for
characterisation by Hyper DSC studies. Figure 3.5 shows that during milling, the
enthalpy of melting decreased gradually and completely vanished after 18 hours. Based
on the DSC results, it was found that indometacin could be turned amorphous when
milled with PVP. The hydrogen bond interaction between PVP and indometacin might
be the main reason facilitating the amorphous state conversion of indometacin. FTIR
73

Chapter 3 Investigation o f surface properties...
studies of the interaction between PVP and indometacin will be discussed in the next
section. The XRPD pattern bas also shown a typical halo shape for the ball milled
sample confirming its amorphous nature.
180
^ 160ê 140 cx5 120 oc 100
CO
20
20 40 60 80 100 120 140 160 180 200
Temperature (°C)
Figure 3.5: Hyper-DSC traces o f indometacin and PVP (70%: 30%) physical mixture
milled for 0.5 (a), 1.5 (b), 3 (c), 6 (d), 9 (e), 12 (fi, and 18 (g) hours.
9 0
S 8 0
3 00 5 0 100 1 5 0 200
T e m p e r a t u r e °C
Figure 3.6: Conventional DSC seem of ball milled indometacin: PVP (70%: 30%) solid
solution (18 hours o f milling).
74

C h apter 3 Investigation o f surface properties .
400
350
300
M 250
: 200 o u 150
100
5 10 15 20 25 30 35 40
P o s i t i o n [° 2Thet a]
Figure 3.7: XRPD pattern o f ball milled indometacin: PVP (70%:30%) solid solution
(18 hours o f milling).
SEM images of the ball milled solid solution are shown in Figure 3.8. Compared to the
melt quenched sample, the ball milled sample has a smaller particle size (5-10 pm).
a b
Figure 3.8: SEM images o f ball milled indometacin: PVP (70%: 30%) solid solution (a,
20 pm and b, 5 pm).
3.4.1.3 Hydrogen bonding between indometacin and PVP
A hydrogen bond is a chemical bond in which a hydrogen atom of one molecule is
attached to an electronegative atom (usually nitrogen, oxygen, or fluorine atom) of
another molecule. Hydrogen bonding can occur within different functional groups of a
single molecule, or between different molecules (Taylor and Zografi, 1998). The
75

Chapter 3 Investigation o f surface properties...
Strength of a hydrogen bond can range from as weak as van der Waals forces to so
strong that they can hardly be distinguished from covalent bonds. The energy of a
hydrogen bond is around 5 to 30 kJ/mole, close to some weak covalent bonds which
only have about 20 times stronger energy. Therefore, the hydrogen bond is often
deemed to be the most important of all directional intermolecular interactions
(Serajuddin, 1999). In pharmaceutical research, intermolecular hydrogen bonding
interaction is frequently utilised in order to improve the stability of an amorphous
material. When hydrogen bonding to a certain carrier, the molecular mobility of an
amorphous compound is reduced, therefore, its crystallisation tendency is hindered.
There are many examples from the literature (Taylor and Zografi, 1998; Watanabe et al,
2003). In a study done by Al-Obaidi (2007), it was found that phase separation
happened very quickly in a griseofulvin-PVP solid dispersion because there was no
hydrogen bonding interaction detected in this system. In contrast, griseofulvin-pHPMA
solid dispersion could remain stable for more than 18 months because of the strong
intermolecular hydrogen bonding between them (Al-Obaidi, 2007).
CH3
Figure 3.9: Hydrogen bonding between PVP and indometacin.
Taylor and Zografi (1997) have used spectroscopic methods to examine the structure of
binary amorphous mixtures of indometacin and PVP at the molecular level. The study
suggested that drug and carrier interact in the solid dispersions through hydrogen bonds
formed between the hydroxyl of indometacin and carbonyl of PVP resulting in
76

Chapter 3 Investigation o f surface properties...
disruption of indometacin’s dimmer structure. The geometry structure of indometacin
and PVP is shown in Figure 3.9.
The interactions between indometacin and PVP of both the melt quenched and ball
milled solid solutions were studied using FTER (Figure 3.10). In the physical mixture,
the peak at 1715 cm ' relates to the dimer form of indometacin while the peak at 1692
cm ' relates to its carbonyl peak. The ball milled and melt quenched solid solutions
show similar spectra indicating the preparation methods did not give a significant
influence to the hydrogen bonding of the components. In the spectra of the solid
solutions, the dimer peak at 1715 cm ' has disappeared, a new peak started to show at
around 1724 cm ', and the carbonyl peak of PVP at 1692 cm ' shifted to a lower
wavenumber. These changes of the peaks indicate that indometacin and PVP are
forming a strong hydrogen bond.
14001700 1600 15001800
Wa\enumber (cm )
Figure 3,10: FTIR spectra o f indometacin and PVP (70%: 30%): a) ball milled solid
solution, h) melt quenched solid solution and c) physical mixture.
77

Chapter 3 Investigation o f surface properties...
3.4.2 Changes of surface free energy of the solid solutions during physical aging
In order to make a bulk cleave into two surfaces, energy is needed to disrupt any
intermolecular bonds and this energy is quantified as surface free energy. Therefore,
surface free energy is usually defined as the energy needed to generate a unit area of
surface. It is one of the most important parameters used to represent the energetic level
on the surface of a solid material because when a solid gets into close contact with
another solid or liquid, their surface energetic level will affect the interaction. For
example, wetting of some liquids on a solid would be easier on the high energy surface
such as glass, ceramics, and metals (held together by covalent, ionic, or metallic
chemical bonds) while for some crystals, where the molecules are held together by weak
molecule force such as van der Waals force or hydrogen bonding, wetting would
become more difficult.
Depending on the nature of the forces such as dispersive (non-polar) forces, or polar
forces (acid base or hydrogen bonding), the surface free energy (y) can be divided into
dispersive (y ) and polar (y ) components. There are several techniques suitable to
determine the surface free energy, such as contact angle measurements and IGC. It has
been discussed that there are some drawbacks with the contact angle methods: 1) when
compressing powders onto a plate or a disk, the compression force applied might alter
the surface properties or surface roughness; 2) Although the powder can be attached to a
glass slide with an adhesive, it still can not solve the problem regarding the surface
roughness (Grimsey et a l, 2002); and 3) Measuring the rate of liquid penetration
through powder beds does not require compression of the powders, but the
measurements can be affected by the particle size, pore geometry and etc (Buckton,
1995). Therefore, IGC as an alternative method drew more interest for surface free
energy determination. Ticehurst et al (1994) showed that result of the IGC and contact
angle methods might not be the same. IGC at infinite dilution condition is probably only
measuring a small part of the powder surface. So with a heterogeneous surface, probes
would tend to interact with the more energetic surface sites first giving a bias result of
the whole sample. However, many studies have shown that these two methods are well
78
Chapter 3 Investigation o f surface properties.
correlated (Dove et a l, 1996; Planinsek et a l, 2001).
It has been discussed in Chapter 2 that the dispersive surface free energy or polar
component data obtained by IGC can be used as a very useful index to detect batch
variability or to predict interfacial interaction. In this section the dispersive surface
energy and acid-base parameters of the indometacin solid solutions are measured as a
function of time at different temperatures in order to understand how structure
relaxation affects the surface properties.
Calculation of the surface free energy
Samples under characterisation need to be packed into a glass column, and minimum
concentration of polar or non-polar probes are injected and carried through the column
in the flow of an inert gas (helium). The time required for the probe to elute out {t,) can
be used as an indicator of the interaction level between the probe and the solid surface.
After correcting the effect of the void space by subtracting tr with tm (retention time of
an inert probe, such as methane), net retention time t„ can be obtained. Therefore, the
net retention volume, which means the amount of carrier gas required to elute out all the
probe molecules, can be calculated using Equation 3.1 :
Vn = — - F ' ( t - t ^ ) --------- Equation 3.1M ' " 273.15
where is the net retention volume, T is the column temperature. Mis the sample mass,
F is the exit flow rate of the carrier gas at 1 atm and 273.15K, and j is the James-Martin
compressibility correction factor for correction of the retention time affected by the
pressure drop in the column.
According to Equation 3.2, the net retention volume can be related to the free energy of
sorption AGads'-
79

Chapter 3 Investigation o f surface properties.
àG ds = \n(V ) + K Equation 3.2
where R is the gas constant and Æisa constant to compensate the effect of the vapour
pressure, weight and surface area of probes in the gas state (Schultz et al., 1987).
The relation of the free energy and the work of adhesion Wads between probe molecule
and solid is shown in Equation 3.3:
AG ds -a- Wds Equation 3.3
where a is the interaction surface area of the liquid probe molecules and N is the
Avogadro constant. Wads is the work of adsorption which can be split into a dispersive
and a specific interaction component according to Fowkes (1964):
Kds = K i + K i Equation 3.4
where W^ is the work of adsorption due to the van der Waals forces and Wfd is the
specific work of adsorption due to polar interactions. As for the calculation of dispersive
surface free energy, only non-polar probes are used, the Wads can be expressed only by
the dispersive interactions:
Equation 3.5
where is the surface tension of the solid and is that of the probe. Combining
Equation 3.3 and 3.5 leads to:
RTln(VJ = IN • • a • { y f f ^ Equation 3.6
80

Chapter 3 Investigation o f surface properties...
Schultz et al. (1987) described a method basing on Equation 3.6 to calculate the
dispersive component of the solid sample ). The values of interaction surface {a)
and dispersive free energy of the probe ( yf ) can be found from the literature (Schultz et
al, 1987; Nardin and Papirer, 1990), therefore, after obtaining the value by IGC
experiment, can be obtained from the slope of Equation 3.6 according to a plot of
RTln V„ versus a • {yf )* for a series of alkane (non-polar probes).
DecanePolar probe ^
lonone
Octane
lexane
leptane
Alkane line
Figure 3.11: An example o f a plot o f RTlnVn versus a • {yf for alkanes: decane,
nonane, octane, heptane and hexane.
When a polar probe such as chloroform or ethanol is used, its RTlnV„ value would lie
above the alkane line, and the vertical distance between the point of the polar probe and
the alkane line is the specific fi-ee energy of adsorption of the probe and the solid
surface (- ). According to Equation 3.7, after obtaining AG^ at different
temperatures, the specific enthalpy and the specific entropy of adsorption can be
81

Chapter 3 Investigation o f surface properties...
obtained:
A G l = Equation 3.7
The value of AG^ can be related to the acidic (electron accepting) parameter Ka and
the basic (electron donating) parameter Kd as shown in Equation 3.8:
- AG^ = • DN + ’ AN* Equation 3.8
where DN is a base (electron donor) number characterised according to Gutmann (1978),
and AN* is an acid (electron acceptor) number (Riddle and Fowkes, 1990). After
plotting - AG^ IAN* versus DN/AN*, the values of Ka and Kd of the solid sample can be
acquired from the intercept and the gradient of the line. The DN and AN* values can be
found from the literature (Gutmann, 1978; Riddle and Fowkes, 1990).
3.4.2.1 Dispersive surface free energy of melt quenched solid solutions
Step-scan DSC studies were conducted and it was shown that the Tg of the solid solution
is around 67 °C (with a ACp of 0.25 J/g), which is close to the Tg value of 68 °C reported
by Matsumoto and Zografi (1999) on a spray dried solid solution with the same
component ratio. There was only one Tg detected over the entire scanning range which
indicates that a single miscible amorphous phase was formed. Based on the Tg value, the
aging temperature was decided to be 7, 17 and 27 °C lower than the Tg (i.e. 60, 50 and
40 °C). The solid solution was therefore split into 3 groups and stored at these three
temperatures in 0 % RH for 2, 4, 6,9, 12 and 18 days. To check that whether the solid
solution could remain amorphous during the aging period, FTIR, XRPD and DSC
(Figures 3.12-3.14) studies were conducted in order to test any recrystallisation of these
samples. Results showed that the solid solution remained amorphous during storage at
each temperature. The XRPD patterns did not show any features of crystalline
82

Chapter 3 Investigation o f surface properties...
indometacin, DSC did not show any melting of the crystals and the FTIR spectra
remained the same at 60 °C for up to 18 days. These results gave evidence that any
surface free energy change measured after aging would be the result of structure
relaxation of the samples rather than recrystallisation.
1800 1700 1600 1500-1,
1400
Wkvenumber (an )
Figure 3,12: FTIR spectra of crystalline indometacin (a), physical mixture (b), and melt
quenched solid solution of indometacin and PVP (70%: 30%) agedfor 0 (c), 6 (d), 12 (e)
and 18 (f) days at 60
83

Chapter 3 Investigation o f surface properties.
40"C
10 15 20 25
Position [®2ThetaJ
30 35 40
50®C
10 15 20 25
Position [*^T1>eta]
30 35 40
60®C
10 15 20 25
Position [®2Theta]
30 35 40
Figure 3.13: XRPD patterns of the melt quenched indometacin: PVP (70%: 30%) aged
at 40, 50 and 60 for 0 (a), 2 (b), 4 (c), 6 (d), 9 (e), 12 (f) and 18 (g) days.
84
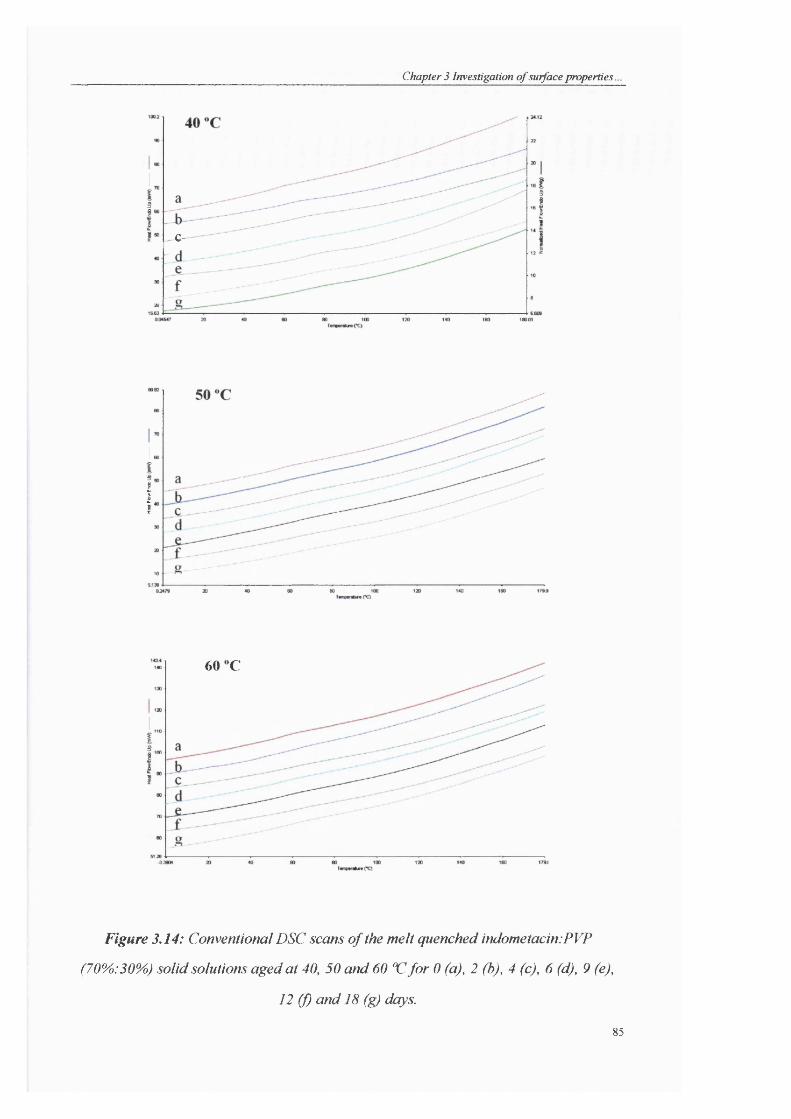
Chapter 3 Investigation o f surface properties.
C-
IÏ
60 C
Figure 3.14: Conventional DSC scans of the melt quenched indometacin:PVP
(70%: 30%) solid solutions aged at 40, 50 and 60 V for 0 (a), 2 (b), 4 (c), 6 (d), 9 (e),
12 (f) and 18 (g) days.
85

C h apter 3 Investigation o f surface properties .
Table 3.1 shows the / of indometacin, PVP, and melt quenched indometacin-PVP solid
solution (the values were means of 4 repeats on the same batch of samples). The y'^of
indometacin is close to the literature value which is 39.65 mJ/m^(Bajdik et a l, 2004)
determined according to Wu’s method (Wu, 1971). The / of PVP is also in good
correlation with the one (48.0 m jW ) reported by Planinsek et al (2001) using IGC.
PVP as received from the manufacturer and the one just freshly melt quenched are close
to each other, which means that any change of of PVP caused by relaxation during
storage is negligible in the laboratory timescale. This is probably because of the slow
relaxation rate of PVP at room temperature benefiting from its relatively high Tg value
(c.a. 170 °C). The y^of the freshly prepared solid solution is 47.2 mJ/m^, higher than
that of the pure indometacin. This result indicates the surface of indometacin was in a
higher energy state after compounding with PVP. It is interesting to note that the
dispersive surface free energy of most pharmaceutical compounds is usually greater
than 40 mJ/m^ as determined by means of either IGC or contact angle measurement.
This is probably due to the reason that the testing materials usually consist of oxygen,
hydrogen, and carbon (Planinsek et al, 2001).
Solid solution ofPVP PVP
Indometacin indometacimPVP(as it is) (melt quenched)
(70%:30%) day 0
/ ( m j W ) 42,24±0.45 47.45±0.48 48.17±0.66 47.20±0.39
Table 3.1: Dispersive surface free energy o f the pure components and the melt quenched
solid solution (indometacin:PVP, 70%:30%) measured by IGC (values are mean ± s.d.,
n=4) .
As shown in Figures 3.15-3.17, the y of the solid solution decreases as a function of
time for all the temperature tested, indicating the high energy sites of the sample were
86

Chapter 3 Investigation o f surface properties...
relaxing toward a lower energy state. The initial y'^of the solid solution is 47 mJ/m^and
the difference between the initial and the minimum is 3.05 mJ/m^ at 40 °C, 5.51
mJ/m^at 50 °C and 6.64 mJ/m^ at 60 °C after aging for 18 days. These results indicate
different decreasing rates of -/ at different temperatures. It can be seen that though at
each time point the solid solution samples were measured 4 times, at some particular
points a deviation of the y value from the overall decreasing trend is shown. This is not
a surprising result. In a previous study, Newell et al. (2001b) used IGC to measure the
of amorphous lactose which was 37.1 ± 2.3 mJ/m^ based on 12 measurements. From the
standard deviation, it is shown that the range of the surface energy may vary
significantly (4.6 mJ/m^). It is logical to expect that the random orientation of
amorphous material would give a wide range of surface energies obtained from different
measurements.
40"C n=4
43
J 42
® 380 2 4 6 8 10 12 14 16 18 20
Time (day)
Figure 3.15: Changes o f dispersive surface free energy o f the melt quenched solid
solution (an indometacin to PVP ratio o f 70%:30%) aged at 40 ®C.
87
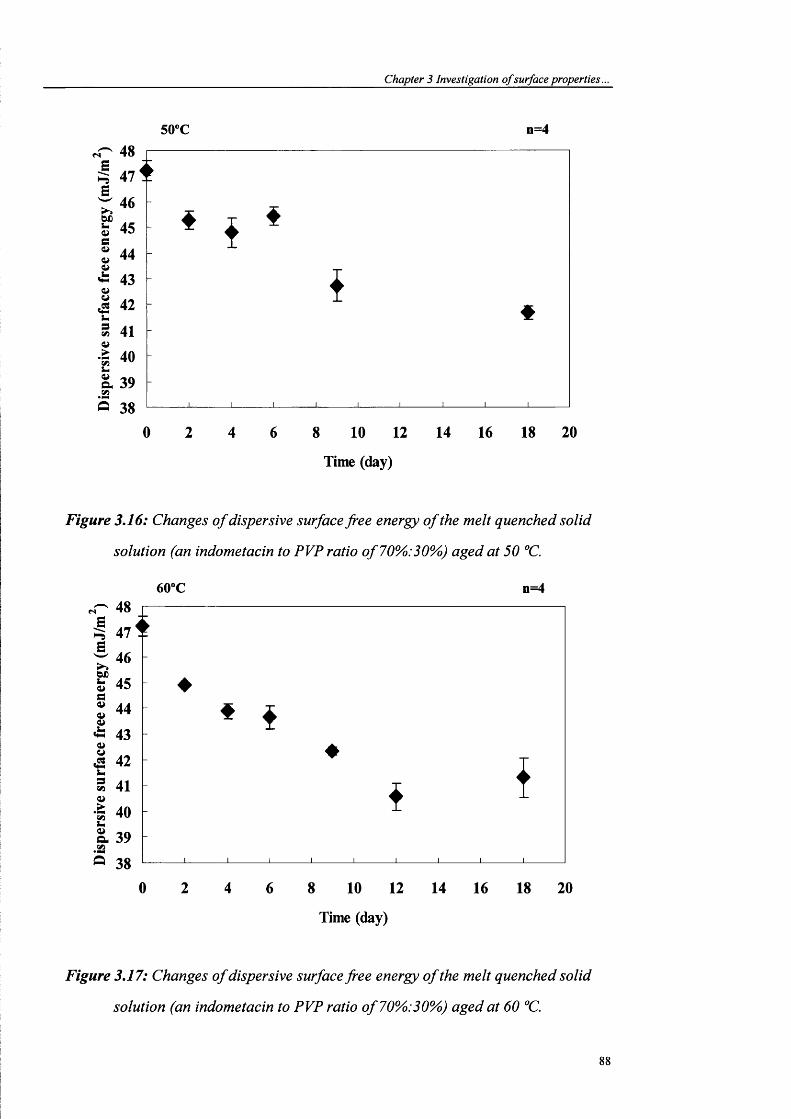
Chapter 3 Investigation o f surface properties.
50"C n=44847
4645
I 44 ^ 43
M 42
4140
^ 39.22O 38
0 6 10 12 14 16 18 202 4 8
Time (day)
Figure 3.16: Changes o f dispersive surface free energy o f the melt quenched solid
solution (an indometacin to PVP ratio of70Vo:30%) aged at 50 °C.
60”C n=448
47
| «
! 44* 43
I 42
S 41
I 40I 39
.25O 38
0 2 4 6 8 10 12 14 16 18 20
Time (day)
Figure 3.17: Changes o f dispersive surface free energy o f the melt quenched solid
solution (an indometacin to PVP ratio o f 70%:30%) aged at 60 °C.
88

Chapter 3 Investigation o f surface properties ...
Relaxation in the glassy state is often referred to as structural relaxation, which means
the changes in atomic/molecular arrangements that occur during relaxation (Hilden and
Morris, 2004). In a study, Hogan and Buckton (2001) have found that amorphous
raftinose particles start to show the external shape of crystals prior to crystallisation.
Therefore, the relaxation process of an amorphous state will lead to changes in the
physicochemical properties of the amorphous form prior to any crystallisation event
happening. The change in the physicochemical properties often associates with the
change of free volume and enthalpy in the bulk while at the surface this change might
be represented by the surface energy, as relaxation is often associated with a loss of
energy. It is reasonable to believe that the decrease of ’Z indicates the surface relaxation
of the solid solution.
The 'Z data were fitted to an empirical Kohlraush-Williams-Watts (KWW) equation in
order to obtain the relaxation parameters of the solid solution. The KWW equation is a
stretched exponential equation containing two adjustable relaxation time constants, t
andy :
(j){t) = exp(-(—)^ ) Equation 3.9T
where t is time and 0(t) is a relaxation function. The parameter t is the relaxation time
while P is regarded as the extent to which the relaxation process deviates from
exponential behavior and is often called a “stretching parameter” (Shamblin et al,
2000). The KWW equation is usually applied to the relaxation data including those
obtained by measuring volume relaxation (Cowie et a l, 1998), dielectric relaxation
(Stickel et a l, 1995), light scattering (Carroll and Patterson, 1985) and enthalpy
relaxation (Hancock et a l, 1995). In DSC studies, relaxation can be estimated from the
relaxation enthalpy, AH. First of all, the maximum enthalpy of relaxation at any storage
temperature z///oomust be calculated using Equation 3.10:
89

Chapter 3 Investigation o f surface properties...
= (T; - T) • ACp Equation 3.10
where Tg is the glass transition temperature of the sample, Cp is the heat capacity and T
is the aging temperature. The relaxation enthalpy of DSC can be normalised using the
following equation:
(f){t) = 1 - Equation 3.11
Therefore these normalised data can be fitted using the KWW equation to obtain the
relaxation parameters t and p. The KWW equation should also be appropriate for the
fitting of the IGC data as well, but an important issue needs to be addressed is to obtain
a minimum value which can reflect the lowest energy state that the sample’s surface can
relax to (like AHa:, in DSC). In the next section of this chapter, a modified KWW
equation will be explained and applied in the calculation of this lowest energy point.
Whereas in the case of the surface free energy study, the IGC data have a relatively high
deviation and also the data points are not enough for the equation to obtain a reasonable
value using this equation. Hence the minimum obtained during experiment was used
accordingly for the normalisation of the IGC data (Equation 3.12):
= 1 - ( -^— Equat i on 3.12y max y min
where is the initial surface free energy and y^^ is the minimum surface free
energy. The normalised data were fitted using the KWW equation. Figure 3.18 shows a
plot of the KWW fitting on the IGC data.
90

Chapter 3 Investigation o f surface properties...
0.9
0.80.70.6
«% 0.5
0.40.30.2
0.1
0 2 4 6 8 10 12 14 16 18 20
Tune(day)
Figure 3.18: Structural relaxation decay function determinedfrom IGC data (n=4). The
aging temperatures are: 40 XI (^),50 °C (M) and 60 XI (k.) with KWWfitting (—).
From the relaxation parameters shown in Table 3.2, it can be seen that as expected, t
values decreased as the aging temperature increased. This is because as the aging
temperature increases, the molecular mobility of the solid solution increases, and the
time needed for the molecules to totally relax would become less. Mirroring the
decrease of t, the p values increased as the aging temperature increased. In a previous
study, Bhugra et al (2007) have shown the temperature dependence of P as the aging
temperature increased, p increased correspondingly. The parameter p is used to
represent the distribution of relaxation times with a value close to one indicating a
system with homogenous relaxation and a value close to zero indicating a large
distribution of the relaxing substrates (Shamblin et al, 2000). As already explained, the
infinite relaxation enthalpy {AHf) can be calculated based on the aging temperature.
From Equation 3.10, it can be seen that J//ao values increase if T^-T increases (i.e. a
lower aging temperature). A higher zl//oo gives the possibility to the molecules to relax
further away from the equilibrium stage, hence the relaxation level of the molecules at a
91

C h apter 3 Investigation o f surface p ro p e r tie s ...
given time point would have a wider distribution potential comparing to a smaller zl//oo
at a higher aging temperature. In many studies, / has been used for comparison of the
relaxation rate because the / value is more robust due to its lower sensitivity to
experimental error (Liu et al, 2002). It is rational to think that 40 °C, as the lowest
aging temperature should have the longest relaxation time. However, Table 3.2 shows
that at the temperature of 40 and 60 °C the / values are similar while at 50 °C the / i s
the highest. These results might be due to the scattering values at some time points
which affect the KWW fitting. Therefore, the wide range of variation of the surface
energy of amorphous sample might be a potential drawback for the use of surface free
energy to accurately detect surface molecular mobility. Table 3.2 also shows 7 which
represents the coefficient of determination, and Chi^/DoF representing the reduced Chi
value which was used to quantify the deviation of predicted values from the actual
values. A Chi^/DoF value close to zero indicates a perfect fit.
40 “C 50 "C 60 "C
T (day) 62.55 10.42 6.02
P 0.409 0.922 0.945
/ (day) 5.43 8.67 5.45
Chf/DoF 0.00376 0.0131 0.0074
0.8789 0.8835 0.9467
Table 3.2: Relaxation parameters obtained from IGC data for the indometacimPVP
(70%: 30%) melt quenched sample after KWWfitting (R , coefficient o f determination,
and Chi /DoF, reduced Chf value).
In order to study the effect of carrier ratio on the surface relaxation, the indometacin to
PVP ratio was increased to 50%:50%. It was expected that if the aging temperature is
the same, the dispersive surface free energy relaxation rate will be slower in this ratio.
92

Chapter 3 Investigation o f surface properties...
because due to the anti-plasticisation effect, when the concentration of PVP increases,
the Tg of the solid solution increases as well resulting a slower molecular mobility. The
Tg of the (indometacin:PVP 50%:50%) solid solution was 78 °C as detected by DSC,
about 10 °C higher than the one with 30% of PVP. XRPD and DSC studies have
confirmed that the sample was in amorphous state. The aging temperatures used were
40, 60 and 70 ®C. After the solid solution was aged for 3, 6, 9, 12 and 18 days, samples
were removed for IGC studies to detect any change of the value.
45
44
40
cn
Ï 38
0 2 4 6 8 1210 14 16 18 20
Time (day)
Figure 3.19: A plot of dispersive surface free energy changes o f melt quenched solid
solutions (an indometacin to PVP ratio o f 50%:50%) stored at 40 (^ ) , 60 (M) and 70
(m )T(n= 4).
Figure 3.19 shows how decreased with time, and the degree of the relaxation is
depending on the aging temperature. At the highest aging temperature 70 ®C, the /
decreased most significantly with a difference of 4.13 mJ/m between the initial and the
end points. At 60 °C the difference is 3.08 mJ/m . This is because the sample would tend
to relax in a higher extent at a temperature closer to its Tg due to the higher molecule
mobility. The remained relatively the same at 40 °C after 18 days. In a study
conducted by Hancock et ai (1995), it was observed that sucrose, PVP and indometacin
93

Chapter 3 Investigation o f surface properties...
relax significantly even at temperatures well below their Tg, however, the authors find
out that the molecular mobility seemed to be greatly reduced to a level which would not
affect the life-time of the samples when they were stored at 50 °C below the Tg. When
the solid solution was aged at 40 °C, about 38 °C lower than its Tg which was close to
the 50 °C general limit, it is reasonable to consider that its relaxation rate would be very
slow at this temperature. Therefore, the studied timeframe 18 days might not be long
enough for the solid solution to show any significant energy reduction.
In order to study the effect of carrier on the / relaxation more directly, the KWW
equation was also applied here to obtain the relaxation parameters. As already explained
previously, the minimum / value was used for normalisation of the data to enable the
fitting (Figure 3.20).
0.90.80.7
* 0.5 0.40.30.20.10.0
0 2 4 6 8 10 12 14 16 18 20
Time (day)
Figure 3,20: Structural relaxation decay function determinedfrom IGC data (n=4). The
aging temperatures are: 60 XI ( ^ ) and 70 ^C(M) with KWWfitting (—).
Since the data for / at 40 °C did not show any significant change, KWW fitting at this
temperature was not performed. For the temperatures at both 60 and 70 °C, KWW
94

C h apter 3 Investigation o f surface p roperties ..
fitting was able to performed, however the P sometimes was over 1 (1.0-1.15) which is
physically impossible, because theoretically the p value is usually between 0 and 1
indicating the distribution of the relaxation. Therefore, during the fitting, the P value
was fixed to 1 in order to obtain the t values. Ramos (2006) has tried to use dispersive
surface free energy to study the surface relaxation of amorphous lactose at 100, 65 and
50 °C, the P values the author obtained were ranging from 0.9 to 1.1 which are similar to
the ones obtained in this study. The KWW equation is an empirical equation which has
been mostly applied to enthalpy relaxation and dielectric relaxation. The suitability of
using KWW equation for the fitting of the dispersive surface free energy relaxation still
needs to be proved by further studies (Ramos, 2006). Furthermore, the high variation of
the normalised values as shown in Figure 3.20 also indicates that / is probably not
sensitive enough for measuring the energy change during surface relaxation, therefore,
the accuracy of fitting using the / data might be affected.
60 "C 70 "C
T (day) 18.18 3.79
P 1 1
/(d ay ) 18.18 3.79
ChP/DoF 0.0053 0.0061
0.9176 0.9572
Table 3.3: Relaxation parameters obtained from IGC data for the indometacin: PVP
(50%:50%) melt quenched sample after KWWfitting (R , coefficient o f determination,
and Chi^/DoF, reduced Chi^ value).
The relaxation parameters are shown in Table 3.3. A temperature dependence of the
relaxation is indicated by the r values while the solid solution at 60 °C has a much
longer relaxation time than the one at 70 °C. At 60 °C, the solid solution containing 30
95

Chapter 3 Investigation o f surface properties...
% of PVP has a relaxation time of 6.02 days and the one containing 50 % of PVP here
has a relaxation time of 18.18 days. This fits with the hypothesis that the PVP could
help to reduce the molecule mobility of the solid solution as a result of reducing its
relaxation rate.
In this section, it has been shown that during aging, the energy on the surface of a melt
quenched solid solution relaxed to a lower state according to the decrease of dispersive
surface energy determined by IGC. This surface relaxation happened prior to the
crystallisation of the surface as confirmed by XRPD, DSC and FTIR measurements.
The surface relaxation has shown temperature dependence as the aging temperature gets
closer to the Tg of the sample, the relaxation time is shorter, and the surface relaxation
can be affected by the amount of carrier PVP which has been proven to be able to
increase the relaxation time of the bulk of indometacin-PVP solid solution (Matsumoto
and Zografi, 1999).
3.4.2.2 Dispersive surface free energy of ball milled solid solutions
Many researchers have shown that preparation method plays a very important role on
the pharmaceutically relevant properties of the final amorphous products, such as the
crystallisation rate (Surana et al, 2004), the apparent solubility (Zhang et al, 2009) and
the dissolution behaviour (Patterson et a l , 2007) etc. Therefore, it would be interesting
to study the effect of preparation method on the dispersive surface free energy of the
indometacin-PVP solid solution. In this section, a ball milled solid solution with an
indometacin to PVP ratio of 70%: 30% was made and studied using IGC to monitor its
dispersive surface free energy during aging. The characterisation of the solid solution by
DSC, XRPD and FTIR has been shown in the previous section. The solid solution was
confirmed to be in an amorphous form and the FTIR study has confirmed that there was
hydrogen bonding between the drug and carrier, similar to the one prepared by melt
quenching method. Step-scan mode DSC studies detected that the Tg of the ball milled
sample was 64 °C which is close to that of the melt quenched one. There was only one
Tg detected for the sample which might indicate the formation of a one-phase system.
96

Chapter 3 Investigation o f surface properties...
The aging temperatures here were chosen to be 50 and 60 °C, and after aging for certain
periods of time, a portion of sample was taken out for IGC characterisation.
The initial surface free energy of the ball milled solid solution was 44 mJ/m . Different
to the melt quenched solid solution which showed an obvious decrease in / during
aging, the ball milled one remained relatively the same after 14 days at 50 and 60 °C
(Figure 3.21). The ranged between 44-45 mJ/m at each sampling point during the
aging period and did not show any significant increase or decrease tendency. XRPD and
DSC results indicated that the solid solution did not crystallise even after 14 days at 60
°C which is very close to its Tg. For the samples which were under measurement of
the sample column would be conditioned at 30 °C for 4 hours under a helium flow prior
to the pulse injection methods were conducted. A concern is that the sample has relaxed
thoroughly during this conditioning period. This concern is reasonable, but considering
that the conditioning temperature is about 34 °C lower than the Tg of the sample, it is
unlikely that the sample has relaxed significantly
Time (day)
Figure 3.21: A plot of dispersive surface free energy changes o f ball milled solid
solutions (an indometacin to PVP ratio o f 70%:30%) stored at 50 (M), and 60
( ^ ) (n=4).
97

Chapter J Investigation o f surface properties...
In order to study this issue further, the retention volume (Vmax, calculated by the time of
the peak’s maximum point) of the probes were investigated, as based on Equation 3.2,
the Fmax is related to the energy of adsorption of the probe. In another words, Vmax might
be able to provide some information of the energy on the surface of the sample. Figure
3.22 shows the V ax change of decane during aging and it is clear to see that Fmax
decreases as a function of time. Moreover, the drop of Vmax at 60 °C is more significant
than the one at 50 °C indicating a temperature dependence of this decreasing tendency.
520
> 320
c 270
0 2 4 6 8 10 12 14 16
Time (day)
Figure 3.22: A plot of decane retention volume changing as a function of time (M, 50
T ; and ♦ , 60 T , n=4f
Retention volume is the volume of helium needed to elute out all the probe molecules.
Therefore the higher extent of the interaction between the probe molecules and the
surface energy sites, the more helium is needed (a bigger Vmax)- Hence Vmax can be used
to indicate the surface energy state. During aging, the Vmax values decreased indicating
the interaction ability between decane and the surface of the solid solutions decreased
(and also the energy state decreased) as a function of time. Decane as a bigger alkane
molecule can interact with surface to a larger extent compared to nonane and octane (the
98

Chapter 3 Investigation o f surface properties ...
retention time for decane is usually much longer than the others). In another words,
decane is more sensitive to any change that occurred to the surface energy sites. The use
of the retention volume of decane to measure the surface energy state of the solid
solution would therefore provide higher sensitivity than the surface free energy method
which also takes into account the sensitivity of smaller molecule probes. This finding
led to consideration of using decane on its own for the surface relaxation study in order
to eliminate the compromise of accuracy caused by the poor sensitivities of the other
probes. The decane Vmax study will be the focus of a later section.
3.4.2.3 The acid-base contributions to the surface free energy during aging
The acidic (electron accepting) parameter Ka and the basic (electron donating)
parameter Kd can be obtained based on the surface energy data using the method
described previously. By studying the Ka and Kd, it is possible to understand the acid
and base properties on the surface of the materials. The Ka, Kd and the basic to acidic
parameter ratios Kd/Ka of indometacin, PVP and the ball milled solid solution are
shown in Figure 3.23. Values of Kd/Ka of greater than 1 indicate a basic nature, and
values of less than 1 imply an acidic nature (Ohta and Buckton, 2004). It is surprising to
see that crystalline indometacin has a negative Kd value. A reasonable explanation for
this observation cannot be given. However, the low Kd/Ka values for both the
amorphous and crystalline indometacin indicate the acid nature on their surfaces.
Indometacin is a weak acid drug with a pKa of 4.5 and it is known that the surface of
indometacin can be acidic. Watanabe et al. (2003) discovered that the acid-base reaction
between indometacin and Si02 mediated by the OH groups at their interface could help
to immobilise the indometacin molecules leading to suppression of crystallisation. In a
more recent study, Telang et al (2009) utilised the acid-base interaction on the surface
of indometacin and a base meglumine to keep the drug stable in its amorphous form.
The Kd/Ka value of PVP is the highest compared to the others indicating a least acidity
of PVP notwithstanding the Kd/Ka value is less than 1 suggesting an overall acid nature
on its surface.
99
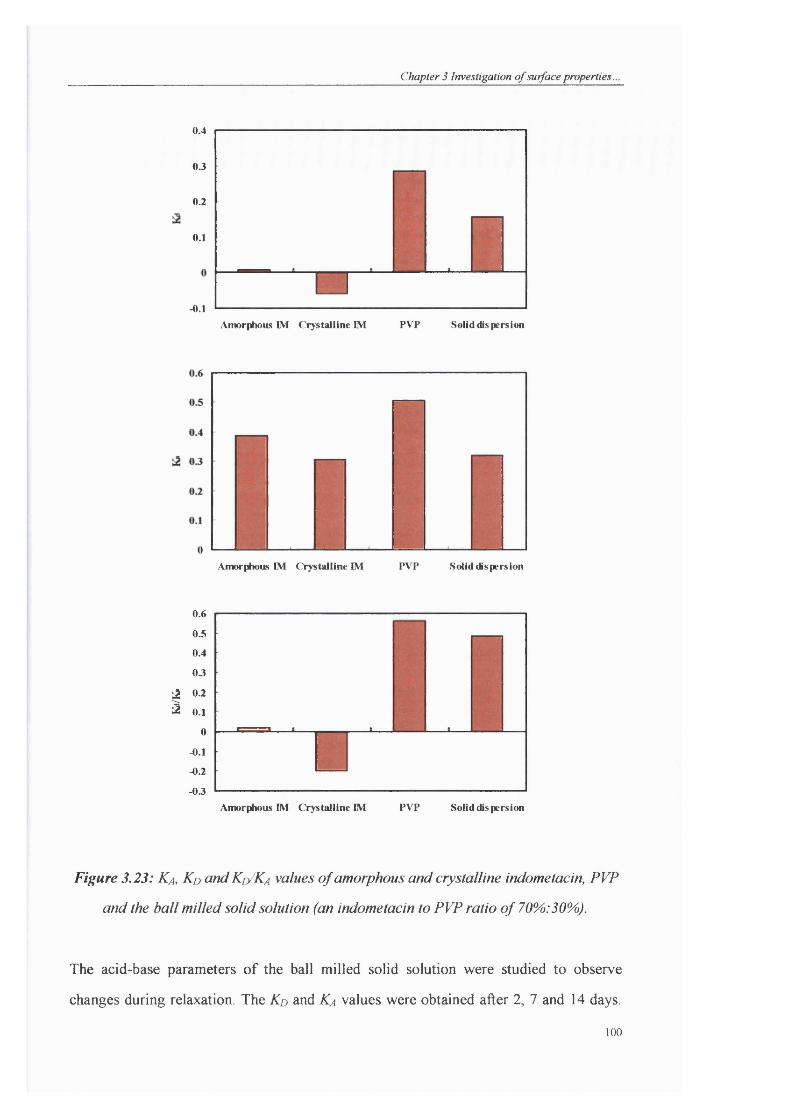
Chapter 3 Investigation o f surface properties.
0 .4
0 3
0.2
0.1
- 0.1Amorphous IM Crystalline IM PVP Solid dispersion
Amorphous IM Crystalline IM PVP Solid dispersion
0.6
03 0 .4
0 3
^ 0.2
^ 0.1
0
-0.1
-0.2
- 0 3
Amorphous IM Crystalline IM PVP Solid dispersion
Figure 3.23: Ka, Kd and Kd/Ka values o f amorphous and crystalline indometacin, PVP
and the ball milled solid solution (an indometacin to PVP ratio of 70%:30%).
The acid-base parameters of the ball milled solid solution were studied to observe
changes during relaxation. The Kd and Ka values were obtained after 2, 7 and 14 days.
100

Chapter 3 Investigation o f surface properties...
The basicity on the surface of the solid solution decreased (or surface acidity increased)
as the aging time increased as illustrated by the Kd/Ka ratio in Figure 3.24. This might
indicate a reorientation of polar surface groups of the sample and thereby affecting its
adhesion-cohesion force balance. Hence it is concluded that the surface relaxation might
have an impact on the polar properties of the solid solution surface.
Time (day)
Figure 3.24: Gutmann Kd/Ka ratio o f the ball milled solid solution o f indometacin and
PVP (70%: 30%) as a function o f time at 60 °C.
101

Chapter 3 Investigation o f surface properties ...
3.4.3 Detecting surface relaxation using the retention volume of decane
Melt quenched indometacin-PVP (70%: 30%) solid solution was used in this section as
a model system for the development of a new method which includes the use of
retention volume {Vmœ) of decane to study the surface relaxation. The sample was firstly
purged under helium flow at 25 °C for 10 hours in order to remove moisture and any
potential organic solvent sorbed. After purging for about 4 hours, both the flame ionised
detector (FID) and thermal conductivity detector (TCD) signals have decreased to the
minimum point and stabilised indicating that water and organic solvents were eluted.
Purging was still carried on for up to 10 hours in order to ensure this process was
sufficiently complete. Because if there is any water or organic solvent remained, their
molecules would occupy the potential surface interaction sites at the surface. This in
return will reduce the probability of the interaction between decane and the surface,
leading to a variation of Vmax value. Therefore, complete removal of water and organic
solvent is crucial for the decane Vmax method.
Decane was chosen as the only probe to be injected for the acquisition of the relaxation
profile because of its higher interaction potential in comparison with the other probes
(nonane, octane, heptane or hexane). Immediately after conditioning finished,
continuous injections of decane and methane were performed for a period of 48 hours.
Each decane injection was followed by a methane one in order to obtain the information
of the void space for the correction of decane’s net retention volume. 45 minutes were
allowed between each injection (15 minutes of signal recording time and 30 minutes of
sample conditioning before next injection was performed). Consequently, only 90
minutes lapsed between each data point (this time interval can be further shortened
depending on the retention time of the probe), instead of 3-4 hours needed for the
dispersive surface energy data. This method provides more data points for the detection
of the surface relaxation trend and it is especially useful for those samples which relax
at a fast rate.
102

Chapter 3 Investigation o f surface properties...
20
19
18
Batch 1
#
'^^^^^oooaaor-o
17
16
Batch 2
1515 20 25 30 35 4 0 45 500 5 10
I'o
Time (hour)
20
19
O t
18
17
t Q y o A a X 1 11111111 i n16
15
15 4 0 4 5 5 00 5 10 20 2 5 30 35
Time (hour)
Figure 3,25: Decrease o f decane Vmax on three different batches of melt quenched
indome tacin and PVP (70%: 30%) solid solution as a function o f aging time at 50 %7. a)
traces o f measurements on three different batches and b) trace of the mean of three
measurements ± s.d.).
103

Chapter 3 Investigation o f surface properties...
It has been discussed in section 3.4.1 and 3.4.2 that the dispersive surface free energy of
the amorphous solid solution sample decreased as the surface relaxation occurred and
also the Vmax of decane dropped indicating a decrease of the interaction capability
between the probe and the surface. Figure 3.25 shows how the Vmax of decane altered as
a function of time when the solid solution was aged at 50 °C. Three different batches of
solid solutions were studied and they showed a very similar relaxation trend, though
their absolute values were different to each other. This difference is attributed to
variation in the surface area and morphology of different batches of samples and also
the tapping condition between different columns. These factors can affect how fast the
inert gas can run through the column (i.e. different retention times), therefore, the
retention volumes are different. In addition, the slight difference of sample weight for
each measurement can influence the time that the vapour probe and helium gas need to
pass through a column, hence the retention volume can be altered. The relaxation rate or
relaxation parameters obtained are based on the trend of the relaxation behaviour rather
than its absolute value, therefore, this difference in the absolute values between each
batch would not affect the accuracy of the result as long as their trends are similar.
6 0 0
5 0 0
c - 4 0 0
3 0 0
200
100
01 .5 2 2 .5 31
lim e (m in)
Figure 3.26: The FID responses showing the decane peaks at different time point
during measurement for the melt quenched solid solution containing indometacin and
PVP with a ratio o f 70%:30% (a, 0 min; b, 90 min; c, 180 min andd, 270 min).
104

Chapter 3 Investigation o f surface properties...
By plotting the decane peaks obtained as a function of time, a clear shift of the
maximum peak position to the left hand side can be observed indicating a decrease in
the retention time (Figure 3.26). Because the sample mass in the column remained
unchanged during the measurement, this decrease in the retention time is solely due to
the change of the interaction capability between the probe and the solid surface. In other
words, the energy state of the surface decreased to a lower level. By DSC and XRPD
measurement, the sample after measurement only showed an amorphous response (also
previous DSC and XRPD studies confirmed that melt quenched solid solution could
remain amorphous even after 18 days stored at 60 ®C), therefore this change in energy is
caused by the surface relaxation.
100
Vcom
Vmax90
80
70
50 ♦---40
30
20
10
00 100 200 300 400 500 600 700
Time (Min)
Figure 3.27: The net retention volume of indometacin: PVP (70% : 30%) physical
mixtures at 50 X! (Vcom, net retention volume calculated using the time point at centre o f
mass o f the peak and V ax, the one calculated using the time point at the maximum of
the peak).
105

Chapter 3 Investigation o f surface properties...
In order to further prove the decrease of decane Vmax was related to the surface
relaxation, the decane Vmax of a physical mixture of indometacin:PVP with the same
ratio as the solid solution was measured at 50 °C to be used as a controlled experiment.
As shovm in Figure 3.27, no matter which method was used to calculate the net
retention volume of decane (by the maximum point of the peak or its center of mass),
the retention volume of the sample remained the same during the measurement. In the
physical mixture, indometacin was used at its stable y-form so that no polymorphic
transformation or any physical changes (at 50 °C) can occur. PVP was expected to be
stable at this studied temperature because of its high Tg. Therefore, it is rational to see
that the decane retention volume remained unchanged for the physical mixture, which
indicates that the decane retention method is measuring the surface relaxation.
One further possibility for the solid solution that the decrease of decane Vmax was due to
the gradual occupation of the energy sites by decane on the solid surface which leads to
a decrease of decane Vmax and solid surface interaction. To examine this, fresh solid
solution sample was kept in the colunm oven at 50 °C for the initial 12 hours without
any injection of decane probe after conditioning and thereafter decane and methane
were injected. The decane Vmax value after 12 hour was found identical to the same
batch of sample which had been exposed to repeated injections of decane from the very
beginning. This indicated that the decane drop was not a result of the continuous probe
injection.
There are two ovens in an IGC instrument, one is for the columns and the other one is
used to keep the probe vapour at a certain temperature (in order for an accurate injection
of vapour probes, the probes need to be kept at a stable temperature condition). The
default temperature for the probe oven is 30 °C. A potential concern was that during the
relaxation study, when the probe was injected to the sample column which was kept at
50 °C, the sudden increase of temperature would give an influence on the retention
volume of decane and cause it to decrease. Therefore a set of experiment was carried
out to study the effect of probe oven temperature on the decane retention volume during
106

Chapter 3 Investigation o f surface properties...
relaxation. During the experiment, the probe oven was fixed at 50 °C which was the
same as the column oven temperature. After 10 hours conditioning at 25 °C, the solid
solution was aged at 50 °C and decane was injected continuously. The retention volume
of decane during relaxation was obtained. As shown in Figure 3.28, both the Vmax and
Vcom of decane decreased as relaxation was occuring. This result clarified that the
sudden increase of the temperature of the probes is not the reason causing the retention
volume of decane to decrease.
104
0 100 200 3 0 0 4 00
Time (min)
500 600 700
106
104
&8 102
100
0 100 200 3 0 0 400
Time (min)
500 600 700
Figure 3.28: Time course o f Vmax and Vcom o f decane kept at 50 during measurement
for the indometacin-PVP (70%:30%) solid solution.
107

Chapter 3 Investigation o f surface properties...
In order to compare the difference of using decane {Vma:) and dispersive surface energy
as an indicator for surface relaxation determination, the solid solution sample was kept
at the column oven (50 °C) and continuous injections of decane, nonane, octane and
methane were conducted for up to 32 hours. This allowed the possibility to acquire the
dispersive surface energy as a function of time. As shown in Figure 3.29, during the
experiment, 9 points of dispersive surface energy as well as decane Vmax could be
obtained. These data points of relaxation were far less than simply injecting a single
probe, decane. A few hours were needed before a second round of measurement started.
From the plot, it can be seen that dispersive surface energy decreased in the initial 14
hours and then started to scatter accompanied with slight increase on further storage.
This phenomenon was probably due to experimental error associated with variability in
the measurement of lower alkanes such as nonane and octane which elute from the
column too quickly. Hence, the accuracy of measurements was jeopardised. From the
plot of decane Vmax (which has a longer retention time), a smooth decreasing trend up to
32 hours can be seen and the Vmax values have a tendency to decrease further. The
sensitivities of using decane Vmax to evaluate the surface structural relaxation is higher
than dispersive surface energy. Furthermore, in the first few hours of aging, the
relaxation of the amorphous sample was very fast and the retention volume of any probe
was changing rapidly. As a consequence, the order of probe injection would probably
influence the results of the dispersive surface energy. All these issues demonstrate that
decane Vmax method is better than the dispersive surface free energy method in probing
surface molecular mobility.
108

Chapter 3 Investigation o f surface properties...
42.0
É 41.0
« 40.5
15 20
Tim e (hour)
20.5 1
20.0 ^
19.5
! 19.0
I> 18.5
18.0
17.5 -
17.0
3Q 350 5 10 15 20 25
Tim e (hour)
Figure 3,29: Plots o f dispersive surface energy and Vmax (decane) as a function o f aging
time for the melt quenched indometacin and PVP (70%: 30%) solid solution at 50 °C. a)
dispersive surface energy calculated using three probes, decane, nonane and octane;
and b) Vmax o f decane.
109

Chapter 3 Investigation o f surface properties.
In a previous secion, KWW fitting was conducted to obtain the t and P values of the
melt quenched solid solution using the dispersive surface energy data. However, unlike
a DSC relaxation study where the infinite enthalpy can be calculated according to the
glass transition temperature and apparent heat capacity of the sample, the dispersive
energy of the surface when it relaxes completely is unknown and there is no existing
equation available to calculate this value. Experimental measurements could be a
possible way to obtain the minimum dispersive surface energy, but only when complete
relaxation achieved within the laboratory timeframe. For a relatively stable sample
which could take months or even years to relax, the time course of experimental
measurements would be problematic and unrealistic. Accordingly, the smallest
dispersive energy value obtained during the experiment was used to make the KWW
fitting feasible.
For the decane Vmax study, the minimum point of Vmax was also unknown. As decane
Vmax can generate relatively more sufficient data points, a modified KWW thereby was
proposed and used to estimate the convergent retention volume after long aging
(Equation 3.13):
^ = min + ^ cxp(-(-)^ ) Equation 3.13T
where E, t, t , P are the same as stated before, and ^ is a pre-exponential factor. As
shown in Equation 3.13, when t is infinite, Aexp(-(thf) gets close to zero, then Vmm can
be defined as a convergent retention volume. Using Equation 3.14, the decane Vmax data
were normalised and fitted to the KWW equation.
(V - V )^(0 = 1 — ^ E q u a t i o n 3.14 - E )\ max nun /
The Vmin of batch 1, 2 and 3 were 16.68 ± 0.03, 14.39 ± 0.18 and 15.64 ± 0.15 mL
no

Chapter 3 Investigation o f surface properties...
respectively and using these values the retention volume of decane can be plotted into a
decay function (Figure 3.30). Moreover, the relaxation parameters of the solid solution
are shown in Table 3.4.
1.0
0.8
so
0.2
0.00 6 30 36 42 4812 18 24
lim e (hour)
Figure 3.30: Decay function of the retention volume o f decane of the melt quenched
solid solution (an indometacin to PVP ratio of 70%:30%) aged at 50 (n=3).
r (hour) P /(hour)
Solid solution 13.1 0.60 4.6
Table 3.4: Structural relaxation parameters o f the melt quenched solid solution (an
indometacin to PVP ratio o f 70%:30%) obtainedfrom decane Vmax-
In this section, a new method using the retention volume of decane to evaluate the
structural relaxation on the surface of an amorphous system was developed and verified.
The repetition of injecting a single probe can provide more data points of the relaxation
111
Chapter 3 Investigation o f surface properties...
compared to the dispersive surface free energy method for which at least three probes
are needed to be injected in order to obtain one value. Furthermore, the long retention
time of decane is able to eliminate the negative effect caused by the rapid clearance of
the lower alkanes and increase the sensitivity of the system, A modified KWW equation
was used to obtain the relaxation parameters based on the Vmax values of decane.
112

Chapter 3 Investigation o f surface properties ...
3.5 Conclusion
PVP and indometacin (30%:70%) solid solutions were prepared by ball milling and melt
quenching. DSC, XRPD and FTIR studies showed that they were completely
amorphous. For each solid solution system, there was only one Tg shown indicating the
formation of a one-phase system. PVP and indometacin was found to form a one phase
system with a higher ratio of PVP (Patterson et al., 2007). The planetary ball mill used
here was able to generate complete miscibility of PVP and indometacin with a
concentration of PVP as low as 30%.
After forming a solid solution with PVP, the dispersive surface free energy of
indometacin increased no matter which preparation method was used. IGC studies
showed that the dispersive surface free energy of the melt quenched solid solution
decreased during physical aging at a temperature lower than its Tg. This relaxation
temperature dependence is because the sample aged at a temperature closer to the Tg
showed the shortest relaxation time and the one further from the Tg showed the longest.
This relaxation was also found to depend on the carrier concentration, as when the
concentration of PVP was increased to 50%, a slower relaxation time was noticed at the
same aging temperature.
In the case of the ball milled solid solution, no change of dispersive surface free energy
was noticed after aging. However, by measuring the retention volume of an individual
probe, decane, decrease of energy state of the surface was observed and this decrease
was also temperature dependent. It was considered that the value of dispersive surface
energy could be affected by the sensitivity of the individual probe used. Sometimes,
even though the energy of the surface has changed, it might not be accurately
represented by the dispersive surface free energy values. The use of decane retention
time led to the development of a novel method for monitoring the energy state change
on the surface of a material and it has some advantages over the surface energy method
such as a short data collecting time and higher sensitivity. A modified KWW equation
was proposed for the fitting of the decane Vmax data in order to obtain the relaxation
113

Chapter 3 Investigation o f surface properties.
parameters of the sample.
Furthermore, the studies of the acid and base contribution on the surface of ball milled
solid solution provided evidence that a reorientation of surface molecular functional
groups could happen during aging. The studies in this chapter have confirmed that the
relaxation process of an amorphous state will lead to changes in the physicochemical
properties of the amorphous form prior to any crystallisation event happens. Also the
studies have confirmed the importance of monitoring the surface properties of solid
dispersions during storage.
114

Cfici‘pter4
Influence of preparation metfiods on surface and Std structuraCrelÔJçation ofsoRd solutions
Chapter 4 Influence o f preparation method...
4.1 Introduction
Stability has been a major concern for many pharmaceutical researchers when preparing
amorphous materials. In many cases, physical stability test is used as an important
method to acquire stability data of the amorphous products. However, this method could
sometimes be problematic and time consuming. Therefore, some alternative methods
have been used to predict the stability of the products instead. Among these methods,
relaxation assessment has been conventionally used since it can provide useful
information about the molecular mobility of the product and therefore its shelf-life can
be predicted. There are several techniques which are very powerful in measuring bulk
relaxation such as differential scanning calorimetry (DSC) and isothermal
microcalorimetry (IMG). DSC and IMC obtain the relaxation information through
different ways: DSC measures the enthalpy recovery of the product after aging for
different time periods, while IMC measures the instant rates of enthalpy relaxation
during aging. Both of these techniques were used in this study to investigate relaxation
of indometacin and polyvinylpyrrolidone (PVP) solid solution systems prepared by ball
milling, melt quenching and spray drying. The effect of preparation method on the
stability of the systems was evaluated.
On the other hand, some studies on polymers have shown that the molecular mobility on
the surface should be differentiated from the bulk because their mobility is different
(Tanaka et a l, 1996; DeMaggio et al, 1997; Kajiyama et a l, 1997). The study of
surface is important because the mobility at a surface or interface can affect the surface
wetting, diffusion and interaction between different materials. Crowley and Zografi
(2003) have shown that crystallisation of amorphous indometacin is surface-initiated;
Wu and Yu (2006) found that the surface crystallisation of indometacin is at a faster rate
than the bulk; and Wu et al (2007) used nano-coating to inhibit crystallisation of
indometacin. All these studies demonstrate that surface molecular mobility would be
critical for developing a stable amorphous formulation. However, in the pharmaceutical
field, the lack of efficient technique for determination of surface molecular mobility has
limited understanding of the molecular mobility on the surface. Thereby, the decane
116
Chapter 4 Influence o f preparation method...
(y max) method developed in the former chapter was applied here to study the relaxation
on the surface of the solid solutions and in comparison to that of the bulk determined by
DSC and IMC. The hypothesis is that since the crystallisation commonly starts from the
surface, the surface would have a higher molecular mobility than the bulk.
Glass fragility of the solid solutions prepared by different methods was studied using
DSC to understand how the molecular mobility of the amorphous samples changes with
temperature, especially when they undergo a glass transition. Glass transition
temperature, Tg is often used to correlate the stability of an amorphous material. A
higher Tg is always favoured to stabilise the product at a given storage temperature.
Because when the storage temperature is very close to or even higher than the Tg, the
glassy sample will deform into rubber state which gives rise to physical collapse,
crystallisation or even degradation (te Booy et a l, 1992). But a high Tg might not be
enough to necessitate good stability. Some studies have shown that degradation could
still happen below the glass transition temperature (Pikal et a l, 1991; Kerr et al, 1993).
Therefore, in this study, zero mobility temperature. To was used as another indicator to
predict the stability of the solid solutions. The zero mobility temperature was used to
describe the temperature at which configuration entropy (molecular mobility) reaches
zero and it can be calculated according to the fragility parameters of the solid solutions.
In addition, the solid solutions were stored at room temperature, 75% relative humidity
(RH) to obtain the actual physical stability data. These data were used to verify the
prediction made from Tq and the relaxation data.
Crystallisation of an amorphous product would frequently lead to slower dissolution
rate. But a relationship between relaxation and the dissolution properties of the product
has not been established. Hence dynamic vapour sorption and dissolution studies were
conducted to investigate the effect of aging on the water uptake and dissolution rate of
the samples. The effect of preparation methods on the dissolution rate after aging was
also studied.
117

Chapter 4 Influence o f preparation method...
4.2 Chapter outline
The aim of the work related in this chapter was to apply the single probe injection
method developed in the previous chapter to study the surface structural relaxation of
solid solutions prepared by different techniques (melt quenching, ball milling and spray
drying). Step-scan DSC was used to study these solid solution systems to obtain the
relaxation information in the bulk and compared to the one determined by inverse gas
chromatography. Furthermore, isothermal microcalorimetry was also used to study the
relaxation of these solid solutions. Glass fragility was measured and the zero mobility
temperature was calculated in order to predict the stability of these solid solutions. The
effect of relaxation on the dissolution behaviour and physical stability of the solid
solutions were investigated.
118

Chapter 4 Influence o f preparation method...
4.3 Methods
4.3.1 Spray drying
Indometacin and PVP with a ratio of 70% to 30% was spray dried using the method
described in Section 2.2.4. 200 mL of ethanol was used to dissolve indometacin and
PVP. The feed concentration in the solvent was 1.5 % w/v and 30 minutes were allowed
for the drug and carrier to dissolve completely into the solvent. The solution was then
spray dried using the following parameters: atomiser gas flow 2.5 kg/h; chamber inlet
flow 30.0 kg/h; inlet temperature 80 °C; and feeding rate 20%. The spray dried samples
collected were passed through a 90 micron sieve and then dried in a vacuumed
desiccator over phosphorus pentoxide ( P 2 O 5 ) at room temperature for 2 hours before
any further study.
4.3.2 Ball milling
Indometacin and PVP (70%: 30%) were milled according to the method described in
Section 2.2.2 and Section 3.3.2.
4.3.3 Melt quenching
Indometacin and PVP (70%: 30%) were melt quenched using the method described in
Section 2.2.3.
4.3.4 Differential scanning calorimetry (DSC) for enthalpy recovery measurement
About 5 mg of fresh solid solution was loaded in a non-hermetically sealed aluminum
pan (PerkinElmer Instruments, Beaconsfield, UK) and stored in a desiccator over P 2 O 5
at 50 °C. After different periods of aging time (up to 48 hours), the pans were taken out
and their enthalpy of relaxation was determined using a Pyris 1 DSC (PerkinElmer
Instruments, Beaconsfield, UK) with step-scan mode. After equilibration at 0 °C for 5
min, samples were heated in a step of 2 °C at 10 °C/min. The isothermal time at each
step was 1 min and 50 to 100 steps were conducted allowing samples to be heated to
100 to 200 °C. For each aging time point, 3 sample pans were prepared and measured.
Indium was used as the reference for DSC calibration.
119

Chapter 4 Influence o f preparation method...
4.3.5 Differential scanning calorimetry for fragility measurement
A Pyris 1 DSC instrument (PerkinElmer Instruments, Beaconsfield, UK) with an
intracooler IIP cooling system (Intracooler IIP, PerkinElmer Instruments) was used for
this study. Dry, high purity N2 gas with a flow rate of 40 mL/min was purged through
the sample. A two-point temperature calibration was performed at each heating rate (2, 5,
10, 20 and 40 °C/min) using the extrapolated onset of melting temperature Tm and fusion
of melting (zl//w) of indium (7^ =156.6 °C) and n-decane (7^ = -29.7 °C). Frequent
calibration checks were conducted during the experiment.
All samples were sieved using a 90 pm sieve to minimise the particle size effect on the
Tg. About 5-6 mg of samples was accurately weighed into non-hermetically sealed pans.
The sample was first heated to 20 °C over its 7 in order to remove any moisture sorbed
and thermal history and then cooled to at least 50 °C below Tg at a cooling rate that
equaled the subsequent heating rate. The sample was then heated at different heating
rate and the onsets of Tg were recorded. All glass transition temperatures obtained were
an average of three measurements.
4.3.6 Inverse gas chromatography (IGC) for surface relaxation study
The surface relaxation of the solid solutions was studied using inverse gas
chromatography. The methods used were described in Section 2.2.5. Around 500 - 800
mg of sample was loaded into a pre-silanised glass column which was then tapped
continuously for 15 minutes. The column was first conditioned at 25 °C and 0% RH in
the column oven under He flow for 10 hours. After the conditioning process finished,
the column oven temperature was immediately increased to 50 °C and then a series of
decane and methane were injected continuously for 48 hours (for ball milled and melt
quenched samples) and 24 hours (for spray dried samples). The data recording time for
each injection was set at 15 minutes and an additional 30 minutes were allowed for
sample reconditioning between each injection. The net retention volumes were
calculated using IGCAnalysis2 software (Surface Measurement Systems, London, UK).
For each solid solution system, 3 to 4 batches of samples were measured.
120

Chapter 4 Influence o f preparation method...
4.3.7 Isothermal microcalorimetry (IMC)
Isothermal microcalorimetry studies were carried out using a 2277 Thermal Activity
Monitor (TAM) (Thermometric AB, Sweden). TAM is a very sensitive machine which
could measure the heat flow of a sample in microwatt-scale. 500 mg of sample was
accurately weighed into a glass ampoule fitted with rubber cap and aluminum over cap
and loaded in one cell and the same amount of talc was used as an inert reference loaded
in another cell. Samples were kept at 50 ± 0.0001 °C for 2 days. The heat flow signal
was amplified 300 folds by a connected amplifier and collected by Digitam 4.1 user
interface (operating software). Data analysis was conducted using Origin software
version 7.0.
4.3.8 X-ray Powder Diffraction (XRPD)
X-ray powder diffractions were performed according to the method described in Section
2.2.7.
4.3.9 Scanning electron microscopy (SEM)
Scanning electron microscopy was applied to study the morphology of the samples. The
measurements were carried out as described in Section 2.2.9.
4.3.10 Atomic force microscopy (AFM)
The surface images of the melt quenched solid solutions were obtained using a
multimode AFM (Veeco, Cambridge, UK). The AFM was equipped with a Nanoscope
IV controller and E-type scanner (Veeco, Cambridge, UK). All images were obtained in
Tapping Mode using a silicon tapping tip (NSGOl, NTI-Europe, The Netherlands) with
a resolution of 5 pm and a scanning rate of 1 Hz. Measurements were controlled and
analyzed using Nanoscope 5.12b software (Veeco, Cambridge, UK).
4.3.11 Dynamic vapour sorption (DVS)
A DVS made by Surface Measurement System, London, UK, was used for this study.
Before loading the samples, the empty glass DVS pans with flat-bottom design were
121

Chapter 4 Influence o f preparation method...
conditioned at 0% RH for 30 minutes followed by conditioning at 90% for another 30
minutes to eliminate any static charge. After drying the pans completely at 0% RH,
about 10-20 mg of sample would be loaded onto one of the pans and the other empty
pan was used as a reference. 600 minutes of conditioning at 0% RH were allowed to dry
the sample powders before running a stepwise ramp. Afterward, RH was increased from
0-90% in the steps of 10% and returned to 0% in the same manner. At each step, a
maximum of 300 minutes were allowed for the samples to sorb moisture and a dm/dt
value of 0.0001 mg/min was used. Two replicates were conducted on each sample.
4.3.12 Dissolution test
A Pharma Test dissolution apparatus (Pharma Test, Germany) was used in this study.
The dissolution profiles of the initial and aged solid solutions were investigated by
using the modified USP paddle method at a rotation speed of 50 rpm at 37 °C and the
paddles were set at 25 mm from the bottom of the vessel. Water (900mL) was used as
the dissolution medium which was degassed by purging with helium for 20 minutes
prior to the tests. Powder samples (containing 25 mg of indometacin) were dropped into
the medium directly during experiments and UV readings were recorded every 3
minutes automatically using a Cecil CE 2020 spectrometer (Cecil Instruments,
Cambridge, UK) at a wavelength of 320 nm. The dissolution tests were conducted in
triplicate for each sample.
4.3.13 Evaluation of the physical stability of the solid solutions
All three solid solution systems were stored in a desiccator over saturated NaCl solution
to achieve an RH of 75% at room temperature for a certain period of time. The physical
stability of these samples was studied using an X-ray powder diffractometer (XRPD;
PW3710 Philips, Holland). The X-ray patterns were obtained using a step of 0.02° in a
20 range of 5-40°, with a rate of one second per step, and the copper radiation K«i and
Ko2 with tube power of 45kV voltage and 30 mA current.
122

Chapter 4 Influence o f preparation method...
4.4 Results and discussion
4.4.1 Physical properties of the solid solutions
XRPD and DSC measurements were carried out to confirm the amorphicity of the solid
solutions prepared by different methods. All systems were completely amorphous
according to the XRPD and DSC results. Figure 4.1 shows the XRPD pattern of the
spray dried sample (XRPD patterns of the ball milled and melt quenched solid solutions
were shown in Chapter 3).
I 00u
150
10 15 20 25
Position |2°Theta|
30 35 40
Figure 4.1: XRPD pattern o f spray dried indometacin: PVP (70%:30%) solid solution.
a b
Figure 4.2: SEM images o f spray dired indometacin: PVP (70%: 30%) solid solution (a,
20 pm and b, 5 pm).
123
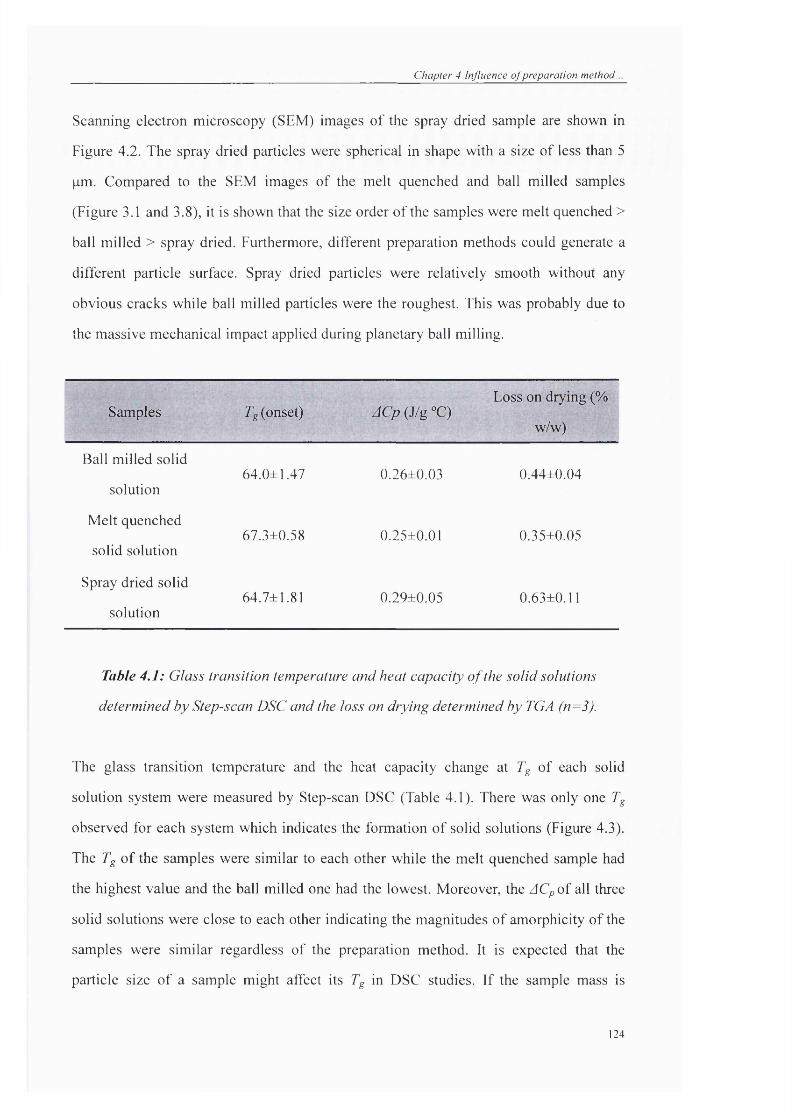
C h apter 4 Influence o f prepara tion m ethod.
Scanning electron microscopy (SEM) images of the spray dried sample are shown in
Figure 4.2. The spray dried particles were spherical in shape with a size of less than 5
pm. Compared to the SEM images of the melt quenched and ball milled samples
(Figure 3.1 and 3.8), it is shown that the size order of the samples were melt quenched >
ball milled > spray dried. Furthermore, different preparation methods could generate a
different particle surface. Spray dried particles were relatively smooth without any
obvious cracks while ball milled particles were the roughest. This was probably due to
the massive mechanical impact applied during planetary ball milling.
Samples Tg (onset) JQ ;(J/g °C )Loss on drying (%
w/w)
Ball milled solid
solution64.0±1.47 0.26±0.03 0.44±0.04
Melt quenched
solid solution67.3±0.58 0.25±0.01 0.35±0.05
Spray dried solid
solution64.7±1.81 0.29±0.05 0.63±0.11
Table 4.1: Glass transition temperature and heat capacity o f the solid solutions
determined by Step-scan DSC and the loss on drying determined by TGA (n=3).
The glass transition temperature and the heat capacity change at Tg of each solid
solution system were measured by Step-scan DSC (Table 4.1). There was only one Tg
observed for each system which indicates the formation of solid solutions (Figure 4.3).
The Tg of the samples were similar to each other while the melt quenched sample had
the highest value and the ball milled one had the lowest. Moreover, the ACpOf all three
solid solutions were close to each other indicating the magnitudes of amorphicity of the
samples were similar regardless of the preparation method. It is expected that the
particle size of a sample might affect its Tg in DSC studies. If the sample mass is
124

Chapter 4 Influence o f preparation method...
constant, it is expected to see that an increase in particle size will result in a higher Tg
value, because a larger particle size might have a higher extent of thermal lag caused by
the thicker sample and the resolution of Tg would be reduced. Furthermore, a larger
particle size might have a worse contact with the bottom of the DSC pan. All these
factors would play an important role for an increased Tg. Therefore, all solid solutions
were sieved through a 90 pm sieve in order to break dovm any lumps or agglomerates
formed during preparation to guarantee a relatively homogenous and smaller
distribution of sample size.
I
Figure 4.3: Step-scan DSC traces o f the spray dried (a), melt quenched (b) and ball
milled (c) solid solutions (an indometacin to PVP ratio of 70%:30%).
Moisture content or any residual organic solvent would affect the relaxation behaviour
of a sample greatly because they can act as a plasticiser to reduce the Tg of the sample
and increase its molecular mobility. Therefore, before the freshly prepared solid
solutions were tested by different techniques, two hours were allowed to dry them in a
vacuum desiccator over P2O5 to minimise any moisture or organic solvent residual
coming from spray drying. Thermal gravimetric analysis (TGA) results of the solid
solutions after drying are shown in Table 4.1. All systems have shown a relatively low
loss on drying level. The spray dried sample had a slightly higher loss of weight than
the others probably due to its lower density and porous structure which would tend to
sorb more moisture or solvents.
125

Chapter 4 Influence o f preparation method...
4.4.2 Relaxation évaluation using Step-scan DSC
Many researchers have applied DSC to determine the relaxation of amorphous materials.
Hancock et al (1995) used conventional-DSC to compare relaxation behaviours
between a small molecular weight pharmaceutical glass and some large molecular
weight polymers. Van den Mooter et al (1999) used relaxation data obtained using
conventional-DSC to predict the physical stability of three amorphous pharmaceutical
compounds. During a DSC scan, an aged sample shows an endothermie relaxation peak,
which is usually referred to as an enthalpy recovery, and its intensity is dependent on the
aging conditions such as time and temperature. This endothermie peak accompanies the
Tg and it is also called an overshoot peak (Van den Mooter et a l, 1999). A disadvantage
of the conventional-DSC method in relaxation study is that the endothermie peak is
usually associated with the heat capacity change in a scan signal and sometimes it is
difficult for the analyzer to perform an accurate calculation. In order to solve this
problem, Craig et al (2000) tried to use modulated-temperature DSC (MTDSC) as a
means to determine the relaxation of amorphous lactose. The advantage of MTDSC is
its capability of separating the apparent heat capacity change at Tg from the enthalpy
recovery (Kawakami and Pikal, 2005), hence greatly helping the accurate assessment of
Tg, heat capacity and relaxation endotherms.
SSDSC is a technique which is similar to the MTDSC. Instead of heating and cooling a
sample repeatedly, the sample under SSDSC examination is heated and held
isothermally in each step and this procedure is repeated until the sample reaches a
temperature required by the study. In a SSDSC, the relaxation endothermie peak can
also be separated from the apparent heat capacity. Figures 4.4 to 4.6 have shown the
enthalpy recoveries of aged solid solutions prepared by ball milling melt quenching and
spray drying respectively after aging for different periods.
126

Chapter 4 Influence o f preparation method.
13.87
48h13.84
13.82
24hI 13.00
Î3 13.78
C 13.76
4h13.74
13.72
58 6260 64 66 68 70 72 74 76 77TemperatreTO
Figure 4.4: Changes of the endothermie peaks of ball milled solid solution (an
indometacin to PVP ratio o f 70%:30%) aged at 50 °C for 0, 2, 4, 8, 24 and 48 hours.
14 12
1410
48h
14.06
16h14.04
Ië 14.021
13.96 4h
13.92
13.90 Oh13.88
63 66 70 72 7484 68 76 78 80Température (*C)
Figure 4.5: Changes of the endothermie peaks o f melt quenehed solid solution (an
indometaein to PVP ratio o f 70%:30%) aged at 50 for 0, 2, 4, 8, 16 and 48 hours.
127

Chapter 4 Influence o f preparation method.
14.16
14.14 48h14.12
14.10
14.06
24h14.06
“ 14.04
14.02
“ 14.00
13.96
13.96
13.94
Oh1392
13.9076 7863 64 66 68 70 72
TemperAre TO
Figure 4.6: Changes of the endothermie peaks o f spray dried solid solution ( an
indometacin to PVP ratio of 70%:30%) aged at 50 %7 for 0, 2, 4, 8, 24 and 48 hours.
3
2
1
00 10 20 30 40 50
Time (hour)
Figure 4,7: Enthalpy recovery of ball milled solid solution (an indometacin to PVP
ratio o f 70%:30%) aged at 50 asa function of time, determined by SSDSC (n=3).
128

Chapter 4 Influence o f preparation method...
3
2
1
0500 10 20 30 40
Time (hour)
Figure 4.8: Enthalpy recovery o f melt quenched solid solution (an indometacin to PVP
ratio oflOYo.SOyo) aged at 50 °C as a function o f time, determined by SSDSC (n=3).
i
4
3
2
1
0500 10 20 30 40
Time (hour)
Figure 4.9: Enthalpy recovery o f melt quenched solid solution (an indometacin to PVP
ratio o f 70%: 30%) aged at 50 °C as a function o f time, determined by SSDSC (n=3).
129

Chapter 4 Influence o f preparation method...
As can be seen from Figures 4.7 to 4.9, no matter which preparation method was used,
the solid solutions have all shown a gradual increase of the enthalpy recovery as aging
time increased. This indicated that the structural rearrangement of the glassy sample
towards the equilibrium state.
Although MTDSC or SSDSC can measure the enthalpy recovery in a more accurate
extent than conventional DSC, its value is not necessarily the same as enthalpy
relaxation because factors such as the “frequency effect” and “temperature scan effect”
may also contribute to the endotherm measured near Tg. These factors might probably
be the reason why the solid solutions at time zero display a small enthalpy peak. The
“frequency effect” in some cases, can make a significant impact to the endotherm even
though it is not related to enthalpy relaxation or recovery. Therefore, miscalculation of
enthalpy recovery might be made if it is not taken into account (Kawakami and Pikal,
2005). It needs to be pointed out that the “frequency effect” at different aging time or
temperature would remain constant as long as the same batch of sample with a similar
particle size and density is used. On the other hand, the “temperature scan effect” is
caused by the lower scan rate of MTDSC or SSDSC (compared to a conventional DSC
experiment). This slow heating procedure might allow the sample to relax even during
the temperature scans. Therefore, the enthalpy loss caused by a temperature scan and
the frequency effect must be addressed in order to obtain an accurate relaxation enthalpy.
A well accepted method is to subtract the raw endotherm data of different aging times
by the enthalpy recovery value obtained with the zero one (Liu et a l, 2002; Kawakami
and Pikal, 2005).
130

Chapter 4 Influence o f preparation method.
1.0
0.9
0.8
0.7
0.6
0.5
0.4
0.3300 10 20 40 50
Time (hour)
Figure 4.10: Structural relaxation decay function o f ball milled (W), spray dried (A)
and melt quenched (A) solid solutions(an indometacin to PVP ratio o f 70%:30%)
determined by enthalpy recovery method, with KWWfitting shown as solid lines (n^3).
Samples r(day) P /(day) Chi- DoF R-
Ball milled solid
solution58.6 0.50 7.9 0.0016 0.9733
Melt quenched
solid solution47.7 0.71 15.6 0.0008 0.9865
Spray dried solid
solution39.9 0.62 9.8 0.0017 0.9785
Table 4.2: Relaxation parameters obtainedfrom DSC data for different solid solutions
containing indometacin: PVP o f 70%: 30% (R , coefficient of determination, and
Chfi/DoF, reduced Chfi value).
The enthalpy relaxation data of the solid solutions were normalised using Equation 3.11
131

Chapter 4 Influence o f preparation method...
and fitted to the Kohlraush-Williams-Watts (KWW) equation in order to obtain the r and
p values according to the method described in Chapter 3. Figure 4.10 shows the fraction
of sample that relaxed after a certain period of time and Table 4.2 shows the relaxation
parameters obtained after fitting to the equation.
As expected, the solid solutions prepared by different methods have shown different
relaxation behaviours (Table 4.2). The relaxation time constant, / was used to evaluate
the relaxation rate of these three systems. The molecular mobility of the systems was in
the order of melt quenched, spray dried and ball milled solid solutions from low to high.
In a study, Liu et al (2002) mentioned that during structural relaxation, a sample starts
to deviate from its initial glassy state, where the configurations were “frozen in” during
processing, towards the equilibrium supercooled liquid state. Hence the relaxation
would be expected to be dependent on the preparation methods. The / of the spray dried
solid solution is in good correlation with the value of a spray dried indometacin and
PVP system (10.0 hours) obtained by Matsumoto and Zografi (1999). Furthermore, the
P values of the solid solutions were also different to each other while the melt quenched
sample has the most homogeneous distribution of relaxation and the ball milled one has
the least. This large distribution in relaxation of the ball milled sample might be due to
its heterogeneity. The ball milled solid solution was found to be less homogenous than
the spray dried and melt quenched ones as indicated by the larger width of its Tg,
because a broad Tg might be a result of some heterogeneous regions within the
amorphous sample or some extra compounds generated by chemical degradation.
Patterson et al (2007) tried to study the effect of different preparation methods on the
physical properties of some pharmaceutical APIs compounded with PVP and it was
found that the ball milled carbamasipine and PVP was less homogenous than the melt
quenched and spray dried ones. Though MTDSC only detected a single Tg on the ball
milled carbamasipine and PVP system, Raman mapping data had indicated that there
was evidence for small clusters of carbamasepine rich areas.
In some previous studies, it has been discovered that preparation methods can play an
132
Chapter 4 Influence o f preparation method...
important influence on the pharmaceutically related properties of the resulted product.
Surana et al. (2004) found that the method used to prepare amorphous trehalose can
affect the enthalpy relaxation, crystallisation behaviours and the rate or extent of water
sorption to the material. In another case amorphous tri-0-methyl-P-cyclodextrin
prepared by different methods also displayed differences in the crystallisation and
relaxation though their glass transition temperature and heat capacity change were
similar (Tsukushi et al, 1994). These findings give support to what was observed in this
study; indometacin-PVP solid solutions prepared by different methods have a different
relaxation profile.
4.4.3 Relaxation evaluation using the retention volume of decane
In Chapter 3, an IGC method based on the use of the retention volume {Vma:d of decane
was developed to study the surface relaxation of the melt quenched solid solution. In
this section this method was further applied to determine the surface relaxation of the
other two solid solution systems at 50 °C in order to compare them to the DSC
relaxation data. Ball milled and melt quenched solid solutions were first conditioned at
25 °C and 0% RH in the column oven under He flow for 10 hours and then the
temperature was increased to 50 °C followed by a series injection of decane and
methane for up to 48 or 24 hours respectively in order to obtain the Vmax information as
a function of aging time.
133

Chapter 4 Influence o f preparation method.
100 -
95 ^
90
1o§ 85 -
1(4-,o 80 r
75 ,
70
65 -
Batch 4
Batch 3Batch 1
Batch 2
10 20 30
Time (hour)
40 50
Figure 4,11: Decrease o f decane Vmax on four different batches o f ball milled solid
solution (an indometacin to PVP ratio of 70%: 30%) as a function of time at 50
103Batch 2
98
B(D
Batch 3
Batch 1
0 5 10 15 20 25
Time (hour)
Figure 4,12: Decrease o f decane Vmax on three different batches o f spray dried solid
solution (an indometacin to PVP ratio of 70%: 30%) as a flmction of time at 50 "C.
134

Chapter 4 Influence o f preparation method...
The Vmax changes of the ball milled and melt quenched solid solutions aged at 50 °C are
shown in Figures 4.11 and 4.12. The Vmax change of the melt quenched solid solution
has already been shown in Chapter 3 (Figure 3.25). For all samples, Vmax of decane
decreased as the aging time increased. The spray dried solid solution displayed a steep
drop of Vmax in the first 3-5 hours followed by a slower decrease later on. In the case of
ball milled solid solution the decrease of Vmax was much slower. The spray dried solid
solution relaxed in a faster manner than the ball milled and melt quenched ones. In order
to have a clear view of the relaxation behaviours, the Vmax data obtained were
normalised using the method developed in Chapter 3 in order to perform a KWW fitting.
Once the surface relaxation parameters were acquired, they were compared to the bulk
relaxation data obtained by DSC study. Figures 4.13 to 4.15 show the comparison of the
KWW fitting obtained using IGC and DSC relaxation data.
SQ
1.0
0.9
0.8
0.7
0.6
0.5 DSC0.4
0.3
0.2 IGC0.1
0.010 20 30 40
Hme (hour)
50 60
Figure 4.13: KWWfitting o f the IGC and DSC data o f the melt quenched solid solution
(an indometacin to PVP ratio o f 70%:30%) aged at 50 °C.
135

Chapter 4 Influence o f preparation method...
1.0
0.9
0.8
0.7
0.6«g 0.5 Q
0.4
DSC
IGC0.3
0.2
0.1
0.06040 500 10 20 30
Tim e (hour)
Figure 4.14: KWWfitting o f the IGC and DSC data o f the ball milled solid solution (an
indometacin to PVP ratio o f 70%:30%) aged at 50 °C.
1.0
0.9
0.8
0.7
^ 0.6 «
0.5 A
0.4 DSC
0.3
0.2
0.1IGC
0.00 40 6010 20 30 50
Time (hour)
Figure 4.15: KWWfitting o f the IGC and DSC data o f the spray dried solid solution (an
indometacin to PVP ratio o f 70%:30%) aged at 50 °C.
136
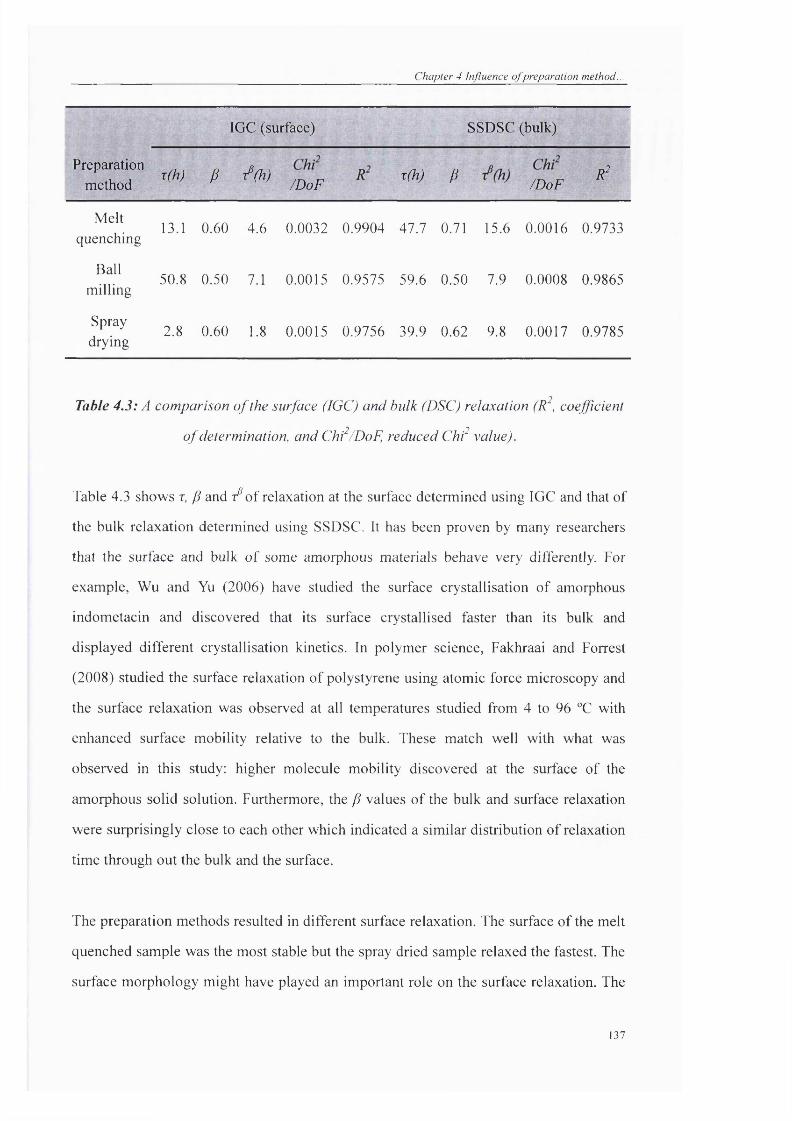
C h ap ter 4 Influence o f p repara tion m ethod...
IGC (surface) SSDSC (bulk)
Preparationmethod t(H) P /(h) /DoF T(h) P /DoF R^
Meltquenching 13.1 0.60 4.6 0.0032 0.9904 47.7 0.71 15.6 0.0016 0.9733
Ballmilling 50.8 0.50 7.1 0.0015 0.9575 59.6 0.50 7.9 0.0008 0.9865
Spraydrying 2.8 0.60 1.8 0.0015 0.9756 39.9 0.62 9.8 0.0017 0.9785
Table 4.3: A comparison o f the surface (IGC) and bulk (DSC) relaxation (R , coefficient
of determination, and Chi /DoF, reduced Chi value).
Table 4.3 shows t , f and / of relaxation at the surface determined using IGC and that of
the bulk relaxation determined using SSDSC. It has been proven by many researchers
that the surface and bulk of some amorphous materials behave very differently. For
example, Wu and Yu (2006) have studied the surface crystallisation of amorphous
indometacin and discovered that its surface crystallised faster than its bulk and
displayed different crystallisation kinetics. In polymer science, Fakhraai and Forrest
(2008) studied the surface relaxation of polystyrene using atomic force microscopy and
the surface relaxation was observed at all temperatures studied from 4 to 96 °C with
enhanced surface mobility relative to the bulk. These match well with what was
observed in this study: higher molecule mobility discovered at the surface of the
amorphous solid solution. Furthermore, the f values of the bulk and surface relaxation
were surprisingly close to each other which indicated a similar distribution of relaxation
time through out the bulk and the surface.
The preparation methods resulted in different surface relaxation. The surface of the melt
quenched sample was the most stable but the spray dried sample relaxed the fastest. The
surface morphology might have played an important role on the surface relaxation. The
137

Chapter 4 Influence o f preparation method...
difference between the surface and bulk relaxation is very significant in melt quenched
and spray dried samples. However, in the case of ball milled sample, the difference was
very limited. During ball milling, mechanical force was applied on the surface of the
particles to facilitate crystalline indometacin dissolving into the rubbery PVP. The
amorphous region of these two components was mainly located on the surface and left
the core of the sample either a small amount of PVP or crystalline indometacin (none of
them would give any relaxation response). Though SSDSC was obtaining the relaxation
information of the whole sample, this relaxation was mainly from the outer layer.
Therefore it has similar relaxation profile to the IGC detected relaxations. This case in
another way proved the capability of IGC in detecting surface relaxation.
Furthermore, AFM was used to study whether surface relaxation could cause any
change on the roughness of the sample. The melt quenched system was investigated
here and this sample was unground, therefore it appeared as a flat cake which was
feasible for the roughness measurement using AFM. The melt quenched samples that
were ground appeared as particles with a very small size and it was difficult to measure
the roughness at the surface of a single particle. The ball milled and spray dried samples
which also appeared as fine particles were not studied here for the same reason. The
melt quenched sample was aged at 50 °C for 48 hours and the root-mean-square
roughness {Rq) of the initial and the aged samples was measured according to the AFM
amplitude images (Figure 4.16). To correct the scanner bow, each image was treated
using the third order plane fit command of the control software in both 3/ and x direction.
The root-mean-square roughness was calculated using Equation 4.1 :
&1 ”— Equation 4.1
where yt is the distance of point i from the centre line and rip is the number of points
taken. However, no apparent change of the roughness on the sample was noticed after
aging (Table 4.4). On the other hand, phase images of the samples indicated a good
138
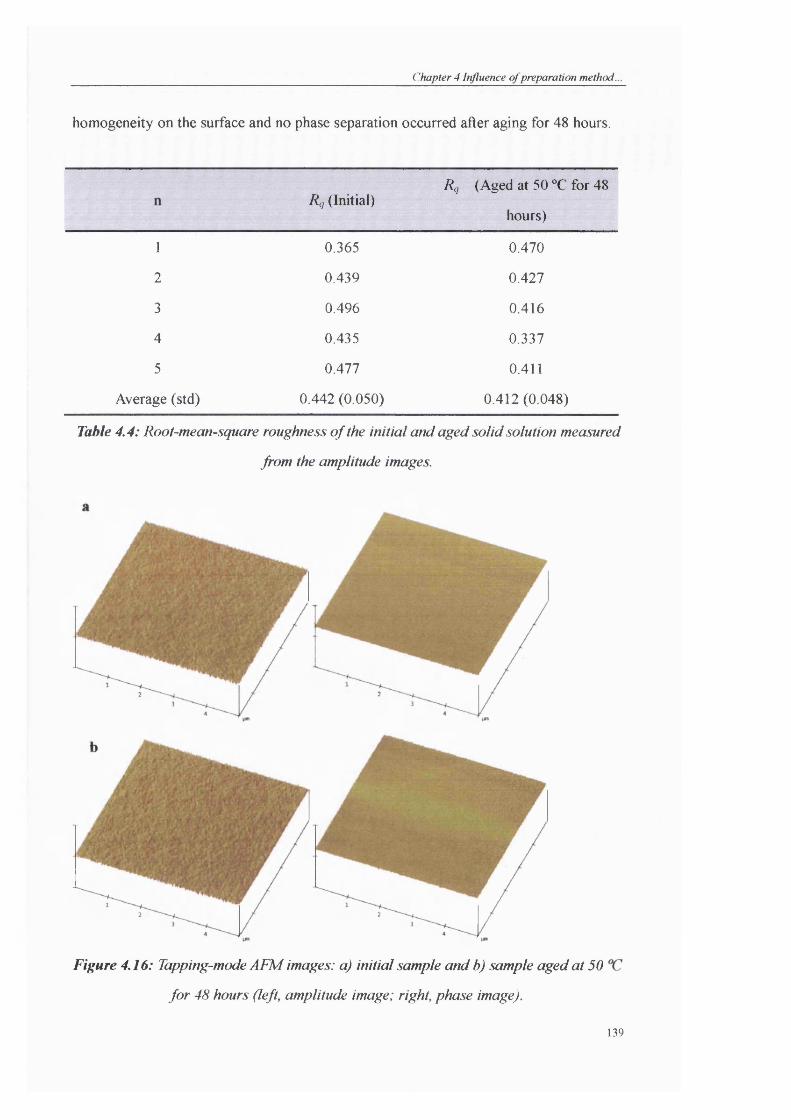
Chapter 4 Influence o f preparation method.
homogeneity on the surface and no phase separation occurred after aging for 48 hours.
Rq (Initial)Rq (Aged at 50 T for 48
hours)
1 0.365 0.470
2 0.439 0.427
3 0.496 0.416
4 0.435 0.337
5 0.477 0.411
Average (std) 0.442 (0.050) 0.412 (0.048)
Table 4,4: Root-mean-square roughness o f the initial and aged solid solution measured
from the amplitude images.
Figure 4.16: Tapping-mode AFM images: a) initial sample and b) sample aged at 50
for 48 hours (left, amplitude image; right, phase image).
139

Chapter 4 Influence o f preparation method...
4.4.4 Relaxation evaluation using isothermal microcalorimetry
In this section, isothermal microcalorimetry was used to study the relaxation behaviours
of the solid solutions. IMC is a technique which can be used to directly measure the
rates of enthalpy relaxation (Liu et al, 2002). IMC can continuously record heat
production rate during enthalpy relaxation which can provide more data points than
DSC which measures cumulative change. IMC is considered to be more sensitive than
DSC in measuring slow relaxation (Liu et al, 2002).
IMC measures the heat flow to or from the sample. An equation was differentiated from
the KWW equation (Equation 3.9) to obtain the expression for heat power P per gram of
sample used, pW/g (Liu et a l , 2002). This equation was used in order to fit the signal
measured by IMC to obtain the relaxation parameters (Liu et a l, 2002):
p - A 'TEquation 4.2
where P is the heat power, A//„ is the relaxation enthalpy at time infinite, t is time in
hour and the other parameters are the same as stated previously. 277.8 in the equation is
a result of unit conversions due to differentiating KWW equation to Equation 4.2.
On the other hand, Liu et al (2002) have suggested using another equation (Equation
4.3), a modified stretched exponential function (MSE), which was originally developed
for NMR relaxation, to interpret the IMC data:
0 ( 0 = exp Equation 4.3
In order to express heat power P obtained from an IMC study. Equation 4.3 can be
expressed as follow:
140

Chapter 4 Influence o f preparation method..
P = 277.8 ■ • (1 + ^ ) • (1 + — • exp Tn 'TiEquation 4.4
The relaxation time constant t which is equivalent to the one in KWW equation can be
calculated using Equation 4.5:
Equation 4.5
The main advantage of MSE equation over the KWW equation is its ability to avoid
problems as time approaches zero. When t approaches zero, the power P remains finite
while in the case of the KWW equation, it becomes infinite, which is physically
impossible. This “time-zero” problem might create errors when analyzing 0 near time
zero and introduce inaccuracies when studying very slow relaxations for short periods
of time, such as a few days (Liu et al, 2002). It needs to be pointed out that as
experiment time increases, the MSE equation reduces to the form of KWW equation
(Liu et a l, 2002).
The solid solutions for study were left in an isothermal microcalorimetry. Thermal
Activity Monitor (TAM) at 50 °C for 48 hours. The rate of enthalpy relaxation of these
samples were measured and analyzed. The heat power signals measured are shovm in
Figures 4.17 to 4.19.
141

Chapter 4 Influence o f preparation method.
kOQ.OJ
X
12
Time (hour)
17
40
35 □ Batch 1
• Batch 2
Batch 330
25
20
15
10
5
022
Figure 4.17: Power time response o f the ball milled solid solution (an indometacin to
PVP ratio o f 70%:30%) measured by IMC at 50 °C.
a.
L.o>oo.«X
Time (hour)
35
Batch 1
Batch 2
Batch 3
30
25
20
15
10
5
0222 7 12 17
Figure 4.18: Power time response o f the melt quenched solid solution (an indometacin
to PVP ratio o f 70%:30%) measured by IMC at 50 °C.
142

C h apter 4 Influence o f prepara tion m ethod.
□ Batch 1
• Batch 2
« 10 ^
Time (hour)
Figure 4.19: Power time response o f the spray dried solid solution (an indometacin to
PVP ratio o f 70%:30%) measured by IMC at 50 °C.
Equations 4.2 and 4.4 were used to tit the power time data of the solid solutions
measured by TAM. The d/A) values obtained after the fitting were compared to the ones
calculated from the DSC study using Equation 3.10 (Table 4.5). A good agreement
between these data was observed.
SampleMSE KWW SSDSC
Ball milling
Melt quenching
Spray drying
3.9
3.5
3.6
4.3
3.8
4.6
3.6
4.4
4.2
Table 4.5: Comparison o f infinite relaxation enthalpy o f the solid solutions (an
indometacin to PVP ratio o f 70%:30%) determined by IMC and calculated according to
the TgValue obtained by SSDSC.
143

Preparation
KWW MSE DSC
Method
r/h P To/h T//h T/h P / / h T/h P / / h
Ball milling 9.7 0.47 3.0 1.9 0.4 10.4 0.50 3.2 59.6 0.50 7.9
Melt quenching 7.8 0.43 2.4 0.9 0.1 8.4 0.45 2.6 47.7 0.71 15.6
Spray drying 1.2 0.22 1.0 1.7 0.5 49.4 0.32 3.4 39.9 0.62 9.8
Table 4.6: Comparison o f relaxation parameters o f the solid solutions (an indometacin to PVP ratio o f 70%: 30%) evaluated using both KWW
and MSE equations in IMC study and the ones determined in DSC study (n=3).
144

Chapter 4 Influence o f preparation method...
Relaxation parameters t and p were calculated after fitting the IMC data to Equations
4.2 and 4.4 and compared to the ones determined using SSDSC (Table 4.6). For all
three solid solutions, the t and / values obtained using IMC were significantly lower
than those obtained using SSDSC. In a previous study, Liu et al. (2002) demonstrated
good agreement between IMC and MTDSC. However, that comparison was only
based on one hydrophilic compound, sucrose. However, in a more recent study,
Bhugra et al (2006) extended this study to two more compounds, indometacin (tested
at 25 and 30 °C) and ketoconazole (tested at 20, 25, 30 and 35 °C), both of which are
hydrophobic. The authors have found that the relaxation times obtained using IMC
were significantly lower than those determined by MTDSC at all tested temperatures.
Though a clear explanation on this phenomenon is still unknown, it was suggested
that this difference is probably due to the high sensitivity of IMC which enables it to
measure some faster modes of motion beside those which also can be measured by
DSC. In another words, DSC could only measure those motions which accompanied
with a change of enthalpy recovery, such as the a-relaxation (namely, structural
relaxation as explained in the Introduction Chapter). Therefore, the faster relaxation
times measured by IMC were probably caused by the inclusion of some faster
motions or relaxation process. This reason could also be used to explain why the P
value derived from IMC was smaller than the one from SSDSC.
According to the IMC relaxation data, different solid solution systems show small
difference in their relaxation parameters which indicates that different preparation
methods have a different impact on their relaxation behaviors as confirmed previously
by both DSC and IGC studies. The relaxation parameter values determined using
KWW equation were similar to the MSE ones for both ball milled and melt quenched
samples. In the case of the spray dried solid solution, the values were slightly different
when determined using the different equations. The reason of this is not clear;
however, considering the subtleties of numerical evaluation and the relative fast
relaxation rates the samples have, this difference was possible to happen.
145

Chapter 4 Influence o f preparation method.
4.4.5 Correlation of fragility, zero mobility temperature and physical stability
It is very important for pharmaceutical researchers to understand how molecular
mobility of amorphous materials changes with temperature. This kind of information
could help one to decide a suitable storage condition that would reduce the rates of
any physical or chemical degradation to an acceptable range (Crowley and Zografi,
2001). Angell (1991) has developed a strong/fragile classification system for glasses
according to the temperature dependence of relaxation time or viscosity above their Tg.
When plotting relaxation or viscosity versus temperature, strong glasses yield a
straight line indicating Arrhenius behaviours while fragile glasses display a significant
deviation from linearity (as shown in Figure 1.6). In other words, the molecular
mobility increases more rapidly in a fragile glass as the Tg is approached during the
heating or cooling procedure. For example, the rate of molecular mobility of sorbitol,
a fragile glass, changes by about one order of magnitude for a temperature change of
10 °C (Bohmer et a l, 1993), while for a strong glass, such as ZnCl], the same level of
change happens every 25 °C (Bohmer et al, 1993).
In this study, the dependence of glass transition temperature on heating rate was
evaluated using DSC to study the fragility of the solid solution systems. The solid
solution sample was first heated to 20 °C above their Tg followed by cooling down to
at least 50 °C lower than it. The cooling rate has to be identical to the subsequent
heating otherwise an error would happen in the measurement of activation enthalpy
(Moynihan et a l, 1974 and 1976; Crichton and Moynihan, 1988). Subsequently, the
sample was scanned at heating rates of 2, 5, 10, 20 and 40 °C/min'^ and the onsets of
Tg were recorded for calculation later. This range of heating rate was chosen because
it is not so slow that the sensitivity of a scan is compromised, while significant
thermal lags which usually happen at fast heating rate can be avoided (Crowley and
Zografi, 2001). Figure 4.20 shows the DSC scans of the solid solutions.
146

Chapter 4 Influence o f preparation method.
23.0
S
I
Ï...I
70
31.5
III
55
Figure 4.20: DSC traces (each trace is a representative of three measurements) o f the
hall milled (I), melt quenched (2) and spray dried (3) samples (an indometacin to
PVP ratio o f 70%:30%) scanned at 40 (a), 20 (b), 10 (c) and 5 (d) °C/min.
147

Chapter 4 Influence o f preparation method..
The activation enthalpy of structural relaxation AEpg at Tg of the sample can be
calculated using the heating rate dependence of Tg {AEpg can be obtained from the
slope of a plot of 1/Tgon against Inq) according to an equation applied by Moynihan et
al (1974):
_ ^ d{\nq) Equation 4.6R d{\IT^)
where R is the gas constant (R=S3\45 J • K’ • mol'^) and q is the heating/cooling rate.
Fragile glasses which display non-Arrhenius behaviour usually have a large AEpg
close to Tg and therefore a less significant effect of heating rate on Tg (Crowley and
Zografi, 2001).
The fragility parameter, w, defined as the slope of the logj versus Tg^T line at the glass
transition temperature (T=7^), can be expressed in the following equation:
m = ^log ipr(r)ü f ( r / r )
Equation 4.77’=7’„
where t is the relaxation time constant and it would slow down to 100 s at Tg (Zallen,
1983). Equation 4.7 can also be expressed in terms of the temperature dependent
apparent activation energy AE* (which can be replaced by A Erg):
AE^m = -------- — Equation 4.8
(InlO)j T
A large value of m indicates a fragile glass and a small value indicates a strong one.
The strength parameter D in Vogel-Tammann-Fulcher (VTF) equation can be
calculated using m based on Equation 4.9. In this case, a value of D more than 30
indicates a strong glass, and if it is lower than 10 the glass displays fragile behaviour.
148

Chapter 4 Influence o f preparation method...
m - m .Equation 4.9
where rrimin is the minimum value of m and it is defined as rrimin log (rTg/ro). As
described before rj-gis approximate 100 s, with tq which is the timescale of vibration
motions being lO**" s, rrimin can be calculated to be 16. Moreover, To, the temperature
at which the molecular mobility (also the configuration entropy) reaches zero, can be
calculated according to the following equation (Yoshioka and Aso, 2005);
T = T ( l ----m
Equation 4.10
4.5
$ y = -96.738s + 288
R^= 0.98694
# y = -« 5 .1 6 1 s + 253.13
R^= 0.9965
■ y = -59 .99s + 179.03
R = 0 .9965
3
2
1.5
1
0.5
02.92 2.93 2.94 2.95 2.96 2.97 2.98
1000/Tgon (K *)
Figure 4.21: Plot logarithm of heating rate as a function of 1/Tgon of the hall milled
(M), spray dried (0 ) and melt quenched ( ^ ) solid solutions (an indometacin to PVP
ratio o f 70%: 30%). The regression straight lines and coefficients of determination are
shown (n=3).
149
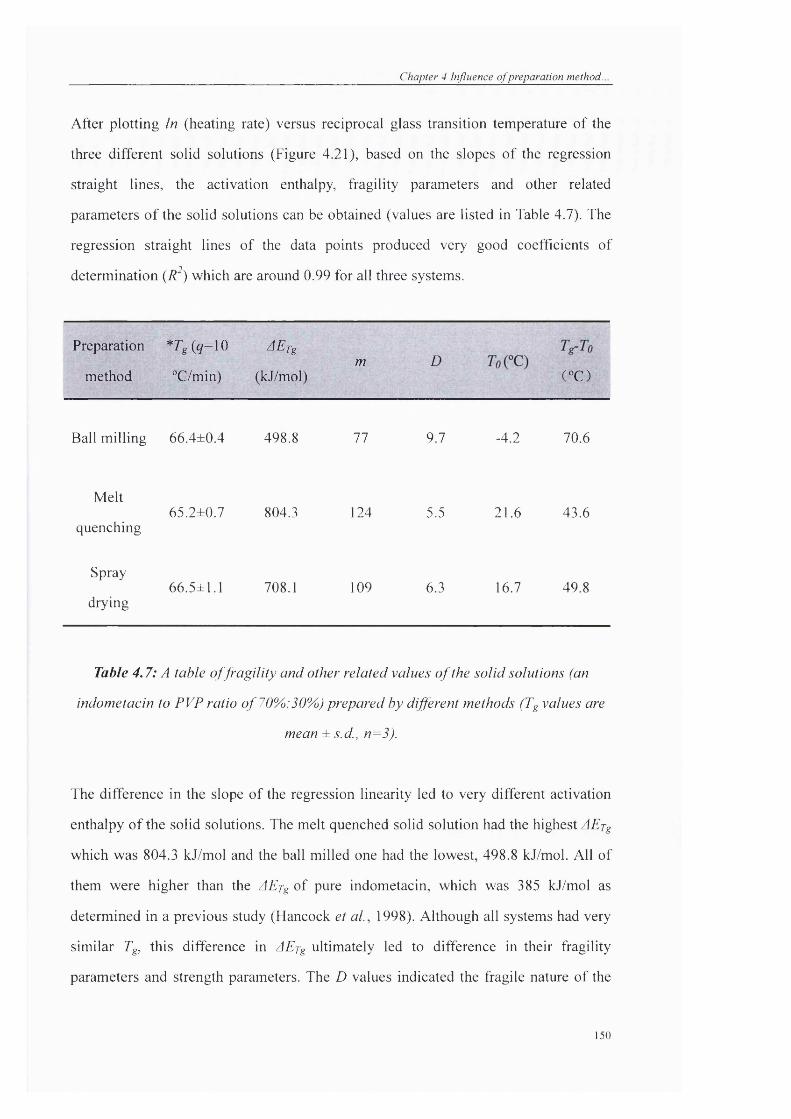
C h apter 4 Influence o f prepara tion m ethod.
After plotting In (heating rate) versus reciprocal glass transition temperature of the
three different solid solutions (Figure 4.21), based on the slopes of the regression
straight lines, the activation enthalpy, fragility parameters and other related
parameters of the solid solutions can be obtained (values are listed in Table 4.7). The
regression straight lines of the data points produced very good coefficients of
determination {R ) which are around 0.99 for all three systems.
Preparation
method
*Tg{q=\Q
°C/min)
AErg
(kJ/mol)m D
(°C)
Ball milling 66.4±0.4 498.8 77 9.7 -4.2 70.6
Melt
quenching65.2±0.7 804.3 124 5.5 21.6 43.6
Spray
drying66.5±1.1 708.1 109 6.3 16.7 49.8
Table 4.7: A table o f fragility and other related values o f the solid solutions (an
indometacin to PVP ratio o f 70%:30%) prepared by different methods (Tg values are
mean ± s. d., n=3).
The difference in the slope of the regression linearity led to very different activation
enthalpy of the solid solutions. The melt quenched solid solution had the highest AEpg
which was 804.3 kJ/mol and the ball milled one had the lowest, 498.8 kJ/mol. All of
them were higher than the AErg of pure indometacin, which was 385 kJ/mol as
determined in a previous study (Hancock et a l, 1998). Although all systems had very
similar Tg, this difference in A Erg ultimately led to difference in their fragility
parameters and strength parameters. The D values indicated the fragile nature of the
150

Chapter 4 Influence o f preparation method...
solid solutions (Z)<10), and both D and m values indicated the melt quenched solid
solution was the most fragile glass among the three while the spray dried one being
the next and the ball milled one being the least. Different preparation methods seemed
to have different impacts on the fragility of the solid solutions. Interestingly, the m
value of ball milled sample matched well with the one reported for amorphous
indometacin {m=ll\ Hancock et al, 1998). Considering that the process of ball
milling does not require any heat or solvent as needed by the other two methods
which include complete melting or dissolution of indometacin and PVP, the fragility
of the ball milled sample was expected to be the closest to the pure indometacin or
PVP (m=46; Buckton et a l, 2006). Therefore, this result further demonstrates the
fragility of a product can largely be affected by the way it is prepared.
The zero mobility temperature To of the solid solutions was calculated according to
Equation 4.10. The values of the melt quenched, spray dried and ball milled samples
were 21.6, 16.7 and -4.2 °C respectively. The accuracy of this calculation method has
been validated previously. Hatley (1997) found that the Tg-Tg of sucrose was 61.5 °C
obtained using this method, which was in good agreement with the value 60 °C
determined by Hancock et al (1995) who based on a more direct approach using
enthalpy relaxation.
Glass transition temperature Tg is considered to be an important factor deciding the
stability of a glass, and the higher the Tg value the more stable the glass would be at a
particular storage temperature. However, some studies have proven that this is not
necessary the case (Tarelli et al, 1994; Hatley and Colaco, 1997). Tq instead, was
considered to be a better measure of stability than Tg. Although the Tg of the solid
solutions studied here were very similar to each other, enthalpy relaxation studies
done by SSDSC indicated that the melt quenched solid solution was the most stable
product, the spray dried one being the next and the ball milled one the last. The Tq and
Tg-Tg values were found to be in good correlation with the SSDSC relaxation studies.
It can be seen from Equation 4.10 that a fragile glass would have a small Tg-Tg while a
151

Chapter 4 Influence o f preparation method...
Strong glass would have the opposite and this is also what is observed based on the
Tg-To data of the solid solutions. Therefore, a fragile glass would have more stability
advantage than the stronger one when below Tg, because the viscosity of a fragile
glass increases more drastically at a given range of temperature drop. So if the
samples have similar Tg, at the same aging temperature, the fragile sample would
appear to be more stable than the strong one. In the case when the temperature is
around or above Tg, the fragile glass is more sensitive to temperature changes than a
strong one. Therefore, when a fragile glass is undergoing glass transition, softening
happens much faster as the temperature increases compared to stronger glasses, and it
is expected that the fragile glass would crystallise more easily. However, a study
indicated that the fragile glass trehalose showed less crystallisation tendency than the
stronger glass sucrose (Hatley, 1997) when above their Tg. In fact, Pikal et al. (1995)
suggested that a higher fragility might provide a better stability if the glass transition
temperatures are the same. This finding matches well with what was observed in this
study.
To further confirm the relation between the fragility, zero mobility temperature, and
the stability, a physical stability study was conducted on the solid solutions. The solid
solutions were stored at room temperature at 70% RH and after a period of time,
samples were taken out for XRPD study. As can be seen in Figure 4.22, the ball
milled sample recrystallised in 70 days, followed by the spray dried one recrystallised
in 188 days as characteristic peaks of crystalline indometacin were observed. The
XRPD patterns of the melt quenched solid sample did not show any significant
change after storage of 188 days indicating the sample might still remain in its
amorphous form. The physical stability order here coincides with the DSC relaxation
data and also the To values obtained from the fragility parameters. Therefore, the
fragility and zero mobility temperature are two important factors which must be taken
into account in prediction of stability study of amorphous materials.
152

Chapter 4 Influence o f preparation method...
J
2600
2400
2200
2000
1800
1600
1400
1200
1000
800
600
400
200
MQ Initial
Initial
70 days
188 days
70 days
188 days
Initial
70 days
188 days
10 15 20 25
Position [2®Theta]
30 35 40
Figure 4.22: XRPD patterns of the ball milled (BM), melt quenched (MQ) and spray
dried (SD) solid solutions (an indometacin to PVP ratio o f 70%:30%) stored at room
temperature and 75% RHfor 0, 70 and 188 days.
153

Chapter 4 Influence o f preparation method.
4.4.6 Effect of relaxation on the dissolution behaviour of the solid solutions
6
M Q aged 15 davs M Q in itia l BM in itia l BM aged 15 days
5
:
I 5 2
1
020 40 60
Relative Humidity (% )
80 100
Figure 4.23: Water vapour sorption isotherms for the unaged and aged (15 days at 50
) melt quenched and ball milled solid solutions of indometacin and PVP
Dynamic vapour sorption (DVS) studies were carried out on the initial solid solutions
and the ones aged for 15 days at 50 °C to evaluate the water sorption behaviours of the
solid solutions. About 10-20 mg of powders were first loaded onto the sample pan,
after conditioning at 0% RH, RH was increased from 0% to 90% in a step of 10%.
Amorphous materials have better apparent solubility and faster dissolution rate than
their crystal forms. But if the amorphous products recrystallise during storage and
their dissolution rate would probably decrease, as a consequence their bioavailability
would be jeopardised, as indicated by some studies (Leuner and Dressman, 2000). It
is interesting to investigate whether the physical aging process would affect the water
sorption or dissolution behaviours even though a sample has not started to
recrystallise. Figure 4.23 shows the water vapour sorption isotherms of the aged and
unaged solid solutions which indicate different water uptake behaviour between the
samples. All isotherms show an inflection at 10% RH and another one can be seen at
154

Chapter 4 Influence o f preparation method...
around 60-70% RH. This type of shape is similar to a type-II Brunauer-Emmett-Teller
(BET) isotherm which shows an initial linear adsorption followed by an inflection
caused by monolayer coverage of the gas molecules and then a rapid increasing
curvature caused by multilayered adsorption or condensation. Type-II BET isotherm
is usually used to describe adsorption on macroporous adsorbents with strong
adsorbate-adsorbent interactions. However, it needs to be borne in mind that the BET
classification does not account for any change in the physical properties of the
adsorbent (Ambarkhane, 2005); it only takes into account the type of adsorbent and
adsorbate, and intermolecular interactions between the surfaces. Physical change such
as glass transition can affect the shape of the isotherm. A glass material even though it
has a Tg higher than the experimental temperature, when it sorbs enough amount of
water which can act as a plasticiser, its molecular mobility can be largely increased
and its dry Tg might be lowered to the experimental temperature. Therefore, the glass
could be in a rubbery state and it would display different water uptake behaviour.
From Figure 4.23, it could be seen that the preparation methods did not give an
obvious difference on the shape of the isotherms of either the aged or unaged solid
solutions. However, the isotherms between the aged and unaged samples were
significantly different. Aging affected both the extent and the rate of water sorption. In
unaged samples, the rate of water sorption was more rapid with a nearly linear
increase in the amount of sorption while the aged samples showed an obvious
sigmoidal shape and sorbed less water. It is known that the surface area or
morphology would affect the rate of sorption of a sample, but in this case, aging did
not cause any discernible change on the particle size and surface morphology, hence
these different water sorption behaviours are a result of relaxation which accompanies
decrease of free volume and/or increase of density. An interesting phenomenon was
observed here, though the difference of water sorption between aged and unaged
samples became more and more pronounced in the range from 10% to 70% RH,
above 70% the sorption rate of the aged samples became faster than the unaged ones.
As a consequence, the sorption profiles of the aged samples gradually approached that
155

Chapter 4 Influence o f preparation method...
of the unaged ones and at 90% RH point. Therefore, it is reasonable to believe that at
90% RH, the water sorption behaviour was independent of its thermal history, which
means the thermal history was erased. One possible reason for this is that the Tg of the
aged samples was lowered by the sorbed water because of the plasticising effect, and
the samples were in the rubbery state starting to sorb a large amount of water (This
sudden change of water sorption profile is similar to the enthalpy recovery around Tg
in the DSC study). Another explanation suggested by Surana et al. (2004) is that the
reversal of aging is caused by the volume expansion during water sorption in the
amorphous structure. After aging, the free volume of the amorphous material would
decrease accompanied by increase in density. However, the sorbed water might be
able to expand the structure as a result to increase its free volume. When the water is
dried at a low temperature, the amorphous structure does not have enough molecular
mobility to relax again and it would stay expanded, thereby, the effect of aging can be
reversed.
6
A g ed fw 15
Second cycle
5
g 4æ8E"5 3Iê 2
1
00 20 40 60 80 too
Relatiw humidity (%)
Figure 4.24: Water sorption profiles o f the unaged melt quenched solid solution of
indometacin and PVP (70%:30%), the one agedfor 15 days at 50 °C and the second
cycle of the aged sample.
156

Chapter 4 Influence o f preparation method...
In order to confirm the effect of the water sorption on the removal of thermal history,
the melt quenched solid solution sample which had been aged for 15 days at 50 °C
was subjected to two RH cycles and the mass change of the sample of the second
cycle was compared to the initial unaged sample. Figure 4.24 shows that after the first
RH cycling, the water sorption ability of the sample has increased dramatically in the
second cycle and its sorption profile is similar to that of the initial unaged sample.
This indicated that the effect of relaxation was removed during the RH cycling
treatment.1006
dm - dry — - Target RH
■ 90
5- 80
■ 70Q 4
- 6 0
S3 - 50
- 40
U2
• 3 0
■ 201
05000 55002500 3000 3500 4000 45000 500 1000 1500 2000
Time/min
1005dm - d r y Target RH
904.5
804
60
I 2.5
30
1
0 .5
05000 5500250 0 3 0 0 0 350 0 4000 4500500 1000 1500 20000
Time/min
Figure 4.25: Dynamic vapour sorption traces o f the hall milled solid solutions: a)
unaged sample and b) sample aged for 15 days at 50 T7.
157

Chapter 4 Influence o f preparation method...
dm - dry Target RH
O 4
100
90
80
70
60 g
so « &
40 «
30
20
10
0 500 1000 1500 2000 2500 3000 3500 4000 4500 5000 5500 6000
I'ime/min
5 100dm - dry - - - T arget RH
90
4 80
70
t 3
50
s2
3 0
1 20
10
0
100 0 1500 2 0 0 0 2 5 0 0 3 0 0 0 3 5 0 0 4 0 0 0 4 5 0 0 5 0 0 0 5 5 0 0 6 0 0 0 650 00 5 0 0
Tim e/m in
Figure 4.26: Dynamic vapour sorption traces o f the melt quenched solid solutions: a)
unaged sample and b) sample aged for 15 days at 50
Figures 4.25 and 4.26 give a clear view of the dynamic vapour sorption traces of the
solid solutions. Correlating with the change of mass plot in Figure 4.23, the aged solid
solutions show small water sorption but rapid equilibrium from 10% to 30% RH.
Above 30%, 300 minutes were not enough for the samples to reach equilibrium state.
In the region of 70% to 90% RH, the water sorption rate has significantly increased
158

Chapter 4 Influence o f preparation method...
compared to the unaged sample. During DVS experiments, instant NIR spectra were
obtained to monitor any potential transition which could happen to the samples, but
no apparent change in the spectra was found on the samples before and after exposure
to different relative humilities. Furthermore, both the aged and unaged samples after
DVS experiments were tested by DSC and it was confirmed that they were still in
amorphous form.
Studies were taken further to investigate whether the difference in the water sorption
behaviours caused by relaxation would reflect on the dissolution profiles of the solid
solutions. The fresh and aged solid solutions prepared by ball milling and melt
quenching were tested (Figure 4.27).
70
MQ initialMQ agetl 15D at 50C' BM initialBM aged I5D at 50C
60
50
? 40
91S
20
0 20 40 60 80 100 120
Time (mln)
Figure 4.27: The dissolution profiles of the unaged and aged solid solutions (an
indometacin to PVP ratio o f 70%:30%) prepared by ball milling and melt quenching
Preparation methods have played an important role on the dissolution profiles of the
solid solutions. Though there is no difference in their water sorption behaviours, the
159

Chapter 4 Influence o f preparation method...
fresh ball milled sample dissolved much faster than the fresh melt quenched one. The
ball milled sample showed a rapid release in the initial state followed by a gradual
approach to equilibrium and after 2 hours it reached around 56 % of release. In the
case of the melt quenching sample, the dissolution rate was much slower and the
release profile did not reach equilibrium. Only 45% of indometacin was released after
2 hours, lower than that of the ball milled one. The higher dissolution rate of the ball
milled sample was probably because of its rougher surface and smaller particle size
and therefore, it would have a higher surface area, i.e. better wettability.
It seems that the solid solution prepared by ball milling was superior to that of the
melt quenched one in both the dissolution rate and extent of release. However, the
dissolution profile of the ball milled sample was more sensitive to the aging process.
As shown in Table 4.8, both t2o and tj2o of the aged ball milled sample dropped in a
larger extent compared to the aged melt quenched one. This result correlated well
with the DSC relaxation data, in which it was indicated that the melt quenched solid
solution relaxed slower than the ball milled one which means a smaller fraction of
sample would have relaxed after aging for 15 days, thereby, the change in the
dissolution profile would also be milder. In addition, though the aged ball milled
sample still showed a faster initial release than the aged melt quenched one, it quickly
reached equilibrium after about 30 minutes while the aged melt quenched sample kept
on releasing and reached around 33 % in 2 hours. The fast equilibrium in the ball
milled sample was probably accounted to the recrystallisation of the amorphous
indometacin, because both the relaxation and the physical stability data have proven
that the ball milled sample was less stable compared to the melt quenched one.
It is usually considered that the dissolution rate would only be jeopardised if the
amorphous content of a product has recrystallised during storage. The studies here
have given evidence that relaxation would also affect the dissolution profile of a
product even though it is still in amorphous state. Hopefully, this finding would give a
better understanding when preparing a stable amorphous formulation.
160

C h apter 4 Influence o f p repara tion m ethod.
Sample ho tl20
Ball milled (unaged) 36% 56%
Ball milled (aged) 10% 19%
Melt quenched (unaged) 17% 45%
Melt quenched (aged) 10% 33%
Table 4.8: Percentage release o f indometacin from the solid solutions (an indometacin
to PVP ratio oj'70yo:30yo) at 20 min (t2o) and 120 min (ti2o) (n=3).
161

Chapter 4 Influence o f preparation method...
4.5 Conclusion
Decane Vmax method has been shown to be very useful in detecting surface relaxation
and this method was applied to study the surface relaxation of the PVP-indometacin
solid solutions prepared by ball milling melt quench and spray drying. The surface
relaxation was then compared to the bulk relaxation obtained from the enthalpy
relaxation detected by SSDSC and it was found that the surface relaxes faster than the
bulk, irrelevant of how the sample was prepared. However, different preparation
methods appeared to have a significant impact on the relaxation kinetics irrespective
of whether at the surface or in the bulk. If the preparation processes were different, the
configuration of the products are frozen into a different initial glassy state, therefore,
how the amorphous product deviate from this state would be affected. The P values of
the surface and the bulk were very similar for all three solid solutions, which
demonstrate a similar distribution of relaxation times between the surface and the bulk.
The IMG study further proved the influence of preparation methods on relaxation.
The high sensitivity of IMG enables it to measure some faster modes of motion rather
than structural relaxation alone, and therefore, difference of relaxation data obtained
by SSDSG and IMG were observed.
The glass fragility of the solid solutions was measured using the heating rate
dependence of glass transition temperature. According to the fragility parameter, the
zero mobility temperature of the samples was obtained. Similarly, preparation
methods were shown to be influential to these values. Ball milling generates
amorphous forms through solid state while spray drying and melt quenching use a
more disorder liquid phase. Hence it was reasonable to observe that the fragility
parameter of the ball milled sample was closer to that of the individual indometacin
and PVP.
The physical stability data showed good correlation with the bulk relaxation data
obtained by SSDSG, which has confirmed the feasibility of predicting the shelf life of
products by comparing their molecular mobility. Furthermore, the fragility and zero
162

Chapter 4 Influence o f preparation method...
mobility temperature were also very useful in predicting the physical stability of an
amorphous sample. Though the Tg of the solid solutions were very similar, their To can
be very different and the rank order of To matched well with the physical stability data.
Therefore, Tq might act as a better indicator than Tg in predicting the stability of an
amorphous sample. All these parameters can provide some guidance when preparing a
stable amorphous product.
Physical aging was found to be able to affect the water sorption behaviours of the
amorphous solid solutions according to DVS experiment, and as a result their
dissolution properties were affected. The aged samples showed a decrease of
dissolution rate and the extent of decrease was correlated to the relaxation rate. The
ball milled solid solution which relaxed faster than the melt quenched one showed a
larger extent of decrease in its dissolution rate. Furthermore, the dissolution property
of the solid solutions was found to be dependent on the preparation method.
163

CUdpterS
effect of preparation methods and Jbrmnlations on tfie dhsoCution rate and sta6iGty of soGd dispersion/soCutions

Chapter 5 Effect o f preparation method and formulation...
5.1 Introduction
In recent years, as high throughput screening is becoming more and more useful,
increased amounts of poorly water-soluble drugs have been developed from the
discovery pipeline. Therefore, solutions are demanded to solve the low aqueous
solubility of these compounds. A commonly used strategy is to turn the drug into the
amorphous form to improve its dissolution rate and hence bioavailability. But in many
cases, the application of the amorphous form is compromised by its poor physical
stability. Some researchers have tried to use additional carriers to form a solid
dispersion/solution with the amorphous drug in order to slow dovm its conversion to the
crystalline form for an enhancement in the stability (Boldyrev et a l, 1994; Matsumoto
and Zografi, 1999; Watanabe et al, 2003). However, when a solid dispersion/solution is
made, two questions would arise immediately: what carrier should be used, since there
are many available; and which preparation method is more suitable for the drug and
carrier combination? In the present study, different types of carriers are used to form
solid dispersion/solutions with the model drug indometacin using different preparation
methods. The stability and dissolution properties of the products were investigated.
Indometacin, being a proton donor with a carboxylic acid group, could interact with
many carriers which makes it a very useful model for this study.
The carriers used in this study can be divided into two categories, those which are
immiscible with the model drug and those which are miscible. Usually, a carrier which
is miscible with a drug is preferred when preparing a solid dispersion/solution because it
could help to form a one-phase system. The Tg of the unstable drug could be improved
by forming a molecular dispersion with a high Tg carrier. The molecular dispersion of
the drug within the carrier matrix is important for separating the drug molecules from
each other. However, these factors are not enough to guarantee a stable amorphous
formulation if intermolecular interactions are not present. The hypothesis here is trying
to show that no matter whether the carrier and drug are miscible or not, strong
intermolecular interactions are vital for the physical stability of a solid
dispersion/solution.
165

Chapter 5 Effect o f preparation method and formulation...
Sometimes, even though a carrier has been shown to be effective in improving the
stability of an amorphous drug, it might not result in a good dissolution profile. A
ternary solid dispersion is therefore prepared which contains a carrier capable of strong
intermolecular interaction and a carrier capable of rapid wettability, and a good stability
and dissolution balance is achieved.
5.2 Chapter outline
The following issues are studied in this chapter: 1) how ball milling parameters could
affect the amorphisation rate of crystalline indometacin and its physical stability; 2) the
stabilisation and solubilising effects of the carriers on the model drug; 3) the effect of
Polyvinylpyrrolidone (PVP) and Hydroxypropyl methylcellulose acetate succinate
(HPMCAS) on the improvement of the dissolution rate and stability of indometacin; 4)
the effect of different preparative methods on the dissolution and stability properties of
the solid dispersion/solution systems; 5) the possibility to prepare a ternary solid
dispersion system which could produce a good balance of stability and dissolution
properties.
166

Chapter 5 Effect o f preparation method and formulation...
5.3 Methods
5.3.1 Spray drying
A GEA Niro SD MICRO™ was used for spray drying purpose. For indometacin and
PVP (25%:75%), 4 g of materials were dissolved into 200 mL of absolute ethanol (a
feed concentration of 2%) and for indometacin and HPMCAS (25%:75%), 3 g of
materials were dissolved into 200 mL of acetone and water (80%:20%). 30 minutes
were allowed for the samples to dissolve completely into the solvents. The solution
prepared was then spray dried using the parameters listed as follow:
atomiser gas flow: 2.5 kg/h
chamber inlet flow: 30.0 kg/h
inlet temperature: 80 °C
feeding rate: 20%
Spray dried samples were collected from the collection bottle and cyclone, passed
through 500 pm and then stored in a vacuumed desiccator over phosphorus pentoxide
( P 2 O 5 ) at room temperature for at least 1 day before further use.
5.3.2 Ball milling
Ball milling was used as described in Section 2.2.2 to prepare different samples required
for this study. To prepare solid dispersion/solution samples, Different carriers were
milled with crystalline indometacin using a planetary miller (Pulverisette 5-Fritsch). 5 g
of powders with a drug to carrier ratio of 75% to 25% were weighed and loaded into a
250 mL Zr02 jar. The Zr02 balls (0=15mm) to sample weight ratio was 16:1 (about 45
milling balls). The powders were milled for 6 hours at a pot rotation speed of 300 rpm.
The milled products were passed through a 500 pm sieve in order to break down any
lumps. The product prepared was stored in a vacuumed desiccator over P 2 O 5 at room
temperature before further use.
167

Chapter 5 Ejfect o f preparation method and formulation...
5.3.3 Thermal gravimetric analysis (TGA)
Thermal gravimetric analysis was performed to study the moisture content of the
samples. The operating conditions were described in Section 2.2.9. For each sample, 3
measurements were conducted.
5.3.4 Differential scanning calorimetry (DSC)
Differential scanning calorimetry studies were performed using a Perkin Elmer Pyris 1
DSC to detect any glass transition, crystallisation or melting of indometacin within the
samples. Step scan, hyper scan and conventional scan modes were used as described in
Section 2.2.6.
5.3.5 X-ray Powder Diffraction (XRPD)
X-ray powder diffractions were performed as described in Section 2.2.7 using a Philip
PW3710 X-ray diffractometer. XRPD was applied for characterisation of the amorphous
or crystalline samples.
5.3.6 Fourier transform infrared spectroscopy (FTIR)
Fourier transform infrared spectroscopy was used as described in Section 2.2.9 to study
the intermolecular interactions between the drug and the carriers.
5.3.7 Scanning electron microscopy (SEM)
Scanning electron microscopy images of the samples were obtained as describe in
Section 2.2.9.
5.3.8 Dissolution test
A Pharma Test automatic dissolution apparatus (Pharma Test, Germany) was used.
Samples (containing 25 mg of indometacin) were first loaded in size 1 gelatin capsules
and then their dissolution profiles were obtained using the modified USP paddle method
at a rotation speed of 100 rpm at 37 °C. The paddles were set at 25 mm from the bottom
of the vessel. Degassed phosphate buffer (pH of 6 .8) was used as dissolution medium
168

Chapter 5 Effect o f preparation method and formulation...
(900 mL for each vessel). UV readings were recorded automatically by a Cecil CE 2020
spectrometric (Cecil Instruments, Cambridge, UK) at intervals of 5 minutes. The
wavelength used was at 320 nm. Three capsules were tested for each sample.
5.3.9 Contact angle measurement
Wettability of the samples was studied by measuring their contact angles. All samples
were compressed into flat-faced discs (3 discs tested for each sample) using a hydraulic
press (5 bars), followed by applying 20 pi of distilled water on their surface. Images
were taken at one second after the contact of the droplet and the surface by a digital
camera and analysed using ImageJ analysis software.
5.3.10 Physical stability studies of the solid dispersion/solutions
The solid dispersion/solutions were stored at conditions with different temperatures and
RH (30 °C 11% RH; 30 °C 75% RH; 40 °C 11% RH and 40 °C 75% RH). The
crystallinity of indometacin in the solid dispersion/solutions was tested using X-ray
powder diffraction (XRPD) and differential scanning calorimetry (DSC), and the
moisture content was measured using thermal gravimetric analysis (TGA) after certain
periods of time. RH of 75% and 11% were achieved using saturated NaCl and LiCl
solutions respectively.
169

Chapter 5 Effect o f preparation method and formulation...
5.4 Results and discussion
5.4.1 Effect of milling conditions on the amorphisation rate of indometacin
Mixtures of crystalline indometacin and 10% PVP were milled under different
conditions in order to investigate how milling parameters could affect the amorphisation
rate of indometacin. The reason of adding a small amount of PVP to indometacin was
because indometacin on its own recrystallised very quickly during milling. After 15
minutes of milling without any additive, the enthalpy of melting of indometacin
decreased slightly and remained on a similar level even though the milling time was
prolonged to a longer period. Indometacin was reported to be miscible with PVP at a
concentration as low as 5% w/w (Matsumoto and Zografi, 1999). Interactions such as
van der Waal’s force and hydrogen bonding between indometacin and PVP could help
to greatly reduce the mobility of the drug as a result of slowing down the
recrystallisation rate.
93.29
90
70
?
80 100 Tempersture ("C)
Figure 5.1: DSC scans of indometacin:PVP (90%: 10%) physical mixture (1), the
mixture that milledfor I hour at 200 rpm (2), 2 hours at 200 rpm (3), and 2 hours at
300 rpm (4).
The amount of the crystalline content in the milling products was determined using
170

Chapter 5 Effect o f preparatim method ami formulation...
DSC. A comparison of the DSC scans for a physical mixture of PVP-indometacin and
the ones milled at different conditions is shown in Figure 5.1. The big endothermie peak
at around 157 °C in the physical mixture was related to the melting of crystalline
indometacin. In the ball milled products the melting peak decreased indicating a
decrease of crystallinity, and also the exothermic peak started to appear at around 40 to
60 °C corresponding to the recrystallisation of the amorphous indometacin. The onset of
recrystallisation shifted to a higher temperature as the milling time and the milling rate
increased, and this reflected that the amorphous phase produced by ball milling was
becoming thermodynamically more stable and the presence of nuclei of crystallisation
probably was decreasing.
120
— 300 rpm
• — 200 rpm100
80
I 60«0
100 150 200 2500 50
Time (min)
Figure 5.2: Effect of milling time on the crystalline indometacin content of the ball
milled product at two rotation speed: 300 rpm and 200 rpm.
Figure 5.2 shows the effect of milling time and rotation speed on the amorphisation rate
of crystalline indometacin. The crystallinity of the sample decreased as a function of
171

Chapter 5 Effect o f preparation method and formulation...
milling time. The amorphisation rate of milling at 300 rpm appeared to be faster than
the one at 200 rpm. Especially in the first 15 minutes, the percentage of crystallinity
dropped to around 37% milled at 300 rpm compared to 61% milled at 200 rpm. After
continuous milling for one hour, the amorphisation rate at both rotation speeds became
significantly slower. The amorphisation effect is determined by the competition between
recrystallisation rate of the amorphous phase and the amorphisation rate of ball milling.
After progressive milling, mechanical energy from the colliding balls generates defects
and destruction of the crystalline phase, but on the other hand, a part of this energy
gradually transform into heat which increases the temperature inside the milling pot.
Therefore, in the local contact region between the balls and the sample, temperature
may increase to a level which could cause the amorphous phase start to crystallise. Also
after continuously receiving large amounts of energy, molecular mobility of the
amorphous phase would increase and recrystallisation could happen much easier.
Consequently ball milling is more efficient at making material amorphous in the early
stage but as milling time increases, the rate of conversion to amorphous state tends to
equal the recrystallisation rate.
A clearer comparison of the milling rotation speed on the amorphisation effect of the
sample is shown in Figure 5.3. The milling duration was fixed at 2 hours and as the
rotation speed increased the crystallinity of the sample dropped down. However, the
efficiency of amorphisation decreased as the rotation speed increased. By increasing the
speed from 100 rpm to 200 rpm, the crystallinity dropped from 90% to around 27%, but
when it was increased further to 350 rpm, the decrease of crystallinity became milder.
Ksiazek et al. (2007) studied the amorphisation rate of selenium in relation with
different milling conditions, and found that the crystallinity level reached a plateau
when the rotation speed increased to a certain point. A faster rotation speed might
increase the temperature further in the pot and adversely compromise the amorphisation
effect. These sets of studies provide some guidance in deciding the milling conditions
for preparing solid dispersion/solutions in the later sections. It is not always favourable
to mill something longer or more intensively. A suitable condition should be carefully
172

Chapter 5 Effect o f preparation method and formulation..
decided in order to reach the maximum efficiency.
-
K 40
^ 30
100 150 200 250 300Rotation speed (rpm)
350 400
Figure 5.3: Effect o f rotation speed on the crystalline indometacin content o f the hall
milled product. Milling duration was fixed at 2 hours.
5.4.2 Carriers which are immiscible with the model drug
5.4.2.1 Physical properties of the solid dispersions
In this section, Neusilin and cellulose derivatives microcrystalline cellulose (MCC) and
silicified microcrystalline cellulose (SMCC) were milled with indometacin (the drug
and carrier ratio was 25% to 75%), a hydrophobic drug which would recrystallise from
its amorphous form easily when milled on its own. MCC is widely used as a filler and
binder and it was rated as the most useful filler for direct compression tabletting by
Shangraw and Demarest (1993). However, it has some limitations such as low bulk
density, high lubricant sensitivity, poor flow characteristics and the influence of
moisture on the compression characteristics (Bolhuis and Chowhan, 1996). To address
these problems, SMCC was developed by a process of ‘silicification’ which leads to the
deposition of SiO] on the surface of the particles. Though it was proven that the
173

Chapter 5 Ejfect o f preparation method and formulation...
fundamental chemical properties of SMCC are very similar to that of its parental
material (Tobyn et a l, 1998; Buckton et a l, 1999), SMCC was found to have many
advantages over MCC (Sherwood et al, 1996; Khalaf et a l, 1997). Our focus in the
study was this extra compound on the surface of the carriers. The hydrogen-bonding
potential of silanols on silica surfaces has been found to be able to improve the physical
stability of some amorphous compounds (Chuang and Maciel, 1996, 1997; Watanabe et
al, 2001). The question is whether this silica on the surface of SMCC could help to
stabilise indometacin in its amorphous form and produce better dissolution properties?
Therefore, carriers with different amounts of silica: MCC (0%) and SMCC (2%, 5% and
10%) were milled with indometacin in order to study the effect of different amounts of
silica on the physical and dissolution properties of indometacin. In addition, as a
comparison, indometacin was also milled with Neusilin, a compound that contains
29.2%-35.5% of silica on the surface.
Surface morphology of the pure materials was characterised using scanning electron
microscopy (SEM) as shown in Figure 5.4. Pure indometacin appeared as long
polyhedral particles with sharp edges and smooth surfaces. Neusilin particles were
spheroid in form with a rougher surface. Neusilin was reported to consist of amorphous
microporous granules of magnesium alumina silicate with a specific surface area of
-300 m^/g (Gupta et a l, 2003). The images of SMCC containing 2% of silica and MCC
showed similar shape, but a close up of the surface of SMCC appeared rougher than that
of MCC, presumably, as noted by Tobyn et al (1998): it is due to the silica on the
surface. This 2% of silica was able to increase the specific surface area of SMCC
fivefold as compared to MCC (Muzikova and Novakova, 2007). The images of SMCC
containing 5% and 10% silica did not show any significant difference to the one
containing 2% of silica.
174

Chapter 5 Ejfect o f preparation method and formulation...
Acc V Spot Magn Oet WD10 0kV 3 0 2000X SE 13.7
Figure 5.4: SEM images o f a) crystalline indometacin; b) pure Neusilin; c) pure SMCC
2%, and d) pure MCC.
Indometacin was then milled with the carriers. At intervals of 5, 15, 30, 60, 120, 240
and 360 minutes, samples were withdrawn and characterised using XRPD in order to
investigate the extent of amorphisation of indometacin (XRPD patterns are shown in
Figure 5.5).
175

Chapter 5 Effect o f preparation method and formulation.
1000
” 600
MCC-mdomgtacin
5 10 15 20 25 30 35 40
P o sitio n [° 2Theta]
SMCC 2%-mdometacia
5 10 15 20 25 30 35 40
P o sitio n [° 2Theta]
SMCC 5%-indometacm
5 10 15 20 25 30 35 40
P o sitio n [° 2Theta]
SMCC 10%-mdometaçin
5 10 15 20 25 30 35 40
P o sitio n [° 2Theta]
700
600
,500
,400
'300
200
100
0
Ngusilin-indometagin
........1
5 10 15 20 25 30 35 40
P ositio n [° 2Theta]
Figure 5.5: XRPD patterns of indometacin milled with different carriers (durg:carrier,
ybr J JO 60 720 2^0 aW 360
Indometacin appeared amorphous by XRPD after milling with all the carriers, but a
difference in the amorphisation rate was noticed. After milling together with Neusilin,
which has the highest amount of silica at the surface for only 15 minutes, indometacin
176

Chapter 5 Effect o f preparation method and formulation.
became XRPD amorphous, indicating a strong interaction between the drug and the
carrier. SMCC showed a slightly faster amorphisation rate of indometacin than that of
MCC. As shown by the arrows in Figure 5.5, the intensity of the peaks belonging to
crystalline indometacin decreased to a larger extent when milled with SMCC after 15
minutes than milled with MCC. Considering that the only difference between SMCC
and MCC is the silica, this extra compound at the surface of SMCC might help to
increase the interaction between the carriers and indometacin. However, among the
three types of SMCC containing different amount of silica, no significant difference on
the amorphisation rate was observed.
It is interesting to point out that as well as the influence of the carriers, the melting
temperature of the compounds could also affect its rate of conversion to amorphous
state. In a previous study, Gupta et al. (2003) tried to turn four different drugs into
amorphous by milling them with Neusilin, and it was found that the amorphisation time
related to the melting temperature of the drug. A higher melting temperature might
require a higher energy to demolish the crystal lattice structure.
Figure 5.6: SEM images o f indometacin milled with a) MCC, b) SMCC, and c) Neusilin
for 6 hours with a drug to carrier ratio o f ISYo:?SYo.
177

Chapter 5 Effect o f preparation method and formulation...
The SEM images of the solid dispersions are shown in Figure 5.6. Post milling, the
particle size of all samples decreased. Indometacin-Neusilin particles had the smallest
particle size (less than 5 pm). The solid dispersions containing SMCC and MCC also
decreased to a size of ca. 15 pm. The particle size reduction was due to the impact force
received during ball milling. Moreover, in the SEM images, there is no sign of any
crystalline structures, indicating the crystalline indometacin has been broken down by
milling.
Step-scan DSC studies were conducted to investigate the glass transition temperature or
any possible fusion of melting of the solid dispersions. It is noticed that all indometacin
solid dispersions containing SMCC or MCC showed a small endothermie peak at
around 150 °C, which is the melting point of indometacin. However, prior to the
endotherm, a broad and shallow exothermic peak could be seen between 95 to 140 °C.
Considered the slow heating rate and constant isothermal holding within a step scan,
this endotherm was very likely caused by the recrystallisation of amorphous
indometacin. It was unclear whether the melting of indometacin was coming from the
initial solid dispersions or recrystallisation during the step scan. Therefore, conventional
DSC and Hyper-DSC scans were conducted to clarify this question. The high heating
rate of Hyper-DSC has been claimed to be able to minimise any undesired phase
transition during a DSC scan and also it enables a higher sensitivity for detecting small
thermal events (McGregor et al, 2004; Saunders et a l, 2004). No melting of
indometacin was detected in either type of DSC scans confirming the amorphous state
of indometacin. SSDSC, conventional DSC and Hyper-DSC scans of Neusilin solid
dispersions did not show any sign of melting which indicated that the solid dispersions
were amorphous. The recrystallisation of indometacin in the SMCC or MCC solid
dispersions during the SSDSC experiment might indicate a less extent of interaction
between the drug and carriers compared to that of the Neusilin.
The glass transition temperatures of the solid dispersions are listed in Table 5.1.
SMCC-indometacin and MCC-indometacin systems have a similar Tg in the range
178

Chapter 5 Effect o f preparation method and formulation...
between 46 to 49 °C which was slightly higher than that of the amorphous indometacin
(42 °C). Therefore, it was expected that a certain level of interaction between the drug
and the carriers existed which helped to raise the Tg. The Tg of the Neusilin-indometacin
solid dispersion was not detected and the exact reason is unknown. The moisture levels
of the solid dispersions were tested by TGA (Table 5.1). Neusilin-indometacin tended to
absorb the most moisture probably due to its high porosity and high specific surface
area. Both the SMCC and MCC systems showed similar moisture levels. A previous
study has shown that SMCC and MCC have similar porosity regardless of the silica
content (Tobyn et a l, 1998), and in two other studies, dynamic vapour sorption
measurements on pure SMCC and MCC indicated similar hygroscopicity (Buckton et
al, 1999; Aljaberi et a l, 2009). Therefore, it is reasonable for the SMCC and MCC
systems here to sorb similar amount of moisture.
Sample ID Tg (°C, onset )Moisture content (%
w/w)
Neusilin-indometacin N/A 5.10
MCC-indometacin 48 4.27
SMCC 2%-indometacin 49 3.77
SMCC 5%-indometacin 49 4.36
SMCC 10%-indometacin 46 4.01
Table 5.1: Glass transition temperature and moisture content o f the solid dispersions o f
indometacin and Neusilin, SMCC (contain different amount o f silica) or MCC.
As discussed in the Introduction Chapter, the term solid dispersion is generally used to
describe a matrix formed by two solids, in many cases, a hydrophobic drug and a
hydrophilic carrier. Depending on the physical status of these two components, such as
crystalline or amorphous, a solid dispersion can be divided into many subtypes. But in
general, amorphous systems can be defined as solid dispersions or solid solutions.
179

C hapter 5 Effect o f p repara tion m ethod an d form ulation .
Though it could be used for a wider meaning, solid dispersion here is used to
particularly represent a system where amorphous drug is dispersed in the carrier matrix,
but the drug and the carrier are immiscible. In this case, the solid dispersion means the
formation of a two-phase system. Meanwhile, solid solution indicates that the
amorphous drug is miscible with the carrier and they are molecularly dispersed into
each other forming a one phase system. The solubility parameter (<)') can be used as a
powerful tool to compare the miscibility between two solids. Compounds with similar
solubility parameter values are easy to mix because of the energy of mixing released by
intramolecular interactions is equaled by the energy released by intermolecular
interactions (Greenhalgh et a l, 1999). Greenhalgh et al (1999) also demonstrated that
compounds with a AÔ less than 7.0 MPa'^^ are likely to be miscible, while if the Aô is
more than 10 MPa*^ , the compounds are likely to be immiscible. Table 5.2 has shown
that both MCC and silica have a AS value of more than 10 MPa‘ with indometacin.
Therefore, indometacin is not miscible with either MCC or SMCC.
MaterialV
(cm^/mol)Sp 4 Method/Reference
Indometacin 229.8" 25.9 23.4 6.0 9.4 VHVthis study
MMP^/Dwan'Isa etIndometacin 275.0" 23.6 20.9 6.5 8.8
(2005)
IGC/Huu-Phuoc etMCC 216.0 39.3 19.4 12.7 31.3
a/. (1987)
Silica 26.1 35.3 12.2 N/A N/A IGC/Rowe (1988)
Table 5.2: Hansan solubility parameters o f indometacin, MCC and silica, a) The molar
volume was obtained according to Fedors’ method (Fedors, 1974), b) The calculation o f
the partial solubility parameter was based on (VH) van Krevelen and Hoftyzer’s method
(van Krevelen and Hoftyzer, 1976); c) The molar volume was calculated by molecular
weight/true density; and d) Molecular Modeling Pro (MMP) software (Chem SWInc.,
Fairfield, CA).
180

Chapter 5 Effect o f preparation method and formulation...
SMCC and MCC in their pure forms are mainly crystalline and their percentage
crystallinities are shown in Table 5.3. In the DSC scans, SMCC and MCC would tend to
degrade before any melting peak starts to appear; therefore, it is difficult to confirm the
solid properties of these carriers in the solid dispersions using DSC. Polar light
microscopy was used here to confirm the amorphous state of the carriers and it was
found that after intensive milling together with indometacin, a small amount of
crystalline SMCC or MCC content still existed. Therefore, the indometacin-MCC and
indometacin-SMCC systems should be characterised as solid dispersions which have
two phases. For a solid dispersion, its physical stability relies on immobilisation and
isolation of the labile amorphous drug in the carrier matrix. Therefore, interactions
between the drug and the carrier would be critical for an improved stability of solid
dispersion. Strong interactions could help to immobilise the amorphous drug molecules
and prevent them getting back together to form nuclei sites. The interaction between
indometacin and MCC, SMCC or Neusilin and the physical stabilities of these solid
dispersions will be discussed in the next section.
Sample % Crystallinity
MCC 86
SMCC 85
MCC+silica (Dry mix) 85
MCC+silica (Wet mix) 86
Table 5.3: Percentage crystallinities o f SMCC, MCC and MCC-silica mixtures (adapted
from Tobyn et al, J998).
5 4.2.2 Drug-carrier interaction determined by FTIR
Interactions between the carriers and indometacin were studied using Fourier transform
infrared (FTIR). Indometacin is a non-steroidal anti-inflammatory drug which has a
carboxylic group and a benzoyl carbonyl group. These two groups were the major focus
181

Chapter 5 Effect o f preparation method and formulation...
in this section of the work. Like many carboxylic acid containing drugs, crystalline
indometacin exhibited a dimer peak at 1715 cm' and a benzoyl carbonyl peak at 1690
cm'\ When it was melt quenched (made amorphous), the acid dimer and benzoyl
carbonyl peaks shifted to 1708 and 1682 cm'* respectively, in addition, a third peak
which was related to the free acid carbonyl appeared at 1735 cm'* (Figure 5.7). A blue
shift (shift to a larger wavenumber) was noticed when indometacin transferred from
amorphous to the crystalline state which indicated that hydrogen bond was not preferred
during crystallisation.
0.7751S40 1620 1600 1760 1760 1740 1720 1700 1660 1660 1640 1620 1600 1560 1560
[1/cm)
Figure 5.7: FTIR spectra of (1) crystalline and (2) amorphous indometacin.
The FTIR spectra of pure MCC and SMCC, their physical mixtures with indometacin
and solid dispersions are shown in Figure 5.8. The small peaks of SMCC and MCC at
1635 cm * are related to the 0-H symmetric stretching, but they would not interfere with
the interpretation of the characteristic peaks of indometacin. Other characteristic peaks
of SMCC and MCC were at 2900 cm * related to C-H symmetric stretching, and bands
between 1000-1200 cm * related to C-C and C-O stretching. Silica has a strong peak at
182

Chapter 5 Effect o f preparation method and formulation...
1070 cm’ but no difference was found in this region between SMCC and MCC. Tobyn
et al (1998) have compared the FTIR spectra of SMCC, MCC and MCC with silica
physical mixtures, and no evidence of spectral difference in their characteristic regions
was found, which means that the silification process did not cause any change on the
spectra of MCC.
The physical mixtures of indometacin and SMCC/MCC were similar to each other and
the characteristic peaks of indometacin did not change indicating an absence of
interaction between the drug and carriers. After milling with SMCC to form solid
dispersions, the dimer peak of indometacin was greatly reduced and shifted to 1709
cm' indicating the disruption of intermolecular interaction associated with crystalline
indometacin. Meanwhile, the carbonyl peak became broader and shifted to 1682 cm '\
indicating increasing amorphisation of indometacin. The melt quenched indometacin
has a characteristic peak at 1735 cm'* which relates to its free acid carbonyl peak. The
spectra of indometacin-SMCC solid dispersions show that this peak has disappeared,
which indicates there was a certain level of interaction between the drug and the carriers.
However, the dimer peak of indometacin was still shown, which meant that there was
some indometacin that was not interacting with SMCC. The solid dispersions of SMCC
and MCC with different grades of silica on the surface did not show any difference in
their FTIR spectra; therefore, it seems that silica did not play a significant impact on the
interaction between indometacin and the carriers.
183

Chapter 5 Effect o f preparation method and formulation.
0.987
096
0.966
0 952
0.938
1800
W «v»rum b«n {lAm]
Figure 5,8: FTIR spectra o f physical mixtures o f I) MCC-indometacin, 2) SMCC
2%-indometacin, and solid dispersions o f 3) MCC-indometacin, 4) SMCC
2%-indometacin, 5) SMCC 5%-indometacin and 6) SMCC 10%-indometacin.
j 0 , 8 -
—r—1650
— r— —r-W »v»ti»nb«n [1*m )
—r— —r— — T — 1550
Figure 5,9: FTIR spectra of Neusilin-indometacin physical mixture (I) atid solid
dispersion (2).
184
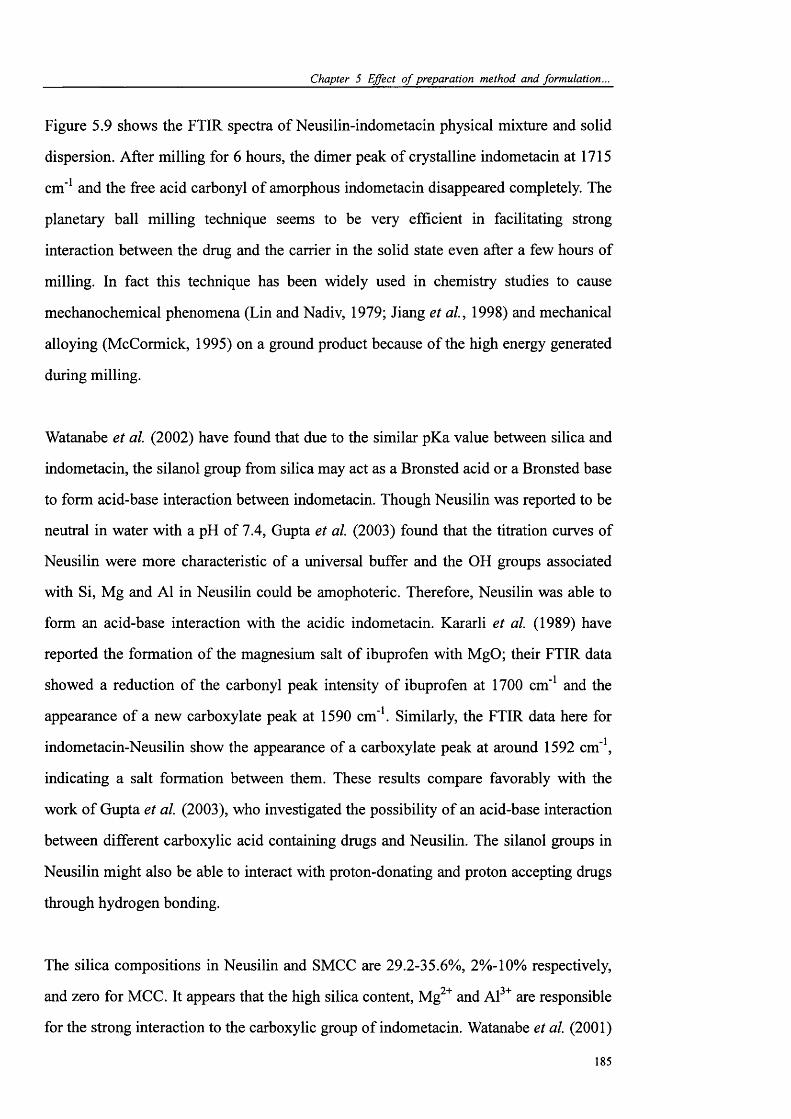
Chapter 5 Effect o f preparation method and formulation...
Figure 5.9 shows the FTIR spectra of Neusilin-indometacin physical mixture and solid
dispersion. After milling for 6 hours, the dimer peak of crystalline indometacin at 1715
cm' and the free acid carbonyl of amorphous indometacin disappeared completely. The
planetary ball milling technique seems to be very efficient in facilitating strong
interaction between the drug and the carrier in the solid state even after a few hours of
milling. In fact this technique has been widely used in chemistry studies to cause
mechanochemical phenomena (Lin and Nadiv, 1979; Jiang et a l, 1998) and mechanical
alloying (McCormick, 1995) on a ground product because of the high energy generated
during milling.
Watanabe et al (2002) have found that due to the similar pKa value between silica and
indometacin, the silanol group from silica may act as a Bronsted acid or a Bronsted base
to form acid-base interaction between indometacin. Though Neusilin was reported to be
neutral in water with a pH of 7.4, Gupta et al (2003) found that the titration curves of
Neusilin were more characteristic of a universal buffer and the OH groups associated
with Si, Mg and A1 in Neusilin could be amophoteric. Therefore, Neusilin was able to
form an acid-base interaction with the acidic indometacin. Kararli et al (1989) have
reported the formation of the magnesium salt of ibuprofen with MgO; their FTIR data
showed a reduction of the carbonyl peak intensity of ibuprofen at 1700 cm' and the
appearance of a new carboxylate peak at 1590 cm '\ Similarly, the FTIR data here for
indometacin-Neusilin show the appearance of a carboxylate peak at around 1592 cm '\
indicating a salt formation between them. These results compare favorably with the
work of Gupta et al (2003), who investigated the possibility of an acid-base interaction
between different carboxylic acid containing drugs and Neusilin. The silanol groups in
Neusilin might also be able to interact with proton-donating and proton accepting drugs
through hydrogen bonding.
The silica compositions in Neusilin and SMCC are 29.2-35.6%, 2%-10% respectively,
and zero for MCC. It appears that the high silica content, Mg " and Al^ are responsible
for the strong interaction to the carboxylic group of indometacin. Watanabe et al (2001)
185

Chapter 5 Effect o f preparation method and formulation...
reported that though in the ratio of 1:1, the percentage of silica which reacted with
amorphous indometacin was not more than 4% after milling for 180 minutes according
to the Tg increment of indometacin and calculation using the Gordan-Taylor equation
(Gordon and Taylor, 1952). Though SMCC has a maximum 10% of silica on the surface,
it might still be not enough for any apparent interaction with indometacin to occur.
Therefore, higher silica content of SMCC probably as much as that of Neusilin might be
needed in order to result in any difference compared to MCC.
5.4.23 Physical stability studies of the solid dispersions
5.4.2.3.1 Effect of silica content on the physical stability
As already discussed in the previous section, Neusilin, SMCC and MCC have different
amount of silica ranging from c.a. 0% to 30% and Neusilin with the highest amount of
silica showed a strong interaction with indometacin compared to SMCC and MCC in
the FTIR study. It would be interesting to investigate whether the different amounts of
silica could result in a different physical stability. Therefore, the solid dispersions of
indometacin and Neusilin, SMCC, and MCC were kept at 30 °C, 11% RH and 40 °C,
75% RH for different periods of time and then samples were taken out for XRPD test to
evaluate their physical stability.
Andronis et al. (1997) have studied the effects of sorbed water on the crystallisation of
indometacin from the amorphous state at 30 °C. It was found that at this particular
temperature, when the RH is below 43%, only the stable y crystal form appears, whereas
at higher RH, only the metastable a crystal form appears. The crystallisation mechanism
of the y form changed from surface-initiated to bulk-initiated crystallisation at 21% RH,
and the crystallisation rates of the y form were higher when crystallisation was
surface-initiated. It was also found by Andronis et al. (1997) that amorphous
indometacin stored in 11% RH gave the fastest crystallisation rate of the y form. Hence
the storage condition of 30 °C, 11% RH was chosen here as one of the storage
conditions. Melt quenched indometacin without any additive recrystallised in 2 days
after storing at 30 °C, 11% RH (Figure 5.10). Two major characteristic peaks which are
186

C h a p ter 5 Effect o f p re p a ra tio n m eth od an d form u la tion ...
corresponding to y-indometacin (11.5° and 21.8°) could be observed indicating a certain
amount of amorphous indometacin had crystallised. After compounding with the
carriers, it remained amorphous for at least 6 months. A halo was still be seen on the
XRPD diffraction patterns of the solid dispersions (Figure 5.11).
0
Position [°2 Theta]
Figure 5.10: XRPD o f a) melt-quenched indometacin and b) melt-quenched
indometacin, stored for 2 days at 30 '"C 11% RH.
187

C hapter 5 Effect o f p repara tion m ethod an d form ulation .
Counts
2 2 5 -1 0 0 -
2 5 -
1 0 0 -
02 2 5 -
1 0 0 -
2 5 -0 :
1 0 0 -
2 5 -
10— , I , I -—
20
Position [°2Theta]
\30
Figure 5.1 J: XRPD o f solid dispersions o f indometacin with MCC (a), SMCC lYo (b),
^ M C C ( c ) , ^ M C C 7 0 % (6 / ; o r ( e ) o / / g r ^ / o r o g g o / J O T 7 7 % 7 ( 7 7 / o r 6
months (a drug to carrier ratio o f 25%: 75%)).
The indometacin solid dispersions were also stored at 40 °C, 75% RH, a commonly used
condition for physical stability studies, and the drug showed different recrystallisation
tendencies. SMCC and MCC containing solid dispersions recrystallised after two weeks
while Neusilin-indometacin system stayed amorphous for more than 6 months. The
higher stability of Neusilin-indometacin can be attributed to the better hydrogen
bonding ability between the silanol groups of Neusilin and the carboxylic group of
indometacin. Meanwhile, the salt formation between the indometacin carboxylic group
and Mg^^ and Al^^ of Neusilin might also be responsible for enhancing stability. The
equivalent stability of SMCC-indometacin and MCC-indometacin solid dispersions
indicated that the different amount of silica on the surface of SMCC did not give a
substantial impact on retarding the recrystallisation of indometacin to SMCC.
188
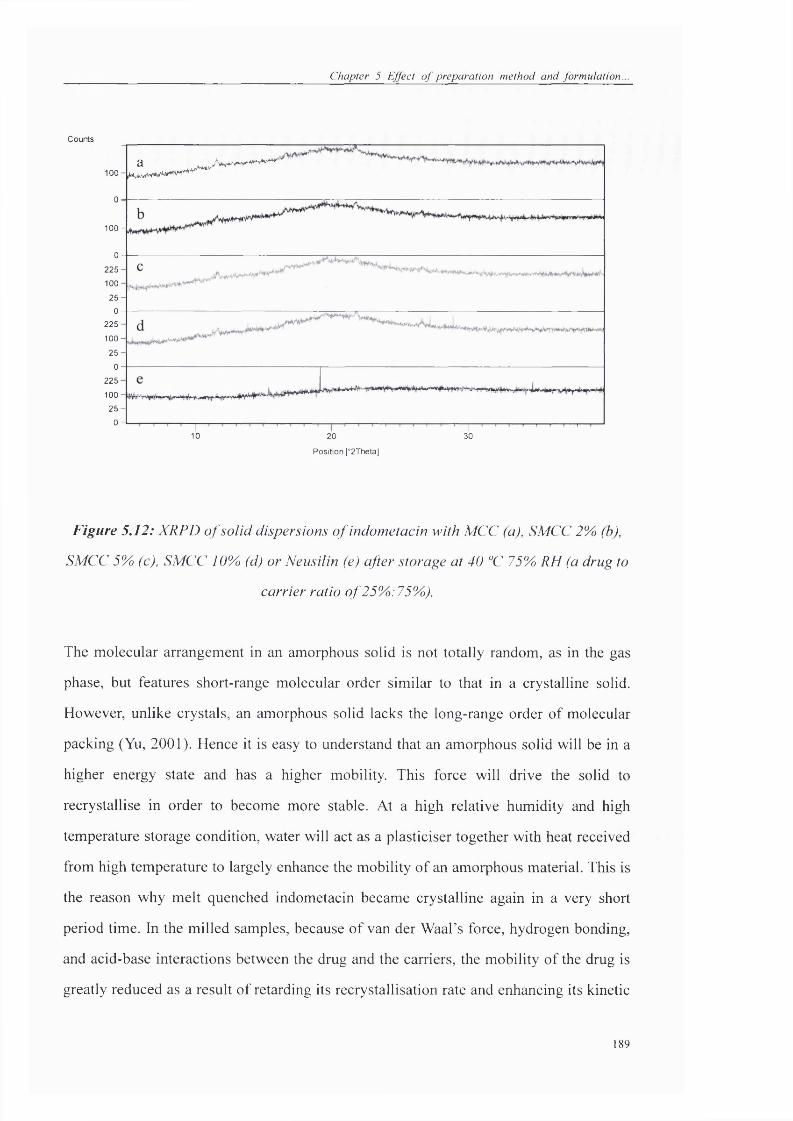
C h a p ter 5 E jfect o f p re p a ra tio n m eth o d a n d form u la tion .
Counts
100
0
1 0 0 -
0225
100
25
0225
100
25
0225
10025
0
x ! --------------------
I10 20
Position [°2Theta]
I30
Figure 5.12: XRPD o f solid dispersions o f indometacin with MCC (a), SMCC 2% (b),
SMCC 5% (c), SMCC 10% (d) or Neusilin (e) after storage at 40 °C 75% RH (a drug to
carrier ratio o f 25%j:75%o).
The molecular arrangement in an amorphous solid is not totally random, as in the gas
phase, but features short-range molecular order similar to that in a crystalline solid.
However, unlike crystals, an amorphous solid lacks the long-range order of molecular
packing (Yu, 2001). Hence it is easy to understand that an amorphous solid will be in a
higher energy state and has a higher mobility. This force will drive the solid to
recrystallise in order to become more stable. At a high relative humidity and high
temperature storage condition, water will act as a plasticiser together with heat received
from high temperature to largely enhance the mobility of an amorphous material. This is
the reason why melt quenched indometacin became crystalline again in a very short
period time. In the milled samples, because of van der Waal’s force, hydrogen bonding,
and acid-base interactions between the drug and the carriers, the mobility of the drug is
greatly reduced as a result of retarding its recrystallisation rate and enhancing its kinetic
189

Chapter 5 Effect o f preparation method and formulation.
stability.
S.4.2.3.2 Effect of milling duration on the physical stability
It has been shown that a longer milling time could render a higher level of amorphous
content. Therefore, indometacin was milled with SMCC (2%) in a drug to carrier ratio
of 25%:75% for 2, 4, 6 and 24 hours and then placed at 30 °C 11% RH to investigate the
effect of milling duration on the physical stability of the solid dispersions. A different
milling ball to sample weight ratio was used here (5:1, approximately 15 balls).
Position [°2 Theta]
Figure 5.13: Indometacin-SMCC (25%:75yo) milled for 2 hours and stored at 30 °C,
11% RHfor a) 0 day, b) 1 week, c) 2 weeks and d) 4 weeks.
190

Chapter 5 Effect o f preparation method and formulation...
Position [°2 Theta]
Figure 5,14: Indometacin-SMCC (25%:75%) milled for 4 hours and stored at 30 °C,
11% RHfor a) 0 day, b) 1 week, c) 2 weeks and d) 4 weeks.
Position [°2 Theta]
Figure 5.15: Indometacin-SMCC (25%:75%) milled for 6 hours and stored at 30 °C,
11% RHfor a) 0 day, b) 1 week, c) 2 weeks and d) 4 weeks.
191

Chapter 5 Effect o f preparation method and formulation...
Position [°2 Theta]
Figure 5.16: SMCC Indometacin-SMCC (25%:75%) milled for 24 hours and stored at
30 °C, 11% RHfor a) 0 day, b) 4 weeks, c) 2 months and d) 4 months.
Figures 5.13 to 5.16 show that the samples which were milled for 2 hours recrystallised
in 1 week, and the intensities of the characteristic peaks of indometacin increased as the
storage time prolonged. The samples milled for 4 and 6 hours also recrystallised in 1
week, though the intensities of the peaks were not as significant and after storage for a
longer period of time, the intensities of the peaks remained nearly the same. It was
indicated that the milling time can be a variable which can affect the stability of the
resultant samples. This was further proved by the samples which were milled for 24
hours. There is not any obvious peak shown and the samples remained amorphous after
storing for 4 months. The higher mechanical force generated by a longer milling time
could help the materials interact with each other in a larger extent. It is known that
hydrogen bonding, salt formation or van der Waal’s forces are the important factors for
keeping the materials stable, and a reasonably long milling time can help the bonding
and interaction develop, resulting in improved kinetic stability. The nucléation effect is
important for an amorphous material to recrystallise. In this case if the interaction
192
Chapter 5 Effect o f preparation method and formulation.
between the drug and the carrier is large enough to avoid the aggregation, the nucléation
effect can be retarded hence the stability can be increased.
Together with the milling time and rotation speed, the number of milling balls could
also affect the milling outcome. The lower amount of balls used here (instead of 45 used
in the previous sections) could decrease the impact and friction forces resulting at a
slower amorphisation rate. Therefore, under the same milling durations, the sample
milled using fewer milling balls probably contains more nucléation sites which could
act as a trigger for crystallisation. For example, both milled for 6 hours, the one milled
by 15 balls recrystallised in one week, but the one milled by 45 balls stayed amorphous
for more than half a year. Hence, when the milling temperature is not too high to cause
any crystallisation or the milling intensity is not too extreme to cause any potential
degradation, by adjusting the rotation speed, milling time, and the milling balls, one
could control the amorphous content and physical stability of the final products. Of
course, the material or size of the milling balls could also influence the milling effect.
This study demonstrates that milling conditions could greatly influence the stability of
the amorphous products.
5 4.2.4 Dissolution properties of the solid dispersions
The dissolution properties of the solid dispersions were studied in pH 6.8 phosphate
buffer and compared to that of the amorphous and crystalline indometacin. No matter
what sample was used for investigation, a dose of 25 mg of indometacin was fixed to
guarantee the sink conditions. Sink conditions mean that the dissolution of the drug will
not be affected by its saturation solubility and it is very important for a dissolution
experiment to be carried out in this condition.
193

Chapter 5 Effect o f preparation method and formulation...
100
Amorphous IM Crystalline EM SMCC 2%-EVI SMCC 5%-EVf SMCC 10%^IM MCC m
0 20 40 60 80 100 120Time (min)
Figure 5.17: Dissolution profiles of crystalline, amorphous indometacin (IM) and the
SMCC and MCC solid dispersions (with a drug to carrier ratio o f 25%: 75%) at pH 6.8
phosphate buffer (37 °C).
Figure 5.17 shows the dissolution profiles of crystalline, amorphous indometacin,
MCC-indometacin and different SMCC-indometacin systems. As expected, crystalline
indometacin showed the slowest dissolution rate compared to the others and amorphous
indometacin was the second slowest. This matches well with the understanding that an
amorphous material would have some dissolution advantages compared to its crystalline
form because of its higher energy state. All indometacin solid dispersions displayed a
significant improvement in the dissolution rate. The systems reached nearly 100% of
release in only 10 minutes and stay in a plateau throughout the two-hour test. Both
SMCC and MCC are excellent fillers for direct compression in tabletting and they are
also good disintegrants which help the powders disperse well into the medium to
prevent aggregation. Also, because of their hydrophilic nature, the powders were wetted
very easily which helped to increase the dissolution rate. SMCC solid dispersions did
not show any difference compared to the MCC one despite having a higher surface area.
194

Chapter 5 Effect o f preparation method and formulation...
«(X)««1
100
90
80
Ui70
60
50
Amorphous IM40
30Crystalline IM
20
10 Neusilin-IM
00 20 40 60 80 100 120
Time (nun)
Figure 5.18: Dissolution profiles of crystalline, amorphous indometacin and
indometacin-Neusilin (25%: 75%) solid dispersion at pH 6.8 phosphate buffer (37 °C).
The dissolution profile of Neusilin-indometacin solid dispersion is shown in Figure 5.18.
The system also displayed a faster dissolution rate compared to the crystalline
indometacin. However compared to the amorphous indometacin, the dissolution
improvement is very small. In the first 40 minutes, Neusilin-indometacin dissolved
slightly faster but after that the dissolution rate became milder and slower than that of
the amorphous indometacin.
195

Chapter 5 Effect o f preparation method and formulation...
6^onCQ«"3cc
100
90
8070
60
50 Neusilin-IM 3-1 capsule40
Neusilin-EM 5-1 capsule3020 Neusilin-IM 5-1 tablet
Neusilin-IM 5-1 powders10
00 10 20 30 40 50 60 70 80 90
Time (min)
Figure 5.19: Dissolution profiles of Neusilin-indometacin solid dispersions with
different carrier to drug ratios and the samples were introduced to the pH 6.8 phosphate
buffer (37 X f via different ways.
Some previous studies have shown that a higher carrier ratio might help to increase the
dissolution rate of solid dispersions (Leonardi et al, 2007). Therefore the Neusilin to
indometacin ratio was increased from 3:1 to 5:1 to investigate the effect of Neusilin
concentration on the dissolution rate of indometacin. However, no obvious change of
dissolution rate was noticed between the samples with different ratios (as shown in
Figure 5.19). For both samples, small aggregates were observed in the medium during
dissolution experiments. It was suspected that the poor dispersion of the powders in the
medium as a result limited the dissolution performance of the solid dispersion.
Therefore, the sample powders were introduced to the dissolution medium in two other
ways during dissolution experiments: 1) the powders were compressed into tablets and
then added to the medium; and 2) powders were directly added to the medium. In either
case, the solid dispersion powders dispersed well into the medium and hence their
dissolution rates have improved (Figure 5.19). Especially when powders were directly
196

Chapter 5 Effect o f preparation method and formulation.
introduced, a rapid release of drug (-90%) was detected in 5 minutes.
An amorphous solid dispersion could not only benefit from the amorphous state of the
drug, but also the smaller particle size and the increased wettability of the hydrophilic
carriers. Figure 5.20 has shown the contact angle of crystalline indometacin in
comparison with its solid dispersions. As expected, SMCC-indometacin and
MCC-indometacin systems showed smallest angle values indicating the best wettability
of the samples. The contact angle of Neusilin and indometacin solid dispersion was just
slightly lower than that of the crystalline one, which might be able to explain why the
dissolution rate improvement of Neusilin was not as much as SMCC and MCC.
b . 60
Figure 5.20: Contact angle of crystalline indometacin and the solid dispersions of
indometacin with Neusilin, SMCC or MCC (a drug to carrier ratio o f 25%: 75%).
An excellent carrier should not only have good interaction ability with a drug in solid
state but also be able to maintain the apparent solubility of the drug at a high level in the
dissolution medium. Indometacin on its own and the solid dispersions of MCC, SMCC
2%, Neusilin with indometacin were placed in the pH 6.8 phosphate buffer and
continuous shaking was maintained for 24 hours. Thereafter, the solutions were taken
out for assessment of the concentration of indometacin. Neusilin system did not show
197

C h apter 5 E jfect o f p repara tion m ethod an d form ulation...
significant improvement of the apparent solubility of indometacin compared to the
amorphous indometacin alone, but both MCC and SMCC were able to increase the
apparent solubility of the drug by about two fold. The dissolution test did not show any
difference between the MCC and SMCC systems, SMCC indeed was shown to be able
to maintain a higher apparent solubility than MCC.
SampleApparent solubility of indometacin
(pg/mL) in 24 hours
MCC-indometacin 1467
SMCC 2%-indometacin 2310
Neusilin-indometacin 968
Indometacin (amorphous) 911
Indometacin (crystalline) 719
Table 5.4: Effect o f carrier species on the apparent solubility o f indometacin compared
with that o f indometacin along (pH 6.8 phosphate buffer at 37 °C) in 24 hours.
S.4.2.5 Preparing the solid dispersions by spray drying
The possibility of preparing indometacin solid dispersions with MCC and Neusilin was
investigated using spray drying as an alternative method. Normally, in a spray drying
preparation, drug and carrier are completely dissolved in solvents in order to achieve a
clear solution for a better feeding efficiency. However, since MCC and Neusilin are not
soluble in any common laboratory solvent used for spray drying, suspensions of the
carriers with completely dissolved indometacin in ethanol were made. The nozzle size
of the GEA Niro spray dryer is -500 pm, therefore, Neusilin with a particle size around
15 pm would be no problem for passing through the nozzle. But since MCC has an
average particle size of around 50 pm, blockage of the nozzle would be expected during
spray drying. To solve this problem, the particle size of MCC was reduced to around 15
198

C hapter 5 Effect o f p repara tion m ethod an d form ulation...
I m using an air jet mill. A relatively higher feeding rate was also used as a precaution to
prevent any blockage of the nozzle. After spray drying, indometacin still remained
crystalline in the MCC systems, albeit XRPD patterns indicated a decrease of the
characteristic peaks of crystalline indometacin. Indometacin and Neusilin spray dried
sample appeared to be amorphous by XRPD. The SEM images of the spray dried
samples are shown in Figure 5.21. On the surface of the MCC-indometacin particles,
some needle shape particles can be seen which is related to the crystalline drug.
Neusilin-indometacin particles showed no sign of any crystalline material. However, by
visual observation, both spray dried samples turned from slightly yellow to white after
storing at 30 °C 11%RH in one week indicating a poor physical stability compared to
their ball milled samples.
a b
Figure 5.21: SEM images o f spray dried indometacin with Neusilin (a) or MCC (b) with
a drug to carrier ratio o f ISYo:?SYo.
5.4.3 Carriers which are miscible with the mode! drug
In the previous section, carriers which are immiscible with indometacin were used to
form solid dispersions with indometacin. Interactions between the drug and the carriers
have been shown to be crucial to the physical stability of the systems as shown by the
FTIR and accelerated stability studies. The planetary ball milling technique has been
shown to be very useful to facilitate this solid-solid interaction between the drug and the
carriers. In this section, PVP and HPMCAS, two carriers which should be miscible with
indometacin according to their solubility parameters (Table 5.5) were used to form solid
199
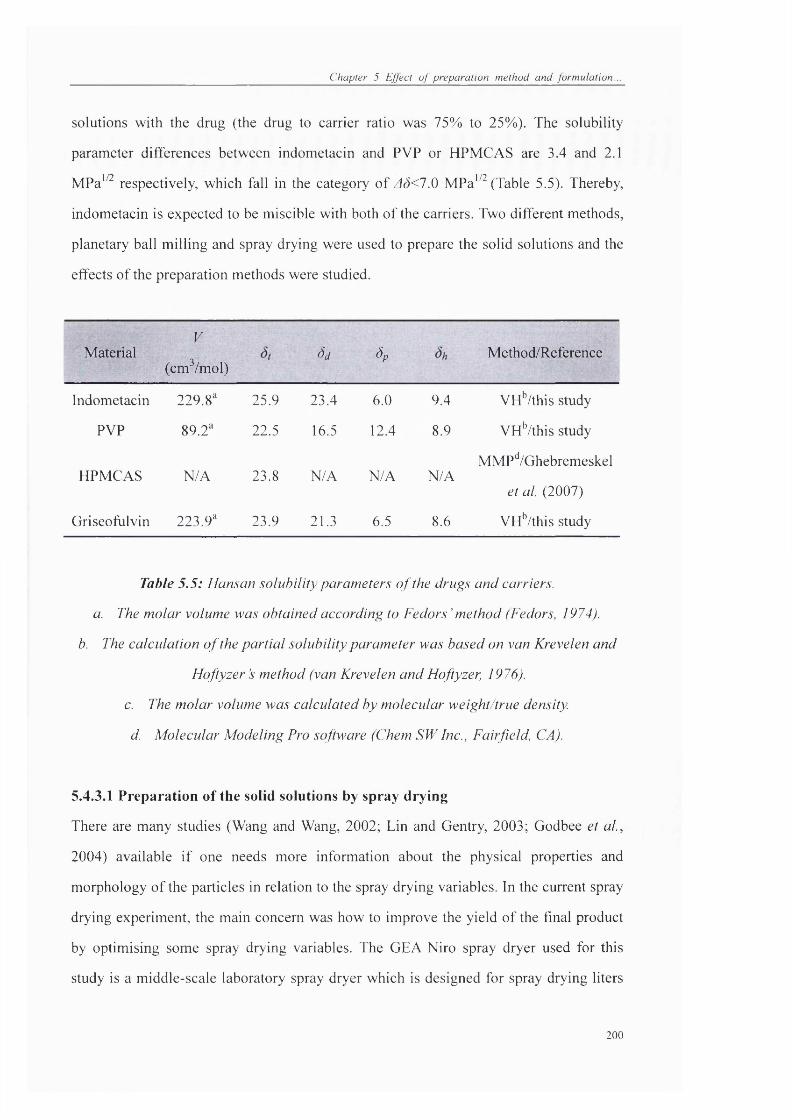
C hapter 5 Effect o f p repara tion m ethod an d form ulation.
solutions with the drug (the drug to carrier ratio was 75% to 25%). The solubility
parameter differences between indometacin and PVP or HPMCAS are 3.4 and 2.1
MPa'^^ respectively, which fall in the category of A0<1.Q MPa'^^ (Table 5.5). Thereby,
indometacin is expected to be miscible with both of the carriers. Two different methods,
planetary ball milling and spray drying were used to prepare the solid solutions and the
effects of the preparation methods were studied.
MaterialV
(cm^/mol)àd 4 Method/Reference
Indometacin 229.8" 25.9 23.4 6.0 9.4 VH'^/this study
PVP 89.2" 22.5 16.5 12.4 8.9 VH^/this study
HPMCAS N/A 23.8 N/A N/A N/AM M P^/Ghebremeske 1
g/ 6f/. (2007)
Griseofulvin 223.9" 23.9 21.3 6.5 8.6 VH^this study
Table 5.5: Hansan solubility parameters o f the drugs and carriers,
a. The molar volume was obtained according to Fedors’ method (Fedors, 1974).
b. The calculation o f the partial solubility parameter was based on van Krevelen and
Hoftyzer’s method (van Krevelen and Hoftyzer, 1976).
c. The molar volume was calculated by molecular weight/true density,
d. Molecular Modeling Pro software (Chem SW Inc., Fairfield, CA).
5.4.3.1 Preparation of the solid solutions by spray drying
There are many studies (Wang and Wang, 2002; Lin and Gentry, 2003; Godbee et al,
2004) available if one needs more information about the physical properties and
morphology of the particles in relation to the spray drying variables. In the current spray
drying experiment, the main concern was how to improve the yield of the final product
by optimising some spray drying variables. The GEA Niro spray dryer used for this
study is a middle-scale laboratory spray dryer which is designed for spray drying liters
200

Chapter 5 Effect o f preparation method and formulation..
of liquid feed. However, the amount of solution used in the study was usually not more
than 300 mL which would lead to a very low product yield. Therefore, 9 batches of PVP
and indometacin (3:1) solutions (200 mL, 3% w/v loading) were spray dried using
different spray drying variables in order to find out the most suitable setting.
Table 5.6 has shown the spray drying variables of 9 different batches. Throughout the 9
batches, the concentration of the solution, nozzle pressure, and atomisation gas flow
were fixed to maintain a relatively constant particle size. The variables altered were
chamber inlet flow, inlet temperature, pumping rate and the solvent types. In the first 3
batches, the inlet temperature was gradually increased and it seemed that at 80 °C the
product has a higher yield than the other two temperatures. If the inlet temperature is too
low, it might not provide enough heat to dry the droplets properly leading to formation
of slurries with bad flowability; meanwhile if the inlet temperature is too high, the outlet
temperature would be too close to the Tg of the particles and they would stick to the
inner wall of the chamber. In both situations, product yield would be hampered. 80 °C
appeared to be a suitable temperature for the PVP and indometacin system. In batch 4
the chamber inlet flow was increased to 30 kg/h (the maximum flow rate the spray dryer
could achieve). A significantly increase in the product yield was noticed.
201

Batch 1 2 3 4 5 6 7 8 9
Atomisation gas
flow (kg/h)2.5 2.5 2.5 2.5 2.5 2.5 2.5 2.5 2.5
Chamber inlet flow
(kg/h)25 25 25 30 20 30 25 25 30
Nozzle pressure
(bar)1.5 1.5 1.5 1.5 1.5 1.5 1.5 1.5 1.5
Inlet Temperature
CC)60 80 100 80 80 80 80 120 80
Pumping rate (%) 20 20 20 20 20 30 20 20 20
Solvent type EtOH EtOH EtOH EtOH EtOH EtOH EtOH:Water 2:1 EtOH:Water 2:1 EtOH:Water 2:1
Final product weight
(g)(13777 0.5421 0.3909 1.7432 0.666 (19403 0.4647 0.2516 (13962
Yield 6.29% 9.96% 6.52% 29.03% 11.09% 15.66% 7.74% 4.19% 6.60%
Table 5.6: List o f the spray drying parameters used for different batches o f operations and their final yields.
202

Chapter 5 Effect o f preparation method and formulation..
A higher chamber inlet flow might enable a better drying effect on the particles and
also facilitate the transportation of the particles to the collection point in favour of a
better yield. In contrast, when the chamber inlet flow was reduced in batch 5, a
decrease in the product yield was noticed. A decrease was also found on batch 6 when
the pumping rate was increased. Because as the chamber inlet flow was fixed, a
higher pumping rate would reduce the drying effect and the moisture content in the
particles would be raised. All batches using ethanol and water mixtures as the
dissolution medium gave relatively poor product yield, because water with a higher
boiling temperature than ethanol would reduce the drying effect when other
parameters are the same. In this case increasing the inlet temperature would help to
increase the drying of the particles but the outlet temperature would be too close to
their Tg resulting in a decrease in the final yield. Therefore, batch 4 appeared to be the
most suitable setting here for the spray drying experiment of PVP and indometacin.
The setting used in batch 4 PVP-indometacin solid solution was also applied to
prepare the HPMCAS-indometacin solid solutions, except that the solvent was
changed to acetone: water (80%:20%) because HPMCAS is insoluble in pure water,
acetone or ethanol. An acceptable yield at around 15% was achieved.
The SEM images of the spray dried particles of PVP-indometacin and
HPMCAS-indometacin solid solutions are shown in Figure 5.22. PVP-indometacin
sample appeared to be spherical while the HPMCAS-indometacin particles were
deformed spheres. The irregular shape of the HPMCAS-indometacin particles might
be due to the high viscosity of the polymer solution. It was found that solvent
evaporation rate and viscosity could be correlated with morphology of particles
(Al-Obaidi, 2007). The different solvent system and the viscosity of the polymer
solution could all play an important role on the morphology of the particles. All the
particles have a size of less than 5 pm.
203

Chapter 5 Effect o f preparation method and formulation..
a b
Figure 5.22: SEM images o f spray dried indometacin with PVP (a) or HPMCAS (h),
with a drug to carrier ratio o f 25yo:75Yo.
XRPD assessments were conducted to investigate the crystallinity of spray dried
PVP-indometacin and HPMCAS-indometacin samples. No characteristic peaks of
indometacin were observed in the XRPD patterns (Figure 5.23) indicating that the
samples were completely amorphous after preparation. Furthermore, DSC was
applied to confirm the amorphous state of the systems. SSDSC showed a single Tg of
PVP-indometacin and HPMCAS-indometacin at 100 and 58 °C respectively,
indicating the complete miscibility between the drug and the carriers and the
formation of solid solutions (Figure 5.24). Conventional DSC at 20 °C/min scan rate
also confirmed this finding by only showing one Pg for the systems.
P os ition p2T heta}
Figure 5.23: XRPD patterns o f spray dried indometacin with PVP (a) or HPMCAS
(b), with a drug to carrier ratio o f ISYo:?SYo.
204

Chapter 5 Effect o f preparaticm method and formulation.
5 £
S!..
3J0
2Q1 801
120 140 160 175
Figure 5,24: DSC scans of spray dried indometacin with HPMCAS (a) or PVP (b),
with a drug to carrier ratio o f 25%: 75%o.
5.4 3.2 Preparation of the solid solutions by ball milling
Indometacin and PVP or HPMCAS with a ratio of 1:3 were milled for 5, 15, 30, 60,
120, 240 and 360 minutes. Samples were withdrawn and characterised using XRPD to
study the amorphous state conversion rate of indometacin (Figure 5.25). By milling
with PVP and HPMCAS, indometacin was able to achieve amorphous in 30 and 60
minutes respectively. SEM studies were conducted to investigate the morphology of
the ball milled samples and the images were shown in Figure 5.26. The ball milled
samples were assessed by SSDSC and conventional DSC studies. Both
PVP-indometacin and HPMCAS-indometacin systems had a single Tg no matter what
scanning mode was used, indicating one-phase systems were formed. In SSDSC
measurements, the Tg were 101 °C for PVP-indometacin and 58 °C for
HPMCAS-indometacin (Figure 5.27). This result showed that the formation of solid
solution by ball milling is possible. During ball milling, heat was generated which
would help to dissolve indometacin into PVP or HPMCAS. Of course, the
presupposition is that the carrier will have a certain level of solubility for the drug
which was predicted by the solubility parameters of the drug and the carriers (Table
5.5).
205

Chapter 5 Effect o f preparation method and formulation...
1000
800
2 600
400
200
10 15 20 25 30 35
P o s i t io n [° 2Theta]
40
2 650
15 20 25 30P o s i t io n [° 2Theta]
Figure 5.25: XRPD patterns of indometacin milled with PVP (I) or HPMCAS (2) for
5 (a), 15 (h), 30 (c), 60 (d), 120 (e), 240 (f), and 360 (g) minutes.
a b
Figure 5.26: SEM images o f ball milled indometacin with PVP (a) or HPMCAS (b),
with a drug to carrier ratio of 25%: 75%.
206

Chapter 5 Effect o f preparation method and formulation...
3.8
3.6
3.4
1 3.0
2.6
22
2.0
80 100 TetnperoÉire (*C)
Figure 5.27: DSC scam of ball milled indometacin with HPMCAS (a) or PVP (b),
with a drug to carrier ratio of 25%: 75%.
5.4 3.3 Hydrogen bonding between the drug and the carriers
FTIR studies were conducted to investigate the drug and carrier interactions. Figure
5 .28 shows the FTIR spectra of PVP and indometacin physical mixtures and the solid
solutions prepared by ball milling and spray drying. In the physical mixtures, the peak
at around 1662 cm' was related to the non-hydrogen bonded carbonyl group of PVP,
and the other two peaks were related to crystalline indometacin as described in the
previous section. After compounding with PVP using both methods, the dimer peak of
indometacin at 1715 cm' disappeared, indicating the absence of any intramolecular
interaction of indometacin molecules and the formation of amorphous indometacin.
Meanwhile, a band started to show at around 1724 cm' which was related to the
hydrogen bonding between the indometacin carboxyl and the PVP carbonyl group
(Taylor and Zografi, 1997). Furthermore, the shift of the carbonyl group of PVP also
indicated increased conjugation between PVP and indometacin.
2 0 7

Chapter 5 Effect o f preparation method and formulation...
1 02
0 98
0 96
0.92
0.86
1850 1750 1700 1650 1600 1550
Wflwiumtera [lAcmJ
Figure 5.28: FTIR spectra o f indometacin and PVP physical mixture (1) and their
spray dried (2) and ball milled (3) samples.
0 96
0 92
0.9
0.86
0.84
0.82
1750 1650 1600 1550 1500
W tv » ru n b « rs [lAm]
Figure 5.29: FTIR spectra o f indometacin and HPMCAS physical mixture (I) and
their spray dried (2) and ball milled (3) samples.
208

Chapter 5 Effect o f preparation method and formulation...
The FTIR spectra of HPMCAS and indometacin related systems are shown in Figure
5.29. The peak at 1750 cm' in the physical mixtures corresponded to the carbonyl
groups in succinoyl and acetyl groups of HPMCAS (Fukui et al, 2001). In the spectra
of solid solutions prepared by ball milling and spray drying, the carbonyl peak of
HPMCAS shifted to a lower wavenumber, together with the disappearance of
indometacin dimer peak and shift of indometacin carbonyl peak. These changes
indicate strong hydrogen bonding between the drug and the carrier.
Both PVP-indometacin and HPMCAS-indometacin systems have displayed strong
hydrogen bonding between the drug and the carriers. Preparation techniques did not
seem to have an impact on the hydrogen bonding results. It is important to point out
that hydrogen bonding is an important factor for the formation of the solid solutions
because interactions between the drug and carriers can increase the likelihood of
molecular dispersions (Patterson et al, 2007). Sekizaki et al (1995) have shown that
a certain degree of solid solution formation was achieved by merely physical mixing
two compounds which are capable of forming strong hydrogen bond.
5.4.3 4 Physical stability of the solid solutions
PVP-indometacin and HPMCAS-indometacin solid solutions were stored at 30 °C
11% RH and 40 °C 75% RH for 2 months to investigate their physical stabilities. After
storage, the samples were taken out for XRPD or DSC assessments. TGA studies
were also conducted to monitor the change of moisture content of the samples (Table
5.7). Increased physical stabilities were achieved by all solid solutions since no
recrystallisation of indometacin was noticed as determined by either XRPD or DSC
tests. This improvement of physical stability of the sample is due to the strong
hydrogen bonding between the two components and the solubility of indometacin into
the carrier matrix which could prevent the drug molecules getting back together to
form nucléation sites.
2 09

C hapter 5 Effect o f p repara tion m ethod an d form ulation.
Initial 30 T 11% RH 40 °C 75% RH
water Water Water
Carrier Method content
%
(w/w)
Solid statecontent
%
(W/W)
Solid statecontent
%
(W/W)
PVPSpray
drying1.76 Amorphous 2.39 Amorphous 10.30
HPMCASSpray
drying
Ball
0.50 Amorphous 0.28 Amorphous 3.77
PVPmilling
Ball
4.14 Amorphous 3.16 Amorphous 12.60
HPMCASmilling
0.85 Amorphous 0.59 Amorphous 2.19
Table 5.7: Physical stability o f the solid solutions (a drug to carrier ratio o f 25%:? 5%)
stored for 2 months in different conditions as determined by XRPD or DSC.
It was observed that both ball milled and spray dried PVP-indometacin samples have
displayed a change of shape after storage at 40 °C 75% RH for 2 months. The
particles looked like they have been melted and became a glass-like cake. It was
difficult to assess these samples using XRPD, because unlike powders, they were very
difficult to be flattened onto an XRPD sample plate. DSC measurements thereby were
conducted to detect any possible change to the samples. Phase separation or
crystallisation was not detected, since there was only one Tg detected and no
endothermie peak of crystalline indometacin was observed. Indometacin remained
amorphous in the samples. Hasegawa et al (2005) in a study had developed a closed
melting method to prepare solid solution of troglitazone and PVP. To lower the
degradation tendency of the drug, troglitazone and PVP physical mixtures were
placed over saturated salt solution to obtain a certain amount of water which could
210

Chapter 5 Effect o f preparation method and formulation...
help to lower the Tg of the materials and enable the preparation of amorphous solid
solutions by heating below the melting of the drug. The change of shape of the
PVP-indometacin solid solutions at 40 °C 75% RH was probably due to the large
amount of water sorbed to the samples (Table 5.7) which acted like a plasticiser to
lower the Tg of the samples down to the studied temperature. Therefore, without
heating the samples over their Tg, the samples could still enter their rubbery state
resulting in melting of the drug in the PVP. The PVP-indometacin solid solutions
stored at 30 °C 11% RH remained powder like, because the water sorbed was limited.
HPMCAS-indometacin solid solutions did not show any apparent change in the shape
or morphology after storage at both conditions, which might imply a better stability
over the PVP solid solutions.
5.4.3.S Dissolution properties of the solid solutions
The dissolution profiles of the PVP-indometacin and HPMCAS-indometacin solid
solutions were studied at pH 6.8 phosphate buffer and the results are shown in Figures
5.30 and 5.31. The effect of preparation method on the dissolution properties was also
investigated.
Solid solutions of PVP and indometacin prepared by both techniques showed a
significant improvement of the dissolution rate of indometacin compared to its pure
crystalline and amorphous samples. The preparation techniques seem to have very
little influence on the dissolution profiles, though the spray dried sample did show a
slightly faster dissolution rate (Figure 5.30). However, the preparation technique
appeared to play an important role in the HPMCAS-indometacin system. After 10
minutes, the spray dried sample showed a faster dissolution rate then amorphous
indometacin while the ball milled sample was slower. This faster dissolution might be
caused by the smaller particle size of the spray dried sample compared to the ball
milled one which enables a higher surface area for the carrier to dissolve in a faster
manner. The ball milled HPMCAS-indometacin did show an advantage in the
dissolution rate compared to amorphous indometacin after 60 minutes as shown in
211

Chapter 5 Effect o f preparation method and formulation...
Table 5.8. The effect of preparation methods on the dissolution rate of indometacin
appeared to be depended on the type of carrier.
T T T
% 60
OS 40 ■ PVP IM hall milled PVP-IM s|**ay dried Amoriiious IM Cnstalline IM
20 40 60 80
Time (min)
100 120
Figure 5.30: Dissolution profiles of crystalline, amorphous indometacin and
indometacin-PVP (25%: 75%) solid solutions prepared by ball milling and spray
drying, studied at pH 6.8phosphate buffer (37
% 60
eg 40HPMCAS IM hall milled HPMC AS-IM sfiray tfc*ied AmoT|ihou.s DVf Cn^titfline IM
20 40 60 80
Time (min)
100 120
Figure 5.31: Dissolution profdes of crystalline, amorphous indometacin and
indometacin-HPMCAS (25%: 75%>) solid solutions prepared by ball milling and spray
drying, studied at pH 6.8 phosphate buffer (37
212

C hapter 5 Ejfect o f p re para tion m ethod an d form ulation...
Increased fold compared to
Sample tio l60 crystalline indometacin
tio teo
Bail milled16.2% 91.2% 1.8 1.5
HPMCAS-indometacin
Spray dried53.2% 102.8% 6.0 1.7
HPMCAS-indometacin
Amorphous32.3% 70.4% 3.6 1.2
indometacin
Crystalline8.9% 61.1% 1 1
indometacin
Table 5.8: Release percentage o f indometacin-HPMCAS (25%:75%) solid solutions,
and crystalline and amorphous indometacin at 10 minutes (tjo) and 60 minutes (t o).
213
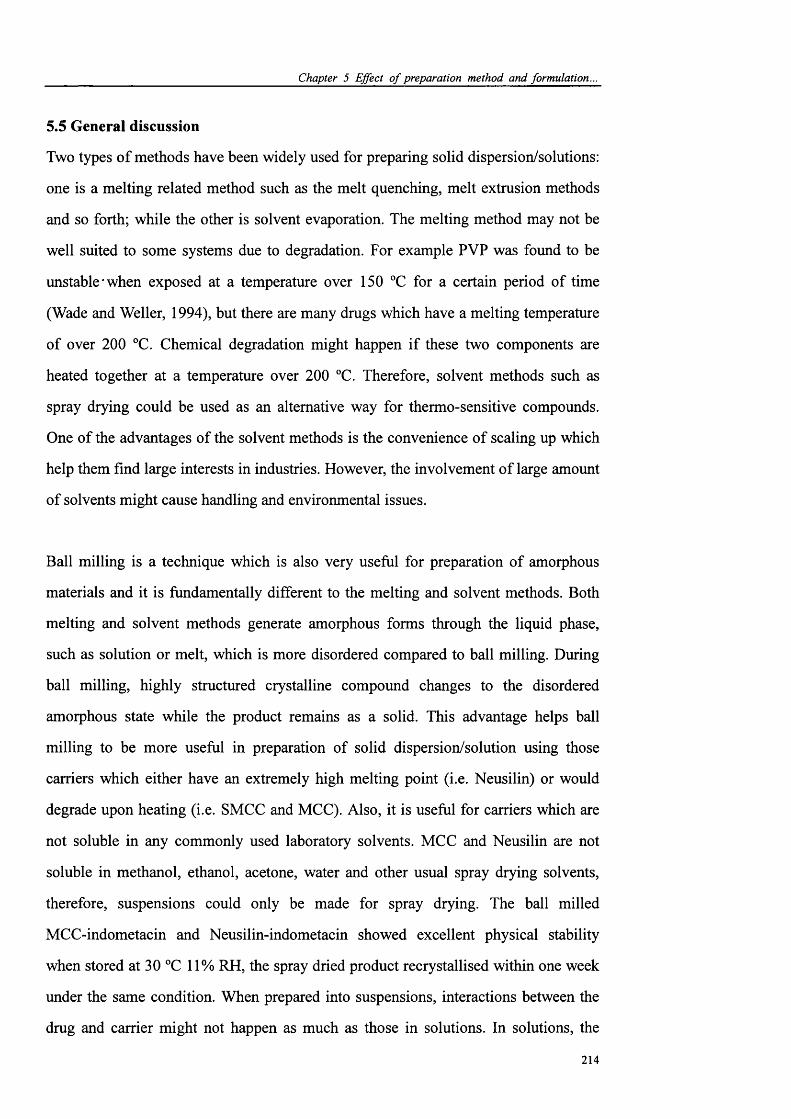
Chapter 5 Effect o f preparation method and formulation...
5.5 General discussion
Two types of methods have been widely used for preparing solid dispersion/solutions:
one is a melting related method such as the melt quenching, melt extrusion methods
and so forth; while the other is solvent evaporation. The melting method may not be
well suited to some systems due to degradation. For example PVP was found to be
unstable when exposed at a temperature over 150 °C for a certain period of time
(Wade and Weller, 1994), but there are many drugs which have a melting temperature
of over 200 °C. Chemical degradation might happen if these two components are
heated together at a temperature over 200 °C. Therefore, solvent methods such as
spray drying could be used as an alternative way for thermo-sensitive compounds.
One of the advantages of the solvent methods is the convenience of scaling up which
help them find large interests in industries. However, the involvement of large amount
of solvents might cause handling and environmental issues.
Ball milling is a technique which is also very useful for preparation of amorphous
materials and it is fundamentally different to the melting and solvent methods. Both
melting and solvent methods generate amorphous forms through the liquid phase,
such as solution or melt, which is more disordered compared to ball milling. During
ball milling, highly structured crystalline compound changes to the disordered
amorphous state while the product remains as a solid. This advantage helps ball
milling to be more useful in preparation of solid dispersion/solution using those
carriers which either have an extremely high melting point (i.e. Neusilin) or would
degrade upon heating (i.e. SMCC and MCC). Also, it is useful for carriers which are
not soluble in any commonly used laboratory solvents. MCC and Neusilin are not
soluble in methanol, ethanol, acetone, water and other usual spray drying solvents,
therefore, suspensions could only be made for spray drying. The ball milled
MCC-indometacin and Neusilin-indometacin showed excellent physical stability
when stored at 30 °C 11% RH, the spray dried product recrystallised within one week
under the same condition. When prepared into suspensions, interactions between the
drug and carrier might not happen as much as those in solutions. In solutions, the
214

Chapter 5 Effect o f preparation method and formulation...
entanglement of carrier chains might help to expose some functional groups which
could interact with a drug easily. In ball milling, the mechanical force generated could
help to facilitate solid-solid interactions regardless of whether the carriers are soluble
or not. In comparison to the melting and solvent methods, the high-energy milling
technique, such as planetary ball milling, has not received much attention in the
preparation of solid solutions. However, the tremendous energy generated by a
planetary mill, makes it more efficient than the conventional ball milling techniques
and even enables the preparation of one-phase systems or the formation of
drug-carrier miscible regions (Boldyrev et al, 1994; Friedrich et al, 2005). In a
previous study Gupta et al (2003) used a roller ball mill to prepare indometacin and
Neusilin solid dispersion using a ratio of 1:5, but FTIR studies indicated that dimer
peak of indometacin still existed after 24 hours of continuous milling. However, the
planetary ball mill used here was able to turn indometacin 100% amorphous in less
than 6 hours using a low drug to carrier ratio (1:3). No dimer peak of indometacin was
shown as tested by FTIR. Also, in this study, indometacin was able to form solid
solutions with PVP and HPMCAS using a planetary ball mill, and the samples
showed similar glass transition temperature and physical stability compared to the
spray dried systems. Though the ball milled samples showed slower dissolution rate
compared to the spray dried ones, they did show obvious improvements compared to
the amorphous and crystalline drug. All these positive results indicate that planetary
ball milling is a very convenient technique. Either solid dispersions or solid solutions
could be made by ball milling according to the miscibility between the drug and the
carriers.
The solubility parameter is a very useful indicator for evaluation of the miscibility
(solubility) between low molecular weight drugs and carriers. Many studies have
demonstrated how to use solubility parameter as a predictor for the selection of
carriers to prepare solid dispersions or solutions (Greenhalgh et al, 1999). However,
good miscibility between the drug and the carrier does not necessarily lead to a good
physical stability. Table 5.5 shows that griseofulvin has a solubility parameter close to
215

Chapter 5 Effect o f preparation method and formulation...
that of PVP (A5<7.0 MPa ^ ), and they are expected to be completely miscible with
each other. Some previous studies have proven the formation of solid solution
between griseofulvin and PVP (Mayersohn and Gibaldi, 1966; Al-Obaidi, 2007).
Though an increased dissolution rate was achieved, griseofulvin recrystallised after
less than 2 weeks at room temperature (Al-Obaidi, 2007). This rapid recrystallisation
is due to lack of interaction between griseofulvin and PVP as both of them are proton
acceptors. Indometacin has a similar solubility parameter to griseofulvin, but its
carboxyl group makes it a proton donor enabling the formation of hydrogen bonding
with the carbonyl group of PVP. Improvements of the physical stability of
indometacin-PVP solid solutions were shown after storage at 30 °C 11% RH and 40
°C 75% RH. Intermolecular interaction seems to be a key factor to be considered
when choosing a carrier for preparing stable solid solutions but not only the
miscibility. Intermolecular interaction is also important to carriers which are
immiscible with the drug. SMCC, MCC and Neusilin, could all interact with
indometacin as indicated by the FTIR results. Instead of the reduction and small shift
that was seen for the SMCC-indometacin and MCC-indometacin systems the dimer
peak of indometacin disappeared after compounding with Neusilin indicating a
stronger interaction. The strong acid-base interaction and hydrogen bonding between
indometacin and Neusilin made the system more stable then the SMCC and MCC
ones as shown by the stability test data. Therefore, when choosing a carrier to form
solid dispersion/solution with a drug, the interaction potency between the components
should be carefully evaluated, such as whether they are a proton donor, proton
acceptor or capable of both, and whether they can form a salt through acid-base
reaction.
Improving the physical properties of an amorphous drug is one of the main reasons
for preparing solid dispersions/solutions however, if the dissolution property of the
drug can not be improved, this formulation would be worthless. For example,
PHPMA contains a hydroxyl and carbonyl group can act as a proton donor or proton
acceptor in favour of hydrogen bonding with many drugs and it has been proved to be
2 1 6

Chapter 5 Effect o f preparation method and formulation...
able to stabilise griseofulvin for a long period of time (Al-Obaidi, 2007). In this study,
PHPMA milled with indometacin and the solid dispersion was found stable after
storage at 30 °C 75% RH for four weeks. However, during dissolution, PHPMA
formed a hydrogel which prevents the release of indometacin leading to a very poor
dissolution profile (Figure 5.32). In order to solve this problem, a ternary system was
developed. MCC which has been shown to significantly increase the dissolution rate
of indometacin in the binary system was added. PHPMA was first milled with
indometacin to allow them interact with each other completely and then MCC was
added and milled for another period of time.
100
90
80
70
60
50
40
30
20
10
0
I
\ PHPMA m (3:1)
PHPMA MCC IM (15:1.5:1)
MCC IM(3:1)
20 40 60Time (min)
80 100 120
Figure 5.32: Dissolution profiles of the solid dispersions of
PHPMA-MCC-indonietacin, PHPMA-indometacin and MCC-indometacin.
The purpose of using two carriers here is to utilise the stabilisation effect of PHPMA
and the excellent solubilising effect of MCC to provide a system with combined
advantages of their both. Figure 5.32 shows that the dissolution rate of
PHPMA-MCC-indometacin system has significantly increased. The
PHPMA-MCC-indometacin system also showed an increase in the physical stability
compared to the MCC-indometacin one after storing at 30 °C 75% RH for 4 weeks
21 7
C h ap ter 5 Effect o f p rep a ra tio n m eth od a n d form u la tion .
(Figure 5.33). Hence ternary solid dispersion can be a very useful approach to prepare
a solid dispersion/solution for a poorly soluble drug.
Counts4 0 0 -
1 0 0 -
4o 8 -
1 0 0 -
10 20 30
Position [°2Ttieta]
Figure 5.33: XRPD patterns o f solid dispersions o f a) PHPMA-MCC-indometacin
(1.5:1.5:1), b) PHPMA-indometacin (3:1) and c) MCC-indometacin (3:1) stored at 30
°C 75% for 4 weeks.
218

Chapter 5 Ejfect o f preparation method and formulation...
5.6 Conclusion
In this study, it was found that the rate of crystalline indometacin to the amorphous
state depends on the milling parameters such as the milling duration and milling
intensity. There are two processes competing during amorphisation: the generation of
amorphous phase caused by the mechanical energy of colliding balls and the
conversion of the amorphous phase back to crystalline caused by increasing
temperature in the milling pot during intensive collision. After prolonged milling, the
rate of generation of amorphous phase would equal that of the formation of crystalline
phase. Physical stability data indicate that longer milling time and higher milling
intensity could help to increase the stability of an amorphous solid dispersion.
Carriers with different amounts of silica on the surfaces were used to prepare solid
dispersions with indometacin. All carriers showed improvement in the stability and
dissolution rate of indometacin. Neusilin which has the highest silica content (c.a.
30%) has shown the best stabilising effect due to its strong interaction with
indometacin. SMCC has three grades of silica, 10%, 5% and 2% but the different
amount of silica did not show any change in the stabilising effect of indometacin,
which means that a higher amount of silica at least close to that of Neusilin on the
surface is needed for an improved stability. The dissolution rate of SMCC and MCC
were similar, nevertheless, SMCC indeed showed faster conversion to the amorphous
state, better wettability, and higher apparent solubility of indometacin compared to
MCC. Spray dried MCC or Neusilin with indometacin recrystallised very quickly
which demonstrated the advantage of planetary ball milling in facilitating solid-solid
interactions. Solid solutions of PVP or HPMCAS with indometacin were formed by
using spray drying and ball milling methods. By using ball milling, it was possible to
produce solid solutions with similar physical properties and stability with those
prepared by spray drying. A difference in the dissolution properties was noticed
between the two methods; however, this difference appears to be carrier specific. The
dissolution profiles of the ball milled and spray dried PVP-indometacin system was
very similar, while the spray dried HPMCAS-indometacin showed a faster dissolution
219

Chapter 5 Effect o f preparation method and formulation...
rate in the initial state compared to the ball milled one. Nevertheless, ball milling as
an alternative method has proven to be very useful and convenient in preparing solid
solution with a poorly soluble drug. Intermolecular interactions have proven to be
critical for improvement of physical stability no matter whether the carrier is miscible
or immiscible. Some carriers have been shown to be more effective in improvement
of dissolution. According to this a ternary solid dispersion was developed using strong
hydrogen bonding carrier PHPMA, and a good solubilising carrier MCC. Improved
physical stability and dissolution properties were able to be achieved benefiting from
the advantages of both carriers.
220

Cfiapterô
ConcCusions and future wor^

Chapter 6 Conclusions and future work
Conclusions
Slow dissolution and poor solubility have significantly limited the bioavailability of
many poorly soluble drugs; hence it is very necessary for pharmaceutical researchers to
find an efficient method to tackle this problem. Among various methods available for
improvement of the dissolution property of drugs (as discussed in the introduction
chapter), the formation of solid dispersions has been found to be a very useful one. In a
solid dispersion, drugs can be (molecularly) dispersed into a hydrophilic carrier matrix
which enables a reduction of the particle size of the drug to the molecular level. The
amorphous state of the drug can provide improved dissolution rate. A major problem
which greatly hampers the application of solid dispersion is the recrystallisation of the
amorphous state during storage. Therefore, the aim of this thesis was to better
understand some fundamental issues such as molecular mobility (both at the surface and
in the bulk) and preparation method in relation to preparation of stable solid dispersions
with improved dissolution rate.
Crystallisation usually happens at the surface initially; therefore molecular mobility at
the surface of the solid dispersions was first to be studied. The hypothesis based here
was that molecular mobility can be represented by the relaxation time which could be
determined by the change of some related physical properties during physical aging.
Since relaxation also accompanies with a decrease in energy, the decrease of the
dispersive surface free energy of the amorphous samples could probably provide useful
information about the surface molecular mobility. Indometacin and PVP with a weight
ratio of 70% to 30% were melt quenched and ball milled, and DSC studies have
confirmed the formation of solid solutions. Planetary ball milling was shown to be
efficient in generation of complete miscibility between PVP and indometacin with a
concentration of PVP as low as 30%. The glass transition of the ball milled sample was
64 °C which was close to that of the melt quenched one (67 °C). In addition, FTIR
studies confirmed the hydrogen bonding interaction between the drug and the carrier,
and preparation method did not seem to have a significant effect on the interaction.
22 2

Chapter 6 Conclusions and future work
The dispersive surface free energy of indometacin increased after compounding with
PVP as determined by inverse gas chromatography which shows the possibility to
increase wettability of a hydrophobic drug by dispersing it in a hydrophilic carrier
matrix. The melt quenched solid solution was aged at 40, 50 and 60 °C at 0% RH for 18
days and samples were taken out at different time points for IGC measurements to
monitor the change of the dispersive surface free energy. XRPD, DSC and FTIR
measurements confirmed that the sample did not show any change and remained in the
amorphous state. IGC measurements have shown that the dispersive surface free energy
of the sample decreased after aging and after fitting the surface energy data to the KWW
equation, relaxation times of the sample were able to be obtained for direct comparison.
The relaxation showed temperature dependence with the sample aged at 40 °C having
the slowest relaxation time while the one aged at 60 °C the fastest. The sample aged at a
higher temperature might tend to recrystallise first since it had the highest surface
molecular mobility. In addition, the melt quenched solid solution with a higher PVP
content (50% w/w) was aged at 40, 60 and 70 °C to study the effect of carrier ratio on
the surface molecular mobility. At 60 °C the relaxation time was slower than that of 70
°C, and at 40 °C decrease of surface energy was absent when the carrier content was
increased. Therefore, for the stability point of view, a higher carrier concentration is
favoured because the drug molecules could be trapped further apart within the carrier
matrix, and higher carrier content could allow higher extent of carrier-drug interaction
and further improvement of glass transition temperature.
The dispersive surface free energy did not change in the case of the ball milled solid
solution after aging at 50 and 60 °C for 14 days; however the retention volume of
decane decreased indicating a decrease of interaction tendency between the surface and
the vapour probe which also showed temperature dependence. This decrease of
interaction tendency indicated a decrease of energy state at the surface. The acid-base
parameters of the ball milled sample indicated a reorientation of polar surface groups
which would affect its adhesion-cohesion force balance. Decane Vmax was found to be
more sensitive than the dispersive surface free energy in measuring the change of
223
Chapter 6 Conclusions and future work
energy state. Furthermore, it could measure the decrease of energy state with a shorter
measuring time.
The newly developed decane Vmax method was applied to study the surface molecular
mobility of the melt quenched and ball milled solid solutions aged at 50 °C at 0% RH,
moreover a spray dried solid solution with the same drug and carrier composition was
added into comparison (the Tg of the spray dried sample was 65 °C which was also close
to that of the other two samples). The decane Vmax obtained were fitted to a modified
KWW equation to obtain the minimum retention volume of decane and with these data,
KWW fitting was able to perform to obtain the relaxation parameters of these samples.
The solid solution prepared by spray drying showed the highest molecular mobility
while the melt quenched one was the slowest. The surface molecular mobility was then
compared to the bulk molecular mobility measured using the DSC relaxation enthalpy
recovery method. The hypothesis here was that since crystallisation is mainly surface
initiated, the molecular mobility at the surface should be higher than that of the bulk.
The results shown here have verified this hypothesis. For all solid solutions regardless
of the preparation method used, surface relaxation is faster than that of the bulk. Surface
molecular mobility should be therefore distinguished from the bulk molecular mobility
in the preparation of amorphous solid dispersions. Preparation methods have shown
significant influence on the molecular mobility both at the surface and in the bulk.
Therefore, the effect of preparation method should be another important factor to
consider in solid dispersion preparation. The surface relaxation data of the ball milled
solid solution was very close to the bulk ones which might suggest that the drug and
carrier miscible regions are mainly located on the outer surface of the sample. The
relaxation time distribution constant suggested that the ball milled sample had a less
homogeneity than the melt quenched one, which might have negative effect for the
physical stability of the sample.
The activation energy of the solid solutions was studied using the scanning rate
dependence of glass transition temperature method and thereby, the fragility parameters
22 4

Chapter 6 Conclusions and future work
of the systems were calculated. Preparation methods also showed great influence on the
fragility of the final products whereas the melt quenched sample was the most fragile
and the ball milled one was the least. According to the fragility parameters, the zero
mobility temperature of the solid solutions could be obtained. The To appeared to be
correlated to the molecular mobility and fragility of the samples. The more fragile the
sample was, the smaller the Tg-To value was. This finding might suggest that when the
glass transition temperatures are the same, the more fragile sample is preferred since it
might have a higher Tq which is positive for the physical stability of the products during
storage. A physical stability test was performed by storing the solid solutions at room
temperature at 75% RH. The ball milled sample showed the fastest crystallisation
whereas the melt quenched one showed the slowest. This result was in good correlation
with the To and molecular mobility data. To appeared to be a better indicator than Tg for
prediction of the physical stability of an amorphous product.
The water sorption and dissolution behaviour of the freshly prepared and aged solid
solutions prepared by melt quenching and ball milling were also investigated. After
aging at 50 °C for 15 days, the water uptake ability of the solid solutions decreased
which was caused by the decrease of molecular mobility and internal energy. In the
dissolution test, the dissolution rate of the aged samples also decreased significantly.
Preparation method appeared to have a significant effect on the dissolution rate: the
initial ball milled sample had a faster dissolution rate than the initial melt quenched one.
The decrease tendency of the dissolution rate of the solid solutions after physical aging
was also depending on the preparation method. The ball milled sample which had the
faster bulk relaxation rate showed a larger decreasing extent than the melt quenched one.
The studies here demonstrated the importance of molecular mobility and preparation
method in relation to the dissolution performance of the solid solutions.
Carriers which are miscible and immiscible with indometacin were prepared into solid
dispersions with the model drug using ball milling and spray drying. The immiscible
carriers used were SMCC, MCC and Neusilin which contain different amount of silica
225
Chapter 6 Conclusions and future work
at the surface. All carriers showed significant improvement of physical stability and
dissolution rate compared to amorphous or crystalline indometacin. Neusilin (c.a. 30%)
which has the highest concentration of silica displayed the fastest rate of conversion to
the amorphous phase. Neusilin also had the best stabilisation effect of amorphous
indometacin which was due to the largest carrier-drug interaction (acid-base interaction
and hydrogen bonding) as confirmed by FTIR. SMCC carriers (2%, 5%, and 10%)
which have slightly higher silica content showed a faster rate of conversion than MCC
(0%), however, they did not show any significant difference in the physical and
dissolution properties compared to MCC. FTIR studies also confirmed that SMCC and
MCC had similar hydrogen bonding tendency to indometacin. Spray drying was used to
prepare solid dispersions of indometacin and Neusilin or MCC. The hypothesis was that
carrier-drug interaction could happen easier through the liquid state than solid state
interactions. However, the spray dried solid dispersions recrystallised within one week
under the same storage condition. For immiscible carriers, ball milling showed an
advantage over spray drying in facilitating solid-solid interactions. It is very important
to choose the right preparation method for a particular type of carrier in order to reach
the maximum stabilisation effect. Furthermore, solid solutions of PVP or HPMCAS
(miscible carriers) with indometacin were prepared by ball milling and spray drying.
Both solid solution systems showed significant improvement of stability and dissolution
performance of indometacin. Preparation method seemed to have an impact on the
dissolution properties of the solid solutions and the extent of impact was carrier
dependent. Ball milling was shown to be very useful and convenient in preparing solid
solutions for both types of carriers. All studies here indicated the importance of
intermolecular interaction in relation to the physical stability of the amorphous solid
dispersions no matter whether the carrier is miscible or immiscible. Therefore,
intermolecular interactions should be one of the main concerns when designing a solid
dispersion formulation. Meanwhile, the formation of a ternary solid dispersion was
found to be a useful strategy for both dissolution and stability improvement. In a ternary
solid dispersion, carriers which have the advantage of rapid dissolution or
intermolecular interaction could be used as a combination and improved dissolution and
2 2 6

Chapter 6 Conclusions and future work
stability are able to be achieved making use of the advantages of the individual carrier.
Future work
According to the finding obtained in this study there are some interesting points which
could be studied further in the future: the decane Vmax method has been found to be very
useful in measuring surface molecular mobility, hence it would be very interesting to
apply it for the study of the surface molecular mobility of amorphous materials at
different relative humidity. It would also be interesting to study the surface molecular
mobility of a solid dispersion with different carrier species. Other surface measuring
techniques such as atomic force microscopy could be used to study the surface of a
sample in correlation with the IGC study. A preliminary study has indicated that the
decane Vmax method is also useful to measure the onset and rate of crystallisation at the
surface. More experiments should be conducted in order to complete this study. The
decane Vmax method could then be applied to study the onset and rate of surface
crystallisation (under different temperatures and relative humidities) in comparison with
the bulk crystallisation studied using isothermal microcalorimetry, XRPD or DSC.
Furthermore, the decane Vmax method focuses on the surface characterisation, however,
the definition of surface is unknown. It would be necessary to investigate how far into
the bulk the IGC method is actually probing. Finally, intermolecular interaction has
been shown to be very important for stability improvement. It would be interesting to
compare the stability of two solid dispersion systems which containing the same carrier
and drug composition with similar Tg but different intermolecular interaction levels.
22 7

(BiôGograpfiy

____________________________________________________________________________Bibliography
Al-Obaidi, H. (2007). "Optimization of drug carrier interactions in spray dried solid dispersions,"
The School of Pharmacy, University of London. Thesis.
Aljaberi, A., Chatterji, A., Shah, N. H. and Sandhu, H. K. (2009). "Functional performance of silicified microcrystalline cellulose versus microcrystalline cellulose: a case study." Drug Dev. Ind. Pharm.: 1-6.
Ambarkhane, A. (2005). "Characterisation of the amorphous solid state using solvent vapour induced
transitions." The School of Pharmacy, University of London. Thesis.
Amidon, G. L., Lennemas, H., Shah, V. P. and Crison, J. R. (1995). "A theoretical basis for a
biopharmaceutic drug classification: the correlation of in vitro drug product dissolution and in vivo
bioavailability." Pharm. Res. 12(3): 413-420.
Andronis, V., Yoshioka, M. and Zografi, G. (1997). "Effects of sorbed water on the crystallization of indomethacin from the amorphous state." J. Pharm. Sci. 86(3): 346-351.
Andronis, V. and Zografi, G. (1997). "Molecular mobility of supercooled amorphous indomethacin,
determined by dynamic mechanical analysis." Pharm. Res. 14(4): 410-414.
Andronis, V. and Zografi, G. (1998). "The molecular mobility of supercooled amorphous
indomethacin as a function of temperature and relative humidity." Pharm. Res. 15(6): 835-842.
Andronis, V. and Zografi, G. (2000). "Crystal nucléation and growth of indomethacin polymorphs
from the amorphous state." J. of Non-Cryst. Solid 271(3): 236-248.
Angell, C. A. (1988). "Structural instability and relaxation in liquid and glassy phases near the
fragile liquid limit." J. of Non-Cryst. Solid 102(1-3): 205-221.
Angell, C. A. (1991). "Relaxation in liquids, polymers and plastic crystals - strong fragile patterns
and problems." J. of Non-Cryst. Solid 131: 13-31.
Angell, C. A. (1995). "Formation of glasses from liquids and biopolymers." Science 267: 1924-1935.
Aso, Y. and Yoshioka, S. (2006). "Molecular mobility of nifedipine-PVP and phenobarbital-PVP
solid dispersions as measured by C-13-NMR spin-lattice relaxation time." J. Pharm. Sci. 95(2): 318-325.
Aso, Y , Yoshioka, S. and Kojima, S. (2000). "Relationship between the crystallization rates of amorphous nifedipine, phénobarbital, and flopropione, and their molecular mobility as measured by
their enthalpy relaxation and H-1 NM R relaxation times." J. Pharm. Sci. 89(3): 408-416.
2 2 9

____________________________________________________________________________Bibliography
Aso, Y., Yoshioka, S. and Kojima, S. (2004). "Molecular mobility-based estimation of the
crystallization rates of amorphous nifedipine and phénobarbital in poly(vinylpyrrolidone) solid
dispersions." J. Pharm. Sci. 93(2): 384-391.
Atkinson, R. M., Bedford, C., Child, K. J. and Tomich, E. G. (1962). "The effect of griseofulvin
particle size on blood levels in man." Antibiot. Chemother. 12: 232-238.
Augsburger, L. L. and Hoag, S. W. (2008). "Pharmaceutical dosage forms: tablets." New York;
London, Informa Healthcare.
Bachrach, W. H. (1959). "Reserpine, gastric secretion, and peptic ulcer." Am. J. Dig. Dis. 4(2):
117-124.
Bajdik, J., Pintye-Hodi, K., Planinsek, O., Tuske, Z., Tasic, L., Regdon, G, Srcic, S. and Eros, I. (2004). "Surface treatment of indomethacin agglomerates with Eudragit." Drug Dev. Ind. Pharm.30
(4): 381-388.
Bauer, G, Rieckmann, P. and Schaumann, W. (1962). "Effect of particle sizes and detergents on the
absorption of spironolactone from the gastrointestinal tract." Arzneimittelforschung 12: 487-489.
Benet, L. Z., Greither, A. and Meister, W. (1976). "Gastrointestinal absorption of drugs in patients
with cardiac failure." in "The effect of disease states on pharmacokinetics of drugs." Washington, D C., American Pharmaceutical Association.
Bhugra, C. and Pikal, M. J. (2008). "Role of thermodynamic, molecular, and kinetic factors in
crystallization from the amorphous state." J. Pharm. Sci. 97(4): 1329-1349.
Bhugra, C., Rambhatla, S., Bakri, A., Duddu, S. P., Miller, D. P., Pikal, M. J. and
Lechuga-Ballesteros, D. (2007). "Prediction of the onset of crystallization of amorphous sucrose
below the calorimetric glass transition temperature from correlations with mobility." J. Pharm. Sci. 96(5): 1258-1269.
Bhugra, C., Shmeis, R., Krill, S. L. and Pikal, M. J. (2006). "Predictions of onset of crystallization
from experimental relaxation times I-correlation of molecular mobility from temperatures above the
glass transition to temperatures below the glass transition." Pharm. Res. 23(10): 2277-2290.
Bhugra, C., Shmeis, R., Krill, S. L. and Pikal, M. J. (2008a). "Different measures of molecular
mobility: Comparison between calorimetric and thermally stimulated current relaxation times below
Tg and correlation with dielectric relaxation times above Tg." J. Pharm. Sci. 97(10): 4498-4515.
Bhugra, C., Shmeis, R., Krill, S. L. and Pikal, M. J. (2008b). "Prediction of onset of crystallization
from experimental relaxation times. II. Comparison between predicted and experimental onset times." J. Pharm. Sci. 97(1): 455-472.
23 0

____________________________________________________________________________Bibliography
Bohmer, R., Ngai, K. L., Angell, C. A. and Plazek, D. J. (1993). "Nonexponential relaxations in
strong and fragile glass formers." J. Chem. Phys. 99(5): 4201-4209.
Boldyrev, V. V., Shakhtshneider, T. P., Burleva, L. P. and Severtsev, V. A. (1994). "Preparation of the
Disperse Systems of Sulfathiazole-Polyvinylpyrrolidone by Mechanical Activation." Drug Dev. Ind. Pharm. 20(6): 1103-1114.
Bolhuis, G. K. and Chowhan, Z. T. (1996). "Materials for direct compaction." In "Pharmaceutical
powder compaction technology." New York, Marcel Dekker.
Breitenbach, J. and Lewis, J. (2003). "Two concepts, one technology: controlled release and solid
dispersion with meltrex." In "Modified-Release Drug Delivery Technology." New York; London, Informa Healthcare.
Broman, E., Khoo, C. and Taylor, L. S. (2001). "A comparison of alternative polymer excipients and
processing methods for making solid dispersions of a poorly water soluble drug." Int. J. Pharm. 222(1): 139-151.
Bruning, R. and Samwer, K. (1992). "Glass transition on long time scales." Phys. Rev. B 46(18): 11318-11322.
Buckton, G. (1995). "Interfacial phenomena in drug delivery and targeting." Chur, Switzerland, Harwood Academic Publishers.
Buckton, G , Adeniyi, A. A., Saunders, M. and Ambarkhane, A. (2006). "HyperDSC studies of amorphous polyvinylpyrrolidone in a model wet granulation system." Int. J. Pharm. 312(1-2): 61-65.
Buckton, G , Ambarkhane, A. and Pincott, K. (2004). "The use of inverse phase gas chromatography
to study the glass transition temperature of a powder surface." Pharm. Res. 21(9): 1554-1557.
Buckton, G. and Darcy, P. (1999). "Assessment of disorder in crystalline powders - a review of analytical techniques and their application." Int. J. Pharm. 179(2): 141-158.
Buckton, G. and Gill, H. (2007). "The importance of surface energetics of powders for drug delivery
and the establishment of inverse gas chromatography." Adv. Drug Del. Rev. 59(14): 1474-1479.
Buckton, G , Yonemochi, E., Yoon, W. L. and Moffat, A. C. (1999). "Water sorption and near IR
spectroscopy to study the differences between microcrystalline cellulose and silicified
microcrystalline cellulose before and after wet granulation." Int. J. Pharm. 181(1): 41-47.
Bym, S. R., Pfeiffer, R. R. and Stowell, J. G. (1999). "Solid-state chemistry of drugs." New York, Academic Press.
231
Bibliography
Carroll, P. J. and Patterson, G. D. (1985). "The distribution of relaxation frequencies from
photon-correlation spectroscopy near the glass-transition." J. Chem. Phys. 82(1): 9-13.
Chadwick, K., Davey, R. and Cross, W. (2007). "How does grinding produce co-crystals? Insights
from the case of benzophenone and diphenylamine." Cryst. Eng. Comm. 9(9): 732-734.
Chidavaenzi, O. C., Buckton, G, Koosha, F. and Pathak, R. (1997). "The use of thermal techniques
to assess the impact of feed concentration on the amorphous content and polymorphic forms present
in spray dried lactose." Int. J. Pharm. 159(1): 67-74.
Chiou, W. L. and Riegelman, S. (1969). "Preparation and dissolution characteristics of several fast-release solid dispersions of griseofulvin." J. Pharm. Sci. 58(12): 1505-1510.
Chiou, W. L. and Riegelman, S. (1971). "Pharmaceutical applications of solid dispersion systems." J. Pharm. Sci. 60(9): 1281-1302.
Chokshi, R. J., Sandhu, H. K., Iyer, R. M., Shah, N. H., Malick, A. W. and Zia, H. (2005). "Characterization of physico-mechanical properties of indomethacin and polymers to assess their
suitability for hot-melt extrusion processs as a means to manufacture solid dispersion/solution." J. Pharm. Sci. 94(11): 2463-2474.
Chuang, 1. S. and Maciel, G. E. (1996). "Probing hydrogen bonding and the local environment of silanols on silica surfaces via nuclear spin cross polarization dynamics." J. Amer. Chem. Soc. 118(2):
401-406.
Chuang, 1. S. and Maciel, G. E. (1997). "A detailed model of local structure and silanol hydrogen
banding of silica gel surfaces." J. Phys. Chem. B 101(16): 3052-3064.
Clas, S. D., Dalton, C. R. and Hancock, B. C. (1999). "Differential scanning calorimetry: applications in drug development." Pharm. Sci. Tech. Today 2(8): 311-320.
Coleman, N. J. and Craig, D. Q. M. (1996). "Modulated temperature differential scanning
calorimetry: A novel approach to pharmaceutical thermal analysis." Int. J. Pharm. 135(1-2): 13-29.
Cowie, J. M. G , Harris, S. and McEwen, 1. J. (1998). "Physical aging in poly(vinyl acetate). 2.
Relative rates of volume and enthalpy relaxation." Macromolecules. 31(8): 2611-2615.
Craig, D. Q., Royall, P. G, Kett, V. L. and Hopton, M. L. (1999). "The relevance of the amorphous
state to pharmaceutical dosage forms: glassy drugs and freeze dried systems." Int. J. Pharm. 179(2): 179-207.
Craig, D. Q. M., Barsnes, M., Royall, P. G. and Kett, V. L. (2000). "An evaluation of the use of modulated temperature DSC as a means of assessing the relaxation behaviour of amorphous
23 2

Bibliography
lactose." Pharm. Res. 17(6): 696-700.
Craig, D. Q. M., Kett, V. L., Andrews, C. S. and Royall, P. G. (2002). "Pharmaceutical applications
of micro-thermal analysis." J. Pharm. Sci. 91(5): 1201-1213.
Crichton, S. N. and Moynihan, C. T. (1988). "Dependence of the glass-transition temperature on
heating rate." J. Non-Cryst. Solid 99(2-3): 413-417.
Crowley, K. J. and Zografi, G. (2001). "The use of thermal methods for predicting glass-former
fragility." Thermochim. Acta 380(2): 79-93.
Crowley, K. J. and Zografi, G. (2002). "Cryogenic grinding of indomethacin polymorphs and
solvates: Assessment of amorphous phase formation and amorphous phase physical stability." J.
Pharm. Sci. 91(2): 492-507.
Crowley, K. J. and Zografi, G. (2003). "The effect of low concentrations of molecularly dispersed
poly(vinylpyrrolidone) on indomethacin crystallization from the amorphous state." Pharm. Res. 20(9): 1417-1422.
Curatolo, W. (1998). "Physical chemical properties of oral drug candidates in the discovery and
exploratory development settings." Pharm. Sci. Tech. Today 1(9): 387-393.
Dannenfelser, R. M., He, H., Joshi, Y., Bateman, S. and Serajuddin, A. T. M. (2004). "Development of clinical dosage forms for a poorly water soluble drug I: Application of polyethylene
glycol-polysorbate 80 solid dispersion carrier system." J. Pharm. Sci. 93(5): 1165-1175.
Davenport, H. W. (1971). "Physiology of the Digestive Tract." Chicago, Year Book Medical Publishers Ltd.
Debenedetti, P. G. (1996). "Metastable liquids: concepts and principles." Princeton, N.J.; Chichester, Princeton University Press.
Debenedetti, P. G. and Stillinger, F. H. (2001). "Supercooled liquids and the glass transition." Nature
410(6825): 259-267.
DeMaggio, G. B., Frieze, W. E., Gidley, D. W., Zhu, M., Hristov, H. A. and Yee, A. F. (1997).
"Interface and surface effects on the glass transition in thin polystyrene films." Phys. Rev. Lett. 78(8): 1524-1527.
Dove, J. W., Buckton, G. and Doherty, C. (1996). "A comparison of two contact angle measurement methods and inverse gas chromatography to assess the surface energies of theophylline and
caffeine." Int. J. Pharm. 138(2): 199-206.
233

Bibliography
Dwan'Isa, J. L., Dinguizli, M., Preat, V., Arien, A. and Brewster, M. (2005). "Qualitative prediction
of solubilization of highly hydrophobic drugs in block copolymer micelles." J. Contr. Rel. 101(1-3): 366-368.
Fakhraai, Z. and Forrest, J. A. (2008). "Measuring the surface dynamics of glassy polymers."
Science 319(5863): 600-604.
Fedors, R. F. (1974). "Method for estimating both solubility parameters and molar volumes of
liquids." Poly. Eng. Sci. 14(2): 147-154.
Ford, J. L. (1986). "The current status of solid dispersions." Pharm. A. Hel. 61(3): 69-88.
Forster, A., Hempenstall, J. and Rades, T. (2001). "Characterization of glass solutions of poorly
water-soluble drugs produced by melt extrusion with hydrophilic amorphous polymers." J. Pharm. Pharmaco. 53(3): 303-315.
Fowkes, F. M. (1964). "Attractive forces at interfaces." Ind. Eng. Chem. 56(12): 40-52.
Friedrich, H., Nada, A. and Bodmeier, R. (2005). "Solid state and dissolution rate characterization of co-ground mixtures of nifedipine and hydrophilic carriers." Drug Dev. Ind. Pharm. 31(8): 719-728.
Fujii, M., Okada, H., Shibata, Y., Teramachi, H., Kondoh, M. and Watanabe, Y. (2005). "Preparation, characterization, and tableting of a solid dispersion of indomethacin with crospovidone." Int. J. Pharm. 293(1-2): 145-153.
Fukui, E., Miyamura, N. and Kobayashi, M. (2001). "Effect of magnesium stearate or calcium
stearate as additives on dissolution profiles of diltiazem hydrochloride from press-coated tablets with
hydroxypropylmethylcellulose acetate succinate in the outer shell." Int. J. Pharm. 216(1-2): 137-146.
Gaisford, S. and Buckton, G. (2001). "Potential applications of microcalorimetry for the study of physical processes in pharmaceuticals." Thermochim. Acta 380(2): 185-198.
Ghebremeskel, A. N., Vemavarapu, C. and Lodaya, M. (2007). "Use of surfactants as plasticizers in
preparing solid dispersions of poorly soluble API: Selection of polymer-surfactant combinations
using solubility parameters and testing the processability." Int. J. Pharm. 328(2): 119-129.
Godbee, J., Scott, E., Pattamunuch, P., Chen, S. and Mathiowitz, E. (2004). "Role of
solvent/non-solvent ratio on microsphere formation using the solvent removal method." J.
Microencapsul. 21(2): 151-160.
Gong, K., Viboonkiat, R., Rehman, I. U., Buckton, G. and Darr, J. A. (2005). "Formation and
characterization of porous indomethacin-PVP coprecipitates prepared using solvent-free supercritical
fluid processing." J. Pharm. Sci. 94(12): 2583-2590.
2 34
____________________________________________________________________________Bibliography
Gordon, M. and Taylor, J. S. (1952). "Ideal copolymers and the second-order transitions of synthetic
rubbers, 1: non-crystalline copolymers." J. Appl. Chem. 2; 493-498.
Greenhalgh, D. J., Williams, A. C., Timmins, P. and York, P. (1999). "Solubility parameters as
predictors of miscibility in solid dispersions." J. Pharm. Sci. 88(11): 1182-1190.
Grimsey, I. M ., Feeley, J. C. and York, P. (2002). "Analysis of the surface energy of pharmaceutical powders by inverse gas chromatography." J. Pharm. Sci. 91(2): 571-583.
Guo, Y , Bym, S. R. and Zografi, G. (2000). "Physical characteristics and chemical degradation of amorphous quinapril hydrochloride." J. Pharm. Sci. 89(1): 128-143.
Gupta, M. K., Tseng, Y. C., Goldman, D. and Bogner, R. H. (2002). "Hydrogen bonding with
adsorbent during storage governs drug dissolution from solid-dispersion granules." Pharm. Res. 19(11): 1663-1672.
Gupta, M. K., Vanwert, A. and Bogner, R. H. (2003). "Formation of physically stable amorphous
drugs by milling with neusilin." J. Pharm. Sci. 92(3): 536-551.
Gutmann, V. (1978). "The donor-acceptor approach to molecular interactions." New York; London, Plenum Press.
Hammerschmidt, J. A., Gladfelter, W. L. and Haugstad, G. (1999). "Probing polymer viscoelastic
relaxations with temperature-controlled friction force microscopy." Macromolecules 32(10): 3360-3367.
Hancock, B. C., Dalton, C. R., Pikal, M. J. and Shamblin, S. L. (1998). "A pragmatic test of a simple
calorimetric method for determining the fragility of some amorphous pharmaceutical materials."
Pharm. Res. 15(5): 762-767.
Hancock, B. C. and Parks, M. (2000). "What is the true solubility advantage for amorphous
pharmaceuticals?" Pharm. Res. 17(4): 397-404.
Hancock, B. C., Shamblin, S. L. and Zografi, G. (1995). "Molecular mobility of amorphous
pharmaceutical solids below their glass-transition temperatures." Pharm. Res. 12(6): 799-806.
Hancock, B. C. and Zografi, G. (1997). "Characteristics and significance of the amorphous state in
pharmaceutical systems." J. Pharm. Sci. 86(1): 1-12.
Hasegawa, S., Hamaura, T., Furuyama, N., Kusai, A., Yonemochi, E. and Terada, K. (2005). "Effects
of water content in physical mixture and heating temperature on crystallinity of troglitazone-PVP
K30 solid dispersions prepared by closed melting method." Int. J. Pharm. 302(1-2): 103-112.
235

Bibliography
Hatley, R. H. (1997). "Glass fragility and the stability of pharmaceutical preparations—excipient selection," Pharm, Dev, Technol, 2(3): 257-264,
Hatley, R, H, and Colaco, C, A, (1997), "Stabilisation of biological molecules, cells and organisms.
Protein Labelling: Bioconjugation techniques for the biomedical sciences," London, Macmillan
Press,
Hilden, L, R, and Morris, K, R, (2004). "Physics of amorphous solids," J, Pharm, Sci, 93(1): 3-12,
Hogan, S, E, and Buckton, G, (2001), "Water sorption/desorption - near IR and calorimetric study of crystalline and amorphous rafFinose," Int. J, Pharm, 227(1-2): 57-69,
Huang, J, J,, Wigent, R, J,, Bentzley, C, M, and Schwartz, J, B, (2006), "Nifedipine solid dispersion
in microparticles of ammonio methacrylate copolymer and ethylcellulose binary blend for controlled
drug delivery - Effect of drug loading on release kinetics," Int. J, of Pharm, 319(1-2): 44-54,
Hutchinson, J, M, (1995), "Physical aging of polymers," Prog, Poly, Sci, 20(4): 703-760,
Huu-Phuoc, N,, Nam-Tran, H,, Buchmann, M, and Kesselring, U, W, (1987), "Experimentally
optimized determination of the partial and total cohesion parameters of an insoluble polymer (microcrystalline cellulose) by gas-solid chromatography," Int. J, Pharm, 34(3): 217-223,
Imaizumi, H,, Nambu, N, and Nagai, T, (1980), "Stability and several physical properties of amorphous and crystalline form of indomethacin," Chem. Pharm, Bull, 28(9): 2565-2569,
Jiang, J, Z,, Larsen, R, K,, Lin, R,, Morup, S., Chorkendorff, I,, Nielsen, K,, Hansen, K, and West, K. (1998), "Mechanochemical synthesis of Fe-S materials," J, Sol, State Chem, 138(1): 114-125,
Kajiyama, T,, Tanaka, K, and Takahara, A, (1997), "Surface molecular motion of the monodisperse
polystyrene films," Macromolecules 30(2): 280-285,
Kanig, J, L, (1964), "Properties of fused mannitol in compressed tablets," J, Pharm, Sci, 53: 188-192,
Kararli, T, T,, Needham, T, E,, Seul, C, J, and Finnegan, P, M, (1989), "Solid-state interaction of magnesium-oxide and ibuprofen to form a salt," Pharm, Res, 6(9): 804-808,
Karavas, E,, Ktistis, G , Xenakis, A, and Georgarakis, E, (2006), "Effect of hydrogen bonding
interactions on the release mechanism of felodipine from nanodispersions with
polyvinylpyrrolidone," Eur, J, Pharm, Biopharm, 63(2): 103-114,
Karki, S., Friscic, T,, Jones, W, and Motherwell, W, D, S, (2007), "Screening for pharmaceutical
23 6

____________________________________________________________________________Bibliography
cocrystal hydrates via neat and liquid-assisted grinding." Mol. Pharm. 4(3): 347-354.
Kaushal, A. M ., Gupta, P. and Bansal, A. K. (2004). "Amorphous drug delivery systems: molecular
aspects, design, and performance." Crit. Rev. Ther. Drug Carrier Syst. 21(3): 133-193.
Kawakami, K. and Pikal, M. J. (2005). "Calorimetric investigation of the structural relaxation of
amorphous materials: Evaluating validity of the methodologies." J. Pharm. Sci. 94(5): 948-965.
Kerc, J. and Srcic, S. (1995). "Thermal-analysis of glassy pharmaceuticals." Thermochim. Acta 248:
81-95.
Kerle, T., Lin, Z. Q., Kim, H. C. and Russell, T. P. (2001). "Mobility of polymers at the air/polymer
interface." Macromolecules 34(10): 3484-3492.
Kerr, W. L., Lim, M. H., Reid, D. S. and Chen, H. (1993). "Chemical reaction kinetics in relation to
glass temperatures in frozen food polymer solutions." J. Sci. Food Agric. 61: 51-56.
Khalaf, A. S., Tobyn, M. J. and Staniforth, J. N. (1997). "Measurement of the flow properties of
silicified microcrystalline cellulose." AAPS conference, Seattle, WA.
Khalid, A. (2006). "Characterisation of spray-dried trehalose/alkaline phosphatase formulations."
The School of Pharmacy, University of London. Thesis.
Khougaz, K. and Clas, S. D. (2000). "Crystallization inhibition in solid dispersions of MK-0591 and
poly(vinylpyrrolidone) polymers." J. Pharm. Sci. 89(10): 1325-1334.
Kiselev, A. V. and Yashin, Y. J. (1969). "Gas-adsorption chromatography." New York; London, Plenum Press.
Konno, H. and Taylor, L. S. (2006). "Influence of different polymers on the crystallization tendency
of molecularly dispersed amorphous felodipine." J. Pharm. Sci. 95(12): 2692-2705.
Ksiazek, K., Wacke, S., Gorecki, T. and Gorecki, C. (2007). "Effect of the milling conditions on the
degree of amorphization of selenium by milling in a planetary ball mill - art. no. 012037." X III International Seminar on Physics and Chemistry of Solids 79: 12037-12037
12250.
Leonardi, D., Barrera, M. G, Lamas, M. C. and Salomon, C. J. (2007). "Development of prednisone: polyethylene glycol 6000 fast-release yablets from solid dispersions: solid-state characterization,
dissolution behavior, and formulation parameters." AAPS PharmSciTech 8(4) E1-E8.
Leuner, C. and Dressman, J. (2000). "Improving drug solubility for oral delivery using solid
23 7

Bibliography
dispersions." Eur. J. Pharm. Biopharm. 50(1): 47-60.
Levy, G , Antkowiak, J. M., Procknal, J. A. and White, D. C. (1963). "Effect of certain tablet
formulation factors on dissolution rate of the active ingredient. II. granule size, starch concentration, and compression pressure." J. Pharm. Sci. 52: 1047-1051.
Lin, I. J. and Nadiv, S. (1979). "Review of the phase-transformation and synthesis of inorganic solids
obtained by mechanical treatment (mechanochemical reactions)." Mat. Sci. Eng. 39(2): 193-209.
Lin, J. C. and Gentry, J. W. (2003). "Spray drying drop morphology: Experimental study." Aerosol Sci.Techn. 37(1): 15-32.
Lin, S. L., Menig, J. and Lachman, L. (1968). "Interdependence of physiological surfactant and drug
particle size on the dissolution behavior of water insoluble drugs." J. Pharm. Sci. 57(12): 2143-2148.
Liu, J. S., Rigsbee, D. R., Stotz, C. and Pikal, M. J. (2002). "Dynamics of pharmaceutical amorphous
solids: The study of enthalpy relaxation by isothermal microcalorimetry." J. Pharm. Sci. 91(8): 1853-1862.
Liu, Y., Russell, T. P., Samant, M. G, Stohr, J., Brown, H. R., Cossy-Favre, A. and Diaz, J. (1997). "Surface relaxations in polymers." Macromolecules 30(25): 7768-7771.
Loftsson, T. and Brewster, M. E. (1996). "Pharmaceutical applications of cyclodextrins. 1. Drug
solubilization and stabilization." J. Pharm. Sci. 85(10): 1017-1025.
Majerik, V., Charbit, G , Badens, E., Horvath, G, Szokonya, L., Bose, N. and Teillaud, E. (2007). "Bioavailability enhancement of an active substance by supercritical antisolvent precipitation." J. Supercr. Fluids 40(1): 101-110.
Marshall, W. R. and Seltzer, E. (1950). "Principles of spray drying. Part I. Fundamentals of spray-dryer operation." Chem. Eng. Prog. 46: 501-508.
Masters, K. (1972). "Spray drying: an introduction to principles, operational practice and
applications." London, L. Hill.
Matsumoto, T. and Zografi, G. (1999). "Physical properties of solid molecular dispersions of indomethacin with poly(vinylpyrrolidone) and poly(vinylpyrrolidone-co-vinylacetate) in relation to
indomethacin crystallization." Pharm. Res. 16(11): 1722-1728.
Maury, M., Murphy, K., Kumar, S., Shi, L. and Lee, G. (2005). "Effects of process variables on the
powder yield of spray-dried trehalose on a laboratory spray-dryer." Eur. J. Pharm. Biopharm. 59(3): 565-573.
238

___________________________________________________________________________ Bibliography
Mayersohn, M. and Gibaldi, M. (1966). "New method of solid-state dispersion for increasing
dissolution rates." J. Pharm. Sci. 55(11): 1323-1324.
Mccormick, P. G. (1995). "Application of mechanical alloying to chemical refining." Mat. Trans.
JIM 36(2): 161-169.
McGregor, C., Saunders, M. H., Buckton, G. and Saklatvala, R. D. (2004). "The use of high-speed
differential scanning calorimetry (hyper-DSC™) to study the thermal properties of carbamazepine
polymorphs." Thermochim. Acta 417(2): 231-237.
Merisko-Liversidge, E. (2002). "Nanocrystals: resolving pharmaceutical formulation issues
associated with poorly water-soluble compounds." Particles. Orlando/Florida, Marcel Dekker: 49.
Mio, H., Kano, J., Saito, F. and Kaneko, K. (2002). "Effects of rotational direction and
rotation-to-revolution speed ratio in planetary ball milling." Materials Science and Engineering
a-Structural Materials Properties Microstructure and Processing 332(1-2): 75-80.
Moynihan, C. T., Easteal, A. J., Debolt, M. A. and Tucker, J. (1976). "Dependence of fictive
temperature of glass on cooling rate." J. Amer. Cer. Soc. 59(1-2): 12-16.
Moynihan, C. T., Easteal, A. J., Wilder, J. and Tucker, J. (1974). "Dependence of glass-transition
temperature on heating and cooling rate." J. Phys. Chem. 78(26): 2673-2677.
Muzikova, J. and Novakova, P. (2007). "A study of the properties of compacts from silicified micro
crystalline celluloses." Drug Dev. Ind. Pharm. 33(7): 775-781.
Nakamichi, K., Nakano, T , Yasuura, H., Izumi, S. and Kawashima, Y. (2002). "The role of the
kneading paddle and the effects of screw revolution speed and water content on the preparation of solid dispersions using a twin-screw extruder." Int. J. Pharm. 241(2): 203-211.
Nardin, M. and Papirer, E. (1990). "Relationship between vapor-pressure and surface-energy of
liquids - application to inverse gas-chromatography." J. Colloid and Interface Sci. 137(2): 534-545.
Newell, H. E. and Buckton, G. (2004). "Inverse gas chromatography: Investigating whether the
technique preferentially probes high energy sites for mixtures of crystalline and amorphous lactose."
Pharm. Res. 21(8): 1440-1444.
Newell, H. E., Buckton, G, Butler, D. A., Thielmann, F. and Williams, D. R. (2001a). "The use of
inverse phase gas chromatography to measure the surface energy of crystalline, amorphous, and
recently milled lactose." Pharm. Res. 18(5): 662-666.
Newell, H. E., Buckton, G, Butler, D. A., Thielmann, F. and Williams, D. R. (2001b). "The use of inverse phase gas chromatography to study the change of surface energy of amorphous lactose as a
23 9

____________________________________________________________________________ Bibliography
function of relative humidity and the processes of collapse and crystallisation." Int. J. Pharm. 217(1-2): 45-56.
Oguchi, T., Matsumoto, K., Yonemochi, E., Nakai, Y. and Yamamoto, K. (1995). "Dissolution
studies in organic-solvents for evaluating hydrogen-bond matrix of cellulose in the ground mixture."
Int. J. Pharm. 113(1): 97-102.
Ohta, M. and Buckton, G. (2004). "The use of inverse gas chromatography to assess the acid-base
contributions to surface energies of cefditoren pivoxil and methacrylate copolymers and possible
links to instability." Int. J. Pharm. 272(1-2): 121-128.
Otsuka, M., Matsumoto, T. and Kaneniwa, N. (1986). "Effect of environmental temperature on
polymorphic solid-state transformation of indomethacin during grinding." Chem. Pharm. Bull. 34(4): 1784-1793.
Patterson, J. E., James, M. B., Forster, A. H., Lancaster, R. W., Butler, J. M. and Rades, T. (2007). "Preparation of glass solutions of three poorly water soluble drugs by spray drying, melt extrusion
and ball milling." Int. J. Pharm. 336(1): 22-34.
Pentikaninen, P. J., Wan, S. H. and Azarnoff, D. L. (1974). "Bioavailability of aminosalicylic acid
and its various salts in humans IV: Comparison of four brands of the sodium salt." J. Pharm. Sci. 63(9): 1431-1434.
Petrie, S. E. B, (1972). "Thermal behavior of annealed organic glasses." J. Poly. Sci. Part A-2 10(7): 1255.
Pikal, M . J., Dellerman, K. M., Roy, M. L. and Riggin, R. M. (1991). "The effects of formulation
variables on the stability of freeze-dried human growth hormone." Pharm. Res. 8: 427-436.
Pikal, M. J., Rigsbee, D. R. and Roy, M. L. (1995). "The relationship between glass transition
temperature and stability of freeze-dried human growth hormone." Symposia Abstract for the 10th
AAPS Annual Meeting. Miami Beach, Florida: 5-9.
Planinsek, O., Trojak, A. and Srcic, S. (2001). "The dispersive component of the surface free energy
of powders assessed using inverse gas chromatography and contact angle measurements." Int. J.
Pharm. 221(1-2): 211-217.
Ramos, R. (2006). "Investigation of the amorphous properties of lactose and indomethacin." The
School of Pharmacy, University of London. Thesis.
Riddle, F. L. and Fowkes, F. M. (1990). "Spectral shifts in acid-base chemistry 1. van der Waals
contributions to acceptor numbers." J. Amer. Chem. Soc. 112(9): 3259-3264.
24 0

Bibliography
Rose, H. E. (1957). "A treatise on the internal mechanics of ball, tube and rod mills." London, Constable.
Roubani-Kalantzopoulou, F. (2004). "Determination of isotherms by gas-solid chromatography
Applications." J. Chromât. A 1037(1-2): 191-221.
Rowe, R. C. (1988a). "Adhesion of film coatings to tablet surfaces - a theoretical approach based on
solubility parameters." Int. J. Pharm. 41(3): 219-222.
Rowe, R. C. (1988b). "Interactions in the ternary powder system microcrystalline cellulose,
magnesium stearate and colloidal silica - a solubility parameter approach." Int. J. Pharm. 45(3):
259-261.
Rowe, R. C. (1989). "Surface free energy and polarity effects in the granulation of a model system."
Int. J. Pharm. 53(1): 75-78.
Royall, P. G., Craig, D. Q. M. and Doherty, C. (1998). "Characterisation of the glass transition of an
amorphous drug using modulated DSC." Pharm. Res. 15(7): 1117-1121.
Salekigerhardt, A., Ahlneck, C. and Zografi, G. (1994). "Assessment of disorder in crystalline
solids." Int. J. Pharm. 101(3): 237-247.
Salekigerhardt, A. and Zografi, G. (1994). "Nonisothermal and isothermal crystallization of sucrose
from the amorphous state." Pharm. Res. 11(8): 1166-1173.
Saunders, M., Podluii, K., Shergill, S., Buckton, G. and Royall, P. (2004). "The potential of high
speed DSC (Hyper-DSC) for the detection and quantification of small amounts of amorphous
content in predominantly crystalline samples." Int. J. Pharm. 274(1-2): 35-40.
Schultz, J., Lavielle, L. and Martin, C. (1987). "The role of the interface in carbon fibre-epoxy
composites." J. Adh. 23(1): 45 - 60.
Sekiguchi, K. and Obi, N. (1961). "Studies on absorption of eutectic mixture. In: A behaviour
eutectic mixture of sulfathiazole and that of ordinary sulfathiazole in man." Chem. Pharm. Bull. 9:
866-872.
Sekiguchi, K., Obi, N. and Ueda, Y. (1964). "Studies on absorption of eutectic mixture. II. absorption
of fused conglomerates of chloramphenicol and urea in rabbits." Chem. Pharm. Bull. 12: 134-144.
Sekikawa, H., Nakano, M. and Arita, T. (1978). "Inhibitory effect of polyvinylpyrrolidone on
crystallization of drugs." Chem. Pharm. Bull. 26(1): 118-126.
241

____________________________________________________________________________Bibliography
Sekizaki, H., Danjo, K,, Eguchi, H., Yonezawa, Y , Sunada, H. and Otsuka, A. (1995). "Solid-state
interaction of ibuprofen with polyvinylpyrrolidone." Chem. Pharm. Bull. 43(6): 988-993.
Serajuddin, A. T. (1999). "Solid dispersion of poorly water-soluble drugs: early promises, subsequent
problems, and recent breakthroughs." J. Pharm. Sci. 88(10): 1058-1066.
Shamblin, S. L., Hancock, B. C., Dupuis, Y. and Pikal, M. J. (2000). "Interpretation of relaxation
time constants for amorphous pharmaceutical systems." J. Pharm. Sci. 89(3): 417-427.
Shamblin, S. L., Tang, X, L., Chang, L. Q., Hancock, B. C. and Pikal, M. J. (1999). "Characterization of the time scales of molecular motion in pharmaceutically important glasses." J.
Phys. Chem. B 103(20): 4113-4121.
Shangraw, R. F. and Demarest, D. A. (1993). "A survey of current industrial practices in the
formulation and manufacture of tablets and capsules." Pharm. Technol. 17: 32-44.
Sherwood, B. E., Hunter, E. A. and Staniforth, J. N. (1996). "Silicified microcrystalline cellulose
(SMCC): a new class of high functionality binders for direct compression tableting." AAPS
conference. New York.
Shmeis, R. A., Wang, Z. R. and Krill, S. L. (2004). "A mechanistic investigation of an amorphous
pharmaceutical and its solid dispersions, part I: A comparative analysis by thermally stimulated
depolarization current and differential scanning calorimetry." Pharm. Res. 21(11): 2025-2030.
Simha, R. and Boyer, R. F. (1962). "On a general relation involving the glass temperature and
coefficients of expansion of polymers." J. Chem. Phys. 37: 1003-1007.
Six, K., Verreck, G , Peeters, J., Augustijns, P., Kinget, R. and Van den Mooter, G. (2001). "Characterization of glassy itraconazole: a comparative study of its molecular mobility below T-g
with that of structural analogues using MTDSC." Int. J. Pharm. 213(1-2): 163-173.
Slade, L. and Levine, H. (1991). "A food polymer science approach to structure-property
relationships in aqueous food systems - nonequilibrium behavior of carbohydrate-water systems."
New York, Plenum Press.
Stickel, F., Fischer, E. W. and Richert, R. (1995). "Dynamics of glass-forming liquids 1.
temperature-derivative analysis of dielectric-relaxation data." J. Chem. Phys. 102(15): 6251-6257.
Surana, R., Pyne, A. and Suryanarayanan, R. (2004). "Effect of preparation method on physical properties of amorphous trehalose." Pharm. Res. 21(7): 1167-1176,
Surana, R., Randall, L., Pyne, A., Vemuri, N. M. and Suryanarayanan, R. (2003). "Determination of
glass transition temperature and in situ study of the plasticizing effect of water by inverse gas
24 2

____________________________________________________________________________Bibliography
chromatography." Pharm. Res. 20(10): 1647-1654.
Tanaka, K., Taura, A., Ge, S. R., Takahara, A. and Kajiyama, T. (1996). "Molecular weight dependence of surface dynamic viscoelastic properties for the monodisperse polystyrene film."
Macromolecules 29(8): 3040-3042.
Tanno, F., Nishiyama, Y., Kokubo, H. and Ohara, S. (2004). "Evaluation of hypromellose acetate
succinate (HPMCAS) as a carrier in solid dispersions." Drug Dev. Ind. Pharm. 30(1): 9-17.
Tarelli, E., Corran, P. H., Bingham, B. R., Mollison, H. and Wait, R. (1994). "Lysine vasopressin
undergoes rapid glycation in the presence of reducing sugars." J. Pharm. Biomed. Analysis 12(11):
1355-1361.
Taylor, L. S. and Zografi, G. (1997). "Spectroscopic characterization of interactions between PVP
and indomethacin in amorphous molecular dispersions." Pharm. Res. 14(12): 1691-1698.
Taylor, L. S. and Zografi, G. (1998). "Sugar-polymer hydrogen bond interactions in lyophilized
amorphous mixtures." J. Pharm. Sci. 87(12): 1615-1621.
te Booy, M., de Ruiter, R. and de Meere, A. (1992). "Evaluation of the physical stability of freeze-dried sucrose-containing formulations by differential scanning calorimetry." Pharm. Res. 9: 109-114.
Telang, C., Mujumdar, S. and Mathew, M. (2009a). "Improved physical stability of amorphous state
through acid base interactions." J. Pharm. Sci. 98(6): 2149-2159.
Telang, C., Mujumdar, S. and Mathew, M. (2009b). "Improved physical stability of amorphous state
through acid base interactions." J. Pharm. Sci. 98(6): 2149-2159.
Thielmann, F. (2004). "Introduction into the characterisation of porous materials by inverse gas
chromatography." J. Chromât. A 1037(1-2): 115-123.
Ticehurst, M. D., Rowe, R. C. and York, P. (1994). "Determination of the surface properties of two
batches of salbutamol sulphate by inverse gas chromatography." Int. J. Pharm. 111(3): 241-249.
Ticehurst, M. D., York, P., Rowe, R. C. and Dwivedi, S. K. (1996). "Characterisation of the surface
properties of alpha-lactose monohydrate with inverse gas chromatography, used to detect batch
variation." Int. J. Pharm. 141(1-2): 93-99.
Tobyn, M. J., McCarthy, G. P., Staniforth, J. N. and Edge, S. (1998). "Physicochemical comparison
between microcrystalline cellulose and silicified microcrystalline cellulose." Int. J. Pharm. 169(2):
183-194.
243
Bibliography
Tong, H., Shekunov, B., York, P. and Chow, A. (2006). "Predicting the aerosol performance of dry
powder inhalation formulations by interparticulate interaction analysis using inverse gas
chromatography." J. Pharm. Sci. 95(1): 228-233.
Tong, P. and Zografi, G. (1999). "Solid-state characteristics of amorphous sodium indomethacin
relative to its free acid." Pharm. Res. 16(8): 1186-1192.
Tsukushi, I., Yamamuro, O. and Suga, H. (1994). "Heat-capacities and glass transitions of ground
amorphous solid and liquid-quenched glass of tri-O-methyl-beta-cyclodextrin." J Non-Cryst. Solids
175(2-3): 187-194.
Turnbull, D. (1987). "Undercooled alloy phases." Warrendale, PA, The Metallurgical Society.
Van den Mooter, G , Augustijns, P. and Kinget, R. (1999). "Stability prediction of amorphous
benzodiazepines by calculation of the mean relaxation time constant using the Williams-Watts decay
function." Eur. J. Pharm. Biopharm. 48(1): 43-48.
van Drooge, D. J. (2006). "Combining the incompatible: inulin glass dispersions for fast dissolution, stabilization and formulation of lipophilic drugs." Groningen, University of Groningen. Thesis.
van Drooge, D. J., Hinrichs, W. L. J., Visser, M. R. and Frijlink, H. W. (2006). "Characterization of the molecular distribution of drugs in glassy solid dispersions at the nano-meter scale, using
differential scanning calorimetry and gravimetric water vapour sorption techniques." Int. J. Pharm. 310(1-2): 220-229.
van Krevelen, D. W. and Hoftyzer, P. J. (1976). "Properties of polymers: their estimation and
correlation with chemical structure." Amsterdam; Oxford, Elsevier.
van Veen, B., Bolhuis, G. K., Wu, Y. S., Zuurman, K. and Frijlink, H. W. (2005). "Compaction
mechanism and tablet strength of unlubricated and lubricated (silicified) microcrystalline cellulose."
Eur. J. Pharm. Biopharm. 59(1): 133-138.
Vasanthavada, M., Tong, W. Q., Joshi, Y. and Kislalioglu, M. S. (2004). "Phase behavior of amorphous molecular dispersions I: Determination of the degree and mechanism of solid solubility."
Pharm. Res. 21(9): 1598-1606.
Vasconcelos, T., Sarmento, B. and Costa, P. (2007). "Solid dispersions as strategy to improve oral bioavailability of poor water soluble drugs." Drug Dis. Today 12(23-24): 1068-1075.
Wade, A. and Weller, P. J. (1994). "Handbook of pharmaceutical excipients." Washington, American
Pharmaceutical Association; London: Pharmaceutical Press.
Wang, F. J. and Wang, C. H. (2002). "Sustained release of etanidazole from spray dried microspheres
24 4
Bibliography
prepared by non-halogenated solvents." J. Contr. Rel. 81(3): 263-280.
Ward, S., Perkins, M., Zhang, J. X., Roberts, C. J., Madden, C. E., Luk, S. Y., Patel, N. and Ebbens, S. J. (2005). "Identifying and mapping surface amorphous domains." Pharm. Res. 22(7): 1195-1202.
Watanabe, H. (1999). "Critical rotation speed for ball-milling." Pow. Techn. 104(1): 95-99.
Watanabe, T., Hasegawa, S., Wakiyama, N., Kusai, A. and Senna, M. (2003). "Comparison between
polyvinylpyrrolidone and silica nanoparticles as carriers for indomethacin in a solid state
dispersion." Int. J. Pharm. 250(1): 283-286.
Watanabe, T., Hasegawa, S., Wakiyama, N., Usui, R, Kusai, A., Isobe, T. and Senna, M. (2002).
"Solid state radical recombination and charge transfer across the boundary between indomethacin
and silica under mechanical stress." J. Sol. State Chem. 164(1): 27-33.
Watanabe, T., Wakiyama, N., Usui, R, Ikeda, M., Isobe, T. and Senna, M. (2001). "Stability of amorphous indomethacin compounded with silica." Int. J. Pharm. 226(1-2): 81-91.
Willart, J. P. and Descamps, M. (2008). "Solid state amorphization of pharmaceuticals." Mol. Pharm. 5(6): 905-920.
Won, D. H., Kim, M. S., Lee, S., Park, J. S. and Hwang, S. J. (2005). "Improved physicochemical characteristics of felodipine solid dispersion particles by supercritical anti-solvent precipitation
process." Int. J. Pharm. 301(1-2): 199-208.
Wu, S. (1971). "Calculation of interfacial tension in polymer systems." J. Polymer Sci. C-Polymer Symposium (34): 19.
Wu, T., Sun, Y , Li, N., de Villiers, M. M. and Yu, L. (2007). "Inhibiting surface crystallization of amorphous indomethacin by nanocoating." Langm. 23(9): 5148-5153.
Wu, T. and Yu, L. (2006). "Surface crystallization of indomethacin below Tg." Pharm. Res. 23(10): 2350-2355.
York, P., Ticehurst, M. D., Osborn, J. C., Roberts, R. J. and Rowe, R. C. (1998). "Characterisation of the surface energetics of milled dl-propranolol hydrochloride using inverse gas chromatography and
molecular modelling." Int. J. Pharm. 174(1-2): 179-186.
Yoshioka, S. and Aso, Y. (2005). "A quantitative assessment of the significance of molecular
mobility as a determinant for the stability of lyophilized insulin formulations." Pharm. Res. 22(8): 1358-1364.
245

Bibliography
Yu, L. (2001). "Amorphous pharmaceutical solids: preparation, characterization and stabilization."
Adv. Drug Deliv. Rev. 48(1): 27-42.
Zallen, R. (1983). "The physics of amorphous solids." New York, Wiley.
Zhang, F., Aaltonen, J., Tian, P., Saville, D. J. and Rades, T. (2009). "Influence of particle size and
preparation methods on the physical and chemical stability of amorphous simvastatin." Eur. J. Pharm. Biopharm. 71(1): 64-70.
2 4 6