out.pdf - UCL Discovery
288
HAEMOGLOBIN DISORDERS AMONG THE TRIBAL POPULATION "THE BAIGA" OF MADHYA PRADESH, INDIA By P. HEMACHANDRA REDDY A thesis submitted for the degree of Doctor of Philosophy in the University of London Perinatal Centre Department of Obstetrics and Gynaecology University College London Medical School London
-
Upload
khangminh22 -
Category
Documents
-
view
10 -
download
0
Transcript of out.pdf - UCL Discovery

HAEMOGLOBIN DISORDERS AMONG THE TRIBAL
POPULATION "THE BAIGA" OF MADHYA PRADESH, INDIA
By
P. HEMACHANDRA REDDY
A thesis submitted for the degree of Doctor of
Philosophy in the University of London
Perinatal Centre
Department of Obstetrics and Gynaecology
University College London Medical School
London
ProQuest Number: 10046204
All rights reserved
INFORMATION TO ALL USERS The quality of this reproduction is dependent upon the quality of the copy submitted.
In the unlikely event that the author did not send a complete manuscript and there are missing pages, these will be noted. Also, if material had to be removed,
a note will indicate the deletion.
uest.
ProQuest 10046204
Published by ProQuest LLC(2016). Copyright of the Dissertation is held by the Author.
All rights reserved.This work is protected against unauthorized copying under Title 17, United States Code.
Microform Edition © ProQuest LLC.
ProQuest LLC 789 East Eisenhower Parkway
P.O. Box 1346 Ann Arbor, Ml 48106-1346

H:#
■’iwr
THE BAIGA

ABSTRACT
In this study the prevalence and molecular nature of hereditary anaemias were studied in
a primitive Central Indian tribe, the Baiga, in relation to socio-cultural, and environmental
aspects and population structure.
The entire population of 17 small villages was studied. "Normal red cell values" were
defined, and 43% of the population appear to be iron deficient. Hereditary anaemia gene
frequencies are, sickle cell 0.0824, G6PD deficiency (in males) 0.0457, B-thalassaemia
0.0057, and deletional a-plus thalassaemia 0.065. Both and deletions were observed
and non-deletional a-thalassaemia was suspected. The over all gene frequencies of Xmn
I polymorphism (C—>T -158 cap site; upstream of G gamma region) were 0.65 for - site
0.35 for + site and preferentially linked to 6 genes.
A theoretical basis has been established for mild sickle cell anaemia: high frequency of a-
thalassaemia and the Xmn I 4- polymorphism, leading to a wide range of genotypes of
different grades of severity. However, in the tribal environment there is a high early
mortality among SS individuals and surviving SS individuals have low genetic fitness of
SS compared to AA or AS. Higher fertility of ASxAA parents and lower mortality among
their offspring suggest AS offspring continue to have a selective advantage against
falciparum malaria.
34% of marriages were consanguineous. The figures suggest pre-reproductive mortality
(up to 20 years) is higher among the offspring of consanguineous than of non-
consanguineous couples. However, the difference was compensated by excess births
related to a longer reproductive span among consanguineous couples.
Viral markers for hepatitis B and C were studied. Tattooing, usual among the Baiga
females had no observable effect on the prevalence of hepatitis. Methods developed in this
study may be adapted to other tribal groups in India and elsewhere.
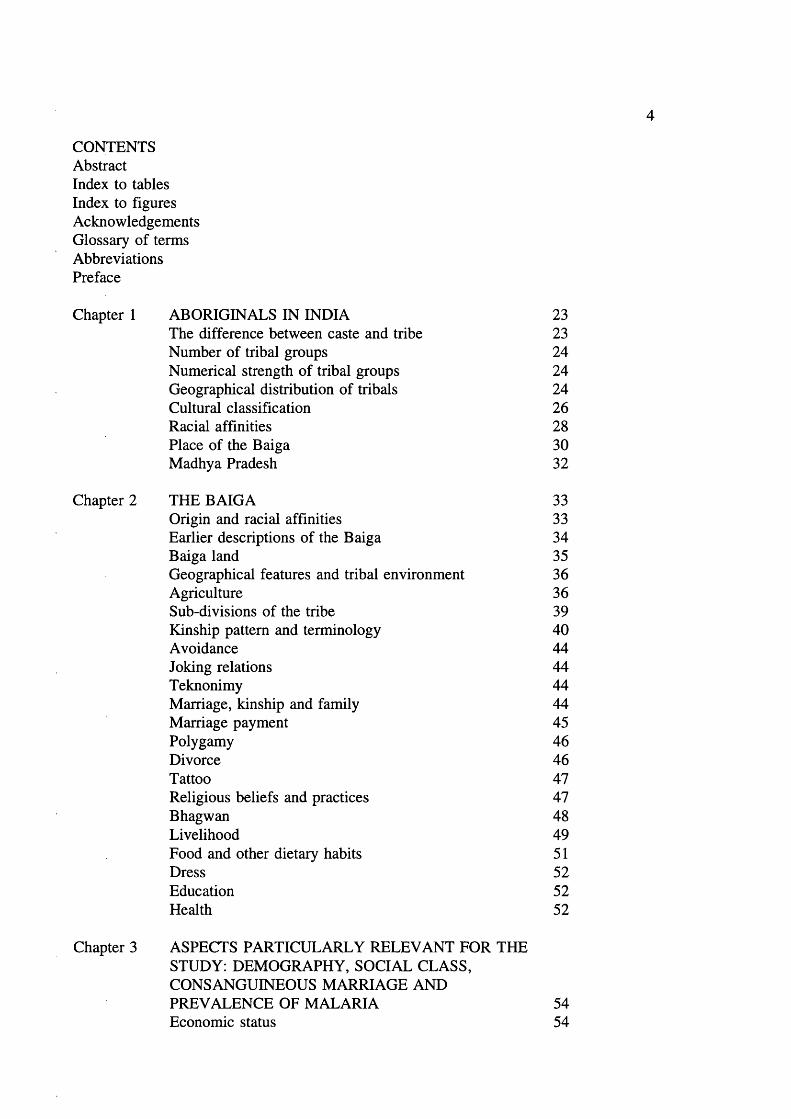
CONTENTS Abstract Index to tables Index to figures Acknowledgements Glossary of terms Abbreviations Preface
Chapter 1 ABORIGINALS IN INDIAThe difference between caste and tribe Number of tribal groups Numerical strength of tribal groups Geographical distribution of tribals Cultural classification Racial affinities Place of the Baiga Madhya Pradesh
Chapter 2 THE BAIGAOrigin and racial affinities Earlier descriptions of the Baiga Baiga landGeographical features and tribal environment AgricultureSub-divisions of the tribeKinship pattern and terminologyAvoidanceJoking relationsTeknonimyMarriage, kinship and familyMarriage paymentPolygamyDivorceTattooReligious beliefs and practicesBhagwanLivelihoodFood and other dietary habitsDressEducationHealth
232324 24 24 26 28 3032
3333343536 363940 44 44 4444454646474748495152 52 52
Chapter 3 ASPECTS PARTICULARLY RELEVANT FOR THE STUDY: DEMOGRAPHY, SOCIAL CLASS, CONSANGUINEOUS MARRIAGE AND PREVALENCE OF MALARIA Economic status
5454
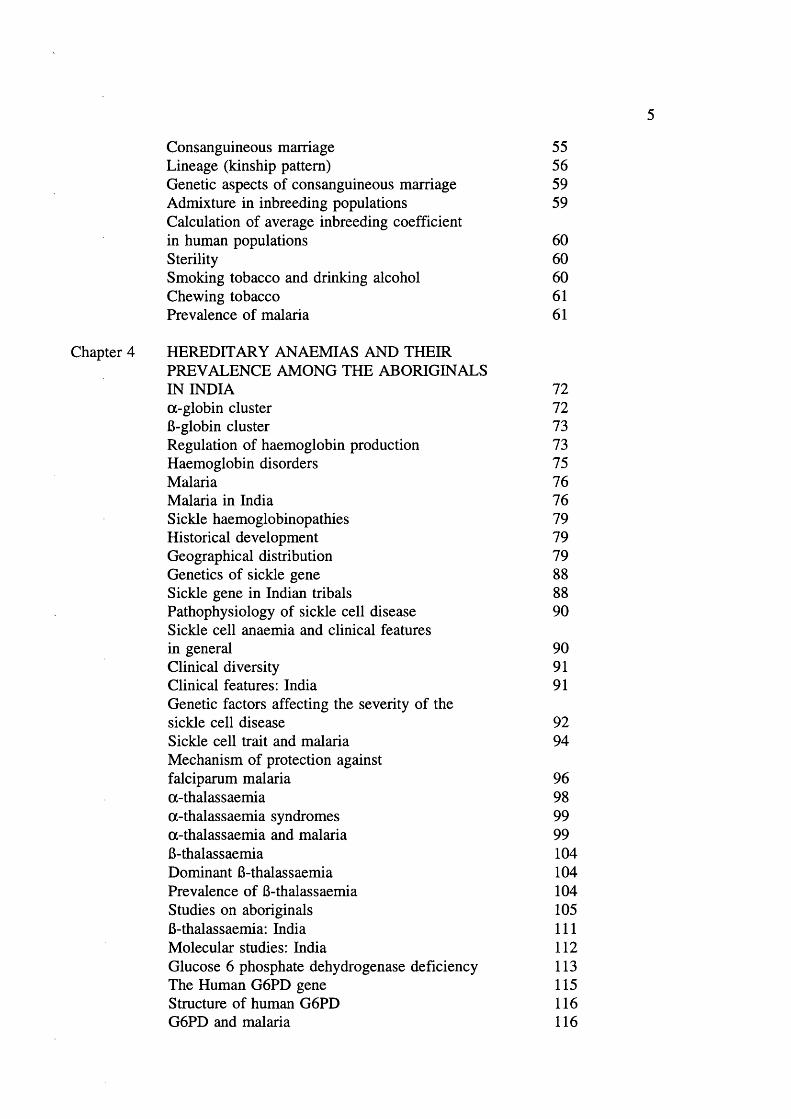
Consanguineous marriage Lineage (kinship pattern)Genetic aspects of consanguineous marriage Admixture in inbreeding populations Calculation of average inbreeding coefficient in human populations SterilitySmoking tobacco and drinking alcohol Chewing tobacco Prevalence of malaria
5556 5959
60 60 60 61 61
Chapter 4 HEREDITARY ANAEMIAS AND THEIRPREVALENCE AMONG THE ABORIGINALS IN INDIA a-globin cluster B-globin clusterRegulation of haemoglobin productionHaemoglobin disordersMalariaMalaria in IndiaSickle haemoglobinopathiesHistorical developmentGeographical distributionGenetics of sickle geneSickle gene in Indian tribalsPathophysiology of sickle cell diseaseSickle cell anaemia and clinical featuresin generalClinical diversityClinical features: IndiaGenetic factors affecting the severity of thesickle cell diseaseSickle cell trait and malariaMechanism of protection againstfalciparum malariaa-thalassaemiaa-thalassaemia syndromesa-thalassaemia and malariaB-thalassaemiaDominant B-thalassaemiaPrevalence of B-thalassaemiaStudies on aboriginalsB-thalassaemia: IndiaMolecular studies: IndiaGlucose 6 phosphate dehydrogenase deficiencyThe Human G6PD geneStructure of human G6PDG6PD and malaria
727273 737576 76 79 79 79 88 88 90
909191
92 94
969899 99 104 104104105 111 112 113115116 116

Geographical distributionHealth problems that can be caused byG6PD deficiencyG6PD deficiency in IndiaG6PD variants in IndiaAIMS AND OBJECTIVES OF THE STUDY
117
117119123125
Chapter 5 METHODS OF THE STUDYPOPULATION, MATERIALS AND METHODS 127Activities in the field 127Research team 127Transport 127Time of data collection 127Interpreter’s help 127Selection of area 128Population 128Demographic/Anthropological data collection, field 131Establishing a rapport in the field 131Field experiences 133Where to stay in the tribal areaduring field work 134Demographic data 134Analysis of data 137Haematological methods, field laboratory 137Red cell indices CBC 5 portable Coulter Counter 140Zinc Protofluor machine for screening iron deficiency 142Fluorescence spot method for G6PD deficiency screening 142 Haematological methods, Jabalpur 147Haemoglobin electrophoresis 148Micro-column chromatography 148Haematological methods, London 149Isoelectric focusing 149Serum ferritins 149Hb F Assay, Betke method (Dacie and Lewis 1991) 150Quantitation of Hb A2 150Hepatitis screening 150DNA methods, Jabalpur and London 150Mouthwash DNA 151Gene analysis, London 153Xmn I polymorphism 154Sickle cell mutation 156a-thalassaemia 158G6PD deficiency, gene analysis 158
Chapter 6 DEMOGRAPHIC DATA: RESULTS AND DISCUSSIONPopulation, age and sex distribution
160160

MortalityFertilityMaternal age distribution and fertilityMate choice and family nameMarital distance and gene flowAge at menarcheAge at marriageTrends in age at marriageMarriage and first conceptionAge difference in spousesMarriage practiceTrends in cousin marriagePolygamyDivorceTwinningInfertilityBreast feedingContraceptionEducationSmoking tobaccoChewing tobaccoDrinking alcoholDISCUSSION
160168168169169170 182 182 182 182 182 183183184 184 184 184 184 192 192 192 192 192
Chapter 7 HAEMATOLOGICAL AND DNA STUDIES: RESULTS AND DISCUSSION Haematological parameters Hereditary anaemias Haemoglobin S 6-thalassaemia G6PD deficiency DNA studies a-thalassaemia Xmn I polymorphism G6PD deficiency DISCUSSION
202202222227227228 228 228 228 229 229
Chapter 8 FAMILY STUDIES: RESULTS AND DISCUSSION 235 Sickle haemoglobin and mortality 246Sickle haemoglobin and parenthood 247Sickle haemoglobin, malaria and mortality 252G6PD deficiency, fertility and mortality 252DISCUSSION 253
Chapter 9 VIRAL MARKERSHepatitis viral markers Results
254254255

GENERAL DISCUSSION AND CONCLUSIONS 256
APPENDICES 260
Appendix 1 260Appendix 2 263
REFERENCES 267
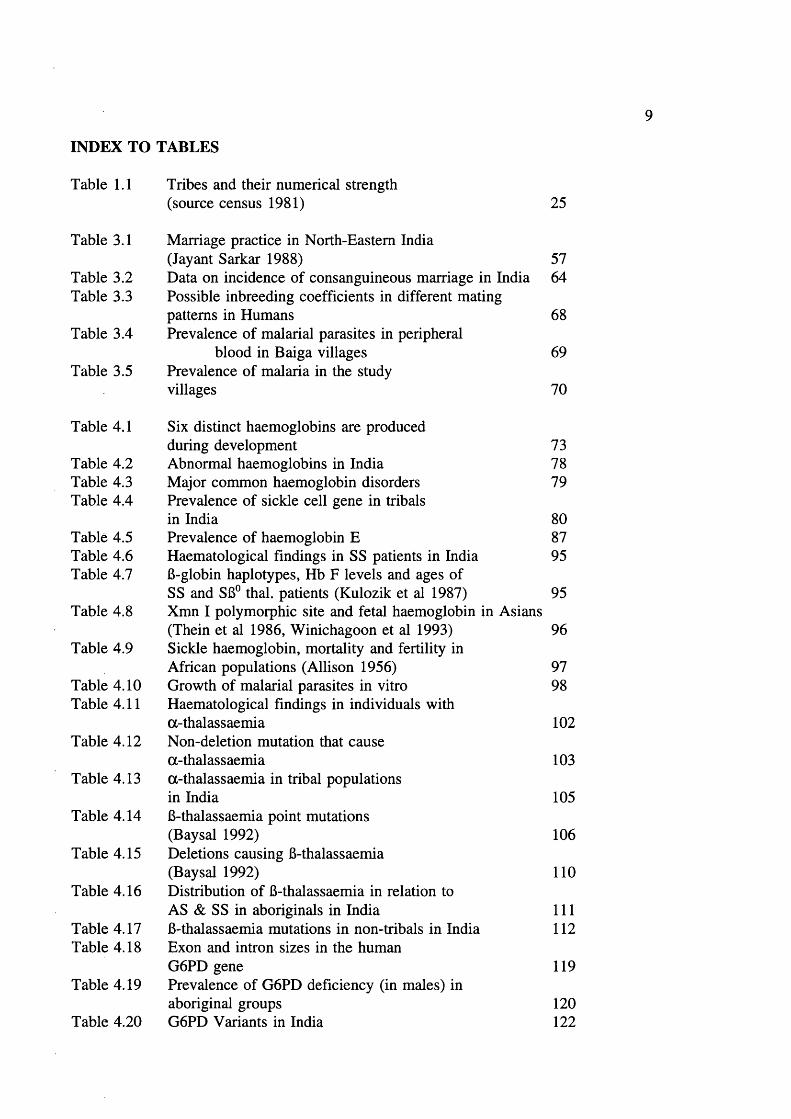
INDEX TO TABLES
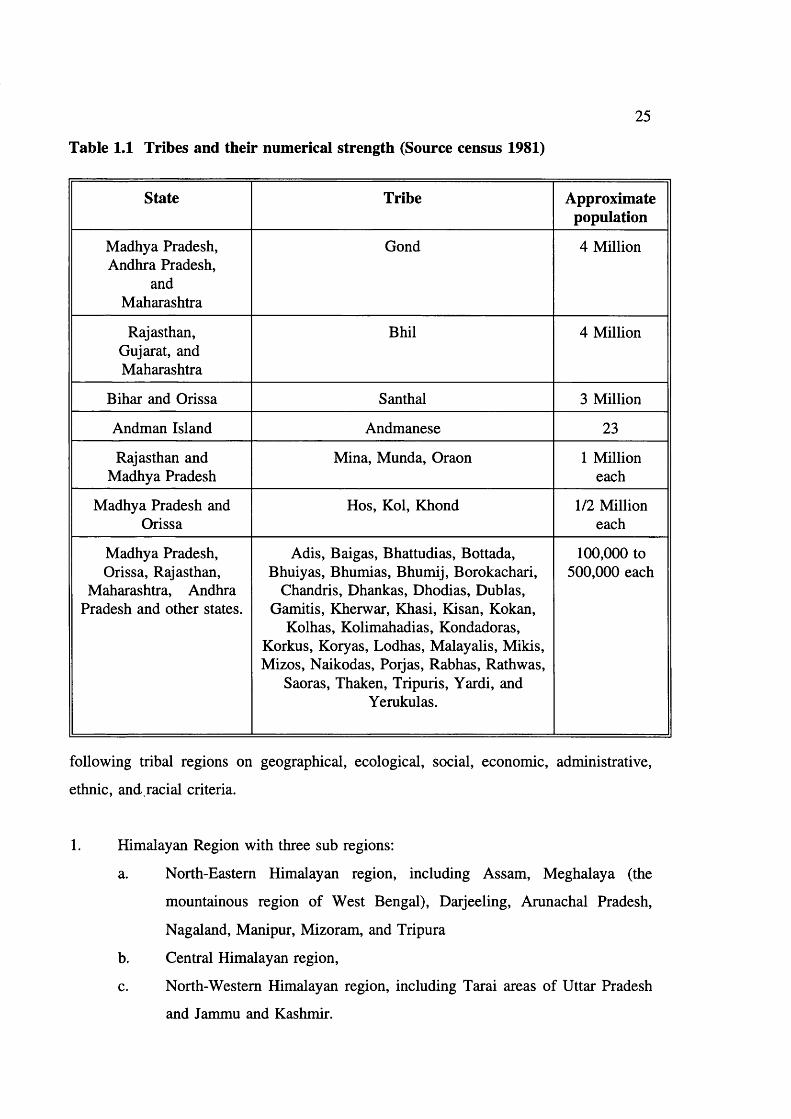
Table 1.1 Tribes and their numerical strength(source census 1981) 25
Table 3.1 Marriage practice in North-Eastern India(Jayant Sarkar 1988) 57
Table 3.2 Data on incidence of consanguineous marriage in India 64Table 3.3 Possible inbreeding coefficients in different mating
patterns in Humans 68Table 3.4 Prevalence of malarial parasites in peripheral
blood in Baiga villages 69Table 3.5 Prevalence of malaria in the study
villages 70
Table 4.1 Six distinct haemoglobins are producedduring development 73
Table 4.2 Abnormal haemoglobins in India 78Table 4.3 Major common haemoglobin disorders 79Table 4.4 Prevalence of sickle cell gene in tribals
in India 80Table 4.5 Prevalence of haemoglobin E 87Table 4.6 Haematological findings in SS patients in India 95Table 4.7 6-globin haplotypes, Hb F levels and ages of
SS and SB® thal. patients (Kulozik et al 1987) 95Table 4.8 Xmn I polymorphic site and fetal haemoglobin in Asians
(Thein et al 1986, Winichagoon et al 1993) 96Table 4.9 Sickle haemoglobin, mortality and fertility in
African populations (Allison 1956) 97Table 4.10 Growth of malarial parasites in vitro 98Table 4.11 Haematological findings in individuals with
a-thalassaemia 102Table 4.12 Non-deletion mutation that cause
a-thalassaemia 103Table 4.13 a-thalassaemia in tribal populations
in India 105Table 4.14 6-thalassaemia point mutations
(Baysal 1992) 106Table 4.15 Deletions causing 6-thalassaemia
(Baysal 1992) 110Table 4.16 Distribution of 6-thalassaemia in relation to
AS & SS in aboriginals in India 111Table 4.17 6-thalassaemia mutations in non-tribals in India 112Table 4.18 Exon and intron sizes in the human
G6PD gene 119Table 4.19 Prevalence of G6PD deficiency (in males) in
aboriginal groups 120Table 4.20 G6PD Variants in India 122
10
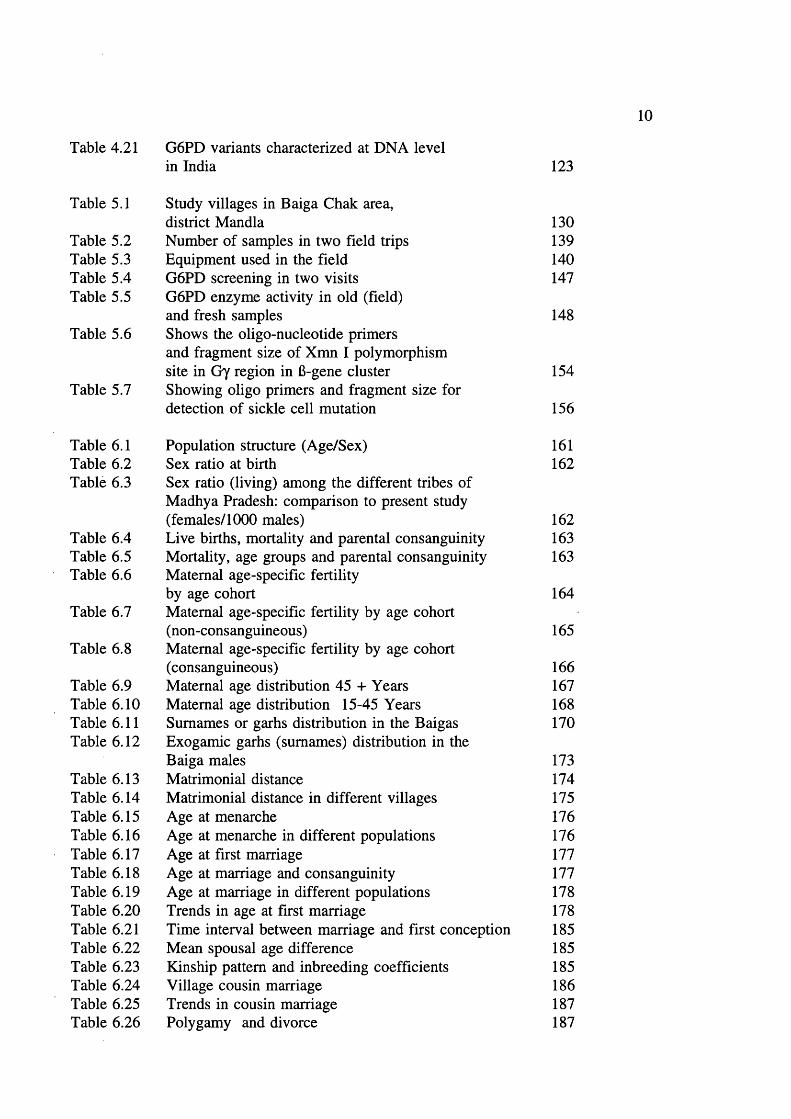
Table 4.21 G6PD variants characterized at DNA level in India 123
Table 5.1
Table 5.2 Table 5.3 Table 5.4 Table 5.5
Table 5.6
Table 5.7
Study villages in Baiga Chak area, district MandlaNumber of samples in two field tripsEquipment used in the fieldG6PD screening in two visitsG6PD enzyme activity in old (field)and fresh samplesShows the oligo-nucleotide primersand fragment size of Xmn I polymorphismsite in Gy region in 6-gene clusterShowing oligo primers and fragment size fordetection of sickle cell mutation
130139140147
148
154
156
Table 6.1 Population structure (Age/Sex) 161Table 6.2 Sex ratio at birth 162Table 6.3 Sex ratio (living) among the different tribes of
Madhya Pradesh: comparison to present study (females/1000 males) 162
Table 6.4 Live births, mortality and parental consanguinity 163Table 6.5 Mortality, age groups and parental consanguinity 163Table 6.6 Maternal age-specific fertility
by age cohort 164Table 6.7 Maternal age-specific fertility by age cohort
(non-consanguineous) 165Table 6.8 Maternal age-specific fertility by age cohort
(consanguineous) 166Table 6.9 Maternal age distribution 45 + Years 167Table 6.10 Maternal age distribution 15-45 Years 168Table 6.11 Surnames or garbs distribution in the Baigas 170Table 6.12 Exogamie garhs (surnames) distribution in the
Baiga males 173Table 6.13 Matrimonial distance 174Table 6.14 Matrimonial distance in different villages 175Table 6.15 Age at menarche 176Table 6.16 Age at menarche in different populations 176Table 6.17 Age at first marriage 177Table 6.18 Age at marriage and consanguinity 177Table 6.19 Age at marriage in different populations 178Table 6.20 Trends in age at first marriage 178Table 6.21 Time interval between marriage and first conception 185Table 6.22 Mean spousal age difference 185Table 6.23 Kinship pattern and inbreeding coefficients 185Table 6.24 Village cousin marriage 186Table 6.25 Trends in cousin marriage 187Table 6.26 Polygamy and divorce 187

11
Table 6.27 Table 6.28 Table 6.29 Table 6.30 Table 6.31 Table 6.32 Table 6.33 Table 6.34 Table 6.35 Table 6.36
Table 7.1 Table 7.2
Table 7.3 Table 7.4 Table 7.5 Table 7.6
Table 7.7
Table 7.8 Table 7.9
Table 7.10
Table 7.11 Table 7.12 Table 7.13 Table 7.14
Table 7.15 Table 7.16
Table 7.17 Table 7.18
Table 7.19 Table 7.20 Table 7.21 Table 7.22
Table 7.23
Table 7.24
Infertility 188Duration of breast feeding 188Contraceptives used-medical 188Contraceptives used-herbal 189Trends in family planning 189Education 189Smoking tobacco 190Chewing tobacco 190Drinking alcohol 191Education in different groups in Madhya Pradesh 191
Blood samples studied and tests done 203Haematological parameters related to sex and age (figures in brackets are number of samples tested) 204Haemoglobin frequency distribution 205Mean cell haemoglobin (MCH) frequency distribution 206Mean cell volume frequency (MCV) distribution 207Mean cell haemoglobin concentration (MCHC) frequency distribution 208ZPP/haem ratio: frequency distribution (upper limit of normal 80) 209Serum ferrritins 209Haematological parameters (with normal ZPP/haem ratio) related to sex and age (figures in brackets are number tested) 212Hereditary anaemias: phenotypic expression and gene frequencies 213Expected and observed AA, AS and SS in the Baigas 213Hb S level (%) in sickle heterozygotes 214Hb Az levels (%) 214MCV and MCH related to % Hb S in sickle heterozygotes(meantSD) (number tested are in brackets)Details of sickle homozygotes (SS) in the Baiga tribe Haematological features of 3 individuals of 6-thalassaemiaHaematological features of G6PD deficients (males) a-thalassaemia, Xmn I polymorphism and Sickle haemoglobinXmn I Polymorphism and sickle haemoglobin Xmn I Polymorphism and fetal haemoglobin Xmn I polymorphism in Gonds Expected Sickle homozygote births in Indian tribals (based on published data: electrophoresis was done on samples)Comparison of reported Hb S percent values in sickle heterozygotesExpected Xmn I polymorphism and a-thalassaemia in SS patients
214215
215216
216217217218
223
226
226

12
Table 8.1
Table 8.2Table 8.3Table 8.4
Table 8.5Table 8.6
Table 8.7
Table 8.8
Table 8.9Table 8.10
Table 8.11
Table 9.1Table 9.2
Families with tested members and parental genotypes in 1st and 2nd field tripsFamilies with members tested for Hb S and genotypes Transmission of Hb A and S genes in two generations Expected genotypes of offspring of parents (AAxAA, ASxAA and ASxAS)Sickle haemoglobin, fertility and mortality Sickle haemoglobin and maternal age distribution (15-44 and >45 yrs)Reproductive behaviour in AAxAS couples wheremother or father was ASSickle Haemoglobin, consanguinity and fertilityrelationshipDistribution of mortalityAA and AS offspring in AAxAS couples where mother father was ASFamilies with members tested for G6PD def. and genotypes
or
238238239
239241
242
242
243244r244
245
Summarizes prevalence of surface antigen of Hepatitis B 255 Prevalence of viral markers in the Baiga tribe 256
13
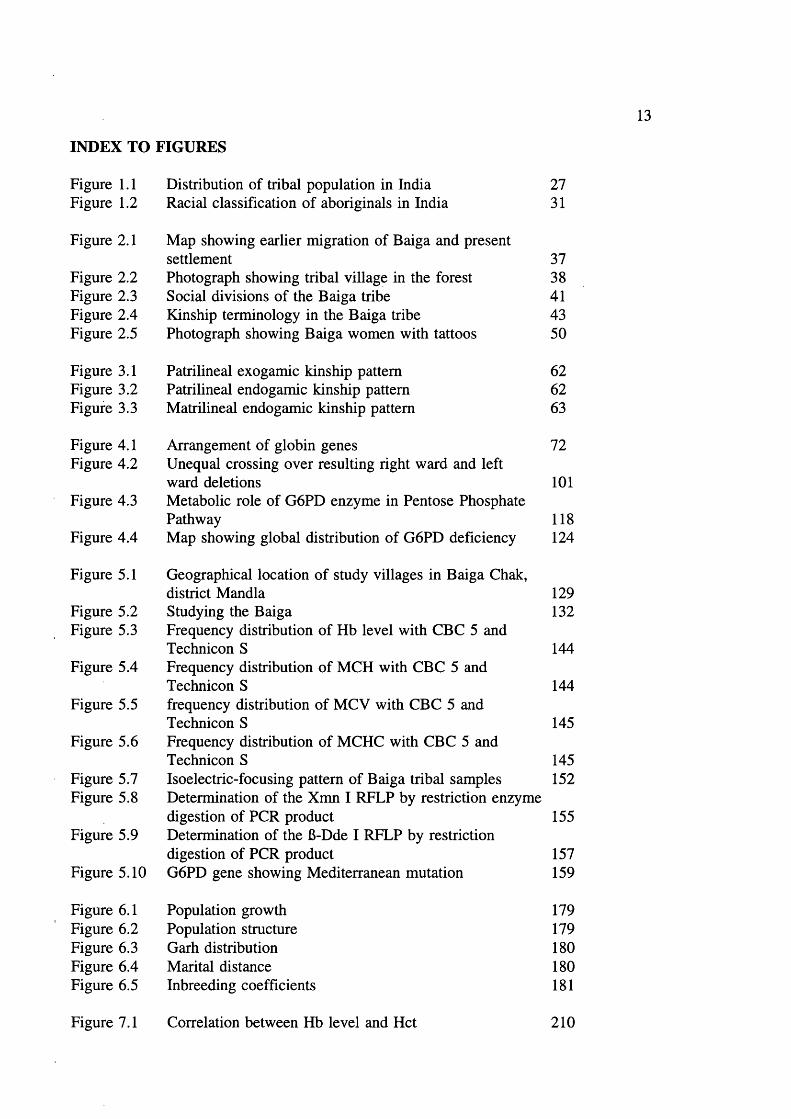
INDEX TO FIGURES
Figure 1.1 Distribution of tribal population in India 27Figure 1.2 Racial classification of aboriginals in India 31
Figure 2.1 Map showing earlier migration of Baiga and presentsettlement 37
Figure 2.2 Photograph showing tribal village in the forest 38Figure 2.3 Social divisions of the Baiga tribe 41Figure 2.4 Kinship terminology in the Baiga tribe 43Figure 2.5 Photograph showing Baiga women with tattoos 50
Figure 3.1 Patrilineal exogamie kinship pattern 62Figure 3.2 Patrilineal endogamie kinship pattern 62Figure 3.3 Matrilineal endogamie kinship pattern 63
Figure 4.1 Arrangement of globin genes 72Figure 4.2 Unequal crossing over resulting right ward and left
ward deletions 101Figure 4.3 Metabolic role of G6PD enzyme in Pentose Phosphate
Pathway 118Figure 4.4 Map showing global distribution of G6PD deficiency 124
Figure 5.1 Geographical location of study villages in Baiga Chak,district Mandla 129
Figure 5.2 Studying the Baiga 132Figure 5.3 Frequency distribution of Hb level with CBC 5 and
Technicon S 144Figure 5.4 Frequency distribution of MCH with CBC 5 and
Technicon S 144Figure 5.5 frequency distribution of MCV with CBC 5 and
Technicon S 145Figure 5.6 Frequency distribution of MCHC with CBC 5 and
Technicon S 145Figure 5.7 Isoelectric-focusing pattern of Baiga tribal samples 152Figure 5.8 Determination of the Xmn I RFLP by restriction enzyme
digestion of PCR product 155Figure 5.9 Determination of the 6-Dde I RFLP by restriction
digestion of PCR product 157Figure 5.10 G6PD gene showing Mediterranean mutation 159
Figure 6.1 Population growth 179Figure 6.2 Population structure 179Figure 6.3 Garh distribution 180Figure 6.4 Marital distance 180Figure 6.5 Inbreeding coefficients 181
Figure 7.1 Correlation between Hb level and Hct 210

14
Figure 7.2 Correlation between MCV and MCH 210Figure 7.3 Correlation between ZPP and Hb 219Figure 7.4 Correlation between MCH and ZPP 219Figure 7.5 Correlation between ZPP and Serum ferritins 220Figure 7.6 Frequency distribution of S% in Hb AS 221Figure 7.7 Frequency distribution of Hb A2 levels 221
Figure 8.1 Family pedigrees of ASxAS 248Figure 8.2 Family pedigrees of AAxSS 251
15
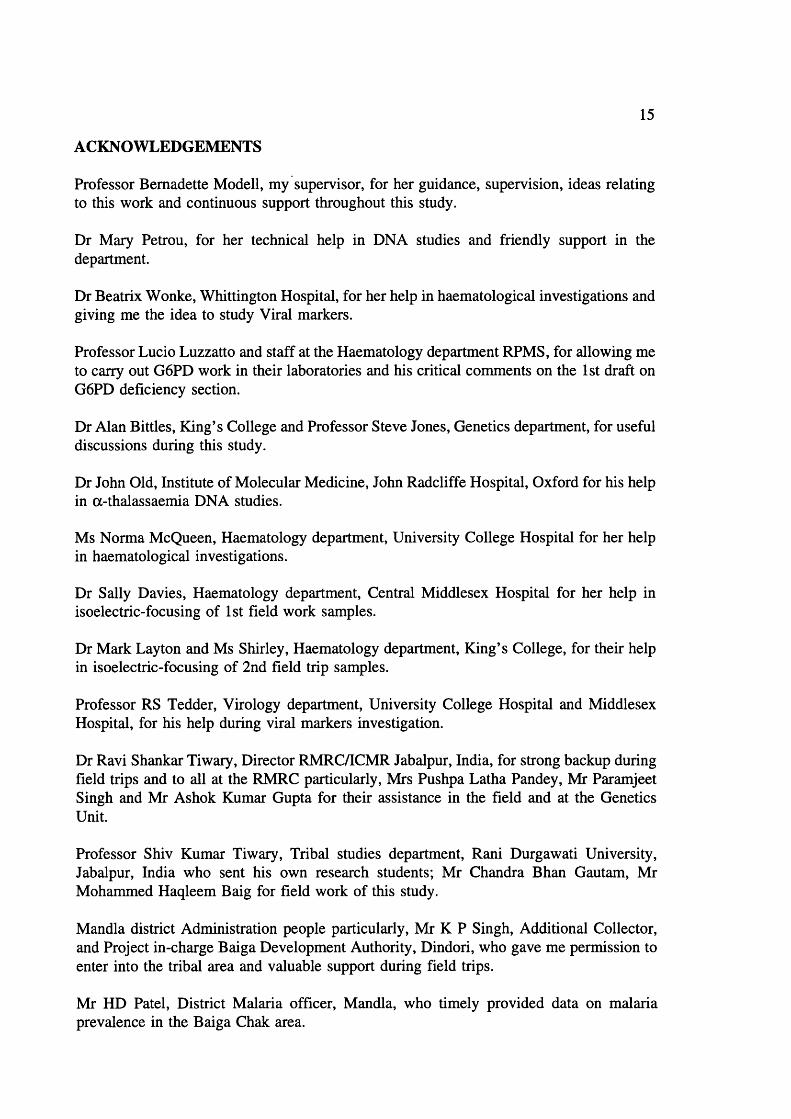
ACKNOWLEDGEMENTS
Professor Bernadette Modell, my supervisor, for her guidance, supervision, ideas relating to this work and continuous support throughout this study.
Dr Mary Petrou, for her technical help in DNA studies and friendly support in the department.
Dr Beatrix Wonke, Whittington Hospital, for her help in haematological investigations and giving me the idea to study Viral markers.
Professor Lucio Luzzatto and staff at the Haematology department RPMS, for allowing me to carry out G6PD work in their laboratories and his critical comments on the 1st draft on G6PD deficiency section.
Dr Alan Bittles, King’s College and Professor Steve Jones, Genetics department, for useful discussions during this study.
Dr John Old, Institute of Molecular Medicine, John Radcliffe Hospital, Oxford for his help in a-thalassaemia DNA studies.
Ms Norma McQueen, Haematology department. University College Hospital for her help in haematological investigations.
Dr Sally Davies, Haematology department. Central Middlesex Hospital for her help in isoelectric-focusing of 1st field work samples.
Dr Mark Layton and Ms Shirley, Haematology department. King’s College, for their help in isoelectric-focusing of 2nd field trip samples.
Professor RS Tedder, Virology department. University College Hospital and Middlesex Hospital, for his help during viral markers investigation.
Dr Ravi Shankar Tiwary, Director RMRC/ICMR Jabalpur, India, for strong backup during field trips and to all at the RMRC particularly, Mrs Pushpa Latha Pandey, Mr Paramjeet Singh and Mr Ashok Kumar Gupta for their assistance in the field and at the Genetics Unit.
Professor Shiv Kumar Tiwary, Tribal studies department. Rani Durgawati University, Jabalpur, India who sent his own research students; Mr Chandra Bhan Gautam, Mr Mohammed Haqleem Baig for field work of this study.
Mandla district Administration people particularly, Mr K P Singh, Additional Collector, and Project in-charge Baiga Development Authority, Dindori, who gave me permission to enter into the tribal area and valuable support during field trips.
Mr HD Patel, District Malaria officer, Mandla, who timely provided data on malaria prevalence in the Baiga Chak area.

16
Forest staff at the Dindori division particularly, SC Dubey, Divisional forest officer, Mr Bairagi, Deputy ranger, Kharidih, for their help.
All the Baiga informants, particularly, Buddh Singh Maravi, a Baiga school teacher from Durkuta village, Arjun Singh Druvae, a Baiga school teacher from Chada village, Sri Sukul Singh, a temporary Baiga worker in the forest department from Kharidih village.
Staff at the Perinatal Centre Mrs Evelyn Dudman for reading the final draft of the thesis, and Mr Mustafa Yazman, Mr Eyyup Gemidjioglu, Ms Chitra Mahadik, Drs suhaib Ahmed, Siret Ratip, Elizabeth Anionwu and Secretaries Mrs Anita King and Saema Shaik and Katie Carroll for their help and cooperation during this study.
The Commonwealth Commission in the United Kingdom, who awarded me a three year Commonwealth Scholarship for this study.
Sir Hailey Stewart Trust and The Galton Society for their generous financial support during field trips to Baiga land and final stages of this study.
Last but not least, my wife, Arubala, for her help during analysis of Demographic data, Haematological investigations, and moral support throughout this study.

17
GLOSSARY OF TERMS
Ghee: Fat product of milk either by cream or melted butter.
Vindhya Satpura Maikal Ranges: The hilly ranges of North-South banks of river Narmada form the fertile land of Narmada valley (see physical map of Madhya Pradesh).
Tehsil: The subdivision of a district.
Bhinjwar, Bharotia, Narotia, Naher, Raibena, Kathhaina, Kondwar, Kundi, Gondwar: Divisions of Baiga tribe.
Garh: Surname; usually originated from their ancestral or occupation (basis); marriages prohibited within the garh.
Mauha: A local liquor made of Bassia Latifolia a plant of deciduous forest. The inflorescence has high nutritious value and is used for making Liquor.
Sukh: The bride price; because Baigas are poor people the Sukh is paid in the form of Liquor, clothes and a small sum of money.
Chotki and Badki: The terms used for junior and senior wives.
Panchayat: The judiciary of the village which is either nominated or elected by village people to solve local judiciary matters.
Tattoo: The ornamental marks on the body of Baiga women.
Mahadeo: Due to Hindu mythology one name of Lord Shiva; the ruler of the Earth Hell and Heaven.
Bhagvan: The name of Hindu supreme power.
Jiv: The eternal part of the human body, which finally unites and interacts with God.
Pujari: The priest: an honourable person in society, and the Baiga believe that they know the cure for every diseases and problems.
Harra: A bush of deciduous forests, its fruit is used as herbal medicine.
Kodo, Kutki and Jagni: Millets used in everyday food in Baiga.
Surpanch: Head of the village.
Bewar: Shifting cultivation or cutting forest
Kutki: Paricum Psidipodium; a millet used in daily meal.

18
Pej: A gruel which is the staple food for Baiga.
Sari'. A 5 metre long cloth piece to cover the body comfortably.
Trishul: An iron or wooden trident.
Chaprasi: A subordinate official or a messenger.
Jat: An endogamous subdivision of the tribe.
Lungoti: Small strip of cloth tied between legs to cover belly.
Mukaddam: Village headman responsible for information activities.
Channa: Cicer arietinum.
Lalbhaji: A nutritious spinach leaves.
Bidi: Tobacco wrapped in folded Tendu leaves with both ends closed.
Clan'. Surname or family name adopted by Gond tribe
Patrilocal: A couple reside at husband’s father’s place after their marriage.
Neolocal: A couple reside in a new place after their marriage.
Matrilocal: A couple reside at wife’s mother’s place after their marriage.
Seoni settlement report: Report of land revenue settlement of Seoni district, 1867 Bombay.
Selection intensity: The process by which certain characters are perpetuated in the organism.
Dravidian: Dravidian is the generic term referring to the people of peninsular India, in contrast to the Indo-Aryans of North India. The Dravidians are thought to be indigenous population of India and have distinctive physical features, languages and customs.
Marriage: In the broadest sense, marriage is a culturally recognised union between any number of people but need not be synonymous with mating.
Incest: Biological incest refers to marriages or matings with close relation (usually confined to primary or nuclear kin), matings from ancestress to remote degree of relatedness.
Consanguineous marriage: A consanguineous marriage is one in which the partners are biologically related to each other prior to marriage.

19
Inbreeding’. The offspring of consanguineous marriages are by definition - inbred.
Scheduled caste’. Socio-economically backward (untouchable) castes as designated scheduled castes by the Government in 1938.
20
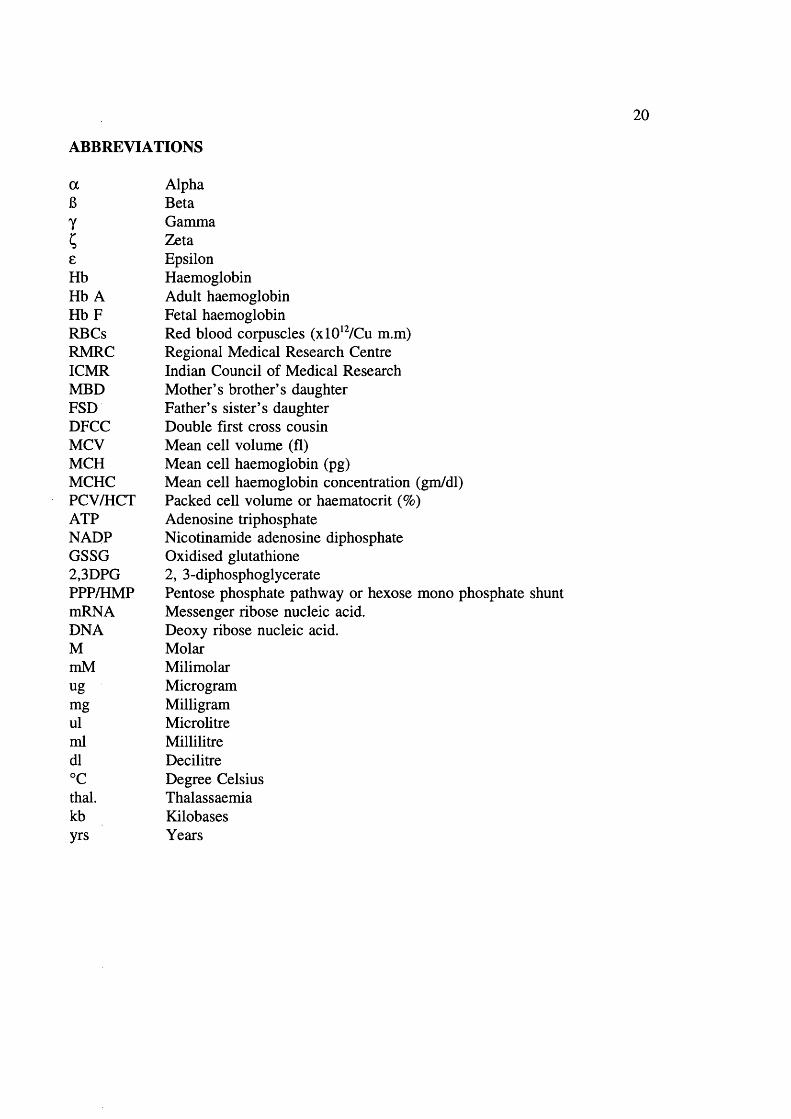
ABBREVIATIONS
a Alpha6 Betay GammaC Zetae EpsilonHb HaemoglobinHb A Adult haemoglobinH bF Fetal haemoglobinRBCs Red blood corpuscles (xlO^VCu m.m)RMRC Regional Medical Research CentreICMR Indian Council of Medical ResearchMED Mother’s brother’s daughterFSD Father’s sister’s daughterDFCC Double first cross cousinMCV Mean cell volume (fl)MCH Mean cell haemoglobin (pg)MCHC Mean cell haemoglobin concentration (gm/dl)PCV/HCT Packed cell volume or haematocrit (%)ATP Adenosine triphosphateNADP Nicotinamide adenosine diphosphateGSSG Oxidised glutathione2,3DPG 2, 3-diphosphoglyceratePPP/HMP Pentose phosphate pathway or hexose mono phosphate shuntmRNA Messenger ribose nucleic acid.DNA Deoxy ribose nucleic acid.M MolarmM Milimolarug Microgrammg Milligramul Microlitreml Millilitredl Decilitre°C Degree Celsiusthal. Thalassaemiakb Kilobasesyrs Years

21
PREFACE
Human population settlement is largely determined by geographical conditions like
availability of fertile land, drinking water, and so on. Primitive societies have been
segregated from more developed societies for various reasons such as invasion in the past,
cultural differences, physical isolation etc. Most aboriginal (tribal) societies have become
confined to hilly and forest areas where only the minimum feasible conditions for survival
exist. Here I ask, who are these aboriginals? How old are they? To answer such
questions one has to consider the whole history of human social and biological evolution.
The tribe is the oldest form of human organization. The present advanced societies have
evolved from this primitive tribal structure with the development of agriculture (perhaps
10,000 years old) and industry. The remaining aboriginal societies that were not reached
by civilisation are thought to represent our ancestral inheritance in terms of culture,
behaviour etc, as far as is still possible. However, as local agriculturists occupied land
farmable for agriculture and pushed hunters and gatherers to marginal areas such as
mountains and deep forest, residual primitive societies now inhabit a different and more
limited physical environment than formerly.
Thus, though studies such as this derive much of their interest from what they may tell us
about our remote ancestors, there must also be many ways in which present primitive
tribals differ from earlier ones.
My training in M.Sc (Physical Anthropology) was initiated to study the evolution and
variation in human populations particularly primitive societies. The experience at Indian
Council of Medical Research, Tribal Research Centre, Jabalpur, really gave me an
opportunity to understand more about genetics of aboriginals.
I have chosen the Baiga for study because they seem to be the most primitive tribe in
Central India. El win was the first person to study closely the social life of Baigas in the
early 1930s. Since then there has been no systematic detailed demographic and genetic
study on them.
22
It is my special and deep interest to learn more about the Baigas (their social life, daily
habits, health, views on Baigas by various workers, government policies, and their
protection). It is important to understand their feelings, interests, likings, and treatment
by local non aboriginal (caste) people to be able to carry out further research on the tribe.
During my thesis study I faced several administrative problems from the Indian
Government, but these were overcome because of my determination to study the tribe.
The field experience with Baigas is really unforgettable. Their honesty, innocence, and
hospitality is immeasurable. Though they co-operated well in my study, they hide certain
things all through the time.
For genetic research, especially to understand the inheritance of recessive genes in a
natural setting, a primitive population is the best. The Baiga gave me a chance to
understand very basic Mendelian inheritance. I dedicate this piece of research to the
Baigas of Central India.

23
CHAPTER 1 ABORIGINALS IN INDIA
This chapter deals with the tribals of India in general, their classification and distribution.
Tribals in India are considered to be aboriginals based on their anthropological
characteristics and they are spread all over the country in hilly and forest areas. Max
Weber (1958) defined a tribe as "having fixed territory, a self contained subsistence
economy and the characteristics of a political association". This definition is no longer
applicable to all the tribes of India, as they are undergoing urbanization and modernization
at different levels. For instance the Gonds of Gondwana region (Madhya Pradesh,
Maharashtra and Andhra Pradesh) and Santhals of Bihar are moving culturally closer to
non aboriginal (caste) populations. In contrast, the Baigas of Central India (Madhya
Pradesh) are still not prepared to join the main stream. The meaning of the term "tribe"
itself has evolved. Vidyarthi (1983) listed its usage in chronological order as; people
having a tribal form of religion (1891); animists (1901); tribal animists or tribal religion
(1911); hill and forest tribe (1921); primitive tribe (1931); tribe (1941); and scheduled tribe
(1951,71).
Indian tribals (aboriginals) differ not only from caste populations (non aboriginals) but also
from one another, in dialect (language), race, and socio-economic and cultural patterns.
The difference between tribe and caste
The caste population is heterogenous and groups are interdependent, the tribals are usually
homogenous, very self contained, isolated, and socio-culturally autonomous. The basis of
subdivision of the caste populations is occupational (on the basis of Hindu varna system)
and castes are interdependent on one another. At the top in the social stratification are the
Brahmans (priests in temples). The Kshastriyas (rulers/warriors) are next in the social
hierarchy. The Vaisyas (the business community) are third and the Shudras (the labouring
community) are at the bottom. These castes are further subdivided into innumerable
groups (sub castes). The occupational basis of caste has been diluted with increasing
education, advancement in technology, employment, urbanization and so on; which has
developed interaction among these groups, resulting in heterogeneity and admixture. By
contrast, most of the tribes are independent of interaction with other groups and for them
every contact from outside is foreign. The Baigas of Central India are among those tribes
24
that still preserve their heritage and endogamie nature.
Number o f tribal groups
There are different opinions regarding the number of tribal communities in the Indian
subcontinent. The criteria for recognising a tribe are not yet defined properly. An
Anthropological survey of India in 1967 estimated 314 tribes taking account of certain
groups of tribals with a common name. However the 1981 census recorded 427 tribal
groups. This number may not be accurate if one includes biological and genetic criteria
in the definition of a tribe. The census of India (1951, 1971) included some of the caste
population among scheduled tribes, on the basis of neglect in the past and backwardness.
For instance, the socio-cultural behaviour of the Saharias of Central India, one of the six
primitive tribes identified by Madhya Pradesh Government, is more like the caste
population than a tribe (personal observation). It is unscientific to include caste
populations among the aboriginal groups, with undefined criteria. In my opinion, the
numbers given by the Anthropological Survey of India seem more scientific and useful for
future reference or research purpose.
Numerical strength of tribals
According to the 1981 Census, 8% of the total population is composed of tribals ie 64
million. The numerical strength of various tribes is given in table 1.1.
Geographical distribution of tribals (aboriginals)
Hills, forests and mountain tracts are the tribal homeland in India and elsewhere. Indian
aboriginals have been classified by different anthropologists and geographers on the basis
of the geographical location of these areas or physical environment. Guha (1951, 1955)
used a three fold classification: the North & North-Eastern, the Central and Peninsular.
Dube (1969) used a four fold classification: the North & North-Eastern, Middle zone.
South zone, and West zone. Roy Burman (1971) used a five fold classification on the
basis of historical, ethnic, and socio-cultural relations: North-Eastern zone. Sub Himalayan
region of North & North-Eastern zone. Central & East zone. West zone and South zone.
Vidyarthi (1983) added the island region to Roy Burman’s classification, and defined the
25
Table 1.1 Tribes and their numerical strength (Source census 1981)
State Tribe Approximatepopulation
Madhya Pradesh, Andhra Pradesh,
and Maharashtra
Gond 4 Million
Rajasthan, Gujarat, and Maharashtra
Bhil 4 Million
Bihar and Orissa Santhal 3 Million
Andman Island Andmanese 23
Rajasthan and Madhya Pradesh
Mina, Munda, Oraon 1 Million each
Madhya Pradesh and Orissa
Hos, Kol, Khond 1/2 Million each
Madhya Pradesh, Orissa, Rajasthan,
Maharashtra, Andhra Pradesh and other states.
Adis, Baigas, Bhattudias, Bottada, Bhuiyas, Bhumias, Bhumij, Borokachari,
Chandris, Dhankas, Dhodias, Dublas, Gamitis, Kherwar, Khasi, Kisan, Kokan,
Kolhas, Kolimahadias, Kondadoras, Korkus, Koryas, Lodhas, Malayalis, Mikis, Mizos, Naikodas, Porjas, Rabhas, Rathwas,
Saoras, Thaken, Tripuris, Yardi, and Yerukulas.
100,000 to 500,000 each
following tribal regions on geographical, ecological, social, economic, administrative,
ethnic, and racial criteria.
Himalayan Region with three sub regions:
a. North-Eastern Himalayan region, including Assam, Meghalaya (the
mountainous region of West Bengal), Darjeeling, Arunachal Pradesh,
Nagaland, Manipur, Mizoram, and Tripura
b. Central Himalayan region,
c. North-Western Himalayan region, including Tarai areas of Uttar Pradesh
and Jammu and Kashmir.

26
One eighth of total tribals are resident in this region.
2. Middle India region;including Bihar, West Bengal, Orissa and Madhya Pradesh.
This includes 55% of total tribals.
3. Western Indian region; including Rajasthan, Gujarat, Maharashtra, Goa, Dadra and
Haveli.
4. South Indian region; including Andhra Pradesh, Tamil Nadu, Karnataka and Kerala.
One sixth of total tribals reside here.
5. The Island region: the islands of Andaman and Nicobar in the Bay of Bengal and
Lakshadweep in the Arabian sea.
The Census of India (1981) estimated the state wise distribution of tribal population in
percentages (See figure 1.1). In the North-Eastern region Nagaland, Mizoram, Arunachal
Pradesh, Meghalaya are harbouring over 50% of the total tribal population. Madhya
Pradesh is harbouring 23% of the total tribal population, followed by the rest of the states.
The Central, North-Eastern and Southern part of the Country are the major homelands for
aboriginals.
Cultural classification
El win (1943) divided Indian aboriginals in to four types on a cultural basis. The first two
classes consist of "the comparatively small block of real primitives living in the hills, their
religion is unique and lively; their tribal organization is unimpaired, their artistic and
choreographic traditions are unbroken".
In the first class (a) "members live a largely communal life, (b) for them axe cultivation
is more than a form of agriculture; it is a way of life, (c) economically they still share with
one another and (d) they are shy of strangers". Examples are the Hill Marias, the Hill
Baigas studied for this thesis, the Jaungas of Keonjhar and Pat-lahara, and Gadabas and
Bongas of Orissa.

27
INDIAJ W M i & M x s m r R
^ HIMACHAL PRADESH*
DELHI
MEGHALAYA
BIHAR TL_'
MADHYA PRADESHd U A R A T n !
MAHARASHTRA---------
5- 10%
10 - 151%
15-50%
>50%
Figure 1.1 Distribution of tribal population in India.(Percentage of tribal population to total populaticwi: 1981 Census)
28
The second class of aboriginals "live in country equally remote and they are equally
attached to their ancient culture; they have started to change in a small way: (a) their
village life has become individualistic, (b) they no longer share things with one another,
(c) they are more accustomed to outside life": As examples, he quoted the difference
between Hill Marias and Bison-horn Marias of Bastar district and between the Bhumia and
Bhinjhwar Baigas.
The third class of aboriginals have begun to lose their hold on tribal culture, religion and
social organization.
The fourth class of aboriginals are advanced and represent the old aristocracy of the
country. They still retain their old tribal, clan and totem rules and observe elements of
tribal religion, though they generally adopt the full Hindu faith and live a modem, even
a European life. Examples are Gond Rajas. He considered this category "won the battle
of culture contact. Aristocratic tradition, economic stability or affluence, outside
encouragement, and a certain arrogance and self confidence characteristic alike of ancient
families and modern enterprise have enabled them to assimilate the blessings of civilization
without injury to themselves".
Racial affinities
The racial classification of the Indian population was started in 1868; and continued
thereafter: Risley (1915) was the first to classify Indian peoples into Dravidian, Indo Aryan
and Mongolian on a linguistic basis. However this attempt had limited success, because
he did not consider physical features. Later a German anthropologist and an Indian
anthropologist, (Von Eickstedt 1935, Guha 1935) studied the morphological features of the
Indian population.
Von Eickstedt divides the people of India into the following three categories.
1. Veddid Group : a. Gondid race, b. Malid sub-race
2. Melanid Group : a. Melanid race, b. Kolid sub-race
3. Indid Group : e. Indid race, f. North Indid sub-race
The Veddas of Ceylon are very primitive aboriginals considered to be "the real and
29
genuine ancient Indians". The very important Gondid sub-group (which includes the
Uraons, Gonds and Khonds) is marked by a somewhat strong physique, longer faces, noses
not so broad; and brown, sometimes even light brown skin. The malid sub-group found
in Southern India is marked by an almost black skin, thicker lips and very broad nose,
such as are commonly found among the Paniyers of South India.
The Melanid group are dark in skin colour, thought to be due to early immigration in to
tropical zones and intermixture with local population. It includes the Santhals, the Hos,
the Gadabas, the Panos, the Yanadis and the Chenchus.
The Indid group are the North Indian populations and different from Melanid, and Veddid
South Indian groups by their lighter skin colour.
Guha (1935) classified all the South Indian tribal groups as "Proto Australoid" and
contrasted them with the Negrito element. The latter had a typical shape of skull and
frizzy hair as seen today in the interior of Malaya. This stock has now almost disappeared
on the Indian mainland, but traces have been found in very remote areas among the
Angami, the Nagos of Andaman and Nicobar Islands, the Bagdis of Raj Mahal hills and
the Kadars of the South-West. Guha considered that the Negritos are the oldest inhabitants
of all and that the Proto-Australoids came later.
Malhotra (1978) provided an overview of morphological features of the Indian population
by examining stature, nasal index, cephalic index, and facial index. He analyzed published
data on 55 populations, and also considered published literature on prehistoric skeletal
evidence (during mesolithic, neolithic, chalcolithic, and iron ages), cultural evidence (lithic
bone tools from the early stone age) and ecological conditions. He concluded that at least
four broad morphological types called Negrito, Australoid, Mongoloid and Caucasoid have
contributed to the biological composition of the Indian population. The Australoids (South
and Central Indian aboriginals) are the oldest in the sub continent and tribals of North-
Eastern India are Mongoloids. Some of the caste populations (of North India) in his study
show Caucasoid elements with a great deal of micro-differentiation.

30
Based on all the above classifications it is concluded that the aboriginal people of India
are mixed: (figure 1.2) (a) the Australoid race is the oldest and is observed in Southern,
Central and to some extent Eastern and Western Indian; (b) the Mongoloid race is
represented by North-Eastern aboriginals, (c) the Negroid element is still represented in the
aboriginals of the Andaman and Nicobar Islands. The Caucasoid element predominates
in the caste (non aboriginal) population of Northern India.
An important Mediterranean element also exist in the caste (non aboriginal) populations,
due to repeated invasions in the past, population migration by various means, trade,
marriage etc; these movements have affected mostly the Punjab, Sindh and Baluchistan
areas of North-Western India.
Place o f the Baigas (the study population)
The Baigas are a hill tribe, scattered in the Central provinces of India. Their detailed
geographical location is described in chapter 2.
After considering all earlier racial classifications of aboriginal groups, views on Baigas by
different authors and taking into account the present study observations, I feel the Baigas
are correctly defined as of Australoid race.
I observed some differences (socio-cultural, religious, habitat, dialect, and physical)
between the neighbouring Gond tribe and the Baiga; the Baigas are definitely in a different
category from the Gonds. The Gonds are more advanced than the Baigas in all respects;
they live on plains as well as in forests, and practise settled cultivation like caste
populations using advanced technology, and speak Hindi and local languages (pingle and
Haimondorf 1987). The Baigas speak a broken form of Hindi and have lost their own
tongue (Russell and Hiralal, 1916). In physical appearance (dress pattern, style, and
appearance) the Gonds look more civilised than the Baigas. The socio-cultural behaviour
of Baigas is more typical of aboriginal groups than the Gonds, though both groups follow
tribe endogamy (marrying within the tribe). The Baigas hardly accept medical care,
whereas the Gonds are more interested in accepting medical attention (personal observation
and district medical records). Though there are no systematic records on mortality among

31
60 08*72 96
32'INDIAPakistan
Racial Content in Indian Tribals
( Simplified )
-1
Bay of Bengal
Arabian Sea Index
Mongoloid
Australoid
Andaman
And
Unclassified & Negrito• c Nicobar
IslandsLaksha Dweep
0000
Figure 1.2 Racial classification of aboriginals in India.

32
these two groups, but I have a strong impression that the death rate among the Gonds is
lower than that among Baigas. In 1975 the Baiga were declared a primitive tribe by the
State Government, based on their socio-cultural level, health, economic state
and backwardness. It seems the Baigas are still aboriginals. Like Elwin I prefer to call
them the "true indigenous people of India".
Madhya Pradesh
In 1985, Tiwari published a book "Primitive Tribes of Madhya Pradesh"; under
Government of India publication. There are 46 tribal groups in Madhya Pradesh (census
of India 1981). Some of these tribes are described by several different names (see
appendix 1).
9 of 45 districts are declared as scheduled tribe districts by the Madhya Pradesh
Government. About 50% of the total tribal population of the state is found in these
districts. The district Bastar only holds 10% of the total state population followed by
Sarguja 7.47%, Rajgarh, Shahdol, Jhabua, Dhar, West Nimor, Mandla and Rajnandgaon
districts.
The Baigas are distributed in 5 main districts viz Shahdol, Mandla, Bilaspur, Rajnandgaon
and Balaghat, but some may also be residing in neighbouring districts. According to the
1971 census the total Baiga population is 176,939.
33
CHAPTER 2 THE BAIGAS
Origin and racial affinities
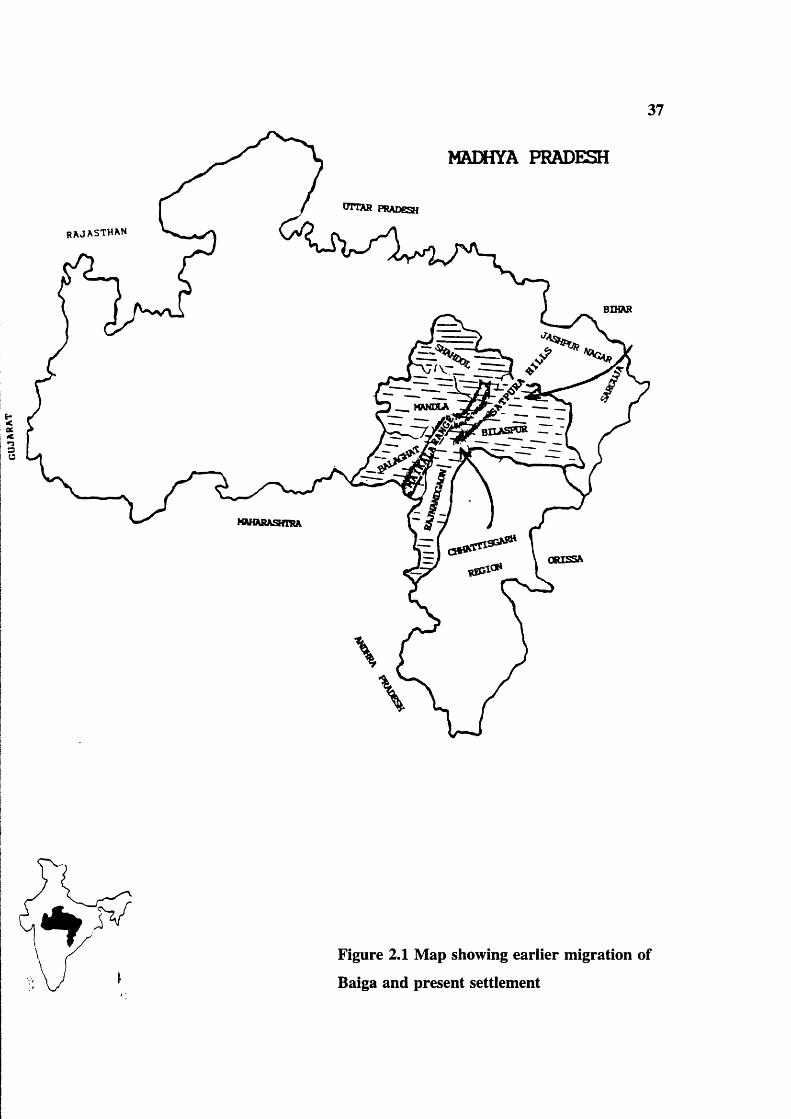
Russell and Hiralal (1916) considered that the Baiga tribe of the Central Provinces are
really a branch of Bhuiyas and they migrated from Chattisgarh into the Satpura hills on
the Western borders of the plain (figure 2.1). Elwin (1939) also described them as "a
branch of the great Bhuiya tribe, which originated from Bengal and Bihar and is to be
found in Jaspur and Sarguja in the present neighbourhood of the Baiga". He also
suggested that they retreated into the surrounding parts of Chattisgarh after the Hindu
invasion. Elwin’s view about distribution was that Baiga migrated not only to Mandla,
Shahdol, Bilaspur, Rajnandgaon and Balaghat districts, but also spread in neighbouring
districts. According to the Baiga development authority, Dindori, there is no systematic
study or population survey on their geographical distribution in Madhya Pradesh. The
present available figures are arbitrary. Grierson also supports the concept that the Baiga
migrated from Chattisgarh region to Mandla, Balaghat, Shadol, Bilaspur (regions) districts,
on the basis of the linguistic affinity of present Baigas of Mandla and Balaghat with the
tribals of Chattisgarh.
Bhuiya and Baiga are in fact synonymous names implying lords of the soil, or sons of the
earth. The Baiga some times call themselves, and local people call them Bhumiraja (lord
of the earth) or Bhumij an (sons of the earth). Russell and Hiralal (1916) noted that
Bhumia are also known as Bhuiya and both are names given by Hindus. The Bhuiyas of
the Central Provinces were employed as village priests by Hindus and by Gonds, and the
Baigas use the Munda (village headman) as priest for the whole tribe. Russell also noted
that the Bhuiyas of the Central Provinces and the Baigas had completely abandoned their
own language long ago and had adopted a broken form of Hindi. Elwin agreed and
considered that the Baiga can be classed as a Kolid group (one of the Australoid groups
that originated from Bengal and Bihar) rather than Gondid or in the Gond category. I
agree with Elwin because of clear differences between the Baiga and the neighbouring
Gond tribe in all respects (culture, physical appearance, social mobility, practice of
agriculture and education).

34
Earlier descriptions of the Baiga
Captain Thompson briefly mentioned the Baigas in 1867 in his Seoni settlement report (see
glossary); he described them as "the wildest of all tribes, inhabiting the most inaccessible
hills and remote forest; living on what they can secure with their bow and arrows, in the
use of which they are very skilful, and the forest produce and the small crops which they
raise on the hill sides. They are extraordinarily shy, it is often difficult to get hold of
them, unless you are accompanied by some one known to them. They fly out of one end
of the village as you appear at the other end, and you can see them scrambling at you from
behind bushes like wild animals" (quote from "The Baiga" by Elwin 1939). This is still
true today in some parts of Baiga land and happened to me on one occasion (see P 126).
In 1939 Elwin produced an anthropological account "The Baiga", still today a major
reference work. Elwin stayed with the Baigas for 5-6 years. He learned their language
and made extensive trips in Baiga land, so was able to speak confidently about them and
describe their socio-cultural life. In the preface to "The Baiga" he writes "The Baiga tribe
is one of those remaining in the Central Provinces of India, that has not been greatly
affected by civilization. Neither the propaganda of Christian missions nor the influence
of Hindu culture has touched the people, who may still be described, in Forsyth’s words,
as less raised above the condition of the mere hunting savage than any, and clinging to the
most secluded solitude. No Indian tribe can be altogether unaffected by the prevailing
Hindu civilization, yet on the whole it is astonishing what little effect this has had upon
the Baiga’s mind".
Elwin was not in favour of "uplift" and modernization programmes for the Baiga. He
wrote "it is not yet too late to save the Baiga from the fate which an over-hasty and
unregulated process of uplift and civilization has brought upon peoples in other parts of
India". He gave several examples of opinions of other anthropologists on primitive groups
(pp 511-512). At one stage he writes "many people in India suffer from the curious and
rather puerile belief that the anthropologist wishes to keep primitive people "as they were"
as material for his research. In fact as a scientist he is not interested in any particular
grade of civilization, he is concerned with things as they are". He viewed the semi
civilized Gond as just as interesting and important as the wilder Baiga. He suggested the
35
Baiga should have more freedom in the forest; "if they were allowed one great annual
hunt, this would have a revivifying effect on tribal life and might even benefit the game
in the long run, for they would be less likely to poach at other times. Killing hares should
be permitted in any case, and it should not be illegal to carry bows and arrows".
He stressed the exploitation of innocent poor Baiga by local officials again and again, and
he condemned the dictatorship of these subordinate officials towards tribals. He writes "I
cannot think of anything more shameful, meaner and disgraceful to an administration that
claims to be enlightened, than the way that subordinates openly rob these poor people".
"I have seen the poorest people robbed of the chicken that they have been saving up for
a festival, or a pot of Ghee which they treasured since a long time, or the fruits which they
got with difficulty. When I introduced plants to them to grow, they usually refused
"because the government people will annexe the fruit crops" (p 518).
At the end of his book he asserted he felt for Baigas throughout the time and tried to make
the Government (of British India) realize, what their real needs were.
During 1932-39 out of every 1000 children born among the Baigas 688 to 891 survived
ie, there was 11-32% infant and childhood mortality. The practice of birth control was
very new to the Baiga during Elwin’s time. There was no preference for boys. Women
generally desired daughters and men sons. They believe if they wanted a boy after birth
of a first son, his umbilical cord should be buried the opposite way up from the way it fell:
after that boys will bom.
Baiga land
The Maikal hills are the backbone of the Baiga region (see figure |2.1) They lie between
21.1 and 22.40°N and 80.46°E and connect the great hill systems of the Vindhyas and
Satpuras, which form the northern and southern walls of the Narmada valley. The Maikal
start in the Rajnandgaon district and run across the Shahdol district, 135 kilometres further
on they enter the Pushparajgarh tehsil of Amarkantak one of the sacred places in India
where the source of the Narmada river is situated. The Maikal range forms a broad plateau
about 2200 square kilometres in extent, which is mostly forest country and inhabited by
36
tribals including the Baigas.
Though the Baigas are scattered in different districts of the Maikal region, Dindori tehsil
is the heart of the Baiga region and density of the population is high. The Baigas in this
region are mostly Bhumia Baiga. The "Baiga Chak" (Baiga predominated land) was
established in 1890 by a letter addressed to Chief Commissioner, Jabalpur in Dindori
tehsil.
Geographical features: and Tribal environment
In India 23% of land is covered by forests and most of the forest is useless for human
settlement. Forest also occupies 23% of the total area in Madhya Pradesh, coverage
varying from one area to the other. Half of the tribal area of the state lies at an altitude
between 1000 - 2000 feet, and one fifth at 2000 - 3000 feet. One quarter is below 1000
feet (Dubey and Bahedur 1967). The thick forest and high temperatures (25-35°C) create
highly congenial conditions for mosquitos to breed and malaria is highly prevalent.
Agriculture
Agriculture is at a primitive stage in most tribal areas. Most tribal houses are attached to
agricultural land and they grow maize, mustard, vegetables and seasonally wheat and rice.
They grow kodo, kutki, jagni and tobacco (see glossary). Cow dung is the major fertilizer.
Though the forest department has allocated some restricted land, it is not productive for
the tribe, and at best can be used only for subsistence. The major limitation is soil
erosion, and there are no proper irrigation and transportation facilities. Tribals necessarily
also depend on forest produce, fishing, agriculture and forest labour. The density of the
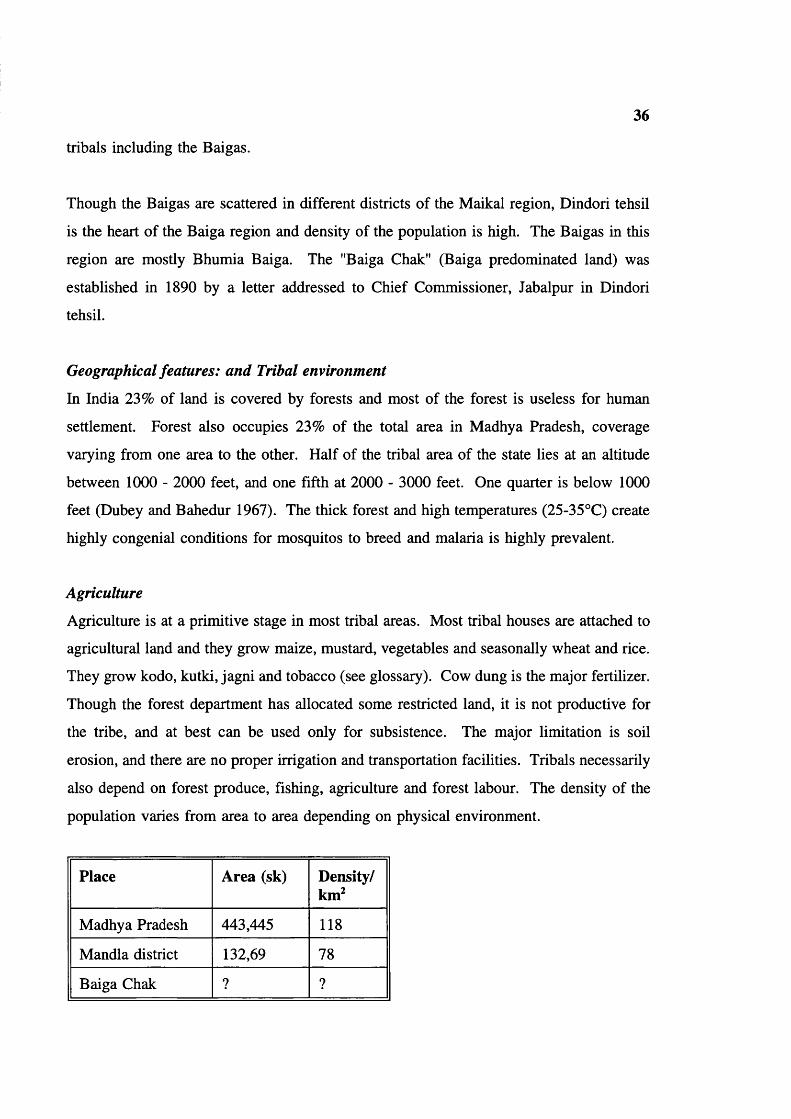
population varies from area to area depending on physical environment.
Place Area (sk) Density/km^
Madhya Pradesh 443,445 118
Mandla district 132,69 78
Baiga Chak ? ?
37
MADHYA PRADESH
RAJ AST HAN
%et>c
s
OTTAR PRADESH
MANEtA
Figure 2.1 Map showing earlier migration of
Baiga and present settlement
38
:
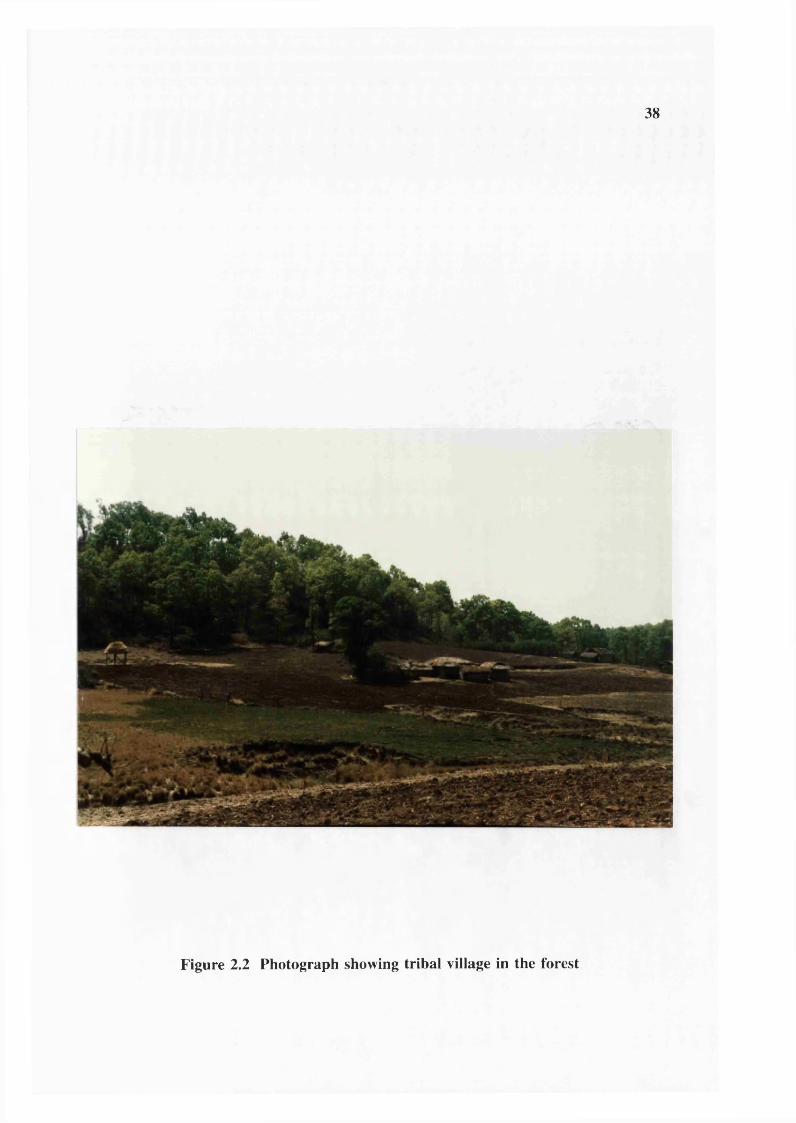
Figure 2.2 Photograph showing tribal village in the forest
39
Sub-divisions o f the tribe
Jat
Russell & Hiralal (1916) described seven further divisions/sub tribes of the Baiga:
Binjhwar, Bharotia, Narotia or Naher, Raibena, Kathbaina, Kondwar or Kundi and
Gondwar. Of these Binjhwar, Barotia and Narotia were the best known. Sub-tribes (Jat)
were again subdivided into a number of exogamie "garbs" with certain rules. A Baiga
might not take a wife from his own garh or from another one who worships the same God.
Elwin (1939) listed ten jats and mentioned that the possibility of intermarriage between
Jats varies from place to place. He described the characteristics and geographical
distribution of different Jats of Baigas as follows:
1. Bhumia: wild, handsome, lightly clad, their hair beautifully dressed in a knot, live
in Mandla (most of the inhabitants of the Baiga Chak are Bhumia) Pandaria,
Kawardha and Rewa districts.
2. Bharotia who live mainly in Baihar, are very like the Bhumia, and a few who live
in the Chak practice bewar and are indistinguishable from them.
3. The Binjhwar Baiga are the most civilized in the Hindu sense. Some of them
dress like ordinary low caste peasants, use the plough and observe some Hindu
feasts and customs. The Binjhwar Baiga live in Baihar, Mandla, Niwas, Jabalpur
and Rewa districts.
4. Muria Baiga who live in Niwas and Mandla distinguish themselves from other
Baiga by shaving their hair. Muria Baigas are influenced by Gonds.
5. Narotia and Bharotia are living in Baihar.
6. Bhaira Baiga are to be found in Bilaspur and Rewa. They are distinguished from
the Bhaina tribe, which inhabits the same locality and is generally believed to be
derived from irregular unions between Baiga and Kawar.
7. Gondwaina and Kondwan Baiga of Balaghat eat monkeys and beef and are
looked down on by other Baiga in consequence. These two Jats are said to live in
Baihar and on the Kawardha border.

40
The dining habits differ from place to place for example Baigas in Dindori and Niwas
tehsil (the Jat Binjhwar), may eat at the hands of Bhumia and Muria. Similarly, Bhaina
and Baiga eat food served by Bhumia and Bhinjhwar sub tribes in Bilaspur. Member of
one Jat can marry the virgin girl of another Jat provided the girl stops further relations
with her parents.
I observed the Baigas are divided into ten endogamous units (Jats). The main jats are
LBinjhwar, 2Muria, S.Raibhaina, 4.Narotia, 5.Bharotia, ô.Bhaina, 7.Kathbhaina, S.Kundi
or Kondwan, 9.Bhumia, and lO.Gondwaina. In the Baigas there is no clan (see glossary),
instead the exogamous unit, the "garh" acts as clan for social functions.
The Baiga believe each group (garh) originally belonged to a particular hill or territory or
jungle, and they must give their girls to the people of another hill or jungle. According
to Vi jay Chourasia (1991), who worked with Baigas and published several reports on them
in daily newspapers, there is no known historical explanation for why the Baiga are
divided into a number of exogamous units (garbs). Members of a garh are a group of
related people identified by a common name. This name might have originated in the past
on the basis of place of residence (example, Gangariya, who lives in Gangar ghat),
occupation (example-Rattudiya, who collects the bones), character (example-Niguniya, who
has a good character) and tree (example-Saradiya, derived from Sarai tree). Garh names
thus have a general resemblance to European population surnames. The Baiga consider
the members of each garh as having the same blood, and so exclude marriage within the
garh.
There is hardly any study on Baiga names. In the present survey, I recorded 102 garhs
(family name) among the people in 17 villages in tehsil Dindori. Most belong to the
Bhumia jat. The present Baiga do not make a clear verbal distinction between Jat and
garh. Buddh Singh Maravi, who is a school teacher and educated Baiga, puts Maravi (a
Gond clan name) after his name to show his high status.
Kinship pattern and terminology
The Baiga kinship pattern is patrilineal and authority is patriarchal. The residence is

41
Baiga tribe strictly endogamous)
Sub tribe: Jat (mostly endogamous
Garhs/surnames (strictly exogamous
Figure 2.3 Social divisions of the Baiga tribe

42
patrilocal or neolocal (see glossary). Usually after marriage the husband constructs a
separate house in close proximity of his parents. Though they live separately, they share
food and alcohol (Mauha) often. The head of the family has full authority over the family
property and it remains with his discretion to divide it among all his sons. Daughters
leave their parental home after marriage. The detailed analysis of kinship pattern in the
present study is described in chapter 6.
Baiga kinship terminology resembles that of South Indian Hindus. A Baiga treats all his
father’s brothers as fathers and all the women his father marries as mothers. The term
"Mama" is used for the mother’s brother, father’s sister’s husband and father-in-law.
Father’s sister, mother’s brother’s wife and mother-in-law are called "Mami". There are
some usage terms like "Dai" for mother, "Baba" for father, "Aji" for father’s mother,
"Buda" for mother’s father, "Budi" for mother’s mother, "Toora" for boy and "Toori" for
girl.
The Baiga uses the term "Kaka" for step father, father’s younger brother and mother’s
younger sister’s husband. "Kaki" for step mother and father’s younger brother’s wife. The
Baiga called "Mahina Behin" for father’s sister’s daughter and mother’s brother’s daughter.
Since cross cousin marriage is a common practice among Baigas, boys can marry their
Mahina Behins. By contrast, in the Northern Indian caste system, boys treat their mother’s
brother’s daughters and father’s sister’s daughters as sisters. The term "Mahina Bhai" is
used for mother’s brother’s son and father’s sister’s son. A Girl can marry her Mahina
Bhai.
The term "Sadhwa" is used for husband’s elder or younger sister’s husband. They use the
term "Samdhi" for ones son’s wife’s father, son’s wife’s father’s brother (younger or
elder). They called "Samdhin" for ones son’s wife’s mother and son’s wife’s mother’s
sisters.
The Grandfather calls his granddaughter "Chhotki" (same as junior wife) and in the past
the grandfather was allowed to marry his Chhotki. Grandmother calls her Grandson
Danni-her Malik or Lord and asks him to fulfil his desires including sex.

Buda Buda Budi
Kaki Kaka MamiBaba MarnaDai
Mahina behin Mahina behinMahina bhaiRELATIONS VIEWED FROM THIS POINT
Samdh i SamdhinSamdhi
Toora TooriDanni to Aji Chootki to Buda
Figure 2.4 Kinship terminology in the Baiga tribe
6
44
In the present survey, Jamandar, a tribal man from Durkuta village moved to his in-laws
home in Tantar village after marriage but such occasions are not common. Unmarried
sons remain with the parents and take care of them.
Avoidance
The Baiga have some rules of avoidance. For example a woman should be distant from
her husband’s elder brother. She should not look directly at him or remain in his company
even when others are present. Similarly a man should not have close intimacy with his
wife’s elder sister. A man should not joke and make love with his wife in the presence
of parents-in-law.
Joking relations
There are some joking relations among Baigas such as (a) a man and his elder brother’s
wife, (b) a woman and her husband’s younger brother, (c) a man and his wife’s younger
sister, (d) a girl and her elder sister’s husband, (e) a man and his grand daughter (f) a
woman and her grandson. They will have not only joking relations and romance, but it
may also end with marriage sometimes.
Teknonimy
A Baiga woman never calls her husband by his name; she always calls him, her son’s
father or daughter’s father.
Marriage, kinship and family
Pre-marital sex is common. Love making is possible while hunting, fishing and during
field work. Marriage is an important social institution in the Baiga conununity with sexual
and economic importance. Among the Baigas both boys and girls enjoy sex after attaining
their puberty. Marriage allows them to have a permanent sexual life. Elwin writes "for
a Baiga woman marriage is specially important. Although pre-nuptial intercourse is
common, she passes through in to a new erotic life, she gains a new freedom. Hitherto
a whole family has watched her movements; now she has to conceal them only from her
husband and marriage makes a responsible women of her; it licences her to bear children;
it establishes her as a responsible member of the community". For men also, marriage

45
brings permanent sexual and social life. Preference is to marry a girl or boy in the same
village. Cross cousin marriages are preferred. Cross cousin marriage is possible despite
garh exogamy because cross cousins have different garh names as the women moves to
the husbands garh on marriage.
A boy can marry his mother’s brother’s daughter (MBD) or father’s sister’s daughter
(FSD) and vice versa. This is called "dudh palatna" in Baiga terms (returning of milk ie,
giving back the girl). Sometimes they exchange girls between brother and sister families.
If a Baiga boy or girl do not find a cousin to marry, they adopt someone in the village as
Mama (uncle) or Mami (aunt) and get married to his or her son or daughter.
This preference for consanguineous marriage is highly relevant to this study as it can have
major effects on gene flow. The back ground is discussed more fully on P 182 and
quantative data is shown.
In the present survey I observed no grandfather and granddaughter and grandmother and
grandson unions, as mentioned by Elwin. I asked many Baigas, and they replied "we do
not do this practice any more". It seems they feel such practices are uncomfortable for
social relations or they have been influenced by neighbouring Hindu caste groups. A
woman is allowed to remarry after her first husband’s death or after divorce from her first
husband with the village panchayat’s permission.
Marriage Payment (Sukh)
In most Hindu caste groups dowry is common. At the time of marriage, the bride’s
parents offer some sort of economic assistance like land, property, money, animals,
furniture and so on to the newly married couple to establish their house separately. By
contrast, in most tribal communities bride price (Sukh) is customary. The groom or
groom’s parents offer some sort of economic assistance to the bride’s parents or the bride.
Since they are poor economically, they offer some alcohol, cloths, animals such as cow,
buffalo, horse which are useful to the family, and a small amount of money.
According to information given by many Baigas especially Budh Singh Maravi, the
46
groom’s parents have to pay Sukh from 3-11 rupees and 3-11 cloths to the bride’s family.
This is traditional: exceptionally some Baigas pay 100 rupees Sukh. The high price of
Sukh denotes the girl’s status, beauty and character.
Regarding cloth, generally the length of cloth should be five metres so that a woman can
cover her body comfortably. Usually an odd number of cloths 3-5-7-9-11, is offered.
There is no explanation why only an odd number should be offered. The answer just is,
it is a Baiga tradition. Sometimes it is related to the number of the bride’s sisters, so that
all of them can have a cloth from their future brother-in-law at their sister’s marriage.
There is also a possibility that the bride’s female cousins can also have a cloth if the
groom is rich enough to offer one.
On the day of the wedding, the groom’s parents or the groom has to offer alcohol to the
bride’s parents and other elders in the village. A marriage involves both a meal and
alcohol and the expenses should be borne by the groom’s parents.
Polygamy
Polygamy is allowed among Baigas. A man can have his Chhotki (junior wife) with the
permission of Bhadki (senior wife). Some men keep their Chhotkis in different villages
and visit them often. Elwin described several examples of polygamy (in page 286), he
writes "polygamy, in fact is only polygamous when it is successful, when it fails it usually
ends in the divorce or separation". He related polygamy to an unbalanced sex ratio : "for
the Baiga critical ages between 17 and 23; there are 1276 Hinduized Baiga and 1355 tribal
Baiga women to every 1000 men".
The sex ratio among the Baiga is no longer unbalanced: data on polygamy in the present
study is described in chapter'6.
Divorce
Divorce is allowed among the Baigas, if the wife is not satisfied sexually or the husband
behaves roughly or vice versa. It should be accepted by the village panchayat. Divorce
may be effected by the husband and wife breaking a straw in the presence of the village

47
panchayat. If the woman remains in the same village and does not marry again the
husband is responsible for her maintenance. When the couples are cousins, uncomfortable
unions or divorce can create psychological tensions between the brother and sister parents
and can decrease the preference for cousin marriage among the Baiga.
Tattoo
Tattoos are an important part of a Baiga woman. Tattooing is the making of permanent
marks on the body. It is considered the wealth of a Baiga woman. There is a strong belief
that tattoos contain the real identity of a Baiga lady. It is believed that if a Baiga woman
fails to get tattooed at all, God will drill holes all over her body with an iron rod in
heaven.
At the age of 5 years or after, each and every girl has to get tattooed.
A triangular mark is made on the forehead when the girl is about 5 years. On the breast
is a peacock, on the arm a turmeric root at adolescence. Arms and breasts are not tattooed
until adolescence. At the time of marriage or after marriage, a line of dots called Palani
are made on the thighs, on the knee a flower, on the back flies or magic chains, on the
legs are fish bones. The Baiga think these different markings will protect the woman from
evil spirits and are good for health. In a real sense the tattoos are a sexual stimulant for
Baiga menfolk, instead of ornaments, tattoos make Baiga women beautiful. Here I would
like to quote Elwin’s words about Baiga tattoos "A Dadaria says, if you buy bangles, my
daughter, they will break in a few days, but if you are tattooed it will last forever". The
Baiga want to make their women beautiful once and for all with tattoos. Generally, the
cost of tattooing is borne by the mother up to marriage, and after marriage is borne by the
father-in-law.
However, I found one girl from one family who was not tattooed at all and she is a
daughter of a educated school teacher from Durkuta village. It may be the beginning of
social change.
Religious beliefs and practices
Russel and Hiralal (1916) noted that the religion of the Baiga was purely animistic.

48
although Binjhwar Baiga preferred Hinduism. Hutton (a great anthropologist) writes "The
beliefs held by the tribes are not mere vague imaginings of superstitious and untaught
minds, but the debris of a real religious system, a definite philosophy to the one time
prevalence of which the manifold survivals in Hinduism testify, linking together
geographically the austro-asiatic and australoid cultures of the forest-clad hills, where the
isolated remains of the original religion still hold out in an unassimilated form". The
Baiga really worships everything he can, in order to be on the safe side. Baigas perform
religious ceremonies for other tribes and even for the Hindus.
Bhagwan (God)
Bhagwan is the Hindu word for God and the Baiga borrowed it from the Hindus. The
Baiga believe Bhagwan is the creator. He created the Bewar (forest), and he allowed the
Baigas into the jungle. He gave them seed to plant, he established the rules of exogamy.
He provided the tribe with taboos that would maintain its integrity and prestige. He is
responsible for life and death. He sends his man to call them when their term of life is
ended. Every "Jiv" (life) goes to him.
The Baiga has lively imagination about God and creation of mankind. They have a variety
of deities. (A) Takurdeo who resides in the Pipal Vruksh (Pipal tree). Takurdeo is the
lord of the village. (B) Takurdeo’s wife is Dhartimata (Goddess of earth). The Baiga
believe she is mother of all and she loves them, her children and they were born from her
womb. They drop a few drops of mahua (alcohol) before drinking and offer black
chickens, black pigs, and black goats to Dhartimata. (C) Dulhadeo who protects from
natural calamities and diseases. (D) Bhimsen, the second of the five Pandavas in the
Hindu epic the Mahabharat. According to the Baiga, Bhimsen is giver of rain for them.
(E) Gansandeo is responsible for driving away tigers from the Baiga villages.
They worship household Gods as well; the chief of these is Asidadi, who lives behind the
hearth. Narayandeo lives on the threshold and protects the Baiga inside the house.
Ratmal, Goddess of night, lives in the house and makes children happy, and protects them
from diseases. Panihar lives in the water pots in a comer of the house. When the women
go to get some water, she protects them. Satdhari lives in the trident (used for fishing) and

49
protects the household from disease. Maswasi, lord of the Chase, who helps the Baiga
while hunting lives in the bow and arrow. Kansasur mata lives in lota (pot) or thali (brass
plate), Lohasur mata lives in the axe; Narbada Mai lives in an iron chain hanging from the
wall. There are other Gods and Goddesses, who protect them from evil spirits.
Livelihood
The Baiga live on daily earnings. The real property of the Baiga is a few axes, some
cooking pots, some ornaments made of aluminium or steel and a house made of mud
mixed with grass. Some families have some cattle. The Baiga economy relies mainly on
agriculture, fishing, hunting, gathering of forest produce and labour for the forest and
public works departments.
The report of a tehsildar of Baihar (during Colonel Bloomfield’s time 1868-1885) reveals
that the Baiga are depending economically on (a) village pujariship (priest), (b) bamboo
matting and baskets, (c) collecting honey and harra (d) labour (e) killing wild animals and
(f) shifting cultivation. Things have changed considerably now. I did not find any
pujariship. Shifting cultivation has been stopped totally and turned to settled cultivation,
and killing of wild animals is banned. Sometimes petty local officials exploit them by
taking their forest produce under the pretence that forest produce belongs to the
Government.
According to Russel and Hiralal (1916) the Baiga formerly practised only shifting
cultivation (slash and burn). They also collect honey, natural gum, fruits and other herbs.
Harvesting forest wood was also part of their livelihood.
Elwin (1939) mentioned about the practice of shifting cultivation in Kawardha region of
Madhya Pradesh (p 108). Attempts were made to stop shifting cultivation since 1867, and
as a result of prohibition of cutting the forest some Baigas migrated to neighbouring
districts. Others agreed to practice settled cultivation (p 118).
After 1935, when shifting cultivation was totally prohibited the forest department allocated
2.5 hectares to each family in the Baiga Chak area for agriculture. They grow kutki maize

50
Figure 2.5 Photograph showing Baiga women with tattoos
51
and rice. The grains are stored for the rest of the year. They grow some vegetables near
their houses. Though settled cultivation is encouraged by the Government, the conditions
for agriculture in tribal areas are different from those in the plains. As the terrain is hilly
and undulating, at an altitude of 2000-3000 feet, there is extensive soil erosion often
leading to destruction of crops.
Fishing is also a part of their livelihood. Collection of forest produce like honey, and
mahua fruits allows them to exchange or for money in the weekly markets. They also
prepare alcohol from mahua fruits for their own drinking. There are small tobacco gardens
beside all Baiga houses. They use the dried leaves for chungi smoking (the dried tobacco
is packed in (sarai) leaves) as a daily habit. They exchange the produce in the weekly
markets in main villages.
In 1967, Dubey and Bahadur published "A Study of Tribal People and Tribal Areas of
Madhya Pradesh" under the auspices of the Government of Madhya Pradesh. They noted
on Baigas; the more civilized Baigas work in the fields of Gonds and other well-to-do
villagers, 55% of the total workers are cultivators, 34.3% as agricultural labourers and
14.6% were engaged in household/cottage industry, mainly bamboo work. They described
that the level of literacy among Baigas was only 2%.
Food and other dietary habits
Pej is their daily food. Pej is a kind of gruel made by boiling millets or rice in large
quantities of water. They eat Pej three times a day, in the morning, afternoon and at night
with alcohol. Sometimes, they eat chapattis made of wheat flour. Rice is eaten by a
common Baiga on rare occasions. They do not buy other vegetables. The Baiga collect
a large variety of roots. They boil and eat them with salt. Seasonally they eat fruits from
the jungle.
They eat meat of different kinds of rats (Elwin described seventeen different types of rats),
crows, goats, chicken and some other forest animals. The availability of wild animals is
steadily decreasing and the forest department banned the hunting of wild animals.

52
Drinking mahua (local alcohol) is a daily habit for Baiga men. They can survive without
Pej but they cannot get sleep without mahua. Occasionally women also drink. For men
smoking chungi is a part of their bodily function: women do not smoke but occasionally
chew tobacco. Tiwary (1985) noticed that besides its ritual and social significance, liquor
has a special charm for the Baiga. They do not consider it as a part of their regular diet,
but emphasize its nutritional values. Chungis (smoking pipes of leaves) are inseparable
companions of the Baiga males. For them the chungi is a device for relaxation and
stimulation for work, and exchange of chungi is a token of friendship. They smoke every
day; Elwin remarked Baiga words "we smoke just as we breathe, unknowingly".
The Baiga have great respect for relatives and they provide nice hospitality. When I was
collecting data in Durkuta village, Suddu Singh (one of my informants) requested me to
come next day for the survey because there was a guest in his home at that time. Further
information on drinking alcohol, smoking tobacco, and chewing tobacco are described in
chapter 6..
Dress
Russel and Hiralal (1916) wrote "A Baiga may be known by his scanty clothing and
tangled hair, and his wife by the way in which her single garment is arranged so as to
provide a safe seating and a place to her child. Baiga women had been engaged in outdoor
work like transplanting rice in the field with babies comfortably sitting/hanged in their laps
or supportively riding on the back with their arms and legs out, while the mother is
stooping low, hour after hour handling the rice plants".
Education
Schools are available in the Baiga Chack area to motivate the education in the tribal
villages but not in every village. In 17 study villages there are 6 1 schools, \in two villages
hostels are attached.
Health
The Government of India realized the need of improving Tribal Health in Central India
and established (in 1984) a research centre in Jabalpur named Regional Medical Research
53
Centre for Tribals under the umbrella of Indian Council of Medical Research, to study the
tribals. In 1986-87, the Regional Medical Research Centre for tribals launched a sample
survey on school going Baiga children for hereditary anaemias and other related genetic
markers and observed 22.3% HbAS, and 8.3% G6PD deficiency in males. (RMRC/ICMR
Annual Report 1986-87). The National Malaria Eradication Programme reported high
malarial endemicity area with a high mortality rate. The study also revealed that their diet
did not meet the recommended dietary allowances. Adequacy of protein was about 90%,
but was only about 60% for calories. Iodine deficiency is a health problem; over 45% of
the children were found to have goitre. Small nullahs (brooks) are major the drinking
water source for the tribals. The health department is trying to provide better drinking
water by digging bore wells in the tribal area.

54
CHAPTER 3 ASPECTS PARTICULARLY RELEVANT FOR THE STUDY:
DEMOGRAPHY, SOCIAL CLASS, CONSANGUINEOUS MARRIAGE AND
PREVALENCE OF MALARIA.
It is important to a scientist who deals with genetic disorders, population genetics and
natural selection in a primitive society to obtain demographic details, especially because
in this type of societies the fertility pattern is very natural with less effects of artificial
influences than elsewhere. For a human geneticist, the aim of understanding demographic
variables such as age and sex distribution, mate choice, marriage and reproductive
behaviour, is to understand transmission of genes and their flow and selection in varied
environmental conditions. There is hardly any literature on marriage in the Baiga
population except Elwin’s work (1939); which emphasised only qualitative aspects of
Baiga. Therefore in the present study a specific effort was made to collect accurate social
and demographic information. Such information is rarely available for primitive
population. The following have been studied by observation and statistically when
possible.
Age and sex distribution. Infant and childhood mortality. Age at menarche and
marriage. Spousal age difference. Mate choice and matrimonial distance. Polygamy
and Divorce, Fertility, Sterility, Breast feeding. Contraception and Family planning.
Two features of particular importance for interpretation of genetic data, namely social/
economic status and the consanguineous marriage are discussed more fully here.
Economic status
Social class is a complex concept depending on inheritance, property, education, economic
status and other factors. It is important for many reasons. One of the most important is
that Social class differences affect all the demographic and cultural variables listed above,
and can confound the interpretation of any genetic (or other) study that is not controlled
for these variables. For example, no study of genetic implications of customary
consanguineous marriage in a developing country has been approximately controlled.

55
Higher social class has been generally associated with occupations needing higher
education and training, and so with delayed marriage, at least for males. Dowry is also
an important factor that can delay marriage in all higher castes in India. By contrast, in
lower caste groups and among aboriginals neither education nor economic factors may
delay marriage. Dowry is uncommon; on the contrary bride price is common form of
marriage payment. Russell and Hiralal (1916); Murdock (1967) reported that bride price
is traditional practice in aboriginals in India.
In the past, the property of aboriginals was forests, hills, mountains and streams. Whatever
the outcome of the forest, honey, fruits, tubers, forest wood, animals and their products are
the major source for their economy. Traditionally these resources have been held in
common, leading to a society with minimum of social and economic distinctions, (though
the recent introduction of land ownership has introduced the concepts and values of private
property and social class). In 1987-88 per capita income in Madhya Pradesh was 2403.8
Rs./Annum; 46.2% people are below the poverty line (since the tribals mostly live in a
subsistence economy outside the economic mainstream they would be classed in this group,
but its meaning in their case is dubious). There are no estimated figures on tribal incomes
in Madhya Pradesh. As yet economic factors have little influence on social class or
marriage age in aboriginals and this has proved particularly helpful in studying
consanguineous marriage, that in most other groups is also related to social class.
Consanguineous marriage
Present day tribal groups and South Indian populations practice the customary cross cousin
marriage, defined as marriage with mother’s brother’s daughter (MED) or father’s sister’s
daughter (PSD) or vice versa. Parallel cousin marriage is between children of 2 brothers
or 2 sisters. The practice of cross cousin marriage is ancient in India was mentioned even
in the Mahabharata (Kapadia 1966). In Southern India (Tamil Nadu, Andhra Pradesh,
Karnataka and Kerala) both types of cross cousin marriages are prevalent among both caste
and tribal groups. Uncle-Niece marriage, marriage with one’s sister’s daughter is a typical
dravidian custom observed among the Brahmins of Tamil Nadu, Karnataka and Andhra
Pradesh. In all these situations family "exogamy" is a strict rule in tribal groups and South
Indian populations. In Northern zone marriages between cousins are not allowed except
56
among Muslims. Cousin marriage of both types is favoured by many Muslims and may
have been re-introduced in Northern India through Islamic invasions. In Central India
marriage regulations, particularly among the upper castes, are like those in Northern zone.
Among all Central Indian Dravidian tribal groups like Gonds, Pradhan, Dhurva and Oraon
bilateral cross cousin marriage is practised (Hazra et al 1988). In Maharashtra state where
both South and North Indian cultural heritages meet (Sanghvi 1966), cross cousin
marriages are practised; tribal groups (Gonds, Kolams, Korku, Pradhan, Andh) follow cross
cousin marriages. In Central Maharashtra matrilocal cross cousin, in Southern Maharashtra
cross cousin & uncle-niece marriages are in practice. The cross cousin marriages are not
compulsory among the Rajput in Rajasthan, but they are frequent. It has been suggested
that this is the result of contact with and absorption of Southern people. Possibly Northern
Conquerors took brides from the Southern people, but refused to give daughters in return.
Consequently the central area is a cultural admixture between North and South.
The marriage system in North-Eastern India is more or less similar to South India.
However there are some restrictions in some caste groups and aboriginals. Jay ant Sarkar
(1988) described the type of marriages practised in different States of North Eastern India
summarized in table 3.1.
Lineage (kinship pattern)
Kinship is a social concept that differs between populations. The concept may coincide
with the genetic kinship pattern, eg in Europeans, or it may differ eg in tribal groups.
Lineage in India is mainly patrilineal. The kindred is defined mainly by the male line of
descent from a common ancestor, whether brides are obtained from unrelated or related
families. In aboriginal groups women come from the same group and often from the same
family, with an "exogamie" rule. The Nayars of Kerala, and the Khasi and Garos of
Assam follow a matrilineal kinship pattern. Authority passes from mother to daughter,
families tend to be matrilocal, men leave their families and join their wive’s families and
adopt their wive’s surnames.

Table 3.1 Marriage practices in North-East India (Jayant Sarkar 1988)
Name of the Ethnic Group
Distribution Kin categories real or classificatory with whom marriage is
Permitted Prohibited
1. Khamti, sinapho, Tangsa, Kaman,
Mishmi, Sulung, Paite, Thadou, Mao,
Kabul, Anal, Tanghkul, Purum,
Mizo
Arunachal Pradesh,
Manipur
Mizoram
MBD FSD and Parallel Cousin
2. Adi (Padam, Gallong), Hill Miri,
Nishi Ao Naga Lalung
Arunachal Pradesh
NagalandAssam
MBDFSDMBDFSD
Parallel cousin
Parallel cousin Parallel cross cousin
3. Wancho, Koniyak, Nocte
Arunachal Pradesh and Nagaland
These tribes prohibit marriage of a girl of aristocrat division with the commoner male but
permit a male of aristocrat division to take a female from commoners.
4. Garo, Khasi
Meghalaya FSSo MBSo Parallel & cross
cousin

58
"Exogamy", (marriage outside the family) means different things in different societies.
The following cross cousin m arriage....
is considered endogamous in Europe, and (family) exogamous in many Indian tribals and
South Indian caste groups because in the latter groups the woman is considered to have
left her original family at marriage, when she enters her husband’s family and takes his
name. By contrast, the following parallel cousin m arriage.....
is considered endogamous both in Europe and among Indian tribals and caste groups.
In this thesis "endogamy" and "exogamy" describe cultural conventions of tribals and
South Indian communities, but from the genetic point of view there is very little difference
between "exogamy" and "endogamy", because these societies are basically endogamous.

59
In a recent review (1990) Bittles concluded that at least 20% of the world population
favours consanguineous marriage, at least 6.5% of marriages between close relatives and
at least 8.4% of all infants bom are offspring of consanguineous parents.
Genetic aspects of consanguineous marriage:
Morton (1973) defined inbreeding for the geneticist, as a number measuring genetic
similarity and probabihty of identity by descent. The coefficient of inbreeding ’F’ is the
probability than an individual receives two genes (at any locus) that are identical by
descent and it was defined by Sewall Wright (1922) following experiments with animals.
Admixture in Inbreeding Populations
Populations may be inbred because of isolation or because they favour consanguineous
marriage or for both reasons. This is partly true for the Baigas. However, in primitive
societies there are also many non-consanguineous marriages and the population is large
enough to allow plenty of gene flow. In addition, there are usually possibilities of
"outbreeding".
Basu (1988) described the possible types of crossings within India as (1) castes x castes,
(2) castes x tribes, (3) tribes x tribes, (4) religious group x religious group, (5) state x state.
There are variants in each of the above marriages. Historically population gene mixing
follows wars, when victorious males take conquered females as wives. In earlier days, the
traders from Arabia, Greece, Egypt & Rome came to India via Western coastal parts and
North-Western passes. Some married local women either with consent, or forcibly. Their
"Racial Apartness" give the hybrids known as Tiyas. The White Tiyas of Kerala who
originated from Irva-English unions are Hindus and their offspring often try to mate with
the darker local people in order to have normal brown pigment in their children. Sarkar
(1954) reported hybrid groups of the Mundas with Maria tribes. They are Khariya Munda,
Kampat Munda, Khangar Munda. In the past there was a considerable admirations for
foreigners. Occasional visitors and local government officials may also sometimes
contribute to genetic admixture in the tribe. I personally interviewed the offspring of a
Baiga woman-and Elwin (the great anthropologist, who stayed in India for a long time).

60
In spite of such inter-mixing, the population has maintained its identity all through time.
Calculation o f average inbreeding coefficient in Human populations
The average inbreeding coefficient of a population (a) can be calculated by the following
equation (Cavalli-Sforza and Bodmer 1971)
a = Z P l F l
Where PI is the relative frequency of inbred individuals
FI is the inbreeding coefficient
Sterility
Sterility is defined as the "physiological incapacity to produce a live birth on the part of the
individual, a couple, a population". In the female, sterility may be primary if a woman has
never been able to bear a child, or secondary if after having one or more children, a women
fails to have further births.
From census data it is usually estimated that approximately 5 percent of couples are
involuntarily sterile (WHO 1975) and infertility varies from as low as 1% in Korea to more
than 20% in some African and New Guinea populations (Muir and Belsey 1980).
Smoking tobacco and drinking alcohol
It is important to consider health implications of habits like smoking tobacco, chewing
tobacco, and drinking alcohol on health and nutrition. Smoking tobacco is a universal habit
affecting both rich and poor in most societies. Smoking and chewing are common practices
in rural parts of developing nations. Smoking takes various forms: cigarettes and pipes
among the rich or high class, Bidis (see glossary) among the poor and rural and chungi
(tobacco wrapped in sarai leaves) in Baiga. Smoking can lead to ischaemic heart
disease, lung cancer, chronic bronchitis and emphysema.

61
Chewing tobacco
There are hardly any studies in aboriginal groups so an attempt was made to study tobacco
chewing in the Baiga tribe.
Prevalence o f malaria
Data was collected on prevalence of malaria from local primary health centres for 51 villages.
The data is for the 12 years 1981-92 (table 3.4). The data concern individuals who attended
primary health centres, and attended medical personnel with complaints, and visits by local
medical staff. The recorded incidence is the minimum rather than the actual, because
acceptance of medical attention is low in the tribal villages, and medical personnel could not
visit all tribal villages during the rainy season due to lack of proper roads. At local primary
health centre all fever cases were given presumptive treatment for malaria at the time of blood
smear collection; and slides were examined at the PHC itself within 1 or 2 days after
collection, and parasite positive cases were administered medical treatment.
The average slide positivity rate (SPR) is 11.2% and ranges from 6.1 to 23.4. Of this 11.2%,
the majority of cases (63.3%) are due to plasmodium falciparum and 36.7% are Plasmodium
vivax and 0.4% are mixed both Pf and Pv. The data also reveal that prevalence is high from
August to December every year, especially falciparum malaria. The collected data covers all
the villages of the present study, which were among the 51 villages in the malarial study.
Table 3.5 shows village-wise data of malaria prevalence for 1990, 1991 for study villages.
The slide positivity rate is particularly high in Tadpatra ie, 50.7, confirming that study villages
are highly endemic for malaria.
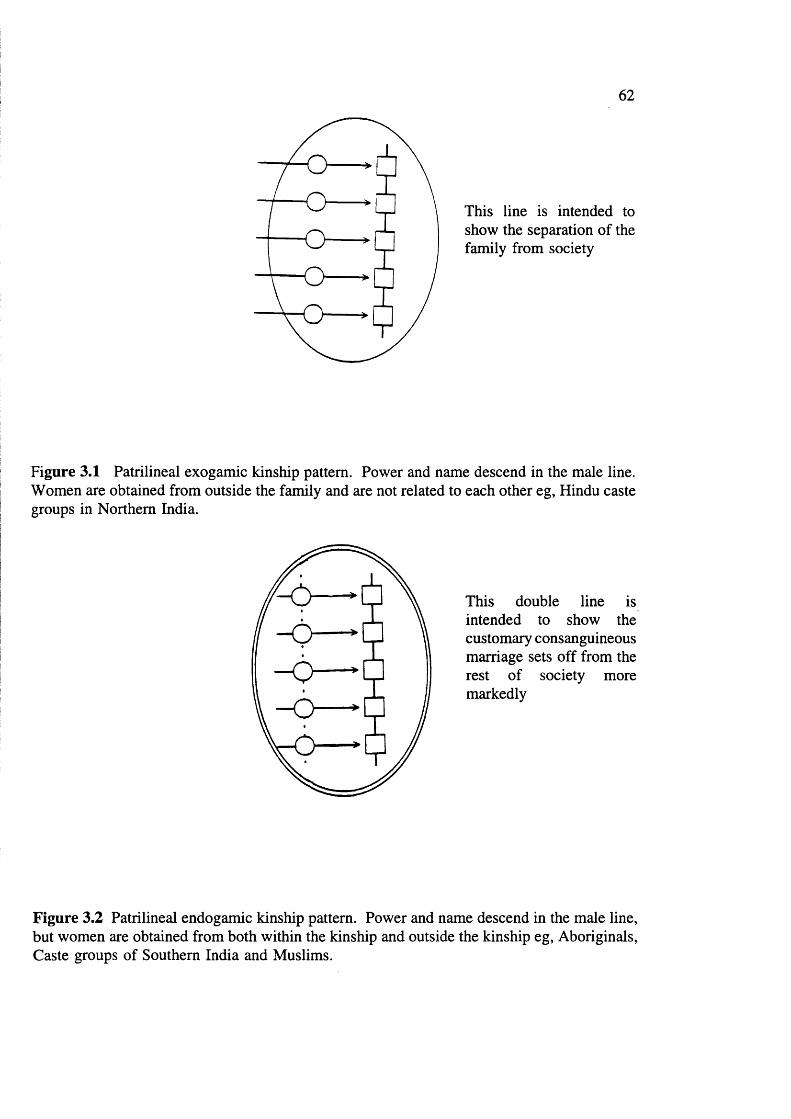
62
This line is intended to show the separation of the family from society
Figure 3.1 Patrilineal exogamie kinship pattern. Power and name descend in the male line. Women are obtained from outside the family and are not related to each other eg, Hindu caste groups in Northern India.
This double line is intended to show the customary consanguineous marriage sets off from the rest of society more markedly
Figure 3.2 Patrilineal endogamie kinship pattern. Power and name descend in the male line, but women are obtained from both within the kinship and outside the kinship eg. Aboriginals, Caste groups of Southern India and Muslims.

63
- O -
rO
Figure 3.3 Matrilineal endogamie kinship pattern. Power and name descend in the female line eg, Nayars of Kerala and Khasi and Garos of Assam (figures are based on Modell and Kuliev 1992).

Table 3.2 Data on incidence of consanguineous marriage in India.
Area Population Number % Type F Reference
EAST
Calcutta Obstetricinpatients
19,111 0.5 1C, 1 1/2C
- Stevenson et al
(1966)
Bihar Muslim 11,733 30.1 1C 0.01883 Afzal(1988)
Bihar Muslim 476 13.9 1C, 2C 0.00758 Ansari and Sinha
(1978)
CENTRAL
Madhya Pradesh 1715 21.4 UN, 1C 2C
0.00923 Goswami(1970)
NORTH
Delhi Sunni Muslim 1483 24.4
1C, 11/2C, 2C
0.01002 Basu(1975)
502 36.5 0.01802 Krishnan(1986)
Lucknow ShiaMuslim
1000 43.4 0.02023 Basu(1975)
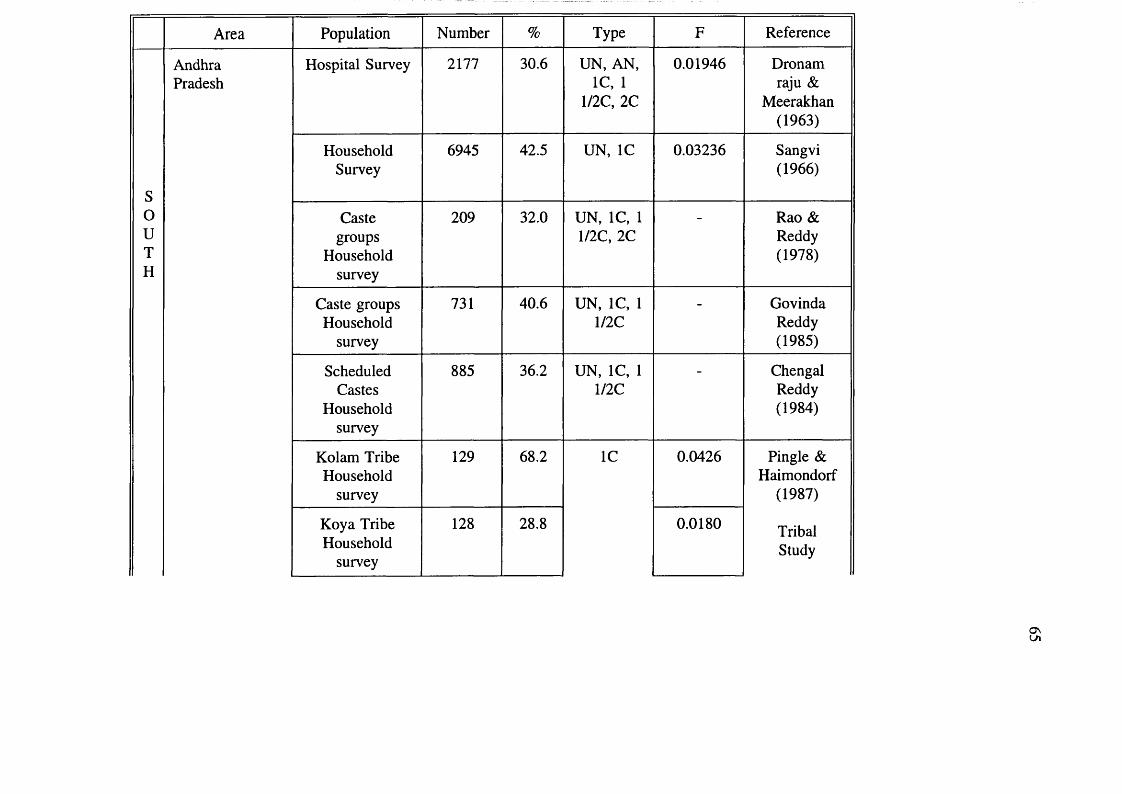
Area Population Number % Type F Reference
SouTH
AndhraPradesh
Hospital Survey 2177 30.6 UN, AN, 1C, 1
1/2C, 2C
0.01946 Dronam raju &
Meerakhan (1963)
HouseholdSurvey
6945 42.5 UN, 1C 0.03236 Sangvi(1966)
Castegroups
Householdsurvey
209 32.0 UN, 1C, 1 1/2C, 2C
Rao & Reddy (1978)
Caste groups Household
survey
731 40.6 UN, 1C, 1me
- GovindaReddy(1985)
ScheduledCastes
Householdsurvey
885 36.2 UN, 1C, 1 1/2C
ChengalReddy(1984)
Kolam Tribe Household
survey
129 68.2 1C 0.0426 Pingle & Haimondorf
(1987)
TribalStudy
Koya Tribe Household
survey
128 28.8 0.0180
O nLA
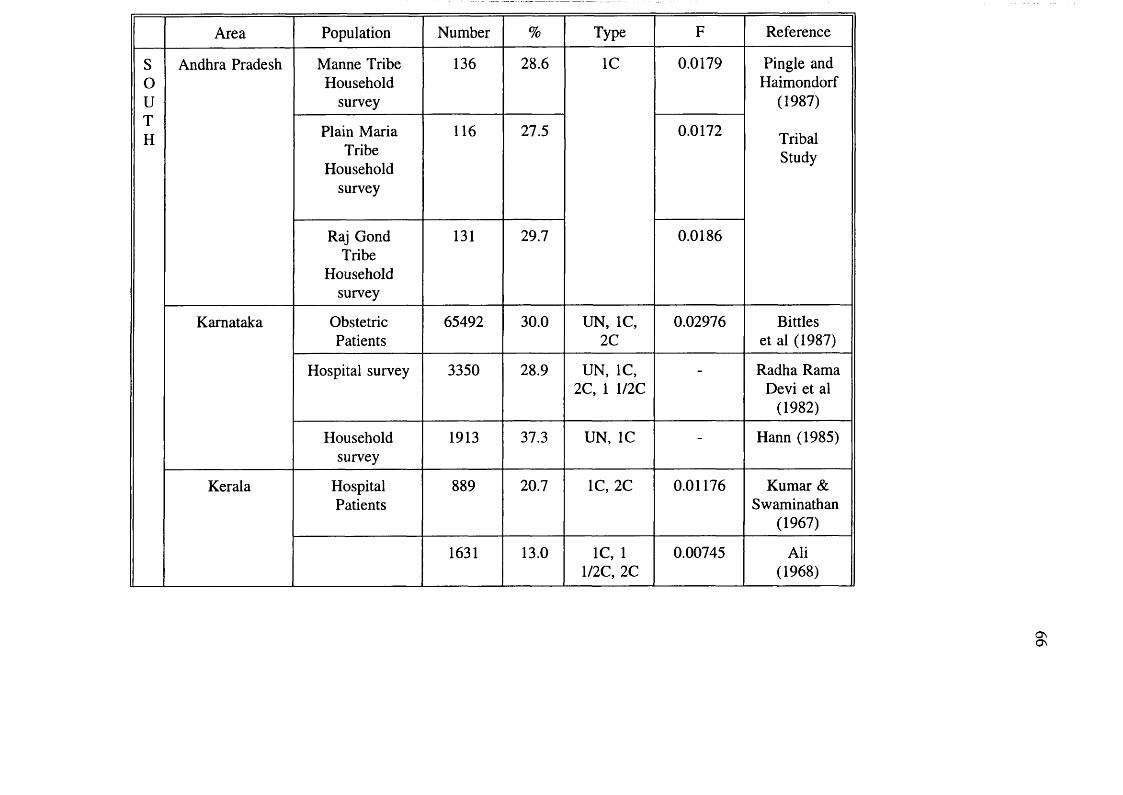
Area Population Number % Type F Reference
SouTH
Andhra Pradesh Manne Tribe Household
survey
136 28.6 1C 0.0179 Pingle and Haimondorf
(1987)
TribalStudy
Plain Maria Tribe
Household survey
116 27.5 0.0172
Raj Gond Tribe
Household survey
131 29.7 0.0186
Karnataka ObstetricPatients
65492 30.0 UN, 1C, 2C
0.02976 Bittles et al (1987)
Hospital survey 3350 28.9 UN, 1C, 2C, 1 1/2C
- Radha Rama Devi et al
(1982)
Householdsurvey
1913 37.3 UN, 1C - Hann (1985)
Kerala HospitalPatients
889 20.7 1C, 2C 0.01176 Kumar & Swaminathan
(1967)
1631 13.0 1C, 1 1/2C, 2C
0.00745 Ali(1968)
§;

Area Population Number % Type F Reference
souTH
Tamil Nadu HouseholdSurvey
31390 30.0 UN, 1C, 1 1/2C, 2C
0.02311 Rao et al (1971)
Householdsurvey
20626 38.6 UN, AN, 1C, 1 1/2C
0.02955 Rao & Imbaraj (1977)
Kota Tribe Household
survey
449 12.6 UN, 1C, 2C,
2 1/2C, 1 1/2C
Ghosh(1972)
HinduMuslim
ChristianHousehold
survey
3504 25.3 UN, 1C, 2C,
1 1/2C
Ramesh et al (1988)
WEST
Bombay Castegroups
Householdsurvey
6597 11.0 1C,1 1/2C, 2C
0.00543 Sangvi(1966)
Bombay ObstetricPatients
39155 9.8 1 1/2C, 1C,
- Stevenson et al (1966)
Maharashtra HouseholdSurvey
5282 26.4 UN, 1C 0.01746 Malhotra(1979)
Abbreviation: 2C:Second Cousin; ICiFirst Cousin; 1 l/2C:First Cousin once removed, 2 1/2C UN: Uncle Niece AN: Aunt Nephew. F: Coefficient of Inbreeding.
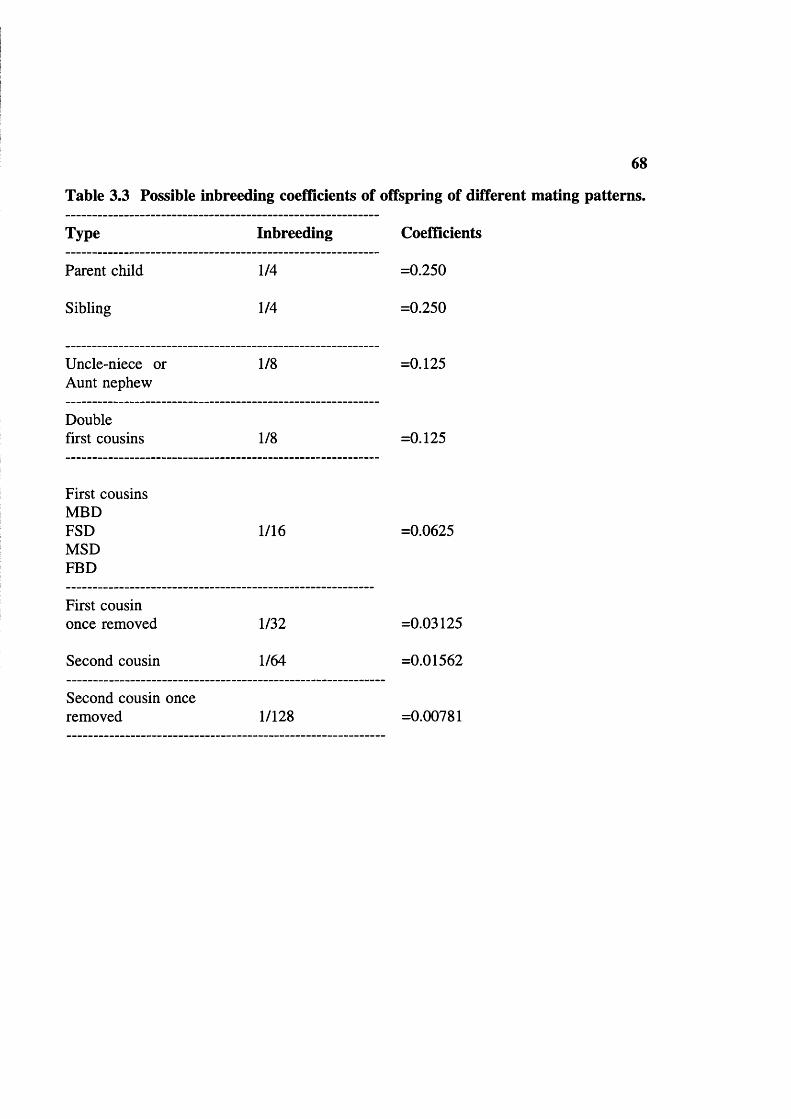
68
Table 3.3 Possible inbreeding coefficients of offspring of different mating patterns.
Type Inbreeding Coefficients
Parent child 1/4 =0.250
Sibling 1/4 =0.250
Uncle-niece or Aunt nephew
1/8 =0.125
Double first cousins 1/8 =0.125
First cousinsMBDFSDMSDFED
1/16 =0.0625
First cousin once removed 1/32 =0.03125
Second cousin 1/64 =0.01562
Second cousin once removed 1/128 =0.00781

Table 3.4 Prevalence of malarial parasites in peripheral blood in Baiga villages 1981-92.
Year Population Examined
Positive cases
Plasmodiumvivax
Plasmodium * falciparum Mixed Total
% of population
1 9 8 1 1 7 3 2 1 5 4 1 0 2 0 8 2 2 0(5 1 .2 6 % )
2 4 3 0 7 . 9
1 9 8 2 1 8 1 8 0 6 2 0 9 3 1 4 1 1 1 6(7 8 .0 % )
1 1 4 3 1 2 3 . 0
1 9 8 3 1 8 7 5 3 3 9 4 3 1 1 2 4 2 1(7 8 .7 % )
2 5 3 5 1 3 . 6
1 9 8 4 1 8 9 6 4 5 7 0 0 3 2 6 4 7 4(5 8 .9 % )
5 8 0 5 1 4 . 1
1 9 8 5 2 0 1 7 6 5 9 4 8 1 9 0 4 1 0(6 8 .0 % )
3 6 0 3 1 0 . 1
1 9 8 6 2 0 5 5 1 3 9 9 7 90 1 5 8(6 2 .9 % )
3 2 5 1 6 . 3
1 9 8 7 2 1 0 2 1 6 1 3 4 1 1 3 692(8 6 .0 % )
- 8 0 5 1 3 . 1
1 9 8 8 2 1 2 7 3 4 8 1 6 1 2 1 20 3( 6 2 .5 % )
1 3 2 5 6 . 7
1 9 8 9 2 1 8 8 0 5 4 6 1 1 6 6 1 6 9(5 0 .4 % )
2 3 3 7 6 . 2
1 9 9 0 2 2 8 8 7 8 4 0 5 4 3 5 3 4 4(4 4 .0 % )
2 7 8 1 9 . 3
1 9 9 1 2 3 5 2 4 1 2 3 7 9 7 8 3 7 5 9(4 8 .9 % )
11 1 5 5 3 1 2 . 5
1 9 9 2 2 2 3 9 5 8 4 3 4 2 6 8 4 9 3(6 4 .6 % )
2 7 6 3 9 . 0
- - 7 6 8 3 6 3 1 2 6(3 6 .3 % )
5 4 5 9(6 3 .3 % )
34 8 6 1 9 1 1 .2
* % o f t o t a l
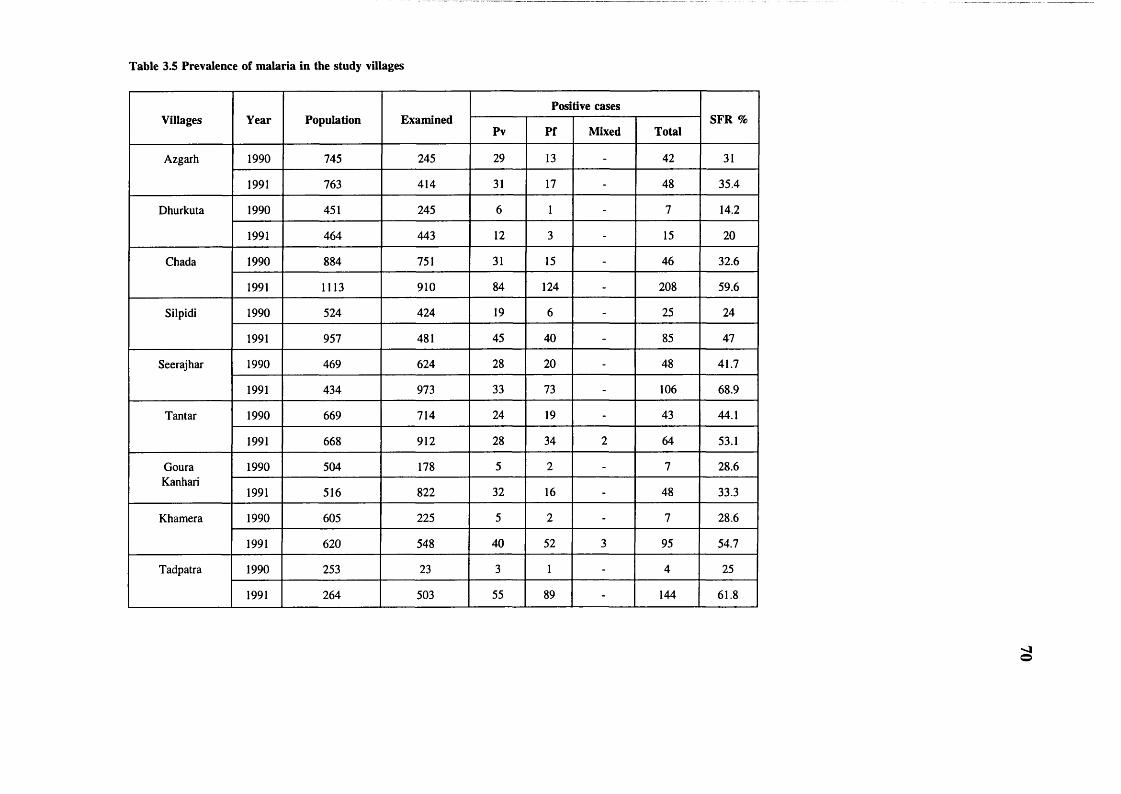
Table 3.5 Prevalence of malaria in the study villages
Villages Year Population ExaminedPositive cases
SFR %Pv Pf Mixed Total
Azgarh 1990 745 245 29 13 - 42 31
1991 763 414 31 17 - 48 35.4
Dhurkuta 1990 451 245 6 1 - 7 14.2
1991 464 443 12 3 - 15 20
Chada 1990 884 751 31 15 - 46 32.6
1991 1113 910 84 124 - 208 59.6
Silpidi 1990 524 424 19 6 - 25 24
1991 957 481 45 40 - 85 47
Seerajhar 1990 469 624 28 20 - 48 41.7
1991 434 973 33 73 - 106 68.9
Tantar 1990 669 714 24 19 - 43 44.1
1991 668 912 28 34 2 64 53.1
Goura 1990 504 178 5 2 - 7 28.6Kanhari
1991 516 822 32 16 - 48 33.3
Khamera 1990 605 225 5 2 - 7 28.6
1991 620 548 40 52 3 95 54.7
Tadpatra 1990 253 23 3 1 - 4 25
1991 264 503 55 89 - 144 61.8

Villages Year Population ExaminedPositive cases
SFR %Pv Pf Mixed Total
Kharidih 1990 825 - - - - - -
1991 845 221 2 10 - 12 83.3
Kapoti 1990 172 - - - - - -
1991 658 54 1 - - 1 -
Doimani 1990 119 - - - - - -
1991 122 58 1 3 - 4 75
Bohera 1990 - - - - - - -
1991 - - - - - - -
Ladra 1990 122 - - - - - -dadar
1991 125 221 17 13 - 30 43.3
Baharpur 1990 1047 99 9 2 - 11 18.2
1991 1105 387 13 13 - 26 50
Bangla 1990 - - - - - - -dadar
1991 - - - - - - -
Kendra 1990 451 - - - - - -bohera
1991 471 128 2 2 - 4 50
SFR Slide falciparum rate Pv Plasmodium vivax Pf Plasmodium falciparum
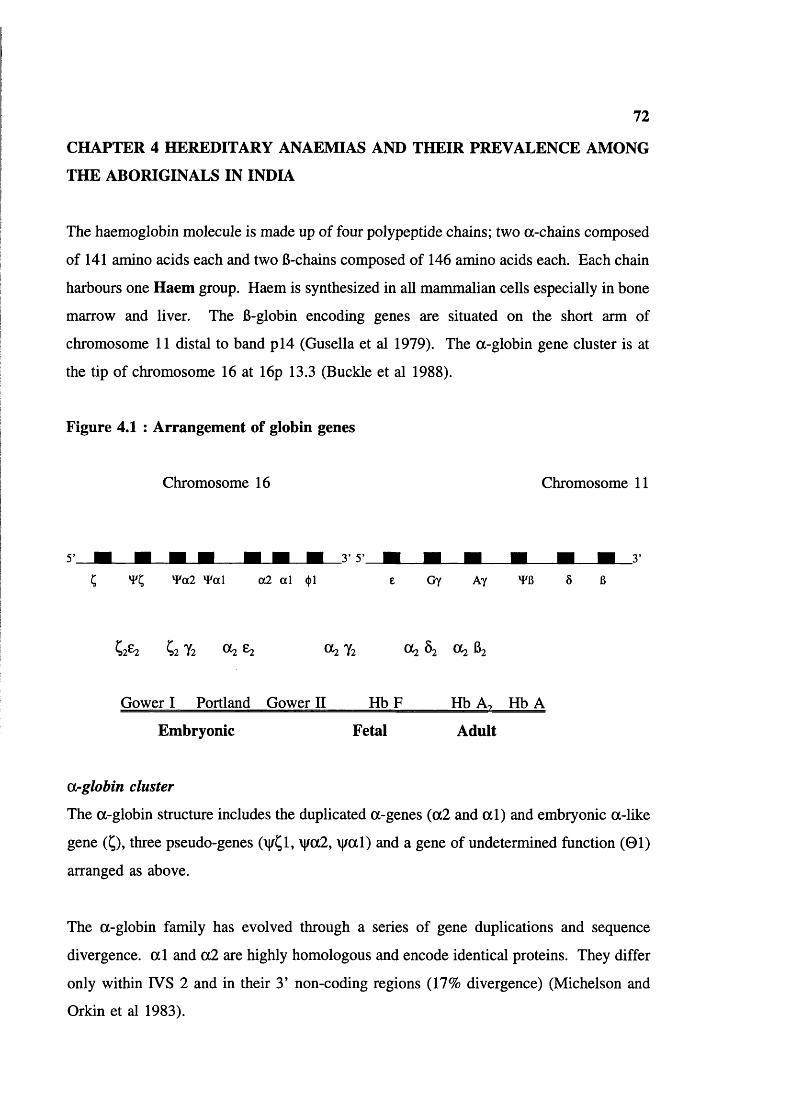
72
CHAPTER 4 HEREDITARY ANAEMIAS AND THEIR PREVALENCE AMONG
THE ABORIGINALS IN INDIA
The haemoglobin molecule is made up of four polypeptide chains; two a-chains composed
of 141 amino acids each and two 6-chains composed of 146 amino acids each. Each chain
harbours one Haem group. Haem is synthesized in all mammalian cells especially in bone
marrow and liver. The 6-globin encoding genes are situated on the short arm of
chromosome 11 distal to band p l4 (Gusella et al 1979). The a-globin gene cluster is at
the tip of chromosome 16 at 16p 13.3 (Buckle et al 1988).
Figure 4.1 : Arrangement of globin genes
Chromosome 16 Chromosome 11
5' _
c v ; Y«2 W a\ a 2 al <t>l e Gy Ay YG
Cz Tz 0^ 2 Ot2 Yz OC2 Ô2 OC2 62
Gower I Portland Gower II Hb F Hb Ao Hb A
Embryonic Fetal Adult
Orglobin cluster
The a-globin structure includes the duplicated a-genes (a2 and a l ) and embryonic a-like
gene (Ç), three pseudo-genes (vÇl, \|/a2, \j/al) and a gene of undetermined function (01)
arranged as above.
The a-globin family has evolved through a series of gene duplications and sequence
divergence, a l and a2 are highly homologous and encode identical proteins. They differ
only within IVS 2 and in their 3’ non-coding regions (17% divergence) (Michelson and
Orkin et al 1983).

73
fi-globin cluster
The 6-globin gene cluster is about 70 kb long with 5 functional genes (figure 4.1) each
composed of three coding regions (exons) and two non-coding regions (introns). This is
also true for a genes. The 5’ leader sequences and approximately the first 100 nucleotides
of the globin gene are encoded in a single exon, followed by intron 1. A second exon
domain extending to approximately codon 100, a second intron and third exon domain
comprising rest of the transcribed DNA. The length of the introns is variable. Exon II
encodes the segments involved in haem binding and a-6 dimer formation whereas exon
III encodes many of the amino acids involved in the globin subunit interactions required
for cooperativity of the haemoglobin tetramers in binding oxygen. The detailed 6-globin
structure has been described by Collins and Weissman (1984).
Table 4.1 Six distinct haemoglobins are produced during development:
Type Gestation Chains Discovery
Gower I 1st 8 weeks Ç2e2 Huehns et al (1964)
Portland 1st week of gestation, in a- thalassaemia hydrops fetalis
;2 y 2 Hecht et al (1967)
Gower II 1st 8 weeks a l e2 Huehns et al (1964)
Hb F 6 weeks-term. <1% in adult
a l f l ??
Hb Az <3% in normal adult
a l Ô2 Kunkle and Wallenius (1955) Kunkle et al (1957)
Hb A Up to 10% in normal fetus from 8-12 weeks
a l 62
Regulation of haemoglobin production
Table 4.1 summarizes the different haemoglobins produced during development. The
human globin gene undergoes orderly ontogenic changes, characterized by two major

74
switches, embryonic to fetal and fetal to adult. The sequential expression of these genes
follows their order on the chromosome in the 5’->3’ direction in man (although not always
in other vertebrate species), and the ratio of a-like and 6-like chains is approximately 1:1.
In early embryonic development, red cells are produced in the yolk sac. As development
progresses the liver becomes the main site of erythropoiesis, the a & y chains begin to
expressed and the embryonic genes are shut off. During this time of transition, the
intermediate haemoglobins Portland (^2y2) and Gower II (a2e2) can be found. At this
stage both y and 6 genes are expressed, but the y genes are 10 times more active than the
6 genes. 6 chain synthesis settles at 7-10% of y chain synthesis by 10-12 weeks and Hb
F (a2y2) is the primary haemoglobin of intrauterine life. It has a higher oxygen affinity
than Hb A and hence allows efficient extraction of oxygen from the maternal circulation.
At about 35 weeks the fetal switch occurs: y chain synthesis decreases and 6 chains
synthesis increases proportionately. At the time of birth, the ratio of y to 6 synthesis is
approximately 2:1, and the orderly shut off of y synthesis continues after birth. There are
two non-allelic y-globin genes, one of which code y-globin chains with glycine and other
with alanine at position 136 of the polypeptide chain. These are termed Gy and Ay
respectively. The relative activity of the Gy and Ay genes in fetal life is 7:3, whereas the
small amount of Hb F in adult life has a ratio 4:6. This is due to more efficient repression
of the Gy gene.
Normal adult haemoglobin comprises Hb A (97%), HbF (<1.0%) and Hb A2 (1.5-3.5%).
Hb A2 ( 0 2 Ô2 ) apparently has no physiologically essential role but its concentration is a
useful in diagnosis of 6-thalassaemia, (>3.5%) a-thalassaemia (normal or reduced) and
some acquired diseases.
The proportion of Hb F in adult peripheral blood may rise, in some situations involving
erythropoietic stress (severe anaemia, 6-thalassaemia major or sickle cell disease, and
during pregnancy). In the rare condition hereditary persistence of fetal haemoglobin
(HPFH) there is no Hb A or Hb Kj and homozygotes survive clinically asymptomatic with
Hb F only (Wood 1976).
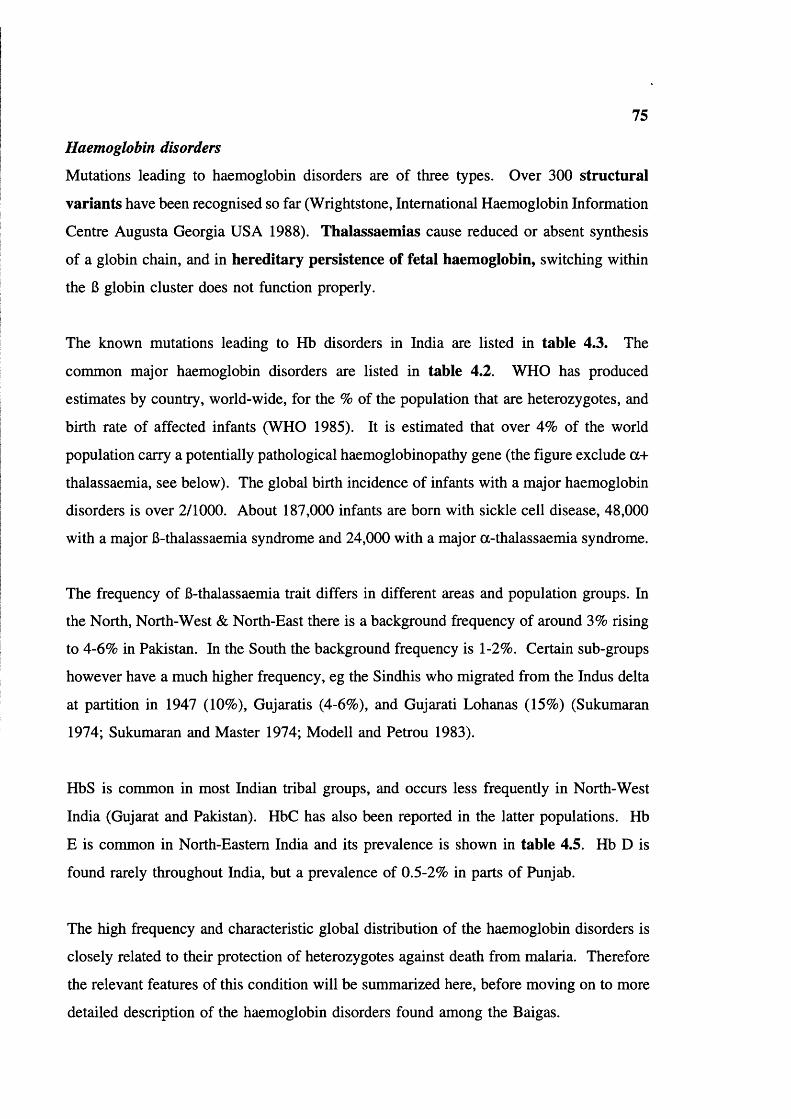
75
Haemoglobin disorders
Mutations leading to haemoglobin disorders are of three types. Over 300 structural
variants have been recognised so far (Wrightstone, International Haemoglobin Information
Centre Augusta Georgia USA 1988). Thalassaemlas cause reduced or absent synthesis
of a globin chain, and in hereditary persistence of fetal haemoglobin, switching within
the B globin cluster does not function properly.
The known mutations leading to Hb disorders in India are listed in table 4.3. The
common major haemoglobin disorders are listed in table 4.2. WHO has produced
estimates by country, world-wide, for the % of the population that are heterozygotes, and
birth rate of affected infants (WHO 1985). It is estimated that over 4% of the world
population carry a potentially pathological haemoglobinopathy gene (the figure exclude a+
thalassaemia, see below). The global birth incidence of infants with a major haemoglobin
disorders is over 2/1000. About 187,000 infants are born with sickle cell disease, 48,000
with a major 6-thalassaemia syndrome and 24,000 with a major a-thalassaemia syndrome.
The frequency of 6-thalassaemia trait differs in different areas and population groups. In
the North, North-West & North-East there is a background frequency of around 3% rising
to 4-6% in Pakistan. In the South the background frequency is 1-2%. Certain sub-groups
however have a much higher frequency, eg the Sindhis who migrated from the Indus delta
at partition in 1947 (10%), Gujaratis (4-6%), and Gujarati Lohanas (15%) (Sukumaran
1974; Sukumaran and Master 1974; Modell and Petrou 1983).
HbS is common in most Indian tribal groups, and occurs less frequently in North-West
India (Gujarat and Pakistan). HbC has also been reported in the latter populations. Hb
E is common in North-Eastern India and its prevalence is shown in table 4.5. Hb D is
found rarely throughout India, but a prevalence of 0.5-2% in parts of Punjab.
The high frequency and characteristic global distribution of the haemoglobin disorders is
closely related to their protection of heterozygotes against death from malaria. Therefore
the relevant features of this condition will be summarized here, before moving on to more
detailed description of the haemoglobin disorders found among the Baigas.

76
Malaria
Malaria is a major tropical endemic disease. It was estimated in the 1950’s that there were
of the order of 250 million cases/year with 2.5 million people dying of malaria per year
(Leonard Jan 1985).
Leonard Jan (1985) classified malaria. Endemic malaria may be present in various degrees
and the following terms are commonly used. Hypo-endemicity denotes areas where there
is little transmission and the effects of malaria on the general population are unimportant.
Meso-endemicity is found typically among small rural conununities in the sub-tropical
zones with varying intensity of transmission depending on local circumstances. Hyper-
endemicity is seen in areas with intense but seasonal transmission where the immunity is
insufficient to prevent the effects of malaria on all age groups. Holo-endemicity denotes
a perennial transmission of high degree resulting in a considerable degree of immune
response in all age groups, but particularly in adults.
Various authors have suggested that malaria originated with the introduction of agriculture
(slash and bum), since this create congenial conditions for mosquito breeding and vector-
man transmission, and so for promotion and diffusion of malaria. Bodmer and Cavalli-
Sforza (1976) proposed that malaria arose 3000 years ago in the African Continent, while
Vogel and Motulsky (1986) propose that it arose 2000 years ago in the Mediterranean area.
If agriculture is the major requirement for the birth of malaria then malaria could be very
ancient in India. Agriculture was established during the Indus Valley Civilisation
(approximately 5000 EC) and skeletal remains of harappans show alterations judged to be
characteristic of SS disease (Kennedy 1981), implying that both malaria and the sickle cell
gene are very ancient.
Malaria in India
MacDonald (1957) reviewed malarial incidence based on data published by Russel (1956).
India heads the list for number of people exposed to infection, but some are protected by
the malarial eradication programme.

77
Recognised common vectors of falciparum malaria in India are: Anopheles culicifacies
(very common in the plains) A. varuna in the hills of Orissa, A. philippinensis and
syndaicus in Bengal, and A. minimus in Assam.
In district Mandla, Madhya Pradesh, Neeru Singh and Nagpal (1985) identified 12 species
of Anopheles mosquitoes; A. annularis, A culicifacies, A. fluviatilis, A. jeyporiensis, A.
maculatus, A. nigerrimus, A. philippinensis, A pallidus, A. splendidus, A. subpictus, A.
turkhudi, and A. vagus. They did not differentiate vectors for different types of malaria.
Neeru Singh et al (1989) also observed that falciparum malaria is chloroquine resistant in
district Mandla.
Infants, young children and pregnant women have been identified as the groups at high risk
for malaria all over the world; followed by mobile population groups, particularly those
engaged in forest-related economy and fishing (Kondrashin 1992). In forest areas, over
50% of malaria cases are due to Plasmodium falciparum (Kondrashin 1992). This is true
for the study area too (see chapter 3; PP 61 and 69-70). A very recent report (WHO
South-East Asia region) shows that 8.8% of the Indian population (75 million people) are
at high risk for malaria in India: of these 2.5% are infants.
Mortality due to a disease such as malaria can be estimated in three ways (1) from clinical
records of the cause of deaths, (2) from observing the rise in mortality during malaria
epidemics and (3) by determining the fall in mortality when malaria is brought under
control. Bradley (1991) and Molineaux (1985) reviewed the consequences of malaria
control and added a fourth method of assessing malarial mortality, namely by calculating
the mortality necessary to maintain the observed level of the sickling gene as a balanced
polymorphism. Data is not available from India on mortality. Bradley (1991) reviewed
the mortality due to malaria in different parts of Africa, and Sri Lanka. In Sri Lanka, the
quarterly crude death rate at the height of an epidemic rose by a factor of 3.4, implying
that 2.5 times more people died of malaria than of all other causes combined during that
period. In Kenya, a marked fall in infant mortality followed reduced malaria transmission,
the effect being greatest in infants between three and ten months of age (Payne et al 1976).

78
Malaria morbidity is mainly a feature of infancy. It may account for 30-35% of cases in
persons seeking health care at rural African dispensaries. It is spread throughout the year
in the forest zone and may account for between 10 and 80% of childhood fevers in the
Savanna zone. Data from this area suggest that mortality may reach its peak where
malaria is combined with malnutrition, maternal overwork and lack of drugs in the season
of maximal transmission (Bradley 1991).
Table 4.2 Abnormal haemoglobins in India
Type Globin chain involved
Position Amino acid change
Area/Population
Hb S Beta Codon 6 Glu—V al Tribals
Hb E Beta Codon 26 Glu—Lys North Eastern Tribals
Hb D Punjab Beta Codon 121 Glu—Gin Punjab
Hb C Beta Codon 6 Glu—Lys Northern, Caste population
Hb Q India Alpha Codon 64 Asp—His
Hb J Meerut Alpha Codon 120 Ala—Glu
Hb J Rajappen Alpha Codon 90 Asp—His ?
Hb O Arab Beta Codon 121 Glu—Lys ?
Hb Koya Dora Alpha T.Codon 142 TAA—TCA Tribals, Southern
Hb Rampa Alpha Codon 95 Pro—Ser Tribals, Southern
Hb Cochin Port Royal
Beta Codon 146 His—Arg ?
79
Table 4.3 Major common Haemoglobin disorders
Type of Hb disorder
Structural variants Hb S
H bE
Hb C
Hb D Punjab
Thalassaemias a-thalassaemia
6-thalassaemia
Hereditary persistence of fetal haemoglobin
HPFH
Sickle haemoglobinopathies
Historical development
The discovery of sickle cell haemoglobin started with the observation of James B Herrick
(1910) in a black student from Grenada, who suffered from repeated episodes of anaemia,
jaundice, pain in the chest and recurrent ulcers on both ankles. Herrick observed a "large
number of thin elongated, sickle-shaped and crescent shaped cells" in the blood film. Later
Washburn (1911), Cook and Meyer (1915), and Mason (1922) reported similar findings.
Mason (1922) concluded that this was a new disease and first used the term "sickle cell
anaemia". Hahn and Gillespie (1927) and later Sherman (1940) in vitro experiments
noticed the sickling. Ingram (1956) demonstrated that the difference in the amino acid
sequence in one small part of the polypeptide chain creates sickle cell haemoglobin.
Geographical distribution
Livingstone (1985) compiled global information on the gene frequencies of abnormal
haemoglobins and G6PD deficiency. Sickle haemoglobin is widely prevalent in sub
Saharan Africa (Lehman and Raper 1949, Lehman 1954, Allison 1954 b, India (Bhatia and
Rao 1987), the highest prevalence is in the East Africa where 40-50% of members of
certain tribes are carriers. A prevalence rate of 10 to 20% is common throughout other
parts of the zone, but there is considerable variation from tribe to tribe (Honig et al 1978).
Haemoglobin S is also common in parts of the Middle East, and occurs in the

80
mediterranean region, particularly in Greece, Sicily, Portugal, Cyprus, Albania (Livingstone
1985). Hb S was first observed in India by Lehman and Cutbush in 1952 and it occurs
mainly in tribals. Detailed data for India is summarized in table 4.4.
Table 4.4 Prevalence of sickle cell gene in India
State Tribe (district) Number of individuals
%References
AS SS
Andhra Pradesh Konda Reddy (Khammam)
92 2.17 0.0* Blake et al (1981)
Koya (Khammam) 159 12.58 0.63*
Pardhan (Adilabad) 101 34.65 0.99*
Raj Gond (Adilabad)
133 14.28 0.75*
Koya Dora (Khammam)
547 7.86 0.00* Goud and Rao (1979)
Lambadi(Warangal)
154 2.64 0.00*
Naik Pod (Adilabad)
90 4.61 0.00*
Pardhan (Adilabad) 122 31.71 0.00*
Raj Gond (Adilabad)
197 11.34 0.00*
Jatapu(Srikakulam)
157 1.27 0.00* Malleshwara Rao et al (1978)
Savara(Srikakulam)
132 1.52 0.00*
Konda Reddy (East Godavari)
129 2.33 - Negi(1967)
Koya(Bhadrachalam)
123 1.43 -
Koya Dora (East Godavari)
112 8.04 -
Koya Kammara (East Godavari)
59 16.95 -
Sugali (Anantpur) 110 2.73 -
Sugali (kumool) 7 14.28 -
Valmiki (East Godavari)
99 20.20 -
Yanadi (Nellore) 187 0.00 -
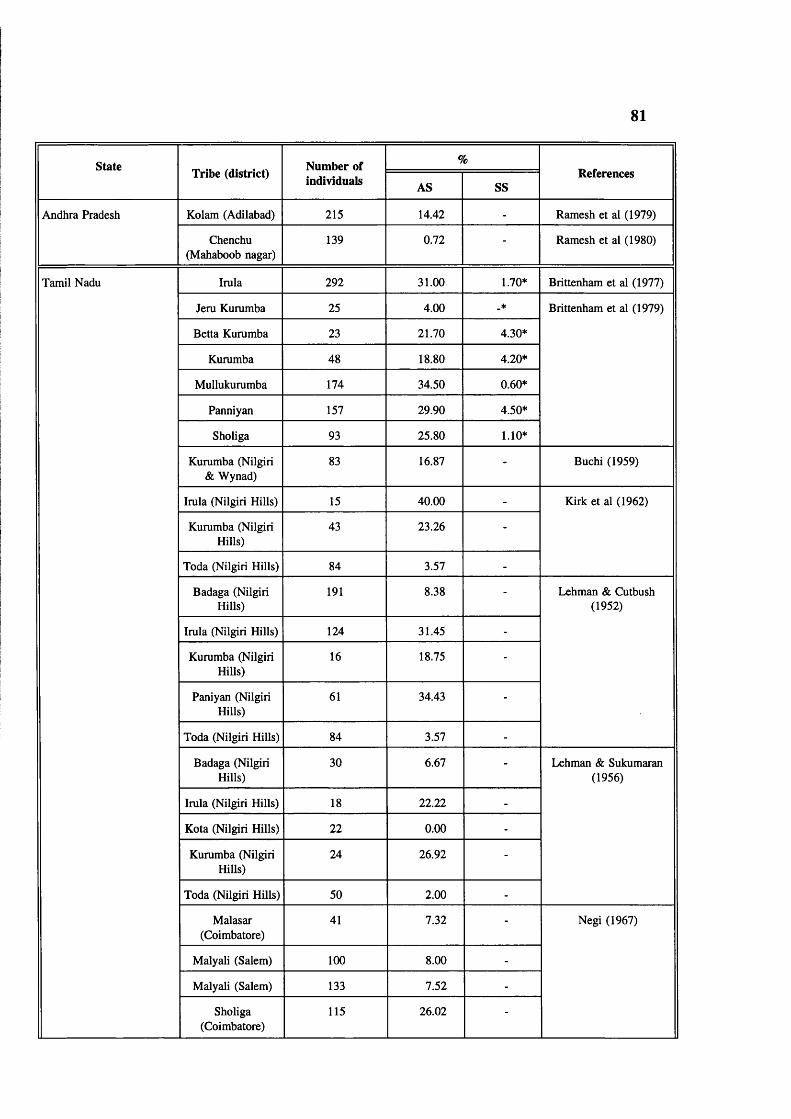
81
State Tribe (district) Number of %Referencesindividuals AS SS
Andhra Pradesh Kolam (Adilabad) 215 14.42 - Ramesh et al (1979)
Chenchu (Mahaboob nagar)
139 0.72 - Ramesh et al (1980)
Tamil Nadu Irula 292 31.00 1.70* Brittenham et al (1977)
Jem Kummba 25 4.00 _* Brittenham et al (1979)
Betta Kummba 23 21.70 4.30*
Kummba 48 18.80 4.20*
Mullukummba 174 34.50 0.60*
Panniyan 157 29.90 4.50*
Sholiga 93 25.80 1.10*
Kummba (Nilgiri & Wynad)
83 16.87 - Buchi (1959)
Imla (Nilgiri Hills) 15 40.00 - Kirk et al (1962)
Kummba (Nilgiri Hills)
43 23.26 -
Toda (Nilgiri Hills) 84 3.57 -
Badaga (Nilgiri Hills)
191 8.38 - Lehman & Cutbush (1952)
Imla (Nilgiri Hills) 124 31.45 -
Kummba (Nilgiri Hills)
16 18.75 -
Paniyan (Nilgiri Hills)
61 34.43 -
Toda (Nilgiri Hills) 84 3.57 -
Badaga (Nilgiri Hills)
30 6.67 - Lehman & Sukumaran (1956)
Imla (Nilgiri Hills) 18 22.22 -
Kota (Nilgiri Hills) 22 0.00 -
Kummba (Nilgiri Hills)
24 26.92 -
Toda (Nilgiri Hills) 50 2.00 -
Malasar(Coimbatore)
41 7.32 - Negi (1967)
Malyali (Salem) 100 8.00 -
Malyali (Salem) 133 7.52 -
Sholiga(Coimbatore)
115 26.02 -
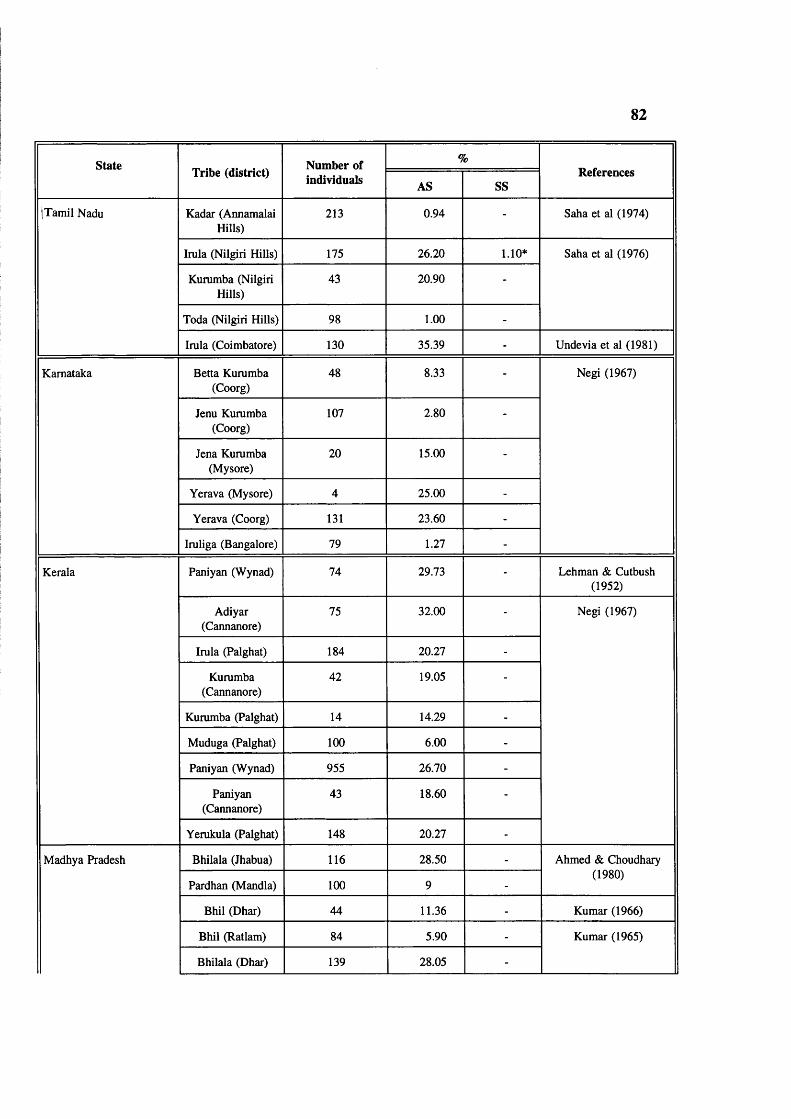
82
state Tribe (district) Number of %Referencesindividuals AS SS
|Tamil Nadu Kadar (Annamalai Hills)
213 0.94 - Saha et al (1974)
Irula (Nilgiri Hills) 175 26.20 1.10* Saha et al (1976)
Kummba (Nilgiri Hills)
43 20.90 -
Toda (Nilgiri Hills) 98 1.00 -
Imla (Coimbatore) 130 35.39 - Unde via et al (1981)
Karnataka Betta Kummba (Coorg)
48 8.33 - Negi (1967)
Jenu Kummba (Coorg)
107 2.80 -
Jena Kummba (Mysore)
20 15.00 -
Yerava (Mysore) 4 25.00 -
Yerava (Coorg) 131 23.60 -
Imliga (Bangalore) 79 1.27 -
Kerala Paniyan (Wynad) 74 29.73 - Lehman & Cutbush (1952)
Adiyar(Cannanore)
75 32.00 - Negi (1967)
Imla (Palghat) 184 20.27 -
Kummba(Cannanore)
42 19.05 -
Kummba (Palghat) 14 14.29 -
Muduga (Palghat) 100 6.00 -
Paniyan (Wynad) 955 26.70 -
Paniyan(Cannanore)
43 18.60 -
Yemkula (Palghat) 148 20.27 -
Madhya Pradesh Bhilala (Jhabua) 116 28.50 - Ahmed & Choudhary
Pardhan (Mandla) 100 9 -
(1980)
Bhil (Dhar) 44 11.36 - Kumar (1966)
Bhil (Ratlam) 84 5.90 - Kumar (1965)
Bhilala (Dhar) 139 28.05 -
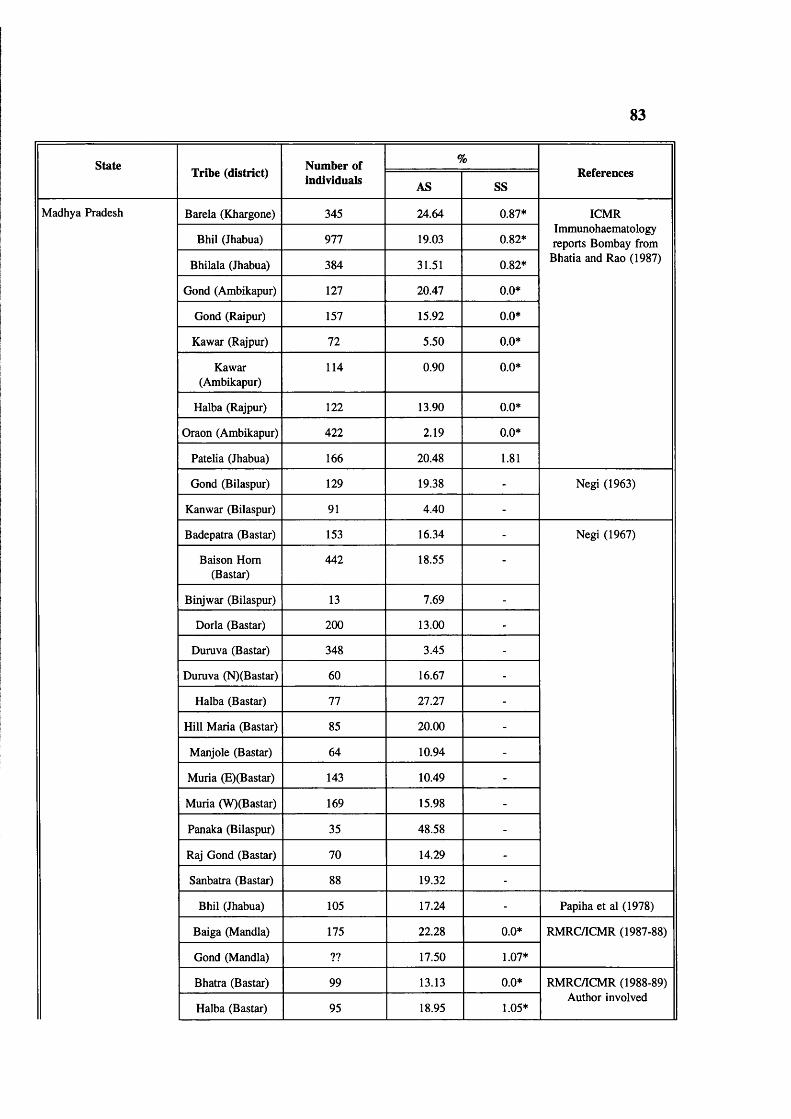
83
state Tribe (district) Number of %Referencesindividuals AS SS
Madhya Pradesh Barela (Khargone) 345 24.64 0.87* ICMR
Bhil (Jhabua) 977 19.03 0.82*Immunohaematology reports Bombay from
Bhilala (Jhabua) 384 31.51 0.82* Bhatia and Rao (1987)
Gond (Ambikapur) 127 20.47 0.0*
Gond (Raipur) 157 15.92 0.0*
Kawar (Rajpur) 72 5.50 0.0*
Kawar(Ambikapur)
114 0.90 0.0*
Halba (Rajpur) 122 13.90 0.0*
Oraon (Ambikapur) 422 2.19 0.0*
Patelia (Jhabua) 166 20.48 1.81
Gond (Bilaspur) 129 19.38 - Negi (1963)
Kanwar (Bilaspur) 91 4.40 -
Badepatra (Bastar) 153 16.34 - Negi (1967)
Baison Horn (Bastar)
442 18.55 -
Binjwar (Bilaspur) 13 7.69 -
Dorla (Bastar) 200 13.00 -
Duruva (Bastar) 348 3.45 -
Duruva (N)(Bastar) 60 16.67 -
Halba (Bastar) 77 27.27 -
Hill Maria (Bastar) 85 20.00 -
Manjole (Bastar) 64 10.94 -
Muria (E)(Bastar) 143 10.49 -
Muria (W)(Bastar) 169 15.98 -
Panaka (Bilaspur) 35 48.58 -
Raj Gond (Bastar) 70 14.29 -
Sanbatra (Bastar) 88 19.32 -
Bhil (Jhabua) 105 17.24 - Papiha et al (1978)
Baiga (Mandla) 175 22.28 0.0* RMRC/ICMR (1987-88)
Gond (Mandla) ?? 17.50 1.07*
Bhatra (Bastar) 99 13.13 0.0* RMRC/ICMR (1988-89)
Halba (Bastar) 95 18.95 1.05*Author involved
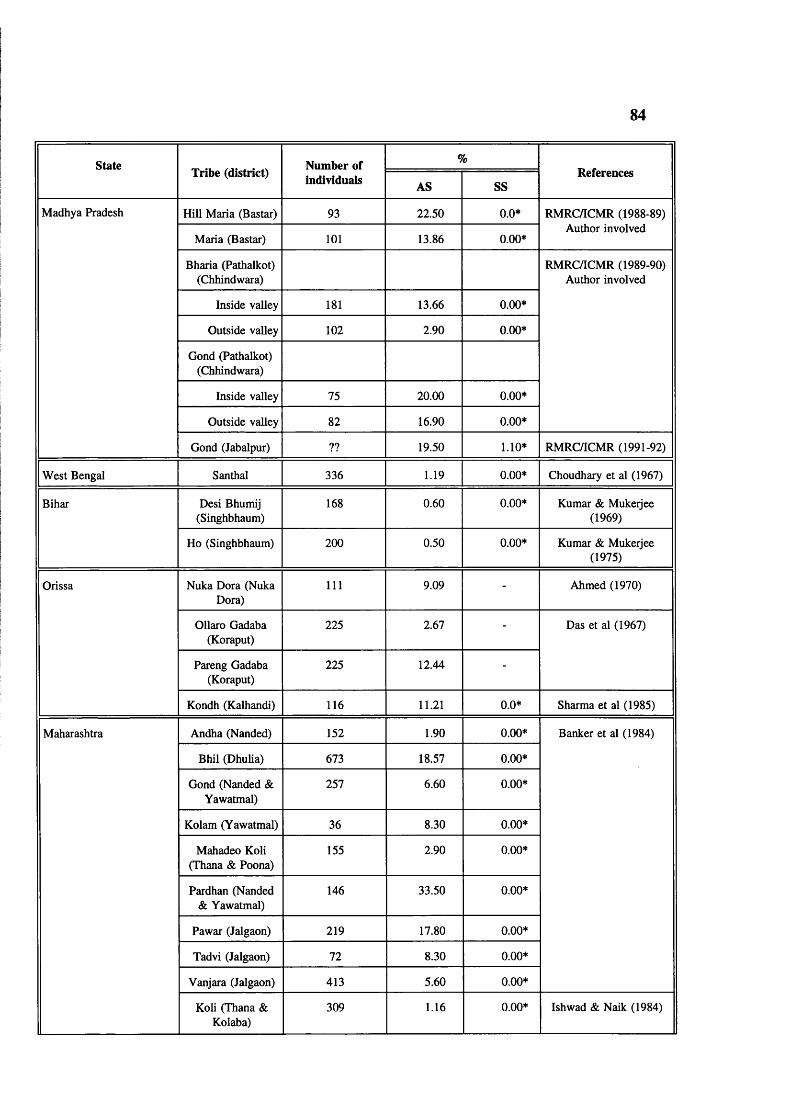
84
sta te Tribe (district)Number of %
Referencesindividuals AS SS
Madhya Pradesh Hill Maria (Bastar) 93 22.50 0.0* RMRC/ICMR (1988-89)
Maria (Bastar) 101 13.86 0.00*Author involved
Bharia (Pathalkot) (Chhindwara)
RMRC/ICMR (1989-90) Author involved
Inside valley 181 13.66 0.00*
Outside valley 102 2.90 0.00*
Gond (Pathalkot) (Chhindwara)
Inside valley 75 20.00 0.00*
Outside valley 82 16.90 0.00*
Gond (Jabalpur) ?? 19.50 1.10* RMRC/ICMR (1991-92)
West Bengal Santhal 336 1.19 0.00* Choudhary et al (1967)
Bihar Desi Bhumij (Singhbhaum)
168 0.60 0.00* Kumar & Mukeijee (1969)
Ho (Singhbhaum) 200 0.50 0.00* Kumar & Mukeijee (1975)
Orissa Nuka Dora (Nuka Dora)
111 9.09 - Ahmed (1970)
Ollaro Gadaba (Koraput)
225 2.67 - Das et al (1967)
Pareng Gadaba (Koraput)
225 12.44 -
Kondh (Kalhandi) 116 11.21 0.0* Sharma et al (1985)
Maharashtra Andha (Nanded) 152 1.90 0.00* Banker et al (1984)
Bhil (Dhulia) 673 18.57 0.00*
Gond (Nanded & Yawatmal)
257 6.60 0.00*
Kolam (Yawatmal) 36 8.30 0.00*
Mahadeo Koli (Thana & Poona)
155 2.90 0.00*
Pardhan (Nanded & Yawatmal)
146 33.50 0.00*
Pawar (Jalgaon) 219 17.80 0.00*
Tadvi (Jalgaon) 72 8.30 0.00*
Vanjara (Jalgaon) 413 5.60 0.00*
Koli (Thana & Kolaba)
309 1.16 0.00* Ishwad & Naik (1984)

85
state Tribe (district) Number of %Referencesindividuals AS SS
Maharashtra Bhil (Dhulia) 673 8.60 0.00* Kate et al (1978)
Katkari (Dhulia) 131 6.11 0.00*
Pawara (Dhulia) 122 22.13 0.00*
Bhil (Aurangabad) 102 1.96 - Negi (1967)
Bhil (Dhulia) 82 15.85 -
Dhor Koli (Thane) 67 7.46 -
Gond(Amarawathy)
29 17.24 -
Katkari (Kolaba) 109 5.5 -
Katkari (Thane) 70 1.43 -
Kokana (Thane) 86 2.33 -
Koli (Poona) 181 0.55 -
Korku(Amarawathy)
172 9.30 -
Pawara (Dhulia) 110 24.55 -
Worli (Thana) 145 6.90 -
Raj Gond (Yavatmal)
283 10 0.35 Rao and Gorakshar (1990)
Pardhan(Yavatmal)
143 30.76 0.7
Kolam (Yavatmal) 144 18.75 0.0*
Raj Gond (Chandrapur)
265 13.6 0.38
Naik Gond (Chandrapur)
111 10.81 0.0*
Pardhan(Chandrapur)
133 31.58 0.0*
Gujarat Banjara (Surendra nagar)
23 4.35 - Negi (1967)
Bhil (Panchmahal) 200 13.50 -
Koli (Junagarh) 78 1.28 -
Koli (Balsar) 36 13.89 -
Konka (Bulsar) 58 8.62 -
Kokana (Dang) 128 7.81 -
Kotwalia (Surat) 71 18.31 -
Naik (Balsad) 12 25.00 -

86
StateTribe (district) Number of %
Referencesindividuals AS SS
Gujarat Patelia(Panchmahal)
15 26.66 - Negi (1967)
Rohit (Balsar) 8 12.50 -
Rohit (Bharuch) 14 7.14 -
Rohit (Surat) 31 3.22 -
Bhil (Panchmahal) 206 15.53 - Vyas et al (1962)
Bhil (Dang) 72 9.72 - Negi (1968)
Bhil (Vasava- Bharuch)
75 26.67 -
Bhil (Vasava- Surat)
19 26.32 -
Dhanaka (Bharuch) 215 19.68 -
Dhanka (Surat) 30 30.00 -
Dodhia (Balsar) 109 13.76 -
Dudhra (Surat) 115 26.09 -
Duwala (Balsar) 109 13.76 -
Duwala (Surat) 211 5.88 -
Gamit (Baruch) 31 19.35 -
Gamit (Surat) 136 25.00 -
Worli (Balsar) 23 13.76 -
Worli (Dang) 15 6.67 -
Naik (Surat) 174 16.09 0.00* Vyas et al (1962)
Gamit (Surat) 207 31.40 0.00*
Dhanka (Bharuch) 215 20.40 0.00*
Rajasthan Bhil (Udaipur) 280 4.20 0.00* Jain et al (1981)
Mina (Udaipur) 56 4.30 0.00*
Bhil (Banswada) 100 18.00 - Negi (1967)
Bhil (Dungari) (Dist. Babarkantha)
69 1.45 -
Bhil (Dungari) (Dist. Banaskantha)
176 10.80 -
Gamit (Sirohi) 58 3.45 -
Gamit (Udaipur) 75 14.76 -
Garasia (Sirohi) 75 20.00 -
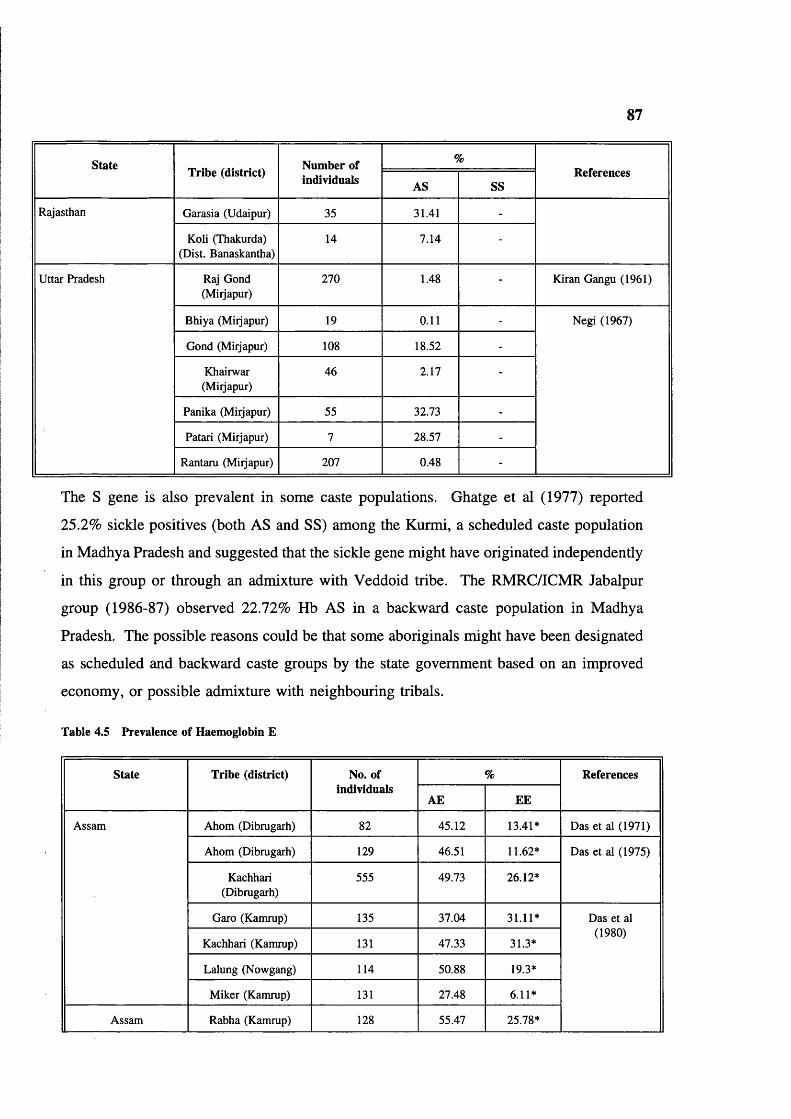
87
State Tribe (district) Number of individuals
%References
AS SS
Rajasthan Garasia (Udaipur) 35 31.41 -
Koli (Thakurda) (Dist. Banaskantha)
14 7.14 -
Uttar Pradesh Raj Gond (Miijapur)
270 1.48 - Kiran Gangu (1961)
Bhiya (Miijapur) 19 0.11 - Negi (1967)
Gond (Miijapur) 108 18.52 -
Khairwar(Miijapur)
46 2.17 -
Panika (Miijapur) 55 32.73 -
Patari (Miijapur) 7 28.57 -
Rantaru (Miijapur) 207 0.48 -
The S gene is also prevalent in some caste populations. Ghatge et al (1977) reported
25.2% sickle positives (both AS and SS) among the Kurmi, a scheduled caste population
in Madhya Pradesh and suggested that the sickle gene might have originated independently
in this group or through an admixture with Veddoid tribe. The RMRC/ICMR Jabalpur
group (1986-87) observed 22.72% Hb AS in a backward caste population in Madhya
Pradesh. The possible reasons could be that some aboriginals might have been designated
as scheduled and backward caste groups by the state government based on an improved
economy, or possible admixture with neighbouring tribals.
Table 4.5 Prevalence of Haemoglobin £
State Tribe (district) No. of individuals
% References
AE EE
Assam Ahom (Dibrugarh) 82 45.12 13.41* Das et al (1971)
Ahom (Dibrugarh) 129 46.51 11.62* Das et al (1975)
Kachhari(Dibrugarh)
555 49.73 26.12*
Garo (Kamrup) 135 37.04 31.11* Das et al (1980)
Kachhari (Kamrup) 131 47.33 31.3*
Lalung (Nowgang) 114 50.88 19.3*
Miker (Kamrup) 131 27.48 6.11*
Assam Rabha (Kamrup) 128 55.47 25.78*
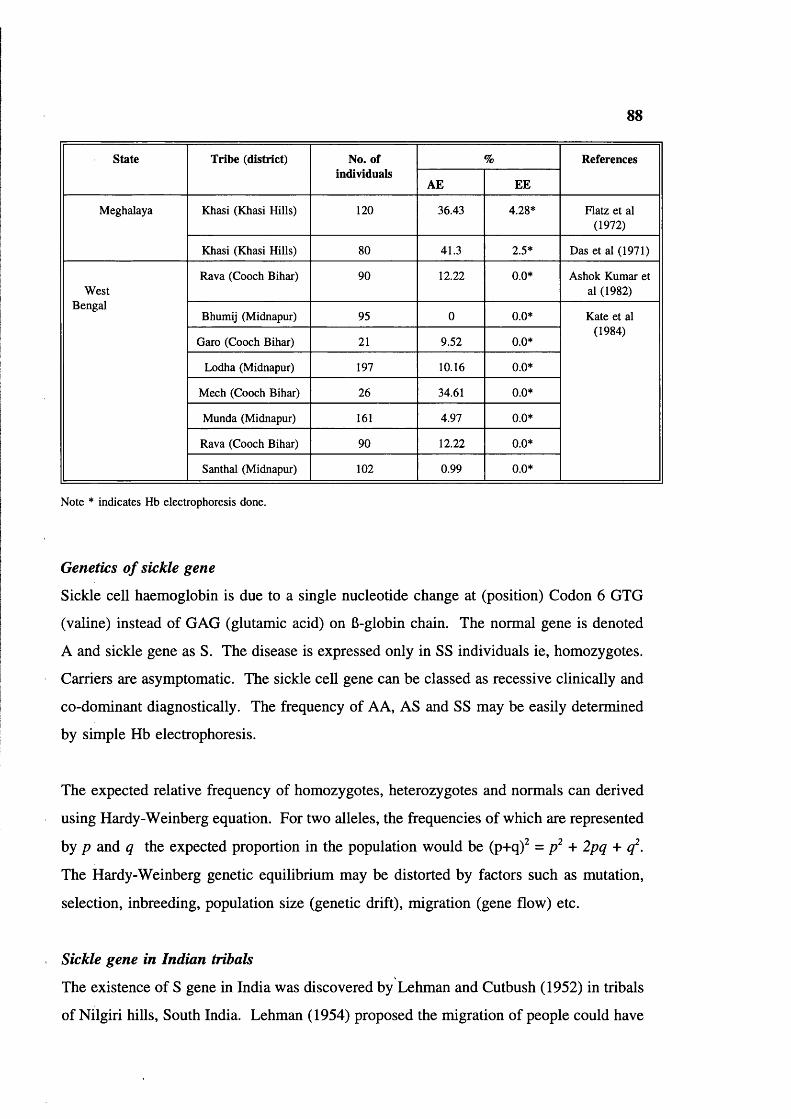
88
sta te Tribe (district) No. of individuals
% References
AE EE
Meghalaya Khasi (Khasi Hills) 120 36.43 4.28* Flatz et al (1972)
Khasi (Khasi Hills) 80 41.3 2.5* Das et al (1971)
WestBengal
Rava (Cooch Bihar) 90 12.22 0.0* Ashok Kumar et al (1982)
Bhumij (Midnapur) 95 0 0.0* Kate et al (1984)
Garo (Cooch Bihar) 21 9.52 0.0*
Lodha (Midnapur) 197 10.16 0.0*
Mech (Cooch Bihar) 26 34.61 0.0*
Munda (Midnapur) 161 4.97 0.0*
Rava (Cooch Bihar) 90 12.22 0.0*
Santhal (Midnapur) 102 0.99 0.0*
Note * indicates Hb electrophoresis done.
Genetics of sickle gene
Sickle cell haemoglobin is due to a single nucleotide change at (position) Codon 6 GTG
(valine) instead of GAG (glutamic acid) on 6-globin chain. The normal gene is denoted
A and sickle gene as S. The disease is expressed only in SS individuals ie, homozygotes.
Carriers are asymptomatic. The sickle cell gene can be classed as recessive clinically and
co-dominant diagnostically. The frequency of AA, AS and SS may be easily determined
by simple Hb electrophoresis.
The expected relative frequency of homozygotes, heterozygotes and normals can derived
using Hardy-Weinberg equation. For two alleles, the frequencies of which are represented
by p and q the expected proportion in the population would be (p+q)^ = + q .
The Hardy-Weinberg genetic equilibrium may be distorted by factors such as mutation,
selection, inbreeding, population size (genetic drift), migration (gene flow) etc.
Sickle gene in Indian tribals
The existence of S gene in India was discovered by Lehman and Cutbush (1952) in tribals
of Nilgiri hills. South India. Lehman (1954) proposed the migration of people could have

89
carried the S gene to India. Later Lehman and Huntsman (1974) supported this hypothesis
on the basis of agricultural practices in Africa and in India.
Kan and Dozy (1978) first reported the linkage of the Hb S gene with an Hpa I restriction
site. In Hb AS individuals 13.0 and 7.6 kb fragments are observed after digestion with
Hpa I whereas in most normals (Hb AA) only 7.6 kb fragments are observed. The
polymorphic sites for B-globin gene in West African populations give fragments 7.0 and
13.0 kb long and 13.0 kb was linked to the 6® gene as in diagram.
6 globin gene
--------------------- 7.6 kbT A T
■ ■ ■ --------------- 7.0 kbT A T
5’------------------- 3’ 13.0 kbT s T
By contrast the sickle gene is associated with 7.6 kb fragment in different populations
(Kenyan (East Africa), Saudi Arabia in Middle East, and tribals (Valmiki, Konda Reddy,
and Koya Dora) in India. There are thus two possible explanations of its origin (Kan and
Dozy 1980). Either the sickle gene arose as a single mutational event and the variant Hpa
I sites resulted from a cross over in the region between 6-globin gene and the Hpa I
recognition site, at an early stage in one or more populations or the sickle mutation has
arisen several times, at least once on a chromosome with the 13.0 kb site as in West Africa
and once on a chromosome with 7.6 kb site in other geographical area. Studies of blood
groups and serum proteins among Valmiki, Konda Reddy, Koya Dora and other tribals of
South India (Brittenham 1973), reveal no similarity to African tribes and support the
explanation of Kan and Dozy, ie multiple origin of sickle gene.
Kulozik et al (1986) studied different populations for numerous RFLPs around 6 globin
gene and found a common haplotype ie ++--H-H- in Indian and Saudi Arabian
populations, confirming that the S gene originated independently in this region. Recently
Labie et al (1989) studied 6' chromosome haplotypes in Nilgiri tribals (Southern India),
and found 91% of S genes are of Asian (Arab-Indian) haplotype. They concluded that in

90
the 6® gene, in presently isolated and dispersed tribal populations the S gene is associated
with one predominant typical haplotype, and that the gene must have arisen and established
before tribal dispersion.
To substantiate the findings of Labie et al (1989) in a very few tribal groups, further
investigations are necessary among different tribal groups from all over the country.
Pathophysiology o f sickle cell disease
The sickling phenomenon is the result of polymerisation of Hb S molecules forming
insoluble fibre like structures which distort the erythrocyte and increase its rigidity,
resulting in sickling. The crescentic cells increase blood viscosity. If the concentration
of Hb S in a solution approaches 30 gm/dl (as in red cells) a semisolid gel forms. The
gelation phase and polymer phase remain in equilibrium, the gel behaving much like a
suspension of microscopic protein crystal in a saturated protein solution. Binding of
oxygen to haemoglobin has a dramatic effect on gelation. Fully deoxygenated Hb S gels
polymerise, while fully oxygenated Hb S does not (Harris 1950). Presence of adult fetal
haemoglobin inhibits gelation.
Sickle cell disease and clinical features in general
As sickle cell disease is a disorder of the 6 chain, affected individuals are characteristically
asymptomatic at birth, and symptoms develop only in the second half of the 1st year when
the fetal switch is complete. Splenomegaly is usually first noted after 6 months of life.
The first vaso occlusive episode is generally experienced between 6 and 12 months and
mostly before 6 years (Powers 1975).
Sickle cell anaemia (SS) is clinically variable: some homozygotes have few problems, most
have problems several times a year and some have severe and unremitting problems.
Characteristic problems are:
Anaemia, infection (due to non-functional spleen), and splenic sequestration crises. These
often lead to early death in developing countries. Surviving may have diverse problems
including vaso occlusive problems eg hand foot syndrome, bone and joint pains, chest

91
syndromes, enlargement of spleen, priapism, stroke, visceral sequestration crises, aplastic
crises, delayed growth and puberty, and eye complications. During pregnancy these may
be more frequent & severe crises with increased fetal wastage, stillbirth, and increased
maternal mortality.
Clinical diversity
The clinical manifestation of sickle cell disease reveals great diversity; for example a mild
clinical course has been well documented in some cases from India (Brittenham 1977, 79;
Rao and Bhatia 1988, Gupta et al 1991), Saudi Arabia, Kuwait & Iran (Ali 1970,
Haghseness et al 1977 and Pembrey et al 1978). The source of this variation is partly
environmental and partly genetic.
Studies from Jamaica (Serjeant 1981) West Africa (Senegal type), Central & Western
Africa (Benin type) (Nagel et al 1985) reveal differences in clinical severity in different
regions.
Christakis et al (1990) compared clinical and haematological features of homozygous sickle
cell disease in Northern Greece and Jamaica. Greek patients had higher haemoglobin
concentration, and lower mean cell haemoglobin concentration and reticulocyte counts, and
comparatively mild disease.
Padmos et al (1991) reported two different forms of homozygous sickle cell disease in
Saudi Arabia based on haematological, clinical, and some molecular genetic features.
Eastern patients all had Asian beta globin haplotype whereas Western patients were more
variable and had predominantly the Benin haplotype. Eastern patients also have deletional
a-thalassaemia. Clinically, Eastern patients had a longer persistence of splenomegaly, a
more normal body build and greater sub-scapular skin fold thickness: Western patients had
more dactylitis and acute chest syndrome.
Clinical features: India
There are a few clinical studies among Indian tribals. Kar et al (1986) compared 131
sickle cell disease patients in Orissa, Eastern India with patients in Jamaica. The Indian
92
patients had a milder disease. 84% had persistent splenomegaly which tended to be
associated with lower haemoglobin, higher reticulocyte counts, higher Hb F levels and
higher mean cell volume. Dactylitis had occurred in 52% of patients, attacks were often
recurrent, starting between ages 5 months and 3 years. Attacks of bone and joint pain
were reported in all, and 67% of patients were admitted to hospital for bone and joint
pains. In 3 patients physical and sexual maturation was slower than their siblings. 4
patients aged 25, 35, 41, and 52 years had avascular necrosis of the femoral head. Other
clinical features included duodenal ulceration in 2 patients, and 2 had coincidental
rheumatic heart disease. Overall clinical features were similar to patients in the Eastern
province of Saudi Arabia and different from that of West African populations.
Haematological findings in this study are summarized in table 4.6
Agarwal and BC Mehta (1980) reported 44 cases of sickle cell syndromes from Bombay,
16 patients had homozygous sickle cell anaemia (HbSS) and 28 had HbS/fi-thalassaemia.
None of the patients with Hb SS had a palpable spleen beyond 6 years of age; while it was
palpable in all the patients with HbS/6-thalassaemia irrespective their age. Hand-foot
syndrome, ankle ulcerations and bleeding episodes were more common in Hb SS. The
level of fetal Hb did not appear to correlate with clinical severity. The frequency of
thrombotic episodes & ankle ulceration were less in comparison with the incidence
described amongst West Africans.
Genetic factors affecting the severity of sickle cell disease
There are different genetic factors such as 1. type of SCD (SS or S/6-thalassaemia or SC),
2. Coincidence of a-thalassaemia, 3. derepression of y genes.
Genetic variation of Gy values has been observed in sickle cell anaemia (SS) patients,
whose increased Hb F levels facilitate such studies. The Gy proportion varies from
population to population and within the population, however most cases have 40% and
some have 60-70% (Gardiner et al 1982). In Gond tribal population of Madhya Pradesh,
the Gy proportion is high (Oner et al 1992).
Gilman and Huisman (1985) observed that the presence of an Xmn I restriction site in

93
sickle cell anaemia and 6-thalassaemia major subjects leads to an increased Hb F level and
variation in Ay Gy ratio. The polymorphic site (C——>T) is at -cap site 158 bp in the
upstream of Gy region. The presence of T creates a restriction site for Xmn I restriction
enzyme whereas presence of C removes the site. Restriction site is as follows:
5’ GAANN NNTTC 3’3’ CTTNN NNAAG 5’
TLack of the restriction site is associated with a low Hb F level. They calculated that the
presence of the site is associated with a 3-11 fold increase in activity of the Gy gene.
Further studies (Harano et al 1985, Thein et al 1987, Winichagoon et al 1993) confirmed
that Xmn I polymorphic site is associated with high production of fetal haemoglobin in
sickle cell homozygotes, 6-thalassaemia major and Hb E/6-thalassaemia individuals; thus
it reduces the severity of the disease.
Kulozik et al (1987) studied variation in Hb F levels in relation to the 6-globin RFLP
haplotypes in SS (mostly tribal) patients from Orissa. The 6® globin gene was found to be
linked to a 6® haplotype +++-++- which is also common in Saudi Arabian patients from
the Eastern Province (table 4.7). The second site in this haplotype is the Xmn I
polymorphism, and this is one of the main causes of the milder disease in these groups.
Labie et al (1989) also observed that 6® Xmn I (+) chromosomes were associated with a
high fetal Hb (15.5+7.9) and high Gy expression (67.2±5.9%) in tribals of Nilgiri hills,
Tamil Nadu.
Thein et al (1987) studied relation of Xmn I site and fetal haemoglobin levels in a group
of random (Asian) normals and 6-thalassaemia cases and found polymorphic site is
responsible for raised Hb F (at homozygous state) (table 4.8) ie, is a contributory cause
of thalassaemia intermedia.
Winichagoon et al (1993) studied 6-thalassaemia/Hb E patients from Thailand and they
observed the disease is milder in patients with +/+ site (Hb 8.5 g/dl), intermediate in
94
patients with -/+ site (Hb 7.4 g/dl) and more severe in patients with -/- site (Hb 7 g/dl).
The fetal Hb levels are higher in patients with Xmn +/+ polymorphic site (table 4.8).
Hence in the present study Xmn I sites were investigated for two reasons
i. incidence of Xmn I sites and association with Hb A and Hb S genes in the Baiga.
ii. relationship of Xmn I restriction site to fetal Hb levels in Hb AA, AS & SS
individuals.
Sickle cell trait and Malaria
Raper (1949), Mackey and Vivarali (1954) noted that in Africa individuals with sickle cell
anaemia (SS) usually die before 5 years of age of their disease. This should have
prevented the sickle gene reaching a high frequency, other factors must have contributed
to the maintenance of high gene frequency eg, heterozygote individuals may be better
adapted to the environmental conditions than normals. Allison also noted increased
fertility of heterozygotes and suggested that protection against malaria might also increase
fertility and thus exposure of the population to infection would tend to increase the
frequency of sickle gene despite elimination of genes through the death of homozygotes
(Allison 1954). The reasons for the higher fertility noted by Allison is unknown.
Allison (1956) observed that mortality was higher in offspring of ASxAS parental
combinations (45.1%) compared to ASxAA (35.3%) and in AAxAA (40.1%), but the
difference was statistically not significant. These differences might due to lethality among
sickle cell homozygotes and also a smaller number of deaths among the offspring of
ASxAA parents (table 4.9). However, the very high general infant and childhood
mortality (38%) might make such genetic effects difficult to observe.
There are no published reports on the selective advantage of sickle cell trait against
falciparum malaria in India, especially in a tribal environment where malaria is hyper
endemic to the maintenance of high gene frequency, eg heterozygote individuals may be
better adapted to the environmental conditions than normals.

95
Table 4.6 Haematological findings in SS patients in India
Variable Mean±SD
Brittenham et al (1977)*
Kar et al (1986) No. 130
Hb (g/dl) 10.5±1.3 (13) 8.73±1.69
Hb F (%) ?? 16.64+5.42
MCHC (g/1) 32±2 (13) 31.5+2.7
RBC (xlO^Vl) 3.8±0.5 (11) 3.35+0.79
MCV (fl) 85+10 (11) 83.6+9.4
MCH (pg) 28±3 (11) 26.6±3.6
Rectic counts (%)
— 6.5±4.7
Hb A" (%) — 1.89+0.52
* Number of samples are in parenthesis.
Table 4.7 b-globin haplotypes, Hb F levels and ages of SS and SB® thal. patients (Kulozik et al 1987).
Globingenotype
Haplotype No Mean HbF( %)
Mean age (yrs)
SS +++-++-/+++-++- 107 16.4 16.6
+++-++-/-++-++- 15 15.5 13.3
+++“++-/+-""+ 1 19.3 4
+++-++-/+-"— 1 22.3 4
-++-++-/-++-++- 1 24.5 18
1 10.5 8
S6° +++-++-/+"—+ 15 14.3 20.2
+++-++-/"++-++ 1 18.4 24
+++-++-/-++-++- 1 18.7 13

96
Table 4.8 Xmn I polymorphic site and Fetal haemoglobin in Asians (Thein et al|l987, Winichagoon et al 1993)
Xmn I H b F(%)Site No.
Normals$ -/- 7 0.60
-/+ 14 0.66
+/+ - -
6-thalassaemiatrait$
-/- 34 1.12
-/+ 31 1.21
+/+ 5 1.83
6-thalassaemia/ Hb E*
-/- 18 ?
-/+ 64 ?
+/+ 85 52.4
Thein et al (198T) Winichagoon et al (1993)
Allison (1954) reviewed relative
frequencies of sickle cell gene in relationship to malarial environment and concluded that
persons with sickle cell trait have a considerable degree of natural resistance to malaria.
Raper (1956) observed a lower incidence and severity of malaria among African children
with sickle cell trait, particularly a reduced frequency of lethal complications such as
cerebral malaria. Studies by Allison (1957) and Rucknagel and Neel (1961), showed that
the children with sickle cell trait have increased resistance to malaria during the critical
period of early childhood, between the loss of passively acquired maternal immunity and
the development of active immunity.
Mechanism of protection against falciparum malaria
It has been suggested that the formation of the needle like crystals of Hb S formation
destroy the parasite at the trophozoite stage. Oxygen consumption by the parasite reduces
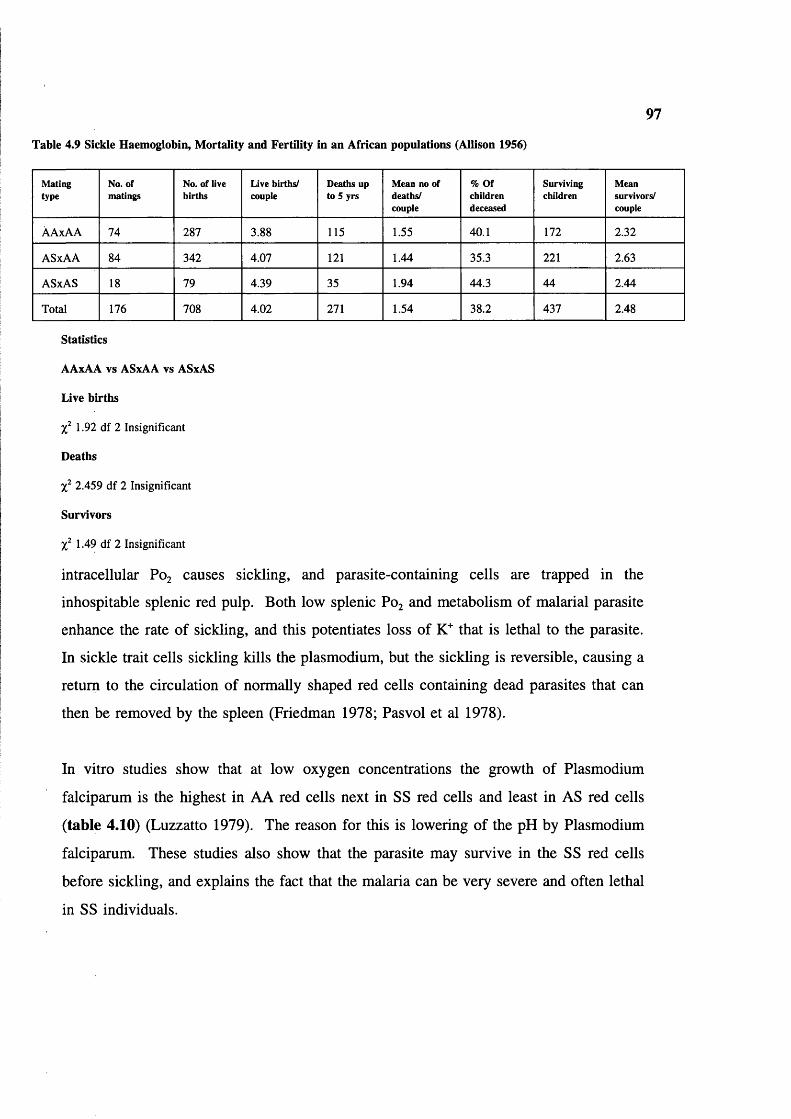
97
Table 4.9 Sickle Haemoglobin, M ortality and Fertility in an African populations (Allison 1956)
Matingtype
No. of matings
No. of live births
Live births/ couple
Deaths up to 5 yrs
Mean no ofdeaths/couple
% Ofchildrendeceased
Survivingchildren
Meansurvivors/couple
ÀAxAA 74 287 3.88 115 1.55 40.1 172 2.32
ASxAA 84 342 4.07 121 1.44 35.3 221 2.63
ASxAS IS 79 4.39 35 1.94 44.3 44 2.44
Total 176 708 4.02 271 1.54 38.2 437 2.48
Statistics
AAxAA vs ASxAA vs ASxAS
Live births
1.92 df 2 Insignificant
Deaths
2.459 df 2 Insignificant
Survivors
1.49 df 2 Insignificant
intracellular P0 2 causes sickling, and parasite-containing cells are trapped in the
inhospitable splenic red pulp. Both low splenic P0 2 and metabolism of malarial parasite
enhance the rate of sickling, and this potentiates loss of K"" that is lethal to the parasite.
In sickle trait cells sickling kills the plasmodium, but the sickling is reversible, causing a
return to the circulation of normally shaped red cells containing dead parasites that can
then be removed by the spleen (Friedman 1978; Pasvol et al 1978).
In vitro studies show that at low oxygen concentrations the growth of Plasmodium
falciparum is the highest in AA red cells next in SS red cells and least in AS red cells
(table 4.10) (Luzzatto 1979). The reason for this is lowering of the pH by Plasmodium
falciparum. These studies also show that the parasite may survive in the SS red cells
before sickling, and explains the fact that the malaria can be very severe and often lethal
in SS individuals.

98
Table 4.10 Growth of malarial parasites in vitro
Erythrocytes Mean growth score
In air In low oxygen
AA 1.0 1.0
AS 0.97 0.09
SS 0.95 0.26
Source Pasvol et al 1978
a-thalassaemia:
Most forms of a-thalassaemia are due to deletion of one or both a-globin genes, a-
thalassaemia 1 or a° thalassaemia is due to deletion of both a globin genes in cis (—) and
a thalassaemia 2 or a^ thalassaemia is usually due to deletion of 1 a-globin gene (-a).
Complete deletion of both a-genes is uncommon except in South-East Asia and Eastern
Mediterranean) and results in marked reduction of a-globin chains, a^ thalassaemia
deletions are extremely common and have only mild effects.
They are due to unequal crossing over between homologous chromosomes during meiosis,
which often give single or triplicated a-globin genes (Embury et al 1980, Goossen et al
1980). Unequal crossing over in the rightward direction gives the -a^ kb deletion and in
leftward direction gives the kb deletion (figure 4.2). The -a^^ deletion is milder than
deletion.
Alpha thalassaemia is also caused by a variety of rarer mutations, including non-deletional
forms and some large deletions on a chromosomes from 5.2 kb to 80 kb long, partially
or fully involving the a-gene (Higgs et al 1989). The non-deletional a-thalassaemias are
thought to be less frequent, and those that are known are often more severe than the
deletional defects. Known non-deletional mutations are listed in table 4.12.
Recently Curuk et al (1993) described a new non-deletion mutation at IVS-I-117 (G—>A)
acceptor splice site in the a 1 globin gene in the Gond tribal population of Madhya
Pradesh, India.

99
Investigating the new born cord blood samples by electrophoresis and measuring the % of
Hb Barts is the simplest method for detecting a-thalassaemia (WHO 1987). However,
many newborns with -^^o/aa have no detectable Hb Barts: DNA studies are needed for
truly accurate results.
Alpha thalassaemia syndromes
The a-thalassaemia mutations may be combined in different ways, some combination being
harmless and others causing alpha thalassaemia syndromes. The commonest combinations
are as follows.
1. Homozygous a^ thalassaemia: When this involves the common deletional forms of a^
thalassaemia it is symptomless, causing only marked microcytosis as in a° thalassaemia
trait. (However, when more severe no-deletional forms of a^ thalassaemia are involved,
eg the Saudi Arabian type moderate to severe Hb H disease may result).
2. Haemoglobin H disease: This is usually caused by the inheritance of 1 a°-thalassaemia
gene from one parent and a^ thalassaemia gene from the other. There is marked anaemia
but relatively few clinical problems. However, when one of the more severe non-
deletional forms of a^ thalassaemia is involved (eg Hb Constant spring) there may be more
marked symptoms. Hb H disease is uncommon except in the limited parts of the world
where a° thalassaemia is found. It is particularly uncommon in Indian sub-continent and
in Africa.
3. Haemoglobin Bart’s hydrops fetalis: It occurs when a fetus is homozygous for a®
thalassaemia. It causes very severe anaemia during fetal development, leading to fetal
asphyxia and oedema. Affected infants die either in utero or within a few minutes of birth.
a-thalassaemia and Malaria
a-thalassaemia is widely distributed in tropical zones of sub-Saharan Africa, India and
South-East Asia at the rate of 30-50% (WHO 1987). Globally up to 18% of the population
carries one or more gene a gene deletions (WHO 1987). This high frequency, and the
coincidence of high frequencies of the gene with the distribution of falciparum malaria.
100
suggest that the mutation has an important protective effect.
Flint et al (1986) found an excellent correlation between prevalence of falciparum malaria
and a-thalassaemia in Melanesia. In the northern islands of Melanesia falciparum malaria
reaches holo-endemic levels, but is less prevalent in the southern islands. The malarial
infection type is mostly Plasmodium falciparum and Plasmodium vivax but rarely
Plasmodium malariae. They analyzed 1800 samples by DNA methods and concluded that
a"' -thalassaemia is strongly correlated with prevalence of falciparum and other types of
malaria at various latitudes and altitudes. They did not find any correlation between the
prevalence of 6-thalassaemia and malaria, as has been found in Mediterranean regions.
Fodde et al (1988) studied two tribal populations of Andhra Pradesh and observed a high
incidence of both deletional and non deletional thalassaemia, each tribe having its own
allele frequencies. They also confirmed a strict relationship between Hb S levels and the
number of a globin genes present in individuals who carried both Hb S and a
thalassaemia. They also found individuals with Hb H disease due to inactivation of three
a globin genes. They concluded that selection by malaria is most probably responsible for
the prevalence of the various types of a thalassaemia.
Modiano et al (1991) reported that the Tharu people of the Tarain region in Southern
Nepal had 7 folds lower incidence of malaria than non Tharu people. To understand this
difference, they performed in vitro culture experiments with Plasmodium falciparum in
both groups. The average in vitro rate of parasite multiplication and frequencies of 6®,
G6PD—, & Duffy (a-b-) did not differ significantly in red cells from Tharus versus non-
Tharus controls. By contrast, they observed an overall a-thal gene frequency of 0.8 in
Tharus, the majority of whom have homozygous a-/a- thalassaemia. They suggested that
holo-endemic malaria has caused preferential survival of subjects with a-thalassaemia, and
that this genetic factor has enable the Tharus as a population to survive for centuries in an
area holo-endemic for malaria.
There are some reports of a thalassaemia in caste populations in India based on cord

5'\pa] a2
Ye n
4.2 kb
al3'
Y0
3.7 kb
RIGHTWARD CROSSOVER
^a1
\pa
Z box
LEFTWARD CROSSOVER
\pa
\pa)
X box
a1
a1
yral
^a1
m
a l ora2 a2/a^ hybrid a l
a2 or^a1 a2 /a1 hybrid
a2
a l
a2
aaa anti 3.7
- a 3 .7
a l
aaa anti 4.2
- a 4 . 2
Figure 4.2 Methods formation of the two common types of a-thalassaemia deletions. The homlogous X, Y and Z boxes are separated
by non-homologous regions of different lengths are shown above. Below rightward crossing over involving the Z boxes leaves a single
hybrid a globin gene (-a^ ). Leftward crossing over involving the X boxes leaves a single, usually a 1 globin gene (-a"* ) (WHO 1987).

Table 4.11 Haematological findings in individuals with a-thalassaemia.
Phenotype Functionalgenes
Hb Barts level at Birth
HbH%(inclusions)
MCV MCH (x/Bglobinchain
synthesisrates
Normal 4 0 0 (none) 85-100 -30 -1 0
a^-thal.trait
3 0-2 0 (rare) 75-85 24-30 -0 9
a°-thal. trait 2 2-8 0 (occasional) 65-75 19-24 -0.7
Hb H Disease
1 10-40 1-40 (many) 60-70 16-22 -0.4
Hb Bart’s Hydrops Fetalis
0 -80 (next is Hb
Portland)
Present 110-120 reduced 0.0
Adapted from Higgs et al 1989
s

103
Table 4.12 Non-deletion mutations that cause a-thalassaemia (from Higgs et al 1989)
D is o r d e r s o f Af f e c
TEDGENE
A f f e c t e d
SEQUENCEM u t a t io n POPULATION Na m e o f t h e
MUTATION
RNA translation a2 Ter. Codon a 142TAA-^CAA
South-East Asian Hb Constant Spring
al Ter. Codon a 142TAA^AAA
Mediterranean Hb Icaria
al Ter. Codon a 142TAA-^TCA
Indian Hb Koya Dora
al Ter. Codon a 142TAA->GAA
Black Hb Seal Rock
-a Exon I a30/31GAGAGG^GA G—G
Black reading frame shift
al Exon III a 116GAC->UAG
Black In Phase Ter.
-a Ini. Codon CCACCATGG-4CCACCGTGG
Black fmRNA transi.
al Ini. Codon CCACCATGG-»CCACCACGG
Medit. fmRNA transi.
a l Ini. Codon CCACCATGG-»CCACCGTGG
Medit. imRNA transi.
-o f? " Ini. Codon CCACCATGG-»CC-CATGG
North-African, Medit. i-mRNA transi.
RNA processing a2 I VS donor site
GAGGTGAGG->GAGG-—
Medit. Aberrant splicing
al Poly (A) signal
AATAAA-»AATAAG
Middle-East, Medit. efficiency of 3’ end processing
Post translational al Exon III a 125 Leu-^Pro South-East Asian Hb Quong Szeinstability
al Exon III a 109 Leu->Arg South-East Asian Hb Suan Dok
a Exon III a l i o Ala-> Asp
Middle-East Hb Petah Tikvah
-a Exon I a l4 T rp^A rg Black Evanston
blood analysis. Dash et al (1988) reported Haemoglobin Barts in 54/300 Punjabi new bom
babies (18%). Twelve (4%) had more than 0.5% of haemoglobin Barts and were
considered to have definite a-thalassaemia trait. Only 4 had more than 2% Hb Barts. 4%
Hb Barts was also reported from Bengal (Swaroop et al 1965) and 1% was found in
Bombay (Sukumaran 1974). Mishra (1989) did not find any Hb H in 454 cord blood

104
samples from Orissa. Hb H disease has been reported in India by various authors
(Chatterjea 1961; Chouhan et al 1970; Agrawal and Mehta 1982).
Prevalence of a-thalassaemia in Indian tribals based on DNA studies is summarized in
table 4.13.
fi-thalassaemia
6-thalassaemia is due to reduced 6-globin chains. In typical 6-thalassaemia trait the a:6
synthesis ratio is 2:1. In homozygotes 6^ synthesis may be completely abolished (6°
thalassaemia) or some residual synthesis remains (6 thalassaemia) about 98% (Weatherall
and Clegg 1981). The details of red cell changes are described by Weatherall (1983).
Most developing red cell dies in the bone marrow and only those that contain some Hb F
survive to enter the circulation. The Hb F level is therefore usually from 50-98%. Hb A2
levels are normal or raised, except in 66 thalassaemia when the ô gene is also involved.
Numerous mutations can cause 6-thalassaemia. The commonest type of lesion causing 6-
thalassaemia at molecular level is point mutation, mostly single base substitutions. The
prevalence and type of different mutations varies with population. Recently Bay sal (1992)
listed 6-thalassaemia mutations in different populations (table 4.14).
Dominant fi-thalassaemia
Several heterozygotes for 6-thalassaemia have been reported with quite severe anaemia.
They are heterozygote for mutations that elongate 6-chains, the abnormal chains then
accumulate as inclusions (Thein et al 1990) which resist the activity of intracellular
proteolytic enzymes. Dominant 6-thalassaemia alleles are very rare and each mutation has
been found in a single family from widely dispersed ethnic groups.
Prevalence of fi-thalassaemia
6-thalassaemia is widely prevalent in populations of Mediterranean, the Middle East &
South East Asia and in areas that such populations have migrated to North-West Europe,
North America, Latin America and Australia. 6-thalassaemia also occurs with a low
incidence in African population (1.5%) Bunn and Forget (1986).
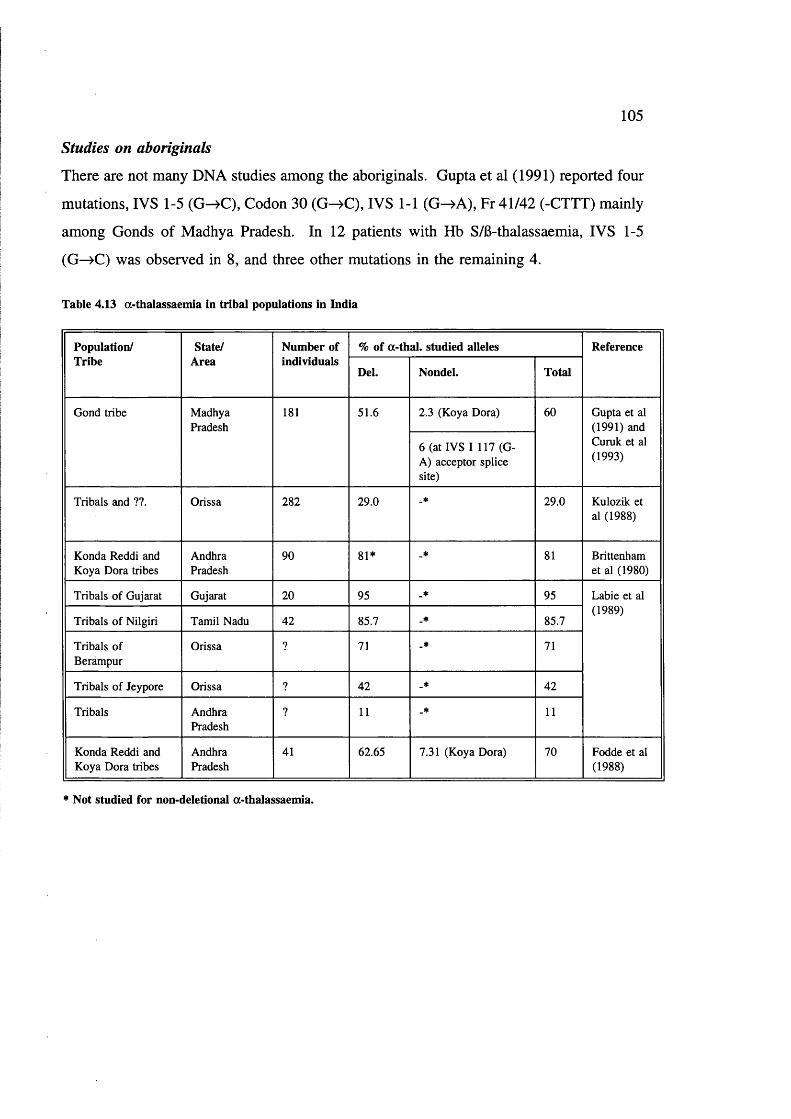
105
Studies on aboriginals
There are not many DNA studies among the aboriginals. Gupta et al (1991) reported four
mutations, IVS 1-5 (G->C), Codon 30 (G ^C ), IVS 1-1 (G ^A ), Fr 41/42 (-CTTT) mainly
among Gonds of Madhya Pradesh. In 12 patients with Hb S/6-thalassaemia, IVS 1-5
(G—>C) was observed in 8, and three other mutations in the remaining 4.
Table 4.13 a-thalassaemia in tribal populations in India
Population/Tribe
State/Area
Number of individuals
% of a-thal. studied alleles Reference
Del. Nondel. Total
Gond tribe MadhyaPradesh
181 51.6 2.3 (Koya Dora) 60 Gupta et al (1991) and Curuk et al (1993)
6 (at IVS I 117 (G- A) acceptor splice site)
Tribals and ??. Orissa 282 29.0 _* 29.0 Kulozik et al (1988)
Konda Reddi and Koya Dora tribes
AndhraPradesh
90 81* _* 81 Brittenham et al (1980)
Tribals of Gujarat Gujarat 20 95 _* 95 Labie et al (1989)
Tribals of Nilgiri Tamil Nadu 42 85.7 _* 85.7
Tribals of Berampur
Orissa ? 71 _* 71
Tribals of Jeypore Orissa ? 42 _* 42
Tribals AndhraPradesh
? 11 _* 11
Konda Reddi and Koya Dora tribes
AndhraPradesh
41 62.65 7.31 (Koya Dora) 70 Fodde et al (1988)
* Not studied for non-deletional a-thalassaemia.
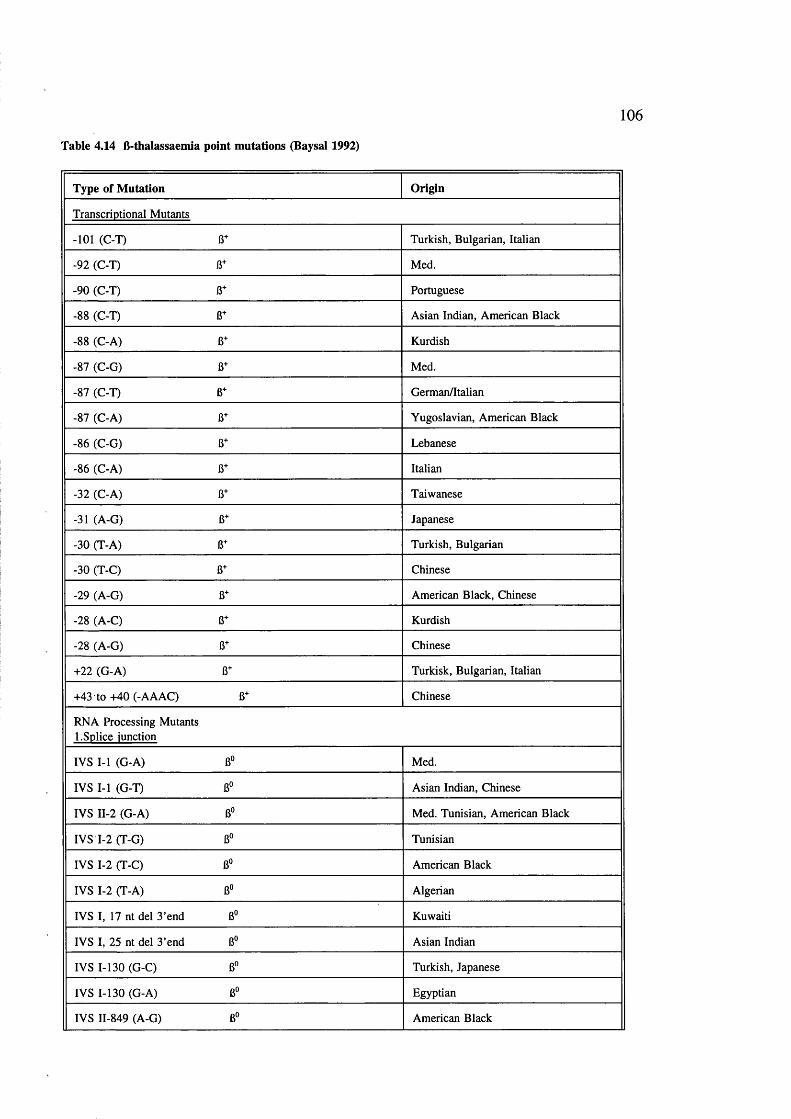
Table 4.14 B-thalassaemia point mutations (Baysal 1992)
106
Type of M utation Origin
Transcriptional Mutants
-101 (C-T) 6+ Turkish, Bulgarian, Italian
-92 (C-T) 6+ Med.
-90 (C-T) 6+ Portuguese
-88 (C-T) 6+ Asian Indian, American Black
-88 (C-A) 6+ Kurdish
-87 (C-G) 6+ Med.
-87 (C-T) 6+ German/Italian
-87 (C-A) 6+ Yugoslavian, American Black
-86 (C-G) 6+ Lebanese
-86 (C-A) 6+ Italian
-32 (C-A) 6+ Taiwanese
-31 (A-G) 6+ Japanese
-30 (T-A) 6+ Turkish, Bulgarian
-30 (T-C) 6+ Chinese
-29 (A-G) 13+ American Black, Chinese
-28 (A-C) B+ Kurdish
-28 (A-G) 6+ Chinese
+22 (G-A) 6+ Turkisk, Bulgarian, Italian
+43 to +40 (-AAAC) 6+ Chinese
RNA Processing Mutants 1. Splice junction
IVS I-l (G-A) 6° Med.
IVS I-l (G-T) 6° Asian Indian, Chinese
IVS II-2 (G-A) 6° Med. Tunisian, American Black
IVS 1-2 (T-G) Tunisian
IVS 1-2 (T-C) B" American Black
IVS 1-2 (T-A) B" Algerian
IVS I, 17 nt del 3'end B° Kuwaiti
IVS I, 25 nt del 3’end B° Asian Indian
IVS 1-130 (G-C) B° Turkish, Japanese
IVS 1-130 (G-A) B“ Egyptian
IVS 11-849 (A-G) B“ American Black

107
Type of M utation Origin
IVS 11-849 (A-C) American Black
2. Consensus sequence
IVS 1-5 (G-C) 13+ Asian Indian, Chinese, Melanesian
IVS 1-5 (G-T) 6+ Med., American Black
IVS 1-5 (G-A) 6+ Algerian, Med.
IVS 1-6 (T-C) 6+ Med.
IVS I, -1 (G-C) (CD 30) 6+ Tunisian, American Black
IVS I, -1 (G-A) (CD 30) ?? Bulgarian
IVS I, -3 (C-T) (CD 29) ?? Lebanese
IVS 1,-128 (T-G) 6+ Saudi Arabian
IVS I, -837 (T-G) 6? Asian Indian
IVS II, -843 (T-G) 6+ Algerian
IVS II -844 (C-G) 8+ Italian
IVS II -848 (C-A) 6+ American Black, Egyptian, Iranian
IVS II -848 (C-G) 8+ Japanese
IVS II -850 (G-C) 8° Yugoslavian
IVS II -850 (-G) 8" Italian
3. IVS Changes
IVS I-110 (G-A) 8+ Med.
IVS 1-116 (T-G) 8° Med.
IVS-4,5 (-AG) 8+ Portuguese
IVS 11-654 (C-T) 8+ Chinese
IVS 11-745 (C-G) 8+ Med.
4. Cryptic Splice Activation
Codon 19 (A-G) (Asn->Ser) Hb Malay 8+
Malaysian
Codon 24 (T-A) 8+ American Black, Japanese
Codon 26 (G-A) (Glu->Lys) Hb E 6* South-East Asian
Codon 27 (G-T) (Ala->Ser) Hb Knossos 8+
Med.
Nonsense and Frameshift 1. Nonsense
Codon 15 (TGG->TAG) 8° Asian Indian
Codon 15 (TGG-»TGA) 8° Portuguese
Codon 17 (A-T) 8° Chinese

108
Type of M utation Origin
Codon 22 (G-T) 6“ Reunion Islander
Codon 26 (G-T) 6° Thai
Codon 35 (C-A) 6“ Thai
Codon 37 (G-A) 6° Saudi Arabian
Codon 39 (C-T) 6° Med.
Codon 43 (G-T) 6" Chinese
Codon 61 (A-T) 6° Black
Codon 90 (G-T) 6° Japanese
Codon 127 (G-T) 6° English
2. Frameshift
Codon 1 (-G) 6° Med.
Codon 5 (-CT) Med.
Codon 6 (-A) B° Med., American Black
Codon 8 (-AA) B° Med.
Codons 8/9 (+G) B° Asian Indian
Codons 9/10 (+C) B° Turkish
Codon 11 (-T) B° Mexican
Codons 14/15 (+G) B° Chinese
Codon 15 (-T) B° Asian Indian, Thai
Codon 16 (-C) B® Asian Indian
Codon 24 (-G, +CAC) B° Egyptian
Codons 25/26 (+T) B" Tunisian
Codons 27/28 (4-C) B° Chinese
Codon 35 (-C) B“ Malaysian
Codons 36/37 (-T) B° Iranian, Kurdish
Codons 36/37/39 (-GACCCAG) Turkish
Codons 38/39 (-C) B« Czechoslovakian
Codon 41 (-C) B« Thai
Codons 41/42 (-CTTT) B° Chinese, Indian
Codon 44 (-C) B° Kurdish
Codon 47 (+A) B“ Surinamese
Codon 54 (+G) B° Japanese
Codon 64 (-G) BO Swiss
Codon 71 (+T) B° Chinese
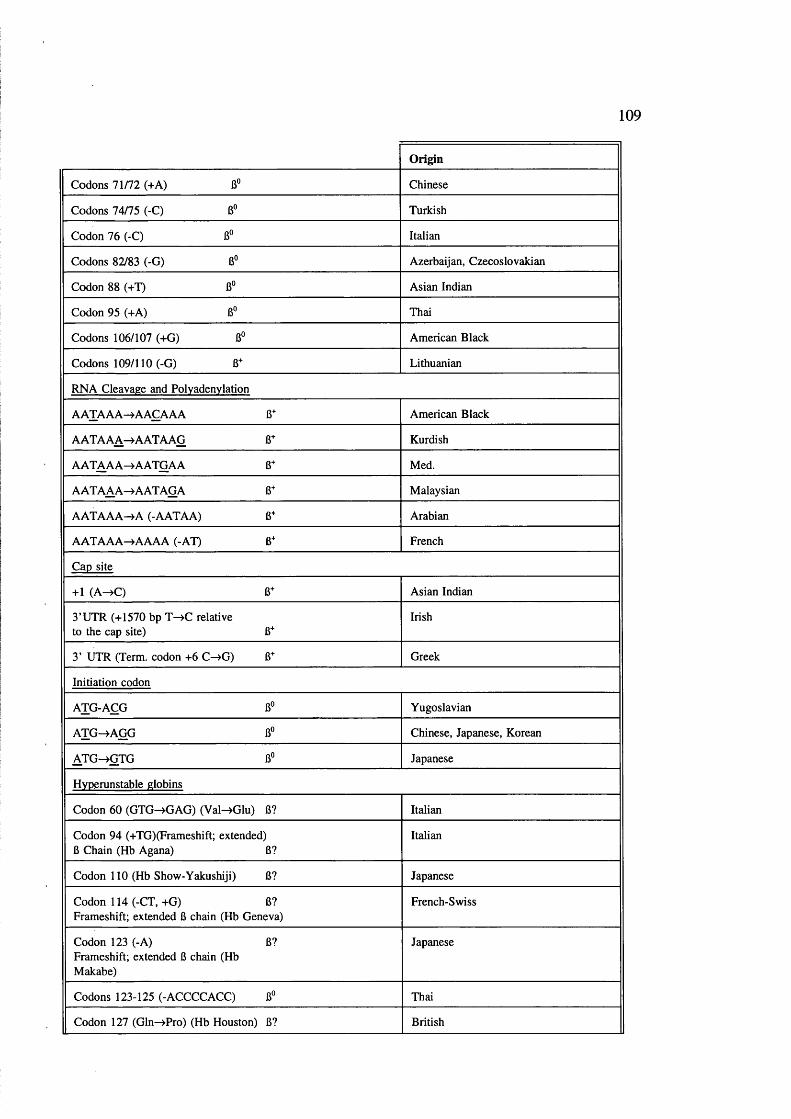
109
Origin
Codons 71/72 (+A) 6" Chinese
Codons 74/75 (-C) 6° Turkish
Codon 76 (-C) 6° Italian
Codons 82/83 (-G) 6" Azerbaijan, Czecoslovakian
Codon 88 (+T) B° Asian Indian
Codon 95 (+A) 6° Thai
Codons 106/107 (+G) 6° American Black
Codons 109/110 (-G) 8+ Lithuanian
RNA Cleavage and Polyadenylation
AATAAA->AAÇAAA 8+ American Black
AATAAA-> AATAAG 8+ Kurdish
AATAAA^AATGAA 8+ Med.
AATAAA^AATAGA 8+ Malaysian
AATAAA->A (-AATAA) 8+ Arabian
AATAAA->AAAA (-AT) 8+ French
Cap site
+1 (A -Æ ) 8+ Asian Indian
3’UTR (+1570 bp T ^ C relativeto the cap site) 8^
Irish
3’ UTR (Term, codon +6 C ^ G ) 8+ Greek
Initiation codon
ATG-AÇG 8° Yugoslavian
ATG^A G G 8° Chinese, Japanese, Korean
A TG^G TG 8" Japanese
Hyperunstable globins
Codon 60 (GTG^GAG) (VaWGlu) 8? Italian
Codon 94 (+TG)(Frameshift; extended)8 Chain (Hb Agana) 8?
Italian
Codon 110 (Hb Show-Yakushiji) 8? Japanese
Codon 114 (-CT, +G) 8? Frameshift; extended 8 chain (Hb Geneva)
French-Swiss
Codon 123 (-A) 8? Frameshift; extended 8 chain (Hb Makabe)
Japanese
Codons 123-125 (-ACCCCACC) 8" Thai
Codon 127 (Gln->Pro) (Hb Houston) 8? British
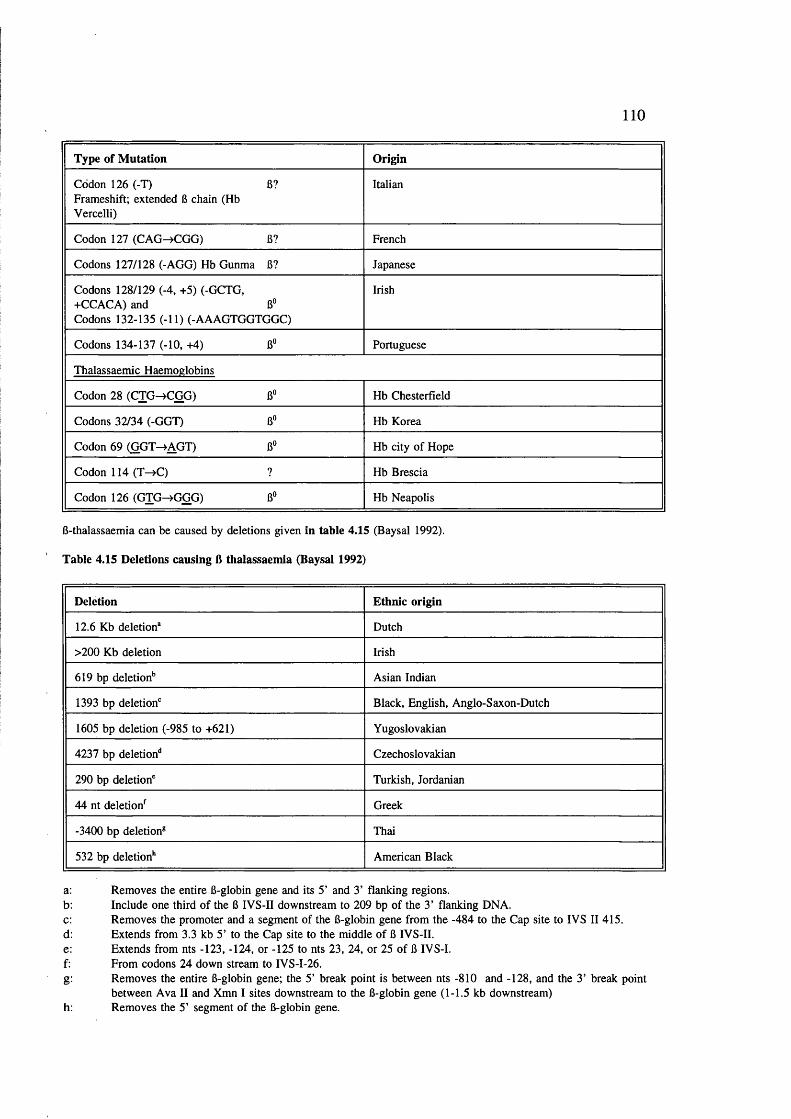
110
Type of M utation Origin
Codon 126 (-T)Frameshift; extended 6 chain (Hb Vercelli)
6? Italian
Codon 127 (CAG^CGG) 6? French
Codons 127/128 (-AGG) Hb Gunma 6? Japanese
Codons 128/129 (-4, +5) (-GCTG, +CCACA) and 6" Codons 132-135 (-11) (-AAAGTGGTGGC)
Irish
Codons 134-137 (-10, +4) 6" Portuguese
Thalassaemic Haemoglobins
Codon 28 (CTG^CGG) 6" Hb Chesterfield
Codons 32/34 (-GGT) 6° Hb Korea
Codon 69 (GGT-»AGT) 6° Hb city of Hope
Codon 114 (T->C) ? Hb Brescia
Codon 126 (GTG^GGG) 6° Hb Neapolis
6-thalassaemia can be caused by deletions given in table 4.15 (Baysal 1992).
Table 4.15 Deletions causing 6 thalassaemia (Baysal 1992)
Deletion Ethnic origin
12.6 Kb deletion* Dutch
>200 Kb deletion Irish
619 bp deletion*’ Asian Indian
1393 bp deletion'’ Black, English, Anglo-Saxon-Dutch
1605 bp deletion (-985 to +621) Yugoslovakian
4237 bp deletion** Czechoslovakian
290 bp deletion' Turkish, Jordanian
44 nt deletion^ Greek
-3400 bp deletion® Thai
532 bp deletion** American Black
a: Removes the entire 6-globin gene and its 5’ and 3’ flanking regions.b: Include one third of the 6 IVS-II downstream to 209 bp of the 3’ flanking DNA.c: Removes the promoter and a segment of the 6-globin gene from the -484 to the Cap site to IVS II 415.d: Extends from 3.3 kb 5’ to the Cap site to the middle of 6 IVS-II.e: Extends from nts -123, -124, or -125 to nts 23, 24, or 25 of 6 IVS-I.f: From codons 24 down stream to IVS-I-26.g: Removes the entire 6-globin gene; the 5’ break point is between nts -810 and -128, and the 3’ break point
between Ava II and Xmn I sites downstream to the 6-globin gene (1-1.5 kb downstream) h: Removes the 5’ segment of the 6-globin gene.

I l l
fi-thalassaemia: India
Table 4.16 Distribution of ft-thalassaemia in relation to AS & SS in aboriginals in India.
State/Area Tribe % of R- thal. tra it
% of Hb References
AS SS
Rajasthan Bhil 3.0 5.7 0.0 Jain et al (1983)
Mina 4.8 4.4 0.5
Garasia 5.0 1.1 0.0
Damor 7.9 0.0 0.0
Gameti 7.4 0.6 0.0
Adivasi 5.4 3.5 0.0
Madhya Pradesh Hill Korwa 10.1 0.0 0.0 RMRC/ICMR Annual Reports (1990-91,
1991-92)Sahariya 4.6 0.0 0.0
Bhil 1.12 19.03 0.82 ICMR Immunohaematology reports Bombay from Bhatia & Rao 1987)
West Bengal Santhal 3.92 1.19 0.0 Choudhury et al (1967)
Bhumij 8.4 0.0 0.0 Ashok Kumar et al (1982)
Maharashtra Raj Gond (Yavatmal district)
1.9 10.0 0.35 Rao and Gorakshar (1990)
Kolam Gond (Yavatmal district)
2.98 18.75 0.0
Raj Gond (Chandrapur district)
5.28 13.58 0.37
Pardhan (Yavatmal district)
1.58 31.57 2.2
Naik Gond (Chandrapur district)
5.6 10.8 0.0
Dadra & Nagar Haveli
Dhodia 1.09 0.0 0.0 Vasantha et al (1982)
Worli 1.22 0.0 0.0
Kokana 2.36 0.0 0.0
6-thalassaemia also occurs in aboriginal groups where sickle haemoglobin has been
reported extensively but in most cases occurs with lower frequency than Hb S.
Interestingly, in some tribal groups 6-thalassaemia has been reported where abnormal

112
haemoglobins are absent (see table 4.16)
Molecular studies: India
There are a very few studies on molecular basis of 6-thalassaemia in the Indian
Subcontinent and all data is derived from families undergoing prenatal diagnosis. Table
4.17 shows the known 6-thalassaemia mutations in India.
Table 4.17 B-thalassaemia mutations in non-tribals in India
Region/Area Mutation % to total Number studied Source
Indian Subcontinent
IVS 1 Pos. 5 (G- C)
35.4
619 bp deletion 22.7
Fr Codons 8/9 (+G)
16.4
Fr 41/42 ( CTTT) 9.1
IVS 1 Pos. 1 (G- T)
5.4
Fr Codon 16 (-G) 4.5
Codon 15 (G-A) 2.7
Cap site (+1) (A- C)
1.8
-88 (C-T) 0.9
25 bp 0.9
55 Parikh et al (1990)
Delhi 619 bp deletion 28.9
IVS 1 Pos.l (G- T)
25.2
IVS 1 Pos. 5 (G- C)
20.0
Fr 8/9 (+G) 12.6
Fr 41/42 ( CTTT) 11.9
Un-characterized 1.5
135 Jain et al (1991)
Bombay IVS I Pos. 5 G-C
60
C 15 (G-A) 18
619 bp del.
IVS I Pos. I G-A
Codon 30 (G-C)
45 Chitra Mahadik (1991) Unpublished results; Personal communication

113
Region/Area M utation % to total Number studied Source
Bombay Fr C 5 (-CT) 2
IVS 1 Pos 1 G-T 2 Chitra Mahadik (1991) Unpublished results; Personal
Fr 41/42 (-CTTT)
2
Fr 55 (+A) 2communication
Eastern IVS 1 Pos. 5 (G- C)
?20
Bhattacharya et al (1992)
Fr Codon 8/9 (+G)
?
619 bp deletion ?
Indian Subcontinent
IVS I Pos. 5 (G- C)
38.3 702 Varawalla et al (1991 a)
619 bp deletion 19.2
Codons 8/9 (+G) 16.4
IVS 1 Pos. 1 (G- T)
10.0
Codons 41/42 (- CTTT)
9.7
Codon 15 (G-A) 2.3
Codon 30 (G-C) 0.9
Codon 16 (-C) 0.6
Cap site +1 (A- C)
0.3
IVS 2 Pos. (G-A) 0.3
-88 (C-T) 0.2
Rare mutations ? 19 Varawalla et al
Fr Codon 5 (-CT) ?(1991 b)
IVS 2 Pos. 837 (T-G)
?
IVS 1 Pos. 110 (G-A)
?
IVS 1 -1 (G-A) ?
Glucose-6-Phosphate Dehydrogenase deficiency
Glucôse-6-Phosphate Dehydrogenase deficiency is the commonest disease producing
enzyme disorder in humans. It is caused by wide range of mutations, some of which
114
rarely produce symptoms while others lead to haemolytic anaemia (Beutler 1983 & 1990).
300 variants are described based on WHO (1967) criteria for G6PD enzyme
characterization, another 100 variants are described with other than WHO criteria (Buetler
1990). Effects are usually very dependent on environmental factors.
G6PD is the initial enzyme of the Pentose Phosphate Pathway, and is the rate limiting
enzyme of the pathway (Yoshida 1973). It catalyses oxidation of Glucose-6-phosphate to
6-Phosphogluconolactone. During this conversion NADP is reduced to NADPH which is
used in reducing glutathione (GSSG) to GSH by glutathione reductase (Figure 4.3) ie, in
allowing the cell to recover from oxidative stress, which oxidises 2 GSH^GSSG.
Marks et al (1958) observed that younger red cells have relatively high G6PD activity, and
activity diminishes as the red cell ages. In G6PD deficiency the older cells are even more
deficient than usual, and G6PD eventually becomes a limiting factor in cell survival.
G6PD deficiency is inherited in a sex-linked fashion; being fully expressed in hemizygous
males and in homozygous females, but in only a proportion (about 10%) of female
heterozygotes. In adult females only one X-chromosome in each cell is active, the other
being inactive. The pattern of X-chromosome inactivation is entirely random, so that most
female heterozygotes for G6PD deficiency carry a double population of red cells in the
mean ratio of 1:1. However, there may be substantial deviations from the mean (Beutler
et al 1962).
G6PD variants have been classified into 5 groups based on the level of enzyme activity
in the red cells, and clinical manifestations. These variants are rare.
Class I includes severely deficient variants that are associated with a chronic non
spherocytic haemolytic anaemic (CNSHA). These variants are rare.
Class II variants have less than 10% residual enzyme activity but without CNSHA, and
include the common Mediterranean and common severe Oriental variants.

115
Class in variants have moderately deficient (10-60%) residual enzyme activity and include
the common African (A) form.
Class IV variants have normal enzyme activity (60-150%)
Class V variants have increased enzyme activity (WHO 1989).
The human G6PD Gene
The G6PD gene has been localized on the long arm X-chromosome Xq 28 (Pai et al 1980)
and it is close to the genes for haemophilia A, mental retardation (the Fragile X site),
protan and deuton colour blindness and adrenal leucodystrophy (Davies et al 1990).
It is a large gene of 17.5 Kb with 13 exon and 12 introns listed in table 4.18 based on
data by Martini et al (1986) with following alterations: The size of intron 3 was altered
from 100 bp to 95 bp; intron 11 from 300 bp to 103 bp and exon 2 from 127 bp to 128
(Vulliamy et al 1988). The 5’ untranslated portion of the mRNA corresponds to exon I
and part of exon II and the Initiation codon is present in exon II and intron II. The G6PD
mRNA expected from the sequence is 2269 nucleotides. The G6PD mRNA has a 5’
untranslated region of 69 and a 3’ untranslated region of 655 bp. The sequence
ATT A A AT was found at position -20 upstream of the transcription initiation site, and may
function as a TATA Box. Over 300 bases have been sequenced upstream of the
transcription initiation site and this region is thought to contain the G6PD promoter
(Martini et al 1986).
1 2 3 4 5 6 7 8 9 10 11 12 13
iijijj; non coding ■ coding
There are two common normal Human G6PD enzymes demonstrable on electrophoresis:
type B is slow moving, and type A is fast moving. Type B is the commonest but G6PD
normal variant A is found in about 20% of African males (Yoshida 1967) this variant has
A—>G at nucleotide 376 (aminoacid 126 Asn—>Asp) (Takizawa et al 1987).

116
All variants of G6PD A share the mutation of G6PD A (Beutler (1990). Restriction
Fragment Length Polymorphism analysis shows that G6PD A' is the most recent variant
in G6PD polymorphism evolution (Vulliamy et al 1991).
The Structure of G6PD
From the cDNA sequence, a single subunit polypeptide chain has 515 amino acids (m w
59,265) (Luzzatto and Mehta 1989). In vitro conversion to dimers and tetramers is
affected by pH, ionic strength, temperature, enzyme concentration (Levy 1979) and the
concentration of NADP which is bound with high affinity (De Flora et al 1974). Luzzatto
and Testa (1978) have suggested that the predominant form of Human erythrocytes G6PD
in vivo is unlikely to be monomeric since the level of NADP would cause these to
aggregate, and that at physiological pH erythrocyte G6PD is likely to be a mix of dimers
and tetramers.
G6PD and Malaria
Like Hb abnormalities G6PD deficiency is extremely prevalent in areas of hyper-endemic
malaria, presumably reflecting selective genetic pressure hy falciparum malaria. Resistance
to the malarial parasite has been demonstrated in vitro. Parasites showed impaired growth
in G6PD Mediterranean deficient red cells (Luzzatto 1980) and this was further confirmed
in cells from both hemizygous males and homozygous females (Roth et al 1983).
Bienzle et al (1972) observed that heterozygous females are protected against malarial
parasites. Usanga and Luzzatto (1985) reported evidence from in vitro studies that G6PD
deficiency confers relative protection against plasmodium falciparum. They also confirmed
that the parasite has its own gene for G6PD which is switched on when it enters G6PD
deficient red cells.
There is evidence that female heterozygotes have a greater selective advantage than
hemizygous males because of increased risk to the latter of neonatal jaundice and favism
in the Mediterranean region.

117
Geographical distribution
G6PD deficiency is widely prevalent in tropical and subtropical regions due to its selective
advantage against falciparum malaria (Livingstone 1985). The geographical distribution
is similar to haemoglobinopathies. The frequency of G6PD deficiency is most accurately
expressed in terms of the proportion of males found to be hemizygous: this figure is the
same as gene frequency. The global frequency and distribution of G6PD deficiency is
summarized in figure 4.4 based on Livingstone 1985 (WHO 1989). WHO estimates
indicate that about 7.5% of the world population carry one or two genes for G6PD
deficiency.
Health problems that can be caused by G6PD deficiency
G6PD deficiency can cause health problems in two ways:
1. Neonatal jaundice: Red cell destruction in neonates leads to haemolysis and jaundice
(Matthay and Mentzer 1981; Lopez and Cooperman 1971). But its severity varies from
population to population depending on environmental factors.
The incidence of neonatal jaundice incidence is increased in Africans, Greeks, Sardinians
(Luzzatto and Mehta 1989).
2. Acute haemolysis: The term favism is used to describe the occurrence of acute
haemolytic reaction in G6PD deficients after eating fava beans. It frequently occurs in
children of below 5 years of age in the Mediterranean region (Belsey 1973) and boys are
affected two or three times more frequently than girls because of the greater number of
hemizygous males than homozygous females.
Antimalarial drugs may also cause acute haemolysis in G6PD deficient subjects: the
enzyme deficiency was first described due to acute haemolysis in some black American
soldiers during the second world war after primaquine administration (Beutler et al 1954).
Haemolysis and jaundice begin within 2 or 3 days of starting the drug. The haemolysis
is largely intravascular and it is associated with haemoglobinuria (Luzzatto and Mehta
1989). Heinz bodies are a characteristic finding in the peripheral blood (Beutler 1972).
The haemolytic reaction with a particular drug differs from one G6PD deficient person to
other and within the same person at different times. Differences between individuals may
be determined by different G6PD variants and genetic differences within the red cell

118
G S H - P e r d x i d a s e
G S H G S S G
G S S G RED UC TA SE
G LU COSE
NADPHN A D P
6 P GG 6 PG 6 P D
P E N T O S EP H O S P H A T E
PATHWAY(oxidat ive)
EMBDEN-MYERHOFPATHWAY(glycolylic)
6 P G D
P E N T O S EP H O S PH A T E
PYRUVATE
LACTATE
Figure 4.3 Metabolic role of G6PD enzyme in Pentose Phosphate Pathway
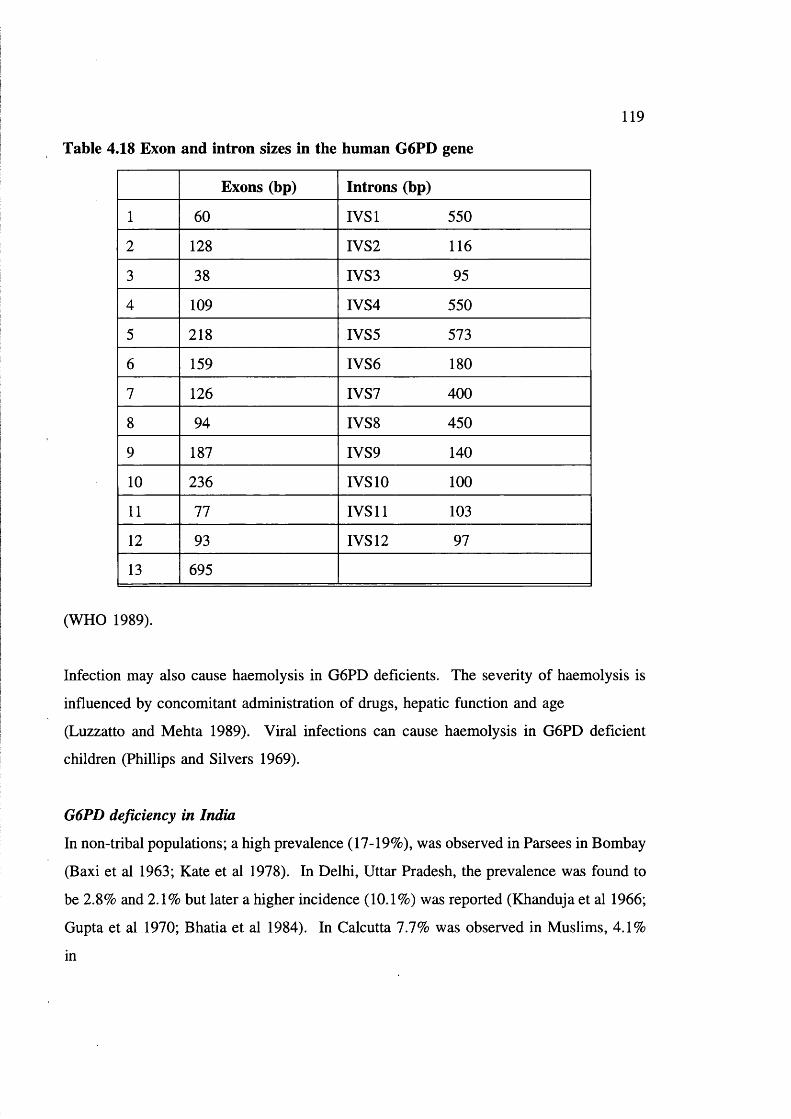
119
Table 4.18 Exon and intron sizes in the human G6PD gene
Exons (hp) Introns (hp)
1 60 IVSl 550
2 128 IVS2 116
3 38 IVS3 95
4 109 IVS4 550
5 218 IVS5 573
6 159 IVS6 180
7 126 IVS7 400
8 94 IVS8 450
9 187 IVS9 140
10 236 IVS 10 100
11 77 IVS 11 103
12 93 IVS 12 97
13 695
(WHO 1989).
Infection may also cause haemolysis in G6PD deficients. The severity of haemolysis is
influenced by concomitant administration of drugs, hepatic function and age
(Luzzatto and Mehta 1989). Viral infections can cause haemolysis in G6PD deficient
children (Phillips and Silvers 1969).
G6PD deficiency in India
In non-tribal populations; a high prevalence (17-19%), was observed in Parsees in Bombay
(Baxi et al 1963; Kate et al 1978). In Delhi, Uttar Pradesh, the prevalence was found to
be 2.8% and 2.1% but later a higher incidence (10.1%) was reported (Khanduja et al 1966;
Gupta et al 1970; Bhatia et al 1984). In Calcutta 7.7% was observed in Muslims, 4.1%
in
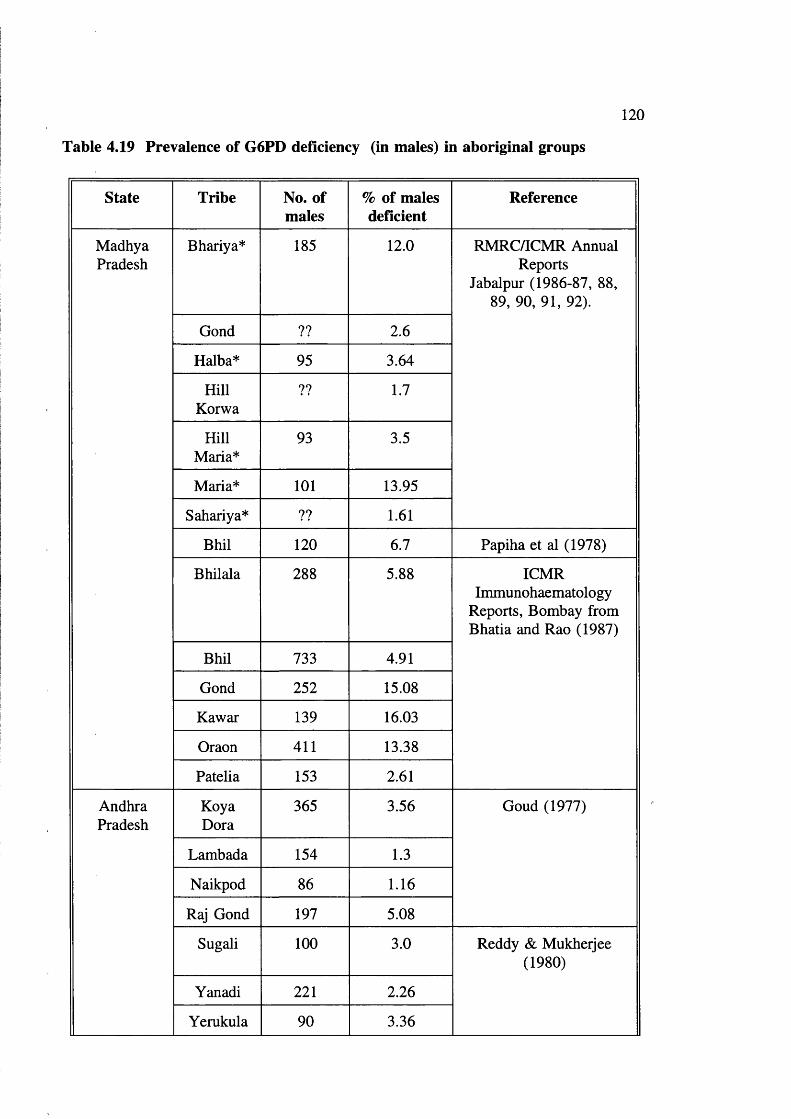
120
Table 4.19 Prevalence of G6PD deficiency (in males) in aboriginal groups
State Tribe No. of males
% of males deficient
Reference
MadhyaPradesh
Bhariya* 185 12.0 RMRC/ICMR Annual Reports
Jabalpur (1986-87, 88, 89, 90, 91, 92).
Gond ?? 2.6
Halba* 95 3.64
HillKorwa
?? 1.7
HillMaria*
93 3.5
Maria* 101 13.95
Sahariya* ?? 1.61
Bhil 120 6.7 Papiha et al (1978)
Bhilala 288 5.88 ICMR Immunohaematology
Reports, Bombay from Bhatia and Rao (1987)
Bhil 733 4.91
Gond 252 15.08
Kawar 139 16.03
Oraon 411 13.38
Patella 153 2.61
AndhraPradesh
KoyaDora
365 3.56 Goud (1977)
Lambada 154 1.3
Naikpod 86 1.16
Raj Gond 197 5.08
Sugali 100 3.0 Reddy & Mukherjee (1980)
Yanadi 221 2.26
Yerukula 90 3.36

121
State Tribe No. of males
% of males deficient
Reference
Tamil Nadu Irula 89 8.99 Saha et al (1976)
Kuruvikkaram
96 4.17 Reddy & Mukherjee (1981)
Orissa Bhuyan 102 14.7 Chotray & Ranjit (1990)
Juanga 53 13.2
Munda 52 11.53
WestBengal
Santhal 164 14.03 Kate et al (1978)
Maharashtra Bhil 215 7.44 ICMR Immunohaematology
Reports, Bombay from Bhatia and Rao (1987)
Gond 104 10.58
Katkari 77 7.8
Pawara 87 3.45
Koli 162 2.47 Ishwad & Naik (1984)
Assam Ahom 130 5.4 Flatz et al (1972)
Garo 76 7.89 Das et al (1982)
Lalung 81 3.7
Rabha 57 15.79
Mikir 83 15.66
Nagaland AngamiNaga
85 27.06 Seth & Seth (1971)

122
State Tribe No. of males
% of males deficient
Reference
UttarPradesh
JohriBhotia
168 2.98 Kapoor & Vaid (1981)
TolchaBhotia
219 3.2
JaadBhotia
51 1.96
MarchaBhotia
235 1.25
RangBhotia
180 4.44
HimachalPradesh
Gujjar 200 2.5Balgir (1983)
* Author involved in studies
Hindus. In Orissa 7.7% and in Andhra Pradesh 4.4% (Kate et al 1978; Ghosh et al 1981;
Veerraju et al 1978). In Bombay a prevalence of 7.4% in mixed group was reported, but
only 0.4% was found in another study (Baxi et al 1961; D'costa et al 1967).
However the biochemical, enzymatic properties, molecular and clinical features need to be
studied to define the specific variants involved.
Table 4.20 G6PD Variants in India
Variant Class Population References
G6PD West Bengal II Bengali Boy West Bengal
Azevedo et al (1968)
G6PD Kerala III Kerala
G6PD Porbandar m Gujarat
G6PDMediterranean
II Punjab

123
Variant Class Population References
G6PD Kalyan III Koli Family (tribe) Maharashtra
Ishwad & Naik (1984)
G6PD Andhra Pradesh
? Andhra Pradesh
G6PD Cutch ? ?
G6PD Jammu ? Jammu & Kashmir Beutler (1975)
G6PD Chatham Ill Punjab Vulliamy et al (1988)
G6PD Punjab II Punjab Verma et al (1987)
G6PD Rohini m Maharashtra Sayyed et al (1992)
Table 4.21 G6PD variants characterized at DNA level in India
Variant Position Aminoacid
Basecharge
Aminoacidcharge
References
1 G6PDMediterranean
exon VI 188 C-T TC C ^TTC
Beutler et al (1990)
2 G6PD Chatham exon IX 335 G-A GCC->ACC
Vulliamy et al (1988)
3 G6PD Kerala- Kalyan
exon IX 317 G-A GAG-^AAG
Ahluwalia et al (1992)
G6PD Variants in India
In India, so far only 11 variants have been described (Sayyed et al 1992) based on
biochemical and enzyme characterisation (table 4.20) Some are not yet described fully.
Mostly of these variants belong to Class III, ie, moderately anaemic, Kerala, Kalyan,
Punjab, Porbandar, Rohini; (Azevedo et al 1968, Ishwad and Naik 1984, Sayyed et al
1992) West Bengal (Azevedo et al 1968, and Chatham (Vulliamy et al 1988) are Class II.
In addition to these; a fast moving variant has been observed in Jalari males of Andhra
Pradesh, a fishing caste population in a coastal area (Naidu et al 1985).

[ yp(cs<.- 'l ,n "t. I'* th e n ta l r p o p u l a h o n tl ia l is hi’m i^ygo iis
V ~ ] < 7 -n .9%
i l l l O - M - ' J X .
15 - 70 9k
. 0.5 - 2,3 - 0 Q T5v
Figure 4.4 Map showing global distribution of G6PD deficiency (WHO 1989)

125
Recently Ahluwalia et al (1992) reported that G6PD Kerala and G6PD Kalyan
(biochemically different variants described separately by Azevedo et al 1968, and Ishwad
and Naik 1984) have the same mutation; amino acid 317 glu—>lys. It has been proposed
to call them both G6PD Kerala-Kalyan. Only 3 Indian G6PD variants have been
identified at the molecular level (table 4.21).
The above review reveals how such a high frequency of the Hb S gene (lethal in
homozygotes) is maintained among the tribals, in the presence of a high frequency of
consanguineous marriage, which in theory should accelerate loss of recessive lethal genes
from the population.
In fact, the broader general hypothesis is that, a customary consanguineous marriage
pattern as practised among so many primitive tribes, may accelerate evolution by selecting
a "benign" as opposed to lethal mutation with a heterozygote advantage.
Data on marriage pattern, reproductive performance and prevalence of hereditary anaemias
is to be collected to see if it will cast light on this hypothesis among the Baiga.
Hereditary anaemias: Whether homozygous sickle cell anaemia is milder among the Baiga
(than elsewhere), and if so how does their genetic fitness compare with that of others.
Alpha thalassaemia: how prevalent is it in the heterozygous and homozygous form? Could
the high frequency of homozygotes be accounted for by a high frequency of homozygotes
being generated by consanguineous marriage, and then coming under strong selection than
heterozygotes.
AIMS AND OBJECTIVES OF THE STUDY
In order to improve our understanding of natural selection in an aboriginal population, the
following were undertaken.
1. Assessment of importance of hereditary anaemias in the Baiga tribe.
a. Prevalence of hereditary anaemias; abnormal haemoglobins, a and fi-

126
thalassaemias and G6PD deficiency,
b. Molecular nature of hereditary anaemias,
c. Impact of hereditary anaemias on health of the tribe (family studies),
d. Importance of demographic features in understanding inheritance of
hereditary anaemia genes,
e. Relation to socio-cultural and environmental conditions (malaria etc) and
2. Testing a field laboratory in tribal environment (developing countries)

127
CHAPTER 5 POPULATION, MATERIALS AND METHODS
Activities in the field
Research Team (first and second visit)
Myself
Two research assistants
Local forest, medical people and school teachers
Transport
Since the area is hilly and forested, there are no proper transportation facilities and the area
is far away from the nearest city (Jabalpur), a matador (extended Jeep) was hired during
the first field visit. During the second visit the Director RMRC/ICMR Jabalpur provided
a Jeep for four months.
Time of data collection
The data was collected only in the first half of the year (January-June). This is the right
period to conduct surveys, because heavy rains from July to November and lack of proper
roads make it very difficult to move from village to village. This underlines how difficult
it is for the Baiga themselves to maintain contacts over even moderate distances during
half the year.
Interpréteras help
Since the Baigas speak a broken form of Hindi with their own style and gestures, it is not
easy to understand or to interview them to obtain information. To interview Baiga women
I enlisted assistance from local female multiple social workers, health workers and nurses.
One of my assistants, Mr Chandra Bhan Gautam (a research scholar from Rani Durgawati
University, Jabalpur) belongs to the (Baiga Chak) tribal area, and helped in collecting data
in the tribal tongue. Mr Bairagi, a Deputy Ranger from Karanjia who has been working
in the tribal area for the last ten years also accompanied me during field work.
128
Selection of the area
The study area was selected in Dindori tehsil, Mandla district, one of the five major Baiga
dominated districts in Madhya Pradesh, because it is believed that the Baigas of this region
are very ancient (figure 2.1). Elwin (1939) concluded, that the inhabitants of this area are
pure, and ancient Baigas. The area is very isolated, and there is no other tribe/caste
resident in the area, so there is least possibility of admixture. The Baiga development
authority consider that the inhabitants of this area are backward relative to other areas.
Population
A small in-depth study was conducted of as many parameters as possible relating to tribal
structure and health status in 17 villages (9 villages in the first trip and 8 villages in next,
see below) in three blocks (administrative units). Rapport was established with the
inhabitants of the villages, and information was collected from all the families (as
described later). Figure 5.1 shows the geographical location of the study population.
Table 5.1 shows the blocks, villages, and number of families studied.
The study was carried out in two field trips:
The first field trip was conducted during January-April 1991, in which methods for
collecting demographic and anthropological data, and feasibility of the study were tested.
Could data be collected for all families in selected villages? Could access be gained and
communication satisfactorily achieved? Was the questionnaire appropriate and useful?
Was it feasible to collect blood/DNA samples from individuals and families? Blood
samples and mouthwash (DNA) samples were collected in the field and analyzed in
London.
The second field trip was carried out in February-July 1992 (a) Demographic and
anthropological data collection was completed, (b) A field laboratory was tested on the
spot to define the haematological profile of the population, assess iron deficiency and
G6PD deficiency. Blood samples were collected for DNA studies in London (c) Basic
studies were done in collaboration with ICMR Jabalpur. The methods used in collecting
data and blood samples and analyzing the data and material are described in the
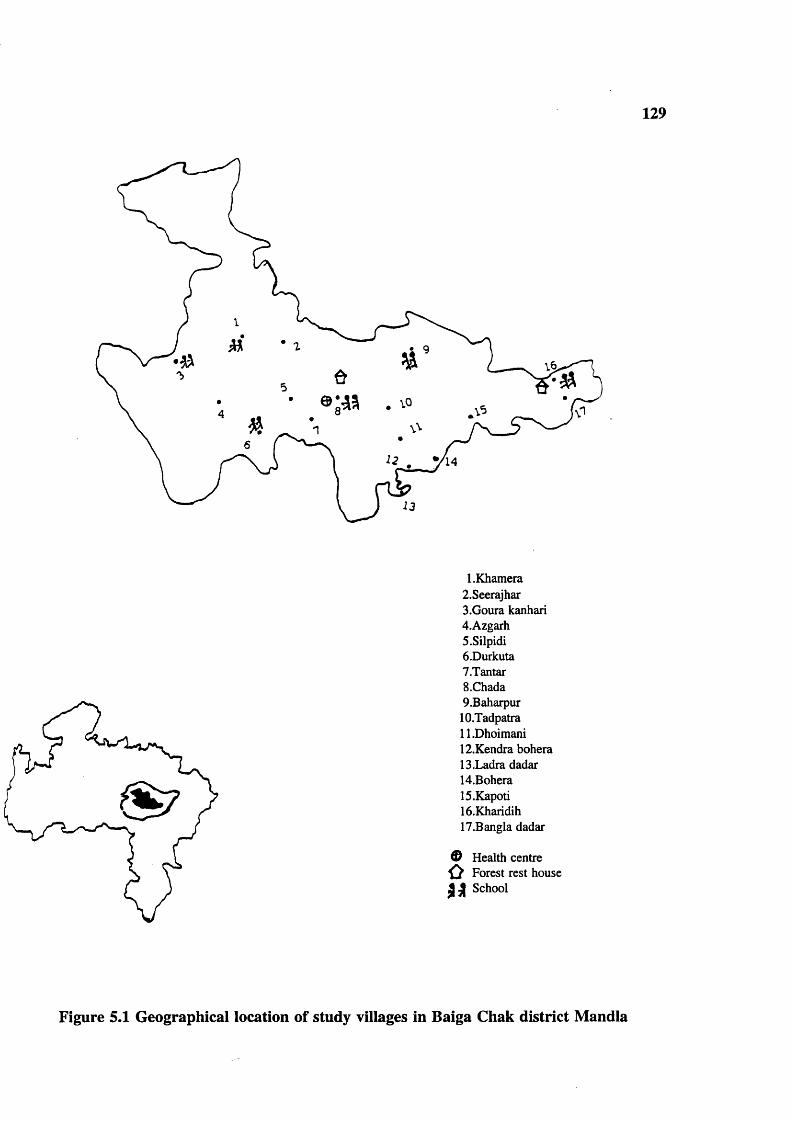
129
1 .Khamera 2.Seerajhar3.Goura kanhari4.Azgarh S.Silpidi6.Durkuta7.Tantar5.Chada9.Baharpur
10.Tadpatra11.Dhoimani12.Kendra bohera13.Ladra dadar14.Bohera15.Kapoti16.Kharidih17.Bangla dadar
0ÙS i
Health centre Forest rest house School
Figure 5.1 Geographical location of study villages in Baiga Chak district Mandla
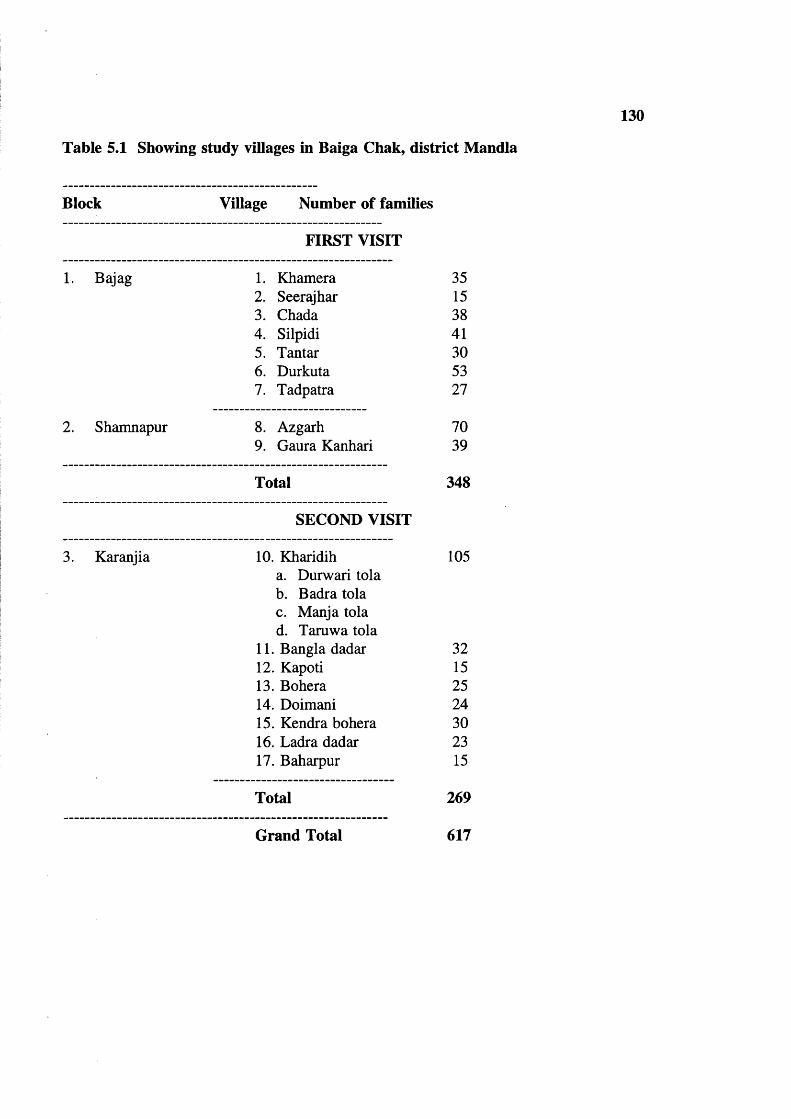
130
Table 5.1 Showing study villages in Baiga Chak, district Mandla
Block Village Number of families
FIRST VISIT
1. Bajag 1. Khamera 352. Seerajhar 153. Chada 384. Silpidi 415. Tantar 306. Durkuta 537. Tadpatra 27
2. Shamnapur 8. Azgarh 709. Gaura Kanhari 39
Total 348
SECOND VISIT
3. Karanjia 10. Kharidih 105a. Durwari tolab. Badra tolac. Manja tolad. Taruwa tola
11. Bangla dadar 3212. Kapoti 1513. Bohera 2514. Doimani 2415. Kendra bohera 3016. Ladra dadar 2317. Baharpur 15
Total 269
Grand Total 617

131
following order:
I Demographic/Anthropological data collection. Field, India.
II. Analysis of Demographic/Anthropological data, London.
III. Haematological methods. Field laboratory, India.
IV. Haematological methods Jabalpur, India.
V. Haematological methods, London.
VI. DNA methods, Jabalpur and London.
VII. Gene analysis, London.
I. Demographic/Anthropological data collection. Field
1. Establishing a rapport in the field (Baiga villages)
The present study involved 17 tribal villages in Dindori tehsil described in detail later. In
order to carry out the work, it was essential to establish a rapport in the villages. It is not
easy to understand primitive people; the best approach is to become participant observer;
and though I did not understand the Baiga language well, I did my best to adopt this style.
At times, I used to smoke tobacco (chungi), eat Pej (local food) and I listened to them as
much as I could. My feeling with the Baigas is that they are not easy to approach, they
maintain their unique isolation, and have difficulty in feeling homely and intimate with an
outsider. Figure 5.2 summarises the approach used to study the tribe.
The district administration must first be approached for permission to enter the area, since
there is a ban on visitors, and foreign and outside researchers, but not on local researchers.
In addition the area is declared "Nuxlite" prone. Nuxlites are political radicals, who
support the tribals against government agencies. Once permission was obtained, the local
administrative staff helped to persuade school teachers and village elders to gather all
tribals in the village in the evenings for meetings. The Forest Ranger, the Deputy Ranger,
and the Beat Guard would help by calling on the village heads (surpunches), to explain the
importance of conducting the survey. Sometimes tribals are very reluctant to co-operate.
School teachers, forest workers and multiple health workers are the best people to pursuade
them because they come in to contact with them regularly in daily life. Local health staff,
doctors, nurses, compounders and multiple social workers were particularly

132
Forest department
Divisional forest officer Dindori
Administrative department
District Collector Mandla
Permission to stay in the Permission to enter in the rest house. area
RangerDeputy Ranger
Local administrative staff Sub divisional officer/ Assistant Collector Dindori
Blocks1. Bajag2. Shamnapur
3. Karanjia
Block development officerBlock medicalofficer
Beat guardsSchool teachers Surpunches Village Heads Village elders
Medical officers Compounders Multiple
health workers
THE BAIGAS, ABORIGINALS
Figure 5.2 Studying the Baiga
helpful during the field work. The tribals go to these health workers for treatment of
various chronic diseases.

133
Field Experiences
I describe some of my experiences while conducting the survey as it is relevant to the
research of a field scientist. In Chada (one of my study villages, see the map for
geographical location) there is a high school, primary health centre, forest rest house,
quarters for school teachers and an Adivasi (aboriginal) Hostel for boys and girls. Arjun
Singh Durvae a postgraduate and teacher in Chada High school, helped me in collecting
data; fortunately he belongs to the Baiga tribe.
The Baigas from Azgarh village were very unwilling to see me & my team mates on our
first visit. There was a rumour in the village that we were family planning programme
people, and everyone in the village climbed to the top of the mountain (see similar
experience of Thomson 100 years ago P 31), and I had to come back empty-handed with
the village surpunch. Next day I organized a meeting with the help of Budh Singh Maravi
(a local Baiga school teacher), and was able to pursuade the villagers to come forward to
give information.
During my second visit (1992) to Tantar village to follow up the 1991 field visit to review
families with sickle cell trait, I requested the members of families to donate blood.
Unfortunately, no one come forward. Everyone started hiding, and eventually all villagers
disappeared. A local nurse from the Primary Health Centre (PHC), Chada village asked
the village elders, but they said a big No. I tried again without success, but this was an
exception.
In Durkuta village Budh Singh Maravi, an educated Baiga and school teacher accompanied
me as an interpreter in data collection. He is the one who usually takes a Baiga deputation
to Delhi, to represent the Baiga cultural heritage on Republic day.
In Kharidih where I stayed three months in the forest rest house for data collection, the
Deputy Ranger appointed Shri Sukul Singh (Kotwar) temporarily to assist me. He was a
temporary worker of the forest department, who looked after the birth and death register
for the Baiga tribe. He knows the area, and the people by name very well. He used to
create some enthusiastic impressions about me and my team and gather all adivasis for a

134
meeting. Some adivasis were scared to see needles and syringes. I, and my team-fellows
used to visit village elders, chat about their problems, likings, how they are isolated, why
they prefer cousins for marriage. Once they feel friendly, they give information about their
life style, and their problems. In fact, the people who live 50 kms away from them are
foreigners to them. Each tribal group has its own tribal boundaries for social life. The
best time and circumstances for interviewing men is morning, not evening because they
drink alcohol in the evening.
Where to stay in the tribal area during field work?
This was an important problem, because there is hardly any facility to stay in, and carry
out research work. There are a few forest rest houses in the area, where I was able to stay
with permission from the Divisional forest officer, Dindori. In Chada there is a forest rest
house, where I got permission to stay for fifteen days during my first field visit, and
thereafter the medical officer & nurse from Chada were kind enough to allow me and my
team to stay in their quarters for the rest of the period. During the second visit I stayed in
a forest rest house in Kharidih, 257 kms away from Jabalpur (35 kms from Chada) in thick
jungle. I stayed in Durkuta village for a week in a tribal house, where I was severely
bitten by bed bugs.
Demographic data
The following data was collected from all families using the questionnaire in Appendix
2. The questionnaire was designed to be able to enter all data on a computer.
a. Years of formal education
Education was recorded carefully in four categories: no formal schooling, 1-5 years of
schooling, 6-10 years of schooling, and >10 years of schooling.
b. Surnames (Garb)
Surnames of both husband and wife were recorded, since the tribe follow surname (garh)
exogamy and sub tribe (jat) endogamy (see P 36).

135
c. Age
Ages had to be estimated carefully, since the people were not able to give their exact date
of birth. I enlisted the help of local school teachers, and educated persons in the village
to estimate the correct ages of all members of each family, for example the teachers
remembered the period of schooling for young people, and had records of current pupils.
People themselves know their age relative to others, from childhood. Local events like
harvesting crops and festivals, were used to cross check the age. School records were used
to check the children’s age given by the parents.
d. Age at menarche of women
Age at menarche was recorded to assess the reproductive span and impact of local
conditions on pubertal development.
e. Family tree
Marriage pattern was recorded by drawing a pedigree for the present generation. Great
care is needed because confusion can easily arise from some of the terms used for kinship
(see figure 2.4 P 40). They use the term "Dudh palatna" returning of milk or a girl for
kinship. The husband uses the same term "Mama" for his father in-law, his mother’s
brother and father’s sister’s husband. Like wise his mother-in-law, his father’s sister, and
mother’s brother’s wife are all called "Mami". Sometimes they adopt or call someone in
the village a Mama irrespective of relation. Pedigrees were drawn to avoid these
confusions. Information could not be collected further back than the second or third
generation because of inability to remember. Definitions of some important terms used
in the study are as follows:
Family
Husband and wife/wives (if more than one), surviving children and any accompanying
person/persons.
Couple
Only married couples were considered. In some families husband or wife married more
than once. To estimate the reproductive performance of a couple (fertility, and mortality)

136
and to avoid the confusion of double and triple marriage, eg, husband, first wife and
children are considered as one couple and the same husband, second wife and children are
counted as one couple and so on. Hence the number of couples were more than the
families in the study.
f. Age at marriage
Year of marriage was estimated carefully with the help of educated villagers, and cross
checked using school records and local events like harvesting crops. It was then related
to age as estimated above.
g. Year of marriage
Year of marriage was estimated from parent’s present age and age at marriage, for all the
families.
h. Time interval between marriage and first conception
This was classified into 4 groups: up to 24 months, 25-36 months, 37-45 months,
49-kmonths. It is important to note this interval to estimate/check the present age of the
wife.
i. Reproduction, infant and child mortality
Information on family size was recorded by interviewing husband and wife privately and
together, so they could check with each other. Information on all deaths and surviving
children was entered on pedigrees already drawn. Mortality was classified into abortions,
stillbirths, deaths between 0-12 months, deaths between 1-12 years, and pre-reproductive
deaths (13-20 years).
j. Polygamy and divorce
Some men and women had married twice or thrice for various reasons; the wife or
husband left or died or wished to have more than one partner. This information was
recorded for all marriages.
137
k. Duration of breast feeding
Information was collected for the last or next-to-last infant or child, to ensure against
faulty memory.
1. Use of medical and herbal contraceptives
Medical contraceptives (tubal ligation, vasectomy, pill) and herbal contraceptives are used
for both temporary and permanent sterilization. Contraceptives used, duration of use if a
reversible method was used, and date of sterilization when applicable, was recorded.
m. Tobacco and alcohol etc
Information on habits like drinking alcohol, chewing tobacco, smoking tobacco was
recorded, a. Daily, b. Weekly, c. Occasionally (once in a month) and d. No.
n. Livelihood
Information on (tasks carried out in) daily life was recorded to assess economic status.
II: Analysis of data, London
Data collected on the first field trip was first analyzed manually to assess its usefulness
and obtain preliminary results, which allowed the second field trip to be planned. After
both field trips, the collected data were edited, and entered in a computerised coding sheet
(40x80 units). The coded data was rechecked with the original questionnaires and then
entered in the Statistical Package for Social Sciences (SPSS). The frequency distribution
was obtained for all variables and statistical tests of significance were applied (% test, and
t-test wherever necessary).
III. Haematological methods-field laboratorv
To study hereditary anaemias we need to have the background haematological profile ie
"normal values" of a study population; accurate local values for Hb, RBC, PCV are
required. Red cell count can be measured accurately only by electronic counters, but these
are usually big and need renewable calibrating material. So in the field we need simplified
methods: (a) that don’t need intravenous blood but can be done by finger prick, (b) do not
need big, heavy equipment, (c) do not need expensive imported equipment and (d) do not

138
need renewable calibrating material of short life span.
One of the main problems in past surveys, especially where thalassaemia is concerned, is
lack of proper red cell indices and accurate Hb A2 estimations.
I contacted Dr. RS Tiwary Director, Regional Medical Research Centre For Tribals for
local support to the laboratory work in the field and in RMRC/ICMR laboratories Jabalpur,
India: he agreed to provide laboratory back up.
In the first field trip blood samples were collected on filter paper via finger prick. Tribals
do not mind and mostly come forward to donate blood through finger prick, because they
usually go to local Primary Health Centres for malaria checks. They are scared to see
needles and syringes. The response is low for intravenous blood.
In the second field trip blood samples were both finger prick and intravenous, because
good amount of blood (5 to 10 ml) was required for DNA studies. The number of samples
are shown in table 5.2 In the first field trip samples were tested in London, and in the
second field trip the same families were followed up and some fresh families were
screened.
Hb electrophoresis and Hb A2 estimation were not performed in the field because they
need proper laboratory facilities (electrophoresis tank, spectrophotometer, power pack,
buffers) and the field area is far from Jabalpur (where these facilities easily can be
obtained). The sickling slide test was not carried out in the field because it needs a
microscope and another technician.
Results from field with limited resources need validation: the results were confirmed as
far as possible in London.
A field laboratory was assembled with simple portable equipment (table 5.3) to test the
feasibility of carrying out the following procedures in the field in primitive conditions.
A. Haematological parameters: Hb, RBC, HCT: derived red cell indices MCH, MCV,
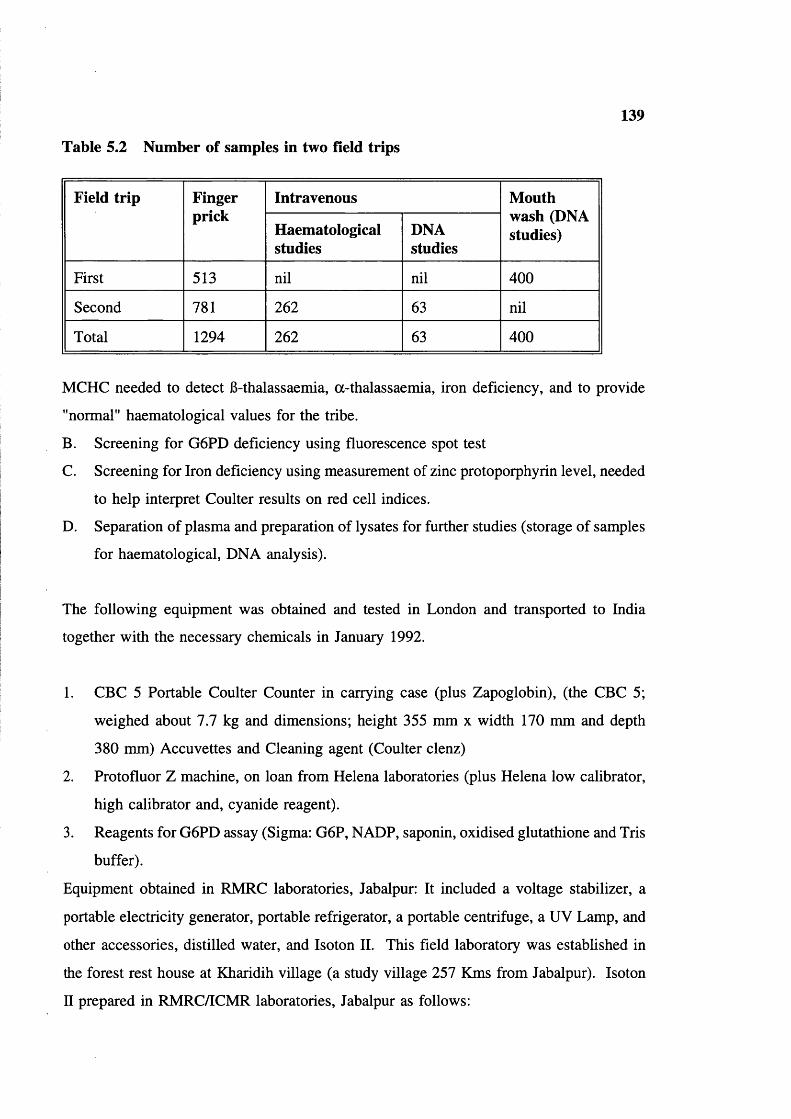
139
Table 5.2 Number of samples in two field trips
Field trip Fingerprick
Intravenous Mouth wash (DNA studies)Haematological
studiesDNAstudies
First 513 nil nil 400
Second 781 262 63 nil
Total 1294 262 63 400
MCHC needed to detect 6-thalassaemia, a-thalassaemia, iron deficiency, and to provide
"normal" haematological values for the tribe.
B. Screening for G6PD deficiency using fluorescence spot test
C. Screening for Iron deficiency using measurement of zinc protoporphyrin level, needed
to help interpret Coulter results on red cell indices.
D. Separation of plasma and preparation of lysates for further studies (storage of samples
for haematological, DNA analysis).
The following equipment was obtained and tested in London and transported to India
together with the necessary chemicals in January 1992.
1. CBC 5 Portable Coulter Counter in carrying case (plus Zapoglobin), (the CBC 5;
weighed about 7.7 kg and dimensions; height 355 mm x width 170 mm and depth
380 mm) Accuvettes and Cleaning agent (Coulter clenz)
2. Protofluor Z machine, on loan from Helena laboratories (plus Helena low calibrator,
high calibrator and, cyanide reagent).
3. Reagents for G6PD assay (Sigma: G6P, NADP, saponin, oxidised glutathione and Tris
buffer).
Equipment obtained in RMRC laboratories, Jabalpur: It included a voltage stabilizer, a
portable electricity generator, portable refrigerator, a portable centrifuge, a UV Lamp, and
other accessories, distilled water, and Isoton II. This field laboratory was established in
the forest rest house at Kharidih village (a study village 257 Kms from Jabalpur). Isoton
n prepared in RMRC/ICMR laboratories, Jabalpur as follows:
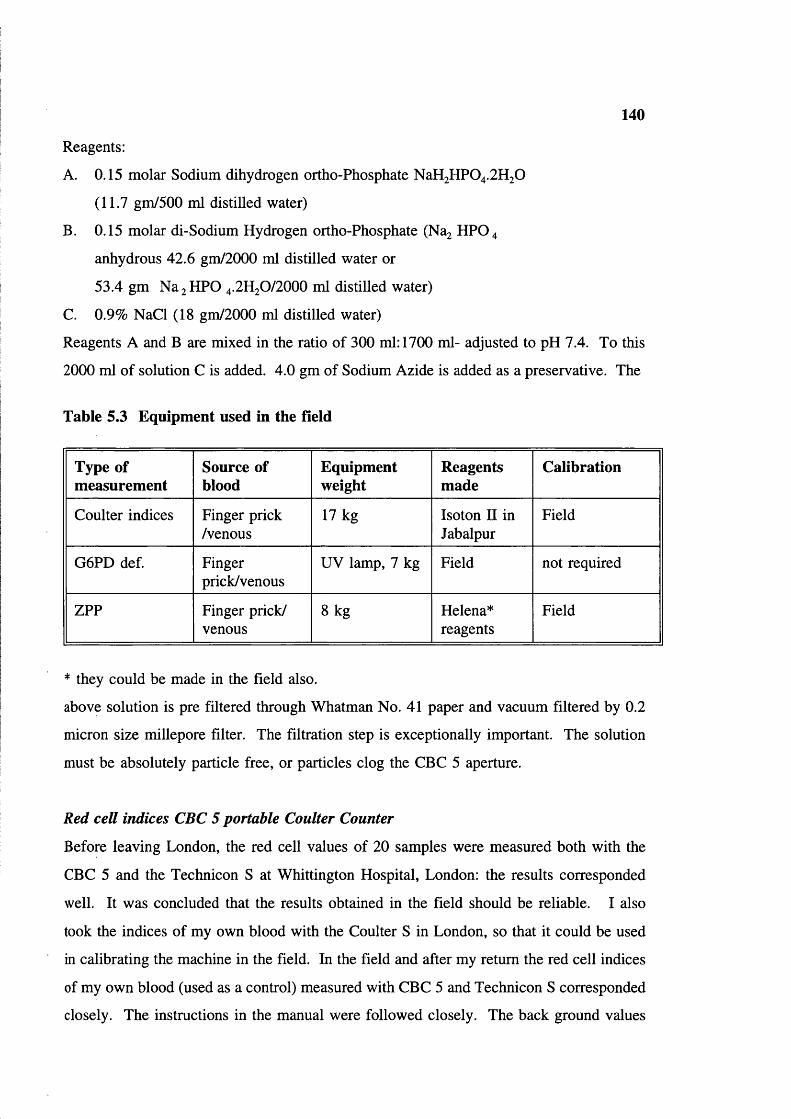
140
Reagents:
A. 0.15 molar Sodium dihydrogen ortho-Phosphate NaH2 HP0 4 .2 H2 0
(11.7 gm/500 ml distilled water)
B. 0.15 molar di-Sodium Hydrogen ortho-Phosphate (Na2 HPO 4
anhydrous 42.6 gm/2000 ml distilled water or
53.4 gm Na 2 HPO 4 .2 H2 O/2 OOO ml distilled water)
C. 0.9% NaCl (18 gm/2000 ml distilled water)
Reagents A and B are mixed in the ratio of 300 ml: 1700 ml- adjusted to pH 7.4. To this
2000 ml of solution C is added. 4.0 gm of Sodium Azide is added as a preservative. The
Table 5.3 Equipment used in the field
Type of measurement
Source of blood
Equipmentweight
Reagentsmade
Calibration
Coulter indices Finger prick /venous
17 kg Isoton II in Jabalpur
Field
G 6 PD def. Fingerprick/venous
UV lamp, 7 kg Field not required
ZPP Finger prick/ venous
8 kg Helena*reagents
Field
* they could be made in the field also.
above solution is pre filtered through Whatman No. 41 paper and vacuum filtered by 0.2
micron size millepore filter. The filtration step is exceptionally important. The solution
must be absolutely particle free, or particles clog the CBC 5 aperture.
Red cell indices CBC 5 portable Coulter Counter
Before leaving London, the red cell values of 20 samples were measured both with the
CBC 5 and the Technicon S at Whittington Hospital, London: the results corresponded
well. It was concluded that the results obtained in the field should be reliable. I also
took the indices of my own blood with the Coulter S in London, so that it could be used
in calibrating the machine in the field. In the field and after my return the red cell indices
of my own blood (used as a control) measured with CBC 5 and Technicon S corresponded
closely. The instructions in the manual were followed closely. The back ground values
141
of Hb, MCH, MCV, and HCT are checked by following instructions. Once the instrument
was calibrated; 40 |xl of whole blood was diluted in a cuvette containing 20 ml of Isoton
II; the ratio of whole blood and diluent is 1:500 for Hb estimation; for RBC count 200 |xl
of the 1st sample diluted in a 2nd cuvette tube containing 20 ml of Isoton; the ratio of
whole blood and diluent is 1:50,000. For each sample RBC, MCH, HCT, and MCV were
assessed first and Hb level afterwards. The channel was washed after each Hb estimation
to avoid the lysis of the next sample (wave length 525 nm). The CBC 5 was calibrated
against my own blood and checked every morning before measuring red cell indices.
Accuracy of results obtained with CBC 5 Coulter Counter
To check the accuracy of results obtained with CBC 5 in the field, in comparison to
electronic Coulter Counter in London, after my return 206 blood samples were assessed
by both CBC 5 and Technicon S from mixed patients who were attending the hospital at
Whittington Hospital, London. For CBC 5, pippeting and measuring with required amount
of Isoton II and mixing the red cells are done manually, whereas all aspects are automatic
for Technicon S. Results were recorded and analyzed to see the difference between both
the instruments.
Hb Level: The haemoglobin levels are same with Coulter CBC 5 and Technicon S (Figure
5.3).
MCH: The mean cell haemoglobin was slightly higher with the CBC 5 in comparison to
Technicon S in most of the samples. The mean difference of MCH was 0.5 pg (higher for
CBC 5): this may be because the CBC 5 gives slightly lower RBC count than Technicon
S. There may be a slight problem in screening in borderline cases ie, where the MCH is
between 25-27 pg, but the observed values were clearly acceptable (figure 5.4).
MCV: The mean cell volume is slightly lower with CBC 5 than Technicon S. The
observed difference may be due to instrument variation (figure 5.5).
MCHC values are high for CBC 5 compared to Technicon S, as is to be expected from
the smaller MCV. The modal value is 32 for Technicon, 34 for CBC 5 (figure 5.6). In

142
this study Hb and the MCH values were the most important parameters, and it is concluded
that these results obtained in the field are acceptably reliable.
Zinc protofluor machine for screening for iron deficiency
The Helena haematofluorometer is a simple machine which measures fluorescence in
whole red cells on a slide, at a fixed wave length (424 nm) characteristic of zinc
protoporphyrin (ZPP). Increased fluorescence gives a semiquantitative indication of iron
deficiency or lead poisoning. Haem is formed in the developing red cell by insertion of
iron into a formed protoporphyrin ring. In iron deficiency or impaired iron utilization (eg
lead poisoning) zinc is inserted into protoporphyrin instead of iron, to make zinc
protoporphyrin (ZPP). The ZPP is stable and remains in the red cells and can be measured
by its fluorescence as above. Fluorescence at 424 nm is therefore an indicator of the
available iron supply at the time the cell was formed. A raised ZPP/haem ratio (>80) is
characteristic of iron deficiency, and lead poisoning, and may also occur in anaemia
associated with (eg) chronic infection.
Principle
The ranges provided by Helena Laboratories are:
<80 pmol ZPP/haem ratio = Normal
>80 jxmol ZPP/haem ratio = Iron deficient
The haemoglobin must be fully oxygenated to avoid spectral shifts. "Protoflour reagents"
added to test blood convert the haemoglobin to cyanmethaemoglobin, which is stable and
has the same spectral characteristics as oxyhaemoglobin. Reagents and procedure are
followed according to kit method of Helena laboratories.
Fluorescence spot method for G6PD deficiency screening
The fluorescent spot test (Beutler 1966; Beutler and Mitchell 1968) is reliable, sensitive
and usable on stored blood. It is based on measuring the fluorescence of NADPH
produced when G6P and NADP are added to haemolysate. The mixture is spotted on to
filter paper after incubation and observed in Ultra-Violet light.

143
Principle
In presence of glucose-6-phosphate dehydrogenase (G6PD) and NADP, G6P is oxidised
to 6-phosphogluconate in the reaction,
G6P + NADP------------------------ 6PG +NADPH
When a G6PD deficient haemolysate is incubated with G6P and NADP a smaller amount
of NADPH is formed. NADPH fluoresces at long wavelength.
To make the test more sensitive, oxidized glutathione (GSSG) is included in the reaction
mixture. In the presence of GSSG, NADPH is re-oxidised by glutathione reductase present
in the lysate.
GSSG + NADPH + H ---------------- 2GSH + NADP
The screening test therefore measures the difference between G6PD activity and
glutathione reductase activity. When the G6PD level is normal NADPH continues to
accumulate, but when levels are deficient, little or no NADPH accumulates.
Because of some modification made for this study I give here the full method modified
from Beutler and Mitchell 1968 as used in Hammersmith Hospital.
Reagents:i. D-G6P 10 mM/1 or 305 mg/100 mlii. NADP 7.5 mM/1 or 60 mg/10 mliii. Saponin 750 mM/1 or 10 gm/1iv. Tris Hcl Buffer pH 7.8V. Oxidized Glutathione (GSSG) 8 mM/1 or 49 gm/1
The above reagents are mixed in following proportion:
2 parts of G6P1 part of NADP2 parts of Saponin3 parts of Tris HCl Buffer1 part of GSSG2 parts of Distilled water
The combined reagent is stable at 20°C for two years and at 4°C for 2 months.
Fresh blood samples (Second field trip)
10 pi of whole blood (anti-coagulated EDTA or Heparin) is added to 100 pi of reagent

144
No. of individuals 6 0 -------
Hb in gm/dl
§ ■ CBC 5 H Tech. S
Figure 5.3 Frequency distribution of Hb level with CBC 5 and Technicon
No. of individuals
17 18 19 20 21 22 23 24 26 26 27 28 29 30 31 32 33 34MCH in pg
CBC 5 Tech. S
Figure 5.4 frequency distribution of MCH with CBC 5 and Technicon S

100 No. of individuals145
6 6 - 6 9 6 0 - 6 4 6 6 - 6 9 7 0 - 7 4 7 6 - 7 9 6 0 - 8 4 8 6 - 8 9 9 0 - 9 4 9 6 - 9 9 1 0 0 - 1 0 4 1 0 6 - 1 0 9
MCV
H I CBC 5 H Tech. S
Figure 5.5 Frequency distribution of MCV with CBC 5 and Technicon S
No. of individuals80
70 k
60 ^
50 r
40 h
30 ^
20 h
lOh
26 27 28 29 30 31 32 33 34 35 36 37MCHC levels
■ i CBC 5 H Tech. S
Figure 5.6 Frequency distribution of MCHC with CBC 5 and Technicon S
146
mixture at room temperature (15-25°C). 10 |l l 1 of reaction mixture is applied to a
Whatman No 1 filter paper at the beginning of the reaction and at interval of 5 and 10
minutes. The spots are examined under UV light. Controls of normal blood and known
G6PD deficient blood were set up in parallel. In the 2nd field visit fresh samples were
screened in the field laboratory. Samples were tested and results recorded every day.
Old blood samples (First field trip)
In the month of March-April 1991 blood spots were collected by finger prick on Whatman
filter paper No 1. Approximately 30 days later the dried filter papers was used for
screening for G6PD deficiency by the UV Fluorescence Spot method at Hammersmith
Hospital, London. Since enzyme activity was decreased due to this delay, the method had
to be slightly modified. The reaction mixture was prepared in two parts as follows:
Part 1 Part 2
50 )Lil 1% Saponin 25 pi 7.5 mM NADP50 pi Distilled water 25 pi 0.0 IM G6P
75 pi Tris HCl Buffer
A single punch of filter paper (representing approximately 5 pi blood) was added to a
labelled test tube containing 100 pi of part 1 reaction mixture and the haemoglobin eluted
completely. The colour of lysate was matched in a normal control, and the 2nd part of the
reaction mixture was added to both test tubes. 10 pi spots on Whatman filter paper were
made at intervals of 0, 10, 15, 20, 25, 30, minutes and so on. The filter papers were
allowed to dry and the fluorescence observed under UV light in the dark room. In "old"
G6PD normal samples fluorescence was visible at 10 minutes and was bright at 75
minutes. Old samples were therefore assayed at 0,10, 75 minutes. Results of both field
(fresh) samples and laboratory (old) samples were compared (table 5.4). It appears the
modified method for "old" samples is reliable.
Validation of results
Quantitative G6PD Assay was carried out using WHO (1967) procedure in London to
check the validity of the results of the field samples. In this assay glutathione is omitted
and the rate of production of NADPH is measured by measuring increased absorption of
light at 540 nm by NADPH. It is assumed that under the reaction conditions the rate of

Table 5.4 G6PD screening in two visits
147
Males Deficient % Place
First visit 284 14 4.92 30 days old samples, Hammersmith Hospital
Second visit 263 11 4.20 fresh samples. Field
Total 547 25 4.57 -
reduction of NADP is proportional to enzyme activity.
In six normal "old" field samples were assayed. G6PD enzyme activity ranged from
8.1%-12.6% even after 30 days. In 2 G6PD deficient "old" field samples the activity
ranged from l.l%-2.6% (see table 5.5). In fresh G6PD normal samples from the
laboratory, the activity was 83.16%. It is clear that activity decreased proportionately in
both G6PD normal and deficient samples, as they aged.
Note: Percent was calculated according to laboratory normal range of G6PD enzyme
activity.
During the second field trip (February-July 1992), G6PD deficient samples were collected
from 10 males and transported to Professor Lucio Luzzatto’s laboratory but unfortunately
there were delays and they arrived in poor condition. Nevertheless Dr Margaret Town
carried out G6PD electrophoresis, and two samples showed G6PD B-like pattern. Other
biochemical and kinetic investigations could not be done.
IV. Haematological methods: Jabalpur
Investigations carried out in the Genetics Unit, RMRC/ICMR laboratories, Jabalpur, India
were 1. Hb electrophoresis on cellulose acetate for screening for abnormal haemoglobins.
2. Micro-column chromatography for Hb A2 and Hb S quantitation.
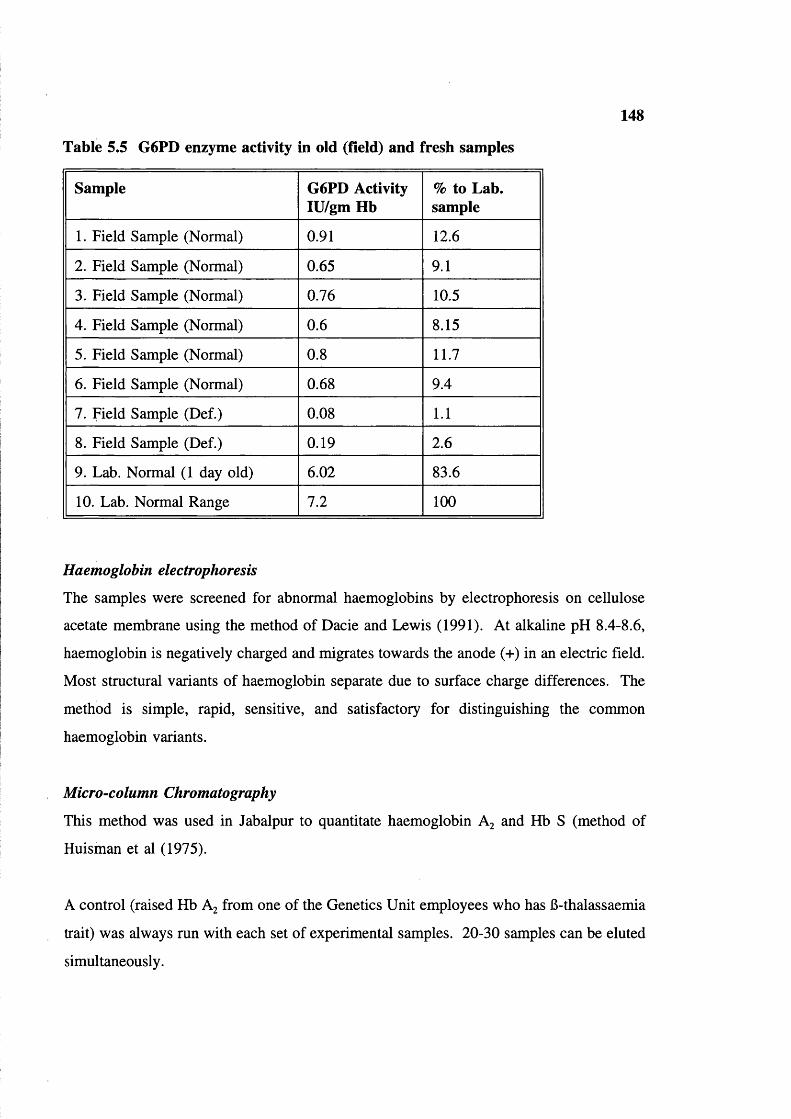
148
Table 5.5 G6PD enzyme activity in old (field) and fresh samples
Sample G6PD Activity lU/gm Hb
% to Lab. sample
1. Field Sample (Normal) 0.91 12.6
2. Field Sample (Normal) 0.65 9.1
3. Field Sample (Normal) 0.76 10.5
4. Field Sample (Normal) 0.6 8.15
5. Field Sample (Normal) 0.8 11.7
6. Field Sample (Normal) 0.68 9.4
7. Field Sample (Def.) 0.08 1.1
8. Field Sample (Def.) 0.19 2.6
9. Lab. Normal (1 day old) 6.02 83.6
10. Lab. Normal Range 7.2 100
Haemoglobin electrophoresis
The samples were screened for abnormal haemoglobins by electrophoresis on cellulose
acetate membrane using the method of Dacie and Lewis (1991). At alkaline pH 8.4-8.6,
haemoglobin is negatively charged and migrates towards the anode (+) in an electric field.
Most structural variants of haemoglobin separate due to surface charge differences. The
method is simple, rapid, sensitive, and satisfactory for distinguishing the common
haemoglobin variants.
Micro-column Chromatography
This method was used in Jabalpur to quantitate haemoglobin A2 and Hb S (method of
Huisman et al (1975).
A control (raised Hb A2 from one of the Genetics Unit employees who has B-thalassaemia
trait) was always run with each set of experimental samples. 20-30 samples can be eluted
simultaneously.

149
V. Haematological methods-London
The results obtained in India were checked; (a) to verify results and (b) to assess the
accuracy of the field lab. The following were done with the help of various experts.
1. Isoelectric focusing for abnormal haemoglobins
2. Plasma ferritin estimation for iron deficiency
3. Fetal Hb estimations
4. Hb A2 estimation by elution from cellulose acetate.
Isoelectric focusing
Blood samples collected on Whatman filter paper No.l during first field trip and
transported to London, were preserved at -20°C, and processed at Central Middlesex
Hospital, London after seven days and gels were scanned in a densitometer at 540 nm for
proportion of A and S in Hb AS individuals.
In the second trip all samples with abnormal haemoglobins detected by Hb electrophoresis
in India were re-investigated by isoelectric focusing at King’s College London (to separate
Hb S and Hb D, because sickling test could not be done in the field). The details of
procedure followed according to Resolve-Hb, Isolab (kit method) instructions. The details
can be obtained from Isolab Inc, Innovative Biochemical methodology. Drawer 4350,
Akron, Ohio USA 44321.
Serum ferritins
For comparison with the results of zinc protoporphyrin assay plasma ferritin was measured
in selected serum/plasma samples at the Endocrine Laboratory, Whittington Hospital,
London. As the serum ferritin concentration usually reflects the body iron store, it is used
for detecting iron deficiency and iron overload. As iron deficiency develops, plasma or
serum ferritin falls before transferrin saturation and free erythrocyte protoporphyrin (FEP).
Thus, serum ferritin is considered the best screening test for early iron deficiency.
The kit method of Becton and Dickinson laboratories was followed. In most normal adults
serum ferritin concentration is in the range of 15-300 pg/l. Individuals with clear cut iron
deficiency anaemia (microcytic anaemia, low serum iron, high TIBC, absence of stainable
150
iron in the bone marrow and a subsequent response to therapeutic iron) almost invariably
have a serum ferritin concentration of less than 15 ng/ml. Depletion of iron stores is
generally associated with ferritin values of approximately 20 ng/ml while iron deficiency
anaemia is generally suspected with ferritin values of 10 ng/ml.
Non iron deficient individuals with an infection or inflammation usually, but not
necessarily, have a lower serum ferritin. This could be a confusing factor in populations
in malarious areas. Acute infection or inflammation causes a drop in the serum iron
concentration and a rise in the serum ferritin level and could mask iron deficiency. Serum
ferritin is often elevated in patients with untreated malignant disease: however, this cannot
be a conunon reason for masking iron deficiency.
Hb F Assay Betke Method (from Dacie and Lewis 1991)
Hb F levels were estimated in samples from which DNA studies were carried out, for
comparison.
Quantitation o f Hb A 2
Results obtained in India (particularly samples of raised (>3.5%) Hb A2 ) by microcolumn
chromatography were checked by elution from cellulose acetate strips at the Haematology
department. University College Hospital, London using the method of Dacie and Lewis
(1991).
Hepatitis screening
Hepatitis screening was carried out at the Virology department, Middlesex Hospital, with
the help of professor RS Tedder. The viral markers hepatitis surface antigen (HBsAg),
antibodies to core antigen for hepatitis B (anti HBc) and antibodies to hepatitis C (anti Hep
C) were screened using standard radio-immunoassay and enzyme linked immuno-sorbent
assay (Elisa) techniques.
VI. DNA Methods-Jabalpur and London
Blood samples were collected from selected individuals (AS, SS) from first field trip for
DNA analysis and DNA was isolated in RMRC/ICMR laboratories, Jabalpur. The isolated

151
DNA was transported to London.
DNA was isolated from anti-coagulated blood using the method of Old and Higgs (1983).
RBCs are washed with reticulocyte saline (0.13 M NaCl, 5.5 M KCl and 7.4 mM M gCy
and lysed with distilled water in a 50 ml falcon tubes. A white pellet (the huffy coat) was
obtained by centrifugation at 2500 g for 20 minutes at 4°C. is incubated at 37°C overnight
after adding 10 ml lysis buffer (100 mM NaCl and 25 mM EDTANa^), 0.5 ml of 10%
SDS and 20 pi Proteinase K (0.5 mg). To the incubated nuclei, 5 ml of chloroform and
5 ml phenol buffer (saturated with 1 M Tris pH 7.4) were added and mixed. Contents
were spun at 2500 g for 10 min. at 4°C. The bottom phenol chloroform layer was
removed without disturbing the viscous DNA layer and this step was repeated again. To
this 5 ml of chloroform was added and spun at 2500 g for 10 min at 4°C. The bottom
chloroform layer was removed with out disturbing the viscous layer and this step was
repeated again. The viscous DNA layer then transferred to a fresh labelled falcon tube.
Care was taken not to take the bottom layer while pippeting. The DNA was precipitated
in one half volume of 7.5 mM Ammonium Acetate and two volumes of absolute alcohol
(99.7%) The hanging DNA in falcon tube was pelleted by centrifugation at 2500 g for 20
minutes at 4°C. The DNA pellet was washed with 70% ethanol and dried completely. The
DNA was dissolved in distilled water/TE Buffer (10 mM Tris pH 8.0 and 1 mM EDTA).
The quantity of DNA was measured using double beam Ultra-Violet Spectrophotometer.
The readings were taken at 260 nm. The yield of DNA was calculated with following
equation; a DNA solution of 1 gm/100 ml in a 1 cm light path has an absorbence of 200
units at 260 nm
Mouthwash DNA
DNA mouthwash is routinely used for screening for various genetic disorders and is
simple, convenient and inexpensive. It is excellent alternative when blood samples are not
available for DNA studies. Mouthwash was collected from 400 individuals (in the field)
who were unwilling to donate the blood samples and preserved at 4°C in Bajag (15 kms
away from the field) primary health centre. Individuals were asked to vigorously agitate

c I
152
1& -== 13 .
4 mim#r ’■c 13%
1#«1(%.
A fS CVS'VirIWV?IIn%#a.1111Î
/VP S c3 ?I tS I
H‘4 L4:k4 4
4 P .Î
4 » /
t *
» #
I 4 # #
»
z rjLL
s oIVs*»4sr3L%rivxTA«V*rnr>rt0
t?s*4 j.
Figure 5.7 Shows isoelectric-focusing pattern of Baiga tribal blood samples
(Controls show A, F, S, & C bands. No Hb C was found in the Baiga)
153
5% sucrose solution for 20 seconds in order to dislodge loosely adhering epithelium
buccal cells from inside of the cheek. The collected buccal cells were separated by
centrifugation for 10-15 minutes.
The supernatant was discarded and the pellet re-suspended in 0.05 M NaOH to avoid
bacterial contamination, and preserved at -20°C in Jabalpur. Samples were transported to
the Perinatal Centre, London within a week of collection. The solution was boiled for 15-
20 minutes and neutralized with 1 M tris pH 1.5-1.1. The solution was mixed thoroughly
and pulse centrifuged to remove debris; 10-15 |il was taken for PCR.
Note: Mouthwash samples were collected before having meal or a few hours after meals
to avoid extraneous material. Prior to this, villagers were requested not to chew tobacco
during the collection of mouth wash, because chewing tobacco is their usual habit.
DNA was also re-extracted from the samples (in London) in which PCR did not work due
to contamination of extraneous material, using following method:
Mouthwash samples were incubated overnight at 37°C with 20 \il of Proteinase K (0.5
mg/20 |i l) , 200 \i\ lysis buffer (described earlier) and 200 |Lil of 10% SDS solution. The
phenol chloroform extraction (as described earlier) was adapted and DNA was precipitated
in 7.5 mM ammonium acetate and ethanol. Since the amount of cellular material is small,
the tubes were kept at -20°C for 2-3 hours to facilitate DNA precipitation. The DNA was
pelleted by centrifugation, washed with 70% ethanol and dissolved in distilled water.
Mouthwash DNA is useful only for gene analysis by PCR. It can not be used for Southern
blot analysis.
VII. Gene analysis-London
Polymerase chain reaction (PCR) method was adopted for gene analysis (Saiki et al 1988)
Oligo primers were designed 15-25 nucleotides long with approximately 50% enriched GC
content. Care was taken by selecting different nucleotides to avoid self annealing. 20
pico-moles of each primer was used in the reaction. The oligo primers were purchased
from Oswell DNA service, Edinburgh. The oligo primers were purified by HPLC and

154
diluted to 5 pg/|il.
Xmn I Polymorphism
A total of 126 DNA samples were tested for Xmn I polymorphism. Primers were designed
to amplify a 641 bp fragment upstream of the Gy region of the 6-globin gene cluster. This
target genomic DNA well covers the Xmn I site at the Gy region.
PCR Conditions
For every reaction a total of 50 pi reaction mixture was used. PCR mix is made up of
1.25 mM dNTPs (dATP, dCTP, dGTP & dTTP) and 10 x Cetus buffer (purchased from
Perkin Elmer or self made: 1.25 ml 2M KCl solution, 0.5ml IM Tris pH 8.3, 75 ml IM
MgCl2 , 5 mg gelatin, 3.2 ml sterile distilled water, and 4 ul/lM Spermidine. Ampli-taq
is used in all the reactions. Polymerase chain reaction was carried out for 30 cycles with
94°C for 1 min, 60°C for 1 min 72°C 1 min/cycle followed by 72°C for 3 min, then 4°C
for refrigeration. The amplified genomic DNA was (digested overnight at 37°C with Xmn)
I restriction enzyme and checked by running the electrophoresis on a 4% agarose gel using
50xAGB buffer.
Xmn I Polymorphism
Table 5.6 Shows the oligo nucleotide primers and fragment size of Xmn I polymorphism site in Gy region in B-gene cluster
Restriction Oligo-primers Fragmepolymorphic site nts
C— T -158 Cap site
UPSTREAM 5’g a A CTT AAG AGA TAA TGG CCT AA 3’ d o w n s t r e a m 3'ATG ACC CAT GGC GTC TGG ACT AG 5’
641 bp
Restriction site
5’ GAANN NNTTC 3’ 3’ CTTNN NNAAG 5’
T
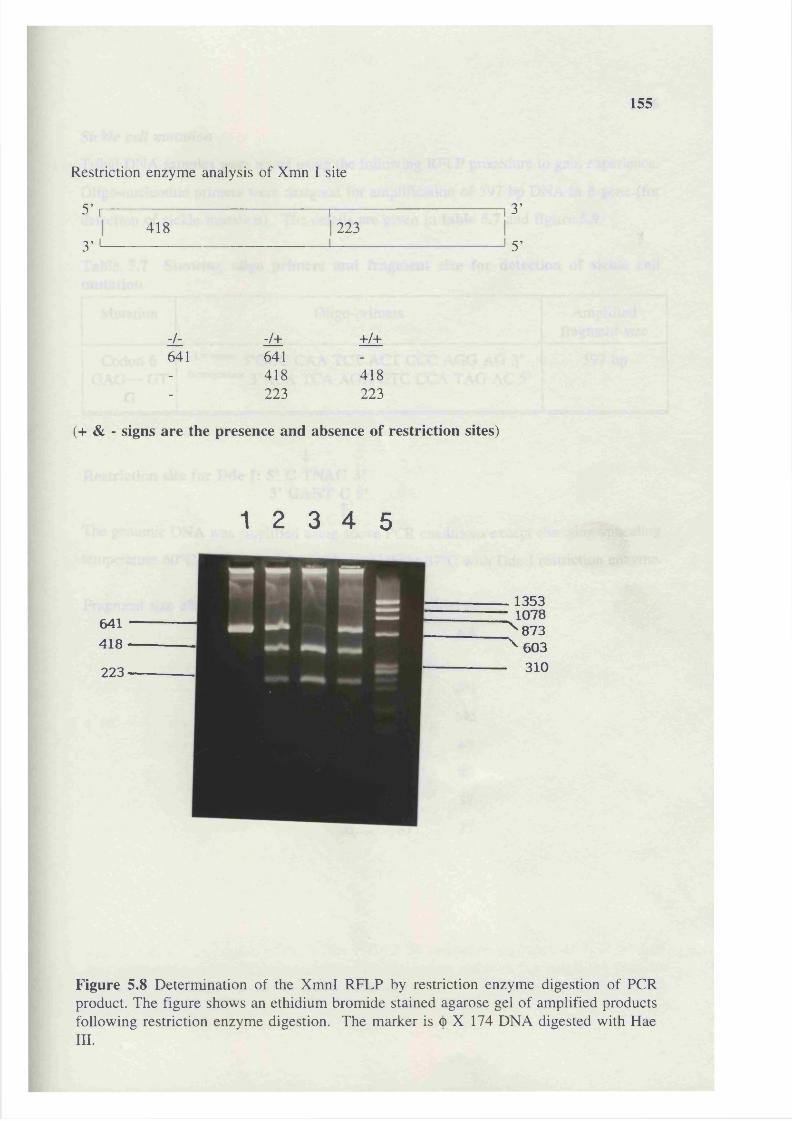
155
Restriction enzyme analysis of Xmn I site
5’ ,---------------------------------------------r—418 223
3’
3’
5’
zL -J± +/+641 641- 418 418- 223 223
(+ & - signs are the presence and absence of restriction sites)
1 2 3 4 5
641418223
. 1353 • 1078 "^873 ’ 603 . 310
Figure 5.8 Determination of the XmnI RFLP by restriction enzyme digestion of PCR product. The figure shows an ethidium bromide stained agarose gel of amplified products following restriction enzyme digestion. The marker is (j) X 174 DNA digested with Haem .
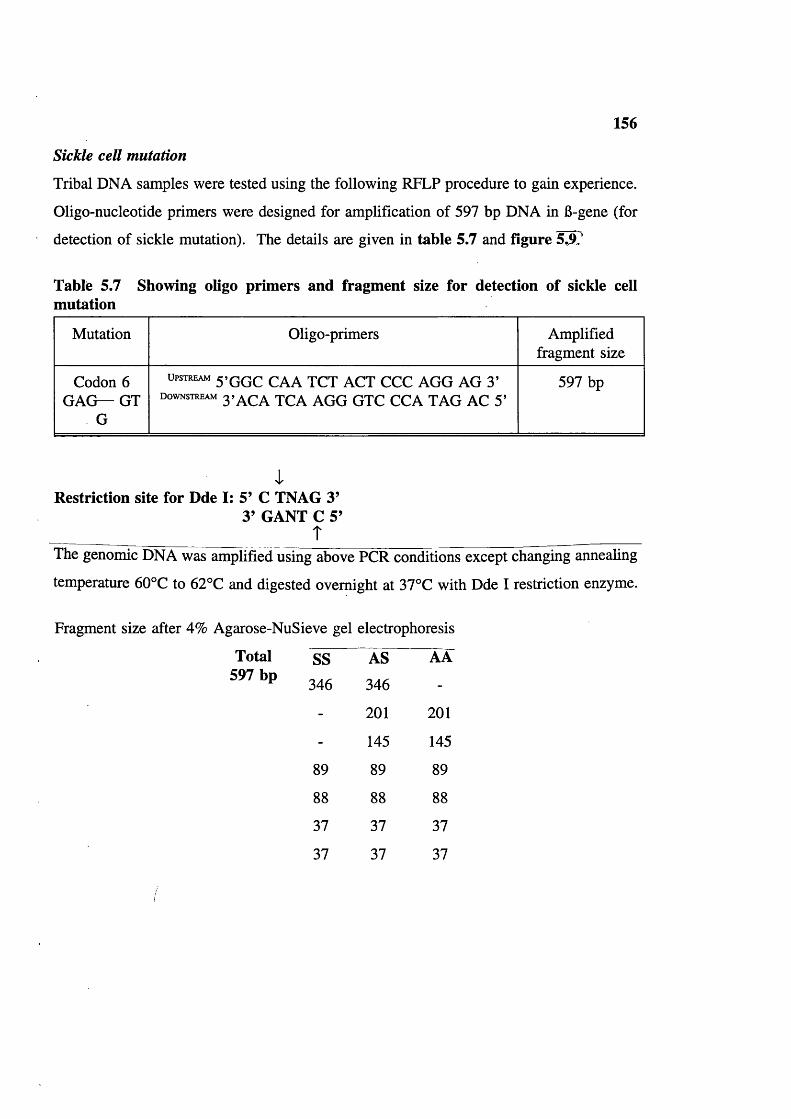
156
Sickle cell mutation
Tribal DNA samples were tested using the following RFLP procedure to gain experience.
Oligo-nucleotide primers were designed for amplification of 597 bp DNA in 6-gene (for
detection of sickle mutation). The details are given in table 5.7 and figure 5J).
Table 5.7 Showing oligo primers and fragment size for detection of sickle cell mutation
Mutation Oligo-primers Amplified fragment size
Codon 6 GAG— GT
G
UPSTREAM 5>GGc CAA TCT ACT CCC AGG AG 3’ d o w n s t r e a m 3»a c A TCA AGG GTC CCA TAG AC 5’
597 bp
Restriction site for Dde I: 5’ C TNAG 3’3’ GANT C 5’
ÎThe genomic DNA was amplified using above PCR conditions except changing annealing
temperature 60°C to 62°C and digested overnight at 37°C with Dde I restriction enzyme.
Fragment size after 4% Agarose-NuSieve gel electrophoresis
Total 597 bp
SS AS AA
346 346 -
- 201 201
- 145 145
89 89 89
88 88 88
37 37 37
37 37 37

157
S
a a 3 g1 2 3 4 5
89 & 88
Figure 5.9 Determination of the 6-Dde I RFLP by restriction digestion of PCR product. The figure shows an ethidium bromide stained agarose gel with the amplified products following restriction enzyme digestion. The marker is (j)X 174 DNA digested with Hae III.
158
Orthalassaemia
a-thalassaemia was investigated by Dr Mary Petrou using Southern blot analysis, method
at the Institute of Molecular Medicine, Oxford. 20 chromosomes from 10 Baiga
individuals were studied for and deletions.
G6PD deficiency: Gene analysis
Preliminary DNA studies were carried out in G6PD laboratory, Hammersmith Hospital
London. G6PD Mediterranean mutation was screened since it is so common and reported
in Punjabi population (Rentier 1990).
In 7 G6PD deficient samples (DNA from mouth wash), G6PD Mediterranean mutation was
sought. The G6PD Mediterranean mutation at base position 563 creates an Mbo II site in
exon VI of the G6PD gene. To identify individuals carrying the mutation, a genomic
fragment encompassing exon VI and VII was amplified using appropriate PCR conditions
(described later). The amplification product was digested overnight with restriction
enzyme Mbo II at 37°C and the digestion products were analyzed on 2.5% agarose and
NuiSieve gel.
PCR conditions:
Cetus buffer (containing 12 mM M gC ^ 10 p,lDNTPs mix 10 mM 1.5 |ilOligo primers (upstream) (100 |Lig/ml) 2 |ilOligo primers (downstream) (100 |ig/ml) 2 |LilDNA mouth wash* 10-15 |ilDistilled water 73.5-68.5 |il
Two drops of mineral oil were added over the mixture to prevent evaporation.
* described earlier.
The genomic DNA was denatured at 94°C for 10 minutes, and the thermal cycler was set
for one cycle with the following temperatures;
94°C for 45 seconds (dénaturation),
62°C for one minute (annealing) and
72°C for one minute (extension), then 1 |xl Ampli-taq (0.5 units/1 |il) was added.
Amplification was carried out using these conditions for 30 cycles. The ampli-taq was

159
purchased from either from Cambio (Cambridge) or Perkin-Elmer Cetus. The restriction
enzyme Mbo II was purchased from Gibco, BRC and BCL of Northumbria Biologicals
Limited.1 2 3 4 5 6 7 8 9 10 n 12 13
B: 5’ACT CCC GAA GAG GGG TTC AAGG 3’ :j; non coding I coding
i
B
i i
VI
5’
VII = = JJ: 3’GAA GGA GAG AGG ACC CTC CGACC 5’
Restriction site
5’ GAAGA(N) 8 ■ 3’ CTTCT(N) 7 -
T
-3 ’-5’
Figure 5.10 Schematic representation of G6PD gene (top) illustrating Exon VI & VII (bottom). The arrows show the position of Mbo II sites present in the normal G6PD gene; the * marks extra site created by the mutation at the position 563. Oligo primers B and J were used in the amplification (Haider et al 1990).
1 2 3 4 5 6 7 8
Fragment sizes of 547 bp amplified DNA (in exon 6 and exon 7) after digesting with Mbo II restriction enzyme. Lane 1,2,3 and 4 are tribal G6PD def. samples and lane 5 G6PD Mediterranean def. control sample showing in addition to the 119 bp, bands of 227 and 100 bp were obtained. Lane 7 undigested amplified DNA and lane 8 markers (pEMBL) digested with Tag and Puv II.
160
CHAPTER 6 DEMOGRAPHIC DATA: RESULTS AND DISCUSSION
Population, Age and Sex distribution (table 6.1)
The population has been growing steadily since 1911 (figure 6.1). In 1911 the total Baiga
population was 30,000 (Russell and Hiralal 1916). The 1961 census of India recorded the
total Baiga population as 144,005 distributed in 15 districts. The 1971 census recorded
176,939 distributed in 18 districts. The increase in recorded numbers probably mainly
reflects population growth. There are no published figures for the 1981 and 1991 census.
42.0% of the population is under 14 years of age, 89.4% under 40 years and only 1.1%
are 60 plus years (table 6.2).
The sex ratio at birth was: 1825 males to 1819 females (females/males=997) (table 6.1).
The living sex ratio is: 1539 males to 1576 females ie, ratio 1024. The change in sex ratio
with age shown in table 6.2 (and figure 6.2) suggests better female survival in childhood,
and higher female mortality among adults probably due to complications of pregnancy and
delivery.
The sex ratio of the present population is compared to other tribal groups residing in
different districts, and to figures for the whole of Madhya Pradesh and the whole of India
in table 6.3. The sex ratio in the study group and in Mandla district is among the highest
in India.
Mortality
In the present study mortality was recorded for under 20 years only. Prenatal mortality
is omitted because tribals could not remember the number of miscarriages and stillbirths.
Mortality (up to 20 years) was found to be 19% in the tribe (table 6.5); in offspring of
consanguineous couples it is 19.7% whereas in offspring of non-consanguineous couples
it was 18.6%; when compared in this way the difference between consanguineous and non-
consanguineous was not significant at 5% and 1% level (P>0.10). The postnatal mortality
was 18.2%; and higher in consanguineous families 19.2% compared to non-consanguineous
17.7%. Infant mortality in consanguineous families was 7.5% and in non-consanguineous
families it was 8.7% whereas the child mortality (13 months-12 years) in consanguineous
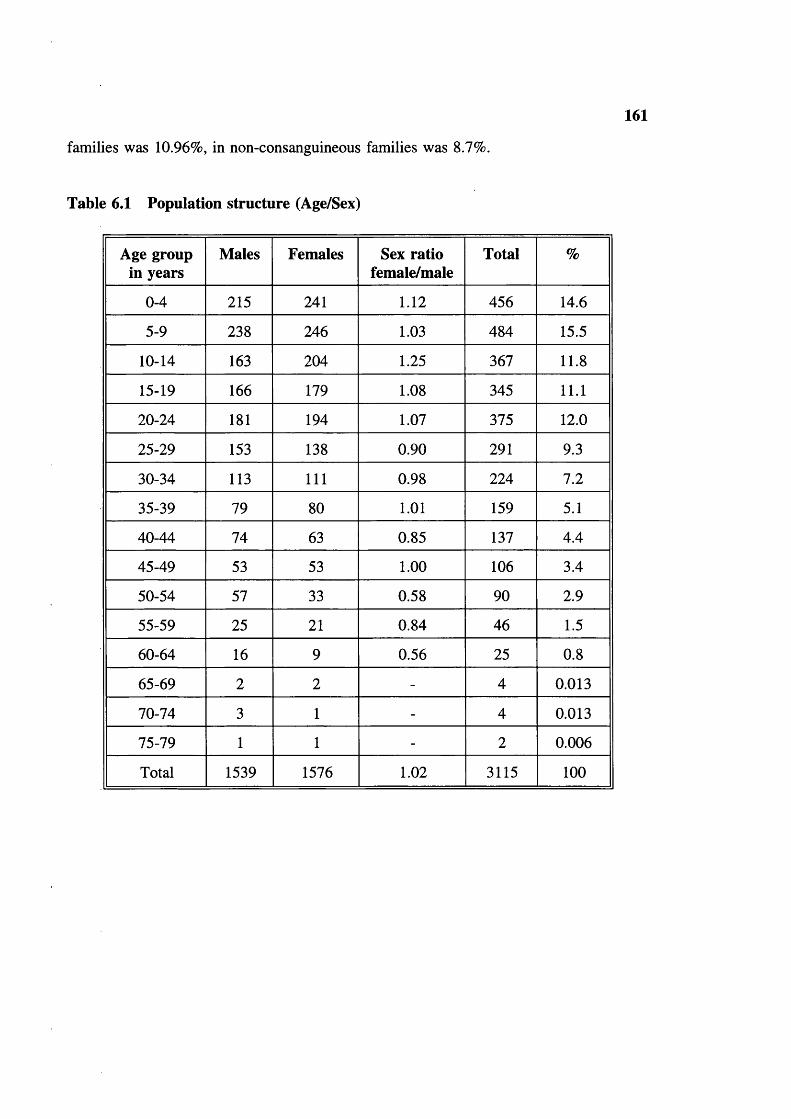
161
families was 10.96%, in non-consanguineous families was 8.7%.
Table 6.1 Population structure (Age/Sex)
Age group in years
Males Females Sex ratio female/male
Total %
0-4 215 241 1.12 456 14.6
5-9 238 246 1.03 484 15.5
10-14 163 204 1.25 367 11.8
15-19 166 179 1.08 345 11.1
20-24 181 194 1.07 375 12.0
25-29 153 138 0.90 291 9.3
30-34 113 111 0.98 224 7.2
35-39 79 80 1.01 159 5.1
40-44 74 63 0.85 137 4.4
45-49 53 53 1.00 106 3.4
50-54 57 33 0.58 90 2.9
55-59 25 21 0.84 46 1.5
60-64 16 9 0.56 25 0.8
65-69 2 2 - 4 0.013
70-74 3 1 - 4 0.013
75-79 1 1 - 2 0.006
Total 1539 1576 1.02 3115 100
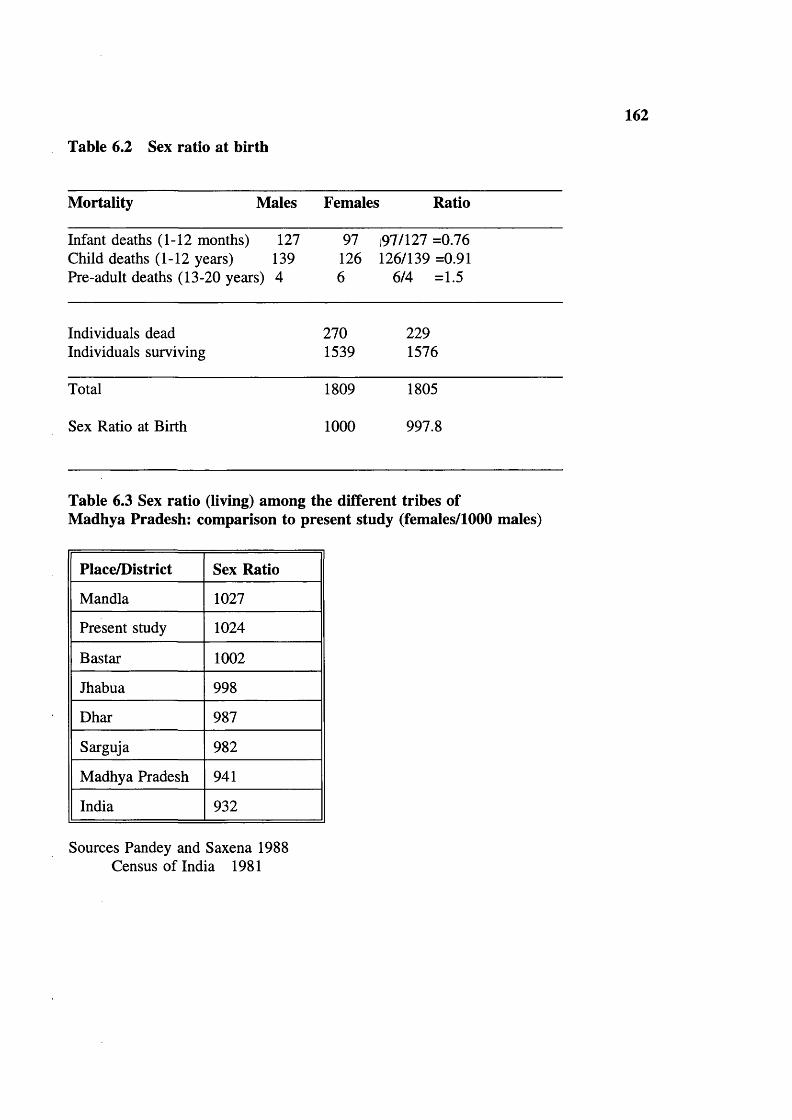
162
Table 6.2 Sex ratio at birth
Mortality Males Females; Ratio
Infant deaths (1-12 months) 127 97 197/127 =0.76Child deaths (1-12 years) 139 126 126/139 =0.91Pre-adult deaths (13-20 years) 4 6 6/4 =1.5
Individuals dead 270 229Individuals surviving 1539 1576
Total 1809 1805
Sex Ratio at Birth 1000 997.8
Table 6.3 Sex ratio (living) among the different tribes of Madhya Pradesh: comparison to present study (females/1000 males)
Place/District Sex Ratio
Mandla 1027
Present study 1024
Bastar 1002
Jhabua 998
Dhar 987
Sarguja 982
Madhya Pradesh 941
India 932
Sources Pandey and Saxena 1988 Census of India 1981
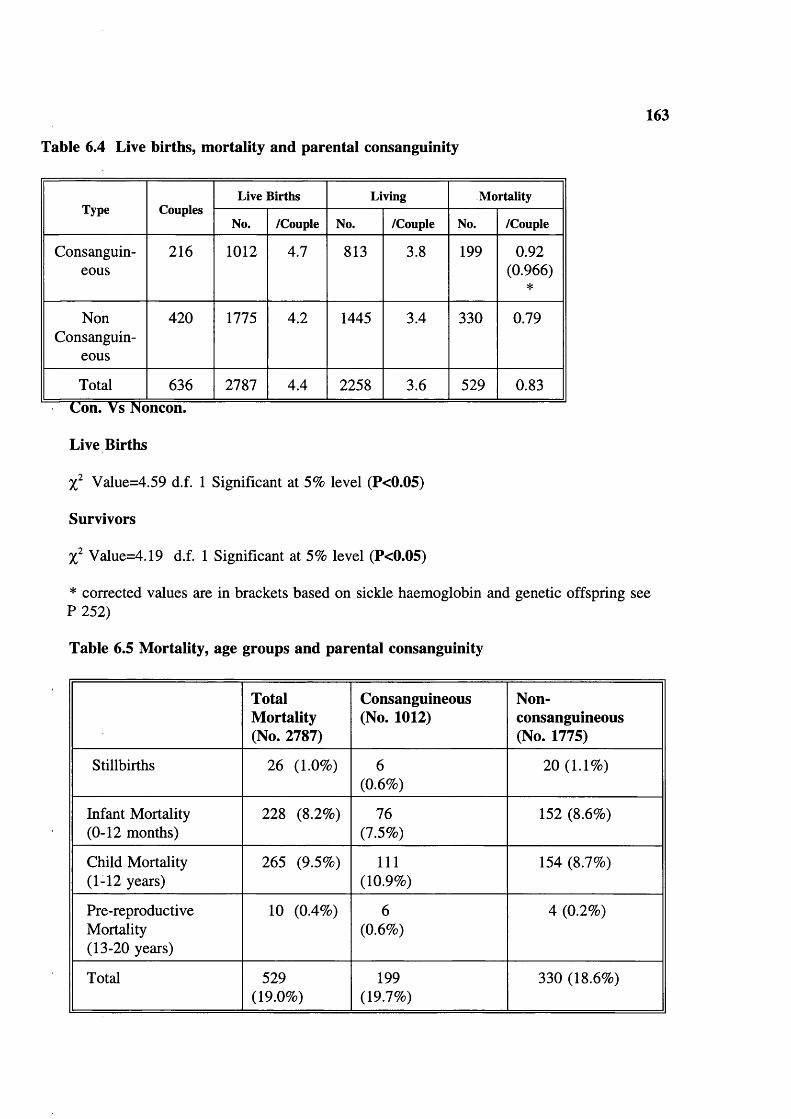
Table 6.4 Live births, mortality and parental consanguinity
163
Type CouplesLive Births Living Mortality
No. /Couple No. /Couple No. /Couple
Consanguineous
216 1012 4.7 813 3.8 199 0.92(0.966)
*
NonConsanguin
eous
420 1775 4.2 1445 3.4 330 0.79
Total 636 2787 4.4 2258 3.6 529 0.83
Live Births
Value=4.59 d.f. 1 Significant at 5% level (P<0.05)
Survivors
X Value=4.19 d.f. 1 Significant at 5% level (P<0.05)
* corrected values are in brackets based on sickle haemoglobin and genetic offspring see P 252)
Table 6.5 Mortality, age groups and parental consanguinity
Total Mortality (No. 2787)
Consanguineous (No. 1012)
Non-consanguineous (No. 1775)
Stillbirths 26 (1.0%) 6 20 (1.1%)(0.6%)
Infant Mortality 228 (8.2%) 76 152 (8.6%)(0-12 months) (7.5%)
Child Mortality 265 (9.5%) 111 154 (8.7%)(1-12 years) (10.9%)
Pre-reproductive 10 (0.4%) 6 4 (0.2%)Mortality (0.6%)(13-20 years)
Total 529 199 330 (18.6%)(19.0%) (19.7%)
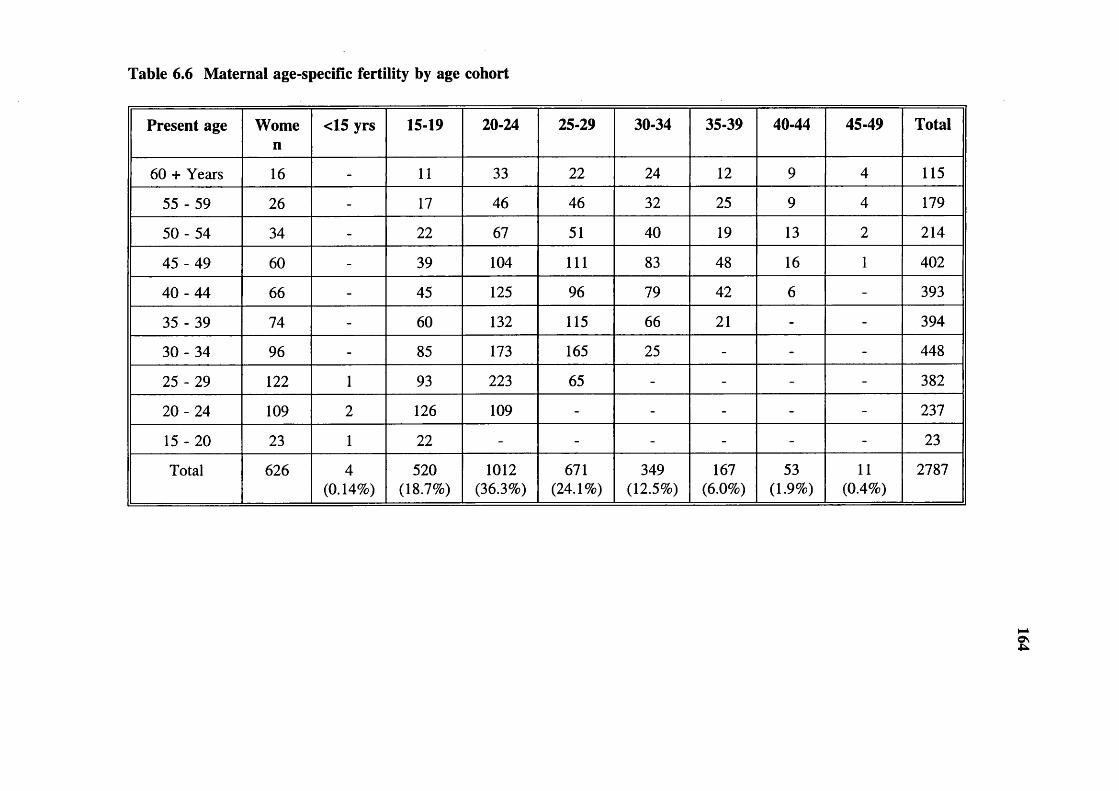
Table 6.6 Maternal age-specific fertility by age cohort
Present age Women
<15 yrs 15-19 20-24 25-29 30-34 35-39 40-44 45-49 Total
60 + Years 16 - 11 33 22 24 12 9 4 115
55 - 59 26 - 17 46 46 32 25 9 4 179
5 0 -5 4 34 - 22 67 51 40 19 13 2 214
45 - 49 60 - 39 104 111 83 48 16 1 402
40 - 44 66 - 45 125 96 79 42 6 - 393
35 - 39 74 - 60 132 115 66 21 - - 394
30 - 34 96 - 85 173 165 25 - - - 448
25 - 29 122 1 93 223 65 - - - - 382
20 - 24 109 2 126 109 - - - - - 237
15 - 20 23 1 22 - - - - - - 23
Total 626 4(0.14%)
520(18.7%)
1012(36.3%)
671(24.1%)
349(12.5%)
167(6.0%)
53(1.9%)
11(0.4%)
2787
£

Table 6.7 Maternal age-specific fertility by age cohort (Non-consanguineous)
Present age Women
<15years
15-19 20-24 25-29 30-34 35-39 40-44 45-49 Total
60 + Years 10 - 10 20 14 12 3 3 1 63
55 - 59 18 - 14 32 29 20 17 5 4 121
50 - 54 22 - 16 39 29 19 11 10 2 126
45 - 49 38 - 23 67 66 48 31 12 1 248
40 - 44 39 - 29 73 59 46 23 4 - 234
35 - 39 41 - 33 72 67 33 12 - - 217
30 - 34 68 - 61 122 120 18 - - - 321
25 - 29 83 1 63 156 44 - - - - 264
20 - 24 78 2 85 80 - - - - - 167
15 - 20 14 - 14 - - - - - - 14
Total 411 3(0.2%)
348(19.6%)
661(37.2%)
428(24.1%)
196(11.0%)
97(5.5%)
34(1.9%)
8(0.5%)
1775
s;

Table 6.8 Maternal age-specific fertility by age cohort (Consanguineous)
Present age Wornen
<15years
15-19 20-24 25-29 30-34 35-39 40-44 45-49 Total
60 + Years 6 - 1 13 8 12 9 6 3 52
55 - 59 8 - 3 14 17 12 8 4 - 58
50 - 54 12 - 6 28 22 21 8 3 - 88
45 - 49 22 - 16 37 45 35 17 4 - 154
40 - 44 27 - 16 52 37 33 19 2 - 159
35 - 39 33 - 27 60 48 33 9 - - 177
3 0 -3 4 28 - 24 51 45 7 - - - 127
25 - 29 39 - 30 67 21 - - - - 118
20 - 24 31 - 41 29 - - - - - 70
15 - 20 9 1 8 - - - - - - 9
Total 215 1(0.1%)
172(17.0%)
351(34.7%)
243(24.0%)
153(15.1%)
70(6.9%)
19(1.9%)
3(0.3%)
1012
osOS
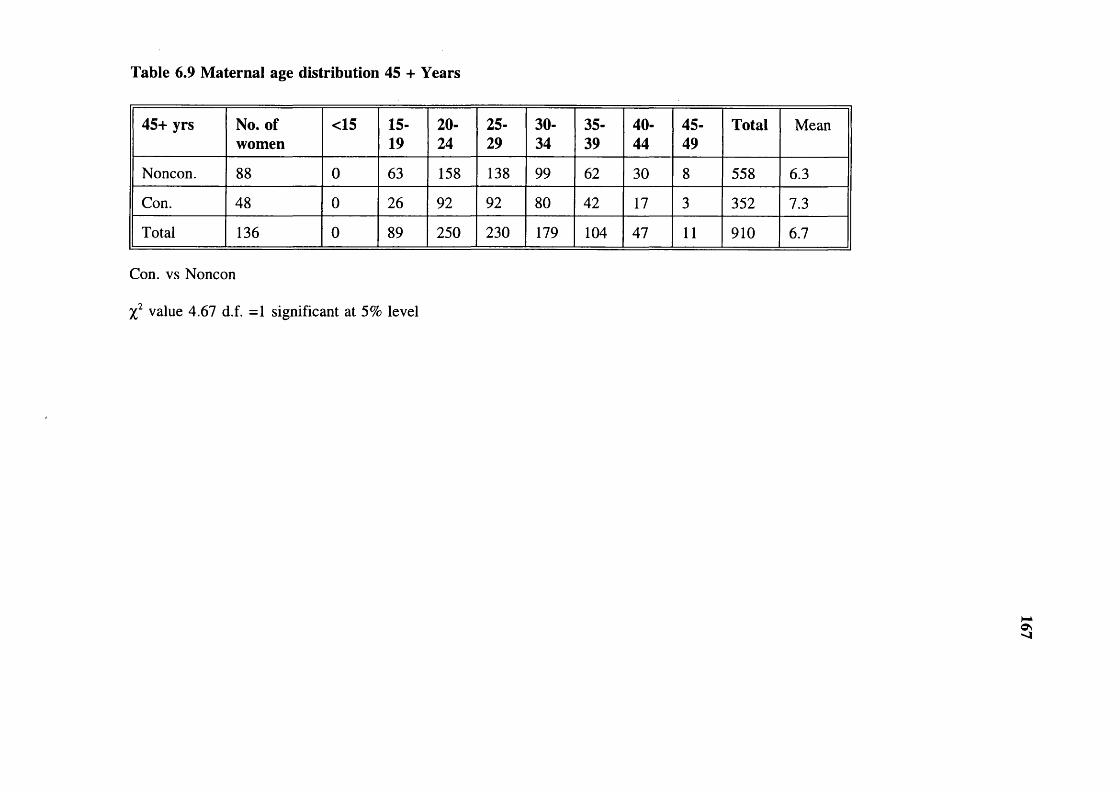
Table 6.9 Maternal age distribution 45 + Years
45+ yrs No. of women
<15 15-19
20-24
25-29
30-34
35-39
40-44
45-49
Total Mean
Noncon. 88 0 63 158 138 99 62 30 8 558 6.3
Con. 48 0 26 92 92 80 42 17 3 352 7.3
Total 136 0 89 250 230 179 104 47 11 910 6.7
Con. vs Noncon
value 4.67 d.f. =1 significant at 5% level
os'-I
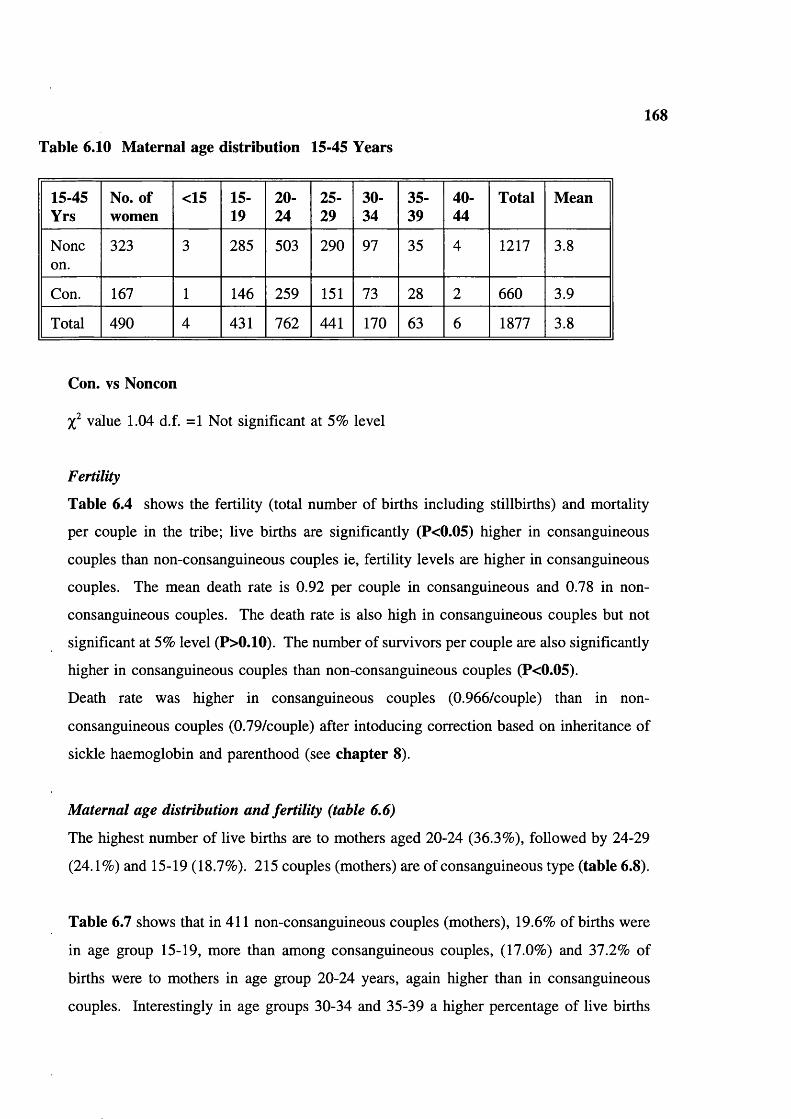
Table 6.10 Maternai age distribution 15-45 Years
168
15-45Yrs
No. of women
<15 15-19
20-24
25-29
30-34
35-39
40-44
Total Mean
Noneon.
323 3 285 503 290 97 35 4 1217 3.8
Con. 167 1 146 259 151 73 28 2 660 3.9
Total 490 4 431 762 441 170 63 6 1877 3.8
Con. vs Noncon
value 1.04 d.f. =1 Not significant at 5% level
Fertility
Table 6.4 shows the fertility (total number of births including stillbirths) and mortality
per couple in the tribe; live births are significantly (P<0.05) higher in consanguineous
couples than non-consanguineous couples ie, fertility levels are higher in consanguineous
couples. The mean death rate is 0.92 per couple in consanguineous and 0.78 in non-
consanguineous couples. The death rate is also high in consanguineous couples but not
significant at 5% level (P>0.10). The number of survivors per couple are also significantly
higher in consanguineous couples than non-consanguineous couples (P<0.05).
Death rate was higher in consanguineous couples (0.966/couple) than in non-
consanguineous couples (0.79/couple) after intoducing correction based on inheritance of
sickle haemoglobin and parenthood (see chapter 8).
Maternal age distribution and fertility (table 6,6)
The highest number of live births are to mothers aged 20-24 (36.3%), followed by 24-29
(24.1%) and 15-19 (18.7%). 215 couples (mothers) are of consanguineous type (table 6.8).
Table 6.7 shows that in 411 non-consanguineous couples (mothers), 19.6% of births were
in age group 15-19, more than arnong consanguineous couples, (17.0%) and 37.2% of
births were to mothers in age group 20-24 years, again higher than in consanguineous
couples. Interestingly in age groups 30-34 and 35-39 a higher percentage of live births
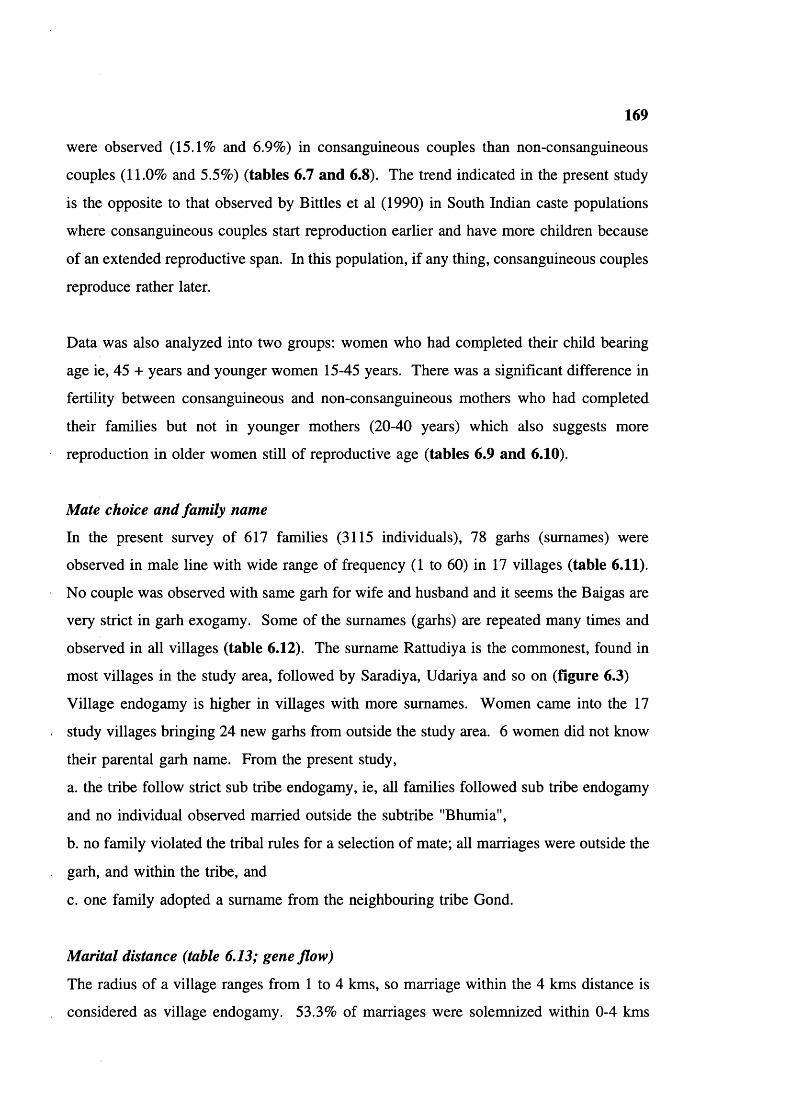
169
were observed (15.1% and 6.9%) in consanguineous couples than non-consanguineous
couples (11.0% and 5.5%) (tables 6.7 and 6.8). The trend indicated in the present study
is the opposite to that observed by Bittles et al (1990) in South Indian caste populations
where consanguineous couples start reproduction earlier and have more children because
of an extended reproductive span. In this population, if any thing, consanguineous couples
reproduce rather later.
Data was also analyzed into two groups: women who had completed their child bearing
age ie, 45 + years and younger women 15-45 years. There was a significant difference in
fertility between consanguineous and non-consanguineous mothers who had completed
their families but not in younger mothers (20-40 years) which also suggests more
reproduction in older women still of reproductive age (tables 6.9 and 6.10).
Mate choice and family name
In the present survey of 617 families (3115 individuals), 78 garhs (surnames) were
observed in male line with wide range of frequency (1 to 60) in 17 villages (table 6.11).
No couple was observed with same garh for wife and husband and it seems the Baigas are
very strict in garh exogamy. Some of the surnames (garhs) are repeated many times and
observed in all villages (table 6.12) The surname Rattudiya is the commonest, found in
most villages in the study area, followed by Saradiya, Udariya and so on (figure 6.3)
Village endogamy is higher in villages with more surnames. Women came into the 17
study villages bringing 24 new garhs from outside the study area. 6 women did not know
their parental garh name. From the present study,
a. the tribe follow strict sub tribe endogamy, ie, all families followed sub tribe endogamy
and no individual observed married outside the subtribe "Bhumia",
b. no family violated the tribal rules for a selection of mate; all marriages were outside the
garh, and within the tribe, and
c. one family adopted a surname from the neighbouring tribe Gond.
Marital distance (table 6.13; gene flow)
The radius of a village ranges from 1 to 4 kms, so marriage within the 4 kms distance is
considered as village endogamy. 53.3% of marriages were solemnized within 0-4 kms

170
distance (table 6.13; figure 6.4) indicating a high proportion of village endogamy in the
tribe. The mean marital distance was 7.1 km and the same trend was observed in all
villages of the study area. Over 90% marriages were solemnized within 20 kms distance.
Mean matrimonial distance was calculated for each village and ranged from 3.87 to 14.9
kms with a large standard deviation (5.2 to 12.8 kms) (table 6.14).
Age at menarche
The mean age at menarche in females was 15.2 yrs, modal value 16 yrs (table 6.15). Age
at menarche of different populations is shown in table 6.16 for comparison. Menarche is
unusually late among the Baiga.
Table 6.11 Surnames or garhs distribution in the Baigas
S. No Surname Male Female Total
1. Addidiya 1 0 12. Aduria 0 2 23. Agariya 1 0 14. Amdariya 9 10 195. Amturiya 1 2 36. Amudiya 2 1 37. Badiya 1 2 38. Bagariya 0 1 19. Bagdariya 2 2 410. Bahadiya 1 0 111. Baradiya 0 1 112. Barangiya 1 0 113. Baraniya 1 1 214. Barathniya 0 1 115. Bariya 4 3 716. Bena 5 2 717. Bhemin 0 2 218. Bherin 0 2 219. Bijariya 3 0 320. Bilagadiya 1 0 121. Bindiya 4 3 722. Bundariya 6 5 1123. Burkundiya 4 0 424. Busandiya 9 11 2025. Chanrdaniya 8 7 1526. Chapudiya 5 6 1127. Chichidiya 0 3 328. Chittudiya 4 1 5
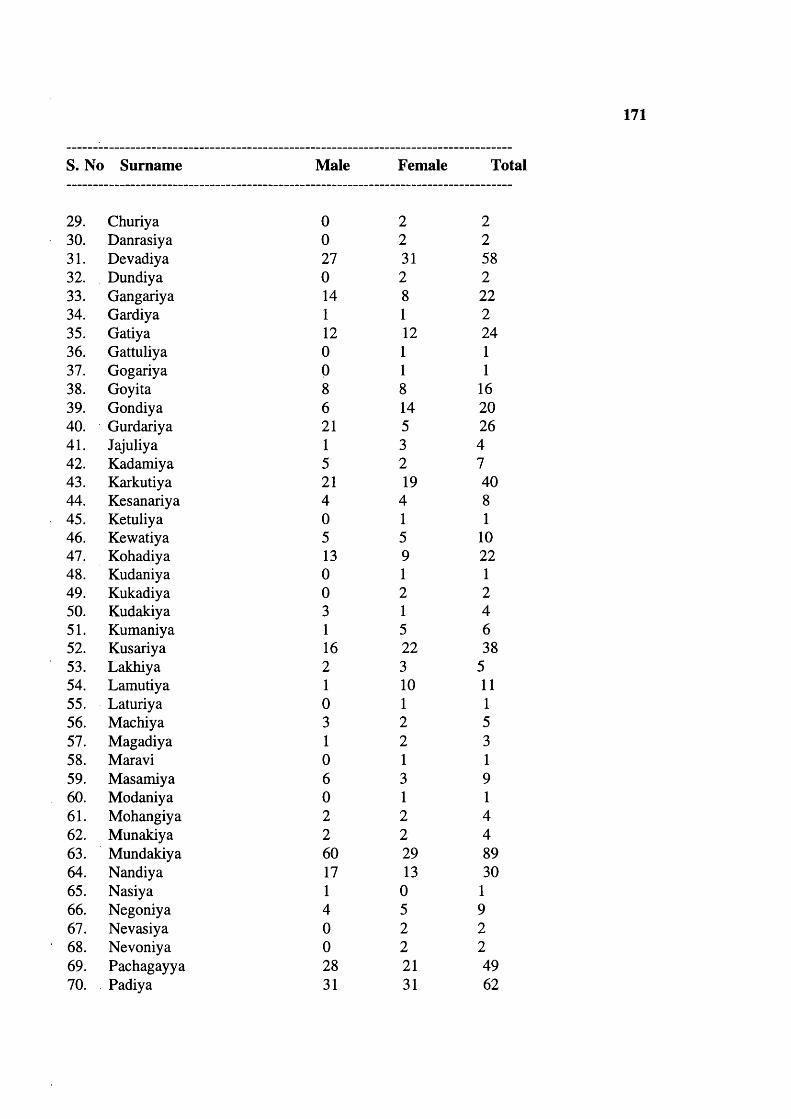
171
S. No Surname Male Female Total
29. Churiya 0 2 230. Danrasiya 0 2 231. Devadiya 27 31 5832. Dundiya 0 2 233. Gangariya 14 8 2234. Gardiya 1 1 235. Gatiya 12 12 2436. Gattuliya 0 1 137. Gogariya 0 1 138. Goyita 8 8 1639. Gondiya 6 14 2040. Gurdariya 21 5 2641. Jajuliya 1 3 442. Kadamiya 5 2 743. Karkutiya 21 19 4044. Kesanariya 4 4 845. Ketuliya 0 1 146. Kewatiya 5 5 1047. Kohadiya 13 9 2248. Kudaniya 0 1 149. Kukadiya 0 2 250. Kudakiya 3 1 451. Kumaniya 1 5 652. Kusariya 16 22 3853. Lakhiya 2 3 554. Lamutiya 1 10 1155. Laturiya 0 1 156. Machiya 3 2 557. Magadiya 1 2 358. Maravi 0 1 159. Masamiya 6 3 960. Modaniya 0 1 161. Mohangiya 2 2 462. Munakiya 2 2 463. Mundakiya 60 29 8964. Nandiya 17 13 3065. Nasiya 1 0 166. Negoniya 4 5 967. Nevasiya 0 2 268. Nevoniya 0 2 269. Pachagayya 28 21 4970. Padiya 31 31 62
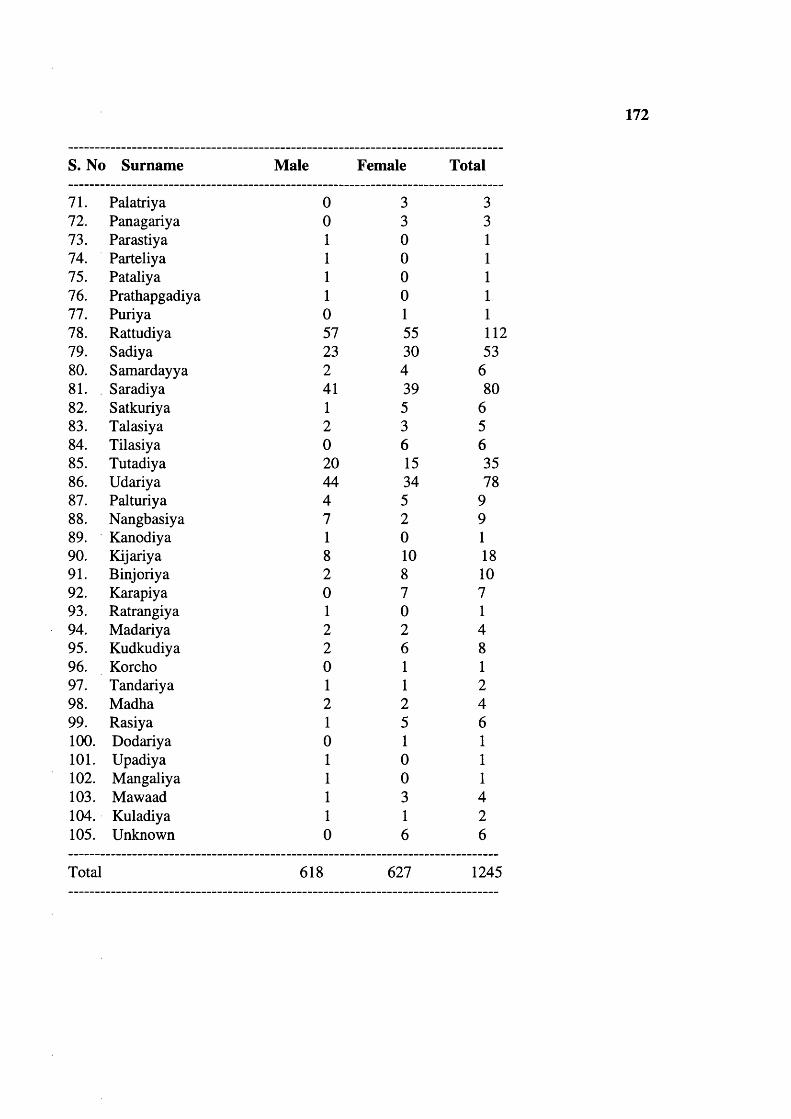
172
S. No Surname Male Female Total
71. Palatriya 0 3 372. Panagariya 0 3 373. Parastiya 1 0 174. Parteliya 1 0 175. Pataliya 1 0 176. Prathapgadiya 1 0 177. Puriya 0 1 178. Rattudiya 57 55 11279. Sadiya 23 30 5380. Samardayya 2 4 681. Saradiya 41 39 8082. Satkuriya 1 5 683. Talasiya 2 3 584. Tilasiya 0 6 685. Tutadiya 20 15 3586. Udariya 44 34 7887. Palturiya 4 5 988. Nangbasiya 7 2 989. Kanodiya 1 0 190. Kijariya 8 10 1891. Binjoriya 2 8 1092. Karapiya 0 7 793. Ratrangiya 1 0 194. Madariya 2 2 495. Kudkudiya 2 6 896. Korcho 0 1 197. Tandariya 1 1 298. Madha 2 2 499. Rasiya 1 5 6100. Dodariya 0 1 1101. Upadiya 1 0 1102. Mangaliya 1 0 1103. Mawaad 1 3 4104. Kuladiya 1 1 2105. Unknown 0 6 6
Total 618 627 1245

173
Table 6.12 Exogamie garhs (surnames) frequencies in the Baiga males
Garh (surnames) 1 Frequencies 1 Total ma
27 1 1 1 2711 1 2 1 223 1 3 1 97 1 4 1 284 1 5 1 203 1 6 1 181 1 7 1 73 1 8 1 242 1 9 1 181 1 12 1 121 1 13 1 131 1 14 1 141 1 16 1 161 1 17 1 171 1 20 1 20
21 1 421 1 23 1 231 1 27 1 271 1 28 1 281 1 31 1 311 1 41 1 411 1 44 1 44
57 1 571 1 60 1 60
Total 78 1 1 618

Table 6.13 Matrimonial distance
174
Distance in kms Number of marriages
Percentage of marriages
0-4 339 53.35-9 120 18.8
10-14 68 10.715-19 39 6.120-24 20 3.125-29 7 1.130-34 17 2.635-39 9 1.440-44 7 1.145-49 7 0.650-57 3 0.5
Total 636 100
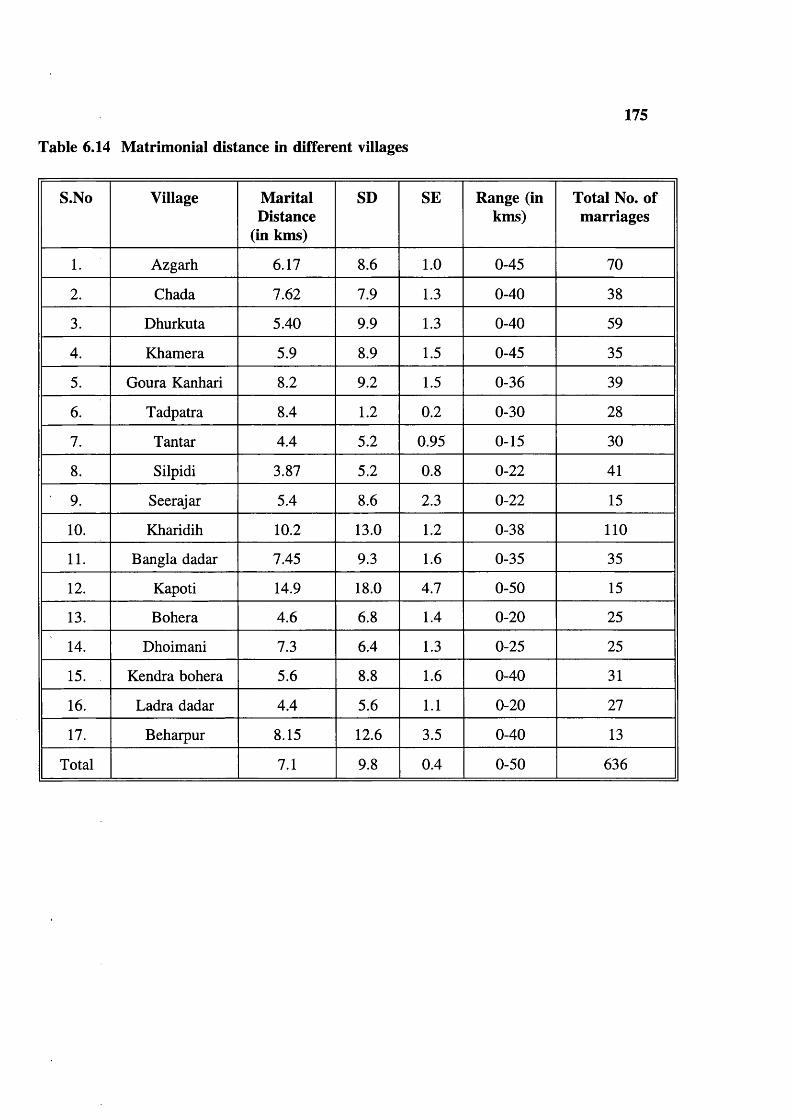
Table 6.14 Matrimonial distance in different villages
175
S.No Village Marital Distance
(in kms)
SD SE Range (in kms)
Total No. of marriages
1. Azgarh 6.17 8.6 1.0 0-45 70
2. Chada 7.62 7.9 1.3 0-40 38
3. Dhurkuta 5.40 9.9 1.3 0-40 59
4. Khamera 5.9 8.9 1.5 0-45 35
5. Goura Kanhari 8.2 9.2 1.5 0-36 39
6. Tadpatra 8.4 1.2 0.2 0-30 28
7. Tantar 4.4 5.2 0.95 0-15 30
8. Silpidi 3.87 5.2 0.8 0-22 41
9. Seerajar 5.4 8.6 2.3 0-22 15
10. Kharidih 10.2 13.0 1.2 0-38 110
11. Bangla dadar 7.45 9.3 1.6 0-35 35
12. Kapoti 14.9 18.0 4.7 0-50 15
13. Bohera 4.6 6.8 1.4 0-20 25
14. Dhoimani 7.3 6.4 1.3 0-25 25
15. Kendra bohera 5.6 8.8 1.6 0-40 31
16. Ladra dadar 4.4 5.6 1.1 0-20 27
17. Beharpur 8.15 12.6 3.5 0-40 13
Total 7.1 9.8 0.4 0-50 636

Table 6.15 Age at menarche
176
Menarcheal Age in Years
Women Percent CumulativePercent
> 12 6 0.9 0.9
13 32 5.1 6.0
14 142 22.5 28.5
15 152 24.1 52.6
16 248 39.2 91.8
17 32 5.1 96.8
18 11 1.7 98.6
19 5 0.8 99.4
19 + 4 0.6 100.0
Total 632 100.0 100.0
Table 6.16 Age ai menarche in different populations
Population In years Reference
Urban (Madras) 12.76 Madhavan (1965)
Rural (Madras) 14.16
Urban (Kerala) 13.24
Rural (Kerala) 14.42
Sickle cell disease (Africa) 14.5 Modebe (1986)
Normal (Africa) 13.3
Baiga tribe 15.2 Present study

177
Table 6.17 Age at first marriage
Type Males Mean±SD Range Females Mean±SD Range
Consanguineous 208 18.4±1.7 10-25 208 16.5±1.7 9-23
Nonconsanguineous
409 18.5±2.0 10-29 408 16.7±1.7 8-25
Total 617 18.5±1.9 10-29 616 16.6±1.7 8-25
Males
t value -0.73 d.f 615 Insignificant 5% level
Females
t value -1.34 d.f. 615 Insignificant 5% level
Table 6.18 Mean age at marriage in different Indian populations
Population Male Female Reference
Rural Urban
Christian - 18.48 19.4 Registrar general of India (Census 1971)
Sikh - 17.8 18.02
Jain - 15.9 17.51
Muslim - 15.51 16.76
Buddhist - 15.28 15.96
Hindus - 15.24 16.76
Brahmin 21.4 - Agarwala (1962)
Kshtriya 20.5 -
Vaisya 20.2 -
Scheduled caste 18.95 -
Forward caste 24.02 17.81 A^inarayana (1990)
Backward caste 22.7 16.1
Muslim 22.5 16.2
Scheduled caste 22.2 15.2
Madhya Pradesh 20.61 16.56 Census 1981
Present study 18.5 16.6

Table 6.19 Mean age at marriage and consanguinity
178
Type Male Female Reference
Unrelated 26.3 20.2 Shami and Zahida (1982)
1st cousin marriage 23.2 18.0
Double first cross cousin
22 17.8
Unrelated 18.5 16.5 Present Study
Related 18.4 16.7
Table 6.20 Trends in age at first marriage
Decade Males MeaniSD Females Mean±SD
>1960 95 18.5±1.8 95 16.5±1.8
1961-70 146 18.5+1.6 145 16.7±1.5
1971-80 157 18.5+2.0 157 16.5±1.7
1981-91 & above
219 18.4±2.0 219 16.6+1.8
Total 617 18.5±1.9 616 16.6±1.7

179
Population in thousands200
150
100
50
0 ^1911 1921 1931 1941 1951 1961 1971
Decade wise population
Series 1
Figure 6.1 Population growth in the Baiga
No. of individuals30 0
2 50
200
150
100
50— FemalesMales
0 -4 5 -9 10-14 15-19 2 0 -2 4 2 5 - 2 9 3 0 - 3 4 3 5 - 3 9 4 0 - 4 4 4 5 - 4 9 5 0 - 5 4 5 5 - 5 9 6 0 - 6 4 65 +
Age groups
Figure 6.2 Population structure
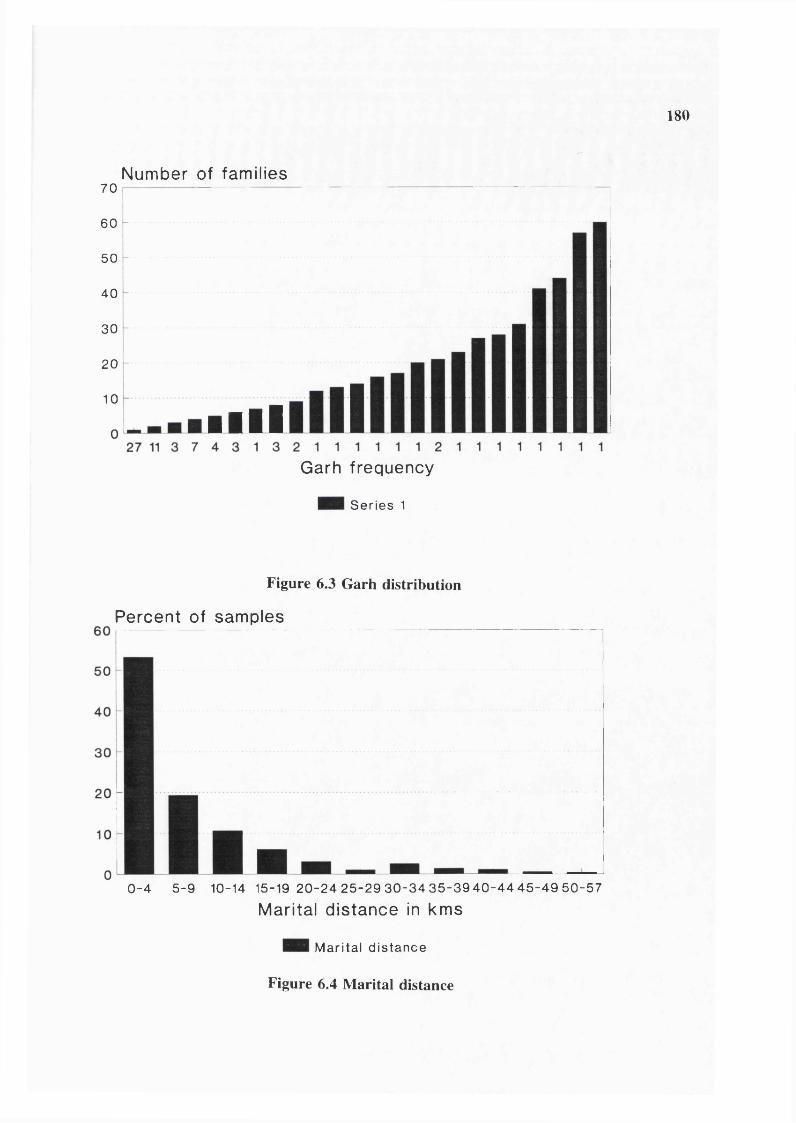
180
Number of families7 0
60
50
40
30
20
10
■ulGarh frequency
Series 1
Figure 6.3 Garh distribution
Percent of samples
0 - 4 5 -9 10-14 15-19 2 0 -2 4 2 5 -2 9 3 0 - 3 4 3 5 -3 9 4 0 -4 4 4 5 -4 9 5 0 -5 7
Marital distance in kms
Marital distance
Figure 6.4 Marital distance
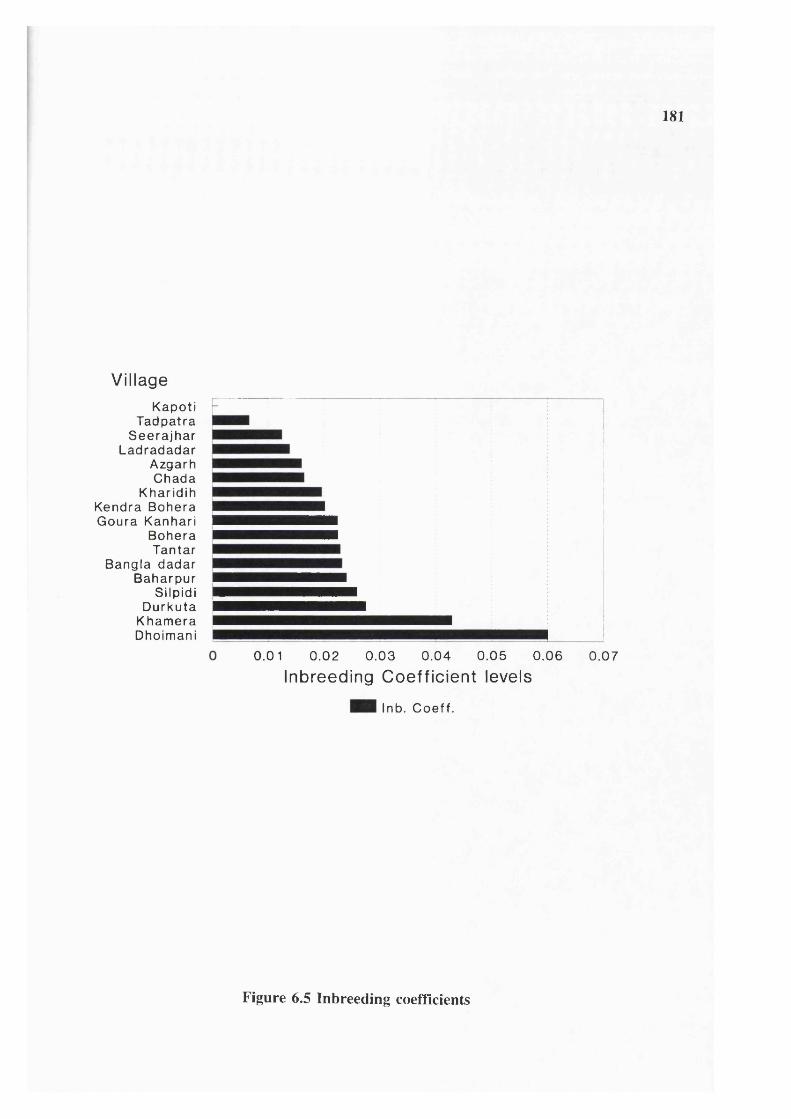
181
VillageKapoti
Tadpatra Seerajhar
Ladradadar Azgarh Chada
Kharidih Kendra Bohera Goura Kanhari
Bohera Tantar
Bangla dadar Baharpur
Silpidi Durkuta
Khamera Dhoimani
0.01 0.02 0 .03 0 .04 0.05 0.06
Inbreeding Coefficient levels0.07
Inb. Coeff.
Figure 6.5 Inbreeding coefficients
182
Age at marriage (table 6.17)
The mean age at first marriage was 18.5 for males (range 10-29 years) and 16.6 for
females (range 8-25 years). There is no significant difference between consanguineous and
non-consanguineous groups either for males or females. It seems that for women marriage
occurs soon after menarche, giving a long reproductive period. Table 6.18 shows the age
at marriage in different populations, for comparison. Table 6.19 shows the relationship
between consanguineous marriage and age of the partners, in a study in Pakistan (Shami
and Zahida 1982).
Trends in age at marriage
Table 6.20 shows that there has been no significant change in age at marriage between
1960 and 90.
Marriage and first conception (table 6.21)
The gap between marriage and first conception revealed that 59.4% of women conceived
within 24 months of marriage and 31.75% of women conceived between 25-36 months.
3.7% of women had not conceived by 48 months.
Age difference between spouses
Mean age difference between husband and wife calculated for age at first marriage (table
6.22) was 1.9 yrs. In Madhya Pradesh over all the average difference between husband
and wife was 4.05 yrs (1981 census). Figures are not available for different populations
in Madhya Pradesh for comparison. Audinarayana (1990) observed a large difference in
four groups in Andhra Pradesh; Forward caste 6.21, Backward caste 6.6, Muslims 6.29 and
Scheduled caste 7.02.
Marriage practice (table 6.23)
34.0% of marriages were consanguineous, 122 (19.2%) marriages were to mother’s
brother’s daughter (MED), 83 (13.1%) marriages to father’s sister’s daughter (FSD) and
11 (1.7%) were between double first cross cousin (DFCC). No uncle-niece or aunt-nephew
and no grand parent-grand children union were observed in the Baiga though they were
mentioned by Elwin (1939). A large variation in the frequency of consanguineous

183
marriages was observed among villages (0.0% to 96.0%) (table 6.24). The minimum
mean inbreeding coefficient is 0.0220 (table 6.23; figure 6.5) with ranges from 0.00 to
0.0600 in different villages. The calculated inbreeding coefficient is a minimum because
there was no information on marriages in past generations.
There are limited number of studies among the tribals of India and particularly in Central
India for comparison (see table 3.2). In the Gond population of Andhra Pradesh, Pingle
and Haimondorf (1987) observed cross cousin marriage with preference for matrilateral
type (MBD) as in the present study population; the frequency consanguineous marriage in
Kolam Gonds was 68.2%, in Koya Gonds 28.89, in Manne Gonds 28.68%, in Maria Gonds
(plains) 27.59% and in Raj Gonds 29.77%. She did not observe uncle-niece, aunt-nephew
unions (as in the present study). By contrast, uncle-niece and aunt-nephew marriages have
been recorded among the Kotas of the Nilgiri hills (Ghosh 1972); Kotas may have adopted
the South Indian custom, but it has not been observed in the Central Indian tribes studied
so far (Pingle and Haimondorf 1987 and present study).
Trends in cousin marriage (table 6.25)
40% of couples who married before 1960 were related compared with 29.4% of those who
married in 1981-90. However the change is not significant at the 5% level (P>0.70). Any
change could also be due to population growth (see figure 6.2) offering a wider mate
choice than fertility.
Polygamy (table 6.26)
In 8 families the husband had 2 wives, and in 1 family, husband had 3 wives. In 2
families, the wife remarried after the death of the first husband.
Elwin (1939) mentioned that polygamy was a decreasing trend (based on 1931 census).
This agrees with the present study observation. The decline may be due to the equalization
of the unbalanced sex ratio mentioned by Elwin.
184
Divorce
6 divorced couples were encountered in this study.
Twinning (table 6.26)
11 pairs of twins were observed out of 2787 live pregnancies 3.9/1000, 5 pairs of males
and 5 pairs of females and 1 unlike pair. The observed figure is low. In Central India
there are 16 twin pregnancies per thousand (a hospital based study) by Goswami and Wagh
(1975). Present results are closer to a South Indian population with 6.9/1000 twin
pregnancies in a hospital based study by Bittles et al (1988), and to Japanese populations
(Bulmer 1960 & 1970).
Infertility (table 6.27)
97.8% of women conceived ie, they are able to produce a fetus. 2.22% of women
(between 21-45 years) were not able to produce a fetus after having regular intercourse
with their husbands ie, had primary infertility. 5.3% of women produced once and stopped
forever ie, had secondary infertility. The observed figures are low compared to many
populations.
Breast feeding (table 6.28)
The data are grouped into four categories, because most of the women answered with a
round figure like 6 months, 1 year and so on. The mean duration of breast feeding was
12-24 months (60%), 20% of women breast fed less than 1 year and 20% of women breast
fed over 2 years.
Contraception (table 6.29-6.31)
Irreversible methods: 22.0% of women had had tubectomy and 2.3% of men had had a
vasectomy. 0.3% of men and women used reversible method such as pills, condoms etc.
These were the most educated members of the community namely school teachers
belonging to the Baiga community in that area.
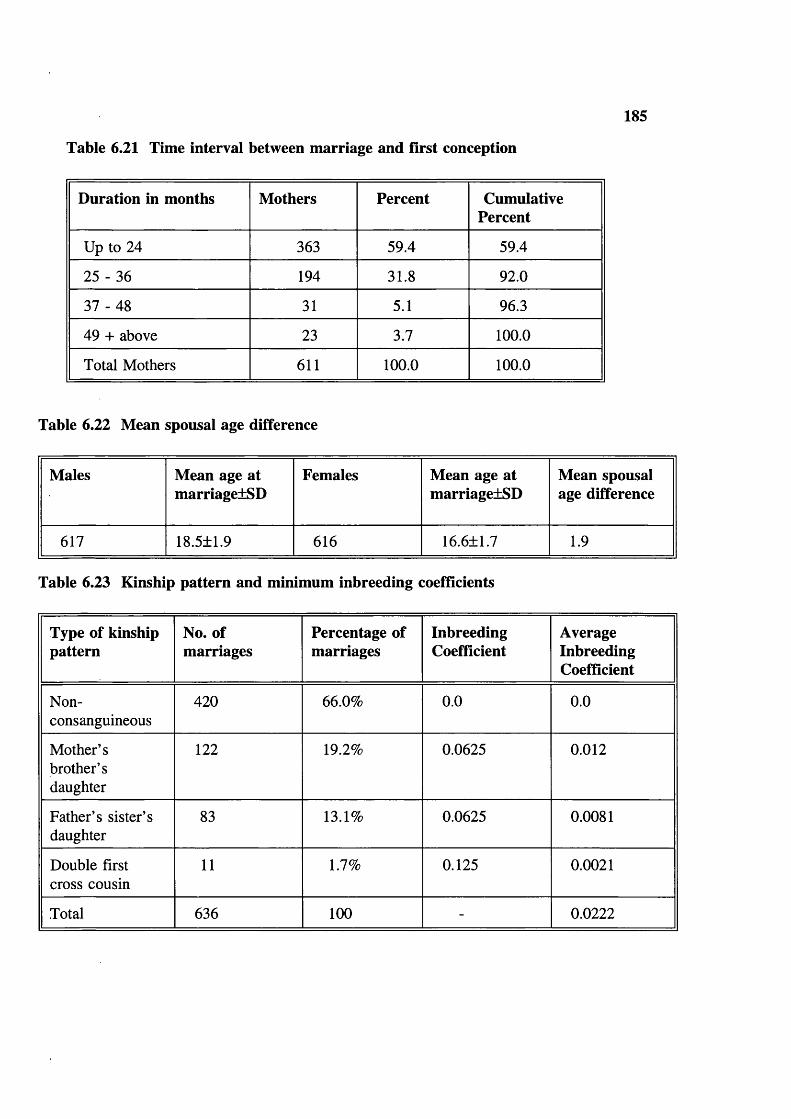
185
Table 6.21 Time interval between marriage and first conception
Duration in months Mothers Percent CumulativePercent
Up to 24 363 59.4 59.4
25 - 36 194 31.8 92.0
37 - 48 31 5.1 96.3
49 + above 23 3.7 100.0
Total Mothers 611 100.0 100.0
Table 6.22 Mean spousal age difference
Males Mean age at marriage±SD
Females Mean age at marriage±SD
Mean spousal age difference
617 18.5±1.9 616 16.6±1.7 1.9
Table 6.23 Kinship pattern and minimum inbreeding coefficients
Type of kinship pattern
No. of marriages
Percentage of marriages
InbreedingCoefficient
AverageInbreedingCoefficient
Non-consanguineous
420 66.0% 0.0 0.0
Mother’sbrother’sdaughter
122 19.2% 0.0625 0.012
Father’s sister’s daughter
83 13.1% 0.0625 0.0081
Double first cross cousin
11 1.7% 0.125 0.0021
Total 636 100 - 0.0222

Table 6.24 Village cousin marriage
186
Village Non-consangui-neous
Consanguineous Total AverageInbreedingCoefficient
MBDFSD DFCC
Azgarh 53 6 10 1 70 0.0160
Chada 28 6 4 0 38 0.01644
Durkuta 38 9 7 5 59 0.02753
Khamera 11 12 12 0 35 0.04285
GouraKanhari
25 11 3 0 39 0.02243
Tadpatra 25 1 2 0 28 0.0066
Tantar 19 7 4 0 30 0.02291
Silpidi 27 11 0 3 41 0.02591
Seerajhar 12 2 1 0 15 0.0125
Kharidih 78 16 14 2 108 0.0196
Bangla dadar 22 7 6 0 35 0.02321
Kapoti 15 0 0 0 15 0.00
Bohera 16 6 3 0 25 0.02250
Dhoimani 1 15 9 0 25 0.060
Kendrabohera
21 8 2 0 31 0.02016
Ladradadar
21 3 3 0 27 0.01388
Baharpur 8 4 1 0 13 0.02403
Total 420 122 83 11 636 0.0222
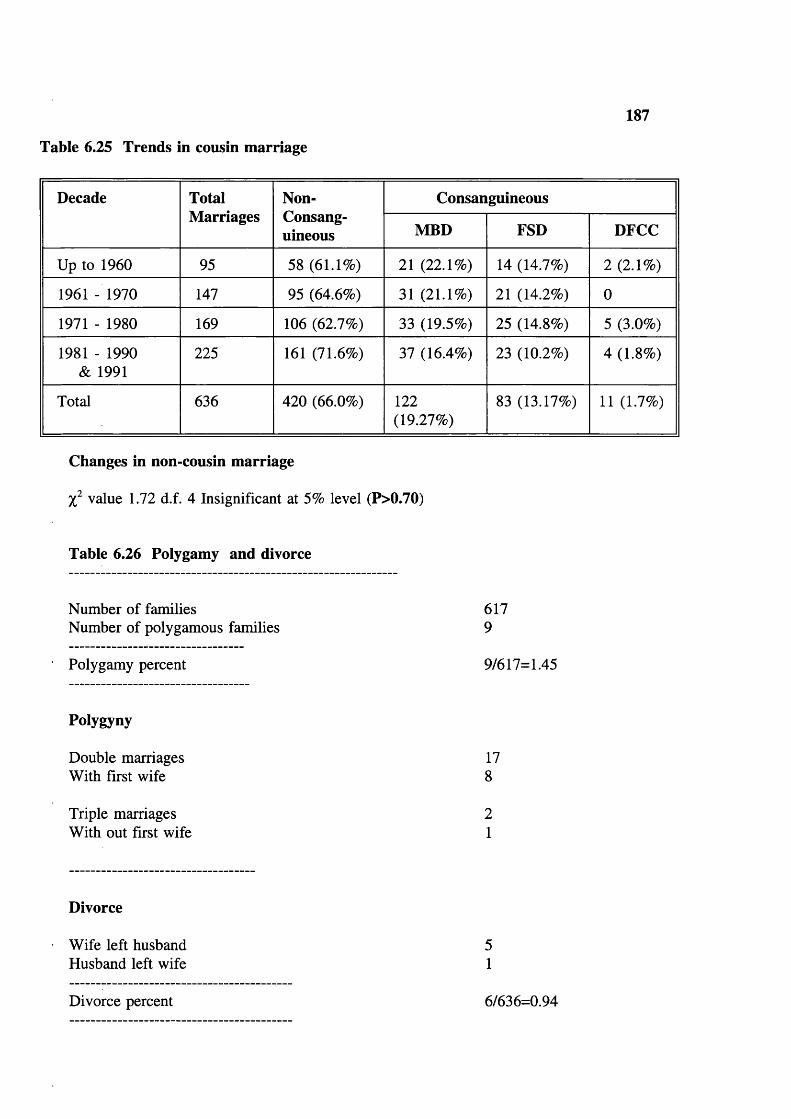
187
Table 6.25 Trends in cousin marriage
Decade TotalMarriages
Non-Consang-uineous
Consanguineous
MBD FSD DFCC
Up to 1960 95 58 (61.1%) 21 (22.1%) 14 (14.7%) 2 (2.1%)
1961 - 1970 147 95 (64.6%) 31 (21.1%) 21 (14.2%) 0
1971 - 1980 169 106 (62.7%) 33 (19.5%) 25 (14.8%) 5 (3.0%)
1981 - 1990 & 1991
225 161 (71.6%) 37 (16.4%) 23 (10.2%) 4 (1.8%)
Total 636 420 (66.0%) 122(19.27%)
83 (13.17%) 11 (1.7%)
Changes in non-cousin marriage
value 1.72 d.f. 4 Insignificant at 5% level (P>0.70)
Table 6.26 Polygamy and divorce
Number of families Number of polygamous families
Polygamy percent
Polygyny
Double marriages With first wife
Triple marriages With out first wife
6179
9/617=1.45
178
21
Divorce
Wife left husband Husband left wife
Divorce percent 6/636=0.94

Table 6.27 Infertility
188
Mothers Age (yrs)
Mother without live births
Mother with one live birth
>20 21 22
21-45 14/636 =2.2% 34/636= 5.3
>45 1/636 =0.2 1/636= 0.2
Table 6.28 Duration of breast feeding
Duration Number of Mothers % CumulativePercent
Up to 12 months 114 18.8% 18.8
13-24 months 357 59.0% 77.8
25-36 months 129 21.2% 98.9
36+ months 6 1.0% 100.0
Total No. of mothers 606 100.0% 100.0
Table 6.29 Contraceptives used-medical
Device Male % Female % Total %
Nocontraception
602 97.4 491 77.7 1093 87.5
Yes temporary sterilization
2 0.3 2 0.3 4 0.3
Yes permanent sterilization vasectomy or tubectomy
14 2.3 139 22.0 153 12.2
Total 618 100.0 632 100.0 1250 100.0

Table 6.30 Contraceptives used-herbal
189
Device Male % Female %
No contraceptives used
610 98.7 615 97.3
Yes temporary sterilized
8 1.3 17 2.7
Yes permanent sterilized
1 0.16 0 0
Total 618 100.0 632 100.0
Table 6.31 Trends in family planning
Decade of marriage
Women Tubectomy % Men Vasectomy %
>1960 95 14 14.7 95 3 3.2
1961-1970 147 41 27.9 146 10 6.8
1971-1980 164 67 40.9 156 1 0.6
1981-1990 & 1991
222 16 7.2 219 0 0
Total 628 138 22 616 142.28
Table 6.32 Education
Type Male Female Total %
Illiterates 1287(83.6%)
1509(95.74%)
2796 89.75
Class 1-5 207(13.5%)
54(3.4%)
261 8.37
Class 6-10 39(2.53%)
12(0.76%)
51 1.63
Class 10+ 6(0.4%)
1 (0.06%) 7 0.022
Total 1539 1576 3115 100.0
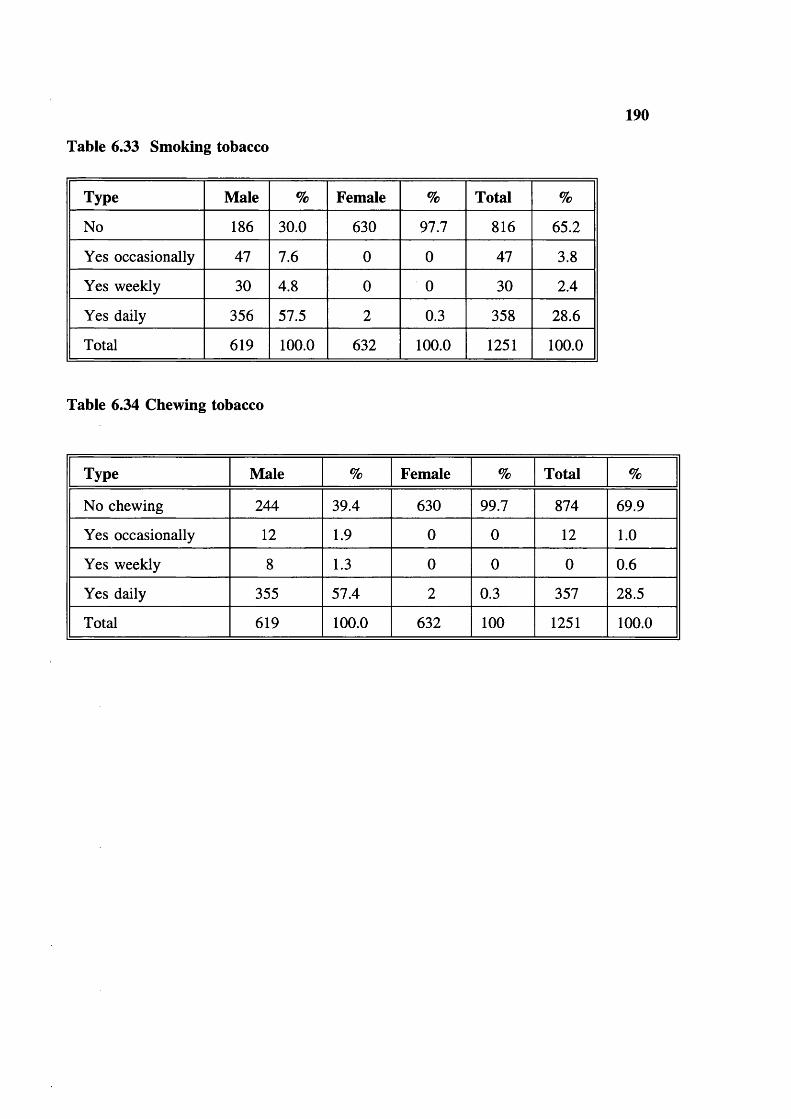
Table 6.33 Smoking tobacco
190
Type Male % Female % Total %
No 186 30.0 630 97.7 816 65.2
Yes occasionally 47 7.6 0 0 47 3.8
Yes weekly 30 4.8 0 0 30 2.4
Yes daily 356 57.5 2 0.3 358 28.6
Total 619 100.0 632 100.0 1251 100.0
Table 6.34 Chewing tobacco
Type Male % Female % Total %
No chewing 244 39.4 630 99.7 874 69.9
Yes occasionally 12 1.9 0 0 12 1.0
Yes weekly 8 1.3 0 0 0 0.6
Yes daily 355 57.4 2 0.3 357 28.5
Total 619 100.0 632 100 1251 100.0
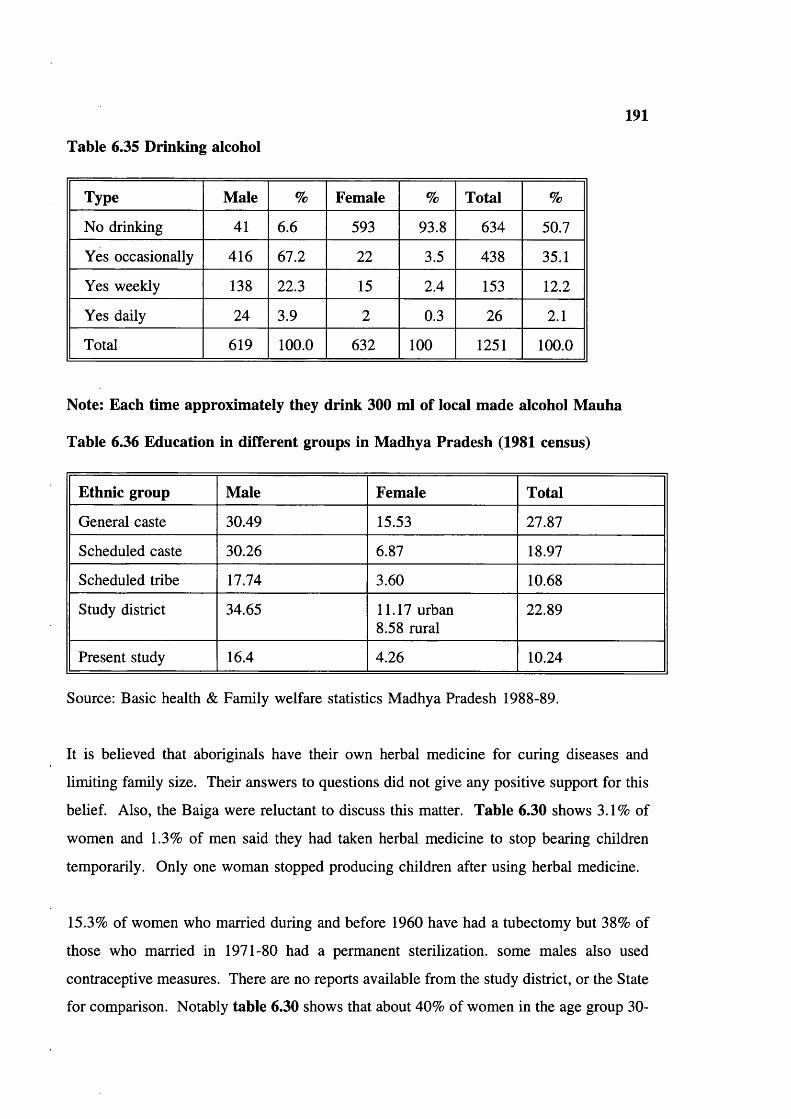
191
Table 6.35 Drinking alcohol
Type Male % Female % Total %
No drinking 41 6.6 593 93.8 634 50.7
Yes occasionally 416 67.2 22 3.5 438 35.1
Yes weekly 138 22.3 15 2.4 153 12.2
Yes daily 24 3.9 2 0.3 26 2.1
Total 619 100.0 632 100 1251 100.0
Note: Each time approximately they drink 300 ml of local made alcohol Mauha
Table 6.36 Education in different groups in Madhya Pradesh (1981 census)
Ethnic group Male Female Total
General caste 30.49 15.53 27.87
Scheduled caste 30.26 6.87 18.97
Scheduled tribe 17.74 3.60 10.68
Study district 34.65 11.17 urban 8.58 rural
22.89
Present study 16.4 4.26 10.24
Source: Basic health & Family welfare statistics Madhya Pradesh 1988-89.
It is believed that aboriginals have their own herbal medicine for curing diseases and
limiting family size. Their answers to questions did not give any positive support for this
belief. Also, the Baiga were reluctant to discuss this matter. Table 6.30 shows 3.1% of
women and 1.3% of men said they had taken herbal medicine to stop bearing children
temporarily. Only one woman stopped producing children after using herbal medicine.
15.3% of women who married during and before 1960 have had a tubectomy but 38% of
those who married in 1971-80 had a permanent sterilization, some males also used
contraceptive measures. There are no reports available from the study district, or the State
for comparison. Notably table 6.30 shows that about 40% of women in the age group 30-

192
40 have had a tubectomy. This may account for the disappearance of the fertility
difference between consanguineous and non-consanguineous couples in more recent
decades (tables 6.7 and 6.8).
Education (table 6.32)
Only 10.2% of people, 16.4% of males and 4.3% of females have had any education.
Only 2.5% passed the 6th class and 0.4% passed the 10th class. Only one female in the
entire study population passed 10th class, she is a daughter of a school teacher. Education
plays a key role for family size, fertility, and health. The observed educational level is
low compared to caste population in the State but close to other tribal groups in the state,
as recorded in the 1981 census, for Madhya Pradesh.
Smoking tobacco (table 6.33)
Smoking is a usual habit for the Baiga males and not for the females. 70% of Baiga males
are smokers; 57.4% smoke daily and the rest smoke occasionally. Only 2 females of the
group studied smoke.
Chewing tobacco (table 6.34)
In the present study, 60.6% males chew tobacco, 57.4% chew daily and the rest chew
occasionally. Only 2 females answered yes. Chewing tobacco seems to be a male habit
in the tribe.
Drinking alcohol (table 6.35)
In the present study 93.4% of males and only 6.2% of females reported drinking local
alcohol (mauha); 3.9% of males said they drank regularly, 67.2% said they drunk
occasionally.
DISCUSSION
Age and Sex structure
Possible reasons for the higher sex ratio in the present study and in tribal districts than in
non tribal districts, state and country are:
193
(a). the proportion of male deaths in infancy and early childhood are higher than
females, and the availability and acceptance of medical attention is low,
(b) the practice of female infanticide and neglect among non aboriginals due to social
factors such as dowry, and
(c) the status of women is better in tribals, compared to non-tribals for socio-cultural
reasons.
There is naturally a higher infant mortality among males. Unbalanced sex ratio has been
rectified since Elwin’s time, perhaps mortality among adult males reduced since settled
cultivation. The natural difference is futher reduced in developed countries by medical
care for children, and in some societies is compensated, or over-compensated by relative
neglect of females and even female infanticide.
Using world fertility survey data reported from the republic of Korea, where there is a
strong preference for sons Choe (1987), observed an unusual pattern of high female
mortality in infancy, and higher female mortality in childhood than during infancy. The
analysis of life tables indicates that male and female children receive unequal care by their
parents. Though male mortality is naturally higher, a social factor (interest in males) leads
to higher female mortality. Similar behaviour is widespread in the caste population of
India. In the present study population there are clearly no such distortions; the observed
mortality in both males and females is natural.
Fertility and Mortality
Fertility levels are higher in consanguineous couples than unrelated couples. Similar
results were observed in the Japanese population (Schull et al 1970). This may be due to
extension of the reproductive span by consanguineous couples, to compensate for increased
mortality among their offspring.
Over all, the observed pre-reproductive mortality is high (19%). This is related to lack of
medical care, the birth delivery system, inadequate immunization in the area,
communicable diseases particularly malaria and possibly gastroenteritis, poor economy, low
literacy, and lack of proper transportation facilities. This is true for most populations of
194
developing countries. However, mortality is falling in the Baiga.
There are a very few comparable studies on aboriginals; Ghosh (1976) studied the Kotas
of the Nilgiri hills. He reported 8.8% of miscarriages and still-births and 30.4% of pre-
reproductive mortality. Consanguineous marriages were more fertile than non-
consanguineous, but there is no significant difference in mortality between offspring of
consanguineous and non-consanguineous marriages in pre and post-natal mortality was
observed. However, such a difference may have been marked by the high mortality. The
mean number of surviving children per married women was only 2.03 whereas in the
present study it is 3.6. The present study population has better survival than the Kotas,
as pre-reproductive mortality is 18.0%.
One South Indian study (Rao and Inbaraj 1977) reported no significant difference in
prenatal or postnatal mortality between consanguineous and non-consanguineous couples.
On the other hand Chakravorty and Chakravorty (1977) and Shami et al (1989) reported
a positive association between prenatal mortality and consanguineous marriage, while Rao
and Reddy (1978) observed no association between prenatal mortality and consanguineous
marriage, but observed higher postnatal mortality in offspring of consanguineous couples
compared to unrelated couples.
However, it is difficult to obtain accurate data on prenatal losses: for example the figures
in the present study are far too low due to the tribal’s poor recall. They do not bother to
remember fetal losses. They believe they are the wish of their deities. A similar criticism
applies to all retrospective studies of pre-natal mortality, especially in populations where
fertility is high.
The observed post natal mortality was higher for consanguineous couples compared to non-
consanguineous, though the difference was not statistically significant. Possible reasons
for this small difference include relatively small sample size, and the fact that the tribe has
practised consanguineous marriage for so many generations. We have no data on the
inbreeding coefficient for past generations, and the observed inbreeding coefficient is
minimum. Since the matrimonial distance is also very low, even if tribals do not marry

195
cousins, many couples are likely to be more distantly related. Bittles et al (1988) and
Ghosh and Majumdar (1979) made similar observations in the South Indian caste
populations. A further important factor affecting the observed differences between
offspring of consanguineous and non-consanguineous couples in tribal populations was
revealed by family studies (see chapter 8).
Mate choice and family name
The garhs (family name) which are common and widespread are the oldest or most
successful ones. The fact that many garhs were observed only once raises the questions
of whether they are the only surviving male children of their parents (this is most likely),
or have brothers who changed their garh name because of migration or mate choice? or
some males have moved to their wives residence after marriage.
Due to prohibition of selecting a partner outside the jat, gene flow is generally within the
sub tribe. Thus sub tribe may come to differ from each other after some generations as
observed eg, in intra tribal variation in the prevalence of sickle cell genes.
Marital distance
In general inhabitants of forest and hilly area and socio-economically backward
communities tend to choose their wives from nearby areas, and physical environment plays
a major role in mate choice. The expected marital distance in tribals is observed in
Baigas. The observed low mean matrimonial distance is related to distance between
villages, difficult physical environment, and lack of transportation facilities in the area.
The nature of the habitat encourages people to select their partners within a small distance.
This may be another reason, in addition to cultural convention, for a high inbreeding
coefficient in the study population.
Similarly, in the Danges population of Maharashtra, Majumdar and Malhotra (1979)
observed that 70% of marriages were solemnized within 5 kms. They concluded that this
was due to the inaccessible nature of the area in which Danges live: the terrain is hilly and
forested and restricts free movement. Pingle and Haimondorf (1987) observed a low
marital distance in the Gond population of Andhra Pradesh (5.39 to 11 miles), and village
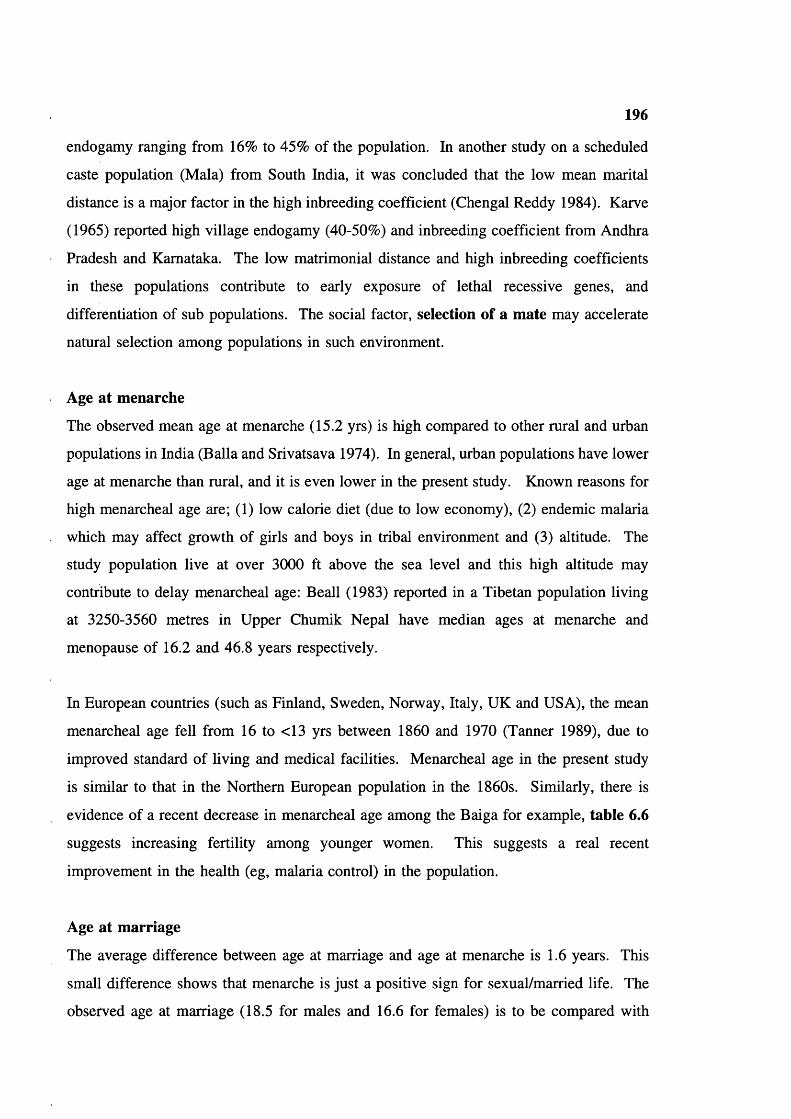
196
endogamy ranging from 16% to 45% of the population. In another study on a scheduled
caste population (Mala) from South India, it was concluded that the low mean marital
distance is a major factor in the high inbreeding coefficient (Chengal Reddy 1984). Karve
(1965) reported high village endogamy (40-50%) and inbreeding coefficient from Andhra
Pradesh and Karnataka. The low matrimonial distance and high inbreeding coefficients
in these populations contribute to early exposure of lethal recessive genes, and
differentiation of sub populations. The social factor, selection of a mate may accelerate
natural selection among populations in such environment.
Age at menarche
The observed mean age at menarche (15.2 yrs) is high compared to other rural and urban
populations in India (Balia and Srivatsava 1974). In general, urban populations have lower
age at menarche than rural, and it is even lower in the present study. Known reasons for
high menarcheal age are; (1) low calorie diet (due to low economy), (2) endemic malaria
which may affect growth of girls and boys in tribal environment and (3) altitude. The
study population live at over 3000 ft above the sea level and this high altitude may
contribute to delay menarcheal age: Beall (1983) reported in a Tibetan population living
at 3250-3560 metres in Upper Chumik Nepal have median ages at menarche and
menopause of 16.2 and 46.8 years respectively.
In European countries (such as Finland, Sweden, Norway, Italy, UK and USA), the mean
menarcheal age fell from 16 to <13 yrs between 1860 and 1970 (Tanner 1989), due to
improved standard of living and medical facilities. Menarcheal age in the present study
is similar to that in the Northern European population in the 1860s. Similarly, there is
evidence of a recent decrease in menarcheal age among the Baiga for example, table 6.6
suggests increasing fertility among younger women. This suggests a real recent
improvement in the health (eg, malaria control) in the population.
Age at marriage
The average difference between age at marriage and age at menarche is 1.6 years. This
small difference shows that menarche is just a positive sign for sexual/married life. The
observed age at marriage (18.5 for males and 16.6 for females) is to be compared with

197
mean State (Madhya Pradesh) figures ie, 20.61 for males and 16.56 for females. The low
mean age at marriage among Baigas is because women are a major asset in the family
economy and there are no social, economic or educational reasons to wait after attaining
puberty. In the Baigas, premarital sex is tolerated and Baiga women go for marriage as
soon as they attain puberty. The present study results agree with other studies: early
marriage is a characteristic feature of low castes and tribes for socio-cultural reasons. It
leads to a long reproductive period.
There are very limited numbers of studies of mean age at marriage among aboriginals in
India, apart from Census Reports. Most existing data refers to the caste populations.
According to the Hindu marriage act (1955) a girl can not marry before reaching 15, years
and subsequently the age limit was raised to 18 years. This limit is not observed in the
study population, which is not influenced by any external controls of age at marriage
(Government policies); and retains a maximal reproductive life span. Limited regard for
government legislation was also observed in South Indian caste populations (Bittles et al
1990). However in some South Indian populations eg, Karnataka female age at marriage
is gradually rising (Caldwell et al 1983; Kulkarni et al 1986) shortening reproductive life.
A study by Mohan Singh (1992) revealed a dramatic increase in age at marriage in rural
North India, from under 12 before 1930 to 19 years in 1988, mainly as a result of socio
economic development and advances in education of women. He noted that government
legislation setting the minimum age at marriage for girls made only a gradual impact, as
pre-pubertal marriages continued until 1970. | Audinarayana (1990) observed increasing
mean age at marriage in four cross cultural groups (Forward caste. Backward caste.
Scheduled caste and Muslims) and also suggested that it will increase in future.
Age differences between Spouses
In general, pubertal age is earlier in girls than boys; the height spurt difference between
boys and girls is 2 yrs (Tanner 1989; P 60-64). This corresponds well with the marriage
age difference (1.9 yrs) in this natural population. Their behaviour differs markedly from
that of the Indian caste populations summarized in table 6.20. The reasons for a large
difference from caste populations are; woman want to marry older man for financial
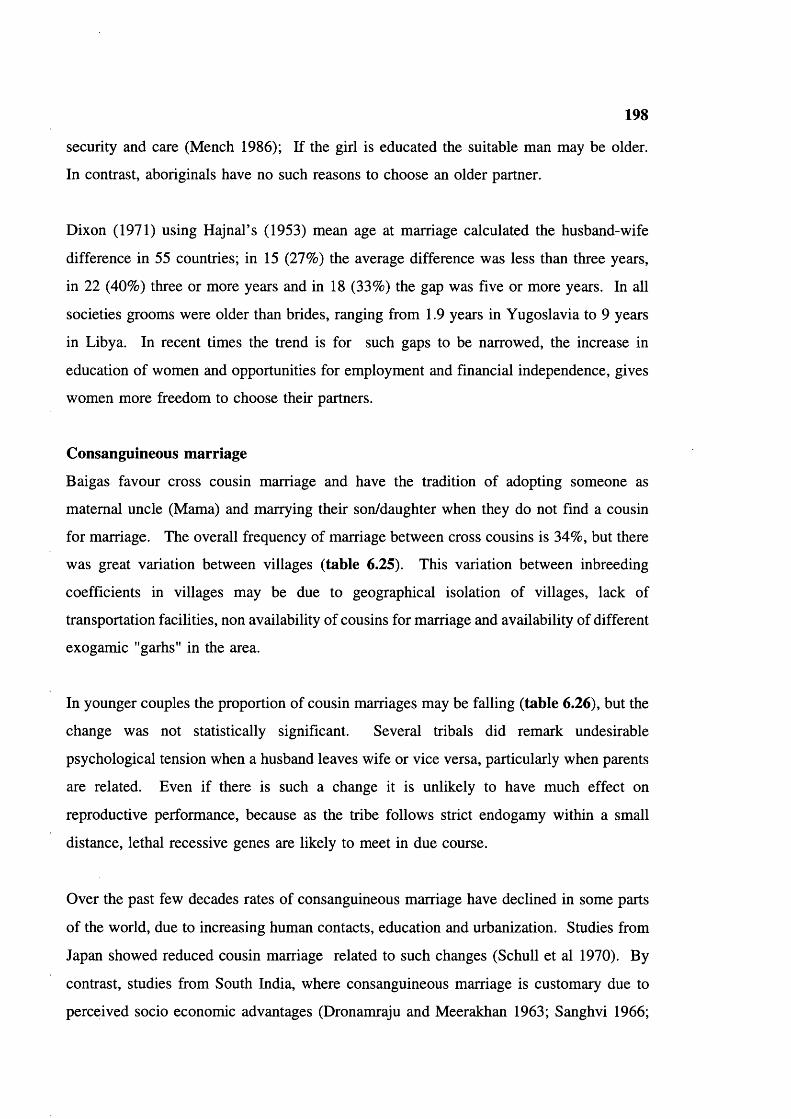
198
security and care (Mench 1986); If the girl is educated the suitable man may be older.
In contrast, aboriginals have no such reasons to choose an older partner.
Dixon (1971) using Hajnal’s (1953) mean age at marriage calculated the husband-wife
difference in 55 countries; in 15 (27%) the average difference was less than three years,
in 22 (40%) three or more years and in 18 (33%) the gap was five or more years. In all
societies grooms were older than brides, ranging from 1.9 years in Yugoslavia to 9 years
in Libya. In recent times the trend is for such gaps to be narrowed, the increase in
education of women and opportunities for employment and financial independence, gives
women more freedom to choose their partners.
Consanguineous marriage
Baigas favour cross cousin marriage and have the tradition of adopting someone as
maternal uncle (Mama) and marrying their son/daughter when they do not find a cousin
for marriage. The overall frequency of marriage between cross cousins is 34%, but there
was great variation between villages (table 6.25). This variation between inbreeding
coefficients in villages may be due to geographical isolation of villages, lack of
transportation facilities, non availability of cousins for marriage and availability of different
exogamie "garhs" in the area.
In younger couples the proportion of cousin marriages may be falling (table 6.26), but the
change was not statistically significant. Several tribals did remark undesirable
psychological tension when a husband leaves wife or vice versa, particularly when parents
are related. Even if there is such a change it is unlikely to have much effect on
reproductive performance, because as the tribe follows strict endogamy within a small
distance, lethal recessive genes are likely to meet in due course.
Over the past few decades rates of consanguineous marriage have declined in some parts
of the world, due to increasing human contacts, education and urbanization. Studies from
Japan showed reduced cousin marriage related to such changes (Schull et al 1970). By
contrast, studies from South India, where consanguineous marriage is customary due to
perceived socio economic advantages (Dronamraju and Meerakhan 1963; Sanghvi 1966;

199
Centerwall and Centerwall 1966) show no significant decline in consanguineous marriages
over the last few decades. Myriam Khlat (1988) reported from Beirut where 25% of
marriages are consanguineous, that marriages between distant relatives declined with time,
while first cousin marriages remained relatively stable. A similar pattern, with an increase
in first cousin marriage, has been observed among British Pakistanis in the UK (Darr and
Modell 1988).
A recent study from Madras city (Ramesh et al, 1988) also showed the existence of
parallel cousin marriages in Dravidian caste groups, by contrast with the typical Dravidian
tradition of cross cousin marriage. The original cultural conditions may be being diluted
in caste populations for various reasons.
Divorce, widowhood and remarriage
The reported divorce rate was low (0.094). However, data in the next chapter suggests that
in some families the couples did not reveal their full marriage history. The reasons for
death of marriage partner are malaria, infectious and waterborne diseases, snake bites, and
maternity complications in women. The tribal elders accept this type of mortality as the
wish of their deities. All divorced and widowed people of either sex remarried. There is
no age limit for men and women for marriage, as long as they wish to marry.
Infertility
The infertility figures are low (2.2% primary infertility and 5.3% secondary infertility).
One possible explanation is discussed in chapter 8.
Breast feeding
The observed long duration of breast feeding (80% of mothers fed their babies >12
months) gives protection from diseases by avoiding bacterial contamination of food and
leads to natural birth spacing (Saxena 1977, Van Ginnekin 1974, Majumdar 1991). Breast
feeding is cut off by an early infant death, and thus in the absence of contraception the
next conception is likely to occur sooner than if breast feeding had continued, leading to
automatic "reproductive compensation" for infant death from whatever cause. This is
likely to be the principal mechanism leading to compensatory increased fertility among

200
consanguineous compared to non-consanguineous couples in this study. There are no
published reports from the State (Madhya Pradesh) available for comparison.
Contraception
Table 6.33 shows that family planning measures are in increasing use in the tribe.
Education
In higher caste groups, the time needed for continuing higher education delays marriage,
and the difficulty of securing a job with low educational qualifications motivates people
to seek higher education, leading to increased age at marriage (McDonald et al 1981). The
low education of aboriginals limits their number of opportunities for employment, and
acquiring civilization and has tremendous influence in the family size. Education so far
has little influence in the tribe; the observed demographic parameters like fertility, and
mortality are near to the natural, especially in the group over 40 years old. Female
education is important to improve the child health and family planning implementation.
In the 17 study villages there are 6 schools (5 primary and 1 middle). In two villages,
schools are attached to hostels. In fact every village should have a school, and preferably
teachers from the same tribe. Tribals may listen to their own people (teachers) rather than
an outsider. Occupational education like wood carving, spinning, fishing etc could be
introduced in the tribe.
Tobacco Smoking
The method of use, quantity and quality of tobacco differs from other groups. Usually,
males start smoking after marriage and it becomes a part of their daily life. They grow
their own tobacco and need not spend money on it. There is no record on incidence of
various diseases linked to tobacco in the population; it is expected that smokers are prone
to get cancers, in general. Unfortunately there was no epidemiological study on tobacco
consumption to assess real health burden depending on age distribution.
Tobacco chewing
Data from India collected in 1960 showed that 15-60% of the adult population used
tobacco in one form or other (WHO Report 1988 p 31). In Asia, especially in rural parts

201
of Bangladesh, Pakistan, and India use of smokeless tobacco is a daily habit, and it is a
habit of aboriginals as well. Prevalence varies widely, it is estimated that at least 100
million persons in India and Pakistan alone use smokeless tobacco. In the Eastern
Mediterranean region and parts of Central Asia, tobacco is most often chewed in
combination with flavouring agents. The use of different forms of tobacco as a part of
betel quid chewing is well established in most of South-East Asia. Tobacco is used with
Pan (Beetle quid) either as dried powder leaves or as a paste (Kiwam Zarda). Some
people used tobacco for cleansing the teeth in India. There is no published literature on
tobacco chewing among tribal groups in India. In the study population 60% of males and
28.5% females chew tobacco. This may lead to oral cancer in the tribe.
Drinking alcohol
The frequency of drinking depends on the family economy (availability of raw material;
mauha buds, and fruits). Some Baiga men did not allow me to collect information on their
drinking habits. For men there is no limit on time to drink, from early morning to late
night.
In conclusion, the population is growing, sex ratio is high and natural in the tribe. The
observed mortality can be further reduced by proper health care programmes like
eradication of malaria, effective implementation of immunization, good drinking water etc.
The family planning methods appear to be effective in younger women, and will be more
effective in the future if female education/awareness is generated in the tribe. Natural
deaths from eg, snake bite, etc are under control with settled cultivation.
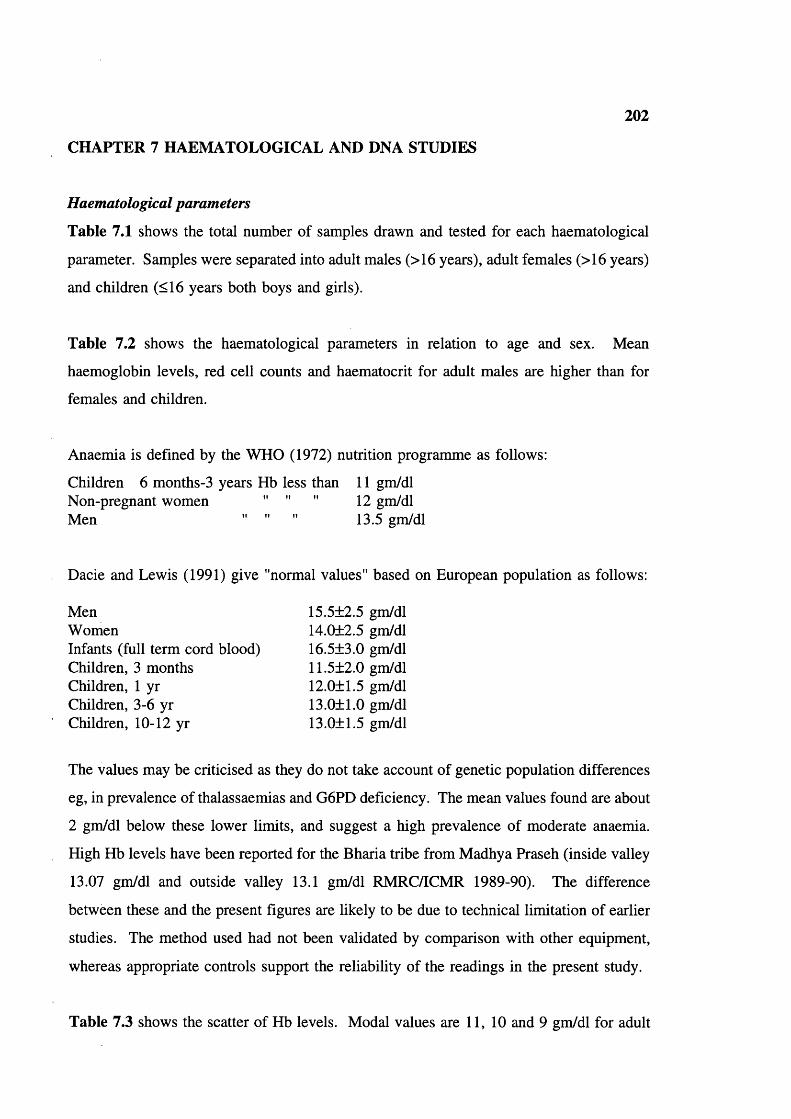
202
CHAPTER 7 HAEMATOLOGICAL AND DNA STUDIES
Haematological parameters
Table 7.1 shows the total number of samples drawn and tested for each haematological
parameter. Samples were separated into adult males (>16 years), adult females (>16 years)
and children (<16 years both boys and girls).
Table 7.2 shows the haematological parameters in relation to age and sex. Mean
haemoglobin levels, red cell counts and haematocrit for adult males are higher than for
females and children.
Anaemia is defined by the WHO (1972) nutrition programme as follows:
Children 6 months-3 years Hb less than 11 gm/dlNon-pregnant women " " " 12 gm/dlMen .............. 13.5 gm/dl
Dacie and Lewis (1991) give "normal values" based on European population as follows:
Men 15.5+2.5 gm/dlWomen 14.0±2.5 gm/dlInfants (full term cord blood) 16.5+3.0 gm/dlChildren, 3 months 11.5+2.0 gm/dlChildren, 1 yr 12.0+1.5 gm/dlChildren, 3-6 yr 13.0±1.0 gm/dlChildren, 10-12 yr 13.0+1.5 gm/dl
The values may be criticised as they do not take account of genetic population differences
eg, in prevalence of thalassaemias and G6PD deficiency. The mean values found are about
2 gm/dl below these lower limits, and suggest a high prevalence of moderate anaemia.
High Hb levels have been reported for the Bharia tribe from Madhya Praseh (inside valley
13.07 gm/dl and outside valley 13.1 gm/dl RMRC/ICMR 1989-90). The difference
between these and the present figures are likely to be due to technical limitation of earlier
studies. The method used had not been validated by comparison with other equipment,
whereas appropriate controls support the reliability of the readings in the present study.
Table 7.3 shows the scatter of Hb levels. Modal values are 11, 10 and 9 gm/dl for adult
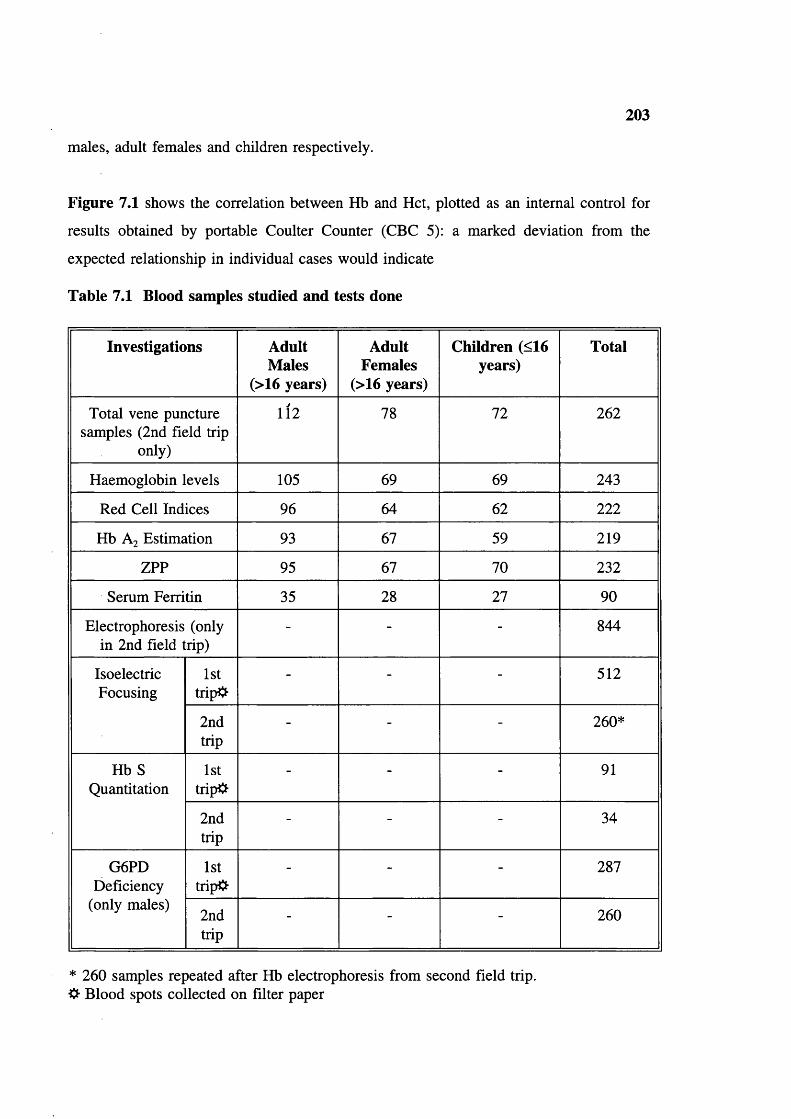
203
males, adult females and children respectively.
Figure 7.1 shows the correlation between Hb and Hct, plotted as an internal control for
results obtained by portable Coulter Counter (CBC 5): a marked deviation from the
expected relationship in individual cases would indicate
Table 7.1 Blood samples studied and tests done
Investigations Adult Males
(>16 years)
Adult Females
(>16 years)
Children (<16 years)
Total
Total vene puncture samples (2nd field trip
only)
112 78 72 262
Haemoglobin levels 105 69 69 243
Red Cell Indices 96 64 62 222
Hb A2 Estimation 93 67 59 219
ZPP 95 67 70 232
Serum Ferritin 35 28 27 90
Electrophoresis (only in 2nd field trip)
- - - 844
IsoelectricFocusing
1sttripO
- - - 512
2ndtrip
- - - 260*
Hb S Quantitation
1sttrip#
- - - 91
2ndtrip
- - - 34
G6PD Deficiency
(only males)
1sttrip#
- - - 287
2ndtrip
- - - 260
* 260 samples repeated after Hb electrophoresis from second field trip. Blood spots collected on filter paper
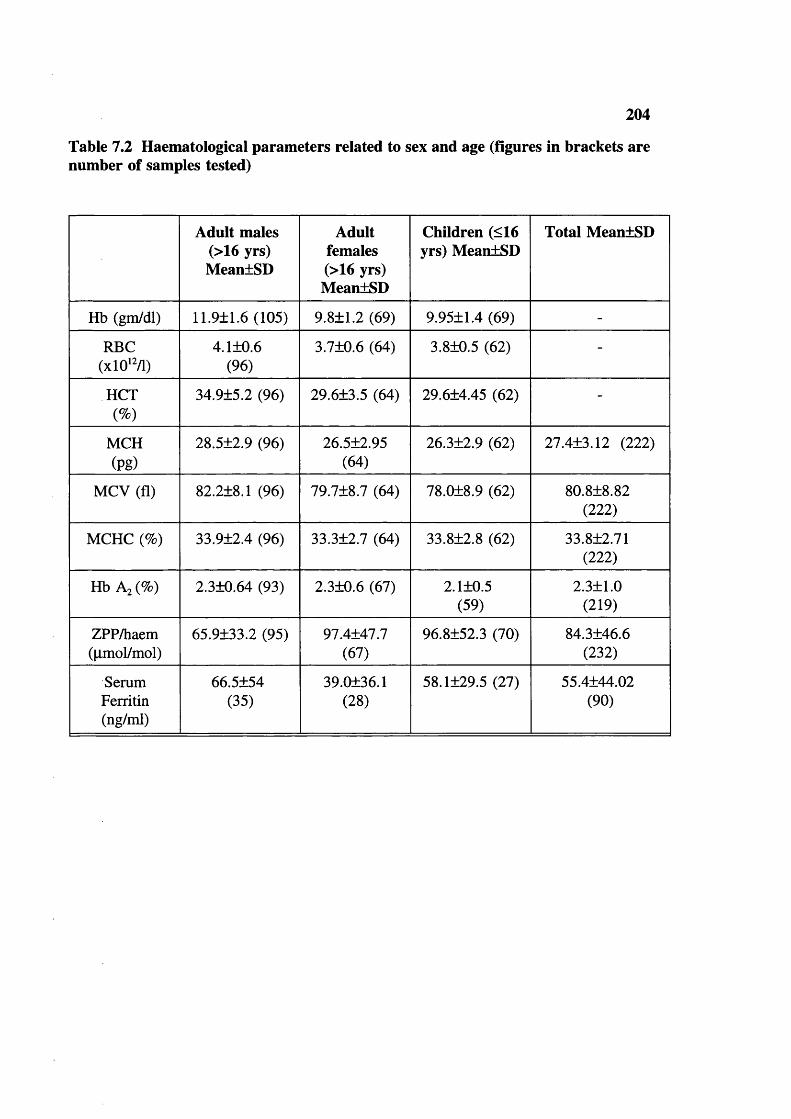
204
Table 7.2 Haematological parameters related to sex and age (figures in brackets are number of samples tested)
Adult males (>16 yrs) MeantSD
Adult females (>16 yrs) MeanlSD
Children (<16 yrs) MeanlSD
Total MeanlSD
Hb (gm/dl) 11.9±1.6 (105) 9.811.2 (69) 9.9511.4 (69) -
RBC(xlO'2/1)
4.1+0.6 (96)
3.710.6 (64) 3.810.5 (62) -
HCT(%)
34.9±5.2 (96) 29.613.5 (64) 29.614.45 (62) -
MCH(Pg)
28.5±2.9 (96) 26.512.95(64)
26.312.9 (62) 27.413.12 (222)
MCV (fl) 82.2±8.1 (96) 79.718.7 (64) 78.018.9 (62) 80.818.82(222)
MCHC (%) 33.9+2.4 (96) 33.312.7 (64) 33.812.8 (62) 33.812.71(222)
Hb Az (%) 2.310.64 (93) 2.310.6 (67) 2.110.5(59)
2.311.0(219)
ZPP/haem(|imol/mol)
65.9133.2 (95) 97.4147.7(67)
96.8152.3 (70) 84.3146.6(232)
SerumFerritin(ng/ml)
66.5154(35)
39.0136.1(28)
58.1129.5 (27) 55.4144.02(90)
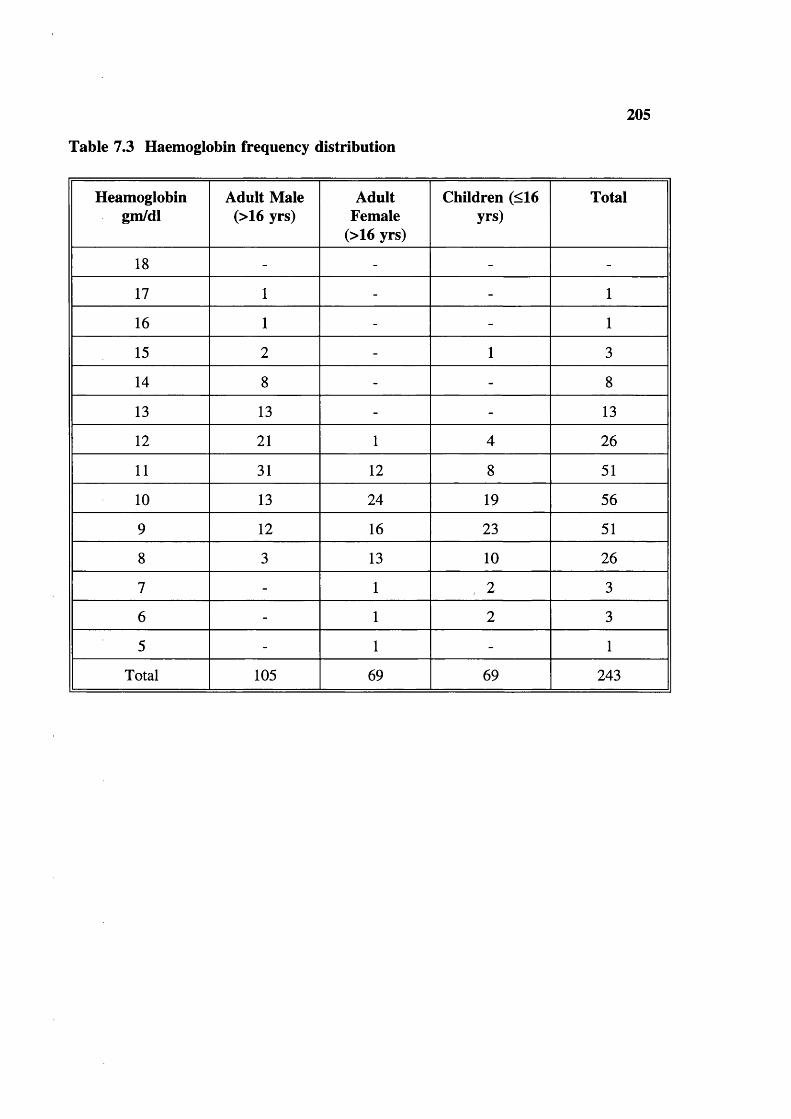
Table 7.3 Haemoglobin frequency distribution
205
Heamoglobingm/dl
Adult Male (>16 yrs)
Adult Female
(>16 yrs)
Children (<16 yrs)
Total
18 - - - -
17 1 - - 1
16 1 - - 1
15 2 - 1 3
14 8 - - 8
13 13 - - 13
12 21 1 4 26
11 31 12 8 51
10 13 24 19 56
9 12 16 23 51
8 3 13 10 26
7 - 1 2 3
6 - 1 2 3
5 - 1 - 1
Total 105 69 69 243

Table 7.4 Mean cell haemoglobin (MCH) frequency distribution
206
MCH(pg)
AdultMales(>16Yrs)
AdultFemales
(>16Yrs)
Children (<16 Yrs)
Total % of total
Normal English males % of total *
34 3 - - 3 1.35 0
33 4 1 2 7 3.2 1.8
32 1 - 1 2 0.9 6.8
31 2 4 1 7 3.2 16.5
30 18 5 1 24 10.8 21.8
29 15 3 3 21 9.5 24.1
28 10 5 10 25 11.3 19.8
27 16 12 7 35 15.8 6.5
26 10 9 11 30 13.6 2
25 6 4 6 16 7.21
24 3 7 6 16 7.2 0
23 4 8 6 18 8.1 0
22 4 4 4 12 5.4 0
21 - - 2 2 0.9 0
20 - 2 1 3 1.3 0
19 - - - - - 1
18 - - 1 1 0.45 0
<27 27(28.1%)
34(53.1%)
37 (57.7%) 98(44.1)
- -
Total 96 64 62 222 - -
* Data from Modell and Berdoukas (1984)
Note: High readings are due to the characterstics of the Coulter counter used in the field
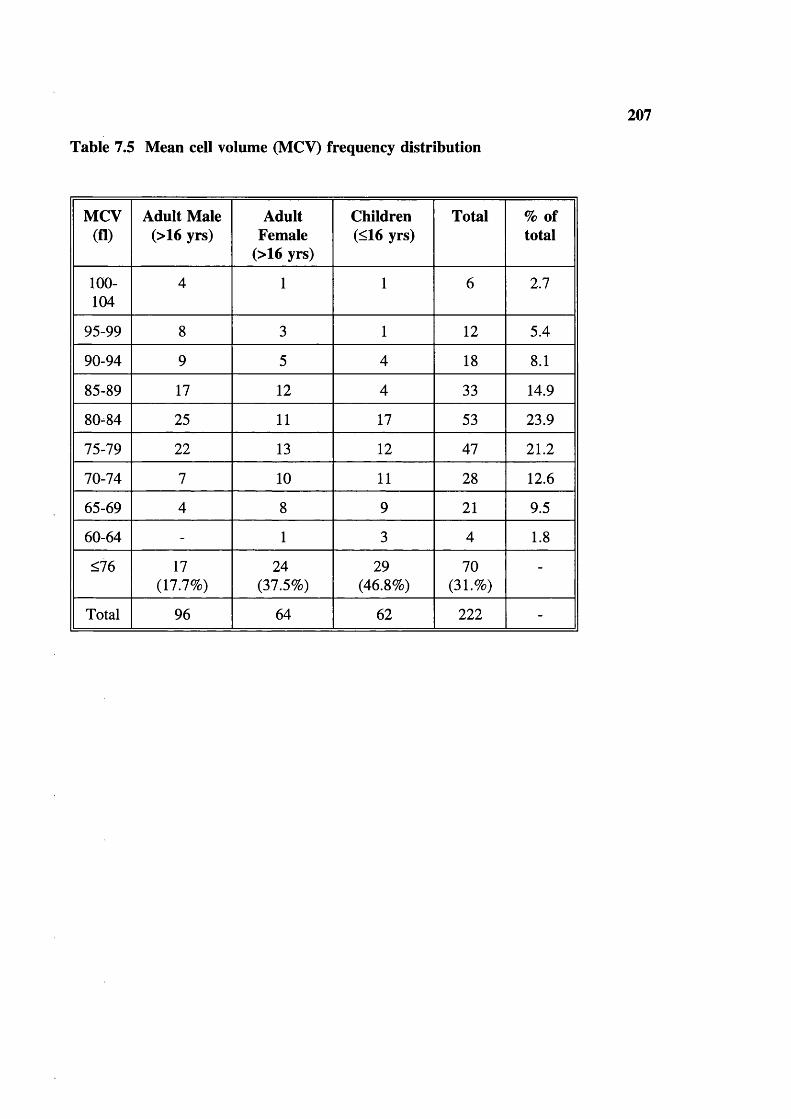
Table 7.5 Mean cell volume (MCV) frequency distribution
207
MCV(fl)
Adult Male (>16 yrs)
Adult Female
(>16 yrs)
Children(<16 yrs)
Total % of total
100-104
4 1 1 6 2.7
95-99 8 3 1 12 5.4
90-94 9 5 4 18 8.1
85-89 17 12 4 33 14.9
80-84 25 11 17 53 23.9
75-79 22 13 12 47 21.2
70-74 7 10 11 28 12.6
65-69 4 8 9 21 9.5
60-64 - 1 3 4 1.8
<76 17(17.7%)
24(37.5%)
29(46.8%)
70(31.<&)
-
Total 96 64 62 222 -

208
Table 7.6 Mean cell haemoglobin concentration (MCHC) frequency distribution
MCHC Adult males (>16 yrs)
Adult females (>16 yrs)
Children(<16 yrs)
Total
44 - - 1 1
43 - - - -
42 - - 1 1
41 1 - - 1
40 1 1 1 3
39 2 1 1 4
38 2 2 2 6
37 2 2 1 5
36 7 2 6 15
35 15 9 6 30
34 16 10 7 33
33 20 11 18 49
32 17 9 6 32
31 6 8 9 22
30 3 3 3 9
29 - 3 - 3
28 2 1 - 3
27 1 1 - 2
26 1 - - 1
25 - 1 1 2
Total 96 64 62 222

209
Table 7.7 ZPP/haem ratio: frequency distribution (upper limit of normal >80)
ZPP/haem(pmol/mol)
Adult Males (>16 yrs)
Adult Females (>16 yrs)
Children (<16 yrs)
Total
>120 6 9 13 28
80-120 12 22 20 54
40-80 42 33 28 103
0-40 35 3 9 47
Total 95 67 70 232
>80 24 38 38 100
<80 71 29 32 132
Table 7.8 Serum ferrritin levels
Ferritinsng/ml
Adult males (>16 yrs)
Adult females (>16 yrs)
Children(<16 yrs)
Total
<15 2 (6.1%) 6 (21.4%) 2 (7.4%) 10(11.1%)
>15 33 22 25 80(88.9%)
Total 35 28 27 90

210
HCT (%)6 0
50
40 I-
30 r
20 h
20151050Mb level (gm/dl)
Total population
Figure 7.1 Correlation between Hb level and Hct
MCH (pg)50
40 [
30
20 h
0 20 40 60 80 100 120MCV (fl)
— Correlation
Figure 7.2 Correlation between MCV and MCH
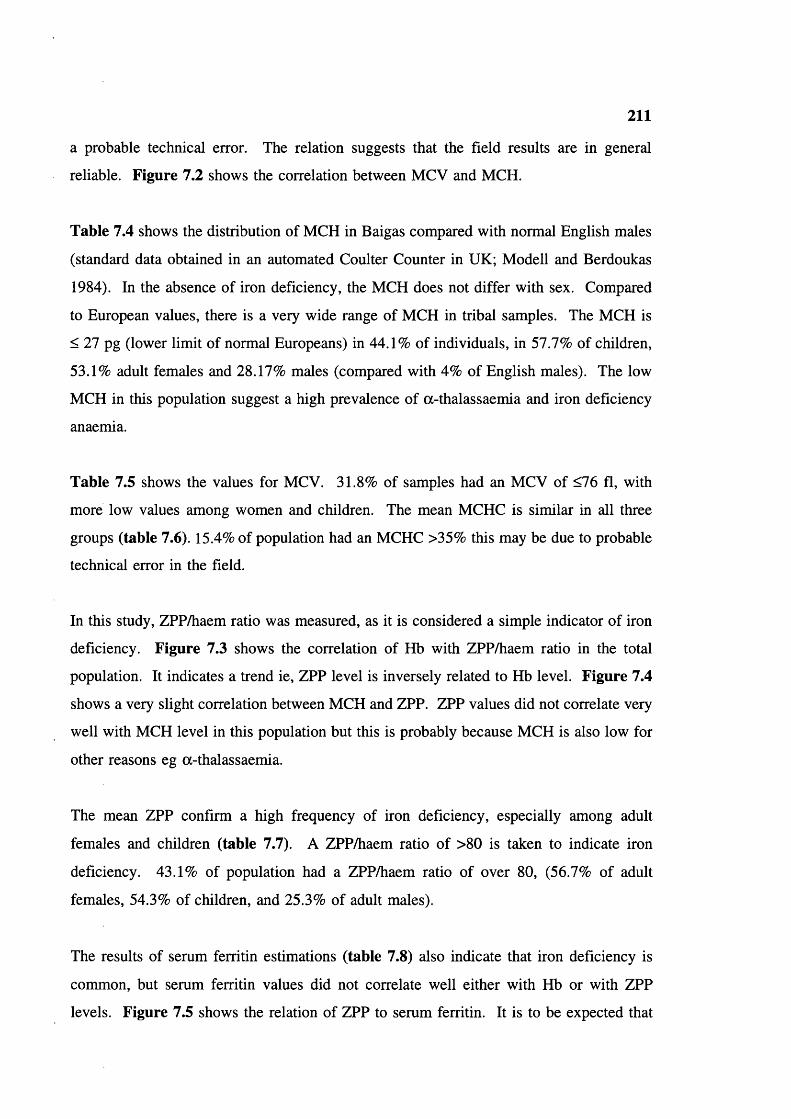
211
a probable technical error. The relation suggests that the field results are in general
reliable. Figure 7.2 shows the correlation between MCV and MCH.
Table 7.4 shows the distribution of MCH in Baigas compared with normal English males
(standard data obtained in an automated Coulter Counter in UK; Modell and Berdoukas
1984). In the absence of iron deficiency, the MCH does not differ with sex. Compared
to European values, there is a very wide range of MCH in tribal samples. The MCH is
< 27 pg (lower limit of normal Europeans) in 44.1% of individuals, in 57.7% of children,
53.1% adult females and 28.17% males (compared with 4% of English males). The low
MCH in this population suggest a high prevalence of a-thalassaemia and iron deficiency
anaemia.
Table 7.5 shows the values for MCV. 31.8% of samples had an MCV of <76 fl, with
more low values among women and children. The mean MCHC is similar in all three
groups (table 7.6). 15.4% of population had an MCHC >35% this may be due to probable
technical error in the field.
In this study, ZPP/haem ratio was measured, as it is considered a simple indicator of iron
deficiency. Figure 7.3 shows the correlation of Hb with ZPP/haem ratio in the total
population. It indicates a trend ie, ZPP level is inversely related to Hb level. Figure 7.4
shows a very slight correlation between MCH and ZPP. ZPP values did not correlate very
well with MCH level in this population but this is probably because MCH is also low for
other reasons eg a-thalassaemia.
The mean ZPP confirm a high frequency of iron deficiency, especially among adult
females and children (table 7.7). A ZPP/haem ratio of >80 is taken to indicate iron
deficiency. 43.1% of population had a ZPP/haem ratio of over 80, (56.7% of adult
females, 54.3% of children, and 25.3% of adult males).
The results of serum ferritin estimations (table 7.8) also indicate that iron deficiency is
common, but serum ferritin values did not correlate well either with Hb or with ZPP
levels. Figure 7.5 shows the relation of ZPP to serum ferritin. It is to be expected that

212
a high ZPP should go with low ferritin but some serum ferritin values did not correlate
with ZPP values; this could be because a significant proportion of individuals have an
Table 7.9 Haematological parameters of samples with normal ZPP/haem ratio ie without evidence of iron deficiency related to sex and age (figures in brackets = number of samples)
Adult males (>16 yrs) Mean±SD
Adult females
(>16 yrs) MeantSD
Children (<16 yrs)
MeantSD
Hb (gm/dl) 12.1±1.6 (71) 10.2tO.85 (27) 10.6tl.2 (32)
RBC(xlO’ /1)
4.2+0.57 (65) 3.73t0.48(27)
3.81t0.45 (26)
HCT(%)
35.1±5.2 (65) 30.7t2.7 (27) 31.7t4.0 (26)
MCH(pg)
28.6+2.3 (64)* 27.2t2.9 (27) 27.8t2.4 (26)
MCV (fl) 82.7±6.98 (62) 81.7t9.4 (27) 82.9t8.0 (26)
MCHC (%) 33.9+1.95 (62) 33.1t2.5(26)*
33.5t2.6 (25)*
Hb Az(%) 2.4+0.64 (54) 2.3t0.6 (23) 2.3t0.6 (22)
ZPP/haem(|imol/mol)
50±15.3 (65) 62.5tl0.3(27)
56.5tl4.2 (26)
* One sample from these are excluded from normal values due to enormous elevation of the values.

213
Table 7.10 Hereditary anaemias: Phenotypic expression and gene frequencies
Type Number Total Genefrequencies
HbS AA=1315 1566 A=0.91768=0.0824
AS=244
SS=7
6-thal.NN=259 262 N=0.9943
T=0.0057NT=3
TT=0
a-thal. aoc/aa =3 10 =0.30 -a"-" =0.35 a a =0.35=3
=2
=1
-a^Vaa =1
G6PD(onlymales)
Gd+=522 547 Gd+=0.9543Gd-=0.0457
Gd-=25
Table 7.11 Expected and observed AA, AS and SS % in the Baigas
Mating AA p AS SS q" Total
With random mating
83.9% 15.1% 0.68% -
30%consanguineousmarriage
84.2% 14.9% 0.91% -
Observed 1315=84.2%
244=15.6%
7=0.45% 1566

Table 7.12 Hb S level (%) in sickle heterozygotes
214
Hypotheticala-globin
genotype
Total Group I (Hb S 11-17%)
i-aJ-a)
Group II (Hb S 18-29%)
(-oc/aa)
Group III (Hb S 30+%)
(acx/aa)
Number of Individuals
125 20 (16%) 92 (74%) 13 (10%)
Hb S, Mean±SD
23.1±5.3 14.8+1.7 23.8+3.0 32.0+2.19
Table 7.13 MCV and MCH related to % Hb S in sickle heterozygotes (mean±SD) (tested numbers are in brackets)
<17 S% 18-29 S% >30 S%
M(3) F ( l ) M (14) F (8) M(2) F ( l )
MCH(pg)
25.6 24.8 27.3±3.6 24.9+3.6 26.3 27.3
MCV(fl)
71 76 78.2+10.2 76.6±2 77.5 81
Table 7.14 Hb Aj levels
Hb A2
levelsAdult males (>16 yrs)
Adult females (>16 yrs)
Children(<16 yrs)
Total
<1.5% 12 (13.0) 6 (8.9) 8 (13.6) 26 (11.9)
1.6-3.5% 79 61 50 190
>3.6% 2 - 1 3
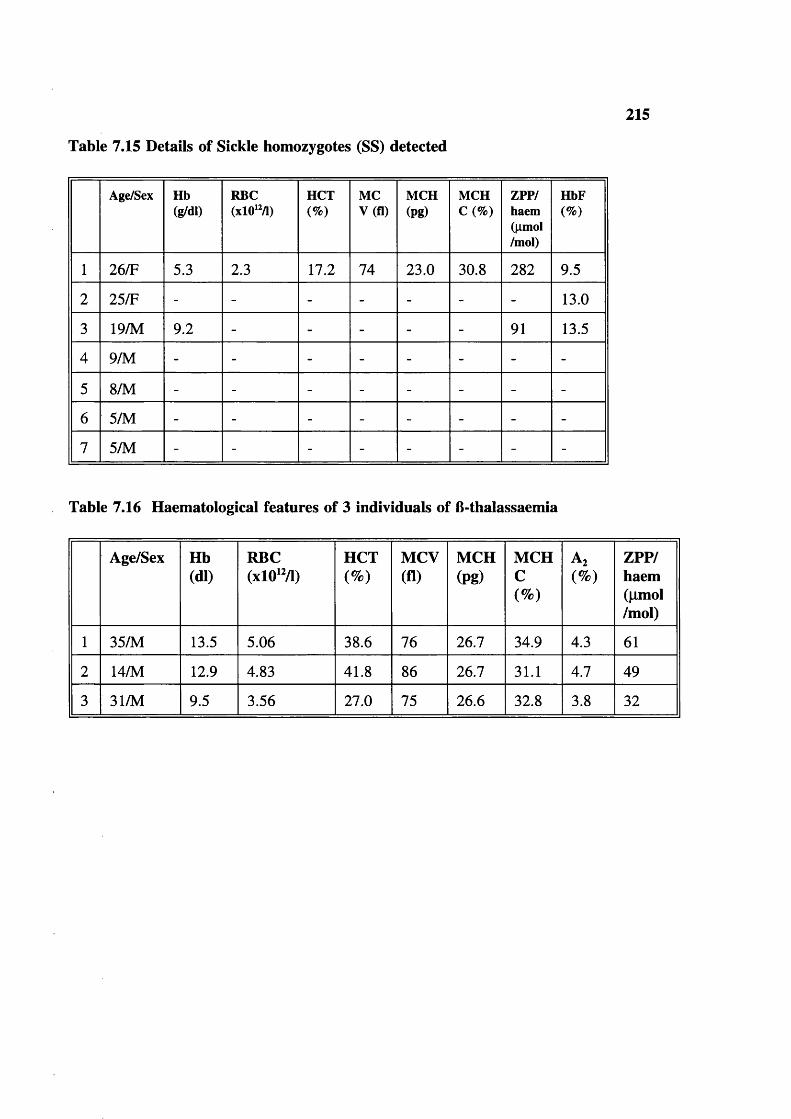
Table 7.15 Details of Sickle homozygotes (SS) detected
215
Age/Sex Hb(g/dl)
RBC(xlO'M)
HCT(%)
MCV(fl)
MCH(pg)
MCHC(%)
ZPP/haem(|imol/mol)
HbF(%)
1 26/F 5.3 2.3 17.2 74 23.0 30.8 282 9.5
2 25/F - - - - - - - 13.0
3 19/M 9.2 - - - - - 91 13.5
4 9/M - - - - - - - -
5 8/M - - - - - - - -
6 5/M - - - - - - - -
7 5/M - - - - - - - -
Table 7.16 Haematological features of 3 individuals of B-thalassaemia
Age/Sex Hb(dl)
RBC(xlO'M)
HCT(%)
MCV(fl)
MCH(pg)
MCHC(%)
Az(%)
ZPP/haem(|imol/mol)
1 35/M 13.5 5.06 38.6 76 26.7 34.9 4.3 61
2 14/M 12.9 4.83 41.8 86 26.7 31.1 4.7 49
3 31/M 9.5 3.56 27.0 75 26.6 32.8 3.8 32
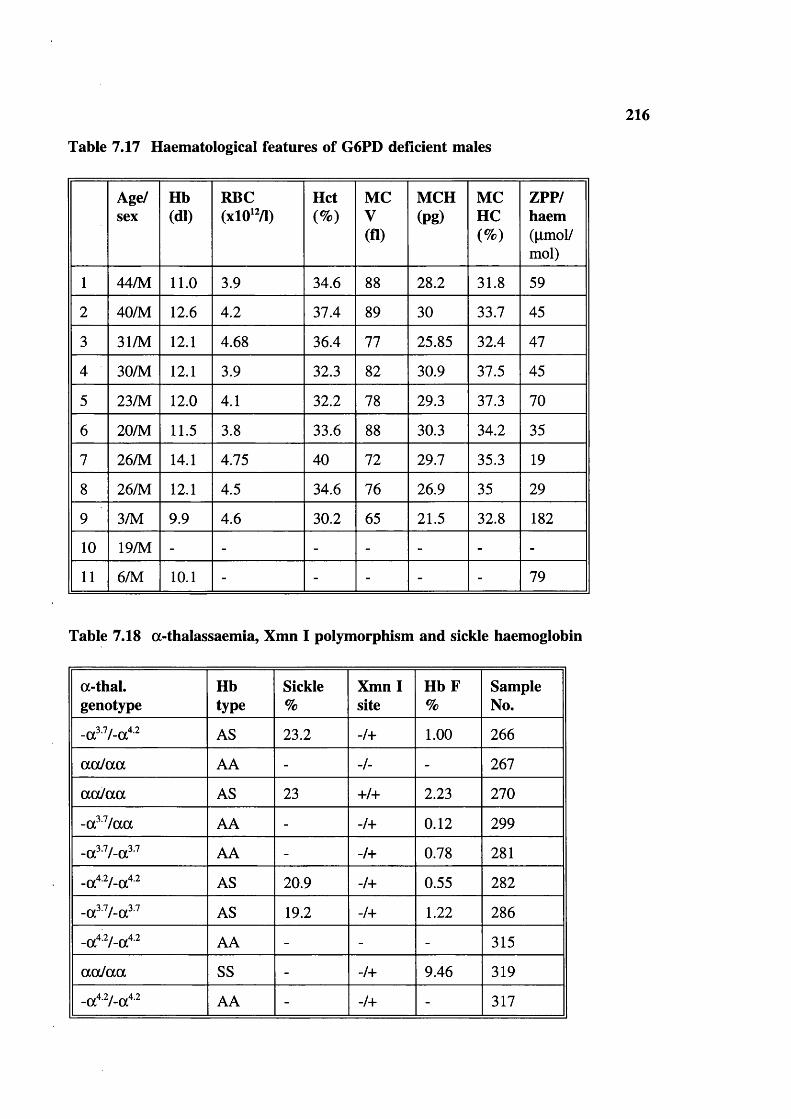
Table 7.17 Haematological features of G6PD deficient males
216
Age/sex
Hb(dl)
RBC(xlO‘ /1)
Hct(%)
MCV(fl)
MCH(pg)
MCHC(%)
ZPP/haem(pmol/mol)
1 44/M 11.0 3.9 34.6 88 28.2 31.8 59
2 40/M 12.6 4.2 37.4 89 30 33.7 45
3 31/M 12.1 4.68 36.4 77 25.85 32.4 47
4 30/M 12.1 3.9 32.3 82 30.9 37.5 45
5 23/M 12.0 4.1 32.2 78 29.3 37.3 70
6 20/M 11.5 3.8 33.6 88 30.3 34.2 35
7 26/M 14.1 4.75 40 72 29.7 35.3 19
8 26/M 12.1 4.5 34.6 76 26.9 35 29
9 3/M 9.9 4.6 30.2 65 21.5 32.8 182
10 19/M - - - - - - -
11 6/M 10.1 - - - - - 79
Table 7.18 a-thalassaemia, Xmn I polymorphism and sickle haemoglobin
a-thal.genotype
Hbtype
Sickle%
Xmn I site
H b F%
SampleNo.
AS 23.2 -/+ 1.00 266
a a la a AA - -/- - 267
a a la a AS 23 +/+ 2.23 270
-a?^/aa AA - -/+ 0.12 299
-a^V-a^^ AA - -/+ 0.78 281
AS 20.9 -/+ 0.55 282
-a^V-a^^ AS 19.2 -/+ 1.22 286
AA - - - 315
aaJaa SS - -/+ 9.46 319
AA - -/+ - 317
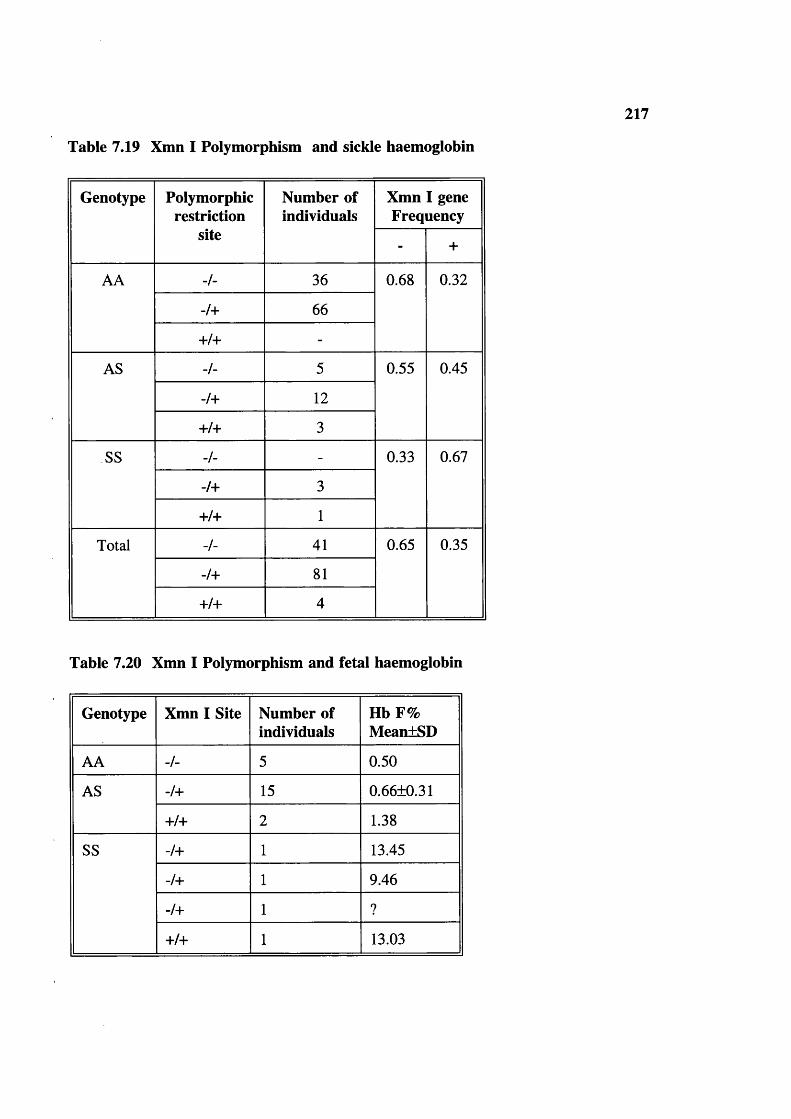
217
Table 7.19 Xmn I Polymorphism and sickle haemoglobin
Genotype Polymorphicrestriction
site
Number of individuals
Xmn I gene Frequency
- +
AA -/- 36 0.68 0.32
-/+ 66
+/+ -
AS -/- 5 0.55 0.45
-/+ 12
+/+ 3
SS -/- - 0.33 0.67
-/+ 3
+/+ 1
Total -/- 41 0.65 0.35
-/+ 81
+/+ 4
Table 7.20 Xmn I Polymorphism and fetal haemoglobin
Genotype Xmn I Site Number of individuals
Hb F% MeantSD
AA -/- 5 0.50
AS -/+ 15 0.66±0.31
+/+ 2 1.38
SS -/+ 1 13.45
-/+ 1 9.46
-/+ 1 ?
+/+ 1 13.03

Table 7.21 Xmn I polymorphism in Gonds
218
Genotype Polymorphicrestriction
sites
Number of individuals
Xmn I gene frequency
- +
AA -/- 7 0.82 0.18
-/+ 4
+/+ -
AS -/- -
-/+ 2
+/+ -
SS -/- -
-/+ 2
+/+ -
-/- 7 0.73 0.27Total -/+ 8
+/+ -
indicates the absence of polymorphic restriction site +: indicates the presence of polymorphic restriction site
indicates the absence of polymorphic restriction site in both chromosomes -/+: indicates the presence of polymorphic restriction site
in one chromosome and absence in other +/+: indicates the presence of polymorphic restriction site
in both chromosomes

219
Hb level20 r
350300250200150100500ZPP/haem ratio
* Correlation
Figure 7.3 Correlation between ZPP and Hb
ZPPXHaem ratio40035030025020 0
150100
* h
500
0 10 20 30 40 50MCH level in pg
Correlation
Figure 7.4 Correlation between MCH and ZPP

220
ZPPXhaem ratio4 00
100 150 200 250Serum ferritins
Total population
Figure 7.5 ZPP and Serum ferritin
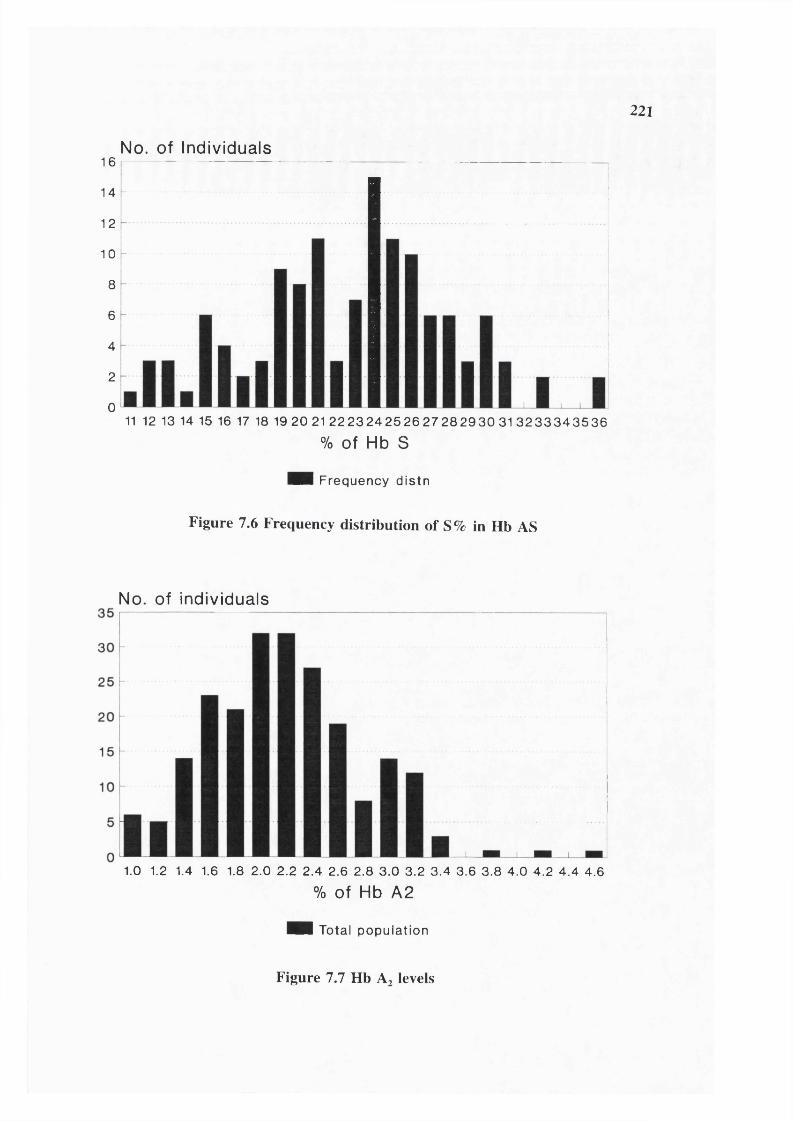
221
16
14
12
10
8
6
4
2
0
No. of Individuals
11 12 13 14 15 16 17 18 19 20 2122 23 24 25 26 27 28 2 9 3 0 3 1 3 2 3 3 3 4 3 5 3 6
% O f Hb S
Hi Frequency distn
Figure 7.6 Frequency distribution of S% in Hb AS
No. of individuals
1.0 1.2 1.4 1.6 1.8 2.0 2.2 2.4 2.6 2.8 3.0 3.2 3.4 3.6 3.8 4.0 4.2 4.4 4.6
% of Hb A2
Hi Total population
Figure 7.7 Hb A? levels

222
infection, liver disease or inflammation.
Serum ferritin values are known to be disturbed by conditions common in tropics such as
infection or liver disease. This could also apply to ZPP/haem ratio, It does not appear to
have been reported and there is no prior reasons to expect such an effect but the method
has not been unduly used in the tropics. The use of the ZPP/haem ratio in field studies
such as this needs to be verified by studies relating results to serum iron concentration.
Nevertheless the data given here suggest ZPP is a reasonable indicator of iron deficiency
in this population.
One aim of these investigations was to define "normal" haematological values for the
population. The haematological values in individuals without evidence of iron deficiency
shown in table 7.9 may represent "normal values". It is noteworthy that the mean Hb in
all groups is still WHO lower limit.
Hereditary anaemias
Haemoglobin S
Sickle haemoglobin was the only abnormal haemoglobin found. Out of 1566 individuals
tested there were 244 heterozygotes (Hb AS) and 7 homozygotes (Hb SS) giving gene
frequencies for Hb S and Hb A 0.0824 and 0.9126 respectively. Using Hardy-Weinberg
formula, expected frequencies with random mating and with 30% consanguineous marriage
are shown in table 7.11. Observed frequencies are also shown. There were only about
half as many homozygotes as expected. An excess of heterozygotes over expectation was
also seen.
The proportions of Hb S and A were measured in 125/244 heterozygotes by column
chromatography and densitometry. Table 7.12 shows that the mean percentage of S
(23.1±5.3%, range 11-37%) was low, in agreement with earlier studies of Rao and Bhatia
(1988) suggesting a high prevalence of alpha thalassaemia. In simple sickle cell trait, the
% Hb S present is always less than the % Hb A. Globin biosynthesis studies show that
the rate of synthesis of the abnormal 6 chain is less than that of normal 6^ chains (Mary

223
Petrou personal communication). This is true for most, if not all abnormal B globins.
When a-thalassaemia is also present, the proportion of Hb S is depressed yet further.
Table 7.22 Expected Sickle homozygote births in Indian tribals (based on published data: electrophoresis was done on samples)
State Tribe (district) Testednumber
Exp.\Ohs.
AS SSvalue df 1
Andhra Key a (Khammam)* 159 Exp. 20.5 0.76 0.20Pradesh
Obs. 20 1
Pardhan 101 Exp. 31 3.76 3.3(Adilabad)'
Obs. 37 1
Raj Gond 133 Exp. 19.3 0.83 0.036(Adilabad)’
Obs. 19 1
Pardhan 122 Exp. 32.76 3 4.3*(Adilabad)^
Obs. 39 0
Raj Gond 197 Exp. 20.76 0.61 0.68(Adilabad)^
Obs. 22 0
Tamil Nadu Irula^ 292 Exp. 83.5 8.73 2.33
Obs. 91 5
Mullu 174 Exp. 51 5.58 5.58*kurumba'’
Obs. 60 1
Paniyan'’ 157 Exp. 49.13 6 0.27
Obs. 47 7
Soliga" 93 Exp. 22.36 1.8 0.26
Obs. 24 1
Irula (Nilgiri 175 Exp. 44.4 3.57 0.76Hills)^
Obs. 46 2
Madhya Barela (Khargone)® 345 Exp. 79 6 1.98Pradesh
Obs. 85 3
Bhil (Jhabua)® 977 Exp. 181.1 10.44 0.707
Obs. 186 8
Bhilala (Jhabua)* 384 Exp. 105.94 10.5 7.7**
Obs. 121 3
Gond 127 Exp. 20.47 1 4.66*(Ambikapur)®
Obs. 26 0

224
State Tribe (district) Testednum ber
ExpAObs.
AS SSvalue d f 1
MadhyaPradesh
Patella (Jhabua)® 166 Exp. 35.9 2.53 0.30
Obs. 35 3
Baiga (Mandla)^ 175 Exp. 35.4 2.28 2.91
Obs. 40 0
Bharia inside valley (Chhind- wara)*
181 Exp. 23.25 0.86 0.99
Obs. 25 1
Gond outside valley (Chhind- wara)*
75 Exp. 13.5 0.75 0.93
Obs. 15 0
Gond inside valley(Chhind-wara)*
82 Exp. 12.74 0.63 0.71
Obs. 14 0
Halba (Bastar)® 95 Exp. 17.9 1.05 0.003
Obs. 18 1
Hill maria (Bastar)®
93 Exp. 18.8 1.2 1.47
Obs. 21 0
Present study 1566 Exp. 236.8 10.6 2.09
Obs. 244 7
Maharashtra Bhil (Dhulia)'° 673 Exp. 113.37 5.8 7.05"
Obs. 125 0
Pardhan (Nanded & Yavatmal)'®
146 Exp. 40.77 4.1 5.92*
Obs. 49 0
Pawar (Jalgone)’® 219 Exp. 35.52 1.73 2.09
Obs. 39 0
Pawara (Dhulia)'® 122 Exp. 24 1.49 1.88
Obs. 27 0
Raj Gond (Yavat- mal)"
283 Exp. 28 0.8 0.055
Obs. 28 1
Pardhan (Yavat- mal)“
143 Exp. 38.6 3.7 2.79
Obs. 44 1
Kolam (Yavat- mal)”
144 Exp. 24.5 1.26 1.53
Obs. 27 0
Raj Gond (Chandra-pur)'‘
265 Exp. 37.8 1.36 0.18
Obs. 36 1

225
Tribe (district) Testednum ber
ExpAObs.
AS SSvalue d f 1
Maharashtra Naik Gond (Chandra-pur)"
111 Exp. 11.34 0.32 0.36
Obs. 12 0
Pardhan (Chandrapur)"
133 Exp. 39.3 4.3 0.59
Obs. 42 3
Gujarat Naik (Surat) 174 Exp. 25.7 1.12 1.33
Obs. 28 0State
Gamit (Surat)’ 207 Exp. 54.8 5 6.95**
Obs. 65 0
* Significant at 5% level (P<0.05) deviated from Hardy Weinberg genetic equilibrium. ** Significant at 1% level (P<0.01) deviated from Hardy Weinberg genetic equilibrium.
1. Blake et al (1981)2. Goud and Rao (1979)3. Brittenham et al (1977)4. Brittenham et al (1979)5. Saha et al (1976)6. ICMR Immunohaematology reports from Bhatia and Rao (1987)7. RMRC/ICMR (1987-88)8. RMRC/ICMR (1989-90) Author involved9. RMRC/ICMR (1988-89) Author involved10. Bankar et al (1984)11. Rao and Gorakhshar (1990)12. Vyas et al (1962)13. Present study
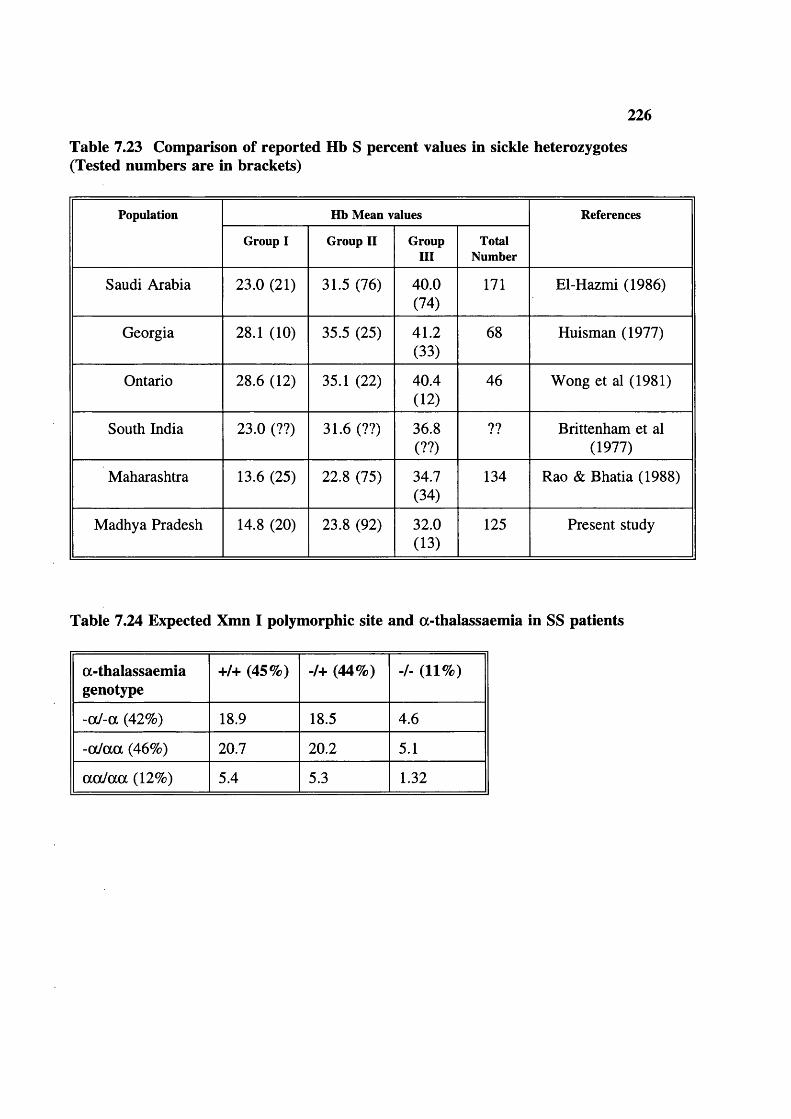
226
Table 7.23 Comparison of reported Hb S percent values in sickle heterozygotes (Tested numbers are in brackets)
Population Hb Mean values References
Group I Group II GroupIII
TotalNumber
Saudi Arabia 23.0 (21) 31.5 (76) 40.0(74)
171 El-Hazmi (1986)
Georgia 28.1 (10) 35.5 (25) 41.2(33)
68 Huisman (1977)
Ontario 28.6 (12) 35.1 (22) 40.4(12)
46 Wong et al (1981)
South India 23.0 (??) 31.6 (??) 36.8(??)
?? Brittenham et al (1977)
Maharashtra 13.6 (25) 22.8 (75) 34.7(34)
134 Rao & Bhatia (1988)
Madhya Pradesh 14.8 (20) 23.8 (92) 32.0(13)
125 Present study
Table 7.24 Expected Xmn I polymorphic site and a-thalassaemia in SS patients
a-thalassaemiagenotype
+/+ (45%) -/+ (44%) -/- (11%)
-aJ-a (42%) 18.9 18.5 4.6
-oc/aa (46%) 20.7 20.2 5.1
aaJaa (12%) 5.4 5.3 1.32

227
because 6^ and 6 chains must compete for the limited amount of a chains available, and
6^ has a higher affinity than Huisman (1977) proposed that the B /B ratio can be uséd
as an indicator of presence and number of a-thalassaemia genes. Rao and Bhatia (1988)
observed following values from tribals of Maharashtra: if Hb S 30%, no a-thalassaemia;
Hb S 18-29% 1 a-thalassaemia gene; Hb S <17% two a-thalassaemia genes. These values
are adapted in the present study. Table 7.12 shows the number and % of Baiga
heterozygote samples tested that fell into each group. The data suggest about 90% of the
population carry 1 or 2 a-thalassaemia genes. In one heterozygous individual the Hb S%
was only 23.0% with genotype a a /a a . This suggests the presence of non-deletional a-
thalassaemia as well. Most of the above results were obtained on dried blood spots.
Table 7.13 shows MCH and MCV of venepuncture samples from 34 AS individuals. The
results suggests that the red cell size is small when the Hb S% is low and the MCH is also
low, suggesting co-incidental alpha thalassaemia.
7 sickle homozygotes (SS) were found (table 7.15). Haematological indices were obtained
for only one, and Hb F for only 3 individuals.
fi-thalassaemia
219 blood samples were tested for B-thalassaemia by measuring red cell indices and Hb
A2 measurements. Table 7.14 shows the mean Hb A2 levels are within the normal range
but 11.9% of individuals had less than 1.5% Hb A2 suggesting a-/a- thalassaemia in the
population. Figure 7.7 shows the frequency distribution of Hb A2 levels. In India 6
individuals were found to be T Hb A2 , all 6 cases were repeated in the UK and only 3
individuals were finally found to have raised Hb A2 levels (>3.5), giving a B-thalassaemia
gene frequency of 0.0057 (table 7.10), However their haematological indices were at the
upper limit of the accepted range for B-thalassaemia trait, suggesting either coincidental
a-thalassaemia or a very mild B-thalassaemia mutation (table 7.16). These heterozygotes
would easily be missed by a screening strategy based on initial testing for microcytosis.
G6PD deficiency
Screening for G6PD deficiency mainly by finger-prick was carried out for 547 males in
243 families, 25 individuals were found to be G6PD deficient giving a gene frequency of
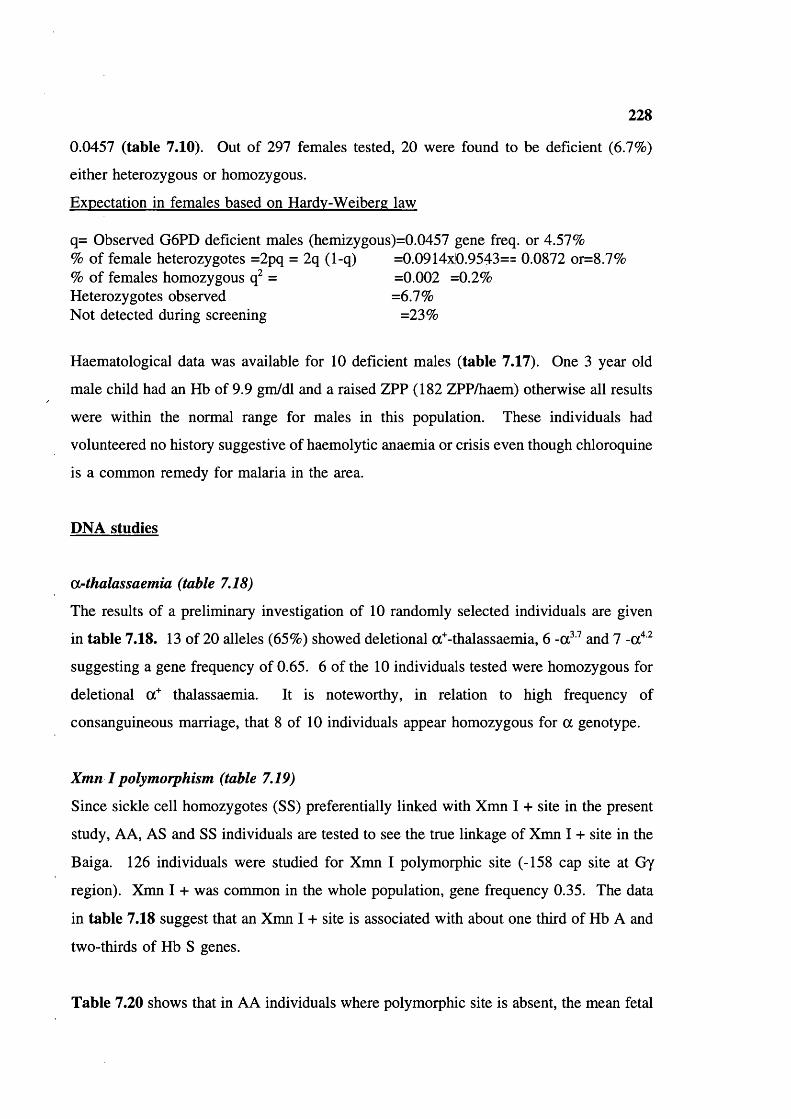
228
0.0457 (table 7.10). Out of 297 females tested, 20 were found to be deficient (6.7%)
either heterozygous or homozygous.
Expectation in females based on Hardv-Weiberg law
q= Observed G6PD deficient males (hemizygous)=0.0457 gene freq. or 4.57%% of female heterozygotes =2pq = 2q (1-q) =0.0914x10.9543== 0.0872 or=8.7%% of females homozygous q = =0.002 =0.2%Heterozygotes observed =6.7%Not detected during screening =23%
Haematological data was available for 10 deficient males (table 7.17). One 3 year old
male child had an Hb of 9.9 gm/dl and a raised ZPP (182 ZPP/haem) otherwise all results
were within the normal range for males in this population. These individuals had
volunteered no history suggestive of haemolytic anaemia or crisis even though chloroquine
is a common remedy for malaria in the area.
DNA studies
a-thalassaemia (table 7.18)
The results of a preliminary investigation of 10 randomly selected individuals are given
in table 7.18. 13 of 20 alleles (65%) showed deletional a^-thalassaemia, 6 and 7
suggesting a gene frequency of 0.65. 6 of the 10 individuals tested were homozygous for
deletional thalassaemia. It is noteworthy, in relation to high frequency of
consanguineous marriage, that 8 of 10 individuals appear homozygous for a genotype.
Xmn I polymorphism (table 7.19)
Since sickle cell homozygotes (SS) preferentially linked with Xmn I + site in the present
study, AA, AS and SS individuals are tested to see the true linkage of Xmn I + site in the
Baiga. 126 individuals were studied for Xmn I polymorphic site (-158 cap site at Gy
region). Xmn I + was common in the whole population, gene frequency 0.35. The data
in table 7.18 suggest that an Xmn I + site is associated with about one third of Hb A and
two-thirds of Hb S genes.
Table 7.20 shows that in AA individuals where polymorphic site is absent, the mean fetal

229
haemoglobin is low 0.50%, in AS individuals with the Xmn I + site the fetal haemoglobin
is slightly raised (0.66%). In 2 of 3 SS individuals where Xmn I site is -/+ or +/+ the fetal
haemoglobin was around 13% and this result is comparable to earlier studies of Kulozik
et al (1987) among tribals from Orissa (table 4.7).
Table 7.21 shows similar data for 15 Gond tribals. The gene frequencies are - site 0.73
and + site 0.27 respectively and again, the Xmn I + site appear to be preferentially
associated with the Hb S gene.
G6PD deficiency
Seven samples from G6PD deficient individuals taken at the first visit were successfully
amplified for exon 6 and 7 where the G6PD Mediterranean mutation is found. None
showed Mediterranean mutation. Fresh samples need to be investigated for biochemical
characterization, followed by DNA studies for G6PD deficient mutations in the tribe.
DISCUSSION
Haematological values
One of the aims of the present study was to define baseline haematological values for the
tribe. The picture in the population is rather confusing, due to the high frequency of both
iron deficiency anaemia and alpha plus thalassaemia. This also raises the question of what
are to be considered normal values for a population.
Genetic factors, such as prevalence of a-thalassaemia, set baseline (genotypic) normal
values which can not be exceeded, and differ between populations. Environmental factors,
such as availability of dietary iron and folic acid, and altitude, interact with population
genotype to give the population haematological phenotype, described in tables 7.2-7.S and
figures 7.1-7.4. By international standards the haemoglobin values and red cell size are
low, but there were relatively few cases of severe anaemia (Hb <8 gm/dl). It is likely that
the common iron deficiency provides additional protection for tribals against malaria
(Snow et al 1991), and other infectious diseases. If samples with evidence of iron
deficiency (raised ZPP) are excluded as in table 7.9, the data on the remaining samples
230
may come closer to representing tribal genetic normal values. These are still considerably
below those defined as "normal values" on the basis of European populations (Dacie and
Lewis 1991 and WHO (1972) nutrition programme). The evidence presented here, based
both on the proportion of Hb S in AS individuals and on direct DNA studies, suggests a
very high gene frequency of thalassaemia (about 0.65). Non-deletional a-thalassaemia
may also be present. By the Hardy-Weinberg formula, at least 42% of the population are
likely to have the genotype -o/-a, 46% -o /a a and at most 12% a o /a a (though the ratios
are distorted by consanguineous marriages). The haematological parameters of people with
these genotypes have been described by Higgs et al (1989) (see table 4.11).
It is clear in a population with such a high frequency of a-thalassaemia, the haematological
values are genetically set at different level from those of North Europeans.
Similarly high frequencies of a-thalassaemia have been described
(a) in tribals of India (reviewed in table 4.13).
(b) Vanuatu, where similar haematological values were noted (Flint et al 1986),
(c) in Africans and American Africans (WHO 1987) and
(d) in parts of the Middle-East (WHO 1987).
Similarly, low haematological values have been noted in individuals from the caste
populations of the Indian sub-continent resident in the UK, after iron deficiency had been
definitely excluded. It was suggested that this indicates a high prevalence of both
deletional and non-deletional a-thalassaemia (Tillyer et al 1993).
It has been estimated that at least 18% of global population carry one or more a-
thalassaemia genes (WHO 1985). This leads to a conclusion that the "normal"
haematological picture varies between populations depending on genetic factors such as
the presence of a-thalassaemia. It is therefore not acceptable to use normal values for
European populations where a-thalassaemia is virtually absent as a global standard. Each
population has its own "normal range" of haematological values, which must be defined
before the frequency of anaemia can be established by reference to Hb level alone.
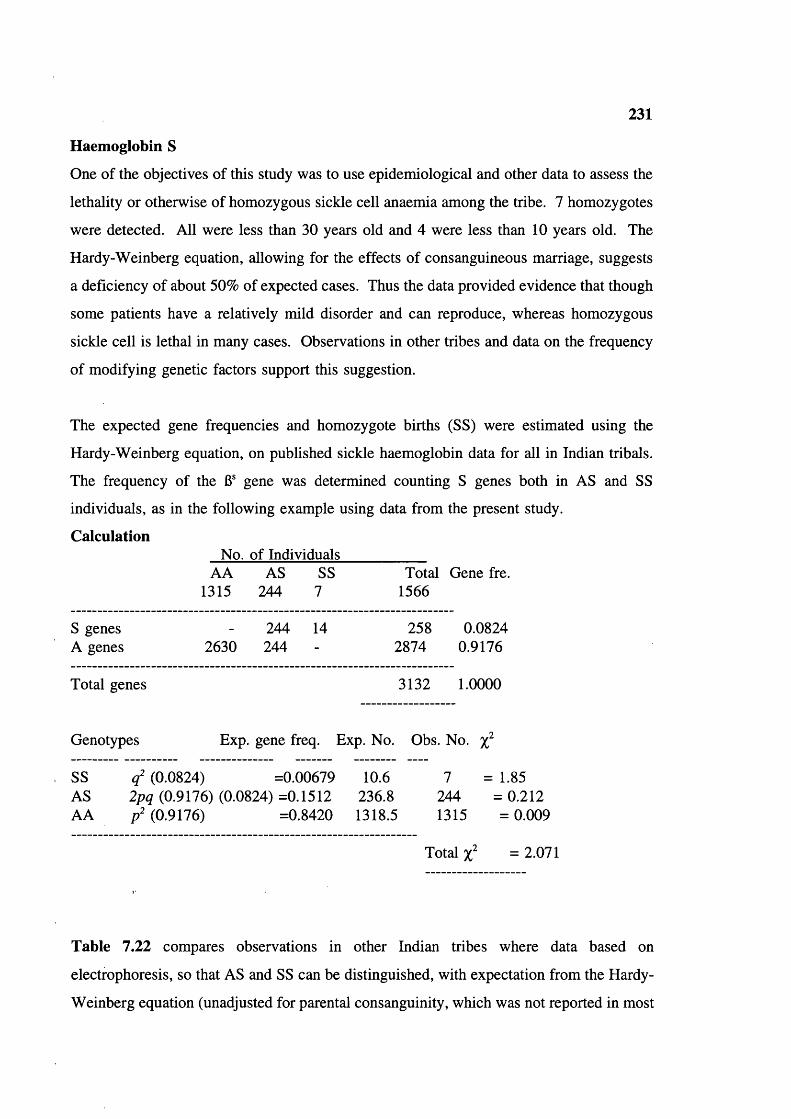
231
Haemoglobin S
One of the objectives of this study was to use epidemiological and other data to assess the
lethality or otherwise of homozygous sickle cell anaemia among the tribe. 7 homozygotes
were detected. All were less than 30 years old and 4 were less than 10 years old. The
Hardy-Weinberg equation, allowing for the effects of consanguineous marriage, suggests
a deficiency of about 50% of expected cases. Thus the data provided evidence that though
some patients have a relatively mild disorder and can reproduce, whereas homozygous
sickle cell is lethal in many cases. Observations in other tribes and data on the frequency
of modifying genetic factors support this suggestion.
The expected gene frequencies and homozygote births (SS) were estimated using the
Hardy-Weinberg equation, on published sickle haemoglobin data for all in Indian tribals.
The frequency of the 6® gene was determined counting S genes both in AS and SS
individuals, as in the following example using data from the present study.
CalculationNo. of Individuals
AA AS SS Total Gene fre.1315 244 7 1566
S genes - 244 14 258 0.0824A genes 2630 244 - 2874 0.9176
Total genes 3132 1.0000
Genotypes Exp. gene freq. Exp. No. Obs. No.
SS ( f (0.0824) =0.00679 10.6 7 = 1.85AS 2/7 (0.9176) (0.0824) =0.1512 236.8 244 = 0.212AA / (0.9176) =0.8420 1318.5 1315 = 0.009
Total = 2.071
Table 7.22 compares observations in other Indian tribes where data based on
electrophoresis, so that AS and SS can be distinguished, with expectation from the Hardy-
Weinberg equation (unadjusted for parental consanguinity, which was not reported in most
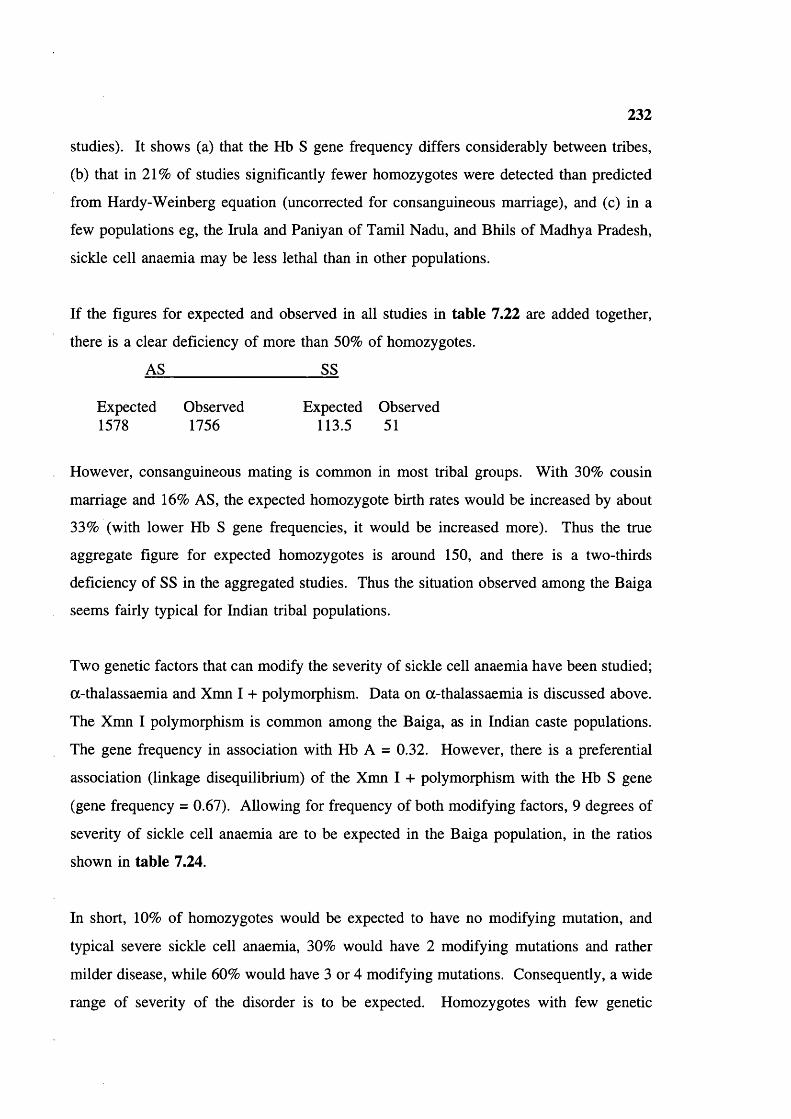
232
studies). It shows (a) that the Hb S gene frequency differs considerably between tribes,
(b) that in 21% of studies significantly fewer homozygotes were detected than predicted
from Hardy-Weinberg equation (uncorrected for consanguineous marriage), and (c) in a
few populations eg, the Irula and Paniyan of Tamil Nadu, and Bhils of Madhya Pradesh,
sickle cell anaemia may be less lethal than in other populations.
If the figures for expected and observed in all studies in table 7.22 are added together,
there is a clear deficiency of more than 50% of homozygotes.
AS____________________ SS
Expected Observed Expected Observed1578 1756 113.5 51
However, consanguineous mating is common in most tribal groups. With 30% cousin
marriage and 16% AS, the expected homozygote birth rates would be increased by about
33% (with lower Hb S gene frequencies, it would be increased more). Thus the true
aggregate figure for expected homozygotes is around 150, and there is a two-thirds
deficiency of SS in the aggregated studies. Thus the situation observed among the Baiga
seems fairly typical for Indian tribal populations.
Two genetic factors that can modify the severity of sickle cell anaemia have been studied;
a-thalassaemia and Xmn I 4- polymorphism. Data on a-thalassaemia is discussed above.
The Xmn I polymorphism is common among the Baiga, as in Indian caste populations.
The gene frequency in association with Hb A = 0.32. However, there is a preferential
association (linkage disequilibrium) of the Xmn I 4- polymorphism with the Hb S gene
(gene frequency = 0.67). Allowing for frequency of both modifying factors, 9 degrees of
severity of sickle cell anaemia are to be expected in the Baiga population, in the ratios
shown in table 7.24.
In short, 10% of homozygotes would be expected to have no modifying mutation, and
typical severe sickle cell anaemia, 30% would have 2 modifying mutations and rather
milder disease, while 60% would have 3 or 4 modifying mutations. Consequently, a wide
range of severity of the disorder is to be expected. Homozygotes with few genetic

233
modifiers are likely to die in early childhood while survivors are likely to be selected for
coexisting modifying factors. Genetic and clinical studies based on surviving homozygotes
are thus likely to reflect a powerful selection bias for milder disease.
The trimodal distribution of % Hb S heterozygotes in the present study agrees with the
findings of Brittenham et al (1979) among the Nilgiri triblas of Tamil Nadu, and tribals
of Maharashtra studied by Rao and Bhatia (1988), and tribals of Orissa studied by
Kuloziok et al (1988). Table 7.23 shows that tribal groups have the lowest mean levels
of Hb S reported.
B-thalassaemia
The 6-thalassaemia gene frequency in the Baiga is low compared to that reported for some
other tribal groups (table 4.16). This suggests that it may be a relatively late introduction,
possibly from the caste population. Identification of the specific mutations would cast
light on this issue.
The red cell indices in the three cases detected by raised Hb A2 were atypical, the MCH
and MCV being unusually high (table 7.16). Factors that could lead to such atypical
values are (a) a mild 6-thalassaemia mutation and (b) coincidence of a-thalassaemia in
these three cases. In any case, it is clear that in such populations 6-thalassaemia trait can
be detected only by Hb A2 estimation. The comparison of results obtained on the same
samples in India and the UK underline the need for external quality control and proper
technical training . A recent DNA study of Gond patients with sickle cell disease in the
Jabalpur area showed that some had Hb S/6-thalassaemia, and the nature of 6-thalassaemia
mutations suggested relatively recent introduction via caste populations (Gupta et al 1991).
When we consider that 89% of the population has 1 or more a-thalassaemia genes, 16%
AS, 8.7% of females (estimated) and 4.57% of males have G6PD deficiency genes and
43.1% of the population is iron deficient, the population presents a formidable battery of
natural defence against malaria. In fact one feels quite sorry for the parasites. Even so,
and even with a malaria eradication programme, the prevalence of positive blood smears
is high, underlining the fact that most of the above are thought to modify, not to prevent

234
infection. This is an amazing level of adaptation to the environment. The malaria parasite
is also highly adaptive, and one might expect under the circumstances, that it would adapt
to the red cells of tribal populations, and so overcome their defences. However, the
bewildering variety of genotypic and phenotype combinations produced by interaction of
the protective factors probably prevents this. It may be the range of genetic and nutritional
variety rather than any single protective mutation, that maintains the tribal constitutional
resistance to malaria.
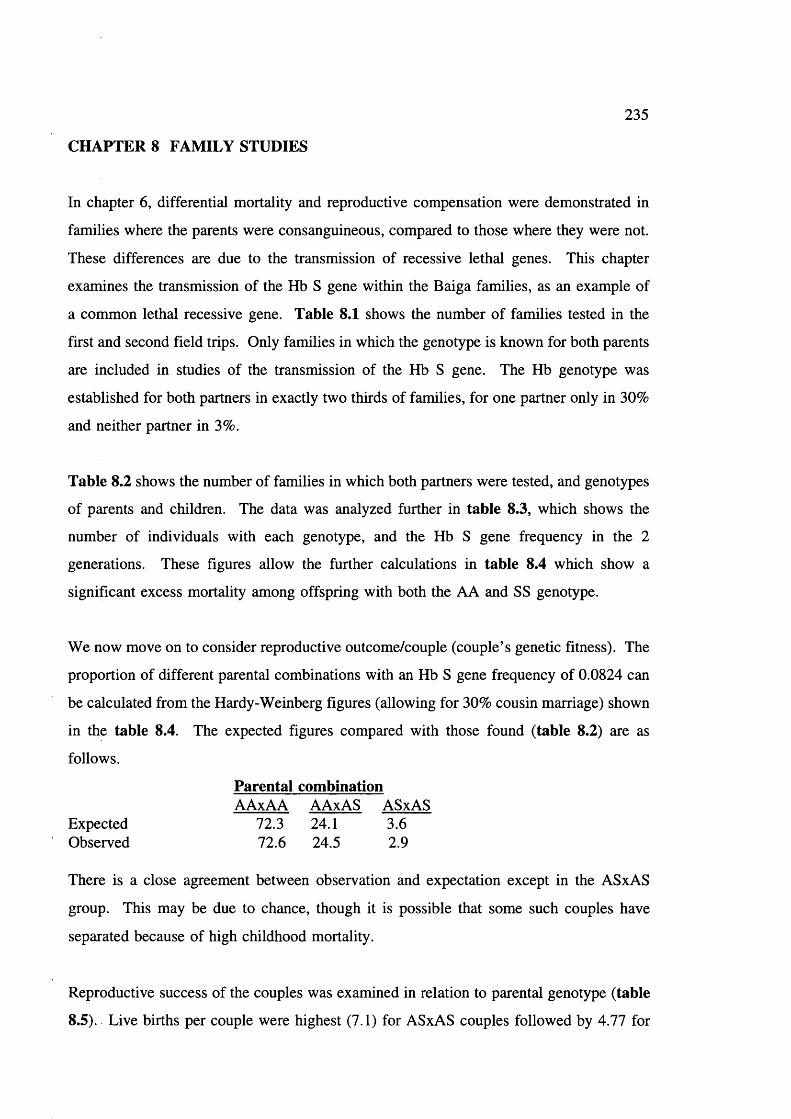
235
CHAPTERS FAMILY STUDIES
In chapter 6, differential mortality and reproductive compensation were demonstrated in
families where the parents were consanguineous, compared to those where they were not.
These differences are due to the transmission of recessive lethal genes. This chapter
examines the transmission of the Hb S gene within the Baiga families, as an example of
a common lethal recessive gene. Table 8.1 shows the number of families tested in the
first and second field trips. Only families in which the genotype is known for both parents
are included in studies of the transmission of the Hb S gene. The Hb genotype was
established for both partners in exactly two thirds of families, for one partner only in 30%
and neither partner in 3%.
Table 8.2 shows the number of families in which both partners were tested, and genotypes
of parents and children. The data was analyzed further in table 8.3, which shows the
number of individuals with each genotype, and the Hb S gene frequency in the 2
generations. These figures allow the further calculations in table 8.4 which show a
significant excess mortality among offspring with both the AA and SS genotype.
We now move on to consider reproductive outcome/couple (couple’s genetic fitness). The
proportion of different parental combinations with an Hb S gene frequency of 0.0824 can
be calculated from the Hardy-Weinberg figures (allowing for 30% cousin marriage) shown
in the table 8.4. The expected figures compared with those found (table 8.2) are as
follows.
Parental combinationAAxAA AAxAS ASxAS
Expected 72.3 24.1 3.6Observed 72.6 24.5 2.9
There is a close agreement between observation and expectation except in the ASxAS
group. This may be due to chance, though it is possible that some such couples have
separated because of high childhood mortality.
Reproductive success of the couples was examined in relation to parental genotype (table
8.5). Live births per couple were highest (7.1) for ASxAS couples followed by 4.77 for
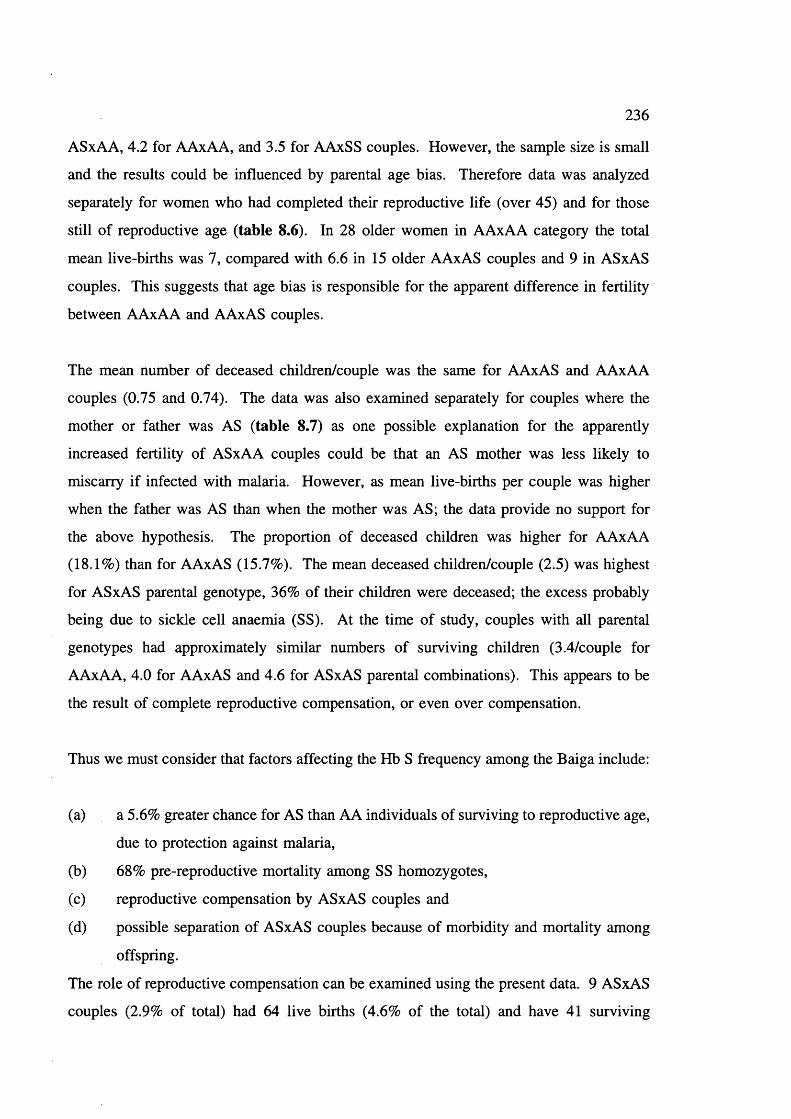
236
ASxAA, 4.2 for AAxAA, and 3.5 for AAxSS couples. However, the sample size is small
and the results could be influenced by parental age bias. Therefore data was analyzed
separately for women who had completed their reproductive life (over 45) and for those
still of reproductive age (table 8.6). In 28 older women in AAxAA category the total
mean live-births was 7, compared with 6.6 in 15 older AAxAS couples and 9 in ASxAS
couples. This suggests that age bias is responsible for the apparent difference in fertility
between AAxAA and AAxAS couples.
The mean number of deceased children/couple was the same for AAxAS and AAxAA
couples (0.75 and 0.74). The data was also examined separately for couples where the
mother or father was AS (table 8.7) as one possible explanation for the apparently
increased fertility of ASxAA couples could be that an AS mother was less likely to
miscarry if infected with malaria. However, as mean live-births per couple was higher
when the father was AS than when the mother was AS; the data provide no support for
the above hypothesis. The proportion of deceased children was higher for AAxAA
(18.1%) than for AAxAS (15.7%). The mean deceased children/couple (2.5) was highest
for ASxAS parental genotype, 36% of their children were deceased; the excess probably
being due to sickle cell anaemia (SS). At the time of study, couples with all parental
genotypes had approximately similar numbers of surviving children (3.4/couple for
AAxAA, 4.0 for AAxAS and 4.6 for ASxAS parental combinations). This appears to be
the result of complete reproductive compensation, or even over compensation.
Thus we must consider that factors affecting the Hb S frequency among the Baiga include:
(a) a 5.6% greater chance for AS than AA individuals of surviving to reproductive age,
due to protection against malaria,
(b) 68% pre-reproductive mortality among SS homozygotes,
(c) reproductive compensation by ASxAS couples and
(d) possible separation of ASxAS couples because of morbidity and mortality among
offspring.
The role of reproductive compensation can be examined using the present data. 9 ASxAS
couples (2.9% of total) had 64 live births (4.6% of the total) and have 41 surviving

237
children (3.6% of the total). It is calculated above that mortality in this group included
9 SS children, representing a loss of 18 S genes from the population. The effect of
reproductive compensation on the number and proportion of S genes among the offspring
is calculated below.
Genes RatioS A
41 offspring of ASxAS couples 41 41 50:50With loss of 9 SS, in 32 remaining offspring 23 41 36:64The 9 SS are replaced with 6 AS and 3 AA 6 12S and A genes in 41 survivors 29 53 35:65
In this example at least, in theory it seems that reproductive compensation has re
introduced 6 S genes, one third of those lost. However, they are accompanied by twice
as many A genes, so that the net effect in reducing selection against the S gene is rather
less than this.
It is also very interesting that, because of reproductive compensation the genetic fitness of
ASxAS couples (ie, the number of healthy offspring they produce relative to the population
mean seems to be no less than that of other couples).
Data was also analyzed in relation to parental consanguinity (table 8.8). 35% of AAxAA,
25% of AAxAS, and 56% of ASxAS couples were consanguineous. Consanguineous
couples in the AAxAA category showed slightly higher fertility and mortality, however the
difference is not significant. The trend was, if anything, the other way in AAxAS couples.
Among the ASxAS parents, 4 non-consanguineous couples had 4.5 live-births per couple
and 5 consanguineous couples had 9.2/couple, but figure 8.1 showing of all these families
shows the consanguineous couples were in older age groups.
AAxSS Families
Two such couples were observed. Their pedigrees are shown in figure 8.2
Family I (from Durkuta village)
In this family, the wife is homozygous SS and aged 25 years. Her husband is normal
(AA). In general she appears healthy, but she cannot perform her agricultural/forest work
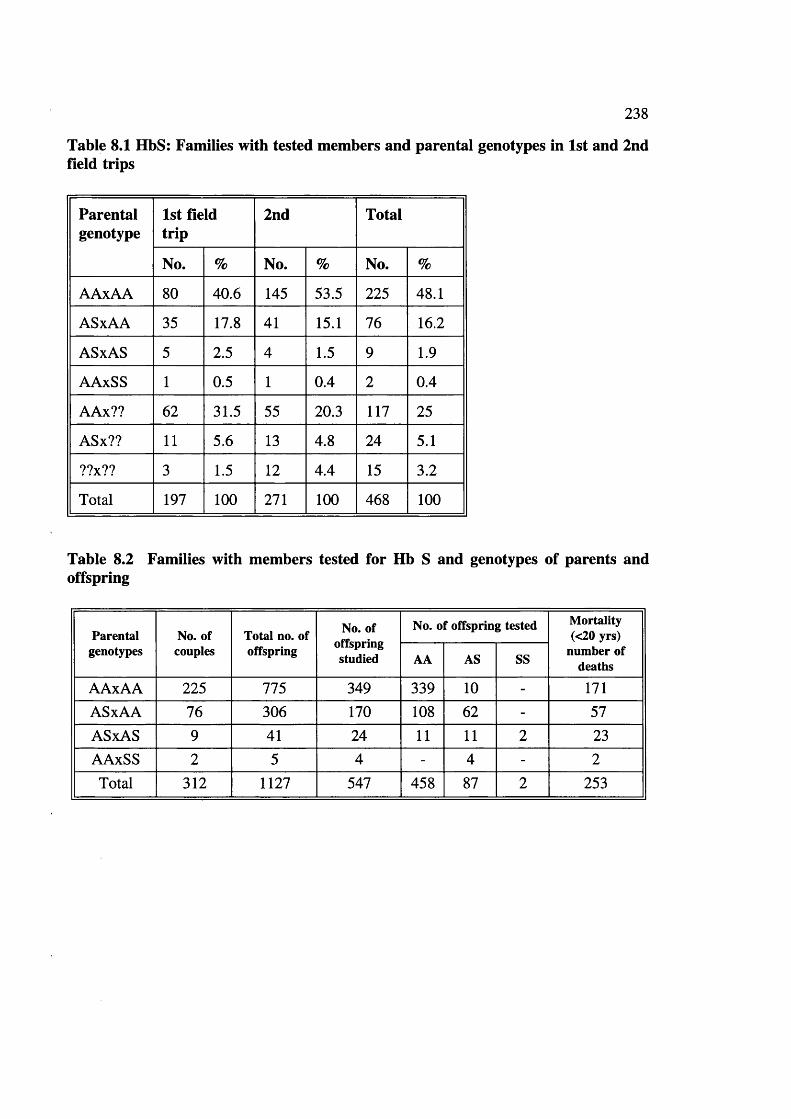
238
Table 8.1 HbS: Families with tested members and parental genotypes in 1st and 2nd field trips
Parentalgenotype
1st field trip
2nd Total
No. % No. % No. %
AAxAA 80 40.6 145 53.5 225 48.1
ASxAA 35 17.8 41 15.1 76 16.2
ASxAS 5 2.5 4 1.5 9 1.9
AAxSS 1 0.5 1 0.4 2 0.4
AAx?? 62 31.5 55 20.3 117 25
ASx?? 11 5.6 13 4.8 24 5.1
??x?? 3 1.5 12 4.4 15 3.2
Total 197 100 271 100 468 100
Table 8.2 Families with members tested for Hb S and genotypes of parents and offspring
Parentalgenotypes
No. of couples
Total no. of offspring
No. of offspring studied
No. of offspring tested Mortality (<20 yrs)
number of deathsAA AS SS
AAxAA 225 775 349 339 10 - 171ASxAA 76 306 170 108 62 - 57ASxAS 9 41 24 11 11 2 23AAxSS 2 5 4 - 4 - 2Total 312 1127 547 458 87 2 253
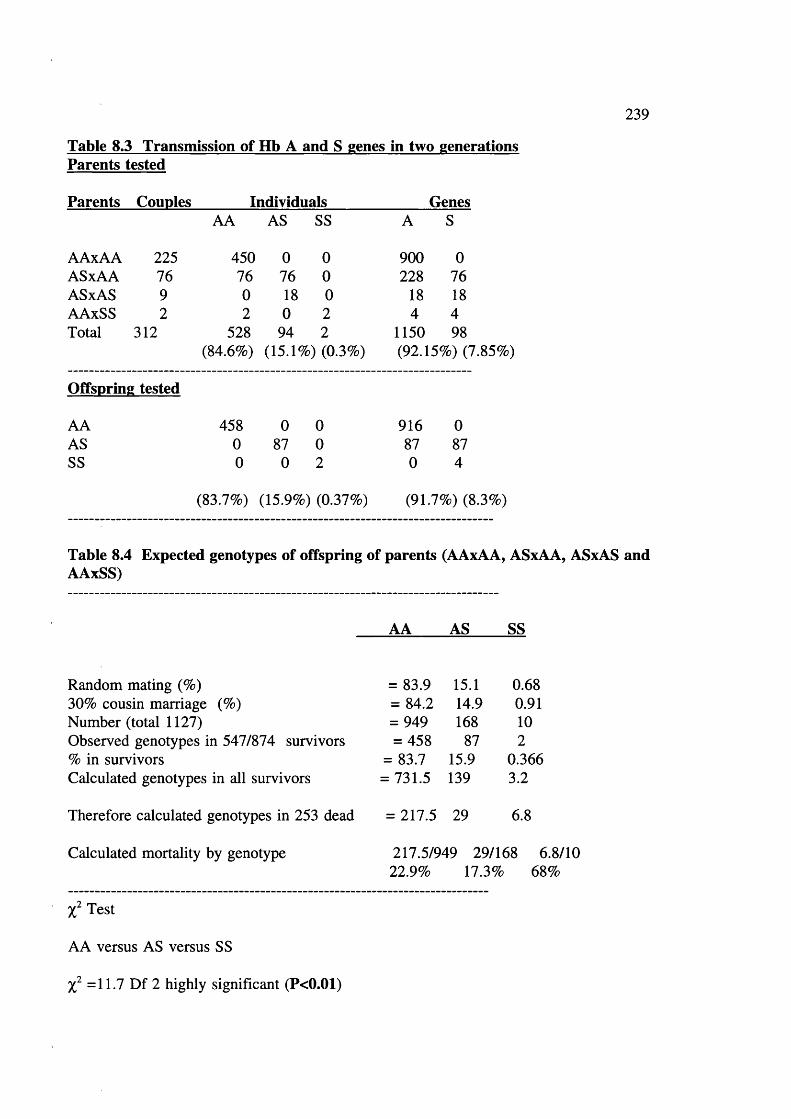
239
Table 8.3 Transmission of Hb A and S genes in two generations Parents tested
Parents Couples_______ Individuals_____________ GenesAA AS SS A S
AAxAA 225 450 0 0 900 0ASxAA 76 76 76 0 228 76ASxAS 9 0 18 0 18 18AAxSS 2 2 0 2 4 4Total 312 528 94 2 1150 98
(84.6%) (15.1%) (0.3%) (92.15%) ('
Offspring tested
AA 458 0 0 916 0AS 0 87 0 87 87SS 0 0 2 0 4
(83.7%) (15.9%) (0.37%) (91.7%) (8.3%)
Table 8.4 Expected genotypes of offspring of parents (AAxAA, ASxAA, ASxAS and AAxSS)
AA AS SS
Random mating (%) = 83.9 15.1 0.6830% cousin marriage (%) = 84.2 14.9 0.91Number (total 1127) = 949 168 10Observed genotypes in 547/874 survivors = 458 87 2% in survivors = 83.7 15.9 0.366Calculated genotypes in all survivors = 731.5 139 3.2
Therefore calculated genotypes in 253 dead = 217.5 29 6.8
Calculated mortality by genotype 217.5/949 29/168 6.8/1022.9% 17.3% 68%
Test
AA versus AS versus SS
=11.7 Df 2 highly significant (P<0.01)
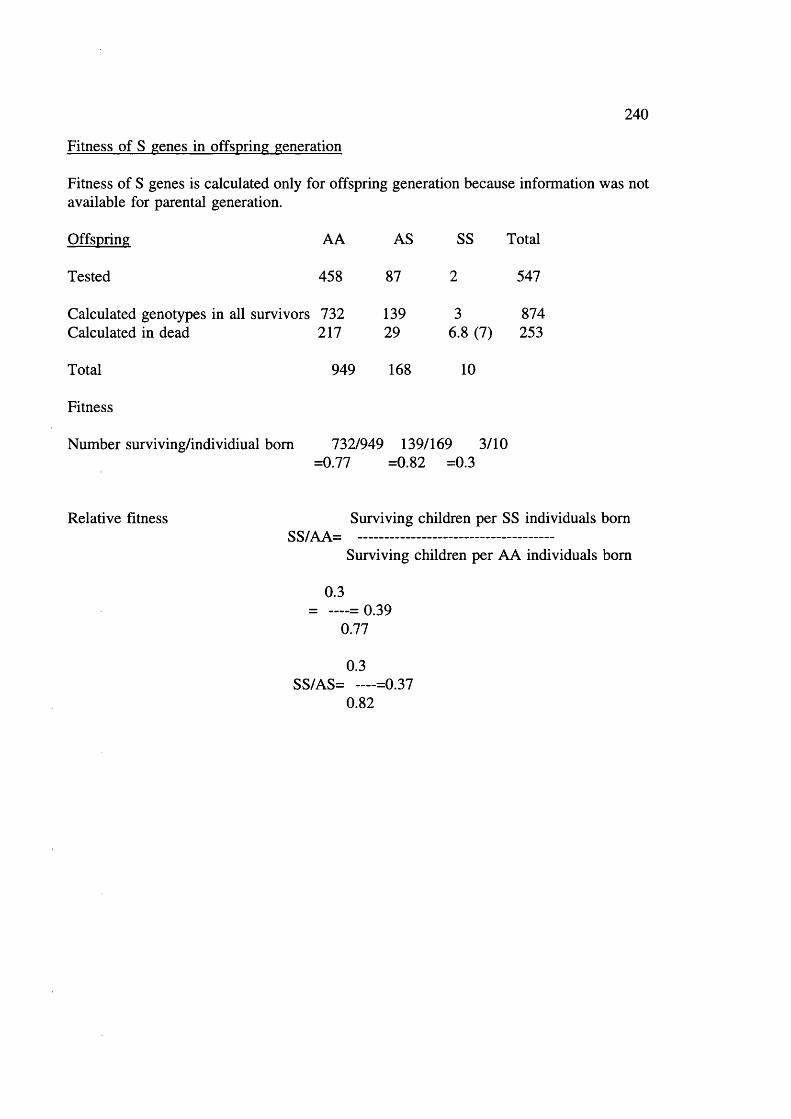
240
Fitness of S genes in offspring generation
Fitness of S genes is calculated only for offspring generation because information was not available for parental generation.
Offspring AA AS SS Total
Tested 458 87 2 547
Calculated genotypes in all survivors 732 139 3 874Calculated in dead 217 29 6.8 (7) 253
Total 949 168 10
Fitness
Number surviving/individiual bom 732/949 139/169 3/10=0.77 =0.82 =0.3
Relative fitness Surviving children per SS individuals bornSS/AA= --------------------------------------
Surviving children per AA individuals born
0.3= — = 0.39
0.77
0.3SS/AS= — =0.37
0.82

241
Table 8.5 Sickle Haemoglobin, fertility and mortality
Parentalgenotype
No. of couples
No. of live
births
Meanlive
births\couple
Deaths <20 yrs Meandeceasedchildren/
couple
No. of living
children
Meanliving/coupleNo. %
AAxAA 225 946 4.2 171 (18.1) 0.76 775 3.4
AAxAS 76 363 4.8 57 (15.7) 0.75 306 4.0
ASxAS 9 64 7.1 23 (35.9) 2.5 41 4.6
AAxSS 2 7 3.5 2 (28.6) 1.0 5 2.5
Total 312 1380 4.42 253 (18.3) 0.81 1127 3.6
Live Births
AAxAA versus ASxAA
4.54 d.f. =1 Significant at 5% level (P<0.05)
Survivors
AAxAA versus ASxAA
5.34 d.f. =1 Significant at 5% level (P<0.05)
Mortality
AAxAA versus ASxAA
1.024 d.f. =1 Insignificant at 5% level (P>0.50)

Table 8.6 Sickle haemoglobin and Maternal age distribution (15-44 and >45 yrs)
242
Genotype Maternalage
Couples <15 15-19 20-24 25-29 30-34 35-39 40-44 45-49 Total Livebirth^Couple
AAxAA >45 28 (12.4%) - 21 47 49 41 26 9 3 196 7.0(225)
15-44 197 2 183 301 159 73 29 3 - 750 3.8
AAxAS >45 15 (19.7%) - 14 23 25 15 17 5 - 99 6.6(76)
15-44 61 - 58 105 59 28 13 1 - 264 4.3
ASxAS >45 3 (33.3%) - 3 7 6 7 2 2 - 27 9.0(9)
15-44 6 - 11 13 6 3 4 - - 37 6.2
AAxSS >45 - - - - - - - - - - -
(2)15-44 2 - 3 4 - - - - - 7 3.5
Total >45 46 (14.7%) - 38 77 80 63 45 14 3 322 7(312)
15-44 266 2 255 423 224 104 46 4 - 1058 3.97
Table 8.7 Reproductive behaviour in AAxAS couples where mother or father was AS
MotherFather
No. of Couples
Livehirths
livehirths/Couple
DeathsSurvivors /Couple
n /Couple % Mortality
ASiAA 32 134 4.2 19 0.6 14.2 115 3.6
AA:AS 44 229 5.2 38 0.86 16.6 191 4.3
Total 76 363 4.8 57 0.75 15.7 306 4.0

Table 8.8 Sickle haemoglobin, consanguinity and fertility relationship
243
Parental genotype No. of couples No. of live births
Mean live births
Deaths <20 yrs (%)
Mean deceased children
No. of living children
Mean living
A Non cons. 146 589 4.0 93 (15.8) 0.64 496 3.4AX Cons. 79 (35.1%) 347 4.4 68 (19.6) 0.86 279 3.5AA Total 225 936 4.1 161 (17.1) 0.71 775 3.4
A Non cons. 57 277 4.9 45 (16.2) 0.8 232 4.1AX Cons. 19 (25%) 86 4.5 12 (14.0) 0.6 74 3.9AS Total 76 363 4.8 57 (15.7) 0.75 306 4.0
A Non cons. 4 18 4.3 7 (38.9) 1.8 11 2.8SX Cons 5 (55.6%) 46 9.2 16 (34.8) 3.2 30 6.0AS Total 9 64 7 23 (35.9) 2.6 41 4.5
A Non cons. 2 7 3.5 2 (28.6) 1.0 5 2.5AX Cons. - - - - - - -
SS Total 2 7 3.5 2 (28.6) 1.0 5 2.5
A Non cons 16 62 3.8 7(11.3) 0.4 55 3.4SX Cons 8 28 3.5 7 (25.0) 0.9 21 2.6?? Total 24 90 3.9 14(15.5) 0.6 76 3.2
A Non cons. 69 280 4.1 53 (18.9) 0.77 227 3.3AX Cons. 48 249 5.2 48 (19.3) 1.0 201 4.2
,?? Total 117 529 4.6 101 (19.1) 0.9 428 3.7
?? Non cons. 10 62 6.2 17 (27.4) 1.7 45 4.5X
?? Cons. 5 35 7.0 8 (22.9) 1.6 27 5.4
Total 15 97 6.5 25 (25.8) 1.6 72 4.8
Non con. 304 1295 4.3 224 (17.0) 0.74 1071 3.5
Con. 164 791 4.8 159 (20.1) 0.97 632 3.9
Total 468 2086 4.5 383 (18.3) 0.8 1703 3.6
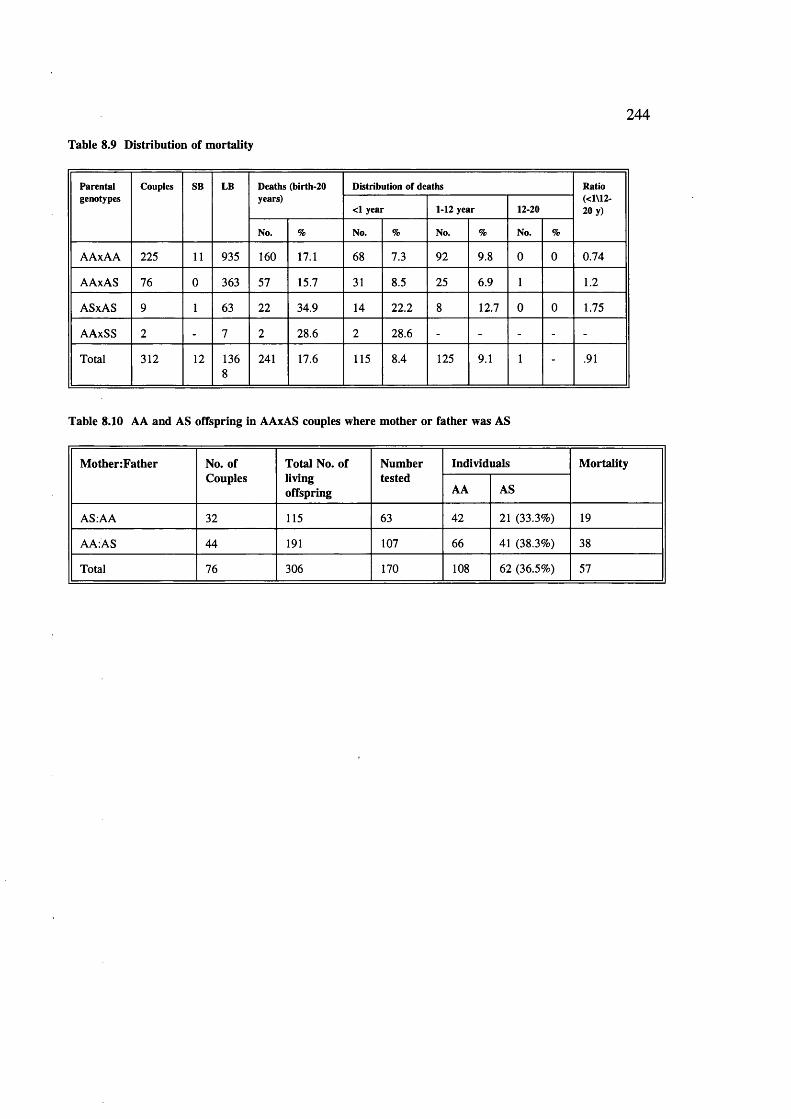
Table 8.9 Distribution of mortality
244
Parentalgenotypes
Couples SB LB Deaths (birth-20 years)
Distribution of deaths Ratio (<1\12- 20 y)<1 year 1-12 year 12-20
No. % No. % No. % No. %
AAxAA 225 11 935 160 17.1 68 7.3 92 9.8 0 0 0.74
AAxAS 76 0 363 57 15.7 31 8.5 25 6.9 1 1.2
ASxAS 9 1 63 22 34.9 14 22.2 8 12.7 0 0 1.75
AAxSS 2 - 7 2 28.6 2 28.6 - - - - -
Total 312 12 1368
241 17.6 115 8.4 125 9.1 1 - .91
Table 8.10 AA and AS offspring in AAxAS couples where m other or father was AS
M otherzFather No. of Couples
Total No. oflivingoffspring
Numbertested
Individuals M ortality
AA AS
AS.AA 32 115 63 42 21 (33.3%) 19
AA:AS 44 191 107 66 41 (38.3%) 38
Total 76 306 170 108 62 (36.5%) 57
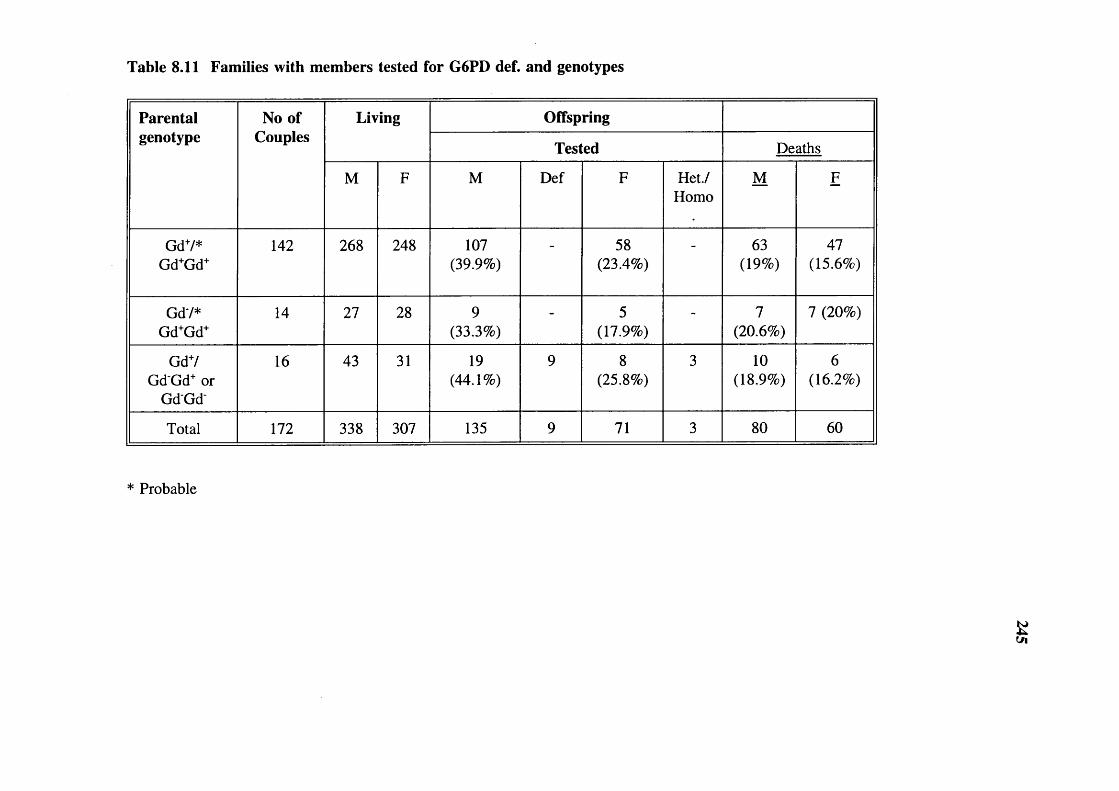
Table 8.11 Families with members tested for G6PD def. and genotypes
Parental No of Living Offspringgenotype Couples
Tested Deaths
M F M Def F Het./Homo
M F
GdV*Gd+Gd+
142 268 248 107(39.9%)
- 58(23.4%)
- 63(19%)
47(15.6%)
GdV*Gd+Gd+
14 27 28 9(33.3%)
- 5(17.9%)
- 7(20.6%)
7 (20%)
GdV GdGd+ or
GdGd
16 43 31 19(44.1%)
9 8(25.8%)
3 10(18.9%)
6(16.2%)
Total 172 338 307 135 9 71 3 80 60
* Probable
&
246
properly. She feel tired after one hour’s work. Her menarcheal age was 15 years, she
has given birth to 2 sons and 1 daughter; now 7, 5, and 3 years old. She had a
tubectomy. She has had no stillbirths and remembers no miscarriage. No blood
transfusion had been given to the time of this study.
Family II (from Bhadra tola Kharidih village)
In this family, the wife is homozygous SS aged 26 years, her husband is AA. Her
menarcheal age was 17 years. To date she did not undergo tubectomy.
She is the first wife. She was not related to her husband in any way before marriage.
Her haematological features are given in table 7.15. She is very inactive. She has had 4
pregnancies and was very weak during pregnancy. Two of her infants died below 12
months of age. Because of her not coping well in agricultural activities, her husband
subsequently also married his mother’s brother’s daughter (MED). There was no
divorce, and this is one of the few polygamous couples noted. Women are a major asset
in the family, doing agricultural and forest labour. It seems her husband married another
women to have regular assistance in all livelihood activities (hunting, gathering,
agriculture, and labour), so that the whole family could be supported.
The perception by elders in the village about this type of situation is that God has cursed
them (they are unlucky) and these people should be given help and proper care in the
tribe. They think Bhagwan (God/Goddess) is not happy with some people.
Sickle haemoglobin and mortality
Table 8.9 shows age distribution of mortality with different parental genotypes; child
mortality (1-12 yrs) was higher than infant mortality in the offspring of AAxAA couples.
In AAxAS and ASxAS parental combinations infant mortality was higher than the child
mortality. In two families with AAxSS parental genotype all deaths were in the infant
period. The fact that early mortality was highest when the both parents are heterozygotes
suggests that sickle cell anaemia is often lethal in the tribe, often in the infants.

247
Sickle haemoglobin and parenthood
Table 8.2 shows that 225 couples were AAxAA. Among the offspring of 5 such
couples, 10 children were found to be AS. These children, though the social offspring
of both parents cannot be the genetic offspring of both parents. The prevalence of
"social offspring" in the population was estimated based on following observations.
AS children among offspring of AAxAA parents = 10/349Only 50% of offspring of AS parents are AS; total = 20/349Only 16% of adults are AS; therefore total I = 125/349 =35.8%
"Social offspring"!
The figure reached is very large, but the calculations are based on only 10 children in 5
families. However, the question can be also approached by examining the AA/AS ratio
among offspring of ASxAA and ASxAS couples.
In AAxAS couples.
Expected AA/AS ratio in 170 offspring = 85/85Observed AA/AS ratio = 108/62Excess AA births = 23/85=27%
As 16% of adults are AS and would not disturb the ratio,total probable social offspring =27+4.3=31.3
In ASxAS couples.
Observed ratio in 24 tested offspring AA/AS/SS were 11/11/2Expected ratio AA/AS 5.5/11Excess AA births 5.5/11=0.50/2 =25%
To understand the matter further, the ratio of AA/AS offspring was checked according
to whether the AS parent was male or female, as the AA/AS ratio among the offspring
of an AS mother should be 50:50. However, the AAiAS ratio was equally unbalanced
whether
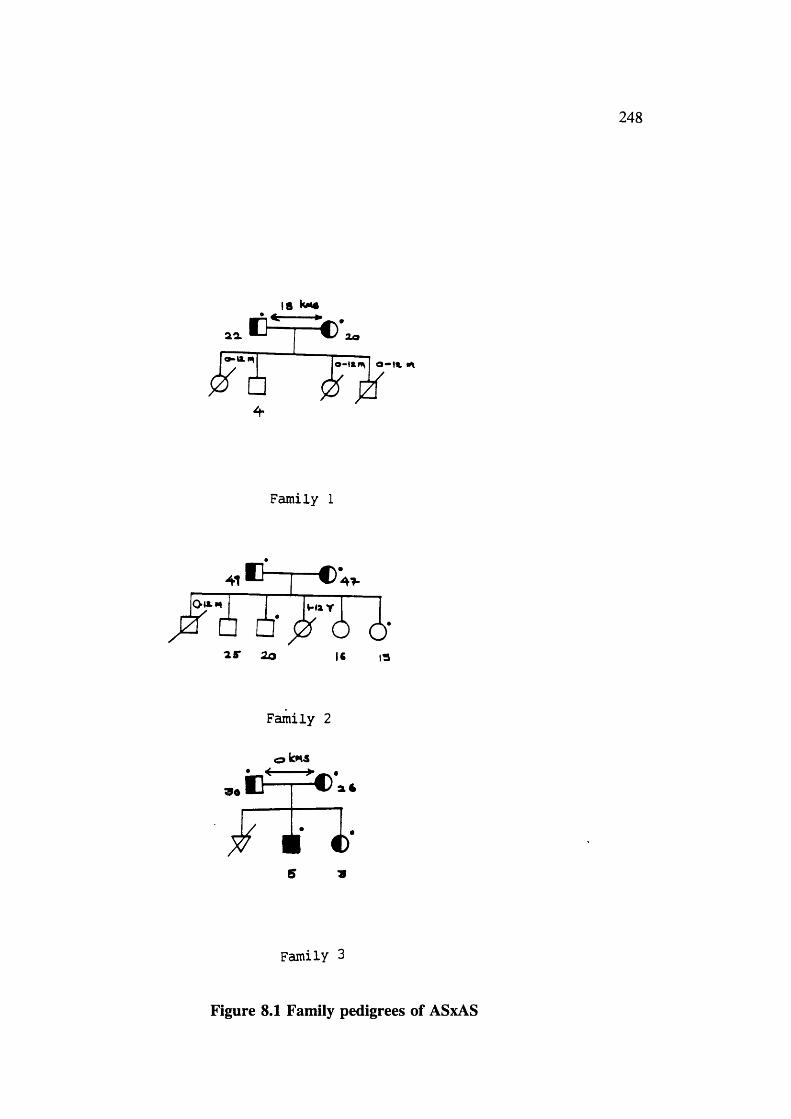
248
18 kM#
Oo
Family 1
0-w.m V*»4 Y
□ a25* 20 IS 13
90
Family 2
iE^=;= ’.4
S 9
Family 3
Figure 8.1 Family pedigrees of ASxAS

33T t - c :31
OHX«
€ □ * j Z □ 6to y 1
249
Family 4
C )(@ km#
Al
0 è* 65 2.
Family 5
6 1
A6
r i ’Î-IXY '- ix Y H lY
□ E ' O j Z p □
13 Xo 16 7 3
Family 6
Figure 8.1 Family pedigrees of ASxAS

250
9 3l« It
Family 7
17 15 i( 5
Family 8
38
IS It IX II 5* II Mown*a
Family 9Figure 8.1 Family pedigrees of ASxAS

251
rr— #I f
Family 1
<a km*
1#
5 1
Family 2
Figure 8.2 Family pedigrees of AAxSS

252
the AS partner was the father or mother (table 8.10). It is clear either that a significant
proportion of the children living with a couple are offspring of the mother’s or father’s
earlier relationships or that informal adoption between families is very common. In
general, tribals treat children well and look after them regardless of who their parents are.
They are considered an asset regardless of sex or age. This is one possible [explanation
why infertility appears low in the tribe.
Sickle haemoglobin, malaria and mortality
The death rate is higher among offspring of parental combination AAxAA (18.07% than
ASxAA (15.7%).
Mortality in offspring of AAxAA couples (almost 100% AA children) =18.1%Mortality in offspring of A Ax AS couples (36.5% AS children) =15.7%Differential mortality attributable to in 36.5% AS children =2.4%Differential mortality AS versus AA =2.4x100/36.5 =6.57%
Correction for "social offspring"
The 2.4% difference in mortality between children of AAxAA and AAxAS couples
should probably be corrected upwards by 35% to allow for the above observations.
2.4% = 2.4+0.85% = 3.24%, ie, if mortality of offspring of AAxAA couples = 18.1%,
the true mortality of offspring of AAxAS couples =14.86%.
Difference in mortality 3.24%
Only half of offspring of AAxAS are AS.
Therfore AS advantage = 3.24x2= 6.48%.
This method of calculating differential mortality is simple and very straight forward.
G6PD deficiency, fertility and mortality
Out of 547 males tested for G6PD deficiency 4.57% were deficients and out of 297 of
females 6.7% were heterozygotes or homozygotes. Table 8.11 shows the number of
couples with different combination of genotypes, the number of offspring living and
dead, and the number of offspring screened for G6PD deficiency. 14 couples were
observed where the father was deficient and the mother was probably normal, and 16
where the mother was heterozygous/homozygous and father was normal.
253
34.7% of the offspring were tested for G6PD deficiency (40% of males and 30% of
females). 50% of the daughters of Gd males should be G6PD deficient, but only 8 such
females tested were deficient. There was no sex difference in mortality in this group.
Where the mother is Gd', half the sons should be Gd', 9/19 tested were deficient. There
was no evidence of increased mortality among males in this group.
DISCUSSION
Sickle haemoglobin, fertility and mortality
The mortality data show that active natural selection for the Hb S gene is continuing in
the tribe. The calculated mortality among children with the AA genotype is 5.6% higher
than among those with the AS genotype. Homozygous sickle cell anaemia appears to be
lethal in at least two thirds of cases before reproduction. Study of couples with ASxAS
parental genotype shows that excess deaths were fully compensated by a greater number
of births, and it was calculated that this compensation reduces selection against the S
genes by up to 30%.
It is interesting to compare the results obtained by Allison (1956) in an African
population (table 4.9). He also observed a high mean mortality in offspring of ASxAS
parental combinations (45.1%) compared to 35.3% in ASxAA and 40.1% in AAxAA.
The difference was insignificant, but this may be due to high mortality from all causes in
the population.
The fact that selection is still occurring for the sickle cell gene in the Baiga shows that
the death rate from malaria is still high, despite the malaria control programme actively
in operation. As explained earlier (see P 70) mortality can be estimated in several ways;
the method used here based on differential mortality of children with different genotypes
may be a useful in addition to the list.
254
CHAPTER 9 VIRAL MARKERS
Hepatitis viral markers
An attempt was made to study the incidence of viral markers for Hepatitis B surface
antigen (HBsAg) and antibodies to core antigen (anti-HBc)) and antibodies to Hepatitis C
in the tribe;
1. to know the general incidence in the tribe,
2. all Baiga females are tattooed. This could be a route for transmission of hepatitis
viruses, and lead to greater prevalence among females.
Hepatitis B is common in tropical areas (table 9.1). Hepatitis B & C are generally
considered to be transmitted through accidental inoculation of a minute quantity of
contaminated blood or fluid, eg by immunization with inadequately sterilized syringes and
needles, tattooing or ear or nose piercing, or accidental inoculation with razors. Perinatal
infection may occur if the mother is a carrier or has acute hepatitis B in later pregnancy
or within two months of delivery.
The first marker to appear in the circulation after infection with Hepatitis B is HBsAg
which appears two to eight weeks prior to biochemical evidence of liver damage. HBsAg
is also known as Australia antigen since its discovery in 1965. Later during
convalescence, HBsAg disappears with production of anti surface-antibody (anti-HBs).
Antibody to the core (anti HBc) usually appears 2-4 weeks after the surface antigen; it
persists throughout infection and after recovery. It is thus a marker of infection at any
time in the past. The carrier state is defined as persistence of hepatitis B surface antigen
in the blood for more than six months. It is more frequent in males, and more likely to
follow infections acquired in childhood than those acquired in adult life.

255
Prevalence
Table 9.1 summarizes the prevalence of surface antigen of Hepatitis B
Incidence North America, Australia,
Northern Europe Western Europe Central Europe
Eastern Europe Mediterranean,
USSR, South East Asia, Central America and
South America
Parts of China, South-East Asia
andTropical Africa
HbsAg 0.2-0.5% 2-7% 8-20%
Source: Zuckerman and Harrison 1990
Hepatitis C
Recently Ramalingaswami and Purcell (1988) reviewed waterborn "non A non B hepatitis"
(NANB). It is responsible for outbreaks of hepatitis with a predilection for young adults.
Diagnosis used to be based on the epidemiological findings of faecal contamination of
drinking water, and serological exclusion of Hepatitis A and B virus infection. It has been
named enterically transmitted or epidemic NANB hepatitis (ENANB). It is common in
Southeast Asia; (India, Nepal, Burma, Indonesia and Thailand), Africa; Algeria, Sudan,
Ethiopia, Somalia, Ivory Coast and Mexican state of Morelos. It is more severe in
pregnant women, in whom it is associated with high mortality (10-20 percent), especially
during last trimester of pregnancy.
Choo et al (1989) identified the hepatitis C virus in 1989. It account for majority of non
A non B infections. Its identification allowed specific tests to be developed and the
incidence of Hepatitis C has been reported since then.
Results
Table 9.2 shows that viral markers were more common in males than females. Hepatitis
B surface antigen was observed in 3/40 in males and 1/57 in females. Antibodies against
hepatitis B core antigen (HBc) were found in approximately 38% of males and 30% of
females. 5.5% of individuals had antibodies for hepatitis C antigen.
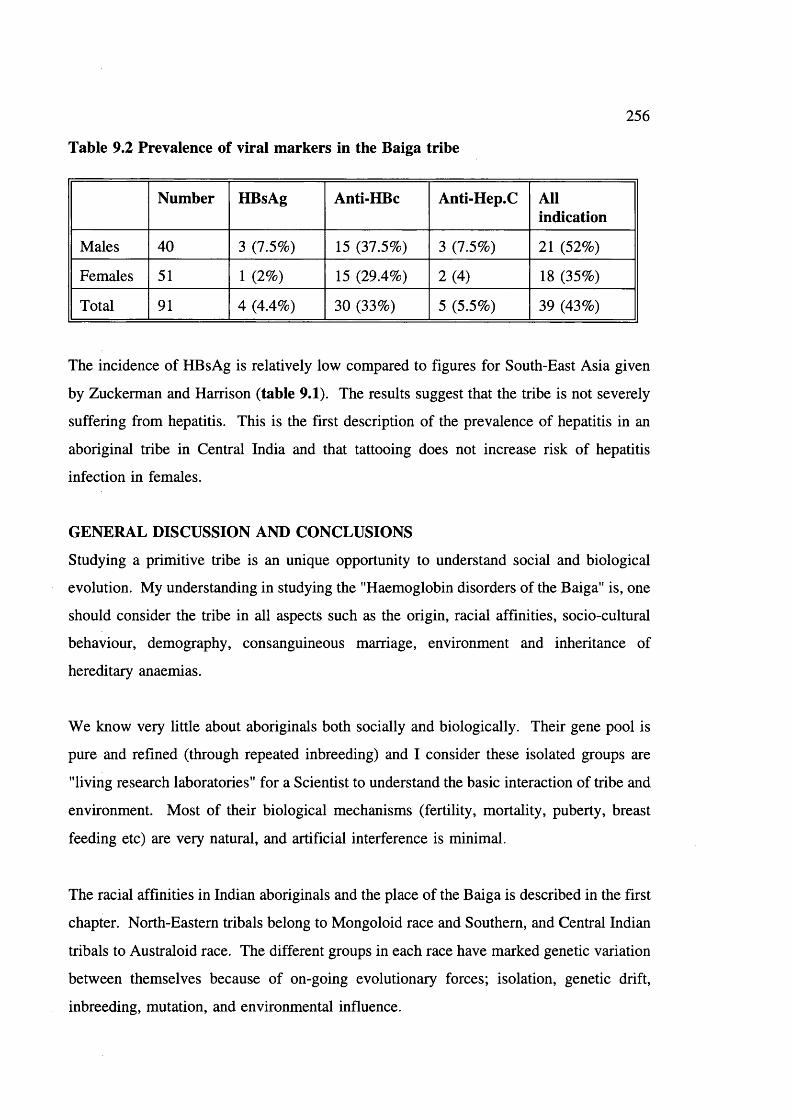
Table 9.2 Prevalence of viral markers in the Baiga tribe
256
Number HBsAg Anti-HBc Anti-Hep.C Allindication
Males 40 3 (7.5%) 15 (37.5%) 3 (7.5%) 21 (52%)
Females 51 1 (2%) 15 (29.4%) 2(4) 18 (35%)
Total 91 4 (4.4%) 30 (33%) 5 (5.5%) 39 (43%)
The incidence of HBsAg is relatively low compared to figures for South-East Asia given
by Zuckerman and Harrison (table 9.1) The results suggest that the tribe is not severely
suffering from hepatitis. This is the first description of the prevalence of hepatitis in an
aboriginal tribe in Central India and that tattooing does not increase risk of hepatitis
infection in females.
GENERAL DISCUSSION AND CONCLUSIONS
Studying a primitive tribe is an unique opportunity to understand social and biological
evolution. My understanding in studying the "Haemoglobin disorders of the Baiga" is, one
should consider the tribe in all aspects such as the origin, racial affinities, socio-cultural
behaviour, demography, consanguineous marriage, environment and inheritance of
hereditary anaemias.
We know very little about aboriginals both socially and biologically. Their gene pool is
pure and refined (through repeated inbreeding) and I consider these isolated groups are
"living research laboratories" for a Scientist to understand the basic interaction of tribe and
environment. Most of their biological mechanisms (fertility, mortality, puberty, breast
feeding etc) are very natural, and artificial interference is minimal.
The racial affinities in Indian aboriginals and the place of the Baiga is described in the first
chapter. North-Eastern tribals belong to Mongoloid race and Southern, and Central Indian
tribals to Australoid race. The different groups in each race have marked genetic variation
between themselves because of on-going evolutionary forces; isolation, genetic drift,
inbreeding, mutation, and environmental influence.

257
Regarding methods: I must make it clear that information given by Baiga friends during
field work (of this study) may not be 100% accurate because they maintain a certain
degree of privacy and they do not keep any documented records. This may be true in
other tribal studies also. I consider it is simply a primitive human behaviour. The amount
of time I spent with each Baiga family is minimum and I do not expect more than this.
For detailed accurate information one should become a participant observer and make
tribals feel like you are a family member like Elwin did in 1930s. This takes several
years.
Elwin (1939) described the social life of Baiga and laid a foundation for observing the
progress in the tribe. Population growth is steady. Mortality is still high in the tribe, but
it is less than in the past. Consanguineous couples are not less genetically fit than non-
consanguineous, and the reproductive compensation reduces the rate of "extrusion of
recessive lethals from the tribe. The long duration of breast feeding itself acts as a
temporary contraceptive and protects babies from various infectious diseases during critical
infant stage.
Present study has established (a) the true frequencies of hereditary anaemias and (b) a
theoretical basis for mild sickle cell anaemia - high frequency of a-thalassaemia and Xmn
I polymorphism, leading to the wide range of genotypes of different grades of severity.
This provides a basis for natural selection of the mildest forms (ie, S always linked to
Xmn I +), providing that the most mildly affected SS individuals are in fact more
genetically J;han others. However, the present study also demonstrated a high early
mortality of SS individuals and very low genetic fitness of SS compared to AA or AS (see
P 235). This shows that in this population, SS of all types is usually lethal; there is only
little natural selection for the milder Xmn I + associated type. This conclusion is
confirmed by the fact that, after probably thousands of years, there is only 60% rather than
100% association of Xmn I + with the sickle gene. Hence Hb S gene must be treated as
lethal in calculations concerning natural selection in the tribe.
It was observed that more homozygotes than expected are generated by the consanguineous
marriage pattern. However, reproductive compensation in ASxAS couples, (probably

258
through interruption of breast feeding and earlier succeeding pregnancy) reduces S genes
loss and so selection against the gene by around 30%. There is also a suggestion within
the data that some ASxAS couples may separate, and this would also reduce selection
against the gene. The same will be true for other lethal recessive genes, and may lead to
their retention within such a population at an unexpectedly high level.
It was also observed that there is continuing strong selection by malaria for the S gene.
It was calculated that it confers on heterozygotes 6.57% better chance of surviving to adult
life than AA individuals, even in the presence of an active antimalarial programmes.
Selection must have been far stronger in the past. Clearly the high frequency of the S
genes in the Baiga population is due to a strong selection by malaria and reduced gene
losses due to reproductive compensation.
A high prevalence of deletioinal a-thalassaemia was observed. Non-deletional a-
thalassaemia may be present. It is suggested that a-thalassaemia protects against malaria
in proportion the reduction in MCH - the smaller the red cells the stronger the protection.
In a population that generates homozygotes rapidly (by consanguineous marriage) of the
a plus thalassaemia mutations will be favoured and a high proportion of people should be
homozygous. The situation being approached in this population.
The prevalence of 6-thalassaemia is very low in the population and it suggests recent
introduction in the population.
For G6PD deficiency, there is no evidence upon which to base any comment except that
in principle, if heterozygosity for G6PD deficiency is protective to females, one would
expect a higher frequency than observed. The reason for this needs further study. Either
its selective advantage is less than expected, or the disadvantage (probably to males) is
more than expected in the tribal situation.
Malaria still a very important selective factor in the tribe. Defenses against it are HbS, a-
thalassaemia, 6-thalassaemia, G6PD deficiency and iron deficiency. In view of the
adaptability of the malaria parasites, protection of the tribe as a whole may depend on the

259
variety of blood pictures presented to the parasite, as well as the individual mutations
present.
It seems possible that the tribal set up allows a rapid evolutionary process and the method
and approach adapted in this study may apply to study other tribal groups in India.
Priorities for the Baiga
Coming to welfare and future of the tribe: it is a complicated and delicate situation!to deal
with. Comparing the tribe in early part of the century (Elwin’s time) and now, there is a
little progress. During recent years Government agencies are doing their best ti improve
the quality of life, but unfortunately the result is not satisfactory. Elwin (1939) was not
in favour of "upliftment" in the tribe. He gave a typical examples of unsuccessful
upliftment programmes by Christian missionaries in tribals of Assam.
It is true that upliftment is not possible without sacrificing ancient tribal heritage, but
Elwin was against this. He also described the rude behaviour of Hindu rulers and local
petty officials interfering with the tribal socio-cultural activities (P 513).
I agree with Elwin that education should be encouraged, simplified, and adapted to the use
of primitive people. Tribals may take greater interest in education based on occupations
like spinning, wood carving or growing vegetables and fruit trees, than literary education,
which is of little use to them. Female (adult) education should be encouraged in the tribal
villages. Audio-visual programmes may be helpful to generate awareness.
We should improve the general health of the tribe. This would require local community
participation, general awareness and education in the tribe. Malaria should be eradicated
completely. To reduce the problem of goitre, idonised salt should be provided to tribals.
Infectious diseases like diarrhoea in infancy should be treated well, and waterborne
diseases can be prevented by providing fresh water in the area.
Tribals access to the forest produce is prohibited totally, and exploitation of tribals remain
same from Elwin time to present day. I strongly agree with Elwin (1939) that freedom
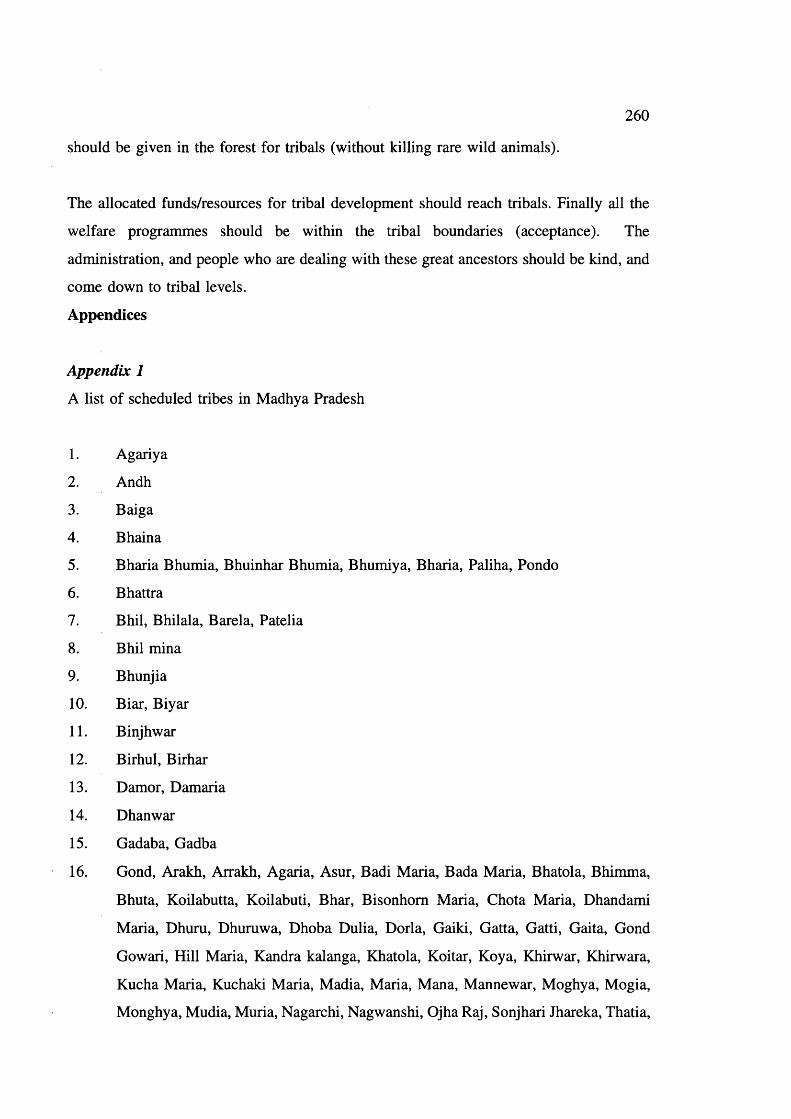
260
should be given in the forest for tribals (without killing rare wild animals).
The allocated funds/resources for tribal development should reach tribals. Finally all the
welfare programmes should be within the tribal boundaries (acceptance). The
administration, and people who are dealing with these great ancestors should be kind, and
come down to tribal levels.
Appendices
Appendix 1
A list of scheduled tribes in Madhya Pradesh
1. Agariya
2. Andh
3. Baiga
4. Bhaina
5. Bharia Bhumia, Bhuinhar Bhumia, Bhumiya, Bharia, Paliha, Pondo
6. Bhattra
7. Bhil, Bhilala, Barela, Patella
8. Bhil mina
9. Bhunjia
10. Biar, Biyar
11. Binjhwar
12. Birhul, Birhar
13. Damor, Damaria
14. Dhanwar
15. Gadaba, Gadba
16. Gond, Arakh, Arrakh, Agaria, Asur, Badi Maria, Bada Maria, Bhatola, Bhimma,
Bhuta, Koilabutta, Koilabuti, Bhar, Bisonhom Maria, Chota Maria, Dhandami
Maria, Dhuru, Dhuruwa, Dhoba Dulia, Dorla, Gaiki, Gatta, Gatti, Gaita, Gond
Gowari, Hill Maria, Kandra kalanga, Khatola, Koitar, Koya, Khirwar, Khirwara,
Kucha Maria, Kuchaki Maria, Madia, Maria, Mana, Mannewar, Moghya, Mogia,
Monghya, Mudia, Muria, Nagarchi, Nagwanshi, Ojha Raj, Sonjhari Jhareka, Thatia,
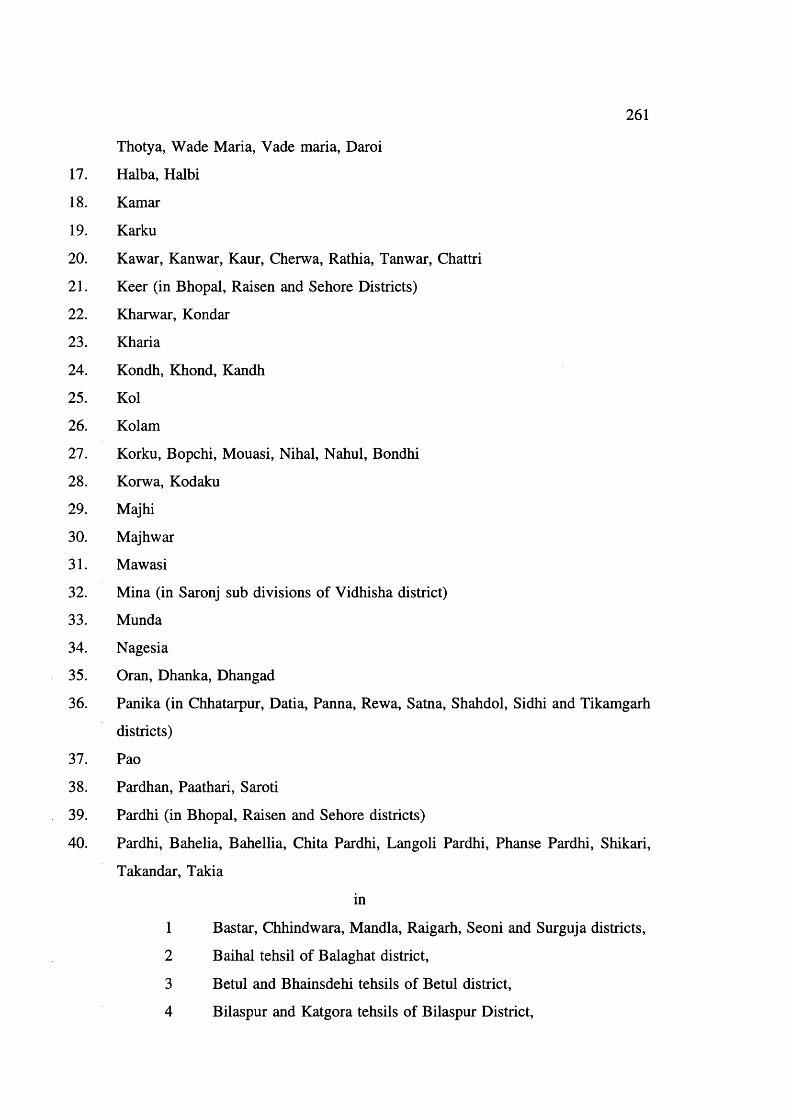
261
Thotya, Wade Maria, Vade maria, Daroi
17. Halba, Halbi
18. Kamar
19. Karku
20. Kawar, Kanwar, Kaur, Cherwa, Rathia, Tanwar, Chattri
21. Keer (in Bhopal, Raisen and Sehore Districts)
22. Kharwar, Kondar
23. Kharia
24. Kondh, Khond, Kandh
25. Kol
26. Kolam
27. Korku, Bopchi, Mouasi, Nihal, Nahul, Bondhi
28. Korwa, Kodaku
29. Majhi
30. Majhwar
31. Mawasi
32. Mina (in Saronj sub divisions of Vidhisha district)
33. Munda
34. Nagesia
35. Oran, Dhanka, Dhangad
36. Panika (in Chhatarpur, Datia, Panna, Rewa, Satna, Shahdol, Sidhi and Tikamgarh
districts)
37. Pao
38. Pardhan, Paathari, Saroti
39. Pardhi (in Bhopal, Raisen and Sehore districts)
40. Pardhi, Bahelia, Bahellia, Chita Pardhi, Langoli Pardhi, Phanse Pardhi, Shikari,
Takandar, Takia
in
1 Bastar, Chhindwara, Mandla, Raigarh, Seoni and Surguja districts,
2 Baihal tehsil of Balaghat district,
3 Betul and Bhainsdehi tehsils of Betul district,
4 Bilaspur and Katgora tehsils of Bilaspur District,

262
5 Durg and Balod tehsils of Durg district,
6 Chowki, Manpur and Mohala Revenue Inspecter Circles of
Rajnandgaon district,
7 Murvara, Patan Sihora tehsils of Jabalpur,
8 Hoshangabad and Sohagpur tehsils of Hoshangabad district and
Narsimhapur district,
9 Harsud tehsil of Khandwa district
10 Bindra-Nawagarh, Dhamtari and Mohasamund tehsils of Raipur
district).
41. Parja
42. Sahariya, Saharia, Seharia, Sehria, Sosia, Sor
43. Saonta, Saunta
44. Saur
45. Sawar, Sawara
46. Sonr

263
Appendix 2
FORMATE for CONSANGUINITY & REPRODUCTIVE BEHAVIOUR among BAIGAS of MADHYA PRADESH-INDIA
PART A
1. Household number---------------------------- Date of interviewDistrict -------------------------------- Tehsil-----------Block Village ---------------
2.Head of the household’s name ------------------------------------
3. Name of the clan --------------------------------- Religion —
4. Educational status of the family (class of study)
A. Wife 1 2 3 4 5 6 7 8 9 10 11 12
B. Husband 1 2 3 4 5 6 7 8 9 10 11 12
C. Children
1.M/F A ge:--------- 0 1 2 3 4 5 6 7 8 9 10 11 12
2.M/F A ge:--------- 0 1 2 3 4 5 6 7 8 9 10 11 12
3.M/F A ge:--------- 0 1 2 3 4 5 6 7 8 9 10 11 12
4.M/F A ge:-------- 0 1 2 3 4 5 6 7 8 9 10 11 12
5. Nutrition 1 status of the family (type of the food)
1 Maize 2 Pulses 3 Rice 4 Wheat
5 Tubers 6 Any other

264
6. Drinking alcohol
Wife
Yes/No Daily Weekly Occasionally
Husband
7. Smoking tobacco
Wife
Yes/No Daily Weekly Occasionally
Husband
8. Chewing tobacco
Wife
Yes/No Daily Weekly Occasionally
Husband
9. Economy of the family for liyelihood
1 Cultiyation 2 Forest Dependence
3 Labour 4 Any other, Goyt. Jobs etc
10. Marriage payment in the family
1 Dowry 2 Bride price 3 None
PART B
1. Name of the Wife Name of the Husband
2. Clan of Wife Husband

265
3. Age at marriage Years Months
WifeHusband
4. Present age of Wife
and Husband
5. Marital distance between wife and Husband in Kms --------------------------
6. Name of the wife’s village
and her mother’s clan
7. Relationship between wife and husband before marriage
1. Relation Yes/No
2. Consanguineous. If consanguineous degree of relationship
a.Cross cousin Maternal ----------------------------------Paternal ----------------------------------
b. Parallel cousin MaternalPaternal
c. Uncle/Niece —
d. Aunt/Nephew ---------------------------------e. Grandfather/Granddaughter ---------------------------------
Ask for multiple marriages and information for each marriage
Pedigree
PART CYear Months
1. Age at puberty of wife
2. Time interval between marriage and first child

3. Duration of breast feeding
Yes No4. Contraceptives used during the period by wife
and husbandHerbal contraceptives used by wife
and husband
7. Total number of pregnancies
266
Live births Abortions Stillbirth Death Deathsup to 28 wks after 28 wks 0-12 months 1-12 yrs
RO
1
2
3
4
5KU: Recent one
If more than one marriage record the reproductive history for the second marriage also

267
REFERENCES
'Audinarayana (1990) Socio-cultural dimensions of marriage in rural India. Mittal publications, New Delhi, India.
Afzal M (1988) Consequences of consanguinity on cognitive behaviour. Behaviour Genet 18:583
Agarwal MB and Mehta BC (1980) Sickle cell syndrome: A study of 44 cases from Bombay. Ind Pediat 23:793
Agarwal MB and Mehta BC (1982) Genotypic analysis of symptomatic thalassaemia syndromes J Postgrad Med 28:1
Agarwala SN (1962) Age at marriage in India. Kitab Mahal publications, Alahabad, India. Ahluwalia A, Corcoram CM, Vulliamy TJ, Ishwad CS, Naidu JM, Angust A, Stevens DJ, Mason PJ and Luzzatto L. (1992) G6PD Kalyan and G6PD Kerala; two deficient variants in India caused by the 317 glu— L y s mutation. Human Mol Genet 1:209.
Ahmed SH (1970) ABO blood groups and sickle cell trait among the Kondh and Nuka Dora of Koraput district (Orissa). In, Bio- Anthropological research in India (edited by HK Rakshit) Anthropological Survey o f India, Calcutta.
Ahmed SH and Choudhury D (1980) ABO blood group and sickle cell trait among the Pardhans of Madhya Pradesh district. Man in India, 60:235.
Ali SA (1970) Milder variant of sickle cell disease in Arabs in Kuwait associated with high level of fetal haemoglobin. Br J Haematol 19:613.
Ali SGM (1968) Inbreeding and endogamy in Kerala (India). Acta Genetica et Statistica Medica 18:369.
Allison AC (1954) The distribution of sickle cell trait in East Africa and elsewhere and its apparent relationships to the incidence of sub tertian malaria. Trans Royal Soc Trop Med Hyg 48:312.
Allison AC (1956) The sickle and Haemoglobin C genes in some African populations. Ann Hum Genet 21:678.
Allison AC (1957) Malaria in carriers of sickle cell trait and in new born children. Exp Parasitol 6:418.
Ansari SA and Sinha SP (1978) Survey on the effects of Inbreeding in two population of Bihar. Ind J Med Res 68:295.
Ashok Kumar G, Dutta S, Banigajra, Chuodhury AR, Dutta S, Talukdar G and Sharma A

268
(1982) Some genetic markers in the tribals of Eastern India. Acta Anthop genet 6:99.
Azevedo E, Kirkman HN, Marrow AC and Motulsky AG (1968) Variants of red cell glucose-6-phosphate dehydrogenase among Asiatic Indian. Ann Hum Genet 31:373-379.
Balgir RS (1983) Demogenetic investigations among the Hindu and Muslim Gujjar— the two Inbreeding Isolates of Sub Himalayan and Himalayan region. PhD thesis, Punjab University Chandigarh, India
Banker MP, Kate SL, Mokashi GD, Khedkar VA and Phadke MA (1984) Distribution of sickle cell haemoglobin among different tribal groups in Maharashtra. Ind J Haematol 2: No 4.
Basic health and family welfare statistics, Madhya Pradesh 1988-89: Prepared and issued by demographic and evaluation cell based on 1981 census. The Directorate o f Public Health and Family Welfare. Madhya Pradesh Bhopal.
Basu C (1988) A brief survey of outbreeding in Modern India. In, Marriage in India (edited by Goswami BE, Sarkar and Danda D) PP 59-66.
Basu SK (1975) Effect of consanguinity among North Indian Muslims. J Pop Res 2:57.
Baxi AJ, Balakrishnan V and Sangvi LD (1961) Deficiency of Glucose 6 Phosphate dehydrogenase observation on a sample from Bombay. Curr Sci 30:16.
Baxi AJ, Balakrishnan V, Undevia IV and Sanghvi LD (1963) Glucose 6 Phosphate dehydrogenase deficiency in the Parsee community, Bombay. Ind J Med Sci 17:493.
Bay sal E (1992) The 6 and Ô thalassaemia. Haemoglobin 16:237
Beall CM (1983) Ages of menopause and menarche in the high altitude Himalayan Population. Annal Hum Biol 10:365.
Belsey MA (1973) The epidemiology of favism. Bull WHO 48:1.
Beutler E, Dern RJ and Alving AS (1954) The haemolytic effect of Primaquine III. A study of primaquine sensitive erythrocytes J Lab Clin Med 44:177.
Beutler E, Yeh M and Fairbanks VF (1962) The normal females as a mosaic of X chromosome activity studies using the gene for G6PD deficiency as a marker. Proc Natl Acad Sci USA 48:9.
Beutler E (1966) A Series of new screening procedures for pyruvate kinase deficiency, glucose-6-phosphate dehydrogenase deficiency. Blood 28:553.
Beutler E and Mitchell M (1968) Special modifications of the fluorescent screening methods for glucose 6 phosphate dehydrogenase deficiency. Blood 32:816.
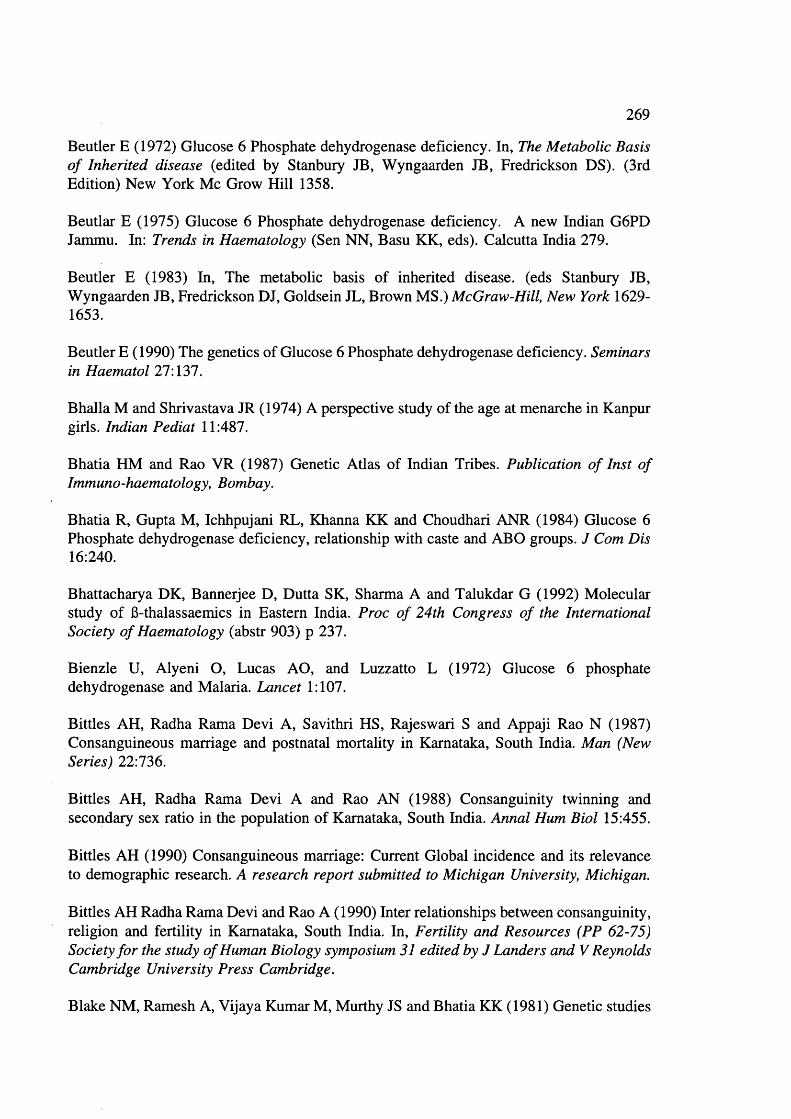
269
Beutler E (1972) Glucose 6 Phosphate dehydrogenase deficiency. In, The Metabolic Basis o f Inherited disease (edited by Stanbury JB, Wyngaarden IB, Fredrickson DS). (3rd Edition) New York Me Grow Hill 1358.
Beutlar E (1975) Glucose 6 Phosphate dehydrogenase deficiency. A new Indian G6PD Jammu. In: Trends in Haematology (Sen NN, Basu KK, eds). Calcutta India 279.
Beutler E (1983) In, The metabolic basis of inherited disease, (eds Stanbury JB, Wyngaarden JB, Fredrickson DJ, Goldsein JL, Brown MS.) McGraw-Hill, New York 1629- 1653.
Beutler E (1990) The genetics of Glucose 6 Phosphate dehydrogenase deficiency. Seminars in Haematol 27:137.
Bhalla M and Shrivastava JR (1974) A perspective study of the age at menarche in Kanpur girls. Indian Pediat 11:487.
Bhatia HM and Rao VR (1987) Genetic Atlas of Indian Tribes. Publication o f Inst o f Immuno-haematology, Bombay.
Bhatia R, Gupta M, Ichhpujani RL, Khanna KK and Choudhari ANR (1984) Glucose 6 Phosphate dehydrogenase deficiency, relationship with caste and ABO groups. J Com Dis 16:240.
Bhattacharya DK, Bannerjee D, Dutta SK, Sharma A and Talukdar G (1992) Molecular study of 6-thalassaemics in Eastern India. Proc o f 24th Congress o f the International Society o f Haematology (abstr 903) p 237.
Bienzle U, Alyeni O, Lucas AO, and Luzzatto L (1972) Glucose 6 phosphate dehydrogenase and Malaria. Lancet 1:107.
Bittles AH, Radha Rama Devi A, Savithri HS, Rajeswari S and Appaji Rao N (1987) Consanguineous marriage and postnatal mortality in Karnataka, South India. Man (New Series) 22:736.
Bittles AH, Radha Rama Devi A and Rao AN (1988) Consanguinity twinning and secondary sex ratio in the population of Karnataka, South India. Annal Hum Biol 15:455.
Bittles AH (1990) Consanguineous marriage: Current Global incidence and its relevance to demographic research. A research report submitted to Michigan University, Michigan.
Bittles AH Radha Rama Devi and Rao A (1990) Inter relationships between consanguinity, religion and fertility in Karnataka, South India. In, Fertility and Resources (PP 62-75) Society for the study o f Human Biology symposium 31 edited by J Landers and V Reynolds Cambridge University Press Cambridge.
Blake NM, Ramesh A, Vijaya Kumar M, Murthy JS and Bhatia KK (1981) Genetic studies

270
on some tribes of the Telangana region AP India. Acta Anth Ca 5:41.
Bodmer WF and Cavalli-Sforza (1976) Genetics, Evolution, and Man. WH Freeman and Company Sanfrancisco (P 307-328).
Bradley DJ (1991) Malaria; In, Disease and Mortality in sub-Saharan Africa (edited by RG Feachem and DT Jamison): A World Bank Publication pp 192-202.
Brittenham G (1973) Sickle cell and Genetic markers. J Am Med Assoc 225:1120
Brittenham G, Lozoff B, Harris JW, Sharma VS and Narasimhan S (1977) sickle cell anaemia and trait in a population of Southern India. Am J Haematol 2:25.
Brittenham G (1977) Genetic modal for the observed distribution of the proportion of Hb S in sickle cell trait. Nature 268:635.
Brittenham G, Lozoff B, Harris JW, Mayson SM, Miller A, and Huisman THJ (1979) Sickle cell anaemia and trait in Southern India. Further studies. Am J Haematol 6:107.
Brittenham G, Lozoff B, Harris JW, Kan YW, Dozy AM and Nayudu NYS (1980) a- globin gene number: Population and restriction endonuclease studies. Blood 55:706.
Buchi EC (1959) Blut, Ceshmack and Farbansinn beiden Kurmba (Nilgiri sub dividien). Arch klaus, vererb Forsch 34:310.
Buckle JF, Higgs DR, Wilkie APM, Super M and Weatherall DJ (1988) Localization of the human a-globin to 16 p 13.3 pter J Med Genet 25:847.
Bulmer MG (1960) The twinning rate in Europe and Africa. Annal Hum Genet 24:121.
Bulmer MG (1970) The Biology of twinning in man. Oxford Clarenden Press pp 74.
Bunn HE and Forget BG (1986) Haemoglobin: Molecular, Genetic and Clinical aspects. WB Saunders, Philadelphia.
Caldwell JC, Reddy PH and Caldwell P (1983) The causes of marriage change in South India. Pop Stud 37:343.
Cavalli-Sforza LL and Bodmer WF (1971) The genetic structure of human Population; Freeman and Co San Fransisco.
Census of India 1981 Sereis I Part I to XII India and States. Registrar general and Census Commissioner, India.
Centre well WR and Centre well SA (1966) Consanguinity and congenital anomalies in South India: a pilot study. J Med Res 54:1160.

271
Chakraborty R and Chakraborty A (1977) On consanguineous marriages and the genetic load. Hum Genet 36:47.
Chatterjea JB (1961) Haemoglobin-H thalassaemia. Bull Calcutta Sch Trop Med 9:93.
Chengal Reddy P (1984) Distribution, endogamy and isolation of Malas of Chittoor district, Andhra Pradesh, India. Soc Biol 31:108.
Choe MK (1987) Sex differentials infant and childhood mortality in Korea. Soc Biol 34:12.
Choo QL, Huo G, Weiner AJ, Overby LR, Bradley DW and Houghton M (1989) Isolation of a cDNA clone derived from a blood-borne non-A and non-B viral hepatitis genome. Science 44:359.
Chotray GP and Ranjit MR (1990) Prevalence of G6PD deficiency in a Malaria endemic tribal area of Orissa, India. Ind J Med Res 92:443.
Choudhaury S, Ghosh J, Mukherjee N, and Roy Choudhury AK (1967) Study of blood group and haemoglobin variants among the Santhal tribe in Midnapur distirct of West Bengal, India. AM J Phy Anthrop 26:307.
Chouhan DM, Sharma RS and Parekh JG (1970) a-Thaalssaemia in India. Ind Med Asso 54:364.
Christakis J, Vavatsi N, Morris JS, Serjeant BE, Serjeant GR Hassapopoulou H, Papadopoulou M, Mandravelli K, and Loukopoulos D (1990) Comparison of homozygous sickle cell disease in Northern Greece and Jamaica. Lancet 355:637.
Collins FS and Weissman SM (1984) The molecular genetics of human haemoglobin. Progress in Nucleic Acid Research and Molecular Biology (Ed Cohn WE, Moldave K) New York Academic Press.
Cook JE and Meyer J (1915) Severe anaemia with remarkable elongated and sickle cell red blood cells and chronic leg ulcer. Arch Intern Med 16:644.
Curuk MA, Bay sal E, Gupta RB, Sharma S and Huisman THJ (1993) An IVS-1-117 (G—>A) acceptor splice site mutation in the al-globin gene is a non-deletional a- thalassaemia 2 determinant in an Indian population. Br J Haematol 85:148.Dacie JV and Lewis SM (1991) Practical Haematology 7th edition Churchill Livingstone Press.
D’costa H, Pattani J, Mahandel K, Desai M and Merchant SM (1967) Glucose 6 phosphate dehydrogenase defect in Indian children. A preliminary report. Indian Paediat 4:193.
Dar A and Modell B (1988) The frequency of consanguineous marriage among the British Pakistanis. J Med Genet 25: 186.

I l l
Das BM, Chakravaithy MR, Delbruck H and Flatz G (1971) High prevalence of Hb E in two populations in Assam. Hum Genetik 12:264.
Das BM, Deka R and Flatz G (1975) Predominance of the Hb E gene in Mongoloid population in Assam, India. Hum Genetik 30:187.
Das BM, Deka R and Das R (1980) Haemoglobin in the six populations of Assam. J Ind Anthropol Soc 15:153.
Das BM, Deka R and Das R (1982) Glucose 6 Phosphate Dehydrogenase deficiency in five tribal population of Assam, India. Indian Anthropologist P 12.
Das SR, Mukherjee DP and Sastry DB (1967) Sickle cell trait in Koraput district and other parts of India. Acta Genet State Med 17:62.
Dash S, Vashist K, Sehgal S, Devi S and Verma A (1988) Isoelectric focusing for measurement of haemoglobin Barts levels in Cord blood and detection of a-thalassaemia. Ind J Med Res 87:62.
Davies KE, Mandel JL, Monaco AP, Nussbaum, and Willard HE (1990) Report of committee on the genetic constitution of X chromosome Cy to genet Cell Genet 55:254.
De Flora A, Morelli A and Giuliano F (1974) Human erythrocyte glucose 6 phosphate dehydrogenase. Content of bound coenzyme. Biochem Biophys Res Commun 59:406.
Dixon RP (1971) Explaining cross-cultural variations in age at marriages and proportions never marrying. Pop Stud 25:215.
Dronamraju KR and Meerakhan P (1963) The frequency and effect of consanguineous marriages in Andhra Pradesh. J Genet 58:387.
Dubey BK and Bahadur F (1967) A study of the tribal people and tribal areas of Madhya Pradesh, published by Tribal Research and Development Institute Madhya Pradesh, Bopal.
Dubey SC (1969) Manav aur sanskriti 2nd edition Rajkamal prakashan Delhi.
Eickstedt EV (1935) The position of Mysore in Indian racial history; In Mysore tribes and castes Moyne Vol 1 Published under the auspices o f Mysore University.
El-Hazmi MAE (1986) Studies on sickle cell heterozygotes in Saudi Arabia-Interaction with a-thalassaemia. Acta Haematol 75:100.
Elwin V (1939) The Baiga. Printed in Great Britain by Wyman & Sons Ltd London.
Elwin V (1943) The aboriginals. Oxford Pamphlets on Indian affairs, Oxford University Press, London.

273
Embury SH, Miller JA, Dozy AM, Kan YW, Chan V and Todd D (1980) Two different molecular organizations account for the single a-globin gene of the a-thalassaemia-2 genotype. J Clin Invest 66:1319.
Faltz G, Chakraborty MR, Das BM and Delbruch H. (1972) Genetic survey in the population of Assam ABO blood groups, G6PD and Haemoglobin types. Hum Hered 22:323.
Flint J, Hill AVS, Bowden DK, Oppenheimer SJ, Sill PR, Serjeantson SW, Bana-Koiri J, Bhatia K, Alpers MP, Boyce AJ, Weatherall DJ and Clegg JB (1986) High frequencies of a-thalassaemia are the result of natural selection by malaria. Nature 321:744.
Fodde R, Losekoot M, vanden Broek MH, Oldenberg M, Rashida N, Shroedre A, Wijner JT, Giordano PC, Nayudu NVS, Meera Khan P and Bernini LF (1988) Prevalence and Molecular heterogeneity of a^ thalassaemia, in two tribal populations from Andhra Pradesh, India. Hum Genet 80:157.
Friedman MJ (1978) Erythrocytic mechanism of sickle cell resistance to malaria. Proc Natl Acad Sci USA 75:1994.
Gardiner MB, Reese AL, Headlee ME and Huisman THJ (1982) The heterogeneity of the y-chain of fetal haemoglobin in Hb S heterozygotes. Blood 60:513.
Ghatge SG, Pradhan PK and Agarwal S (1977) Haemoglobin S in Kurmi community of Madhya Pradesh-a preliminary report. Ind J Med Res 66:260.
Ghosh AK (1976) The Kotas of Nilgiri hills: A demographic study. J Biosoc Sci 8:17.
Ghosh AK and Majumdar PP (1979) Genetic load in an isolated tribal population of South India: Hum Genet 51:203.
Ghosh AK (1972) Inbreeding in the Kota of Nilgiri Hills, Madras. Soc Biol 19:289.
Ghosh U, Bannerjee T, Bannerjee PK and Saha N (1981) Distribution of haemoglobin and Glucose 6 Phosphate dehydrogenase phenotypes among different caste groups of Bengal. Hum Hered 31:199.
Gilman JG and Huisman THJ (1985) DNA sequence variation associated with elevated fetal Gy-globin production. Blood 66:783.
Goosen M, Dozy AM, Embury SH, Zachariades Z, Hadjiminas MG, Stomatoyannopolous G, Kan YW. (1980) Triplicated a-globin gene loci in humans. Proc Natl Acad Sci USA 77:518
Goswami HK (1970) Frequency of consanguineous marriages in Madhya Pradesh. Acta Geneticae et Gemellologiae 19:486.

274
Goswami HK and Wagh KV (1975) Twinning in India. Acta Genetcae Medicae et Genaellogiae 24:347.
Goud JD (1977) Population genetic study of five tribal endogamous groups of Andhra Pradesh. PhD Thesis, Osmania University Hyderabad
Goud JD and Rao PR (1979) Genetic studies among the five tribal populations of Andhra Pradesh, South India Anthrop Anz 37:1.
Govinda Reddy P (1985) Effect of Inbreeding on mortality: A study among three South Indian communities. Hum Biol 57:47.
Guesella JF, Varsanyi-Briener A, Kao FT, Jones C, Puck TT, Keys C, Orkins S and Housman D. (1979) Precise localization of human 6-globin gene complex on chromosome11. Proc Natl Acad Sci USA 76:5239.
Guha BS (1935) The racial affinities of people of India. In Census o f India vol I part III BPO, Simla.
Guha BS (1955) Indian aboriginal and who they are Adivasis, Publication division Delhi.
Guha GS (1951) The tribes of India 2 vols Bhartiya Adimjati Sevak Sangh New Delhi.
Gupta RB, Tiwary RS, Pande PL, Kutlar F, Oner C, Oner R and Huisman THJ (1991) Haemoglobinopathies among the Gond tribal groups of Central India, interaction of a and 6-thalassaemia and 6 chain variants. Haemoglobin \ 15:441.
Gupta S, Ghai OP, Chandra RK (1970) Glucose 6 Phosphate dehydrogenase deficiency in the new bom and its relation to semm bilirubin. Indian J Pediat 37:169.
Haghshenass M, Ismial Beig F, Clegg JB et al (1977) Mild sickle cell anaemia in Iran associated with high levels of fetal haemoglobin. J Med Genet 14:168.
Hahn EV and Gillespie EB (1927) Sickle cell anaemia. Arch Intern Med 39:233.
Haidar BK, Mason PJ, Berrib A, Ankara-Badu G, Ali AA, Oppelhiem Ariella and Luzzatto L. (1990) Origin and spread of the Glucose 6 Phosphate Dehydrogenase variant (G6PD Mediterranean) in the Middle East. Am J Hum Genet 47:1013.
Hajnal J (1953) Age at marriage and proportions marrying. Pop Stud 7:111.
Hann KL (1985) Inbreeding and fertility in a South Indian Population. Annal Hum Biol 12:267.
Harano T, Reese AL, Ryan R, Abraham BL and Huisman THJ (1985) Five haplotypes in Black 6-thalassaemia heterozygotes: three are associated with high and two with low Gy values in fetal haemoglobin. Br J Haematol 59:333.

275
Harris JW (1950) Studies on the destruction of red blood cells VIII molecular orientation in sickle cell haemoglobin mutations. Proc Soc Exp Biol Med 75:197.
Hazra D, De PJ, Sinha RK, Gosal S, Maity T and Goswami BB (1988) Marriages system in Central India. In, Marriages in India (edited by BB Goswami J Sarkar and D Danda) Anthropological survey o f India, Calcutta PP 16-33.
Hecht F, Motulsky AG, Lemire AJ and Shepard TE (1966) Predominance of haemoglobin Gower I in early human embryonic development. Science 152:91.
Herrick JB (1910) Peculiar elongated and sickle shaped red cell corpuscles in a case severe anaemia. Arch Intern Med 6:517.
Higgs DR, Vickers MA, Wilkie AOM, Pretorious IM, Jarman AP and Weatherall DJ. (1989) A review of the molecular genetics of the human a-globin gene cluster. Blood 73:1081.
Honig GR, Koshy M, Mason G and Vida LN (1978) Sickle cell syndromes II. the sickle cell anaemia a-thalassaemia syndrome. J Pediat 92:556.
Huehns ER, Dance N, Beaven GH and Hecht F and Motulsky AG (1964) Human embryonic haemoglobins; Cold Spring Harbor Symp Quant Biol. 19:327.
Huisman THJ, Schroeder WA, Brodie AN, Mayson SM and Jackway (1975) Microchromatography of Haemoglobins III* A rapid method for the determination of haemoglobin Aj. J Lab Cli Med 86:700.
Huisman THJ (1977) Trimodality in the percentage of 6-chain variant in heterozygotes: the effect of number of active Hb a structural loci. Haemoglobin 1:349.
Ingram VM (1956) A specific difference between the globins of normal human and sickle cell anaemia haemoglobin. Nature 178:792.
Ishwad CS, and Naik SN (1984) A new glucose 6 phosphate dehydrogenase variant (G6PD Kalyan) found in a Koli family. Hum Genet 66:171.
Jain PK, Verma IC, Petrou M, Modell B and Old JM (1991) Molecular characterization of 6-thalassaemia in North India. Proc o f the 8th International Congress o f Human Genetics. Washington DC (abstr 1024, p 192)
Jain RC, Andrew AMR and Choubisa SL (1983) Sickle cell and thalassaemia gene in the tribal population of Rajasthan. Ind J Med Res 78:836.
Kan YW and Dozy AM (1978) Polymorphism of DNA sequence adjacent to human 6- globin structural gene; relationship to sickle mutation. Proc Natl Acad Sci USA 75:5631- 5635.

276
Kan YW and Dozy AM (1980) Evolution of Haemoglobin S & C genes in world populations. Science 209:388.
Kapadia KM (1966) Marriage and family in India 3rd Ed Oxford University Press London.
Kapoor AK and Vaid NK (1981) G6PD deficiency among the Bhotias of Kumaon. Res Proc Delhi Uni Dept o f Anthropology 8:17.
Kar EC, Satapathy RK, Kulozik AE Kuiozik M, Sirr S, Serjeant BE and Serjeant GR (1986) Sickle cell disease in Orissa State; India. Lancet 1198-1201.
Karve I (1965) Kinship organization in India. Second revised edition. Asia Publishing House Bombay.
Kate SL, Mukherjee BN, Malhotra KC, Phadke MA, Mutalik GS, Sainani GS (1978) Red cell Glucose 6 Phosphate dehydrogenase Deficiency and Haemoglobin variants among ten endogenous groups of Maharashtra and West Bengal. Hum Genet 44:339.
Kate SL, Mokashi GD, Khedkar VA, Mukherjee M (1984) Prevalence of Haemoglobin E in ten population groups of West Bengal, India. Ind J Haematol vol 2 No 4.Kennedy KAR (1981) Skeletal Biology: When bones tell tales. Archaecology 34:17.
Khanduja PC, Agarwal KN, Julka S, Bhargava SK, Taneja PN (1966) Incidence of glucose 6 Phosphate dehydrogenase deficiency and some observation on patients with haemoglobin urea. Ind J Pediat 33:341.
Khlat M (1988) Consanguineous marriage and reproduction in Beirut, Lebanon. Am J Hum Genet 43:188-196.
Kiran Gangu (1961) A note on the sickle cell trait among the Raj Gonds. East Anth 25:(2).
Kirk RL, Lai LYC, Vos GH and Vidhyarthi LP (1962) A genetic study of the Oraons of the Chota Nagpur Plateau Bihar, India. Am Jm Phy Anth 20:375.
Kondrashin AV (1992) Malaria in the WHO South-East Asian region. Ind J Malariol 29:129.
Krishnan G (1986) effect of parental consanguinity on anthropometric measurements among the Sheikh Sunni Muslim boys of Delhi. Am J Phy Anthrop 70:60.
Kulkami PM, Savanur LR and Gokhle CV (1986) Increase in age at marriage in rural Karnataka: Evidence from a repeat survey. Demography India 15:149.
Kulozik A, Kar BC, Serjeant BE, Serjeant GR and Weatherall DJ (1988) a-thalassaemia in India: Its interaction with sickle disease. Blood 71:467.
211
Kulozik AE, Wainscoat JS, Serjeant GR, Al-Awamy B, Essan F, Falusi Y, Hagn SK, Hilali AM, Kate S, Ranasinghe WACP and Weatherall DJ (1986) Geographical survey of 6" globin gene haplotypes: Evidence for an independent Asian origin of sickle cell mutation. Am J Hum Genet 39:239.
Kulozik AE, Kar BC, Satapathy RK, Serjeant BE, Serjeant GR and Weatherall DJ (1987) Fetal haemoglobin levels and 13* globin haplotypes in an Indian population with sickle cell disease. Blood 69:1742.
Kumar N (1965) ABO blood groups and sickle cell trait investigations in Madhya Pradesh: Rati am and the adjacent districts. Bull Dept Anthropological Society 3 (3 & 4).
Kumar N (1966) ABO blood groups and sickle cell trait distribution in Malwa, Western Madhya Pradesh. J Ind Anth Soc 1:129.
Kumar N and Mukherjee DP (1969) A genetic survey among the Desi Bhumij of Chota Nagpur in Bihar. Anthropologist Special vol:75.
Kumar N and Mukherjee DP (1975) Genetic distances among the Ho tribe and other groups of Central India. Am J Phy Anth 42:489.
Kumar S, Pai RA and Swaminathan MS (1967) Consanguineous marriages and the genetic load due to lethal genes in Kerala. Annal Hum Genet 31:141.
Kunkel HG and Wallenius G (1955) New Haemoglobin in normal adult blood. Science 122:288.
Kunckle HG, Ceppellini R, Mueller-Eberhard U and Wolf J (1957) Observations on the minor basic haemoglobin component in the blood of normal individuals and patients with thalassaemia. J Clin Invest 36:1615.
Labie D, Shrinivas R, Dunda O, Dode C, Lapoumeroulie C, Devi V, Devi S, Ramasami K, Elion J, Ducrocq E, Dacrocq R, Krishnamoorthy R and Nagel RL (1989) Haplotype in tribal India bearing the sickle gene; evidence of unicentric origin of 6* mutation and the unicentric origin of tribal population of India. Hum Biol 61:479.
Lehman H and Raper AB (1949) Distribution of sickle cell trait in Uganda and its ethnological significance. Nature 164:494.
Lehman H and Cutbush M (1952) Sickle cell trait in Southern India. Br Med J 1:289.
Lehman H (1954a) Distribution of sickle cell gene; A New light on the origin of the East Africans. Eugenics Review 46:101.
Lehman H (1954b) Origin of the Sickle cell. S Afr J Sci 50:140.
Lehman H and Sukumaran PK (1956) Examination of 146 South Indian Aboriginals for

278
Haemoglobin variants. Man No 97:95.
Lehman H and Huntsman RG. (1974) Man’s Haemoglobins, 2nd Ed Philadelphia JB, Lippincott Co.
Leonard JBC (1985) Essential Malariology. William Heinmann Medical books Ltd pp 177- 179 and 200-202.
Levy H (1979) Glucose 6 phosphate dehydrogenase deficiency. Adv Enzy 48:97.
Livingstone FB (1985) Frequencies of haemoglobin variants. Oxford Uni Press.
Lopez R, and Cooperman JM (1971) Glucose 6 phosphate dehydrogenase deficiency and hyperbilirubinaemia in the newborn. Am J Dis Child 122:66.
Luzzatto L and Testa U (1978) Human erythrocyte glucose 6 phosphate dehydrogenase. Structure and function in normal and mutant subjects. Curr Top Haematol 1:1
Luzzatto L (1979) Genetics of red cells and susceptibility to malaria. Blood 54:976.
Luzzatto L (1980) Genetics of human red cells and susceptibility to malaria. In, Modem Genetic Concepts Techniques in the study o f Parasites (ed Michal F) Tropical Diseases Research Series No 4 Schwabe & Co, Basel.
Luzzatto L and Mehta A (1989) Glucose 6 phosphate dehydrogenase deficiency. In: The Metabolic basis of inherited disease, 6th ed. (edited by Scriver CR, BeaudetAL Sly WS and Valle D) New York, McGraw-Hill 2237-2265.
MacDonald G (1957) The epidemiology of malaria Oxford University Press Amen House London EC4.
Mackey IP and Vivarelli F (1954) Sickle cell Anaemia. Br Med J 1:276.
Madhavan S (1965) Age at menarche of South Indian girls belonging to the states of Madras and Kerala. Ind J Med Res 53:669.
Mahadevan K (1979) Socio-cultural dimensions of marriages in rural India, A study of Andhra Pradesh by Mittal Publications, New Delhi, India.
Mahadik C (1991) Personal communication.
Majumdar AK (1991) Breast feeding, birth Interval and child mortality in Bangladesh. J Bio soc Sci 23:297.
Majumdar PP and Malhotra KC (1979) Matrimonial distance, inbreeding Co-efficient and population size: Dhangar data. Annal Hum Biol 6:17.

279
Malhotra KC (1978) Morphological composition of the people of India. J Hum Evol 7:45- 53.
Malhotra KC (1979) Inbreeding among the Dangar castes of Maharashtra, India. J Bio soc Sci 11:397.
Malleshwara Rao, Blake NM and Veerraju P (1978) Genetic study of Savara and Jatapu tribes of Andhra Pradesh, India. Hum Hered 29:122.
Marks PA, Johnson AB and Hirschberg E (1958) Effect of age on the enzyme activity in erythrocytes. Pro Natl Acad Sci USA 44:529.
Martini G, Tonoolo D, Vulliamy T, Luzzatto L, Dono R, Viglietto G, Urso M and Persico M.(1986) Structural analysis of the X linked gene encoding human glucose 6 Phosphate dehydrogenase. EMBO J 5:1849.
Mason VR (1922) Sickle cell Anaemia. J Am Med Asso 79:1318.
Mattay KK and Mentzer WC (1981) Erythrocyte enzymopathies in Newborn. Clin Haematol. 10:31.
McDonald PE, Rerzicka LT and Caldwell JC (1981) Inter-relationship between nuptiality and fertility: the evidence from the world fertility Survey Conference London 1980. 2:77- 146 Voorberg Netherlands: International Statistical Institute.
Mench B (1986) Age differences between spouses in first marriages. Soc Biol 23:229-240.
Michelson AM and Orkin SH (1983) Boundaries of gene conversion within the duplicated human a-globin genes concerted evolution by segmental recombination. J Biol Chem. 258:15245.
Mishra RC (1989) Detection of a-thalassaemia in sickle cell trait patients by Hb Barts screening and quantification of Hb A and Hb S. Ind J Med Res 90:459.
Modebe O (1986) The effect of homozygous sickle cell disease on the age of menarche in Nigerian school girls. Annal Human Biol 13:181.
Modell B and Petrou M (1983) The problem of haemoglobinopathies in India. Ind J Haematol 1:5.
Modell B and Berdoukas C (1984) The clinical approach to thalassaemia. Published by Grune & Station London.
Modell B and Kuliev AM (1992) Social and Genetic implications of customary consanguineous marriage among British Pakistanis. Galton Institute Occasional papers, Series, No 4, The Galton Institute, London, UK
280
Modiano G, Morpurgo G, Terrinato L, Noveletto A, Di Rieno A, Colombo B, Purpura M, Mariani M, Santachiara-Benerecatti S, Brega A, Dixit KM, Shrestha SL, Lania A, Wanachiwanawin W and Luzzatto L (1991) Protection against malaria morbidity: Near fixation of the a-thalassaemia gene in a Nepalese population. Am J Hum Genet 48:390.
Mohan Singh (1992) Changes in the age at marriage of women in Rural North India. J Biosoc Sci 24:132.
Molineaux L (1985) La lutte contre less maladies parasitaires: Le problème du paludisme, notamment en Afrique. In; La lutte contre La morte Vallin J and Loopez A (edi) PP 111- 140. Travaux et documents no 108 Paris Presse Universitaires de France.
Morab SG (1988) Marriages system in South India. In, Marriage in India (edited by BB Goswami J Sarkar and D Danda); Anthropological survey o f India pp 3-15.
Morton NE (1973) Population structure of micronesia. In methods and theories o f Anthropological genetics. Edited by MH Crawford and PL Workman (Albuquerque) University o f New Mexico Press PP 333-366.
Muir DG and Belsey MA (1980) Pelvic inflammatory disease and its consequences in developing world. Am J Obs Gyn 138:913.
Murdock GP (1967) Ethnographic Atlas. Published by University o f Pittsberg Press.
Nagel RL, Fabry ME, Pangier J et al (1985) Haematologically and genetically distinct forms of sickle cell anaemia in Africa. N Eng J Med 312:880.
Naidu JM, Mohrenwieser HW and Neel JV (1985) A Sero-biochemical genetic study of Jalari and Brahmin caste population of Andhra Pradesh, India. Hum Hered 35:148.
Neeru Singh and Nagpal BN (1985) Mosquitoes of Mandla District of Madhya Pradesh. Ind J Malariol 22:111.
Neeru Singh, Shukla MM, Sharma VP and Saxena BN (1989) A focus of high degree chloroquine resistant P. falciparum in Mandla district (MP). Ind J Malariol 26:45.
Negi RS (1963) ABO blood groups and sickle cell trait and colour blindness in the Maria of Bastar, Gond and Kawar of Bilaspur. Bull Dept Anthropological Survey o f India 12:149.
Negi RS (1967) Sickle cell trait distribution in India, PhD. thesis submitted Calcutta University, Calcutta.
Negi RS (1968) Sickle cell trait in India: a review of known distribution. Bull Dept Anthropological Survey o f India 27:439.
Old JM and Higgs DR (1983) Gene analysis; In, Methods in Haematology: the thalassaemias edited by DJ Weatherall. Churchill Livingstone Edinburgh pp 74-102.
281
Oner C, Dimovski AJ, Olivieri NF, Schiliro G, Codrington JF, Fattoum S, Adekile AD, Oner R, Yuregir GT, Altay C, Gurgey A, Gupta RB, Jogessar VB, Kitundu MN, Loukopoulos D, Tamagnini GP, Ribeiro MLS, Kutler F, Gu LH, Lanclos D and Huisman THJ (1992) 6® Haplotypes in various world populations. Hum Genet 89:99.
Padmos MA, Roberts GT, Sackey K, Kulozik A, Bail S, Morris JS, Serjeant BE and Serjeant GR (1991) Two different forums of homozygous sickle cell disease occur in Saudi Arabia. Br J Haematol 79:93.
Pai GS, Sprekle JA, Do TT, Mareni CE and Migeon BR (1980) Localization of loci for hypoxanthine phosphoriboxyltransferase and glucose 6 phosphate dehydrogenase and biochemical evidence of non-random X chromosome expression from studies of a human X autosome translation Proc Natl Acad Sci USA 77:2810.
Pandey GD and Saxena B (1988) District level planning for health and family welfare for tribals. Demography India 17:216.
Papiha SS, Roberts DF, Mukerjee DP, Singh SD and Malhotra M (1978) A genetic survey in the Bhil tribe of Madhya Pradesh, Central India. Am J Phy Anth 53:275.
Parikh P, Collon M, Boem C and Kazazian HH (1990) Ethnic distribution of 6- thalassaemia in Indian sub continent. Lancet n:1006.
Pasvol G, Weatherall DJ and Wilson RJM (1978) Cellular mechanism for the protective effect of HbS against P. falciparum malaria. Nature 274:701.
Payne D, Grab B, Fontaine RE and Hempel JHG (1976) Impact of control measures on malaria transmission and general mortality. Bull WHO 54:369.
Pembrey ME, Wood WG, Weatherall DJ and Perrine RP (1978) Fetal haemoglobin production and the sickle cell gene in the oasis of Eastern Saudi Arabia. Br J Haematol 40:415.
Phillips SM and Silvers NP (1969) Glucose 6 phosphate dehydrogenase deficiency, infectious hepatitis, acute haemolysis and renal failure. Ann Intern Med 70:99.
Pingle U and Haimendorf F (1987) Gonds and their Neighbours: A study of genetic diversity Published by ethnographic and folk culture society Lucknow.
Powers DR (1975) The narural history of sickle cell disease - the first ten years Semin in Haematol 12:267.
Radha Rama Devi A, Appaji Rao N and Bittles AH (1987) Inbreeding and the incidence of child hood genetic disorders in Karnataka, South India. J Med Gen 24:362.
Ramalingaswami V and Purcell RH (1988) Water-born non-A and non-B Hepatitis. Lancet i:51\.
282
Ramesh A, Murthy JS and Blake NM (1979) Genetic studies on the Kolams of Andhra Pradesh India. Hum Hered 29:147.
Ramesh A, Blake NM, Vijaykumar M and Murthy JS (1980). Genetic study on the Chenchu Tribes of Andhra Pradesh, India. Hum Hered 30:291.
Ramesh A, Srikumari CR, and Sukumar S (1988) Parallel cousin marriages in Madras, Tamil Nadu: New Trends in Dravidian Kinship. Soc Biol 36:248.
Rao AP and Reddy VR (1978) Inbreeding among three endogamous Groups in a multicaste village of Andhra Pradesh, India. Soc Biol 30:109.
Rao PR and Goud JD (1979) Sickle cell haemoglobin and glucose 6 phosphate dehydrogenase deficiency in tribal populations of Andhra Pradesh. Ind J Med Res 70:807.
Rao PSS, Inbaraj G and Kaliaperumal VG (1971) An epidemiological study of the consanguinity in a large South Indian town. Ind J Med Res 59:294.
Rao PSS and Inbaraj SG (1977) Inbreeding on fertility and sterility in Southern India. JMed Genet 16:24.
Rao VR and Bhatia HM (1988) Quantitative assessment of Hb S in sickle cell heterozygotes among some tribes in Maharashtra. Ind J Med Res 87:257.
Rao VR and Gorakhshakar AC (1990) Sickle cell haemoglobin, 6-thalassaemia, and G6PD deficiency in tribes of Maharashtra, India. Gene Geography 4:131.
Raper AB (1949) The incidence of sicklaemia. E Afr Med J 26:281.
Raper AB (1956) Sickling in relation to morbidity from malaria and other diseases. Br Med J 1:965.
Reddy AP and Mukharjee BN (1980) G6PD deficiency and colour vision defect in 6 endogamous groups of Andhra Pradesh. Ind J Phys Anthropol & Hum Genet 6:29.
Reddy AP and Mukherjee BN (1981)Genetic studies of a nomadic tribe: Kuruvikkarans of Andhra Pradesh and Tamil Nadu. J Ind Anth Soc 16:179.
Regional Medical Research Centre for Tribals/Indian Council of Medical Research; lobdXpm, Annual Report, (1986-87, 1987-88, 1988-89, 1990-91, 1991-92). India
Registrar general of India 1982, Female age at marriage: An analysis of 1971 census data. Paper 4 of 1977. Census o f India 1971 sereies I New Delhi Office o f Registrar general.
Risley HH (1915) The people of India. Thaper Springs and Co; Calcutta.
Roth EE Jr, Roventas Suarez C, Rinaldi A and Nagel RL (1983) Glucose 6 Phosphate

283
dehydrogenase deficiency inhibit in vitro growth of plasmodium falciparum. Proc Natl Acad Sci USA 80:298.
Roy Burman BR and Haret HL (1971) A preliminary apraisal of the Scheduled tribes of India. New Delhi Office o f the registrar general, India.
Rucknagel DL and Neel JB (1961) The haemoglobinopathies; In, Progress in Medical Genetics Edited by Steinberg AG Vol I pp 158-260. Grune and Stratton New York.
Russell and Hiralal RB (1916) Tribes and castes of Central Provinces of India. Cosmo Publication New Delhi.
Russel PF (1956) World wide malaria distribution, prevalence, and control. Amer J Trop Med Hyg 5:937.
Saha N, Kirk RL, Shanbhag S, Joshi SR and Bhatia HM (1974) Genetic study among the Kadars of Kerla. Hum Hered 24:198.
Saha N, Kirk RL, Shanbhag S, Joshi SR and Bhatia HM (1976) Population genetic studies in the Kerala and the Nilgiri (South-West Asia). Hum Hered 26:175.
Saiki RK, Gelfand DH, Stoffels S, Scharf R, Higuchi R, Horn GT, Mullis KB and Erlich HA (1988) Primer directed enzyme amplification of DNA with a thermostable DNA polymerase. Science 239:487
Sangvi LD (1966) Inbreeding in India. Eugenics Quarterly 13:291.
Sarkar J (1988) Marriage system in North India. In, Marriages in India (edited by BB Goswami, Sarkar J and D Danda) Anthropological Survey o f India pp 47-55.
Sarkar SS (1954) The aboriginal races of India. P 95 Calcutta Book land.
Saxena PC (1977) Breast feeding: Its effect on postpartum Amenorrhoea. Soc Biol 24:45.
Sayyed Z, Mukherjee MB, Mudera VC, Rohan Kolah, Snehlata Gupte (1992) Characterization of G6PD Rohini — a new class III Indian variant Ind J Med Res 96:96.
Schull WJ, Furusho T, Yamamoto M, Nagavo H and Komatsu I (1970) The effect of prenatal consanguinity and inbreeding in Hirado Japan IV. Fertility and reproductive compensation Human Genetik 9:294.
Serjeant GR (1981) Observations on the epidemiology of sickle cell disease. Trans Royal Soc Trop Med Hyg 75:228.
Seth P and Seth S (1971) Biogenetical studies of Nagas. G6PD deficiency in Angami Nagas. Hum Biol 43:557

284
Shami SA and Zahida (1982) studies on the consanguineous marriages in the population of Lahore, Punjab, Pakistan. Biologia 28:1.
Shami SA, Schmitt LH and Bittles AH (1989) Consanguinity related antenatal and Postnatal mortality in the population of seven Pakistani Punjab cities. J Med Genet 26:261.
Sharma JC, Sharma K and Mohan RS (1985) A study of some of the genetic traits in the Khond tribe of Orissa. J Ind Anth Soc 20:50.
Sharma RS, Kabir SMS, Baxi AJ, Shanbaug SR and Bhatia HM (1971) Haematological and Genetical studies in the Saraswat and Lohana communities. Proceedings o f the annual meetings o f Indian society o f Haematology and blood transfusion Manglore pp 27.
Sherman IJ (1940) The sickling phenomenon with special references to the differentiation of sickle cell anaemia from the sickle cell trait. Johns Hopk Hosp 103:8-25.
Siddoo JK, Siddoo SK, Chase WH, Morgan Dean L and Perry WH (1956) Thalassaemia in Sikhs Blood 11:197.
Singer and Fisher (1952) Studies on abnormal haemoglobin: the distribution of type S (sickle cell) haemoglobin and type F (alkali resistance) haemoglobin within the red cells population in sickle cell anaemia. Blood 7:1216.
Snow RW, Byass P, Shenton FC and Greenwood BM (1991) The relationship between Anthropometrivc measuremets and measurements of iron status and susceptibility to malaria in Gambian children. Trans R Soc Trop Med hyg 85:548.
Sovani NV and Dhandekar K (1955) Fertility Survey of Nasik Kolaba and Satara (north) District. Publication No 31, Gokhle Institute o f Politics and Economics
Stevenson AC, Johnstone HA, Stewart MIP, and Golding DR (1966) Congenital malformation: a report of a study of series of consecutive births in 24 centres. Bull WHO 34: supplement. 1-125.
Sukumaran PK and Master HR (1974) The distribution of abnormal haemoglobin in Indian population. Proc o f 1st conference o f Indian Society o f Human Genetics. 1:91.
Sukumaran PK (1974) Abnormal haemoglobins in India. In, Trends in Haematology (edited by N.N.Sen) pp 225.
Swaroop S, Bannerjee PG, Ghosh SK and Chatterjea JB (1965) Haemoglobin Barts in Bengale blood. Bull Calcutta Sch Trop Med 13:47.
Takizawa T, Yoneyama V, Miwa S and Voshida A (1987) A sigle nucleotide base transition is the base of the common human glucose 6 phosphate dehydrogenase variant A (+). Genomics 1:228
285
Tanner JM (1989) Foetus into Man Physical growth from conception to maturity: Second edition Castlemead Publications Ware P 160.
Thein SL, Wainscoat JS, Sampietro M, Old JM, Cappellini D, Fiorelli G, Modell B and Weatherall DJ (1987) Association of thalassaemia intermedia with a beta-globin gene haplotype. Brit J Haematol 65:367.
Thein SL, Hesketh C, Taylor P, Temperley J, Hutchinson RM, Old JM, Wood WG, Clegg JB and Weatherall DJ (1990) Molecular basis for dominant inherited inclusion body 6- thalassaemia. Proc Natl Acad Sci USA 87:3924.
Tillyer ML, Varawalla NY, Tillyer CR, Sandhu P and Modell B (1993) Screening for thalassaemia, abnormal haemoglobin and Iron deficiency in a British Asian Population (In Press)
Tiwary DN (1985) Primitive tribes of Madhya Pradesh. Government o f India publication, A strategy for tribal development, New Dehli.
Undevia JV, Gulati RK, Sukumaran PK, Bhatia HM, Master HR, Balakrishnan V and Sangvi LD (1981) Genetic variation in Tamil Nadu in Biology of the people of Tamil Nadu. Edited by ISHG and Anthropological society o f Calcutta.
Usanga EA and Luzzatto L (1985) Adaptation of plasmodium falciparum to glucose-6- phosphate dehydrogenase deficient host red cells by production of parasite encoded enzyme. Nature 313:793.
Van Ginnekin J (1974) Prolonged breast feeding as a birth spacing method. Studies in family planning. 5 (6).
Varawalla NY, Old JM, Sarkar R, Venkatesan R and Weatherall DJ (1991a) The spectrum of B-thalassaemia mutations on the Indian subcontinent: the basis for prenatal diagnosis. Br J Haematol 78:242-247.
Varawalla NY, Old JM and Weatherall DJ (1991b) Rare B-thalassaemia mutation in Asian Indian. Br J Haematol 79:640.
Vasantha K, Gorakhshakar AC, Pavri RS, and Bhatia HM (1982) Genetic markers in malaria endemic tribal population of Dadra and Nagar Havely. Proc Recent trends in Immuno haematology 162-168.
Veerraju P, Basu BR and Anand NE (1978) Red Cell Glucose 6 phosphate dehydrogenase deficiency among Andhas. Am J Phys Anthro 49:143.
Verma C, Wijnen J Th and Meera Khan P (1987) G6PD Punjab a dialysis sensitive variant of Human Glucose 6 Phosphate dehydrogenase. J Genet 66:17
Vidhyarthi LP (1983) Tribes of India-people of India:/», Some genetical aspects XV
286
International Congress o f Genetics. India December 12-21ICMR Publications New Delhi.
Vijay Chourasiya (1991) Personal Communication.
Vogel F and Motulsky AG (1986) Human Genetics problems and approach; 2nd edition. Verlag, Berlin, Heidelberg, New York Tokyo.
Vulliamy TJ, Urso MD, Battestuzzi G, Estrada, Foulkes NS, Martini G, Calalbro V, Poggi V, Giordano R, Town M, Luzzatto L and Perisco MG (1988) Diverse point mutation in the human Glucose 6 Phosphate Dehydrogenase gene cause enzyme deficiency and mild or severe haemolytic anaemia. Proc Natl Acad Sci 85:5171.
Vulliamy TJ, Othman A, Town M, Nathwani A, Falusi AG, Mason PJ, and Luzzatto L (1991) Polymorphic sites in the African population detected by sequence analysis of the glucose 6 phosphate dehydrogenase gene outline the evolution of the variants A and A-. Proc Natl Acad Sci USA. 88:8568.
Vyas GN, Bhatia HM, Sukumaran PK, Balakrishnan V, Sanghani LD (1962) Study of blood groups abnormal haemoglobins and other genetical characters in some tribes of Gujarat. Am J Phys Anth 20:255.
Washburn RE (1911) Peculiar and elongated red blood corpuscles in a case of severe anaemia. Virginia Med Semi-monthly 315:490.
Weatherall DJ and Clegg CB (1981) Thalassaemia Syndromes 3rd edition. Blackwell Scientific Publications, Oxford.
Weatherall DJ (1983) The diagnostic features of thé different forms of thalassaemia; In Methods in Haematology: The thalassaemias Edited by Weatherall DJ. Churchill Livingstone Edinburgh. PP 1-26.
Weber Max (1958) The religion of India. Macmillan and Co London.
WHO group (1967) Standardization of procedures for the study of glucose 6 phosphate dehydrogenase. WHO Technical Report series No 366.
WHO (1972) Nutritional anaemias WHO Technical report series No 503.
WHO (1975) Smoking and its effects on health. WHO Technical Report series No 568.
WHO report (1975b) The epidemiology of infertility. World Health Organization Technical Report series No 582.
WHO (1985) report on update of the Progress of Haemoglobinopathies control group for the community control of Hereditary Anaemias. Unpublished report o f the WHO : HMG/WG/85.8.

287
WHO (1987) Alpha Thalassaemia Unpublished report o f WH0:WH0/HDP/WG/HAÆ>1.5
WHO (1988) Smoking and its effect on health. WHO Technical Report series No 773.
WHO Bulletin (1989) Glucose 6 Phosphate Dehydrogenase deficiency. 67:6:601.
Winichagoon P, Thonglairoam V, Fucharoen S, Wilairat P, Fukumaki Y and Wasi P (1993) Severity differences in 6-thalassaemia/ haemoglobin E syndromes: Implication of genetic factors. Br J Haematol 83:633.
Wong SC, Ali MAM and Boyadiau SB (1981) Sickle cell trait in Canada. Trimodal distribution of HbS as a result of interaction with a-thalassaemia gene. Acta Haematol 65:157
Wood WG (1976) Haemoglobin synthesis during human fetal development. Br Med Bull 32:282.
Wright S (1922) Coefficients of Inbreeding and relationship Amer Nat. 56:330.
Wrightstone RN, Blackwell RG, Bunn HF, Heller P, Huisman THJ, Jones RT, Kleihauer EF, Koler RD, McCurdy PR, Schroeder WA and Winter WP (1988) Haemoglobin variants. International Haemoglobin Information Centre (IHIC) Comphrehensive Sickle Cell Centre Augusta, Georgia, USA.
Yoshida A (1973) Haemolytic anaemia and G6PD deficiency not in vitro activity of enzyme related to the severity of genetic disease. Science 179:532.
Zuckerman AJ and Harrison TJ (1990) Hepatitis B virus and Hepatitis D virus. In, Princiles and Practice o f Clincal Virology Second Ed. John Wiley & sons