10104205.pdf - UCL Discovery
289
AN ASSESSMENT OF THE ROLE OF STABILITY ON THE BEHAVIOUR OF DRUGS IN THE COLONIC ENVIRONMENT TIAGO JOSE TEIXEIRA BERNARDO DE SOUSA This thesis is submitted in partial fulfilment of the requirements for the degree of Doctor of Philosophy The School of Pharmacy University of London
-
Upload
khangminh22 -
Category
Documents
-
view
0 -
download
0
Transcript of 10104205.pdf - UCL Discovery

AN ASSESSMENT OF THE ROLE OF STABILITY
ON THE BEHAVIOUR OF DRUGS IN THE
COLONIC ENVIRONMENT
TIAGO JOSE TEIXEIRA BERNARDO DE SOUSA
This thesis is submitted in partial fulfilment of the requirements
for the degree of Doctor o f Philosophy
The School o f Pharmacy
University o f London

ProQuest Number: 10104205
All rights reserved
INFORMATION TO ALL USERS The quality of this reproduction is dependent upon the quality of the copy submitted.
In the unlikely event that the author did not send a complete manuscript and there are missing pages, these will be noted. Also, if material had to be removed,
a note will indicate the deletion.
uest.
ProQuest 10104205
Published by ProQuest LLC(2016). Copyright of the Dissertation is held by the Author.
All rights reserved.This work is protected against unauthorized copying under Title 17, United States Code.
Microform Edition © ProQuest LLC.
ProQuest LLC 789 East Eisenhower Parkway
P.O. Box 1346 Ann Arbor, Ml 48106-1346

To my parents

ACKNOWLEDGMENTS
First and foremost I would like to thank my supervisor Dr Abdul Basit for his tremendous help, encouragement and support since day one. It was under his guidance that I became passionate about research and I still am! I would have been lost without him.
My immense gratitude to my industrial supervisors: Prof Bertil Abrahamsson for his guidance and sound advice (and for always making me feel welcome in Molndal), Dr Ronnie Paterson for his enthusiasm and brainstorming discussions especially in the beginning of this project and to Dr Vanessa Moore for providing the determination needed to bring this project to a successful end.
I am indebted to AstraZeneca R&D for sponsoring this project and for making facilities and resources always so readily available. Special thanks to Anders Carlsson for always being there when needed and to Britta Polentarutti for all the help with the in vivo work. I’m also grateful to Dr Mohammed Yasin, Dr Claire Deadman and Phil Hayward for the precious help with the plasma sample analysis. Also thanks to Dr Iain Grant, Maria Andersson, Shanoo Ravalia and Dr Talia Buggins.
Many thanks to the staff at School o f Pharmacy, namely Sir Keith Barnes, Isabel Gonçalves, Catherine Baumber and John Frost for their kind help, Steve Coppard for help with the animal work and Sunny for sorting out HPLC problems.
I wish to thank all my friends and colleagues at SOP, past and present, namely: Matt (thanks for the Starbucks coffee breaks), Emma (thanks for the many proof reads and emotional support), Hala (I won’t forget the fun colonic surgeries at St George’s), Richard, Fang, Karolina, Basel, Roy, Rita, Lara, Paulo, Gabi, Ana, Luis, Stefan, Diane, Da, Meena, Peng, Jon Tutas, Felipe, Ding, Enosh, Chandra, Mike, Hamid, Mohammed A., Mohammed M. and Cyrus.
A big thank you to my brothers, sisters-in-law and nieces for providing such a loving environment for me: Luis, Sergio (I couldn’t have made it without you!), Teresa, Susana, Mariana and Carolina. Thanks to my closest extended family particularly: Tio Rogério, Tia Bina, Guida (thanks for the many texts), Ito and Rogério.
A few close friends had the patience to put up with me during these crazy times specially: Joana (thanks for your encouragement to start this), Lara Leijser, Ben, Helen (thanks for the proof reads!) and Mario.
I dedicate this thesis to my parents: to my father, the memory of his life keeps me going and to my mother, I continuously admire her courage and strength through the toughest hours in life.

Plagiarism Statement
This thesis describes research conducted in the School o f Pharmacy, University o f
London betw een 2004 and 2008 under the supervision o f Dr Abdul Basit. I certify
that the research described is original and that any parts o f the w ork that have been
conducted by collaboration are clearly indicated. 1 also certify that I have written all
the text herein and have clearly indicated by suitable citation any part o f this
dissertation that has already appeared in publication.
i' A c< c^__
Signature Date

Abstract
There are 100 trillion (lO''*) microbes in the human gastrointestinal tract, concentrated mainly in the
large intestine. They secrete a diverse array o f enzymes giving them an imm ense metabolic potential,
which has serious implications for drugs exposed to the large intestinal environm ent. The aim o f this
thesis was to investigate in vitro and in vivo factors that impact on the metabolic stability o f a series o f
compounds.
Analytical HPLC-UV methodologies were developed to quantify the model drugs sulfasalazine,
balsalazide, olsalazine, 5-aminosalicylic acid, sulindac and m etronidazole from a bacterially rich faecal
environment. LC/MS m ethodologies were developed for the sensitive analysis o f the model drugs from
plasma. A new and simple LC/MS method for the plasm a analysis o f captopril was also developed.
An easy and ready-to-use in vitro model fermenter to routinely test drug m olecules for bacteria-related
stability, using human faecal slurry, was developed and validated. Similarity was observed between
model drugs metabolic rates using faecal slurry collected from different volunteers. The slurry
concentration affects drug degradation and 10%w/v seems to com bine easier handling/accurate volume
m easurem ent with good metabolic activity. The use o f sm aller volum es (< lm l) and independent vials
(as opposed to 96 well plates) reduces the variability o f drug degradation rates. The presence o f
nutrients increases in vitro drug metabolism. In this in vitro model, drug stability in rat intestinal
contents and dog faecal material was also assessed, the contents o f these animals in vitro predict drug
metabolic trends obtained w ith human faecal slurries for the model drugs studied.
For the first time a fistulated dog model was used to study bacteria-related drug m etabolism in vivo and
successfully detected the appearance o f the bacterial drug metabolites in plasma. Furthermore the use
o f antibiotics for the study o f bacteria-related drug metabolism was assessed in vivo and further work is
required to fully assess the use o f antibiotics to assess bacteria-related drug stability in vivo.
Given the potentially serious implications o f bacterial m etabolism on drug perform ance or toxicity, an
assessm ent o f the action o f the microbiota should form an integral part o f the drug developm ent
process. Therefore the model developed in this thesis will be o f prim ary value to scientists working in
early drug development where new drug molecules/formulations are being developed that reach the
lower confines o f the gastrointestinal tract.

Table of contents
A C K N O W L E D G M E N T S ........................................................................................................................................................................ 3
P L A G I A R I S M S T A T E M E N T .............................................................................................................................................................. 4
A B S T R A C T ......................................................................................................................................................................................................... 5
T A B L E O F C O N T E N T S ........................................................................................................................................................................... 6
L I S T O F F I G U R E S .................................................................................................................................................................................... 13
L I S T O F T A B L E S .......................................................................................................................................................................................21
C H A P T E R 1: I N T R O D U C T I O N .................................................................................................................................................... 2 4
1 .1 . O v e r v i e w o f t h e h u m a n g a s t r o i n t e s t i n a l t r a c t .................................................................................... 25
1 .1 .1 . T h e s t o m a c h ........................................................................................................................................................................2 6
1 .1 .2 . T h e sm a ll in t e s t in e ..........................................................................................................................................................2 7
1 .1 .3 . T h e large in te s t in e ........................................................................................................................................................... 2 9
1 .2 . P h y s i o l o g y o f t h e g a s t r o i n t e s t i n a l t r a c t w it h f o c u s o n t h e m i c r o b i o t a ......................31
1 .3 . D r u g s AND THE MICROBIOTA.................................................................................................. ;....................................... 37
1 .4 . M o d e l s t o s t u d y in t e s t in a l b a c t e r i a - a s s o c i a t e d d r u g m e t a b o l i s m .....................................4 0
1 .4 .1 . A n im a l in vivo s tu d ie s .................................................................................................................................................. 41
1 .4 .1 .1 . E lu c id a t io n o f b a c te r ia l m e ta b o lis m b y c o m p a r in g b ile m e ta b o lite s w ith fa e c a l
m e ta b o l i t e s ...................................................................................................................................................................................... 41
1 .4 .1 .2 . E lu c id a tio n o f b a c te r ia l m e ta b o lis m b y c o m p a r in g lo w e r g u t m e ta b o lite s w ith u p p er
g u t m e ta b o l i t e s ..............................................................................................................................................................................41
1 .4 .1 .3 . E lu c id a tio n o f b a c ter ia l m e ta b o lis m b y c o m p a r in g g n o to b io t ic o r a n tib io t ic trea ted
a n im a ls w ith c o n v e n t io n a l a n im a ls ..................................................................................................................................4 2
1 .4 .2 . H u m a n in vivo s t u d ie s ...................................................................................................................................................4 4
1 .4 .2 .1 . E lu c id a t in g b a c te r ia l m e ta b o lis m b y c o m p a r in g e x te n d e d r e le a s e an d im m e d ia te
r e le a s e fo r m u la t io n s .................................................................................................................................................................. 4 4
1 .4 .2 .2 . E lu c id a t in g b a c ter ia l m e ta b o lis m b y c o m p a r in g in tr a v e n o u s d ru g d e liv e r y w ith ora l
d ru g d e l iv e r y .................................................................................................................................................................................. 4 5
6

1.4.2.3. Comparing metabolism in ileostomy patients with healthy volunteers.......................... 46
1.4.3. In vitro s tu d ie s ...................................................................................................................................... 46
1.4.3.1. Static batch cu ltu res ................................................................................................................... 47
1.4.3.2. Semi-continuous culture system s............................................................................................48
1.4.3.3. Continuous culture sy stem s..................................................................................................... 49
1.4.3.4. Simulator o f the human intestinal microbial ecosystem (SH IM E )...................................51
1.4.3.5. Com puter-controlled system with peristaltic mixing, water absorption and
absorption o f fermentation products......................................................................................................... 53
1.4.3.6. Immobilisation o f faecal m icrobiota...................................................................................... 54
1.5. D r u g m e t a b o l ic r e a c t i o n s p e r f o r m e d b y t h e g a s t r o i n t e s t i n a l m i c r o b i o t a 55
1.5.1. R eduction ................................................................................................................................................ 58
1.5.1.1. Azo reduction: prontosil, neoprontosil, sulfasalazine, balsalazide and olsalazine ..58
1.5.1.2. N itrazepam .................................................................................................................................... 64
1.5.1.3. C lonazepam ................................................................................................................................... 66
1.5.1.4. M isonidazole.................................................................................................................................67
1.5.1.5. O m eprazole................................................................................................................................... 68
1.5.1.6. Sulfinpyrazone............................................................................................................................. 68
1.5.1.7. Sulindac.......................................................................................................................................... 69
1.5.1.8. D igoxin........................................................................................................................................... 70
1.5.1.9. Z onisam ide.................................................................................................................................... 71
1.5.1.10. M etronidazole........................................................................................................................... 72
1.5.2. H ydrolysis............................................................................................................................................... 73
1.5.2.1. L actu lose........................................................................................................................................ 73
1.5.2.2. S orivudine......................................................................................................................................74
1.5.3. Removal o f succinate group: succinylsulfathiazole..................................................................... 75
1.5.4. Dehydroxylation: L -dopa.................................................................................................................... 76
1.5.5. Acétylation: 5-aminosalicylic a c id ...................................................................................................77
1.5.6. Deacetylation: phenacetin ................................................................................................................... 78
1.5.7. Cleavage o f N-oxide bond: ranitidine and n izatid ine .................................................................. 79
1.5.8. Proteolysis: Insulin and calcitonin.................................................................................................... 80
7
1.5.9. Denitration: Glyceryl trinitrate and isosorbide d in itra te ............................................................80
1.5.10. Amine formation and hydrolysis o f an amide linkage: chloram phenicol..............................82
1.5.11. Deconjugation: drugs excreted in bile as inactive con jugates................................................83
1.5.12. Thiazole ring-opening: Levam isole................................................................................................84
1.5.13. Isoxazole scission: R isperidone....................................................................................................... 85
1.5.14. Deglycosylation: Q uercetin-3-glucoside.......................................................................................86
1.5.15. N-demethylation: M etham phetam ine............................................................................................ 87
1.5.16. O ther chemical reac tio n s..................................................................................................................88
1.5.16.1. A zetirelin...................................................................................................................................... 88
1.5.16.2. Potassium oxonate......................................................................................................................89
1.5.16.3. Flucytosine...................................................................................................................................89
1.5.16.4. H esperidin ....................................................................................................................................90
1.5.16.5. D aidzein ....................................................................................................................................... 91
1.6. S u m m a r y ......................................................................................................................................................... 92
1.7 . A im s AND O b j e c t i v e s ..............................................................................................................................................................9 2
CHAPTER 2: ANALYTICAL METHOD DEVELOPMENT AND VALIDATION FOR THE
QUANTIFICATION OF MODEL DRUGS IN FAECAL AND PLASMA SAMPLES...................93
2 .1 . O v e r v i e w ........................................................................................................................................................................................ 9 4
2 .2 . In t r o d u c t i o n ...............................................................................................................................................................................9 4
2 .3 . C h a p t e r A IM S ...............................................................................................................................................................................9 9
2 .4 . M a t e r i a l s ....................................................................................................................................................................................1 0 0
2 .5 . M e t h o d s ........................................................................................................................................................................................1 0 4
2.5.1. Analysis o f model drugs in faecal samples using H PL C /U V ...............................................104
2.5.1.1. Preparation o f biological m a tr ix ............................................................................................ 104
2.5.1.2. Preparation o f stock and working standard so lu tio n s ...................................................... 104
2.5.1.3. Preparation o f calibration standards.......................................................................................105
2.5.1.4. Sample preparation p ro ced u re ................................................................................................105
2.5.1.5. Chromatographic conditions.................................................................................................. 106
2.5.2. Analysis o f model drugs in plasm a samples using LC M S /M S .......................................... 106
8

2.5.2.1. Preparation o f biological m a tr ix ............................................................................................106
2.5.2.2. Preparation o f stock and w orking standard so lu tio n s ..................................................... 108
2.5.2.3. Preparation o f calibration standards..................................................................................... 108
2.5.2.4. Sample preparation p ro ced u re ...............................................................................................109
2.5.2.5. Chrom atographic cond itions.................................................................................................. 110
2.5.3. Bio-analytical m ethod validation ................................................................................................... 113
2.5.3.1. Linearity (standard calibration cu rv es)...............................................................................113
2.5.3.2. S pecificity ....................................................................................................................................113
2.5.3.3. Limit o f detection and limit o f quantification....................................................................113
2.5.3.4. Precision and accuracy ............................................................................................................. 114
2.5.3.5. Extraction recovery ................................................................................................................... 114
2 .6 . R e s u l t s a n d d i s c u s s i o n ..................................................................................................................................................115
2.6.1. For HPLC/UV detection from faecal sam ples........................................................................... 115
2.6.1.1. Sample p repara tion ................................................................................................................... 115
2.6.1.2. Retention tim e s .......................................................................................................................... 115
2.6.1.3. Linearity, correlation coefficient, precision, accuracy, limit o f detection and limit o f
quan tifica tion ................................................................................................................................................. 123
2.6.2. For LC/M S/M S detection from plasm a sam p les.......................................................................125
2.6.2.1. Sample p repara tion ................................................................................................................. 125
2.6.2.2. Retention tim e s ...........................................................................................................................126
2.6.2.3. Linearity, correlation coefficient, precision, accuracy, limit o f detection and limit o f
quan tifica tion ................................................................................................................................................. 131
2 .7 . C h a p t e r c o n c l u s i o n s ........................................................................................................................................................1 3 2
CHAPTER 3: STUDIES USING FAECAL MATERIAL FROM HUMANS TO ASSESS DRUG
STABILITY IN THE DISTAL GASTROINTESTINAL TRACT.......................................................133
3.1. O v e r v i e w ....................................................................................................................................................... 134
3.2. In t r o d u c t i o n ............................................................................................................................................... 134
3.2.1. Variability in culture source (hum an faecal m aterial) between individuals for the
purposes o f drug m etabolism ........................................................................................................................... 137
9

3.2.2. Concentration o f the culture sou rce...............................................................................................137
3.2.3. Volume o f the in vitro fem ien te r....................................................................................................138
3 .2 .4 . Culture medium com position..........................................................................................................138
3.2.5. Comparison o f in vitro metabolism o f the drugs sulfasalazine, balsalazide, olsalazine,
sulindac and m etron idazole.............................................................................................................................139
3 .3 . C h a p t e r A IM S ............................................................................................................................................................................141
3 .4 . M a t e r i a l s ................................................................................................................................................................................... 141
3 .5 . M e t h o d s ....................................................................................................................................................................................... 143
3.5.1. Variability in culture source (human faecal material) between individuals for the
purposes o f drug m etabolism ...........................................................................................................................143
3.5.2. Concentration o f culture source ...................................................................................................... 146
3.5.3. Volume o f the in vitro batch ferm en ter........................................................................................ 146
3.5.4. Culture medium com position.......................................................................................................... 147
3.5.5. Com parison o f in vitro metabolism o f the drugs sulfasalazine, balsalazide, olsalazine,
sulindac and m etron idazole............................................................................................................................. 148
3 .6 . R e s u l t s a n d D i s c u s s i o n ...................................................................................................................................................15 0
3.6.1. Variability in culture source (human faecal material) between individuals for the
purposes o f drug m etabolism ...........................................................................................................................150
3.6.2. Concentration o f culture source ...................................................................................................... 151
3.6.3. Volume o f the in vitro batch ferm en ter........................................................................................ 156
3.6.4. Culture medium com position.......................................................................................................... 159
3.6.5. Com parison o f in vitro metabolism o f the drugs sulfasalazine, balsalazide, olsalazine,
sulindac and m etron idazole............................................................................................................................. 162
3 .7 . C h a p t e r CONCLUSIONS........................................................................................................................................................ 1 6 9
CHAPTER 4: STUDIES USING CAECAL, COLONIC AND FAECAL CONTENTS FROM
RAT TO ASSESS DRUG STABILITY IN THE DISTAL GASTROINTESTINAL TR A C T.... 171
4 .1 . O v e r v i e w ...................................................................................................................................................................................... 17 2
4 .2 . In t r o d u c t i o n .............................................................................................................................................................................173
4.2.1. Physiology o f the rat gastrointestinal t r a c t ...................................................................................181
10

4.2.1.1. Transit times in the rat gastrointestinal trac t..................................................................... 182
4.2.1.2. The pH o f the rat gastrointestinal tract................................................................................. 183
4.2.1.3. The water content in the rat gastrointestinal trac t..............................................................184
4.3. C h a p t e r A IM S ...............................................................................................................................................184
4.4. M a t e r i a l s .....................................................................................................................................................185
4.5. M e t h o d s .........................................................................................................................................................185
4.5.1. Quantification o f water from rat intestinal con ten ts..................................................................185
4.6. R e s u l t s a n d d i s c u s s i o n ..........................................................................................................................187
4.6.1. The use o f rat gastrointestinal contents to study drug stability ................................................187
4 .7 . C h a p t e r CONCLUSIONS....................................................................................................................................................... 2 0 3
CHAPTER 5: IN VITRO-IN VIVO CORRELATION OF BACTERIA-RELATED DRUG
STABILITY BY THE USE OF A DOG MODEL.................................................................................... 205
5.1. O v e r v i e w .......................................................................................................................................................206
5 .2 . In t r o d u c t i o n ........................................................................................................................................................................... 2 0 7
5.2.1. Physiology o f the dog gastrointestinal trac t.................................................................................207
5 .2 .2 . The fistulated dog m o d e l ........................................................................................................................................ 2 0 9
5.2.3. Use o f dog fistulated model to assess the in vitro-in vivo correlation o f bacteria-related
stability o f model d ru g s.................................................................................................................................. 211
5.2.4. An investigation into the use o f antibiotic therapy to assess in vivo bacteria-related
stability o f model d ru g s....................................................................................................................................213
5 .3 . C h a p t e r a i m s ........................................................................................................................................................................... 2 1 7
5 .4 . M a t e r i a l s .................................................................................................................................................................................. 2 1 7
5.5. M e t h o d s ..................................................... 218
5.5.1. The use o f dog faecal material to study in vitro bacteria-associated drug stability and an
investigation into the effect o f antibiotic therapy in bacteria’s m etabolic activity in vitro in the
dog 218
5.5.2. Solubility measurem ents o f sulfasalazine, balsalazide, olsalazine, sulindac and
metronidazole using different vehicle form ulations.................................................................................220
5.5.3. In vitro drug stability o f sulfasalazine in a vehicle formulation with dog faecal slurry 220
11

5 .5 .4 . Use o f dog fistulated model to assess the in vitro-in vivo correlation o f bacteria-related
stability o f model d ru g s....................................................................................................................................221
5 .5 .5 . An investigation into the use o f antibiotic therapy to assess in vivo bacteria-related
stability o f model d ru g s ....................................................................................................................................223
5 .6 . R e s u l t s a n d d i s c u s s i o n ................................................................................................................................................ 2 2 4
5 .6 .1 . The use o f dog faecal material to study in vitro bacteria-associated drug stability and an
investigation into the effect o f antibiotic therapy in bacteria’s metabolic activity in the dog...... 224
5 .6 .2 . Solubility measurem ents o f sulfasalazine, balsalazide, olsalazine, sulindac and
metronidazole using different vehicle form ulations.................................................................................23 1
5 .6 .3 . In vitro drug stability o f sulfasalazine in a vehicle formulation with dog faecal slurry 2 3 5
5 .6 .4 . Use o f dog fistulated model to assess the in vivo colonic stability o f sulfasalazine,
balsalazide and o lsalazine................................................................................................................................2 3 6
5 .6 .5 . An investigation into the use o f antibiotic therapy to assess in vivo bacteria-related
stability o f model d ru g s ....................................................................................................................................249
5 .7 . C h a p t e r CONCLUSIONS......................................................................................................................................................2 6 5
CHAPTER 6: GENERAL DISCUSSIONS AND FUTURE W O R K ..................................................268
6 .1 . F u t u r e WORK............................................................................................................................................................................2 7 2
REFERENCES.................................................................................................................................................. 274
12
List of figuresFigure 1.1: Anatomy o f the Gastrointestinal Tract in Man
(http://www.thomhtfulhouse.or2/ima2es/awaker1eld-llO 5e.ip2. no d a te) .......................................26
Figure 1.2: Total bacterial numbers in the distal gastrointestinal tract obtained from human sudden
death victims (n=10). I, ileum; C, caecum; A, ascending colon; T, transverse colon; D,
descending colon; and S/R, sigmoid/rectum (adapted from Macfarlane and Macfarlane, 2004). 32
Figure 1.3: Single stage continuous culture system (adapted from Macfarlane et al., 1989)...................50
Figure 1.4: The three-stage compound continuous culture system (adapted from Macfarlane et al. 1998)
.......................................................................................................................................................................51
Figure 1.5: Schematic representation o f the Simulator o f the Human Intestinal Microbial Ecosystem
(SHIME) (adapted from De Boever et al., 2000).................................................................................52
Figure 1.6: Schematic presentation o f the system to simulate conditions in the large intestine. A mixing
units; B pH electrode; C alkali pump; D dialysis pump; E dialysis light; F dialysis circuit with
hollow fibres; G level sensor; H water absorption pump; I peristaltic valve pump; J gas outlet
with water lock (adapted from Minekus et al. 1999)............................................................................ 54
Figure 1.7: Proposed reactions for the azo reduction o f prontosil (A), neoprontosil (B), sulfasalazine
(C), balsalazide (D) and olsalazine (E)................................................................................................... 65
Figure 1.8: Proposed reaction for the reduction of nitrazepam......................................................................66
Figure 1.9: Proposed reaction for the reduction o f clonazepam................................................................... 67
Figure 1.10: Proposed reaction for the metabolism o f misonidazole..........................................................67
Figure 1.11: Proposed reaction for the metabolism of omeprazole............................................................ 68
Figure 1.12: Proposed reaction for the reduction o f sulfinpyrazone.............................................................69
Figure 1.13: Proposed reaction for the metabolism o f sulindac................................................................... 69
Figure 1.14: Proposed reaction for the metabolism o f digoxin.................................................................... 71
Figure 1.15: Proposed reaction for the metabolism o f zonisamide............................................................. 72
Figure 1.16: Proposed reaction for the metabolism o f metronidazole........................................................73
Figure 1.17: Proposed reaction for the metabolism of lactulose..................................................................74
Figure 1.18: Proposed reaction for the hydrolysis o f sorivudine................................................................. 75
13

Figure 1.19: Proposed mechanism for the lethal toxicity o f sorivudine and 5-fluorouracil in humans and
rats (adapted from Okuda et al., 1998)........................................................................................................... 75
Figure 1.20: Proposed reaction for the m etabolism o f succinylsulfathiazole...............................................76
Figure 1.21 : Proposed reaction for the metabolism o f L -d o p a ......................................................................... 77
Figure 1.22: Proposed reaction for the m etabolism o f 5-aminosalicylic ac id ...............................................78
Figure 1.23: Proposed m echanism for the metabolism o f phenace tin .............................................................. 78
Figure 1.24: Proposed reaction for the metabolism o f ranitidine......................................................................79
Figure 1.25: Proposed reaction for the m etabolism of n izatid ine.....................................................................79
Figure 1.26: Proposed reaction for the metabolism o f glyceryl trin itra te ...................................................... 81
Figure 1.27: Proposed reaction for the m etabolism o f isosorbide d in itra te ...................................................81
Figure 1.28: Proposed reaction for the m etabolism o f chloram phenicol....................................................... 82
Figure 1.29: Proposed reaction for the metabolism o f levam isole.................................................. 85
Figure 1.30: Proposed reaction for the m etabolism o f risperidone.................................................................. 86
Figure 1.31: Proposed reaction for the metabolism o f quercetin-3-glucoside..............................................87
Figure 1.32: Proposed reaction for the n-demethylation o f m etham phetam ine........................................... 88
Figure 1.33: Proposed reaction for the m etabolism o f potassium o xonate ....................................................89
Figure 1.34: Proposed reaction for the metabolism o f flucy tosine.................................................................. 90
Figure 1.35: Proposed reaction for the m etabolism o f hesperid in ................................................................... 90
Figure 1.36: Proposed reactions for the m etabolism o f daidzein ........................................................................91
Figure 2.1: Chemical structure o f chosen model drugs........................................................................................102
Figure 2.2: Representative chromatogram o f blank faecal slurry (A) and faecal slurry spiked with
sulfasalazine (*) at 500|iM (B )...................................................................................................................... 117
Figure 2.3: Representative chromatogram o f blank faecal slurry (A) and faecal slurry spiked with
balsalazide (*) at 500pM (B )..........................................................................................................................118
Figure 2.4: Representative chromatogram o f blank faecal (A) and faecal slurry spiked with olsalazine
(*) at 500pM (B)..................................................................................................................................................119
Figure 2.5: Representative chromatogram o f blank faecal slurry (A) and faecal slurry spiked with 5-
am inosalicylic acid (*) at 250pM (B )............................................................................................................120
Figure 2.6: Representative chromatogram o f blank faecal slurry (A) and faecal spiked with sulindac (*)
at 500pM (B )........................................................................................................................................................121
14

Figure 2.7; Representative chromatogram o f blank faecal slurry (A) and faecal slurry spiked with
metronidazole (*) at 500pM (B )..................................................................................................................... 122
Figure 2.8: Representative chromatogram o f blank dog plasm a spiked with sulfasalazine at a
concentration o f 5 i]g /m l....................................................................................................................................127
Figure 2.9: Representative chromatogram o f blank dog plasm a spiked with balsalazide at a
concentration o f 1000T]g/ml.............................................................................................................................127
Figure 2.10: Representative chrom atogram o f blank dog plasm a spiked with olsalazine at a
concentration o f IGOOrig/ml.............................................................................................................................128
Figure 2.11: Representative chrom atogram o f blank dog plasm a spiked with 5-aminosalicylic acid at a
concentration o f lOOrig/ml...............................................................................................................................128
Figure 2.12: Representative chromatogram o f blank dog plasm a spiked with sulindac at a concentration
o f lO rig/m l.............................................................................................................................................................129
Figure 2.13: Representative chromatogram o f blank dog plasm a spiked with metronidazole at a
concentration o f 5rig/ml (limit o f de tec tion )...............................................................................................129
Figure 2.14: Representative chromatogram o f blank dog plasm a spiked with captopril at a
concentration o f 2r|g/m l (limit o f detec tion )...............................................................................................130
Figure 3.1: Picture o f the anaerobic workstation (A) and diagram o f anaerobic workstation containing a
representation o f the static batch culture ferm enter ( B ) .......................................................................... 144
Figure 3.2: Sulfasalazine incubation with faecal slurry prepared from 5 different volunteers 150
Figure 3.3 : In vitro stability o f sulfasalazine (A) and 5-am inosalicylic acid formation during
sulfasalazine incubation (B), using different percentages o f faecal slurry (46.7%, 16.7% , 10%,
5% and 2 % ) .......................................................................................................................................................... 153
Figure 3.4 : 5-Am inosalicylic acid incubation using different percentages o f pooled human faecal
slurry (46.7%, 16.7% and 10%).......................................................................................................................156
Figure 3.5: In vitro stability o f sulphasalazine using different volum es o f ferm enter during incubation
(10% pooled faecal s lu r ry ) ...............................................................................................................................157
Figure 3.6: Sulfasalazine stability incubated using a final volum e o f 600pl in a 96 deep well plate... 159
15

Figure 3.7: In vitro stability o f sulfasalazine (A) and 5-aminosalicylic acid formation (B) during in
vitro stability study o f sulfasalazine, using pooled faecal slurry prepared with different nutritious
m edia...................................................................................................................................................................... 161
Figure 3.8 \ In vitro stability o f sulfasalazine, balsalazide and olsalazine (A) and 5-aminosalicylic acid
formation from sulphasalazine, balsalazide and olsalazine (B), using pooled faecal slurry 164
Figure 3.9: Sulindac in vitro fermentation using pooled human faecal s lu rry ..............................................168
Figure 3.10: M etronidazole in vitro fermentation using pooled human faecal slurry.................................169
Figure 4.1: Azo reduction o f (a) Direct Black 38 (160nmol), (b) Direct Red 2 (233nmol), (c) Direct
Blue 15 (188nm ol) by anaerobic bacterial suspensions from human faeces (), from monkey
faeces () and rat intestinal contents (); (Cerniglia et al., 1982)............................................................. 176
Figure 4.2: Degradation o f morin, hesperitin, kampferol and luteolin by rat, rabbit and human faecal
bacteria (adapted from Lin et al., 2003)...................................................................................................... 177
Figure 4.3: Nitroreduction o f 6-nitrochrysene to 6-aminochrysene by anaerobic bacterial suspensions
from human faeces () and from mouse () and rat () intestinal contents (M anning et al., 1988).. 179
Figure 4.4: Diagram o f the rat gastrointestinal tract (adapted from Kararli, 1995)................................... 181
Figure 4.5: pH o f the rat gastrointestinal tract (adapted from M cConnell et al., 2008)........................... 183
Figure 4.6: Sulfasalazine in-vitro stability using 10% slurry o f faecal, colonic and caecal rat contents
(rat 1 ) ..................................................................................................................................................................... 189
Figure 4.7: Sulfasalazine in-vitro stability using 10% slurry o f faecal, colonic and caecal rat contents
(rat 2 ) ..................................................................................................................................................................... 189
Figure 4.8: Sulfasalazine in-vitro stability using 10% slurry o f faecal, colonic and caecal rat contents
(rat 3 ) ..................................................................................................................................................................... 190
Figure 4.9: Balsalazide in-vitro stability using 10% slurry o f faecal, colonic and caecal rat contents (rat
1)..............................................................................................................................................................................192
Figure 4.10: Balsalazide in-vitro stability using 10% slurry o f faecal, colonic and caecal rat contents
(rat 2 ) ..................................................................................................................................................................... 192
Figure 4.11: Balsalazide in-vitro stability using 10% slurry o f faecal, colonic and caecal rat contents
(rat 3 ) ....................................................... 193
Figure 4.12: Olsalazine in-vitro stability using 10% slurry o f faecal, colonic and caecal rat contents (rat
1)..............................................................................................................................................................................193
16

Figure 4.13: Olsalazine in-vitro stability using 10% slurry o f faecal, colonic and caecal rat contents (rat
2 ) ..............................................................................................................................................................................194
Figure 4.14: Olsalazine in-vitro stability using 10% slurry o f faecal, colonic and caecal rat contents (rat
3 ) ..............................................................................................................................................................................194
Figure 4.15 : Sulfasalazine, balsalazine and olsalazine in-vitro stability using 10% slurry o f faecal
contents (mean±SD values from rats 1 -3)................................................................................................... 196
Figure 4.16 : Sulfasalazine, balsalazine and olsalazine in-vitro stability using 10% slurry o f colonic
contents (mean±SD values from rats 1 -3)................................................................................................... 196
Figure 4.17 : Sulfasalazine, balsalazine and olsalazine in-vitro stability using 10% slurry o f caecal
contents (mean±SD values from rats 1-3)....................................................................................................197
Figure 4.18 : Sulindac in-vitro stability using 10% slurry o f faecal, colonic and caecal rat contents (rat
2 ) ..............................................................................................................................................................................199
Figure 4.19 : Sulindac in-vitro stability using 10% slurry o f faecal, colonic and caecal rat contents (rat
3 ) ..............................................................................................................................................................................199
Figure 4.20 : Sulindac in-vitro stability using 10% slurry o f faecal, colonic and caecal rat contents (rat
4 ) ............................................................................................................................................................................. 200
Figure 4.21: Sulindae in-vitro stability using 10% slurry o f faecal, colonic and caecal rat contents (rat
5 ) ............................................................................................................................................................................. 200
Figure 4.22 : M etronidazole in-vitro stability using 10% slurry o f faecal, colonic and caecal rat contents
(rat 2 ) .....................................................................................................................................................................201
Figure 4.23 : M etronidazole in-vitro stability using 10% slurry o f faecal, colonic and caecal rat contents
(rat 3 ) .....................................................................................................................................................................201
Figure 4.24 : M etronidazole in-vitro stability using 10% slurry o f faecal, colonic and caecal rat contents
(rat 4 ) .....................................................................................................................................................................202
Figure 4.25 : M etronidazole in-vitro stability using 10% slurry o f faecal, colonic and caecal rat contents
(rat 5 ) .....................................................................................................................................................................202
Figure 5.1: Diagram o f the dog gastrointestinal tract (adapted from Sutton, 2 0 0 4 )...................................208
Figure 5.2: Schematic representation o f the fistulated dog model and the site o f drug adm inistration 210
17

Figure 5.3: Sulfasalazine in-vitro stability using 10% dog faecal slurry, pooled slurry from 4 dogs,
fresh faecal samples collected before (A) and after (B) the dogs were under a two week large
spectrum antibiotic th e ra p y ............................................................................................................................ 226
Figure 5.4: Balsalazide in-vitro stability using 10% dog faecal slurry, pooled slurry from 4 dogs, fresh
faecal samples collected before (A) and after (B) the dogs were under a two week large spectrum
antibiotic therapy ............................................................................................................................................... 227
Figure 5.5: O lsalazine in-vitro stability using 10% dog faecal slurry, pooled slurry from 4 dogs, fresh
faecal samples collected before (A) and after (B) the dogs were under a two week large spectrum
antibiotic the rapy ............................................................................................................................................... 228
Figure 5.6: M etronidazole in-vitro stability using 10% dog faecal slurry, pooled slurry from 4 dogs
(fresh faecal samples collected after the dogs were under a two week large spectrum antibiotic
therapy)................................................................................................................................................................. 229
Figure 5.7: Sulindac in-vitro stability using 10% dog faecal slurry, pooled slurry from 4 dogs, fresh
faecal samples collected before (A) and after (B) the dogs were under a two week large spectrum
antibiotic the rapy ............................................................................................................................................... 230
Figure 5.8: In vitro stability o f sulfasalazine in the same vehicle formulation to be adm inistered in vivo
(5% solutol, pH 8.7) using pooled dog faecal s lu rry ............................................................................... 236
Figure 5.9: Sulfasalazine and 5-aminosalicylic acid plasm a concentration-tim e profiles after the
adm inistration o f sulfasalazine solution in Dog A ...................................................................................238
Figure 5.10: Sulfasalazine and 5-aminosalicylic acid plasm a concentration-tim e profiles after the
adm inistration o f sulfasalazine solution in Dog B .................................................................................... 238
Figure 5.11 : Sulfasalazine and 5-aminosalicylic acid plasm a concentration-tim e profiles after the
adm inistration o f sulfasalazine solution in Dog C .................................................................................... 239
Figure 5.12: Sulfasalazine and 5-aminosalicylic acid plasm a concentration-tim e profiles after the
adm inistration o f sulfasalazine solution in Dog D ...................................................................................239
Figure 5.13: Sulfasalazine and 5-aminosalicylic acid plasm a concentration-tim e profiles after the
adm inistration o f sulfasalazine solution in the four dogs (A) and its m ean ±SD (B )..................... 240
Figure 5.14 : Balsalazide and 5-aminosalicylic acid plasma concentration-tim e profiles after the
adm inistration o f balsalazide solution in Dog A ...................................................................................... 241
18

Figure 5.15 : Balsalazide and 5-aminosalicylic acid plasma concentration-tim e profiles after the
adm inistration o f balsalazide solution in Dog B ...................................................................................... 241
Figure 5.16 ; Balsalazide and 5-aminosalicylic acid plasma concentration-tim e profiles after the
adm inistration o f balsalazide solution in Dog C ........................................................................................242
Figure 5.17 : Balsalazide and 5-aminosalicylic acid plasma concentration-time profiles after the
adm inistration o f balsalazide solution in Dog D ...................................................................................... 242
Figure 5.18: Balsalazide and 5-aminosalicylic acid plasm a concentration-tim e profiles after the
adm inistration o f balsalazide solution in the four dogs (A) and its mean±SD (B)........................ 243
Figure 5.19 ; Olsalazine and 5-aminosalicylic acid plasma concentration-tim e profiles after the
adm inistration o f olsalazine solution in Dog A .........................................................................................244
Figure 5.20 : Olsalazine and 5-aminosalicylic acid plasma concentration-time profiles after the
adm inistration o f olsalazine solution in Dog B .........................................................................................244
Figure 5.21 : Olsalazine and 5-aminosalicylic acid plasma concentration-time profiles after the
adm inistration o f olsalazine solution in Dog C .........................................................................................245
Figure 5.22 : Olsalazine and 5-aminosalicylic acid plasma concentration-time profiles after the
administration o f olsalazine solution in Dog D .........................................................................................245
Figure 5.23: Olsalazine and 5-aminosalicylic acid plasma concentration-tim e profiles after the
adm inistration o f olsalazine solution in the four dogs (A) and its mean±SD ( B ) ...........................246
Figure 5.24: Mean (±SD) plasma concentration-time profiles for sulfasalazine, balsalazide and
olsalazine and their metabolite 5-aminosalicylic acid after their adm inistration in so lu tio n 247
Figure 5.25: Sulindac plasm a concentration-time profile before and after antibiotic therapy in Dog A;
(samples were taken up to 48 hours but only plasm a concentrations up to 24 hours are shown for
clarity )................................................................................................................................................................... 251
Figure 5.26: Sulindac plasm a concentration-time profile before and after antibiotic therapy in Dog B;
(sam ples were taken up to 48 hours but only plasm a concentrations up to 24 hours are show n for
clarity )................................................................................................................................................................... 251
Figure 5.27: Sulindac plasm a concentration-time profile before and after antibiotic therapy in Dog C;
(samples were taken up to 48 hours but only plasm a concentrations up to 24 hours are shown for
clarity )................................................................................................................................................................... 252
19

Figure 5.28; Sulindac plasma concentration-tim e profile before and after antibiotic therapy in Dog D;
(samples were taken up to 48 hours but only plasma concentrations up to 24 hours are shown for
clarity).................................................................................................................................................................... 252
Figure 5.29: Sulindac plasma concentration-tim e profile before and after antibiotic therapy in the four
dogs (A) and its mean±SD profiles (B); (sam ples were taken up to 48 hours but only plasma
concentrations up to 24 hours are shown for c la r ity ) ...............................................................................253
Figure 5.30: M etronidazole plasma concentration-tim e profile before and after antibiotic therapy in
Dog A .................................................................................................................................................................... 254
Figure 5.31: M etronidazole plasm a concentration-tim e profile before and after antibiotic therapy in
Dog B ..................................................................................................................................................................... 254
Figure 5.32: M etronidazole plasm a concentration-tim e profile before and after antibiotic therapy in
D o g C ..................................................................................................................................................................... 255
Figure 5.33: M etronidazole plasma concentration-tim e profile before and after antibiotic therapy in
D o g D .................................................................................................................................................................... 255
Figure 5.34: Metronidazole plasma concentration-tim e profile before and after antibiotic therapy in the
four dogs (A) and its mean±SD (B )............................................................................................................... 256
Figure 5.35: Captopril plasm a concentration-tim e profiles before and after antibiotic therapy in Dog A
................................................................................................................................................................................. 257
Figure 5.36: Captopril plasm a concentration-tim e profiles before and after antibiotic therapy in Dog B
................................................................................................................................................................................. 257
Figure 5.37: Captopril plasm a concentration-tim e profiles before and after antibiotic therapy in Dog C
................................................................................................................................................................................. 258
Figure 5.38: Captopril plasm a concentration-tim e profiles before and after antibiotic therapy in Dog D
................................................................................................................................................................................. 258
Figure 5.39: Captopril plasm a concentration-tim e profiles before and after antibiotic therapy in the four
dogs (A) and its mean±SD profiles (B ) ........................................................................................................259
20

List of tablesTable 1.1: Types o f studies perform ed on drug substrates for the gastrointestinal microbiota that
indicate bacterial m etabo lism ............................................................................................................................57
Table 2.1 : Preparation o f calibration standards for faecal s lu rry ......................................................................105
Table 2.2: Chrom atographic conditions for faecal sample detection o f sulfasalazine, balsalazide,
olsalazine, 5-aminosalicylic acid, sulindac and m etronidazole............................................................. 107
Table 2.3: Preparation o f calibration standards for plasm a sam ples................................................................108
Table 2.4: Chrom atographic conditions for the plasma detection o f sulfasalazine, balsalazide,
olsalazine, 5-aminosalicylic acid, sulindac, m etronidazole and captopril.........................................111
Table 2.5: M ass spectrom eter parameters for the detection o f sulfasalazine, balsalazide, olsalazine, 5-
am inosalicylic acid, sulindac, m etronidazole and captopril in plasm a sam ples..............................112
Table 2.6: Drug retention times using HPLC m ethodology for faecal quantification o f sam ples 123
Table 2.7: Linearity, correlation coefficient, precision, accuracy, lim it o f detection (LOD) and limit o f
quantification (LOQ) for the analytical m ethod o f the model drugs in faecal samples. M ean ±SD,
N - 5 ..........................................................................................................................................................................124
Table 2.8: Efficiency o f extraction procedure for sulfasalazine, balsalazide and 5-aminosalicylic acid
from plasm a sam p les ..........................................................................................................................................126
Table 2.9: Drug retention times using LC/M S/M S m ethodology for plasm a quantification o f samples
.................................................................................................................................................................................. 130
Table 2.10: Linearity, correlation coefficient, accuracy, limit o f detection (LOD) and limit o f
quantification (LOQ) for the analytical m ethod o f the m odel drugs in plasm a samples. M ean
±SD, N = 5 ...............................................................................................................................................................131
Table 3.1: D ifferent variables described in the literature to study in vitro bacteria-related drug stability
.................................................................................................................................................................................. 136
Table 3.2: Quantitative com position o f Saline phosphate buffer pH 6.8 .......................................................... 141
Table 3.3: Quantitative com position o f Schaedler Anaerobic B ro th ................................................................ 142
Table 3.4: Quantitative com position o f Brain Heart Infusion............................................................................. 143
Table 3.5: Details for slurry preparation and ferm entation experim ents com paring faecal slurry from
different individuals............................................................................................................................................ 145
21

Table 3.6; Details for slurry preparation and fermentation experiments com paring different
concentrations o f culture sou rce .....................................................................................................................146
Table 3.7: Details for slurry preparation and fermentation experim ents comparing different volum es o f
batch fen u e n te rs ................................................................................................................................................. 147
Table 3.8: Details for slurry preparation and fermentation experiments com paring different culture
m e d ia ..................................................................................................................................................................... 148
Table 3.9: Details for slurry preparation and fermentation experiments comparing different drugs.... 149
Table 3.10: Average coefficient variation o f drug concentration using different volumes o f ferm enters
..................................................................................................................................................................................158
Table 3.11. Urinary and faecal excretion (over 24-96h) o f total 5-aminosalicylic acid (% o f dose)
following oral administration o f various azo-prodrugs adaptaded from (Sandbom and Hanauer,
2003)...................................................................................................................................................................... 167
Table 4.1. Com parison between pH and bacterial numbers between animal species and man (adapted
from Rowland et al., 1986, Smith, 1965, Evans et al., 1988, Salminen et al., 1998) (ND: not
determ ined)...........................................................................................................................................................174
Table 4.2. Bacterial numbers and enzyme activities o f caecal contents or faeces from different animal
species. (Rowland et al., 1986)........................................................................................................................175
Table 4.3. Percent conversion o f 7-Nitrobenz[a]anthracene to 7-Am inobenz[a]anthracene by intestinal
bacteria (adapted from More head et a!., 1994)...........................................................................................178
Table 4.4. Summary o f the percent o f total metabolite found for the metabolism o f 1-Nitropyrene
(adapted from King et al., 1990)................................................................................................................... 180
Table 4.5: Average length post mortem o f the gastrointestinal tract o f humans and rats (adapted from
Kararli, 1995)...................................................................................................................................................... 182
Table 4.6: Distribution o f water content in the rat gastrointestinal tract (adapted from M cConnell et al.,
2 0 0 8 ).......................................................................................................................................................................184
Table 4.7: Drugs tested in each rat (due to very limited contents available not all drugs were able to be
tested in all rats but a minimum o f three rats were used for each drug)..............................................186
Table 4.8: Details for slurry preparation and fermentation experim ents com paring different locations in
the rat intestine and com paring different d ru g s ........................................................................................ 187
22

Table 4.9: Percentage o f water present in the gastrointestinal contents collected from five rats (n.d.: not
determ ined due to very limited am ount).......................................................................................................188
Table 5.1: Average length post mortem o f the gastrointestinal tract o f dogs (adapted from Kararli,
1995)...................................................................................................................................................................... 209
Table 5.2: Summary data for plasm a pharm acokinetics o f sulfasalazine, balsalazide and olsalazine
when adm inistered to healthy human volunteers; 5-ASA (5-aminosalicylic acid) (adapted from
Sandborn and Hanauer, 2 0 0 3 )....................................................................................................................... 212
Table 5.3: Summary data for urinary and faecal excretion o f 5-aminosalicylic acid (5-ASA) and parent
com pound following adm inistration o f sulfasalazine, balsalazide and olsalazine in human healthy
volunteers (adapted from Sandbom and Hanauer, 2 0 0 3 )....................................................................... 213
Table 5.4: Details for slurry preparation and fermentation experim ents using dog faecal m ateria l 219
Table 5.5: Sulfasalazine solubility using different vehicle form ulations......................................................232
Table 5.6: Balsalazide solubility with different vehicle form ulations...........................................................233
Table 5.7: Olsalazine solubility with different vehicle form ulations.............................................................233
Table 5.8: Sulindac solubility with different vehicle form ulations................................................................ 234
Table 5.9: M etronidazole solubility with different vehicle fo rm ulations.....................................................234
Table 5.10: Summary o f mean pharm acokinetic data (±SD) for parent drug and metabolites after the
three adm inistrations in solution.....................................................................................................................248
Table 5.11: Summary o f mean pharm acokinetic data (±SD) for sulindac, metronidazole and captopril
before and after antibiotic therapy ................................................................................................................. 260
23

Chapter 1: Introduction
24

1. Chapter 1: Introduction
1.1. Overview of the human gastrointestinal tract
The oral route is the preferred route for drug administration with eighty-four percent
of the fifty bestselling pharmaceutical products in the US and European markets given
by mouth (Lennemas and Abrahamsson, 2005). However, oral administration is
arguably the most complex route of drug delivery. For an orally administered drug to
be effective it must (a) dissolve in the fluids of the gastrointestinal (GI) tract (b)
remain intact in the lumen (c) cross the epithelial membrane and (d) undergo minimal
first pass metabolism. Oral bioavailability is therefore a multi-factorial process
dependent on the solubility, stability, permeability and metabolism of the drug
molecule. While much has been written on the role of dissolution, penneability and
first-pass metabolism on oral drug bioavailability (Lindahl et al., 1997, Dressman et
al., 1998, Amidon et al., 1995, Lennemâs and Abrahamsson, 2005, McConnell et al.,
2008a), less attention has been paid to the stability of the drug in the intestinal lumen.
Instability is often associated with pH and/or enzyme mediated degradation in the
upper gut. These can be overcome by formulation approaches such as enteric coating.
A major stability factor that is often overlooked is the effect of the microbiota in the
gastrointestinal tract.
Before an orally administered drug or dosage form reaches the colonic microbiota, it
is subject to the fluctuating conditions along the gastrointestinal tract. Figure 1.1
shows the gastrointestinal tract of man.
25

aUnd(taliwary gland)
Parotid gland (Miivary gland)
Sutwnandibwlar gland
(lahvary gland)
Ootopbagu»
U * * f
Bilo duct
Jwunum
%Tamvnal daum Caacunt
Sigmoid colon
Rectum
Anu«
Trantvereecolon
Appendix
Figure 1.1: Anatomy of the Gastrointestinal Tract in Man
(http://www.thou2htfiilho11se.or2/imases/awakef1elcl-l 105e.ipii. no date)
1.1.1. The stomach
The stomach is located in the left upper part of the abdomen immediately below the
diaphragm and is divided into four parts: the fundus, body, antrum and pylorus. When
the stomach is empty, it contracts, and the colon ascends to occupy the vacated space.
The opening from the oesophagus into the stomach is the gastro-oesophageal
sphincter or junction. It is also known as the cardia. The contracted stomach possesses
a volume of 50ml that can expand to around 1500ml to accommodate food (Martini,
1995). The stomach not only acts as a short-term reservoir for food but also processes
the food into a semi-solid mixture known as chyme that will facilitate the absorption
26

of nutrients from the small intestine. The pylorus is the outlet from the stomach into
the duodenum and it regulates the delivery of food to the small intestine, it releases
about I-5ml of chyme once or twice per minute (King et al., 1984).
The mean fluid volume in the stomach, measured post-mortem, is 118ml (Gotch et al.,
1957). The stomach maintains a pH in the region of 1.0 to 2.5 by the daily secretion
of around 1.5 litres o f gastric juice containing hydrochloric acid, pepsinogen and
mucus. This pH is the optimum pH for pepsinogen function and it also functions as
bactericidal. This is the reason that the stomach is not heavily colonised by bacteria,
although some bacteria can escape the early post-meal period when the pH is around
4-5 and larger volumes of chyme are moving down to the small intestine. The mucus,
secreted by epithelial columnar cells, is especially important to form a functional
layer, 140pm thick. This layer prevents the digestion of the mucosa by its own
proteolytic enzymes and lubricates the stomach mucosa facilitating the movement of
ingested material
1.1.2. The small intestine
The small intestine is between 6 and 7 metres in length and is divided into duodenum
(0.25m), jejunum (2.8m) and ileum (4.2m) although there are no clear anatomical
divisions between the different regions (Kararli, 1995, Watts and Ilium, 1997). It has
an internal diameter o f 3-4 cm and surface area of 120 m^ (Edwards, 1997). The main
functions o f the small intestine are to mix food with enzymes to facilitate digestion, to
mix the intestinal contents with the intestinal secretions to enable absorption to occur,
27

and to propel the unabsorbed materials into more distal regions of the gastrointestinal
tract. Deep folds known as plicae circulares, or folds o f kerckring justify the large
small intestinal surface area for nutrient absorption. These folds extend further into
the lumen of the small intestine in finger-like protrusions, termed villi. A single layer
of columnar cells, which in turn are covered by microvilli, covers the villi. Located
between adjacent villi, the Crypts of Lieberkühn possess cells other than columnar
absorptive cells that are responsible for epithelial renewal, hormone and peptide
secretion, as well as secretion of basic mucus.
The duodenum possesses Brunner’s glands that produce bicarbonate ions into the
lumen, which in combination with the alkaline pancreatic juice containing buffering
ions contribute to the neutralisation of the acidic chyme. This prevents mucosal
damage by direct neutralisation of hydrochloric acid and through inactivation of
pepsin. The pH of the luminal contents increases along the length of the small
intestine from around 5.5 to 6 in the duodenum, 7 in the jejunum and approximately
7.5 in the ileum (Evans et al., 1988).
The large surface area of the small intestine that contributes for the efficient
absorption of nutrients also renders the small intestine the ideal site for the absorption
of drugs. A prerequisite for absorption o f drugs is their dissolution in the luminal
contents; the mean post mortem fluid volume in the small intestine is 212ml (Gotch et
al., 1957), which is greater than the fluid volume found in other sections of the
gastrointestinal tract improving the chances o f drug dissolution in the small intestine.
Recently, through the use of a magnetic resonance imaging technique Schiller and co
workers determined the free fluid volume (water not bound to solid intestinal
28

contents; free water that exists as fluid pockets) available in the small intestine and
demonstrated a high variability (105 ± 72ml) (Schiller et al., 2005). The rate of
absorption o f drugs is also influenced by the rate of blood flow to and from the
absorptive epithelium (Edwards, 1997) and the rich vasculature of the small intestine
facilitates rapid drug absorption and removal from the site of absorption into the
systemic circulation, thus maintaining the concentration gradient and driving further
absorption.
Chyme transfer from the stomach to the small intestine stimulates segmental
contractions which involve adjacent segments of the small intestine relaxing and
contracting, providing mixing of the chyme and increasing nutrient absorption
through contact with the mucosal layer. The velocity o f the peristaltic waves diminish
as they approach the ileum, indicating that the transit o f undigestible material which is
emptied from the stomach is more rapid in the proximal small intestine (Kellow et al.,
1986). Peristaltic waves project chyme distally through the small intestine towards the
ileocecal valve where the contents empty into the colon (Pocock et al., 1999).
1.1.3. The large intestine
The large intestine, wider, with smaller surface area (0.3 m^) and shorter (1.5 metres
long) than the small intestine, extends from the distal end of the ileum to the anus and
is subdivided into caecum (which is poorly defined in man), colon, rectum and anal
canal (Edwards, 1997). The colon can be further subdivided into ascending (20cm),
transverse (45cm), descending (30cm) and sigmoid (40cm) portions. The diameter of
29

the lumen is higher near the caecum (8.5cm) and gradually diminishes across the
ascending, transverse, descending, and sigmoid colon (2.5cm) to rectum. The mean
total water volume in the large intestine measured post mortem is 187ml (Cummings
et al., 1990). The more recent work using magnetic resonance imaging to investigate
free water pockets in the large intestine (water not bound to solid large intestinal
contents) reported a volume o f 13 ± 12ml (Schiller et 2005). These values indicate
that the small intestine contains a larger fluid volume for drug dissolution when
compared with the large intestine.
The principal functions of the large intestine are to conserve water and electrolytes
secreted into the gut during digestion, to provide a controllable route for the excretion
of waste products o f metabolism and toxic substances, and to contain safely the
microorganisms that, by fermentation, conclude the digestive process (Cummings,
1983). The mucosal surface o f the colon is similar to that of the small intestine at
birth, but rapidly changes by losing villi leaving a flat mucosa with deep crypts
(Edwards, 1997). Irregular folds known as plicae semilunares increase the surface
area of the colon.
The colonic epithelium consists o f a single layer of columnar cells lining the lumen.
Numerous crypts o f Lieberkühn that are responsible for the production and
differentiation of the epithelial layer punctuate the colonic epithelium. Goblet cells are
present in the epithelium and are responsible for the production of mucus, important
in lubricating the surface of the colon and in minimising friction between the mucosal
surface and the semi-solid luminal contents. The thickness of the mucus layer
increases along the large intestine from 23.1±16(pm ± SD) in the caecum to
30

65.7±47(^im ± SD) in the rectum (Varum et al., 2008). Mucus is composed of water
(95%), mucins (glycoproteins), lipids and inorganic salts. Mucins are degraded by
colonic bacterial microbiota. Much of the colonic mucin is sulphated and the degree
o f sulphation is greater in the distal colon. A few Paneth cells exist in the caecum and
ascending colon and they are involved in a variety o f functions including secretion of
digestive enzymes, production of trophic factors and elimination of heavy metals.
1.2. Physiology of the gastrointestinal tract with focus on the microbiota
The term micro flora has been used to describe microorganisms residing on body
surfaces including the gastrointestinal tract. This is because these microorganisms
were originally thought to be plants and were incorrectly classified as “flora”. Since
this denomination is scientifically inaccurate and misleading, the term microbiota is
preferred. We often consider the members of the human intestinal microbiota as key
players in maintaining human health and well-being: they are implicated in
developmental, immunological and nutrition host functions (Egert et al., 2006).
However in numerical terms, of the total human and bacterial cells making up the
body, only ten percent are eukaryotic. This has tempted some authors to suggest that
human’s role as host of gut bacteria is simply to function as an advanced fermenter,
carefully designed to maximize the productivity of the remaining ninety percent of
prokaryotic microbiotal cells (Nicholson and Wilson, 2005).
The human gut is sterile at birth, shortly after which a number o f microbial
strains/species, find their way on to body surfaces and into the alimentary canal. Most
o f this inoculum is derived largely from the mother’s vaginal and faecal microbiota
3 1

(conventional birth) or from the outside environm ent (caesarean delivery). Initially,
faeultatively anaerobie baeterial species, such as Escherichia coli and streptococci
populate the gut. These nutritionally undem anding bacteria create an adequate
environm ent for the developm ent o f the anaerobic species that later dom inate the gut
(C um m ings et ah, 2004, M acfarlane and M acfaiiane, 1997).
M oving along the different seetions o f the gut, pH and redox potential undergo
extreme variations (Evans et ah, 1988, Stirnip et ah, 1990). These variations will
impact and reflect the microbiotal colonisation o f the d igestive tract. There is a
progressive increase in both num bers and species tow ards the ileo-caecal junc tion and
bacteria find an optimal growth environm ent once they reaeh the large intestine
(Figure 1.2).
13
12
if 11CX)
10
0£
t
11 C .À I D S/R
Region o f the gut
Figure 1.2: Total bacterial num bers in the distal gastrointestinal tract obtained
from hum an sudden death victims (n=10). I, ileum; C, caecum ; A, ascending
colon; T, transverse colon; D, descending colon; and S/R, sigm oid/rectum
(adapted from M acfarlane and M acfarlane, 2004)
32

The intra-luminal pH influences bacterial concentration in each section of the gut: a
low pH destroys most bacteria. On the other hand, the redox potential is influenced by
the bacterial concentration in each gastrointestinal section and higher bacterial
concentrations are responsible for lower redox potentials. Redox or oxidation-
reduction potential is especially important when studying the activity of the
microbiota because it acts as an indicator of the physiological and metabolic state o f
bacteria (Oktyabrsky and Smirnova, 1989, Celesk et al., 1976). Redox potential is
defined as a measurement of the ability of a system to oxidise (lose electrons) or
reduce (gain electrons) and the major end products of bacterial fermentation (short
chain fatty acids) are electronically charged at the gastrointestinal pH. A lower redox
potential is therefore expected in the gastrointestinal regions where there is active
bacterial growth and metabolism of substrates into short chain fatty acids.
Bacterial activity is further influenced by other physiological parameters.
Gastrointestinal transit time, for example, has been associated with changes in
bacterial metabolism. Gastrointestinal transit time measures the time that it takes for a
substance to pass from mouth to rectum. Cummings et al., (1992) recorded transit
times for 185 healthy adults (using radio-opaque pellets) and found a mean whole-gut
transit time of 70 hours with values ranging from 23 to 168 hours. Although inter
subject transit times are highly variable, what is common to all subjects is that the
greater part of this time (almost 80%) will be spent in the colon rather than in the
small bowel (Tuleu et al., 2002, Wilding, 2001, Varum et al., 2008). In general, slow
colonic transit times result in reduced activities of saccharolytic bacteria and short
chain fatty acid production rates due to substrate deprivation in the distal gut.
However, Cummings et al. (1979) did notice that subjects with longer transit times
33

have an increased production of bacterial metabolites (phenols). Slow transit times are
also associated with high prevalence of colonic disorders (Burkitt et al., 1972).
The stomach is not heavily colonised due to a prohibitive pH. Flow rate is at its
greatest at the top of the small intestine and microorganisms are removed quickly by
peristalsis, which, together with bile and pancreatic fluid secretions, does not allow
increased microbial multiplication (Drasar and Barrow, 1985). The bacterial
concentration in the proximal small bowel is, therefore, modest when compared to
bacterial concentrations further along in the gastrointestinal tract (Simon and
Gorbach, 1984).
Bacteria exist adherent to the mucosal epithelium or in microhabitats (trapped in the
mucous gel layer or in the intestinal lumen probably associated with either food
particles or with each other) (Fanaro et al., 2003, Tannock, 1999). In the ascending
colon, microorganisms, having plentiful supply of dietary nutrients, tend to grow
rapidly, while in the transverse and descending colon substrate availability is lower
and bacteria growth slows. Substrates available for microbial fermentation in the
human colon include carbohydrates and proteins: these are mostly from dietary origin
but can also be host derived e.g. jfrom mucus (Egert et al., 2006). These materials are
degraded by bacterial enzymes which can be located extracellularly, cell-bound or
released into the environment by cell lysis. Studies into the location of enzymatic
activity have been contradictory and are enzyme specific, for some enzymes like
glycosidases their activity is higher in cell associated suspensions (McBain and
Macfarlane 1998), for pectinolytic enzymes for example, their activity is higher
extracellularly (Sirotek et al., 2004). The end products of enzymatic action will be
34

oligomers and their component sugars and amino acids, which are then fermented to
short chain fatty acids (acetate, propionate, butyrate), branched chain fatty acids (such
as isobutyrate, isovalerate and 2-methylbutyrate), H2 , CO2 and other neutral, acidic
and basic end products (Cummings et al., 2004). Short chain fatty acids are, from a
nutritional point of view, the major products of fermentation; butyrate is of particular
importance because it is the major energy source for colonocytes (the epithelial cells
that line the colon). Short chain fatty acids can affect colonic epithelial cell transport,
colonocyte metabolism, growth and differentiation, hepatic control of lipids and
carbohydrates and provide energy to muscle, kidney, heart and brain (Cummings and
Macfarlane, 1997). Bacteria in the large intestine also fulfil important vitamin
requirements for the body: they synthesize B complex vitamins including thiamine,
riboflavin and vitamin B 12, and vitamin K (Hill, 1997). The average diet does not
contain enough vitamin K (important for blood clotting) and its synthesis by bacteria
is essential (Hill, 1997). A further benefit o f the gastrointestinal microbiota is to act as
an effective barrier against opportunistic and pathogenic microorganisms (Gibson and
Wang, 1994).
The detection and identification of intestinal microbiota has occupied scientists for
over a century (Savage, 2001). The first observations of faecal microbes described
them as some “apparently randomly appearing bacteria” (Escherich, 1885), however,
the current estimate for the total number o f prokaryotes that inhabit the human gut
goes up to 100 trillion (10*" ) microbes (Ley et al., 2006). This number makes the
human gastrointestinal tract one of the most populated microhabitats on earth
(Whitman et al., 1998).
35

It is not known exactly how many bacterial cells exist in the human gut and which
species they all belong to. Most conventional methods dilute the sample and incubate
it with specific growth media, the final number of bacteria is detemiined by
multiplying the number of colonies that develop (viable culturable microorganisms)
by the degree of dilution (Finegold et al., 1983). However, not all bacteria are able to
be cultured in growth media, which can lead to an underestimation of their numbers
and there is a risk that the growth media can never be truly specific which allows the
possibility o f bacteria being counted more than once on different “specific” growth
media. Culturing methods are also laborious and time-consuming especially with
anaerobic habitats (Vaughan et al., 2000). Based on culturing studies Finegold et al.
(1983) proposed an estimated figure of 400 bacterial species inhabiting the human
gastrointestinal tract. Current advances have made it possible to study bacterial
populations by culture-independent approaches using molecular genetic methodology.
Ribosomal RNA gene sequences are ideal for the classification of organisms since
they are universally distributed among all cellular life forms and they posses very
slow genetic evolution which allows the comparison between genetic sequences
(domains) that have remained the same and sequences that have evolved. Usually a
new species is found when less than 98% of domains are similar (Rajilic-Stojanovic et
al., 2007). It is still unknown if this is a faultless species distinction. In a recent large-
scale comparative analysis of bacteria ribosomal RNA gene sequences to better
characterise the adherent colonic mucosal and faecal microbial communities, mucosal
tissue and faecal samples were obtained from three healthy adult subjects. This
represented the first application of high throughput sequencing applied on samples of
the human gastrointestinal tract and a total o f 395 bacterial phylotypes corresponding
to different species o f bacteria were identified (Eckburg et al., 2005). However, only
36

three individuals provided samples for the aforementioned study which
underestimates the tme diversity of the human population. Rajilic-Stojanovic et al.
(2007), recently compiled different ribosomal RNA studies together with culture-
dependent studies, they reported a total of 1183 distinct bacterial species in the human
gut (898 species using ribosomal RNA studies alone) and based on the variability
seen so far between individuals they predicted an estimated diversity o f the human
gastrointestinal microbiota in excess of 3000 species.
The species identification from ribosomal RNA gene sequencing techniques occurs
by alignment of the sequences with sequences stored in databanks. Using this
technique most species identified from healthy subjects using mucosal and faecal
samples belong to eight dominant phylogenetic phyla: Firmicutes, Bacteroidetes,
Proteobacteria, Fusobacteria, Verrucomicrobia, Cyanobacteria, Spirochaeates and
Actinobacteria (Eckburg et al., 2005, Wang et al., 2005). Firmicutes are by far the
most abundant and diverse group that include the Clostridia and Bacilli class;
Bacteroidetes are also present in high numbers (Eckburg et al., 2005, Wang et al.,
2005).
1.3. Drugs and the microbiota
From the aforementioned discussion the gastrointestinal tract is populated with large
numbers of bacteria that contribute to normal digestive function. Most o f these
bacteria reside in the large intestine and their primary function is to ferment
carbohydrate and protein that escape digestion in the upper gut into absorbable
energy. In addition, the metabolic reactions performed by these bacteria and their
37

respective enzymes have the ability to metabolise drugs and other xenobiotics far
more extensively than any other part of the body (Scheline, 1973, Abu Shamat, 1993,
Mikov, 1994). Scheline has even suggested that the gastrointestinal microbiota has the
ability to act as an organ with a metabolic potential at least equal to the liver
(Scheline, 1973). There are, however, important differences between hepatic and
bacterial metabolism. The liver is primarily responsible for metabolism via oxidation
and conjugation producing polar high molecular weight metabolites, while the
gastrointestinal microbiota is involved in reductive and hydrolytic reactions
generating non-polar low molecular weight byproducts. Furthermore, all drugs that
are delivered to, or absorbed into, the blood stream, are subject to hepatic metabolism.
However, extent and rate of bacterial metabolism will be influenced by the amount of
drug that reaches the distal gut.
The majority of drugs are rapidly and completely absorbed in the upper gut and have
minimal contact with intestinal bacteria. This goes someway towards explaining why
over the last forty years only thirty or so marketed drugs have been identified as
substrates for intestinal bacteria. However, the biopharmaceutical complexity o f new
drug candidates is providing an increasing number of compounds that suffer from low
solubility, low permeability or both (Davis, 2005). Drugs that display these properties
will reach the lower confines of the gastrointestinal tract, presenting themselves to the
host microbiota. Furthermore, drugs that are delivered via the intravenous route or
that are fully absorbed from the upper parts of the gastrointestinal tract may still reach
the lower gut by secretion or difftision from the systemic circulation into the intestinal
lumen, or may be excreted in the bile, possibly as conjugates following a recycling
process known as enterohepatic recirculation. There is an increasing trend to develop
3 8

modified release preparations (colon specific or extended release systems) to improve
therapy via the oral route (Basit, 2005, Rubinstein, 2005, Ibekwe et al., 2006, Tiwari
and Rajabi-Siahboomi, 2008, Ibekwe et al., 2008). In such cases, most if not the entire
drug load will be deposited in the large intestine, providing further opportunity for
exposure to the microbiota. Drugs can also come in direct contact with bacteria via
rectal administration in the form of suppositories or enemas. Given all this it is
expected that opportunities for microbiota-mediated metabolism will increase and
drug stability assessment in the presence of intestinal bacteria becomes of increasing
importance.
The stability o f a drug to the microbiota is clinically relevant; metabolism can render
a drug pharmacologically active, inactive or toxic. An important example of the
significance of this was seen in Japan in 1993 when sorivudine, a promising antiviral
drug was introduced into the Japanese market. This was later discovered to be
transformed by gut microbiota into (E)-5-(2-bromovinyl)uracil which can inhibit the
metabolism of the anti-cancer drug 5-fluorouracil leading to toxic levels of this drug.
Within forty days o f reaching the Japanese market this bacterially-metabolized
interaction was responsible for the death of eighteen patients who were co
administered sorivudine with oral 5-fluouracil prodrugs (Okuda et al., 1998).
Sorivudine was withdrawn from the market a few weeks after these deaths. This
highlights the importance of studying drug metabolism by the microbiota.
39

1.4. Models to study intestinal bacteria-associated drug metabolism
Since the majority o f gut bacteria are found in the large intestine this is the main site
for biotransformation. However, the inaccessibility of the human colon prevents the
direct examination o f the metabolic and ecological activity of the microbiota. Human
and animal experiments to study this region are costly and have ethical drawbacks.
Toxicity issues also render the use of in vivo methodologies unviable in early drug
development. The use of in vitro methodologies is over simplistic due to the complex
continuous influx o f endogenous compounds throughout the digestive tract such as
intestinal secretions, the absorption of fermentation products and the interactions
between the host and the bacterial population. Acknowledging these difficulties,
research has focused on studying specific features of the colonic environment rather
than an attempt to fully simulate the human colon. Studies that specifically focused on
bacterial drug metabolism are presented hereafter as well as other methods that,
although initially used to study other features of the colon (like the production of
short chain fatty acids), could potentially be used for drug metabolic studies. In vivo
studies are particularly relevant as they can provide unique insight into the in vivo
relevance of colonic metabolism of a particular compound. There is no one ideal
method but rather a combination o f methods should be used to elucidate a role for gut
bacteria in drug metabolism.
40

1.4.1. Animal in vivo studies
1.4.1.1. Elucidation of bacterial metabolism by comparing bile metabolites
with faecal metabolites
The simplest in vivo studies are based on the identification of the organs responsible
for the production of specific metabolites. They are usually perfomied in rats with
cannulated bile ducts kept in stainless steel metabolic cages for urine and faecal
collection. The quantification of metabolites in faeces relative to the metabolites
found in bile after oral administration of a compound can give an idea of the location
where metabolism occurs. With the drug risperidone, for example, a group of
metabolites is exclusively found in faeces and not in bile of rats providing strong
evidence that the reaction is a result of bacterial action (Meuldermans et al., 1994).
These types of in vivo studies normally require simultaneous in vitro evaluation to
detect which metabolites can result from bacterial action to strengthen evidence for
colonic bacterial metabolism.
14.1.2. Elucidation of bacterial metabolism by comparing lower gut
metabolites with upper gut metabolites
Another methodology for locating the production of specific metabolites includes the
removal of the stomach, small intestines, caecum and large intestines of rats 1 and 6
hours after an oral dose o f the compound being analysed (Yoshisue et al., 2000). The
contents o f these organs are taken out for quantification o f metabolites of the
41

administered compound. If after 6 hours there is an increased amount of certain
metabolites in caecum and large intestinal contents as compared to gastric and small
intestinal contents then there is indication of colonic metabolism. The authors
complemented this work with further in vitro and in vivo work emphasising the role
of colonic bacteria in the metabolism of this particular compound (potassium
oxonate).
1.4.1.3. Elucidation of bacterial metabolism by comparing gnotobiotic or
antibiotic treated animals with conventional animals
The previous methods are not stand alone techniques to prove bacterial metabolism,
most require further in vivo or in vitro methodologies to strengthen evidence of
colonic bacterial metabolism of a particular compound. This is due to the fact that
they are unable to distinguish between metabolites produced in the colonic lumen by
colonic bacteria and metabolites than can be the result o f intracellular metabolism by
the colonic mucosa. To overcome this, a methodology was designed to specifically
eliminate from an animal its bacterial metabolism. Such animals can be gnotobiotic
animals or antibiotic treated animals. Drug absorption and metabolism using these
animals is then compared against conventional animals.
A gnotobiotic animal is defined as one in which all the life forms are known. It may
be germ-free if it is free from any detectable microbes, or it may be associated with
any number of strains of microorganisms the identity of which are known. The
gnotobiotic animal is a useful tool in which to investigate the influence o f indigenous
42

microbiota on the host (Coates et al., 1988). Thus, the microbiota is implicated in a
reaction sequence when a drug metabolite is found in the conventional animal
(harbouring the indigenous microbiota), but not in the germ-ffee animal (Goldman,
1984).
Germ-ffee animals are, however, physiologically different from conventional controls
and thus may show differences in their in vivo handling o f xenobiotics (Ilett et al.,
1990). Morphologically, the germ-ffee rat caecum is greatly enlarged and, being filled
with liquid contents, fails to develop its normal musculature. The overall mass of the
small intestine is decreased, its surface area is smaller, the crypts are shorter and the
villi o f the small intestine are more uniform and slender than in their respective
conventional control animals (Heneghan, 1984). Germ-ffee rats also show a slower
intestinal transit and while active transport seems unaffected by the presence or
absence of microbiota, passive absorption tends to be increased in the germ-ffee state
(Heneghan, 1984).
Animals lacking a gut microbiota can be obtained more conveniently by pretreatment
with antibiotics and the differential sensitivity o f microbiota to various antibiotics
offers an experimental means of selectively modifying bacterial populations in the gut
(Ilett et al, 1990). By comparison to gnotobiotic animals only relatively short-term
experiments are possible, which are usually adequate for metabolic studies but not for
long-tenu toxicity or carcinogenicity assays (Coates et al, 1988).
It has been suggested that a good model to study the human colonic fermentation is
the germ ffee rat colonised with bacteria ffom human faecal samples. It has been
43

demonstrated that rats, bom germ-free, maintained in isolators and associated with
human microbiota by orally dosing with fresh human faecal suspension retain
bacteriological and metabolic characteristics of the human microbiota (Edwards and
Parrett, 1999). The labour intensiveness of this technique and the impracticality of
keeping these animals with a stable microbiota for long periods of time have
prevented their use for drug metabolite studies.
1.4.2. Human in vivo studies
The use of animal models has some economical and logistical advantages over the use
of human models: easier experimental set up and less stringent ethic regulations
apply. However, for the study of bacteria associated metabolism, as previously
mentioned, there is evidence of variability between animal species and man. This
inter-species variability has led scientists to use human volunteers instead of animals
to determine how bacteria degrade drug substrates in the human colon.
1.4.21. Elucidating bacterial metabolism by comparing extended release and
immediate release formulations
This technique compares the kinetic profiles o f parent drug and metabolites using oral
formulations that have different release profiles. A targeted drug release can deliver
the drug to known locations where certain metabolites can be produced. One example
of this is a study used to prove the bacterial metabolism of digoxin. The kinetics o f a
poorly absorbed digoxin tablet was compared with the kinetics of a well absorbed44

fomiulation (Lindenbaum et al., 1981). Poorly absorbed formulations release the drug
distally where there is a higher concentration of bacteria. If the administration of
poorly absorbed fomiulations causes a sharp increase in the concentration of
metabolites then the most probable explanation for this is that metabolite formation
occurs as a result o f metabolism by colonic bacteria. Similar conclusions can be
drawn from the comparison of immediate release formulations versus sustained
release formulations used to study metronidazole (Koch and Goldman, 1979). One of
the drawbacks of these studies using oral formulations with different release profiles
is related to the fact that they are dependent on the formulation to deliver the drug
successfully.
1.4.2 2. Elucidating bacterial metabolism by comparing intravenous drug
delivery with oral drug delivery
Bacterial metabolites can only be present if the drug has contact with bacteria. By
administering the drug intravenously, contact of the drug molecule with bacteria is
minimised whilst the oral administration will allow this contact in the distal
gastrointestinal tract. Any increased or new metabolites found after oral
administration that are quantitatively less or absent from the intravenous formulation
may be derived from bacterial metabolism (Yoshisue et al., 2000). One of the
weaknesses o f this approach is that molecules administered intravenously might be
secreted into the gastrointestinal lumen via the bile duct from the liver, or via efflux
mechanisms in the gastrointestinal tract and can therefore come in contact with the
microbiota.
45

1.4.2 3. Comparing metabolism in ileostomy patients with healthy volunteers
Most of these previous in vivo methods attempt to prevent or favour drug contact with
the section o f the gut where bacterial metabolism is likely to occur by modifying the
way the drug is delivered. A different approach is the use of patients that lack that
section of the gut i.e. ileostomy patients where the small intestine is brought to the
outside, rather than carrying on into the colon. Although the presence o f microbes has
been detected to some extent in ileostomy effluent (Gorbach et al., 1967), it is
believed that in this situation the drug will only present itself to a limited microbiota
and probably for a very short period of time when compared to healthy individuals.
Ileostomy patients have been used to study the drugs olsalazine, sulphinpyrazone and
sulindac (Wadworth and Fitton, 1991, Strong et al., 1987). Parent drugs and
metabolites concentration-time curves can be compared after oral administration to
healthy volunteers versus ileostomy patients and if increased metabolites are found in
healthy volunteers then they are likely the result o f bacterial metabolism. The
availability o f ileostomy patients is, however, very limited and not possible in early
drug development.
1.4.3. In vitro studies
In vivo determination of drug metabolism in the human colon is, in most cases,
invasive, time consuming, and requires medical supervision and ethical approval. In
early drug development in vitro methods are needed for routine screenings of46

molecules or to further study a specific class o f compounds. The biggest challenge
with in vitro simulation of the colonic environment is the creation of a fermentation
system containing bacterial numbers and diversity similar to the human colon.
Considering, however, that the inaccessibility of the human colon does not permit the
use o f human colonic contents for in vitro experiments, it is believed that such an
environment is more closely simulated with the use of human faecal material (that
possesses microbiota derived directly from the microbiota present in the human
colon) than with the use of intestinal contents ffom other animals. The methods of
modelling the human colon in vitro are summarised.
1.4.3.1. Static batch cultures
The simplest in vitro fermenters are static batch cultures. These cultures can use
specific strains of bacteria, caecal or intestinal contents of animals (normally rat) or
faeces (animal or human), which then are placed into a suitable medium (buffer or
nutritious media) (Coates et al., 1988). The drug is added in solution at time zero and
regular samples are withdrawn and quantified for the amount of drug and its
metabolites. Important variables include the maintenance of an anaerobic
environment, a pH that reflects the colonic environment and the employment of
continuous mixing o f the contents to allow the drug and bacteria to be evenly
distributed.
One of the disadvantages of this methodology is its suitability only for very short
incubation periods. This is due to the continuously changing conditions in the
47

cultures: marked and progressive changes in pH, redox potential, and bacterial
population (Rumney and Rowland, 1992). It has been suggested that these fermenters
can be used for periods of 24-48h with the limitation that the culture follows a typical
bacterial growth curve, thus short time course experiments provide more accurate
results (Gibson and Fuller, 2000). Fortunately, incubation periods of up to 2 hours are
sufficient for most drug metabolic studies.
These static batch cultures have the advantage that a range of compounds can be
screened in a relatively short period of time, and that only small amounts of drug are
required which is essential in early drug development studies (Williams et al., 2005).
Static batch cultures can make use of an anaerobic cabinet or use continuous sparging
of nitrogen to keep the environment anaerobic. Different drugs or other variables can
be tested simultaneously in different vials; the size of the vials is also changeable
according to the amount of drug/culture source available. The simplicity, easiness of
use and affordability in terms of materials used makes this model the ideal in vitro
method for short-term drug metabolite studies simulating the colonic environment.
Such models have also been used to assess drug release ffom bacteria-sensitive film
coatings for colonic delivery (Wilson and Basit, 2005, Basit et al., 2004, McConnell
et al., 2007, McConnell et al., 2008b, Siew et al., 2004, Yang, 2008)
I.4.3.2. Semi-continuous culture systems
Semi-continuous culture systems have never been used to study drug metabolism but
employing them would offer the advantage o f being able to be used for longer periods
48

of incubation compared to static batch cultures due to the addition of fermentable
substrates (nutrient for bacteria) into the system. A detailed description of semi-
continuous systems is given by Rumney and Rowland (1992) and is summarised as
follows.
The system contains a fermenter vessel held within a 37°C water bath and is equipped
with a number of portholes for sampling, addition of nutrient medium, and removal of
culture contents. A pH meter and pH control facilities (acid and alkali infusion
pumps) may be incorporated into the system, as can an electrometer for the
measurement o f redox potential. The mixed culture is maintained at a pH of 6.5 to 6.8
in an autoregulatory manner, thus making external pH control unnecessary.
1.4 3.3. Continuous culture systems
In the semi-continuous system described, part o f the culture media is removed and
replenished at intervals, this does not reproduce the continuous flow system that exists
in the human colon. To more closely model the dynamic equilibrium naturally present
within the gut, a system was designed to continuously add fresh growth medium and
simultaneously remove spent culture (Coates et al., 1988). These types of systems
were named continuous culture systems and are able to closely control the bacterial
microbiota and their numbers, the pH, temperature, redox potential and nutrient status
(Marsh, 1995, Ilett et al., 1990).
49

T hese continuous culture system s w ere traditionally single-stage chemostats (Figure
1.3) that soon becam e outdated g iven the com plexity o f large intestinal fermentation,
d ifferent parts o f the colon have different nutrient availability and different physical
conditions (Allison et al., 1989). A three-stage com pound continuous culture system
w as developed and validated (Gibson et al., 1988, M acfarlane et al 1998) that enables
the activities o f intestinal bacteria to be studied under the low pH, carbohydrate-
excess conditions that characterise the proxim al colon and ultimately the
carbohydrate-depleted , nonacidic environm ent that is ana logous to the distal colon.
M edium p u m ppH C ix itro lle r
F e rm e n ta t io n easeJ w ith
w a te r ja c k e t
2M NaOH F ilter
G a s e s o u t
W a s te co n fec tio n
Figure 1.3: Single stage continuous culture system (adapted from M acfarlane
et af, 1989)
This continuous culture system (Figure 1.4) consists o f three vessels, V I , V2, and V3,
with respective operating volum es o f 0.22, 0.32, and 0.32 L. T em perature (37®C) and
pH were autom atically controlled, pH 5.5, 6.2 and 6.8 in each vessel respectively.
Each fem ienter is m agnetically stirred and m aintained under an atm osphere o f C O 2
50

and the growth m edium is eontinuously sparged with Oi-free Ni and fed by peristaltie
pum p to V 1, whieh sequentially supply V2 and V3 via a series o f weirs.
pH C on tro lle rs
Medium
2M NaOH
C irculating w ater bath
W astecollection
Figure 1.4; The three-stage eom pound continuous culture system (adapted
from M acfarlane et al. 1998)
1.4.3.4. Simulator of the human intestinal microbial ecosystem (SHIME)
A m ore intricate system aim ing to study the ecological system present in the
gastrointestinal tract was developed by M olly et al. (1993) consisting o f a five-stage
reactor nam ed sim ulated hum an intestinal m icrobial ecosystem (SH IM E ) (Figure 1.5).
The small intestine is s im ulated by a two-step “ fill and draw ” system (300ml w orking
volum e in each reactor), the large intestine by a three-step reactor (1000m l, 1600ml
51

and 1200ml w orking volum e respectively). Each reactor vessel has eight ports; for
input and output o f m edium ; sampling o f liquid phase and headspace gases; pH
electrode; pH control (acid and base); and for the headspace flushing. Vessels 1 and 2
are inoculated over eight consecutive days with 10ml o f a diet suspension and vessels
3, 4 and 5 are inoculated with 50ml o f 20% faecal suspension. A dding soygem i
pow der to the vessels aids in achieving the fermentation balance (De B oever et al.,
2000). The analysis o f a num ber o f m icroorganism -associated activities resembled
those appearing in vivo, thus, this reactor can evaluate the dynam ics o f the microbial
ecology o f the gastrointestinal tract and could possibly be used for drug m etabolism
studies (M olly et ah, 1994). One o f the major disadvantages o f the SH IM E simulator
is that it requires a m in im um o f two w eeks period to stabilise the microbial
com m unity before it can be used for in vitro investigations (Possem iers et ah, 2004).
P anc rea tic juice
N;P i l t
/ | : « IVessel 2 Vessel 3 Vessel 4
Figure 1.5: Schem atic representation o f the S im ulator o f the H um an Intestinal
Microbial E cosystem (SH IM E) (adapted from De Boever et ah, 2000)
52
1.4.3 5. Computer-controlled system with peristaltic mixing, water absorption
and absorption of fermentation products
Minekus et al. (1999) introduced a new type of system that combines the removal of
metabolites and water with peristaltic mixing. This system (Figure 1.6) consists of
four glass units, each with a flexible wall inside, connected to each other. It is kept at
37°C with a computer controlled sequential squeezing of the walls causing a
peristaltic wave, which forces the chyme to circulate through the loop-shaped system.
The inoculum can be either fresh faecal samples or microbial cultures taken from
previous fermenters, both approaches achieved stable cultures. The pH is controlled
by the addition of 5M NaOH, a dialysis liquid is used to maintain the appropriate
electrolyte concentrations and is pumped from a bottle through hollow-fibre
membranes positioned in the lumen of the reactor. The amount of chyme in the
reactor is monitored with a pressure sensor and kept at a set level by the absorption of
water, with a pump in the dialysis circuit. The feeding medium was mixed and kept
anaerobic with nitrogen, and was introduced into the reactor with the peristaltic valve
system and a peristaltic valve pump was used to remove chyme from the reactor.
This system is a useful tool to study the fate of undigested components and their
effect on microbial metabolism and ecology in the lumen of the large intestine
(Minekus et al., 1999). Due to the complexity of the system, it might not be such a
useful system to use in short term drug metabolism studies when compared to other in
vitro models which are more straightforward.
53

Figure 1.6: Schematic presentation o f the system to sim ulate conditions in the
large intestine. A mixing units; B pH electrode; C alkali pump; D dialysis
pump; H dialysis light; F dialysis circuit with hollow fibres; G level sensor; H
w ater absorption pump; 1 peristaltie valve pump; J gas outlet with w ater lock
(adapted from M inekus et al. 1999)
1.4.3.6. immobilisation of faecal microbiota
The ability to m aintain a stable ecological environm ent in vitro is fundamental for the
success o f a large intestinal simulator. M ost systems show a high variability o f
bacterial num bers and species over time or require a long stabilisation period before
any investigation can occur. Researchers believe that the variability is due to the free
m ovem ent o f bacterial cells in the vessels, by m oving freely, cells can be rem oved in
an unbalanced way from the system when spent media is removed.
54

Cinquin et al. (2004) proposed the use of cell immobilisation and continuous
fermentation to overcome these difficulties. The immobilisation was achieved by
entrapment of bacteria cells (isolated from infant faeces) within a porous
polysaccharide matrix. The bacterial cells are trapped in cell beads that can be grown
in any suitable nutritious media. When immobilised cells are transferred in a growth
medium a high-cell density layer is formed extending from the bead surface to a
radial depth where lack of substrate prevents cell growth (Cinquin et al., 2004). The
main advantage of bacterial immobilisation is the stability over long experimental
trials, due to the continuous inoculation of the medium by shedding of free cells from
highly colonised beads retained in the reactor. This ability allows the system to
rapidly restore its previous equilibrium. The advantage o f this model is the ability to
test different parameters using the same conditions by using beads precolonised with
the same microbiota, this can be useful to compare metabolic rates of different
compounds. The lack of diversity can, on the other hand, be a disadvantage since the
human colon is a continuously evolving fermentation ecosystem. The use of fresh
samples rather than precolonised beads to inoculate in vitro systems ensures bacterial
and nutrient diversity that is likely to occur in vivo.
1.5. Drug metabolic reactions performed by the gastrointestinal microbiota
The following section highlights over 30 drug substrates for the gastrointestinal
microbiota. A detailed understanding of the metabolic reactions involved and the
types of studies to confirm a role for gut microbiota in metabolism is also presented
(summarised in Table 1.1). The section is subdivided according to the class of
reaction.
55

Sul)stratcs
(references)
In vitro studies - static hatch cultures In vivo studies - elucidation o f bacterial metabolism
O th e r
H u m a n . R a t a n im a l s B a c te r ia l
F a e c e s F a e c e s ' " T ' " ' C u l tu r e s c o n te n ts o r faeca l
c o n te n ts
C o m p a r in g C o m p a r in g ( " m P ' r i n g I 's in g l o c a t io n o f e x te n d e d in tr a v e n o u s ilc o s to n iv g n o to h io tic m e ta lx d i te a n d « i t h o r n lp r o d u c t io n im m e d ia te fo rm u la t io n s h e a l th y a n t ib io t ic
re le a s e v o lu n te e r s t r e a te d
I’r o n to s i l
((iiiiüi.11 cl al . I ') 7 1 1 ✓ / ✓
N e o p ro n to s i l
(C im ycll cl al . 1971 ) ✓ ✓ y/
S u lp h a s a la ^ in c
(I’cp p c rc o m a n J C io ld inan , 1972) V V V
B a ls a la z id c
(C h an Cl al . 1983) V
O U a la z in e
(W ailw o rth and 1 m o n . 1991) y /
l . -d o p a
(G o ld in d a l . . 1973) V
C h lo ra m p h e n ic o l
( l lo l l . 1967) y
5 -A m in o sa llc y lic ac id
(D u ll cl al 1987: D clo m cn ic cl / / / / /ah . 2 0 0 1 )
P lio n acee in
(S n iilh and G n fr ilh .l. 1974) y
U igox iii
(l.in d c n b a u in cl al . 1981 ) / V V V
K a n ilid ii ic
(Ha.sil and la ic c y . 2001 ) /
.N iza tid in e
(Ba.sil cl a l.. 2002) v'
Q u e rc e t in -3 g lu c o s id e
(S c h n c id c r cl a l.. 2 000) y/
In s u lin
(T o z a k ic l a l . 1997) V
C a lc i to n in
(T o z a k ic l a l.. 1997) V
N itr a z e p a m
(T a k c n o and S aka i. 1990. R a in c l al. ✓ y/1997)
C lo n a z e p a m
(E lm e r a n d R e m in d . 1984) ✓
S u lp h in p y ra z o n e
(S lro n g el a l.. 1987) y/
(continued)
56

/ / I vitro studies - static hutch cultures In vivo studies - elucidation oj bacterial inetaholisinSubstrates
(references) H u m a nR a t
in te s t in a lc o n te n ts
R a t
O th e r
a n i m a l s B a c te r ia l i n te s t in a l C u l tu r e s o r faeca l c o n te n ts
l o c a t io n o f m e ta b o l i te p r o d u c t io n
t o m p a r i n g C o m p a r in g e x te n d e d in t r a v e n o u s
“ ft* svith o ra l im m e d ia te fo rm u la t io n s
re le a s e
C o m p a r in g U sin g ile o s to m y g n o to h io t ic
h e a l th y a n t ib io t ic v o lu n te e r s t r e a te d
S u lin d u c
(S lro n g c l ul . I9S 7) V
I s o s s o rh id e D in i t r a lc
(S lia iiia l. 1993) ✓ ✓
G ly c e ry l T r i n l l r a l c
(A b u S b an ia l an d B cckcll, 1983)
✓ /
O m e p r a z o le
V(W a ta n a b c cl a l., 1995) V
l .e v a n i iso le
( S b u c l a l , 1991) ✓ ✓
M e tr o n id a z o le
(K o c h cl a l., 1979; S b am al, 1993)
V ✓ V
M is o n id a z o le
(K o ch c l al , 19X0) V / ✓
R is p e r id o n e
V /(M cu ldcnnan .< cl al . 1994)
M e lh a m p lu ’ta n i in e
(C a ld w e ll a n d lla w k sw n rib , 1973)
V
/ o n i s a n i i d e
(K ila m u ra cl a l ., 1997) V V yA z e lir e l in
(S asak i cl al , 1997) ✓ V ✓ / ✓S o r iv u d in e
(O k u d a Cl a l., 1998) ✓
P o ta s s iu m O x o n a te
(Y o sh isu c cl al , 2000) V V
F lu c y to s in e
(V e rm e s cl a l., 2 0 0 3 , H a m s cl a l., 1986))
✓ /l l e s p e r id in
(L e e Cl a l,. 2 0 0 4 ) y yU a id z e in
(R a m Cl a l., 20 0 4 ) ✓Table 1.1: Types o f studies perfom ied on drug substrates for the
gastrointestinal m icrobiota that indicate bacterial m etabolism
57

1.5.1. Reduction
1.5.1.1. Azo reduction: prontosil, neoprontosil, sulfasalazine, balsalazide and
olsalazine
Mechanism of azo reduction
The reduction of the azo bond has been the basis o f many prodrugs and delivery
systems that target the colonic region of the gastrointestinal tract. This reduction
reaction occurs with the aid of azoreductase enzymes produced by mammalian liver
enzymes (microsomal and cytosolic), large intestinal microbiota and other
microorganisms (Walker et al., 1971; Gingell & Walker, 1971; Zbaida, 1995).
In 1975 (Dubin and Wright) studied the kinetics o f bacterial azo-reduction by
anaerobic cultures of Proteus vulgaris and found a zero-order dependence in
reduction rate over a three to four fold range in azo compound concentration. The
authors suggested that the zero-order process occurs extracellularly and by a reaction
independent o f azo substrate concentration. The reduction rate is detennined by the
generation o f the reduced flavin (benzyl viologen, flavin mononucleotide (FMN) or
riboflavin) that acts as an electron carrier (shuttle) between the reducing enzyme and
the azo compound (Brown, 1981).
58

It was later suggested that both an intracellular enzymatic component and an
extracellular (zero-order) non-enzymatic reduction exist (Van den Mooter et al.,
1997). Under anaerobic conditions, bacterial azo reduction represents a non-
enzymatic reduction (extracellular reduction) by enzymatically generated reduced
flavins (intracellular reduction).
It was also recently shown that E. coli azo reductases have quinone reductase activity
in addition to flavin reductase activity and that the presence quinoid redox mediators
such as 2-hydroxy-1,4-naphthoquinone, anthraquinone-2-sulfonate and anthraquinone
can facilitate bacterial reduction of azo compounds (Liu et al., 2009)
Azo reductases, located intracellularly, use NADPH (nicotinamide adenine
dinucleotide phosphate), NADH (nicotinamide adenine dinucleotide) or both as their
electron source. The enzyme oxidises NAD(P)H and transfers two electrons to the
electron mediator (the reduced flavins or the reduced quinones) which transport the
electrons from the azo reductase to the azo compound (Levine, 1991).
Azo reductases from microorganisms are difficult to classify due to the very low
homology at the enzyme’s primary structure level. Current classification uses azo
reductases preference for an electron donor, subdividing them into three groups:
NADH-preferring azo reductases, NADPH-preferring azoreductases, and general azo
reductases (Punj & John, 2007).
The crystal structure of an FMN bound azo reductase isolated from one of the most
predominant Enterococcus species found in human stools (Enterococcus faecalis) was
59

deteniined (Liu et al., 2007). Significant differences in structure and architecture o f
the active site were found in comparison with an azo reductase previously isolated
from E. coli implicating that different bacteria produce azo reductases with different
substrate specificities and kinetics (Liu et al., 2007).
The non-enzymatic reduction takes place in two steps, the fonnation of the hydrazo
intermediate, followed by the reductive splitting of the nitrogen bond. The rate
determining factors in anaerobic azo-bond reduction include the redox potential o f the
mediator compared with that o f the substrate, the membrane permeability of the
mediator, the specificity of the azo-reductase enzymes with respect to the mediator
(Kopecek et al.,1992).
Furthermore, steric and electrostatic factors also play a role in azo bond reduction to
the hydrazo intermediate: a low electron density within the azo region and thus
substitution with electron-withdrawing groups will favour this reaction. This effect is
explained by the fact that electron-withdrawing groups lead to a decreased electron
density at the N=N double bond, hence electron transfer to this group is released (Van
den Mooter et al., 1997). This was confinned by Pricelius et al. (2007), azo-reduction
was enhanced by incorporating electron-withdrawing groups at the aromatic ring of
the azo molecule, especially ortho-substitutions. The rate o f the reduction is
dependent upon the charge density of the azo region, but the subsequent
disproportionation o f the hydrazo compounds to free amines is dependent upon the
charge difference between the azo nitrogen atoms (Van den Mooter et al., 1997).
60

As discussed, the rate-detemiining step for the majority of bacterial azo reduction
does not appear to involve a molecular structure specific phenomenon such as
selective membrane permeation or enzyme binding of the azo substrate. However,
there are discrepancies in the literature regarding the possibility of membrane
permeation o f the azo compound. It is possible that for some molecules, azo reduction
only occurs after the molecule is inside the cell, the reaction would then occur
intracellularly. Wuhrman et al. (1980) found that some azo compounds are not
reduced by whole cells and are readily reduced by cell extracts indicating that
transport of the azo compound through cell wall and plasma membrane is a limiting
factor. This was further confirmed by findings that azo-reduction was specifically
inhibited with compounds that have difficulty in permeating membranes such as
highly charged azo compounds (sulfonated azo dyes) (Wuhrman et al. 1980).
Prontosil, neoprontosil, sulfasalazine, balsalazide and olsalazine
The conversion of prontosil and neoprontosil to sulfanilamide are the first known
examples where large intestinal bacteria have an impact on prodrug activation. Both
drugs were used as antibacterial agents in man and in 1937 (Fuller) discovered that
the antibacterial action of prontosil was due to the molecule sulphanilamide.
In the rabbit, prontosil was found to be most actively metabolised to sufanilamide in
the liver and kidney (Fonts et al., 1957). Antibiotics were later found to suppress the
conversion of orally administered prontosil (Figure 1.7 (A) ) to sulfanilamide in the
rat, so prontosil can be split to sulfanilamide partly in the gut before absorption and
partly in the tissues after absorption (Gingell et al., 1971). Even when given
61

intraperitoneally prontosil could be split by gut bacteria since it can be transported
into the gut by the bile (Gingell et al., 1971).
Neoprontosil is water-soluble and highly polar, as a result it is not readily absorbed
from the intestine and when given intraperitoneally a large proportion is excreted in
the bile unchanged. Gingell et al. (1971) suggests that, in the rat, neoprontosil,
whether given orally or intraperitoneally is split to sulfanilamide mainly by the gut
microbiota (Figure 1.7 (B) ). In vitro evidence was provided that neoprontosil is
readily reduced by rat caecal and faecal homogenates, the output of sulfanilamide in
the urine after giving neoprontosil is furthermore suppressed by antibiotics.
Prontosil and neoprontosil belong to the chemical group of sulfonamide drugs.
Sulfonamide drugs were the first antimicrobial drugs and initiated the antibiotic
revolution in medicine. In 1941, just after nine years o f existence of this new class of
compounds, the innovative idea of combining them with an anti-inflammatory
molecule like salicylic acid occurred (Bachrach, 1988, Svartz, 1988). This was
believed to be extremely beneficial for the treatment o f inflammatory diseases that
had bacterial origin. Linking salicylic acid to sulfapyridine was achieved by a diazo
coupling, yielding sulfasalazine, which is used for maintenance of moderately severe
ulcerative colitis. Sulfasalazine has limited small intestinal absorption and, in the
colon, its azo bond is reduced by bacteria (Figure 1.7 (C) ) releasing sulfapyridine and
5-aminosalicylate (Peppercorn and Goldman, 1976, Peppercorn and Goldman, 1973).
Azo reduction by colonic bacteria releases the active moiety, 5-aminosalicylic acid
(which acts topically in the gut lumen) and sulfapyridine, which is rapidly absorbed
(Hayllar and Bjamason, 1991).
62
The cleavage of the azo bond in sulfasalazine by intestinal bacteria was documented
in 1972 (Peppercorn and Goldman), these studies showed that the excreta of rats fed
sulfasalazine did not contain unchanged sulfasalazine. However, with antibiotic
treated or with germ-free rats unchanged sulfasalazine was recovered in the caecum
and faeces. Intestinal bacterial strains were also cultured in the presence of
sulfasalazine and in all cases the azo bond cleavage was detected. In addition, in
humans, a pharmacokinetic study performed in healthy volunteers (Schroder and
Campbell, 1972) demonstrated no faecal and a very small urinary excretion of the
intact drug.
Sulfasalazine is more effective in ulcerative colitis than in Crohn’s disease, the latter
is not always localized in the colonic region of the gastrointestinal tract, which is
consistent with the drug being more effective when the pathology is in a region where
bacterial breakdown is more likely to occur (Peppercorn and Goldman, 1973).
Sulfasalazine causes side effects in some patients (anorexia, nausea, skin rash, blood
dyscrasias). It is believed that circulating sulfapyridine is the main cause o f unwanted
effects and effort has been made to replace sulfapyridine by carrier molecules thought
unlikely to produce side effects. As a consequence, balsalazide was synthesized from
4-aminobenzoyl-|3-alanine by diazo coupling with salicylic acid. The results of
metabolic studies in man showed that trace amounts o f unchanged drug were found in
normal faeces and urine (Chan et al., 1983). These studies suggested that reduction to
5-aminosalicylic acid and the carrier molecule was almost complete (Figure 1.7 (D) ).
63

Olsalazine is a prodrug consisting o f two 5-aminosaIycilic acid moieties bridged by
an azo bond. Little olsalazine is metabolised before entry into the colon where
azoreductase-containing bacteria split unabsorbed olsalazine into two 5-
aminosalicylic acid molecules (Figure 1.7 (E) ) (Wadworth and Fitton, 1991).
In healthy volunteers, urinary recovery of 5-aminosalicylic acid was found in the first
8 hours after administration of a single oral dose of olsalazine. This contrasts with
ileostomy patients where no 5-aminosalicylic acid was detected in the urine following
olsalazine's administration. Studies in both healthy volunteers and patients with
ulcerative colitis demonstrated that a dose of olsalazine is almost completely
metabolised due to the low faecal recovery of unchanged olsalazine (Wadworth and
Fitton, 1991).
15.1.2. Nitrazepam
Nitrazepam is responsible for fetal abnormalities and Takeno and Sakai (1990) tried
to detemiine whether nitrazepam is the active teratogenic substance or whether
metabolic activation is required for the teratogenic response. They also investigated
the role o f gut microbiota metabolism in nitrazepam-induced teratogenicity in rats by
comparison with antibiotic treated rats. The results obtained by this study suggested
that nitrazepam requires activation by nitroreductase for the teratogenic activity and
that the gut microbiota is the primary site for reductive metabolism (Figure 1.8).
64

(A)
Prontosil
(B)
Neoprontosil
(C)
HjN
W I " +Sulfanilamide
Sulfanilamide
+
HjN
Triaminobenzene
Sulfasalazine
(D)
(E)
Balsalazide
5-Aminosalicylic
Acid
1 - ^ Sulfapyridine
+
5-Aminosalicylic 4-Aminobenzoyl-(3-
Acid alanine
,COOH
Olsalazine
NHj
w5-Aminosalicylic
Acid
Figure 1.7: Proposed reactions for the azo reduction of prontosil (A),
neoprontosil (B), sulfasalazine (C), balsalazide (D) and olsalazine (E)
65

Nitrazepam’s reduction has been found to occur in different environments; rat liver
mitochondria, microsomal fractions, bacteria from the rat intestinal tract and bacteria
with nitroreductase activity in the human intestinal tract. Its reduction rate in rat
caecal contents is approximately seven times higher that that of the liver (Rafii et al.,
1997). The proposed mechanism for nitrazepam’s teratogenicity starts with its
nitroreduction to 7-aminonitrazepm by the intestinal microbiota. 7-Aminonitrazepam
is then converted in the liver to 7-acetylaminonitrazepam, which is teratogenic in
boths rats and mice (Takeno et al., 1993).
Nitrazepam
>
7-Aminonitrazepam
Figure 1.8: P roposed reac tion fo r the reduc tion o f n itrazepam
1.5.13. Clonazepam
Elmer and Remmel (1984) studied the metabolism of clonazepam in vitro and in vivo
using germ-free and ex-germ-free rats and the incubation of clonazepam with rat
intestinal lumen contents gave nearly complete reduction of clonazepam to 7-
aminoclonazepam (Figure 1.9). A definitive role for the intestinal microbiota in the
metabolism and disposition of clonazepam in the rat was established and mammalian
tissues play a relatively minor role in clonazepam reduction
66

Clonazepam
HjN-
7-Aminoclonazepam
Figure 1.9: Proposed reaction for the reduction of clonazepam
1.5.14. Misonidazole
Misonidazole is a 2-nitroimidazole derivative, which is an effective radiosensitiser of
hypoxic cells that is being tested as an adjunct to radiation therapy in the treatment of
human cancer. Studies performed by Koch et al. (1980) showed that misonidazole is
metabolised to its amino derivative [ 1 -(2-aminoimidazol-1 -yl)-3-methoxypropan-2-
ol] in pure or mixed cultures of the intestinal microbiota (Figure 1.10) and that the
metabolite is further metabolised to release CO2 . The metabolite appears in the
excreta of conventional rats but is not detectable in the excreta of germ-free rats so its
formation is due to the intestinal microbiota in vivo as well as in vitro (Koch et al.,
1980).
N. ;N0, ;
c r -Misonidazole
0CH3
1 -(2-am inoim idazol-1 -yl)-
3-methoxypropan-2-ol
Figure 1.10: Proposed reaction for the metabolism of misonidazole
67

1.5.1.5. Omeprazole
Omeprazole is a substituted benzimidazole that effectively suppresses gastric acid
secretion by inhibiting H /K -A T Pase in the parietal cell. Watanabe et al. (1995)
examined the effect of intestinal microbiota on the pharmacokinetics of omeprazole.
The in vitro experiments showed that omeprazole is metabolised by the intestinal
contents of the rat, being reduced to sulfide metabolites (Figure 1.11). However, the
gut microbiota did not alter the oral pharmacokinetics because the compound might
be completely absorbed before reaching the hindgut, where microbial activity is
extensive.
Omeprazole
.CH.
•OCH,
Omeprazole sulphide
metabolite
Figure 1.11: Proposed reaction for the metabolism of omeprazole
1.5.1.6. Sulfinpyrazone
Sulfinpyrazone is a uricosuric agent with a potential value in thromboembolic
disorders. Strong et al. (1987) studied the bacterial reduction of sulfinpyrazone by
comparison of the plasma concentration-time curves after a single oral dose in healthy
volunteers and in ileostomy patients. The data indicates that the gut microbiota is the
sole site of sulfinpyrazone reduction in man (Figure 1.12).
68

Sulfinpyrazone Sulfinpyrazone sulphide
m etabolite
Figure 1.12: Proposed reaction for the reduction of sulfinpyrazone
1.5.17. Sulindac
Simultaneously with the study of sulfinpyrazone, Strong et al. (1987) examined the
bacterial reduction of sulindac, a non-steroidal anti-inflammatory analgesic used in
the treatment of rheumatoid arthritis and similar conditions. The study using healthy
volunteers and ileostomy patients indicates that gut microbiota contributes
significantly to the formation of sulindac sulfide in man, probably by reduction of
sulindac which is excreted in bile (Figure 1.13).
SulindacSulindac sulphide
metabolite
Figure 1.13: Proposed reaction for the metabolism of sulindac
69

1.5.18. Digoxin
Some patients treated with digoxin may convert the cardiac glycoside to inactive
metabolites. If the lactone ring on the digoxin molecule is saturated (Figure 1.14),
metabolites such as dihydrodigoxin or its aglycone, dihydrodigoxigenin are formed.
These reduced derivatives have markedly decreased cardiac activity, possibly because
they bind poorly to the Na-K-ATPase o f cardiac cells and are taken up less avidly by
cardiac muscle.
Lindenbaum et al. (1981) suggested that the formation of reduced metabolites from
digoxin occurs in the gastrointestinal tract, conceivably by colonic bacteria. This was
suggested after the observation that the maximal production o f reduced derivatives
from digoxin happens when the most poorly absorbed tablets are taken. On the other
hand, the lowest percentage of reduction products was excreted after digoxin was
given intravenously. Lindenbaum et al. (1981) further hypothesised that variation in
the activity o f the gut microbiota explains why only a minority (10%) of patients on
prolonged digoxin therapy excrete reduced derivatives. In many other subjects, such
metabolites are not detectable. As aforementioned, the reduction products possess
markedly decreased cardiac activity therefore reducing digoxin’s effectiveness if the
reaction occurs.
Antibiotics erythromycin and tetracycline were also proven to block the reduction of
digoxin in vitro and in vivo (Lindenbaum et al., 1981). In addition, to further confirm
that the gut microbiota is responsible for this reaction, the ability to metabolise
70

digoxin to dihydrodigoxin in four volunteers was shown when a preparation releasing
digoxin in the more distal small intestine was given (Magnusson et al., 1982).
Digoxin
Dihydrodigoxin
Dihydrodigoxige
Figure 1.14: Proposed reaction for the metabolism of digoxin
1.5.1.9. Zonisamide
Zonisamide is an anticonvulsant clinically used for the treatment of epilepsy. It is
primarily metabolised to 2-sulphamoyacetylphenol by reduction of the benzisoxazole
ring and the studies performed by Kitamura et al. (1997) concluded that intestinal
bacteria play a major role in this reductive metabolism of zonisamide to 2-
sulphamoylacetylphenol in vivo (Figure 1.15).
The relative contribution of intestinal bacteria to the in-vivo metabolism of
zonisamide was examined in rats. The treatment with antibiotics caused a significant
decrease in the urinary and faecal excretion of 2-sulphamoylacetylphenol, re
contamination of the antibiotic-treated rats with microbiota restored the excretion of
the metabolite (Kitamura et al., 1997). In the same study the caecal contents of mice,
71

hamsters, rabbits and guinea-pigs, like those of rats, had the ability to catalyse the
reduction of zonisamide to its metabolite under anaerobic conditions, the highest
activity was observed with mice and the lowest with guinea-pigs.
Zonisamide 2-Sulphamoylacetylphenol
Figure 1.15: Proposed reaction for the metabolism of zonisamide
1.5.1.10. Metronidazole
Metronidazole is a 5-nitroimidazole derivative with activity against protozoa and
anaerobic bacteria. Besides the biotransformation in the liver by side-chain oxidation
and glucuronide formation the drug can undergo reductive metabolism producing
small amounts of reduced metabolites.
N-(2-Hydroxyethyl)-oxamic acid and acetamide are formed when metronidazole is
reduced as the result of the activity of anaerobic bacteria (Figure 1.16); it decomposes
with loss of the imidazole ring (Koch and Goldman, 1979). Metronidazole’s
metabolism in conventional rats was compared with germ-free rats and the
metabolites N-(2-hydroxyethyl)-oxamic acid and acetamide were only found in
excreta of conventional rats and not in the urine or faeces of germ-free rats (Koch et
al., 1979, Koch and Goldman, 1979). Those metabolites are also formed after
incubation of metronidazole with either C. perfringens or rat caecal contents (Koch et
72

al., 1979). In addition, both metabolites were found in small amounts in the urine of
human patients taking the drug, presumably, as in the rat, they represent metabolites
formed by the intestinal microbiota (Koch et al., 1981).
OH +
M e t r o n i d a z o l e
CH ,
NHy
N - ( 2 - h y d r o . x y e t h y l ) o x a m i c A c e t a m i d e
a c i d
Figure 1.16: Proposed reaction for the metabolism of metronidazole
1.5.2. Hydrolysis
1.5.2.1. Lactulose
Lactulose, the keto analogue of lactose (4-(f3-D-galactopyranosyl)-D-fructose)
appears to depend on metabolism by the intestinal bacteria for its therapeutic activity.
The drug is hydrolyzed by several kinds of intestinal bacteria (lactobacillus,
bacteroides and E. coli) to fonn lactic and acetic acids, which lower the pH of the
intestinal contents (Elkington et al., 1969) (Figure 1.17). At the lower pH, ammonia
and the other amines present in the gastrointestinal tract become protonated and tend
to be excreted in faeces; the accentuated elimination of these amines is responsible for
the laxative effect of lactulose (Peppercorn and Goldman, 1976).
73

► A +HO CH , CH
L a c t i c A c i d A c e t i c A c i dL a c t u l o s e
Figui e 1.17; Pi oposed reaction for the m etabolism o f lactulose
1.5.2.2. Sorivudine
Sorivudine was release into the Japanese m arket in 1993 as an antiviral drug. In a
tox icokinetic study perform ed by O kuda et al. (1998) to investigate 18 acute deaths
associa ted with interactions betw een sorivudine and oral 5-tluorouracil (5-FU)
prodrugs, one o f the m ajor m etabolites o f sorivudine was found to be involved in this
lethal toxicity. The authors found that so rivud ine 's metabolite (E)-5-(2-
brom ovinyljuracil (B V U ) inactivates a key enzym e regulating the systemic 5-FU
level (F igure 1.18 and Figure 1.19), the m arked increase in 5-FU tissue levels leads to
death in rats and humans. BVU is generated from sorivudine by rat gut microbiota.
B actero ides species, such as Bacteroides eggerthii and Bacteroides vulgatus, which
abundan tly exist in hum an intestines, were identified as the m ajor bacteria, which
generate B V U from sorivudine (N akayam a et al., 1997). Little B V U was detected in
the p lasm a o f genn-free rats, and oral or i.v. adm inistration gave similar levels o f
B V U in the urine o f genn-free rats (Ashida et al., 1993). These results indicate that
the fo n na tion o f BVU is predom inantly due to the action o f enterobacteria.
74

E-5-(2-bromovinyl)uracil
Sorivudine (BVU)
Figure 1.18: Proposed reaction for the hydrolysis of sorivudine
M arked in c r e « e in ^ ''T oxicity to boo® m arrow '"\tiBftu® S-FU Igvols _ _ and lnt®aitiws_ _
f r
T o 9 » f u f N A W h .. (FT)
! Flooro- Hi-5-FU p-a lamina
Liver
\ ' NXOF*imark I »
Hî-BVU
rwoPH S onvud ine (SRV)
pPD Inactivated DPD
Figure 1.19: Proposed mechanism for the lethal toxicity of sorivudine and 5-
fluorouracil in humans and rats (adapted from Okuda et al., 1998)
1.5.3. Removal of succinate group: succinylsulfathiazole
The sulfa drug succinylsulfathiazole is itself inactive and poorly absorbed from the
gastrointestinal tract, but is converted by intestinal bacteria to sulfathiazole (Figure
1.20), which has strong antibacterial action (Poth et al., 1942). The reaction involves
the removal of the succinate group.
75

Succinylsulfathiazole
■OH
Succinate
V °
* ,xx.xSulfathiazole
Figure 1.20: Proposed reaction for the metabolism of succinylsulfathiazole
1.5.4. Dehydroxylation: L-dopa
L-dopa is effective in the therapy of Parkinson’s disease where dopamine depletion
within the central nervous system is responsible for the disease’s clinical
abnormalities. It is believed that L-dopa undergoes decarboxilation within the central
nervous system and exerts its beneficial effect by restoring the level of dopamine.
Most of the decarboxylation of L-dopa, however, occurs outside the CNS and the
intestinal bacteria may be capable of this reaction (Figure 1.21) (Peppercorn and
Goldman, 1976).
The metabolites m-tyramine and m-hydroxyphenylacetic acid are found in the urine
of conventional, but not germfree, rats. The dehydroxylation reactions at the para
position of the catechol ring which are required to form these metabolites can be
demonstrated in preparations of rat caecal contents indicating the importance of the
microbiota in this aspect of L-dopa metabolism (Goldin et al., 1973).
76

m - t y r a m i n e
L - D o p a
m - h y d r o x y p h c n y l a c c t i c
a c i d
Figure 1.21: Proposed reaetion for the m etabolism o f L-dopa
1.5.5. Acétylation: 5-aminosalicyIic acid
5-Am inosalieylic acid (5-ASA, mesalazine) is used in the treatment o f inflam m atory
bowel disease and is also the active com ponent o f the prodrugs sulphasalazine,
balsalazide and olsalazine mentioned earlier in this review. 5-aminosalicylic acid
efficacy is correlated with its deliveiy to the diseased site and intestinal m etabolism
m ay be important in determ ining drug efficacy.
A cetylated 5-aminosalicylic acid has been found in the faeces o f animals dosed with
5-aminosalicylic acid (or its prodrugs). Dull et al. (1987) proved that in vitro
suspensions o f either guinea pig caecal contents or faeces from rats, dogs or hum ans
acetylated 5-aminosalicylic acid in yields lower than 3.4%. Furthennore , 5-
aminosalicylic acid w as incubated with faecal suspensions obtained from gem ifree
rats finding no acetylating activity, which supported the conclusion that intestinal
bacteria m ediate this acétylation reaction. 5-aminosalicylic acid is acetylated in
77

human faecal suspensions under both aerobic and anaerobic as well as by individual
bacteria (Figure 1.22) (Van Hogezand et al., 1992, Deloménie et al., 2001).
N. .C H ,
Y
5-Aminosalicylic
COOH
N-acetyl-5-
aminosalicylic acid
Figure 1.22: Proposed reaction for the metabolism of 5-aminosalicylic acid
1.5.6. Deacetylation: phenacetin
The analgesic phenacetin is rapidly and almost completely absorbed from the
gastrointestinal tract and metabolised mostly to acetaminophen in the liver. However,
a small amount of phenacetin is converted to p-phenetidin (Figure 1.23). The
deacetylation reaction involved in forming this metabolite can be demonstrated when
rat caecal contents are incubated with phenacetin under anaerobic conditions (Smith
and Griffiths, 1974). The formation of p-phenetidin correlates with
methemoglobinemia, one of the complications of the use of phenacetin and with
nephritis that accompanies chronic phenacetin abuse (Smith and Griffiths, 1974).
H3C'Phenacetin p-Phenetidine
Figure 1.23: Proposed mechanism for the metabolism of phenacetin
78

1.5.7. Cleavage of N-oxide bond: ranitidine and nizatidine
Basil and Lacey (2001) used a batch culture fermentation system simulating the
conditions of the colon to assess the in vitro stability of ranitidine. In this study a
marked decline in ranitidine concentration was noted over time and further analysis
indicated that metabolism occurred via cleavage of an N-oxide bond within the
molecule with the resultant loss of an oxygen atom (Figure 1.24). Such metabolism
may in part be responsible for the poor absorption of ranitidine from the colon (Basil
et al., 2004).
R a n i t i d i n e
Figure 1.24: Proposed reaction for the metabolism of ranitidine
The other Hz-receptor antagonists, cimetidine, famotidine and nizatidine were studied
also to assess the in vitro stability to colonic bacteria (Basil et al., 2002). That study
noted a marked decline in nizatidine concentration over time and no such decline was
noted for cimetidine or famotidine. The metabolic reaction pathway for nizatidine is
complex, although the metabolism is initiated via cleavage of an N-oxide bond within
the molecule (Figure 1.25).
Nizatidine
Figure 1.25: Proposed reaction for the metabolism of nizatidine
79

1.5.8. Proteolysis: Insulin and calcitonin
The possibility of delivering peptide and protein drugs to the colon has been
investigated: however peptide drugs such as insulin and calcitonin are degraded by
some proteolytic enzymes in rat caecal contents (Tozaki et ah, 1997). Further to this,
calcitonin was more susceptible to proteolysis in rat caecal contents than insulin
(Tozaki et ah, 1995). Calcitonin was rapidly degraded in the supernatant and insulin
was mainly metabolised by microorganism’s membrane enzymes (Tozaki et ah,
1995). Some protease inhibitors could inhibit the degradation of peptides in rat caecal
contents, suggesting that these protease inhibitors might be useful for improving the
large-intestinal absorption of peptides by the systemic circulation (Tozaki et ah,
1997).
1.5.9. Denitration: Glyceryl trinitrate and isosorbide dinitrate
Glyceryl trinitrate and isosorbide dinitrate are among the most commonly used
organic nitrates for the treatment o f angina pectoris. The metabolism of glyceryl
trinitrate by a mixed culture o f rat caecal contents has been investigated by Abu
Shamat and Beckett (1983). In their studies, following combination of glyceryl
trinitrate with rat caecal contents, the drug disappeared exponentially from the
anaerobic incubation mixture to give the metabolites glyceryl-1,3-dinitrate, glyceryl-
1,2-dinitrate, glyceryl-1-mononitrate and glyceryl-2-mononitrate (Figure 1.26). A
comparison with the rate of in vitro metabolism in human faecal microbiota was also
performed.
80

Isosorbide dinitrate in addition to other metabolic pathways can be metabolised in
vitro by anaerobic intestinal microorganisms of both rat and man (Figure 1.27) (Abu
Shamat, 1993). The metabolic pathway involves step-wise denitration to produce
isomeric mononitrates and isosorbide. In the same study a comparison with the rate of
in vitro metabolism in human faecal microbiota was performed.
H 2 C — Q N O 2 1
H C ------ Q N O2 I _____
H26---ONO2 I
Glyceryl trinitrate
H2C— ONO2
H2C— ONO2
Glyceryl-1,3- dinitrate
HC ONO2
Glyceryl-2-mononitrate
H2G ONO2
IH C ONO2
CH3
Glyceryl-1,2- dinitrate
H2C ONO2
ICHgCHj
Glyceryl-1- mononitrate
Figure 1.26: Proposed reaction for the metabolism of glyceryl trinitrate
OjNÔ
ONO;
Isosorbide dinitrateIsosorbide
Figure 1.27: Proposed reaction for the metabolism of isosorbide dinitrate
81

1.5.10. Amine formation and hydrolysis of an amide linkage: chloramphenicol
Chloramphenicol, an agent used in treating typhoid fever, rickettsial diseases,
brucellosis, and anaerobic infections, contains a nitrobenzene group and an amide of
dichloroacetic acid. When incubated with bacteria commonly found in human faeces a
number of reactions can be detected and these include the conversion of a nitro group
to a primary aromatic amine (Figure 1.28) and hydrolysis of the amide linkage (Holt,
1967).
It has been suggested that the most serious complication of chloramphenicol, aplasia
of the marrow is due the activity of the intestinal microbiota (Holt, 1967). This is
supported by the fact that marrow aplasia has only been reported in patients taking
chloramphenicol by the oral route. Furthermore, patients susceptible to this
complication belong to the few percent of the population whose microbiota contains
coliform organisms capable of metabolising chloramphenicol to the critical
metabolites.
O jN ".
Chloramphenicol
H gN " ^ OH
p-aminophenyl-2-amino-
1,3-propanediol
Figure 1.28: Proposed reaction for the metabolism of chloramphenicol
82

1.5.11. Deconjugation: drugs excreted in bile as inactive conjugates
Bacteria have evolved to metabolise conjugated bile acids that have escaped
absorption from the ileum and reach the colonic region (Narushima et ah, 2006). Bile
acids are synthesized in the liver from cholesterol and conjugated to either glycine or
taurine before being secreted into the small intestine through the bile. Bacteria have a
role in their deconjugation by removing the amino acid molecule on the carboxyl
group (Thomas et al., 2001, Nagengast et al., 1995, Schiller, 2007). This activity takes
place mainly in the caecum and ascending colon where deconjugated bile acids are
then absorbed and enter the enterohepatic circulation.
The metabolism of the sex steroid hormones also involves an enterohepatic
circulation that is dependent upon a biologically active microbiota. These hormones
undergo a cycle of biliary excretion, mucosal and bacterial deconjugation and
intestinal reabsorption. Approximately 60% of circulating estrogens are conjugated in
the form of glucuronides or sulfates, and are excreted in the bile (Simon and Gorbach,
1984, Orme and Back, 1990). Deconjugation, the prerequisite step for mucosal cell
reabsorption, is catalysed by enzymes produced by both the intestinal wall
(glucuronidases) and bacteria (glucuronidases and sulfatases); their activity increases
from the upper to the lower small intestine and colon (Winter and Bokkenheuser,
1987, Adlercreutz and Martin, 1980).
The microbiota also plays a role in maintaining the enterohepatic circulation of drugs
other than estrogens, which are excreted in the bile as inactive conjugates o f sulfate or
glucuronic acid. The removal o f the polar conjugating group by the bacterial83

microbiota not only restores the active drug but also allows it to be reabsorbed and
returned to its site of action. Thus, the mierobiota may prolong the action o f drugs by
allowing their enterohepatic circulation to continue. Evidence from studies with
digitoxin in the dog is consistent with an enterohepatic circulation of digitoxin, which
depends on the hydrolysis of the glucuronide in the gastrointestinal tract (Peppercorn
and Goldman, 1976).
The drug indomethacin is widely used as an anti-inflammatory agent. The studies
performed by Smith (1978) suggested that indomethacin, although in man is rapidly
eliminated in urine as its glucuronide, in dogs and monkeys is initially metabolised to
its acyl-glucuronide, which is excreted in the bile. The intestinal microorganisms then
free the drug from its glucuronide metabolite so that it may cyele baek through the
liver, forming metabolites.
Morphine also undergoes conjugation and excretion in the bile and thus its half-life
could be influenced by the deconjugating activity of the microbiota (Peppercorn and
Goldman, 1976).
1.5.12. Thiazole ring-opening: Levamisole
Levamisole has been extensively used as an antihelmintic drug in veterinary and
human medicine and recently some anti-colon cancer activity has been attributed to
this compound (Shu et al., 1991).
84

Shu et al. (1991) showed that anaerobic incubation of levamisole with human
intestinal microbiota resulted in the formation of three thiazole ring-opened
metabolites, namely levametabol-I, II and III (Figure 1.29). The study demonstrated
that strongest metabolisers include Bacteroides and Clostridium spp and it has been
suggested that levametabol-I possesses anti-colon cancer activity (Shu et al., 1991).
Levametabol I
Levametabol II
Levamisole
Levametabol III
Figure 1.29: Proposed reaction for the metabolism of levamisole
1.5.13. Isoxazole scission: Risperidone
Risperidone is an antipsychotic drug with very potent serotonin-SHTz and potent
dopamine-D] antagonist properties. Meuldermans et al. (1994) studied the metabolism
of risperidone and among major metabolic pathways was the scission of the isoxazole
in the benzisoxazole ring system which appeared to be effected primarly by the
intestinal microbiota (Figure 1.30). In this study incubation of risperidone with
intestinal contents from rats showed that the benzisoxazole of risperidone was easily
cleaved in the presence of caecal and colonic contents to a metabolite with a phenol
and a carbonyl function under aerobic as well as under anaerobic conditions. In vivo
85

studies in rats contributed for this evidence by detecting bacterial metabolites in the
rat’s faecal excreta and not in the bile.
Risperidone
>
Risperidone metabolite
Figure 1.30: Proposed reaction for the metabolism of risperidone
1.5.14. Deglycosylation: Quercetin-3-glucoside
Quercetin is a flavonoid that is widely distributed in plants, usually linked to sugars
such as glucose (quercetin-3-glucoside) or rutinose (rutin). Evidence suggests that
quercetin has sparing effects on the cardiovascular system, possibly due to its
antioxidative properties and inhibitory effects on cyclic phosphodiesterase and
cyclooxygenase, which are involved in platelet aggregation (Schneider et al., 2000).
When orally ingested quercetin and other flavonoids are partially degraded by
bacteria in the human intestinal tract, resulting in the formation of 3,4-
dihydroxyphenylacetic acid (Figure 1.31) (Schneider et al., 2000). Studies using
germ-free rats associated with Eubacterium ramulus and Enterococcus casseliflavus
showed that both species are capable of metabolizing quercetin-3-glucoside. Based on
the wide occurrence of Eu. Ramulus in the human intestinal tract it is believed that
this species plays a dominant role in bacterial transformation of flavonoids (Schneider
et al., 2000).86

O u c r c c t i n - 3 - g l u c o s i d c
3 , 4 - D i h y d r o p h c n y l a c c t i c
Figure 1.31 : Proposed reaction for the metabolism of quercetin-3-glucoside
1.5.15. N-demethylation: M ethamphetamine
Methamphetamine is a sympathomimetic drug liable to serious abuse. The detection
of metabolites of this drug in the faeces raised the possibility of being metabolised by
intestinal microbiota.
A study performed by Caldwell and Hawksworth (1973) showed that the intestinal
contents of guinea-pigs possess the ability to biotransfonn methamphetamine by N-
demethylation (Figure 1.32) and probably one other pathway. It was found that when
methamphetamine is incubated with guinea pig caecal contents, 47% is converted to
amphetamine while a 76% conversion was observed following incubation with rectal
contents from the same animal (Caldwell and Hawksworth, 1973). The differences
seen in the extent of metabolism between caecal and rectal contents are probably a
reflection of the differences in the amount of material from these two regions used in
the incubations, rather than a fundamental difference in the activity of their
microbiota. This transformation is probably of little consequence in man since
methamphetamine is quite efficiently absorbed in the upper portion of the gut.
87

CH]
M ethamphetamine Amphetamine
Figure 1.32: Proposed reaction for the n-demethylation of methamphetamine
1.5.16. Other chemical reactions
1.5.16.1. Azetirelin
Azetirelin is a novel thyrotropin-releasing hormone (TRH) analogue which shows
relative selectivity for action on the central nervous system (CNS) and less
thyrotropin (TSH)-releasing activity than TRH (Sasaki et al., 1997).
Sasaki et al. (1997) evaluated the effect of luminal bacterial metabolism on intestinal
absorption of azetirelin in antibiotic-treated rats and the results of in vitro incubation
studies with rat luminal contents showed that azetirelin is metabolised by an oxygen-
sensitive bacteria localised mainly in the large intestine. Faecal suspensions from rats,
dogs, and humans showed comparable metabolic activity, azetirelin breakdown in the
bacterial suspension was pH-dependent and was inhibited in the presence of
bacitracin or puromycin (Sasaki et al., 1997).
88

1.5.16.2. Potassium oxonate
Potassium oxonate has recently been added to tegafur and to 5-chloro-2,4-
dihydropyridine to form S-1, a new oral 5-fluorouracil (5-FU)-derivative antitumor
agent, with the purpose of inhibiting the phosphorylation of 5-FU and reducing the
gastrointestinal toxicity of the agent (Yoshisue et ah, 2000). In a study on the
biotransformation of potassium oxonate, Yoshisue et ah (2000) found that potassium
oxonate converts to cyanuric acid and that one of the routes is the direct conversion to
cyanuric acid by gut microbiota in the caecum (Figure 1.33).
Potassium Oxonate Cyanuric Acid
Figure 1.33: Proposed reaction for the metabolism of potassium oxonate
1.5.16.3. Flucytosine
Flucytosine has anti-fungal properties and Vermes et ah (2003) investigated the rate
of active conversion of flucytosine to 5-fluorouracil by microorganisms in the
intestinal microbiota (Figure 1.34). In in vitro experiments, the human intestinal
microbiota was capable of converting flucytosine to 5-fluorouracil (Harris et ah,
1986). This metabolism was also strongly reduced in patients receiving antimicrobial
agents (Vermes et ah, 2003).
89

Y; NH,;
5-FluorouracilFlucytosine
Figure 1.34: Proposed reaction for the metabolism of flucytosine
1.5.16.4. Hesperidin
Lee et al. (2004) studied the metabolism of hesperidin (a natural product with anti
allergy activity) by intestinal bacteria and incubated hesperidin with fresh human and
rat faecal suspensions. During the incubation Lee et al. (2004) found that hesperidin
was metabolised to hesperitin (Figure 1.35) via hesperetin-7-O-glucopyranoside.
Hesperitin was also found to have antiallergic activity so the authors suggested that
hesperidin may be a prodrug, which is metabolised to hesperetin by intestinal
bacteria.
Hesperidin Hesperitin
Figure 1.35: Proposed reaction for the metabolism of hesperidin
90

1.5.16.5. Daidzein
Daidzein (4,7-dihydroxyisoflavone), a principal soy isoflavonoid, is a weakly
estrogenic compound with potential health benefits for several conditions, including
hypercholesterolemia and osteoporosis (Rafii et al., 2004).
The conversion o f daidzein to metabolites by the intestinal microbiota is essential for
absorption, bioavailability and estrogen activity o f this compound. In a study
performed by Rafii et al. (2004) the ability o f faecal bacteria from rhesus monkeys to
metabolize daidzein was documented, dihydrodaidzein and equol were the two
principal metabolites produced (Figure 1.36).
Daidzein
Dihydrodaidzein
Equol
Figure 1.36: Proposed reactions for the metabolism o f daidzein
91

1.6. Summary
The human intestinal microbiota can have a major impact on drug metabolism and
ultimately on oral bioavailability. More than 30 marketed drugs have been identified
as substrates for colonic bacteria. However, these examples are merely the tip of the
iceberg as the next generation of drugs have a higher probability of being presented to
the microbiota in the lower gut, either through poor solubility/permeability properties
or formulation development strategies. The numbers of potential substrates are
expected to increase. Given the potentially serious implications of bacterial
metabolism of drug performance or toxicity, an assessment of the action of the
microbiota should now form an integral part of the drug development process.
1.7. Aims and Objectives
The aim of this thesis was to develop a standardised in vitro model that could be used
routinely by scientists to assess drug stability in the colonic environment. To correlate
in vitro-in vivo assessments o f bacteria related drug stability.
The objectives are therefore:
to develop easy analytical assays to quantify model drugs in biological media
to assess the importance o f certain factors affecting in vitro modelling of the
colonic environment and establish a standardised in vitro model for routine
assessments o f drug stability
to investigate which bacterial source should be used in vitro to routinely
assess bacteria-associated drug stability
to correlate in vitro-in vivo assessments of bacteria-associated drug stability
using a suitable animal model
92

CHAPTER 2: Analytical method development and
validation for the quantification of model drugs in
faecal and plasma samples
93
2. CHAPTER 2: Analytical method development and validation for the
quantification of model drugs in faecal and plasma samples
2.1. Overview
The drugs sulfasalazine, balsalazide, olsalazine, sulindac and metronidazole were
chosen as model drugs for the work described in this thesis both in vitro and in vivo.
These drugs are commercially available, extensively used in clinical practice and
represent good model molecules for the study of bacteria-related drug stability.
However, literature provides very limited or complicated analytical methodologies for
the quantification of these drugs from biological fluids.
The purpose of this chapter was to develop a clear and robust analytical methodology
that would allow the detection and quantification o f these model drugs in vitro from
faecal systems. Furthermore there was also a need to develop very sensitive detection
and quantification methodologies of these molecules in plasma for in vivo evaluation
of drug bacteria-related metabolism in dogs.
2.2. Introduction
The human colon, being an oxygen-free environment lacks the final electron acceptor:
oxygen and reduction therefore becomes the main bacterially-mediated reaction
occurring in the lower gastrointestinal tract (Goldman, 1978). The model drugs
chosen for the work reported in this thesis are representative of this main chemical
reaction occurring in the colonic environment. The drugs sulfasalazine, balsalazide,
94

olsalazine, sulindac and metronidazole were the model drugs chosen to investigate the
transformations incurred on drug molecules by the gastrointestinal microbiota. They
all undergo bacterially mediated reduction.
Sulfasalazine was probably the first designer drug in medical history, designed in
1940 to combine the antibacterial sulphur component with the anti-inflammatory
salicylate constituent for the treatment of rheumatoid arthritis (Svartz, 1988). It was
later found that the drug provided significant improvements in patients suffering from
ulcerative colitis and it is still presently one of the key compounds to be used in
maintenance therapy for this debilitating disease (Moshkovska and Mayberry, 2007).
Its pharmacological activity is achieved by the release from the molecule, through the
activity o f the colonic microbiota, of 5-aminosalicylic acid which acts topically in the
gut lumen (Peppercorn and Goldman, 1972).
Sulfasalazine was a natural choice for the work presented in this thesis not only
because o f its history, being in use worldwide since the 1940’s but also because of its
popularity. Current statistics suggest that overall prescribing of sulfasalazine is on the
increase with 698 million tablets prescribed between 1990 and 1998 alone (Parry et
al., 2002). The choice of sulfasalazine also permits its comparison with two further
molecules within the same class possessing the same chemical bond to be degraded
by colonic bacteria: balsalazide and olsalazine. Balsalazide was designed to release 5-
aminosalicylic acid in the colonic environment using a different carrier molecule than
sulfasalazine and olsalazine was designed to deliver two molecules of 5-
aminosalicylic acid to the lower gut.
95

The study of these three molecules has a further advantage of originating an already
known metabolite: 5-aminosalicylic acid. A common metabolite to all three drugs will
not only save time in the analysis o f samples but also be extremely valuable if in vivo
studies are required for comparison of colonic stability of these drugs: absorption
metabolism and excretion of the metabolite would be the same.
Another commonly used and well known drug that has been found to be degraded by
bacterial enzymes, is sulindac, a non-steroidal anti-inflammatory analgesic used in the
treatment of rheumatoid arthritis. This drug will undergo a reduction reaction in a
bacterial environment to originate a sulfide metabolite (Strong et ah, 1987). Although
within the same major group of molecules that undergo reduction in the colonic
environment, it is unknown how easily certain molecules might be reduced in
comparison to others therefore this compound is expected to provide an interesting
comparison with the azo molecules sulfasalazine, balsalazide and olsalazine.
As a further molecule that provides an interesting comparison to both the azo-class
compounds and to sulindac is the routinely used antibiotic metronidazole. This choice
was based on the fact that metronidazole’s bacterial-mediated reduction occurs with
the loss of an imidazole ring (Koch and Goldman, 1979). This reaction mechanism
differs from the hydrazo formation in the azo-reduction mechanism and differs from
the sulfide formation mechanism in sulindac. For this research we focus our attention
on the bacterial degradation of metronidazole and not on metronidazole’s antibacterial
activity for which it is used therapeutically. It is worth pointing out that most of
metronidazole’s antibacterial activity in a normal treatment occurs after
metronidazole’s systemic absorption from the upper gastrointestinal tract, the
9 6

considerations of this research focus on bacterial activity over the molecule in a
potential scenario where metronidazole would be in direct contact with the bacterially
rich colonic environment.
Before the work begins into investigating bacterial mediated metabolism of these
model drugs there is a need for a quick, easy and sensitive analytical method that can
quantify these molecules in biological media such as faecal material. High
performance liquid chromatography was the analytical technique chosen since it
shows an improved selectivity and efficiency in separating non-volatile organic drugs
as compared to other chromatography techniques. Chromatography in general has
been defined as a separation method in which mixtures are resolved by differential
migration o f their constituents during passage through a chromatographic column.
The separation process distributes the substances between two phases: the mobile
phase and the stationary phase. The physical and chemical properties o f the solute
molecules in a given environment will determine the interaction between the mobile
and the stationary phase.
A number o f HPLC-UV methods have been developed for the individual analysis of
sulfasalazine, balsalazide, olsalazine and 5-aminosalicylic acid in biological samples.
For example sulfasalazine has been quantified in the plasma before but with poor
limits o f quantification (O.lmg/L) (Awni et al., 1995); the same for olsalazine
(0.15pg/ml) (Miller et al., 1993). More complex or sophisticated methods have been
reported for the quantification o f 5-aminosalicylic acid from plasma and urine and
include the use of an aeetylation procedure prior to analysis that quantifies 5-
97

aminosalicylic acid indirectly in the forni of its acetylated derivative (Fischer et al.,
1981), (Miller et al., 1993) (Van Hogezand, 1984).
A recent in vivo study quantified 5-aminosalicylic acid in horse faecal material (Knoll
et al., 2002), however, their drug extraction procedure from the sample was time
consuming as it required concentration of the sample by removing the solvent with
vacuum and reconstituting the dry residue in mobile phase. The stationary phase
described in Knoll et al., (2002) was used as a starting point for the method developed
in this chapter since this column seemed to demonstrate the longer retention time that
is desirable for the analysis of this compound.
As for sulindac, although there are a variety of chromatographic methods available,
they quantify the drug mostly in plasma/urine with the use of UV detection (Swanson
and Boppana, 1981, Musson et al., 1984) or fluorescence detection (Siluveru and
Stewart, 1995). The only described analytical method for the determination of
sulindac from faecal samples is from 1987 (Strong et al., 1987) and chromatographic
technology has evolved, current stationary columns generally achieve better
separation and better peak shapes, the development of a new chromatographic method
seemed therefore appropriate.
Chromatographic methods available for metronidazole in the literature also quantify
the drug in plasma or urine using either UV detection (Galmier et al., 1998, Yeung et
al., 1998, Okonkwo and Eta, 1988), or using photodiode array detection (Menelaou et
al., 1999). The most recent quantification of metronidazole in faecal samples was in
1986 (Bolton and Culshaw) and requires a laborious extraction procedure prior to the
9 8

liquid chromatography step where the sample has to be fiilly evaporated and
reconstituted, the development of an easy assay/extraction procedure for routine
quantification of metronidazole was also necessary.
For plasma sample analysis of the in vivo work none of the available analytical
methods was suitable due to their limit of detection; the amount to quantify was very
limited due to the low dose administered and due to the compound’s low absorption.
LC MS/MS methods were developed for all drugs.
Captopril was also chosen as a model molecule both in vitro and in vivo, but the
development o f an HPLC/UV for in vitro detection was not successful. It was still
decided to develop a LC MS/MS methodology for its detection in plasma samples.
The choice of Captopril is based on the fact that it possesses a proved low colonic
absorption once it is administered in a colonic specific formulation its bioavailability
is very low (Wilding et ah, 1992). This made captopril a very interesting compound to
include in an in vivo study designed to identify the in vivo relevance of the bacterial
metabolism.
2.3. Chapter aims
The aim of this chapter is to develop and validate a sensitive and robust analytical
methodology for the study of the chosen model drugs both in vitro and in vivo. In
vitro quantification o f the model drugs in faecal samples is developed through the use
o f HPLC/UV technique and in vivo quantification of the model drugs in dog plasma
is developed through the use of a more sensitive LC MS/MS technique.
99

2.4. Materials
Sulfasalazine
Sulfasalazine (MW==398.39g/mol) (Figure 2.1 A) was obtained from Sigma-Aldrich
CO., St Louis, USA (BN: 094K0957), and certified as 98% pure. It is a bright yellow
or brownish yellow fine powder, practically insoluble in water, very slightly soluble
in alcohol, practically insoluble in methylene chloride. It dissolves in dilute solutions
o f alkali hydroxides.
Balsalazide disodium
Balsalazide disodium (MW=437.3g/mol) (Figure 2.1 B ) was obtained from Beijing
Mediking Pharmaceutical CO., Beijing, China (BN: 050791) and certified as 101.8%
pure. It occurs as a yellow crystalline dehydrate powder, non hygroscopic and highly
soluble in water.
Olsalazine sodium
Olsalazine Sodium (MW=364.2g/mol) (Figure 2.1 C ) was obtained from Beijing
Huameihuli Bio-Chem Trade Centre, Beijing, China (BN: 0509209), and certified as
99.5% pure. It is a yellow, fine, crystalline powder, sparingly soluble in water, soluble
in dimethyl sulphoxide, very slightly soluble in methanol.
5-aminosalicylic acid
5-aminosalicylic acid (MW= 153.1 g/mol) (Figure 2.1 D ) was obtained from Sigma-
Aldrich CO., St Louis, USA (BN 093K1055), and certified as 99% pure.
100

Metronidazole
Metronidazole (MW=171.2g/mol) (Figure 2.1 E) was obtained from Sigma-Aldrich
CO., St Louis, USA, and certified as 99% pure.
Sulindac
Sulindac (MW=356.4g/mol) (Figure 2.1 F) was obtained from Sigma-Aldrich CO., St
Louis, USA, and certified as 98% pure.
Captopril
Captopril (MW=217.3g/mol) (Figure 2.1 G) was obtained from Sigma-Aldrich CO.,
St Louis, USA, and certified as 98% pure.
101

(^ ) Sulfasalazine \ /
O
I I- S NH
I IO
(B) Balsalazide
(C) Olsalazine
HOOC.
HO
COOH
\ / , / OH
(()) 5-aminosalicylic acid
H OOC.
HO
(^) Metronidazole
'OH
(F) Sulindac
■COOH
(^ ) Captopril
COOH
SH
'3
Figure 2.1: Chemical structure of chosen model drugs
102
Other reagents
• Potassium dihydrogen orthophosphate from BDH, VWR international
Ltd., Poole England, AnalaR grade
• Dipotassium hydrogen orthophosphate from BDH, VWR international
Ltd., Poole England, AnalaR grade
• Sodium chloride from BDH, VWR international Ltd., Poole England,
AnalaR grade
Solid phase extraction cartridges
• Strata X SPE cartridges from Phenomenex UK Ltd
• Oasis HLB SPE cartridges from Waters Ltd
HPLC columns
• Atlantis T3 5pm 4.6x150mm from Waters Ltd.
• Lichrospher 100 RP18 endcapped 5pm 250x4 from Merck
• Luna 5pm Phenyl-Hexyl 250x4.6mm with security guard phenyl
cartridges from Phenomenex UK Ltd
• Atlantis dC18 3pm 4.6x30mm from Waters Ltd
• Atlantis dC18 3pm 4.6x50mm from Waters Ltd
• Luna 5pm HILIC 150x4.6mm from Phenomenex UK Ltd
Analytical equipment
• HPLC/UV: autoinjector /pump/UV detector Agilent series 12000 from
Agilent Technologies, Gemiany
103

HPLC/MS/MS: Mass spectrometer SCIEX API 4000 from ABI- SCIEX,
Toronto, Canada; HPLC pump Agilent Series 1100 from Agilent
Technologies, Gennany; HPLC autoinjector HTC PAL from Leap
Technologies, France.
2.5. Methods
2.5.1. Analysis of model drugs in faecal samples using HPLC/UV
2.5.1.1. Preparation of biological matrix
Faecal samples of three healthy volunteers are collected and the slurry is prepared by
homogenising the faecal sample with saline phosphate buffer pH 6.8 at a final
concentration of 10%w/v slurry (further details for the slurry preparation are
described in Chapter 3)
2.5.1.2. Preparation of stock and working standard solutions
Saline phosphate buffer was prepared according to the British Pharmacopoeia formula
by dissolving l.Og of potassium dihydrogen orthophosphate, 2.0g of dipotassium
hydrogen orthophosphate and 8.5g of sodium chloride in 900ml of water and adding
sufficient water to produce 1000ml. pH was measured and adjusted to 6.8 if necessary
by adding NaOH or HCL as required.
Stock standard solutions o f sulfasalazine, balsalazide, olsalazine, 5-aminosalicylic
acid, metronidazole and sulindac were prepared at 3.04mM concentration in saline
phosphate buffer pH6.8. A series of working standard solutions o f each drug were104

prepared by appropriate dilution o f the stock solution in saline phosphate buffer,
giving final concentrations of 0.02mM, 0.17mM, 0.35mM, 0.44mM, 0.52mM,
0.87mM, 2.17mM and 3.04niM.
2.5 .13 . Preparation of calibration standards
The calibration standards for sulfasalazine, balsalazide, olsalazine 5-aminosalicylic
acid, sulindac and metronidazole were prepared by spiking 150pl of standard
solutions into 500pl of drug free faecal slurry as indicated in Table 2.1. These vials,
once prepared were immediately vortexed and the drug was extracted as quickly as
possible to avoid any drug metabolism before analysis. The extraction procedure
dilutes a 50pl sample of each vial with 150pl of acetonitrile to precipitate the slurry
proteins.
Final standard concentration Volume of faecal slurry Volume of spiking
standard solution5pM SOOpl ISOpl o f 0.02mM solution
40pM 500pl 1 SOpl of 0.17mM solution
80pM SOOpl ISOpl of 0.3SmM solution
lOOpM SOOpl ISOpl of 0.44mM solution
120pM SOOpl ISOpl of O.S2mM solution
200pM SOOpl ISOpl of 0.87mM solution
500pM SOOpl ISOpl o f 2.17mM solution
700pM SOOpl ISOpl o f 3.04mM solution
Table 2.1: Preparation of calibration standards for faecal slurry
2.5 .14. Sample preparation procedure
105

Prior to analysis the faecal samples were treated using the following procedure: 50pl
aliquot of faecal slurry sample was transferred into a 2ml Eppendorf microcentrifuge
tube followed by the addition of 150pl of ice-cold acetonitrile. The mixture was
vortexed immediately for 1 minute and then centrifuged at 10 OOOrpm for 10 minutes.
Around 150pl of the supernatant was transferred directly into HPLC vials containing
an insert.
2 .5 .15 . Chromatographic conditions
The chromatographic conditions are summarised in Table 2.2 for all drugs. The
analysis was run at a flow rate of Iml/min and the chromatographic separation of the
analyte was achieved at ambient room temperature (25°C).
2.5.2. Analysis of model drugs in plasma samples using LC MS/MS
2 .5 .21 . Preparation of biological matrix
Control Labrador dog plasma collected in vaccutainer heparin tubes, internal supply
o f AstraZeneca R&D, Molndal, Sweden.
106

DrugHPLCcolumn
Injectionvolume
Mobile phaseUV
wavelength
Sulfasalazine Waters water(0.5%TFA)/acetonitrileAtlantis T3
5pl(0.5%TFA) gradient 25%-
228nm5 pm 60% organic over 15
4.6x150mm minutes
Balsalazide Waters water(0.5%TFA)/acetonitrileAtlantis T3
5pl(0.5%TFA) gradient 25%-
3 lOnm5 pm 60% organic over 15
4.6x150mm minutes
Olsalazine Waters water(0.5%TFA)/acetonitrileAtlantis T3
5pl(0.5%TFA) gradient 25%-
310nm5 pm 60% organic over 15
4.6x150mm minutes
Sulindac Waters water(0.5%TFA)/acetonitrileAtlantis T3
5 pm5pl
(0.5%TFA) gradient 25%- 60% organic over 15
285nm
4.6x150mm minutes
5-aminosalicylic Merckacid Lichrospher water(0.5%TFA)/methanol
100RP18 20pl (0.5%TFA) isocratic at 5% 228muendcapped organic5pm 250x4
Metronidazole Phenomenex Luna 5 pm
Phenyl-Hexyl 250x4.6mm
water(0.5 %TF A)/methano 15pl (0.5%TFA) isocratic at 2%
organic228mu
Table 2.2: Chromatographic conditions for faecal sample detection of
sulfasalazine, balsalazide, olsalazine, 5-aminosalicylic acid, sulindac and
metronidazole
107

2.5.2.2. Preparation of stock and working standard solutions
Stock standard solutions of sulfasalazine, balsalazide, olsalazine, 5-aminosalicylic
acid, metronidazole, sulindac and captopril were prepared at lOpg/ml and Ipg/ml in
acetonitrile ; water (1:1). A series of working standard solutions of each drug were
prepared by appropriate dilution of the stock solutions in acetonitrile/water, giving
final concentrations of lOr^g/ml, 20r|g/ml, 50rig/ml and lOOrig/ml.
2.5.2.3. Preparation of calibration standards
The calibration standards for sulfasalazine, balsalazide, olsalazine, 5-aminosalicylic
acid, sulindac, metronidazole and captopril in control dog plasma were prepared for
each assay batch by adding working standard solution to lOOpl aliquots of control dog
plasma as indicated in Table 2.3, the final sample volume after evaporation and
reconstitution is lOOpl.
Nominal standard cone.
r]g/mL
Vol. of analyte working solution.
Spiked (pL)
Volume o f (1:1) acetonitrile/water
(pL)
Spiking solution concentration
0 0 50 ■ - ■2 (when quantifiable) 40 10 5rig/ml
5 50 0 10 Tig/ml10 10 40 100 rjg/ml20 20 30 100 T|g/ml50 50 0 100 Tig/ml100 10 40 1 pg/ml200 20 30 1 pg/ml500 50 0 1 pg/ml1000 10 40 10 pg/mlTable 2.3: Preparation of calibration standards for plasma samples
108

2.5.2 4. Sample preparation procedure
• Solid phase extraction
An aliquot o f dog plasma (200pl) is spiked and mixed with a known amount o f the
drug to be extracted. A small amount (lOOpl) of 1% formic acid is added to neutralize
the compound. 200pl of water is added to the plasma samples and mixed to aid drug
adherence to the cartridges. The phenomex strata x or Oasis HLB cartridges are
placed into the solid phase extraction device and 1ml o f methanol is first added to
activate the cartridges, vacuum is then applied, the cartridges are not allowed to
completely dry. The plasma samples are then passed through slowly until everything
passes through. 1 ml o f water is then added to wash o f all proteins and finally the drug
is collected with two elutions of 500pl of methanol. This collected sample is then
evaporated to dryness under vacuum and the residue was reconstituted with lOOpl of
acetonitrile : water (1:1).
• Liquid-liquid extraction
An aliquot of dog plasma (200pl) is spiked and mixed with a known amount o f the
drug to be extracted. A small amount (lOOpl) of 1% formic acid is added to neutralize
the compound. Then 3ml of Methyl-Tert-Buttyl-Ether is added and mixed. This is a
broad organic solvent that will help the drug extraction from the plasma into the
organic phase. The mixture is vortexed for 2 min and centrifuged at lOOOOrpm for 5
minutes, the supernatant is then removed and a second extraction using 3 ml o f ethyl
acetate is performed, the supernatant from the second extraction is added to the first
109

supernatant extraction and this mixture is then evaporated to dryness under vacuum.
The residue was reconstituted with lOOpl of acetonitrile : water (1:1).
• Protein precipitation
200 pL o f each plasma sample was transferred to borosilicate glass tubes followed by
ImL o f acetonitrile as the crash solvent. The mixtures were vortexed for 2 minutes,
after which they were centrifuged at 10 000 rpm for 10 minutes at 4 °C. The
supernatant was transferred into other borosilicate glass tubes and evaporated to
dryness under vacuum. The residue was reconstituted with lOOpl of acetonitrile :
water (1:1). For metronidazole analysis samples ranging from 30min to 12 hour were
diluted by a factor of 5 with acetonitrile:water (1:1) due to their high concentration.
2.5.2.S. Chromatographic conditions
An HPLC system (Agilent Series 1100) equipped with a HTC PAL autoinjector, was
employed. The chromatographic/MS conditions are summarised in Table 2.4 and
Table 2.5 for all drugs.
Data were collected using a PE SCIEX API 4000 triple quadrupole mass spectrometer
operated in Multiple Reaction monitoring mode. Atmospheric pressure ionisation was
performed, using a Turbo Spray ion source.
110

DrugHPLC
column
Injection
volumeFlow Mobile phase
Sulfasalazine; Watersbalsalazide; Atlantis 10%acetonitrile/84%water/6%formic
olsalazine dC18 30x4.6mm,
3 pm
lOpl 1.2ml/min acid: isocratic for 0.5min then increase to 90% organic over 2.5min
5-aminosalicylic
acid
Phenomenex Luna 5 pm
HILIC 15 0x4.6mm
20pl Iml/min92%acetonitrile /8%amonium
formate isocratic
Sulindac Waters Atlantis
dC18 30x4.6mm,
3 pm
lOpl 1.2ml/min
20%acetonitrile/74%water/6%fonnic acid: isocratic for 0.5min then increase to 90% organic over
2.5min
Metronidazole WatersAtlantis
dCI850x4.6mm,
lOpl 1 ml/min55%acetonitrile/39%water/6%formic
acid isocratic
3 pm
Captopril Waters Atlantis
dC18 5 0x4.6mm,
3 pm
15pl Iml/min5 5 %acetonitrile/3 9%water/6%formic
acid isocratic
Table 2.4: Chromatographic conditions for the plasma detection of
sulfasalazine, balsalazide, olsalazine, 5-aminosalicylic acid, sulindac,
metronidazole and captopril
111

Curtain Nebuliser Heater Collision
Drug Ionisation Vaporiser Ionisation gas gas gas Declustering activated collision Ions monitoredtemperature voltage (V) setting(psi)
setting(psi)
setting(psi)
potential (V) dissociation(CAD)
energy (V)
Sulfasalazine Positive ion mode
550°C -4500 12 40 45 -65 5 36m/z
397.02-^197.20
Balsalazide Positive ion mode
550“C -4500 12 40 45 -75 5 -32m/z
3 5 5 .9 2 ^2 4 0 .3 0
Olsalazine Positive ion mode
550°C -4500 12 40 45 -40 5 -26m/z
300.98-^254.90
5-aminosalicylicacid
Negative ion mode 500°C -4500 12 45 50 -45 5 -22
m/z151 .91^108 .20
Sulindac Positive ion mode
700°C 5500 12 45 45 106 6 59m/z
357.02-^233.20
Metronidazole Positive ion mode 700°C 5500 12 45 45 66 6 21
m/z172.17-^128.10
Captopril Positive ion mode
750°C -4500 10 45 45 -40 5 -16m/z
215.88-^182.10
Table 2.5: Mass spectrometer parameters for the detection of sulfasalazine, balsalazide, olsalazine, 5-aminosalicylic acid, sulindac,
metronidazole and captopril in plasma samples
h-»h-»N>

2.5.3. Bio-analytical method validation
2.5.3.1. Linearity (standard calibration curves)
Linearity in analytical terms means that the concentration of the analyte in the
samples within a given range is directly proportional to the signal obtained by the
instrument. Linearity is established by calculation of a regression line using the least
squares method, a correlation close to or more than 0.99 is desirable. Linearity was
evaluated using spiked faecal samples in the concentration range o f 0-500pM and in
dog plasma samples in the concentration range of O-lOOOrig/ml.
2.5.3.2. Specificity
Specificity of the analytical method is the ability to differentiate and quantify the
analyte in the presence of other components in the sample. Specificity was ensured
for six sources of faecal samples and four sources of dog plasma samples.
2.5.3.3. Limit of detection and limit of quantification
The limit of detection was defined as the concentration corresponding to three times
the level o f baseline noise. The signal to noise ratio was performed by comparing
measured signals of known concentrations of drugs with those o f blank faecal
samples or blank plasma samples. This value represents the smallest concentration
113

that can be distinguished from the blank. On the other hand, the limit of quantification
is defined as the concentration above which quantification is possible within a certain
preset level of certainty. The analyte response at the lower limit of quantification
should be five times that of drug free (blank) sample.
2.S.3.4. Precision and accuracy
The percentage coefficient variation and percentage o f accuracy of mean were used to
validate precision and accuracy of the assay by determining the standard samples of
the drug in faecal and plasma samples.
2.5.3.S. Extraction recovery
The extraction recovery o f the drug in biological samples was evaluated by comparing
the mean peak responses using three drug concentrations in the biological media to
the mean peak responses of buffer standards with equivalent concentration. Five
injections were made for each concentration.
114

2.6. Results and discussion
2.6.1. For HPLC/UV detection from faecal samples
2.6.1.1. Sample preparation
The chosen method for sample preparation from faecal material was protein
precipitation by the addition of ice-cold acetonitrile. The addition of acetonitrile to the
samples is the easiest procedure to stop the fermentation reaction occurring between
the biological media (bacterial enzymes) and the drug molecule. The reaction stops by
the precipitation o f enzymes present in the faecal slurry, reducing the temperature by
adding acetonitrile at an ice-cold temperature also adds to the effect of slowing down
the collision between molecules and therefore further preventing the reaction from
occurring.
Simultaneously with stopping the fermentation reaction, protein precipitation also
clears the samples, which facilitates drug analysis. With this in mind the natural
choice for sample preparation was protein precipitation in order to achieve a quick
and easy simulataneous fennentation stop and sample preparation; this sample
extraction method was used for all drugs.
2.6.1.2. Retention times
A representative chromatogram of blank faecal slurry together with a typical
chromatogram produced by the method for faecal sample analysis developed for each
Figure 2.4, Figure 2.6, Figure 2.7 and Figure 2.8. The retention times for
sulfasalazine, balsalazide, olsalazine, 5-aminosalicylic acid, sulindac and
115

metronidazole are summarised in Table 2.6. These retention times achieved optimum
chromatographic conditions and required optimisation of the chromatographic
conditions, namely mobile phase characteristics: pH and volume and type of organic
solvent present. The addition of 0.5% of trifluoracetic acid (TFA) adjusted the pH to
2.5; this low pH value achieved the best retention for all molecules tested. The
organic solvent present also caused a great impact in the retention times, methanol
was found to be a weaker organic solvent when compared to acetonitrile and therefore
was used to extend the retention time of compounds such as 5-aminosalicylic acid and
metronidazole. The ratio of organic/water in the mobile phase also affected drastically
the retention times, lower volumes of organic solvents will resolve peaks from the
solvent front and extend their retention times. For sulfasalazine, balsalazide and
olsalazine a gradient method was thought ideal since a starting low volume organic
permitted a good resolution from the endogenous components of the faecal slurry and
a progressive rise in the organic volume has the advantage of a shorter run time. For
5-aminosalicylic acid and metronidazole the low volume of organic solvent had to be
maintained throughout the run in order to extend as much as possible the retention
times for the compounds to achieve no interference from the solvent front.
116

(A)120
100
80
C3Vuc 40rons5 0
-2 0
Time (m in u te s )
(B) 120
-40
100
8 0
6 0
4 0
20
0
-20
Time (m inu tes )
Figure 2.2: Representative chrom atogram o f blank faecal slurry (A) and faecal
slurry spiked with sulfasalazine (*) at 500pM (B)
117

(A)
c 3
u c m Sio (/) S3 <
60
50
40
30
10
0
103 5 6 7 8 90 2 41
-10Time ( m in u te s )
(B)60
O
50
40
30
10
0
-104 5 6
Time (minutes)9 10
Figure 2.3: Representative chromatogram o f blank faecal slurry (A) and faecal
slurry spiked with balsalazide (*) at 500pM (B)
118

(A) 59
49
39
29
19
(B)59
1 2 3 4 5 6 7 8 9 10 11 12 13 14
Time (m in u te s )
49
39
29
19
9
1 t12 1310
Time ( m in u te s )
Figure 2.4; Representative chromatogram of blank faecal (A) and faecal slurry
spiked with olsalazine (*) at 500pM (B)
119

(A)
25
20
15
10
5
0
5
-10
(B)
4 5
Time (m in u te s )
30
25
20
10
5
0
97 85 63 42Time (minutes)
Figure 2.6: Representative chrom atogram o f blank faecal slurry (A) and faecal
slurry spiked with 5-am inosalicylic acid (*) at 250pM (B)
120

(A)74
64
54
w.t; 44c3Uu
•5 24
14
4yv.
(B)74
4 5
Time (m in u te s )
64
54
" 44
c 34
14
4
-6 r 0 4 5
Time (minutes)
Figure 2.7: Representative chrom atogram o f blank faecal slun-y (A) and faecal
spiked with sulindac (*) at 500pM (B)
121

(A)
c -1 03S: -'5O« -20 <
-30
-35
3 5 6 7 84
Time (m in u te s )
(B)10
5
0
-5
-10
I "O -20 < 0
-2 5
-30
-35
-40
Time (minutes)
Figure 2.8: Representative chrom atogram o f blank faecal slurry (A) and faecal
slurry spiked with m etronidazole (*) at 500pM (B)
122

Drug Retention times (min)
Sulfasalazine 10.8
Balsalazide 8.9
Olsalazine 12.7
5-Aminosalicylic acid 3.9
Sulindac 7.5
Metronidazole 6.2
Table 2.6: Drug retention times using HPLC methodology for faecal
quantification o f samples
2.6.I.3. Linearity, correlation coefficient, precision, accuracy, limit of detection and limit of quantification
The standard curves had linear response up to SOOpM and good linearity (r^>0.9) was
achieved for all molecules as can be seen in Table 2.7. Precision, accuracy, limit of
detection and limit of quantification are also reported in Table 2.7.
123

DrugCoiTclation
coefficient
Cone.
pM
Calculated
concentration
pM
Accuracy
(%)
Intra
day
C.V.
Inter
day
C.V.
LOD
pM
LOQ
pM
(%) (%)
Sulfasalazine 20 22.9 ± 1.37 114.5 4.2 4.7
0.9925 ‘ 120 120.4 ±2.1 100.3 4.6 10.1 5 20
500 492.2 ±41.6 98.4 1.9 8.8
Balsalazide 20 22.3 ± 2.4 111.5 1.0 3.0
0.9866 120 125.1 ±5.2 104.2 5.4 1.9 5 20
500 483.0 ± 10.3 96.6 0.9 1.4
Olsalazine 20 22.5 ±0 .2 112.5 3.1 2.1
0.9913 120 132.9 ± 2 .0 110.7 6.3 1.1 5 20
500 475.0 ± 11.9 95.0 12.0 0.9
5-aminosalicylic 80 86.2 ±2.5 107.7 5.3 6.9
acid 0.9809 200 217.8 ±8.5 108.9 4.3 1.9 40 80
500 476.3 ± 12.3 95.2 2.1 3.3
Sulindac 80 73.4 ±0.8 91.7 0.9 6.1
0.9938 200 210.4 ±7.5 105.2 1.8 6.1 20 80
500 488.8 ± 15.7 97.8 3.2 2.8
Metronidazole 80 91.3 ± 12.7 114.1 9.0 6.8
0.9992 200 195.3 ± 11.1 97.65 3.7 14.9 40 80
500 536.4 ±25.0 107.3 7.4 10.2
Table 2.7: Linearity, correlation coefficient, precision, accuracy, limit of
detection (LOD) and limit of quantification (LOQ) for the analytical method
of the model drugs in faecal samples. Mean ±SD, N=5
124

2.6.2. For LC/MS/MS detection from plasma samples
2.6.2.1. Sample preparation
When quantifying plasma samples, since bacterial enzymes are not present, the
sample preparation does not need to stop the fermentation reaction and therefore the
drug extraction procedure should be selected based on the method that allows the
highest efficiency in extracting the drug from the sample. Ideally the same procedure
should be used in all plasma samples to be analysed since this will save time and all
plasma samples will possess more than one drug molecule so any extraction
procedure used for one will have to also be efficient enough for the other.
Sulfasalazine, balsalazide and 5-aminosalicylic acid were used to test the efficiency of
three extraction procedures from plasma; solid phase extraction, liquid-liquid
extraction and protein precipitation (Table 2.8).
Although for sulfasalazine and balsalazide solid phase extraction seems to be the most
efficient method for plasma sample preparation, this methodology did not work for 5-
aminosalicylic acid. A different cartridge, the Oasis HLB cartridge was attempted but
without success as can be seen in Table 2.8. 5-aminosalicylic acid does not seem to be
able to be retained inside the cartridge and is probably washed away with the water
together with the proteins. As such the chosen method for sample preparation was
protein precipitation, which is a simple, straightforward procedure that allows good
extraction for all drugs.
125

Drug Extraction procedure Peak area
Sulfaisalazine solid phase extraction 4.97x10''
liquid liquid extraction 2.36x10''
protein precipitation 3.70x10''
Balsalazide solid phase extraction 8.99x10^
liquid liquid extraction no peak detected
protein precipitation 4.35x10^
5-aminosalicylic acid solid phase extraction -
strata x cartridgesno peak detected
solid phase extraction - oasis
HLB cartridgesno peak detected
liquid liquid extraction no peak detected
protein precipitation 1.35x10''
Table 2.8: Efficiency of extraction procedure for sulfasalazine, balsalazide and
5-aminosalicylic acid from plasma samples
2.6.2.2. Retention times
The effect of the mobile phase characteristics is similar to the one exemplified for the
faecal slurry method development. Representative chromatograms for the drugs
sulfasalazine, balsalazide, olsalazine, sulindac, metronidazole and captopril in dog
Figure 2.18. The retention times obtained are summarised in Table 2.9.
126

1300 -
1200 - 1100 - 1000 -
900 -
800 -
^ 700 -
^ 600 -
500 -
400 -
300 -
200 - 100 -
02.1 2.2 2.3 2.4 2.5 2 6 2.7 2.8
T im e , m in2.9 3.0 3.1 3.2 3.3
Figure 2.9: Representative chrom atogram o f blank dog plasm a spiked with
sulfasalazine at a concentration o f 5r|g/ml
2.49
5.6x10⁴
5.2 x10⁴_
4 .8 x1Q4_
4.4 x1Q4_
4.0 x10⁴_
3.6 x10⁴_
> 3 .2 x104_V i
I 2 .8 x1Q4_
2.4 x10⁴_
2.0 x1Q4_
1.6x1Q4_
1.4x10⁴_
1.0x10⁴_
8000 -
1.9 2.0 2.1 2.2 2.3 2.4 2.5 2.6 2.7 2.8
T im e, m in
2.9 3.0 3.1 3.2
Figure 2.10: R epresentative chrom atogram o f blank dog plasm a spiked with
balsalazide at a concentration o f lOOOrig/ml
127

2 82
9800 -
8800 -
7800 -
c 6800 -
5800 -
4800 -
3800 -
2800 -
1800 -
800
2,1 2.2 2.3 2.4 2.5 2.6 2.7 2.8 2.9 3.0 3.1 3.2 3 3 3.4 3 5Time min
Figure 2.12; [Representative chrom atogram o f blank dog plasm a spiked with
olsalazine at a concentration o f 1000i]g/ml
1.87
9000 -
8000 -
c 7000 -
6000 -
5000 -
4000 -
3000 -
2000 -
1000 -
0.2 0.4 0.6 0.8 1.0 1.2 1.6 .8 2.0 2.2 2.41.4Time min
Figure 2.14: Representative chrom atogram o f blank dog p lasm a spiked with 5-
aminosalicylic acid at a concentration o f lOOi^g/ml
128

2 .243600 -
3200 -
2800 -
2400 -
2000 -
1600 -
1200 -
800
400
0.2 0.6 1.6 2.0 2.2 2.4 2.6 2.8 3.0 3.2 3.40.4 0 .8 1.0 1.2 1.4 1.8T im e min
Figure 2.15: Representative chromatogram of blank dog plasma spiked with
sulindac at a concentration of 10Y]g/ml
1950 -
1800 -
1650 -
1500 - 0.65
1350 -
1200 -
I1050 -
900
750
600
450
300
150
0.2 0.3 0.4 0.5 0.6 0.7 T im e min
0.9
Figure 2.17: Representative chromatogram of blank dog plasma spiked with
metronidazole at a concentration of Si'ig/ml (limit of detection)
129

0 7052
48
44
40
36
32
28
24
20
16
12
8
4
zU00.1 0 .2 0.3 0.4 0 .5 0.6 0.7 0.8 0.9 1.0 1.1 1.2 1.3 1.4
T im e m in
Figure 2.18; Representative chrom atogram o f blank dog plasma spiked with
captopril at a concentration o f 2r]g/ml (limit o f detection)
Drug Retention times (min)
Sulfasalazine 2.63
Balsalazide 2.49
Olsalazine Z82
5-Am inosalicylic acid 1.87
Sulindac 2 J4
M etronidazole 0.65
Captopril 0.70
Table 2.9: D rug retention times using LC /M S/M S m ethodology for p lasm a
quantification o f samples
130

2,6.2.3. Linearity, correlation coefficient, precision, accuracy, limit of
detection and limit of quantification
The standard curves had linear response up to lOOOqg/ml and good linearity (r^>0.9)
was achieved for all molecules as can be seen in Table 2.10. Precision, accuracy, limit
o f detection and limit of quantification are also reported in Table 2.10.
Drug Correlationcoefficient
Cone.T]g/ml
Calculatedconcentration
Tlg/ml
Accuracy(%)
LODTlg/ml
LOQTlg/ml
Sulfasalazine 5 4.8 ±0.9 96.00.9922 100
100098.1 ±20.9
972.4 ± 172.898.197.2
2 5
Balsalazide 5 4.6 ±0.5 92.00.9974 100
100090.9 ± 8.2
978.8 ±98.090.99T8
2 5
Olsalazine 20 27.6 ±3.9 135.0
0.9925 200
1000
196.0 ±6.2 1024.9 ±
148.9
9&0
102.510 20
5-aminosalicylic 5 4.3 ± 0.5 86.0acid
0.9827 100
1000
98.9 ± 12.7 1014.2 ±
122.7
9&9
101.42 5
Sulindac 2 3.6 ±0.1 720.9993 100
100099.2 ± 0.6
993.3 ± 3.399.2 99 3
2 2
Metronidazole 10 11.8±0.1 118.00.9980 100
1000100.5 ±4 .7
970.6 ± 86.8100.597.0
5 10
Captopril 2 1.99 ±0.1 9 9 J
0.9956 20
50
18.6 ±2.5
50.6 ± 2.9
93.0
101.22 2
Table 2.10: Linearity, correlation coefficient, accuracy, limit of detection
(LOD) and limit of quantification (LOQ) for the analytical method of the
model drugs in plasma samples. Mean ±SD, N=5
131

2.7. Chapter conclusions
This chapter reported for the first time a simple and universal HPLC-UV method for
the simultaneous analysis of sulfasalazine, balsalazide and olsalazine in faecal
samples together with a universal LC/MS methodology for the sensitive analysis of
these molecules in plasma samples. The quantification of the metabolite 5-
aminosalicylic acid has also been developed and a simple HPLC-UV or LC/MS
method can be used for its analysis in faecal samples or plasma samples accordingly.
Simple and robust methodologies for the analysis of sulindac and metronidazole have
also been developed for their quantification both in faecal samples and plasma
samples. A new and simple LC/MS method for the analysis of captopril in plasma
samples was also developed. These analytical methodologies are fundamental for the
work described in this thesis and for further assessments of bacteria-related drug
stability in vitro and in vivo that can use these drugs as models.
132

Chapter 3: Studies using faecal material from
humans to assess drug stability in the distal
gastrointestinal tract
133

3. Chapter 3: Studies using faecal material from humans to assess drug
stability in the distal gastrointestinal tract
3.1. Overview
Over 30 established drug moleeules are metabolised to some extent by the
gastrointestinal microbiota as referenced in chapter 1. However, pharmaceutical
research has failed to investigate which factors affect bacteria-related drug stability.
Due to the inaccessibility of the human colon for routine purposes, the most common
approach for the in vitro study of colonic drug stability is the use of static batch
cultures allowing the direct incubation of the drug with a bacterial preparation.
This chapter investigates the development and validation of a suitable in vitro model
for the study of bacteria-related drug stability. A number o f variables were
investigated and the drug sulfasalazine was chosen as a model drug to investigate
those variables.
The same fermenter is then used to compare the stability of sulfasalazine with the
bacterial stability o f other drug molecules within the same class (azo compounds):
balsalazide and olsalazine; and a comparison with the bacterial stability of two further
molecules is also described: sulindac and metronidazole.
3.2. Introduction
The invasiveness, time consumption and ethical requirements of any in vivo study
makes researchers develop in vitro systems that are easy to set up and easy operate for
134

routine purposes. The challenge here is that such simulators should possess the full
metabolic potential present in the distal gastrointestinal tract and still remain simple
and straightforward to operate.
The objective of this chapter is to investigate a variety o f factors that affect
bacterially-mediated drug metabolism. A static batch fermenter was chosen for its
simplicity. This fermenter uses intestinal contents of animals (normally rat) or faeces
(animal or human) incubated in a suitable medium (buffer or nutritious media). The
study drug can then be added in solution at time zero and regular samples are
withdrawn and quantified for the amount of drug and/or metabolites. The
environment in the distal gastrointestinal tract is anaerobic and it was decided to set
up the static batch simulator inside an anaerobic workstation. This workstation is a
closed environment where a mixture of 80% nitrogen, 10% carbon dioxide and 10%
hydrogen gases are continuously pumped; temperature and humidity are controlled
(37°C and 70% respectively).
Such a simple static batch fermenter can be however, subject to many variables and
several factors can affect the performance of the fermenter. Previous researchers have
not agreed on one unique fermenter as seen in Table 3.1. A non-standardised
methodology makes it difficult to understand which variables play an important role
in bacteria-related drug metabolism. It is the objective o f this chapter to investigate
these factors in a systematic way in an attempt to validate and develop an easy and
ready to use fermenter.
135

S u b stra te C u ltu re source M ediaC o n ten tra tio n
o f cu ltu re source
V olum e R eference
Insulin & calcitonin
Rat caecal contents
Isotonic phosphate
buffer pH 7.433% suspension 800fxl Tozaki et al.,
1997
AzetirelinRat intestinal
contentsBicarbonate
buffer pH 7.0
50% suspension (filtered through
4 layers o f gauze)
1ml Sasaki et al., 1997
DigoxinHuman faeces
Chopped meat glucose broth
l% -3 % 7ml Lindenbaum et al., 1981
FlucytosineHuman faeces
Salinephosphate
buffer10% 15ml Vermes et al.,
2003
HesperidinHuman or rat
faeces
Anaerobicdilutionmedium
not available 20ml Lee et al., 2004
Cimetidine,FamotidineNizatidine
Ranitidine
Human faecesPhosphate
buffer pH 6.810% 100ml
Basit et al., 2002
Basit and Lacey, 2001
Levamisole Inoculum prepared with human faeces
Brain heart infusion
not available 1000ml Shu et al., 1991
Sulfasalazine Inoculum of two
Lactobacillus species and one Streptococcus
Bacto-thiol broth with 5%
fetal calf serum
not availablenot
availablePeppercorn and Goldman, 1972
Q uercetin-3-glucoside
Rat faecesPotassium phosphate
buffer pH 6.8
30% (only supernatant was
used after centrifugation)
1mlSchneider et
al., 2000
GlycerylTrinitrate
Rat caecal contents and human faecal
contents
pH 7.4 anaerobic GT
broth2%, 4% and 8%
notavailable
Abu Shamat and Beckett,
1983
Risperidone Rat intestinal contents
Tris-HCl buffer pH 7.4 33%
notavailable
M euldermans et al., 1994
Zonisamide Caeca! contents o f mice,
hamster, rabbit and guinea-pig
phosphate buffer pH 7.4
33% 2mlKitam ura et al.,
1997
Potassiumoxonate
Rat caecal contents
W ater 60% notavailable
Yoshisue et al., 2000
Table 3.1: Different variables described in the literature to study in vitro
bacteria-related drug stability136

3.2.1. Variability in culture source (human faecal material) between individuals
for the purposes of drug metabolism
There is conflicting data about the variability that exists between the microbiota o f
human populations living in different geographical locations, or between the
microbiota of human populations with different diets (Mata et al., 1969, Drasar et al.,
1976). However, microbiologists generally agree that the large intestinal microbiota is
dominated by anaerobic species and that major bacterial groups (rather than
individual bacterial species) are remarkably similar among human populations. This
section assesses the variability between volunteers on the ability to degrade drugs of
faecal microbiota collected from different volunteers.
3.2.2. Concentration of the culture source
The large intestine absorbs water and electrolytes and hosts the bacterial microbiota,
which is responsible for the digestion of foodstuff not digested from the upper
gastrointestinal tract. The resulting faecal material, being the end product o f the large
intestine will possess a lack of bacterial nutrients and reduced water content when
compared to the content found in the proximal large intestine. Table 3.1 shows the
different concentrations of the culture source found in the literature where previous
batch fermenters were used. This section investigates the importance o f the
concentration of culture source on the ability to degrade drugs o f the batch fermenter.
137

3.2.3. Volume of the in vitro fermenter
This chapter also addresses the importance of the fermenter volume and if the stability
of drugs is affected by the use o f different volumes. Previous literature shows that
different researchers choose to work with different volumes (Table 3.1).
Ideally a small volume is easier to work and time saving since it would facilitate the
manual handling of samples. Working with small volumes is also advantageous in
early drug development where only very small quantities o f drug can be used.
3.2.4. Culture medium composition
The faecal material, being the end product of the large intestine possesses not only
reduced water content but also a lack of bacterial nutrients when compared to the
content found in the proximal large intestine. To better simulate the large intestinal
luminal content when using human faecal material as culture source the material will
be homogenised with different bacterial nutritious media eommercially available.
This will feed the microbiota present in the faecal material and allow for the
production of more bacterial enzymes. A preliminary assessment o f their effect on
drug metabolism is made in this section.
138

3.2.5. Comparison of in vitro metabolism of the drugs sulfasalazine, balsalazide,
olsalazine, sulindac and metronidazole
The azo bond has been the basis of many prodrugs and delivery systems that target
the colonic region of the gastrointestinal tract, this bond is cleaved by azoreductase
enzymes produced by the large intestinal microbiota allowing the release o f the active
therapeutic agent only after this cleavage. One such prodrug is sulfasalazine. The role
of the microbiota in sulfasalazine’s activity was first discovered in 1972 (Peppercorn
and Goldman, 1972) in an in-vivo animal study where the drug was administered to
conventional and germ-free rats. Only the metabolites of the azo-bond reduction were
found in urine and faeces of conventional rats and no such metabolites were found in
the excreta of germ-free animals. Moreover, the administration of antibiotics to
decrease the intestinal bacteria leads to a decrease in the appearance of sulfasalazine
metabolites. Simultaneously with this historical in-vivo study there were in-vitro
observations that a wide range of culturable intestinal bacteria can perform
sulfasalazine’s reduction. Later in 1983 sulfasalazine was incubated with various
bacterial suspensions isolated from human faeces (Azad Khan et al., 1983). These in-
vitro studies all consider individual bacterial species rather than an attempt to include
the wide range of bacterial species commonly found in the human colon. The
incubation with highly nutritious media to keep bacterial species viable also renders
little proximity to the actual colonic environment where only nutrients that escape
upper gut digestion and absorption will arrive to the colon and then be degraded by
bacteria: nutrient availability will diminish throughout the colon. There is a lack of
uniformity in the way prodrugs like sulfasalazine are tested for bacterial stability.
139

In humans (Schroder and Campbell, 1972) sulfasalazine has a limited small intestinal
absorption and reaches the colon where it undergoes bacterially-mediated
degradation. The metabolites formed are sulfapyridine, which is readily absorbed and
mainly excreted in urine and 5-aminosalicylic acid, poorly absorbed and mainly
excreted in faeces. 5-Aminosalicylic acid will exert a local anti-inflammatory action
in the colon and thus sulfasalazine serves as a vehicle to deliver 5-aminosalicylic acid
to the colonic environment. Sulfasalazine has been well established in the treatment of
ulcerative colitis and has a place in the treatment of Crohn’s Disease, the only
limitation to its use is the development of adverse side effects, o f which the most
serious include hematologic effects (haemolytic anemic, leukopenia, agranulocitosis
and pancytopenia) (Das et al., 1973).
This chapter compares in vitro fermentation rates of sulfasalazine and two other azo
compounds that deliver 5-aminosalicylic acid to the colon: balsalazide and olsalazine.
Azo-compounds are probably the most well-known drugs susceptible to bacterial
metabolism, perhaps due to the clinical relevance of the azo-reduction. However,
there are other drugs whose bacterially mediated degradation has equal clinical
relevance, two of such drugs are sulindac and metronidazole. Sulindac and
metronidazole were therefore studied as model drugs to be studied in the in vitro
fermenter.
140

3.3. Chapter aims
The aim of this chapter is to investigate and establish an in vitro fermentation system
than can be used to assess the stability of drugs in a bacterial environment resembling
the human colon. It is known that many factors might affect reactions in in vitro
fermentation models but it is not known how those factors influence drug stability.
This chapter studies some of the key factors affecting drug stability, model drugs that
can be used and suggests guidelines to keep certain factors constant. It reports an
easy, standardised and validated model to assess drug stability in the distal
gastrointestinal tract.
3.4. Materials
Sulfasalazine, balsalazide, olsalazine, 5-aminosalicylic acid, metronidazole and
sulindac used have been mentioned previously in section 2.4.
Saline phosphate buffer pH 6.8
The composition of saline phosphate buffer pH6.8 according to the British
Pharmacopoeia formula is shown in Table 3.2.
Formula Amount
Potassium dihydrogen orthophosphate l.Og
Dipotassium hydrogen orthophosphate 2.0g
Sodium chloride 8.5g
Water up to 1000ml volume
pH 6.8
Table 3.2: Quantitative composition o f Saline phosphate buffer pH6.8
141

Schaedler Anaerobe Broth
Schaedler Anaerobe Broth was obtained from Oxoid LTD, Basingstoke, Hampshire,
England, (BN: 435910). It is a medium free from thioglycollate for the growth of
aerobic and anaerobic organisms and is provided in powder form that requires
suspension in distilled water. The composition of this media is shown in Table 3.3.
This medium is autoclaved before use.
Form ula gm/litre
Tryptone Soya Broth 10.0
Special peptone 5.0
Yeast extract 5.0
Glucose 5.0
Cysteine HCl 0.4
Haemin O.OI
Tris Buffer 0.75
pH 7.6 ± 0.2
Table 3.3: Quantitative composition of Schaedler Anaerobic Broth
Brain H eart Infusion
Brain Heart Infusion was obtained from Oxoid LTD, Basingstoke, Hampshire,
England, (BN: 408009). It is a highly nutritious infusion medium recommended for
the cultivation of streptococci, pneumococci, meningococci and other fastidious
organisms and is provided in powder form that requires suspension in distilled water.
The composition of this media is shown in Table 3.4. This medium is autoclaved
before use.
142

Form ula gm/litre
Calf brain infusion solids 12.5
Beef heart infusion solids 5.0
Proteose peptone 10.0
Glucose 2.0
Sodium chloride 5.0
Disodium phosphate 2.5
pH 7.4 ±0.2
Table 3.4: Quantitative composition o f Brain Heart Infusion
3.5. Methods
3.5.1. Variability in culture source (hum an faecal m aterial) between individuals
for the purposes of drug metabolism
Faecal samples of five healthy volunteers were collected and placed inside the
Anaerobic Workstation (Electrotek model AW500TG)
Figure 3.1 within 30 minutes after defecation avoiding prolonged contact of bacteria
with the aerobic environment. Inside the workstation there is complete absence of
oxygen, the temperature is kept at 37°C and humidity is 70%. A 13%w/w slurry is
then prepared for each of the volunteers using saline phosphate buffer pH 6.8.
143

(A)
(B)
G a s tlovv
Anaerobic environment3 7 ‘C
V ia l 1 Vial 3V ia l 2 T em perature
control
CO
otating
stirrer
Figure 3.1: Picture o f the anaerobic workstation (A) and diagram o f anaerobic
w orkstation containing a representation o f the static batch culture ferm enter (B)
144

The homogenisation is performed with the help of a disperser (Ultra-Turrax disperser
TI8) for 5-10 minutes. Any unhomogenised fibrous material is removed by sieving
the slurry through an open mesh fabric (Sefar Nitex 350 pm). Each slurry is used
individually.
The volume of 150pl of a 2mM sulfasalazine solution prepared with saline phosphate
buffer pH 6.8 is added into each slurry vial containing 450pl of slurry (50pl slurry
sample were taken already before adding the drug - blank sample). The final
sulfasalazine concentration used during incubation is 500pM. All vials and
experiments were prepared and performed in triplicates.
The incubation started as soon as the drug solution was added to the slurry and took
place simultaneously for all vials in a shaker placed inside the anaerobic workstation
for a period of 4 hours. Samples of 50pl were removed at 0, 15, 30, 60, 120, 180 and
240 minutes. These samples were centrifuged for lOOOOrpm for 10 minutes after
adding 150pl of ice-cold acetonitrile. The clear supernatant was aspirated and the
drug concentration was quantified through the HPLC method developed and
described in chapter 2. Table 3.5 summarises certain details for the methodology used
for the slurry preparation and fermentation experiments.
Num ber of volunteers Medium
Homogenisation and sieving
Final slurry concentration
Final drug concentration
Finalvolume
Samplingvolume
Samplingtimes Centrifuging
Saline phosphate buffer pH
6.8
5-10 minutes with5 (used
individually; n= 3)
disperser and sieved through a
350pm mesh10%
sulfasalazine
500pM600pl 50pl
0, 15, 30, 60, 120, 180 and 240 minutes
lOOOOrpm for 10
minutesfabrics
Table 3.5: Details for slurry preparation and fermentation experiments
comparing faecal slurry from different individuals
145

3.5.2. Concentration of culture source
Faecal samples o f three healthy volunteers were collected and placed inside the
anaerobic workstation (Electrotek model AW500TG) within 30 minutes after
defecation. Each faecal sample is divided in three different samples that are used to
prepare slurries with different percentages o f saline phosphate buffer versus faecal
material. The final percentage of faecal material in the different slurries prepared
(taking into account the addition of drug solution) is 46.7%, 16.7%, 10%, 5% and 2%.
The slurry preparation and fermentation experiments follow a similar procedure to the
one described in section 3.4.1; a summary can be found in Table 3.6.
Number of volunteers
Medium Homogenisation Final slurry Final drug and sieving concentration concentration
Finalvolume
Samplingvolume
Samplingtimes
Centrifuging
3 (pooled and n = 3)
Saline phosphate buffer pH
6.8
5-10 minutes with disperser and sieved
through a 350pm mesh fabrics
46.7%, 16.7%,
10%, 5% and 2%
sulfasalazine
500pM
600pl 50pl 0, 15,30, 60, 120, 180 and 240 minutes
1 OOOOrpm for 10 minutes
Table 3.6: Details for slurry preparation and fermentation experiments
comparing different concentrations o f culture source
Samples were analysed by the HPLC method described in chapter 2.
3.5.3. Volume of the iu vitro batch fermeuter
Faecal samples of three healthy volunteers were collected and placed inside the
Anaerobic Workstation (Electrotek model AW500TG) within 30 minutes after
defecation avoiding prolonged contact o f bacteria with aerobic environment. The
slurry o f each of the volunteers was added together in equal amounts. Different
146

volumes (70ml, 20ml, 1ml and 500(il) were then transferred into separate vials. 500pl
of slurry was also transferred into a 96 deepwell plate. This was performed in
triplicates.
The slurry preparation and fermentation experiments follow a similar procedure to the
one described in section 3.4.1; a summary can be found in Table 3.7.
Number o f Medium volunteers
Final slurry Final drug concentration concentration
Finalvolume
Samplingvolume
Samplingtimes
81ml, lOmI,
24ml, 2ml.0, 15,30,
sulfasalazine 1 2ml, lOOpI, 60, 120,10% 180 and
500pM 600pl, 50pl, 240
600pl 50pl minutes
(96well (96wellplate) plate)
Saline 5-10 minutes with 3 (pooled and phosphate disperser and sieved
n = 3) buffer pH through a 350pm6.8 mesh fabrics
Table 3.7: Details for slurry preparation and fermentation experiments
comparing different volumes of batch fermenters
Samples were analysed by the HPLC method described in chapter 2.
3.5.4. Culture medium composition
Faecal samples of three healthy volunteers were collected and placed inside the
Anaerobic Workstation (Electrotek model AW500TG) within 30 minutes after
defecation avoiding prolonged contact of bacteria with aerobic enviromiient. Each
faecal sample is divided in three different samples that are used to prepare slurries
with schaedler anaerobic broth, brain heart infusion broth and saline phosphate buffer
pH 6.8. After the slurries were prepared, equal amounts of each volunteer were pooled
together. Each of these slurries will have 10% faecal material after the drug is added
147

to the slurry. The slurry preparation and fermentation experim ents follow a similar
procedure than the one described in section 3.4.1; a sum m ary can be found in Table
3.x.
Number of volunteers
Media Homogenisation and sieving
Final slurry Final drug concentration concentration
Finalsolume
Samplingvolume
Samplingtimes Centrifuging
3 (pooled andn - 3)
Saline phosphate buffer pll
6.8
5-10 minutes with disperser and sieved
through a 350pm mesh fabrics
10%sulfasalazine
5()0pM
600pl, 50pl,0. 15.30, 60, 120,180 and
240 minutes
lOOOOrpm for 10
minutes
3 (pooled and n - 3)
Schaedler anaerobic
broth pll 7.6
5-10 minutes with disperser and sieved
through a 350pm mesh fabrics
10%sulfasalazine
500pM
600pl, 50pl,0, 15,30, 60, 120,180 and
240 minutes
lOOOOrpm for 10
minutes
3 (pooled and n 3 )
Brainheart
infusionbroth
5-10 minutes with disperser and sieved
through a 350pm mesh fabrics
10%sulfasalazine
500pM
600pl, 50pl,0, 15,30, 60, 120, 180 and
240
lOOOOrpm for 10
minutespll 7.4 minutes
Table 3.8: Details for slurry preparation and fermentation experim ents
com paring different culture media
Samples w ere analysed by the H PLC methods described in chapter 2.
3.5.5. Comparison of in vitro metabolism of the drugs sulfasalazine, balsalazide,
olsalazine, sulindac and metronidazole
Faecal samples o f three healthy volunteers (two females, one male) w ere collected
and placed inside the Anaerobic W orksta tion (Electrotek model A W 5 0 0 T G ) within
30 minutes after defecation avoiding prolonged contact o f bacteria with aerobic
environm ent. The slurry preparation and femrentation experim ents follow a similar
procedure than the one described in section 3.4.1; a sum m ary can be found in Table
3.9.
148

Number of volunteers
Media Homogenisation and sieving
Final slurry Final drug concentration concentration
Finalvolume
Samplingvolume
Samplingtimes Centrifuging
3 (pooled and n - 3)
Saline phosphate buffer pi 1
6.8
5-10 minutes with disperser and
sieved through a 350pm mesh
fabrics
10%sulfasalazine
500pM
600pl, 50pl, 0. 15. 30. 60. 120. 180 and 240 minutes
lOOOOrpm for 10
minutes
3 (pooled and n = 3)
Saline phosphate buffer pH
6.8
5-10 minutes with disperser and
sieved through a 350pm mesh
fabrics
10%balsalazide
500pM
600pl, 50pl. 0, 15, 30, 60, 120. 180 and 240 minutes
1 OOOOrpm for 10
minutes
3 (pooled and n = 3)
Saline phosphate buffer pH
6.8
5-10 minutes with disperser and
sieved through a 350pm mesh
fabrics
10"oolsalazine
500pM
600pl, 50pl, 0. 15. 30. 60. 120. 180 and 240 minutes
1 OOOOrpm for 10
minutes
3 (pooled and n = 3)
Saline phosphate buffer pH
6.8
5-10 minutes with disperser and
sieved through a 350pm mesh
fabrics
10%sulindac
500pM
600pl, 50pl, 0. 15. 30. 60. 120. 180 and 240 minutes
1 OOOOrpm for 10
minutes
3 (pooled and n = 3)
Saline phosphate buffer pH
6.8
5-10 minutes with disperser and
sieved through a 350pm mesh
fabrics
10%metronidazole
500pM
600pl, 50pl, 0. 15.30.60. 120. 180 and 240 minutes
lOOOOrpm for 10
minutes
com paring dit'ferent drugs
150pl o f a 2m M sulfasalazine, balsalazide, olsalazine, sulindac and m etronidazole
solutions prepared with saline phosphate buffer pH 6.8 is added into three slurry vials
containing 450p l o f slurry (50pl slurry sam ple w ere taken already before adding the
drug - blank sample). The final drug eoneentration used during incubation is 500pM .
Samples w ere analysed by the H PL C m ethods described in chapter 2.
149

3.6. Results and Discussion
3.6.1. Variability in culture source (human faecal material) between individuals
for the purposes of drug metabolism
The variability among volunteers is important to establish the number of volunteers
needed to study bacteria-related drug stability. Figure 3.2 shows sulfasalazine
degradation with slurry prepared from five different volunteers, although some
variability is encountered, for all volunteers more than 50% of drug has been
degraded after 120 minutes showing a similar trend. It was decided that samples from
a minimum of three volunteers, pooled together, should be included in bacteria-
related drug stability studies.
500
volunteer 1450
volunteer 2
volunteer 3400
—"—volunteer 4350
volunteer 5300 buffer control
i 250
o 200
150
100
50
180 210 225 2400 15 30 45 60 75 90 105 120 135 150 165 195Time (m inutes)
Figure 3.2: Sulfasalazine incubation with faecal slurry prepared from 5
different volunteers
150
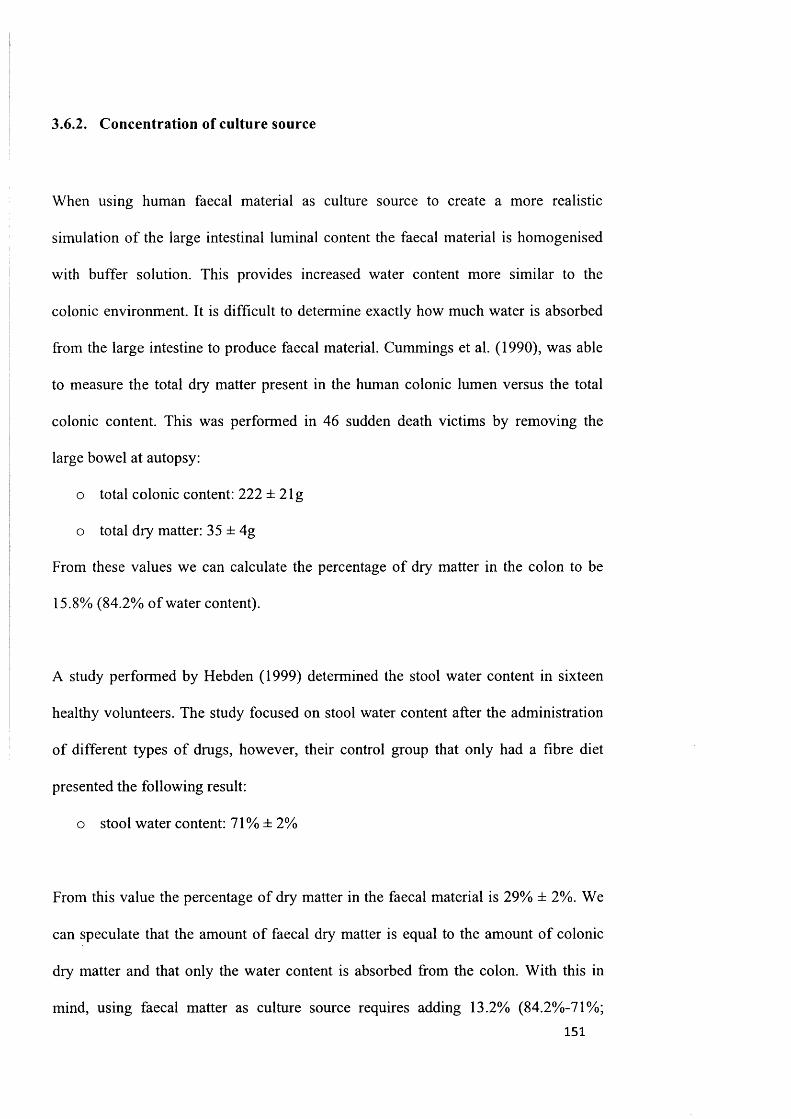
3.6.2. Concentration of culture source
When using human faecal material as culture source to create a more realistic
simulation of the large intestinal luminal content the faecal material is homogenised
with buffer solution. This provides increased water content more similar to the
colonic environment. It is difficult to detemiine exactly how much water is absorbed
from the large intestine to produce faecal material. Cummings et al. (1990), was able
to measure the total dry matter present in the human colonic lumen versus the total
colonic content. This was performed in 46 sudden death victims by removing the
large bowel at autopsy:
o total colonic content: 222 ± 2 lg
o total dry matter: 35 ± 4g
From these values we can calculate the percentage of dry matter in the colon to be
15.8% (84.2% of water content).
A study performed by Hebden (1999) determined the stool water content in sixteen
healthy volunteers. The study focused on stool water content after the administration
of different types of drugs, however, their control group that only had a fibre diet
presented the following result:
o stool water content: 71% ± 2%
From this value the percentage of dry matter in the faecal material is 29% ± 2%. We
can speculate that the amount of faecal dry matter is equal to the amount of colonic
dry matter and that only the water content is absorbed from the colon. With this in
mind, using faecal matter as culture source requires adding 13.2% (84.2%-7l%;151

colonie water content minus stool water content) o f water or buffer to closely simulate
the percentage of water content present in the colon. Faecal slurry of 86.8% would
therefore better simulate the colonic water content. However, slurry prepared with
such low water content does not allow regular samples to be withdrawn, the slurry is
highly viscous and no accurate volumes can be measured. The lowest water content
slurry that allowed an easy and accurate volume measurement of samples is 46.7%.
This will be compared against the 16.7%, 10%, 5% and 2% faecal slurries.
Working with in vitro models permits experimental manipulations that would not be
possible in vivo. To be able to manipulate variables is important when studying the
interactions among microbial species and drugs that occur in the human colonic
environment. One of those variables is the concentration of bacterial source to use;
changing the percentage of the culture source could change the rate of bacterial drug
metabolism. Sulfasalazine was used as a model drug and its stability when incubated
in vitro with different percentages o f human faecal slurry is shown in Figure 3.3 (A).
The results show an increased degradation rate when the molecule is incubated with
46.7% faecal material. The percentage of 46.7% is the one that more closely
resembles the colonic environment. The stability when the drug is incubated in a
46.7% slurry is reduced as compared to the stability o f the molecule when incubated
in a 16.7%, 10%, 5% or a 2% slurry.
152

(A)
(B)
■ 4 6 .7 % slurry
■ 5% slurry
• 1 6 .7% slu rry
■2% slurry
• 10% slurry
■ bu ffer contro l
500
4 0 0
2 300
200
100
0 IS 30 45 60 75 90 105 120 135 150 165 180 195 210 22 5 24 0
Time (m in u tes)
4 6 .7 % s lu rr y 1 6 .7 % s lu rr y 1 0 % s lu rr y
5 % s lu rr y 2 % s lu rr y400
300
S 2 0 0
100
0 15 30 45 60 75 90 105 120 135 150 165 180 195 210 225 240Time (minutes)
Figure 3.3 : In vitro stability of sulfasalazine (A) and 5-aminosalicylic acid
formation during sulfasalazine incubation (B), using different percentages of
faecal slurry (46.7%, 16.7% , 10%, 5% and 2%)
153

It seemed interesting, for mass balance purposes, to quantify the fomiation of the
active molecule; 5-aminosalicylic acid in the different slurry concentrations, the
results are shown in Figure 3.3 (B). 5-Aminosalicylic acid, formed after bacterial
degradation of sulfasalazine, shows a quicker formation rate after sulfasalazine is
incubated with the higher percentage of slurry (46.7%). In fact the formation of 5-
aminosalicylic acid from sulfasalazine in the different percentages o f slurry
corresponds closely to the degradation of sulfasalazine.
The formation of 5-aminosalicylic acid from sulfasalazine at the highest slurry
percentage indicates a slight decrease in the concentration of this molecule after 60
minutes. It was therefore decided at this point that 5-aminosalicylic acid should be
tested for stability in this faecal slurry fermenter. The three higher percentages of
slurry were chosen to test this and the results for the incubation o f 5-aminosalicylic
acid in this fermentation system is shown in Figure 3.4. It can be seen that 5-
aminosalicylic acid is indeed susceptible to bacterial degradation, however this
degradation is only noticeable when 5-aminosalicylic acid is incubated with the
higher percentage of slurry, and even at this percentage, its degradation seems to
occur at a slow rate. The degradation of 5-aminosalicylic acid in a bacterial
environment was first described by (Dull et al., 1987), the reaction mechanism was
found to be acétylation and recently Knoll et al. (2002) incubated 5-aminosalicylic
acid with caecal contents from horses for 31h and noticed a very low degree of
acétylation. This slow degradation rate is confirmed by the results seen in Figure 3.4,
however, it is unknown if this degradation has any clinical relevance for some
patients.
154

Further research needs to be perfomied to understand the reasons for the difference in
sulfasalazine degradation in these different slurry concentrations. One explanation is
the increased bacterial numbers or the presence of more extracellular enzymes in the
46.7% slurry as compared to the other percentages. Nevertheless, lower percentages
o f slurry have their advantages; they require a smaller amount of sample available,
they are easier to handle and to homogenise, they allow a more accurate volume
measurement especially for very small volumes. It was decided to use 10% as the
standardised concentration of culture source in future experiments, this concentration
combines the easiness of sample handling with a clearly visible degradation rate.
It is worth pointing out at this stage that humans, especially in diseased situations can
have a very variable faecal water content ranging from 78% - 98% in certain
diarrhoeal states (Bolton and Culshaw, 1986). Therefore, the intestinal health of the
volunteers providing samples for fermentation experiments is crucial as this can have
a direct impact on the degradation rate o f the drug studied. With this in mind perhaps
the use o f samples from animals kept in controlled environments under controlled
diets provides an advantage over human samples, if consistency between results
throughout time is needed. An ideal situation would also be the measurement of
faecal water content after each defecation before slurry preparation. However, this is
not possible since the measurement of water content in a sample usually requires 24
hours and the slurries have to be prepared within 30 min of defecation.
155

500
400
•2 300
U 20046.7% slurry
16.7% slurry
100 10% slurry
120 1650 15 30 45 60 75 90 105 135 150 180 195 210
Time (m inu tes)
Figure 3.4 : 5-Aminosalicylic acid incubation using different percentages of
pooled human faecal slurry (46.7%, 16.7% and 10%).
3.6.3. Volume of the in vitro batch fermenter
In Figure 3.5 the degradation of sulfasalazine in a batch fermenter with different vials
containing different volumes of slurry is shown. The concentration of the slurry was
kept constant at 10%. As expected the control profiles corresponding to the incubation
of sulfasalazine in saline phosphate buffer slurry indicate no degradation even after 4
hours incubation at 37°C in the anaerobic environment. The degradation profiles with
the slurry indicate a rapid degradation rate, complete after 120 minutes and very
similar in all the different volumes used.
156

600
500
81m l slurryZ 400
81m l buffer control
24m l slurry300
24m l buffer contro l
1.2m l slurry
200 1.2m l buffer contro l
SGOpl slurry
" 600pl buffer control100
160 180 200 220 2400 20 40 60 80 100 120 140Time (m inutes)
Figure 3.5: In vitro stability of sulphasalazine using different volumes of
fermenter during incubation (10% pooled faecal slurry)
It is therefore possible to conclude that the volume of the fermenter does not impact in
the stability profile of the drug in the in vitro fermenter. The average coefficient
variation was calculated for the drug concentration in each fermenter and is shown in
Table 3.10. The larger fermenters (81ml and 24ml) possess a coefficient variation for
the slurry vials >15%, this is probably due to the difficulty in working inside the
workstation with large vials where a larger volume of sampling is required, a smaller
volume facilitates the sampling withdrawal process and reduces the possibility of
errors. Larger sampling volumes are beneficial for analytical purposes if the drug
concentration is too small to quantify, having larger volumes allows sample
evaporation and resolubilisation in smaller volumes facilitating the analysis. On the
other hand, the smaller vials are easier to handle and, for example, vortexing the vials
before each sampling time is easier with smaller vials. The use of smaller vials also
frees precious space inside the workstation for other equipment (like pH meters, redox
157

meters, homogenisers, etc...). The use of small volumes in drug stability studies is
also important in early stages of the drug development process when only limited
amounts of drug are available.
VolumeAverage coefficient variation
(phosphate buffer control)
Average coefficient variation
(pooled faecal slurry)
600 pi T8% 11.9%
1.2 ml 6.0% 8.8%
24 ml 0.9% 23.7%
81 ml 10.8% 87.5%
Table 3.10: Average coefficient variation of drug concentration using different
volumes of fermenters
An attempt was also made to use 96 well plates with the smaller volume; the use of
these plates would streamline these types of studies by allowing a much higher
number of samples present in the workstation at the same time and therefore a higher
number of drugs/variables to be studied simultaneously. The use of 96 well plates
would optimise the batch fermenter system into a high throughput in vitro testing
technique. The results for the use of a 96 well plate with sulfasalazine are represented
in Figure 3.6. The buffer control shows a high degree o f variation with these plates for
sulfasalazine. The high variability observed with the use of 96 well plates might be a
consequence of the difficulty in homogenising the slurry once it is inside each well or
a consequence of drug binding to the plates, not allowing a uniform homogenisation
when the plate is stirring. This phenomenon was also observed for the drugs
balsalazide and olsalazine. As a consequence a fermenter system that makes use of
separate vials with a small volume is preferred and was chosen for future
experiments. The use o f separate vials allows the homogenisation of each vial before
158

withdrawing a sample using a vortex mixer, this reduces the variability between
samples.
10% slurry5 0 0
buffer control
50 0
Z 4 0 0
C 3 0 0
200
100
0 IS 30 45 6 0 75 90 120 135 165105 150 180
Time (m in u te s )
Figure 3.6: Sulfasalazine stability incubated using a final volume of 600pl in a
96 deep well plate
3.6.4. Culture medium composition
Sulfasalazine’s stability and its 5-aminosalicylic acid formation when incubated in
vitro with faecal slurries prepared in different culture media can be seen in
Figure 3.7. The results show an increased degradation rate when the molecule is
incubated with the slurry prepared with schaedler anaerobic broth, a slower
degradation with the slurry prepared with brain heart infusion and the slowest
degradation rate is found when the slurry is prepared with saline phosphate buffer pH
6.8. These results show that the nutrients available to the bacteria have a direct
159

influence on drug metabolism. Schaedler anerobic broth provides more general
nutrients that are used by almost every aerobic and anaerobic bacteria. On the other
hand brain heart infusion provides selective nutrients for certain species of bacteria.
This difference in nutrients might explain the difference in sulfasalazine’s
degradation, the more general media (schaedler anaerobic broth), actively supplying
nutrients to all bacteria present causes increased enzymatic production in all species.
This leads to a quicker action over the drug substrate.
When no nutrients are supplied the gastrointestinal microbiota is still able to
significantly metabolise drug molecules as seen with the slurry prepared with saline
phosphate buffer. The use of buffer slurry for the stability screening of drugs in the
colonic environment might be underestimating the reality of that colonic environment
where bacteria will have more nutrients available. With this in mind the choice of
either schaedler anaerobe broth media or brain heart infusion media instead of saline
phosphate buffer in preparation o f the faecal slurry would probably provide a more
realistic simulation. However, having a highly nutritive media represents an
extremely degradative environment for the drug, which might not be fully
representative of all the population. Certain patients for example might possess a
nutrient deprived medium in the colon; by using a buffer slurry in the fermenter it is
expected that if drug degradation occurs with this model system then degradation will
occur in vivo. It also facilitates the slurry preparation procedure by not having a need
for a time consuming preparation of the culture media.
This section is now complete, the importance of certain variables in bacteria-related
drug stability was tested and it appears im portant that the ferm enter system uses a
160

pooled faecal slurry from at least three individuals, at a 10% concentration, using
individual 600pl vials and using phosphate buffer to prepare the slurry.
(A) 500
400
b u f f e r s lu r r y
b ra in H e a r t I n f u s io n S lu rryC 300
s c h a e d le r A n a e r o b ic B ro th S lu rry
b u f f e r c o n tr o lo 200
100
0 15 30 45 60 75 90 105 120 135 150 165 180 195 210 225 240
Time (minutes)
(B)
500
4 00
Buffer S lurry
= 300
Brain H eart Infusion Slurry
S ch a e d le r A naerob ic Broth S lurryo 200
100
0 15 30 45 60 75 90 105 120 135 150 165 180 195 210 225 240Time (m inutes)
Figure 3.7: In vitro stability of sulfasalazine (A) and 5-aminosalicylic acid
formation (B) during in vitro stability study of sulfasalazine, using pooled
faecal slurry prepared with different nutritious media.
161

3.6.5. Comparison of in vitro metabolism of the drugs sulfasalazine, balsalazide,
olsalazine, sulindac and metronidazole
The feiTnenter system optimised in the previous sections will now be used to look at
the degradation rate of several drug molecules known to be susceptible to bacterial-
related metabolism. When medical scientists think of bacterial-related drug stability in
the distal gastrointestinal tract the drugs sulfasalazine, balsalazide and olsalazine
come immediately to mind. This is because they are well-established drugs in the
treatment o f ulcerative colitis and Crohn’s disease and also because o f the
revolutionary fashion in which they deliver the active drug to the intended site:
through the use of bacteria’s metabolic ability. It is surprising then to find that,
although several in vivo studies have been performed in animals and humans where
these drugs have been tested (Wadworth and Fitton, 1991, Chan et al., 1983, Knoll et
al., 2002), the only in vitro testing to study the bacterial azo-reduction of these drugs
was performed in 1972 for sulfasalazine (Peppercorn and Goldman). This was a
simple incubation culture using three strains of bacteria (two Lactobacillus strains and
one Streptococcus strain) incubated for seven days with sulfasalazine, the results were
reported as a considerable or complete disappearance of sulfasalazine together with
the appearance of sulfapyridine and 5-aminosalicylic acid. Such report clearly proves
bacteria’s role in azo-reduction but azo-compounds should play a bigger role in
modem biopharmaceutical research since they can provide the much-needed standard
model dmg to which other newer molecules, also substrates for bacteria, can be
compared against. Current researchers that come across a need to test bacteria-related
dmg stability do not have standard molecules to compare their work against, they also
162
lack standard in vitro models to test them and standard drugs to validate those models.
This work aims to fill that gap and sulfasalazine, balsalazide and olsalazine have been
studied in the in vitro fermentation model described in this chapter and their
degradation rates is shown in this section.
Figure 3.9 (A) shows fermentation of the three azo prodrugs, sulfasalazine has the
highest degradation rate being fully metabolised after 120 minutes when compared to
balsalazide and olsalazine. Balsalazide has a slower degradation rate than
sulfasalazine taking 180 minutes under the same conditions to fully degrade.
Olsalazine on the other hand presents a slow degradation rate having around 30% of
drug intact even after 240minutes incubation time. Phosphate buffer controls were
constant in all drugs throughout the experiment.
Figure 3.9 (B) evaluates the formation from these drug molecules o f the active
metabolite 5-aminosalicylic acid. The rate of formation of the metabolite is
comparable to the degradation to the rate of degradation of the parent compound. 5-
aminosalicylic acid fonnation from sulfasalazine corresponds to the quickest
fonnation followed by the rate of release o f 5-aminosalicylic acid from balsalazide.
The 5-aminosalicylic acid appearance from olsalazine should be analysed per se
because this parent compound will originate two molecules of 5-aminosalicylic acid
as metabolites. This explains why over time metabolite concentration from olsalazine
is higher than the two drugs sulfasalazine and balsalazide.
163

(A)
5 0 0
4 0 0balsa laz ide
o lsalazine
su lp h asa laz in e
b a lsa laz ide buffer contro l.9 3 0 0
olsa laz ine buffer contro l
su lfasa laz ine buffer control
o 200
100
0 1 5 3 0 9 0 1 0 5 1 2 0 1 3 5 1 5 0 1 6 5 1 8 0 1 9 5 2 1 0 2 2 5 2 4 04 5 6 0 7 5
(B)Tim e (m in u tes)
1000
900
800
700
600
C 5 500
400
3005 -A S A fr o m b a ls a la z id e
2005 -A S A fr o m o l s a la z in e
5 -A S A fr o m s u l f a s a la z in e100
0 15 30 45 60 75 90 105 120 135 150 165 180 195 210 225 240
Time (minutes)
Figure 3.9 : In vitro stability of sulfasalazine, balsalazide and olsalazine (A)
and 5-aminosalicylic acid formation from sulphasalazine, balsalazide and
olsalazine (B), using pooled faecal slurry.
164
The interest of these findings relies on the fact that bacterial enzymatic activity is not
only dependent on the type of susceptible chemical bond but also on the
stereochemistry of the molecular structure surrounding the susceptible bond. The
differences shown here for these three drug molecules are unexpected since the
chemical bond broken by bacterial enzymes is the same in the three drugs; the azo
bond.
There are several possible explanations for these observations of different degradation
rates in these drugs. The differences can result from different chemical abilities for the
molecule to become reduced. For example, the differences might be a mere indication
of how reductive the different chemical groups are. Sulfapyridine moiety of
sulfasalazine would have a higher electron donating ability than the group 4-
aminobenzoyl-b-alanine from balsalazide and even higher than 5-aminosalicylic acid
from olsalazine. Or for example the different chemical ability for the molecule to
become reduced might be explained due to the different molecular structure
surrounding the azo bond. The structure surrounding the azo bond in sulfasalazine
might allow an easier breakage than olsalazine for instance, the azo bond in olsalazine
might be chemically more protected and harder to break.
Another possibility is that the enzyme azoreductase is located within the bacterial cell,
there is some evidence that azoreductase activity is mainly located intracellularly on
certain bacterial species (Song et ah, 2003, Peppercorn and Goldman, 1972). In this
situation the different drug molecules will have to cross the bacterial membrane to
reach the enzyme that then carries out the reaction. The different rates o f degradation
165

might therefore be related to different pemieability rates of the drug molecules when
they cross bacterial membranes.
A third possibility is that the enzyme azoreductase is very selective towards the
molecular structure of the compound it metabolises and therefore it will show a higher
docking affinity towards the molecules that most resemble their natural substrate. And
as such and according to these results sulfasalazine would have a higher resemblance
to azoreductase’s natural substrate and shows higher affinity for this enzyme, docking
in the most efficient way in the active enzymatic site. Balsalazide would show less
affinity and olsalazine molecule even less.
A question that at this point is worth considering is whether or not this different
metabolic rate has any in vivo relevance. Pharmacokinetic studies in man (Chan et al.,
1983, Wadworth and Fitton, 1991) have shown that for an ingested dose of 2g, the
faecal excretion of the parent compound hardly contains any sulfasalazine (0.1%)
when compared to balsalazide (12%) or olsalazine (5%). Another in vivo study
comparing these three azo drugs analysed the urinary and faecal excretion of the
metabolite 5-aminosalicylic acid, sulfasalazine seems to have higher excretion values
o f the metabolite than balsalazide and olsalazine, the results can be seen in Table
3.11.
These pharmacokinetic differences may be explained by different rates o f bacterial
metabolism of these drugs within the colonic environment. In fact the correlation
seems to exist between the in vivo pharmacokinetic data described in the literature for
166

these drugs and the data obtained in the in vitro fennentation model. However, many
factors may play a role in vivo and there should be caution when interpreting this
data. For example, the pemieability of the parent molecule alone could explain the
different in vivo pharmacokinetic results. Also, these dmgs were not administered as
solutions and therefore the different solubility of these drugs throughout the
gastrointestinal tract might also affect absorption and the subsequent pharmacokinetic
data.
ProdrugsUrinary excretion (%)
Mean Median
Faecal Excretion (%)
Mean Median
Sulfasalazine 11-33 22 23-75 38
Olsalazine 14-31 16-27 47-50 17-36
Balsalazide 12-35 20 46 22
Table 3.11. Urinary and faecal excretion (over 24-96h) o f total 5-
aminosalicylic acid (% of dose) following oral administration of various azo-
prodrugs adaptaded from (Sandborn and Hanauer, 2003).
When thinking of other established molecules that are substrates for bacterial
metabolism and that could be used as model drugs sulindac and metronidazole come
to mind. Sulindac because the bacterial reduction reaction also originates an active
metabolite. On the contrary to the azo-compounds, this bacterial transformation has
limited relevance in vivo since sulindac is well absorbed in the upper gastrointestinal
tract and the formation of the active metabolite occurs significantly in body cells.
However, in vitro, this compound seems interesting to study and might provide a
suitable degradation rate to be used as a model drug. The ability o f bacteria to
biotransform sulindac has never been shown in vitro and its bacterial
167

biotransformation is from a study comparing human healthy volunteers with
ileostomy patients that lack the main fermentation site of the colon (Strong et al.,
1987).
Sulindac’s degradation rate when incubated in the in vitro fermentation model using
pooled human faecal slurry can be seen in Figure 3.10. Sulindac has a quick
degradation rate being fully metabolised after 120 minutes. This makes sulindac a
good model drug to be used as standard molecule for comparison with other
degradation rates from other molecules or for validation of in vitro fermentation
systems.
500
400
slurry
H 300buffer control
200
100
0 15 30 45 60 75 90 105 120 135 150 165 180 195 210 225 240
Time (m inutes)
Figure 3.10: Sulindac in vitro fermentation using pooled human faecal slurry
Metronidazole was chosen based on being an established drug in clinical use for over
40 years. Metronidazole has been studied in vitro with specific bacterial cultures (C.
perfringens) and with rat caecal contents, the latter is discussed in the next chapter,
but has never been tested in vitro human faecal material. It seemed therefore
168

interesting to study this drug in such an environment. The results for metronidazole
degradation when incubated with human faecal material can be seen in Figure 3.11.
Metronidazole appears to have the quickest degradation rate, even in comparison with
sulindac and sulfasalazine and therefore metronidazole seems a good model molecule
to use in bacteria-related drug stability studies.
5 0 0
4 0 0
£
I slurry
I 3 0 0
§8
buffer control
200
100
0 1 5 3 0 4 5 6 0 7 5 9 0 1 0 5 120 1 3 5 150 165 1 8 0 1 9 5 210 2 2 5 2 4 0
Time (m inutes)
Figure 3.11: Metronidazole in vitro fermentation using pooled human faecal
slurry
3.7. Chapter conclusions
There is a need develop a standardised procedure to test drug stability in an
environment that resembles the human distal gastrointestinal tract. This environment
is host to a complex ecosystem of 100 trillion microbes whose metabolic activity is
dependent on many factors, making it difficult in vitro simulate. This chapter assesses
some of the factors that can influence in vitro fermentation models to study drug
stability and suggests a standardised model that can be used routinely.
169

The in vitro fermenter described uses human faecal material as the bacterial source
and the work performed indicates that similarities exist in the metabolic activity of
slurries prepared from different volunteers. However, it is suggested the use of a
pooled slurry of three different to minimise any possible variability. The
concentration of the slurry was shown to affect the drug degradation rate but a 10%
concentration seems to be a good indicator of degradation and yet allowing an easy
handling and an accurate volume measurement. The work also indicates that a smaller
volume and the use of independent vials facilitates the procedure and reduces the
variability. The use of buffer slurry instead of a more nutritive media is also preferred
for its simplicity but bearing in mind that the degradation rate is probably an
underestimation of the colonic degradation rate where more nutrients are available.
The relevance of the system presented in this chapter can be compared to the
importance of a dissolution apparatus. The dissolution apparatus does not predict drug
bioavailability in vivo but it creates a standardised test for which different
formulations can be compared between each other. In a similar way, the model
described here creates a consistent way for testing the stability o f drug molecules in a
bacterially rich environment. It also assesses the degradation rates of five model drugs
in this fermenter, model drugs whose bacterial metabolism has clinical relevance. The
degradation rate obtained in this chapter for these model drugs should be used in the
future to compare with the stability o f new drugs and to compare with degradation
rates obtained with future optimised simulators of the distal gastrointestinal tract.
170

Chapter 4: Studies using caecal, colonic and faecal
contents from rat to assess drug stability in the distal
gastrointestinal tract
171

4. Chapter 4; Studies using caecal, colonic and faecal contents from rat to
assess drug stability in the distal gastrointestinal tract
4.1. Overview
In pharmaceutical research animals have always played an important role. Animal
models provide a filter to identify those drugs that are worthy of the relatively costly
human studies that may follow and pharmacokinetic studies allow optimisation of the
drug molecule/formulation. The animal used depends both on the drug and the site of
the human body to be simulated. To study the human gastrointestinal microbiota
several animal models have been employed by microbiological scientists but the
degree of correlation between these and the ecology of the human gastrointestinal
tract remains unclear. These animal models are discussed, with particular focus on
their intestinal microbiological composition and the in vitro metabolism of
xenobiotics.
The aim of this chapter was to establish if animal/human in-vitro correlation exists for
intestinal microbiota-mediated metabolism by comparing the use of rat intestinal
contents with human faecal material in in vitro fermentation studies. Furthermore, the
rat is used to assess the appropriate location from which contents should be collected
from the animals i.e. caecal contents, colonic contents or faecal material. This chapter
addresses the variability in intestinal bacteria related degradation for five commonly
used drugs in vitro between rats and humans.
172

4.2. Introduction
Animal species have been used throughout the years in pharmaceutical research in an
attempt to predict the behaviour of drugs in the human body. However, it is well
known that different species metabolise drug compounds in different ways due to
differences in anatomy and physiology. Likewise, intestinal microbiota-mediated
metabolism is variable between species because the bacterial colonisation of the
intestine is different. Intestinal colonisation by bacteria depends on gastrointestinal
physiology including pH, motility and secretion, and can also vary with age, diet and
disease. The pH and bacterial population changes along the gastrointestinal tract in
man and commonly used laboratory animals is shown in Table 4.1.
SpeciesGastrointestinal tract
regionMean pH
values
Bacterial concentration
(CFU/g of contents)
stomach 1.0-2.5 10
Mansmall proximal 6.6 10
intestine distal 7.5 10^-10^large proximal
intestine distal6.47.0
io ‘'- io’^. cardiac stomach . . 5.0 10*"
10^^pyloric 3.8small proximal 6.5-6.7 lO^ -lO '^
Rat intestine distal 6.8-7.1 107.8_io8.0caecum 6.8 108.4
colon 6.6 NDfaeces 6.9 108.6
stomach 3.4-5.5 10^^small proximal 6.2 105.6_io5.9
Dog intestine distal 6.6-7.5 105.8-io7.0caecum 6.4 10 ''
colon 6.5 N.Dfaeces 6.2 10 ''
(continued)
173

stomach 2.8-4.8 1 0 ^-1 0 ^^
small proximal 5.6-5 . 8107.8_ 1 0 8 .6
Monkey intestine distal 6.0 108.6_io9.o
caecum 5.0 1 0 ^^colon 5.1 NDfaeces 5.5 1 0 ^^
Mouse
. cardiac stomach , .pyloric
small proximalintestine distal
4.53.1NDND
1 0 ^^1 0 ^^
106.3_io6.8107.5_io8.0
caecum ND 1 0 8 .8
colon ND NDfaeces ND 1 0 '«
stomach 1.9 1 0 ^^small proximal 6 .0 -6 . 8 1 0 ^-1 0 ^ ’
Rabbit intestine distal caecum
7.5-8.06 . 6
lOS.O-1 0 6 .7
1 0 8 .5
colon 7.2 NDfaeces 7.2 1 0 8 .7
stomach 4.1-4.5 107.6
small proximal 7.6-7.7 106.7-io7.6
Guinea Pig intestine distal caecum
8 .1 -8 . 2
7.0
108.4_ 1 0 8 .7
1 0 '"colon 6.7 NDfaeces 6.7 1 0 8 .8
. . cardiac stomach , .pyloric
6.92.9
107.Ü
1 0 ^^small proximal 6 .1 -6 . 6
106.5_ 1 0 6 .3
Hamster intestine distal 6.9-7.1 1 0 6 .0_ 1 0 6 .6
caecum 7.1 1 0 ' 'colon ND NDfaeces ND IO8.0
stomach 2.2-4.3 107.0-1 0 8 .6
small proximal 6 .0 -6 . 2106.5_io7.0
Pig intestine distal caecum
6.9-7.56.3
107.6_io8.01 0 8 .6
colon 6 . 8 NDfaeces 7.1 1 0 8 .8
Table 4.1. Comparison between pH and bacterial numbers between animal
species and man (adapted from Rowland et al., 1986, Smith, 1965, Evans et
al., 1988, Salminen et al., 1998) (ND: not determined)
174

Table 4.1 demonstrates that although the human and rabbit upper gastrointestinal tract
contains few organisms, bacteria are found in large numbers in the stomach and upper
intestine of other animals. All animals including humans display comparable bacterial
numbers in the lower intestine. Beyond a simple assessment o f bacteria numbers,
Rowland et al., (1986) compared the activity of certain microbial enzymes of five
species of laboratory animals with that of man. The sources o f contents used were
caecal contents of rats, mice, hamsters and guinea-pigs and freshly voided faeces from
three marmosets and three humans volunteers. The findings are shown in Table 4.2.
The rat, guinea-pig and marmoset differed significantly from the human in three of
the four enzymes studied and the mouse and hamster in two out o f four enzymes.
Enzyme activities (^mol/h per g caecal contents or faeces)of caecal Bacterial
Species contents
or faeces
(g)
numbers
(•og/g)B-glucosidase D-glucoronidase
Azo
reductase
Nitro
reductase
Nitrate
reductase
Rat 2.9 10.8 ±0.8 34.3 ±5.5 156.3 ±28.8 2.0 ±0.6 4.0 ±0.7 3.9±1.0
Mouse 0.3 10.2 ±0.2 55.6 ±22.0 42.9 ± 4.6 2.3 ±0 .7 6.5 ±0.7 1.8 ±0 .4
Hamster 1.5 10.4 ±0.1 30.1 ±2.3 60.8 ± 14.8 2.9 ±0.3 3.9 ±0.6 1.7±0.2
Guinea-
pig46.2 10.3 ±0.1 8.4 ±3 .0 11.3 ± 1.5 1.4 ±0.3 0.4 ±0.1 5.6 ± 1.8
M armoset 1.7 10.8 ±0.3 35.1 ±8.0 11.7 ±5.5 2.1 ±0.7 0.6 ± 0.2 1.9 ± 1.0
Human 110 11.3 ±0.2 49.5 ±8.1 35.5 ±19.9 n. d. 1.0 ±0.2 8.0 ±2.3
Table 4.2. Bacterial numbers and enzyme activities o f caecal contents or
faeces from different animal species. (Rowland et al., 1986).
The metabolic action of intestinal bacteria can be compared between species. For
example, Cemiglia et al., (1982) studied the azo reduction o f three azo-dyes in
bacterial suspensions isolated from human faeces and intestinal contents from
175

m onkey and rats. As can been seen from Figure 4.1 there was almost no difference in
the reduction rates for each dye by the bacterial suspensions from human, rat and
m onkey intestinal microbiota.
2 4 0 'i
200
2 4 0 ,Q
± 2(WE
t> 160
n-0K 120 1
1 BOla
1
Ï 4 0O
1
3 1 2
160-
120
24n c u b a t io n Timo, b
2 4 0
1
2 0 0
160
3■o01 120-
008 0
Q 4 0
4 6I tuubc il ion Time, h
4 6 8I n c u b o t io n Time, h
Figure 4.1: Azo reduction o f (a) Direct Black 38 (IbOnmol), (b) Direct Red 2
(233nmol), (c) Direct Blue 15 (188nm ol) by anaerobic bacterial suspensions
from hum an faeces ( > ' ), from m onkey faeces ( • — • ) and rat intestinal
contents ( ); (Cerniglia et al., 1982).
A s aforem entioned, diet is an im portant factor in bacterial composition, and also in
bacterial enzymatic activity. A nim als and their gastrointestinal bacteria evolved
together; the natural substrates for most o f the microbiotal enzym es are com pounds
com m only available in nature that animals ingest. O ne such group o f com pounds is
176

the flavonoids. Flavonoids are present in fruits and vegetables and reach the large
intestine where they are hydrolysed to absorbable aglycones, which are further
degraded by the intestinal microbiota. Lin et al., (2003) compared the degradation of
thirteen flavonoids aglycones in rat, rabbit and human faeces. Comparing the
degradation of flavonoids among faeces of the three species, very close resemblance
was found between rabbits and rats but these were very different from man. The
authors suggest that similar strains of enterobacteria might reside in rabbits and rats,
whereas those in humans seemed quite different. Figure 4.2 shows the differences in
degradation of some flavonoids aglycones in faeces of the three different species.
Degradation of Luteoiin (by rat, rabbit and human faeces)
*— H um an faecal —— R at faeca l — — R abbit faecal
100
8 0
1I# 20
0 8 12 1 6 20 2 44
Time (h)
Degradation of Hesperitin (by rat, rabbit and human faeces)
— Hu ma n faecal — Rat faecal — — R abbit faecal
100
2
0 8 12 16 20 244
Degradation of Kampferol (by rat, rabbit and human faeces)
— Hu ma n fa eca l — Rat fa eca l — Rabbi t faeca l
100
8 0
•I2#
20
0 8 12 16 20 2 44
Time (h )
Degradation of Morin (by rat, rabbit and human faeces)
— Hu ma n faecal — Rat faecal — — R abbit faecal
100
8 0
6 0
4 0
200
0 4 8 12 16 20 2 4
Time (h) Time (h)
Figure 4.2: Degradation of morin, hesperitin, kampferol and luteoiin by rat,
rabbit and human faecal bacteria (adapted from Lin et al., 2003).
177

A further intestinal bacterial reaction, which has been studied between species, is the
metabolism o f xenobiotics by nitroreduction. Contradictory results have been found.
For example, 7-Nitrobenz[a]anthracene (a compound generally found in the
environment as a combustion product, including cigarette smoke and automobile
exhaust) is metabolised to different extents by mouse, rat, pig and man (Table 4.3)
and to different extents by varying pure bacterial cultures (Morehead et al., 1994).
The authors believe that these differences are probably due to the diets of the species.
Bacteria Percent ± SDPure Cultures
Bacteroides sp. 50.8 ± 3.6Butyrivibrio sp. 34.9 ±5 .6
Clostridium clostridiforme 44.3 ± 2.0C. nexile 42.1 ± 1.9
C. paraputrificans 35.5 ± 1.6C. perfringens 54.7 ±2.5
Eubacterium sp. 51 .0±2 .7E. hadrum strain 1 42.3 ± 1.3E. hadrum strain 2 36.6 ± 2.8
Mixed populationsHuman 63.5 ±5.1Mouse 32.3 ± 1.6
Pig 60.7 ±2.3Rat 88.4 ± 4 .7
Table 4.3. Percent conversion o f 7-N itrobenz[a] anthracene to 7-
Aminobenz[a]anthracene by intestinal bacteria (adapted from Morehead et al.,
1994)
Variability between animal species and man was also found for the bacterial
nitroreduction of 6-nitrochrysene (compound commonly found in diesel engine
exhaust and in certain photocopier fluids and may constitute a carcinogenic risk to
humans). Manning et al., (1988) compared the nitroreduction of 6-nitrochrysene using
microbiota from human, rat and mouse. The rates of nitroreduction were consistently
178

different am ong hum an, rat and m ouse intestinal m icrobiota as can be seen in Figure
4.3. T he hum an intestinal m icrobiota m etabolises 6-nitrochrysene to the greatest
extent. The authors suggested that differences in n itroreductase activity could be due
to d ifferences in the predom inant genera o f intestinal m icrobiota and that the
microbiota associated with hum ans would possess bacterial species m ore active in
perform ing nitroreduction (M anning et al., 1988).
40
H um an3 0
£ 20-MousG
RatU)
24Time (hours)
Figure 4.3: N itroreduction o f 6-nitrochrysene to 6-am inoehrysene by
anaerobic bacterial suspensions from hum an faeces ( • ) and from m ouse ( ^ )
and rat ( ■ ) intestinal contents (M anning et al., 1988).
C ontrary to these described studies, another s tudy found similar metabolic rates in the
n itroreduction o f [ ’"^Cj-l-nitropyrene between animal species and man (K ing et al.,
1990). ['"‘C J-l-n i tropyrene (a com pound found in com bustion em ission particulate
matter) presents very sim ilar reductive m etabolites produced by the intestinal
m icrobiota from different species and man as can be seen in Table 4.4. T he authors
point out that this similarity suggests a com m on nitroreductase m echan ism between
the different species and m an for the b io transform ation o f 1-nitropyrene (K ing et al.,
1990).
179

Sample1-
aminopyrene
N-formyl-1-
aminopyrene
N-acetyl-1-
aminopyrene
unknown
metabolite A
unknown
metabolite B
Rat(caecum 79.4 ± 11.0 1.0±0.1 3.0 ±0.2 1.2 ±0.1 5.0 ±2 .0
and colon)
Mouse(caecum 88.0 ± 2 .4 1.2±0.1 3.4 ±0.03 1.0 ±0.03 1.2±0.1
and colon)
Humanfaeces
93.0 ±5.0 1.4±0.1 4.4 ± 0.4 1.0 ±0.01 3.3 ±0 .2
Combinedbacterial 87.4 ±4 .0 1.41 ±0.2 3.4 ±0.01 1.0 ± 0 .4 1.2±0.1strains
Table 4.4. Summary of the percent of total metabolite found for the
metabolism of 1-Nitropyrene (adapted from King et al., 1990)
This nitroreduction example indicates that similarities or differences between the
ability of the gastrointestinal microbiota of different animal species and humans to
metabolise compounds should be seen on a basis of individual molecules. The
enzymatic systems developed by bacteria that colonise the gastrointestinal tract are
complex and evolved to metabolise specific chemical molecules needed for bacterial
survival. The similarities in bacterial metabolic rates between animal species could be
explained because some of those enzymatic systems are more flexible and others very
specific for certain chemical structures. Some molecules might be able to trigger some
o f those enzymes in a very quick and specific way presenting different metabolic rates
between animal species. Other molecules might be degraded by general enzymatic
mechanisms present in most intestinal bacteria, which allows them to be metabolised
similarly between animal species.
180
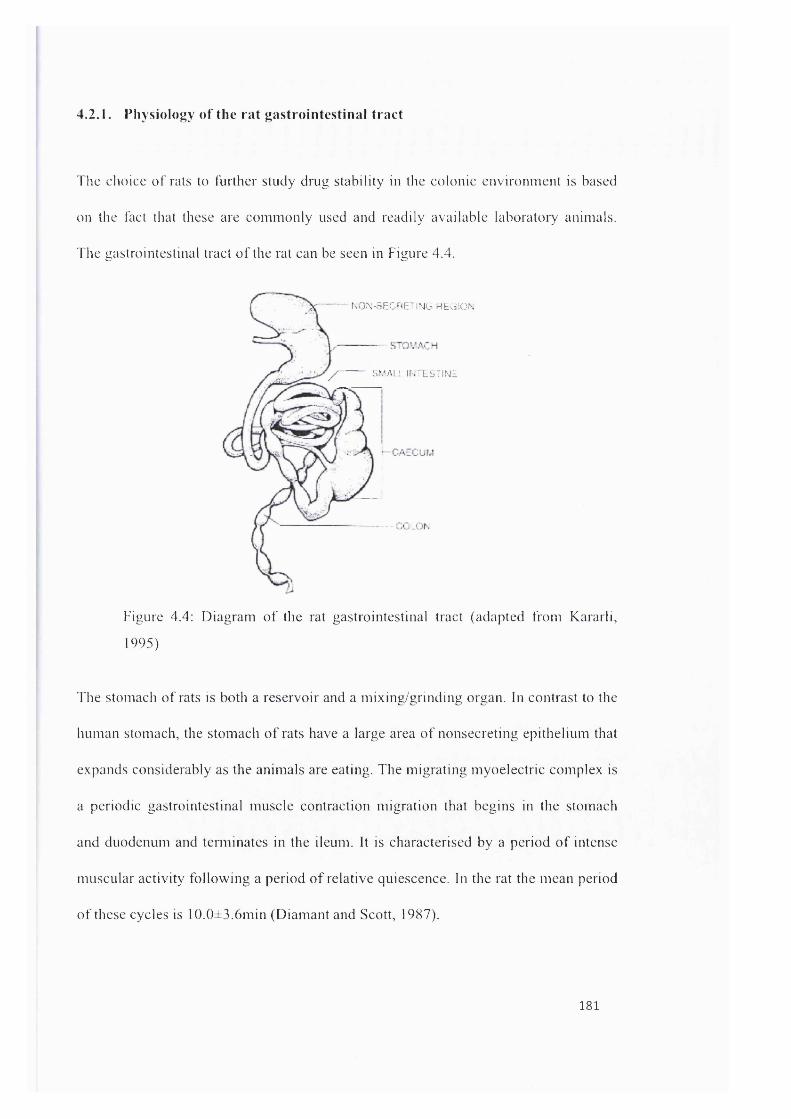
4.2.1. Physiology of the rat gastrointestinal tract
The choice o f rats to further study drug stability in the colonic environm ent is based
on the fact that these are com m only used and readily available laboratory animals.
The gastrointestinal tract o f the rat can be seen in Figure 4.4.
NON-SECOETiMG HbGiON
SMAI Î IN'LSTINE
Figure 4.4: D iagram o f the rat gastrointestinal tract (adapted from Kararli,
1995)
The stomach o f rats is both a reservoir and a m ixing/grinding organ. In contrast to the
hum an stomach, the stom ach o f rats have a large area o f nonsecreting epithelium that
expands considerably as the anim als are eating. The m igrating myoelectric com plex is
a periodic gastrointestinal m uscle contraction m igration that begins in the stomach
and duodenum and tenn ina tes in the ileum. It is characterised by a period o f intense
m uscular activity following a period o f relative quiescence. In the rat the m ean period
o f these cycles is 10.0±3.6min (D iam ant and Scott, 1987).
181

The small intestine is the major site for the absorption of nutrients and drugs due to its
large surface area; such a large surface area is made possible by the presence of villi
and microvilli. The villi have characteristic shapes and patterns in different species:
they are finger shaped in humans and tongue shaped in the rat. In the rat there are 65
microvilli per square micrometer of villi surface (Kararli, 1995).
There are some significant species differences in the anatomy of the large intestine.
The caecum for example, is poorly defined in humans, in rats is large and it is the
location where microbial fermentation mainly occurs (Kararli, 1995). The colon of
rats is not sacculated nor long, it is less important for microbial fermentation,
compared to the caecum and mainly important for re-absorption of water and
formation o f faecal pellets.
4.2.1.1. Transit times in the rat gastrointestinal tract
When considering the differences between the human and rat gastrointestinal tracts,
the issue o f size is certainly obvious. The average length post mortem for humans,
and rats can be seen in Table 4.5.
Small Intestine
Caecum
Colon
Total
Human (cm)
625
10-30
150
795
Rat (cm)
102-148.5
5-7
9-11
120-170Table 4.5: Average length post mortem of the gastrointestinal tract of humans
and rats (adapted from Kararli, 1995)
182

These different lenghts has impact on transit time o f gastrointestinal contents. Also,
the rate o f passage can vary between the type o f diet, the particle size o f the digesta
and m orphological characteristics o f the gastrointestinal tracts. In fasted rats the
transit time in the different sections o f the gastrointestinal tract averaged from
different studies using pellets or granules as transit markers was 2 hours (s tom ach), 3
hours (small intestine), 2-11 hours (caecum), 4-24 hours (colon) (Mori et al., 1989,
Tuleu et al., 1999, Ciftci and Groves, 1996). It is worth pointing out that although
whole gut transit times might be comparable in rats to those in hum ans, due to its
different length (Table 4.5) the speed o f transit is m uch s low er in the rat.
4.2.1.2. The pH of the rat gastrointestinal tract
The pH along the gastrointestinal tract in the fed rat has been show n to increase from
3.3-5.0 in the stom ach to 6.5-8.0 in the small intestine and with values ranging
between 6.6-7.6 in the colon (Smith, 1965). In a more recent study (M cConnell et al.,
2008), the intestinal pH was not show n to reach above pH 7, as show n in Figure 4.5.
- o f e d r a t s ( n = S)
F a s te d r a t s (n = 5 )
/6
4
3
2
Figure 4.5: pH o f the rat gastrointestinal tract (adapted from M cConnell et al.,
2008)
183

4.2 .13 . The water content in the rat gastrointestinal tract
The total water content in the gut contents o f rats was investigated (Cizek, 1954) and
varied from 4.3 to 10.5g. More recent data collected by McConnell et al. (2008)
showed the distribution of this water throughout the gut, and is summarised in Table
4.6.
Stom ach(m l)
Sm allIn testine
(m l)
C aecum(m l)
Colon(m l)
T o ta l(m l)
Fed 0.85 2.9 2.2 1.8 7.7R at
Fasted 0.26 1.0 1.2 0.7 3.2Table 4.6: Distribution of water content in the rat gastrointestinal tract
(adapted from McConnell et al., 2008)
4.3. C hapter aims
The aim of this chapter was to establish any correlations between a commonly used
laboratory animal (rat) and human in vitro intestinal microbiota-mediated metabolism.
To achieve this end, the objectives were:
■ To investigate the in vitro metabolism of five model drugs using intestinal
contents derived from rats
■ To establish the appropriate site from which intestinal contents should be
collected (caecal, colonic or faecal)
184

R at 1 Rat 2 Rat 3 Rat 4 Rat 5
Strain; Wistar Strain: Wistar Strain: Wistar Strain: Wistar Strain: Wistar
Sex: Male Sex: Male Sex: Male Sex: Male Sex: Male
Age: 12-14 weeks Age: 12-14 weeks Age: 12-14 weeks Age: 12-14 weeks Age: 12-14 weeks
Source: SOP Source: SOP Source: SOP Source: SOP Source: SOP
Weight: 362.Og Weight: 502.Og Weight: 498.2g Weight: 357.Og Weight: 345.0g
4.4. Materials
Sulphasalazine, balsalazide, olsalazine, sulindac and metronidazole are described in
Chapter 2. Saline phosphate buffer pH 6.8 was prepared as described in Chapter 2.
Rats
4.5. Methods
4.5.1. Quantification of w ater from ra t intestinal contents
Five male Wistar rats were housed in separate cages for two hours with free access to
food and water and their faeces collected as soon as defecated throughout this time.
Each rat was then sacrificed and the abdominal cavity cut open, the caecum
(distinctive organ because of its proportionally large size when compared to the
remaining intestines) was isolated as well as the colon and both organs were removed.
A sample of the faecal, caecal and colonic content material was collected, weighted
and frozen at -80®C. The samples were then dried using freeze drying technique where
the frozen material undergoes low pressure with heat to sublime the frozen water
directly from the solid phase to gas. The use o f rat gastrointestinal contents to study
drug stability
185

The faeces, the caecum and the colon from 5 male Wistar rats were collected as
described in section 4.5.1. These were placed inside the Anaerobic Workstation
(Electrotek model AW500TG) within 30 minutes to avoid prolonged contact of
bacteria with aerobic environment. Inside the workstation there is complete absence
of oxygen, the temperature is kept at 37“C and humidity is 70%. The caecal and
colonic contents were squeezed out of the organs and weighed. Due to the small
amount of content available from each section of the rats, not all drugs could be tested
in all rats and a summary of which drugs were tested with each rat is shown in Table
4.7.
FaecesColoniccontents
Caecalcontents
R a t i
Rat 2
Rat 3
Rat 4
Rat 5
sulfasalazine sulfasalazine sulfasalazinebalsalazide balsalazide balsalazideolsalazine olsalazine olsalazine
sulfasalazine sulfasalazine sulfasalazinebalsalazide balsalazide balsalazideolsalazine olsalazine olsalazinesulindac sulindac sulindacmetronidazole metronidazole metronidazole
sulfasalazine sulfasalazine sulfasalazinebalsalazide balsalazide balsalazideolsalazine olsalazine olsalazinesulindac sulindac sulindacmetronidazole metronidazole metronidazole
sulindac sulindac sulindacmetronidazole metronidazole metronidazole
sulindac sulindac sulindacmetronidazole metronidazole metronidazole
e notTable 4.7: Drugs tested in each rat (due to very limited contents availab
all drugs were able to be tested in all rats but a minimum of three rats were
used for each drug)
186

Each o f the slurries prepared will have 10% intestinal content after the drug is added
to the slurry. The slurry preparation and fermentation experiments follow a similar
procedure to the one described in section 3.5.1; a summary can be found in Table 4.8.
Number of rats
Intestinalcontent Medium
Homogenisation and sieving
Final slurry Final drug concentration concentration
Finalvolume
Samplingvolume
Samplingtimes Centrifuging
minimum 3 (each rat was
tested individually)
Faeces, colonic content and
caecal content (tested
individually)
Saline phosphate
buffer pH 6.8
5-10 minutes with disperser and sieved
through a 350pm mesh fabrics
10%
sulfasalazine, balsalazide. olsalazine,
sulindac and metronidazole
500pM
600pl 50pl0, 15, 30, 60,
120,180 and 240 minutes
1 OOOOrpm for 10 minutes
Table 4.8: Details for slurry preparation and fermentation experiments
comparing different locations in the rat intestine and comparing different
drugs
Samples were analysed by the HPLC/UV methodology developed and described in
chapter 2.
4.6. Results and discussion
4.6.1. The use of rat gastrointestinal contents to study drug stability
One o f the advantages of being able to use certain animals to investigate bacteria
related drug metabolism is the ability to collect contents from the intestinal location
where bacteria are most active. In the rat the major site for the fermentation of
foodstuff is the caecum. The function of the colon is mostly to absorb water and
formation of faecal pellets. The contents o f the caecum are expected to contain a
higher amount of water. A comparison of the water content found in the caecum,
colon and faecal material in the rat is shown in Table 4.9. Generally there is a higher
percentage of water content in the caecum content, although a high variability is
187

present. The high variability is probably explained due to the faet that only a small
fraction of the contents was withdrawn for measuring water content, the remaining
was used to perfonn the fermentation experiments. Perhaps ideally, for an accurate
measurement of water content the whole content o f the intestines should be used.
Rat 1 Rat 2
W ater Content
Rat 3 Rat 4 Rat s
caecum 99% 81.8% 87.3% 77.9% 79.3%colon 62.6% 78.4% n.d. 79.7% n.d.faecal n.d. 64.5% 67.4% 78.6% 70.5%
Table 4.9: Percentage o f water present in the gastrointestinal contents
collected from five rats (n.d.: not determined due to very limited amount)
The metabolism of sulfasalazine when incubated with gastrointestinal contents from
rat 1,2 and 3 is represented in Figure 4.6,
Figure 4.7 and Figure 4.9 respectively. In each rat the degradation rate of
sulfasalazine when incubated with faecal contents is compared with colonic and
caecal contents. The first thing that becomes apparent from these experiments is that
although the drug sulfasalazine is degraded in all rats, there is a noticeable variability
between the different rats. It is worth pointing out that all rats are fed the same diet
(standard rat chow) and are kept under similar conditions. The variability between rats
probably indicates that bacterial colonisation of the gastrointestinal tract is affected by
other factors besides diet and animal physiology, factors that are specific for each
individual animal. The general trends o f degradation remain similar but each ra f s
microbiota is unique in its metabolic activity.
188

5 0 0
4 5 0
Faecal slu rry4 0 0
Colonic slurry3 5 0
Caecal slurry
: 3 0 0
Buffer control
s 2 5 0
" 200
15 0
100
50
0 15 30 45 60 75 9 0 105 120 135 150 165 180 195 210 2 2 5 2 40
T im e ( m in u te s )
Figure 4.6: Sulfasalazine in-vitro stability using 10% slurry of faecal, colonic
and caecal rat contents (rat 1 )
5 0 0
4 5 0
4 0 0
Faecal slurry3 5 0
I Colonic slurry3 0 0
C aecal slurryE 2 5 0
85 Buffer control
200
150
100
5 0
45 75 120 16 5 180 195 210 22 5 24 00 15 30 60 9 0 105 135 ISO
T im e ( m in u te s )
Figure 4.7: Sulfasalazine in-vitro stability using 10% slurry o f faecal, colonic
and caecal rat contents (rat 2)
189

50 0
45 0
40 0
350Faecal slu rry
300Colonic slu rry
250
Caecal slu rry
<J 200
Buffer contro l
150
100
0 15 30 4 5 60 75 90 10 5 120 135 150 195 210 22 5165 180 24 0
T im e ( m in u te s )
Figure 4.9: Sulfasalazine in-vitro stability using 10% slurry of faecal, colonic
and caecal rat contents (rat 3)
The degradation rates seen with rat faecal slurries for sulfasalazine (Figure 4.6,
Figure 4.7 and Figure 4.9) compare well with the data obtained in the previous
chapter for sulfasalazine stability in human faecal slurries. This might be an
advantage if rats are easily available, then they would provide a good qualitative
indication of this drug’s degradation in human faecal slurry. When comparing the
degradation in rat faecal slurries with the degradation in colonic and caecal slurries
there is some variability present. Sulfasalazine’s degradation rate with caecal contents
is probably unexpectedly fast given that the rat’s caecum possesses a higher amount
of water content (Table 4.9) and therefore bacterial enzymes would be expected to be
present in a more diluted media, therefore providing a slower degradation rate when
compared to the slurry prepared from faecal material. On the other hand, the bacteria
present in the faecal material are directly derived from the bacteria present in the
caecum. In this caecal location the amount of nutrients present is at its maximum (this
190

is the main site for bacterial fennentation o f foodstuff) and slurry prepared with such
material is likely to possess a higher amount of nutrients for bacteria. The slurry
prepared with colonic contents presents a slow degradation rate when compared to the
degradation rate obtained with caecal and faecal contents in all rats and this is
probably due to the fact that the high nutrient availability present in the caecum
diminishes as soon as the contents move down the gastrointestinal tract towards the
colon to be excreted. The water content present in the colon is still higher than the
water content present in the faecal material making the slurry more dilute in
bacterial/enzyme concentration when compared to faeces, which probably explains
the slower degradation rate when compared to faeces.
The stability of two other azo drugs balsalazide and olsalazine was also investigated
in gastrointestinal contents collected from rats. The metabolism of balsalazide when
incubated with gastrointestinal contents from rat 1 ,2 and 3 is represented in Figure
4.10, Figure 4.12 and Figure 4.13 respectively and for olsalazine in Figure 4.14,
Figure 4.15 and Figure 4.17. The variability between rats present for the drug
sulfasalazine is also visible for balsalazide and olsalazine confirming that the
gastrointestinal contents of each individual rat have unique metabolic rates. The
degradation rates obtained with rat faecal slurries for balsalazide and olsalazine are a
good indicator of the degradation rates obtained in the previous chapter with human
faecal slurries. This makes it possible to use rat faecal material to evaluate human
faecal drug stability for the drug balsalazide and olsalazine.
191

50 0
4 5 0
Faecal s lu rry4 0 0
Colonic slu rry3 5 0
C aecal s lu rry3 0 0
Buffer con tro l2 5 0
200
1 50
100
50
00 15 3 0 45 60 75 9 0 105 120 135 150 165 180 195 210 2 2 5 24 0
T im o ( m in u te s )
Figure 4.10: Balsalazide in-vitro stability using 10% slurry of faecal, colonic
and caecal rat contents (rat 1)
550
500
4 5 0
4 0 0
Faecal slu rry3 5 0
Colonic slurry= 3 00
C aecal slu rry2 50
Buffer contro l200
150
100
0 15 45 60 75 90 105 120 150 165 180 195 210 2 2 5 2 4030 135
T im e (m in u te s )
Figure 4.12: Balsalazide in-vitro stability using 10% slurry o f faecal, colonic
and caecal rat contents (rat 2)
192

550
5 0 0
4 5 0
4 0 0Faecal slurry
3 5 0 Colonic slurry
g 3 0 0 C aecal slurry
Buffer control2 5 0
200
150
100
120 135 150 1 65 180 195 210 2 2 5 2 4 00 15 30 45 60 75 9 0 105
T im e (m in u te s )
Figure 4.13: Balsalazide in-vitro stability using 10% slurry of faecal, colonic
and caecal rat contents (rat 3)
55 0
50 0
Faecal slu rry
4 5 0 Colonic slurry
Caecal slurry4 0 0
Buffer contro l? 3 5 0
o 3 0 0
200
100
4 5 75 105 120 1 35 150 165 180 195 210 22 5 2 4 00 15 30 60 9 0
T im e (m in u te s )
Figure 4.14: Olsalazine in-vitro stability using 10% slurry of faecal, colonic
and caecal rat contents (rat 1 )
193

55 0
50 0
4 5 0
4 0 0
Faecal slurryS 3 5 0
Colonic slurryo 3 0 0
Caecal slurry2 5 0
Buffer control200
150
100
50
0 15 30 45 6 0 75 90 105 120 135 150 165 180 195 210 2 2 5 2 4 0
Tim e (m in u te s )
Figure 4.15: Olsalazine in-vitro stability using 10% slurry of faecal, colonic
and caecal rat contents (rat 2)
55 0
5 0 0
4 5 0
4 0 0
Faecal slurry\ 3 5 0
Colonic slurry
° 3 0 0 Caecal slurry
Buffer control25 0
200
150
100
0 15 30 4 5 60 75 9 0 105 120 135 150 165 180 195 210 22 5 24 0
T im e (m in u te s )
Figure 4.17: Olsalazine in-vitro stability using 10% slurry of faecal, colonic
and caecal rat contents (rat 3)
194

It is also possible to compare the stability of balsalazide and olsalazine in rat faecal
slurries with rat colonic slurries and rat caecal slurries. As had been observed
previously for sulfasalazine, the high metabolic activity of the slurry prepared with
caecal contents (comparable to the more concentrated faecal slurry) is probably due to
the fact that the caecum is a more nutritive environment (main site for the
fermentation of foodstuff in the rat). Once the intestinal contents move through to the
colon from the caecum their nutrient availability is reduced and that is probably why
the colonic environment in the rat shows a slower degradation rate for these drugs.
When we compare between the degradation rates o f the drugs sulfasalazine,
balsalazide and olsalazine in rat gastrointestinal contents (Figure 4.18,
Figure 4.19 and Figure 4.21) it is possible to observe similar degradation rates
between the drugs as observed in the previous chapter with human faecal slurries.
Generally in the rat sulfasalazine degradation rate is faster than balsalazide and
followed by olsalazine which ties in with the data obtained with human faecal
slurries. This makes it possible to use rat intestinal contents not only as a qualitative
indicator of drug degradation in human faecal slurries but also to quantitatively
compare between these three different azo drugs. It is interesting to note, however,
that some slurries seem more active towards certain drugs than others. For example
the quickest slurry to metabolise the drug balsalazide in rat 2 (Figure 4.12) is the
faecal slurry and in the same rat olsalazine is metabolised quicker by the caecal slurry
(
Figure 4.15).
195

500
S u lfasa laz ine40 0
B alsa lazine
O lsalazine
S u lfa sa laz in e 's buffer control.2 300
B alsa laz ine 's buffer control
O ls a la z in e 's buffer contro l
Ü 200
100
180 195 210 225 24045 60 75 90 105 120 135 150 1650 15 30
Time (minutes)
Figure 4.18 : Sulfasalazine, balsalazine and olsalazine in-vitro stability using
10% slurry of faecal contents (mean±SD values from rats 1-3)
500
S ulfasa laz ine
B alsalazine
40 0 O lsalazine
S u lfasa laz in e 's buffer control
B alsa laz ine 's buffer control~ 300
O lsalaz ine 's buffer control
200
100
120 135 150 165 180 195 210 225 2400 15 30 45 60 75 90 105
Time (minutes)
Figure 4.19 : Sulfasalazine, balsalazine and olsalazine in-vitro stability using
10% slurry of colonic contents (mean±SD values from rats 1-3)
196

500
S u lfasa laz ine
B alsa lazine40 0
O lsalazine
S u lfasa laz in 's buffer control
B alsa laz ine 's buffer control. 2 30 0
O lsa laz ine 's buffer control
U 200
100
0 15 30 4 5 60 75 90 105 120 135 150 165 180 195 210 2 2 5 24 0
Time (minutes)
Figure 4.21 : Sulfasalazine, balsalazine and olsalazine in-vitro stability using
10% slurry of caecal contents (mean±SD values from rats 1-3).
Given such variability using rat gastrointestinal contents it seemed interesting at this
stage to explore this variability between different rats/location of contents with
different drugs but at the same time to try and keep variability to a minimum and
continue studying drugs metabolised by the same reaction mechanism (reduction).
The chosen drugs were sulindac and metronidazole, which undergo reduction
reactions once in the presence of bacteria but different enzymes affect these drugs
than the ones that affect the azo compounds. One of the disadvantages of using rat
gastrointestinal contents is the limited amount of contents available, the
gastrointestinal contents collected from rat 1 for example were only enough to test the
drugs sulfasalazine, balsalazide and olsalazine. Sulindac and metronidazole were
tested in gastrointestinal contents from rats 2 and 3 and two other rats: rat 4 and rat 5.
197

The metabolism of sulindac when incubated with gastrointestinal contents from rat 2,
3, 4 and 5 is represented Figure 4.23, Figure 4.24, Figure 4.25 and
Figure 4.26 respectively and for metronidazole in Figure 4.28, Figure 4.30 and Figure
4.31 respectively. It can be seen that each of the four rats used to test these drugs
show quite different degradation rates, this variability between rats was previously
observed for the drugs sulfasalazine, balsalazide and olsalazine. Interestingly some
drugs seem to degrade better in some rats and other drugs in other rats. For example,
metronidazole presents quicker degradation rates than sulindac for rats 2 and 3
(Figure 4.23, Figure 4.24, and
Figure 4.23) but for rats 4 and 5 sulindac is degraded quicker than metronidazole
(Figure 4.25,
Figure 4.26, Figure 4.30 and Figure 4.31). The variability confirms that, although the
drugs are degraded in all rats, each rat possesses quite unique degradation rates and
specific for each drug.
When comparing the activity of the different locations where the gastrointestinal
contents were collected in each rat sulindac is distinctive from the previous azo drugs.
There is a noticeable faster degradation of sulindac in faecal slurries for rats 2, 3 and 5
(Figure 4.23, Figure 4.24 and
Figure 4.26) and simultaneously a close proximity between the degradation rates
using caecal and colonic contents. Rat 4 on the other hand presents quite different
degradation rates both for sulindac (Figure 4.25) and metronidazole (Figure 4.30), the
colonic slurry seems to show no activity and the caecal slurry seems more active than
the faecal slurry for both of these drugs.
198

500
4 5 0
Faecal S lurry4 0 0
Colonic S lurry35 0
C aecal S lurry3 0 0
Buffer control2 2 5 0
200
150
100
15 45 75 9 0 105 120 135 150 165 180 195 210 2 2 5 24 00 30 60
T im e ( m in u te s )
Figure 4.23 : Sulindac in-vitro stability using 10% slurry of faecal, colonic and
caecal rat contents (rat 2)
500
450
Faecal slu rry400
Colonic slu rry350
C aecal slu rry300
Buffer control250
S 200
150
100
50
00 15 30 45 60 75 90 105 120 135 150 165 180 195 210 225 240
Time (minutes)
Figure 4.24 : Sulindac in-vitro stability using 10% slurry o f faecal, colonic
and caecal rat contents (rat 3)
199

500
4 5 0
4 0 0 Faecal slurry
35 0Colonic slurry
30 0C aecal slurry
250Buffer control
5 200
150
100
50
0 15 30 4 5 60 75 9 0 105 120 135 1 50 165 180 195 210 22 5 2 4 0
T im e (m in u te s )
Figure 4.25 : Sulindac in-vitro stability using 10% slurry of faecal, colonic and
caecal rat contents (rat 4)
45 0
4 0 0
35 0
3 00
2 5 0
5 200 Faecal slu rry
Colonic slurry150
C aecal slu rry100
Buffer control
0 15 30 45 6 0 75 90 105 120 135 150 165 180 195 210 22 5 2 4 0
T im e (m in u te s )
Figure 4.26: Sulindac in-vitro stability using 10% slurry o f faecal, colonic and
caecal rat contents (rat 5)
200

5 0 0
4 5 0
4 0 0
3 5 0
Faecal slurry3 0 0
Colonic slurryS 2 5 0
Caecal slurry200
Buffer control
150
100
5 0
0 15 30 45 60 75 90 105 120 135 150 165 180 195 210 22 5 2 4 0
T im e (m in u te s )
Figure 4.28 : Metronidazole in-vitro stability using 10% slurry of faecal,
colonic and caecal rat contents (rat 2)
5 0 0
4 5 0
4 0 0
3 5 0
Faecal slurry3 0 0
Colonic slu rry% 25 0
Caecal slurryU 200
Buffer control15 0
100
50
150 2 2 5 2 4 00 15 30 45 60 75 9 0 105 120 135 165 180 195 210
T im e (m in u te s )
Figure 4.23 : M etronidazole in-vitro stability using 10% slurry o f faecal,
colonic and caecal rat contents (rat 3)
201

5 0 0
4 5 0
4 0 0
Faecal S lurry
Colonic S lurry
Caecal Slurry
Buffer control
3 5 0
2 3 0 0
% 2 5 0
150
100
50
45 75 105 120 135 150 165 180 195 210 2 2 5 24 00 15 30 60 9 0
T im e (m in u te s )
Figure 4.30 : Metronidazole in-vitro stability using 10% slurry of faecal,
colonic and caecal rat contents (rat 4)
• Faecal slurry
Colonic slurry
C aecal slurry
Buffer control
500
4 5 0
4 0 0
35 0
3 0 0
25 0
U 200
150
100
50
15 45 60 75 9 0 105 12 0 135T im e ( m in u te s )
150 165 180 195 210 22 5 24 00 30
Figure 4.31 : Metronidazole in-vitro stability using 10% slurry of faecal,
colonic and caecal rat contents (rat 5)
202

Metronidazole has been incubated previously in vitro with rat caecal contents (Koch
and Goldman, 1979) and with full degradation of the compound before 30 minutes for
a 10% slurry. It is worth pointing out that the methodology followed by Koch and
Goldman (1979) involved the full removal o f the caecum and its contents and
vortexing this mixture (in a tube with glass beads) with phosphate buffer pH7.4. This
might explain the reason why such slurry seems to metabolise metronidazole more
actively than the data described in this section where rat caecal contents were used
independently from the caecum. Perhaps the vortexing with glass beads of the caecal
mucosa removed mucosa-associated bacteria that actively transform this drug or
perhaps even mucosal cells are destroyed and their intracellular enzymes released into
the slurry with this procedure. Nevertheless, both studies clearly indicate that rat
intestinal contents actively metabolise metronidazole.
4.7. Chapter conclusions
The work presented in this chapter indicates that rat gastrointestinal contents can
predict the metabolic trends that occur when human faecal contents are used. Rat
gastrointestinal contents fermentation experiments allow a comparison between the
degradation rate of different drugs that is predictive of the degradation rates when
human faeces are used. Sometimes humans, due to their continuously changing eating
and drinking habits provide faecal material not easily collected (too aqueous) and rats
have the advantage o f having a controlled diet and providing more uniform and
regular faeces. However, due to anatomical and bacterial differences between rats and
humans, correlation cannot be guaranteed for all drugs; an evaluation should always
203

be perfomied for each study drug to be able to make the decision to use an animal
species. Rats also have the disadvantage of providing very small amounts of faecal
material at once, several hours collection with continuous surveillance is required for
this collection.
The answer to the question of which gastrointestinal contents from rat (caecal, colonic
or faecal material) should be used for future fermentation experiments depends on the
purpose of the study. If the intended study aims to obtain a qualitative prediction of
drug stability in the distal gastrointestinal environment then faecal material provides a
good qualitative indication. On the other hand, it is known that the caecum is the main
site in the rat’s gastrointestinal tract where bacteria-related metabolism occurs, it has
more nutrients for bacteria and is less viscous, therefore being the ideal source of
contents to use in quantitative drug stability studies.
The in vitro results presented in this chapter make it possible to use animals to further
study bacterial-related drug metabolism. Animal use permits in vivo studies on drug
degradation in the distal gastrointestinal tract. How in vivo relevant is bacteria-related
metabolism? Is there an in vitro-in vivo correlation? These questions will attempt to
be answered in the following chapter.
204

Chapter 5: In vitro-in vivo correlation of bacteria-
related drug stability by the use of a dog model
205

5. Chapter 5: In vitro-in vivo correlation of bacteria-related drug stability by
the use of a dog model
5.1. Overview
In vitro batch fermenters to study intestinal bacteria related drug stability have the
main limitation of being closed systems which over simplifies the continuous
replenishment of nutrients and removal of waste products from bacterial metabolism
observed in the human colon in vivo. In addition to all these limitations the in vitro
system might also mislead the researcher into believing that bacterial stability is the
only factor influencing drug plasma levels when a drug reaches the colonic
environment. There are other factors that influence drug levels like intestinal mucosal
metabolism, absorption, systemic metabolism and excretion.
The work described in this chapter permits us to look at the in vivo relevance of the in
vitro data. Dogs were chosen for their similar gastrointestinal physiology when
compared to humans. The in vitro femienter is used with dog faecal material to test
the model drugs, which are then administered to the dog’s colon in vivo. The in vivo
administration is made possible by the use of dogs fistulated in the earlier part o f the
colon, the fistula allows the direct administration of drugs in solution to the dog’s
colon. This is the first in vivo study of bacterial drug metabolism where drugs were
administered in vivo directly into the bacterially rich colonic environment and parent
drug and metabolite levels were quantified. A second study was also performed with
the use of antibiotics as a way assessing the effect of eradicating gastrointestinal
bacteria in drug bioavailability from the colon.
206
5.2. Introduction
The evaluation of luminal colonic drug stability in vivo is difficult to study. The use
of humans in any in vivo study is costly and carries ethical issues. Many factors affect
drug plasma concentrations in vivo and it is almost impossible to understand when
bacterial metabolism becomes clinically relevant. One of the main difficulties with
previous in vivo models found in the literature, and described in Chapter 1, is that the
drug has to go through the upper gastrointestinal tract. This will lead to drug
metabolism and absorption before the drug reaches the most metabolically active site
in the gut: the large intestine. To avoid that factor it was decided to administer the
drug directly into the colonic environment by the use o f a fistulated dog model. An
added advantage of using dogs is that their gastrointestinal physiology is similar to
humans and, in many cases, drug bioavailability is comparable to that in humans
(Dressman, 1986). Dogs are also easier to handle than other species o f similar size
such as monkeys.
5.2.1. Physiology of the dog gastrointestinal tract
The gastrointestinal tract of the dog can be seen in Figure 5.1. The stomach o f dogs is
both a reservoir and a mixing/grinding organ. The migrating myoelectric complex
mean period in the dog ranges from 90 to 134 min (Sutton, 2004).
207

HVAIl IN^ESllNE CAECUM
..— COLON
Figure 5.1; Diagram of the dog gastrointestinal tract (adapted from Sutton,
2004)
In the small intestine the villi, as in humans, are finger shaped and with 34 microvilli
per square micrometer of villi surface (Kararli, 1995). Moving through to the large
intestine, the caecum in dogs is a lateral appendage directly out of the line of
intestinal movement. The dog colon does not have sacculations but its anatomy
reflects the human in at least two aspects: it is the main gastrointestinal site for
microbial fenuentation and it is comprised of ascending, transverse and descending
regions (Sutton, 2004).
The average length of the dog’s gastrointestinal tract can be seen in Table 5.1. The
mean total gastrointestinal transit time, measured recently using the InteliSite®
Companion device in Beagle dogs, is 22.6 ± 5.0 h (McGirr et al., 2008). The same
study detected a mean gastric emptying time of 1.0 ± 0.8 h, mean small intestinal
transit time of 1.3 ± 0.6 h and a mean colonic retention time of 20.4 ± 5.4 h.
208

Dog(Canis familiaris)
(cm)Small Intestine 414
Caecum 8
Colon 60
Total 482Table 5.1: Average length post mortem of the gastrointestinal tract of dogs
(adapted from Kararli, 1995)
The dog gastrointestinal pH ranges between: 3.4-5.5 (stomach), 6.2-7.5 (small
intestine) and 6.5 in the colon (Kararli, 1995).
When trying to determine the fluid content in the dog gastrointestinal tract, one study
found that it ranged from 92 ml (female dog, fasted) and 107 ml (male, fasted) to 222
ml (female, fed) and 418 ml (male fed) (Cizek, 1954). There is no information as to
the regional distribution of this water.
5.2.2. The fistulated dog model
The fistulated dog consists of a dog that has a permanent fistula connecting the initial
portion of the colonic lumen with the outside. The surgery to install such a fistula is
performed at a very early age and the dogs possess an otherwise normal physiology.
Fistulated dogs have been used in the past with fistulas in different locations
throughout the gut mainly for the study of how certain features of the gastrointestinal
tract affect drug pharmacokinetics. For example, dogs fistulated at midjejunum were
used previously to study gastrointestinal hydrodynamics when poorly soluble drugs
209

are administered (Scholz et al., 2002). A schematic representation of the dog model
can be seen in Figure 5.2.
direct colonic drug
administration I y
Figure 5.2: Schematic representation of the fistulated dog model and the site of
drug administration
Only liquids can be passed through the fistula in the fistulated dog model and
therefore drugs should be administered as a liquid either in solution, suspension or
emulsion form. It was decided to administer the drugs in solution to avoid the effect
of drug dissolution delaying the rate at which bacterial enzymes cleave drug
molecules, which could affect the rate of microbial metabolism. It was also decided
that a volume of 10ml of drug solution was adequate, a larger volume of liquid
administered directly to the colon could cause an unwanted bowel movement and a
smaller volume would not be enough to solubilise the desired amount of drug to
administer. It was therefore necessary to screen the solubility of the chosen
compounds. This chapter will study model drug’s solubility in different possible
solutions using different solubilisers or vehicle combinations together with changes in
pH. Solubility is defined as maximum amount of solute dissolved in a solvent at
equilibrium. The resulting solution is called a saturated solution. Ideally a vehicle
should be chosen where the amount of drug dissolved at saturated conditions is higher
210

than the amount to administer. It is also assessed in this Chapter that the use of
solubilisers does not affect the bacteria-associated drug degradation rate in vitro, this
is tested for the model drug sulfasalazine. A test is also perfomied to predict if there
would be re-precipitation of any drug upon dilution in a media where no solubilisers
are present.
It is worth pointing out that this fistulated dog model only allows one-way delivery,
liquids can be delivered into the colon through the fistula but the fistula does not
allow the removal of colonic contents.
5.2.3. Use of dog fistulated model to assess the in vitro-in vivo correlation of
bacteria-related stability of model drugs
The drugs sulfasalazine, balsalazide and olsalazine were studied in vitro in human
faecal slurries (Chapter 3) and in rat intestinal contents (Chapter 4). In all these in
vitro fermentations, one common trend can be seen: for the same slurry incubation
sulfasalazine appears to have a more rapid degradation rate, followed by balsalazide
and olsalazine shows the slowest degradation. This difference is interesting given that
the bacteria mediated reaction is the same for all o f them: azo-reduction. However, a
more interesting outcome would be to find out if these differences have clinical
relevance in vivo. Human in vivo studies perfonned so far comparing different 5-
aminosalicylic acid prodrugs in healthy volunteers and patients with active and
inactive ulcerative colitis have reported wide variations in results (Sandbom and
Hanauer, 2003). A compilation summary table of plasma pharmacokinetics for these
211

drugs and the metabolite 5-aminosalicylic acid is shown in Table 5.2 and of urinary
and faecal excretion data of 5-aminosalicylic and parent prodrugs in Table 5.3.
Drug, doseSulfasalazine 2-4g
(0.8-1.6g 5-ASA)
Balsalazide 2.25g
(0.79 g 5-ASA)
Olsalazine l-4g
(l-4g 5-ASA)
Parent drug Tmax
(hours)not determined Range 1.0-2.0 not determined
Parent drug Cmax
(nmol/ml)Range 14.7-76.6 Mean 0.05 Mean 2.3-32
Parent drug AUC
(nmol/ml x h)Range 133-804 Mean 0.04 Mean 13-117
5-ASA Tmax (hours) Mean 11.6-14.3 Mean 9.2-9.5 not determined
5-ASA Cmax
(nmol/ml)Mean 0.7-3.5 Mean 2.3-3.5 Mean 1.2-4.5
5-ASA AUC (nmol/ml
X h)Mean 9.6-27.5 Mean 13.9-22.8 not determined
Table 5.2: Summary data for plasma pharmacokinetics of sulfasalazine.
balsalazide and olsalazine when administered to healthy human volunteers; 5-
ASA (5-aminosalicylic acid) (adapted from Sandbom and Hanauer, 2003)
The variation observed in these in vivo studies makes it difficult to determine if
relevant differences exist in the pharmacokinetic profiles of the azo-bonded prodrugs.
The variation is probably explained by the use of different volunteers in each study
and by different dosages administered. A systematic in vivo study where some of
these variables are kept constant is needed. Furthermore, of greater utility would be to
isolate the colonic environment and firstly establish if at a colonic level small in vitro
differences obtained with the in vitro fermenter model can be detected in vivo
212

Drug Sulfasalazine Balsalazide Olsalazine
Urinary excretion of parentM ean 0-1 %
coumpound (mean, median or Mean 3-6% M ean 1% M edian 1%
range)Range 0-4%
Urinary excretion of total 5-ASA
(mean or median)
Mean 11-33%
Median 22%Mean 22-35%
M ean 14-31%
M edian 16-27%
Total urinary excretion of parentMean 11-33% M ean 22-35% Mean 15-31%
compound plus total 5-ASA
(mean or median) Median 22% M edian 20% M edian 17-32%
Faecal excretion of parent
compound (mean or median)Mean 0-7% M ean 12% M ean 4-5%
Faecal excretion of total 5-ASA M ean 45-75%| M ean 46% Mean 47-50%
(mean or median) Median 38% M edian 22% M edian 17-36%
Total faecal excretion of parentMean 48-76% M ean 46% Mean 51-55%
compound plus total 5-ASA
(mean or median) Median 38% M edian 22% M edian 17-36%
Table 5.3: Summary data for urinary and faecal excretion of 5-aminosalicylic
acid (5-ASA) and parent compound following administration of sulfasalazine,
balsalazide and olsalazine in human healthy volunteers (adapted from
Sandbom and Hanauer, 2003)
5.2.4. An investigation into the use of antibiotic therapy to assess in vivo
bacteria-related stability o f model drugs
Evaluating the pharmacokinetic profiles of drugs before and after large spectrum
antibiotic therapy is the only way to in vivo differentiate between microbial-mediated
213

metabolism and intracellular metabolism occurring in the colonic mucosa in a healthy
gut. It allows the use of the same animal and therefore eliminates any individual
differences in drug pharmacokinetics.
Previous studies have made use o f gnotobiotic animals (germ-free or antibiotic
treated) to prove gut microbial metabolism of drugs. Koch et al., for example, in 1980
compared the metabolism of misonidazole in conventional and germ-free rats. This
study administered the same dose of radioactive misonidazole to conventional and
then to germ-free rats. The radioactive misonidazole was only recovered in the faeces
of germ-free rats; the authors believe that the reason for this is that bacteria are
capable of further metabolism of misonidazole, which explains why misonidazole is
not detectable in urine or faeces of conventional rats. One of the metabolites of
misonidazole found in conventional rats for instance was not found in either urine or
faeces of germ free rats. This metabolite (AIM) is formed from misonidazole in vitro
when this is incubated with rats caecal contents and therefore the authors believe that
it is a metabolite that can be attributed exclusively to the reduction of misonidazole by
the intestinal microbiota.
These types o f previous studies using gnotobiotic animals (germ free or antibiotic
treated) were always performed in rats and never in dogs (which possess more similar
gastrointestinal physiology, drug bioavailability to humans). Furthermore the studies
should screen for parent compound plasma concentrations throughout time to provide
a more detailed idea of the effect in bioavailability o f bacteria-associated metabolism.
214

There are a few disadvantages with the use of antibiotics for the study of colonic drug
stability. The animals have to be kept under intense large spectrum antibiotics during
a two-week treatment course, this is a drawback in busy animal units where animals
are continuously in demand. Another disadvantage is that antibiotic treated animals
can only be used for a short period of time, namely only one dose can be administered
after the antibiotic therapy. Because of these disadvantages and to try and maximise
the valuable resource of having animals pre-treated with antibiotics, it was decided
that a single dose of a cocktail solution containing three drugs should be dosed.
The drugs chosen include sulindac and metronidazole; both of them served as model
drugs for bacteria-mediated degradation in vitro in human faecal slurries (Chapter 3),
and in rat intestinal content faecal slurries (Chapter 4). And a third drug: captopril, a
molecule with unknown degradation in a bacterial environment but a drug whose
colonic stability is o f great clinical interest.
It is difficult to compare with other in vivo studies since no one has administered
these drugs before to the colonic environment of dogs. In vivo human studies have
shown that sulindac is readily absorbed after oral administration (Duggan et al.,
1977). It is believed that both mammalian tissues and the gastrointestinal microbiota
have a role in vivo in converting sulindac into the therapeutically active metabolite
sulfide. A mutual role in this reduction is possible since sulindac and its metabolites
undergo extensive enterohepatic circulation. When sulindac was administered as a
single dose of 200 mg to 14 subjects, it produced a mean peak plasma concentration
o f about 4 mg/L after 1 h; mean peak plasma concentrations for the sulfide and
sulfone were about 3 and about 2 mg/L, respectively, after 2 h (Duggan et al., 1977).
215

When metronidazole is administered to humans it is readily and almost completely
absorbed after oral administration and is widely distributed in the body (Lamp et al.,
1999). It is metabolised in the liver by oxidation to 2-hydroxymethylmetronidazole
and 2-methyl-5-nitroimidazol-l-acetic acid, and by conjugation with glucuronic acid.
Peak plasma concentrations of about 6 and 12 pg/ml are achieved, usually within 1 to
2 hours, after single doses of 250 and 500 mg respectively (Lamp et al., 1999). Some
accumulation occurs and consequently there are higher concentrations when multiple
doses are given. Absorption may be delayed, but is not reduced overall by food.
Captopril, contrary to the other drugs studied in this chapter has never been tested in
vitro for colonic stability (no suitable analytical methodology was available to
quantify this drug from faecal slurries and the different attempts to develop an
analytical methodology for this drug during the progress of this work have failed for
faecal slurries). However, the possibility of colonic degradation as an explanation for
captopril’s low colonic absorption has intrigued scientists for over a decade (Wilding
et al., 1992). Captopril was therefore included in this study. As for captopril’s
pharmacokinetic details, it is a drug readily absorbed after oral administration. The
analysis o f captopril concentrations in plasma samples from 20 volunteers following
oral administration of 100 mg of captopril resulted in a mean peak concentration of
1.47 mg/L after 0.75 h (Franklin et al., 1998).
216

5.3. Chapter aims
This chapter aims to assess the use of the dog as an animal model to test bacteria-
related drug metabolism both in vitro and in vivo. To investigate the in vitro
metabolism of model drugs using dog faecal material. To detect in vivo bacterial
metabolism by direct administration of the drug into the colonic environment and by
plasma quantification of the metabolite of the model drugs studied previously in vitro.
To evaluate if the different drug degradation rates observed in vitro have clinical
relevance in vivo. A further aim is to evaluate the use of antibiotics as an in vivo tool
in the assessment of bacterial-related metabolism.
5.4. Materials
Sulfasalazine, balsalazide, olsalazine, 5-aminosalicylic acid, metronidazole, sulindac
and captopril used have been mentioned previously in section 2.3.
Dimethyl acetamide (DMA), Polyethylene glycol 400 (PEG 400), Propylene glycol
and Tween 80 were purchased from Sigma Aldrich, (Poole, UK). Solutol HS 15
(polyethylenglycol 660-12-hydroxystearate) was purchased from BASF ChemTrade
(Burgbemheim, Germany).
217

Dogs
Four male Labrador dogs aged 2-7 years, weighing 25-35 kg, supplied by Terje
Gammelsrud and Jonas Falck, Norway, were used in the study.
Antibiotics
- Sinulox veterinary 250mg (containing 200mg amoxicillin and 50mg clavulanic
acid), tablet formulation, dose 10 mg/kg of dog’s body weight.
- Tribrissen veterinary 480mg (containing 400mg sulfadiazin and 80mg trimetoprim),
dose 15mg/kg of dog’s body weight.
5.5. Methods
5.5.1. The use of dog faecal material to study in vitro bacteria-associated drug
stability and an investigation into the effect of antibiotic therapy in
bacteria’s metabolic activity in vitro in the dog
Faecal samples of four male Labrador dogs were collected and placed inside the
Anaerobic Workstation (Electrotek model AW500TG) within 30 minutes after
defecation. The four slurries are pooled together in equal amounts. Each of the
slurries prepared will have 10% intestinal content after the drug is added to the slurry.
The slurry preparation and fermentation experiments follow a similar procedure to the
one described in section 3.5.1 ; a summary can be found in Table 5.4.
218

Number . . .. Homogenisation Final slurry Final drug Final Sampling Sampling ^ .Medium . . . . . . . . . . . .. Centrifugingof dogs and sieving concentration concentration volume volume times
sulfasalazine.Saline 5-10 minutes with balsalazide, 0 ,1 5 ,3 0 ,
4 (pooled, phosphate disperser and olsalazine, 600pl 50pl 1 OOOOrpm forn=3) buffer pH through a 10% sulindac and '8 0 and
^ g 350pm mesh metronidazolefabrics minutes
500pM
Table 5.4: Details for slurry preparation and fermentation experiments using
dog faecal material
Samples were analysed by the HPLC/UV methodology developed and described in
chapter 2.
A 10 day treatment was then conducted on the four dogs with two different
antibiotics: Sinulox veterinary (containing amoxicillin and clavulanic acid) and
Tribrissen veterinary (containing sulfadiazin and trimetoprim). On the last day of
antibiotic treatment faecal samples o f the same four male Labrador dogs were
collected and placed inside the Anaerobic Workstation (Electrotek model AW500TG)
within 30 minutes after defecation. The slurry preparation and the experimental setup
for this fermentation followed the same procedure as described above before the dogs
undertook antibiotic therapy Table 5.4. Samples were analysed by the HPLC/UV
methodology developed and described in chapter 2.
219

5.5.2. Solubility measurements o f sulfasalazine, balsalazide, olsalazine, sulindac
and metronidazole using different vehicle formulations
The fistulated dog model is limited to liquid administrations and it was decided that
10ml of drug in solution would be administered through the fistula. The solubility of
the model drugs has to be assessed in different potential vehicle formulations that
could deliver the desired amount o f drug in solution to the dog’s colon. The solubility
was measured using 2ml capacity eppendorf vials where an excess of drug was added
to I ml o f the intended vehicle formulation. The vials were then placed into a shaking
incubator at 37°C for 6 hours (work was previously performed over longer periods but
6 hours was found to be suitable for saturation equilibrium to be reached), all
experiments were performed in triplicates. After the incubation period finished for
each vial a sample was quantified through the HPLC-UV method developed in
Chapter 2.
An experiment was also performed where 1ml of the chosen vehicle formulation at
the concentration administered was diluted I Ox with distilled water and the diluted
sample visually assessed in search o f any precipitation.
5.5.3. In vitro drug stability o f sulfasalazine in a vehicle formulation with dog
faecal slurry
Faecal samples of four male Labrador dogs were collected and placed inside the
Anaerobic Workstation (Electrotek model AW500TG) within 30 minutes after
defecation avoiding prolonged contact o f bacteria with aerobic environment. The
220

slurry o f each of the dogs was added together in equal amounts. Pooled slurry (500|l i 1)
was then transferred into 2ml vials.
The fermentation experiments follow a similar procedure to the one described in the
previous section 5.5.1, but using an optimised solubility formulation.
Samples were analysed by the HPLC method developed and described in chapter 2.
5.5.4. Use of dog fistulated model to assess the in vitro-in vivo correlation of
bacteria-related stability of model drugs
Composition and concentrations of drug solutions:
1. Sulphasalazine: 130mM (518 mg) in water / 5% solutol (final pH 8.7,
final volume 10 ml)
2. Balsalazide: 130mM (569 mg) in water / 5% solutol (final pH 10.1,
final volume 10 ml)
3. Olsalazine: 65mM (237 mg) in water / 5% solutol (final pH 10.1, final
volume 10 ml)
Study protocol
This study was approved by the Animal Ethics Committee of Gothenburg (Sweden).
221

. Diet
The dogs are fasted approx. 20 h before administration and were fed 4 hours after
dosing. Water ad lib before study started.
• Experimental setup
The dogs were placed in special slings. They remained in these during administration
and early blood sampling. For the first 4 hours after administration they were placed
in the slings. After 4 hours they are given a chance to defecate and then they received
food and put back in their own kennel.
• Administration
The solutions were administered directly into the colon by the aid o f a thin catheter.
The catheter is then rinsed with 5 ml of pH 6.8 buffer so that no drug remains in the
catheter.
• Blood sampling
Blood samples were collected from veins in the front leg, back leg or neck. Prior to
administration a first blood sample was taken (t=0). Blood samples (2ml) were then
collected at: 0.5, 1,2,4, 6, 8, 12, 24 and 48 hours after administration of the solutions.
A total o f 10 samples o f 2 ml was collected from each dog per experimental day.
• Sample treatment
Approximately 2 ml of blood was collected in Vaccutainer heparin (LH 34 I.U)
sampling tubes. The sampling tubes were turned a few times to mix the blood and
heparin gently. Within 30 minutes after blood sampling the sampling tubes were
222

centrifuged at 3000g for 10 minutes at 4°C. The plasma was transferred to labelled 4
ml CryoviaF'^ tubes and frozen in a -20°C. The samples were analysed with the
LC/MS/MS method developed and described in Chapter 2.
After the study was completed, the animals rested for 3 weeks before the next study
started.
5.5.5. An investigation into the use of antibiotic therapy to assess in vivo
bacteria-related stability of model drugs
Cocktail solution: 5% solutol in water, pH 10.1
■ Metronidazole - 100 mM (171.2 mg) in 10 ml
■ Sulindac - 20 mM (71.3 mg) in 10 ml
■ Captopril - 45 mM (97.8 mg) in 10 ml
The experimental set-up, administration, blood sampling and sample treatment
procedures are the same as described in section 5.5.3.
Antibiotic treatment
This study was approved by the Animal Ethics Committee o f Gothenburg (Sweden).
After the first administration of the cocktail solution, a 10 day antibiotic treatment
was conducted using two different tablet formulations of antibiotics administered
simultaneously:
223

Synulox vet. (containing amoxicillin and clavulan acid)
Tribrissen vet. (containing sulfadiazine and trimethoprim)
Antibiotic administration was twice a day for 10 days. The second cocktail dose was
administered on the next day after the last day of antibiotics.
5.6. Results and discussion
5.6.1. The use of dog faecal material to study in vitro bacteria-associated drug
stability and an investigation into the effect of antibiotic therapy in
bacteria’s metabolic activity in the dog
One of the main advantages for the use of animals to study bacteria-related drug
metabolism is the possibility of changing an animal’s microbiota in vivo. In this
section, it was firstly evaluated if dogs can be used as a model to test bacteria-related
drug stability. This was studied by testing drug stability with fresh dog faecal
material. Secondly it was evaluated if the use of antibiotics to eradicate most bacterial
species in the dog would reduce the metabolic activity of the dog’s faecal material.
Dog faeces were collected before antibiotic therapy and the stability o f the drugs
sulfasalazine, balsalazide, olsalazine, metronidazole and sulindac was assessed in
slurries prepared with such faeces. The results are shown in Figure 5.3 (A), Figure 5.4
(A), Figure 5.5 (A), Figure 5.6 (A) and Figure 5.7 (A). All drugs show degradation
and there is a good correlation between these results and the results obtained from
chapter 4 with rat faecal slurries. The same trends are visible between the different2 2 4

drugs as seen in the experiments described in chapter 3 with human faecal slurries.
Then the dogs underwent a two-week large spectrum antibiotic therapy and their
faeces collected on the last day o f antibiotic administration. The stability o f the same
drugs was assessed in slurries prepared with these faeces collected after the antibiotic
therapy; the results are shown in Figure 5.3 (B), Figure 5.4 (B), Figure 5.5 (B), Figure
5.6 (B) and Figure 5.7 (B).
225

550
(A)500
450
400
350
300Slurry, b efo re an tib io tic th e ra p y
250
Buffer control200
150
100
0 15 30 45 60 75 90 105 120 135 150 165 180 195 210 225 240Time (m in u te s )
550
500
450
400
a 350
300
250
200Slurry, a f te r an tib io tic th e rap y
150Buffer contro l
100
0 15 30 45 60 75 90 105 120 135 150 165 180 195 210 225 240Time (m in u te s )
Figure 5.3: Sulfasalazine in-vitro stability using 10% dog faecal slurry, pooled
slurry from 4 dogs, fresh faecal samples collected before (A) and after (B) the
dogs were under a two week large spectrum antibiotic therapy
226

(A)
(B)
550
500
450
400
3 350
Slurry, befo re antib io tic th e rap y300
Buffer controlu 250
200
150
100
50
75 90 105 120 135 150 165 180 195 210 225 2400 15 30 45 60Tim e (m in u te s )
550
500
450
400
350
II 300
c8 250
s200
Slurry, a f te r an tib io tic th e rap y150
Buffer control100
50
180 195 210 225 2400 15 30 45 60 75 90 105 120 135 150 165T im e (m in u te s )
Figure 5.4: Balsalazide in-vitro stability using 10% dog faecal slurry, pooled
slurry from 4 dogs, fresh faecal samples collected before (A) and after (B) the
dogs were under a two week large spectrum antibiotic therapy
227

(A)
(B)
550
500
450
400
Za.Slurry, b e fo re antib io tic th e rap y
350co Buffer control
3002
I 250
3200
150
100
50
0 30 60 75 90 105 120 135 150 165 180 195 210 225 24015 45Time (minutes)
550
500
450
400
1 350
%300
1 250
200
150Slurry, a f te r an tib io tic the rap y
100Buffer control
0 15 30 45 60 75 90 105 120 135 150 165 180 195 210 225 240Time (minutes)
Figure 5,5: O lsalazine in-vitro stability using 10% dog faecal slurry, pooled
slurry from 4 dogs, fresh faecal samples collected before (A) and after (B) the
dogs were under a two week large spectrum antibiotic therapy
228

(A)
(B)
600
550
500
450
I 400Slurry, b e fo r e an tib io tic th erap y
o 350
300 B u ffer contro l
250
200
150
100
50
00 20 40 60 80 180 200 220 240100 120 140 160
T im e (m in u te s )
600
550
500
4 5 0
400ii 350
I 300
o 250Slurry, a fter a n tib io tic th erap y
200
B u ffer control150
100
0 15 30 45 60 75 90 105 120 135 1 5 0 165 1 8 0 1 9 5 210 225 240T im e ( m i n u t e s )
Figure 5.6: M etronidazole in-vitro stability using 10% dog faecal slurry,
pooled slurry from 4 dogs (fresh faecal samples collected after the dogs were
under a two week large spectrum antibiotic therapy)
229
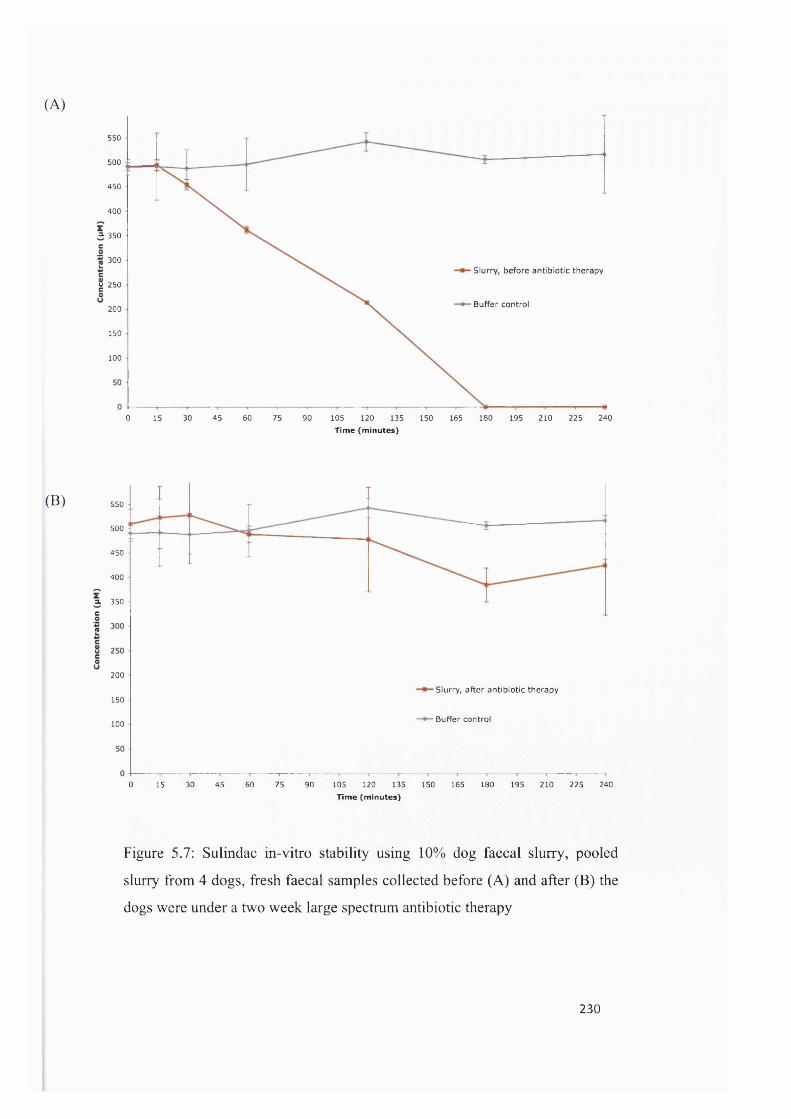
(A)
550
500
450
400
3 350
300Slurry, befo re an tib io tic th e rap y
u 250
Buffer control200
150
100
0 60 180 195 210 225 24015 30 45 75 90 105 120 135 150 165T im e (m in u te s )
(B) 550
500
450
400
a. 350
200
Slurry, a f te r an tib io tic th e rap y150
Buffer control100
0 15 30 45 60 75 90 105 120 135 150 165 180 195 210 225 240Tim e (m in u te s )
Figure 5.7: Sulindac in-vitro stability using 10% dog faecal slurry, pooled
slurry from 4 dogs, fresh faecal samples collected before (A) and after (B) the
dogs were under a two w eek large spectrum antibiotic therapy
230

The almost complete elimination of any degradation on all drugs verifies the
effectiveness o f the antibiotic treatment in eliminating bacteria and in eliminating the
bacteria-related metabolism.
5.6.2. Solubility measurements of sulfasalazine, balsalazide, olsalazine, sulindac
and metronidazole using different vehicle formulations
One of the limitations for the use o f the fistulated dog models is the administration of
a limited volume of drug: 10ml. It is believed that larger volumes administered might
trigger an unusual bowel movement and cause the dogs to defecate, which would
influence the results. But by limiting the drug volume there is also a limit on the
amount o f drug that can be administered if the drug is administered as a solution. It
was decided to administer the drug in solution since the administration of a
suspension would add a dissolution step that could influence the rate of degradation
and absorption of the drug molecule
This maximum amount of drug that can be put in solution in 10ml is dependent on the
drug solubility in a given vehicle. The solubility of sulfasalazine, balsalazide and
olsalazine in several vehicle fonnulations is shown in Table 5.5, Table 5.6 and Table
5.7 respectively. Of the vehicles tested the formulation that showed higher solubility
for all drugs was 5% solutol in water at pH 8.7 for sulfasalazine and the same vehicle
but at pH 10.1 for all other drugs. The difference in pH is due to the fact that
sulfasalazine is a very acidic drug and in such a small volume it was not possible to
rise the pH by adding enough base.
231

Vehicle Solubility (mg/ml) (±SD)
Saline phosphate buffer pH6.8 2.25mg/ml(±0.07)
13%DMA with saline phosphate buffer pH6.8
3.94mg/ml(±0.69)
50% PEG with saline phosphate buffer pH 6.8
4.90mg/ml(±0.05)
Saline phosphate buffer with added sodium hydroxide to pH 9.2
3.89mg/ml(±Q.63)
50% PEG with 5% ethanol in water 3.90mg/ml(±0.06)
70% PEG with 5% ethanol in saline phosphate buffer pH 6.8 I2.08mg/ml(±1.10)
50% PEG with 5% ethanol in saline phosphate buffer pH 6.8 5.9mg/ml(±0.14)
20% propylene glycol with 5% Tween 80 in saline phosphate buffer pH6.8 5.08mg/ml(±Q.15)
55% propylene glycol with 17% PEG and 10% ethanol in saline phosphate
buffer pH6.85.19mg/ml(±Q.G8)
60% PEG with 5% ethanol in saline phosphate buffer pH8.0
14.90mg/ml(±1.24)
5% solutol in water pH 8.7 135.54mg/ml(±0.27)
Table 5.5; Sulfasalazine solubility using different vehicle formulations
This fonuulation was selected and the solubility of the drugs sulindac and
metronidazole was also assessed in this vehicle formulation and compared to saline
phosphate buffer pH6.8 (Table 5.8 and Table 5.9). For the drug captopril, since a
HPLC/UV methodology for its detection was not possible, a visual assessment was
performed to look for any precipitation at the concentration to administer with the
selected vehicle.
232

Vehicle Solubility (mg/ml) (±SD)
Saline phosphate buffer pH6.8 9.30mg/ml(±0.74)
13%DMA with saline phosphate buffer pH6.8 204.68mg/ml(±8.38)
50% PEG with saline phosphate buffer pH 6.8
121.55mg/ml(±3.42)
Saline phosphate buffer with added sodium hydroxide to pH 9.2
240.45mg/ml(±24.01 )
50% PEG with 5% ethanol in water 129.06mg/ml(±l .03)
60% PEG with 5% ethanol in saline phosphate buffer pH8.0 13 7.66mg/ml(±2.22)
5% solutol in water pH 10.1 250.04mg/ml(±15.09)
Table 5.6: Balsalazide solubility with different vehicle formulations
Vehicle Solubility (mg/ml) (±SD)
Saline phosphate buffer pH6.8 9.40mg/ml(±0.25)
13%DMA with saline phosphate buffer pH6.8 19.60mg/ml(±0.61 )
50% PEG with saline phosphate buffer pH 6.8 55.89mg/ml(±0.95)
Saline phosphate buffer with added sodium hydroxide to pH 9.2 45.62mg/ml(±1.10)
50% PEG with 5% ethanol in water 73.98mg/ml(±1.62)
60% PEG with 5% ethanol in saline phosphate buffer pH8.0 94.50mg/ml(±1.59)
5% solutol in water pH 10.1 99.36mg/ml(±2.27)
Table 5.7: Olsalazine solubility wit 1 different vehicle formulations
233

Vehicle Solubility (mg/ml) (±SD)
Saline phosphate buffer pH6.8
5% solutol in water pH 10.1
23.54mg/ml(±3.1)
76.93mg/ml(±4.2)
Table 5.8: Sulindac solubility with different vehicle formulations
Vehicle Solubility (mg/ml) (±SD)
Saline phosphate buffer pH6.8
5% solutol in water pH 10.1
10.63mg/ml(±0.35)
18.98mg/ml(±1.36)
Table 5.9: Metronidazole solubility with different vehicle formulations
All drugs presented a solubility value higher than the dose administered allowing the
correct administration o f the drugs in solution. The dose to administer for the drugs
sulfasalazine, balsalazide and olsalazine was decided based on the clinical relevance
o f a 500mg dose (usual maintenance therapy for ulcerative colitis with sulfasalazine is
500mg three to four times daily). Since the main aim is to be able to detect 5-
aminosalicylic acid concentrations in the plasma it was decided that all drugs should
be administered in an equivalent molar concentration for the 5-aminosalicylic acid
formation: 130mM for sulfasalazine and balsalazide and 65mM for olsalazine. For the
cocktail study with the drugs sulindac, metronidazole and captopril the dose between
the administration before and after antibiotics was kept exactly the same. These doses
also have clinical relevance, being the normal daily dose for captopril (lOOmg) and
around half the single oral dose for metronidazole (400mg) and sulindac (200mg).
234

A test was perfomied to assess if the drug in the vehicle formulation would re
precipitate once in contact with an environment without solubilisers. This was tested
for all solutions administered and there was no visual indication o f any precipitation
occurring when an aliquot of these solutions was diluted lOx with distilled water.
5.6.3. In vitro drug stability of sulfasalazine in a vehicle formulation with dog
faecal slurry
There was a need to assess if the use of solutol as a solubiliser interferes with the
bacterial degradation rate of drugs. Some solubilisers, like cyclodextrins, are known
to improve solubility of drugs by incorporating the drug molecule in the core o f their
molecular structure and changing the chemical and physical properties o f the drug
molecule. If a similar mechanism of action for solutol occurs then this might
influence the ability of bacterial enzymes to reach the intended active site for the
cleavage o f the molecule. Figure 5.8 shows the in vitro stability profile for
sulfasalazine solubilised in the vehicle. The degradation profile obtained is similar to
the degradation profile obtained for the dog poled faecal slurry when sulfasalazine
was not solubilised in the presence of 5% solutol. This indicates that solutol does not
affect the bacterial-mediated metabolism in vitro when used at a 5% concentration in
the drug solution to be tested.
235

550
500
450
400
350
E 300 • Slurry
g 250 —^ Buffer control
200
150
10050
0 40 60 80 100 120 160 180 200 22020 140 240Time (minutes)
Figure 5.8: In vitro stability of sulfasalazine in the same vehicle formulation to
be administered in vivo (5% solutol, pH 8.7) using pooled dog faecal slurry
5.6.4. Use of dog fistulated model to assess the in vivo colonic stability of
sulfasalazine, balsalazide and olsalazine
From the results obtained (Figure 5.9 to Figure 5.24 and Table 5.10) the first thing
that becomes apparent is the variability observed between the different dogs. Several
factors can explain this variability. The amount of contents that are present inside the
colon at the time of administration might vary between dogs and between
administration days. More contents would probably start degrading the drug molecule
in a more efficient way. Ultimately, as in any in vivo study there is variability
between each animal, variability in transit time, absorption of drugs, body metabolism
and excretion. All these will impact in drug plasma profiles. Variability with human
236

in vivo studies where these drugs were used was previously observed (Sandborn and
Hanauer, 2003).
One common result is that for all the three model drugs very small amount of the
parent molecule is absorbed into the plasma and a comparable high amount of the
metabolite 5-aminosalicylic acid is absorbed into the plasma achieving a maximum
concentration after 4-6 hours after the parent drug administration. This is an
interesting result since 5-aminosalicylic acid is a topically acting drug designed to
exert its therapeutic action locally in the colonic mucosa. This probably explains some
of the variability seen with these results since this drug is not designed to be well
absorbed.
The appearance of 5-aminosalicylic acid as a metabolite for all these drugs is in
accordance with the results obtained in vitro. The slower appearance o f 5-
aminosacylic acid in vivo as compared to its quick appearance in the in vitro
fermenter is probably due to the amount of drug present, it is believed that the high
amount o f drug molecules present will compete for the same enzymes and that will
cause the bacterial reaction to be extended in time.
237

3.2
2.8S u lfasa laz ine
5-ASA
I 1.6c8I .,2
I0- 0.8
0.4
02 6 8 10 12 14 16 18 20 22 24 26 28 30 32 34 36 38 40 42 44 46 480 4
Time (h)
Figure 5.9: Sulfasalazine and 5-aminosalicylic acid plasma concentration-time
profiles after the administration of sulfasalazine solution in Dog A
3.2
2.8
^ 2.4
S u lfasa laz ine
^ 2 5-ASA
1.6
0.4
00 2 4 6 8 10 12 14 16 18 20 22 24 26 28 30 32 34 36 38 40 42 44 46 48
Time (h)
Figure 5.10: Sulfasalazine and 5-am inosalicylic acid plasm a concentration
time profiles after the adm inistration o f sulfasalazine solution in Dog B
238

3.6
3.2
?■ 2.8S u lfasa laz ine
5-ASA
2
I -l „&
0.8
0.4
00 2 4 6 8 10 12 14 16 18 20 22 24 26 28 30 32 34 36 38 40 42 44 46 48
Time (h)
Figure 5.11: Sulfasalazine and 5-aminosalicylic acid plasma concentration
time profiles after the administration of sulfasalazine solution in Dog C
2.4
2S u lfasa laz ine
5-ASA1.6
1.2
E 0.8
S a.
0.4
00 2 8 10 12 14 16 18 20 22 24 26 28 30 32 34 36 38 40 42 44 46 484 6
Time (h)
Figure 5.12: Sulfasalazine and 5-am inosalicylic acid plasm a concentration
time profiles after the administration o f sulfasalazine solution in Dog D
239

(A)
3.6 Dog A - Sulfasalazine
Dog A - 5-ASA3.2
Dog B - Sulfasalazine
Dog B - 5-ASA
Dog C - Sulfasalazine2.4
Dog C - 5-ASA
Dog D - Sulfasalazine
1.6 Dog D - 5-ASA
0.4
0 8 12 16 20 24 28 32 36 40 44 484
(B)
Time (h)
3.6
3.2
Sulfasalazine
5-ASA
■5 2.4
1.6
0.4
0 364 8 12 16 20 24 28 32 40 44 48Time (h)
Figure 5.13: Sulfasalazine and 5-am inosalicylic acid plasm a concentration
time profiles after the adm inistration o f sulfasalazine solution in the four dogs
(A) and its m ean ±SD (B)
240

3.6
3.2
B alsalazide^ 2.8 E
r5-ASA
2
§ 1.68
0.8
0.4
06 8 10 12 14 16 18 20 22 24 26 28 30 32 34 36 38 40 42 44 46 480 2 4
T im e (h )
Figure 5.14 : Balsalazide and 5-aminosalicylic acid plasma concentration-time
profiles after the administration of balsalazide solution in Dog A
3.6
3.2
I 2.8 Balsalazide
5-ASA
co 21
0.8
0.4
00 2 6 8 10 12 14 16 18 20 22 24 26 28 30 32 34 36 38 40 42 44 46 484
T im e (h )
Figure 5.15 : Balsalazide and 5-aminosalicylic acid plasm a concentration-tim e
profiles after the adm inistration o f balsalazide solution in Dog B
241

7.2
6.4
5.6 B alsalazide
E
I 5ASA
I!"E 2.4
Z 1.6
6 8 10 12 14 16 18 20 22 24 26 28 30 32 34 36 38 40 42 44 46 480 2 4Time (h)
Figure 5.16 : Balsalazide and 5-aminosalicylic acid plasma concentration-time
profiles after the administration of balsalazide solution in Dog C.
2.4
B alsa lazide
E SASA
IsoI§8isa.
0.4
0 2 6 8 10 12 14 16 18 20 22 24 26 28 30 32 34 36 38 40 42 44 46 484Time (h)
Figure 5.17 ; Balsalazide and 5-am inosalicylic acid plasm a concentration-tim e
profiles after the adm inistration o f balsalazide solution in Dog D
242

(A) 7.2
Dog A - B alsa lazide
Dog A - 5-ASA
Dog B - B alsa lazide
Dog B - 5-ASA
6.4
5.6
EDog C - B alsa lazideIcDog C - 5-ASA
Dog D - B alsa lazideo
Ig8i
Dog D - 5-ASA3.2
2.4
0.8
4832 36 40 440 8 12 164
(B)
5 .6
B alsalazide
I 4 . 8
I5 4
5-ASA
II 3 .2
88
I1.6
4 0 4 88 12 1 6 20 2 4Time (h)
2 8 3 2 3 6 4 40 4
Figure 5.18: Balsalazide and 5-am inosalicylic acid plasm a concentration-tim e
profiles after the adm inistration o f balsalazide solution in the four dogs (A)
and its m ean±SD (B).
243

4.4
3.6
O lsalazineE
Itr
5-ASA
1!iZ
0.8
0.4
6 8 10 12 14 16 18 20 22 24 26 28 30 32 34 36 38 40 42 44 46 480 2 4Time (h)
Figure 5.19 : Olsalazine and 5-aminosalicylic acid plasma concentration-time
profiles after the administration of olsalazine solution in Dog A
5.2
4.8
4.4
4
L.SI 3. s0 2.8h1 1.6I 1.2
O lsalazine
5-ASA
0.80.4
06 8 10 12 14 16 18 20 22 24 26 28 30 32 34 36 38 40 42 44 46 480 2 4
Time (h)
Figure 5.20 : Olsalazine and 5-am inosalicylic acid plasm a concentration-tim e
profiles after the administration o f olsalazine solution in Dog B
244

3.2
2.8
- 2.4O lsalazine
5 2 5-ASA
1.6
S 1.2
iSa- 0 .8
0.4
02 6 8 10 12 14 16 18 20 22 24 26 28 30 32 34 36 38 40 42 44 46 480 4
Time (h)
Figure 5.21 : Olsalazine and 5-aminosalicylic acid plasma concentration-time
profiles after the administration of olsalazine solution in Dog C
3.6
3.2
O lsalazine
5-ASA2 2.4
1.6
1.2
0.8
0.4
0 2 4 6 8 10 12 14 16 18 20 22 24 26 28 30 32 34 36 38 40 42 44 46 48Time (h)
Figure 5.22 : Olsalazine and 5-am inosalicylic acid plasm a concentration-tim e
profiles after the adm inistration o f olsalazine solution in Dog D
245

(A)
4.8
O lsalazine4
E 5-ASA
E 3 .2 cÏo!= 2.4
s8I -«a.
0.8
00 8 12 16 20 24 28 32 36 40 44 484
Time (h)
Time (h)
Dog A - O lsalazine
Dog A - 5-ASA
Dog B - O isalazine
Dog B - 5-ASA
Dog C - O lsalazine
Dog C - 5-ASA
Dog D - O lsalazine
Dog D - 5-ASA
Figure 5.23: Olsalazine and 5-am inosalicylic acid plasm a concentration-tim e
profiles after the adm inistration o f olsalazine solution in the four dogs (A) and
its m ean iS D (B)
246

5.6
S u lfasa laz in e
5-ASA from S u lfasa laz ine4.8
B alsa lazide
5-ASA from B alsalazide
O lsalazine= 3.2
5-ASA from O lsalazine
S 2.4
1.6
0.8
24 32 36 40 44 480 8 12 16 20 284Time (h)
Figure 5.24: Mean (±SD) plasma concentration-time profiles for sulfasalazine,
balsalazide and olsalazine and their metabolite 5-aminosalicylic acid after their
administration in solution
247

Administeredsolution Drug in plasma Dog A Dog B D ogC Dog D Mean (±SD)
Parent AUC(sulfasalazine) (0-48 h)
(nmol.h/ml)Z873 1.053 1.322 2.090 1.834 (±0.820)
Cmax(nmol/ml)
0.800 0.490 0.520 0.990 0.701 (±0.237)
Tmax(h)
1.000 0.500 0.500 0.500 0.625 (±0.250)
SulfasalazineMetabolite AUC
(5-aminosalicylic (0-48 h) 46.143 23.210 28.203 25.390 30.736 (±10.472)acid) (nmol.h/ml)
Cmax(nmol/ml)
3.150 2.920 3.640 2.370 3.019 (±0.525)
Tmax(h)
4.000 6.000 6.000 6.000 5.500 (±1.000)
Parent AUC(balsalazide) (0-48 h)
(nmol.h/ml)0.264 0.643 0.461 0.61 I 0.494 (±0.173)
Cmax(nmol/ml)
0.171 0.204 0.229 0.490 0.273 (±0.146)
Tmax(h)
0.500 0.500 0.500 0.500 0.500 (±0.000)
BalsalazideMetabolite AUC
(5-aminosalicylic (0-48 h) 40.255 26.245 55.162 42.493 41.039 (±11.846)acid) (nmol.h/ml)
Cmax(nmol/ml)
3.622 3.728 7.063 2.375 4.197 (±2.007)
Tmax(h)
4.000 6.000 6.000 6.000 6.000 (±1.633)
Parent AUC(olsalazine) (0-48 h)
(nmol.h/ml)10.101 2.771 1.599 10.926 6.349 (±4.843)
Cmax(nmol/ml)
1.540 1.140 0.880 3.140 1.676 (±1.015)
Tmax(h)
AUC
1.000 0.500 0.500 0.500 0.625 (±0.250)Olsalazine
Metabolite(5-aminosalicylic (0-48 h) 44.663 67.072 21.780 45.258 44.693 (±18.494)
acid) (nmol.h/ml)Cmax
(nmol/ml)4.290 5.130 3.180 3.400 3.999 (±0.892)
Tmax(h)
6.000 6.000 6.000 6.000 6.000(±0.000)
Table 5.10: Summary of mean pharmacokinetic data (±SD) for parent
and metabolites after the three administrations in solution
drug
248

In vitro, one of the interesting trends observed was that for the same slurry incubation
sulfasalazine appears to have a more rapid degradation rate, followed by balsalazide
and olsalazine. In vivo however, given the variability observed between animals it is
not possible to conclude that the in vitro trend is observed in vivo from the results
obtained. This was also made difficult due to the limitations in sampling times, much
shorter plasma sampling times could have facilitated the visualisation of any
differences in the 5-aminosalicylic acid plasma profiles.
For all drugs administered the amount of 5-aminosalicylic acid detected in the plasma
is significantly higher than the amount of the parent compound. This is in accordance
with the fact that sulfasalazine, balsalazide and olsalazine all possess low absorption
rates and most drug will remain in the colonic environment where bacteria can exert
their action (Chan et al., 1983, Wadworth and Fitton, 1991).
5.6.5. An investigation into the use o f antibiotic therapy to assess in vivo
bacteria-related stability of model drugs
Profound changes occur in the normal human intestinal microbiota as a result of
antibiotic administration. During the course of large spectrum antibiotic therapy
bacteria’s growth mechanisms are inhibited and bacterial numbers fall drastically. The
in vitro stability o f the model drugs changed completely before and after antibiotic
therapy as was seen in section 5.6.1. There was a clear inactivation of the drug
metabolism when faeces collected after antibiotic therapy were used. As a result big
differences are expected to occur in the plasma concentrations o f drugs that would
usually be metabolised by the gastrointestinal microbiota.
249

The use o f antibiotic therapy to study bacteria-related drug stability in vivo allows
drug pharmacokinetic profiles to be compared before and after the antibiotic
administration. The antibiotics chosen were a combination of two tablet formulations
commonly used in veterinary practice. They contained a combination of amoxicillin
with clavulanic acid for one of the tablets and a combination of sulfadiazine and
trimethoprim in another tablet. Both tablets were administered simultaneously.
Amoxicillin belongs to the antimicrobial group that inhibits the synthesis o f the
bacterial cell wall called [3-lactam antibiotics. It has a broad antimicrobial spectrum
over a wide range of Gram-positive bacteria and is also active against some species of
Gram-negative organism. The common association of amoxicillin with clavulanic
acid avoids the emergence of resistant enterobacteria by acting as a competitive
inhibitor o f beta-lactamases secreted by certain baeteria to confer resistance to beta-
lactam antibiotics. Sulfadiazine and trimethoprim both act to inhibit different steps of
folic acid production inside the bacterial cell, essential for bacterial multiplication. So
the combination of these different mechanisms is expected to eradicate the majority of
bacterial species present in the gastrointestinal tract.
A drug that is subject to microbial degradation in the colonic lumen is expected to
achieve much higher drug plasma concentrations after antibiotic therapy. Two of the
model drugs chosen for this cocktail solution, sulindac and metronidazole, both
possessed high degradation rates in vitro and are, therefore, expected to achieve
higher plasma concentrations after antibiotic therapy administration. The results
Figure 5.25 to Figure 5.40 and a summary of the pharmacokinetic data is presented in
Table 5.11.
250

30
28
26
B efore an tib io tic th e rap y24
A fter an tib io tic th e rap y
0 2 4 6 8 10 12 14 16 18 20 22 24Tim e (h )
Figure 5.25: Sulindac plasma concentration-time profile before and after
antibiotic therapy in Dog A; (samples were taken up to 48 hours but only
plasma concentrations up to 24 hours are shown for clarity)
52
48
44 Before an tib io tic th e rap y
40
A fter an tib io tic th e rap y
w 24
o 20
0 2 4 6 8 10 12 14 16 18 20 22 24Tim e (h )
Figure 5.26: Sulindac plasma concentration-time profile before and after
antibiotic therapy in Dog B; (samples were taken up to 48 hours but only
plasma concentrations up to 24 hours are shown for clarity)
251

90
80
B efore an tib io tic th e rap y
A fter an tib io tic th e rap y.2 50
12 20 22 242 4 6 8 10 14 16 180Time (h)
Figure 5.27: Sulindac plasma concentration-time profile before and after
antibiotic therapy in Dog C; (samples were taken up to 48 hours but only
plasma concentrations up to 24 hours are shown for clarity)
320
280
B efore an tib io tic th e rap y
240A fter an tib io tic th e rap y
5 200
i 160
120
80
40
20 22 240 2 4 6 8 10 12 14 16 18Time (h)
Figure 5.28: Sulindac plasma concentration-time profile before and after
antibiotic therapy in Dog D; (samples were taken up to 48 hours but only
plasma concentrations up to 24 hours are shown for clarity)
252

(A) 320
Dog A befo re an tib io tic th e rap y280
Dog A a f te r an tib io tic the rap y
Dog B before antib io tic th e rap y240
E Dog B a f te r an tib io tic the rapyg5 2 0 0 Dog C befo re antib io tic th e rap y
.2 Dog C a f te r an tib io tic the rap y
1, 160
Ii "i
Dog D befo re an tib io tic the rap y
Dog D a f te r an tib io tic the rap y
40
8 12 16 20 240 4
(B)
Tim e (h )
200
B efore an tib io tic th e rap y160
A fter an tib io tic the rap yE
I120!8
8 80
sa.
0 4 8 12 16 20 24T im e (h )
Figure 5.29: Sulindac plasma concentration-time profile before and after
antibiotic therapy in the four dogs (A) and its mean±SD profiles (B); (samples
were taken up to 48 hours but only plasma concentrations up to 24 hours are
shown for clarity)
253

3600
3200
2800B efore A ntibiotic th e rap y
2400A fter an tib io tic th e rap y
.2 2000
u 1600
E 1200
800
400
0 2 4 6 8 10 12 14 16 18 20 22 24 26 28 30 32 34 36 38 40 42 44 46 48T im e (h )
Figure 5.30: Metronidazole plasma concentration-time profile before and after
antibiotic therapy in Dog A
3600
3200
Before an tib io tic th e rap y
2800
A fter an tib io tic th e rap y£ 2400
% 2000
= 1600
S 1200
800
400
0 2 4 6 8 10 12 14 16 18 20 22 24 26 28 30 32 34 36 38 40 42 44 46 48Tim e (h )
Figure 5.31: M etronidazole plasma concentration-tim e profile before and after
antibiotic therapy in Dog B
254

13000
12000
11000
Before an tib io tic th e rap y10000
E 9000A fter an tib io tic th e rap y
8000
7000
a 6000
" 5000IS 4000
3000
2000
1000
0 2 4 6 8 10 12 14 16 18 20 22 24 26 28 30 32 34 36 38 40 42 44 46 48T im e (h )
Figure 5.32: Metronidazole plasma concentration-time profile before and after
antibiotic therapy in Dog C
15000
14000
13000
12000 B efore an tib io tic th e rap y
11000
A fter an tib io tic the rap y"S: 100009000
% 8000
7000
8 6000
I 5000
4000
3000
2000
1000
00 2 4 6 8 10 12 14 16 18 20 22 24 26 28 30 32 34 36 38 40 42 44 46 48
Tim e (h )
Figure 5.33: M etronidazole plasm a concentration-tim e profile before and after
antibiotic therapy in Dog D
255

(A)15000
14000 Dog A - B efore an tib io tic th e rap y
13000 Dog A - A fter an tib io tic th e rap y
12000 Dog B - Before an tib io tic the rap y
11000 Dog B - A fter an tib io tic the rap y
10000Dog C - B efore an tib io tic the rap y
9000Dog C - A fter an tib io tic th e rap y
8000Dog D - B efore an tib io tic th e rap y
7000Dog D - A fter an tib io tic th e rap y
6000
5000
4000
3000
2000
1000
36 40 44 4820 24 28 320 8 12 164
(B)
Tim e (h )
9000
8000Before an tib io tic th e ra p y
7000
A fter an tib io tic th e ra p y
6000
p 5000
4000
3000
2000
1000
036 40 44 4824 28 320 8 12 16 204
Tim e (h )
Figure 5.34: M etronidazole plasm a concentration-tim e profile before and after
antibiotic therapy in the four dogs (A) and its m ean±SD (B)
256

4.5
3.5Before an tib io tic th e rap y
E
.2 A fter an tib io tic th e rap y
IIi0.
0.5
6 8 10 12 14 16 18 20 22 24 26 28 30 32 34 36 38 40 42 44 46 480 2 4Tim e (h )
Figure 5.35: Captopril plasma concentration-time profiles before and after
antibiotic therapy in Dog A
6.5
B efore an tib io tic th e rap y
5.5A fter an tib io tic th e rap y
F 4.5
3.5
1.5
0.5
0 2 4 6 8 10 12 14 16 18 20 22 24 26 28 30 32 34 36 38 40 42 44 46 48T im e (h )
Figure 5.36: Captopril plasma concentration-time profiles before and after
antibiotic therapy in Dog B
257

16
14 Before an tib io tic th e rap y
12 After an tib io tic th e rap yE1.0iI 8c8
i ‘0.
4
2
02 6 8 10 12 14 16 18 20 22 24 26 28 30 32 34 36 38 40 42 44 46 480 4
Tim e (h )
Figure 5.37: Captopril plasma concentration-time profiles before and after
antibiotic therapy in Dog C
B efore antib io tic the rap y
A fter an tib io tic th e rap y
E
IÎ88
:a.
0 2 4 6 8 10 12 14 16 18 20 22 24 26 28 30 32 34 36 38 40 42 44 46 48T im e (h )
Figure 5.38: Captopril plasm a concentration-tim e profiles before and after
antibiotic therapy in Dog D
258

(A)Dog A - befo re an tib io tic th e rap y
14 Dog A - a f te r an tib io tic th e rap y
Dog B - befo re an tib io tic th e rap y
E Dog B - a f te r an tib io tic th e rap y
I Dog C - befo re an tib io tic th e rap y
Dog C - a f te r an tib io tic th e rap y
c8S
Dog D - befo re an tib io tic th e rap y
Dog D - a f te r an tib io tic th e rap y
E
I
0 4 8 12 16 20 24 28 32 36 40 44 48
(B)
b
Time (h)
12
10 Before an tib io tic th e rap y
After an tib io tic th e rap y8
4
2
00 4 8 12 16 20 24 28 32 36 40 44 48
Time (h)
Figure 5.40: Captopril plasm a concentration-tim e profiles before and after
antibiotic therapy in the four dogs (A) and its m ean±SD profiles (B)
259

Administered Before or aftersolution antibiotic therapy Dog A Dog B DogC Dog D Mean (±SD)
AUC(0-48 hours) 56 582 88 050 224.175 319J75 172.145 (±122.377)
(ng.h/ml)B efore Cmax
(ng/ml)2&2I 43,95 8 9 ^ ^ 312.42 1 18.47 (±131.868)
Tmax(h)
AUC
0.500 0.500 0.500 0.500 0.500 (±0.000)
Sulindac(0-48 hours) 87.600 93 922 55 J6 5 401.107 159.598(±161.869)
(ng.h/ml)
A fter Cinax(ng/ml) 21.810 51.180 16 580 284 930 93.625(±128.443)
Tmax(h)
0.500 0.500 1.000 0.500 0.625(±0.250)
AUC(0-48 hours) 44805.08 53589.35 125637.1 160680.8 96178.093(±56218.102)
(ng.h/ml)B efore Cmax
(ng/ml)Tmax
3419.90 3746^8 12944.65 14301.19 8603.080(±5824.335)
1.000 0.500 0.500 0.500 0.625(±0.250)Metronidazole (h)
AUC(0-48 hours) 23568 58223.01 32654.31 32654.31 36774.9 (±14926,51)
(ng.h/ml)A fter Cmax
(ng/ml)2420.34 3749.49 3453.80 650189 4031.355 (±1742.819)
Tmax(h)
1.000 0.500 0.500 0.500 0.625(±0.250)
AUC(0-48 hours) 23.155 52.3625 155.1925 101.1275 82.959(±57.909)
(ng.h/ml)B efore Cmax
(ng/ml)4 J 8 0 6.550 15.360 16.010 10.575(±5.973)
Tmax 2.000 1.000 6.000 1.000 2.500(±2.380)Captopril (li)
AUC(0-48 hours) 1.7025 2.115 2T262 2.100 7.295(± 10.646)
(ng.h/ml)A fter Cmax
(ng/ml)Z270 2^:20 4.490 2.800 3.095(±0.964)
Tmax(h)
1.000 1.000 6.000 1.000 2.250(±2.500)
Table 5.11: Summary o f mean pham iacokinetic data (±SD) for sulindac,
metronidazole and captopril before and after antibiotic therapy
260

There is a great degree of variability that can be explained due to similar reasons
described in the previous section. Both sulindac and metronidazole are detected in the
plasma o f all dogs before and after antibiotic therapy, however, the plasma
concentration after antibiotic therapy is lower than before antibiotic therapy. The
same trend of a higher plasma concentration before antibiotic therapy was also
obtained for the third drug molecule tested, captopril.
The most plausible explanation for the lower parent drug plasma concentration after
antibiotic therapy is changes in gastrointestinal transit time. The most common
adverse effect o f antibiotics is diarrhoea (Barbut and Meynard, 2002), this is due to
the changes the antibiotics bring to the intestinal environment. The dogs were kept
under vigilance and diarrhoea was not observed, however, the dogs could have been
experiencing a quicker transit time after antibiotic therapy, even without noticeable
diarrhoea. This can lead to less time for large intestinal absorption and therefore lower
concentrations of drug appearing in the plasma.
The drugs were administered on the following day after antibiotic therapy and this
might not be long enough for transit time to normalise after a 10 day antibiotic
therapy. One suggestion would be to administer drugs one or perhaps two days
following the end of antibiotic therapy. However, bacteria will quickly thrive in the
large intestine after antibiotics are stopped since their optimal growing conditions are
re-established. Bacterial growth would render pointless this study to quantify drug
plasma concentrations after antibiotic administration. In addition to this, in a study
performed with patients that experience diarrhoea as a result o f antibiotic therapy the
range o f time for occurrence o f diarrhoeal symptoms is 0-45 days after the start of
261

antibiotic treatment (Wistrom et al., 2001). This indicates that transit times would
probably require up to 45 days after the start of antibiotic therapy to normalise; one or
two days after antibiotic therapy would not be enough to guarantee normal transit
times.
A better way of perfomiing the study would have been to measure transit times before
and after antibiotic therapy. Transit times can be measured through the use of
radiolabelled materials and scintigraphy techniques that allow tracing the material
progress through the digestive tract in real time and accurately measure
gastrointestinal transit times. With this technique we could guarantee an
administration only when transit times normalise, although, bacteria could grow after
antibiotic therapy ends.
Another explanation for the results obtained is that the colonic mucosa changes with
the antibiotic therapy in such a way that can affect the permeability o f drugs. Bacteria
are generally seen as a first defence mechanism by degrading harmful
substances/organisms before they are allowed to contact the absorbing epithelium. By
eradicating bacteria with the use of antibiotics the mucosal epithelium in the colon
might create a mechanism that tightens up the uptake o f molecules from the lumen.
The influence of the microbiota on the host’s physiology is far from understood and it
is believed to be a very complex interaction. For example, there is accumulating
evidence that the collaboration between enteric bacteria and the intestinal epithelial
cell contributes to the development of the intestinal ecosystem by modifying epithelial
cell functions. This was observed when germ-fi*ee mice with B. thetaiotaomicron
262
induced the expression of the matrix metalloprotease matrilysin, which activates
antimicrobial peptides or prodefensins in the mucosal epithelium (Lopez-Boado et al.,
2000). It is also clear that the immunological responses o f conventional animals differ
greatly from those of germ-free animals. Microscopically lymphoid aggreagates such
as Peyer’s patches are small and poorly defined in the intestine of germ-free animals
(Rothkotter and Pabst, 1989). Furthermore, the use of gnotobiotic animals has shown
that bacteria have a profound impact on the anatomical, physiological and
immunological development of the host, including effects on the intestinal epithelial
cell functions and on the composition of the diffuse gut-associated lymphoid tissue
(Cebra, 1999, Falk et al., 1998, Shroff et al., 1995). For instance Backhed et al. found
that conventionalisation of germ-free mice led to a 60%-increase in body fat content
(Backhed et al., 2004).
It is also possible that certain transporters that affect the permeability of the drugs
sulindac, metronidazole and captopril might become less active with the use of
antibiotics in the way they allow a drug to permeate. When comparing the values for
the pharmacokinetic data for the different drugs (Table 5.11), it becomes apparent that
the reduction in AUC after the antibiotic therapy is higher for certain drugs than in
others. For example, sulindac's AUC is reduced 7% (from I72.1r]g.h/ml before
antibiotic therapy to I59.5T]g.h/ml after antibiotic therapy), metronidazole’s AUC is
reduced 61% (from 96178.lr]g.h/ml before antibiotic therapy to 36774.9rtg.h/ml) and
in captopril a surprising 91% AUC reduction is observed (from 82.9T]g.h/ml before
antibiotic therapy to 7.2rig.h/ml after antibiotic therapy). One of the few known
transporters present in the healthy human colon is the proton-coupled peptide
transporter hPepTI; drug substrates for this transporter include (3-lactam antibiotics2 6 3

and angiotensin-converting enzyme inhibitors such as captopril. This might go
someway into explaining the higher reduction in captopriTs plasma levels as
compared to the other drugs administered. During the 10 days antibiotic therapy both
clavulanic acid and amoxicillin possess p-lactam rings. Although the 10*' day of
antibiotic therapy was the previous day to the cocktail dose, it is expected that the
concentration of these molecules in the colonic environment might still be high
enough to compete with captopril for the hPepTl transporter.
The use of antibiotics to alter bacterial populations in the intestine as a potential
means to modulate plasma equol concentrations was studied recently in monkeys
(Blair et al., 2003). Equol production is a function o f the bacterial metabolism of
daidzein (which can be found in diet products such as soy). Interestingly the study
demonstrated that individual antibiotics alter plasma equol levels in unique patterns.
Treatment with the antibiotic kanamycin for instance reduced plasma equol levels
while increasing plasma levels of daidzein; treatment with doxycycline did not affect
plasma equol levels but plasma levels of daidzein were elevated. The authors suggest
that the some of the antibiotics used might have a direct effect on equol metabolism
they may alter absorption through the intestinal wall. In a similar way the study
described in this chapter presents unique results that contribute to further question the
use of antibiotics to assess in vivo bacteria-associated drug stability. O f noticeable
interest is that plasma equol concentrations returned to baseline values within 8 weeks
(Blair et al., 2003) after the end of antibiotic treatment suggesting that only after that
time the large intestinal environment re-establishes its normal bacterial levels.
264

The results obtained in this section might have implications for drug therapy in
general. Certain drugs that undergo enterohepatic recirculation are already known to
have lower plasma levels when antibiotics are used (mechanism described in Chapter
1). However, can antibiotics change the pharmacokinetic profile of other drugs by
changing the functioning of intestinal epithelial cells and alter drug permeability?
5.7. Chapter conclusions
This chapter describes in vitro and in vivo investigations into the use of the dog as a
suitable model to study bacteria-associated colonic drug stability. The in vitro work
presented indicates that faecal material from dogs can be used in fermentation
experiments to successfully predict drug degradation rates obtained in fermentation
experiments with human faecal material. For scientists that have easy access to animal
units where dogs are being kept it might be advantageous to use dogs since there is no
extra cost associated with the collection of faecal material and given that dogs tend to
have regular defecation behaviour it might be easier and straightforward to get hold of
these in a regular basis. It is also worth pointing out that dogs (as well as rats), by
having a controlled diet, provide more uniform and regular faeces when compared to
humans. On the other hand anatomical and bacterial differences between dogs and
humans might not allow correlation between colonic drug stability for all drugs and
each study drug should be evaluated before making a decision to use dogs.
The in vitro work performed after the dogs were submitted to antibiotic therapy
confirms the inactivity of the dog faecal slurry towards drug molecules when bacteria
265

are eradicated by large spectrum antibiotic treatment. This clearly confirms that the
drug metabolic rates observed when the faecal slurry was collected before antibiotic
therapy were due to bacteria and their enzymes.
The results obtained for the administration of the drugs sulfasalazine, balsalazide and
olsalazine indicate a certain degree of variability, both between individual dogs and
between drugs. This variability is inherent to all in vivo studies and was seen
previously with human in vivo where these drugs were used. The formation of the
active metabolite 5-aminosalicylic acid as a result o f bacterial degradation was
detected for all the three model drugs. It is difficult to detect the small differences in
the degradation profiles between the different model drugs that had been obtained
with the in vitro work. Perhaps these differences that can be seen in vitro are not in
vivo relevant. Also, the use of shorter plasma sampling time points would have
allowed a more accurate comparison between the 5-aminosalicylic plasma profiles
obtained with the administration o f these different drugs.
The work described in this chapter questions the use of antibiotic therapy to
investigate drug stability in the colonic environment in vivo. Antibiotics, by
temporarily eliminating from an animal its intestinal microbiota, are thought to
provide the ideal comparative situation in the same animal (dosing the drug before
and after antibiotic therapy) for the study of bacterial-related metabolism. However,
in vivo many other factors affect drug plasma concentrations and antibiotics might
interfere with some o f those factors, namely permeability o f drugs. From the current
work the use o f antibiotics does not appear advantageous and in fact it might
266

complicate the situation further over other in vivo models for the study of bacteria-
related drug stability.
267

Chapter 6: General discussions and future work
268

6. General discussions and future work
More drugs than ever before are reaching the lower confines of the gut either because
new molecules tend to suffer from low solubility/low permeability or because new
formulations, designed to improve oral therapy, tend to adopt modified release
preparations. The lower gastrointestinal tract is one of the most complex and dynamic
microbial ecosystems that actively metabolises carbohydrates and proteins escaping
digestion in the upper gut. In addition, the metabolic reactions performed by these
bacteria and their respective enzymes have the ability to metabolise drugs and other
xenobiotics far more extensively than any other part o f the body. The stability of a
drug to the microbiota is clinically relevant: metabolism can render a drug
pharmacologically active, inactive or toxic. As a consequence, there is a clear need to
assess drug stability in the presence of intestinal bacteria.
The work described in this thesis standardises in vitro drug stability studies in a
bacterially rich environment by developing and validating a suitable in vitro
fermentation model. The in vitro fermenter developed uses human faecal material as
the bacterial source and the work performed indicates that similarities exist in the
metabolic activity of slurries prepared from different volunteers. However, it is
suggested that the use of a pooled slurry of three different volunteers minimises any
possible variability. The concentration of the slurry was shown to affect the drug
degradation rate but a 10% concentration seemed to be a good indicator of
degradation yet allowing easy handling and accurate volume measurement. The work
also indicates that a smaller volume (<lml) and the use of independent vials (as
269

opposed to 96 well plates) facilitates the procedure and reduces the variability. The
use o f buffer slurry instead of a more nutritive media is also preferred for its
simplicity all the while bearing in mind that the degradation rate is probably an
underestimation of the degradation rate in the colonic environment where more
nutrients are available.
Five model drugs were assessed in this fermenter, model drugs whose bacterial
metabolism has clinical relevance. The degradation rates obtained in this in vitro
model for these model drugs should be used as positive controls for comparison
purposes with other drug molecules. Three of the model drugs used (sulfasalazine,
balsalazide and olsalazine) although belonging to the same class of compounds (the
azo compounds) show very different degradation rates between them: sulfasalazine
degrades faster, followed by balsalazide and olsalazine possessing the slowest
degradation rate.
The use of animal gastrointestinal contents as bacterial source for the in vitro
fermentation system was also investigated. Rat caecal, colonic and faecal contents as
well as dog faecal contents were used and successfully predicted the degradation rate
of model drugs in comparison to the use of human faecal material in the fermentation
model.
In addition, a fistulated dog model was used for the first time to study the in vivo
relevance o f drug stability in the colonic enviromnent. This model allows the drug to
avoid the upper gastrointestinal tract, which is a major disadvantage of previous in
vivo models since drug dissolution and absorption in the upper gut impact on the drug
270

concentration reaching the colonic environment. This in vivo model was used to
assess the in vivo relevance of bacteria-related metabolism o f the model drugs
screened in the developed in vitro fermenter. The formation of the active metabolite
resulting from bacterial degradation was detected in vivo for all the three model
drugs.
A second in vivo study was also performed with the use of antibiotics as a way
assessing the effect of eradicating gastrointestinal bacteria in drug bioavailability
from the colon. This allowed an understanding of the complexity in modulating
bacteria in vivo and from the current work the use of antibiotics does not appear
advantageous for the in vivo study of bacteria-related drug metabolism.
This work will be of value to scientists working in early drug development where new
drug molecules/formulations are being developed that are likely to reach this region
of the gastrointestinal tract. New molecules can be screened to assess whether there
will be development issues with an extended release formulation option later in the
programme. Existing molecules that for their properties/formulations have the ability
to come into contact with the gastrointestinal microbiota should also be tested for
stability and the possibility of formation of toxic metabolites should be assessed.
271

6.1. Future work
The azo-compounds are the most well-known class of drugs that are subject to
bacterial metabolism in the colonic environment. The enzyme involved in this
reaction (azoreductase) has just been sequenced (Liu et al., 2007) and its three
dimensional structure is available in the protein databank. The detailed study of
this structure and active site could provide an explanation for the different
trends obtained in this thesis between three different azo drugs. A thorough
screening of which molecular structures provide the best enzyme efficiency
could prove beneficial for future azo-polymers or azo prodrugs being
developed by research in pharmaceutical delivery.
The work described in this thesis focuses on model drugs that undergo one
common reaction mechanism; reduction. The study of drugs that are subject to
other reactions would provide interesting comparative data.
The in vivo work described raised questions regarding the use of antibiotics
and their impact on drug bioavailability. This might be relevant in clinical
practice. Further studies perhaps by the use of genn-free animals should be
performed to establish if real differences exist in drug absorption in vivo
comparing to conventional animals.
The ideal culture source for the in vitro fermenter would be human colonic
contents. This could be obtained through colonoscopies procedures, colostomy
272

bags or even during surgeries in colonic bowel resections. Such contents would
provide a more predictive and perhaps in vivo quantitative in vitro simulator.
The improvement of the current in vitro fermentation model should assess the
possibility of creating a cleaner system, this would have numerous advantages
for its routine use. It is suggested the use of bacterial gene cloning techniques
to allow the lull enzymatic potential to be present but in cleaner systems
without the need for the use of faecal samples. Such systems could also
facilitate the analytical quantification of the drugs, therefore streamlining the
process.
273

References
Abu Shamat, M., 1993. The role of the gastrointestinal microflora in the metabolism of drugs. Int. J. Pharm., 97, 1-13.
Abu Shamat, M. S., Beckett, A. H., 1983. Glyceryl trinitrate: Metabolism by the intestinal flora. J. Pharm. Pharmacol., 35, 7 IP.
Adlercreutz, H., Martin, F., 1980. Biliary excretion and intestinal metabolism of progesterone and estrogens in man. J. Steroid Biochem., 13, 231-244.
Allison, C., McFarlan, C., MacFarlane, G. T., 1989. Studies on mixed populations of human intestinal bacteria grown in single-stage and multistage continuous culture systems. Appl. Environ. Microbiol., 55, 672-8.
Amidon, G. L., Lennemas, H., Shah, V. P., Crison, J. R., 1995. A theoretical basis for a biopharmaceutics drug classification: The correlation of in vitro drug product dissolution and in vivo bioavailability. Pharm. Res., 12, 413-420.
Ashida, N., Ijichi, K., Watanabe, Y., Machida, H., 1993. Metabolism of 5'-ether prodrugs o f l-p-d-arabinofuranosyl-e-5(2-bromovinyl)uracil in rats. Biochem. Pharmacol., 46, 2201-2207.
Awni, W. M., Braeckman, R. A., Locke, C. S., Dube, L. M. & Granneman, G. R., 1995. The influence of multiple oral doses of zileuton on the steady-state pharmacokinetics o f sulfasalazine and its metabolites, sulfapyridine and n- acetylsulfapyridine. Clin. Pharmacokinet., 29 Suppl 2, 98-104.
Azad Khan, A. K., Guthrie, G., Johnston, H. H. & Truelove, S. C., 1983. Tissue and bacterial splitting of sulphasalazine. Clin. Sci., 64, 349-354.
Bachrach, W. H., 1988. Sulfasalazine: 1. An historical perspective. Am. J. Gastroenterol., 83, 487-496.
Backhed, F., Ding, H., Wang, T., Hooper, L. V., Koh, G. Y., Nagy, A., Semenkovich, C. F. & Gordon, J., 1., 2004. The gut microbiota as an environmental factor that regulates fat storage. PNAS, 101, 15718-15723.
Basit, A. W., 2005. Advances in colonic drug delivery. Drugs, 65, 1991-2007.
Basit, A. W., Lacey, L. F., 2001. Colonic metabolism of ranitidine: Implications for its delivery and absorption. Int. J. Pharm., 227, 157-165.
Basit, A. W., Newton, J. M., Lacey, L. F., 2002. Susceptibility o f the Hi-receptor antagonists cimetidine, famotidine and nizatidine, to metabolism by the gastrointestinal microflora. Int. J. Pharm., 237, 23-33.
Basit, A. W., Podczeck, F., Newton, J. M., Waddington, W. A., Ell, P. J., Lacey, L. F., 2004. The use o f formulation technology to assess regional gastrointestinal drug absorption in humans. Eur. J. Pharm. Sci., 21, 179-189.
274

Barbut, F. & Meynard, J. L., 2002. Managing antibiotic associated diarrhoea. BMJ, 324, 1345-6.
Blair, R. M., Appt, S. E., Franke, A. A. & Clarkson, T. B., 2003. Treatment with antibiotics reduces plasma equol concentration in cynomolgus monkeys (macaca fascicularis). y. Nutr., 133,2262-7.
Bolton, R. P. & Culshaw, M. A., 1986. Faecal metronidazole concentrations during oral and intravenous therapy for antibiotic associated colitis due to clostridium difficile. Gut, 27, 1169-72.g
Brown, J. P., 1981. Reduction of Polymeric Azo and Nitro Dyes by Intestinal Bacteria. Appl. Environ. Microbiol., 48(5), 1283-1286.
Burkitt, D. P., Walker, A. R., Painter, N. S., 1972. Effect of dietary fibre on stools and the transit-times, and its role in the causation of disease. Lancet, 2, 1408-12.
Caldwell, J., Hawksworth, G. M., 1973. The déméthylation of methamphetamine by intestinal micro flora. J. Pharm. Pharmacol., 25, 422-424.
Cebra, J. J., 1999. Influences o f microbiota on intestinal immune system development. Am. J. Clin. Nutr., 69, 1046S-1051S.
Celesk, R. A., Asano, T., Wagner, M., 1976. The size, ph and redox potential of the cecum in mice associated with various microbial floras. Proc. Soc. Exp. Biol. Med., 151,260-263.
Cemiglia, C. E., Freeman, J. P., Franklin, W. & David Pack, L., 1982. Metabolism of benzidine and benzidine-congener based dyes by human, monkey, and rat intestinal bacteria. Biochem. Biophys. Res. Commun., 107, 1224-1229.
Chan, R. P., Pope, D. J., Gilbert, A. P., Sacra, P. J., Baron, J. H., Lennard-Jones, J. E., 1983. Studies of two novel sulfasalazine analogs, ipsalazide and balsalazide. Dig. Dis. Sci., 28, 609-615.
Ciftci, K. & Groves, M. J., 1996. Delivery o f antitumour compounds to the rat colon: In vitro and in vivo evaluation. Int. J. Pharm., 145, 157-164.
Cinquin, C., Le Blay, G., Fliss, L, Lacroix, C., 2004. Immobilization of infant fecal microbiota and utilization in an in vitro colonic fermentation model. Microb. Ecol., 48, 128-138.
Cizek, L. J., 1954. Total water content of laboratory animals with special reference to volume of fluid within the lumen o f the gastrointestinal tract. Am. J. Physiol., 179, 104-10.
Coates, M. E., Drasar, B. S., Mallett, A. K., Rowland, I. R., 1988. Methodological considerations for the study of bacterial metabolism. In Rowland, I. R. (Ed.) Role of the gut flora in toxicity and cancer. London, Academic Press.
Cummings, J. H., Antoine, J.-M., Azpiroz, F., Bourdet-Sicard, R., Brandtzaeg, P., Calder, P. C., Gibson, G. R., Guamer, F., Isolauri, E., Pannemans, D., Shortt, C., Tuijtelaars, S., Watzl, B., 2004. Passclaim - gut health and immunity. Eur. J. Nutr., 43, 118-173.
275

Cummings, J. H., Bingham, S. A., Heaton, W., Eastwood, M. A., 1992. Fecal weight, colon cancer risk, and dietary intake of nonstarch polysaccharides (dietary fiber). Gastroenterology, 103, 1783-1789.
Cummings, J. H., Hill, M. J., Bone, E. S., Branch, W. J., Jenkins, D. J., 1979. The effect of meat protein and dietary fiber on colonic function and metabolism. II. Bacterial metabolites in feces and urine. Am. J. Clin. Nutr., 32, 2094-101.
Cummings, J. H., Macfarlane, G. T., 1997. Role of intestinal bacteria in nutrient metabolism. JPEN J. Parenter. Enteral Nutr., 21, 357-65.
Cummings, J. H., Banwell, J. G., Segal, I., Coleman, N., Englyst, H. N. & Macfarlane, G. T., 1990. The amount and composition of large bowel contents in man. Gastroenterology, 98, A408.
Cummings, J. H., 1983. Fermentation in the human large intestine: Evidence and implications for health. Lancet, 1, 1206-9.
Cummings, J. H., Macfarlane, G. T., Drasar, B. S., 1989. The gut micro flora and its significance. In: Whitehead, R. (Ed.) Gastrointestinal and oesophageal pathology, London, Churchill Livingstone.
Das, K. M., Eastwood, M. A., McManus, J. P. A. & Sircus, W., 1973. Adverse reactions during salicylazosulfapyridine therapy and the relation with drug metabolism and acetylator phenotype. The New England Journal o f Medicine, 289, 491-495.
Davis, S. S., 2005. Formulation strategies for absorption windows. Drug Discov. Today, 10, 249-257.
De Boever, P., Deplancke, B., Verstraete, W., 2000. Fermentation by gut microbiota cultured in a simulator of the human intestinal microbial ecosystem is improved by supplementing a soygerm powder. J. Nutr., 130, 2599-2606.
Deloménie, C., Fouix, S., Longuemaux, S., Brahimi, N., Bizet, C., Picard, B., Denamur, E., Dupret, J.-M., 2001. Identification and functional characterization of arylamine n-acetyltransferases in eubacteria: Evidence for highly selective acétylation o f 5-aminosalicylic acid. J. Bacteriol., 183, 3417-3427.
Diamant, S. C. & Scott, R. B., 1987. Migrating action potential complexes—a feature o f nornial jejunal myoelectric activity in the rat. Can. J. Physiol. Pharmacol., 65, 2269-73.
Drasar, B. S., Goddard, P., Heaton, S., Peach, S. & West, B., 1976. Clostridia isolated from faeces. J. Med. Microbiol., 9, 63-71.
Drasar, B. S., Barrow, P. A., 1985. The bacterial flora of the normal intestine. In: Barrow, P. A. (Ed.) Intestinal microbiology, Wokingham, Van Nostrand Reinhold.
Drasar, B. S., Hill, M. J., Williams, R. E. O., 1970. The significance o f the gut flora in safety testing of food additives. In: Roe, F. J. C. (Ed.) Metabolic aspects of food safety. New York, Academic.
Dressman, J. B., 1986. Comparison of canine and human gastrointestinal physiology. Pharm. Res., 3, 123-131.
276

Dressman, J. B., Amidon, G. L., Reppas, C., Shah, V. P., 1998. Dissolution testing as a prognostic tool for oral drug absorption: Immediate release dosage forms. Pharm. Res., 15, 11-22.
Dubin, P., & Wright, K. L., 1975. Reduction of Azo Food Dyes in Cultures o f Proteus vulgaris. Xenobiotica, 5(9), 563-571.
Duggan, D. E., Hare, L. E., Ditzler, C. A., Lei, B. W. & Kwan, K. C., 1977. The disposition o f sulindac. Clin. Pharmacol. Ther., 21, 326-35.
Dull, B. J., Salata, K., Goldman, P., 1987. Role of the intestinal flora in the acétylation o f sulphasalazine metabolites. Biochem. Pharmacol., 36, 3772-3774.
Eckburg, P. B., Bik, E. M., Bernstein, C. N., Purdom, E., Dethlefsen, L., Sargent, M., Gill, S. R., Nelson, K. E., Reiman, D. A., 2005. Diversity of the human intestinal microbial flora. Science, 308, 1635-1638.
Edwards, C., 1997. Physiology of the colorectal barrier. Advanced Drug Delivery Reviews, 28, 173-190.
Edwards, C. A., Parrett, A. M., 1999. Colonic fermentation - in vitro and in vivo approaches to measurement. Sci. Aliment., 19, 291-300.
Egert, M., de Graaf, A. A., Smidt, H., de Vos, W. M., Venema, K., 2006. Beyond diversity: Functional microbiomics of the human colon. Trends Microbiol., 14, 86-91.
Elkington, S. G., Floch, M. H., Conn, H. O., 1969. Lactulose in the treatment of chronic portal-systemic encephalopathy. N. Engl. J. Med., 281, 408-412.
Elmer, G. W., Remmel, R. P., 1984. Role of intestinal micro flora in clonazepam metabolism in the rat. Xenobiotica, 14, 829-840.
Escherich, T., 1885. Die darmbakterien des neugeborenen und sauglings. Fortschr. Med., 3, 515-522, 447-547.
Evans, D. F., Pye, G., Bramley, R., Clark, A. G., Dyson, T. J., Hardcastle, J. D., 1988. Measurement of gastrointestinal ph profiles in normal ambulant human subjects. Gut, 29, 1035-1041.
Falk, P. G., Hooper, L. V., Midtvedt, T. & Gordon, J. L, 1998. Creating and maintaining the gastrointestinal ecosystem; What we know and need to know from gnotobiology. Microbiol. Mol. Biol. Rev., 62, 1157-70.
Fanaro, S., Chierici, R., Guerrini, P., Vigi, V., 2003. Intestinal microflora in early infancy: Composition and development. Acta Paediatr., 92, 48-55.
Finegold, S. M., Sutter, V. L., Mathisen, G. E., 1983. Normal and indigenous flora. In: Hentges, D. J. (Ed.) Human intestinal micro flora in health and disease. New York, Academic Press.
Fischer, C., Maier, K. & Klotz, U., 1981. Simplified high-performance liquid chromatographic method for 5-aminosalicylic acid in plasma and urine. J. Chromatogr., 225, 498-503.
Fischer, C., Maier, K. & Klotz, U., 1983. Specific measurement o f 5-aminosalicylic acid and its acetylated metabolite in human bile. Br. J. Clin. Pharmacol., 15, 273-4.
Fouts, J. R., Kamm, J. J., Brodie, B. B., 1957. Enzymatic reduction o f prontosil and other azo dyes. J. Pharmacol. Exp. Ther., 120, 291-300.
277

Franklin, M. E., Addison, R. S., Baker, P. V. & Hooper, W. D., 1998. Improved analytical procedure for the measurement of captopril in human plasma by gas chromatography—mass spectrometry and its application to phaiTnacokinetic studies. J Chromatogr B Biomed Sci Appl, 705, 47-54.
Fuller, A. T., 1937. Is p-aminobenzenesulphonamide the active agent in prontosil therapy? Lancet, 1, 194-198.
Galmier, M. J., Frasey, A. M., Bastide, M., Beyssac, E., Petit, J., Aiache, J. M. & Lartigue-Mattei, C., 1998. Simple and sensitive method for determination of metronidazole in human serum by high-performance liquid chromatography. J Chromatogr B Biomed Sci Appl, 720, 239-43.
Gibson, G. R., Cummings, J. H., Macfarlane, G. T., 1988. Use of a three-stage continuous culture system to study the effect of mucin on dissimilatory sulfate reduction and methanogenesis by mixed populations of human gut bacteria. Appl. Environ. Microbiol., 54, 2750-5.
Gibson, G. R., Fuller, R., 2000. Aspects of in vitro and in vivo research approaches directed toward identifying probiotics and prebiotics for human use. J. Nutr., 130, 391S-395S.
Gibson, G. R., Wang, X., 1994. Regulatory effects of bifidobacteria on the growth of other colonic bacteria. J. Appl. Bacteriol., 77, 412-20.
Gingell, R., Bridges, J. W., Williams, R. T., 1971. The role o f the gut flora in the metabolism of prontosil and neoprontosil in the rat. Xenobiotica, 1, 143-156.
Gingell, R. & Walker, R., 1971. Mechanisms of Azo Reduction by Streptococcus faecalis 11. The Role of Soluble Flavins. Xenobiotica, 1:3, 231-239.
Goldin, B. R., Peppercorn, M. A., Goldman, P., 1973. Contributions o f host and intestinal microflora in the metabolism of 1-dopa by the rat. J. Pharmacol. Exp. Ther., 186, 160.
Goldman, P., 1978. Biochemical pharmacology of the intestinal flora. Annu. Rev. Pharmacol. Toxicol., 18, 523-39.
Goldman, P., 1984. Gnotobiotic rats in studies o f drug metabolism. In: Coates, M. E. & Gustafsson, B. E. (Eds.) The germ-free animal in biomedical research, London, Laboratory Animals Ltd.
Gorbach, S. L., Nahas, L., Weinstein, L., Levitan, R., Patterson, J. F., 1967. Studies of intestinal microflora. IV. The microflora of ileostomy effluent: A unique microbial ecology. Gastroenterology, 53, 874-80.
Gotch, F., Nadell, J. & Edelman, 1. S., 1957. Gastrointestinal water and electrolytes. Iv. The equilibration o f deuterium oxide (dzo) in gastrointestinal contents and the proportion of total body water (t.B.W.) in the gastrointestinal tract. The Journal of Clinical investigation, 36, 289-296.
Harris, B. E., Manning, B. W., Federle, T. W., Diasio, R. B., 1986. Conversion of 5- fluorocytosine to 5-fluorouracil by human intestinal microflora. Antimicrob. Agents Chemother., 29, 44-48.
Hayllar, J., Bjamason, I., 1991. Sulphasalazine in ulcerative colitis: In memoriam? Gut, 32, 462-3.
278

Heneghan, J. B., 1984. Physiology of the alimentary tract. In: Coates, M. E., Gustafsson, B. E. (Eds.) The germ-ffee animal in biomedical research, London, Laboratory Animals Ltd.
Hill, M. J., 1997. Intestinal flora and endogenous vitamin synthesis. Eur. J. Cancer Prev., 6 Suppl 1, S43-5.
Holt, R., 1967. The bacterial degradation of chloramphenicol. Lancet, 1, 1259.
Ibekwe, V. C., Liu, P., Fadda, H. M., Khela, M. K., Evans, D. P., Parsons, G. E., Basil, A. W., 2006. An investigation into the in vivo performance variability of pH responsive polymers for ileo-colonic drug delivery using gamma scintigraphy in humans. J Pharm Sci, 95, 2760-6.
Ibekwe, V. C., Padda, H. M., McConnell, E. L., Khela, M. K., Evans, D. P., Basil, A. W., 2008. Interplay between intestinal ph, transit time and feed status on the in vivo performance of ph responsive ileo-colonic release systems. Pharm Res.
Ilett, K. P., Tee, L. B. G., Reeves, P. T., Minchin, R. P., 1990. Metabolism of drugs and other xenobiotics in the gut lumen and wall. Pharmacol. Ther., 46, 67-93.
Kararli, T. T., 1995. Comparison of the gastrointestinal anatomy, physiology, and biochemistry of humans and commonly used laboratory animals. Biopharm. Drug Dispos., 16, 351-380.
Kellow, J. E., Borody, T. J., Phillips, S. P., Tucker, R. L. & Haddad, A. C., 1986. Human interdigestive motility: Variations in patterns from esophagus to colon. Gastroenterology, 91, 386-95.
Khoshini, R., Dai, S.-C., Lezcano, S., Pimentel, M., 2007. A systematic review of diagnostic tests for small intestinal bacterial overgrowth. Dig. Dis. Sci., Nov 8, online version.
King, L. C., Kohan, M. J., George, S. E., Lewtas, J. & Claxton, L. D., 1990. Metabolism of 1-nitropyrene by human, rat, and mouse intestinal flora: Mutagenicity o f isolated metabolites by direct analysis of hplc fractions with a microsuspension reverse mutation assay. J. Toxicol. Environ. Health, 31, 179-192.
King, P. M., Adam, R. D., Pryde, A., McDicken, W. N. & Heading, R. C., 1984. Relationships o f human antroduodenal motility and transpyloric fluid movement: Non-invasive observations with real-time ultrasound. Gut, 25, 1384-91.
Kitamura, S., Sugihara, K., Kuwasako, M., Tatsumi, K., 1997. The role o f mammalian intestinal bacteria in the reductive metabolism of zonisamide. J. Pharm. Pharmacol., 49, 253-256.
Knoll, U., Straubs, P., Schusser, G. & Ungemach, P. R., 2002. Study of the plasma pharmacokinetics and faecal excretion of the prodrug olsalazine and its metabolites after oral administration to horses. J. Vet. Pharmacol. Ther., 25, 135-143.
Koch, R. L., Beaulieu, B. B., Goldman, P., 1980. Role of the intestinal flora in the metabolism of misonidazole. Biochem. PhannacoL, 29, 3281-3284.
Koch, R. L., Beaulieu, B. B., Jr., Chrystal, E. J. T., Goldman, P., 1981. A metronidazole metabolite in human urine and its risk. Science, 211, 398-400.
279

Koch, R. L., Chrystal, E. J. T., Beaulieu, B. B., Jr., Goldman, P., 1979. Acetamide - a metabolite of metronidazole formed by the intestinal flora. Biochem. Pharmacol., 28, 3611-3615.
Koch, R. L., Goldman, P., 1979. The anaerobic metabolism of metronidazole forms n- (2-hydroxyethyl)-oxamic acid. J. Phannacol. Exp. Ther., 208, 406-410.
Kopecek, J. & Kopeckova, P., 1992. A-(2-hydroxypropyl)methacrylamideCopolymers for Colon-Specific drug delivery. In Oral Colon-Specific Drug Delivery, Friend, D. R., Ed., CRC Press: London, 189-211.
Lamp, K. C., Freeman, C. D., Klutman, N. E. & Lacy, M. K., 1999. Pharmacokinetics and pharmacodynamics o f the nitro imidazole antimicrobials. Clin. Pharmacokinet., 36,353-73.
Lee, N. K., Choi, S. H., Park, S. H., Park, E. K., Kim, D. H., 2004. Antiallergic activity o f hesperidin is activated by intestinal micro flora. Pharmacology, 71, 174- 180.
Lennemas, H., Abrahams son, B., 2005. The use of biopharmaceutic classification of drugs in drug discovery and development: Current status and future extension. J. Pharm. Pharmacol., 57, 273-285.
Levine, W. G., 1991. Metabolism of Azo Dyes: Implication for Detoxification and Activation. Drug Metab. Rev., 23(3&4), 253-309.
Ley, R. E., Peterson, D. A., Gordon, J. I., 2006. Ecological and evolutionary forces shaping microbial diversity in the human intestine. Cell, 124, 837-48.
Lin, Y.-T., Hsiu, S.-L., Hou, Y. C., Chen, H.-Y. & Chao, P.-D. L., 2003. Degradation offlavonoid aglycones by rabbit, rat and human fecal flora. Biol. Pharm. Bull., 26, 747-751.
Lindahl, A., Ungell, A.-L., Knutson, L., Lennemas, FI., 1997. Characterization of fluids from the stomach and proximal jejunum in men and women. Pharm. Res., 14, 497-502.
Lindenbaum, J., Rund, D. G., Butler, V. P., Jr, Tse-Eng, D., Saha, J. R., 1981. Inactivation of digoxin by the gut flora: Reversal by antibiotic therapy. N. Engl. J. Med., 305, 789-94.
Liu, G., Zhou, J., Wang, J., Zhou, M., Lu, H., Jin, R., 2009. Acceleration of azo dye decolorization by using quinone reductase activity of azoreductase and quinone redox mediator. Bioresource Technol. 100, 2791-2795.
Liu, Z. J., Chen, H., Shaw, N., Hopper, S. L., Chen, L., Chen, S., Cemiglia, C. E. & Wang, B. C., 2007. Crystal stmcture of an aerobic fmn-dependent azoreductase (azoa) from enterococcus faecalis. Arch. Biochem. Biophys., 463, 68-77.
Lopez-Boado, Y. S., Wilson, C. L., Hooper, L. V., Gordon, J. I., Hultgren, S. J. & Parks, W. C., 2000. Bacterial exposure induces and activates matrilysin in mucosal epithelial cells. J. Cell Biol., 148, 1305-15.
Macfarlane, G. T., Macfarlane, S., 1997. Human colonic microbiota: Ecology, physiology and metabolic potential of intestinal bacteria. Scand. J. Gastroenterol., Supplement 222, 3-9.
280

Macfarlane, G. T., Macfarlane, S., Gibson, G. R., 1998. Validation of a three-stage compound continuous culture system for investigatinig the effect of retention time on the ecology and metabolism of bacteria in the humam colon. Microb. Ecol., 35, ISO- 187.
Macfarlane, S., Macfarlane, G. T., 2004. Bacterial dliversity in the human gut. Adv Appl Microbiol, 54, 261-89.
Magnus son, J. O., Bergdahl, B., Bogentoft, C., Johnsjson, U. E., 1982. Metabolism of digoxin and absorption site. Br. J. Clin. Pharmacol., 14, 284-285.
Manning, B. W., Campbell, W. L., Franklin, W., D)elclos, K. B., Cemiglia, C. E., 1988. Metabolism of 6-nitrochrysene by intestimal microflora. Appl. Environ. Microbiol., 54, 197-203.
Marsh, P. D., 1995. The role of continuous cullture in modelling the human microflora. J. Chem. Technol. Biotechnol., 64, 1-9.
Martini, F. H., 1995. Fundamentals of anatomy and physiology. New Jersey, Prentice- Hall International, Inc.
Mata, L. J., Carrillo, C. & Villatoro, E., 1969. Fecal nnicroflora in healthy persons in a preindustrial region. Appl. Microbiol., 17, 596-602.
McBain, A. J., Macfarlane, G. T., 1998. Ecological amd physiological studies on large intestinal bacteria in relation to production of hydlrolytic and reductive enzymes involved in formation o f genotoxic metabolites. J. Meed. Microbiol., 47, 407-416.
McConnell, E. L., Tutas, J., Mohamed, M. A. M., Blanning, D., Basit, A. W., 2007. Colonic drug delivery using amylose films: The irole o f aqueous ethylcellulose dispersions in controlling drug release. Cellulose, 14, 25.
McConnell, E. L., Fadda, H. M., Basit, A. W., 2008ja. Gut instincts: Explorations in intestinal physiology and dmg delivery. Int. J. Pharm.,, In Press.
McConnell, E. L., Short, M. D., Basit, A. W., 200)8b. An in vivo comparison of intestinal ph and bacteria as physiological trigger mechanisms for colonic drug delivery. J. Controlled Release, In Press.
McConnell, E. L., Basit, A. W., Murdan, S., 2008c. Measurements of rat and mouse gastrointestinal ph, fluid and lymphoid tissue, and implications for in-vivo experiments. J. Pharm. Pharmacol., 60, 63-70.
McGirr, M. E., McAllister, S. M., Peters, E. E., Vickcers, A. W., Parr, A. F. & Basit, A. W., 2008. The use of the intelisite® companion (device to deliver mucoadhesive polymers to the dog colon. Eur. J. Phami. Sci.
Menelaou, A., Somogyi, A. A., Barclay, M. L. & Blochner, F., 1999. Simultaneous quantification o f amoxycillin and metronidazole in jplasma using high-performance liquid chromatography with photodiode array detecticon. J Chromatogr B Biomed Sci Appl, 731, 261-6.
Meuldermans, W., Hendrickx, J., Mannens, G., Lavrijjsen, K., Janssen, C., Bracke, J., Le Jeune, L., Lauwers, W., Heykants, J., 1994. Thie metabolism and excretion of risperidone after oral administration in rats and dogs.. Drug Metab. Dispos., 22, 129- 138.
281

Mikov, M., 1994. The metabolism of drugs by the gut flora. Eur. J. Drug Metab. Pharmacokinet., 19, 201-207.
Miller, L. G., Hopkinson, J. M., Motil, K. J., Corboy, J. E. & Andersson, S., 1993. Disposition of olsalazine and metabolites in breast milk. J. Clin. Pharmacol., 33, 703- 6 .
Minekus, M., Smeets-Peeters, M., Bemalier, A., Marol-Bonnin, S., Havenaar, R., Marteau, P., Alric, M., Fonty, G., Huis in’t Veld, J. H. J., 1999. A computer-controlled system to simulate conditions of the large intestine with peristaltic mixing, water absorption and absorption o f fermentation products. Appl. Microbiol. Biotechnol., 53, 108-14.
Molly, K., Vande Woestyne, M., De Smet, I., Verstraete, W., 1994. Validation of the simulator of the human intestinal microbial ecosystem (shime) reactor using microorganism-associated activities. Microb. Ecol. Health Dis., 7, 191-200.
Molly, K., Vande Woestyne, M., Verstraete, W., 1993. Development of a 5-step multi-chamber reactor as a simulation of the human intestinal microbial ecosystem. Appl. Microbiol. Biotechnol., 39, 254-8.
Morehead, M. C., Franklin, W., Fu, P. P., Evans, F. E., Heinze, T. M. & Cemiglia, C. E., 1994. Metabolism of 7-nitrobenz[a]anthracene by intestinal microflora. J. Toxicol. Environ. Health, 43, 369-380.
Mori, M., Shirai, Y., Uezono, Y., Takahashi, T., Nakamura, Y., Makita, H., Nakanishi, Y. & Imasato, Y., 1989. Influence of specific gravity and food on movement of granules in the gastrointestinal tract of rats. Chem. Pharm. Bull. (Tokyo). 37, 738-41.
Moshkovska, T. & Mayberry, J. F., 2007. Duration of treatment with 5-aminosalicylic acid compounds. World J Gastroenterol, 13, 4310-5.
Musson, D. G., Vincek, W. C., Constanzer, M. L. & Detty, T. E., 1984. Analytical methods for the determination of sulindac and metabolites in plasma, urine, bile, and gastric fluid by liquid chromatography using ultraviolet detection. J. Pharm. Sci., 73, 1270-3.
Nagengast, F. M., Grubben, M. J., van Munster, I. P., 1995. Role of bile acids in colorectal carcinogenesis. Eur. J. Cancer, 31 A, 1067-70.
Nakayama, H., Kinouchi, T., Kataoka, K., Akimoto, S., Matsuda, Y., Ohnishi, Y., 1997. Intestinal anaerobic bacteria hydrolyse sorivudine, producing the high blood concentration of 5-(e)-(2-bromovinyl)uracil that increases the level and toxicity of 5- fluorouracil. Pharmacogenetics, 7, 35-43.
Narushima, S., Itoha, K., Miyamoto, Y., Park, S. H., Nagata, K., Kumma, K., Uchida, K., 2006. Deoxycholic acid formation in gnotobiotic mice associated with human intestinal bacteria. Lipids, 41, 835-43.
Nicholson, J. K., Wilson, I. D., 2005. Gut microorganisms, mammalian metabolism and personalized health care. Nat. Rev. Microbiol., 3, 431-438.
Nobilis, M., Vybiralova, Z., Sladkova, K., Lisa, M., Holcapek, M. & Kvetina, J., 2006. High-performance liquid-chromatographic determination of 5-aminosalicylic acid and its metabolites in blood plasma. J. Chromatogr. A, 1119, 299-308.
282

Okonkwo, P. O. & Eta, E. I., 1988. Simultaneous determination of chloroquine and metronidazole in human biological fluid by high pressure liquid chromatography. Life Sci., 42, 539-45.
Oktyabrsky, O. N., Smirnova, G. V., 1989. Dynamics o f redox potential in bacterial cultures growing on media containing different sources of carbon, energy and nitrogen. Acta Biotechnol., 9, 203-209.
Okuda, H., Ogura, K., Kato, A., Takubo, H., Watabe, T., 1998. A possible mechanism of eighteen patient deaths caused by interactions of sorivudine, a new antiviral drug, with oral 5-fluorouracil prodrugs. J. Pharmacol. Exp. Ther., 287, 791-9.
Orme, M. L. E., Back, D. J., 1990. Factors affecting the enterohepatic circulation of oral contraceptive steroids. Am. J. Obstet. Gynecol., 163, 2146-52.
Parry, S. D., Barbatzas, C., Peel, E. T. & Barton, J. R., 2002. Sulphasalazine and lung toxicity. Eur. Respir. J., 19, 756-64.
Peppercorn, M. A., Goldman, P., 1972. The role of intestinal bacteria in the metabolism of salicylazosulfapyridine. J. Pharmacol. Exp. Ther., 181, 555-562.
Peppercorn, M. A., Goldman, P., 1973. Distribution studies of salicylazosulfapyridine and its metabolites. Gastroenterology, 64, 240-245.
Peppercorn, M. A., Goldman, P., 1976. Drug-bacteria interactions. Rev. Drug Inter., II, 75-88.
Possemiers, S., Verthe, K., Uyttendaele, S., Verstraete, W., 2004. Pcr-dgge-based quantification of stability of the microbial community in a simulator of the human intestinal microbial ecosystem. FEMS Microbiol. Ecol., 49, 495-507.
Poth, E. J., Knotts, F. L., Lee, J. T., Inui, F., 1942. Bacteriostatic properties of sulfanilamide and some of its derivatives. Arch. Surg., 44, 187-207.
Press, A. G., Hauptmann, I. A., Hauptmann, L., Fuchs, B., Fuchs, M., Ewe, K. & Ramadori, G., 1998. Gastrointestinal ph profiles in patients with inflammatory bowel disease. Aliment. Pharmacol. Ther., 12, 673-8.
Pricelius, C., Held, C., Murkovic, M., Bozic, M., Kokol, V., Cavaco-Paulo, A. & Guebitz, G. M., 2007. Enzymatic reduction of azo and indigoid compounds. Appl. Microbiol. Biotechnol., 77, 321-327.
Priebe, M. G., Vonk, R. J., Sun, X., He, T., Harmsen, H. J. M., Welling, G. W., 2002. The physiology o f colonic metabolism. Possibilities for interventions with pre- and probiotics. Eur. J. Nutr., 41, 1/2-1/10.
Punj, S., John, G. H., 2008. Purification and Identification of an FMN-dependent NAD(P)H Azoreductase from Enterococcus faecalis. Curr. Issues Mol. Biol., 11(2), 59-66.
Rafii, F., Hotchkiss, C., Heinze, T. M., Park, M., 2004. Metabolism of daidzein by intestinal bacteria from rhesus monkeys (macaca mulatta). Comparative Medicine, 54, 165-169.
Rafii, F., Sutherland, J. B., Hansen, E. B., Cemiglia, C. E., 1997. Reduction of nitrazepam by clostridium leptum, a nitroreductase-producing bacterium isolated from the human intestinal tract. Clin. Infect. Dis., 25, S I21-2.
283
Rajilic-Stojanovic, M., Smidt, H., de Vos, W. M., 2007. Diversity of the human gastrointestinal tract microbiota revisited. Environ Microbiol, 9, 2125-36.
Rothkotter, H. J. & Pabst, R., 1989. Lymphocyte subsets in jejunal and ileal peyer's patches o f normal and gnotobiotic minipigs. Immunology, 67, 103-8.
Rowland, I. R., Mallett, A. K., Beame, C. A., Farthing, M. J. G., 1986. Enzyme activities o f the hindgut micro flora of laboratory animals and man. Xenobiotica, 16, 519-523.
Rubinstein, A., 2005. Colonic drug delivery. Drug Discov. Today: Technol. , 2, 33- 37.
Rumney, C. J., Rowland, I. R., 1992. In vivo and in vitro models o f the human colonic flora. Grit. Rev. Food Sci. Nutr., 31, 299-331.
Ryde, E. M. & Ahnfelt, N. O., 1988. The pharmacokinetics of olsalazine sodium in healthy volunteers after a single i.V. Dose and after oral doses with and without food. Eur. J. Clin. Pharmacol., 34, 481-8.
Salminen, S., Bouley, C., Boutron-Ruault, M. C., Cummings, J. H., Franck, A., Gibson, G. R., Isolauri, E., Moreau, M. C., Roberffoid, M. & Rowland, I., 1998. Functional food science and gastrointestinal physiology and function. Br. J. Nutr., 80 Suppl I, S I47-71.
Sandbom, W. J., Hanauer, S. B. & Buch, A., 2004. Comparative pharmacokinetics of equimolar doses of 5-aminosalicylate administered as oral mesalamine (asacol) and balsalazide: A randomized, single-dose, crossover study in healthy volunteers. Aliment. Pharmacol. Ther., 19, 1089-98.
Sandbom, W. J. & Hanauer, S. B., 2003. Systematic review: The pharmacokinetic profiles o f oral mesalazine formulations and mesalazine pro-drugs used in the management of ulcerative colitis. Aliment. Pharmacol. Ther., 17, 29-42.
Sasaki, I., Tamura, T., Shibakawa, T., Fujita, T., Murakami, M., Yamamoto, A., Muranishi, S., 1997. Metabolism of azetirelin, a new thyrotropin-releasing hormone (trh) analogue, by intestinal microorganisms. Pharm. Res., 14, 1004-7.
Savage, D. C., 2001. Microbial biota of the human intestine: A tribute to some pioneering scientists. Curr Issues Intest Microbiol, 2, 1-15.
Scheline, R. R., 1973. Metabolism of foreign compounds by gastrointestinal microorganisms. Pharmacol. Rev., 25, 451-523.
Schiller, C., Frohlich, C. P., Giessmann, T., Siegmund, W., Monnikes, H., Hosten, N. & Weitschies, W., 2005. Intestinal fluid volumes and transit o f dosage forms as assessed by magnetic resonance imaging. Aliment. Pharmacol. Ther., 22, 971-979.
Schiller, L. R., 2007. Evaluation o f small bowel bacterial overgrowth. Curr. Gastroenterol. Rep., 9, 373-7.
Scholz, A., Abrahamsson, B., Diebold, S. M., Kostewicz, E., Polentarutti, B. I., Ungell, A. L. & Dressman, J. B., 2002. Influence of hydrodynamics and particle size on the absorption of felodipine in labradors. Pharm. Res., 19, 42-6.
284

Schneider, H., Simmering, R., Hartmann, L., Pforte. H., Blaut, M., 2000. Degradation of quercetin-3-glucoside in gnotobiotic rats, associated with human intestinal bacteria. J. Appl. Microbiol., 89, 1027-1037.
Schroder, H., Campbell, D. E. S., 1972. Absorption, metabolism, and excretion of salicylazosulfapyridine in man. Clin. Pharmacol. Ther., 13, 539-551.
Shaw, P. N., Sivner, A. L., Aarons, L. & Houston, J. B., 1983. A rapid method for the simultaneous determination of the major metabolites of sulphasalazine in plasma. J. Chromatogr., 274, 393-397.
Shroff, K. E., Meslin, K. & Cebra, J. J., 1995. Commensal enteric bacteria engender a self-limiting humoral mucosal immune response while permanently colonizing the gut. Infect. Immun., 63, 3904-13.
Shu, Y. Z., Kingston, D. G. I., Van Tassell, R. L., Wilkins, T. D., 1991. Metabolism of levamisole, an anti-colon cancer drug, by human intestinal bacteria. Xenobiotica, 21,737-750.
Siew, L. P., Man, S. M., Newton, J. M., Basit, A. W., 2004. Amylose formulations for drug delivery to the colon: A comparison of two fennentation models to assess colonic targeting performance in vitro. Int. J. Pharm., 273, 129-134.
Siluveru, M. & Stewart, J. T., 1995. Determination of sulindac and its metabolites in human serum by reversed-phase high-performance liquid chromatography using online post-column ultraviolet irradiation and fluorescence detection. J. Chromatogr. B. Biomed. Appl., 673, 91-6.
Simon, G. L., Gorbach, S. L., 1984. Intestinal flora in health and disease. Gastroenterology, 86, 174-93.
Sirotek, K., Slovakova, L., Kopecny, J., Marounek, M., 2004. Fermentation of pectin and glucose, and activity o f pectin-degrading enzymes in the rabbit caecal bacterium bacteroides caccae. Lett. Appl. Microbiol., 38, 327-332.
Smith, G. E., Griffiths, L. A., 1974. Metabolism of n-acetylated and o-alkylated drugs by the intestinal microflora during anaerobic incubation in vitro. Xenobiotica, 4, 477- 487.
Smith, H. W., 1965. Observations on the flora o f the alimentary tract o f animals and factorsaffecting its composition. J. Pathol. Bacteriol., 89, 95-122.
Smith, R. V., 1978. Metabolism of drugs and other foreign compounds by intestinal microorganisms. World Rev. Nutr. Diet., 29, 60-76.
Song, Z. Y., Zhou, J. T., Wang, J., Yan, B. & Du, C. H., 2003. Decolorization of azo dyes by rhodobacter sphaeroides. Biotechnol. Lett., 25, 1815-8.
Stirrup, V., Ledingham, S. J., Thomas, M., Pye, G., Evans, D. P., 1990. Redox potential measurement in the gastrointestinal tract in man. Gut, 31, A 1171-A 1171.
Strong, H. A., Renwick, A. G., George, C. P., Liu, Y. P., Hill, M. J., 1987. The reduction o f sulphinpyrazone and sulindac by intestinal bacteria. Xenobiotica, 17, 685-696.
Sutton, S. C., 2004. Companion animal physiology and dosage form performance. Advanced Drug Delivery Reviews, 56, 1383-1398.
285

Svartz, N., 1988. Sulfasalazine; II. Some notes on the discovery and development of salazopyrin. Am. J. Gastroenterol., 83, 497-503.
Swanson, B. N. & Boppana, V. K., 1981. Measurement of sulindac and its metabolites in human plasma and urine by high-performance liquid chromatography. J. Chromatogr., 225, 123-30.
Takeno, S., Hirano, Y., Kitamura, A., Sakai, T., 1993. Comparative development toxicity and metabolism of nitrazepam in rats and mice. Toxicol. Appl. Pharmacol., 121,233-238.
Takeno, S., Sakai, T., 1990. The role o f gut flora metabolism in nitrazepam-induced teratogenicity in rats. Eur. J. Pharmacol., 183, 2439-2440.
Tannock, G. W., 1999. Analysis of the intestinal microflora: A renaissance. Antonie Van Leeuwenhoek, 76, 265-78.
Thomas, L. A., Veysey, M. J., French, G., Hylemon, P. B., Dowling, R. H., 2001. Bile acid metabolism by fresh human colonic contents: A comparison of caecal versus faecal samples. Gut, 49, 835-842.
Tiwari, S. B., Rajabi-Siahboomi, A. R., 2008. Extended-release oral drug delivery technologies: Monolithic matrix systems. Methods Mol Biol, 437, 217-43.
Tozaki, H., Emi, Y., Horisaka, E., Fujita, T., Yamamoto, A., Muranishi, S., 1995. Metabolism of peptide drugs by the microorganisms in rat cecal contents. Biol. Pharm. Bull., 18, 929-931.
Tozaki, H., Emi, Y., Horisaka, E., Fujita, T., Yamamoto, A., Muranishi, S., 1997. Degradation of insulin and calcitonin and their protection by various protease inhibitors in rat caecal contents: Implications in peptide delivery to the colon. J. Pharm. Pharmacol., 49, 164-168.
Tuleu, C., Andrieux, C., Boy, P. & Chaumeil, J. C., 1999. Gastrointestinal transit of pellets in rats: Effect of size and density. International Jomal of pharmaceutics, 180, 123-131.
Tuleu, C., Basit, A. W., Waddington, W. A., Ell, P. J., Newton, J. M., 2002. Colonic delivery of 4-aminosalicylic acid using amylose-ethylcellulose-coated hydroxypropylmethylcellulose capsules. Aliment. Phannacol. Ther., 16, 1771-1779.
Van den Mooter, G., Maris, B., Samyn, C., Augustijns, P., Kinget, R., 1997. Use of Azo Polymers for Colon-Specific Drug Delivery. J. Pharm. Sci., 86(12), 1321-1327.
Van Hogezand, R. A., 1984. Determination of sodium azodisalicylate,salazosulphapyridine, and their metabolites in serum, urine and faeces by high- performance liquid chromatography. J. Chromatogr., 305, 470-476.
Van Hogezand, R. A., Kennis, H. M., Van Schaik, A., Koopman, J. P., van Hees, P. A. M., 1992. Bacterial acétylation of 5-aminosalicylic acid in faecal suspensions cultured under aerobic and anaerobic conditions. Eur. J. Clin. Pharmacol., 43, 189- 192.
Varum, F. J., McConnell, E. L., Sousa, J. J., Veiga, F., Basit, A. W., 2008. Mucoadhesion and the gastrointestinal tract. Crit Rev Ther Drug Carrier Syst, 25, 207-58.
286

Vaughan, E. E., S chut, P., Heilig, H. G., Zoetendal, E. G., de Vos, W. M., Akkermans, A. D., 2000. A molecular view of the intestinal ecosystem. Curr Issues Intest Microbiol, 1, 1-12.
Venues, A., Kuijper, E. J., Guchelaar, H. J., Dankert, J., 2003. An in vitro study on the active conversion of flucytosine to fluorouracil by microorganisms in the human intestinal micro flora. Chemotherapy, 49, 17-23.
Wadworth, A. N., Fitton, A., 1991. Olsalazine - a review of its pharmacodynamic and pharmacokinetic properties, and therapeutic potential in inflammatory bowel disease. Drugs, 41, 647-664.
Walker, R., Gingell, R., & Murrells, D. P., 1971. Mechanisms of Azo Reduction by Streptococcus faecalis 1. Optimization of Assay Conditions. Xenobiotica, 1:3, 221- 229.
Wang, M., Ahme, S., Jeppsson, B., Molin, G., 2005. Comparison of bacterial diversity along the human intestinal tract by direct cloning and sequencing of 16S rRNA genes. PEMS Microbiol Ecol, 54, 219-31.
Washington, N., Washington, C. & Wilson, C. C., 2001. Physiological pharmaceutics: Barriers to drug absorption, London, Taylor and Francis.
Watanabe, K., Yamashita, S., Puruno, K., Kawasaki, H., Gomita, Y., 1995. Metabolism of omeprazole by gut flora in rats. J. Phami. Sci., 84, 516-517.
Watts, P. J. & Ilium, L., 1997. Colonic drug delivery. Drug Del. Ind. Pharm., 23, 893- 913.
Whitman, W. B., Coleman, D. C., Wiebe, W. J., 1998. Prokaryotes: The unseen majority. Proc. Natl. Acad. Sci. U. S. A., 95, 6578-83.
Wilding, 1. R., Davis, S. S., Bakhshaee, M., Stevens, H. N. E., Sparrow, R. A. & Brerman, J., 1992. Gastrointestinal transit and systemic absorption of captopril from a pulsed-release formulation. Pharm. Res., 9, 654-657.
Wilding, 1. R., 2001. The enterion capsule: A novel technology for undersanding the biopharmaceutical complexicity of new molecular entities (NMEs). Drug Del. Tech., 1, 8 - 11.
Williams, B. A., Bosch, M. W., Awati, A., Konstantinov, S. R., Smidt, H., Akkermans, A. D. L., Verstegen, M. W. A., Tamminga, S., 2005. In vitro assessment of gastrointestinal tract (git) fermentation in pigs: Fermentable substrates and microbial activity. Anim. Res., 54, 191-201.
Wilson, P. J., Basit, A. W., 2005. Exploiting gastrointestinal bacteria to target drugs to the colon: An in vitro study using amylose coated tablets. Int J Pharm, 300, 89-94.
Winter, J., Bokkenheuser, V. D., 1987. Bacterial metabolism of natural and synthetic sex hormones undergoing enterohepatic circulation. J. Steroid Biochem., 27, 1154- 1149.
Wistrom, J., Norrby, S. R., Myhre, E. B., Eriksson, S., Granstrom, G., Lagergren, L., Englund, G., Nord, C. E. & Svenungsson, B., 2001. Frequency of antibiotic- associated diarrhoea in 2462 antibiotic-treated hospitalized patients: A prospective study. J. Antimicrob. Chemother., 47, 43-50.
287

Wuhnnann, K., Mechsner K. & Kappeler, T., 1980. Investigation on Rate - Determining Factors in the Microbial Reduction of Azo Dyes. European J. Appl. Microbiol. Biotechnol., 9, 325-338.
Yang, L., 2008. Biorelevant dissolution testing of colon-specific delivery systems activated by colonic microflora. J. Controlled Release, 125, 77-86.
Yeung, P. K., Little, R., Jiang, Y., Buckley, S. J., Poliak, P. T., Kapoor, H. & Veldhuyzen van Zanten, S. J., 1998. A simple high performance liquidchromatography assay for simultaneous determination of omeprazole and metronidazole in human plasma and gastric fluid. J. Pharm. Biomed. Anal., 17, 1393- 8 .
Yoshisue, K., Masuda, H., Matsushima, E., Ikeda, K., Nagayama, S., Kawaguchi, Y., 2000. Tissue distribution and biotransformation of potassium oxonate after oral administration o f a novel antitumor agent (drug combination of tegafur, 5-chloro-2,4- dihydroxypyridine, and potassium oxonate) to rats. Drug Metab. Dispos., 28, 1162-7.
Zbaida, S., 1995. The Mechanism of Microsomal Azoreduction: Predictions Based on Electronic Aspects of Structure-Activity Relationships. Drug Metab. Rev., 27(3), 497-516.
288