ProQuest Dissertations - UCL Discovery
276
The effect of physiotherapy on respiratory function in ventilated children Thesis submitted for the Degree of Doctor of Philosophy University College London University of London 2001 Eleanor Main The Portex Unit of Anaesthesia, Intensive Therapy and Respiratory Medicine, Institute of Child Health and Physiotherapy Department, Great Ormond Street Hospital for Children NHS Trust London
-
Upload
khangminh22 -
Category
Documents
-
view
1 -
download
0
Transcript of ProQuest Dissertations - UCL Discovery
The effect of physiotherapy on respiratory
function in ventilated children
Thesis submitted for the
Degree of Doctor of Philosophy
University College London
University of London
2001
Eleanor Main
The Portex Unit of Anaesthesia, Intensive Therapy and Respiratory Medicine,
Institute of Child Health
and Physiotherapy Department, Great Ormond Street Hospital for Children NHS Trust
London

ProQuest Number: 10013944
All rights reserved
INFORMATION TO ALL USERS The quality of this reproduction is dependent upon the quality of the copy submitted.
In the unlikely event that the author did not send a complete manuscript and there are missing pages, these will be noted. Also, if material had to be removed,
a note will indicate the deletion.
uest.
ProQuest 10013944
Published by ProQuest LLC(2016). Copyright of the Dissertation is held by the Author.
All rights reserved.This work is protected against unauthorized copying under Title 17, United States Code.
Microform Edition © ProQuest LLC.
ProQuest LLC 789 East Eisenhower Parkway
P.O. Box 1346 Ann Arbor, Ml 48106-1346
Abstract
Background: Chest physiotherapy to clear secretions is routine in many
intensive care units, although there is little evidence to substantiate its use above routine
suction procedures. Until recently evaluation o f such treatments has been limited by a
lack o f objective measures o f respiratory function. This study aimed to evaluate the
performance o f a new respiratory function monitor in assessing the effects o f therapeutic
interventions such as physiotherapy. In addition the study aimed to establish whether
physiotherapy offered an advantage over routine suction procedures w ith respect to
selected indices o f respiratory function.
Subjects: Consent was obtained for 101 muscle relaxed, fully ventilated children
recruited to the study between April 1998 and March 2000. O f these, 56 had a primary
cardiac diagnosis and 45 had primary or secondary respiratory problems and all required
physiotherapy treatment.
Methodology and equipment: Validation and pilot studies were undertaken to
assess the accuracy o f the “ CO2 SMO Plus” . Subjects were randomly allocated to receive
either physiotherapy or nursing suction in the morning and the alternative intervention in
the afternoon. Arterial blood gases, tidal volume, respiratory mechanics, CO2 parameters
and deadspace values were recorded before and after both interventions. Group and
individual responses to treatment were evaluated and compared.
Results: Validation studies demonstrated that the “ CO2 SMO Plus” could
provide accurate and reproducible data, provided that tracheal tube leak was <20%.
Data from 89 children (tracheal tube leak <20%) were analysed, 81 o f whom had both
physiotherapy and nursing suction performed on the same day. Physiotherapy treatments
were significantly longer than nursing suction, involved greater saline instillations and
more suction catheters (p<0.005). Physiotherapy resulted in increased alveolar and
physiological deadspace (p<0.01) and reductions in Rp,, HCO3-, base excess, O2
saturation and PeC02 (p<0.05). Following nursing suction, V t e and were reduced
(p<0.05). There was considerable individual variation in response to both physiotherapy
and suction.
Conclusions: The “ CO2 SMO Plus” was accurate and useful fo r investigating the
effect o f clinical interventions in muscle relaxed patients, provided that tracheal tube
leak was <20%. The demonstrable differences between the physiological effects o f
physiotherapy and nursing suction could be attributable to the longer, more vigorous
physiotherapy treatments which included chest wall vibrations.

For my father, who started out on this project with me,
but then departed this world to do a higher degree o f his own, with love always.
Acknowledgments
M y enormous gratitude goes to the children and their families who were kind enough to
participate in this study despite their very difficult circumstances. Also to nursing and
physiotherapy staff for helping with patient recruitment, tolerating the intrusion o f
respiratory function measurements and helping with data collection.
I am indebted to Janet Stocks who single-handedly depleted national red pen stocks in
her enthusiasm to cover my thesis in ink (and without whose kindness, support and
expert guidance throughout this journey 1 would not have managed nearly as well). I am
also extremely grateful to Rosemary Castle, Catherine Dunne and Ammani Prasad for
helping me do Really-Boring-but-Essential-Stuff including some proof-reading and to
Rosemary Castle, Di Newham and Tim Peters for proof-reading all o f the thesis.
Thanks to Peter Milligan and Angie Wade for endeavouring to share the mysteries o f
statistics with me and to David Hatch for doing the same with “ deadspace” .
Also my gratitude to my family: to Callum and Daniel who were useless at proof reading
but spectacularly good at keeping my feet on the ground and grimy deposits on my
clothes and making me laugh, and to Colin for his unfailing enthusiasm for me to finish
this thesis.
“Beware o f the man who M/orks hard to learn something, learns it, and finds himself no
wiser than before. He is fid. I o f murderous resentment o f people who are ignorant
M/ithont having come by their ignorance the hard way. ”
Kurt Vonnegut, Jr. - Cat's Cradle
Project Supervisors:Professor Janet Stocks; Institute of Child Health, London
Professor Di Newham: Kings College, London
This project was granted approval by the Institute o f Child Health and Great Ormond
Street Hospital for Children NHS Trust Research Ethics Committee and written,
informed consent was obtained from parents o f infants and children who were recruited
into the study.
TABLE OF CONTENTS
TITLE PAGE..............................................................................................................................................1
ABSTRACT............................................................................................................................................... 2
ACKNOW LEDGMENTS......................................................................................................................... 3
CONTENTS................................................................................................................................................5
LIST OF ABBREVIATIONS AND DEFINITIONS............................................................................ 15
1. INTRODUCTION AND LITERATURE R EVIEW ......................................................................... 17
1.1 I n t r o d u c t io n .............................................................................................................................................................17
1.2 L it e r a t u r e r e v ie w ...................................................................................................................................................17
1.2.1 Adverse effects o f mechanical ventilation .......................................................................................19
1.2.2 The general effects o f physiotherapy or nursing .suction............................................................. 20
1.2.2.1 Sputum c lea ran ce ........................................................................................................................................................ 21
1.2.2.2 A rterial blood gases.................................................................................................................................................... 21
1.2.2.3 R espiratory m echanics (Crs and Rrs)..................................................................................................................... 22
1.2.2.4 Acute lobar a telectasis and chest rad iog raph .....................................................................................................23
1.2.2.5 Prevention and treatm ent o f pneum onia or common pulm onary com plications....................................25
1.2.2.6 D eadspace and ventilation / perfusion b a lan ce .................................................................................................26
1.2.2.7 Potentially adverse effects o f multi m odality trea tm en ts ................................................................................26
1.2.3 The efficacy o f individual components o f physiotherapy treatments in ventilated patients.. 28
1.2.3.1 Positioning and postural d ra in ag e ......................................................................................................................... 28
1.2.3.2 M anual hyperinflation, hyperventilation or hyperoxygenation ...................................................................29
1.2.3.3 C hest percussion (clapping) and v ib ratio n s....................................................................................................... 31
1.2.3.4 Instillation o f sa lin e .................................................................................................................................................... 32
1.2.3.5 Tracheal su c tio n ...........................................................................................................................................................32
1.2.4 Evidence for physiotherapy treatments being better than nursing suction alone.....................33
1.2.5 Evidence to support the u.se o f respiratory function testing in the paediatric intensive care
unit.....................................................................................................................................................................35
1.2.5.1 Tidal breathing p a ram ete rs ...................................................................................................................................... 36
1.2.5.2 Respiratory m echanics............................................................................................................................................... 38
1.2.5.2.1 R espiratory C o m p lian ce ................................................................................................................................. 39
1.2.5.2.2 R espiratory R e s is tan c e ................................................................................................................................... 40
1.2.5.3 CO 2 M onitoring ............................................................................................................................................................40
1.2.5.4 D eadspace m easu rem en ts .........................................................................................................................................42
1.2.5.5 Blood g a se s ....................................................................................................................................................................43
2. OUTCOME MEASURES: THEORETICAL BACKGROUND.....................................................45
2.1 V e n t il a t o r y p a r a m e t e r s ; F l o w , r e s p ir a to r y r a t e , pressures a n d v o l u m e s ...........................46
2.2 Re s p ir a to r y m e c h a n ic s ........................................................................................................................................48
2.2.1 Respiratory compliance...................................................................................................................... 51
2.2.2 Respiratory Resistance........................................................................................................................52
2.3 CÛ2 MONITORING....................................................................................................................................................... 53
2.3.1 ETCO 2 .................................................................................................................................................... 53
2 J .2 I /C O ;......................................................................................................................................................................5 ^
......................................................................................................................... J'/
2.4 R e s p ir a to r y deadspace a n d s in g le b r e a th C O ; (S B C O 2 ) a n a ly s is ............................................... 55
2.4.1 Apparatus deadspace...........................................................................................................................55
2.4.2 Anatomical deadspace (VDau-way)......................................................................................................56
2.4.3 Alveolar deadspace (VDaiy)................................................................................................................ 58
2.4.4 Physiological deadspace (VDphyJ.....................................................................................................59
2.5 A r t e r ia l BLOOD GASES............................................................................................................................................60
2.5.1 pH and PaC02.......................................................................................................................................61
2.5.2 PaO 2 ............................................... 62
2 J . j / / C 0 r ................................................................................................................................................................... 62
2 .5.4 Ba.se Exce.ss........................................................................................................................................... 63
2 . J . J . % ....................................................................................................................................................................... 62
2.5.6 Factors affecting re.su Its ..................................................................................................................... 63
3. VALIDATION OF EQUIPM ENT..................................................................................................... 65
3.1 V a l id a t io n o f t h e “ C O 2 SM O P lu s ” .............................................................................................................65
3.1.1 Accuracy o f volume (flow) recordings..............................................................................................65
3.1.1.1 M ethods:.........................................................................................................................................................................66
3.1.1.2 R esu lts .............................................................................................................................................................................67
3.1.1.2.1 Neonatal flow se n so r....................................................................................................................................... 67
3.1.1.2.2 Paediatric flow s e n so r .....................................................................................................................................68
3.1.1.2.3 A dult flow se n so r ..............................................................................................................................................69
3.1.2 Accuracy o f pressure recordings...................................................................................................... 70
3.1.3 Pressure/flow relationships with all .sen.sors....................................................................................71
3.1.3.1 Neonatal sen so r............................................................................................................................................................ 72
3.1.3.2 Paediatric se n so r ......................................................................................................................................................... 73
3.1.3.3 A dult sen so r...................................................................................................................................................................75
3.1.4 Accuracy o f resistance calculations..................................................................................................77
3.1.5 Accuracy o f compliance calculations............................................................................................... 78
3.1.5.1 M e th o d ............................................................................................................................................................................78
3.1.5.2 R e su lts .............................................................................................................................................................................79
3.1 .6Accuracy o/"CO; recordings..............................................................................................................81
3.1.6.1 M e th o d ............................................................................................................................................................................81
3.1.6.2 R esu lts .............................................................................................................................................................................81
3.1.7 Deadspace measurements...................................................................................................................82
4. STUDY DESIGN AND M ETHO DO LO G Y..................................................................................... 84
4.1 H y p o theses a n d a im s o f t h e s t u d y ................................................................................................................. 84
4.2 St u d y d e s ig n a n d p r o t o c o l ............................................................................................................................... 85
4.2.1 Study population and inclu.sion criteria .......................................................................................... 86
4.2.2 Therapeutic interventions...................................................................................................................89
4.2.3 Outcomes............................................................................................................................................... 90
4.2.4 Measurement too ls ...............................................................................................................................92
4.3 D a t a m a n a g e m e n t a n d s t a t is t ic a l m e t h o d s .............................................................................................92
4.3.1 Data managem ent................................................................................................................................93
4.3.2 Statistical m ethods ...............................................................................................................................93
5. P ILO T AND IN-VIVO VALIDATION STUDIES............................................................................ 96
5.1 P il o t St u d y .................................................................................................................................................................96
5.1.1 Introduction .......................................................................................................................................... 96
5.1.2 Levels o f ventilatory .support............................................................................................................. 96
5.1.3 Validation o f measurement interval:................................................................................................ 97
5.1.3.1 M e tlio d ........................................................................................................................................................... 98
5.1.3.2 Results............................................................................................................................................................ 98
5.2 IN-VIVO STUDIES........................................................................................................................................................ 102
5.2.1 Tracheal lube leak.................................................................................................................... 103
5 .2 . 1.1 Methods........................................................................................................................................................ 104
5.2.1.2 Results.......................................................................................................................................................... 104
5.2.1.3 Discussion.....................................................................................................................................................109
5.2.2 Normal variability o f parameters....................................................................................................110
5.2.2.1 Effect o f discoiuiecting tlie flow sensor.................................................................................................. 110
5.2.2.1.1 M ethod ................................................................................................................................................110
5.2.2.1.2 Results................................................................................................................................................. 111
5.2.2.2 Establishing potential perimeters for clinical significance..................................................................113
5.2.2.2.1 M e thod ................................................................................................................................................113
5.2.2.2.2 Results................................................................................................................................................. 114
5.2.3 Deadspace mea.surements.................................................................................................................115
6. RESULTS........................................................................................................................................... 117
6.1 St u d y p o p u la t io n d e m o g r a p h ic s ...................................................................................................................117
6.1.1 Tracheal tube leak..............................................................................................................................121
6.1.2 Ranges o f peak expiratory floM> and Vje In I he .study population..............................................122
6.2 Ra n d o m is a t io n .......................................................................................................................................................123
6.3 Ph y s io t h e r a i’ y a n d n u r s in g t r e a t m e n t d e t a il s .................................................................................... 124
6.3.1 Sputum yield and adver.se events ................................................................................................. 126
6.4 V e n t il a t io n paral ieter s d u r in g d a t a c o l l e c t io n in te r v a l s ......................................................... 127
6.5 T h e effect of p h y s io t h e r a p y a n d n u r s in g sue t io n ...............................................................................128

6.5.1 Tracheal tube leak..............................................................................................................................132
6.5.2 Tidal volum e .......................................................................................................................................133
6.5.3 Compliance......................................................................................................................................... 133
6.5.4 Resistance ............................................................................................................................................134
6.5.5 CO2 Values.......................................................................................................................................... 135
6.5.6 Deadspace calculations.................................................................................................................... 136
6.5.7 Arterial Blood Gases.........................................................................................................................137
6.5.8 Differences between nursing and physiotherapy treatments......................................................137
6.6 I n d iv id u a l r e s u lts .............................................................................................................................................139
6.6.1 Tidal volum e .......................................................................................................................................140
6.6.2 Resistance............................................................................................................................................141
6.6.3 Compliance......................................................................................................................................... 142
6.6.4 CO2 va lues .......................................................................................................................................... 143
6.6.5 Deadspace calculations.................................................................................................................... 143
6.6.6 Arterial Blood Ga.ses.........................................................................................................................145
6.6.7 Individual patients ’ responses to physiotherapy.......................................................................... 148
7. D IS C U S S IO N .................................................................................................................................................................. 152
7.1 Is THE “ C O 2 S M O P lu s ” a u s e fu l c l i n i c a l t o o l f o r e v a lu a t in g t h e e f fe c ts o f th e r a p e u t ic
INTERVENTIONS?.............................................................................................................................................................. 152
7 .1.1 Evaluation o f methods and equipment...........................................................................................153
7.1.1.1 Software problem s with “C O 2SM O P lu s” ........................................................................................................155
7.1.1.2 Phase d e la y ..................................................................................................................................................................156
7.1.1.3 PaCOz and PeCO ] calib ra tion ............................................................................................................................... 156
7.1.1.4 Early practical lim itations o f using the “CO î SM O P lus” to m onito r respiratory function in
ventilated infants.......................................................................................................................................................................157
7.1.1.5 Sum m ary.......................................................................................................................................................................158
7.2 D oes r e s p ir a to r y p h y s io th e ra p y in t h e p a e d ia t r ic in te n s iv e c a r e u n i t im p ro v e
RESPIRATORY FUNCTION ? ..............................................................................................................................................159
7.2.1 No .significant change in Vjor C-.s- ofter physiotherapy ............................................................. 160
7.2.2 Reduction in fi,s after physiotherapy.............................................................................................. 161
7.2.3 Changes in CO2 parameters and metabolic dem and .................................................................. 163
7.2.4 Significant increa.ses in VDaiv and VD^hys after physiotherapy.................................................. 164
7.2.5 Changes in arterial blood gas values.............................................................................................172
7.2.6 Monitoring respiratory function during treatm ent......................................................................173
7.2.7 Within-subject responses to treatment............................................................................................174
7.2.8 Cross contamination between age, intensive care units, diagnosis and ventilation modality. 176
7.2.9 Avoiding the harmful effects o f physiotherapy .............................................................................7 7 7
7.2.10 Further research in paediatric physiotherapy........................................................................... 179
7.3 Is RESPIRATORY PHYSIOTHERAPY MORE EFFECTIVE THAN NURSING SUCTION AT REMOVING
SECRETIONS AND IMPROVING RESPIRATORY FUNCTION IN VENTILATED CHILDREN?................................. 181
7.3.1 Changes in Vj and C,s....................................................................................................................... J81
7.3.2 Changes in /?„...................................................................................................................................... 182
7.3.3 Change in VDphy., and VDah..............................................................................................................78^
7.3.4 Changes in bloodga.ses.....................................................................................................................183
7.3.5 Summary .............................................................................................................................................. 183
7.4 L im it a t io n s o f r e s p ir a t o r y f u n c t io n m e a s u r e m e n t s a n d s t u d y d e s ig n in v e n t il a t e d
CHILDREN ..............................................................................................................................................................186
7.4.1 Physiological lung models................................................................................................................ 186
7.4.2 Mode o f ventilation ............................................................................................................................187
7.4.3 Changes in respiratory rate and volumes...................................................................................... 187
7.4.4 Mea.surements ofR,-.s and influence o f the tracheal tube ............................................................ 188
7.4.5 Sputum yield .........................................................................................................................................189
7.4.6 Clinical significance...........................................................................................................................191
7.4.7 Immediate outcomes...........................................................................................................................191
7.4.8 Study population size and .sample................................................................................................... 193
7.4.9 Ob.servation effect and heterogeneity between .staff populations and therapy procedures. 198
7.5 W h a t a r e t h e fu id r e d ir e c t io n s ? .......................................................................................................199
7.6 O v e r a l l s u m m a r y ............................................................................................................................................................. 201
8. PUBLICATIONS RELATED TO THE CURRENT STUDY........................................................202
8.1 St e r n a l CLOSURE PAPER, C r it ic a l C a r e M e d ic in e , 2001 ........................................................................... 202
8.2 T r a c h e a l LEAK PAPER, I n t e n s iv e C a r e M e d ic in e , 2 0 0 1 .................................................................207
9. REFERENCE LIST............................................................................................................................228
10. APPENDIX....................................................................................................................................... 266
10.1 P a r e n t s I n f o r m a t io n Sh e e t .................................................................................................................................... 266
10.2 E q u ip m e n t v a l id a t io n .................................................................................................................................................268
10.2.1.1 W ithin subject v a ria b ility ..........................................................................................................272
10.3 St u d y p r o t o c o l .............................................................................................................................................................. 273
List of Illustrations
Figure 1-1 : Flow volume curves in a) a patient with normal lungs and b) a child with
asthma and expiratory flow lim itation.............................................................................38
Figure 1-2: Comparison between SBCO2 curve in a) a patient w ith normal lungs and
b) a child with severe asthma........................................................................................... 41
Figure 2-1: The “ CO2 SMO Plus” respiratory monitor with flow sensor and infra-red
capnography device...........................................................................................................45
Figure 2-2: Flow, pressure and volume traces plotted against tim e ...........................47
Figure 2-3: Single compartment lung m odel................................................................. 50
Figure 2-4: Respiratory deadspace................................................................................. 55
Figure 2-5: Three Phases o f Single Breath CO2 Curve................................................ 57
Figure 2-6: Volumetric Capnography.............................................................................58
Figure 3-1 : Variable flow through an adult sensor with a 300mL syringe..................66
Figure 3-2: Accuracy o f volume recordings with neonatal sensor..............................67
Figure 3-3: Accuracy o f volume recordings with paediatric sensor........................... 68
Figure 3-4: Accuracy o f volume recordings with adult sensor.................................... 69
Figure 3-5: Volume accuracy o f lOOmL applied signal over range o f flows and
measurement conditions................................................................................................... 70
Figure 3-6: Percentage error and CV o f measured pressure against manometer
pressure.............................................................................................................................. 71
Figure 3-7: Pressure-flow relationships o f the neonatal sensor w ith and without
3.0mm tracheal tube attached.......................................................................................... 72
Figure 3-8: Apparatus resistance-flow relationships in the neonatal flow sensor.... 73
Figure 3-9: Pressure-flow relationships o f the paediatric flow sensor with various
tracheal tubes attached..................................................................................................... 74
Figure 3-10: Resistance-flow relationships o f the paediatric flow sensor with
different tracheal tube attachments................................................................................. 74
Figure 3-11: Pressure-flow relationships o f the adult flow sensor w ith different
tracheal tube attachments.................................................................................................75
Figure 3-12: Resistance flow relationships o f the adult flow sensor w ith different
tracheal tubes attached......................................................................................................76
10
Figure 3-13: Linear expression (from the equation o f motion) o f Cm and Rrs from
several breaths in one individual......................................................................................78
Figure 3-14: Example o f Crs measurements with lung model settings o f 0.5 and 1.0
mL/cmHiO during changes o f PIP and respiratory rate............................................... 79
Figure 3-15: Influence o f PIP and respiratory rate on measured compliance, w ith
lung model settings at 0.5, 1.0 and 3.0 mL/cmH20...................................................... 80
Figure 4-1 : Four year old boy with “ CO2 SMO Plus” flow sensor attached between
tracheal tube and ventilator tubing.................................................................................. 86
Figure 4-2: Physiotherapist performing manual hyperinflation w ith chest wall
vibrations during expiration..............................................................................................90
Figure 5-1 : Examples o f trended data before and after treatment in a spontaneously
breathing and a mechanically ventilated child................................................................ 97
Figure 5-2: Variability o f V it. /kg and tracheal tube leak in 10 individuals during
quiet clinical periods.........................................................................................................98
Figure 5-3: Comparison o f mean values for different measurement intervals against
45 minute mean..................................................................................................................99
Figure 5-4: Variability o f C,.s and R,s during quiet clinical periods.............................. 99
Figure 5-5: R,s and C,s data for different time intervals compared with a 45 minute
in terva l..............................................................................................................................100
Figure 5-6: Variability o f VCO 2 and ETCO 2 during quiet clinical periods 101
Figure 5-7: Variability o f CO2 parameters, comparing different data collection
intervals to a 45 minute in terva l...................................................................................101
Figure 5-8: The relationship between V t and change in tracheal tube leak ............ 105
Figure 5-9: The relationship between tracheal tube leak and V t e ............................ 106
Figure 5-10 The relationship between tracheal tube leak and Crs and R rs .............106
Figure 5-11 : Flow-volume and pressur-volume loops before tracheal tube change in
a 7 week old infant...........................................................................................................107
Figure 5-12: Flow-volume and pressure-volume loops after tracheal tube change in
a 7 week old infant...........................................................................................................107
Figure 5-13: Influence o f tracheal tube change on V te, in a 7 week old infant.......108
Figure 5-14: Influence o f tracheal tube change on Crs and Rrs in a 7 week old infant 108
Figure 5-15: Median and interquartile range o f C , s at different tracheal tube leaks 109
11
Figure 5-16: Difference (after - before intervention) in selected parameters in 10
patients after disconnection, physiotherapy or nursing suction.................................112
Figure 6-1 : Ages o f study patients.................................................................................117
Figure 6-2: Body weight o f children in study...............................................................118
Figure 6-3: Diagnostic groups o f children in study..................................................... 119
Figure 6-4: Ventilation mode for different age groups and diagnoses..................... 119
Figure 6-5: Chart o f patients receiving physiotherapy treatments............................ 120
Figure 6-6: Chart o f patients receiving nursing suction............................................. 120
Figure 6-7: Chart o f patients receiving both physiotherapy and nursing suction ...120
Figure 6-8: Magnitude o f tracheal tube leaks in study population........................... 121
Figure 6-9: Flow and volume range in the study population..................................... 123
Figure 6-10: Duration o f physiotherapy and nursing treatments............................... 124
Figure 6-11 : Suction catheters used per treatment by physiotherapists and nurses. 125
Figure 6-12: Saline instilled per treatment by physiotherapists and nurses..............125
Figure 6-13: Number o f chest wall vibrations performed during physiotherapy
treatment........................................................................................................................... 126
Figure 6-14: The difference between C,,s as a) absolute and b) weight corrected
values against age.............................................................................................................133
Figure 6-15: The influence o f a) age and b) weight on R, values in the study
population........................................................................................................................ 134
Figure 6-16: Change in R,s relative to reported sputum yield after physiotherapy. 135
Figure 6-17: The influence o f age on a) VD;,i, vay and b) VDaiv..................................137
Figure 6-18: Significant individual changes in V te following treatment................... 140
Figure 6-19: Significant individual changes in R,s after treatment.............................141
Figure 6-20: Significant individual changes in C, after treatment.............................142
Figure 6-21: Significant individual changes in PeC02 after treatment......................143
Figure 6-22: Relative changes in VDpi,ys........................................................................144
Figure 6-23: Individual changes in HCO?- after treatment....................................... 146
Figure 6-24: Individual changes in base excess after treatment.................................147
Figure 6-25: Individual changes in O2 saturation........................................................147
Figure 6-26: Relationship between change in PaC02 and V t e after treatment 151
Figure 7-1: Alveolar deadspace, defined by the area between VDairway, V te and the
gradient between PaC02 and PeC02............................................................................ 165
12

Figure 7-2: SBCO2 before and after physiotherapy..................................................167
List of Tables
Table 3-1: Rapp and Rtt through neonatal flow sensor.......................................73
Table 3-2: Rapp and Rtt through paediatric flow sensor.....................................75
Table 3-3: Rapp and Rtt through adult sensor at variable flow s........................ 76
Table 3-4: Mean C, calculations by the “ CO2 SMO Plus” compared with set Crs on
neonatal lung simulator (variable ventilation settings)..................................................81
Table 3-5: Accuracy o f CO2 measurements...................................................................82
Table 5-1: Effect o f disconnecting the flow sensor compared with physiotherapy
treatment and nursing suction.........................................................................................I l l
Table 5-2: Repeatability o f measurements in 33 individuals in the absence o f any
interventions.....................................................................................................................114
Table 6-1 : Details o f tracheal tube leak during data collection in 11 patients
excluded from analysis....................................................................................................122
Table 6-2: Differences between paired physiotherapy (p) and nursing suction (n)
treatments..........................................................................................................................124
Table 6-3: Recordings o f ventilatory parameters during measurement periods 127
Table 6-4: Effect o f physiotherapy on respiratory function .......................................130
Table 6-5: Effect o f nursing suction on respiratory function .................................... 131
Table 6-6: Comparing nursing suction with physiotherapy (paired data).............. 138
Table 6-7: Demographic data on individuals with significant changes in V te, C^ or
Rn,....................................................................................................................................... 148
Table 6-8: Examples o f individuals with clinically significant improvements after
physiotherapy...................................................................................................................149
Table 6-9: Examples o f patients with clinically significant deterioration following
physiotherapy...................................................................................................................150
Table 7-1 : Value o f F depends on power required to detect a difference with
specified precision (p<0.05)...........................................................................................194
Table 7-2: Numbers o f subjects needed to detect a 10% change (20% for R^j at 5%
significance with a power o f 80%, 90%, 95% and 99% ..............................................194
13
Table 7-3: Numbers o f subjects needed to detect 0.5 o f a standard deviation change
between nursing suction and physiotherapy at 5% significance w ith a power o f 80%,
90%, 95% and 99%..............................................................................................195
Table 10-1: Accuracy o f volumes recorded by “ CO2 SMO Plus” using the neonatal
flow sensor....................................................................................................................... 268
Table 10-2: Accuracy o f volumes recorded by “ CO2 SMO Plus” using the paediatric
flow sensor....................................................................................................................... 269
Table 10-3: Accuracy o f volumes recorded by “ CO2 SMO Plus” using the adult flow
sensor................................................................................................................................ 270
Table 10-4: Pressure recordings by “ CO2 SMO Plus” compared to D ig itron ..........271
Table 10-5: Within subject variability o f parameters in 33 individuals over a 30
minute period................................................................................................................... 272
List of Equations
Equation 2-1...................................................................................................................... 46
Equation 2-2.......................................................................................................................50
Equation 2-3.......................................................................................................................52
Equation 2-4:..................................................................................................................... 52
Equation 2-5:..................................................................................................................... 53
Equation 2-6:..................................................................................................................... 59
Equation 2-7:..................................................................................................................... 59
Equation 2-8:..................................................................................................................... 60
Equation 2-9:..................................................................................................................... 60
Equation 2-10:...................................................................................................................60
Equation 2-11 : ...................................................................................................................60
Equation 2-12.................................................................................................................... 63
Equation 2-13.................................................................................................................... 63
Equation 3-1...................................................................................................................... 77
Equation 3-2...................................................................................................................... 77
Equation 5-1.....................................................................................................................104
Equation 7-1 :................................................................................................................... 193
14
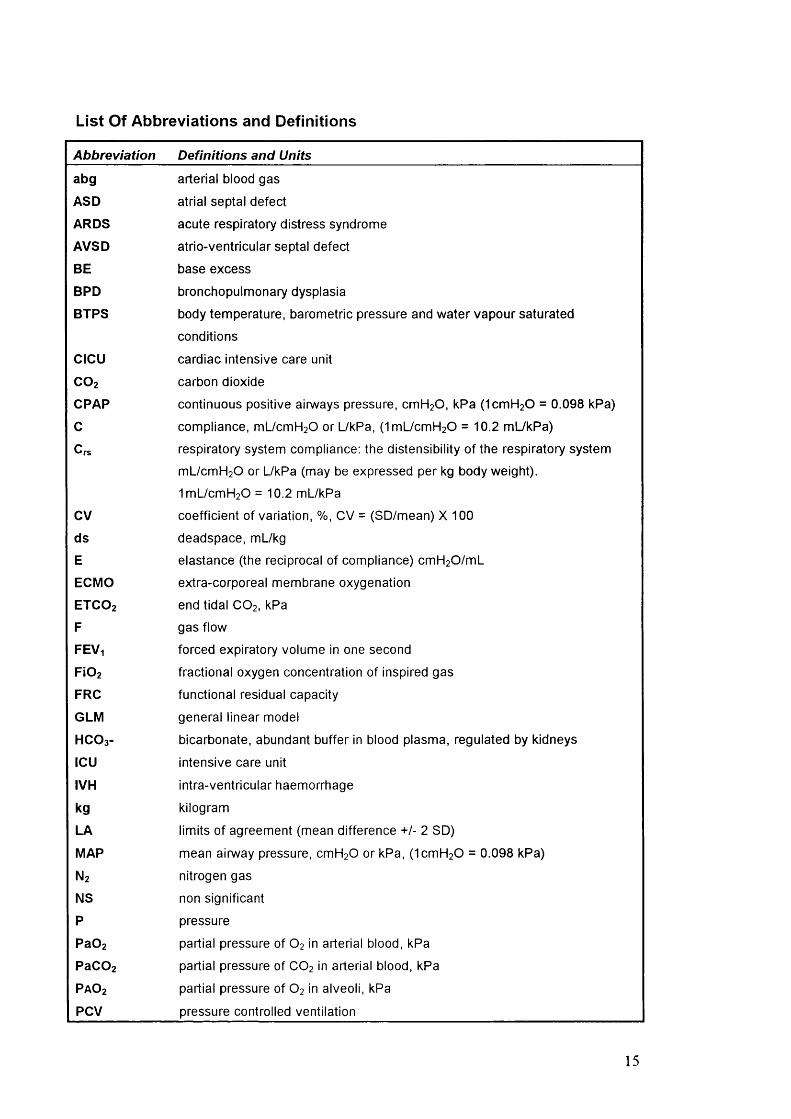
List Of Abbreviations and Definitions
Abbreviation Definitions and Units
abg
ASD
ARDS
AVSD
BE
BPD
BTPS
CICU
CO2
CPAP
C
Crs
CV
ds
E
ECMO
ETCO2
F
FEVi
Fi02FRO
GLM
HCO3-
ICU
IVH
kgLA
MAP
N2
NS
P
Pa02
PaC02PAO2
PCV
arterial blood gas
atrial septal defect
acute respiratory distress syndrome
atrio-ventricular septal defect
base excess
bronchopulmonary dysplasia
body temperature, barometric pressure and water vapour saturated
conditions
cardiac intensive care unit
carbon dioxide
continuous positive airways pressure, cmH20, kPa (1cmH20 = 0.098 kPa)
compliance, mL/cmH20 or L/kPa, (1mL/cmH20 = 10.2 mUkPa)
respiratory system compliance: the distensibility of the respiratory system
mL/cmH20 or L/kPa (may be expressed per kg body weight).
1mL/cmH20 = 10.2 mL/kPa
coefficient of variation, %, CV = (SD/mean) X 100
deadspace, mL/kg
elastance (the reciprocal of compliance) cmH2 0 /mL
extra-corporeal membrane oxygenation
end tidal CO2 , kPa
gas flow
forced expiratory volume in one second
fractional oxygen concentration of inspired gas
functional residual capacity
general linear model
bicarbonate, abundant buffer in blood plasma, regulated by kidneys
intensive care unit
intra-ventricular haemorrhage
kilogram
limits of agreement (mean difference +/- 2 SD)
mean airway pressure, cmhi20 or kPa, (1cmH20 = 0.098 kPa)
nitrogen gas
non significant
pressure
partial pressure of O2 in arterial blood, kPa
partial pressure of CO2 in arterial blood, kPa
partial pressure of O2 in alveoli, kPa
pressure controlled ventilation
15
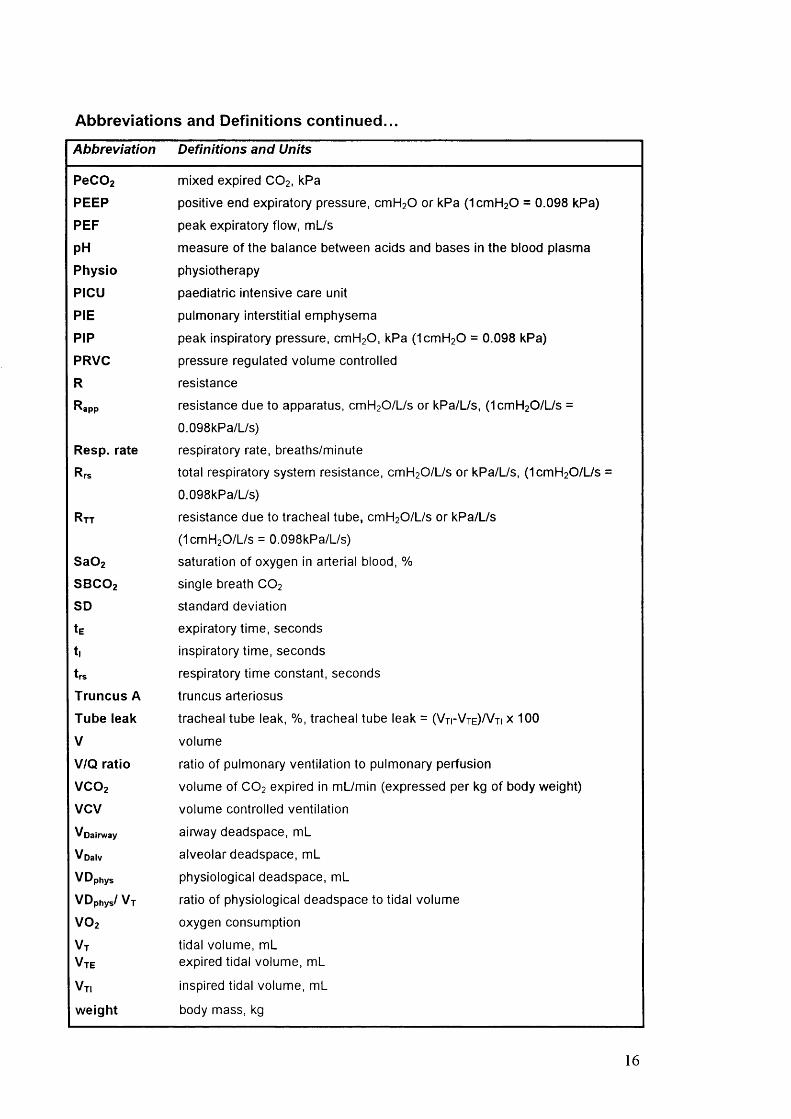
Abbreviations and Definitions continued...
Abbreviation Definitions and Units
PeCOzPEEP
PEF
p H
Physio
PICU
PIE
PIP
PRVC
R
Rapp
Resp. rate
Rtt
Sa02
SBCO2SD
tEt |
t rs
Truncus A
Tube leak
V
V/Q ratio
VCO2VCV
Voairway
Voalv
VDphysVDphys/ Vt
VO2
Vt
Vte
Vti
weight
mixed expired CO2 . kPa
positive end expiratory pressure, cmH20 or kPa (1cmH20 = 0.098 kPa)
peak expiratory flow, mL/s
measure of the balance between acids and bases in the blood plasma
physiotherapy
paediatric intensive care unit
pulmonary interstitial emphysema
peak inspiratory pressure, cmH20, kPa (1cmH20 = 0.098 kPa)
pressure regulated volume controlled
resistance
resistance due to apparatus, cmH20/L/s or kPa/L/s, (1cmH20/L/s =
0.098kPa/L/s)
respiratory rate, breaths/minute
total respiratory system resistance, cmH20/L/s or kPa/L/s, (1cmH20/l_/s
0.098kPa/L/s)
resistance due to tracheal tube, cmH20/L/s or kPa/L/s
(1cmH20/L/s = 0.098kPa/L/s)
saturation of oxygen in arterial blood, %
single breath CO2
standard deviation
expiratory time, seconds
inspiratory time, seconds
respiratory time constant, seconds
truncus arteriosus
tracheal tube leak, %, tracheal tube leak = ( V t i- V t e ) / V ti x 100
volume
ratio of pulmonary ventilation to pulmonary perfusion
volume of CO2 expired in mL/min (expressed per kg of body weight)
volume controlled ventilation
airway deadspace, mL
alveolar deadspace, mL
physiological deadspace, mL
ratio of physiological deadspace to tidal volume
oxygen consumption
tidal volume, mL expired tidal volume, mL
inspired tidal volume, mL
body mass, kg
16
1. Introduction and literature review
1.1 Introduction
Chest physiotherapy and tracheal suction to clear pulmonary secretions from the
ventilated child are routine in many intensive care units. Historically, studies to assess
the clinical effectiveness o f such treatments have been limited by the lack o f objective,
non-invasive measures o f respiratory function. There is little firm evidence to
substantiate the use o f physiotherapy in ventilated children or to recommend it above the
suction techniques used by nursing staff. This study aimed to use a new portable non-
invasive respiratory monitor (“ CO2 SMO Plus” , Novametrix Medical Systems Inc.
version 3.0, CT, USA) to measure respiratory function before and after physiotherapy
and nursing suction procedures. The principal aims o f the study were to assess the
effects o f respiratory physiotherapy treatments in ventilated children and to establish
whether such treatments offer a significant advantage over routine suction used by
nursing staff in the intensive care unit. In addition, considerable efforts were made to
validate the “ CO2 SMO Plus” respiratory monitor and to evaluate its clinical usefulness
in objectively assessing therapeutic interventions in the intensive care unit.
The first three chapters o f this thesis include a literature review, the theoretical
background pertaining to respiratory parameters o f interest in this project and how they
were measured or calculated by the monitor and a description o f the validation work
undertaken to evaluate the performance o f the “ CO2 SMO Plus” .
The latter four chapters include a description o f the study design and methodology used
in the project, a report o f the in-vivo and pilot studies performed, results o f the study
and a discussion o f the findings with reference to other publications in relevant research
fields.
Finally two publications which issued directly or indirectly from the work done in this
project are included preceding the Appendix and reference list.
1.2 Literature review
Mechanically ventilated patients are inefficient at clearing mucus from their own
airways. The tracheal tube covers normal ciliated tracheal tissue and prevents normal
movement o f mucus towards the epiglottis and oesophagus. In addition the “ foreign”
tracheal tube moves against and irritates the soft membranes o f the tracheal walls,
17
thereby stimulating further production o f mucus. Most mechanically ventilated infants
are well sedated and may be pharmacologically paralysed, so that the ability to cough
effectively is either seriously compromised or absent. Accumulation o f mucus in the
airways because o f increased production or decreased clearance due to defects in the
ciliary clearance apparatus w ill contribute to the morbidity o f airway diseases by
predisposing patients to respiratory infections, airflow obstruction and discomfort.
There is a significant association between chronic production o f mucus and an increased
risk o f mortality (Kim, 1997). The management o f mucus hypersecretion can be
undertaken either by improving clearance by physical methods or by pharmacological
methods (Marriott, 1981; Kim, 1997). Mucus hypersecretion may not be the primary
problem in many ventilated children, but the presence o f the tracheal tube, as well as
respiratory pathology and sedation or muscle relaxation, w ill significantly reduce normal
mucociliary clearance, thereby creating a vulnerability to further disease. Regular suction
(performed by nursing staff or physiotherapists) combined with a number o f other
modalities has become an important part o f reducing respiratory complications
associated with mechanical ventilation.
Physiotherapy techniques in intensive care have developed over the last two decades but
there remains little conclusive evidence to support or guide airway clearance techniques
in ventilated children. Current practice is often based on locally established routines,
experience, clinical intuition based on anatomical and physiological knowledge and some
wisdom from eclectic and often conflicting publications. There is also wide variability in
the role o f the physiotherapist in intensive care units depending on the country, training,
local traditions, staffing levels and expertise. There is little, i f any, evidence to
recommend dynamic physiotherapy airway clearance techniques above the use o f routine
airway clearance techniques employed by nursing staff in paediatric intensive care units
(Stiller, 2000).
The lack o f research evidence to support physiotherapy practice in intensive care has
also been in part due to the difficulty in identifying appropriate and sensitive outcome
parameters. Until recently, equipment for measuring lung function in the intensive care
unit has been too cumbersome, invasive, inaccurate or expensive to use routinely.
However new developments in ventilator design and respiratory monitors have made
18
continuous and non-invasive measures o f various respiratory parameters possible. Some
o f these have the potential to be useful in evaluating the efficacy o f airway clearance
techniques.
1.2.1 Adverse effects of mechanical ventilation
The various cardio-respiratory complications associated with mechanical ventilation
have been extensively studied. They include atelectasis, barotrauma, pulmonary oedema,
tracheal tube obstruction, compromised cardiac output and pulmonary blood flow,
hypoxia, hypo- or hyper-capnia and nosocomial pneumonia (Rivera and Tibballs, 1992;
Clough et al. 1994; Meade et al. 1997; McGuire et al. 1997; Gannon et al. 1998;
Dreyfuss and Saumon, 1998; Stewart et al. 1998). Mechanical ventilation in preterm
infants has been associated with retinopathy o f prematurity, intraventricular
haemorrhage, and bronchopulmonary dysplasia (Greenough, 1999). It has also been
shown to reduce postnatal alveolar multiplication and increase the amount o f bronchial
smooth muscle and submucosal glands (Greenough, 1992; Thompson et al. 1992). The
pathology that precipitated the need for assisted ventilation may be exacerbated by the
high tidal volumes or airway pressures needed to obtain or maintain optimal gas
exchange (Parker et al. 1990; Dreyfuss and Saumon, 1993; Rosen et al. 1993).
There are few controlled paediatric studies comparing the various modes o f ventilation
in terms o f patient outcomes. Currently, the choice o f ventilator mode depends largely
on the equipment available, the patient's disease state, and the clinician’ s preference
based on personal experience (MacDonald and Johnson, 1996). Survival o f small infants
has improved significantly in recent years and the focus is now on reducing the incidence
o f ventilation-induced lung injury and other complications. This involves improved
understanding o f conditions producing respiratory failure, the response o f the
respiratory system to various therapies and the effects o f changes in ventilator strategies
(Stenson et al. 1998).
The rationale for physiotherapy assumes that removal o f secretions from the airways w ill
improve delivery o f gas from the ventilator, help to resolve atelectasis and improve
respiratory function. The improvement in clinical status may facilitate early weaning
19

from ventilation and reduce lung damage associated with mechanical ventilation.
Preterm infants are particularly susceptible to lung damage from mechanical ventilation
and should be weaned as soon as possible (Hislop et al. 1987; Haworth et al. 1989).
1.2.2 The general effects of physiotherapy or nursing suction
There are a large number o f publications which are relevant to the efficacy o f
physiotherapy or nursing suction procedures, but many o f them have significant flaws in
design or execution and results have to be interpreted with caution. Published reviews
examining the efficacy o f respiratory physiotherapy have been frustrated by studies o f
poor quality or with small study numbers, multiple treatment modalities and inter and
intra-professional differences in performing techniques, multiple patient groups with
different diagnoses, and multiple outcomes (Hussey, 1992). The lack o f consensus and
conflicting results in the literature regarding optimal methods o f airway clearance
diminish confidence in the interpretation o f research findings and extrapolation o f adult
studies or those in non-ventilated or selective paediatric populations to the general
paediatric population. Despite quite extensive bibliographies, reviews on the efficacy o f
respiratory physiotherapy tend to arrive at similar conclusions; that the evidence is
limited and that there is an urgent need for further research to be performed (Stiller,
2000). Sometimes airway clearance procedures are performed by nurses but referred to
as "chest physiotherapy" (Dulock, 1991; Lewis et al. 1992). Unfortunately these
publications have the potential to reflect inaccurately upon the practices o f
physiotherapists (Higgins, 1974; Ciesla, 1996; Krause and Hoehn, 2000; Flenady and
Gray, 2000; van der Schans et al. 2000).
The rationale for chest physical therapy in intensive care units is to minimise pulmonary
secretion retention and to maximise oxygenation by re-expanding atelectatic lung
segments (Ciesla, 1996). Chest physiotherapy is regularly performed in ventilated
children with the justification that it helps prevent or resolve complications associated
with artificial respiration (retention o f secretions and atelectasis) and speeds up the
resolution o f primary respiratoi*y disorders. Prior to accessible measures o f respiratory
function in the intensive care unit, physiotherapists have had to rely on sub-optimal and
relatively subjective markers to evaluate the efficacy o f treatment. These markers have
included sputum weight, changes in chest radiographs, auscultation and O2 saturation.
20
Arterial blood gas measurements remain the gold standard for clinical assessment o f
lung function, but are not always readily available and are not necessarily routinely taken
before and after chest physiotherapy.
1.2.2.1 Sputum clearance
The efficacy o f sputum clearance may be demonstrated directly by sputum weight or via
indirect measures o f pulmonary function such as radio-labelled aerosol clearance
(Bateman et al. 1981). Sputum weight has always been a controversial outcome measure
in physiotherapy trials because o f intra- and inter-subject variability. Sputum yield varies
during the course o f the day in any individual and different pathophysiology w ill result in
different amounts o f sputum but not in a predictable or consistent fashion. Some studies
dispute the correlation between the amount o f sputum and improved pulmonary function
in ventilated patients (Mackenzie et al. 1989; Hasani et al. 1994) while others suggest
that sputum clearance is associated with an improvement in respiratory function
(Cochrane et al. 1977). Some authors suggest that the connection between sputum
production and pulmonary function is irrelevant as long as it can be demonstrated that
physiotherapy treatments are advantageous in clearing secretions (Etches and Scott,
1978; May and Munt, 1979; Pavia, 1990; Gallon, 1991). Many studies to date which
used sputum weight as an outcome have been undertaken in non-ventilated patients, but
a recent study found that total static respiratory system compliance (Crs) and sputum
clearance were improved by the addition o f manual hyperinflation to a physiotherapy
treatment o f positioning and suctioning in mechanically ventilated patients without
compromise o f cardiovascular stability or gas exchange (Hodgson et al. 2000).
1.2.2.2 Arterial blood gases
The reported effects o f physiotherapy treatments on arterial blood gases are conflicting.
Some publications report a significant fall in PaO] after physiotherapy techniques or
tracheal tube suction (Gormezano and Branthwaite, 1972) while others report no
changes in PaO] after physiotherapy despite treatment protocols without pre
oxygenation (Mackenzie et al. 1978). Hypoxaemia has frequently been reported
following tracheal tube suction in ventilated neonates (Holloway et al. 1966; Simbruner
et al. 1981 ; Fox et al. 1978; Durand et al. 1989; Hussey, 1992), although Finer and
Boyd showed a greater increase in PaO] in neonates following physiotherapy and
suction than in neonates treated with postural drainage and suction alone (Finer and
21
Boyd, 1978). One study reported significant increases in Pa02 after percussion in
premature babies, but the study design included increasing ventilation pressures by 25%.
There can be little doubt that the increase in peak inspiratory pressure is very likely to
have influenced the observed improvement in blood gases after suction (Tudehope and
Bagley, 1980).
Several studies in ventilated adults or infants have shown that pre-oxygenation,
delivered manually or by the ventilator, completely prevented post suction hypoxaemia
or produced an increase in PaOz immediately after treatment (Connors et al. 1980;
Goodnough, 1985; Preusser et al. 1988; Kerem et al. 1990; Stone et al. 1991). Some
authors suggest that in the presence o f significant atelectasis, an increase in PaOz may be
seen after resolution o f atelectasis with physiotherapy, even i f pre-oxygenation is not
incorporated (Holody and Goldberg, 1981; Mackenzie and Shin, 1985; Ciesla, 1996).
Atelectasis may be associated with more widespread disturbances o f gas exchange than
is generally realised, perhaps because o f distension o f adjacent lung regions (Fletcher
and Larsson, 1985).
In summary, it appears that hypoxaemia may be associated with physiotherapy and / or
tracheal tube suction. Many publications have recommended pre-oxygenation or
hyperinflation breaths as effective ways o f avoiding or minimising the hazards o f suction
and physiotherapy (Young, (a) 1984; Riegel and Forshee, 1985; Gunderson et al. 1986;
Kerem et al. 1990; Shah et al. 1992; Mancinelli-Van and Beck, 1992; Odell et al. 1993;
Wood, 1998). Alternatively, suction through closed ports to maintain PEEP and tidal
volumes during the procedure may reduce suction related hypoxaemia (Gunderson et al.
1986).
1.2.2.3 Respiratory mechanics (Crs snd Rrs)
The evidence for the effects o f physiotherapy on respiratory system compliance (C^) and
resistance (Rrs) in ventilated adults and children is also conflicting. This may be related
to institutional differences in treatment modalities, differences in patient populations or
differences in calculating respiratory mechanics. Suction has been associated with
significant deterioration in C,s in fully ventilated, muscle relaxed, new-born babies
(Brandstater and Muallem, 1969) and percussion in fully ventilated adults produced a
22
reduction in Crs after treatment, while manual hyperinflation improved Crs by a maximum
o f 16% which was sustained for more than an hour in patients with lung disease (Jones
et al. 1992). Another study found no significant difference in C , s between mechanically
ventilated adults who received pre-oxygenation and tracheal tube suction, w ith and
w ithout manual hyperinflation and chest wall vibrations after cardiac surgery (Eales et
al. 1995). By contrast, Mackenzie et al, in two separate studies, found statistically
significant (p<0.01) increases in Crs 2 hours after physiotherapy in mechanically
ventilated adults but no change in R,s(Mackenzie et al. 1980; Mackenzie and Shin,
1985). Other studies have also shown an increase in Crs after physiotherapy (Winning et
al. 1975). In animal studies, negative pressure applied to the trachea was shown to
decrease lung compliance and this was partly attributed to collapse o f alveoli and
increased venous admixture, possibly as a result o f the continued perfusion o f the
collapsed alveoli (Velasquez and Farhi, 1964).
Very significant falls in both R , s and expiratory time constant ( t , s ) measurements have
been reported after tracheobronchial suction or lavage for infants whose pre-treatment
values o f resistance were elevated compared with reference data. No changes in C^
values were noted (Prendiville et al. 1986). In the same study, severe but clinically
inapparent mucus obstruction o f the airways was revealed in two infants by a
progressively rising R,-* during continuous monitoring. In addition, R^ has been shown to
fall significantly (p<0.005) following vibrations and suction in a neonatal population,
possibly as a result o f the removal o f secretions from the airways, but Rr$ returned to
baseline values within 2 hours o f suction, (Fox et al. 1978). In non-intubated adults,
significant reduction in airflow obstruction after chest physiotherapy has been reported
(Cochrane et al. 1977).
1.2.2A Acute lobar atelectasis and chest radiograph
Atelectasis at a macroscopic or microscopic level refers to the collapse o f lung regions
as gases are resorbed from underventilated alveoli. Atelectasis may be due to several
factors including regional airway obstruction by retained secretions. O f all the
pulmonary complications associated with ventilation (including pneumonia,
bronchopulmonary infection, acute respiratory distress syndrome, atelectasis and acute
23

or chronic respiratory disease) acute lobar atelectasis has quite consistently been shown
to respond favourably to physiotherapy (Marini et al. 1979; Hammon and Martin, 1981;
Fourrier et al. 1994). However, with the exception o f one study (Galvis et al. 1994),
most o f these studies were performed on ventilated adult patients and results may not be
extrapolated to a paediatric population with confidence. The predominance o f upper
lobe collapse observed in paediatric intensive care patients contrasts w ith the high
incidence o f lower lobe collapse in their adult counterparts. M ultiple factors are likely to
be contributory and include the anatomical and physiological differences between adults
and children, the pathophysiology o f childhood respiratory disease and more critical
positioning o f tracheal tubes in younger patients and their movement w ith patient
positioning (Thomas et al. 1999).
Three randomised studies comparing the efficacy o f fiberoptic bronchoscopy to
respiratory therapy in resolving acute lobar atelectasis, found respiratory therapy alone
to be superior or equivalent to fiberoptic bronchoscopy (Marini et al. 1979; Hammon
and Martin, 1981; Fourrier et al. 1994). A further study concluded that routine post
lobectomy bronchoscopy offered no advantage over physiotherapy in preventing the
development o f postoperative atelectasis (Jaworski et al. 1988). Ciesla et al, in two
separate studies, found that physiotherapy assisted in the resolution o f atelectasis in
ventilated adults and improved PaO] without the negative haemodynamic side effects o f
therapeutic bronchoscopy (Ciesla et al. 1981; Ciesla, 1996). Physiotherapy techniques in
addition to hyperinflation and suction have been shown to enhance and hasten resolution
o f acute lobar atelectasis after a single treatment (Stiller et al. 1990; Stiller et al. 1996).
In a prospective study o f 47 ventilated adults, Mackenzie et al. found that chest
radiographs within 24 hours o f physiotherapy showed improvement in 68% o f patients.
Chest physiotherapy was most effective in the treatment o f unilobar densities and
produced dramatic improvement in atelectasis o f acute onset (Mackenzie et al. 1978).
The single paediatric study on mechanically ventilated infants, found that physiotherapy
was effective in the treatment o f various degrees o f lung collapse. Lung expansion,
documented by chest radiographs, improved notably in 48 o f 57 infants (Galvis et al.
24
1994). Zach et al reported improvement in atelectasis in unventilated children receiving
physiotherapy (Zach and Oberwaldner, 1987).
In contrast to the studies reported above. Reines et al. found that chest physiotherapy
was associated with significantly (p< 0.01) more frequent and severe atelectasis in
children after heart surgery than in patients who had not received physiotherapy (Reines
et al. 1982). However, this study was done almost 20 years ago, and relatively small
subjects numbers (19 and 25 in each group), coupled with the fact that both
physiotherapy and ventilation techniques have evolved considerably since then, reduce
the confidence with which this evidence can be applied.
1.2.2.5 Prevention and treatment of pneumonia or common pulmonary
complications
Two very early publications suggested that prophylactic chest physiotherapy could
prevent post-operative pulmonary complications (including atelectasis and pneumonia)
in adults following abdominal surgery (Thoren, 1954; Palmer and Sellick, 1953). Since
then however, there has been little consistency in the literature regarding the role o f
physiotherapy in prevention or treatment o f common pulmonary complications in
ventilated patients (with the exception o f acute lobar atelectasis). While some studies
suggest there is moderate evidence that routine prophylactic postoperative chest
physiotherapy in both adult and paediatric populations significantly reduced the
frequency o f post operative complications (Bartlett et al. 1973; Morran et al. 1983;
Rockwell and Campbell, 1976; Rello et al. 1996), others have reported detrimental
effects or no effect in reducing the incidence or resolution o f nosocomial pneumonia
(Graham and Bradley, 1978; Reines et al. 1982; Ntoumenopoulos et al. 1998). One
randomised trial involving 171 patients concluded that chest physiotherapy was "at best
useless in patients with primary infectious pneumonia" (Britton et al. 1985).
Some authors have suggested that relatively recent policies o f encouraging early
mobilisation and ambulation following many surgical procedures have reduced the need
for prophylactic physiotherapy treatment (Dull and Dull, 1983; Hallbook et al. 1984;
Jenkins et al. 1989).
25
A recent Cochrane review based on three small trials found there was no evidence that
peri-extubation physiotherapy compared with non-active techniques (positioning and
suction alone) or no intervention prevented post-extubation lobar collapse, though there
appeared to be a reduction in re-intubation episodes when 1 to 2 hourly physiotherapy
treatments were performed prior to extubation (Flenady and Gray, 2000). The numbers
o f babies studied were small and 2 o f the 3 studies were carried out over 10 and 20
years ago respectively. Since then, enormous changes have occurred both in the medical
and physiotherapy management o f ventilated patients. Extrapolation o f this information
to current practice must therefore be very guarded.
1.2.2.6 Deadspace and ventilation / perfusion balance
Very few studies have reported deadspace or ventilation / perfusion matching as
outcomes for physiotherapy, although a major cause o f impaired gas exchange in
ventilated patients is atelectasis, causing intrapulmonary shunt. The effect o f body
position on ventilation / perfusion relationships has frequently been examined but this
has been particularly in relation to optimising positioning in acute respiratory distress
syndrome (ARDS) or unilateral lung disease, rather than specifically w ith regard to
physiotherapy (Rattenborg and Holaday, 1967; Secker-Walker et al. 1975; Moran et al.
1977; Batra et al. 1981; Dean, 1985; McCarthy, 1987; Moriya et al. 1987; Cohen, 1997;
Walther et al. 1998). A single case study reported that alveolar deadspace (Voaiv) was
significantly reduced after resolution o f a partially atelectatic lung (Fletcher and Larsson,
1985).
Another study concluded that external mechanical vibration o f the chest was useful in
the management o f hypoxaemia in patients with atelectasis or pneumonia and that
improved ventilation / perfusion (V/Q) balance was the reason for the observed
significant increase in Pa02 30 and 60 minutes after treatment (Holody and Goldberg,
1981). Yet another study showed a decrease in intrapulmonary shunt and significant
improvement in respiratory compliance 2 hours after physiotherapy in 19 mechanically
ventilated patients with post-traumatic respiratoi-y failure (Mackenzie and Shin, 1985).
1.2.2.7 Potentially adverse effects of multimodality treatments
The physiological and haemodynamic effects o f physiotherapy have been extensively
investigated. Some o f these will be described later under the heading o f specific
26
treatment modalities. Several authors have reported arrhythmia’ s during or following
suction or physiotherapy (Hammon et al. 1992), while others have found that patients
without adequate sedation have had significant and sometimes dramatic increases in
heart rate, blood pressure, cardiac output, oxygen consumption (VO 2), carbon dioxide
elimination (VCO 2) and PaC02 during such treatments. Some o f these studies described
significant reduction in certain or all o f these effects with sedation or pharmacological
paralysis (Bodai, 1982; Weissman et al. 1984; Klein et al. 1988; Stone et al. 1991;
Hammon et al. 1992; Weissman and Kemper, 1993; Harding et al. 1994; Weissman et al.
1994; Singer et al. 1994; Cohen et al. 1996; Horiuchi et al. 1997).
Physiotherapy and suction treatments have also been associated with significant
increases in intracranial pressure (ICP), although in most cases, the simultaneous
increase in blood pressure has resulted in adequate or only transiently inadequate
cerebral perfusion pressures (GPP) (Parsons and Shogan, 1984; Gar rad d and Bullock,
1985; Durand et al. 1989; Singh et al. 1991; Crosby and Parsons, 1992; Paratz and
Burns, 1993; Wang et al. 1993; Bru ci a, 1993; Bnjcia and Rudy, 1996; Imle et al. 1998).
Adequate sedation and pharmacological paralysis have been reported effective at
controlling these responses to tracheal suction (Parsons and Shogan, 1984; Ninan et al.
1986; Ninan et al. 1986; Fanconi and Duc, 1987; Ersson et al. 1990). Brimioulle et al
claimed that passive mobilisation techniques were not associated with adverse effects in
patients with raised ICP (Brimioulle et al. 1997).
In 1998, Harding et al proposed a connection between encephaloclastic porencephaly
and chest physiotherapy in extremely preterm infants (Harding et al. 1998). The study
involved retrospective analysis o f 454 infants o f birth weight less than 1500gm delivered
between 24 to 27 weeks o f gestation. Patients with encephaloclastic porencephaly
received two to three times as many chest physiotherapy treatments in the second, third,
and fourth weeks o f life as control infants (p < 0.001). Affected subjects also had more
prolonged and severe hypotension in the first week than control subjects (p < 0.01), and
were less likely to have had a cephalic presentation (p < 0.01). The brain lesion was
considered by the authors to be caused by impact o f the brain with the skull during
shaking movements that could occur during chest physiotherapy with percussion. Since
the publication by Harding, several authors have disputed the connection between
27

encephaloclastic porencephaly and physiotherapy and have also pointed out the
significant methodological errors and risks o f type 1 error in this work (Beeby et al.
1998; Gray et al. 1999; Vincon, 1999). Gray et al and Beeby et al reported that they had
not found any cases o f encephaloclastic porencephaly over the same 3-year period,
despite similar criteria for the initiation o f physiotherapy treatment. Gray noted that
while Harding found a strong association (P < 0.001) between chest physiotherapy and
encephaloclastic porencephaly, severe hypotension and noncephalic presentation were
also statistically significant and the “ model collapsed” when these variables were entered
into the multivariate analysis. It was thus likely that the lesion occurred only in the
sickest infants and the fact that they had more chest physiotherapy just reflected their
degree o f illness.
1.2.3 The efficacy of individual components of physiotherapy treatments in
ventilated patients.
Most frequently physiotherapy treatments involve a combination o f treatment
techniques. Research attempting to tease out the effects o f different components o f
treatment rarely tests each component in isolation. Instead they involve designs where a
specific technique is included or not in a control group and then the differences between
the groups are attributed to the specific technique. There are several treatment
modalities commonly used in ventilated children which include those discussed below.
1.2.3.1 Positioning and postural drainage
Postural drainage refers to therapeutic drainage in bronchopulmonary diseases in which
there is copious mucus secretion, such as chronic bronchitis, bronchiectasis, pulmonary
abscess, or cystic fibrosis. The patient is placed so that gravity assisted drainage o f the
affected lobe may be facilitated. There are eleven described therapeutic positions which
have the aim o f allowing gravity to assist in accelerating drainage o f mucus from the
lung periphery to larger airways. The duration o f postural drainage may vary
considerably ( 15 - 60 minutes) depending on the age and tolerance o f the patient as well
as the clinical requirements o f the treatment (Bateman et al. 1981; Ciesla, 1996). Results
from some studies on non-ventilated adults claim that postural drainage adds benefit to
traditional chest physiotherapy (Sutton et al. 1982; Johnson et al. 1987). One study
found that postural drainage and manual hyperinflation in ventilated patients did not
reduce the risk o f nosocomial pneumonia (Ntoumenopoulos et al. 1998), but no other
28
studies reporting the efficacy o f these techniques in adult or paediatric intensive care
have been found.
Chest physiotherapy including postural drainage has been implicated in causing or
exacerbating gastro-oesophageal reflux in young patients with cystic fibrosis (Button et
al. 1997; Taylor and Threlfall, 1997; Heine et al. 1998; Button et al. 1998; Button,
1999), but this effect has been disputed by others (Phillips et al. 1998) and was not
found in patients with chronic bronchitis and bronchiectasis (Chen et al. 1998).
Positioning refers to the more general aim o f optimising V/Q matching, and the
physiological rationale for it in the intensive care unit has been well described in some
disorders. Prone positioning has been shown to improve oxygenation in the short term in
critically ill adults and children (Langer et al. 1988; Pappert et al. 1994; Mizuno et al.
1995; Chatte et al. 1997; Mure et al. 1997; Numa et al. 1997; Jolliet et al. 1998; Mizuno
and Aizawa, 1999). Improvements in lung function have also been described for patients
with unilateral lung disease when they are positioned in side lying, although the optimal
position is different in adult and paediatric patients because o f differences in regional
ventilation and perfusion (Zack et al. 1974; Ibanez et al. 1981; Prokocimer et al. 1983;
Rivara et al. 1984; Gillespie and Rehder, 1987; Larsson et al. 1989; Lu mb and Nunn,
1991; Webster, 1999). In children and adults, the effect o f posture on the distribution o f
perfusion is similar, however, in children ventilation in response to gravity is the reverse
o f that seen in adults, being preferentially distributed to the upper lung whether diseased
or normal (Heaf et al. 1983; Davies et al. 1985; Bhuyan et al. 1989). Positioning therapy
to assist resolution o f acute atelectasis has been recommended, but the evidence for this
is unclear (Dean, 1985; Dean and Ross, 1992; Dean, 1997).
1.2.3.2 Manual hyperinflation, hyperventilation or hyperoxygenation
Manual lung inflation involves disconnection o f the patient from mechanical ventilation
to provide temporary manual ventilation. Specific techniques o f performing manual
inflation depend on whether the aim is to achieve hyperinflation, hyperoxygenation,
hyperventilation or a combination o f these.
29
M anual hyperinflation commonly involves a slow, deep inspiration, inspiratory pause
and fast unobstructed expiration, although the technique should be modified for patients
w ith reduced or compromised cardiac output. Specific aims o f this procedure are to
improve tidal volume and alveolar recruitment by re-inflating areas o f atelectasis,
thereby improving compliance and ventilation/perfusion matching. Hyperinflation w ill
additionally often stimulate cough in self ventilating patients and thus assist in airway
clearance (Clement and Hubsch, 1968; Windsor et al. 1972; Bartlett et al. 1973; Stiller
et al. 1996). Hyperinflation manoeuvres have been shown to effectively re-expand
collapsed lung tissue and improve oxygenation in anaesthetised ventilated adults with
healthy lungs (Rothen et al. 1999).
Research examining the efficacy o f manual hyperinflation specifically in airway clearance
is conflicting or not comparable because o f significant differences in technique and
methodology (Barker and Bales, 2000). Controversy exists regarding the safety and
effectiveness o f application o f manual lung hyperinflation in intubated patients. Tidal
volumes, pressures and FiOz are not controlled and there are inherent dangers o f
barotrauma or hypoxaemia in the absence o f additional oxygen (Brandstater and
Muallem, 1969; Fox et al. 1978; Gattinoni et al. 1993; McKelvie, 1998; Clarke et al.
1999; Dorges et al. 2000). Whereas some studies suggest that the addition o f manual
hyperinflation in treatment does not offer any advantage (Novak et al. 1987; Bales et al.
1995), others have found that manual hyperinflation was associated with an
improvement in respiratory compliance and sputum clearance in mechanically ventilated
patients without compromise o f cardiovascular stability or gas exchange (Jones et al.
1992; Hodgson et al. 2000).
Hyperoxygenation involves delivering greater FiO], with the purpose o f improving
oxygenation. It may be used in combination with manual hyperinflation during
physiotherapy treatments and is recommended in preference to hyperinflation alone in
reducing suction-induced hypoxaemia, or facilitating recovery after suction (Chulay and
Graeber, 1988; Lookinland and Appel, 1991). Stone and others, comparing the efficacy
o f ventilator versus manual hyperinflation in delivering hyperoxygenation or
hyperinflation breaths before, during, and/or after tracheal suctioning, found that
ventilator delivered breaths were either superior or equivalent to manually delivered
30
breaths in preventing suction-induced hypoxaemia, and that delivery o f manual
hyperinflation breaths resulted in increased airway pressure and increased
haemodynamic consequences (Stone, 1990; Grap et al. 1996). By contrast, Goodnough
(1985) claimed that manual hyperinflation with FiOz o f 1 provided better protection than
ventilator delivered breaths o f the same FiOz, but recommended monitoring o f
haemodynamic parameters because o f potential alterations in arterial blood pressure and
heart rate associated with manual hyperinflation (Goodnough, 1985).
Manual hyperventilation involves rapid delivery o f breaths usually w ith the aim o f
improving oxygenation or blowing o ff CO2 It is rarely used in physiotherapy treatments,
but may be helpful in patients in whom hypercapnia should be avoided, for example
patients with head injuries in whom low PaCOi may be advantageous prior to treatment,
or patients in pulmonary hypertensive crisis who have extremely reduced C,s and may be
difficult to oxygenate. The efficacy o f hyperventilation in physiotherapy treatments has
not been reported.
1.2.3.3 Chest percussion (clapping) and vibrations
Chest percussion or clapping in paediatric patients involves tapping the chest wall with
cupped hand, fingers or soft plastic cu ff to mobilise secretions. Vibrations refer to the
manual technique o f shaking the chest wall during the expiratory phase o f respiration.
Chest percussion or vibrations are reported to enhance mucociliary clearance from
central and peripheral aii*ways (May and Munt, 1979; Bateman et al. 1981; Mackenzie et
al. 1989; Ambrosino et al. 1995). The exact mechanisms by which percussion and
vibration are felt to achieve mucociliary clearance are unclear, but alteration o f airflow
and release o f pulmonary chemical mediators have been proposed (King et al. 1983;
Gallon, 1991). A t bronchoscopy, secretions have been seen to move into the upper
airways when vibrations are applied to the chest wall (Ciesla, 1996). Other authors have
suggested that chest wall vibrations and manual hyperinflation are associated with large
fluctuations in cardiothoracic pressure and hence are inadvisable (Laws and McIntyre,
1969).
Some studies assessing the efficacy o f percussion and vibrations in ventilated adults and
infants have found a significant increase in PaCL while pH or PaCOz were unaffected
31
(Finer and Boyd, 1978; Holody and Goldberg, 1981). Another study, however, found a
significant fall in PaC^ after chest percussion in ten patients who produced no sputum or
small amounts o f sputum, while there was no significant change in PaOz in 12 patients
who produced moderate to large amounts o f mucopurulent secretions (Connors et al.
1980). Some authors suggested that in non-ventilated patients postural drainage was the
most useful therapeutic component while percussion and vibrations had nothing to add
(K ir illo ff et al. 1985; Sutton et al. 1985; Pavia, 1990).
Bronchospasm, increased risk o f arrhythmia, decreased blood pressure, increased heart
rate and short term decline in FEV] (forced expiratory volume) have all been associated
with percussion in both ventilated and non-ventilated patients (Campbell et al. 1975;
Wollmer et al. (b) 1985; Hammon et al. 1992; Ntoumenopoulos, 1994).
Pharmacological bronchodilation therapy has been proposed in cases where the benefits
o f treatment are thought to outweigh the risks o f bronchospasm (Gallon, 1991).
1.2.3.4 Instillation of saline
Saline instillation into the tracheal tube o f ventilated patients is commonly used to
stimulate cough or loosen thick, sticky secretions so that they may easily be removed
with suction, but evidence for the practice is equivocal (Swartz et al. 1996; Schwenker
et al. 1998). Some authors suggest that at best saline instillation is not effective and at
worst may be detrimental in terms o f O2 saturation (Bostick and Wendelgass, 1987;
Ackerman, 1993; Hagler and Traver, 1994; McKelvie, 1998; Ackerman and M ick, 1998;
Blackwood, 1999; Kinloch, 1999), while others suggest it is well tolerated even in
infants and may be helpful in removing secretions adherent to the chest wall (Shorten et
al. 1991; Whitnack, 2000). Several reviews suggest normal saline instillation in
ventilated patients should be discontinued as a routine or standard practice until more
research has proved its efficacy (Raymond, 1995; Druding, 1997).
1.2.3.5 Tracheal suction
Tracheal suctioning is a necessary practice carried out in intensive care units. I t involves
the removal o f pulmonary secretions from a patient with an artificial airway in place via
a catheter connected to a negative pressure source (Stone and Turner, 1989).
Sometimes suction is used to stimulate a cough in patients making spontaneous
ventilatory efforts who have a poor cough reflex. It has been shown that despite its
32

usefulness in the management o f ventilated patients, suction can be associated with many
detrimental effects including hypoxaemia, mechanical trauma, apnoea, bronchospasm,
pneumothorax, atelectasis, cardiac arrhythmia, fluctuations in ICP, infection and even
death on rare occasions (Brandstater and Muallem, 1969; Fox et al. 1978; Young, (a)
1984; Stone and Turner, 1989; Shorten, 1989; Clark et al. 1990; Jaw et al. 1991;
Czarnik et al. 1991; Mehrabani et al. 1991; Paratz, 1992; Singer et al. 1994; Boothroyd
et al. 1996; Clarke et al. 1999). Accepted methods for reducing complications
associated with suction include pre-oxygenation, adequate sedation, reassurance and
suctioning via a port adapter or closed suction system in patients who require
maintenance o f PEEP and/or positive pressure ventilation during suction (Urban and
Weitzner, 1969; Cabal et al. 1979; Bodai, 1982; Brown et al. 1983; Goodnough, 1985;
G raff et al. 1987; Chulay and Graeber, 1988; Harshbarger et al. 1992; Mancinelli-Van
and Beck, 1992). Pre-oxygenation with ventilator breaths has been recommended above
disconnection and manual hyperinflation because o f the reduced risk o f barotrauma, loss
o f PEEP and FiO i (Chulay and Graeber, 1988; Stone et al. 1991; McCabe and Smeltzer,
1993; Glass et al. 1993).
1.2.4 Evidence for physiotherapy treatments being better than nursing suction
alone.
There are few publications which examine the differences between respiratory
physiotherapy and nursing suction, or whether physiotherapy should be provided
routinely or selectively in addition to routine nursing care. Interpretation o f these studies
is made more difficult by the variability in techniques between units and the overlap
between nursing and physiotherapy practice in many cases.
One study o f patients with acute lobar atelectasis compared hyperinflation and suction
alone with treatments that comprised positioning, vibrations, hyperinflation and suction.
Fourteen cases were alternately allocated to either physiotherapy regimen, which were
performed hourly for 6 hours. After one treatment, patients in the intensive treatment
group showed a mean 60% resolution o f their atelectasis as seen on chest radiographs,
compared with a 7.6% resolution in the non active group. After the six-hour treatment
period, the difference between the groups remained significant although less so, but after
24 and 48 hours, the difference between groups was not significant. These results
33
suggest that, at least initially in the course o f acute lobar atelectasis, positioning and
vibrations add to the efficacy o f a treatment o f hyperinflation and suction alone (Stiller
et al. 1990).
Another study randomised 46 patients to receive physiotherapy and nursing suction, or
nursing suction alone. Twice as many patients developed nosocomial pneumonia in the
nursing only group (8/24) compared with the physiotherapy group (4/22) although the
differences were not statistically significant, (p = 0.24). The length o f ventilation time
and ICU stay were similar and there were no differences in pulmonary dysfunction
between the two groups (Ntoumenopoulos et al. 1998). Although physiotherapy was
not associated with a reduced incidence o f nosocomial pneumonia in this study, the
trend to more frequent nosocomial pneumonia in the control patients suggests that a
larger study might have revealed different results.
A review o f physiotherapy practice in Australia found that although the methods o f
chest treatment and the indicators for commencing chest treatment were similar in
neonatal intensive care units, clinical techniques and protocols for chest physiotherapy
varied greatly between units. The results revealed that both physiotherapists and nursing
staff played a role in the performance o f chest treatment in all but one unit where it was
the responsibility o f nursing staff. However, the greatest variability between neonatal
intensive care units was in the individual treatment protocols employed pre- and post-
extubation o f the neonate. It was concluded that further well-controlled studies with
larger sample sizes were needed to validate the use o f chest physiotherapy for the
neonate, especially in relation to the techniques and specific protocols employed (Lewis
et al. 1992). This study highlighted the considerable inconsistency and overlap between
physiotherapy and nursing suction practices and the need for careful definition o f terms
o f practice both in research and clinical management.
A questionnaire survey distributed to nurses and physiotherapists at the Royal Hospital
for Sick Children in Edinburgh revealed that there was significant disagreement over
paediatric nasopharyngeal suction in terms o f appropriate catheter size, suction pressure
and method o f suction as well as use o f pre-oxygenation and knowledge o f adverse
effects. The paper concluded that further theoretical and practical education was needed
34

in the use o f nasopharyngeal suction and that a standard method should be implemented
throughout the hospital (Macmillan, 1995). This study was specific to one institution,
but highlighted an issue likely to be equally relevant to others both nationally and
internationally.
1.2.5 Evidence to support the use of respiratory function testing in the
paediatric intensive care unit.
While there is little evidence to date to suggest that routine measurements o f respiratory
function reduce either morbidity or mortality on the ICU, they could make an important
contribution to the management o f ventilated infants by improving understanding o f
pulmonary physiology, and the response o f the paediatric lung to different types o f
ventilatory support and therapeutic interventions, including physiotherapy and nursing
suction. Respiratory function monitoring has a potential role in monitoring the course o f
the disease, assessing the effects o f treatments and guiding appropriate ventilation
settings. In addition there may be potential for using respiratory monitoring for
diagnostic purposes (classification, prognosis, choice o f treatment) (Sly et al. 1996).
The technological advancement o f ventilators for children has been impressive in the last
decade. Developing in parallel have been the “ stand alone” and integrated respiratory
monitors which facilitate continuous analysis and display o f a variety o f respiratory
parameters. The range o f respiratory function tests that can be performed on the
ventilated patient is considerable and several investigations which previously required
complex equipment have now been incorporated into modern ventilators and respiratory
monitors. The accuracy and validity o f many o f these systems has yet to be established,
but this is an essential prerequisite before attempts can be made to assess their clinical
efficacy and usefulness (Gerhardt and Bancalari, 1991; Petros et al. 1993; Greenough,
1994; Numa and Newth, 1995; Hammer and Newth, 1995; Macnaughton, 1997). There
are many factors which have the potential to confound measurements o f respiratory
function in ventilated patients including tracheal tube leak, site o f measurements, posture
and spontaneous ventilatoi7 effort. These all need to be considered during
measurements and interpretation o f data obtained from mechanically ventilated children
(Kuo et al. 1996; Kondo et al. 1997).
35
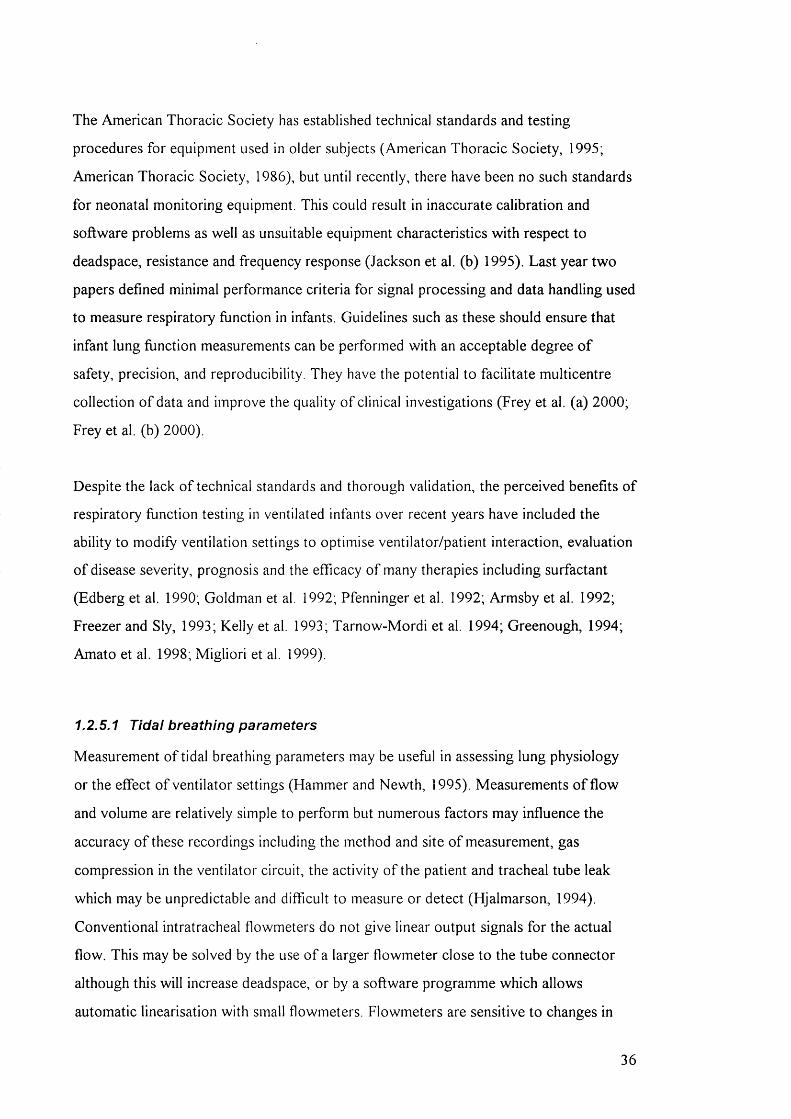
The American Thoracic Society has established technical standards and testing
procedures for equipment used in older subjects (American Thoracic Society, 1995;
American Thoracic Society, 1986), but until recently, there have been no such standards
for neonatal monitoring equipment. This could result in inaccurate calibration and
software problems as well as unsuitable equipment characteristics w ith respect to
deadspace, resistance and frequency response (Jackson et al. (b) 1995). Last year two
papers defined minimal performance criteria for signal processing and data handling used
to measure respiratory function in infants. Guidelines such as these should ensure that
infant lung function measurements can be performed with an acceptable degree o f
safety, precision, and reproducibility. They have the potential to facilitate multicentre
collection o f data and improve the quality o f clinical investigations (Frey et al. (a) 2000;
Frey et al. (b) 2000).
Despite the lack o f technical standards and thorough validation, the perceived benefits o f
respiratory function testing in ventilated infants over recent years have included the
ability to modify ventilation settings to optimise ventilator/patient interaction, evaluation
o f disease severity, prognosis and the efficacy o f many therapies including surfactant
(Edberg et al. 1990; Goldman et al. 1992; Pfenninger et al. 1992; Armsby et al. 1992;
Freezer and Sly, 1993; Kelly et al. 1993; Tarnow-Mordi et al. 1994; Greenough, 1994;
Amato et al. 1998; M igliori et al. 1999).
1.2.5.1 Tidal breathing parameters
Measurement o f tidal breathing parameters may be useful in assessing lung physiology
or the effect o f ventilator settings (Hammer and Newth, 1995). Measurements o f flow
and volume are relatively simple to perform but numerous factors may influence the
accuracy o f these recordings including the method and site o f measurement, gas
compression in the ventilator circuit, the activity o f the patient and tracheal tube leak
which may be unpredictable and difficult to measure or detect (Hjalmarson, 1994).
Conventional intratracheal flowmeters do not give linear output signals for the actual
flow. This may be solved by the use o f a larger flowmeter close to the tube connector
although this w ill increase deadspace, or by a software programme which allows
automatic linearisation with small flowmeters. Flowmeters are sensitive to changes in
36
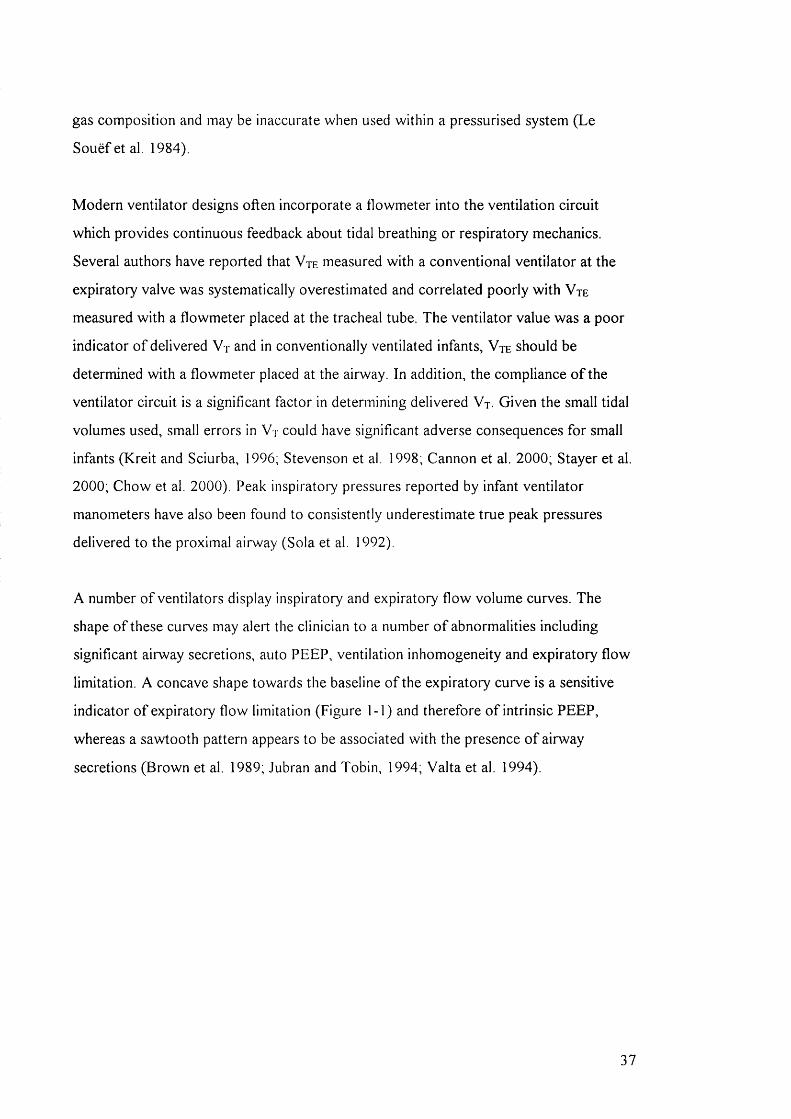
gas composition and may be inaccurate when used within a pressurised system (Le
Souëf et al. 1984).
Modem ventilator designs often incorporate a flowmeter into the ventilation circuit
which provides continuous feedback about tidal breathing or respiratory mechanics.
Several authors have reported that V t e measured with a conventional ventilator at the
expiratory valve was systematically overestimated and correlated poorly w ith V te
measured w ith a flowmeter placed at the tracheal tube. The ventilator value was a poor
indicator o f delivered V j and in conventionally ventilated infants, Vte should be
determined with a flowmeter placed at the airway. In addition, the compliance o f the
ventilator circuit is a significant factor in determining delivered V t. Given the small tidal
volumes used, small errors in V t could have significant adverse consequences for small
infants (Kreit and Sciurba, 1996; Stevenson et al. 1998; Cannon et al. 2000; Stayer et al.
2000; Chow et al. 2000). Peak inspiratoi-y pressures reported by infant ventilator
manometers have also been found to consistently underestimate true peak pressures
delivered to the proximal airway (Sola et al. 1992).
A number o f ventilators display inspiratory and expiratory flow volume curves. The
shape o f these curves may alert the clinician to a number o f abnormalities including
significant airway secretions, auto PEEP, ventilation inhomogeneity and expiratory flow
limitation. A concave shape towards the baseline o f the expiratory curve is a sensitive
indicator o f expiratory flow limitation (Figure 1-1) and therefore o f intrinsic PEEP,
whereas a sawtooth pattern appears to be associated with the presence o f airway
secretions (Brown et al. 1989; Jubran and Tobin, 1994; Valta et al. 1994).
37
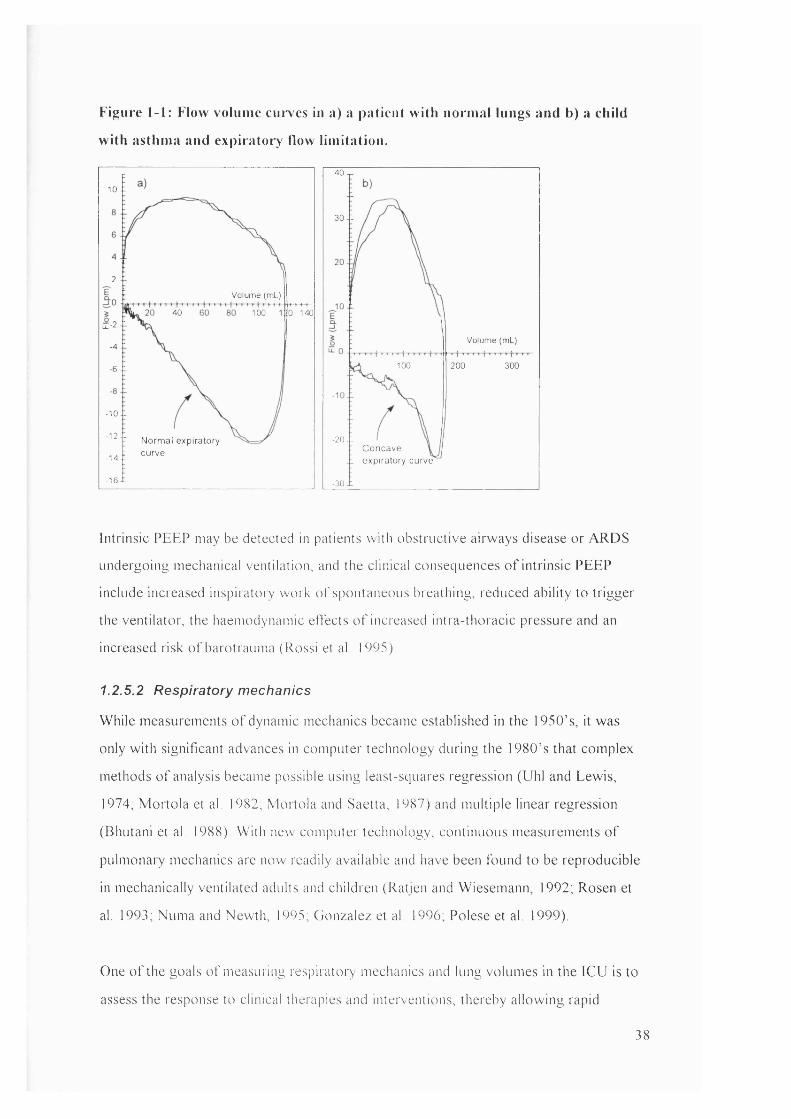
Figure 1-1: Flow volume cui*ves lu a) a patient with normal lungs and b) a child
with asthma and expiratory flow limitation.
40
10- 1
30 -1
2 .1Volume (m l)
40 100 0 140iI-2 -1
Volume (m l)-4-1
100 200 300- 6 . 1
- 10-1
' '1 Normal expiratory M4.Î ""ve
20.1Concave \ expiratory curve
-16-tl -30 i -
Intrinsic PEEP may be detected in patients with obstructive airways disease or ARDS
undergoing mechanical ventilation, and the clinical consequences o f intrinsic PEEP
include increased inspiratory work o f spontaneous breathing, reduced ability to trigger
the ventilator, the haemodynamic etfects o f increased intra-thoracic pressure and an
increased risk o f barotrauma ( Rossi et al. 1995).
1.2.5.2 Respiratory mechanics
While measurements o f dynamic mechanics became established in the 1950’s, it was
only w ith significant advances in computer technology during the I980 ’ s that complex
methods o f analysis became possible using least-squares regression (Uhl and Lewis,
1974; M ortola et al. 1982; Mortola and Saetta, 1987) and multiple linear regression
(Bhutani et al. 1988). With new computer technology, continuous measurements o f
pulmonai-y mechanics are now readily available and have been found to be reproducible
in mechanically ventilated adults and children (Ratjen and Wiesemann, 1992; Rosen et
al. 1993; Numa and Newth, 1995; Gonzalez et al. 1996, Polese et al. 1999).
One o f the goals o f measuring respiratory mechanics and lung volumes in the ICU is to
assess the response to clinical therapies and interventions, thereby allowing rapid
38

responses to ensure optimal management o f the patient and the ability to predict the
likelihood o f successful weaning (Garg et al. 1991; Hjalmarson, 1994; Kugelman et al.
1995; Hammer and Newth, 1995; Macnaughton, 1997).
A recent review o f the clinical relevance o f monitoring respiratory mechanics in the
ventilated patient concluded that assessment o f respiratory mechanics had assisted in the
understanding o f patient-ventilator relationships and pathophysiology and would be very
useful in terms o f adopting new ventilation strategies (Appendini and Marco, 2001).
1.2.5.2.1 R esp ira tory C om pliance
A retrospective study about the theoretical benefits o f matching ventilatory support to
the requirements indicated by respiratory mechanics (whereby the most efficient
ventilation could be administered while minimising lung overdistension), found that
those infants managed by monitoring pulmonary mechanics had fewer pneumothoraces
and grade I- I I intraventricular haemorrhages (IV H ) than infants who were managed
prior to this “ measurement-response regimen” . However the incidence o f pulmonary
interstitial emphysema (PIE) and bronchopulmonary dysplasia (BPD) was similar, as
were survival rates, length o f time on mechanical ventilation and length o f stay in
hospital (Rosen et al. 1993).
A prospective randomised controlled trial was conducted to determine i f outcomes
could be improved in neonates requiring mechanical ventilation i f regular pulmonary
function tests were performed. One group received conventional clinical management
while the other received conventional management and regular measurements o f Crs. No
significant differences in terms o f the duration that oxygen and mechanical ventilation
were needed, the frequency o f the development o f chronic lung disease, the pattern o f
cranial ultrasound abnormality or the length o f hospital stay were found between the two
groups. The study concluded that measurements o f pulmonary mechanics may be o f
limited use, but conceded that some o f the staff' were not used to interpreting the
information provided in a relatively new way and that the frequency o f Crs measurements
(once a day) was insufficient for producing differences in clinical outcomes (Stenson et
id. 1998).
39
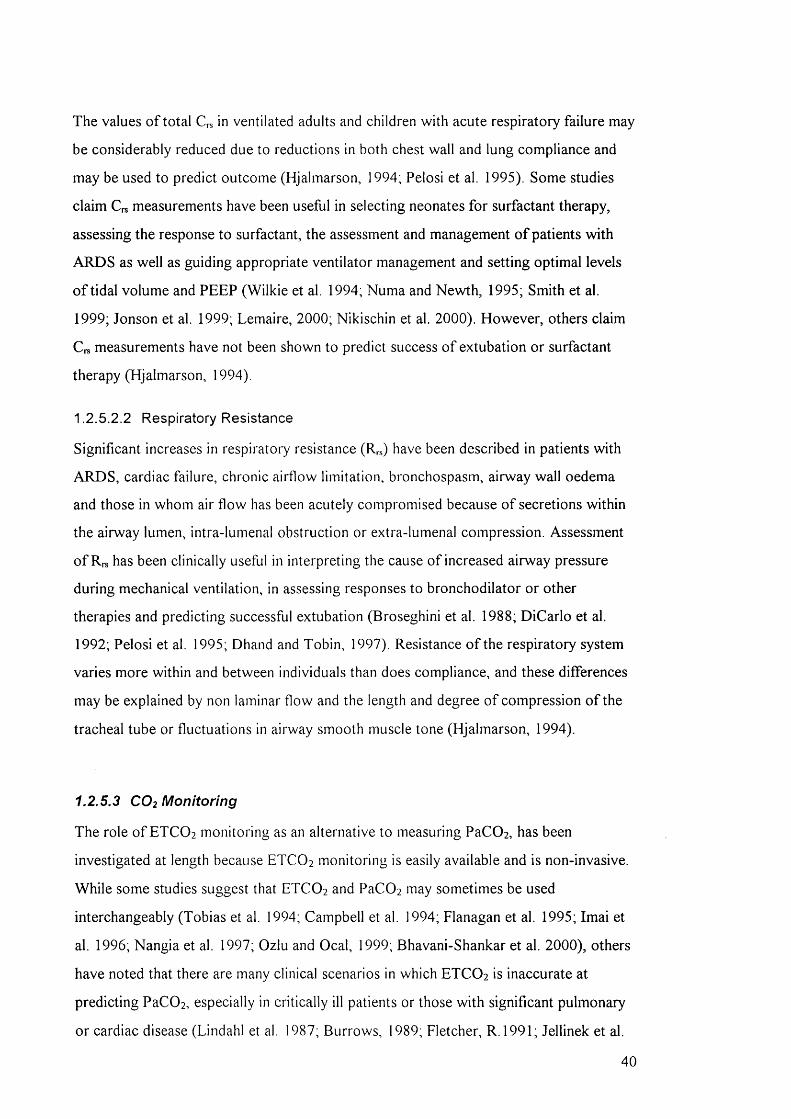
The values o f total C,s in ventilated adults and children with acute respiratory failure may
be considerably reduced due to reductions in both chest wall and lung compliance and
may be used to predict outcome (Hjalmarson, 1994; Pelosi et al. 1995). Some studies
claim Crs measurements have been useful in selecting neonates for surfactant therapy,
assessing the response to surfactant, the assessment and management o f patients with
ARDS as well as guiding appropriate ventilator management and setting optimal levels
o f tidal volume and PEEP (Wilkie et al. 1994; Numa and Newth, 1995; Smith et al.
1999; Jonson et al. 1999; Lemaire, 2000; Nikischin et al. 2000). However, others claim
Crs measurements have not been shown to predict success o f extubation or surfactant
therapy (Hjalmarson, 1994).
1.2 .5.2.2 R esp ira tory Resistance
Significant increases in respiratory resistance (R,s) have been described in patients with
ARDS, cardiac failure, chronic airflow limitation, bronchospasm, airway wall oedema
and those in whom air flow has been acutely compromised because o f secretions within
the airway lumen, intra-lumenal obstruction or extra-lumenal compression. Assessment
o f Rrs has been clinically useful in interpreting the cause o f increased airway pressure
during mechanical ventilation, in assessing responses to bronchodilator or other
therapies and predicting successful extubation (Broseghini et al. 1988; DiCarlo et al.
1992; Pelosi et al. 1995; Dhand and Tobin, 1997). Resistance o f the respiratory system
varies more within and between individuals than does compliance, and these differences
may be explained by non laminar flow and the length and degree o f compression o f the
tracheal tube or fluctuations in airway smooth muscle tone (Hjalmarson, 1994).
1.2.5.3 CO2 Monitoring
The role o f ETCO 2 monitoring as an alternative to measuring PaC02, has been
investigated at length because ETCO2 monitoring is easily available and is non-invasive.
While some studies suggest that ETCO2 and PaC02 may sometimes be used
interchangeably (Tobias et al. 1994; Campbell et al. 1994; Flanagan et al. 1995; Imai et
al. 1996; Nangia et al. 1997; Ozlu and Ocal, 1999; Bhavani-Shankar et al. 2000), others
have noted that there are many clinical scenarios in which ETCO 2 is inaccurate at
predicting PaC0 2 , especially in critically ill patients or those with significant pulmonary
or cardiac disease (Lindahl et al. 1987; Burrows, 1989; Fletcher, R.1991; Jellinek et al.
40

1993, Russell and Graybeal, 1994, Kerr et al. 1996, Pianosi and Hochman, 1996, Prause
et al. 1997; Laffon et al. 1998). The reasons for a mismatch between ETCO2 and PaCOi
in a changing clinical scenario reflect changes in V/Q matching and physiological
deadspace (Yamanaka and Sue, 1987; Taskar et al. 1995). A prerequisite for
proportionality between ETCO2 and PaC02 is a constant V/Q relationship which would
leave deadspace unchanged. Other reasons may include failure o f ETCO2 to equilibrate
with alveolar gas as a result o f airway obstruction, rapid respiratory rate or short
expiratory time. Despite these problems, a rising or falling ETCO2 remains potentially
useful as a continuous and non-invasive indicator o f change in respiratory function
during mechanical ventilation.
Several authors have suggested the shape o f the single breath CO2 curve (SBCO2 ) might
yield valuable information about gas exchange, airway pathology and ventilation
inhomogeneity (Figure 1-2) in patients with respiratory disease, and that because the
method is simple and non-invasive, it has promising applications in young children and
infants (Fletcher et al. 1981, Schreiner et al. 1993, You et al. 1994, Ream et al. 1995,
Kars et al. 1997; Olsson et al. 1999, Stromberg and Gustafsson, 2000).
Figure 1-2; Comparison between SBCO2 curve in a) a patient with normal lungs
and b) a child with severe asthma
Almost horizontal ‘alveolar plateau’
o 27
Volume (ml)
100 200
Steeply sloping ‘alveolar plateau’
Volume (ml)
60 80 100
Ihe almost simultaneous emptying o f C02.from alveoli in normal lungs is reflected in the horizontal phase I I I o f the SBCO2 p lo t (a), whereas the ventilation inhomogeneity and delayed emptying o f C02 ,from alveoli in patients with asthma is reflected in the steeply sloping phase I I I in p lo t (b).
In addition, the SBCO2 curve allows an estimation o f Vophys and Voainvay Several adult
studies have suggested that the shape o f the SBCO2 curve and calculation o f Voaiv
41
would be usefijl in the diagnosis o f acute pulmonary embolism, based on the fact that the
large amount o f wasted ventilation would be reflected in the large Vophys or raised V/Q
ratio (Eriksson et al. 1985; Wollmer et al. (a) 1985; Fletcher R, et al. 1986; Fletcher and
Jogi, 1986; Burki, 1986; Eriksson et al. 1989; Olsson et al. 1998; Kline and Arunachlam,
1998; Johanning et al. 1999; Kline et al. 2001).
1.2.5.4 Deadspace measurements
Pulmonary deadspace (defined in section 2.4) refers to the ventilated areas o f the lung or
upper respiratory tract which do not participate in gas exchange (wasted ventilation).
This includes mechanical deadspace which is composed o f external artificial airways.
The relationship between ineffective versus effective volume ( V d / V t ) can be calculated
for different deadspace components or for total deadspace. Deadspace volumes
correlate positively with body weight, height and body surface area (Shenkman et al.
1996; Puri et al. 1999) and are affected by body and neck position, alveolar volume at
end o f expiration, V t , intubation status, ventilation modality and length o f tracheal tube
(Marsh et al. 1973; Klingstedt et al. (a) 1990; Klingstedt et al. (b) 1990; Casati et al.
1997; Neto et al. 2000).
Methods for calculation o f respiratory deadspace include collection o f CO2 expired in a
Douglas bag or use o f the modified Bohr equation (Equation 2-6). The accuracy o f
deadspace measurements using a metabolic monitor has been shown to compare
favourably to the traditional Douglas bag method thus providing a convenient and
simple alternative (Fletcher and Jonson, 1984; Kiiski et al. 1991; Arnold et al. 1993;
Arnold et al. 1996; Lum et al. 1998).
Bronchoalveolar lavage in rabbits has been found to elevate Voaiv, Vophys and the
deadspace/tidal volume ratios and is associated with a fall in the arterial/alveolar PO2
ratio. Surfactant treatment improves gas exchange but does not restore the lung to its
pre-bronchoalveolar lavage condition, which indicates that the exogenous surfactant
only partially affects the recruitment o f the atelectatic areas (Wenzel et al. (a) 1999).
Children w ith cyanotic congenital heart disease had significantly larger Vophys/Vr than
normal children or those with acyanotic heart disease (p< 0.01) (Mecikalski et al. 1984;
42
Fletcher and Jogi, 1986; Lindahl et al. 1987; Bermudez and Lichtiger, 1987; Burrows,
1989; Fletcher, 1989; Arnold et al. 1996)
Measurements o f respiratory deadspace have been useful in predicting successful
weaning from mechanical ventilation in some adult and paediatric patients (Hardman and
Aitkenhead, 1999; Hubble et al. 2000) and may also have the potential to provide
important prognostic information in infants with congenital diaphragmatic hernias
(Arnold et al. 1995) or to provide non-invasive estimates o f cardiac output (Arnold et
al. 1996). Quantification o f alveolar deadspace may be directly related to the
effectiveness o f pulmonary perfusion (Severinghaus et al. 1998).
1.2.5.5 Blood gases
Blood gas analysis allows for the qualitative and quantitative assessment o f the efficacy
o f gas exchange and both metabolic and respiratory acid-base problems, including the
interrelationships between ventilation, oxygenation, and metabolic conditions. Blood gas
analysis is a useful adjunct to clinical patient assessment and other diagnostics in
determining appropriate therapy for specific and complex conditions.
Arterial blood gases have remained the mainstay o f respiratory function monitoring in
the intensive care unit, however because o f their invasive nature, other systems are
constantly being investigated as efficient alternatives (Harrison et al. 1997). Clinical
scoring systems o f respiratory distress are not easy to establish because the clinical signs
are few and non specific. Cyanosis is not easily recognised until saturations fall close to
70%, corresponding to a PaO] o f about 5.32kPa. Hypercapnea has no clinical signs until
it is dangerously far advanced. Arterial blood gases are the prime determinants o f the
need to intubate, change ventilation or extubate (Numa and Newth, 1995).
The lack o f continuous monitoring still makes it difficult to assess acute changes in
hypoxia and hypercapnea. However, the development o f portable bedside blood gas
analysers (Sediame et al. 1999) and more recently, the continuous intra-arterial fibre-
optic blood gas monitoring systems have allowed almost immediate or immediate
assessment o f respiratory status (Numa and Newth, 1995).
43
In summary, there remain large gaps in our knowledge about the effects o f
physiotherapy on respiratory function in ventilated children. The recent availability o f
potential tools for measurement o f respiratory function have made it possible to attempt
to answer some o f the questions regarding the use and effects o f physiotherapy
treatments. Combinations o f the therapies described above were included for assessment
in this study and tidal volumes, C^, Rrs, deadspace volumes, CO2 parameters and arterial
blood gases were selected as outcome measures in appraising the efficacy o f
physiotherapy and nursing suction procedures. The follow ing chapter examines the
theoretical background, methods o f measurement and algorithms employed in
calculation o f these parameters by the “ CO2 SMO Plus” .
44

2. Outcome measures: theoretical background
At the inception of this thesis, the “ CO2SMO Plus” respiratory monitor (Figure 2-1)
was a relatively new portable device for measurements o f respiratory function. Potential
advantages o f this device as a research tool included the capacity to measure and store
recorded data electronically so that subsequent analysis could be performed. In
addition, measurements were non-invasive and made at the mouth of the tracheal tube,
and thus avoided the potential measurement errors associated with gas compression in
the ventilator tubing (Cannon et al. 1999).
Figure 2-1: The “CO2SMO Plus” respiratory monitor with flow sensor and infra
red capnography device.
The neonatal flow sensor shown in right foreground with the infra-red CO2 sensor straddling the combined flow-pressure transducer and in the left foreground without the CO2 sensor
The “ CO2 SMO Plus” directly recorded four variables: flow, pressure, time and CO2
concentration. Flow and pressure were measured instantaneously through an integrated
fixed orifice differential flow-pressure transducer, thereby minimising potential
problems related to time lag. Data were electronically recorded by a 20 bit resolution,
100 Hz flow data sampling microprocessor. The time signal was generated from the
“ CO2SMO Plus” internal clock. The CO2 concentration was measured in real time by a
45
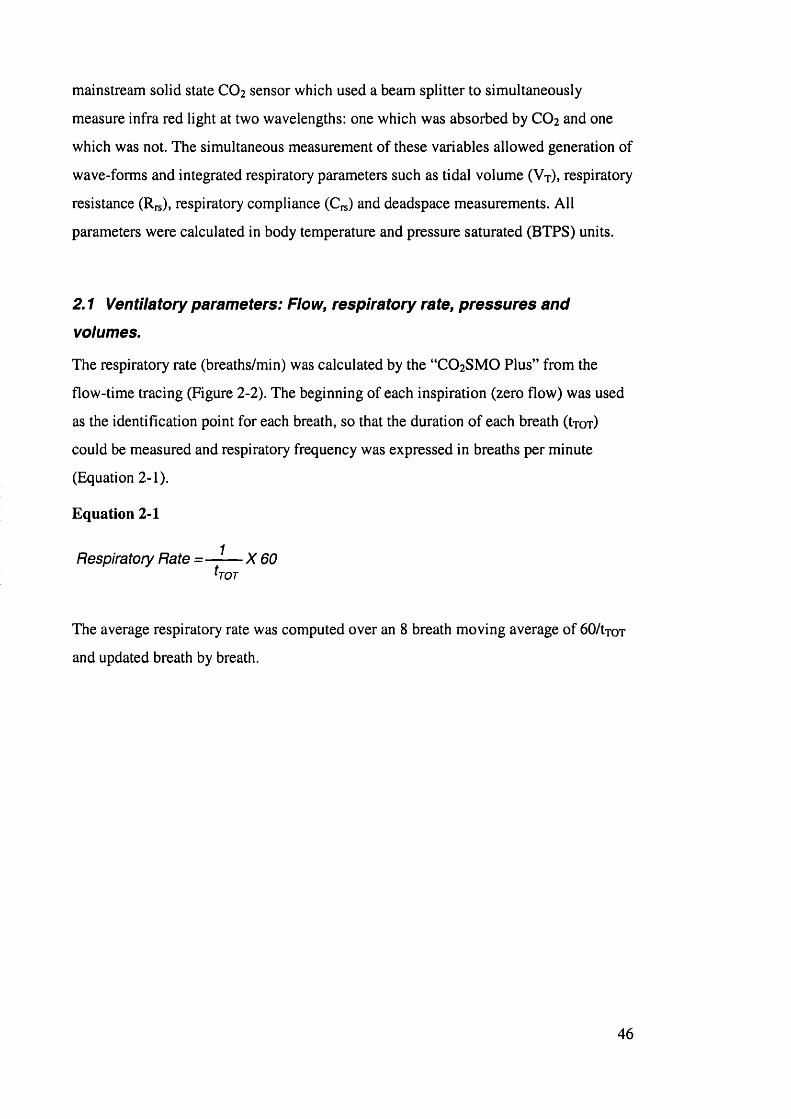
mainstream solid state CO2 sensor which used a beam splitter to simultaneously
measure infra red light at two wavelengths: one which was absorbed by CO2 and one
which was not. The simultaneous measurement of these variables allowed generation of
wave-forms and integrated respiratory parameters such as tidal volume (Vj), respiratory
resistance (Rrs), respiratory compliance (Crs) and deadspace measurements. All
parameters were calculated in body temperature and pressure saturated (BTPS) units.
2 ,1 Ventilatory parameters: Flow, respiratory rate, pressures and
volumes.
The respiratory rate (breaths/min) was calculated by the “CO2SMO Plus” from the
flow-time tracing (Figure 2-2). The beginning of each inspiration (zero flow) was used
as the identification point for each breath, so that the duration of each breath (tjor)
could be measured and respiratory frequency was expressed in breaths per minute
(Equation 2-1).
Equation 2-1
Respiratory Rate = — - — X 60hoT
The average respiratory rate was computed over an 8 breath moving average of bO/tjoT
and updated breath by breath.
46

Figure 2-2: Flow, pressure and volume traces plotted against time
LL-12-16 Time (seconds)
E 16 -
120
S 80
3 40
rhe respiratory rate was automatically calculated from the flow-time tracing (in red), while PEEP, PIP and MAP were measured or calculatedfrom the pressure-time p lo t (in green). Volumes (in blue) were integrated from flow and time.
Peak inspiratory pressure (PIP) was measured from the pressure-time plot (Figure 2-2)
and was derived from the highest absolute pressure data point during the inspiratory
phase. Mean airway pressure (MAP) was the average pressure in the airway during a
complete breath. The value was calculated as the average o f all data pressure points
during a respiratory cycle. Positive end expiratory pressure (PEEP) was the positive
pressure maintained at the end o f expiration. PIP, MAP and PEEP were all expressed in
cmHzO (1 cmHzO = 0.098 kPa).
Volumes were derived from the integration o f flow with respect to time and minute
ventilation (M Y ) was an expression o f volume per minute which was calculated from
tidal volume ( V t ) multiplied by the respiratory rate. V j expressed per kg body weight
was automatically calculated by “ CO2 SMO Plus” when the weight o f the patient was
entered. Tracheal tube leaks could be identified by a difference in magnitude between
Vn and Vte and were commonly encountered in the paediatric intensive care unit where
uncuffed tracheal tubes were routinely used. Unfortunately, magnitude o f tracheal tube
leak was not automatically calculated by the “ CO2 SMO Plus” and was calculated during
47
analysis o f each subject from raw V t i and V t e data (Equation 5 - 1 ) . Because o f the
potential for tracheal tube leak to result in a gross overestimation o f V n but less
underestimation o f V t e , V te was considered to be more accurate and preferable for
calculations o f VT/kg, Vophy/ V t , VCO2, M V and other derived respiratory parameters
(Kuo et al. 1996).
2.2 Respiratory mechanics
The simultaneous measurement o f flow and pressure by the “ CO2 SMO Plus” facilitated
the automatic calculation o f the dynamic mechanical properties o f the respiratory system
(Rrs and Crs) (MacNaughton, 1997). Several methods have traditionally been used to
calculate dynamic Crs and including the Mead-Whittenberger technique (Mead and
Whittenberger, 1953), Least-Squares analysis and multiple linear regression. (Davis et
al. 1996). The “ CO2 SMO Plus” provided calculations o f Crs using both the Mead-
Whittenberger technique and Least-Squares analysis, while calculating Rrs by Least-
Squares analysis alone.
Measurements o f C,s and Rrs with the “ CO2 SMO Plus” were not valid except in the
absence o f respiratory muscle activity. When assisted ventilation was augmented with
spontaneous breaths, pressure changes at the airway opening were distorted by the
combination o f muscular effort by the patient and pressure delivery by the ventilator,
and no longer reflected the underlying respiratory mechanics. Subjects were only eligible
for this study i f they were paralysed or deeply sedated so that no spontaneous breaths
occurred and so that measurements reasonably reflected underlying R^ and Crs. Several
authors have found that accurate measures o f Cn, could be obtained as long as patients
were relaxed and not making spontaneous respiratory efforts. Paralysis was not essential
i f sedation was adequate (Conti et al. 1995; lo tti et al. 1995).
Compliance (C,*) expressed in mL/cmH2 0 is a measure o f the distensibility or elasticity
o f the respiratory system and refers to the ratio o f change in volume to change in
pressure over the respiratory cycle. Thus, i f the lung inflates easily the lung is compliant,
whereas i f the lung needs high pressures to inflate it, it is s tiff or non-compliant
(Widdicombe and Davies, 1991). C,s is determined by the relationship between the
inward elastic recoil o f the lungs and the outward elastic recoil o f the chest wall. The
48
soft bones o f the infant rib cage mean that the elastic recoil o f the thorax is very low
(Papastamelos et al. 1995). Therefore the force opposing pulmonary elastic recoil is
small (Phelan et al. 1982). As the chest wall contributes little to the performance o f the
respiratory system in new-born infants, the properties o f the lungs can be approximated
by measurements over the whole respiratory system. The compliance o f the chest wall
decreases after approximately 6 months o f age with the development o f muscles, rib
ossification and the stiffening o f the chest wall (Motoyama and Davis, 1990).
Respiratory system compliance (C,^) depends on numerous factors including delivered
V t , FRC, lung water content, tissue elasticity, surfactant action, pulmonary blood f l o w
and volume and the visco-elastic properties o f the respiratory system (Fletcher M et al.
1990; Fletcher M et al. 1991; Hjalmarson, 1994).
Respiratory system resistance ( R , . s ) , expressed in cmH20/L/s, is defined as the pressure
required to move gas at a flow o f IL/s. It is defined by the combination o f airway
resistance and tissue resistance. R , s decreases with age as airway calibre increases with
growth. Airway calibre may additionally be influenced by bronchial smooth muscle tone,
mucosal oedema, scar tissue, secretions or thickening o f the airway wall due to muscle
hypertrophy or stenosis, as well as the presence o f a tracheal tube (Hatch and Fletcher,
1992). Since airway resistance is proportional to the fourth power o f the radius o f the
airway, even small changes in calibre can lead to marked changes in airway resistance. In
intubated patients the tracheal tube offers a significant resistance to flow and makes it
hard to obtain a leak proof seal. The characteristics and size o f a tracheal tube w ill
influence the passage o f air and resistance to air flow through it (Manczur et al. 2000).
Tidal volume has been shown to decrease slightly and R, increase when a smaller
diameter tracheal tube is used (Farstad and Bratlid, 1991). The same authors also
reported increased V t and peak airflow through the tracheal tube i f the peak inspiratory
pressure (PIP) was increased which resulted in a decreased Crs and an increased Rrs. Rrs,
or its reciprocal ‘conductance’ , has the potential to provide information about the large
airways while Crs or its reciprocal ‘elastance’ w ill describe the conditions that affect the
recoil o f the lungs in infants (Hjalmarson, 1994).
Most methods for calculating C , s and R , s assume that the lung is a single compartment
model which can be described by a linear differential equation (Equation 2-2). The single
compartment model likens the respiratory system to a balloon on a pipe (Figure 2-3).
49
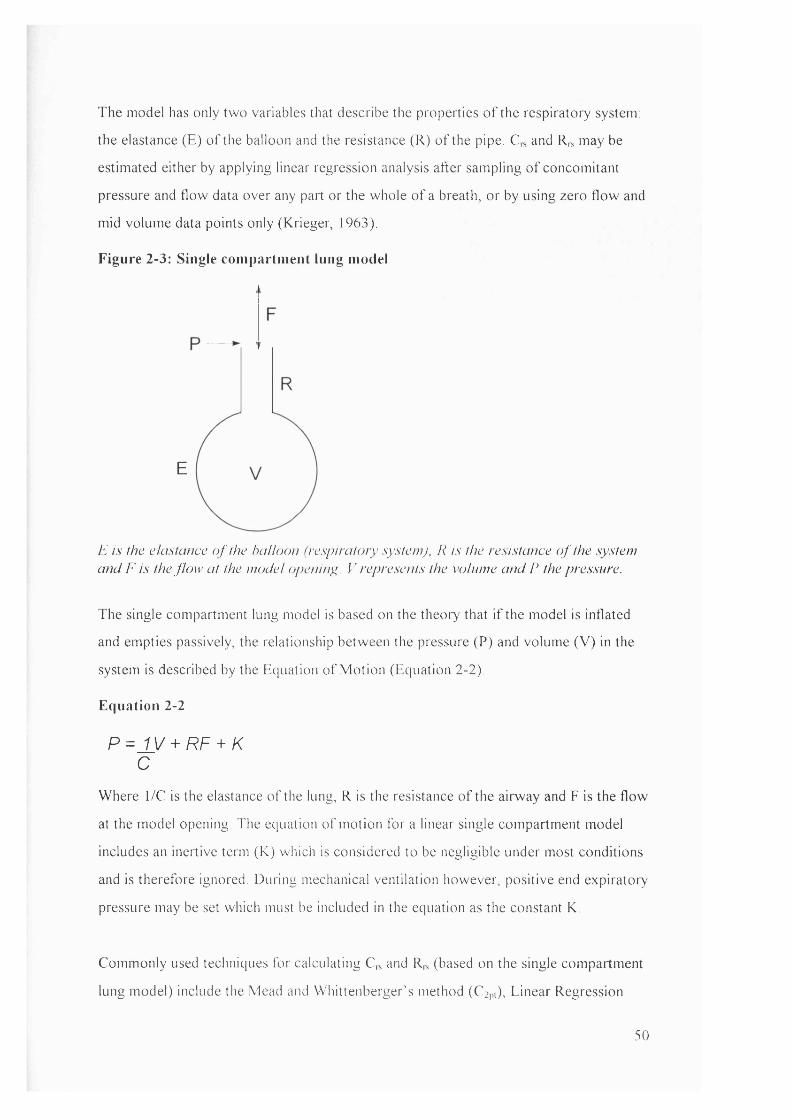
The model has only two variables that describe the properties o f the respiratory system:
the elastance (E) o f the balloon and the resistance (R) o f the pipe. C,s and R,s may be
estimated either by applying linear regression analysis after sampling o f concomitant
pressure and flow data over any part or the whole o f a breath, or by using zero flow and
mid volume data points only (Krieger, 1963).
Figure 2-3: Single compartment lung model
E
E is the elastance o f the haiioon (respiratory system), R is the resistance o f the system and E is the f lo w at the model openiny. V represents the volume and R the pressure.
The single compartment lung model is based on the theory that i f the model is inflated
and empties passively, the relationship between the pressure (P) and volume (V ) in the
system is described by the Equation o f M otion (Equation 2-2).
Equation 2-2
P = ± V + RF + Kc
Where 1/C is the elastance o f the lung, R is the resistance o f the airway and F is the flow
at the model opening. The equation o f motion for a linear single compartment model
includes an inertive term (K ) which is considered to be negligible under most conditions
and is therefore ignored. During mechanical ventilation however, positive end expiratory
pressure may be set which must be included in the equation as the constant K.
Commonly used techniques for calculating C,-s and R,s (based on the single compartment
lung model) include the Mead and Whittenberger’ s method (C 2pi), Linear Regression
50
Analysis and the Least-squares method (Sly et al. 1996). The latter two methods utilise
all data points during the breath cycle for calculation. The Mead and Whittenberger
method uses only the points o f zero flow to calculate C, and mid volume data points to
calculate Rrs during the respiratory cycle (Krieger, 1963). The “ CO2 SMO Plus” provided
calculations o f Crs using both the Least-squares method (Cjyn: Equation 2-4) and zero
flow points (Czpi). The “ CO2 SMO Plus” calculated separately for the inspiratory and
expiratory limbs o f the respiratory cycle using the Least-squares method. This method
minimised the sum o f squares between the observed pressure and the best fit curve,
which resulted in expressions for Rrs and Crs consisting o f cross products o f volume,
flow and pressure (Equation 2-4 and Equation 2-5).
The methods for measuring R , s and C , s have all been shown to be reasonably accurate
under ideal conditions. Although C , s and R , s are now quite commonly calculated using
the flow and pressure transducers incorporated into modern mechanical ventilators,
several authors have referred to potential problems related to the interpretation o f these
parameters. Kuo et al. found that certain factors such as tracheal tube leak adversely
influence the accuracy o f each algorithm differently with some methods remaining
relatively robust in the presence o f a leak (linear regression analysis) and others
becoming grossly inaccurate (C2pi) (Kuo et al. 1996). The performance o f the Least-
squares method in relation to the other methods has not been assessed but its accuracy
in the presence o f leak w ill be discussed in 5.2.1. Other authors have cited inadequate
sampling frequency, time lag, contaminant electrical frequencies in the intensive care
unit environment and the Bernoulli effect in lateral port sampling as factors which
adversely affect accuracy o f respiratory mechanics calculations (Sly et al. 1996;
MacNaughton, 1997).
2.2.1 Respiratory compliance
The “ CO2 SMO Plus” calculated Cdy„ by the Least-Squares method (Equation 2-3)
which minimised the summed squared difference between the observed pressure (Po)
and the best fit curve (Pb), using all the data points on the pressure/volume plot during
the respiratory cycle. This was done by summing the square o f the difference between all
observed points in the actual pressure waveform and a best fit curve (Pb - Po), which
resulted in the equation:
51

Equation 2-3
S = E(Pb-Po) = s (Pb - (iy + RF)f C
Where S is the summed squared difference between the observed pressure (Po: pressure
drop at the airway opening) and the pressure o f the best fit curve curve (Pb), V is the
volume, R is the resistance o f the airway, C is the compliance and F is the flow at the
model opening.
From Equation 2-3, solutions for R and C can be found (Equation 2-4 and Equation 2-
5), which were continuously computed by the “ CO2 SMO Plus” during respiratory
monitoring.
Equation 2-4:
C —Z p v - rZ vf
Where V is the volume, P is the pressure drop at the airway opening (PIP - PEEP), R is
the resistance o f the airway and F is the flow at the model opening. The points o f zero
flow during the breath cycle are excluded from the calculation.
2.2.2 Respiratory Resistance.
Rre was derived separately by the “ CO2 SMO Plus” for both the inspiratory or expiratory
portion o f the breath. In this study expired resistance, calculated from raw data (V, F
and P) on the expiratory limb o f each breath cycle, was o f specific interest because it
utilised the passive expiratory cycle and thus potentially provided more clinically
important information about the condition o f the large airways in patients and less about
the ventilator (Hjalmarson, 1994). In addition, the expiratory limb o f the breath cycle
was less likely to suffer from the confounding influence o f tracheal tube leak. The Least-
squares method employed by the “ CO2 SMO Plus” to calculate expired respiratory
resistance is derived from differentiation o f Equation 2-3.
52
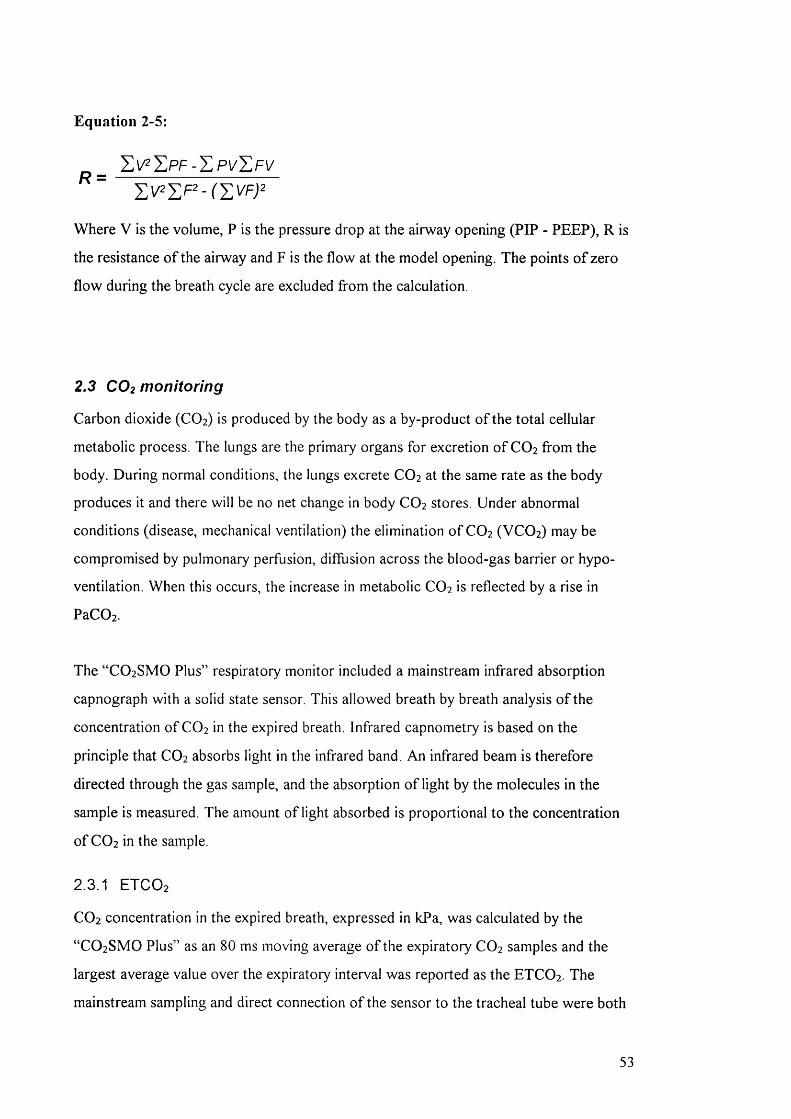
Equation 2-5:
'Z v^ 'Z p f - Z p v 'L f vR =
- ( I ,V F )^
Where V is the volume, P is the pressure drop at the airway opening (PIP - PEEP), R is
the resistance o f the airway and F is the flow at the model opening. The points o f zero
flow during the breath cycle are excluded from the calculation.
2.3 CO2 monitoring
Carbon dioxide (CO 2) is produced by the body as a by-product o f the total cellular
metabolic process. The lungs are the primary organs for excretion o f CO2 from the
body. During normal conditions, the lungs excrete CO2 at the same rate as the body
produces it and there w ill be no net change in body CO2 stores. Under abnormal
conditions (disease, mechanical ventilation) the elimination o f CO2 (VCO 2) may be
compromised by pulmonary perfusion, diffusion across the blood-gas barrier or hypo
ventilation. When this occurs, the increase in metabolic CO2 is reflected by a rise in
PaCOz.
The “ CO2 SMO Plus” respiratory monitor included a mainstream infrared absorption
capnograph with a solid state sensor. This allowed breath by breath analysis o f the
concentration o f CO2 in the expired breath. Infrared capnometry is based on the
principle that CO2 absorbs light in the infrared band. An infrared beam is therefore
directed through the gas sample, and the absorption o f light by the molecules in the
sample is measured. The amount o f light absorbed is proportional to the concentration
o f CO2 in the sample.
2.3.1 ETCO 2
CO2 concentration in the expired breath, expressed in kPa, was calculated by the
“ CO2 SMO Plus” as an 80 ms moving average o f the expiratory CO2 samples and the
largest average value over the expiratory interval was reported as the ETCO 2 The
mainstream sampling and direct connection o f the sensor to the tracheal tube were both
53
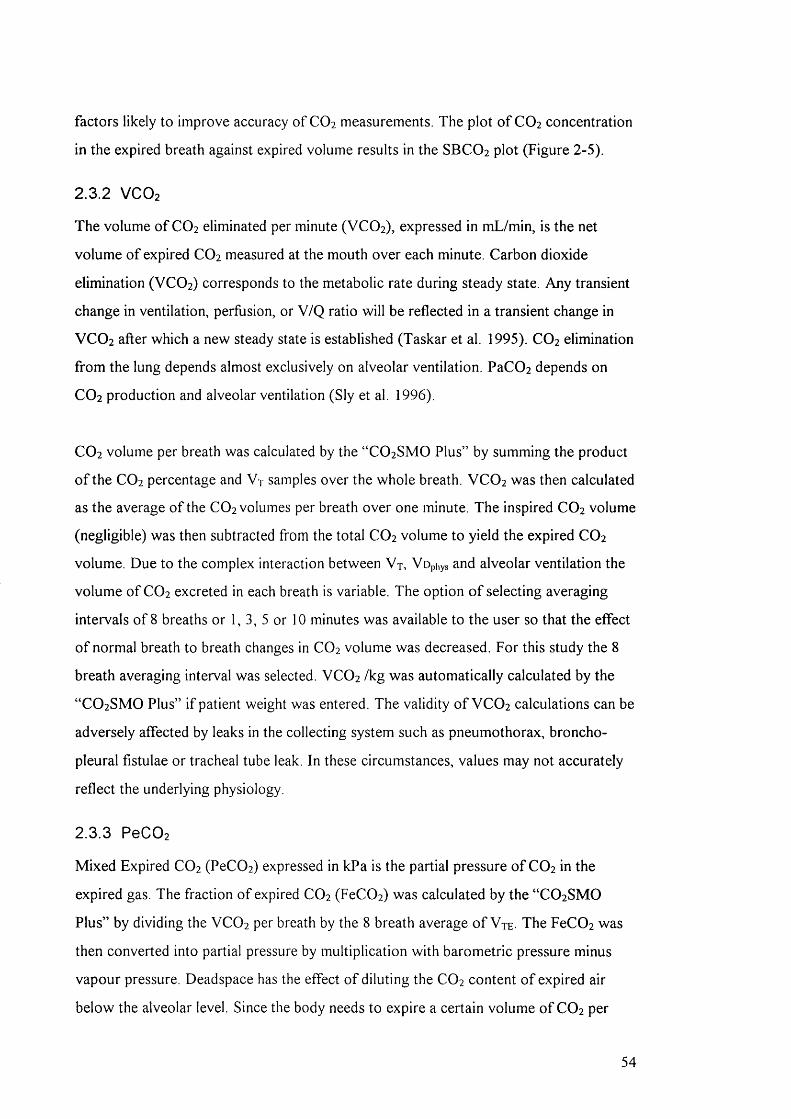
factors likely to improve accuracy o f CO2 measurements. The plot o f CO2 concentration
in the expired breath against expired volume results in the SBCO2 plot (Figure 2-5).
2.3.2 VC O 2
The volume o f CO2 eliminated per minute (VCO 2), expressed in mL/min, is the net
volume o f expired CO2 measured at the mouth over each minute. Carbon dioxide
elimination (VCO 2) corresponds to the metabolic rate during steady state. Any transient
change in ventilation, perfusion, or V/Q ratio w ill be reflected in a transient change in
VCO 2 after which a new steady state is established (Taskar et al. 1995). CO2 elimination
from the lung depends almost exclusively on alveolar ventilation. PaCO: depends on
CO2 production and alveolar ventilation (Sly et al. 1996).
CO2 volume per breath was calculated by the “ CO2 SMO Plus” by summing the product
o f the CO2 percentage and V | samples over the whole breath. VCO 2 was then calculated
as the average o f the CO2 volumes per breath over one minute. The inspired CO2 volume
(negligible) was then subtracted from the total CO2 volume to yield the expired CO2
volume. Due to the complex interaction between V t , Vophys and alveolar ventilation the
volume o f CO2 excreted in each breath is variable. The option o f selecting averaging
intervals o f 8 breaths or 1, 3, 5 or 10 minutes was available to the user so that the effect
o f normal breath to breath changes in CO2 volume was decreased. For this study the 8
breath averaging interval was selected. VCO 2 /kg was automatically calculated by the
“ CO 2 SMO Plus” i f patient weight was entered. The validity o f VCO 2 calculations can be
adversely affected by leaks in the collecting system such as pneumothorax, broncho
pleural fistulae or tracheal tube leak. In these circumstances, values may not accurately
reflect the underlying physiology.
2.3.3 PeCOz
Mixed Expired CO2 (PeC02) expressed in kPa is the partial pressure o f CO2 in the
expired gas. The fraction o f expired CO2 (FeC02) was calculated by the “ CO2 SMO
Plus” by dividing the VCO 2 per breath by the 8 breath average o f V te - The FeC02 was
then converted into partial pressure by multiplication with barometric pressure minus
vapour pressure. Deadspace has the effect o f diluting the CO2 content o f expired air
below the alveolar level. Since the body needs to expire a certain volume o f CO2 per
54
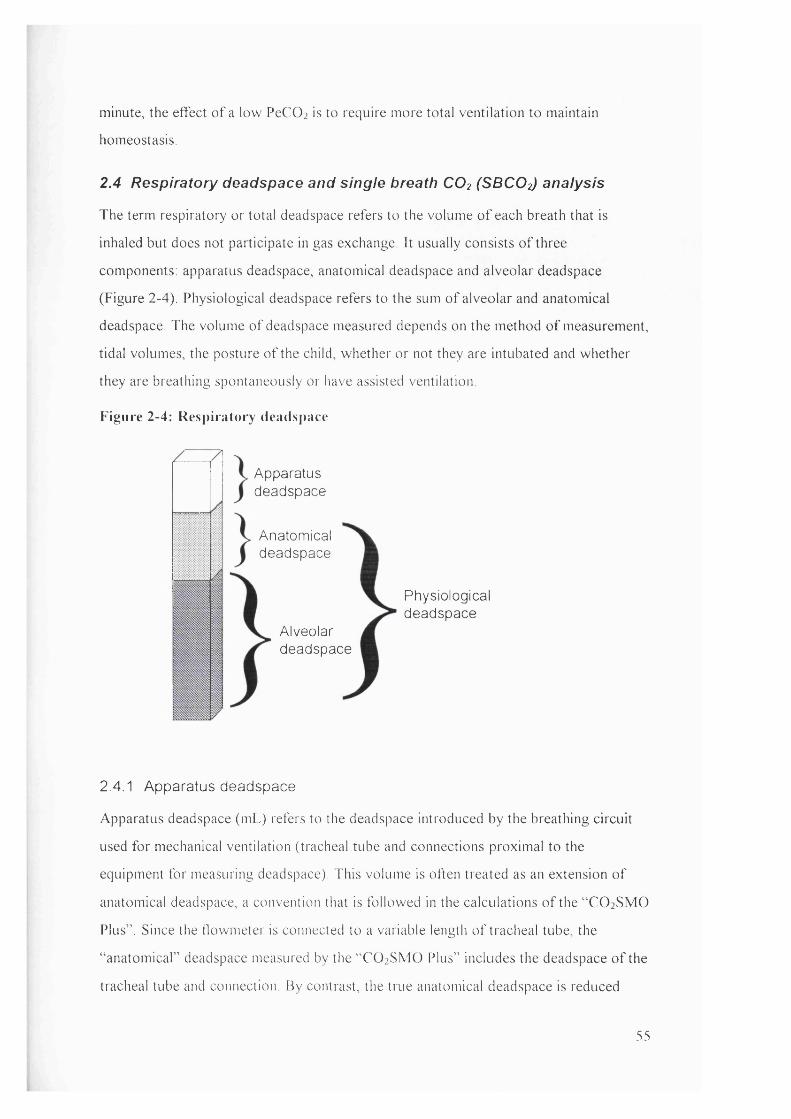
minute, the effect o f a low PeCO: is to require more total ventilation to maintain
homeostasis.
2.4 Respiratory deadspace and single breath CO2 (SBCO2) analysis
The term respiratory or total deadspace refers to the volume o f each breath that is
inhaled but does not participate in gas exchange. It usually consists o f three
components: apparatus deadspace, anatomical deadspace and alveolar deadspace
(Figure 2-4). Physiological deadspace refers to the sum o f alveolar and anatomical
deadspace. The volume o f deadspace measured depends on the method o f measurement,
tidal volumes, the posture o f the child, whether or not they are intubated and whether
they are breathing spontaneously or have assisted ventilation
Figure 2-4: Respiratory deadspace
Apparatusdeadspace
Anatomicaldeadspace
Alveolardeadspace
Physiologicaldeadspace
2.4.1 Apparatus deadspace
Apparatus deadspace (mL) refers to the deadspace introduced by the breathing circuit
used for mechanical ventilation (tracheal tube and connections proximal to the
equipment for measuring deadspace). This volume is often treated as an extension o f
anatomical deadspace, a convention that is followed in the calculations o f the “ CO 2 SMO
Plus” . Since the flowmeter is connected to a variable length o f tracheal tube, the
“ anatomical” deadspace measured by the “ CO2 SMO Plus” includes the deadspace o f the
tracheal tube and connection. By contrast, the true anatomical deadspace is reduced
55
during mechanical ventilation since the conducting areas o f the nasopharynx are
bypassed by the tracheal tube. The apparatus deadspace subtracted from the measured
anatomical deadspace would yield the volume o f the anatomical deadspace (excluding
the conducting areas o f the nasopharynx). Because the purpose o f this study was to
evaluate the effect o f therapeutic interventions, no effort was made to measure or
subtract the apparatus deadspace from the anatomical deadspace since it remained
constant throughout the measurement period.
2.4.2 Anatomical deadspace (Voairway)
Anatomical deadspace (VD;,i,^ay) is defined as extending from the airway opening to the
interface between inspired and alveolar gas. Its volume is that o f all the conducting
airways and naso-pharynx and is difficult both to identify anatomically and to measure.
One way o f measuring Voaii vay is to calculate physiological deadspace (Vophy.,) from the
Bohr equation (Equation 2-9). In normal subjects V[)ai,^ay is almost equal to the Vophys.
However this assumption is not true in patients with lung disease in whom Vophys can be
considerably larger than Vi)ai,^ay (Widdicombe, 1974; West, 1995).
The use o f expired CO2 analysis to measure respiratory deadspace was introduced by
Aitken and Clarke-Kennedy in 1928. Fowler developed a functional method o f
measuring Voaii^ay which involved plotting the concentration o f N 2 in expired gas against
expired volume during a washout procedure (Fowler, 1948). Fletcher et al then adapted
the technique to use expired CO2 concentration plotted against expired volume (Fletcher
(a), 1984; Fletcher (a), 1986). The “ CO2 SMO Plus” simultaneously measured CO2 and
flow during expiration from which a plot o f expired CO2 versus volume could be
generated. This plot known as single breath CO2 (SBCO2) or volumetric capnography
was used to estimate a number o f respiratory parameters such as VCO 2 , Voainvay, Voaiv
and alveolar tidal volume (Figure 2-5)
56
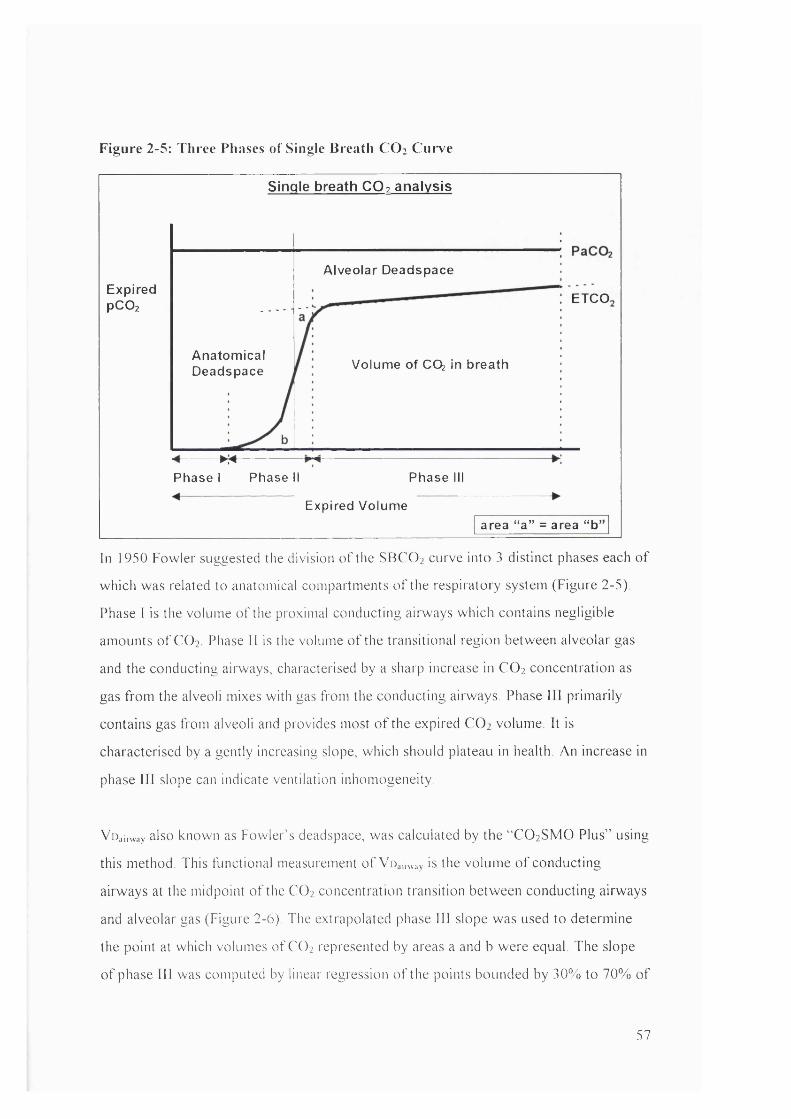
Figure 2-5: Three Phases of Single Breath C O 2 Curve
Single breath CO? analysis
ExpiredPCO2
A lveo la r Deadspace
ETCO.
A na tom ica lDeadspace Volum e o f CO^ in breath
* 7 +Phase I Phase II Phase III
Expired Volum earea “ a ” = area “ b ’
In 1950 Fowler suggested the division o f the SBCO2 curve into 3 distinct phases each o f
which was related to anatomical compartments o f the respiratoi"y system (Figure 2-5).
Phase I is the volume o f the proximal conducting airways which contains negligible
amounts o f CO2 Phase 11 is the volume o f the transitional region between alveolar gas
and the conducting airways, characterised by a sharp increase in CO 2 concentration as
gas from the alveoli mixes with gas from the conducting airways. Phase III primarily
contains gas from alveoli and provides most o f the expired CO 2 volume. It is
characterised by a gently increasing slope, which should plateau in health. An increase in
phase III slope can indicate ventilation inhomogeneity.
VD;,i,-way also known as Fowler’s deadspace, was calculated by the “ CO2 SMO Plus” using
this method. This functional measurement o f Vir,inv:,y is the volume o f conducting
airways at the midpoint o f the CO2 concentration transition between conducting airways
and alveolar gas (Figure 2-6). The extrapolated phase 111 slope was used to determine
the point at which volumes o f CO2 represented by areas a and b were equal. The slope
o f phase III was computed by linear regression o f the points bounded by 30% to 70% o f
57
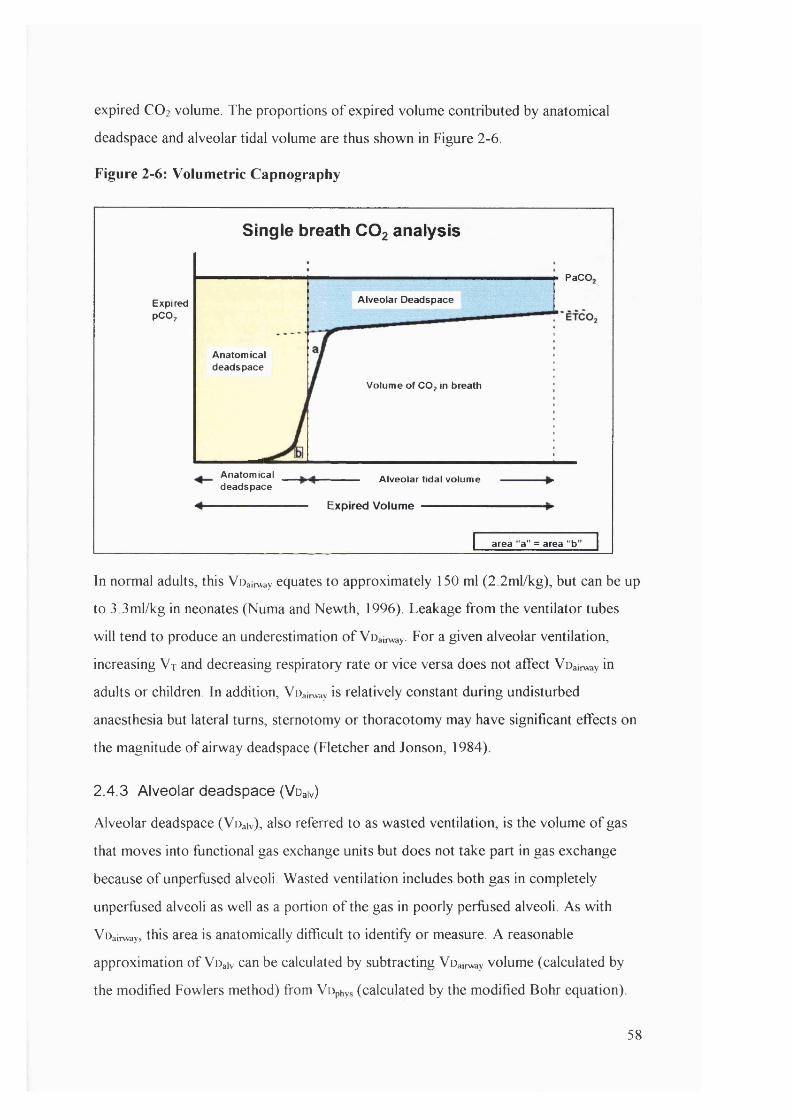
expired CO2 volume. The proportions o f expired volume contributed by anatomical
deadspace and alveolar tidal volume are thus shown in Figure 2-6.
Figure 2-6: Volumetric Capnography
Single breath COg analysis
PaCO.
Alveolar DeadspaceExpiredPCO;
Anatomicaldeadspace
Volume of CO; in breath
Anatomicaldeadspace
Alveolar tidal volume
Expired Volume
area “a” = area “b'
In normal adults, this VDairway equates to approximately 150 ml (2.2ml/kg), but can be up
to 3 .3ml/kg in neonates (Numa and Newth, 1996). Leakage from the ventilator tubes
will tend to produce an underestimation o f Voainvay- For a given alveolar ventilation,
increasing V t and decreasing respiratory rate or vice versa does not affect Voairway in
adults or children. In addition, Voainvay is relatively constant during undisturbed
anaesthesia but lateral turns, sternotomy or thoracotomy may have significant effects on
the magnitude o f airway deadspace (Fletcher and Jonson, 1984).
2.4.3 Alveolar deadspace (Voaiv)
Alveolar deadspace (Voaiv), also referred to as wasted ventilation, is the volume o f gas
that moves into functional gas exchange units but does not take part in gas exchange
because o f unperfused alveoli. Wasted ventilation includes both gas in completely
unperfused alveoli as well as a portion o f the gas in poorly perfused alveoli. As with
Voainvay, this area is anatomically difficult to identify or measure. A reasonable
approximation o f Voaiv can be calculated by subtracting Voainvay volume (calculated by
the modified Fowlers method) from Vophys (calculated by the modified Bohr equation).
58
This was the method utilised by the “ CO2 SMO Plus” to calculate Voaiv The derivation
o f the Bohr equation is discussed in 2.4.4.
Oxygen uptake depends on the matching between alveolar ventilation and pulmonary
perfusion (V/Q matching) and on diffusion time, diffusion gradient and diffusion area
(Poets and Martin, 1996). Voaiv /V t reflects the degree to which alveolar ventilation and
perfusion fail to match each other, whether regionally in the lung as in pulmonary
embolism or globally as in asthma.
Wasted ventilation may occur due to any condition that abnormally elevates the
ventilation/perfusion (V/Q) ratio such as pulmonary hypotension, pulmonary embolus,
hyperventilation, obstruction o f pulmonary arterioles and alveolar hyperinflation. In
children both gross hypo- and hyper-perfusion cause an increase in Voaiv (Fletcher and
Jonson, 1984). V d .,|v increases with age with the growth o f the gas exchange surface.
2.4.4 Physiological deadspace (Vophys)
Physiological deadspace (Vopi.ys) refers to the sum o f Vd^iv and Voainv-ny. Once again,
however, Vophys is not an identifiable anatomical volume and the methods that measure it
are based on functional definitions o f deadspace rather than morphological definitions.
The “ CO2 SMO Plus” calculated Vi)pi,ys and alveolar deadspace (Voaiv) using a modified
version o f the Bohr equation developed by Christian Bohr in 1891. The theoretical basis
for the Bohr equation is that the volume o f CO2 in a breath collected at the mouth is
equivalent to the volume expired from the functional alveolar space. The total amount o f
a gas in an expired breath is the volume o f that gas times its fractional concentration.
Because CO2 in the expired gas must have come from alveolar ventilation:
Equation 2-6: VCO2 = VtFi:C0 2
where V jis the volume exhaled per minute and FeC02 is the fractional concentration o f
CO2 in mixed expired gas. Since the expired volume ( V t ) consists o f both deadspace
and the expired alveolar volume. Equation 2-6 can be rearranged:
Equation 2-7: VtFi:C0 2 = (Vr - Vd)FaC0 2 + Vd x 0
59
where FaC02 is the fractional concentration o f CO2 in the alveolar space. The
concentration o f CO2 in the deadspace is assumed to be zero. N ow Equation 2-7 is
rearranged:
Equation 2-8: V dFaCOz = V tFaCOz - V tFeC02
Then
Equation 2-9: VdA^t = (FaC0 2 - FeCOz) / FaCOz
Then converting the fractional concentrations to partial pressure:
Equation 2-10: VdA^t = (PaCOz - PeCOi) / ?aC0 2
This is the modified version o f the Bohr equation for CO2 Enghoff further modified this
equation (Nunn, 1989) by suggesting that ideal alveoli have PaC02 equal to PaC02 in
normal subjects and that the measured arterial blood gas can be used to replace PACO2 :
Equation 2-11: Vo/V-r = (PaC0 2 - PECO2) / Paco2
PeC02 (PeC02) was calculated by the "CO 2 SIVIO Plus” from the concentration o f CO2
in expired gas and PaC0 2 was obtained from simultaneous blood gas analysis. V d /V t is
sometimes referred to as the wasted fraction o f each breath. It is typically 0.33 in normal
adults but can be higher (0.44 - 0.47) in neonates (Numa and Newth, 1996). Vophy* may
increase with lung disease because o f V/Q mismatching (Hlastala and Berger, 1996). An
increase in delivered V t in a ventilated child would result in a progressive decrease in
V d/ V t . Multiplying the Vd /V t by V t gives the total volume o f deadspace. The volume
o f air in the tracheal tube, connector and tubing proximal to the CO2 measurement w ill
contribute to this volume. Vophys is obtained when Vr);,i,.w:.y is subtracted from total
deadspace volume.
2.5 Arterial blood gases
Arterial blood gases are the gold standard for monitoring changes in respiratory function
in ventilated children. The portable bedside system used for analysis o f blood gases in
the intensive care units at Great Ormond Street Hospital was the Hewlett Packard i-Stat
Blood Analysis System. The system analyses arterial blood gases when a cartridge filled
w ith a patient’ s arterial blood sample is inserted into a hand held analyser. A capillary
chamber draws the sample into the cartridge. Calibrant is drawn from a gas-tight sealed
60
pouch to the sensors and electrochemical measurements are made on the calibrant fluid.
Then a diaphragm pump delivers the blood sample and electrochemical measurements
are repeated. The i-Stat system uses miniaturised versions o f standard electrochemical
electrodes to perform potentiometric (voltage) and amperometric (current)
measurements on solutions and relate these to the concentrations o f the analytes o f
interest.
Each i-Stat cartridge contains sensors for the measurement o f pH, PaC02 and PaOi,
heating elements, reference electrodes, sensors for the measurement o f specific analytes
and a buffered aqueous calibrant solution o f known concentrations. The calibrant
solution is buffered to pH = 7.43 which contains 30mmHg o f PCO2 and IbOmmHg o f
PO2 and automated internal calibration occurs daily.
An independent study comparing the performance o f the i-STAT portable clinical
analyser for measuring blood gases and pH to a conventional blood gas analyser
(ABL520 Radiometer) found that the two systems gave nearly identical values and that
blood gas analysis using the i-STAT portable device was comparable w ith that
performed by a conventional laboratory blood gas analyser (Sediame et al. 1999).
2.5.1 pH and PaC02
PaC02 along with pH is used to assess the balance between acids and bases in the blood
plasma. The ingestion and production o f acidic and basic material by the body is offset
by the amount o f acidic and basic material metabolised and excreted. Normal blood
plasma is slightly alkaline with an excess o f hydroxyl ions in comparison to hydrogen.
The PaC02 is a measure o f the partial pressure o f CO2 dissolved in arterial blood. It
represents the respiratory component o f acid base balance and reflects the balance
between cellular production o f CO2 and ventilatory removal o f CO2 A change in PaC02
indicates an alteration in this balance. Causes o f primaiy respiratory acidosis (increase in
PaC0 2 ) in paralysed ventilated children include airway obstruction, mechanical hypo
ventilation or acute changes in V/Q matching. Primary causes o f respiratory alkalosis
(decreased PaC0 2 ) include mechanical hyperventilation, acute improvement in
pulmonary gaseous exchange, oedema and neurological disorders.
61

PaCO] and pH are measured by direct potentiometry. Potentiometric measurements
measure the potential difference between the sensing electrode and a non-responding
reference electrode in a solution. The concentration o f pH or CO2 are then related to
potential difference through the Nernst equation.
The manufacturers compared the accuracy o f pH and PaCO] measurements w ith the i-
Stat against the accuracy o f four other validated systems. The mean CV between
methods was between 0.04% and 0.05% for pH and between 1.3% and 3% for PaCO]
The correlation between methods exceeded 0.98 in all cases but one (where r = 0.95) for
pH and exceeded 0.98 in all cases for PaCO]
2.5.2 PaO]
PaO] is a measurement o f the partial pressure o f oxygen dissolved in arterial blood.
Some causes for reduction in PaO] include decreased pulmonary ventilation, impaired
pulmonary gas exchange, and cardiopulmonary shunting and V/Q inequality.
PaO] is measured amperometrically. Amperometric measurements are the steady state
measurements o f the current flowing through an electrode when an electrochemical
reaction is occurring. The current generated at the electrode is directly proportional to
the number o f electrons being transferred between the electrode and the analyte in
solution. Oxygen thus permeates through a gas permeable membrane from the blood
sample onto an internal electrolyte solution where it is reduced at the cathode. The
oxygen reduction current is proportional to the dissolved oxygen concentration.
The comparison o f HP i-Stat performance in PO] measurements against 4 other
validated systems yielded a correlation which exceeded 0.995 in all cases. The mean CV
between methods was between 2.06% and 3.92%.
2.5.3 HCO 3-
Bicarbonates are inorganic salts that contain the HCO 3 - radical. They are an important
factor in determining the pH o f the blood and the concentration o f bicarbonate ions is
regulated primarily by the kidneys. HCO 3- (bicarbonate) is the most abundant buffer in
blood plasma and an indicator o f the alkali reserve or buffering capacity o f the blood.
HCO 3 - represents the metabolic component o f acid-base balance and causes o f primary
metabolic acidosis (decrease in HCO 3-) include lactate acidosis (hypoxia), diarrhoea and
62

ketoacidosis. Causes o f primary metabolic alkalosis include vomiting and alkaline
treatments. HCO 3 - is calculated by the following equation using measured values for pH
and PaCOz
Equation 2-12
log HCO3- = pH + log PaC0 2 - 7.608
2.5.4 Base Excess
Base excess o f the extracellular fluid or standard base excess is defined as the
concentration o f titratable base minus the concentration o f titratable acid when titrating
the average intracellular fluid to an arterial plasma pH o f 7.4 at PaCO] o f 40mmHg at
37°C. Excess concentration o f base in the average extracellular fluid remains virtually
constant during acute changes in PaCO] and reflects only the non respiratory component
o f pH disturbances. Base excess is calculated by the following equation using the
measured pH and calculated HCO 3 -
Equation 2-13
BEecf = HCO3 - 24.8 + 16.2(pH - 7.4)
2.5.5 SaO]
SaO] or oxygen saturation is the amount o f oxyhaemoglobin expressed as a fraction o f
the total amount o f haemoglobin able to bind oxygen (oxy- plus deoxyhaemoglobin).
SaO] is calculated from measured PaO], PaCO] and pH. This calculation assumes
normal affinity o f oxygen for haemoglobin and assumes that normal amounts o f
dysfunctional haemoglobin are present. SaO] is a useful predictor o f the amount o f
oxygen that is available for tissue perfusion. Reduced levels o f SaO] may be caused by
low PaO] or impaired ability o f haemoglobin to carry oxygen.
2.5.6 Factors affecting results
Exposing the arterial blood sample to air allows CO] to escape which causes PaCO] to
decrease, pH to increase and HCO 3 - to be under-estimated. In addition PaO] w ill
increase when values are below 150mmHg or decrease when values are above
150mmHg. Allowing blood to stand (without exposure to air) before testing allows
PaCO] to increase and pH to decrease due to metabolic processes which causes HCO 3-
to be overestimated. Thus changes in the measured pH and PaCO] affect the calculated
63
values. SaO] values calculated from measured PaCO] and an assumed oxyhaemoglobin
dissociation curve may differ significantly from the direct measurement.
64
3. Validation of equipment
3.1 Validation of the “CO2SMO Pius”
The manufacturers printed specifications relating to the “ CO2 SMO Plus” (Novametrix
Medical Systems inc. Wallingford, CT) suggested that the accuracy, linearity, dead
space, resistance and frequency response o f the instrument were suitable for the
purposes o f this research. However, these investigations were not performed in clinical
environments and did not take into account the potential effects o f adding a tracheal
tube to the flow meter circuit. Addition o f a tracheal tube may cause significant
degradation o f the linear range over which the flow meter is accurate (Jackson et al. (b)
1995). In addition a wide variety o f algorithms are used in the “ CO2 SMO Plus”
software, some o f which have underlying assumptions that may not be valid when
applied to measurements in ventilated infants. Further in vitro studies were therefore
performed to identify potential hardware and software problems. In-vivo studies were
also necessary to determine the effects o f tracheal tube leaks, appropriate measurement
intervals for obtaining baseline and post-treatment data, normal variability o f parameters
in the absence o f intervention, and the effects o f connection and disconnection o f the
flow sensor. These could not be accurately assessed in-vitro (Jackson et al. (b) 1995).
3.1.1 Accuracy of volume (flow) recordings
Accuracy o f flow recording and linearity for the neonatal, paediatric and adult flow
sensors were established by connecting each in turn to an appropriate size o f calibrated
Hans-Rudolf syringe. Different volumes were passed through the flow sensors at
variable frequencies to establish whether flow and time were successfully integrated by
the “ CO2 SMO Plus” to produce an accurate reflection o f the known volumes. This
method had the dual advantage o f assessing accuracy o f volume integration as well as
determining the linear range in which flow recordings were accurate. The flow range for
which volume was accurately integrated was determined by the linear range o f the
neonatal, paediatric or adult flow sensor. Flow sensor specifications published by the
manufacturers suggested that the neonatal and adult flow sensors were accurate to
within 3% between flows o f 0.25 to 28L/min and 2 to 180L/min respectively. The
manufacturer’ s limits for V t were 1 - 500mL for the neonatal flow sensor, 30 - lOOOmL
65
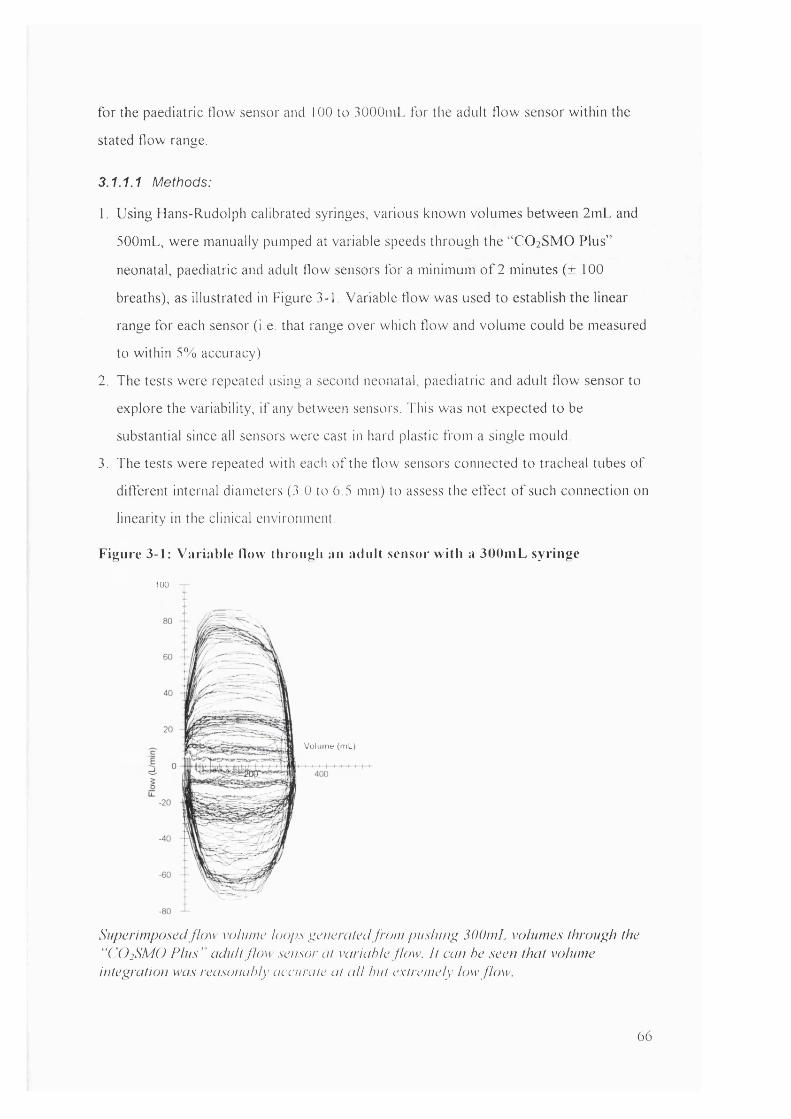
fo r the paediatric flow sensor and 100 to 3000niL for the adult flow sensor w ithin the
stated flow range.
3.1.1.1 Methods:
1. Using Hans-Rudolph calibrated syringes, various known volumes between 2mL and
500mL, were manually pumped at variable speeds through the “ CO 2 SMO Pius”
neonatal, paediatric and adult flow sensors for a minimum o f 2 minutes (± 100
breaths), as illustrated in Figure 3-1, Variable flow was used to establish the linear
range for each sensor (i.e. that range over which flow and volume could be measured
to w ithin 5% accuracy).
2. The tests were repeated using a second neonatal, paediatric and adult flow sensor to
explore the variability, i f any between sensors. This was not expected to be
substantial since all sensors were cast in hard plastic from a single mould.
3. The tests were repeated with each o f the flow sensors connected to tracheal tubes o f
different internal diameters (3 .0 to 6.5 mm) to assess the effect o f such connection on
linearity in the clinical environment.
Figure 3-1: Variable How through au adult sensor w ith a 300mL syringe
100
Volume (mL)
Superimposed flow volume loops generated from pushing, 300mL volumes through the ' ‘CÜ 2SMO P lus" adult flow sensor at variable flow. I t can he seen that volume intep;ration was reasonably accurate at a ll but extremely low flow.
66
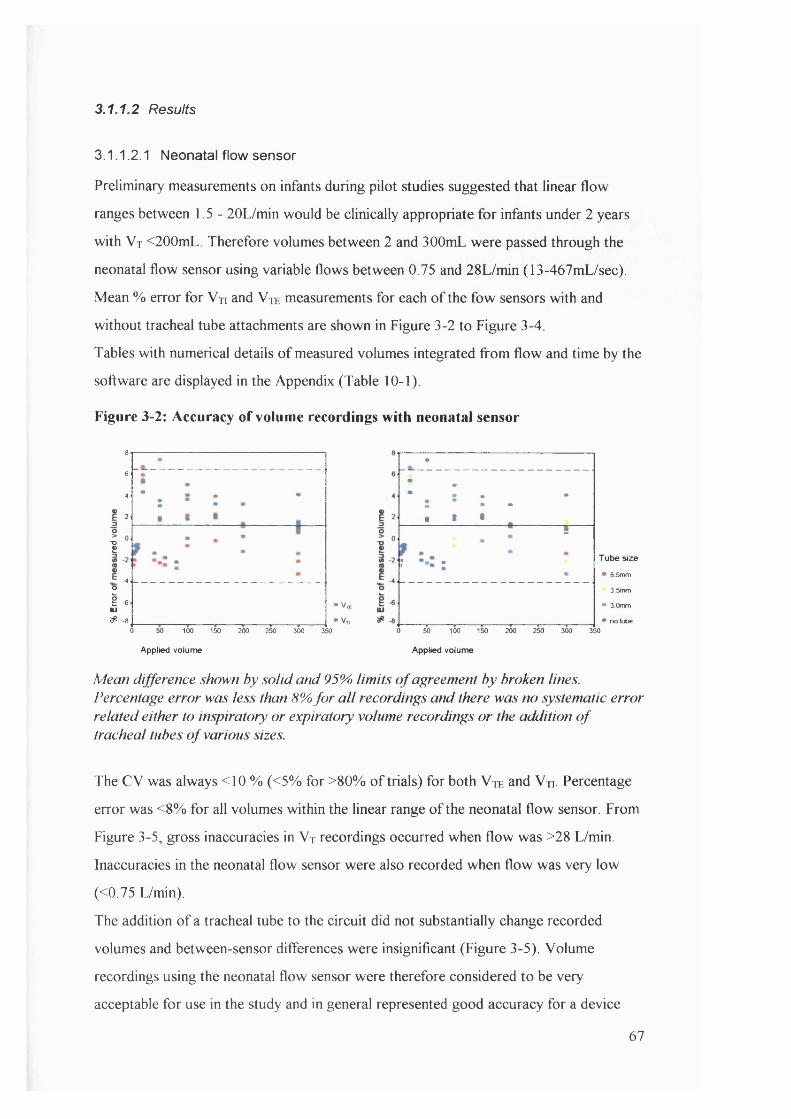
3.1.1.2 Results
3.1.1.2.1 Neonatal flow sensor
Preliminary measurements on infants during pilot studies suggested that linear flow
ranges between 1.5- 20L/min would be clinically appropriate for infants under 2 years
with V t <200mL. Therefore volumes between 2 and 300mL were passed through the
neonatal flow sensor using variable flows between 0.75 and 28L/min (13-467mL/sec).
Mean % error for Vn and V je measurements for each o f the fbw sensors with and
without tracheal tube attachments are shown in Figure 3-2 to Figure 3-4.
Tables with numerical details o f measured volumes integrated from flow and time by the
software are displayed in the Appendix (Table 10-1).
Figure 3-2: Accuracy of volume recordings with neonatal sensor
8642
I
-4OI -6 ■ V,lU^ -8 • V,
100 150 200 250 300 350
•
: ; : .
• * • ■
•
.....S ..............
r :•
T ube size
• 6 5mm 3.5mm
• 3 0mm• no tube
Applied volume
50 100 150 200 250 300 350Applied volume
Mean difference shown by solid and 95% lim its o f agreement by broken lines. Percentage error was less than 8% fo r a ll recordings and there was no systematic error related either to inspiratory or expiratory volume recordings or the addition o f tracheal tubes o f various sizes.
The CV was always <10 % (<5% for >80% o f trials) for both V te and Vn. Percentage
error was <8% for all volumes within the linear range o f the neonatal flow sensor. From
Figure 3-5, gross inaccuracies in V t recordings occurred when flow was >28 L/min.
Inaccuracies in the neonatal flow sensor were also recorded when flow was very low
(<0.75 L/min).
The addition o f a tracheal tube to the circuit did not substantially change recorded
volumes and between-sensor differences were insignificant (Figure 3-5). Volume
recordings using the neonatal flow sensor were therefore considered to be very
acceptable for use in the study and in general represented good accuracy for a device
67
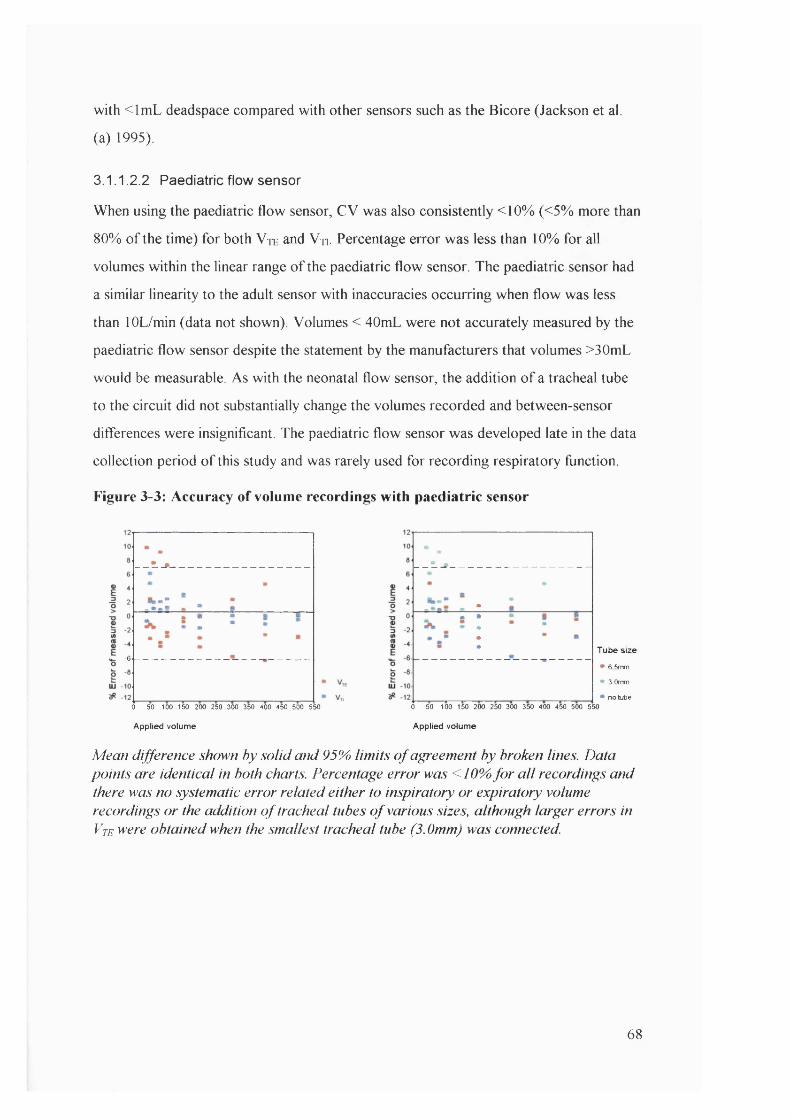
with < lm L deadspace compared with other sensors such as the Bicore (Jackson et al.
(a) 1995).
3.1.1.2.2 Paediatric flow sensor
When using the paediatric flow sensor, CV was also consistently <10% (<5% more than
80% o f the time) for both V te and Vn. Percentage error was less than 10% for all
volumes within the linear range o f the paediatric flow sensor. The paediatric sensor had
a similar linearity to the adult sensor with inaccuracies occurring when flow was less
than lOL/min (data not shown). Volumes < 40mL were not accurately measured by the
paediatric flow sensor despite the statement by the manufacturers that volumes >30mL
would be measurable. As with the neonatal flow sensor, the addition o f a tracheal tube
to the circuit did not substantially change the volumes recorded and between-sensor
differences were insignificant. The paediatric flow sensor was developed late in the data
collection period o f this study and was rarely used for recording respiratory function.
Figure 3-3: Accuracy of volume recordings with paediatric sensor
-6
0 50 100 150 200 250 300 350 400 450 500 550
Applied volume
Tube size
• 6 5mm• 3.0mm• no tube
0 50 100 150 200 250 300 350 400 450 500 550
Applied volume
Mean difference shown by solid and 95% lim its o f agreement by broken lines. Data points are identical in both charts. Percentage error was <10% fo r a ll recordings and there was no systematic error related either to inspiratory or expiratory volume recordings or the addition o f tracheal tubes o f various sizes, although larger errors in Vte were obtained when the smallest tracheal tube (3.0mm) was connected.
68
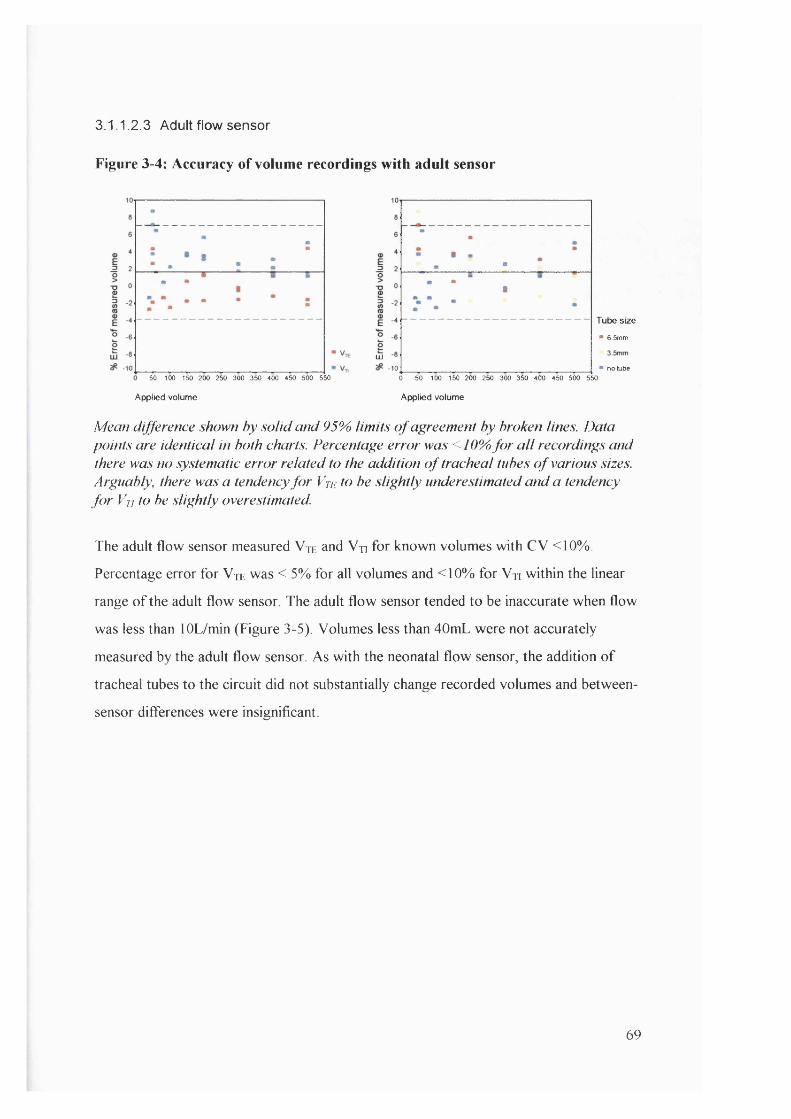
3.1.1.2.3 Adult flow sensor
Figure 3-4: Accuracy of volume recordings with adult sensor
Tube size
■ 6.5mm
LU
-10 • no Lube50 100 150 200 250 300 350 400 450 500 550 0 50 100 150 200 250 300 350 400 450 500 550
Applied volume Applied volume
Mean difference shown by solid and 95% limits o f agreement by broken lines. Data points are identical in both charts. Percentage error was <10% fo r a ll recordings and there was no systematic error related to the addition o f tracheal tubes o f various sizes. Arguably, there was a tendency fo r Vte to be slightly underestimated and a tendency fo r Vn to be slightly overestimated.
The adult flow sensor measured Vtk and Vn for known volumes with CV <10%.
Percentage error for V je was < 5% for all volumes and <10% for Vn within the linear
range o f the adult flow sensor The adult flow sensor tended to be inaccurate when flow
was less than lOL/min (Figure 3-5). Volumes less than 40mL were not accurately
measured by the adult flow sensor As with the neonatal flow sensor, the addition o f
tracheal tubes to the circuit did not substantially change recorded volumes and between-
sensor differences were insignificant.
69

Figure 3-5: Volume accuracy of lOOmL applied signal over range of flows and
measurement conditions
Neonatal flow sensor
110
_iE
E3 ° sensor 1
° sensor 2
10 20 30 400
80
Ï 60
50
Adult flow sensor
%
D sensor 1
sensor 1: 3.0 tube
“ sensor 1: 6.5 tube
“ « n s o r2
Flow (L/min)10 20
Flow (L/min)
Volumes recorded by the neonatal and adidt flow sensor using a lOOmL Hans-Rudolph calibrated syringe. The neonatal flow sensor became inaccurate when flow exceeded 28L/min and the adidt flow sensor became inaccurate when flo w < lOL/min. Ihere d id not appear to be any systematic error related either to inter-sensor variability or the addition o f tracheal tubes o f various sizes.
3.1.2 Accuracy of pressure recortdings
The accuracy o f pressure recordings made by the “ CO2 SMO Plus” was checked against
a range o f static pressures generated by a syringe and simultaneously recorded by a
Digitron pressure manometer (P200UL) connected in series. The neonatal, paediatric
and adult flow sensors were all checked in this fashion and the results are summarised in
Figure 3-6 (and tabulated in the Appendix: 10-4). The pressure recordings by the
“ CO2 SMO Plus” compared favourably with those by the Digitron with < 3% error for
all sensors over the pressure range assessed. The range assessed (0-70 cmH20)
exceeded that which would be encountered clinically.
There was no drift in recordings except when there were small transient leaks in the
syringe system, which were recorded by both the “ CO2 SMO Plus” and the Digitron.
70
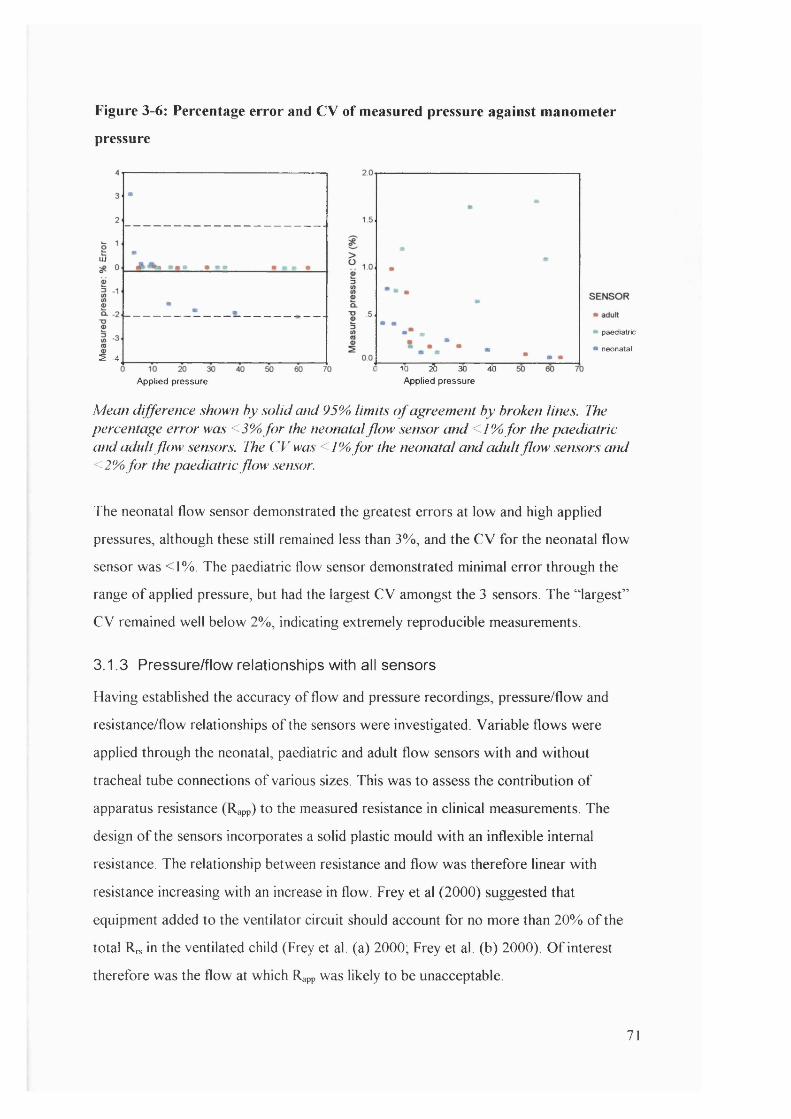
Figure 3-6: Percentage error and C V of measured pressure against manometer
pressure
LU
5 -4
Applied pressure
paediatric
neonatal
10 ^ 30 40Applied pressure
Mean difference shown by solid and 95% limits o f agreement by broken lines. The percentage error was <3% fo r the neonatal flow sensor and <1% fo r the paediatric and adult flow sensors. The CV was < /% fo r the neonatal and adult flow sensors and <2% fo r the paediatric flow sensor.
The neonatal flow sensor demonstrated the greatest errors at low and high applied
pressures, although these still remained less than 3%, and the CV for the neonatal flow
sensor was <1%. The paediatric flow sensor demonstrated minimal error through the
range o f applied pressure, but had the largest CV amongst the 3 sensors. The “ largest”
CV remained well below 2%, indicating extremely reproducible measurements.
3.1.3 Pressure/flow relationships with all sensors
Having established the accuracy o f flow and pressure recordings, pressure/flow and
resistance/flow relationships o f the sensors were investigated. Variable flows were
applied through the neonatal, paediatric and adult flow sensors w ith and without
tracheal tube connections o f various sizes. This was to assess the contribution o f
apparatus resistance (Rapp) to the measured resistance in clinical measurements. The
design o f the sensors incorporates a solid plastic mould with an inflexible internal
resistance. The relationship between resistance and flow was therefore linear with
resistance increasing with an increase in flow. Frey et al (2000) suggested that
equipment added to the ventilator circuit should account for no more than 20% o f the
total Rrs in the ventilated child (Frey et al. (a) 2000; Frey et al. (b) 2000). O f interest
therefore was the flow at which Rapp was likely to be unacceptable.
71
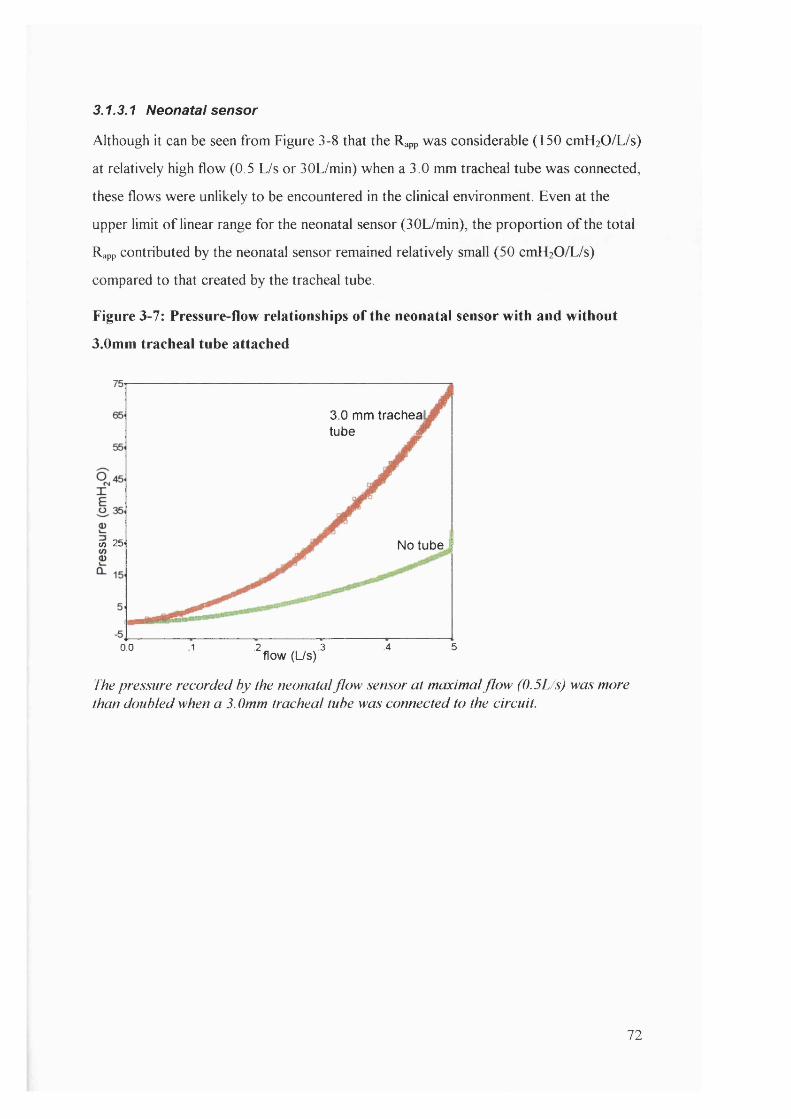
3.1.3.1 Neonatal sensor
Although it can be seen from Figure 3-8 that the Rapp was considerable (150 cmHzO/L/s)
at relatively high flow (0.5 L/s or 30L/min) when a 3.0 mm tracheal tube was connected,
these flows were unlikely to be encountered in the clinical environment Even at the
upper limit o f linear range for the neonatal sensor (30L/min), the proportion o f the total
Rapp contributed by the neonatal sensor remained relatively small (50 cmH20/L/s)
compared to that created by the tracheal tube.
Figure 3-7: Pressure-flow relationships of the neonatal sensor with and without
3.0mm tracheal tube attached
3.0 mm tracheal tube À
Ü) 25- No tube
.5.2 .3 .40.0 1f lo w (L /S )
'/'he pressure recorded by the neonatal flow sensor at maximal f lo w (0.5L/s) was more than doubled when a 3.0mm tracheal tube was connected to the circuit.
72

Figure 3-8: Apparatus resistance-flow relationships in the neonatal flow sensor
150i
3.0 mm tracheal tube ^
100«)r iqXEo
I 50 No tu b e j
0.0 1 2 .3 .4 .5flow (L/s)
I 'he relative resistive contribution o f the neonatal flow sensor remained small when compared to the resistance created by the addition o f a 3. Omm tracheal tube.
Table 3-1: Rapp and Rjt through neonatal flow sensor
Flow (Umin) Flow (Us) Rapp (no tube) cmH20/Us Rtt (3 0mm) cmHzO/Us
3.0 0.05 5.12(0.65) 25.4 (1.22)
4.2 0.07 6.90 (0.58) 30.6 (1.24)
6.0 0.10 10.5 (0.49) 37.9 (1.51)
12.0 0.20 20.2 (0.33) 59.1 (0.59)
18.0 0.30 28.2 (0.33) 88.5 (1.18)
24.0 0.40 36.3 (0.27) 116(1.71)
29.4 0.49 44.2 (0.17) 144 (1.29)
Results are expressed as mean (SD)
The Rapp o f the neonatal flow sensor contributed between 20 and 35% o f the combined
Rapp and R tt (Table 3 -1 ) , depending on the magnitude o f flow. It was thus unlikely to
contribute more than 20% o f the total R^ in the ventilated child.
3.1.3.2 Paediatric sensor
The paediatric and adult sensors contributed minimally to the total resistance in
comparison to the resistance o f the tracheal tubes. The clinical range o f flow
73

encountered in this study was much lower than the range portrayed by these charts, with
peak flows rarely above 30L/min (0.5L/s).
Figure 3-9: Pressure-flow relationships of the paediatric flow sensor with various
tracheal tubes attached
1203.0 tracheal
tube100
4.5 tracheal80O tubehTE 60Ü23I /)tA 6.5 tM g ie a l tube£
no tracheal tube
-201.00.0 .5 1.5 2.0
Flow (Us)
rhe pressure generated by the addition o f a 3. Omm tracheal tube was excessive at flows exceeding 0.5L/s. The pressure generated by the paediatric flo w sensor itse lf (no tracheal tube) was negligible.
Figure 3-10: Resistance-flow relationships of the paediatric flow sensor with
different tracheal tube attachments
160
3.0 trachea! tube
140
120
_ ] 100 '
Ô■£ 80.
EO 60' 4.5 tracheal tube
20 6.5 tn lal tube
no tracheal tube-20
0.0 .5 1.0 1.5 2.0Flow (Lis)
The relative resistance exerted by the paediatric flow sensor was negligible compared to the resistance exerted by the tracheal tubes. The largest resistance was generated by the smallest (3.0mm) tube.
74
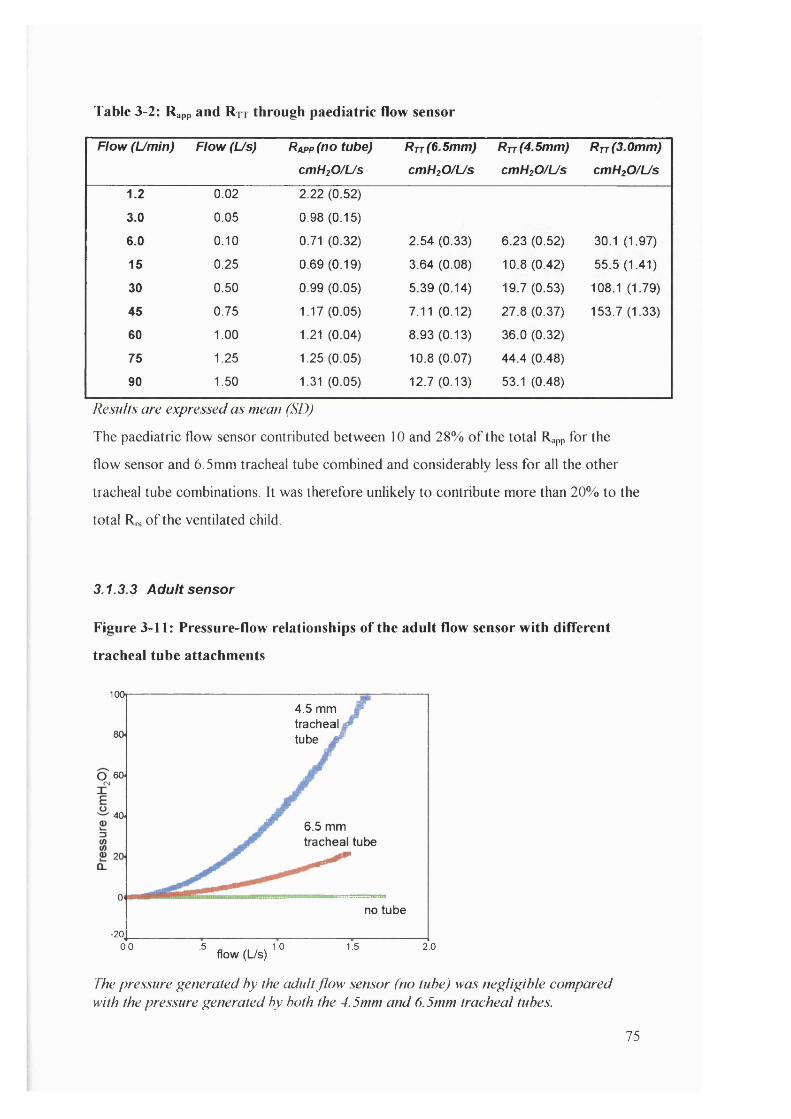
Table 3-2: Rapp and Rjt through paediatric flow sensor
Flow (Umin) Flow (Us) Rapp (no tube) cmHtO/Us
R t t (6.5mm) cmH20/Us
R t t (4.5mm)
cmH20/Us
R t t (3.0mm)
cmH20/Us
1.2 0.02 2.22 (0.52)
3.0 0.05 0.98 (0.15)
6.0 0.10 0.71 (0.32) 2.54 (0.33) 6.23 (0.52) 30.1 (1.97)
15 0.25 0.69 (0.19) 3.64 (0.08) 10.8 (0.42) 55.5 (1.41)
30 0.50 0.99 (0.05) 5.39 (0.14) 19.7 (0.53) 108.1 (1.79)
45 0.75 1.17(0.05) 7.11 (0.12) 27.8 (0.37) 153.7 (1.33)
60 1.00 1.21 (0.04) 8.93 (0.13) 36.0 (0.32)
75 1.25 1.25 (0.05) 10.8 (0.07) 44.4 (0.48)
90 1.50 1.31 (0.05) 12.7 (0.13) 53.1 (0.48)
Results are expressed as mean (SD)
The paediatric flow sensor contributed between 10 and 28% o f the total Rapp for the
flow sensor and 6.5mm tracheal tube combined and considerably less for all the other
tracheal tube combinations. It was therefore unlikely to contribute more than 20% to the
total Rn. o f the ventilated child
3.1.3.3 Adult sensor
Figure 3-11: Pressure-flow relationships of the adult flow sensor with different
tracheal tube attachments
100,4.5 mm tracheal tube M80
O 60
406.5 mm tracheal tube
no tube
-20,0.0 .5 1.0 1.5 2.0
flow (L/s)
The pressure generated by the adult flow sensor (no tube) was negligible compared with the pressure generated by both the 4.5mm and 6.5mm tracheal tubes.
75

Figure 3-12: Resistance flow relationships of the adult flow sensor with different
tracheal tubes attached.
4.5 mm tracheal tube Jeo
50(/)
O 40
Ü 30
6.5 mm tracheal tube
10
no tube-10
.5 1.00.0 1.5 2.0flow (L/s)
The linear increase in resistance with increase in flow was demonstrated by the addition o f a 4.5 mm and 6.5 mm tracheal tube. The relative resistance o f the adult flow sensor (no tube) was comparatively negligible.
Table 3-3: Rapp and Rtt through adult sensor at variable flows
Flow(Umin)
Flow (Us) R a p p (no tube) cmH20/Us
R t t (6.5mm) cmH20/Us
R t t (4.5mm)
cmH20/Us
18 0.3 0.04 (0.08) 4.51 (0.12) 13.8 (0.41)
30 0.5 0.16(0.05) 5.99 (0.14) 21.3 (0.39)
45.6 0.76 0.22 (0.04) 8.14(0.10) 30.7 (0.72)
60 1.0 0.28 (0.04) 10.2 (0.17) 39.6 (0.41)
73.2 1.22 0.35 (0.05) 12.3(0.12) 46.6 (0.72)
84.6 1.41 0.38 (0.04) 13.7 (0.28) 55.1 (0.32)
Results are expressed as mean (SD)
The adult flow sensor contributed less than 3% o f the total Rapp for the flow sensor and
6.5mm tracheal tube combined and considerably less for the other tracheal tube
combinations. It would therefore represent a negligible proportion o f the total in the
ventilated child.
76

3.1.4 Accuracy of resistance calculations
I t was not possible to check the resistance calculations o f the “ CO2 SMO Plus” against
the pre-set resistance options o f the neonatal lung model, since it was impossible to
generate a consistent or accurate flow throughout the breath cycle in any o f the
ventilators available. However, since the accuracy o f both pressure and flow recordings
on the “ CO2 SMO Plus” have been reasonably established (3.1.1 and 3.1.2), the accuracy
o f Rrs recordings should essentially be dependent on the algorithms for being
reasonably executed. From 2.2.2, the algorithm used by “ CO2 SMO Plus” to calculate
(utilising all raw data points throughout the breath cycle) is expressed by:
Equation 3-1
'L v^'Lp f -Y.pv 'ZfvR =
- ('LVF)'-
Where R is the resistance o f the system, V is the volume, P is the pressure drop at the
airway opening (PIP - PEEP) and F is the flow at the model opening. Using raw data
from breath cycles obtained from four patients in pilot studies, manual calculations were
performed to assess whether Rrs values calculated by the “ CO2 SMO Plus” could be
reproduced. In addition, the same raw data were plotted using a linear function based on
the equation o f motion, where the slope o f the function was R and the intercept was E.
Equation 3-2
P F— = — X R + E V V
In all the cases assessed, the value calculated by “ CO2 SMO Plus” was comparable to the
value obtained from manual calculation as well as the slope o f the linear function. For
example in one individual (Figure 3-13), the “ CO2 SMO Plus” value for Rrs was 26.1
cmH20/L/s while the manual recalculation yielded a value o f 24.3 cmH20/L/s and the
slope o f the linear regression model suggested a value o f 23.5 cmH20/L/s.
77

Figure 3-13: Linear expression (from the equation of motion) of Cr and from
several breaths in one individual
.18
.16
.14
.12
I .10
>T .082
I Slope: 23.5 cmHzO/L/s
Intercept: 0.985 cm HjO/m L.04
-.002 -.001 0.000 .001 .002 .003 .004
Flow / Volume
The linear expression ofpressure/vohme plotted against flow/volume yielded a slope (RrJ o f 23.5 cmH2Ü/L/s which compared favourably with the calculated value fo r Rrs (26.1 cmH2Ü/L/s). The y intercept ( I/C) suggested a Crs value o f 1.02 mUcmH20, which was identical to the calculated value o f Crs (T 02 mL/cmH2()).
3.1.5 Accuracy of compliance calculations
3.1.5.1 Method
The neonatal sensor was used to assess the accuracy o f compliance calculations against
the known compliance values o f the Manley neonatal lung simulator (SLE). The lung
simulator offered compliance settings o f 0.5, 1.0 and 3.0 mL/cmHzO The neonatal
sensor was connected directly between the lung simulator and either a Servo 300 or
Bear Cub ventilator. The Servo 300 was used to produce volume controlled (VC) and
pressure regulated volume controlled (PRVC) ventilation modes. The Bear Cub was
used to produce pressure controlled modes.
The “ CO2 SMO Plus” compliance recordings were evaluated against the set compliance
o f the neonatal lung throughout a range o f clinically appropriate peak pressures and
respiratory rate settings (Figure 3-14). These assessments were repeated using different
ventilation modalities (pressure control, volume control and pressure regulated volume
78
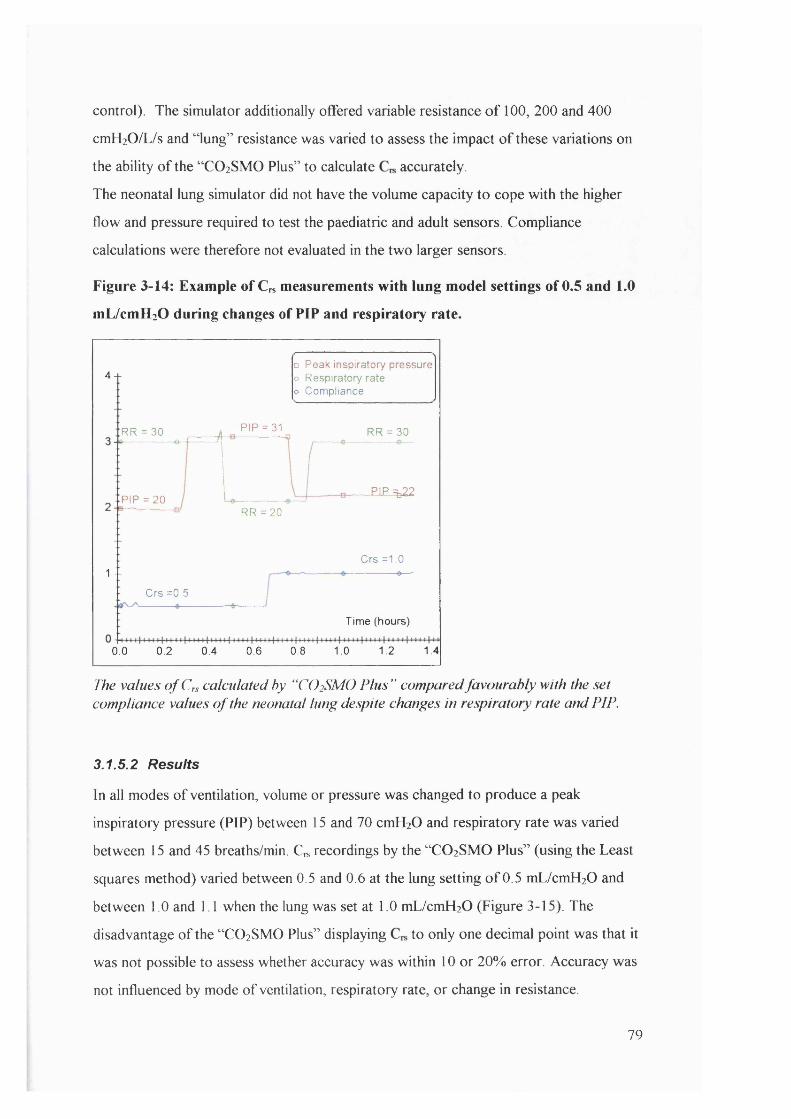
control). The simulator additionally offered variable resistance o f 100, 200 and 400
cmH2 0 /L/s and “ lung” resistance was varied to assess the impact o f these variations on
the ability o f the “ CO2 SMO Plus” to calculate accurately.
The neonatal lung simulator did not have the volume capacity to cope with the higher
flow and pressure required to test the paediatric and adult sensors. Compliance
calculations were therefore not evaluated in the two larger sensors.
Figure 3-14: Example of Cr* measurements with lung model settings of 0.5 and 1.0
mL/cmHzO during changes of PIP and respiratory rate.
4 +
1 --
□ Peak inspiratory pressure o Respiratory rate o Compliance
RR = 30 PIP = 31 RR = 30
PIP = 20RR = 2 0
Crs =0,5
0.0 0.2 0.4 0.6 0.6 1.0
PIP =b22
Crs =1.0---------0-
Time (hours)
1.2 1.4
The values o f Crs calculated by “ CO2SMO Plus ” compared favourably with the set compliance values o f the neonatal lung despite changes in respiratory rate and PIP.
3.1.5.2 Results
In all modes o f ventilation, volume or pressure was changed to produce a peak
inspiratory pressure (PIP) between 15 and 70 cmH20 and respiratory rate was varied
between 15 and 45 breaths/min. Cn* recordings by the “ CO2 SMO Plus” (using the Least
squares method) varied between 0.5 and 0.6 at the lung setting o f 0.5 mL/cmH20 and
between 1.0 and 1.1 when the lung was set at 1.0 mL/cmH20 (Figure 3-15). The
disadvantage o f the “ CO2 SMO Plus” displaying to only one decimal point was that it
was not possible to assess whether accuracy was within 10 or 20% error. Accuracy was
not influenced by mode o f ventilation, respiratory rate, or change in resistance.
79

Figure 3-15: Influence of PIP and respiratory rate on measured compliance, with
lung model settings at 0.5, I.O and 3.0 mL/cmHzO
40 4.0
O 3.5. ^ 3.5
3 .0 ------
Ü 2.5. 2.5
Appliedcompliance
2 0 .
1.5# 0.5
Ü 1 .0 ' - 1.0
05 -------
0.0 m 3.010 15 20 25 30 35 40 45
Peak inspiratory pressure (cmHjO)
Appliedcwnpliance
m 0.5
Calculated values o f Crs remained relatively accurate throughout different ranges o f PIP and respiratory rate. The “CO2SMO Plus ” had a slight tendency to overestimate the lung-model compliance set at 0.5 and 1.0 mL/cmH2Ü, but measurement error remained <8% throughout the range o f PIP and RR tested. Note the frequency dependence o f C „ calculations when the lung model was set to C „ 3 mUcmH20.
While most calculated values o f remained accurate throughout different ranges o f
PIP and respiratory rate, when the neonatal lung was set at a compliance o f 3.0
mL/cmH20, the “ CO2 SMO Plus” calculations for displayed frequency dependence
with increasing inaccuracy as respiratory rate increased. This was o f limited concern
however, since neonates in a clinical environment with very compliant lungs would be
unlikely to require respiratory frequencies above 35 breaths per minute. Crs was
calculated with acceptable measurement errors when ventilation settings were within
reasonable clinical range (Table 3-4: respiratory rate < 36 bpm and PIP < 30 cmH20). In
addition, R,s appeared to influence calculations o f when the lung-model was set to a
compliance o f 3 .0 mL/cmH20, with calculations becoming more inaccurate with
increasing Rr While the combination o f compliant lungs and high respiratory system
resistance could potentially introduce errors in measurement, it would rarely be
encountered in a clinical setting. Under these circumstances, the underlying assumptions
o f a single compartment lung model (2.2) would probably not apply and calculations o f
respiratory mechanics would be unreliable. The combination o f moderate to high
respiratory rate (20 - 30bpm) and high resistance (400 cmH20/L/s) resulted in gross
inaccuracy.
80

Table 3-4: Mean Crs calculations by the “CO 2 SM O Plus” compared with set Crs on
neonatal lung simulator (variable ventilation settings)
Neonatal lung model compliance
Recordedcompliance
CV(%) % Error
PC Ventilation 0.5 0.51 (0.03) 5.8 2.0%
1.0 1.02 (0.04) 3.9 2.0%
3.0 2.93 (0.14) 4.8 -2.3%
VC Ventilation 0.5 0.51 (0.03) 6.0 2.0%
1.0 1.06 (0.05) 4.7 6.0%
3.0 2.97 (0.21) 7.0 -1.2%
PRVC 0.5 0.54 (0.05) 9.2 8.0%
Ventilation 1.0 1.03 (0.02) 1.9 3.0%
3.0 2.98 (0.15) 5.0 -0.6%
The 2-point compliance (C2pi), calculated by “ CO2 SMO Plus” using only points o f zero
flow during the breath cycle (Mead-Whittenberger technique) was consistently less
accurate than the Cdy,, calculations. The Cdy„ parameter, using all data points throughout
the breath cycle was therefore used preferentially as an outcome parameter in this study.
3.1.6 Accuracy of CO2 recordings
3.1.6.1 Method
Two neonatal, paediatric and adult flow sensors were connected in turn to a circuit with
two known CO2 gas concentrations, 5% and 5.6% (H P. CAL 1 Gases, expire 08/2001).
In each case connection was interrupted with and without re-calibration to assess
whether concentration o f gas returned to zero immediately upon disconnection and
whether re-calibration was essential after each disconnection.
3.1.6.2 Results
Results are demonstrated in Table 3-5. Although there was a slight tendency to under
estimate gas concentration, measurement errors were always less than 5% and variability
was extremely small for all sensors. Upon disconnection and reconnection, CO2
measurements returned rapidly to zero and reached accurate mean values within three
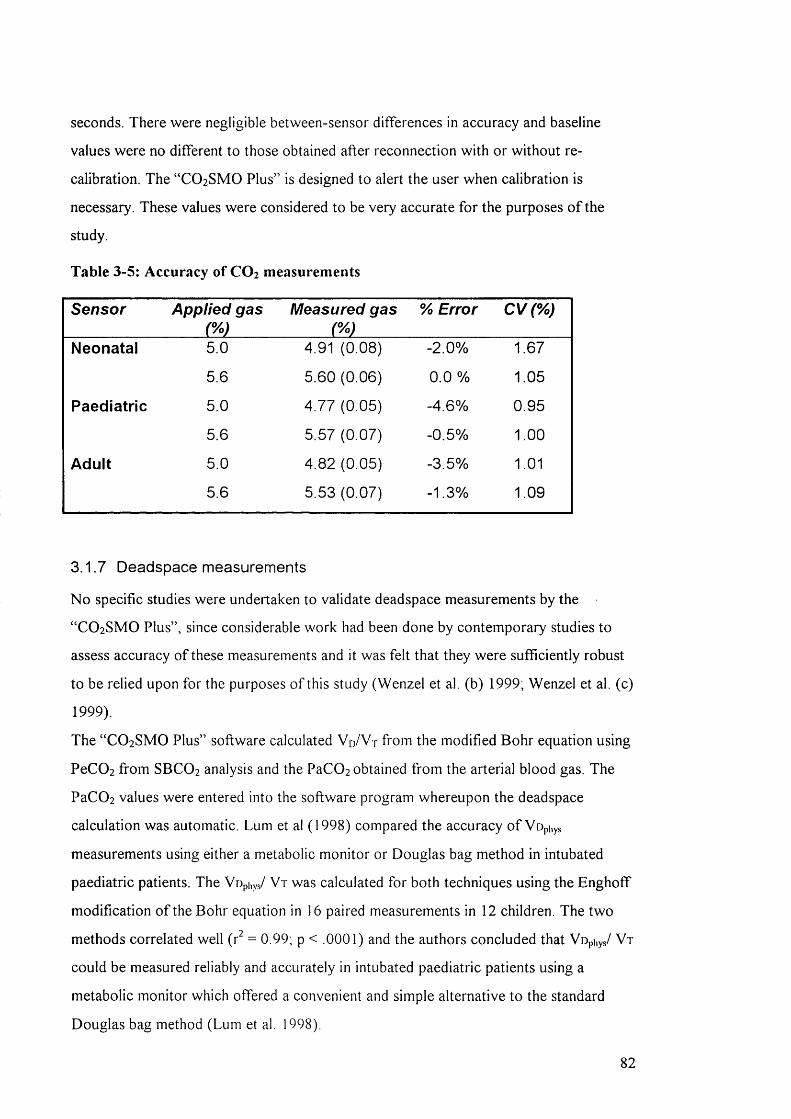
seconds. There were negligible between-sensor differences in accuracy and baseline
values were no different to those obtained after reconnection w ith or without re
calibration. The “ CO2 SMO Plus” is designed to alert the user when calibration is
necessary. These values were considered to be very accurate for the purposes o f the
study.
Table 3-5: Accuracy of CO 2 measurements
Sensor Applied gas Measured gas % Error CV(% )
Neonatal 5.0 4.91 (0.08) -2.0% 1.67
5.6 5.60 (0.06) 0.0 % 1.05
Paediatric 5.0 4.77 (0.05) -4.6% 0.95
5.6 5.57 (0.07) -0.5% 1.00
Adult 5.0 4.82 (0.05) -3.5% 1.01
5.6 5.53 (0.07) -1.3% 1.09
3.1.7 Deadspace measurements
No specific studies were undertaken to validate deadspace measurements by the
“ CO2 SMO Plus” , since considerable work had been done by contemporary studies to
assess accuracy o f these measurements and it was felt that they were sufficiently robust
to be relied upon for the purposes o f this study (Wenzel et al. (b) 1999; Wenzel et al. (c)
1999).
The “ CO2 SMO Plus” software calculated Vo/V-r from the modified Bohr equation using
PeC02 from SBCO2 analysis and the PaC02 obtained from the arterial blood gas. The
PaC0 2 values were entered into the software program whereupon the deadspace
calculation was automatic. Lum et al (1 9 9 8 ) compared the accuracy o f Vophys
measurements using either a metabolic monitor or Douglas bag method in intubated
paediatric patients. The Vuphys/ V t was calculated for both techniques using the Enghoff
modification o f the Bohr equation in 16 paired measurements in 12 children. The two
methods correlated well (r^ = 0 .9 9 ; p < .0 0 0 1 ) and the authors concluded that Vophys/ V t
could be measured reliably and accurately in intubated paediatric patients using a
metabolic monitor which offered a convenient and simple alternative to the standard
Douglas bag method (Lum et al, 1998).
82
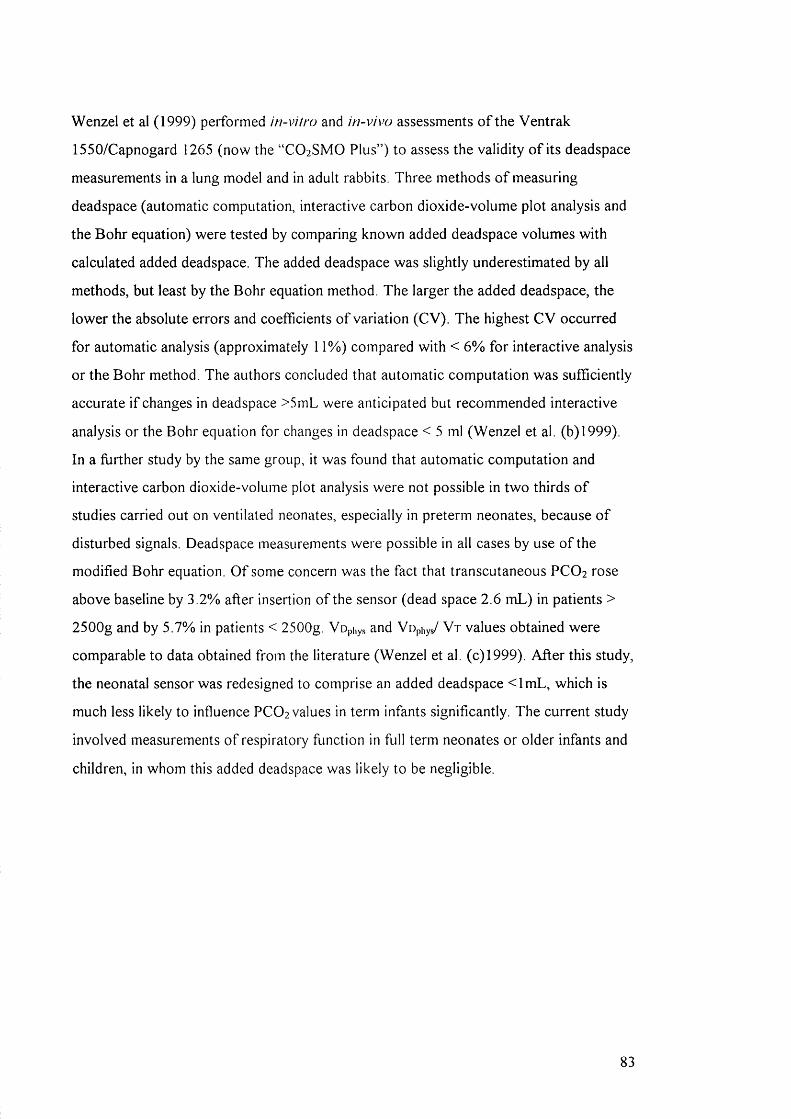
Wenzel et al (1999) performed in-vi/ro and in-vivo assessments o f the Ventrak
1550/Capnogard 1265 (now the “ CO2 SMO Plus” ) to assess the validity o f its deadspace
measurements in a lung model and in adult rabbits. Three methods o f measuring
deadspace (automatic computation, interactive carbon dioxide-volume plot analysis and
the Bohr equation) were tested by comparing known added deadspace volumes with
calculated added deadspace. The added deadspace was slightly underestimated by all
methods, but least by the Bohr equation method. The larger the added deadspace, the
lower the absolute errors and coefficients o f variation (CV). The highest CV occurred
for automatic analysis (approximately 11%) compared with < 6% for interactive analysis
or the Bohr method. The authors concluded that automatic computation was sufficiently
accurate i f changes in deadspace >5mL were anticipated but recommended interactive
analysis or the Bohr equation for changes in deadspace < 5 ml (Wenzel et al. (b)1999).
In a further study by the same group, it was found that automatic computation and
interactive carbon dioxide-volume plot analysis were not possible in two thirds o f
studies carried out on ventilated neonates, especially in preterm neonates, because o f
disturbed signals. Deadspace measurements were possible in all cases by use o f the
modified Bohr equation. O f some concern was the fact that transcutaneous PCO2 rose
above baseline by 3.2% after insertion o f the sensor (dead space 2.6 mL) in patients >
2500g and by 5.7% in patients < 2500g. Vopiiys and Vophys/ V t values obtained were
comparable to data obtained from the literature (Wenzel et al. (c)1999). After this study,
the neonatal sensor was redesigned to comprise an added deadspace < lm L , which is
much less likely to influence PCO2 values in term infants significantly. The current study
involved measurements o f respiratory function in full term neonates or older infants and
children, in whom this added deadspace was likely to be negligible.
83
4. Study design and methodology
The project was granted approval by the Institute o f Child Health and Great Ormond
Street Hospital for Children, NHS Trust Research Ethics Committee and written,
informed consent was obtained from parents o f infants and children who were recruited
into the study.
4.1 Hypotheses and aims of the study
The core methodology o f this study involved measurements o f respiratory function in
ventilated children using a relatively new monitoring device (“ CO2 SMO Plus” ). An
essential part o f the study therefore involved validation o f the “ CO2 SMO Plus” in terms
o f its accuracy and practical usefulness in the ventilated paediatric population. There
were three major hypotheses:
Hypotheses:
1. The “ CO2 SMO Plus” offers a useful clinical tool for evaluating the clinical effects o f
therapeutic interventions.
2. Respiratory physiotherapy in the paediatric intensive care unit improves respiratory
function by:
• Increasing tidal volume ( V t ) and compliance (C,s)
• Decreasing resistance (R,s) and physiological deadspace (Vophys),
• Improving gas exchange as defined by improvement in CO2
parameters (ETCO2, VCO 2 and PeC02) and arterial blood gases.
3. Respiratory physiotherapy is more effective than nursing suction at removing
secretions and thereby improving respiratory function.
Aims:
The aims o f the study related broadly to the two principal objectives, namely to evaluate
the validity o f the “ CO2 SMO Plus” respiratory monitor and to investigate the effects o f
physiotherapy treatments on respiratoi*y function.
The principal aims o f the study were:
• To evaluate the validity and clinical usefulness of the C O 2 SM O Plus” in the
intensive care unit. To accomplish this, in -v ilro validation procedures were
planned, as well as pilot studies and in-vivo tests to ensure that the “ CO2 SMO Plus”
84
was an accurate and useflil tool for measuring respiratory function in ventilated
children. Details o f these tests and their results are found in sections 3 and 5.
• To evaluate the efficacy of respiratory physiotherapy techniques in the
paediatric intensive care unit. To accomplish this, neonates, infants and children
with different diagnoses who were receiving physiotherapy treatments were
recruited for measurements o f respiratory function before and after such treatment.
The ultimate aim o f the study was to analyse and interpret data obtained
appropriately and to disseminate findings and suggest changes in practice i f these
were indicated.
• To establish whether respiratoi*y physiotherapy treatments offer a significant
advantage over routine airway clearance techniques used by nursing staff in
ventilated children. To accomplish this, effects o f physiotherapy treatments as well
as effects o f nursing suction needed to be independently established so that statistical
tests could be performed on the mean differences in individuals in whom data had
been collected for both techniques.
4.2 Study design and protocol
The study involved a simple cross-over design in which patients were randomly
allocated to receive either physiotherapy treatment or routine airway clearance by
nursing staff in the morning and the alternative intervention in the afternoon o f the same
day. Specific protocol details may be found in the Appendix (10.3). In essence, after
recruitment and randomisation, a neonatal, paediatric or adult flow sensor was selected
according to the age, body weight and ventilator settings o f the patient and the sensor
was attached between the tracheal tube and ventilator tubing so that continuous
recordings o f respiratory function measurements could be made. The sensor was left in
situ for the duration o f the study (usually most o f the day) so that trends in respiratory
function could be assessed but the critical data collection periods were at least 15
minutes before and 30 minutes after both physiotherapy and nursing suction treatments.
Arterial blood gases were taken immediately before and 25-35 minutes after both
nursing suction and chest physiotherapy. No ventilator changes or other clinical or
nursing interventions were performed during the data collection periods. In the event
that no other clinical interventions were performed after either treatment, longer periods
following treatment were analysed.
85
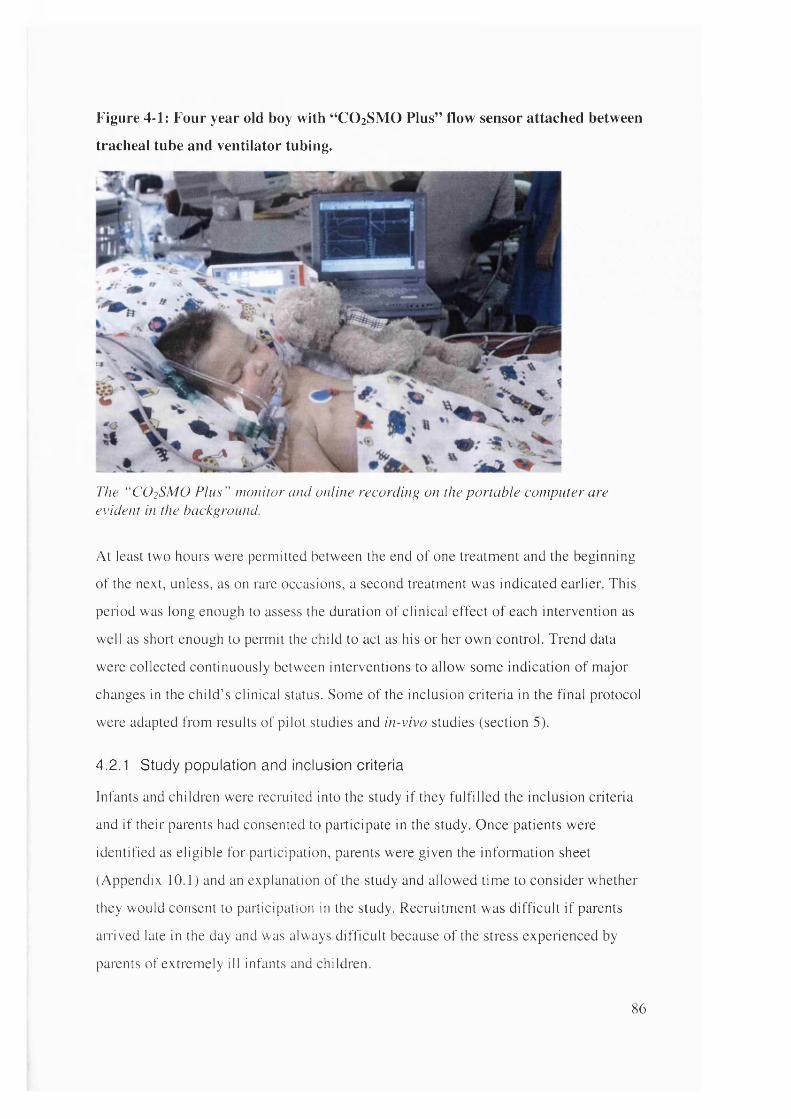
Figure 4-1: Four year old boy with “CO 2 SMO Plus” flow sensor attached between
tracheal tube and ventilator tubing.
The “ CO2SMO P lus” nw nitor and online recording on the portable computer are evident in the background.
At least two hours were permitted between the end of one treatment and the beginning
of the next, unless, as on rare occasions, a second treatment was indicated earlier. This
period was long enough to assess the duration of clinical effect of each intervention as
well as short enough to permit the child to act as his or her own control. Trend data
were collected continuously between interventions to allow some indication of major
changes in the child ’ s clinical status. Some of the inclusion criteria in the final protocol
were adapted from results of pilot studies and in-vivo studies (section 5).
4.2.1 Study population and inclusion criteria
Infants and children were recruited into the study i f they fu lfilled the inclusion criteria
and i f their parents had consented to participate in the study. Once patients were
identified as eligible for participation, parents were given the information sheet
(Appendix 10.1) and an explanation of the study and allowed time to consider whether
they would consent to participation in the study. Recruitment was d ifficu lt i f parents
airived late in the day and was always d ifficu lt because of the stress experienced by
parents of extremely ill infants and children.
86
Fully ventilated patients were recruited from the cardiac intensive care unit (CICU)
or paediatric intensive care unit (PICU). Patients from the neonatal intensive care unit
(N ICU) were excluded because o f concerns that the flow sensor would substantially
increase apparatus deadspace and because physiotherapy interventions are rarely
performed on preterm infants in this institution.
Recruited subjects had been pharmacologically paralysed and sedated with analgesia
according to unit protocols using standard doses o f vecuronium (2-4 mcg/kg/min),
morphine (10-40mcg/kg/hr) and midazolam (1-6 mcg/kg/min). Muscle relaxation and
sedation were instituted for clinically indicated reasons and not for the purposes o f
data collection. In the absence o f spontaneous respiratory efforts, valid measurements
o f Crs and R,s were possible and variations in respiratory rate or V j due to patient
effort rather than treatment effect were removed. In addition, the wide within subject
variability o f respiratory parameters in spontaneously breathing subjects would make
it difficult to distinguish treatment effect from data “ noise” (section 5.1.2).
Subjects were recruited i f they were receiving physiotherapy treatments and were
likely to continue requiring such interventions. Clinical indications for physiotherapy
interventions include changes on chest radiograph, added or decreased breath sounds
on auscultation, increasing ventilatory requirements and/or deteriorating blood gases.
The physiotherapist managing each patient made the decision about whether
treatment was indicated.
Subjects were recruited i f they were likely to continue requiring pharmacological
paralysis and full ventilatory support for the duration o f the data collection interval
(at least 8-10 hours following recruitment).
Subjects were recruited i f there was an arterial line in situ for sampling o f arterial
blood for analysis.
Subjects were recruited i f there was no audible or clinically obvious tracheal tube
leak. Unfortunately, it was not always possible to assess magnitude o f leak prior to
the commencement o f monitoring, since such data were rarely displayed or
inaccurately displayed on available ventilatory equipment. I f after monitoring had
commenced, the magnitude o f tracheal tube leak was greater than 20%, efforts were
made to reduce the airway leak by repositioning the child and i f these were
unsuccessful, the registrar or consultant was informed, so that the tracheal tube could
be changed. Data were only analysed when the mean tracheal tube leak was less than
87
20% for the duration o f the data collection intervals before and after treatment
(section 5.2.1).
Since only paralysed or extremely well sedated patients were recruited from the
PICU and CICU populations, the selection o f patients was likely to be specific and
limited to a relatively narrow range o f clinical conditions. The CICU population
would almost all be surgical patients, younger than three months, having undergone
primary repair o f major congenital cardiac defects such as transposition o f the great
arteries, truncus arteriosus and hypoplastic left ventricle. In addition many o f these
patients, following major cardiac surgery would have delayed sternal closure. A
minority o f patients would have been admitted to CICU with meconium aspiration
and pulmonary hypertension. In general CICU patients would be paralysed in the
early post operative period, to assist in establishing haemodynamic stability, reducing
pulmonary oedema, managing pulmonary hypertension or when delayed sternal
closure necessitated pharmacological paralysis. Patients would almost without
exception be recruited to the study within the second or third day o f surgery.
By contrast, pharmacologically paralysed patients in the PICU, would consist o f
children within all age groups, including some with acute or chronic respiratory
failure, some following head injury and some following major elective surgical
procedures such as gastric transposition. In these patients, the purpose o f
pharmacological paralysis would vary according to the diagnosis; at times to reduce
mobility (gastric transposition), at times to reduce intra-cranial pressure (head injury),
at times to allow optimal delivery o f ventilation (respiratory failure).
In general a pharmacologically paralysed paediatric population would be associated
w ith significant severity o f illness, haemodynamic, cardiac or respiratory instability
and the potential for physiotherapy treatments or suction to be poorly tolerated.
However, because o f the inability o f this patient group to move or clear secretions,
they would be particularly vulnerable to respiratory complications associated with
ventilation.
The predominant mode o f ventilation encountered in the neonatal and younger
patient groups in the CICU would be lung protective pressure preset modalities.
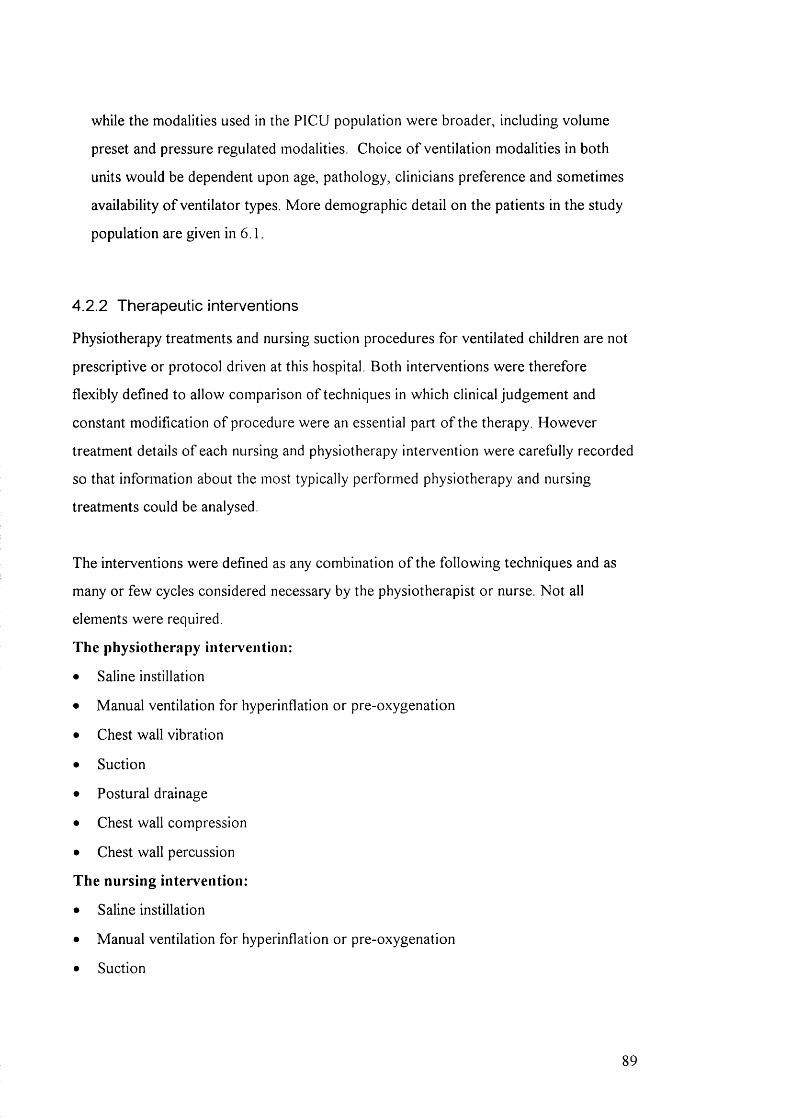
while the modalities used in the PICU population were broader, including volume
preset and pressure regulated modalities. Choice o f ventilation modalities in both
units would be dependent upon age, pathology, clinicians preference and sometimes
availability o f ventilator types. More demographic detail on the patients in the study
population are given in 6.1.
4.2.2 Therapeutic interventions
Physiotherapy treatments and nursing suction procedures for ventilated children are not
prescriptive or protocol driven at this hospital. Both interventions were therefore
flexibly defined to allow comparison o f techniques in which clinical judgement and
constant modification o f procedure were an essential part o f the therapy. However
treatment details o f each nursing and physiotherapy intervention were carefully recorded
so that information about the most typically performed physiotherapy and nursing
treatments could be analysed.
The interventions were defined as any combination o f the following techniques and as
many or few cycles considered necessary by the physiotherapist or nurse. Not all
elements were required.
The physiotherapy intervention:
Saline instillation
Manual ventilation for hyperinflation or pre-oxygenation
Chest wall vibration
Suction
Postural drainage
Chest wall compression
Chest wall percussion
"he nursing intervention:
Saline instillation
Manual ventilation for hyperinflation or pre-oxygenation
Suction
89

Figure 4-2: Physiotherapist performing manual hyperinflation with chest wall
vibrations during expiration.
?
4.2.3 Outcomes
Outcomes of interest included tidal volume (V j), compliance (Qs), resistance (Rrs),
end-tidal CO 2 (ETCO 2), CO 2 elimination (V C O 2), mixed expired CO 2 (PeC02),
respiratory deadspace volumes (Vophys, Voaiv, Voairway and Vophys/ V t ) and arterial blood
gases (pH, PaC02, Pa02, HCO 3-, base excess and O2 saturation). Although it was
important to assess the behaviour of each parameter independently, respiratory
parameters are frequently intenelated: an increase in one often occurs with a
simultaneous decrease or increase in another. It was therefore considered important to
review changes in parameters relative to each other.
Respiratory rate, PIP, Vje and M V may be partly determined by the ventilator settings
and partly determined by patient effort. In the presence of spontaneous ventilatory
effort, any or all of these parameters may have been expected to change in response to a
physiotherapy treatment as a result of several factors including removal o f secretions,
increased anxiety, increased metabolism or arousal from sedation. For the purposes of
this study however, recruited subjects were all paralysed or heavily sedated so that no
efforts at spontaneous respiration were made. Respiratory rate therefore did not vary as
a result of physiotherapy treatments and was not influenced by pressure (PC) or volume
90
controlled (VC) mode o f ventilation. However changes in VxEand PIP were determined
by both treatment effect and the mode o f ventilation.
Patients ventilated with a P C mode maintained constant levels o f PIP, MAP and PEEP
before and after treatment, while V t e was potentially variable. Changes in Crs or R r* as a
result o f the physiotherapy treatment would have been expected to result in changes o f
V t e - An increase in C , s or reduction in R , s would generally be accompanied by an
increase in Vte and vice versa. By contrast, patients ventilated with a VC mode
maintained constant V t e before and after treatment, while PIP and M AP were
potentially variable. In this instance, changes in C,s or R,s after treatment would be
expected to result in changes to the measured pressures. An increase in C , s or decrease
in Rrs would be associated with a drop in PIP, while PIP would increase i f C , s decreased
or Rns increased. Since mode o f ventilation significantly influenced the primary parameter
o f interest following treatment, analysis o f data was performed separately for patients
receiving different modes o f ventilation.
Important reference data were also collected to ensure that inadvertent changes in
ventilation settings had not occurred during data collection. These reference data
included respiratory rate, peak inspiratory pressure, positive end expiratory pressure,
mean airway pressure, peak expiratory flow, inspired CO2 , inspiratory and expiratory
time.
In general, improvement was defined as a significant increase in Vr. C , - s , PaOz and O2
saturation, while a change in the opposite direction indicated a deterioration as a result
o f the intervention. Similarly, decreases in R , s , ETCO 2 , PeC02 and respiratory
deadspace volumes were considered to indicate improvements in respiratory function
while changes in the opposite direction indicated a deterioration as a result o f the
intervention. Interpretation o f changes in isolated parameters can however be misleading
and often requires examination o f simultaneous changes in related parameters to
determine the change in respiratory status accurately. A reduction in VCO 2 for example
may be related either to a deterioration in the efficiency o f gas exchange (indicated by a
simultaneous increase in PaC0 2 ) or to an improvement in clinical status (associated with
a simultaneous reduction in PaC02). Changes in VCO 2 are thus difficult to interpret in
91

isolation. They require examination in conjunction with simultaneous changes in V t ,
ETCO 2 and PaCOi
4.2.4 Measurement tools
The “ CO2 SMO Plus” respiratory profile monitor was selected for use in this study
because it offered a safe and non-invasive, portable instrument which was accurate,
reasonably cost effective and easy to use. In addition on-line recording and display
facilities were considered critical for downloading and analysing data. (Broseghini et al.
1988). The advantages o f continuous measurement included acquisition o f trend data
reflecting the way in which respiratory function changed over time in response to
interventions such as physiotherapy or nursing suction. Isolated or ‘ snapshot’
measurements may have obscured the dynamic nature o f the response o f the respiratory
system to clinical changes. A small risk o f increased unplanned extubation with the
added weight o f the “ CO2 SMO Plus” pneumotachograph in the ventilator circuit has
been identified (IMuma and Newth, 1995), thus connections were always safely secured
to minimise this risk.
The “ CO2 SMO Plus” respiratory monitor, like many respiratory measurement systems
combined simultaneous measurements o f pressure, flow and CO 2 at the tracheal tube
opening. From these data, several respiratory parameters were automatically calculated
including V t , R ,s , C ,s and respiratory deadspace. In addition, flow/volume and
pressure/volume loops and single breath CO2 curves were generated and electronically
stored. Arterial blood gases were analysed using portable i-Stat clinical analysers
(Hewlett - Packard, USA).
4.3 Data management and statistical methods
The electronic data collection and memory capacity o f the “ CO2 SMO Plus” meant that
immense amounts o f data were generated from each patient, both in terms o f trended
measurements which yielded average values for each minute o f recording and waveform
data, which yielded real-time breath by breath data at lOOHz. Details o f algorithms
contained in the software for calculation o f respiratory parameters are discussed in
chapter 2.0. The memory capacity o f the “ CO2 SMO Plus” monitor was limited, but a
92
computer connected to the “ CO2 SMO Plus” during recording could provide continuous
data recording and storage limited only by the memory capacity o f the computer.
4.3.1 Data management
Data electronically recorded by the “ CO2 SIVIO Plus” were exported to M icrosoft Excel
software. From the Excel program, data were exported to a statistical software program
for analysis (SPSS). Once in SPSS, additional respiratory parameters not calculated or
displayed by the “ CO2 SMO Plus” such as body weight corrected Crs, V t, VCO 2 and
tracheal tube leak were calculated from raw data. Then data collection intervals were
identified and separated from the entire set so that mean values and standard deviations
could be aggregated for each respiratory parameter, for the 15 minute period before and
after both physiotherapy and nursing suction. Mean aggregated values for 30, 45, 60, 75
and 90 minute intervals following treatments were also calculated. These data were
entered on a spreadsheet in SPSS, which incorporated data from all patients, as well as
demographic information and information about diagnosis, ventilation modality, tracheal
tube size and leak, details o f the treatment intervention and randomisation. Similarly,
arterial blood gas data as well as parameters computed from them were entered into the
main spreadsheet. Demographic data were organised into categories to allow analysis
according to factors such as age group, diagnosis, ventilation modality or treatment.
4.3.2 Statistical methods
The scarcity o f consistent, good quality published data involving respiratory function
measurements in fully ventilated paediatric patients meant that prospective power
calculations were difficult to perform and it was not possible to anticipate in advance
how many patients would be adequate to demonstrate significant changes in particular
respiratory parameters (Healy, 1992; Florey, 1993). Knowing that some data might not
be technically satisfactory, it was decided to recruit 100 patients so that some analysis o f
subgroups could be performed. Retrospective power calculations were performed to
assess the power o f the study sample to detect significant changes in respiratory
parameters and these are discussed in 7.4.8.
Various statistical methodologies were used for analysis o f data in the pilot, in-vivo, and
main studies. Bland and Altman analysis was used to assess accuracy o f volume and
93
pressure recordings o f the neonatal, paediatric and adult “ CO2 SMO Pius” flow sensors
with and without tracheal tubes o f different sizes in situ. During validation and in-vivo
studies, the Bland and Altman approach was frequently used to assess the degree o f
error in the “ CO2 SMO Plus” measurements or to see whether these measurements were
interchangeable with validated measurement systems (Hans-Rudolph calibrated syringes
or validated pressure manometers). The Bland and Altman method recommends plotting
the difference between the techniques against the average o f the standard and new
measurement. This approach provides detailed information not only about the
relationship between two parameters, but the magnitude o f the absolute difference
between them, in terms o f a mean difference and the 95% confidence limits o f that
difference. This enables an estimation o f the maximum error that is likely to occur i f one
method is substituted for another. The width o f the confidence intervals depends both on
the variability o f the relationship between the two techniques and the number o f
observations. This method is likely to be less misleading than the use o f simple
regression analysis, which has been frequently used in the past and which may show a
strong correlation between two methods, even though one is giving readings that are
systematically much greater or smaller than the other. Similarly it avoids the pitfalls o f
making ‘ type 2 errors’ , wherein two methods are stated to be similar because ‘ there was
no statistically significant difference between them’ , simply because too few subjects
were measured for the study to have sufficient power to detect any differences that were
present (Bland and Altman, 1986; Bland and Altman, 1995; Bland and Altman, 1999).
Other methods o f expressing validation and in-vivo results were descriptive, tabulated or
graphical depending on which method was considered to summarise the data most
efficiently. Demographic data in the main study section were expressed in bar charts and
changes due to physiotherapy and nursing suction were examined by standardised paired
sample t-tests. Patients with mean tracheal tube leaks larger than 20% during the data
collection interval were excluded from analysis and results were confirmed using a
general linear model analysis (SPSS) to assess any residual effects o f tracheal tube leak
in patients with tracheal tube leaks less than 20%. For parameters with large between
subject variability, such as R , s , V i y , i v and PeC02, results were confirmed with non-
parametric Wilcoxon tests.
94
Finally, in addition to evaluating group changes in parameters following treatment,
normal within-subject variability (in the absence o f any interventions) was calculated for
each measured parameter and the relative percentage changes following treatment were
displayed by histogram to illustrate percentage changes in individuals (section 6.6).
Changes were compared to normal variability for each parameter. This was to assess the
likelihood o f changes being clinically significant.
Data from all subjects were pooled in the first instance, and then population sub-groups
(according to ventilation mode, age and diagnosis, etc.) were examined separately to
determine any differences. The mean changes following physiotherapy were compared
to the mean differences after nursing suction in the same individuals, so that differences
in techniques, i f any, could be identified. AN O VA calculations were used to determine
what, i f any, characteristics those patients who responded favourably to physiotherapy
or nursing suction had in common. Details o f analysis are described in appropriate
sections.
95
5. Pilot and in-vivo validation studies
5.1 Pilot Study
5.1.1 Introduction
Initial measurements on the intensive care unit exposed areas o f concern about the
design o f the study that required further investigation w ith a view to revising the initial
protocol. The specific areas o f concern were that:
1. In the absence o f oesophageal manometry, respiratory mechanics could not be
measured during spontaneous breathing, and patterns o f breathing may be too
variable to interpret changes in other parameters.
2. A 15 minute period o f recording may be insufficient to represent accurately the
baseline status o f the child.
3. Variations in the magnitude o f tracheal tube leak may adversely affect quality o f data
obtained.
4. The absence o f normative data with regard to physiotherapy and ventilated children
made it difficult to determine what changes would constitute clinical significance.
Investigations were therefore undertaken to assess the impact o f these factors and are
described briefly below:
5.1.2 Levels of ventilatory support
Fifteen infants were recruited to the study and had respiratory function measurements
before and after physiotherapy and nursing suction. The initial protocol did not exclude
patients who were breathing spontaneously or combining spontaneous breaths with
mechanically supported breaths. However, it became clear from early studies that:
1. Respiratory function measurements in children making spontaneous efforts had wide
within-subject variability which made it very difficult to tease out treatment effect
from broad ranges o f “ noisy” data (Figure 5-1). Variability was minimal in paralysed
patients, allowing treatment effect to be more easily identified. In addition, complex
interactions between respiratory rate, volumes and pressure in the spontaneously
breathing individual would create difficulty in identifying sensitive outcomes.
96

2. Measurements o f respiratory mechanics (R^ and Cn,) were not valid in patients
making spontaneous respiratory efforts. These children would have required
additional oesophageal manometry to differentiate between chest wall and lung
mechanics (Sly et al 1996). Such differentiation was not possible with the "CO2 SMO
Plus" alone. Although oesophageal monitoring would have been useful during this
study, the complexity o f its use was unlikely to recommend it as a pragmatic clinical
tool for routine physiotherapy treatments. Since and were considered
important outcomes, only fully ventilated, paralysed or heavily sedated infants and
children were recruited into the study after completion o f the pilot study. A further
reason for limiting measurements to paralysed patients was that differences in
alveolar ventilation during spontaneous ventilation would lead to non-equilibrium
between PeCOi and PaCOi, and values o f Vophys and Voaiv would be variable (Taskar
et al. 1995).
Figure 5-1: Examples of trended data before and after treatment in a
spontaneously breathing and a mechanically ventilated child.
Spontaneous breaths ■ R rs» 10• ETCO,• PIP » io• PEEP
VCO.,x 100
Timefminutes
Ventilated breathsr '
• Rrsx 10• ETCO• PIP X 10 » PEEP» Crs• R. X 1 ■• V C O , X 10 » V -, X 10
Time (minutes)
60
The wide within-subject variability evident in the patient on the left who is breathing spontaneously between ventilator breaths, would make it d ifficu lt to distinguish changes as a result o f therapy. By contrast, subtle changes in Vte and Crs after physiotherapy in the patient on the right are clearly visible.
5.1.3 Validation of measurement interval;
The choice o f measurement interval involved satisfying both the requirement that it was
long enough to be representative o f the patient’ s true clinical status while short enough
to be clinically realistic amongst the multiple interventions performed on patients in
intensive care. The intensive care environment is incompatible with a study design which
97
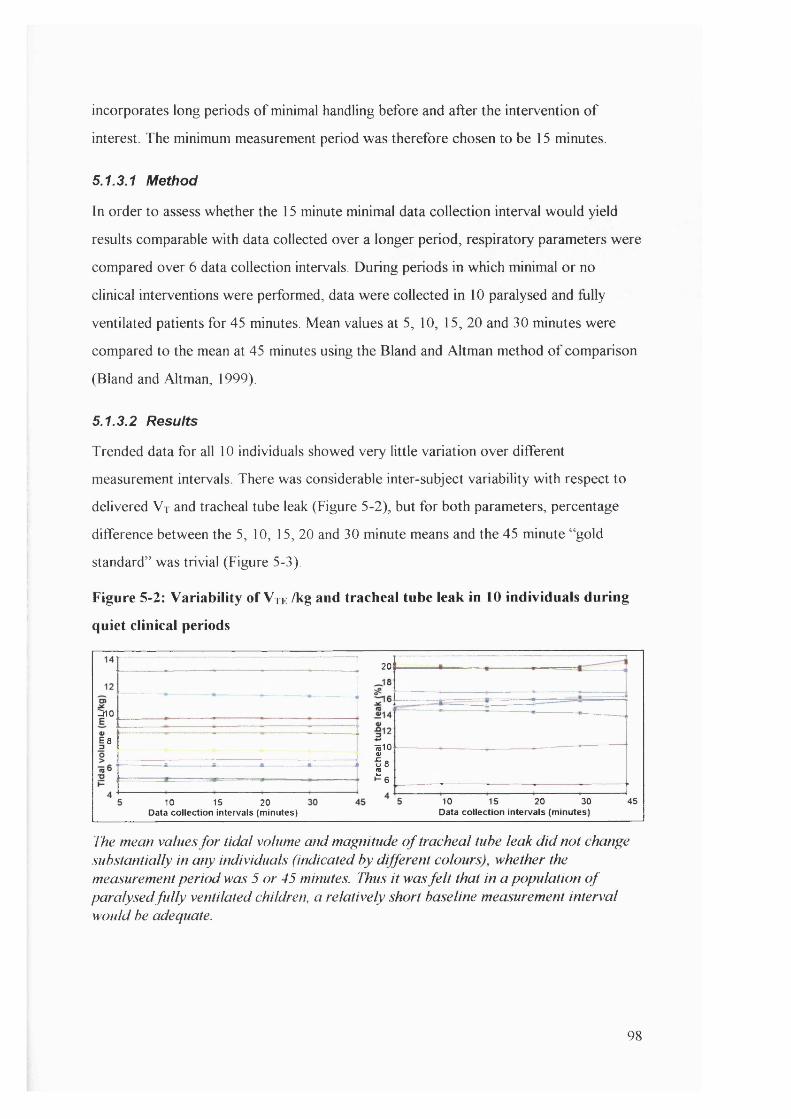
incorporates long periods o f minimal handling before and after the intervention o f
interest. The minimum measurement period was therefore chosen to be 15 minutes.
5.1.3.1 Method
In order to assess whether the 15 minute minimal data collection interval would yield
results comparable with data collected over a longer period, respiratory parameters were
compared over 6 data collection intervals. During periods in which minimal or no
clinical interventions were performed, data were collected in 10 paralysed and fiilly
ventilated patients for 45 minutes. Mean values at 5, 10, 15, 20 and 30 minutes were
compared to the mean at 45 minutes using the Bland and Altman method o f comparison
(Bland and Altman, 1999).
5.1.3.2 Results
Trended data for all 10 individuals showed very little variation over different
measurement intervals There was considerable inter-subject variability with respect to
delivered V t and tracheal tube leak (Figure 5-2), but for both parameters, percentage
difference between the 5, 10, 15, 20 and 30 minute means and the 45 minute “ gold
standard” was trivial (Figure 5-3).
Figure 5-2: Variability of V te /kg and tracheal tube leak in 10 individuals during
quiet clinical periods
201
rno
287510
I:10 15 20 30
Data collection intervals (minutes)4510 15 20
Data collection intervals (minutes)
The mean values fo r tidal volume and magnitude o f tracheal tube leak d id not change substantially in any individuals (indicated by different colours), whether the measurement period was 5 or 45 minutes. Thus it was fe lt that in a population o f paralysed fu lly ventilated children, a relatively short baseline measurement interval would be adequate.
98
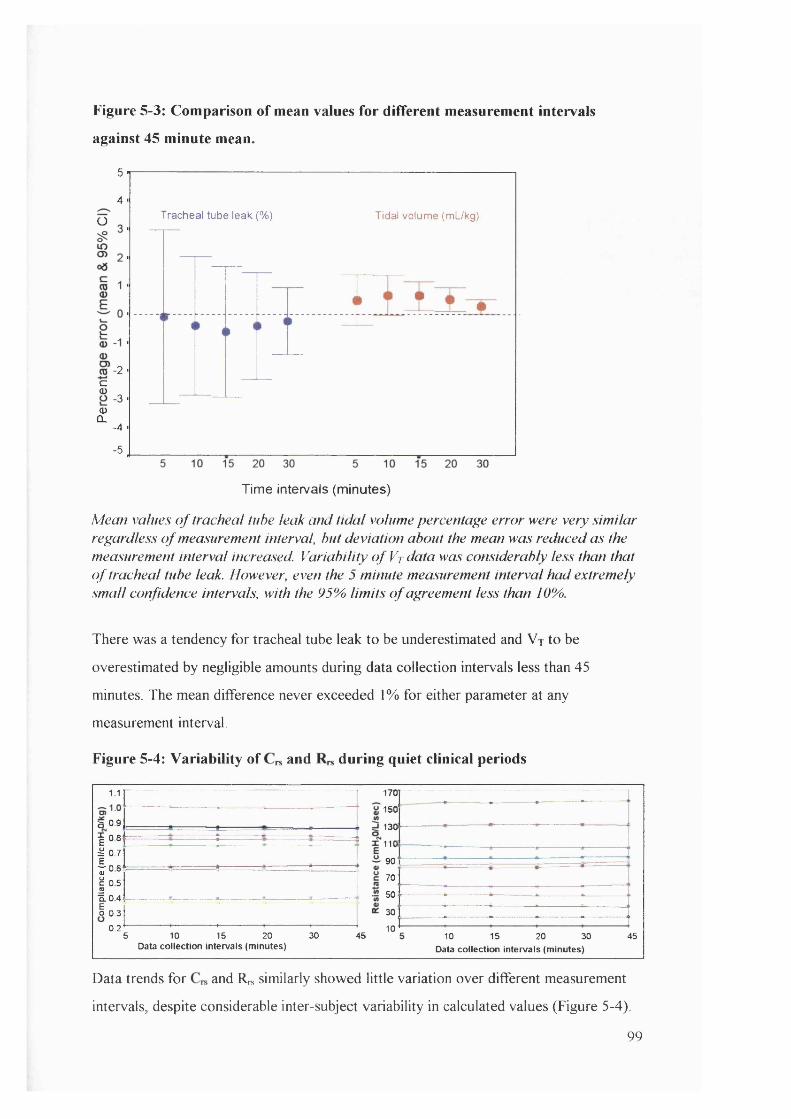
Figure 5-3: Comparison of mean values for different measurement intervals
against 45 minute mean.
5
4Tracheal tube leak (%) Tidal volume (mUkg)O
-2c<D
30)
CL■4
5
Time intervals (m inutes)
Mean values o f tracheal tube leak and tida l volume percentage error were very sim ilar regardless o f measurement interval, but deviation about the mean was reduced as the measurement interval increased. Variability o f Vt data was considerably less than that o f tracheal tube leak. However, even the 5 minute measurement interval had extremely small confidence intervals, with the 95% lim its o f agreement less than 10%.
There was a tendency for tracheal tube leak to be underestimated and V r to be
overestimated by negligible amounts during data collection intervals less than 45
minutes. The mean difference never exceeded 1% for either parameter at any
measurement interval.
Figure 5-4: Variability of and during quiet clinical periods
1.1
B 0.9I 0.8^ 0.7
fo e I “ 5â04 I 0.3
0.2
170
150
1301
lie90
70
50
30
5 10 15 20Data collection intervals (minutes)
30 4510
10 15 20 30Data collection intervals (minutes)
45
Data trends for and Rrs similarly showed little variation over different measurement
intervals, despite considerable inter-subject variability in calculated values (Figure 5-4).
99
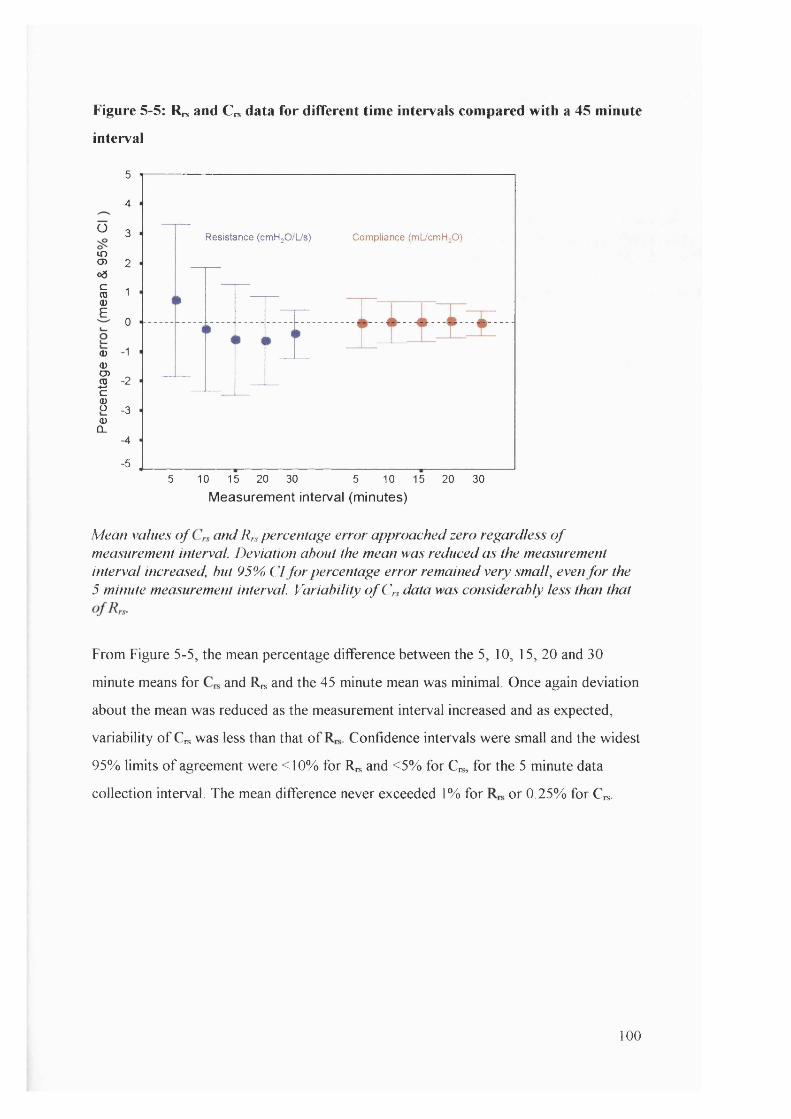
Figure 5-5: Rn* and Crs data for different time intervals compared with a 45 minute
interval
Ü
inO)o3cCD0)£
CD
0)CD
i5cS(DQ_
5
4
3 Resistance (cmH^O/L/s) Compliance (mlicmHjO)
2
1
0
■1
■2
3
4
■55 10 15 20 30 5 10 15 20 30
M e a s u r e m e n t in te r v a l ( m in u te s )
Mean values o f and Ifs percentage erro r approached zero regardless o f measurement interval. Deviation about the mean was reduced as the measurement in terval increased, hut 95% C l fo r percentage e rro r remained very small, even f o r the 5 minute measurement interval. Variability o f C» data was considerably less than that
From Figure 5-5, the mean percentage difference between the 5, 10, 15, 20 and 30
minute means for and Rrs and the 45 minute mean was minimal. Once again deviation
about the mean was reduced as the measurement interval increased and as expected,
variability o f Cn, was less than that o f Confidence intervals were small and the widest
95% limits o f agreement were <10% for ICs and <5% for C^, for the 5 minute data
collection interval. The mean difference never exceeded 1% for or 0.25% for C^.
100
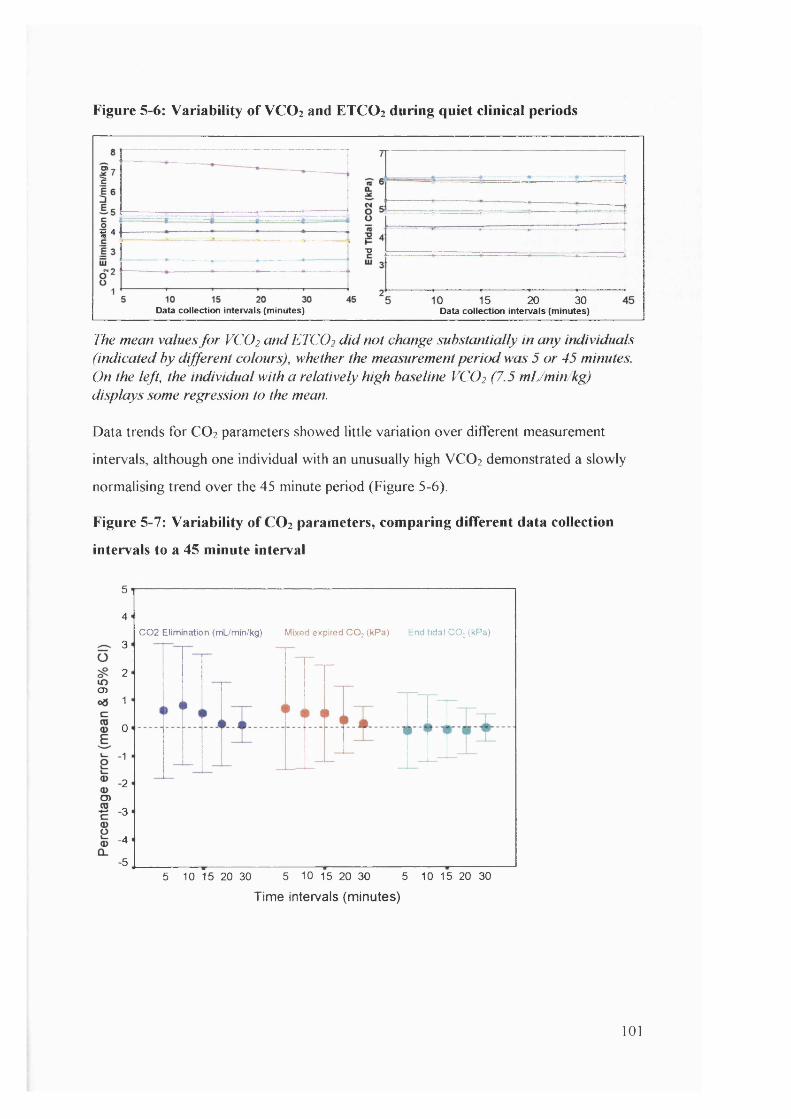
Figure 5-6: Variability of VC O 2 and ETCO 2 during quiet clinical periods
% 4
"O
D 15 20 30Data collection Intervals (minutes)Data collection intervals (minutes)
ITie mean values fo r VCO2 and ETCO2 d id not change substantially in any individuals (indicated by different colours), whether the measurement period was 5 or 45 minutes. On the left, the individual with a relatively high baseline VCO2 (7.5 mL/min/kg) displays some regression to the mean.
Data trends for CO2 parameters showed little variation over different measurement
intervals, although one individual with an unusually high VCO 2 demonstrated a slowly
normalising trend over the 45 minute period (Figure 5-6).
Figure 5-7: Variability of CO 2 parameters, comparing different data collection
intervals to a 45 minute interval
5
4C02 Elimination (mL/min/kg) Mixed expired CO; (kPa) End tidal CO; (kPa)
3
2o>
1
0
1
2O)
3
-4
•55 10 15 20 30 5 10 15 20 305 10 15 20 30
Time intervals (minutes)
101

Figure 5-7 demonstrates minimal difference in CO2 values between the 5, 10, 15, 20 and
30 minute means and the 45 minute mean. As with the other respiratory parameters,
deviation about the mean reduced as the measurement interval increased. ETCO 2
appeared to have the lowest variability o f the CO2 parameters, although even the widest
95% limits o f agreement for the other two did not exceed 8%. There was a (minimal)
tendency for VCO 2 and PeC02 to be overestimated during data collection intervals <45
minutes, although the mean difference never exceeded 1% for VCO 2 and PeC02 or
0 .2 5 . for ETCO 2 .
The outstanding feature o f these recordings was the stability o f various respiratory
parameters in paralysed patients during quiet clinical periods. The study protocol
required at least 15 minutes o f baseline measurement and 15 minutes after each
treatment. This investigation provided confidence that the data obtained in 15 minutes
would be as useful as data obtained during longer periods.
While these data suggested that measurement intervals as short as 5 minutes were
sufficient to obtain baseline data in a paralysed patient, there were concerns that even 45
minutes could potentially be insufficient to demonstrate slowly changing parameters as a
result o f therapy. It was therefore decided that 15 minutes would represent a reasonable
compromise as a baseline and post treatment interval. It also represented a measurement
interval which most medical or nursing staff would be willing to accommodate in terms
o f willingness to delay non-urgent interventions (nappy changes, chest radiograph,
position change). Efforts were made to ensure at least 2 measurement intervals (30
minutes) were obtained in all patients after treatment, and longer periods in as many
patients as possible.
5.2 In-vivo studies
The following investigations were undertaken concurrently with the primary study, but
analysed in advance o f the primaiy study data since it was anticipated that the results
would influence:
1. which subjects would finally be included in analysis
2. interpretation o f results in terms o f clinically significant changes.
102
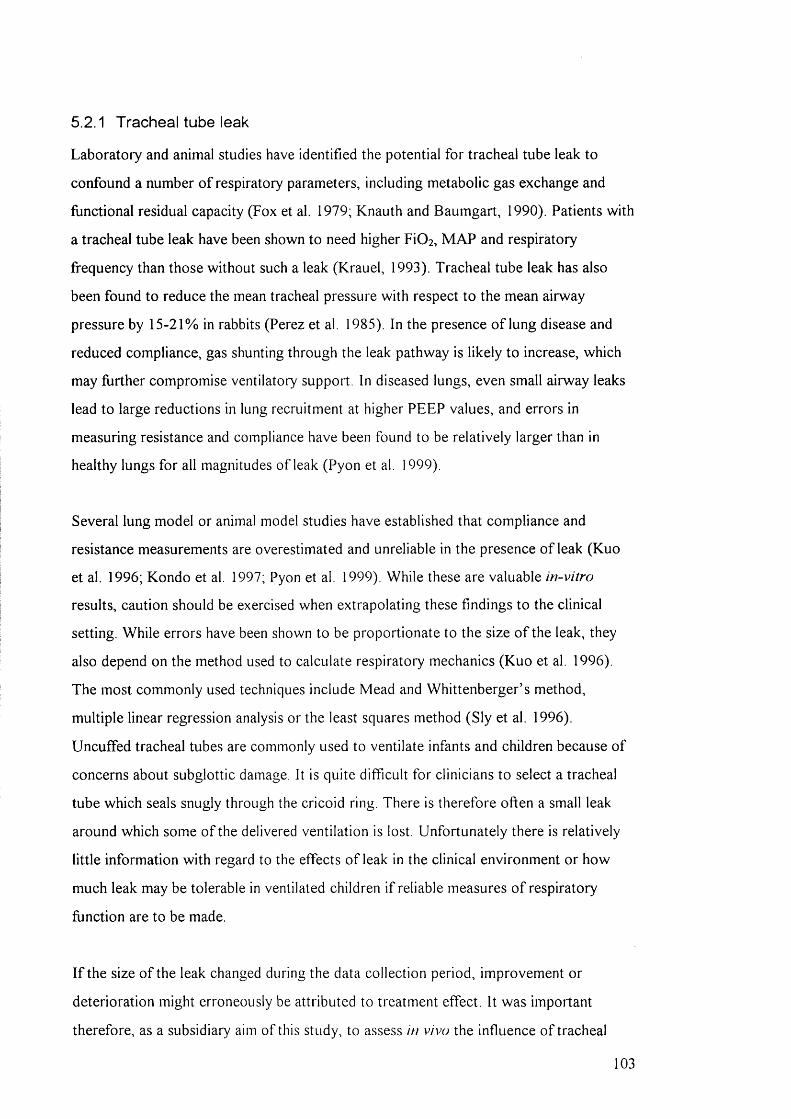
5.2.1 Tracheal tube leak
Laboratory and animal studies have identified the potential for tracheal tube leak to
confound a number o f respiratory parameters, including metabolic gas exchange and
functional residual capacity (Fox et al. 1979; Knauth and Baumgart, 1990). Patients with
a tracheal tube leak have been shown to need higher FiOz, M AP and respiratory
frequency than those without such a leak (Krauel, 1993). Tracheal tube leak has also
been found to reduce the mean tracheal pressure with respect to the mean airway
pressure by 15-21% in rabbits (Perez et al. 1985). In the presence o f lung disease and
reduced compliance, gas shunting through the leak pathway is likely to increase, which
may further compromise ventilatory support. In diseased lungs, even small airway leaks
lead to large reductions in lung recruitment at higher PEEP values, and errors in
measuring resistance and compliance have been found to be relatively larger than in
healthy lungs for all magnitudes o f leak (Pyon et al. 1999).
Several lung model or animal model studies have established that compliance and
resistance measurements are overestimated and unreliable in the presence o f leak (Kuo
et al. 1996; Kondo et al. 1997; Pyon et al. 1999). While these are valuable in-vitro
results, caution should be exercised when extrapolating these findings to the clinical
setting. While errors have been shown to be proportionate to the size o f the leak, they
also depend on the method used to calculate respiratory mechanics (Kuo et al. 1996).
The most commonly used techniques include Mead and Whittenberger’ s method,
multiple linear regression analysis or the least squares method (Sly et al. 1996).
Uncuffed tracheal tubes are commonly used to ventilate infants and children because o f
concerns about subglottic damage. It is quite difficult for clinicians to select a tracheal
tube which seals snugly through the cricoid ring. There is therefore often a small leak
around which some o f the delivered ventilation is lost. Unfortunately there is relatively
little information with regard to the effects o f leak in the clinical environment or how
much leak may be tolerable in ventilated children i f reliable measures o f respiratory
function are to be made.
I f the size o f the leak changed during the data collection period, improvement or
deterioration might erroneously be attributed to treatment effect. It was important
therefore, as a subsidiary aim o f this study, to assess in vivo the influence o f tracheal
103
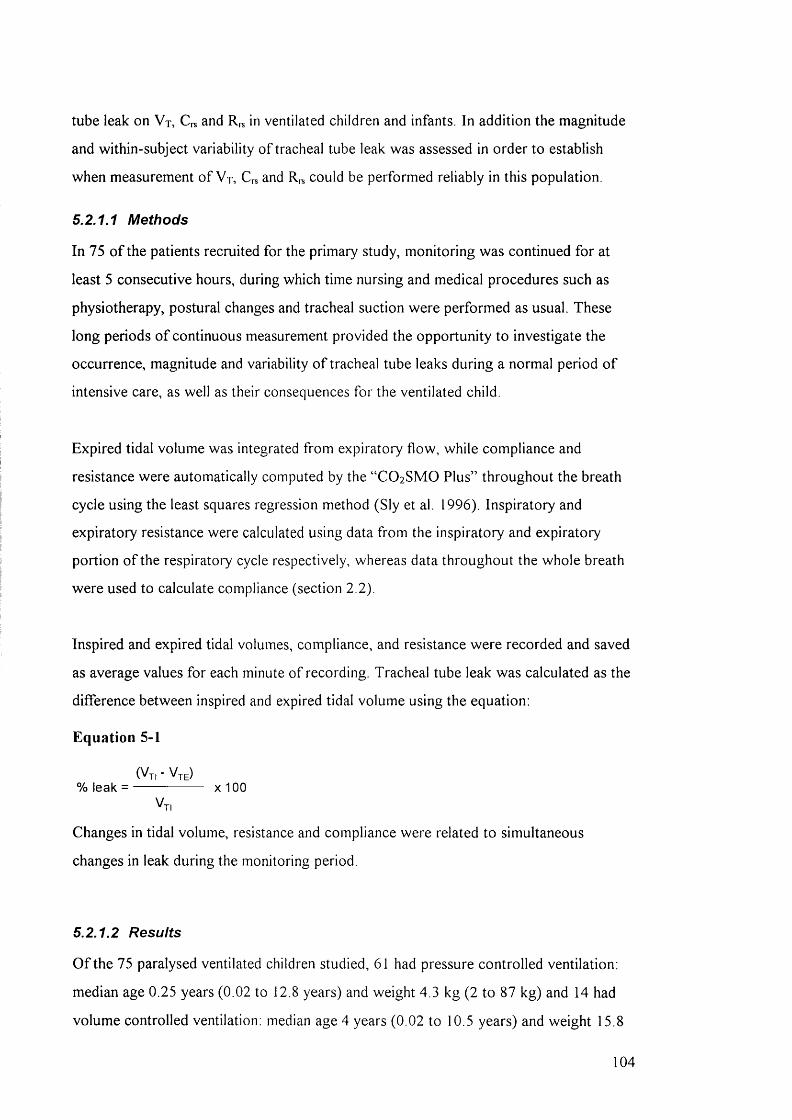
tube leak on V j, C, and R,., in ventilated children and infants. In addition the magnitude
and within-subject variability o f tracheal tube leak was assessed in order to establish
when measurement o f V t, C,s and R,s could be performed reliably in this population.
5.2.1.1 Methods
In 75 o f the patients recruited for the primary study, monitoring was continued for at
least 5 consecutive hours, during which time nursing and medical procedures such as
physiotherapy, postural changes and tracheal suction were performed as usual. These
long periods o f continuous measurement provided the opportunity to investigate the
occurrence, magnitude and variability o f tracheal tube leaks during a normal period o f
intensive care, as well as their consequences for the ventilated child.
Expired tidal volume was integrated from expiratory flow, while compliance and
resistance were automatically computed by the “ CO2 SMO Plus” throughout the breath
cycle using the least squares regression method (Sly et al. 1996). Inspiratory and
expiratory resistance were calculated using data from the inspiratory and expiratory
portion o f the respiratory cycle respectively, whereas data throughout the whole breath
were used to calculate compliance (section 2.2).
Inspired and expired tidal volumes, compliance, and resistance were recorded and saved
as average values for each minute o f recording. Tracheal tube leak was calculated as the
difference between inspired and expired tidal volume using the equation:
Equation 5-1
(Vt, -V te)% leak = ------------------ X 100
Vt,
Changes in tidal volume, resistance and compliance were related to simultaneous
changes in leak during the monitoring period.
5.2.1.2 Results
O f the 75 paralysed ventilated children studied, 61 had pressure controlled ventilation:
median age 0.25 years (0.02 to 12.8 years) and weight 4.3 kg (2 to 87 kg) and 14 had
volume controlled ventilation: median age 4 years (0.02 to 10.5 years) and weight 15.8
104

kg (3 to 30 kg). 4 children in each group had a cuffed tracheal tube: median age 8 years
( 4 - 1 6 yrs) weight 22 kg (13.9 - 87 kg). Ten children ( 13%) had a mean tracheal tube
leak greater than 20% (2 1 .9 - 65.1%), median age 0.12 years (0.02 - 1.3 yrs) and weight
2.95 kg (2.6 - 9.8 kg). In the latter group, there were particularly wide within and
between-subject fluctuations with respect to the magnitude o f leak, V t e , C , s and
during the monitoring period.
Figure 5-8 summarises data recorded over several hours in two infants in whom
ventilatory settings remained constant during the monitoring period. The relationship
between both inspired and expired tidal volume and changes in percentage o f leak are
displayed.
Figure 5-8: The relatioiiship between V| and change in tracheal tube leak
a) 16 month old male on pressure controlled ventilation b) 5 day old female on volume controlled ventilation16
° V T , (m L /kg )
* V T , (m L /kg )
12
I'”E 8<ui •Iro 4h-
2
0 10 20 30 40 70 8050 60
° VT, (m L /kg )
* VT, (m L /kg )
C D
0 10 20 30 40 50 60 70 80
Tracheal tube leak (%)
The relationship between ins/)ired and expired tida l volume andpercetUa^e leak in a) an infant on pressure pre-set ventilation (Servo 300) and h) an in fant on volume pre-set ventilation (Servo 300). Tracheal lube leak was calculated from the difference between inspiratory (Vj/) and expiratory (Vm) tida l volume. Idich data po in t repre.sents the mean value from one minute o f recording
In the first example from a 16 month old male infant on pressure controlled ventilation
(Figure 5-8a) the leak varied between 1 0 % and 70% over a six hour period and was
accompanied by a 30% increase in inspired tidal volume and a 60% reduction in expired
volume. By contrast, but as expected, during volume controlled ventilation (Figure 5-
8 b) inspired volume remained relatively constant in a 5 day old (2.88 kg) infant over 7
105
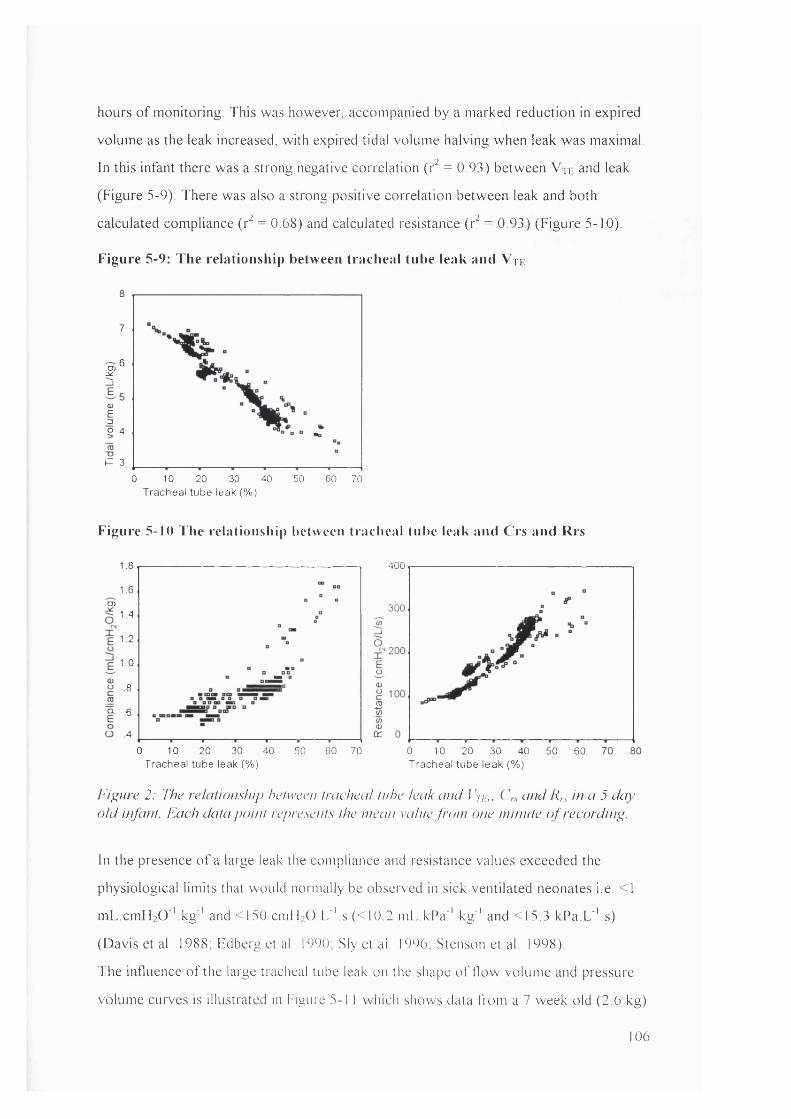
hours o f monitoring. This was however, accompanied by a marked reduction in expired
volume as the leak increased, with expired tidal volume halving when leak was maximal.
In this infant there was a strong negative correlation (r^ = 0.93) between Vn- and leak
(Figure 5-9). There was also a strong positive correlation between leak and both
calculated compliance (r^ = 0.68) and calculated resistance (r^ = 0.93) (Figure 5-10).
Figure 5-9: The relationship between tracheal tube leak and Vue
8
7
r0)E3o 4
P 3
10 20 30 50 60 700 40Tracheal tube leak (%)
Figure 5-10 The relationship between tracheal tube leak and Crs and Rrs
1.8
1.6CD
1.4
1.2
1.0
8
p- .6
4
100 20 30 40 50 60 70
400
Tracheal tube leak (%)0 10 20 30 40Tracheal tube leak (%)
50 60
Figure 2: The relalionship helweeii Iracheal In he leak and fV/i., (-fud Rrs hi a 5 day old infant. Each data point repre.sent.s the mean vaine from one minute o f recording.
In the presence o f a large leak the compliance and resistance values exceeded the
physiological limits that would normally be observed in sick ventilated neonates i.e. < 1
mL.cm H 2 0 'Vkg'' and <150 cmH2 0 .L ''.s (<10 2 m L.kPa''.kg '' and <15.3 kPa.L''.s)
(Davis et al. 1988; Edberg et al. 1990, Sly et ai. 1996, Stenson et al 1998)
The influence o f the large tracheal tube leak on the shape o f flow volume and pressure
volume curves is illustrated in Figure 5-1 1 which shows data from a 7 week old (2.6 kg)
106
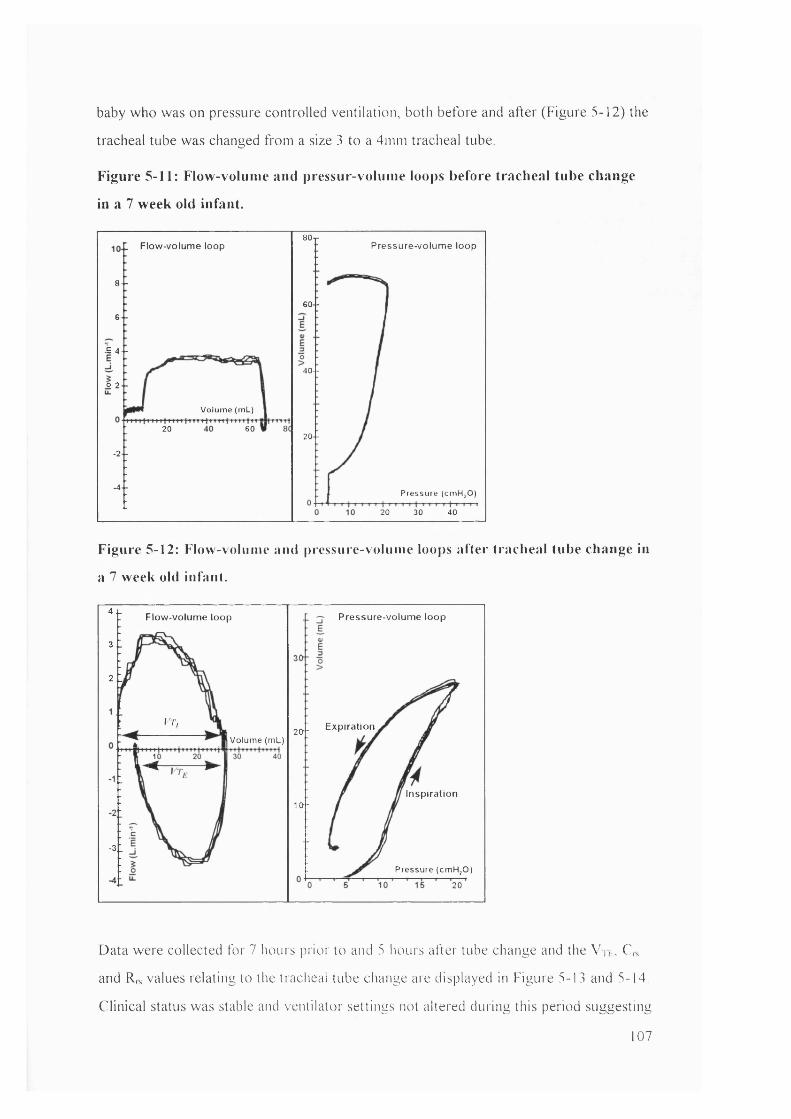
baby who was on pressure controlled ventilation, both before and after (Figure 5-12) the
tracheal tube was changed from a size 3 to a 4mm tracheal tube
Figure 5-11: Flow-voluine and pressur-volume loops before tracheal tube change
in a 7 week old infant.
80-rPressure-volum e loopFiow-volume loop
8 ■ -
6 0 -6 -
•E 4 - -
40--
o 2 -
Vo lum e (mL)
20 602 0 -
-2-
-4 -Pressure (c m H ,0 )
20 30 40
Figure 5-12: Flow-vohime and pressure-voluine loops after tracheal tube change in
a 7 week old infant.
4^ Pressure-volum e loopFiow-volume loop
3 1
2 L
VT, 2Q.1 ExpirationV olum e (m L)
Inspiration1 0 -
-31Pressure (cm H jO )
20
Data were collected for 7 hours prior to and 5 hours after tube change and the V ik, C,s
and R,s values relating to the tracheal tube change are displayed in Figure 5-13 and 5-14.
Clinical status was stable and ventilator settings not altered during this period suggesting
107
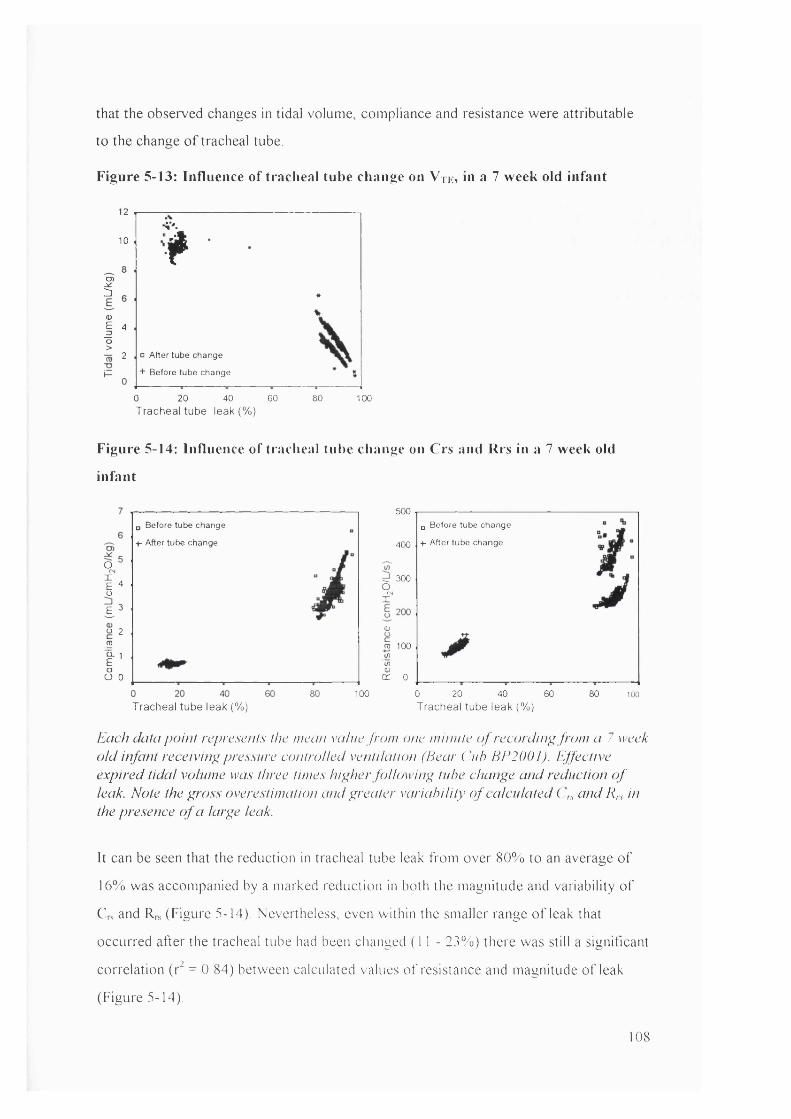
that the observed changes in tidal volume, compliance and resistance were attributable
to the change o f tracheal tube.
Figure 5-13: Influence of tracheal tube change on V tk, in a 7 week old infant
12
10
I<DI “o>m 2
V'.f□ After tube change
+ Before tube change
0 20 40 60Tracheal tube leak (% )
80 100
Figure 5-14: Influence of traciieal tube change on Crs and Rrs in a 7 week old
infant
o#4oE 3
o 2 roI 'oO 0
500o Before tube change
+- After tube change
□ Before tube change
+- After tube change400
d 3009.I*
(Uro 100w(/)0)cr 0
100 0 20 40 60 80 100Tracheal tube leak (%) Tracheal tube leak (% )
Each data po in t represents the mean value from one mum te o f record ing from a 7 week o ld infant receiving pressure controlled ventilation (Hear ( ’///? HE2001). Effective expired tida l volume was three times h igher fo llow ing tube change and reduction o f leak. Note the gr'oss overestimation and p;reater variab ility o f calculated ( \ and Rrs in the presence o f a larye leak.
It can be seen that the reduction in tracheal tube leak from over 80% to an average o f
16% was accompanied by a marked reduction in both the magnitude and variability o f
C,s and R,s (Figure 5-14). Nevertheless, even within the smaller range o f leak that
occurred after the tracheal tube had been changed ( 1 1 - 23%) there was still a significant
correlation (r^ = 0.84) between calculated values o f resistance and magnitude o f leak
(Figure 5-14).
108
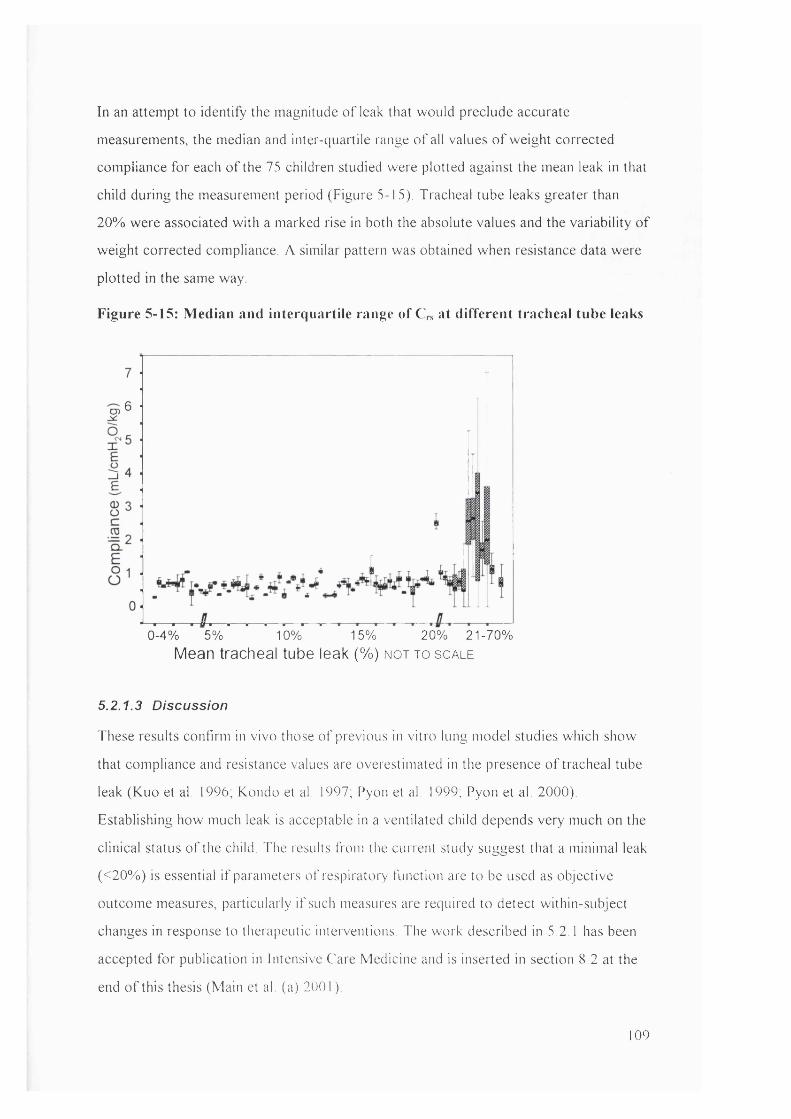
In an attempt to identify the magnitude o f leak that would preclude accurate
measurements, the median and inter-quaitile range o f all values o f weight corrected
compliance for each o f the 75 children studied were plotted against the mean leak in that
child during the measurement period (Figure 5-15). Tracheal tube leaks greater than
20% were associated w ith a marked rise in both the absolute values and the variability o f
weight corrected compliance. A similar pattern was obtained when resistance data were
plotted in the same way.
Figure 5-15: Median and interquartile range of C,s at different tracheal tube leaks
0-4% 5% 10% 15% 20% 21-70%Mean tracheal tube leak (%) n o t t o s c a l e
5.2.1.3 Discussion
These results confirm in vivo those o f previous in vitro lung model studies which show
that compliance and resistance values are overestimated in the presence o f tracheal tube
leak (Kuo et al. 1996, Kondo et al. 1997, Pyon et al. 1999, Pyon et al. 2000).
Establishing how much leak is acceptable in a ventilated child depends very much on the
clinical status o f the child. The results from the current study suggest that a minimal leak
(<20% ) is essential i f parameters o f respiratory function are to be used as objective
outcome measures, particularly i f such measures are required to detect within-subject
changes in response to therapeutic interventions. The work described in 5.2.1 has been
accepted for publication in Intensive Care Medicine and is inserted in section 8.2 at the
end o f this thesis (Main et al (a) 2001 )
109
During ventilation, leak magnitude reflects both overestimation o f Vu, much o f which
having passed through the flow-meter will leak out around the tube before entering the
child’s lungs, and the reduction in Vte. Kondo et al. found that leak during expiration
was smaller and hence that V te was likely to be more accurate than V ti (Kondo et al.,
1997). For this reason, V te was used in preference to V ti in all calculations during
subsequent analyses.
Detailed discussion o f the issues surrounding tracheal tube leak and interpretation o f
respiratory function monitoring in ventilated children will fo llow in 8.2, but based on the
information available from the tracheal tube leak analysis, a decision was made to
exclude children with tracheal tube leaks >20% from data analysis. In addition, change
in leak during the measurement period was minimised by ensuring that the child’ s
posture and head position were similar before and after treatment.
5.2.2 Normal variability of parameters
5.2.2.1 Effect of disconnecting the flow sensor
Although it had been established that normal variability o f respiratory parameters in
paralysed ventilated subjects was minimal, there was some concern that disconnection
and reconnection o f the flow sensor, as required for each physiotherapy treatment or
nursing suction, would introduce a degree o f additional variability, which would
confound results.
5.2.2.1.1 Method
During quiet clinical periods, in which minimal clinical interventions were performed,
baseline data were obtained for 15 minutes in 10 patients who were recruited into the
pilot study. The flow sensor was then removed from the ventilator circuit for 3 minutes,
before being returned to the circuit for a final 15 minutes. The mean difference in
selected respiratory parameters before and after disconnection was compared to the
mean change following physiotherapy and nursing suction for those 10 patients.
Additional arterial blood gases were not taken prior to and follow ing disconnection,
hence data for these parameters were not available for comparison.
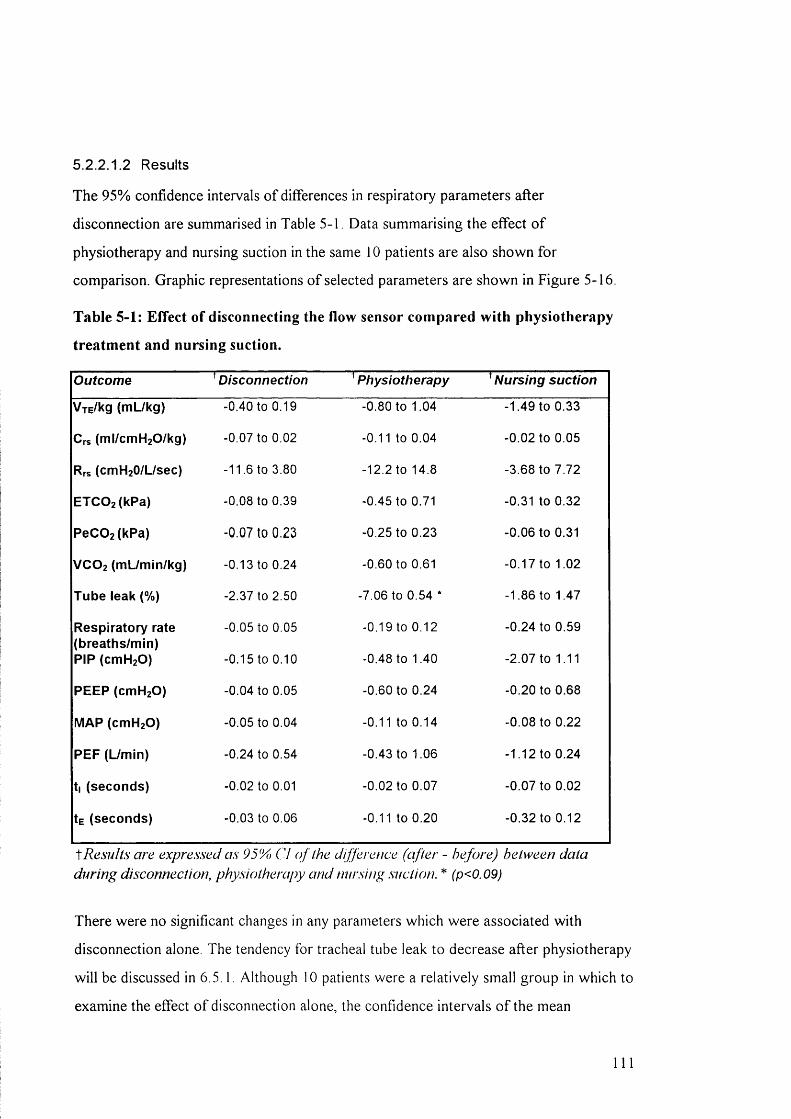
5.2.2.1.2 Results
The 95% confidence intervals o f differences in respiratory parameters after
disconnection are summarised in Table 5-1. Data summarising the effect o f
physiotherapy and nursing suction in the same 10 patients are also shown for
comparison. Graphic representations o f selected parameters are shown in Figure 5-16.
Table 5-1: Effect of disconnecting the flow sensor compared with physiotherapy
treatment and nursing suction.
Outcome ^Disconnection Physiotherapy Nursing suction
V rE /k g ( m U k g ) -0.40 to 0.19 -0.80 to 1.04 -1.49 to 0.33
C rs ( m l / c m H 2 0 /k g ) -0.07 to 0.02 -0.11 to 0.04 -0.02 to 0.05
Rrs ( c m H 2 0 /L /s e c ) -11.6 to 3.80 -12.2 to 14.8 -3.68 to 7.72
E T C 0 2 ( k P a ) -0.08 to 0.39 -0.45 to 0.71 -0.31 to 0.32
P e C O z fk P a ) -0 .0 7 to 0 .2 3 -0.25 to 0.23 -0.06 to 0.31
V C O 2 ( m L / m in / k g ) -0.13 to 0.24 -0.60 to 0.61 -0.17 to 1.02
T u b e le a k (% ) -2.37 to 2.50 -7.06 to 0.54 * -1.86 to 1.47
R e s p i r a t o r y r a te -0.05 to 0.05 -0.19 to 0.12 -0.24 to 0.59( b r e a t h s /m in )
P IP ( c m H 2 0 ) -0.15 to 0.10 -0.48 to 1.40 -2.07 to 1.11
P E E P ( c m H 2 0 ) -0.04 to 0.05 -0.60 to 0.24 -0.20 to 0.68
M A P ( c m H 2 0 ) -0.05 to 0.04 -0.11 to 0.14 -0.08 to 0.22
P E P ( U m in ) -0.24 to 0.54 -0.43 to 1.06 -1.12 to 0.24
t | ( s e c o n d s ) -0.02 to 0.01 -0.02 to 0.07 -0.07 to 0.02
1e ( s e c o n d s ) -0.03 to 0.06 -0.11 to 0.20 -0.32 to 0.12
Results are expressed as 95% Cl o f the difference (after - before) between data during disconnection, physiotherapy and nursing suction. * (p<0.09)
There were no significant changes in any parameters which were associated with
disconnection alone. The tendency for tracheal tube leak to decrease after physiotherapy
w ill be discussed in 6.5.1. Although 10 patients were a relatively small group in which to
examine the effect o f disconnection alone, the confidence intervals o f the mean
111

differences were small and provided some confidence that there were no systematic
errors associated with disconnection o f the flow sensor.
Figure 5-16: Difference (after - before intervention) in selected parameters in 10
patients after disconnection, physiotherapy or nursing suction
Tidal volume (mL/kg) Iracheal tube leak (%)
disconnection
ptiyslotherapy
nursing suction
2
(cmHjO/L/sec)
10 :c -1
0
-101
m disconnection
I physiottierapy
B nursing suction -202
1.5
P eC O ; (kPa)VCO 2 (mL/min/ kg) ETCO ; (kPa)1.0
0.0
TJ
H disconnection
0 physiotherapy
0 nursing suction
CO2 Parameters
1 1 2
From Figure 5-16 it can be seen that for all parameters, the mean difference after
disconnection was negligible and the confidence intervals o f the difference were smaller
for disconnection than they were for either o f the treatment interventions. From these
data it was concluded that disconnection o f the flow sensor did not constitute a threat to
evaluation o f treatment effect.
S.2.2.2 Establishing potentiai perimeters for ciinicai significance
In the absence o f published data demonstrating effects o f physiotherapy or nursing
suction on respiratory function in ventilated children, it was difficult to decide what
magnitude o f change in individuals would constitute clinical significance. It was
therefore decided to determine the variability o f individual respiratory parameters in the
absence o f interventions so that reasonable limits could be established for treatment
related changes which were significantly larger than the limits for normal variability.
S .2 .2 .2 .1 M ethod
Data were obtained from 33 randomly selected patients in the study population in whom
there were two consecutive 15 minute periods without clinical interventions. The mean
values o f selected respiratory parameters in the consecutive time periods were
compared, to assess normal variability o f individual parameters during quiet clinical
periods. The percentage difference and 95% LA in respiratory parameters between time
periods were calculated for each parameter.
13
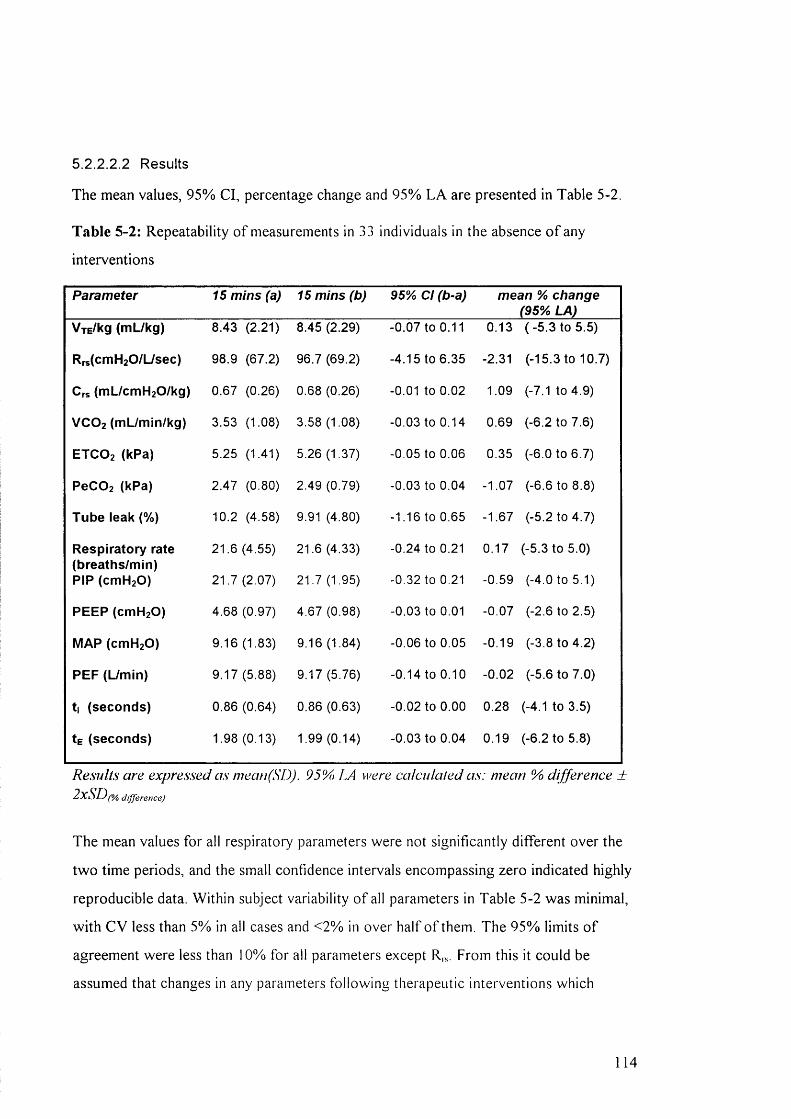
5.2.2.2 2 Results
The mean values, 95% Cl, percentage change and 95% L A are presented in Table 5-2.
Table 5-2: Repeatability o f measurements in 33 individuals in the absence o f any
interventions
Parameter 15 mins (a) 15 mins (b) 95% Cl (b-a) mean % change (95% LA)
V jE /k g ( m L / k g ) 8.43 (2.21) 8.45 (2.29) -0.07 to 0.11 0.13 (-5 .3 to 5.5)
R r s (c m H 2 0 /L /s e c ) 98.9 (67.2) 96.7 (69.2) -4.15 to 6.35 -2.31 (-15.3 to 10.7)
C rs ( m L /c m H z O /k g ) 0.67 (0.26) 0.68 (0.26) -0.01 to 0.02 1.09 (-7.1 to 4.9)
V C O 2 ( m L / m in / k g ) 3.53 (1.08) 3.58 (1.08) -0.03 to 0.14 0.69 (-6.2 to 7.6)
E T C O 2 ( k P a ) 5.25 (1.41) 5.26 (1.37) -0.05 to 0.06 0.35 (-6.0 to 6.7)
P e C 0 2 ( k P a ) 2.47 (0.80) 2.49 (0.79) -0.03 to 0.04 -1.07 (-6.6 to 8.8)
T u b e le a k (% ) 10.2 (4.58) 9.91 (4.80) -1.16 to 0.65 -1.67 (-5.2 to 4.7)
R e s p i r a t o r y r a te 21.6 (4.55) 21.6 (4.33) -0.24 to 0.21 0.17 (-5.3 to 5.0)( b r e a t h s / m in )
P IP ( c m H 2 0 ) 21.7 (2.07) 21.7 (1.95) -0.32 to 0.21 -0.59 (-4.0 to 5.1)
P E E P ( c m H 2 0 ) 4.68 (0.97) 4.67 (0.98) -0.03 to 0.01 -0.07 (-2.6 to 2.5)
M A P ( c m H 2 0 ) 9.16 (1.83) 9.16 (1.84) -0.06 to 0.05 -0.19 (-3.8 to 4.2)
P E P ( L / m in ) 9.17 (5.88) 9.17 (5.76) -0.14 to 0.10 -0.02 (-5.6 to 7.0)
t | ( s e c o n d s ) 0.86 (0.64) 0.86 (0.63) -0.02 to 0.00 0.28 (-4.1 to 3.5)
te ( s e c o n d s ) 1.98 (0.13) 1.99 (0.14) -0.03 to 0.04 0.19 (-6.2 to 5.8)
Results are expressed as meati(SD). 95% LA were calcula/ed as: mean % difference ±2xSD(% difference)
The mean values for all respiratory parameters were not significantly different over the
two time periods, and the small confidence intervals encompassing zero indicated highly
reproducible data. Within subject variability o f all parameters in Table 5-2 was minimal,
w ith CV less than 5% in all cases and <2% in over half o f them. The 95% limits o f
agreement were less than 10% for all parameters except R , s . From this it could be
assumed that changes in any parameters following therapeutic interventions which
114

exceeded ± 10%, (or ±20% for R,J within individual subjects were statistically
significant changes which had the potential to be clinically important.
5.2.3 Deadspace measurements
A software problem relating to the automated calculation o f deadspace by the
“ CO2 SMO Plus” program was discovered approximately 9 months after data collection
had begun. A t this stage approximately 48 patients had been studied. A t times, the
PaCOz values entered by the investigator were “ rounded up” or “ rounded down” in a
rather random and inaccurate fashion. For example, a PaCO] o f 5.78 kPa may have
become 5.7 kPa, while 5.01 kPa may have become 5.2 kPa. Attempts to correct for this
by entering a single decimal PaCO] value were not always successful, for example
entering 5.8 kPa resulted in the software changing this to 5.9 kPa. The potential
consequences o f this problem were that by “ rounding up” a pre-treatment PaC0 2 value
while “ rounding down” a post-treatment value, the change in deadspace may not have
been reflected in the calculated value. A t worst, the deadspace may have been shown to
increase or decrease when in fact the opposite was true. This rounding error did not
occur in all instances, but in approximately 1 in 4 blood gas entries.
After this problem was discovered, manual deadspace calculations were used when
PaC02 values were inappropriately altered. However, there were concerns that affected
deadspace data collected prior to this discovery would be unacceptable. To confirm that
it was reasonable to accept the early calculations, deadspace calculations from the
“ CO2 SMO Plus” software were compared to manual calculations using the original
blood gas values. Fifty paired blood samples were used in this comparison, 25 taken
before and 25 after treatment. The samples were selected such that at least one o f each
paired sample was influenced by the PaC0 2 rounding error described above.
Differences in PaC02, Vd/V i and Vophys after treatment were calculated and manual
calculations (using original blood gas values) were compared with the “ CO2 SMO Plus”
calculation in each case. When comparing PaCO] and Vn/Vr, in 22 o f 25 cases the
direction o f change following treatment was the same by both manual calculation and
the automated “ CO2 SMO Plus” calculations. In the remaining 3 cases no change
1 15
following treatment was recorded by the “ CO2 SMO Plus” CO2 values while very small
(± 0 .0 3 kPa) changes were suggested by the original PaC02 values. A standardised t-test
o f the paired differences showed no significant difference between the “ CO2 SMO Plus”
and manual calculations (p = 0 .3 4 and 0 .3 8 for PaC02 and Vophys/ V t respectively).
When Vophys was compared using both methods o f calculation, the direction o f change
following treatment was the same in all 25 cases, and the t-test revealed no significant
difference between the paired samples (p = 0 .9 0 ) . As a result o f this exercise, it was felt
that early recordings o f blood gas values would yield an accurate reflection o f change
following treatment i f not precisely accurate absolute values. In addition, the fact that
the rounding error occurred intermittently meant that the majority o f the affected blood
gases had been corrected within this exercise. During final analysis, PaC02 and
deadspace values were calculated with and without the early blood gas values and no
differences in significance were found.
16
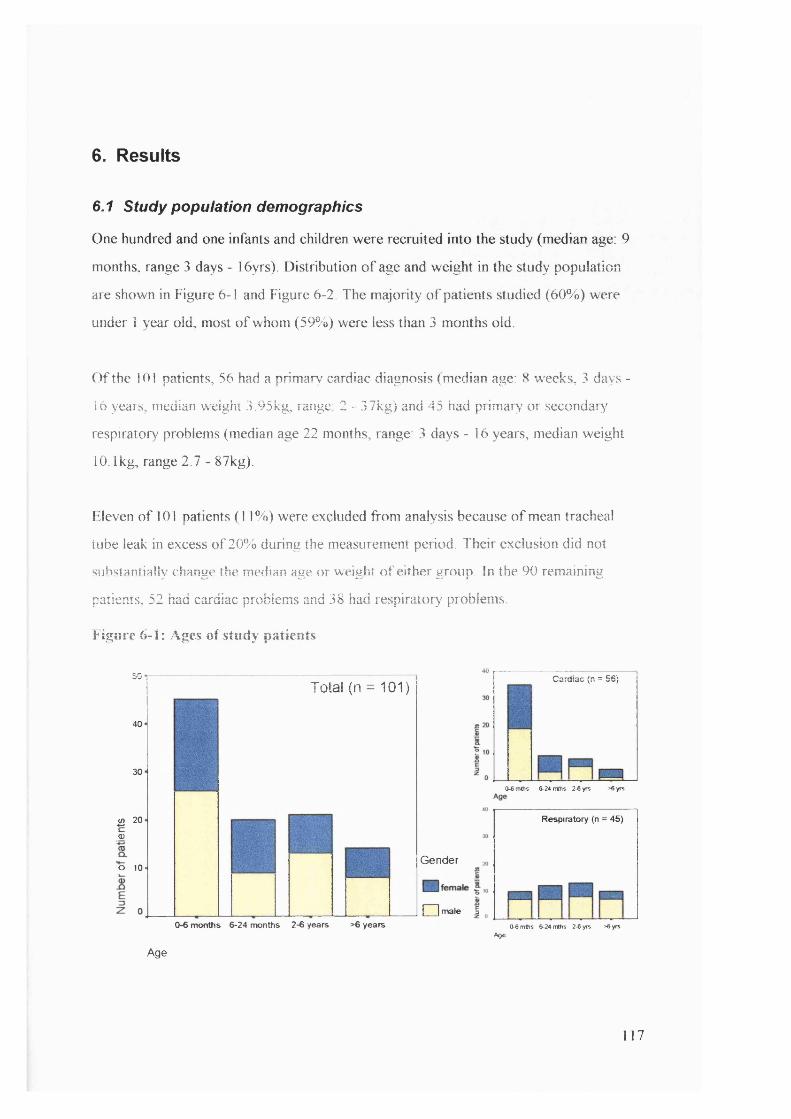
6. Results
6.1 study population demographics
One hundred and one infants and children were recruited into the study (median age: 9
months, range 3 days - 16yrs). Distribution o f age and weight in the study population
are shown in Figure 6-1 and Figure 6-2. The majority o f patients studied (60%) were
under 1 year old, most o f whom (59%) were less than 3 months old.
O f the 101 patients, 56 had a primary cardiac diagnosis (median age: 8 weeks, 3 days -
16 years, median weight 3.95kg, range: 2 - 37kg) and 45 had primary or secondary
respiratory problems (median age 22 months, range: 3 days - 16 years, median weight
10.1kg, range 2.7 - 87kg).
Eleven o f 101 patients (1 1%) were excluded from analysis because o f mean tracheal
tube leak in excess o f 20% during the measurement period. Their exclusion did not
substantially change the. median age or weight o f either group In the 90 remaining
patients, 52 had cardiac problems and 38 had respiratory problems.
Figure 6-1: Ages o f study patients
50
40
30
B 20(D
o 10
Total (n = 101)
0-6 months 6-24 months 2-6 years >6 years
Cardiac (n = 56)
(W mms 6-24 mms 2-6 yrs >6 yrs
Respiratory (n = 45)
Gender
□ male ICk6mths 6-24 mths 2-6 yrs >6 yrs
AgeAge
117
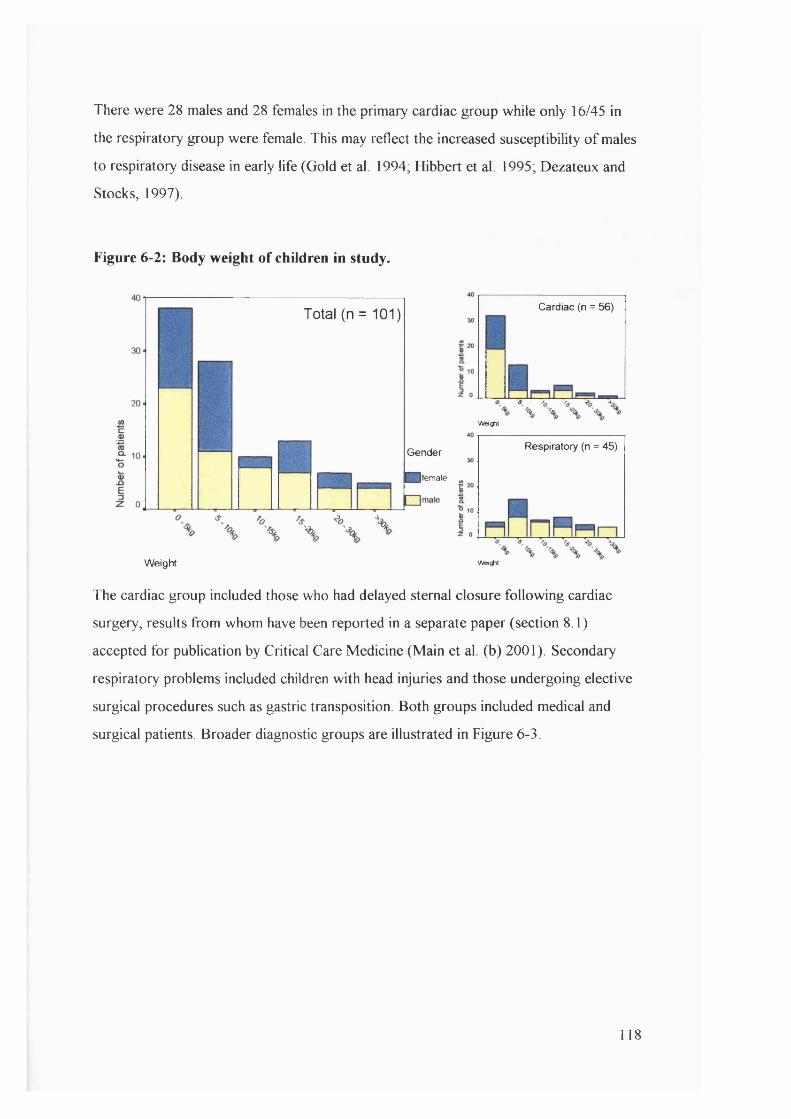
There were 28 males and 28 females in the primary cardiac group while only 16/45 in
the respiratory group were female. This may reflect the increased susceptibility o f males
to respiratory disease in early life (Gold et al. 1994; Hibbert et al. 1995; Dezateux and
Stocks, 1997).
Figure 6-2: Body weight of children in study.
Cardiac (n = 56)Total (n = 101)
W e iÿ it
Respiratory (n = 45)Gender
female
Weight W e iÿ it
The cardiac group included those who had delayed sternal closure following cardiac
surgery, results from whom have been reported in a separate paper (section 8.1)
accepted for publication by Critical Care Medicine (Main et al. (b) 2001). Secondary
respiratory problems included children with head injuries and those undergoing elective
surgical procedures such as gastric transposition. Both groups included medical and
surgical patients. Broader diagnostic groups are illustrated in Figure 6-3.
118
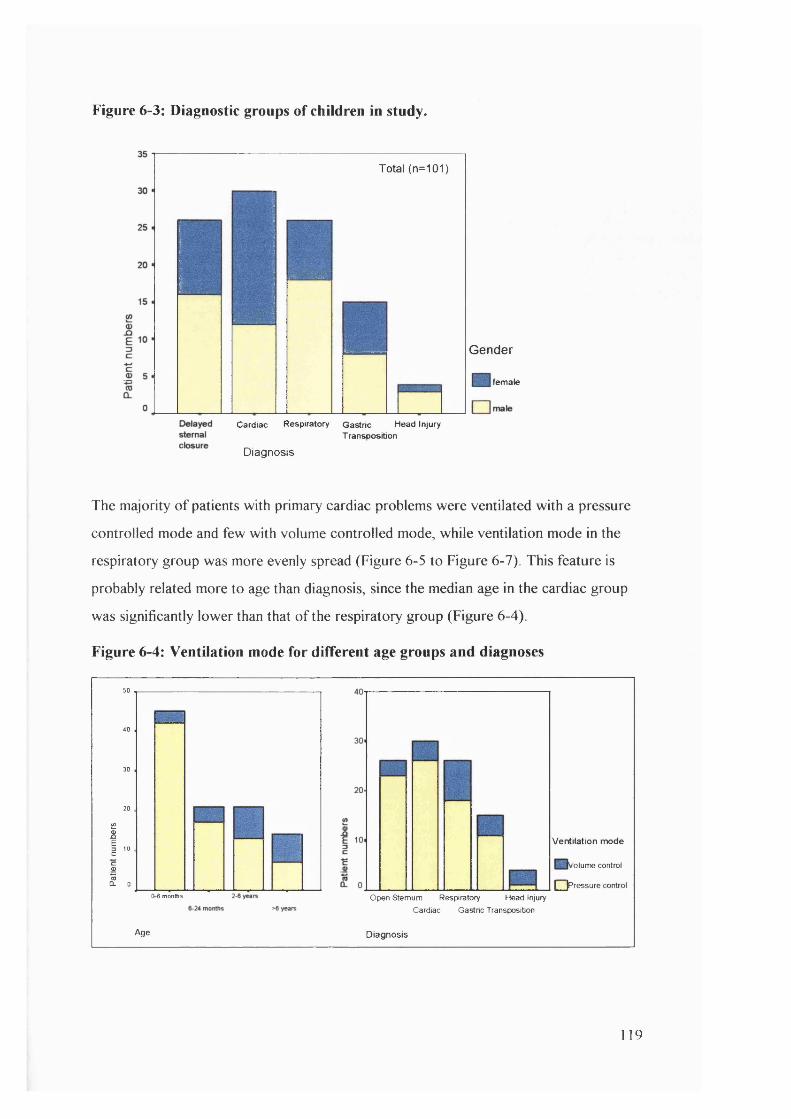
Figure 6-3: Diagnostic groups of children in study.
Total (n=101)
G en d e r
femak
Cardiac Respiratory Gastric Head Injury Transposition
Diagnosis
The majority o f patients with primary cardiac problems were ventilated with a pressure
controlled mode and few with volume controlled mode, while ventilation mode in the
respiratory group was more evenly spread (Figure 6-5 to Figure 6-7). This feature is
probably related more to age than diagnosis, since the median age in the cardiac group
was significantly lower than that o f the respiratory group (Figure 6-4).
Figure 6-4: Ventilation mode for different age groups and diagnoses
50
40
30
20
i2SI'"c
I .0-6 months
Ventilation mode
'olume control
I pressure control
Age
Open Sternum Respiratory Head Injury
Cardiac Gastric Transposition
Diagnosis
119
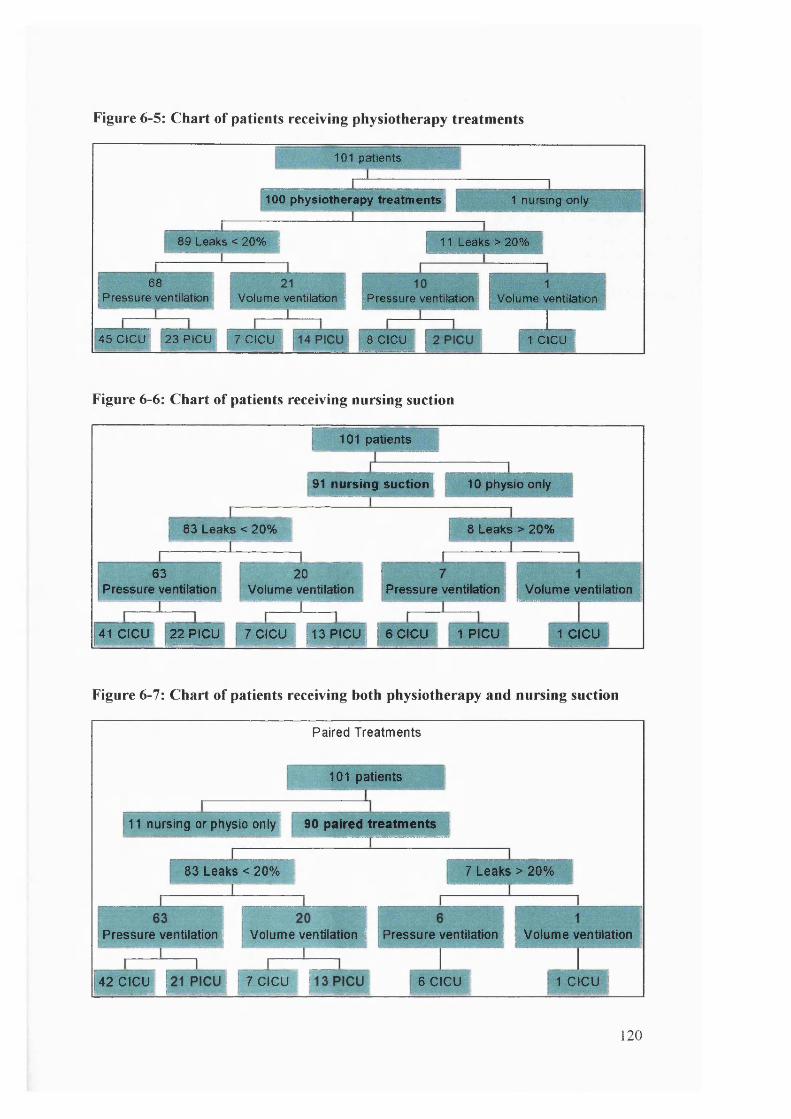
Figure 6-5: Chart of patients receiving physiotherapy treatments
101 patients
1 0 0 physiotherapy treatments! 1 nursing only
89 Leaks < 20% I 11 Leaks > 20%
68Pressure ventilation Volume ventilation I [Pressure ventilation Volume ventilation
45CICU! 23PICU 7 CICU 8 CICU 1 CICU i
Figure 6 -6 : Chart of patients receiving nursing suction
[ 10 1 p a t ie n ts
91 n u r s in g s u c t io n t { 1 0 p h y s io o n ly
8 3 L e a k s < 2 0 % I 8 L e a k s > 2 0 %
6 3 f 2 0
P re s s u re v e n t i la t io n | V o lu m e v e n t ila t io n
41 C IC U j 2 2 P IC U 7 C IC U 1 3 P IC U ,
P re s s u re v e n t ia t io n
6 e c u ' 1 P C U
V o lu m e v e n t i la t io nIflwr fftvn .-Wlh |<V
1 C IC U
Figure 6-7: Chart of patients receiving both physiotherapy and nursing suction
P a ire d T re a tm e n ts
1 01 p a t ie n ts
11 n u rs in g o r p h y s io o n ly ; 9 0 p a i r e d t r e a t m e n t s |
8 3 L e a k s < 2 0 % ; 7 L e a k s > 2 0 %
P re s s u re v e n t i la t io n i: V o lu m e v e n t i la t io n | P re s s u re v e n t i la t io n ; V o lu m e v e n t i la t io n
4 2 C IC U 7 C IC U 6 C IC U 1 C IC U
1 2 0
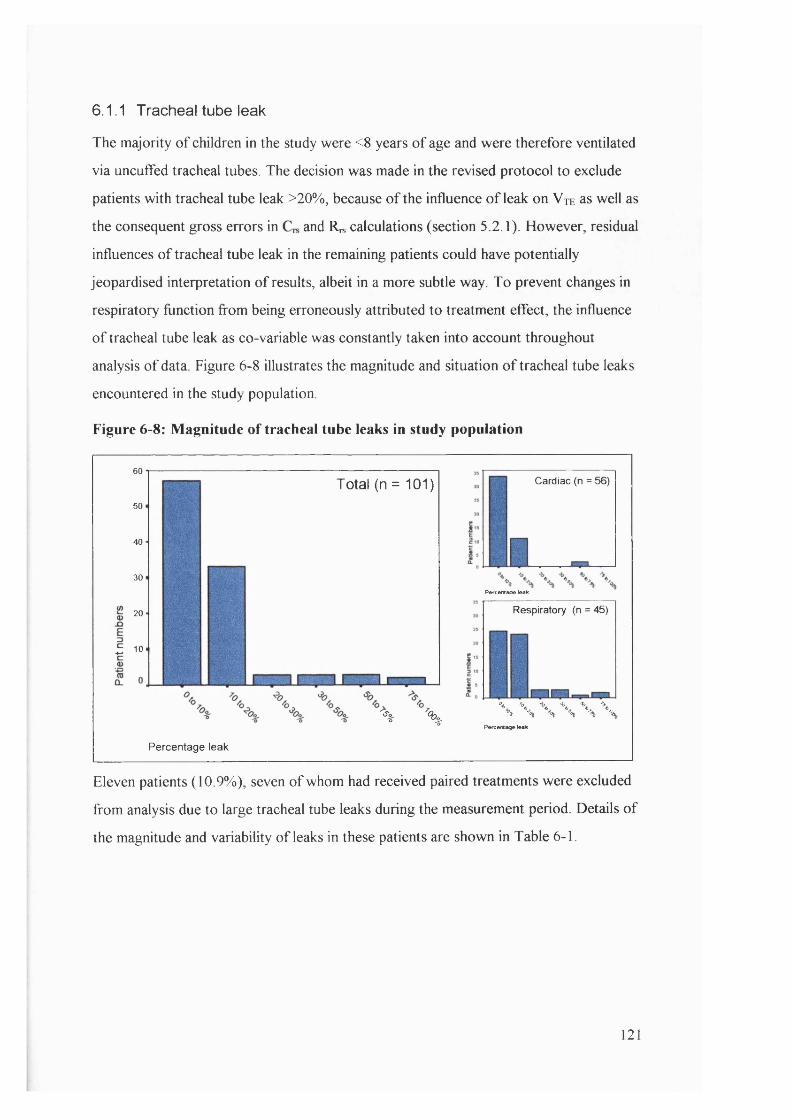
6.1.1 T racheal tube leak
The majority o f children in the study were <8 years o f age and were therefore ventilated
via uncuffed tracheal tubes. The decision was made in the revised protocol to exclude
patients with tracheal tube leak >20%, because o f the influence o f leak on V te as well as
the consequent gross errors in and R« calculations (section 5.2.1). However, residual
influences o f tracheal tube leak in the remaining patients could have potentially
jeopardised interpretation o f results, albeit in a more subtle way. To prevent changes in
respiratory function from being erroneously attributed to treatment effect, the influence
o f tracheal tube leak as co-variable was constantly taken into account throughout
analysis o f data Figure 6-8 illustrates the magnitude and situation o f tracheal tube leaks
encountered in the study population
Figure 6 -8 : Magnitude of tracheal tube leaks in study population
60
50
40
30
20
10
Total (n = 101) Cardiac (n = 56)
P*rcM#Boe leak
Respiratory (n = 45)
% \WWW
Pefcentage leak
Percentage leak
Eleven patients (10.9%), seven o f whom had received paired treatments were excluded
from analysis due to large tracheal tube leaks during the measurement period. Details o f
the magnitude and variability o f leaks in these patients are shown in Table 6-1.
121
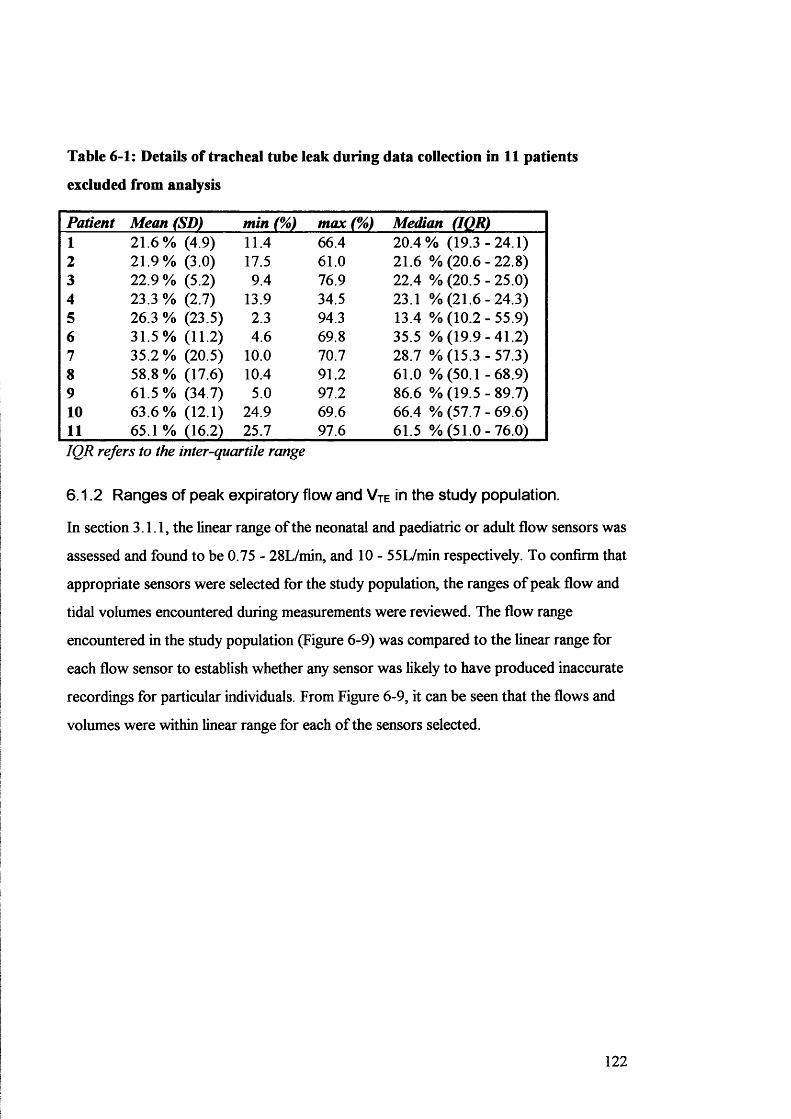
Table 6-1: Details of trachea! tube leak during data collection in 11 patients
excluded from analysis
Patient Mean (SD) min (%) max (%) Median (IQR)1 21.6% (4.9) 11.4 66.4 20.4% (1 9 .3 -2 4 .1 )2 21.9% (3.0) 17.5 61.0 21.6 % (20.6 - 22.8)3 22.9 % (5.2) 9.4 76.9 22.4 % (20.5 - 25.0)4 23.3 % (2.7) 13.9 34.5 23.1 % (2 1 .6 -2 4 .3 )5 26.3 % (23.5) 2.3 94.3 13.4 % (10.2 - 55.9)6 31.5% (11.2) 4.6 69.8 35.5 % (1 9 .9 -4 1 .2 )7 35.2 % (20.5) 10.0 70.7 28.7 % (15.3 - 57.3)8 58.8 % (17.6) 10.4 91.2 61.0 % (50.1 -6 8 .9 )9 61.5% (34.7) 5.0 97.2 86.6 % (1 9 .5 -8 9 .7 )10 63.6% (12.1) 24.9 69.6 66.4 % (57.7 - 69.6)11 65.1 % (16.2) 25.7 97.6 61.5 % (5 1 .0 -7 6 .0 )IQR refers to the inter-quartile range
6.1.2 Ranges of peak expiratory flow and Vte in the study population.
In section 3.1.1, the linear range o f the neonatal and paediatric or adult flow sensors was
assessed and found to be 0.75 - 28L/min, and 10 - 55L/min respectively. To confirm that
appropriate sensors were selected for the study population, the ranges o f peak flow and
tidal volumes encountered during measurements were reviewed. The flow range
encountered in the study population (Figure 6-9) was compared to the linear range for
each flow sensor to establish whether any sensor was likely to have produced inaccurate
recordings for particular individuals. From Figure 6-9, it can be seen that the flows and
volumes were within linear range for each o f the sensors selected.
122
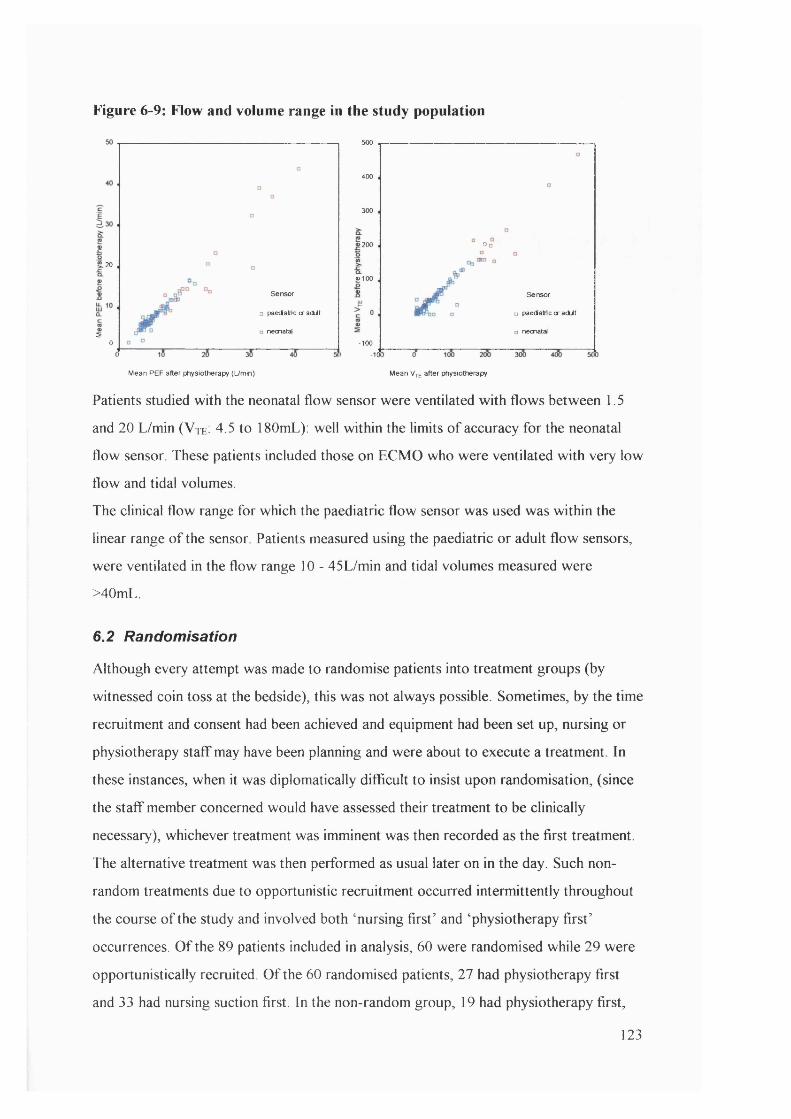
Figure 6-9: Flow and volume range in the study population
500
400
300
200 □ □
20
«100
Sensor Sensor
□ paedainc or adit D paedainc or adito neonatal o neonatal5
0 -100- 10»
Mean PEP after physiotherapy (L/min) Mean V^e after physiotherapy
Patients studied with the neonatal flow sensor were ventilated with flows between 1.5
and 20 L/min (V te: 4.5 to 180mL): well within the limits o f accuracy for the neonatal
flow sensor These patients included those on ECMO who were ventilated w ith very low
flow and tidal volumes.
The clinical flow range for which the paediatric flow sensor was used was within the
linear range o f the sensor Patients measured using the paediatric or adult flow sensors,
were ventilated in the flow range 10 - 45L/min and tidal volumes measured were
>40mL.
6.2 Randomisation
Although every attempt was made to randomise patients into treatment groups (by
witnessed coin toss at the bedside), this was not always possible. Sometimes, by the time
recruitment and consent had been achieved and equipment had been set up, nursing or
physiotherapy staff may have been planning and were about to execute a treatment In
these instances, when it was diplomatically difficult to insist upon randomisation, (since
the staff member concerned would have assessed their treatment to be clinically
necessary), whichever treatment was imminent was then recorded as the first treatment.
The alternative treatment was then performed as usual later on in the day. Such non-
random treatments due to opportunistic recruitment occurred intermittently throughout
the course o f the study and involved both ‘nursing first’ and ‘physiotherapy first’
occurrences. O f the 89 patients included in analysis, 60 were randomised while 29 were
opportunistically recruited. O f the 60 randomised patients, 27 had physiotherapy first
and 33 had nursing suction first. In the non-random group, 19 had physiotherapy first,
123
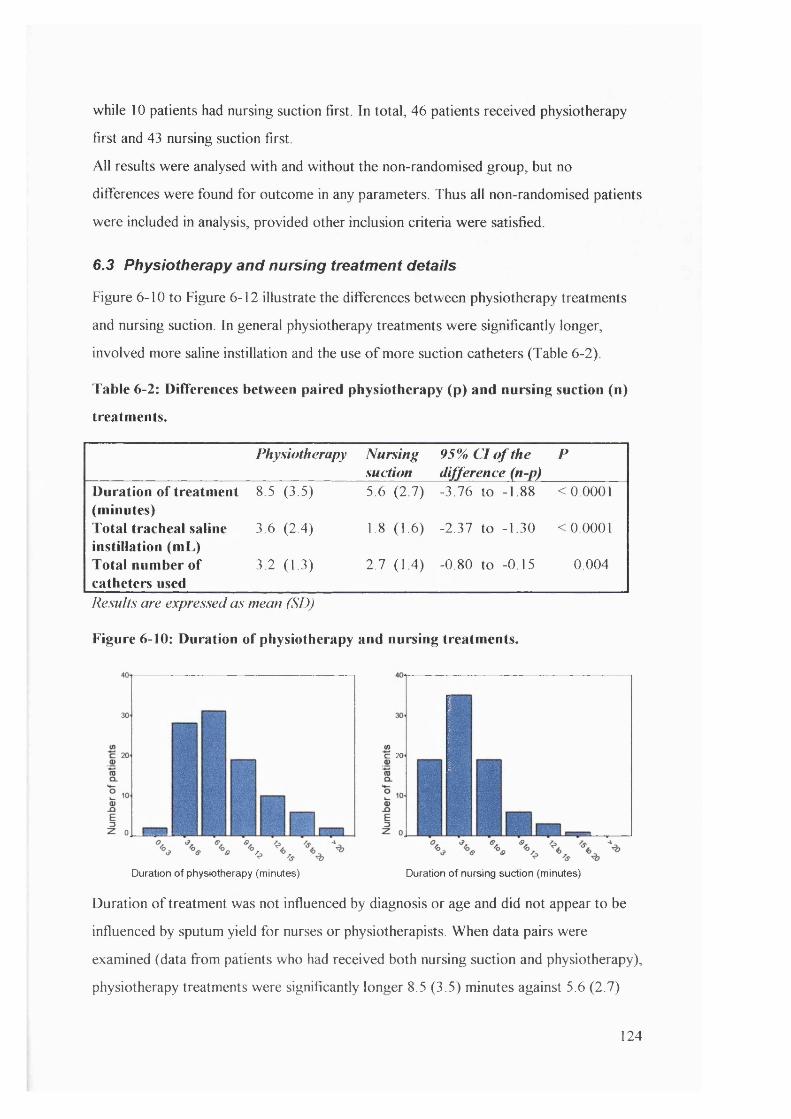
while 10 patients had nursing suction first. In total, 46 patients received physiotherapy
first and 43 nursing suction first.
A ll results were analysed with and without the non-randomised group, but no
differences were found for outcome in any parameters. Thus all non-randomised patients
were included in analysis, provided other inclusion criteria were satisfied.
6.3 Physiotherapy and nursing treatment details
Figure 6-10 to Figure 6-12 illustrate the differences between physiotherapy treatments
and nursing suction. In general physiotherapy treatments were significantly longer,
involved more saline instillation and the use o f more suction catheters (Table 6-2).
Table 6-2: Differences between paired physiotherapy (p) and nursing suction (n)
treatments.
Physiotherapy Nursingsuction
95% C l o f the difference (n-p)
P
Duration of treatment (minutes)
8.5 (3.5) 5.6 (2.7) -3.76 to -1.88 <0.0001
Total tracheal saline instillation (mL)
3.6 (2.4) 1.8 (1.6) -2.37 to -1.30 <0.0001
Total number of catheters used
3.2 (1.3) 2.7 (1.4) -0.80 to -0.15 0.004
Results are expressed as mean (SD)
Figure 6 - 1 0 : Duration of physiotherapy and nursing treatments.
C 20
Duration of physiotherapy (minutes) Duration of nursing suction (minutes)
Duration o f treatment was not influenced by diagnosis or age and did not appear to be
influenced by sputum yield for nurses or physiotherapists. When data pairs were
examined (data from patients who had received both nursing suction and physiotherapy),
physiotherapy treatments were significantly longer 8.5 (3.5) minutes against 5.6 (2.7)
124
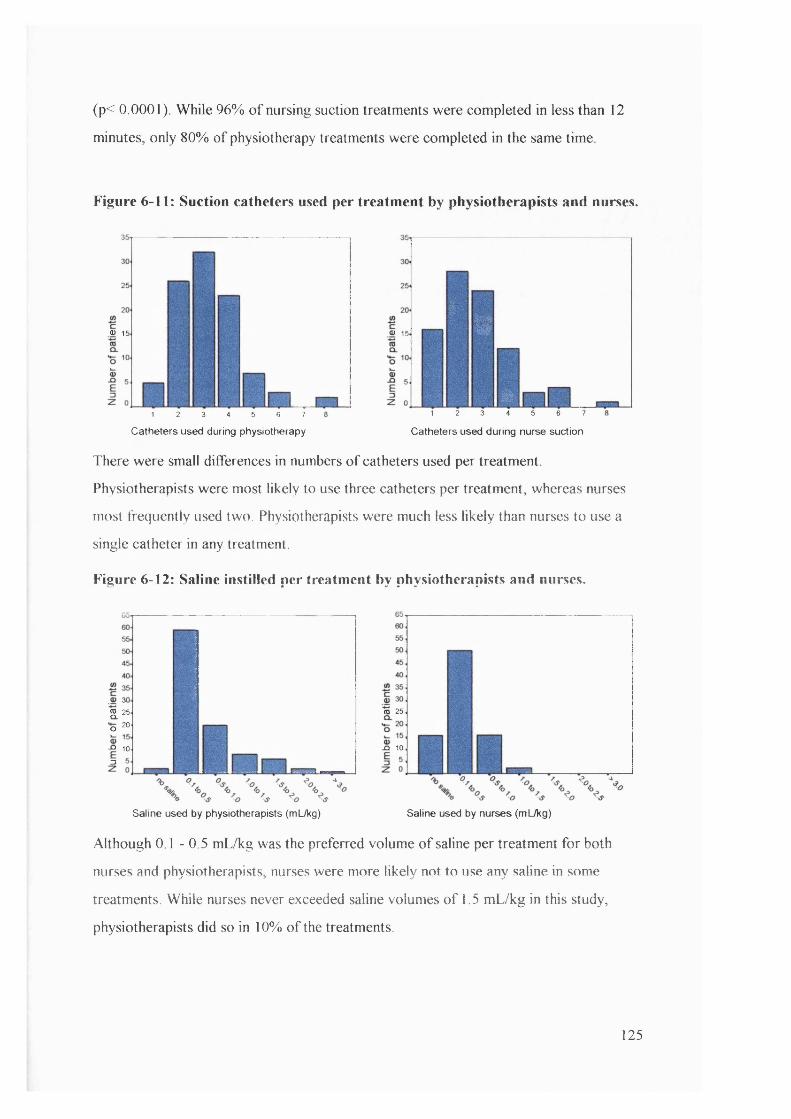
(p< 0.0001). While 96% o f nursing suction treatments were completed in less than 12
minutes, only 80% o f physiotherapy treatments were completed in the same time
Figure 6 - 1 1 : Suction catheters used per treatment by physiotherapists and nurses.
0) 15 0) 15
1 2 3 4 5 6 7
Catheters used during physiotherapy
&%
k1 2 3 4 5 6 7
Catheters used during nurse suction
There were small differences in numbers o f catheters used per treatment
Physiotherapists were most likely to use three catheters per treatment, whereas nurses
most frequently used two. Physiotherapists were much less likely than nurses to use a
single catheter in any treatment.
Figure 6 - 1 2 : Saline instilled per treatment by physiotherapists and nurses.
2 .2 5
•o 20
- Q 10
3
ro 25
X ( 10
Saline used by physiotherapists (mUkg) Saline used by nurses (mL/kg)
Although 0.1 - 0.5 mL/kg was the preferred volume o f saline per treatment for both
nurses and physiotherapists, nurses were more likely not to use any saline in some
treatments. While nurses never exceeded saline volumes o f 1.5 mL/kg in this study,
physiotherapists did so in 10% o f the treatments.
125
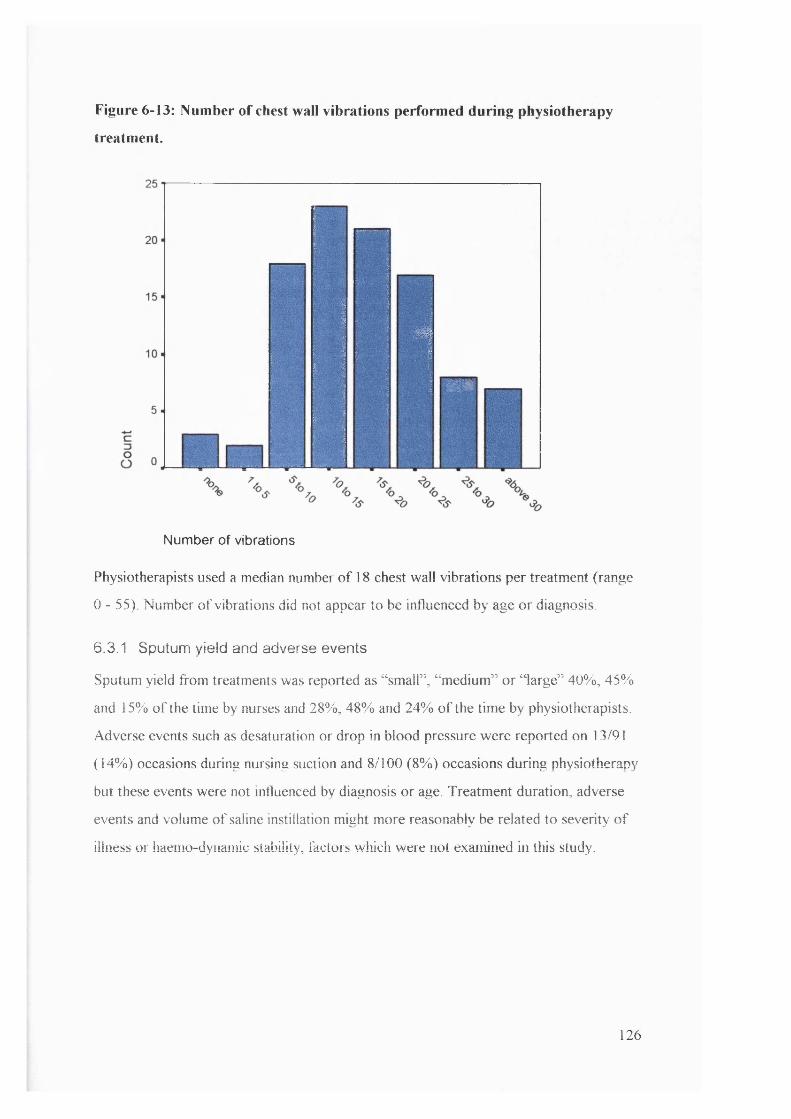
Figure 6-13: Number of chest wall vibrations performed during physiotherapy
treatment.
%
a #
N u m b e r o f v ib r a t io n s
Physiotherapists used a median number o f 18 chest wall vibrations per treatment (range
0 - 55). Number o f vibrations did not appear to be influenced by age or diagnosis.
6.3.1 Sputum yield and adverse events
Sputum yield from treatments was reported as “ small” , “ medium” or “ large” 40%, 45%
and 15% o f the time by nurses and 28%, 48% and 24% o f the time by physiotherapists.
Adverse events such as desaturation or drop in blood pressure were reported on 13/91
(14%) occasions during nursing suction and 8/100 (8%) occasions during physiotherapy
but these events were not influenced by diagnosis or age. Treatment duration, adverse
events and volume o f saline instillation might more reasonably be related to severity o f
illness or haemo-dynamic stability, factors which were not examined in this study.
126
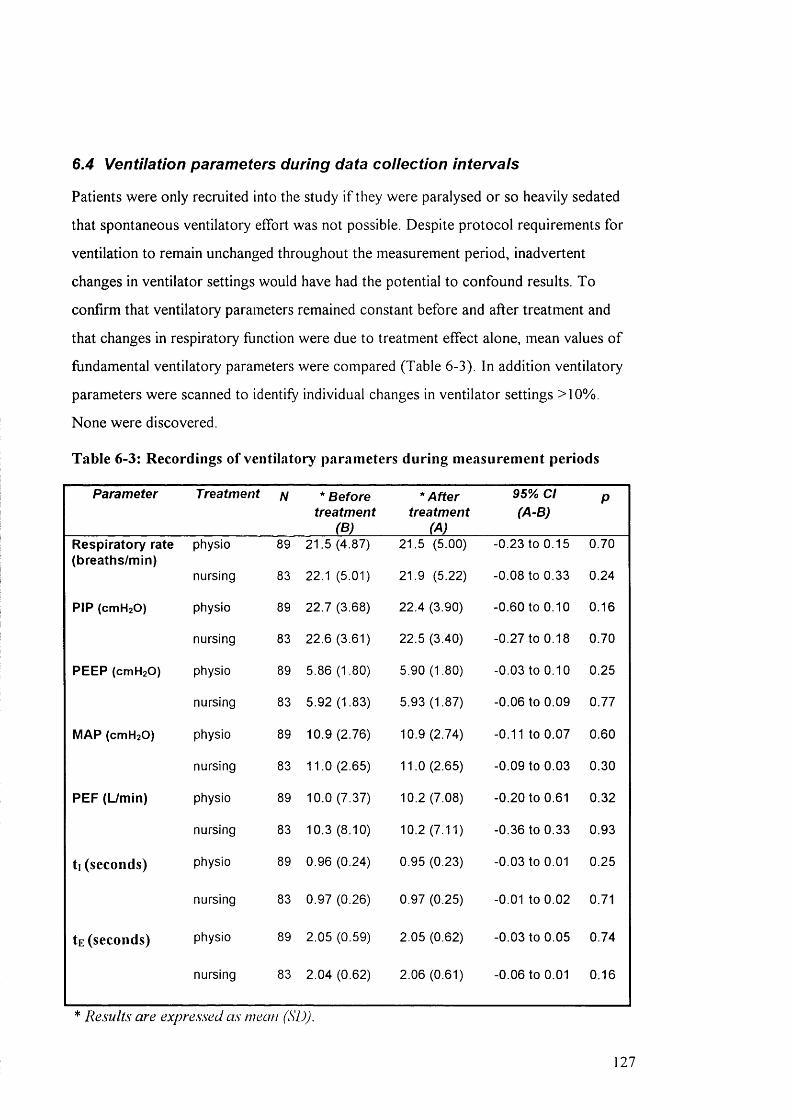
6.4 Ventilation parameters during data collection intervals
Patients were only recruited into the study i f they were paralysed or so heavily sedated
that spontaneous ventilatory effort was not possible. Despite protocol requirements for
ventilation to remain unchanged throughout the measurement period, inadvertent
changes in ventilator settings would have had the potential to confound results. To
confirm that ventilatory parameters remained constant before and after treatment and
that changes in respiratory function were due to treatment effect alone, mean values o f
fundamental ventilatory parameters were compared (Table 6-3). In addition ventilatory
parameters were scanned to identify individual changes in ventilator settings >10%.
None were discovered.
Table 6-3: Recordings of ventilatory parameters during measurement periods
Parameter Treatment N * Before treatment
(B)
* After treatment
(A)
95% Cl (A-B)
P
Respiratory rate physio 89 21.5 (4.87) 21.5 (5.00) -0.23 to 0.15 0.70(breaths/min)
nursing 83 22.1 (5.01) 21.9 (5.22) -0.08 to 0.33 0.24
PIP (cmHzO) physio 89 22.7 (3.68) 22.4 (3.90) -0.60 to 0 . 1 0 0.16
nursing 83 22.6 (3.61) 22.5 (3.40) -0.27 to 0.18 0.70
PEEP (cmH2 0 ) physio 89 5.86 (1.80) 5.90 (1.80) -0.03 to 0.10 0.25
nursing 83 5.92 (1.83) 5.93 (1.87) -0.06 to 0.09 0.77
MAP (cmHzO) physio 89 10.9 (2.76) 10.9(2.74) -0.11 to 0.07 0.60
nursing 83 11.0 (2.65) 11.0 (2.65) -0.09 to 0.03 0.30
PEF (Umin) physio 89 10.0 (7.37) 10.2 (7.08) -0 . 2 0 to 0.61 0.32
nursing 83 10.3 (8.10) 10.2 (7.11) -0.36 to 0.33 0.93
ti (seconds) physio 89 0.96 (0.24) 0.95 (0.23) -0.03 to 0.01 0.25
nursing 83 0.97 (0.26) 0.97 (0.25) -0 . 0 1 to 0 . 0 2 0.71
tE (seconds) physio 89 2.05 (0.59) 2.05 (0.62) -0.03 to 0.05 0.74
nursing 83 2.04 (0.62) 2.06 (0.61) -0.06 to 0 . 0 1 0.16
* Results are expressed as mean (SD).
21

Whether analysed as a whole group, or as separate sub-groups (pressure or volume
controlled ventilation), mean values o f ventilation parameters before treatment were not
significantly different from those following treatment (Table 6-3). The single exception
to this was peak inspiratory pressure (PIP) when analysis was performed on the volume
controlled ventilation group alone. In this group, there was a trend for PIP to decrease
after physiotherapy (p<0.08) which was persistent after 30 minutes (p<0.03). Since
patients on VC V have a set volume delivered on each breath and pressure required for
delivering the volume depends on underlying respiratory mechanics, the pressure change
in this group was likely to reflect underlying changes in respiratory function as a result
o f treatment. The stability o f ventilation parameters during the measurement intervals
confirmed that these potential variables were not likely to influence outcomes when
examining physiotherapy and nursing suction treatment effects.
6.5 The effect of physiotherapy and nursing suction.
Having established the differences in techniques between nursing suction and
physiotherapy (section 6.3), standardised t-tests were used to compare data before and
after treatment to investigate the effects o f physiotherapy and nursing treatments and
then to investigate statistical differences between the two methods. These tests were
initially performed on all patients with tracheal tube leak <20% (n = 89 and 83 for
physiotherapy and nursing treatments, respectively) and then repeated after splitting
patients into groups o f pressure or volume controlled ventilation (Figure 6-5 and Figure
6-6) to establish the effects, i f any, o f ventilation mode on treatment response. For
parameters where concern existed about normal distribution o f data (for example Rrs,
Voaiv), additional non parametric tests (Wilcoxon) were performed to confirm results.
For parameters where concern existed about the influence o f changes in tracheal tube
leak, general linear model analyses were performed to separate treatment effect from
tracheal tube leak effect. Analysis was therefore performed using data from 89 patients
who had physiotherapy and 83 patients who had nursing suction (o f whom 83 had both
physiotherapy and nursing suction performed on the same day). A comparison o f results
from the 15-minute periods prior to and following physiotherapy are presented in Table
6-4, while the effects o f nursing suction and comparison o f these treatments are shown
in Table 6-5 and Table 6-6 respectively.
128

Although the minimum data collection period prior to and following physiotherapy was
15 minutes, it was possible to continue measurements in some patients for up to 90
minutes after treatment. By continuing monitoring whenever possible, it was hoped that
data from such patients would allow assessment o f any delayed or more prolonged
treatment effect. Details o f these more prolonged effects are given below each table.
Parameters measured included tidal volumes, CO2 outcomes, respiratory compliance and
resistance, arterial blood gases and deadspace measurements.
The difference in numbers between patients with Vophy*, Voaiv and Vophys/ V t,
calculations and arterial blood gas values is by virtue o f the fact that a small minority o f
patients had blood gases taken between 23 and 29 minutes after treatment (a little earlier
than the 30 minute interval at which all other values were compared) because o f some
imminent significant clinical intervention. In these cases, we elected not to include the
deadspace calculations since they represented comparison between values at different
measurement intervals. In reality, it made no difference at all to the end result whether
they were included or not.
129

Table 6-4: Effect of physiotherapy on respiratory function
Parameter N before physio (B)
after physio (A)
95% Cl (A-B)
mean % change
P
Tube leak (%) 89 9.44 (6.95) 8.81 (7.03) -1.36 to 0.10 -0 . 6 0.09 t
ViE/kg (mL/kg) 89 8.27 (2.66) 8.36 (2.74) -0.12 to 0.30 1 . 1 0.38
Rrs (cmHzO/L/sec) 89 72.8 (63.2) 65.9 (45.0) -14.2 to 0.39 -9.5 0 06 $
Crs (mL/cmH2 0 /kg) 89 0.67 (0.29) 0.68 (0.32) -0.01 to 0.03 1.5 0.41
VCO2 (mL/min/kg) 89 4.30 (1.58) 4.27 (1.50) -0.15 to 0.08 -0.7 0.57
ETC0 2 (kPa) 89 5.10 (1.38) 5.04 (1.21) -0.19 to 0.08 -1 . 8 0.39
PeC0 2 (kPa) 89 3.30 (1.83) 3.24 (1.78) -0.14 to 0.01 -1 . 8 o .io tt
VOaii->vay/hg (mL/kg) 89 1.61 (0.54) 1.60 (0.55) -0.05 to 0.03 -0 . 6 0.57
Voaiv/kg (mL/kg) 75* 1.64 (1.03) 1.92 (1.32) 0.15 to 0. 41 17.1 <0 .0 0 1
Vophys/kg (mL/kg) 75* 3.24 (1.34) 3.54 (1.60) 0.16 to 4.43 9.3 <0 .0 0 1
Vophys/ V t 75* 0.41 (0.14) 0.42 (0.14) 0.00 to 0.03 2.4 0.07
pH 80* 7.41 (0.09) 7.41 (0.08) -0 . 0 1 to 0 . 0 1 0 . 0 0.95
PaC0 2 (kPa) 80* 5.30 (1.41) 5.22 (1.11) -0.30 to 0.12 -1.5 0.39
Pa0 2 (kPa) 80* 12.7 (4.81) 12.6 (5.80) -1.16 to 0.96 -0 . 8 0.85
HCO3- (mmol/L) 80* 24.8 (3.78) 24.4 (3.52) -0.72 to -0.06 -1 . 6 0 . 0 2
Base Excess 80* 0.17 (4.21) -0.18 (3.86) -0 . 6 8 to -0 . 0 1 -206 0.05
O2 Saturation (%) 80* 94.3 (7.62) 93.6 (8.02) -1.26 to -0.07 -0.7 0.03
Results are expressed as mean (SD). Significant results are in hold type.O f the 89 patients in whom data M>ere collected fo r 15 minutes after physiotherapy, recordings were continued fo r 30 minutes in 75 patients, 45 minutes in 42 patients and 60 minutes in 26patients. I t was only pos.sible to continue recording without significant c lin ica l interventions in 14 patients at 75 minutes and 8 patients at 90 minutes.^p<0.09 after 30 minutes, ^ p^ 0.06 after 30 minutes, p ' 0.05 after 30 minutes.A ll other parameters remained non-significant after longer time intervals.*Data dependent on blood gas analyses were collected at di.screte intei'vals immediately before physiotherapy and 30 minutes afterwards.
130

Table 6-5: Effect of nursing suction on respiratory function
Parameter N before nurse suction (B)
after nurse suction (A)
95% Cl (A-B)
Mean % change
P
Tube leak (%) 83 9.50 (6.77) 8.91 (6.60) -1.35 to 0.18 -0 . 6 0.13
VjE/kg (mUkg) 83 8.47 (2.79) 8.31 (2.42) -0.44 to 0.11 -1.9 0.23
Rrs (cmHaO/L/sec) 83 73.5 (51.9) 72.3 (51.9) -4.61 to 2.16 -1 . 6 0.47
Crs(mL/cmH2 0 /kg) 83 0 . 6 8 (0.28) 0.67 (0.30) -0.03 to 0.01 -1.5 0.23
VCO2 (mL/min/kg) 83 4.22 (1.18) 4.29 (1.31) -0.06 to 0.19 1.7 0.30
ETC0 2 (kPa) 83 5.04 (1.44) 5.09 (1.26) -0.05 to 0.16 1 . 0 0.32
PeC0 2 (kPa) 83 3.29 (1.93) 3.30 (1.86) -0.05 to 0.07 0.3 0.72
Voairway/kg (mL/kg) 83 1.59 (0.55) 1.59 (0.53) -0.03 to 0.03 0 . 0 0.96
Voaiv/kg (mL/kg) 73* 1.73 (1.14) 1.74 (1.05) -0.12 to 0.13 0 . 6 0.94
Vophys/kg (mL/kg) 73* 3.31 (1.46) 3.32 (1.32) -0.13 to 0.14 0.3 0.95
Vophys/ V t 73* 0.40 (0.14) 0.41 (0.13) -0 . 0 1 to 0 . 0 2 2.5 0.27
pH 80* 7.42 (0.08) 7.41 (0.08) -0 . 0 1 to 0 . 0 1 -0 . 1 0.47
PaC0 2 (kPa) 80* 5.20 (1.21) 5.25 (1.06) -0 . 1 1 to 0 . 2 1 1 . 0 0.51
PO2 (kPa) 80* 13.4 (6.39) 12.7 (4.79) -1.41 to 0.17 -5.2 0 . 1 2
HCO3- (mmol/L) 80* 24.7 (3.54) 24.9 (3.71) -0.17 to 0.61 0 . 8 0.27
Base Excess 80* 0.13 (3.88) 0.23 (4.20) -0.30 to 0.49 76.9 0.63
O2 saturation (%) 80* 94.2 (7.14) 94.3 (7.29) -0.60 to 0.80 0 . 0 1 0.78
Results are expressed as mean (SD). O f the S3 patients in whom data were collected fo r 15 minutes after nurse suction, recordings M>ere continued fo r 30 minutes in 74 patients, 45 minutes in 49 patients and 60 minutes in 24 patients. I t was only possible to continue recording without significant c lin ica l interventions in 9 patients at 75 minutes. A ll changes in re.spiratory parameters remained non-significant after longer time intervals.*Data dependent on blood gas analysis were collected at di.screte intervals immediately before nursing suction and 30 minutes afterwards.
13
6.5.1 Tracheal tube leak
From Table 6-4 there appeared to be a tendency for reduction in tracheal tube leak
following physiotherapy (p<0.09). This effect was unlikely to be attributable to more
proficient reconnection after treatment, since disconnection and reconnection alone did
not suggest any such relationship (5.2.2.1). It was possible therefore that the change in
leak was related to underlying changes in respiratory mechanics. However, tracheal tube
leak, Cn, and have complex relationships with each other and a reduction in leak in
the absence o f any changes in physical connection would usually be associated with
either an improvement in C,s or reduction in R,s. However, reduction in leak results in
less overestimation o f both C,s and R , s (5 .2 .1). The exclusion o f patients with large leaks
from this study increased the probability that the observed reduction in leak was
associated with either a real improvement in C,s (which was not evident from Table 6 -4 )
or a real reduction in R,s (possible from Table 6 -4 ). Since even minor leaks may have
confounded measurements o f and R,s, general linear model (G LM ) analysis was
performed to assess the covariant effect o f change in tracheal tube leak during the
measurement period.
When “ change in leak” and “ treatment effect” were explored as separate co-variables
influencing Crs and R , s (SPSS, GLM; repeated measures), there was no evident
physiotherapy effect on C , s after treatment, but a significant within-subject effect o f leak
change (p<0.05). This effect was sustained at 30 minutes, and was persistent, even when
excluding all patients with tracheal tube leak > 10%. By contrast, physiotherapy
emerged as significantly influencing R,s (p<0.03) while change in leak had no within-
subject effect. Treatment effect remained significant at 30 minutes after physiotherapy.
Nursing suction did not appear to have any influence on R,*. It therefore appears that
physiotherapy treatments may have reduced R , s , which in turn reduced tracheal tube
leak, and that this reduction in leak influenced C , s .
When “ change in leak” and “ treatment effect” were explored as separate co-variables
influencing V t e , (GLM), there was no evident effect o f either physiotherapy or leak
(provided leaks >20% were excluded). Nursing suction, however tended to produce a
32
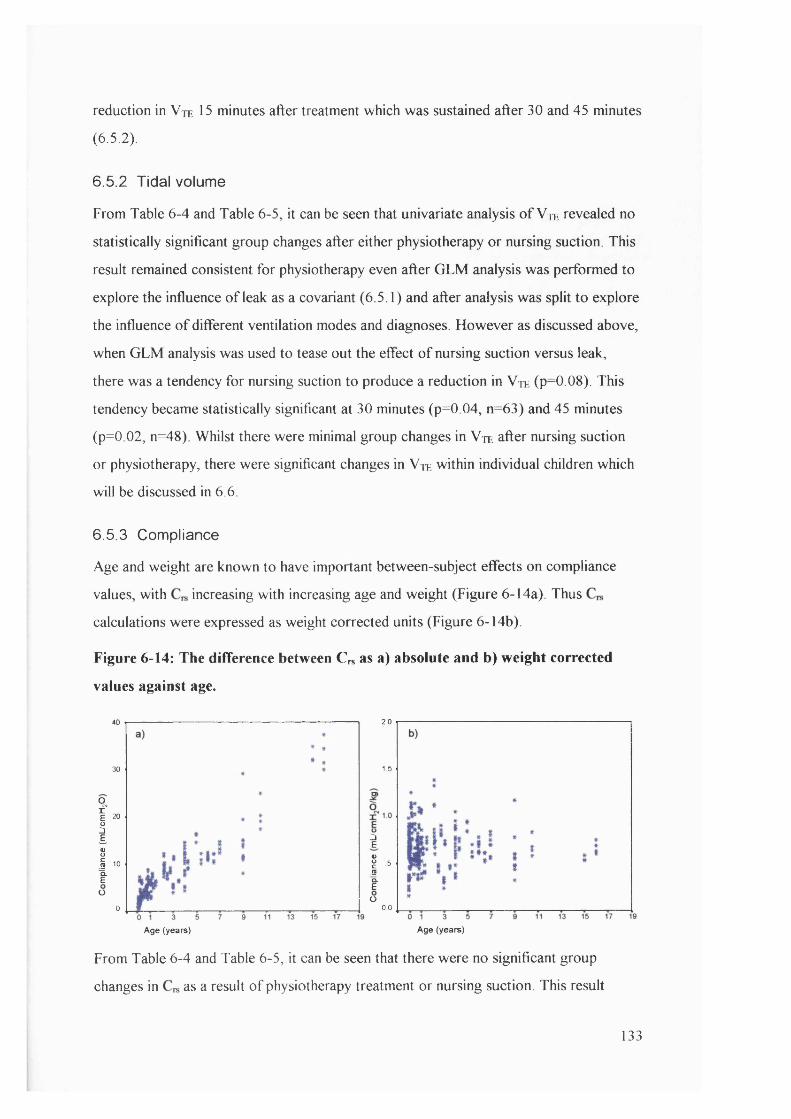
reduction in Vte 15 minutes after treatment which was sustained after 30 and 45 minutes
(6.5.2).
6.5.2 Tidal volume
From Table 6-4 and Table 6-5, it can be seen that univariate analysis o f Vte revealed no
statistically significant group changes after either physiotherapy or nursing suction. This
result remained consistent for physiotherapy even after GLM analysis was performed to
explore the influence o f leak as a covariant (6.5.1) and after analysis was split to explore
the influence o f different ventilation modes and diagnoses. However as discussed above,
when GLM analysis was used to tease out the effect o f nursing suction versus leak,
there was a tendency for nursing suction to produce a reduction in V t e (p=0.08). This
tendency became statistically significant at 30 minutes (p=0.04, n=63) and 45 minutes
(p=0 02, n=48). Whilst there were minimal group changes in V t e after nursing suction
or physiotherapy, there were significant changes in V t e within individual children which
w ill be discussed in 6.6.
6.5.3 Compliance
Age and weight are known to have important between-subject effects on compliance
values, with increasing with increasing age and weight (Figure 6 -14a). Thus
calculations were expressed as weight corrected units (Figure 6 -14b).
Figure 6-14: The difference between € „ as a) absolute and b) weight corrected
values against age.
40
30
of -ÎS.1 10 tÜ
0
Age (years)
2,0
1.5
Î
.1 = ÎÜ
0.0
Age (years)
From Table 6-4 and Table 6-5, it can be seen that there were no significant group
changes in as a result o f physiotherapy treatment or nursing suction. This result
133
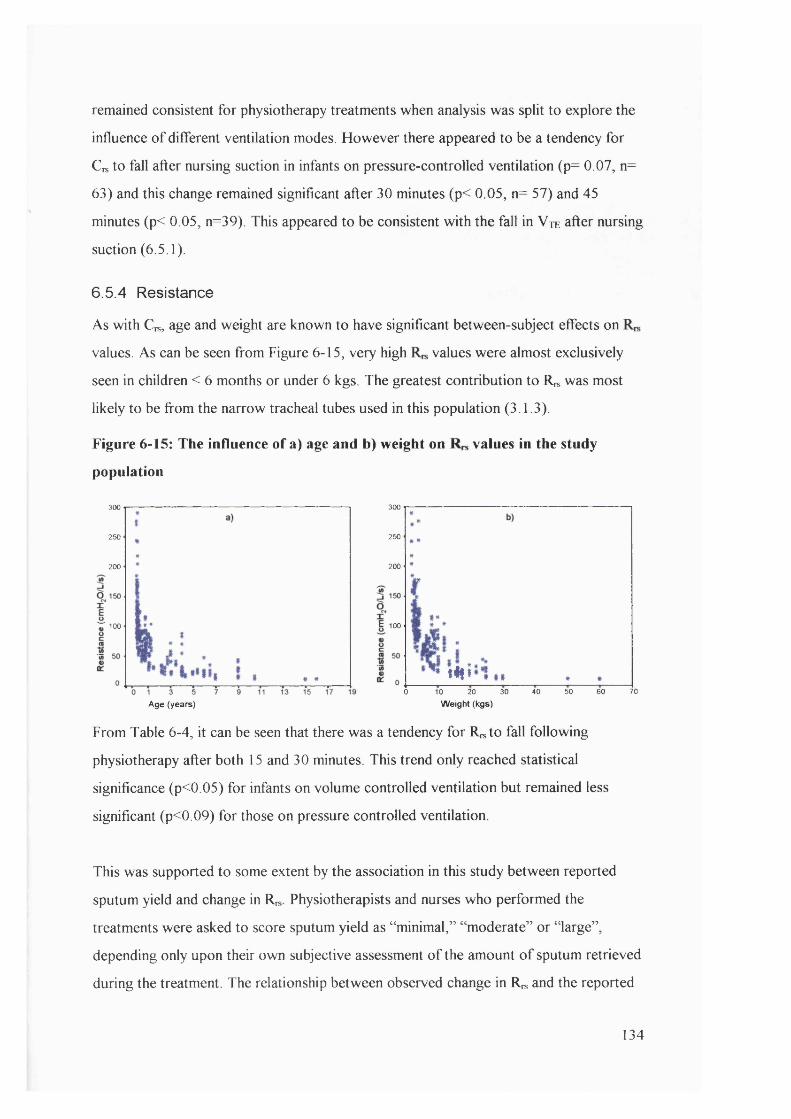
remained consistent for physiotherapy treatments when analysis was split to explore the
influence o f different ventilation modes. However there appeared to be a tendency for
Crs to fall after nursing suction in infants on pressure-controlled ventilation (p= 0.07, n=
63) and this change remained significant after 30 minutes (p< 0.05, n= 57) and 45
minutes (p< 0.05, n=39). This appeared to be consistent w ith the fall in Vte after nursing
suction (6.5.1).
6.5.4 Resistance
As with Crs, age and weight are known to have significant between-subject effects on
values. As can be seen from Figure 6-15, very high values were almost exclusively
seen in children < 6 months or under 6 kgs. The greatest contribution to R „ was most
likely to be from the narrow tracheal tubes used in this population (3.1.3).
Figure 6-15: The influence of a) age and b) weight on values in the study
population
300
250
200
% 100 **
Age (years)
300
250
200
E 100
tifi700 10 20 30 40 50 60
Weight (kgs)
From Table 6-4, it can be seen that there was a tendency for R^to fall following
physiotherapy after both 15 and 30 minutes. This trend only reached statistical
significance (p<0.05) for infants on volume controlled ventilation but remained less
significant (p<0.09) for those on pressure controlled ventilation.
This was supported to some extent by the association in this study between reported
sputum yield and change in Rn, Physiotherapists and nurses who performed the
treatments were asked to score sputum yield as “ minimal,” “ moderate” or “ large” ,
depending only upon their own subjective assessment o f the amount o f sputum retrieved
during the treatment. The relationship between observed change in R , and the reported
134
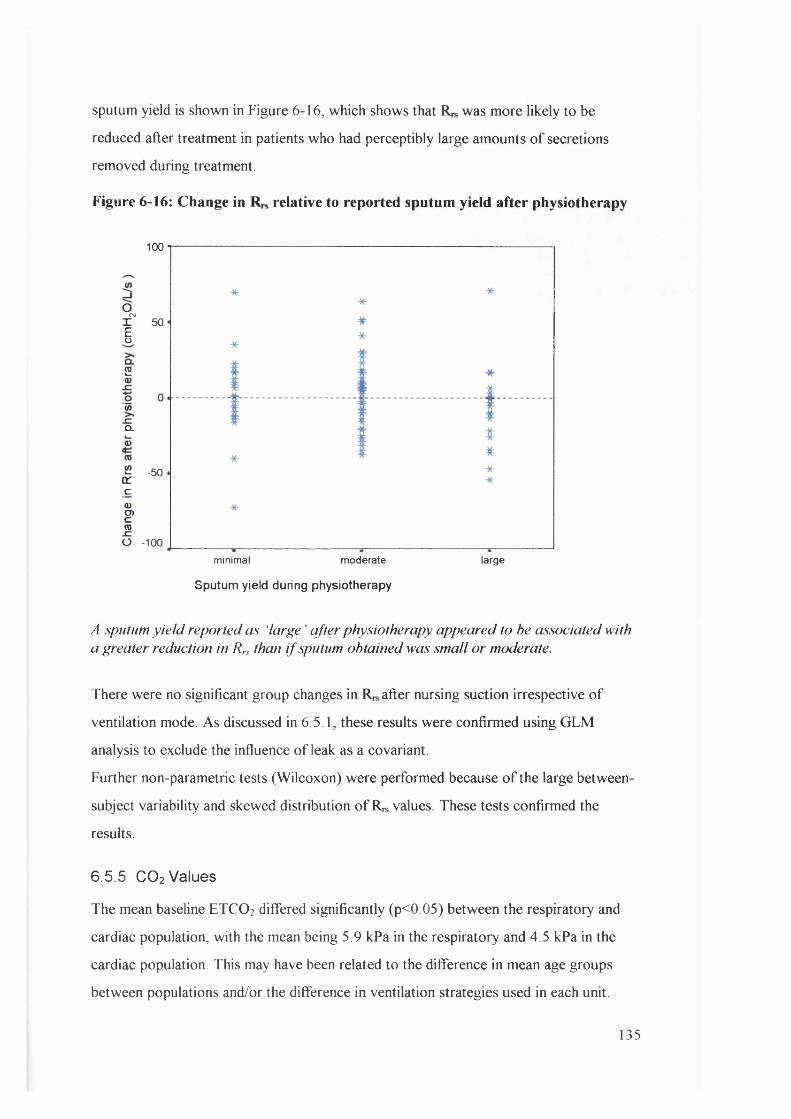
sputum yield is shown in Figure 6-16, which shows that was more likely to be
reduced after treatment in patients who had perceptibly large amounts o f secretions
removed during treatment.
Figure 6-16: Change in relative to reported sputum yield after physiotherapy
100
oX 50
§
20)
Q .
0>
-50 -a:c<DO)c(0
O -100
minimal moderate large
Sputum yield during physiotherapy
A sputum y ie ld reported as ‘large ' after physiotherapy appeared to be associated with a greater reduction in Rrs than i f sputum obtained was small o r moderate.
There were no significant group changes in after nursing suction irrespective o f
ventilation mode As discussed in 6.5.1, these results were confirmed using GLM
analysis to exclude the influence o f leak as a covariant.
Further non-parametric tests (Wilcoxon) were performed because o f the large between-
subject variability and skewed distribution o f R^ values. These tests confirmed the
results.
6.5.5 CO2 Values
The mean baseline ETCO2 differed significantly (p<0.05) between the respiratory and
cardiac population, with the mean being 5.9 kPa in the respiratory and 4.5 kPa in the
cardiac population. This may have been related to the difference in mean age groups
between populations and/or the difference in ventilation strategies used in each unit.
135
There were no significant group changes in VCO 2 or ETCO 2 as a result o f either
physiotherapy or nursing suction at any time interval after treatment (Table 6-4 and
Table 6-5). This result remained consistent even when data were separated into groups
according to ventilation mode or diagnosis and when G LM analysis was performed to
examine the influence o f leak.
There was a tendency for PeC02 to fall (p<0.10) immediately after physiotherapy and a
statistically significant drop in PeC02 after 30 minutes (p<0.05, n=75). When G LM
analysis was performed to exclude the influence o f leaks, the tendency for PeC0 2 to fall
after 15 minutes due to treatment alone reached statistical significance (P<0.05) which
was sustained 30 minutes after physiotherapy. In addition, when analysis was split
according to ventilation mode, the drop in PeC0 2 following physiotherapy was only
significant in patients on pressure controlled ventilation.
6.5.6 Deadspace calculations
From Table 6-4 and Table 6-5, it can be seen that there were statistically significant
increases in VOaiv (p < 0.001) and VUphys (p<0.001) following physiotherapy as well as a
tendency for Vophy/ V t to increase. By contrast, there were no statistically significant
changes in Voainvay, Voaiv, Vophys/ V t or Vophys following nursing suction, irrespective o f
ventilation modality. Because o f the large standard deviations present in Voaiv, further
non-parametric tests were performed which concurred with the standardised t-test.
Since the Voainvay component o f Vophys was unaffected by physiotherapy (Table 6-4), the
observed changes in Vophys must have been due to alterations in Voaiv. Although
statistically convincing, it is unclear whether this increase in deadspace constitutes a
clinically significant change and potential mechanisms for these findings w ill be explored
in section 7.2.4.
Age and weight were predictably important factors influencing VDai,^ay, Voaiv and Vophys,
w ith deadspace increasing with age (Figure 6-17). The increased spread o f Voaiv (Figure
6-17 b) compared to Voaii^ay (Figure 6-17 a) is most likely related to the large variability
in respiratory pathology in the study population, a factor which has less impact on
V Dairway-
136

Figure 6-17: The influence of age on a) Voairway and b) VoaK
tt 40
N .
40 1 3 5 7
Age (years)0 1 3 5
Age (years)
6.5.7 Arterial Blood Gases
All infants had arterial lines in situ and arterial blood gases were taken before and after
physiotherapy and nursing suction. Baseline and post treatment values for pH were
significantly higher in the cardiac population than in the respiratory group (7.44 vs 7.36
kPa). In addition, pH was significantly higher in children younger than 6 months (>
7.44) when compared to older age groups (pH < 7.40). The baseline PaCOi was lower
in the cardiac group than the respiratory group (4.85 vs 5.85). Because o f the lower
mean age o f the cardiac population, it is unclear whether between-subject influences
were related primarily to age, ventilation strategies or diagnosis.
There was no significant group difference in pH or PaC02 or PaC^ following either
physiotherapy or nursing suction and no significant group changes in HCO 3-, base
excess and O2 saturation following nursing suction. These results remained consistent
when groups were analysed separately according to diagnosis or age. There were
however statistically significant reductions in HCO3-, base excess and O2 saturation
following physiotherapy. These results were confirmed by non-parametric statistical
tests (Wilcoxon) and remained consistent even when data were analysed separately
according to ventilation mode. These results suggested that there was a mild metabolic
acidosis following physiotherapy.
6.5.8 Differences between nursing and physiotherapy treatments.
To assess whether the effects o f physiotherapy treatments were substantially different
from those o f nursing suction, mean changes after physiotherapy were compared with
137
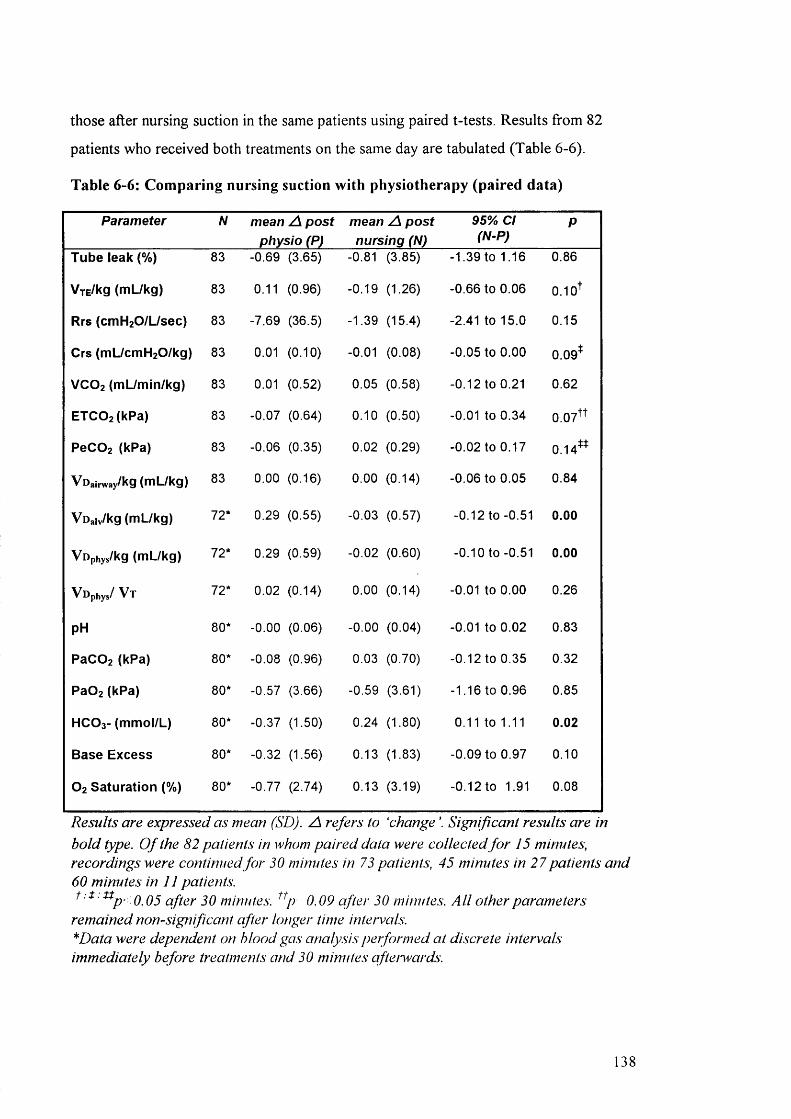
those after nursing suction in the same patients using paired t-tests. Results from 82
patients who received both treatments on the same day are tabulated (Table 6-6).
Table 6-6: Comparing nursing suction with physiotherapy (paired data)
Parameter N mean A post physio (P)
mean A post nursing (N)
95% Cl (N-P)
P
Tube leak (%) 83 -0.69 (3.65) -0.81 (3.85) -1.39 to 1.16 0 . 8 6
VxE/kg (mL/kg) 83 0.11 (0.96) -0.19 (1.26) -0 . 6 6 to 0.06 0.1 o'*’
Rrs (cmH2 0 /L/sec) 83 -7.69 (36.5) -1.39 (15.4) -2.41 to 15.0 0.15
Crs (mL/cmH2 0 /kg) 83 0 . 0 1 (0 .1 0 ) -0 . 0 1 (0.08) -0.05 to 0.00 0.09*
VCO2 (mL/min/kg) 83 0.01 (0.52) 0.05 (0.58) -0 . 1 2 to 0 . 2 1 0.62
ETC0 2 (kPa) 83 -0.07 (0.64) 0 . 1 0 (0.50) -0.01 to 0.34 0.07**
PeC0 2 (kPa) 83 -0.06 (0.35) 0 . 0 2 (0.29) -0.02 to 0.17 0.14**
Voainvay/kg (mL/kg) 83 0 . 0 0 (0.16) 0 . 0 0 (0.14) -0.06 to 0.05 0.84
Voaiv/kg (mL/kg) 72* 0.29 (0.55) -0.03 (0.57) -0.12 to -0.51 0.00
Vophys/kg (mL/kg) 72* 0.29 (0.59) -0 . 0 2 (0.60) -0.10 to -0.51 0.00
Vophys/ V t 72* 0.02 (0.14) 0 . 0 0 (0.14) -0 . 0 1 to 0 . 0 0 0.26
pH 80* -0 . 0 0 (0.06) -0 . 0 0 (0.04) -0 . 0 1 to 0 . 0 2 0.83
PaC0 2 (kPa) 80* -0.08 (0.96) 0.03 (0.70) -0.12 to 0.35 0.32
PaÛ2 (kPa) 80* -0.57 (3.66) -0.59 (3.61) -1.16 to 0.96 0.85
HCO3- (mmol/L) 80* -0.37 (1.50) 0.24 (1.80) 0 . 1 1 to 1 . 1 1 0.02
Base Excess 80* -0.32 (1.56) 0.13 (1.83) -0.09 to 0.97 0 . 1 0
O2 Saturation (%) 80* -0.77 (2.74) 0.13 (3.19) -0.12 to 1.91 0.08
Results are expressed as mean (SD). A refers to ‘change \ Significant results are in bold type. O f the 82 patients in whom paired data were collected fo r 15 minutes, recordings were continued fo r 30 minutes in 73 patients, 45 minutes in 27 patients and 60 minutes in 11 patients.
' ^P ' 0.05 after 30 minutes, 0.09 after 30 minutes. A ll other parametersremained nonsign ificant after longer time intervals."^Data were dependent on blood gas analysis performed at discrete intervals immediately before treatments and 30 minutes afterwards.
138
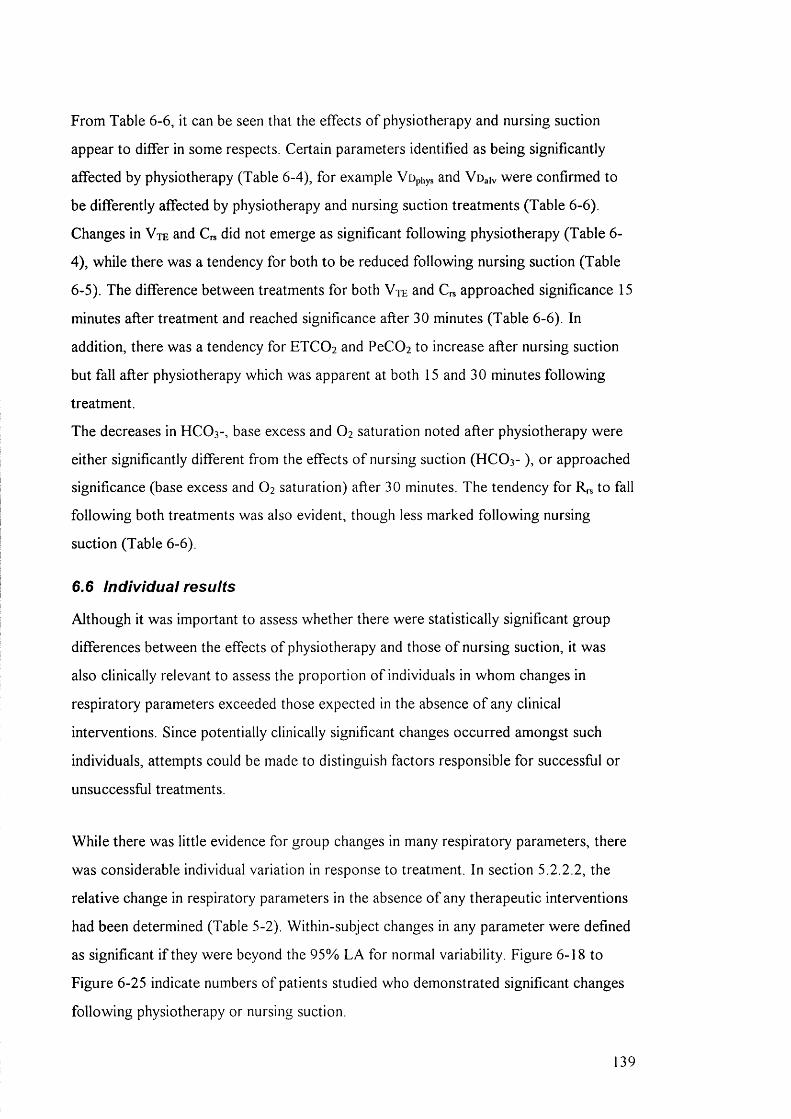
From Table 6-6, it can be seen that the effects o f physiotherapy and nursing suction
appear to differ in some respects. Certain parameters identified as being significantly
affected by physiotherapy (Table 6-4), for example Vop ys and Voaiv were confirmed to
be differently affected by physiotherapy and nursing suction treatments (Table 6-6).
Changes in V t e and C^ did not emerge as significant following physiotherapy (Table 6-
4), while there was a tendency for both to be reduced following nursing suction (Table
6-5). The difference between treatments for both Vte and C^ approached significance 15
minutes after treatment and reached significance after 30 minutes (Table 6-6). In
addition, there was a tendency for ETCO 2 and PeCOi to increase after nursing suction
but fall after physiotherapy which was apparent at both 15 and 30 minutes following
treatment.
The decreases in HCO 3 -, base excess and O2 saturation noted after physiotherapy were
either significantly different from the effects o f nursing suction (HCO 3- ), or approached
significance (base excess and O 2 saturation) after 30 minutes. The tendency for R ,s to fall
following both treatments was also evident, though less marked following nursing
suction (Table 6-6).
6.6 individual results
Although it was important to assess whether there were statistically significant group
differences between the effects o f physiotherapy and those o f nursing suction, it was
also clinically relevant to assess the proportion o f individuals in whom changes in
respiratory parameters exceeded those expected in the absence o f any clinical
interventions. Since potentially clinically significant changes occurred amongst such
individuals, attempts could be made to distinguish factors responsible for successful or
unsuccessful treatments.
While there was little evidence for group changes in many respiratory parameters, there
was considerable individual variation in response to treatment. In section 5.2.2.2, the
relative change in respiratory parameters in the absence o f any therapeutic interventions
had been determined (Table 5-2). Within-subject changes in any parameter were defined
as significant i f they were beyond the 95% LA for normal variability. Figure 6-18 to
Figure 6-25 indicate numbers o f patients studied who demonstrated significant changes
following physiotherapy or nursing suction.
39

6.6.1 Tidal volume
Figure 6-18: Significant individual changes in V te following treatment.
Change after nursing suction (n=83)Change after physiotherapy (n=89)
CD Significant increase I I Change within 95% LA S Significant decrease
From Figure 6-18, 34% (30/89) o f children studied demonstrated a significant increase
in Vte after physiotherapy while Vte fell significantly in 20% (18/89). Following nursing
suction, Vte increased significantly in 16% (13/83) o f patients studied while 29%
(24/83) showed a significant fall in V t e These proportions were similar in patients for
whom data collection continued for 30 and 45 minutes after treatment.
Attempts were made to identify factors which might predict improvement or
deterioration Multivariate analysis (ANOVA) was performed by grouping patients into
3 categories (significant increase, change within 95% LA and significant decrease) and
then exploring the influence o f factors such as age, diagnosis, ventilation mode or length
o f treatment performed. No factors emerged as significantly influencing the categories
selected. However factors such as disease severity and oxygenation index were not
assessed.
140
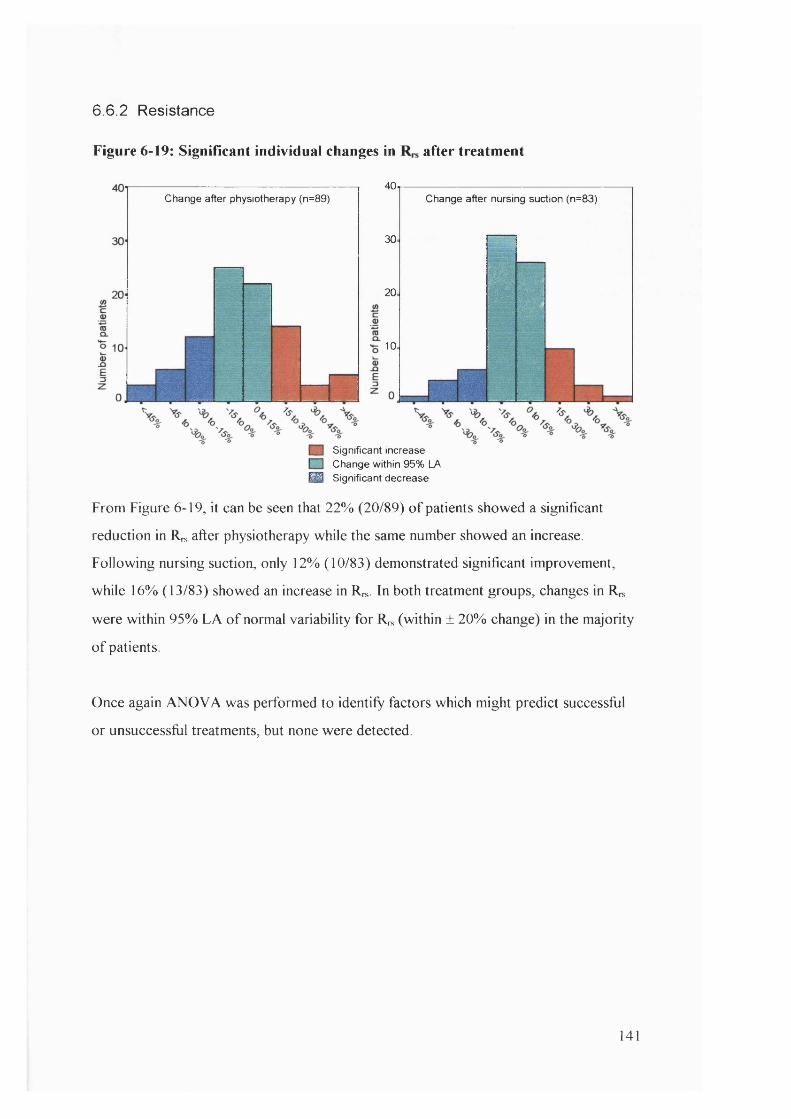
6 .6 .2 Resistance
Figure 6-19: Significant individual changes in after treatment
Change after physiotherapy (n=89)40
30
20
10
Change after nursing suction (n=83)
il- S ’- - 1
Significant increase I I Change within 95% LA ^ Significant decrease
From Figure 6-19, it can be seen that 22% (20/89) o f patients showed a significant
reduction in Rrs after physiotherapy while the same number showed an increase.
Following nursing suction, only 12% (10/83) demonstrated significant improvement,
while 16% (13/83) showed an increase in Rn,. In both treatment groups, changes in Rn,
were within 95% LA o f normal variability for R , (within ± 20% change) in the majority
o f patients
Once again ANOVA was performed to identify factors which might predict successful
or unsuccessful treatments, but none were detected.
141

6 .6 .3 Compliance
Figure 6-20: Significant individual changes in Crs after treatment
change after physiotherapy (n=89)
20
15
,10
change after nursing suction(n=83)
t é :
-■■ -----
% %
n Significant increase I I Change within 95% LA M Significant decrease
Although there were no significant group changes in Cn, after physiotherapy or nursing
suction, there was a tendency for to fail after nursing suction in patients on pressure
controlled ventilation (6.5.3). This tendency is masked in Figure 6-20, by inclusion o f all
patients. 34% (30/89) o f patients showed significant improvement in after
physiotherapy compared with 26% (22/83) after nursing suction By contrast,
approximately 34% showed significant reduction in after both treatments.
One neonatal cardiac surgery patient demonstrated a fall in compliance >20% after both
physiotherapy and nursing suction. Three other individuals also demonstrated a >10%
drop in compliance as a result o f both physiotherapy and nursing suction (one cardiac
surgery patient, one with Duchenne’s muscular dystrophy and one after gastric
transposition). A 9 year old girl with asthma demonstrated marked improvements
(>30%) following both physiotherapy and nursing suction. On two occasions patients
displayed improvement (>10%) with physiotherapy but deteriorated (>10%) with
nursing suction and on two occasions, individuals improved (>10%) with nursing
suction but deteriorated (>10%) with physiotherapy.
142
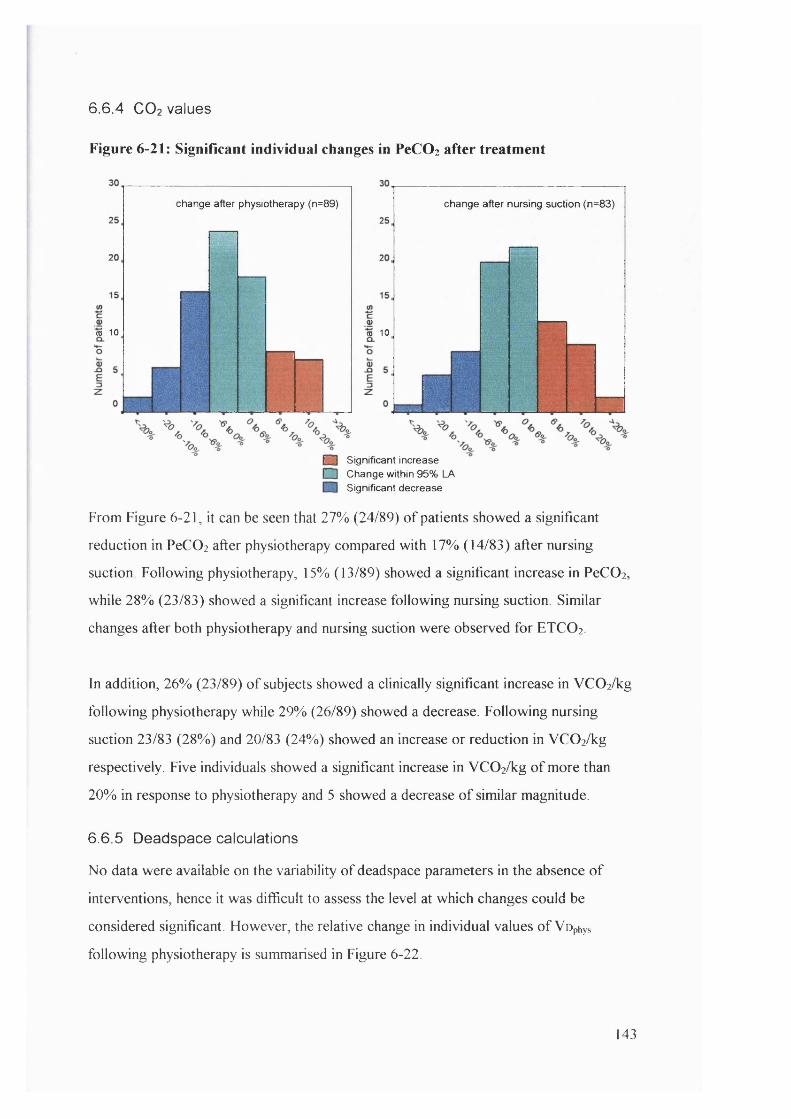
6 .6 .4 C O 2 values
Figure 6-21: Significant individual changes in PeCOz after treatment
change after physiotherapy (n=89) change after nursing suction (n=83)
m 10 m 10
m Significant increase [~~~1 Change within 95% LA
Significant decrease
From Figure 6-21, it can be seen that 27% (24/89) o f patients showed a significant
reduction in PeCO] after physiotherapy compared with 17% (14/83) after nursing
suction. Following physiotherapy, 15% (13/89) showed a significant increase in PeCOi,
while 28% (23/83) showed a significant increase following nursing suction. Similar
changes after both physiotherapy and nursing suction were observed for ETCO2 .
In addition, 26% (23/89) o f subjects showed a clinically significant increase in VC02/kg
following physiotherapy while 29% (26/89) showed a decrease. Following nursing
suction 23/83 (28%) and 20/83 (24%) showed an increase or reduction in VC 0 2 /kg
respectively. Five individuals showed a significant increase in VC02/kg o f more than
20% in response to physiotherapy and 5 showed a decrease o f similar magnitude.
6.6.5 Deadspace calculations
No data were available on the variability o f deadspace parameters in the absence o f
interventions, hence it was difficult to assess the level at which changes could be
considered significant. However, the relative change in individual values o f Vophys
following physiotherapy is summarised in Figure 6-22.
143
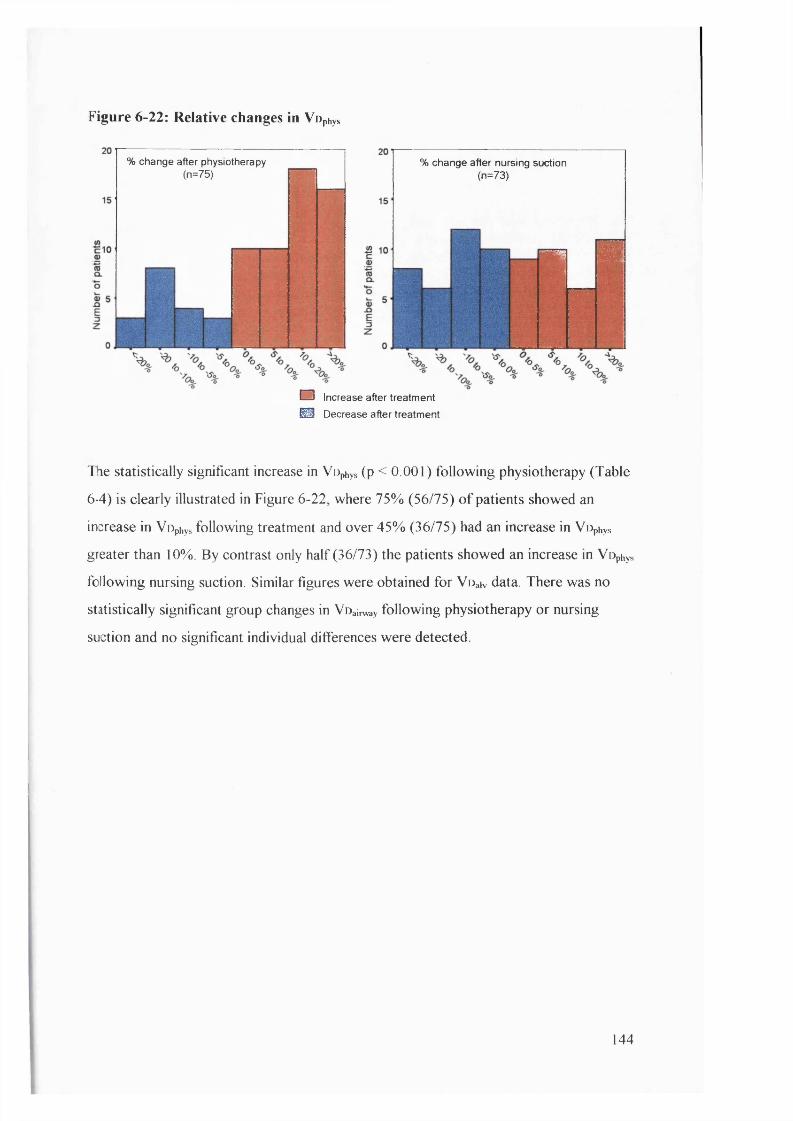
Figure 6-22: Relative changes in Vophys
% change after nursing suction (n=73)
% change after physiotherapy (n=75)
" a&
i r
1
m
O Increase after treatment
@ Decrease after treatment
The statistically significant increase in VOphys (p < 0.001) following physiotherapy (Table
6-4) is clearly illustrated in Figure 6-22, where 75% (56/75) o f patients showed an
increase in Vophys following treatment and over 45% (36/75) had an increase in Vophys
greater than 10%. By contrast only half (36/73) the patients showed an increase in Vophys
following nursing suction. Similar figures were obtained for Voaiv data. There was no
statistically significant group changes in Voairway following physiotherapy or nursing
suction and no significant individual differences were detected.
144
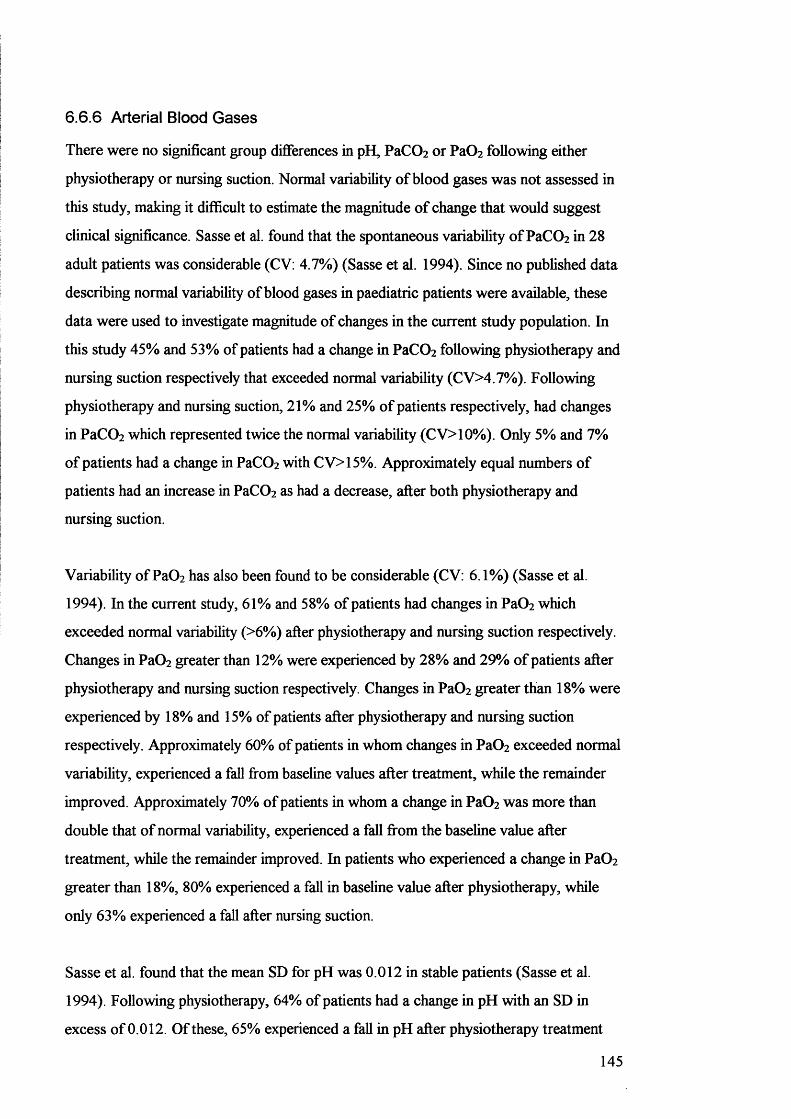
6.6.6 Arterial Blood Gases
There were no significant group differences in pH, PaC02 or PaC^ following either
physiotherapy or nursing suction. Normal variability o f blood gases was not assessed in
this study, making it difficult to estimate the magnitude o f change that would suggest
clinical significance. Sasse et al. found that the spontaneous variability ofPaCOz in 28
adult patients was considerable (CV: 4.7%) (Sasse et al. 1994). Since no published data
describing normal variability o f blood gases in paediatric patients were available, these
data were used to investigate magnitude o f changes in the current study population. In
this study 45% and 53% o f patients had a change in PaCOz following physiotherapy and
nursing suction respectively that exceeded normal variability (CV>4.7%). Following
physiotherapy and nursing suction, 21% and 25% o f patients respectively, had changes
in PaCOz which represented twice the normal variability (CV>10%). Only 5% and 7%
o f patients had a change in PaC02 with CV>15%. Approximately equal numbers o f
patients had an increase in PaC0 2 as had a decrease, after both physiotherapy and
nursing suction.
Variability o f Pa02 has also been found to be considerable (CV: 6.1%) (Sasse et al.
1994). In the current study, 61% and 58% o f patients had changes in Pa02 which
exceeded normal variability (>6%) after physiotherapy and nursing suction respectively.
Changes in PaC^ greater than 12% were experienced by 28% and 29% o f patients after
physiotherapy and nursing suction respectively. Changes in PaO^ greater than 18% were
experienced by 18% and 15% o f patients after physiotherapy and nursing suction
respectively. Approximately 60% of patients in whom changes in Pa02 exceeded normal
variability, experienced a fall from baseline values after treatment, while the remainder
improved. Approximately 70% o f patients in whom a change in Pa02 was more than
double that o f normal variability, experienced a fall fi"om the baseline value after
treatment, while the remainder improved. In patients who experienced a change in Pa02
greater than 18%, 80% experienced a fall in baseline value after physiotherapy, while
only 63% experienced a fall after nursing suction.
Sasse et al. found that the mean SD for pH was 0.012 in stable patients (Sasse et al.
1994). Following physiotherapy, 64% o f patients had a change in pH with an SD in
excess o f 0.012. Of these, 65% experienced a fall in pH after physiotherapy treatment
145
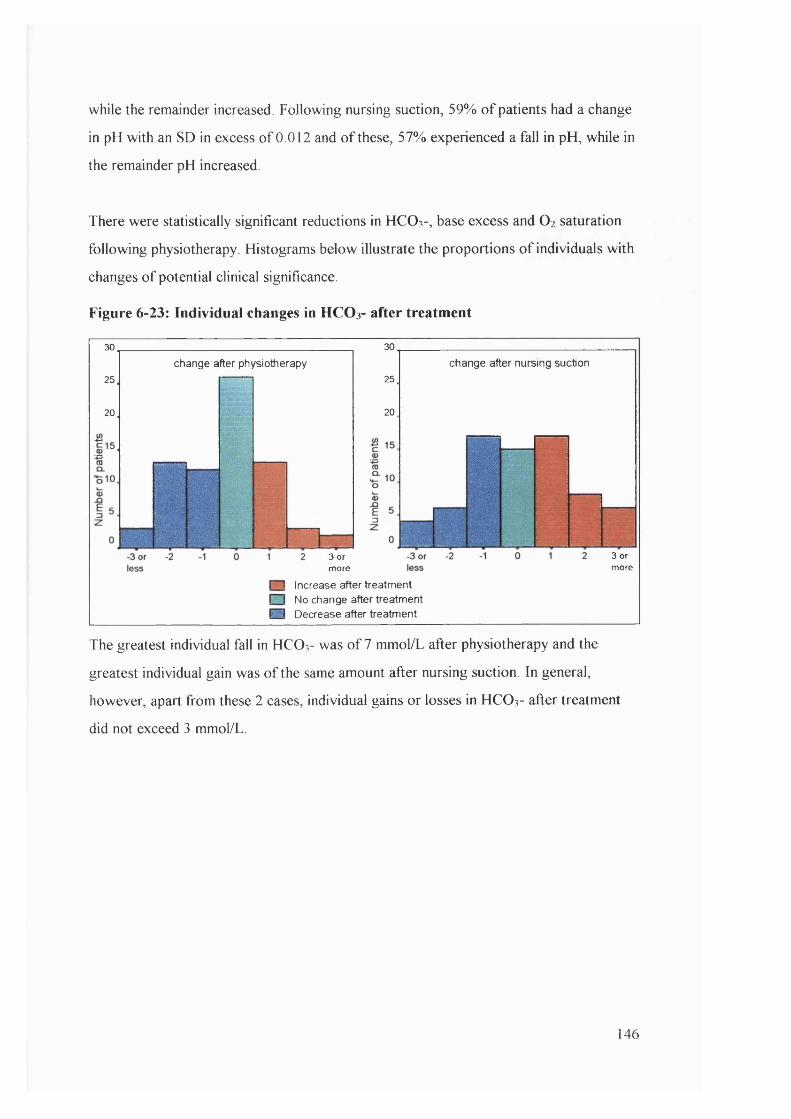
while the remainder increased. Following nursing suction, 59% o f patients had a change
in pH with an SD in excess o f 0.012 and o f these, 57% experienced a fall in pH, while in
the remainder pH increased.
There were statistically significant reductions in HCO 3-, base excess and O2 saturation
following physiotherapy. Histograms below illustrate the proportions o f individuals with
changes o f potential clinical significance.
Figure 6-23: Individual changes in HC O 3- after treatment
30
25
20
change after physiotherapy
30
25
20
change after nursing suction
3 or more
3 or more
n Increase after treatment I I No change after treatment n Decrease after treatment
The greatest individual fall in HCO3- was o f 7 mmol/L after physiotherapy and the
greatest individual gain was o f the same amount after nursing suction. In general,
however, apart from these 2 cases, individual gains or losses in HCO 3- after treatment
did not exceed 3 mmol/L.
146
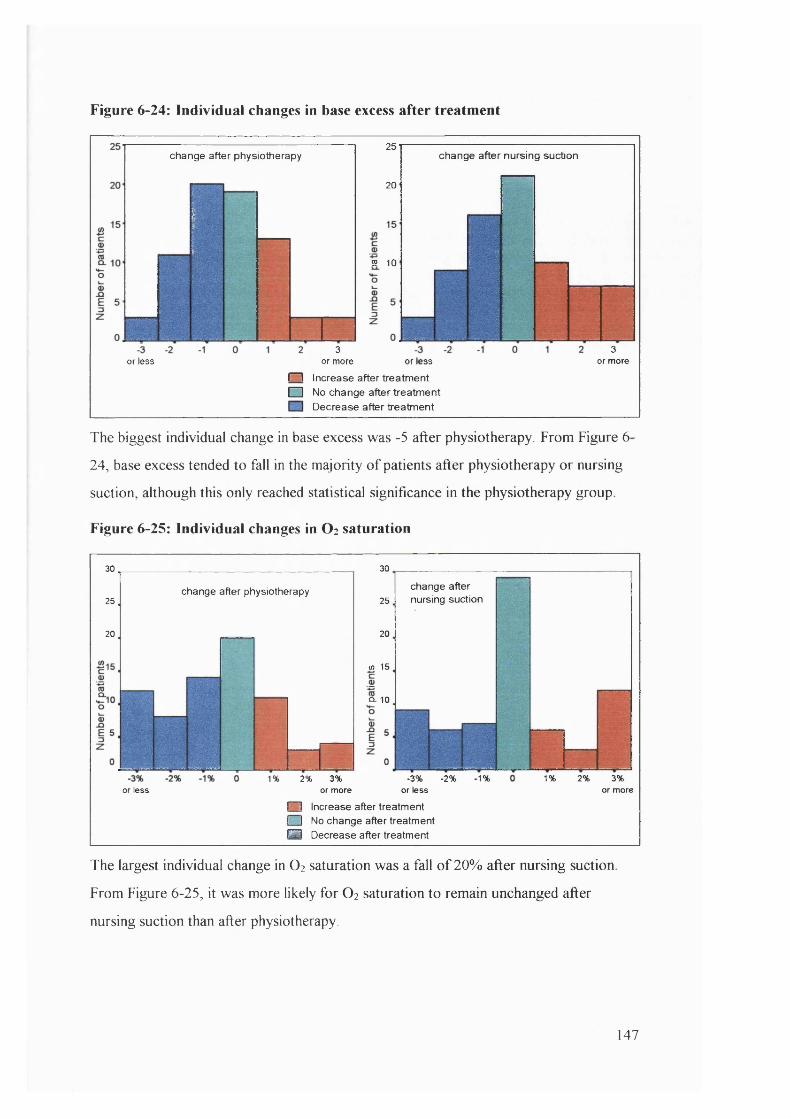
Figure 6-24: Individual changes in base excess after treatment
change after physiotherapy
or less
25
20
change after nursing suction
3or more
2 10
or ess3
or more
n increase after treatment □ No change after treatment
Decrease after treatment
The biggest individual change in base excess was -5 after physiotherapy. From Figure 6-
24, base excess tended to fail in the majority o f patients after physiotherapy or nursing
suction, although this only reached statistical significance in the physiotherapy group
Figure 6-25: Individual changes in O 2 saturation
30
25
20
change after physiotherapy
or less
30
25
20
« 15
change after nursing suction
Q- 10
1% 2% 3%or more
-3% -2%or less
- 1% 1% 2% 3%or more
n Increase after treatment I I No change after treatment ^ Decrease after treatment
The largest individual change in O2 saturation was a fall o f 20% after nursing suction
From Figure 6-25, it was more likely for O2 saturation to remain unchanged after
nursing suction than after physiotherapy.
147
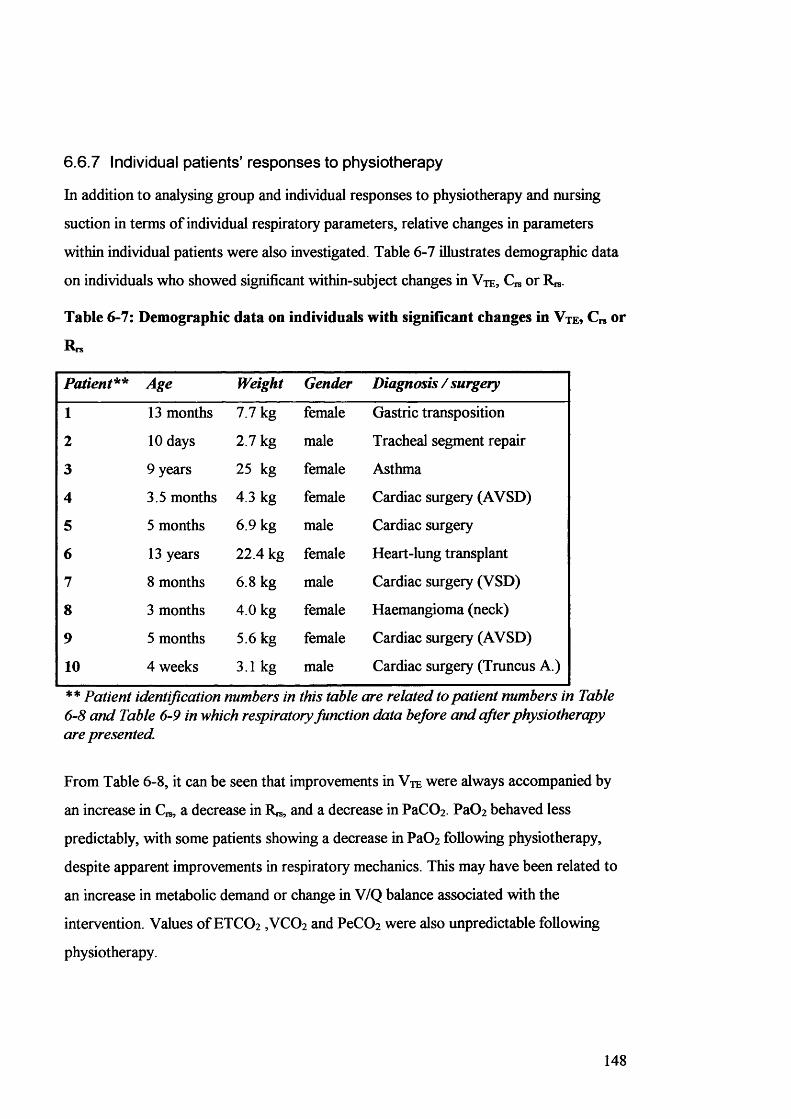
6.6.7 Individual patients’ responses to physiotherapy
In addition to analysing group and individual responses to physiotherapy and nursing
suction in terms o f individual respiratory parameters, relative changes in parameters
within individual patients were also investigated. Table 6-7 illustrates demographic data
on individuals who showed significant within-subject changes in V t e , C is or R ^ .
Table 6-7: Demographic data on individuals with significant changes in Vte? C„ or
R rs
Patient** Age Weight Gender Diagnosis / surgery
1 13 months 7.7 kg female Gastric transposition
2 10 days 2.7 kg male Tracheal segment repair
3 9 years 25 kg female Asthma
4 3.5 months 4.3 kg female Cardiac surgery (AVSD)
5 5 months 6.9 kg male Cardiac surgery
6 13 years 22.4 kg female Heart-lung transplant
7 8 months 6.8 kg male Cardiac surgery (VSD)
8 3 months 4.0 kg female Haemangioma (neck)
9 5 months 5.6 kg female Cardiac surgery (AVSD)
10 4 weeks 3.1 kg male Cardiac surgery (Truncus A.)
* * Patient identification numbers in this table are related to patient numbers in Table 6-8 and Table 6-9 in which respiratory function data before and after physiotherapy are presented.
From Table 6-8, it can be seen that improvements in V t e were always accompanied by
an increase in C , a decrease in R^, and a decrease in PaCOz PaOz behaved less
predictably, with some patients showing a decrease in Pa0 2 following physiotherapy,
despite apparent improvements in respiratory mechanics. This may have been related to
an increase in metabolic demand or change in V/Q balance associated with the
intervention. Values o f ETCO2 ,VC02 and PeC02 were also unpredictable following
physiotherapy.
148
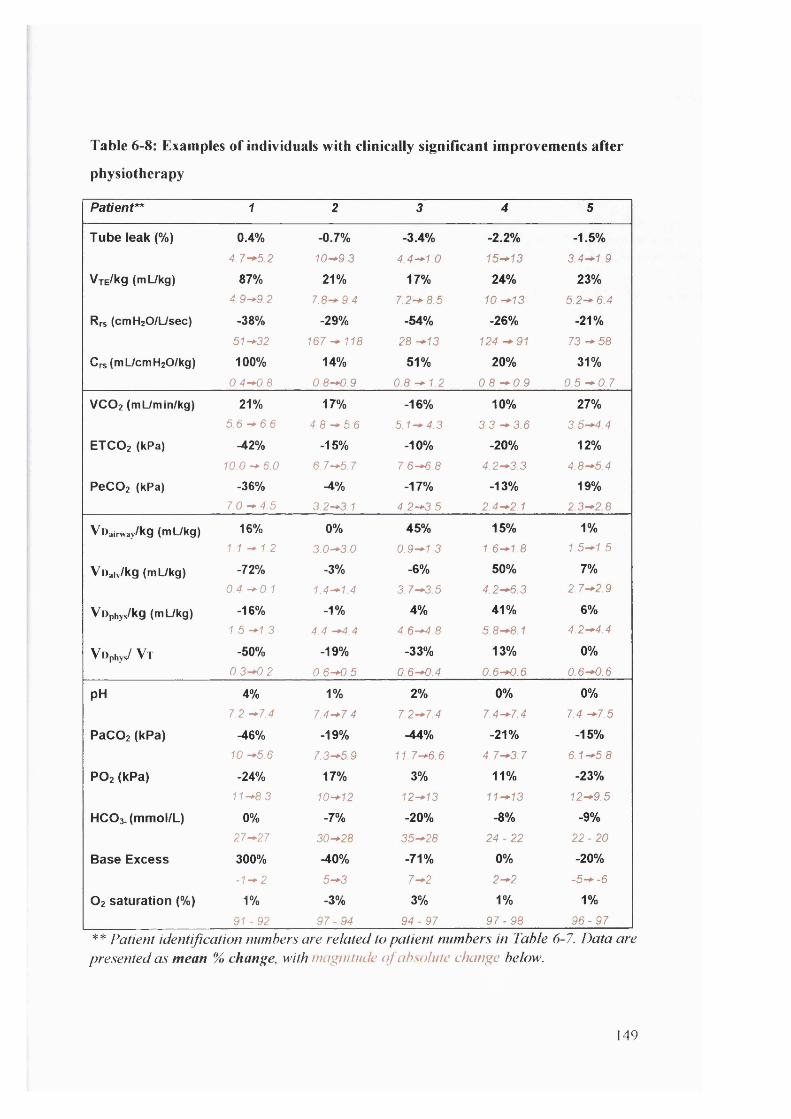
Table 6-8: Examples of individuals with clinically significant improvements after
physiotherapy
Patient** 1 2 3 4 5
T u b e le a k (% ) 0 .4 % -0 .7 % -3 .4 % -2 .2 % -1 .5 %
4 .7-^5 2 10-*9.3 4.4-*1.0 15-*13 3.4-*1.9
Vte/Kq (mUkg) 87% 2 1 % 1 7 % 2 4 % 2 3 %
4.9-*9.2 7.8-* 9.4 7.2-* 8.5 10 -+13 5.2-* 6.4
Rrs (cmHaO/L/sec) -3 8 % -2 9 % -5 4 % -2 6 % -2 1 %
51-*32 1 6 7 ^ 1 1 8 28 -+13 124 91 7 3 - 5 8
Crs(mUcmH20/kg) 1 0 0 % 14 % 5 1 % 2 0 % 3 1 %
0 .4 -^ .8 0.8-*0.9 0.8 -+ 1.2 0,8 -^0 .9 0.5 - 0 . 7
VCO2 (mL/min/kg) 21% 17 % -1 6 % 1 0 % 2 7 %
5 .6 -*■ 6 ,6 4.8 -*5 .6 5.1-*4.3 3 , 3 - 3 6 3 .5 -4 .4
ETCO2 (kPa) -4 2 % -1 5 % -1 0 % -2 0 % 1 2 %
1 0 0 -^ 6 .0 6.7-^5.7 7.6-*6.8 4 ,2 -3 3 4 8—5.4
P eC 02 (kPa) -3 6 % -4% -1 7 % -1 3 % 1 9 %
7 .0 -*4 5 3.2-*3.1 4.2-*3.5 2 ,4 -2 ,1 2 .3 - 2 8
Vl)airway/kg (mL/kg) 16% 0% 4 5 % 1 5 % 1%
1.1 -* 1.2 3.0-*3 0 0 .9^1 .3 1,6—1.8 1 .5 -1 .5
Voaiv/kg (mUkg) -7 2 % -3% -6 % 5 0 % 7%
0.4 -*0.1 1.4-*1.4 3 .7 ^ 3 5 4.2-*6.3 2 .7 -2 .9
VOphys/kg (mL/kg) -1 6 % -1 % 4 % 4 1 % 6%
1.5 -*1.3 4,4 ^ , 4 4.6-*4.8 5 .8 -8 1 4 .2 - 4 4
Vophys/ V t -5 0 % -1 9 % -3 3 % 1 3 % 0 %
0.3-*0.2 0 .6 -0 .5 0.6-*0.4 0 .6 -0 .6 0 .6 -0 .6
p H 4% 1% 2 % 0 % 0%
1.2 -*1.4 7.4-*7.4 7.2-*7.4 7 ,4 -7 4 7.4 —7,5
P aC 02 (kPa) ^ 6 % -1 9 % -4 4 % -2 1 % -1 5 %
10 -*5.6 7 ,3 ^ 5 9 11.7-*6.6 4 ,7 -3 .7 6.1-*5.8
P O 2 ( k P a ) -2 4 % 1 7 % 3% 1 1 % -2 3 %
11-*8.3 10-*12 12-*13 1 1 -1 3 12-*9.5
HCO3. ( m m o l /L ) 0% -7 % -2 0 % -8 % -9 %
27-*27 30^28 35^28 2 4 -2 2 2 2 -2 0
B a s e E x c e s s 3 0 0 % -4 0 % -7 1 % 0 % -2 0 %
-1-^2 5-^3 7 ^2 2—2 -5— -6
O 2 s a t u r a t io n (% ) 1% -3 % 3% 1% 1%
9 1 -9 2 9 7 -9 4 9 4 -9 7 9 7 -9 8 9 6 -9 7** Patient identification numbers are related to patient numbers in Table 6-7. Data are presented as mean % change, with magnitude o f absolute change below.
149

Table 6-9: Examples of patients with clinically significant deterioration following
physiotherapy
Patient 8 10
T u b e le a k (% )
VjE/kg (m Ukg)
Rrs (cmHzO/Usec)
Crs(mL/cmH20/kg)
-2 .5 %
6. 7 ^3 6
- 16%
13^11
7 1 %
24-*42
-3 9 %
1. 2 - * 0.7
-0 .2%
7. 6 - * 7.4
-1 6 %
7. 8 - * 6.6
19%102-*121
- 20%
0 . 7-*0 5
2 .3 %
15-*17
- 13%
7. 0 - * 6.1
18%50-*59
-1 4 %
0 . 7 ^ . 6
-4 .3 %
20-*16
-3 8 %
5 . 9 - * 3.7
10%60-*66
-6%
0 . 5 - * 0.6
-2 .5 %
14-*11
- 18%
9 .0 - * 7.4
7 %
77-*%3
- 20%
0 . 8 - * 0.6
V C O 2 mL/m in/kg)
E TC O 2 (kPa)
PeC 02 (kPa)
-4 1 %
3 . 8 - * 2.2
12%5 9 - * 6.6
-3 1 %
2. 1- * 1.4
-2 6 %
2 . 5 - * 1.9
8%3 . 9 - * 4.2
13%1. 9 - * 1.7
5%
3 . 1- * 3.2
- 21%
3 . 0 - * 3.7
19%2. 1-*2 5
-2 8 %
4 . 0 - * 2.9
3 6 %
4 . 5 - * 6.1
13%3 . 0 - * 3.4
- 18%
4 . 6 - * 3.8
1 6 %
3 . 4 - * 4.1
11%2 . 2 - * 2.5
VOairway/kg (iTI L/kg) n o a b g 4% 3% -14% -2 3 %
1. 4 - * 1.4 1. 3-*1 3 1. 3 - * 1.1 3 . 0 - * 2.3
VOaiv/kg (m Ukg) 8% -2 0 % 2 0 8 % -3 3 %
3 . 1- * 3.4 1. 9-*1 5 0 . 2 - * 0.7 1. 0 - * 0.7
Vophys/kg (m Ukg) 6% -1 3 % 2 1 % -2 6 %
4.5 - * 4.8 3. 2 - * 2.8 1. 5 - * 1.8 4 . 0 - * 3.0
^ Ophys/ ^ T 1 7 % -4% 2 6 % -2 %
0 . 6 - * 0.7 0 . 5 - * 0.5 0 . 4 - * 0.5 0 . 4 - * 0.4
p H 0 .3 % 0 .3 % 1 .2 % 1 .3 %
7. 4 - * 7.4 7. 6 - * 7.5 7. 5 - * 7.4 7 .6 -^ 7 .5
P a C 0 2 (k P a ) 2 2 % 10% 2 1 % 2 3 %
4. 5 - * 5.5 3 . 9 - * 4.3 5 2 ^ , 3 3 . 9 - * 4.8
P O 2 ( k P a ) -2 5 % -1 4 % -5 3 % -1 4 %
1 5 -*1 1 13-*11 14- * 6.8 16-*14
H C 0 3 . ( m m o l / L ) 1 4 % 4 % 0% 0%
22-*25 26-*27 31-*31 2 6 ^ 2 6
B a s e E x c e s s 3 0 0 % 3 3 % -2 5 % -3 3 %
- 3-*0 3-*4 8-*6 3 -» 2
O 2 s a t u r a t io n (% ) -2 % -2% -1 3 % 0 %
98-*96 9 9 ^ 9 7 99-*86 99-*99
** Patient identification numbers are related to patient numbers in Table 6-7. Data are presented as mean % change, with magnitude o f absolute change below.
150
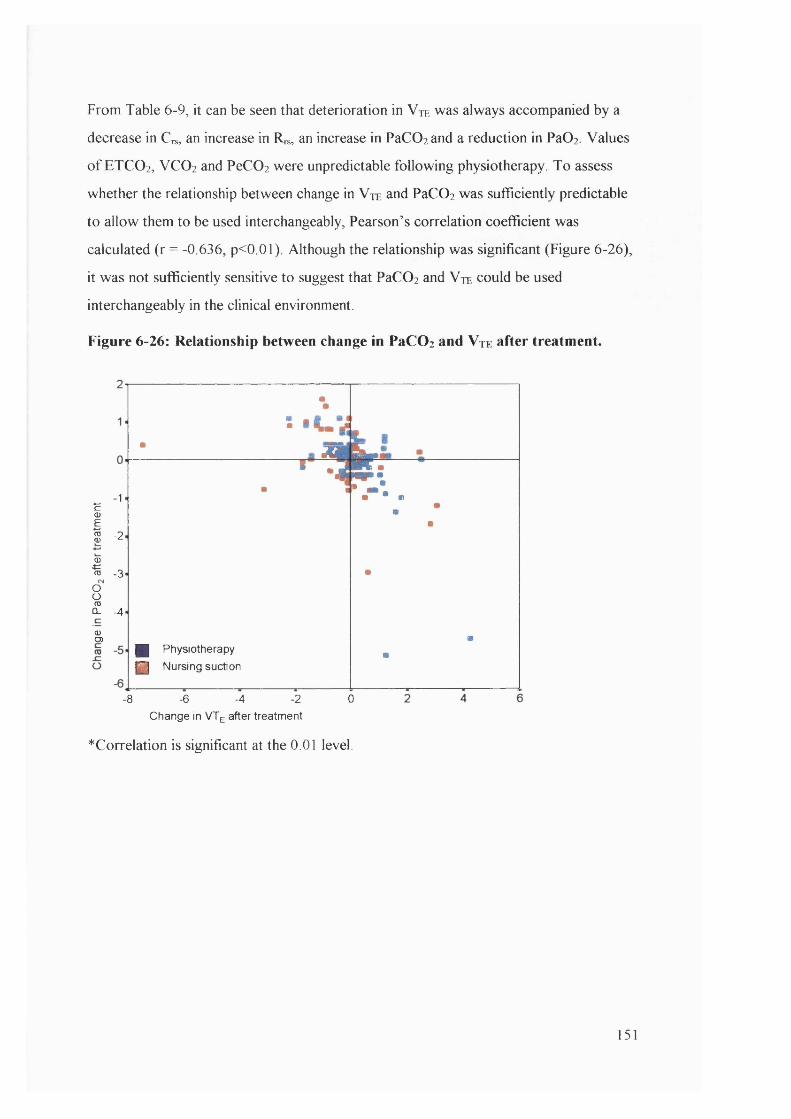
From Table 6-9, it can be seen that deterioration in V te was always accompanied by a
decrease in Crs, an increase in Rrs, an increase in PaC02 and a reduction in PaOi Values
o f ETCO 2 , VCO 2 and PeC02 were unpredictable following physiotherapy. To assess
whether the relationship between change in Vte and PaC0 2 was sufficiently predictable
to allow them to be used interchangeably, Pearson’s correlation coefficient was
calculated (r = -0.636, p<0.01). Although the relationship was significant (Figure 6-26),
it was not sufficiently sensitive to suggest that PaC02 and V te could be used
interchangeably in the clinical environment.
Figure 6-26: Relationship between change in PaCOz and Vte after treatment.
Ï '
I -2
-3IOoTOCL - 4
<DO)
■
■:. ‘ 1 St.
•■
#
g Physiotherapy P i Nursing suction
##
-8 - 6 - 4 - 2 0Change in VTg after treatment
^Correlation is significant at the 0.01 level.
151

7. Discussion
The three principal hypotheses at the outset o f this study proposed that: a) the
“ CO2 SMO Plus” would be a useful clinical tool for evaluating the clinical effects o f
therapeutic interventions, b) respiratory physiotherapy in the paediatric intensive care
unit improves respiratory function and c) respiratory physiotherapy is more effective
than nursing suction at removing secretions and thereby improving respiratory function.
The results o f the study and the extent to which they succeeded in proving or disproving
these hypotheses w ill be discussed, particularly in relation to relevant published
literature. In addition, the limitations o f respiratory function measurements in ventilated
children and general limitations o f this study design will be explored. Finally, potential
future directions for research in this field w ill be discussed together with clinical
recommendations based on the evidence available from this and other current studies for
the application o f evidence based practice.
7.1 Is the “CO2SMO Plus” a useful clinical tool for evaluating the effects
of therapeutic interventions?
The execution o f the study involved measurements o f respiratory function in ventilated
children using the relatively new “ CO2 SMO Plus” device. Thus an essential aspect o f
this study involved validation o f the device in terms o f its accuracy in the ventilated
paediatric population and evaluation o f its clinical usefulness. To accomplish this, in-
vitro validation procedures were planned and executed (section 3), as well as pilot and
in-vivo studies (section 5) to ensure that the “ CO2 SMO Plus” was an accurate and
objective tool for measuring respiratory function in ventilated children. Since an a p r io r i
decision had to be made with regard to the number o f parameters to be used as outcome
variables, only 10 o f the 104 available respiratory function parameters were selected as
appropriate and evaluated in addition to a few reference parameters such as respiratory
rate, PEEP and peak and mean airway pressure. Thus the usefulness o f the “ CO2 SMO
Plus” can only be commented upon specifically in relation to the parameters evaluated in
this study. Following pilot studies it was realised that evaluation o f the “ CO2 SMO Plus”
in paralysed patients would be essential before its potential use in spontaneously
breathing individuals could be considered.
152
Details o f these tests and their results have been presented in sections 3 and 5.
7.1.1 Evaluation of methods and equipment
The manufacturer’ s specifications suggested that the accuracy and performance o f the
“ CO2 SMO Plus” were acceptable for the nature o f this research. However, further
studies were undertaken to confirm these data because in the clinical environment,
special considerations such as the addition o f a tracheal tube have been known to cause
significant degradation o f the accurate linear range (Jackson et al. (b) 1995).
The volume integration o f all sensors was found to be accurate and the addition o f
tracheal tubes o f variable sizes did not perceptibly change the accuracy o f volume
measurements for any o f them. The linear ranges o f all sensors w ith and without tracheal
tubes attached were accurate within broad and acceptable clinically encountered flow
ranges. Pressure recordings were also found to be accurate for all sensors and
assessment o f pressure / flow relationships revealed that the Ra,,,, o f the neonatal flow
sensor contributed a relatively small amount to total R, , and that the Rapp o f the
paediatric and adult flow sensors contributed negligibly towards total Rn,. The Least
Squares Analysis algorithms employed by the “ CO2 SMO Plus” software for calculation
o f Rrs and C , s were cross checked against multiple linear regression o f the raw data
points o f flow, pressure and volume and confirmed to be analogous. In addition,
comparison o f “ CO2 SMO Plus” C,s calculations against known Qs values in a neonatal
lung simulator revealed accuracy within a variety o f physiological conditions. Finally,
CO2 measurements displayed by the “ CO2 SMO Plus” were compared with known CO2
concentrations and the percentage error was found to be <5% for all sensors. Deadspace
measurements in the “ CO2 SMO Plus” were validated (Wenzel et al. (b)1999; Wenzel et
al. (c)1999) and validity o f the i-Stat blood gas analyser were established by other
authors and were not repeated in this study.
Early pilot and in vivo studies exposed concerns about the validity o f Cr* and R^ data
obtained in partially ventilated or spontaneously ventilating individuals and clarified the
duration o f measurement required to obtain representative baseline data. In addition,
normal variability for selected respiratory function parameters in muscle relaxed, fully
ventilated patients was established so that significant changes could be identified and the
153

effect o f sensor disconnection was investigated. Finally the effects o f tracheal tube leak
on measurements o f respiratory function were thoroughly investigated so that limits o f
applicability for data obtained could be identified. Thus from validation work and in vivo
studies undertaken at the beginning o f this study, it appeared that the “ CO2 SMO Plus”
respiratory monitor was an accurate and potentially useful measurement tool in the
paediatric intensive care unit.
I t should be noted however that measurements in this study were undertaken in special
and controlled circumstances on muscle relaxed and fully ventilated patients. Early
measurements on spontaneously breathing patients generated data that were extremely
variable and difficult to analyse. Validation o f the “ CO2 SMO Plus” under general
intensive care unit conditions was not established, and applications for this equipment
may be limited by other factors including the inability to distinguish between
spontaneous and ventilator breaths in patients receiving assisted mechanical ventilation.
The sophistication and sensitivity o f breath triggering on modern ventilators may mean
that pressure controlled breaths may be difficult to distinguish from pressure supported
spontaneous breaths.
The “ CO2 SMO Plus” equipment was relatively easy to use at the bedside and provided
on-line real time information about pulmonary function. However, software available at
the time o f the study did not provide continuous calculated values o f tracheal tube leak
and to date the manufacturers continue to resist requests to adapt software to calculate
and display this data continuously for clinicians at the bedside. Thus validity o f Crs and
Rh-s measurements could only be roughly estimated at the bedside by a crude judgement
o f leak magnitude derived from the discrepancy between V ti and Vte on the flow
volume loops. It was only during detailed retrospective analysis o f exported data that
the validity o f these outcomes could be confirmed. This would be o f extremely limited
value to clinicians at the bedside wishing to make instantaneous decisions on the basis o f
accurate C,s or Rrs calculations.
Trend data generated from the average values o f breath by breath data for each
parameter have the potential to be genuinely useful in the intensive care unit, both by
providing an instant and objective measure o f efficacy o f therapeutic interventions and
154
by providing an indication o f spontaneous deterioration or improvement in respiratory
function so that timely and appropriate changes in ventilator management could be
instigated. Good examples o f these benefits were encountered periodically in individuals
throughout the course o f the study while other monitoring methods, including arterial
blood gas measurements (because o f the intervals between sampling), were insensitive to
these clinical changes. In addition, examination o f flow, pressure and volume wave
forms has the potential to assist in optimising ventilation rate as well as the ratio
between inspiratory and expiratory time. The shapes o f flow volume, pressure volume
and SBCO2 curves have the potential to provide immediate and diagnostic information
about many aspects o f respiratory function including C , - s , Rrs, air trapping or the presence
o f secretions in the large airways.
However, the expense o f this type o f monitoring is considerable and the benefits would
be unlikely to apply in all cases. “ Single patient use” flow sensors currently cost in
excess o f £31 and good graphics displays are possible only with a computer monitor
incorporated into the measurement circuit. It is beyond the scope o f this study to
provide analysis o f risks, benefits and health economics associated with the provision o f
routine respiratory function monitoring to all patients receiving mechanical ventilation.
The decision as to whether this type o f monitoring should be provided routinely or
selectively in addition to standard monitoring is at this time unsupported by an evidence
base. It is also difficult at present to anticipate selection criteria for monitoring, although
critically ill, paralysed patients requiring ventilation for several days would seem to be
more appropriate for example than those requiring brief ventilatory support following
surgery.
7.1.1.1 Software problems with “CO2SMO Plus”
The software developed by the “ CO2 SMO Plus” manufacturers to manage respiratory
function data is continually evolving to meet the requirements o f intensive care
monitoring in patients o f all ages. The monitoring device had both hard and software
problems initially and at the outset o f this study, some relating specifically to equipment
recently adapted for use in infants and some general software faults. Some o f these were
resolved slowly over time, but new versions o f the software were constantly being
155

released, with parameters changing names and abbreviations, both mid project and
between versions and systems. Some o f these problems were identified only because o f
intensive and careful scrutiny o f data and may not have been evident to medical staff at
the bedside, unaware o f the limitations o f the software and equipment. The lack o f
thorough clinical validation o f biomedical equipment prior to release remains a
significant problem in incorporating new technology into the intensive care unit
environment (Frey et al. (a) 2000; Frey et al. (b) 2000). Feedback from the
manufacturers was intermittent, and often slow.
7.1.1.2 Phase delay
Any equipment which calculates or derives parameters from raw data signals depends on
the fact that the signals are obtained simultaneously so that there is no phase delay in the
processing o f these signals which w ill lead to errors in calculation. In the “ CO2 SMO
Plus” , for example, R,s is calculated from raw pressure and flow signals and delays
between these transducers ( if they were connected in series) would lead to errors in
calculation. Fletcher et al. found that even small phase shifts between flow and CO2
signals could lead to significant errors in deadspace calculation (Fletcher and Jonson,
1984).
The compact sensor design o f the “ CO2 SMO Plus” overcomes these concerns by the
fact that the infra-red CO2 sensor straddles the pressure / flow sensor in the neonatal and
paediatric models, thereby ensuring that flow, pressure and CO2 are measured
simultaneously. In the adult sensor, there is a 2cm difference between points o f CO2 and
pressure/flow measurement. This would produce a negligible phase lag and degree o f
error in deadspace parameters calculated from these signals.
7.1.1.3 PaCOz and PeCO^ calibration
Since the difference between PaC02 and PeC02 conveys potentially important
information about the magnitude o f deadspace, it would have been desirable to calibrate
CO2 measurements simultaneously between the “ CO2 SMO Plus” and the i-Stat arterial
blood gas analysers. However, this was not possible in practice since the i-Stat blood
gas analysers and “ CO2 SMO Plus” are both internally calibrated against known
concentrations o f CO2 Both methods however showed minimal measurement error
156

when checked separately and thus although there might have been small errors in
calibration between the instruments, these would not have substantially changed the
magnitude or direction o f clinical changes. In addition, these errors would have been
negligible in comparison to the rounding errors discussed in section 5.2.3.
7.1.1.4 Early practical limitations of using the “CO2SMO Plus” to monitor
respiratory function in ventilated infants.
Several practical problems were encountered specifically in relation to the use o f the
“ CO2 SMO Plus” in the clinical environment. Broader considerations w ith regard to the
limitations o f respiratory function measurements in ventilated patients w ill be discussed
later in the chapter (7.4).
There were important and valid concerns with regard to the potential increase in dead
space and the potential for CO2 retention introduced by insertion o f the flow sensor into
the ventilator circuit, especially in critically ill preterm infants (Wenzel et al. (b)1999).
The additional deadspace introduced by the neonatal flow sensor was < lm L and this
was felt to be acceptable in full term neonates and infants. This concern was largely
overcome by limiting recruitment o f subjects to term babies or infants and children in
this study. The added deadspace o f the “ CO2 SMO Plus” neonatal flow sensor is
amongst the smallest available but the potential for CO2 retention in preterm infants
remains a concern in future studies involving this population group.
Prior to the development o f the paediatric flow sensor, the “ CO2 SMO Plus”
manufacturer’s guidelines suggested that all patients with an internal tracheal tube
diameters o f 4.0mm or more be measured with the adult flow sensor. The linear range
o f the adult flow sensor was however incapable o f valid measurements under the low
flow conditions sometimes encountered in small patients w ith a tracheal tube o f 4.0mm
diameter. In some o f these patients volume could not be successfully integrated and
rejection criteria for imperfect wave forms meant that there was inadequate data
available for SBCO2 or ETCO 2 to be calculated. This problem was overcome by using
flow as an indicator for selecting appropriate sensor size rather than tracheal tube
diameter and in some instances (prior to the development o f the paediatric flow sensor),
it was appropriate to use the neonatal flow sensor in patients with a tracheal tube
157

diameter o f as much as 6.0mm. Since all patients were muscle relaxed and fully
ventilated, concerns that the resistance created by adding the neonatal flow sensor to a
large diameter tracheal tube would increase work o f breathing. In addition, there was no
evidence for CO2 retention in any individual where the neonatal flow sensor was
connected to a tracheal tube larger than 4.0 mm.
Early software limitations prohibited entry o f body weight values o f more than 9.9kg for
the neonatal flow sensor and did not permit entry o f body weight values to 2 decimal
places. In these cases, weight corrected parameters such as V t per kilogram were
recalculated during analysis.
Excessive collection o f water in the ventilator tubing was associated with poor
performance o f the infrared CO2 sensor. Methods for connection and disconnection
were modified to minimise moisture accumulation in the sensor and water was regularly
emptied from ventilation tubing. Careful ventilator tubing placement and removal o f
excess moisture prior to measurements improved performance in later studies.
Early soft and hardware faults left the data collection system vulnerable to crashing.
Data could not be automatically saved during measurements and because o f this, critical
data were lost on a number o f occasions. Constant communication with the
manufacturer’s and feedback from them resulted in resolution o f most o f these
problems.
7.1.1.5 Summary
Respiratory function monitoring in ventilated children may be advantageous from both a
clinical as well as research perspective. As a research tool, the “ CO2 SMO Plus” has been
shown to produce reliable data under controlled conditions in certain patient groups and
as a clinical tool, it has the benefit o f providing immediate feedback on the effects o f
therapeutic interventions as well as on spontaneous trends in clinical progress. The data
storage capacity and non-invasive nature o f the monitoring are additional benefits in the
research and clinical environments.
158
The continuous and simultaneous measurement or calculation o f several respiratory
parameters provide essential clues about the efficiency o f respiratory function and gas
exchange that would not be available from examination o f isolated parameters alone.
The relationship between VCO 2 and ETCO 2 for example, w ill provide evidence o f gas
exchange when an arterial line is not in place for determination o f blood gases. A parallel
relationship between ETCO 2 or PeC02 and PaC02, indicates a steady state balance
wherein CO2 elimination matches production. When the trends o f VCO 2 and ETCO 2 do
not run parallel in a critically ill child with one rising while the other falls, this may
indicate that CO2 elimination is less efficient, with a rise in ETCO 2 reflecting a build up
o f CO2 in arterial blood. This might suggest the need for an increase in ventilatory
support. By contrast, an acute fall in ETCO 2 coinciding with a rising VCO 2 , may
indicate an improvement in CO2 elimination and ventilatory support might be reduced.
7.2 Does respiratory physiotherapy in the paediatric intensive care unit
improve respiratory function ?
The second o f the central hypotheses in the current study proposed that respiratory
physiotherapy in the paediatric intensive care unit would improve respiratory function by
increasing V t and C,s, decreasing R,s and Vophys and improving gas exchange.
Statistically the results o f the study did not support the proposals that Vy, Cm, VCO 2 ,
ETCO 2 , pH, PaC02, Pa02 or Vophys improved immediately after physiotherapy.
However, there was a significant small reduction in R,,s after physiotherapy in patients on
volume pre-set ventilation and the same tendency (p<0.09) in patients receiving pressure
pre-set ventilation. The unexpected and statistically significant, albeit small, increase in
Voaiv and Vophys after physiotherapy suggested that gas exchange and respiratory
function may have deteriorated after treatment. In addition, there were statistically
significant reductions in HCO 3-, base excess and O2 saturation after treatment. The
theoretical reasons and clinical implications o f these results in context o f comparisons
w ith other published data are explored in detail below.
159
7.2.1 No significant change in Vt or Crs after physiotherapy
There were no significant group changes in or V t after physiotherapy but a tendency
fo r both to decrease after nursing suction, which became statistically significant when
effects o f tracheal tube leak were adjusted for in analysis (6.5.2 and 6.5.3). Compliance
is dependent upon and defined by the relationship between volume and pressure in the
lungs. Thus a reduction in V t after treatment would be expected to be accompanied by a
reduction in C,-s as long as ventilator pressures remained unchanged. Cn, depends on
numerous factors including tissue elasticity, lung water content, surfactant action,
pulmonary blood flow and volume and the visco-elastic properties o f the respiratory
system. The separate elements o f physiotherapy treatments, for example manual
hyperinflation, saline instillation, chest wall vibrations might all have had different levels
o f influence upon any combination o f these factors. The differences in Crs response to
physiotherapy and nursing suction were likely to be multi-factorial and related to
differences in treatment techniques and how these influenced any combination o f the
factors mentioned above. In this study for example, Crs response may have reflected
differences in the way manual hyperinflation was performed. Jones et al. suggested that
the hyperinflation aspect o f physiotherapy treatment improved C , s while the percussion
aspect caused a deterioration (Jones et al. 1992). In this study, percussion was rarely
performed during physiotherapy treatment, but manual hyperinflation was routinely
performed before treatment, between cycles o f treatment and following treatment before
reconnection to the ventilator. Manual hyperinflation was less regularly performed
during the shorter nursing suction events. On the other hand, negative suction pressure
has been shown to be associated with collapse o f alveoli and a reduction in Cn,
(Velasquez and Farhi, 1964), and the tendency for V t and C , - s to decrease following
nursing suction may have been a reflection o f a general technique in which suctioning
(collapsing alveoli) played a greater role than manual hyperinflation (recruiting alveoli).
Previous studies in both adult and paediatric populations have produced conflicting
evidence with regard to the effects o f physiotherapy on V t and C , - . s , most likely due to
heterogeneity o f populations studied, interventions used and outcome measures
reported. Some studies claimed an improvement in Crs after physiotherapy (Winning et
al. 1975; Mackenzie et al. 1980), while others suggested no change or a deterioration
(Bales et al. 1995). It is particularly difficult to differentiate between studies in terms o f
160

which aspects o f treatment may have resulted either in improvement or deterioration o f
C.-S.
Tidal volume did not change after physiotherapy in this study. This concurs w ith a study
on ventilated children conducted more than 20 years ago (Fox et al. 1978). Remarkably,
V t has rarely been used as an outcome in studies o f physiotherapy efficacy in ventilated
patients, but this may reflect the difficulty to date in measuring this parameter accurately
(Brandstater and Muallem, 1969; Prendiville et al. 1986).
The available evidence suggests therefore that the effect o f physiotherapy on Crs may be
variable and dependent on several factors, including the age o f the patient as well as the
duration o f treatment and techniques performed. Factors such as diagnosis and severity
o f illness w ill very likely also be important in determining the response o f Crs to
physiotherapy. Macnaughton found an association between improved compliance and
recruitment o f atelectatic lung (Macnaughton, 1997), probably due to an increase in V t.
Thus any physiotherapy treatment which succeeds in such recruitment might be
expected to produce an improvement in C,*. Atelectasis is currently well recognised as a
criteria for selection o f patients for treatment.
One study found that sedation and analgesia in ventilated children improved Crs
compared with awake patients (Irazuzta et al. 1993). Since all patients in the current
study were paralysed and fully ventilated, the response o f Crs to physiotherapy may have
been dampened. It is possible that the response o f C,* in awake and spontaneously
breathing patients could be significantly greater.
7.2.2 Reduction in Rrs after physiotherapy
In this study R,s decreased significantly 15 minutes after physiotherapy in patients on
volume pre-set ventilation (p<0.05) and there was a tendency for the same result in
patients with pressure pre-set ventilation (p<0,09), indicating that one o f the primary
goals o f treatment (removing secretions) may have been achieved. These results were
sustained and apparent 30 minutes after treatment. They may have been sustained for
longer, but it was not possible to continue measurements in a large enough sample to
assess this. There was no reduction in R,s after nursing suction.
161
The literature regarding the effects o f physiotherapy on R,* is conflicting. Mackenzie et
al. found no change in R,., after physiotherapy in 42 ventilated adults (Mackenzie et al.
1980), while others found significant reductions in R,s in paediatric populations after
physiotherapy (Prendiville et al. 1986; Fox et al. 1978). Cochrane et al. found a
significant reduction in airflow obstruction in non-intubated adults after chest
physiotherapy (Cochrane et al. 1977). Because o f the relative contribution o f tracheal
tube resistance to total Rrs in the ventilated patient, sensitivity o f this parameter to
therapeutic interventions may be dependent on, amongst other things, age, the length o f
the tracheal tube, position o f or kinks in the tracheal tube and the relative size o f the
tracheal tube in relation to the tracheal diameter. The tracheal tube in paediatric patients
is almost the same size as the trachea, and hence contributes a relatively small
proportion o f the overall R , s . In adults however, the tracheal tube is only about half the
width o f the trachea and hence contributes substantially to overall R , - s . It is possible
therefore that R,s is a more sensitive measurement o f respiratory function in ventilated
children than in ventilated adult patients. However, because R s is proportional to the
fourth power o f the radius, small tracheal tubes generate a large resistance to flow and
even small obstructions within an infant tracheal tube (for example due to secretions)
w ill generate critical increases in R,s by further reducing the effective lumen.
In any event, measures o f airway resistance may be insensitive indicators o f changes in
peripheral airways, especially i f homeostatic mechanisms for maintaining ventilation-
perfusion relationships are effective (Menkes and Britt, 1980). Thus the changes
observed in this study probably reflected removal o f secretions from upper airways and
are unlikely to have been associated with any changes in R,s o f peripheral airways. This
was supported to some extent by the association in this study between reported sputum
yield and change in R,s (6.5.4).
Traditional methods o f assessing the success o f physiotherapy treatments, such as large
sputum yield, can be remarkably deceptive and may not reflect the clinical status o f the
patient accurately. On a few occasions during the course o f this study, patients with
large sputum yield did not respond as expected with improved respiratory function but
instead, exhibited a short term deterioration in V | - , C , s or other respiratory parameters.
This was possibly due to bronchial reactivity or other responses to the impact o f
162

vigorous physiotherapy techniques. Individual physiological responses to physiotherapy
may depend on many factors including the diagnosis, underlying respiratory
pathophysiology, presence or absence o f bronchial hyper-responsiveness and
tracheomalacia. This raises doubts about whether sputum yield is an adequate or
appropriate outcome criterion for physiotherapy treatment success, since although large
sputum yield is intuitively beneficial for the patient, it is not always associated w ith a
short term improvement in lung function. I f it could be established that large sputum
yield is associated with improved longer term outcomes (d ifficu lt in intensive care unit
environments), then the immediate deterioration observed in some patients could be
considered a reasonable risk which could be compensated for by a transient increase in
ventilatory support. This assumption may not be reasonable in very ill children. On the
other hand, while outcomes such as V t or C , - s may reflect the short term clinical status o f
the patient, they may inaccurately represent the longer term benefit achieved by removal
o f secretions and may thus also be inadequately sensitive to the overall picture o f
treatment effect.
Oesophageal manometry was not performed in this study since in paralysed patients, it
was not required for distinguishing between lung and chest wall compliance. In
spontaneously breathing subjects however, the addition o f oesophageal manometry
could be helpful in studying the mechanical properties o f the chest wall and lungs
separately. The measurement o f oesophageal pressure is a relatively invasive monitoring
tool however, and may not always be accurate (Heaf et al. 1986).
7.2.3 Changes in CO2 parameters and metabolic demand
In this study there were no significant changes in ETCO 2 or VCO 2 after physiotherapy,
but PeC02 was reduced significantly (p<0.05) when effects o f tracheal tube leak were
adjusted for in analysis. The lack o f change in VCO 2 after physiotherapy appears to
contradict the findings o f many previous studies, in which the haemodynamic and
metabolic demands encountered during physiotherapy treatment created a significant rise
in VCO 2 (Weissman et al. 1984; Singer et al. 1994; Horiuchi et al. 1997). However, this
was most likely due to the fact that patients in this study were muscle relaxed and
sedated during measurements, since these daigs have been demonstrated to reduce the
163
metabolic, haemodynamic, and ventilatory responses to chest physical therapy (Harding
et al. 1993; Harding et al. 1994).
In contrast to the advantages o f pharmacological paralysis in terms o f reduced
haemodynamic response to treatment, there are the disadvantages o f artificially
producing conditions in which patients have no effective means o f sputum clearance (no
cough, impaired mucociliary clearance, continuous mechanical ventilation) and in whom
manual techniques o f airway clearance become essential for reduction in morbidity
associated with intubation and mechanical ventilation (King, 1987).
7.2.4 Significant increases in Voaiv and Vophys after physiotherapy.
Unexpected findings from this study were the significant increases in Vophys and Voaiv
following physiotherapy which were not evident after nursing suction. Because Vophys is
comprised o f V d;,iv and it is likely that this result reflects primarily the Voaiv
component o f VOphys, since Vi)ainv.iy did not change after treatment. The increase in Voaiv
implied some disruption in the pulmonary V/Q balance and sub-optimal gas exchange.
However, although this disruption appeared to suggest that lung function was reduced
30 minutes after treatment, there were no other substantial indications (in terms o f V t ,
Cns, Rrs, CO2 parameters or blood gases) that respiratory function had been compromised
by treatment. In fact, there was some suggestion that respiratory function might have
improved slightly (reduced R,s, decreased PeCO] with stable VCO 2).
Alterations in ventilation rate or tidal volume have not been found to have any effect on
Voaii^ay (Flctchcr and Jonson, 1984; Baker and Burki, 1987). Similarly, Vophy* was not
influenced by increases in respiratory rate, but an increase in V t significantly increased
Vophys. These results indicate that V /Q matching could be influenced by a change in V t .
Voaii-way has however, been shown to decrease in response to bronchial constriction
(Olsson et al. 1999). In the current study, there were no significant group or individual
changes in VDai,-way after physiotherapy or nursing suction, indicating that bronchial
constriction was unlikely to have been an important by-product o f treatment in this
patient population. Some physiotherapy techniques have been reported to cause
bronchoconstriction (Campbell et al. 1975), and the lack o f such effect in this study
164
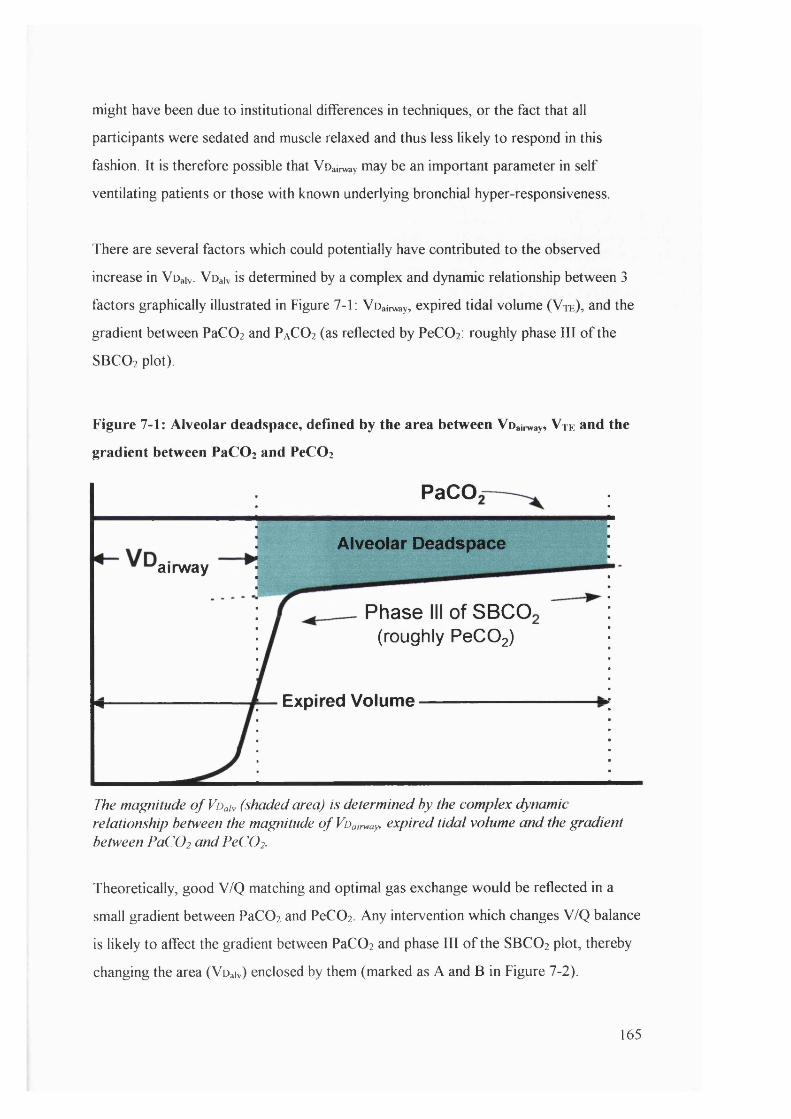
might have been due to institutional differences in techniques, or the fact that all
participants were sedated and muscle relaxed and thus less likely to respond in this
fashion. It is therefore possible that Voainvay may be an important parameter in self
ventilating patients or those with known underlying bronchial hyper-responsiveness.
There are several factors which could potentially have contributed to the observed
increase in Voaiv. Voaiv is determined by a complex and dynamic relationship between 3
factors graphically illustrated in Figure 7-1: Voainvay, expired tidal volume ( V t e ) , and the
gradient between PaCOi and PaC02 (as reflected by PeCOz: roughly phase I I I o f the
SBCO2 plot).
Figure 7-1: Alveolar deadspace, defined by the area between Voairway, V te and the
gradient between PaCOz and PeCOi
PaCO
Alveolar Deadspaceairway
Phase III of SBCO(roughly PeCOg)
Expired Volume
The magnitude o f Voah (shaded area) is determined by the complex dynamic relationship between the magnitude o f Voairway, expired tidal volume and the gradient between PaC0 2 and PeC0 2 .
Theoretically, good V/Q matching and optimal gas exchange would be reflected in a
small gradient between PaC02 and PeC02 Any intervention which changes V/Q balance
is likely to affect the gradient between PaC02 and phase I II o f the SBCO2 plot, thereby
changing the area (Voaiv) enclosed by them (marked as A and B in Figure 7-2).
165
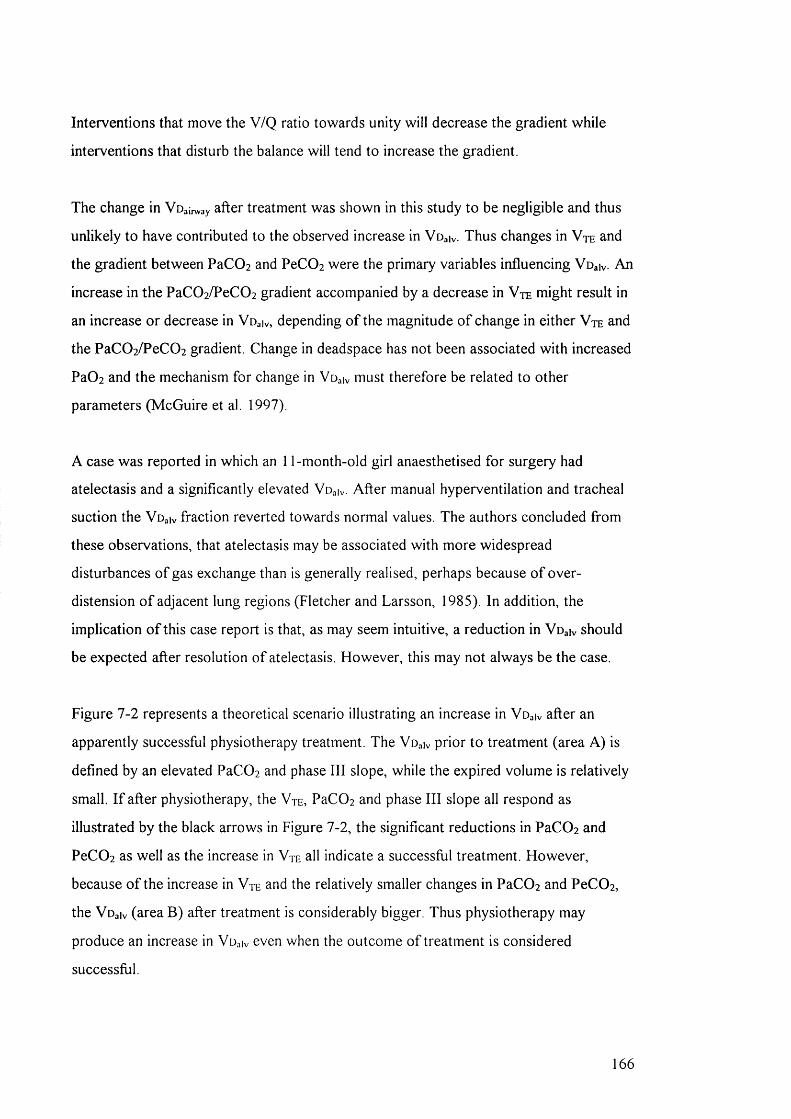
Interventions that move the V/Q ratio towards unity w ill decrease the gradient while
interventions that disturb the balance w ill tend to increase the gradient.
The change in Voainvay after treatment was shown in this study to be negligible and thus
unlikely to have contributed to the observed increase in Voaiv. Thus changes in Vte and
the gradient between PaCOz and PeCOz were the primary variables influencing Voaiv An
increase in the PaC0 2 /PeC0 2 gradient accompanied by a decrease in Vte might result in
an increase or decrease in Voaiv, depending o f the magnitude o f change in either V t e and
the PaC02/PeC02 gradient. Change in deadspace has not been associated with increased
PaÛ2 and the mechanism for change in Voaiv must therefore be related to other
parameters (McGuire et al. 1997).
A case was reported in which an 11-month-old girl anaesthetised for surgery had
atelectasis and a significantly elevated Voaiv. After manual hyperventilation and tracheal
suction the Voaiv fraction reverted towards normal values. The authors concluded from
these observations, that atelectasis may be associated with more widespread
disturbances o f gas exchange than is generally realised, perhaps because o f over
distension o f adjacent lung regions (Fletcher and Larsson, 1985). In addition, the
implication o f this case report is that, as may seem intuitive, a reduction in Voaiv should
be expected after resolution o f atelectasis. However, this may not always be the case.
Figure 7-2 represents a theoretical scenario illustrating an increase in Voaiv after an
apparently successful physiotherapy treatment. The Voaiv prior to treatment (area A) is
defined by an elevated PaC02 and phase I I I slope, while the expired volume is relatively
small. I f after physiotherapy, the V t e , PaC02 and phase I II slope all respond as
illustrated by the black arrows in Figure 7-2, the significant reductions in PaC02 and
PeC02 as well as the increase in V t e all indicate a successful treatment. However,
because o f the increase in V t e and the relatively smaller changes in PaC02 and PeC02,
the Voaiv (area B) after treatment is considerably bigger. Thus physiotherapy may
produce an increase in Vu iv even when the outcome o f treatment is considered
successful.
166
Figure 7-2: SBCO2 before and after physiotherapy
A: A lv e o la r D e a d s p a c e
ETCO
ExpiredPCO2
B: A lv e o la r D e a d s p a c eETCO
AnatomicalDeadspace
Volume of CO; in breath
Expired Volume
Area A represents Voah p rio r to a successful physiotherapy treatment in which tida l volume is improved and PaCO2 and PeCÜ2 are reduced as illustrated by the black arrows. The Voah fo llow ing treatment (area B) is considerably bigger because o f the increase in V te and the relatively smaller changes in PaCO2 and PeC02. Thus physiotherapy may produce an increase in Voah even when the outcome o f treatment is considered successful.
Another consideration is the different response intervals o f each o f these factors after a
significant intervention. The change in V te in response to treatment would be likely to
be immediate whereas the change in gradient between PaC0 2 and PeC0 2 would depend
on how quickly the V/Q balance could be re-established.
There is scant evidence in the literature to indicate exact timing for equilibrium between
ventilation and perfusion, but available evidence points to the fact that there is a
continuum o f response times both in which hypoxic pulmonary vasoconstriction occurs
and in which it is relieved. There is disagreement in the literature about the time required
for hypoxic pulmonary vasoconstriction to reach its full intensity, although research
suggests that the development o f hypoxic pulmonary vasoconstriction is biphasic with an
immediate phase followed by a delayed response which could take hours to develop (De
Canniere et al. 1992; Leach et al. 1994, Zhang et al. 1995; Vejlstrup et al. 1997). The
time taken for resolution o f hypoxic pulmonary vasoconstriction would also depend on
167

many factors, including the proportion o f lung involved (Barer, 1989), the age o f the
child, gravity and posture, how long the localised hypoxia (atelectasis) had been present
(Beck et al. 1992; Marshall et al. 1994; Bialecki et al. 1998), mixed venous O2
saturation (Domino et al. 1992), vascular distending pressure (Domino et ai. 1993) and
whether there was nitric oxide (NO) in the circuit or other pharmacological factors
influencing the reactivity o f pulmonary vasculature. NO has been shown to be capable o f
rapidly (within 30 minutes) reversing marked induced hypoxic pulmonary
vasoconstriction (Roberts et al. 1993; Pison et al. 1993; Channick et al. 1994;
Lonnqvist, 1997). In addition, pulmonary microvascular networks are extremely
complex in nature and reactivity to hypoxia is perceptibly different in different lung
regions (Oyamada et al. 1997). In a study by Taskar et a l, minute ventilation was
electively increased or decreased in 44 sedated and fully ventilated adults. After 20
minutes, V d;,|v had decreased in patients who had minute ventilation reduced but
remained unchanged when minute ventilation was increased (Taskar et al. 1995). This
study demonstrates both the potential difference in time taken for development and
resolution o f V/Q mismatch as well as the seemingly incongruous reduction in Voaiv
after a reduction in minute ventilation.
Most hypoxic pulmonary vasoconstriction studies explore gross lung pathology changes
which are induced in laboratory settings rather than the more subtle and localised
continuum o f pathologies encountered in a clinical population, thus it is even more
difficult to extrapolate information regarding the timing o f V/Q rebalance. Given these
variables in the clinical environment, it is virtually impossible to suggest the length o f
time required for pulmonary reperfusion o f previously atelectatic areas recruited during
physiotherapy. It is likely however that pulmonary perfusion to acutely acquired
atelectasis would resolve relatively more quickly than that to chronic collapse, and that
neonatal patients would respond more quickly than older patients, as would patients
with NO or high inspired Fi0 2 . Older patients with chronic lobar collapse w ill be more
likely to show a sluggish pulmonary reperfusion response to resolved atelectasis. I t is
probably reasonable to suggest that an interval o f 30 minutes following physiotherapy
(when blood gases in this study were taken and Vophys calculated) might have been
generally insufficient for V/Q equilibrium to be completely re-established.
168
If, as illustrated in Figure 7-2, physiotherapy improved alveolar ventilation, by recruiting
atelectatic areas and removing secretions, whilst pulmonary perfusion had not had time
to readjust, the result would be an increase in Voaiv as observed in this study. However,
the increase in Voaiv could also be explained by a decrease in pulmonary perfusion, or a
combination o f increased ventilation and decreased perfusion. It is difficult to ascertain
which o f these was primarily responsible for the observed increase in Voaiv. Other
outcomes o f the study were examined to assist with interpretation o f this result.
There was no substantial evidence to suggest that pulmonary perfusion had been
compromised after physiotherapy (Table 6-4), apart from the very small changes in
derived arterial blood gas parameters (HCO 3 -, base excess and O 2 saturation) which
hinted at mild metabolic acidosis and which might have occurred as a result o f reduced
cardiac output. There were no changes in pH, PaCOz or Pa0 2 . Details o f other variables
such as pulmonary artery pressure, which might have provided further evidence for
decreased pulmonary perfusion, were not recorded in this study since they were rarely
monitored. A previous study found a significant decrease in intra-pulmonary shunt and
no change in cardiac output after physiotherapy in 19 adults with post traumatic
respiratory failure (Mackenzie and Shin, 1985), but the extent to which such findings
can be extrapolated to the current study is limited.
Evidence for improved pulmonary ventilation in the current study was also scant but
perhaps more persuasive. Changes in Vte tended to be positive after physiotherapy, and
the fact that PeC0 2 fell (p<0.05 after 30 minutes), while VCO 2 remained unchanged,
supports this. The fall in PeCÛ2 coupled with the fact that PaC0 2 did not change
significantly after treatment would mean that Vophys/ V t , calculated using the Bohr
equation would be increased as would Vophys and Voaiv in the absence o f changes in
Voaii^ay. Confusingly, as suggested above, marked changes in V t might also result in a
reduced Voaiv after resolution o f acute atelectasis (Fletcher and Larsson, 1985), but this
would depend on rapid reperfusion and rapid equilibrium o f V/Q matching. In addition,
less successful treatments, (defined by an increase in the PaC0 2 /PeC0 2 gradient and no
change or deterioration in Vr) might also result in an enlarged Voaiv Therefore, it is
169

critical that the increase or decrease in deadspace is interpreted in the light o f relative
changes in other parameters.
A full understanding o f the behaviour o f Voaiv in response to therapeutic interventions
would involve a study design that repeated blood gas measurements and deadspace
calculations for several hours after treatment, until a new V/Q balance had been
established in each individual. Therapeutic success would reflect ultimately that the V/Q
matching established at the improved alveolar ventilation volumes had resulted in a
smaller Voaiv and overall improvement in respiratory function. A study with this design
would be very difficult to conduct in an intensive care unit environment, where clinical
interventions or position changes which could confound both arterial blood gas values
and tidal breathing parameters are regularly performed.
Since there is little evidence to substantiate either the argument for or against an
increase in ventilation or a decrease in perfusion, it is possible that the combination o f a
small increase in ventilation and a small reduction in perfusion, was responsible for the
significant increase in V d.,iv.
The increase in Voaiv 30 minutes after physiotherapy was o f particular interest in this
study because it represented a new and potentially sensitive measure o f the impact o f
therapy on V/Q matching, a parameter which has not previously been explored in
physiotherapy research because o f the invasive nature o f traditional ventilation/perfusion
scanning.
Further investigation is required to assess full duration o f this effect, and whether
prophylactic measures should be taken to minimise the consequences o f an increase in
Voaiv Interestingly, any manoeuvres such as an increase in PIP, might take equally long
to produce the desired effect given the potential delay in reversing hypoxic pulmonary
vasoconstriction. In addition, Vophys and Vo^iv appear to be more sensitive to “ hidden”
physiological processes associated with physiotherapy treatments which are not
particularly evident from examination o f other parameters, and may be important in
guiding treatments in the fiiture. However, interpretation o f deadspace changes is
dependent on concurrent changes in more traditional outcomes (V j, blood gases).
170
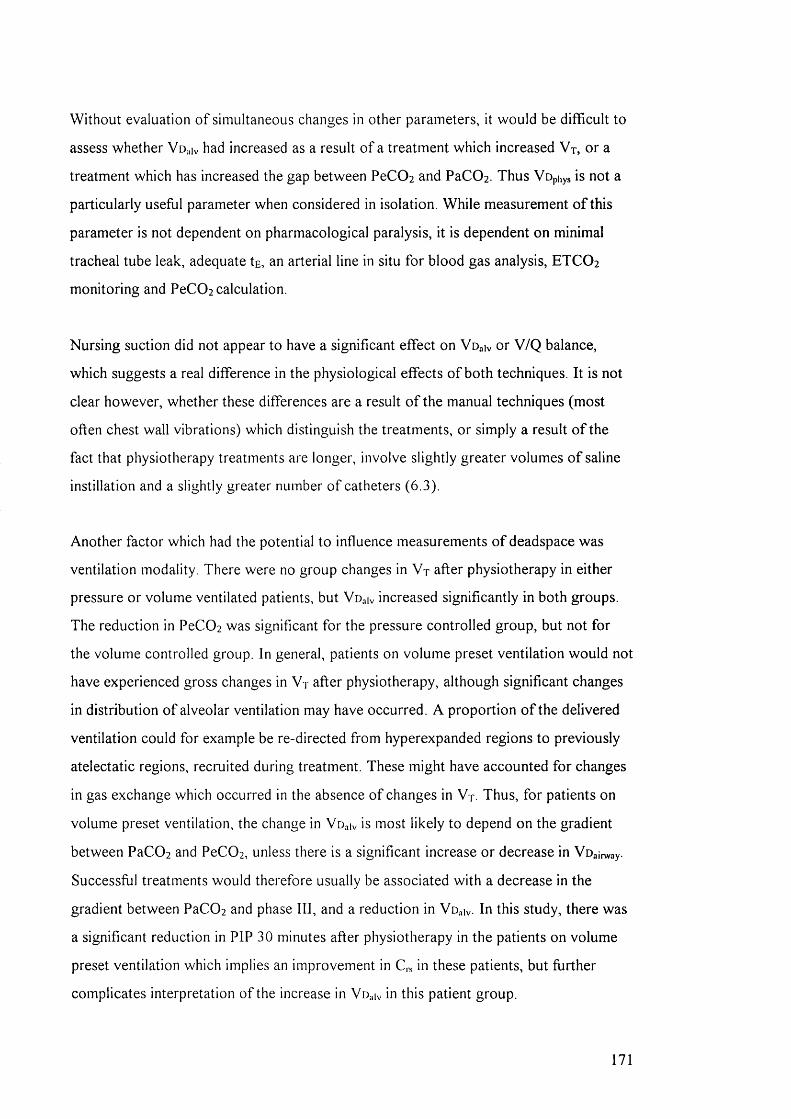
Without evaluation o f simultaneous changes in other parameters, it would be difficult to
assess whether V e).,iv had increased as a result o f a treatment which increased V t , or a
treatment which has increased the gap between PeC0 2 and PaCOz Thus Vophys is not a
particularly useful parameter when considered in isolation. While measurement o f this
parameter is not dependent on pharmacological paralysis, it is dependent on minimal
tracheal tube leak, adequate te, an arterial line in situ for blood gas analysis, ETCO 2
monitoring and PeC0 2 calculation.
Nursing suction did not appear to have a significant effect on Voaiv or V/Q balance,
which suggests a real difference in the physiological effects o f both techniques. I t is not
clear however, whether these differences are a result o f the manual techniques (most
often chest wall vibrations) which distinguish the treatments, or simply a result o f the
fact that physiotherapy treatments are longer, involve slightly greater volumes o f saline
instillation and a slightly greater number o f catheters (6.3).
Another factor which had the potential to influence measurements o f deadspace was
ventilation modality. There were no group changes in V t after physiotherapy in either
pressure or volume ventilated patients, but Vo^iv increased significantly in both groups.
The reduction in PeC0 2 was significant for the pressure controlled group, but not for
the volume controlled group. In general, patients on volume preset ventilation would not
have experienced gross changes in V t after physiotherapy, although significant changes
in distribution o f alveolar ventilation may have occurred. A proportion o f the delivered
ventilation could for example be re-directed from hyperexpanded regions to previously
atelectatic regions, recruited during treatment. These might have accounted for changes
in gas exchange which occurred in the absence o f changes in V t. Thus, for patients on
volume preset ventilation, the change in Vd^k, is most likely to depend on the gradient
between PaC0 2 and PeC0 2 , unless there is a significant increase or decrease in Voairway-
Successful treatments would therefore usually be associated with a decrease in the
gradient between PaC0 2 and phase III, and a reduction in Voaiv. In this study, there was
a significant reduction in PIP 30 minutes after physiotherapy in the patients on volume
preset ventilation which implies an improvement in C,s in these patients, but further
complicates interpretation o f the increase in Vo iv in this patient group.
171

Children with cyanotic congenital heart disease have been shown to have significantly
larger Vophys/Vy than normal children or those w ith acyanotic heart disease (p< 0 .0 1 )
(Mecikalski et al. 1984; Fletcher and Jogi, 1986; Bermudez and Lichtiger, 1987; Lindahl
et al. 1987; Burrows, 1989). In addition, respiratory mechanics have been found to be
abnormal in patients with cardiac disease both before and following cardiac surgery
(Polese et al. 1999). While these factors may have contributed slightly to an increase in
baseline values o f V o p h y / V t in the cardiac surgery population, they would not have
contributed to the observed changes after physiotherapy. This was confirmed both by
the fact that nursing suction did not result in any change in Vophys/ V t and also by the
fact that significant increases in Vophys were demonstrated in the non-cardiac population
after physiotherapy.
7.2.5 Changes in arterial blood gas values
The results o f this study demonstrated no group changes in pH, PaCOz and PaO] after
physiotherapy and small but statistically significant reductions in HCO3-, base excess and
O2 saturation. The latter three parameters represent calculated values derived from the
measured values o f pH, PaCOz and PaO], none o f which showed significant changes
after treatment. HCO3- is the most abundant buffer in blood plasma and represents the
metabolic component o f acid-base balance. The most plausible cause o f reduction in
HCO3- would be from lactic acidosis (hypoxia). Base excess remains virtually constant
during acute changes in PaC0 2 and reflects only the non-respiratory component o f pH
disturbances. Sa0 2 is a useful predictor o f how much O2 is available for tissue perfusion.
In general therefore the blood gas results suggest a mild metabolic acidosis that might be
related to a decline in effective cardiac output or uncompensated increase in metabolic
demand after treatment. These differences in HCO3-, base excess and O2 saturation were
observed both for patients with primary cardiac diagnoses as well as non-cardiac
paediatric intensive care unit admissions.
Changes in HCO 3-, base excess and O2 saturation after physiotherapy have not
previously been reported in the literature although several studies have reported an
increase in metabolic demand as a result o f physiotherapy and others have described
172

significant reduction in such metabolic demand with sedation or pharmacological
paralysis (Hammon et al. 1992; Harding et al. 1994; Singer et al. 1994; Weissman et al.
1994; Cohen et al. 1996; Horiuchi et al. 1997). A il patients in the current study were
pharmacologically paralysed and would therefore have had significantly dampened
responses to the stresses o f physiotherapy treatment. I t is thus interesting to note the
extremely mild yet statistically significant demonstration o f metabolic acidosis associated
w ith physiotherapy in this patient group and important to realise the potential for
significantly greater physiological responses in patients with less sedation or muscle
relaxation.
The drop in O2 saturation observed in the current study concurs with previous studies
on the effects o f suctioning (Simbruner et al. 1981; Kerem et al. 1990; Hussey, 1992).
While several studies have reported a drop in Pa0 2 after physiotherapy treatments or
suction, this was not observed in the current study. This may have reflected the fact that
the large majority o f patients were pre-oxygenated prior to treatment via ventilator
delivered or manual inflation breaths. There is strong evidence to suggest that pre
oxygenation, sedation and competence are mandatory to avoid hypoxaemia from suction
(Stiller, 2000). The same review by Stiller, investigating the effects o f physiotherapy on
ventilated adults found that there was moderate evidence for improvements in arterial
blood gases after treatment. This was not confirmed by the current study. The
differences in mean baseline values o f PaC0 2 and pH between patients on PICU and
CICU may have reflected both the age group differences in each population, as well as
the accompanying ventilation policies (a tendency to aim for more alkalotic gases in
younger groups with cardiac diagnoses).
The fact that pH, PaCÛ2 and Pa0 2 did not change substantially with physiotherapy may
reflect powerful physiological compensatory mechanisms optimising perfusion to match
ventilation. Blood gases have been shown to be minimally disturbed until the whole
system fails (H illier et al. 1997; Stromberg and Gustafsson, 2000).
7.2.6 Monitoring respiratory function during treatment
A t present, routine monitoring o f respiratory function during physiotherapy treatment
remains unfeasible. The “ CO2 SMO Plus” or equivalent respiratory monitor would be an
173

impractical and inaccessible tool for measuring outcome after physiotherapy or nursing
suction in all cases. The initial costs o f monitors and laptop computers and the ongoing
expenses o f flow sensors and maintenance o f such equipment would be prohibitively
expensive for any physiotherapy department and impossible to justify in terms o f costs
recouped by avoiding unnecessary or harmful treatments. I f however, such monitoring
became commonplace in paediatric intensive care units and monitors were routinely set
up at each bedside, the additional information about changes in pressure, volume, or
CO2 parameters would be very useful for physiotherapists seeking immediate and direct
feedback about the efficacy o f treatment. The need for and efficacy o f tracheobronchial
suction and lavage could be determined by monitoring the resistance o f the respiratory
system during mechanical ventilation (Prendiville et al. 1986).
7.2.7 Within-subject responses to treatment
Individual responses to physiotherapy were variable in this study with some patients
demonstrating improvements in Vn:, C,s and R,s (Table 6 - 8 ) while others deteriorated
(Table 6-9). These observations may be o f more clinical relevance than statistical
analysis o f group changes and could potentially direct future research towards
assessment o f clinically significant within-subject changes.
While a reasonable number o f individuals showed a statistically significant improvement
in V te (3 0 % ), C , - s (3 7 % ) and R , - s (2 3 % ) after physiotherapy, an equal number showed a
deterioration and still more did not have any change at all. Although the changes were
significant when compared to the normal variability o f these parameters in untreated
patients, it remains unclear which proportion o f these had clirncally significant changes.
The real numbers o f patients appreciating clinically significant improvements w ill be
somewhat less than the figures noted above. Following nursing suction procedures, only
1 1 % , 2 6 % and 15% showed a significant improvement in Vy, C , s and Rrs respectively.
An optimistic interpretation o f these results would focus on the fact that some patients
improved significantly. A pessimistic interpretation would emphasise that the majority o f
patients treated showed either insubstantial changes after treatment or deteriorated
which provides a strong argument for rationalising physiotherapy or nursing treatments
174
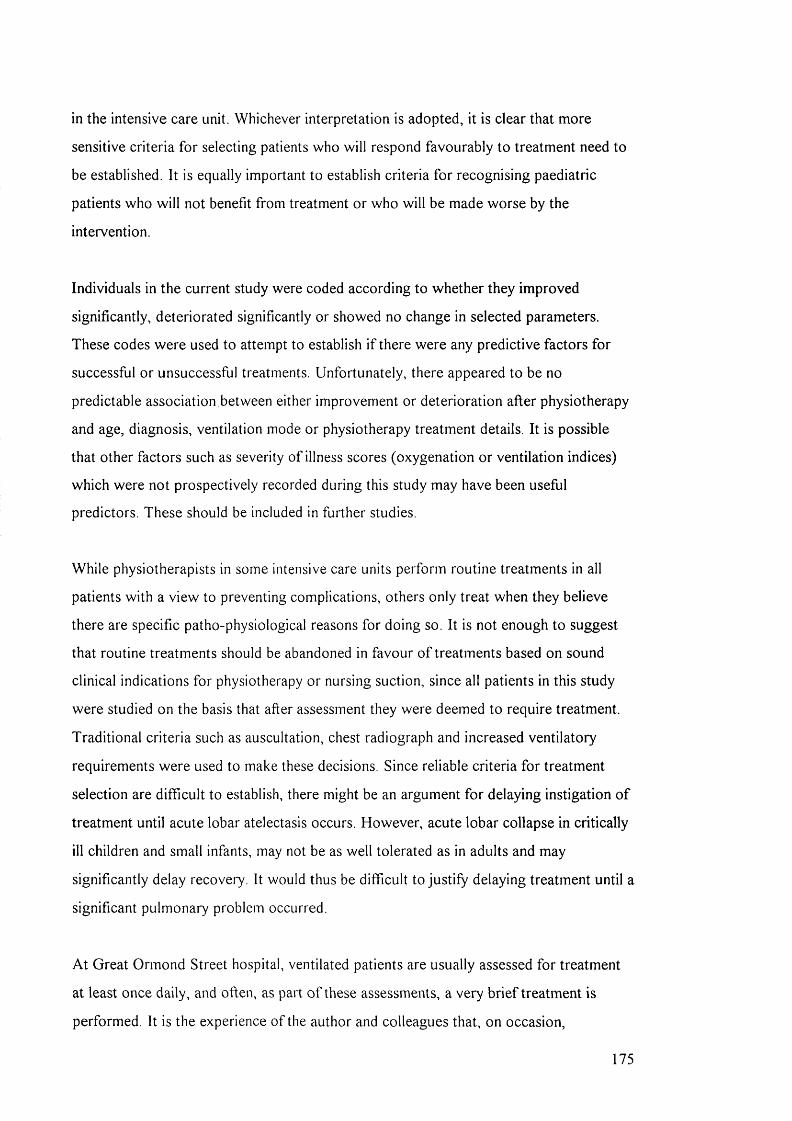
in the intensive care unit. Whichever interpretation is adopted, it is clear that more
sensitive criteria for selecting patients who w ill respond favourably to treatment need to
be established. It is equally important to establish criteria for recognising paediatric
patients who w ill not benefit from treatment or who w ill be made worse by the
intervention.
Individuals in the current study were coded according to whether they improved
significantly, deteriorated significantly or showed no change in selected parameters.
These codes were used to attempt to establish i f there were any predictive factors for
successful or unsuccessful treatments. Unfortunately, there appeared to be no
predictable association between either improvement or deterioration after physiotherapy
and age, diagnosis, ventilation mode or physiotherapy treatment details. It is possible
that other factors such as severity o f illness scores (oxygenation or ventilation indices)
which were not prospectively recorded during this study may have been useful
predictors. These should be included in further studies.
While physiotherapists in some intensive care units perform routine treatments in all
patients with a view to preventing complications, others only treat when they believe
there are specific patho-physiological reasons for doing so. It is not enough to suggest
that routine treatments should be abandoned in favour o f treatments based on sound
clinical indications for physiotherapy or nursing suction, since all patients in this study
were studied on the basis that after assessment they were deemed to require treatment.
Traditional criteria such as auscultation, chest radiograph and increased ventilatory
requirements were used to make these decisions. Since reliable criteria for treatment
selection are difficult to establish, there might be an argument for delaying instigation o f
treatment until acute lobar atelectasis occurs. However, acute lobar collapse in critically
ill children and small infants, may not be as well tolerated as in adults and may
significantly delay recovery. It would thus be difficult to justify delaying treatment until a
significant pulmonary problem occurred.
A t Great Ormond Street hospital, ventilated patients are usually assessed for treatment
at least once daily, and often, as part o f these assessments, a very brief treatment is
performed. It is the experience o f the author and colleagues that, on occasion,
175
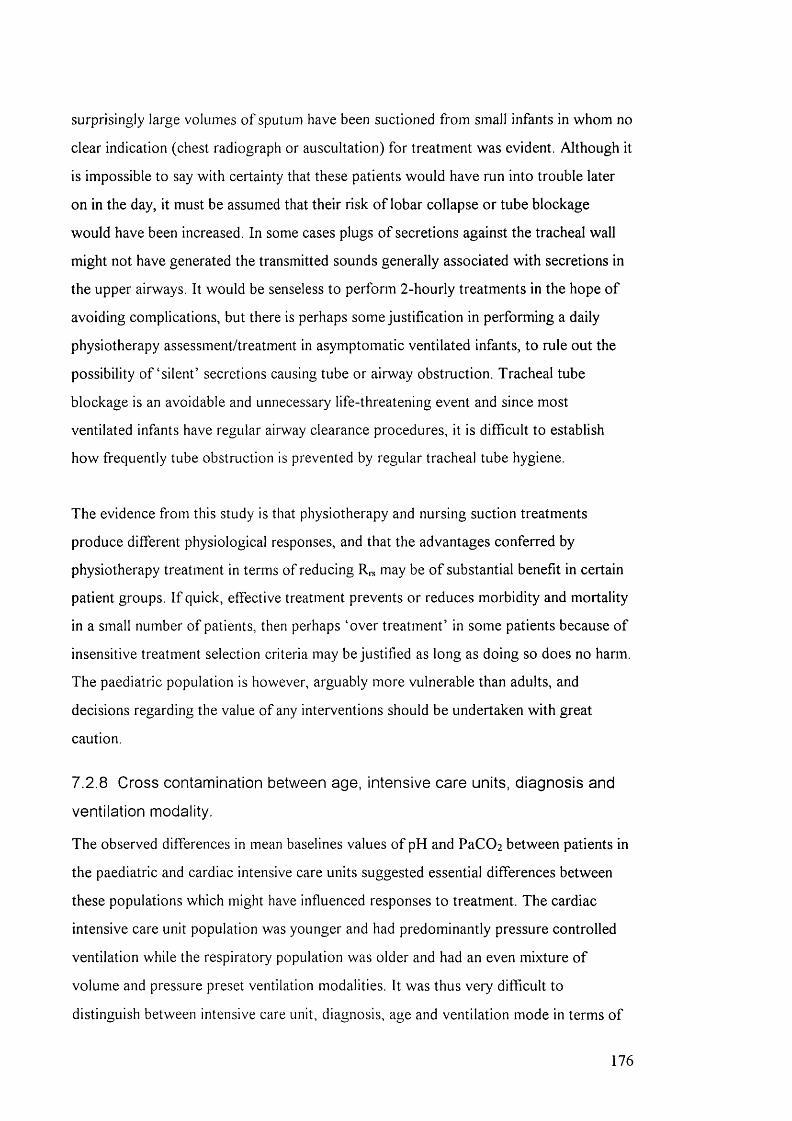
surprisingly large volumes o f sputum have been suctioned from small infants in whom no
clear indication (chest radiograph or auscultation) for treatment was evident. Although it
is impossible to say with certainty that these patients would have run into trouble later
on in the day, it must be assumed that their risk o f lobar collapse or tube blockage
would have been increased. In some cases plugs o f secretions against the tracheal wall
might not have generated the transmitted sounds generally associated with secretions in
the upper airways. It would be senseless to perform 2-hourly treatments in the hope o f
avoiding complications, but there is perhaps some justification in performing a daily
physiotherapy assessment/treatment in asymptomatic ventilated infants, to rule out the
possibility o f ‘ silent’ secretions causing tube or airway obstruction. Tracheal tube
blockage is an avoidable and unnecessary life-threatening event and since most
ventilated infants have regular airway clearance procedures, it is difficult to establish
how frequently tube obstruction is prevented by regular tracheal tube hygiene.
The evidence from this study is that physiotherapy and nursing suction treatments
produce different physiological responses, and that the advantages conferred by
physiotherapy treatment in terms o f reducing R,-s may be o f substantial benefit in certain
patient groups. I f quick, effective treatment prevents or reduces morbidity and mortality
in a small number o f patients, then perhaps ‘ over treatment’ in some patients because o f
insensitive treatment selection criteria may be justified as long as doing so does no harm.
The paediatric population is however, arguably more vulnerable than adults, and
decisions regarding the value o f any interventions should be undertaken with great
caution.
7.2.8 Cross contamination between age, intensive care units, diagnosis and
ventilation modality.
The observed differences in mean baselines values o f pH and PaCOz between patients in
the paediatric and cardiac intensive care units suggested essential differences between
these populations which might have influenced responses to treatment. The cardiac
intensive care unit population was younger and had predominantly pressure controlled
ventilation while the respiratory population was older and had an even mixture o f
volume and pressure preset ventilation modalities. It was thus very difficult to
distinguish between intensive care unit, diagnosis, age and ventilation mode in terms o f
176

which variable primarily determined the response to treatment. In addition it was
difficult to use any o f these variables in AN O V A procedures because o f the
contamination o f covariables. It remains unclear how this problem may be addressed in
future except by separate analysis o f the different patient groups.
7.2.9 Avoiding the harmful effects of physiotherapy
The potentially harmful haemodynamic, metabolic and respiratory effects o f
physiotherapy and suction treatments have been well described ( 1 .2 .2 .7). Several
authors have described methods for minimising or abolishing these effects and amongst
these, adequate sedation, pre-oxygenation, and careful haemodynamic monitoring, are
the most important. Further clear recommendations for evidence based practice include
the necessity for careful monitoring o f ICP and CPP when appropriate to ensure that
there are no detrimental effects o f physiotherapy treatment, as well as monitoring o f
airway pressure or tidal volumes when manual hyperinflation is used.
In the current study, there was no significant fall in PaÛ2 after physiotherapy or nursing
suction and this probably reflected the success o f routine pre-oxygenation in avoiding
this hazard. Given the large number o f published reports on hypoxaemia following
airway clearance techniques, this result supports the continued and routine practice o f
pre-oxygenation.
However, despite customary pre-oxygenation and careful haemodynamic monitoring in
this muscle relaxed, fully ventilated population, there was still demonstrable and
statistically significant evidence for mild metabolic acidosis following physiotherapy
treatment. Since muscle relaxants, analgesia and sedation have all been shown to reduce
the physiological demands associated with physiotherapy and tracheal tube suction
significantly, it follows that the metabolic demands in a less sedated population would be
likely to be substantially greater, and this should be borne in mind when planning any
treatment in critically ill ventilated children. In view o f the evidence that metabolic
demands are increased during treatment (supported by the current study), an assessment
o f metabolic reserve should be made before intervening.
177
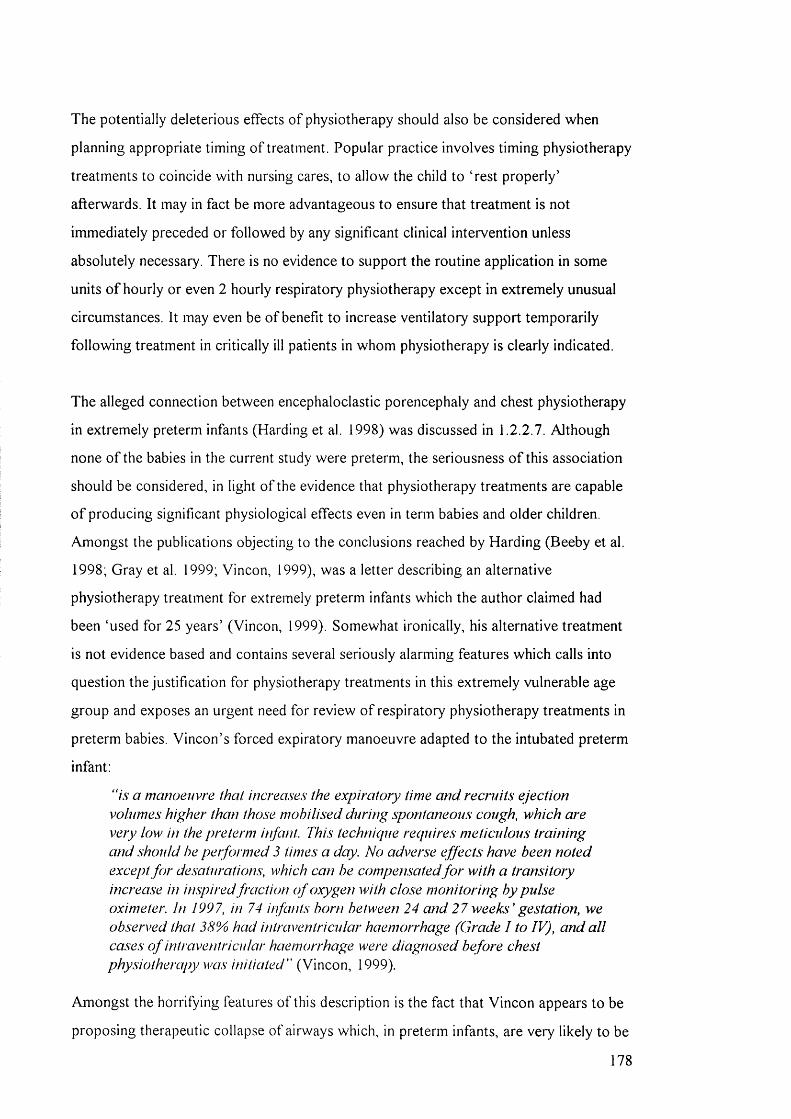
The potentially deleterious effects o f physiotherapy should also be considered when
planning appropriate timing o f treatment. Popular practice involves timing physiotherapy
treatments to coincide with nursing cares, to allow the child to ‘ rest properly’
afterwards. It may in fact be more advantageous to ensure that treatment is not
immediately preceded or followed by any significant clinical intervention unless
absolutely necessary. There is no evidence to support the routine application in some
units o f hourly or even 2 hourly respiratory physiotherapy except in extremely unusual
circumstances. It may even be o f benefit to increase ventilatory support temporarily
following treatment in critically ill patients in whom physiotherapy is clearly indicated.
The alleged connection between encephaloclastic porencephaly and chest physiotherapy
in extremely preterm infants (Harding et al. 1998) was discussed in 1.2.2.7. Although
none o f the babies in the current study were preterm, the seriousness o f this association
should be considered, in light o f the evidence that physiotherapy treatments are capable
o f producing significant physiological effects even in term babies and older children.
Amongst the publications objecting to the conclusions reached by Harding (Beeby et al.
1998; Gray et al. 1999; Vincon, 1999), was a letter describing an alternative
physiotherapy treatment for extremely preterm infants which the author claimed had
been ‘used for 25 years’ (Vincon, 1999). Somewhat ironically, his alternative treatment
is not evidence based and contains several seriously alarming features which calls into
question the justification for physiotherapy treatments in this extremely vulnerable age
group and exposes an urgent need for review o f respiratory physiotherapy treatments in
preterm babies. Vincon’s forced expiratory manoeuvre adapted to the intubated preterm
infant:
“ is a manoeuvre that, increases the expiratory time and recruits ejection volumes higher than those mobilised during spontaneous cough, which are very low in the preterm infant. This technique requires meticulous training and .should he performed 3 times a day. No adverse effects have been noted except fo r de.saturations, which can be compensated fo r w ith a transitory increa.se in in.spired fraction o f oxygen with clo.se monitoring by pulse oximeter. In 1997, in 74 infants born between 24 and 27 weeks' gestation, we observed that 38% had intraventricular haemorrhage (Grade I to IV), and a ll ca.ses o f intraventricular haemorrhage M ere diagnosed before chest phy.siotherapy m x l s in itia ted ’’ (Vincon, 1999).
Amongst the horrifying features o f this description is the fact that Vincon appears to be
proposing therapeutic collapse o f airways which, in preterm infants, are very likely to be
178
surfactant depleted, and further, that he would continue such treatments in infants
diagnosed with any severity o f IVH. The cause o f the observed desaturation is quite
explicit. I f this is the nature and quality o f objections generated within the physiotherapy
profession against publications such as Harding’s, then it is not surprising that the
practice o f respiratory physiotherapy has been discontinued in many neonatal units.
7.2.10 Further research in paediatric physiotherapy
During 2000, two publications reviewed the evidence for physiotherapy treatments in
intensive care, one o f which focussed on ventilated children (Stiller, 2 0 0 0 ; Krause and
Hoehn, 2000). These reviews concluded similarly that there was an urgent need for
further better designed studies. Stiller notes that virtually every aspect o f physiotherapy
management in ventilated patients needs validation (Stiller, 2000). A recent systematic
review on chest physiotherapy for babies undergoing extubation from mechanical
ventilation demonstrated that although treatment did not significantly reduce the rate o f
post extubation lobar collapse, there was a reduction in the rate o f reintubation (Flenady
and Gray, 2 0 0 0 ).
A disturbing feature o f many published physiotherapy studies is that the limitations o f
measuring respiratory function in ventilated patients experienced in this study (including
tracheal tube leak) must have been encountered to a greater or lesser degree, yet these
have rarely, i f ever, been mentioned. There must be some degree o f caution in
interpretation o f results from these studies since the validity o f their findings is critically
dependent on controlling or minimising these factors.
There is little or no evidence in the literature that physiotherapy prevents or is effective
at treating common pulmonary complications in ventilated patients with the exception o f
acute lobar atelectasis (Stiller, 2000). The lack o f evidence regarding the effects o f
physiotherapy does not necessarily mean that it is not good practice. It is likely, despite
the lack o f evidence, that the majority o f intubated children require regular suction to
maintain patent tracheal tubes and clear the central airways o f secretions. The available
evidence shows that physiotherapy may have short-lived beneficial effects in some
children, although this in itself is not enough to suggest policies on treatment frequency.
179

There simply is not enough information to weigh benefits against the risks o f treatment
and costs associated with the provision o f routine physiotherapy to children in intensive
care who are receiving mechanical ventilation. The current study involved the
measurement o f multi-modality treatments rather than the effects o f specific techniques,
and there is little guidance for which specific individual treatment techniques offer
advantages over others. Positioning has been shown to be o f short term benefit for some
patients (ARDS and unilateral lung disease) and there is some guidance for treatment o f
acute lobar atelectasis, but beyond that there is no evidence to support selection o f some
techniques over others for specific pulmonary conditions (Stiller, 2000). Thus the
necessity for physiotherapy treatments in ventilated infants cannot be supported or
refuted on the basis o f available evidence.
A randomised controlled trial involving physiotherapy and nursing suction vs nursing
suction alone could shed light upon whether physiotherapy treatments reduced the
incidence o f atelectasis or airway obstruction in ventilated individuals. Large subject
numbers would need to be recruited and there would be some debate regarding the
ethical issues o f withdrawing established treatments. Studies demonstrating the efficacy
o f physiotherapy ideally need to be seen to contribute to the ‘big picture’ in terms o f
reduced ventilation time, reduced morbidity and mortality or reduced hospital stay.
However, physiotherapy treatments are only likely to benefit a small proportion o f
patients significantly, and then only in the short term (Stiller, 2 0 0 0 ). Since physiotherapy
is only one o f many interventions in a multitude o f diagnostic and clinical scenarios, it
would be extremely difficult to achieve the statistical power to prove either efficacy in
terms o f major outcomes (such as intensive care unit days) or cost effectiveness in terms
o f any subtle advantages o f physiotherapy treatment in ventilated children.
Although this may cast a pessimistic shadow upon the ability o f physiotherapy to
achieve any credibility in studies o f major outcomes, there remain basic and established
facts o f care requirements in artificially ventilated individuals:
1 . airway clearance is compromised, especially in sedated or muscle relaxed
patients,
2 . the effects o f anaesthetic significantly reduce respiratory function and
180

3. airway secretions must be removed so that complications associated with
artificial ventilation are avoided.
I t is thus at least intuitively clear that some degree o f airway clearance procedures are
essential in ventilated children. What remains to be clarified are issues such as the
relative benefit o f some techniques over others, the frequency o f treatment required and
the selection criteria for maximum benefit.
Thus although it is important to recognise the need for physiotherapy studies to enter
the arena o f multicentre blinded randomised controlled trials eventually, it is not feasible
to do so until an understanding o f short term effects o f physiotherapy treatments in
specific patient groups can be achieved. Reasonable assumptions can then be made
about the likelihood o f these effects influencing the longer term outcomes.
7.3 Is respiratory physiotherapy more effective than nursing suction at
removing secretions and improving respiratory function in ventilated
children?
The final hypothesis o f this study aimed to establish whether respiratory physiotherapy
treatments offered a significant advantage over routine airway clearance techniques used
by nursing staff in ventilated children. To accomplish this, the effects o f physiotherapy
treatments and nursing suction on respiratory function were independently established.
Then statistical tests were performed on the mean differences between physiotherapy
and nursing suction effects within individuals in whom data had been collected for both
techniques. Examination o f treatment details revealed that physiotherapy treatments
were generally longer, involved instillation o f more saline and the use o f more suction
catheters per treatment. The results o f the study suggested that there were differences in
physiological effects between treatment techniques and these w ill be discussed below.
7.3.1 Changes in Vt and Crs
While there were no significant changes in V t or Cm after physiotherapy, there was a
tendency for both to fall 15 minutes after nursing suction (p<0.08), which was sustained
and reached statistical significance (p<0.05) both at 30 and 45 minutes after treatment.
The direction o f change in C,s and V r after physiotherapy was positive (albeit
181

insignificant) whereas the direction o f change after nursing suction was negative. Thus a
comparison o f the mean differences between techniques yielded a tendency (p<0 . 1 0 )
after 15 minutes for a difference between treatment modalities in terms o f V t and
which reached significance after 30 minutes (p<0.05).
After physiotherapy 30% and 37% o f all individuals showed a significant improvement
in V t and Crs, respectively, while the remainder showed no change, or deterioration in
these parameters after treatment. By contrast, following suction alone, only 11% and
26% o f all individuals showed improvements in V t and C, respectively with the
remainder showing no change, or deterioration in these parameters. For both V t and Crs,
there were more than twice as many patients with improvements in excess o f 1 0 % in the
physiotherapy group than in the suction group. From these data, there is a suggestion
that physiotherapy treatment may offer some advantage over nursing suction, i f not in
significantly improving V r and C , s , then at least in terms o f not substantially worsening
these parameters after treatment.
It is unclear why the treatments performed by physiotherapists did not have the same
deleterious consequences for V t or C , s as suction alone. Perhaps, as suggested in 7.2.1,
some aspects o f treatment which distinguished physiotherapy from nursing suction, for
example, manual hyperinflation or chest wall vibrations, somehow compensated for the
detrimental effects o f suction alone on V t and C , s . These adverse effects might be
minimised by a policy o f concluding each suction procedure with a few manual
hyperinflation breaths to counteract any atelectatic effects o f suction. Manual
hyperinflation may have a short lived beneficial effect on respiratory function, but it has
also been shown to cause adverse cardiovascular effects in some patients. Reducing the
time o f maximal inflation may improve the margin o f safety in these patients (Rothen et
al. 1999).
7.3.2 Changes in Rrs
There was a significant group fall in respiratoi-y R,s after physiotherapy but no significant
group change in R,s after nursing suction alone. Both treatment techniques had a
common direction o f change in that R,s tended to be reduced. Thus comparison between
182
techniques did not yield a statistically significant difference (p<0.15), although
physiotherapy treatment resulted in a substantially greater mean reduction in Rrs than
suction alone.
7.3.3 Change in Vophys and Voaiv
The statistically significant increases in Vophys and Voaiv observed after physiotherapy
were discussed in detail in 7.2.4. These differences were not observed after suction
alone and examination o f paired data revealed that in respect o f Voaiv and Vophys, this
was a statistically significant physiological difference between physiotherapy and nursing
treatment effect. The positive aspect o f this result is that nursing suction appears not to
have substantial effects on the balance between ventilation and perfusion in the lungs,
which is desirable i f suction is considered primarily as a maintenance procedure. On the
other hand, suction alone is also less likely to be responsible for ultimately improving
gas exchange and an improvement in the V/Q ratio.
7.3.4 Changes in blood gases
The small but statistically significant falls in HCO 3-, base excess and O2 saturation
observed following physiotherapy, were not seen after nursing suction alone.
Comparison o f the mean differences between groups demonstrated that the differences
in HCO 3- were statistically significant while the differences in base excess and O 2
saturation approached significance (p<0 . 1 0 ). These data suggest that the slight increase
in metabolic demand created by the more vigorous physiotherapy treatment is not
apparent after nursing suction alone. Differences between physiotherapy and nursing
suction in terms o f pH, PaC0 2 and PaC^ were not statistically significant.
7.3.5 Summary
The evidence from this study suggests that respiratory physiotherapy is different to
nursing suction in several respects and that both may have important and complementary
roles in the management o f ventilated children. This study suggested that, wheri
compared to nursing suction, physiotherapy:
1 ) is potentially more efficient at removing pulmonary secretions (decreased Rps)
183

2 ) is less detrimental in terms ofC ^ and Vte
3) causes significantly greater increases in Voaiv and Vophys
4) results in a reduced PeCOz
5) causes mild metabolic acidosis as reflected by deterioration in HCO 3 -, base excess
and SaOi.
The apparent physiological cost (albeit small and short lived) o f physiotherapy treatment
suggested by deterioration in arterial blood gas parameters and increase in deadspace
volumes, may support the current policy o f limiting physiotherapy treatments to patients
exhibiting specific clinical indications.
Suction alone was associated with a slight tendency for C , - s and V t to decrease and no
other significant deterioration in respiratory function. Suction therefore remains an
important, relatively benign method o f maintaining the patency o f the airway, without
compromising critically ill ventilated children.
There is limited or conflicting literature regarding the physiological effects o f separate
manual components o f physiotherapy treatments such as percussion or vibrations. The
differences noted in this study between physiotherapy and nursing suction indicate that
chest wall vibrations and positioning (either in terms o f the techniques themselves or in
terms o f the additional time performing them) may confer additional physiological
effects to the treatment which may have contributed to the observed differences in R^,
Vophys and Voaiv.
A recent review o f respiratory physiotherapy in ventilated adults found little or no
evidence that routine physiotherapy in addition to nursing care prevents common
pulmonary complications or is effective in altering the clinical course o f pulmonary
conditions commonly encountered in the intensive care unit (Stiller, 2000). Stiller also
noted the lack o f research comparing the ability o f various professional groups to
perform selected tasks, and the inability to suggest guidelines in terms o f whom would
be best suited to perform intensive care unit airway clearance techniques. The current
study focused essentially on comparison between the effects o f different treatment
packages rather than relative abilities between professional groups. It has confirmed the
184
advantages and disadvantages o f the more vigorous physiotherapy treatments as well as
demonstrated the effects o f suction procedures without manual techniques. I t has not,
nor was it intended to, suggest that one professional group is superior to another in
terms o f airway management in the intensive care unit.
I t has also not managed to prove conclusively the hypothesis that physiotherapy is more
effective than nursing suction in improving respiratory function in ventilated children.
The first portion o f the hypothesis (more effective at removing secretions) may be
supported by the relatively larger reduction o f R ,s following physiotherapy treatment,
although the clinical significance o f the results remains unclear. The latter portion o f the
hypothesis (improvement in respiratory function) has not been supported by the results
o f this study, but neither has the corollary. The debate regarding the relative advantages
o f physiotherapy versus nursing suction techniques is unresolved, primarily because the
changes induced by either technique on the selected parameters were generally small and
there was considerable heterogeneity in response.
The basic necessity o f airway clearance procedures in ventilated children and the
different advantages and disadvantages offered by physiotherapy and nursing suction,
suggest that both techniques have important roles to play. The current and evolved
practice in our intensive care unit is that regular suction by nurses is intermittently and
less frequently supplemented by physiotherapy treatments in ventilated infants. This
might offer the best o f both techniques in that frequent, less physiologically intensive
suction procedures keep the airway patent, while physiotherapy is performed less
frequently but has the potential to be more effective at clearing secretions.
Another important aspect o f the differences between physiotherapy and nursing suction
is the essentially different philosophy regarding purpose o f treatment. In general, nurses
view tracheal tube suction as being a necessary routine, which maintains patency o f the
airway for ventilation and prevents accumulation o f secretions. Physiotherapists at this
hospital, on the other hand, believe that treatment should be based on careful assessment
o f clinical need in individual patients and claim that routine treatments are rarely
performed. The aim o f treatment is thus more proactive; to reverse adverse changes in
respiratory status that are related to retention o f secretions. When considered from this
185

perspective, the minimal group changes in respiratory function after nursing suction do
not reflect failure in techniques, but success in maintaining airway patency with minimal
physiological debt. The relatively greater physiological consequences o f physiotherapy
treatment should be accompanied by policies o f selective treatment in which the benefits
are considered to outweigh the risks o f treatment.
7.4 Limitations of respiratory function measurements and study design
in ventiiated children
The intensive care unit is not a particularly easy research environment. Several factors
contribute to problems with measurement in ventilated children and it remains difficult
to control the multiple variables inherent in the management o f these patients. Medical
and nursing interventions are constantly and necessarily performed which may confound
or influence measurements o f physiological response to treatments. The continuous
infusion o f essential drug therapies such as diuretics may also interact with outcomes o f
interest and represent factors which are very difficult to control during research
measurements. It is thus virtually impossible to acquire reliable data assessing the effect
o f singular therapies in ventilated patients unless the outcomes o f interest are relatively
immediate.
The impact o f certain issues upon the success o f this study were difficult to anticipate
prior to commencement but will direct the design o f future studies. Other difficulties
were not easy to control within a paediatric intensive care unit environment and w ill
continue to be a problem in future studies. The perceived limitations o f the current study
are discussed below
7.4.1 Physiological lung models
Most techniques for measuring respiratory mechanics are based on a linear single
compartment model, in which the lung is represented as a balloon on a pipe (2.2). This
model has two components, the compliance o f the balloon and the resistance o f the pipe.
In the presence o f a tracheal tube or any significant airway disease, such a simple model
can rarely represent the respiratoi-y system (Sly et al. 1996). In addition measurements
obtained are difficult to interpret or compare because validity o f the techniques have not
been established in infants with normal lungs versus those with lung disease. It is
186
therefore with some caution that measurements in the intensive care unit should be
interpreted.
In addition, deadspace measurements based upon the Bohr equation make the
assumption that PaC0 2 is equivalent to PaC0 2 . In diseased lungs, where the alveolar
arterial barrier may be compromised, this assumption is not valid. The assumption made
by Enghoff (PaC0 2 ~ PaC0 2 ) is less robust in critically ill children where pulmonary
oedema or factors such as V/Q imbalance may inhibit the equilibrium between the PCO2
in arterial blood and alveolar gas. The result o f this mismatch in PaC0 2 and PaCÛ2
would be an over-estimation o f Vd/Vt.
7.4.2 Mode of ventila tion
The two main modes o f ventilation used in paediatric patients are ‘ pressure preset’ and
‘volume preset’ modes. While there is some evidence that the mode o f ventilation w ill
not significantly influence measurements o f respiratory mechanics (Kessler et al. 2001),
changes in other outcomes such as V r and PIP are critically dependent on mode o f
ventilation and such data from patients on different modes o f ventilation cannot be
pooled for analysis, especially in studies which seek to evaluate the effects o f therapeutic
interventions. Responses to therapeutic respiratory manoeuvres such as physiotherapy
w ill be different depending on whether volume or pressure preset ventilation prevails
and the selection o f outcome variables would have to reflect this. The numbers o f
subjects available for recruitment into respiratory function studies o f therapy in
ventilated patients is limited by this factor.
7.4.3 Changes in respiratory rate and volumes
Measurements o f respiratory mechanics change when ventilatory rate or tidal volumes
are changed. In general, an increase in respiratory rate would result in a decrease in both
Rrs and C,s (Nicolai et al. 1993). Thus measured changes in respiratory mechanics due to
therapy could be invalidated by changes in ventilator rate during measurement periods.
Similarly, the respiratory system is less compliant at high and low volumes.
Consequently altering the level o f PEEP, PIP or expiratory time, all o f which can move
187
the infant to a different part o f the pressure volume curve, can have a dramatic influence
on the measured C, . R,s may also be changed by differences in airway calibre and lung
tissue resistance when delivered tidal volumes or flow are changed (Sly et al. 1996). It
therefore becomes very difficult to interpret changes during serial measurements in an
intubated ventilated subject, i f there are changes in clinical condition and/or therapeutic
interventions. The ideal research environment in the intensive care unit would thus
require constant ventilation settings, but this is not always possible or desirable in sick
ventilated infants. Every reasonable effort was made to minimise these known sources o f
error by avoiding ventilator changes during data collection periods in the current study
and data were excluded when such adjustments were unavoidable.
7.4.4 M easurem ents of Ks and influence o f the tracheal tube
Respiratory system resistance is dominated by the upper airways and in ventilated
patients, the tracheal tube creates a high resistance, turbulent flow and bypasses the
upper part o f the respiratoi'y system which is usually important in maintaining dynamic
control o f lung volumes. The tracheal tube is known to be a non-linear flow dependent
resistance, dependent on many factors including entry effects, laminar flow, turbulent
flow and distorted flow profile due to secretions, the position o f the tube and the
properties o f the tube wall (Sly et al. 1996).
The presence o f secretions in the tracheal tube tends to decrease flow and increase
resistance without any increase in the resistive properties o f the underlying respiratory
system. Hence measurements o f R,s may not accurately reflect modest changes in
peripheral airway resistance after therapeutic interventions such as physiotherapy.
However, the change in R,s due to the removal o f secretions from the upper respiratory
tract including the tracheal tube was o f particular interest in the current study and
changes in peripheral resistance were considered to be less important. Other studies
wishing to assess purely the resistive properties o f the peripheral respiratory system
would have to interpret R,,s values with caution. Respiratory system resistance may be a
more sensitive outcome following physiotherapy in paediatric patients than in adults
because o f the relatively larger size o f the tracheal tube in relation to the tracheal
188
diameter and the relatively greater contribution o f tracheal secretions to obstruction o f
the airway.
Tracheal tube diameter, curvature and position also influence Rrs and kinks in the
tracheal tube w ill cause an increase in Rn,. Thus changes in position after treatment may
distort measurements o f Rrs and mislead with regard to relationships between treatment
and changes in R,s For the purposes o f this study, measurements before and after
treatment were made in the same position and changes unrelated to the treatment
intervention were unlikely to have been significant.
The problems associated with measurements o f V t , C , s and R,-s in the presence o f
tracheal tube leak have been discussed in detail in 5.2.1 and remain a significant issue in
ventilated paediatric patients. Moderate to large tracheal tube leaks (>20%) can
considerably compromise accuracy and validity o f respiratory function measurements in
ventilated infants, both by contributing to gross over-estimations in respiratory
mechanics and by creating wide within-subject variability in delivered tidal volumes and
respiratory mechanics. This variability can contribute to large changes in several
measured or calculated parameters after physiotherapy or nursing suction, which may be
entirely unrelated to treatment effect. The delivered tidal volume in the presence o f
tracheal tube leak depends additionally upon the mode o f ventilation, with the
consequences o f tracheal tube leak being worse for patients on volume preset ventilation
(Watt and Fraser, 1994).
The magnitude o f tracheal tube leak is often not accurately displayed on ventilators or
respiratory monitoring equipment, i f at all, and the extent to which calculated
parameters are inaccurate therefore cannot often be estimated.
7.4.5 Sputum yield
Sputum weight, whether wet or dry, has always been a controversial outcome measure
in physiotherapy research because o f wide intra- and inter-subject variability. Sputum
yield varies during the course o f the day in any individual and different pathophysiology
w ill result in different amounts o f sputum but not in a predictable or consistent fashion.
Age and weight w ill also influence the volume o f sputum produced and, in ventilated
patients, volume o f instilled saline will influence sputum recovery. While some authors
189

dispute the correlation between volume o f sputum and improved pulmonary function,
others suggest that sputum clearance is associated with an improvement in respiratory
function. Still others suggest that the connection between sputum production and
pulmonary function is irrelevant as long as it can be demonstrated that physiotherapy
treatments are advantageous in clearing secretions (see section 1 .2 .2 . 1 ).
The reality is that there is probably some truth in all three o f these statements. The
relationship between sputum and respiratory function is complex. I f the sputum plug is
the patients primary problem, removal o f it w ill probably be associated w ith an
improvement in respiratory function. I f however, there is additional underlying bronchial
reactivity, or haemodynamic instability, the physiological demands imposed by the
treatment techniques may result in a temporary deterioration in respiratory function,
despite the removal o f a plug. There was evidence for both o f these clinical scenarios in
a number o f individuals during the course o f this study. In general, removal o f thick
obstructive material from the airways is considered to be a desirable clinical outcome,
even i f there is a temporary deterioration in respiratory function, provided that the
deterioration is relatively small and short-lived. In these patients, it would appear that
sputum, despite being controversial, is the most important and accessible indicator o f
treatment success.
However, much o f the time, in a significant proportion o f ventilated children (and
adults), secretions are not thick or potentially obstructive, and in these cases the
physiological demand imposed by the treatment is less justifiable. Sometimes treatments
have re-inflation or recruitment o f atelectatic lung segments as primary goals rather than
removal o f secretions. In these patients, sputum yield is an inadequate and misleading
outcome measure, while respiratory function measures would provide more information
w ith regard to the efficacy o f treatment.
For physiotherapists to truly understand the beneficial and/or potentially harmful
consequences o f their treatments, further information is required about the magnitude
and duration o f these effects and whether anything can be done to prevent or minimise
detrimental effects. Measurement o f sputum alone would be incapable o f providing
answers to these questions. However, sputum remains useful adjunct to other measures
o f respiratory function and adds a depth o f understanding to the complexity involved
w ith assessing outcomes to physiotherapy treatment. Sputum measurements additionally
help to describe the proportion o f patients with copious or minimal secretions and, when
190

considered in the context o f an individuals response to a single and specific treatment,
then the issues o f wide intra- and inter-subject variability become irrelevant. Thus it
remains for many clinicians the most obvious and accessible measure o f treatment
success in individual patients, especially in the absence o f dramatic changes on chest
radiograph or auscultation. In this study, although sputum data was collected crudely,
the correlation between large (perceived) amounts o f sputum and reduction in Rrs
suggested that this crude measure might be helpful in predicting treatment effect in the
presence o f copious secretions (Fig 6-16).
7.4.6 C lin ical s ignificance
The difficulty o f establishing clinical significance in the presence or absence o f statistical
significance is an obstacle in medical research. The statistical tools used for scientific
rigour are not particularly useful in deciding what makes a tangible difference to
patients. Thus although every effort was made in this study to identify changes that were
beyond the expected limits o f normal variability, it remained difficult to determine
whether statistically substantial changes (either improvement or deterioration) made any
real clinical difference to patients. Overtly alarming clinical events were extremely rare
during measurements, which implies that any statistically significant results
demonstrated by this study involved subtle, i f any, physiological and clinical signs. It
would be very difficult to determine the accumulative influence o f these sub-clinical
physiological events on the overall course o f recovery in the intensive care unit. I f these
statistically significant changes truly represent negligible clinical events, then the manner
in which this type o f research is done requires urgent review. Ultimately it would be
difficult to justify changes in service provision based on statistical rather than clinical
relevance. It is impossible to prove that the benefits o f the treatment outweigh the risks
i f neither the clinical benefits nor risks can be identified.
7.4.7 Immediate outcomes
Data acquired during in-vivo studies suggested that as little as 5 minutes would be
sufficient to acquire baseline data in paralysed patients. The 15 minute period selected
for this study was thus sufficient for assessing baseline values and acute changes in
191
respiratory function due to physiotherapy or nursing suction. However, this study design
was insufficient for assessing delayed changes or prolonged changes in function. I f for
example, the effects o f physiotherapy peaked 80 minutes after therapy, then this may
have been missed by the current study. In addition, trends for either improvement or
deterioration o f respiratory function would be missed by such an approach. Finally,
analysis o f short term effects o f therapeutic interventions may be o f limited value to
service providers who may be more interested in whether patients who have the
intervention get better faster, or go home quicker. Indeed other outcomes, such as
quality o f life for patients and their families following discharge or long term disability,
may be the most relevant issues to address, but are the least accessible in terms o f their
direct relationship with physiotherapy treatments in intensive care.
Consequently, for future studies, while acknowledging the enormous difficulty in
maintaining a reasonably controlled research environment for prolonged periods o f time,
it would be useful to continue measurements for as long as possible after treatment.
Efforts were made in the current study to continue measurements in patients after both
physiotherapy and nursing suction, but for various reasons, including medical and
nursing interventions, collection o f valid data could not be continued indefinitely
following treatment. Tidal volume data for example was collected on 89 patients for 15
minutes after physiotherapy. Only 75 o f these patients could be followed up for 30
minutes, 42 o f these for 45 minutes and 26 o f these for an hour. Only 9 patients had
continuous measurements without significant clinical interventions for 90 minutes after
treatment. This attrition o f sample size (due to essential medical or nursing interventions
precluding further measurements) is likely to complicate achievement o f adequate power
over longer periods in future studies.
Some immediate outcomes in this study showed statistically significant changes which
suggested at least some o f the goals o f therapy were achieved (reduction in R^). They
might also suggest the possibility that over the longer term, these therapies might
contribute subtly to reducing mortality, morbidity, intensive care unit days or inpatient
stay. Hospital stay is influenced by a multitude o f factors such as patient age groups,
diagnoses, ventilation modalities, variability o f physiotherapy and medical therapy
options, severity o f illness, staffing levels, social class, family circumstances, pressure on
192
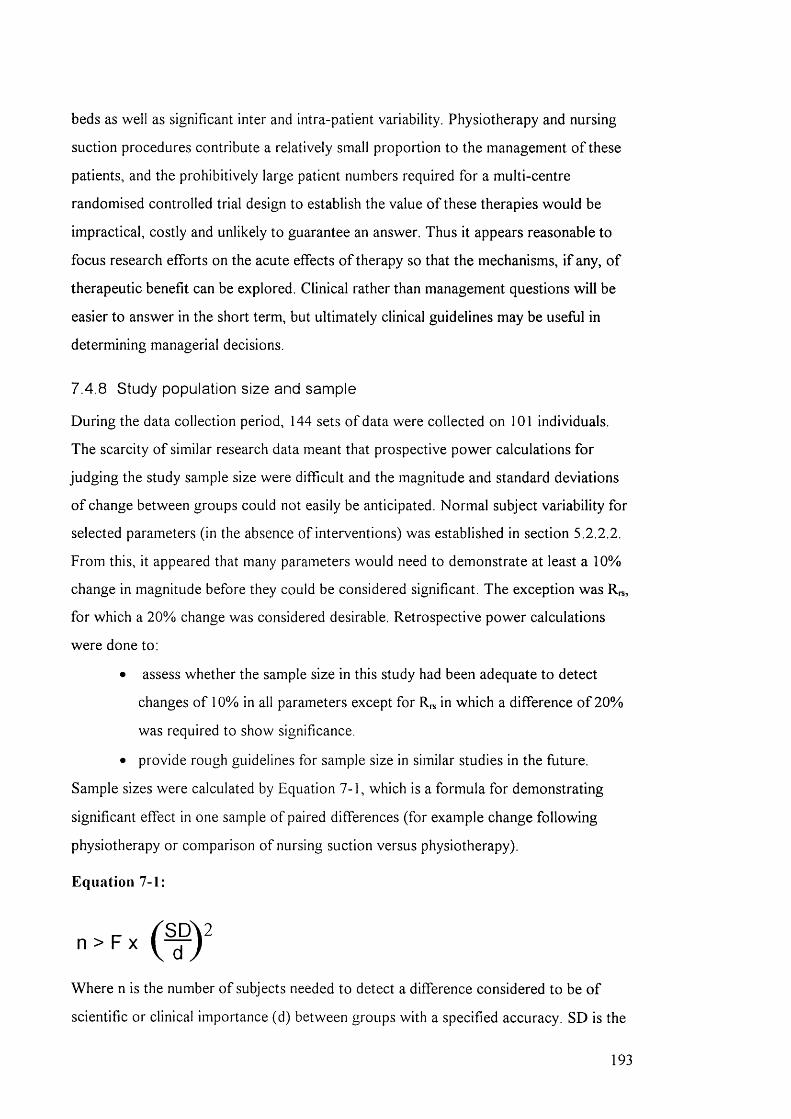
beds as well as significant inter and intra-patient variability. Physiotherapy and nursing
suction procedures contribute a relatively small proportion to the management o f these
patients, and the prohibitively large patient numbers required for a multi-centre
randomised controlled trial design to establish the value o f these therapies would be
impractical, costly and unlikely to guarantee an answer. Thus it appears reasonable to
focus research efforts on the acute effects o f therapy so that the mechanisms, i f any, o f
therapeutic benefit can be explored. Clinical rather than management questions w ill be
easier to answer in the short term, but ultimately clinical guidelines may be useful in
determining managerial decisions.
7.4.8 Study population size and sample
During the data collection period, 144 sets o f data were collected on 101 individuals.
The scarcity o f similar research data meant that prospective power calculations for
judging the study sample size were difficult and the magnitude and standard deviations
o f change between groups could not easily be anticipated. Normal subject variability for
selected parameters (in the absence o f interventions) was established in section 5.2.2.2.
From this, it appeared that many parameters would need to demonstrate at least a 10%
change in magnitude before they could be considered significant. The exception was R^,
for which a 2 0 % change was considered desirable. Retrospective power calculations
were done to;
• assess whether the sample size in this study had been adequate to detect
changes o f 1 0 % in all parameters except for R r s in which a difference o f 2 0 %
was required to show significance.
• provide rough guidelines for sample size in similar studies in the future.
Sample sizes were calculated by Equation 7-1, which is a formula for demonstrating
significant effect in one sample o f paired differences (for example change following
physiotherapy or comparison o f nursing suction versus physiotherapy).
Equation 7-1:
Where n is the number o f subjects needed to detect a difference considered to be o f
scientific or clinical importance (d) between groups with a specified accuracy. SD is the
193

standard deviation o f the differences between groups and F is dependent on the power
and significance level required (selected from Table 7-1):
Table 7-1: Value of F depends on power required to detect a difference with
specified precision (p<0.05)
Power required
Significance level (p < 0.05)
80%
7.85
90%
10.51
95%
12.88
99%
18.37
With F taken as 10.51, a false positive result may be expected 5% o f the time and detection o f a difference ( i f one exists) may be expected 90% o f the time
From Table 5-2 it was felt that a 10% change would be required to demonstrate a
change that was significantly different from normal variability in V t e , Crs, VCO 2 , ETCO 2
and PeC0 2 and a 20% change for R,s Thus the number o f subjects needed to detect this
magnitude o f difference with confidence was calculated (Table 7-2).
Table 7-2: Numbers of subjects needed to detect a 10% change (20% for Rrs) at
5% significance with a power of 80%, 90%, 95% and 99%
Parameter Group
mean
baseline
SD of
the diff
between
groups
change
required
n for
80%
power
n for
90%
power
n for
95%
power
n for
99%
power
mean
change
detected
Vte (mL/kg) 8.27 0.99 0.83 12 16 19 27 0.13
Rrs (cmH20/L/s) 7.28 34.8 14.6 45 60 74 105 6.90
Crs (mL/cmH20/kg) 0.67 0.11 0.068 21 28 34 48 0.01
VCO2 (mL/min/kg) 4.30 0.54 0.43 13 17 21 29 0.02
ETCO2 (kPa) 5.10 0.63 0.51 13 17 20 29 0.06
PeC02 (kPa) 3.30 0.35 0.33 9.0 13 16 22 0.06
The study sample (n) recruited was .sufficient to detect a 10%) change in these parameters with a power o f 99%o, even when .subgroups were analysed. The exception is Rrs fo r which a 20% difference was recpnred to demonstrate a .significant change, and fo r which a .slightly greater .sample size may have been appropriate.
In retrospect therefore, the 101 subjects recruited to this study were generously
adequate to detect significant changes i f they existed, even with patients excluded from
analysis (for tracheal tube leak > 2 0 %) and subgroup analysis for ventilation mode.
194
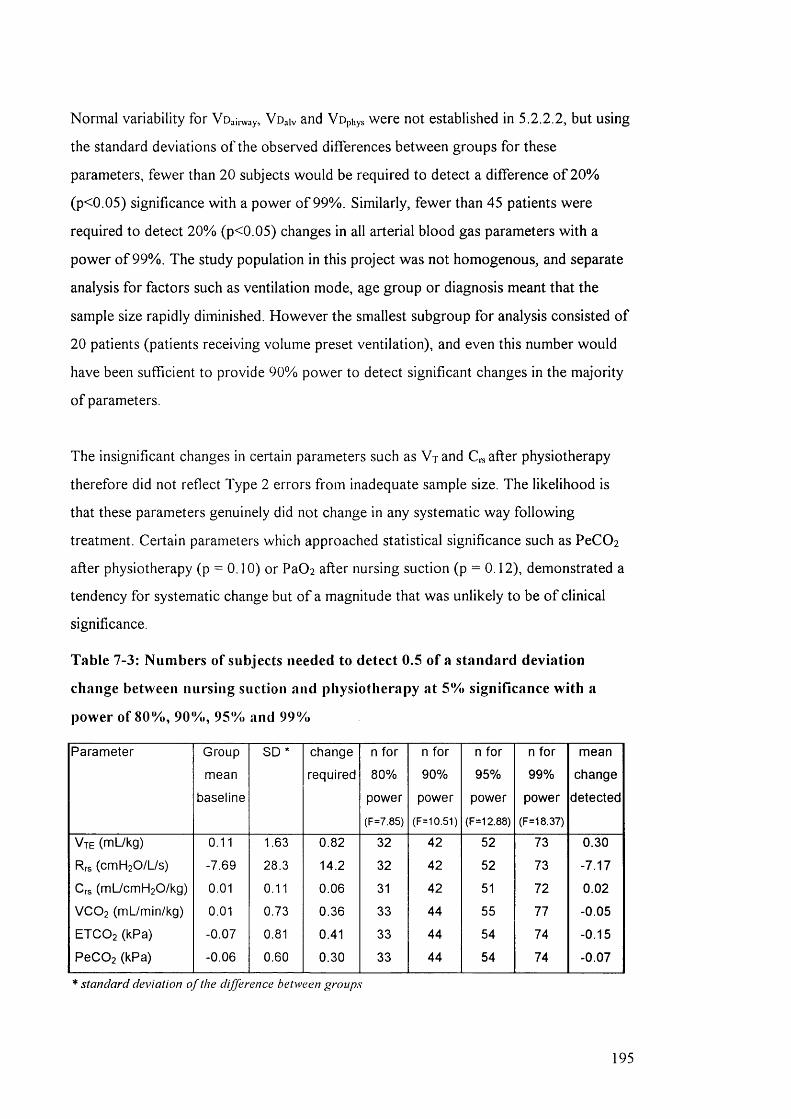
Normal variability for Voaii vay, Voaiv and Vophys were not established in 5.2.2.2, but using
the standard deviations o f the observed differences between groups for these
parameters, fewer than 2 0 subjects would be required to detect a difference o f 2 0 %
(p<0.05) significance with a power o f 99%. Similarly, fewer than 45 patients were
required to detect 20% (p<0.05) changes in all arterial blood gas parameters w ith a
power o f 99%. The study population in this project was not homogenous, and separate
analysis for factors such as ventilation mode, age group or diagnosis meant that the
sample size rapidly diminished. However the smallest subgroup for analysis consisted o f
2 0 patients (patients receiving volume preset ventilation), and even this number would
have been sufficient to provide 90% power to detect significant changes in the majority
o f parameters.
The insignificant changes in certain parameters such as V j and C,s after physiotherapy
therefore did not reflect Type 2 errors from inadequate sample size. The likelihood is
that these parameters genuinely did not change in any systematic way following
treatment. Certain parameters which approached statistical significance such as PeCOz
after physiotherapy (p = 0 . 1 0 ) or PaC>2 after nursing suction (p = 0 . 1 2 ), demonstrated a
tendency for systematic change but o f a magnitude that was unlikely to be o f clinical
significance.
Table 7-3: Numbers of subjects needed to detect 0.5 of a standard deviation
change between nursing suction and physiotherapy at 5% significance with a
power of 80%, 90%, 95% and 99%
Parameter Group
mean
baseline
SD * change
required
n for
80%
power
(F=7.85)
n for
90%
power
(F=10.51)
n for
95%
power
(F=12.88)
n for
99%
power
(F=18.37)
mean
change
detected
Vte (mL/kg) 0.11 1.63 0.82 32 42 52 73 0.30
Rrs (cmH20/L/s) -7.69 28.3 14.2 32 42 52 73 -7.17
Crs (mL/cmH20/kg) 0.01 0.11 0.06 31 42 51 72 0.02
VCO 2 (mL/min/kg) 0.01 0.73 0.36 33 44 55 77 -0.05
ETCO2 (kPa) -0.07 0.81 0.41 33 44 54 74 -0.15
PeC02 (kPa) -0.06 0.60 0.30 33 44 54 74 -0.07
* standard deviation o f the difference betM>een groups
195

With 82 subjects in the current study, the sample would have had 99% power to detect a
significant (p<0.05) change o f half a standard deviation o f the difference between groups
i f it existed between physiotherapy and nursing suction treatments. While V t e , Crs,
ETCO 2 and PeCOz approached significance, in terms o f difference in treatment effect,
this was not due to inadequate power to detect relatively large changes, but due to the
fact that the differences, albeit systematic, were small. The sample was thus adequately
powered to detect the larger significant differences between nursing suction and
physiotherapy in terms o f Vophys, Voaiv, HCO 3 - and 0% saturation. It could be argued
however, that when comparing 2 treatments, somewhat smaller differences could be
relevant. The smaller the difference in relation to the standard deviation o f the
difference, the larger the number o f subjects required.
I f statistical significance in any parameter could not be achieved with 100 patients, the
likelihood o f the parameter representing a significant beneficial or detrimental clinical
change for the entire group is small. Even results which were substantially significant
such as the Vu iv and Vophys after physiotherapy could not be tangibly related to obvious
clinical effects within the group. Nevertheless, the 95% limits o f agreement for
parameters such as V i e , R . s and C , . , indicate that there may have been significant changes
within individual patients. In addition, any intervention which has the potential to do
great harm, even to a very small minority o f patients, should be identified as a risk factor
for that minority. It would be important for a study with such an aim to have sufficient
numbers to encounter these risk factors. No dramatic clinical consequences were
observed after any treatment during the course o f this study.
The current study has demonstrated the sensitivity o f various parameters to
physiotherapy or nursing suction in fully ventilated children and this is potentially
valuable information in identifying parameters that could be sensitive enough to be
related to clinical change. For parameters such as deadspace the significant results
demonstrate a potentially exciting outcome not previously explored in physiotherapy
research. Future studies should be directed towards finding ways o f exploring the
clinical impact o f outcomes which appear to be sensitive to interventions such as
physiotherapy. Although it may be argued that simultaneous study o f multiple
parameters can lead to Type I errors, the nature o f respiratory function is such that the
196
simultaneous interactions between variables can add greater levels o f understanding
between and within each other. For example, none o f the outcomes in this study would
have been valid unless the effects o f tracheal tube leak had been assessed. Vophys needs
to be understood in the light o f V t and C , - s needs to be assessed relative to leak and V t
as well as ventilation mode.
The exclusion o f all but paralysed patients from this study meant that results were only
obtained in a particularly narrow spectrum o f paediatric intensive care patients. This
limits the extrapolation o f results to a more general paediatric population. Furthermore,
the criteria for pharmacological paralysis in this hospital appeared to generate specific
subgroups o f populations for example following cardiac or gastric transposition surgery
or patients with head injury. There is the potential for this sort o f selection to have
influenced the results systematically. Patients following cardiac surgery for example
might be expected to have significant intra-cardiac shunt and changes in V/Q
relationships, and thus have greater baseline V d iv than general paediatric intensive care
unit patients. There were however no significant differences in response to treatment
when results were analysed according to diagnostic groups and it appears reasonable to
extrapolate results o f this study to other paralysed fully ventilated paediatric
populations. Differences in response to treatment are probably likely to depend on
factors such as severity o f illness, haemodynamic stability or bronchial hyper
responsiveness rather than diagnosis alone. The theoretical advantage o f data collection
in specific patient groups is that inferences can be made about the way in which that
specific population responds to physiotherapy or nursing suction.
The inclusion criterion for patients to be muscle relaxed and fully ventilated ensured
collection o f reliable data (in the absence o f tracheal tube leak) from which inferences
could be made about the effects o f physiotherapy or nursing suction as well as allowing
valid measurements o f respiratory mechanics. However, it is relatively rare for patients
in our intensive care units to be paralysed and fully ventilated. Thus very little
information has been obtained about the effects o f physiotherapy or nursing suction on
the majority o f paediatric intensive care unit admissions. What can be deduced from
available literature is that patients less well sedated would be likely to demonstrate
greater anxiety and suffer a larger metabolic demand from treatment. Increases in
197
respiratory rate, heart rate, blood pressure and V r would be generated from patient
effort and these would complicate analysis o f respiratory function data. While these
appear to suggest a larger physiological debt, patients who are less well sedated tend to
have greater cardiovascular stability and would potentially tolerate treatment better. In
general however, paralysed fully ventilated patients are entirely different to those with
assisted ventilation and it would not be advisable to extrapolate results between these
groups. Since these two populations probably require to be studied separately in terms
o f the influence o f physiotherapy on respiratory function, it is not critical that the results
o f this study be extrapolated to self-ventilating children. Future studies would need to
identify appropriate outcomes valid for non-paralysed children w ith assisted ventilation,
including respiratory rate and a measure o f work o f breathing.
7.4.9 Observation effect and heterogeneity between staff populations and
therapy procedures
The fact that the nurses and physiotherapists involved were aware they were being
observed might have altered their normal practice slightly. The effect in general for both
professional groups would probably be to bias performance towards “ best practice” . It
remained o f interest however to investigate how “ best practise” physiotherapy
interventions compared with “ best practise” nursing interventions in terms o f effects on
respiratory function. In all probability observer bias became insignificant as the study
progressed, although this would have occurred more quickly for physiotherapy
treatment since there were far fewer staff involved. It is unlikely that this effect would
have had any statistically significant effect on outcome.
The combined paediatric and cardiac intensive care units at Great Ormond Street
Hospital had approximately 130 nursing staff members. By contrast, the physiotherapy
department had fewer than 25 staff who would be called upon to work in the intensive
care environment. O f these approximately 3 were full time senior staff members and 3
were senior staff on 6 month clinical rotations through the units. Thus during the data
collection period, it is unlikely that more than 15 physiotherapy staff members were
involved with treatments, while it is likely that about 4 times this number o f nursing staff
198
would have performed treatments during respiratory function measurements. There is a
theoretical risk with such heterogeneity o f staff populations that the variability o f skills
and experience would be greater in the nursing staff population and that this variability
could potentially have influenced the outcome o f this study.
This risk is offset by the fact that the proportional representation o f nursing and
physiotherapy staff in this study was probably similar to other units in this and other
countries. This heterogeneity thus reflects a clinical reality in terms o f staff populations,
which, i f corrected for in a research study might produce misleading results.
Furthermore, data with regard to physiotherapy and nursing levels o f experience were
informally and crudely collected. Staff who had worked in the units for over one year
were considered to be experienced, staff who had only worked in the unit for three
months to a year were considered to be moderately experienced while staff employed for
less than three months were considered to be inexperienced. Multivariate analyses were
performed to assess any overt relationship between these 3 levels o f experience in both
nurses and physiotherapy staff and whether patients had statistically significant
improvement, deterioration or no change, in selected parameters. No relationship was
observed, suggesting that other variables, probably relating to the individual and time
specific circumstances o f each patient were more likely to influence the outcome o f the
treatment, provided that essentially competent treatments were performed by both
physiotherapy and nursing staff.
Physiotherapy and suction techniques vary considerably between institutions and
countries. It is thus impossible to generalise or extrapolate results to institutions where
policies on airway clearance are dissimilar.
7.5 What are the future directions ?
Future studies should attempt to identify factors linking patients who respond favourably
to physiotherapy, so that patient selection criteria can be established which are easily
available to clinicians. The ANO VA procedures performed in this study were largely
unsuccessful at determining common factors between patients who improved or
deteriorated after treatment. The failure o f these analysis procedures may have been a
reflection on inadequate power within subgroups, or o f the fact that other variables
199
which were not prospectively collected (such as pulmonary artery pressure, severity o f
illness scores or oxygenation or ventilation indices) may have been more useful. Future
studies should also attempt to identify more sensitive reference variables. Outcome
parameters sensitive to different types o f ventilatory assistance, the presence or absence
o f leak and spontaneous versus paralysed patients w ill all need to be established.
Future studies should attempt to differentiate the individual effects o f different treatment
modalities on respiratory function. If, for example, it was conclusively shown that
tracheal tube suction alone produced a reduction in V t and C , - s , while manual
hyperinflation improved both V t and C , s , it would be simple to recommend practice in
which the necessary but potentially deleterious effects o f suction were minimised by
ending the treatment with a period o f hyperinflation.
The randomised crossover design in this study was particularly effective in controlling
for the multitude o f variables in ventilated patients that may have made comparisons
between patients difficult and this will remain a useful study design in future. Repeated
measures would also be helpful to identify whether within-subject responses to second
or third physiotherapy or nursing treatments are consistent in selected patients.
Intra-arterial fibre-optic blood gas monitoring systems offer on-line information on
oxygenation, ventilation, and acid-base status and allows immediate detection o f acute
and potentially life-threatening events (Numa and Newth, 1995; Kilger et al. 1995).
These devices have been shown to be accurate in paediatric populations (Weiss et al.
1996; Weiss et al. 1999; Macintosh and Britto, 1999), and, when inserted through a
peripheral intravenous cannula, the Paratrend monitor can be used to provide an
accurate estimation o f arterial blood gas values in children with respiratory failure
(Tobias et al. 1998; Tobias et al, 2000).
Ideal respiratory monitoring devices would accurately display tracheal tube leak and
calculate compliance separately during the expiratory and inspiratory phases o f each
breath. There are now a multitude o f measurement tools available for assessing
respiratory function in ventilated patients and as technology advances, the accuracy and
validity o f these will improve even for difficult patient groups, for example, those on
200
high frequency ventilation, or those with extremely low volumes and flow for example
ECMO patients. Ultrasonic flowmeters, infrared gas analysers, SFô multiple breath
washout and oscillation mechanics all hold promise for the future (Schibler et al. 1997,
Schibler et al. 2000).
7.6 Overall summary
This study has established that the “ CO2 SMO Plus” is a valid, reliable and potentially
useful tool for monitoring specific respiratory function parameters in muscle relaxed,
fully ventilated paediatric patients. It has also explored group and within-subject changes
in selected parameters due to respiratory physiotherapy treatments. In addition, it has
clarified differences between the physiological effects o f physiotherapy and suction alone
and thus suggested the potential and distinct advantages o f both therapies. Finally,
although this study has not contributed substantially to the overall understanding o f the
clinical importance o f these physiological effects, it has addressed the limitations o f
respiratory function measurements in ventilated patients and attempted to interpret
results objectively within those limits. In this respect at least, this study is distinguishable
from the majority o f other similar studies and should potentially offer a base-line
position from which future research may benefit.
”1 don't have any solution hut 1 certainly admire the problem. "
Ashleigh Brilliant
201

8. Publications related to the current study.8.1 sternal closure paper, Critical Care Medicine, 2001
Pediatric Critical Care
Effect of delayed sternal closure after cardiac surgery on respiratory function in ventilated infants
Eleanor Main, MSc; Martin J. Elliott, MD; Margrid Schindler, MB 88; Janet Stocks, PhD
Objective: Studies examining the effect of sternal closure on respiratory function have not been published, and currently there is little evidence to guide ventilation management immediately after closure. The aim of this study was to establish the impact of delayed sternal closure on expired tidal volume, respiratory system compliance, and COg elimination immediately after the procedure in infants who had undergone open heart surgery.
Design: Prospective study of respiratory function before and after delayed sternal closure.
Setting: Cardiac intensive care unit. Great Ormond Street Hospital, London.
Patients: Seventeen infants (median age, 2 wks) with open median sternotomy incisions after cardiac surgery. Data were collected between August 1998 and March 2000.
Interventions: Respiratory function was measured continuously for 30 mins before and after delayed sternal closure in paralyzed ventilated infants.
Measurements and Results: Four babies were excluded from the study because they required either immediate increase in ventilation after delayed sternal closure (n = 3) or removal of pericardial blood collection (n = 1). In the remaining 13 infants, expired tidal volume and COg elimination decreased significantly (p < .005) by a mean of 17% and 29%, respectively, after sternal
closure. In five of the remaining 13 patients, the magnitude of tracheal tube leak increased by ^10% after delayed sternal closure, thereby invalidating recorded changes in respiratory system compliance. Of the eight infants in whom there was a minimal change in leak, respiratory system compliance decreased significantly (p < .05) by a mean of 19%._
Conclusions: This study supports the hypothesis that respiratory function may be compromised after delayed sternal closure and that ventilatory support should be increased to counteract the anticipated decrease in tidal volume. Extra vigilance should be applied in monitoring blood gases after delayed sternal closure to assess clinical responses to sternal closure or changes in ventilatory support. Accurate assessment of change in respiratory system compliance after any therapeutic intervention may be precluded by changes in tracheal tube leak during the procedure. (Grit Care Med 2001; 29:1798-1802)
Key Words: respiratory mechanics; mechanical ventilation; cardiopulmonary interaction; intensive care unit; respiratory compliance; respiratory resistance; cardiac surgical procedures; cardiopulmonary bypass; human; infant; newborn; postoperative care; respiration; artificial; sternum; surgery; treatment outcome; neonates; postoperative period; pulmonary; hemodynamics; postoperative complications.
Early repair of complex congenital heart malformations such as transposition of the great arteries, total anomalous pulmonary venous drainage, and
complete atrioventricular septal defects may lead to life-threatening respiratory and hemodynamic dysfunction when sternal closure occurs. Intraoperative development of myocardial and pulmonary
From the Physiotherapy Department (EM) and the Cardio-Respiratory and Critical Care Unit (MJE, MS), Great Ormond Street Hospital for Children NHS Trust, London, UK; and the Portex Anaesthesia, Intensive Therapy and Respiratory Medicine Unit (EM, JS), Institute of Child Health, London.
Supported, in part, by Portex PLC (to JS).This work was undertaken by Great Ormond Street
Hospital for Children National Health Service (NHS) Trust, which received a proportion of its funding from the NHS Executive. The views expressed in this publication are those of the authors and are not necessarily those of the NHS Executive.
Copyright €> 2001 by Lippincott Williams & Wilkins
1798
edema contributes to this effect. To avoid a fatal outcome in these situations, the surgeon may postpone sternal closure for several hours or days until edema has reduced and cardiopulmonary stability has been achieved. This procedure, with optimal inotropic and ventilatory assistance, can provide the necessary interim support vital for ultimate survival (1, 2). Delayed sternal closure (DSC) in this article refers to closure of the sternal edges, fascia, and skin.
When eventually performed, DSC may alter ventilatory variables immediately after the procedure, suggesting that closure may be associated with a temporary decline in pulmonary function related to a reduction of intrathoracic volume. Recently, a retrospective study reported significant increases in peak inspiratory and mean airway pressures after DSC, although ventilation modalities and tracheal tube type were not specified (3).
202
However, no prospective studies to date have quantified the change in pulmonary variables associated with DSC. Consequently, changes in ventilatory support may be randomly and inconsistently applied, with or without the guidance of arterial blood gas values.
Several authors have contended that respiratory measurements in ventilated patients may assist in evaluating responses to therapeutic or clinical interventions or optimizing ventilation (4-9 ). Such measurements have become more feasible now that pressure and flow transducers commonly are integrated into modern ventilators and respiratory monitors.
This study was undertaken to measure the degree, if any, of pulmonary compromise caused by DSC so that recommendations might be explored in terms of optimizing ventilatory management after this procedure. The aim of this study was
Grit Care Med 2001 Vol. 29, No. 9

to assess the influence of DSC on expired tidal volume (Vtk), vo lum e of CO^ e lim inated (Vcü;,), and tota l respiratory system compliance in m echanical ly ven ti lated infants who had und e rg o n e open hear t surgery.
M A T E R IA L S A N D M E T H O D S
D ata w ere co lle c te d b etw een A u gust 1998
and M a rc h 200U in th e card iac in te n s iv e care
u n it at G re at O rm o n d S tre e t H o sp ita l fo r C h il
d ren N H S T ru s t, L o n d o n . W r it te n in fo rm ed
con sent fo r re s p ira to ry fu n c tio n m o n ito r in g
was ob ta in ed fro m th e p aren ts o f a ll in fan ts
in c lu d ed in the study.
T h e C O ^S M O P lu s re s p ira to ry m o n ito r
(vers io n 3.Ü; N o v a m e tr ix M e d ic a l System s,
W a llin g fo rd , C T ) w as used to m easu re resp ira
to ry variab les c o n tin u o u s ly in 17 v e n tila te d
in fan ts (n in e m a le , e ig h t fem a le ) w ith open
m ed ian s te rn o to m y inc is ion s before and a fte r
delayed c losure fo llo w in g su rg e ry for the c a r
diac m a lfo rm a tio n s lis ted in T ab le 1. T h e m e
d ian age a t m e a s u re m e n t was 2 w ks (ra n g e , 3
days to 3 yrs), and m e d ia n w e ig h t was 3.1 kg
(ra n g e , 2 - 1 6 kg). Vrt:, Vco^, and C ,, w ere de
te rm in e d c o n tin u o u s ly fo r 3 0 m in s before and
a fte r D S C , d u rin g w h ic h t im e v e n tila to r p res
sures and rate w ere n o t m o d ifie d (F ig . 1). A ll
17 babies w ere v e n tila te d on pressure preset
m o d a lit ie s because a ll had un cu ffed tracheal
tubes w ith variab le leaks, th e re b y p re c lu d in g
the use o f v o lu m e preset v e n tila t io n . In fu s io n s
o f v e c u ro n iu m , m id a z o la m , and m o rp h in e
provided m uscle re la x a tio n , sed ation , and a n
algesia, respective ly . B ecause none o f the ba
bies w ere m a k in g in d e p e n d e n t re s p ira to ry e f
forts , m e a s u re m e n ts o f C,.,. c o u ld be m ade by
u sing pressure changes a t th e a irw ay op e n in g
w ith o u t a d d it io n a l e so p h ag ea l m a n o m e try
(1 0 ). T he in fa n ts also had c o n tin u o u s m o n i
to r in g o f a rte r ia l h e m o g lo b in oxygen s a tu ra
tio n (Saov), in tra s y s te m ic a r te r ia l pressure,
and e le c tro c a rd io g ra m . A r te r ia l b lo o d gas
analysis w as p e rfo rm e d w ith in 1 h r before and
repeated w ith in 1 h r a fte r s te rn a l c losure. In
creased v e n tila to ry re q u ire m e n ts (pressures,
ra te , or d e liv e red oxygen c o n c e n tra tio n ) d u r
ing th is p e r io d w ere no ted . D a ta o b ta in ed w ere
stable w ith l it t le v a r ia b ility except for the tu g
g in g and m o v e m e n t created by the surg ical
p ro ce d u re .
T h e C O .jS M O P lu s m e a s u re s p ress u re ,
flow , and CO ^ c o n c e n tra tio n c o n tin u o u s ly via
a d isposable , f ix e d -o rific e , d iffe re n tia l pressure
flow sen sor inserted betw een th e tra ch ea l tube
and the v e n tila to r c irc u it . A n eo n ata l sensor
w ith c o m b in e d app aratu s deadspace o f 0 .7 m L
was used in a ll in fa n ts s tu d ied . Pressure and
(low w ere m easu red in s ta n ta n e o u s ly across
the flow sen so r w ith no t im e lag. D a ta w ere
recorded e le c tro n ic a lly by a 2 0 -b i l re s o lu tio n ,
lO U -H z flo w data s a m p lin g m ic ro processo r.
D u rin g rep ea ted c a lib ra tio n checks o f the n eo
nata l sensor w ith the tra ch ea l tube in s itu
(1 1 ), the m ean (so) m e a s u re m e n t e r ro r was
found to be 1.3 (1 .9 % ) over a v o lu m e range o f
2 - 3 0 0 m L (H a n s -R u d o lf ca lib ra ted syringes,
Kansas C ity , M O ). T he m ean co e ffic ien ts o f
v a ria tio n for repeated in v itro m ea s u re m e n ts
w ere 2 .6 % and 2 .4 % , respectively , fo r insp ired
tida l v o lu m e (V t i ) and V t e , w h ereas m ean p e r
cen tag e e rro rs fo r V t i and V tk w ere 2 .2 % (1 .6 % ) and 0 .8 % (2 .9 % ), respectively . S im i
la rly , c a lib ra tio n checks o f the pressure tra n s
d u c ers re v e a le d th a t m e a s u re m e n ts w e re
w ith in 3 % o f app lied pressure over a range o f
2 - 6 0 cm H , 0 (0 .2 -5 .9 kPa).
V n and V tk w ere ca lcu la ted sep arate ly by
d ig ita l in te g ra tio n o f flow . Exhaled v o lu m e
was used for both V te and Vcov ca lc u la tio n s in
th is s tudy (1 2 ). By co n tras t, 0^ , was c o m p u te d
a u to m a tic a lly w ith the C O ^S M O Plus by ap p ly
ing the least squares regression m eth o d to all
v o lu m e , p re s s u re , an d f lo w d a ta p o in ts
th ro u g h o u t th e w h o le b rea th cycle. T h e use o f
m u ltip le lin e a r regression is now w id e ly re c
og n ized as one o f the m ost ap p ro p ria te m e th
ods o f m e a s u rin g resp ira to ry m echan ics in
ve n tila te d in fa n ts because it does n o t re q u ire
any special v e n tila to r se ttin g o r m an eu vers
and a llow s C,.,. and resp ira to ry system resis
tance (R rJ to be d e te rm in e d on lin e on a
b re a th -b y -b re a th basis d u r in g o n g o in g m e
ch a n ica l v e n tila tio n (10 , 13). Vco^ was c a lc u
lated as the net v o lu m e o f exhaled COv m e a
sured at the tra ch ea l tube over each m in u te .
T h is value was d ivided by th e w e ig h t o f the
Tab le 1. Diagnoses
Diagnosis No.
Transposition of the great arteries 6Com plex cardiac defects 4Total anom alous pulm onary venous 2
connectionsTruncus arteriosus 2Hypoplastic left heart 2in te rrup ted aortic arch 1Total 17
in fa n t and expressed in m illi l ite rs per m in u te
per k ilo g ra m . V t k , and Vco^ w ere recorded
and saved as average values for each m in u te o f
re c o rd in g . D a ta w e re ana lyzed by assessing
b oth in d iv id u a l responses to DS C (3 0 data
p o in ts b efore and a fte r s terna l c losure) in each
in fa n t and g ro u p m ean d ifferences by using
th e s ta n d a rd iz e d S tu d e n t ’s / - te s t . Because
n u m b e rs w ere s m a ll, g ro u p differences w ere
c o n firm e d by a W ilc o x o n co m p a riso n .
V e n tila tio n index (V I) and oxygenatio n in
dex (0 1 ) w ere ca lcu la ted before and a fte r DSC
by u s in g the fo llo w in g fo rm u las :
V I =
Pacov (m m H g ) X P IP (cm H^O) X re s p ira to ry ra te (b p m )
1000
01 =
M A P (cm H^O) X Fio^ X 100
Pao% (m m H g )
T ra c h e a l tube leak p o te n tia lly can affect
m e a s u re m e n ts o f re s p ira to ry fu n c tio n (1 2 ,
1 4 - 1 7 ) . W e th e re fo re assessed the m ag n itu d e
o f th e tra ch ea l tu b e leak th ro u g h o u t the m e a
s u re m e n t periods to assess its in flu en ce , if
any, on c a lcu la ted values o f V t e , V co^, and C ,,.
T ra c h e a l tu b e leak expressed as a percentage
was c a lcu la ted as th e d ifferen c e betw een in
sp ired and exp ired tid a l v o lu m e by using the
fo llo w in g eq u atio n :
% leak =(V|-| - Vtk)
X 100
R E S U L T S
Three babies were excluded from the s tudy because they exhibited sudden deter io ra t ion in Sao% or hem odynam ic in stability, r equ ir ing im m edia te increase in venti latory suppor t with DSC. A fur ther infant was excluded because a large pericardial collection of blood was removed d u r in g DSC. This was accompanied by an im m edia te clinical im provem ent, thereby p rec lud ing in te rp re ta t ion of the effects of DSC. In the rem ain ing 13 infants, Vtk
and VcOv decreased significantly (p <8 ■ Cornpkanca (mL/cmH,0)
• Tidil Volume p«f Kg (mL) » VCO, per kg (ml/m n)
6
S terna l c lo su reII
II2§13
00 30 60
Figure 1. S ix ty -m inute trend in recorded data
d uring sternal closure in a 2-w k-o ld (3 .3 -kg ) in
fant. LCD.,, volum e of C D , elim inated .
F igure 2. T idal volum e: Ind iv idual and group
changes in response to delayed sternal closure (n
= 13). d , confidence interval.
Crit Care Med 2001 Vol. 29, No. 9 1799
203
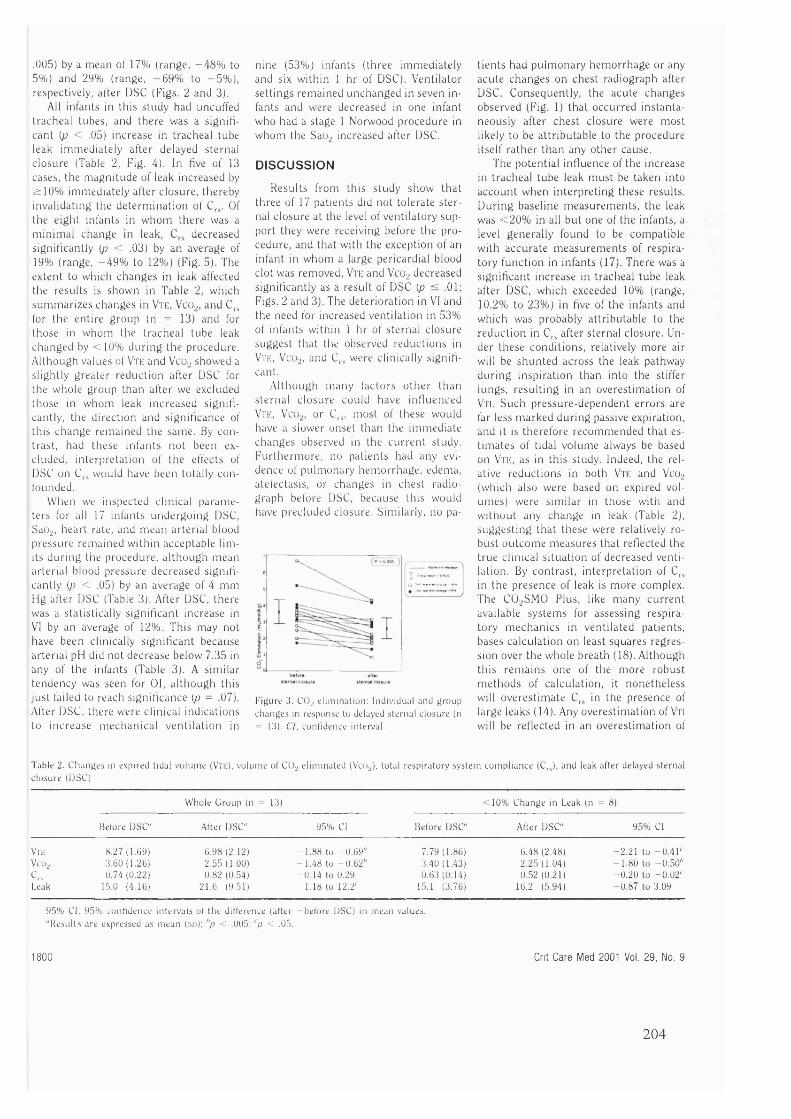
.005) by a m ean of 17% (range, - 4 8 % to 5%) and 29% (range, - 6 9 % to - 5 % ) , respectively, after DSC (Figs. 2 and 3).
All infants in this study had uncuffed tracheal tubes, and there was a significant {p < .05) increase in t racheal tube leak immediately after delayed ste rnal c losure (Table 2, Fig. 4). In five of 13 cases, the m agn i tude of leak increased by > 1 0 % immediately after c losure, thereby invalidating the de te rm in a t io n of C^,. Of the e ight infants in w h o m there was a m in im al change in leak, decreased s ignificantly [p < .03) by an average of 19% (range, - 4 9 % to 12%) (Fig. 5). The extent to which changes in leak affected the results is shown in Table 2, which su m m arizes changes in V t k , V c ü ^ , and C,, for the entire g ro u p (n = 13) and for those in w hom the tracheal tube leak changed by < 1 0 % d u r in g the procedure . A l though values of V t k and Vco^ showed a slightly g reater reduction after DSC for the whole g roup th an after we excluded those in w hom leak increased significantly, the d irection and significance of this change rem ained the same. By c o n trast, had these in fan ts n o t been excluded, in te rp re ta t ion of the effects of DSC on C\s would have been totally c o n founded.
W hen we inspected clinical p a ram eters for all 17 infants u n d e rg o in g DSC, Sau%, heart rate, and m ean arteria l blood pressure rem ained w ith in acceptable l im its d u r in g the procedure , a l th o u g h m ean arterial blood pressure decreased significantly (p < .05) by an average of 4 m m Hg after DSC (Table 3). After DSC, there was a statistically s ignificant increase in VI by an average of 12%. This may not have been clinically s ignificant because arterial pH did not decrease below 7.35 in any of the infants (Table 3). A similar tendency was seen for 01, a l th o u g h this Just failed to reach significance [p - .07). After DSC, there were clinical indications to increase m ech an ica l v en t i la t io n in
nine (53%) infants (three immediately and six with in 1 hr of DSC). Ventilator set t ings rem ained u n changed in seven in fants and were decreased in one infant who had a stage 1 Norwood procedure in w h o m the Sao% increased after DSC.
D IS C U S S IO N
Results from this s tudy show th a t three of 17 patients did not tolerate s te r nal c losure at the level of ventilatory su p port they were receiving before the p ro cedure, and that with the exception of an infant in whom a large pericardial blood clot was removed, V t k and Vcu% decreased significantly as a result of DSC {p < .01; Figs. 2 and 3). The de ter io ra t ion in VI and the need for increased ventilation in 53% of infants within 1 h r of s ternal c losure suggest that the observed reduct ions in V t k , Vcüv, and C^, were clinically significant.
A l th o u g h m any factors o th e r th an s te rna l c losure cou ld have inf luenced V t k , Vco.;, or C,„ m ost of these would have a slower onset than the imm edia te changes observed in the c u r re n t study. F u r th e rm o re , no patients had any evidence of pu lm onary hem orrhage , edema, atelectasis, or changes in chest radiograph before DSC, because this would have precluded closure. Similarly, no pa-
Figure 3. CO^ elim ination : individual and group
changes in response to delayed sternal closure (n
= 13). C l, confidence interval.
t ien ts had p u lm onary h e m o rrh ag e or any acute changes on ches t radiograph after DSC. Consequently , the acute changes observed (Fig. 1) th a t occurred in s tan ta neously after ches t c losure were m ost likely to be a t tr ibu tab le to the procedure itself r a th e r th an any o th e r cause.
The potential influence of the increase in tracheal tube leak m u s t be taken into a cc o u n t w h en in te rp re t ing these results . D ur ing baseline m easu rem en ts , the leak was < 2 0 % in all b u t one of the infants, a level generally found to be compatible with accura te m e a su re m e n ts of respiratory func tion in infants (17). There was a s ignificant increase in tracheal tube leak after DSC, which exceeded 10% (range, 10.2% to 23%) in five of the infants and w hich was probably a ttr ibu tab le to the r educt ion in C^, after sternal closure. Under these condit ions, relatively m ore air will be sh u n te d across the leak pathway d u r in g inspira t ion than into the stiffer lungs, re su l t ing in an overest im ation of V t i . S u ch p ressu re -dependen t e rro rs are far less m arked d u r in g passive expiration, and it is therefore recom m ended that est im a tes of tidal volume always be based on V t k , as in this study. Indeed, the relative reduct ions in both V t k and Vcu% (which also were based on expired volumes) were sim ilar in those with and w ith o u t any change in leak (Table 2), suggest ing tha t these were relatively robust o u tco m e m easures that reflected the t rue clinical s i tua t ion of decreased ven tilat ion. By con tras t , in te rpre ta tion of C.^ in the presence of leak is m ore complex. The CO 2 SMO Plus, like m any c u r re n t available sys tem s for assessing respiratory m ec h an ic s in venti lated patients , bases calcula tion on least squares regression over the whole b reath (18). Although th is r e m a in s one of the m ore robust m e th o d s of calcula tion , it none the less will overes t im ate C,..; in the presence of large leaks (14). Any overest im ation of V t i
will be reflected in an overest im ation of
Table 2. Changes in expired tidal vo lum e (Vt k ), volum e of CO^ elim inated (Vc(n), total respiratory system com pliance (C ,J , and leak after delayed sternal closure (D SC )
W hole G roup (n = 13) < 1 0 % Change in Leak (n = 8)
Before D S C A fter DSC" 95% Cl Before DSC" After DSC" 95% Cl
Vtk 8 .2 7 (1 .6 9 ) 6 .98 (2 .12) - 1 .8 8 to - 0 .6 9 * 7.79 (1 .86) 6 .48 (2 .48) - 2 .2 1 to - 0 .4 1 'VCO; 3 .6 0 (1 .2 6 ) 2 .55 (1 .00) - 1 .4 8 to -0 .6 2 " 3 .4 0 (1 .4 3 ) 2 .2 5 (1 .0 4 ) - 1 .8 0 to -0 .5 0 "
C,s 0.74 (0 .22) 0 .82 (0 .54) - 0 .1 4 to 0.29 0 .6 3 (0 .1 4 ) 0.52 (0 .21) - 0 .2 0 to - 0 .0 2 'Leak 15.0 (4 .16) 21.6 (9 .51) 1.18 to 12.2' 15.1 (3 .76) 16.2 (5 .94) - 0 .8 7 to 3.09
95% C l. 95% confidence intervals of the difference (after -b e fo re DSC) in mean values. "Results are expressed as m ean (su); ’’p < .0t)5; ‘p < .05.
1800 Crit Care Med 2001 Vol. 29, No. 9
204

Crs, thereby m ask ing any clinical red u c tion in this param eter . Several lung and anim al model studies have established tha t calculated is p roport ionate ly re lated to tracheal tube leak and is grossly overestimated with increasing m agni tude of leak (12. 14. 15, 17).
Although it has been suggested that the use of the expiratory port ion of each breath to calculate respiratory m echanics m igh t reduce the confounding effect of leak (10, 12, 14), this was no t available on CO2 SMO Plus at the t ime of data collection. In addit ion, this approach has yet to be validated and potentially is f raught with difficulties, particularly in the presence of any alinearities of the respiratory system. Calculated values of th a t are recorded in the presence of a significant leak, or change in leak, therefore m u s t be
I 'ig u rc 4. T rach eal tube leak: Ind iv idu a l and
group changes in response to delayed sternal
closure (n = Id ). Cl, conhdence interval.
stern«l closure
Figure 5. C o m p liance: In d iv id u a l and group
changes in response to delayed sternal closure in
those in w hom tracheal tube leak changed by
< 1 0 % (n = 8). Cl, confidence in tew al.
in te rpreted with caution. In this study, there was a s t rong positive re la tionship between change in leak and change in C^, ( / = .64). Thus, w hen the potential effect of leak was disregarded, there was no significant change in C„. By contrast , when the five infants in w hom leak had increased by > 1 0 % were excluded, a significant (p < .05) decrease in was observed (Table 2).
Uncuffed tracheal tubes com m only are used to venti late infants and ch ild ren because of concerns about subglottic d a m age, bu t the confounding influence of tra c h e a l tu b e leaks c a n be a real disadvantage in te rm s of objectively assessing therapeutic in terventions. When a substantia l leak exists with co n cu r re n t overest im ation of Vti and hence it is impossible to assess the m agn i tude or d irection of any physiologic changes in r e sp i r a to ry m e c h a n ic s , a l t h o u g h the m agni tude of the e r ro r will depend, to some extent, on the precise m eth o d of calcula tion (15). Any a t te m p t to use m ea su re m en ts of to evaluate therapeutic in te rven tions or to delect w ith in-subjec t changes in clinical sta tus would require negligible leak th ro u g h o u t the study period (17). A lthough such a condit ion may not be a tta inable unless a cuffed tube is in situ (4), m any publications report ing resp ira tory m echanics in ventilated infants and children have failed to report e ither the change in or m agni tude of this vital confound ing factor. Unfortunately, significant leaks are not always audible or clinically obvious, nor is their m agn i tude accurate ly reported (if at all) on m ost m on ito rs or venti lators.
The th ree babies excluded from this study because of the need for imm edia te increase in ventilatory suppor t had all received relatively low baseline tidal volum es before the procedure when c o m pared with the rem ain ing infants (mean 5.9 mL/kg compared with m ean 8.3 mL/ kg). This suggests that the levels of ventilatory support immediately before clo
sure may have been only ju s t sufficient to cope w ith c u r r e n t clinical condit ions, with no buffer with which to tolerate any sudden de te r io ra t ion in respiratory m e chanics . The early and severe respiratory com prom ise evidenced by these three babies em phasizes the need for increased vigilance d u r in g and after s ternal closure.
Infants in this study were venti lated with pressure preset modes because of the ir age and the fact tha t they had u n cuffed tracheal tubes. Had cuffed tracheal tubes been used, volume preset modes may have proved m ore robust against the decrease in respiratory compliance experienced after s te rnal closure. However, a decrease in compliance after s ternal closure would m anifes t in an increased peak inspiratory p ressure required to m ain ta in the sam e vo lum e w ith c o n cu r re n t risk of b a ro trau m a . In this study, the median age at m e a su re m e n t was 2 wks, an age g roup in which pressure preset ventilation often is preferred above volume ventilation so that venti la tor-induced lung injury may be avoided. Regardless of ventilatory mode, a m odera te to large t ra cheal tube leak would confound in te rp re ta t ion of com p lian ce calcu la t ions and make it difficult to provide optimal and consis ten t levels of ventilation and posit ive e n d - e x p i r a t o r y p r e s s u r e (19). W hereas norm al practice in ou r unit has been to increase mechanical ventilation by 10% to 20% before DSC in an tic ipation of any de ter io ra t ion in m echanics du r in g the p rocedure , no objective evidence as to w h e th e r this practice was necessary was available. Because in te r p re ta t io n of ch an g es in tidal volume, Vcov, and will be c o n fo u n d ed by changes in ven ti la to r se ttings, the latter were held c o n s tan t for the purposes of this s tudy and were increased only if c lin ically indicated by close m o n ito r in g of the infants. The results of this study su p port the practice of increas ing ventilatory suppor t before DSC, especially in infants with uncuffed tracheal tubes with pressure preset ventilation.
Table 8. Fffect of delayed sternal closure (DSC ) on clin ical variables (n = 17)
Variable before DSC" After DSC" 95% Cl
A rteria l oxygen saturation 93.4 (6 .14) 9 4 .Ü (6 .45) - 1 . 8 to 3.1Heart rate 151 (18.1) 156 (16.8) - 2 . 3 to 11.5Mean arteria l blood pressure 56.Ü (9 .63) 52.4 (6 .78) - 7 . 2 to - Ü .U ’pH 7.47 (U.05) 7 .45 (U.U6) - 0 .0 7 to U.U2V entila tion index 17.1 (4 .99) 19.1 (7.ÜU) U.3 to 3 .7*O xygenation index 3.59 (1 .26) 4.41 (1 .81) - U . l to 1.9"
9.5% C l. 95% confidence interval o f the difference (after -b e fo re DSC) in m ean values.
"Results are expressed as mean (so): */; < .05; ‘p = .07.
C O N C L U S IO N S
This s tudy su p p o r ts the hypothesis that respiratory function may be c o m p ro mised after s te rnal c losure and highlights the d ifficulty in object ively assess ing th e rap eu t ic in te rven t ions in ventilated infants and children.
W hen ste rna l c losure is im m in en t , ventilatory suppor t should be increased to c o u n te rac t the antic ipated decrease in
Crit Care Med 2001 Vol. 29, No. 9 1801
205

T his study supports
the hypothesis
tha t respiratory
function may be compro
mised after sternal closure
and highlights the difficulty
in objectively assessing ther
apeutic interventions in ven
tilated infants and children.
tidal volume. Extra vigilance should be applied in m o n ito r in g blood gases after DSC to assess clinical responses to s te r nal closure or changes in ventilatory su p port.
Assessment of in response to any th e ra p e u t ic in te rv e n t io n will be p r e vented by a change in tracheal tube leak. F u r th e r studies may benefit from the use of cuffed tracheal tubes.
In future, it is essential that venti lators and m on ito rs provide a c o n tinuous and accurate display of the m agn i tude of leak and that this is d o cum en ted w h e n ever m easures of C^s are reported.
R E F E R E N C E S
1. O d im JN, T ch erven ko v C l, Dobell Alt: D elayed .sternal closure: A lifesaving m a n e u
ver a fte r early o pera tion for com plex con
g e n ita l h e a rt d isease in th e n e o n a te .
J T h o ra c C a rd io v a s c S u rg 1 9 8 9 ; 98:
4 1 3 -4 1 6
2. Iyer RS. Jacobs JR, de Levai MR, et al: O u t
comes after delayed sternal closure in pedi
a tric heart operations: A 10-year experience.
Arm Thorac S u rg 1997; 6 3 :4 8 9 -4 9 1
3. M ck lh in n ey DB, Reddy VM , Parry AJ, et al:
M anagem ent and outcom es of delayed ster
nal closure after cardiac surgery in neonates
and in fa n ts . C r it C a re M e d 2 0 0 0 ; 28:
1 1 8 0 -1 1 8 4
4. N um a AH , N ew th CJ!.: Assessment of lung
function in the intensive care un it. P ed iatr
P u lm o n o l 1995; 1 9 ;1 1 8 -1 2 8
5. Rosen W C, M am m el M C, F isher JM, et al:
The effects o f bedside pulm onary m on ito ring
d u r in g in fa n t m e c h a n ic a l v e n t i la t io n .
P ed ia tr P u lm o n o l 1993; 1 6 H 4 7 -1 5 2
6. H ja lm a rs o n 0 : Lun g fu n c tio n tes tin g —
Useless in ventilated newborns? 7 / W w / r
1994; 1 5 3 :8 2 2 -5 2 6
7. M acnaughton PD: Assessment of lung func
tion in the ven tilated patient. In tensive Care
M ed 1997; 2 3 :8 1 0 -8 1 8
8. Stenson BJ, C lover RM, W ilk ie BA, et al:
Randomised controlled tria l of respiratory
system com pliance m easurem ents in m e
ch a n ica lly ven tila ted neonates. A rch D is
C h ild 1998; 7 8 :F 1 5 -F 1 9
9. H a m m er J, New th CJ: In fan t lung function
testing in the intensive care u n it. Intensive
Care M ed 1995; 2 1 :7 4 4 -7 5 2
10. Sly PD, l^anteri C, N icolai T: M easurem ent of
Respiratory Function in the Intensive Care
Unit. In: In fa n t R espira tory F u n ction Test
ing. First Fd ition . Stocks J, Sly PD. Tepper
RS, M organ WJ (Fds). New York, W iley,
1996, pp 4 4 5 -4 8 4
11. Jackson FA, Coates AL, Gappa M , et al: In
v itro assessment of infant pu lm onary func
tion equ ipm ent. Ped iatr P u lm o n o l 1995; 19:
2 0 5 -2 1 3
12. Kondo T, M atsum oto 1, Lan leri CJ, et al:
R espiratory m echanics d u rin g m echanical
ven tila tion : A m odel study on the effects of
leak a ro u n d a tra c h e a l tu b e . P e d ia t r
P u lm o n o l 1997; 2 4 ;4 2 3 -4 2 8
13. Kessler V, G u ttm an n J, Newth CJL; Dynam ic
respiratory system m echanics in infants d u r
ing pressure and volum e controlled ven tila
tion . E u r Respir J 2001; 17 :115 -121
14. Pyon K H , Pandit PB, Habib RH: Effects of
airw ay leaks on lung volum e recru itm en t
and accuracy of respiratory mechanics m ea
surem ents. A m J Respir C rit Care M ed 1999;
159:A671
15. Kuo CY, G erhard t T , Bolivar J, et al: Effect of
leak around the endotracheal tube on m ea
surem ents o f pu lm onary com pliance and re
sistance d u rin g m echanical ven tila tion ; A
lung m odel study. P ed ia tr P u lm o n o l 1996;
2 2 :3 5 -4 3
16. Pyon K H , Pandit PB, C ourtney SE, et al:
Airw ay leak effects on lung m echanical esti
mates: Role o f ven tila to ry settings. A m J
Respir C r it C are M ed 2000; 161:A803
17. M ain E, Castle R, Stocks J, et al: Respiratory
function in the PICU: How m uch tracheal
tube leak is permissible? Abstr. E u r Respir J
1999; 14(Suppl 30): 155s.
18. lo tti GA, Braschi A, B run ner JX, et al: Respi
ratory m echanics by least squares fittin g in
m ech an ica lly ven tila ted patients: A p p lica
tions d u rin g paralysis and during pressure
sup p o rt v e n tila t io n . In te n s iv e C are M ed
1995; 2 1 :4 0 6 -4 1 3
19. Deakers TW , Reynolds G, S tre tton M, et al:
Cuffed endotracheal tubes in pediatric in te n
sive care. J P e d ia tr 1994; 1 2 5 :5 7 -6 2
1802 Crit Care Med 2001 Vol. 29, No. 9
206

8.2 Tracheal leak paper, Intensive Care Medicine, 2001
Intensive Care Medicine
© Springer-Verlag 2001
D O I10. lOOT/sOO 1340101105
Neonatal and Pediatric Intensive Care
The influence of endotracheal tube leak on the assessment of respiratory function in ventilated childrenEleanor Main^’ Rosemary C astle\ Janet Stocks^ Ian James^ and David Hatch*
(1) Portex Anaesthesia Intensive Therapy and Respiratory Medicine Unit, Institute o f
Child Health, 30 Guilford Street, London W CIN 1ER, UK
(2) Physiotherapy Department, Great Ormond Street Hospital for Children NHS Trust,
Great Ormond Street, London W Cl N 3JH, UK
(3) Cardiorespiratory and Critical Care Unit, Great Ormond Street Hospital for Children
NHS Trust, Great Ormond Street, London W Cl N 3JH, UK
E-mail; [email protected]
Phone: 20-74059200 Ext: 5144
Fax: 20-78138281
Received: 7 December 2000 / Final revision received: 4 May 2001 / Accepted: 21
August 2001 / Published online: 12 October 2001
D.Hatch, R.Castle and J.Stocks are supported by SIMS Portex PLC.
This work was undertaken by Great Ormond Street Hospital for Children NHS Trust
which received a proportion o f its funding from the NHS Executive; the views expressed
in this publication are those o f the authors and are not necessarily those o f the NHS
Executive.
207
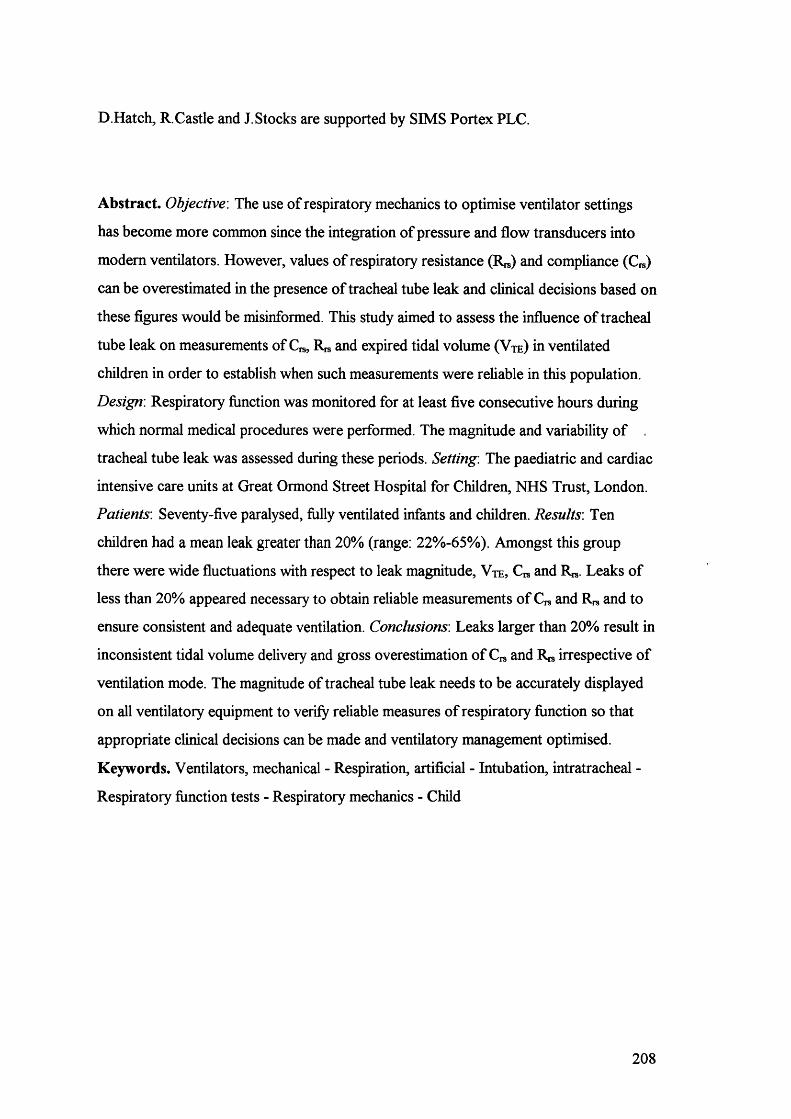
D.Hatch, R.Castle and J. Stocks are supported by SIMS Portex PLC.
Abstract. Objective : The use o f respiratory mechanics to optimise ventilator settings
has become more common since the integration o f pressure and flow transducers into
modem ventilators. However, values o f respiratory resistance (R^) and compliance (C^)
can be overestimated in the presence o f tracheal tube leak and clinical decisions based on
these figures would be misinformed. This study aimed to assess the influence o f tracheal
tube leak on measurements o f Crs, Rrs and expired tidal volume ( V t e ) in ventilated
children in order to establish when such measurements were reliable in this population.
Design: Respiratory function was monitored for at least five consecutive hours during
which normal medical procedures were performed. The magnitude and variability o f
tracheal tube leak was assessed during these periods. Setting: The paediatric and cardiac
intensive care units at Great Ormond Street Hospital for Children, NHS Trust, London.
Patients: Seventy-five paralysed, fully ventilated infants and children. Results: Ten
children had a mean leak greater than 20% (range: 22%-65%). Amongst this group
there were wide fluctuations with respect to leak magnitude. Vie, and R^ Leaks o f
less than 20% appeared necessary to obtain reliable measurements o f and and to
ensure consistent and adequate ventilation. Conclusions: Leaks larger than 20% result in
inconsistent tidal volume delivery and gross overestimation o f and Ris irrespective o f
ventilation mode. The magnitude o f tracheal tube leak needs to be accurately displayed
on all ventilatory equipment to verify reliable measures o f respiratory function so that
appropriate clinical decisions can be made and ventilatory management optimised.
Keywords. Ventilators, mechanical - Respiration, artificial - Intubation, intratracheal -
Respiratory function tests - Respiratory mechanics - Child
208
IntroductionIn the last decade, several authors have noted the potential for respiratory measurements
in ventilated patients to assist in optimising ventilation, by reducing iatrogenic lung
damage from lung over-distension and hastening the clinicians' response time to clinical
changes. In addition, sheer stress on the lungs can be avoided by ventilating with
appropriate tidal volumes and optimal levels o f PEEP (1-6). The use o f respiratory
mechanics to guide clinical ventilatory management has become more common since the
integration o f pressure transducers into modern ventilator equipment and respiratory
monitors. Many ventilators now display respiratory parameters such as resistance and
compliance and intensivists therefore have on-line information about the respiratory
function o f their patients. I f there is any intention to act on these readily displayed
figures, it is essential to examine their accuracy and the conditions under which they
might become unreliable. Data about the accuracy o f measurement devices and the
validity o f calculated parameters are seldom given in specification manuals, and
information about restricted applicability or conditions under which the measurement
and calculation o f the parameters may become erroneous are limited. One confounder,
which has been identified in laboratory and animal studies and which is especially
pertinent to paediatric ventilation, is the tracheal tube leak. Uncuffed tracheal tubes are
commonly used to ventilate infants and children because o f concerns about subglottic
damage. However there is relatively little information with regard to the effects o f leak
in the clinical environment or how much leak may be tolerable in ventilated children.
Tracheal tube leak can confound a number o f parameters o f interest, including metabolic
gas exchange and functional residual capacity (7,8). Krauel et al showed that patients
w ith a tracheal tube leak needed higher Fi02, MAP and respiratory frequency than those
without such a leak (9). Tracheal tube leak has been found to reduce the mean tracheal
pressure with respect to the mean airway pressure by 15-21% in rabbits (10). The
predictive value o f MAP in guiding clinical decisions is thus reduced in the presence o f
leak. Furthermore any increase in the magnitude o f tracheal tube leak may result in a
disproportionate decrease in oxygenation by decreasing mean tracheal pressure, and a
reduction in the efficiency o f tidal ventilation and lung recruitment via PEEP. In the
presence o f lung disease and reduced compliance, gas shunting through the leak
pathway is likely to increase, which may further compromise ventilatory support. In
diseased lungs, even small airway leaks lead to large reductions in lung recruitment at
209
higher PEEP values, and errors in measuring resistance and compliance have been found
to be relatively larger than in healthy lungs for all magnitudes o f leak (11).
Several lung model or animal model studies have established that compliance and
resistance measurements are overestimated and unreliable in the presence o f leak (11-
13). While these are valuable in-vitro results, caution should be exercised when
extrapolating these findings to the clinical setting. Kuo et al noted that while errors were
proportionate to the size o f the leak, they also depended on the method used to calculate
respiratory mechanics (13). The most commonly used techniques include Mead and
Whittenberger’ s method, multiple linear regression analysis or the least squares method
(14).
The aim o f this study was to assess in vivo the influence o f tracheal tube leak on expired
tidal volume (V te), respiratory compliance (C,s) and respiratory resistance (Rr*) in
ventilated children and infants. In addition the magnitude and within-subject variability
o f tracheal tube leak was assessed in order to establish when such measurements could
be performed reliably in this population.
210
Materials and Methods
The “ CO2 SMO Pius” respiratory monitor (IMovametrix Medical Systems Inc. USA,
version 3.0) was used to measure respiratory function continuously in 75 paralysed,
ventilated babies and children between May 1998 and August 1999. Inclusion criteria
were that patients were muscle relaxed, fully ventilated and were unlikely to have
changes in ventilatory parameters for the duration o f measurement. A range o f
ventilators including Bear Cub BP2001, Sei*vo 300 and 900 and SLE 2000 were used,
w ith the pressure pre-set modalities preferentially used in young babies and both volume
and pressure pre-set modalities used in older children. No patients were excluded from
analysis and data from the entire measurement period were analysed for all patients.
The “ CO2 SMO Plus” measures pressure, flow and capnography continuously via a
disposable fixed orifice differential pressure flow sensor connected between the tracheal
tube and the ventilator circuit. The flow sensor was attached and taped firm ly to the
mouth o f the tracheal tube thereby avoiding the possibility o f leak at this junction. A
neonatal sensor (combined apparatus deadspace 0.8 ml), was used in children less than 2
years, whereas a paediatric sensor (deadspace < 4 ml) was used in older children.
Pressure and flow were measured instantaneously across the flow sensor with no time-
lag. Data were electronically recorded by a 20 bit resolution, 100 Hz flow data sampling
microprocessor and transferred to Analysis Plus software on a portable PC running
Analysis Plus! software version 3.0 (Novametrix Medical Systems, Wallingford, CT).
Repeated calibrations o f the sensors over appropriate volume ranges (2 - 300 ml for
neonatal sensors and 40 -500 ml for the paediatric or adults sensors) demonstrated that
on average the sensors were capable o f measuring applied volume changes within 0.9 %
(SD: 2.3 %) accuracy. Furthermore these tests showed that on average, inspired
volumes differed by less than 2 % (SD: 2.3 %) against expired volumes when assessed
in vitro (Table 1). This accuracy was maintained when calibration was repeated after
connecting appropriately sized tracheal tubes (Table 1). Similarly pressure recordings by
the “ CO2 SMO Plus” monitor over a range o f 2-60 cmH20 were within ± 2% o f those
displayed by an electronic manometer (Digitron - pressure manometer P200UL). Prior
to use the accuracy o f individual sensors was checked by using a calibrated syringe
(Hans Rudolf Inc.- calibrated volume syringe) to deliver a 10 ml (neonatal) or 100 ml
(paediatric/adult) sensor signal. The least squares algorithms employed by the
“ CO2 SMO Plus” to calculate C,,s and R,s were checked against linear regression o f raw
211

data points and found to be accurate to within 5%. In addition Cr* measurements were
checked against known values o f C,* on a Manley neonatal lung simulator and
measurement errors were found to be < 5% for the full clinical range o f respiratory rates
and peak inspiratory pressures.
W ritten informed consent was obtained from the parents o f all children included in the
study. Subjects were monitored continuously for at least 5 consecutive hours, during
which time nursing and medical procedures such as physiotherapy, postural changes and
tracheal suction were performed as usual. These long periods o f continuous
measurement provided the opportunity to investigate the occurrence, magnitude and
variability o f tracheal tube leaks during a normal period o f intensive care, as well as their
consequences for the ventilated child. Only paralysed children were studied because
those making spontaneous ventilatory efforts would have required additional
oesophageal manometry to differentiate between chest wall and lung mechanics, which
was not available from the "CO2 SMO Plus" (14). A ll patients were paralysed and
sedated with pain relief according to unit protocols using standard doses o f vecuronium
(2-4 mcg/kg/min), morphine (IO-l4mcg/kg/hr) and midazolam (1-6 mcg/kg/hr).
Expired tidal volume was integrated from expiratoi-y flow, while compliance and
resistance were automatically computed by the “ CO 2 SMO Plus” throughout the breath
cycle using the least squares regression method (14). Inspiratory and expiratory
resistance were calculated using data from the inspiratory and expiratory portion o f the
respiratory cycle respectively, whereas data throughout the whole breath was used to
calculate compliance.
Inspired and expired tidal volumes, C,s, and R,s were continuously recorded and breath
by breath values were averaged for each minute o f recording. Tracheal tube leak was
neither automatically calculated nor displayed by the “ CO2 SMO Plus” or Analysis Plus
software. For the purposes o f this study, it was computed from online recordings as the
difference between each minute’s averaged values o f inspired and expired tidal volume
using the equation:
(V t, - V t e )% le a k = — X 1 0 0
Vj!
Changes in tidal volume, resistance and compliance were related to simultaneous
changes in leak during the monitoring period.
212
Results
O f the 75 paralysed ventilated children studied, 61 had pressure controlled ventilation:
median age 0.25 years (0.02 to 12.8 years) and weight 4.3 kg (2 to 87 kg) and 14 had
volume controlled ventilation: median age 4 years (0.02 to 10.5 years) and weight 15.8
kg (3 to 30 kg). 4 children in each group had a cuffed tracheal tube: median age 8 years
(4 -1 6 yrs) weight 22 kg (13.9 - 87 kg), all o f whom had tube leaks <5%. Tracheal tube
sizes ranged between 3.0 and 7.5mm. Over half o f the infants (43/75) were studied
following corrective cardiac surgery for congenital defects: median age 8 weeks (3days -
16 yrs). The remaining children were studied in the paediatric intensive care unit
following admission for a variety o f reasons including head injury, gastric transposition
surgery, respiratory or multi-organ failure: median age 22 months (1 week to 16 yrs).
Ten children (13%) had a mean tracheal tube leak greater than 20% (21.9 - 65.1%),
median age 0.12 years (0.02 - 1.3 yrs) and weight 2.95 kg (2.6 - 9.8 kg). In the latter
group, there were particularly wide within and between-subject fluctuations with respect
to the magnitude o f leak, Vn;, C , . s and R,s during the monitoring period.
Figure 1 summarises data recorded over several hours in two infants in whom
ventilatory settings remained constant during the monitoring period. The relationship
between both inspired and expired tidal volume and changes in percentage o f leak are
displayed. In the first example from a 16 month old male infant on Servo 300 pressure
pre-set ventilation (figure la) the leak varied between 10% and 70% over a six hour
period and was accompanied by a 30% increase in inspired tidal volume and a 60%
reduction in expired volume. By contrast, but as expected, during volume controlled
ventilation (also via a Servo 300 ventilator), (figure lb ) inspired volume remained
relatively constant in a 5 day old (2.88 kg) infant over 7 hours o f monitoring. This was
however, accompanied by a marked reduction in expired volume as the leak increased,
w ith expired tidal volume halving when leak was maximal. In this infant there was a
strong negative correlation (r^ = 0.93) between Vn; and leak. There was also a strong
positive correlation between leak and C , - s (r^ = 0.68) and inspiratory and expiratory
resistance (r^ > 0.92) (Figures 2a, 2b, 2c, 2d). It can be seen that, in the presence o f a
large leak, values o f C r s and R , s in this neonate, were distorted far beyond the range
previously reported in ventilated newborns i.e. 0.2-1 m l.cmH20''.kg'' and 70 -150
cmHzO.r'.s (5,14-17).
213
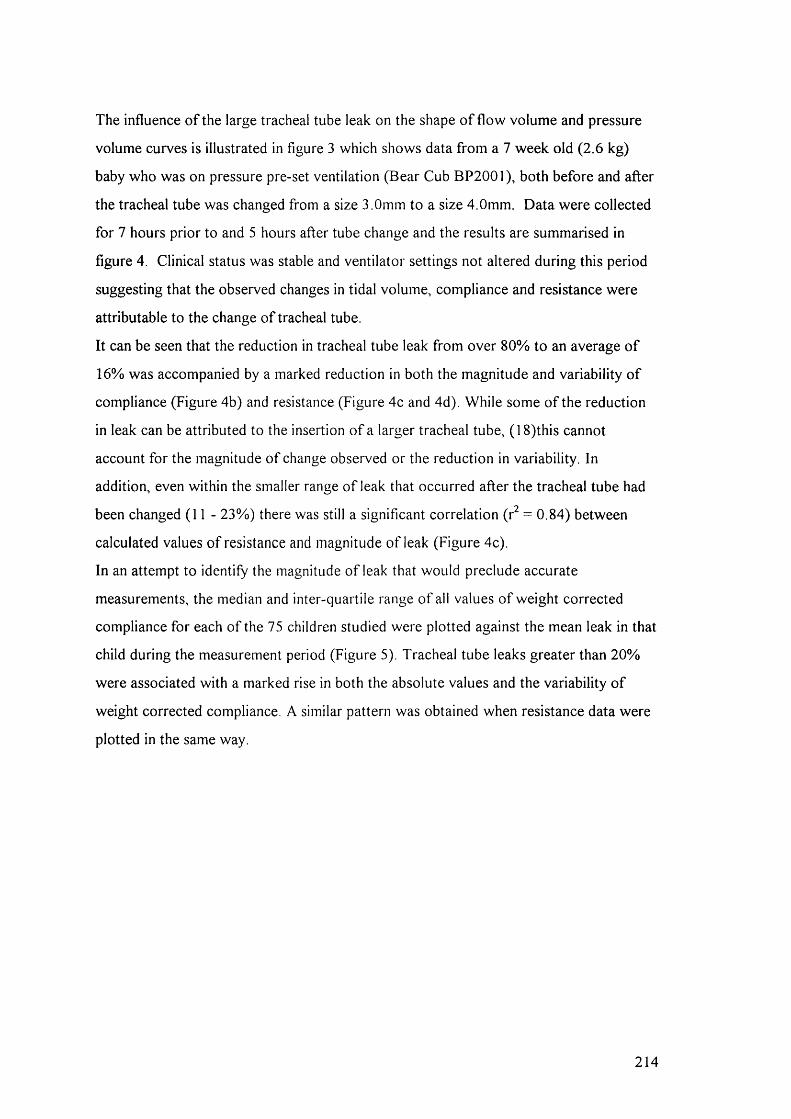
The influence o f the large tracheal tube leak on the shape o f flow volume and pressure
volume curves is illustrated in figure 3 which shows data from a 7 week old (2.6 kg)
baby who was on pressure pre-set ventilation (Bear Cub BP2001), both before and after
the tracheal tube was changed from a size 3.0mm to a size 4.0mm. Data were collected
for 7 hours prior to and 5 hours after tube change and the results are summarised in
figure 4. Clinical status was stable and ventilator settings not altered during this period
suggesting that the observed changes in tidal volume, compliance and resistance were
attributable to the change o f tracheal tube.
It can be seen that the reduction in tracheal tube leak from over 80% to an average o f
16% was accompanied by a marked reduction in both the magnitude and variability o f
compliance (Figure 4b) and resistance (Figure 4c and 4d). While some o f the reduction
in leak can be attributed to the insertion o f a larger tracheal tube, (IS)this cannot
account for the magnitude o f change observed or the reduction in variability. In
addition, even within the smaller range o f leak that occurred after the tracheal tube had
been changed (11 - 23%) there was still a significant correlation (r^ = 0.84) between
calculated values o f resistance and magnitude o f leak (Figure 4c).
In an attempt to identify the magnitude o f leak that would preclude accurate
measurements, the median and inter-quartile range o f all values o f weight corrected
compliance for each o f the 75 children studied were plotted against the mean leak in that
child during the measurement period (Figure 5). Tracheal tube leaks greater than 20%
were associated with a marked rise in both the absolute values and the variability o f
weight corrected compliance. A similar pattern was obtained when resistance data were
plotted in the same way.
214
Discussion
These results confirm in vivo those o f previous in vitro lung model studies which show
that compliance and resistance values are overestimated in the presence o f tracheal tube
leak (11-13,19). Interpretation o f these findings is dependent both on the ability o f the
monitoring equipment to record volume and pressure changes accurately and the
absence o f various confounding issues such as changes in ventilatory management
and/or clinical status that can occur when undertaking such studies on the ICU.
Many o f the potential confounders were avoided by limiting measurements to paralysed
fully ventilated children in whom ventilatory settings remained unchanged during the
period o f monitoring. Since unit policy was to maintain a constant paralysis rather than
intermittently reducing doses, the observations reported in this paper should not have
been confounded by any changes in mechanics associated with waxing or waning o f the
muscle relaxant agent used.
Extensive bench testing to validate the accuracy o f the “ CO2 SMO Plus” sensors
suggested that the observed discrepancies between Vn and Vrc were indeed due to the
presence o f a tracheal tube leak rather than any equipment or software errors. The
importance o f assessing the accuracy o f both equipment and software used to assess
respiratory function in infants has been stressed in several recent publications (20-24)
Magnitude o f leak is conventionally assessed as the percentage difference between Vn
and Vte and as such there will obviously be a strong negative relationship between
percent leak and Vte However the clinical significance o f a calculated leak w ill to some
extent depend on the type o f ventilatory management.
During pressure controlled ventilation, leak magnitude reflects both overestimation o f
Vn, much o f which having passed through the flow-meter w ill leak out around the tube
before entering the child’s lungs, and the reduction in V te- In turn the latter w ill
primarily reflect a reduction in the actual delivered volume although in the presence o f a
very loose fitting tube or any secretions within the tube some expired air may shunt
through the leak pathway without passing through the flow-meter thereby
underestimating true expired volume. During pressure controlled ventilation there w ill
be some compensatory increase in delivered volume as the ventilator attempts to
maintain a constant peak inspired pressure whereas this w ill be far less marked during
volume controlled ventilation as shown in figure lb. Consequently, the same magnitude
o f leak is likely to reflect a greater reduction in delivered tidal volume during volume
2 1 5
than pressure controlled ventilation (25). Theoretically during pressure controlled
ventilation in the presence o f a very large leak and/or a low bias flow the time to reach
peak inflation pressure could be prolonged thereby rendering inspired volume artificially
larger relative to expired volume. In such circumstances the clinical significance o f the
observed leak would only be obviated i f expired volume remained constant. Such an
occurrence never occurred in this study, the magnitude o f the leak always being
primarily dependent on the reduction o f the expired tidal volume rather than
overestimation o f inspired tidal volume.
Thus, changes in tracheal tube leak do not simply confound the calculation o f
respiratory function parameters, but may be associated with significant clinical
consequences i f there is inconsistent ventilatory delivery. For example, inadequate
ventilation may occur i f the leak increases following a change in patient position,
whereas, unless appropriate modifications o f ventilator settings are made, excessive
ventilation with the attendant risks o f volutrauma or barotrauma can occur i f the leak
suddenly decreases. This study has illustrated the magnitude and variability o f leak
during routine intensive care. In general, the larger the mean leak, the greater the
variability both in delivered tidal volume and in the values calculated for compliance and
resistance. In the presence o f tracheal tube leak, apparent changes in compliance or
resistance may not reflect real clinical changes, but simply a change in the magnitude o f
leak due, for example, to physiotherapy or alterations in head, neck or body position.
Whether such changes have a beneficial or deleterious clinical effect w ill depend on the
adequacy o f ventilation prior to the intervention and the magnitude o f leak change.
Confusingly, the clinician will see an apparent “ improvement” in compliance but
"deterioration" in resistance as the leak gets larger, since both are increasingly
overestimated as leak increases, whereas the opposite is true i f a reduction in tracheal
tube leak occurs. Clinical decisions based on these data would be unsound and any
attempt to optimise ventilatoi"y management in order to achieve optimal blood gases
while minimising the risk o f lung injury is not possible in the presence o f such intra
subject variability.
Clinical interpretations may be further confounded by the fact that changes in the clinical
status o f the child may also cause changes in leak magnitude. Thus, a reduction in
respiratory compliance may result in an increased leak, which could in turn exacerbate
further clinical deterioration due to inadequate ventilatory delivery. Conversely, any
216
improvement in respiratory compliance could lessen the leak and further increase
ventilation delivery, potentially leading to over-inflation. This is in some ways analogous
to the situation that seemed to occur during the early trials o f surfactant, when failure to
adjust ventilator settings following surfactant therapy led to over-inflation o f the lungs
thereby masking any improvement in dynamic lung compliance due to the therapeutic
intervention (14,16,17,26,27)
Establishing how much leak is acceptable in a ventilated child depends very much on the
clinical status o f the child. The results from this study suggest that attempts to optimise
ventilatory management in the clinical situation are impossible in the presence o f tube
leaks greater than 15 - 20%. For satisfactoi*y clinical management and to avoid exposure
o f the child to sudden changes in tidal volume delivery and gas exchange, maximum leak
should not exceed 20% and variability o f leak should be < 10%.
Whereas measurements o f C,s appear to be more robust, any attempt to use resistance as
an outcome variable to evaluate therapeutic interventions such as steroid or
bronchodilator therapy would require negligible leak throughout the entire period o f
study. Such a condition may not be attainable unless a cuffed tube is in situ (1).
Sly et al suggested that the use o f the expiratoi-y portion o f each breath to calculate
respiratory mechanics might reduce the confounding effect o f leak but cautioned that
this method has not yet been thoroughly validated (14). A lung model study by Kondo et
al suggested that resistance could be reported reliably provided only the expiratory
portion o f the breath was used, when airway pressure was lower and hence leak smaller
(12). This is in contrast to the results from this in vivo study, which found that both
inspiratory and expiratory resistance were overestimated and unreliable in the presence
o f tracheal tube leak greater than 10%. The discrepancy in results between in vivo and in
vitro studies may be explained by the difficulty o f designing lung models to approximate
the clinical situation where the presence o f lung disease may exaggerate the effect o f
leak, and indicates that results from in-vitro studies should be interpreted with caution.
In addition, in the presence o f a large leak, changes in time constant and introduction o f
phase lags between flow and pressure signals are likely to invalidate the data collected
and the algorithms applied, irrespective o f phase o f the respiratory cycle. When
interpreting measurements o f resistance in ventilated infants, it should be noted that, in
addition to the presence o f any leak, measurements may be confounded by the resistance
o f the tracheal tube which may represent the largest component o f the total resistance,
217
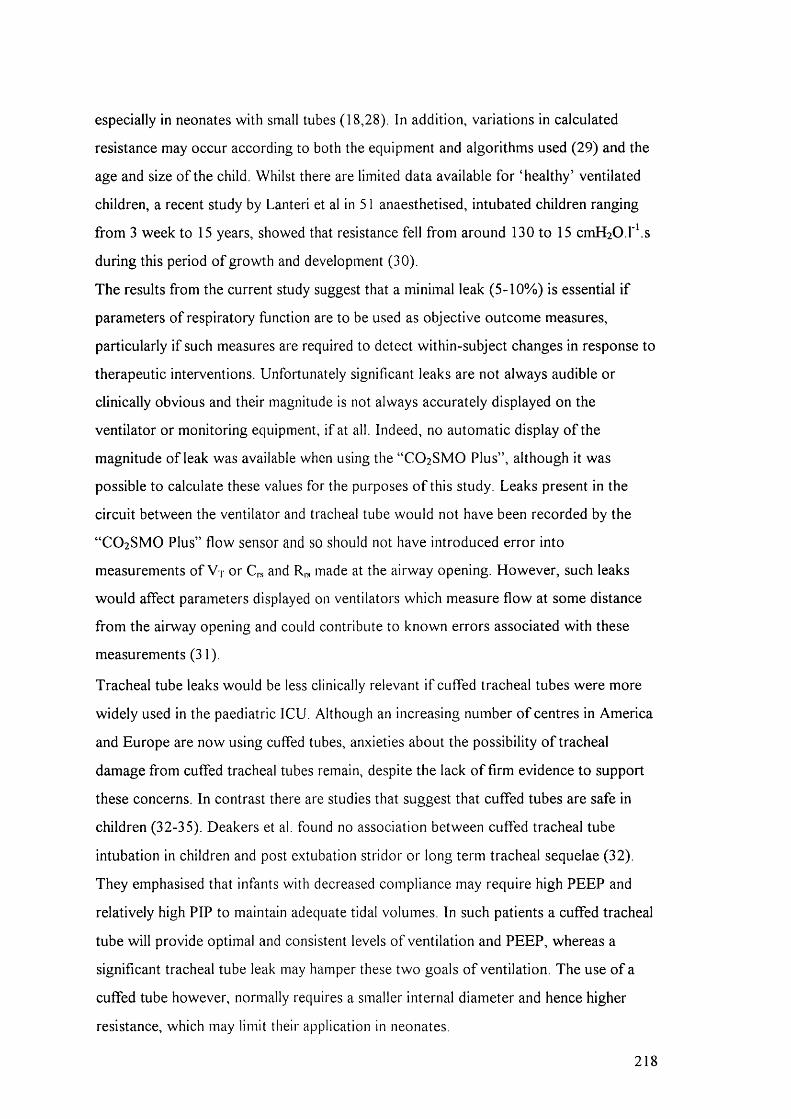
especially in neonates with small tubes (18,28). In addition, variations in calculated
resistance may occur according to both the equipment and algorithms used (29) and the
age and size o f the child. Whilst there are limited data available for ‘ healthy’ ventilated
children, a recent study by Lanteri et al in 51 anaesthetised, intubated children ranging
from 3 week to 15 years, showed that resistance fell from around 130 to 15 cmH20.1'\s
during this period o f growth and development (30).
The results from the current study suggest that a minimal leak (5-10%) is essential i f
parameters o f respiratory function are to be used as objective outcome measures,
particularly i f such measures are required to detect within-subject changes in response to
therapeutic interventions. Unfortunately significant leaks are not always audible or
clinically obvious and their magnitude is not always accurately displayed on the
ventilator or monitoring equipment, i f at all. Indeed, no automatic display o f the
magnitude o f leak was available when using the “ CO 2 SMO Plus” , although it was
possible to calculate these values for the purposes o f this study. Leaks present in the
circuit between the ventilator and tracheal tube would not have been recorded by the
“ CO2 SMO Plus” flow sensor and so should not have introduced error into
measurements o f Vp or C,s and made at the airway opening. However, such leaks
would affect parameters displayed on ventilators which measure flow at some distance
from the airway opening and could contribute to known errors associated with these
measurements (31).
Tracheal tube leaks would be less clinically relevant i f cuffed tracheal tubes were more
widely used in the paediatric ICU. Although an increasing number o f centres in America
and Europe are now using cuffed tubes, anxieties about the possibility o f tracheal
damage from cuffed tracheal tubes remain, despite the lack o f firm evidence to support
these concerns. In contrast there are studies that suggest that cuffed tubes are safe in
children (32-35). Deakers et al. found no association between cuffed tracheal tube
intubation in children and post extubation stridor or long term tracheal sequelae (32).
They emphasised that infants with decreased compliance may require high PEEP and
relatively high PIP to maintain adequate tidal volumes. In such patients a cuffed tracheal
tube w ill provide optimal and consistent levels o f ventilation and PEEP, whereas a
significant tracheal tube leak may hamper these two goals o f ventilation. The use o f a
cuffed tube however, normally requires a smaller internal diameter and hence higher
resistance, which may limit their application in neonates.
218
Conclusion
The magnitude o f tracheal tube leak is not stable in individual children and in general,
the larger the leak, the greater the variability o f respiratory function measurements
obtained. Leaks larger than 20% result in gross over-estimations o f compliance and
resistance irrespective o f mode o f ventilation. Even when leak is less than 20%, a
significant correlation between its magnitude and measures o f respiratory mechanics
remains. Consequently, measures o f respiratory function cannot be used to optimise
ventilatory management in the presence o f moderate to large leaks and it may become
clinically difficult to ensure consistent and adequate ventilation. I f changes in mechanics
are to be used as reliable outcome measures in ventilated children it is probably
advisable to ensure that the leak is less than 5-10% and the variability is small.
The magnitude o f leak needs to be accurately displayed on all ventilatory equipment to
facilitate appropriate clinical decisions. Further work is required to establish the
significance o f clinical changes (including blood gases) which accompany any change in
tracheal tube leak in specific groups o f ventilated children.
219
References1.Numa AH, Newth CJL (1995) Assessment o f lung function in the intensive care unit.
Pediatr Pulmonol 19:118-128
2.Rosen WC, Mammel MC, Fisher JM, Coleman JB, Bing DR, Holloman K, Boros S
(1993) The effects o f bedside pulmonary monitoring during infant mechanical
ventilation. Pediatr Pulmonol 16:147-152
3.Hjalmarson O (1994) Lung function testing - useless in ventilated newborns? Eur J
Pediatr 153:S22-S26
4.Macnaughton PD (1997) Assessment o f lung function in the ventilated patient.
Intensive Care Med 23:810-818
5.Stenson BJ, Glover RM, Wilkie RA, Laing lA , Tarnow-Mordi WO (1998)
Randomised controlled trial o f respiratory system compliance measurements in
mechanically ventilated neonates. Arch Dis Child 78:F15-F19
ô.Hammer J, Newth CJ (1995) Infant lung function testing in the intensive care unit.
Intensive Care Med 21 (9):744-752
7.Knauth A, Baumgart S (1990) Accurate, noninvasive quantitation o f expiratory gas
leak from uncuffed infant endotracheal tubes. Pediatr Pulmonol 9:55-60
8.Fox WW, Schwartz JO, Shaffer TH (1979) Effects o f endotracheal tube leaks on
functional residual capacity determination in intubated neonates. Pediatr Res 13 (1):60-
64
9.Krauel J (1993) Fourth European Workshop on Neonatology. Biol Neonate 64:167-
190
10.Perez FJ, Heldt OP, Gregory GA (1985) The effect o f a gas leak around the
endotracheal tube on the mean tracheal pressure during mechanical ventilation. Am Rev
Respir Dis 132 (2):339-342
11.Pyon KH, Pandit PB, Habib RH (1999) Effects o f airway leaks on lung volume:
recruitment and accuracy o f respiratory mechanics measurements (abstract). Am J
Respir Crit Care Med 159:A67I
12.Kondo T, Matsumoto 1, Lanteri CJ, Sly PD (1997) Respiratory mechanics during
mechanical ventilation: a model study on the effects o f leak around a tracheal tube.
Pediatr Pulmonol 24 (6):423-428
220

13.Kuo CY, Gerhardt T, Bolivar J, Claure N, Bancaiari E (1996) Effect o f leak around
the endotracheal tube on measurements o f pulmonary compliance and resistance during
mechanical ventilation: a lung model study. Pediatr Pulmonol 22:35-43
14. Sly PD, Lanteri C, Nicolai T (1996) Measurement o f respiratory function in the
intensive care unit. In: Stocks J, Sly PD, Tepper RS, Morgan WJ (eds), Infant
respiratory function testing, 1st edn. Wiley, New York, pp 445-484
15.Hammer J, Numa A, Patel N, et al. (1995) Normal values for pulmonary function in
intubated infants (abstract). Am J Respir Crit Care Med 151 (4): A439
16.Davis JM, Veness-Meehan K, Notter RH, Bhutani VK, Kendig JW, Shapiro D L
(1988) Changes in pulmonary mechanics after the administration o f surfactant to infants
with respiratory distress syndrome. N Engl J Med 319:476-479
17.Edberg KE, Ekstrom-Jodal B, Hallman M, Hjalmarson O, Sandberg K, Silberberg A
(1990) Immediate effects on lung function o f instilled human surfactant in mechanically
ventilated newborn infants with IRDS. Acta Paediatr Scand 79:750-755
18,Sly PD, Brown KA, Bates JHT, Spier S, M ilic-Em ili J (1988) Noninvasive
determination o f respiratoi"y mechanics during mechanical ventilation o f neonates; a
review o f current and future techniques. Pediatr Pulmonol 4:39-47
19.Pyon KH, Pandit PB, Courtney SE, Habib RH (2000) Airway leak effects on lung
mechanical estimates: role o f ventilatory settings (abstract). Am J Respir Crit Care Med
161 (3):A803
20.Wenzel U, Wauer RR, Wagner MH, Schmalisch G (1999) In vitro and in vivo
assessment o f the Ventrak 1550/Capnogard 1265 for single breath carbon dioxide
analysis in neonates. Br J Anaesth 83 (3):503-510
21.Frey U, Stocks J, Sly P, Bates J (2000) Specification for signal processing and data
handling used for infant pulmonary function testing. ERS/ATS Task Force on Standards
for Infant Respiratory Function Testing. European Respiratory Society/American
Thoracic Society. Eur Respir J 16 (5): 1016-1022
22.Frey U, Stocks J, Coates A, Sly P, Bates J (2000) Specifications for equipment used
for infant pulmonary function testing. ERS/ATS Task Force on Standards for Infant
Respiratory Function Testing. European Respiratory Society/ American Thoracic
Society. Eur Respir J 16 (4):73 1 -740
221
23.Schmalisch G, Foitzik B, Wauer RR, Stocks J (2000) In vitro assessment o f
equipment and software used to assess tidal breathing parameters in infants. Eur Respir J
17:100-107
24. Jackson EA, Coates AL, Gappa M, Stocks J (1995) In vitro assessment o f infant
pulmonary function equipment. Pediatr Pulmonol 19:205-213
25. Watt JW, Fraser M H (1994) The effect o f insufflation leaks upon ventilation. A
quantified comparison o f ventilators. Anaesthesia 49 (4):320-323
26.Kelly E, Bryan H, Possmayer F, Frndova H, Bryan C (1993) Compliance o f the
respiratory system in newborn infants pre- and postsurfactant replacement therapy.
Pediatr Pulmonol 15:225-230
27.Goldsmith LS, Greenspan JS, Rubenstein SD, Wolfson MR, Shaffer TH (1991)
Immediate improvement in lung volume after exogenous surfactant: alveolar recruitment
versus increased distension. J Pediatr 1 19:424-428
28.Le Souëf PN, England SJ, Bryan AC (1984) Total resistance o f the respiratory
system in preterm infants with and without an endotracheal tube. J Pediatr 104:108-111
29.Maher JK, Hugen CAC, MacLaughlin EF, Deakers TW, Newth CJL (1998)
Comparison o f dynamic and passive measurements o f respiratory mechanics in
ventilated infants and children (abstract). Am J Respir Crit Care Med 157:A122
30.Lanteri CJ, Sly PD (1993) Changes in respiratory mechanics with age. J Appl Physiol
74:369-378
31.Cannon M L, Cornell J, Tripp-Hamel DS, Gentile M A, Hubble CL, Meliones JN,
Cheifetz IM (2000) Tidal volumes for ventilated infants should be determined with a
pneumotachometer placed at the endotracheal tube. Am J Respir Crit Care Med 162
(6):2109-2112
32.Deakers TW, Reynolds G, Stretton M, Newth CJL (1994) Cuffed endotracheal tubes
in pediatric intensive care. J Pediatr 125:57-62
33.Khine HH, Corddry DH, Kettrick RG, Martin TM , McCloskey JJ, Rose JB, Theroux
MC, Zagnoev M (1997) Comparison o f cuffed and uncuffed endotracheal tubes in
young children during general anesthesia. Anesthesiology 86 (3):627-631
34.Browning DH, Graves SA (1983) Incidence o f aspiration with endotracheal tubes in
children. J Pediatr 102 (4):582-584
222

35.Newth CJL, Rachman B, Patel N, Hammer J (2000) Cuffed versus uncuffed
endotracheal tubes in pediatric intensive care (abstract). Am J Respir Crit Care Med 161
(3):A79
223
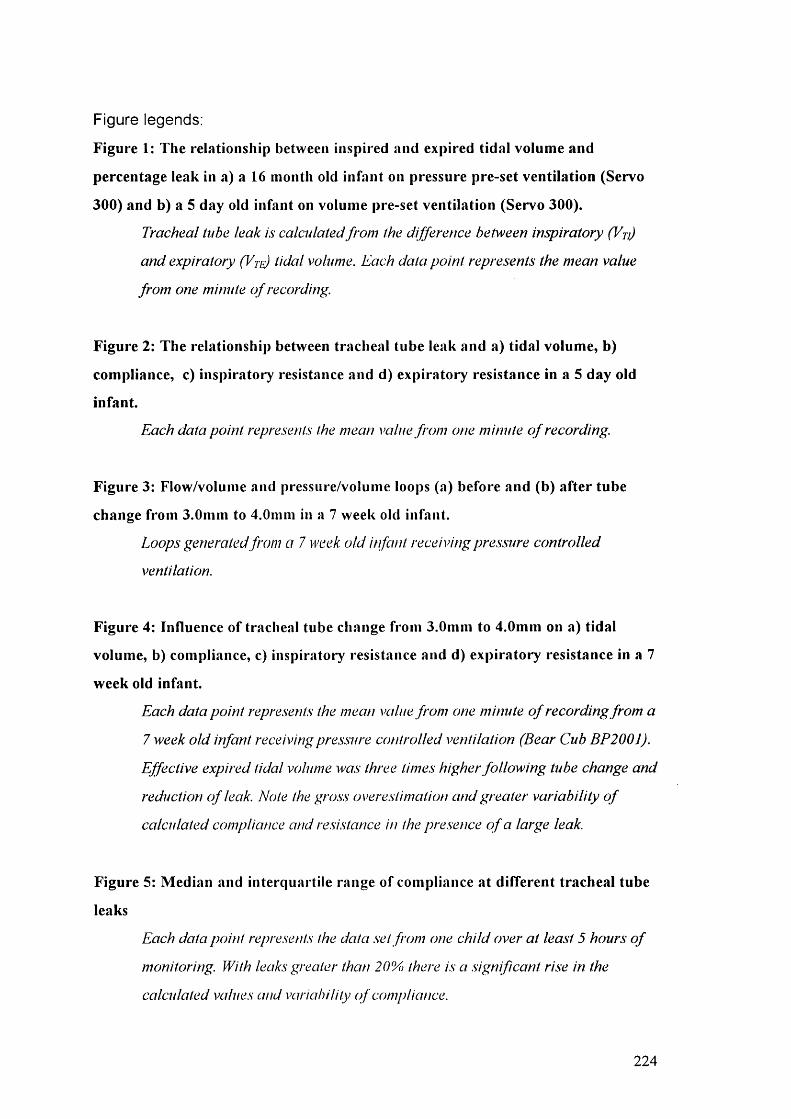
Figure legends:
Figure 1: The relationship between inspired and expired tidal volume and
percentage leak in a) a 16 month old infant on pressure pre set ventilation (Servo
300) and b) a 5 day old infant on volume pre set ventilation (Servo 300).
Tracheal tube leak is calculated from the difference between inspiratory (V ti)
and expiratory (V te) tidal volume. Each data point represents the mean value
from one minute o f recording.
Figure 2: The relationship between tracheal tube leak and a) tidal volume, b)
compliance, c) inspiratory resistance and d) expiratory resistance in a 5 day old
infant.
Each data point repre.sents the mean value from one minute o f recording.
Figure 3: Flow/volume and pressure/volume loops (a) before and (b) after tube
change from 3.0mm to 4.0mm in a 7 week old infant.
Loops generated from a 7 week o ld infant receiving pres.sure controlled
ventilation.
Figure 4: Influence of tracheal tube change from 3.0mm to 4.0mm on a) tidal
volume, b) compliance, c) inspiratoi*y resistance and d) expiratory resistance in a 7
week old infant.
Each data point represents the mean value from one minute o f recording from a
7 week o ld infant receiving pressure controlled ventilation (Bear Cmb BP2001).
Effective expired tidal volume was three times higher fo llow ing tube change and
reduction o f leak. Note the gross overestimation and greater variab ility o f
calculated compliance and resistance in the pre.sence o f a large leak.
Figure 5: Median and interquartile range of compliance at different tracheal tube
leaks
Each data point represents the data set from one ch ild over at least 5 hours o f
monitoring. With leaks greater than 20% there is a significant rise in the
calculated values and variability o f compliance.
224
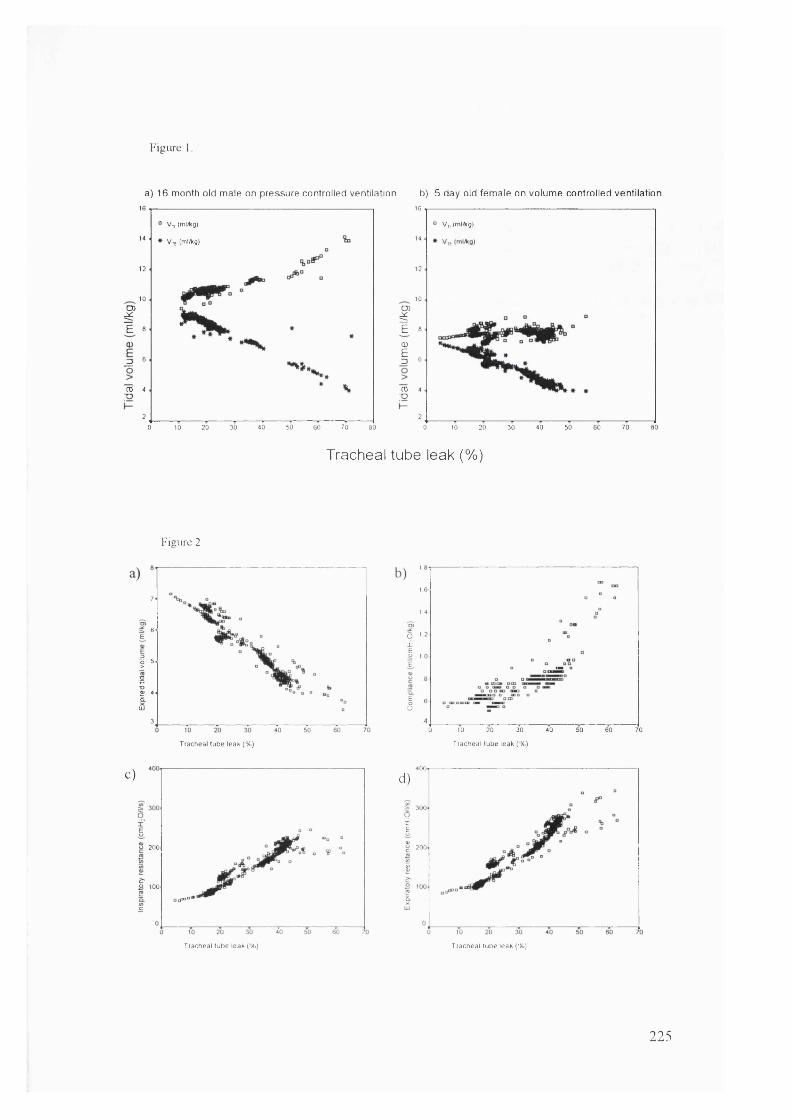
Figure
a) 16 month old male on pressure controlled ventilation b) 5 day old female on volume controlled ventilation
fE
g
ro■ o
16“ Vy, (ml/kg)
14 * V,E (ml/Kg)
12
10
8
6
4
2
30 40 50 60 700 10 20 80
fE,cuE
TO■D
16
° V „ (ml/kg)
14
12
10
8
6
4
2
20 30 40 50 60 70 800 10
Figure 2
Tracheal tube leak (%)
7
6E
I 'srUJ
3
1
I
a 1x ’
1 1 E
I0 10 20 30 40 50 60 70
Trachea l tube leak (% ) Trachea l tu b e leak (% )
c)
5 200
'Ao 100
T racheal tube leak (% )
4 0 0.d )
300.px'E
20 0 .CS
T rachea l tube leak (% )
225
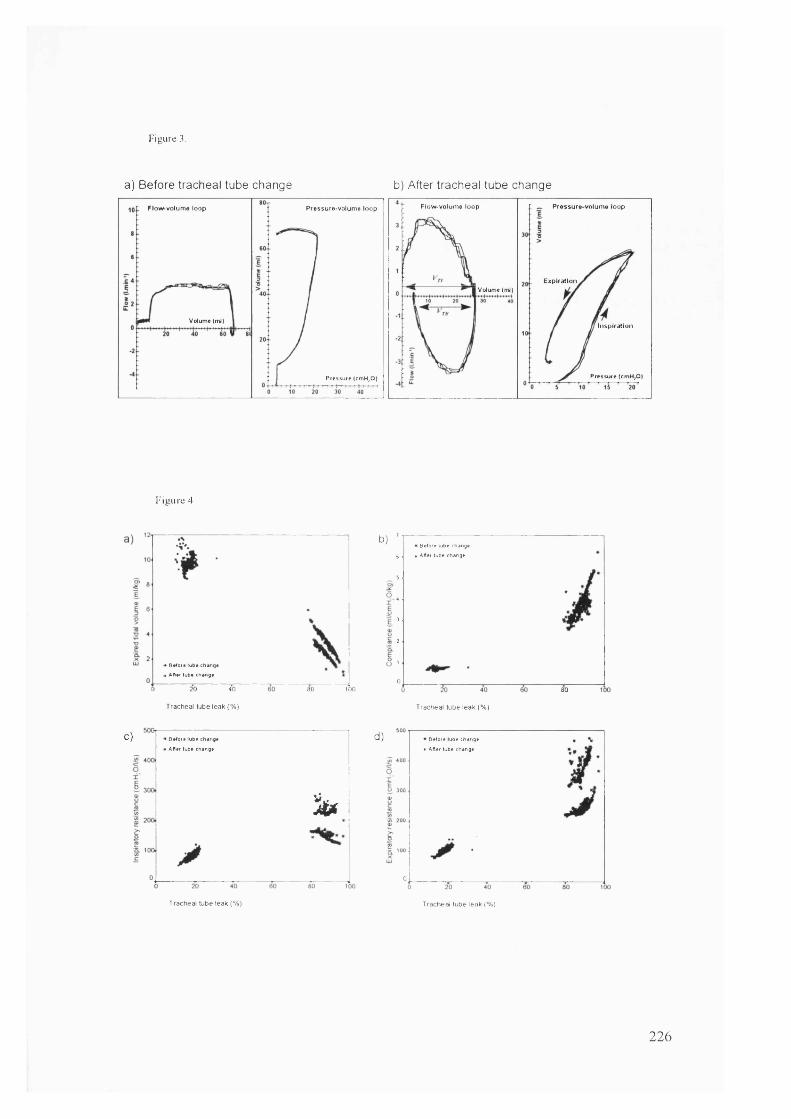
Figure 3.
a) Before tracheal tube change b) After tracheal tube change
F low -vo lum e loop P ressure vo lum e loopF low -vo lum e loop Pressure-vo lum e loop
E xp ira tionVolume (ml)
Volume (ml)In s p ira tio n
Pressure (cmH,0|Pressure |cmH,0)
Figure 4
• Before tube change
, After tube change
10 ' 40
Tracheal tube leak (% )
80 too
b)Before lube change
Alter tube change
080
Tracheal tube leak (% )
C) • Before lube change
I After lube change
% (
d) Before lube change
After lube change
0
Tracheal tube leak |% ) Tracheal tube leak (% |
226
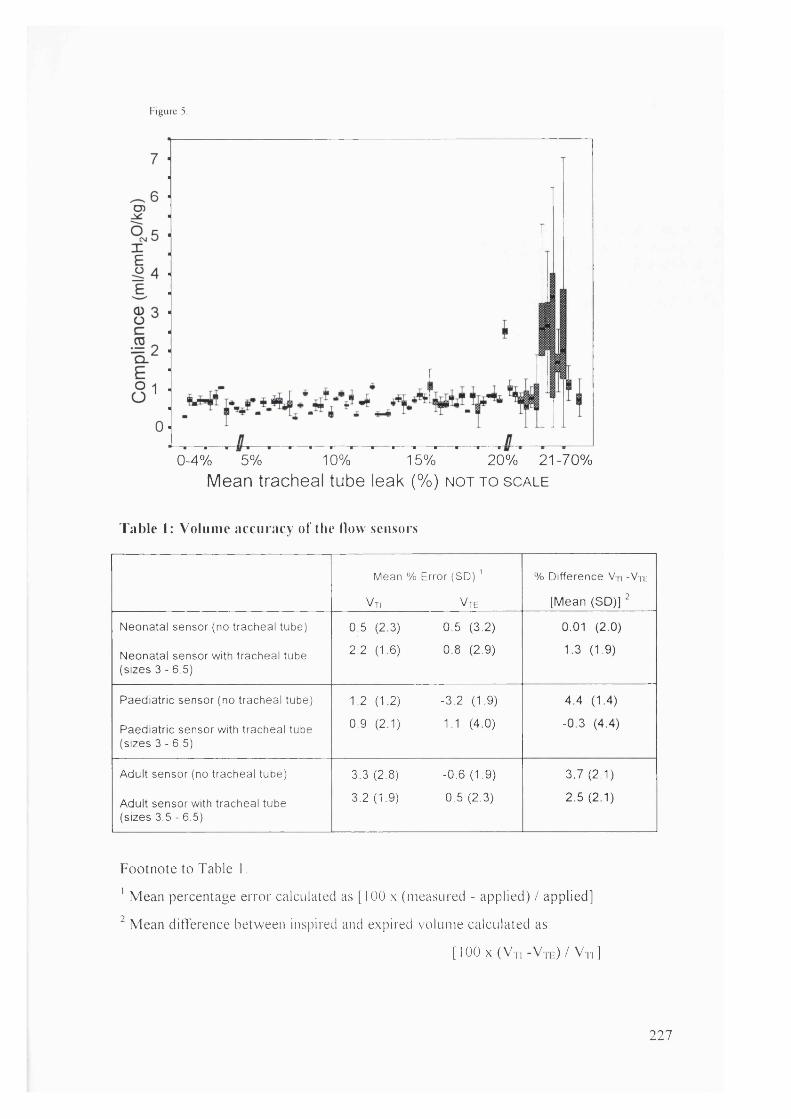
Figure 5.
0-4% 5% 10% 15% 20% 21-70%Mean tracheal tube leak (%) n o t t o s c a le
Table 1: Volume accuracy of the How sensors
Mean % Error (SO)
Vti Vte
% Difference V,i -Vtk
[Mean (SD)] ^
Neonatal sensor (no tracheal tube) 0.5 (2.3) 0.5 (3.2) 0.01 (2.0)
Neonatal sensor with tracheal tube (sizes 3 - 6.5)
2.2 (1.6) 0.8 (2.9) 1.3 (1.9)
Paediatric sensor (no tracheal tube) 1.2 (1.2) -3.2 (1.9) 4.4 (1.4)
Paediatric sensor with tracheal tube (sizes 3 - 6.5)
0.9 (2.1) 1.1 (4.0) -0.3 (4.4)
Adult sensor (no tracheal tube) 3.3 (2.8) -0.6 (1.9) 3.7 (2.1)
Adult sensor with tracheal tube (sizes 3.5 - 6.5)
3.2 (1.9) 0.5 (2.3) 2.5 (2.1)
Footnote to Table I .
' Mean percentage error calculated as [100 x (measured - applied) / applied]
Mean ditTerence between inspired and expired volume calculated as:
[ I O O x ( V n - V | , . : ) / V n ]
227
9. Reference List
Ackerman, M.H. (1993) The effect o f saline lavage prior to suctioning. Am J.Crit.Care
2, 326-330.
Ackerman, M.H. and M ick, D.J. (1998) Instillation o f normal saline before suctioning in
patients with pulmonary infections: a prospective randomized controlled trial.
Am J.Crit.Care 7, 261-266.
Amato, M B , Barbas, C.S., Medeiros, D M., Magaldi, R.B., Schettino, G.P., Lorenzi-
Filho, G , Kairalla, R A , Deheinzelin, D , Munoz, C , Oliveira, R , Takagaki, T.Y. and
Carvalho, C.R. (1998) Effect o f a protective-ventilation strategy on mortality in the
acute respiratory distress syndrome . N.ErtgU.Med. 338,347-354.
Ambrosino, N., Callegari, G , Galloni, C , Brega, S. and Pinna, G. (1995) Clinical
evaluation o f oscillating positive expiratory pressure for enhancing expectoration in
diseases other than cystic fibrosis. M onaldi Arch Chest D is 50, 269-275.
American Thoracic Society (1986) Pulmonai'y function laboratory personnel
qualification and quality assurance in pulmonary function laboratories.
Am.Rev.Respir.Dis. 133/4, 623-627.
American Thoracic Society (1995) Standardization o f Spirometery 1994 Update.
Am.J.Respir. Crit. Care.Med. 152, 1107-1 136.
Appendini, L.M . and Marco, M.D. (2001) Clinical relevance o f monitoring respiratory
mechanics in the ventilator-supported patient: an update (1995-2000). Current Opinion
in C ritica l Care 7, 41-48.
Armsby, D.H., Bellon, G., Carlisle, K., Rector, D , Baldwin, R , Long, W., Stevenson,
D.K. and Ariagno, R.L. (1992) Delayed compliance increase in infants w ith respiratory
distress syndrome following synthetic surfactant. Pediatr.Pulmonol. 14, 206-213.
Arnold, J.H., Bower, L.K. and Thompson, I.E. (1995) Respiratory deadspace
measurements in neonates with congenital diaphragmatic hernia. Crit Care M ed 23,
371-375.
228
Arnold, J H , Stenz, R.I., Thompson, J E. and Arnold, L.W. (1996) Noninvasive
determination o f cardiac output using single breath CO2 analysis. C rit Care M ed 24,
1701-1705.
Arnold, J.H., Thompson, I.E. and Arnold, L.W. (1996) Single breath C 02 analysis:
description and validation o f a method. C rit Care M ed 24, 96-102.
Arnold, J.H., Thompson, I.E. and Benjamin, P.K. (1993) Respiratory deadspace
measurements in neonates during extracorporeal membrane oxygenation. C rit Care
M ed 21, 1895-1900.
Baker, R.W. and Burki, N.K. (1987) Alterations in ventilatory pattern and ratio o f
dead-space to tidal volume. Chest 92, 1013-1017.
Barer, G.R. (1989) Hypoxia and the pulmonai'y circulation: a brie f review. Z E rkr
Atmimgsorgane 173, 109-115.
Barker, M. and Eales, C.J. (2000) The effects o f manual hyperflation using self-inflating
manual resuscitation bags on arterial oxygen tensions and lung compliance - a meta
analysis o f the literature. South African Journal o f Physiotherapy, 56(1):7-16
Bartlett, R.H., Gazzaniga, A.B. and Geraghty, T.R. (1973) Respiratory maneuvers to
prevent postoperative pulmonary complications. A critical review. JAMA 224, 1017-
1021 .
Bateman, J R , Newman, S.P., Daunt, K.M ., Sheahan, N.F., Pavia, D. and Clarke, S.W.
(1981) Is cough as effective as chest physiotherapy in the removal o f excessive
tracheobronchial secretions? Thorax 36, 683-687.
Batra, G , Traystman, R , Rudnick, H. and Menkes, H. (1981) Effects on body position
and cholinergic blockade on mechanics o f collateral ventilation. Journal o f Applied
Physiology: Respiratory, Environmental & Exercise J^hysiology 50, 358-362.
Beck, K.C., Vettermann, J. and Rehder, K. (1992) Gas exchange in dogs in the prone
and supine positions. J.Appl.Physiol 72, 2292-2297.
Beeby, P.J., Henderson-Smart, D.J., Lacey, J.L. and Rieger, 1. (1998) Short- and long
term neurological outcomes following neonatal chest physiotherapy. J Paediatr Child
Health 34, 60-62.
229
Bermudez, J. and Lichtiger, M. (1987) Increases in arterial to end-tidal CO2 tension
differences after cardiopulmonary bypass. Am slh Arialg 66, 690-692.
Bhavani-Shankar, K., Steinbrook, R.A., Brooks, D C and Datta, S. (2000) Arterial to
end-tidal carbon dioxide pressure difference during laparoscopic surgery in pregnancy.
Anesthesiology 93, 370-373.
Bhutan!, V.K., Sivieri, E.M., Abbasi, S. and Shaffer, T.H. (1988) Evaluation o f
neonatal pulmonary mechanics and energetics: a two factor least mean square analysis.
Pediatr.Pulmonol 4, 150-158.
Bhuyan, U., Peters, A.M., Gordon, 1., Davies, H. and Helms, P. (1989) Effects o f
posture on the distribution o f pulmonary ventilation and perfusion in children and adults.
Thorax 44, 480-484.
Bialecki, R.A., Fisher, C.S., Murdoch, W.W., Barthlow, H G , Stow, R.B., Mallamaci,
M . and Rumsey, W. (1998) Hypoxic exposure time dependently modulates endothelin-
induced contraction o f pulmonary artery smooth muscle. Am J Physiol 274, L552-
L559
Blackwood, B. (1999) Normal saline instillation with endotracheal suctioning: primum
non nocere (first do no harm). J Adv Nurs 29, 928-934.
Bland, J.M. and Altman, D.G. (1995) Comparing methods o f measurement: why
plotting difference against standard method is misleading. Lancet 346, 1085-1087.
Bland, J.M. and Altman, D.G. (1999) Measuring agreement in method comparison
studies. Statistical Methods in Medical Research 8, 135-160.
Bland, J.M. and Altman, D.J. (1986) Statistical methods for assessing agreement
between two methods o f clinical measurement. Lancet 307-310.
Bodai, B 1 (1982) A means o f suctioning without cardiopulmonary depression. Heart
Lung 11, 172-176.
Boothroyd, A E , Murthy, B.V., Darbyshire, A. and Petros, A.J. (1996) Endotracheal
suctioning causes right upper lobe collapse in intubated children. Acta Paediatr 85,
1422-1425.
230

Bostick, J. and Wendelgass, S T. (1987) Normal saline instillation as part o f the
suctioning procedure: effects on Pa02 and amount o f secretions. Heart Lung 16, 532-
537.
Brandstater, B. and Muallem, M. (1969) Atelectasis following tracheal suction in
infants. Anesthesiology 31,468-473.
Brimioulle, S., Moraine, J.J., Norrenberg, D. and Kahn, R.J. (1997) Effects o f
positioning and exercise on intracranial pressure in a neurosurgical intensive care unit.
Phys Ther 77, 1682-1689.
Britton, S., Bejstedt, M. and Vedin, L. (1985) Chest physiotherapy in primary
pneumonia. B r M ed J (Clin Res Ed) 290, 1703-1704.
Broseghini, C , Brandolese, R., Poggi, R., Polese, G., Manzin, E., M ilic-Em ili, J. and
Rossi, A. (1988) Respiratory mechanics during the first day o f mechanical ventilation in
patients with pulmonary edema and chronic airway obstruction. Am.Rev.Respir.Dis.
138, 355-361.
Brown, K., Sly, P D , M ilic-Emili, J. and Bates, J.H. (1989) Evaluation o f the flow -
volume loop as an intra-operative monitor o f respiratory mechanics in infants. Pediatr
Pulmonol 6, 8-13.
Brown, S.E., Stansbury, D.W., Merrill, E.J., Linden, O S. and Light, R.W. (1983)
Prevention o f suctioning-related arterial oxygen desaturation. Comparison o f off-
ventilator and on-ventilator suctioning. Chest 83, 621-627.
Brucia, J. and Rudy, E. (1996) The effect o f suction catheter insertion and tracheal
stimulation in adults with severe brain injury. Heart & Lung: Journal o f Acute &
C ritica l Care. 25,295-303.
Brucia, J.J. (1993) The effect o f suction catheter insertion on head injured adults.
Western Reserve University (Health Science.s).
Burki, N.K. (1986) The dead space to tidal volume ratio in the diagnosis o f pulmonary
embolism. Am Rev Re.spir Dis 133, 679-685.
231

Burrows, F. A. (1989) Physiologic dead space, venous admixture, and the arterial to
end-tidal carbon dioxide difference in infants and children undergoing cardiac surgery.
Anesthesiology 70, 219-225.
Button, B.M ., Heine, R.G., Catto-Smith, A G., Phelan, P.O. and Olinsky, A. (1997)
Postural drainage and gastro-oesophageal reflux in infants with cystic fibrosis. Arch Dis
C hild 76, 148-150.
Button, B.M., Heine, R.G., Catto-Smith, A.G. and Phelan, P.O. (1998) Postural
drainage in cystic fibrosis: is there a link with gastro-oesophageal reflux? J Paediatr
C hild Health 34,330-334.
Button, B.M. (1999) Postural drainage techniques and gastro-oesophageal reflux in
infants with cystic fibrosis. Eur Respir J 14, 1456-1457.
Cabal, L., Devaskar, S., Siassi, B., Plajstek, C , Waffarn, P., Blanco, C. and Hodgman,
J. (1979) New endotracheal tube adaptor reducing cardiopulmonary effects o f
suctioning. C rit Care M ed 7, 552-555.
Campbell, A.H., O'Connell, J.M. and Wilson, F. (1975) The effect o f chest
physiotherapy upon the FEVi in chronic bronchitis. M ed J Anst 1, 33-35.
Campbell, F A , McLeod, M.E., Bissonnette, B. and Swartz, J.S. (1994) End-tidal
carbon dioxide measurement in infants and children during and after general anaesthesia.
CanJAnaesth 41, 107-110.
Cannon, M L., Cheifetz, I.M ., Craig, D M., Hubble, C.L., Quick, G , Ungerleider, R M ,
Smith, P.K. and Meliones, J.N. (1999) Optimizing liquid ventilation as a lung protection
strategy for neonatal cardiopulmonai-y bypass: full functional residual capacity dosing is
more effective than half functional residual capacity dosing. Crit. Care M ed 27, 1140-
1146.
Cannon, M L., Cornell, J., Tripp-Hamel, D.S., Gentile, M .A ., Hubble, C.L., Meliones,
J.N. and Cheifetz, I.M . (2000) Tidal volumes for ventilated infants should be
determined with a pneumotachometer placed at the endotracheal tube. Aw J Respir C rit
Care M ed 162, 2109-2112.
232

Casati, A., Salvo, I., Torri, G. and Calderini, E. (1997) Arterial to end-tidal carbon
dioxide gradient and physiological dead space monitoring during general anaesthesia:
effects o f patients'position. Minerva Amslesiol 63, 177-182.
Channick, R.N., Newhart, J.W., Johnson, F.W. and Moser, K .M . (1994) Inhaled nitric
oxide reverses hypoxic pulmonary vasoconstriction in dogs. A practical nitric oxide
delivery and monitoring system. Chest 105,1842-1847.
Chatte, G., Sab, J.M., Dubois, J.M., Sirodot, M ., Gaussorgues, P. and Robert, D.
(1997) Prone position in mechanically ventilated patients with severe acute respiratory
failure. Am.J.Respir.Crii.Care Med. 155,473-478.
Chen, H.C., Liu, C Y , Cheng, H.F., Ho, S C , Chiang, L.L. and Kuo, H P (1998)
Chest physiotherapy does not exacerbate gastroesophageal reflux in patients with
chronic bronchitis and bronchiectasis. Changgenp^ Yi Xne Za Zhi 21, 409-414.
Chow, L., Vanderhal, A., Raber, J. and Sola, A. (2000) Measurement o f tidal volume
o f neonates: are pulmonary mechanics monitors affected by different ventilators?
Am.J.Respir.Crit.Care.Med. 161, A800-A800(Abstract)
Chulay, M. and Graeber, G.M. (1988) Efficacy o f a hyperinflation and
hyperoxygenation suctioning intervention. Heart Lvng 17, 15-22.
Ciesla, N.D. (1996) Chest physical therapy for patients in the intensive care unit. Phys
Ther 76, 609-625.
Ciesla, N.D., Klemic, N. and Imle, P C (1981) Chest physical therapy for the patient
w ith multiple trauma. Physical Therapy 61, 202-205.
Clark, A.P., Winslow, E.H., Tyler, D.O. and White, K.M . (1990) Effects o f
endotracheal suctioning on mixed venous oxygen saturation and heart rate in critically ill
adults. Heart Lung 19, 552-557.
Clarke, R.C., Kelly, B E., Convery, P.N. and Fee, J.P. (1999) Ventilatory
characteristics in mechanically ventilated patients during manual hyperventilation for
chest physiotherapy. Anaesthesia 54, 936-940.
Clement, A.J. and Hubsch, S.K. (1968) Chest physiotherapy by the 'bag squeezing'
method: a guide to technique. Physiotherapy 54, 355-359.
233
Clough, J.B., Duncan, A.W. and Sly, P.O. (1994) The effect o f sustained positive
airway pressure on derived cardiac output in children. Ariaeslhesia S: Intensive Care
22, 30-34.
Cochrane, G.M., Webber, B.A. and Clarke, S.W. (1977) Effects o f sputum on
pulmonary function. B rM e d J 2, 1181-1183.
Cohen, D , Horiuchi, K., Kemper, M. and Weissman, C. (1996) Modulating effects o f
propofol on metabolic and cardiopulmonary responses to stressful intensive care unit
procedures. C rit Care M ed 24,612-617.
Cohen, E. (1997) Physiology o f the lateral position and one-lung ventilation. Chest
S u rg C lin N A m 7,753-771.
Connors, A.F., Hammon, W.E., Martin, R.J. and Rogers, R M (1980) Chest physical
therapy. The immediate effect on oxygenation in acutely ill patients. Chest 78, 559-
564.
Conti, G , Vilardi, V., Rocco, M,, DeBlasi, R A , Lappa, A., Bufi, M., Antonelli, M. and
Gasparetto, A. (1995) Paralysis has no effect on chest wall and respiratory system
mechanics o f mechanically ventilated, sedated patients. Intensive. Care Med. 21, 808-
812.
Crosby, L.J. and Parsons, L.C. (1992) Cerebrovascular response o f closed head-injured
patients to a standardized endotracheal tube suctioning and manual hyperventilation
procedure. JNenrosci Nnrs 24,40-49.
Czarnik, R E., Stone, K.S., Everhart, C.J. and Preusser, B.A. (1991) Differential effects
o f continuous versus intermittent suction on tracheal tissue. Heart & Lung: Journal o f
C ritica l Care. 20, 144-151.
Davies, H., Kitchman, R , Gordon, 1. and Helms, P. (1985) Regional ventilation in
infancy. Reversal o f adult pattern. N.Engl. J.Med. 313, 1626-1628.
Davis, G.M., Stocks, J., Gerhardt, T., Abbasi, S. and Gappa, M. (1996) The
Measurement o f Dynamic Lung Mechanics in Infants. In; Stocks, J., Sly, P D , Tepper,
R.S. and Morgan, W J , (Eds.) Infant Respiratory Function Testing, 1 edn. pp. 258-
282. New York: John Wiley & Sons, Inc.
234
Davis, J.M., Veness-Meehan, K., Notter, R.H., Bhutan], V.K., Kendig, J.W. and
Shapiro, D.L. (1988) Changes in pulmonary mechanics after the administration o f
surfactant to infants with respiratory distress syndrome. N.Engl.J.Med. 319, 476-479.
De Canniere, D , Stefanidis, C., Hallemans, R , Delcroix, M ., Brimioulle, S. and Naeije,
R. (1992) Stimulus-response curves for hypoxic pulmonary vasoconstriction in piglets.
Cardiovasc Res 26, 944-949.
Dean, E. (1985) Effect o f body position on pulmonary function. Phys Ther 65,613-
618.
Dean, E. (1997) Oxygen transport deficits in systemic disease and implications for
physical therapy. Phys Ther 77, 187-202.
Dean, E. and Ross, J. (1992) Discordance between cardiopulmonary physiology and
physical therapy. Toward a rational basis for practice. Chest 101, 1694-1698.
Dezateux, C. and Stocks, J. (1997) Lung development and early origins o f childhood
respiratory illness. Br.M ed.Buli 53,40-57.
Dhand, R. and Tobin, M.J. (1997) Inhaled bronchodilator therapy in mechanically
ventilated patients. AmJ.Respir.Crit.Care A4ed. 156, 3-10.
DiCarlo, J.V., Raphaely, R C , Steven, J.M., Norwood, W .l. and Costarino, A T. (1992)
Pulmonary mechanics in infants after cardiac surgery. 0 /7 Care Med 20, 22-27.
Domino, K B , Cheney, F.W., Eisenstein, B.L. and Hlastala, M.P. (1992) Effect o f
regional alveolar hypoxia on gas exchange in pulmonary edema. Am Rev Respir D is
145, 340-347.
Domino, K.B., Eisenstein, B.L., Tran, T. and Hlastala, M.P. (1993) Increased
pulmonary perfusion worsens ventilation-perfusion matching. Anesthesiology 79, 817-
826.
Dorges, V., Ocker, H., Hagelberg, S., Wenzel, V., Idris, A H. and Schmucker, P.
(2000) Smaller tidal volumes with room-air are not sufficient to ensure adequate
oxygenation during bag-valve-mask ventilation. Resuscitation 44, 37-41.
235

Dreyfuss, D. and Saumon, G. (1993) Role o f Tidal Volume,FRC, and End-inspiratory
Volume in the Development o f Pulmonai'y Edema following Mechanical Ventilation.
Am.Rev.Respir.Dis. 148, 1194-1203.
Dreyfuss, D. and Saumon, G. (1998) Ventilator-induced lung injury; lessons from
experimental studies. Am.J.Respir.Crit.Care.Med. 157, 294-323.
Druding, M.C. (1997) Re-examining the practice o f normal saline instillation prior to
suctioning. Medsiirg.Nurs. 6, 209-212.
Dull, J.L. and Dull, W.L. (1983) Are maximal inspiratory breathing exercises or
incentive spirometry better than early mobilization after cardiopulmonary bypass? Phys
Ther 63, 655-659.
Dulock, H.L. (1991) Chest physiotherapy in neonates: a review. AACN C lin Issues
C rit Care Nurs 2, 446-452.
Durand, M., Sangha, B., Cabal, L.A., Hoppenbrouwers, T. and Hodgman, J E (1989)
Cardiopulmonary and intracranial pressure changes related to endotracheal suctioning in
preterm infants. C rit Care Med 17, 506-510.
Eales, C.J., Barker, M. and Cubberley, N.J. (1995) Evaluation o f a single chest
physiotherapy treatment to post-operative, mechanically ventilated cardiac surgery
patients. Physiotherapy Theory & Practice l l( l) :2 3 -8
Edberg, K.E., Ekstrom-Jodal, B., Hallman, M., Hj aim arson, 0 ., Sandberg, K. and
Silberberg, A. (1990) Immediate effects on lung function o f instilled human surfactant
in mechanically ventilated newborn infants with IRDS. Acta Paediatr.Scand. 79, 750-
755.
Eriksson, L., Wollmer, P., Jonson, B., Fletcher, R , Albrechtsson, U., Larusdottir, H.
and Olsson, C.G. (1985) SBT-C02: a new method for the diagnosis o f pulmonary
embolism? Clin Physiol 5 Suppl 3, 111-115.
Eriksson, L., Wollmer, P., Olsson, C G , Albrechtsson, U., Larusdottir, H., Nilsson, R.,
Sjogren, A. and Jonson, B. (1989) Diagnosis o f pulmonary embolism based upon
alveolar dead space analysis. Chest 96, 357-362.
236
Ersson, U., Carlson, H., Meiistrom, A., Ponten, U., Hedstrand, U. and Jakobsson, S.
(1990) Observations on intracranial dynamics during respiratory physiotherapy in
unconscious neurosurgical patients. Acta Anaeslhesiol Scand 34, 99-103.
Etches, P C and Scott, B. (1978) Chest physiotherapy in the newborn: effect on
secretions removed. Pediatrics 62,713-715.
Fanconi, S. and Due, G. (1987) Intratracheal suctioning in sick preterm infants:
prevention o f intracranial hypertension and cerebral hypoperfusion by muscle paralysis.
Pediatrics 79, 538-543.
Farstad, T. and Bratlid, D. (1991) Effects o f endotracheal tube size and ventilator
settings on the mechanics o f a test system during intermittent flow ventilation.
Pediatr.Pulmonol. 11, 15-21.
Finer, N.N. and Boyd, J. (1978) Chest physiotherapy in the neonate: a controlled study.
Pediatrics 61, 282-285.
Flanagan, J.F., Garrett, J.S., McDuffee, A. and Tobias, J.D. (1995) Noninvasive
monitoring o f end-tidal carbon dioxide tension via nasal cannulas in spontaneously
breathing children with profound hypocarbia. C rit Care M ed 23, 1140-1142.
Flenady, V.J. and Gray, P H. (2000) Chest physiotherapy for preventing morbidity in
babies being extubated from mechanical ventilation. Cochrane Database Syst Rev
CD000283
Fletcher, M E., Ewert, M., Stack, C , Hatch, D.J. and Stocks, J. (1990) Influence o f
tidal volume on respiratory compliance in anesthetized infants and young children.
J.Appl.Physiol. 68, 1127-1133.
Fletcher, M E., Stack, C , Ewart, M., Davies, C.J., Ridley, S., Hatch, D.J. and Stocks, J
(1991) Respiratory compliance during sedation, anesthesia, and paralysis in infants and
young children. J.Appl.Physiol. 70, 1977-1982.
(a) Fletcher, R. (1984) Airway deadspace, end-tidal C02, and Christian Bohr. Acta
Anaesthe.siol Scand 28, 408-41 1.
(a) Fletcher, R. (1986) On-line expiratory C02 monitoring. In t J Clin M on it Comput
3, 155-163.
237

Fletcher, R. (1989) Relationship between alveolar deadspace and arterial oxygenation in
children with congenital cardiac disease. B r J Anaesth 62, 168-176.
Fletcher, R. (1991) The relationship between the arterial to end-tidal PC02 difference
and hemoglobin saturation in patients with congenital heart disease. Anesthesiology 75,
210-216.
(b) Fletcher, R. and Jogi, P. (1986) Increased alveolar deadspace after closure o f
cardiac septal defects; pulmonary air embolism or failure o f homeostasis? CJin Physiol
6, 423-430.
(b) Fletcher, R. and Jonson, B. (1984) Deadspace and the single breath test for carbon
dioxide during anaesthesia and artificial ventilation. Effects o f tidal volume and
frequency o f respiration. B r J Anaesth 56, 109-119.
Fletcher, R , Jonson, B , Gumming, G. and Brew, J. (1981) The concept o f deadspace
with special reference to the single breath test for carbon dioxide. B r J Anaesth 53, 77-
8 8 .
Fletcher, R. and Larsson, A. (1985) Gas exchange in the partially atelectatic lung.
Anaesthesia 40, 1186-1188.
(c) Fletcher, R., Niklason, L. and Drefeldt, B. (1986) Gas exchange during controlled
ventilation in children with normal and abnormal pulmonary circulation: a study using
the single breath test for carbon dioxide. Anesih Analg 65, 645-652.
Florey, C.d.V. (1993) Sample size for beginners. Br.MedJ. 306, 1 181-1184.
Fourrier, F., Fourrier, L. and Lestavel, P. (1994) Acute lobar atelectasis in ICU
patients: comparative randomized study o f fibroptic bronchoscopy versus respiratory
therapy. Intensive Care Medicine 20, s40
Fowler, W.S. (1948) Lung function studies. II. The respiratory dead space.
A m. J. Physiol 154,405-416.
Fox, W.W., Schwartz, J.G. and Shaffer, T.H. (1978) Pulmonary physiotherapy in
neonates: physiologic changes and respiratoiy management. J.Pediatr. 92, 977-981.
238

Fox, W.W., Schwartz, J.G. and Shaffer, T.H. (1979) Effects o f endotracheal tube leaks
on functional residual capacity determination in intubated neonates. Pediatr.Res. 13,
60-64.
Freezer, N.J. and Sly, P.D. (1993) Predictive value o f measurements o f respiratory
mechanics in preterm infants with HMD. Pediair.Pulnionol. 16, 116-123.
(a) Frey, U., Stocks, J., Coates, A., Sly, P. and Bates, J. (2000) Specifications for
equipment used for infant pulmonary function testing. ERS/ATS Task Force on
Standards for Infant Respiratory Function Testing. European Respiratory Society/
American Thoracic Society. EnrRe.spir.J 16,731-740.
(b) Frey, U., Stocks, J., Sly, P. and Bates, J. (2000) Specification for signal processing
and data handling used for infant pulmonary function testing. ERS/ATS Task Force on
Standards for Infant Respiratory Function Testing. European Respiratory
Society/American Thoracic Society. Eur Respir J 16, 1016-1022.
Gallon, A. (1991) Evaluation o f chest percussion in the treatment o f patients with
copious sputum production. Respir M ed 85,45-51.
Gal vis, A G ., Reyes, G. and Nelson, W.B. (1994) Bedside management o f lung collapse
in children on mechanical ventilation: saline lavage—simulated cough technique proves
simple, effective. Pediatr.Pulnicmol. 17, 326-330.
Gannon, C M , Wiswell, T E and Spitzer, A R (1998) Volutrauma, PaC02 levels, and
neurodevelopmental sequelae following assisted ventilation. Clin Perinatol 25, 159-
175.
Garg, M ., Lew, C D , Ramos, A.D., Platzker, A C and Keens, T.G. (1991) Serial
measurement o f pulmonary mechanics assists in weaning from extracorporeal membrane
oxygenation in neonates with respiratory failure. Chest 100, 770-774.
Garradd, J. and Bullock, M. (1985) The effect o f respiratory therapy on intracranial
pressure in ventilated neurosurgical patients. Anstralian Journal o f Physiotherapy 32,
107-111.
239

Gattinoni, L., Pesenti, A., Bombino, M., Pelosi, P. and Brazzi, L. (1993) Role o f
extracorporeal circulation in adult respiratory distress syndrome management. New
Horiz 1,603-612.
Gerhardt, T O and Bancalari, E. (1991) Measurement and monitoring o f pulmonary
function. Clin Perwato l 18,581-609.
Gillespie, D.J. and Rehder, K. (1987) Body position and ventilation-perfusion
relationships in unilateral pulmonary disease. Chest 91, 75-79.
Glass, C , Grap, M.J., Corley, M.C. and Wallace, D. (1993) Nurses' ability to achieve
hyperinflation and hyperoxygenation with a manual resuscitation bag during
endotracheal suctioning. Heart Lung 22, 158-165.
Gold, D R , Wypij, D , Wang, X., Speizer, F.E., Pugh, M , Ware, J.H., Ferris, B G , Jr.
and Dockery, D.W. (1994) Gender and race-specific effects o f asthma and wheeze on
level and growth o f lung function in children in six U.S. cities.
Am.J.Respir.Crit.Care.Med. 149, 1198-1208.
Goldman, S.L., Bosque, E., McCann, E. and Lewis, K. (1992) Pulmonary mechanics in
premature infants one month after treatment with synthetic surfactant. J.Pediatr. 120,
S25-S28
Gonzalez, A., Tortorolo, L , Gerhardt, T., Rojas, M., Everett, R. and Bancalari, E.
(1996) Intrasubject variability o f repeated pulmonary function measurements in preterm
ventilated infants. Pediatr Pulmonol 21,35-41.
Goodnough, S.K. (1985) The effects o f oxygen and hyperinflation on arterial oxygen
tension after endotracheal suctioning. Heart Lung 14, 11-17.
Gormezano, J. and Branthwaite, M.A. (1972) Effects o f physiotherapy during
intermittent positive pressure ventilation. Changes in arterial blood gas tensions.
Anaesthesia 27, 258-264.
Graff, M ., France, J., Hiatt, I.M. and Hegyi, T (1987) Prevention o f hypoxia and
hyperoxia during endotracheal suctioning. Crit Care Med 15, 1133-1135.
240
Graham, W.G. and Bradley, D.A. (1978) Efficacy o f chest physiotherapy and
intermittent positive-pressure breathing in the resolution o f pneumonia. N E n g lJ M ed
299, 624-627.
Grap, M.J., Glass, C., Corley, M. and Parks, T. (1996) Endotracheal suctioning:
ventilator vs manual delivery o f hyperoxygenation breaths. Am J C rit Care 5, 192-197.
Gray, P.H., Flenady, V.J. and Blackwell, L. (1999) Potential risks o f chest
physiotherapy in preterm infants. J Pediatr 135,131
Greenough, A. (1992) Intensive care, ventilation, and management o f acute respiratory
disease in the neonate. Curr.Opin.Pediatr. 4, 206-21 1.
Greenough, A. (1994) Clinical application o f lung function testing in ventilated infants.
M onald i Arch Chest D is 49, 61-65.
Greenough, A. (1999) Chronic lung disease o f prematurity—prevention by inhaled
corticosteroids? Lancet 354, 266-267.
Gunderson, L.P., McPhee, A.J. and Donovan, E.F. (1986) Partially ventilated
endotracheal suction. Use in newborns with respiratory distress syndrome. Am J Dis
C hild 140, 462-465.
Hagler, D.A. and Traver, G A (1994) Endotracheal saline and suction catheters:
sources o f lower airway contamination. American Journal o f C ritica l Care. 3, 444-
447.
Hallbook, T., Lindblad, B , Lindroth, B. and Wolff, T. (1984) Prophylaxis against
pulmonary complications in patients undergoing gall-bladder surgery. A comparison
between early mobilization, physiotherapy with and without bronchodilatation. Ann
Chir Gynaecol 73,55-58.
Hammer, J. and Newth, C.J.L. (1995) Infant lung function testing in the intensive care
unit. Intensive.Care Med. 21,744-752.
Hammon, W.E., Connors, A.F. and McCaffree, D R (1992) Cardiac arrhythmias
during postural drainage and chest percussion o f critically ill patients. Chest 102, 1836-
1841.
241
Hammon, W.E. and Martin, R.J. (1981) Chest physical therapy for acute atelectasis. A
report on its effectiveness. Phys Ther 61, 217-220.
Harding, J., Kemper, M. and Weissman, C. (1993) Alfentanil attenuates the
cardiopulmonary response o f critically ill patients to an acute increase in oxygen demand
induced by chest physiotherapy. Anesih Analg 77, 1122-1129.
Harding, J., Kemper, M. and Weissman, C. (1994) Midazolam attenuates the metabolic
and cardiopulmonary responses to an acute increase in oxygen demand. Chest 106,
194-200.
Harding, J.E., Miles, F.K., Becroft, D M., Allen, B.C. and Knight, D.B. (1998) Chest
physiotherapy may be associated with brain damage in extremely premature infants. J
Pediatr 132, 440-444.
Hardman, J.G. and Aitkenhead, A R (1999) Estimation o f alveolar deadspace fraction
using arterial and end-tidal C02; a factor analysis using a physiological simulation.
Anaesth Intensive Care 27, 452-458.
Harrison, A.M., Lynch, J.M., Dean, J.M. and Witte, M .K. (1997) Comparison o f
simultaneously obtained arterial and capillary blood gases in pediatric intensive care unit
patients. C rit Care Med 25, 1904-1908.
Harshbarger, S. A., Hoffman, L.A., Zullo, T.G. and Pinsky, M R (1992) Effects o f a
closed tracheal suction system on ventilatory and cardiovascular parameters. Am J C rit
Care 1, 57-61.
Hasani, A., Pavia, D., Agnew, J.E. and Clarke, S.W. (1994) Regional lung clearance
during cough and forced expiration technique (FET): effects o f flow and viscoelasticity.
Thorax 49, 557-561.
Hatch, D.J. and Fletcher, M. (1992) Anaesthesia and the respiratory system in infants
and young children. Br.J.Anaesth. 68,398-410.
Haworth, S.G., Hislop, A.A., Odom, N. and McGregor, C.G. (1989) Growth potential
o f the immature transplanted rat lung. Am.Rev.Respir.Dis. 139, A196.-A196.
Heaf, D P , Helms, P., Gordon, M B. and Turner, H.M. (1983) Postural effects on gas
exchange in infants. N.Engl.J.Med. 308,1505-1508.
242

Heaf, D P., Turner, H., Stocks, J. and Helms, P. (1986) The accuracy o f esophageal
pressure measurements in convalescent and sick intubated infants. Pediatr.Pulmonol
2, 5-8.
Healy, M.J.R. (1992) Size, power, confidence. Arch.D is.Child 67, 1495-1497.
Heine, R.G., Button, B.M., Olinsky, A., Phelan, P.D. and Catto-Smith, A.G. (1998)
Gastro-oesophageal reflux in infants under 6 months with cystic fibrosis. Arch D is
C hild 78, 44-48.
Hibbert, M., Lannigan, A., Raven, J., Landau, L. and Phelan, P. (1995) Gender
differences in lung growth. Pediatr.Pulmonol. 19,129-134.
Higgins, I T. (1974) Critical review o f respiratory therapy: epidemiologic
considerations. Am Rev Respir Dis 110, 16-19.
Hillier, S.C., Graham, J.A., Hanger, C C , Godbey, P.S., Glenny, R.W. and Wagner,
W.W. (1997) Hypoxic vasoconstriction in pulmonary arterioles and venules. J A p p l
Physiol 82, 1084-1090.
Hislop, A. A., Wigglesworth, J .S., Desai, R. and Aber, V. (1987) The effects o f preterm
delivery and mechanical ventilation on human lung growth. Early.Hum.Dev. 15, 147-
164.
Hjalmarson, O. (1994) Lung function testing—useless in ventilated newborns?
Eur.J.Pediatr. 153 , S22-S26
Hlastala, M.P. and Berger, A.J. (1996) Physiology o f Re.spi ra ti on, 1 edn. New York:
Oxford university press.
Hodgson, C , Denehy, L., Ntoumenopoulos, G., Santamaria, J. and Carroll, S. (2000)
An investigation o f the early effects o f manual lung hyperinflation in critically ill patients.
Anaesth Intensive Care 28, 255-261.
Holloway, R , Desai, S.D., Kelly, S.D., Thambiran, A.K., Strydom, S.E. and Adams,
E.B. (1966) The effect o f chest physiotherapy on the arterial oxygenation o f neonates
during treatment o f tetanus by intermittent positive-pressure respiration. S A frM e d J
40, 445-447.
243
Holody, B. and Goldberg, H.S. (1981) The effect o f mechanical vibration physiotherapy
on arterial oxygenation in acutely ill patients with atelectasis or pneumonia. Am Rev
Respir D is 124,372-375.
Horiuchi, K., Jordan, D , Cohen, D , Kemper, M.C. and Weissman, C. (1997) Insights
into the increased oxygen demand during chest physiotherapy. Crit.Care Med. 25,
1347-1351.
Hubble, C L., Gentile, M .A., Tripp, D.S., Craig, D M., Meliones, J.N. and Cheifetz,
I.M . (2000) Deadspace to tidal volume ratio predicts successful extubation in infants
and children. Crit.Care Med 28,2034-2040.
Hussey, J.M. (1992) Effects o f chest physiotherapy for children in intensive care after
surgery. Physiotherapy. 78, 109-1 13.
Ibanez, J., Raurich, J.M., Abizanda, R., Claramonte, R , Ibanez, P. and Bergada, J.
(1981) The effect o f lateral positions on gas exchange in patients with unilateral lung
disease during mechanical ventilation. Intensive.Care Med. 7, 231-234.
Imai, K., Chinzei, M., Oguchi, K., Tam ai, H., Sato, Y , Umeyama, T., Tagami, M. and
Hanaoka, K. (1996) [Usefulness ofNODSS (nasal/oral discriminate sampling system) in
end-tidal carbon dioxide gas monitoring]. M asiii 45, 837-841.
Imle, P C , Mars, M P , Ciesla, N.D., Anderson, P. A. and Delaney, P A (1998) The
effect o f chest physical therapy on intracranial pressure and cerebral perfusion pressure.
Physiotherapy Canada, 49,48-55.
lo tti, G.A., Braschi, A., Brunner, J.X., Smits, T., Olivei, M ., Palo, A. and Veronesi, R.
(1995) Respiratory mechanics by least squares fitting in mechanically ventilated
patients; applications during paralysis and during pressure support ventilation. Inten.sive
Care M ed 21, 406-413.
Irazuzta, J., Pascucci, R , Perlman, N. and Wessel, D. (1993) Effects o f fentanyl
administration on respiratory system compliance in infants. Crit.Care M ed 21, 1001-
1004.
(a) Jackson, E., Stocks, J , Pilgrim, L., Dundas, I. and Dezateux, C A (1995) A critical
assessment o f uncalibrated respiratory inductance plethysmography (Respitrace) for the
244
measurement o f tidal breathing parameters in newborns and infants. Pediatr.Pulmonol.
20, 119-124.
(b) Jackson, E A , Coates, A.L., Gappa, M. and Stocks, J. (1995) In vitro assessment
o f infant pulmonary function equipment. Pediatr.Pulmonol. 19, 205-213.
Jaw, M.C., Soong, W.J., Chen, S.J. and Hwang, B. (1991) Pneumothorax: a
complication o f deep endotracheal tube suction: report o f 3 cases.
Chung. Hua. I. Hsu eh. Tsa. Chih. (Taipei.) 48, 313-317.
Jaworski, A., Goldberg, S.K., Walkenstein, M .D , Wilson, B. and Lippmann, M L
(1988) U tility o f immediate postlobectomy fiberoptic bronchoscopy in preventing
atelectasis. Che.st 94, 38-43.
Jellinek, H , Hiesmayr, M., Simon, P., Klepetko, W. and Haider, W. (1993) Arterial to
end-tidal CO2 tension difference after bilateral lung transplantation. C rit Care M ed 21,
1035-1040.
Jenkins, S C., Soutar, S.A,, Loukota, J.M., Johnson, L.C. and Moxham, J. (1989)
Physiotherapy after coronary artery surgery: are breathing exercises necessary? Thorax
44, 634-639.
Johanning, J.M., Veverka, T.J., Bays, R.A., Tong, G.K. and Schmiege, S.K. (1999)
Evaluation o f suspected pulmonary embolism utilizing end-tidal CO2 and D-dimer. Am
JS urg 178,98-102.
Johnson, N.T., Marini, J.J. and Pierson, D.J. (1987) Acute lobar atelectasis: effect o f
chest percussion and postural drainage (CPPD) on resolution. Am Rev Respir D is 135,
A433
Jolliet, P., Bulpa, P. and Chevrolet, J.C. (1998) Effects o f the prone position on gas
exchange and hemodynamics in severe acute respiratory distress syndrome . Crit.Care
Med. 26, 1977-1985.
Jones, A.Y., Hutchinson, R.C. and Oh, T.E. (1992) Effects o f bagging and percussion
on total static compliance o f the respiratory system. Physiotherapy 78, 661-666.
245
Jonson, B , Richard, J.C., Straus, C , Mancebo, J., Lemaire, F. and Brochard, L. (1999)
Pressure-volume curves and compliance in acute lung injury. Evidence O f recruitment
above the lower inflection point. Am J.Respir.Cril.Care.Med. 159, 1172-1178.
Jubran, A. and Tobin, M.J. (1994) Use o f flow-volume curves in detecting secretions in
ventilator-dependent patients. Am. J.Respir.Cril. Care.Med. 150, 766-769.
Kars, A.H., Bogaard, J.M., Stijnen, T., de Vries, J., Verbraak, A.F. and Hilvering, C.
(1997) Dead space and slope indices from the expiratory carbon dioxide tension-
volume curve. Eur.Respir.J. 10,1829-1836.
Kelly, E , Bryan, H., Possmayer, F., Frndova, H. and Bryan, C. (1993) Compliance o f
the respiratory system in newborn infants pre- and postsurfactant replacement therapy.
Pediatr.Pulmonol. 15, 225-230.
Kerem, E., Yatsiv, 1. and Goitein, K.J. (1990) Effect o f endotracheal suctioning on
arterial blood gases in children. Intensive Care Med 16, 95-99.
Kerr, M .E., Zempsky, J., Sereika, S., Orndoff, P. and Rudy, E.B. (1996) Relationship
between arterial carbon dioxide and end-tidal carbon dioxide in mechanically ventilated
adults with severe head trauma. C rit Care M ed 24, 785-790.
Kessler, V., Guttmann, J. and Newth, C.J.L. (2001) Dynamic respiratory system
mechanics in infants during pressure and volume controlled ventilation. Eur Respir J
17, 115-1.
Kiiski, R , Takala, J. and Eissa, N.T. (1991) Measurement o f alveolar ventilation and
changes in deadspace by indirect calorimetry during mechanical ventilation: a laboratory
and clinical validation. C rit Care M ed 19, 1303-1309.
Kilger, E., Briegel, J., Schelling, G., Polasek, J., Manert, W., Groh, J. and Haller, M.
(1995) Long-term evaluation o f a continuous intra-arterial blood gas monitoring system
in patients with severe respiratory failure. Infusionsther. Tran.sfusion.smed. 22, 98-104.
Kim, W.D. (1997) Lung mucus: a clinician's view. Eur Re.spir J 10, 1914-1917.
King, M. (1987) Role o f mucus viscoelasticity in clearance by cough. Eur J Respir D is
Suppl 153 , 165-172.
246

King, M ., Phillips, D M , Gross, D., Vartian, V., Chang, H.K. and Zidulka, A. (1983)
Enhanced tracheal mucus clearance with high frequency chest wall compression.
American Review o f Respiratory Disease 128, 511-515.
Kinloch, D. (1999) Instillation o f normal saline during endotracheal suctioning: effects
on mixed venous oxygen saturation. Am J C rit Care 8, 231-240.
K irillo ff, L.H., Owens, G.R., Rogers, R.M. and Mazzocco, M.C. (1985) Does chest
physical therapy work? Chest 88, 436-444.
Klein, P., Kemper, M., Weissman, C , Rosenbaum, S.H., Askanazi, J. and Hyman, A.I.
(1988) Attenuation o f the hemodynamic responses to chest physical therapy. Chest 93,
38-42.
Kline, J.A. and Arunachlam, M. (1998) Preliminary study o f the capnogram waveform
area to screen for pulmonary embolism. Ann Emery; Med 32, 289-296.
Kline, J.A , Israel, E.G., Michelson, E.A., O'Neil, B.J., Plewa, M.C. and Portelli, D C
(2001) Diagnostic accuracy o f a bedside D-dimer assay and alveolar dead-space
measurement for rapid exclusion o f pulmonary embolism: a multicenter study. JAMA
285, 761-768.
(a) Klingstedt, C , Hedenstierna, G., Baehrendtz, S., Lundqvist, H , Strandberg, A.,
Tokics, L. and Brismar, B. (1990) Ventilation-perfusion relationships and atelectasis
formation in the supine and lateral positions during conventional mechanical and
differential ventilation. Acta Anaesthesiol Scand 34, 421-429.
(b) Klingstedt, C , Hedenstierna, G., Lundquist, H., Strandberg, A., Tokics, L. and
Brismar, B. (1990) The influence o f body position and differential ventilation on lung
dimensions and atelectasis formation in anaesthetized man. Acta Anaesthesiol Scand
34, 315-322.
Knauth, A. and Baumgart, S. (1990) Accurate, noninvasive quantitation o f expiratory
gas leak from uncuffed infant endotracheal tubes. Pediatr.Pulmonol. 9, 55-60.
Kondo, T., Matsumoto, I., Lanteri, C.J. and Sly, P.D. (1997) Respiratory mechanics
during mechanical ventilation: a model study on the effects o f leak around a tracheal
tube. Pediatr.Pulmonol. 24, 423-428.
247
Krauel, J. (1993) 4th European Workshop on Neonatology. Biol.Neonate. 64, 167-
190.
Krause, M.F. and Hoehn, T. (2000) Chest physiotherapy in mechanically ventilated
children: a review. C rit Care M ed 28, 1648-1651.
Kreit, J.W. and Sciurba, F.C. (1996) The accuracy o f pneumotachograph measurements
during mechanical ventilation. Am J Re.spir C rit Care M ed 154, 913-917.
Krieger, I. (1963) Studies on mechanics o f respiration in infancy. Am. J.Dis. Child.
105, 439-448.
Kugelman, A., Saiki, K., Platzker, A C. and Garg, M. (1995) Measurement o f lung
volumes and pulmonary mechanics during weaning o f newborn infants with intractable
respiratory failure from extracorporeal membrane oxygenation. Pediatr Pulmonol 20,
145-151.
Kuo, C Y , Gerhardt, T., Bolivar, J., Claure, N. and Bancalari, E. (1996) Effect o f leak
around the endotracheal tube on measurements o f pulmonary compliance and resistance
during mechanical ventilation: a lung model study. Pediatr.Pulmonol. 22, 35-43.
Laffon, M ., Gouchet, A., Sitbon, P., Guicheteau, V., Biyick, E., Duchalais, A. and
Mercier, C. (1998) Difference between arterial and end-tidal carbon dioxide pressures
during laparoscopy in paediatric patients. Can. J.Anaesth. 45, 561-563.
Langer, M , Mascheroni, D., Marcolin, R. and Gattinoni, L. (1988) The prone position
in ARDS patients. A clinical study. Chest 94, 103-107.
Larsson, A., Jonmarker, C , Lindahl, S.G.E. and Werner, O. (1989) Lung function in
the supine and lateral decubitus positions in anaesthetized infants and children. British
Journal o f A nae.sthesia 62, 378-384.
Laws, A.K. and McIntyre, R.W. (1969) Chest physiotherapy: a physiological
assessment during intermittent positive pressure ventilation in respiratory failure. Can
Anaesth Roc J 16, 487-493.
Le Souëf, P.N., England, S.J. and Bryan, A C. (1984) Passive respiratory mechanics in
newborns and children. Am.Rev.Re.spir.Dis. 129, 552-556.
248
Leach, R M , Robertson, T.P., Twoit, C.H. and Ward, J.P. (1994) Hypoxic
vasoconstriction in rat pulmonary and mesenteric arteries. Am J Physiol 266, L223-
L231
Lemaire, F. (2000) ARDS and PV curves: the inseparable duet? Intensive.Care Med.
26, 1-2.
Lewis, J.A., Lacey, J.L. and Henderson-Smart, D.J. (1992) A review o f chest
physiotherapy in neonatal intensive care units in Australia. J Paediatr C h ild Health 28,
297-300.
Lindahl, S.G., Yates, A.P. and Hatch, D.J. (1987) Relationship between invasive and
noninvasive measurements o f gas exchange in anesthetized infants and children.
Anesthesiology 66, 168-175.
Lonnqvist, P.A. (1997) Inhaled nitric oxide in newborn and paediatric patients with
pulmonary hypertension and moderate to severe impaired oxygenation: effects o f doses
o f 3-100 parts per million. Intensive.Care Med. 23, 773-779.
Lookinland, S. and Appel, P.L. (1991) Hemodynamic and oxygen transport changes
following endotracheal suctioning in trauma patients. Nurs Res 40, 133-139.
Lum, L., Saville, A. and Venkataraman, S .T. (1998) Accuracy o f physiologic deadspace
measurement in intubated pediatric patients using a metabolic monitor: comparison with
the Douglas bag method. Crit Care M ed 26, 760-764.
Lu mb, A.B. and Nunn, J.F. (1991) Respiratory function and ribcage contribution to
ventilation in body positions commonly used during anesthesia. Anesthesia & Analgesia
73, 422-426.
MacDonald, K.D. and Johnson, S.R. (1996) Volume and pressure modes o f mechanical
ventilation in pediatric patients. Re.spir Care Clin N Am 2, 607-618.
Macintosh, 1. and Britto, J. (1999) Continuous intra-arterial blood gas monitoring.
Care Crit.III. 15, 3
Mackenzie, C F., Imle, P C. and Ciesla, N. (1989) Chest physiotherapy in the intensive
care unit. Williams & Wilkins
249

Mackenzie, C F. and Shin, B. (1985) Cardiorespiratory function before and after chest
physiotherapy in mechanically ventilated patients with post-traumatic respiratory failure.
C rit Care M ed 13,483-486.
Mackenzie, C F., Shin, B , Hadi, F. and Imle, P C. (1980) Changes in total lung/thorax
compliance following chest physiotherapy. Ariesfh Analg 59, 207-210.
Mackenzie, C F , Shin, B. and McAslan, T.C. (1978) Chest physiotherapy: the effect on
arterial oxygenation. Anes/h Analg 57, 28-30.
Macmillan, C. (1995) Nasopharyngeal suction study reveals knowledge deficit.
Nursing Times. 91, 28-30.
Macnaughton, P.D. (1997) Assessment o f lung function in the ventilated patient.
Intensive. Care Med. 23, 810-818.
(a) Main, E , Castle, R., Stocks, J., James, l.G. and Hatch, D.J. (2001) The influence o f
endotracheal tube leak on the assessment o f respiratoi*y function in ventilated children.
Int.CareM ed.iln Press)
(b) Main, E., E lliott, M.J., Schindler, M. and Stocks, J. (2001) The effect o f delayed
sternal closure after cardiac surgery on respiratory function in ventilated infants.
Crit.Care.Med (In Press)
Mancinelli-Van, A.J. and Beck, S.L. (1992) Preventing hypoxemia and hemodynamic
compromise related to endotracheal suctioning. Am..).Cril.Care 1, 62-79.
Manczur, T., Greenough, A., Nicholson, G.P. and Rafferty, G.F. (2000) Resistance o f
pediatric and neonatal endotracheal tubes: influence o f flow rate, size, and shape.
Crit.Care M ed 28, 1595-1598.
Marini, J.J., Pierson, D.J. and Hudson, L.D. (1979) Acute lobar atelectasis: a
prospective comparison o f fiberoptic bronchoscopy and respiratory therapy.
Am.Rev.Respir.Dis. 119, 971 -978.
M arriott, C. (1981) The viscoelastic nature o f mucus secretion. Chest 80, 804-808.
Marsh, H.M., Rehder, K., Sessler, A D. and Fowler, W.S. (1973) Effects o f mechanical
ventilation, muscle paralysis, and posture on ventilation-perfusion relationships in
anesthetized man. Anesthesiology 38, 59-67.
250

Marshall, B E., Hanson, C.W., Frasch, F. and Marshall, C. (1994) Role o f hypoxic
pulmonary vasoconstriction in pulmonary gas exchange and blood flow distribution. 2.
Pathophysiology. Intemive Care Med 20,379-389.
May, D.B. and Munt, P.W. (1979) Physiologic effects o f chest percussion and postural
drainage in patients with stable chronic bronchitis. Chest 75, 29-32.
McCabe, S.M. and Smeltzer, S.C. (1993) Comparison o f tidal volumes obtained by
one-handed and two-handed ventilation techniques. Am J C rit Care 2, 467-473.
McCarthy, E.J. (1987) Ventilation perfusion relationships. AANA J 55, 437-440.
McGuire, G , Crossley, D., Richards, J. and Wong, D. (1997) Effects o f varying levels
o f positive end-expiratory pressure on intracranial pressure and cerebral perfusion
pressure. C rit Care M ed 25, 1059-1062.
McKelvie, S. (1998) Endotracheal suctioning. Nirrs C rit Care 3, 244-248.
Mead, J. and Whittenberger, J.L. (1953) Physical properties o f human lungs measured
during spontaneous respiration. J.Appl.Physiol. 5, 779-796,
Meade, M O , Cook, D.J., Kernerman, P. and Bernard, G. (1997) How to use articles
about harm: the relationship between high tidal volumes, ventilating pressures, and
ventilator-induced lung injury. Crit Care M ed 25, 1915-1922.
Mecikalski, M B , Cutillo, A G. and Renzetti, A D (1984) Effect o f right-to-left
shunting on alveolar dead space. B u ll Enr Physiopatho! Re.spir 20, 513-519.
Mehrabani, D , Gowen, C.W. and Kopelman, A.E. (1991) Association o f
pneumothorax and hypotension with intraventricular haemorrhage. Arch D is Child 66,
48-51.
Menkes, H. and Britt, J. (1980) Physical therapy rationale for physical therapy.
American RevicM o f Respiratory Di.sease 122, 127-131.
M igliori, C , Gallina, M R and Bona, G. (1999) Practical applications o f monitoring
respiratory mechanics in newborn. Minerva Pediatr 51, 57-64.
251

Mizuno, K. and Aizawa, M . (1999) Effects of body position on blood gases and lung
mechanics o f infants with chronic lung disease during tube feeding. Pediatr.Int. 41,
609-614.
Mizuno, K., Itabashi, K. and Okuyama, K. (1995) Effect o f body position on the blood
gases and ventilation volume of infants with chronic lung disease before and after
feeding. A m J P e r in a to l 12, 275-277.
Moran, J.F., Jones, R.H. and Wolfe, W.G. (1977) Regional pulmonary function during
experimental unilateral pneumothorax in the awake state. J Thorac Cardiovasc Surg
74, 396-402.
Moriya, E., Kawakami, K., Sudoh, M. and Ikawa, S. (1987) The effect o f body position
on ventilation and perfusion in the lung. Phy.siologi.st. 30, S60-S61
Morran, C G , Finlay, l.G., Mathieson, M ., McKay, A.J., Wilson, N. and McArdle, C.S.
(1983) Randomized controlled trial of physiotherapy for postoperative pulmonary
complications. B r JAnae.slh 55, 1113-1117.
Mortola, J P., Fisher, J.T., Smith, B , Fox, G. and Weeks, S. (1982) Dynamics of
breathing in infants. J.Appl.Physiol. 52, 1209-1215.
Mortola, J P. and Saetta, M . (1987) Measurements o f respiratory mechanics in the
newborn; a simple approach. Pediatr.Pnlmonol. 3, 123-130.
Motoyama, E.K. and Davis, P.J. (1990) Smith's Ane.sthesia fo r In fants and Children, 5
edn. St Louis Baltimore Philadelphia Toronto: The C V Mosby Company.
Mure, M ., Martling, C.R. and Lindahl, S.G. (1997) Dramatic effect on oxygenation in
patients with severe acute lung insufficiency treated in the prone position . Crit.C are
M e d 25, 1539-1544.
Nangia, S., Saili, A. and Dutta, A.K. (1997) End tidal carbon dioxide monitoring—its
reliability in neonates. Ind ian J Pediatr 64, 389-394.
Neto, F.J., Luna, S.P., Massone, F., Thomassian, A., Vargas, J.L., Junior, J R., D'Utra,
V.B. and Crocci, A.J. (2000) The effect o f changing the mode o f ventilation on the
arterial-to-end-tidal C 02 difference and physiological dead space in laterally and
dorsally recumbent horses during halothane anesthesia. Vet Surg 29, 200-205.
252
Nicolai, T., Lanteri, C J. and Sly, P.D. (1993) Frequency dependence o f elastance and
resistance in ventilated children with and without the chest opened. E ur.R esp irJ. 6,
1340-1346.
Nikischin, W., Brendel-Muller, K., Viemann, M ., Oppermann, H. and Schaub, J. (2000)
Improvement in respiratory compliance after surfactant therapy evaluated by a new
method. Ped.Pi4lmonol. 29, 276-283.
Ninan, A., O'Donnell, M ., Hamilton, K., Tan, L. and Sankaran, K. (1986) Physiologic
changes induced by endotracheal instillation and suctioning in critically ill preterm
infants with and without sedation. Am .J.Perinalol. 3, 94-97.
Novak, R.A., Shumaker, L., Snyder, J.V. and Pinsky, M.R. (1987) Do periodic
hyperinflations improve gas exchange in patients with hypoxemic respiratory failure?
C rit Care M ed 15, 1081-1085.
Ntoumenopoulos, G. (1994) Cardiac arrhythmias during postural drainage and chest
percussion. Chest 105, 1303
Ntoumenopoulos, G., Gild, A. and Cooper, D.J. (1998) The effect o f manual lung
hyperinflation and postural drainage on pulmonary complications in mechanically
ventilated trauma patients. Anaesth.Intensive ('a re 26, 492-496.
Numa, A.H., Hammer, J. and Newth, C.J. (1997) Effect o f prone and supine positions
on functional residual capacity, oxygenation, and respiratory mechanics in ventilated
infants and children. Am JR esp ir C rit Care M ed 156, 1 185-1189.
Numa, A H. and Newth, C.J. (1996) Anatomic dead space in infants and children. J
A pp l Physiol 80, 1485-1489.
Numa, A H and Newth, C.J.L. (1995) Assessment o f lung function in the intensive care
unit. Pediatr.Pnlm onol. 19, 118-128.
'H u rm M P ■ AppliedRe.spiratory Physiology, 3 edn. London; Butterworths.
Odell, A., Allder, A., Bayne, R , Everett, C , Scott, S., Still, B. and West, S. (1993)
Endotracheal suction for adult, non-head-injured, patients. A review o f the literature.
Intensive C rit Care Nnrs 9, 274-278.
253

Olsson, K., GreifF, L., Karlefors, F., Johansson, S. and Wollmer, P. (1999) Changes in
airway dead space in response to methacholine provocation in normal subjects. C lin
Physio l 19,426-432.
Olsson, K., Jonson, B., Olsson, C.G. and Wollmer, P. (1998) Diagnosis o f pulmonary
embolism by measurement o f alveolar dead space. J In te rn .M ed 244, 199-207.
Oyamada, Y , Mori, M ., Kuwahira, I., Aoki, T., Suzuki, Y ., Suzuki, K., Miyata, A.,
Nishio, K., Sato, N ., Naoki, K., Kudo, H ., Ohta, Y. and Yamaguchi, K. (1997) Effects
o f active vasoconstriction and total flow on perfusion distribution in the rabbit lung. Am
J Physio l 273, R1465-R1473
Ozlu, O. and Ocal, T. (1999) Comparison of endtidal CO 2 and arterial blood gas
analysis in paediatric patients undergoing controlled ventilation with a laryngeal mask or
a face mask. P aediatr Anaesth 9, 409-413.
Palmer, K .N .V . and Sellick, B.A. (1953) The prevention o f post operative pulmonary
atelectasis. Lancet 1, 164-168.
Papastamelos, C , Panitch, H B , England, S.E. and Allen, J.L. (1995) Developmental
changes in chest wall compliance in infancy and early childhood. J.Appl.Physiol. 78,
179-184.
Pappert, D , Rossaint, R , Slama, K., Gaining, T. and Falke, K.J. (1994) Influence of
positioning on ventilation-perfusion relationships in severe adult respiratory distress
syndrome. Chest 106, 1511-1516.
Paratz, J. (1992) Haemodynamic stability o f the ventilated intensive care patient; a
review. A ustra lian Journa l o f Physiotherapy 38, 167-172.
Paratz, J. and Burns, Y. (1993) The effect o f respiratory physiotherapy on intracranial
pressure, mean arterial pressure, cerebral perfusion pressure and end tidal carbon
dioxide in ventilated neurosurgical patients. Physiotherapy Theory & Practice 9, 3-11.
Parker, J.C., Hernandez, L.A., Longenecker, G.L., Peevy, K. and Johnson, W. (1990)
Lung edema caused by high peak inspiratory pressures in dogs. Role o f increased
microvascular filtration pressure and permeability. Am.Rev.Respir.Dis. 142, 321-328.
254
Parsons, L.C. and Shogan, J.S. (1984) The effects o f the endotracheal tube
suctioning/manual hyperventilation procedure on patients with severe closed head
injuries. H eart & Lung 13,372-380.
Pavia, D. (1990) The role o f chest physiotherapy in mucus hypersecretion. Lung 168
Suppl, 614-621.
Pelosi, P., Cereda, M ., Foti, G , Giacomini, M . and Pesenti, A. (1995) Alterations o f
lung and chest wall mechanics in patients with acute lung injury: effects o f positive end-
expiratory pressure. Am. J.Respir.Crit.Care.M ed. 152,531-537.
Perez, F.J., Heldt, G.P. and Gregory, G.A. (1985) The effect o f a gas leak around the
endotracheal tube on the mean tracheal pressure during mechanical ventilation. Am Rev
Respir D is 132, 339-342.
Petros, A.J., Lamond, C.T. and Bennett, D. (1993) The Bicore pulmonary monitor. A
device to assess the work o f breathing while weaning from mechanical ventilation.
Anaesthesia 48, 985-988.
Pfenninger, J., Aebi, C , Bachmann, D. and Wagner, B.P. (1992) Lung mechanics and
gas exchange in ventilated preterm infants during treatment o f hyaline membrane disease
with multiple doses o f artificial surfactant (Exosurf). Pediatr Pnlm onol 14, 10-15.
Phelan, P.D., Landau, L.l. and Olinsky, A. (1982) Physiology o f respiration. In: Phelan,
P.D., Landau, L .l. and Olinsky, A., (Eds.) Re.spiralory Illne.ss in Children, 2 edn. pp.
444-490. Blackwell Scientific Publications
Phillips, G.E., Pike, S.E., Rosenthal, M. and Bush, A. (1998) Holding the baby: head
downwards positioning for physiotherapy does not cause gastro-oesophageal reflux.
Eur.Respir.J. 12, 954-957.
Pianosi, P. and Hochman, J. (1996) End-tidal estimates o f arterial PCO 2 for cardiac
output measurement by C 02 rebreathing: a study in patients with cystic fibrosis and
healthy controls. Ped ia tr Pnlm onol 22, 154-160.
Pison, U., Lopez, F.A., Heidelmeyer, C F., Rossaint, R. and Falke, K.J. (1993) Inhaled
nitric oxide reverses hypoxic pulmonary vasoconstriction without impairing gas
exchange. J A pp l Physiol 74, 1287-1292.
255

Poets, C F. and Martin, R.J. (1996) Noninvasive Determination o f Blood Gases. In:
Stocks, J., Sly, P D , Tepper, R.S. and Morgan, W.J., (Eds.) In fan t Respiratory
Function Testing, 1 edn. pp. 411-444. New York: John Wiley & Sons, Inc.
Polese, G , Lubli, P., Mazzucco, A., Luzzani, A. and Rossi, A. (1999) Effects o f open
heart surgery on respiratory mechanics. Intensive Care M e d 25, 1092-1099.
Prause, G., Hetz, H., Lauda, P., Pojer, H ., Smolle-Juettner, F. and Smolle, J. (1997) A
comparison o f the end-tidal-CO] documented by capnometry and the arterial pC 02 in
emergency patients. Resuscitation 35, 145-148.
Prendiville, A., Thomson, A. and Silverman, M . (1986) Effect o f tracheobronchial
suction on respiratory resistance in intubated preterm babies. A rch .D is .C h ild 61, 1178-
1183.
Preusser, B.A., Stone, K.S., Gonyon, D S , Winningham, M L., Groch, K.F. and Karl,
J.E. (1988) Effects o f two methods of preoxygenation on mean arterial pressure,
cardiac output, peak airway pressure, and postsuctioning hypoxemia. H eart Lung 17,
290-299.
Prokocimer, P., Garbino, J., Wolff, M. and Regnier, B (1983) Influence of posture on
gas exchange in artificially ventilated patients with focal lung disease. Intensive.Care
Med. 9 ,69-72.
Puri, G D , Singh, H , Kaushik, S. and Jindal, S.K. (1999) Physiological deadspace
during normocapnie ventilation under anaesthesia. Anaesth Intensive Care 27, 159-
163.
Pyon, K .H ., Pandit, P.B., Courtney, S.E. and Habib, R.H. (2000) Airway leak effects
on lung mechanical estimates: Role of ventilatory settings. Am. J .Respir .C rit.C are Med.
161 , A803
Pyon, K .H ., Pandit, P.B. and Habib, R.H. (1999) Effects o f airway leaks on lung
volume: Recruitment and accuracy of respiratory mechanics measurements.
Am.J.Re.spir.Crit.Care.Med. 159, A671-A671
256
Ratjen, F. A. and Wiesemann, H.G. (1992) Variability o f dynamic compliance
measurements in spontaneously breathing and ventilated newborn infants. F^ediatr
P ylm ono l 12, 73-80.
Rattenborg, C.C. and Holaday, D A. (1967) Mechanisms affecting ventilation and
perfusion o f the lungs during anesthesia. C lin Anesth I , 23-40.
Raymond, S.J. (1995) Normal saline instillation before suctioning: helpful or harmful?
A review o f the literature. A m J.C rit.C a re 4, 267-271.
Ream, R.S., Schreiner, M.S., Neff, J.D., McRae, K .M ., Jawad, A.F., Scherer, P.W. and
Neufeld, G.R. (1995) Volumetric capnography in children. Influence o f growth on the
alveolar plateau slope . Anesthesiology 82,64-73.
Reines, H .D ., Sade, R M , Bradford, B F and Marshall, J. (1982) Chest physiotherapy
fails to prevent postoperative atelectasis in children after cardiac surgery. Ann Snrg
195 ,451-455 .
Rello, J., Sonora, R , Jubert, P., Artigas, A., Rue, M. and Valles, J. (1996) Pneumonia
in intubated patients: role o f respiratory airway care. Am J . Respir.C rit.Care Med. 154 ,
111-115.
Riegel, B. and Forshee, T. (1985) A review and critique of the literature on
preoxygenation for endotracheal suctioning. H eart Lung 14, 507-518.
Rivara, D , Artucio, H , Arcos, J. and Hiriart, C. (1984) Positional hypoxemia during
artificial ventilation. Crit.Care M ed 12, 436-438.
Rivera, R. and Tibballs, J. (1992) Complications o f endotracheal intubation and
mechanical ventilation in infants and children. C rit.C are Med. 20, 193-199.
Roberts, J.D., Chen, T .Y ., Kawai, N., Wain, J., Dupuy, P., Shimouchi, A , Bloch, K.,
Polaner, D. and Zapol, W .M . (1993) Inhaled nitric oxide reverses pulmonary
vasoconstriction in the hypoxic and acidotic newborn lamb. C irc Res 72, 246-254.
Rockwell, G.M . and Campbell, S.K. (1976) Physical therapy program for the pediatric
cardiac surgical patient. Phys Ther 56, 670-675.
257

Rosen, W.C., Mammel, M .C., Fisher, J.M., Coleman, J.B., Bing, D R , Holloman, K.
and Boros, S. (1993) The effects o f bedside pulmonary monitoring during infant
mechanical ventilation. P ediatr.Pnlm onol 16,147-152.
Rossi, A., Polese, G , Brandi, G. and Conti, G. (1995) Intrinsic positive end-expiratory
pressure (PEEPi). Intensive.Care Med. 21,522-536.
Rothen, H .U ., Neumann, P., Berglund, J.E., Valtysson, J., Magnusson, A. and
Hedenstierna, G. (1999) Dynamics o f re-expansion o f atelectasis during general
anaesthesia. B r J Anaesth 82, 551-556.
Russell, G.B. and Graybeal, J.M. (1994) Reliability o f the arterial to end-tidal carbon
dioxide gradient in mechanically ventilated patients with multisystem trauma. J Trauma
36, 317-322.
Sasse, S. A., Chen, P. A. and Mahutte, C.K. (1994) Variability o f arterial blood gas
values over time in stable medical IC U patients. Chest 106, 187-193.
Schreiner, M .S., Leksell, L.G., Gobran, S R., Hoffman, E.A., Scherer, P.W. and
Neufeld, G.R. (1993) Microemboli reduce phase I I I slopes o f CO 2 and invert phase I I I
slopes o f infused SF6. Re.spir Physiol 91, 137-154.
Schwenker, D., Ferrin, M. and Gift, A G (1998) A survey o f endotracheal suctioning
with instillation o f normal saline. Am.,J.Crit.Care 7, 255-260.
Seeker-Walker, R H , Alderson, P.O., Wilhelm, J., Hill, R.L. and Markham, J. (1975)
Regional ventilation-perfusion relationships. Re.spiration 32, 265-276.
Sediame, S., Zerah-Lancner, F., d'Ortho, M .P., Adnot, S. and Harf, A. (1999)
Accuracy of the i-STAT bedside blood gas analyser. E ur Re.spir J 14, 214-217.
Severinghaus, J.W., Astrup, P. and Murray, J.F. (1998) Blood gas analysis and critical
care medicine. Am.J.Re.spir.Crit.Care.Med. 157, SI 14 -S 122
Shah, A.R., Kurth, C D , Gwiazdowski, S.G., Chance, B. and Delivoria-Papadopoulos,
M . (1992) Fluctuations in cerebral oxygenation and blood volume during endotracheal
suctioning in premature infants. J Pediatr 120, 769-774.
Shenkman, Z.E., Crisnic, I.M . and Avidan, A. (1996) Calculation of dead space
volume. Can J Anaesth 43,319
258
Schibler, A., Schneider, M . and Kraemer, R. (1997) Moment ratio analysis (M R A ) o f
the multiple breath nitrogen washout (M B N W ) in a lung model and in infants with lung
disease. Eur.R espirJ. 10, 3 ls(Abstract)
Schibler, A., Schneider, M ., Frey, U. and Kraemer, R. (2000) Moment ratio analysis o f
multiple breath nitrogen washout in infants with lung disease. Eur.Respir.J. 15, 1094-
1101.
Shorten, D R. (1989) Effects o f tracheal suctioning on neonates: a review o f the
literature. Intensive Care Nurs 5,167-170.
Shorten, D R., Byrne, P.J. and Jones, R.L. (1991) Infant responses to saline instillations
and endotracheal suctioning. J.Ohs/et.Gynecol.Neona/al.Nurs. 20, 464-469.
Simbruner, G , Coradello, H., Fodor, M ., Havelec, L., Lubec, G. and Poliak, A. (1981)
Effect o f tracheal suction on oxygenation, circulation, and lung mechanics in newborn
infants. Arch D is C h ild 56,326-330.
Singer, M ., Vermaat, J , Hall, G , Latter, G. and Patel, M. (1994) Hemodynamic effects
o f manual hyperinflation in critically ill mechanically ventilated patients. Chest 106,
1182-1187.
Singh, N .C., Kissoon, N., Frewen, T. and Tiffin, N. (1991) Physiological responses to
endotracheal and oral suctioning in paediatric patients: the influence o f endotracheal
tube sizes and suction pressures. C lin Intensive Care 2, 345-350.
Sly, P D , Lanteri, C. and Nicolai, T. (1996) Measurement o f Respiratory Function in
the Intensive Care Unit. In: Stocks, J., Sly, P D , Tepper, R.S. and Morgan, W.J., (Eds.)
In fa n t Re.spiratory Function Testing, 1 edn. pp. 445-484. New York: John Wiley &
Sons, Inc.
Smith, J., Pieper, C H ., Maree, D. and Gie, R.P. (1999) Compliance o f the respiratory
system as a predictor for successful extubation in very-low-birth-weight infants
recovering from respiratory distress syndrome. S A fr M ed .1 89, 1097-1 102.
Sola, A., Farina, D , Rodriguez, S. and Kurlat, 1. (1992) Lack o f relationship between
the true airway pressure and the pressure displayed with an infant ventilator. C rit Care
M e d 20, 778-781.
259
Stayer, S.A., Bent, S.T., Skjonsby, B.S., Frolov, A. and Andropoulos, D.B. (2000)
Pressure control ventilation; three anesthesia ventilators compared using an infant lung
model. Anesth A na lg 91, 1 145-1 150.
Stenson, B.J., Glover, R .M ., Wilkie, R.A., Laing, I.A . and Tarnow-Mordi, W O (1998)
Randomised controlled trial o f respiratory system compliance measurements in
mechanically ventilated neonates. A rch .D is .C h ild 78, F15-F19
Stevenson, G .W ., Tobin, M.J., Horn, B.J., Sautel, M ., Chen, E.H., Hall, S.C. and Cote,
C.J. (1998) The effect o f circuit compliance on delivered ventilation with use o f an
adult circle system for time cycled volume controlled ventilation using an infant lung
model. Paedia tr Anae.sth 8, 139-144.
Stewart, T.E., Meade, M O , Cook, D.J., Granton, J.T., Hodder, R .V ., Lapinsky, S.E.,
Mazer, C D , McLean, R.F., Rogovein, T.S., Schouten, B D , Todd, T.R. and Slutsky,
A S. (1998) Evaluation of a ventilation strategy to prevent barotrauma in patients at
high risk for acute respiratory distress syndrome. Pressure- and Volume-Limited
Ventilation Strategy Group. N.Engl.J.Med. 338, 355-361.
Stiller, K. (2000) Physiotherapy in intensive care: towards an evidence-based practice.
Chest 118, 1801-1813.
Stiller, K., Geake, T., Taylor, J., Grant, R. and Hall, B. (1990) Acute lobar atelectasis.
A comparison o f two chest physiotherapy regimens. Chest 98, 1336-1340.
Stiller, K., Jenkins, S., Grant, R., Geake, T., Taylor, J. and Hall, B. (1996) Acute lobar
atelectasis: a comparison o f five physiotherapy regimens. Phy.siotherapy Theory &
Practice, 12, 197-209.
Stone, K.S. (1990) Ventilator versus manual resuscitation bag as the method for
delivering hyperoxygenation before endotracheal suctioning.
AACN. Clin.Is.sues. Crit. Care Nnrs. 1 , 289-299.
Stone, K.S., Talaganis, S. A., Preusser, B. and Gonyon, D.S. (1991) Effect o f lung
hyperinflation and endotracheal suctioning on heart rate and rhythm in patients after
coronary artery bypass graft surgery. H eart Lung 20, 443-450.
260

Stone, K.S. and Turner, B. (1989) Endotracheal suctioning. Annu.Rev.Nurs.Res.
7:27-49, 27-49.
Stromberg, N.O. and Gustafsson, P.M. (2000) Ventilation inhomogeneity assessed by
nitrogen washout and ventilation-perflision mismatch by capnography in stable and
induced airway obstruction. Pediatr P u lm o iio l 29,94-102.
Sutton, P.P., Lopez-Vidriero, M .T ., Pavia, D., Newman, S.P., Clay, M .M ., Webber, B.,
Parker, R.A. and Clarke, S.W. (1985) Assessment o f percussion, vibratory-shaking and
breathing exercises in chest physiotherapy. E ur J Respir D is 66, 147-152.
Sutton, P.P., Pavia, D , Bateman, J.R. and Clarke, S.W. (1982) Chest physiotherapy: a
review. E ur J Respir D is 63, 188-201.
Swartz, K., Noonan, D M. and Edwards-Beckett, J. (1996) A national survey o f
endotracheal suctioning techniques in the pediatric population. H eart Lung 25, 52-60.
Tarnow-Mordi, W .O., Wilkie, R.A. and Reid, E. (1994) Static respiratory compliance
in the newborn. I: A clinical and prognostic index for mechanically ventilated infants.
A rch D is C h ild F e ta l Neonatal E d 70, F I 1 -F 15
Taskar, V., John, J., Larsson, A., Wetterberg, T. and Jonson, B. (1995) Dynamics of
carbon dioxide elimination following ventilator resetting. Chest 108, 196-202.
Taylor, C.J. and Threlfall, D. (1997) Postural drainage techniques and gastro-
oesophageal reflux in cystic fibrosis. Lancet 349, 1567-1568.
Thomas, K., Habibi, P., Britto, J. and Owens, C M (1999) Distribution and
pathophysiology of acute lobar collapse in the pediatric intensive care unit. C rit Care
M e d 27, 1594-1597.
Thompson, P J , Greenough, A., Gamsu, H R. and Nicolaides, K .H. (1992) Ventilatory
requirements for respiratory distress syndrome in small-for-gestational-age infants.
E urJ .P ed ia tr. 151,528-531.
Thoren, L. (1954) Postoperative pulmonary complications: observations o f their
prevention by means of physiotherapy. Acta C h ir Scand 107, 193-204.
261
Tobias, J D , Connors, D , Strauser, L. and Johnson, T. (2000) Continuous pH and
PCO 2 monitoring during respiratory failure in children with the Paratrend 7 inserted into
the peripheral venous system. J.Fedialr. 136, 623-627.
Tobias, J.D., Flanagan, J.F., Wheeler, T.J., Garrett, J.S. and Burney, C. (1994)
Noninvasive monitoring o f end-tidal CO 2 via nasal cannulas in spontaneously breathing
children during the perioperative period. C rii Care M e d 22, 1805-1808.
Tobias, J.D., Meyer, D.J.J. and Helikson, M .A . (1998) Monitoring o f pH and P C 02 in
children using the Paratrend 7 in a peripheral vein. Can.J.Anaesth. 45, 81-83.
Tudehope, D .I. and Bagley, C. (1980) Techniques of physiotherapy in intubated babies
with the respiratory distress syndrome. AnsI.Paedia/r.J. 16, 226-228.
Uhl, R.R. and Lewis, F.J. (1974) Digital computer calculation o f human pulmonary
mechanics using a least squares fit technique. Compnt B iom ed Res 7, 489-495.
Urban, B J and Weitzner, S.W. (1969) Avoidance of hypoxemia during endotracheal
suction. Anesthesiology 31, 473-475.
Yalta, P., Corbeil, C , Lavoie, A., Campodonico, R., Koulouris, N., Chassé, M ., Braidy,
J. and Milic-Emili, J. (1994) Detection o f expiratory flow limitation during mechanical
ventilation. Am.J.Respir. Crit. Care.Med. 150, 1311-1317.
van der Schans, C P , Prasad, A. and Main, E. (2000) Chest physiotherapy compared to
no chest physiotherapy for cystic fibrosis. Cochrane Database Syst Rev 2, CD001401
Vejlstrup, N.G., O'Neill, M ., Nagyova, B. and Dorrington, K.L. (1997) Time course of
hypoxic pulmonary vasoconstriction; a rabbit model o f regional hypoxia. Am J Respir
C rit Care M ed 155, 216-221.
Velasquez, T. and Farhi, L.E. (1964) Effect o f negative pressure breathing on lung
mechanics and venous admixture. J A pp l Physiol 19, 665
Vincon, C. (1999) Potential risks of chest physiotherapy in preterm infants. J Pediatr
135, 131-132.
Walther, S.M., Domino, K.B. and Hlastala, M.P. (1998) Effects o f posture on blood
flow diversion by hypoxic pulmonary vasoconstriction in dogs. B r J Anaesth 81, 425-
429.
262
Wang, M .H ., Cheng, S.Y., Wang, Y C , Lee, B.W., Lin, Y Y and Tseng, C L (1993)
[The effect o f intracranial pressure caused by airway suction in hypertensive
intracerebral hemorrhagic comatose patients]. Chung.Hua.I.Hsueh. Tsa. Chih. (Taipei.)
52, 109-115.
Watt, J.W. and Fraser, M .H . (1994) The effect o f insufflation leaks upon ventilation. A
quantified comparison o f ventilators. Anae.sthe.sia 49, 320-323.
Webster, N.R. (1999) Importance of position in which patients are nursed in intensive-
care units. Lancet 354, 1835-1836.
Weiss, I.K ., Fink, S., Edmunds, S., Harrison, R. and Donnelly, K. (1996) Continuous
arterial gas monitoring: initial experience with the Paratrend 7 in children. Intensive
C a re M e d 22, 1414-1417.
Weiss, I.K ., Fink, S., Harrison, R , Feldman, J.D. and Brill, J.E. (1999) Clinical use of
continuous arterial blood gas monitoring in the pediatric intensive care unit. Pediatrics
103, 440-445.
Weissman, C. and Kemper, M . (1993) Stressing the critically ill patient: the
cardiopulmonary and metabolic responses to an acute increase in oxygen consumption.
J C rit Care 8, 100-108.
Weissman, C , Kemper, M ., Damask, M .C., Askanazi, J , Hyman, A.I. and Kinney, J.M.
(1984) Effect o f routine intensive care interactions on metabolic rate. Chest 86, 815-
818.
Weissman, C , Kemper, M . and Harding, J. (1994) Response o f critically ill patients to
increased oxygen demand: hemodynamic subsets. C rit Care M e d 22, 1809-1816.
(a) Wenzel, U., Rudiger, M ., Wagner, M .H. and Wauer, R.R. (1999) Utility o f
deadspace and capnometry measurements in determination o f surfactant efficacy in
surfactant-depleted lungs . C rit Care M ed 27, 946-952.
(b) Wenzel, U., Wauer, R.R. and Schmalisch, G. (1999) Comparison o f different
methods for dead space measurements in ventilated newborns using C02-volume plot.
Intensive Care M ed 25, 705-713.
263

(c) Wenzel, U., Wauer, R.R., Wagner, M .H . and Schmalisch, G. (1999) In vitro and in
vivo assessment o f the Ventrak 1550/Capnogard 1265 for single breath carbon dioxide
analysis in neonates. B r J Anaesth 83,503-510.
West, J.B. (1995) Respiratory physiology - the essentials, 5th E d ition , 5th edn.
Baltimore: Williams & Wilkins.
Whitnack, J. (2000) Instillation of normal saline during endotracheal suctioning: effects
on mixed venous oxygen saturation. Am J C rit Care 9, 78-79.
Widdicombe, J.G. (1974) Respiratory physiology. M T P In te rna tiona l Review o f
Science Physiology.
Widdicombe, J.G. and Davies, A. (1991) Respiratory Physiology, 2nd edn. London:
Edward Arnold.
Wilkie, R.A., Bryan, M .H . and Tarnow-Mordi, W O (1994) Static respiratory
compliance in the newborn. II: Its potential for improving the selection o f infants for
early surfactant treatment. Arch D is C h ild Fetal Neonatal E d 70, F16-F18
Windsor, H .M ., Harrison, G.A. and Nicholson, T.J. (1972) "Bag squeezing": a
physiotherapeutic technique. Med.J.Anst. 2, 829-832.
Winning, T.J., Brock-Utne, J.G. and Goodwin, N .M . (1975) A simple clinical method
of quantitating the effects o f chest physiotherapy in mechanically ventilated patients.
Anaesth Intensive Care 3, 237-238.
(a) Wollmer, P., Eriksson, L. and Jonson, B. (1985) Regional distribution o f perfusion
and ventilation in pulmonai-y hypertensive vascular disease. C lin Physiol 5 Suppl 3,
105-109.
(b) Wollmer, P., Ursing, K., Midgren, B. and Eriksson, L. (1985) Inefficiency o f chest
percussion in the physical therapy of chronic bronchitis. E n r J Respir D is 66, 233-239.
Wood, C.J. (1998) Endotracheal suctioning: a literature review. Intensive C rit Care
Nnrs 14, 124-136.
Yamanaka, M .K. and Sue, D.Y. (1987) Comparison of arterial-end-tidal PCO 2
difference and dead space/tidal volume ratio in respiratory failure. Chest 92, 832-835.
264

You, B , Peslin, R., Duvivier, C., Vu, V D and Grilliat, J P (1994) Expiratory
capnography in asthma; evaluation of various shape indices. E ur Respir J 7, 318-323.
(a) Young, C.S. (1984) A review of the adverse effects o f airway suction.
Physiotherapy. 70, 104-106.
(b) Young, C.S. (1984) Recommended guide lines for suction. Physiotherapy 70, 106-
108.
Zach, M .S. and Oberwaldner, B. (1987) Chest physiotherapy - the mechanical approach
to antiinfective therapy in cystic fibrosis. In fection 15, 381-384.
Zack, M B., Pontoppidan, H. and Kazemi, H. (1974) The effect o f lateral positions on
gas exchange in pulmonary disease. A prospective evaluation. Am.Rev.Respir.Dis. 110,
49-55.
Zhang, P., Woodmansey, P A. and Morice, A H (1995) Acute hypoxic
vasoconstriction in isolated rat small and large pulmonaiy arteries. Physiol Res 44, 7-
18.
265
10. Appendix
10.1 Parents Information Sheet
Information Sheet
The effect of dynamic respiratory physiotherapy and routine airway clearance
techniques on respiratory function in the paediatric intensive care
We would like to ask your permission to include your child in this project
Aim of the study.
Almost all children who are ventilated in the intensive care unit will have chest physiotherapy
and routine suction to clear secretions from the airways.
The aim of this project is to investigate exactly what effect the chest physiotherapy treatments
have on lung function and whether these treatments are more effective than the suction that is
done by nurses.
Why is the study being done?
We do not know exactly what effect chest physiotherapy has on the lungs. We also do not know
whether these treatments are any better than the routine suction that is done by the nurse.
This is because suitable equipment has not been available until recently to measure lung
function in the intensive care unit. Now that the equipment is available, it will help us to evaluate
the treatment we are providing in an objective way.
How is the study to be done?
A very small monitor will be attached to the ventilator tubing which will measure how much air is
going to the lungs from the ventilator. This monitor can be left in place for long periods of time
without causing any problems or interfering with routine treatment in any way. The monitor will
be attached for most of the day on which the study will take place and will automatically measure
what is happening to the lungs before and after each treatment.
In the morning your child will be auctioned either by the nurse or by the physiotherapist. In the
afternoon, the your child will receive whichever treatment they did not have in the morning. If
your child needs further suction or treatment in between, these will be performed as normal by
the nursing or physiotherapy staff. The way in which your child is managed on the intensive care
unit will not be affected by this study.
Your child will already have an arterial line in place. This is so that the nurse can draw small
blood samples routinely to make sure the ventilator is giving your child the right amount of
support.
266

Where possible, we will try and use the blood gas measurements that are taken by the nurse, but
if not we will take an extra sample before and after the 2 treatments. In total this will be less than
1 ml (half a teaspoon) of blood over the whole day and will not cause any distress or discomfort
to your child.
One of the research team will spend most of the day near the bedside to make a note of what
time the treatments occur, but if at any time you or your family wish to be alone with your child,
we will be happy to accommodate your wishes.
Are there any risks and discomforts?
No risk or discomfort to your child is foreseen.
What are the potential benefits?
Although this study will have no direct benefits to your child, it will help us in the future to
manage other children in the best possible way.
Who will have access to the research records?
Only the researchers and a representative of the research ethics committee will have access to
the data collected during this study. This research has been approved by an independent
research ethics committee who believe that it is of minimal risk to you.
Do I have to take part in this study?
If you decide now or at a later stage that you do not wish to participate in this research project,
that is entirely your right and will not in any way change the way your child is treated.
Researcher who will have contact with the family
Eleanor Main: Phone: 0171 4059200 ext:5424
Rosemary Castle: Phone: 0171 4059200 ext:5454
Catherine Dunne: Phone: 0171 4059200 ext: 5144
Who do I speak to if problems arise?
If you have any complaints about the way in which this research project has been or is being
conducted, please in the first instance discuss them with the researcher, if the problems are not
resolved, or you wish to comment in any way, please contact the chairman of the Research
Ethics Committee, by post via the Research and Development Office, Institute of Child Health,
30 Guilford Street, London, WC1N 1EH, or if urgent, by telephone on 0171 242 9789. ext. 2620
and the committee administration will put you in contact with him.
267

10.2 Equipment validation
Table 10-1: Accuracy of volumes recorded by “ C O 2S M O Plus” using the neonatal
flow sensor.
Tracheal Tube
Size
Applied
Volume
* Recorded volume (mL) CV(%) % Error
(mL) V ti V te V ti V t e V ti V t e
No tracheal 2 1 . 9 7 ( 0 . 1 5 ) 1 . 9 5 ( 0 . 1 6 ) 7 . 6 8 . 2 - 1 . 5 % - 2 . 5 %
tube 4 3 . 9 5 ( 0 . 1 3 ) 3 . 9 2 ( 0 . 1 3 ) 3 . 3 3 . 3 - 1 . 3 % - 2 . 0 %
6 5 . 9 6 ( 0 . 1 7 ) 5 . 9 3 ( 0 . 1 6 ) 2 . 9 2 . 7 - 0 . 7 % - 1 . 2 %
8 7 . 9 2 ( 0 . 1 9 ) 7 . 9 5 ( 0 . 2 3 ) 2 . 4 2 . 9 - 1 . 0 % - 0 . 6 %
1 0 9 . 9 4 ( 0 . 2 2 ) 9 .9 1 ( 0 . 3 1 ) 2 . 2 3 .1 - 0 . 6 % - 0 . 9 %
2 0 2 0 . 9 ( 0 . 6 5 ) 2 1 .1 ( 0 . 6 8 ) 3 .1 3 . 2 4 . 3 % 5 . 4 %
4 0 3 9 . 4 ( 2 . 9 1 ) 3 9 . 2 ( 3 . 8 6 ) 7 . 4 9 . 8 - 1 . 4 % - 2 . 0 %
5 0 5 0 . 8 ( 1 . 0 7 ) 5 3 . 7 ( 3 . 6 7 ) 2 .1 6 . 9 1 . 7 % 7 . 3 %
6 0 5 8 . 9 ( 4 . 6 1 ) 5 8 . 5 ( 5 . 6 3 ) 7 . 8 9 . 6 - 1 . 8 % - 2 . 5 %
8 0 7 8 . 2 ( 6 . 6 2 ) 7 7 . 7 ( 7 . 6 3 ) 8 . 5 9 . 8 - 2 . 2 % - 2 . 8 %
1 0 0 1 0 2 ( 1 . 3 3 ) 1 0 2 ( 1 . 0 0 ) 1 .3 1 . 0 1 . 8 % 2 .1 %
1 5 0 1 5 3 ( 1 . 8 5 ) 1 5 6 ( 5 . 9 3 ) 1 .2 3 . 8 1 . 9 % 3 . 9 %
2 0 0 2 0 6 ( 4 . 5 3 ) 2 0 3 ( 1 . 5 3 ) 2 . 2 0 . 8 3 . 2 % 1 . 4 %
3 0 0 3 1 2 ( 5 . 6 8 ) 3 0 3 ( 1 . 4 0 ) 1 .8 0 . 5 4 .1 % 0 . 9 %
3.0 tracheal 2 0 2 0 . 9 ( 0 . 7 8 ) 2 1 . 3 ( 0 . 7 5 ) 3 . 7 3 . 5 4 . 3 % 6 . 6 %
tube 5 0 5 1 . 5 ( 3 . 5 8 ) 4 8 . 9 ( 2 . 0 6 ) 7 . 0 4 . 2 3 . 0 % - 2 . 3 %
1 0 0 1 0 4 ( 4 . 4 2 ) 1 0 4 ( 2 . 7 6 ) 4 . 3 2 . 7 4 . 0 % 3 . 6 %
1 5 0 1 5 3 ( 1 . 4 1 ) 1 5 0 ( 2 . 3 4 ) 0 . 9 1 .6 2 . 0 % - 0 . 2 %
2 0 0 2 0 0 ( 7 . 2 2 ) 1 9 8 ( 4 . 9 3 ) 3 . 6 2 . 5 0 . 2 % - 1 . 2 %
3 0 0 3 0 3 ( 3 . 2 0 ) 2 9 0 ( 4 . 1 6 ) 1.1 1 . 4 1 .1 % - 3 . 3 %
3.5 tracheal 2 0 2 1 . 0 ( 0 . 9 7 ) 2 1 . 2 ( 0 . 5 9 ) 4 . 6 2 . 8 5 . 2 % 5 . 9 %
tube 1 0 0 1 0 3 ( 1 . 8 0 ) 1 0 4 ( 2 . 2 4 ) 1 .7 2 . 2 0 . 0 1 % - 0 . 7 %
3 0 0 3 0 5 ( 2 . 9 3 ) 3 0 2 ( 7 . 2 4 ) 1 .0 2 . 4 1 . 6 % 0 . 8 %
4.5 tracheal tube 3 0 0 3 0 4 ( 4 . 6 3 ) 2 9 4 ( 3 . 4 4 ) 1 .5 1 .2 1 . 3 % - 2 .1 %
6.5 tracheal 5 0 5 1 . 8 ( 2 . 3 5 ) 5 1 . 0 ( 1 . 4 5 ) 4 . 5 2 . 9 3 . 5 % 1 . 9 %
tube 1 5 0 1 5 5 ( 2 . 0 2 ) 1 5 3 ( 2 . 0 6 ) 1 .3 1 . 3 3 . 2 % 2 . 2 %
1 0 0 1 0 5 ( 2 . 4 6 ) 1 0 4 ( 2 . 6 7 ) 2 . 3 2 . 6 5 . 0 % 4 . 0 %
2 0 0 2 0 3 ( 4 . 2 0 ) 2 0 2 ( 3 . 8 3 ) 2 .1 1 . 9 1 . 4 % 1 .1 %
3 0 0 3 0 2 ( 1 1 . 1 ) 2 9 6 ( 6 . 3 2 ) 3 . 7 2 .1 0 . 6 % - 1 . 4 %
268

^Results are expressed as M ean (SD). F low Between 0.75 - 28 L/m in.
Table 10-2: Accuracy of volumes recorded by “CO 2SMO Plus” using the
paediatric flow sensor.
Tracheal
Tube Size
Applied
Volume
(mL)
Recorded volume (mL) CV % Error
V ti VjE Vji V ie V ji V te
No tracheal 40 40.3 (1.9) 39.4 (3.5) 4.7 8.9 0.7% -1.5%
tube 50 51.1 (2.1) 48.4 (2.2) 4.1 4.6 2.1% -3.2%
60 61.2 (2.0) 59.1 (2.2) 3.2 3.7 2.0% -1.6%
80 80.7 (1.9) 77.0 (2.0) 2.4 2.6 0.9% -3.7%
100 102 (2.5) 97.2 (3.3) 2.4 3.4 2.5% -2.9%
150 155 (3.0) 150 (5.8) 1.9 3.9 3.1% -0.2%
200 200 (3.7) 191 (3.6) 1.9 1.9 -0.1% -4.4%
300 303 (3.6) 283 (20.2) 1.2 7.2 1.0% -5.7%
400 399 (10.6) 375 (6.0) 2.7 1.6 -0.3% -6.3%
500 500 (3.3) 485 (12.3) 0.7 2.5 0.1% -3.0%
3.0 tracheal 40 39.7 (1.3) 43.9 (4.4) 3.4 9.9 -0.7% 9.8%
tube 50 53.1 (2.7) 51.2 (2.7) 5.0 5.3 6.1% 2.5%
60 60.7 (1.4) 64.6 (1.8) 2.3 2.8 1.1% 7.6%
80 81.7 (1.9) 87.3 (2.9) 2.3 3.3 2.1% 9.1%
100 101 (2.1) 107 (2.7) 2.1 2.5 0.7% 7.3%
150 148 (3.1) 151 (6.1) 2.1 4.0 -1.5% 0.9%
200 197 (4.7) 200 (7.8) 2.4 3.9 -1.7% 0.1%
300 300 (3.5) 307 (9.0) 1.2 2.9 0.1% 2.4%
400 396 (5.8) 418 (11.0) 1.5 2.6 -1.1% 4.6%
500 501 (4.1) 510 (8.7) 0.8 1.7 0.3% 0.2%
6.5 tracheal 50 52.4 (3.1) 49.4 (4.6) 5.9 9.4 4.7% -1.2%
tube 80 80.5 (2.1) 76.6 (2.6) 2.6 3.4 0.7% -4.3%
100 101 (2.1) 97.7 (2.1) 2.1 2.2 1.3% -2.3%
150 154 (2.9) 149 (6.5) 1.9 4.4 2.9% -0.8%
200 203 (4.7) 194 (7.4) 2.3 3.8 1.5% -3.1%
300 297 (4.7) 304 (22.4) 1.6 7.4 -0.9% 1.2%
400 400 (3.7) 390 (13.1) 0.9 3.4 0.1% -2.6%
500 498 (7.6) 486 (32.5) 1.5 6.7 -0.5% -2.9%
^Results expressed as mean (SD).
269

Table 10-3: Accuracy of volumes recorded by “ C O 2 S M O Plus” using the adult
flow sensor.
Tracheal Applied Recorded volume (mL)
Tube Size volume (mL)
CV(%) % Error
V ti V te V ti V te V ti V te
No tracheal 4 0 3 9 . 4 ( 3 . 9 ) 3 8 . 9 ( 1 . 9 ) 9 . 8 4 . 8 - 1 . 4 % - 2 . 7 %
tube 5 0 5 1 . 9 ( 2 . 0 ) 4 9 . 0 ( 1 . 6 ) 3 . 9 3 . 2 3 . 7 % - 1 . 9 %
6 0 6 3 . 9 ( 6 . 1 ) 6 1 . 0 ( 5 . 3 ) 9 . 5 8 . 7 6 . 4 % 1 . 6 %
8 0 8 0 . 3 ( 6 . 5 ) 7 8 . 9 ( 7 . 2 ) 8 .1 9 .1 0 . 4 % - 1 . 4 %
1 0 0 1 0 2 ( 9 . 6 ) 9 7 . 5 (6.3) 9 . 4 6 . 5 2 . 2 % - 2 . 5 %
1 5 0 1 5 5 ( 4 . 5 ) 1 4 7 ( 4 . 5 ) 2 . 9 3 .1 3.5% - 1 . 8 %
2 0 0 2 0 7 ( 5 . 5 ) 2 0 3 ( 1 5 . 3 ) 2 . 7 7 . 6 3 . 5 % 1 . 3 %
3 0 0 3 0 8 ( 6 . 1 ) 2 9 9 ( 1 7 . 4 ) 2 . 0 5 . 8 2 . 5 % -0.2%
4 0 0 4 0 5 ( 1 6 . 5 ) 4 0 4 ( 1 8 . 5 ) 4 .1 4 . 6 1 . 3 % 1 . 1 %
5 0 0 5 2 5 ( 2 8 . 9 ) 4 8 9 ( 4 5 . 2 ) 5 . 5 9 . 3 5 . 0 % - 2 . 2 %
3.5 tracheal 5 0 5 4 . 3 ( 2 . 5 ) 5 1 . 3 ( 2 . 1 ) 4 . 5 4 .1 8 . 7 % 2 . 6 %
tube 2 0 0 2 0 6 ( 4 . 8 ) 1 9 7 ( 4 . 4 ) 2.3 2 . 2 3.1% - 1 . 7 %
3 0 0 3 0 5 (6.1) 2 9 5 ( 1 1 . 1 ) 2 . 0 3 . 7 1 . 7 % - 1 . 6 %
4 0 0 4 0 8 ( 1 2 . 1 ) 3 9 5 ( 1 1 . 2 ) 3 . 0 2 . 8 2 . 1 % - 1 . 2 %
5 0 0 5 0 6 ( 2 3 . 2 ) 4 9 2 ( 1 5 . 4 ) 4 . 6 3 .1 1 . 1 % - 1 . 6 %
6.5 tracheal 5 0 5 3 . 5 ( 3 . 1 ) 5 2 .1 (2.7) 5 . 9 5 . 2 7 . 1 % 4 . 3 %
tube 1 5 0 1 5 6 (3.9) 15 1 ( 6 . 6 ) 2 . 5 4 . 4 3.8% 0 . 5 %
2 0 0 2 1 1 (5.6) ) 2 0 2 ( 7 . 3 ) 2 . 7 3 . 6 5 . 6 % 1 . 2 %
3 0 0 3 0 8 ( 2 3 . 5 ) 2 9 8 ( 1 0 . 9 ) 7 . 6 3 . 6 2 . 6 % - 0 . 5 %
4 0 0 4 1 2 (7.6) 4 0 6 ( 9 . 4 ) 1 . 8 2 . 3 3 . 1 % 1 . 6 %
5 0 0 5 0 8 ( 3 6 . 3 ) 5 2 2 ( 4 4 . 5 ) 7 . 2 8 . 5 1 . 5 % 4 . 4 %
*Results expressed as mean (SD). Volmves - 40niL were not accurate ly measured w ith the adu lt f lo w semor.
270
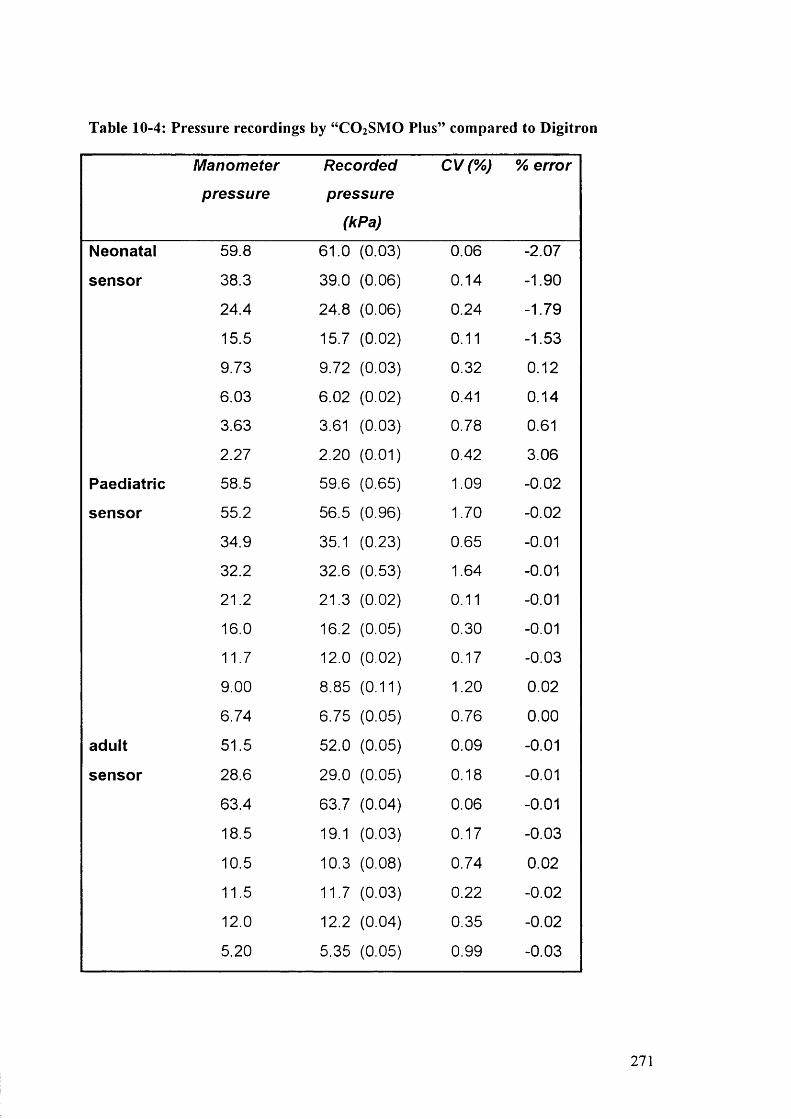
Table 10-4: Pressure recordings by “C O 2S M O Pius” compared to D igitron
Manometer
pressure
Recorded
pressure
(kPa)
CV(%) % error
Neonatal 59.8 61.0 (0.03) 0.06 -2.07
sensor 38.3 39.0 (0.06) 0.14 -1.90
24.4 24.8 (0.06) 0.24 -1.79
15.5 15.7 (0.02) 0.11 -1.53
9.73 9.72 (0.03) 0.32 0.12
6.03 6.02 (0.02) 0.41 0.14
3.63 3.61 (0.03) 0.78 0.61
2.27 2.20 (0.01) 0.42 3.06
Paediatric 58.5 59.6 (0.65) 1.09 -0.02
sensor 55.2 56.5 (0.96) 1.70 -0.02
34.9 35.1 (0.23) 0.65 -0.01
32.2 32.6 (0.53) 1.64 -0.01
21.2 21.3 (0.02) 0.11 -0.01
16.0 16.2 (0.05) 0.30 -0.01
11.7 12.0 (0.02) 0.17 -0.03
9.00 8.85 (0.11) 1.20 0.02
6.74 6.75 (0.05) 0.76 0.00
adult 51.5 52.0 (0.05) 0.09 -0.01
sensor 28.6 29.0 (0.05) 0.18 -0.01
63.4 63.7 (0.04) 0.06 -0.01
18.5 19.1 (0.03) 0.17 -0.03
10.5 10.3 (0.08) 0.74 0.02
11.5 11.7 (0.03) 0.22 -0.02
12.0 12.2 (0.04) 0.35 -0.02
5.20 5.35 (0.05) 0.99 -0.03
271
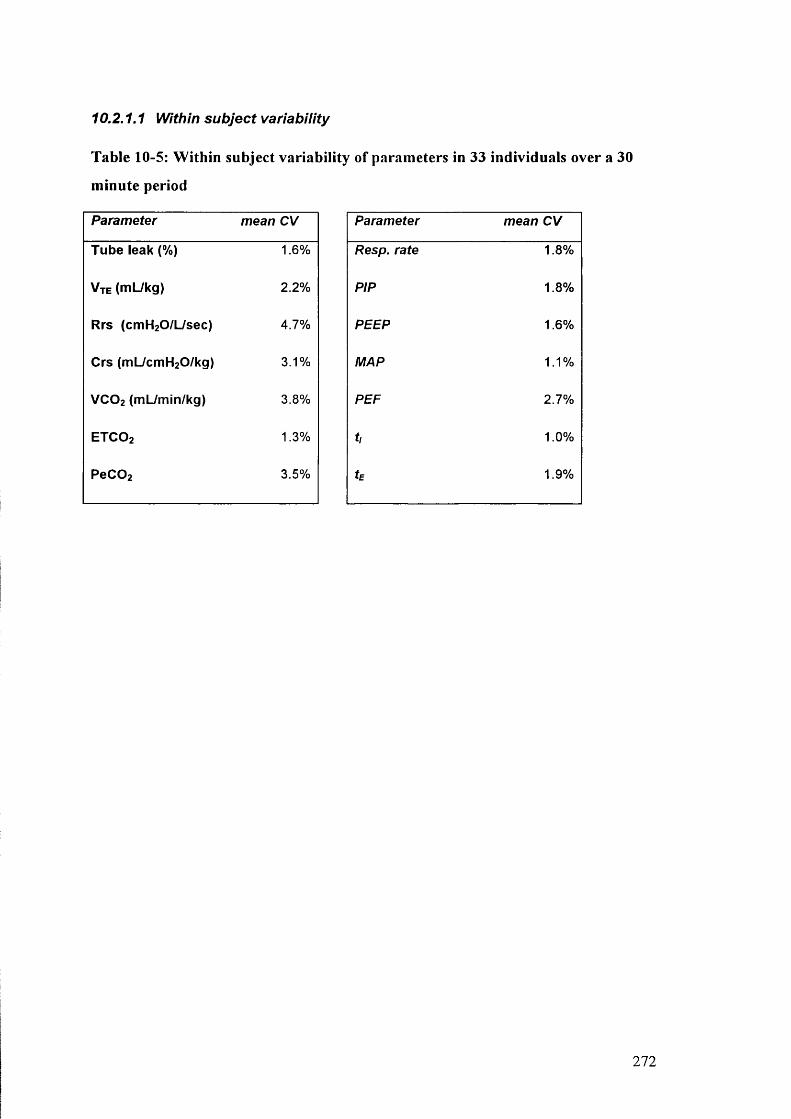
10.2.1.1 Within subject variability
Table 10-5: W ithin subject variability of parameters in 33 individuals over a 30
minute period
Parameter mean CV
Tube leak (%) 1.6%
Vte (mL/kg) 2.2%
Rrs (cmH20/L/sec) 4.7%
Crs (mL/cmH20/kg) 3.1%
VCO2 (mL/min/kg) 3.8%
ETCO2 1.3%
PeC02 3.5%
Parameter mean CV
Resp. rate 1.8%
PIP 1.8%
PEEP 1.6%
MAP 1.1%
PEF 2.7%
t, 1.0%
tE 1.9%
272
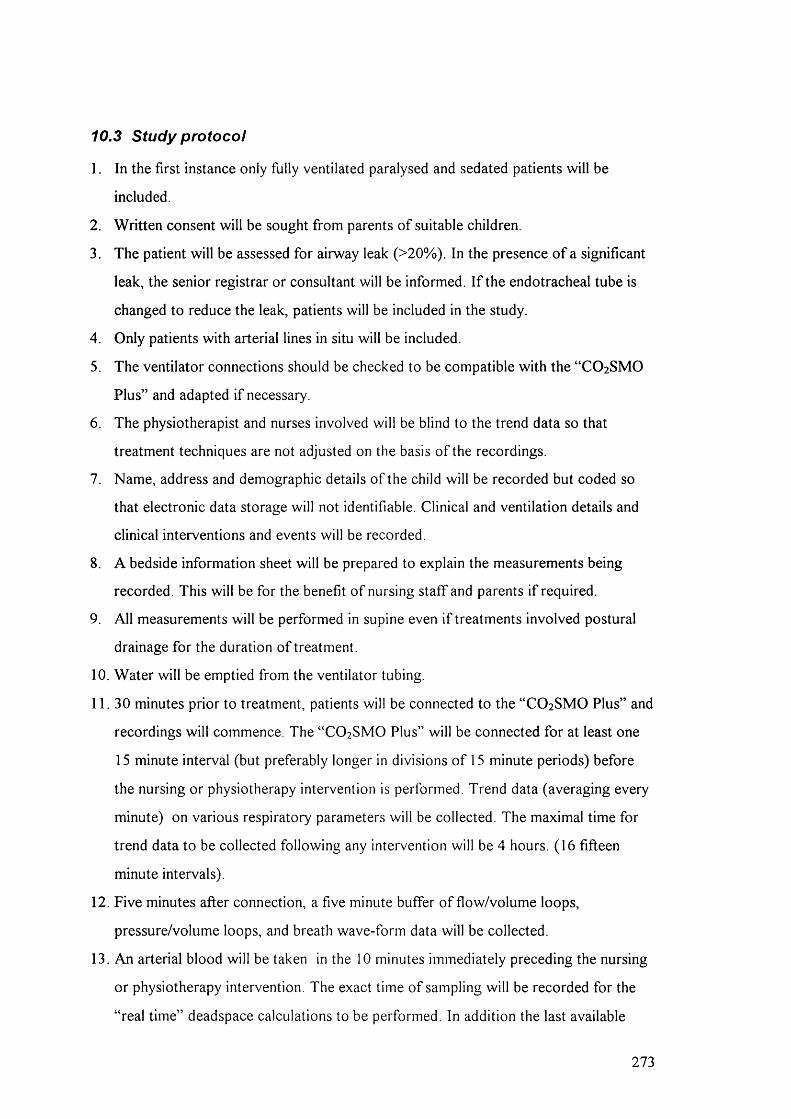
10.3 Study protocol
1. In the first instance only fully ventilated paralysed and sedated patients will be
included.
2. Written consent will be sought from parents of suitable children.
3. The patient will be assessed for airway leak (>20%). In the presence o f a significant
leak, the senior registrar or consultant will be informed. I f the endotracheal tube is
changed to reduce the leak, patients will be included in the study.
4. Only patients with arterial lines in situ will be included.
5. The ventilator connections should be checked to be compatible with the “CO 2 SMO
Plus” and adapted if necessary.
6. The physiotherapist and nurses involved will be blind to the trend data so that
treatment techniques are not adjusted on the basis o f the recordings.
7. Name, address and demographic details o f the child will be recorded but coded so
that electronic data storage will not identifiable. Clinical and ventilation details and
clinical interventions and events will be recorded.
8. A bedside information sheet will be prepared to explain the measurements being
recorded. This will be for the benefit o f nursing staff and parents if required.
9. All measurements will be performed in supine even if treatments involved postural
drainage for the duration of treatment.
10. Water will be emptied from the ventilator tubing.
11. 30 minutes prior to treatment, patients will be connected to the “CO 2 SMO Plus” and
recordings will commence. The “CO 2 SMO Plus” will be connected for at least one
15 minute interval (but preferably longer in divisions o f 15 minute periods) before
the nursing or physiotherapy intervention is performed. Trend data (averaging every
minute) on various respiratory parameters will be collected. The maximal time for
trend data to be collected following any intervention will be 4 hours. (16 fifteen
minute intervals).
12. Five minutes after connection, a five minute buffer o f flow/volume loops,
pressure/volume loops, and breath wave-form data will be collected.
13. An arterial blood will be taken in the 10 minutes immediately preceding the nursing
or physiotherapy intervention. The exact time of sampling will be recorded for the
“real time” deadspace calculations to be performed. In addition the last available
273

blood gas prior to recording will be collected for assessing general stability o f this
parameter in the individual patient.
14. Immediately prior to the nursing or physiotherapy treatment, data recording will
cease and the “CO 2 SMO Plus” will be disconnected. This will allow the flow/volume
loops, pressure/volume loops, and breath wave-forms from the five minute period
preceding the intervention to be downloaded.
15. During the physiotherapy or nursing intervention, detailed recording o f the
intervention will be taken on the form provided.
16. Water will be removed from the ventilator tubing prior to reconnection.
17. The patient will be settled in the supine position following treatment.
18. As soon as the patient has finished having treatment and is settled (no further
handling) the “CO 2 SMO Plus” will be reconnected and recording will recommence.
19. Five minutes after connection, a five minute buffer o f flow/volume loops,
pressure/volume loops, and breath wave-form data will be collected.
20. Trend data will continue to be collected for at least 30 minutes following treatment
but where possible, trend data will be collected continuously between interventions
for the purpose of;
Assessing the effect o f any clinical interventions between treatments
Assessing the length of effect o f the previous intervention
Assessing the general respiratory stability o f the individual.
Assessing normal variability during the day for that individual.
Calculating physiological deadspace measurements when routine
arterial blood gas measurements are taken.
21. Ideally, no nursing cares, suction, ventilator changes, chest radiographs, position
changes or any examinations or handling should occur during the 30 minute data
collection periods immediately prior to or following treatment. The exception will
obviously be in the event o f urgent clinical need in which case the data will have to
be discarded. Where possible minimal interventions should occur in the hour
preceding and following interventions so that arterial blood gases are reflective o f
clinical status rather than extraneous factors.
22. At least 30 minutes and less than one hour after treatment another “real time”
arterial blood gas will be collected and deadspace calculations will be performed. In
274
addition the next available blood gas will be collected for assessing general stability
o f this parameter in the individual patient.
23. I f suction is required during the 4 hour interval following treatments, then it will be
documented. Any other clinical interventions for example feeds, nursing cares,
position changes, chest radiographs, changes in ventilation during the four hour
period following either intervention will be recorded in detail and taken into account
during analysis o f the data. The research team will remain present to document these
interventions. The trend data collected around these interventions will be analysed.
24. Only experienced nursing and physiotherapy staff will perform the interventions. It is
possible that only 3-4 physiotherapists will do the treatments while several more may
do the nursing interventions.
275