Application_of_mass_spectromet.pdf - UCL Discovery
239
A p p l ic a t io n of M ass Spectrometry AND PROTEOMICS TO STUDY KiDNEY F u n c t io n ; the C oncept of R enal INTRACRINE REGULATION Pedro Rodriguez CutiUas DEPARTMENT OF BIOCHEMISTRY AND MOLECULAR BIOLOGY UNIVERSITY COLLEGE LONDON GOWER STREET, LONDON This thesis is forthedeg^ ( f Doctor c fPhilosophy from the Urm ersity c fL ondon
-
Upload
khangminh22 -
Category
Documents
-
view
1 -
download
0
Transcript of Application_of_mass_spectromet.pdf - UCL Discovery

A p p l ic a t io n o f M ass Sp e c t r o m e t r y
AND PROTEOMICS TO STUDY K iD N EY
F u n c t io n ; t h e C o n c e p t o f R e n a l
INTRACRINE REGULATION
Pedro Rodriguez CutiUas
DEPARTMENT OF BIOCHEMISTRY AND
MOLECULAR BIOLOGY
UNIVERSITY COLLEGE LONDON
GOWER STREET, LONDON
This thesis is fo rthedeg^
( f Doctor c f Philosophy from the Urmersity c fL ondon
ProQuest Number: 10014843
All rights reserved
INFORMATION TO ALL USERS The quality of this reproduction is dependent upon the quality of the copy submitted.
In the unlikely event that the author did not send a complete manuscript and there are missing pages, these will be noted. Also, if material had to be removed,
a note will indicate the deletion.
uest.
ProQuest 10014843
Published by ProQuest LLC(2016). Copyright of the Dissertation is held by the Author.
All rights reserved.This work is protected against unauthorized copying under Title 17, United States Code.
Microform Edition © ProQuest LLC.
ProQuest LLC 789 East Eisenhower Parkway
P.O. Box 1346 Ann Arbor, Ml 48106-1346
Abstract
The accepted view on horm onal regulation o f renal function is that hormones operating
on the basolateral side o f renal tubular cells contro l the expression, localisation and activity
o f proteins involved in key renal functions.
The studies presented in this thesis aimed at the esqjloration o f the idea that
bioactive peptides present in the tubular flu id (or ‘pre-urine’) may also have a role in
contro lling renal tubular cell function. To this end, urine from renal Fanconi syndrome
(PS) patients was analysed and compared w ith that o f norm al individuals. In addition, the
protein com position o f apical and basolateral membranes from rat renal tubular cells was
also investigated.
Methods fo r the extraction o f polypeptides from urine were investigated.
Im plem entation o f these methods fo r the analysis o f FS urine (w ith emphasis on D ent’s
disease) gave insights in to the nature o f low molecular w e ^h t proteinuria and si^gested
that the reuptake o f proteins from the glomerular filtra te shows some kind o f specificity
and it is not as promiscuous as previously thought. In addition to plasma proteins,
numerous peptides w ith previously reported bioactive actions were detected in both
norm al and FS urine, although the relative abundance o f these peptides was altered in FS
patients.
In a separate set o f experiments, several proteins w ith potential roles in signal
transduction were found in apical membrane segments o f renal tubular cells. The presence
o f bioactive peptides in D ent’s and norm al urine and the find ing that proteins w ith
signalling roles are located on apical membranes support the notion o f an intracrine system
operating in the lumen o f the healthy tubules. I t is concluded that an alteration on the
horm onal com position o f the tubular flu id , as in diseases that lead to proteinuria, may
contribute to the progression o f these diseases w ith the end result o f renal dysfunction and
ultim ately kidney failure.
Ab b r e v ia t io n s
A n alphabetically indexed lis t o f abbreviations used in this thesis is presented below. Hyphenation o f acronyms is prevalent in mass spectrom etry and analytical chem istry in general; the individual terms and common concatenations are listed below.
P -2-G P I p-2-glycoprotein IID E One-dimensional gel electrophoresis2 D E Two-dimensional gel electrophoresis2D -LC Two-dimensional liqu id chromatographyA C N A ceton itiile (M eth}i cyanide)A D H Antid iuretic hormone (vasopresin)A D IF Autosomal dom inant idiopathic Fanconi syndromeAm Bic Am onium bicarbonate (N H 2 H 2 GO 3)Ang AngiotensinAPS Am m onium persulphateA Q AquapoiinATP Adenosine triphosphateB BM Brush border membrane (apical membrane)B K BradyldninB LM Basolateral membraneBM E p- mercaptoethanolBM P Bone m oiphogenic proteinBPB Brom ophenol blueCIS Octadecyd silane packing materialcAM P Cyclic jf^dPCBB Colloidal coomassie b rillian t blueQ D Collision-induced dissociationDa D altonD H B Dihydroxybenzoic acidD T P D ith io th re ito lEO F Epitherm al growth factorESI Electrospray ionisationFS Renal Fanconi syndromeH C C A a- cyano- 4- hydroxy cinammic acidHM W P H igh molecular weight proteinuriaH P LC High-performance liqu id chromatographyH P X HemopexinJAM lodoacetamideIC A T Isotope-coded a ffin ity taglE F Isoelectric focusingIG F Insulin-like growth factorIG FBP IG F binding proteinIP G Im m obilised p H gradientIR Infra-redLC Liquid chromatographyLC M S O n-line liqu id chromatography w ith mass spectrometric
detectionL IF T Proprietry technology used to focus fragm ent ions in a single
LM W PM A LD I-P S D experiment Low molecular weight proteinuria
m /z Mass-to-chai^e ratioM A L D I Matrix-assisted laser desorption/ionisationM r M olecular weightMS Mass spectrometryM S/M S Tandem mass spectrometryN a /K ATPase Sodium /potassium ATPase pumpNaPi Sodium phosphate cotransporterPAG E Polyaci}damide gel electrophoresisPD G F Platelet-derived growth factorPED F Pigment epithelium-derived factor
p i Isoelectric po in tP i Inoiganic phosphateP K A Protein kinase A (cAMP-regulated protein kinase)P K C Protein kinase Cppm Parts per m illionPSD Post-source decayPT Proxim al tubular cellP T H Parathyroid hormoneQ -TO F Quadmpole tim e-o f-fligh tRBP Retinal binding proteinRP Reversed-phases e x Strong cation exchangeSDS Sodium dodecyl sulphateSPE Solid phase extractionTE M E D N ,N ,N ' ,N ' - Tetrameth}deth)denediamineT F A Trifluoroacetic acidT IC Total ion chromatogramTO F T im e-of-flightT T R TransthyretinU V U ltravio letVD BP V itam in D binding protein
A c k n o w t f.d g m f n t s
I would like to acknowledge the contribution o f other people to the w ork presented in this
thesis and those w ithout whose help it would have not been possible. F irst and forem ost I
am grateful to m y Supervisors, Prof. M ke W aterfiled and P rof. Robert U nw in, and m y
M entor, Prof. A lm a Burlingame, fo r giving me the opportun ity to carry out m y studies in a
challenging and m ultid iscip linary research environm ent, w hich has broaden m y views on
both biomedical and bioanalytical sciences. I am particularly indebted to P rof. U nw in fo r
stim ulating discussions; much o f the ideas presented here were inspired from these
conversations. I would also like to thank Prof. Burlingame fo r his hospita lity when I visited
his laboratory at the U niversity o f California in San Francisco; these visits were invaluable
to m y research. I am also grateful to D r. Rainer Cramer fo r an excellent course on
biological mass spectrometry that sparked m y interest in this subject. D r. Robert Chalkley
and M r. Steve Corless directed m y firs t steps in the Bioanalytical Chem istry Laboratory at
the Ludwig Institu te fo r Cancer Research (LICR), U niversity College London branch and
m y practical knowledge o f H P LC and LC M S is in part due to the ir in itia l training and
guidance. I am also grateful to D r. John Timms fo r showing me how to run 2D gels and
fo r answering all m y practical questions regarding protein chemistry. I would also like to
express m y gratitude to A lice Yang who provided guidance and help on the analysis o f 2D
gels using bioinform atics packages, and to Richard Jacob, who wrote algorithms that
greatly facilitated the tabulation o f results derived fro m lai^e scale protein analyses. I
would also like to thank all the other members o f the Bioanalytical Chem istry Laboratory
at the LIC R , U niversity College London branch, fo r providing help whenever requested.
This w ork would not have been possible w ithout the contributions o f external
collaborators; D r. A nthony N orden (Addenbrooke’s Hospital, Cambridge) provided
clinical samples, and the renal cortical tubule membranes were prepared by D r. Joanne
Marks (Royal Free Hospital, London), and D r. Juerg B iber (U niversity o f Zurich,
Switzerland). Finally, I am grateful to m y w ife and m y daughter fo r putting up w ith m y in
occasions, absent m ind and because they were the driving force behind this thesis.
Pu b l ic a t io n s D e r iv e d fr o m t h is T h e s is
Full Papers
Pedro R C utillas. Joanne Marks, Juei^ Biber, Richard Jacob, Rainer Cramer, Mike D Waterfield,
Alma L Burlingame and Robert J Unwin (2004) Direct comparison of two shotgun analytical
methods fo r membrane protein analysis; towards r-haract.eri7.ing the renal proximal tubular cell
membrane proteome (manuscript in preparation).
Pedro R C utillas. Robert J Chalkley, K irk C Hansen, Rainer Cramer, Anthony GW Norden, Mike
D Waterfield, Alma L Burlingame, and Robert J Unwin (2004) Abnormalities in the urinary
proteome o f Dent’s disease patients (CLCN5 mutation) im ply specificity in the reabsoiption of
proteins by renal proximal tubular cells. (Submitted).
Pedro R C utillas. Alma L. Burlingame, and Robert J. Unwin (2004) Proteomic approaches and
their application to study renal function. Nem inPhysido^ad Sàenœs. (In Press).
Pedro R C utillas. Anthony GW Norden, Rainer Cramer, Ahna L Burlingame and Robert J
Unwin (2003) Urinary proteomics of renal Fanconi syndrome in Proteorrics in Nephrology
(Thongboonkerd, V., ed). Vol. 141. pp 155-169.
Pedro R C utillas. Anthony GW Norden, Rainer Cramer, Alma L Burlingame and Robert J Unwin
(2003). Detection and analysis of urinaiy peptides by on-line liquid chromatography and mass
spectrometry: application to patients with renal Fanconi syndrome. Qimcal Sdenœ. Vol. 104. pp 483-
490.
Anthony GW Norden, Peter Sharratt, Pedro R Cutillas. Sharon C Gardner, and Robert J Unwin
(2004) Quantitative amino acid and proteomic analysis of normal and Fanconi urine: no s^nificant
protein fragment excretion in normal urine. Kidnsy Iiiternadcnd. (Submited).
P r e se n t a t io n s at In t e r n a t io n a l Co n f e r e n c e s
Pedro R Cutillas. Robert Chalkley, K irk Hansen, Rainer Cramer, Anthony Norden, Alma L.
Burlingame, and Robert J. Unwin (2003) Probing the specificity o f the megalin-mediated endocytic
pathway by proteomics. The 36* Conference of the American Society fo r Nephrology. San Diego,
USA.
Pedro R C utillas. Joanne Marks, Rainer Cramer, Alma L. Burlingame, Robert J. Unwin (2003)
Proteomic analysis of the renal cortex brush border membrane preparation: towards characterizing
the proximal tubular cell apical membrane proteome. The 36* Conference of the American Society
fo r Nephrology. San Diego, USA.

Pedro R C utillas. K irk C Hansen, Robert J. Qialkley, Robert Unwin, Aima L. Burlingame (2003)
Relative quantitation o f polypeptides in the urine of Dent’s disease patients by multidimensional
liquid chromatography and complementary quantitative mass spectrometric approaches. Sixth
International Symposium on Mass Spectrometry in the Health and Life Sciences: Molecular and
Cellular Proteomics. San Francisco, USA. Moleadarand CdhdzrProteomics. Vol 2 (Suppl 7): pp S47.
Pedro R C utillas. Robert Unwin; Rainer Cramer (2003) Analysis o f polypeptides in the urine of
Dent’s disease patients by capillary liquid chromatography coupled w ith matrix assisted laser
desorption/ionization tim e-of-flight mass spectrometry (pLCM ALDI-TO F-M S). 16
International Mass Spectrometry Conference (IMSG16), Edinburgh, UK.
Pedro R C utillas. Anthony GW Norden, Rainer Cramer, Alma L Burlingame and Robert J Unwin
(2003) Qualitative abnormalities in the proteome of Dent’s Disease urine. World Congress of
Nephrology2003. Berlin, Germany. Nephrcldg)!Dialysis TransplantatknVcA 18 (Suppl 4): pp 638.
Pedro R C utillas. Anthony GW Norden, Rainer Cramer, Alma L Burlingame and Robert J Unwin
(2002) Proteomic analysis of renal Fanconi Urine. The 35* Conference of the American Society for
Nephrology. Philadelphia, USA.
Pedro R C utillas» Rainer Cramer, Alma L Burlingame and Robert J Unwin (2002) A Column-
switching LGM S/M S Set-up fo r the ‘Qean-up’, Separation and Characterization o f Peptides
Present in Small Volumes of Biological Fluids. Proceedings o f the 50* conference of the American
Society of Mass Spectrometry and Allied Topics. Orlando, USA
Co n t e n t s
1. INTRODUCTION............................................................................. 131.1. B iological B a c k g r o u n d ......................................................................................................13
1.1.1. Hormonal Regulation o f Renal Function............................................................ 131.1.2. Reabsorption o f polypeptides from the glomerular filtrate .............................191.1.3. The renal Fanconi syndrom e................................................................................22
1.2. A n a ly tic a l M e t h o d s ............................................................................................................261.2.1. Gel Electrophoresis o f Proteins........................................................................... 261.2.2. Liquid Chromatography.........................................................................................271.2.3. Biological mass spectrometry...............................................................................31
1.3. The proteomics w orkflo w ................................................................................................. 411.3.1. Targeted approaches fo r the detection and quantitation ofproteins............ 411.3.2. Two-dimensional gel electrophoresis and mass spectrometry-based methods ................................................................................................................................................ 421.3.3. Liquid chromatography-tandem mass spectrometry based methods............ 43
1.4. A ims a n d S c o p e ......................................................................................................................... 44
2. EXPERIMENTAL............................................................................. 462.1. M a ss spe c tr o m e tr y ............................................................................................................... 46
2.1.1. MALDI-TOF MS and MALDI-TOF/TOF MS/MS.............................................462.1.2. ESI-QTOFM S ......................................................................................................... 472.1.3. LC-ESI-QTOF M S ...................................................................................................48
2.2. L iquid c h r o m a to g r a ph y ......................................................................................................492.2.1. Column packing ....................................................................................................... 492.2.2. Reversed phase HPLC ............................................................................................502.2.3. Strong cation exchange HPLC ..............................................................................51
2.3. G el electrophoresis.............................................................................................................. 522.3.1. One-dimensional SDS-PAGE................................................................................522.3.2. Two-dimensional PAGE .........................................................................................532.3.3. Gel staining and analysis...................................................................................... 53
2.4. Enzy m a tic digestion of p r o t e in s ................................................................................... 542.4.1. In-solution digestion ............................................................................................... 542.4.2. In-gel digestion ........................................................................................................ 55
2 .5 . D a t a A n a l y s i s ...........................................................................................................................552.6. Extraction of polypeptides from u r in e .....................................................................56
2.6.1. Precipitation .............................................................................................................562.6.2. Solvent extraction ....................................................................................................562.6.3. Liquid chromatography..........................................................................................56
2.7. La bellin g of polypeptides with isotope co ded affinity t a g s ....................... 572.8. Operation of the c olum n sw itching liquid chrom atograph y tandem
MASS SPECTROMETRY SETUP...........................................................................................................582.8.1. Description o f the system .................................................................................... 582.8.2 Operation o f the system ...........................................................................................58
2.9. P roteomic a n a l y sis of m em brane pr epa r a t io n s ...................................................592.10. Pa t ie n t s ......................................................................................................................................59
3. ANALYSIS OF URINARY POLYPEPTIDES BY LIQUID CHROMATOGRAPHY AND MASS SPECTROMETRY................61
3.1. M ethods for the extraction of polypeptides from u r in e ...............................623.1.1. Extraction o f urinary peptides by reversed phase liquid chromatography. 633.1.2. Extraction o f urinary peptides by organic solvent precipitation ................... 653.1.3. Extraction o f urinary peptides by solvent-solvent extraction..........................653.1.4. Extraction ofpolypeptides from urine by reversed phase and strong cation exchange solid phase extraction ......................................................................................663.1.5. Manufacture o f microcapillary liquid chromatographic columns.................683.1.6. Column switching liquid chromatography fo r the extraction and analysis o f urinary pep tides ...................................................................................................................73
3.2. A n a l y sis of polypeptides in the urine of r en a l Fa n co ni p a t ie n t s 803.2.1. The peptide composition o f renal Fanconi and Normal urines..................... 803.2.2. Comparison with published reports on the composition o f renal Fanconi urinary pep tides .................................................................................................................. 863.2.3. Possible implications fo r the pathophysiology o f the renal Fanconi syndrome...............................................................................................................................87
4. COMPARATIVE PROTEOMIC ANALYSIS OF DENT’S AND NORMAL URINE................................................................................. 89
4.1. A n a l y sis of u r in a r y polypeptides b y gel elec tr o ph o resis............................ 904.1.1. One dimensional SDS-PAGE o f D en t’s and normal urinary proteins 904.1.2. Two dimensional gel electrophoresis o f D en t’s and normal urinary proteins ................................................................................................................................................ 94
4.2. A n a l y sis of D e n t ’s a n d N orm al urina r y proteom es b y liquid
CHROMATOGRAPHY AND MASS SPECTROMETRY..................................................................... 1094.2.1. Microcapillary reversed phase liquid chromatography o f urinary proteins 1104.2.2. Multidimensional liquid chromatography o f proteins labelled with stable isotopes................................................................................................................................118
4.3. C om parison of the results presented in this c hapter with published
STUDIES ON THE PROTEOME OF URINE.........................................................................................1254.4. Lesso n s lea rn ed from the direct com parison of three a n alytic a l
APPROACHES TO URINARY PROTEOMICS..................................................................................... 1314.5. R atio nalizatio n of the differences o bserv ed betw een the proteom es of D e n t ’s a n d N o r m a l u r ina r y proteom es ........................................................................... 134
5. PROTEOMIC ANALYSIS OF BASOLATERAL AND APICAL MEMBRANES FROM KIDNEY CORTEX..................................... 141
5.1. A n a l y sis of proteins present in br u sh bo rd er m em bra n es o bta in ed b y MAGNESIUM PRECIPITATION........................................................................................................... 1445.2. A n a l y sis of proteins present in br u sh bo rd er a n d ba so la ter al MEMBRANE PREPARATIONS............................................................................................................ 1515.3. A n a l y sis of proteins in B B M a n d B LM vesicles b y isotope coded affinity
TAGS, LIQUID CHROMATOGRAPHY AND MASS SPECTROMETRY.......................................... 1645.4. Su m m a r y .....................................................................................................................................168
6. CONCLUDING REMARKS AND OUTLOOK........................... 171

7. APENDICES....................................................................................176I. Exam ples of ta n d em m a ss spe c t r a ...................................................................................176II. Proteins D etected in FS U rine a n d Co n t r o l ........................................................... 179III. Proteins detected in br u sh bo rder m em bra n es isolated b y m a g n esiu m precipitation a n d differencial c e n t r ifu g a t io n .......................................................... 184IV. Proteins identified in renal cortical m em brane fractions isolated b y
FREE-FLOW ELECTROPHORESIS...................................................................................................... 192A. Proteins identified in basolateral membrane fractions........................................ 192B. Proteins identified in brush border membrane fractions.....................................204
8. REFERENCES.................................................................................215
10
L IriTxxJlpicüm
T ables a n d F ig u r e s
Figure 1.1.1. Mechanism and regulation of inorganic phosphate (Pi) reabsorption in PT cells.. 16
Figure 1.1.2. Mechanism and regulation of water reabsorption from the distal tubules.................18
Figure 1.1.3. The megalin-cubilin endocytic pathway in renal PT cells........................................ 20
Figure 1.2.1. Ion formation by MALDI............................................................................................33
Figure 1.2.2. Ion formation by ESI................................................................................................. 35
Figure 1.2.3. The principle of tandem mass spectrometry in space............................................. 39
Figure 1.2.4. Nomenclature of peptide fragment ions generated in MS/MS or PSD experiments..................................................................................................................................................39
Figure 3.1.1. LC-MS analysis of peptides in untreated urine........................................................ 64
Figure 3.1.2. Recovery of peptides from solvent-solvent extraction experiments....................... 66
Figure 3.1.3. Solid phase extraction of urinary peptides using RP and SCX chromatography... 67
Figure 3.1.4. Methods for the construction of microcapillary liquid chromatographic columns...69
Figure 3.1.5. Performance of columns packed in house using porous ceramic frits.................... 70
Figure 3.1.6. Recovery of proteins from in-house packed columns..............................................70
Figure 3.1.7 Recovery of peptides from RP and SCX columns....................................................71
Figure 3.1.8. Recovery of urinary peptides from in-house packed chromatographic columns. ..72
Figure 3.1.9. Operation of the Column-switching...........................................................................74
Figure 3.1.10. Sensitivity of the column switching LC-ESI-MS/MS method.................................75
Figure 3.1.11. Elution profile of small urinary and plasma peptides............................................. 76
Table 3.1.1. Peptides identified by column switching LC-ESI-MS/MS......................................... 76
Figure 3.2.1. LC-MS/MS Survey Scan of One FS Urinary SCX Peptide Fraction.......................81
Figure 3.2.2. Classification of identified polypeptides from urine of Fanconi syndrome patients..................................................................................................................................................83
Figure 3.2.3. Mass spectra of IGF-II............................................................................................... 84
Table 3.2.1. Examples of bioactive peptides found in Dent’s disease urine by LC-MS/MS 85
Figure 4.1.1. ID SDS-PAGE of urinary proteins............................................................................91
Table 4.1.1. Proteins identified by ID SDS-PAGE and LC-ESI-MS/MS......................................92
Figure 4.1.2 Tandem Mass Spectra of peptides matching kininogen and transthyretin............. 93
Figure. 4.1.3. Two-dimensional gel electrophoresis analysis of Normal and Dent’s urinaryproteomes................................................................................................................................95
Figure 4.1.4. Two-dimensional gel electrophoretic profiles of selected urinary proteins 96
Figure 4.1.5. MALDI-TOF mass spectrum and peptide mass map of spot 33........................... 103
Figure 4.1.6. Mass spectrometric analysis of spot 42.................................................................. 104
Figure 4.1.7. Analysis of spot 15 by MALDI-TOF.........................................................................105
Figure 4.1.8. Analysis of spot 15 by LC-ESI-MS/MS................................................................... 106
Figure 4.2.1. Chromatographic elution profile of urinary proteins...............................................112
Figure 4.2.2. Plot of the m/z values found in each of the capillary LC fractions........................ 113
Figure 4.2.3. Polypeptides identified by pLC................................................................................ 114
1. Irtroduakn
Figure 4.2.4. Chromatographic elution profiles of apo-AIV tryptic peptides................................115
Figure 4.2.5. Chromatographic elution profile of selected apolipoproteins.................................116
Figure 4.2.6. Chromatographic elution profile of selected carrier proteins................................. 117
Figure 4.2.7 Chromatographic elution profile of selected bioactive peptides............................. 118
Figure 4.2.8. Comparison of the quantitative data obtained by LC-ESI-Q-TOF and LC-MALDI- TOF/TOF analytical platforms.............................................................................................. 120
Figure 4.2.9. Relative quantitation of an angiogenin tryptic peptide demonstrating the dynamic range of LC-MALDI-TOF/TOF and LC-ESI-Q-TOF..............................................................121
Figure 4.2.10. Representative ion pairs used for the relative quantitation of urinary proteins by multidimensional LC-ESI-MS of ICAT labeled peptides.......................................................122
Table 4.2.1. ICAT ratios................................................................................................................. 123
Figure 4.3.1. Comparison of published studies on urinary proteomes by 2DE......................... 126
Figure 4.3.2. Ratio of urinary proteins to albumin as determined by immunochemistry........... 129
Table 4.5.1. Summary of proteins identified in the urine of Dent’s and Normal individuals 134
Figure 4.5.1 .Interpretation of results............................................................................................. 138
Figure 5.1.1. SDS-PAGE of BBM preparations...........................................................................145
Table 5.1.1. Comparison of statistical values from 2D-LC and SDS-PAGE approaches 145
Figure 5.1.2. Distribution of pi and Mr of the proteins identified in BBM preparations by twodifferent proteomic approaches............................................................................................146
Figure 5.1.3. Function of the identified gene products present in BBM vessicles..................... 148
Table 5.1.2. Examples of the proteins found in BBM membrane preparations........................149
Figure 5.2.1. SDS-PAGE of BBM and BLM preparations..........................................................152
Table 5.2.1. Proteins identified in gel fraction 1 of the brush border membrane analysis.......... 153
Table 5.2.2. Proteins identified in gel fraction 1 of the basolateral membrane analysis............. 154
Figure 5.2.2. Analysis BBM and BLM protein markers in fraction 1............................................156
Figure 5.2.3. Elution of multidrug resistance protein and multidrug resistance protein-associated protein peptides in fraction 1................................................................................................ 157
Figure 5.2.4. Detailed analysis of spectrin in fraction 1................................................................158
Table 5.2.3. Proteins identified in gel fraction 17 of the brush border membrane analysis....... 159
Table 5.2.4. Proteins identified in gel fraction 17 of the basolateral membrane analysis........... 160
Table 5.2.5. Selection of Proteins with Homology to RIKEN cDNA 4632401 COB..................... 161
Figure 5.2.5. Sequence and analysis of a novel renal membrane protein................................ 162
Figure 5.3.1. Ratio of megalin and Na+/K+-APTase in BBM and BLM as determined by LC- MS/MS of ICAT-labelled protiens.........................................................................................165
Figure 5.3.2. ICAT ratios of spectrin and PDZK-1 in BBM and BLM vesicles............................ 166
Figure 5.3.3. ICAT ratios of two G proteins in BBM and BLM vesicles.......................................166
12
1. Iritm hctkn
1. Introduction1.1. Biological Background
The kidney has several roles in maintaining mammalian body homeostasis. O f
importance, these roles include allowing the excretion o f toxic substances such as end-
products o f metabolism, while retaining others that are essential o r o f value, such as water,
energy sources (e.g., sugars and amino acids), salts, vitam ins, etc. Reabsorption o f
im portant molecules such as water and salts is under tigh t horm onal and neuronal control,
such that organisms can quickly adapt to changes in the ir environment. W ithout being
comprehensive o r exhaustive, this section aims to summarize general aspects o f horm onal
regulation o f kidney function as well as the features o f renal physiology and
pathophysiology that are relevant to the studies presented in this thesis.
1.1.1. Hormynd Re^âatkn c f Rend Fvmokn
Geneml aspects
The functional un it o f the kidney is the nephron; it has been estimated that there
are 0.8 to 1.2 m illion nephrons per human kidney [1], Anatom ically and functionally
nephrons are divided in to tw o main structures: the M alpighian capsule and the tubules.
The M alpighian capsule consists o f the glomerulus and the Bowman capsule, while the
tubules can be subdivided in to the proxim al and distal tubules, the loop o f Henle, and the
connecting segment. A fferent and efferent arteries are separated by a capillary plexus that
is the site o f filtra tio n o f blood. The glomerulus produces an ultrafiltra te o f plasma. The
physical basis o f this u ltra filtra tion is provided by a filtra tio n barrier, which is form ed by
fenestrated capillary endothelium, a basement membrane, and s lit pores between the
visceral epithelial cells that are on the other side o f the basement membrane (to the
endothelium and known as podocytes).
The hydraulic pressure o f blood in the capillaries and the perm eability o f the
filtra tio n barrier determine u ltra filtra tion . A bout 180 liters o f glom erular filtra te - that is,
tubular flu id - are produced per day. The precise volume is determined by the glomerular
filtra tio n rate, which can be, in turn, regulated by peptide hormones such as angiotensin
(Ang) I I , endothelins, epithermal growth factor (EGF), among others (reviewed in [2]).
Neuronal innervations also seems to play a role in the regulation o f glomerular filtra tion
rate [2 ].
13
1. Iritrakctim
Size and charge o f the filtra tio n barrier pores determine which molecules are
filtered; it is generally accepted that substances w ith a molecular radius o f -600 nm are
norm ally excluded from the filtra tion , whereas those w ith a radius o f 2 0 0 nm are freely
filtered [ 2 ], This means that large proteins are norm ally not present in the glomerular
filtra te and that the molecular weight cu t-o ff fo r filtra tio n is between 60 to 70 kDa fo r
globular proteins. In contrast, other physiologically im portant molecules, such as vitamins,
minerals, water, and sugars, are freely filtered.
Certain small molecules present in the tubular flu id are selectively reabsorbed along
the tubules so that they on ly appear in urine in significant amounts when the ir
concentrations in plasma are above the norm al range levels. The bulk o f this reabsorption
occurs in the proxim al tubule and it is mediated by proxim al tubular (PT) cells, which are a
specialized type o f renal epithelial (tubule) cell. As w ith all renal epithelial cells, PT cells are
polarized so that the ir cell membrane is divided in to three anatom ically and functionally
distinctive domains: the basal, the lateral, and the apical membranes. The basal membrane
faces the in terstitia l space (and peritubular capillary blood); the lateral side mediates cell-cell
contacts and it is rich in adhesion molecules; finally, the apical membrane, also called brush
border membrane (in the proxim al tubule) due to its numerous invaginations, faces the
lumen o f the tubules and it is rich in ion channels and transporters that mediate the
reabsorption o f solutes fro m the tubular flu id .
The passage o f solutes at the apical membrane is by facilitated d iffusion under
the ir concentration gradient, which is generated by active transport on the basal
membrane. For example, a NaVK^-ATPase operating at the basolateral membrane
actively pumps Na' ions outside the cell. This creates a concentration gradient that drives
the energy free transport o f Na"^ ions from the tubular flu id in to the cell through apical
Na"^ channels and transporters. In many cases, entry o f Na' ions is coupled w ith the co
transport o f other molecules (symport), i.e., w ith the entry o f e.g., inorganic phosphate
(Pr), glucose o r amino acids.
Regulation o f this absorptive process in the proxim al tubule is thought to be
mediated by hormones present in the in terstitia l flu id and operating on the basolateral
membrane; these hormones act from blood and modulate the activ ity and expression o f
ATP driven transporters operating basolateraUy. In addition, the signal induced by certain
regulatory factors diffuses from the basal side o f tubular cells to the apical side such that
14

1. IrüivdM tim
regulation occurs at the level o f transcriptional expression and localization o f co
transporters and ion channels at the brush border membrane.
Additionally; it has been recently found that peptide hormone receptors are also
located on the apical side o f tubular cells so that regulation may also takes place by the
action o f bioactive peptides present in the lumen o f tubules [3]. F o r example, receptors fo r
Ang I I [4], insulin-like growth factor (IG F )-I and I I [5], transform ing growth factor
(TGF)-/? [ 6 ], G uan}Iin [7], and parathyroid hormone (PTE^ [ 8 ] have been found to be
located on apical membranes o f tubular cells and the intralum inal concentrations o f Ang I I
and IGF-1 were reported to be ~ 4 nM and 1 nM , respectively [9 -1 1 ]. In this respect, it was
found that Ang I I stimulates ion transport across tubular cells when administrated in to the
lumen o f the tubules to a greater degree than when it acted at the basolateral membrane
[ 1 2 ]. The presence o f peptide hormones in the tubular flu id could arise fro m the ir filtra tion
at the glomerulus as w ell as from the ejq^ression and secretion o f these peptides by renal
cells. F o r example, it has been reported that renal cells express and secrete bioactive
peptides in to the tubular flu id ; these include angiotensin [4;9;12-14], EG F [15], platelet
derived growth factor (PDGF) [16], kininogen (brad}Irin in precursor) [17;18], and
osteopontin [19;20].
Regulation o f phosphate absorption
A n example o f a reabsorption process that is regulated by the apical expression o f
the transporter is that o f inoiganic phosphate (Pi), which is mediated by members o f the
N a V P i co-tranporters (NaP^ gene fam ily [2 1 ]. The main kidney NaPi isoform is the type
Ila N a V P i (N aP i-II) and it is expressed in PT cells and located at the brush border
membrane. I t has been estimated that ~ 80% o f filte red phosphate is reabsorbed in the
firs t segment o f the proxim al tubule [ 2 1 ]. The mechanisms by which phosphate
reabsorption is regulated are not com pletely known, but it is believed that this regulation is
m ainly mediated by exocytic insertion and endocytic retrieval o f NaPi molecules at the
brush border membrane from and in to subapical vesicles. I t is also suspected that
phosphorylation plays a part in the m odulation o f N aP i-II activ ity because there is some
evidence that this co-transporter is a phosphoprotein [ 2 1 ], but no experimental evidence
exists regarding how phosphorylation may modulate N aP i-II activity. Certain peptide
hormones (chiefly PTH) and dietary phosphate decrease the rate o f P i to be reabsorbed by
PT cells by prom oting the retrieval o f N aP i-II molecules in to early subapical endosomes
15
/. Introduction
and, conversely, those factors that increase the rate of Pi reabsorption promote the
insertion o f transporters on the brush border [21].
25(O H) V it D3PTH Pi:3 Na
cAM P
25(OH) Vit D3
PKA
Gene expressioncAM P
PTH 3 N a
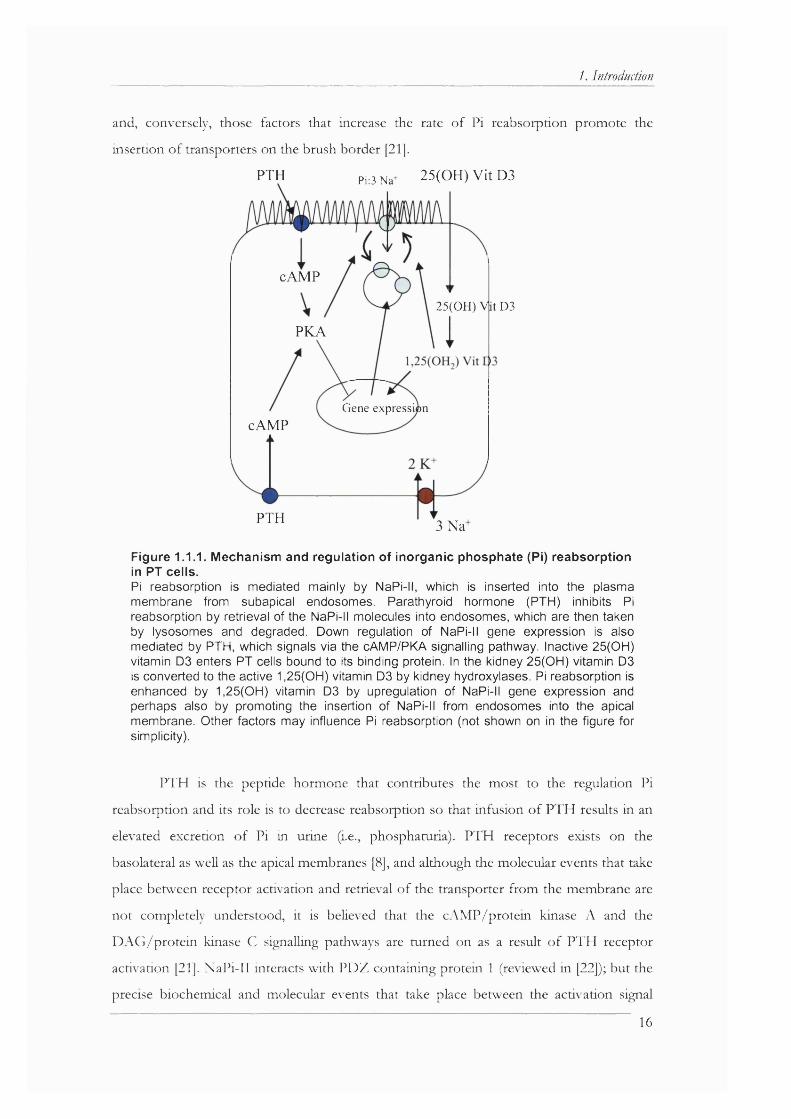
Figure 1.1.1. Mechanism and regulation of inorganic phosphate (Pi) reabsorption in PT cells.Pi reabsorption is mediated mainly by NaPi-ll, which is inserted into the plasma membrane from subapical endosomes. Parathyroid hormone (PTH) inhibits Pi reabsorption by retrieval of the NaPi-ll molecules into endosomes, which are then taken by lysosomes and degraded. Down regulation of NaPi-ll gene expression is also mediated by PTH, which signals via the cAMP/PKA signalling pathway. Inactive 25(OH) vitamin D3 enters PT cells bound to its binding protein. In the kidney 25(OH) vitamin D3 is converted to the active 1,25(OH) vitamin 03 by kidney hydroxylases. Pi reabsorption is enhanced by 1,25(OH) vitamin 03 by upregulation of NaPi-ll gene expression and perhaps also by promoting the insertion of NaPi-ll from endosomes into the apical membrane. Other factors may influence Pi reabsorption (not shown on in the figure for simplicity).
PTH is the peptide hormone that contributes the most to the regulation Pi
reabsorption and its role is to decrease reabsorption so that infusion o f PTH results in an
elevated excretion o f Pi in urine (i.e., phosphaturia). PTH receptors exists on the
basolateral as well as the apical membranes [8], and although the molecular events that take
place between receptor activation and retrieval o f the transporter from the membrane are
not completely understood, it is believed that the cAM P/protein kinase A and the
D A G /protein kinase C signalling pathways are turned on as a result o f PTH receptor
activation [211. NaPi-11 interacts with PD Z containing protein 1 (reviewed in [22]); but the
precise biochemical and molecular events that take place between the activation signal
16
1. Introduction
transduction cascades and the retrieval o f N aP i-II in to endosomes to its fina l degradation
in lysosomes are unknown. Figure 1.1.1 summarises the molecular mechanism o f P i
reabsorption.
In contrast to PTH and dietary phosphate, which decrease reabsorption o f P i from
the tubular flu id , vitam in D is believed to play a role in increasing P i reabsorption. The
mechanism seems to involve an upregulation o f N aP i-II gene expression or changes in the
lip id com position o f membranes.
O ther factors have been found to have an effect on P i reabsorption, including
insulin, grow th factors (such as IG F, TGF-beta and EG F), atrial natriuretic peptide,
thyroid hormone, glucocorticoids, and glucagon, among others [21]. Some o f these factors
stimulate Na-P i cotransport (e.g., IG F -I, and insulin), while others decrease it (e.g., EG F
and TGF-beta). Since studies from which the above discussion is derived were conducted
to test the effect o f specific factors, i t is not known the precise contributions o f each o f the
factors to the regulation o f Pi reabsorption. Therefore, knowledge o f the com position o f
the in terstitia l flu id around PT cells would be required in order to know the contributions
o f each factor to Pi homeostasis. Furthermore, as mentioned above, receptors fo r some o f
these bioactive peptides are thought to be located on the apical side o f tubular cells. Thus,
the com position o f the tubular flu id should also be considered when making a model o f Pi
regulation together w ith the knowledge o f receptor availability and their response to a
m ixture o f factors (rather than just considering a factor at a time).
Regulation o f w ater reabsorption
The regulation o f P i reabsorption, b rie fly discussed above, is an example o f a
regulatory process that is understood to occur at the proxim al tubule. However, other
processes are regulated in more distal parts o f the tubule. One example is that o f water
reabsorption. As w ith Pi, the bulk o f filtered water is reabsorbed by PT cells, but the fine-
tuning o f water homeostasis and its regulation occurs in the distal tubule and collecting
duct. Similarly, as w ith the regulation o f Pi, m odulation o f water reabsorption is controlled
by exocytic insertion and endocytic retrieval o f vesicles containing water channels in to the
apical membrane.
17
/. Introduction
PKCPKAexpression
nucleus cAM P
2 K
H,0 3Na-
A D H
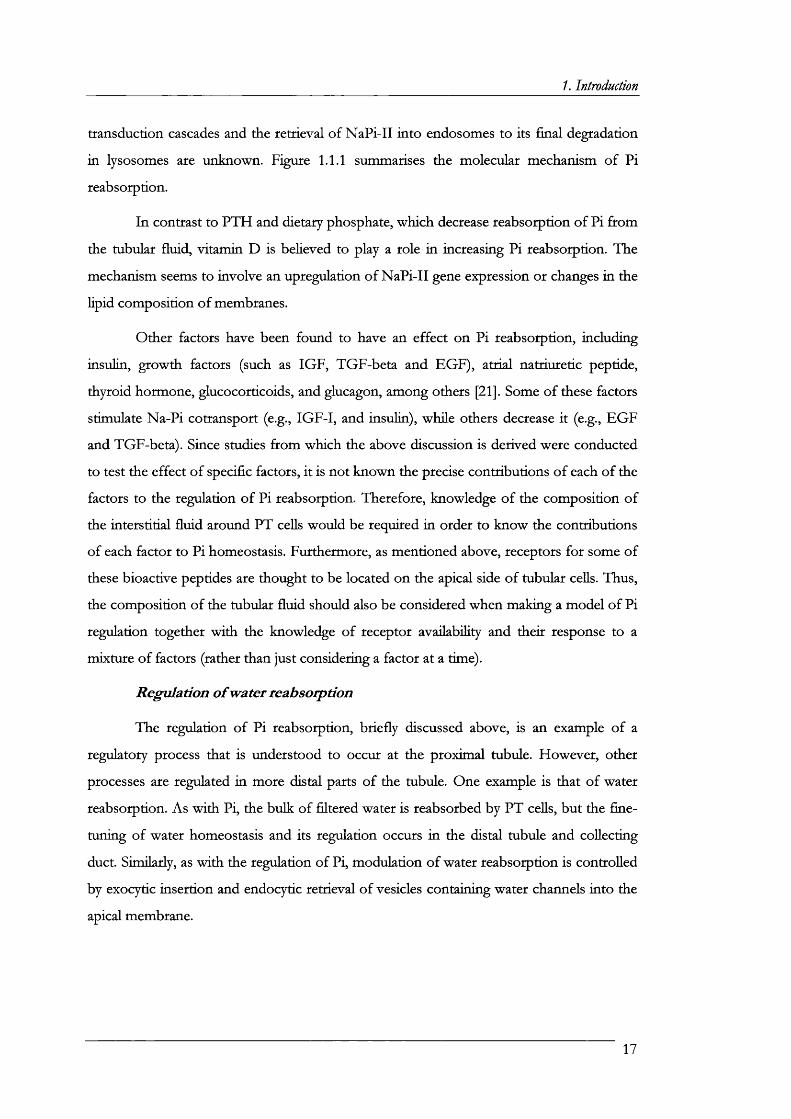
Figure 1.1.2. Mechanism and regulation of water reabsorption from the distal tubules.Water is reaborbed from the glomerular filtrate in distal tubule and collecting duct by water channels (aquaporin 2, AQ2, in the apical membrane and AQ3 at the basolateral). Factors that increase the activity of PKA, such as antidiuretic hormone (ADH), promotes the insertion of AQ2 from subapical endosomes into the apical membrane. Conversely, diuretic factors promote the retrieval of AQ2 from the membrane into endosomes and signal through PKC. PKA also influences AQ2 gene expression.
l li is process is understood in some detail and it has been the subjects of several
recent reviews [23-25] (Figure 1.1.2). Vasopressin, acting on basolateral receptors,
promotes the insertion o f vesicles containing aquaporin 2 into the apical membrane [26].
Aquaporin 2 is one o f the members o f the aquaporin gene family that was found shortly
after cloning the first water channel [27]. Upon vasopressin activating its receptor, the
intracellular cAMP levels are increased. This is a consequence o f vasopressin receptor
activating tetrameric G proteins, which in turn, activate adenylate cyclase; the latter
catalyses the conversion of ATP into cAMP, which then activates protein kinase A (PKA).
It was found that PKA phosphory lates aquaporin 2 at a conserved serine residue (Ser-256)
and, as a result, this water channel is translocated from subapical vesicles to the plasma
membrane, where it mediates the reabsorption o f water from the tubular fluid (reviewed in
[23]) along the concentration gradient generated by the basolateral water channel isoforms
aquaporins 3 and 4 [23]. The retrieval o f aquaporin 2 from the apical membrane seems to
18
1. Introduction
be prom oted by factors that increase the activity o f protein kinase C (PKC) such as
phorbol esters and prostaglandin E2, although it has been found that PKC does not
directly phosphorylate aquaporin 2 [28] so that it was proposed that retrieval may be
caused by rearrangements on the cytoskeleton.
O ther factors may play a role in water homeostasis; among these, bradykinin (BK)
seems to augment water (and salt) lost by the kidney [29]. B K is form ed from its precursor
kininogen, which is synthesized, among other tissues, by proxim al and distal renal tubular
cells [17;30]. Proteolytic action o f tissue kaUikrein converts kininogen in to kaUidin II,
which is then further hydrolysed by peptidases in to BK. Kininases exist which cleave and
thus inactivate B K . Since B K acts by activating PKC, the inh ib ito ry properties o f this
peptide in water reabsorption may be explained by the actions o f PKC on the retrieval o f
aquaporin 2 from the apical membrane o f distal tubular cells. B K receptors seem to be
expressed in distal tubular cells and located in both apical and basolateral membranes [30-
33]; therefore, it seems possible that intralum inal B K may have a role in regulating water
homeostasis.
O ther factors have been found to influence water perm eability o f the collecting
duct including endothelins [34], prostaglandin [35], and perhaps also other factors that
increase the PKC or P K A signalling pathways such as EG F [36] also have an effect on
water reabsorption. In addition, nucleotides may also have an effect in water regulation
[37]. The relative contributions o f these factors in regulating water absorption are not
known because o f the d ifficulties in testing the responses o f biological systems to a
com bination o f hormones and because o f the lack o f knowledge on the precise
com position o f the in terstitia l and tubular fluids.
1.1.2. ^absorption of polypeptides from the glomerular filtrate
In contrast to the reabsorption o f solutes from the tubular flu id discussed in the
preceding section, which occurs down their concentration gradients, the reuptake o f
polypeptides is thought to occur by receptor-mediated endocytosis, a process that requires
the direct input o f metabolic energy. This process also occurs in the firs t segment o f the
proxim al tubular cells and at least two o f the receptors that mediate this process have been
identified and named gp330/megaHn and the cobalamin receptor, also known as cubihn
[38]. These two proteins seem to mediate the reabsorption o f most, i f not all, peptides and
proteins in the tubular flu id. Furtherm ore, megalin has been im plicated in the reabsorption
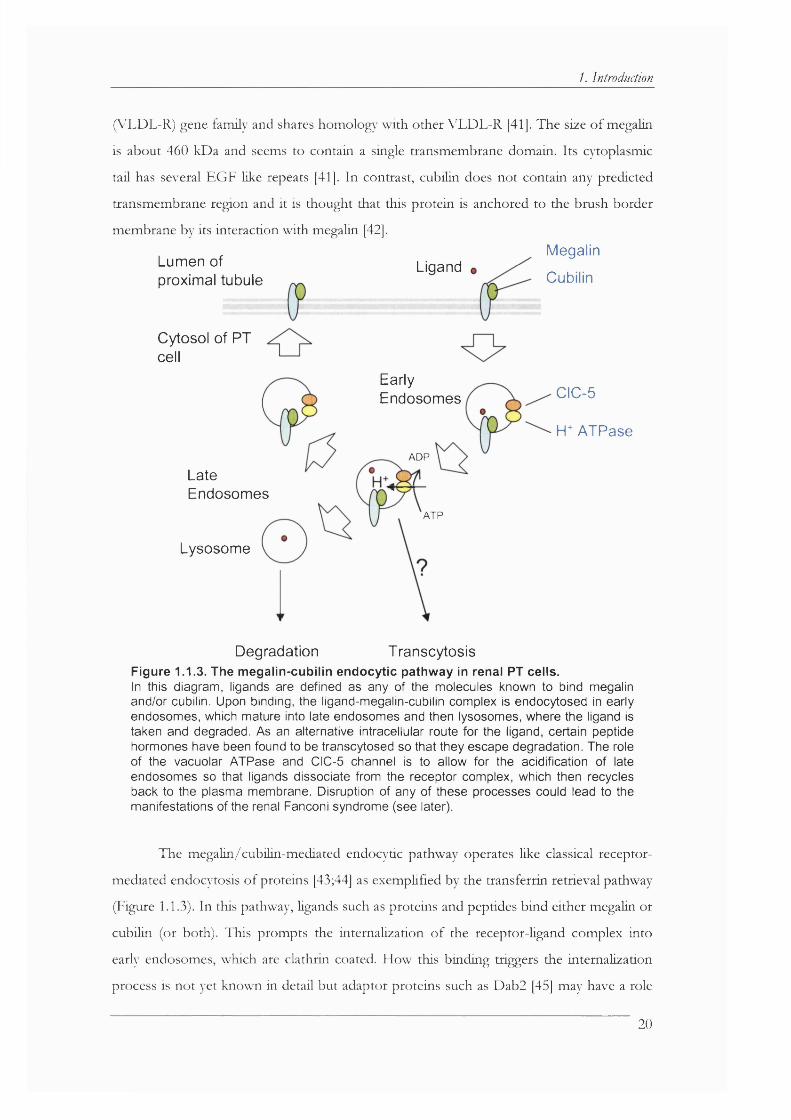
o f certain drugs [39;40]. Megalin is a member o f the very low density lipoprote in receptor19
1. introduction
(\"LDL-R) gene family and shares homology with other \T^DL-R [41]. The size o f megalin
is about 460 kDa and seems to contain a single transmembrane domain. Its cytoplasmic
tail has several EG F like repeats [41]. In contrast, cubdin does not contain any predicted
transmembrane region and it is thought that this protein is anchored to the brush border
membrane by its interaction with megalin [42].Megalin
Lumen of proximal tubule
Cytosol of PT cell
Ligand
LateEndosomes
Lysosome
Cubilin
EarlyEndosomes
ADP
ATP
CIC-5
H +A TPase
Degradation TranscytosisFigure 1.1.3. The megalin-cubilin endocytic pathway in renal PT cells.In this diagram, ligands are defined as any of the molecules known to bind megalin and/or cubilin. Upon binding, the ligand-megalin-cubilin complex is endocytosed in early endosomes, which mature into late endosomes and then lysosomes, where the ligand is taken and degraded. As an alternative intracellular route for the ligand, certain peptide hormones have been found to be transcytosed so that they escape degradation. The role of the vacuolar ATPase and CIC-5 channel is to allow for the acidification of late endosomes so that ligands dissociate from the receptor complex, which then recycles back to the plasma membrane. Disruption of any of these processes could lead to the manifestations of the renal Fanconi syndrome (see later).
The megaHn/cubüin-mediated endocytic pathway operates Hke classical receptor-
mediated endocytosis o f proteins [43;44] as exemplified by the transferrin retrieval pathway
(Figure 1.1.3). In this pathway, ligands such as proteins and peptides bind either megalin or
cubilin (or both). This prompts the internalization o f the receptor-ligand complex into
early endosomes, which are clathrin coated. How this binding triggers the internalization
process is not yet known in detail but adaptor proteins such as Dab2 [45] may have a role
20

1. Introduction
in mediating endocytosis. Certain GTPases such as Rab5 have been known fo r some time
to play a role in receptor mediated endocytosis and they may also prove to have a role in
megalin-cubilin internalization [46]. Once inside the cells, these early subapical endosomes
are matured in to late endosomes and then lumen acidified by a vacuolar H^-ATPase to ~
pH 5.5; this allows fo r the dissociation o f the Ligand from the receptor [47]. Late
endosomes transfer their cargo to lysosomes where they are degraded, while the receptor is
recycled back to the plasma membrane so that another round o f receptor mediated
endocytosis can take place.
O ther members o f this pathway have been identified. For example, a chloride
channel, termed ClC-5, seems to be needed fo r allow ing the passage o f chloride ions
alongside protons in to endosomes so that the ir acidification is not electrogenic. Loss o f
function o f the ClC-5 channel in knocked-out mice resulted in low molecular weight
proteinuria and D ent’s disease patients, who also have low molecular weight proteinuria,
have been found to have mutations in the CLCN5 gene, which codes fo r the ClC-5
protein. Endosomes in PT cells o f CLCN5 knocked-out (KO ) mice showed a slow
tra fficking rate from subapical endosomes to the apical membrane [48]. Sim ilarly, D ent’s
disease patients had a low concentration o f megalin in urine when comparing them to
normal individuals, which suggest that less megalin is shed from tubular cells in to urine
because there is less o f it present at the apical membrane [49]. Megalin also interacts w ith
the N a^/H ^ exchanger isoform 3 (N H E3) and although the significance o f this is not fuUy
clear, N H E 3 may also have a role in counteracting the electrogenic acidification o f
endosomes. A nd since the activity o f N H E 3 is regulated [50], this lin k may also provide a
way o f regulating protein reuptake and could explain the decrease o f proteinuria by drugs
that in h ib it the form ation o f peptide hormones, e.g., Ang I I by angiotensin converting
enzyme (ACE) inhibitors or receptor blockers [51]. Another chloride channel isoform ,
namely ClC-4, has recently also been im plicated in m egalin-cubilin mediated endocytosis
[52].
The m egalin-cubilin endocytic pathway is probably im portant fo r the salvage o f
amino acids, which otherwise would be lost in urine in the fo rm o f protein. I t is estimated
that about 0 .1 % o f albumin is filtered from plasma and present in the glomerular filtra te
[53]. This corresponds to 8 g o f albumin filtered every day. Furtherm ore, plasma contains
other proteins w ith lower molecular weight than albumin and therefore they are filtered
more readily than albumin. As discussed above, megalin and cubilin mediate the reuptake
21
1. Introduction
o f many proteins including albumin [54;55]. Thus, large amounts o f amino acids would be
lost in urine i f this pathway was defective and this is indeed the case as exemplified by
mutations that cause low molecular weight proteinuria (see later).
In addition, transcytosis o f certain vitam ins seems to be dependent on the megahn-
cubihn endocytic pathway and thus this pathway may be also essential fo r the salvage o f
vitam ins such as re tinol [56;57] and thyroglobulin [58], fo r which transcytosis from the
tubular flu id in to the in terstitia l flu id is dependant on their b inding to megalin and /or
cubilin. O ther vitam ins are endocytosed by this pathway bound to the ir carrier proteins
including vitam in D3 and vitam in B12 [59-61], which is also im portant fo r the
reabsorption o f peptide hormones such as insulin and PTH [62;63]. The fact that the
m egalin-cubilin pathway is needed fo r the activation o f vitam in D3 precursor in to its active
form [64] highlights the importance o f this pathway fo r norm al vitam in physiology [65].
Lipoproteins [6 6 ] and advanced glycation end products [67] also seem to be ligands o f
megalin and /o r cubilin.
In addition to its expression in kidney, megalin is expressed in brain and K O mice
showed abnormalities in brain development [43]. Later, megalin was im plicated in the
biology o f sonic hedgehog, a growth factor involved in central nervous system
development [6 8 ]. These findings could be explained by direct signalling functions o f
megalin or by a function o f this protein in endocytosing and thus term inating the signal
induced by this growth factor [69]. Moreover, megalin could also be involved in signalling
indirectly by mediating the internalisation o f hormones, such as retinol, that have their
receptors located intracellularly [69]. Recently, the cytoplasmic ta il o f megalin has been
shown to interact w ith proteins w ith signalling roles and a role in signal transduction has
been suggested fo r megalin [70-72], although no conclusive evidence is yet available in this
respect.
/. 1.3. The renal Fanconi syndrome
The renal Fanconi syndrome (FS), previously known as Lignac-de Toni-Debre-
Fanconi, is attributed to have been described by Abderhalden in 1903 (reviewed in [73]).
Later, Lignac (1921), Fanconi (1931), T on i (1933), and Debre (1934) independently
described a condition characterized by renal disease, dwarfism, rickets, and albuminuria. In
1936, Fanconi suggested that these studies were describing the same condition, and in
1943 McCune proposed to collectively call this disorder FS [73].
22
1. Introduction
There are several forms o f the FS and all o f them present d ifferent degrees o f the
same manifestations including defective reabsorption o f several solutes and bone disease
(rickets in adults and osteomalacia in children) [73]. Solutes that faü to be reabsorbed and
appear in urine at abnormally high concentrations include glucose, urate, phosphate,
bicarbonate, water, potassium, amino acids, peptide hormones, and proteins [73]. C linical
features include polyuria (large water excretion in urine), dehydration, hypokalaemia (low
potassium concentration in blood), rickets, and im paired growth. A consistent clinical
finding is low molecular weight proteinuria (LMW P).
I t is im portant to distinguish between high molecular weight proteinuria (HM W P)
and LM W P. In the form er, proteins appear in urine as a consequence o f an overload o f
proteins in the tubular flu id secondary to disruption o f the glomerular filte r. The
reabosorption mechanisms are overwhelmed and thus proteins leak in to urine. In contrast,
in LM W P the glomerular filte r is not compromised and the defect is in the reabsorption o f
polypeptides from the glomerular filtrate. Therefore, LM W P is also known as tubular
proteinuria. The fact that FS patients have LM W P suggested that the defect is on the
transport mechanism that mediates the uptake o f proteins and other solutes from the
glomerular filtrate. Indeed, it has become apparent that a dysfunction o f any o f the steps
involved in m egalin-cubilin endocytic pathway can or could result in FS [73].
There are not known human diseases caused by mutations in the megalin gene,
possibly because loss o f function o f megalin would be lethal, as it is in megalin K O mice
[74;75]. These mice show developmental abnormalities itic lud ing brain m alform ations and
most o f them die at b irth . O nly one in fifty megalin K O mice reach adulthood and they
show the manifestations o f the FS. Recently, another megalin K O mice, w ith a conditional
targeted m utation o f the kidney gene, has been reported [76], which allowed to study the
effects o f megalin loss o f function in the kidney in more detail. I t was shown that megalin
K O mice have poor bone m ineralisation, probably due to loss o f vitam in D in urine, and
confirm ed previous studies that pointed to the importance o f the m egalin-cubilin
endocytic pathway in the intake o f vitam in D precursor bound to its carrier protein in to
the kidney PT cells. This step is im portant fo r the subsequent conversion o f the inactive
25-hydroxy vitam in D 3 in to the active 1,25-dehydroxy vitam in D 3 by kidney specific
hydroxylases [74;75].
Mutations in the cubilin gene that lead to dysfunction o f cubilin are associated w ith
a form o f anaemia due to defective absorption o f vitam in from the intestine [77].
23
Patients w ith Imerslund-Gmsbecks disease have mutations in the cubilin gene [78] and
dogs w ith defective processing o f cubilin have also been reported [79]. In addition to
anaemia, due to defective absorption o f vitam ins from the intestine, Imerslund-Grasbecks
patients and dogs w ith mutations in the cubihn gene present the manifestations o f the FS
including LM W P.
As brie fly outlined in the preceding section o f this thesis. D ent’s disease, a
congenital form o f the FS linked to the X p ll.2 2 chromosome, is caused by loss o f
function o f the CLCN5 gene, which codes fo r the ClC-5 protein [80-82]. In addition to FS,
D ent’s patients often develop kidney stones (nephrohthiasis). I t was shown that other X -
hnked conditions, in addition to D ent’s disease, such as X -linked recessive nephrohthiasis,
and X-hnked recessive hypophosphataemic rickets are caused by CLCN3 mutations and it
was proposed to coUectively caU ah these conditions D ent’s disease [80]. As discussed in
Chapter 1.1.2, the role o f the ClC-5 channel seems to be in the endosomal acidification
needed fo r the dissociation o f the receptor-hgand complex [83] as suggested by the co-
locahsation o f ClC-5 w ith the vacuolar ATPase proton pump in PT cehs [84]. There also
exist two murine models o f D ent’s disease, which show the manifestations o f the FS,
including LM W P [85;86]. I t has been demonstrated that recycling o f the megalin-cubhn
receptor complex is disrupted in CLC-5 K O mice [48].
I t is not known how a defect in the reabsorption o f proteins can cause the
manifestations o f FS and kidney stones. P iwon et al. proposed that the hypercalcuria and
phosphaturia is secondary to the LM W P [85]. As discussed in Chapter 1.1.1, the reuptake
o f filtered phosphate is mediated by N aP i-II in PT cells and regulated by PTH and vitam in
D). There are basolateral and apical receptors fo r PTH and an im portant route fo r the
intake o f vitam in D in to PT cells is through the endocytosis o f vitam in D binding protein
(VDBP). Since the effect o f PTH is to decrease the reuptake o f phosphate from the
tubular flu id , an increased intralum inal P TH concentration would produce phosphaturia.
A nd indeed, this is a common manifestation o f D ent’s disease and other form s o f the FS.
Lowe’s syndrome, another X-hnked congenital form o f the FS, is characterized by
cataracts and mental retardation, in addition to having LM W P and the other
manifestations o f the FS [87]. The gene mutated is the oculocerebrorenal syndrome o f
Lowe (OCRL). This gene codes fo r a phosphatidyhnositol (P tdlns)-(4,5)-bisphosphate (P2)
5-phosphatase, which catalyses the conversion P tdlns(4 ,5 )P 2 in to Ptdlns(4)P. The OCRL
phosphatase is located in the lysosomal membrane and in the trans-Golgi network [88;89].
24
1. Introduction
I t has been suggested that loss o f function o f this protein results in an accumulation o f
inosito l phospholipids and that this leads to a defective tra fficking o f endosomes [89].
Another hypothesis to account fo r the LM W P observed in Lowe patients is that abnormal
concentrations o f inosito l phospholipids lead to a defective regulation o f the cytoskeleton,
which in turn leads to defective tra fficking o f endosomes [90]. This hypothesis is based on
the observation that P tdIns(4 ,5 )P 2 , the substrate o f OCRL, can dissociate pro filin -actin
complexes and it also binds certain cytoskeletal binding proteins such as Ezrin, Radixin,
and Moesin [90]. Thus, it is possible that Lowe patients have a more severe phenotype
than patients w ith other forms o f the FS because a defect on endosome tra fficking would
lead to m alfunction o f many cell types in several organs since the O CLR enzyme is
expressed in several organs, whereas ClC-5 expression is restricted to the kidney.
A lternatively, o r in addition, it has been suggested that the pathophysiology o f Lowe
syndrome is attributable to leakage o f lysosome enzymes in to the circulation, which
subsequently mediate ceU in ju ry [91].
O ther congenital diseases that give rise to the manifestations o f the FS include:
cystinosis, W ilson disease, glycogen storage disease type I, fructose intolerance and
autosomal dom inant id iopathic FS (A D IF). The molecular bases o f A D IF have not been
identified, although the gene have been mapped to a large region o f chromosome 15 [92].
Diseases o f carbohydrate metabolism also lead to FS. A t least in part, this may be because
a defective production o f metabolic energy impairs ATP generation and therefore function
o f ATP-dependent processes, such as the vacuolar proton ATPase required fo r endosomal
acidification [73].
In addition to the genetic causes introduced above, environmental factors can also
produce the symptoms o f the FS, among these certain chemotherapeutic drugs and heavy
metals have been described to give some o f the manifestations o f the FS [73]. The
molecular bases by which these compounds produce FS are no t known; but it is believed
that cadmium inh ib its the vacuolar ATPase pump that co-localises w ith ClC-5 and is
responsible fo r acidifying endosomes in PT cells [93]. FS phenotype is thus probably
produced by inh ib ition o f receptor-mediated endocytosis by a mechanism sim ilar to that
described above fo r D ent’s disease.
25
1. Introduction
1.2. Analytical Methods
The aim o f this section is to brie fly introduce and discuss the physicochemical
basis o f the analytical methods used during the course o f the studies presented in this
thesis. Two main methods were used to separate proteins, namely gel electrophoresis and
liqu id chromatography (LC). The separated proteins were then analysed by mass
spectrometry (MS). A b rie f overview o f these methods wiU be presented below. In the next
section it w ill be discussed how the com bination o f analytical approaches is currently used
in the fie ld o f proteom ics to characterize qualitatively whole proteomes and to make
relative quantitative analyses o f changes that occur in these proteomes as a result o f a
stimulus, genetic defect, disease, etc.
1.2.1. Gel 'Electrophoresis o f Proteins
The w ord electrophoresis describes a process in which charged molecules migrate
in an electric fie ld [94]. I f the charges o f these molecules d iffe r they w ill migrate fio m one
o f the poles to the other at d ifferent velocities and this provides the basis fo r separation.
Electrophoresis o f proteins fo r analytical purposes is commonly carried out in acrylamide
gels [94]. These gels are form ed by the polymerisation o f acrylamide molecules w ith
occasional crosslinks provided by N ,N ,N ‘,N ‘-methylenebisacrylamide (bis-acrylamide ).
Acrylam ide gels contain pores, the sizes o f which are determined by the
concentration o f acrylamide and bis-acrylamide present in the gel. A common form o f gel
electrophoresis o f proteins is that o f sodium dodecyl sulphate (SDS) polyacrylamide gel
electrophoresis (PAGE). In this form o f electrophoresis, proteins are reduced and
denatured in the presence o f the anionic detergent SDS, which binds strongly to the amino
acids o f the reduced prote in (on average one SDS molecule binds to every other amino
acid). As a result, the in trinsic charge o f the protein is overwhelmed by the negative
charges o f SDS, and therefore, proteins o f sim ilar molecular weight have the same
apparent charge. Under these conditions, the separation by PAG E is believed to be mainly
determined by the sieving effects o f the pores present in the acrylamide gels. Therefore,
protein m igration in SDS-PAGE can be related to the size or molecular weight o f the
protein [94].
Another form o f electrophoresis o f proteins is that o f isoelectric focusing (lE F)
[94]. Proteins are amphoteric molecules, w ith different proteins having d ifferent isoelectric
points (p i), and therefore they can be separated on this basis. The m ethod o f lE F relies on
26
1. Introduction
in troducing ampholytes in the acrylamide gel that form a pH gradient upon the application
o f an electric field. Since gels w ith very low porosity are used (4%) sieving effects are
negligible. Ampholytes are m ixtures o f synthetic polyamino-polycarboxyHc acids that cover
a specific pH range (e.g. pH 3 to 10). W hen the protein m ixture is loaded and an electrical
fie ld applied, proteins migrate to the position in the gel u n til they reach the region o f the
gel in which the pH matches the ir isoelectric point, i.e. the po in t in the gel in which their
charge is zero [94]. Because charge is zero, the protein accumulates o r ‘focusses’ in that gel
region and does no t further migrate in the electric field.
Two-dim ensional gel electrophoresis (2DE) combines the two electrophoretic
methods described above; ia the firs t dimension proteins are separated on the bases o f p i
by lE F , while in the second they are separated by SDS-PAGE according to their molecular
weight. This mode o f electrophoresis was simultaneously described fo r proteins in 1975 by
O ’Farrell [95] and Klose [96] and is currendy w idely used fo r the separation and
visualisation o f whole proteomes.
W ith the in troduction o f gels w ith im m obilized pH gradients (IPG ) fo r the lE F
step, the reproducibility o f 2DE-based separations improved. O ther technological
advances included the inclusion o f chaotrophes (e.g., urea and thiourea) and neutral or
zw itterionic detergents (e.g., CHAPS) in the buffe r used fo r the lE F separation [97]. The
inclusion o f these solubilising reagents is thought o f being o f particular importance
because otherwise proteins tend to precipitate when they reach their p i.
Current research trends in the fie ld o f 2D E are directed at im proving the
solubilisation o f as many protein classes as possible during the lE F (e.g., [97-101]) and to
the development o f detection methods w ith more dynamic range and sensitivity than the
classic staining o f proteins that use silver nitrate and Commassie blue dyes (e.g., [102-104].
1.2.2. U qu id Chromatographj
Much or the practical w ork carried out during the studies described in this thesis
was perform ed using liqu id chromatography (LC), either by itse lf as the main separation
method, or in com bination w ith gel electrophoresis to increase the separation capacity o f
the analytical approach.
Molecules can be separated on the basis o f the ir d ifferent partition or d istribution
between two im m iscible phases [105]. In column LC these two phases are provided by a
stationary phase, which consists o f chromatographic beads w ith distinct functionality, and
27

1. Introduction
a liqu id m obile phase. Molecules can be separated when their d istribution coefficients
(Kd) are different. K d is defined as the concentration o f a molecule in the stationary phase
divided by its concentration in the mobile phase.
Several forms o f liqu id chromatography are available, including reversed-phase
(RP), ion exchange, size exclusion chromatography, a ffin ity chromatography, etc. The
practical studies described in this thesis were carried out using high performance LC
(HPLC) and the types o f chromatography used were RP and ion exchange. The principles
o f these types o f LC are brie fly described in the follow ing.
Reversed-phase liq u id chrom atography
In RP-LC, proteins and peptides are separated according to their hydrophobicity
[105]. The fiinctiona l groups on RP stationary phase are provided by aliphatic carbon
chains; these are hydrophobic (non-polar) and mediate the retention o f peptides and
proteins by hydrophobic and van der Waals interactions. The m obile phase is relatively
polar. Due to the fact that proteins and peptides have sim ilar K d values, they cannot be
w ell separated by isocratic elution. Instead, gradient elution is norm ally carried out in order
to separate these molecular species [106;107].
The choice o f stationary phase depends on the hydrophobicity o f the analytes
under study. Thus, more hydrophobic species, such as proteins can be separated by
relatively hydrophilic alkylsüane stationary phases such as butyl (C4) or octyl (C 8 ) (i.e.
chromatographic silica beads derivatised w ith aliphatic chains containing 4 or 8 carbon
atoms) containing relatively large pore sizes. Derivatised silica beads w ith pore sizes o f 30
nm are norm ally used fo r the separation o f proteins, although the use o f gigaporous beads,
w ith pore sizes o f 100 to 300 nm, have been reported fo r fast chromatography o f proteins
[108] and these were used fo r some o f the experiments described in this thesis (see later).
In contrast, small peptides are better separated w ith columns packed w ith beads
derivatised w ith octadecyl groups (i.e. C l 8 ) containing relatively small pore sizes ( 1 0 nm
are norm ally used in commercially available columns fo r peptide analysis).
Typically, loading and equilibration is carried out using an aqueous m obile phase
containing trace organic solvent and acid. Polypeptides are eluted w ith increasing
concentration o f organic solvent (organic m odifier) in the m obile phase [106; 107]. RP-LC
is currently w idely used fo r the analysis o f proteins and peptides due to its high resolution.
Moreover, RP-LC is easily hyphenated (i.e., coupled) to mass spectrometry and
28

1. Introduction
consequently this form o f LC is now extensively used in proteom ic related applications fo r
high throughput analysis (e.g., [109-113])
The solvophobic theory has been used to explain the mechanism o f retention in
RP [114]. A n in tu itive and non-mathematical description o f this theory is that there is a
gain o f entropy o f the system as a result o f hydrophobic residues in the analyte escaping
from water molecules, which would otherwise form structured lattices around the
molecule, thus decreasing entropy. As a result, the interaction o f non-polar groups w ith the
bonded stationary phase is thermodynamically favoured. W hether the retention in RP
occurs by partition or absorption is not known, but the solvophobic theory seems to
explain both models [114].
Io n exchange chrom atography
In ion exchange chromatography, the stationary phase consists o f charged
functional groups and separation o f molecular species occurs on the bases o f their
differences in charge [105]. The m obile phase is composed o f a solution containing the
counter ion o f that present in the stationary phase. There are two main types o f ion
exchangers, namely anion exchangers and cation exchangers. The form o f ion exchange
used here was strong cation exchange (SCX), in which sulfonic acid groups are linked to
the stationary phase; these groups are negatively charged and ionised at any pH.
Polypeptide samples dissolved in a solvent o f low pH and ion ic strength are loaded in the
SCX colum n so that aU the polypeptides have at least one positive charge, which interacts
w ith the negative charge o f the sulfonic acid groups. E lu tion is carried out by increasing
the ion ic strength o f the m obile phase or by increasing its pH . This mode o f
chromatography has been used fo r the analysis o f peptides and proteins [115] and
currendy it is used fo r 2D-LC based separations in proteomics (e.g., [116]).
M icrocap illary and N ano-H ow L iq u id Chrom atography
Traditionally, analysis by packed HPLC is carried out in columns w ith an internal
diameter (ID ) o f 4.6 mm [105]. These so called analytical columns have typical flow rates
o f 1 m l/m in . Columns w ith ID s o f 1 and 2 m m are termed narrow bore columns and
those packed in capillaries w ith ID s o f 800 pm, 500 pm, 300 pm and 150 pm are known as
microcapiUary (p) columns. Columns w ith narrower ID s are available; these are termed
‘nanoflow ’ columns and have internal diameteters o f 100 pm, 75 pm, and 50 pm.
29
1. Introduction
The advantages o f perform ing HPLC separations in columns w ith narrow ID s
have been reviewed [117-119]. The ID o f the colum n influences none o f the parameters
used to measure the efficiency o f a LC separation, although length does have an effect. For
example, the efficiency o f an HPLC column is often measured in terms o f plate numbers
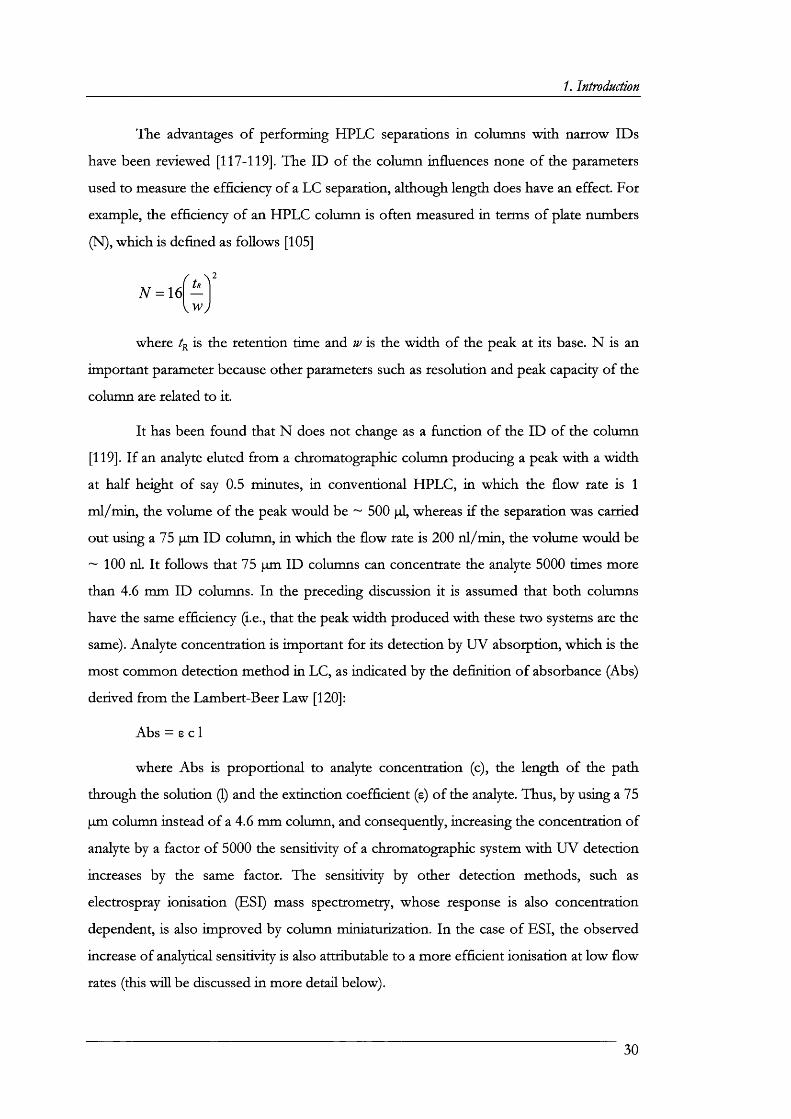
(N), which is defined as follows [105]
Vwy
where t- is the retention tim e and w is the w id th o f the peak at its base. N is an
im portant parameter because other parameters such as resolution and peak capacity o f the
column are related to it.
I t has been found that N does not change as a function o f the ID o f the column
[119]. I f an analyte eluted from a chromatographic column producing a peak w ith a w id th
at ha lf height o f say 0.5 minutes, in conventional HPLC, in which the flow rate is 1
m l/m in , the volume o f the peak would be ~ 500 pi, whereas i f the separation was carried
out using a 75 pm ID column, in which the flow rate is 200 n l/m in , the volume would be
~ 100 nl. I t follows that 75 pm ID columns can concentrate the analyte 5000 times more
than 4.6 m m ID columns. In the preceding discussion it is assumed that both columns
have the same efficiency (i.e., that the peak w idth produced w ith these two systems are the
same). Analyte concentration is im portant fo r its detection by U V absorption, which is the
m ost common detection method in LC, as indicated by the defin ition o f absorbance (Abs)
derived from the Lambert-Beer Law [120]:
Abs — E c 1
where Abs is proportional to analyte concentration (c), the length o f the path
through the solution 0 and the extinction coefficient (e) o f the analyte. Thus, by using a 75
pm column instead o f a 4.6 mm column, and consequently, increasing the concentration o f
analyte by a factor o f 5000 the sensitivity o f a chromatographic system w ith U V detection
increases by the same factor. The sensitivity by other detection methods, such as
electrospray ionisation (ESI) mass spectrometry, whose response is also concentration
dependent, is also im proved by column m iniaturization. In the case o f ESI, the observed
increase o f analytical sensitivity is also attributable to a more efficient ionisation at low flow
rates (this wiU be discussed in more detail below).
30
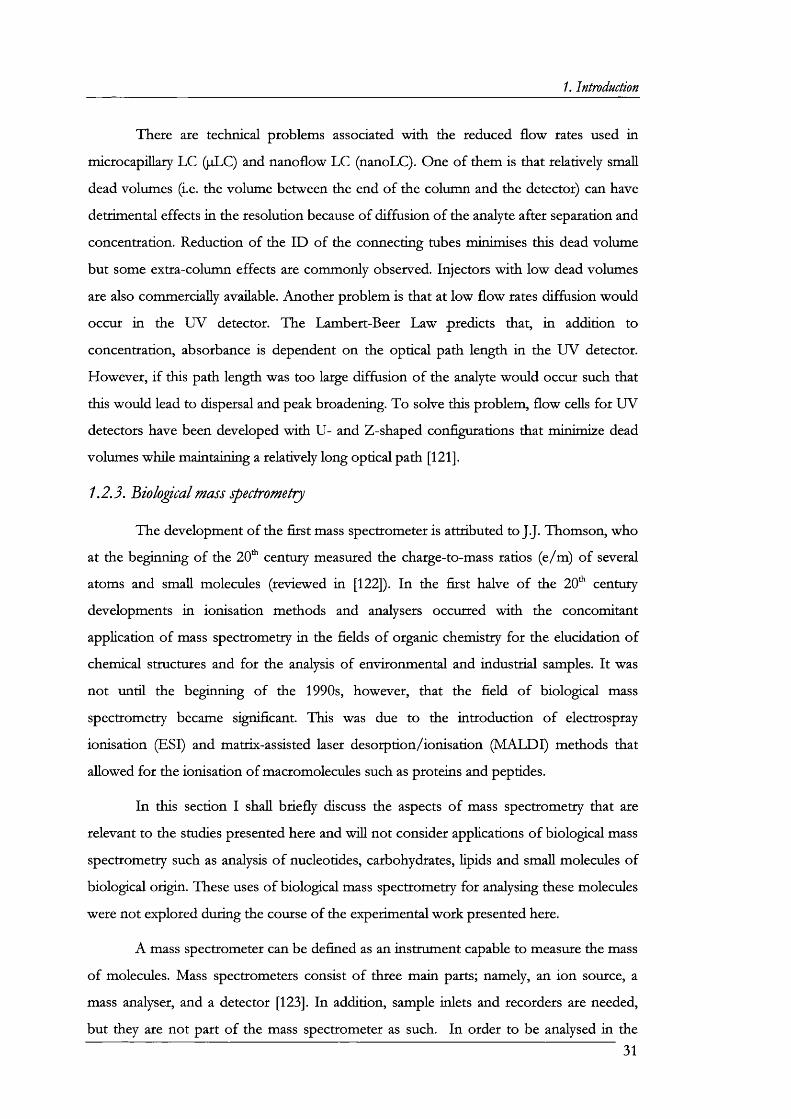
/. Introduction
There are technical problems associated w ith the reduced flow rates used in
m icrocapillary LC (pLC) and nanoflow LC (nanoLC). One o f them is that relatively small
dead volumes (i.e. the volume between the end o f the column and the detector) can have
detrimental effects in the resolution because o f d iffusion o f the analyte after separation and
concentration. Reduction o f the ID o f the connecting tubes minimises this dead volume
but some extra-column effects are commonly observed. Injectors w ith low dead volumes
are also commercially available. Another problem is that at low flow rates d iffusion would
occur in the U V detector. The Lambert-Beer Law .predicts that, in addition to
concentration, absorbance is dependent on the optical path length in the U V detector.
However, i f this path length was too large d iffusion o f the analyte would occur such that
this would lead to dispersal and peak broadening. To solve this problem , flow cells fo r U V
detectors have been developed w ith U - and Z-shaped configurations that m inim ize dead
volumes w hile m aintaining a relatively long optical path [1 2 1 ].
1.2.3. Biological mass spectrometry
The development o f the firs t mass spectrometer is attributed to J.J. Thomson, who
at the beginning o f the 2 0 * century measured the charge-to-mass ratios (e/m ) o f several
atoms and small molecules (reviewed in [122]). In the firs t halve o f the 20* century
developments in ionisation methods and analysers occurred w ith the concomitant
application o f mass spectrometry in the fields o f organic chemistry fo r the elucidation o f
chemical structures and fo r the analysis o f environmental and industrial samples. I t was
not u n til the beginning o f the 1990s, however, that the fie ld o f biological mass
spectrometry became significant. This was due to the in troduction o f electrospray
ionisation (ESI) and matrix-assisted laser desorption/ionisation (M A LD I) methods that
allowed fo r the ionisation o f macromolecules such as proteins and peptides.
In this section I shall b rie fly discuss the aspects o f mass spectrometry that are
relevant to the studies presented here and wiU not consider applications o f biological mass
spectrometry such as analysis o f nucleotides, carbohydrates, lipids and small molecules o f
biological origin. These uses o f biological mass spectrometry fo r analysing these molecules
were not explored during the course o f the experimental w ork presented here.
A mass spectrometer can be defined as an instrum ent capable to measure the mass
o f molecules. Mass spectrometers consist o f three main parts; namely, an ion source, a
mass analyser, and a detector [123]. In addition, sample inlets and recorders are needed,
but they are not part o f the mass spectrometer as such. In order to be analysed in the
31
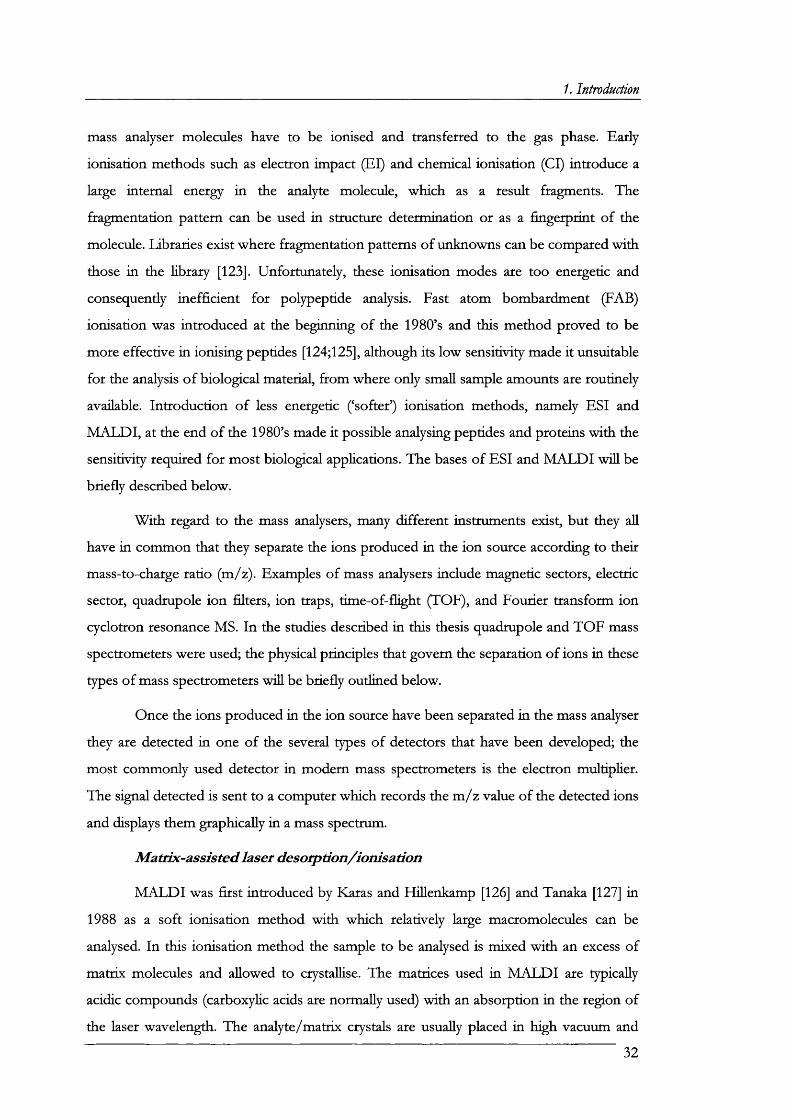
1. Introduction
mass analyser molecules have to be ionised and transferred to the gas phase. Early
ionisation methods such as electron im pact (E l) and chemical ionisation (C l) introduce a
large internal energy in the analyte molecule, which as a result fragments. The
fragmentation pattern can be used in structure determ ination or as a fingerprin t o f the
molecule. Libraries exist where fragmentation patterns o f unknowns can be compared w ith
those in the lib rary [123]. Unfortunately, these ionisation modes are too energetic and
consequently ine ffic ien t fo r polypeptide analysis. Fast atom bombardment (FAB)
ionisation was introduced at the beginning o f the 1980’s and this method proved to be
more effective in ionising peptides [124;125], although its low sensitivity made it unsuitable
fo r the analysis o f biological material, from where only small sample amounts are routinely
available. In troduction o f less energetic (‘softer’) ionisation methods, namely ESI and
M A L D I, at the end o f the 1980’s made it possible analysing peptides and proteins w ith the
sensitivity required fo r m ost biological applications. The bases o f ESI and M A L D I w ill be
brie fly described below.
W ith regard to the mass analysers, many d ifferent instruments exist, but they all
have in common that they separate the ions produced in the ion source according to their
mass-to-charge ratio (m /2 ). Examples o f mass analysers include magnetic sectors, electric
sector, quadrupole ion filters, ion traps, tim e-o f-fligh t QTOF), and Fourier transform ion
cyclotron resonance MS. In the studies described in this thesis quadrupole and TO F mass
spectrometers were used; the physical principles that govern the separation o f ions in these
types o f mass spectrometers w ill be brie fly outlined below.
Once the ions produced in the ion source have been separated in the mass analyser
they are detected in one o f the several types o f detectors that have been developed; the
m ost commonly used detector in modem mass spectrometers is the electron m ultip lier.
The signal detected is sent to a computer which records the m /z value o f the detected ions
and displays them graphically in a mass spectrum.
M atrix-assisted laser desorption/ionisation
M A LD I was firs t introduced by Karas and Hiüenkamp [126] and Tanaka [127] in
1988 as a soft ionisation method w ith which relatively large macromolecules can be
analysed. In this ionisation m ethod the sample to be analysed is m ixed w ith an excess o f
m atrix molecules and allowed to crystallise. The matrices used in M A L D I are typically
acidic compounds (carboxylic acids are norm ally used) w ith an absorption in the region o f
the laser wavelength. The analyte/m atrix crystals are usually placed in high vacuum and
32
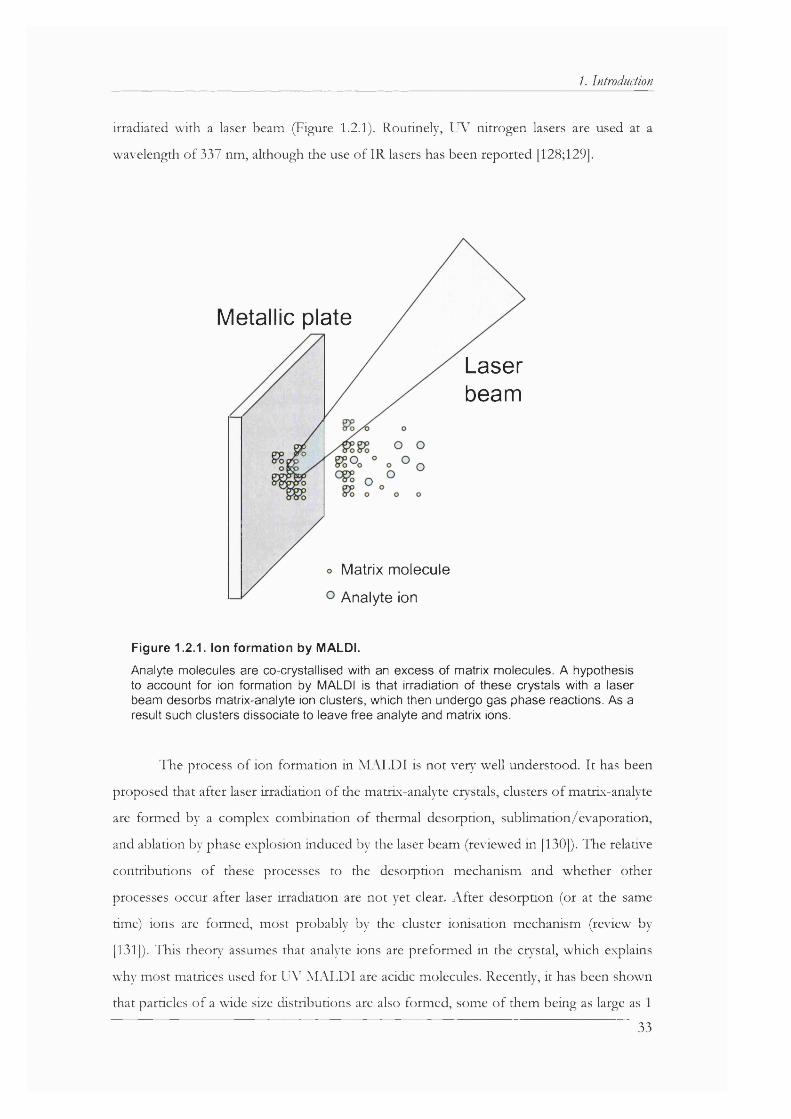
/. Introduction
irradiated w ith a laser beam (Figure 1.2.1). Routinely, U \^ nitrogen lasers are used at a
wavelength o f 337 nm, although the use o f IR lasers has been reported [128;129].
Metallic plate
Laserbeam
Matrix molecule
Analyte ion
Figure 1.2.1. Ion formation by MALDI.
Analyte molecules are co-crystallised with an excess of matrix molecules. A hypothesis to account for ion formation by MALDI is that irradiation of these crystals with a laser beam desorbs matrix-analyte ion clusters, which then undergo gas phase reactions. As a result such clusters dissociate to leave free analyte and matrix ions.
The process o f ion form ation in R L \LD I is not very well understood. It has been
proposed that after laser irradiation o f the matrix-analyte cry stals, clusters o f matrix-analyte
are formed by a complex combination o f thermal desorption, sublimation/evaporation,
and ablation by phase explosion induced by the laser beam (reviewed in [130]). The relative
contributions o f these processes to the desorption mechanism and whether other
processes occur after laser irradiation are not yet clear. A fte r desorption (or at the same
time) ions are formed, most probably by the cluster ionisation mechanism (review by
[131]). This theor}' assumes that analyte ions are preformed in the cr\'Stal, which explains
why most matrices used for UV M A LD I are acidic molecules. Recently, it has been shown
that particles o f a wide size distributions are also formed, some o f them being as large as 1
33

1. Introduction
p.m [132]. Upon desorption, matrix-analyte ions clusters are form ed and they undergo
proton transfer reactions, which fo r peptides can be schematised as follows [131]:
{(M + nH)"^ + (n -l)A ' + x ma} —> M H ^ + (n -l)A H + x ma
where M : analyte; ma: m atrix; A : anion; { . . . } : cluster.
Protonated analyte ions are formed, whose m /z values can then be
measured by MS analysers; TO F analyser is the most commonly used, although
instruments exist that hyphenate M A L D I to ion traps, FT-ICR , and Q -TO F analysers.
Electrospray ionisation
ESI is another soft ionisation method that was introduced by Fenn [133] at
approximately the same tim e as M A L D I, although the principles o f the form ation o f ions
from macromolecules in atmospheric pressure had been described by D ole in the late
1960s [134]. The process o f ion form ation by ESI is depicted in Figure 1.2.2. In ESI, ions
are formed from solution by the application o f high voltage to a capillary from where the
sample is sprayed.
The mechanism by which ions are form ed in ESI is understood in some detail.
Application o f a high voltage creates a fine spray which consists o f droplets o f solvent
containing analyte ions [135;136]. These droplets protrude from the capillary tip , solvent
evaporates and the droplets divide in to smaller droplets as a result o f fission that takes
place when the repulsion is greater than the cohesive forces that hold the drop together.
When the droplets are small, ions are form ed by one o f the two mechanisms that have
been proposed, namely the fie ld evaporation mechanism proposed by Thom son and
Iribam e [137] o r the solvent evaporation model proposed by D ole et al [134]. In the
form er, desolvated ions are form ed by repulsion between the opposite charges in molecule
and those on the droplet surface, which eject the molecule out o f the droplet. The solvent
model postulates that solvent evaporates fcom the nanometre size droplets formed as a
result o f repetitive fission u n til analyte molecules are le ft as ions.
34
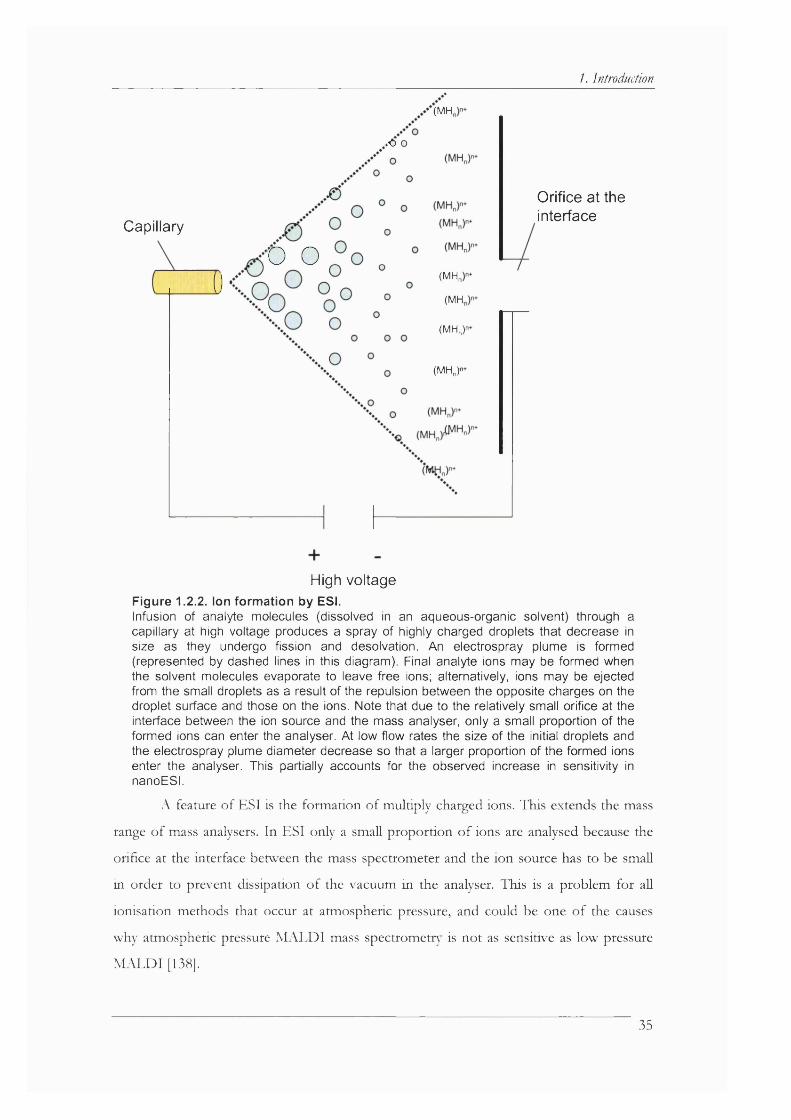
/. Introduction
(MH,
.«6 O
Capillary
o o(MH,
(MH,
(MHJ
(MHJ-
Orifice at the interface
High voltage Figure 1.2.2. Ion formation by ESI.Infusion of analyte molecules (dissolved in an aqueous-organic solvent) through a capillary at high voltage produces a spray of highly charged droplets that decrease in size as they undergo fission and desolvation. An electrospray plume is formed (represented by dashed lines in this diagram). Final analyte ions may be formed when the solvent molecules evaporate to leave free ions; alternatively, ions may be ejected from the small droplets as a result of the repulsion between the opposite charges on the droplet surface and those on the ions. Note that due to the relatively small orifice at the interface between the ion source and the mass analyser, only a small proportion of the formed ions can enter the analyser. At low flow rates the size of the initial droplets and the electrospray plume diameter decrease so that a larger proportion of the formed ions enter the analyser. This partially accounts for the observed increase in sensitivity in nanoESI.
A feature o f ESI is the form ation o f m ultiply charged ions. This extends the mass
range o f mass analysers. In ESI only a smaU proportion o f ions are analysed because the
orifice at the interface between the mass spectrometer and the ion source has to be small
in order to prevent dissipation o f the vacuum in the analyser. This is a problem for aU
ionisation methods that occur at atmospheric pressure, and could be one o f the causes
why atmospheric pressure M A LD I mass spectrometr}' is not as sensitive as low pressure
i\L \L D l [138].
35
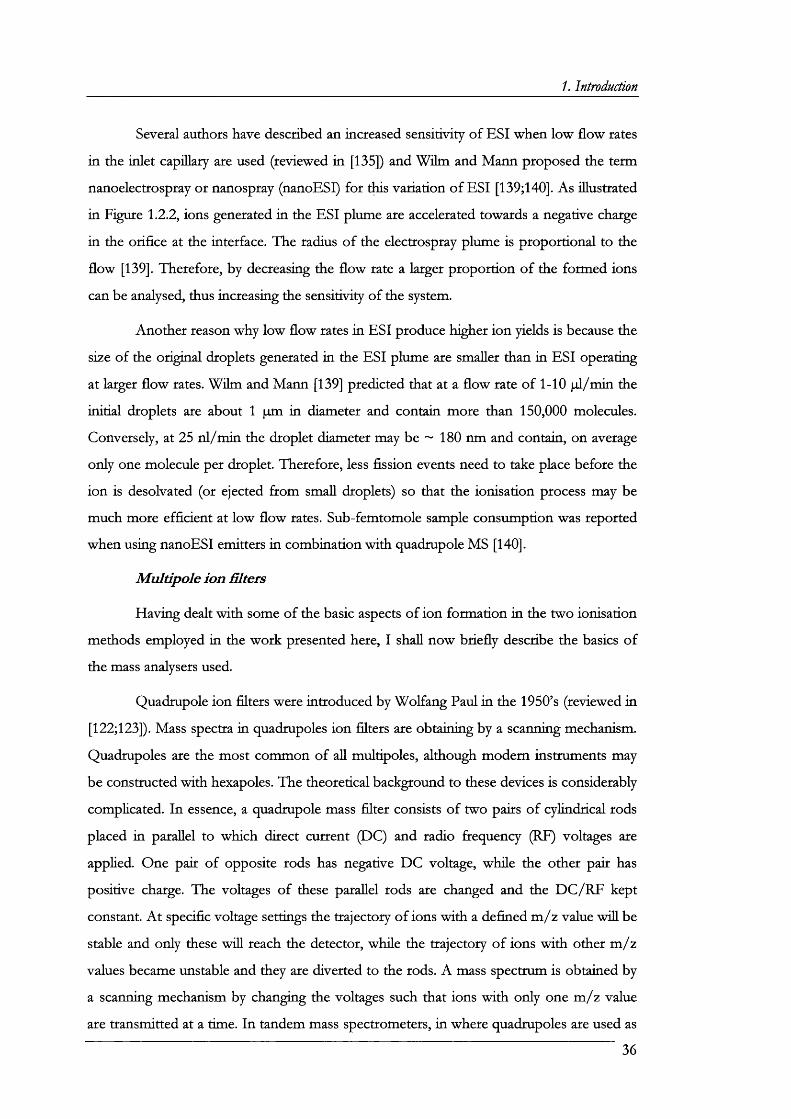
1. Introduction
Several authors have described an increased sensitivity o f ESI when low flow rates
in the in le t capillary are used (reviewed in [135]) and W ilm and Mann proposed the term
nanoelectrospray or nanospray (nanoESI) fo r this variation o f ESI [139; 140]. As illustrated
in Figure 1.2.2, ions generated in the ESI plume are accelerated towards a negative charge
in the orifice at the interface. The radius o f the electrospray plume is proportional to the
flow [139]. Therefore, by decreasing the flow rate a larger proportion o f the form ed ions
can be analysed, thus increasing the sensitivity o f the system.
Another reason why low flow rates in ESI produce higher ion yields is because the
size o f the original droplets generated in the ESI plume are smaller than in ESI operating
at larger flow rates. W ilm and Mann [139] predicted that at a flow rate o f 1-10 p l/m in the
in itia l droplets are about 1 |um in diameter and contain more than 150,000 molecules.
Conversely, at 25 n l/m in the droplet diameter may be ~ 180 nm and contain, on average
only one molecule per droplet. Therefore, less fission events need to take place before the
ion is desolvated (or ejected from small droplets) so that the ionisation process may be
much more efficient at low flow rates. Sub-femtomole sample consumption was reported
when using nanoESI emitters in com bination w ith quadrupole MS [140].
M ultipo le ion Glters
Having dealt w ith some o f the basic aspects o f ion form ation in the two ionisation
methods employed in the w ork presented here, I shall now brie fly describe the basics o f
the mass analysers used.
Quadrupole ion filters were introduced by W olfang Paul in the 1950’s (reviewed in
[122; 123]). Mass spectra in quadrupoles ion filters are obtaining by a scanning mechanism.
Quadrupoles are the most common o f all multipoles, although modem instruments may
be constructed w ith hexapoles. The theoretical background to these devices is considerably
complicated. In essence, a quadrupole mass filte r consists o f two pairs o f cylindrical rods
placed in parallel to which direct current (DC) and radio frequency (RE) voltages are
applied. One pair o f opposite rods has negative D C voltage, while the other pair has
positive charge. The voltages o f these parallel rods are changed and the D C /R F kept
constant. A t specific voltage settings the trajectory o f ions w ith a defined m /z value wiU be
stable and only these wiU reach the detector, while the trajectory o f ions w ith other m /z
values became unstable and they are diverted to the rods. A mass spectrum is obtained by
a scanning mechanism by changing the voltages such that ions w ith only one m /z value
are transm itted at a time. In tandem mass spectrometers, in where quadrupoles are used as
36
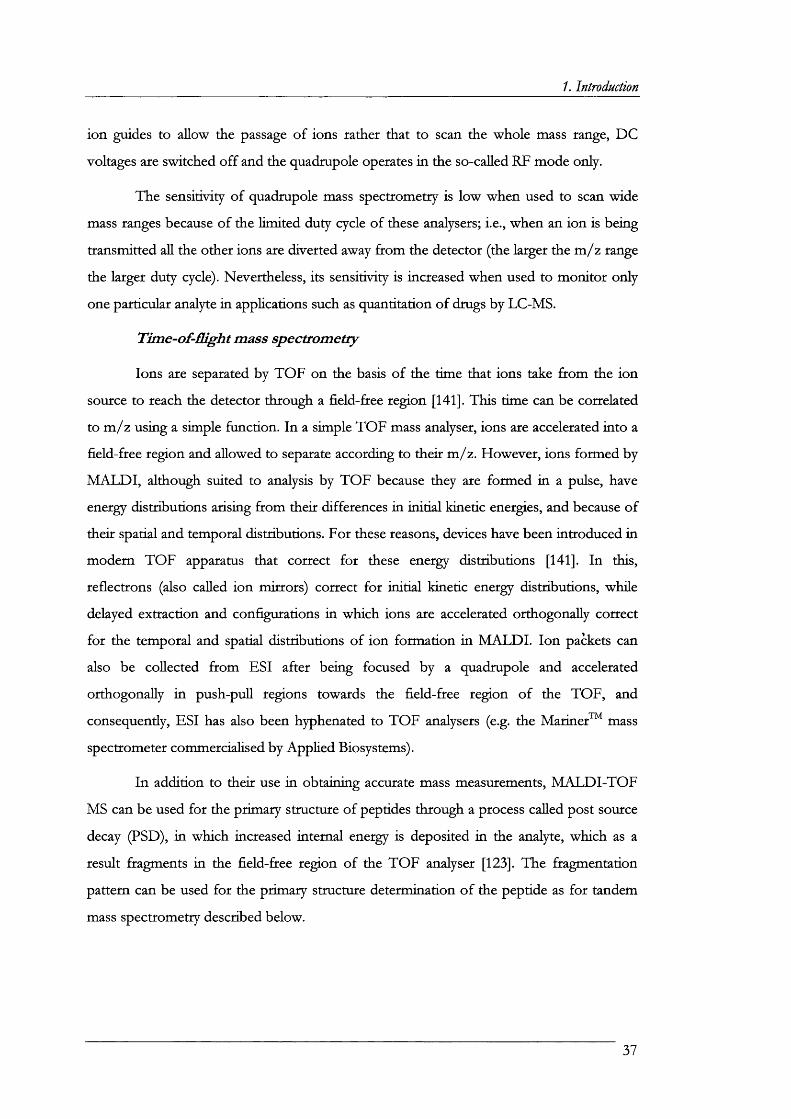
1.
ion guides to allow the passage o f ions rather that to scan the whole mass range, DC
voltages are switched o ff and the quadrupole operates in the so-called RF mode only.
The sensitivity o f quadrupole mass spectrometry is low when used to scan wide
mass ranges because o f the lim ited duty cycle o f these analysers; i.e., when an ion is being
transm itted all the other ions are diverted away from the detector (the larger the m /z range
the larger duty cycle). Nevertheless, its sensitivity is increased when used to m onitor only
one particular analyte in applications such as quantitation o f drugs by LC-MS.
Tim e-of-fUght mass spectrometry
Ions are separated by TO F on the basis o f the tim e that ions take from the ion
source to reach the detector through a field-free region [141]. This time can be correlated
to m /z using a simple function. In a simple TO F mass analyser, ions are accelerated in to a
field-free region and allowed to separate according to the ir m /z . However, ions form ed by
M A L D I, although suited to analysis by TO F because they are formed in a pulse, have
energy distributions arising from their differences in in itia l kinetic energies, and because o f
the ir spatial and temporal distributions. For these reasons, devices have been introduced in
modem TO F apparatus that correct fo r these energy distributions [141]. In this,
refiectrons (also called ion m irrors) correct fo r in itia l kinetic energy distributions, while
delayed extraction and configurations in which ions are accelerated orthogonally correct
fo r the tem poral and spatial distributions o f ion form ation in M A L D I. Ion packets can
also be collected from ESI after being focused by a quadrupole and accelerated
orthogonally in push-pull regions towards the field-free region o f the TO F, and
consequently, ESI has also been hyphenated to TO F analysers (e.g. the Mariner™ mass
spectrometer commercialised by Applied Biosystems).
In addition to their use in obtaining accurate mass measurements, M A L D I-T O F
MS can be used fo r the prim ary structure o f peptides through a process called post source
decay (PSD), in which increased internal energy is deposited in the analyte, which as a
result fragments in the field-free region o f the TO F analyser [123]. The fragmentation
pattern can be used fo r the prim ary structure determ ination o f the peptide as fo r tandem
mass spectrometry described below.
37

/. Introduction
Tandem mass spectrometry (M S /M S )
The purpose o f tandem mass spectrometry (M S/MS) experiments is to fragment
ions such that structural in form ation can be obtained from the fragment ions. There are
two main types o f M S/M S, M S/M S in space and M S/M S in time [123;142]. The latter is
carried out in ion traps and w ill not be discussed here in any detail. M S/M S in space is
perform ed in tandem mass spectrometers containing two mass analysers on-line (Figure
1.2.3). The firs t analyser is capable to isolate the ion to be analysed, which is then
fragmented in a collision cell; a second mass analyser determines the m /z values o f the
fragment ions produced. Several types o f tandem mass spectrometers exist, including trip le
quadrupoles, quadrupole-tim e-of-flight (Q -TO F), and T O F /T O F mass spectrometers.
The w ork described below was carried out using two different Q -TO F instruments and a
T O F /T O F .
Peptides fragment in their backbone and this in form ation can be used to
determine their amino acid sequence de novo. For convention (proposed in 1984 by
R oepstorff and Fohbnan [143]) carboxyl term inal fragment ions (i.e. fragment ions that
retain the charge at the C terminus) are termed x, y, and z ions, while the amino term inal
peptides are named a, b, c fragment ions (Figure 1.2.4). The differences in masses between
fragment ions o f the same type give the sequence amino acid residues in the peptide chain.
O ften, sequencing o f a few amino acids is enough fo r the identification o f the protein
from which the peptide was derived.
The Q -TO F instruments commercialised by MDS-Sciex and Micromass allow fo r
Data Dependent Acquisition experiments. In this, eluents from HPLC runs are fed direcdy
in to the ESI-MS and the m /z values o f the eluting peptides are recorded in MS mode only.
When a m ultip ly charged ion is detected (peptide ions are norm ally m ultip ly charged by
ESI) the mass spectrometer switches to M S/M S mode; the peptide ion is selected fo r
fragmentation and a M S/M S spectrum is produced. A fte r a predetermined tim e the mass
spectrometer switches back to MS mode so that other eluting peptides can be detected and
sequenced. In this way several peptides can be automatically sequenced in a relatively short
time.
38
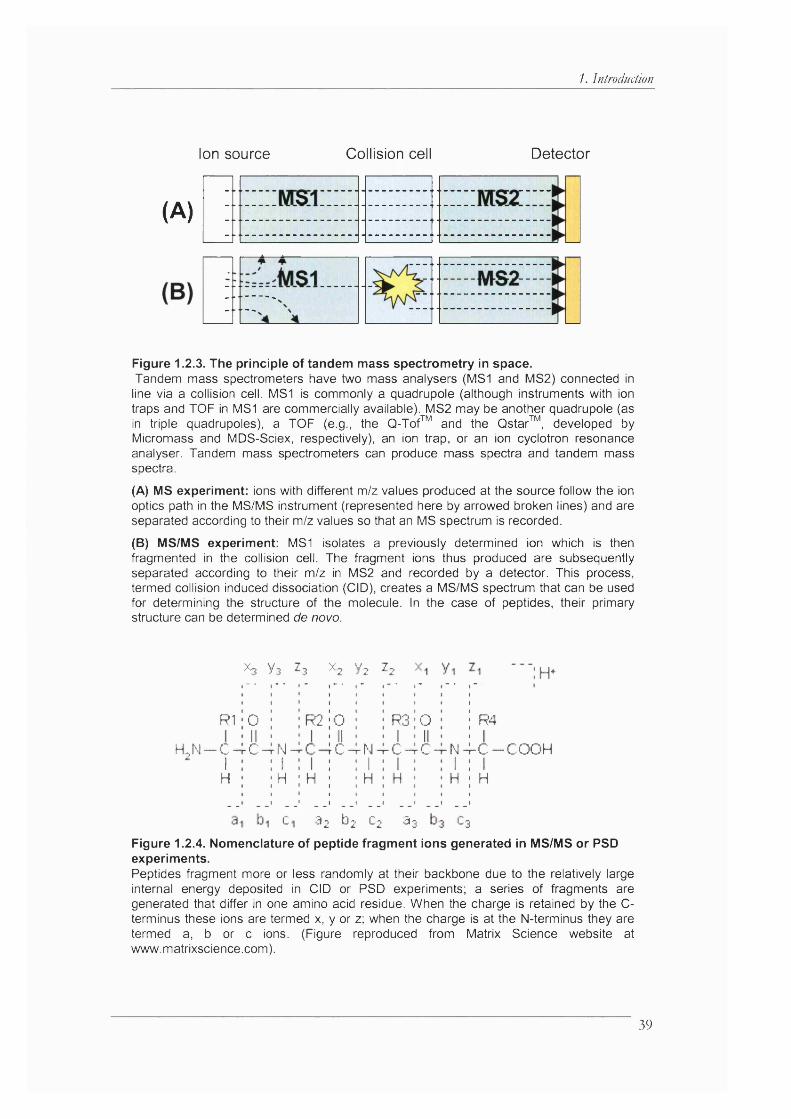
1. Introduction
Ion source Collision cell Detector
(A)
Figure 1.2.3. The principle of tandem mass spectrometry in space.Tandem mass spectrometers have two mass analysers (MSI and MS2) connected In line via a collision cell. MSI is commonly a quadrupole (although instruments with ion traps and TOF in MSI are commercially available). MS2 may be another quadrupole (as in triple quadrupoles), a TOF (e.g., the Q-Tof™ and the Qstar^" , developed by Micromass and MDS-Sciex, respectively), an ion trap, or an ion cyclotron resonance analyser. Tandem mass spectrometers can produce mass spectra and tandem mass spectra.
(A) MS experiment; ions with different m/z values produced at the source follow the ion optics path in the MS/MS instrument (represented here by arrowed broken lines) and are separated according to their m/z values so that an MS spectrum is recorded.
(B) MS/MS experiment: MS1 isolates a previously determined ion which is then fragmented in the collision cell. The fragment ions thus produced are subsequently separated according to their m/z in MS2 and recorded by a detector. This process, termed collision induced dissociation (CID), creates a MS/MS spectrum that can be used for determining the structure of the molecule. In the case of peptides, their primary structure can be determined 6e novo.
X 3 y 3 Z 3 y 2 y 2 ^ 2 : h ^
RI
H , N - C -I
H
0 R 2 0 R 3 0
II 1 II 1 IIr C ^ r N - n
1 1r C - i r N n
1r C - n
1r C - i r N - i -
1 11
H1
H1
H
1H
1 , H ;
R4
-C -C O O HI
H
c- 3 2 ^2 C2 33 C3
Figure 1.2.4. Nomenclature of peptide fragment ions generated in MS/MS or PSD experiments.Peptides fragment more or less randomly at their backbone due to the relatively large internal energy deposited in CID or PSD experiments; a series of fragments are generated that differ in one amino acid residue. When the charge is retained by the 0- terminus these ions are termed x, y or z; when the charge is at the N-terminus they are termed a, b or c ions. (Figure reproduced from Matrix Science website at www.matrixscience.com).
39
/. Introduction
U q u id chromatography mass spectrometry (LC -M S )
LC has been hyphenated to MS both on-line and off-line. In o ff-line LC-MS
fractions from the LC run are collected and then the molecules present in these fractions
analysed by any o f the MS methods described above (or indeed by any other method). In
on-line LC-MS the eluent from the LC is directly fed in to the mass spectrometer. This
mode o f LC-MS is commonly carried out using ESI-MS. As discussed above, a great
im provem ent in sensitivity can be achieved when the ESI process is perform ed at low flow
rates. In addition, the concentration capacity o f nanoLC is greater than that o f
conventional LC and nanoLC requires passage o f the m obile phase at low flow rate.
M oreover, the solvents used in RP-LC are compatible w ith ESI. Consequently, the
hyphenation o f nanoLC and nanoESI-M S/M S has been very successful fo r the analysis o f
proteins and peptides w ith great sensitivity (e.g [144]). When LC is combined w ith ESI and
M S/M S instruments that allow fo r D D A a large amount o f peptides can be sequenced in
a relatively short tim e (e.g., [116]).
40
1. Introduction
1.3. The proteomics workflow.
The analytical methods used during the studies presented in this thesis have been
introduced in the preceding discussion. In the follow ing, a b rie f account is presented on
how these methods are combined fo r the analysis o f gene expression in the fie ld that is
known as proteomics.
1.3.1. Targeted approaches fo r the detection and quantitation of proteins
In conventional biochemistry, a common m ethod to detect and quantify proteins
is that o f immunochemistry. This approach is in principle very pow erful provided
antibodies fo r the proteins under study are available. Due to the specificity o f antibodies
virtually any protein or peptide can be detected in a background o f other proteins w ithout
the need fo r sample pre-treatment. In addition to the ir use in Westerns blots and
immunoassays such as ELISA , antibodies can be used fo r localising proteins in cells and
tissues, thus making possible to detect the intracellular localization o f the protein under
study.
Several investigators have used immunochemical methods fo r identification o f
several proteins or peptides in kidney tissues and in urine in a proteom ic scale. For
example, the group o f Knepper and colleagues has developed antibodies fo r each o f the
transporters involved in sodium reuptake from the glomerular filtra te [145]. These
antibodies have been used to fo llow the changes o f the ir target in animal models o f disease
after perturbation o f defined physiological parameters [146-149]. Norden el aL have also
used immunochemical methods fo r the quantitation o f several proteins in both Fanconi
syndrome patients and contro l urine, and these studies provided in form ation on the nature
o f LM W P [150;151].
A lthough this strategy is pow erful to fo llow the change in expression levels o f
specific proteins, it is not suitable fo r the identification o f new candidates involved in
physiological processes because there is a lim it on the number o f antibodies that can be
used at a time, and the promises o f comprehensive protein arrays is yet to be fu lfilled.
Furthermore, immunochemical methods are somehow biased in that it is the investigator
who chooses the set o f antibodies to be used. Problems o f specificity, expense, and
availability o f antibodies should also be considered. Finally, fo r obvious reasons, antibodies
cannot be used to fo llow the expression o f genes whose products have not yet been
characterized.
41
1. Introduction
1.3.2. Tm-dimensionalgel electrophoresis and mass spectrometry-hased methods
The bases o f protein separation by 2D E have been introduced in section 1.2.2 o f
this chapter. Changes in gene expression as a result o f disease or d ifferent cell states have
been analysed w ith this method, which is the most w idely used approach in proteomics fo r
protein p ro filing [152-155]. Typically, the protein samples to be compared are separated in
parallel gels. A fte r staining and scanning, gels spots that show an altered level o f expression
are excised, and in-gel digested w ith a suitable protease (trypsin is almost always used). The
peptides produced are then analysed by MS, most commonly by M A L D I-T O F MS, or
nanoLC-ESI-M S/M S. The technical advances in biological MS, outlined in Chapter 1.2.3,
and bioinform atics during the 1990s meant that mass spectrometers have now enough
sensitivity fo r the identification o f proteins showing a fa int signal in silver stained gel spots.
A n approach fo r the identification o f proteins using in-gel digestion and MS data is
that o f peptide mass fingerprinting (PMF) [156] in which the m /z values o f the peptide
ions observed in the M A L D I-T O F mass spectrum are used to search a protein database.
Search algorithms have been developed that compare those m /z values to those derived
from the theoretical digestion o f aU proteins in the database (e.g., [157;158]). The protein
present in the gel spot is identified when the theoretical and the observed m /z values are
the same w ith in a defibied mass error. A lgorithm s that assess the statistical probability that
the h it is correct have also been developed [157;158], although operator intervention is
needed to identify false positives.
A n alternative to M A L D I-T O F MS and PMF fo r the identification o f gel
separated proteins is LC-ESI-M S/M S followed by sequence-tag searches [156], in which
the peptides generated by in-gel digestion o f the protein spot are separated by LC and
detected and sequenced by M S/M S. Sequencing by MS is carried out using tandem mass
spectrometers, as outlined in Chapter 1.2.3.
Proteomics studies using the approach o f 2D E in com bination w ith MS have
demonstrated the usefulness o f these methods to compare gene expression profiles o f
related proteomes. For example, 2D E has been used in the context o f nephrology to
identify proteins differentially expressed in kidney medulla and cortex [159;160], to analyse
proteins patterns o f workers exposed to toxic levels o f cadmium [161], to identify changes
in gene expression in renal cells as a result o f hypoxia [162], and to comparatively analyse
rat urinary proteomes before and after sodium overload [163].
42

1. Introduction
1.3.3. U qu id chromatographj-tandem mass spectrometry based methods
As an alternative to 2DE-based methods, in which proteins are separated and then
analysed one at a time by MS, strategies based on LC -M S/M S are being used fo r the
‘shotgun’ identification o f all the proteins in a sample (reviewed in [164]). In this method,
proteins are firs t digested w ith a suitable protease and the peptides generated (there could
be several hundred thousand i f a whole cell lysate is to be analysed) are separated by two-
dimensional (2D)-LC; the firs t dimension usually being SCX-LC and the second RP-LC.
Peptides are detected and sequenced on-line by M S/M S. Peptides are thus separated by
charge in the firs t dimension and by hydrophobicity in the second. The mass spectrometer
separates eluting peptides according to the it m /z value, and therefore, MS provides a th ird
dimension o f separation. For this reason this approach has been termed m ultidim ensional
protein identification technology (MudPiT) by the group o f Yates, which was one o f the
firs t groups that implemented this approach fo r large scale proteomics [113]. A 90 m inute
reversed phase LC run can, in com bination w ith ESI-M S/M S detection, sequence about
900 peptides/run. Therefore, a 2D -LC -M S/M S experiment in which 20 SCX fractions are
analysed could generate 18,000 M S/M S spectra, which in an ideal scenario, could generate
the same number o f peptide sequences.
The drawback o f this method, when compared w ith 2D E based approaches, is
that quantitation is not straightforward such that labelling w ith stable isotopes is needed
fo r relative quantitation. Methods fo r labelling peptides p rio r to 2D -LC -M S/M S include
isotope coded a ffin ity tags (IC AT) firs t introduced by the Aebersold group [165;166] and
later commercialised by Applied Biosystems. The IC A T reagents are alkylating compounds
that label cysteine amino acid residues. One o f the samples to be analyzed is labelled w ith
an IC A T reagent containing nine ’^C, while the other is labelled w ith the same compound
but containing the common ^ C. A fte r labelling, the samples are m ixed and analysed by
2D -LC -M S/M S as described above fo r M udPiT.
A problem associated w ith the IC A T strategy is that these reagents label cysteine
residues and therefore proteins that do not contain this amino acid in their coding region
cannot be quantified w ith this method. Recently, other investigators have reported the
development o f compounds based on the IC A T principle [167]. A lternative strategies have
also been described that involve metabolic labelling by growing cell cultures in media
containing amino acids that incorporate heavy stable isotopes [168], o r in media in which
replaces as an nitrogen source [169].
43
1. Introduction
1.4. Aims and Scope
The prim ary aim o f the studies that constitute the subject o f this thesis was to use
mass spectrometry based analytical approaches to investigate the notion that factors
present in the tubular flu id have a role in contro lling renal physiology. As discussed in
preceding sections o f this chapter, there are several published studies suggesting that
lum inal factors contribute to the horm onal regulation o f solute transport in renal mbules.
For instance, several receptors fo r bioactive peptides are known to be located on lum inal
membranes, and in addition, renal cells express bioactive peptides; since many o f them
appear in urine, they probably are also present in tubular fluid. These observations po in t to
a model o f renal physiology in which intracrine regulation (i.e., regulation from the lum inal
side o f tubular cells) plays an im portant homeostatic function in the kidney, in addition to
the roles perform ed by classical autocrine and paracrine horm onal systems.
In spite o f the evidence already present, the relative amounts o f peptide hormones
in the tubular flu id remain unknown. Therefore, it is not possible to predict which
peptide(s) may have greater contributions to the regulation o f tubular cell function.
Moreover, it has been shown that actions o f growth factors on cultured cells may vary
depending on whether cells are exposed to individual factors in isolation or as part o f a
m ixture. Thus, it would be o f great interest to know the horm onal com position o f
in terstitia l and tubular fluids. In this regard, one o f the aims o f the studies presented in this
thesis was to investigate the peptide hormone com position o f renal tubular flu id.
Renal FS patients have a defect on the reabsorption o f proteins and peptides from
the glomerular hltrate, but it is generally accepted that the physical integrity o f the
glomerular filte r is not affected in these patients. Consequentiy, the urinary com position o f
FS patients is believed to be close to that o f norm al tubular flu id. U rine samples from
these patients were analysed fo r peptides and proteins using some o f the approaches
introduced in previous sections o f this chapter. The results obtained during the course o f
these experiments are the subject o f Chapters 3 and 4.
Proteom ic methods were also used to analyse the proteomes o f cortical apical and
basolateral membranes in order to detect the presence o f proteins that may be involved in
signal transduction cascades. For a signalling system to operate there must be extracellular
components as w ell as intracellular ones. In this context, experiments presented in Chapter
5 o f this thesis suggest that proteins w ith previously reported signaling functions are
44
1. Introduction
present at the apical membrane o f tubular cells and this further supports the existence o f
an intracrine control o f renal function.
45
2. ~Experimental
2. Experimental
2.1. Mass spectrometry
Mass spectrometry-based experiments were carried out using instruments located
and maintained at the Bioanalytical Chemistry laboratory (D r R. Cramer, head) o f the
Ludwig Institute fo r Cancer Research (UCL branch, P ro f M .D . W aterfield, director) or in
the Mass Spectrometry Facility (University o f CaHfomia in San Francisco, Prof.. A .L.
Burlingame, director).
2 /. /. M A L D I-T O F M S and M A L D I-T O F /T O F M S /M S
Instrumentation
M A L D I-T O F MS experiments were carried out using one o f the follow ing
instruments:
Voyager E lite X L (PE Biosystems. Framingham. M A . USA)
This is a low pressure M A L D I-T O F instrum ent equipped w ith a U V nitrogen laser
(337 nm wavelength) that operates at pulse rate o f 3 ns and also an IR Q-switched
E rb ium -Y ttrium -A lurn iiiium -G am et (E r-YAG ) laser (2.94 pm wavelength) and a pulse
rate o f about 1 0 0 ns.
U ltraflex T O F /T O F ™ (Bruker Daltonics. Bremen. Germany)
This is also a low pressure M A L D I-T O F instrum ent equipped w ith L IF T
technology so that in PSD experiments the fragments ions are recorded at once obviating
the need fo r spectra stitching. Since there is only one analyser, it may be argued that this
instrum ent is capable to perform M S/M S experiments in time.
4700 Proteomics Analyzer M A L D I-T O F /T O F ™ (PE Biosystems. Foster City. CA. USA)
This is also a low pressure M A L D I-T O F /T O F capable o f high collision energy
fragmentation in a collision ceU located in between two TO F analysers. This instrum ent
can perform M S/M S experiments in space.
Sample preparation and analysis
Samples to be analysed by M A L D I-T O F MS were prepared using the dried
droplet protocol. Standard laboratory procedures in the Bioanalytical Chemistry laboratory
o f the L IC R were followed. In short, the sample analyte was mixed w ith an excess o f
46
2. Experimental
m atrix. Typically, 0.5 p i o f sample solution was mixed w ith 1 p i o f saturated solutions o f
2,5-dihydroxybenzoic acid (2,5-DHB, Bruker Daltonics or Sigma) o r a-cyano-4-
hydroxycinammic acid (HCCA, Hewlett-Packard, BobHngen, Germany). Saturated
solutions o f 2,5-D HB were freshly prepared just before analysis by dissolving an excess o f
solid m atrix in HPLC grade water. HCCA was purchased as already made solutions in
methanol. A fte r m ixing sample and m atrix solutions on the M A L D I target, they were dried
w ith a stream o f warm air.
Analysis was perform ed by averaging the spectra produced by 50 to 300 laser shots
depending on the individual signal-to-noise ratio (S /N ). Laser intensity was varied
depending on the observed signal intensity so that peaks were not saturated. Spectra
showing saturated peaks were discarded. Instruments were externally calibrated using a
standard m ixture o f peptides fo r the analysis o f low molecular weight peptides such as
those produced from protein digestions. Internal calibration was perform ed when the
spectra contained autolytic peptides o f known mass derived from the protease. When
larger polypeptides were analysed the calibration was perform ed externally using a m ixture
o f proteins.
2.1.2. ESI-Q TO F M S
Instruments
O -Tof™ instrum ent (Micromass. Manchester. U K )
This is a hybrid instrum ent consisting o f a quadrupole (Q l) and a TO F connected
through another quadruple (Q2) that is used as a collision cell. W hen scanning a large mass
range, Q l and Q2 operate in RF mode only so that ions w ith a wide m /z range are
transm itted to a push-pull region where ions are accelerated orthogonally towards the
field-free region o f the TO F. In M S/M S experiments Q l isolates the desired ion and
transmits it to Q2 where it fragments due to collision induced dissociation (C ID ).
QSTAR™ (Sciex / PE Biosystems. Foster C ity. CA. USA)
This is another hybrid Q—TO F mass spectrometer w ith ion optics sim ilar to those
described above fo r the Q -Tof™ instrument.
M atiner^^ (PE Biosystems. Foster City. CA. USA)
This instrum ent consists o f an ESI ion source, a quadrupole operating in RF
mode, and a TO F region. The quadrupole focuses the ions towards a push-pull region,
47
2. Experimental
which accelerates ion packets towards the fie ld free region o f the TO F mass analyser. As
fo r the Qstar and Q -Tof, in the M ariner the acceleration towards the TO F is orthogonal.
The quadrupole operates in RF mode only; therefore this instrum ent cannot perform
M S/M S experiments, although structural in form ation can be obtained by in-source
fragmentation.
Operation ofES l-Q -Tof
The mass spectrometers described above were equipped w ith nanoflow ion
sources and fused silica ESI emitters w ith 50 pm I.D . tapered to 15 pm at the tip
(PicoTip™ , New Objective, W obum , M A , USA). These tips are no t coated w ith
conductive material and the high voltage was applied at a liqu id metal junction about 3 cm
from the tip o f the emitter. Sample was introduced from a syringe pump or from the
eluent o f HPLC runs at flow rates o f 0.2 to 2 p l/m in depending on the application.
O ptim al operation parameters were determined empirically by infusing a standard peptide.
Typical spray tip potential was 1800-3500 V depending on the tip o f the em itter and the
flow rates. Voltages at the orifice o f the interface ranged from 40 to 150 V . The Q -Tof™
and QSTAR™ instruments were calibrated using the fragment ions generated from a
M S/M S fragmentation o f [G lu^]-Fibrmopeptide B. The Mariner™ was calibrated using the
doubly and trip ly charged neurotensin.
2.13. UC-ESl-QTOE M S
NanoflowLC was perform ed in an Ultimate™ HPLC system (LC Packings,
Amsterdam, Netherlands) or in an A B I system (Applied Biosystems) converted to low
flow rates by means o f a precolumn split constructed in-house.
The U ltim ate system consisted o f an autosampler (Famos™) that loaded 5 p i o f
sample solution at a flow rate o f 40p l/m in onto a peptide trap colum n (0.3 x 1 mm,
PepMap, LC Packings) placed at a switching valve (Switchos™). Peptides loaded in the
peptide trap column were washed fo r 2 minutes at 40 p l/m in w ith 0.1% form ic acid. A fte r
this time, peptides were eluted using gradient elution at 2 0 0 p i/m in onto a main analytical
column (CIS PepMap, 75 jum x 15 cm). Solvent A was 0.1% form ic acid and solvent B
was 80% acetonitrile (ACN) / 0.08% form ic acid. E lu tion was carried out from 5%B to
45%B in 30, 60, 90, or 120 minutes depending on the application.
The A B I system consisted o f a 140C pump, a 750B U V detector in which the flow
ceU had been replaced by a low volume flow ceU (35 nl) w ith Z configuration (LC
48
2. Experimental
Packings), and a rheodyne in jector (Rohnert Park, CA, USA) model 8125 in which the
sample loop was replaced by a peptide trap column as above. Sample solutions were
loaded in a H am ilton a ir-tight syringe (10, 25, and 100 p i syringes were used) and injected
manually directly in the peptide trap column, washed w ith 10 to 250 p i o f 0.1% form ic acid
and eluted w ith the same gradient elution conditions as fo r the U ltim ate system described
above w ith the exception that in addition to 75 pm columns, columns w ith other ID s were
also used. For 150 pm x 150 m m columns (CIS PepMap) the flow rate was 1 p l/m in .
Flow rates were obtained by means o f a precolumn split that consisted o f a T-junction and
a 50 pm I.D . capillary tube o f 0.5 m in lenght. The flow rate o f solvent eluting from the
column was measured using a calibrated glass m icropipette and the flow rates in the pump
were m odified so as to achieve the desired flow rate at the column.
The eluents o f the HPLC runs were analysed on-line by one o f the ESI mass
spectrometers described above. W hen the Q -T o f o r the QSTAR were used they were
operated in Data Dependent Acquisition, which allows fo r the automatic switching from
MS to M S/M S experiments whenever an ion o f a predetermined nature is detected.
2.2. Liquid chromatography
2.2.1. Column packing
Several methods fo r packing capillary HPLC columns were tried and tested.
Frits were constructed as previously published using porous filters [117;170;171],
porous ceramic plugs [172], or unions containing stainless steel screens [173].
Briefly, capillaries were fritted w ith PVD F porous filters (MilHpore) by placing the
filte r on a plastic surface and using the end o f a capillary (320 pm ID ) to cut a section o f
the filte r, which was then pushed inside the capillary using a narrower capdlary (280 pm
O D ). The narrower capillary was then taken out, applied epoxy glue, and inserted again
in to the w ider capillary. A fte r allow ing drying, the colum n was ready to be packed.
Capillaries were also ftitte d using potassium silicate solutions that form ed a porous
plug at the end o f the capillary. In this, 300 p i potassium silicate solution (Si0 2 :K 2 0 , 21:9,
Merk) was mixed w ith 100 p i formamide, vortexed fo r 1-2 minutes, centrifuged, and the
solution positioned inside the capillary by capillary action; the end o f the capillary was
inserted in the solution fo r 3-4 s. Polymerisation was perform ed by placing the capillary in
heat block at 37°C fo r 1 h.
49

2. Experimental
A final method fo r column frittin g was tested in which beads are retained by
placing stainless steal unions containing integrated frits at the end o f the capillary to be
packed. These unions are commercially available from Valeo Instruments (Schenkon,
Switzerland) and columns packed using these frits were very robust.
Once the column was fritted, it was packed as described in the literature by
introducing chromatographic beads suspended in a slurry in to the capillary at high pressure
[117;170;171;173]. B riefly, the non-fritted end o f the capillary was placed at the end o f a
slurry reservoir, which consisted o f an empty stainless steal column (4.6 mm I.D . x 5 cm
long) whose ends had been drilled w ith a 1 m m d rill. The slurry reservoir was filled w ith
slurry (packing material suspended in organic solvent). The end o f the slurry reservoir that
is not connected to the column to be packed was connected to a HPLC pump. The flow
rate o f the HPLC pump was set at 100 p l/m in , and thereafter adjusted so that the
backpressure was ~2000 p .s.i u n til the column was packed. Columns were le ft
conditioning overnight at 2 0 0 0 p .s.i, after which time the flow was switched o ff from the
pump and the column le ft depressurising from the fr it u n til the backpressure reading at the
pump was zero (typically 24 h.).
2.2.2. E£ versed phase H P LC
O ff line LC-MS experiments were perform ed in m icrocapillary HPLC (pLC)
columns (POROS 10 R2, 320 pm I.D . x 250 mm long), which were packed in house as
described above in fused silica tubes using stainless steel unions w ith integrated frits.
Gradient elution was carried out from 15% B to 60% B in 30 minutes after an in itia l
isocratic step o f 8 minutes at 5% B. M obile phase A was 0.1% TF A and m obile phase B
was 80% A C N /0.1% TFA. The A B I HPLC system described above was used fo r these
experiments. The sample loop was 5 p i and the flow rate was 20 p l/m in .
O ff-line L C -M A L D I-T O F /T O F experiments were also conducted. This system
consisted o f an U ltim ate HPLC (LC Packings) equipped w ith a 75 pm x 150 m m column
(PepMap, LC Packings) and operated as described above fo r the on-line LC -ESI-M S/M S
analyses w ith the exception that the eluents o f these LC runs were directly spotted on
M A L D I plates by a robot (Probot, LC Packings). The flow rate from the column was 330
n l/m in and that o f the m atrix solution (saturated CHCA in 70% methanol / 0.4% TFA)
was 800 n l/m in . The LC eluent and the m atrix were mixed at a T -junction and spotted on
the M A L D I target every 30 seconds. Solvent A and B were as above and the gradient was
50
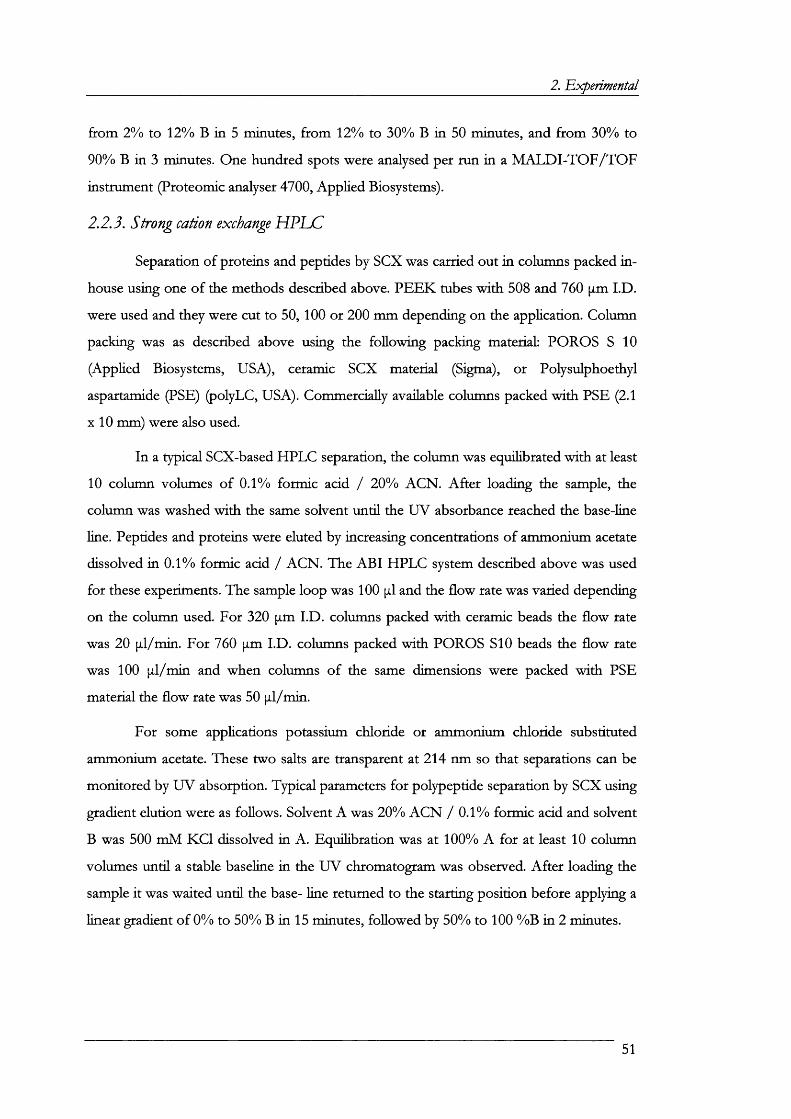
2. Experimental
from 2% to 12% B in 5 minutes, from 12% to 30% B in 50 minutes, and from 30% to
90% B in 3 minutes. One hundred spots were analysed per run in a M A L D I-T O F /T O F
instrum ent (Proteomic analyser 4700, Applied Biosystems).
2.2.3. Strong cation exchange H P LC
Separation o f proteins and peptides by SCX was carried out in columns packed in -
house using one o f the methods described above. P E E K tubes w ith 508 and 760 pm I.D .
were used and they were cut to 50, 100 or 200 m m depending on the application. Column
packing was as described above using the follow ing packing material: POROS S 10
(Applied Biosystems, USA), ceramic SCX material (Sigma), or Polysulphoethyl
aspartamide (PSE) (polyLC, USA). Commercially available columns packed w ith PSE (2.1
X 10 mm) were also used.
In a typical SCX-based HPLC separation, the column was equilibrated w ith at least
10 column volumes o f 0.1% form ic acid / 20% AC N . A fte r loading the sample, the
column was washed w ith the same solvent u n til the U V absorbance reached the base-line
line. Peptides and proteins were eluted by increasing concentrations o f ammonium acetate
dissolved in 0.1% form ic acid / AC N . The A B I HPLC system described above was used
fo r these experiments. The sample loop was 100 p i and the flow rate was varied depending
on the column used. For 320 pm I.D . columns packed w ith ceramic beads the flow rate
was 20 p l/m in . For 760 pm I.D . columns packed w ith POROS 810 beads the flow rate
was 100 p l/m in and when columns o f the same dimensions were packed w ith PSE
material the flow rate was 50 p i/m in .
For some applications potassium chloride or ammonium chloride substituted
ammonium acetate. These two salts are transparent at 214 nm so that separations can be
m onitored by U V absorption. Typical parameters fo r polypeptide separation by SCX using
gradient elution were as follows. Solvent A was 20% A C N / 0.1% form ic acid and solvent
B was 500 m M K C l dissolved in A . Equilibration was at 100% A fo r at least 10 column
volumes u n til a stable baseline in the U V chromatogram was observed. A fte r loading the
sample it was waited u n til the base- line returned to the starting position before applying a
linear gradient o f 0% to 50% B in 15 minutes, followed by 50% to 100 %B in 2 minutes.
51
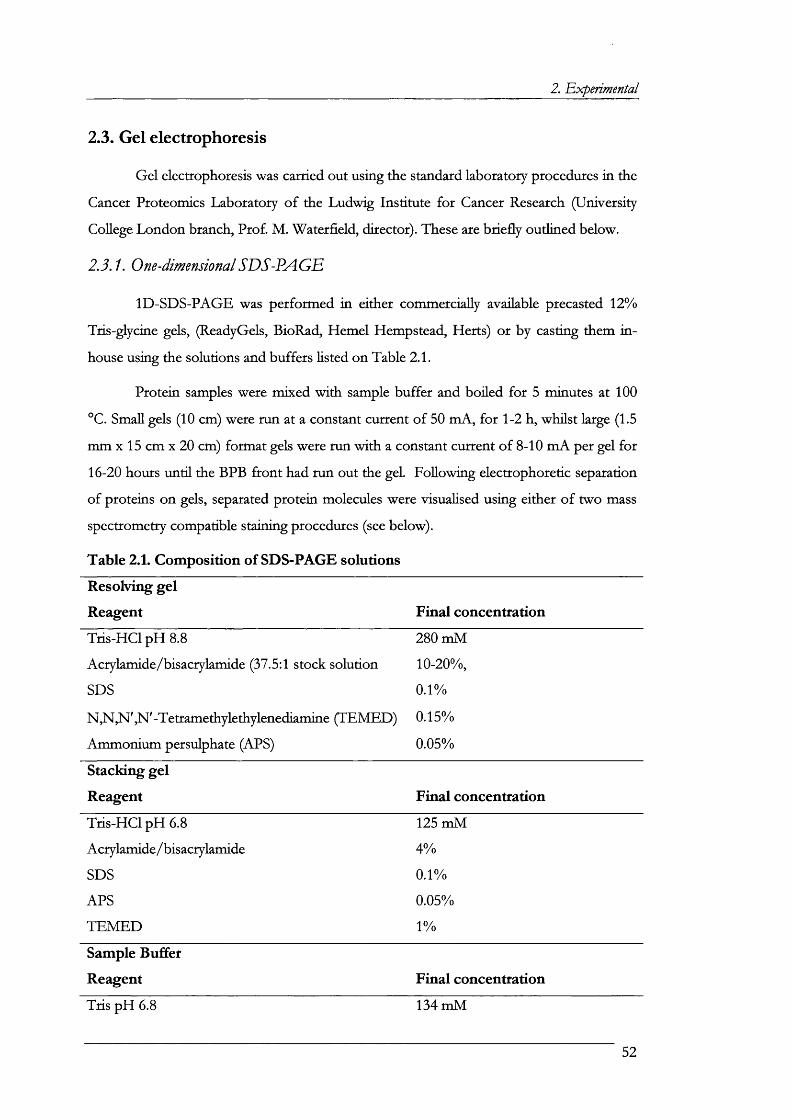
2. Experimental
2.3. Gel electrophoresis
Gel electrophoresis was carried out using the standard laboratory procedures in the
Cancer Proteomics Laboratory o f the Ludw ig Institute fo r Cancer Research (University
College London branch, Prof. M . W aterfield, director). These are b rie fly outlined below.
2.3.1. One-dimensional SDS-PAGE
ID -SD S-PAG E was perform ed in either commercially available precasted 12%
Tris-glycine gels, (ReadyGels, BioRad, Hemel Hempstead, Herts) o r by casting them in -
house using the solutions and buffers listed on Table 2.1.
Protein samples were m ixed w ith sample buffer and boiled fo r 5 minutes at 100
°C. Small gels (10 cm) were run at a constant current o f 50 m A, fo r 1-2 h, w hilst large (1.5
mm X 15 cm x 20 cm) form at gels were run w ith a constant current o f 8-10 m A per gel fo r
16-20 hours un til the BPB fro n t had run out the gel. Follow ing electrophoretic separation
o f proteins on gels, separated proteiu molecules were visualised using either o f two mass
spectrometry compatible staining procedures (see below).
Table 2.1. Composition of SDS-PAGE solutions
Resolving gel
Reagent Final concentration
Tris-H C l pH 8 . 8 280 m M
Acrylam ide/bisacrylam ide (37.5:1 stock solution 1 0 -2 0 %,
SDS 0.1%
N ,N ,N ' ,N ' -Tetramethylethylenediamine (TEM ED ) 0.15%
Am m onium persulphate (APS) 0.05%
Stacking gel
Reagent Final concentration
T ris-H C l pH 6 . 8 125 m M
Acrylam ide/bisacrylam ide 4%
SDS 0.1%
APS 0.05%
T E M E D 1 %
Sample Buffer
Reagent Final concentration
Tris pH 6 . 8 134 m M
52
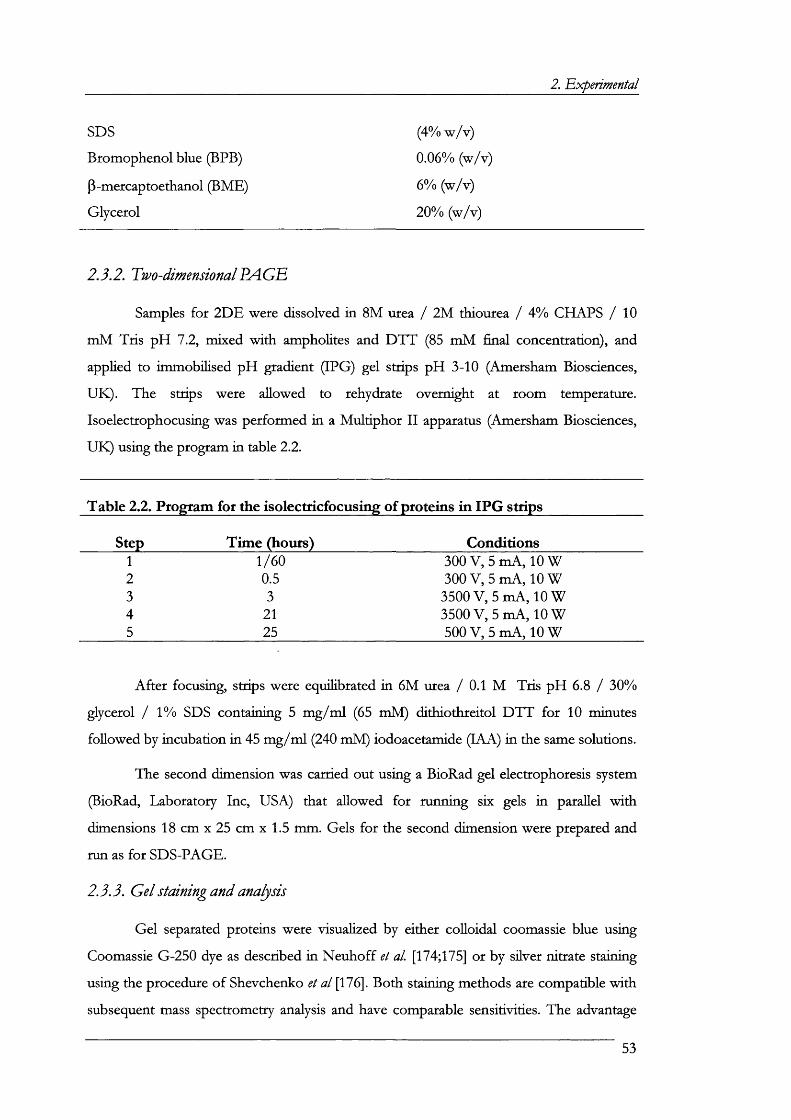
2. Experimental
SDS (4 % w /v)
Brom ophenol blue (BPB) 0.06% (w /v)
P-mercaptoethanol (BME) 6 % (w /v)
G lycerol 20% (w /v)
2.3.2. Two-dimensional PAG E
Samples fo r 2D E were dissolved in 8 M urea / 2M thiourea / 4% CHAPS / 10
m M Tris pH 7.2, mixed w ith ampholites and D T T (85 m M fina l concentration), and
applied to im m obilised pH gradient (IPG) gel strips pH 3-10 (Amersham Biosciences,
U K ). The strips were allowed to rehydrate overnight at room temperature.
Isoelectrophocusing was perform ed in a M ultiphor I I apparatus (Amersham Biosciences,
U K ) using the program in table 2.2.
Table 2.2. Program for the isolectricfocusing of proteins in IPG strips_____________
Step__________ Time (hours)____________________Conditions1 1/60 300 V ,5 m A , 10 W2 0.5 300 V ,5 m A , 10 W3 3 3500 V , 5 m A, lo w4 2 1 3500 V , 5 m A, lo w5 25 500 V , 5 m A, lo w
A fte r focusing, strips were equilibrated in 6 M urea / 0.1 M Tris pH 6 . 8 / 30%
glycerol / 1% SDS containing 5 m g /m l (65 mM ) d ith io th re ito l D T T fo r 10 minutes
followed by incubation in 45 m g /m l (240 m M ) iodoacetamide (lA A ) in the same solutions.
The second dimension was carried out using a BioRad gel electrophoresis system
(BioRad, Laboratory Inc, USA) that allowed fo r running six gels in parallel w ith
dimensions 18 cm x 25 cm x 1.5 mm. Gels fo r the second dimension were prepared and
run as fo r SDS-PAGE.
2.3.3. Gel staining and analysis
Gel separated proteins were visualized by either colloidal coomassie blue using
Coomassie G-250 dye as described in N euho ff et al [174;175] or by silver nitrate staining
using the procedure o f Shevchenko et al [176]. Both staining methods are compatible w ith
subsequent mass spectrometry analysis and have comparable sensitivities. The advantage
53

2. 'Experimental
o f colloidal Coomassie blue staining over silver staining is that the intensity o f bands or
spots is more linear w ith relation to protein concentration than the silver staining method.
Conversely, silver staining is faster than Coomassie staining when high sensitivities are
required.
Protein staining using Coomassie blue G-250 has been described [174;175]. B riefly,
gels were fixed from 3 h to overnight in 50% (v /v ) ethanol / 2% (v /v ) phosphoric acid.
A fte r washing the gels three times w ith water (1 /2 hours per wash), gels were incubated
w ith staining solution (34% (v /v ) M eO H / 17% (w /v) (N H J 2 SO4 / 3% (v /v ) phosphoric
acid) fo r Ihour, after which time 0.7 g /L (soHd) Coomassie Blue G-250 was added to the
solution. Gels were then le ft shaken u n til bands o f the required intensity were visible. The
end po in t o f labelling is reached after 3-4 days o f incubation. Sensitivity was about 10-50
ng o f protein (BSA).
Mass spectrometric compatible silver staining was carried out as described w ith
m inor m odifications [176]. B riefly, gels were fixed using 40% ethanol / 10% acetic acid
overnight and then washed w ith 50% ethanol fo r 10 minutes follow ed by 3 washes in
water (10 m in/wash). Gels were then sensitised in 0.02% sodium thiosulphate fo r Im in ,
washed in water twice ( 1 m in/wash) and stained w ith pre-cooled 0.1% silver nitrate fo r 30
minutes at 4 °C. A fte r washing twice w ith water ( 1 m in/wash), the signal was developed by
incubating in 0.04% form alin, 2% sodium carbonate. The reaction was stopped w ith 1%
acetic acid.
Gels were scanned using a densitometer (BioRad model GS-800 calibrated
densitometer) and analysed (curated) using the software package Melanie™. For 2D gels,
spot intensity was expressed as optical density (O D) normalised to tota l O D .
2.4. Enzymatic digestion of proteins
2.4.1. In-solution digestion
Proteins present in HPLC fractions were digested w ith trypsin dissolved in 25 m M
ammonium bicarbonate. The amount o f trypsin used was adjusted so that the ratio
substrateztrypsin was between 50:1 and 20:1 (w /w ). The reaction was perform ed overnight
at 37 °C and D T T to a final concentration o f 1 m M was added after digestion to reduce
disulphide bridges.
54
2. 'Experimental
W hen reduction and alkylation was perform ed before proteolytic digestion, protein
solutions were solubilised in 6 M urea / 0.05% SDS/ 50 m M ammonium bicarbonate / 5
m M Tris(2-carboxyethyl)phosphine (TCEP), heated at 50 °C fo r 1 hour and subsequently
labelled w ith the alkylating agent (either iodoacetamide or IC A T reagent) fo r 2h at 37°C in
the dark. Before adding trypsin, samples were diluted to final concentrations o f 1.2M urea
and 0.01% SDS.
2.4.2. In-gel digestion
In-gel digestion was perform ed using published procedures [177;178]. B riefly, gel
pieces from silver stained gels were de-stained using H 2 O2 ( l% v /v ) ; th is step was
om itted w hen pieces fro m CBB stained gels were subjected to in -ge l digestion. The
fo llo w in g was perfo rm ed fo r b o th silver and C BB stained gel pieces. A fte r w ashing
the gel pieces 3 tim es w ith 50% A C N , they were dried in a SpeedVac u n til a ll the
so lvent had been evaporated. S u ffic ie n t lO m M D T T (in 25m M am m onium
bicarbonate, p H 8 ) was added to cover gel pieces, w h ich were then incubated fo r
45m in at 50°C, a fte r w h ich tim e the D T T so lu tion was rem oved and su ffic ien t
50m M JA M (in 25m M A m B ic p H 8 ) added to cover gel pieces. In cu ba tion was fo r
Ih r at ro o m tem perature in the dark. A fte r w ashing the gel pieces w ith 50% A C N
and d ry ing in the SpeedVac as above, 50 ng o f tryps in dissolved in 25 m M A m B ic
was added and incubated o ve rn igh t at 37 °C. T ry p tic peptides were extracted fro m
the gel pieces by the add ition o f 5% T F A / 50 % A C N (th is was done a to ta l o f 3
tim es). E xtracted peptides were concentrated to dryness in the SpeedVac and then
dissolved w ith a suitable vo lum e 0 .1 % fo rm ic acid.
2.5. Data Analysis
Proteins were identified by either peptide mass fingerprinting (PMF) o r sequence
tag searches (STS) using MS or M S/M S data, respectively. For PMF, m /z values from
M A L D I-T O F MS spectra were fed in to M S-Fit (Protein Prospector). For internally
calibrated spectra, the tolerated mass error was set to 50 ppm and fo r externally calibrated
spectra to 200 ppm. Routinely, m /z values were searched against the N C B I protein
database restricted to the entries o f the organism under study (human fo r the urinary
polypeptide analysis and mammalian or rodent fo r the membrane proteome experiment).
55
2. Experimental
For STS, data from the nanoLC-MSMS runs were converted to peak lis t files,
which were then fed in to M ASCO T to search the N C B I protein database. Mass error
tolerance was set up to 1 0 0 ppm fo r the parent ions and 150 ppm fo r the fragment ions.
As fo r PMF, searches were restricted to the taxonomy o f the organism under study.
Considered m odifications fo r both STS and PMF were oxidation o f methionines, pyro-
glutamation o f N-term inus, and carbamidomethylation o f cysteines. W hen searching w ith
data from IC A T experiments, IC A T m odified cysteines were considered instead o f
carbamidomethyl cysteine. In-solution digestion in the presence o f LAM can m odify N -
term in i o f peptides. Therefore, in these cases carbamidomethylation o f the N-term inus
was also considered as a possible m odification.
For PMF, a prote in was identified when more than 5 peptides matched an entry
and those covered more than 35% o f the protein. For STS, a protein was identified when 2
peptides matched a prote in and the Mowse score given by M ASCO T was w ell above the
statistical probability that the h it was correct. In cases where only one peptide matched a
protein, the correctness o f the h it was confirm ed my manual assignation o f all the peaks in
the M S/M S spectrum to theoretical fragment ions. In some cases, when it was observed
that the M S/M S spectra were o f good quality but not statistically significant hits were
returned by M ASCOT, these were interpreted de novo.
2.6. Extraction of polypeptides from urine
2.6.1. Precipitation
Three d ifferent methods fo r the precipitation o f urinary proteins were investigated.
Dye precipitation was carried out as described by Marshall [161] using Coomassie blue dye
R-250. Acetone precipitation was carried out in 50% acetone at —20°C. Finally,
m ethanol/ch loroform precipitation was carried out as described [179].
2.6.2. Solvent extraction
Urine samples were treated w ith 3 x 900 p i etherrethyl acetate (1:1). The organic
layer was discarded and peptides in the aqueous layer precipitated w ith
m ethanol:chloroform (3:1). The pellet was redissolved in 0.1 % form ic acid.
2.6.3. U qu id chromatographj
Tw o types o f RP column were used fo r the extraction o f polypeptides from urine:
solid phase extraction (SPE) cartridges (OASIS, reversed phase cartridges, 80 Â pore size,
56
2. Experimental
Waters, M A , USA) and POROS R20 (20 [im bead size, 2000 A pore size. Applied
Biosystems) packed in house in 760 pm x 50 mm P E E K tubes.
Extraction by SPE was carried out by gravity flow as follows. A volume o f utine
containing 10 pm ol o f creatinine was added to an equal volume o f 1% TFA. Cartridges
were conditioned w ith 1 m l o f 80% methanol / 0 .1 % form ic acid and equilibrated w ith 1
m l 4% methanol / 0.1% form ic acid. The sample was applied twice thought the cartridge,
which was then washed w ith 1 m l 4% m ethanol/0.1% form ic acid. Peptides were eluted
using 1 m l o f 80% methanol / 0.1% form ic acid. E luted peptides were dried in a SpeedVac
and reconstituted in 5% aceton itrile /0.5% form ic acid.
Extraction by HPLC was carried out as follows. U tine samples were injected in an
HPLC system equipped w ith an RP column connected on-line to a SCX column. Samples
were injected in the RP column (packed in-house w ith POROS R2 20 in a P E E K mbe
w ith dimensions 50 x 0.76 mm) and washed w ith 20 column volumes o f 4% A C N /0.1%
TFA at a flow rate o f 100 p l/m in . A pre-equiHbrated SCX column (packed in housed w ith
POROS HS in a P E E K tube w ith dimensions 50 x 0.76 mm) was then connected to the
end o f the RP column and peptides eluted directly from the RP column to this SCX
column using 150 p i o f 80% A C N /0.1% TFA. Peptides bound to the SCX column were
washed w ith 20 column volumes o f 4% A C N /0.1% TFA , after which tim e polypeptides
were eluted w ith 150 p i o f 2 M ammonium acetate dissolved in 25% A C N /0 .1% TFA.
E luted polypeptides were dried in a Speed Vac to remove the volatile ammonium acetate,
re-issolved in 5% A C N / 0.1% TFA , and the protein quantified using the Bradford assay
[180].
2.7. Labelling of polypeptides with isotope coded affinity tags
In some experiments proteins were labelled w ith IC A T reagents p rio r to the it
separation by SCX follow ed by RP LC and the it analysis by MS. In this, proteins were
resuspended in 6 M urea / 50 m M ammonium bicarbonate / 5 m M T ris(2-
carboxyethyl)phosphine and subsequently labelled w ith the cleavable IC A T reagents fo r 2h
at 37°C in the dark. Equal amounts o f each o f the samples to be compared were mixed,
adjusted to about ~1M urea, and sequence grade trypsin to a final ratio o f 1:20 (w /w ) was
added to the reaction m ixture, which was then incubated overnight at 37° C.
IC A T labelled peptides were separated ftom free label by SCX HPLC as described
in section 2.2.3. This step was also used to separate the peptide m ixture in to fractions.
57
2. 'Expérimental
Labeled peptides present in SCX fractions were separated from unlabeUed ones by avidin
a ffin ity chromatography using manufacturer’s recommendations. The b io tin m oiety o f the
IC A T label was removed by acid cleavage using manufacturer’s instructions. The solution
used to cleave the IC A T reagent was removed by Speed-Vac evaporation and IC A T-
labelled peptides redissolved in 0.1% form ic acid. Identification and quantitation o f IC A T
pairs was carried out by LC -M S/M S as described in section 2.1.
2.8. Operation of the column switching liquid chromatography tandem
mass spectrometry set up
2.8.1. Description of the system
The column switching consisted o f three columns connected through two HPLC
injectors. The flow rates were provided by independent HPLC pumps and fuse silica
tubing (50 ^m ID ) was used fo r delivery o f the m obile phase.
Column 1 was a SCX column packed in-house to 1 cm in 320 pm I.D . fused silica
capillary using Ceramic beads (Sigma) w ith 50 pm mean bead size. These beads were held
in place in the column by a restrictor (a 50 pm I.D . / 280 pm O .D . fused silica capillary) at
the end o f the 320 pm capillary. Thus, this column did not have a fr it (i.e., it was not
plugged) which nrinim ized sample losses due to absorption. Column 2 was a PepMap
column (LC Packings) w ith dimensions 300 pm x 1 mm. Column 3 was also a PepMap
column (LC Packings) w ith dimensions 75 pm x 150 mm.
HPLC pumps were two A B I 140B delivery systems. Pump 1 operated isocratically
at a flow rate o f 40 p l/m in and the mobile phase was 0.1% form ic acid / 5 % AC N . Pump
two was programmed fo r gradient elution and operated as described above fo r RP
nanoLC-MS/MS.
Injector 1 was a Rheodyne in jector model 7010 fitted w ith a 40 p i sample loop.
Injector 2 was a Rheodyne 8125 in which the loop was replaced by colum n 2. A pre
column flow rate split was made so that the flow from pump 2 was decreased to 2 0 0
n l/m in .
2.8.2 Operation of the system
The sample was injected through in jector 1 in to column 1 at 40 p l/m in and the
column washed fo r 2 minutes. Molecules that did not b ind column 1 were diverted to
58

2. Expérimental
waste. A fte r washing, column 1 and 2 were connected in-line. Polypeptides were eluted
from column 1 directly to column 2 by injecting 40 p i o f 500 m M ammonium acetate from
in jector 1. E luting peptides were trapped in column 2, which was then washed to remove
salts in the m obile phase coming from pump 1. In jector 2 was then switched so that
column 2 and 3 were now in-line. Pump 2 then delivered a gradient o f A C N that eluted
peptides in to a ESI-MSMS instrum ent (QStar, M D S-Sciex/ABI).
2.9. Proteomic analysis of membrane preparations
Rat renal cortical membrane preparations were generous gifts from D r. Joanne
Marks (Royal Free Hospital, London, U K ) and D r. Juerg B iber (University o f Zurich,
Switzerland).
Brush border membranes (BBM) were prepared by D r. Marks using the method o f
B iber [181] in which BBM are separated from tota l membrane by magnesium
precipitation. BBM as w ell as basolateral membranes (BUM) were also prepared by D r.
B iber using a method based on free-flow electrophoresis as described by Kaufm ann [8 ].
The protein contents o f BBM and BUM preparations were quantified using the
Bradford assay and proteins separated by 12% SDS-PAGE. Proteins were visualized by
colloidal CBB G-250 staining and the whole lane cut in to 20 gel pieces irrespective o f stain
intensity. The identities o f the proteins present in these gel pieces were determined by in
gel digestion, nanoLC-ESI-M S/M S, and STS searches as described above.
2.10. Patients
AJl patients participating in the study had clin ical and laboratory features o f the
renal Fanconi syndrome and had been described before in detail [80-82, 150, 151]. The
molecular genetic features o f the D ent’ disease patients smdied had been elucidated [80-
82]. Patient 1 had total CLCN5 deletion, patient 2 has m utation W 279X, patient 3 has a
spHce-site m utation that leads to deletion o f codons 132-241, and patient 4 has m utation
R34X. Each o f these mutations is associated w ith loss o f function o f the ClC-5 chloride
channel. Tw o Lowe syndrome patients were also studied [150-151]. These are brothers
and, in addition to renal Fanconi syndrome, these patients have mental and growth
retardation and visual im pairm ent. A patient w ith A D IF , described previously [150-151],
was also studied. Patients presented creatinine clearances o f between 60 and 101 m l/m in .
C ontrol urine was collected from three male subjects w ith no history o f renal disease.59

2. Experimental
Urine samples were obtained from D r. Antony N orden (Department o f C linical
Biochemistry, Addenbrookes Hospital, Cambridge). The study was approved by the local
research ethics committee, and all the subjects gave their inform ed consent. Samples were
frozen in liqu id nitrogen, transported in dry ice and stored at -80 °C u n til the day o f
analysis.
60
3. Urina^ peptide analysis bj LC-M S/M S
3. Analysis of urinary polypeptides by liquid chromatography
and mass spectrometry
This chapter is divided in to two sections. The firs t one describes the studies that
were carried out in order to find and optim ise a method suitable fo r the extraction o f
polypeptides from urine. I t wiU be shown that although several methods were tested fo r
the extraction o f peptides and proteins from urine, only liqu id chromatography based on
SCX could separate peptides o f a wide molecular weight range from other urinary
compounds.
The second section presents an account on the analysis o f renal Fanconi patient’s
urinary polypeptides using the methods tested and reported in the firs t part o f the chapter.
Possible im plications fo r the pathophysiology o f the FS w ill be discussed.
61

3. Urinary peptide analysis by LC-M S/M S
3.1. Methods for the extraction of polypeptides from urine
This section describes results o f experiments aimed at investigating the suitability
o f methods fo r the extraction o f polypeptides from urine such that they are in a form
suitable fo r mass spectrometry (MS) analysis. The main criteria used here to define an
efficient extraction procedure were specificity (that is, the extraction m ethod ideally should
only isolate polypeptides), comprehensiveness (i.e. all polypeptides should be extracted by
this method), and high recovery. The latter was defined as fraction o f polypeptide
recovered as a function o f amount o f polypeptide present in the original samples.
Recovery was an im portant parameter because although urine is available in large volumes,
specimens from patients are sometimes unavailable or scarce. Moreover, it was anticipated
that the method, once optim ised, could be used fo r analysing other biological fluids, such
as tubular flu id obtained during m icropuncture experiments, fo r which the volumes
available are very small.
Urine is a complex m ixture in which peptides are only present at trace levels.
Reversed phase (RP) liqu id chromatography (LC) was firs t used to investigate whether
polypeptides could be separated from other urinary compounds on the basis o f
hydrophobicity. In gradient RP-LC compounds elute firom the column according to their
hydrophobic character, more hydrophobic compounds eluting later. However,
experimental evidence demonstrated that RP, by it self, was not suitable fo r the extraction
o f peptides from urine. Consequently, it was concluded that it is necessary to extract
urinary components p rio r to LC-MS analysis. Several methods have been described fo r the
extraction o f polypeptides from biological fluids [182], including solvent extraction
[183;184], soHd phase extraction (SPE) [185;186], u ltra filtra tion [187;188], precipitation
[161;189], dialysis [190;191], o r a com bination o f these [192;193j. Tw o o f these
approaches, namely precipitation and solvent extraction, were investigated during the
course o f the studies described in this thesis, but they proved to be unsuitable to the
extraction o f small peptides and proteins; precipitation did not separate peptides from
other urinary compounds, while solvent extraction showed low recovery. The use o f
methods that rely on separation o f molecular species by size was not investigated here
because the aim was to be able to analyse small peptides as w ell as proteins.
Finally, ion exchange chromatography, specifically strong cation exchange (SC]Q,
proved to be effective, in com bination w ith RP-LC and MS, to extract, detect and
characterise urinary peptides and small proteins. The approach was firs t used fo r the
62

3. Urinaiy peptide analysis by hC -M SI M S
analysis o f peptides in norm al urine, and was later implemented fo r the characterization o f
peptides and proteins in N orm al and renal Fanconi patient’s urines. The results o f these
experiments are described below in some detail.
3.1.1. Extraction of urinary peptides by reversed phase liquid chromatograply
Experiments aimed to assess the possibility that peptides could be separated ftom
m atrix compounds by reversed phase chromatography showed that many compounds
coeluted w ith standard peptides spiked in urine (Figure 3.1.1). In a representative
experiment, contro l urine was spiked w ith angiotensin (Ang) I to a concentration o f 10
nM. One m icroliter (containing 10 fm o l Ang I) o f this solution was injected in the
chromatographic system described in the legend to Figure 3.1.1. The guard column was
washed w ith 150 p i 0 . 1 % form ic acid so that salts and other hydrophilic compounds were
directed to waste before switching the valve to the ‘in ject’ position. The length and internal
diameter o f the guard column were 1 mm and 300 pm, respectively, and thus its volume
was about 0.07 pi. This means that the guard column was washed w ith a volume o f
acidified water equivalent to more than 2000 times its chromatographic bed volume. The
solvent used fo r washing was diverted to waste. A fte r switching the in jector so that guard
column and analytical column were on-line, a 0.75 % B /m in gradient was applied, which
eluted compounds according to their hydrophobicity in to the ESI-MS. Figure 3.1.1 shows
the results o f one o f the runs. Ang I had a t^ o f 45.5 minutes approximately and many
compounds co-eluted w ith Ang I; this complicated its detection.
I t was evident from these experiments that although most peptides o f interest are
above 1 kDa, the fact that peptides are detected in ESI-MS as m ultip ly charged species
means that their m /z falls w ith in the range o f singly charged m atrix compounds, a fact that
complicates peptide analysis.
The nature o f the m atrix compounds detected in the experiment described in
Figure 3.1.1 is unknown. The presence o f organic acids in urine has been reported
[194;195]. These are small compounds, however, and therefore they may not be the
species that seem to interfere w ith peptide analysis (Figure 3.1.1). The largest organic acid
that could be found in the studies cited is arachidonic acid w ith a M r o f 304 Da [194;195].
63
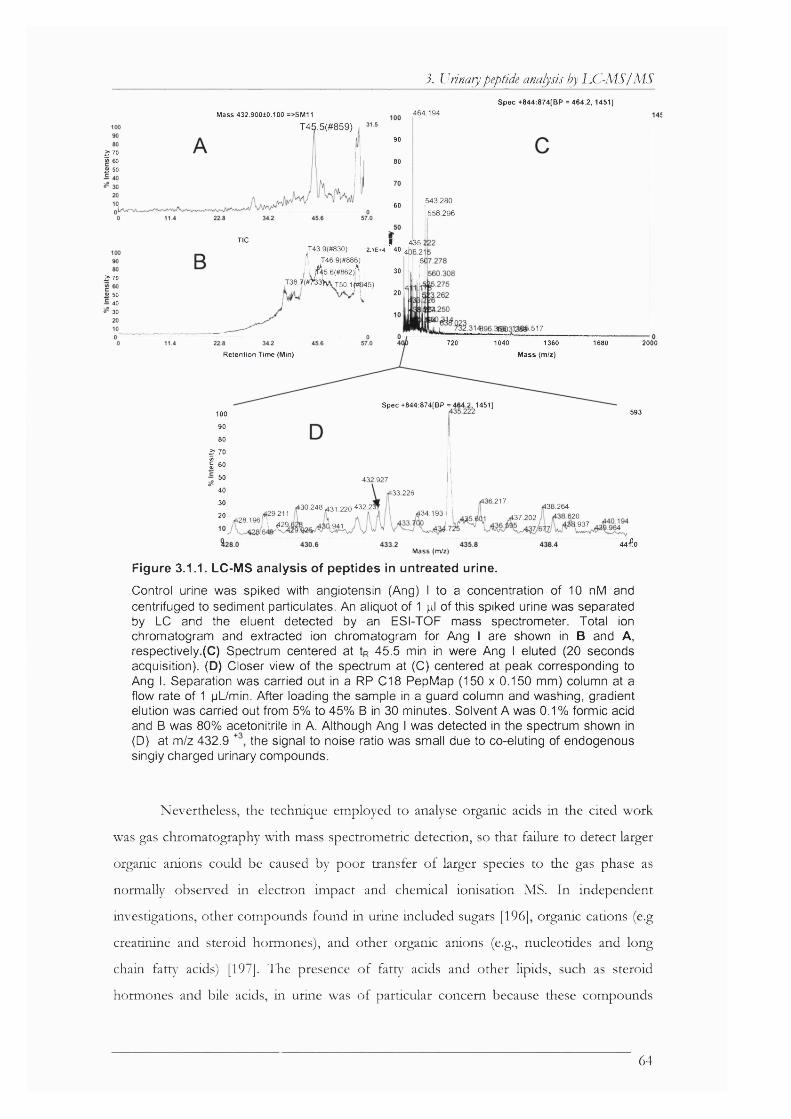
3. Urinary peptide analysis by LC-MS j AiSSp ec + 8 4 4 :874 [B P = 464 .2 , 1451]
Mass 432.900±0,100 =>SM11 464 194
T45.5(#859)90
70 « 60 £ 50
80
543.280
558 29660
TIC ; 435.;T43.9{#830) 2.1E-4 40 ^ g
j\ T46.9(#886) 5
/1 ^5 .6 (# 86 2 )|^ 30 I !T38.y(#TO 3V k T50 1 ^ 4 5 ) l l U
\ 20 II
70£ 50 - 40
30
1517
720 1040 1360
M ass (m /2 )
1680 2000
R etention Tim e (Min)
Spec +844:874[B P = 464.2, 1451]5931 0 0
90
80
I:50 432.92740 133 226
136 21730 138.264130 248 431 220 “ 32 2!129.211
\ 429.1
134 19320 1620137 202i28 196 19371.941
M ass (m /z)
Figure 3.1.1. LC-MS analysis of peptides in untreated urine.
4 4 fo
Control urine was spiked with angiotensin (Ang) I to a concentration of 10 nM and centrifuged to sediment particulates. An aliquot of 1 pi of this spiked urine was separated by LC and the eluent detected by an ESI-TOF mass spectrometer. Total ion chromatogram and extracted ion chromatogram for Ang I are shown in B and A, respectively.(C) Spectrum centered at tp 45.5 min in were Ang I eluted (20 seconds acquisition). (D) Closer view of the spectrum at (C) centered at peak corresponding to Ang I. Separation was carried out in a RP C18 PepMap (150 x 0.150 mm) column at a flow rate of 1 pL/min. After loading the sample in a guard column and washing, gradient elution was carried out from 5% to 45% B in 30 minutes. Solvent A was 0.1% formic acid and B was 80% acetonitrile in A. Although Ang I was detected in the spectrum shown in (D) at m/z 432.9 the signal to noise ratio was small due to co-eluting of endogenous singly charged urinary compounds.
Nevertheless, the technique employed to analyse organic acids in the cited work
was gas chromatography with mass spectrometric detection, so that failure to detect larger
organic anions could be caused by poor transfer o f larger species to the gas phase as
normally obser\ed in electron impact and chemical ionisation MS. In independent
investigations, other compounds found in urine included sugars [196], organic cations (e.g
creatinine and steroid hormones), and other organic anions (e.g., nucleotides and long
chain fatt\' acids) [197]. The presence o f fatt\- acids and other lipids, such as steroid
hormones and bile acids, in urine was o f particular concern because these compounds
64

3. Urinary peptide analysis by UC-MSI M S
have been described as “ column killers” [105]. Consequendy, it was decided that an
extraction procedure p rio r to RP-LC/M S was necessary in order to separate peptides from
urinary m atrix compounds.
3.1.2. Extraction of urinary peptides by organic solvent precipitation
Precipitation o f proteins in organic solvents, such as ethanol, chloroform and
acetone, salts, o r in acids, e.g., trichloroacetic acid, is a common procedure employed in
protein chemistry fo r the separation o f proteins ftom other compounds such as salts and
detergents. This separation method is based in the fact that proteins denature in these
solvents such that the ir hydrophobic amino acid residues, which in aqueous environments
face the in terio r o f the protein, became exposed. Interaction o f the hydrophobic chains by
van der Waals forces between these residues is thought to occur w ith the end result o f
aggregation, and consequently, precipitation [198;199j. A fte r centrifugation, un
precipitated material remains in the supernatant, which is aspirated and discarded.
Experiments aimed at assessing the usefulness o f this method fo r the separation o f
small peptides revealed that other compounds co-precipitate w ith peptides such that
although precipitation w ith organic solvents or dyes has been used fo r the extraction o f
proteins from urine p rio r to proteom ic studies [161;189;200], this method may not be
suitable fo r the isolation o f small peptides before LC-MS analyses.
3.1.3. Extraction of urinary peptides by solvent-solvent extraction
Solvent-solvent extraction has been used to extract organic anions from utine
[183;184] and it has been used fo r the extraction o f peptides from tissues [184]. In this
procedure organic acids were extracted w ith a 1:1 etheriethyl acetate solution. By acidifying
utine p rio r to extraction the ionisable groups are protonated and thus solubility o f organic
anions in the organic layer increases.
A variation o f this procedure was used in the experiments described in this thesis
to extract organic anions in to the organic layer, which was then discarded. Peptides in the
aqueous layer were subsequently precipitated. This step was introduced because it was
observed that the aqueous layer contained pigments, which interfered w ith peptide
analysis.
65
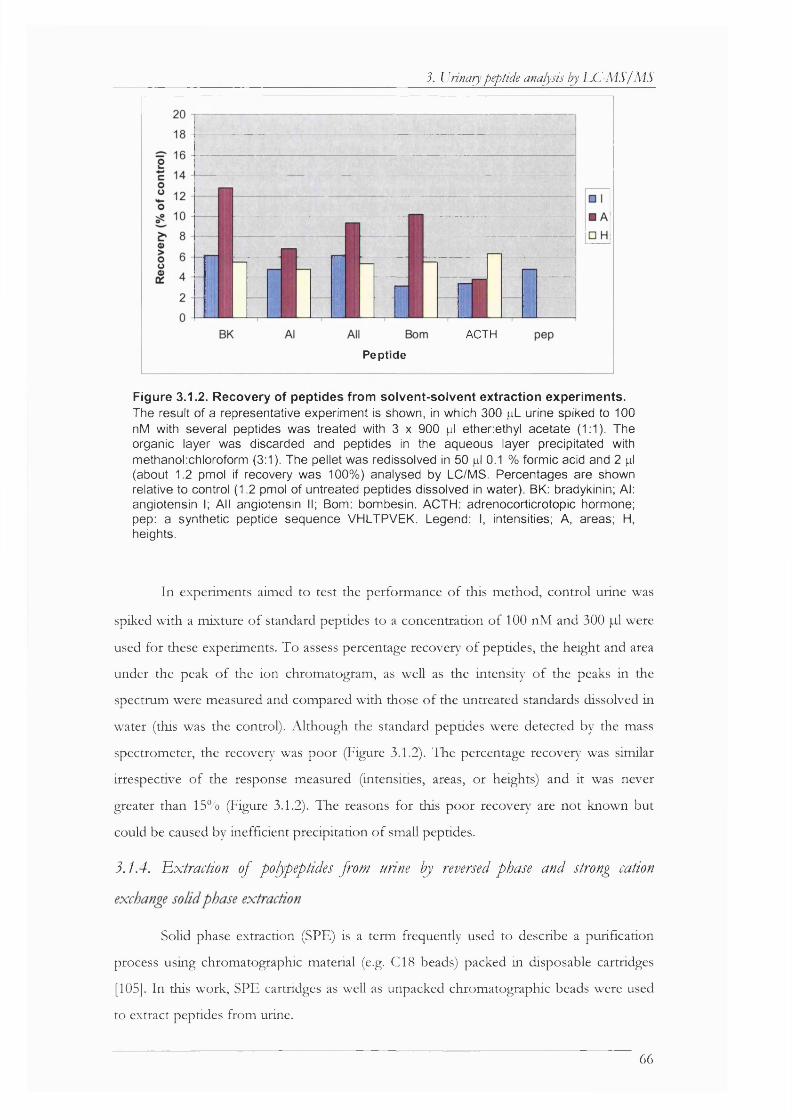
3. Urinary peptide analysis by UC-MS/ MS
ACTH
Peptide
Figure 3.1.2. Recovery of peptides from solvent-solvent extraction experiments.The result of a representative experiment is shown, in which 300 pL urine spiked to 100 nM with several peptides was treated with 3 x 900 pi ether:ethyl acetate (1:1). The organic layer was discarded and peptides in the aqueous layer precipitated with methanohchloroform (3:1). The pellet was redissolved in 50 pi 0.1 % formic acid and 2 pi (about 1.2 pmol if recovery was 100%) analysed by LC/MS. Percentages are shown relative to control (1.2 pmol of untreated peptides dissolved in water). BK: bradykinin; Al: angiotensin I; All angiotensin II; Bom: bombesin. ACTH: adrenocorticrotopic hormone; pep: a synthetic peptide sequence VHLTPVEK. Legend: I, intensities; A, areas; H, heights.
In experiments aimed to test the performance o f this method, control urine was
spiked w ith a m ixture o f standard peptides to a concentration o f 100 nM and 300 p i were
used for these experiments. To assess percentage recovery o f peptides, the height and area
under the peak o f the ion chromatogram, as weU as the intensity^ o f the peaks in the
spectrum were measured and compared w ith those o f the untreated standards dissolved in
water (this was the control). A lthough the standard peptides were detected by the mass
spectrometer, the recover}^ was poor (Figure 3.1.2). The percentage recoveiy^ was similar
irrespective o f the response measured (intensities, areas, or heights) and it was never
greater than 15% (Figure 3.1.2). The reasons fo r this poor recovery^ are not known but
could be caused by inefficient precipitation o f small peptides.
3.1.4. Extraction of polypeptides from urine by reversed phase and strong cation
SoHd phase extraction (SPE) is a term frequendy used to describe a purification
process using chromatographic material (e.g. CIS beads) packed in disposable cartridges
[105]. In this work, SPE cartridges as well as unpacked chromatographic beads were used
to extract peptides from urine.
66
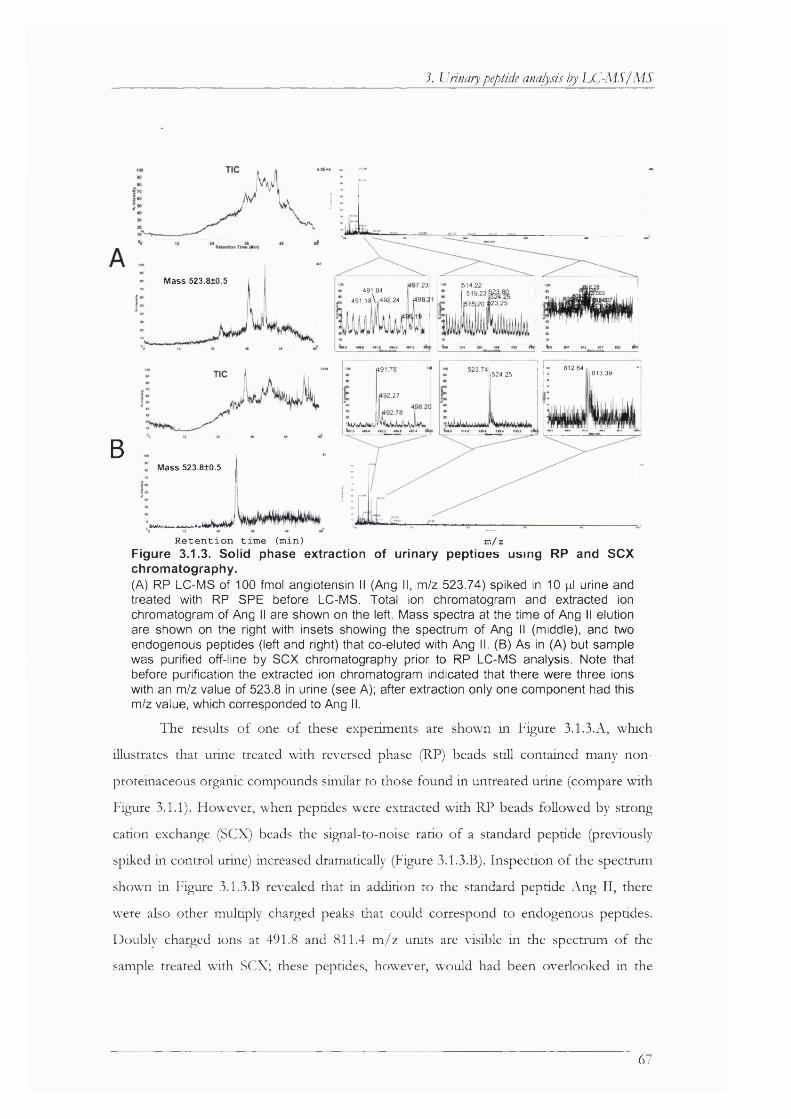
3. Urinary peptide analysis by LC-MS I MS
Mass 523.8+0.5
B. Mass 523.810.5
Jkwjk, .«wAwW'
R e t e n t i o n t i m e ( m i n )
97.23 514 22 519.23623491.84
4 9 1 .18 \i492 24 i 1498 20 «23.25
812.84491.78 523.74 813.39524.25
92.27
'V/*/UAi>v
m / z
Figure 3.1.3. Solid phase extraction of urinary peptioes using RP and SCX chromatography.(A) RP LC-MS of 100 fmol angiotensin II (Ang II, m/z 523.74) spiked in 10 pi urine and treated with RP SPE before LC-MS. Total ion chromatogram and extracted ion chromatogram of Ang II are shown on the left. Mass spectra at the time of Ang II elution are shown on the right with insets showing the spectrum of Ang II (middle), and two endogenous peptides (left and right) that co-eluted with Ang II. (B) As in (A) but sample was purified off-line by SCX chromatography prior to RP LC-MS analysis. Note that before purification the extracted ion chromatogram indicated that there were three ions with an m/z value of 523.8 in urine (see A); after extraction only one component had this m/z value, which corresponded to Ang II.
The results o f one o f these experiments are shown in Figure 3.1.3.A , which
illustrates that urine treated w ith reversed phase (RP) beads still contained many non-
proteinaceous organic compounds similar to those found in untreated urine (compare w ith
Figure 3.1.1). However, when peptides were extracted w ith RP beads followed by strong
cation exchange (SCX) beads the signal-to-noise ratio o f a standard peptide (previously
spiked in control urine) increased dramatically (Figure 3.1.3.B). Inspection o f the spectrum
shown in Figure 3.1.3.B revealed that in addition to the standard peptide Ang II, there
were also other m ultiply charged peaks that could correspond to endogenous peptides.
Doubly charged ions at 491.8 and 811.4 m /z units are visible in the spectrum o f the
sample treated w ith SCX; these peptides, however, would had been overlooked in the
67
3. Urinary peptide analysis by LC-M S I M S
sample treated w ith RP beads only. Later experiments demonstrated that the ion at 491,8
m / 2 units is an uromoduHn fragment.
These studies demonstrated that SCX chromatography provides a means to
separate peptides from neutral and acidic urinary compounds. Peptides are zw itterionic
molecular species but by lowering the pH to 3 most, i f no t aU, peptides are positively
charged. Therefore, they can be retained by the SCX beads w ith sulfonic acid functionality
(which is negatively charged at any pH). A fte r washing these beads w ith a low ionic
strength buffe r to remove acidic and neutral compounds, peptides are eluted w ith a high
ion ic strength buffer, which disrupts the ion ic interactions between the opposite charges
on the SCX beads and peptides. This procedure thus separates polypeptides from neutral
and acidic urinary compounds.
3.1.5. Manufacture of microcapillary liquid chromatographic columns
The efficiency o f the extraction procedure should increase i f carried out in packed
columns. For this reason it was decided to pack chromatographic columns in silica and
P E E K capillaries using commercially available packing materials. The concept o f packing
microcapiUary columns is straightforward; a capillary tube is ftitte d (i.e. plugged) at one end
and the packing material w ith the desired functionality is inserted from the other end at
high pressure [119]. However, there are several technical d ifficulties associated w ith
packing columns.
One o f them is ftitting . Several reports exist describing frittin g o f capillaries by
sintering methods [201], restrictors and tapers [202;203], porous filters [117;170;171],
porous ceramic plugs [172], and unions containing stainless steel screens [173].
McCormack et al reported the use o f Teflon filters to fr it capillary columns [171].
However, Davis et al claimed that hydrophilic PVD F filters have less a ffin ity fo r peptides
than Teflon so that columns constructed w ith these frits are less likely to cause losses o f
analyte by absorption to the filte r [117]. The manufacturer also reports that hydrophilic
PVD F binds less protein than Teflon [204] (this company sells both Teflon and PVD F
filters). Therefore, a hydrophilic PVD F filte r (0.65 pm pore diameter) was in itia lly used fo r
the w ork described in this report.
68
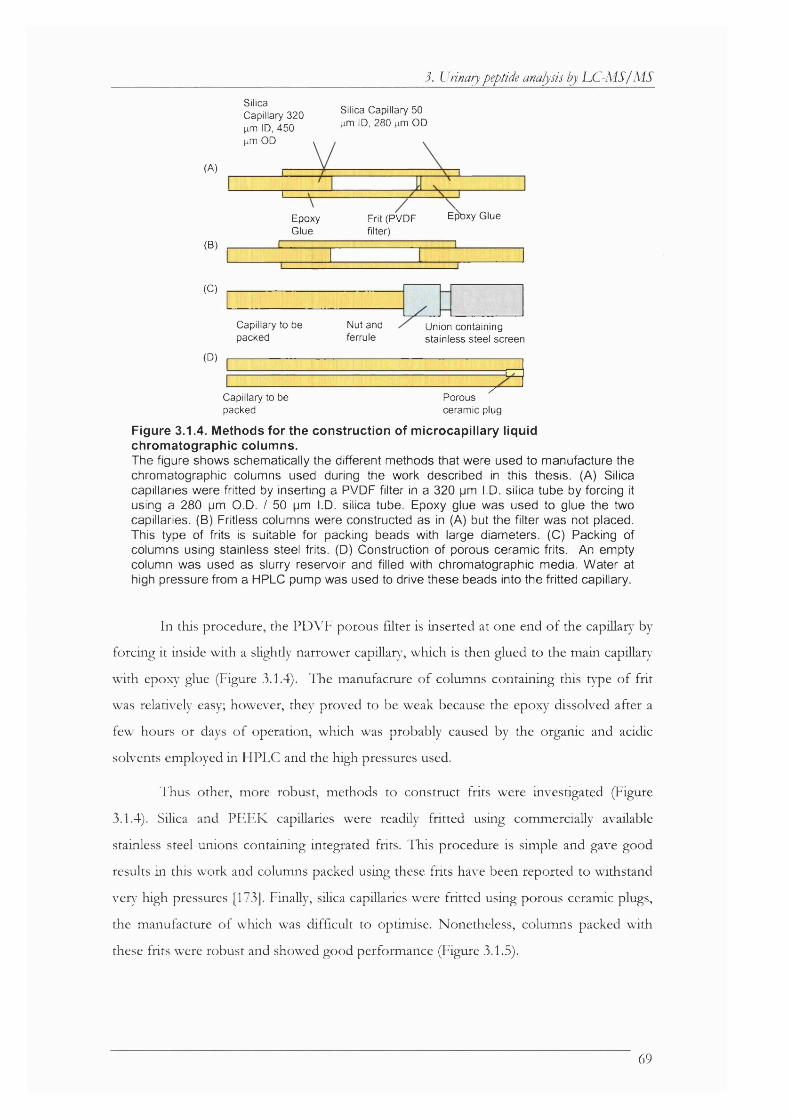
3. Urina/y peptide analysis by LC-A4S/MS
SilicaCapillary 320 pm ID, 450 pm OD
Silica Capillary 50 pm ID, 280 pm OD
(A)
EpoxyGlue
Frit (PVDF filter)
E ^x y Glue
(B)
(C)
(D)
Capillary to be Nut and Union containingpacked ferrule stainless steel screen
Capillary to be packed
—---------ZPorousceramic plug
Figure 3.1.4. Methods for the construction of microcapillary liquid chromatographic columns.The figure shows schematically the different methods that were used to manufacture the chromatographic columns used during the work described in this thesis. (A) Silica capillaries were fritted by inserting a PVDF filter in a 320 pm I.D. silica tube by forcing it using a 280 pm O.D. / 50 pm I.D. silica tube. Epoxy glue was used to glue the two capillaries. (B) Fritless columns were constructed as in (A) but the filter was not placed. This type of frits is suitable for packing beads with large diameters. (C) Packing of columns using stainless steel frits. (D) Construction of porous ceramic frits. An empty column was used as slurry reservoir and filled with chromatographic media. Water at high pressure from a HPLC pump was used to drive these beads into the fritted capillary.
In this procedure, the PDVF porous filte r is inserted at one end o f the capülar\' by
forcing it inside w ith a slightly narrower capillar}', which is then glued to the main capillar}^
w ith epox} glue (Figure 3.1.4). The manufacture o f columns containing this type o f fr it
was relatively easy; however, they proved to be weak because the epoxy dissolved after a
few hours or days o f operation, which was probably caused by the organic and acidic
solvents employed in HPLC and the high pressures used.
Thus other, more robust, methods to construct frits were investigated (Figure
3.1.4). Silica and PEEK capillaries were readily fritted using commercially available
stainless steel unions containing integrated frits. This procedure is simple and gave good
results in this work and columns packed using these frits have been reported to withstand
very high pressures [173]. Finally, süica capillaries were fritted using porous ceramic plugs,
the manufacture o f which was d ifficu lt to optirnise. Nonetheless, columns packed w ith
these frits were robust and showed good performance (Figure 3.1.5).
69
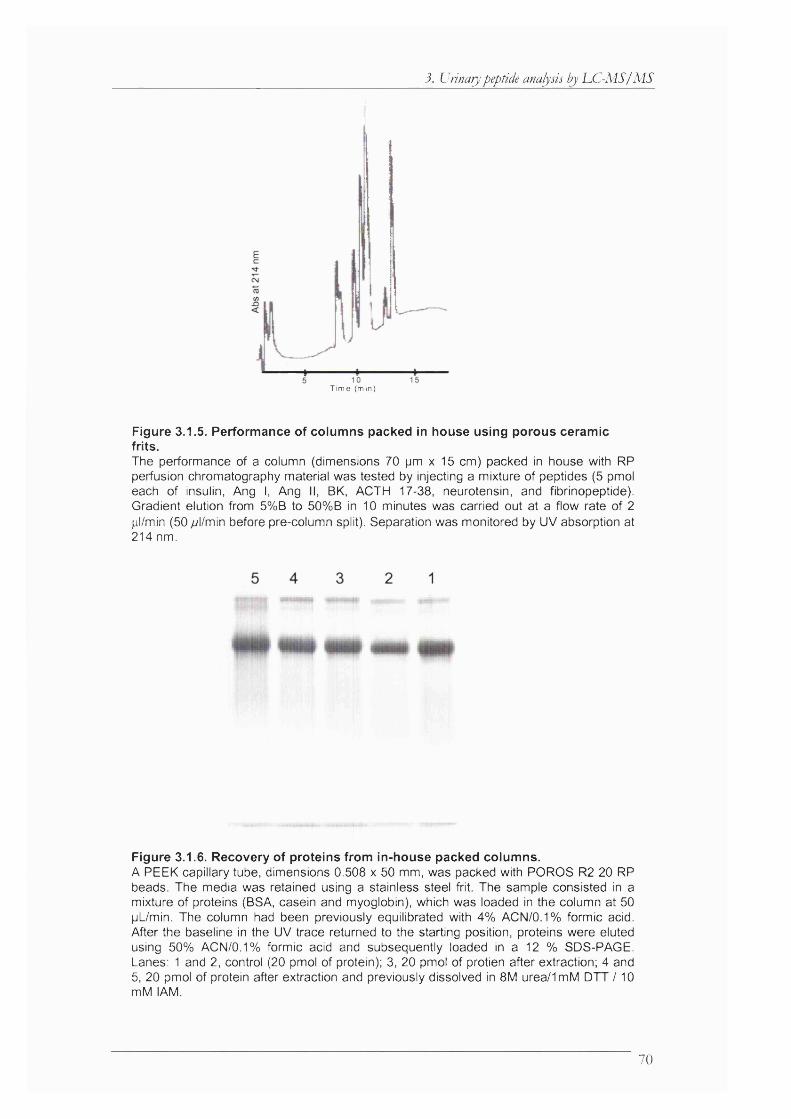
3. Urinary peptide analysis by UC-MS/MS
T i m e ( mi n)
Figure 3.1.5. Performance of columns packed In house using porous ceramic frits.The performance of a column ((dimensions 70 pm x 15 cm) packed in house with RP perfusion chromatography material was tested by injecting a mixture of peptides (5 pmol each of insulin, Ang I, Ang II, BK, ACTH 17-38, neurotensin, and fibrinopeptide). Gradient elution from 5%B to 50%B in 10 minutes was carried out at a flow rate of 2 pl/min (50 /vl/min before pre-column split). Separation was monitored by UV absorption at 214 nm.
Figure 3.1.6. Recovery of proteins from in-house packed columns.A PEEK capillary tube, dimensions 0.508 x 50 mm, was packed with POROS R2 20 RP beads. The media was retained using a stainless steel frit. The sample consisted in a mixture of proteins (BSA, casein and myoglobin), which was loaded in the column at 50 pL/min. The column had been previously equilibrated with 4% ACN/0.1% formic acid. After the baseline in the UV trace returned to the starting position, proteins were eluted using 50% ACN/0.1% formic acid and subsequently loaded in a 12 % SDS-PAGE. Lanes: 1 and 2, control (20 pmol of protein); 3, 20 pmol of protien after extraction; 4 and 5, 20 pmol of protein after extraction and previously dissolved in 8 M urea/1 mM DTT /10 mM I AM.
70
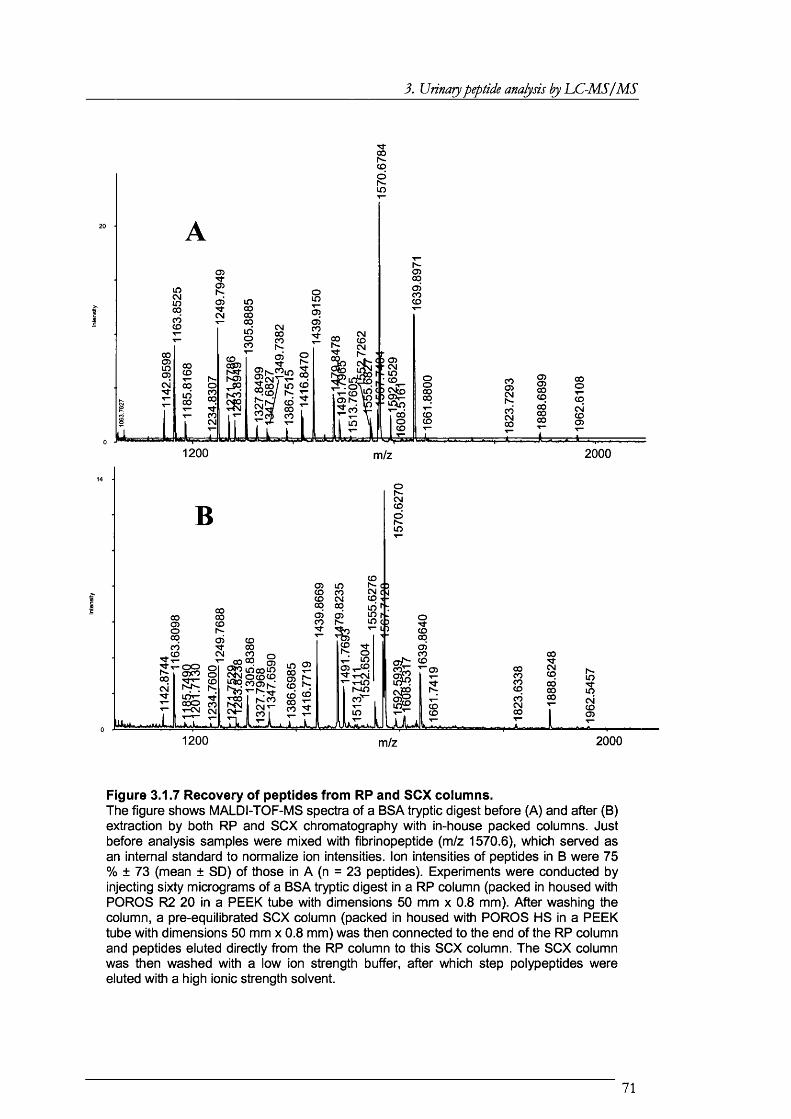
3. Urinary peptide analysis by UC-M S/M S
ICO
8
iIO)I
sÎ
00
gG)
98 O)
II
o 00CO00
gCOoo
gCD
ICD0 0CO I
1200 2000m/z
8
§
C3> ID CD CO CD CM OO 00
8 SI
§CD
00
IS A 5
ilifIi
0 0i§
C35O
1200 2000m/z
Figure 3.1.7 Recovery of peptides from RP and SCX columns.The figure shows MALDI-TOF-MS spectra of a BSA tryptic digest before (A) and after (B) extraction by both RP and SCX chromatography with in-house packed columns. Just before analysis samples were mixed with fibrinopeptide (m/z 1570.6), which served as an internal standard to normalize ion intensities. Ion intensities of peptides in B were 75 % ± 73 (mean ± SD) of those in A (n = 23 peptides). Experiments were conducted by injecting sixty micrograms of a BSA tryptic digest in a RP column (packed in housed with POROS R2 20 in a PEEK tube with dimensions 50 mm x 0.8 mm). After washing the column, a pre-equilibrated SCX column (packed in housed with POROS HS in a PEEK tube with dimensions 50 mm x 0.8 mm) was then connected to the end of the RP column and peptides eluted directly from the RP column to this SCX column. The SCX column was then washed with a low ion strength buffer, after which step polypeptides were eluted with a high ionic strength solvent.
71
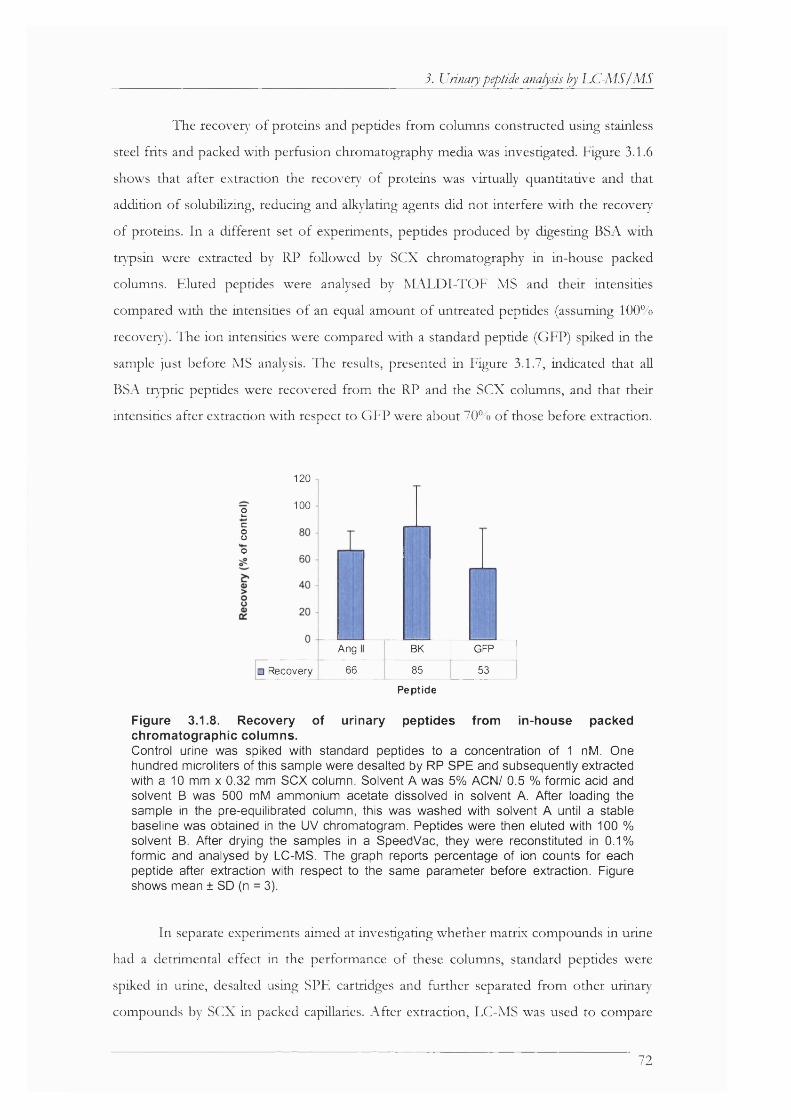
3. Urinary peptide analysis by LC-M S/M S
The recovety o f proteins and peptides from columns constructed using stainless
steel frits and packed w ith perfusion chromatography media was investigated. Figure 3.1.6
shows that after extraction the recovery o f proteins was virtually quantitative and that
addition o f solubüixing, reducing and alkylating agents did not interfere w ith the recovery
o f proteins. In a different set o f experiments, peptides produced by digesting BSA w ith
tr)q3 sin were extracted by RP followed by SCX chromatography in in-house packed
columns. Eluted peptides were analysed by M A LD I-T O F MS and their intensities
compared w ith the intensities o f an equal amount o f untreated peptides (assuming 1 0 0 %
recovery). The ion intensities were compared w ith a standard peptide (GFP) spiked in the
sample just before MS analysis. The results, presented in Figure 3.1.7, indicated that all
BSA tn ^ tic peptides were recovered from the RP and the SCX columns, and that their
intensities after extraction w ith respect to GFP were about 70% o f those before extraction.
1 2 0
1 0 02c8o
Ang BK GFP
66 85 53□ Recovery
Re ptide
Figure 3.1.8. Recovery of urinary peptides from in-house packed chromatographic columns.Control urine was spiked with standard peptides to a concentration of 1 nM. One hundred microliters of this sample were desalted by RP SPE and subsequently extracted with a 10 mm x 0.32 mm SCX column. Solvent A was 5% ACN/ 0.5 % formic acid and solvent B was 500 mM ammonium acetate dissolved in solvent A. After loading the sample in the pre-equilibrated column, this was washed with solvent A until a stable baseline was obtained in the UV chromatogram. Peptides were then eluted with 100 % solvent B. After drying the samples in a SpeedVac, they were reconstituted in 0.1% formic and analysed by LC-MS. The graph reports percentage of ion counts for each peptide after extraction with respect to the same parameter before extraction. Figure shows mean ± SD (n = 3).
In separate experiments aimed at investigating whether matrix compounds in urine
had a detrimental effect in the performance o f these columns, standard peptides were
spiked in urine, desalted using SPE cartridges and further separated from other urinan-
compounds by SCX in packed capillaries. A fte r extraction, LC-MS was used to compare
72

3. Urinary peptide analysis by LC-M S/M S
ion intensities o f the peptides before and after extraction. Figure 3.1.8 shows that after
extraction, extracted peptides produced between 50 and 80 % o f the contro l peptide
intensities.
3.1.6. Column smtching liquid chromatography fo r the extraction and analysis of
urinary peptides
Having found in the experiments thus far described that SCX chromatography is
an effective method fo r the separation o f peptides from other compounds in utine, the
peptide content o f utine from renal Fanconi syndrome patients and contro l subjects was
investigated. A suitable w orkflow fo r the extraction and analysis o f urinary peptides would
be to extract peptides from urine by SCX, after which the eluted peptides would be in a
form amenable to RP LC-MS analysis.
The aim o f the experiments described in this section was to assemble a system that
would allow fo r high recoveries o f peptides while m aintaining specificity. Sample losses
commonly occur, among other reasons, as a result o f transfer o f liqu id between mbes and
in the walls o f pipette tips because it is virtua lly impossible to collect and dispense the
entire liqu id sample firom vessel to vessel. In order to overcome this problem , column
switching techniques have been developed [105], in which the eluent from one column is
transferred directly to another column using a system o f valves such that sample losses on
the walls o f vessels are obviated. Once the sample is injected in the system no further
operator handling o f the analyte is required. Several reports exist on the use o f column
switching methods fo r the extraction o f peptides [205-207] and other molecules [208]
from biological fluids before their mass spectrometric analysis. Recently, colum n switching
methods have also been used fo r the two-dimensional separation o f peptides in proteom ic
studies [209].
In a study aimed at assessing the feasibility o f colum n-switching LC-MS fo r the
analysis o f urinary peptides, a system was assembled that consisted o f three columns (a
short SCX, a short RP peptide trap column, and a “ nano-flow” analytical column)
connected via two HPLC injectors. Two HPLC pumps served the m obile phase to the
SCX and to the RP analytical column independently. Figure 3.1.9 shows a scheme fo r the
operation o f this system and experiments aimed at identifying the sensitivity that could be
achieved by it demonstrated that low femtomole amounts o f standard peptides spiked in
urine could be detected using this system Figure 3.1.10.
73

3. Urinary peptide analysis by LC-MS I M S
In order to assess the suitabilit}' o f this system for the analysis o f peptides in urine,
peptides in urine samples from three forms o f the renal Fanconi syndrome and control
subjects were analysed. Plasma samples were also analysed for comparison. It was found
that numerous small peptides were present in these specimens when only 5 pi o f sample
was used. Representative elution profiles are displayed in Figure 3.1.11 and the identities o f
the peptides identified are shown in Table 3.1.1.
Pump 1. Isocratic
Pump 2. Gradient of ACN.
(A)
Valveposition:Inject
Valve position: Inject /
Column 2.
■4)1 ^ ES l-M S/M S
Column 3.Column 1.VSample Loop
Waste
Valveposition:Inject
Valve
(B) \
position:Load
.... ESl-M S/M S
yWaste
Valveposition:Inject
(C) \
Valveposition:Inject
Waste
ESI-M S/M S
Fjgure 3.1.9. Operatjon of the Column-swjtchjng.(A) The sample is loaded on column 1 (SCX), which is then washed with low ionic strength buffer from pump 1 (broken line). Neutral and acidic compounds are diverted to waste. (B) A high ionic strength solvent from pump 1 is used to elute peptides bound to column 1 directly to a reversed phase peptide trap column (column 2 ) placed at the sample loop of a second injector. Peptides are trapped to this second column, which is then washed to remove salts. (C) A gradient of acetonitrile (solid line) elutes peptides from column 2 to the analytical column 3 (018 RP), which then separates peptides according to their hydrophobicity. Detection and characterization of eluting peptides was carried out on-line by ESI-Q-Tof MS using a QSTAR instrument.
74

3. Urinary peptide analysis by LC-M S/AIS
2
1
1
5 00
0 201 0
100
50
tim e (m in )
10 20 time (mln)
6 -
4 -
2 1
0 4--- ^0
a 100 -1oâ 50
I 0
30
l i ■ J , 1 J jlii200
a / :
50 250
Y,2
450 650 850
Figure 3.1.10. Sensitivity of the column switching LC-ESI-MS/MS method.(Top Panel) Selected ion monitoring of m/z 558.3 at 1 fmol level. Urine was spiked with neurotensin (Mr 1671.9) to a concentration of 1 nM. One microliter of this solution was mixed with a low ionic strength solution and analysed with the column-switching LC- MS/MS system. 01 was set up to transmit m/z 558.3 only and the ion current at this m/z value is shown on the left.(Bottom Panel) Data dependent acquisition (DDA) Experiment at 10 fmol level.Urine was spiked with several peptides to a concentration of 10 nM each. One microliter of this solution was analysed using full mass range (300 to 2000 m/z) in the first quadrupole and DDA. In this mode of mass spectrometry, ions are selected for MS/MS only when the ion has a previously determined intensity in the MS scan. All peptides were observed at 10 fmol level and the figure shows the spectrum of neurotensin as an example. The arrow points to the time where neurotensin eluted.
A ll o f the peptides identified are protein fragments probably derived from
degradation by proteases. Most protein fragments identified in urine were also identified in
plasma, which suggest that these fragments originated in plasma and were subsequently
filtered in the kidney, although the contribution o f kidney peptidases and proteases to this
degradation cannot be excluded.
An exception is uromodulin, which was found present in all urine samples but was
not detected in plasma because this is a protein o f renal origin. I t was also found that
certain peptide hormones, namely IG F -II, angiotensinogen, and kaUidin II, were detected
in some FS patients but not detected in normal urine or plasma. Another potentially
bioactive peptide, pigment epithelium-derived factor, was found in plasma and a FS patient
but was not found in normal urine. The potential significance o f these results w ill be
discussed in the next section o f this chapter.
75
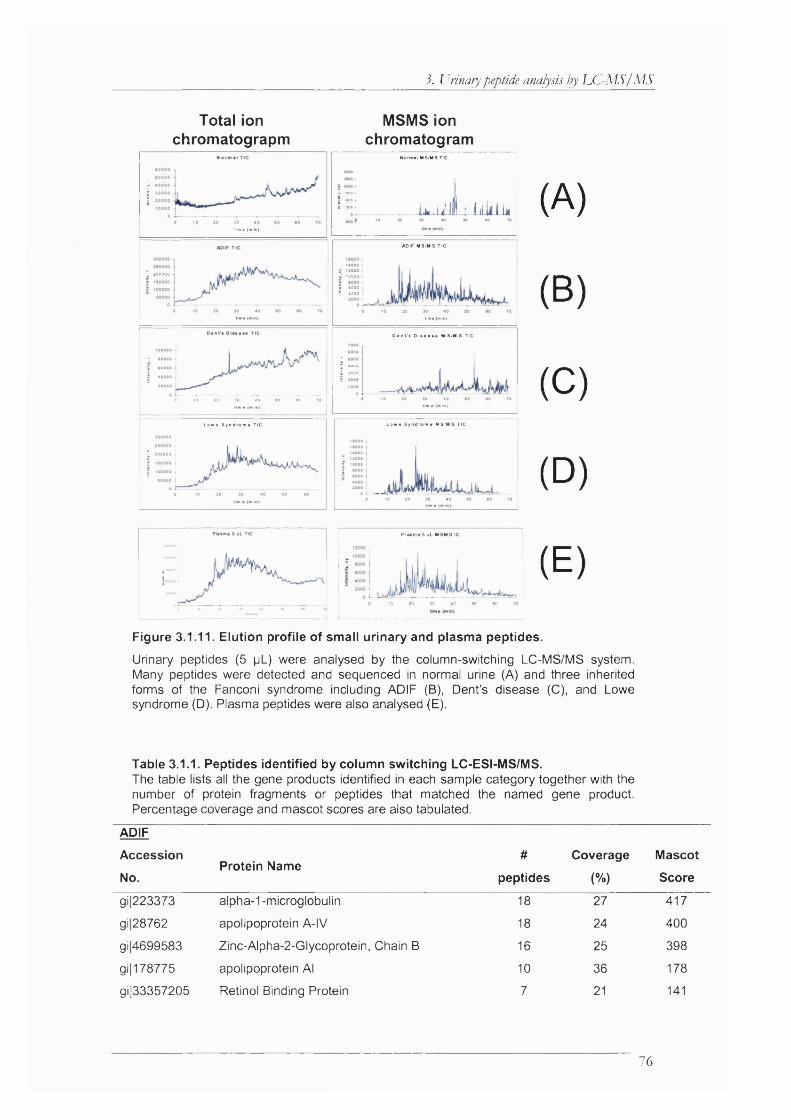
3. Urinary peptide analysis by LC-MS/ MS
Total ion chromatograpm
MSMS ion chromatogram
Î 7
Normal MS/MS TIC
U .iill A iilÜI W1 . 1 . N
^ 200000 £ 10000 11 Zl
ADIF MS/MS TIC
tlm.(mln)
i;::
D an t's D im # *** M S/M S TIC
0 .0 30 30 40 SO 60 Ï0
200000
Low « S yndrom * TIC Low * S yndrom * MS/MS TIC
r
Plasma 5 uL MSMS 1C
(A)
(B)
(C)
(D)
(E)10 20 30 40 SO 60
Figure 3.1.11. Elution profile of small urinary and plasma peptides.
Urinary peptides (5 pL) were analysed by the column-switching LC-MS/MS system. Many peptides were detected and sequenced in normal urine (A) and three inherited forms of the Fanconi syndrome including ADIF (B), Dent’s disease (C), and Lowe syndrome (D). Plasma peptides were also analysed (E).
Table 3.1.1. Peptides identified by column switching LC-ESI-MS/MS.The table lists all the gene products identified in each sample category together with the number of protein fragments or peptides that matched the named gene product. Percentage coverage and mascot scores are also tabulated.
ADIF
Accession
No.Protein Name
#
peptides
Coverage
(%)
Mascot
Score
gi|223373 alpha-1-microglobulin 18 27 417
gi|28762 apolipoprotein A-IV 18 24 400
gi14699583 Zinc-Alpha-2-Glycoprotein, Chain B 16 25 398
gi|178775 apolipoprotein AI 10 36 178
gi|33357205 Retinol Binding Protein 7 21 141
76

3. Urinary peptide analysis by LC-MS I M S
gi|23243412 Uromodulin, Tamm-Horsfail glycoprotein 4 2 141
gi|1195503 beta 2 -microglobulin 13 39 140
gi|7770227 alpha2-HS glycoprotein 5 8 135
gi|224917 lipoprotein CHI 4 29 118
gi|230651 Transthyretin 7 31 97
gi|32171249 prostaglandin D2 synthase 21kDa (brain) 4 13 94
gi|7427517 heparan sulfate proteoglycan 2 8 2 93
gi|13937967 Similar to semenogelin 1 6 12 85
gi|181387 cystatin 0 3 19 74
gi|27692693 Albumin 5 8 72
gi|532198 Angiotensinogen 3 10 55
gi|17028367 Gelsolin 2 8 54
gi|7245524 Transferrin, Human Serum Chain A, 2 7 38
gi|422816 Pigment epithelium-derived factor 4 13 34
gi|482007 Ig kappa chain - human 2 10 26
Dent’s disease
Accession
No.Protein Name
#
peptides
Coverage
(%)
Mascot
Score
g 12521983 alpha2-HS glycoprotein 6 5 113
g 132171249 prostaglandin D2 synthase 21kDa (brain 3 13 108
g 12914175 Apolipoprotein A-l 4 7 87
g 123243412 Uromodulin,Tamm-Horsfall glycoprotein 3 2 78
g 1223130 fibrinogen betaB 1-118 1 11 71
g 1231241 Alphal-Antitrypsin 4 61 64
g 1563320 apolipoprotein A-IV 2 11 61
g 14699583 Zinc-Alpha-2-Glycoprotein 4 10 46
g 1230651 Transthyretin (Chain A, Prealbumin) 2 30 41
g 17427517 heparan sulfate proteoglycan 2 3 1 37
g 130023 pre-pro-alpha-2 type 1 collagen 2 5 27
g 1224917 lipoprotein CHI 2 29 16
Lowe svndrome
Accession
No.Protein Name
#
peptides
Coverage
(%)
Mascot
Score
gill 78775 Apo-AI (proapolipoprotein) 12 31 221
gi|181387 cystatin C 7 32 199
gi|223373 apha-1 -microglobulin 9 23 182
gl| 17028367 gelsolin 6 20 163
gijl 942682 beta-globin (Human Hemoglobin) 5 26 148
11
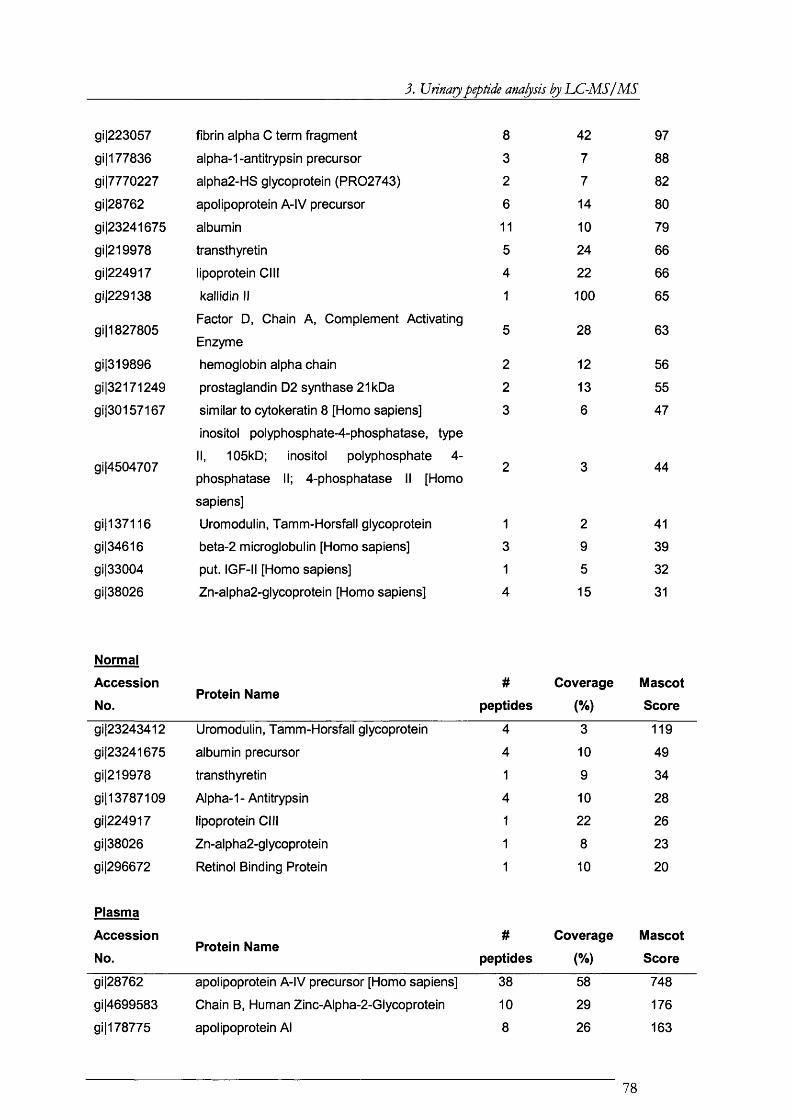
3. Urinary peptide analysis by LC -M S/M S
gi|223057 fibrin alpha C term fragment 8 42 97
gi|177836 alpha-1-antitrypsin precursor 3 7 88
gi|7770227 alpha2-HS glycoprotein (PR02743) 2 7 82
gi|28762 apolipoprotein A-IV precursor 6 14 80
gi|23241675 albumin 11 10 79
gi|219978 transthyretin 5 24 66
gi|224917 lipoprotein CHI 4 22 66
gi|229138 kallidin II 1 100 65
gi11827805Factor D, Chain A, Complement Activating
Enzyme5 28 63
gi|319896 hemoglobin alpha chain 2 12 56
gi|32171249 prostaglandin D2 synthase 21kDa 2 13 55
gi|30157167 similar to cytokeratin 8 [Homo sapiens]
inositol polyphosphate-4-phosphatase, type
3 6 47
gi14504707II, 105kD; inositol polyphosphate 4-
phosphatase II; 4-phosphatase II [Homo
sapiens]
2 3 44
gi|137116 Uromodulin, Tamm-Horsfall glycoprotein 1 2 41
gi|34616 beta-2 microglobulin [Homo sapiens] 3 9 39
gi|33004 put. IGF-II [Homo sapiens] 1 5 32
gi|38026 Zn-alpha2-glycoprotein [Homo sapiens] 4 15 31
Normal
Accession
No.Protein Name
#
peptides
Coverage
(%)
Mascot
Score
gi|23243412 Uromodulin, Tamm-Horsfall glycoprotein 4 3 119
gi|23241675 albumin precursor 4 10 49
gi|219978 transthyretin 1 9 34
gill 3787109 Alpha-1-Antitrypsin 4 10 28
gi|224917 lipoprotein CHI 1 22 26
gi|38026 Zn-alpha2-glycoprotein 1 8 23
gi|296672 Retinol Binding Protein 1 10 20
Plasma
Accession
No.Protein Name
#
peptides
Coverage
(%)
Mascot
Score
gi|28762 apolipoprotein A-IV precursor [Homo sapiens] 38 58 748
gi|4699583 Chain B, Human Zinc-Alpha-2-Glycoprotein 10 29 176
gijl 78775 apolipoprotein AI 8 26 163
78
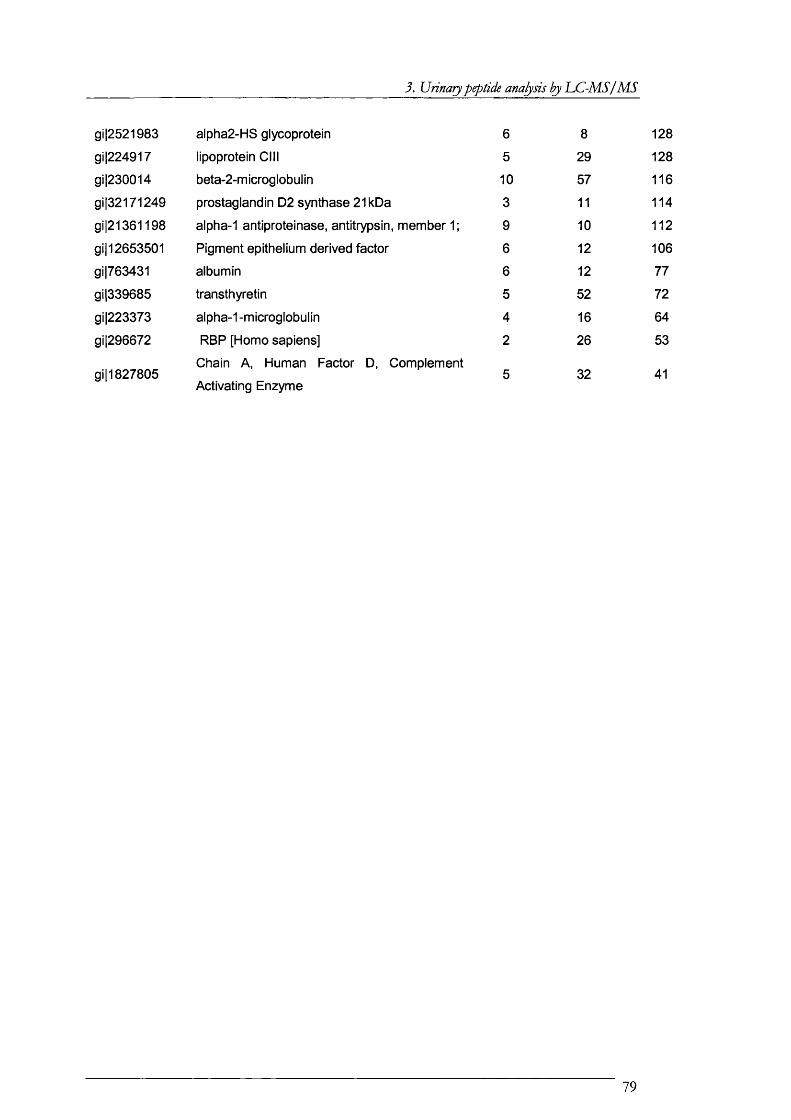
3. Urinary peptide analyâs by IXl-M SI M S
gi|2521983 alpha2-HS glycoprotein 6 8 128
gi|224917 lipoprotein GUI 5 29 128
gi|230014 beta-2 -microglobulin 10 57 116
gi|32171249 prostaglandin D2 synthase 21kDa 3 11 114
gi|21361198 alpha-1 antiproteinase, antitrypsin, member 1; 9 10 112
gi|12653501 Pigment epithelium derived factor 6 12 106
gi|763431 albumin 6 12 77
gi|339685 transthyretin 5 52 72
gi|223373 alpha-1-microglobulin 4 16 64
gi|296672 RBP [Homo sapiens] 2 26 53
gill 827805Chain A, Human Factor D, Complement
Activating Enzyme5 32 41
79

3. Urinary peptide analysis by LC-M S I M S
3.2. Analysis of polypeptides in the urine of renal Fanconi patients
The preceding section demonstrated that peptides can be extracted from urine by
s e x . However, although the column switching set-up described above was useful fo r
characterizing small peptides, larger polypeptides could no t be detected w ith that method
because the fragmentation o f large polypeptides needed fo r the generation o f M S/M S
spectra, and hence sequence inform ation, is ine ffic ien t fo r large peptides. For this reason,
virtua lly aU methods reported in the literature fo r the analysis o f polypeptides by LC-
M S/M S involve digesting the polypeptide m ixture w ith a protease (normally trypsin), after
which the peptide m ixture is separated by LG (or 2D-LC) and the peptides detected and
sequenced by M S/M S [116]. Another lim ita tion was that only small sample volumes could
be loaded in the column switching set-up.
This section describes the results obtained from the analysis o f renal FS and
control urinary peptides using a strategy that involved extraction and separation o f
peptides and smaU proteins by RP SPE followed by SCX LG. Fractions collected from
these LG runs were digested w ith trypsin, and the peptides thus generated were further
separated by RP-LG and analysed on-line by ESI-M S/M S. Three D ent’s disease, one Lowe
syndrome, one A D IF , and three N orm al samples were smdied. These analyses were
standardized to creatinine concentration to compensate fo r the difference in water
excretion between individual samples.
3.2.1. The peptide composition of renal Fanconi and Norm al urines
To generate a pro file o f small and medium size polypeptides isolated from urine o f
renal FS patients, peptides were de-salted by RP SPE and separated from acidic and
neutral compounds by capillary SGX. I t was evident from the experiments presented in the
previous section o f this chapter that the com plexity o f the urinary peptide content o f these
samples was high. Therefore, SGX was also used to separate the polypeptide m ixture
obtained by SPE. Sample pre-treatment in this fashion showed an acceptable recovery o f
small and medium size peptides (about 60 — 80 %, see previous section o f this chapter).
This allowed fo r the selective enrichment o f small polypeptides and proteins.
80
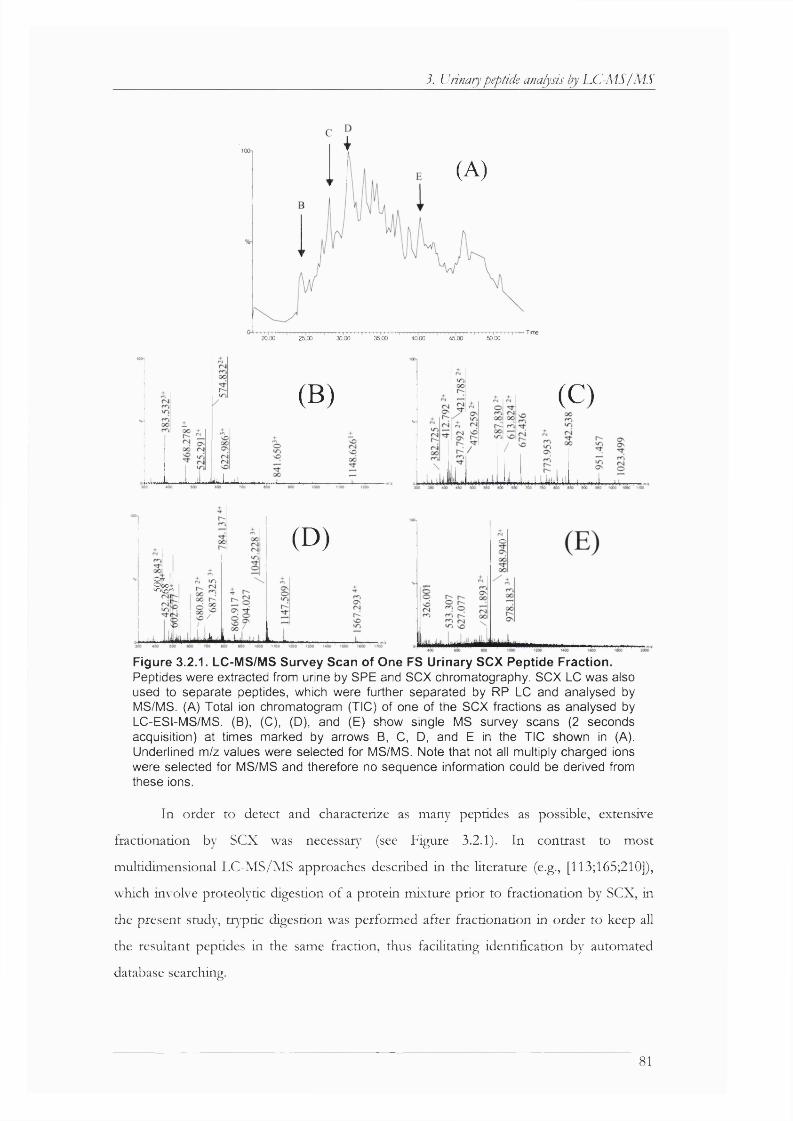
3. Urinary peptide analysis bj LC-MS/ M S
10C>1
(A)
Time20 00 3500 50.0025 00 30 00 40 00 45 00
J a
(B) (C)
m
àU j v
(D) o
Figure 3.2.1. LC-MS/MS Survey Scan of One FS Urinary SCX Peptide Fraction.Peptides were extracted from urine by SPE and SCX chromatography. SCX LC was also used to separate peptides, which were further separated by RP LC and analysed by MS/MS. (A) Total ion chromatogram (TIC) of one of the SCX fractions as analysed by LC-ESI-MS/MS. (B), (C), (D), and (E) show single MS survey scans (2 seconds acquisition) at times marked by arrows B, C, D, and E in the TIC shown in (A). Underlined m/z values were selected for MS/MS. Note that not all multiply charged ions were selected for MS/MS and therefore no sequence information could be derived from these ions.
In order to detect and characterize as many peptides as possible, extensive
fractionation by SCX was necessar\' (see Figure 3.2.1). In contrast to most
multidimensional LC-M S/M S approaches described in the Literature (e.g., [113;165;210]),
which involve proteolytic digestion o f a protein m ixture prio r to fractionation by SCX, in
the present study, trt’p tic digestion was performed after fractionation in order to keep all
the resultant peptides in the same fraction, thus facilitating identification by automated
database searching.
81

3. Urinary peptide analysis by LC-M S/M S
Figure 3,2.1 illustrates the com plexity o f the peptide m ixture fo llow ing trypsin
digestion. Inspection o f TO F-M S spectra collected at any po in t during the
chromatographic run showed that several peptides co eluted at any one time. The Data
Dependent Acquisition capability o f MassLynx^’ allowed fo r the switching from MS to
M S/M S mode when peptides o f a predetermined intensity are detected. Hence, more
abundant ions are selected more readily than low abundant ones, thus abundant species are
more Hkely to be selected. Since ESI norm ally produces m ultip ly charged peptide ions,
parameters were chosen so that only m ultip ly charged ions were selected fo r M S/M S.
Figure 3.2.1 shows four MS scans at four d ifferent time points o f the LC-ESI-M S/M S run
(at 2 seconds/scan). Twenty-six putative peptides were recorded, o f which eighteen were
selected fo r M S/M S. Hence, as a rough estimate, and according to the data presented in
Figure 3.2.1, about 70% o f eluting m ultip ly charged ions were selected fo r Fragmentation.
The m ajority o f polypeptides identified were serum polypeptides (Figure 3.2.2),
which correlated weU w ith published lists o f plasma polypeptides [211;212]. A large
number o f peptides having potential biological activity were also identified in FS patients
(Table 3.2.1), which were absent from the N orm al urine, when the analysis was
standardized to creatinine concentration. Since samples underwent tryptic digestion in
order to create peptides more amenable to tandem mass spectrometry, it is not possible to
assert whether the full-length species were present in the native specimens. However, in
many instances a large percentage o f the polypeptide was sequenced. As an illustration.
Figures 3.2.3 shows that sequence coverage o f 8 8 % was achieved fo r the IG F -II
polypeptide chain, which v irtua lly represents fu ll sequence coverage, considering that
tryptic peptides w ith less than four amino acids are usually not recorded. Examples o f
M S/M S spectra that led to the identification o f selected bioactive peptides is presented in
Appendix I, while Appendix I I lists aU the gene products identified during the course o f
these experiments.
Bradykinin and kallid in I I were also detected as full-length species. These peptides
can be generated by trypsin cleavage o f their common precursor (kinin). However,
nanoLC-M S/M S experiments o f the undigested polypeptide fraction o f FS urine
demonstrated that both bradykinin and kallid in I I are present in these samples before
tryptic digestion. In addition to serum proteins, cellular, extracellular and membrane
associated proteins were also present (see Figure 3.2.2 and Appendix II).
82
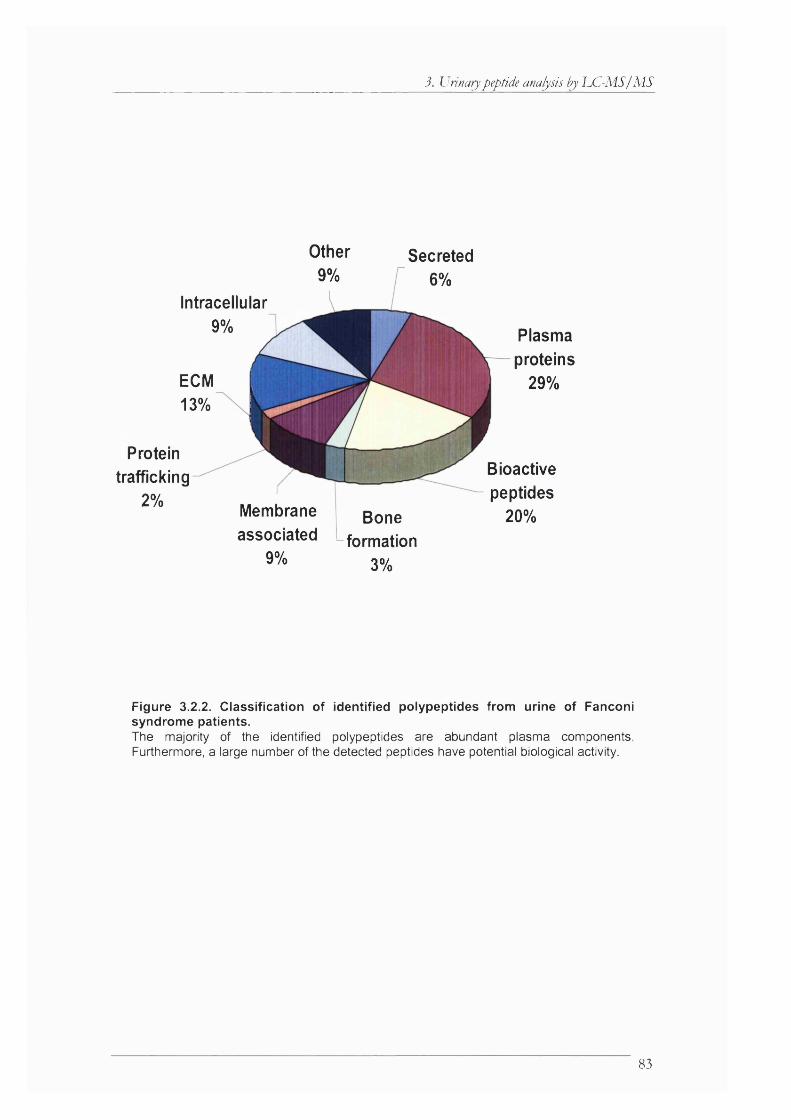
3. Urinary peptide analysis by UC-MS/ M S
Other9%
Secreted6%
Intracellular9%
ECM13%
Proteintrafficking
2% Membraneassociated
9%
Boneformation
3%
Plasmaproteins
29%
Bioactivepeptides
20%
Figure 3.2.2. Classification of identified polypeptides from urine of Fanconi syndrome patients.The majority of the identified polypeptides are abundant plasma components. Furthermore, a large number of the detected peptides have potential biological activity.
83
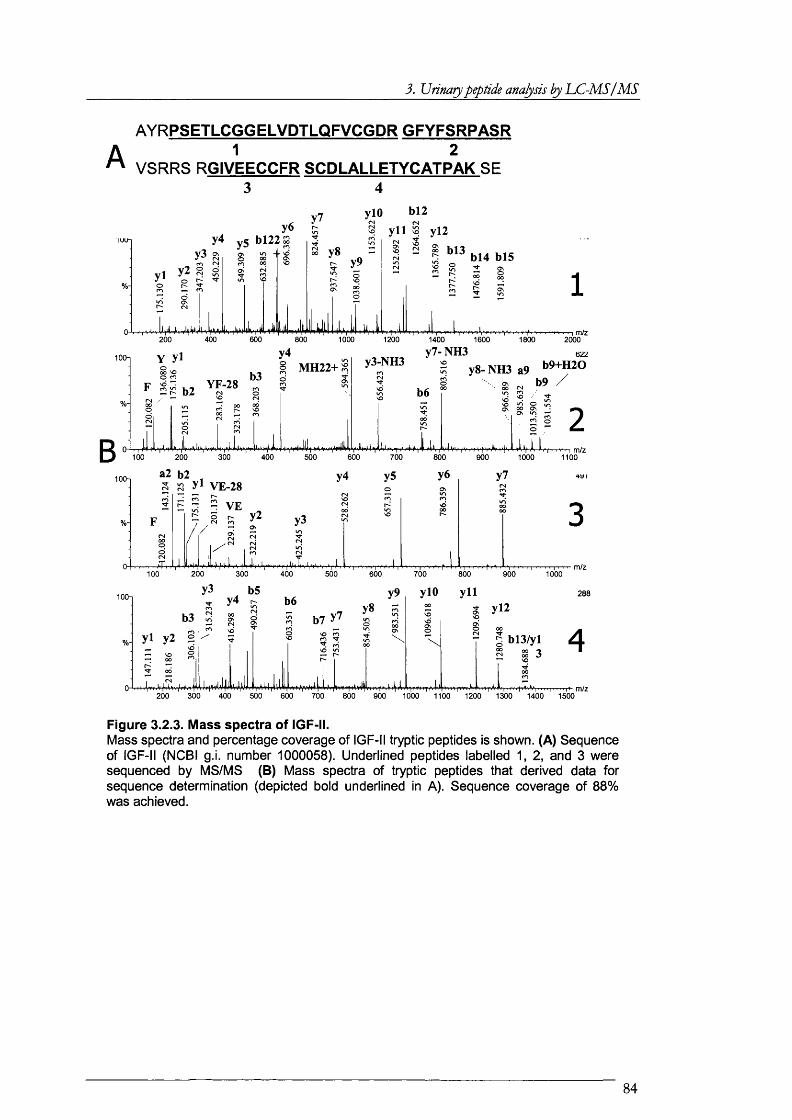
3. Urinary peptide analysis by LC-M S I M S
AAYRPSETLCGGELVDTLQFVCGDRGFYFSRPASR
1 2 VSRRS RGIVEECCFR SCDLALLETYCATPAK SB
bl2
bl4 bl5
1400 1600
y7- NH3y8-NH3 a9 *»9+H20
b9
y3-NH3MH22+YF-28b2
VE-28
ylO y ll 288
900 1000 1100 1200 1300 1400 1500
Figure 3.2.3. Mass spectra of IGF-II.Mass spectra and percentage coverage of IGF-II tryptic peptides is shown. (A) Sequence of IGF-II (NCBI g.i. number 1000058). Underlined peptides labelled 1, 2, and 3 were sequenced by MS/MS (B) Mass spectra of tryptic peptides that derived data for sequence determination (depicted bold underlined in A). Sequence coverage of 88% was achieved.
84
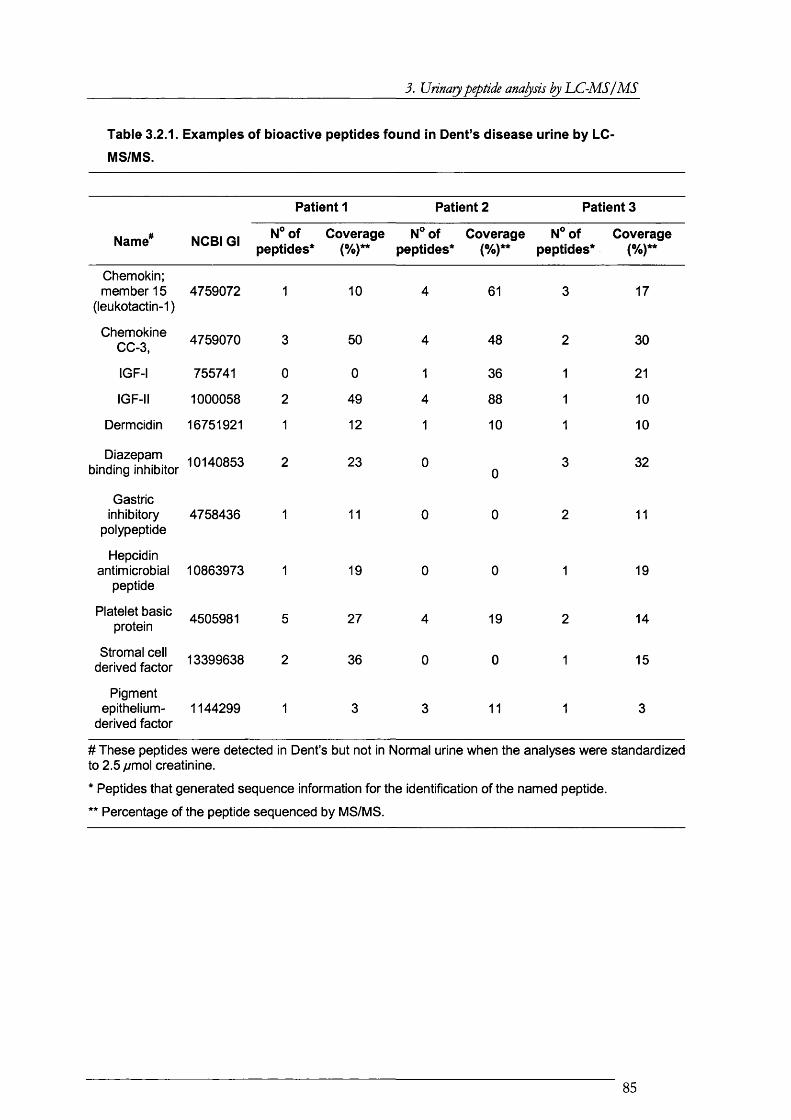
3. Urinary peptide analysis by LC-M S/M S
Table 3.2.1. Examples of bioactive peptides found in Dent's disease urine by LC-
MS/MS.
Patient 1 Patient 2 Patient 3
Name* NCBI GI N° of peptides*
Coverage(%)**
N° of peptides*
Coverage(%)**
N® of peptides*
Coverage(%)**
Chemokin; member 15
(leukotactin-1)4759072 1 10 4 61 3 17
ChemokineCC-3, 4759070 3 50 4 48 2 30
IGF-I 755741 0 0 1 36 1 21
IGF-II 1000058 2 49 4 88 1 10
Dermcidin 16751921 1 12 1 10 1 10
Diazepam binding inhibitor 10140853 2 23 0
03 32
Gastricinhibitory
polypeptide4758436 1 11 0 0 2 11
Hepcidinantimicrobial
peptide10863973 1 19 0 0 1 19
Platelet basic protein 4505981 5 27 4 19 2 14
Stromal cell derived factor 13399638 2 36 0 0 1 15
Pigment epithelium-
derived factor1144299 1 3 3 11 1 3
# These peptides were detected in Dent’s but not in Normal urine when the analyses were standardized to 2.5//mol creatinine.
* Peptides that generated sequence information for the identification of the named peptide.
** Percentage of the peptide sequenced by MS/MS.
85
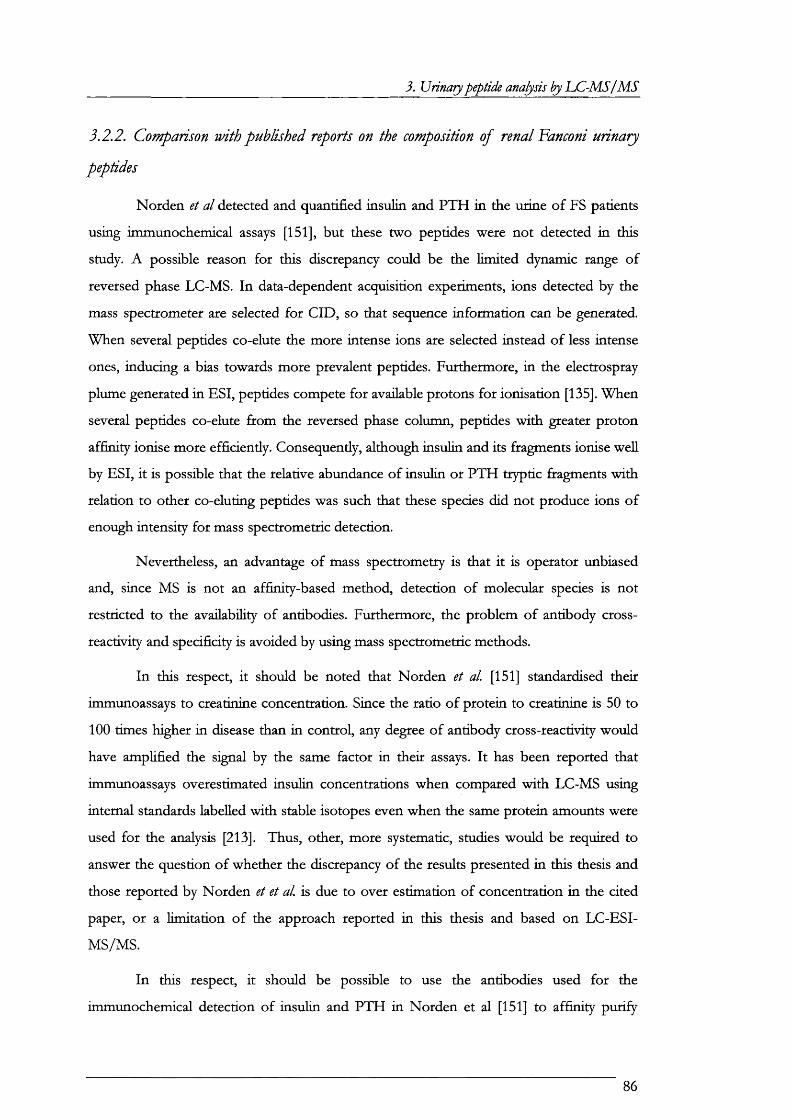
3. Urinary peptide analysis by UC-MS IM S
3.2.2. Comparison with published reports on the composition of renal Fanconi urinary
peptides
Norden et al detected and quantised insulin and PTH in the urine o f FS patients
using immunochemical assays [151], but these two peptides were no t detected in this
study. A possible reason fo r this discrepancy could be the lim ited dynamic range o f
reversed phase LC-MS. In data-dependent acquisition experiments, ions detected by the
mass spectrometer are selected fo r C ID , so that sequence inform ation can be generated.
When several peptides co-elute the more intense ions are selected instead o f less intense
ones, inducing a bias towards more prevalent peptides. Furtherm ore, in the electrospray
plume generated in ESI, peptides compete fo r available protons fo r ionisation [135]. When
several peptides co-elute from the reversed phase column, peptides w ith greater proton
a ffin ity ionise more efficiently. Consequendy, although insulin and its fragments ionise w ell
by ESI, it is possible that the relative abundance o f insulin o r PTH tryptic fragments w ith
relation to other co-eluting peptides was such that these species did not produce ions o f
enough intensity fo r mass spectrometric detection.
Nevertheless, an advantage o f mass spectrometry is that it is operator unbiased
and, since MS is not an affinity-based method, detection o f molecular species is not
restricted to the availability o f antibodies. Furthermore, the problem o f antibody cross
reactivity and specificity is avoided by using mass spectrometric methods.
In this respect, it should be noted that Norden et al [151] standardised their
immunoassays to creatinine concentration. Since the ratio o f protein to creatinine is 50 to
1 0 0 times higher in disease than in control, any degree o f antibody cross-reactivity would
have am plified the signal by the same factor in their assays. I t has been reported that
immunoassays overestimated insulin concentrations when compared w ith LC-MS using
internal standards labelled w ith stable isotopes even when the same protein amounts were
used fo r the analysis [213]. Thus, other, more systematic, studies would be required to
answer the question o f whether the discrepancy o f the results presented in this thesis and
those reported by Norden et et al is due to over estimation o f concentration in the cited
paper, o r a lim ita tion o f the approach reported in this thesis and based on LC -ESI-
MS/MS.
In this respect, it should be possible to use the antibodies used fo r the
immunochemical detection o f insulin and PTH in Norden et al [151] to a ffin ity purify
86
3. Urinary peptide analysis by LC -M S/M S
these molecules, which could then be analysed by MS. A ny degree o f cross-reactivity could
then be detected by MS.
3.2.3. Possible iîTîplications fo r the pathophysiology of the renal Fanconi syndrome
The results presented above indicated that there are several polypeptides that are
detectable in FS patients, but not in norm al urine when the analyses were standardized to
creatinine concentration (to correct fo r differences in water excretion). Possible
im plications o f these findings are discussed below.
A lthough the three inherited form s o f the renal FS studied have d ifferent
genotypes, all o f them show LM W P, which suggest that the reabsorption o f polypeptides
from the glomerular filtra te is compromised in these patients [73]. Lowe’s syndrome
patients have a more severe and systemic phenotype than other FS patients [214]. In
addition to FS, these patients suffer from cataracts, blindness, and mental and growth
retardation. I t has been suggested that in these patients a leak o f lysosomal enzymes may
result in generalized cell in ju ry [91]. However, it is not clear how a defect on the re-uptake
o f metabolites by PT cell results in the progressive loss o f kidney function, which is also a
feature o f D ent’s disease and A D IF .
I t has been proposed that the toxicity o f proteinuria per se may be responsible fo r
this damage (reviewed in [215]). A lbum in overload, resulting from glomerular disease has
been reported to induce apoptosis [216], and an enhanced rate o f endocytosis leading to
activation o f as yet unidentified signal transduction pathways [217], which result in the
upregulation o f pro-inflam atory cytokines [218]. However, in contrast to glomerular
proteinuria, in tubular proteinuria there is no t usually an associated overload o f albumin,
since the integrity o f the glomerular membrane is no t compromised u n til FS is advanced;
thus, other factors may contribute to the progressive kidney failure observed in FS
patients. Thus an alternative explanation to account fo r the progressive loss o f kidney
function in FS patients is that, as in some glomerular diseases [219], biologically active
peptides contribute to the pathophysiology o f FS.
Results presented in this thesis and elsewhere [220], and data reported in other
studies [151], showed that there is a large number o f potentially bioactive polypeptides in
the urine o f these patients, and therefore, they must also be at high concentrations in
tubular flu id. Many o f these polypeptides are known to be present in serum (e.g.,
chemokine 14 and 15, IG F I and II, BMP-1, E D G F and PDG F) [221] and are filtered. I t
follows that failure o f re-uptake by PT cells o f these peptides w ill result in the
87
3. Urinary peptide analysis by LC-M S/M S
concentration o f these cytokines and chemokines in more distal portions o f the renal
tubular lumen, potentially exposing the lin ing o f epithelial cells to direct stimulation.
Lum inal membrane receptors have akeady been demonstrated fo r a number o f
circulating and locally produced bioactive peptides [3], suggesting the proposed intrarenal
paractine or autocrine system may be overwhelmed in FS. For example, TG F-P has been
linked to progressive glomerular and tubular in jury [222]. A lthough, this particular cytokine
was not detected in the urine o f FS patients, BMP-1, a member o f the TG F-P fam ily was
found in FS but not in norm al utine. As described fo r glom erular diseases, such cytokines
and chemokines can upregulate the production o f extracellular m atrix proteins and recruit
immune cells, which in turn have a role in producing more peptides w ith biological
activity. The consequence is an accumulation o f extracellular m atrix proteins and
in terstitia l fibrosis, which contribute to progressive renal failure [219].
88
4. A.nalysis ofDenfs and Normal urinary proteomes
4. Comparative proteomic analysis of Dent’s and Normal
urine
Experiments described in Chapter 3 revealed the presence o f several polypeptides
in the urine o f renal Fanconi syndrome patients, which were not detectable in norm al urine
when the analysis was standardized to creatinine concentration. However, some o f these
molecular species could be norm al components o f urine, and failure to detect them could
be due to lim ited dynamic range o f the analytical methodology. Protein concentration in
the urine o f renal Fanconi syndrome patients is fifty to a hundred times higher than in the
urine from contro l subjects. Methods used fo r the identification o f proteins are dependent
on the amount o f analyte present in the sample such that proteins present at high levels are
detected more readily than those present at low levels. Therefore, since the analyses
described in the previous chapter were standardized to volume (corrected fo r water
excretion by standardizing to creatinine) the analytical method detected more proteins in
FS urine than in contro l samples.
Therefore, to investigate whether the proteins found in renal Fanconi syndrome
urine are norm al components o f urine, although present at lower concentrations, a
comparative proteom ic strategy was set up, which focused on the qualitative pro file o f a
form o f FS (Dent’s disease) urine versus norm al urine. To this end, the analyses were
standardized to protein concentration. Tw o main approaches were used fo r the separation
o f polypeptides, namely gel electrophoresis and liqu id chromatography. MS and M S/M S
were used fo r the identification and /o r quantitation o f the separated proteins. The results
obtained by these two approaches, and the conclusions and new knowledge acquired by
analysing the data, are the subject o f this chapter and w ill the described in turn.
89
4. Analyâs ofDenfs and Norma/ urinary proteomes
4.1. Analysis of urinary polypeptides by gel electrophoresis
A lthough ID SDS-PAGE is relatively tolerant to the presence o f low
concentration o f salts, the isoelectric focusing o f proteins in the firs t dimension o f 2D E
requires the sample to be free o f charged compounds. Furtherm ore, proteins in norm al
urine are present at low concentrations, and therefore, they have to be concentrated in
order to load a relatively large amount o f protein on the IPG strips. A lthough several
methods fo r the extraction o f proteins from urine p rio r to gel electrophoresis have been
described in the literature (reviewed in [161]), experiments described in Chapter 3
demonstrated that RP LC was an efficient method fo r desalting urinary proteins.
Therefore, it was decided to use RP LC to desalt urinary proteins. These desalted proteins
were in a solvent (concentrated acetonitfile in trace acid) amenable to dry in vacuum. The
dried protein extracts were then reconstituted in Laem li buffer fo r ID SDS-PAGE or in
loading buffe r fo r 2D E p rio r to their separation by gel electrophoresis.
4.1.1. One dimensional SDS-PAGE of Dent’s and normal urinary proteins
The patterns o f urinary proteins derived from four D ent’s disease patients and
four norm al individuals were compared by ID SDS-PAGE. Samples were desalted by
perfusion RP LC and equal amounts o f protein loaded on each gel lane. As Figure 4.1.1
shows, the patterns were very sim ilar w ith in sample groups and strikingly different
between D ent’s and norm al individuals. Specifically, bands labelled 1 to 4 in Figure 4.1.1,
among others, appeared in all norm al samples w ith high intensity, whereas they were
absent from the D ent’s samples. In contrast, bands 7 and 8 in the same gel produced
higher intensities in D ent’s samples than in norm al samples. These patterns were also seen
when another purification methods, i.e., precipitation, was used to concentrate proteins
(data not shown).
G el bands from the gel displayed in Figure 4.1.1 were excised and subjected to in
gel digestion. The resultant tryp tic peptides were analysed by LC -ESI-M S/M S. The
identity o f proteins in 10 o f the bands could be determined and Table 4.1.1 lists all the
proteins identified in these experiments. In eight o f these bands there was more than one
protein and some proteins were identified in more than one band, which is probably a
consequence o f post-translational m odifications, most probably proteolytic digestion. A
total o f 24 d ifferent gene products were identified w ith confidence; Mascot scores were
high (well above the Hmit o f statistical confidence, see Table 4.1.1) and at least 2 peptides
derived sequence in form ation that matched the listed protein (Table 4.1.1). The exceptions
90

4. Analysis of Deni’s and Normal urinary proteomes
were a -l antichym otr\psin, kininogen, T4-binding globulin, complex form ing glycoprotein
HC, transthyretin, and cystatin C, fo r which only one peptide was sequenced or had low
Mascot scores. Nevertheless, further inspection o f the MS/M S spectra indicated that the
matches were probably correct. As an example. Figure 4.1.2 shows the M S/M S spectra o f
transthyretin and kininogen tr\-ptic peptides. A ll the fragment ions could be assigned to
theoretical fragmentations o f the peptides.
N o r m a l D e n t ’sk Da ^ >
7550
IU i.,
35
30
\
X /9 10
15"La#
Figure 4.1.1. ID SDS-PAGE of urinary proteins.Proteins were desalted by perfusion RP LC, quantified and same amounts of protein loaded in each lane of a 12% acrylamide gel. After silver nitrate staining, numbered bands were excised, in-gel digested and analysed by LC-ESI-MS/MS. Results of these analyses are displayed in Table 4.1.1.
91
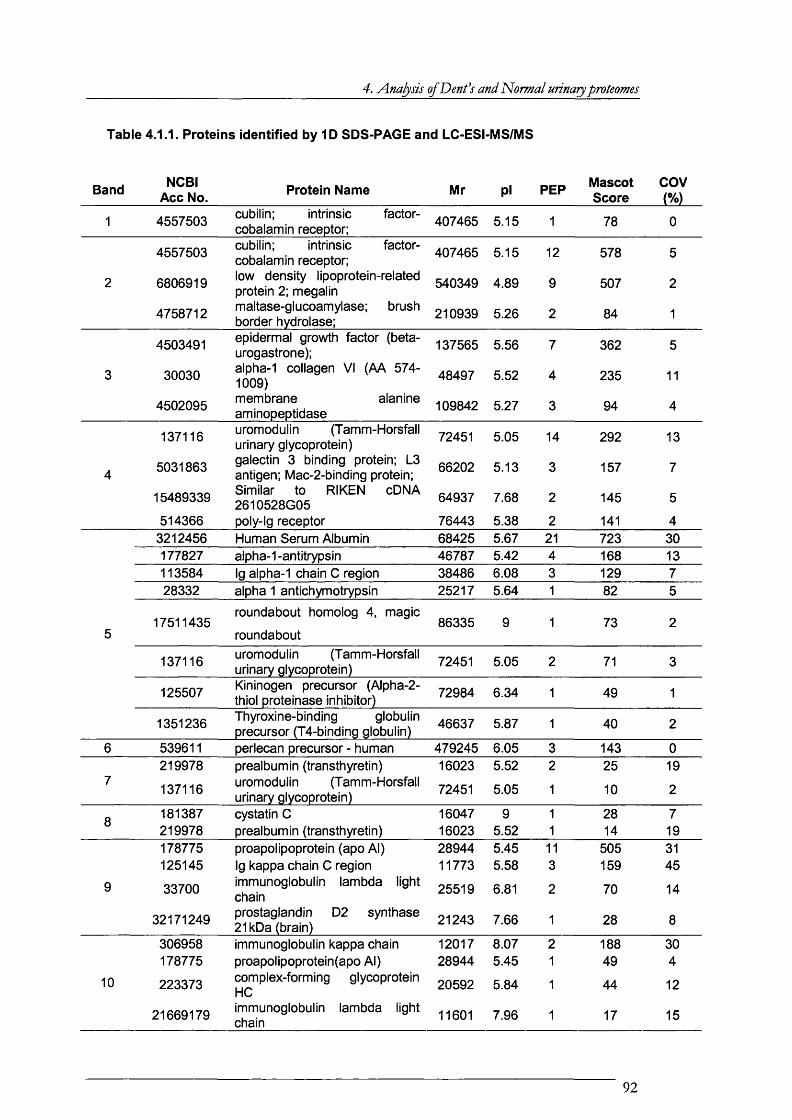
4. Analysis of Deni's and 'Normal urinary proteomes
Table 4.1.1. Proteins identified by ID SDS-PAGE and LC-ESI-MS/MS
Band NCBI Acc No. Protein Name Mr pi PEP Mascot
Scorecov(%)
1 4557503 cubilin; intrinsic factor- cobalamin receptor; 407465 5.15 1 78 0
2
4557503
6806919
4758712
cubilin; intrinsic factor- cobalamin receptor; low density lipoprotein-related protein 2 ; megalin maltase-glucoamylase; brush border hydrolase;
407465
540349
210939
5.15
4.89
5.26
12
9
2
578
507
84
5
2
1
3
4503491
30030
epidermal growth factor (beta- urogastrone);alpha-1 collagen VI (AA 574- 1009)membrane alanine aminopeptidase
137565
48497
5.56
5.52
7
4
362
235
5
11
4502095 109842 5.27 3 94 4
4
137116
5031863
15489339
514366
uromodulin (Tamm-Horsfall urinary glycoprotein) galectin 3 binding protein; L3 antigen; Mac-2-binding protein; Similar to RIKEN cDNA 2610528G05 poly-lg receptor
72451
66202
64937
76443
5.05
5.13
7.68
5.38
14
3
2
2
292
157
145
141
13
7
5
43212456 Human Serum Albumin 68425 5.67 21 723 30177827 alpha-1-antitrypsin 46787 5.42 4 168 13113584 Ig alpha-1 chain 0 region 38486 6.08 3 129 728332 alpha 1 antichymotrypsin 25217 5.64 1 82 5
517511435
roundabout homolog 4, magic
roundabout86335 9 1 73 2
137116 uromodulin (Tamm-Horsfall urinary glycoprotein) 72451 5.05 2 71 3
125507 Kininogen precursor (Alpha-2- thiol proteinase inhibitor) 72984 6.34 1 49 1
1351236 Thyroxine-binding globulin precursor (T4-binding globulin) 46637 5.87 1 40 2
6 539611 perlecan precursor - human 479245 6.05 3 143 0
7219978
137116
prealbumin (transthyretin) uromodulin (Tamm-Horsfall urinary glycoprotein)
16023
72451
5.52
5.05
2
1
25
10
19
2
8181387219978
cystatin 0prealbumin (transthyretin)
1604716023
95.52
11
2814
719
9
178775125145
33700
proapolipoprotein (apo Al)Ig kappa chain 0 region immunoglobulin lambda light chain
2894411773
25519
5.455.58
6.81
113
2
505159
70
3145
14
32171249 prostaglandin D2 synthase 21 kDa (brain) 21243 7.66 1 28 8
10
306958178775
223373
immunoglobulin kappa chain proapolipoprotein(apo Al) complex-forming glycoprotein HC
1201728944
20592
8.075.45
5.84
21
1
18849
44
304
12
21669179 immunoglobulin lambda light chain 11601 7.96 1 17 15
92
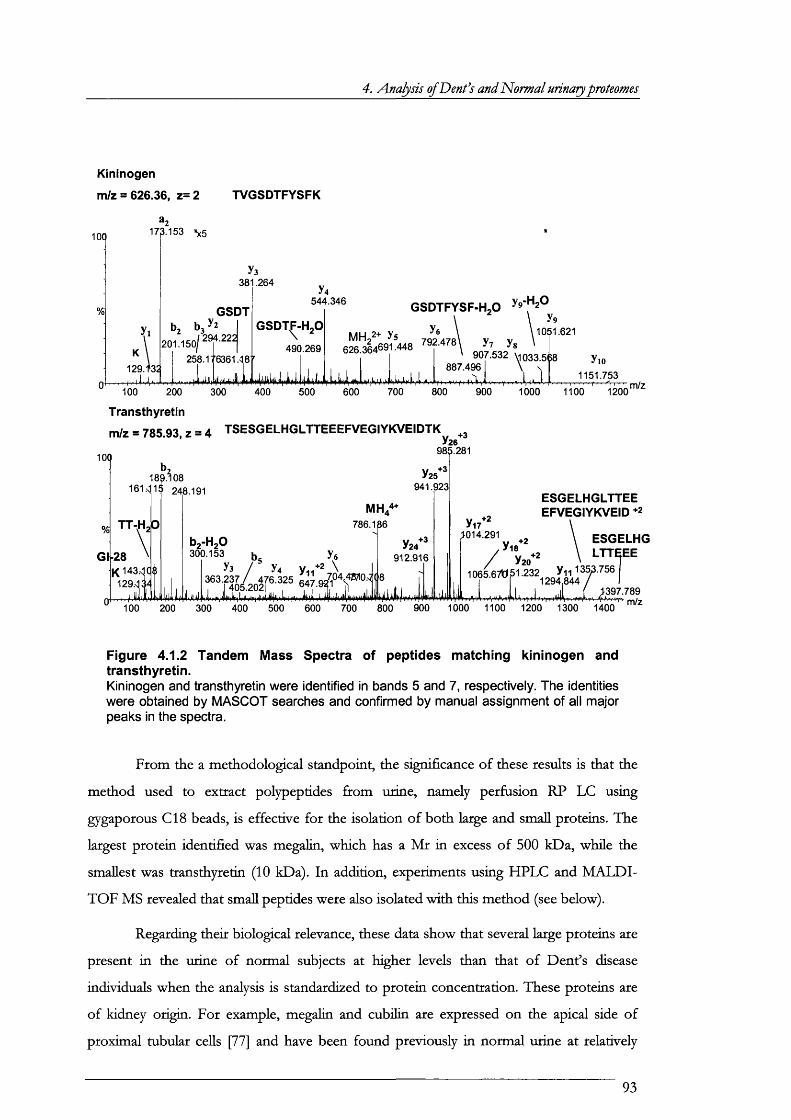
4. Analysis ofDenfs and Normal urinary proteomes
Kininogen
m/z = 626.36, z= 2 TVGSDTFYSFK
100
%
173.153 \ 5
YlK
129.1'33
ya381.264
GSDTb, 6 3 ^ 2
201 .150/
258.1
Y4544.346
GSDT^-HgO
490.26958.176361.48'
300 400 500
GSDTFYSF-H2O
6 & i '4 4 8 7^^478
If. Lii| Ik ly U ^H l|i'
y9-H20yp
1051.621y? y«
' 907.532 \i033.5è8 887.496 \ \
aJ___ A J iyio
1151.753m/z
100 200 600 700 800 900 1000 1100 1200
Transthyretinm/z = 785.93, z = 4 TSESGELHGLTTEEEFVEGIYKVEIDTK
>26
100
%
Gt
189.108161 .<11
TT-H
28 'Ki43.<|q
a129.<l3i!
248.191
100 200
786.186
bg-HgO300.153
ya / - y4/
Y25941.923
+3
985.281
+3
Y24912.916
>014.291
ESGELHGLTTEE EFVEGIYKVEID +2
Vis+2
Y20+2
ESGELHGLTTEEE
iU-rVfA.lJMA900 1000 1100 1200 1300 1400
' >397.7894:>^m/z300 400 500 600 700 800
Figure 4.1.2 Tandem Mass Spectra of peptides matching kininogen and transthyretin.Kininogen and transthyretin were identified in bands 5 and 7, respectively. The identities were obtained by MASCOT searches and confirmed by manual assignment of all major peaks in the spectra.
From the a methodological standpoint, the significance o f these results is that the
method used to extract polypeptides from urine, namely perfusion RP LC using
gygaporous C l 8 beads, is effective fo r the isolation o f both large and small proteins. The
largest protein identified was megalin, which has a M r in excess o f 500 kDa, while the
smallest was transthyretin (10 kDa). In addition, experiments using HPLC and M A L D I-
TO F MS revealed that small peptides were also isolated w ith this method (see below).
Regarding theic biological relevance, these data show that several large proteins are
present in the urine o f norm al subjects at higher levels than that o f D ent’s disease
individuals when the analysis is standardized to protein concentration. These proteins are
o f kidney origin. For example, megalin and cubilin are expressed on the apical side o f
proxim al tubular cells [77] and have been found previously in norm al urine at relatively
93
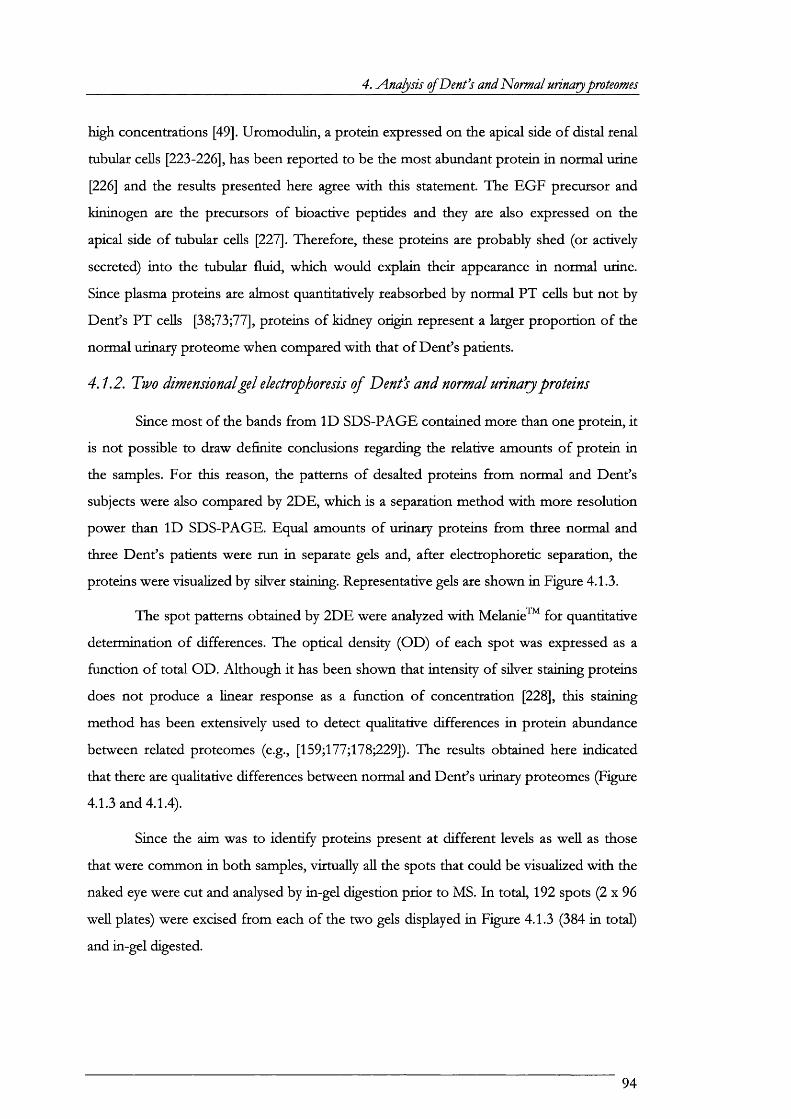
4. A.najysis of Dent’s and Normal urinary proteomes
high concentrations [49]. U rom odulin, a protein expressed on the apical side o f distal renal
tubular cells [223-226], has been reported to be the m ost abundant protein in norm al urine
[226] and the results presented here agree w ith this statement. The EG F precursor and
kininogen are the precursors o f bioactive peptides and they are also expressed on the
apical side o f mbular cells [227]. Therefore, these proteins are probably shed (or actively
secreted) in to the tubular flu id , which would explain their appearance in norm al urine.
Since plasma proteins are almost quantitatively reabsorbed by norm al PT cells but not by
Dent’s PT cells [38;73;77], proteins o f kidney origin represent a larger proportion o f the
normal urinary proteome when compared w ith that o f D ent’s patients.
4.1.2. Two dimensional gel electrophoresis of Dents and normal urinary proteins
Since m ost o f the bands from ID SDS-PAGE contained more than one protein, it
is not possible to draw definite conclusions regarding the relative amounts o f protein in
the samples. For this reason, the patterns o f desalted proteins from norm al and D ent’s
subjects were also compared by 2DE, which is a separation m ethod w ith more resolution
power than ID SDS-PAGE. Equal amounts o f urinary proteins from three norm al and
three D ent’s patients were run in separate gels and, after electrophoretic separation, the
proteins were visualized by silver staining. Representative gels are shown in Figure 4.1.3.
The spot patterns obtained by 2D E were analyzed w ith Melanie™ fo r quantitative
determ ination o f differences. The optical density (O D ) o f each spot was expressed as a
function o f total O D . A lthough it has been shown that intensity o f silver staining proteins
does not produce a linear response as a function o f concentration [228], this staining
method has been extensively used to detect qualitative differences in protein abundance
between related proteomes (e.g., [159;177;178;229]). The results obtained here indicated
that there are qualitative differences between norm al and D ent’s urinary proteomes (Figure
4.1.3 and 4.1.4).
Since the aim was to identify proteins present at d ifferent levels as w ell as those
that were common in both samples, v irtua lly aU the spots that could be visualized w ith the
naked eye were cut and analysed by in-gel digestion p rio r to MS. In total, 192 spots (2 x 96
weU plates) were excised from each o f the two gels displayed in Figure 4.1.3 (384 in total)
and in-gel digested.
94
4. Analysis of Dent’s and Normal urinary proteomes
f « « 26 IJ g W 29 56 57 , 30 ,3 2 -,^ r2 «
" 6 , 6 , -
* ^ 5 8 60 6 2 * 3 6 4 ' 38 60 gg 63 54
=' 135 *
23-
25 '7 , p » 4 6 ^MO
i38
36
6
'. àr
Figure. 4.1.3. Two-dimensional gel electrophoresis analysis of Normal and Dent’s urinary proteomes.Equal amounts (150 /vg) of Dent’s (left) and Normal (right) urinary proteins were loaded in IPG strips pH 3-10 and focused for 24 hours. The second dimension was in 15% acrylamide gels, which were subsequently stained with silver nitrate. Gels were curated using Melanie™. All the spots that could be visualized were excised from the gel, in-gel digested, and analysed by MALDI-TOF MS and/or LC-ESI-MS/MS. Numbered spots returned significant hits and the protein(s) present in these are listed in Table 4.1.2.
The resultant tr\"ptic peptides were analysed by \L \L D I-T O F -M S and/or LC-ESI-
MS/MS followed by peptide mass mapping or sequence tag searches, respectively. The
identity o f the proteins found in 174 o f these spots were determined, which lead to fifty^
different gene products (Table 4.1.2)
An example o f the data obtained by M A LD I-T O F MS and their analysis by
peptide mass fingerprinting is given in Figure 4.1.5, which shows the IM ALD I-TO F
spectrum o f spot 33 in Figure 4.1.3. The m /z values were fed in to M S-Fit and used to
search the N C BI protein database (restricted to Homo sapiens entries). The search returned
a statistically significant h it (Mowse score 3.81e+005, Figure 4.LSD); the protein was
retinol binding protein, and the peptides identified covered 76% o f the protein. Since all
the spectra were internally calibrated w ith known autolytic tiy-ptic peptides, the mass
accuracy was w ith in 50 ppm, w ith the exception o f a peak at 3140.76 m /z units, which was
not assigned to a RBP peptide because o f the relatively large mass error. Close inspection
o f the spectrum revealed that this mass error was due to poor peak shape (Figure 4.1.5C
insert), which tilts the centroid mass o f the peak to the right. This is probably due to low
ion abundance, w liich in turn, leads to poor ion statistics. Increasing the mass error
95
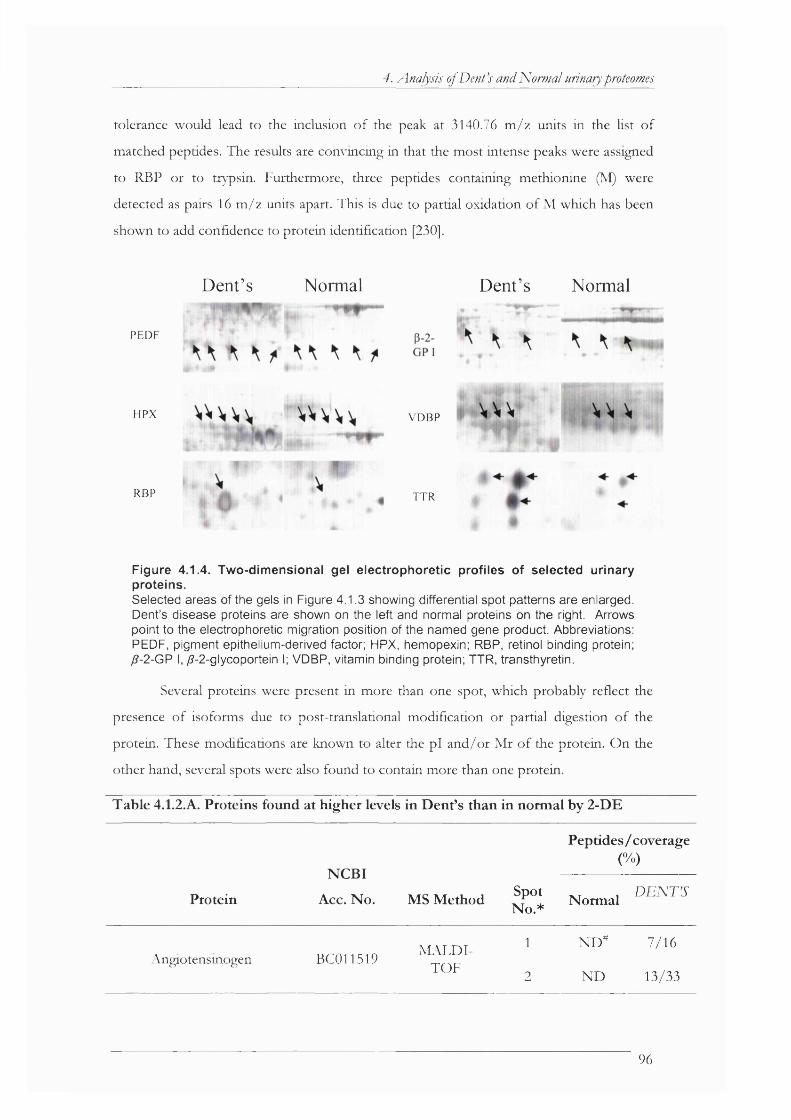
4. Analysis of Dent’s and Normal urinary proteomes
tolerance would lead to the inclusion o f the peak at 3140.76 m /z units in the list o f
matched peptides. The results are convincing in that the most intense peaks were assigned
to RBP or to tr}"psin. Furthermore, three peptides containing methionine (M) were
detected as pairs 16 m /z units apart. This is due to partial oxidation o f M which has been
shown to add confidence to protein identification [230].
PEDF
D e n t ’ s N o r m a l D e n t ’ s N o r m a l
HPX
■-VDBP
RBP TTR■
Figure 4.1.4. Two-dimensional gel electrophoretic profiles of selected urinary proteins.Selected areas of the gels in Figure 4.1.3 showing differential spot patterns are enlarged. Dent’s disease proteins are shown on the left and normal proteins on the right. Arrows point to the electrophoretic migration position of the named gene product. Abbreviations: PEDF, pigment epithelium-derived factor; HPX, hemopexin; RBP, retinol binding protein; ;ff-2-GP I, yff-2-glycoportein I; VDBP, vitamin binding protein; TTR, transthyretin.
Several proteins were present in more than one spot, which probably reflect the
presence o f isoforms due to post-translational m odification or partial digestion o f the
protein. These modifications are known to alter the p i and/or M r o f the protein. On the
other hand, several spots were also found to contain more than one protein.
Table 4.1.2.A . P roteins found at h igher levels in D en t’s than in norm al by 2-D E
N C B I
Acc. N o .
P ep tides/ coverage (% )
P rote in MS M ethodSpotN o .*
1 D E m ’S N orm a l
Angiotensinogen BC011519i\L \L D I-
TO F
1
2
ND"" 7/16
N D 13/33
96

4. Analysis of Denfs and Normal urinary proteomes
3 N D 26/81
A po -A I A15879M A L D I-
TO F4
5
N D
N D
9/42
6/28
6 N D 29/65
A po -A IV M14566M A L D I-
TO F 7
8
N D
N D
28/65
10/28
[3-2-microglobuIlin V00567M A L D I-
TO F9 N D 6/50
10 N D 12/49
P-2-glycoprotein I P02749M A L D I-
TO F
11
12
13
N D
N D
N D
12/40
12/40
9/37
Carbonic anhydrase P00915M A L D I-
TO F14 N D 8/42
M A L D I-
Cystatin C M27891TO F
LC-ESI-MSMS
15 N D10/41
3/19
Cystatin M Q15828M A L D I-
TO F16 N D 6/43
Complement factor H-related M84526M A L D I-
TO F17 N D 8/57
18 8/25 10/32
Hemopexin X02537M A L D I-
TO F
19
20
21
N D
9/29
N D
10/34
10/34
10/34
IG F binding protein 2 P I8065M A L D I-
TO F
22
23
N D
N D
8/35
7/28
Lysozyme pi 1126628LC -ESI-MSMS
15 N D 1/9
97
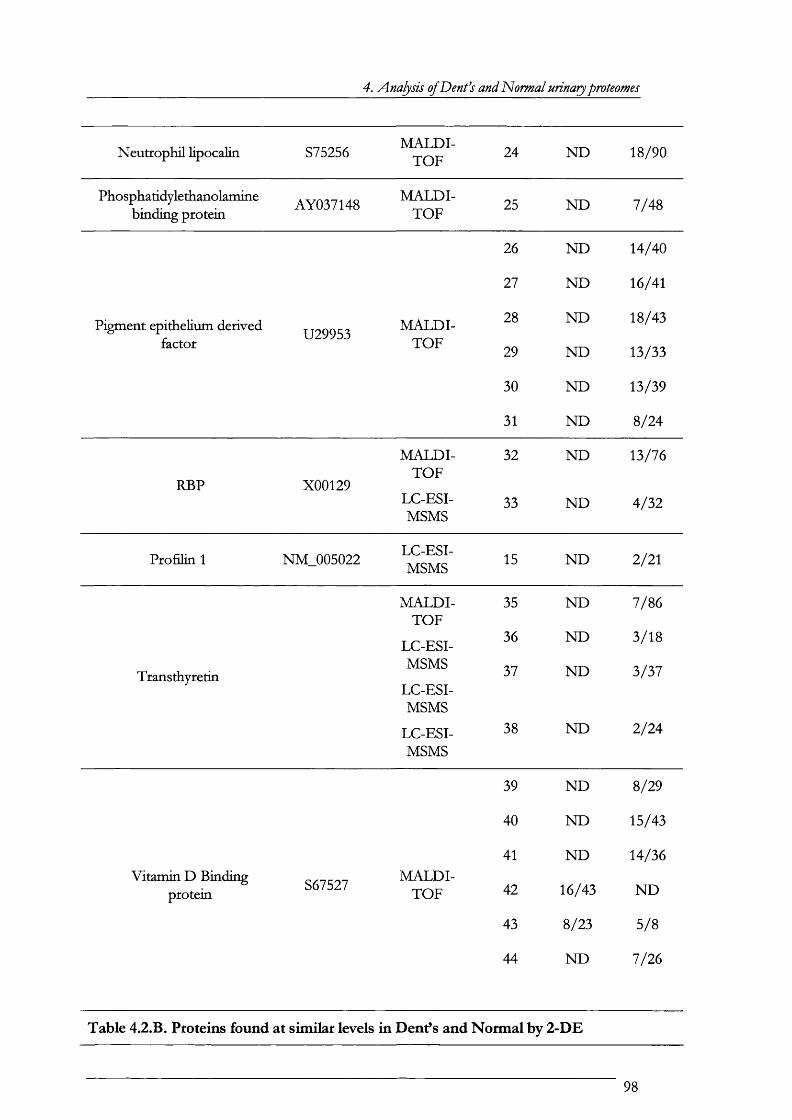
4. A.nalyâs of Denfs and Norma/ urinary proteomes
N eutrophil lipocalin S75256M A L D I-
TO F24 N D 18/90
Phosphatidylethanolamine AY037148 binding protein
M A L D I-TO F
25 N D 7/48
26 N D 14/40
27 N D 16/41
Pigment epithelium derived U29953 factor
M A L D I-TO F
28
29
N D
N D
18/43
13/33
30 N D 13/39
31 N D 8/24
M A L D I- 32 N D 13/76
RBP X00129TO F
LC-ESI-MSMS
33 N D 4/32
P ro filin 1 NM_005022LC -ESI-MSMS
15 N D 2/21
M A L D I- 35 N D 7/86TO F
LC-ESI-36 N D 3/18
TransthyretinMSMS
LC-ESI-MSMS
37 N D 3/37
LC -ESI- 38 N D 2/24MSMS
39 N D 8/29
40 N D 15/43
41 N D 14/36
V itam in D Binding S67527 protein
M A L D I-TO F 42 16/43 N D
43 8/23 5/8
44 N D 7/26
Table 4.2.B. Proteins found at similar levels in Dent’s and Normal by 2-DE
98
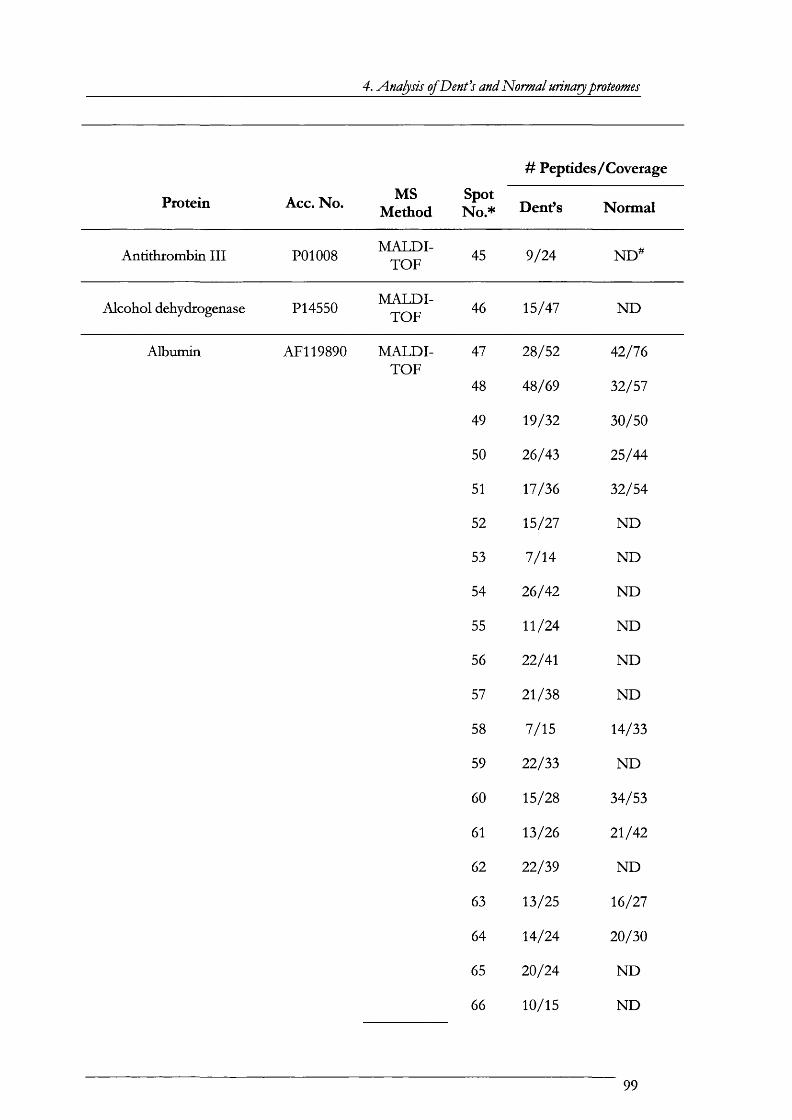
4. Analjâs of Dent’s and Normal urinary proteomes
# Peptides/Coverage
Protein . MS Acc. No. j MethodSpotNo.* DenPs Normal
A ntith rom bin I I I P01008 45 9 /24 N D ^
A lcoho l dehydrogenase P14550 46 15/47 N D
A lbum in AF119890 M A L D I- TO F
47
48
28/52
48/69
42/76
32/57
49 19/32 30/50
50 26/43 25/44
51 17/36 32/54
52 15/27 N D
53 7 /14 N D
54 26/42 N D
55 11/24 N D
56 22/41 N D
57 21/38 N D
58 7/15 14/33
59 22/33 N D
60 15/28 34/53
61 13/26 21/42
62 22/39 N D
63 13/25 16/27
64 14/24 20/30
65 20/24 N D
66 10/15 N D
99
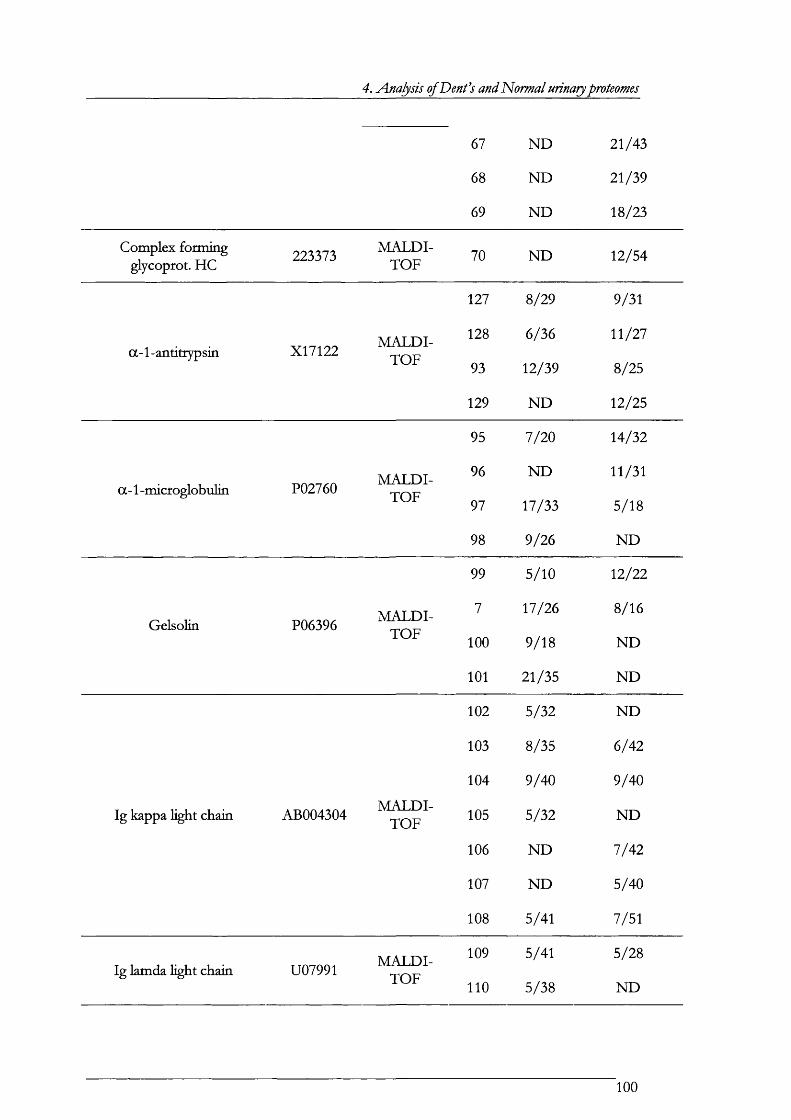
4. Analysis of Dent’s and Normal urinary proteomes
67 N D 21/43
68 N D 21/39
69 N D 18/23
Complex form ing glycoprot. HC
223373 70 N D 12/54
127 8/29 9/31
a -1-antitrypsin X17122128
93
6/36
12/39
11/27
8/25
129 N D 12/25
95 7/20 14/32
a -1 -m icroglobulin P0276096
97
N D
17/33
11/31
5/18
98 9/26 N D
99 5/10 12/22
Gelsolin P063967
100
17/26
9/18
8/16
N D
101 21/35 N D
102 5/32 N D
103 8/35 6/42
104 9/40 9/40
Ig kappa light chain AB004304 105 5/32 N D
106 N D 7/42
107 N D 5/40
108 5/41 7/51
Ig lamda ligh t chain U07991109
110
5/41
5 /38
5/28
N D
100
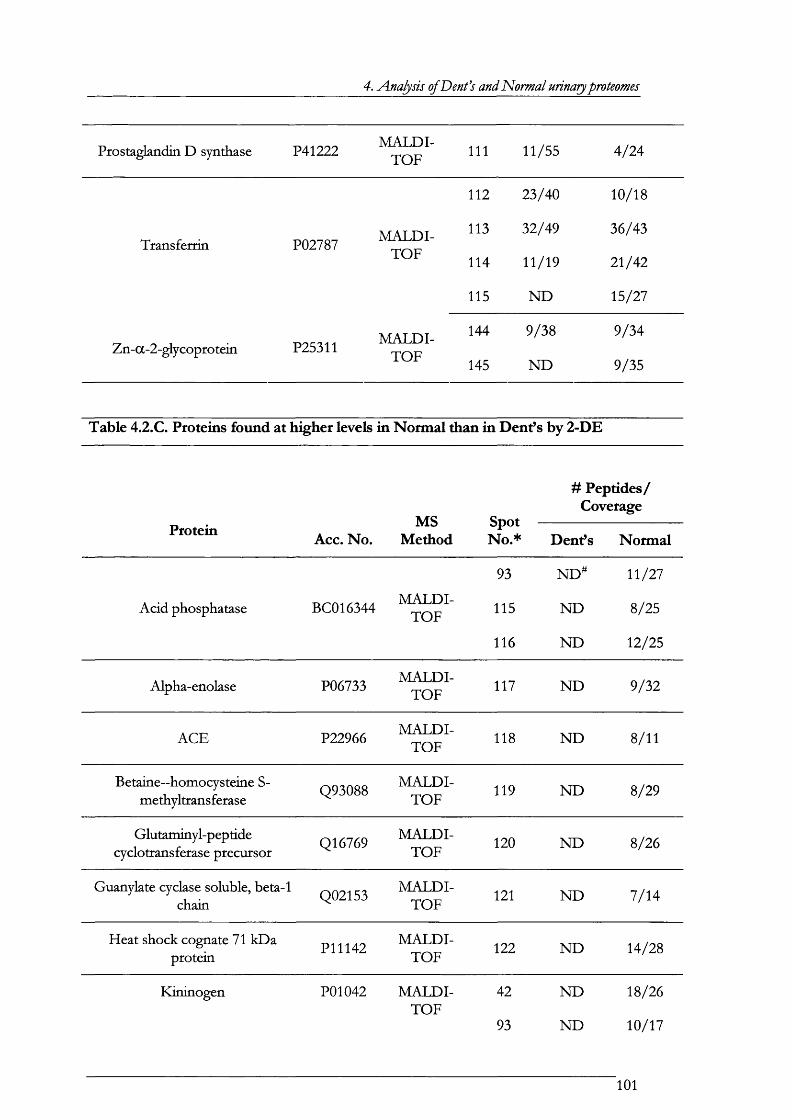
4. Analysis of Dent’s and Normal urinary proteomes
Prostaglandin D synthase P41222M A L D I-
TO F111 11/55 4/24
112 23/40 10/18
Transferrin P02787M A L D I-
TO F
113
114
115
32/49
11/19
N D
36/43
21/42
15/27
Zn-a-2-glycoprotein P25311M A L D I-
TO F
144
145
9/38
N D
9/34
9/35
Table 4.2.C. Proteins found at higher levels in Normal than in Dent’s by 2-DE
Protein Ace. No.MS
MethodSpotNo.*
# Peptides/ Coverage
Dent’s Normal
93 N D ^ 11/27
A cid phosphatase BC016344M A L D I-
TO F115
116
N D
N D
8/25
12/25
Alpha-enolase P06733M A L D I-
TO F117 N D 9/32
AC E P22966M A L D I-
TO F118 N D 8/11
Betaine—homocysteine S- methyltransferase
Q93088 M A L D I-TO F
119 N D 8/29
Glutam inyl-peptide cyclotransferase precursor
Q16769M A L D I-
TO F120 N D 8/26
Guanylate cyclase soluble, beta-1 0091 chain ^
M A L D I-TO F
121 N D 7/14
Heat shock cognate 71 kDa protein
P I1142M A L D I-
TO F122 N D 14/28
Kininogen PCI042 M A L D I-TO F
42
93
N D
N D
18/26
10/17
101

4. Analysis of Deni’s and 'Normal urinary proteomes
115 N D 9/16
123 N D 8/16
124 N D 9/19
125 N D 5/15
126 N D 20/44
127 N D 15/22
128 N D 13/20
129 N D 9/16
130 N D 15/19
131 N D 13/17
132 N D 21/31
133 N D 11/16
134 N D 8/18
L-kctate dehydrogenase B chain P07195M A L D I-
TO F135 N D 10/35
MBL-associated serine protease (MASP)-2
M A L D I-TO F
136 N D 10/53
Myeloperoxidase A90533M A L D I-
TO F121 N D 12/17
Mdm-1 protein M20823M A L D I-
TO F137 N D 14/27
Polynaeric-ininiunoglobulinreceptor
P01833M A L D I-
TO F138 N D 11/17
Similar to orosomucoidM A L D I-
TO F
139N D 5/22
Urom odulin M17778 M A L D I- 118 N D 12/20TO P
139
140
141
N D
N D
N D
7/14
13/18
19/25
102
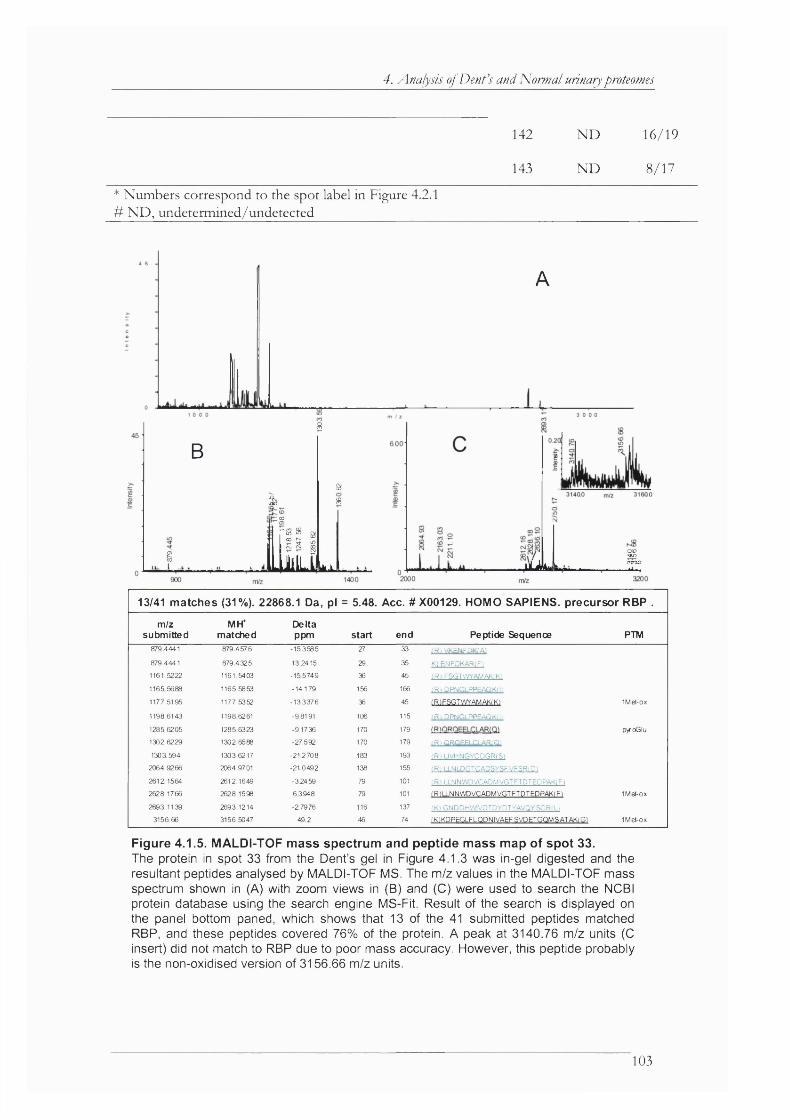
4. Analysis of Den f s and 'Normal urinary proteomes
142
143
ND
N D
16/19
8/17
* Numbers correspond to the spot label in Figure 4.2.1# N D , undetermined/undetected
A
sB
a& *eg
A 11 .ULi lài. jjU L
%(TOO- ^ - 1
13/41 m atches (31%). 22868.1 Da, pi = 5.48. A g o . #X 00129. HOMO SAPIENS, precursor RBP .
m / z
s u b m i t t e d
M H *
m a t c h e d
D e l t a
p p m S t a r t e n d P e p t i d e S e q u e n c e P T M
879 4 4 4 1 879 4 5 7 6 -1 5 .3 5 8 5 27 33 f R l V K E N F D K tA l
879 4 4 4 1 879 4 3 2 5 1 3 .2 4 1 5 29 35 K l E N F D K A R (F )
1 1 6 1 .5 2 2 2 1 1 6 1 .5 4 0 3 -1 5 .5 7 4 9 36 45 (R ) F S G T W Y A M A K IK )
11 65 5 6 8 8 1 1 6 5 .5 8 5 3 -1 4 .1 7 9 156 166 iR lD P N G L P P E A Q K tn
1 1 7 7 ,5 1 9 5 1 1 7 7 .5 3 5 2 -1 3 .3 3 7 6 36 45 (R )F S G T W rA M A K (K ) 1M e t-o x
1 1 9 8 .6 1 4 3 1 1 98 6261 -9 .8 19 1 106 115 (R iD P N G L P P E A Q K fl)
1 2 8 5 .6 2 0 5 1 2 8 5 6 3 2 3 -9 .1 7 3 6 170 179 pyroGlu
1 3 0 2 .6 2 2 9 1 3 0 2 .6 5 8 8 -2 7 .5 9 2 170 179 ( R l O R O E E L C L A R fO I
1 3 0 3 .5 9 4 1 3 0 3 .6 2 1 7 -2 1 .2 7 0 8 183 193 ( R )L IV H N G Y C D G R (S l
2 0 6 4 .9 2 6 6 2 0 6 4 .9 7 0 1 -2 1 .0 4 9 2 138 155 ( R ) LLNLDCTCADSYSFYFSRiDl2 6 1 2 .1 5 6 4 2 6 1 2 .1648 -3 .2 4 5 9 79 101 ( R ) L L N N W D V C A D M V G T F T D T E D P A K IF I
2 6 2 8 .1 7 6 6 2 6 2 8 .1 5 9 8 6 .3 9 4 8 79 101 (R IL L N N W D V C A D M V G T F T D T E D P A K IF I IM e t-o x
2 6 9 3 .1 1 3 9 2 6 9 3 .1 2 1 4 -2 .7 9 7 6 116 137 (K ) G N D D H W IV D T D Y D T Y A V Q Y S C R d l
3 1 5 6 .6 6 3 1 5 6 .5 0 4 7 49 2 46 74 (K )K D P E G L F L Q D N IV A E F S V D E T G Q M S A T A K (G ) IM e t-o x
Figure 4.1.5. MALDI-TOF mass spectrum and peptide mass map of spot 33.The protein in spot 33 from the Dent’s gel in Figure 4.1.3 was in-gel digested and the resultant peptides analysed by MALDI-TOF MS. The m/z values in the MALDI-TOF mass spectrum shown in (A) with zoom views in (B) and (C) were used to search the NCBI protein database using the search engine MS-Fit. Result of the search is displayed on the panel bottom paned, which shows that 13 of the 41 submitted peptides matched RBP, and these peptides covered 76% of the protein. A peak at 3140.76 m/z units (C insert) did not match to RBP due to poor mass accuracy. However, this peptide probably is the non-oxidised version of 3156.66 m/z units.
103
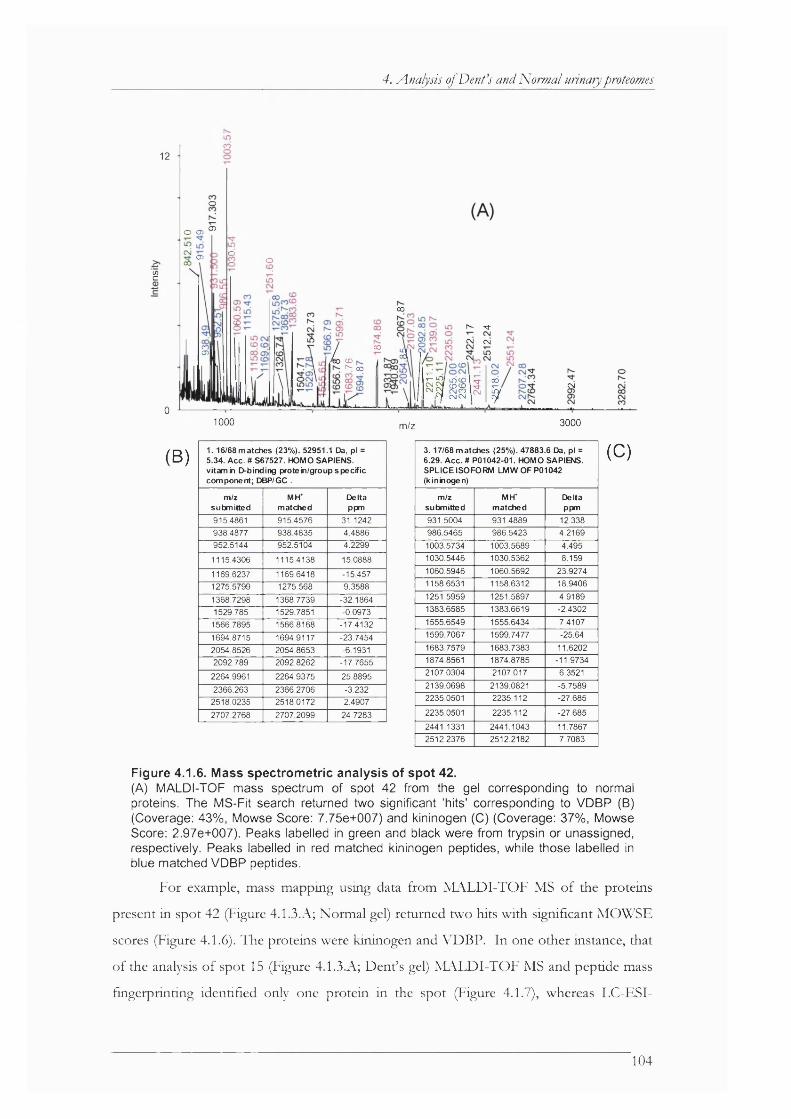
4. Analysis of Denis and Normal urinary proteomes
12
o
CDO CD
OO) Owc
ooCD D- Tj-
cy cNj
Kim; I8 7 ” a
“ ^ œ ICN
01000 3000m/z
(B) 1.16/68 matches (23%). 52951.1 Da, pi = 5.34. A g o . # S67527. HOMO SAPIENS, vitamin D-bindlng protein/group specific component; DBP/GC .
m/z MKT Deltasulxnitted matched ppm915.4861 915.4576 31.1242938.4877 938 4835 4.4886952.5144 952.5104 4.2299
1115.4306 1115.4138 15.0888
1169.6237 1169.6418 -15.4571275.5799 1275.568 9.35881368.7298 1368.7739 -32.18641529.785 1529 7851 -0.09731566.7895 1566.8168 -17.41321694.8715 1694.9117 -23.74542054.8526 2054.8653 -6.19312092.789 2092.8262 -17.7655
2264.9961 2264.9375 25.88952366.263 2366.2706 -3.232
2518.0235 2518.0172 2.49072707.2768 2707 2099 24.7283
3.17/68 matches (25%). 47883.6 Da, pi =6.29. Acc. # P01042-01. HOMO SAPI04S.SPLICE ISO FORM LMWOFP01042(kininogen)
m/z MH* Deltasutxnitted matched ppm931.5004 931.4889 12.338986 5465 986.5423 4.21691003.5734 1003.5689 4.4951030.5446 1030.5362 8.1591060.5946 1060.5692 23.92741158.6531 1158.6312 18.94061251.5959 1251.5897 4.91891383.6585 1383.6619 -2.43021555.6549 1555.6434 7.41071599.7067 1599.7477 -25.641683.7579 1683.7383 11.62021874.8561 1874.8785 -11.97342107.0304 2107.017 6.35212139.0698 2139.0821 -5.75892235.0501 2235.112 -27.685
2235.0501 2235.112 -27.685
2441.1331 2441.1043 11.78672512.2376 2512.2182 7.7083
(C)
Figure 4.1.6. Mass spectrometric analysis of spot 42.(A) MALDI-TOF mass spectrum of spot 42 from the gel corresponding to normal proteins. The MS-Fit search returned two significant ‘hits’ corresponding to VDBP (B) (Coverage; 43%, Mowse Score: 7.75e+007) and kininogen (0) (Coverage: 37%, Mowse Score: 2.97e+007). Peaks labelled in green and black were from trypsin or unassigned, respectively. Peaks labelled in red matched kininogen peptides, while those labelled in blue matched VDBP peptides.
For example, mass mapping using data from M A LD I-T O F MS o f the proteins
present in spot 42 (Figure 4.1.3.A; Norm al gel) returned two hits w ith significant MOWSE
scores (Figure 4.1.6). The proteins were kininogen and \T )B P . In one other instance, that
o f the analysis o f spot 15 (Figure 4.1.3.A; Dent’s gel) M \L D l-T O F MS and peptide mass
fingerprinting identified only one protein in the spot (Figure 4.1.7), whereas LC-ESl-
104
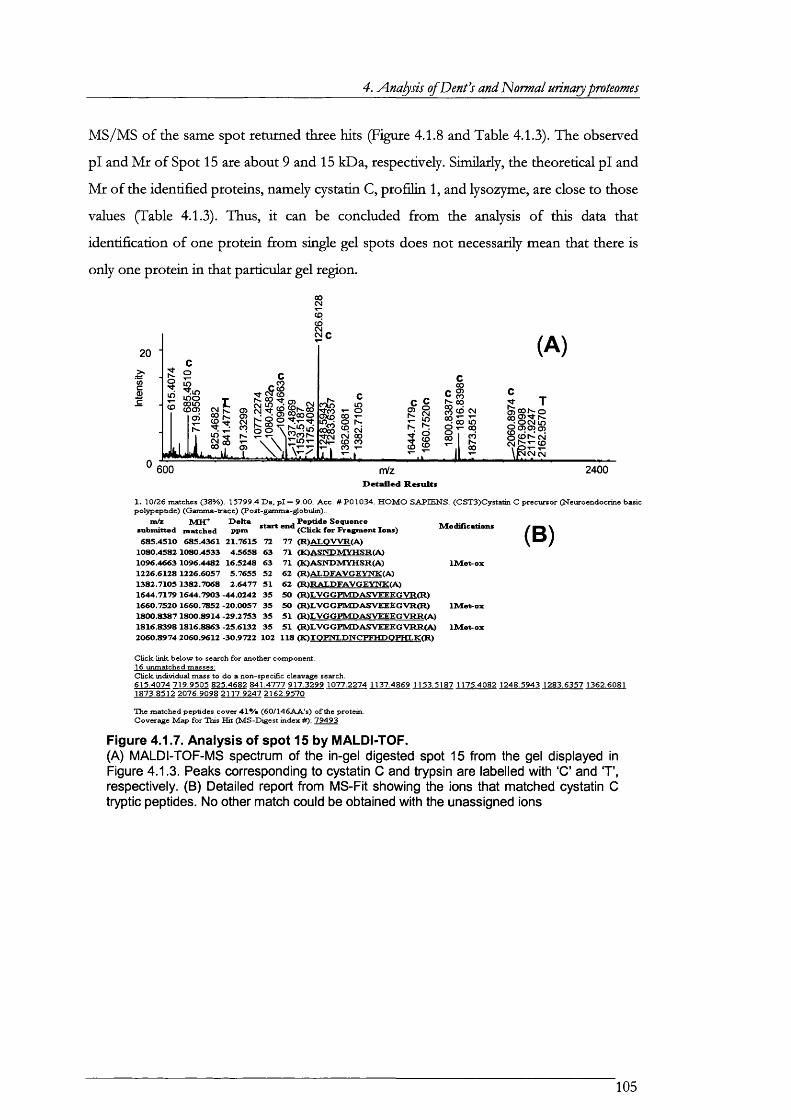
4. Analysis ofDenfs and Normal urinaiy proteomes
M S/M S o f the same spot returned three hits (Figure 4.1.8 and Table 4.1.3). The observed
p i and M r o f Spot 15 are about 9 and 15 kDa, respectively. Similarly, the theoretical p i and
M r o f the identified proteins, namely cystatin C, p ro filin 1, and lysozyme, are close to those
values (Table 4.1.3). Thus, it can be concluded from the analysis o f this data that
identification o f one protein from single gel spots does not necessarily mean that there is
only one protein in that particular gel region.
20 ■
I
co
in
O)
600
O)
(A)
fili.00 r; 7% ill
nVzDetailed Results
2400
1. 10 /26 matches (3 8 % ). 15799 .4 D a . p l = 9 .00 . A cc . # f 010 34 . H O M O S A P IE N S . (C S T 3 )C ys ta tm C p re cu rso r (N euroendocrine basic p o lyp e p tid e ) (G am m a-trace ) (Post-gam m a-g lobu lin)..
m/z MHT*" Delta Peptide Sequencesubmitted matched ppm 685.4510 685.4361 21.7615 72
1080.4582 1080.4533 4.5658 631096.4663 1096.4482 16.5248 63 1226.6128 1226.6057 5.7655 521382.7105 1382.7068 2.6477 511644.7179 1644.7903 -44.0242 35 1660.7520 1660.7852 -20.0057 35 1800.8387 1800.8914 -29.2753 35 1816.8398 1816.8863 -25.6132 35
start end (Click for Fragment Ions)77 (R)A L O W R (A>71 QOASPTDMYHSR/A)71 (K)ASNDMYHSR(A)62 fRlALDFAVGEYWK/A'I 62 (RIRALDFAVGEYNK/A50 (RlLVGGFMDASVEEEGVRfRl50 (R)I,VGGPMDASVEEEGVR(R)51 (RlLVGGPMDASVEEEGVTtRI-Ai 51 (R)I.VGGPMDASVEEEGVItR(A)
Modifications (B)
2060.8974 2060.9612 -30.9722 102 118 f ia TOFNIsDNCFFHDOPHLKrR
C lic k lin k b e lo w to search fo r another com ponent.16 unm atched masses:C lic k ind iv idua l mass to do a non-specific cleavage search.6 1 5 .4 0 7 4 7 1 9 .9 5 0 5 8 2 5 .4 6 8 2 8 4 1 .4 7 7 7 9 1 7 .3 2 9 9 1 0 7 7 .2 27 4 113 7 .4 86 9 115 3 .5 18 7 117 5 .4 08 2 1 24 8 .5 94 3 1 2 8 3 .6 35 7 1362.6081 1 87 3 .8 5 1 2 2 0 7 6 .9 0 9 8 2 1 1 7 .9 2 4 7 2 1 6 2 .9 5 7 0
The m atched pep tides co ve r 4 1 % (6 0 /1 4 6 A A 's ) o f the pro te in .C overage M a p fo r This ü t -D iges t index # ): 7 9 4 9 3
Figure 4.1.7. Analysis of spot 15 by MALDI-TOF.(A) MALDI-TOF-MS spectrum of the in-gel digested spot 15 from the gel displayed in Figure 4.1.3. Peaks corresponding to cystatin C and trypsin are labelled with ‘C’ and T , respectively. (B) Detailed report from MS-Fit showing the ions that matched cystatin C tryptic peptides. No other match could be obtained with the unassigned ions
105

4. Analysis ofDenfs and Normal urinary proteomes
(B) byu.32b (C)/ 690.790
/%- /831.833 %- 950.800
(h l , r ° m/z 0- 1 ll750 1000
lOOn
%-
m/z 0
(D)701.321
737.798
600 800 1000
2+
11x5
1091.952 4 # m/z
y?y$ \ 7 2 4
5 8 9 ,3 0 0 \1 6 8 ' T " \ 1 /2 5 .8 2 4
y«9 0 4 .4 4 2
600 800 1000
(E).
1 3 8 4 .6 4 3 [ ,1 4 5 0 .7 0 3
1905.424 Y u Y n Y i/ 1 4 4 8 .5 7 ;
1000 1 200 y,
1 0 0 6 .5 4 5
y% /
3 3 8 , 1 4 9 ^ 7 4
4 4 8 .2 7 6
y. Ysy5n3.781 /iVo ^ f
5 5 » 29
Yfi Yt2 9 0 661 3 8 9 8 0 8 4 2 8 g Q g '|^ ^
W " r n - v IS 4 r iT ï i -r i' ,"T, '.T *A *
Yg
1 4 0 0
(F): Yi2
2 3 3 .5 8 2
r - Y io Y .1 0 0 8 .& M
1 0 0 2 0 0 3 0 0 4 0 0 5 0 0 6 0 0 7 00 80 0 9 0 0 1 0 0 0 1 1 0 0 1 2 0 0 1 3 0 0
Ye7 6 4 .3 9 5
Yi
1 7 1 .0 7 7
3 0 . . , , , 7 3 y . , 7 : ^
1618.3163 7 6 .1 9 6 4 8 9 .2 6 7
JL
y? Ys(G)
> ® \ |9 35 .5 01 Y i o
Figure 4.1.8. Analysis of spot 15 by LC-ESI-MS/MS.Examples of three peptides that generated MS/MS spectra for the identification of three different proteins are given. (A) Extracted ion chromatogram of ions at m/z 830.9, 690.3, and 700.8. (B), (C), and (D) show MS survey spectra at points b, c, and d, respectively, on the ion chromatogram in (A). (E) MS/MS spectrum of ion at m/z 830.82 whose sequence matched cystatin C. (F) MS/MS spectrum of ion at m/z 690.33, that matched profilin 1. (G) MS/MS spectrum of ion at m/z 700.76 that corresponded to a lysozyme peptide. Other details of this analysis are given on Table 4.1.3.
Table 4.1.3. Proteins Identified from the analysis spot 15 by LC-ESI-MS/MS
NCBI gl Protein name # Peptides /coverage (%)
Theoretical pl/Mr (Da)
4503107 cystatin C 3/19 9.00/160854826898 profilin 1 2/21 8.44/152994930016 Lysozyme 1/9 9.28/15157
106
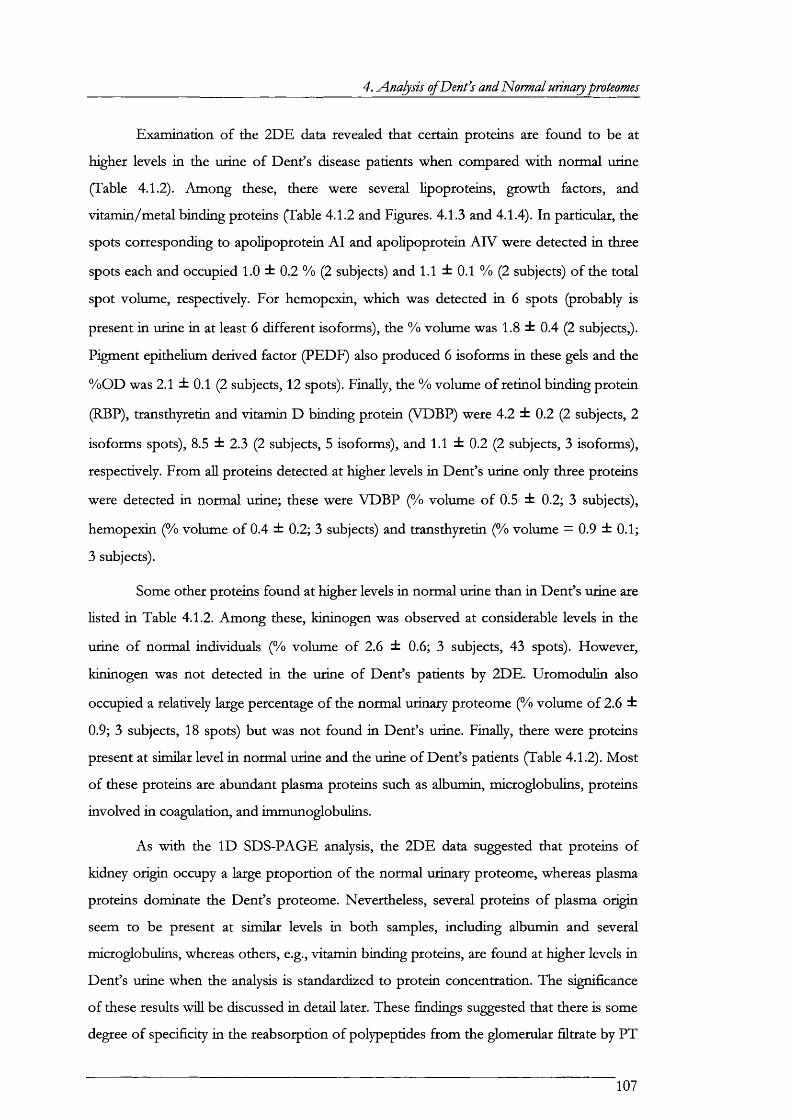
4. A.nalysis ofDenfs and Norma/ urinary proteomes
Exam ination o f the 2D E data revealed that certain proteins are found to be at
higher levels in the urine o f D ent’s disease patients when compared w ith norm al urine
(Table 4.1.2). Am ong these, there were several lipoproteins, growth factors, and
vitam in/m eta l binding proteins QTable 4.1.2 and Figures. 4.1.3 and 4.1.4). In particular, the
spots corresponding to apolipoprotein A I and apolipoprotein A IV were detected in three
spots each and occupied 1.0 ± 0.2 % (2 subjects) and 1.1 ± 0.1 % (2 subjects) o f the tota l
spot volume, respectively. For hemopexin, which was detected in 6 spots (probably is
present in urine in at least 6 d ifferent isoforms), the % volume was 1.8 ± 0.4 (2 subjects,).
Pigment epithelium derived factor (PEDF) also produced 6 isoform s in these gels and the
% O D was 2.1 ± 0.1 (2 subjects, 12 spots). Finally, the % volume o f re tino l binding protein
(RBP), transthyretin and vitam in D binding protein (VDBP) were 4.2 ± 0.2 (2 subjects, 2
isoform s spots), 8.5 ± 2.3 (2 subjects, 5 isoforms), and 1.1 ± 0.2 (2 subjects, 3 isoforms),
respectively. From aU proteins detected at higher levels in D ent’s urine only three proteins
were detected in norm al urine; these were VD BP (% volume o f 0.5 ± 0.2; 3 subjects),
hemopexin (% volume o f 0.4 ± 0.2; 3 subjects) and transthyretin (% volume = 0.9 ± 0 .1 ;
3 subjects).
Some other proteins found at higher levels in norm al urine than in D ent’s urine are
listed in Table 4.1.2. Am ong these, kininogen was observed at considerable levels in the
urine o f norm al individuals (% volume o f 2.6 ± 0.6; 3 subjects, 43 spots). However,
kininogen was not detected in the urine o f D ent’s patients by 2DE. U rom odulin also
occupied a relatively large percentage o f the norm al urinary proteome (% volum e o f 2.6 ±
0.9; 3 subjects, 18 spots) but was not found in Dent’s urine. Finally, there were proteins
present at sim ilar level in norm al urine and the urine o f D ent’s patients (Table 4.1.2). M ost
o f these proteins are abundant plasma proteins such as albumin, m icroglobulins, proteins
involved in coagulation, and imm unoglobulins.
As w ith the ID SDS-PAGE analysis, the 2D E data suggested that proteins o f
kidney origin occupy a large proportion o f the norm al urinary proteome, whereas plasma
proteins dominate the D ent’s proteome. Nevertheless, several proteins o f plasma origin
seem to be present at sim ilar levels in both samples, including albumin and several
m icroglobulins, whereas others, e.g., vitam in binding proteins, are found at higher levels in
D ent’s urine when the analysis is standardized to protein concentration. The significance
o f these results w ill be discussed in detail later. These findings suggested that there is some
degree o f specificity in the reabsorption o f polypeptides from the glomerular filtra te by PT
107

4. Analysis of Dent’s and Normal urinary proteomes
cells. A detailed discussion o f the possible significance o f these results w ill be presented in
section 4.5.
108

4. Analyâs of Dent’s and Normal urinary proteomes
4.2. Analysis of Dent’s and Normal urinary proteomes by liquid
chromatography and mass spectrometry
The experiments described in the firs t part o f this chapter revealed the presence o f
qualitative differences in the protein com position between D ent’s disease patients and
norm al individuals. These differences could be physiologically relevant o r they could have
been introduced at the tim e o f analysis o r during sample preparation. A lthough repetition
o f the experiments adds statistical significance to the results, when the source o f error is
in trinsic to the method, repetition o f the experiments would not detect the presence o f
artifacts, i f present. Therefore, two completely d ifferent analytical strategies based on liqu id
chromatography and M S/M S were employed as an orthogonal means to validate and
complement the data obtained by gel electrophoresis. Separation o f polypeptides by liqu id
chromatography has been described by several laboratories as an alternative to 2D E fo r
the separation and analysis o f fuU length (e.g., [109;110;220;231] o r digested proteins
(e.g.e.g., [113;210]) . A fte r separation, protein characterization is carried out by M S/M S,
either on-line by ESI coupled to ion traps [113;210] or Q -T o f instruments [220;232], or
o ff-line using M A L D I coupled to T O F /T O F mass spectrometers [232].
Q uantitation by LC-MS is more complicated than by 2DE, and although the signal
intensity in LC-ESI-M S is related to analyte concentration [144;233-238]], signal
suppression due to co-elution o f m atrix compounds o r other analytes could make the
accurate quantitative analysis by LC-MS unreliable [239-241]. This is specially the case
when small differences in analyte concentration or amounts are present. Thus, addition o f
internal standards can im prove quantitation in LC-MS and is w idely employed in
pharmacological and environmental analyses (e.g.e.g., [242;243]). Recently, isotope labelled
internal standards have also been used fo r the absolute quantitation o f proteins [234;244]
and peptides by LC-MS. The ideal internal standard is an isopicaUy labelled version o f the
analyte o f interest. When the aim is to compare the amounts o f protein present in two
samples, one o f the samples is labelled w ith a compound containing a tag w ith heavy
isotopes (e.g., ^^C, o r D ) while the other sample is labelled w ith the same compound
but containing normal, Hght, isotopes. Since the chemical and physical characteristics o f
these compounds are identical (except fo r M r), labelled peptides co-elute during RP and
s e x LC and have the same behaviour during ionisation in the ion source o f the mass
spectrometer. This is the basis o f the method named isotope coded a ffin ity tags (1CA T),
which was introduced by Gygi and Aebersold [165;166]. Recently, other investigators have
109

4. Analysis ofDenfs and Normal urinary proteomes
reported the development o f compounds based on the IC A T principle [167;245].
A lternative strategies have been described that involve metabolic labelling by growing cell
cultures in media containing amino acids [168;246] w ith heavy isotopes or as an
nitrogen source [169]. These are elegant approaches, albeit they are restricted to the
analysis o f proteins extracted from cell cultures and cannot be applied to the analysis o f
proteins obtained from in-vivo sources.
In the experiments described below, proteins were firs t extracted from urine using
a com bination o f RP and SCX chromatography in order to separate polypeptides from
inorganic and organic salts respectively. By doing this, compounds that are relatively
hydrophobic and positively charged at acidic pH are extracted, whereas organic and
inorganic salts, organic acids, bile acids, and lipids are diverted to waste. Polypeptides are
relatively hydrophobic and therefore RP columns retain them, whereas salts are not
retained and appear in the solvent front. Proteins and peptides are also zw itterionic
species, but at pH 2-3 most, i f not all, peptides are positively charged so that they are
retained by beads w ith SCX functionality; this provides a physicochemical basis fo r the
separation o f peptides from neutral and acidic compounds. Thus, after extraction, peaks in
U V chromatograms are likely to correspond to the absorbance o f peptides and proteins
and are probably free from most m atrix interferences. Proteins and peptides were then
analysed by M A L D I-T O F MS before and LC-ESI-M S/M S after, digestion o f the samples
w ith trypsin. Approxim ate relative quantitation was obtained by using the intrinsic
in form ation in the mass spectra. As stated above, ion intensity in ESI is dependant on
analyte concentration, and although the issues o f ion suppression are a concern, ion
intensities o f several peptide ions corresponding to the same protein added confidence to
the quantitation. The results o f these experiments were later validated by independent
experiments using m ultidim ensional chromatography o f IC A T labelled peptides. This
section describes the results and the conclusions o f these two studies.
4.2.1. Microcapillarj reversed phase liquid chromatography of urinary proteins
As stated above RP LC is a pow erful m ethod fo r the separation o f molecular
species on the basis o f their hydrophobicity, more hydrophobic compounds eluting later
than less hydrophobic (more hydrophilic) ones. M iniaturization o f conventional LC has
several advantages including an increase in sensitivity. In the experiments described here
microcapiUary LC (pLC) was used fo r the separation o f polypeptides after extraction by
RP and SCX. A pLC RP column packed in house in 320 pm x 25 cm fused silica capillaries
110

4. Analyâs of Dent’s and Norma/ urinary proteomes
was used. ; the packing material was gygaporous beads (2000 Â pore size) w ith C l 8 RP
functionality, which allows fo r the separation o f relatively large polypeptides at a relatively
high flow rate (and thus short analysis time).
A fte r the extraction step, the protein content was quantified and 5 pg injected in
the pLC system in which the separation was m onitored by U V absorption at a wavelength
o f 214 nm. Representative chromatograms are depicted in Figure 4.2.1 showing significant
differences in the elution profiles between D ent’s and norm al urinary proteins. Fractions,
collected every 3 minutes (60 p i volume) from these runs, were lyophUised and analysed by
M A L D I-T O F MS fo r intact M r determination. Figure 4.2.2 summarises all the ions w ith
m / 2 values identified during M A L D I-T O F MS analysis. Several ions were detected in one
set o f samples but not in the other, indicating qualitative differences between the two
samples. I t should be noted that many ions w ith low m /z values were detected by
M A L D I-T O F MS, whereas 2D E analyses did no t show many spots at this molecular
weight (Figure 4.2.2). In contrast, M A L D I-T O F MS faded to detect the large proteins that
were readdy detectable by 2DE. These results highlight the fact that large proteins do not
ionise efficiently by M A L D I so that smaU and medium size polypeptides are detected
preferentiaUy. I t can be concluded from this experiment that the 2D separation afforded
by LC -M A LD I-T O F complements the data obtained by 2DE.
In order to investigate the identity o f the observed peptide ions, fractions were
digested w ith trypsin. The resultant tryptic peptides were further separated by nano-flow
LC and sequenced by ESI-M S/M S. Figure 4.2.3 summarises ad gene products identified
during these experiments. A lthough the number o f tryptic peptides detected per gene
product has been shown to correlate w ith then abundance in the original sample [247], it is
arguable whether this parameter can be taken as an accurate indication o f protein
concentration. Nevertheless, a higher number o f tryptic peptides detected per protein
correlates w ith a higher probability that the identification is correct [157]. For proteins
generating only one tryptic peptide, the identity was confirm ed by manual interpretation o f
the M S/M S spectrum.
I l l
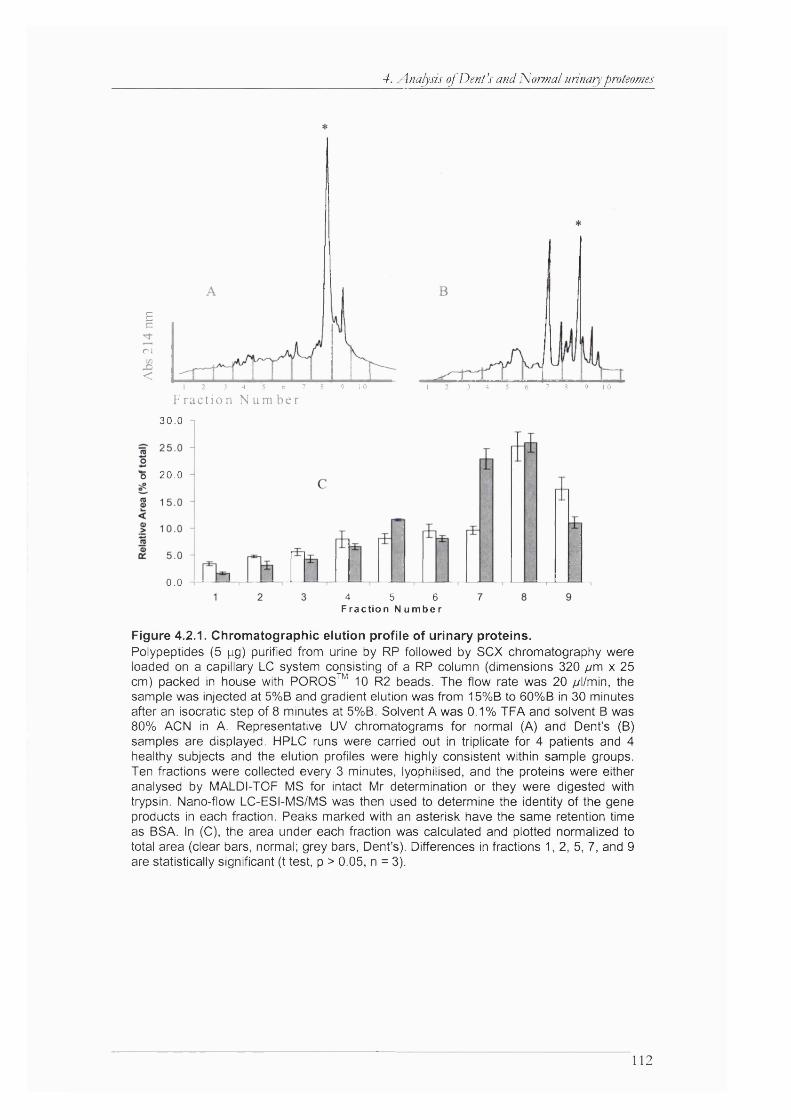
4. Analysis ofDenfs and Normal urinary proteomes
£c
n
<7 9 I 04 6 8 1 3 6 7 8 9 I 04
F ract i on N u m her30.0
o 20 .0
0.04 5 6
F ra c tio n N u m b e r
Figure 4.2.1. Chromatographic elution profile of urinary proteins.Polypeptides (5 pg) purified from urine by RP followed by SCX chromatography were loaded on a capillary LC system consisting of a RP column (dimensions 320 /ym x 25 cm) packed in house with POROS™ 10 R2 beads. The flow rate was 20 yul/min, the sample was injected at 5%B and gradient elution was from 15%B to 60%B in 30 minutes after an isocratic step of 8 minutes at 5%B. Solvent A was 0.1% TFA and solvent B was 80% AON in A. Representative UV chromatograms for normal (A) and Dent’s (B) samples are displayed. HPLC runs were carried out in triplicate for 4 patients and 4 healthy subjects and the elution profiles were highly consistent within sample groups. Ten fractions were collected every 3 minutes, lyophilised, and the proteins were either analysed by MALDI-TOF MS for intact Mr determination or they were digested with trypsin. Nano-flow LC-ESI-MS/MS was then used to determine the identity of the gene products in each fraction. Peaks marked with an asterisk have the same retention time as BSA. In (C), the area under each fraction was calculated and plotted normalized to total area (clear bars, normal; grey bars. Dent’s). Differences in fractions 1, 2, 5, 7, and 9 are statistically significant (t test, p > 0.05, n = 3).
112
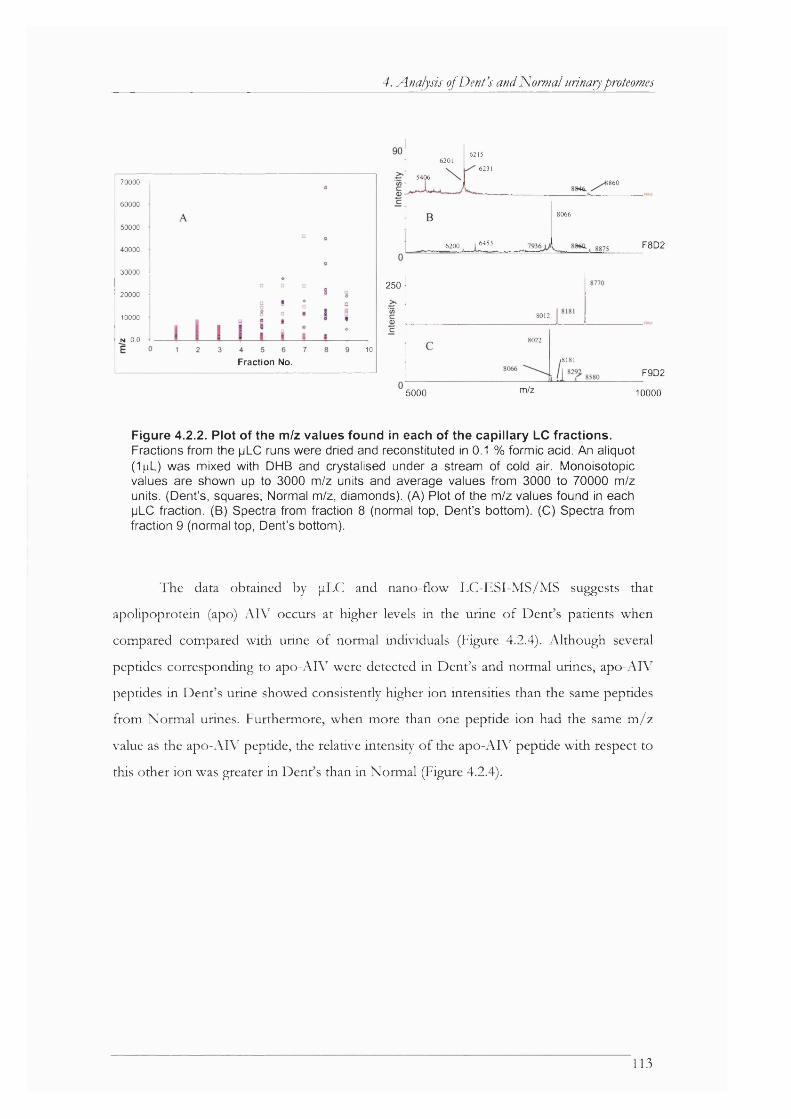
4. A.nalysis of Dent’s and Normal urinary proteomes
62156201
62315406
70000 1 I860
600008066
50000
6453 F8D2620040000 '
30000 1
25020000 -
801210000
N 0 0 802210
,8181Fraction No.F9D2
m/z5000 10000
Figure 4.2.2. Plot of the m/z values found In each of the capillary LC fractions.Fractions from the pLC runs were dried and reconstituted in 0.1 % formic acid. An aliquot (1|iL) was mixed with DHB and crystalised under a stream of cold air. Monoisotopic values are shown up to 3000 m/z units and average values from 3000 to 70000 m/z units. (Dent’s, squares; Normal m/z, diamonds). (A) Plot of the m/z values found in each pLC fraction. (B) Spectra from fraction 8 (normal top. Dent’s bottom). (C) Spectra from fraction 9 (normal top. Dent’s bottom).
The data obtained by pLC and nano-flow LC-ESI-M S/M S suggests that
apolipoprotein (apo) A IV occurs at higher levels in the urine o f Dent’s patients when
compared compared w ith urine o f normal individuals (Figure 4.2.4). A lthough several
peptides corresponding to apo-AIV were detected in Dent’s and normal urines, apo-AIV
peptides in D ent’s urine showed consistently higher ion intensities than the same peptides
from Norm al urines. Furthermore, when more than one peptide ion had the same m /z
value as the apo-AW peptide, the relative intensity o f the apo-AW peptide w ith respect to
this other ion was greater in Dent’s than in Norm al (Figure 4.2.4).
113
CD (/) 3 -O CQ (D5 ' Q. P 3
CD CD05 (T)
(/) &
o o
llc r (D
I ?
- t CD (/) —-aI3
Tl 3 1
O (O'Ï ICO ^
3 ' MCO
IJ°= îCD Q. O (DCD W
!|CD Q-
3 O'o
&
%CD
CD jQ C CD
sr I- o
§■O O
a .0)5)
CDcCO
§
O
CD
itÜi t
Tryptic Peptides Sequenced/Gene Product identifiedMeprin A
MHC class I antigei Monocyte antigen CD1 _
neuroblastoma, suppressii p Nucleobindin 1 precurso p
Orosomucoid 1 orosomucoid 2
Osteoclast-associate recc Osteopontin
PEBF PEDF
plasminogen^ PDGF A ctiaii L
predicted osteoblast protc ^=3 prepro-alptia-2 ctiait o
Proline-rich acidic pro te i , Pro-platelet basic protei
prosaposin Prostaglandin D2 synthas< Prostate differentiation fac Pro static acid phosphatast
F^oriasin Putative gene gi 207847
Retinol Binding Prote Ribonuclease 4 precurso
secretoglobin Serine protease inhibitor! serine protease, umbilici
similar to glucosamine-6 -s Similar PEBP (Neuropolyi Similar cDNA 2 300005BC Similar cDNA 2610528GC
Superoxide dsmutasc Supervillir tetranectin
Thy-1 membrane glycoprc Transferrin
Ubiquitir protein product gi 18490
Uromodulir Vitamin D binding prote Zn-alpha2-glycoproteir
FC35p)=>
defens In Dermatopontin
dermcldin desmocollin 1 desmocollin 2
diazepam binding Eoslnophll-derlved
EM ILIN-2bi factor H homologue |=i
fibrinogen, alpha Ganglloslde M2 p
gastric Inhibitory Guanylln precursor ^
Hemoglobin beta p Hemopexin E
Perlecan Ë Heparin cofactor II t=
HIstone H2A.F/Z & Ig gamma-1 chain C
Ig kappa chain Ig lambda chain
IGFBP-2 IGFBP-4 IGFBP-6 IGFBP-7 B
IGF-II IgG receptor
Inhibitor C,trypsln lnhlbltor,Kunltz type Inter-alpha Inhibitor E
Kalllkrein ^ Kininogen f e
latentTGF-beta- p Leuclne-rlch alpha-
Leukocyte- Llpoproteln GUI
LIthostathlne b Lumlcan □
Lymphocyte surface ° Lysozyme ^
lysyl oxidase lysyl oxidase-like 1 Matrllln 4 Isoform 2 matrix G la protein
matrix, extracellular
C=lp
r
r
Acr Ser P ro t Inhibitor
Album in C ollagen alpha 1 type X '
C ollag en alpha 3 type ' Alpha-1-m icroglobülin
Alpha-2-antip iasm in
alpha-fibrinogen
E N a C
A ngiom odulin antithrom bin III
ap o -H A polipoprote in A -l
A polipoprote in A -IV
Apolipoprote in C l A polipoprote in C-ll
apolipoprotein D A polipoprote in E
A polipoprote in F A T P a s e . H * transportii
B eta -2 m itjroglobulin beta-trace
bone m orphogenetic pi
CA11
cadherin 13
calcium binding protein
calgranulin B
CD14 antigen precursor
C D 5 antigen (p56-62) C D 5 9
C hrom ogranin A C lusterin
coFilin 1
C om plem en t facto r B C om plem en t facto r D
C om plem en t facto r H cystatin B
C ystatin C cystatin M
Cystic fibrosis antigen
. IÎ
I?
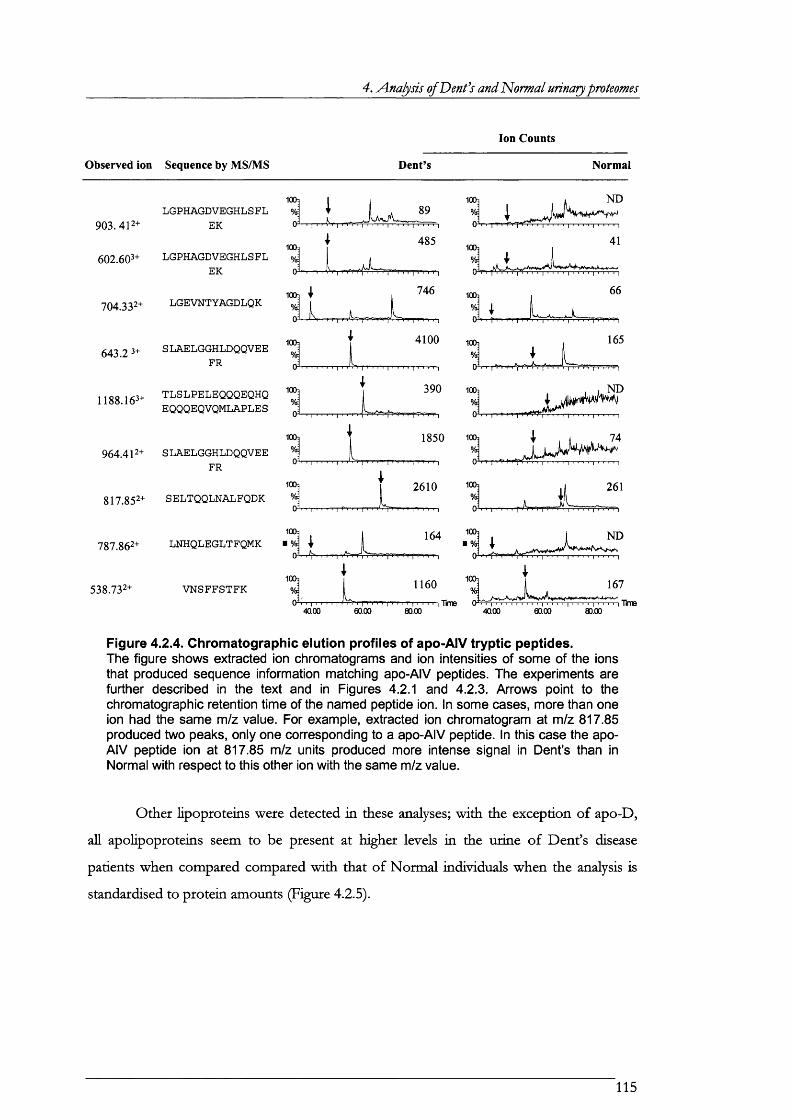
4. Analysis of Dent's and Normal urinaiy proteomes
Observed ion Sequence by MS/MS Dent’s
Ion Counts
Normal
903.412+
704.332+
787.862+
538.732+
LGPHAGDVEGHLSFLEK
LGEVNTYAGDLQK
643 2 3+ SLAELGGHLDQQVEE FR
1188 162+ t l s l p e l e q q q e q h qEQQQEQVQMLAPLES
964.412+ SLAELGGHLDQQVEE FR
817.852+ SELTQQLNALFQDK0+r-r-T-
LNHQLEGLTFQMK
VNSFFSTFK
L
89
485
602.602+ LGPHAGDVEGHLSFLEK ob, p I 1 . r,'
746
I 41001(
390
18501(
2610
___j
661(
165
ND
OVr-r
1850 T
261
rr-rr ■ | ■ i i | i i ■ i |
164 ND
I I11 i(1160 167
iTime Time40.00 60.00 80.00 40.00 80.00
Figure 4.2.4. Chromatographic elution profiles of apo-AIV tryptic peptides.The figure shows extracted ion chromatograms and ion intensities of some of the ions that produced sequence information matching apo-AIV peptides. The experiments are further described in the text and in Figures 4.2.1 and 4.2.3. Arrows point to the chromatographic retention time of the named peptide ion. In some cases, more than one ion had the same m/z value. For example, extracted ion chromatogram at m/z 817.85 produced two peaks, only one corresponding to a apo-AIV peptide. In this case the apo- AIV peptide ion at 817.85 m/z units produced more intense signal in Dent’s than in Normal with respect to this other ion with the same m/z value.
O ther lipoproteins were detected in these analyses; w ith the exception o f apo-D,
all apolipoproteins seem to be present at higher levels in the urine o f D ent’s disease
patients when compared compared w ith that o f N orm al individuals when the analysis is
standardised to protein amounts (Figure 4.2.5).
115

4. Analysis of Dent’s and'Normal urinaiy proteomes
Ion Intensities
Protein m/z Dent’s Normal
1 0 0 1
Apo-J 937.43 ■ %210
T*rtT-i7 rfi , I i -rrTi f ...................
Apo-D 392.17
10 '
2+ %30
.............
100n
Apo-CIII 5 9 8 .7 5 2 +
Apo-E 9 1 0 .7 5 3 +
Apo-AIV 1310.03 2+
Apo-AIV 538.73 2+
Apo-AI 693.81 2+
390
lOCh
o
lOOn
90
350
1 ND
1600
..........
1400
t+ T f r ,20.00 40.00 60.00 80.00
Time 0 1 |T T TT | ,-P IT | I T I I j I I I i f i I I I I I I I I'l I I , I , r I I I T lm C
20.00 40.00 60.00 80.00
Figure 4.2.5. Chromatographic elution profile of selected apolipoproteins.The figure shows the extracted ion chromatograms and retention times of selected apolipoproteins together with their ion intensities. Arrows point to the chromatographic retention time of the named peptide ion. These are results obtained from the experiments described in the captions of Figure 4.2.1 and 4.2.3.
Similarly, Figure 4.2.6 shows the extracted ion chromatograms o f some o f the
tryptic peptides that provided sufficient sequence in form ation fo r the identification o f
carrier proteins. As in the 2D E analysis, IGFBP-2, hemopexin, (3-2-glycoprotein I, VDBP,
and RBP seemed to be present at higher levels in the urine o f D ent’s patients, while tryptic
peptides o f urom odulin and IG FBP-7 produced stronger signals in norm al urine (Figure
4.2.6). These data agree w ith and thus validate the data obtained by the 2D E analyses.
116
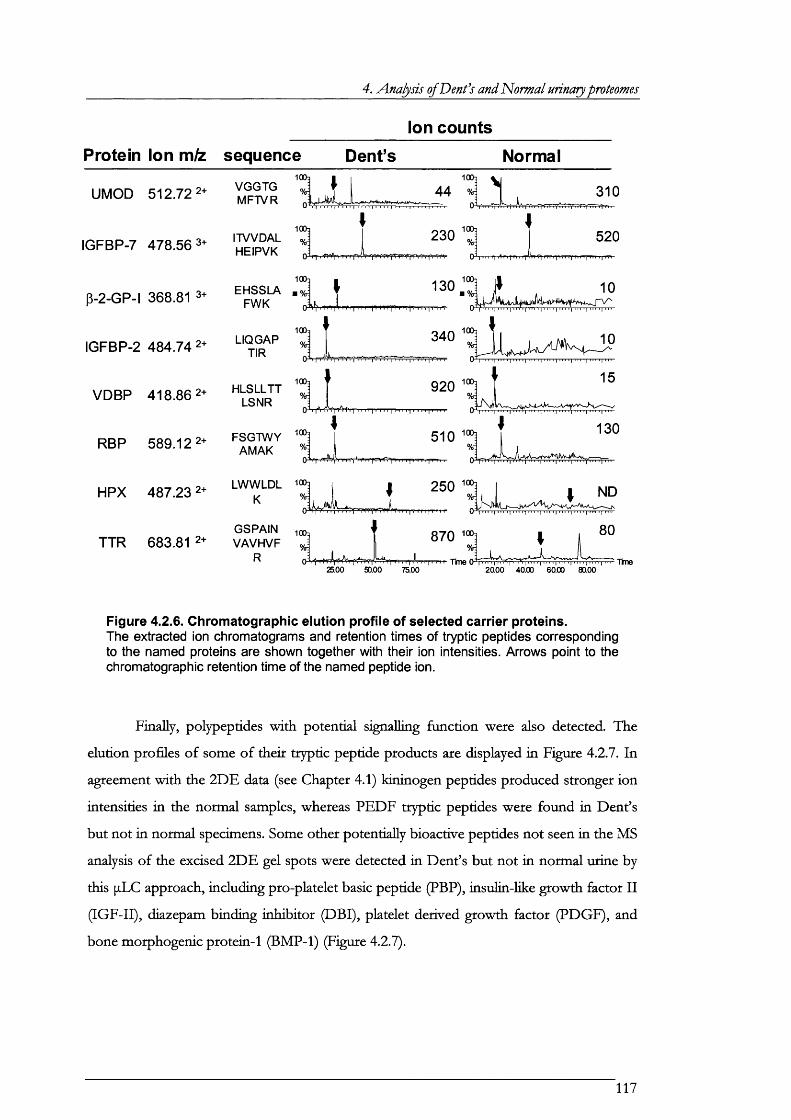
4. Analysis ofDenfs and Normal urinaiy proteomes
Ion counts
Protein Ion m/z sequence Dent’s Normal
UMOD 512.72 2+
IGFBP-7 478.56 3+
P-2-GP-I 368.81 3+
IGFBP-2 484.74 2+
VDBP 418.86 2+
RBP 589.12 2+
HPX 487.23 2+
TTR 683.81 2+
100q IVGGTG fM FTVR
lOOqITVVDAL HEIPVK
100]EHSSLA
FWK
44
130ICO:
1003 340LIQGAPTIR
15lOOq 920HLSLLTTLSNR
1301003 510
r-'
LWWLDL 1«>; K
GSPAIN 1003 VAVHVF %:
R
250 % \ ND
870%
25.00 50.00 75.00n I " ' I ' 111 Tme 0 Tme
20.00 40.00 60.00 80.00
Figure 4.2.6. Chromatographic elution profile of selected carrier proteins.The extracted ion chromatograms and retention times of tryptic peptides corresponding to the named proteins are shown together with their ion intensities. Arrows point to the chromatographic retention time of the named peptide ion.
Finally, polypeptides w ith potential signalling function were also detected. The
elution profiles o f some o f the ir tryptic peptide products are displayed in Figure 4.2.7. In
agreement w ith the 2D E data (see Chapter 4.1) kininogen peptides produced stronger ion
intensities in the norm al samples, whereas PED F tryp tic peptides were found in D ent’s
but not in norm al specimens. Some other potentially bioactive peptides not seen in the MS
analysis o f the excised 2D E gel spots were detected in D ent’s but not in norm al urine by
this pLC approach, including pro-platelet basic peptide (PBP), insulin-Hke grow th factor I I
(IG F -II), diazepam binding inh ib ito r (D B I), platelet derived growth factor (PDGF), and
bone morphogenic protein-1 (BMP-1) (Figure 4.2.7).
117
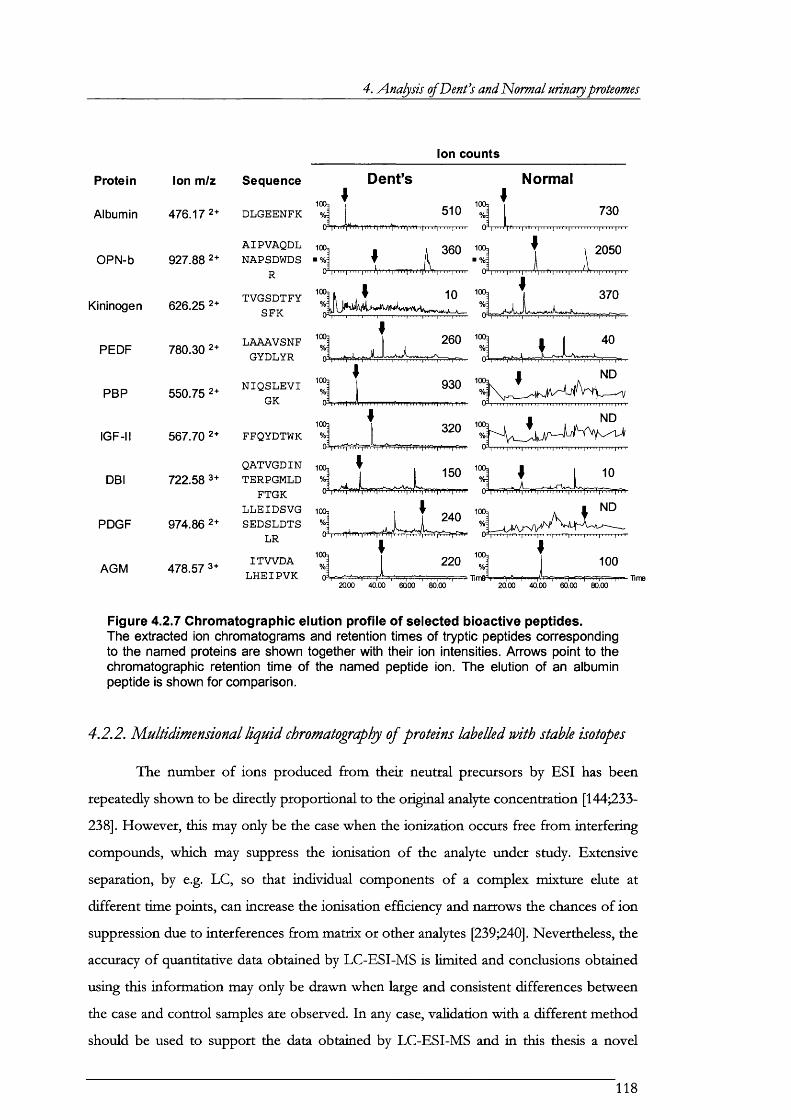
4. Analysis of Dent’s and Normal urinaiy proteomes
Ion counts
Protein Ion m/z Sequence
Albumin 476.17 2+ d lg ee n fk
AIPVAQDLOPN-b 927.88 2+ NAPSDWDS
Kininogen 626.25
PEDF
PBP
IGF-I
DBI
PDGF
AGM
780.30
2 +
2 +
TVGSDTFYSFK
LAAAVSNFGYDLYR
N IQ SL E V IGK550.75 2+
567.70 2+ FFQYDTWK
QATVGDIN 722.58 3+ TERPGMLD
FTGK LLEIDSVG
974.86 2+ SEDSLDTS LR
478.57 3+ I T W O A LHEIPVK
D e n t’s N orm al
'2 1 510100, ^q 1 730
■1, , t ....... 1 " “m f I 2050l l L k
3 I j ,
3 1
'2 1 32»
. . . L . ! _ L J "0 I l l ' l l ! n i l i i iT V fn n ^ i ,11,1,1 , jT T r îT Y ÏT ljr f lT 0 ‘■j 1111 iT T rfi- i n H p r r , , - n , T p - i , r fT T T r jT T T rîîT i
3 1 3 1r im S ^ l " ' f l n D . i n , " . | ^ ! T n , r r | i i r r ' , p - r T 7 f f î . | i , ^
2000 40.00 6000 80.00 20.00 40.00 60.00 80.00■ Time
Figure 4.2.7 Chromatographic elution profiie of selected bioactive peptides.The extracted ion chromatograms and retention times of tryptic peptides corresponding to the named proteins are shown together with their ion intensities. Arrows point to the chromatographic retention time of the named peptide ion. The elution of an albumin peptide is shown for comparison.
4.2.2. IS/Lultidimensional liqu id chromatography o f proteins labelled with stable isotopes
The number o f ions produced from their neutral precursors by ESI has been
repeatedly shown to be direcdy proportional to the original analyte concentration [144;233-
238]. However, this may only be the case when the ionization occurs free from interfering
compounds, which may suppress the ionisation o f the analyte under study. Extensive
separation, by e.g. LC, so that individual components o f a complex m ixture elute at
d ifferent time points, can increase the ionisation efficiency and narrows the chances o f ion
suppression due to interferences from m atrix o r other analytes [239;240]. Nevertheless, the
accuracy o f quantitative data obtained by LC-ESI-MS is lim ited and conclusions obtained
using this in form ation may only be drawn when large and consistent differences between
the case and control samples are observed. In any case, validation w ith a d ifferent method
should be used to support the data obtained by LC-ESI-M S and in this thesis a novel
118

4. Analysis ofDenfs and Norma/ urinary proteomes
method, termed isotope coded a ffin ity tags (IC AT) [165], was used to further investigate
the differences between the urinary proteomes o f D ent’s disease patients and N orm al
subjects.
The method o f IC A T was firs t introduced by Gygi et al [165] and the reagents
were later commercialised by Applied Biosystems. The firs t commercially available
reagents consisted o f three parts; a th io l reactive group (so that these reagents alkylate
cysteine residues), a linker, and a b io tin moiety. In one o f the reagents, deuterium atoms
(D) substitute fo r eight o f the protons in the linker, so that the difference in mass between
the ligh t and the heavy IC A T reagents is 8 Da. Several problems w ith these reagents were
observed. First, fo r doubly labelled compounds the difference in mass is 16 Da, which is
the same as an oxidised methionine, a common m odification in proteins and peptides.
Thus, due to this ambiguity a doubly labelled peptide could be confounded w ith an
oxidized peptide and this in turn could also lead to erroneous assignments o f IC A T pairs.
Second, analogues incorporating deuterium and protium elute at slightly d ifferent times
during RP-LC such that compounds labelled w ith D elute w ith a few seconds difference to
those containing norm al H isotope. This makes quantitation time consuming and d ifficu lt
to automate. Finally, the label was found to be too bulky and made the ionisation and
fragmentation o f labelled peptides inefficient. Therefore, later developmental efforts were
directed to overcome these problems and a new version o f these reagents was
commercialised, which contains nine ^ C atoms instead o f eight D as the isotope used fo r
relative quantitation, the difference between the two reagents is 9 Da instead o f 8 Da, and
they contain an acid cleavable group so that the bulky b io tin m oiety is removed before LC-
M S/M S analysis.
These new cleavable IC A T reagents (cICAT) were used to label D ent’s and
N orm al urinary proteins; D ent’s proteins were labelled w ith the heavy reagent, while
N orm al proteins were labelled w ith the ligh t reagent. P rio r to labeling, proteins were
precipitated using 50% acetone and further extracted using SCX LC. T ryptic digestion was
carried out after labelling and m ixing the two samples, and separation o f the peptides thus
generated was carried out by SCX LC, using a gradient o f ammonium chloride in trace
form ic acid. Four fractions per urine sample were collected. A vid in a ffin ity
chromatography was used to purify labelled peptides in each o f the SCX fractions as
recommended by the manufacturer. Cleavage o f the b io tin m oiety was also perform ed
using manufacturer’s recommendations.
119
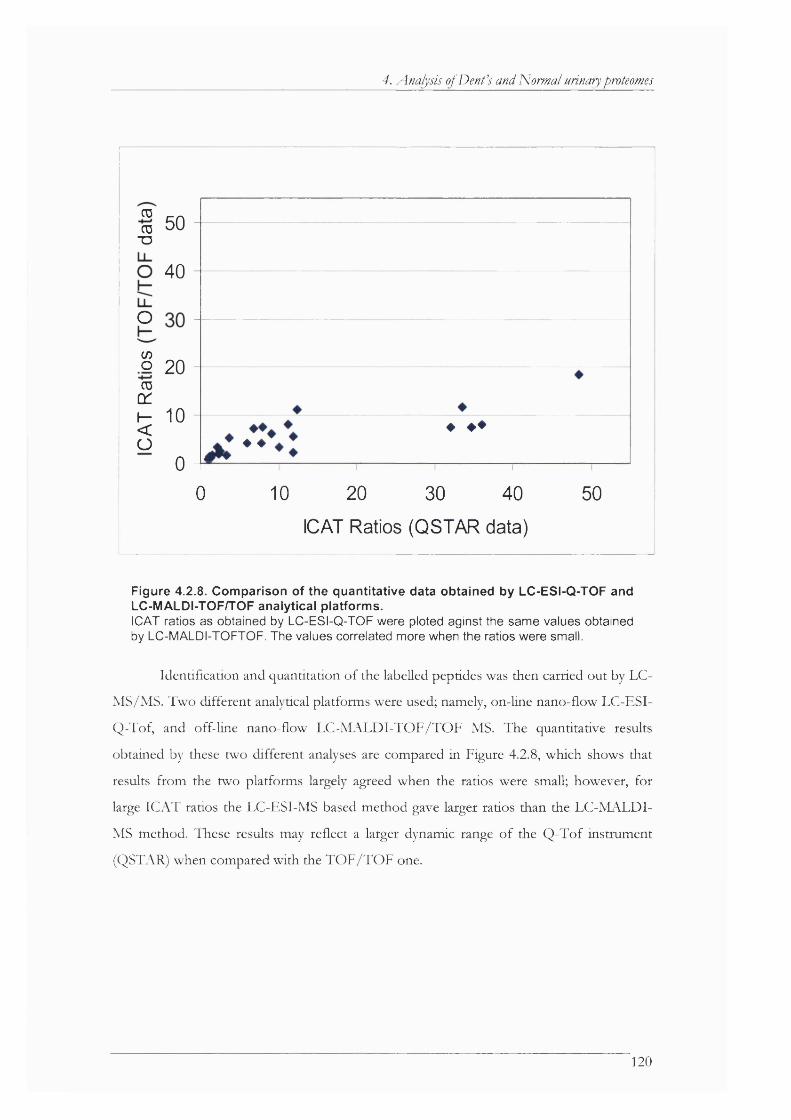
4. Analysis of Dent's and Normal urinary proteomes
03CD
"O
O
</)o03
0 :I -<o
50
40
20
10 ♦ ♦ ♦♦ ♦
00 10 20 30 40
ICAT Ratios (QSTAR data)
50
Figure 4.2.8. Comparison of the quantitative data obtained by LC-ESI-Q-TOF and LC-MALDI-TOF/TOF analytical platforms.ICAT ratios as obtained by LC-ESI-Q-TOF were ploted aginst the same values obtained by LC-MALDI-TOFTOF. The values correlated more when the ratios were small.
Identification and quantitation o f the labelled peptides was then carried out by LC-
MS/MS. Two different analytical platforms were used; namely, on-line nano-flow LC-ESl-
Q -Tof, and off-line nano-flow LC -N L \LD l-T O F /T O F MS. The quantitative results
obtained by these two different analyses are compared in Figure 4.2.8, which shows that
results from the two platforms largely agreed when the ratios were small; however, for
large IC A T ratios the LC-ESI-MS based method gave larger ratios than the LC -M A LD l-
MS method. These results may reflect a larger dynamic range o f the Q -T o f instrument
(QSTAR) when compared w ith the T O F /T O F one.
120
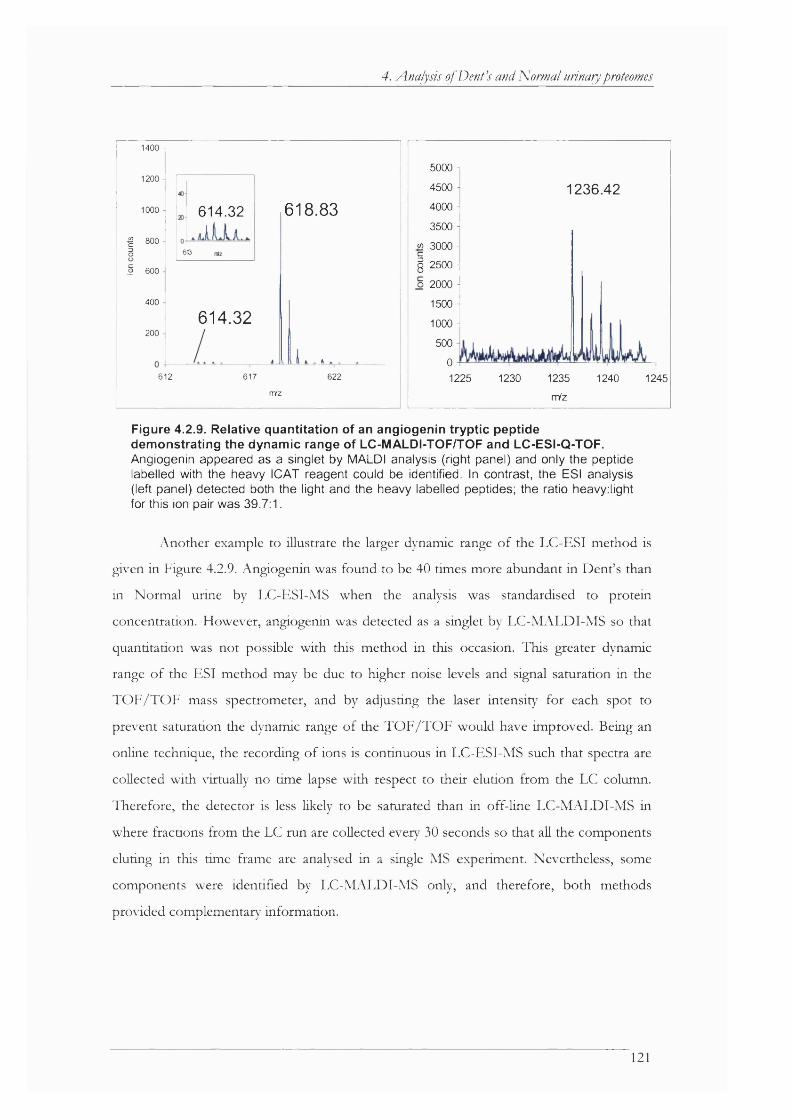
4. Analysis ofDenfs and Normal urinary proteomes
1400 1
1200 J
618.836 1 4 .3 21000 -
I 800 §
I 600
60
400
614.32200
612 617 622
rrVz
5000 -
4500 -
4000 1
3500 J
«3 3000 -
0 2500 o 2 0 0 0 -
1500 -
1000 -
500
1 2 3 6 .4 2
01225 1230 1235
nVz
1240 1245
Figure 4.2.9. Relative quantitation of an angiogenin tryptic peptide demonstrating the dynamic range of LC-MALDI-TOF/TOF and LC-ESI-Q-TOF.Angiogenin appeared as a singlet by MALDI analysis (right panel) and only the peptide labelled with the heavy ICAT reagent could be identified. In contrast, the ESI analysis (left panel) detected both the light and the heavy labelled peptides; the ratio heavy;light for this ion pair was 39.7:1.
Another example to illustrate the larger dynamic range o f the LC-ESI method is
given in Figure 4.2.9. Angiogenin was found to be 40 times more abundant in Dent’s than
in Norm al urine by LC-ESI-MS when the analysis was standardised to protein
concentration. Elowever, angiogenin was detected as a singlet by LC -M ALD I-M S so that
quantitation was not possible w ith this method in this occasion. This greater dynamic
range o f the ESI method may be due to higher noise levels and signal saturation in the
T O F /T O F mass spectrometer, and by adjusting the laser intensity fo r each spot to
prevent saturation the dynamic range o f the T O F /T O F would have improved. Being an
online technique, the recording o f ions is continuous in LC-ESI-MS such that spectra are
collected w ith \tirtually no time lapse w ith respect to their elution from the LC column.
Therefore, the detector is less likely to be saturated than in off-line LC -M ALD I-M S in
where fractions from the LC run are collected every 30 seconds so that all the components
eluting in this time frame are analysed in a single MS experiment. Nevertheless, some
components were identified by LC -M ALD I-M S only, and therefore, both methods
provided complementar}- inform ation.
121
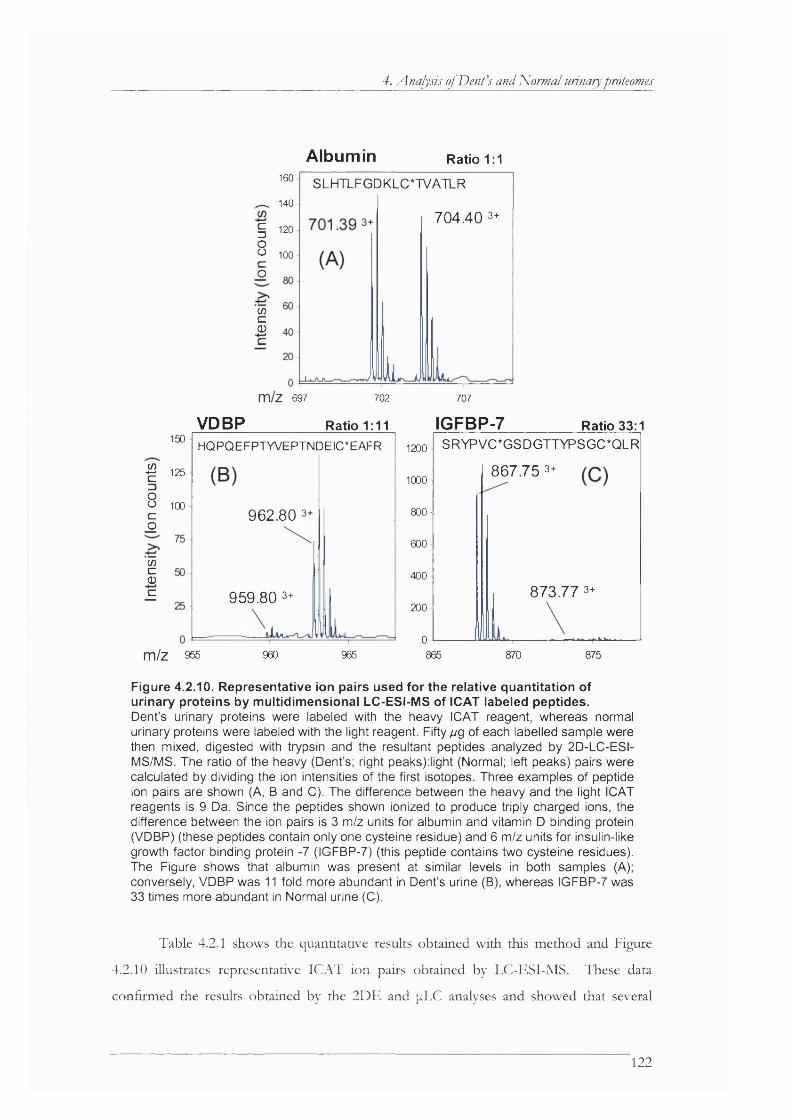
4. Analysis of Deni s and Normal urinary proteomes
Albumin Ratio 1:1160 SLHTLFGDKLC*TVATLR
^ 140
§ 120
8 100co
704 .40 3+
U)cCDC
m / z 697 702 707
VDBP Ratio 1:11 IGFBP-7 Ratio 33:1150 HQPQEFPTYVEPTNDEIC*EAFR
^ 125
8 100co
962 .80 3
(/)c0)c 959 .80 3+
m /z 955 960 965
SRYPVC*GSDGTTYPSGC*QLR1200
867 .75 3+1000
æo
600
400
8 73 .77 3+200
0865 870 875
Figure 4.2.10. Representative ion pairs used for the relative quantitation of urinary proteins by multidimensional LC-ESI-MS of ICAT labeled peptides.Dent’s urinary proteins were labeled with the heavy ICAT reagent, whereas normal urinary proteins were labeled with the light reagent. Fifty/vg of each labelled sample were then mixed, digested with trypsin and the resultant peptides analyzed by 2D-LC-ESI- MS/MS. The ratio of the heavy (Dent’s; right peaks):light (Normal; left peaks) pairs were calculated by dividing the ion intensities of the first isotopes. Three examples of peptide ion pairs are shown (A, B and C). The difference between the heavy and the light ICAT reagents is 9 Da. Since the peptides shown ionized to produce triply charged ions, the difference between the ion pairs is 3 m/z units for albumin and vitamin D binding protein (VDBP) (these peptides contain only one cysteine residue) and 6 m/z units for insulin-like growth factor binding protein -7 (IGFBP-7) (this peptide contains two cysteine residues). The Figure shows that albumin was present at similar levels in both samples (A); conversely, VDBP was 11 fold more abundant in Dent’s urine (B), whereas IGFBP-7 was 33 times more abundant in Normal urine (C).
Table 4.2.1 shows the quantitative results obtained w ith this method and Figure
4.2.10 illustrates representative IC A T ion pairs obtained by LC-ESI-MS. These data
confirmed the results obtained by the 2DE and pLC analyses and showed that several
122

4. Analysis ofDenfs and Normal urinary proteomes
proteins o f plasma origin were present at sim ilar levels in D ent’s and norm al urine when
the analysis was standardized to total protein content (Table 4.2.1). In contrast, and in
agreement w ith the 2D E and pLC data, carrier proteins such as H PX, RBP, VDBP, ^-2-
G P-I, and several IGFBPs were present at higher levels in D ent’s urine samples. Several
cytokines were also present at higher levels in D ent’s samples, again in agreement w ith the
results obtained by pLC. However, results disagreed fo r transferrin, TTR , OPN, and
PEDF. TTR and OPN do no t have a cysteine residue in their coding sequence and
therefore they cannot be labelled by IC A T reagents, while PED F only has one cysteine-
containing tryp tic peptide; however, this peptide was not detected among the complex
peptide m ixture generated upon trypsin digestion o f the whole sample. Transferrin
appeared to be present at higher levels in. D ent’s urine by IC A T, which also disagreed w ith
the 2D E data. This probably reflects a saturation o f signal in the silver-stained gels. O n
the other hand, the detection o f urom odulin, kininogen, and EG F precursor, and others,
present at higher levels in norm al urine by IC A T agreed w ith the gel electrophoresis
and /o r pLC data (Table 4.2.1 and Figure 4.2.10).
Table 4.2.1. ICAT ratios.The ratios of Dent’s over Normal urinary proteins as determined by the ICAT strategy are shown as average ± standard deviation of 4 Dent’s samples over a pool of 5 normal urine samples.
Protein Ratio D/NProteins found at hiaher levels in Normal
latent TGF-yff BP > 0.02CD59 0.021 ± 0.01uromodulin 0.028 ± 0.007IGFBP7 0.027 ± 0.018poly-lg receptor 0.031 ± 0.008EGF (urogastrone) 0.039 ± 0.01TNF receptor superfamily 0.080 ± 0.047kininogen 0.084 ± 0.008CD27 (TNF receptor) 0.086 ± 0.009perlecan 0.099 ± 0.05lithostathine 0.13 ±0.036urokinase 0.14 ±0.005urinary protein 1 0.24 ± 0.1TNF 0.28 ± 0.1
Proteins found at similar levelsIg y chain 0.46 ± 0.2Ig/f 0.60 ± 0.11cystatin M 0.93 ± 0.4albumin 1.0 ± 0.3pancreatic ribonuclease 1.0 ±0.9a-2-HS-glycoprotein 1.3 ± 0.3ÛT-1-microglobulin 1.4 ± 0.4
123
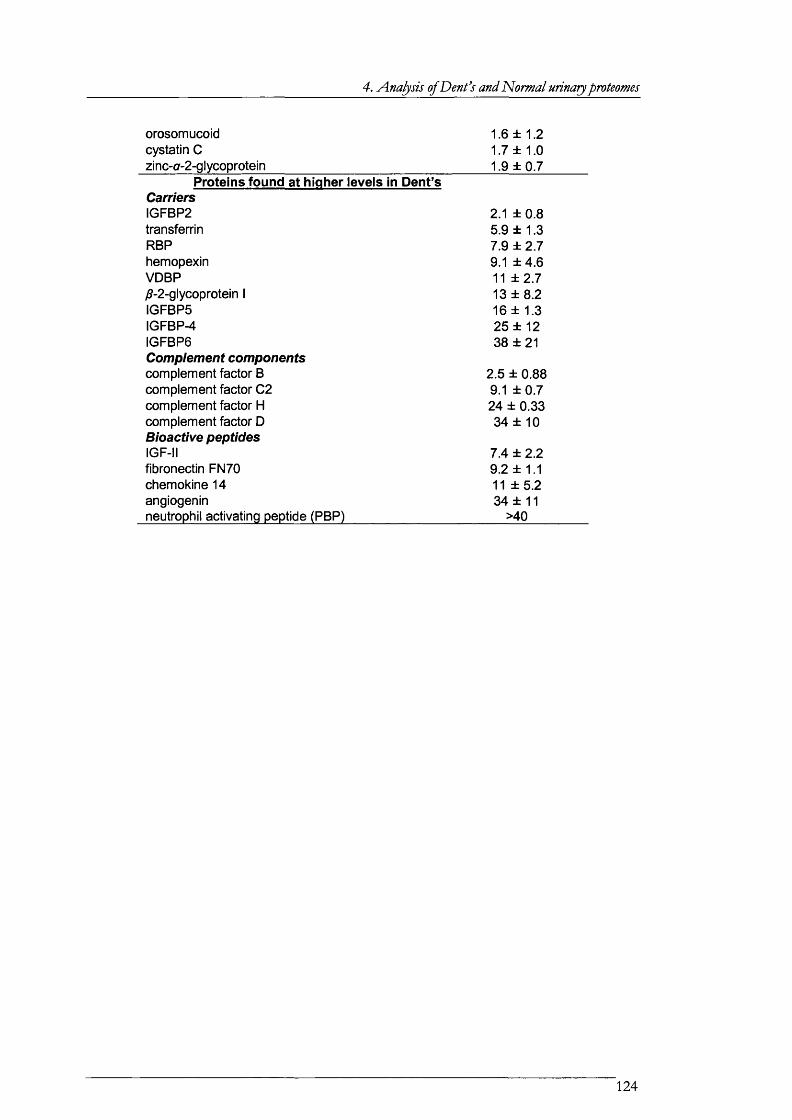
4. Analysis ofDenfs and 'Normal urinary proteomes
orosomucoid cystatin Czinc-a-2 -glycoprotein
1.6 ± 1.2 1.7 ± 1.0 1.9 ±0 .7
Proteins found at hiaher levels in Dent’sCarriersIGFBP2 2.1 ± 0.8transferrin 5.9 ± 1.3RBP 7.9 ± 2.7hemopexin 9.1 ±4 .6VDBP 11 ±2 .7yff-2 -glycoprotein 1 13 ± 8.2IGFBPS 16 ± 1.3IGFBP-4 2 5 ± 12IGFBPS 38 ±21Complement com ponentscomplement factor B 2.5 ± 0.88complement factor C2 9.1 ±0 .7complement factor H 24 ± 0.33complement factor D 34 ±1 0Bloactive peptidesIGF-II 7.4 ± 2.2fibronectin FN70 9.2 ± 1.1chemokine 14 11 ±5 .2angiogenin 34 ± 11neutrophil activating peptide (PBP) >40
124
4. Analysis ofDenfs and Normal urinary proteomes
4.3. Comparison of the results presented in this chapter with published
studies on the proteome of urine
Urine is the most readily available biological flu id and therefore its analysis
provides the least intrusive method fo r the diagnosis o f specific conditions. As a result,
considerable interest has been placed in the characterization o f the urinary proteome w ith
the emphasis in its comparison w ith the proteome in d ifferent disease states [161],
Examples o f applications in which urinary proteomics have been used to identify markers
o f diseases include several types o f cancer [248-251], rheumatoid arthritis [252], glomerular
disease [190;229;253], unspecific inflam m atory abscess [247] and cadmium nephrotoxicity
[161]. Recently, analysis o f proteins in urine has also been used to study kidney function
after perturbation o f a defined physiological parameter [163].
When comparing the protein patterns o f utine as determined by 2D E it is found
that these patterns vary between studies. Figure 4.3.1 shows the gel images from five
studies in where norm al proteins were separated by 2DE. The gel image from the Danish
Centre fo r Human Genome Research (Figure 4.3.1.A ) shows the urinary patterns after
separation by lE F in the firs t dimension and SDS PAG E in the second dimension. N o
details on the staining or extraction procedure are given in the it database (at
proteomics.cancer.dk). The intensity o f the spot corresponding to urom odulin is weaker in
this image than in the image obtained from a representative gel obtained during this study
(Figure 4.3.l.F ), whereas orosomucoid displays a strong intensity in gel A but not in gel F.
Figure 4.3.1.B displays the gel patterns as determined by IP G on the firs t dimension and
SDS PAG E on the second after stiver nitrate staining and extraction by dye precipitation
[161]. This pattern is sim ilar to the one in F w ith the exception that orosom ucoid (also
known as a-1-acid glycoportein) was not detected in F, probably due to its high acidity.
The gel image in Pang et et a i [247] in Figure 4.3.l.C was obtained after SPE
extraction using RP disks and Sypro Ruby staining [247]. The lack o f albumin and
transferrin is quite surprising in this gel since these are the two o f the most abundant
proteins in urine. This may be due to artefacts introduced during the staining procedure or
to degradation or low recovery o f proteins during SPE extraction. In a parallel
investigation the authors detected these two proteins by LC -M S/M S after proteolytic
digestion o f the whole sample [247].
125

4. Analysis of Dent's and Normal urinary proteomes
- H S A
♦•«i-Zn-ajÇP .■
• a - l - M G .
orosomucoicl * • * * ? ,
MW
I I* _v~ ^ -e -T H G
* a-1-acid GP
Ji
l l -
b -1-MG
Zn-a2-GP
K,A, Igs
n - * vI I I3 4 > I I I pi
I « II
17, . acr^jp»"!-----------Membrane « Eerrdopeptidase ..^ '^ j^ m b ra n e
T ,
a -1-acid G P
Zn-a-GP
Q -1-MG
HSA y T F
Zn-a-GP
a-1-M C^ - «I , K,A, Igs
a -1-acid GP 2
-T N G-
HSA
TF
F
HSP / w ia e ta l lo -e n d o p e p t id a s e .,— Zn-a-GPV-
ApolV_^j : nexin«0 . \Jr . * -
Anionexchanger 2 fucosyitran^ferase
• • ^
lyi^L-associated e* protease
a -1 -M G \K,A, Igs
Figure 4.3.1. Comparison of published studies on urinary proteomes by 2DE.Patterns of human urinary proteomes from normal individuals as previously published are shown (A-E) and compared compared with one of the gels obtained from this work (F). Gel images are reproduced from: A, the Danish Centre for Human Genome Research (at proteomics.cancer.dk); B, Marshall et al. [161]; G, Pang el al [247]; D and E, Thongboonkerd et et al. [189]; F, this study (normal subjects). The identities of the protein present in some of the major spots are shown.
126
4. Analysis of Dent’s and Normal urinary proteomes
Thongboonkerd et al reported two methods fo r the extraction o f proteins from
urine, namely precipitation using organic solvent, and ultracentrifugation [189]. The
protein patterns obtained by these two procedures were strikingly d ifferent (see Figure
4.3.1.D and E). Precipitation gave a pattern that is consistent w ith the patterns obtained in
this study and that o f Marshall et al, w ith the exception that urom odulin, the most
abundant protein in urine, was not detected by Thongboonkerd et al In contrast,
ultracentrifugation enriched fo r membrane proteins [189]. I t has been suggested that urine
contains a low density ‘membrane fraction’ that arises from exocytosis o f proteins in
defined vesicles [254].
In view o f this comparison, it can be argued that variation exists in the 2D E
patterns o f urinary proteins as reported by different groups, probably due to differences in
sample preparation and /o r staining method.
Relative quantitation o f proteins as determined by 2D E is somewhat misleading
since urom odulin, the most abundant protein in urine [223;226], produced low spot
intensity w ith respect to other protein spots in most o f the smdies reported in the
literature. The low representation o f hydrophobic proteins in 2D gels has been
documented [98;100;101;255-258] so that alternatives fo r the analysis o f hydrophobic
proteins based on ID SDS-PAGE (e.g., [259]) o r LC-MS (e.g. [260]) have been described.
Furthermore, urom odulin has a quaternary structure consisting o f four subunits and it also
forms complexes w ith other proteins [280]. Perhaps because o f its tendency to form
aggregates, urom odulin is prone to precipitation, and is found in kidney stones [261]. This
is exploited in its purification [262] and may be a cause o f its low representation in 2D gels.
In contrast to the 2D E data, the ID SDS-PAGE data presented in this thesis (see Figure
4.1.1) agreed w ith the assertion that urom odulin is the m ost abundant protein in normal
urine, and therefore results obtained w ith by the latter method may be more indicative o f
the true nature o f the sample under study. However, the low resolution o f ID SDS-PAGE
makes it unsuitable fo r most proteom ic applications dealing w ith complex protein
mixtures.
Marshall et al investigated the protein patterns in the urine o f subjects
occupationally exposed to cadmium [161]. Since cadmium exposure causes the
manifestations o f renal Fanconi syndrome [73] it would be expected to find a correlation
between their data and the data presented here. The cited study indicated that several low
127
4. Analysis of Den A and Normal urinary proteomes
molecular weight proteins such as RBP, apo-AI, (32-microglobulin, a-1 m icroglobulin, and
Igs are present at higher levels in case versus contro l subjects [161]. These findings agreed
w ith the data obtained here fo r all the proteins except fo r a-1 m icroglobuhn and the Igs,
fo r which no significant differences were observed in this study. The study was based on
2D E and gels were stained w ith silver nitrate. The low dynamic range o f silver nitrate
signal intensity as a fim ction o f protein amount has been documented [102;263] and the
results presented by Marshall et al [161] were not followed by other analytical methods.
Therefore, the discrepancy in a-1 m icroglobulin and Igs amounts between their data and
this data could be explained by saturation o f signal in the silver stained 2D gels.
The im plem entation o f LC -M S/M S methods fo r the characterization o f urinary
proteins has also been reported [112;247]. In the studies cited. Pang et al [247] identified
36 proteins by ID -LC -M S /M S and 90 by 2D -LC -M S/M S in the urine o f a subject before
and after suffering from an inflam m atory condition, w hilst Spahr et al [112] identified 124
protein in commercial lyophUised urinary proteins by ID -LC -M S /M S . The data presented
by these authors is consistent w ith the data presented here and m ost o f the reported
proteins in these papers were also found during the course o f this work. I t should be
noted, however, that certain bioactive peptides present in renal Fanconi patients were not
detected in these two studies, including IG F -I, IG F -II, BMP-1, PDG F, and PBP, which
reinforces the data presented in this thesis, and may indicate that the presence o f these
peptides in urine is specific fo r renal Fanconi syndrome patients.
M ore targeted proteom ic studies, based on immunochemistry, aimed at the
identification o f proteins and peptides in the urine o f renal Fanconi patients have also been
described. Norden et al reported quantitative analyses o f several proteins in the urines
from the same subjects used during this w ork [151;264]. Nevertheless, direct comparison
o f theic data w ith this data is d ifficu lt because these authors standardised their analyses to
creatinine concentration, whereas in the studies reported here the standardisation were to
protein concentration. Thus, in order to compare these two datasets the concentration
values fo r each o f the proteins reported in Norden et al was divided by the concentration
o f albumin. For this comparison, albumin was chosen to normalise all the other proteins
because albumin has the same concentration ratio w ith respect to other protein in D ent’s
and in N orm al urine (see Figure 4.2.10).
128
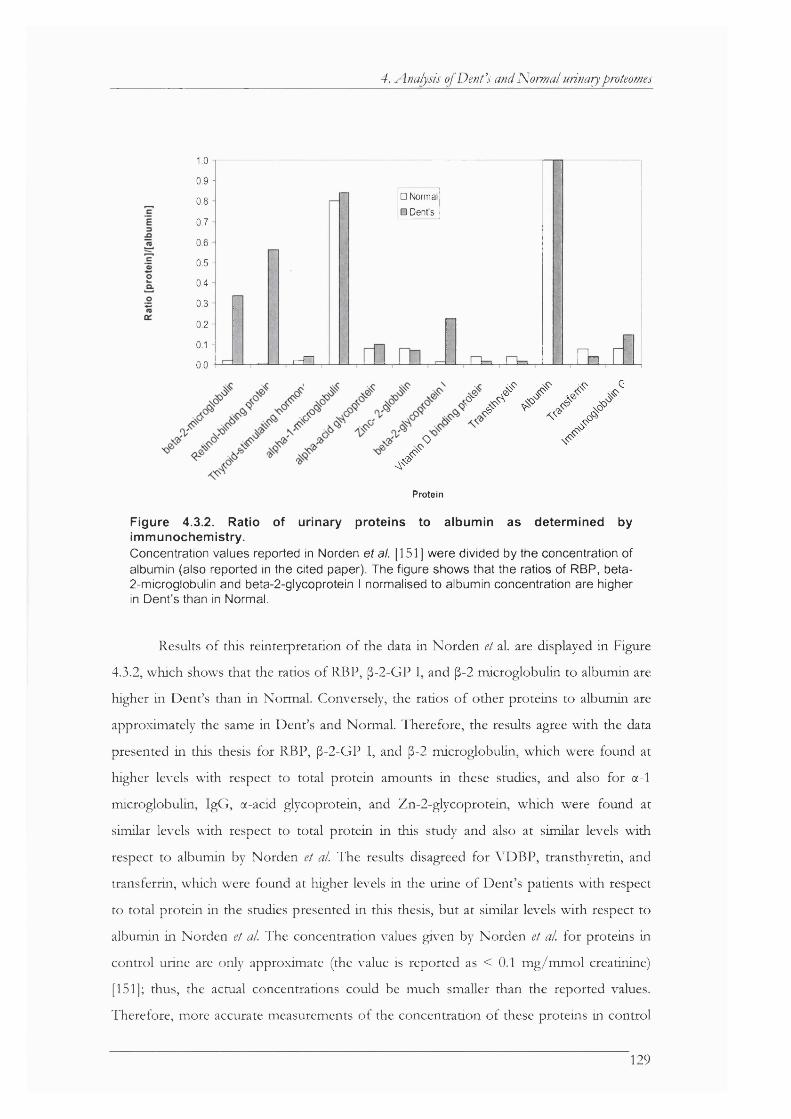
4. Analysis of Deni’s and Normal urinary proteomes
1.0
0.9 -
0.8
0.7
0.6
0.5 -
0.4
0.3
0.2
0.1
0.0 r-n
□ Normal
□ Dent's
H n n
yo '
' / < / /y
Protein
Figure 4.3.2. Ratio of urinary proteins to albumin as determined by immunochemistry.Concentration values reported in Norden et a\. [151] were divided by the concentration of albumin (also reported in the cited paper). The figure shows that the ratios of RBP, beta- 2-microglobulin and beta-2-glycoprotein I normalised to albumin concentration are higher in Dent’s than in Normal.
Results o f this reinterpretation o f the data in Norden et al. are displayed in Figure
4.3.2, which shows that the ratios o f RBP, (3-2-GP I, and [3-2 m icroglobulin to albumin are
higher in Dent’s than in Normal. Conversely, the ratios o f other proteins to albumin are
approximately the same in Dent’s and Normal. Therefore, the results agree w ith the data
presented in this thesis for RBP, [3-2-GP I, and [3-2 m icroglobulin, which were found at
higher levels w ith respect to total protein amounts in these studies, and also fo r a-1
m icroglobulin, IgG , a-acid glycoprotein, and Zn-2-glycoprotein, which were found at
similar levels w ith respect to total protein in this study and also at similar levels w ith
respect to albumin by Norden et al. The results disagreed fo r VDBP, transthyretin, and
transferrin, which were found at higher levels in the urine o f Dent’s patients w ith respect
to total protein in the studies presented in this thesis, but at similar levels w ith respect to
albumin in Norden et al. The concentration values given by Norden et ai fo r proteins in
control urine are only approximate (the value is reported as < 0.1 m g/m m ol creatinine)
[151]; thus, the actual concentrations could be much smaller than the reported values.
Therefore, more accurate measurements o f the concentration o f these proteins in control
129
4. Analysis ofDenfs and Normal urinary proteomes
and D ent’s urines w ould be needed in order to make a more appropriate comparison o f
the data obtained by immunoassays w ith the data presented in this thesis.
130

4. Analysis of Deni’s and Normal urinary proteomes
4.4. Lessons learned from the direct comparison of three analytical
approaches to urinary proteomics
The results presented in Sections 1 and 2 o f this chapter indicated that there are
several differences in the qualitative com position o f D ent’s disease urinary proteome when
compared compared w ith that o f norm al subjects. These differences were found by
independent analytical approaches aimed at the identification and relative quantitation o f
proteins. A lthough the results obtained by these d ifferent approaches gave consistent
results fo r most proteins, there also were some inconsistencies, the possible source o f
which is discussed below.
2D E is the m ost frequently used separation m ethod to compare the polypeptide
patterns o f related samples because o f its resolution power, which allows fo r the display o f
several hundreds to thousands o f protein spots. However, there are several problems
associated w ith this technique [265]. For example, 2D E is not suitable fo r the separation o f
very hydrophobic, large, small, and very basic or acidic proteins;, and low abundant
proteins are masked by high abundant ones in most 2D gels. In addition, not all proteins
can be visualised by silver o r other staining methods [266]. For example, it has been shown
that certain acidic proteins, such as OPN, are poorly stained by silver nitrate [266]. This
may explain why this prote in was readily detected by the pLC method used this study but
was no t identified by 2DE. A n additional caveat o f 2D E based proteom ic studies is that,
in some occasions, gel spots contain more than one protein, making quantitation
unreliable. Results presented in section 1 o f this chapter showed that spots from 2D gels
sometimes consist o f a m ixture o f proteins, and often M A L D I-T O F MS and peptide mass
mapping analysis does no t allow, by itself, fo r the identification o f several proteins in a
m ixture.
Nevertheless, 2D E is the most w idely used separation method in proteomics
because o f its robustness, its advanced state o f development, and because it provides a
visual p latform fo r the qualitative and quantitative comparison o f related proteomes
[156;267]. Furtherm ore, the data obtained by 2D E is easy to visualize and interpret and it
is the only method employed in this laboratory that allows fo r the identification o f proteins
isoform s based on p i heterogeneity. Indeed, in the studies that are the subject o f this thesis
176 proteins were identified by 2DE, which corresponded to 50 d ifferent genes. This
means that, on average, each gene was identified as 3.5 protein isoforms. These isoforms
may arise by post-translational m odifications such as proteolysis o r covalent m odifications
131
4. Analysis of Dent's and Normal urinary proteomes
w ith phosphates, lipids, or sugars. The nature and extent o f these m odifications were not
investigated here.
L iquid chromatography has also been used p rio r to mass spectrometry fo r the
separation o f proteins [109;110;231;268] o r the it proteolytic products
[112;113;165;166;210;247;269]. The advantage o f this approach is that it is more sensitive
and less tim e consuming, as w ell as less biased, than 2D E such that results from these
strategies only partially overlap w ith those obtained by 2D E analysis. In the experiments
described here, over 120 proteins were detected by the pLC approach, whereas only 50
were detected by the 2D E method. This is particularly significant when we consider the
fact that 10 times more protein was used fo r the 2D E analysis than fo r the [jlLC runs.
However, some large proteins may not elute in a defined peak or they may precipitate
during the chromatographic run so that they may not be detectable by this method.
Moreover, quantitation by non-gel based proteom ic methods, albeit feasible, is more
challenging than by 2D E because isotopic labeling is needed fo r accurate quantitation.
One o f these isotope labelling strategies, namely m ultidim ensional LC o f IC A T
labelled proteins [165], was employed in the experiments described in this thesis. The data
obtained w ith this m ethod validated the data obtained w ith the other two methods in most
o f the cases. A n im portant discrepancy between the data obtained by IC A T and that
obtained by 2D E was observed fo r transferrin, fo r which the IC A T strategy showed that
this protein is about 5 times more abundant in D ent’s urine when the analysis is
standardized to protein concentration, whereas 2D E analysis did not show differences fo r
this protein. One o f the problems associated w ith silver nitrate staining o f gel separated
proteins is that the staining intensity saturates at high protein concentration and therefore
this staining procedure is only suitable fo r the detection o f qualitative differences between
two samples. For more quantitative w ork, other staining procedures, such as those based
on fluorescence emission, may give larger dynamic range. Another problem associated
w ith the IC A T strategy is that no t all proteins contain cysteine residues in their coding
sequence. For example, TTR, PDG F, and several apoHpoproteins appeared to be present
at higher levels in D ent’s when compared w ith the same amounts o f norm al urinary
protein by pLC and /o r 2DE. However, these proteins could not be quantified by the
IC A T strategy because they do not contain cysteine residues.
Polypeptides are heterogeneous from a physicochemical po in t o f view; properties
o f proteins and peptides, such as hydrophobicity, p i, and charge, range enormously and
132
4. Analysis of Dent’s and Normal urinary proteomes
some o f them are very d ifficu lt to solubilise in aqueous solvents (e.g., membrane proteins),
whereas others are readily soluble in water. Conversely, hydrophobic proteins are better
solubilised in organic solvents, whereas hydrophilic ones precipitate in these solvents.
These d ifferent physical and chemical properties reflect the fact that polypeptides perform
very d ifferent physiological functions in the cell and extraceUularly, protein functions
ranging fio m structural to catalytic. This makes certain proteins very d ifficu lt to purify and
there do not exist ‘o ff-the -se lf methods fo r the isolation o f proteins, as fo r e.g. D N A ,
because purification methods norm ally exploit some kind o f physical property o f the
molecule o f interest. Consequently, due to the same physicochemical heterogeneity o f
proteins that enables them to carry out diverse biological functions, no single separation
technique may be completely adequate fo r comprehensively analysing all the proteins in a
sample. Thus, an im portant lesson learned during the course o f the studies described in
this thesis is that proteom ic studies may benefit by adopting several separation methods
before mass spectrometric analysis i f a comprehensive picture o f the proteome under
study is to be obtained.
133
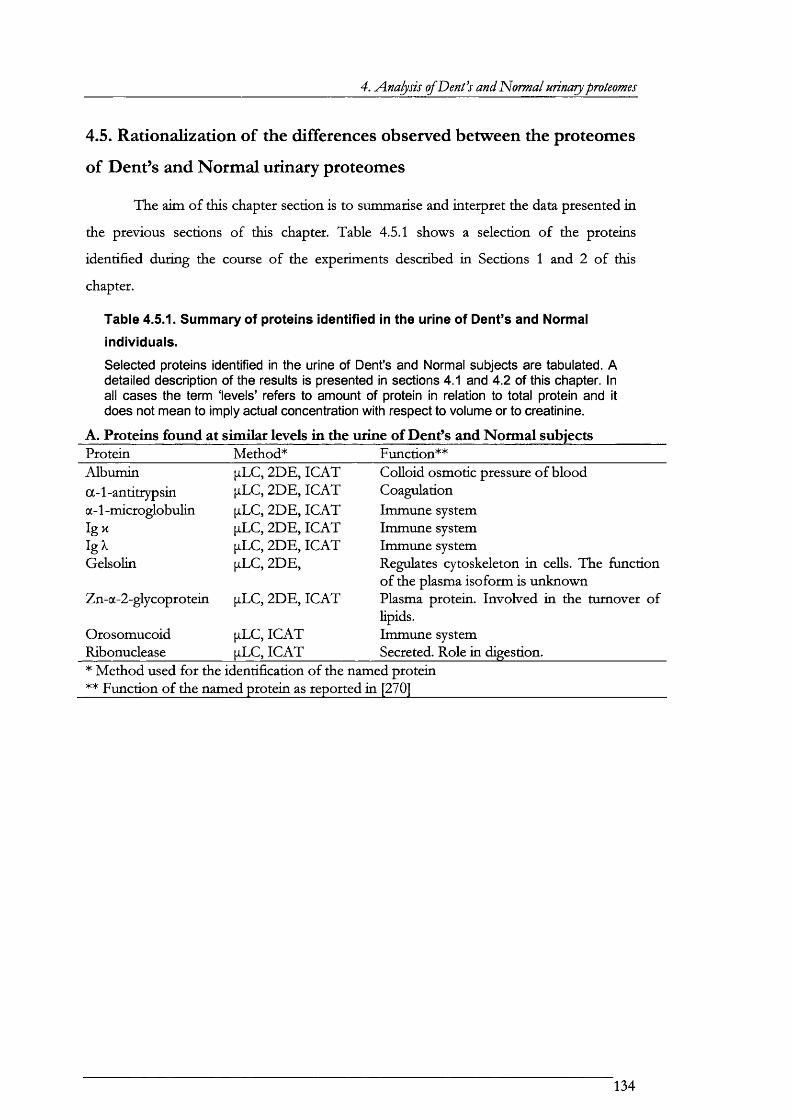
4. Analysis ofDenfs and N om al urinary proteomes
4.5. Rationalization of the differences observed between the proteomes
of Dent’s and Normal urinary proteomes
The aim o f this chapter section is to summarise and interpret the data presented in
the previous sections o f this chapter. Table 4.5.1 shows a selection o f the proteins
identified during the course o f the experiments described in Sections 1 and 2 o f this
chapter.
Table 4.5.1. Summary of proteins identified in the urine of Dent’s and Normal
individuals.
Selected proteins identified in the urine of Dent’s and Normal subjects are tabulated. A detailed description of the results is presented in sections 4.1 and 4.2 of this chapter. In all cases the term ‘levels’ refers to amount of protein in relation to total protein and it does not mean to imply actual concentration with respect to volume or to creatinine.
A. Proteins found at similar levels in the urine of Denfs and Normal subjects______Protein M ethod* Function**A lbum in pLC, 2D E, IC A T C ollo id osmotic pressure o f blooda-1-antitrypsin pLC, 2D E, IC A T Coagulationa-1 -m icroglobulin pLC, 2D E, IC A T Immune systemIgK pLC, 2D E, IC A T Immune systemIgX pLC, 2D E, IC A T Immune systemGelsoHn pLC, 2DE, Regulates cytoskeleton in cells. The fim ction
o f the plasma isoform is unknownZn-a-2-glycoprotein pLC, 2D E, IC A T Plasma protein. Involved in the turnover o f
lipids.Orosom ucoid pLC, IC A T Immune systemRibonuclease pLC, IC A T Secreted. Role in digestion.* M ethod used fo r the identification o f the named protein ** Function o f the named protein as reported in [270]
134
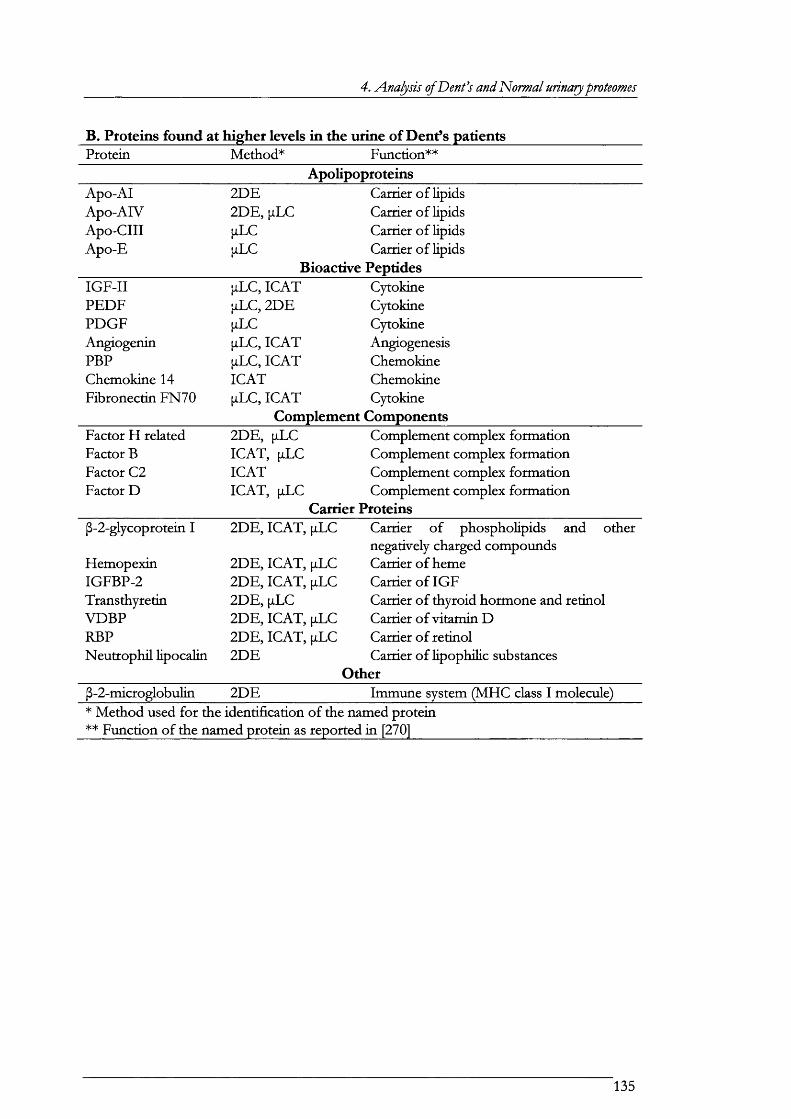
4. Analysis ofDenfs and Normal urinary proteomes
B. Ptoteins found at higher levels in the urine of Denfs patientsProtein M ethod* Function**
ApolipoproteinsA po -A I 2D E Carrier o f lipidsA p o -A IV 2D E, pLC Carrier o f lipidsA p o -C III pLC Carrier o f lipidsA po-E pLC Carrier o f lipids
Bioactive PeptidesIG F -II pLC, IC A T CytokinePEDF pLC, 2D E CytokinePDG F pLC CytokineAngiogenin pLC, IC A T AngiogenesisPBP |iLC , IC A T ChemokineChemokine 14 IC A T ChemokineFibronectin FN70 pLC, IC A T Cytokine
Complement ComponentsFactor H related 2DE, pLC Complement complex form ationFactor B IC A T, pLC Complement complex form ationFactor C2 IC A T Complement complex form ationFactor D IC AT, pLC Complement complex form ation
Carrier ProteinsP-2-glycoprotein I 2DE, IC A T, pLC Carrier o f phospholipids and other
negatively charged compoundsHemopexin 2DE, IC A T, pLC Carrier o f hemeIG FBP-2 2DE, IC A T, pLC Carrier o f IG FTransthyretin 2DE, [jlLC Carrier o f thyroid hormone and retinolVD BP 2DE, IC A T, pLC Carrier o f vitam in DRBP 2DE, IC A T, pLC Carrier o f re tino lN eutrophil lipocalin 2D E Carrier o f lipoph ilic substances
OtherP-2-m icroglobulin 2D E Immune system (M HC class I molecule)* M ethod used fo r the identification ** Function o f the named protein as
o f the named protein reported in [270]
135

4. Analysis of Deni's and Normal urinary proteomes
C. Proteins found at higher levels in the urine of Normal subjectsProtein M ethod* Function**Latent TGF-[3 BP IC A T , pLC Binds and modulates TG F -^ actionsCD59 IC A T, pLC Inhib its complement form ation
U rom odulinIC A T, pLC, ID E , 2D E
Binds and may modulate cytokine activity
IGFBP7 IC A T, [iLC Binds and may modulate IG F actionsUrokinase IC A T, pLC Activates plasmin in to an active formT N F receptor IC A T Receptor fo r T N F
Kininogen IC A T, pLC, 2D EPrecursor o f Bradykinin and other bioactive peptides
EG F precursor IC A T, ID E Precursor o f EG FT N F IC A T CytokineUrinary protein 1 IC A T, pLC UnknownLithostathine IC A T, pLC In h ib it crystal form ationMegalin ID E Endocytosis o f proteinsC ubilin ID E , pLC Endocytosis o f proteinsPoly-Ig receptor 2DE, pLC, IC A T TranscytosisA cid phosphatase 2DE, pLC Enzyme. Physiological role unknownOsteopontin pLC Bioactive peptide* M ethod used fo r the identification o f the named protein * * Function o f the named protein as reported in [270]
D ent’s disease is the result o f a defective chloride channel termed ClC-5 [80]. In
non-affected individuals this channel has a role in the megalin-mediated endocytic pathway
o f proteins in proxim al tubular epithelial cells. A defective ClC-5 results in inefficient
delivery o f megahn from endosomal compartments to the apical brush border plasma
membrane such that proteins present in the glomerular filtra te, norm ally reabsorbed in this
tubular segment, leak in to urine producing the symptom o f low molecular weight (or
tubular) proteinuria. Indeed, the quantitatively elevated excretion o f proteins in the urine
o f D ent’s disease patients and animal models o f this disease is w ell documented
[85;86;151;264;271-273]. However, no studies were available at the date o f w riting this
thesis describing the qualitative com position o f the proteome o f D ent’s disease urine w ith
comparison to that o f norm al urine. Since the ClC-5 channel is involved in the megalin-
mediated endocytosis, results described herein are probably also relevant to the function o f
this pathway.
I t was found that several plasma proteins are present in norm al and D ent’s urine
at sim ilar levels (Table 4.4.1.A ). Conversely, several transport proteins seemed to be
present at higher levels in the urine o f D ent’s patients than in that o f contro l subjects when
136

4. Analysis ofDenfs and 'Normal urinary proteomes
the analysis was standardised to tota l protein amount (Table 4.4.l.B ). In a healthy nephron
most proteins present in the glomerular filtra te are reabsorbed in the firs t segment o f the
proxim al tubule by megalin-mediated endocytosis [38;77]. However, some proteins fa il to
be reabsorbed so that trace amount o f protein is always present in norm al urine.
The results presented herein may be interpreted by assuming that the endocytic
apparatus in proxim al tubular cells has a higher a ffin ity fo r transport proteins than fo r
other protein classes. Thus, certain transport proteins such as hemopexin, VD BP, RBP,
transthyretin and P-2-glycoprotein I, which transport valuable molecules in plasma and are
readily filtered given the ir size, may be almost completely reabsorbed by cells expressing
functional ClC-5 channels and therefore appear in norm al urine to a lesser degree than
other filtered proteins w ith less a ffin ity fo r this endocytic machinery. Conversely, in D ent’s
patients they appear in urine at the same proportion than other filtered proteins because
this pathway is defective. See also Figure 4.5.1 fo r further explanation o f this
interpretation.
As shown in Figure 4.3.2, previously reported results also showed that the ratio o f
RBP to albumin concentration is on average about 40 times higher in the urine o f D ent’s
disease patients than in norm al urine [151;264]. Thus, the reinterpretation o f these results
support the notion that RBP is reabsorbed to a greater extent than albumin fcom the
glomerular filtrate, assuming that the integrity o f the glomerular membrane is not
compromised.
Another protein class that appears to have a great a ffin ity fo r megalin is the
apoHpoprotein fam ily (Table 4.4.1.B). Megalin is a member o f the low-density lipoprotein
receptor fam ily [41], and therefore, although megalin has a ffin ity fo r several d ifferent
proteins and peptides [44], it may have greater a ffin ity fo r the lipoprote in fam ily o f
proteins than fo r other proteins. Table 4.4.l.B also shows that several complement
components were detected at higher levels in the urine o f D ent’s patients when compared
compared w ith that o f normal subjects. Interestingly, complement factors and
apolipoproteins have been found to be nephrotoxic either by themselves or by the action
o f the ir lip id content on epithelial tubular cells [274-279]; thus these findings may be
clinically relevant.
137
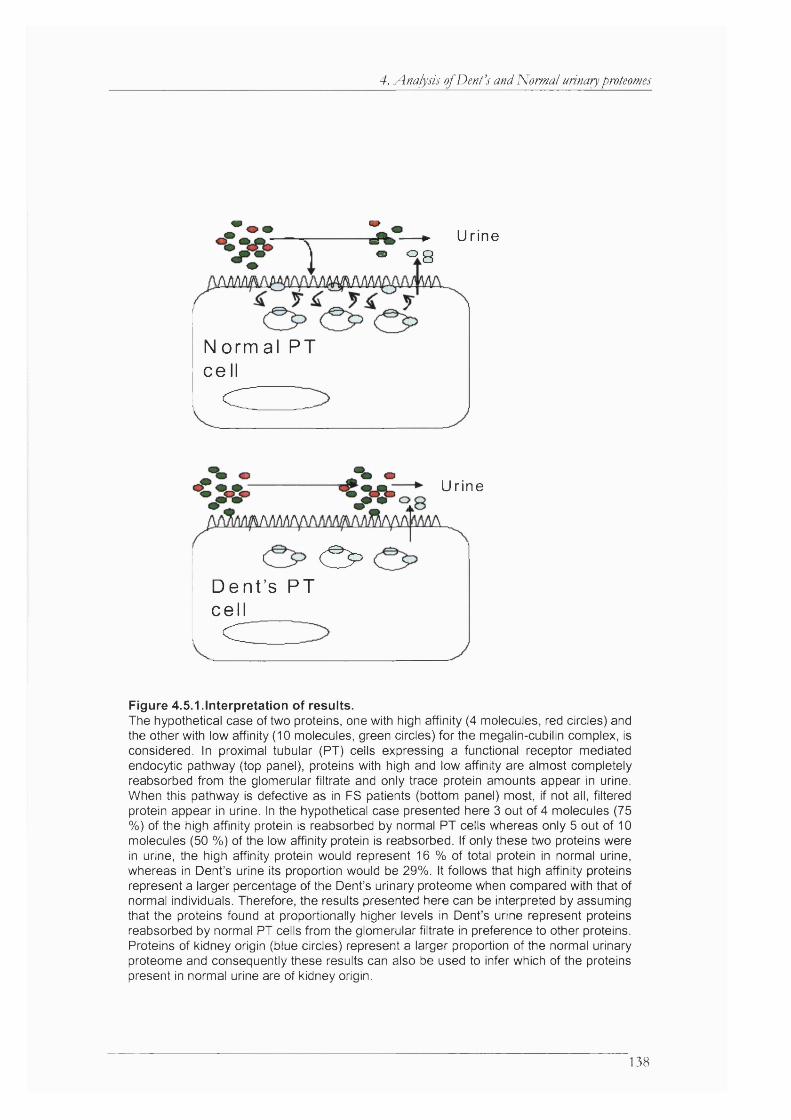
4. Analysis of Dent’s and Normal urinary proteomes
— ► Ur i neo O Q
N orma l PT cel l
C
U r in e
( >D e n t ’s PT cellc
Figure 4.5.1.Interpretation of results.The hypothetical case of two proteins, one with high affinity (4 molecules, red circles) and the other with low affinity (10 molecules, green circles) for the megalin-cubilin complex, is considered. In proximal tubular (PT) cells expressing a functional receptor mediated endocytic pathway (top panel), proteins with high and low affinity are almost completely reabsorbed from the glomerular filtrate and only trace protein amounts appear in urine. When this pathway is defective as in PS patients (bottom panel) most, if not all, filtered protein appear in urine. In the hypothetical case presented here 3 out of 4 molecules (75 %) of the high affinity protein is reabsorbed by normal PT cells whereas only 5 out of 10 molecules (50 %) of the low affinity protein is reabsorbed. If only these two proteins were in urine, the high affinity protein would represent 16 % of total protein in normal urine, whereas in Dent’s urine its proportion would be 29%. It follows that high affinity proteins represent a larger percentage of the Dent’s urinary proteome when compared with that of normal individuals. Therefore, the results presented here can be interpreted by assuming that the proteins found at proportionally higher levels in Dent’s urine represent proteins reabsorbed by normal PT cells from the glomerular filtrate in preference to other proteins. Proteins of kidney origin (blue circles) represent a larger proportion of the normal urinary proteome and consequently these results can also be used to infer which of the proteins present in normal urine are of kidney origin.
138
4. Analysis ofDenfs and NorTnal urinary proteomes
O ther proteins found in D ent’s urine but not in norm al urine in this study and
previous studies [151;264] include cytokines and chemokines such as angiotensinogen,
IG F -II, PED F, BMP-1, and platelet basic protein among others. In contrast, kininogen
was found in norm al urine at higher levels than in D ent’s urine when the analysis was
standardised to tota l protein amount, which suggests that the source o f this protein is
renal.
Angiotensin converting enzyme (ACE) was also found in norm al urine suggesting
that molecular machinery involved in the angiotensin system is present in tubular flu id.
Since receptors fo r some o f these and other peptides have been located on the lum inal side
o f tubular epithelial cells [3-5;8], the altered relative concentrations o f bioactive peptides in
the tubular flu id may contribute to a dysregulation in ceU signaUing. In this respect, a
greater angiotensin concentration in the tubular flu id o f D ent’s patients may contribute to
an alteration in flu id and electrolyte homeostasis.
In addition, several proteins w ith putative regulatory function are present at lower
levels in the urine o f D ent’s patients than in that o f norm al subjects when the analysis is
standardized to total protein. For example, urom odulin, a protein whose putative function
is to bind and modulate cytokine activity [280], is present at lower levels in D ent’s urine
w ith respect to total protein than in norm al urine. O ther proteins involved in regulation
and found at lower levels in D ent’s than in norm al are CD59 (which is involved in
inh ib iting complement complex form ation [281]), IGFBP7 and TGF-P BP (which, as their
name indicate, are involved in binding and perhaps regulating, IG F and TG F-^
respectively). Another protein found in N orm al urine at higher levels than in D ent’s urine
is lithostathine, a protein involved in inh ib iting calcite crystal form ation in pancreas [282].
Interestingly, a common manifestation in D ent’s disease is accumulation o f crystals, which
end up in the form ation o f kidney stones. Thus, the proposed regulatory role o f these
proteins may be overwhelmed as a result o f the defective reabsorption o f polypeptides in
the firs t segment o f proxim al tubular cells in D ent’s patients. Taken together, these
alterations may contribute to the progressive kidney failure observed in these patients by
the aberrant stim ulation o f apical receptors on tubular cells w ith the concom itant
dysregulation o f gene expression and cell function.
Therefore, an im portant conclusion derived from the studies presented in this
chapter is that, in addition to quantitative differences, there exist several qualitative
differences between the urinary proteomes o f D ent’s and N orm al individuals. The elevated
139

4. Analysis ofDenfs and Norynal urinary proteomes
amounts o f transport proteins in samples form D ent’s disease patients suggest that the
endocytic apparatus that is disrupted in these patients may have evolved to have more
a ffin ity fo r proteins that transport valuable molecules in plasma such as vitam in binding
proteins than fo r other protein classes (e.g., albumin). This endocytic apparatus may also
have more a ffin ity fo r bioactive peptides so that small plasma molecules do not disrupt the
proposed ‘intracrine’ homeostatic contro l o f peptides secreted by renal tubular cells and
present in the tubular flu id. Finally, a further role o f the proxim al tubular endocytic
machinery may be to protect distal parts o f the nephron from the cytotoxic effects o f
certain plasma proteins such as the lipoproteins and complement components. I t is
conceptually possible that the cubiHn-megalin receptor system has d ifferent affin ities fo r
d ifferent proteins. A lternatively, the observed differential a ffin ity m ight be explained by
assuming that there exist other, as yet unidentified, receptors specific fo r d ifferent proteins
in the proxim al tubule.
140
5. The membrane proteomes of proximal tubular cells
5. Proteomic analysis of basolateral and apical membranes
from kidney cortexResults presented in the previous two chapters indicated that there are several
peptides w ith potential biological activity in the urine o f both norm al individuals and FS
patients. Interestingly, some o f these peptides (e.g., EG F precursor and kininogen)
represent a larger p roportion o f the norm al urinary proteome when compared w ith that o f
D ent’s disease urine. Conversely, other bioactive peptides (e.g., IG F -I and II) are present
at higher levels in D ent’s urine than in normal urine when the analysis was normalized to
protein amounts. Thus, it is open to consideration whether an alteration o f the bioactivity
o f the mbular flu id in these patients contributes to the progression o f the disease and to its
manifestations.
I t may be proposed that there is a signalling network that operates from the apical
side o f renal tubular cells such that peptides present in the mbular flu id have a role in
contro lling the physiology o f these cells. Furthermore, results presented in Chapter 4
suggest that there may be specificity in the reabsorption o f polypeptides from the
glomerular filtrate, and this finding strongly suggests that either megalin has different
affin ities fo r d ifferent ligands, o r there are other, as yet unidentified, receptors expressed
on proxim al mbular cell apical membranes.
To investigate the possibility o f intracellular signaling occurring from the apical
side o f renal mbular cells, proteins present in renal proxim al mbular (PT) cells brush
border membranes (BBM) and basolateral membranes (BLM ) were analysed using
proteom ic approaches and the results o f these experiments constim te the topic o f this
chapter. I t was anticipated that these experiments may also be able to detect the presence
o f other putative receptors fo r proteins on the apical side o f PT cells, i f present.
PT cells are the main type o f cells in the renal cortex so that homogenates from
this renal segment are mainly composed o f PT cells. G lom eruli are also located in the
cortex but treatment w ith coUagenase separates glom eruli from mbular cells. There is only
a lim ited knowledge regarding the protein com position o f the BBM and the B LM from
renal mbular and other epithelial cells. The main function o f PT cells is to reabsorb solutes
from the glomerular filtrate. But, in addition to ion channels and transporters involved in
the reabsorption o f solutes and their release in to blood, there also are protein components
141

5. The membrane proteomes of proximal tubular cells
that regulate the activity and localisation o f these proteins, and there also exist several
cytoskeletal proteins that provide a scaffold fo r the other proteins to interact.
As discussed in previous chapters, most studies aimed at characterizing complex
proteomes use 2D E fo r the separation o f proteins, which are then identified one at a time
using MS. This approach is very pow erful and has given insights in to changes in gene
expression secondary to specific perturbations o f biological systems [267]. However, it is
now accepted that not a ll proteins may be amenable to 2D E analysis [265]. Am ong these,
hydrophobic proteins such as integral membrane proteins may no t enter the firs t
dimension in 2D E, and therefore membrane proteins may be underrepresented in 2D E
gels [257;258]. A lthough advances in 2D E technology may overcome this problem in the
future [97;98;255], some reports exist that use ID SDS-PAGE o r 2D -LC followed by
M S/M S fo r the analysis o f membrane proteins. For example, the proteomes o f
m itochondria [283], G olgi membranes [284], peroxisomes [285], lip id rafts [286],
chloroplasts membranes [287], and plasma membranes o f cancer cell lines [288], have been
analysed using ID SDS-PAGE as the separation m ethod follow ed by identification by
M A L D I-T O F and /o r LC-ESI-M S/M S. A n advantage o f ID over 2D E is that membrane
proteins are readily solubilised by the detergent SDS; unfortunately, the anionic character
o f SDS makes it incom patible w ith lE F such that in trinsic membrane proteins are not
efficiently analysed by 2DE.
As an alternative to gel electrophoresis, protein analysis by 2D -LC -M S/M S has
also been reported fo r the analysis o f membrane proteins in a high throughput manner.
The groups o f Yates (e.g., [258]) and Aebersold [166] have used approaches based on 2D -
LC -M S/M S fo r the analysis o f brain and m icrosomal membrane proteins, respectively.
Since this approach involves digesting the protein m ixture w ith a protease p rio r to two
rounds o f LC, problems concerning the solubility o f proteins are avoided. Peptides are
more soluble than proteins in aqueous solvents and since each protein produces several
peptides upon enzymatic digestion, the probability that some o f them are going to be
soluble in aqueous solvents, and thus detected, increases.
A lthough 2D-LC-M S and ID E -LC -M S based approaches fo r ‘shotgun’
proteomics are increasingly used fo r the analysis o f proteins, there are not studies assessing
and comparing ditecdy their performance. In the studies presented in this thesis, these two
analytical strategies were investigated fo r membrane protein analysis. In the firs t o f the
approaches to be compared, proteins from cortical brush border membranes were
142

5. The membrane proteomes of proximal tubular cells
separated by SDS-PAGE, and subsequently, the complete gel lane was cut to obtain 15-20
gel pieces containing the complete membrane proteome. Proteins were extracted from the
gel pieces by in-gel digestion and the identity o f these proteins determined by LC-ESI-
M S/M S. In the second approach, the membrane protein m ixture was digested w ith a
protease, and the resultant peptide m ixture separated by tw o rounds o f chromatography;
namely, SCX follow ed by RP-LC. As in the SDS-PAGE based method, the detection and
characterization o f eluting peptides was carried out by on-line ESI-M S/M S. This mode o f
mass spectrometry provides sequence inform ation, and therefore, identification o f the
gene products is, in most cases, unambiguous.
In prelim inary experiments using enriched brush border membrane preparations
obtained by magnesium precipitation and differential gradient centrifugation more than
two hundred proteins were detected; most o f them have been previously reported to be
located at the apical membrane. In addition to transporters and ion channels known to be
involved in the reabsorption o f solutes from the glomerular filtrate, many membrane
proteins known to be involved in signal transduction were also identified, which suggests
that signalling may also be occurring at the apical side o f tubular cells. However, there also
were proteins that are markers o f the basolateral membrane, which indicates that the
membrane preparation was not o f enough purity; in addition to apical membrane proteins,
proteins from other membrane compartments were also present in these preparations.
Therefore, in order to obtain a more accurate description o f the apical membrane
proteome o f proxim al mbular cells, other methods fo r separating apical and basolateral
membranes were investigated. A free flow electrophoresis method was expected to
provide a purer source o f apical membrane and also basolateral membrane preparations so
that a quantitative comparison could be made, which, in turn, would reveal how much
each protein was enriched in the respective membrane preparation.
143
5. The membrane proteomes of proximal tubular cells
5.1. Analysis of proteins present in brush border membranes obtained
by magnesium precipitation
Enhchm ent o f brush border membranes from cortical kidney segments by
magnesium precipitation was described in 1981 by B iber et al [181] as an im provem ent o f
a method previously described by Booth and Kenny [289]. This is now a method widely
used to enrich fo r the components o f renal apical membranes (e.g., [290]) and it is based
on the fact that the brush border and the basolateral membranes have different lip id ,
carbohydrate and protein ratios (a fact that reflects their d ifferent functional roles) such
that they have d ifferent charges and densities. Thus, these tw o membrane segments can be
separated by density gradient centrifugation using divalent cations; the most commonly
used ones being magnesium and calcium [291]. In addition to brush border membranes, it
is also known that the method isolates components o f endosomes and it has been
acknowledged that these preparations may also isolate other components in addition to
apical membrane proteins [291], although the precise nature o f the components isolated by
this m ethod was not known at the time o f w riting this thesis.
Cortical brush border membrane preparations obtained by the method o f B iber
were a g ift from D r. J. Marks at the Royal Free Hospital, London. Seventy micrograms o f
protein were separated by either SDS-PAGE (undigested) o r by SCX after proteolysis o f
all the protein components. In both cases the final identification o f components was by
LC -ESI-M S/M S using long gradient runs in order to increase the peak capacity o f the
system. A bout 300 to 500 M S/M S spectra could be generated per each SCX or gel piece
fraction when 90-minute gradients were employed.
The gel lane shown in Figure 5.1.1 containing the entire BBM proteome was cut
in to 19 gel pieces o f equal size and the proteins present in each gel piece were in-gel
digested w ith trypsin. The tryptic peptides thus generated were separated by RP nanoLC
and detected and sequenced as they eluted from the run by on-line ESI-M S/M S. A total o f
about 7000 M S/M S spectra were collected, which led to the identification o f 251 proteins.
These proteins are listed in Appendix I I I .
Proteins present in BBM preparations were also analysed by 2D -LC-M S/M S. To
this end, proteins were digested w ith trypsin and the resultant peptide m ixture was
separated by SCX HPLC. Fractions collected from these runs were further separated and
analysed by LC -ESI-M S/M S as above fo r the in-gel digested proteins. A tota l o f 20
144
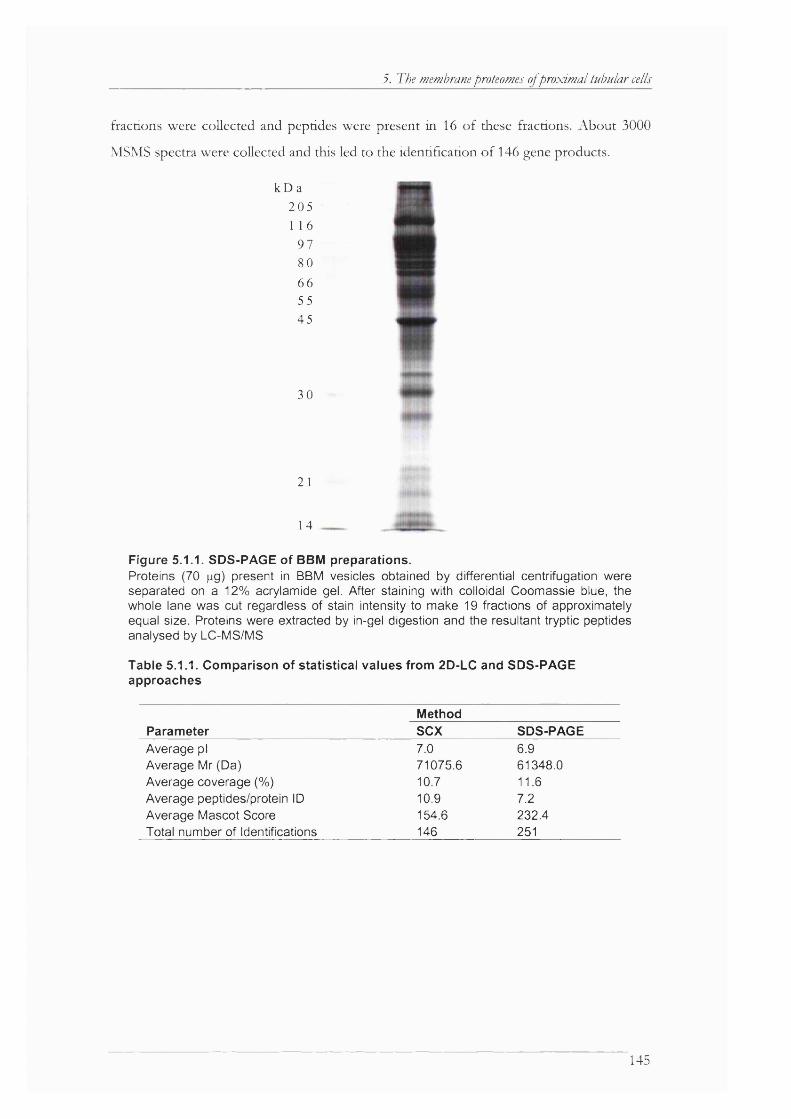
5. The membrane proteomes of proximal tubular cells
fractions were collected and peptides were present in 16 o f these fractions. About 3000
MSMS spectra were collected and this led to the identification o f 146 gene products.
kD a 205 1 1 6
97 80 66 55 45
30
2 1
14
Figure 5.1.1. SDS-PAGE of BBM preparations.Proteins (70 gg) present in BBM vesicles obtained by differential centrifugation were separated on a 12% acrylamide gel. After staining with colloidal Coomassie blue, the whole lane was cut regardless of stain intensity to make 19 fractions of approximately equal size. Proteins were extracted by in-gel digestion and the resultant tryptic peptides analysed by LC-MS/MS
Table 5.1.1. Comparison of statistical values from 2D-LC and SDS-PAGE approaches
ParameterMethodSCX SDS-PAGE
Average pi 7.0 6.9Average Mr (Da) 71075.6 61348.0Average coverage (%) 10.7 11.6Average peptides/protein ID 10.9 7.2Average Mascot Score 154.6 232.4Total number of Identifications 146 251
145

5. The membrane proteomes of proximal tubular cells
35
§ 30 8 25
I 20
I 15
I 10 -j
% «0
pi Distribution
□ SCX
□ SDS-PAGE
<4 4-5 5-6 6-7 7-8
pi
8-9 9-10 10-11 >11
3 0 -------------------------------------
.8 25ro20
P 153 10 - 2o 5
^ 0 -
IW" distribution
□ SCX
□ SDS-PAGE
Q Hi rin ^ Hi i~h m<10 10-25 25-40 40-50 50-60 60-70 70-80 80-90 90-100 100- 150- >200
150 200
IVfc'(kDa)
Figure 5.1.2. Distribution of pi and Mr of the proteins identified in BBM preparations by two different proteomic approaches.The theoretical pi and Mr of the proteins identified in BBM were plotted against the percentage of total number of proteins identified. No obvious differences were observed in the pi distributions (top panel), whereas the SCX method seemed to detect larger proteins than the SDS-PAGE method (bottom panel).
In order to investigate whether these methods are biased towards certain protein
classes, the M r and p i values o f the proteins identified were compared. Table 5.1.1 shows
that there is no difference in the average p i value o f the proteins identified by these
methods. However, proteins identified by the SDS-PAGE method were on average
smaller in size than those identified by the 2D-LC approach. Similarly, Figure 5.1.2
indicates that there were not apparent differences in the p i distributions o f the proteins
identified by these methods, whereas proteins identified by the 2D-LC method were on
average larger than those identified by the gel approach (Figure 5.1.2). In 2D-LC
experiments proteins were digested prio r to separation by HPLC. Since larger proteins
produce more tr\y>tic peptides than smaller proteins the chances that they are going to be
146

5. The membrane proteomes of proximal tubular cells
identified in automated data acquisition experiments is greater, and this may explain why
larger proteins were more represented in 2D -LC experiments. Another explanation to
account fo r the observed differences in the average and d istribution o f M r obtained by the
two methods under comparison is that the m igration o f proteins in SDS-PAGE along the
gel is not linear w ith respect to their M r, Instead, m igration o f proteins in PAG E is
proportional to the log(lO) o f their M r. Thus, i f the gel lane is cut in to sections o f equal
size, those pieces at the lower end o f the gel contain a narrower M r range than those cut at
the top o f the gel. Consequently, in SDS-PAGE experiments low molecular weight
proteins are more likely to be identified, when the whole lane is cut in to pieces o f equal
size.
The quality o f the identifications obtained by these two methods was also
compared. Parameters used to assess the probabilities that the identifications are correct
include number o f peptides that generated sequence in form ation matching the gene
product, the sequence coverage achieved, and other statistical factors such as the Mascot
or Mowse scores included in bioinform atics packages. Table 5.1.1 shows that proteins
identified by the SDS-PAGE method had, on average, a greater coverage than those
identified by the 2D-LC method. In contrast, more peptides matched the identified protein
in the 2D E-LC analysis than in the SDS-PAGE approach. This may seem counterintuitive
since more peptides matching a given protein should cover a greater percentage o f its
sequence. But, in fact, this observation agrees w ith the fact that larger proteins were
identified by the 2D -LC method (see Table 5.1.1 and Figure 5.1.2). A larger protein
generates more peptides and therefore more o f these are detected by LC-M S/M S.
However, since the proteins identified by the 2D -LC method were on average larger than
those found by the SDS-PAGE method, these peptides covered a smaller sequence o f the
protein.
More proteins were detected by the SDS-PAGE than by the 2D -LC approach
(Table 5.1.1). M oreover, running o f gels and their subsequent handling was, in the hands
o f the author, more robust than SCX HPLC. Protocols fo r running gels are better
established than those fo r HPLC in most biochem istry laboratories and less
instrum entation is required fo r SDS-PAGE than fo r HPLC. For these reasons, further
experiments were carried out using the SDS-PAGE approach whenever possible.
Proteins w ith diverse functions were identified (Figure 5.1.3 and Table 5.1.2). As
expected, many proteins involved in the reabsorption o f solutes from the tubular flu id
147

5. The membrane proteomes of proximal tubular cells
were detected including ion channels and transporters. Several endopeptidases, already
known to be located on apical membranes, were also detected. Moreover, proteins
involved in the trafficking o f endosome were identified, which suggest that these
membrane preparations also enrich for endosome components. Several membrane-
associated proteins that have been reported to have roles in signal transduction were also
identified. I f the membrane preparations were pure, this would indicate that signalling is
also accruing at the apical membrane. Finally, the fact that proteins, whose functions have
not been determined yet, were also found in these fractions highlights the potential o f this
approach fo r the discovert' o f novel functions fo r the apical side o f mbular cells and for
the annotation o f the genome (i.e. fo r sorting each gene product to its intracellular
location).
Un know n/other 31%
Carriers6%
Transporters6%
Translation1%
Channels2%
Endosometrafficking
5%
Metabolism21%
Peptidases4%
Structural11% Signal
Transduction10%
Receptors3%
Figure 5.1.3. Function of the identified gene products present in BBM vessicles.A total of 251 proteins were identified and classified into arbitrarily selected functional categories
Proteins, which are believed to be located exclusively on the basolateral
membrane, such as the Na /K '-A TP ase and the glucose transporter 2, were also detected.
This was not totally unexpected because although the method used to isolate BBM is
148

5. The membrane proteomes of proximal tubular cells
known to enrich fo r the components o f the BBM , it is also known that this method does
not allow fo r the complete isolation o f this membrane segment [181;291]. However, the
precise com position o f membrane vesicles obtained by this method had not been reported
before and the results reported here are novel in that respect.
Table 5.1.2. Examples of the proteins found in BBM membrane preparations.
Channels________________________________________________________________intracellular chloride ion channel protein p64H1chloride intracellular channel 5barttinvoltage-dependent anion channel 1 [Mus musculus]Endosome trafficking_____________________________________________________lysosomal membrane glycoprotein-type B precursorsimilar to Vacuolar ATP synthase subunit d (V-ATPase d subunit) (Vacuolar proton pump d subunit) (V syntaxin 3syntaxin binding protein Munc18-2Metabolism______________________________________________________________ATP synthase alpha chain, mitochondrial precursoraldehyde dehydrogenase family 9, subfamily A l; 4-trimethylaminobutyraldehyde
dehydrogenase [RattusCytochrome P450 4A2 precursor (CYPIVA2) (Laurie acid omega-hydroxylase) (P450-LA-
omega 2) (P450 K-5FRUCTOSE-1,6-BISPHOSPHATASE (FBPASE)Peptidases_______________________________________________________________dipeptidyl-peptidase IV (EC 3.4.14.5), membrane-bound form precursor - rat kidney aminopeptidase M; Leucine arylaminopeptidase 1 kidney-derived aspartic protease-like protein X-prolyl aminopeptidase (aminopeptidase P) 2, membrane-bound Glutamyl aminopeptidase (EAP) (Aminopeptidase A) (APA)Receptors_______________________________________________________________beta-1-adrenergic receptor - ratlow density lipoprotein receptor-related protein 2; glycoprotein 330; low density lipoprotein-relatcubilin; cubilin (intrinsic factor-cobalamin receptor)folate receptor 1 (adult); folate binding protein 1 ; folate receptor 1similar to G-protein coupled receptor 112 [Homo sapiens]Signal transduction_______________________________________________________guanine nucleotide-binding protein alpha 11 subunit guanine nucleotide binding protein (G protein) alpha 12 GTP-binding protein (G-alpha-i2)guanine nucleotide-binding protein, beta-2 subunit [Mus musculus] annexin VI Annexin VSer-Thr protein kinase related to the myotonic dystrophy protein kinaseAnnexin A4 (Annexin IV) (Lipocortin IV) (36 kDa zymogen granule membrane associatedprotein) (ZAP36phospholipid scramblase 1Guanine nucleotide-binding protein G(I)/G(S)/G(T) beta subunit 1 (Transducin beta chain 1)Transporters_____________________________________________________________FXYD domain-containing ion transport regulator 2 isoform b; ATPase, Na+/K+ transporting, gamma 1 poSodium/potassium-transporting ATPase beta-1 chain (Sodium/potassium-dependent ATPase beta-1 subunitMultidrug resistance protein 1 (P-glycoprotein 1 ) low affinity Na-dependent glucose transporter (SGLT2) solute carrier family 34 (sodium phosphate), member 2
149

5. The membrane proteomes of proximal tubular cells
UnknownPDZ domain containing 1similar to RIKEN cDNA 0610006H10 gene [Mus musculus]similar to CG10869-PA [Drosophila melanogaster]similar to hypothetical protein AF506821 [Mus musculus]hypothetical protein XP_243379hypothetical protein XP_228339similar to hypothetical protein MGC32871 [Homo sapiens]similar to hypothetical protein DKFZp434l1117.1 - human (fragment)similar to Hypothetical protein KIAA0173similar to KIAA0802 protein [Homo sapiens]____________________
150

5. The membrane proteomes of proximal tubular cells
5.2. Analysis of proteins present in brush border and basolateral
membrane preparations
The method o f magnesium precipitation combined w ith differential density
centrifugation is useful fo r the enrichment o f BBM from kidney cortexes. However, as
shown in the experiments described in the previous section, this method does not purify
BBM components to homogeneity so that proteins from other subcellular fractions are
also present in these preparations. Consequently, it is no t possible to assert w ith
confidence which o f the identified proteins is a BBM protein and which one is a
contaminant. Therefore, a d ifferent strategy was used to investigate the protein
com position o f BBM and also B LM vesicles. Since it may not be possible to purify to
homogeneity a given subcellular compartment, it may be necessary to experimentally
determine which components are enriched in a given preparation in order to characterise
the proteome o f the organelle under study.
The group o f M urer has used a m ethod based on free flow electrophoresis to
separate BBM from B LM extracted from kidney cortex [8] and samples o f these
preparations were used as a source to investigate and to compare the proteomes o f these
two subcellular compartments.
Same amounts o f BBM and BLM proteins were loaded and separated in SDS-
PAG E gels, which were subsequently stained w ith colloidal Coomassie blue (Figure 5.2.1).
As w ith the experiments described in the previous section, the whole gel lanes were cut
in to pieces. However, because o f the lessons learned from the experiments described in
the preceding section, this time the pieces were cut in to sections o f approximately the
same M r range instead o f pieces o f equal size.
A total o f 344 and 454 proteins were detected in the BBM and B LM fractions,
respectively. A fte r deletion o f proteins that appeared in more than one gel section, 268
proteins were identified in the BBM and 332 in the B LM fractions. The proteins identified
are listed in Appendix IV . As w ith BBM preparations obtained by d ifferential density
centrifugation, these membrane vesicles contained a m ixture o f proteins known to be
located to the respective membrane sections; but there also were contaminating
components o f the other membrane section, the cytosol and from m itochondria.
To illustrate the data obtained during the course o f these experiments, the analysis
o f gel pieces 1 and 17 w ill be described in some detail, as follows. The gel piece in firaction
151
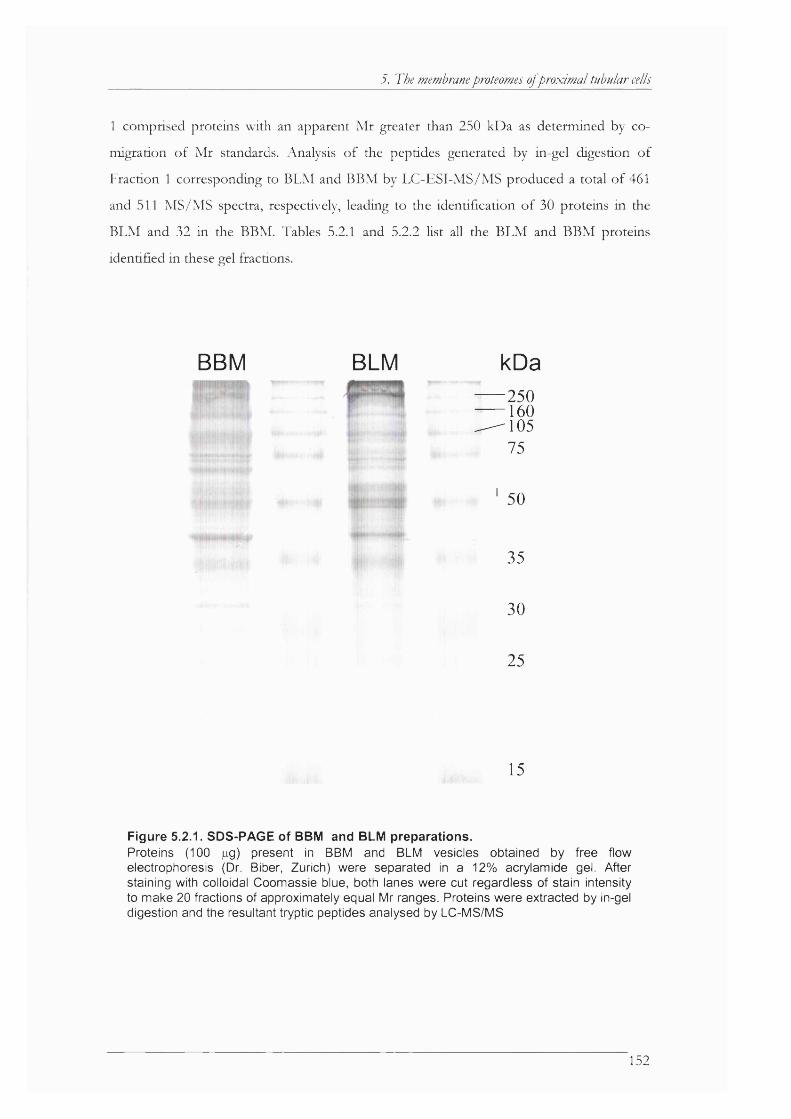
5. The membrane proteomes of proximal tubular cells
1 comprised proteins w ith an apparent M r greater than 250 kDa as determined by co
migration o f M r standards. Analysis o f the peptides generated by in-gel digestion o f
Fraction 1 corresponding to BLM and BBM by LC-ESI-M S/M S produced a total o f 461
and 511 MS/MS spectra, respectively, leading to the identification o f 30 proteins in the
BLM and 32 in the BBM. Tables 5.2.1 and 5.2.2 list all the BLM and BBM proteins
identified in these gel fractions.
BBM BLM kDa 250 160^ 1 0 5
75
50
35
30
25
15
Figure 5.2.1. SDS-PAGE of BBM and BLM preparations.Proteins (100 gg) present in BBM and BLM vesicles obtained by free flow electrophoresis (Dr. Biber, Zurich) were separated in a 12% acrylamide gel. After staining with colloidal Coomassie blue, both lanes were cut regardless of stain intensity to make 20 fractions of approximately equal Mr ranges. Proteins were extracted by in-gel digestion and the resultant tryptic peptides analysed by LC-MS/MS
152
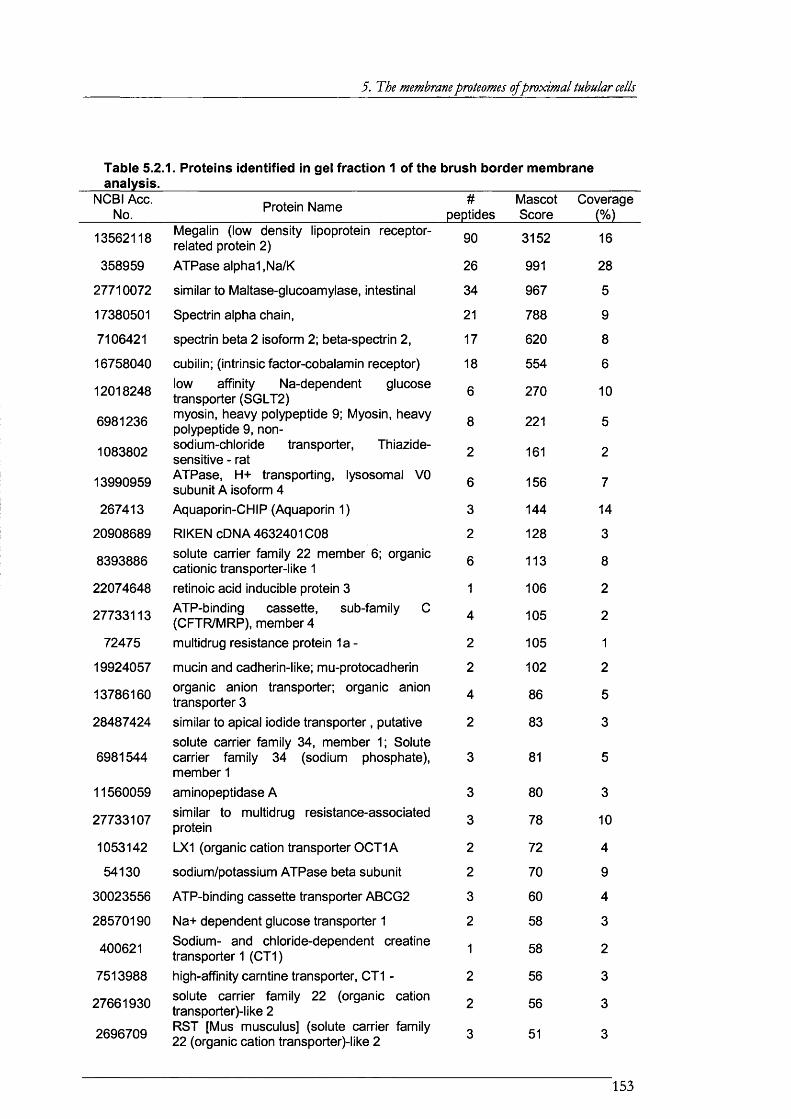
5. The membrane proteomes of proximal tubular cells
Table 5.2.1. Proteins identified in gel fraction 1 of the brush border membrane analysis.______________________________________________________________
NCBI Ago. No. Protein Name # Mascot Coverage
peptides Score
13562118
358959
27710072
17380501
7106421
16758040
12018248
6981236
1083802
13990959
267413
20908689
8393886
22074648
27733113
72475
19924057
13786160
28487424
6981544
11560059
27733107
1053142
54130
30023556
28570190
400621
7513988
27661930
2696709
Megalin (low density lipoprotein receptor- related protein 2 )ATPase alpha1,Na/K
similar to Maltase-glucoamylase, intestinal
Spectrin alpha chain,
spectrin beta 2 isoform 2 ; beta-spectrin 2 ,
cubilin; (intrinsic factor-cobalamin receptor)low affinity Na-dependent glucosetransporter (SGLT2)myosin, heavy polypeptide 9; Myosin, heavy polypeptide 9, nonsodium-chloride transporter. Thiazide-sensitive - ratATPase, H+ transporting, lysosomal VO subunit A isoform 4Aquaporin-CHIP (Aquaporin 1)
RIKEN cDNA 4632401008solute carrier family 22 member 6 ; organic cationic transporter-like 1
retinoic acid inducible protein 3ATP-binding cassette, sub-family C (CFTR/MRP), member 4multidrug resistance protein la -
mucin and cadherin-like; mu-protocadherinorganic anion transporter; organic anion transporter 3similar to apical iodide transporter, putativesolute carrier family 34, member 1; Solute carrier family 34 (sodium phosphate), member 1aminopeptidase Asimilar to multidrug resistance-associated proteinLX1 (organic cation transporter OCT1A
sodium/potassium ATPase beta subunit
ATP-binding cassette transporter ABCG2
Na+ dependent glucose transporter 1Sodium- and chloride-dependent creatine transporter 1 (CT1 )high-affinity carntine transporter, CT1 -solute carrier family 22 (organic cation transporter)-like 2RST [Mus musculus] (solute carrier family 22 (organic cation transporter)-like 2
90
26
34
21
17
18
6
8
2
6
3
2
6
1
4
2
2
4
2
3152
991
967
788
620
554
270
221
161
156
144
128
113
106
105
105
102
86
83
81
80
78
72
70
60
58
58
56
56
51
16
28
5
9
8
6
10
5
2
7
14
3
8
2
2
1
2
5
3
3
10
4
9
4
3
2
3
3
3
153
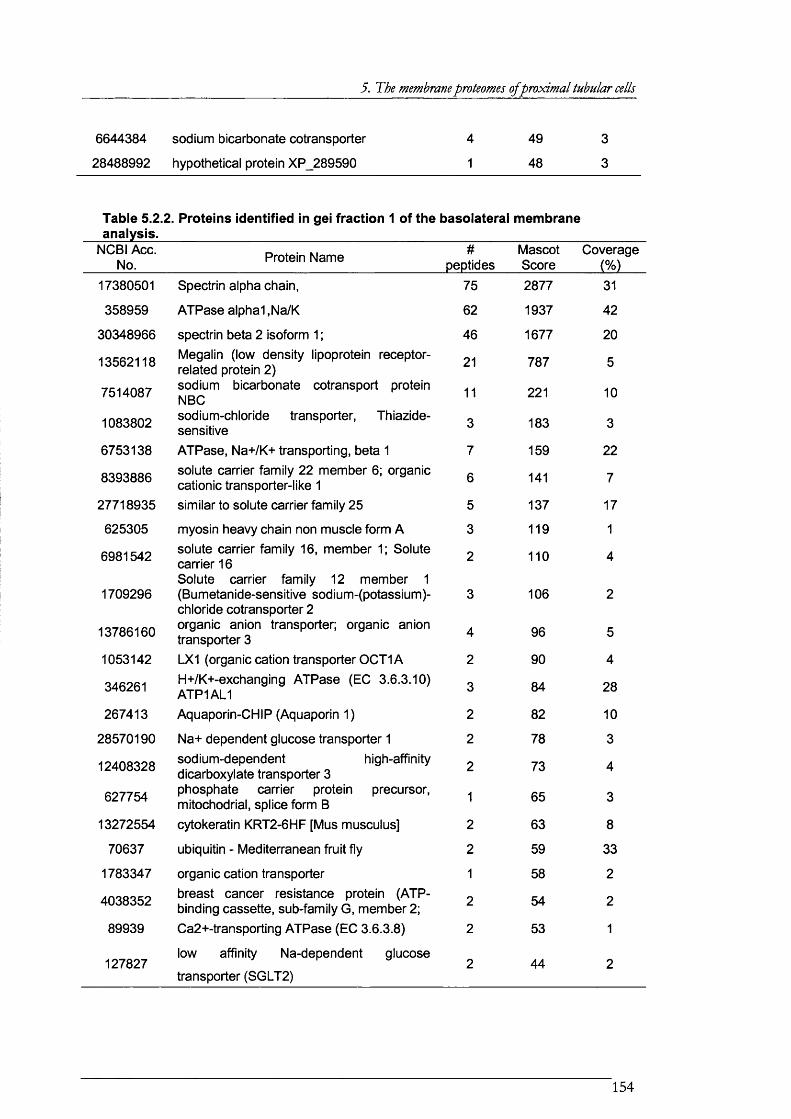
5. The membrane proteomes of proximal tubular cells
6644384 sodium bicarbonate cotransporter 4 49 3
28488992 hypothetical protein XP_289590 1 48 3
Table 5.2.2. Proteins identified in gei fraction 1 of the basoiaterai membrane analysis.
NCBI Acc. No. Protein Name #
peptidesMascotScore
Coverage(%)
17380501 Spectrin alpha chain, 75 2877 31
358959 ATPase alpha 1 ,Na/K 62 1937 42
30348966 spectrin beta 2 isoform 1 ; 46 1677 20
13562118
7514087
Megalin (low density lipoprotein receptor- related protein 2 )sodium bicarbonate cotransport protein NBC
21
11
787
221
5
10
1083802 sodium-chloride transporter, Thiazide- sensitive 3 183 3
6753138 ATPase, Na+/K+ transporting, beta 1 7 159 22
8393886 solute carrier family 22 member 6 ; organic cationic transporter-like 1
6 141 7
27718935 similar to solute carrier family 25 5 137 17
625305 myosin heavy chain non muscle form A 3 119 1
6981542
1709296
13786160
solute carrier family 16, member 1; Solute carrier 16Solute carrier family 12 member 1 (Bumetanide-sensitive sodium-(potassium)- chloride cotransporter 2 organic anion transporter; organic anion transporter 3
2
3
4
110
106
96
4
2
5
1053142 LX1 (organic cation transporter 0CT1A 2 90 4
346261 H+/K+-exchanging ATPase (EC 3.6.3.10) ATP1AL1 3 84 28
267413 Aquaporin-CHIP (Aquaporin 1) 2 82 10
28570190 Na+ dependent glucose transporter 1 2 78 3
12408328
627754
sodium-dependent high-affinity dicarboxylate transporter 3 phosphate carrier protein precursor, mitochodrial, splice form B
2
1
73
65
4
3
13272554 cytokeratin KRT2-6HF [Mus musculus] 2 63 8
70637 ubiquitin - Mediterranean fruit fly 2 59 33
1783347 organic cation transporter 1 58 2
4038352 breast cancer resistance protein (ATP- binding cassette, sub-family G, member 2; 2 54 2
89939 Ca2+-transporting ATPase (EC 3.6.3.8) 2 53 1
127827low affinity Na-dependent glucose
transporter (SGLT2)2 44 2
154
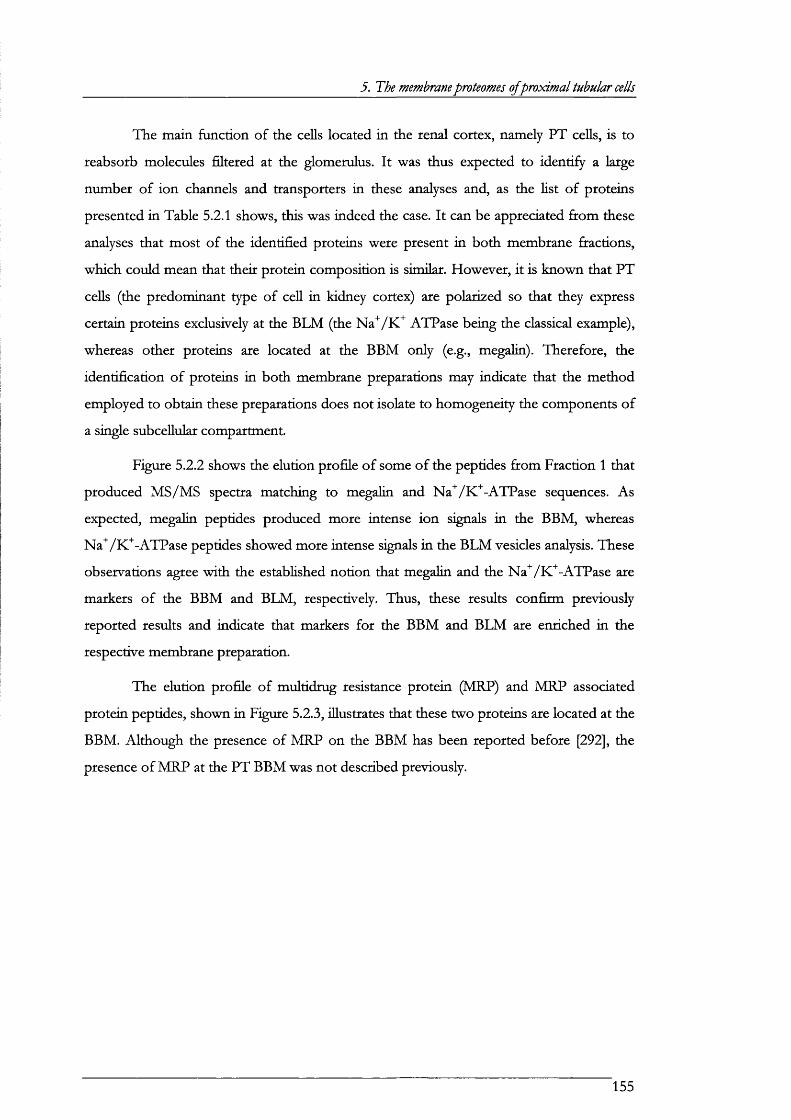
5. The membrane proteomes of proximal tubular cells
The main function o f the cells located in the renal cortex, namely PT cells, is to
reabsorb molecules filtered at the glomerulus. I t was thus expected to identify a large
number o f ion channels and transporters in these analyses and, as the lis t o f proteins
presented in Table 5.2.1 shows, this was indeed the case. I t can be appreciated firom these
analyses that most o f the identified proteins were present in both membrane firactions,
which could mean that the ir protein com position is similar. However, it is known that PT
cells (the predom inant type o f cell in kidney cortex) are polarized so that they express
certain proteins exclusively at the BLM (the N a ^/K ^ ATPase being the classical example),
whereas other proteins are located at the BBM only (e.g., megalin). Therefore, the
identification o f proteins in both membrane preparations may indicate that the method
employed to obtain these preparations does not isolate to homogeneity the components o f
a single subcellular compartment.
Figure 5.2.2 shows the elution profile o f some o f the peptides from Fraction 1 that
produced M S/M S spectra matching to megalin and Na^/K^-ATPase sequences. As
expected, megalin peptides produced more intense ion signals in the BBM , whereas
Na^/K^-ATPase peptides showed more intense signals in the B LM vesicles analysis. These
observations agree w ith the established notion that megalin and the Na^/K^-ATPase are
markers o f the BBM and BLM , respectively. Thus, these results confirm previously
reported results and indicate that markers fo r the BBM and B LM are enriched in the
respective membrane preparation.
The elution pro file o f m ultidrug resistance protein (MRP) and MRP associated
protein peptides, shown in Figure 5.2.3, illustrates that these two proteins are located at the
BBM. A lthough the presence o f MRP on the BBM has been reported before [292], the
presence o f MRP at the PT BBM was not described previously.
155
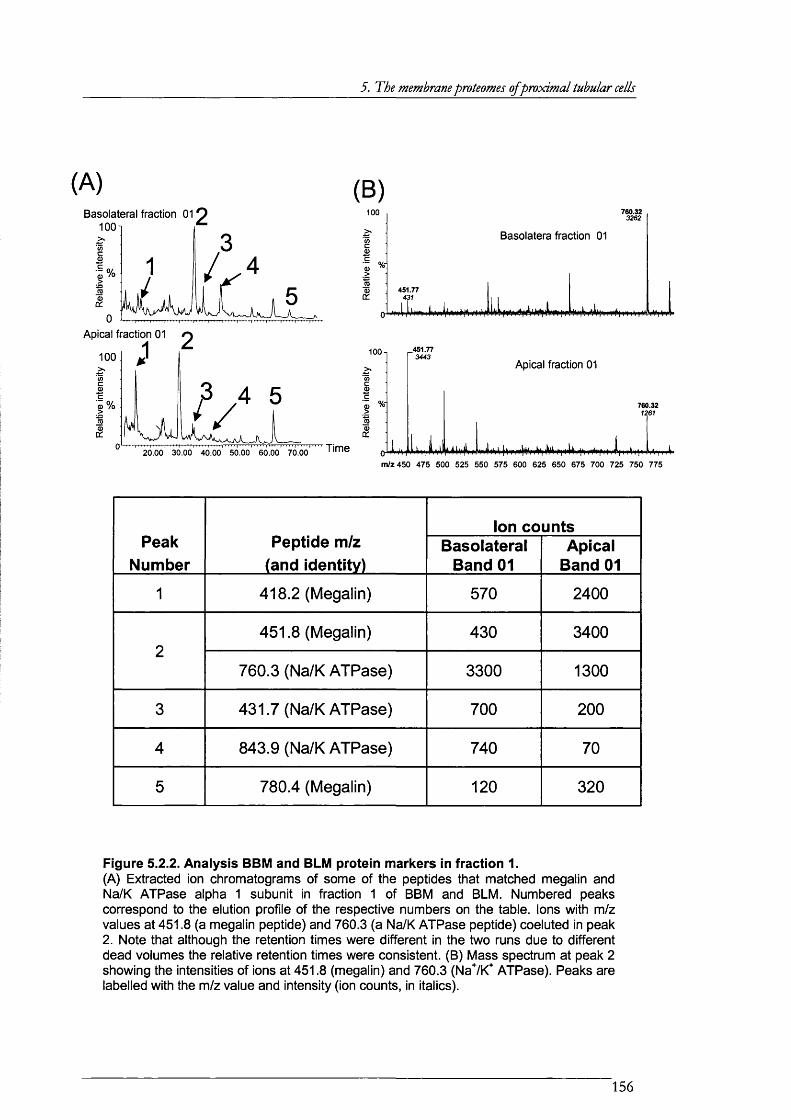
5. The membrane proteomes of proximal tubular cells
(A) (B)Basolateral fraction
IOO1
Apical fraction 01
100 J J
0%
Time20.00 30.00 40.00 50.00 60.00 70.00
100 760.323262
I Basolatera fraction 01
1 J1
a
451.77431
J*
451.773443
Apical fraction 01
760.321261
m/z450 475 500 525 550 575 600 625 650 675 700 725 750 775
PeakNumber
Peptide m/z (and identity)
Ion countsBasolateral
Band 01Apical
Band 01
1 418.2 (Megalin) 570 2400
2451.8 (Megalin) 430 3400
760.3 (Na/K ATPase) 3300 1300
3 431.7 (Na/K ATPase) 700 200
4 843.9 (Na/K ATPase) 740 70
5 780.4 (Megalin) 120 320
Figure 5.2.2. Analysis BBM and BLM protein markers in fraction 1.(A) Extracted ion chromatograms of some of the peptides that matched megalin and Na/K ATPase alpha 1 subunit in fraction 1 of BBM and BLM. Numbered peaks correspond to the elution profile of the respective numbers on the table. Ions with m/z values at 451.8 (a megalin peptide) and 760.3 (a Na/K ATPase peptide) coeluted in peak 2. Note that although the retention times were different in the two runs due to different dead volumes the relative retention times were consistent. (B) Mass spectrum at peak 2 showing the intensities of ions at 451.8 (megalin) and 760.3 (NaVK"" ATPase). Peaks are labelled with the m/z value and intensity (ion counts, in italics).
156
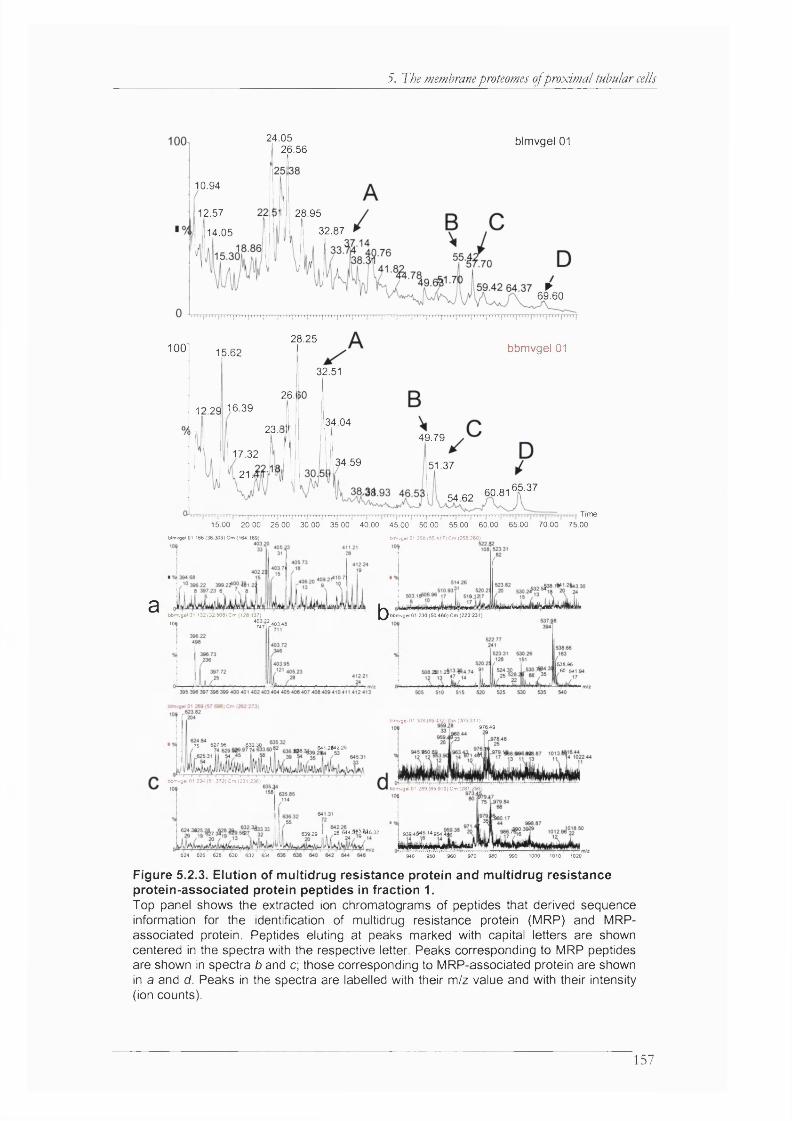
5. The membrane proteomes ojproximal tubular cells
24.05 26.56
bimvgel 01
10.94
12.57 28.95
32.8714.05
6?60
28.25100 bbmvgel 0115.62
32.51
26.16.3912.29
34.0423.1
49.79
17.3234.59 51.37
21..65.3760.8154.62
Time15.00 20.00 25.00 30.00 35.00 40.00 45.00 50.00 55.00 60.00 65.00 70.00 75.00
bimvgel 01 166 (38 309) Cm (164 169) bimvgel 01 258 (55 417) Cm (255 260)
a b I bbmvgel 01 230 (50 460) Cm (223.231 )bbmvgel 01 132 (32 508) Cm (128 137)
108 % i l 4 0 3 48
I 538 9660 RA
WmvgelOl 308 (69 412) Cm (305 311)976 49
75 627 96 632 30 641 254229
bbmvgel 01 234 (51 372) Cm (231 236}bbmvgel 01 289 (65 910) Cm (281 290)
639 29 I , 28 644 § i | f t l6 32 939 4 ^ 6 14954,440
624 626 628 630 632 634 940 950 960 970 980 990 1000 1010 1020
Figure 5.2.3. Elution of multidrug resistance protein and multidrug resistance protein-associated protein peptides in fraction 1.Top panel shows the extracted ion chromatograms of peptides that derived sequence information for the identification of multidrug resistance protein (MRP) and MRP- associated protein. Peptides eluting at peaks marked with capital letters are shown centered in the spectra with the respective letter. Peaks corresponding to MRP peptides are shown in spectra b and c; those corresponding to MRP-associated protein are shown in a and d. Peaks in the spectra are labelled with their m/z value and with their intensity (ion counts).
157
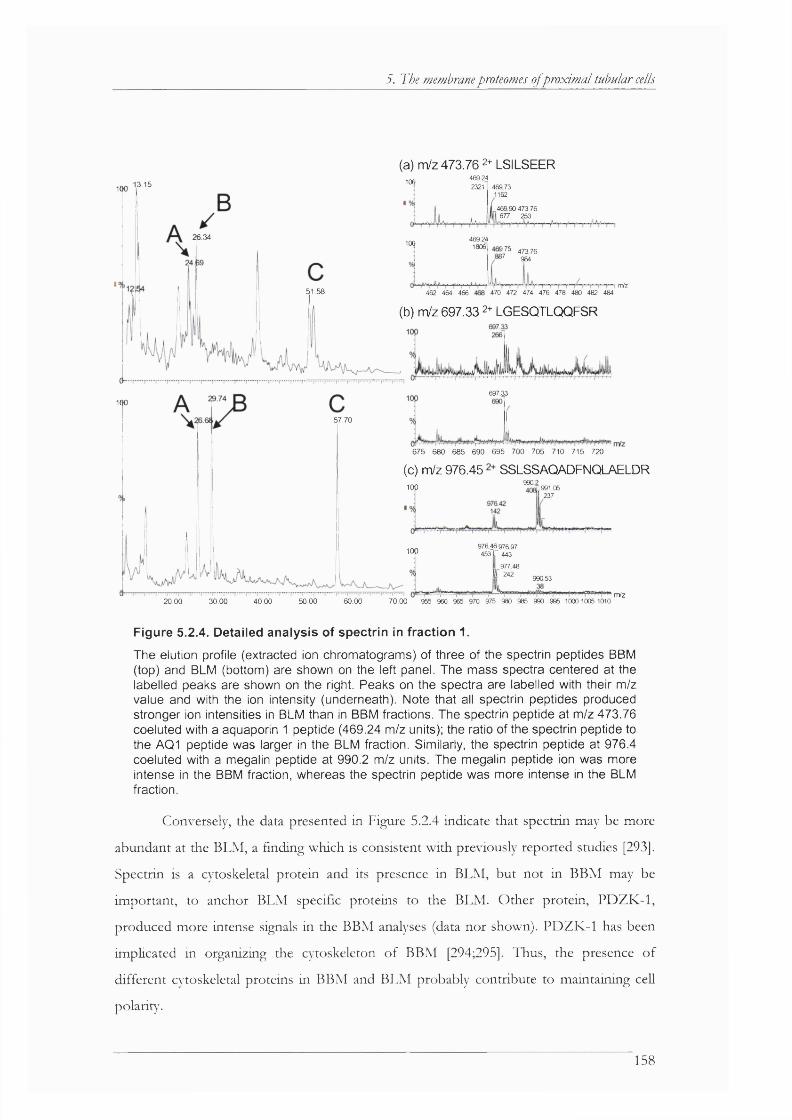
5. The membrane proteomes of proximal tubular cells
(a) m/z 473.76 2+ LSILSEER469,24
23211001 3 .1 5 469 73
1162100
469 90 473.76 677 253
.34 169.241806106
*7 ^ 473.76 984
nVz5 1 .5 8 462 464 466
(b) m/z 697.33 2+ LGESQTLQQFSR
470 472 474 476 478 480 482 484
697 33
100
5 7 .7 0
6 7 5 6 8 0 6 8 5 6 9 0 6 9 5 7 0 0 7 0 5 7 1 0 7 1 5 7 2 0
(c) m/z 976.45 SSLSSAQADFNQLAELDRlOp 990.:
1991.05237
976 4 6 976.97 4 5 3 l r 443
977 48
yr 242
lop
990.53
rrVz20.00 3 0 .0 0 4 0 .0 0 5 0 .0 0 6 0 .0 0 7 0 .0 0 955 960 965 970 975 980 985 990 995 10 00 10 05 1010
Figure 5.2.4. Detailed analysis of spectrin in fraction 1.
The elution profile (extracted ion chromatograms) of three of the spectrin peptides BBM (top) and BLM (bottom) are shown on the left panel. The mass spectra centered at the labelled peaks are shown on the right. Peaks on the spectra are labelled with their m/z value and with the ion intensity (underneath). Note that all spectrin peptides produced stronger ion intensities in BLM than in BBM fractions. The spectrin peptide at m/z 473.76 coeluted with a aquaporin 1 peptide (469.24 m/z units); the ratio of the spectrin peptide to the AQ1 peptide was larger in the BLM fraction. Similarly, the spectrin peptide at 976.4 coeluted with a megalin peptide at 990.2 m/z units. The megalin peptide ion was more intense in the BBM fraction, whereas the spectrin peptide was more intense in the BLM fraction.
Conversely, the data presented in Figure 5.2.4 indicate that spectrin may be more
abundant at the BLM , a finding which is consistent w ith pre\dously reported studies [293].
Spectrin is a cytoskeletal protein and its presence in BLM , but not in BBM may be
im portant, to anchor BLM specific proteins to the BLM . O ther protein, PDZK-1,
produced more intense signals in the BBM analyses (data nor shown). PDZK-1 has been
implicated in organizing the cytoskeleton o f BBM [294;295]. Thus, the presence o f
different cytoskeletal proteins in BBM and BLM probably contribute to maintaining cell
polarity.
158
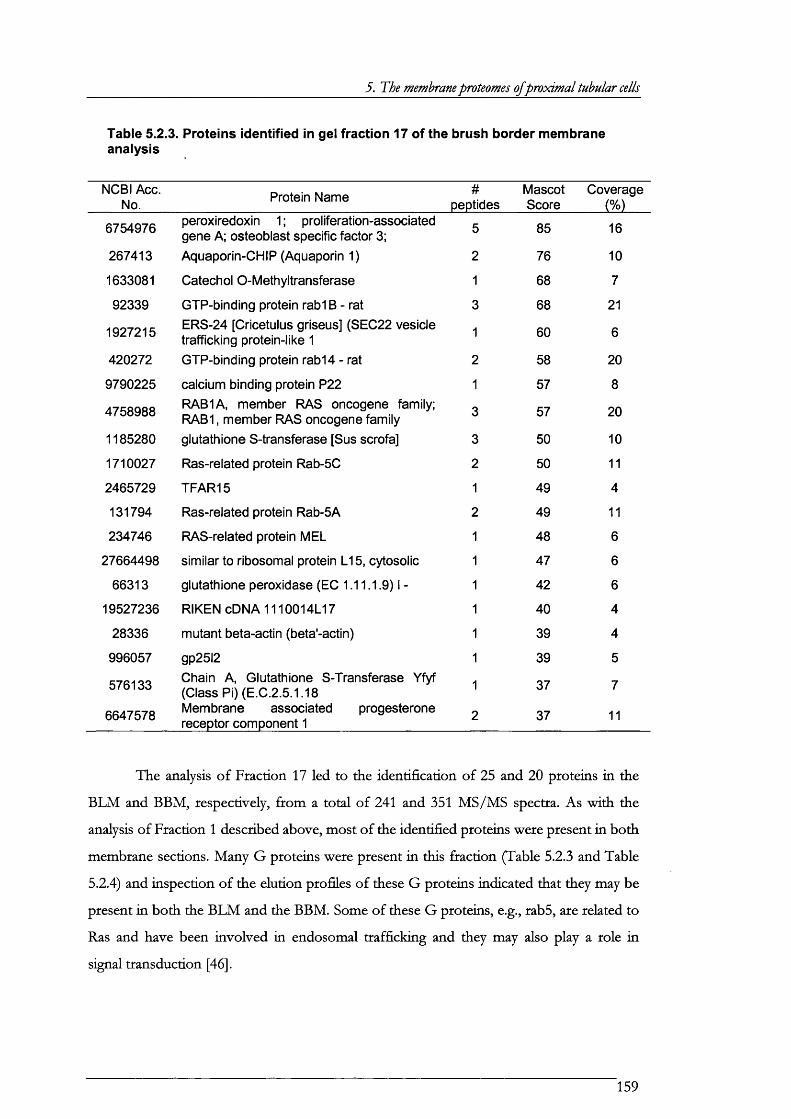
5. The membrane proteomes of proximal tubular cells
Table 5.2.3. Proteins identified in gel fraction 17 of the brush border membrane analysis
NCBI Acc. No. Protein Name #
peptidesMascotScore
Coverage(%)
6754976 peroxiredoxin 1 ; proliferation-associated gene A; osteoblast specific factor 3; 5 85 16
267413 Aquaporin-CHIP (Aquaporin 1) 2 76 10
1633081 Catechol O-Methyltransferase 1 68 7
92339 GTP-binding protein rabIB - rat 3 68 21
1927215 ERS-24 [Cricetulus griseus] (SEC22 vesicle trafficking protein-like 1
1 60 6
420272 GTP-binding protein rab14 - rat 2 58 20
9790225 calcium binding protein P22 1 57 8
4758988 RAB1A, member RAS oncogene family; RAB1, member RAS oncogene family 3 57 20
1185280 glutathione S-transferase [Sus scrofa] 3 50 10
1710027 Ras-related protein Rab-5C 2 50 11
2465729 TFAR15 1 49 4
131794 Ras-related protein Rab-5A 2 49 11
234746 RAS-related protein MEL 1 48 6
27664498 similar to ribosomal protein LI 5, cytosolic 1 47 6
66313 glutathione peroxidase (EC 1.11.1.9) 1 - 1 42 6
19527236 RIKEN CDNA1110014L17 1 40 4
28336 mutant beta-actin (beta'-actin) 1 39 4
996057 gp25l2 1 39 5
576133
6647578
Chain A, Glutathione S-Transferase Yfyf (Class Pi) (E.C.2.5.1.18 Membrane associated progesterone receptor component 1
1
2
37
37
7
11
The analysis o f Fraction 17 led to the identification o f 25 and 20 proteins in the
B LM and BBM , respectively, from a total o f 241 and 351 M S/M S spectra. As w ith the
analysis o f Fraction 1 described above, m ost o f the identified proteins were present in both
membrane sections. Many G proteins were present in this fraction (Table 5.2.3 and Table
5.2.4) and inspection o f the elution profiles o f these G proteins indicated that they may be
present in both the B LM and the BBM. Some o f these G proteins, e.g., rab5, are related to
Ras and have been involved in endosomal tra ffick ing and they may also play a role in
signal transduction [46].
159
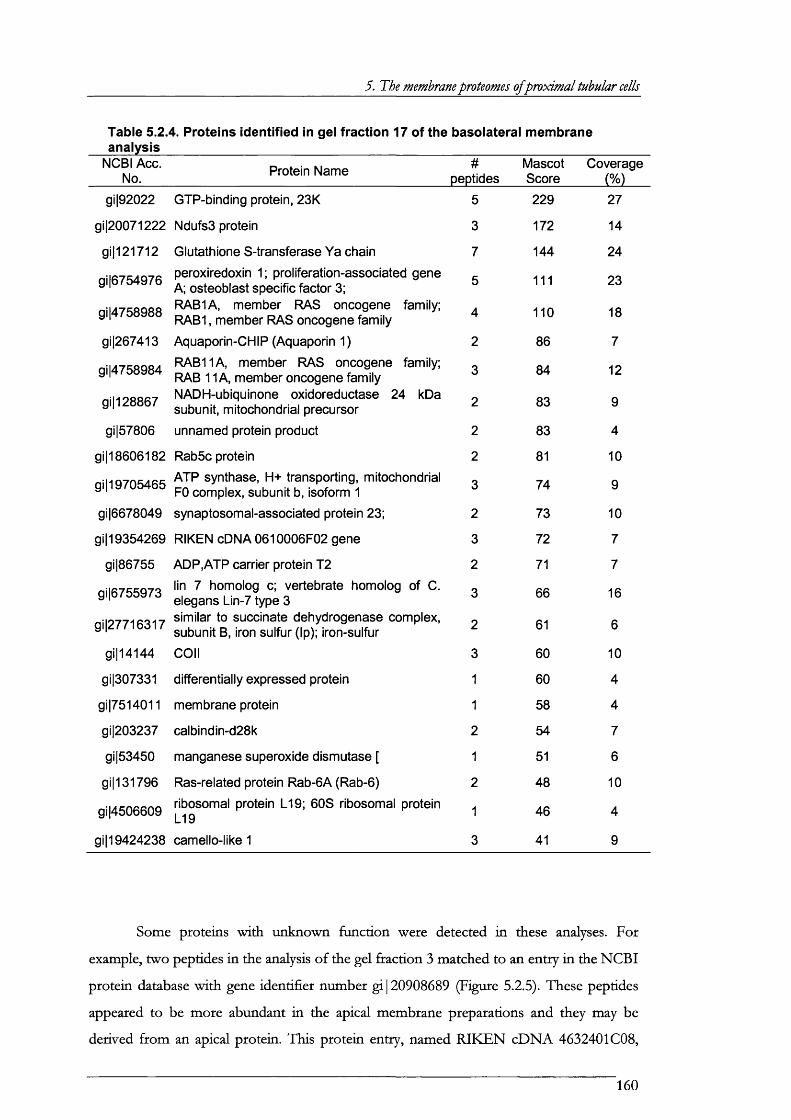
5. The membrane proteomes of proximal tubular cells
Table 5.2.4. Proteins identified in gel fraction 17 of the basolateral membrane analysis
NCBI Acc. No. Protein Name #
peptidesMascotScore
Coverage(%)
gi|92022 GTP-binding protein, 23K 5 229 27
gi|20071222 Ndufs3 protein 3 172 14
gi|121712 Glutathione S-transferase Ya chain 7 144 24
gi|6754976
gi14758988
peroxiredoxin 1; proliferation-associated gene A; osteoblast specific factor 3;RAB1A, member RAS oncogene family; RAB1, member RAS oncogene family
5
4
111
110
23
18
gi|267413 Aquaporin-CHIP (Aquaporin 1) 2 86 7
gi|4758984
gi|128867
RAB11A, member RAS oncogene family; RAB 11 A, member oncogene family NADH-ubiquinone oxidoreductase 24 kDa subunit, mitochondrial precursor
3
2
84
83
12
9
gi|57806 unnamed protein product 2 83 4
gi|18606182 Rab5c protein 2 81 10
gijl 9705465 ATP synthase, H+ transporting, mitochondrial FO complex, subunit b, isoform 1 3 74 9
gi16678049 synaptosomal-associated protein 23; 2 73 10
gi|19354269 RIKEN cDNA 0610006F02 gene 3 72 7
gi|86755 ADP,ATP carrier protein T2 2 71 7
gi|6755973
gi|27716317
lin 7 homolog c; vertebrate homolog of C. elegans Lin-7 type 3similar to succinate dehydrogenase complex, subunit B, iron sulfur (Ip); iron-sulfur
3
2
66
61
16
6
gi|14144 c o il 3 60 10
gi|307331 differentially expressed protein 1 60 4
gi|7514011 membrane protein 1 58 4
gi|203237 calbindin-d28k 2 54 7
gl|53450 manganese superoxide dismutase [ 1 51 6
gi|131796 Ras-related protein Rab-6A (Rab-6 ) 2 48 10
gi14506609 ribosomal protein LI 9; 60S ribosomal protein LI 9 1 46 4
gijl 9424238 camello-like 1 3 41 9
Some proteins w ith unknown function were detected in these analyses. For
example, two peptides in the analysis o f the gel fraction 3 matched to an entry in the N C B I
protein database wdth gene identifie r number g i| 20908689 (Figure 5.2,5). These peptides
appeared to be more abundant in the apical membrane preparations and they may be
derived from an apical protein. This protein entry, named R IK E N cD N A 4632401C08,
160

5. The membrane proteomes of proximal tubular cells
originated from the translated version o f a cD N A clone reported by the R IK E N Mouse
Gene Encyclopaedia Project (FA N TO M consortium) [296]. This cD N A clone was
derived from mouse skin tissue and to the knowledge o f the author their expression in
kidney has not been reported before, although homologous proteins are known to be
expressed in the kidney (Table 5.2.5).
Table 5.2.5. Selection of Proteins with Homology to RIKEN cDNA 4632401C08.Some of the protein sequences returned by homology using Blast searches against the
of RIKEN cDNA 4632401C08 are shown
IDE SIM LALI BEXPE Organism PROTEIN Tissueexpression Function
Ref
100 100 634 0.0Mus
musculus4632401 C08Rik protein Kidney ND [296]
53 70 596 e-171Mus
musculus
Na+ and Cl -dependent
transporter XTRP2.Kidney
Na:neurotransmitter
symport[297]
40 58 606 e-169Bos
Taurus
Na+ and Cl -dependent
neurotransmitter transporter
NTT73
RetinaNa : neu rotransmitter
symport[298]
52 69 596 e-168
Rattus
norvegic
us
Renal osmotic stress-induced
Na-CI organic solute
cotransporter
Kidney
cortex
Na:neurotransmitter
symport[299]
53 72 575 e-166Homo
sapiens
Hypothetical protein
FLJ31236Kidney
Na:neurotransmitter
symport[300]
45 63 608 e-161Homo
sapiens
Neurotransmitter transporter
RB21AUnknown
Na:neurotransmitter
symport[301]
46 64 581 e-161Mus
musculus
X transporter protein 3 similar
1Unknown
Na:neurotransmitter
symport[302]
Definitions;IDE : percentage of pairwise sequence identitySIM: percentage of similarityLALI: number of residues alignedBEXPE: blast expectation valuePROTEIN: one-line description of aligned protein
161
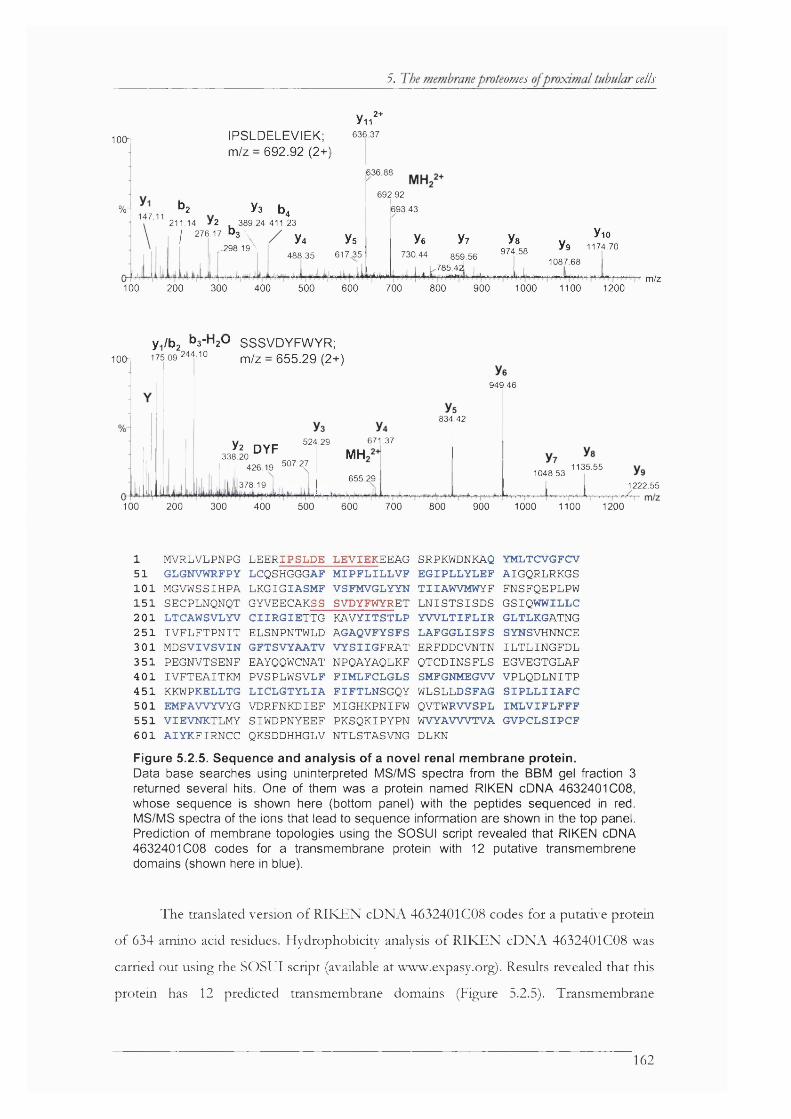
J. o/ivfJ cf/Zf
lOCh
» 1 H 7 1 ,
IPSLDELEVIEK;m/z = 692.92 (2+)
b2 Y3 b,211.14 > 2 389.24 411.23
j 276.17 D 3 \
,298.19^Y4
488.35
2 +Yii636.37
1636 88
500
Ys617.35
692,92
6 9 3 . 4 3
Ye730.44
4>Wii
y?859.56
785.421
Ya974.58
Y 10Yg 1174.70
1087.68
m/z100 200 300 400 600 700 800 900 1000 1100 1200
y^/bj D3-M2U SSSVDYFWYR;10(h 175.09 244.10 ^Ti/z = 655.29 (2+ )
949.46
834.42
671.37524.2933ÏLDYF
426.19 507.27MH
1135.551048.53655.29
378.19 1222.55
400100 200 300 500 600 700 800 900 1000 1100 1200
1511011512 0 1251301351401451501551601
M VRLVLPNPGGLGNVWRFPYM G VW SSIHPASECPLNQNQTLTCAWSVLYVIV F L F T P N ITM D SV IV SV INPEG N VTSEN FIV F T E A IT K MKKWPKELLTGEMFAWYVYGV IE V N K T L M YA IY K F IR N C C
LE E R IPSL D E LEVIEKEEAGLCQSHGGGAFLKGIGIASM FGYVEECAKSSC IIR G IE T T GELSNPNTW LDGFTSVYAATVEAYQQWCNATPVSPLW SVLFL IC L G T Y L IAV D R F N K D IE FS IW D P N Y E E FQKSDDHHGLV
M IP F L IL L V FVSFMVGLYYNSVDYFWYRETKAVYITSTLPAGAQVFYSFSV Y SIIG F R A TNPQAYAQLKFFIM LFCLGLSFIFTLNSG Q YM IG H K P N IF WP K S Q K IP Y P NN TLS TA S V N G
SRPKWDNKAQEG IPLLYLEFTIIAWVMWYFL N IS T S IS D SY W L T I F L I RL A FG G L ISFSER FDDCVNTNQ T C D IN S F L SSMFGNMEGWWLSLLDSFAGQVTW RW SPLWVYAVWTVADLKN
YMLTCVGFCVA IG Q R LR K G SFNSFQEPLPWGSIQWWILLCGLTLKGATNGSYNSVHNNCEIL T L IN G F D LEG VEG TG LAFV P L Q D L N IT PS I P L L IIA F CIM L V IF L F F FG V PC L SIPC F
Figure 5.2.5. Sequence and analysis of a novel renal membrane protein.Data base searches using un interpreted MS/MS spectra from the BBM gel fraction 3 returned several hits. One of them was a protein named RIKEN cDNA 4632401008, whose sequence is shown here (bottom panel) with the peptides sequenced in red. MS/MS spectra of the ions that lead to sequence information are shown in the top panel. Prediction of membrane topologies using the SOSUI script revealed that RIKEN cDNA 4632401008 codes for a transmembrane protein with 12 putative transmembrene domains (shown here in blue).
The translated version o f R IK E N cD N A 4632401 COS codes fo r a putative protein
o f 634 amino acid residues. Hydrophobicit)- analysis o f R IK E N cD N A 4632401 COS was
carried out using the SOSUI script (available at www.expasy.org). Results revealed that this
protein has 12 predicted transmembrane domains (Figure 5.2.5). Transmembrane
162

5. The membrane proteomes of proximal tubular cells
prediction using other publically available software also predicted R IK E N cD N A
4632401C08 is a putative transmembrane protein w ith a topology consisting o f 12
transmembrane domains (not shown).
Blast searches revealed that this protein has 53 % sim ilarity and 70 % hom ology to
a mouse Na^ineurotransm itter transporter termed XTRP2 and it is also sim ilar to other
sodium coupled neurotransm itter symporters (Table 5.2.5). The mouse XTRP2 protein is
mainly expressed in kidney and it is predicted to be a transmembrane protein. Thus
R IK E N cD N A 4632401C08 may be a novel transmembrane protein expressed in renal
cortex and located on the apical membrane o f PT cells. Its hom ology to
Na^:neurotransmitter symporters suggest that this protein may also have a role in the
reuptake o f this class o f molecule.
To summarize, although the results presented in this section comparing the
proteomes o f BBM and B LM vesicles indicated that the methods to isolate these vesicles
isolate qualitatively sim ilar proteomes, semi-quantitative analysis reveals that certain
proteins are enriched in specific membrane preparations. As expected, the N a ^/K ^-
ATPase is enriched in BLM , whereas megalin is enriched in the BBM . The fo ld
enrichment as determined by ion counts produced by ESI-MS is about 4 fo ld fo r these
components in their respective membrane compartment. This contrasts w ith published
results that suggest a greater enrichment fo ld (a 10 to 40 fo ld enrichment o f Na^/K"^-
ATPase activity in B LM has been reported [8]). This discrepancy may be caused by the
lim ited quantitative accuracy o f ESI-MS. Thus, as discussed in the previous chapter,
although quantitative data generated by ESI-MS can give an approximate indication o f
analyte abundance, it was decided to employ isotopic labelling to obtain a more accurate
picture o f BBM and B LM proteomes. Prehrninary experiments using this approach are
described in the next section o f this chapter. Finally, the identification o f proteins o f at
present unknown functions highlights the potential o f this m ethod fo r the identification o f
novel proteins and fo r the annotation o f the genome.
163

5. The membrane proteomes of proximal tubular cells
5.3. Analysis of proteins in BBM and BLM vesicles by isotope coded
affinity tags, liquid chromatography and mass spectrometry
Results presented in the previous section o f this chapter demonstrated that
although the markers o f BBM and BLM are enriched in their respective preparation, the
proteomes o f BBM and BLM vesicles isolated by free flow electrophoresis are qualitatively
similar, and the fo ld enrichment o f the proteins identified is not sufficiently high to
unambiguously assign a subcellular location to proteins o f otherwise unknown localization.
For this reason it was decided to use the isotope-coded a ffin ity tags ( IC A l] strategy in
order to determine w ith a greater degree o f accuracy the fo ld enrichm ent o f each protein
in these membrane vesicles. I t was envisaged that this would lead to greater certainty as to
the intracellular localization o f the identified gene products.
To this end, proteins in BBM were labelled w ith the ligh t IC A T reagent, while
B LM proteins were labelled w ith the heavy IC A T reagent. Equal amounts o f labelled
protein (100 jug) from each membrane fraction were mixed, digested w ith trypsin, and the
resultant tryptic peptide m ixture separated from the free IC A T reagent and in to fractions
by s e x LC. The labelled peptides were separated from non-labeUed ones by avidin a ffin ity
chromatography and then analysed by LC-ESI-M S/M S. Prehrninary experiments are
presented in this chapter section to illustrate the approach.
Figure 5.3.1 shows that, as expected, markers fo r the BBM and B LM were
enriched in their respective membrane preparation. The fo ld enrichm ent o f megalin and
the Na^/K'^-ATPase in the BBM and BLM , respectively, was about 6 fold. Several
cytosohc proteins were also isolated in these membrane preparations. As an example.
Figure 5.3.1 shows that, aldolase B, an abundant cytosohc protein was present in both
membrane preparations at sim ilar levels. The interpretation o f this find ing is not easy; it
may be that, as proposed before [283], components o f a defined cytosohc metabohc
pathway associate at the interface o f membranes so that transfer o f reactants and products
is more efficient. Since aldosase B protein appears at sim ilar levels in both membranes
(and also in m itochondrial preparations [283]), its association w ith biological membranes
may be unspecific. A lternatively, this protein may not associate w ith biological membranes,
and it may just be a contaminant whose appearance in subceUular preparations may be due
to the behef that it may not be possible to completely separate ah the components present
in an organeUe from cytosohc components.
164
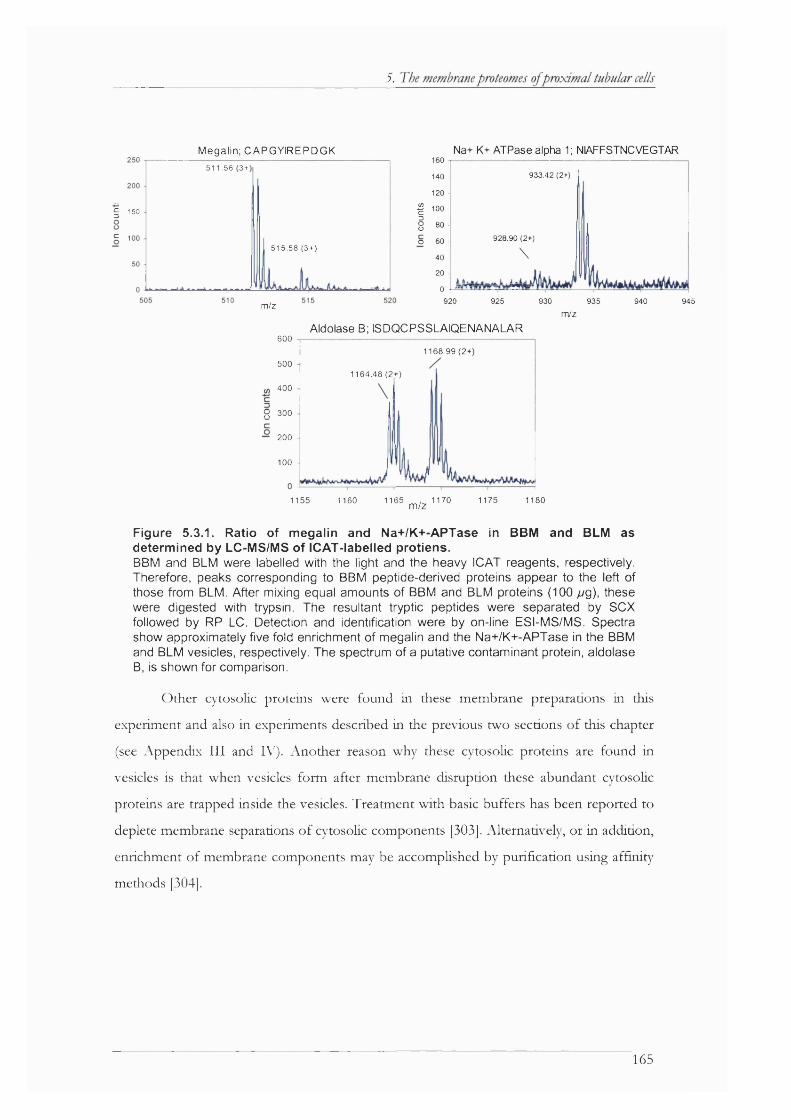
J.
Megalin; CAPGYIREPDGK
5 1 5 0
51 1.56 3 +
515.58 (3+)
160
140
120 I 100 § 80 O 60
40
20 0
Na+ K+ ATPase alpha 1; NIAFFSTNCVEGTAR
933.42 (2+)
928.90 (2+)
\
m/z 920 925 930 935m/z
940
Aldolase B; ISDQCPSSLAIQENANALAR600
1168.99 (2+)500
1164.48 (2+)
400
p 300
200 -
100 -
1165 1170 1175 11801155 1160 m/z
Figure 5.3.1. Ratio of megalin and Na+/K+-APTase in BBM and BLM as determined by LC-MS/MS of ICAT-labelled protiens.BBM and BLM were labelled with the light and the heavy ICAT reagents, respectively. Therefore, peaks corresponding to BBM peptide-derived proteins appear to the left of those from BLM. After mixing equal amounts of BBM and BLM proteins (100 /yg), these were digested with trypsin. The resultant tryptic peptides were separated by SOX followed by RP LC. Detection and identification were by on-line ESI-MS/MS. Spectra show approximately five fold enrichment of megalin and the Na+/K+-APTase in the BBM and BLM vesicles, respectively. The spectrum of a putative contaminant protein, aldolase B, is shown for comparison.
Other cytosolic proteins were found in these membrane preparations in this
experiment and also in experiments described in the previous two sections o f this chapter
(see Appendix I I I and I\^ . Another reason why these cytosolic proteins are found in
vesicles is that when vesicles form after membrane dism ption these abundant cytosolic
proteins are trapped inside the vesicles. Treatment w ith basic buffers has been reported to
deplete membrane separations o f cytosolic components [303]. Alternatively, or in addition,
enrichment o f membrane components may be accomplished by purification using affinity"
methods [304].
945
165
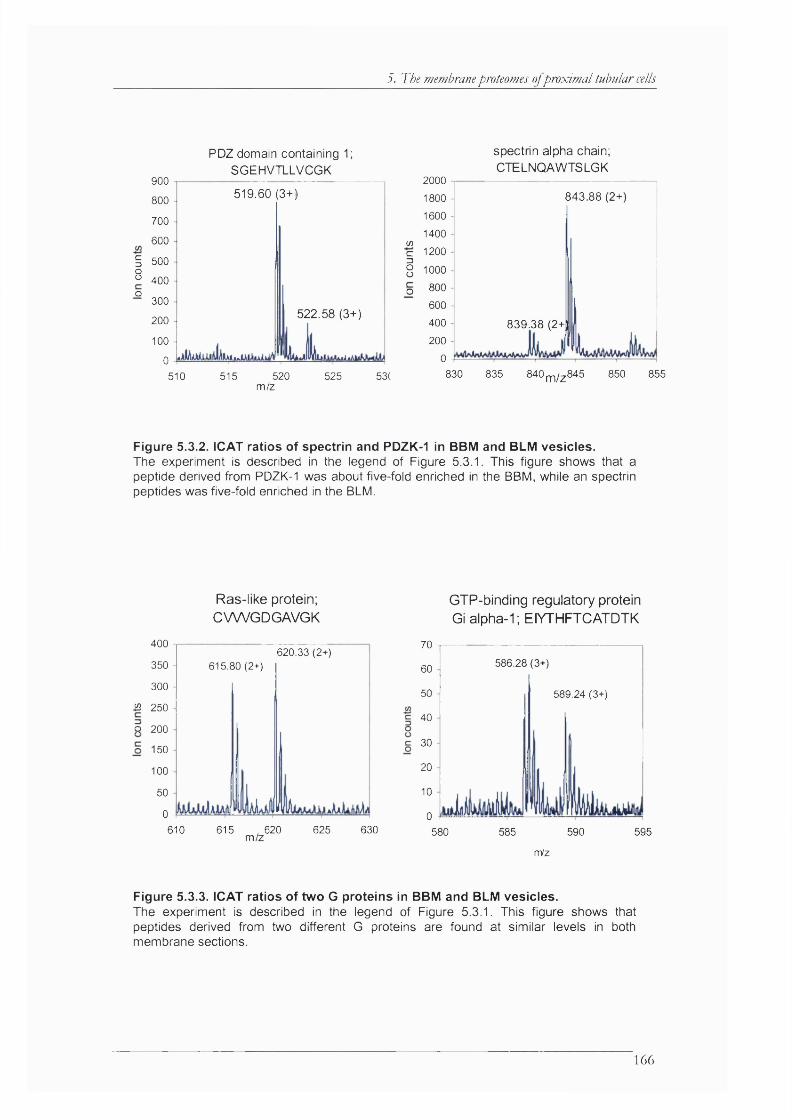
5. The membrane proteomes oj proximal tubular cells
PDZ domain containing 1; SGEHVTLLVCGK
900
800
700
600c3 5008 400o
300
200100
0
519.60 (3+]
522.58 (3+)
spectrin alpha chain; CTELNQAWTSLGK
20001800
1600
1400œc 12003oo 1000o 800
600
400
2000
843.88 (2+)
839.38 (2+ni
510 515 520 525 53( 830 835 840m/z
m/z845 850 855
Figure 5.3.2. ICAT ratios of spectrin and PDZK-1 in BBM and BLM vesicles.The experiment is described in the legend of Figure 5.3.1. This figure shows that a peptide derived from PDZK-1 was about five-fold enriched in the BBM, while an spectrin peptides was five-fold enriched in the BLM.
Ras-like protein; CVWGDGAVGK
400620.33 (2+)
350 615.80 (2+)
300
iQ 250
o 200
50
100
50
0
610 615 620 625 630m/z
GTP-binding regulatory protein Gi alpha-1; EIYTHFTCATDTK
70
586.28 (3+)60
50 589.24 (3+)
40
30
20
10
0580 585 590 595
nrVz
Figure 5.3.3. ICAT ratios of two G proteins in BBM and BLM vesicles.The experiment is described in the legend of Figure 5.3.1. This figure shows that peptides derived from two different G proteins are found at similar levels in both membrane sections.
166
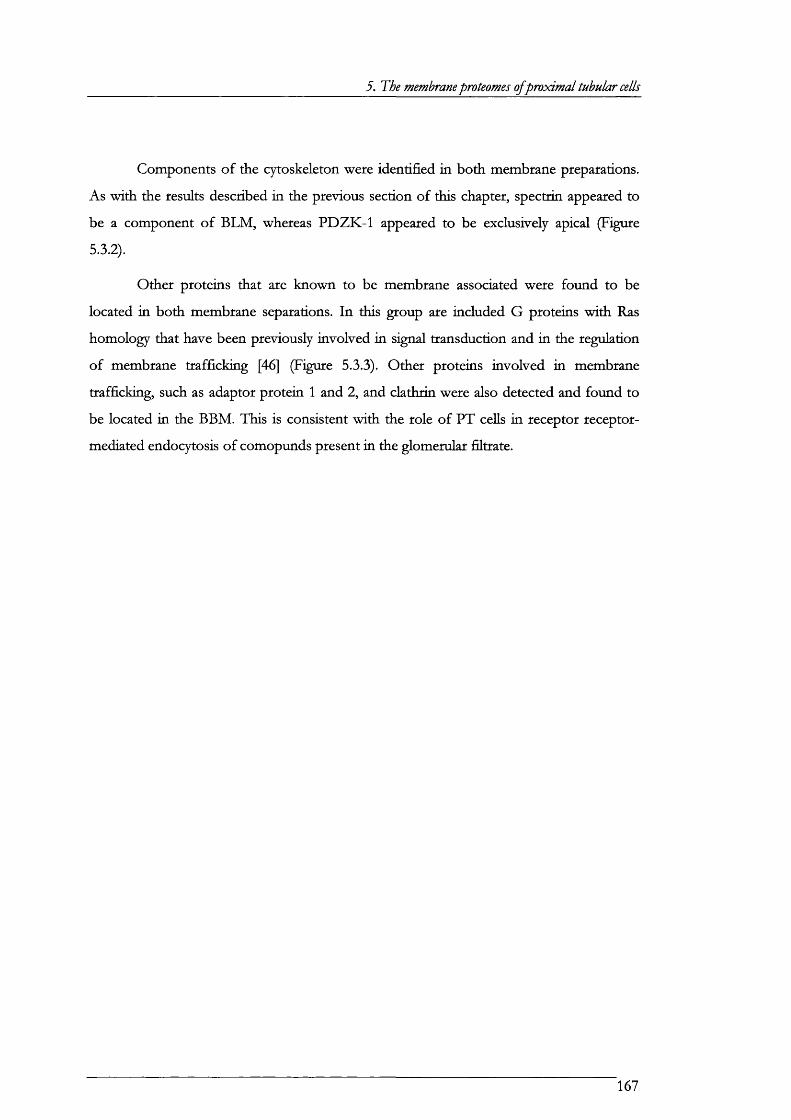
5. The membrane proteomes of proximal tubular cells
Components o f the cytoskeleton were identified in both membrane preparations.
As w ith the results described in the previous section o f this chapter, spectrin appeared to
be a component o f B LM , whereas P D ZK -1 appeared to be exclusively apical (Figure
5.3.2).
O ther proteins that are known to be membrane associated were found to be
located in both membrane separations. In this group are included G proteins w ith Ras
homology that have been previously involved in signal transduction and in the regulation
o f membrane tra ffick ing [46] (Figure 5.3.3). O ther proteins involved in membrane
trafficking, such as adaptor protein 1 and 2, and clathrin were also detected and found to
be located in the BBM . This is consistent w ith the role o f PT cells in receptor receptor-
mediated endocytosis o f comopunds present in the glomerular filtrate.
167
5. The membrane proteomes of proximal tubular cells
5.4. Summary
Results presented in this chapter have demonstrated the application o f mass
spectrometdc-based approaches fo r the identification o f membrane proteins in a manner
suitable fo r proteome wide studies. I t is predicted that these methods, in com bination w ith
cell fractionation techniques, wiU lead to the identification o f not only the proteomes o f
each cell type but also the subcellular location o f each gene product. The characterization
o f the m itochondrial proteome has akeady been reported [283] and attempts to analyse the
plasma membrane proteomes o f certain cell types [258] and G olgi membranes [259] are
also published.
Currently, there is a great interest in the elucidation o f the proteomes o f specific
organelles [154;305-308] in the view that this in form ation can lead to a better
understanding o f the function o f each subcellular structure. U ltim ately, this knowledge
may lead to a better understanding o f cell biology and physiology. Nevertheless, it is
recognized that the ceU fractionation methods currently available do no t isolate subcellular
organelles or fractions to homogeneity, although protein components specific fo r the
respective organeUe may be enriched w ith respect to other ceUular components. For
example, Taylor et al analysed the proteome o f heart m itochondria by SDS-PAGE
separation o f proteins foUowed by excision o f gel bands, the proteins present in which
were identified by M A L D l-T O F MS and LC-ESI-M S/M S [283]. Therefore, this approach
was very sim ilar to the one o f the methods used during the course o f the experimental
w ork described here and presented in the firs t section o f this chapter. The difference is
that Taylor et al did not explore 2D -LC -M S/M S as an alternative to SDS-PAGE foUowed
by LC-M S/M S. More than 400 protein identification were reported in the cited paper
[283], many o f them were known m itochondrial proteins, and there also were proteins that
had not been previously reported in m itochondria, including proteins w ith potential
signaUing roles. Surprisingly, proteins involved in carbohydrate metabolism, and thought to
be exclusively cytosolic, were also found in these m itochondrial preparations. The authors
speculate that the association o f enzymes involved in a defined metabolic pathway w ith the
outer m itochondrial membrane may facilitate the transfer o f products and substrates thus
making the pathway more effective.
Nevertheless, the fact that in troduction o f ‘contam inant’ proteins in the isolation
o f ceUular organeUes may be unavoidable cast doubt on the assignation o f the intraceUular
location o f a given protein. Results describing the proteome o f organeUes would be less
168

5. The membrane proteomes of proximal tubular cells
ambiguous i f it was possible to determine the extent o f enrichment o f each component in
its respective subcellular preparation and then compare it w ith the enrichm ent o f known
and bona fide markers o f the organeUe under study. In this respect, the experimental w ork
presented in this chapter has demonstrated that contaminant proteins are present in the
proteomes o f the BBM and B LM vesicles. A n approach fo r quantitative proteomics based
on isotopic labelling was then used (Section 5.3), which provided in form ation on how
enriched proteins from BBM are w ith respect to those in BLM vesicles. This was done in a
m ultip lex and high throughput fashion compatible w ith proteome wide studies. Further
experiments using the approach described above could be carried out in the future to
make a more comprehensive description o f the proteomes present in BBM and BLM
vesicles.
Another lesson learned from the results obtained during these experiments is that
the set o f proteins identified may be d ifferent depending on the method used. I t has been
reported that the average molecular weight o f m itochondrial proteins is about 50 kDa
[283]. Here, I have shown that the calculated average molecular weight o f a given
proteome may be dependent on the method used fo r the ir analysis. Indeed, the proteome
o f BBM isolated by magnesium precipitation and differential centrifugation had an average
molecular weight o f ~ 60 or ~ 70 kDa, depending upon whether the analysis was carried
out by SDS-PAGE or SCX, respectively. A lthough this conclusion may not be surprising
and a careful theoretical consideration may have predicted it, to the best o f the author’s
knowledge, this phenomenum has not been reported before.
Several hundred proteins were identified in both membrane preparations (Sections
5.1 and 5.2). Many channels and transporters were identified, consistent w ith the function
o f the cells present in the renal cortex, which is to mediate the reuptake o f solutes freely
filtered at the glom eruli and present in the tubular flu id. The endocytic receptors megalin
and cubilin were also identified together w ith proteins involved in receptor-mediated
endocytosis, including the adaptor proteins AP-1 and AP-2, clathrin and small GTPases
that regulate endocytosis (e.g., Rab5). The latter seemed to be present in both BBM and
BLM , whereas adaptor proteins were more abundant in BBM vesicles.
Some proteins w ith signalling functions were present in both membranes. For
example, Ras and Ras related proteins were identified in BBM and BLM , which suggests
that at least part o f the molecular machinery o f the Ras signal transduction pathway is
located on the apical side o f PT cells. Failure to identify receptors fo r hormones in these
169
5. The membrane proteomes of proximal tubular cells
analyses may be explained by the low stochiom etric concentrations o f these proteins on
membranes. Since intracellular cascades am plify the signal generated at the receptor, only
low stochiom etric amounts o f receptors are needed to generate an intracellular signal
cascade, and consequently their concentration on membranes is low when compared w ith
cytoskeletal, structural and other house-keeping’ proteins. Therefore, although hormone
receptors fo r the peptides identified in chapters 3 and 4 could not be detected, their
presence on the apical side o f tubular cells cannot be excluded. Also, renal cortexes contain
PT cells and the site o f regulation may be on more distal parts o f the tubules.
Nevertheless, the presence o f proteins w ith potential signalling roles in the BBM
preparations suggests that factors present in the tubular flu id may be capable to stimulate
tubular cells.
Several structural proteins, such as spectrin and P D ZK -1, which are located at the
B LM and BBM , respectively, were also identified. Spectrin is known to be located at the
B LM and this protein binds other proteins located at this membrane segment such as the
Na^/K^-ATPase [309]. On the other hand, P D ZK -1 interacts w ith N a P i-II [303;309] and
the experiments presented in this thesis suggest that this protein is exclusively located at
the BBM. These proteins form part o f the cytoskeleton and their association w ith
membranes may serve to dock proteins specific fo r their respective membrane
compartment. This may provide a structural basis fo r membrane architecture and
organization, which ultim ately determine cell polarity.
To summarize, approaches to determine the proteomes o f BBM and BLM from
renal cortical cells were assessed and implemented. Several hundred membrane
components were identified during these experiments. U ltim ately, unambiguous
assignation o f proteins to the ir respective sub-membranous localization w ill need
quantitative methodologies. In this respect, although immunochemical methods can be
used fo r the relative quantitation o f proteins, proteome wide quantitative methods, such as
those described in this chapter, may be used instead in a faster and less biased fashion to
unambiguously characterize the proteomes o f subcellular compartments.
170
6. Conclusion
6. Concluding Remarks and Outlook
The purpose o f the studies presented in this thesis was to develop and im plem ent
mass spectrometry-based analytical methods to test the idea that polypeptide hormones
operating from the tubular lumen o f nephrons may have a role in contro lling renal
physiology. Chapter 3 has brie fly described the development o f methods, and their
prelim inary applications to extract polypeptides from urine in a form amenable to analysis
by MS. Chapter 4 presented an account on the proteome o f norm al and D ent’s disease
urine. Finally, studies aimed at the identification o f the proteomes o f BBM and B LM were
described in Chapter 5.
Experimental w ork perform ed during the studies presented here indicates that a
com bination o f chromatographic techniques can extract polypeptides from urine
efficiently. These studies, presented in Chapter 3, demonstrate that by com bining RP w ith
SCX chromatography peptides w ith theoretical molecular weights ranging from 1 kDa to
600 kDa can be extracted. Therefore, the advantage o f this m ethod when compared w ith
methods based on size exclusion (e.g., dialysis, u ltra filtra tion , o r gel filtra tion) is that
polypeptides o f a wide molecular weight range can be isolated. This is illustrated in
experiments presented in Chapter 3, where data is presented showing that numerous
peptides were detected and sequenced by M S/M S using this approach. The results o f these
experiments have been published [220;272].
Chapter 3 also illustrates a method fo r the analysis o f peptides present in small
volumes o f biological fluids. These experiments were presented in the 50* conference o f
the American Society fo r Mass Spectrometry [310] and demonstrated that peptides can be
analysed w ith high sensitivity by a com bination o f capillary chromatographic columns w ith
mass spectrometric detection. This system could be used fo r the analysis o f peptides
present in tubular flu id. However, the com plexity o f the system means that two HPLC
pumps and a mass spectrometer have to be exclusively dedicated to these analyses.
Therefore, other, less instrum entally demanding, methods w ill have to be investigated fo r
the analysis o f tubular flu id. In this respect, M A L D I-T O F may be more tolerant to the
presence o f low molecular weight compounds that may interfere w ith peptide analysis, and
prelim inary experiments (not shown in this thesis) suggest that a single extraction by
capillary RP-LC can, in com bination w ith M A L D I-T O F , be used fo r the analysis o f
urinary peptides w ith high sensitivity.
171
6. Condi4sim
Chapter 4 is an account o f the experimental work carried out during the studies
aimed at the analysis o f Dent’s disease and normal m inary proteomes. Unlike previous
studies on the peptide composition o f the urine o f Dent’s disease and other foims o f the
FS, the analysis was standardised to protein concentration rather than to volume o f urine
or creatinine concentration. Therefore, the results present a qualitative picture o f these
proteomes, albeit the differences in qualitative composition were quantified using the
intrinsic inform ation obtained byLC ESI-M S, 2DE, and also the IC A T strategy.
I t was found that the parameter o f ion intensity obtained in LGESI-MS
experiments correlates well w ith the quantitative results obtained by 2DE and LCM S of
IC A T labelled peptides. Recently, it has been shown that ion intensities produced in LG
ESI-MS experiments can be correlated w ith protein abundance [233]. The intensity
generated in ESI-MS is proportional to analyte concentration, and although ion
suppression due to interferences w ith other analytes may be o f concern, when these
differences are large, as in biological fluids, quantitative inform ation obtained by LG ESI-
MS can be used as a first indication o f differences in the proteomes o f case versus control
samples.
An important conclusion regarding the methodology used during these studies is
that a single proteomic approach may fail to identify all the proteins present in a biological
sample. This is probably due to the heterogeneous physicochemical nature o f proteins;
since analytical approaches exploit o f the analytes’ properties fo r their identification, the
fact that the physical and chemical properties o f proteins d iffe r also means that more than
one approach w ill be needed fo r comprehensive proteomic analyses.
Regarding their biological significance, perhaps the most important conclusion o f
the results presented in this thesis is that the megalin-cubilin receptor complex may have
different affinities fo r different proteins. Thus, vitamin-binding proteins seem to be
reabsorbed more efficiently from the glomerular filtrate than other plasma proteins such as
albumin. This finding strongly suggests that the salvage o f vitamins (bound to their
carriers) is physiologically more important than the salvage o f amino acids (in the form of
protein) such that this endocytic pathway may have evolved to have more a ffin ity to this
type o f molecule.
Other protein classes fo r which this pathway seems to have more affin ity are the
lipoproteins, bioactive peptides, and complement components. These proteins have been
reported to be toxic to cultured cells and they may also be toxic to renal tubular cells.
172
6. Cæidptsim
Consequently, another role of this pathway may be to protect tubular cells from the
bioactivity o f plasma components and it may explain why endocytosis occurs in the first
segment o f the tubules. Indeed, an important physiological role o f the megalin-cubilin
endocytic pathway may be to protect distal tubular cells from the bioactivity o f plasma
proteins and to allow the intracrine regulation o f renal function - that may operate at the
lumen o f the tubules - to work unperturbed.
These results may be explained by assuming that the megalin-cubilin receptor
complex has different affinities to different ligands. Alternatively there may be other
receptors that mediate the reuptake o f specific proteins from the glomerular filtrate. This
possibility was explored and the results presented in Chapter 5, where studies aimed at the
characterisation o f the BBM and BLM proteomes have been described. Megalin and
cubilin were the only proteins w ith known roles in endocytosis that could be identified in
these analyses. Therefore, these results do not support the notion o f other endocytic
receptors fo r proteins present in the proximal tubule. However, this possibility cannot be
completely excluded because the MS/MS data was used to interrogate a protein database.
Since not all the gene products have been added to this database there may be still
unidentified genes w ith roles in endocytosis and expressed in the BBM o f PT cells. Once
the sequence o f the rat genome is completed and all the open reading frames identified,
the MS data generated in the experiments described in Chapter 5 could be used to
interrogate the annotated rat genome. I t may be predicted that other proteins may be
identified w ith this exercise.
Results presented in Chapter 5 also confirmed that there are proteins present in
BBM w ith potential roles in signal transduction and consequently these results reinforce
the notion that luminal factors could contribute to the regulation renal function.
The studies presented in this thesis have demonstrated that there is an alteration in
the relative amounts o f peptides and proteins in Dent’s disease urine when compared
compared w ith normal urine. One o f the manifestations o f this and other forms o f the FS
is progressive renal failure. I t can be proposed that progression o f renal disease in FS
patients is secondary to the alteration in urine composition, which, at least in part, reflects
the composition o f tubular fluid. Bioactive peptides in normal tubular flu id may have
functions in maintaining cell polarity and in providing autocrine and paracrine loops w ith
roles in keeping an extracellular composition compatible w ith cell survival. The results in
Chapter 4 also identified proteins o f renal origin that may have a role in regulating this
173
6. Condmim
process. In diseases that lead to proteinuria, such as FS and diabetes, these regulatory
systems may be overwhelmed and an abnormal stimulation o f luminal receptors may lead
to an altered stimulation o f signal transduction pathv^ys that would result in an abnormal
regulation o f gene expression.
I f this hypothesis were tme, it would be expected to find differences in renal gene
expression between normal and animal models o f the disease such as the CLCN-5 and the
megalin knock-out mice. Consequently, experiments aimed at the characterisation o f gene
expression in CLCN-5 K O and normal mice kidneys could be carried out to invest^ate
the possibility o f an altered renal gene expression in these mice.
I t has also been reported that in renal cells from CLCN5 K G mice and Dent’s
disease patients there is an altered delivery o f apical proteins to the BBM [48;311].
Therefore, the Q C 5 protein may be involved in sorting proteins from the ER and Golgi
to the BBM. Proteomic strategies as those used in Chapter 5 could be used to investigate
this hypothesis further and to determine which apical proteins, if any, fa il to be delivered
to the BBM in PT cells o f CLCN5 K G mice.
I have also speculated that there may be an altered bioactivity in the tubular flu id
o f patients w ith tubular proteinuria, which is based on the observation that the peptide
hormone composition o f FS urine is different from that o f normal subjects. Functional
experiments could be carried out in order to investigate the extent o f this alteration;
cultured renal tubular cells could be exposed to FS and normal urine and/or urinary
proteins. The response o f these cells could then be investigated by, fo r example, measuring
the phosphorylation o f known components o f signal transduction pathways.
In conclusion, the experimental work carried out during the studies presented in
this thesis identified an approach fo r the extraction o f polypeptides from urine in a form
compatible w ith MS analysis. Implementation o f these methods fo r the analysis o f FS
urine (with emphasis on Dent’s disease) gave insights into the nature o f low molecular
weight proteinuria and suggested that the reuptake o f proteins from the glomerular filtrate
shows some kind o f specificity and it is not as promiscuous as previously thought. The
presence o f bioactive peptides in Dent’s and normal urine and the finding that proteins
w ith signalling roles are located on apical membranes support the notion o f an intracrine
system operating in the lumen o f the healthy tubules. An alteration on the hormonal
composition o f the tubular fluid, as in diseases that lead to proteinuria, may contribute to
174
6. Ccndusicn
the progression o f these diseases w ith the end result o f renal dysfunction and ultimately
kidney failure.
175
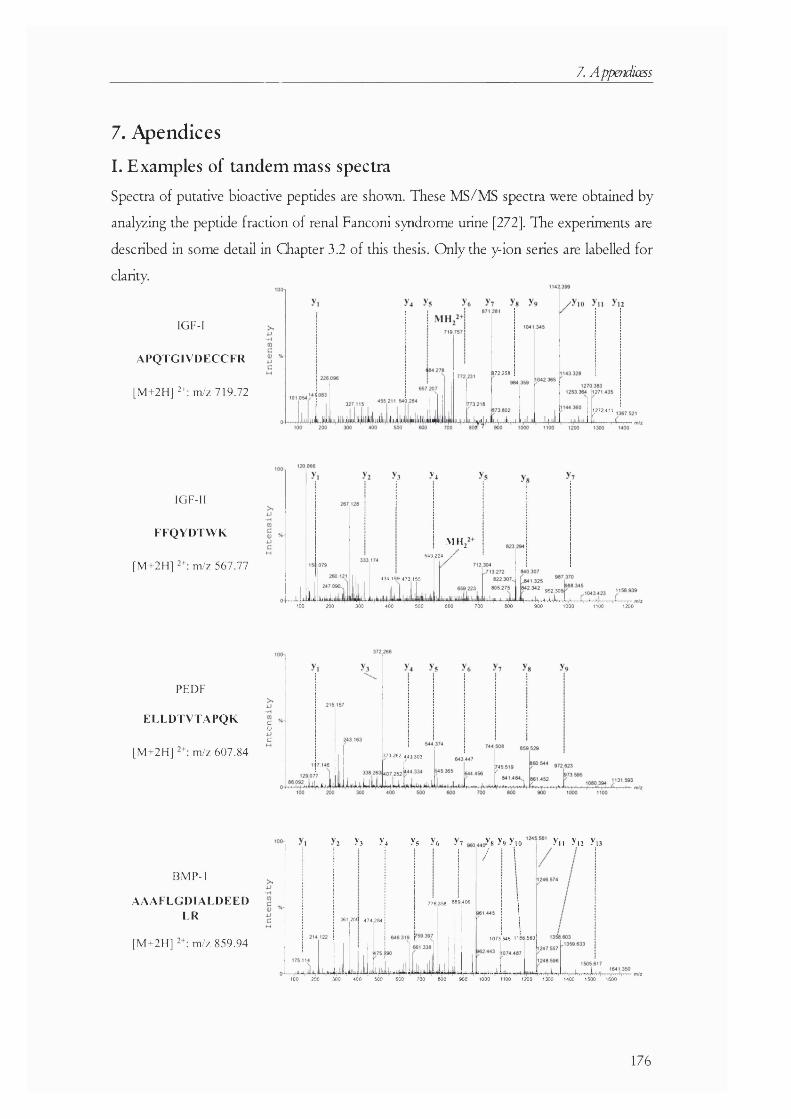
7. Appendkess
7. Apendices
I . E x a m p le s o f t a n d e m m a s s s p e c tra
Spectra of putative bioactive peptides are shown. These MS/MS spectra were obtained by
analyzing the peptide fraction of renal Fanconi syndrome urine [272]. The experiments are
described in some detail in Chapter 3.2 o f this thesis. O nly the y-ion series are labelled for
clarity.
IGF-l
APQTGIVDECCFR
[M+2H]2+:m/z 719.72
I
372 250
1,272 411
IGF-II
FFQ YD TW K
[M+2H] m/z 567.77
ilul4
V4
IVlHj549 224 / '
434 1 99 4 73 1 55
952 305
U.,.4.Lk.100 200 300 400 500 600 700 800 900 1000 1100 1200
PEDF
ELLD TVTAPQ K
[M+2H] m/z 607.84
sc
373 262 443 303
BMP-1
AAAFLGDIALDEEDLR
[M+2H] m/z 859.94
y3 y
361 20a 474 284
% y6 y?/Vs >'9 y,o
776 350 889 406
1073 546 1100 563
y.i y,2 y,
100 200 300 400 500 600 700 800 900 1000 1100 1200 1300 1400 1500 1600
176
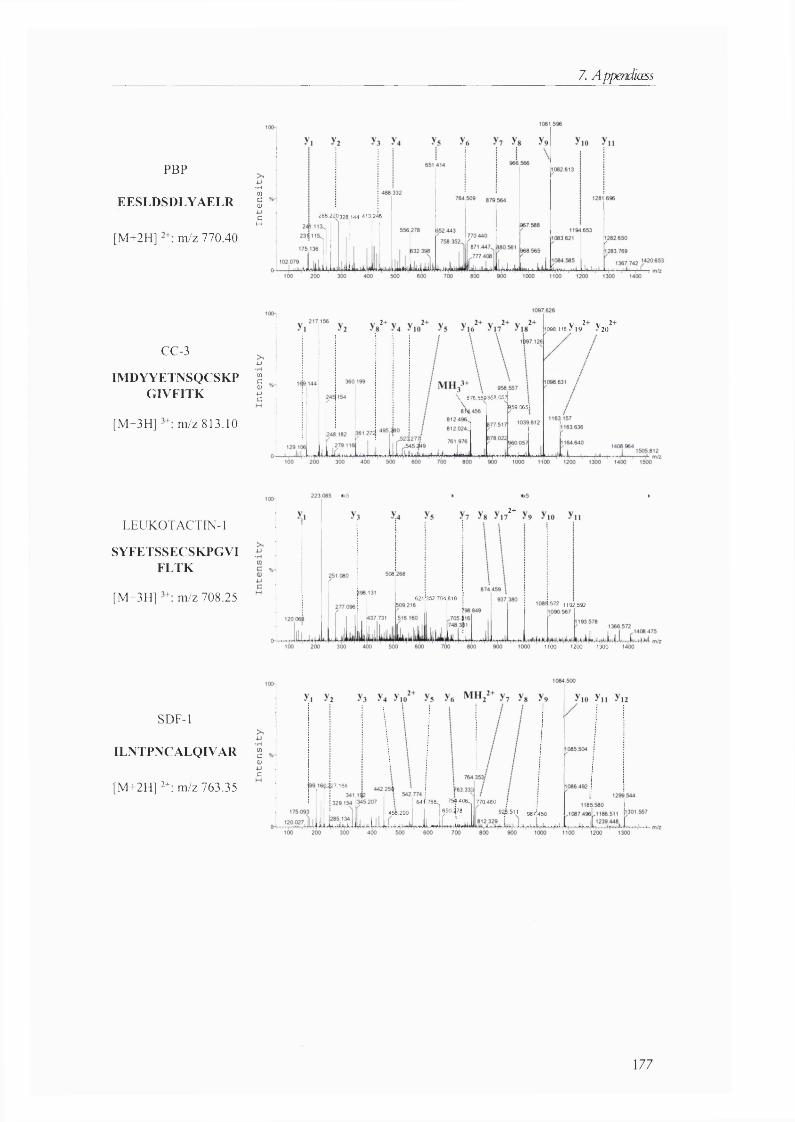
7. Appendiœss
PBP
EESLDSDLYAELR
[M+2H] m/z 770.40
■HwsCH
288 220328 144 413 246
CC^
IM D YYETNSQ C SK PG IV F IT K
[M+3H] m/z 813.10
2 + 1098 118 y 19 y20
4J
œc(U4Jc \ 876 559958 057
959,0651
LEUKOTACTIN-1
SYFETSSECSKPGVIFLTK
[M+3H] m/z 708.25
2 +
621=352 704 818572 1192 592
1100 1200 1300
SDF-1
IL N TP N C A LQ IV A R
[M+2H] 2"; m/z 763.35
MCttJc
0 ^ 7 166
64 ( 788 75ÿ406^
i x S770480 /
9 511 987=45045è290
177
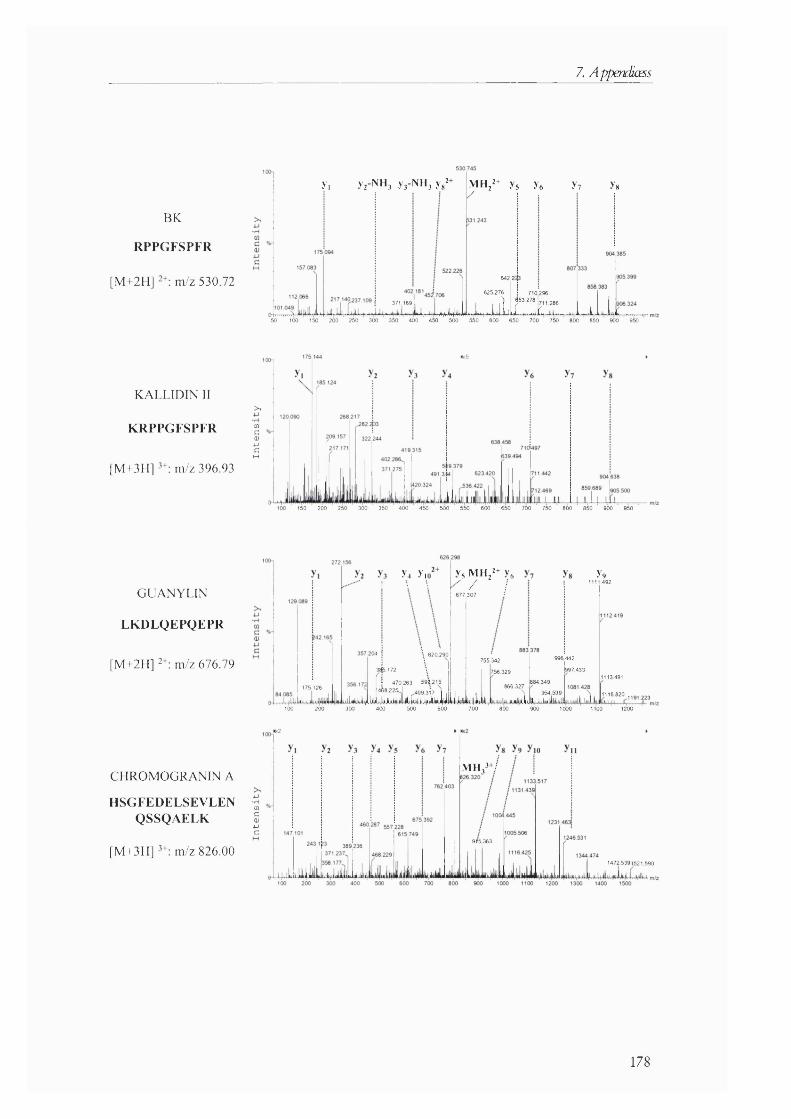
7. Appendiœss
BK
RPPGFSPFR
[M+2H] m/z 530.72
y, v,-N H 3 y3-NH3 y7
371 1691,
*4M
MH7+ ys y
642.2
625 276
u l O
y?
710296
I71I 286
y«
50 100 150 200 250 300 350 400 450 500 550 600 650 700 750 800 850 900 950
KALLID IN II
KRPPGFSPFR
[M+3H] m/z 396.93
>1[0c<uucM
150 200 250 300 350 400 450 500 550 600 650 700 750 800 850 900 950
GUANYLIN
LKDLQ EPQ EPR
[M+2H] m/z 676.79
CHROMOGRANIN A
HSGFEDELSEVLENQSSQAELK
[M+3H] m/z 826.00
175,126
Wvi
>4 y,
jjUitUüi*
i \ 'I : : 520 290
i \3 ,72 \i 470 263 59)215
G iâ g a lu
V sM H ,’ * y,/ /
677 307 /
Y91111 492
755 342
756 329
m866 327
996 442
997 433
884 349
954 539
a u ü
n l3 4 9 1
1116820 ,
100 200 300 400 500 600 700 800 900 1000 1100 1200
IMH7+/
4J
03C0)i-lc
9 f5 363
1472 5391521 590
178
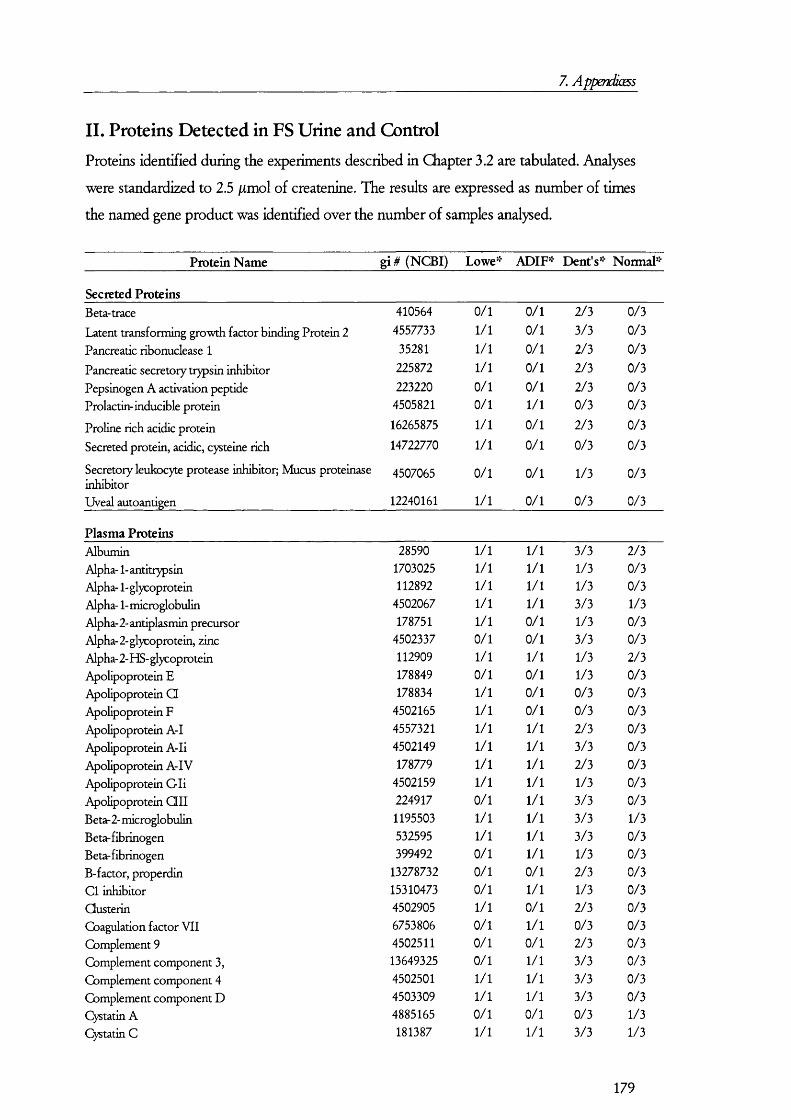
7. Appendicess
IL Proteins Detected in FS Urine and ControlProteins identified during the experiments described in Chapter 3.2 are tabulated. Analyses
were standardized to 2.5 fimol o f createnine. The results are expressed as number o f times
the named gene product was identified over the number o f samples analysed.
Protein Name gi# (NCBI) Lowe’*‘ ADIF«- Dent's" Normal"'
Secreted ProteinsBeta-trace 410564 0/1 0/1 2/3 0/3
Latent transforming growth factor binding Protein 2 4557733 1/1 0/1 3/3 0/3Pancreatic ribonuclease 1 35281 1/1 0/1 2/3 0/3
Pancreatic secretory trypsin inhibitor 225872 1/1 0/1 2/3 0/3
Pepsinogen A activation peptide 223220 0/1 0/1 2/3 0/3Prolactin-inducible protein 4505821 0/1 1/1 0/3 0/3
Proline rich acidic protein 16265875 1/1 0/1 2/3 0/3
Secreted protein, acidic, cysteine rich 14722770 1/1 0/1 0/3 0/3
Secretory leukocyte protease inhibitor; Mucus proteinase 4507065 0/1 0/1 1/3 0/3inhibitorUveal autoantigen 12240161 1/1 0/1 0/3 0/3
Plasma ProteinsAlbumin 28590 1/1 1/1 3/3 2/3Alpha-1-antitrypsin 1703025 1/1 1/1 1/3 0/3Alpha-1-glycoprotein 112892 1/1 1/1 1/3 0/3Alpha-1-microglobulin 4502067 1/1 1/1 3/3 1/3Alpha- 2- antiplasmin precursor 178751 1/1 0/1 1/3 0/3Alpha-2-glycoprotein, zinc 4502337 0/1 0/1 3/3 0/3Alpha- 2- HS- glycoprotein 112909 1/1 1/1 1/3 2/3Apolipoprotein E 178849 0/1 0/1 1/3 0/3Apolipoprotein Q 178834 1/1 0/1 0/3 0/3Apolipoprotein F 4502165 1/1 0/1 0/3 0/3Apolipoprotein A-1 4557321 1/1 1/1 2/3 0/3Apolipoprotein A-Ii 4502149 1/1 1/1 3/3 0/3Apolipoprotein A-IV 178779 1/1 1/1 2/3 0/3Apolipoprotein C li 4502159 1/1 1/1 1/3 0/3Apolipoprotein Q I I 224917 0/1 1/1 3/3 0/3Beta-2-microglobulin 1195503 1/1 1/1 3/3 1/3Beta-fibrinogen 532595 1/1 1/1 3/3 0/3Beta-fibrinogen 399492 0/1 1/1 1/3 0/3B-factor, properdin 13278732 0/1 0/1 2/3 0/3Cl inhibitor 15310473 0/1 1/1 1/3 0/3Qusterin 4502905 1/1 0/1 2/3 0/3Coagulation factor V II 6753806 0/1 1/1 0/3 0/3Complement 9 4502511 0/1 0/1 2/3 0/3Complement component 3, 13649325 0/1 1/1 3/3 0/3Complement component 4 4502501 1/1 1/1 3/3 0/3Complement component D 4503309 1/1 1/1 3/3 0/3Cystatin A 4885165 0/1 0/1 0/3 1/3Cystatin C 181387 1/1 1/1 3/3 1/3
179
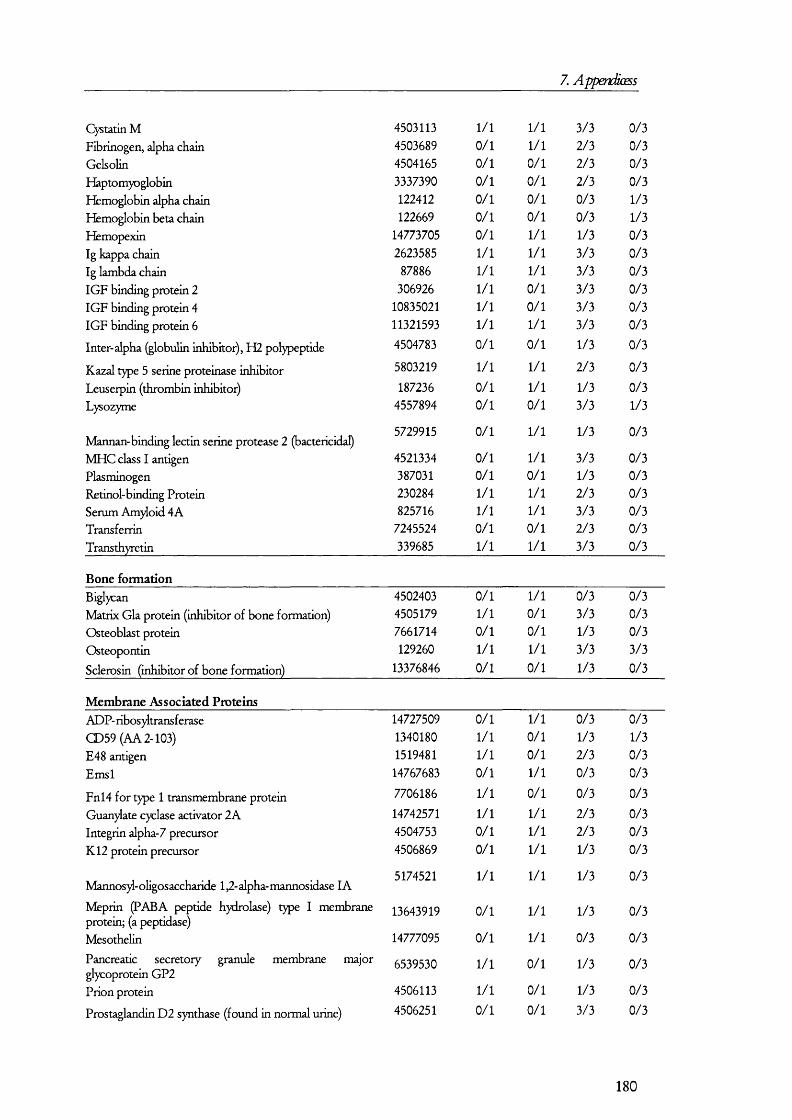
7. AppendioEss
Cystatin M 4503113 1/1 1/1 3/3 0/3Fibrinogen, alpha chain 4503689 0/1 1/1 2/3 0/3Gelsolin 4504165 0/1 0/1 2/3 0/3Haptomyoglobin 3337390 0/1 0/1 2/3 0/3Hemoglobin alpha chain 122412 0/1 0/1 0/3 1/3Hemoglobin beta chain 122669 0/1 0/1 0/3 1/3Hemopexin 14773705 0/1 1/1 1/3 0/3Ig kappa chain 2623585 1/1 1/1 3/3 0/3Ig lambda chain 87886 1/1 1/1 3/3 0/3IG F binding protein 2 306926 1/1 0/1 3/3 0/3IG F binding protein 4 10835021 1/1 0/1 3/3 0/3IG F binding protein 6 11321593 1/1 1/1 3/3 0/3
Inter-alpha globulin inhibitor), H2 polypeptide 4504783 0/1 0/1 1/3 0/3
Kazal type 5 serine proteinase inhibitor 5803219 1/1 1/1 2/3 0/3
Leuserpin (thrombin inhibitor) 187236 0/1 1/1 1/3 0/3Lysozyme 4557894 0/1 0/1 3/3 1/3
5729915 0/1 1/1 1/3 0/3Mannan-binding lectin serine protease 2 (bactericidal)M HC class I antigen 4521334 0/1 1/1 3/3 0/3Plasminogen 387031 0/1 0/1 1/3 0/3Retinol-binding Protein 230284 1/1 1/1 2/3 0/3Serum Am)Ioid 4A 825716 1/1 1/1 3/3 0/3Transferrin 7245524 0/1 0/1 2/3 0/3Transthyretin 339685 1/1 1/1 3/3 0/3
Bone formationBiglycan 4502403 0/1 1/1 0/3 0/3Matrix Gla protein (inhibitor of bone formation) 4505179 1/1 0/1 3/3 0/3Osteoblast protein 7661714 0/1 0/1 1/3 0/3Osteopontin 129260 1/1 1/1 3/3 3/3
Sclerosin (inhibitor of bone formation) 13376846 0/1 0/1 1/3 0/3
Membrane Associated ProteinsADP- ribosyltransferase 14727509 0/1 1/1 0/3 0/3CD59 (AA2-103) 1340180 1/1 0/1 1/3 1/3E48 ant^en 1519481 1/1 0/1 2/3 0/3Emsl 14767683 0/1 1/1 0/3 0/3
Fnl4 for type 1 transmembrane protein 7706186 1/1 0/1 0/3 0/3
Guanylate cyclase activator 2A 14742571 1/1 1/1 2/3 0/3Integrin alpha-7 precursor 4504753 0/1 1/1 2/3 0/3K12 protein precursor 4506869 0/1 1/1 1/3 0/3
5174521 1/1 1/1 1/3 0/3Mannos)l-oligosaccharide 1,2-alpha-mannosidase lA
Meprin (PABA peptide hydrolase) type I membrane 13643919 0/1 1/1 1/3 0/3protein; (a peptidase)Mesothelin 14777095 0/1 1/1 0/3 0/3
Pancreatic secretory granule membrane major 6539530 1/1 0/1 1/3 0/3glycoprotein GP2Prion protein 4506113 1/1 0/1 1/3 0/3
Prostaglandin D2 synthase (found in normal urine) 4506251 0/1 0/1 3/3 0/3
180
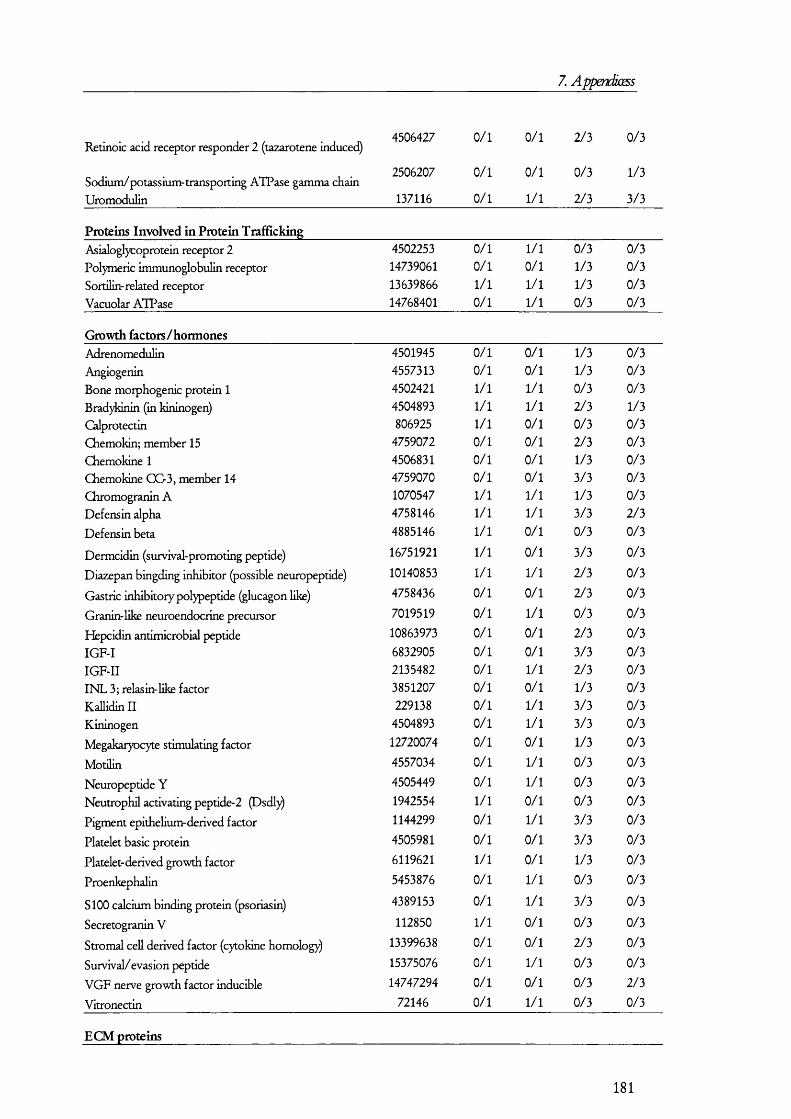
7. Appendiœss
Retinoic acid receptor responder 2 (tazarotene induced)4506427 0/1 0/1 2/3 0/3
Sodium/potassium-transporting ATPase gamma chain2506207 0/1 0/1 0/3 1/3
Uromodulin 137116 0/1 1/1 2/3 3/3
Proteins Involved in Protein TraffickingAsialoglycoprotein receptor 2 4502253 0/1 1/1 0/3 0/3Polymeric immunoglobulin receptor 14739061 0/1 0/1 1/3 0/3Sortilin-related receptor 13639866 1/1 1/1 1/3 0/3Vacuolar ATPase 14768401 0/1 1/1 0/3 0/3
Growth factors/hormonesAdrenomedulin 4501945 0/1 0/1 1/3 0/3Angiogenin 4557313 0/1 0/1 1/3 0/3Bone morphogenic protein 1 4502421 1/1 1/1 0/3 0/3Bradykinin (in kininogen) 4504893 1/1 1/1 2/3 1/3Calprotectin 806925 1/1 0/1 0/3 0/3Qiemokin; member 15 4759072 0/1 0/1 2/3 0/3Chemokine 1 4506831 0/1 0/1 1/3 0/3Chemokine GC3, member 14 4759070 0/1 0/1 3/3 0/3Qiromogranin A 1070547 1/1 1/1 1/3 0/3Defens in alpha 4758146 1/1 1/1 3/3 2/3
Defens in beta 4885146 1/1 0/1 0/3 0/3
Dermcidin (survival-promoting peptide) 16751921 1/1 0/1 3/3 0/3
Diazepan bingding inhibitor (possible neuropeptide) 10140853 1/1 1/1 2/3 0/3
Gastric inhibitory polypeptide (glucagon like) 4758436 0/1 0/1 2/3 0/3
Granin-like neuroendocrine precursor 7019519 0/1 1/1 0/3 0/3
Hepcidin antimicrobial peptide 10863973 0/1 0/1 2/3 0/3IG F-I 6832905 0/1 0/1 3/3 0/3IG F -II 2135482 0/1 1/1 2/3 0/3IN L 3; relasin-like factor 3851207 0/1 0/1 1/3 0/3Kallidinll 229138 0/1 1/1 3/3 0/3Kininogen 4504893 0/1 1/1 3/3 0/3
Megakaryocyte stimulating factor 12720074 0/1 0/1 1/3 0/3
Motilin 4557034 0/1 1/1 0/3 0/3
Neuropeptide Y 4505449 0/1 1/1 0/3 0/3
Neutrophil activating peptide-2 (Dsdl)) 1942554 1/1 0/1 0/3 0/3
Pigment epitheUum-derived factor 1144299 0/1 1/1 3/3 0/3
Platelet basic protein 4505981 0/1 0/1 3/3 0/3
Platelet-derived growth factor 6119621 1/1 0/1 1/3 0/3
Proenkephalin 5453876 0/1 1/1 0/3 0/3
SlOO calcium binding protein (psoriasin) 4389153 0/1 1/1 3/3 0/3
Secretogranin V 112850 1/1 0/1 0/3 0/3
Stromal cell derived factor (cytokine homology) 13399638 0/1 0/1 2/3 0/3
Survival/evasion peptide 15375076 0/1 1/1 0/3 0/3
VGF nerve growth factor inducible 14747294 0/1 0/1 0/3 2/3
Vitronectin 72146 0/1 1/1 0/3 0/3
ECM proteins
181
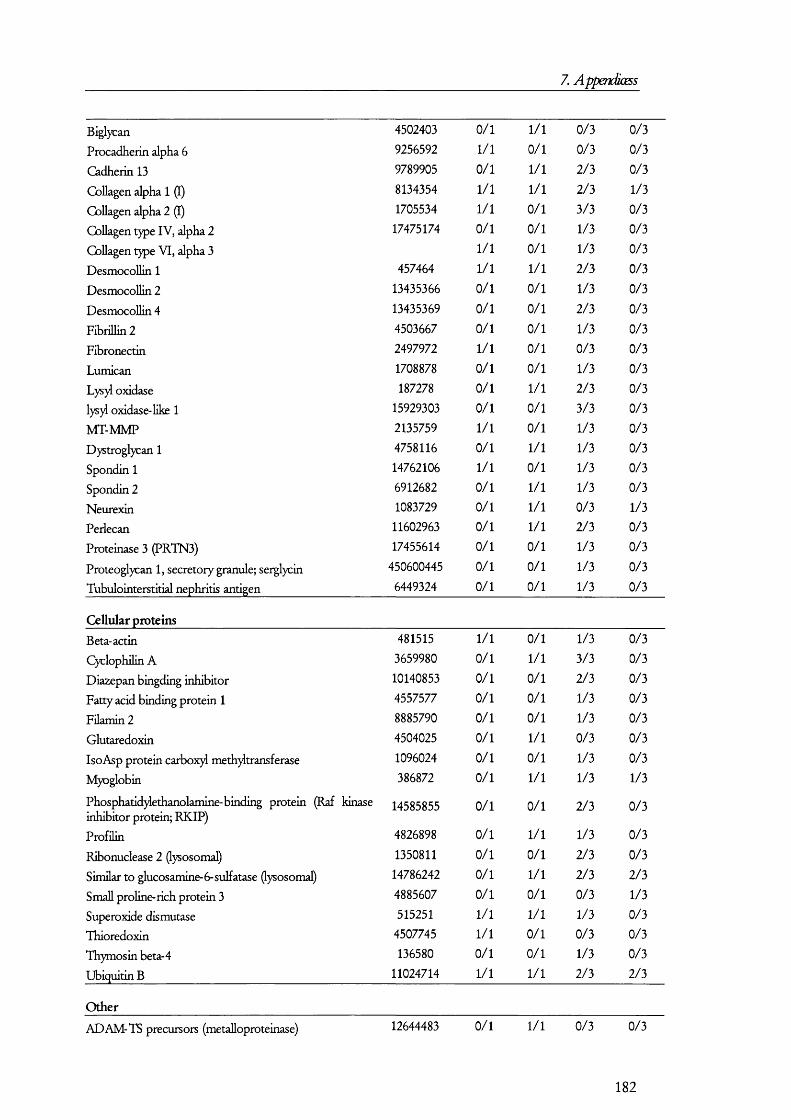
7. Appendiœss
Biglycan 4502403 0/1 1/1 0/3 0/3
Procadherin alpha 6 9256592 1/1 0/1 0/3 0/3
Cadherin 13 9789905 0/1 1/1 2/3 0/3
Collagen alpha 1 (I) 8134354 1/1 1/1 2/3 1/3
Collagen alpha 2 (I) 1705534 1/1 0/1 3/3 0/3
Collagen type IV , alpha 2 17475174 0/1 0/1 1/3 0/3
Collagen type V I, alpha 3 1/1 0/1 1/3 0/3
Desmocollin 1 457464 1/1 1/1 2/3 0/3
DesmocoUin 2 13435366 0/1 0/1 1/3 0/3
DesmocoUin 4 13435369 0/1 0/1 2/3 0/3
Fibrillin 2 4503667 0/1 0/1 1/3 0/3
Fibronectin 2497972 1/1 0/1 0/3 0/3
Lumican 1708878 0/1 0/1 1/3 0/3
Lys)l oxidase 187278 0/1 1/1 2/3 0/3
lys}l oxidase-like 1 15929303 0/1 0/1 3/3 0/3
MT-MMP 2135759 1/1 0/1 1/3 0/3
Dystroglycan 1 4758116 0/1 1/1 1/3 0/3
Spondin 1 14762106 1/1 0/1 1/3 0/3
Spondin 2 6912682 0/1 1/1 1/3 0/3
Neurexin 1083729 0/1 1/1 0/3 1/3
Perlecan 11602963 0/1 1/1 2/3 0/3
Proteinase 3 (PRTN3) 17455614 0/1 0/1 1/3 0/3
Proteoglycan 1, secretory granule; serglycin 450600445 0/1 0/1 1/3 0/3
Tubulointerstitial nephritis antigen 6449324 0/1 0/1 1/3 0/3
Cellular proteinsBeta-actin 481515 1/1 0/1 1/3 0/3
Cyclophilin A 3659980 0/1 1/1 3/3 0/3
Diazepan bingding inhibitor 10140853 0/1 0/1 2/3 0/3
Fatty acid binding protein 1 4557577 0/1 0/1 1/3 0/3
Filamin 2 8885790 0/1 0/1 1/3 0/3
Glutaredoxin 4504025 0/1 1/1 0/3 0/3
IsoAsp protein carbox)i meth)4transferase 1096024 0/1 0/1 1/3 0/3
Myoglobin 386872 0/1 1/1 1/3 1/3
Phosphatidylethanolamine-binding protein (Raf kinase inhibitor protein; RKIP)
14585855 0/1 0/1 2/3 0/3
Profilin 4826898 0/1 1/1 1/3 0/3
Ribonuclease 2 (lysosomal) 1350811 0/1 0/1 2/3 0/3
Similar to glucosamine- 6- sulfatase (lysosomal) 14786242 0/1 1/1 2/3 2/3
Small proline-rich protein 3 4885607 0/1 0/1 0/3 1/3
Superoxide dismutase 515251 1/1 1/1 1/3 0/3
Thioredoxin 4507745 1/1 0/1 0/3 0/3
Thymosin beta-4 136580 0/1 0/1 1/3 0/3
Ubiquitin B 11024714 1/1 1/1 2/3 2/3
Other
ADAM-TS precursors (metalloproteinase) 12644483 0/1 1/1 0/3 0/3
182

7. Appendiœss
Beta-microseminoprotein 17451678 1/1 0/1 2/3 0/3
DJ14N1.2 calcium binding protein 12314268 0/1 1/1 0/3 0/3
DW F-1 protein; Ellis van Creveld syndrome protein 7657073 0/1 0/1 1/3 0/3
Eosinophil-derived neurotoxin; ribounuclease 2 4506549 0/1 0/1 0/3 1/3
Gastric-associated differentially expressed protein 4758436 0/1 0/1 2/3 0/3YA61PProstate stem cell antigen 5031995 0/1 0/1 0/3 1/3
Putative gene 20784470 1/1 0/1 1/3 0/3
Semenogelin I 4506883 1/1 1/1 0/3 0/3
Semenogelin I I 4506885 1/1 1/1 0/3 2/3
Seminal peptide 20 225667 0/1 1/1 0/3 0/3
SPRl 7662665 0/1 0/1 0/3 1/3
Sulfated glycoprotein-2 338057 1/1 1/1 0/3 0/3
Unnamed protein product 16551700 0/1 0/1 2/3 0/3
Unnamed protein product 16554039 0/1 0/1 1/3 0/3
Unnamed protein product7460042;1043288212383068,
0/1 0/1 0/3 1/3
10438196, 0/1 0/1 1/3 0/3Unnamed protein product 17028332
Number of protein hits per number of samples analyzed
183
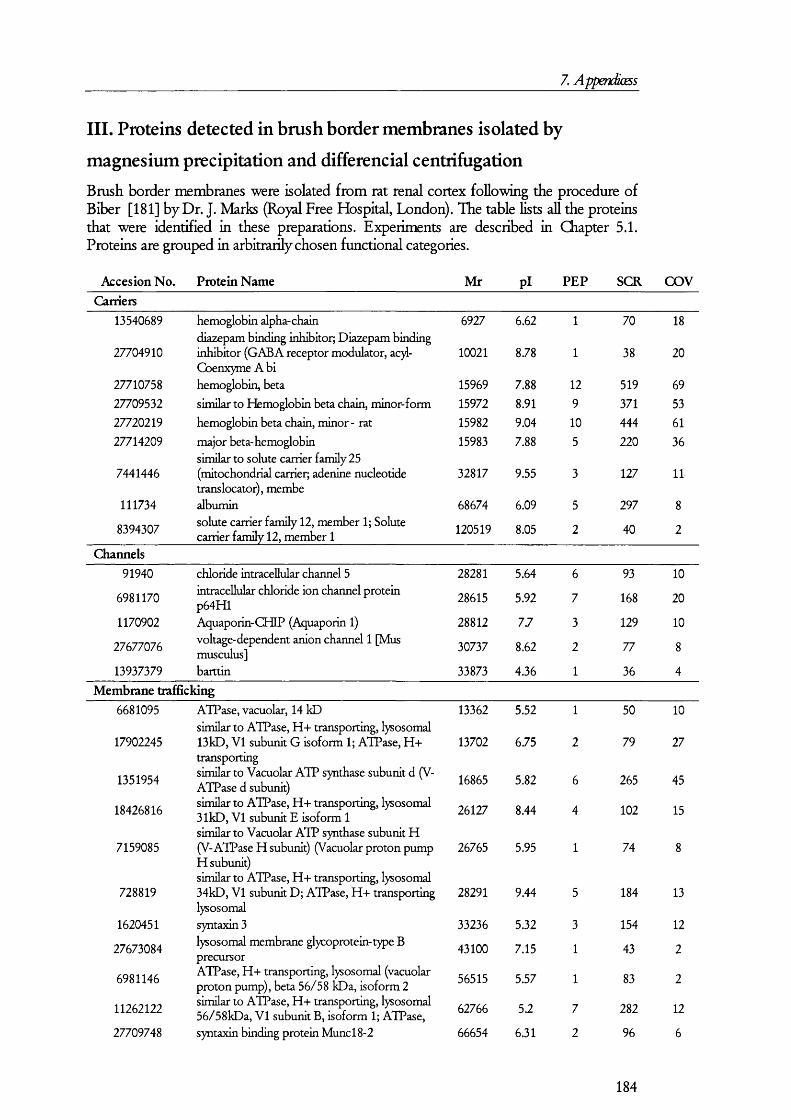
7. Appendiœss
III. Proteins detected in brush border membranes isolated by
magnesium precipitation and differencial centrifugationBrush border membranes were isolated from rat renal cortex following the procedure o f Biber [181] by D r. J. Marks (R o)^ Free Hospital, London). The table lists all the proteins that were identified in these preparations. Experiments are described in Chapter 5.1. Proteins are grouped in arbitrarily chosen functional categories.
Accesion No. Protein Name Mr p i PEP SCR GOVCarriers
13540689 hemoglobin alpha-chaindiazepam binding inhibitor. Diazepam binding
6927 6.62 1 70 18
27704910 inhibitor (GAB A receptor modulator, ac)4- Coenxyme A bi
10021 8.78 1 38 20
27710758 hemoglobin, beta 15969 7.88 12 519 6927709532 similar to Hemoglobin beta chain, minor-form 15972 8.91 9 371 5327720219 hemoglobin beta chain, minor - rat 15982 9.04 10 444 6127714209 major beta-hemoglobin
similar to solute carrier family 2515983 7.88 5 220 36
7441446 (mitochondrial carrier, adenine nucleotide translocator), membe
32817 9.55 3 127 11
111734 albumin 68674 6.09 5 297 8
8394307 solute carrier family 12, member 1; Solute carrier family 12, member 1 120519 8.05 2 40 2
Channels91940 chloride intracellular channel 5 28281 5.64 6 93 10
6981170 intracellular chloride ion channel protein p64Hl 28615 5.92 7 168 20
1170902 Aquaporin- CHIP (Aquaporin 1) 28812 7.7 3 129 10
27677076 voltage-dependent anion channel 1 [Mus musculus] 30737 8.62 2 77 8
13937379 barttin 33873 4.36 1 36 4Membrane trafficking
6681095
17902245
1351954
18426816
7159085
728819
1620451
27673084
6981146
11262122
27709748
ATPase, vacuolar, 14 kDsimilar to ATPase, H + transporting, lysosomal13kD, V I subunit G isoform 1; ATPase, H +transportingsimilar to Vacuolar ATP synthase subunit d (V- ATPase d subunit)similar to ATPase, H + transporting, lysosomal 31kD, V I subunit E isoform 1 similar to Vacuolar ATP synthase subunit H (V-ATPase H subunit) (Vacuolar proton pump H subunit)similar to ATPase, H + transporting, lysosomal 34kD, V I subunit D; ATPase, H + transporting lysosomal syntaxin3lysosomal membrane glycoprotein-type B precursorATPase, H-t- transporting, lysosomal (vacuolar proton pump), beta 56/58 kDa, isoform 2 similar to ATPase, H + transporting, lysosomal 56/58kDa, V I subunit B, isoform 1; ATPase, syntaxin binding protein Muncl8-2
13362
13702
16865
26127
26765
5.52
6.75
5.82
8.44
5.95
28291 9.44
33236
43100
56515
62766
66654
5.32
7.15
5.57
5.2
6.31
50
79
265
102
74
184
154
43
83
282
96
10
27
45
15
13
12
2
12
6
184

7. Appendiœss
27708570
11560095
similar to ATPase, H + transporting, lysosomal (vacuolar proton pump), alpha 70 kDa, isoform 1GTP-binding regulatory protein Gs alpha-XL chain - rat
71924
91566
7.53
5.23
61
69
Metabolism
25282441
517440
8248819
7514079139291662771720727709856
27705116
119740
1050930
13592043
27708936
27668132
27697107
13994119
2765944427665018
27664758
27720565
4501887
27700285
2030207513937391
223556
12018296
6980964
27717949
13929182
27687605276851996978809
cytochrome-c oxidase (EC 1.9.3.1) chain IV ,cardiac - rat (fragment)multidrug resistance protein 4similar to ATP synthase, H-k transporting,mitochondrial FO complex, subunit f, isoform2; hypotheticytochrome c, somatic [Mus musculus]thioredoxinperoxiredoxin 6similar to actin gamma, cytoskeletal - ratglutathione S-transferase, alpha 1; Glutathione-S-transferase, alpha type (Ya)similar to palmito)! protein thioesterase-likeprotein [Mus musculus]similar to Esterase Dhydroxyac)! glutathione hydrolase; glyoxalaseII; round spermatid protein RSP29ATP synthase gamma chain, mitochondrial2-4-dienoyl-Coenzyme A reductase 2,peroxisomal; putative peroxisomal 2,4-dieno)d-CoA reductaseketohexokinaseN-eth)^maleimide sensitive fusion protein attachment protein alpha monoglyceride lipase
Sulfotransferase K2 (rSULTlCZA) hydroxyar}Iamine sulfotransferase (EC 2.8.2.-) 2A - ratsimilar to glyceraldehyde-3-phosphatedehydrogenase [Mus musctdus]retinol dehydrogenase type IGlyceraldehyde 3-phosphate dehydrogenase(C A P D ^ (38 kDa BFA-dependent ADP-ribos)Iation substrate)lactate dehydrogenase Amalate dehydrogenase-like enzymealdo-keto reductase family 1, member A l; aldo-keto reductase family 1, member A l (aldehydereductaslactate dehydrogenase B; Lactate dehydrogenease Baldo-keto reductase family 7, member A2 (aflatoxin aldehyde reductase) long chain alpha-hydroxy acid oxidase =FMN- dependent alpha-hydroxy acid-oxidizing enzyme EC 1.1.3.1fructose-bisphosphate aldolase (EC 4.1.2.13) A - ratsimilar to aldolase B aldolase BFRUCTOSE- 1,6-BISPHOSPHATASE (D-
2623 5.44 1 33 52
7541 8.01 1 81 20
10457 9.69 1 47 12
11598 9.61 114 2011666 4.8 1 43 1222165 8.94 1 41 622196 5.5 72 11
25303 8.78 3 99 14
25590 5.23 41 3
28065 5.95 1 60 7
28878 6.46 1 63 4
30172 8.87 1 57 4
31272 8.51 4 132 10
32729 6.24 1 67 5
33171 5.3 3 142 15
33478 6.92 1 60 434817 7 5 203 18
34817 7 219 21
35526 6.45 1 120 5
35639 9.14 1 ' 31 3
35813 8.43 1 33 4
36427 8.45 1 68 436460 6.16 7 176 14
36483 6.84 270 27
36589 5.7 4 269 15
37574 6.27 1 57 4
39045 7.9 3 118 7
39235 8.31 3 102 5
39500 8.66 7 211 2539579 8.66 7 124 2039584 5.54 8 240 20
185
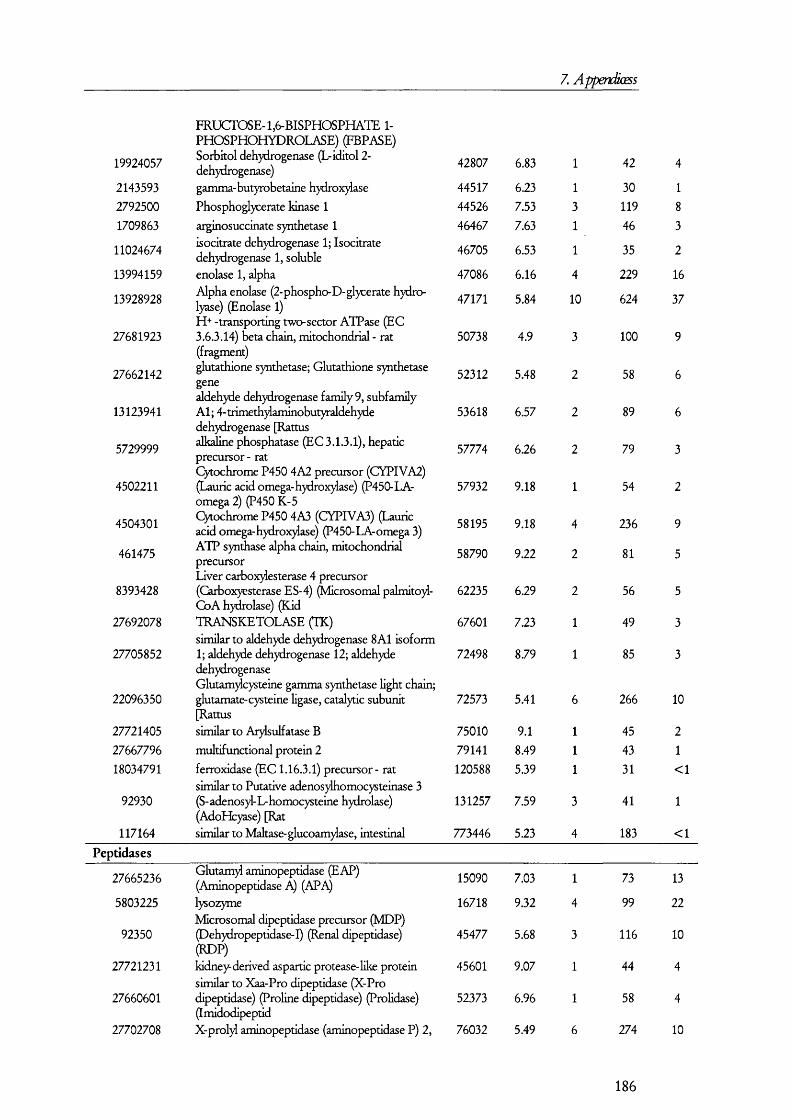
7. Appendiœss
19924057
214359327925001709863
11024674
13994159
13928928
27681923
27662142
13123941
5729999
4502211
4504301
461475
8393428
27692078
27705852
22096350
277214052766779618034791
92930
117164
FRUCTOSE-1,6-BISPHOSPHATE 1- PHOSPHOHYDROLASE) (FBPASE) Sorbitol dehydrogenase (L-iditol 2- dehydrogenase)gamma-butyrobetaine hydrox)dase
Phosphoglycerate kinase 1 arginosuccinate synthetase 1 isocitrate dehydrogenase 1; Isocitrate dehydrogenase 1, soluble enolase 1, alphaAlpha enolase (2-phospho-D- glycerate hydro- lyase) (Enolase 1)H+ -transporting two-sector ATPase (EC 3,6.3.14) beta chain, mitochondrial - rat (fragment)glutathione synthetase; Glutathione synthetase genealdehyde dehydrogenase family 9, subfamily A l; 4-tiimeth)laminobutyraldehyde dehydrogenase [Rattus alkaline phosphatase (EC 3.1.3.1), hepatic precursor - ratCytochrome P450 4A2 precursor (CYPIVA2) (Laurie acid omega-hydrox)4ase) (P450-LA- omega 2) (P450 K-5Cytochrome P450 4A3 (CYPIVA3) (Laurie acid omega-hydrox)Iase) (P450-LA-omega 3) ATP synthase alpha chain, mitochondrial precursorLiver carboxjiesterase 4 precursor(Carboxyesterase ES-4) (Microsomal palmitoyl-CoAhy^lase) (KidTRANSKETOLASE (TR)similar to aldehyde dehydrogenase 8A1 isoform1; aldehyde dehydrogenase 12; aldehydedehydrogenaseClutam}Icysteine gamma synthetase light chain; glutamate-cysteine ligase, catalytic subunit [Rattussimilar to Aiyisulfatase B
multifunctional protein 2
ferroxidase (EC 1.16.3.1) precursor - rat similar to Putative adenosylhomocysteinase 3 (S- adenosyl-L- homocysteine hydrolase) (AdoHcyase) [Ratsimilar to Maltase- glucoam)Iase, intestinal
42807 6.83 1 42 4
44517 6.23 1 30 144526 7.53 3 119 846467 7.63 1 46 3
46705 6.53 1 35 2
47086 6.16 4 229 16
47171 5.84 10 624 37
50738 4.9 3 100 9
52312 5.48 2 58 6
53618 6.57 2 89 6
57774 6.26 2 79 3
57932 9.18 1 54 2
58195 9.18 4 236 9
58790 9.22 2 81 5
62235 6.29 2 56 5
67601 7.23 1 49 3
72498 8.79 1 85 3
72573 5.41 6 266 10
7501079141
9.18.49
120588 5.39
131257 7.59
773446 5.23
454331
41
183
21<1
1
<1Peptidases
27665236 Clutam)! aminopeptidase (EAP) (Aminopeptidase A) (APA) 15090 7.03 1 73 13
5803225 lysozymeMcrosomal dipeptidase precursor (MDP)
16718 9.32 4 99 22
92350 (Dehydropeptidase-1) (Renal dipeptidase) (RDP)
45477 5.68 3 116 10
27721231 kidney-derived aspartic protease-like protein similar to Xaa-Pro dipeptidase (X-Pro
45601 9.07 1 44 4
27660601 dipeptidase) (Proline dipeptidase) (Prolidase) (Imidodipeptid
52373 6.96 1 58 4
27702708 X-prol)I aminopeptidase (aminopeptidase P) 2, 76032 5.49 6 274 10
186
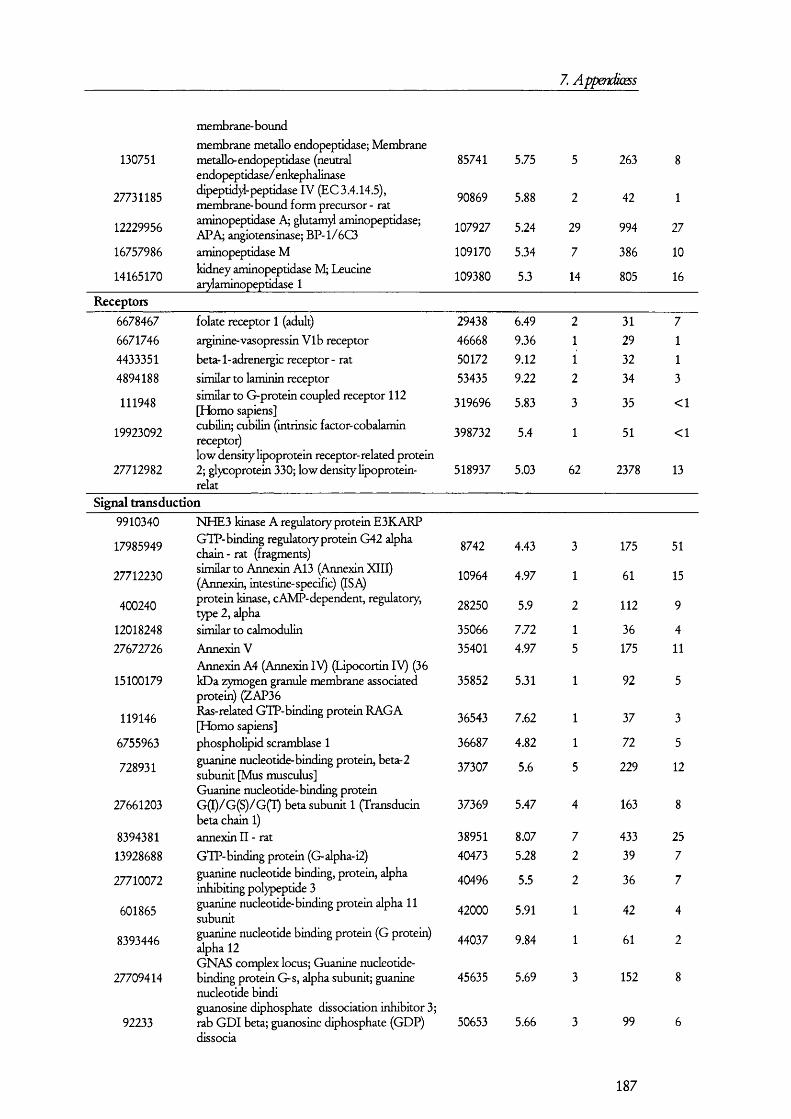
7. Appendicess
membrane- boundmembrane métallo endopeptidase; Membrane
130751 métallo-endopeptidase (neutral endopeptidase/enkephalinase
85741 5.75 5 263 8
27731185 dipeptid)!-peptidase IV (EC 3.4.14.5), membrane-bound form precursor - rat 90869 5.88 2 42 1
12229956 aminopeptidase A; glutam}! aminopeptidase; 107927 5.24 29 994 27APA; angiotensinase; BP-1 /6C316757986 aminopeptidase M 109170 5.34 7 386 10
14165170 kidney aminopeptidase M; Leucine 109380 5.3 14 805 16aiylaminopeptidase 1Receptors
6678467 folate receptor 1 (adult) 29438 6.49 2 31 76671746 arginine-vasopressin V lb receptor 46668 9.36 1 29 14433351 beta-1-adrenergic receptor - rat 50172 9.12 1 32 14894188 similar to laminin receptor 53435 9.22 2 34 3
111948similar to G-protein coupled receptor 112 319696 5.83 3 35 <1[Homo sapiens]
19923092 cubilin; cubilin (intrinsic factor-cobalamin receptor)low density lipoprotein receptor-related protein
398732 5.4 1 51 <1
27712982 2; glycoprotein 330; low density lipoprotein- relat
518937 5.03 62 2378 13
Signal transduction9910340
17985949
27712230
400240
1201824827672726
15100179
119146
6755963
728931
27661203
839438113928688
27710072
601865
8393446
27709414
92233
NHE3 kinase A regulatory protein E3KARPGTP-binding regulatory protein G42 alphachain - rat (fragments)similar to Annexin A13 (Annexin X III)(Annexin, intestine-specific) (ISA)protein kinase, cAMP-dependent, regulatory,type 2, alphasimilar to calmodulinAnnexin VAnnexin A4 (Annexin IV ) (Lipocortin IV ) (36 kDa zymogen granule membrane associated protein) (ZAP36Ras-related GTP-binding protein RAGA [Homo sapiens] phospholipid scramblase 1 guanine nucleotide-binding protein, beta-2 subunit [Mus musculus]Guanine nucleotide-binding protein G (I)/G (S )/G (l) beta subunit 1 (Transducin beta chain 1) annexin I I - ratGTP-binding protein (G-alpha-i2) guanine nucleotide binding, protein, alpha inhibiting polypeptide 3 guanine nucleotide-binding protein alpha 11 subunitguanine nucleotide binding protein (G protein) alpha 12GNAS complex locus; Guanine nucleotide- binding protein G-s, alpha subunit; guanine nucleotide bindiguanosine diphosphate dissociation inhibitor 3; rab G D I beta; guanosine diphosphate (GDP) dissocia
8742 4.43 3 175 51
10964 4.97 1 61 15
28250 5.9 2 112 9
35066 7.72 1 36 435401 4.97 5 175 11
35852 5.31 1 92 5
36543 7.62 1 37 3
36687 4.82 1 72 5
37307 5.6 5 229 12
37369 5.47 4 163 8
38951 8.07 7 433 2540473 5.28 2 39 7
40496 5.5 2 36 7
42000 5.91 1 42 4
44037 9.84 1 61 2
45635 5.69 3 152 8
50653 5.66 3 99 6
187
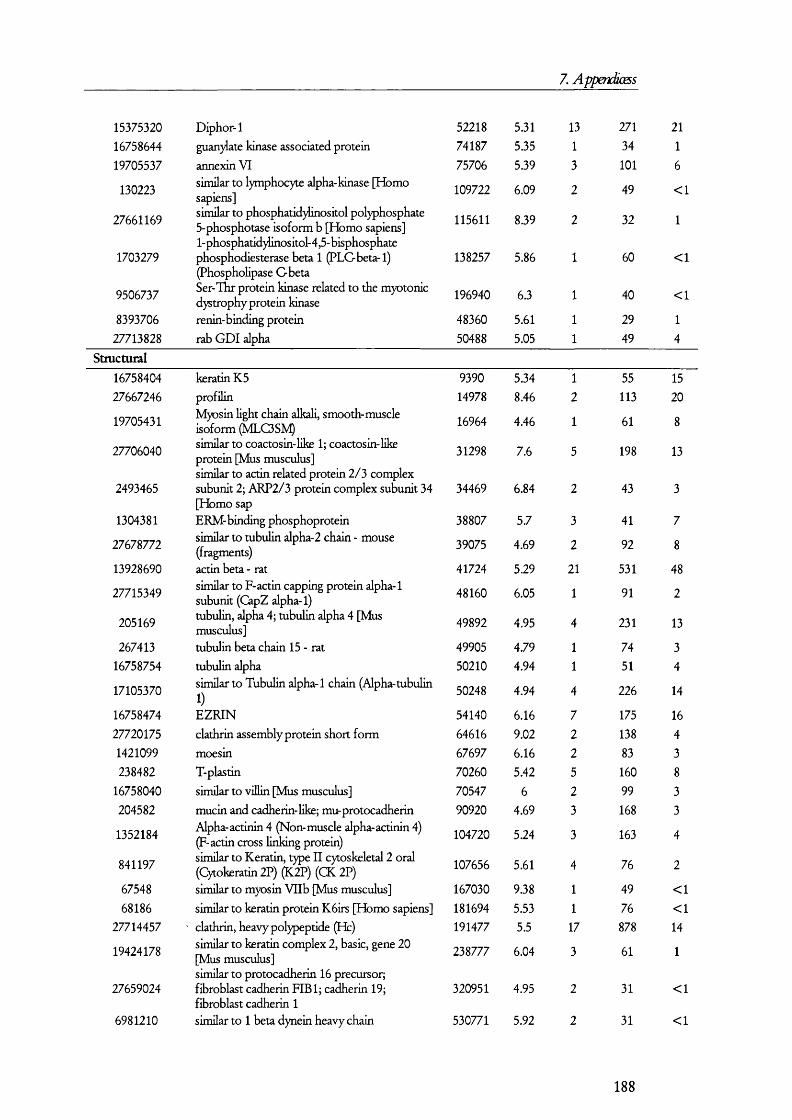
7. Appendicess
153753201675864419705537
130223
27661169
1703279
9506737
839370627713828
Diphor-1guan)4ate kinase associated protein
annexin V Isimilar to lymphocyte alpha-kinase [Homo sapiens]similar to phosphatid)hnositol polyphosphate 5-phosphotase isoform b [Homo sapiens]1- phosphatid}Iinositol- 4,5- bisphosphate phosphodiesterase beta 1 (PLCbeta-1) (Phospholipase G betaSer-Thr protein kinase related to the myotonic dystrophy protein kinase renin-binding protein
rab G D I alpha
52218 5.31 13 271 2174187 5.35 1 34 175706 5.39 3 101 6
109722 6.09 2 49 <1
115611 8.39 2 32 1
138257 5.86 1 60 <1
196940 6.3 1 40 <1
48360 5.61 1 29 150488 5.05 1 49 4
Structural16758404 keratin K5 9390 5.34 1 55 1527667246 profilin 14978 8.46 2 113 20
19705431 Myosin light chain alkali, smooth-muscle isoform (MLC3SM) 16964 4.46 1 61 8
27706040 similar to coactosin-like 1; coactosin-like 31298 7.6 198 13protein [Mus musculus]similar to actin related protein 2/3 complex
5
2493465 subunit 2; ARP2/3 protein complex subunit 34 [Homo sap
34469 6.84 2 43 3
1304381 ERM-binding phosphoprotein 38807 5.7 3 41 7
27678772 similar to tubulin alpha-2 chain - mouse (fragments) 39075 4.69 2 92 8
13928690 actin beta - rat 41724 5.29 21 531 48
27715349 similar to F-actin capping protein alpha-1 subunit (CapZ alpha-1) 48160 6.05 1 91 2
205169 tubulin, alpha 4; tubulin alpha 4 [Mus musculus] 49892 4.95 4 231 13
267413 tubulin beta chain 15 - rat 49905 4.79 1 74 316758754 tubulin alpha 50210 4.94 1 51 4
17105370 similar to Tubulin alpha-1 chain (Alpha-tubulin 1) 50248 4.94 4 226 14
16758474 E2R IN 54140 6.16 7 175 1627720175 clathrin assembly protein short form 64616 9.02 2 138 41421099 moesin 67697 6.16 2 83 3238482 T-plastin 70260 5.42 5 160 8
16758040 similar to villin [Mus musculus] 70547 6 2 99 3204582 mucin and cadherin-like; mu-protocadherin 90920 4.69 3 168 3
1352184 Alpha-actinin 4 (Non-muscle alpha-actinin 4) (F-actin cross linking protein) 104720 5.24 3 163 4
841197 similar to Keratin, type I I cytoskeletal 2 oral (Cytokemtin 2P) (K2P) (CK 2P) 107656 5.61 4 76 2
67548 similar to myosin VHb [Mus musculus] 167030 9.38 1 49 <168186 similar to keratin protein K6irs [Homo sapiens] 181694 5.53 1 76 <1
27714457 ' clathrin, heavy polypeptide (H ) 191477 5.5 17 878 14
19424178 similar to keratin complex 2, basic, gene 20 238777 6.04 3 61 1[Mus musculus]similar to protocadherin 16 precursor;
27659024 fibroblast cadherin F IB l; cadherin 19; fibroblast cadherin 1
320951 4.95 2 31 <1
6981210 similar to 1 beta dynein heavy chain 530771 5.92 2 31 <1
188
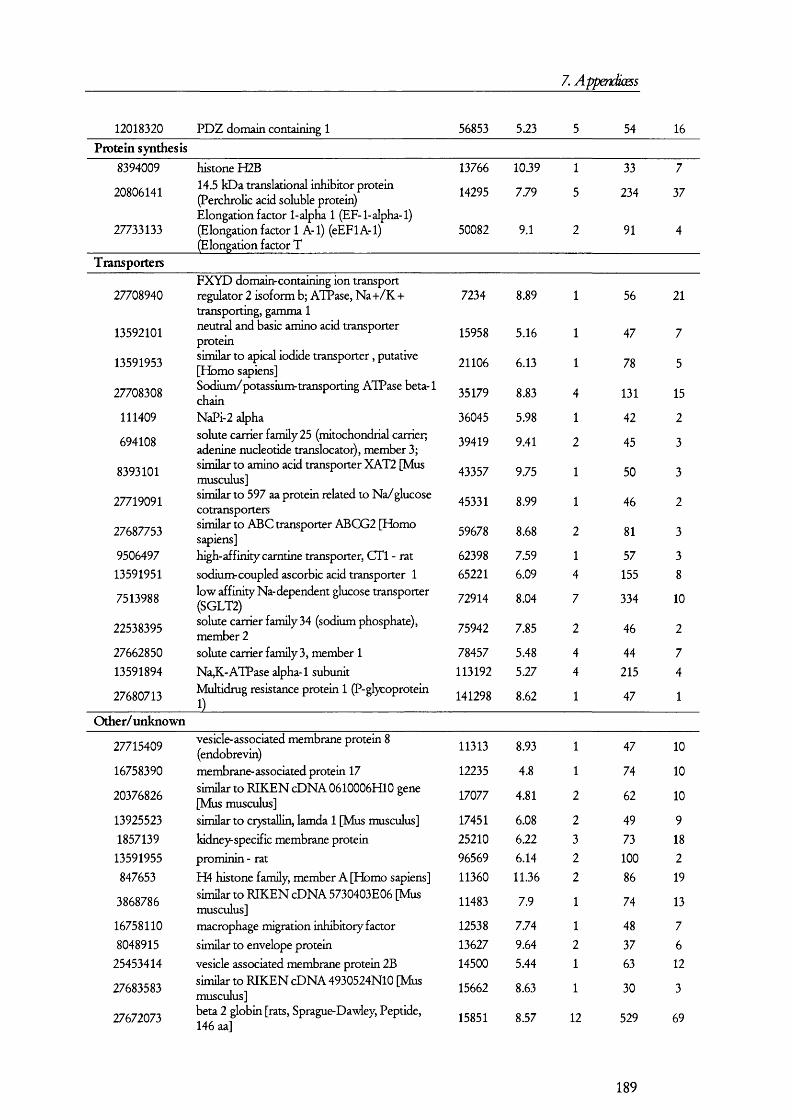
7. Appendiœss
12018320 PD 2 domain containing 1 56853 5.23 54 16Protein synthesis
8394009 histone H2B 13766 10.39 1 33 7
20806141 14.5 kDa translational inhibitor protein 14295 7.79 5 234 37(Perchrolic acid soluble protein) Elongation factor 1-alpha 1 (EF-1-alpha-1)
27733133 (Elongation factor 1 A-1) (eEFlA-1) (Elongation factor T
50082 9.1 2 91 4
TransportersFXYD domain-containing ion transport
27708940 regulator 2 isoform b; ATPase, Na-i-/K + transporting, gamma 1
7234 8.89 1 56 21
13592101 neutral and basic amino acid transporter protein 15958 5.16 1 47 7
13591953 similar to apical iodide transporter, putative 21106 6.13 1 78 5[Homo sapiens]
27708308 Sodium/potassium-transporting ATPase beta-1 chain 35179 8.83 4 131 15
111409 NaPi-2 alpha 36045 5.98 1 42 2
694108 solute carrier family 25 (mitochondrial carrier; 39419 9.41 2 45 3adenine nucleotide translocator), member 3;
8393101 similar to amino acid transporter XAT2 [Mus 43357 9.75 1 50 3musculus]
27719091 similar to 597 aa protein related to Na/glucose cotransporters 45331 8.99 1 46 2
27687753 similar to ABC transporter ABCG2 [Homo 59678 8.68 2 81 3sapiens]9506497 high-affinity camtine transporter, C Tl - rat 62398 7.59 1 57 313591951 sodium? coupled ascorbic acid transporter 1 65221 6.09 4 155 8
7513988 low affinity Na-dependent glucose transporter 72914 8.04 7 334 10(SGLT2)
22538395 solute carrier family 34 (sodium phosphate), member 2 75942 7.85 2 46 2
27662850 solute carrier family 3, member 1 78457 5.48 4 44 713591894 Na^K-ATPase alpha-1 subunit 113192 5.27 4 215 4
27680713 Multidrug resistance protein 1 (P-glycoprotein
1)141298 8.62 1 47 1
Other/unknown
27715409 vesicle-associated membrane protein 8 (endobrevin) 11313 8.93 1 47 10
16758390 membrane-associated protein 17 12235 4.8 1 74 10
20376826 similar to R IK E N cDNA 0610006H10 gene [Mus musculus] 17077 4.81 2 62 10
13925523 similar to crystaUin, lamda 1 [Mus musculus] 17451 6.08 2 49 91857139 kidney specific membrane protein 25210 6.22 3 73 1813591955 prominin - rat 96569 6.14 2 100 2847653 H4 histone family, member A [H>mo sapiens] 11360 11.36 2 86 19
3868786similar to R IK EN cDNA 5730403E06 [Mus musculus] 11483 7.9 1 74 13
16758110 macrophage migration inhibitory factor 12538 7.74 1 48 78048915 similar to envelope protein 13627 9.64 2 37 6
25453414 vesicle associated membrane protein 2B 14500 5.44 1 63 12
27683583 similar to R IK EN cDNA 4930524N10 [Mus musculus]
15662 8.63 1 30 3
27672073beta 2 globin [rats, Sprague-Dawley, Peptide, 146 aa] 15851 8.57 12 529 69
189
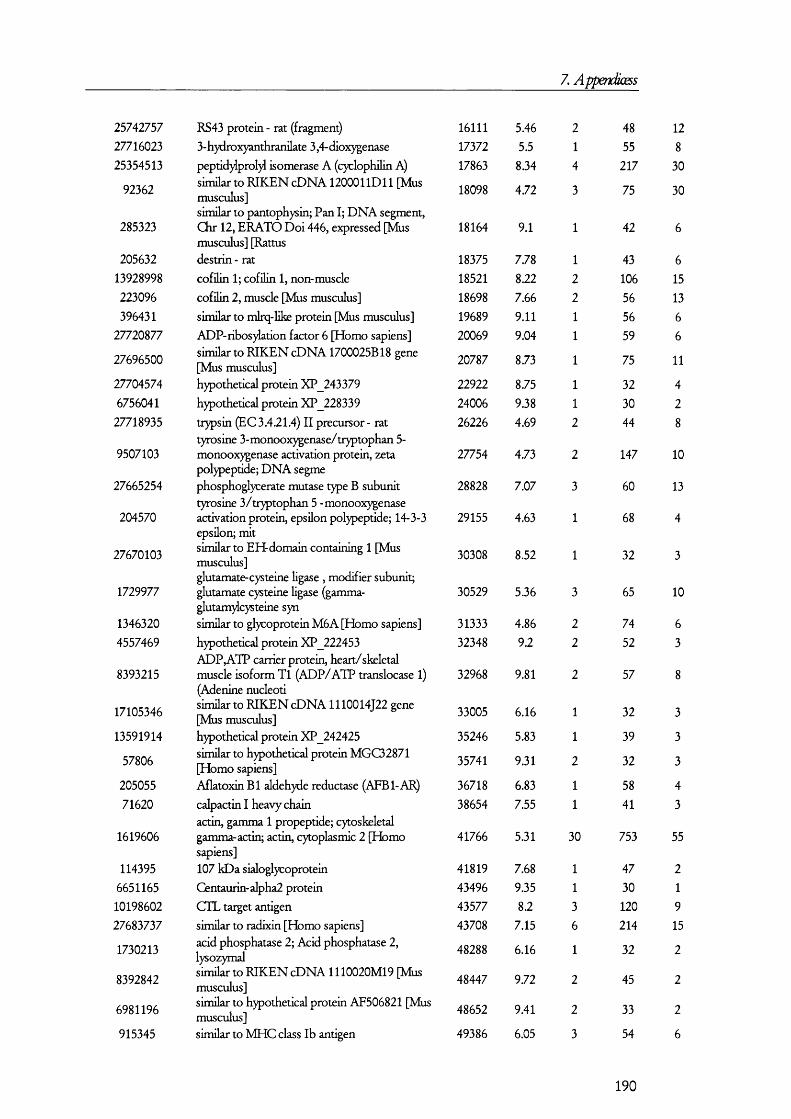
7. Appendiœss
25742757 RS43 protein - rat (fragment) 16111 5.46 2 48 1227716023 3-hydroxyanthranilate 3,4-dioxygenase 17372 5.5 1 55 825354513 peptid)lprol)l isomerase A (cyclophilin A) 17863 8.34 4 217 30
92362 similar to R IK EN cDNA 12000I ID 11 [Mus musculus]similar to pantophysin; Pan I; D N A segment,
18098 4.72 3 75 30
285323 Q ir 12, ERATO Doi 446, expressed [Mus musculus] [Rattus
18164 9.1 1 42 6
205632 destrin - rat 18375 7.78 1 43 613928998 cofilin 1; cofilin 1, non-muscle 18521 8.22 2 106 15223096 cofilin 2, muscle [Mus musculus] 18698 7.66 2 56 13396431 similar to mlrq-like protein [Mus musculus] 19689 9.11 1 56 6
27720877 ADP-nhos)dation factor 6 [Homo sapiens] 20069 9.04 1 59 6
27696500 similar to R IK EN cDNA 1700025B18 gene 20787 8.73 1 75 11[Mus musculus]27704574 hypothetical protein XP 243379 22922 8.75 1 32 46756041 hypothetical protein XP 228339 24006 9.38 1 30 2
27718935 trypsin (EC 3.4.21.4) I I precursor - rat tyrosine 3-monooxygenase/tryptophan 5-
26226 4.69 2 44 8
9507103 monooxygenase activation protein, zeta polypeptide; D N A segme
27754 4.73 2 147 10
27665254 phosphoglycerate mutase type B subunit tyrosine 3 /tryptophan 5 - monooxygenase
28828 7.07 3 60 13
204570 activation protein, epsilon polypeptide; 14-3-3 epsilon; mit
29155 4.63 1 68 4
27670103 similar to EH-domain containing 1 [Mus 30308 8.52 1 32 3musculus]glutamate-cysteine ligase , modifier subunit;
1729977 glutamate cysteine ligase (gamma- glutam)4cysteine syn
30529 5.36 3 65 10
1346320 similar to glycoprotein M6A [Homo sapiens] 31333 4.86 2 74 64557469 hypothetical protein XP 222453
ADPyATP carrier protein, heart/skeletal32348 9.2 2 52 3
8393215 muscle isoform T l (ADP/ATP translocase 1) (Adenine nucleoti
32968 9.81 2 57 8
17105346 similar to R IK EN cDNA 1110014J22 gene 33005 6.16 1 32 3[Mus musculus]13591914 hypothetical protein XP 242425 35246 5.83 1 39 3
57806 similar to hypothetical protein MGC32871 35741 9.31 2 32 3[Homo sapiens]205055 Aflatoxin B l aldehyde reductase (AFBl-AR) 36718 6.83 1 58 471620 calpactin I heavy chain
actin, gamma 1 propeptide; cytoskeletal38654 7.55 1 41 3
1619606 gamma-actin; actin, cytoplasmic 2 [Homo sapiens]
41766 5.31 30 753 55
114395 107 kDa sialoglycoprotein 41819 7.68 1 47 26651165 Centaurin- alpha2 protein 43496 9.35 1 30 110198602 CTL target antigen 43577 8.2 3 120 927683737 similar to radixin [Homo sapiens] 43708 7.15 6 214 15
1730213 acid phosphatase 2; Acid phosphatase 2, 48288 6.16 1 32 2lysozymal
8392842 similar to R IK EN cDNA 1110020M19 [Mus 48447 9.72 2 45 2musculus]
6981196similar to hypothetical protein AF506821 [Mus 48652 9.41 2 33 2musculus]
915345 similar to M HC class Ib antigen 49386 6.05 3 54 6
190
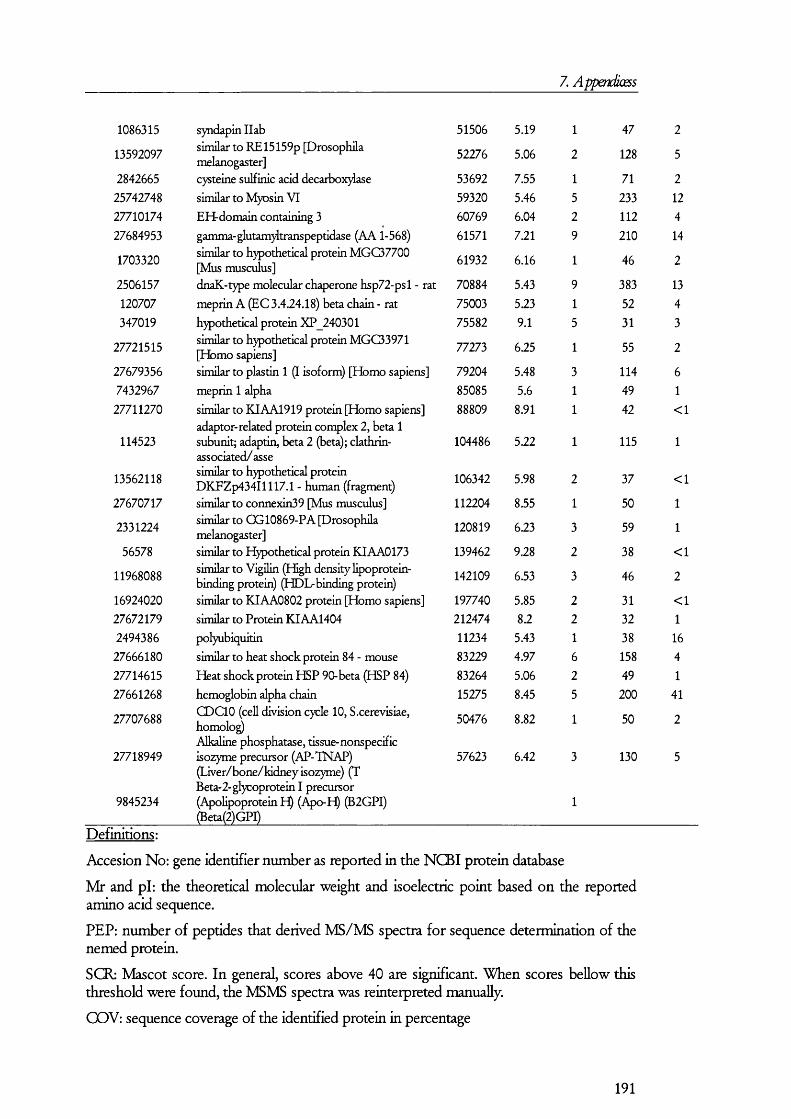
7. Appendioess
1086315 syndapin Ilab 51506 5.19 1 47 2
13592097 similar to RE15159p [Drosophila 52276 5.06 2 128 5melanogaster]2842665 cysteine sulfinic acid decarbox}4ase 53692 7.55 1 71 225742748 similar to Myosin V I 59320 5.46 5 233 1227710174 EH-domain containing 3 60769 6.04 2 112 427684953 gamma-glutam)itranspeptidase (AA 1-568) 61571 7.21 9 210 14
1703320 similar to hypothetical protein MGC37700 61932 6.16 1 46 2[Mus musculus]2506157 dnaK-type molecular chaperone hsp72-psl - rat 70884 5.43 9 383 13120707 meprin A (EC 3.4.24.18) beta chain - rat 75003 5.23 1 52 4347019 hypothetical protein XP 240301 75582 9.1 5 31 3
27721515 similar to hypothetical protein MGC33971 77273 625 1 55 2[Homo sapiens]27679356 similar to plastin 1 (I isoform) [Homo sapiens] 79204 5.48 3 114 67432967 meprin 1 alpha 85085 5.6 1 49 127711270 similar to KIAA1919 protein [Homo sapiens]
adaptor-related protein complex 2, beta 188809 8.91 1 42 <1
114523 subunit; adaptin, beta 2 (beta); clathrin- associated/ asse
104486 5.22 1 115 1
13562118 similar to hypothetical protein DKFZp434Il 117.1 - human (fragment) 106342 5.98 2 37 <1
27670717 similar to connexin39 [Mus musculus] 112204 8.55 1 50 1
2331224 similar to OG10869-PA [Drosophila 120819 6.23 3 59 1melanogaster]56578 similar to Hypothetical protein KIAA0173 139462 9.28 2 38 <1
11968088 similar to Vigilin (High density lipoprotein- 142109 6.53 3 46 2binding protein) (HDL-binding protein)
16924020 similar to KIAA0802 protein [Homo sapiens] 197740 5.85 2 31 <127672179 similar to Protein KIAA1404 212474 8.2 2 32 12494386 polyubiquitin 11234 5.43 1 38 1627666180 similar to heat shock protein 84 - mouse 83229 4.97 6 158 427714615 Heat shock protein HSP 90-beta (HSP 84) 83264 5.06 2 49 127661268 hemoglobin alpha chain 15275 8.45 5 200 41
27707688 CDCIO (cell division cycle 10, S.cerevisiae, homolog)Alkaline phosphatase, tissue-nonspecific
50476 8.82 1 50 2
27718949 isozyme precursor (AP-TNAP) (Liver/bone/kidney isozyme) (T Beta-2-glycoprotein I precursor
57623 6.42 3 130 5
9845234 (Apolipoprotein (Apo-E^ (B2GPI) (Beta(2)GPI)
1
Definitions:
Accesion No: gene identifier number as reported in the NCBI protein database
M r and p i: the theoretical molecular weight and isoelectric point based on the reported amino acid sequence.
PEP: number o f peptides that derived MS/MS spectra fo r sequence determination o f the nemed protein.
SCR: Mascot score. In general, scores above 40 are significant. When scores bellow this threshold were found, the MSMS spectra was reinterpreted manually.
GOV : sequence coverage o f the identified protein in percentage
191
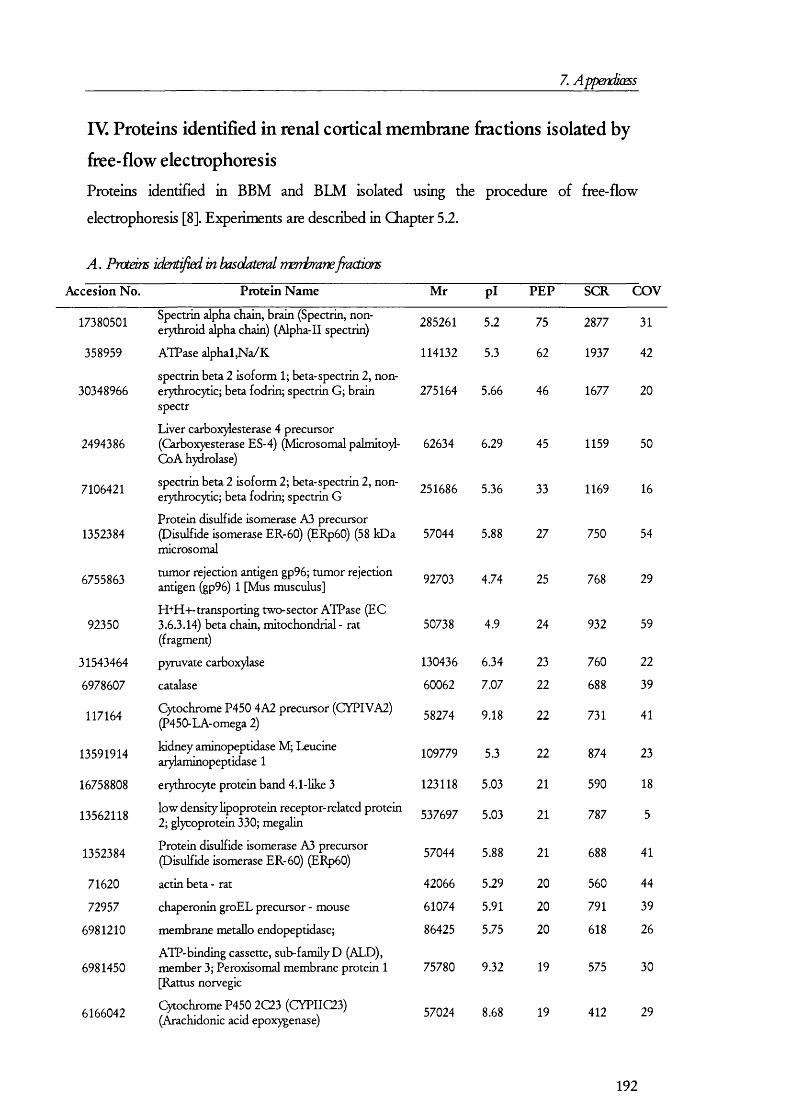
7. Appendioess
IV. Proteins identified in renal cortical membrane fractions isolated by
free-flow electrophoresisProteins identified in BBM and BLM isolated using the procedure o f free-flow
electrophoresis [8]. Experiments are described in Chapter 5.2.
A . Proteins identified in basdateral merrhrane jraOions
Accesion No. Protein Name M r p i PEP SCR GOV
17380501 Spectrin alpha chain, brain (Spectrin, non- erythroid alpha chain) (Alpha-II spectrin) 285261 5.2 75 2877 31
358959 ATPase alphal,Na/K 114132 5.3 62 1937 42
30348966spectrin beta 2 isoform 1; beta-spectrin 2, non- erythrocytic; beta fodrin; spectrin G; brain spectr
275164 5.66 46 1677 20
2494386Liver carbox)lesterase 4 precursor (Carboxyesterase ES-4) (Microsomal palmitoyl- GoA hydrolase)
62634 6.29 45 1159 50
7106421 spectrin beta 2 isoform 2; beta-spectrin 2, non- erythrocytic; beta fodrin; spectrin G 251686 5.36 33 1169 16
1352384Protein disulfide isomerase A3 precursor (Disulfide isomerase ER-60) (ERp60) (58 kDa microsomal
57044 5.88 27 750 54
6755863tumor rejection antigen gp96; tumor rejection antigen (gp96) 1 [Mus musculus] 92703 4.74 25 768 29
92350H+H-k-transporting two-sector ATPase (EC 3.6.3.14) beta chain, mitochondrial - rat (fragment)
50738 4.9 24 932 59
31543464 pyruvate carboxylase 130436 6.34 23 760 22
6978607 catalase 60062 7.07 22 688 39
117164Cytochrome P450 4A2 precursor (CYPIVA2) (P450-LA-omega 2) 58274 9.18 22 731 41
13591914 kidney aminopeptidase Leucine aiylaminopeptidase 1 109779 5.3 22 874 23
16758808 erythrocyte protein band 4.1-like 3 123118 5.03 21 590 18
13562118low density lipoprotein receptor-related protein 2; glycoprotein 330; megalin 537697 5.03 21 787 5
1352384 Protein disulfide isomerase A3 precursor (Disulfide isomerase ER-60) (ERp60) 57044 5.88 21 688 41
71620 actin beta - rat 42066 5.29 20 560 44
72957 chaperonin groEL precursor - mouse 61074 5.91 20 791 39
6981210 membrane métallo endopeptidase; 86425 5.75 20 618 26
6981450ATP-binding cassette, sub-family D (ALD), member 3; Peroxisomal membrane protein 1 [Rattus norvegic
75780 9.32 19 575 30
6166042 Cytochrome P450 2C23 (CYPIIC23) 57024 8.68 19 412 29
192

7. Appendiœss
111948
27658450
8394307
6678571
6679891
11693172
25742739
13994159
448251
404105
238482
11560059
114523
4503131
4758012
19424318
6978847
13928998
27683443
18203577
13929034
6981486
7514087
8745552
17902245
13385454
27370516
28336
129731
dipeptid)d-pepticlase IV (EC 3.4.14.5), membrane-bound form precursor - rat
similar to cadherin 16 [Mus musculus]
solute carrier family 3, member 1
villin 2 [Mus musculus]
alpha glucosidase 2, alpha neutral subunit [Mus musculus]
calreticulin
fatty acid Coenzyme A ligase, long chain 2; Ac)4 CoA synthetase, long chain
annexin V I
beta spectrin (beta fodrin)
human alpha-catenin' [Homo sapiens]
long chain alpha-hydroxy acid oxidase =FMN- dependent alpha-hydroxy acid-oxidizing enzyme EC 1.1.3.1
aminopeptidase A
ATP synthase alpha chain, mitochondrial precursor
catenin (cadherin-associated protein), beta 1, 88kDa; catenin
clathrin heavy chain; clathrin, heavy polypeptide-like 2 [Homo sapiens]
enoyl-Coenzyme A, hydratase/3-hydroxyac)4 Coenzyme A dehydrogenase
flavin-containing monooxygenase 1
PDZ domain containing 1
similar to hypothetical protein MGC13047 [Homo sapiens]
Sodium/potassium-transporting ATPase alpha- 4 chain (Sodium pump 4) (Na4-/K+ ATPase4 )
solute carrier family 27 (fatty acid transporter), member 32; solute carrier family 27
ribophorin I
sodium bicarbonate cotransport protein NBC - rat
voltage-dependent anion channel 1 [Sus scrofa]
E ZR IN
glycine amidinotransferase (L-arginine:glycine amidinotransferase) [Mus musculus]
isocitrate dehydrogenase 2 (NADP+), mitochondrial [Mus musculus]
mutant beta-actin (beta-actin) [Homo sapiens]
Protein disulfide isomerase precursor (PDI) (Prol)4 4-hydrox)4ase beta subunit)
91610 5.88 17 487 17
94401 4.59 17 514 20
78913 5.48 17 450 21
69417 5.83 17 462 22
109791 5.75 16 258 16
48137 4.33 16 257 36
79155 6.6 16 507 24
76106 5.39 15 374 22
272627 5.63 15 455 6
100702 6.06 14 475 16
39502 7.9 14 425 43
108499 5.19 13 295 12
58904 9.22 13 448 26
86069 5.53 13 395 16
193260 5.48 12 397 8
79179 9.28 12 363 17
60427 8.66 12 389 29
57252 5.23 12 355 27
116513 7.78 12 517 13
115940 5.52 12 320 9
71447 8.82 12 387 18
68376 6.05 11 275 23
116822 6.44 11 221 10
30822 8.62 11 512 44
54254 6.16 10 327 20
48779 8 10 220 25
51358 8.88 10 259 22
42128 5.22 10 251 28
57315 4.82 10 232 18
193

7. Appendiœss
7657583 solute earner lamily 25 (mitochondnai earner; adenine nueleotide transloeator), member 13; 74819 8.77 10 334 16
4502099 solute earner family 25, member 5; 2F1; adenine nueleotide transloeator 2 (fibroblast) 33102 9.76 10 298 28
207603 truneated TJDP-glueuronosyltransferase (EC 2.4.1.17) 47347 8.5 10 289 27
6680027 glutamate dehydrogenase [Mus museulus] 61640 8.05 9 309 18
126897 Malate dehydrogenase, mitoehondrial preeursor 36030 8.83 9 384 34
205660 NADPH-eytoehrome P-450 oxidoreduetase 77285 5.3 9 298 15
27684065similar to NADH-ubiquinone oxidoreduetase 75 kDa subunit, mitoehondrial preeursor (Complex I-75Kd)
45829 5.12 9 449 27
418146 Ubiquinol- eytoehrome Creduetase eomplex eore protein 2, mitoehondrial preeursor 48400 9.16 9 401 22
33086580 Ab2-305 43767 6.09 8 232 14
19705431 albumin 70670 6.09 8 340 17
1619606 aldolase B 40035 8.66 8 285 27
19705543 Mg87 protein 38851 8.95 8 99 17
7514017 multifunetional beta-oxidation protein 2, peroxisomal - rat 79781 8.49 8 264 13
205632 Na,K-ATPase alpha-1 subunit 114504 5.27 8 219 7
32189340solute earner family 25 member 4; adenine nueleotide transloeator 1 (skeletal musele); ADP/ATP tra
33174 9.84 8 229 23
6753138ATPase, Na-n/K-t- transporting, beta 1 polypeptide; sodium/potassium ATPase beta subunit [Mus museulus
35571 8.83 7 159 22
66063 aeyl-CoA oxidase (EC 1.3.3.6) ehain A, peroxisomal spUee form I I - rat 75042 8.24 7 217 19
3121992 Aldehyde dehydrogenase, mitoehondrial (ALDHelass 2) (A LD H l) (ALDH-E2) 54813 5.83 7 321 16
22096350 Alpha enolase (2-phospho-D-glyeerate hydrolyase) (Non-neural enolase) (N IÆ ) (Enolase 1) 47513 5.84 7 196 20
728931 ATP synthase gamma ehain, mitoehondrial 30229 8.87 7 203 23
2119726 dnaK-type moleeular ehaperone grp75 preeursor - rat 73984 5.87 7 309 10
6980972glutamate oxaloaeetate transaminase 2; Glutamate oxaloaeetate transaminase 2, mitoehondrial (aspart
47683 9.13 7 238 17
121712 Glutathione S-transferase Ya ehain (GST elass- alpha) 25706 9.04 7 144 24
72222 heat shoek protein 90-beta [validated] - human 83584 4.97 7 224 10
1586819 myosin VI:SUBUNIT=heavy ehain 147614 9.01 7 281 5
21704020 N A D H dehydrogenase (ubiquinone) Fe-S protein 1 [Mus museulus] 80724 5.51 7 362 12
7549225 PALS2-alpha spliee variant [Mus museulus] 61172 5.82 7 153 15
194
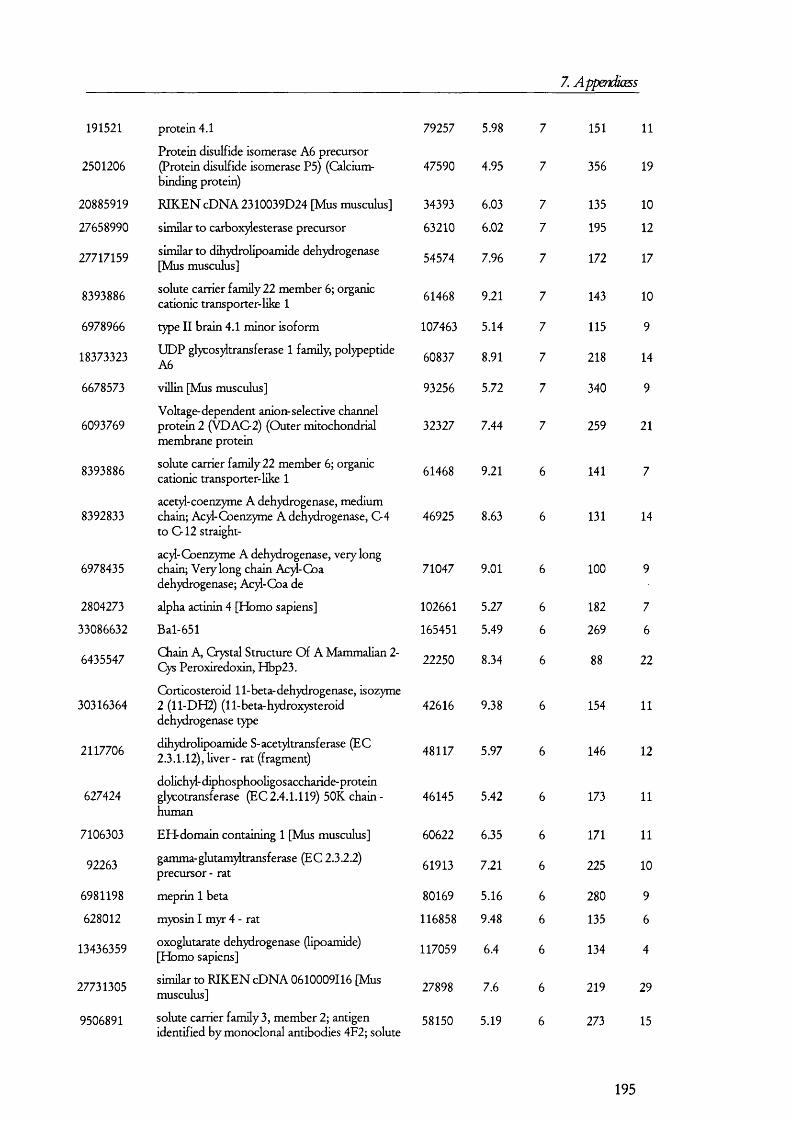
7. AppendÎŒss
191521
2501206
20885919
27658990
27717159
8393886
6978966
18373323
6678573
6093769
8393886
8392833
6978435
2804273
33086632
6435547
30316364
2117706
627424
7106303
92263
6981198
628012
13436359
27731305
9506891
protein 4.1
Protein disulfide isomerase A6 precursor (Protein disulfide isomerase P5) (Calcium- binding protein)
R IK E N cDNA 2310039D24 [Mus musculus]
similar to carboxylesterase precursor
similar to dihydrolipoamide dehydrogenase [Mus musculus]
solute carrier family 22 member 6; organic cationic transporter-like 1
type I I brain 4.1 minor isoform
UDP glycos)dtransferase 1 family, polypeptide A6
villin [Mus musculus]
Voltage-dependent anion-selective channel protein 2 (VDAG2) (Outer mitochondrial membrane protein
solute carrier family 22 member 6; organic cationic transporter-like 1
acetyl-coenzyme A dehydrogenase, medium chain; Acyl-Coenzyme A dehydrogenase, C 4 to C 12 straight-
ac)I-Coenzyme A dehydrogenase, very long chain; Very long chain Ac)I-Coa dehydrogenase; Ac)I-Coa de
alpha actinin 4 [Homo sapiens]
Bal-651
Chain A, Crystal Structure O f A Mammalian 2- Cys Peroxiredoxin, Hbp23.
Corticosteroid 11-beta-dehydrogenase, isozyme 2 (11-DH2) (11-beta-hydroxysteroid dehydrogenase type
dihydrolipoamide S-aceiyltransferase (EC 2.3.1.12), liver - rat (fragment)
dolich)I-diphosphoohgosaccharide-protein glycotransferase (EC 2.4.1.119) 50K chain- human
EH-domain containing 1 [Mus musculus]
gamma-glutamyltransferase (EC 2.3.2.2) precursor - rat
meprin 1 beta
myosin I myr 4 - rat
oxoglutarate dehydrogenase (lipoamide)[Homo sapiens]
similar to R IK E N cDNA 0610009116 [Mus musculus]
solute carrier family 3, member 2; antigen identified by monoclonal antibodies 4F2; solute
79257
47590
34393
63210
54574
61468
107463
60837
93256
32327
61468
46925
71047
102661
165451
22250
46145
60622
61913
80169
116858
117059
27898
58150
5.98
4.95
6.03
6.02
7.96
9.21
5.14
8.91
5.72
7.44
9.21
8.63
9.01
5.27
5.49
8.34
42616 9.38
48117 5.97
5.42
6.35
7.21
5.16
9.48
6.4
7.6
5.19
151
356
135
195
172
143
115
218
340
259
141
131
100
182
269
154
146
173
171
225
280
135
134
219
273
11
19
10
12
17
10
9
14
9
21
14
7
6
22
11
12
11
11
10
9
6
4
29
15
195
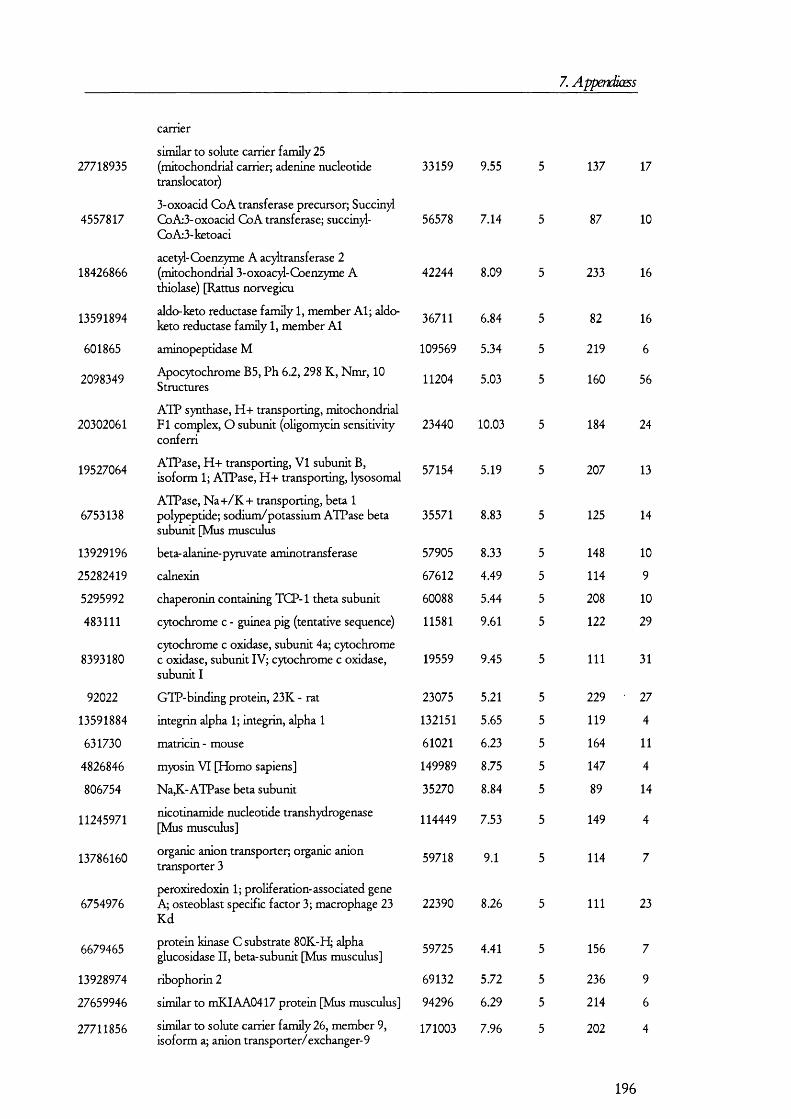
7. Appendkess
27718935
4557817
18426866
13591894
601865
2098349
20302061
19527064
6753138
13929196
25282419
5295992
483111
8393180
92022
13591884
631730
4826846
806754
11245971
13786160
6754976
6679465
13928974
27659946
27711856
earner
similar to solute carrier family 25 (mitochondrial carrier; adenine nucleotide transloeator)
3-oxoacid CoA transferase precursor; Succin)d CoA;3-oxoacid CoA transferase; succin)4- CoA;3-ketoaci
acetyl-Coenzyme A ac)dtransferase 2 (mitochondrial 3-oxoac)4-Coenzyme A thiolase) [Rattus norvegicu
aldo-keto reductase family 1, member A l; aldo- keto reductase family 1, member A l
aminopeptidase M
Apocytochrome B5, Ph 6.2, 298 K, Nmr, 10 Structures
ATP synthase, H-k transporting, mitochondrial F I complex, O subunit (oligomycin sensitivity conferri
ATPase, H-k transporting, V I subunit B, isoform 1; ATPase, H-k transporting, lysosomal
ATPase, N a + /K + transporting, beta 1 polypeptide; sodium/potassium ATPase beta subunit [Mus musculus
beta-alanine-pyruvate aminotransferase
calnexin
chaperonin containing TCP-1 theta subunit
cytochrome c - guinea pig (tentative sequence)
cytochrome c oxidase, subunit 4a; cytochrome c oxidase, subunit IV ; cytochrome c oxidase, subunit I
GTP-binding protein, 23K - rat
integrin alpha 1; integrin, alpha 1
matricin - mouse
myosin V I [Homo sapiens]
Na,K-ATPase beta subunit
nicotinamide nucleotide transhydrogenase [Mus musculus]
organic anion transporter; organic anion transporter 3
peroxiredoxin 1; proliferation-associated gene A; osteoblast specific factor 3; macrophage 23 Kd
protein kinase C substrate 80K-H; alpha glucosidase II, beta-subunit [Mus musculus]
ribophorin 2
similar to mKIAA0417 protein [Mus musculus]
similar to solute carrier family 26, member 9, isoform a; anion transporter/exchanger-9
33159
56578
42244
36711
109569
11204
57154
35571
57905
67612
60088
11581
23075
132151
61021
149989
35270
114449
59718
59725
69132
94296
171003
9.55
7.14
8.09
6.84
5.34
5.03
23440 10.03
5.19
8.83
8.33
4.49
5.44
9.61
19559 9.45
5.21
5.65
6.23
8.75
8.84
7.53
9.1
22390 8.26
4.41
5.72
6.29
7.96
137
87
233
82
219
160
184
207
125
148
114
208
122
111
229
119
164
147
89
149
114
111
156
236
214
202
17
10
16
16
6
56
24
13
14
10
9
10
29
31
27
4
11
4
14
23
196
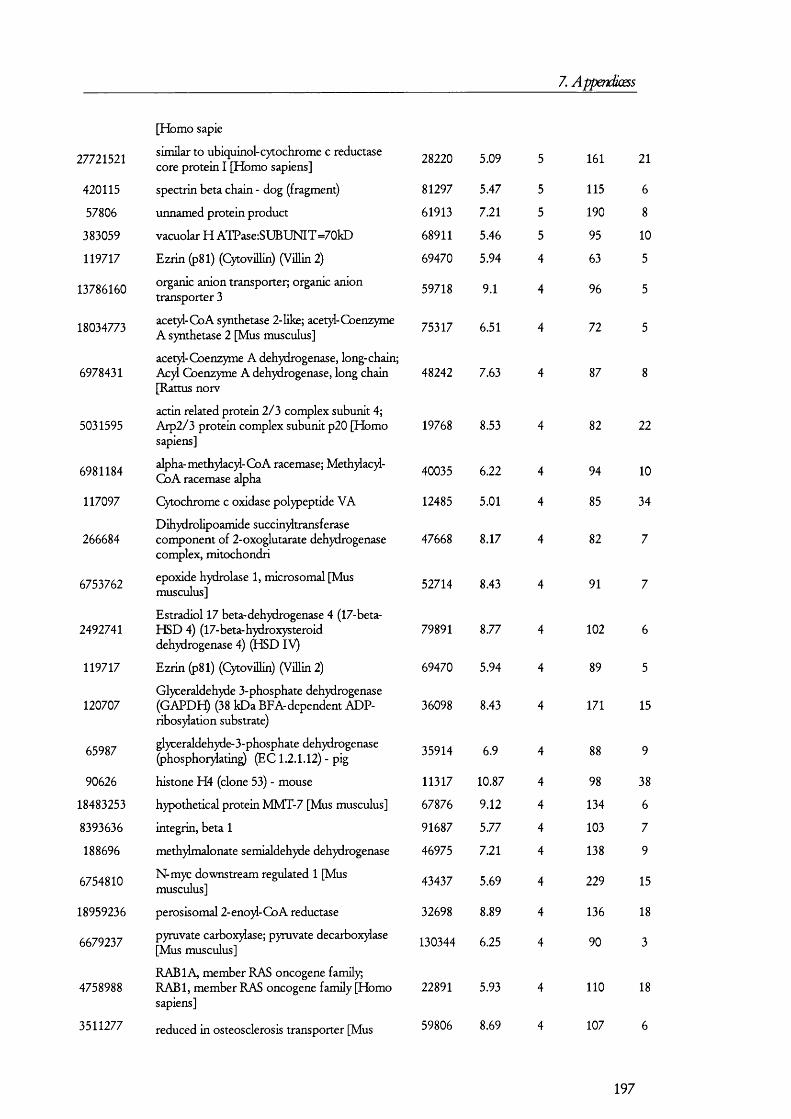
7. Appendiœss
27721521
420115
57806
383059
119717
13786160
18034773
6978431
5031595
6981184
117097
266684
6753762
2492741
119717
120707
65987
90626
18483253
8393636
188696
6754810
18959236
6679237
4758988
3511277
[Homo sapie
similar to ubiquinol-cytochrome c reductase core protein I [Homo sapiens]
spectrin beta chain - dog (fragment)
unnamed protein product
vacuolar H ATPase:SUBUNIT =70kD
Ezrin (p81) (CytoviUin) (Villin 2)
organic anion transporter; organic anion transporter 3
acetyd-CoA synthetase 2-like; acet}d-Coenzyme A synthetase 2 [Mus musculus]
acet)4-Coenzyme A dehydrogenase, long-chain; Ac)4 Coenzyme A dehydrogenase, long chain [Rattus norv
actin related protein 2/3 complex subunit 4; Arp2/3 protein complex subunit p20 [Homo sapiens]
alpha-meth)4ac)4-CoA racemase; Meth)4ac)4- CoA racemase alpha
Cytochrome c oxidase polypeptide VA
Dihydrolipoamide succinjdtransferase component of 2-oxoglutarate dehydrogenase complex, mitochondri
epoxide hydrolase 1, microsomal [Mus musculus]
Estradiol 17 beta-dehydrogenase 4 (17-beta- HSD 4) (17- beta- hydroxysteroid dehydrogenase 4) (HSD IV )
Ezrin (p81) (CytoviUin) (ViUin 2)
Glyceraldehyde 3-phosphate dehydrogenase (G A P D ^ (38 kDa BEAr dependent ADP- ribosylation substrate)
glyceraldehyde-3-phosphate dehydrogenase (phosphoiydating) (EC 1.2.1.12) - pig
histone H4 (clone 53) - mouse
hypothetical protein MMT-7 [Mus musculus]
integrin, beta 1
meth)4malonate semialdehyde dehydrogenase
N-myc downstream regulated 1 [Mus musculus]
perosisomal 2-eno)4-CoA reductase
pyruvate carbox)&ase; pyruvate decarbox)4ase [Mus musculus]
RABIA, member RAS oncogene family;RABl, member RAS oncogene family [Homo sapiens]
reduced in osteosclerosis transporter [Mus
28220 5.09
81297
61913
68911
69470
59718
75317
48242
19768
40035
12485
47668
52714
79891
69470
36098
35914
11317
67876
91687
46975
43437
32698
130344
22891
59806
5.47
7.21
5.46
5.94
9.1
6.51
7.63
8.53
6.22
5.01
8.17
8.43
8.77
5.94
8.43
6.9
10.87
9.12
5.77
7.21
5.69
8.89
6.25
5.93
8.69
161
115
190
95
63
96
72
87
82
94
85
82
91
102
171
9 8
134
103
138
229
136
90
110
107
21
6
8
10
5
5
5
22
10
34
6
5
15
38
6
7
9
15
18
3
18
6
197

7. Appendiœss
21313668
16758640
18426858
135826
313014
346261
625305
1709296
1709863
25282441
6753074
1703286
1167996
4557343
19705465
1673514
9845234
19424238
18543177
14144
16758434
28380037
8393243
21759113
21313290
musculus]
R IK E N cDNA 2310001A20 [Mus musculus]
S AGI (supressor of actin mutations 1, homolog)-like; suppressor of actin 1
succinate dehydrogenase complex, subunit A, flavoprotein (Fp)
Thiosulfate sulfurtransferase (Rhodanese)
vacuolar proton ATPase [Homo sapiens]
H+ / +/K+-exchanging ATPase (EC 3.6.3.10) A TP IA LI - human (fragment)
myosin heavy chain nonmuscle form A - human
Solute carrier family 12 member 1 (Bumetanide-sensitive sodium- (potassium)- chloride cotransporter 2
14.5 kDa translational inhibitor protein (Perchloric acid soluble protein)
2-4-dienoyl-Coenzyme A reductase 2, peroxisomal; putative peroxisomal 2,4-dienoyl- CoA reductase [Ra
adaptor protein complex AP-2, mul; adaptor- related protein complex AP-2, mul; clathrin- associated A
Aminopeptidase N (pAPN) (Alanyl aminopeptidase) (Microsomal aminopeptidase) (Aminopeptidase
anhyrin G119
antiquitin; antiquitin 1; aldehyde dehydrogenase 7A1 [Homo sapiens]
ATP synthase, H-i- transporting, mitochondrial FO complex, subunit b, isoform 1
B-cell receptor associated protein [Homo sapiens]
calpactin I heavy chain
camello-like 1
citrate synthase; citrate synthase precursor
c o n [Oryctolagus cuniculus]
D-amino acid oxidase
Dimeth)Ianiline monooxygenase [N-oxide forming] 1 (Hepatic flavin-containing monooxygenase 1) (FMO
dodecenoyl-Coenzyme A delta isomerase (3,2 trans- eno)l- Coenyme A; dodeceno)!- Coenzyme A delta isome
Electron transfer flavoprotein alpha-subunit, mitochondrial precursor (Alpha-ETE)
electron transferring flavoprotein, dehydrogenase [Mus musculus]
46576
67509
72596
33384
26271
10542
227799
14352
49965
120266
55845
28965
23621
38939
24964
52176
26159
39138
60818
32348
35360
68903
5.97
6.84
6.75
7.84
8.45
4.24
5.53
122648 7.f
7.79
31614 8.51
9.57
109139 5.15
8.54
6.44
9.39
9.57
7.55
8.73
8.53
4.66
6.7
8.94
9.55
8.62
7.34
9
6
6
17
15
28
1
26
14
109
140
103
158
43
84
119
106
112
109
45
135
69
174
74
54
96
41
65
60
123
142
133 15
60 11
86 4
2
7
9
10
8
9
6
10
198
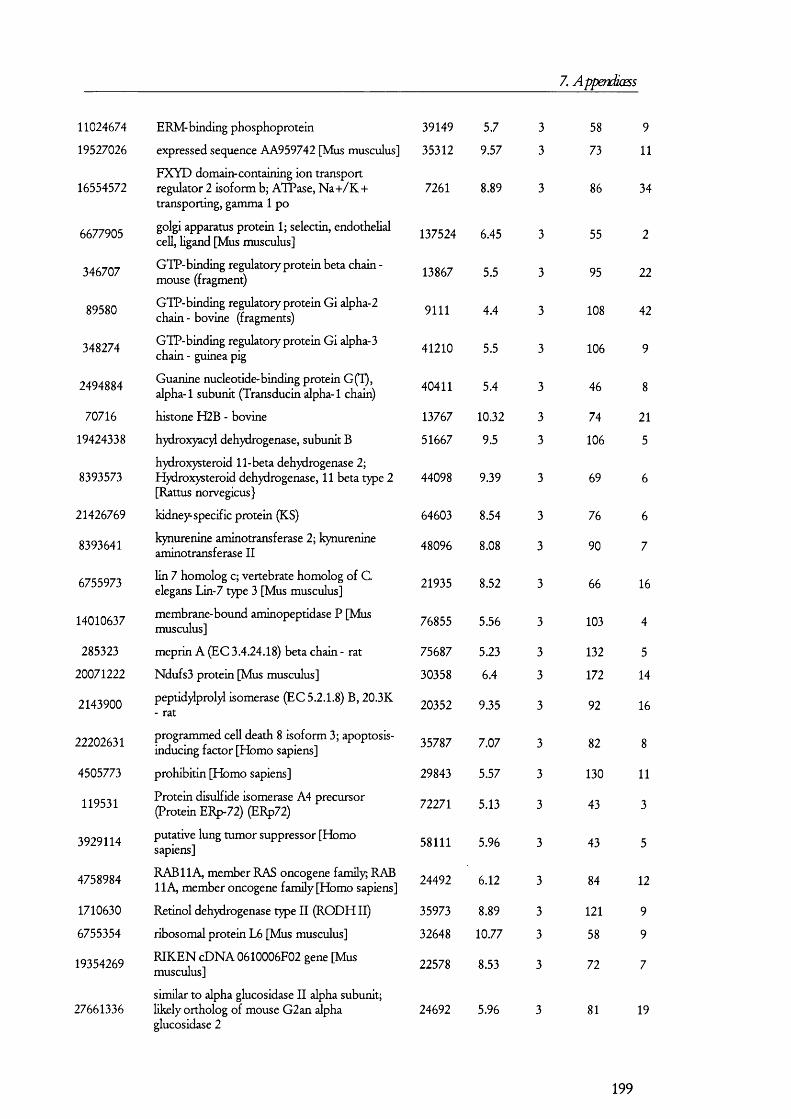
7. Appendiœss
11024674 ERM-binding phosphoprotein 39149 5.7 3 58 9
19527026 expressed sequence AA959742 [Mus musculus] 35312 9.57 3 73 11
16554572FXYD domain-containing ion transport regulator 2 isoform b; ATPase, Na-i-/K-t- transporting, gamma 1 po
7261 8.89 3 86 34
6677905 golgi apparatus protein 1; selectin, endothelial cell, ligand [Mus musculus] 137524 6.45 3 55 2
346707 GTP-binding regulatory protein beta chain - mouse (fragment) 13867 5.5 3 95 22
89580 GTP-binding regulatory protein Gi alpha-2 chain - bovine (fragments) 9111 4.4 3 108 42
348274 GTP-binding regulatory protein Gi alpha-3 chain - guinea pig 41210 5.5 3 106 9
2494884 Guanine nucleotide-binding protein G(T), alpha-1 subunit (Transducin alpha-1 chain) 40411 5.4 3 46 8
70716 histone H2B - bovine 13767 10.32 3 74 21
19424338 hydroxyac)d dehydrogenase, subunit B 51667 9.5 3 106 5
8393573hydroxysteroid 11-beta dehydrogenase 2; Hydroxysteroid dehydrogenase, 11 beta type 2 [Rattus norvegicus}
44098 9.39 3 69 6
21426769 kidneys specific protein (KS) 64603 8.54 3 76 6
8393641 kynurenine aminotransferase 2; kynurenine aminotransferase I I 48096 8.08 3 90 7
6755973 lin 7 homolog c; vertebrate homolog of C. elegans Lin-7 type 3 [Mus musculus] 21935 8.52 3 66 16
14010637 membrane-bound aminopeptidase P [Mus musculus] 76855 5.56 3 103 4
285323 meprin A (EC 3.4.24.18) beta chain - rat 75687 5.23 3 132 5
20071222 Ndufs3 protein [Mus musculus] 30358 6.4 3 172 14
2143900 peptid)4prol)d isomerase (EC 5.2.1.8) B, 20.3K - rat 20352 9.35 3 92 16
22202631 programmed cell death 8 isoform 3; apoptosis- inducing factor [Homo sapiens] 35787 7.07 3 82 8
4505773 prohibitin [Homo sapiens] 29843 5.57 3 130 11
119531 Protein disulfide isomerase A4 precursor (Protein ERp-72) (ERp72) 72271 5.13 3 43 3
3929114 putative lung tumor suppressor [Homo sapiens] 58111 5.96 3 43 5
4758984 RAB 11 A, member RAS oncogene family RAB 11 A, member oncogene family [Homo sapiens] 24492 6.12 3 84 12
1710630 Retinol dehydrogenase type I I (R O D H II) 35973 8.89 3 121 9
6755354 ribosomal protein L6 [Mus musculus] 32648 10.77 3 58 9
19354269 R IK E N cDNA 0610006F02 gene [Mus musculus] 22578 8.53 3 72 7
27661336similar to alpha glucosidase I I alpha subunit; likely ortholog of mouse G2an alpha 24692 5.96 3 81 19glucosidase 2
199

7. Appendiœss
27679634
20910231
27667200
27677028
6644384
114395
1083802
13928930
8393886
4758162
135536
1729977
72870
14010881
12831209
4558732
267413
4038352
89939
13272554
1053142
28570190
12408328
6981542
70637
similar to antiquitin - rat (fragment)
similar to hypothetical protein FLJ32569 [Homo sapiens] [Mus musculus]
similar to hypothetical protein MGC30702 [Mus musculus]
similar to Spectrin beta chain, brain 1 (Spectrin, non-erythroid beta chain 1) (Beta-II spectrin) (
sodium bicarbonate cotransporter
Sodium/potassium-transporting ATPase beta-1 chain (Sodium/potassium-dependent ATPase beta-1 subunit
sodium-chloride transporter. Thiazide-sensitive- rat
solute carrier family 15, member 2; solute carrier family 15 (H-k/peptide transporter), member 2 [Ra
solute carrier family 22 member 6; organic cationic transporter-like 1
synapse-associated protein 97; discs large homolog 1; presynaptic protein SAP97 [Homo sapiens]
T-OOMPLEX PR O TEIN 1, ALPHA SUBUNIT (TCP-1-ALPHA) (OCT-ALPHA) (65 K D A N TIG EN )
Transketolase (TK)
translation elongation factor eEF-1 alpha chain- mouse
UDP- glucuronosyltransf erase
unconventional myosin Myr2 I heavy chain
voltage dependent anion channel
Aquaporin-CHIP (Water channel protein for red blood cells and kidney proximal tubule) (Aquaporin 1)
breast cancer resistance protein [Homo sapiens] (ATP-binding cassette, sub-family G, member 2; breast cancer resistance protein; mitoxantrone resist)
Ca2- I - transporting ATPase (EC3.6.3.8) - rabbit
cytokeratin KRT2-6HF [Mus musculus]
L X l (organic cation transporter O C TIA )
Na-t- dependent glucose transporter 1
sodium-dependent high-affinity dicarbox)date transporter 3
solute carrier family 16, member 1; Solute carrier 16 (monocarbox)dic acid transporter), member 1 [
ubiquitin - Mediterranean fruit fly
17605
55742
67088
56057
122228
35578
82009
61468
60814
68342
50437
61455
118815
30062
29040
72897
42471
62452
52141
66455
53831
8446
6.43
5.99
8.75
6.89
6.4
8.83
111445 7.98
8.25
9.21
103443 5.63
5.71
7.23
9.1
7.95
9.41
9.11
7.7
8.85
135535 5.42
5.11
6.22
8.86
8.09
8.62
6.56
81
158
122
134
59
96
183
72
56
52
96
74
94
68
69
118
82
54
53
63
90
78
73
110
59
22
6
2
10
4
6
7
2
16
10
4
33
200
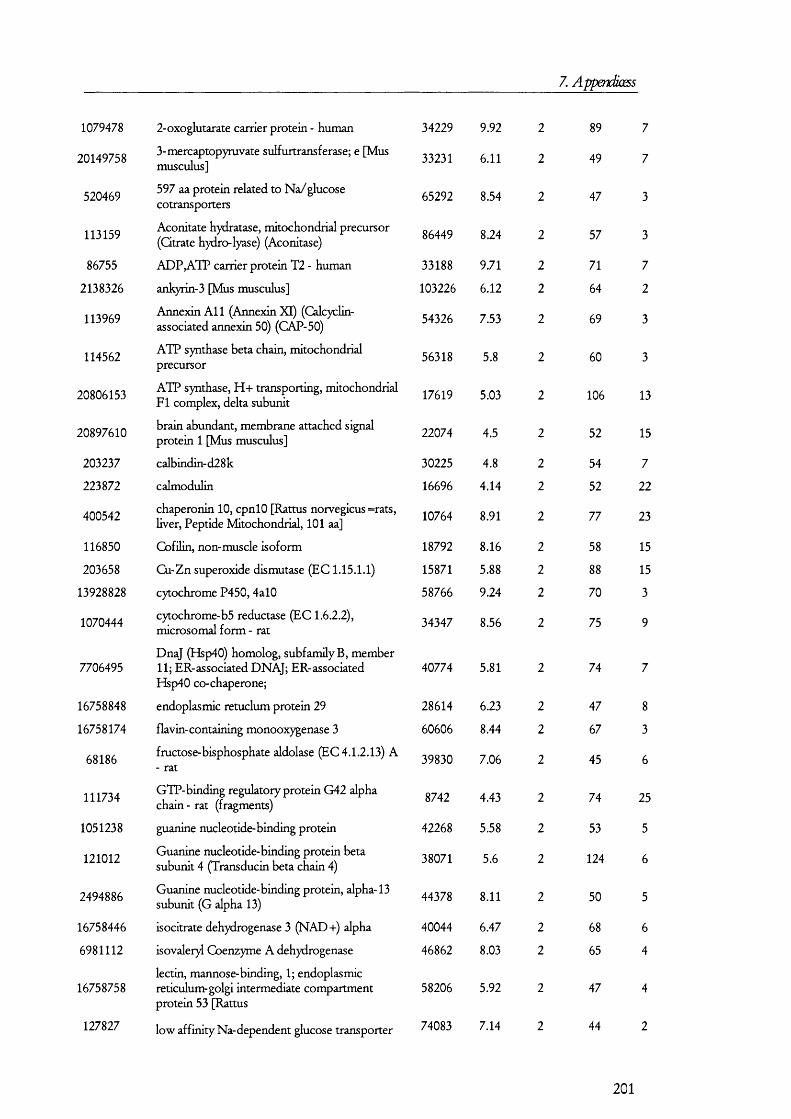
7. Appendiæss
1079478
20149758
520469
113159
86755
2138326
113969
114562
20806153
20897610
203237
223872
400542
116850
203658
13928828
1070444
7706495
16758848
16758174
68186
111734
1051238
121012
2494886
16758446
6981112
16758758
127827
2-oxoglutarate carrier protein - human
3-mercaptopyruvate sulfurtransferase; e [Mus musculus]
597 aa protein related to Na/glucose cotransporters
Aconitate hydratase, mitochondrial precursor (Citrate hydro-lyase) (Aconitase)
ADP,ATP carrier protein T2 - human
anl^rin-3 [Mus musculus]
Annexin A l 1 (Annexin X I) (Calcyclin- associated annexin 50) (CAP-50)
ATP synthase beta chain, mitochondrial precursor
ATP synthase, H + transporting, mitochondrial F I complex, delta subunit
brain abundant, membrane attached signal protein 1 [Mus musculus]
calbindin-d28k
calmodulin
chaperonin 10, cpnlO [Rattus norvégiens =rats, hver. Peptide Mitochondrial, 101 aa]
Cofilin, non-muscle isoform
Cu-Zn superoxide dismutase (EC 1.15.1.1)
cytochrome P450, 4al0
cytochrome-b5 reductase (EC 1.6.2.2), microsomal form - rat
DnaJ (Hsp40) homolog, subfamily B, member 11; ER-associated DNAJ; ER-associated Hsp40 CO-chaperone;
endoplasmic retuclum protein 29
flavin-containing monooxygenase 3
fructose-bisphosphate aldolase (EC 4.1.2.13) A - rat
GTP-binding regulatory protein G42 alpha chain - rat (fragments)
guanine nucleotide-binding protein
Guanine nucleotide-binding protein beta subunit 4 (Transducin beta chain 4)
Guanine nucleotide-binding protein, alpha-13 subunit (G alpha 13)
isocitrate dehydrogenase 3 (NAD 4-) alpha
isovaleiy Coenzyme A dehydrogenase
lectin, mannose-binding, 1; endoplasmic reticulum-golgi intermediate compartment protein 53 [Rattus
low affinity Na-dependent glucose transporter
34229
33231
65292
86449
33188
103226
54326
56318
17619
22074
30225
16696
18792
15871
58766
34347
28614
60606
8742
42268
38071
44378
40044
46862
58206
74083
9.92
6.11
8.54
8.24
9.71
6.12
7.53
5.8
5.03
4.5
4.8
4.14
10764 8.91
8.16
5.88
9.24
8.56
40774 5.81
6.23
8.44
39830 7.06
4.43
5.58
5.6
8.11
6.47
8.03
5.92
7.14
89
49
47
57
71
64
69
60
106
52
54
52
77
58
88
70
75
74
47
67
45
74
53
124
50
68
65
47
44
7
2
3
3
13
15
7
22
23
15
15
3
3
6
25
5
6
5
6
4
4
2
201
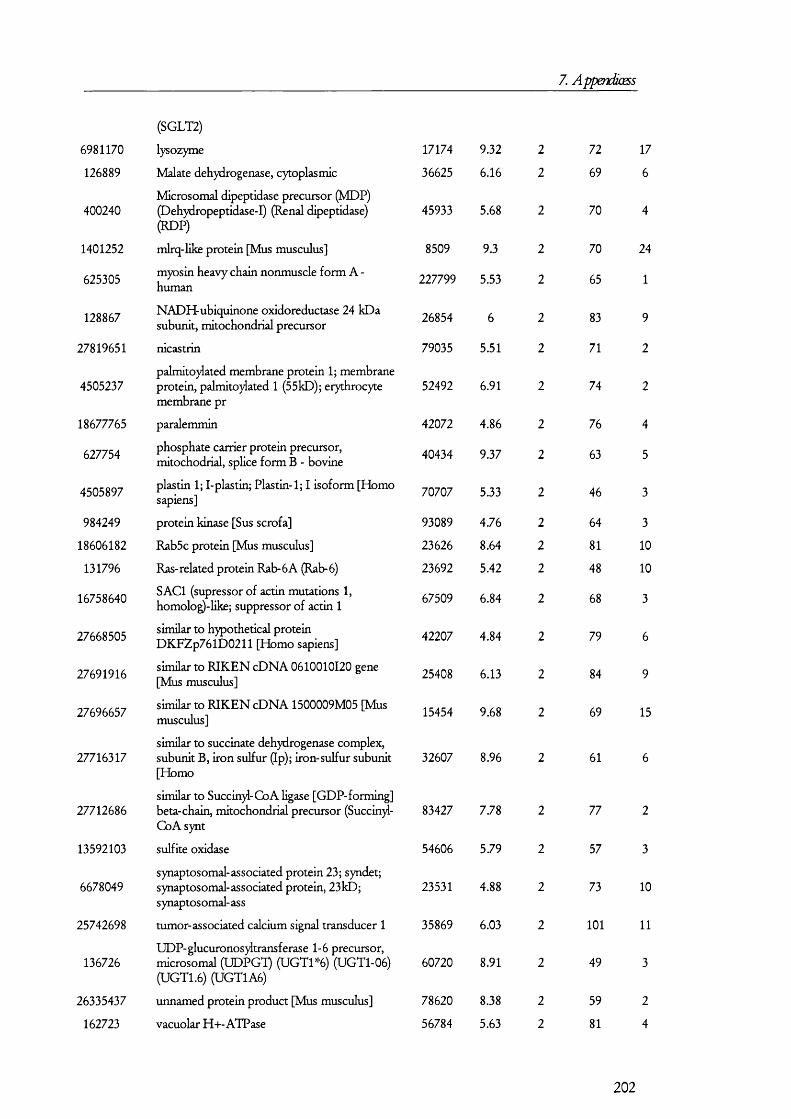
Z Appendiœss
6981170
126889
400240
1401252
625305
128867
27819651
4505237
18677765
627754
4505897
984249
18606182
131796
16758640
27668505
27691916
27696657
27716317
27712686
13592103
6678049
25742698
136726
26335437
162723
(SGLT2)
lysozyme
Malate dehydrogenase, cytoplasmic
Microsomal dipeptidase precursor (MDP) (Dehydropeptidase-1) (Renal dipeptidase) (RDP)
mlrq-like protein [Mus musculus]
myosin heavy chain nonmuscle form A - human
NADH-ubiquinone oxidoreductase 24 kDa subunit, mitochondrial precursor
nicastrin
palmitO)4ated membrane protein 1; membrane protein, palmito)dated 1 (55kD); erythrocyte membrane pr
paralemmin
phosphate carrier protein precursor, mitochodrial, splice form B - bovine
plastin 1; I-plastin; Plastin-1; I isoform [Homo sapiens]
protein kinase [Sus scrofa]
Rab5c protein [Mus musculus]
Ras-related protein Rab-6A (Rab-6)
SACl (supressor of actin mutations 1, homolog)-like; suppressor of actin 1
similar to hypothetical protein DKFZp761D0211 [Homo sapiens]
similar to R IK E N cDNA 0610010120 gene [Mus musculus]
similar to R IK E N cDNA 1500009M05 [Mus musculus]
similar to succinate dehydrogenase complex, subunit B, iron sulfur (Ip); iron-sulfur subunit [Homo
similar to Succinyl-CoA ligase [GDP-forming] beta-chain, mitochondrial precursor (Succin)i- CoAsynt
sulfite oxidase
synaptosomal-associated protein 23; syndet; synaptosomal-associated protein, 23kD; synaptosomal- ass
tumor-associated calcium signal transducer 1
UDP-glucuronos)dtransf erase 1-6 precursor, microsomal (UDPGT) (UGT1%) (UGTl-06) (UGT1.6) (UGT1A6)
unnamed protein product [Mus musculus]
vacuolar H-k-ATPase
17174
36625
45933
8509
227799
26854
79035
42072
40434
70707
93089
23626
23692
67509
42207
25408
15454
32607
83427
54606
23531
35869
60720
78620
56784
9.32
6.16
5.68
9.3
5.53
6
5.51
52492 6.91
4.86
9.37
5.33
4.76
8.64
5.42
6.84
4.84
6.13
9.68
8.96
7.78
5.79
4.88
6.03
8.91
8.38
5.63
72
69
70
70
65
83
71
74
76
63
46
64
81
48
68
79
84
69
61
77
57
73
101
49
59
81
176
24
1
9
2
4
5
3
3
10
10
3
6
9
15
2
3
10
11
3
2
4
202
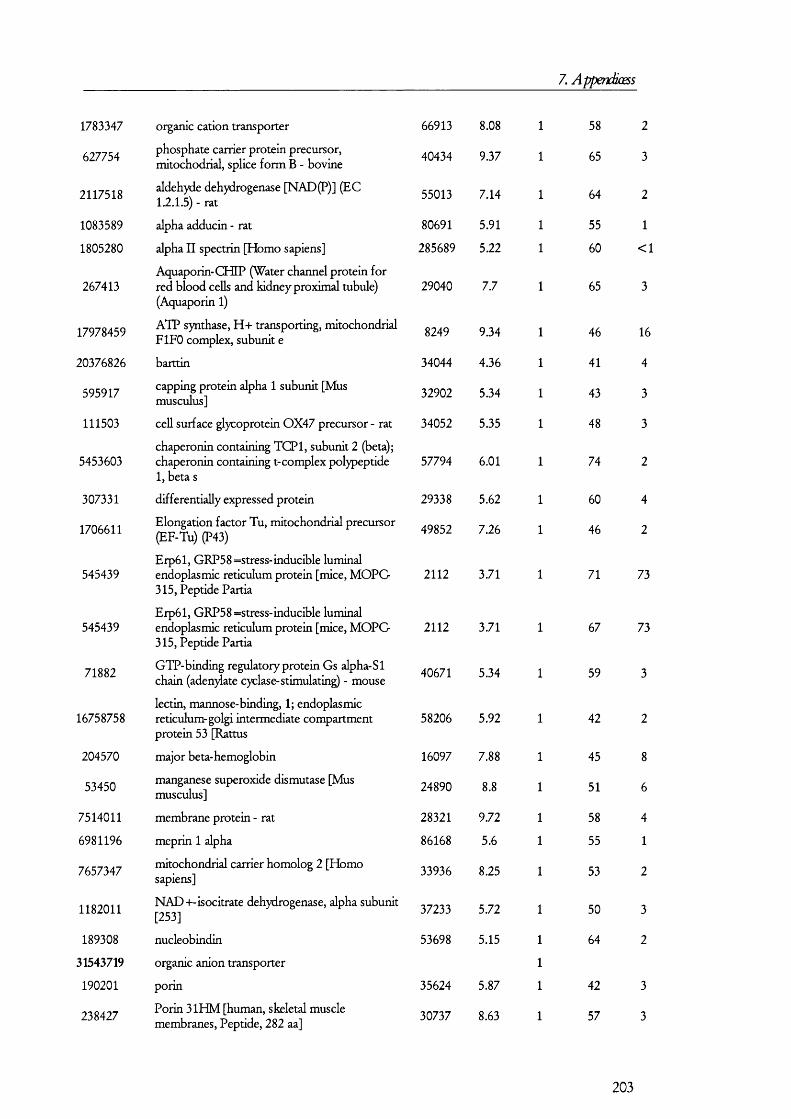
7. Appendiœss
1783347 organic cation transporter 66913 8.08 1 58 2
627754 phosphate carrier protein precursor, mitochodrial, splice form B - bovine 40434 9.37 1 65 3
2117518aldehyde dehydrogenase [NAD(P)] (EC 1.2.1.5) - rat 55013 7.14 1 64 2
1083589 alpha adducin - rat 80691 5.91 1 55 1
1805280 alpha I I spectrin [Homo sapiens] 285689 5.22 1 60 <1
267413Aquaporin-CHIP (Water channel protein for red blood cells and kidney proximal tubule) (Aquaporin 1)
29040 7.7 1 65 3
17978459 ATP synthase, H + transporting, mitochondrial FIFO complex, subunit e 8249 9.34 1 46 16
20376826 barttin 34044 4.36 1 41 4
595917 capping protein alpha 1 subunit [Mus musculus] 32902 5.34 1 43 3
111503 cell surface glycoprotein 0X 47 precursor - rat 34052 5.35 1 48 3
5453603chaperonin containing TCPl, subunit 2 (beta); chaperonin containing t-complex polypeptide 1, beta s
57794 6.01 1 74 2
307331 differentially expressed protein 29338 5.62 1 60 4
1706611 Elongation factor Tu, mitochondrial precursor (EF-Tu) (P43)
49852 7.26 1 46 2
545439Erp61, GRP58 =stress-inducible luminal endoplasmic reticulum protein [mice, M OPG 315, Peptide Partia
2112 3.71 1 71 73
545439Erp61, GRP5 8 =stress-inducible luminal endoplasmic reticulum protein [mice, M OPG 315, Peptide Partia
2112 3.71 1 67 73
71882 GTP-binding regulatory protein Gs alpha-SI chain (adenylate cyclase-stimulating) - mouse 40671 5.34 1 59 3
16758758lectin, mannose-binding, 1; endoplasmic reticulum-golgi intermediate compartment protein 53 [Rattus
58206 5.92 1 42 2
204570 major beta-hemoglobin 16097 7.88 1 45 8
53450 manganese superoxide dismutase [Mus musculus] 24890 8.8 1 51 6
7514011 membrane protein - rat 28321 9.72 1 58 4
6981196 meprin 1 alpha 86168 5.6 1 55 1
7657347 mitochondrial carrier homolog 2 [Homo sapiens] 33936 8.25 1 53 2
1182011 NAD-t~isocitrate dehydrogenase, alpha subunit [253] 37233 5.72 1 50 3
189308 nucleobindin 53698 5.15 1 64 2
31543719 organic anion transporter
190201 porin 35624 5.87 1 42 3
238427 Porin 31HM [human, skeletal muscle 30737 8.63 1 57 3
203

7. Appendiœss
200966 put. serine protease inhibitor 45737 8.91 1 60 2
66035 pyruvate dehydrogenase (lipoamide) (EC 1.2.4.1) alpha chain 1 precursor - rat 43853 8.35 1 42 2
4506609 ribosomal protein L19; 60S ribosomal protein L19 [Homo sapiens] 23565 11.48 1 46 4
13385656 R IK E N cDNA 0610010D20 [Mus musculus] 34964 7.62 1 45 3
5453706 similar to Caenorhabditis elegans protein G42C1.9 [Homo sapiens] 39072 7.67 1 50 3
27718935similar to solute carrier family 25 (mitochondrial carrier; adenine nucleotide translocator), membe
33159 9.55 1 46 4
54130 sodium/potassium ATPase beta subunit [Mus musculus] 31861 8.32 1 52 4
12408328 sodium-dependent high-affinity dicarboxjiate transporter 3 66455 8.09 1 80 2
6677897 stromal cell derived factor receptor 1 [Mus musculus] 31446 6.11 1 53 3
6678177 syntaxin 4A (placental) [Mus musculus] 34258 5.84 1 42 3
12860092 unnamed protein product [Mus musculus] 20432 5.66 1 52 7
B. Proteins identified in brush border rrurhrane fractions
Accesion No. Protein Name M r p i PEP SCR CO Y
13562118 low density lipoprotein receptor-related protein 2; megalin 537697 5.03 90 3152 16
13591914 kidney aminopeptidase M; Leucine aiydaminopeptidase 1 109779 5.3 54 1801 40
13928998 PDZ domain containing 1 57252 5.23 49 1352 65
462608 Moesin (Membrane-organizing extension spike protein) 67839 6.22 48 1121 46
17105370ATPase, H-t- transporting, lysosomal (vacuolar proton pump), beta 56/58 kDa, isoform 2 [Rattus norveg
56857 5.57 47 1250 51
12832989 unnamed protein product [Mus musculus] (CytoviUin) (Villin 2) 69506 5.9 39 824 32
119717 Ezrin (p81) (CytoviUin) (VUlin 2) 69470 5.94 38 898 38
27710072 similar to Maltase-glucoam)4ase, intestinal 777951 5.23 34 967 5
33302595 Glutam)& aminopeptidase (EAP) (Aminopeptidase A) (APA) 108440 5.24 33 834 31
1586819 myosin V I :SUBUNIT=heavy chain 147614 9.01 30 1083 20
4758012 clathrin heavy chain; clathrin, heavy polypeptide-like 2 [Homo sapiens] 193260 5.48 29 1149 21
358959 ATPase alphal,Na/K 114132 5.3 26 991 28
204

7. Appendiaess
109893dnaK-type molecular chaperone grp78 precursor - mouse
72491 5.12 26 915 36
114523 ATP synthase alpha chain, mitochondrial precursor 58904 9.22 26 988 39
11024674 ERM-binding phosphoprotein 39149 5.7 24 731 48
6978773 dipeptidjd peptidase 4 88689 5.87 22 668 27
17380501Spectrin alpha chain, brain (Spectrin, non- eiythroid alpha chain) (Alpha-II spectrin) (Fodrin alpha
285261 5.2 21 788 9
28436809 radixin [Homo sapiens] 68636 5.88 21 476 22
11230802 actinin alpha 4; alpha actinin 4 [Mus musculus] 105368 5.25 20 749 23
27720877 similar to Myosin V I 59947 5.46 20 778 39
71625 actin gamma - bovine (tentative sequence) 41977 5.31 19 580 46
16758040 cubilin; cubilin (intrinsic factor-cobalamin receptor) 407570 5.4 18 554 6
7106421spectrin beta 2 isoform 2; beta-spectrin 2, non- erythrocytic; beta fodrin; spectrin G; brain spectr
251686 5.36 17 620 8
2804273 alpha actinin 4 [Homo sapiens] 102661 5.27 17 548 23
20892559ATPase, H-n transporting, lysosomal (vacuolar proton pump), alpha 70 kDa, isoform 1 [Mus musculus]
68625 5.42 17 601 28
117164Cytochrome P450 4A2 precursor (CYPIVA2) (Laurie acid omega-hydroxylase) (P450-LA- omega 2) (P450 K-5
58274 9.18 17 740 29
90292 alpha-adaptin C - mouse 104863 6.51 16 492 16
13994159 annexin V I 76106 5.39 16 445 26
28940unnamed protein product [Homo sapiens] (ATP synthase beta chain, mitochondrial precursor)
57976 5.8 16 697 33
16924020 X-prol)l aminopeptidase (aminopeptidase P) 2, membrane- bound 76545 5.49 15 517 19
347019 dnaK-type molecular chaperone hsp72-psl - rat 71112 5.43 15 514 21
6978847 flavin-containing monooxygenase 1 60427 8.66 15 585 29
19527064ATPase, H-k transporting, V I subunit B, isoform 1; ATPase, H4- transporting, lysosomal (vacuolar prot
57154 5.19 14 462 20
7514017 multifunctional beta-oxidation protein 2, peroxisomal - rat 79781 8.49 14 535 23
20892559ATPase, H-k transporting, lysosomal (vacuolar proton pump), alpha 70 kDa, isoform 1 [Mus musculus]
68625 5.42 14 375 24
17902245 E ZR IN 54254 6.16 14 345 28
9506891solute carrier family 3, member 2; antigen identified by monoclonal antibodies 4F2; solute 58150 5.19 14 498 34carrier
205

z Appendiœss
19424318 eno)4-Coenzyme A, hydratase/3-hydroxyac)4 Coenzyme A dehydrogenase 79179 9.28 13 411 18
6753138ATPase, N a + /K + transporting, beta 1 polypeptide; sodium/potassium ATPase beta subunit [Mus musculus
35571 8.83 13 372 26
87528 dnaK-type molecular chaperone t^PA 5 precursor - human 72185 5.03 12 469 23
22219429 Chain M, Ap2 Clathrin Adaptor Core 50006 9.6 12 257 27
17105334 folate hydrolase; N-acet)4ated alpha-linked acidic dipeptidase 84715 7.04 11 277 15
16359229 ribophorin I [Mus musculus] 68657 6.02 11 348 21
806754 Nad^-ATPase beta subunit 35270 8.84 11 262 22
109533 alkaline phosphatase (EC 3.1.3.1) precursor- mouse 57794 6.52 11 380 23
13990959
a4 subunit isoform [Mus musculus] (ATPase, H-k transporting, lysosomal VO subunit A isoform 4; ATPase, H-k transporting, lysosomal (vacu)
96341 5.94 10 360 10
13277651 Akap2 protein [Mus musculus] 88337 5.17 10 390 13
462608 Moesin (Membrane-organizing extension spike protein) 67839 6.22 10 275 13
6755863 tumor rejection antigen gp96; tumor rejection antigen (gp96) 1 [Mus musculus] 92703 4.74 10 432 13
57806 unnamed protein product (gamma-glutam}4 transpeptidase) 61913 7.21 10 397 14
6755863 tumor rejection antigen gp96; tumor rejection antigen (gp96) 1 [Mus musculus] 92703 4.74 10 409 14
13928828 cytochrome P450,4al0 58766 9.24 10 363 16
3157995 D O C 2 p59 isoform (mitogen-responsive phosphoprotein; DOC-2 p82 isoform ) 58957 5.66 10 384 21
7706262 vacuolar ATPase subunit H [Homo sapiens] 56399 6.07 10 296 25
22096350 Alpha enolase (2-phospho-D- glycerate hydro- lyase) (Non-neurd enolase) (N ÎÆ ) (Enolase 1) 47513 5.84 10 379 26
71620 actin beta - rat 42066 5.29 10 234 30
6981450ATP-binding cassette, sub-family D (ALD), member 3; Peroxisomal membrane protein 1 [Rattus norvegic
75780 9.32 9 159 11
21361142 PDZ domain containing 1 [Homo sapiens] 57379 5.36 9 228 15
18373323 UDP glycos)itransferase 1 family, polypeptide A6 60837 8.91 9 334 17
32189394ATP synthase, H-k transporting, mitochondrial F I complex, beta polypeptide; ATP synthase, H-k transpo
56525 5.26 9 294 24
27705116 similar to R IK E N cDNA 120001 ID 11 [Mus musculus] 18155 4.72 9 363 38
6981236 myosin, heavy polypeptide 9; Myosin, heavy polypeptide 9, non-muscle 227566 5.49 8 221 5
404105 'human alpha-catenin' [Homo sapiens] 100702 6.06 8 250 10
206
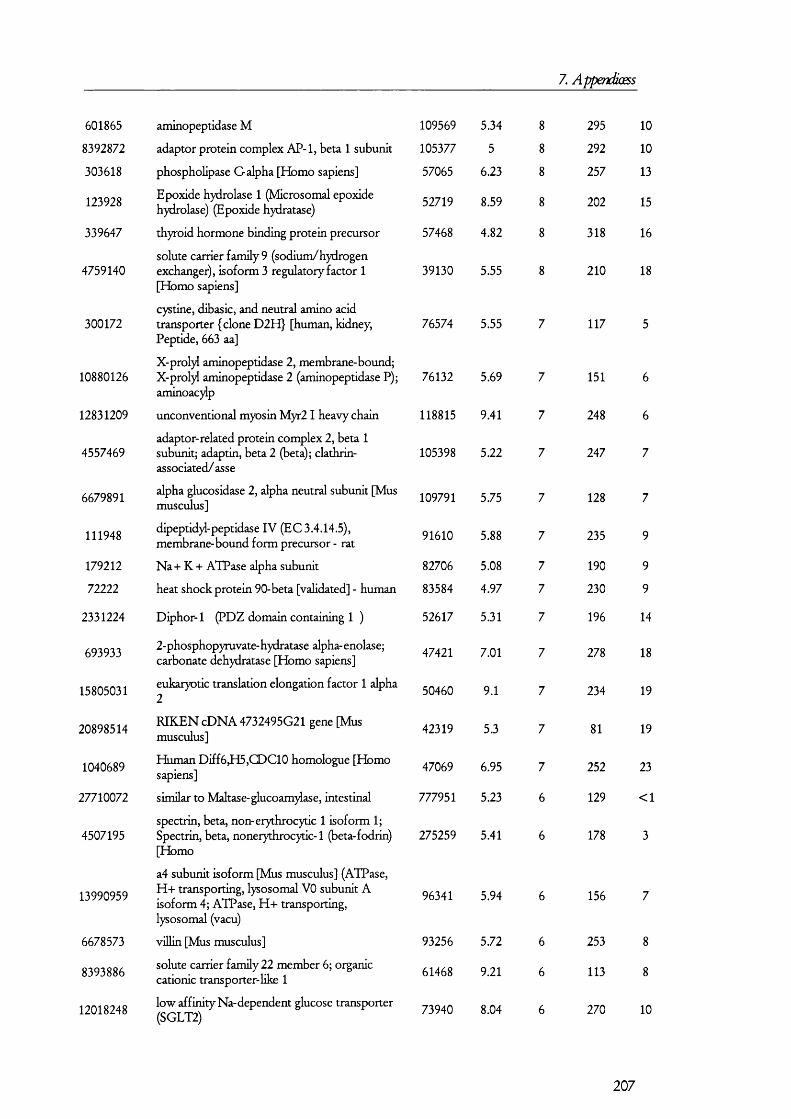
7. Appendiœss
601865
8392872
303618
123928
339647
4759140
300172
10880126
12831209
4557469
6679891
111948
179212
72222
2331224
693933
15805031
20898514
1040689
27710072
4507195
13990959
6678573
8393886
12018248
aminopeptidase M
adaptor protein complex AP-1, beta 1 subunit
phospholipase G alpha [Homo sapiens]
Epoxide hydrolase 1 (Microsomal epoxide hydrolase) (Epoxide hydratase)
thyroid hormone binding protein precursor
solute carrier family 9 (sodium/hydrogen exchanger), isoform 3 regulatory factor 1 [Homo sapiens]
cystine, dibasic, and neutral amino acid transporter {clone D2H} [human, kidney. Peptide, 663 aa]
X-prol)4 aminopeptidase 2, membrane-bound; X-prol)d aminopeptidase 2 (aminopeptidase P); aminoac)dp
unconventional myosin Myr21 heavy chain
adaptor-related protein complex 2, beta 1 subunit; adaptin, beta 2 (beta); clathrin- associated/ asse
alpha glucosidase 2, alpha neutral subunit [Mus musculus]
dipeptid)4-peptidase IV (EC 3.4.14.5), membrane-bound form precursor - rat
Na-i- K-t- ATPase alpha subunit
heat shock protein 90-beta [validated] - human
Diphor-1 (PDZ domain containing 1 )
2-phosphopyruvate- hydratase alpha- enolase; carbonate dehydratase [Homo sapiens]
eukaryotic translation elongation factor 1 alpha 2
R IK E N cDNA 4732495G21 gene [Mus musculus]
Human Diff6JH5,CDC10 homologue [Homo sapiens]
similar to Maltase-glucoam)4ase, intestinal
spectrin, beta, non-erythrocytic 1 isoform 1; Spectrin, beta, nonerythrocytic-1 (beta-fodrin) [Homo
a4 subunit isoform [Mus musculus] (ATPase, H-k transporting, lysosomal VO subunit A isoform 4; ATPase, H-k transporting, lysosomal (vacu)
villin [Mus musculus]
solute carrier family 22 member 6; organic cationic transporter-like 1
low affinity Na-dependent glucose transporter (SGLT2)
109569
105377
57065
52719
57468
39130
76574
76132
118815
105398
91610
82706
83584
52617
47421
50460
42319
47069
777951
96341
93256
61468
73940
5.34
5
6.23
8.59
4.82
5.55
5.55
5.69
9.41
5.22
109791 5.75
5.88
5.08
4.97
5.31
7.01
9.1
5.3
6.95
5.23
275259 5.41
5.94
5.72
9.21
8.04
10
10
13
15
16
18
295
292
257
202
318
210
117
151
248
247
128
235
190
230
196
278
234
81
252
129
178 3
156 7
253 8
113 8
9
9
14
18
19
19
23
<1
270 10
207
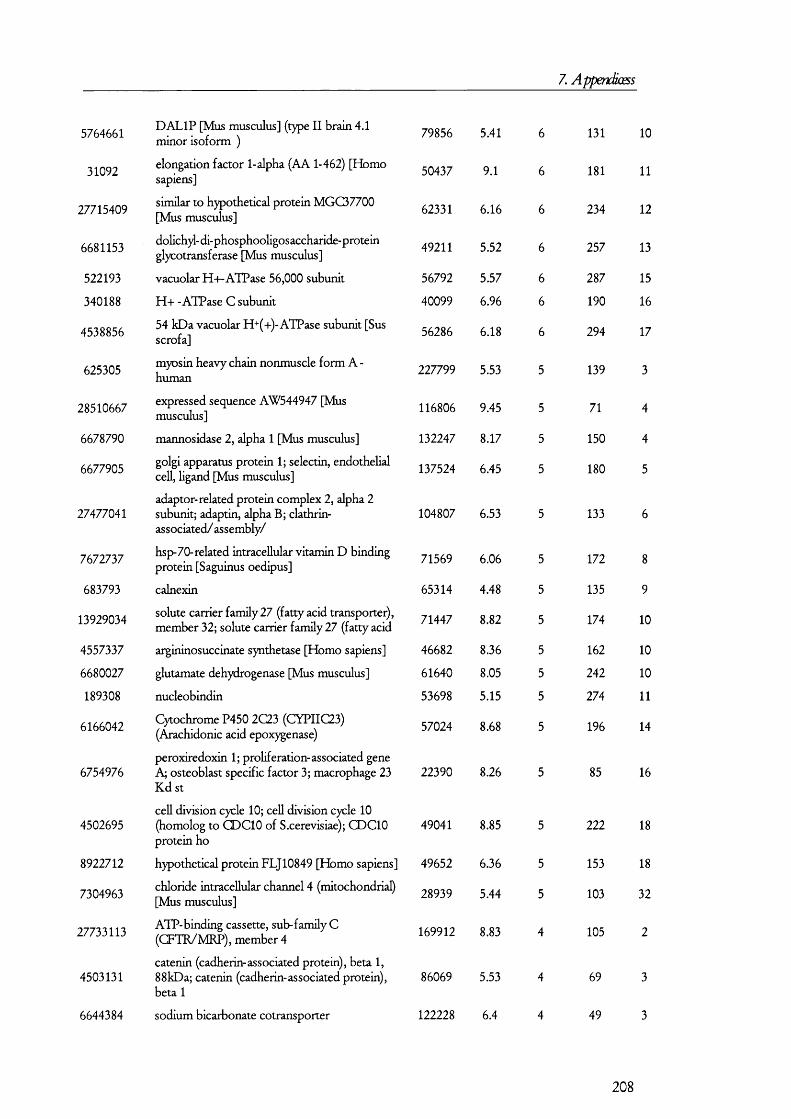
7. Appendiæss
5764661
31092
27715409
6681153
522193
340188
4538856
625305
28510667
6678790
6677905
27477041
7672737
683793
13929034
4557337
6680027
189308
6166042
6754976
4502695
8922712
7304963
27733113
4503131
6644384
D A LIP [Mus musculus] (type I I brain 4.1 minor isoform )
elongation factor 1-alpha (AA 1-462) [Homo sapiens]
similar to hypothetical protein MGC37700 [Mus musculus]
dolich)4- di- phosphooligos accharide- protein glycotransferase [Mus musculus]
vacuolar H-i-ATPase 56,000 subunit
H-k - ATPase C subunit
54 kDa vacuolar H+(-i-)-ATPase subunit [Sus scrofa]
myosin heavy chain nonmuscle form A - human
expressed sequence AW544947 [Mus musculus]
mannosidase 2, alpha 1 [Mus musculus]
golgi apparatus protein 1; selectin, endothelial cell, ligand [Mus musculus]
adaptor-related protein complex 2, alpha 2 subunit; adaptin, alpha B; clathrin- associated/ assembly/
hsp-70-related intracellular vitamin D binding protein [Saguinus oedipus]
calnexin
solute carrier family 27 (fatty acid transporter), member 32; solute carrier family 27 (fatty acid
argininosuccinate synthetase [Homo sapiens]
glutamate dehydrogenase [Mus musculus]
nucleobindin
Cytochrome P450 2C23 (CYPIIC23) (Arachidonic acid epoxygenase)
peroxiredoxin 1; proliferation-associated gene A; osteoblast specific factor 3; macrophage 23 Kd St
cell division cycle 10; cell division cycle 10 (homolog to CDCIO of S.cerevisiae); CDCIO protein ho
hypothetical protein FLJ10849 [Homo sapiens]
chloride intracellular channel 4 (mitochondrial) [Mus musculus]
ATP-binding cassette, sub-family C (CFTR/MRP), member 4
catenin (cadherin-associated protein), beta 1, 88kDa; catenin (cadherin-associated protein), beta 1
sodium bicarbonate cotransporter
79856
50437
62331
49211
56792
40099
56286
227799
116806
132247
137524
71569
65314
71447
46682
61640
53698
57024
22390
49041
49652
28939
5.41
9.1
6.16
5.52
5.57
6.96
6.18
5.53
9.45
8.17
6.45
104807 6.53
6.06
4.48
8.82
8.36
8.05
5.15
8.68
8.26
8.85
6.36
5.44
169912 8.83
86069
122228
5.53
6.4
131
181
234
257
287
190
294
139
71
150
180
133
172
135
174
162
242
274
196
85
222
153
103
105
69
49
10
11
12
13
15
16
17
3
4
4
5
9
10
10
10
11
14
16
18
18
32
208

7. Appendiœss
13928930
205632
2224709
6005944
1363274
13786160
15487264
27806351
8394307
5174735
135395
4502695
120707
1619606
464496
11560059
2696709
205660
2492741
26331764
27721231
30023556
177207
27670717
27708570
2852699
6981544
1136741
solute carrier family 15, member 2; solute carrier family 15 (H + // peptide transporter), member 2 [Ra
NaJK.-ATPase alpha-1 subunit
KIAA0384 [Homo sapiens] (catenin src [Mus musculus])
villin 1; Villin-1 [Homo sapiens]
cell surface antigen R B I3-6 - rat (phosphodiesterase I )
organic anion transporter; organic anion transporter 3
villin-like protein [Mus musculus]
villin 2 [ezrin] [Bos taurus]
solute carrier family 3, member 1
tubulin, beta, 2 [Homo sapiens]
Tubulin alpha-1 chain (Alpha-tubulin 1)
cell division cycle 10; cell division cycle 10 (homolog to CDCIO of S.cerevisiae); CDCIO protein ho
Glyceraldehyde 3-phosphate dehydrogenase (G A P D ^ (38 kDa BFA-dependent ADP- ribos)dation substrate)
aldolase B
Protein-tyrosine phosphatase, non-receptor type 12 (Protein-tyrosine phosphatase G l) (TTPGl)
aminopeptidase A
RST [Mus musculus] (solute carrier family 22 (organic cation transporter)-like 2 [Mus musculus])
NADPH-cytochrome P-450 oxidoreductase
Estradiol 17 beta-dehydrogenase 4 (17-beta- HSD 4) (17-beta-hydroxysteroid dehydrogenase 4) (HSD IV )
unnamed protein product [Mus musculus]
similar to plastin 1 (I isoform) [Homo sapiens]
ATP-binding cassette transporter ABCG2
4F2 antigen heavy chain
similar to hypothetical protein MGC33971 [Homo sapiens]
similar to villin [Mus musculus]
A kinase anchor protein [Mus musculus]
solute carrier family 34, member 1; Solute carrier family 34 (sodium phosphate), member 1 [Rattus n
KIAA0002 [Homo sapiens]
82009
114504
105457
93093
100962
59718
97531
68832
78913
50255
50804
49041
36098
40035
88893
108499
60806
77285
79891
70789
79831
73428
58049
78357
70946
96458
69347
59035
8.25
5.27
6.34
5.99
5.98
9.1
5.92
6.06
5.48
4.79
4.94
8.85
8.43
8.66
5.4
5.19
8.45
5.3
8.77
9.16
5.48
9.25
5.2
6.25
6
5.22
9.01
5.75
63
101
80
152
86
86
72
99
112
156
116
131
124
137
51
80
51
82
97
104
83
60
79
156
159
187
81
174
4
4
4
5
5
5
5
6
13
14
14
15
16
<1
3
3
4
4
4
4
4
5
5
5
5
5
6
209
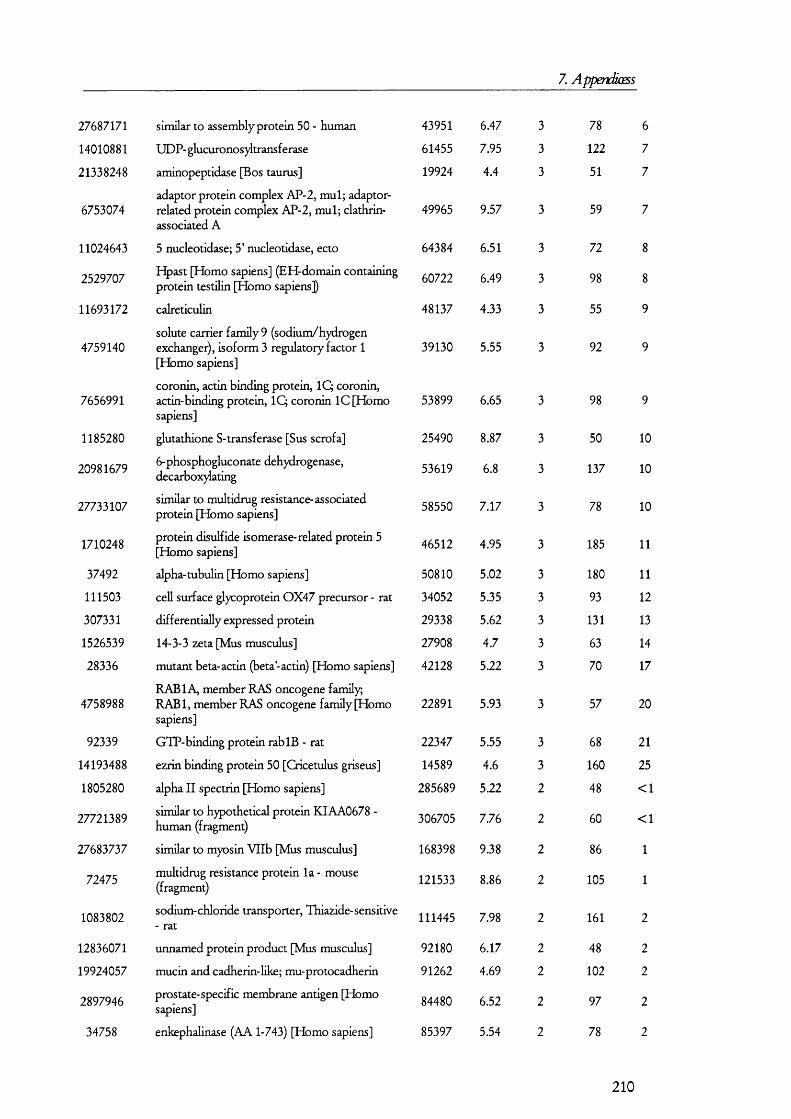
7. AppendÎŒSs
27687171
14010881
21338248
6753074
11024643
2529707
11693172
4759140
7656991
1185280
20981679
27733107
1710248
37492
111503
307331
1526539
28336
4758988
92339
14193488
1805280
27721389
27683737
72475
1083802
12836071
19924057
2897946
34758
similar to assembly protein 50 - human
UDP- glucuronos)^transf erase
aminopeptidase [Bos taurus]
adaptor protein complex AP-2, mul; adaptor- related protein complex AP-2, mul; clathrin- associated A
5 nucleotidase; 5' nucleotidase, ecto
Hpast [Homo sapiens] (EH-domain containing protein testilin [Homo sapiens])
calreticulin
solute carrier family 9 (sodium/hydrogen exchanger), isoform 3 regulatory factor 1 [Homo sapiens]
coronin, actin binding protein, IQ coronin, actin-binding protein, IQ coronin 1C [Homo sapiens]
glutathione S-transferase [Sus scrofa]
6-phosphogluconate dehydrogenase, decarbox)4ating
similar to multidmg resistance-associated protein [Homo sapiens]
protein disulfide isomerase- related protein 5 [Homo sapiens]
alpha-tubulin [Homo sapiens]
cell surface glycoprotein 0X47 precursor - rat
differentially expressed protein
14-3-3 zeta [Mus musculus]
mutant beta-actin (beta-actin) [Homo sapiens]
RABIA, member RAS oncogene family,RABl, member RAS oncogene family [Homo sapiens]
GTP-binding protein rablB - rat
ezrin binding protein 50 [Cricetulus griseus]
alpha I I spectrin [Homo sapiens]
similar to hypothetical protein KIAA0678 - human (fragment)
similar to myosin V llb [Mus musculus]
multidrug resistance protein la - mouse (fragment)
sodium-chloride transporter. Thiazide-sensitive - rat
unnamed protein product [Mus musculus]
mucin and cadherin-like; mu-protocadherin
prostate-specific membrane antigen [Homo sapiens]
enkephalinase (AA 1-743) [Homo sapiens]
43951
61455
19924
49965
64384
60722
48137
39130
53899
25490
53619
58550
46512
50810
34052
29338
27908
42128
22891
22347
14589
285689
306705
168398
121533
6.47
7.95
4.4
9.57
6.51
6.49
4.33
5.55
6.65
8.87
6.8
7.17
4.95
5.02
5.35
5.62
4.7
5.22
5.93
5.55
4.6
5.22
7.76
938
8.86
111445 7.98
92180
91262
84480
85397
6.17
4.69
6.52
5.54
78
122
51
59
72
98
55
92
98
50
137
78
185
180
93
131
63
70
57
68
160
48
60
86
105
161
48
102
97
78
10
10
10
11
11
12
13
14
17
20
21
25
<1
<1
1
1
210

7. Appendiœss
35336
4314340
4507031
6981196
127805
187512
20908689
27661930
27666274
28487424
28570190
291868
4038352
729927
7304885
7513988
1053142
106054
12053195
123576
16758174
27684065
3641398
4758412
6005733
dipeptid)d peptidase iv [Homo sapiens]
Human alpha-adaptin A homolog [AA 159- 977] [Homo sapiens]
solute carrier family 5 (sodium/glucose cotransporter), member 1; Human Na-k/glucose cotransporter 1
meprin 1 alpha
S O D IlM /G L U œ S E COTRANSPORTER 1 (NA(-h)/GLUœ SE COTRANSPORTER 1) (H IG H A FFIN ITY SODIUM-GLUCOSE COTRAN
microsomal epoxide hydrolase (EC 3.3.2.3)
R IK EN cDNA 4632401008 [Mus musculus]
solute carrier family 22 (organic cation transporter)-like 2
similar to membrane protein, palmito)4ated 3 (MAGUK p55 subfamily member 5); protein associated wit
similar to apical iodide transporter, putative [Homo sapiens] [Mus musculus]
Na+ dependent glucose transporter 1
ATPase
breast cancer resistance protein [Homo sapiens] (ATP-binding cassette transporter A B G G 2)
Long-chain-fatty-acid-Co A ligase 2 (Long- chain ac)4-CoA synthetase 2) (LACS 2)
annexin A ll; annexin X I [Mus musculus]
high-affinity camtine transporter, CTl - rat
L X l (organic cation transporter O C TlA )
gamma-glutam^dtransferase (EC 2.3.2.2) type 1 precursor, short splice form - human
hypothetical protein [Homo sapiens] (Protein kinase C and casein kinase substrate in neurons protein 2)
47 kDa heat shock protein precursor (Collagen-binding protein 1) (Colligin 1)
flavin-containing monooxygenase 3
similar to NADH-ubiquinone oxidoreductase 75 kDa subunit, mitochondrial precursor (Complex I-75Kd)
NADP-dependent isocitrate dehydrogenase [Homo sapiens]
polypeptide N- acet)4galactosamin}4transferase 2; UDP-CalNAc transferase 2 [Homo sapiens]
phosphatid)4inositol-binding clathrin assembly protein; clathrin assembly lymphoid-myeloid leukemia
88947
90845
74305
86168
73886
36842
72403
90500
77390
68933
52141
68677
72897
78900
54419
62797
62452
39737
51663
46352
60606
45829
46944
65433
70879
5.67
5.89
7.82
5.6
7.44
6.46
5
9.31
5.86
8.52
8.86
5.35
8.85
6.81
7.53
7.59
6.22
8.66
5.26
8.27
8.44
5.12
6.34
8.63
7.22
79
59
63
96
57
52
128
56
89
83
58
63
55
56
100
56
72
90
83
55
100
64
104
52
91
211
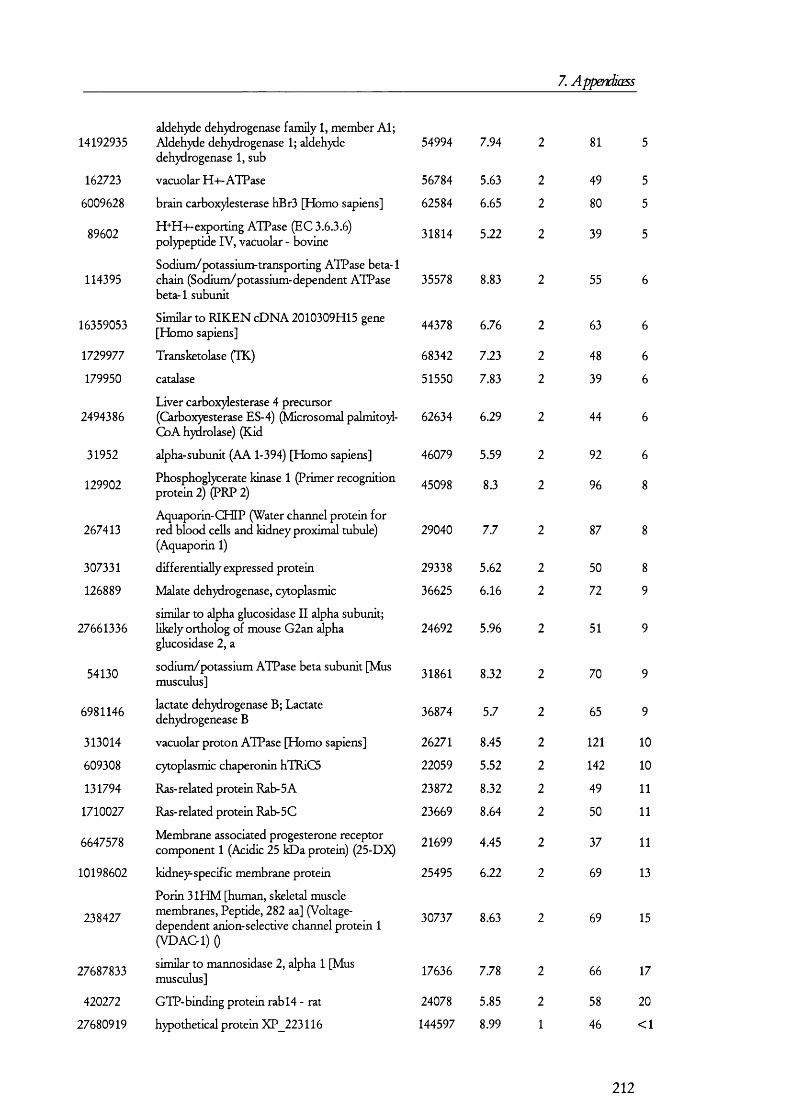
7. Appendiœss
14192935
162723
6009628
89602
114395
16359053
1729977
179950
2494386
31952
129902
267413
307331
126889
27661336
54130
6981146
313014
609308
131794
1710027
6647578
10198602
238427
27687833
420272
27680919
aldehyde dehydrogenase family 1, member Al; Aldehyde dehydrogenase 1; aldehyde dehydrogenase 1, sub
vacuolar H+-ATPase
brain carbox)4esterase hBr3 [Homo sapiens]
H+H+-exporting ATPase (EC 3.6.3.6) polypeptide IV , vacuolar - bovine
Sodium/potassium-transporting ATPase beta-1 chain (Sodium/potassium-dependent ATPase beta-1 subunit
Similar to R IK EN cDNA 2010309H15 gene [Homo sapiens]
Transketolase (TK)
catalase
Liver carboxjdesterase 4 precursor (Carboxyesterase ES-4) (Microsomal palmitoyl- CoA hydrolase) (Kid
alpha-subunit (AA 1-394) [Homo sapiens]
Phosphoglycerate kinase 1 (Primer recognition protein 2) (PRP 2)
Aquaporin-CHIP (Water channel protein for red blood cells and kidney proximal tubule) (Aquaporin 1)
differentially expressed protein
Malate dehydrogenase, cytoplasmic
similar to alpha glucosidase I I alpha subunit; likely ortholog of mouse G2an alpha glucosidase 2, a
sodium/potassium ATPase beta subunit [Mus musculus]
lactate dehydrogenase B; Lactate dehydrogenease B
vacuolar proton ATPase [Homo sapiens]
cytoplasmic chaperonin hTRiC5
Ras-related protein Rab-5A
Ras-related protein Rab-5C
Membrane associated progesterone receptor component 1 (Acidic 25 kDa protein) (25-D5Q
kidneys specific membrane protein
Porin 31HM [human, skeletal muscle membranes. Peptide, 282 aa] (Voltage- dependent anion-selective channel protein 1 (V D A C l) 0
similar to mannosidase 2, alpha 1 [Mus musculus]
GTP-binding protein rabl4 - rat
hypothetical protein XP 223116
54994
56784
62584
31814
35578
44378
68342
51550
46079
45098
29040
29338
36625
24692
31861
36874
26271
22059
23872
23669
21699
25495
30737
17636
24078
144597
7.94
5.63
6.65
5.22
8.83
6.76
7.23
7.83
62634 6.29
5.59
8.3
7.7
5.62
6.16
5.96
8.32
5.7
8.45
5.52
8.32
8.64
4.45
6.22
8.63
7.78
5.85
8.99
81
49
80
39
55
63
48
39
44
92
96
87
50
72
51
70
65
121
142
49
50
37
69
69
66
58
46
10
10
11
11
11
13
15
17
20
<1
212
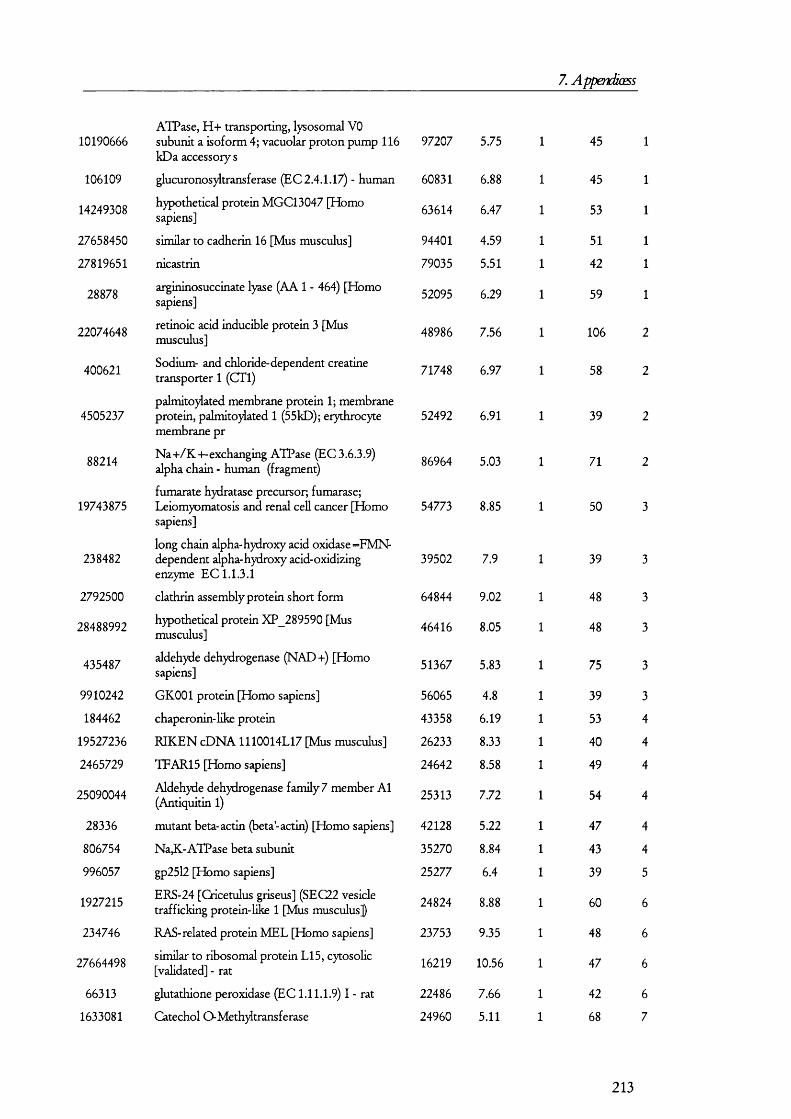
7. Appendiœss
10190666
106109
14249308
27658450
27819651
28878
22074648
400621
4505237
88214
19743875
238482
2792500
28488992
435487
9910242
184462
19527236
2465729
25090044
28336
806754
996057
1927215
234746
27664498
66313
1633081
ATPase, H + transporting, lysosomal VO subunit a isoform 4; vacuolar proton pump 116 kDa accessory s
glucuronosyltransferase (EC 2.4.1.17) - human
hypothetical protein MGC13047 [Homo sapiens]
similar to cadherin 16 [Mus musculus]
nicastrin
argininosuccinate lyase (AA 1 - 464) [Homo sapiens]
retinoic acid inducible protein 3 [Mus musculus]
Sodium- and chloride-dependent creatine transporter 1 (CTl)
palmitoylated membrane protein 1; membrane protein, palmito)lated 1 (55kD); eiythrocyte membrane pr
Na +/K4-exchanging ATPase (EC 3.6.3.9) alpha chain - human (fragment)
fumarate hydratase precursor; fumarase; Leiomyomatosis and renal cell cancer [Homo sapiens]
long chain alpha-hydroxy acid oxidase =FMN- dependent alpha-hydroxy acid-oxidizing enzyme EC 1.1.3.1
clathrin assembly protein short form
hypothetical protein XP 289590 [Mus musculus]
aldehyde dehydrogenase (NAD +) [Homo sapiens]
GKOOl protein [Homo sapiens]
chaperonin-like protein
R IK EN cDNA 1110014L17 [Mus musculus]
TFAR15 [Homo sapiens]
Aldehyde dehydrogenase family 7 member A l (Antiquitin 1)
mutant beta-actin (beta-actin) [Homo sapiens]
Na,K-ATPase beta subunit
gp25l2 [Homo sapiens]
ERS-24 [Cricetulus griseus] (SEC22 vesicle trafficking protein-like 1 [Mus musculus])
RAS-related protein MEL [Homo sapiens]
similar to ribosomal protein L15, cytosoUc [validated] - rat
glutathione peroxidase (EC 1.11.1.9) I - rat
Catechol 0-Meth)Itransferase
97207
60831
63614
94401
79035
52095
48986
71748
86964
54773
39502
64844
46416
51367
56065
43358
26233
24642
25313
42128
35270
25277
24824
23753
16219
22486
24960
5.75
6.88
6.47
4.59
5.51
6.29
7.56
6.97
52492 6.91
5.03
8.85
7.9
9.02
8.05
5.83
4.8
6.19
8.33
8.58
7.72
5.22
8.84
6.4
8.88
9.35
10.56
7.66
5.11
45
45
53
51
42
59
106
58
39
71
50
39
48
48
75
39
53
40
49
54
47
43
39
60
48
47
42
68
213
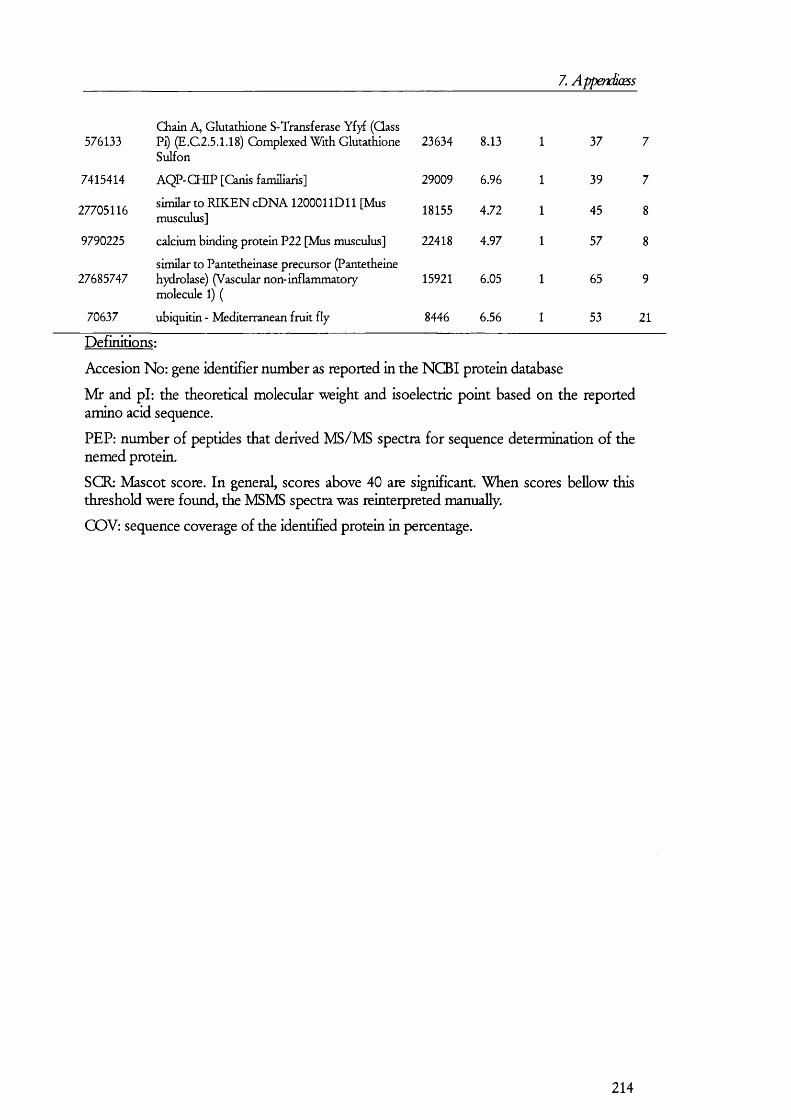
7. Appendiœss
Chain A, Glutathione S-Transferase Yfyf (Qass576133 Pi) (E.C2.5.1.18) Complexed With Glutathione
Sulfon23634 8.13 1 37 7
7415414 AQP-CHIP [Canis familiaris] 29009 6.96 1 39 7
27705116 similar to R IK EN cDNA 120001 I D l l [Mus musculus] 18155 4.72 1 45 8
9790225 calcium binding protein P22 [Mus musculus] 22418 4.97 1 57 8
27685747similar to Pantetheinase precursor (Pantetheine hydrolase) (Vascular non-inflammatory molecule 1) (
15921 6.05 1 65 9
70637 ubiquitin - Mediterranean fruit fly 8446 6.56 1 53 21
Definitions:
Accesion No: gene identifier number as reported in the NCBI protein database
Mr and pi: the theoretical molecular weight and isoelectric point based on the reported amino acid sequence.
PEP: number of peptides that derived MS/MS spectra for sequence determination of the nemed protein.
SCR: Mascot score. In general, scores above 40 are significant. When scores bellow this threshold were found, the MSMS spectra was reinterpreted manually.
GOV: sequence coverage of the identified protein in percentage.
214
8. R erenœs
8. References1. Tisher OQ Madsen KM: Anatomy of the Kidney. In Brenner and Rector's The
Kidney, edn 5th. Edited by Barry M.Brenner. Philadelphia: W. B. Saunders; 1976:3-71.
2. Maddox DA, B tenner BM: Glome mlar Ultrafiltration. In Brenner and Rector's The Kidney, edn 5th. Edited by Barry M.Brenner. Philadelphia: W. B. Saunders; 1976:286.
3. Capasso G, Unwin R, DebnamE: Hormonal influences on renal tubule transport: glucagon, somatostatin, insulin, glucocorticoid and thiroid hormones, catecholamines and selected gut-renal peptides. In TheKidney. Edited by Seldin D.W., Giebisch G. Philadelphia: Lippincott WDliams and Wilkins; 2000:1411-1439.
4. Poumarat JS, Houillier P, Rismondo Q Roques B, Lazar G, Paillard M, Blanchard A: The luminal membrane of rat thick limb expresses ATI receptor and aminopeptidase activities. KidneyInL 2002,62:434-445.
5. Hammerman MR, Rogers S: Distribution of IGF receptors in the plasma membrane of proximal tubular cells. 1987,253:F841-F847.
6. Won Hong S, Isono M, Chen S, Iglesias-de la Cruz MQ Han DC, Ziyadeh FN: Increased Glomerular and Tubular Expression of Transforming Growth Factor-{beta}l. Its Type II Receptor, and Activation of the Smad Signaling Pathway in the db/db y io u s t. A m ]P a th d 2001,158:1653-1663.
7. Jin XH, SiragyHM, Carey RM: Renal interstitial cGMP mediates natriuresis by direct tubule mechanism. HypertensionlOOl, 38:309-316.
8. Kaufmann M, Muff R, Stieger B, Biber J, Murer H, Fischer J: Apical and basolateral parathyroid hormone receptors in rat renal cortical membranes.Endocrindog^\39A, 134:1173-1178.
9. Navar L, Harrison-Bemard L, Wang Q Ceivenka L, Mitchell KD:Concentrations and actions of intraluminal angiotensin IhJA m S ocN ^hro l 1999,10:189-195.
10. SiragyHM: AT(1) and AT(2) receptors in the kidney: Role in disease and treatment A rrmcan Journal ( f Kidney Diseases 2000,36:S4-S9.
11. Wang YP, Chen JQ Chen LG, Tay YC, Rangan GK, Harris DCH Induction of monocyte chemoattractant protein-1 in proximal tubule cells by urinary
A rnS ocN qhd 1997,8:1537-1545.
12. Kovacs G, Peti-Peterdi J, Rosivall L, Bell PD: Angiotensin II directly stimulates macula densa Na-2Q-K cotransport via apical ATI Am ]Physid Renal Physid 2002,282:301-306.
215
8. R emKEs
13. Qian JSD, Wang TT, Zhang SL, Qien X, Carrière S: Catecholamines and angiotensinogen gene expression in kidney proximal tubular cells. Mdeadar and CEÜ^rBiodoenistrylOOO^ 212:73-79.
14. Quan A, Baum M: The renal nerve is required for regulation of proximal tubule transport by intraluminally produced ANGII. Am J.Ph)sid 2001, 280:524-395.
15. Tang M[, Lin Y[, Huang JJ: Thyroid hormone upregulates gene expression, synthesis and release of pro-epidermal growth factor in adult rat kidney.Sd 1995,57:1477-85.
16. Silver BJ, Jaffer FE, Abboud HE: Platelet-derived growth factor synthesis in mesangial cells: induction by multiple peptide mitogens. ProcN adAadSd U SA 1989,86:1056-60.
17. Iwai N, Matsunaga M, Kita T, Tei M, Kawai G Detection of low molecular kininogen messenger RNAin human \d d n ty . ] Hypertens Si4ppl 1988,6:399- 400.
18. Kate H MYaMH Isolation and identification of hydroxyproline analogues of bradykinin in human urine. PEBS letters 1988,232:252-254.
19. Kleinman JG, Beshensky A, Worcester EM, Brown D: Expression of osteopontin, a urinary inhibitor of stone mineral crystal growth, in rat Vdànty. Kidney InL 1995, 47:1585-1596.
20. Yuansheng Xie MSSNINMAaFG: Expression, roles, receptors, and regulation of osteopontin in the kidney. Kidney In ttm ttiand 2001,60:1645-1657.
21. Murer H, Hernando N, Forster I, Biber J: Proximal Tubular Phosphate Reabsorption: Molecular Mechanisms. PhyskLReu 2000,80:1373-1409.
22. Bacic D, Capuano P, Gisler SM, Pribanic S, Christensen El, Biber J, Loffing J, Kaissling B, Wagner CA, Murer H Impaired PTH-induced endocytotic down- regulation of the renal type Ha Na4-/Pi-cotransporterin RAP-deficient mice with reduced megalin expression. F fiu ^ A n h . 2003,446:475-484.
23. Nielsen S, FrokiaerJ, Marples D, Kwon TH, Agre P, Knepper MA* Aquaporins in the kidney: from molecules to medicine. PhysiolReu 2002,82:205-244.
24. Deen PM, van Balkom BW, Kamsteeg EJ: Routing of the aquaporin-2 water charmel in health and disease. E urJ.C d lB id 2000, 79:523-530.
25. King LS, Yasui M: Aquaporins and disease: lessons from mice to humans.Trends inEridocrM cg^aridM ttabdisrnlO O l, 13:355-360.
26. Deen PM, Verdijk MA Knoers NV, Wieiinga B, Mermens LA van Os CH, van Cost BA Requirement of human renal water channel aquaporin-2 for vasopressin-dependent concentration of urine. Sdenœ 1994,264:92-95.
216
8. R erenœs
27. Preston GM, Carroll TP, Guggino WB, Agre P: V^peamnce of water channels in Xenopus oocytes expressing red cell CHIP28 protein. Sdenœ 1992,256:385- 387.
28. van Balkom BW, Savelkoul PJ, Markovich D, Hofman E, Nielsen S, van der SP, Deen PM: The role of putative phosphorylation sites in the taigetii^ and shuttling of the aquaporin-2 water c h a n n e l . 2002,277:41473- 41479.
29. Gunning ME, Ingelfinger JR, King AJ, Brenner BM: Vasoactive Peptides andthe Kidney. In Brenner andRectar's The Kidney edn 5th. Edited by Barry MBrenner. Philadelphia: W. B. Saunders; 1976.
30. Song Q, Wang DZ, Harley RA, Chao L, Chao J: Cellular localization of low- molecular-weight kininogen and bradykinin B2 receptor mRNAs in human yidney. AmJ.Physid 1996,270:F919-F926.
31. Dean R, Murone Q Lew RA, Zhuo J, Casley D, Muller-Esterl W, Alcorn D, Mendelsohn FA: Localization of bradykinin B2 binding sites in rat kidney following chronic ACE inhibitor treatment KkheylnL 1997,52:1261-1270.
32. Wang DZ, Chao L, Chao J: Cellular localization of bradykinin B1 receptor mRNAin the human kidney. Inirimopharrruoology 1996,33:151-156.
33. Zhuo J, Dean R, Marie Q Aldred PG, Harris P, Alcorn D, Mendelsohn FA: Localization and interactions of vasoactive peptide receptors in renomedullaiy interstitial cells of the kidney. Kidney IntSvtppl 1998,67:S22-S28.
34. Nadler SP, Zimpelmann JA, Hebert RL: Endothelin inhibits vasopressin- stimulated water permeability in rat terminal inner medullary collecting duct J.dm lrwEst 1992,90:1458-1466.
35. Nadler SP, Zimpelmann JA, Hebert RL: PGE2 inhibits water permeability at a post-cAMP site in rat terminal iimer medullary collecting duct. AmJ.Physid 1992,262:F229-F235.
36. Han JS, Maeda Y, Ecelbarger Q Knepper MA Vasopressin-independent regulation of collecting duct water permeability. Am J.Ph)sid 1994,266:F139- F146.
37. Ecelbarger CA, Maeda Y, Gibson CQ Knepper MA Extracellular ATP increases intracellular calcium in rat terminal collecting duct via a nucleotide receptor. A mJ.Physiol 1994,267:F998-1006.
38. Christensen El, Bim H: Megalin and cubilin: synergistic endocytic receptors in renal proximal tubule. A m ]P hysid2001,280:F562-F573.
39. Farquhar MG: The unfolding story of megalin (gp330): now recognized as a dmg roceptor. J.CHnlniEst 1995,96:1184.
40. Moestmp SK, Cui S, Vorum H, Bregengard Q Bjom SE, Norris K, Gliemann J, Christensen El: Evidence that epithelial glycoprotein 330/megalin mediates uptake of polybasic drugs. J.Q inlm est 1995,96:1404-1413.
217
8. R^œnœs
41. Saito A, Pietromonaco S, Loo AK, Farquhar MG: Complete cloning and sequencing of rat gp330/" megalin,” a distinctive member of the low density lipoprotein receptor gene family. Proc Nad Acad Sd U S A 1994, 91:9725-9.
42. Kozyraki R: Cubilin, a multifunctional epithelial receptor: an overview.JMoLMed 2001, 79:161-167.
43. Christensen El, Bim H: Megalin and cubilin: multifunctional endocytic receptors. NatReuMoLCdlBid. 2002,3:256-266.
44. Verroust PJ, Bim H, Nielsen R, Kozyraki R, Christensen El: The tandem endocytic receptors megalin and cubilin are important proteins in renal pathology. Kidney In t 2002,62:745-56.
45. Morris SM, TaUquist MD, Rock CO, Cooper JA: Dual roles for the Dab2 adaptor protein in embryonic development and kidney transport EM BO J 2002,21:1555-1564.
46. Qague MJ, Urbe S: The interface of receptor trafficking and signalling. J Cell Sd 2001,114:3075-3081.
47. Marshansl^ V, Ausiello DA, Brown D: Physiological importance of endosomal acidification: potential role in proximal tubulopathies.Qm:CpmN^h7dH)pe}1j0Ts. 2002,11:527-537.
48. Christensen El, Devuyst O, Dom C, Nielsen R, Van Der SP, Verroust P, Lemth M, Cuggino WB, Courtoy PJ: Loss of chloride channel C105 impairs endocytosis by defective trafficking of megalin and cubilin in kidney i icox\maXX\AovXts. Proc.NadA(odSdU.S.A 2003,100:8472-8477.
49. Norden AC, LapsleyM, Igarashi T, Kelleher CL, Lee PJ, Matsuyama T, Scheinman SJ, Shiraga H, Sundin DP, Thakker RV, Unwin RJ, Verroust P, Moestmp SK: Urinary megalin deficiency implicates abnormal tubular endocytic function in Fanconi syndtom t.].Am SocNephwL 2002,13:125-133.
50. Besse-Eschmann V, Klisic J, Nief V, Le Hir M, Kaissling B, Ambuhl PM: Regulation of the proximal tubular sodium/proton exchanger NHE3 in rats with puromycin aminonucleoside (PAN)-induced nephrotic syndrome.J.AmS(x:NephroL 2002,13:2199-2206.
51. Tojo A, Qnozato ML, Kurihara H, Sakai T, Goto A, Fujita T: Angiotensin II blockade restores albumin reabsorption in the proximal tubules of diabetic rats. Hyperîens.Res. 2003,26:413-419.
52. Mohammad-Panah R, Harrison R, Dhani S, Ackerley C, Huan LJ, Wang Y, Bear CE: The chloride channel 0 0 4 contributes to endos omal acidification and trafficking. JBidChem 2003,278:29267-29277.
53. Lote G Prindpks cfTmdphysidc^^ edn 4. Kluweer Academic Publishers; 1982.
218
8. R^emioss
54. Bim H, Vomm H, Verroust PJ, Moestmp SK, Christensen El: Receptor- associated protein is important for normal processing of megalin in kidney proximal t u b u l e s . 2000,11:191-202.
55. Cui S, Verroust PJ, Moestmp SK, Christensen El: Megalin/gp330 mediates uptake of albumin in renal proximal Xxj\y\Ac. Am ].Physid 1996,271:F900-F907.
56. Christensen El, Moskaug JO, Vorum H, Jacobsen Q Gundersen TE, N)4qaer A, Blomhoff R, Willnow TE, Moestmp SK: Evidence for an essential role of megalin in tmnsepithelial transport of ixûm A. J.AmSoaNephrcL 1999,10:685- 695.
57. Marino M, Andrews D, Brown D, McQuskey RT: Tlanscytosis of retinol- binding protein across renal proximal tubule cells after megalin (gp 330)- mediated e n d o c y t o s i s . / . / 4 2001,12:637-648.
58. Marino M, Chiovato L, Lisi S, Pinchera A, McQuskey RT: Phosphoinositide 3- kinase inhibits megalin-mediated transcytosis of thyroglobulin across thyroid epithelial cells at a post-sorting level. EurJ.EridoowoL 2001,145:477- 483.
59. Bim H, Willnow TE, Nielsen R, Norden AG, Bonsch Q Moestmp SK, Nexo E, Christensen El: Megalin is essential for renal proxhnal tubule reabsorption and accumulation of tianscobalamin-B(12). 2002,282:F408-F416.
60. Kozyraki R, Fyfe J, Verroust PJ, Jacobsen Q Dautry-Varsat A, GburekJ, Willnow TE, Christensen El, Moestmp SK: Megalin-dependent cubilin-mediated endocytosis is a major pathway for the apical uptake of transferrin in polarizedepithelia.Proc.NatLAcadSdU.SA 2001,98:12491-12496.
61. Sousa MM, Norden AG, Jacobsen Q Willnow TE, Christensen El, Thakker RV, Verroust PJ, Moestmp SK, Saraiva MJ: Evidence for the role of megalin in renal uptake of transthyretin. C&^ 2000,275:38176-38181.
62. FElpert J, N}4qaer A, Jacobsen Q Wallukat G, Nielsen R, Moestmp SK, Haller H, Luft FC, Christensen El, Willnow TE: Megalin antagonizes activation of the parathyroid hormone rtcti X o t. J.BioLChem 1999,274:5620-5625.
63. Orlando RA, Rader K, Authier F, Yamazaki H, Posner BI, Bergeron JJ, Farquhar MG: Megalin is an endocytic receptor for i n s u l i n . 1998, 9:1759-1766.
64. Nylqaer A, Dragun D, Walther D, Vomm H, Jacobsen Q Herz J, Melsen F, Christensen El, Willnow TE: An endocytic pathway essential for renal uptake and activation of the steroid 25-(OH) vitamin D3. Gdl 1999,96:507-515.
65. Christensen El, Willnow TE: Essential role of megalin in renal proximal tubule for vitamin h o m e o s t a s i s . 1999,10:2224-2236.
66. Hammad SM, Barth JL, Knaak Q Argraves WS: Megalin acts in concert with cubilin to mediate endocytosis of high density lipoproteins./.Rô/Qjem 2000, 275:12003-12008.
219

8. R erences
67. Saito A, Nagai Tanuma A, Hama H, Qio K, Takeda T, Yoshida Y, Toda T, Shimizu F, Horiuchi S, Gejyo F: Role of megalin in endocytosis of advanced glycation end products: implications for a novel protein binding to both megalin and advanced glycation end i roAncXs.JAmSoc.Nq)hixi 2003, 14:1123-1131.
68. McCarthy RA, Barth JL, Chintalapudi MR, Knaak Q Argraves WS: Megalin functions as an endocytic sonic hedgehog receptor./Rzbi0 ^ 2 0 0 2 , 277:25660-25667.
69. McCarthy RA, Argraves WS: Megalin and the neurodevelopmental biology of sonic hedgehog and retinol. J Cell Sd 2003,116:955-960.
70. Larsson M, F^alm G, Sakwe AM, Engstrom A, Hoglund AS, Larsson E, Robinson RQ Sundbeig Q Rask L: Selective interaction of megalin with postsynaptic density-95 (PSD-95)-like membrane-associated guanylate kinase (MAGUK) proteins. Bkxhem]. 2003,373:381-391.
71. Petersen FIH, FElpert J, Militz D, Zandler V, Jacobsen Q Roebroek AJ, Willnow TE: Functional interaction of megalin with the megalinbinding protein (MegBP), a novel tetratrico peptide repeat-containing adaptor molecule./ C dlSd 2003,116:453-461.
72. Stockinger W, S ailler B, Strasser V, Recheis B, Fasching D, Kahr L, Schneider WJ, Nimpf J: The PX-domain protein SNX17 interacts with members of the LDL receptor family and modulates endocytosis of the LDL receptor. EM BO J 2002,21:4259-4267.
73. Bergeron M, Gougoux A, Noel J, Parent L: The renal fanconi syndrome. In The MiEWt/zc Azje (fvdxrited disease edn 8th. Edited by Scriver CR, Sly WS, Valle D, V, Childs B. New York. London.: McGraw-Hill, Health Professions Division; 2001:5023-5038.
74. Leheste JR, Rolinski B, Vorum H, Hlpert J, Nylqaer A, Jacobsen Q Aucouturier P, Moskaug JO, Otto A, Christensen El, Willnow TE: Megalin knockout mice as an animal model of low molecular weight proteinuria. A m ]. PathoL 1999, 155:1361-1370.
75. N}4gaer A, Dragun D, Walther D, Vorum H, Jacobsen Q Herz J, hfclsen F, Qiristensen E, TE W: An Endocytic Pathway Essential for Renal Uptake and Activation of the Steroid 25-(OH) Vitamin D3. Gdl 1999,96:507-515.
76. Leheste JR, Melsen F, Wellner M, Jansen P, Schlichting U, Renner-MuUer I, Andreassen TT, Wolf E, Bachmann S, Nylqaer A, Willnow TE: Hypocalcemia and osteopathy in mice with kidney-specific megalin gene defect FASEB J. 2003,17:247-249.
77. Christensen El, Bim H: Megalin and cubilin: multifunctional endocytic receptors. N at RevM d Cdl B id 2002,3:256-66.
78. Aminoff M, Carter JE, Chadwick RB, Johnson Q Gras beck R, Abdelaal MA, Broch H, Jenner LB, Verroust PJ, Moestmp SK, de la CA, Krahe R Mutations in
220
8. R^eerenœs
CUBN, encoding the intrinsic factor-vitamin B12 receptor, cubilin, cause hereditaiymegaloblastic anaemia \.NaLGeneL 1999,21:309-313.
79. Fyfe JQ Ramanujam KS, Ramaswamy K, Patterson DF, Seetharam B: Defective bmsh-border expression of intrinsic factor-cobalamin receptor in canine inherited intestinal cobalamin malabsorption. 1991,266:4489- 4494.
80. Lloyd SE, Pearce SH, Fisher SE, Steinmeyer K, Schwappach B, Scheinman SJ, Harding B, Bolino A, Devoto M, Goodyer P, Rigden SP, Wrong O, Jentsch IJ, Craig IW, Thakker RV: A common molecular basis for three inherited kidney stone diseases. Nature 1996,379:445-449.
81. Pook MA, Wrong O, Wooding Q Norden AG, Feest TG, Thakker RV : Dent's disease, a renal Fanconi syndrome with nephrocalcinosis and kidney stones, is associated with a microdeletion involving DXS255 and maps to ^ n .2 2 . HumMoLGenet 1993,2:2129-2134.
82. Wrong OM, Norden AG, Feest TG: Dent's disease; a familial proximal renal tubular syndrome with low-molecular-weight proteinuria, hypercalciuria, nephrocalcinosis, metabolic bone disease, progressive renal failure and a maiked male predominance. Q M . 1994,87:473-493.
83. Devuyst O, Guggino WB: Chloride channels in the kidney: lessons learned from knockout animals .A m ] Physid Renal Physid 2002,283:1176-1191.
84. Gunther W, Luchow A, Quzeaud F, Vandewalle A, Jentsch TJ: ClC-5, the chloride channel mutated in Dent's disease, colocalizes with the proton pump in endocytotically active kidney cells. PwcNadAcadSd U.S.A 1998, 95:8075-8080.
85. Piwon N, Gunnther W, Schwake M, Bosl M, Jentsch TJ: ClC-5 Q- channel dismption impairs endocytosis in a mouse model for Dent's disease. Nature 2000,408:369-373.
86. Wang SS, Devuyst O, Courtoy PJ, Wang XT, Wang H Wang Y, Thakker RV, Guggino S, Guggino WB: Mice lacking renal chloride channel, CLG5, are a model for Dent's disease, a nephrolithiasis disorder associated with defective receptor- mediated endocytosis. H um M d Genet 2000 9:2937-45.
87. Chamas LR, Bemardini I, Rader D, Hoeg JM, Gahl WA: Clinical and laboratory findings in the oculocerebrorenal syndrome of Lowe, with special reference to growth and renal function. N E r^J.M ed 1991,324:1318-1325.
88. Suchy SF, Olivos-Glander IM, Nussabaum RL: Lowe syndrome, a deficiency of phosphatidylinos itol 4,5-bis phosphate 5-phosphatase in the Golgi apparatus. 1995,4:2245-2250.
89. Zhang X, Jefferson AB, Auethaveldat V, Majerus PW: The protein deficient in Lowe syndrome is a phosphatidylinos itol-4,5-bis phosphate 5-phosphatase.PvocNatLAcadSdUS.A 1995,92:4853-4856.
221
8. R erenœs
90. Pendaries Q Tronchere H, Plantavid M, Payrastre B: Phos phoinos itide signaling disorders in human diseases. FEBS Lett. 2003,546:25-31.
91. UngewickeU AJ, Majerus PW: Increased levels of plasma lysosomal enzymes in patients with Lowe syndrome. PivcNaîLAcadSci U.S.A 1999,96:13342- 13344.
92. Lichter-Konecki U, Broman KW, Blau EB, Konecki DS: Genetic and physical mapping of the locus for autosomal dominant renal Fanconi syndrome, on chromosome 15ql5.3. A m /. Hum Gen. 2001,68:264-268.
93. Sabolic I, Ljubojevic M, Herak-Krambeiger CM, Brown D: Cd-MT causes endocytosis of bmsh-border transporters in rat renal proximal tubules. Am /. Ph)sid 2002,283:1389-1402.
94. Walker JM: Electrophoretic techniques865. In Prindples and tedomques ( f practical Uodoenistry edn 4. Edited by Wilson K, Walker J.
Cambridge, UK: Cambridge University press; 1994:425-461.
95. OFarrell PH: High resolution two-dimensional electrophoresis of proteins.J.BidChem 1975,250:4007-4021.
96. Klose J: Protein mapping by combined isoelectric focusing and electrophoresis of mouse tissues. A novel apporach to testing for induced point mutations in mammals. Hurmn^netik 1975,26:231-243.
97. Shaw MM, Riederer BM: Sample preparation for two-dimensional gel electrophoresis. Pvoteonics. 2003,3:1408-1417.
98. Henningsen R, Gale BL, Straub KM, DeNagel DG Application of zwitterionic detergents to the solubilization of integral membrane proteins for two- dimensional gel electrophoresis and mass spectrometry. PrGtecmcs. 2002, 2:1479-1488.
99. Lilley KS, Razzaq A, Dupree P: Two-dimensional gel electrophoresis: recent advances in sample preparation, detection and quantitation.Qm.G)pin.ChemBioL 2002, 6:46-50.
100. Herbert B: Advances in protein solubilisation for two-dimensional electrophoresis. Electrophoresis 1999,20:660-663.
101. Luche S, Santoni V, Rabilloud T: Evaluation of nonionic and zwitterionic detergents as membrane protein solubilizers in two-dimensional electrophoresis. Protecmcs. 2003,3:249-253.
102. Lopez MF, Berggren K, Chemokalskaya E, Lazarev A, Robinson M, Patton WF:A comparison of silver stain and SYPRO Ruby Protein Gel Stain with respect to protein detection in two-dimensional gels and identification by peptide mass profiling. Electrophoresis 2000,21:3673-3683.
103. Gharbi S, Gaffney P, Yang A, Zvelebil MJ, Cramer R, Waterfield MD, Timms JF: Evaluation of two-dimensional differential gel electrophoresis for proteomic
222
8. R^ermjes
expression analysis of a model breast cancer cell system. MdCdlPvoteonics. 2002,1:91-98.
104. Nishiyaim A, Inscho EW, Navar LG: Interactions of adenosine Al and A2a receptors on renal microvascular reactivity. 2001,280:F406-F395.
105. Snyder LR, Kirkland JJ, Glajch JL: Practicd HPL C method deidoprmity edn 2nd. New York: John Willey and Sons, Inc.; 1997.
106. Snyder LR, Stadalius MA, Quarry MA Gradient Elution in Reversed-Phase Hplc Separation of Macromolecules. 4 Chemistry 1983,55:1412-8&
107. Snyder LR, Dolan JW, Cox GB: Hplc Purification of Peptides and Proteins by Reversed Phase Gradient Elution - Method Development by Computer- Simulation. v4 m Biotech. Lab. 1989, 7:8-8c
108. Chen H, Horvath G High-speed high-performance liquid chromatography of peptides and proteins. /. 0W?M&^y4 1995, 705:3-20.
109. Opiteck GJ, Ramirez SM, Joigenson JW, Moseley MA Comprehensive two- dimensional high-performance liquid chromatography for the isolation of overexpressed proteins and proteome mapping. A Biochem 1998,258:349- 361.
110. Opiteck GJ, Jorgenson JW, Moseley MA, Anderegg RJ : T wo- dimensional microcolumn HPLC coupled to a single-quadrupole mass spectrometer for the elucidation of sequence tags and peptide mapping./. Micvocxi Sep. 1998, 10:365-375.
111. Shen Y, Zhao I Belov ME, Conrads TP, Anderson G A, Tang K, Pasa-Tolic L, Veenstra TD, Lipton MS, Udseth HR, Smith RD: Packed capillary reversed- phase liquid chromatography with high-performance electrospray ionization Fourier transform ion cyclotron resonance mass spectrometry for iptoX&omics.AnaLChem 2001,73:1766-1775.
112. Spahr CS, Davis MT, McGinley MD, Robinson JH, Bures EJ, Beierle J, Mort J, Courchesne PL, Chen K, Wahl RQ Yu W, LuethyR, Patterson SD: Towards defining the urinary proteome using liquid chromatography-tandem mass spectrometry I.Profifing an unfractionated tryptic digest PrOteonrks 2001,1:93- 107.
113. Washburn MP, Wolters D, Yates JR, III: Large-scale analysis of the yeast proteome by multidimensional protein identification technology.NatBiotechnoL 2001,19:242-247.
114. Vailaya A, Horvath G Retention in reversed-phase chromatography: partition or adsorption?/.OvwTîz/ïgryl 1998,829:1-27.
115. Qirnrnins DL: Stron cation-exchange high performance liquid chromatography as a versatile toi for the characterization and purification of peptides. Cfetv4cfi« 1997,352:21-30.
223
8. RfermEs
116. Lin D, Tabb DL, Yates JR, III: Lai^e-scale protein identification usii% mass spectrometty. BijodoimBiophys.ActalO '}) 1646:1-10.
117. Davis MT, Stahl DQ Swidereck KM, Lee TD: Capillary liquid chromatography/mass spectrometry for peptide and protein characterization. AfecW» 1994,6:304-314.
118. Moritz RL, Reid GE, Ward LD, Simpsom RJ: Capillary HPLG a method for protein isolation and peptide mapping. Methods 1994,6:213-226.
119. Vissers JP: Recent developments in microcolumn liquid chromatography.J.ChnmOogKA 1999,856:117-143.
120. Gordon DB: Spectroscopic Techniques. In Prindpks and tedomqttes (fpractical bkdoenistry, edn 4. Edited by Wilson K, Walker J. Cambridge, UK: Carnbridge University press; 1994:324-379.
121. Bruin GJM, Stegeman G, Van Asten AC, Xu X, KraakJC, Poppe H: Optimization and evaluation of the performance of arrangements for UV detection in high-resolution separations using fused-silica capillaries./.ChromüoQ'. A 1991,559:163-181.
122. Michael AGrayson: MeasnringMass. Edited by Michael A Graynon. Philadelphia: Chemical Heritage Press; 2002.
123. Hoffmann E, Stroobant V: Mass Spectrometty Prindples and Applications, edn 2nd. Edited by Hoffmann E, Stroobant V. Chichester: John Wiley and Sons, Ltd; 2002.
124. Hemling ME: Fast atom bombardment mass spectrometry and its application to the analysis of some peptides and proteins. PharmRes. 1987, 4:5-15.
125. Proctor BL: Recent developments in mass spectrometry for the analysis of complex vM xtnixs. Annj4,ReuPhammxiT(KiooL 1983,23:171-192.
126. Karas M, Hllenkamp F: Laser desorption ionization of proteins with molecular masses exceeding 10,000 dsXXom.AnaLOoem 1988,60:2299-2301.
127. Tanaka K, Hiroald W, Ido Y, Aldta S, Yoshida Y, Toshida T: Rapid CommnMass Spectrom. 2003,2:151.
128. Cramer R, Burlingame AL: High-resolution infrared laser desorption/ionization and matrix-assisted laser desorption/ionization time-of-flight mass spectrometry of synthetic ipoXymtts.JMass Spectmn 1999, 34:1089-1092.
129. Cramer R, Richter Stimson E, Burlingame AL: Analysis of phospho- andglycopolypeptides with infrared matrix-assisted laser desorption and ionization. 1998, 70:4939-4944.
130. Dreisewend K: The desorption process in MALDI. ChemReu 2003,103:395- 426.
224
8. R^e"emiŒS
131. Karas M, Kruger R: Ion formation in MALDI: the cluster ionization mechanism. OxmReu 2003,103:427-440.
132. Alves S, Kalberer M, Zenobi R: Direct detection of particles formed by laser ablation of matrices during matrix-assisted laser desorption/ionization.Rapid CommmMass SpeOrom 2003,17:2034-2038.
133. Fenn JB, Mann M, Meng CK, Wong SF, Whitehouse CM: Electrospray ionization for mass spectrometry of large biomolecules. Sdenoe 1989,246:64-71.
134. Dole M, Mack, LL, Hines R, Mobley R, Ferguson L, Alice M; Molecular beams of mzcvoiorss. ] OxmPhys 1968,49:2240-2249.
135. Gaskell SJ: Electrospray: Principles and Practice. ] Mass Spectromdry 1997, 32:677-688.
136. Cecil NB, Enke GO: Practical implications of some recent studies in electrospray ionization fundamentals. Mass SpectromReu 2001,20:362-387.
137. Thomson B, Iribame J: On the evaporation of charged ions from small droplets. J Ch&nPhys 1976,64:2287-2294.
138. Moyer SQ Cotter RJ: Atmospheric pressure M ALDI. AnoLChemlQQly 74:468A- 476A.
139. Wilm M, Mann M: Electrospray and Taylor-Cone theory, Dole's beam of macromolecules at last? IrOenatkmLJournal c f mass speOrometry and ionpreoesses 1994, 136:167-180.
140. Wilm M, Mann M: Analytical properties of the nanoelectrospray ion source.A nal ÇhemV^9(iy 68:1- 8.
141. Cotter RJ: Time-of-flight mass spectrometry for the structural analysis of biological molecules. A nal Qxm 1992,64:1027A-1039A.
142. Gordon DB: Mass spectrometric techniques. In Prindples andtedjniques (fpractkal hkdxmstry^ edn 4. Edited by Wilson K, Walker J. Cambridge, UK: Cambridge University press; 1994:381-461.
143. Roepstorff P, Fohlman J: Proposal for a common nomenclature for sequence ions in mass spectra of peptides. BiotredMass Spectrcm 1984,11:601.
144. William E .Haskins, Ziqiang Wang, Christopher J.Watson, Rebecca RRostand, Steven RWitowski, David HPowell, Kennedy RT: Capillary LOMS 2 at the Attomole Level for Monitoring and Discovering Endogenous Peptides in Microdialysis Samples Collected in W \o . A nal ChemlOOl, 73:5005-5014.
145. KnepperMA: Proteomics and the JAmSocNephroL 2002,13:1398-1408.
146. Bickel CA, Knepper MA, Verbalis JG, Ecelbaiger CA: Dysregulation of renal salt and water transport proteins in diabetic Zucker rats. KidnsylrjL 2002, 61:2099-2110.
225

8. R erenæs
147. Brooks HL, Sorensen AM, Terris J, Schultheis PJ, Lorenz JN, Shull GE, Knepper MA; Profiling of renal tubule Na+ transporter abundances in NHE3 and N Πnull mice using targeted p r o t e o m i c s . 2001,530:359-366.
148. Brooks HL, Allred AJ, Beutler KT, Coffman TM, Knepper MA: Targeted proteomic profiling of renal Na( +) transporter and channel abundances in angiotensin II type la receptor knockout mice. HypertensionlOOl, 39:470-473.
149. Knepper MA, Masilamani S: Targeted proteomics in the kidney using ensembles o f ânûhodics. ActaPhysidScard 2001,173:11-21.
150. Norden AG, Scheinman SJ, Deschodt-Lanckman MM, Lapsley M, Nortier JL, Thakker RV, Unwin RJ, Wrong O: Tubular proteinuria defined by a study of Dent's (CLCN5 mutation) and other tubular diseases. Kidnsyint 2000,57:240-9.
151. Norden AG, Lapsley M, Lee PJ, Pusey CD, Scheinman SJ, Tam FW, Thakker RV, Unwin RJ, Wrong O: Glomerular protein sieving and implications for renal failure in Fanconi syndrome. KiàTsylnL 2001, 60:1885-1892.
152. Banker DD: Proteomics. Indian J MedSd 2002,56:22-24.
153. Arthur JM: Proteomics. Cun^.OpinNqhxLH' peiiens. 2003,12:423-430.
154. Zhu FÎ, BilginM, Snyder M: Vvot om ics.Anm iReuBiodxm 2003, 72:783-812.
155. Page Mf, Moyses Q CunninghamMf, Holt G, Matheson A; Proteomics. EXS 2003,19-30.
156. Mann M, Hendrickson RQ Pandey A: Analysis of proteins and proteomes by mass si tcXxom ttiry. AnmiReuBiahem 2001,70:437-473.
157. Perkins D, Pappin DJ, Creasy DM, Cottrell JS: Probability-based protein identification by searching sequence databases using mass spectrometry data. Electrcphcnvsis 1999,20:3551-3567.
158. Qauser KR, Baker PR, Burlingame AL: Role of accurate mass measurement { + / - 10 ppm) in protein identification strategies employing MS or MS/MS and database searching. A m/ 1999, 71:2871.
159. Arthur JM, Thongboonkerd V, Scherzer JA, Cai J, Pierce WM, Klein JB: Differential expression of proteins in renal cortex and medulla: a proteomic approach. KidnEylrL 2002,62:1314-1321.
160. Witzmann FA, Fultz CD, Grant RA, Wright LS, Komguth SE, Siegel FL: Differential expression of cytosolic proteins in the rat kidney cortex and medulla: prelimiriary proteornics.EtotpAmK 1998,19:2491-2497.
161. Marshall T, Williams KM High resolution two-dimensional electrophoresis of human urinary proteins. y l OmricaActa 1998,372:147-160.
162. Thongboonkerd V, Gozal E, Sachleben LR, Jr., Arthur JM, Pierce WM, Cai J,Chao J, Bader M, Pesquero JB, Gozal D, Klein JB: Proteomic analysis reveals
226

8. R^eerenaes
alterations in the renal kallikrein pathway during hypoxia-induced h y p e r t e n s i o n . 2002,277:34708-34716.
163. Thongboonkerd V, Klein JB, Pierce WM, Jevans AW, Arthur JM: Sodium loading changes urinary protein excretion: a proteomic analysis. ARendPh)sidlOO'}>, 284:F1155-F1163.
164. Legato J, Knepper MA, Star RA, Mejia R; Database for renal collecting duct regulatory and transporter proteins. Phfysid Genomes 2003,13:179-181.
165. Gygi SP, Rist B, Gerber SA, Turecek F, Gelb MH, Aebersold R; Quantitative analysis of complex protein mixtures using isotope-coded affinity tags.NatBiotechnoL 1999,17:994-999.
166. Han DK, Eng J, Zhou H, Aebersold R: Quantitative profiling of differentiation-induced microsomal proteins using isotope-coded affinity tags and mass spectrometry. NatBictedmoL 2001,19:946-951.
167. Qiu Y, Sousa E A, He wick RM, Wang JH; Ac id- labile is otope- c oded extractants: a class of reagents for quantitative mass spectrometric analysis of complex protein rm xturcs. AmLChem 2002, 74:4969-4979.
168. Blagoev B, Kratchmarova I, Qng SE, Nielsen M, Foster LJ, Mann M A proteomics strategy to elucidate functional protein-protein interactions applied to EGF signaling. NotBiatedmoL 2003,21:315-318.
169. Washburn MP, Ulaszek R, Deciu C, Schieltz DM, Yates JR, III: Analysis of quantitative proteomic data generated via multidimensional protein identification technology. v4 mZ C&m 2002, 74:1650-1657.
170. Tong D, Moritz RL, Eddes JS, Reid GE, Rasmussen RK, Dorow DS, Simpson RJ: Fabrication of stable packed capillary reversed-phase columns for protein structural analysis././Wem 1997,16:425-431.
171. McCormack AL, Eng JK, Yates III JR: Peptide Sequence Analysis on Quadmpole Mass Spectrometers. Methods 1994,6:274-283.
172. Cortes H, Pfeiffer Q Richter T, Stevens T: Porous ceramic bed supports for fused silica packed capillary columns used in liquid chromatography././/rÿ ResoLQmmtto^& 1987,10:446-448.
173. Shen Y, Zhao R, Belov ME, Conrads TP, Anderson G A, Tang K, Pasa-Tolic L, Veenstra TD, Lipton MS, Udseth HR, Smith RD: Packed capillary re vers ed- phase liquid chromatography with high-performance electrospray ionization Fourier transform ion cyclotron resonance mass spectrometry for proteomics. A mZGWr 2001,73:1766-1775.
174. Neuhoff V, Stamm R, Pardowitz I, Arold N, Ehrhardt W, Taube D: Essential problems in quantification of proteins following colloidal staining with coomassie brilliant blue dyes in polyacrylamide gels, and their solution.Ekctrophcfresis 1990,11:101-17.
227
8. R^eerenoes
175. Neuhoff V, Arold N, Taube D, Ehrhardt W: Improved staining of proteins in polyacrylamide gels including isoelectric focusing gels with clear background at nanogram sensitivity using Coomassie Brilliant Blue G-250 and R-250. El&tmphœesis 1988,9:255-62.
176. Shevchenko A, Wilm M, Vorm O, Mann M: Mass spectrometric sequencing of proteins silver-stained polyacrylamide %c\s.AnaLOjem 1996,68:850-858.
177. Benvenuti S, Cramer R, Quinn CQ Bmce J, Zvelebil M, Corless S, Bond J, Yang A, Hockfield S, Burlingame AL, Waterfield MD, Jat PS: Differential proteome analysis of replicative senescence in rat embryo fibroblasts. M d GdlPwteonics 2002,1:280-92.
178. Benvenuti S, Cramer R, Bruce J, Waterfield MD, Jat PS: Identification of novel candidates for replicative senescence by functional proteomics. Onoo^ne 2002,21:4403-13.
179. Wessel D, Flugge UI: A method for the quantitative recovery of protein in dilute solution in the presence of detergents and lipids. A naLBiahem 1984, 138:141-143.
180. Bradford MM: A rapid and sensitive method for the quantitation of micmgram quantities of protein utilizing the principle of protein-dye binding. y4 1976, 72:248-254.
181. Biber J, Stieger B, Haase W, Murer H: A high yield preparation for rat kidney bmsh border membranes. Different behaviour of lysosomal markers. Bixxhim Bicphys Acta 1981, 647:169-76.
182. Henion J, Brewer E, Rule G: Sample preparation for LC/MS/MS: analyzing biological and environmental S2Lmç\ s. AmLChem 1998, 70:650A-656A.
183. Kim M, Warren T, Kimball E: Purification and characterization of low molecular weight transforming growth factor from the urine of melanoma p a t i e n t s . 1985,260:9237-9243.
184. Meng Q, Balcells E, DellTtalia L, Durand J, Opaiil S: Sensitive Method for Quantitation of angiotensin converting enzyme (ACE) activity in tissue.Bicxhem Pharrmod 1995, 50:1445-1450.
185. Sato K, Hirata Y, I mai T, Iwashima M, Morumo F: Characterization of immunoreactive adrenomedulin in human plasma and urine. LifeSâmes 1995,57:189-194.
186. Walters A, Myrdal P, Pinsuwan S, Manka A, Yalkocusl^S: Determination of melatonan II in rabbit urine using solid phase extraction sample preparation followed by reversed-phase high performance liquid c h r o m a t o g r a p h y . / 1997,690:99-103.
187. Fierens Q Thienpont LMR, Stocld D, WOlekens E, Leenheer A Quantitative analysis of urinary C-peptide by liquid chromatography-tandem mass spectrometry with a stable isotopic ally labelled internal standard./.Q jrcm tto^. A 2000, 896:275-278.
228
8. R^hmæs
188. Sanchez J, Hochstrasser D: Preparation and solubilization of body fluids for 2-D. In 2-D pnteonE aridysh pntoools. Edited by Link AJ. Totowa, New Jersey: Humana Press Inc; 1999.
189. Thongboonkerd V, McLeish KR, Arthur JM, Klein JB: Proteomic analysis of normal human urinaiy proteins isolated by acetone precipitation or ultracentrifugation. lOdnsylnL 2002,62:1461-1469.
190. Cutler P, Bell DJ, BirreU HQ GonnellyJQ Connor SQ Holmes E, Mitchell BQ Monte SY, Neville B .\ Pickford R, PoUey S, Schneider K, Skehel JM- An integrated proteomic approach to studying glomemlar nephrotoxicity.Electivphoresis 1999,20:3647-3658.
191. Oesteigaard M, Wolf H, Oemtoft TF, Celis JE : Ps orias in (S100A7) : A putative urinaiy marker for the follow-up of patients with bladder squamous cell carcinomas. Electrophœesis 1999,20:349-354.
192. Heine G RFW: Mapping of peptides and protein fragments in human urine using liquid chromatography-mass spectrometiy./. GjrcmOo^.yA 1997, 776:117-124.
193. Schulz-Knappe P, Schrader M, standker L, Richter R, Hess R, Jmgens M, Forssmann W: Peptide bank generated by laige-scale preparation of circulating human peptides./. Chrmuto^. A 1997, 776:125-132.
194. Kim KR, Kim JFk Jeong DH, Paek DJ, Liebich HM: Gas chromatographic profiling analysis of urinaiy oi^anic acids from nonsmokers and smokers./.ChrxmOo . B 1997, 701:1-8.
195. Lewis S, Neydon CN, Burlingame AL: High resolution gas chromatographic/ real time mass spectrometric identification of oiganic acids in human urine. v4 W C&7721979,51:1275-1285.
196. Fu D, Zopf D: Analysis of sialyllactoses in blood and urine by high- performance liquid chromatography. A nd Oxm 1999,269:113-123.
197. Burckhardt G, Pritchard JB: Oiganic anion and cation antiporters. In TheKidney edn 3rd. Edited by Seldin DW, Giebish G. Lippincott Williams and Wilkins; 2000.
198. Sivaraman T, Kumar TK, Jayaraman G, Yu G The mechanism of 2,2,2- trichloroacetic acid-induced protein precipitation./.P?ite»7G6em 1997,16:291-297.
199. van Oss Q: On the mechanism of the cold ethanol precipitation method of plasma protein fractionation./.Ptüésw Qxm 1989,8:661-668.
200. Birkenmeier G, Kopperschlager G: Dye-promoted precipitation of serum proteins. Mechanism and application./R méécWI 1991,21:93-108.
201. Hsieh S, Jorgenson JW: Preparation and evaluation of sluny-packed liquid chromatography microcolumns with inner diameters from 12 to 33 microns.A n dO xm 1996,68:1212-1217.
229
8. R^hmoes
202. Lord GA, Gordon DB, Myers P, King BW: Tapers and res trie tors for capillaiy electrochromatography and capillary electrochromatography-mass spectrometry./. OmïïmtoQ , A 1997,768:9-16.
203. Ishihama Y, Rappsilber J, Andersen JS, Mann M Microcolumns with selfassembled particle frits for proteomics./. Chromao^. A 2002,979:233-239.
204. Millipore Ltd. www.millipore.com. www. 2003.
205. Oosterkamp AJ, Gelpi E, Abian J: Quantitative peptide bioanalysis using column-switching nano liquid chromatography/mass spectrometiy./.Af^s Spectrcm 1998,33:976-983.
206. van der HE, ten Hove GJ, Herberts CA, Meiring HD, van Els CA, de Jong AP: A microcapillaiy column switching HPLOelectrospray ionization MS system for the direct identification of peptides presented by major histocompatibility complex class I m oXtcvXts.AriaLO xm 1998, 70:3742-3751.
207. Racaityte K. LESMUKKLDBKS: Analysis of neuropeptide Y and its metabolites by high-performance liquid chromatography-electrospray ionization mass spectrometry and integrated sample clean-up with a novel restricted-access sulphonic acid cation exchanger./. Chronvtogr. A 2000, 890:135-144.
208. Unger M, Jacobsen W, Holzgrabe U, Benet L2: Quantitative liquid chmmatography-mass spectrometry determination of isatin in urine using automated on-line extraction./. Chromao^. B. 2002,767:245-253.
209. Isobe T, Uchida K, Taoka M, Shinkai F, Manabe T, Okuyama T: Automated two- dimensional liquid chromatographic system for mapping proteins in highly complex mixtures./.OWTîriïgr. A 1991,588:115-123.
210. Yates III JR, Link AJ, Schieltz D: Direct analysis of proteins in mixtures: application to protein complexes. In Mass spedrcmtry cfprotems and peptides. Edited by Chapman JR Totowa, New Jersey Humana Press; 2000:17-26.
211. Blommback B, Hanson LA Plasrm prOténs. Chichester: John Wiley and Sons; 1979.
212. Richter R, Schulz-Knappe P, Schrader M, Standker L, Jurgens M, Tammen H, Forssmann W-G: Composition of the peptide fraction in human blood plasma: database of circulating human peptides. / ChrcmOo r. B: 1999, 726:25-35.
213. Kippen AD., Cerini F, Vadas L, Stocklin R, Vu 1, Offord RE., K R Development of an isotope dilution assay for precise determination of insulin, Opeptide, and proinsluin levels in non-diabetic and type II diabetic individuals with comparison to \mmmvo2iSS2ty. J.BicLOoem 1997,272:12513- 12522.
214. Chamas L, Bemardini I, Rader D, Hoeg J, Gahl W: Clinical and laboratory findings in the oculocerebrorenal syndrome of Lowe, with special reference to growth and renal function. N E n ^ ] Med 1991,324:1318-1325.
230
8. R erenoes
215. Ibrahim HN, Rosenberg ME, Hostetter TH: Proteinuria. In Thelüdney, edn 3rd. Edited by Seldin DW, Giebish G. Philadelphia: Lippincott Williams and Wilkins; 2000:2269-2294.
216. Erkan E, De Leon M, Devarajan P: Albumin overioad induces apoptosis in LLCPK(1) cc\ïs, AmJ.PhysidRemlPhysiol2001,280:F1107-F1114.
217. Verroust PJ, Ko2yraki R: The roles of cubilin and megalin, two multiligand receptors, in proximal tubule function: possible implication in the progression of renal disease. Cmr.CpmNephroLH‘)pertens. 2001,10:33-38.
218. Zoja Q Benigni A, Remuzzi G: Protein overioad activates proximal tubular cells to release vasoactive and inflammatoiy mediators. Exp.N qhoL 1999, 7:420-428.
219. Johnson DW: Growth factors in progressive renal disease. NephrdoQi 2000, 5:251-261.
220. Outillas PR, Norden AG, Cramer R, Burlingame AL, Unwin RJ: Detection and analysis of urinaiy peptides by on-line liquid chromatography and mass spectrometiy: application to patients with renal Fanconi syndrome.ainS d(Loncf 2003,104:483-490.
221. Richter R, Schulz-Knappe P, Schrader M, standker L, Juigens M, Tammen H, Forssmann WG: Composition of the peptide fraction in human blood plasma: database of circulating human pcpûdcs.J.Chwmatogr.B 1999, 726:25-35.
222. Fukuda K, Yoshitomi K, Yanagida T, Tokumoto M, Hirakata H: Quantification of TGF-betal mRNA along rat nephron in obstructive nephropathy.A mJ.Physid Rend Physiol 2001,281:F513-F521.
223. Bleyer AJ, Trachtman H, Sandhu J, GorryMC, Hart TO Renal manifestations of a mutation in the uromodulin (Tamm Hors fall protein) gene. A mJ.IGdney Dis. 2003,42:E20-E26.
226. Kokot F, Dulawa J: Tamm-Hors fall protein updated. N ^h rm 2000,85:97-102.
227. Kajikawa K, Yasui W, Sumiyoshi FI, Yoshida K, Nakayama H, Ayhan A, Yokozaki H, Ito H, Tahara E: Expression of epidermal growth factor in human tissues. Immunohistochemical and biochemical analysis. V irdxm Anh.A PathcLAnatHistcpathoL 1991,418:27-32.
228. Lopez MF, Beiggren K, Chemokalskaya E, Lazarev A, Robinson M, Patton WF:A comparison of silver stain and SYPRO Ruby Protein Gel Stain with respect to protein detection in two-dimensional gels and identification by peptide mass profiling. Electrophoresis 2000,21:3673-3683.
229. Tracy RP, Young DS, Hill HD, Cutsforth GW, Wilson DM: Two-dimensional electrophoresis of urine specimens from patients with renal disease.AppLTheor.E leOrophor. 1992,3:55-65.
231
8. R^€7mjes
230. Corless S, Cramer Rj On-target oxidation of methionine residues using hydrogen peroxide for composition-restricted matrix-assisted laser desorption/ionisation peptide mass mapping. Rapid Qjmmn.Mass Spectmm 2003,17:1212-1215.
231. Opiteck G J LKaJJ: Comprehensive On-Line LC/LC/MS of Proteins. C h e rn m i, 69:1518-1524.
232. Hansen KQ Schmitt-TJlms G, Challdey RJ, Hirsch J, Baldwin MA, Burlingame AL: Mass Spectrometric Analysis of Protein Mixtures at Low Levels Using Qeavable 130Isotope-coded Affinity Tag and Multidimensional Chromatography. M oLCdlPnteæràs. 2003,2:299-314.
233. Chelius D, Bondarenko PV: Quantitative profiling of proteins in complex mixtures using liquid chromatography and mass spectrom etry. J.PvoteonE:Res. 2002,1:317-323.
234. Bamidge DR, Dratz EA, Martin T, Bonilla LE, Moran LB, Lindall A: Absolute quantification of the G protein-coupled receptor rhodopsin by LC/MS/MS using proteolysis product peptides and synthetic peptide standards.AnaLOoem 2003, 75:445-451.
235. Feng WY, Chan KK, Covey JM Electrospray LOMS/MS quantitation, stability, and preliminary pharmacokinetics of bradykinin antagonist polypeptide B201 (NSC 710295) in the m ouse. J.Pharm Bion^AnaL 2002, 28:601-612.
236. Lawrence JF, Niedzwiadek B, Menard C, Lan BP, Lewis D, Kuper-Goodman T, Carbone S, Holmes G Comparison of liquid chromatography/mass spectrometry, ELISA, and phosphatase assay for the determination of microcystins in blue-green algae products./.y4 0 4 C M 2001,84:1035-1044.
237. Darby SM, Miller ML, Allen RO, LeBeau M: A mass spectrometric method for quantitation of intact insulin in blood sam ples. J. A naLTa>ciœL 2001,25:8-14.
238. Garcia MQ Hogenboom AC, Zappey H, Irth Ft Effect of the mobile phase composition on the separation and detection of intact proteins by reversed- phase liquid chromatography-electrospray mass spectm m etiy. J.OmmOognA 2002,957:187-199.
239. Eric T.Gangl, Meg Annan, Neil Spooner, Vouros P: Reduction of Signal Suppression Effects in ESI-MS Using a Nanosplitting Device. v4W Chem 2001,73:5635-5644.
240. Pascoe R, FoleyJP, Gusev AI: Reduction in matrix-related signal suppression effects in electrospray ionization mass spectrometry using on-line two- dimensional liquid chromatography. Chem 2001, 73:6014-6023.
241. Gustavsson SA, Samskog J, Markides KE, Langstrom B: Studies of signal suppression in liquid chromatography-electrospray ionization mass spectrometry using volatile ion-pairing reagents./. ChranOogr. A 2001, 937:41-47.
232

8. R^ermoes
242. Means JQ Olsen PD, Schoffers E: Development of an isotope dilution liquid chromatography/tandem mass spectrometiy detection method for DNA adducts of selected aromatic amines. S p e c t r c m 2003,14:1057- 1066.
243. Lepine F, Deziel E, Milot S, Rahme LG: A stable isotope dilution assay for the quantification of the Pseudomonas quinolone signal in Pseudomonas aeruginosa cultures. BiochimBioph)s.Acta2002>, 1622:36-41.
244. Gerber SA, Rush J, Stemman O, Kirschner MW, Gygi SP: Absolute quantification of proteins and phosphoproteins from cell lysates by tandemMS.Pm cNatLAcadS(iU.S.A 2003,100:6940-6945.
245. Mason DE, Liebler DG Quantitative analysis of modified proteins by LG MS/MS of peptides labeled with phenyl isocyzvtiXt. ].Proteoime.Res. 2003, 2:265-272.
246. Qng SE, Foster LJ, Mann M Mass spectrometric-based approaches in quantitative proteomics. Methods 2003,29:124-130.
247. Pang JX, Ginanni N, Dongre AR, Hefta SA, Opiteck GJ: Biomaiker Discovery in Urine hyV roticow ics.JProteomRes 2002,1:161-169.
248. Edwards JJ, Anderson NG, ToUaksen SL, von Eschenbach AC, Guevara J, Jr.: Proteins of human urine. II. Identification by two-dimensional electrophoresis of a new candidate marker for prostatic cancer. CLinOxm 1982,28:160-163.
249. TichyM, Stulik J, Kovarova H, Mate j a F, Urban P: Analysis of monoclonal immunoglobulin light chains in urine using two-dimensional electrophoresis. Necplasmt 1995,42:31-34.
250. Celis JE, Rasmussen HH, Vorum H, Madsen P, Honore B, Wolf H, Omtoft TF: Bladder squamous cell carcinomas express ps orias in and externalize it to the urine./.LW 1996,155:2105-2112.
251. Grover PR, Resnick MI: Analysis of prostatic fluid: evidence for the presence of a prospective marker for prostatic cancer. Prostate 1995,26:12-18.
252. Clark PM, Kricka LJ, Whitehead TP: Pattern of urinaiy proteins and peptides in patients with rheumatoid arthritis investigated with the Iso-Dalt technique. CLinChem 1980,26:201-204.
253. Aicher L, Wahl D, Arce A, Grenet O, Steiner S: New insights into cyclosporine A nephrotoxicity by proteome coaAysis. Electrophoresis 1998,19:1998-2003.
254. McKee JA, Shai K, Ecelbaiger CA, Fernandez-Llama P, Terris J, Knepper MA Detection of Na 4-Transporter Proteins in Urine./y4 mSocNephrol 2000, 11:2128-2132.
255. Herbert BR, Harry JL, Packer NH, Gooley AA, Pedersen SK, Williams KL: What place for polyacrylamide in proteomics? Trends BictechnoL 2001,19:83-59.
233

8. Rferenæs
256. Santoni V, Kieffer S, Desclaux D, Masson F, Rabilloud T: Membrane proteomics; use of additive main effects with multiplicative interaction model to classify plasma membrane proteins according to their solubility and electrophoretic properties. Electrophcmis 2000,21:3329-3344.
257. Santoni V, Molloy M, Rabilloud T: Membrane proteins and proteomics: un amour impossible? EleOrophonesis 2000,21:1054-1070.
258. Wu OC, Yates JR; The application of mass spectrometiy to membrane proteomics. N at Biotechnol 2003,21:262-7.
259. Bell AW, Ward MA, Blackstock WP, Freeman HN, QioudharyJS, Lewis AP, Chotai D, Fazel A, Gushue JN, Paiement J, Palcy S, Qievet E, Lafneniere-Roula M, Solaii R, Thomas DY, Ro'MeyA, Bergeron JJ: Proteomics characterization of abundant Golgi membrane protcm s.J.BioLChm i 2001,276:5152-5165.
260. le Contre J, Whitelegge JP, Gross A, Turk E, Wright EM, Kaback HR, Faull KF: Proteomics on full-length membrane proteins using mass spectrometry.Biodxrristry 2000,39:4237-4242.
261. Romero M, Nocera S, Nesse AB; Decreased Tamm-Hors fall protein in Lithiasic patients. CLin Biodxm 1997,30:63-67.
262. Cavallone D, Malagolini N, Frasca G-M, Stefoni S, Serafini-Cessi F: Salt- precipitation method does not isolate to homogeneity Tamm-Hors fall glycoprotein from urine of proteinuric patients and pregnant women. Clin Biodxm In Press, Uncorrected Proof.
263. Nishihara JQ Champion KM: Quantitative evaluation of proteins in one- and two-dimensional polyacrylamide gels using a fluorescent stain. Electrophoresis 2002,23:2203-2215.
264. Norden AG, Scheinman SJ, Deschodt-Lanckman MM, Lapsley M, Nortier JL, Thakker RV, Unwin RJ, Wrong O: Tubular proteinuria defined by a study of Dent's (CLCN5 mutation) and other tubular diseases. Kidney InL 2000, 57:240-249.
265. Gygi SP, Cordials GL, Zhang Y, Rochon Y, Aebersold R: Evaluation of two- dimensional gel electrophoresis-based proteome analysis technology.ProcNatLAaidScLU.S.A 2000,97:9390-9395.
266. Goldberg HA, Warner KJ: The staining of acidic proteins on polyacrylamide gels: enhanced sensitivity and stability of " Stains-all" staining in combination with silver m trsitc. A na l Biodxm 1997,251:227-233.
267. Naaby-Hansen S, Waterfield MD, Cramer Rj Proteomics-post-genomic cartography to understand gene function. Trends PharrrucoLSd 2001,22:376- 384.
268. Wall DB, Kachman MT, Gong SS, Parus SJ, Long MW, Lubman DM: Isoelectric focusing nonporous silica reversed-phase high-performance liquid chromatography/electrospray ionization time-of-flight mass spectrometry: a three-dimensional liquid-phase protein separation method as applied to
234

8. R erenœs
the human eiythroleukemia cell-line. Rapid QmmnMass Spectrcm 2001, 15:1649-1661.
269. Link AJ, Eng J, Schieltz DM, Carmack E, Mize GJ, Morris DR, Garvik BM, Yates III JR; Direct analysis of protein complexes using mass spectrometry. N atBiotedj. 1999,17:676-682.
270. ExPASy Molecular Biology Server, www.expasy.ch/.
271. Cutillas PR, Norden AG, Cramer R, Burlingame AL, Unwin RJ: Detection and analysis of urinary peptides by on-line liquid chromatography and mass spectrometry: application to patients with renal Fanconi syndrome. CLinSd 2003,104:483-490.
272. Cutillas PR, Norden AGW, Cramer R, Burlingame AL, Unwin RJ: Urinary Proteomics of Renal Fanconi Syndrome. \nPrxteomcs mNephrdog^ Edited by Thongboonkerd V, Klein JB. Basel: Karger, 2004:142-154.
273. Wrong O, Norden A, Feest T: Dent's disease; a familial proximal renal tubular syndrome with low-molecular-weight proteinuria, hyperealciuria, nephrocaleinosis, metabolic bone disease, progressive renal failure and a marked male predominance. (JM 1994,87:473-493.
274. Morita Y, Ikeguchi H, Nakamura J, Hotta N, Yuzawa Y, Matsuo S: Complement activation products in the urine from proteinuric patients. J.AmSocN^hTvL 2000,11:700-707.
275. Nangaku M, Pippin J, Couser WG: Complement membrane attack complex (C5b-9) mediates interstitial disease in experimental nephrotic syndrome.].Am SocNephrd 1999,10:2323-2331.
276. Qng AC, Jowett TP, Moorhead JF, Owen JS: Human high density lipoproteins stimulate endothelin-1 release by cultured human renal proximal tubular cells. Kidney In t 1994,46:1315-1321.
277. Arici M, Chana R, Lewington A, Brown J, Brunskill Nf: Stimulation of Proximal Tubular Cell Apoptosis by Albumin-Bound Fatty Acids Mediated by Peroxisome Proliferator Activated Keceptot-^am rna.]Am SocN ephrdlO O i, 14:17-27.
278. Di Paolo S, Grandaliano G, Gesualdo L, Ranieri E, Schena FP: Low-density lipoproteins enhance transforming growth factor-beta 1 (TGF- beta 1) and monocyte chemotactic protein-1 (MCP-1) expression induced by cyclosporin in human mesar^ial cells. Q m E xpIrrm m d 1999,117:355-60.
279. Moorhead JF, Chan MK, El-Nahas M, Vaighese 2: Lipid nephrotoxicity in chronic progressive glomerular and tubulo- interstitial disease. Lanoet 1982, 2:1309-11.
280. Hession Q Decker JM, Sherblom AP, Kumar S, Yue CQ Mattaliano RJ, lizard R, Kawashima E, Schmeissner U, Heletl^S,.: Uromodulin (Tamm-Hors fall glycoprotein): a renal ligand for lymphokines. Sdenoe 1987,237:1479-1484.
235
8. R erences
281. Vakeva A, Laurila P, Men S: Loss of expression of protectin (CD59) is associated with complement membrane attack complex deposition in myocardial infarction. Lablm sst 1992,67:608-616.
282. Gerbaud V, Pignol D, Loret E, Bertrand JA, Berland Y, Fontecilla-Camps J-Q Ganselier J-P, Cabas N, Verdier J-M: Mechanism of Calcite Crystal Growth Inhibition by the N-terminal Undecapeptide of Lithostathine. CWz 2000,275:1057-1064.
283. Ta}lor SW, Fahy E, Zhang B, Glenn CM, Wamock DE, Wiley S, Murphy AN, Gaucher SP, Capaldi RA, Gibson BW, Ghosh SS: Characterization of the human heart mitochondrial proteome. N at Biotedond 2003,21:281-6.
284. Bell AW, Ward MA, Blackstock WP, Freeman HN, Choudhary JS, Lewis AP, Chotai D, Fazel A, Gushue JN, Paiement J, Palcy S, Chevet E, Lafneniere-Roula M, Solaii R, Thomas DY, Rowley A, Bergeron JJ: Proteomics characterization of abundant Golgi membrane proteins./Ric/ 0?mi2001,276:5152-65.
285. Kikuchi M, Hatano N, Yokota S, Shimozawa N, Imanaka T, Taniguchi H: Proteomic analysis of rat liver peroxisome: Presence of peroxisome-specific isozyme of Ion pro teas e./Rw/Gjew2003.
286. Nebl T, Pestonjamasp KN, Lesz)k JD, CrovieyJL, Oh SW, Luna EJ: Proteomic analysis of a detergent-resistant membrane skeleton from neutrophil plasma membranes./Rioi0^2002,277:43399-43409.
287. Ferro M, Salvi D, Bmgiere S, Miras S, Kowalski S, Louwagie M, Garin J, Joyard J, Rolland N: Proteomics of the Chloroplast Envelope Membranes from Arabidopsis thaliana. 2003,2:325-345.
288. Adam PJ, Boyd R Tyson KL, Fletcher GQ Stamps A, Hudson L, Poyser HR, Redpath N, Griffiths M, Steers G, Harris AL, Patel S, Berry J, Loader JA, Townsend RR, Daviet L, Legrain P, Parekh R, Terrett JA: Comprehensive proteomic analysis of breast cancer cell membranes reveals unique proteins with potential roles in clinical cancer. JBidOxm20Q?>, 278:6482-6489.
289. Booth AG, Kenny AJ: A rapid method for the preparation of microvilli from rabbit kidney. Biodxm ] 1974,142:575-581.
290. Marks J, Carvou NJ, Debnam ES, Srai SK, Unwin RJ: Diabetes increases facilitative glucose uptake and GLUT2 expression at the rat proximal tubule bmsh border m e m b r a n e . 2003.
291. Murer H, Gmaj P: Transport studies in plasma membrane vesicles isolated from renal cortex. 1986,30:171-186.
292. van Aubel RA, Smeets PH, Peters JG, Bindels RJ, Russel FG: The MRP4/ABCC4 gene encodes a novel apical organic anion transporter in human kidney proximal tubules: putative efflux pump for urinary cAMP and c(^Æ P .JAmSocNephwL 2002,13:595-603.
293. Rodman JS, Mooseker M, Farquhar MG: Cytoskeletal proteins of the rat kidney proximal tubule bmsh border. Eur.J Cdl BioL 1986,42:319-327.
236
8. Refermjs
294. Gisler SM, Pribanic S, Bacic D, Forrer P, Gantenbein A, Sabouiin LA, Tsuji A, Zhao ZS, Manser E, Biber J, Murer H: PDZKl: I. A major scaffolder in bmsh borders of proximal tubular cells. Kidnsylrt. 2003, 64:1733-1745.
295. Gisler SM, Madjdpour Q Bacic D, Pribanic S, Ta}dor SS, Biber J, Murer H: PDZKl: II. An anchoring site for the PKA-binding protein D-AKAP2 in renal proximal tubular cells. Kidney InL 2003,64:1746-1754.
296. Kawai J, Shinagawa A, Shibata K, Yoshino M, Itch M, Ishii Y, Arakawa T, Hara A, Fukunishi Y, Konno H, Adachi J, Fukuda S, Aizawa K, Izawa M, Nishi K, Kiyosawa H, Kendo S, Yamanaka I, Saito T, Okazaki Y, Gojobori T, Bono H, Kasukawa T, Saito R, Kadota K, Matsuda H, Ashbumer M, Batalov S, Casavant T, Fleischmann W, Gaasterland T, Gissi Q King B, Kochiwa H, Kuehl P, Lewis S, Matsuo Y, Nikaido I, Pesole G, Quackenbush J, Schriml LM, Staubli F, Suzuki R, Tomita M, Wagner L, Washio T, Sakai K, Okido T, Furuno M, Aono H, BaldareUi R, Barsh G, Blake J, Boffelli D, Bojunga N, Caminci P, de Bonaldo MF, Brownstein M[, Bult Q Fletcher Q Fujita M, Gaiiboldi M, Gustincich S, Hill D, Hofmann M, Hume DA, Kamiya M, I^e NH, Lyons P, Marchionni L, Mashima J, Mazzarelli J, Mombaerts P, Nonione P, Ring B, Ringwald M, Rodriguez I, Sakamoto N, Sasaki H, Sato K, Schonbach Q Seya T, Shibata Y, Storch KF,Suzuki H, To}^oka K, Wang KH, Weitz Q Whittaker Q Wüming L, Wynshaw- Boris A, Yoshida K, Hasegawa Y, Kawaji FI, Kohtsuki S, Hayashizaki Y: Functional annotation of a full-length mouse c DNA collection. Natm elOOl, 409:685-690.
297. Nash SR, Giros B, Kings more S, Kim K, El-Mestikawy S, Dong Q, Fumagalli F, Seldin M, Caron B: Cloning, gene stmcture, and genomic localization of an orphan transporter from mouse kidney with six alternatively-spliced isoforms. Reœptors.Channds 1998,6:113-128.
298. Sakata K, Shimada S, Yamashita T, Inoue K, Tohyama M: Cloning of a bovine orphan transporter and its short splicing variant FEBS Lett 1999,443:267-270.
299. Wasserman JQ Delpire E, Tonidandel W, Kojima R, GuUans SR: Molecular characterization of ROSIT, a renal osmotic stress-induced Na(+)-Q(-)- organic solute cotransporter, Physid 1994,267:F688-F694.
300. Tashiro FI, Yamazaki M, Watanabe K, Kumagai A, Itakura S, Fukuzumi Y, Fujimori Y, Komiyama M, Sugiyama T, Iiie R, Otsuki T, Sato FI, Wakamatsu A, Ishii S, Yamamoto J, Isono Y, Kawai-FEo Y, Saito K, Nishikawa T, Kimura K, Yamashita H, Matsuo K, Nakamura Y, Sekine M, Kikuchi FE Kanda K, Wagatsuma M, Murakawa K, Kanehoii K, Takahashi-Fujii A, Oshima A, Sugiyama A, Kawakami B, Suzuki Y, Sugano S, Nagahari K, Masuho Y, Nagai KIT. NEDO human cDNA sequencing project.Submitted 001-2001 to the EMBL GenBank DDBJ databases . 2001.
301. Zhou Y, Yu L, Zhao SY. Cloning of a new human cDNA similar to Rattus norvégiens neurotransmitter transporter rB21a. Submitted FEB-2002 to the EMBL GenBank DDBJ databases . 2002.
237
8. R erenoss
302. Kiss H, Darai E, Kiss Q Kost-Alimova M, Klein G, Dumanski JP, Imrch S. Comparative Sequence Analysis of the Common Eliminated Region 1 (C3CER1) on Human Chromosome 3p21.3 with the Orthologous Regions on Mouse Chromosome 9F. Submitted JAN-2002 to the EMBL GenBank DDBJ databases. 2002.
303. Hernando N, Deliot N, Gisler SM, Lederer E, Weinman EJ, Biber J, Murer H PDZ-domain interactions and apical expression of type Ha Na/P(i) cotransporters.Proc.Nad.AcadSdU.SA 2002,99:11957-11962.
304. Goshe MB, Blonder J, Smith RD: Affinity labeling of highly hydrophobic integral membrane proteins for proteome-wide analysis. J ProteofmRes. 2003, 2:153-161.
305. Brunet S, Thibault P, Gagnon E, Kearney P, Beigeron JJ, Desjardins M Organelle proteomics: looking at less to see more. Trends Cdl Bid, 2003, 13:629-638.
306. Dreger M Suhcellular proteomics. Mass SpectromReu 2003,22:27-56.
307. Dreger M Proteome analysis at the level of suhcellular structures .Eur.J 5 00 72 2003,270:589-599.
308. Taylor SW, Fahy E, Ghosh SS: Global oiganellar proteomics. Trend Biotechnd 2003,21:82-88.
309. Woroniecki R, Ferdinand JR, Morrow JS, Devarajan P: Dissociation of spectrin- ankyiin complex as a basis for loss of Na-K-ATPase polarity after ischemia.A m J Physid Renal Physid 2003,284:F358-F364.
310. Cutillas PR, Norden AG, Cramer R, Burlingame AL, Unwin RJ. A Column- switching LCMS/MS Set-up for the 'Qean-up', Separation and Characterization of Peptides Present in Small Volumes of Biological Fluids. Proceedings of the 50th conference of the American Society of Mass Spectrometiy and Allied Topics . 2002.
311. Moulin P, Igarashi T, Van Der SP, Cosyns JP, Verroust P, Thakker RV,Scheinman SJ, Courtoy PJ, Devuyst O: Altered polarity and expression of H-f- ATPase without ultrastructural changes in kidneys of Dent's disease patients. lOdneylnL 2003,63:1285-1295.
238