TO THE POSSIBILITY OF CALCULATION - Thaijo
19
142 ENGINEERING ACCESS, VOL. 8, NO. 2, JULY-DECEMBER 2022 Applying Multi-Criteria Approaches to the Weld Bead Geometry Problem in Laser Welding With Filler Wire Process Using the Al-Mg-Mn-Zr-Er Alloy Sheet Kenechukwu Obinna Okponyia, Sunday Ayoola Oke * and Akwaeno Uduak Umoh Department of Mechanical Engineering, University of Lagos, Lagos, Nigeria [email protected] * (Corresponding author) Abstract. Al-Mg-Mn-Zr-Er alloy sheet is a prominent industrial material used by the automotive and aerospace industries. Yet little is known about which parameters substantially affect the weld bead geometry in laser welding. This article establishes the most influential process parameters in laser welding with filler wire process on the Al-Mg-Mn-Zr-Er alloy sheets focusing on laser power, welding speed, wire feed speed parameters. The data obtained from a paper was used for analysis. Five methods were compared, namely analytic hierarchy process (AHP) method, fuzzy analytic hierarchy process (FAHP) method, best-worst method, entropy method and criteria importance through inter-criteria correlation (CRITIC) method. The arithmetic mean (AM) method and the root mean square (RMS) method were used to compare the results of the five methods. Using the AM method, the FAHP method is the best (AM, 0.3367), the entropy method is the second position (AM, 0.3337) and the three methods of AHP, best worst and CRITIC (AM, 0.3333 each) were placed in the third position. Besides, for the RMS method, the entropy and FAHP methods were the first and second positions with the RMS values of 0.2094 and 0.1954, respectively. The third to the last positions were allocated to best worst (RMS, 0.1948), AHP (RMS, 0.1894) and CRITIC (RMS, 0.1274), respectively. Consequently, the FAHP method is the best and recommended to develop cost reduction strategies in the workshop. The novelty of this article is the application of five multicriteria methods, namely AHP, FAHP, best-worst, entropy and CRITIC to the Al-Mg-Mn-Zr-Er alloy sheets. Received by 20 August 2021 Revised by 26 October 2021 Accepted by 6 March 2022 Keywords: laser welding, selection, process parameters, multicriteria analysis 1. Introduction After At present, the invention of the laser is being celebrated in its 61st anniversary worldwide [1]. Interestingly, from the introduction of lasers to the industry to date, tremendous success has been reported in the global usage of lasers for materials processing [1]. This success has been attributed to the huge development of the output of laser power that enables multiple materials processing tasks to cope with the demand on product features by the industries and their customers [2]. Consequently, lasers have been positioned as useful and undeniably developmental industrial tools in diverse material processing tasks [1]. Furthermore, globally, the market for laser welding and cutting robots in 2020 was estimated at 518.52 million USD and is expected to grow at 8.6% from 2020 to 2027 [3]. Thus there is a great potential for laser welding penetration worldwide and substantial opportunities for a wider technological scope and enhanced product quality attainment in the industry [4],[ 5]. Laser welding describes a welding method that applies laser's energy heat source to join metal pieces or thermoplastics with a concentrated heat source that directs narrow but deep welds at high welding speed [4]-[6]. The workpiece is often located under a microscope while the wire is hand-gripped. The about-to- be-welded sample is examined using cross wires in the ocular. The wire (filler object) is afterwards positioned on the location to be welded while the wire melts by the impact of the laser pulse as well as the base object beneath. Then the wire and the object are welded but the weld bead is central to this welding system [4]-[5]. A weld bead describes a laser welding deposit of the filler material in a welding pass [5]. Several fusion deficiencies in weld failures have been reported due to little or poor interest in the shape and size of weld beads. Thus, significant attention should be directed to weld beads to achieve good welds known to be uniform and straight, devoid of holes, cracks, slags, craters, dips and not extremely thin [7]. The adequate weld bead shape is a function of parameters, including laser line power that explains the heat energy delivered to the base plate assessed in a unit length of weld, wire feed speed and welding speed [5]. Consequently, weld bead geometry is a critical issue in the delivery of acceptable welded joints [7]-[14]. However, some existing studies advocate for more intensive analysis of weld bead geometry as it is influenced by welding parameters [7],[9]. Unfortunately, the literature review reveals that extremely meagre attention was made to study the effects of process parameters such as laser
-
Upload
khangminh22 -
Category
Documents
-
view
0 -
download
0
Transcript of TO THE POSSIBILITY OF CALCULATION - Thaijo
142 ENGINEERING ACCESS, VOL. 8, NO. 2, JULY-DECEMBER 2022
Applying Multi-Criteria Approaches to the Weld Bead
Geometry Problem in Laser Welding With Filler Wire
Process Using the Al-Mg-Mn-Zr-Er Alloy Sheet
Kenechukwu Obinna Okponyia, Sunday Ayoola Oke* and Akwaeno Uduak Umoh
Department of Mechanical Engineering, University of Lagos, Lagos, Nigeria
[email protected] *(Corresponding author)
Abstract. Al-Mg-Mn-Zr-Er alloy sheet is a prominent
industrial material used by the automotive and aerospace
industries. Yet little is known about which parameters
substantially affect the weld bead geometry in laser
welding. This article establishes the most influential
process parameters in laser welding with filler wire
process on the Al-Mg-Mn-Zr-Er alloy sheets focusing on
laser power, welding speed, wire feed speed parameters.
The data obtained from a paper was used for analysis. Five
methods were compared, namely analytic hierarchy
process (AHP) method, fuzzy analytic hierarchy process
(FAHP) method, best-worst method, entropy method and
criteria importance through inter-criteria correlation
(CRITIC) method. The arithmetic mean (AM) method and
the root mean square (RMS) method were used to compare
the results of the five methods. Using the AM method, the
FAHP method is the best (AM, 0.3367), the entropy method
is the second position (AM, 0.3337) and the three methods
of AHP, best worst and CRITIC (AM, 0.3333 each) were
placed in the third position. Besides, for the RMS method,
the entropy and FAHP methods were the first and second
positions with the RMS values of 0.2094 and 0.1954,
respectively. The third to the last positions were allocated
to best worst (RMS, 0.1948), AHP (RMS, 0.1894) and
CRITIC (RMS, 0.1274), respectively. Consequently, the
FAHP method is the best and recommended to develop cost
reduction strategies in the workshop. The novelty of this
article is the application of five multicriteria methods,
namely AHP, FAHP, best-worst, entropy and CRITIC to
the Al-Mg-Mn-Zr-Er alloy sheets.
Received by 20 August 2021
Revised by 26 October 2021
Accepted by 6 March 2022
Keywords:
laser welding, selection, process parameters, multicriteria
analysis
1. Introduction
After At present, the invention of the laser is being
celebrated in its 61st anniversary worldwide [1].
Interestingly, from the introduction of lasers to the industry
to date, tremendous success has been reported in the global
usage of lasers for materials processing [1]. This success
has been attributed to the huge development of the output
of laser power that enables multiple materials processing
tasks to cope with the demand on product features by the
industries and their customers [2]. Consequently, lasers
have been positioned as useful and undeniably
developmental industrial tools in diverse material
processing tasks [1].
Furthermore, globally, the market for laser welding
and cutting robots in 2020 was estimated at 518.52 million
USD and is expected to grow at 8.6% from 2020 to 2027
[3]. Thus there is a great potential for laser welding
penetration worldwide and substantial opportunities for a
wider technological scope and enhanced product quality
attainment in the industry [4],[ 5]. Laser welding describes
a welding method that applies laser's energy heat source to
join metal pieces or thermoplastics with a concentrated heat
source that directs narrow but deep welds at high welding
speed [4]-[6]. The workpiece is often located under a
microscope while the wire is hand-gripped. The about-to-
be-welded sample is examined using cross wires in the
ocular. The wire (filler object) is afterwards positioned on
the location to be welded while the wire melts by the
impact of the laser pulse as well as the base object beneath.
Then the wire and the object are welded but the weld bead
is central to this welding system [4]-[5].
A weld bead describes a laser welding deposit of the
filler material in a welding pass [5]. Several fusion
deficiencies in weld failures have been reported due to little
or poor interest in the shape and size of weld beads. Thus,
significant attention should be directed to weld beads to
achieve good welds known to be uniform and straight,
devoid of holes, cracks, slags, craters, dips and not
extremely thin [7]. The adequate weld bead shape is a
function of parameters, including laser line power that
explains the heat energy delivered to the base plate
assessed in a unit length of weld, wire feed speed and
welding speed [5].
Consequently, weld bead geometry is a critical issue
in the delivery of acceptable welded joints [7]-[14].
However, some existing studies advocate for more
intensive analysis of weld bead geometry as it is influenced
by welding parameters [7],[9]. Unfortunately, the literature
review reveals that extremely meagre attention was made
to study the effects of process parameters such as laser
ENGINEERING ACCESS, VOL. 8, NO. 2, JULY-DECEMBER 2022 143
power, welding speed, feed speed in laser welding with
filter wire process [8]. Furthermore, for the unique joints of
Al-Mg-Mn-Zr-Er alloy sheets, almost no existing studies
have been reported on multicriteria studies to choose the
best parameter in laser welding with filler wire process
[15]-[21]. Besides, no comparisons among several
multicriteria methods have been documented in the present
context of laser welding of Al-Mg-Mn-Zr-Er alloy sheets.
Therefore, this study compares the optimisation
technique on the weld bead geometry, involving process
parameters, using the analytic hierarchy process (AHP)
method, fuzzy analytic hierarchy process (FAHP) method,
best-worst method, entropy method and criteria importance
through inter-criteria correlation (CRITIC), to choose the
best parameter among laser power, welding speed, and feed
speed. The data obtained from the literature are analyzed
and used to validate the approach presented in this study. It
is expected that the results obtainable from this research
will enhance planning activities in the laser welding
workshop and activities. The principal contributions of this
study may be summed up as follows:
1. This study is the first to compare the
performance of the AHP, FAHP, entropy, BWM
and CRITIC methods for the laser welding
process parametric selection of the Al-Mg-Mn-
Zr-Er alloy.
2. For the parametric selection problem of the Al-
Mg-Mn-Zr alloy, the subjective features of the
AHP, FAHP and BWM and individual data-
oriented assessments of the objective weighing
methods of the CRITIC and entropy methods, the
complete methods (all the five approaches) have
been adopted.
3. Since a sole method of multicriteria analysis
seems inappropriate to assure a precise choice,
five multicriteria approaches were used to rank
the laser welding process parametric factors.
4. A rare approach involving the arithmetic mean
method and the root mean square method for the
comparative analysis of the results is presented.
2. Literature Review
2.1 Welded Joints Involving Al-Mg-Mn-Zr-
Er Alloys
While welding, the laser welding operator is
constantly associated with airborne particles (or fumes),
vibrations, moving mechanical parts, the danger of electric
shock, noise, caustic chemicals (or toxic) substances
among others. Despite these challenges, the operator must
endeavour to produce high-quality welds by selecting
proper fixtures, cutting and welding programmes to achieve
the system's goals. But the goal attainment largely depends
on the weld bead geometry. Although the literature has
reported on weld bead geometry, consideration concerning
the Al-Mg-Mn-Zr-Er alloy sheets is poorly discussed. But
the Al-Mg-Mn-Zr-Er alloy sheets, which are Al-Mg-Mn-Zr
with erbium are attracted by the industry for their ability to
enhance machinability and lower the rate of fatigue crack
propagations. The precipitate of Al3(Er, Zr) in the Al-Mg-
Mn-Zr-Er alloy sheets may draw the Al, Zn and Mg
elements in heterogeneous nucleation and significantly
lower the large brittle second phase of the Al3Mg2
compound, which exists at the grain boundary [18].
In this article, parameters such as laser power,
welding speed, feed speed in the laser welding of Al-Mg-
Mn-Zr-Er alloy sheets to select the best parameter with
filler wire process. The optimisation technique was
compared using analytic hierarchy process (AHP), method,
fuzzy analytic hierarchy (FAHP) method, best-worst
method, entropy method and criteria importance through
inter-criteria correlation (CRITIC) method. Consequently,
this article is novel with the novelty being about the
application of five multicriteria methods, namely the AHP,
FAHP, best-worst, entropy and CRITIC to the Al-Mg-Mn-
Zr-Er alloy sheets. Subsequently, a literature review to
support the material analyzed is presented.
Wei et al. [15] welded the Al-Mg-Mn-Zr-Er alloy
sheets using the tungsten inert gas welding and examine the
mechanical and microstructural properties of the joints. The
joints revealed a growth in tensile strength by 57MPa while
the weld joint coefficient grew to 0.8 as the application of
Al-Mg-Mn-Zr-Er welding wire was made to fill the welds.
Furthermore, the strengthening of grain refinement was
experienced. Yang et al. [22] welded Al-Mg-Mn-Zr-Er
samples by applying tungsten inert gas welding and
observed their microstructural characterization.
Furthermore, hardness and tensile experiments were
conducted on the samples. A 72% ultimate tensile strength
of the joint relative to the base metal was obtained. It was
concluded that tungsten inert gas welding is adequate to
weld the newly developed Er-enclosing aluminium alloys.
In another work, Yang et al. [16] employed laser beam
welding in comparison with the tungsten inert gas welding
to join Al-4-7Mg-0.7Mn-0.3Er alloy plates and exploited
the weld's microstructural and mechanical properties. The
tensile strength of the laser beam welding exceeded that of
the tungsten inert gas welding by 10%. Besides, the
superiority of the laser beam welding was demonstrated in
smaller equiaxed grains in the fusion zone, significant
growth of nucleation rate and the burning loss rates of
magnesium.
Furthermore, Yang et al. [17] joined the alloys of Al-
Mg-Mn-Er-Zr and Al-Mg-Mn in laser welding to examine
the effects of Zr and Er addition on the properties
(mechanical, microhardness and microstructure) of the Al-
Mg-Mn alloy welded joints. Improvement in the tensile
outcome through the ultimate tensile strength and the yield
strength evaluation was noticed as the Zr and Er were
added to the Al-Mg-Mn alloy joint. The driving force for
this enhancement was attributed to grain refining
strengthening. In Lei et al. [18], the fatigue crack
propagation of Al-Mg-Mn-Zr alloys with erbium was
144 ENGINEERING ACCESS, VOL. 8, NO. 2, JULY-DECEMBER 2022
examined. It was reported that the Al3(Er-Zr) precipitate
could lower the stress concentration occurring at the grain
boundary to reduce fatigue crack propagation. Furthermore,
Zhang et al. [23] used a fibre laser to weld a 20mm thick
Al-Zn-Mg-Cu alloy with the filler wire to compare the Al-
Mg-Mn alloy with Al-Mg-Mn-Zr-Er alloy welded joints.
Success was reported on the fine grains outcome of the
weld.
Besides, Wu et al. [19] conducted isothermal
compression tests on Al-Zn-Mg-Er-Zr alloy and developed
constitutive models of the Arrhenius kind equation. The
flow stress was reported to have been substantially
influenced by the strain rate and deformation temperature,
which also influenced the material constraints. It was
concluded that the contributed constitutive equation can
adequately represent the hot deformation characteristics of
the Al-Zn-Mg-Er-Zr alloy. Also, Wu et al. [20] extended a
previous study to examine a different range of temperature
573 to 733K instead of 300 to 460°C previously reported.
Besides, in the alloy, Kn newly displaces the Zn to test Al-
Kn-Mg-Er-Zr alloy under the strain rates of 0.001 to 10 s-1
.
It was reported that two areas of high power dissipation
efficiency occurred with the highest value at 653k 0.001s-1
while the peak values were revealed at above 37%. It was
concluded that the occurrence of L12-structured Al3(Er, Zr)
particulates competently pinned the movement of
dislocation and the boundary slide.
Furthermore, Wu et al. [24] studied the influences of
homogenization handling on the precipitation
characteristics of Al3(Er,Zr) particulates and their
influences on recrystallization confrontation in the Al-Zn-
Mg-Er-Zr alloy was studied using multiple homogenization
handlings. The authors reported finer particulates size,
superior density and volume ratio of the Al3(Er, Zr)
particulates in 75% of the homogenization handlings. It
was concluded that the double-phase homogenized cum
ram heating homogenized samples exhibited substantially
reduced recrystallized proportion weighed against the
traditional one-phase homogenized specimens.
Pros and Cons of the Al-Mg-Mn-Zr-Er Literature
The Al-Mg-Mn-Zr-Er alloy is a new alloy that
provides substantial product diversification opportunities in
the aerospace and automobile industries. In this article,
some positive and negative viewpoints on the studies of Al-
Mg-Mn-Zr-Er alloy are presented. Perhaps the strongest
argument to study the Al-Mg-Mn-Zr-Er alloy may be
obtained from the need to understand its microstructural
and mechanical characterization. Most studies [15]-
[16],[22] deployed the tensile and hardness tests to explore
the mechanical attributes of the alloy and the scanning
electron microscope, optical microscope, energy-dispersive
X-ray (EDX), and transmission electron microscopy
(TEM) to examine the microstructural characteristics. In
the first case, the ultimate tensile strength of joints
indicates the structural integrity of the joint relative to the
base metal. For the microstructural examinations, the idea
was to examine the fusion boundary and understand the
quality of the particles between the base metal and the
fusion zone. Though a perfect understanding is yet to be
attained concerning the microstructural and mechanical
properties of the Al-Mg-Mn-Zr-Er alloy, proponents of this
idea continue to research towards its fuller realization.
Advocates of the physical property exploration of the Al-
Mg-Mn-Zr-Er alloy also pursue the goal of enhancing
recrystallization resistance of the alloy where the
minimization of the width regarding precipitation fee zone
around the grain boundary to enhance the strengthening
effect of the alloy. However, many agree that excessive
pursuit of the physical attributes of the microstructural and
mechanical properties of Al-Mg-Mn-Zr-Er alloy can be a
negative experience since it is at the expense of other
aspects of research concerning the Al-Mg-Mn-Zr-Er alloy
such as the economics of the laser welding process
parameters with filler wire process. A study of the laser
welding process parameters offers a deep insight into
resource deployment and control in association with the
process parameters.
Aravind et al. [25] found that VIKOR multicriteria
method was useful in the identification of the most
important laser welding parameters with the Ti6Al4V as
the work material thereby enhancing process organization.
However, various multicriteria methods that have been
proved to be effective in engineering decision making are
available in the literature. Some five key methods that
warrants testing in the laser welding processing of the Al-
Mg-Mn-Zr-Er alloy are the AHP method, FAHP method,
best-worst method, entropy method and CRITIC method.
However, there is little attention paid to the use of these
methods in the perspective of laser welding of process
parameters concerning the Al-Mg-Mn-Zr-Er alloy.
Nonetheless, it is thought that by using these methods in
the proposed context, more balanced literature on the Al-
Mg-Mn-Zr-Er alloy and the wider laser welding literature
is possible.
2.2 Weld Bead Geometry and Laser Welding
Process
In a study, Yang et al. [8] deployed the Taguchi
method to optimise the chosen welding parameters of
welding speed, laser power and wire feed rate while the
weld quality is the response variable. Nevertheless, the
study concludes that the welding speed has the greatest
impact on the weld quality while the least impact on the
weld quality was felt by the laser power. Furthermore, Bidi
et al. [9] contributed another work to the model bead
geometry optimisation. Besides, the considered response is
the weld bend geometry while the principal parameter is
the H/L ratio. In another work, the heat input concerning
the bead geometry is the focal point of discussion by Tayier
et al. [14]. The authors welded the zincalume (G550)
materials using the MIG and LBM processes. Nonetheless,
the outcome of their study is that the wire speed (MIG) and
the welding speed (LBW) yielded 0.6089 and 0.0221
kJ/min of energy at the welding speed and wire speed of
16mm/sec and 3 m/min, respectively.
ENGINEERING ACCESS, VOL. 8, NO. 2, JULY-DECEMBER 2022 145
Besides, Choudhury and Chandrarasekaran [10]
conducted gas tungsten are welding experiments using the
Inconel 825 as the work material but centred attention on
the optimization of weld bead attributes while deploying
the Box-Behnken design for the computational aspects. The
parameters considered in the article are the gas flow rate
welding speed, welding current, and are length.
Nonetheless, an important result of the study is that for the
responses chosen, the welding current was the most
influential parameter in the gas tungsten arc welding
process. The second parameter of importance in the process
is the welding speed. In another article, Nabavi et al. [13]
instituted physical-oriented contour plots to estimate the
pattern of weld behaviour by analyzing the power density
and heat input. The weld bead characteristics are the main
focus of the study. Nonetheless, the article concludes that a
higher penetration-to-width proportion yields elevated
fracture load. Furthermore, Khan et al. [26] elaborated on
the weld bead geometry but considered a different route in
analysis by analyzing the influence of laser beam
defocusing on the weld geometry with emphasis on
welding 22MnB5 grade of press-hardened steel. The
considered responses are the defects, including cyclic
humping, porosity, and weld concavity. The important
conclusion of the article is that the developed framework
showed competence to predict the molten weld pool
geometry.
Yet in another work, Huang et al. [27] offered a new
approach to optimizing the weld strength of the steel-
PMMA joint using the innovative Taguchi method. The
principal result of the study is that the joint efficiency
attained 70% of the base PMMA, which was not previously
discussed in the literature. In another research, Hietala et al.
[28] optimized the tensile-shear strength of lap joints built
up by laser welding. The ARS-600 steel was thoroughly
analyzed using diverse welding parameters and patterns of
welds. In another article, the development mechanism of
the weld bead and temperature field close to the fusion
region was examined. The study concludes that the
influence of the nozzle distance on the temperature field
was more compared with the laser power and welding
speed. In a study, Aravind et al. [25] optimized the welding
parameters while welding Ti6Al4V by the combined use of
the VIKOR and Taguchi method. Nonetheless, the study
concludes that the 7th
experimental trial yielded the
optimized parameters at the power, speed, shielding gas
flow rate of 1.3kW, 0.3m/min and 20L/min, respectively.
Besides, Horvath et al. [12] established an approach to
weld bead profile development with a focus on multi-pass
welding. Kannan et al. [29] employed Deng's similarity
oriented method jointly with the entropy weight approach
and Taguchi orthogonal matrix of L9 for the bead-on-plate
welding of Nitinol shape memory alloy. The parameters
considered are the shielding gas blown distance, laser
power, welding speed, and focus position.
Pros and Cons of Weld Bead Geometry Literature
Weld bead geometry is a significant focal point of
most research on welding efficiency improvement. As with
many other determinants of welding efficiency, there have
been doubts and research discussions on the present
direction of research on weld bead geometry, especially as
it relates to the laser welding process. Also, there have been
promotion and support for the current emphasis of research
on weld bead geometry regarding the laser welding
process. Current weld bead geometry research advocates
for methods to create the least weld bead width as well as
the fusion zone area as one of the strongest research
aspects. Researchers involved in weld bead geometry
discussions have a very strong drive regarding the positive
outcomes that studies have brought to enhancing the
quality of weld beads and consequently the structural
integrity of the welds. Since the heat input into the welded
joints could be controlled during operations. Thus, weld
bead geometry studies are popular but some critics have
been raised by other researchers that question the probable
negative influences of channeling many efforts on weld
bead geometry research at the expense of other aspects
with some economic benefits to the process. Criticisms of almost sole investment of research
efforts on weld bead geometry in laser welding are vast and
they have advanced several reasons it could be detrimental
to the healthy development of the laser welding literature.
One such argument is that the influence of process
parameters on the welding quality is downplayed and the
order of importance of parameters, which may guide
economic decisions for the laser welding process is not
known. Without understanding the prioritization of process
parameters while the optimisation of the weld bead
geometry is the focus judicious distribution of scarce laser
welding process resources may not be achieved. This result
in conflicts among operators and the labour union may be
forced to intervene. However, while supporting this new,
Yang et al. [8] offered a Taguchi approach and considered
the delta values to determine the prioritized parameters. By
furthering this approach with some key multicriteria
methods of AHP method, FAHP method, best-worst
method, entropy method and CRTIC method and evolving
a comparison is perceived to correct the present knowledge
deficiency in the literature concerning the selection of
process parameters. Next, the summary of the literature is
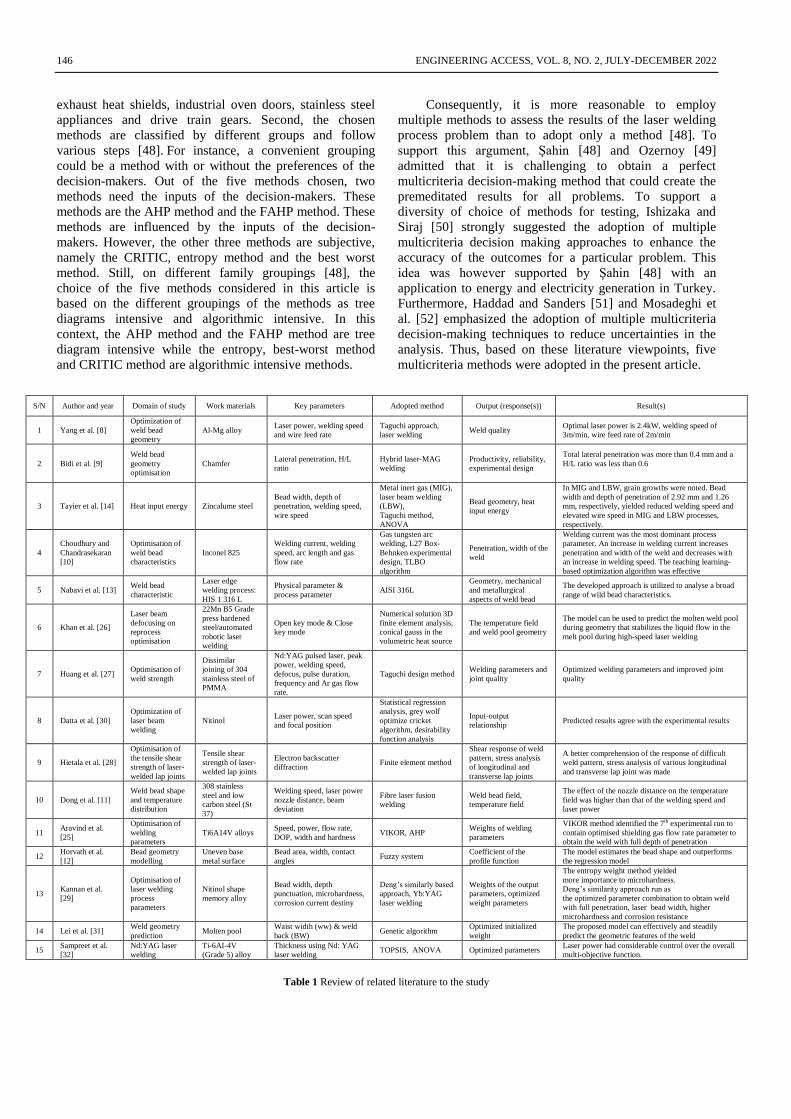
given in Table 1.
Furthermore, motivated by Şahin [48] in the diverse
choice of multicriteria methods to solve a problem and rank
alternatives, this article chooses five multicriteria methods
in this study. These methods are the analytics hierarchy
process (AHP) method, fuzzy analytic hierarchy process
(FAHP) method, entropy method, best waist method and
the criteria importance through intercriteria correlation
(CRITIC). The principal reasons which aided the selection
of these methods are explained as follows. First, the chosen
methods are commonly used by researchers and by
providing enough and new details about their utility will
enable works is in the area to expand knowledge and
practice by replicating the methods in different contexts.
For example, process engineers and researchers in heavy
industrial situations will find the methods useful. They may
be applied to operations involving the production of
146 ENGINEERING ACCESS, VOL. 8, NO. 2, JULY-DECEMBER 2022
exhaust heat shields, industrial oven doors, stainless steel
appliances and drive train gears. Second, the chosen
methods are classified by different groups and follow
various steps [48]. For instance, a convenient grouping
could be a method with or without the preferences of the
decision-makers. Out of the five methods chosen, two
methods need the inputs of the decision-makers. These
methods are the AHP method and the FAHP method. These
methods are influenced by the inputs of the decision-
makers. However, the other three methods are subjective,
namely the CRITIC, entropy method and the best worst
method. Still, on different family groupings [48], the
choice of the five methods considered in this article is
based on the different groupings of the methods as tree
diagrams intensive and algorithmic intensive. In this
context, the AHP method and the FAHP method are tree
diagram intensive while the entropy, best-worst method
and CRITIC method are algorithmic intensive methods.
Consequently, it is more reasonable to employ
multiple methods to assess the results of the laser welding
process problem than to adopt only a method [48]. To
support this argument, Şahin [48] and Ozernoy [49] admitted that it is challenging to obtain a perfect
multicriteria decision-making method that could create the
premeditated results for all problems. To support a
diversity of choice of methods for testing, Ishizaka and
Siraj [50] strongly suggested the adoption of multiple
multicriteria decision making approaches to enhance the
accuracy of the outcomes for a particular problem. This
idea was however supported by Şahin [48] with an
application to energy and electricity generation in Turkey.
Furthermore, Haddad and Sanders [51] and Mosadeghi et
al. [52] emphasized the adoption of multiple multicriteria
decision-making techniques to reduce uncertainties in the
analysis. Thus, based on these literature viewpoints, five
multicriteria methods were adopted in the present article.
S/N Author and year Domain of study Work materials Key parameters Adopted method Output (response(s)) Result(s)
1 Yang et al. [8]
Optimization of
weld bead
geometry
Al-Mg alloy Laser power, welding speed
and wire feed rate
Taguchi approach,
laser welding Weld quality
Optimal laser power is 2.4kW, welding speed of
3m/min, wire feed rate of 2m/min
2 Bidi et al. [9]
Weld bead
geometry
optimisation
Chamfer Lateral penetration, H/L
ratio
Hybrid laser-MAG
welding
Productivity, reliability,
experimental design
Total lateral penetration was more than 0.4 mm and a
H/L ratio was less than 0.6
3 Tayier et al. [14] Heat input energy Zincalume steel
Bead width, depth of
penetration, welding speed,
wire speed
Metal inert gas (MIG),
laser beam welding
(LBW),
Taguchi method,
ANOVA
Bead geometry, heat
input energy
In MIG and LBW, grain growths were noted. Bead
width and depth of penetration of 2.92 mm and 1.26
mm, respectively, yielded reduced welding speed and
elevated wire speed in MIG and LBW processes,
respectively.
4
Choudhury and
Chandrasekaran
[10]
Optimisation of
weld bead
characteristics
Inconel 825
Welding current, welding
speed, arc length and gas
flow rate
Gas tungsten arc
welding, L27 Box-
Behnken experimental
design, TLBO
algorithm
Penetration, width of the
weld
Welding current was the most dominant process
parameter. An increase in welding current increases
penetration and width of the weld and decreases with
an increase in welding speed. The teaching learning-
based optimization algorithm was effective
5 Nabavi et al. [13] Weld bead
characteristic
Laser edge
welding process:
HIS 1 316 L
Physical parameter &
process parameter AISI 316L
Geometry, mechanical
and metallurgical
aspects of weld bead
The developed approach is utilized to analyse a broad
range of wild bead characteristics.
6 Khan et al. [26]
Laser beam
defocusing on
reprocess
optimisation
22Mn B5 Grade
press hardened
steel/automated
robotic laser
welding
Open key mode & Close
key mode
Numerical solution 3D
finite element analysis,
conical gauss in the
volumetric heat source
The temperature field
and weld pool geometry
The model can be used to predict the molten weld pool
during geometry that stabilizes the liquid flow in the
melt pool during high-speed laser welding
7 Huang et al. [27] Optimisation of
weld strength
Dissimilar
joining of 304
stainless steel of
PMMA
Nd:YAG pulsed laser, peak
power, welding speed,
defocus, pulse duration,
frequency and Ar gas flow
rate.
Taguchi design method Welding parameters and
joint quality
Optimized welding parameters and improved joint
quality
8 Datta et al. [30]
Optimization of
laser beam
welding
Nitinol Laser power, scan speed
and focal position
Statistical regression
analysis, grey wolf
optimize cricket
algorithm, desirability
function analysis
Input-output
relationship Predicted results agree with the experimental results
9 Hietala et al. [28]
Optimisation of
the tensile shear
strength of laser-
welded lap joints
Tensile shear
strength of laser-
welded lap joints
Electron backscatter
diffraction Finite element method
Shear response of weld
pattern, stress analysis
of longitudinal and
transverse lap joints
A better comprehension of the response of difficult
weld pattern, stress analysis of various longitudinal
and transverse lap joint was made
10 Dong et al. [11]
Weld bead shape
and temperature
distribution
308 stainless
steel and low
carbon steel (St
37)
Welding speed, laser power
nozzle distance, beam
deviation
Fibre laser fusion
welding
Weld bead field,
temperature field
The effect of the nozzle distance on the temperature
field was higher than that of the welding speed and
laser power
11 Aravind et al.
[25]
Optimisation of
welding
parameters
Ti6A14V alloys Speed, power, flow rate,
DOP, width and hardness VIKOR, AHP
Weights of welding
parameters
VIKOR method identified the 7th experimental run to
contain optimised shielding gas flow rate parameter to
obtain the weld with full depth of penetration
12 Horvath et al.
[12]
Bead geometry
modelling
Uneven base
metal surface
Bead area, width, contact
angles Fuzzy system
Coefficient of the
profile function
The model estimates the bead shape and outperforms
the regression model
13 Kannan et al.
[29]
Optimisation of
laser welding
process
parameters
Nitinol shape
memory alloy
Bead width, depth
punctuation, microhardness,
corrosion current destiny
Deng’s similarly based
approach, Yb:YAG
laser welding
Weights of the output
parameters, optimized
weight parameters
The entropy weight method yielded
more importance to microhardness.
Deng’s similarity approach run as
the optimized parameter combination to obtain weld
with full penetration, laser bead width, higher
microhardness and corrosion resistance
14 Lei et al. [31] Weld geometry
prediction Molten pool
Waist width (ww) & weld
back (BW) Genetic algorithm
Optimized initialized
weight
The proposed model can effectively and steadily
predict the geometric features of the weld
15 Sampreet et al.
[32]
Nd:YAG laser
welding
Ti-6AI-4V
(Grade 5) alloy
Thickness using Nd: YAG
laser welding TOPSIS, ANOVA Optimized parameters
Laser power had considerable control over the overall
multi-objective function.
Table 1 Review of related literature to the study
ENGINEERING ACCESS, VOL. 8, NO. 2, JULY-DECEMBER 2022 147
S/N Author and year Domain of study Work materials Key parameters Adopted method Output (response(s)) Result(s)
16 Yang et al. [33] Laser welding - Low fidelity & high fidelity NSGA algorithm Optimal solutions
The integrated optimal method could generate a
desirable bead profile and reduce distortion in deep
penetration laser welding
17 Reisgen et al.
[34] Laser welding
DP600 and TRIP
700 steel sheets
Power, speed, focus
position
Response surface
methodology (Box–
Behnken design)
Weld quality,
productivity and total
operation cost
Strong, efficient and low-cost wild joints could be
achieved using the optimum welding condition
18 Zhang et al. [35] Laser pulse
shaping Pulsed Laser
CLBW continuous laser
beam welding PLBW
(Pulsed laser beam welding)
PLBW Pulsed laser shapes
It predicts the sensitivity of solidification
cracks, the formation and growth processes of hot
cracks in pulsed laser welding
19 Qu et al. [36] Weld geometry Buried pipeline
Bevel angle, residual wild
height, weld root opening
and thickness
Numerical method and
range analysis method
Weld geometry
parameters
Deformation of explosion front surface is larger than
that of explosion back surface of the buried pipeline
20 Paranthaman et
al. [37]
CO2 welding
process
The dissimilar
metal joint
between stainless
steel and corten
steel
2mm thick steel sheets of
DSS-2205 and Corten-steel
Duplex stainless steel
(ASTM 332205
1332201)
Weld joint quality To find out the optimum welding for a meters for
welding dissimilar metal joint
21 Grünenwald et
al. [38] Weld geometry
Oscillation of the
laser beam
Laser power, welding
speed, and focal point
The laser beam
(Oscillation)
Geometrical dimension
of the weld
Lower oscillation frequencies with higher amplitudes
were obtained
22 Prieto et al. [39]
E-mobility sector
(battery coolers
and battery
boxes)
3003 aluminium
alloy plates
Laser beam intensity
profiles, oscillation
frequencies
Overlap welding,
CIVAN proprietary
coherent beam
combining and optical
phased array
technologies
Weld seam geometry
width and depth of
penetration
Defect-free weld seam geometry width and depth of
penetration were obtained
23 Guo et al. [40] Laser welding of
stiffened plates
Al-Li alloy
stiffened plates
Ultimate strength, failure
mode, strain evolution,
weld morphology
Tension experiments,
digital image
correlation,
metallographic
experiment
Welding deformation,
residual stress
The finite element model can accurately predict the
failure modes and ultimate strength of the stiffened
plate
24 Gupta et al. [41] Laser welding
Nb-1%C laser
welding
Laser power, welding
speed, beam diameter
Energy dispersive
spectroscopy & X-ray
diffraction phase
analysis
Reduction of tensile
strength and ductility of
the joints
Laser welding is an alternative technique for the
fabrication of reactive niobium alloy
25 Robertson and
Kaplan [42] Laser welding
Multibeam laser
welding
Powder ratios high speed,
films, time and location Beam orientation Impact of a molten front
Logging inter-key-hole wall of a beam process was
impacted by the presence of a fully molten front
26 Mashinini and
Hattingh [43]
Heat input and
fatigue
performance
Welded T6A14V
sheet
Laser power and welding
travel speed Fatigue data Weld geometry changes
Laser powder variation was not the sole determinant in
fatigue life
27 Errico et al. [44] Laser welding
AISI 304
stainless steel
plate with
AISi316 powder
Laser power, translation
speed, power feed rate, gas
flow rate and laser spot
diameter
Coaxial powder
feeding method
Evaluated filler powder
in the welding
Demonstrated the feasibility of the
laser welding of AISI 304 stainless steel with AISI
316L powder.
28 Liu et al. [45]
CO2 laser-MAG
hybrid welding
process
Co2 laser metal
active gas
(MAG) hybrid
welding
technique.
Wavelength LD pump laser Interference from the
welding arc
A computer-based system is developed to collect the
waveforms of the electrical welding
29 Sathish et al.
[46]
4-GTAW
welding DMR 249 steel DOP (depth of penetration)
RSM, Taguchi
optimisation technique Predict the RSM error
Optimized welding process parameters for achieving
maximum DOP with better achieves during 4-GTAn
Process
30 Chen et al. [47] Laser MIG
welding
Hybrid laser-
MIG welding of
aluminium alloy
Electromagnetic force,
surface tension and
buoyancy
Mathematical model Calculated element
distribution
Provides an effective method for
parametric optimization to improve the properties of
hybrid laser–MIG welding joints
Table 1 Review of related literature to the study (continue)
3. Methods
Based on the literature review, the study concerning
laser welding on the optimisation of weld bead geometry
has been extensively documented and noted to be adequate.
However, the selection of parameters is an additional task
to be conducted which considering the optimisation or even
in its absence. For a deep insight into the problem studied,
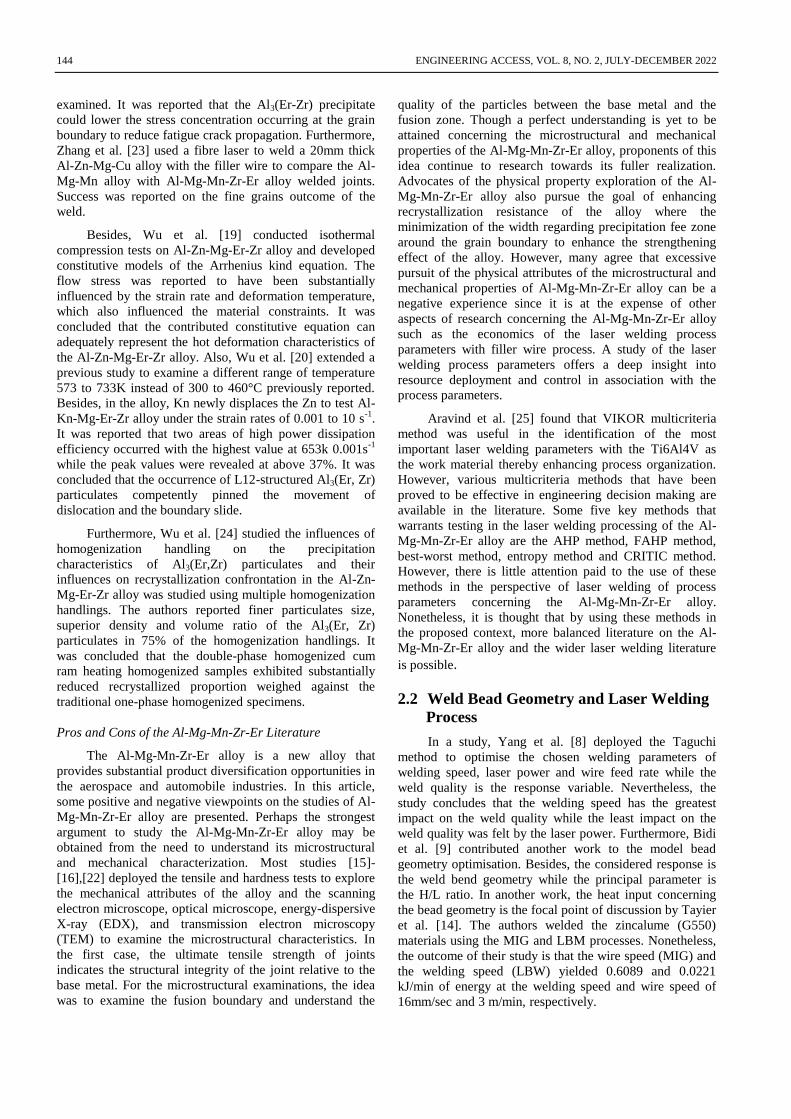
the physical representation of the weld bead geometry is
considered. Fig. 1 shows the profile of a weld bead
geometry accompanied by its parameters, namely, depth of
penetration (Dp), bead weight (Wb), electrode deposit area
(Aed), the height of reinforcement (Hf), plate fusion area
(Apf) and wetting angle ( ) [7],[53]. Kurtulmus et al. [7]
argued that measurement of weld bead parameters is the
best achieved from their images. However, the weld bead
geometry may be directly predicted from the measurements
of welding process parameters such as the laser per,
welding speed and feed speed for laser welding
considerations.
Fig. 1 Geometric parameters of a bead on plate weld [7], [53]; Key: Aed: Electrode deposit area; Apf: Plate fusion area; Dp: Penetration depth; Hr:
Reinforcement height; Wb: Bead width; : Wetting angle
With the background of the weld bead geometry, the
procedures taken in the present study are highlighted. The
steps taken in this section are as follows:
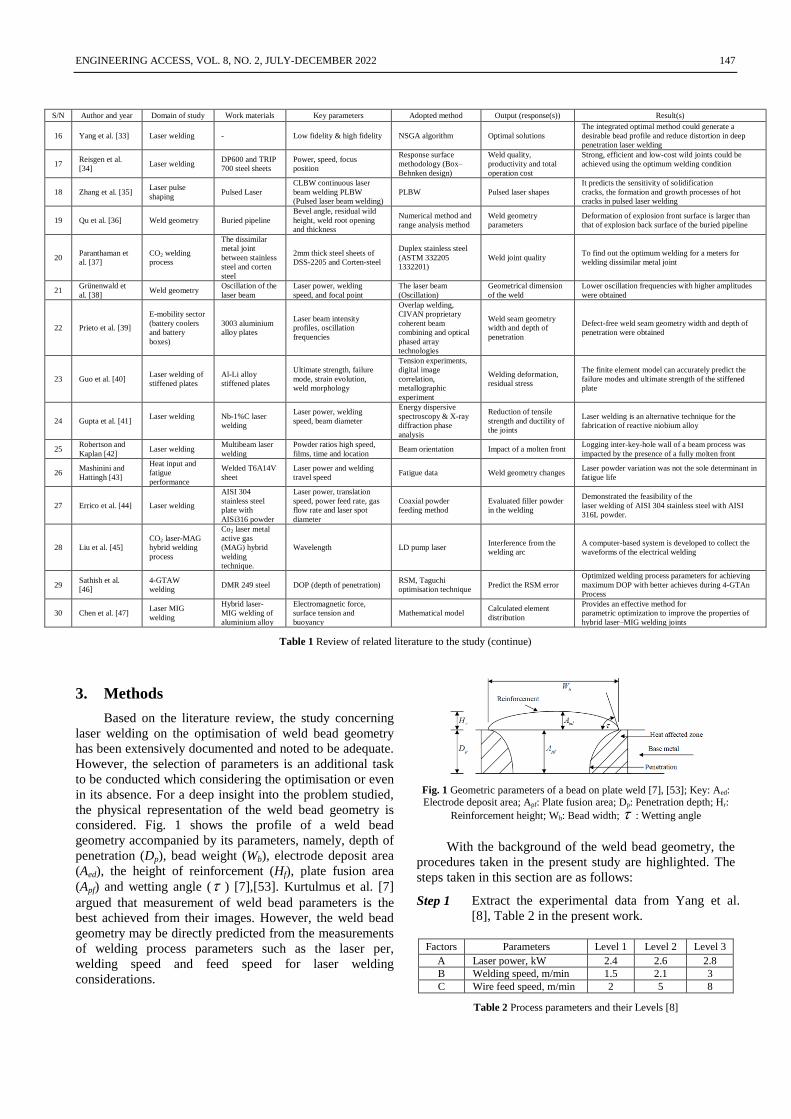
Step 1 Extract the experimental data from Yang et al.
[8], Table 2 in the present work.
Factors Parameters Level 1 Level 2 Level 3
A Laser power, kW 2.4 2.6 2.8
B Welding speed, m/min 1.5 2.1 3
C Wire feed speed, m/min 2 5 8
Table 2 Process parameters and their Levels [8]
148 ENGINEERING ACCESS, VOL. 8, NO. 2, JULY-DECEMBER 2022
In this article, the three critical parameters that have
been considered central to the evaluation of the weld bead
geometrical analysis for the Al-Mg-Mn-Zr-Er alloy are
laser power, welding speed and wire feed speed. These
have been chosen according to the literature guidance and
the experience of the authors. By some explanations of
what these factors means are essential to understand the
procedure proposed in the present work. First, the laser
power is explained. The laser power, characteristically
calculated in megawatts, accounts for the quantity of
optimal power that the laser outputs [8, 54]. The laser
power is central to the stability of the welding operation as
it influences the weed bead geometry by regulating the
quantity of energy absorbed into the Al-Mg-Mn-Zr-Er
alloy. As described by Kant et al. [55], laser power is
highly influential on process parameters. In a laser sheet
bending process, they illustrated how the control aspect of
the laser power works. They asserted that growth in the
bend angle is experienced as growth in laser power is
instituted. However, they cautioned that as it attains a peak,
decay in performance is expected with additional growth in
laser power.
The welding speed also referred to as travel speed, is
the proportion of the length of weld to the time to weld. It
may be viewed as the linear rate that the laser beam travels
along with the Al-Mg-Mn-Zr-Er alloy and it is often
expressed in millimetres per minute [8]. Furthermore, it is
known in the literature that generally, the penetration made
by the laser beam into the base material increases with the
increase in the welding speed. Also, it decreases as the
welding speed decreases [8]. The last factor, wire feed
speed, which is often independent of the power setting.
There are different positions to set the wire feed rate: off,
good, too fast, too slow, far too first and far too slow.
Matys et al. [54] suggested the inclusion of the following
beam profile (Gaussian or flat top), size of the tip, tip
angulation, energy and power of the laser, time of
irradiation distance to the target and pulse duration and
repletion rate.
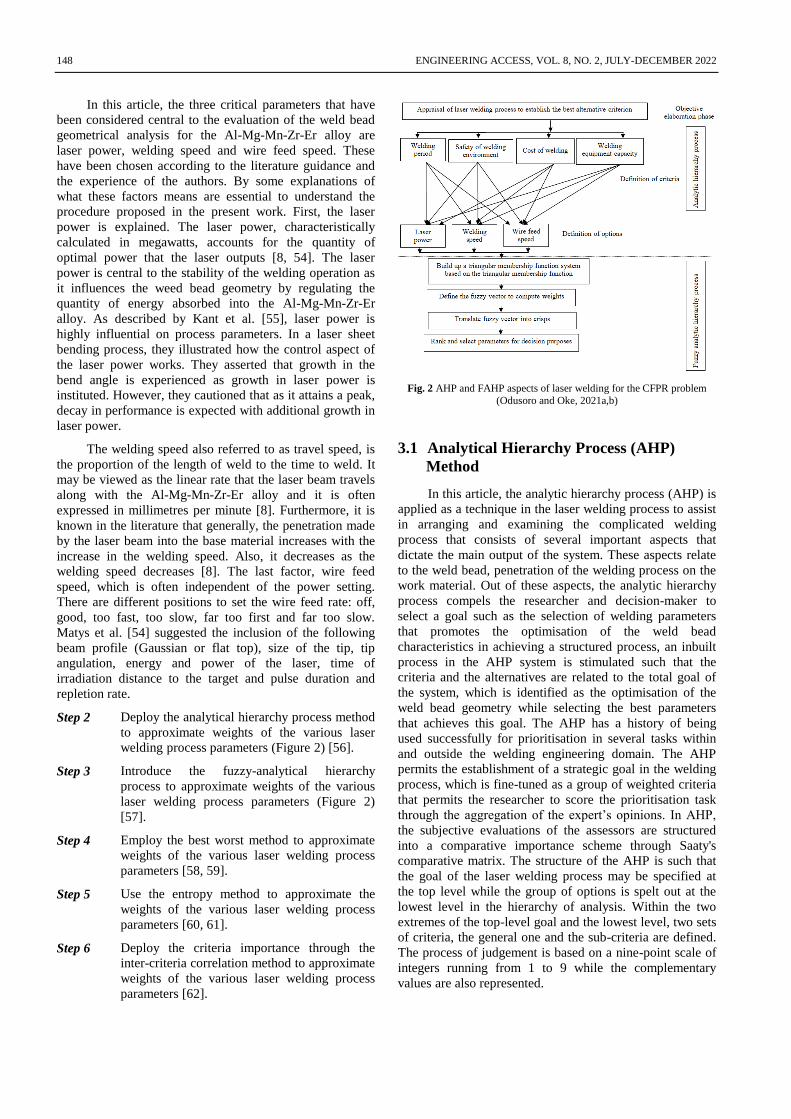
Step 2 Deploy the analytical hierarchy process method
to approximate weights of the various laser
welding process parameters (Figure 2) [56].
Step 3 Introduce the fuzzy-analytical hierarchy
process to approximate weights of the various
laser welding process parameters (Figure 2)
[57].
Step 4 Employ the best worst method to approximate
weights of the various laser welding process
parameters [58, 59].
Step 5 Use the entropy method to approximate the
weights of the various laser welding process
parameters [60, 61].
Step 6 Deploy the criteria importance through the
inter-criteria correlation method to approximate
weights of the various laser welding process
parameters [62].
Fig. 2 AHP and FAHP aspects of laser welding for the CFPR problem
(Odusoro and Oke, 2021a,b)
3.1 Analytical Hierarchy Process (AHP)
Method
In this article, the analytic hierarchy process (AHP) is
applied as a technique in the laser welding process to assist
in arranging and examining the complicated welding
process that consists of several important aspects that
dictate the main output of the system. These aspects relate
to the weld bead, penetration of the welding process on the
work material. Out of these aspects, the analytic hierarchy
process compels the researcher and decision-maker to
select a goal such as the selection of welding parameters
that promotes the optimisation of the weld bead
characteristics in achieving a structured process, an inbuilt
process in the AHP system is stimulated such that the
criteria and the alternatives are related to the total goal of
the system, which is identified as the optimisation of the
weld bead geometry while selecting the best parameters
that achieves this goal. The AHP has a history of being
used successfully for prioritisation in several tasks within
and outside the welding engineering domain. The AHP
permits the establishment of a strategic goal in the welding
process, which is fine-tuned as a group of weighted criteria
that permits the researcher to score the prioritisation task
through the aggregation of the expert’s opinions. In AHP,
the subjective evaluations of the assessors are structured
into a comparative importance scheme through Saaty's
comparative matrix. The structure of the AHP is such that
the goal of the laser welding process may be specified at
the top level while the group of options is spelt out at the
lowest level in the hierarchy of analysis. Within the two
extremes of the top-level goal and the lowest level, two sets
of criteria, the general one and the sub-criteria are defined.
The process of judgement is based on a nine-point scale of
integers running from 1 to 9 while the complementary
values are also represented.
ENGINEERING ACCESS, VOL. 8, NO. 2, JULY-DECEMBER 2022 149
The following steps are undertaken in the use of the
AHP [56]:
Step 1 A pair-wise comparison matrix is developed
using the scale of relative importance
A matrix is a framework containing information about
the laser welding criteria of laser power, welding speed and
welding rate speed arrange both in columns and rows with
each criterion established in a single row or column where
the intersection is often ignored. The matrix is often in a
square matrix that permits a pairwise comparison of the
possible groupings of criteria. Pairwise comparison is a
procedure conducted to compare laser welding factors in
pairs to ascertain if a factor is preferred to the other. The
number of pairwise comparisons possible is a function of
the number of factors in the square matrix. The higher the
number of factors, the greater the number of pairwise
comparison entries and vice-versa.
Step 2 Each column on the pair-wise comparison
matrix table is then summed up
Step 3 Each segment on the pair-wise comparison
matrix table is then divided by the total sum on
its corresponding row.
Step 4 The criteria weights are calculated using
Equation (1) [56]:
Criterion weight (CW) =
Sum of values on rows/total number of factors (1)
Notice that the total number of factors is 3
Step 5 To check for consistency of the obtained
results, the weighted sum (WS) is first off
calculated by multiplying each factor/criterion
by their corresponding criteria weight and then
summing up each row.
Step 6 The ratio of the weighted sum to criteria
weight (WS/CW) is calculated for each factor.
Step 7 The consistency index (CI) is calculated using
Equation (2) [56]:
1
max
n
nCI
(2)
where max is the largest eigenvalue of the n-
order matrix and is the average of the ratio of
the weighted sum to criteria weight, n is the
number of criteria/factors, which is 3
Step 8 The consistency ratio (CR) is then calculated
using Equation (3) [56]:
CR = CI/Random index (RI) (3)
; where the random index is the consistency
index of the randomly generated pair-wise
matrix.
The consistency ratio is the proportion of the
consistency index to the random index. It is an indicator of
the comparative strength of the analysis conducted using
the expert’s opinion. In this case, one of the authors was
the assessor and the senior author verified the assessment
for completeness and correctness. As the consistency ratio
decreases, the better the degree of satisfaction of the
researcher with the assessment conducted. However, an
increase in the value of the consistency ratio beyond 0.1
indicates poor data and adjustments need to be undertaken
to ascertain that the consistency ratio falls within limits.
The consistency ratio is used to decide if the assessor could
proceed with the results of the ranking and select the best
candidate or not. According to Saaty [56], as the
consistency ratio is above 0.1 the obtained rankings and
choice of the best to the worst criterion is not consistent
and unreliable. Interestingly, if a value of 0 is obtained, a
perfectly consistent evaluation of the ranks for the criteria
is made. The evaluations in this instance are reliable and
decisions made on them are promising.
The role of consistency ratio for the weight
calculations involving the laser welding of the Al-Mg-Mn-
Zr-Er alloy is to evaluate the degree to which the method
predicts the attributes of the factors for the Al-Mg-Mn-Zr-
Er alloy. Consistency occurs when the ratio obtained is less
than 0.10, indicating a strong association between the
method and the attributes of the data. For instance, a value
of 0.05 shows a promising consistency in the evaluation.
An analysis of consistency is essential since significant
benefits of the method are obtained from the understanding
that the quality of data, particularly those obtained from
experts’ judgments assists in revealing the competence of
the method to correctly predict the best to the worst criteria
according to the aim of applying the analytic hierarchy
process.
3.2 Fuzzy Analytical Hierarchy Process
(FAHP) Method
The fuzzy analytic hierarchy process (FAHP) is a
modification of the AHP that corrects the weakness of the
AHP regarding its inability to track the imprecision and
uncertainty inherent in the evaluation of the laser welding
process parameters. While coordinating the measures from
the field the decision-maker might have introduced errors
and also errors do arise from other sources too. These
errors are corrected by using the FAHP method, which
combines the AHP method and the fuzzy logic method.
Consequently, the FAHP draws inspiration from the AHP
method by following the Saaty's importance scale but with
modifications to account for values in-between those being
considered. Thus, fuzzy numbers are created uniquely
different from others as it possesses three component
values of a lower component, a middle component and a
higher component whose value representations are
progressive. To achieve the goal of FAHP, two common
scales are used to achieve priority, namely the triangular
150 ENGINEERING ACCESS, VOL. 8, NO. 2, JULY-DECEMBER 2022
and trapezoidal scales. However other methods of scales
have been developed but not common.
The steps taken in the fuzzy analytical hierarchy
process approach are as follows:
Step 1 The scale of relative importance as used in the
analytical hierarchy process method is changed
to a fuzzy scale of relative importance which
uses fuzzy numbers.
Step 2 A pair-wise comparison matrix is developed
using the scale of relative importance
Step 3 The pair-wise comparison matrix obtained will
be changed to fuzzy numbers using the fuzzy
scale of relative importance. To change the
values of fractions, (4) is used [57]:
umlumlA
1,
1,
1),,(
~ 11 (4)
Step 4 The fuzzy geometric mean ir~
is calculated and
is the cube root of the multiplication of each
value in each column, (5) [57]:
),,(),,(~~
22211121 umlumlAA
),,( 212121 uummll (5)
Step 5 The fuzzy weights iw~ are calculated [57]:
1
321 )~~~(~~ rrrrw ii (6)
Step 6 The fuzzy weights will then be changed to
numerical values, (7) [57]:
3
umlwi
(7)
3.3 Best Worst Method
Although there are numerous effective multicriteria
methods, the development of novel methods that are
straightforward always attracts the interest of decision-
makers and researchers. The best-worst method is a novel
method that emerged in 2015 with unique descriptions of
two features that are uncommonly emphasized in other
methods [58, 59]. These are the least and most essential
criteria that are identified by the experts. Then the assessor
establishes the levels, that the other criteria are better than
the considered criteria; the assessor also determines the
level at which the considered criterion is better than the
worst criterion [58],[59].
In this method, the most important criteria (wire feed
speed) and the least important criteria (laser power) are
used to create a linear programming problem and the Excel
16 software was used for this computation. Three decision
criteria are selected in the software and the most and least
important criteria are also noticed. The preference of the
decision-maker is then expressed on 'the best criterion over
all the other criterion', and the preference of 'all the other
criteria over the worst' by selecting a number between 1
and 9 as was the same case in the AHP method where the
scale of relative importance was used for this decision. The
best worst method follows the following steps [58], [59]:
Step 1 Establish the set of decision criteria.
Step 2 Establish the preference of the best criterion over
others by employing a scale of comparative
importance which ranges from 1 to 9.
Step 3 Determine the preference of the worst criterion
over all the other criteria, using a scale of
relative importance from 1 to 9.
Step 4 Find the optimal weight using (8)-(12) [58],[59]:
iMin (8)
Subject to
ijBjb waw , for all j (9)
iwjwj waw , for all j (10)
1jw (11)
,0jw for all j (12)
; where l is the term for the objective function,
wlp, ws and wwfs, are the weights of laser power,
welding speed and wire feed speed respectively
aBj is the value in the columns considering the
row parameter one at a time
wj is the value of the individual criterion when a
particular factor is considered
It may also be computed by using the BWM
excel solver.
3.4 Entropy Method
The entropy weight approach is claimed to be an
objective approach as it excludes inputs from experts in the
area of laser welding and only acts on a set of weight
conversion mechanisms [21],[60],[61],[63]. Consequently,
it has a huge popular usage by decision-makers in the
engineering field. The entropy is based on the degree of
disparity among the criteria where the higher degree of
dispersion indicates more level of differentiation among the
criteria and more information may be obtained from the
association of the criteria by deploying the entropy method.
The steps taken in this method are as follows
[21],[60],[61],[63]:

ENGINEERING ACCESS, VOL. 8, NO. 2, JULY-DECEMBER 2022 151
Step 1 The Decision matrix (extracted data) is
normalized using Equation (13) [21, 60, 61, 63]:
m
j
ij
ij
ij
x
xr
1
(13)
where rij is the normalized matrix and xij is the
individual value in each segment
Step 2 The entropy, ej is calculated using Equation (14)
[21, 60, 61, 63]:
m
i
ijijj rrhe1
ln (14)
; wherem
hln
1
ej is the entropy for the jth
assessment parameter
within the boundary of the assessment parameters
[61]
m is the number of alternatives, which is 3 [21],
[60],[61],[63].
Step 3 The degree of diversification, dj is calculated
using Equation (15) [21], [60], [61], [63]:
dj = 1 - ej (15)
Step 4 The weight of each criterion is then calculated,
Equation (16) [21, 60, 61, 63]:
j
j
jd
dw (16)
3.5 Criteria Importance through Inter-
Criteria Correlation (CRITIC) Method
The birth of the unique method, CRITIC was in 1995,
which could be applied to achieve an understanding of the
characteristics weights of the elements of the decision
matrix, notably the laser welding parameters of laser
power, welding speed and the wire feed speed. The
CRITIC method has different phases of detailing the
weight and the ranking attributes. It employs the coefficient
of correlation among the various characteristics to establish
the association among the mentioned parameters.
The steps taken in this method are as follows:
Step 1 The decision matrix is normalized using Equation
(18) [62]:
worst
j
best
j
worst
jij
ijXX
XXX
(17)
Step 2 The standard deviation, j of each column, is
estimated and is done with the aid of the excel
software.
Step 3 The symmetric matrix of n x n with element rjk is
determined and is the linear correlation coefficient
between the vectors xj and xk and this is also done
using the Excel 16 software.
Step 4 Calculate the measure of the conflict created by
criterion j concerning the decision situation
defined by the rest of the criteria using the
following expression:
m
k
jkr1
)1( (18)
Step 5 The quantity of the data about each criterion is
then determined using Equation (19) [62]:
m
k
ijjj rC1
)1( (19)
Step 6 The objective weights are finally calculated using
Equation (20) [62]:
m
k
j
j
j
C
Cw
1
(20)
However, the consistency index, CI, of the result is
then calculated using Equation (21) [56]:
1max
n
nCI
(21)
But, the consistency ratio (CR) is given by
Equation (22) [56]:
CR = CI/RI (22)
; where RI is the random index
Besides, the best worst method has been
distinguished as less computationally laborious regarding
the computational time to achieve data collection,
calculation and analysis compared with the analytic
hierarchy process (AHP) method. But the AHP method has
outstanding benefits, including the ability to incorporate a
wide range of criteria, extensive usage in engineering
practice, it is trusted by many researchers. The CRITIC
method is preferred to users because of its objectivity in
assessment and considers the contrast intensity as well as
the conflicting feature of the assessment criteria. For the
entropy method, it has much attraction because users it has
objectivity in-built in it. It has been stated to have wide
applications. The fuzzy AHP is credited for transforming
qualitative descriptions into quantitative interpretation with
uncertainty and imprecision content.
152 ENGINEERING ACCESS, VOL. 8, NO. 2, JULY-DECEMBER 2022
3.6 Comparison Indices
In attempts to compare a few significant multicriteria
characteristics, two principal comparative indices,
arithmetic mean (Equation (23)) and root mean square
(Equation (24)) were built up. The results of the application
are discussed in the next section.
A =
n
i
fssp WWLn 1
)(1
(23)
RMS =
n
i
fssp WWLn 1
)(1 (24)
; where RMS is the root mean square, n is the number of
measurements such as laser power (lp), welding speed (ws)
and wire feed speed (wfs) and A is the arithmetic mean.
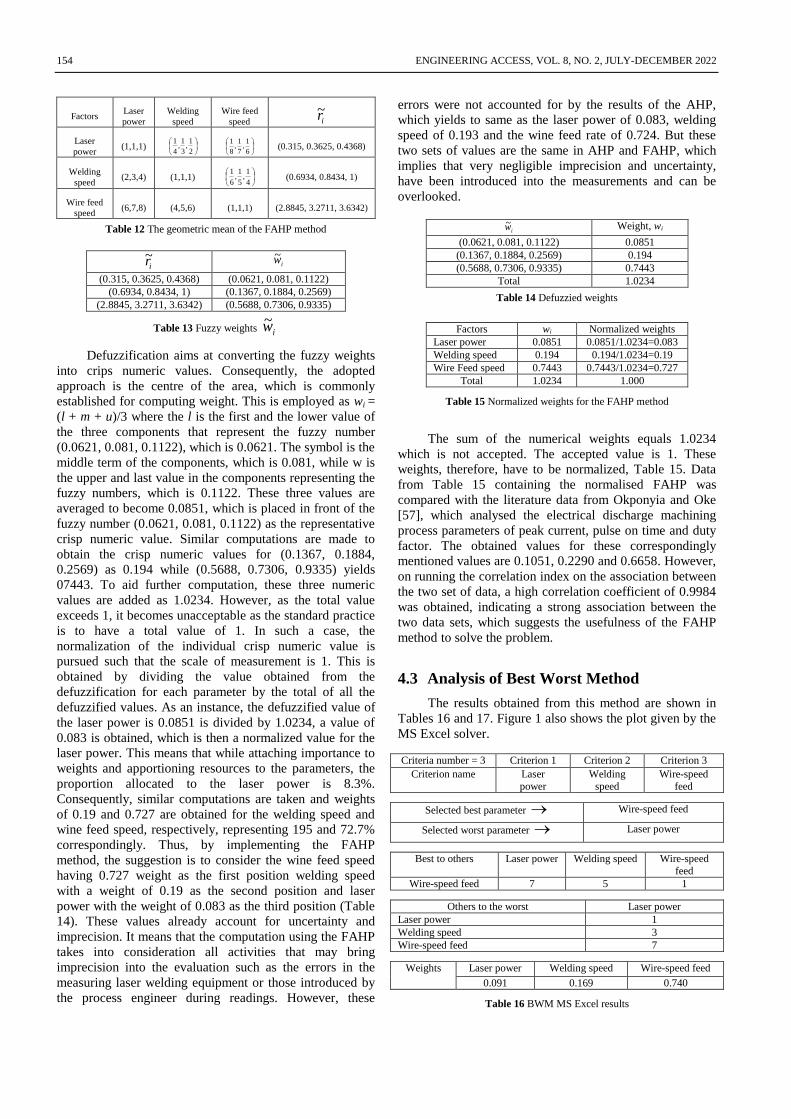
4. Results and Discussion
4.1 Analytical Hierarchy Process Method
A pair-wise comparison matrix is created which gives
the relative importance of various attributes concerning the
goal or objective. It compares two of the attributes at a time
and shows their relative importance. It is created with the
help of a scale of relative importance which is as follows:
The scale of relative importance
1 Equal Importance
3 Moderate Importance
5 Strong Importance 7 Very Strong Importance
9 Extreme Importance
2,4,6,8 Intermediate values 1/3, 1/5, 1/7, 1/9 Values for Inverse Comparison
To solve the pair-wise comparison matrix, a 3 x 3
matrix will be provided as there are three criteria: Laser
power, welding speed, and wire feed speed. Before going
further, it is important to note that while making decisions,
the decision-maker has to select the most important factor
and also the least important factor and this is normally due
to preference. Concerning these three factors, wire feed
speed has been chosen to be the most important while laser
power has been chosen to be the least important, which
means that mathematically, wire feed speed > welding
speed > laser power.
Factors Laser power Welding speed Wire feed speed
Laser power 1 x/3x = 1/3 x/7x = 1/7
Welding speed 3x/x = 3 1 x/5x = 1/5
Wire feed speed 7x/x = 7 5x/x = 5 1
Table 3 Pair-wise comparison matrix
Pairwise comparison in laser welding is adopted from
L.L. Thurstone's law of comparative judgment. This
principle empowers the researcher (expert in the present
case) to compare the factors of the laser welding process in
pairs and judge which factor is preferred to the other using
number assignments. Table 3 shows the results of the
pairwise comparison undertaken among the three laser
welding factors of laser power, welding speed and wire
feed speed. The explanation of the table proceeds from the
second row containing the factor, laser power and its
interaction with itself, welding speed and wire feed speed.
Matched against itself, the laser power means that laser
power is as important as itself and therefore given 1 point.
Likewise, all entries of the factor matched against itself
obtain a value of 1. Still along the second row but at the
intersection of the laser power with the welding speed, a
judgment of 1/3 is eventually obtained. To understand the
computation, the symbol x is attached as the maximum
possible score between the laser power and any other
factor, but the welding speed is evaluated by the researcher
as not as important as the laser power. This means the
welding speed carries the third weight of importance as the
laser power. This is why a value of x/3x is assigned to this
cell and the outcome is 1/3. Similarly, the wire feeds speed
is judged to be not as important as the laser power. It is to
the strength of one-seventh in importance and therefore
assigned a value of x/7x and 1/7. The reverse of these
values of 3 and 7 is given to the intersection of welding
speed with laser power (row 3) and wire feed speed with
laser power (row 4), respectively. Thus, by using the same
idea, Table 2 is completed. The sum of each column is then
calculated and is shown in Table 4. Each value on each
segment is then divided by the sum on each column, Table
5. The criteria weights are therefore estimated by summing
the rows by the total and dividing by the total number of
factors, which is equal to 3, Table 6.
Factors Laser power Welding speed Wire feed speed
Laser power 1 0.33 0.14
Welding speed 3.00 1 0.20
Wire feed speed 7.00 5.00 1
Total 11.00 6.33 1.34
Table 4 Sum of pair-wise comparison matrix
Factors Laser power Welding speed Wire feed speed
Laser power 0.0909 0.0526 0.1045
Welding speed 0.2727 0.1579 0.1493
Wire feed speed 0.6364 0.7895 0.7463
Table 5 Pair-wise comparison matrix
Factors Laser
power
Welding
speed
Wire feed
Speed
Sum of
weights CW
Laser power 0.0909 0.0526 0.1045 0.2480 0.083
Welding speed 0.2727 0.1579 0.1493 0.5799 0.193
Wire feed speed 0.6364 0.7895 0.7463 2.1721 0.724
Table 6 Criteria weights of the AHP Method
Table 6 should be the weights for the considered
factors but while dealing with the AHP method, the
consistency of the result should be calculated. This is done
first, by calculating the ratio of the weighted sum to criteria
weights. The weighted sum is calculated by multiplying
each element by their criteria weight and adding the row
values as shown in Table 7. The ratio of the weighted sum
to criteria weight is then calculated (WS/CW), Table 8.
ENGINEERING ACCESS, VOL. 8, NO. 2, JULY-DECEMBER 2022 153
Criterion weight (CW)
0.083 0.193 0.724
Factors Laser
power
Welding
speed
Wire feed
speed WS
Laser power 0.0075 0.0102 0.0756 0.0933
Welding speed 0.0226 0.0305 0.1081 0.1611
Wire feed speed 0.0526 0.1526 0.5403 0.7455
Table 7 The weighted sum on the AHP method
Factors WS/CW
Laser power 1.1286
Welding speed 0.8336
Wire feed speed 1.0297
Table 8 The ratio of the weighted sum to criteria weight of the AHP
method
The consistency index, CI, of the result is then
calculated using (21); where
9973.03
0296.18336.01286.1max
Therefore, CI = (0.9973-3)/(3-1) = -0.6676
The consistency ratio of the result is finally calculated
from Equation (22). The random index is the consistency
index of the randomly generated pair-wise matrix, which is
given in Table 9 obtained from the literature (for up to 10
criteria).
n 1 2 3 4 5 6 7 8 9 10
RI 0.00 0.00 0.58 0.90 1.12 1.24 1.32 1.41 1.45 1.49
Table 9 Random index for n =10 criteria
Therefore, for three criteria:
CR = -0.6676/0.58 = -1.1510
For consistency, CR < 0.10, which is satisfied in this case
as the obtained CR is -1.1510. The calculated weighted
result is therefore consistent. In summary, the weights
obtained from the AHP method are given in Table 10.
Laser power 0.083
Welding speed 0.193
Wire Feed speed 0.724
Table 10 AHP weights for criteria
4.2 Analysis of Fuzzy Analytical Hierarchy
Process Method
To apply the FAHP to evaluate the weights of the
laser welding parameters, the scale of importance adopted
for the AHP is transformed into a fuzzy scale where the
crisp numeric values, which are individual are represented
by fuzzy numbers, each of which comprises three
components identified as the lower, middle and upper
values, which are the first, second and third components,
respectively of the fuzzy numbers. These three component
representation is unique for the triangular fuzzy numbers
adopted in the present study. While other component types
abound such as the trapezoidal, for convenience of
computations and are commonly used, the triangular fuzzy
numbers are adopted in the present article. With an equal
number of descriptions as the AHP such as equal,
moderate, strong, very strong, extremely strong and
intermediate values, the FAHP differs in the scale of
importance specification by having three components of
each fuzzy number. For instance, the "equal" description
has the fuzzy number as "(1, 1, 1)", which means the lower,
middle and upper components of the fuzzy number are 1.
Similarly, other fuzzy numbers representing moderate,
strong, very strong, extremely strong and intermediate
values are respectively stated as (2, 3, 4), (4 5 6), (7, 8, 9),
(9, 9, 9), (1, 2, 3), (3, 4, 5), (5, 6, 7) and (7, 8, 9). However,
the advantage of using the fuzzy scale of comparative
importance is to solve the limitation of the ordinary scale of
comparative importance that does not tackle the values in-
between the various criteria such as 2.5, 3.5, etc.
The fuzzy scale of relative importance
Equal (1,1,1)
Moderate (2,3,4)
Strong (4,5,6)
Very Strong (6,7,8)
Extremely Strong (9,9,9)
Intermediate values (1,2,3)
Intermediate values (3,4,5)
Intermediate values (5,6,7)
Intermediate values (7,8,9)
The fuzzy scale of relative importance solves the
limitations of the ordinary scale of relative importance
which does not account for values in between the different
criteria. For example, values like 2.5,3.5, etc. Table 2 is
recalled for the computation here. The values are then
changed to their corresponding fuzzy numbers, Table 11.
The next step is to calculate the fuzzy geometric
mean, ir~
which was proposed by Buckley (1985) as
reported in Okponyia and Oke [57], Table 12. The fuzzy
weights are then calculated using (6):
1
321 )(~~ rrrrw ii
; where 321 rrr = (3.8929,4.477,5.071), therefore:
1
321 )( rrr
8929.3
1,
477.4
1,
071.5
1 (Table 13)
Factors Laser power Welding speed Wire feed speed
Laser power (1,1,1)
2
1,
3
1,
4
1
6
1,
7
1,
8
1
Welding speed (2,3,4) (1,1,1)
4
1,
5
1,
6
1
Wire feed speed (6,7,8) (4,5,6) (1,1,1)
Table 11 Transformation of pair-wise comparison matrix to fuzzy
numbers
154 ENGINEERING ACCESS, VOL. 8, NO. 2, JULY-DECEMBER 2022
Factors Laser
power
Welding
speed
Wire feed
speed ir~
Laser
power (1,1,1)
2
1,
3
1,
4
1
6
1,
7
1,
8
1
(0.315, 0.3625, 0.4368)
Welding
speed (2,3,4) (1,1,1)
4
1,
5
1,
6
1
(0.6934, 0.8434, 1)
Wire feed
speed (6,7,8) (4,5,6) (1,1,1) (2.8845, 3.2711, 3.6342)
Table 12 The geometric mean of the FAHP method
ir~ iw~
(0.315, 0.3625, 0.4368) (0.0621, 0.081, 0.1122)
(0.6934, 0.8434, 1) (0.1367, 0.1884, 0.2569)
(2.8845, 3.2711, 3.6342) (0.5688, 0.7306, 0.9335)
Table 13 Fuzzy weights iw~
Defuzzification aims at converting the fuzzy weights
into crips numeric values. Consequently, the adopted
approach is the centre of the area, which is commonly
established for computing weight. This is employed as wi =
(l + m + u)/3 where the l is the first and the lower value of
the three components that represent the fuzzy number
(0.0621, 0.081, 0.1122), which is 0.0621. The symbol is the
middle term of the components, which is 0.081, while w is
the upper and last value in the components representing the
fuzzy numbers, which is 0.1122. These three values are
averaged to become 0.0851, which is placed in front of the
fuzzy number (0.0621, 0.081, 0.1122) as the representative
crisp numeric value. Similar computations are made to
obtain the crisp numeric values for (0.1367, 0.1884,
0.2569) as 0.194 while (0.5688, 0.7306, 0.9335) yields
07443. To aid further computation, these three numeric
values are added as 1.0234. However, as the total value
exceeds 1, it becomes unacceptable as the standard practice
is to have a total value of 1. In such a case, the
normalization of the individual crisp numeric value is
pursued such that the scale of measurement is 1. This is
obtained by dividing the value obtained from the
defuzzification for each parameter by the total of all the
defuzzified values. As an instance, the defuzzified value of
the laser power is 0.0851 is divided by 1.0234, a value of
0.083 is obtained, which is then a normalized value for the
laser power. This means that while attaching importance to
weights and apportioning resources to the parameters, the
proportion allocated to the laser power is 8.3%.
Consequently, similar computations are taken and weights
of 0.19 and 0.727 are obtained for the welding speed and
wine feed speed, respectively, representing 195 and 72.7%
correspondingly. Thus, by implementing the FAHP
method, the suggestion is to consider the wine feed speed
having 0.727 weight as the first position welding speed
with a weight of 0.19 as the second position and laser
power with the weight of 0.083 as the third position (Table
14). These values already account for uncertainty and
imprecision. It means that the computation using the FAHP
takes into consideration all activities that may bring
imprecision into the evaluation such as the errors in the
measuring laser welding equipment or those introduced by
the process engineer during readings. However, these
errors were not accounted for by the results of the AHP,
which yields to same as the laser power of 0.083, welding
speed of 0.193 and the wine feed rate of 0.724. But these
two sets of values are the same in AHP and FAHP, which
implies that very negligible imprecision and uncertainty,
have been introduced into the measurements and can be
overlooked.
iw~ Weight, wi
(0.0621, 0.081, 0.1122) 0.0851
(0.1367, 0.1884, 0.2569) 0.194
(0.5688, 0.7306, 0.9335) 0.7443
Total 1.0234
Table 14 Defuzzied weights
Factors wi Normalized weights
Laser power 0.0851 0.0851/1.0234=0.083
Welding speed 0.194 0.194/1.0234=0.19
Wire Feed speed 0.7443 0.7443/1.0234=0.727
Total 1.0234 1.000
Table 15 Normalized weights for the FAHP method
The sum of the numerical weights equals 1.0234
which is not accepted. The accepted value is 1. These
weights, therefore, have to be normalized, Table 15. Data
from Table 15 containing the normalised FAHP was
compared with the literature data from Okponyia and Oke
[57], which analysed the electrical discharge machining
process parameters of peak current, pulse on time and duty
factor. The obtained values for these correspondingly
mentioned values are 0.1051, 0.2290 and 0.6658. However,
on running the correlation index on the association between
the two set of data, a high correlation coefficient of 0.9984
was obtained, indicating a strong association between the
two data sets, which suggests the usefulness of the FAHP
method to solve the problem.
4.3 Analysis of Best Worst Method
The results obtained from this method are shown in
Tables 16 and 17. Figure 1 also shows the plot given by the
MS Excel solver.
Criteria number = 3 Criterion 1 Criterion 2 Criterion 3
Criterion name Laser
power
Welding
speed
Wire-speed
feed
Selected best parameter Wire-speed feed
Selected worst parameter Laser power
Best to others Laser power Welding speed Wire-speed
feed
Wire-speed feed 7 5 1
Others to the worst Laser power
Laser power 1
Welding speed 3
Wire-speed feed 7
Weights Laser power Welding speed Wire-speed feed
0.091 0.169 0.740
Table 16 BWM MS Excel results
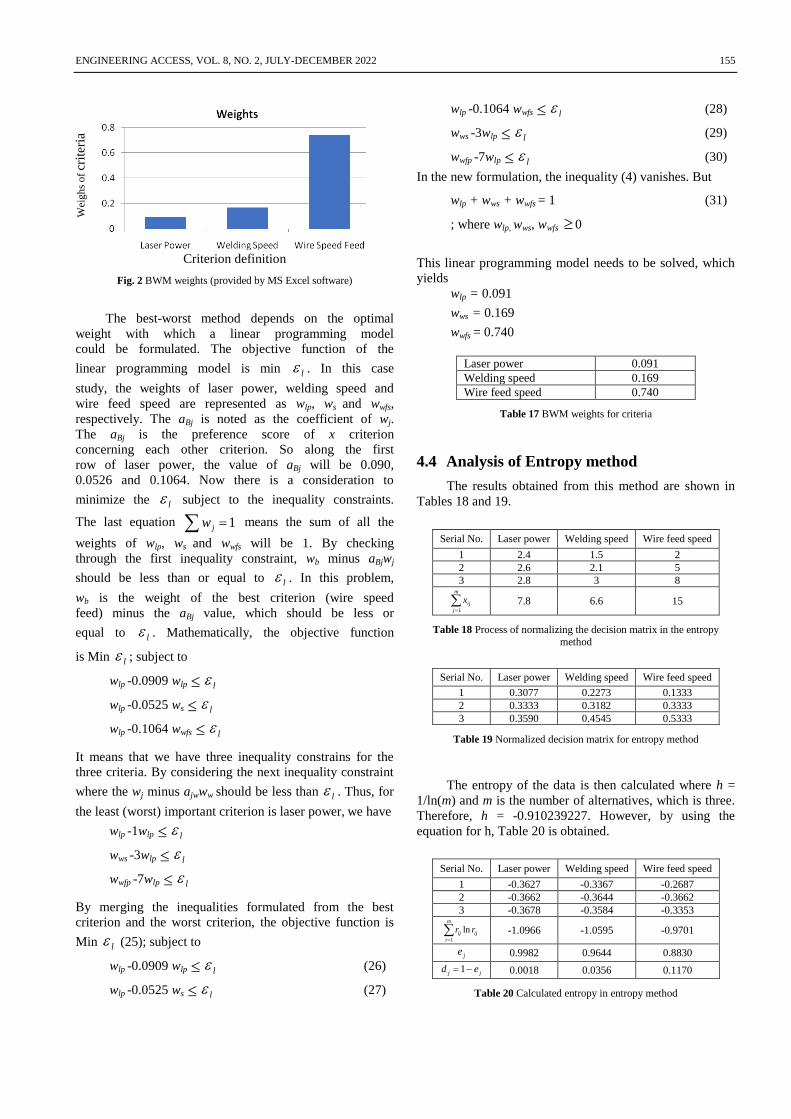
ENGINEERING ACCESS, VOL. 8, NO. 2, JULY-DECEMBER 2022 155
Criterion definition
Fig. 2 BWM weights (provided by MS Excel software)
The best-worst method depends on the optimal
weight with which a linear programming model
could be formulated. The objective function of the
linear programming model is min l . In this case
study, the weights of laser power, welding speed and
wire feed speed are represented as wlp, ws and wwfs,
respectively. The aBj is noted as the coefficient of wj.
The aBj is the preference score of x criterion
concerning each other criterion. So along the first
row of laser power, the value of aBj will be 0.090,
0.0526 and 0.1064. Now there is a consideration to
minimize the l subject to the inequality constraints.
The last equation 1jw means the sum of all the
weights of wlp, ws and wwfs will be 1. By checking
through the first inequality constraint, wb minus aBjwj
should be less than or equal to l . In this problem,
wb is the weight of the best criterion (wire speed
feed) minus the aBj value, which should be less or
equal to l . Mathematically, the objective function
is Min l ; subject to
wlp -0.0909 wlp l
wlp -0.0525 ws l
wlp -0.1064 wwfs l
It means that we have three inequality constrains for the
three criteria. By considering the next inequality constraint
where the wj minus ajwww should be less than l . Thus, for
the least (worst) important criterion is laser power, we have
wlp -1wlp l
wws -3wlp l
wwfp -7wlp l
By merging the inequalities formulated from the best
criterion and the worst criterion, the objective function is
Min l (25); subject to
wlp -0.0909 wlp l (26)
wlp -0.0525 ws l (27)
wlp -0.1064 wwfs l (28)
wws -3wlp l (29)
wwfp -7wlp l (30)
In the new formulation, the inequality (4) vanishes. But
wlp + wws + wwfs = 1 (31)
; where wlp, wws, wwfs 0
This linear programming model needs to be solved, which
yields
wlp = 0.091
wws = 0.169
wwfs = 0.740
Laser power 0.091
Welding speed 0.169
Wire feed speed 0.740
Table 17 BWM weights for criteria
4.4 Analysis of Entropy method
The results obtained from this method are shown in
Tables 18 and 19.
Serial No. Laser power Welding speed Wire feed speed
1 2.4 1.5 2
2 2.6 2.1 5
3 2.8 3 8
m
j
ijx1
7.8 6.6 15
Table 18 Process of normalizing the decision matrix in the entropy
method
Serial No. Laser power Welding speed Wire feed speed
1 0.3077 0.2273 0.1333
2 0.3333 0.3182 0.3333
3 0.3590 0.4545 0.5333
Table 19 Normalized decision matrix for entropy method
The entropy of the data is then calculated where h =
1/ln(m) and m is the number of alternatives, which is three.
Therefore, h = -0.910239227. However, by using the
equation for h, Table 20 is obtained.
Serial No. Laser power Welding speed Wire feed speed
1 -0.3627 -0.3367 -0.2687
2 -0.3662 -0.3644 -0.3662
3 -0.3678 -0.3584 -0.3353
m
i
ijij rr1
ln
-1.0966 -1.0595 -0.9701
je 0.9982 0.9644 0.8830
jj ed 1 0.0018 0.0356 0.1170
Table 20 Calculated entropy in entropy method
Wei
gh
s o
f cr
iter
ia
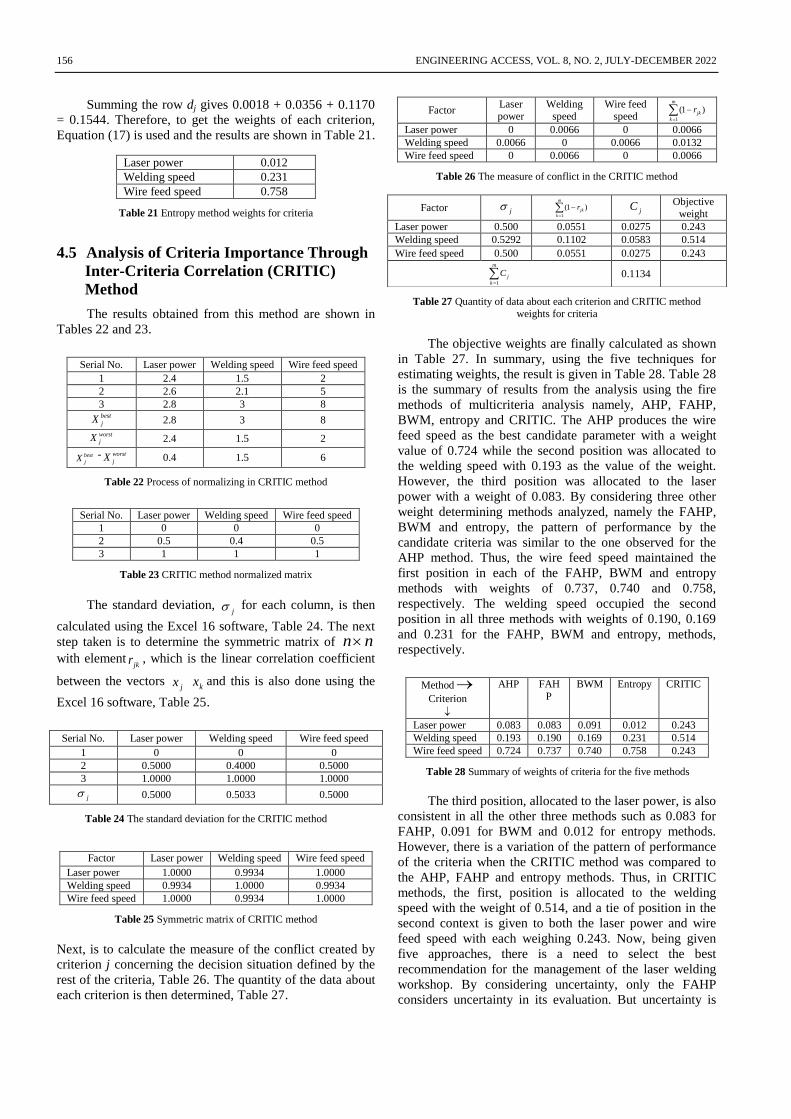
156 ENGINEERING ACCESS, VOL. 8, NO. 2, JULY-DECEMBER 2022
Summing the row dj gives 0.0018 + 0.0356 + 0.1170
= 0.1544. Therefore, to get the weights of each criterion,
Equation (17) is used and the results are shown in Table 21.
Laser power 0.012
Welding speed 0.231
Wire feed speed 0.758
Table 21 Entropy method weights for criteria
4.5 Analysis of Criteria Importance Through
Inter-Criteria Correlation (CRITIC)
Method
The results obtained from this method are shown in
Tables 22 and 23.
Serial No. Laser power Welding speed Wire feed speed
1 2.4 1.5 2
2 2.6 2.1 5
3 2.8 3 8 best
jX 2.8 3 8
worst
jX 2.4 1.5 2
best
jX - worst
jX 0.4 1.5 6
Table 22 Process of normalizing in CRITIC method
Serial No. Laser power Welding speed Wire feed speed
1 0 0 0
2 0.5 0.4 0.5
3 1 1 1
Table 23 CRITIC method normalized matrix
The standard deviation, j for each column, is then
calculated using the Excel 16 software, Table 24. The next
step taken is to determine the symmetric matrix of nn
with elementjkr , which is the linear correlation coefficient
between the vectors jx
kx and this is also done using the
Excel 16 software, Table 25.
Serial No. Laser power Welding speed Wire feed speed
1 0 0 0
2 0.5000 0.4000 0.5000
3 1.0000 1.0000 1.0000
j 0.5000 0.5033 0.5000
Table 24 The standard deviation for the CRITIC method
Factor Laser power Welding speed Wire feed speed
Laser power 1.0000 0.9934 1.0000
Welding speed 0.9934 1.0000 0.9934
Wire feed speed 1.0000 0.9934 1.0000
Table 25 Symmetric matrix of CRITIC method
Next, is to calculate the measure of the conflict created by
criterion j concerning the decision situation defined by the
rest of the criteria, Table 26. The quantity of the data about
each criterion is then determined, Table 27.
Factor Laser power
Welding speed
Wire feed speed
m
k
jkr1
)1(
Laser power 0 0.0066 0 0.0066
Welding speed 0.0066 0 0.0066 0.0132
Wire feed speed 0 0.0066 0 0.0066
Table 26 The measure of conflict in the CRITIC method
Table 27 Quantity of data about each criterion and CRITIC method
weights for criteria
The objective weights are finally calculated as shown
in Table 27. In summary, using the five techniques for
estimating weights, the result is given in Table 28. Table 28
is the summary of results from the analysis using the fire
methods of multicriteria analysis namely, AHP, FAHP,
BWM, entropy and CRITIC. The AHP produces the wire
feed speed as the best candidate parameter with a weight
value of 0.724 while the second position was allocated to
the welding speed with 0.193 as the value of the weight.
However, the third position was allocated to the laser
power with a weight of 0.083. By considering three other
weight determining methods analyzed, namely the FAHP,
BWM and entropy, the pattern of performance by the
candidate criteria was similar to the one observed for the
AHP method. Thus, the wire feed speed maintained the
first position in each of the FAHP, BWM and entropy
methods with weights of 0.737, 0.740 and 0.758,
respectively. The welding speed occupied the second
position in all three methods with weights of 0.190, 0.169
and 0.231 for the FAHP, BWM and entropy, methods,
respectively.
Method
Criterion
AHP FAH
P
BWM Entropy CRITIC
Laser power 0.083 0.083 0.091 0.012 0.243
Welding speed 0.193 0.190 0.169 0.231 0.514
Wire feed speed 0.724 0.737 0.740 0.758 0.243
Table 28 Summary of weights of criteria for the five methods
The third position, allocated to the laser power, is also
consistent in all the other three methods such as 0.083 for
FAHP, 0.091 for BWM and 0.012 for entropy methods.
However, there is a variation of the pattern of performance
of the criteria when the CRITIC method was compared to
the AHP, FAHP and entropy methods. Thus, in CRITIC
methods, the first, position is allocated to the welding
speed with the weight of 0.514, and a tie of position in the
second context is given to both the laser power and wire
feed speed with each weighing 0.243. Now, being given
five approaches, there is a need to select the best
recommendation for the management of the laser welding
workshop. By considering uncertainty, only the FAHP
considers uncertainty in its evaluation. But uncertainty is
Factor j
m
k
jkr1
)1(
jC Objective weight
Laser power 0.500 0.0551 0.0275 0.243
Welding speed 0.5292 0.1102 0.0583 0.514
Wire feed speed 0.500 0.0551 0.0275 0.243
m
k
jC1
0.1134
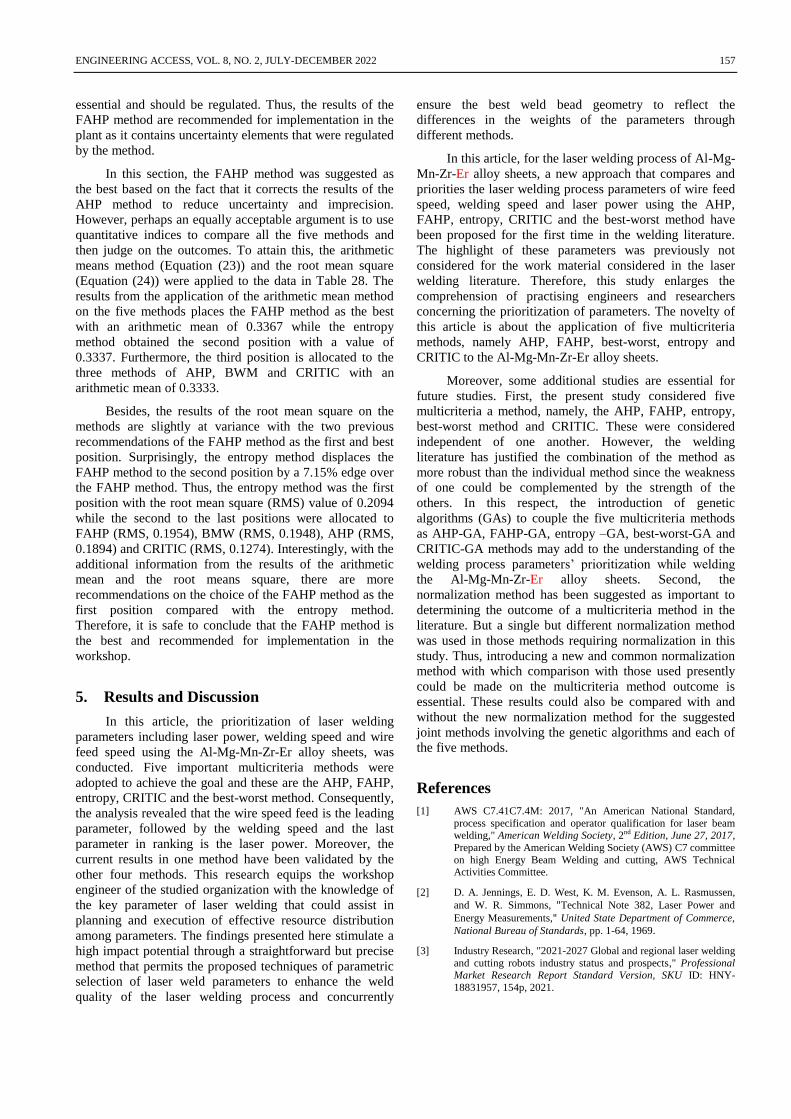
ENGINEERING ACCESS, VOL. 8, NO. 2, JULY-DECEMBER 2022 157
essential and should be regulated. Thus, the results of the
FAHP method are recommended for implementation in the
plant as it contains uncertainty elements that were regulated
by the method.
In this section, the FAHP method was suggested as
the best based on the fact that it corrects the results of the
AHP method to reduce uncertainty and imprecision.
However, perhaps an equally acceptable argument is to use
quantitative indices to compare all the five methods and
then judge on the outcomes. To attain this, the arithmetic
means method (Equation (23)) and the root mean square
(Equation (24)) were applied to the data in Table 28. The
results from the application of the arithmetic mean method
on the five methods places the FAHP method as the best
with an arithmetic mean of 0.3367 while the entropy
method obtained the second position with a value of
0.3337. Furthermore, the third position is allocated to the
three methods of AHP, BWM and CRITIC with an
arithmetic mean of 0.3333.
Besides, the results of the root mean square on the
methods are slightly at variance with the two previous
recommendations of the FAHP method as the first and best
position. Surprisingly, the entropy method displaces the
FAHP method to the second position by a 7.15% edge over
the FAHP method. Thus, the entropy method was the first
position with the root mean square (RMS) value of 0.2094
while the second to the last positions were allocated to
FAHP (RMS, 0.1954), BMW (RMS, 0.1948), AHP (RMS,
0.1894) and CRITIC (RMS, 0.1274). Interestingly, with the
additional information from the results of the arithmetic
mean and the root means square, there are more
recommendations on the choice of the FAHP method as the
first position compared with the entropy method.
Therefore, it is safe to conclude that the FAHP method is
the best and recommended for implementation in the
workshop.
5. Results and Discussion
In this article, the prioritization of laser welding
parameters including laser power, welding speed and wire
feed speed using the Al-Mg-Mn-Zr-Er alloy sheets, was
conducted. Five important multicriteria methods were
adopted to achieve the goal and these are the AHP, FAHP,
entropy, CRITIC and the best-worst method. Consequently,
the analysis revealed that the wire speed feed is the leading
parameter, followed by the welding speed and the last
parameter in ranking is the laser power. Moreover, the
current results in one method have been validated by the
other four methods. This research equips the workshop
engineer of the studied organization with the knowledge of
the key parameter of laser welding that could assist in
planning and execution of effective resource distribution
among parameters. The findings presented here stimulate a
high impact potential through a straightforward but precise
method that permits the proposed techniques of parametric
selection of laser weld parameters to enhance the weld
quality of the laser welding process and concurrently
ensure the best weld bead geometry to reflect the
differences in the weights of the parameters through
different methods.
In this article, for the laser welding process of Al-Mg-
Mn-Zr-Er alloy sheets, a new approach that compares and
priorities the laser welding process parameters of wire feed
speed, welding speed and laser power using the AHP,
FAHP, entropy, CRITIC and the best-worst method have
been proposed for the first time in the welding literature.
The highlight of these parameters was previously not
considered for the work material considered in the laser
welding literature. Therefore, this study enlarges the
comprehension of practising engineers and researchers
concerning the prioritization of parameters. The novelty of
this article is about the application of five multicriteria
methods, namely AHP, FAHP, best-worst, entropy and
CRITIC to the Al-Mg-Mn-Zr-Er alloy sheets.
Moreover, some additional studies are essential for
future studies. First, the present study considered five
multicriteria a method, namely, the AHP, FAHP, entropy,
best-worst method and CRITIC. These were considered
independent of one another. However, the welding
literature has justified the combination of the method as
more robust than the individual method since the weakness
of one could be complemented by the strength of the
others. In this respect, the introduction of genetic
algorithms (GAs) to couple the five multicriteria methods
as AHP-GA, FAHP-GA, entropy –GA, best-worst-GA and
CRITIC-GA methods may add to the understanding of the
welding process parameters’ prioritization while welding
the Al-Mg-Mn-Zr-Er alloy sheets. Second, the
normalization method has been suggested as important to
determining the outcome of a multicriteria method in the
literature. But a single but different normalization method
was used in those methods requiring normalization in this
study. Thus, introducing a new and common normalization
method with which comparison with those used presently
could be made on the multicriteria method outcome is
essential. These results could also be compared with and
without the new normalization method for the suggested
joint methods involving the genetic algorithms and each of
the five methods.
References
[1] AWS C7.41C7.4M: 2017, "An American National Standard,
process specification and operator qualification for laser beam welding," American Welding Society, 2nd Edition, June 27, 2017,
Prepared by the American Welding Society (AWS) C7 committee
on high Energy Beam Welding and cutting, AWS Technical Activities Committee.
[2] D. A. Jennings, E. D. West, K. M. Evenson, A. L. Rasmussen,
and W. R. Simmons, "Technical Note 382, Laser Power and
Energy Measurements," United State Department of Commerce,
National Bureau of Standards, pp. 1-64, 1969.
[3] Industry Research, "2021-2027 Global and regional laser welding
and cutting robots industry status and prospects," Professional Market Research Report Standard Version, SKU ID: HNY-
18831957, 154p, 2021.
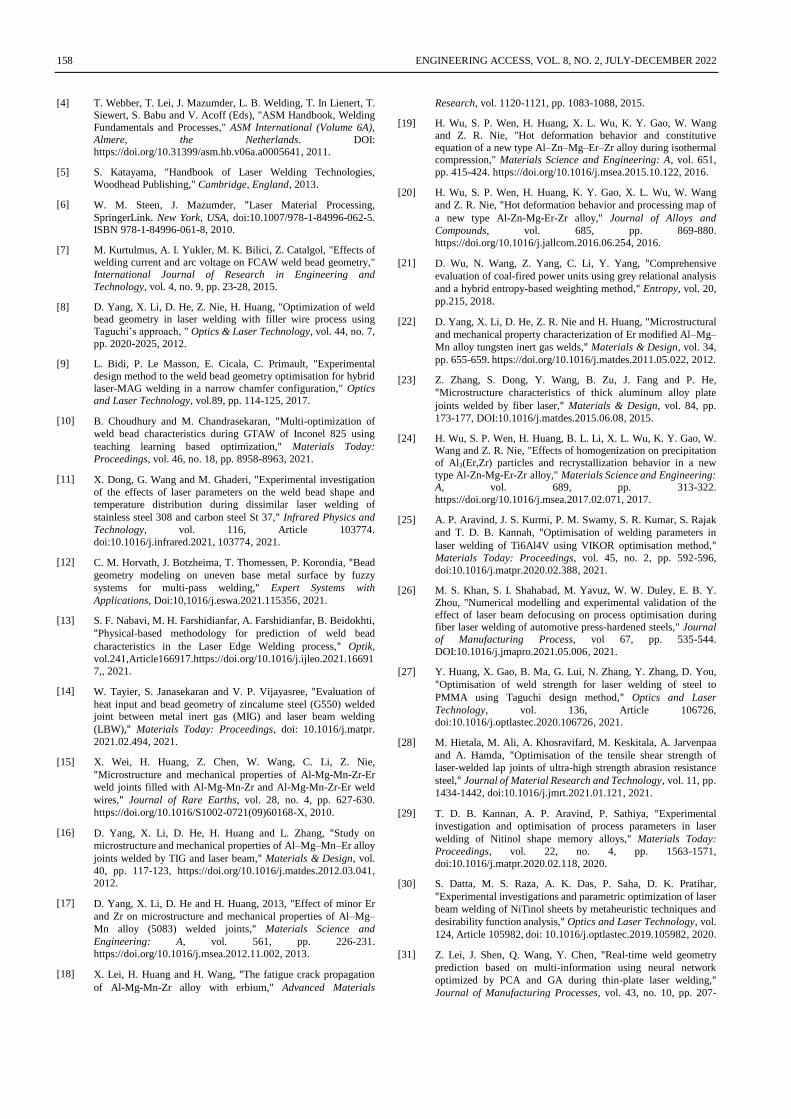
158 ENGINEERING ACCESS, VOL. 8, NO. 2, JULY-DECEMBER 2022
[4] T. Webber, T. Lei, J. Mazumder, L. B. Welding, T. In Lienert, T. Siewert, S. Babu and V. Acoff (Eds), "ASM Handbook, Welding
Fundamentals and Processes," ASM International (Volume 6A),
Almere, the Netherlands. DOI: https://doi.org/10.31399/asm.hb.v06a.a0005641, 2011.
[5] S. Katayama, "Handbook of Laser Welding Technologies,
Woodhead Publishing," Cambridge, England, 2013.
[6] W. M. Steen, J. Mazumder, "Laser Material Processing,
SpringerLink. New York, USA, doi:10.1007/978-1-84996-062-5. ISBN 978-1-84996-061-8, 2010.
[7] M. Kurtulmus, A. I. Yukler, M. K. Bilici, Z. Catalgol, "Effects of
welding current and arc voltage on FCAW weld bead geometry," International Journal of Research in Engineering and
Technology, vol. 4, no. 9, pp. 23-28, 2015.
[8] D. Yang, X. Li, D. He, Z. Nie, H. Huang, "Optimization of weld bead geometry in laser welding with filler wire process using
Taguchi’s approach, " Optics & Laser Technology, vol. 44, no. 7,
pp. 2020-2025, 2012.
[9] L. Bidi, P. Le Masson, E. Cicala, C. Primault, "Experimental
design method to the weld bead geometry optimisation for hybrid
laser-MAG welding in a narrow chamfer configuration," Optics and Laser Technology, vol.89, pp. 114-125, 2017.
[10] B. Choudhury and M. Chandrasekaran, "Multi-optimization of
weld bead characteristics during GTAW of Inconel 825 using
teaching learning based optimization," Materials Today:
Proceedings, vol. 46, no. 18, pp. 8958-8963, 2021.
[11] X. Dong, G. Wang and M. Ghaderi, "Experimental investigation
of the effects of laser parameters on the weld bead shape and
temperature distribution during dissimilar laser welding of
stainless steel 308 and carbon steel St 37," Infrared Physics and
Technology, vol. 116, Article 103774.
doi:10.1016/j.infrared.2021, 103774, 2021.
[12] C. M. Horvath, J. Botzheima, T. Thomessen, P. Korondia, "Bead
geometry modeling on uneven base metal surface by fuzzy
systems for multi-pass welding," Expert Systems with
Applications, Doi:10,1016/j.eswa.2021.115356, 2021.
[13] S. F. Nabavi, M. H. Farshidianfar, A. Farshidianfar, B. Beidokhti,
"Physical-based methodology for prediction of weld bead
characteristics in the Laser Edge Welding process," Optik,
vol.241,Article166917.https://doi.org/10.1016/j.ijleo.2021.16691
7,, 2021.
[14] W. Tayier, S. Janasekaran and V. P. Vijayasree, "Evaluation of
heat input and bead geometry of zincalume steel (G550) welded joint between metal inert gas (MIG) and laser beam welding
(LBW)," Materials Today: Proceedings, doi: 10.1016/j.matpr.
2021.02.494, 2021.
[15] X. Wei, H. Huang, Z. Chen, W. Wang, C. Li, Z. Nie,
"Microstructure and mechanical properties of Al-Mg-Mn-Zr-Er
weld joints filled with Al-Mg-Mn-Zr and Al-Mg-Mn-Zr-Er weld
wires," Journal of Rare Earths, vol. 28, no. 4, pp. 627-630.
https://doi.org/10.1016/S1002-0721(09)60168-X, 2010.
[16] D. Yang, X. Li, D. He, H. Huang and L. Zhang, "Study on
microstructure and mechanical properties of Al–Mg–Mn–Er alloy
joints welded by TIG and laser beam," Materials & Design, vol.
40, pp. 117-123, https://doi.org/10.1016/j.matdes.2012.03.041,
2012.
[17] D. Yang, X. Li, D. He and H. Huang, 2013, "Effect of minor Er
and Zr on microstructure and mechanical properties of Al–Mg–
Mn alloy (5083) welded joints," Materials Science and
Engineering: A, vol. 561, pp. 226-231.
https://doi.org/10.1016/j.msea.2012.11.002, 2013.
[18] X. Lei, H. Huang and H. Wang, "The fatigue crack propagation
of Al-Mg-Mn-Zr alloy with erbium," Advanced Materials
Research, vol. 1120-1121, pp. 1083-1088, 2015.
[19] H. Wu, S. P. Wen, H. Huang, X. L. Wu, K. Y. Gao, W. Wang
and Z. R. Nie, "Hot deformation behavior and constitutive
equation of a new type Al–Zn–Mg–Er–Zr alloy during isothermal compression," Materials Science and Engineering: A, vol. 651,
pp. 415-424. https://doi.org/10.1016/j.msea.2015.10.122, 2016.
[20] H. Wu, S. P. Wen, H. Huang, K. Y. Gao, X. L. Wu, W. Wang
and Z. R. Nie, "Hot deformation behavior and processing map of
a new type Al-Zn-Mg-Er-Zr alloy," Journal of Alloys and
Compounds, vol. 685, pp. 869-880.
https://doi.org/10.1016/j.jallcom.2016.06.254, 2016.
[21] D. Wu, N. Wang, Z. Yang, C. Li, Y. Yang, "Comprehensive
evaluation of coal-fired power units using grey relational analysis
and a hybrid entropy-based weighting method," Entropy, vol. 20,
pp.215, 2018.
[22] D. Yang, X. Li, D. He, Z. R. Nie and H. Huang, "Microstructural
and mechanical property characterization of Er modified Al–Mg–
Mn alloy tungsten inert gas welds," Materials & Design, vol. 34,
pp. 655-659. https://doi.org/10.1016/j.matdes.2011.05.022, 2012.
[23] Z. Zhang, S. Dong, Y. Wang, B. Zu, J. Fang and P. He,
"Microstructure characteristics of thick aluminum alloy plate
joints welded by fiber laser," Materials & Design, vol. 84, pp.
173-177, DOI:10.1016/j.matdes.2015.06.08, 2015.
[24] H. Wu, S. P. Wen, H. Huang, B. L. Li, X. L. Wu, K. Y. Gao, W. Wang and Z. R. Nie, "Effects of homogenization on precipitation
of Al3(Er,Zr) particles and recrystallization behavior in a new
type Al-Zn-Mg-Er-Zr alloy," Materials Science and Engineering: A, vol. 689, pp. 313-322.
https://doi.org/10.1016/j.msea.2017.02.071, 2017.
[25] A. P. Aravind, J. S. Kurmi, P. M. Swamy, S. R. Kumar, S. Rajak
and T. D. B. Kannah, "Optimisation of welding parameters in
laser welding of Ti6Al4V using VIKOR optimisation method," Materials Today: Proceedings, vol. 45, no. 2, pp. 592-596,
doi:10.1016/j.matpr.2020.02.388, 2021.
[26] M. S. Khan, S. I. Shahabad, M. Yavuz, W. W. Duley, E. B. Y.
Zhou, "Numerical modelling and experimental validation of the
effect of laser beam defocusing on process optimisation during fiber laser welding of automotive press-hardened steels," Journal
of Manufacturing Process, vol 67, pp. 535-544.
DOI:10.1016/j.jmapro.2021.05.006, 2021.
[27] Y. Huang, X. Gao, B. Ma, G. Lui, N. Zhang, Y. Zhang, D. You,
"Optimisation of weld strength for laser welding of steel to
PMMA using Taguchi design method," Optics and Laser
Technology, vol. 136, Article 106726, doi:10.1016/j.optlastec.2020.106726, 2021.
[28] M. Hietala, M. Ali, A. Khosravifard, M. Keskitala, A. Jarvenpaa
and A. Hamda, "Optimisation of the tensile shear strength of
laser-welded lap joints of ultra-high strength abrasion resistance
steel," Journal of Material Research and Technology, vol. 11, pp.
1434-1442, doi:10.1016/j.jmrt.2021.01.121, 2021.
[29] T. D. B. Kannan, A. P. Aravind, P. Sathiya, "Experimental
investigation and optimisation of process parameters in laser
welding of Nitinol shape memory alloys," Materials Today:
Proceedings, vol. 22, no. 4, pp. 1563-1571,
doi:10.1016/j.matpr.2020.02.118, 2020.
[30] S. Datta, M. S. Raza, A. K. Das, P. Saha, D. K. Pratihar,
"Experimental investigations and parametric optimization of laser
beam welding of NiTinol sheets by metaheuristic techniques and
desirability function analysis," Optics and Laser Technology, vol.
124, Article 105982, doi: 10.1016/j.optlastec.2019.105982, 2020.
[31] Z. Lei, J. Shen, Q. Wang, Y. Chen, "Real-time weld geometry
prediction based on multi-information using neural network
optimized by PCA and GA during thin-plate laser welding,"
Journal of Manufacturing Processes, vol. 43, no. 10, pp. 207-
ENGINEERING ACCESS, VOL. 8, NO. 2, JULY-DECEMBER 2022 159
217. DOI: 10.1016/j.jmapro.2019.05.013, 2019.
[32] K. R. Sampreet, V. Mahidhar, R. Kannan, Arunagiri and T. D. B.
"Optimization of parameters in Nd:YAG laser welding of Ti-6Al-
4V using TOPSIS, Materials Today: Proceedings," vol. 21, no. 1,
pp. 244-247, https://doi.org/10.1016/j.matpr.2019.05.401, 2020.
[33] Y. Yang, Z. Gao and L. Cao, "Identifying optimal process
parameters in deep penetration laser welding by adopting
Hierarchical-Kriging model," Infrared Physics and Technology,
vol. 92, pp. 443-453, doi: 10.1016/j.infrared.2018.07.006, 2018.
[34] U. Reisgen, M. Schleser, O. Mokrov, E. Ahmed, "Optimization
of laser welding of DP/TRIP steel sheets using statistical
approach," Optics and Laser Technology, vol. 44, no. 1, pp. 255-
262, doi: 10.1016/j.optlastec.2011.06.028, 2012.
[35] P. Zhang, Z. Jia, Z. Yu, H. Shi, S. Li, D. Wu, H. Yan, X. Ye, J.
Chen, F. Wang and Y. Tian, "A review on the effect of laser
pulse shaping on the microstructure and hot cracking behavior in
the welding of alloys," Optics & Laser Technology, vol. 140, Article 107094, https://doi.org/10.1016/j.optlastec.2021.107094,
2021.
[36] Y. Qu, Z. Li, J. Li, D. Zou, R. Zhang and Y. Yu, "Effect of weld
geometry parameters on dynamic behavior of buried X70 steel
pipeline under subsurface detonation," International Journal of
Pressure Vessels and Piping, doi: 10.1016/j.ijpvp.2021.104504,
2021.
[37] V. Paranthaman, D. Veeman and V. S. Mahesh, "Optimization of
CO2 welding process on dissimilar metals," Materials Today:
Proceedings, vol. 39, doi: 10.1016/j.matpr.2020.07.694, 2020.
[38] S. Grünenwald, A. Unt and A. Salminen, "Investigation of the
influence of welding parameters on the weld geometry when
welding structural steel with an oscillated high-power laser
beam," Procedia CIRP, vol. 74, pp.461-465,
https://doi.org/10.1016/j.procir.2018.08.150, 2018.
[39] C. Prieto, E. Vaamonde, D. Diego-Vallejo, J. Jimenez, B.
Urbach, Y. Vidne and E. Shekel, "Dynamic laser beam shaping
for laser aluminium welding in e-mobility applications,"
Procedia CIRP, vol. 94, pp. 596-600.
https://doi.org/10.1016/j.procir.2020.09.084, 2020.
[40] Z. Guo, R. Bai, Z. Lei, H. Jiang, J. Zou and C. Yan,
"Experimental and numerical investigation on ultimate strength
of laser-welded stiffened plates considering welding deformation
and residual stresses," Ocean Engineering, vol. 234, Article
109239, https://doi.org/10.1016/j.oceaneng.2021.109239, 2021.
[41] S. K. Gupta, S. Jaypuria, D. K. Pratihar, P. Saham, "Study on
mechanical and metallurgical properties of fiber laser welded Nb-
1% Zr-0.1% C alloy," Optics & Laser Technology, vol. 127,
Article 106153, 2020.
[42] S. M. Robertson and A. F. H. Kaplan "Multi-keyhole separation
during multi-spot laser welding of duplex steel," Optics and
Laser Technology, vol. 143, 2021.
[43] P. M. Mashinini, D. G. Hattingh, "Influence of laser heat input on
weld zone width and fatigue performance of Ti-6Al-4V sheet,"
Materials Science and Engineering B, vol. 262, Article 114699,
doi: 10.1016/j.mseb.2020.114699, 2020.
[44] V. Errico, S. L. Campanelli, A. Angelastro, M. Mazzarisi and G.
Casalino, "On the feasibility of AISI 304 stainless steel laser
welding with metal powder," Journal of Manufacturing
Processes, vol. 56, pp. 96-105,
https://doi.org/10.1016/j.jmapro.2020.04.065, 2020.
[45] S. Liu, F. Liu, H. Zhang, Y. Shi, "Analysis of droplet transfer
mode and forming process of weld bead in CO2 laser–MAG
hybrid welding process," Optics & Laser Technology, vol. 44, no. 4, pp. 1019-1025. https://doi.org/10.1016/j.optlastec.2011.10.016,
2012.
[46] T. Sathish, S. D. Kumar, K. Muthukumar and K. Suyambu K.
"Natural inspiration technique for the parameter optimization of
A-GTAW welding of naval steel," Materials Today:
Proceedings, vol. 21, doi: 10.1016/j.matpr.2019.07.600, 2019.
[47] X. Chen, G. Yu, X. He, S. Li and Z. Li, "Numerical study of heat
transfer and solute distribution in hybrid laser-MIG welding,"
International Journal of Thermal Sciences, vol. 149, Article 106182. doi: 10.1016/j.ijthermalsci.2019.106182, 2020.
[48] M. Şahin, "A comprehensive analysis of weighting and
multicriteria methods in the context of sustainable energy,"
International Journal of Environmental Science and Technology, vol. 18, pp. 1591–1616, https://doi.org/10.1007/s13762-020-
02922-7, 2021.
[49] V. M. Ozernoy, "Choosing the “Best” multiple criteria decision-
making method," Information Systems and Operational
Research, vol. 30, pp. 159–171.
https://doi.org/10.1080/03155986.1992.11732192, 1992.
[50] A. Ishizaka, S. Siraj, "Are multi-criteria decision-making tools
useful? An experimental comparative study of three methods,"
European Journal of Operational Research, vol. 264, pp. 462–
471, https://doi.org/10.1016/j.ejor.2017.05.041, 2018.
[51] M. Haddad and D. Sanders, "Selection of discrete multiple
criteria decision making methods in the presence of risk and
uncertainty," Operations Research Perspectives, vol. 5, pp. 357–
370, https://doi.org/10.1016/j.orp.2018.10.003, 2018.
[52] R. Mosadeghi, J. Warnken, R. Tomlinson, H. Mirfenderesk,
"Uncertainty analysis in the application of multi-criteria decision-
making methods in Australian strategic environmental decisions,"
Journal of Environmental Planning and Management, vol. 56,
pp. 1097–1124, https://doi.org/10.1080/09640568.2012.717886,
2013.
[53] I. Yukler and I. Calis, "Weld Bead Geometry," MUTEF
Publications, İstanbul, 1999.
[54] J. Matys, M. Dominiak and R. Flieger, "Energy and power
density: A key factor in lasers studies," Journal of Clinical and
Diagnostic Research, vol. 9, no. 12, pp. ZLO1-ZL02. doi:
10.7860/JCDR/2015/1556.6955, 2015.
[55] R. Kant, S. N. Joshi and U. S. Dixit, "Research issues in the laser
sheet bending process," in Materials Forming and Machining, pp.
73-97, doi: 10.1016/b978-0-8570-483-4.000041, 2016.
[56] T. L. Saaty, "Decision making with the analytic hierarchy
process," International Journal of Services Sciences, vol. 1, no. 1,
pp. 83–98, 2008.
[57] K. O. Okponyia and S. A. Oke, "Exploring aluminium alloy
metal matrix composites in EDM using coupled factor-level-
present worth analysis and fuzzy analytic hierarchy process,"
International Journal of Industrial Engineering and Engineering
Management, vol. 2, no. 1, pp. 25-44, 2020.
[58] M. Singh M. and R. Rathi, "Investigation on critical success
factors associated with lean six sigma implementation in MSMEs
using best-worst method," International Journal of Six Sigma and
Competitive Advantage, vol. 12, no. 2/3, pp. 209-233. doi:
10.1504/IJSSCA. 2020. 110976, 2020.
[59] V. Raghunathan, R. Ranganathan and M. Palamisamy, "An
efficient supplier selection model for the pump industry through
the best-worst method," International Journal of Services and
Operations Management, vol. 28, no. 3, pp. 360-378. doi:10.1504/IJSONA2021.113601, 2021.
[60] J. Liang, Z. D. Shi, M. J. Wierman, "Information entropy, rough
entropy and knowledge granulation in incomplete information
systems," International Journal of General Systems, vol. 35, pp.
641–654, 2006.

160 ENGINEERING ACCESS, VOL. 8, NO. 2, JULY-DECEMBER 2022
[61] H. Zhao, L. Yao, G. Mei, T. Liu and Y. Ning, "A Fuzzy
comprehensive evaluation method based on AHP and entropy for
landslide susceptibility map," Entropy, vol. 19, pp. 396, 2017.
[62] N. M. Raffic, K. G. Babu, S. Srinivasan, S.
Thirumurugaveerakumar and R. B. Kanna, "Experimental
investigation on surface roughness and cutting tool – Workpiece
interface temperature for AA6061 using CRITIC and TOPSIS
techniques," Materials Today: Proceedings, In press,
https://doi.org/10.1016/j.matpr.2021.05.145, 2021.
[63] X. Dong, H. Lu, Y. Xia, Z. Xiong, "Decision-making model
under risk assessment based on entropy," Entropy, vol. 18, pp.
404, 2016.
Biographies
Kenechukwu Obinna Okponyia is a
B.Sc. student at the Department of
Mechanical Engineering, University of
Lagos, Lagos, Nigeria
Sunday Ayoola OKE received his
Ph.D. in Industrial Engineering from the
University of Ibadan, Nigeria in 2008. He
is currently a lectures at the Department
of Mechanical Engineering, University of
Lagos, Lagos, Nigeria. His research
interest includes manufacturing and
optimization studies.
Akwaeno Uduak Umoh is an M.Sc.
student at the Department of Mechanical Engineering,
University of Lagos, Lagos, Nigeria.