Karstic morphologies identified with geophysics around Saulges caves (Mayenne, France)
Upload
independentCategory
view
3download
0
Marine Chemistry 150 (2013) 25–38
Contents lists available at SciVerse ScienceDirect
Marine Chemistry
j ourna l homepage: www.e lsev ie r .com/ locate /marchem
The influence of salinity on the molecular and optical properties of surfacemicrolayers in a karstic estuary
Oliver J. Lechtenfeld a, Boris P. Koch a,b,⁎, Blaženka Gašparović c, Sanja Frka c,Matthias Witt d, Gerhard Kattner a
a Alfred Wegener Institute for Polar and Marine Research, Am Handelshafen 12, D-27570 Bremerhaven, Germanyb University of Applied Sciences, An der Karlstadt 8, D-27568 Bremerhaven, Germanyc Ruđer Bošković Institute, Bijenička cesta 54, HR-10000 Zagreb, Croatiad Bruker Daltonik GmbH, Fahrenheitstrasse 4, D-28359 Bremen, Germany
⁎ Corresponding author at: AlfredWegener InstituteAm Handelshafen 12, D-27570 Bremerhaven, Germanfax: +49 471 4831 2115.
E-mail address: [email protected] (B.P. Koch).
0304-4203/$ – see front matter © 2013 Elsevier B.V. Allhttp://dx.doi.org/10.1016/j.marchem.2013.01.006
a b s t r a c t
a r t i c l e i n f oArticle history:Received 1 October 2012Received in revised form 22 December 2012Accepted 25 January 2013Available online 13 February 2013
Keywords:Sea-surface microlayerUltra-high resolution mass spectrometryFT-ICR MSDissolved organic matterMolecular compositionOptical properties
Sea-surface microlayers and the corresponding underlying waters of the karstic Krka Estuary (Croatia) werestudied with respect to optical and molecular properties of dissolved organic matter (DOM). Solid-phaseextracted DOMwas separated by reversed-phase chromatography and analyzedwith ultra-high resolution Fou-rier transform ion cyclotron resonancemass spectrometry (FT-ICRMS). The number and summedmagnitudes ofFT-ICR MS peaks, enriched in themicrolayer, increased with increasing salinity along the estuary. The molecularhydrogen to carbon ratio (as a measure of polarity) of enriched compounds was higher for the low salinity sam-ples than for a high salinity marine station, which we propose is a consequence of a salt-mediated separationmechanism. Absorption and fluorescence of all samples decreased along the estuarywith themicrolayer samplesshowing higher absorption than the underlying water. Chromatographic and FT-ICR MS data revealed a distinctshift towards a smaller molecular size in themicrolayer compared to the underlying water. The redistribution ofdissolved organic carbonwithin chromatographic fractions and the decrease inmolecular sizewas interpreted toresult from photo-degradation and/or microbial reprocessing. Collision induced dissociation of selected FT-ICRMSmass peaks revealed the presence of sulfur containing anthropogenic surfactants enriched in themicrolayer.Molecular level investigation of estuarine surface microlayers will help to better understand the highly dynamiccharacter of these systems, the accumulation of natural organicmatter and anthropogenic pollutants and the roleof surface microlayers for the sea-air energy exchange.
© 2013 Elsevier B.V. All rights reserved.
1. Introduction
The surfacemicrolayer is the phase-boundary between hydrosphereand atmosphere (lakes, rivers, estuaries and oceans). Surface films aremicrohabitats, photochemical reactors, filters, and physical membranesand control the gas exchange between air and water (Liss and Duce,1997). Various definitions exist for themicrolayer, mainly defined oper-ationally according to the sampling technique (glass plate, Garrett'sscreen, rotating drum) and the study subject (biological, chemical orphysical properties). The vertical extent of the microlayer ranges frommolecular monolayers up to millimeters (Hardy, 1982). A visual repre-sentation of a coherent organic film at the sea surface is the sea slick,which appears quickly during calm wind conditions (Hunter and Liss,1981). Sea-surfacemicrolayers (SML) are known to exist even at higherthan global average wind speeds, potentially covering most of the
for Polar andMarine Research,y. Tel.: +49 471 4831 1346;
rights reserved.
ocean's surface at any time, hence they are of global importance (Wurlet al., 2011).
The SML consists generally of adsorbed surface active substances(SAS) that are amphiphilic molecules reducing the surface tension ofthe water-air interface. This includes a large variety of substancessuch as polysaccharides (Sieburth et al., 1976), transparent exopolymerparticles (TEP, Wurl and Holmes, 2008), polypeptides (Kuznetsova etal., 2004), lipid-like material (Gašparović et al., 1998; Kattner andBrockmann, 1978; Lass and Friedrichs, 2011) but also living bacteria(Cunliffe et al., 2011) and phytoplankton (Hardy and Apts, 1984; Jouxet al., 2006) and their exudates (e.g. Kattner et al., 1985). Many studiesdemonstrated that hydrophobic substances accumulate in the SML(e.g., Kattner et al., 1983), including anthropogenic pollutants such as hy-drocarbons and trace metals (Guitart et al., 2007; Wurl and Obbard,2004). The chemical composition of the SML and the enrichment factorsof individual substances vary widely in time and space, depending onthe trophic state of the system, wind regime, seasonality, and anthropo-genic pollution. Differences in the composition of the SML and the under-lying subsurface water are reflected in the dissolved organic matter(DOM) composition, e.g. amino acid concentrations (Kuznetsova et al.,

26 O.J. Lechtenfeld et al. / Marine Chemistry 150 (2013) 25–38
2004), chromophoric dissolved organic matter (CDOM) distribution(Tilstone et al., 2010), physico-chemical properties (Zhang et al., 2003),and bacterial production and respiration (Reinthaler et al., 2008). Howev-er, an exact description of the SML lacks detailed and comprehensivemolecular information on the identity of the constituting substances,although some recent studies report high resolution mass spectrometrydata (Frew et al., 2006; Morales-Cid et al., 2009; Schmitt-Kopplin et al.,2012).
For the chemical characterization of natural organic matter (NOM)salt-free and pre-concentrated extracts are obtained by e.g., solid-phaseextraction (Dittmar et al., 2008). This is a prerequisite formanyanalyticaltechniques, such as reversed-phase chromatography, nuclear magneticresonance spectroscopy or mass spectrometry. Ultra-high resolutionFourier transform ion cyclotron resonance mass spectrometry (FT-ICRMS) is an advanced analytical tool to study the extremely complex mix-tures of NOM (Hertkorn et al., 2008; Xian et al., 2012). Due to its highmass resolution and accuracy, several thousands of molecular formulasper sample can be identified. Recent applications to investigate DOM in-clude soil porewater (D'Andrilli et al., 2010a), groundwater (Longneckerand Kujawinski, 2011), river and coastal water (Liu et al., 2011; Stubbinset al., 2010), open ocean and deep sea water (D'Andrilli et al., 2010b;Flerus et al., 2012), as well as sediment porewater (Schmidt et al.,2009). The information derived by FT-ICRMS is typically restricted to el-emental composition and is non-quantitative. However, recent improve-ments of this technique included single mass fragmentation capabilitieswhich lead to structural information on individual NOMmolecules (Wittet al., 2009). By combining reversed-phase chromatographic separationwith FT-ICR MS the molecular complexity of NOM samples can be re-duced, which enhances the analytical resolving power and enables tochemically characterize sample moieties (Koch et al., 2008; Liu et al.,2011).
The Krka Estuary is particularly suitable to identify the chemical char-acteristics of the organic surface microlayer since constantly low terres-trial discharge results in relatively homogeneous organo-chemicalconditions (Cauwet, 1991). Therefore extraction and analytical biasesdue to the different chemical composition of samples along the estuaryare potentially minimized. On the other hand, the strong horizontal sa-linity gradient und vertical stratification of the Krka Estuary allowsstudying microlayer versus underlying water composition under differ-ent ionic strength conditions and seasonal variations.
In our study, we present the first detailed chemical description ofsea-surface microlayers compared with subsurface water with ad-vanced molecular methods. Samples from the Krka Estuary were ana-lyzed with FT-ICR MS and reversed-phase high performance liquidchromatography (RP-HPLC) using absorption and fluorescence detec-tion. This combination ofmethodswas applied to identify so far chem-ically uncharacterized components of the microlayer and to studytheir distribution patterns. We aimed to derive insights into the mo-lecular properties of the microlayer and the bulk subsurface waterand the influence of increasing salt concentration on the chemicalproperties of microlayer-enriched substances. This molecular infor-mation will help to better describe the chemical processes leading toa phase transfer from underlying water into the microlayer.
2. Methods
2.1. Sampling site and sample collection
Samples were collected in the highly stratified estuary of the KrkaRiver in the Middle Eastern Adriatic Sea near the Croatian city ofŠibenik. The hydrographic and biological features of this estuary are de-scribed in detail elsewhere (Legović et al., 1994; Svensen et al., 2007;Vojvodić and Ćosović, 1992). For reasons of comparability we adoptedstation labels from these previous studies.
Surface microlayer (SML) and underlying water (ULW) sampleswere collected at three stations: In the upper estuary (Lake Prokljan,
E3), characterized by low salinity and low anthropogenic impact(Vojvodić and Ćosović, 1992), in the lower estuary, near the city ofŠibenik (E4a) with significant anthropogenic influence on the estuary(Legović et al., 1994), and in the saline waters off the coast of Zlarin Is-land (C1). Samples were collected on September 9, 2008 (E4a only) andbetweenMay 18 andMay 20, 2009 (E3, E4a and C1). It should be notedthat the marine station C1 is located 4 km away from the mouth ofthe estuary, therefore only partly reflecting a parameter continuum.However, this station has been extensively used as reference stationin the past.
SML samples (0.5–1 L) were derived with a Garrett-type screenmade of stainless steel, with 1.03 mm2mesh size and 0.24 mmwire di-ameter and poured into a clean glass bottle. The screen was cleanedwith dichloromethane and rinsed with sample water prior collectionand glass bottles were cleanedwith chromosulfuric acid and thoroughlyrinsed with ultra pure water. The thickness of the sampled water layerwas determined from the collected water volume being approximately110 μm. ULW (4 L) was collected directly with a clean glass bottlefrom 0.4 m depth. To avoid surface film contamination, the samplingbottle was slowly pushed underwater and opened at depth. All sampleswere GF/F filtered (~0.7 μm nominal pore size, Whatman). Samples fornutrient analysis were poisoned and stored at 4 °C (Kattner, 1999).Acidified samples (pH 2 with hydrochloric acid; suprapur, Merck) forDOC determinations were stored frozen at−20 °C and solid-phase ex-traction (SPE, 1 g; Mega Bond Elut, PPL, Varian) was performedaccording to Dittmar et al. (2008). Briefly, methanol (3 mL) and acidi-fied (pH 2 with hydrochloric acid; suprapur) ultra pure water (3 mL)were used to clean and pre-condition the adsorbent. After applyingthe samples, remaining salt was rinsed with 3 mL acidified ultra-purewater and the cartridge bed dried with a N2-flow. The eluted SPE sam-ples (3–5 mL methanol, LichroSolv, Merck) with a nominal enrichmentfactor between 200 and 900were stored at−20 °C until FT-ICRMS andRP-HPLC analysis.
2.2. DOC and nutrient analysis
DOCwas determined by high temperature catalytic oxidation (TOC–VCPN analyzer, Shimadzu). For external calibration potassium hydrogenphthalate (KHP, Merck) was used. Aliquots of the methanol extracts(50 μL) from the SPE samples were evaporated under N2 gas flow tocomplete dryness and subsequently redissolved in 6.5 mL ultrapurewater for DOC analysis (SPE-DOC). All samples (in duplicate)were acid-ified (0.1 MHCL suprapur, Merck) and purgedwith O2 for>5 min. Per-formance of the instrumentwas recorded bydaily analysis of in-lab KHPstandard solutions and reference samples (deep sea reference, DSR,Hansell research lab). The average instrument blank was 3.4 μM C(n=11) and repeatability of the DSR was >95%. The SPE efficiency[%] was calculated as 100×SPE-DOC [μM]/(enrichment factor×DOC[μM]). Nutrient samples (nitrate, nitrite, phosphate, silicate) from the2009 campaign were analyzed using an autoanalyzer (Evolution III, Al-liance instruments) with standard seawater methods (Kattner andBecker, 1991 and references therein).
2.3. HPLC measurements
An HPLC system (Hitachi/VWR) was used for the chromatographicseparation of the SPE samples (Koch et al., 2008). The system consistedof a gradient pump (L-2130), autosampler (L-2200), column oven(L-2300), diode array detector (DAD, L-2450, optical path length:1 cm) and fluorescence detector (FLD, L-2485). The separation wasperformed using a polar endcapped C18 reversed-phase column (4 μmHydro-RP 80 Å, 250×4 mm,with AQ C18 Guard Column; Phenomenex,Synergi) running a linear gradient from 100% ultrapure water, adjustedto pH 7 (±0.05) with diluted NaOH (suprapur, Merck), to 100%metha-nol between 6 and 20 min. The flow increased in the same time periodfrom 0.2 to 0.4 mL min−1. The column oven temperature was 25 °C.

27O.J. Lechtenfeld et al. / Marine Chemistry 150 (2013) 25–38
Both detectors were connected in series; absorbance was recorded be-tween 200 and 400 nm, and the fluorescence signal was measured at260 nm excitation and 430 nm emission wavelength (ex260/em430).The excitation/emission pair used tomonitor the fluorescence signal ap-proximates the “peak A” of UV humic-like fluorescence. This peak wasrepeatedly found with excitation-emission-matrix spectroscopy of ter-restrial organic matter and marine organic matter extracts (Coble,1996; Coble et al., 1998) and generally shows high fluorescence intensi-ty. Methanol reached the detector after ~22.5 min. 10 μL of each meth-anol extract were injected. The average relative standard deviation ofthe chromatogram peak areas were 2.4±1.1% as determined fromeight repeated injections of a DOM extract. DAD and FLD chromato-grams were blank corrected (injection of 10 μL ultrapure water).
The main benefit of the chromatographic method was to induce aphysico-chemical separation (as difference in polarity) of NOM com-ponents. Investigation of the distinct fractions (DOC content, opticalormolecular properties) can reveal intrinsic differences between sam-ples that are not accessible from bulkmeasurements. Tomaximize theseparation effect, a gradient from 100% water (the matrix of the orig-inal sample) to 100% methanol (the extraction solvent) was applied.The distribution of peaks within this gradient therefore reflects thefull polarity spectrum of all extracted compounds. However, also sizeeffects need to be considered in the analysis of NOM samples withreversed-phase columns (Hutta et al., 2011; Lechtenfeld et al., 2011).
Absorbance at 210 nm was selected for the evaluation of theRP-HPLC-DAD spectra, according to the recently established relation-ship between DOC content and DOM absorption at this wavelength forindividual chromatographic fractions (Lechtenfeld et al., 2011). As afirst approximation, the average molar extinction coefficient (ε210 nm)was calculated for the total chromatogram according to Eq. (1):
ε210 nm L mol−1cm−1h i
¼ totalpeakarea L½ �=DOCinjected mol½ � � 1 cm−1
ð1Þ
where the total peak area refers to the integrated and blank-correctedabsorbance of a sample between 4 and 36 min. DOCinjected is the amountof DOC injected on the RP column. The approximate DOC amount foreach peak (DOCcalc) was then calculated from Eq. (2):
DOCcalc mol½ � ¼ peak area L½ �=ε210 nm � 1cm ð2Þ
where peak area [L] is the integrated and blank-corrected absorbance ofeach chromatographic peak. Absorbance at 355 nmwavelength is com-monly used to characterize coastal and estuarine CDOM (Blough anddelVecchio, 2002). To facilitate comparison with literature CDOM absorp-tion coefficients (α(λ)), we estimated the absorption coefficients ofthe original sample, which were not measured, from Eq. (3):
α 355 nmð Þ m−1h i
¼ 2:303� ε355 nm � SPE�DOC M½ � � 100 cmm−1h i
=enrichmentfactor
ð3Þ
We used Eq. (1) to calculate the peak-area integrated extinctioncoefficient ε355 nm, not necessitating assumption on individual peakextinction coefficients. This approach yields only a lower limit forthe CDOM absorption coefficients of the original sample because itdoes not consider CDOM extraction efficiencies.
2.4. FT-ICR MS measurements
DOMmethanol extracts (1:1 dilutedwith ultrapurewater) were an-alyzed with an FT-ICRmass spectrometer (Apex ultra, Bruker Daltonics,Billerica, MA) equipped with a 12 T refrigerated actively shieldedsuperconducting magnet (Bruker Biospin, Wissembourg, France). Anelectrospay ionization (ESI) source was used in negative ion mode
(capillary voltage: −4.4 kV) with a syringe pump for continuous infu-sion of the sample at a rate of ~2 μL min−1.
Fragmentation experiments via quadrupole isolation with 1 Da iso-lation window and collision induced dissociation (qCID-MS/MS) in thehexapole collision cell with Argon as collision gas (−14.5 eV)were car-ried out. Dissociation products were further transferred into the ICR celland detected in amass to charge ratio (m/z) range of 147–2000.MS/MSmass spectra were acquired for two samples from 2009 on two highmagnitude mass peaks (m/z m/z 311, C1, SML; m/z 325, E4a, SML). Al-though numerous peaks on a single nominal mass were detected, thehigh mass accuracy of FT-ICR MS allowed the calculation and thereforeidentification of dissociated small molecules from mass differences inthe fragmentation spectra.
Five hundred scans were added for a full spectrum and 67 to 220for a fragmentation spectrum. FT-ICR mass spectra were externallycalibrated with arginine cluster and internally recalibrated withseven masses that were repeatedly found in marine DOM samples(Flerus et al., 2011). The standard deviation of the mass error of thecalibration masses was below 0.03 ppm.
All peaks were singly charged ions and therefore the m/z ratio rep-resents (molecular) mass [Da] of the compounds. Molecular formulaswere calculated from the exact mass in the range of 200–700 Da withan accuracy ≤±0.5 ppm with a home-build algorithm, allowing forthe following elemental compositions: C0–∞H0–∞O0–∞N0–2S0–2. For un-ambiguous elemental formula assignment the “nitrogen-rule” and ele-mental ratios O/C≤1, N/C≤1, H≤2C+2+N (Koch et al., 2005, 2007)were applied and the elemental combination N2S2 was excluded toavoid ambiguous assignments. Usually the corresponding 13C or 34S iso-tope mass peak magnitudes were too low for verification of the molec-ular formula with the isotope peak abundances (relative abundance of13C and of 34S is 1.1% and 4.2%, respectively). Remaining ambiguouslyassignedmass peaks were checked according to the homologous series,i.e., chemical building block approach (Koch et al., 2007). A molecularformula must be a member of a continuous “CH2” and “CH4\O” seriesand the number of O-atoms must be larger than the length of the“CH4\O” series. To facilitate further comparison of sample pairs (SMLvs ULW), we manually adjusted the lower relative peak magnitudelimit (based on the highest peak of the NOM perimeter, see below) forsamples E4a — 2008, ULW, C1 — 2009, SML and ULW (0.5% instead of1%, signal to noise ratio always ≥4), resulting in comparable relativepeak magnitude frequency distributions for all samples. This approachwas necessary due to the deviating maximum peak magnitudes causedby either different total carbon content in the SPE samples or prominent‘contaminant’ peaks (identified as O3S, O4S- and O5S-compounds, seeResults section and Fig. 1). A degradation index (IDEG) was introducedby Flerus et al. (2012) using relative peakmagnitudes of two quintuplesof peaks ubiquitously found in FT-ICR MS samples. IDEG approximatesthe degradation state of solid-phase extracted DOM which is mainlydominated by heterotrophic and photochemical reworking. It is calcu-lated according to Eq. (4) from the raw magnitudes of ‘POSIDEG’(C13H18O7, C14H20O7, C15H22O7, C15H22O8, C16H24O8) and ‘NEGIDEG’
(C21H26O11, C17H20O9, C19H22O10, C20H22O10, C20H24O11) peaks, thatshowed a positive or negative correlationwith the samples’Δ14C values(Flerus et al., 2012):
IDEG ¼ ∑NEGIDEG=∑ NEGIDEG þ POSIDEGð Þ ð4Þ
A comparison with a surfactant database (http://www.terrabase-inc.com) revealed 71 molecular formulas in our samples that poten-tially represent anthropogenic surfactants. In the van Krevelen dia-gram, several series of homologous compounds from the databasewere identified that were enriched or exclusively found in the SMLsamples. Exclusion of method blank masses on a presence absencebasis is to date the only possibility to exclude false positive molecularformulas (e.g. contaminants) from a mass list. As this study was fo-cused mainly on naturally occurring DOM, we consequently excluded

Fig. 1. A: Negative ESI FT-ICR mass spectra of a bulk water (ULW) and a microlayer sample (SML). SPE samples were derived from the middle station in the Krka estuary (E4a — 2008).B: Visual representation of all assignedmolecular formulas for the ULW (n=4311) and the SML (n=4769) sample in a van Krevelen plot. Molecular hydrogen to carbon (H/C) vs. oxygento carbon (O/C) ratios are plotted according to the relative peak magnitude. Prominent sulfur (“×”) and CnH2nCOOH/CnH2n-2COOH (“o”) peaks are indicated in the ULW sample andmarked in the van Krevelen plots (black arrows and circles). Plots were prepared using Ocean Data View (R. Schlitzer, http://odv.awi.de).
28 O.J. Lechtenfeld et al. / Marine Chemistry 150 (2013) 25–38
all molecular formulas from the “terrabase-inc” database from thefinal FT-ICR MS dataset prior evaluation, considered to be the mostconservative approach. Evidence for the presence of contaminantmolecules in FT-ICR mass spectra can be obtained with fragmentationexperiments of equivocal peaks, as demonstrated in this study.
Weighted average (wa) mass and elemental ratios were calculatedfrom the relative peak magnitudes. Using weighted average parame-ters is a common way to facilitate comparison of FT-ICR MS spectra.Compared to the number-average approach, weighted averages donot imply equal concentrations of all NOM compounds and allow sam-ple comparisons beyond a presence/absence basis. However, it is onlya semi-quantitative approach assuming comparable ionization effi-ciencies and volatilities of the sample compounds in the ESI introduc-tion system. Recent studies have demonstrated the applicability of theweighted-average approach for biogeochemical interpretations ofFT-ICR MS data (Flerus et al., 2012; Liu et al., 2011; Schmitt-Kopplinet al., 2012).
The coarse shape of the spectra showed the almost Gaussian peakdistribution that is characteristic for FT-ICR mass spectra of NOM(e.g., D'Andrilli et al., 2010b; Koch et al., 2005). The reference peakwas defined as the highest magnitude peak within this perimeter,usually found between 380 and 450 Da (Fig. 1). Occasionally thebase peak of the spectrum was not the maximum of the typicalNOM peak distribution (i.e., the reference peak), resulting in fewpeaks with relative magnitudes >100% (typically S-compounds,Fig. 1). Double bond equivalents (DBE, representing the sum ofπ-bonds and rings in a neutral molecule) were calculated accordingto the following equation:
DBE ¼ 1þ1=2 2C�HþNð Þ ð5Þ
where C, H and N is the number of carbon, hydrogen and nitrogenatoms in a molecular formula.
To evaluate molecular differences between surface microlayersfrom different stations (and salinities), enrichment factors (EF) foreach station (SML and ULW) were calculated according to Eq. (6):
EFi ¼ Xi½ �SML= Xi½ �ULW ð6Þ
where EFi is the enrichment factor for a molecular formula “i” and[Xi]SML, [Xi]ULW is the relative peak magnitude for this formula in theSML and corresponding ULW sample. Before classifying compounds
as enriched or depleted, a threshold was set (enriched: EF≥1.5; de-pleted: EF≤0.67), taking into account the degree of mass peakmagni-tude repeatability of FT-ICRMSmeasurements (b10% peakmagnituderelative standard deviation for ESI negative full scanmode; Kido Souleet al., 2010). We did not assess the peak magnitude repeatability inthis study, but the conservative EF thresholds require that the normal-izedmagnitude of a compound in the SML (ULW) is at least 50% differ-ent from the ULW (SML).
2.5. Statistical analysis
For multivariate statistical analyses (Software “R”, 2012) we usedrelative peak magnitudes of all molecular formulas (after exclusionof the doubly assigned peaks). Group average cluster analysis basedon the Bray–Curtis dissimilarity (Bray and Curtis, 1957) and PrincipalComponent Analysis (PCA, Pearson, 1901) were carried out. Signifi-cance tests for two groups of samples were either performed withtheMann–Whitney U-test or theWilcox signed rank test (paired sam-ples), based on the null hypothesis that both groups differ by less than“0” (i.e., they are equal). For p-values smaller than the significancelevel α=0.05 the null hypothesis was rejected (i.e., both groups dif-fer). Variables were always heteroskedastic and non-normally distrib-uted, as tested with the Bartlett- and Shapiro–Wilk-test (α=0.05).
3. Results
3.1. Physico-chemical conditions and nutrients
The water temperatures were between 20 and 22 °C in May 2009and 25 °C in September 2008. Surface layer salinity increased from theupper estuary towards the Adriatic Sea (Table 1) because of thewedge-shaped freshwater layer in the estuary. At the Šibenik station(E4a) salinitywasmuchhigher in 2008, reflecting the very low freshwa-ter input in late summer. The SML had consistently higher DOC concen-trations compared to theULW(meanDOC-EF=1.42±0.29). DOC in theSML increased with salinity while macro nutrient concentrations weresimilar in all sample pairs (SML/ULW, relative differences b1%) andonly ULW data are reported. In 2009, nitrate and silicate concentrationsat the two estuary stations E3 and E4a were 15.6±1.3 μM and 36.6±3.6 μM, while at the marine site C1, concentrations were 1.4 μM and4.4 μM, respectively. Nitrite and phosphate were always below 0.5 μMand 0.1 μM, respectively. Extraction efficiencies for the SPE recovered

Table 1Overview and general data of all samples. SML: surface microlayer, ULW: underlying water, IDEG: molecular degradation index after Flerus et al. (2012).
Sample Location Sample-type Temperature [°C] Salinity DOC [μM] SPE efficiency [%] IDEG
E4a — 2008 Middle estuary SML 25.0 30 181.3 26.8 0.36ULW 25.0 30 101.2 22.4 0.32
E3 — 2009 Upper estuary SML 21.3 1.9 89.3 33.6 0.21ULW 21.3 1.8 59.8 23.3 0.20
E4a — 2009 Middle estuary SML 22.0 6.3 97.1 31.9 0.23ULW 22.0 6.3 84.2 26.8 0.20
C1 — 2009 Marine station SML 20.3 34.9 174.5 25.6 0.21ULW 20.3 34.8 142.1 22.9 0.17
29O.J. Lechtenfeld et al. / Marine Chemistry 150 (2013) 25–38
DOC varied between 22 and 33% (Table 1), with a significantly higheramount of DOC recovered from the SML samples (average SML:29.5±3.9%; average ULW: 23.8±2.0%, pb0.04). The reason for thelower extraction efficiency compared to Dittmar et al. (2008) is notclear. However, the extract C/N ratios (19.4±3.5) were similar toreported values for PPL (Dittmar et al., 2008; Hertkorn et al., 2012) indi-cating a comparable extraction of NOM components.
3.2. HPLC
The correlation between the total absorbance of the entire chromato-grams (total peak area [L]) and theDOC concentration of the extractwassignificant for all samples (r=0.94; n=8, pb0.001), although a non-zero y-intercept points towards some DOC fraction not absorbing at210 nm. The average molar extinction coefficient ε210 nm was highestfor the samples from the middle station E4a and lowest for the marinestation C1 (Table 2). The ε210 nm (SML) / ε210 nm (ULW) ratio as well asthe calculated absorption coefficient α (λ=210, 355 nm) for the origi-nal sample (i.e., considering the nominal enrichment factors of the ex-tracts, Table 2) revealed an accumulation of CDOM in the SML samples(mean ratios α(SML)/α(ULW)=1.9±0.4 for λ=210 nm and 2.4±1.1 for λ=355 nm). In contrast, the DOC normalized peak area of thetotal fluorescence (ex260/em430) showed highest values for the upperestuary station E3 and lowest values for the marine station C1, as wellas generally higher fluorescence values for all ULW samples (Table 2).The decrease in total DOC normalized fluorescence is in accordancewith the characteristics of the UV humic like “Peak A”, that is known toexhibit a linear negative correlation with salinity in estuaries (Coble,1996).
TheDAD210 nm-chromatograms of all SML andULWsamples showedfour major peaks while in some samples two additional small peaksappeared (Fig. 2). Peakswere grouped as hydrophilic (-H) and lipophilic(-L). The main features of the SML samples were an additional peak at20.43±0.17 min (4-H, n=3; not present in the 2008 sample) and a rel-atively higher absorbing peak at 10.73±0.07 min (2-H, n=3). Inde-pendent of the sample type, all samples (except E4a — 2008) showed
Table 2HPLC derived solid-phase extract average molar extinction coefficient ε210 nm and calculatedsample with the most intense signal (100%) and normalized to the injected DOC amount.
Sample Sample-type ε210 nm [L mol−1 cm−1] α(λ) in original sample [
210 nm 355
E4a — 2008 SML 527.6 5.90 0.27ULW 548.4 2.86 0.18
E3 — 2009 SML 488.7 3.52 0.27ULW 441.6 1.50 0.07
E4a — 2009 SML 531.4 3.93 0.18ULW 456.0 2.48 0.08
C1 — 2009 SML 424.2 4.47 0.13ULW 343.8 2.64 0.07
a major contribution of very polar, water eluting components (fractions1-H to 4-H versus 5-L and 6-L, DAD210 nm, pb0.02). Fluorescence(ex260/em430) revealed a peak at 29.04±0.04 min (n=3) that wasonly present in the ULW samples with the exception of the E4a —
2008 sample.
3.3. FT-ICR MS
FT-ICR MS analyses resulted in 4311 to 6128 assigned molecularformulas per sample (number of total peaks per sample with S/N>4and 200–700 m/z: 11,435–13,702). Twenty-nine molecular formulasbelonged to doubly assigned peaks with m/z>550 Da and could notbe unequivocally assigned according to the defined criteria. Thesummed peak magnitude of all doubly assigned peaks was only0.01% of the total magnitude of all peaks. As a conservative approach,these peaks were removed from the final data set.
The general pattern of the molecular mass, O/C and H/C distributionof all samples (Fig. 1) resembled that of solid-phase extracted marinesurface waters, as found in other studies (e.g., Gonsior et al., 2011;Kujawinski et al., 2009). The mean elemental ratios were O/C=0.438±0.158 and H/C=1.253±0.357 (n=41,953). Thirty-two per-cent of all formulas contained one or twonitrogen atoms, 17% containedone or two sulfur atoms and 4% contained nitrogen and sulfur (as com-pound classes N1S1, N2S1 or N1S2). The number of nitrogen, oxygen andsulfur peaks per sample did not show any clear trend (Table 3).
Comparing the weighted average elemental ratios of H/C and O/C(wa H/C, wa O/C) for all samples (Table 3), an increase of both ratioswas foundwith increasing salinity and DOC concentration. The weight-ed average mass (wa mass) and number of peaks did not show anytrendwith salinity or DOC. Compared to ULW, the SML samples showedhigher abundances of sulfur compounds (lower wa C/S ratio), highersaturation (higher waH/C ratios and lowerwaDBE values), and smallerwamass. During the 2008 campaign all of these differenceswere partic-ularly pronounced (Table 3).
Cluster analysis based on all molecular formulas clearly separated allsamples according to their salinities (Fig. 3A). In addition, the SML
absorption coefficients α(λ). Total DOC normalized fluorescence (FLU) is relative to the
m-1] Ratio α(λ) SML/ULW FLU [%] Ratio FLU SML/ULW
nm 210 nm 355 nm
2.1 1.6 58.0 0.7673.2
2.3 4.0 78.4 0.78100.0
1.5 2.2 70.0 0.8087.9
1.7 1.8 23.0 0.9424.5

Fig. 2. Reversed phase high performance liquid chromatograms of microlayer and underlying water extracts (E3, SML and E3, ULW) with diode array (200-350 nm, left Y-axis) and relativefluorescence (FLD, ex260/em430 nm, black line, right Y-axis) signals. Diode array intensities were converted to molar extinction coefficient εOC and displayed as color scale for both samples.For peak labels, see text.
30 O.J. Lechtenfeld et al. / Marine Chemistry 150 (2013) 25–38
samples separated from the ULW samples at the low salinity stations E3and E4a (2009). The station E4a — 2008 showed a lower similarity tothe 2009 samples and also less similarity between SML and ULW. Forthe samples from2009, the PCA (Fig. 3B) confirmed the clear separationbetween differences in salinity (PC1, 76% of variance) and between SMLand ULW (PC2, 9.5% of variance).
Out of all samples, 826–3213 molecular formulas (accounting for 5–48% of the summedmagnitude) were enriched or appeared uniquely inthe SML samples, while 655–2049 molecular formulas (3–13%) wereenriched in or unique to the ULW samples (Table 4). For the 2009 sam-ples the summed relativemagnitude of enriched (depleted) compoundsincreased (decreased) with increasing salinity (Fig. 4) and changed con-sistently with the number of enriched (depleted)molecular formulas. In
Table 3FT-ICR MS weighted average (wa) molecular parameters of the complete SPE sample set. H/Number-percentage of CHO, CHNO, CHOS, and CHNOS compounds to all detected ions.
Sample Sample-type Assigned formulas wa H/C wa O/C wa mass [Da]
E4a — 2008 SML 4769 1.440 0.364 415.71ULW 4311 1.348 0.400 421.52
E3 —2009 SML 5420 1.231 0.461 452.32ULW 6128 1.217 0.450 459.13
E4a — 2009 SML 5247 1.251 0.467 448.25ULW 5558 1.229 0.471 463.17
C1 — 2009 SML 5530 1.266 0.484 457.11ULW 4972 1.253 0.492 466.24
2008, a pronounced enrichment of compounds in the SML sample wasobserved. The “unique” peaks, belonging to SML or ULW in a samplepair, were equally distributed in the vanKrevelen space and had low rel-ative magnitudes (mean for all unique peaks: 1.33±0.48%). Thereforethe corresponding peaks in the paired sample were likely below themagnitude threshold and thus not present in the evaluation data set.Fig. 5 shows the EF values in a color coded van Krevelen diagram for sta-tion E3 and C1 distinguishing between enriched and depletedcompounds.
On average, 20% of all molecular formulas in a sample and even 25–38% of all SML-enriched compounds contained at least one sulfur atom.The latter accounted for 28–44% of the summedmagnitude of enrichedpeaks. Eight to 44% of all enriched compounds contained at least one
C: hydrogen to carbon ratio, O/C: oxygen to carbon ratio, DBE: double bond equivalents.
wa DBE CHO peaks [%] CHNO peaks [%] CHOS peaks [%] CHNOS peaks [%]
7.03 49.5 27.1 19.9 3.47.98 52.3 31.4 14.0 2.19.45 47.5 33.1 16.4 2.99.82 48.4 34.3 14.1 3.29.11 47.0 32.0 18.3 2.79.60 47.7 32.5 16.3 3.59.00 42.5 33.7 19.4 4.59.26 44.1 33.1 17.4 5.4

Fig. 3. Multivariate statistical analysis of untransformed FT-ICR MS peak magnitudes of allmolecular formulas (n=41,953). A: cluster analysis (Bray-Curtis similarity) for all samples.B: principal component analysis (PCA) for the 2009 samples (SML=microlayer, solid lines;ULW=underlying water, dashed lines). The circle size specifies the salinity of each sample.
Fig. 4. Magnitude proportions of all molecular formulas that were enriched (EF>1.5)or uniquely found in the microlayer (SML) or underlying water (ULW) sample ofeach station (ULW enriched corresponds to EFb0.67) with the corresponding salinities.
31O.J. Lechtenfeld et al. / Marine Chemistry 150 (2013) 25–38
nitrogen atom comprising 18–35% of the total enriched intensity. Theaverage EF of the sulfur compound classes (N0S1-2) was higher thanfor all molecular formulas, and it was lower for the nitrogen compoundclasses (N1-2S0). The highest EFs for N and S-compounds were found inthe 2008 samples, while the average EF of all depleted compounds wassimilar regardless the compound class or the sample station (Table 4).
Table 4Average enrichment factors (EF) for all, CHNO, and CHOS molecular formulas for theenriched (enr.) and depleted (depl.) compounds. Values in brackets are the numberof respective peaks, not including the unique peaks. For E4a — 2008 depl., values wereomitted (n.a.; only one peakwith EFb0.67). Unique peaks include all compound classes.
EF for sample all compounds CHNOcompounds
CHOScompounds
Unique peaks(all)
enr. depl. enr. depl. enr. depl. enr. depl.
E4a — 2008 3.36 n.a. 2.14 n.a. 5.97 n.a.(1872) n.a. (386) n.a. (303) n.a. (1341) (882)
E3 — 2009 2.16 0.58 1.72 0.61 2.57 0.57(107) (622) (32) (97) (35) (43) (719) (1427)
E4a — 2009 1.94 0.60 1.69 0.60 2.33 0.61(204) (497) (66) (75) (55) (95) (679) (990)
C1 — 2009 1.97 0.58 1.78 0.54 2.73 0.60(591) (44) (245) (11) (91) (18) (1173) (615)
3.4. Fragmentation experiments
To elucidate the structure of some compounds identified by FT-ICRMS, collision induced dissociation (qCID-MS/MS) experiments wereperformed on two high magnitude nominal masses (m/z 311, 325)from different spectra. The fragmentation pattern for m/z 311.16864(Fig. 6, sample C1 — 2009, SML) strongly suggested that the oxygenwas bound in a sulfonate group and not in a carboxylic group (SO2
loss, but no loss of CO2/H2O, typically observed from CID fragmentationof carboxylic acids; Levsen et al., 2007;Witt et al., 2009). After the initialloss of C2H6 from the molecular ion [M\H]− repeated abstractions of(CH2)n-units were detected, resulting in the base peak at m/z 183
Fig. 5. Van Krevelen visualization of FT-ICR MS derived molecular formulas that wereenriched or depleted in the surface microlayer of a low salinity sample (E3, S=6) and ahigh salinity sample (C1, S=35), not including unique peaks for clarity. The enrichmentfactor for each peak is color coded (same scale for all panels). In the top left panel, the loca-tion of anthropogenic surfactant homologues from a database (http://www.terrabase-inc.com) are displayed as neutral molecules in the van Krevelen space (APEO=alkylphenolethoxylates, (L)AS=(linear) alkylbenzenesulfonates). Plots were prepared using OceanData View (R. Schlitzer, http://odv.awi.de).

Fig. 6. Collision induced dissociation (qCID-MS/MS) spectrum of nominal mass 311 of a microlayer sample (C1— 2009, SML) with exactm/z values for fragment ions. Fragments from cal-culated mass differences are displayed together with possible neutral structures of the major ions: undecylbenzenesulfonic acid (A, molecular ion peak), non-enylbenzenesulfonic acid(B), undecylphenol (C) and styrenesulfonic acid (D, base peak). “×”=major additional sulfur compounds (O4S, O5S), which possibly resulted from fragmentation of additional molecularions at the isolation nominal mass. Other peaks present in the original spectrum C1— 2009, SML at mass 311 are shown in the insert with assigned molecular formulas.
32 O.J. Lechtenfeld et al. / Marine Chemistry 150 (2013) 25–38
with the molecular formula C8H8O3S (DBE=5). A benzene ring in themolecule is a reasonable assumption (accounting for 4 DBE). Otherlowmagnitude sulfur and non-sulfur ions were present in the full spec-trum at nominal mass 311, and fragment ions of these were alsodetected (Fig. 6). In contrast to the fragment ions, theywere alsopresentwith a higher relativemagnitude in the original spectrum. The fragmen-tation spectrum of nominal mass 325 (E4a — 2009, SML) showed frag-ment ions at the same mass differences but no detectable peak at m/z170.
This approach strongly suggests that the molecular formulas of thebase peaks at the nominal mass 311 and 325 (m/z 311.16864 and325.18429) have only one major structural isomer and belong to thegroup of linear alkylbenzenesulfonates (LAS, which are widespreadanthropogenic surfactant products). However, the exact substitutionpattern and potential branching of the alkyl rest could not be resolvedand might contribute to a higher degree of structural diversity forthese peaks. According to these results, we assume that the other mo-lecular formulas that belonged to the same pseudo-homologous“CH2”-series (C13+kH19+2kO3S; k=0–7) were true homologues andas well LAS compounds. In all samples most of the homologue molec-ular formulas of the LAS were also found, but with lower magnitudes.Enrichment factors for these mass peaks varied between EF=1 and17.
4. Discussion
The Krka River Estuary is a well-studied biogeochemical system (seeMarine Chemistry special issue 32, 1991) with low freshwater inflowand low terrestrial organic matter load (Cauwet, 1991). The karsticcatchment of the Krka River is reflected in low particulate organic mat-ter carbon to nitrogen ratios (Svensen et al., 2007) suggesting mainlyautochthonous productionwithin the estuary. The persistent and stronghalocline at the freshwater/saltwater interface in themicrotidal estuaryprevents exchange between surface brackish water and deep saline
water. The halocline acts also as a barrier for autochthonous dissolvedand particulate organic matter produced in the surface layer. Higher in-flow of river water in May results in a shorter water residence time inthe whole estuary as compared to September (Legović, 1991).
Our bulk chemical data showed low DOC concentrations along theestuary transect increasing from the upper estuary to themarine stationin May 2009. In the Krka Estuary non-conservative DOC mixing occurs,highlighting the importance of the autochthonous production (Louis etal., 2009; Sempere and Cauwet, 1995). The very low phosphate concen-trations throughout the whole estuary and lipid and fatty acid analysis(B. Gašparović et al. unpubl.) indicate growth limitation and point to-wards low production and post spring-bloom conditions. Compared tothe upper estuary (station E3), nitrate was slightly elevated at the mid-dle station E4a, which is closest to the only larger city along the estuary.Human activitymay induce higher nutrient levels (Legović et al., 1994),although this was not observed in our phosphate data.
4.1. Chromatographic and optical properties
DOC and total absorbance (λ=210 nm) were always higher in themicrolayer than in the underlying water. The absorption coefficientsα(355 nm) fell in the range of previously reported values for AdriaticSea CDOM (Berto et al., 2010) and revealed high EFs for CDOM in theSML ranging from 4.0 (station E3) to 1.8 (station C1) which is clearlyhigher than the enrichment of total DOC (mean EF of 1.42). Suchhigh CDOM-EFs agree with data from slick samples (Blough, 1997;Wurl et al., 2009), although visible surface slicks were not present atthe sampling time. Considering enhanced photochemical degradationof CDOM in the SML a continuous CDOM enrichment has to occur inthe SML (Wurl et al., 2009).
The first two peaks in the DAD210 nm chromatograms (1-H, 2-H)showed the highest differences between SML and ULW samples. In ad-dition to a pure polarity separation, the first two peaks partly reflect asize exclusion separation with a larger average molecular size for peak

33O.J. Lechtenfeld et al. / Marine Chemistry 150 (2013) 25–38
1-H compared to peak 2-H (Lechtenfeld et al., 2011). This is a result ofthe narrow average pore size diameter of the RP column with only80 Å, resulting in an exclusion of the largest molecules or stronglybound aggregates. The peaks 1-H and 2-H therefore elute prior thedead volume of sample methanol and their separation resulted from amixed mode separation mechanism preventing a direct correlationbetween hydrophobicity/molecular size and retention time. However,in all SML samples the proportion of the calculated DOC content(%-DOCcalc) is higher in peak 2-H than in peak 1-H likely resultingfrom a higher contribution of lower molecular weight compounds inthe SML (Fig. 7). This is also supported by a smaller weighted averagemass of SML compared to ULW compounds as detected by FT-ICR MS.
The trend of smaller average molecular size in the SML sample wasespecially evident from the 2008 samples from the middle station E4a.There, in the ULW sample, peaks 1-H and 2-H were shifted towardslower retention time (i.e., higher average size compared to the 2009ULW samples). The E4a — 2009, SML sample showed in contrast ahigher DOCcalc contribution and pronounced shift of peak 2-H to lowermolecular size (compared to the 2008 ULW and 2009 SML samples).These results likely reflect an enhanced photochemical degradation oforganicmatter in the SML, presumably combinedwith enhancedmicro-bial breakdown (Obernosterer et al., 2005). Hence, the pronounced ac-cumulation of small breakdown products in the SML in September2008 can be explained with the extended exposure to such degradationprocesses due to the longer water residence time in summer (Legović,1991). This is also supported by size-exclusion chromatography, whichshowed a unique peak of lowmolecular size compounds only appearingin the SML sample from 2008 (data not shown).
The total DOC normalized fluorescence decreased greatly from thefreshwater E3 to the marine C1 station (on average 73% reduction forSML and ULW samples, Table 2). We assume that this change was dueto differences in autochthonous production in the estuary (Ahel et al.,1996; Cetinic et al., 2006; Svensen et al., 2007) and that the degradationof fluorophores during the transport from station E3 to C1 is responsiblefor the decrease in fluorescence. We further assume that the degrada-tion of only small amounts of terrestrial humic-like material (Bloughand del Vecchio, 2002) from the karstic watershed of the Krka River isa minor contribution to the observed fluorescence decrease, in contrastto humic-rich river estuaries (Yamashita et al., 2008). Moreover, the
Fig. 7. Relative proportions of the calculated DOC amount (DOCcalc) for the chromatographicpeaks for all samples with the corresponding total DOC concentration in the extract(SPE-DOC). For peak names refer to Fig. 2. Peaks that do not appear in all samples arehighlighted (4-H and 6-L, black boxes).
DOC normalized total fluorescence ratio SML/ULW was always belowone (Table 2). This indicates that fluorophores with either differentquantum yield or higher abundance were present in the ULW samples,strongphotobleaching in the SML took place or quenching effects due tothe different compositions of both phases were dominant.
The occurrence of the unique fluorescence peak in the ULW samplesat 29 min (not detected in the 2008 samples) presumably reflectsfluorophores derived from primary production (Koch et al., 2008). Thecontribution of this peak to the total fluorescence was highest in thefreshwater E3 sample and lowest in the marine C1 sample. This mightbe a discrimination effect in the microlayer enrichment mechanism(due to the changing ionic strength) or a consequence of degradationalong the estuarine transport. However, this peak was also found indeeper water layers of the estuary (data not shown), suggesting thatthis fraction is also rapidly degraded in the SML.
4.2. Molecular characterization
FT-ICRMS analyses revealed that each SML sample had higherwaH/C(from +0.01 to +0.09) and lower wa mass (from −5.7 to −14.9 Da)compared to the ULW samples (Table 3). However, based on the com-plete sample set, there was no significant trend between thesemolecularparameters and salinity or DOC. Only the classification of all molecularformulas in each SML/ULW sample pair into “enriched/depleted inthe SML” can explain these results in terms of microlayer chemical char-acteristics (Fig. 5). Applying this approach, changes in numbers andproportional intensity of enriched/depleted compounds with increasingsalinity were revealed in the estuary (Fig. 4): At low salinities (i.e., lowionic strength) only compounds with very high H/C ratios were enrichedin the SML. In contrast, at the high salinity marine station C1, the meanH/C ratio of compounds enriched in the SML and those enriched in theULW were more similar (Table 5). The change in the H/C ratios of theenriched and depleted compounds points towards a separation mecha-nism of hydrophobic constituents at the phase transition betweenULW and SML.
The concept of “salting-out” of hydrophobic substances (Setschenov,1889) implies that the water solubility of hydrophobic molecules de-creases with increasing ionic strength (Xie et al., 1997). Applied to theULW/SML system, we assume that only at high ionic strength, thewater-solubility of “moderately” hydrophobic (amphiphilic) substancesis sufficiently reduced to accumulate in the SML. The salt-mediated, ad-ditional enrichment of compounds with intermediate H/C values there-fore reduces the average H/C ratio of all enriched compounds at themarine station. Indications that the FT-ICR MS molecular H/C ratio canbe interpreted as a measure of hydrophobicity of compounds (at con-stant O/C ratio) were already derived from coupled RP-HPLC-FT-ICRMS experiments (Koch et al., 2008; Liu et al., 2011).
Consistentwith the results from theHPLC analyses and the FT-ICRMSdata from the total samples, themeanmolecularmass of all SML enrichedcompoundswas lower than for the total of all peaks and especially lowerthan for the ULW enriched compounds (i.e., depleted in the SML) in thecorresponding paired sample (Table 5). This agreeswith previous reportsof photochemically produced and enriched low-molecular-weight com-pounds in surface microlayers (Schmitt-Kopplin et al., 2012; Zhou andMopper, 1997).
In addition, the contribution of S-compounds (on number and inten-sity basis) to all SML enrichedmolecular formulaswas higher in the lowsalinity samples than in the high salinity samples, while the proportionof N-compounds increased slightly with salinity (Fig. 8). Moreover, thedifference in the H/C ratio andmass between the enriched and depletedN-compounds is always larger than the corresponding difference be-tween the S-compounds. This suggests that, compared to nitrogen com-pounds, the size and polarity distribution of sulfur bearing compoundsismore similar in SML and ULW. Thus, S-compounds are less influencedby the “salting-out” effect along the estuary.

Table 5Mean values and standard deviation for H/C, O/C, mass and DBE for all compounds that were enriched (enr.) or depleted (depl.) in the SML, not including the unique peaks. For E4a —
2008 depl., values were omitted (n.a.; only one peak with EFb0.67).
Sample H/C O/C mass [Da] DBE
enr. depl. enr. depl. enr. depl. enr. depl.
E4a — 2008 1.454 n.a. 0.371 n.a. 405.3 n.a. 6.8 n.a.±0.295 n.a. ±0.152 n.a. ±103.4 n.a. ±3.5 n.a.
E3 — 2009 1.476 1.117 0.487 0.382 401.6 483.9 6.3 11.9±0.363 ±0.299 ±0.186 ±0.143 ±86.1 ±131.6 ±5.0 ±3.4
E4a — 2009 1.462 1.113 0.521 0.497 386.3 566.0 5.9 12.9±0.311 ±0.266 ±0.186 ±0.127 ±81.7 ±97.7 ±3.5 ±4.1
C1 — 2009 1.383 1.347 0.500 0.464 403.7 480.2 6.9 9.7±0.276 ±0.425 ±0.167 ±0.165 ±88.9 ±155.3 ±3.1 ±8.1
34 O.J. Lechtenfeld et al. / Marine Chemistry 150 (2013) 25–38
The variation between enriched and depleted compounds in theH/C dimension (the effect was less pronounced for the O/C ratios)was also demonstrated by the multivariate statistical analysis. Thedifference in the H/C ratios (Table 5) and the distance between SMLand ULW samples on the PC2 axis (Fig. 3B) reflect the difference inhydrophobicity. It should be noted that there is only little composi-tional overlap of the enriched/depleted substances between the foursample pairs, which can be attributed partly to the defined relativemagnitude and EF thresholds.
Microlayer enriched compoundswith a similar range of H/C and O/Cratios and lowmolecular mass were also found in the SML off the coastof Mallorca Island (Morales-Cid et al., 2009) and a study on the sea-airphase transfer of organicmatter (Schmitt-Kopplin et al., 2012). Air bub-bles mediate an enhanced transport of surface-active compounds fromthe bulk phase to the SML and further into the atmosphere. Active en-richment due to breaking waves is also the reason why at rough windconditions, mean enrichment factors of surfactants can be even higherthan at calm winds (Wurl et al., 2011). However, this did not influencethe sample composition in our study, due to prevailing calm wind con-ditions during sampling.
The late summer 2008 sample from the middle station E4a could bedescribed as a superposition of the high salinity sample C1 and the an-thropogenically influenced middle estuary station from 2009. The dif-ferent environmental conditions (longer water residence time, highersolar radiation dose, higher temperature) were likely reflected in thehigher wa H/C, lower wa O/C ratios, wa mass and wa DBE values aswell as high DOC concentration for both 2008 — E4a samples. Also, a
Fig. 8. Enrichment properties of different compound classes (CHO, CHNO, CHOS) for all staSML and ULW together with the salinity of the SML sample. B: mean molecular H/C ratio anwell as ULW enriched compounds for E4a — 2009 were omitted for this figure due to theircomposition, as the peaks were selected by their EF and not their relative magnitude.
set of high magnitude (>5% relative peak magnitude), highly enriched(EF>2.5) compounds was found (Fig. 1), likely corresponding to satu-rated (CnH2nCOOH) and mono unsaturated (CnH2n-2COOH) fatty acids,not present in the 2009 samples. If we consider that enrichment inthe SML is dependent on the polarity of individual molecules (reflectedby theH/C ratio) and the ionic strength of themedium, these results arein accordance with the proposed physico-chemical separation at thephase boundary. Frka et al. (2009) reported surface active substanceconcentrations at the Šibenik site that were three times higher in theSML and five times higher in the ULW in summer than in winter.These substances accumulate in the estuarine SML during the lowrun-off summer months, being more hydrophobic than in winter. Re-ports on the enrichment of hydrophobic lipid-like compounds or fattyacids (having high H/C and low O/C ratios) in SML samples are ambigu-ous (e.g., Gašparović et al., 2007; Lass and Friedrichs, 2011). However,based on mass spectrometric analysis, Frew et al. (2006) reported anenrichment of surface-active lipids in slicked SML samples.
Seasonal differenceswere also reflected in very high EFs of some com-pounds in the September 2008 sample set compared to the May 2009samples from the same station. The E4a — 2008 SML sample showeda clearly higher abundance of unique high magnitude, high H/C, andlow O/C compounds which cannot be explained alone with the salinity-trend for the enrichment of substances. A set of high magnitude, sulfurbearing compounds contributed mainly to this enrichment.
Our fragmentation experiments revealed the occurrence of LAS inthe SML, most pronounced in the 2008 sample close to the city ofŠibenik, which is in agreement with earlier studies (Ahel and Terzic,
tions. A: relative magnitude contribution to all enriched and unique compounds in thed C: mean molecular mass for the SML or ULW enriched compound classes. CHNOS aslow abundances. Mean ratios were used to highlight the differences in the molecular

35O.J. Lechtenfeld et al. / Marine Chemistry 150 (2013) 25–38
2003). Calculation of concentrations of these substances was not possi-ble, as FT-ICR MS data do not allow quantitative conclusions but themagnitude distribution of the LAS peaks in our samples (Fig. 9) corre-spond well to the distribution determined by the industrial productionprocess (Alzaga et al., 2003). A comparison of the relative peak magni-tudes for each sample pair revealed a high enrichment in the SML forsome LAS homologues for both high saline samples (E4a — 2008 andC1— 2009; Fig. 9). Relativemagnitudes and enrichmentweremost pro-nounced in the 2008 sample, probably as a result of the longer waterresidence time in the estuary (Legović, 1991). This strongly suggests en-hanced enrichment of LAS in the microlayer with increasing salinityaided by the “salting-out” effect and suppression of the heterotrophicmetabolic activity in higher saline waters (Terzic et al., 1992; Alzagaet al., 2003).
Other highly SML enriched sulfur compounds in the 2008 samplesmay also be passively or actively enriched from lower layers or mayoriginate from autochthonous production in the surface layer. However,primary productionwasunusually lowduring September (B. Gašparovićet al. unpubl.). The contemporary view on the molecular structuring ofSML (Cunliffe et al., 2011) requires a hydrated layer of a heterogeneouspolymeric network. Carbohydrates (Kuznetsova et al., 2005;Williams etal., 1986) andTEP (Cunliffe et al., 2009;Wurl et al., 2009) are enriched inSML with a high fraction of sulfate ester groups (Wurl and Holmes,2008). However, high molecular weight, oxygen-rich compounds werenot detected in our FT-ICR MS samples. Our findings based on FT-ICRMS fragmentation and database comparison hence necessitate verycareful interpretation of sulfur containing molecular formulas as wellas other potential non-ionic surfactantmasses in future FT-ICRMS stud-ies of solid-phase extracted NOM.
An approach to assess the general degradation state of anNOM sam-ple is the degradation index (IDEG, Eq. (4); Flerus et al., 2012). In ourstudy the SML samples had generally higher IDEG-values than the ULWsamples, indicating a higher degree of degradation in the SML. More-over, the 2008 samples had higher values than the 2009 samples. An ex-planation for the higher degree of degradation could be the enhancedphotochemical and microbial reworking in the SML and the decouplingbetween autotrophic production and transformation of organic matterin this particular physico-chemical environment (as supported by the29 min FLD peak; Obernosterer et al., 2005; Santos et al., 2011). There-fore, the IDEG parameter might also be well applicable to characterizethe degradation state of sea surface microlayers. Our ongoing research
Fig. 9. Relative peak magnitude distributions in the surface microlayer and enrichment factKrka Esturay. The “x” indicates that the position of the benzene sulfonate group is unknownwere calculated for xC7–xC9 and xC14 as the magnitudes for these homologues in the ULW
aims at understanding the molecular mechanisms and biogeochemicalcauses for the observed differences in the IDEG parameter.
Major processes that determine the molecular composition andhence the degradation state of NOM in the surface microlayer with re-spect to the bulk water phase are depicted in Fig. 10: The SML is char-acterized by a strong enrichment of bacterial biomass (Sieburth et al.,1976) and predominating heterotrophic processes (Reinthaler et al.,2008; Santos et al., 2011). Together with the photoinhibition of photo-autotrophs in the SML (due to high UV-B radiation) a decoupling ofproduction and degradation can occur (Obernosterer et al., 2005).The pronounced exposure to sunlight in stratified estuaries and lowwind conditions then favors the photochemical breakdown of DOMmolecules in the SML (Tilstone et al., 2010). Physico-chemical pro-cesses further determine the composition of the SML and ULW, suchas diffusion, bubble entrainment (Wurl et al., 2011), “salting-out” ofhydrophobic molecules (Xie et al., 1997) and spontaneous verticalphase separation and horizontal segregation of surface active sub-stances (Frka et al., 2012). However, sorption of organic compoundson suspended particles also changes the partitioning between water,solid phase and the hydrophobic surface microlayer (Brunk et al.,1997; Gschwend and Schwarzenbach, 1992) andmight lead to furthermolecular fractionation between these phases in shelf waters (Boehm,1980). The chemical observations presented in this study are a super-position of all these effects, determining the equilibrium state of hy-drophobic and hydrophilic substances between SML and ULW. Ourcurrent research aims at resolving the relative contribution of each ef-fect on the molecular level distribution of compounds.
5. Conclusions
Our ultra-high resolution mass spectrometry results on solid-phaseextracted DOM from surface microlayers and underlying waters in thekarstic Krka River Estuary demonstrated that the SML is a layer withconsiderable compositional analogy to the ULW. However, specific dif-ferences in the molecular composition were attributable to the salinitygradient, a factor which is so far rarely considered in SML studies. In ad-dition to the highly dynamic chemical and physical character of theSML, surface microlayers sampled in estuarine or coastal zones are par-ticularly prone to anthropogenic influences. Hydrophobic and surface-active compounds released from ship traffic and wastewater dischargepotentially influence the distribution of substances at the sea surface,
ors for the proposed linear alkylbenzenesulfonate (LAS) homologues xC7–xC14 in theand the length of the alkyl rest is expressed as “C” and number. No enrichment factorssamples were below the threshold.
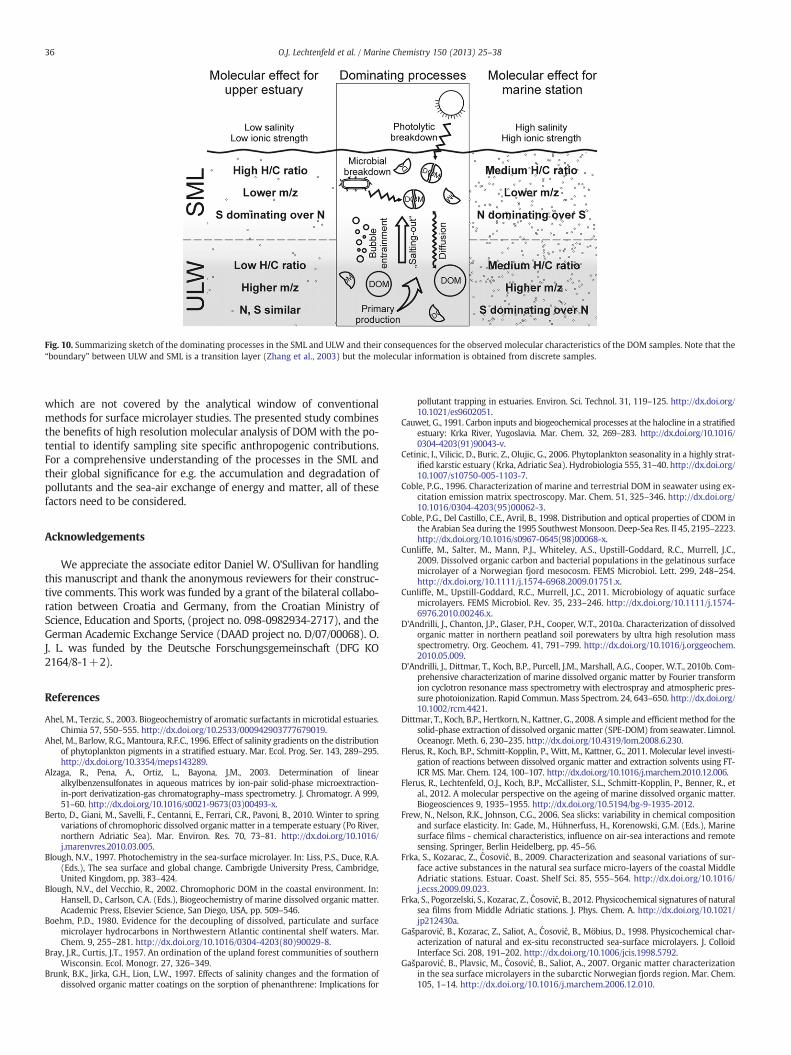
Fig. 10. Summarizing sketch of the dominating processes in the SML and ULW and their consequences for the observed molecular characteristics of the DOM samples. Note that the“boundary” between ULW and SML is a transition layer (Zhang et al., 2003) but the molecular information is obtained from discrete samples.
36 O.J. Lechtenfeld et al. / Marine Chemistry 150 (2013) 25–38
which are not covered by the analytical window of conventionalmethods for surface microlayer studies. The presented study combinesthe benefits of high resolution molecular analysis of DOM with the po-tential to identify sampling site specific anthropogenic contributions.For a comprehensive understanding of the processes in the SML andtheir global significance for e.g. the accumulation and degradation ofpollutants and the sea-air exchange of energy and matter, all of thesefactors need to be considered.
Acknowledgements
We appreciate the associate editor Daniel W. O'Sullivan for handlingthis manuscript and thank the anonymous reviewers for their construc-tive comments. This work was funded by a grant of the bilateral collabo-ration between Croatia and Germany, from the Croatian Ministry ofScience, Education and Sports, (project no. 098-0982934-2717), and theGerman Academic Exchange Service (DAAD project no. D/07/00068). O.J. L. was funded by the Deutsche Forschungsgemeinschaft (DFG KO2164/8-1+2).
References
Ahel, M., Terzic, S., 2003. Biogeochemistry of aromatic surfactants in microtidal estuaries.Chimia 57, 550–555. http://dx.doi.org/10.2533/000942903777679019.
Ahel, M., Barlow, R.G., Mantoura, R.F.C., 1996. Effect of salinity gradients on the distributionof phytoplankton pigments in a stratified estuary. Mar. Ecol. Prog. Ser. 143, 289–295.http://dx.doi.org/10.3354/meps143289.
Alzaga, R., Pena, A., Ortiz, L., Bayona, J.M., 2003. Determination of linearalkylbenzensulfonates in aqueous matrices by ion-pair solid-phase microextraction-in-port derivatization-gas chromatography–mass spectrometry. J. Chromatogr. A 999,51–60. http://dx.doi.org/10.1016/s0021-9673(03)00493-x.
Berto, D., Giani, M., Savelli, F., Centanni, E., Ferrari, C.R., Pavoni, B., 2010. Winter to springvariations of chromophoric dissolved organic matter in a temperate estuary (Po River,northern Adriatic Sea). Mar. Environ. Res. 70, 73–81. http://dx.doi.org/10.1016/j.marenvres.2010.03.005.
Blough, N.V., 1997. Photochemistry in the sea-surface microlayer. In: Liss, P.S., Duce, R.A.(Eds.), The sea surface and global change. Cambrigde University Press, Cambridge,United Kingdom, pp. 383–424.
Blough, N.V., del Vecchio, R., 2002. Chromophoric DOM in the coastal environment. In:Hansell, D., Carlson, C.A. (Eds.), Biogeochemistry of marine dissolved organic matter.Academic Press, Elsevier Science, San Diego, USA, pp. 509–546.
Boehm, P.D., 1980. Evidence for the decoupling of dissolved, particulate and surfacemicrolayer hydrocarbons in Northwestern Atlantic continental shelf waters. Mar.Chem. 9, 255–281. http://dx.doi.org/10.1016/0304-4203(80)90029-8.
Bray, J.R., Curtis, J.T., 1957. An ordination of the upland forest communities of southernWisconsin. Ecol. Monogr. 27, 326–349.
Brunk, B.K., Jirka, G.H., Lion, L.W., 1997. Effects of salinity changes and the formation ofdissolved organic matter coatings on the sorption of phenanthrene: Implications for
pollutant trapping in estuaries. Environ. Sci. Technol. 31, 119–125. http://dx.doi.org/10.1021/es9602051.
Cauwet, G., 1991. Carbon inputs and biogeochemical processes at the halocline in a stratifiedestuary: Krka River, Yugoslavia. Mar. Chem. 32, 269–283. http://dx.doi.org/10.1016/0304-4203(91)90043-v.
Cetinic, I., Vilicic, D., Buric, Z., Olujic, G., 2006. Phytoplankton seasonality in a highly strat-ified karstic estuary (Krka, Adriatic Sea). Hydrobiologia 555, 31–40. http://dx.doi.org/10.1007/s10750-005-1103-7.
Coble, P.G., 1996. Characterization of marine and terrestrial DOM in seawater using ex-citation emission matrix spectroscopy. Mar. Chem. 51, 325–346. http://dx.doi.org/10.1016/0304-4203(95)00062-3.
Coble, P.G., Del Castillo, C.E., Avril, B., 1998. Distribution and optical properties of CDOM inthe Arabian Sea during the 1995 Southwest Monsoon. Deep-Sea Res. II 45, 2195–2223.http://dx.doi.org/10.1016/s0967-0645(98)00068-x.
Cunliffe, M., Salter, M., Mann, P.J., Whiteley, A.S., Upstill-Goddard, R.C., Murrell, J.C.,2009. Dissolved organic carbon and bacterial populations in the gelatinous surfacemicrolayer of a Norwegian fjord mesocosm. FEMS Microbiol. Lett. 299, 248–254.http://dx.doi.org/10.1111/j.1574-6968.2009.01751.x.
Cunliffe, M., Upstill-Goddard, R.C., Murrell, J.C., 2011. Microbiology of aquatic surfacemicrolayers. FEMS Microbiol. Rev. 35, 233–246. http://dx.doi.org/10.1111/j.1574-6976.2010.00246.x.
D'Andrilli, J., Chanton, J.P., Glaser, P.H., Cooper, W.T., 2010a. Characterization of dissolvedorganic matter in northern peatland soil porewaters by ultra high resolution massspectrometry. Org. Geochem. 41, 791–799. http://dx.doi.org/10.1016/j.orggeochem.2010.05.009.
D'Andrilli, J., Dittmar, T., Koch, B.P., Purcell, J.M., Marshall, A.G., Cooper, W.T., 2010b. Com-prehensive characterization of marine dissolved organic matter by Fourier transformion cyclotron resonance mass spectrometry with electrospray and atmospheric pres-sure photoionization. Rapid Commun. Mass Spectrom. 24, 643–650. http://dx.doi.org/10.1002/rcm.4421.
Dittmar, T., Koch, B.P., Hertkorn, N., Kattner, G., 2008. A simple and efficientmethod for thesolid-phase extraction of dissolved organic matter (SPE-DOM) from seawater. Limnol.Oceanogr. Meth. 6, 230–235. http://dx.doi.org/10.4319/lom.2008.6.230.
Flerus, R., Koch, B.P., Schmitt-Kopplin, P., Witt, M., Kattner, G., 2011. Molecular level investi-gation of reactions between dissolved organic matter and extraction solvents using FT-ICR MS. Mar. Chem. 124, 100–107. http://dx.doi.org/10.1016/j.marchem.2010.12.006.
Flerus, R., Lechtenfeld, O.J., Koch, B.P., McCallister, S.L., Schmitt-Kopplin, P., Benner, R., etal., 2012. A molecular perspective on the ageing of marine dissolved organic matter.Biogeosciences 9, 1935–1955. http://dx.doi.org/10.5194/bg-9-1935-2012.
Frew, N., Nelson, R.K., Johnson, C.G., 2006. Sea slicks: variability in chemical compositionand surface elasticity. In: Gade, M., Hühnerfuss, H., Korenowski, G.M. (Eds.), Marinesurface films - chemical characteristics, influence on air-sea interactions and remotesensing. Springer, Berlin Heidelberg, pp. 45–56.
Frka, S., Kozarac, Z., Ćosović, B., 2009. Characterization and seasonal variations of sur-face active substances in the natural sea surface micro-layers of the coastal MiddleAdriatic stations. Estuar. Coast. Shelf Sci. 85, 555–564. http://dx.doi.org/10.1016/j.ecss.2009.09.023.
Frka, S., Pogorzelski, S., Kozarac, Z., Ćosović, B., 2012. Physicochemical signatures of naturalsea films from Middle Adriatic stations. J. Phys. Chem. A. http://dx.doi.org/10.1021/jp212430a.
Gašparović, B., Kozarac, Z., Saliot, A., Ćosović, B., Möbius, D., 1998. Physicochemical char-acterization of natural and ex-situ reconstructed sea-surface microlayers. J. ColloidInterface Sci. 208, 191–202. http://dx.doi.org/10.1006/jcis.1998.5792.
Gašparović, B., Plavsic, M., Ćosović, B., Saliot, A., 2007. Organic matter characterizationin the sea surface microlayers in the subarctic Norwegian fjords region. Mar. Chem.105, 1–14. http://dx.doi.org/10.1016/j.marchem.2006.12.010.

37O.J. Lechtenfeld et al. / Marine Chemistry 150 (2013) 25–38
Gonsior, M., Peake, B.M., Cooper, W.T., Podgorski, D.C., D'Andrilli, J., Dittmar, T., et al., 2011.Characterization of dissolved organic matter across the Subtropical Convergence offthe South Island, New Zealand. Mar. Chem. 123, 99–110. http://dx.doi.org/10.1016/j.marchem.2010.10.004.
Gschwend, P.M., Schwarzenbach, R.P., 1992. Physical chemistry of organic compounds inthe marine environment. Mar. Chem. 39, 187–207. http://dx.doi.org/10.1016/0304-4203(92)90101-f.
Guitart, C., García-Flor, N., Bayona, J.M., Albaigés, J., 2007. Occurrence and fate of polycyclicaromatic hydrocarbons in the coastal surfacemicrolayer. Mar. Pollut. Bull. 54, 186–194.http://dx.doi.org/10.1016/j.marpolbul.2006.10.008.
Hardy, J.T., 1982. The sea-surfacemicrolayer: Biology, chemistry and anthropogenic enrich-ment. Prog. Oceanogr. 11, 307–328. http://dx.doi.org/10.1016/0079-6611(82)90001-5.
Hardy, J.T., Apts, C.W., 1984. The sea-surface microlayer: phytoneuston productivity andeffects of atmospheric particulate matter. Mar. Biol. 82, 293–300. http://dx.doi.org/10.1007/bf00392409.
Hertkorn, N., Frommberger, M., Witt, M., Koch, B.P., Schmitt-Kopplin, P., Perdue, E.M.,2008. Natural organic matter and the event horizon of mass spectrometry. Anal.Chem. 80, 8908–8919. http://dx.doi.org/10.1021/ac800464g.
Hertkorn, N., Harir, M., Koch, B.P., Michalke, B., Grill, P., Schmitt-Kopplin, P., 2012. Highfield NMR spectroscopy and FTICR mass spectrometry: powerful discovery toolsfor the molecular level characterization of marine dissolved organic matter fromthe South Atlantic Ocean. Biogeosci. Discuss. 9, 745–833. http://dx.doi.org/10.5194/bgd-9-745-2012.
Hunter, K.A., Liss, P.S., 1981. Organic sea surface films. In: Duursma, E.K., Dawson, R.(Eds.), Marine organic chemistry. Elsevier Oceanography Series. Elsevier ScientificPublishing Company, Amsterdam, pp. 259–298.
Hutta, M., Gora, R., Halko, R., Chalanyova, M., 2011. Some theoretical and practical aspectsin the separation of humic substances by combined liquid chromatography methods.J. Chromatogr. A 1218, 8946–8957. http://dx.doi.org/10.1016/j.chroma.2011.06.107.
Joux, F., Agogue, H., Obernosterer, I., Dupuy, C., Reinthaler, T., Herndl, G.J., et al., 2006.Microbial community structure in the sea surface microlayer at two contrastingcoastal sites in the northwestern Mediterranean Sea. Aquat. Microb. Ecol. 42,91–104. http://dx.doi.org/10.3354/ame042091.
Kattner, G., 1999. Storage of dissolved inorganic nutrients in seawater: poisoning withmercuric chloride. Mar. Chem. 67, 61–66. http://dx.doi.org/10.1016/s0304-4203(99)00049-3.
Kattner, G., Becker, H., 1991. Nutrients and organic nitrogenous compounds in themarginalice zone of the Fram Strait. J. Mar. Syst. 2, 385–394. http://dx.doi.org/10.1016/0924-7963(91)90043-t.
Kattner, G., Brockmann, U.H., 1978. Fatty-acid composition of dissolved and particulatematter in surface films. Mar. Chem. 6, 233–241. http://dx.doi.org/10.1016/0304-4203(78)90032-4.
Kattner, G., Nagel, K., Brockmann, U.H., Hammer, K.D., Eberlein, K., 1983. Composition ofnatural surface films in the North Sea. In: Sündermann, J., Lenz, W. (Eds.), North SeaDynamics. Springer Verlag, Berlin, Heidelberg, pp. 662–670.
Kattner, G., Nagel, K., Eberlein, K., Hammer, K.D., 1985. Components of natural surfacemicrolayers and subsurface water. Oceanol. Acta 8, 175–183.
Kido Soule, M.C., Longnecker, K., Giovannoni, S.J., Kujawinski, E.B., 2010. Impact of instru-ment and experiment parameters on reproducibility of ultrahigh resolution ESI FT-ICRmass spectra of natural organic matter. Org. Geochem. 41, 725–733. http://dx.doi.org/10.1016/j.orggeochem.2010.05.017.
Koch, B.P., Witt, M., Engbrodt, R., Dittmar, T., Kattner, G., 2005. Molecular formulae of ma-rine and terrigenous dissolved organic matter detected by electrospray ionizationFourier transform ion cyclotron resonance mass spectrometry. Geochim. Cosmochim.Acta 69, 3299–3308. http://dx.doi.org/10.1016/j.gca.2005.02.027.
Koch, B.P., Dittmar, T., Witt, M., Kattner, G., 2007. Fundamentals of molecular formula as-signment to ultrahigh resolutionmass data of natural organic matter. Anal. Chem. 79,1758–1763. http://dx.doi.org/10.1021/ac061949s.
Koch, B.P., Ludwichowski, K.-U., Kattner, G., Dittmar, T., Witt, M., 2008. Advanced character-ization of marine dissolved organic matter by combining reversed-phase liquid chro-matography and FT-ICR-MS. Mar. Chem. 111, 233–241. http://dx.doi.org/10.1016/j.marchem.2008.05.008.
Kujawinski, E.B., Longnecker, K., Blough, N.V., Vecchio, R.D., Finlay, L., Kitner, J.B., et al., 2009.Identification of possible source markers in marine dissolved organic matter usingultrahigh resolution mass spectrometry. Geochim. Cosmochim. Acta 73, 4384–4399.http://dx.doi.org/10.1016/j.gca.2009.04.033.
Kuznetsova, M., Lee, C., Aller, J., Frew, N., 2004. Enrichment of amino acids in the sea sur-face microlayer at coastal and open ocean sites in the North Atlantic Ocean. Limnol.Oceanogr. 49, 1605–1619. http://dx.doi.org/10.4319/lo.2004.49.5.1605.
Kuznetsova, M., Lee, C., Aller, J., 2005. Characterization of the proteinaceousmatter inmarineaerosols. Mar. Chem. 96, 359–377. http://dx.doi.org/10.1016/j.marchem.2005.03.007.
Lass, K., Friedrichs, G., 2011. Revealing structural properties of the marine nanolayerfrom vibrational sum frequency generation spectra. J. Geophys. Res. Oceans 116.http://dx.doi.org/10.1029/2010jc006609.
Lechtenfeld, O.J., Koch, B.P., Geibert,W., Ludwichowski, K.-U., Kattner, G., 2011. Inorganicsin organics: quantification of organic phosphorus and sulfur and trace element spe-ciation in natural organic matter using HPLC-ICPMS. Anal. Chem. 83, 8968–8974.http://dx.doi.org/10.1021/ac201765a.
Legović, T., 1991. Exchange of water in a stratified estuary with an application to Krka(Adriatic Sea). Mar. Chem. 32, 121–135. http://dx.doi.org/10.1016/0304-4203(91)90032-r.
Legović, T., Žutić, V., Gržetić, Z., Cauwet, G., Precali, R., Viličić, D., 1994. Eutrophication inthe Krka estuary. Mar. Chem. 46, 203–215. http://dx.doi.org/10.1016/0304-4203(94)90056-6.
Levsen, K., Schiebel, H.-M., Terlouw, J.K., Jobst, K.J., Elend, M., Preiß, A., et al., 2007.Even-electron ions: a systematic study of the neutral species lost in the
dissociation of quasi-molecular ions. J. Mass Spectrom. 42, 1024–1044. http://dx.doi.org/10.1002/jms.1234.
Liss, P.S., Duce, R.A. (Eds.), 1997. The Sea Surface andGlobal Change. Cambrigde UniversityPress, Cambridge, United Kingdom.
Liu, Z., Sleighter, R.L., Zhong, J., Hatcher, P.G., 2011. The chemical changes of DOM fromblack waters to coastal marine waters by HPLC combined with ultrahigh resolutionmass spectrometry. Estuar. Coast. Shelf Sci. 92, 205–216. http://dx.doi.org/10.1016/j.ecss.2010.12.030.
Longnecker, K., Kujawinski, E.B., 2011. Composition of dissolved organic matter in ground-water. Geochim. Cosmochim. Acta 75, 2752–2761. http://dx.doi.org/10.1016/j.gca.2011.02.020.
Louis, Y., Garnier, C., Lenoble, V., Mounier, S., Cukrov, N., Omanovic, D., et al., 2009. Kineticand equilibrium studies of copper-dissolved organic matter complexation in watercolumn of the stratified Krka River Estuary (Croatia). Mar. Chem. 114, 110–119.http://dx.doi.org/10.1016/j.marchem.2009.04.006.
Morales-Cid, G., Gebefugi, I., Kanawati, B., Harir, M., Hertkorn, N., Rossello-Mora, R., etal., 2009. Automated microextraction sample preparation coupled on-line to FT-ICR-MS: application to desalting and concentration of river and marine dissolvedorganic matter. Anal. Bioanal. Chem. 395, 797–807. http://dx.doi.org/10.1007/s00216-009-3025-0.
Obernosterer, I., Catala, P., Reinthaler, T., Herndl, G.J., Lebaron, P., 2005. Enhanced hetero-trophic activity in the surface microlayer of the Mediterranean Sea. Aquat. Microb.Ecol. 39, 293–302. http://dx.doi.org/10.3354/ame039293.
Pearson, K., 1901. On lines and planes of closest fit to systems of points in space. Philos.Mag. Ser. 6 (2), 559–572. http://dx.doi.org/10.1080/14786440109462720.
Reinthaler, T., Sintes, E., Herndl, G.J., 2008. Dissolved organic matter and bacterial produc-tion and respiration in the sea-surface microlayer of the open Atlantic and the west-ern Mediterranean Sea. Limnol. Oceanogr. 53, 122–136. http://dx.doi.org/10.4319/lo.2008.53.1.0122.
Santos, L., Santos, A.L., Coelho, F., Gomes, N.C.M., Dias, J.M., Cunha, A., et al., 2011. Relation be-tween bacterial activity in the surface microlayer and estuarine hydrodynamics. FEMSMicrobiol. Ecol. 77, 636–646. http://dx.doi.org/10.1111/j.1574-6941.2011.01147.x.
Schmidt, F., Elvert, M., Koch, B.P., Witt, M., Hinrichs, K.-U., 2009.Molecular characterizationof dissolved organic matter in pore water of continental shelf sediments. Geochim.Cosmochim. Acta 73, 3337–3358. http://dx.doi.org/10.1016/j.gca.2009.03.008.
Schmitt-Kopplin, P., Liger-Belair, G., Koch, B.P., Flerus, R., Kattner, G., Harir, M., et al.,2012. Dissolved organic matter in sea spray: a transfer study from marine surfacewater to aerosols. Biogeosciences 9, 1571–1582. http://dx.doi.org/10.5194/bg-9-1571-2012.
Sempere, R., Cauwet, G., 1995. Occurrence of organic colloids in the stratified estuary ofthe Krka Estuary (Croatia). Estuar. Coast. Shelf Sci. 40, 105–114. http://dx.doi.org/10.1016/0272-7714(95)90016-0.
Setschenov, M., 1889. Über die Konstitution der Salzlösungen auf Grund Ihres Verhaltenszu Kohlensäure. Z. Phys. Chem. 117–128.
Sieburth, J.M., Willis, P.J., Johnson, K.M., Burney, C.M., Lavoie, D.M., Hinga, K.R., et al., 1976.Dissolved organic matter and heterotrophic microneuston in the surface microlayerof the North Atlantic. Science 194, 1415–1418. http://dx.doi.org/10.1126/science.194.4272.1415.
Stubbins, A., Spencer, R.G.M., Chen, H.M., Hatcher, P.G., Mopper, K., Hernes, P.J., et al.,2010. Illuminated darkness: molecular signatures of Congo River dissolved or-ganic matter and its photochemical alteration as revealed by ultrahigh precisionmass spectrometry. Limnol. Oceanogr. 55, 1467–1477. http://dx.doi.org/10.4319/lo.2010.55.4.1467.
Svensen, C., Viličić, D., Wassmann, P., Arashkevich, E., Ratkova, T., 2007. Plankton distribu-tion and vertical flux of biogenic matter during high summer stratification in the KrkaEstuary (Eastern Adriatic). Estuar. Coast. Shelf Sci. 71, 381–390. http://dx.doi.org/10.1016/j.ecss.2006.07.022.
Terzic, S., Hrsak, D., Ahel, M., 1992. Primary biodegradation kinetics of linearalkylbenzenesulfonates in estuarine waters. Water Res. 26, 585–591. http://dx.doi.org/10.1016/0043-1354(92)90231-r.
Tilstone, G.H., Airs, R.L., Martinez-Vicente, V., Widdicombe, C., Llewellyn, C., 2010. High con-centrations of mycosporine-like amino acids and colored dissolved organic matter inthe sea surface microlayer off the Iberian Peninsula. Limnol. Oceanogr. 55, 1835–1850.http://dx.doi.org/10.4319/lo.2010.55.5.1835.
Vojvodić, V., Ćosović, B., 1992. The hydrophobic fraction of organicmatter in the Krka RiverEstuary. Mar. Chem. 39, 251–267. http://dx.doi.org/10.1016/0304-4203(92)90012-y.
Williams, P.M., Carlucci, A.F., Henrichs, S.M., Vanvleet, E.S., Horrigan, S.G., Reid, F.M.H., etal., 1986. Chemical and microbiological studies of sea-surface films in the SouthernGulf of California and off the West Coast of Baja California. Mar. Chem. 19, 17–98.http://dx.doi.org/10.1016/0304-4203(86)90033-2.
Witt, M., Fuchser, J., Koch, B.P., 2009. Fragmentation studies of fulvic acids using collisioninduced dissociation Fourier transform ion cyclotron resonance mass spectrometry.Anal. Chem. 81, 2688–2694. http://dx.doi.org/10.1021/ac802624s.
Wurl, O., Holmes, M., 2008. The gelatinous nature of the sea-surface microlayer. Mar.Chem. 110, 89–97. http://dx.doi.org/10.1016/j.marchem.2008.02.009.
Wurl, O., Obbard, J.P., 2004. A review of pollutants in the sea-surface microlayer (SML):a unique habitat for marine organisms. Mar. Pollut. Bull. 48, 1016–1030. http://dx.doi.org/10.1016/j.marpolbul.2004.03.016.
Wurl, O., Miller, L., Röttgers, R., Vagle, S., 2009. The distribution and fate of surface-activesubstances in the sea-surface microlayer and water column. Mar. Chem. 115, 1–9.http://dx.doi.org/10.1016/j.marchem.2009.04.007.
Wurl, O., Wurl, E., Miller, L., Johnson, K., Vagle, S., 2011. Formation and global distributionof sea-surface microlayers. Biogeosciences 8, 121–135. http://dx.doi.org/10.5194/bg-8-121-2011.
Xian, F., Hendrickson, C.L., Marshall, A.G., 2012. High resolution mass spectrometry.Anal. Chem. 84, 708–719. http://dx.doi.org/10.1021/ac203191t.

38 O.J. Lechtenfeld et al. / Marine Chemistry 150 (2013) 25–38
Xie, W.H., Shiu, W.Y., Mackay, D., 1997. A review of the effect of salts on the solubility oforganic compounds in seawater. Mar. Environ. Res. 44, 429–444. http://dx.doi.org/10.1016/s0141-1136(97)00017-2.
Yamashita, Y., Jaffé, R., Maie, N., Tanoue, E., 2008. Assessing the dynamics of dissolved or-ganic matter (DOM) in coastal environments by excitation emission matrix fluores-cence and parallel factor analysis (EEM-PARAFAC). Limnol. Oceanogr. 53, 1900–1908.http://dx.doi.org/10.4319/lo.2008.53.5.1900.
Zhang, Z.B., Liu, L.S., Liu, C.Y., Cai, W.J., 2003. Studies on the sea surface microlayer — II.The layer of sudden change of physical and chemical properties. J. Colloid InterfaceSci. 264, 148–159. http://dx.doi.org/10.1016/s0021-9797(03)00390-4.
Zhou, X.L., Mopper, K., 1997. Photochemical production of low-molecular-weight carbonylcompounds in seawater and surface microlayer and their air-sea exchange. Mar.Chem. 56, 201–213. http://dx.doi.org/10.1016/s0304-4203(96)00076-x.
Copyright © 2022 FDOKUMEN