The effects of riverine discharge on temperature, salinity, suspended sediment and chlorophyll a in...
10
The effects of riverine discharge on temperature, salinity, suspended sediment and chlorophyll a in a Mississippi delta estuary measured using a flow-through system Robert R. Lane a, * , John W. Day Jr. a , Brian D. Marx b , Enrique Reyes c , Emily Hyfield d , Jason N. Day a a Department of Oceanography and Coastal Sciences, Louisiana State University, Baton Rouge, LA 70803, USA b Department of Experimental Statistics, Louisiana State University, Baton Rouge, LA 70803, USA c East Carolina University, Department of Biology, Greenville, NC 27858, USA d Post, Buckley, Schuh & Jernigan, Inc., Tampa, FL 33607, USA Received 27 June 2005; accepted 2 April 2007 Available online 11 June 2007 Abstract The impact of diverted Mississippi River water on temperature, salinity, total suspended sediment (TSS) and chlorophyll a were monitored in the Breton Sound estuary from September 7, 2000, to August 28, 2002. Twenty-seven transects were carried out using a flow-through system to continuously measure temperature, salinity, turbidity and fluorescence, and discrete water samples were taken at 16 locations for calibration. Discharge from the river diversion structure ranged from 0 to 213 m 3 /s, with several large pulses of water released during the spring of 2001 and 2002. There was a strong seasonal temperature signal in the estuary, with summer highs of >30 C and winter lows of <12 C. Incoming river water was usually cooler than estuarine waters, with temperatures as low as 6 C, but generally equilibrated to the rest of the estuary within several kilometers. Salinity in the upper estuary was fresh throughout the study, and increased up to 14 and 30 PSU along Western and Eastern routes, respectfully, with distance from the diversion. Discharge from the river diversion greatly affected salinity, with the large spring pulses often causing the entire estuary to become fresh for a short period of time (<1 month). There was also a temporal lag of about two weeks between discharge and salinity in the lower estuary. River water entering the estuary had TSS concentrations ranging from 40 to 252 mg/L, with an average of 118 mg/L. Sediment from the river diversion reached about 10e15 km into the estuary during spring pulses. There were highly fluctuating TSS concentrations at the Gulf end of the estuary during winter and spring, due to wind resuspension. Chlorophyll a con- centrations were highest in mid-estuary during summer and fall low discharge, and lowest during winter and spring high discharge. Chlorophyll a levels were generally less than 10 mg/L in the upper estuary, with concentrations rising in the mid-estuary generally to 20e30 mg/L during late summer and fall, and decreasing in the lower estuary. There were several periods of less than a month with unusually high chlorophyll a con- centrations, ranging from 38 to >60 mg/L, that occurred during late summer and early winter. Ó 2007 Elsevier Ltd. All rights reserved. Keywords: flow-through; river diversion; wetland restoration; water quality 1. Introduction Overbank flooding and crevasses of the Mississippi River were major geological processes in the formation and maintenance of the Mississippi delta (Hatton et al., 1983; Ke- sel, 1988, 1989; Roberts, 1997; Davis, 2000; Day et al., 2000, 2007). Each year the river flood supplied a pulse of freshwater, suspended sediments, inorganic nutrients, and organic mate- rials that stimulated primary and secondary production. This increased plant productivity provided higher rates of food pro- duction for consumers, and increased organic soil formation. Freshwater pulses also maintained a salinity gradient that * Corresponding author. E-mail address: [email protected] (R.R. Lane). 0272-7714/$ - see front matter Ó 2007 Elsevier Ltd. All rights reserved. doi:10.1016/j.ecss.2007.04.008 Estuarine, Coastal and Shelf Science 74 (2007) 145e154 www.elsevier.com/locate/ecss
-
Upload
independent -
Category
Documents
-
view
3 -
download
0
Transcript of The effects of riverine discharge on temperature, salinity, suspended sediment and chlorophyll a in...
Estuarine, Coastal and Shelf Science 74 (2007) 145e154www.elsevier.com/locate/ecss
The effects of riverine discharge on temperature, salinity, suspendedsediment and chlorophyll a in a Mississippi delta estuary
measured using a flow-through system
Robert R. Lane a,*, John W. Day Jr. a, Brian D. Marx b, Enrique Reyes c,Emily Hyfield d, Jason N. Day a
a Department of Oceanography and Coastal Sciences, Louisiana State University, Baton Rouge, LA 70803, USAb Department of Experimental Statistics, Louisiana State University, Baton Rouge, LA 70803, USA
c East Carolina University, Department of Biology, Greenville, NC 27858, USAd Post, Buckley, Schuh & Jernigan, Inc., Tampa, FL 33607, USA
Received 27 June 2005; accepted 2 April 2007
Available online 11 June 2007
Abstract
The impact of diverted Mississippi River water on temperature, salinity, total suspended sediment (TSS) and chlorophyll a were monitored inthe Breton Sound estuary from September 7, 2000, to August 28, 2002. Twenty-seven transects were carried out using a flow-through system tocontinuously measure temperature, salinity, turbidity and fluorescence, and discrete water samples were taken at 16 locations for calibration.Discharge from the river diversion structure ranged from 0 to 213 m3/s, with several large pulses of water released during the spring of2001 and 2002. There was a strong seasonal temperature signal in the estuary, with summer highs of >30 �C and winter lows of <12 �C.Incoming river water was usually cooler than estuarine waters, with temperatures as low as 6 �C, but generally equilibrated to the rest of theestuary within several kilometers. Salinity in the upper estuary was fresh throughout the study, and increased up to 14 and 30 PSU along Westernand Eastern routes, respectfully, with distance from the diversion. Discharge from the river diversion greatly affected salinity, with the largespring pulses often causing the entire estuary to become fresh for a short period of time (<1 month). There was also a temporal lag of abouttwo weeks between discharge and salinity in the lower estuary. River water entering the estuary had TSS concentrations ranging from 40 to252 mg/L, with an average of 118 mg/L. Sediment from the river diversion reached about 10e15 km into the estuary during spring pulses. Therewere highly fluctuating TSS concentrations at the Gulf end of the estuary during winter and spring, due to wind resuspension. Chlorophyll a con-centrations were highest in mid-estuary during summer and fall low discharge, and lowest during winter and spring high discharge. Chlorophyll alevels were generally less than 10 mg/L in the upper estuary, with concentrations rising in the mid-estuary generally to 20e30 mg/L during latesummer and fall, and decreasing in the lower estuary. There were several periods of less than a month with unusually high chlorophyll a con-centrations, ranging from 38 to >60 mg/L, that occurred during late summer and early winter.� 2007 Elsevier Ltd. All rights reserved.
Keywords: flow-through; river diversion; wetland restoration; water quality
1. Introduction
Overbank flooding and crevasses of the Mississippi Riverwere major geological processes in the formation and
* Corresponding author.
E-mail address: [email protected] (R.R. Lane).
0272-7714/$ - see front matter � 2007 Elsevier Ltd. All rights reserved.
doi:10.1016/j.ecss.2007.04.008
maintenance of the Mississippi delta (Hatton et al., 1983; Ke-sel, 1988, 1989; Roberts, 1997; Davis, 2000; Day et al., 2000,2007). Each year the river flood supplied a pulse of freshwater,suspended sediments, inorganic nutrients, and organic mate-rials that stimulated primary and secondary production. Thisincreased plant productivity provided higher rates of food pro-duction for consumers, and increased organic soil formation.Freshwater pulses also maintained a salinity gradient that
146 R.R. Lane et al. / Estuarine, Coastal and Shelf Science 74 (2007) 145e154
supported a high diversity of wetland and aquatic habitats forestuarine species (Day et al., 1997, 2000).
The construction of flood control levees and closure of mi-nor distributary channels began soon after colonization of NewOrleans by the French in 1719 (Boesch, 1996; Colten, 2000).Since the early 1900s most of coastal Louisiana has been hy-drologically isolated from the Mississippi River by the com-pletion of massive flood control levees that have completelyhalted riverine input to coastal wetlands (Kesel, 1988, 1989;Mossa, 1996). As a consequence of this lack of river flooding,resuspended sediment from bay bottoms and eroded marshedge have replaced fluvial sources of inorganic sediments inmany regions of coastal Louisiana (Hatton et al., 1983; Bau-mann et al., 1984; Reed, 1988). In addition, canal dredgingand spoil bank construction associated mainly with the oiland gas industry has further altered the natural hydrology ofthe delta, promoting saltwater intrusion events and limitinghydrological exchange (Bass and Turner, 1977; Swenson andTurner, 1987). These modifications to the coastal landscapehave led to a massive loss of wetlands during the 20th century,with about 4500 km2 lost by the end of the 20th century (Sal-inas et al., 1986; Boesch et al., 1994; Coast, 2050, 1998; Dayet al., 2000, 2007).
Relative sea-level rise (RSLR), the combined effect of eu-static sea-level rise (le2 mm/year, Gornitz et al., 1982) andcoastal subsidence, in the Mississippi delta is in excess of10 mm/year (Penland and Ramsey, 1990). This is much higherthan reported for other deltas, such as the Nile (5 mm/year,Stanley, 1990), Ebre (3 mm/year, Ibanez et al., 1997) or Rhone(1e6.5 mm/year, L’Homer, 1992). This high rate of regionalsubsidence and extensive human modifications make the Missis-sippi River delta an excellent laboratory to study the effects ofglobal change and human impact on deltas worldwide.
There is a strong consensus in the scientific and managementcommunity that the long-term survival of Louisiana’s coastalwetlands depends, as one of the major restoration strategies,on the reintroduction of river flow into the interdistributarybasins to stem salinity intrusion and supply nutrients and sedi-ments for wetland restoration (Templet and Meyer-Arendt,1988; Kesel, 1989; Boesch, 1996; Day et al., 2000, 2007; Gos-selink, 2001). The State of Louisiana and Federal Governmenthave developed a plan for river diversions that will mimic flood-ing events of the Mississippi River (Chatry and Chew, 1985;Coast, 2050, 1998). This study focuses on the second largestdiversion structure in operation in Louisiana, located at Caer-narvon, and the effect of diverted river water on several key wa-ter quality parameters in Breton Sound estuary, a large expanseof coastal wetlands between the diversion structure and the Gulfof Mexico. This region is greatly affected by the Caernarvondiversion that allows up to 226 m3/s of Mississippi River waterto enter the estuary (Lane et al., 1999, 2004, 2006).
We carried out 27 transects in the Breton Sound estuaryfrom September 7, 2000, to August 28, 2002, using a flow-through system to continuously measure temperature, salinity,turbidity, and fluorescence. The work presented in this paperwas part of a large interdisciplinary project, PULSES, studyingthe effects of the Caernarvon diversion on the Breton Sound
estuary (http://www.lsu.edu/cei/pulses_numan.html). The pur-pose of this project was to extend our understanding of the ef-fect of pulsed riverine input into coastal wetlands. Our specificobjectives were to examine this effect by measuring the finescale spatial and temporal distribution of temperature, salinity,suspended sediments, and chlorophyll a in the Breton Soundestuary. We hypothesized there would be: (1) rapid reductionof suspended sediment concentration with distance from the di-version structure; (2) low chlorophyll a levels in areas of highsuspended sediment, with higher chlorophyll levels immedi-ately after suspended sediment concentrations decreased; and(3) a negative effect on salinity and temperature throughoutthe estuary associated with structure discharge.
2. Study area
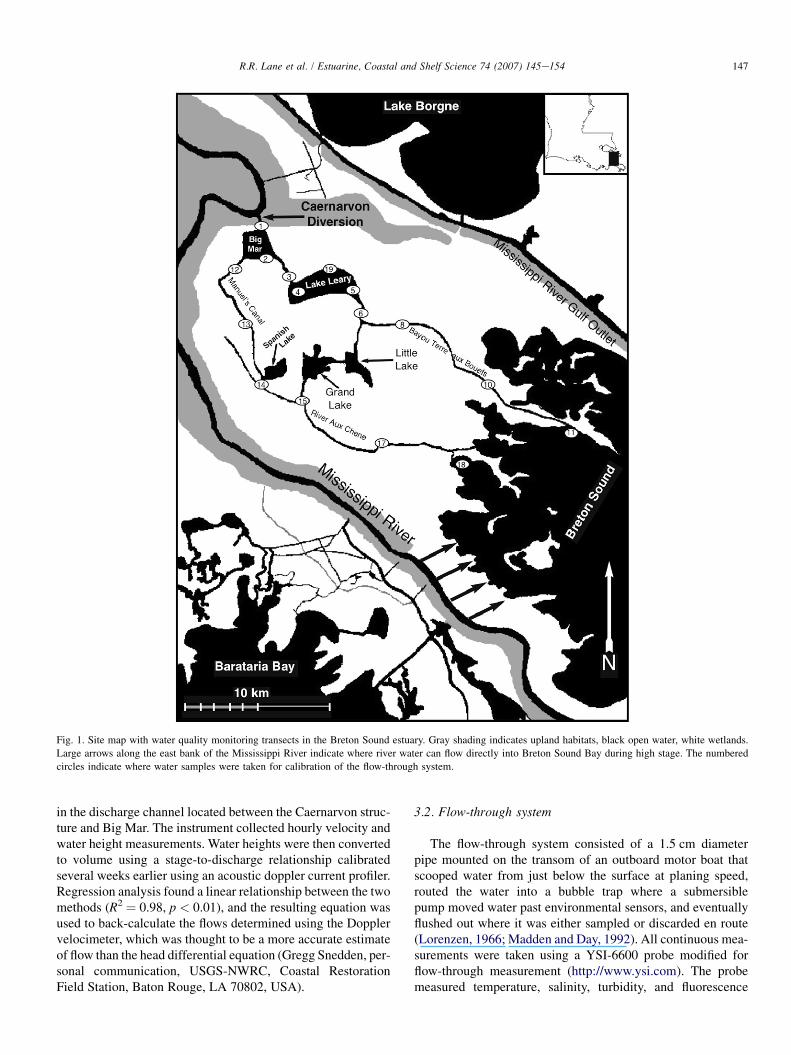
The Caernarvon river diversion structure is located on theeast bank of the Mississippi River at river mile 81.5 (Fig. 1),and consists of five 4.6 m wide box culverts with vertical liftgates, with a capability of passing up to 225 m3/s. The structurewas completed in 1991 and freshwater discharge began in Au-gust of that year. Discharge since structure completion to Janu-ary 2000 averaged 21 m3/s, with great variation throughout theyear. Between the Caernarvon diversion and the Gulf of Mexicothere are about 1100 km2 of fresh to brackish wetlands. Divertedwater must travel 30e40 km through two major routes domi-nated by wetlands before reaching the open waters of BretonSound, and an additional 50 km before reaching Gulf waters(Fig. 1). The two major routes are via (1) Lake Leary and BayouTerra aux Boeufs to the east (referred to as the Eastern route),which carries approximately 2/3 of the flow, and (2) Manuel’sCanal and River aux Chene to the west (referred to as the West-ern route), which carries the remaining 1/3 of flow (Chuck Vil-larubia, personal communication, Louisiana Department ofNatural Resources, Coastal Restoration Division, Baton Rouge,LA 70802, USA). Water depths range from 3 to 3.5 m in themain channels and from 1 to 1.25 m in the surrounding lakesand bayous (Hassan Mashriqui, personal communication, LSUHurricane Center, Louisiana State University, Baton Rouge,LA 70803, USA). The water column is well mixed throughoutthe estuary, and there is considerable interaction between di-verted river water and estuarine wetlands due to tides, northerlywind events and storms. Levees prevent Mississippi River waterfrom entering most of Breton Sound estuary. However, riverwater can flow directly into Breton Sound Bay below the pointwhere artificial levees end on the eastern bank of the river, andaffects water quality in the outer bays of the estuary (Fig. 1).
3. Methods
3.1. Structure discharge
Discharge from the structure was calculated from a ratingcurve developed by the Louisiana Department of NaturalResources (Chuck Villarubia, personal communication).Discharge from the structure was also measured episodicallyby the USGS using an acoustic doppler velociometer deployed
147R.R. Lane et al. / Estuarine, Coastal and Shelf Science 74 (2007) 145e154
Fig. 1. Site map with water quality monitoring transects in the Breton Sound estuary. Gray shading indicates upland habitats, black open water, white wetlands.
Large arrows along the east bank of the Mississippi River indicate where river water can flow directly into Breton Sound Bay during high stage. The numbered
circles indicate where water samples were taken for calibration of the flow-through system.
in the discharge channel located between the Caernarvon struc-ture and Big Mar. The instrument collected hourly velocity andwater height measurements. Water heights were then convertedto volume using a stage-to-discharge relationship calibratedseveral weeks earlier using an acoustic doppler current profiler.Regression analysis found a linear relationship between the twomethods (R2 ¼ 0.98, p < 0.01), and the resulting equation wasused to back-calculate the flows determined using the Dopplervelocimeter, which was thought to be a more accurate estimateof flow than the head differential equation (Gregg Snedden, per-sonal communication, USGS-NWRC, Coastal RestorationField Station, Baton Rouge, LA 70802, USA).
3.2. Flow-through system
The flow-through system consisted of a 1.5 cm diameterpipe mounted on the transom of an outboard motor boat thatscooped water from just below the surface at planing speed,routed the water into a bubble trap where a submersiblepump moved water past environmental sensors, and eventuallyflushed out where it was either sampled or discarded en route(Lorenzen, 1966; Madden and Day, 1992). All continuous mea-surements were taken using a YSI-6600 probe modified forflow-through measurement (http://www.ysi.com). The probemeasured temperature, salinity, turbidity, and fluorescence
148 R.R. Lane et al. / Estuarine, Coastal and Shelf Science 74 (2007) 145e154
every 5 s. The average speed of the boat was 50 km/h, provid-ing a reading approximately every 70 m. Prior to each transectthe YSI-6600 probe was calibrated for turbidity and conductiv-ity using known standards, and the time synchronized with anonboard digital time device. The flow-through system was runthrough the Eastern and Western routes described above anddiscrete samples were taken at 16 locations for additional cal-ibration (Fig. 1). The transects were completed in 4e6 h, cov-ering approximately 210 km, providing an essentially synopticsurvey of the estuary.
3.3. Discrete sample analysis
Water samples were taken at 16 sampling locations fromwater exiting the flow-through system and immediately storedat 4 �C for preservation. Total suspended sediments weredetermined by filtering 100e200 mL of sample water throughpre-rinsed, dried and weighed 47 mm 0.7 mm Whatman GF/Fglass fiber filters. Filters were then dried for 1 h at 105 �C,weighed, dried for another 15 min, and reweighed for qualityassurance (Greenberg et al., 1992). Chlorophyll a was deter-mined using a modified version of Strickland and Parsons(1972) technique. Pigments were extracted with a 40:60 ratioof dimethyl sulfoxide (DMSO):90% acetone (Burnison, 1980).The extract was measured with a Turner Designs model 10-AUfluorometer.
3.4. Statistical analysis
Temperature and salinity data were taken directly from theYSI-6600 Sonde instrument, while turbidity and fluorescencewere converted to TSS and chlorophyll a, respectively, usinglinear regression. Simple linear regression analysis was carriedout for each transect using turbidity and fluorescence as inde-pendent variables and TSS and chlorophyll a as dependentvariables. JMP statistical software (Sall et al., 2005) wasused to test for significant differences between the slope ofthe regression and the mean (alpha <0.05), provide R2 corre-lation coefficients, and the regression equations that were usedto calculate TSS and chlorophyll a values from turbidity andfluorescence data, respectively, from the flow-through system.
In addition, an analysis of variance was carried out on thediscrete water samples, with the factors of interest being struc-ture discharge, season, route, and distance from the diversionstructure. Discharge was smoothed using a 2-week running av-erage, and divided into three categories: low flow (�19 m3/s),medium flow (20e59 m3/s), and high flow (�60 m3/s). Sea-sons were designated according to solar solstice and equinoxdesignations. The routes were the Eastern and Westerndescribed above. Distance from the diversion structure wasdivided into three categories: D1 (1e8 km), D2 (9e18 km),and D3 (19e40 km). Data were available for all treatmentcombinations, but the number of replications was unbalanced.Least square means were calculated for significant interactionsand main effects. Statements about interaction plots reflect anexperiment wise Type 1 error rate (falsely finding significance)
controlled at the 5% level, using Bonferroni adjustment, andonly significant interactions were reported in the text.
4. Results
Simple linear regression analysis found significant correla-tions between in situ signals measured by the flow-through sys-tem and discrete samples analyzed in the laboratory for alltransects. R2 coefficients of correlation had a mean of 0.76(min 0.45; 0.03 SE) for TSS and 0.73 (min. 0.50; SE 0.03)for chlorophyll a (Table 1). There was no relationship foundbetween R2 coefficients and season or structure discharge. Indi-vidual transect data for each parameter can be found online inLane (2003). The data were separated into the two routes, East-ern and Western, and graphed (see Fig. 3).
4.1. Discharge
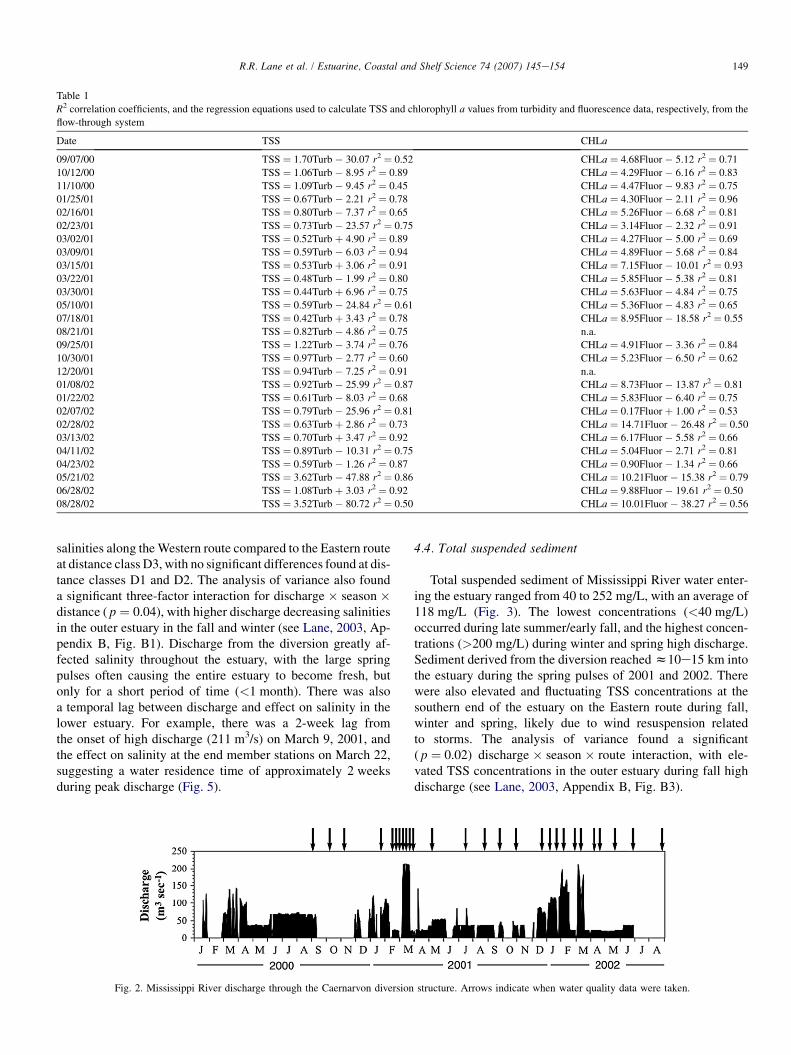
Discharge from the Caernarvon structure ranged from 0 to213 m3/s (Fig. 2). Most of the discharge in 2000 occurredbetween March and September, with flows peaking at139 m3/s on March 14, decreasing to about 37 m3/s for therest of March, and rapidly rising to 68 m3/s in June that con-tinued for the rest of the summer. There was no water dis-charged during several months in fall 2000, but starting inlate November, three moderate sized (z100 m3/s) pulseswere released, followed by a large (z200 m3/s) in the springof 2001. Discharge decreased and remained relatively constant(z40 m3/s) during summer and fall, with short interruptionsof no flow. Discharge increased again in December 2001,and continued to increase, with short interruptions in flow,peaking in February 9, 2002, at 166 m3/s. Discharge decreasedand peaked again on March 15 at 181 m3/s. Flow decreased toz20 m3/s, rising briefly to z37 m3/s, and then falling to zerofor the remainder of the study.
4.2. Temperature
There was a strong seasonal signal in temperature in theBreton Sound estuary, with summer highs of >30 �C and win-ter lows of <12 �C (Fig. 3). Incoming Mississippi River watertemperature was usually cooler than estuarine waters, withtemperatures as low as 6 �C, but generally equilibrated to therest of the estuary within several kilometers. During largestructure discharges there were several times when coolerwater from the diversion propagated through the entire estuary.This was evident during the pulses of January 2001, January2002 and February 2002, when water temperature throughoutthe estuary ranged from 6.3 to 10.2 �C.
4.3. Salinity
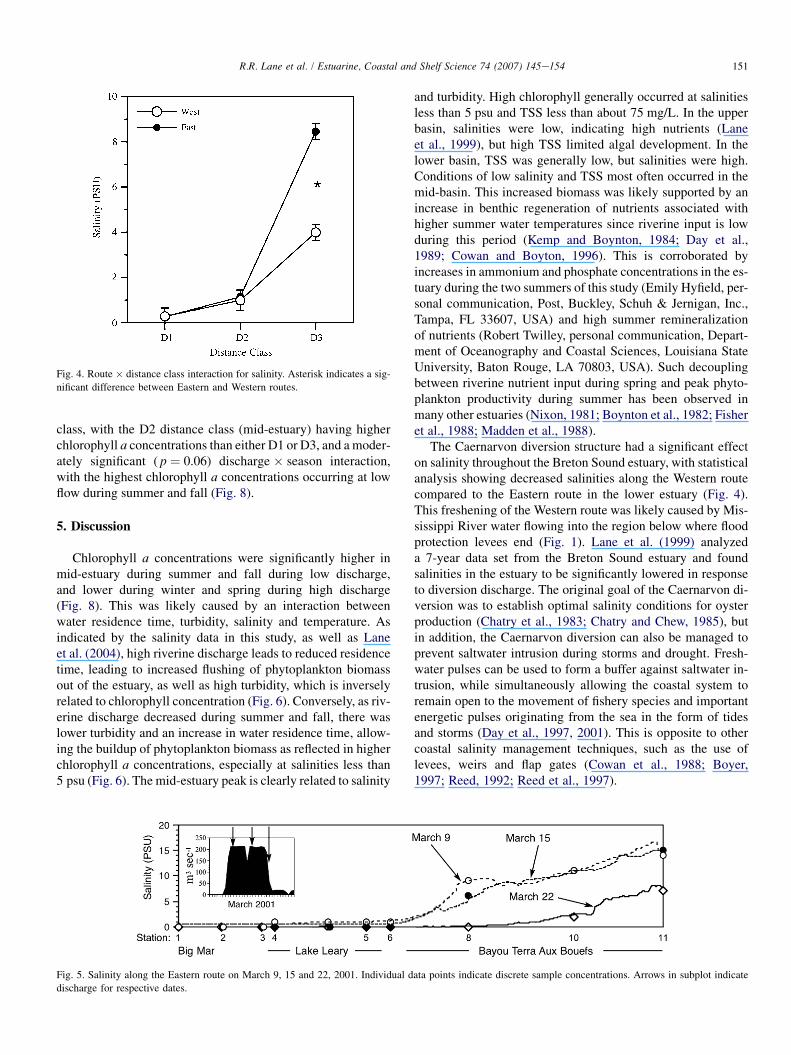
Salinity in the upper estuary was fresh throughout the study,and increased in the outer estuary up to 14 and 30 PSU along theWestern and Eastern routes, respectively (Fig. 3). The analysisof variance detected this effect with a significant ( p < 0.001)route � distance class interaction (Fig. 4), indicating decreased
149R.R. Lane et al. / Estuarine, Coastal and Shelf Science 74 (2007) 145e154
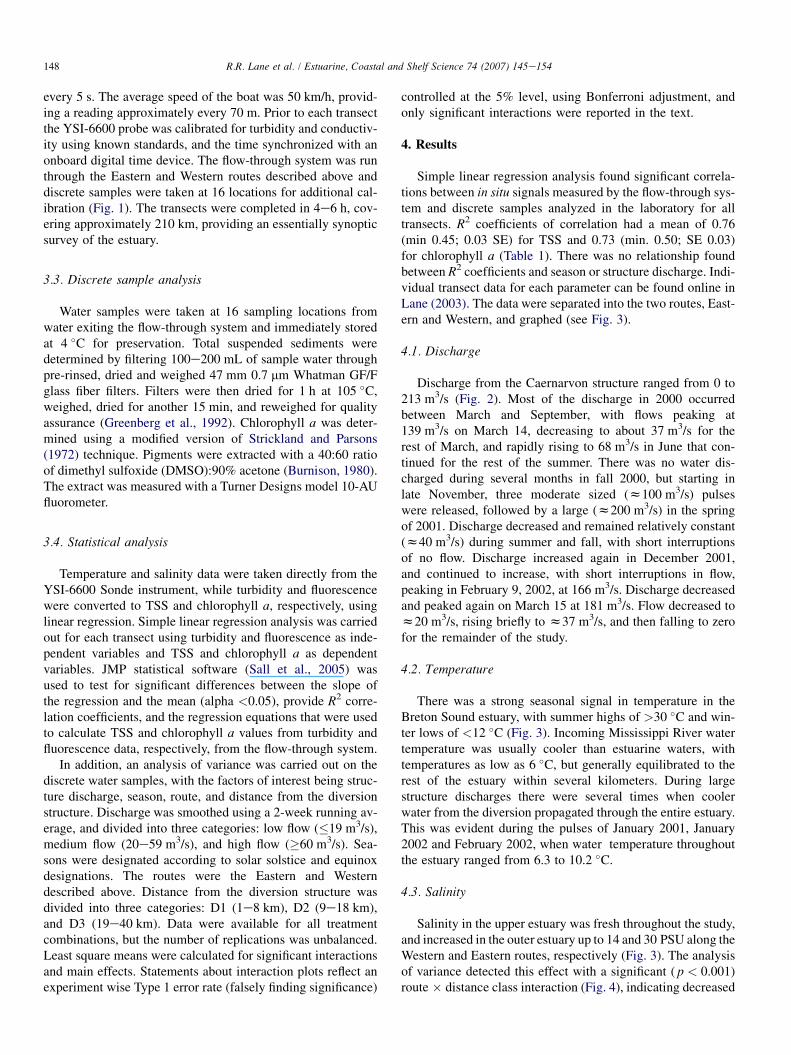
Table 1
R2 correlation coefficients, and the regression equations used to calculate TSS and chlorophyll a values from turbidity and fluorescence data, respectively, from the
flow-through system
Date TSS CHLa
09/07/00 TSS ¼ 1.70Turb � 30.07 r2 ¼ 0.52 CHLa ¼ 4.68Fluor � 5.12 r2 ¼ 0.71
10/12/00 TSS ¼ 1.06Turb � 8.95 r2 ¼ 0.89 CHLa ¼ 4.29Fluor � 6.16 r2 ¼ 0.83
11/10/00 TSS ¼ 1.09Turb � 9.45 r2 ¼ 0.45 CHLa ¼ 4.47Fluor � 9.83 r2 ¼ 0.75
01/25/01 TSS ¼ 0.67Turb � 2.21 r2 ¼ 0.78 CHLa ¼ 4.30Fluor � 2.11 r2 ¼ 0.96
02/16/01 TSS ¼ 0.80Turb � 7.37 r2 ¼ 0.65 CHLa ¼ 5.26Fluor � 6.68 r2 ¼ 0.81
02/23/01 TSS ¼ 0.73Turb � 23.57 r2 ¼ 0.75 CHLa ¼ 3.14Fluor � 2.32 r2 ¼ 0.91
03/02/01 TSS ¼ 0.52Turb þ 4.90 r2 ¼ 0.89 CHLa ¼ 4.27Fluor � 5.00 r2 ¼ 0.69
03/09/01 TSS ¼ 0.59Turb � 6.03 r2 ¼ 0.94 CHLa ¼ 4.89Fluor � 5.68 r2 ¼ 0.84
03/15/01 TSS ¼ 0.53Turb þ 3.06 r2 ¼ 0.91 CHLa ¼ 7.15Fluor � 10.01 r2 ¼ 0.93
03/22/01 TSS ¼ 0.48Turb � 1.99 r2 ¼ 0.80 CHLa ¼ 5.85Fluor � 5.38 r2 ¼ 0.81
03/30/01 TSS ¼ 0.44Turb þ 6.96 r2 ¼ 0.75 CHLa ¼ 5.63Fluor � 4.84 r2 ¼ 0.75
05/10/01 TSS ¼ 0.59Turb � 24.84 r2 ¼ 0.61 CHLa ¼ 5.36Fluor � 4.83 r2 ¼ 0.65
07/18/01 TSS ¼ 0.42Turb þ 3.43 r2 ¼ 0.78 CHLa ¼ 8.95Fluor � 18.58 r2 ¼ 0.55
08/21/01 TSS ¼ 0.82Turb � 4.86 r2 ¼ 0.75 n.a.
09/25/01 TSS ¼ 1.22Turb � 3.74 r2 ¼ 0.76 CHLa ¼ 4.91Fluor � 3.36 r2 ¼ 0.84
10/30/01 TSS ¼ 0.97Turb � 2.77 r2 ¼ 0.60 CHLa ¼ 5.23Fluor � 6.50 r2 ¼ 0.62
12/20/01 TSS ¼ 0.94Turb � 7.25 r2 ¼ 0.91 n.a.
01/08/02 TSS ¼ 0.92Turb � 25.99 r2 ¼ 0.87 CHLa ¼ 8.73Fluor � 13.87 r2 ¼ 0.81
01/22/02 TSS ¼ 0.61Turb � 8.03 r2 ¼ 0.68 CHLa ¼ 5.83Fluor � 6.40 r2 ¼ 0.75
02/07/02 TSS ¼ 0.79Turb � 25.96 r2 ¼ 0.81 CHLa ¼ 0.17Fluor þ 1.00 r2 ¼ 0.53
02/28/02 TSS ¼ 0.63Turb þ 2.86 r2 ¼ 0.73 CHLa ¼ 14.71Fluor � 26.48 r2 ¼ 0.50
03/13/02 TSS ¼ 0.70Turb þ 3.47 r2 ¼ 0.92 CHLa ¼ 6.17Fluor � 5.58 r2 ¼ 0.66
04/11/02 TSS ¼ 0.89Turb � 10.31 r2 ¼ 0.75 CHLa ¼ 5.04Fluor � 2.71 r2 ¼ 0.81
04/23/02 TSS ¼ 0.59Turb � 1.26 r2 ¼ 0.87 CHLa ¼ 0.90Fluor � 1.34 r2 ¼ 0.66
05/21/02 TSS ¼ 3.62Turb � 47.88 r2 ¼ 0.86 CHLa ¼ 10.21Fluor � 15.38 r2 ¼ 0.79
06/28/02 TSS ¼ 1.08Turb þ 3.03 r2 ¼ 0.92 CHLa ¼ 9.88Fluor � 19.61 r2 ¼ 0.50
08/28/02 TSS ¼ 3.52Turb � 80.72 r2 ¼ 0.50 CHLa ¼ 10.01Fluor � 38.27 r2 ¼ 0.56
salinities along the Western route compared to the Eastern routeat distance class D3, with no significant differences found at dis-tance classes D1 and D2. The analysis of variance also founda significant three-factor interaction for discharge � season �distance ( p ¼ 0.04), with higher discharge decreasing salinitiesin the outer estuary in the fall and winter (see Lane, 2003, Ap-pendix B, Fig. B1). Discharge from the diversion greatly af-fected salinity throughout the estuary, with the large springpulses often causing the entire estuary to become fresh, butonly for a short period of time (<1 month). There was alsoa temporal lag between discharge and effect on salinity in thelower estuary. For example, there was a 2-week lag fromthe onset of high discharge (211 m3/s) on March 9, 2001, andthe effect on salinity at the end member stations on March 22,suggesting a water residence time of approximately 2 weeksduring peak discharge (Fig. 5).
4.4. Total suspended sediment
Total suspended sediment of Mississippi River water enter-ing the estuary ranged from 40 to 252 mg/L, with an average of118 mg/L (Fig. 3). The lowest concentrations (<40 mg/L)occurred during late summer/early fall, and the highest concen-trations (>200 mg/L) during winter and spring high discharge.Sediment derived from the diversion reached z10e15 km intothe estuary during the spring pulses of 2001 and 2002. Therewere also elevated and fluctuating TSS concentrations at thesouthern end of the estuary on the Eastern route during fall,winter and spring, likely due to wind resuspension relatedto storms. The analysis of variance found a significant( p ¼ 0.02) discharge � season � route interaction, with ele-vated TSS concentrations in the outer estuary during fall highdischarge (see Lane, 2003, Appendix B, Fig. B3).
Fig. 2. Mississippi River discharge through the Caernarvon diversion structure. Arrows indicate when water quality data were taken.
150 R.R. Lane et al. / Estuarine, Coastal and Shelf Science 74 (2007) 145e154
4.5. Chlorophyll a
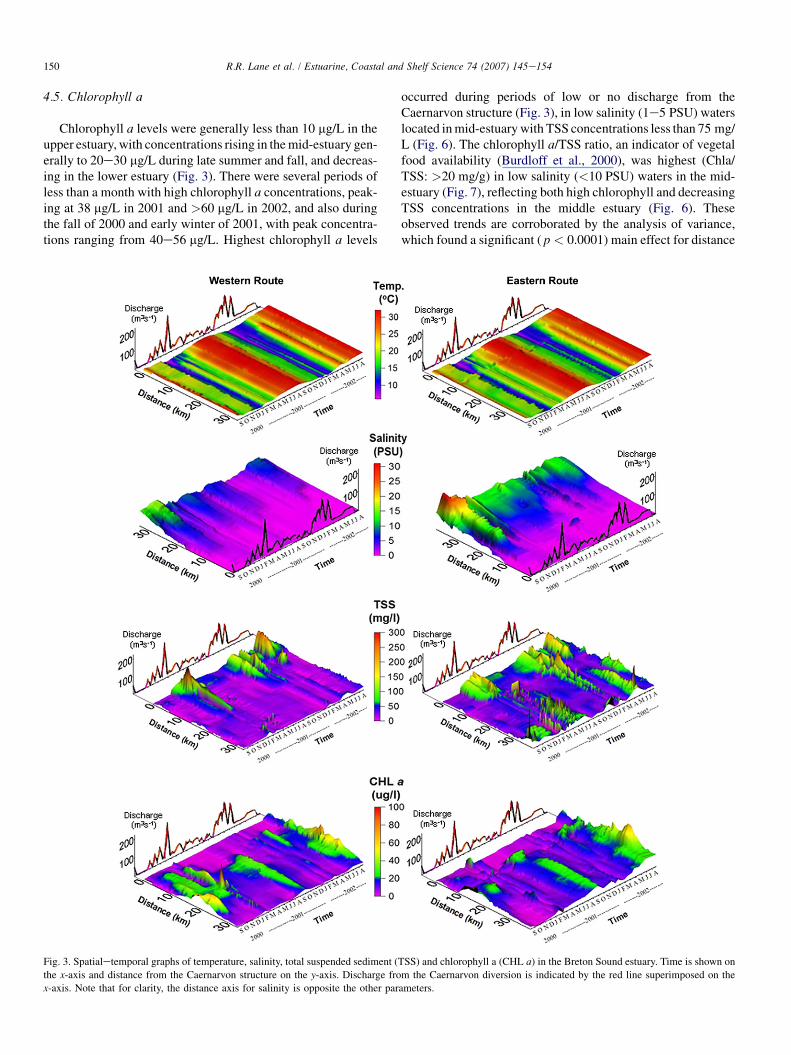
Chlorophyll a levels were generally less than 10 mg/L in theupper estuary, with concentrations rising in the mid-estuary gen-erally to 20e30 mg/L during late summer and fall, and decreas-ing in the lower estuary (Fig. 3). There were several periods ofless than a month with high chlorophyll a concentrations, peak-ing at 38 mg/L in 2001 and >60 mg/L in 2002, and also duringthe fall of 2000 and early winter of 2001, with peak concentra-tions ranging from 40e56 mg/L. Highest chlorophyll a levels
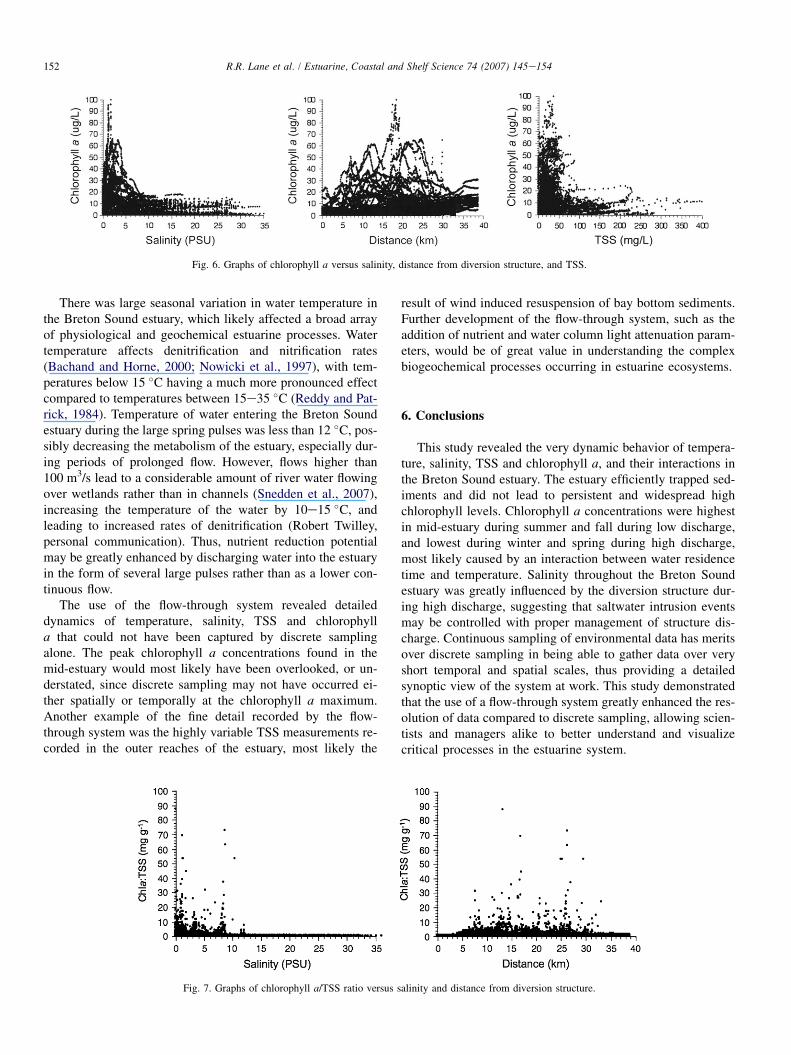
occurred during periods of low or no discharge from theCaernarvon structure (Fig. 3), in low salinity (1e5 PSU) waterslocated in mid-estuary with TSS concentrations less than 75 mg/L (Fig. 6). The chlorophyll a/TSS ratio, an indicator of vegetalfood availability (Burdloff et al., 2000), was highest (Chla/TSS: >20 mg/g) in low salinity (<10 PSU) waters in the mid-estuary (Fig. 7), reflecting both high chlorophyll and decreasingTSS concentrations in the middle estuary (Fig. 6). Theseobserved trends are corroborated by the analysis of variance,which found a significant ( p < 0.0001) main effect for distance
Fig. 3. Spatialetemporal graphs of temperature, salinity, total suspended sediment (TSS) and chlorophyll a (CHL a) in the Breton Sound estuary. Time is shown on
the x-axis and distance from the Caernarvon structure on the y-axis. Discharge from the Caernarvon diversion is indicated by the red line superimposed on the
x-axis. Note that for clarity, the distance axis for salinity is opposite the other parameters.
151R.R. Lane et al. / Estuarine, Coastal and Shelf Science 74 (2007) 145e154
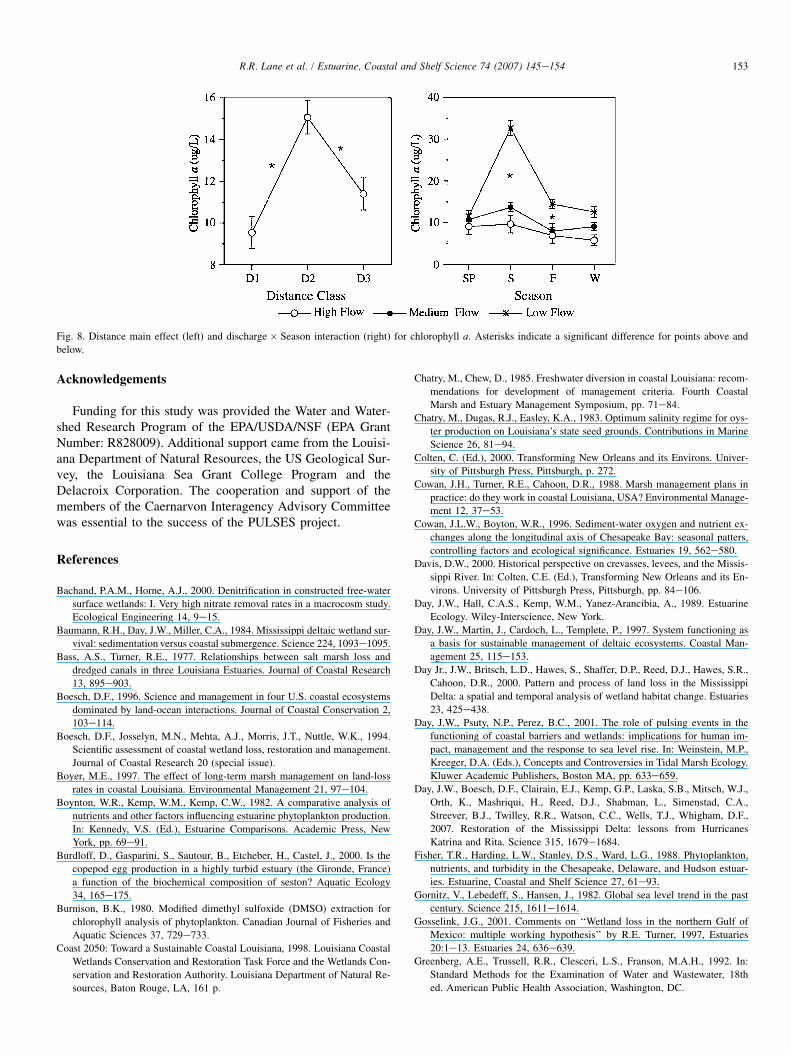
class, with the D2 distance class (mid-estuary) having higherchlorophyll a concentrations than either D1 or D3, and a moder-ately significant ( p ¼ 0.06) discharge � season interaction,with the highest chlorophyll a concentrations occurring at lowflow during summer and fall (Fig. 8).
5. Discussion
Chlorophyll a concentrations were significantly higher inmid-estuary during summer and fall during low discharge,and lower during winter and spring during high discharge(Fig. 8). This was likely caused by an interaction betweenwater residence time, turbidity, salinity and temperature. Asindicated by the salinity data in this study, as well as Laneet al. (2004), high riverine discharge leads to reduced residencetime, leading to increased flushing of phytoplankton biomassout of the estuary, as well as high turbidity, which is inverselyrelated to chlorophyll concentration (Fig. 6). Conversely, as riv-erine discharge decreased during summer and fall, there waslower turbidity and an increase in water residence time, allow-ing the buildup of phytoplankton biomass as reflected in higherchlorophyll a concentrations, especially at salinities less than5 psu (Fig. 6). The mid-estuary peak is clearly related to salinity
Fig. 4. Route � distance class interaction for salinity. Asterisk indicates a sig-
nificant difference between Eastern and Western routes.
and turbidity. High chlorophyll generally occurred at salinitiesless than 5 psu and TSS less than about 75 mg/L. In the upperbasin, salinities were low, indicating high nutrients (Laneet al., 1999), but high TSS limited algal development. In thelower basin, TSS was generally low, but salinities were high.Conditions of low salinity and TSS most often occurred in themid-basin. This increased biomass was likely supported by anincrease in benthic regeneration of nutrients associated withhigher summer water temperatures since riverine input is lowduring this period (Kemp and Boynton, 1984; Day et al.,1989; Cowan and Boyton, 1996). This is corroborated byincreases in ammonium and phosphate concentrations in the es-tuary during the two summers of this study (Emily Hyfield, per-sonal communication, Post, Buckley, Schuh & Jernigan, Inc.,Tampa, FL 33607, USA) and high summer remineralizationof nutrients (Robert Twilley, personal communication, Depart-ment of Oceanography and Coastal Sciences, Louisiana StateUniversity, Baton Rouge, LA 70803, USA). Such decouplingbetween riverine nutrient input during spring and peak phyto-plankton productivity during summer has been observed inmany other estuaries (Nixon, 1981; Boynton et al., 1982; Fisheret al., 1988; Madden et al., 1988).
The Caernarvon diversion structure had a significant effecton salinity throughout the Breton Sound estuary, with statisticalanalysis showing decreased salinities along the Western routecompared to the Eastern route in the lower estuary (Fig. 4).This freshening of the Western route was likely caused by Mis-sissippi River water flowing into the region below where floodprotection levees end (Fig. 1). Lane et al. (1999) analyzeda 7-year data set from the Breton Sound estuary and foundsalinities in the estuary to be significantly lowered in responseto diversion discharge. The original goal of the Caernarvon di-version was to establish optimal salinity conditions for oysterproduction (Chatry et al., 1983; Chatry and Chew, 1985), butin addition, the Caernarvon diversion can also be managed toprevent saltwater intrusion during storms and drought. Fresh-water pulses can be used to form a buffer against saltwater in-trusion, while simultaneously allowing the coastal system toremain open to the movement of fishery species and importantenergetic pulses originating from the sea in the form of tidesand storms (Day et al., 1997, 2001). This is opposite to othercoastal salinity management techniques, such as the use oflevees, weirs and flap gates (Cowan et al., 1988; Boyer,1997; Reed, 1992; Reed et al., 1997).
Fig. 5. Salinity along the Eastern route on March 9, 15 and 22, 2001. Individual data points indicate discrete sample concentrations. Arrows in subplot indicate
discharge for respective dates.
152 R.R. Lane et al. / Estuarine, Coastal and Shelf Science 74 (2007) 145e154
Fig. 6. Graphs of chlorophyll a versus salinity, distance from diversion structure, and TSS.
There was large seasonal variation in water temperature inthe Breton Sound estuary, which likely affected a broad arrayof physiological and geochemical estuarine processes. Watertemperature affects denitrification and nitrification rates(Bachand and Horne, 2000; Nowicki et al., 1997), with tem-peratures below 15 �C having a much more pronounced effectcompared to temperatures between 15e35 �C (Reddy and Pat-rick, 1984). Temperature of water entering the Breton Soundestuary during the large spring pulses was less than 12 �C, pos-sibly decreasing the metabolism of the estuary, especially dur-ing periods of prolonged flow. However, flows higher than100 m3/s lead to a considerable amount of river water flowingover wetlands rather than in channels (Snedden et al., 2007),increasing the temperature of the water by 10e15 �C, andleading to increased rates of denitrification (Robert Twilley,personal communication). Thus, nutrient reduction potentialmay be greatly enhanced by discharging water into the estuaryin the form of several large pulses rather than as a lower con-tinuous flow.
The use of the flow-through system revealed detaileddynamics of temperature, salinity, TSS and chlorophylla that could not have been captured by discrete samplingalone. The peak chlorophyll a concentrations found in themid-estuary would most likely have been overlooked, or un-derstated, since discrete sampling may not have occurred ei-ther spatially or temporally at the chlorophyll a maximum.Another example of the fine detail recorded by the flow-through system was the highly variable TSS measurements re-corded in the outer reaches of the estuary, most likely the
result of wind induced resuspension of bay bottom sediments.Further development of the flow-through system, such as theaddition of nutrient and water column light attenuation param-eters, would be of great value in understanding the complexbiogeochemical processes occurring in estuarine ecosystems.
6. Conclusions
This study revealed the very dynamic behavior of tempera-ture, salinity, TSS and chlorophyll a, and their interactions inthe Breton Sound estuary. The estuary efficiently trapped sed-iments and did not lead to persistent and widespread highchlorophyll levels. Chlorophyll a concentrations were highestin mid-estuary during summer and fall during low discharge,and lowest during winter and spring during high discharge,most likely caused by an interaction between water residencetime and temperature. Salinity throughout the Breton Soundestuary was greatly influenced by the diversion structure dur-ing high discharge, suggesting that saltwater intrusion eventsmay be controlled with proper management of structure dis-charge. Continuous sampling of environmental data has meritsover discrete sampling in being able to gather data over veryshort temporal and spatial scales, thus providing a detailedsynoptic view of the system at work. This study demonstratedthat the use of a flow-through system greatly enhanced the res-olution of data compared to discrete sampling, allowing scien-tists and managers alike to better understand and visualizecritical processes in the estuarine system.
Fig. 7. Graphs of chlorophyll a/TSS ratio versus salinity and distance from diversion structure.
153R.R. Lane et al. / Estuarine, Coastal and Shelf Science 74 (2007) 145e154
Fig. 8. Distance main effect (left) and discharge � Season interaction (right) for chlorophyll a. Asterisks indicate a significant difference for points above and
below.
Acknowledgements
Funding for this study was provided the Water and Water-shed Research Program of the EPA/USDA/NSF (EPA GrantNumber: R828009). Additional support came from the Louisi-ana Department of Natural Resources, the US Geological Sur-vey, the Louisiana Sea Grant College Program and theDelacroix Corporation. The cooperation and support of themembers of the Caernarvon Interagency Advisory Committeewas essential to the success of the PULSES project.
References
Bachand, P.A.M., Horne, A.J., 2000. Denitrification in constructed free-water
surface wetlands: I. Very high nitrate removal rates in a macrocosm study.
Ecological Engineering 14, 9e15.
Baumann, R.H., Day, J.W., Miller, C.A., 1984. Mississippi deltaic wetland sur-
vival: sedimentation versus coastal submergence. Science 224, 1093e1095.
Bass, A.S., Turner, R.E., 1977. Relationships between salt marsh loss and
dredged canals in three Louisiana Estuaries. Journal of Coastal Research
13, 895e903.
Boesch, D.F., 1996. Science and management in four U.S. coastal ecosystems
dominated by land-ocean interactions. Journal of Coastal Conservation 2,
103e114.
Boesch, D.F., Josselyn, M.N., Mehta, A.J., Morris, J.T., Nuttle, W.K., 1994.
Scientific assessment of coastal wetland loss, restoration and management.
Journal of Coastal Research 20 (special issue).
Boyer, M.E., 1997. The effect of long-term marsh management on land-loss
rates in coastal Louisiana. Environmental Management 21, 97e104.
Boynton, W.R., Kemp, W.M., Kemp, C.W., 1982. A comparative analysis of
nutrients and other factors influencing estuarine phytoplankton production.
In: Kennedy, V.S. (Ed.), Estuarine Comparisons. Academic Press, New
York, pp. 69e91.
Burdloff, D., Gasparini, S., Sautour, B., Etcheber, H., Castel, J., 2000. Is the
copepod egg production in a highly turbid estuary (the Gironde, France)
a function of the biochemical composition of seston? Aquatic Ecology
34, 165e175.
Burnison, B.K., 1980. Modified dimethyl sulfoxide (DMSO) extraction for
chlorophyll analysis of phytoplankton. Canadian Journal of Fisheries and
Aquatic Sciences 37, 729e733.
Coast 2050: Toward a Sustainable Coastal Louisiana, 1998. Louisiana Coastal
Wetlands Conservation and Restoration Task Force and the Wetlands Con-
servation and Restoration Authority. Louisiana Department of Natural Re-
sources, Baton Rouge, LA, 161 p.
Chatry, M., Chew, D., 1985. Freshwater diversion in coastal Louisiana: recom-
mendations for development of management criteria. Fourth Coastal
Marsh and Estuary Management Symposium, pp. 71e84.
Chatry, M., Dugas, R.J., Easley, K.A., 1983. Optimum salinity regime for oys-
ter production on Louisiana’s state seed grounds. Contributions in Marine
Science 26, 81e94.
Colten, C. (Ed.), 2000. Transforming New Orleans and its Environs. Univer-
sity of Pittsburgh Press, Pittsburgh, p. 272.
Cowan, J.H., Turner, R.E., Cahoon, D.R., 1988. Marsh management plans in
practice: do they work in coastal Louisiana, USA? Environmental Manage-
ment 12, 37e53.
Cowan, J.L.W., Boyton, W.R., 1996. Sediment-water oxygen and nutrient ex-
changes along the longitudinal axis of Chesapeake Bay: seasonal patters,
controlling factors and ecological significance. Estuaries 19, 562e580.
Davis, D.W., 2000. Historical perspective on crevasses, levees, and the Missis-
sippi River. In: Colten, C.E. (Ed.), Transforming New Orleans and its En-
virons. University of Pittsburgh Press, Pittsburgh, pp. 84e106.
Day, J.W., Hall, C.A.S., Kemp, W.M., Yanez-Arancibia, A., 1989. Estuarine
Ecology. Wiley-Interscience, New York.
Day, J.W., Martin, J., Cardoch, L., Templete, P., 1997. System functioning as
a basis for sustainable management of deltaic ecosystems. Coastal Man-
agement 25, 115e153.
Day Jr., J.W., Britsch, L.D., Hawes, S., Shaffer, D.P., Reed, D.J., Hawes, S.R.,
Cahoon, D.R., 2000. Pattern and process of land loss in the Mississippi
Delta: a spatial and temporal analysis of wetland habitat change. Estuaries
23, 425e438.
Day, J.W., Psuty, N.P., Perez, B.C., 2001. The role of pulsing events in the
functioning of coastal barriers and wetlands: implications for human im-
pact, management and the response to sea level rise. In: Weinstein, M.P.,
Kreeger, D.A. (Eds.), Concepts and Controversies in Tidal Marsh Ecology.
Kluwer Academic Publishers, Boston MA, pp. 633e659.
Day, J.W., Boesch, D.F., Clairain, E.J., Kemp, G.P., Laska, S.B., Mitsch, W.J.,
Orth, K., Mashriqui, H., Reed, D.J., Shabman, L., Simenstad, C.A.,
Streever, B.J., Twilley, R.R., Watson, C.C., Wells, T.J., Whigham, D.F.,
2007. Restoration of the Mississippi Delta: lessons from Hurricanes
Katrina and Rita. Science 315, 1679e1684.
Fisher, T.R., Harding, L.W., Stanley, D.S., Ward, L.G., 1988. Phytoplankton,
nutrients, and turbidity in the Chesapeake, Delaware, and Hudson estuar-
ies. Estuarine, Coastal and Shelf Science 27, 61e93.
Gornitz, V., Lebedeff, S., Hansen, J., 1982. Global sea level trend in the past
century. Science 215, 1611e1614.
Gosselink, J.G., 2001. Comments on ‘‘Wetland loss in the northern Gulf of
Mexico: multiple working hypothesis’’ by R.E. Turner, 1997, Estuaries
20:1e13. Estuaries 24, 636e639.
Greenberg, A.E., Trussell, R.R., Clesceri, L.S., Franson, M.A.H., 1992. In:
Standard Methods for the Examination of Water and Wastewater, 18th
ed. American Public Health Association, Washington, DC.
154 R.R. Lane et al. / Estuarine, Coastal and Shelf Science 74 (2007) 145e154
Hatton, R.S., Delaune, R.D., Patrick, J.W.H., 1983. Sedimentation, accretion,
and subsidence in marshes of Barataria Basin, Louisiana. Limnology and
Oceanography 28, 494e502.
Ibanez, C., Canicio, A., Day, J.W., Curco, A., 1997. Morphologic development,
relative sea level rise and sustainable management of water and sediment in
the Ebre Delta, Spain. Journal of Coastal Conservation 3, 191e202.
Kemp, W.M., Boynton, W.R., 1984. Spatial and temporal coupling of nutrient
inputs to estuarine primary production: the role of particulate transport and
decomposition. Bulletin of Marine Science 35, 522e535.
Kesel, R.H., 1988. The decline in the suspended load of the Lower Mississippi
River and its influence on adjacent wetlands. Environmental and Geolog-
ical Water Science 11, 271e281.
Kesel, R.H., 1989. The role of the lower Mississippi River in wetland loss
in southeastern Louisiana, USA. Environmental and Geological Water
Science 13, 183e193.
Lane, R.R., Day, J.W., Thibodeaux, B., 1999. Water quality analysis of a fresh-
water diversion at Caernarvon, Louisiana. Estuaries 22, 327e336.
Lane, R.R., 2003. The effect on water quality of riverine input into coastal
wetlands. PhD dissertation, Department of Oceanography and Coastal Sci-
ences, Louisiana State University, Baton Rouge, 159 pp. <http://etd.lsu.edu/
docs/available/etd-1111103e095030/>.
Lane, R.R., Day, J.W., Justic, D., Reyes, E., Day, J.N., Hyfield, E., 2004.
Changes in stoichiometric Si, N and P ratios of Mississippi River water
diverted through coastal wetlands to the Gulf of Mexico. Estuarine,
Coastal and Shelf Science 60, 1e10.
Lane, R.R., Day Jr., J.W., Day, J., 2006. Wetland surface elevation, vertical ac-
cretion, and subsidence at three Louisiana estuaries receiving diverted Mis-
sissippi River water. Wetlands 26, 1130e1142.
L’Homer, A., 1992. Sea-level changes and impacts on the Rhone coastal lowlands.
In: Tooley, M., Jelgersma, S. (Eds.), Impacts of Sea-Level Rise on European
Coastal Lowlands. Blackwell Publishers, Oxford, England, pp. 136e152.
Lorenzen, C.J., 1966. A method for the continuous measurement of in vivo
chlorophyll concentration. Deep-Sea Research 13, 223e227.
Madden, C.J., Day, J.W., 1992. An instrument system for high-speed mapping
of chlorophyll a and physico-chemical variables in surface waters. Estuar-
ies 15, 421e427.
Madden, C.J., Day, J.W., Randall, J.M., 1988. Freshwater and marine coupling
in estuaries of the Mississippi River deltaic plain. Limnology Oceanogra-
phy 33, 982e1004.
Mossa, J., 1996. Sediment dynamics in the lowermost Mississippi River. En-
gineering Geology 45, 457e479.
Nixon, S.W., 1981. Freshwater inputs and estuarine productivity. Proceedings
of the National Symposium on Freshwater Inflow to Estuaries. Cross and
Williams, Slidell LA, pp. 31e55.
Nowicki, B.L., Kelly, J.R., Requintina, E., Keuren, D.V., 1997. Nitrogen losses
through sediment denitrification in Boston Harbor and Massachusetts Bay.
Estuaries 20, 626e639.
Penland, S., Ramsey, K.E., 1990. Relative sea-level rise in Louisiana and
the Gulf of Mexico: 1908e1988. Journal of Coastal Research 6,
323e342.
Reddy, K.R., Patrick, W.R., 1984. Nitrogen transformation and loss in flooded
soils and sediments. Critical Reviews in Environmental Control 13, 273e
309.
Reed, D.J., 1988. Sediment dynamics and deposition in a retreating coastal salt
marsh. Estuarine, Coastal and Shelf Science 26, 67e79.
Reed, D.J., 1992. Effect of weirs on sediment deposition in Louisiana coastal
marshes. Environmental Management 16, 55e65.
Reed, D.J., Luca, N.D., Foote, A.L., 1997. Effect of hydrolic management on
marsh surface sediment deposition in coastal Louisiana. Estuaries 20,
301e311.
Roberts, H.H., 1997. Dynamic changes of the holocene Mississippi river delta
plain: the delta cycle. Journal of Coastal Research 13, 605e627.
Sall, J., Creighton, L., Lehman, A., 2005. JMP Start Statistics: A Guide to Sta-
tistical and Data Analysis using JMP and JMP IN Software. Brooks/Cole-
Thompson Learning, Belmont, CA, 560 pp.
Salinas, L.M., DeLaune, R.D., Patrick, W.H., 1986. Changes occurring along
a rapidly submerging coastal area: Louisiana. Journal of Coastal Research
2, 269e284.
Snedden, G.A., Cable, J.E., Swarzenski, C., Swenson, E., 2007. Sediment
discharge into a subsiding Louisiana deltaic estuary through a Missis-
sippi River diversion. Estuarine, Coastal and Shelf Science 71, 181e193.
Stanley, D., 1990. Recent subsidence and northeast tilting of the Nile Delta,
Egypt. Marine Geology 94, 147e154.
Strickland, J.D.H., Parsons, T.R., 1972. A Practical Handbook of Seawater
Analysis. Bulletin of the Fisheries Research Board of Canada, 167 pp.
Swenson, E.M., Turner, R.E., 1987. Spoil banks: effects on a coastal
marsh water-level regime. Estuarine, Coastal and Shelf Science 24,
599e609.
Templet, P.H., Meyer-Arendt, K.J., 1988. Louisiana wetland loss: a regional
water management approach to the problem. Environmental Management
12, 181e192.