Coreflooding Oil Displacements with Low Salinity Brine
167
Copyright by Scott Michael Rivet 2009
-
Upload
khangminh22 -
Category
Documents
-
view
1 -
download
0
Transcript of Coreflooding Oil Displacements with Low Salinity Brine

Copyright
by
Scott Michael Rivet
2009
ii
Coreflooding Oil Displacements
with Low Salinity Brine
APPROVED BY
_______________________________________ Larry Lake, Advisor
_______________________________________ Gary Pope, Co-advisor
iii
Coreflooding Oil Displacements
with Low Salinity Brine
by
Scott Michael Rivet, B.S.
Thesis
Presented to the Faculty of the Graduate School
of The University of Texas
in Partial Fulfillment
of the Requirements
for the Degree of
Master of Science in Engineering
The University of Texas at Austin
December 2009
iv
ACKNOWLEDGMENTS
I would like to express my sincere gratitude toward Dr. Larry Lake
and Dr. Gary Pope for their guidance. You were both very supportive,
helpful and understanding throughout my time here at The University of
Texas. I’ve enjoyed working with you both and wish ya’ll the best.
I would also like to acknowledge the Chemical Enhanced Oil
Recovery Research Project in the Center for Petroleum and Geosystems
Engineering and it’s member sponsors for their financial support. The
Chemical EOR Research Project’s sponsors include, in no particular order,
Hess, Oxy, Pemex, Stepan, Petrobras, Rex Energy, Harcros, ConocoPhillips,
Petronas, Marathon, Huntsman, ExxonMobil, Total, Shell, BP, Chevron,
StatoilHydro, BASF, Schlumberger, SNF, ENI, Cairn and Saudi Aramco.
I would also like to thanks the Department of Petroleum and
Geosystems Engineering, The Friend’s of Alec Fellowship, the Energy and
Mineral Resources Fellowship, the H.B. Burt Harkin’s Jr. Professorship
Endowment Fellowship and the John and Mary Wheeler Endowed Graduate
Fellowship for their financial support.
I am also thankful for the suggestions and assistance of Dr. Steven
Bryant, Dr. Do Hoon Kim, Chris Britton, Yihao “Jarren” Xie, Aigul
Kurmanova, Dr. Larry Britton, Glen Baum, Gary Miscoe, Esther Barrientes,
Kiki Peckhman, Joanna Castillo, Will Slaughter and David Levitt to name a
few.
Lastly, I would like to thanks my parents for their support.
v
Coreflooding Oil Displacements
with Low Salinity Brine
by
Scott Michael Rivet, M.S.E.
The University of Texas at Austin, 2009
Supervisors: Larry Lake and Gary Pope
Waterflooding is applied worldwide to improve oil recovery. Evidence of
enhancement in waterflood efficiency by injecting low salinity brine has been
observed in the laboratory and in the field. The technology is of considerable
interest because of its simplicity and its low cost.
In this work, laboratory corefloods were conducted to study the effect of low
salinity waterflooding on oil recovery rate, residual oil saturation and relative
permeability. Evidence of low salinity enhanced oil recovery was observed
some of these corefloods. Improved oil recovery was generally accompanied
by an increase in water-wetness, based on an observed decrease in end-point
water relative permeability and an increase in end-point oil relative
permeability. Injecting low salinity brine produced a persistent wettability
vi
alteration that eliminated oil recovery salinity dependence in subsequent
floods. However, the sensitivity to salinity was restored by re-aging the core
with the same oil. Tertiary low salinity recovery reported by other researchers
was never observed. Low salinity waterflooding produced no oil recovery
benefit in cores that were initially strongly water-wet.
Based on these results, a working hypothesis is that injecting low salinity
brine induces a wettability alteration from mixed-wet to water-wet in some
cores and that this change improves the oil recovery. More experiments are
needed both to identify the characteristics of the cores that are favorable for
low salinity enhanced oil recovery and to better understand and quantify the
mechanism.
vii
TABLE OF CONTENTS
ACKNOWLEDGMENTS iv
ABSTRACT v
TABLE OF CONTENTS vii
LIST OF TABLES x
LIST OF FIGURES xi
NOMENCLATURE xv
CHAPTER
1. INTRODUCTION 1
2. LITERATURE REVIEW 5
2.1. Early Work with Fresh Water 5
2.2. Wettability 7
2.3. Focused Low Salinity Research Begins 11
2.4. The Oil Industry Takes Notice 14
2.5. Recent Work 18
3. EXPERIMENTAL APPARATUS 26
3.1. Experimental Equipment 26
3.1.1. Pumps 26
3.1.2. Solution Reservoir 27
3.1.3. Oil Reservoir 27
3.1.4. Fraction Collectors 27
3.1.5. Pressure Transducers 28
3.1.6. Pressure Data Acquisition 28
3.1.7. Filter Presses 29
3.1.8. Ovens 29
viii
3.1.9. Core Holders 29
3.2. Analytical Equipment 30
3.2.1. Air Minipermeameter 30
3.2.2. pH Meter 30
3.2.3. Viscometer 31
3.2.4. Conductivity Meter 31
4. EXPERIMENTAL PROCEDURE 34
4.1. Core Preparation 33
4.1.1. Epoxy Encased Cores 33
4.1.2. Core Holder Confined Cores 34
4.2. Air permeability measurement 34
4.3. Fluid Preparation 34
4.3.1. Brine 35
4.3.2. Crude Oil 35
4.4. Brine Saturation 35
4.5. Pore Volume Determination 36
4.5.1. Gravimetric Pore Volume 37
4.5.2. Tracer Measured Pore Volume 37
4.6. Brine Flood 38
4.7. Oil Injection 39
4.8. Aging 39
4.9. Waterflood 39
5. DATA ANALYSIS 41
5.1. Pore Volume Calculation 41
5.1.1. Gravimetric Calculations 41
5.1.2. Tracer Calculations 41
5.1.3. Porosity 42
5.2. Permeability Calculations 42
ix
5.2.1. Brine Permeability 42
5.2.2. Air Permeability 43
5.2.3. Relative Permeability 43
5.3. Phase Saturation Determination 44
5.4. Endpoint Mobility Ratio 45
6. EXPERIMENTAL RESULTS
AND DISSCUSSION 46
6.1. SERIAL WATERFLOODS
IN BEREA CORE 46
6.2. PARALLEL WATERFLOODS
IN BEREA CORES 66
6.3. SERIAL WATERFLOODS
IN RESERVOIR B CORE 88
6.4. SERIAL WATERFLOODS
IN RESERVOIR C CORE 107
7. SUMMARY AND CONCLUSIONS 130
WORKS CITED 145
VITA 150
x
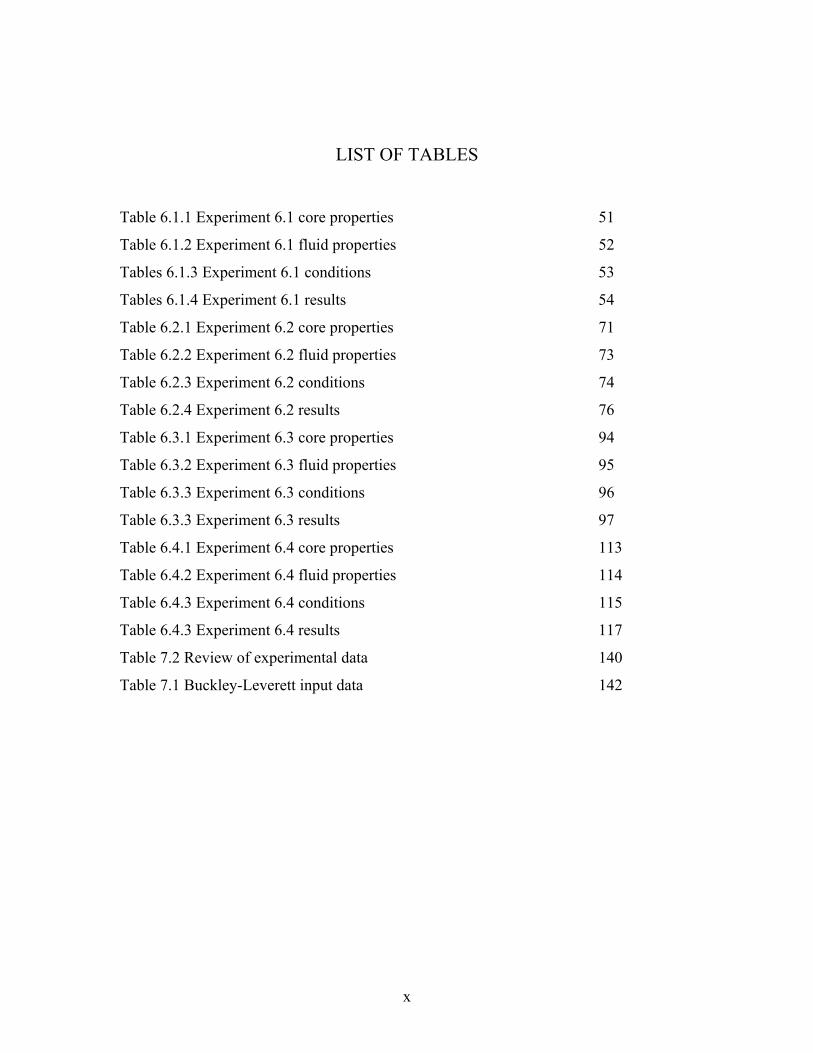
LIST OF TABLES
Table 6.1.1 Experiment 6.1 core properties 51
Table 6.1.2 Experiment 6.1 fluid properties 52
Tables 6.1.3 Experiment 6.1 conditions 53
Tables 6.1.4 Experiment 6.1 results 54
Table 6.2.1 Experiment 6.2 core properties 71
Table 6.2.2 Experiment 6.2 fluid properties 73
Table 6.2.3 Experiment 6.2 conditions 74
Table 6.2.4 Experiment 6.2 results 76
Table 6.3.1 Experiment 6.3 core properties 94
Table 6.3.2 Experiment 6.3 fluid properties 95
Table 6.3.3 Experiment 6.3 conditions 96
Table 6.3.3 Experiment 6.3 results 97
Table 6.4.1 Experiment 6.4 core properties 113
Table 6.4.2 Experiment 6.4 fluid properties 114
Table 6.4.3 Experiment 6.4 conditions 115
Table 6.4.3 Experiment 6.4 results 117
Table 7.2 Review of experimental data 140
Table 7.1 Buckley-Leverett input data 142
xi
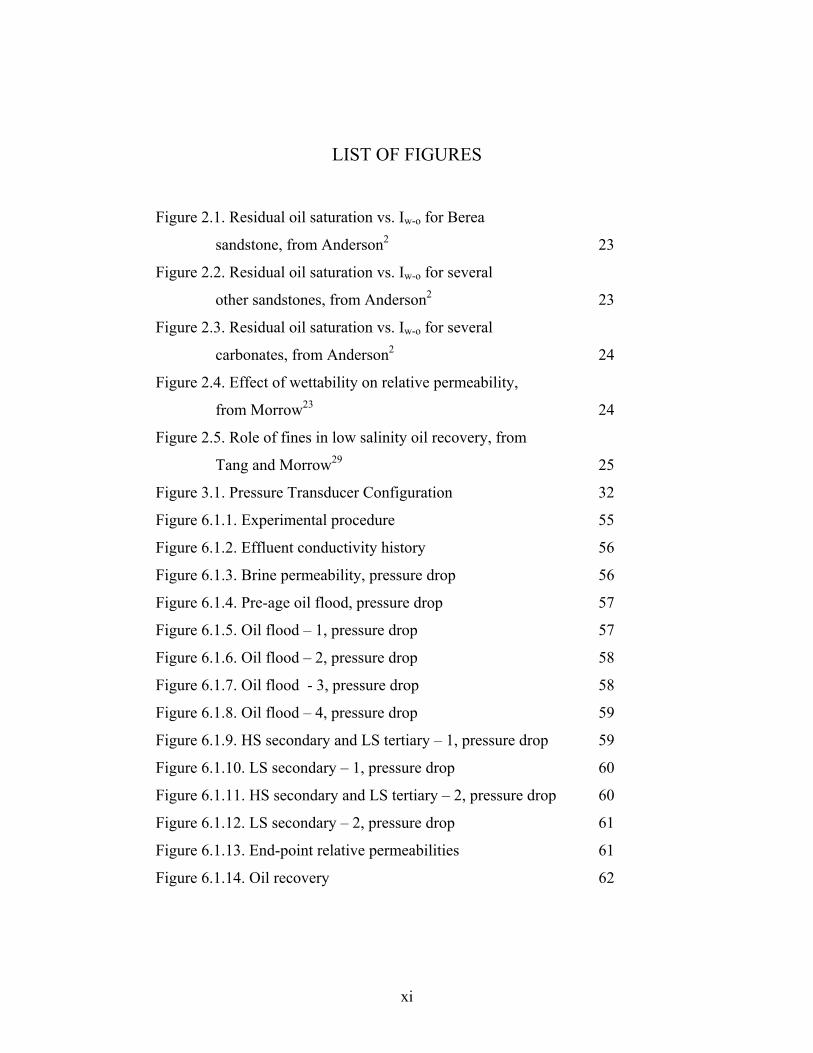
LIST OF FIGURES
Figure 2.1. Residual oil saturation vs. Iw-o for Berea
sandstone, from Anderson2 23
Figure 2.2. Residual oil saturation vs. Iw-o for several
other sandstones, from Anderson2 23
Figure 2.3. Residual oil saturation vs. Iw-o for several
carbonates, from Anderson2 24
Figure 2.4. Effect of wettability on relative permeability,
from Morrow23 24
Figure 2.5. Role of fines in low salinity oil recovery, from
Tang and Morrow29 25
Figure 3.1. Pressure Transducer Configuration 32
Figure 6.1.1. Experimental procedure 55
Figure 6.1.2. Effluent conductivity history 56
Figure 6.1.3. Brine permeability, pressure drop 56
Figure 6.1.4. Pre-age oil flood, pressure drop 57
Figure 6.1.5. Oil flood – 1, pressure drop 57
Figure 6.1.6. Oil flood – 2, pressure drop 58
Figure 6.1.7. Oil flood - 3, pressure drop 58
Figure 6.1.8. Oil flood – 4, pressure drop 59
Figure 6.1.9. HS secondary and LS tertiary – 1, pressure drop 59
Figure 6.1.10. LS secondary – 1, pressure drop 60
Figure 6.1.11. HS secondary and LS tertiary – 2, pressure drop 60
Figure 6.1.12. LS secondary – 2, pressure drop 61
Figure 6.1.13. End-point relative permeabilities 61
Figure 6.1.14. Oil recovery 62

xii
Figure 6.1.15. Oil cut 62
Figure 6.1.16. Average oil saturation 63
Figure 6.1.17. Initial and residual oil saturations 63
Figure 6.1.18. Effluent pH history 64
Figure 6.1.19. Crude A viscosity vs. shear rate 64
Figure 6.1.20. High salinity brine viscosity vs. shear rate 65
Figure 6.1.21. Low salinity brine viscosity vs. shear rate 65
Figure 6.2.1. Experimental procedure 77
Figure 6.2.2. Flood 1, brine flood pressure drop 77
Figure 6.2.3. Flood 1, oil flood pressure drop 78
Figure 6.2.4. Flood 1, waterflood pressure drop 78
Figure 6.2.5. Flood 2, brine flood pressure drop 79
Figure 6.2.6. Flood 2, oil flood pressure drop 79
Figure 6.2.7. Flood 2, waterflood pressure drop 80
Figure 6.2.8. Flood 3, brine flood pressure drop 80
Figure 6.2.9. Flood 3, oil flood pressure drop 81
Figure 6.2.10. Flood 3, waterflood pressure drop 81
Figure 6.2.11. Flood 4, brine flood pressure drop 82
Figure 6.2.12. Flood 4, oil flood pressure drop 82
Figure 6.2.13. Flood 4, waterflood pressure drop 83
Figure 6.2.14. Flood 5, brine flood pressure drop 83
Figure 6.2.15. Flood 5, oil flood pressure drop 84
Figure 6.2.16. Flood 5, waterflood pressure drop 84
Figure 6.2.17. End-point relative permeabilities 85
Figure 6.2.18. Oil recovery 85
Figure 6.2.19. Oil cut 86
Figure 6.2.20. Average oil saturation 86
Figure 6.2.21. Initial and residual oil saturations 87
xiii
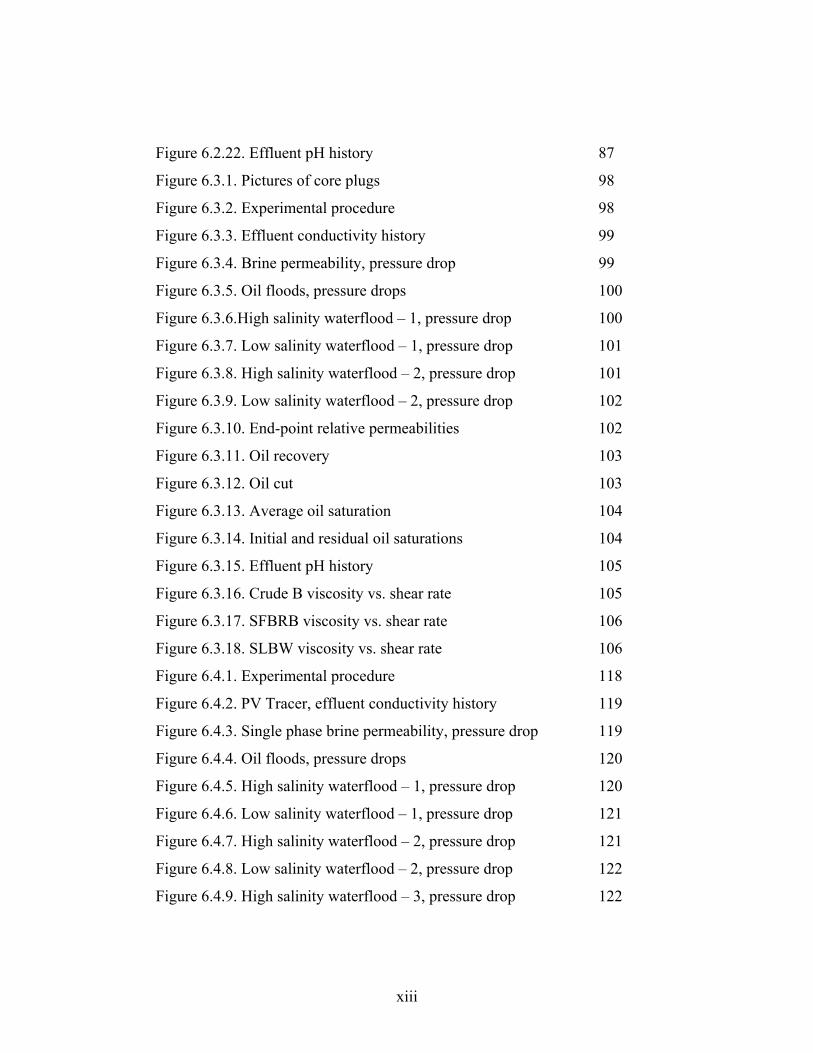
Figure 6.2.22. Effluent pH history 87
Figure 6.3.1. Pictures of core plugs 98
Figure 6.3.2. Experimental procedure 98
Figure 6.3.3. Effluent conductivity history 99
Figure 6.3.4. Brine permeability, pressure drop 99
Figure 6.3.5. Oil floods, pressure drops 100
Figure 6.3.6.High salinity waterflood – 1, pressure drop 100
Figure 6.3.7. Low salinity waterflood – 1, pressure drop 101
Figure 6.3.8. High salinity waterflood – 2, pressure drop 101
Figure 6.3.9. Low salinity waterflood – 2, pressure drop 102
Figure 6.3.10. End-point relative permeabilities 102
Figure 6.3.11. Oil recovery 103
Figure 6.3.12. Oil cut 103
Figure 6.3.13. Average oil saturation 104
Figure 6.3.14. Initial and residual oil saturations 104
Figure 6.3.15. Effluent pH history 105
Figure 6.3.16. Crude B viscosity vs. shear rate 105
Figure 6.3.17. SFBRB viscosity vs. shear rate 106
Figure 6.3.18. SLBW viscosity vs. shear rate 106
Figure 6.4.1. Experimental procedure 118
Figure 6.4.2. PV Tracer, effluent conductivity history 119
Figure 6.4.3. Single phase brine permeability, pressure drop 119
Figure 6.4.4. Oil floods, pressure drops 120
Figure 6.4.5. High salinity waterflood – 1, pressure drop 120
Figure 6.4.6. Low salinity waterflood – 1, pressure drop 121
Figure 6.4.7. High salinity waterflood – 2, pressure drop 121
Figure 6.4.8. Low salinity waterflood – 2, pressure drop 122
Figure 6.4.9. High salinity waterflood – 3, pressure drop 122
xiv
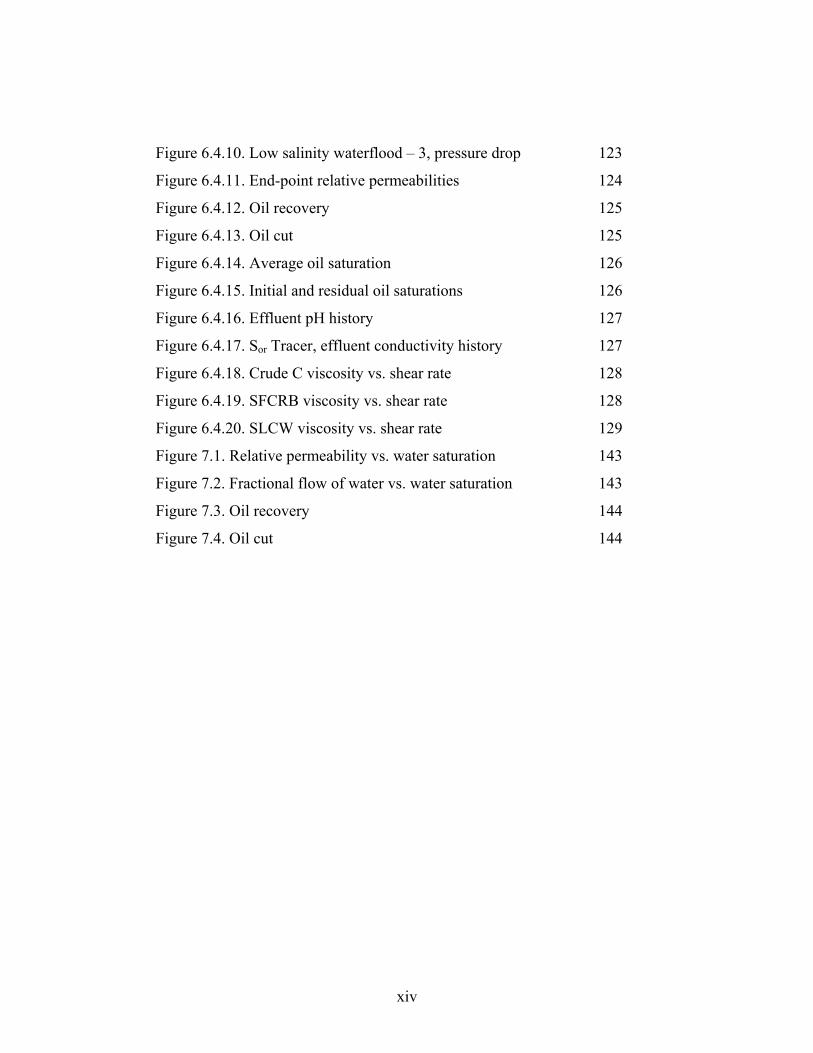
Figure 6.4.10. Low salinity waterflood – 3, pressure drop 123
Figure 6.4.11. End-point relative permeabilities 124
Figure 6.4.12. Oil recovery 125
Figure 6.4.13. Oil cut 125
Figure 6.4.14. Average oil saturation 126
Figure 6.4.15. Initial and residual oil saturations 126
Figure 6.4.16. Effluent pH history 127
Figure 6.4.17. Sor Tracer, effluent conductivity history 127
Figure 6.4.18. Crude C viscosity vs. shear rate 128
Figure 6.4.19. SFCRB viscosity vs. shear rate 128
Figure 6.4.20. SLCW viscosity vs. shear rate 129
Figure 7.1. Relative permeability vs. water saturation 143
Figure 7.2. Fractional flow of water vs. water saturation 143
Figure 7.3. Oil recovery 144
Figure 7.4. Oil cut 144
xv
NOMENCLATURE
A Area of core (cm2)
b Klinkenberg gas coefficient (dimensionless)
C Conductivity (Sm-1)
Cinitial Initial conductivity (Sm-1)
Cinjected Injected conductivity (Sm-1)
CD Normalized conductivity (dimensionless)
HS High salinity
HSB High salinity brine
Iw-o Relative wettability index of water and oil (dimensionless)
k Brine pereability (md)
keff,j Effective permeability of j (md)
kg Nitrogen permeability (md)
krj Relative permeability of phase j (dimensionless)
kro Relative oil permeability (dimensionless)
krw Relative water permeability (dimensionless)
kroº End point relative oil permeability (dimensionless)
krwº End point relative water permeability (dimensionless)
L Core length (cm)

xvi
mbrine saturated Brine saturated core's weight (g)
mvacuum Vacuumed core's weight (g)
∆P Pressure drop (psi)
∆Pj Pressure drop of phase j (psi)
P1 Inlet pressure (psi)
P2 Outlet pressure (psi)
P Average pressure (psi)
Psc Pressure at standard conditions (psi)
Pv Pore volume (ml)
Pv,grav Gravimetric pore volume (ml)
Pv,tracer Tracer measured pore volume (ml)
q Flow rate (ml/min)
qj Flow rate of phase j (ml/min)
qsc Flow rate at standard conditions (ml/min)
Sj Saturation of phase j (dimensionless)
Sji Initial saturation of phase j (dimensionless)
So Saturation of oleic phase (dimensionless)
Sor Residual oil saturation (dimensionless)
Sw Saturation of aqueous phase (dimensionless)
Swirr Irreducible water saturation (dimensionless)
xvii
∆Sj Change in saturation of phase j (dimensionless)
TDS Total dissolved solids (ppm)
Vbulk Core bulk volume (ml)
Vtj Total volume of phase j injected into core (ml)
Ve End volume of core (ml)
Greek Symbols
μ Viscosity (cp)
μj Viscosity of phase j (cp)
ρbrine Density of brine (g/ml)
σ Interfacial tension between aqueous and oleic phases
(dynes/cm)
φ Porosity (fraction)

1
CHAPTER 1
INTRODUCTION
Waterflooding is dominant among fluid injection methods and is without
question responsible for maintaining production rate and reserves in North
America.8 As the world’s oil fields mature, waterflooding will continue to be
applied to unlock the enormous endowment of oil reserves left behind by
primary recovery.
The first waterflood occurred as a result of accidental water injection in
Pithole City, Pennsylvannia in 1865.20 Indeed many early waterfloods
occurred accidentally by leaks from shallow water sands or by surface water
entering drilled wells. The first waterflood in Texas was initiated in Brown
County in 1936 and within 10 years waterflooding was in operation in most
North American oil regions.8 By the early 50’s waterflood engineering had
been edified by Leverett’s19, Buckley and Leverett’s6 and Welge’s33
pioneering papers.
When a waterflood is designed, the injected brine is normally chosen because
it is readily available and because it is similar to the native reservoir brine and
therefore will not damage the formation. However multiple researchers3, 4, 11,
2
13, 16, 17, 22, 25, 29, 30, 32, 35, 36, 37 have demonstrated that injecting low salinity brine
can increase oil recovery efficiency in some cases.
Low salinity waterflooding was discovered by researchers at The University
of Wyoming in the 90’s11, 30, 35 doing experiments to determine the affect of
brine, crude oil, mineralogy and experimental procedure on wettability. In the
subsequent decade the technology has repeatedly been proven in the
laboratory16, 25, 29, 36, 37 and in the field.17, 22, 32
The general consensus among researchers is that injecting low salinity brine
creates a wetting state more favorable to oil recovery. Wettability affects the
microscopic distribution and flow of oil and water in porous media and thus
the residual oil saturation. The mechanism(s) responsible for this wettability
alteration are debated.
Even after extensive research, low salinity waterflooding remains quite
controversial. The mechanism(s) responsible is poorly understood, the
reproducibility of published results is doubted and the technology’s scalability
to the field is questioned. Nonetheless, low salinity waterflooding is appealing
because it could offers considerable recovery benefit, is relatively low cost
and is relatively simple compared to other chemical EOR techniques.
3
This research effort was undertaken to study the effect of low salinity
waterflooding on oil recovery rate, residual oil saturation and relative
permeability. This effort has consisted of 21 different waterfloods using nine
brines, three crude oil, six outcrop Berea cores and two oil reservoir cores.
The results provide a foundation for future research.
Four experiments were performed: Serial floods in Berea core, Parallel floods
in Berea cores, Serial floods in Reservoir B core and Serial floods in
Reservoir C core. The serial experiments were conducted in the same core,
one after another, to eliminate the possibility that natural variations between
cores were responsible for any contrasts between the high salinity and low
salinity results. The parallel experiments were conducted in separate cores to
evaluate the affect of different injection brine cation composition. Separate
cores were necessary because injecting low salinity brine could alter a crude
oil/rock/brine system’s wettability and thus affect subsequent injections.
Evidence of low salinity enhanced oil recovery was observed in a few cases.
Improved recovery was generally accompanied by an increase in water-
wetness, based on an observed decrease in krwº and an increase in kroº. In the
serial experiments injecting low salinity brine produced a persistent

4
wettability alteration that eliminated oil recovery salinity dependence in
subsequent floods. However, sensitivity to salinity was restored by re-aging.
Tertiary low salinity recovery reported by other researchers25, 29, 36, 37 was
never observed.
5
CHAPTER 2
LITERATURE REVIEW
Multiple researchers3, 4, 11, 13, 16, 17, 22, 25, 29, 30, 32, 35, 36, 37 have observed a
reduction in residual oil saturation when low salinity brine is injected instead
of high salinity brine. However after decades of research, the mechanisms
responsible are still uncertain.
In the laboratory, when a waterflood is performed in the secondary mode it
means it is the first injection post-oil flood. A waterflood performed in the
tertiary mode is performed after the secondary mode injection.
2.1 Early Work with Fresh Water
Researchers4, 21 began injecting fresh water into core samples almost a half
century ago. Researchers hoped to better understand the effect of authigenic
clay content and studied the impact of fresh water on permeability and oil
recovery.

6
Martin21 injected fresh water into Maracaibo Basin and East Texas Woodbine
reservoir cores to study the effects of clay content on recovery efficiency and
relative permeability. Several cores were flooded with cycles of toluene and
fresh water to remove clay materials. The cores were flooded with heavy oil
then the oil was displaced with fresh water. The pre-treated cores had lower
irreducible water saturations and higher water relative permeabilites. The
treated and untreated cores had similar residual oil saturations and oil relative
permeabilites. Permeability to fresh water decreased over the course of several
hours or days after the fresh water injection was initiated. The original water
permeability could be restored momentarily by reversing the flow direction,
suggesting pore throat plugging by migrating fines. Martin proposed that in
the clay-rich cores a clay-water dispersion was created with a higher apparent
viscosity and lower water relative permeability then the free water.
Bernard4 injected NaCl brine and distilled water into sandpacks, Berea cores
and outcrop cores from Wyoming. Initial oil saturation was established with
Soltrol oil then NaCl brine or distilled water was injected. In constant flow
rate experiments, injecting distilled water increased recovery in both the
secondary and tertiary modes. The increased recovery was always
accompanied by a massive increase in pressure drop; three orders of
magnitude in one case. NaCl brine and distilled water produced similar
7
recoveries in constant pressure drop experiments. Bernard attributed the
increased recovery to improved microscopic sweep efficiency induced by clay
swelling and plugging of pore throat by migrating fines.
2.2 WETTABILITY
Wettability is defined as “the tendency of one fluid to spread on or adhere to a
solid surface in the presence of other immiscible fluids.”8 When the fluids are
water and oil, the wettability is the tendency for the rock to preferentially
imbibe oil, water or both.2
Many different degrees of wettability have been presented in the literature. A
rock is water-wet if the aqueous phase will be retained by capillary forces in
the smaller pores and on the walls of the larger pores and the oleic phase
occupies the center of the larger pores and form globules that might extend
over many pores. A rock is neutrally-wet if there is no preference for one fluid
or another. A rock is fractionally-wet if it is composed of different minerals,
each with different surface chemistry and adsorption properties, which can
lead to wettability variations.2 A rock is mixed-wet if the oleic phase
completely occupies the large pores and the aqueous phase occupies the small
pores or if different minerals within the same pore are wet by different
8
fluids.26 And lastly, a rock is oil-wet if the oleic phase occupies the small
pores and coats the walls of the large pores and the aqueous phase occupies
the center of the larger pores. According to Jarrell et al.12 oil-wet reservoirs do
not occur naturally and all reservoirs that claim to be oil-wet are actually
mixed-wet because the oleic phase does not occupy the small pores.
Wettability can be indexed with the Amott wettability test.1 The Amott
wettability index (Iw-o) is obtained by a combined imbibition and displacement
test. It ranges from +1 to -1, with a +1 indicating a strongly water-wet and a -
1 indicating a strongly oil-wet.
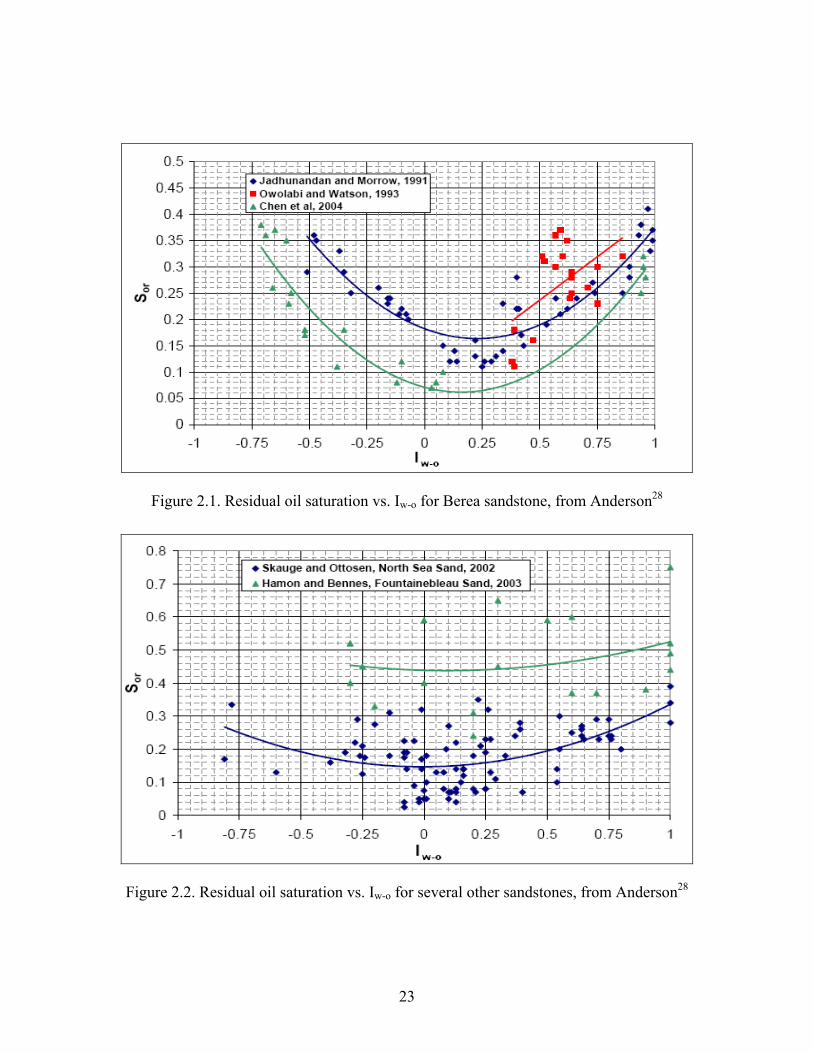
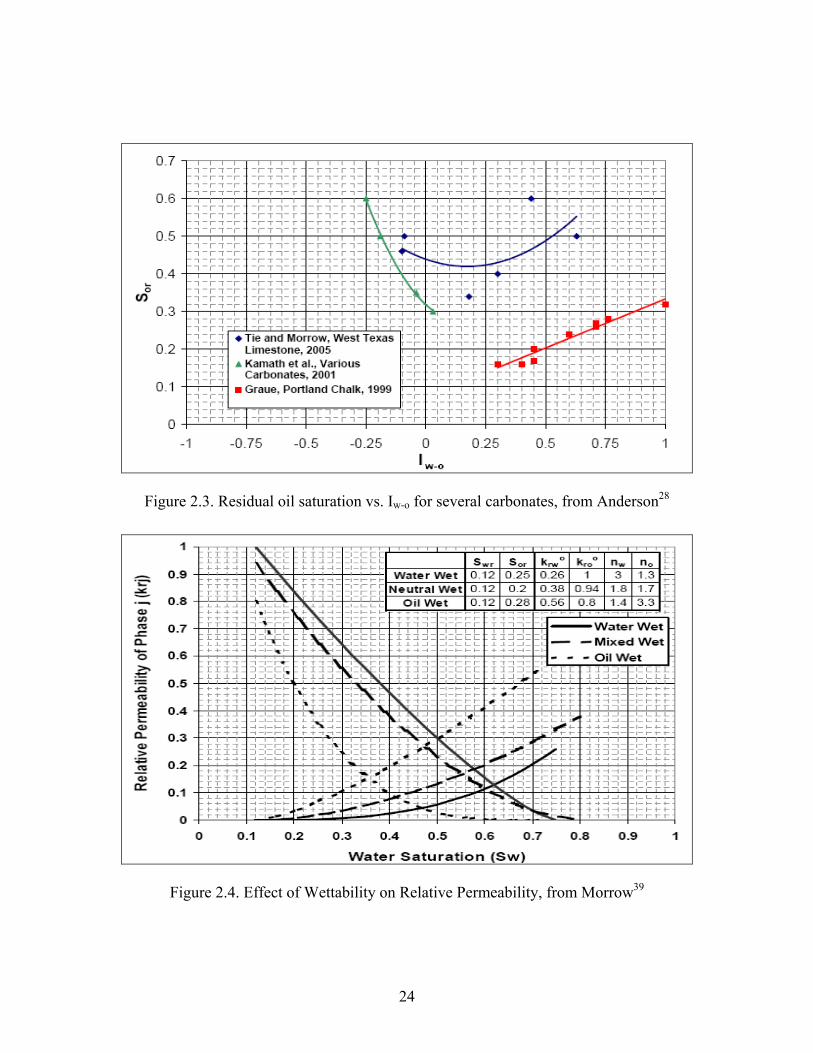
The affect of wettability, measured with the Amott index, on residual oil
saturation has been studied experimentally by several researchers.7, 9-11, 14, 23, 24,
31 Figures 2.1 – 2.3 display experimental data for Berea sandstone, other
sandstones and several carbonates. The residual oil saturation is lowest when
the wettability is nearest to neutral or mixed-wet.
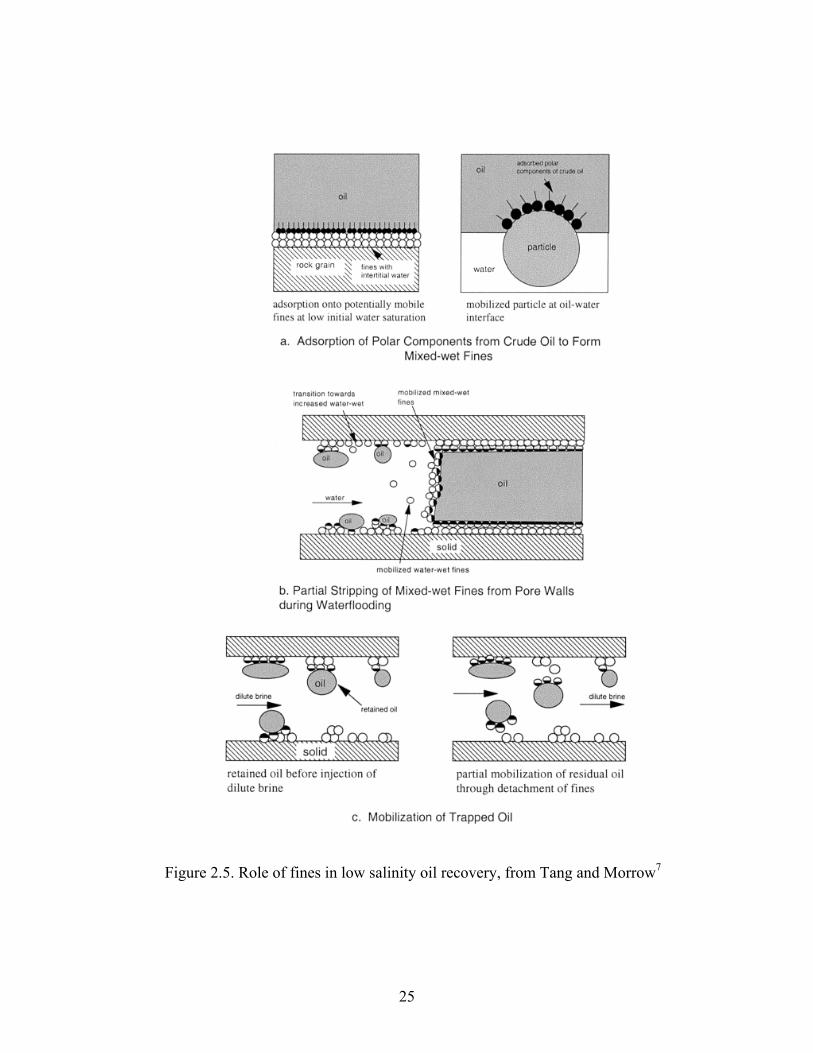
The relative permeability of a wetting phase is lower then the relative
permeability of a non-wetting phase. If a crude oil/rock/brine system becomes
more water-wet, the water relative permeability will decrease while the oil
9
relative permeability will increase. Morrow23 illustrated this with relative
permeability data fit to Corey type functions shown in Figure 2.4.
Prior to the heralding of low salinity enhanced oil recovery, researchers
manipulated brine composition to better understand the factors that determine
a crude oil/rock/brine system’s wettability.
Jadhunandan and Morrow11 studied the relationship between waterflood oil
recovery and wettability. Wettability was modified by adjusting the aging
temperature, initial water saturation, brine composition and crude oil. Berea
sandstone cores and 3 different oils were used. Brines were composed of
NaCl, CaCl2 and a trace concentration of sodium azide. All brines possessed
high salinity, only the Na/Ca ratios were adjusted. Fifty crude oil/brine/rock
systems were tested. Maximum oil recovery by waterflooding was obtained at
very weakly water-wet conditions. Wettability was measured after waterflood
with the Amott method.1 Iw-o decreased with increasing calcium-ion content
with the Moutray crude oil. Wettability was insensitive to Ca2+ with the other
oils. With both crudes Iw-o increased with increasing Swi, and Iw-o decreased
with increasing aging temperature.
10
Yildiz and Morrow35 conducted corefloods using Berea sandstone, Moutray
crude oil and either a Na brine composed of 4% NaCl + 0.5% CaCl2 or a Ca
brine composed of 2% CaCl2. Recovery was higher with the Ca brine when
the connate and injected brines were identical. The highest recovery was
achieved by initially saturating the core with Ca brine, injecting Na brine until
residual oil saturation was achieved, then injecting Ca brine. Almost 13%
incremental recovery was achieved about 1 PV after the start of the tertiary Ca
brine flood. Wettability was measured after waterflood with the Amott
method.1 Greater waterflood recovery was achieved in mixed-wet cores.
Spontaneous imbibition of Na brine was 4 times greater then Ca brine after
about 2 days.
Tang and Morrow30 investigated the effects of connate and injection brine
salinity, aging time and temperature on waterflooding and imbibition with 3
different crude oils and 3 different brines. In imbibition experiments with
identical connate and invading brines, decreasing the salinity of both brines
produced higher final recovery. In experiments with constant connate brine
salinity and variable invading brine salinity, decreasing invading brine salinity
increased recovery. In experiments with variable connate brine salinity and
constant invading brine salinity, decreasing connate brine salinity increased
recovery.
11
In waterfloods with identical connate and injected brines, decreasing the
salinity of both brines produced higher recovery primarily by delaying
breakthrough. In waterfloods with constant connate brine salinity and variable
injected brine salinity, diluting injected brine 100 times produced ~5%
incremental oil recovery. In waterfloods with variable connate brine salinity
and constant injected brine salinity, decreasing connate brine salinity
dramatically improved recovery – about 40% incremental oil recovery was
achieved by diluted the connate brine 100 times.
Increasing aging time increased recovery by spontaneous imbibition and
decreased waterflood recovery. Increasing experiment temperature produced
higher oil recovery by spontaneous imbibition and waterflood.
2.3 Focused Low Salinity Research Begins
Based on these findings researchers, began to focus on the only variable that
can be manipulated in a reservoir – the injection brine salinity. Researchers
noticed that improved recovery by injection of low salinity brine only
occurred when crude oil and clay bearing sandstone mineralogy were present.
12
Based on this observation, Tang and Morrow29 offered the first theoretical
interpretation of the mechanism responsible.
Tang and Morrow29 observed an increase in waterflood and spontaneous
imbibition recovery with a decrease in salinity in numerous cases. The authors
used Berea, Bentheim, CS Reservoir, Clashach and fired and acidized Berea
cores, CS crude and refined oil and 7 different brines ranging from 35,960
ppm TDS to 151.5 ppm TDS.
Recovery improved significantly in the CS reservoir and Berea cores when
low salinity brine was injected instead of high salinity, but recovery improved
only marginally in the more clay free Bentheim and Clashach cores. Berea
cores that were fired and acidized, to stabilize fines, were insensitive to brine
salinity. Cores that were repeatedly waterflooded produced fines and were
sensitive to brine salinity in early waterfloods, but stopped producing fines
and were insensitive to brine salinity in late waterfloods. Cores initially 100%
saturated with crude oil – with fines completely immersed in the oil phase –
were insensitive to brine salinity. And lastly, cores saturated with refined
mineral oil, rather then crude oil, were insensitive to salinity.
13
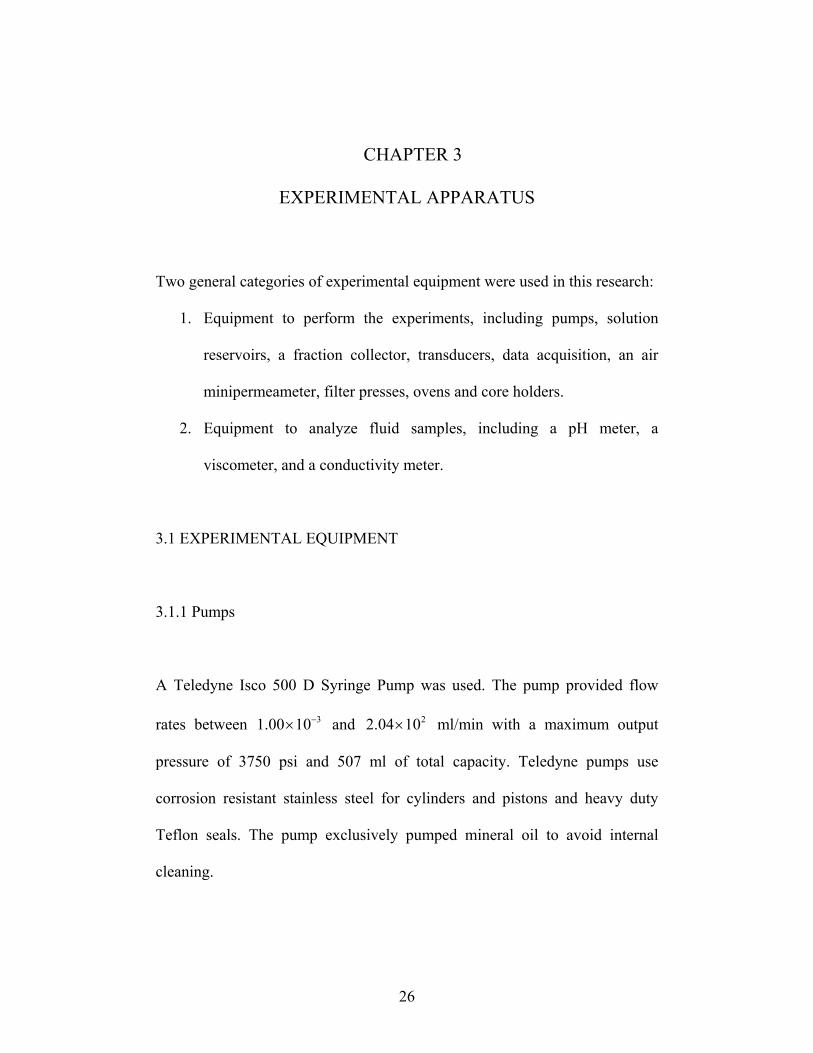
Tang and Morrow conclude that heavy polar components in the crude oil
adsorb onto fine particles along the pore walls and that these mixed-wet fines
are stripped by low salinity brine, altering wettability and increasing oil
recovery. A figure from their paper illustrating the proposed mechanism is in
Figure 2.5.
Zhang and Morrow36 conducted waterflood and spontaneous imbibition
experiments using 4 different samples of Berea sandstone and three different
crude oils. These authors observed improved recovery by injecting low
salinity brine in secondary and tertiary modes. The impact of low salinity
brine varied significantly between the different samples of Berea, suggesting
that mineralogy was the most important variable affecting improved recovery.
The lowest permeability block of Berea (knitrogen ~ 60 to 140 md) showed no
sensitivity to salinity. The lack of response was attributed to the presence of
chlorite. In several cases, cores responded to low salinity brine in the
secondary but not the tertiary mode. Low salinity effects become more
dramatic as the initial water saturation increased. In all cases, injection of low
salinity brine was accompanied by an increase of pressure followed by a
gradual decrease. Effluent pH also increased.

14
Publications indicating no benefit of low salinity waterflooding are also
present in the literature. Sharma and Filoco27 investigated the impact of
connate and injection brine salinity and crude oil on oil recovery, residual
saturations and wettability using Berea cores, 3 different oils and NaCl brine
in various concentrations.
In imbibition experiments decreasing connate brine salinity increased
recovery and significantly affected relative permeability. The salinity of the
displacing brine had no significant impact. Drainage experiment’s recovery
and relative permeability were insensitive to salinity. During waterflooding of
crude oil, oil recovery increased with decreasing connate brine salinity.
However, during waterflooding of mineral oil, recovery was insensitive to
connate brine salinity. In all cases, waterflood recovery was insensitive to the
salinity of the injected brine.
Sharma and Filoco suggested that low salinity connate brine changes the
wetting properties of the rock surface from water-wet to mixed-wet and
thereby decreases residual oil saturation.
2.4 The Oil Industry Takes Notice
15
Encouraged by results from at The University of Wyoming, researchers at BP
began to evaluate the applicability of low salinity waterflooding at the field
scale. Numerous core floods and single well tests were preformed, a
mechanism was proposed, a computer model was created and an interwell test
was conducted.
Webb et al.32 observed a reduction in residual oil saturation in the near well
bore region by injecting low salinity brine. Three different brines were
injected into a clastic formation from a producing well. Saturation was
measured after each injection using a pulsed neutron capture log. A base line
Sor was established with a synthetic native brine (250,000 ppm). Synthetic sea
water (120,000 ppm), injected second, did not reduce oil saturation further. A
low salinity brine (3,000 ppm), injected last, reduced Sor significantly in two
sand intervals and slightly in another.
McGuire et al.22 confirmed the low salinity induced Sor reduction in the near
well bore region. Experiments were carried out from four different wells in a
clastic North Slope reservoir. Saturations were measured using single well
chemical tracer tests (SWCTT) after a high salinity flood then again after a
low salinity flood. In all four cases residual oil saturation decreased after the
low salinity flood. On the basis of the increase in the pH of the effluent brine,
16
the authors proposed that saponification caused production of natural
surfactants that increased recovery by reducing interfacial tension.
Jerauld et al.13 created a model that included salinity dependent residual oil
saturation and relative permeability. Using coreflood and SWCTT data
researchers correlated the incremental benefit of low salinity waterflooding
with kaolinite fraction. Residual oil saturation, relative permeability and brine
density and viscosity were made functions of salinity. Simulation results are
strongly affected by dispersion because of the salinity dependence. The
simulation successfully history matched single well and coreflood
experiments.
Lager et al.16 achieved improved waterflood recovery by injecting low salinity
brine in secondary and tertiary modes. Fines migration or significant
permeability reduction because of low salinity injection were never observed,
leading Lager et al. to question the link between fines migration and oil
recovery proposed by Tang and Morrow.29 A 40% increase in recovery was
observed using a North Sea crude with a very low acid number (AN < 0.05),
leading Lager et al. to dismiss the low salinity induced alkali flooding
hypothesis proposed by McGuire et al.22
17
In several experiments Lager et al. noticed a significant drop in Ca2+ and Mg2+
effluent concentration during a low salinity waterflood. Researchers saturated
a North Slope core with synthetic reservoir brine and crude, then achieved a
35% OOIP recovery with a high salinity brine flood. The same core was
restored and repeatedly flushed with NaCl-only brine to replace all the
multivalent cations present on the mineral surface, then flooded with crude.
The ensuing high salinity waterflood achieved a higher recovery of 48%
OOIP and subsequent low salinity tertiary floods produced no additional oil.
These results prompted Lager et al. to suggest multi-component ionic
exchange was responsible for the increase in oil recovery. The authors cite 4
different mechanisms that could sequester oil: cation exchange, ligand
bonding, cation bridging and water bridging, and suggest that the strength of
all is reduced when contacted with low salinity brine.
Lager et al.17 conducted a low salinity interwell field test in a sandstone oil
reservoir. The experiment was carried out between 1 injector and 2 producers.
Oil rate had fallen to 150 bbl/day after natural depletion, a standard
waterflood and a flood of miscible injectant. In May 2005, low salinity water
injection began. About 6 months later the oil rate at one of the producers
began to rise; peaking at 320 bbl/day. Water chemistry also changed
dramatically with the arrival of the oil bank. Magnesium ion concentration fell
18
from 0.75 meq/l to less then 0.01 meq/l, maintained this low level for 5
months, then rose back to 0.5 meq/l. Pore volume was measured with barium
ion tracers; the low salinity induced oil bank arrived after about 0.3 PV
injected – in good agreement with experimental data. The other producer
showed no response perhaps due to a sealing fault between it and the injector.
No loss of injectivity was reported, implying no formation damage.
Researchers also carried out a SWCTT: reducing a high salinity Sor of
0.30±0.02, to 0.28±0.02 with a non optimized low salinity brine, then further
to 0.20±0.02 with an optimized low salinity brine, highlighting the importance
of cation selection.
2.5 Recent work
As more and more low salinity experiments were conducted the importance of
mineralogy – specifically clay content – continued to be emphasized, but a
comprehensive and predictive mechanistic model remained unavailable. Many
recent experiments have been conducted in candidate reservoir core because
low salinity response remains difficult to forecast. Researchers observed
dramatic results with clay-rich sandstone reservoir cores and, for the first
time, in almost clay free cores.
19
Zhang et al.37 reported increased recovery in the tertiary mode by reducing
reservoir brine salinity 20 times. Two consolidated reservoir sandstone cores
were used. X-ray diffraction indicated that each of the cores were rich in chert
and kaolinite. Two different crudes and a mineral oil were used.
Almost 70% incremental oil recovery was achieved in the secondary mode.
Both the high and low salinity secondary floods were conducted in the same
core. Tertiary recovery was also quite large; 25% incremental recovery in the
best case. The recovery was achieved slowly, taking more then 10 injected
pore volumes. In several cases the pH fell upon injection of low salinity brine;
contrary to other researcher’s observations. Pressure drop was closely tied to
incremental recovery. In all cases where significant incremental recovery was
achieved pressure drop increased significantly then fell gradually.
Pu et al.25 observed low salinity tertiary recovery from an almost clay free
core for the first time. Researchers injected coalbed methane (CBM) water
into 3 sandstone reservoir cores composed of quartz, feldspar, dolomite and
anhydrite cements but which had very little clay. The CBM water’s salinity
was about 1,316 ppm TDS. Cores were first waterflooded with high salinity
formation brine (38,651 ppm). When oil production to high salinity brine
ceased CBM water was injected.
20
In all cases CBM water liberated additional oil. In each core the benefit of
tertiary low salinity flooding became less dramatic after each flood and
restoration. A core was acidized to remove dolomite crystals and subsequently
its recovery became insensitive to low salinity flooding. Pu et al. proposes that
dolomite crystals play an important role in the low salinity recovery
mechanism. Some of the dolomite crystals become mixed-wet as they
contacted the oil phase during aging. During the low salinity flood the
dolomite crystals may detach from the pore walls releasing oil from the rock
surface. The detached dolomite crystals will then reside at the crude oil/brine
interface increasing resistance to flow of brine at the interface, delay snap-off
at pore-throats and preventing the collapse of oil lamella.
Agbalaka et al.3 conducted waterflood experiments to study the recovery
benefit of using low salinity brine. Researchers used Berea sandstone and
Milne Point Unit cores. 4%, 2% and 1% NaCl brine and Trans Alaskan
Pipeline System (TAPS) crude oil and refined decane spiked with TAPS crude
were used.
Incremental oil was recovered in tertiary mode by switching from 4% to 2%
to 1% NaCl brine. Improved recovery was also achieved by injecting low
21
salinity brine in the secondary mode. Pressure drop data was unpublished.
Researchers measured wettability with the Amott method1 and found an
increase in the degree of water-wetness with a decrease in NaCl concentration.
Injection of low salinity brine has improved waterflood recovery in numerous
laboratory and field experiments. The general consensus among researchers is
that injecting low salinity brine creates a wetting state more favorable to oil
recovery. Wettability affects the microscopic distribution and flow of oil and
water in porous media and thus the residual oil saturation. The mechanisms
responsible for this wettability alteration are debated. Tang and Morrow29
hypothesized heavy polar components in the crude oil adsorb onto fine
particles along the pore walls and that these mixed-wet fines are striped by
low salinity brine. Lager et al.16 concluded that increased recovery resulted
from low salinity induced multi-component ionic exchange that caused
reduction in ion binding between the crude oil and the rock surface. Pu et al.25
proposed that during a low salinity flood mix-wet dolomite crystals detach
from the pore walls releasing oil from the rock surface. The detached
dolomite crystals will then reside at the crude oil/brine interface increasing
resistance to flow of brine at the interface, delay snap-off at pore-throats and
preventing the collapse of oil lamella.
22
Mechanisms not involving wettability alteration have also been suggested.
Bernard4 attributed the increased recovery to improved microscopic sweep
efficiency induced by clay swelling and plugging of pore throat by migrating
fines. However the massive pressure drop increases suggest a reduction in
residual oil saturation due to capillary desaturation. McGuire et al.22 proposed
that saponification caused production of natural surfactants that increased
recovery through reduction of interfacial tension. However low salinity
flooding has reduced residual saturation in cores containing crudes with
extremely low acid numbers and in cores where effluent pH decreased as the
low salinity bank arrived at the outlet.
23
Figure 2.1. Residual oil saturation vs. Iw-o for Berea sandstone, from Anderson28
Figure 2.2. Residual oil saturation vs. Iw-o for several other sandstones, from Anderson28
24
Figure 2.3. Residual oil saturation vs. Iw-o for several carbonates, from Anderson28
Figure 2.4. Effect of Wettability on Relative Permeability, from Morrow39
25
Figure 2.5. Role of fines in low salinity oil recovery, from Tang and Morrow7
26
CHAPTER 3
EXPERIMENTAL APPARATUS
Two general categories of experimental equipment were used in this research:
1. Equipment to perform the experiments, including pumps, solution
reservoirs, a fraction collector, transducers, data acquisition, an air
minipermeameter, filter presses, ovens and core holders.
2. Equipment to analyze fluid samples, including a pH meter, a
viscometer, and a conductivity meter.
3.1 EXPERIMENTAL EQUIPMENT
3.1.1 Pumps
A Teledyne Isco 500 D Syringe Pump was used. The pump provided flow
rates between 31.00 10−× and 22.04 10× ml/min with a maximum output
pressure of 3750 psi and 507 ml of total capacity. Teledyne pumps use
corrosion resistant stainless steel for cylinders and pistons and heavy duty
Teflon seals. The pump exclusively pumped mineral oil to avoid internal
cleaning.
27
3.1.2 Solution Reservoir
Kontes Chromaflex Columns, made of borosilicate glass and Teflon end
pieces, were used as fluid reservoirs for brine. The pressure rating for each
column was 40 psi and the capacity was 543 ml. To inject solution into a core
the column was oriented vertically and mineral oil from the pump was
injected into the top, displacing the more dense brine which exited the column
at the bottom.
3.1.3 Oil Reservoir
Stainless steel columns with Swagelok fittings on each end – manufactured in
The University of Texas Petroleum and Geosystems Engineering Department
machine shop – were used as oil reservoirs. The columns were approximately
2’ long, 1” OD, and 1/8” thick and had a pressure rating well in excess of 100
psi. To inject oil into a core the column was oriented vertically and
compressed air was injected into the top, displacing the more dense oil phase
which exited the column at the bottom.
3.1.4 Fraction Collectors
28
A Spectrum Chromatography Fraction Collector was used to collect effluent
fluid samples. The fraction collector had a capacity of 174 - ten ml test tubes.
The fraction collector positioned a test tube to receive fluid for a preset
amount of time. After the time expired, a new test tube was positioned to
receive fluid. During most experiments the time allotted for each sample was
set so that approximately 8 ml of fluid was collected in each test tube.
3.1.5 Pressure Transducers
Differential pressure transducers were used to measure pressure drop between
pressure taps on the core. The transducers measure differential pressure by
detecting the deflection of an internal diaphragm and converting the
information to an output voltage. Four 0 to 10 psid, one 0 to 50 psid and one 0
to 300 psid Cole-Parmer Wet/Wet Differential Pressure Transmitters were
used. Figure 3.1 shows the configuration of the core and the transducers.
3.1.5 Pressure Data Acquisition
Voltage signals from the pressure transducers were input to a National
Instruments USB-6008 8-input, 16-bit, 10kS/s Multifunction I/O board. The
29
I/O board was connected to a desktop computer via a USB cable where a
labVIEW program recorded differential pressure at preset time intervals.
3.1.6 Filter Presses
Oil samples were filtered using a stainless steel OFITE low pressure filter
press. Oil was forced through filter paper at the bottom of the filter by
compressed air injected at the top of the filter.
Brine solutions were filtered with a Millipore Vacuum Filter. Brine was pulled
through filter paper by a vacuum pump.
3.1.7 Ovens
Coreflood experiments and aging intervals were conducted inside an oven
when elevated temperature was required. The ovens possessed digital
temperature set points and thermometers. Temperature was also independently
measured to ensure accuracy.
3.1.8 Core Holders
30
A 1.5” internal diameter core holder manufactured by Phoenix Instruments
was used. The core holder was manufactured with 316 stainless steel and was
rated for 2,000 psi and 150ºC. Three pressure taps were placed seven cm apart
from each other.
3.2 ANALYTICAL EQUIPMENT
3.2.1 Air Minipermeameter
Air permeability was measured using a minipermeameter constructed in the
Petroleum and Geosystems Engineering Department at The University of
Texas. The permeameter measures flow rate and inlet pressure.
3.2.2 pH meter
pH was measured using a Thermo Scientific Orion 4-Star pH/Dissolved
Oxygen Benchtop Meter. To take a measurement a pH probe was dipped into
a sample. The sample was gently agitated until a steady reading was obtained.
The meter was calibrated before each measurement with standard buffers of
pH 3.00 and pH 7.00.
31
3.2.3 Viscometer
Bulk viscosity was measured using the Contraves Low Shear 30 viscometer.
The instrument measures the shear stress between a spinning cup and bob and
calculated fluid viscosity. Approximately 0.9 ml of fluid was required for each
measurement. Viscosity was measured over a range of shear rates, from
0.0237 to 69.5 sec-1 and at the experiment temperature. Viscosity measure at
11 sec-1 was used in subsequent calculation because this shear rate is most
representative of an oil reservoir.
3.2.4 Conductivity meter
A Fisher Scientific TraceableTM meter was used to measure conductivity. The
meter’s probe was submerged in a sample and an electric field was induced.
The meter measured voltage drop between a current electrode and a pickup
electrode and calculated conductivity.
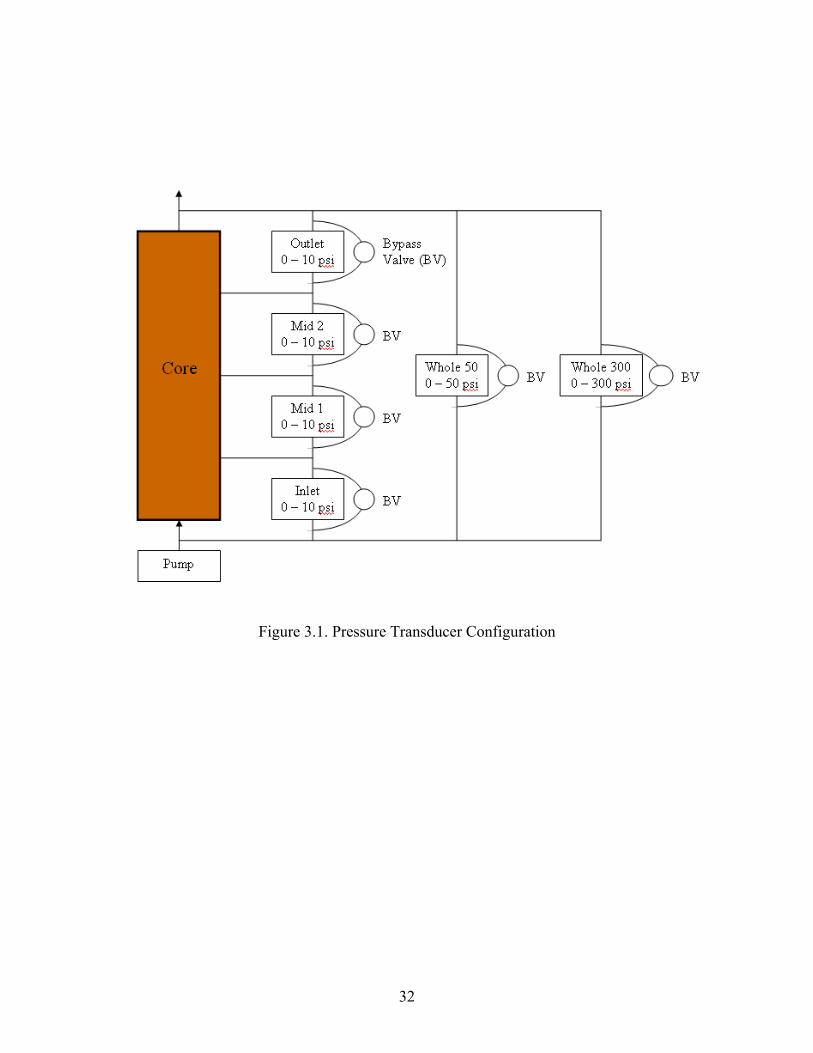
32
Figure 3.1. Pressure Transducer Configuration
33
CHAPTER 4
EXPERIMENTAL PROCEDURE
4.1 CORE PREPARATION
Cores were either encased in epoxy or placed inside a core holder.
4.1.1 Epoxy encased cores
To prepare epoxy encased cores, first polycarbonate plastic endpieces were
fabricated. The endpiece faces which contacted the core were milled to a
depth of 1/16 inches to ensure adequate fluid contact across the entire core
face. Epoxy resin was prepared by mixing 2 parts EPONTM Resin 828 and 1
part VersamidR 125 Hardener by weight, obtained from Miller Stephen. The
core was placed inside a hollow polycarbonate plastic cylinder, 2.5 inches in
diameter, and epoxy resin was poured between the cylinder and core. Or the
core was placed inside a polyethylene mold and the mold was filled with
epoxy resin. The layer of epoxy resin was sufficiently thick to allow the core
to withstand approximately 50 psi. The epoxy resin was allowed to cure for
about a day. After curing, inflow and outflow holes and pressure taps were
connected to 1/8-inch NPT fittings.
34
4.1.2 Core holder confined cores
Both outcrop cores and reservoir core plugs were confined in a core holder.
Reservoir core plugs were first stacked to achieve the desire core length.
Cores were wrapped in several layers of tylon tape and encased in heat shrink
plastic. High porosity metal screens were placed at the inlet and outlet faces to
prevent core damage. Cores were inserted into the coreholder and subject to
about 1000 psi of confining pressure applied with mineral oil and a hydraulic
hand pump.
4.2 AIR PERMEABILITY MEASUREMENT
Air permeability was measured using the minipermeameter described in
Chapter 3.2.1. Compressed nitrogen was injected into the prepared cores at a
range of flowrates. A rotameter was used to measure the flowrate of gas. An
analog pressure dial was used to measure pressure drop. Air permeability was
calculated with a spreadsheet which accounted for Klinkenberg15 effect.
4.3 FLUID PREPARATION
35
4.3.1 Brine
DI water and salts were mixed in the appropriate proportions. Normally 3.5 L
of brine were mixed at a time. Every brine sample was filtered with the
Millipore vacuum filter. Brine was poured into that filtration apparatus and a
vacuum pump pulled the fluid through a Millipore HA, 47-mm 0.45 micron
nominal pore opening cellulose filter.
4.3.2 Crude oil
Every oil sample was filtered with the OFITE filter press. The oil was forced
through a Millipore HA, 47-mm 0.45 micron nominal pore opening cellulose
filter. With Crude A it was necessary to first filter the oil with 5.0 micron
filter paper, then 1.2 micron filter paper and finally with 0.45 micron filter
paper.
4.3 BRINE SATURATION
After core preparation and air permeability measurement the following steps
were taken to saturate the core with brine:
36
• The core was flooded with several pore volumes of CO2 gas to remove
oxygen.
• A vacuum pump was connected to the outflow valve and a vacuum
pressure gauge was connected to the inlet valve, all other valves were
closed. The core was evacuated for about half an hour, then the
vacuum pump was turned off and the core pressure was monitored to
check for leaks.
• If the vacuum was maintain for another half hour the core inflow was
attached to a burette containing brine. The inflow valve was opened
and brine was sucked into the core. The inflow was shut when no more
brine would enter the core and the volume of brine imbibed was
recorded.
4.4 PORE VOLUME MEASUREMENT
Pore volume was measured in three ways: volumetrically, gravimetrically and
with a salinity tracer.
4.4.1 Volumetric pore volume
37
After the core was vacuumed the volume of brine imbibed was measured.
Because of dead volume, especially in the core holder, the volumetric pore
volume is inaccurate. The volumetric pore volume was used mostly to check
if the core was thoroughly saturated.
4.4.2 Gravimetric pore volume
Pore volume was measured gravimetrically when cores were encased in
enamel. Cores were weighed twice: when evacuated and when saturated with
brine. The difference in weight between the vacuumed and saturated core,
divided by the brine density, is the gravimetric pore volume.
4.4.3 Tracer measured pore volume
Pore volume was measured with a salinity tracer when cores were placed
inside a core holder. The core was initially saturated and flooded with 1.0%
NaCl and 0.3% CaCl2 tracer brine. Then high salinity connate brine was
injected and effluent samples were collected. Effluent conductivity was
measured and normalized by the initial and injected conductivities. Pore
volume was calculated using Equation (5.3). Brine was injected using the
solution reservoir arrangement described in Chapter 3.1.2.
38
4.5 TRANSDUCER CALIBRATION
Pressure transducers were calibrated before every injection. The following
procedure was used:
• Pressure transducer lines were loosely attached to the core and
transducer bypass valves were opened.
• Brine was driven through the transducer line from an elevated
reservoir to force air bubbles out of the system.
• Transducer lines were tightened one at a time after air bubbles had
been expelled and the elevated reservoir was disconnected.
• Transducer offsets were adjusted until the differential pressure across
each transducer was zero.
• The transducer bypass valves were closed.
4.6 BRINE FLOOD
After pore volume was measured, temperature was elevated to experiment
temperature. Cores were flooded with at least 5 pore volumes of connate
brine. Brine was injected using the solution reservoir arrangement described
in Chapter 3.1.2. The cores were oriented vertically and the brine was injected
39
at the bottom. Flowrate was regularly measured volumetrically with a burette
and stop watch. Pressure drop was measured with transducers.
4.7 OIL FLOOD
Oil floods were conducted at constant injection pressure and at experiment
temperature. The cores were oriented vertically and oil was injected at the top.
Oil was injected using the oil reservoir arrangement described in Chapter
3.1.3. Produced oil and water were collected in burettes. Oil-water and air-oil
interfaces were recorded to calculated saturation. Flowrate was regularly
measured with a stop watch. Pressure drop was measured with transducers.
4.8 AGING
Oil saturated cores were aged at an aging temperature. Cores were normally
aged for several days to allow the crude oil, brine and rock to equilibrate.
After aging experiment temperature was restored.
4.9 WATERFLOOD
40
Comparing the results of high salinity and low salinity waterfloods was the
principle aims of this research. Injection rates were sufficiently slow to avoid
the oil mobilizing region of the capillary desaturation curve. HS and LS brines
were injected using the solution reservoir arrangement described in Chapter
3.1.2. Normally about 5 to 7 pore volumes of water were injected. After 5 to 7
pore volumes oil production had completely ceased or was less then 0.1%.
Sample were collected with a fraction collector in 10 ml test tubes so that
accurate recovery vs. time data could be calculated. Each test tube’s oil-water
and air-oil interface was recorded, permitting the calculation of production
rate, oil cut, oil recovery and average saturation. Pressure drop was measured
with transducers.
41
CHAPTER 5
DATA ANALYSIS
5.1 Pore Volume and Porosity Calculation
5.1.1 Gravimetric Calculations
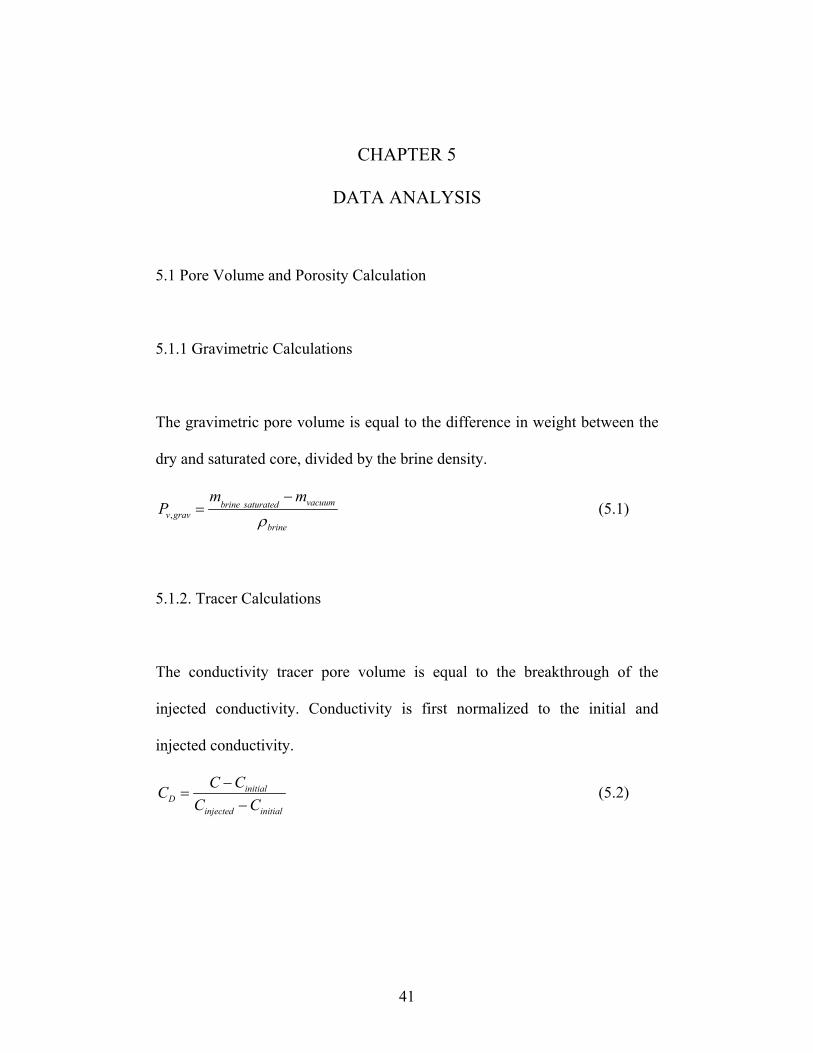
The gravimetric pore volume is equal to the difference in weight between the
dry and saturated core, divided by the brine density.
,vacuumbrine saturated
v gravbrine
m mP
ρ−
= (5.1)
5.1.2. Tracer Calculations
The conductivity tracer pore volume is equal to the breakthrough of the
injected conductivity. Conductivity is first normalized to the initial and
injected conductivity.
initialD
injected initial
C CCC C
−=
− (5.2)
42
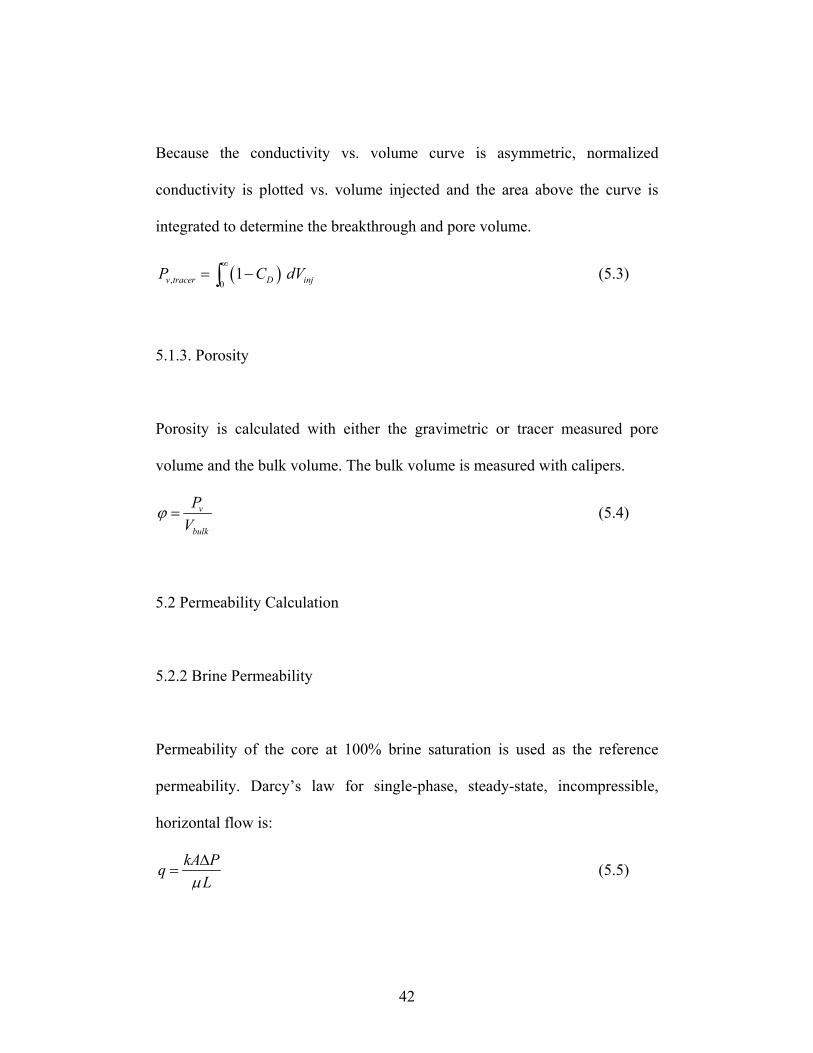
Because the conductivity vs. volume curve is asymmetric, normalized
conductivity is plotted vs. volume injected and the area above the curve is
integrated to determine the breakthrough and pore volume.
( ), 01v tracer D injP C dV
∞= −∫ (5.3)
5.1.3. Porosity
Porosity is calculated with either the gravimetric or tracer measured pore
volume and the bulk volume. The bulk volume is measured with calipers.
v
bulk
PV
ϕ = (5.4)
5.2 Permeability Calculation
5.2.2 Brine Permeability
Permeability of the core at 100% brine saturation is used as the reference
permeability. Darcy’s law for single-phase, steady-state, incompressible,
horizontal flow is:
kA PqLμΔ
= (5.5)
43
and in laboratory units of cc/min, md, cm2, psi, cp and cm:
245kA Pq
LμΔ
= (5.6)
5.2.1 Air Permeability
Nitrogen permeability is calculated with a modified version of Darcy’s Law:
( )2 21 2
2 sc scg
q LPkA P P
μ=
− (5.7)
The permeability determined from Equation (5.5) is usually higher than the
brine permeability because of an electro-kinetic phenomenon known as the
Klinkenberg15 effect. The gas permeability is related to the brine permeability
by:
1gbk kP
⎛ ⎞= +⎜ ⎟⎝ ⎠
(5.8)
and
1 2
2P PP +
= (5.9)
5.2.3 Relative Permeability
44
Permeability to each flowing phase in the presence of another phase is defined
as the effective permeability to that phase and is calculated using:
,j j j
eff jj
q Lk
A Pμ
=Δ
(5.10)
Effective permeabilites for each phase were normalized to 100% brine
permeability for relative permeability calculations.
,eff jrj
kk
k= (5.11)
5.3 Phase Saturation Determination
For each injection sequence, fluids were injected until steady-state was
achieved. Steady-state conditions are summarized as follows:
• Constant flow rates
• Constant phase fractional flow
• Constant pressure drop
• Production of fluids with the same composition as that of the injected
fluids
Saturations were then calculated using the material balance equations.
45
Volumes of each phase in the effluent samples were read from test tubes or
burettes. These volume readings were used to calculate saturation, fractional
flow and flow rate of each phase. Saturations were estimated with a material
balance on each phase. Assuming that there is no phase partitioning, no
adsorption, and that the fluids are incompressible, the volume balance for
phase j is:
( )tj e j jiV V PV S S− = − (5.12)
which yields that change in saturation of phase j:
tj ej
v
V VS
P
⎡ ⎤−⎣ ⎦Δ = (5.13)
5.4 Endpoint Mobility Ratio
The endpoint mobility ratio for oil and water is a measure of the stability of
the displacement of oil by water injection. The endpoint mobility ratio is
defines as:34
rw o
ro w
kMk
μμ
= (5.14)
46
CHAPTER 6
EXPERIMENTAL RESULTS AND DISSCUSSION
6.1 SERIAL WATERFLOODS IN BEREA CORE
In this experiment a sequence of two high salinity secondary, two low salinity
secondary and two low salinity tertiary waterfloods were conducted in a single
Berea sandstone core. The objective of this experiment was to evaluate the
effect of low salinity injection on recovery rate, residual oil saturation and
relative permeability. The waterfloods were conducted in the same core,
serially, to eliminate the possibility that natural variations between cores were
responsible for any contrasts between the high and low salinity results.
A single core was cut from a block of visually homogeneous Berea sandstone.
Two brines were used during waterflood experiments. A high salinity brine
(HSB) with 29,700 ppm TDS and a low salinity brine (LSB) with 1140 ppm
TDS. Both brines had a nearly equal equivalent-molar ratio of Na and Ca.
Also an oxygen scavenger, sodium dithionite, was included in every brine
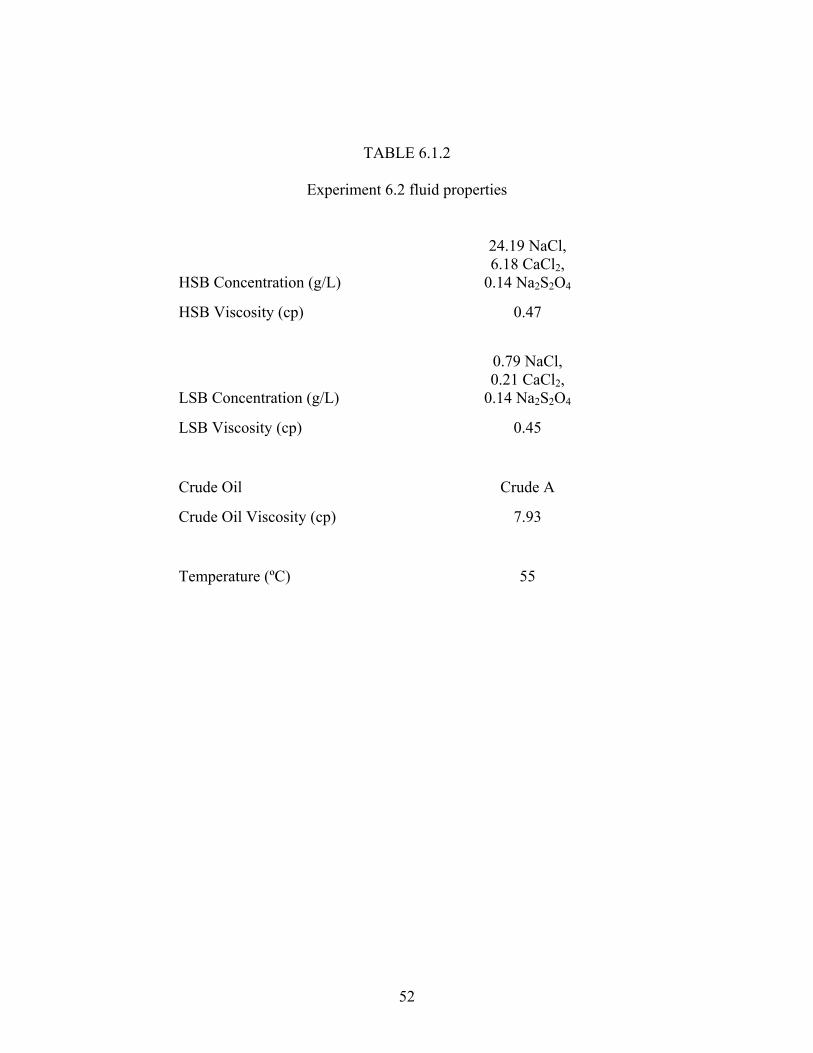
reduce redox potential. Properties of the core and fluids are given in Tables
6.1.1 and 6.1.2, respectively.
47
The following procedures, described in detail in Chapter 4, were employed.
The core was confined inside a core holder and permeability to nitrogen gas
was measured. Pore volume was measured with a salinity tracer. The core was
vacuum saturated with tracer brine then several additional pore volumes of
tracer brine were injected. Temperature was elevated to 55ºC. HSB was
injected, the effluent fluid was sampled and pore volume and permeability
were calculated. Crude A was injected to establish Soi then the saturated core
was aged for 2 days at 75ºC.
Temperature was reduced to 55ºC and the following floods were conducted:
• Oil flood – 1
• HS secondary and LS tertiary – 1 (HSS and LST – 1)
• High salinity connate brine restoration
• Oil flood – 2
• LS secondary – 1 (LSS – 1)
• High salinity connate brine restoration
• Oil flood – 3
• HS secondary and LS tertiary – 2 (HSS and LST – 2)
• High salinity connate brine restoration
• Oil flood – 4
48
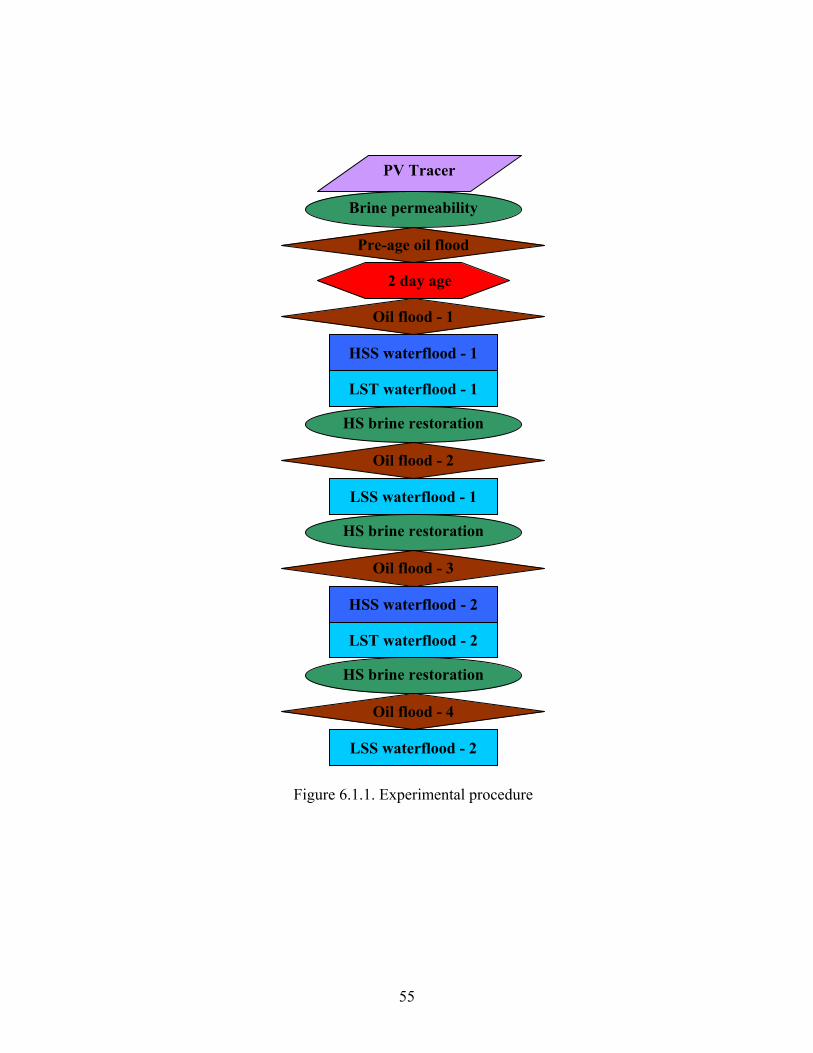
• LS secondary – 2 (LST – 2)
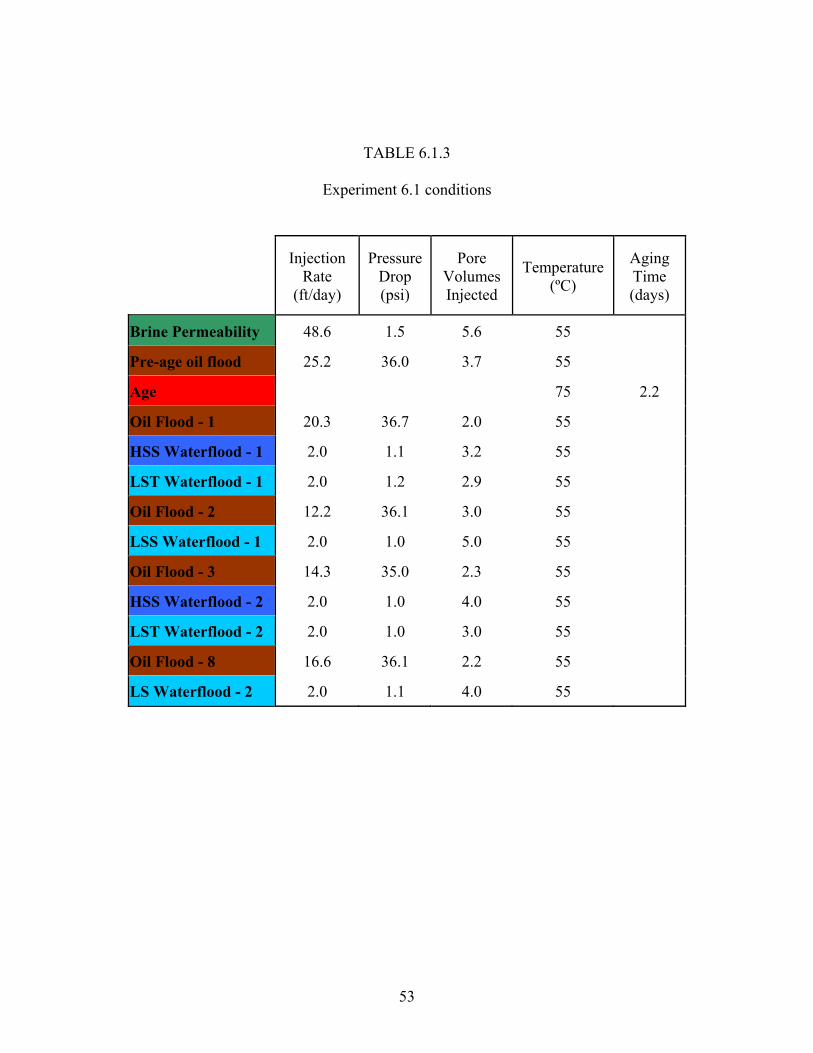
A diagram of the experimental procedures is in Figure 6.1.1. Experimental
conditions are in Table 6.1.3.
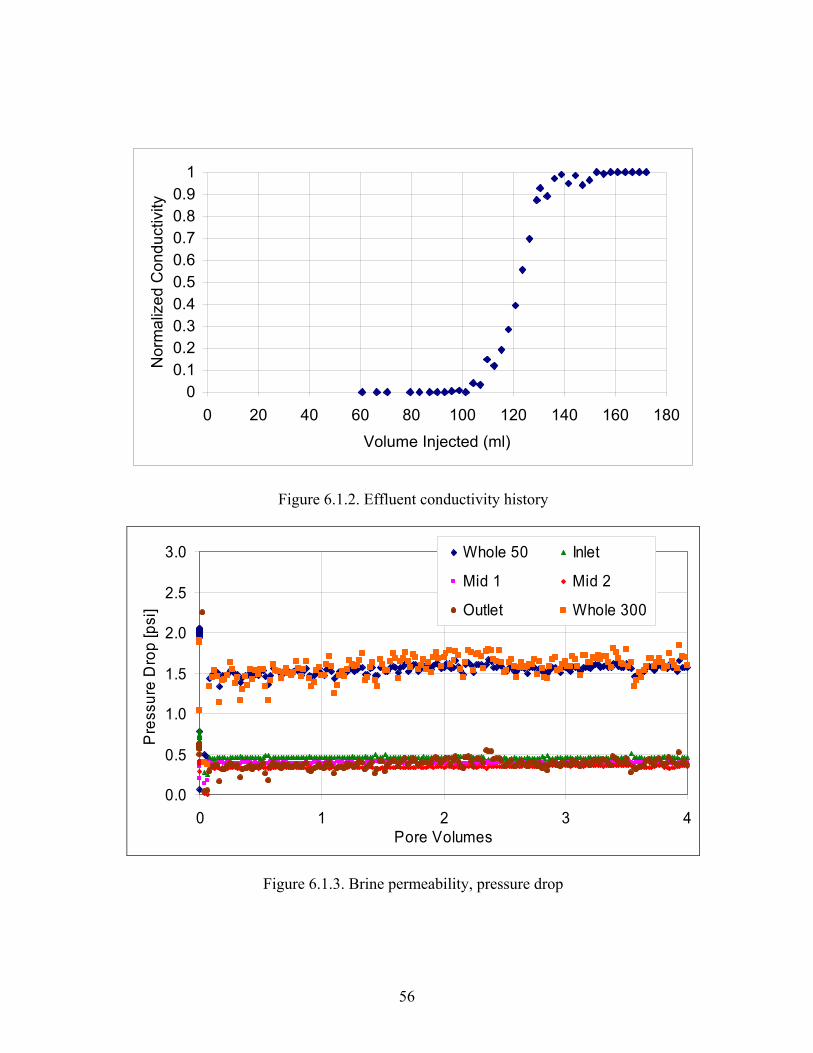
Figure 6.1.2 displays the effluent conductivity history. Figure 6.1.3 displays
the pressure drop during the HS connate brine flood. Porosity and
permeability were 21.9% and 471 md, respectively.
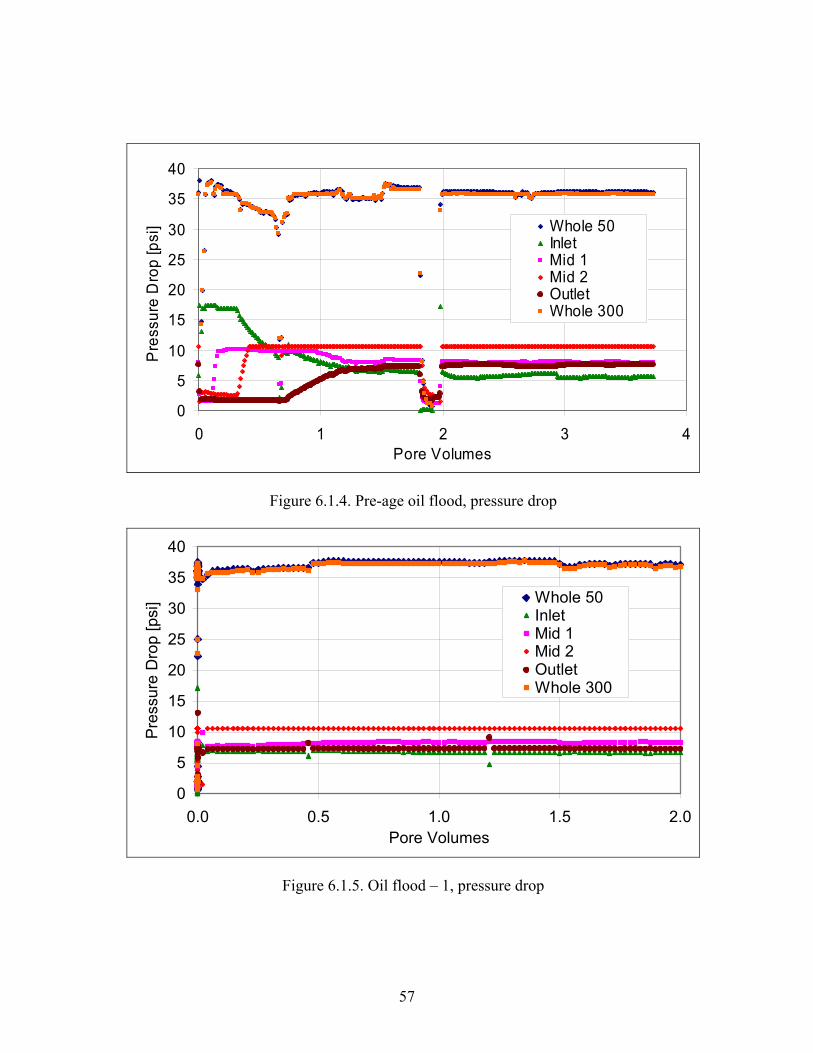
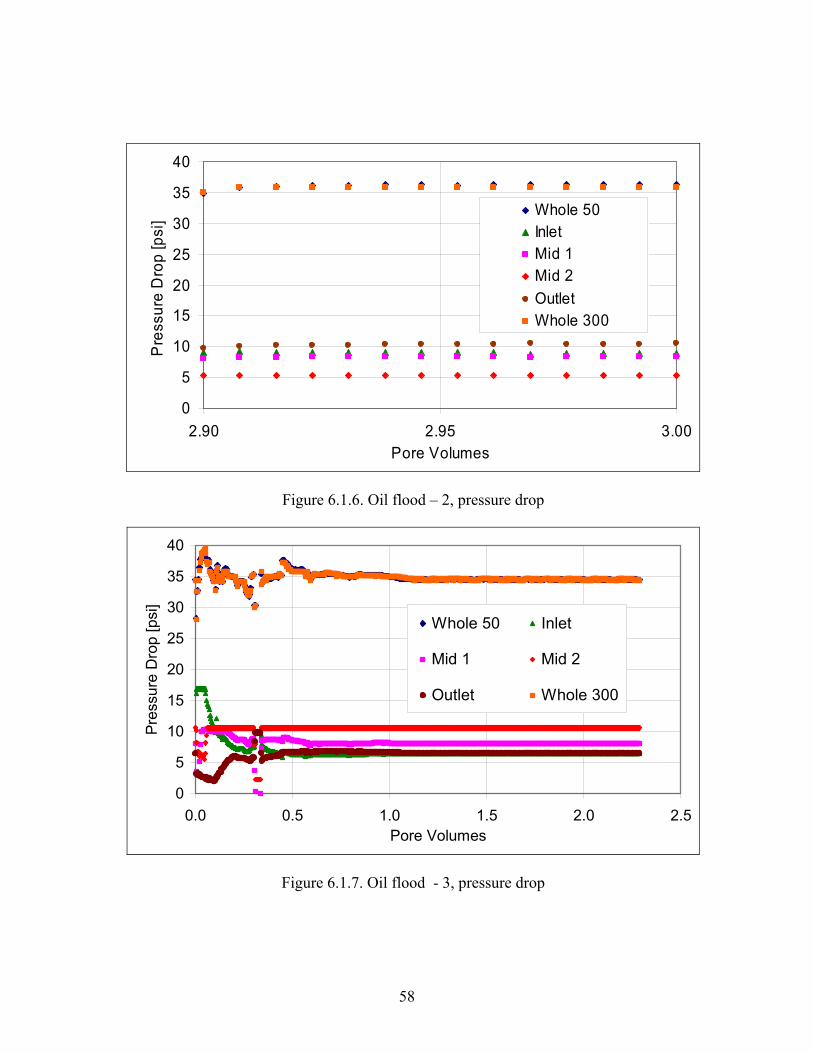
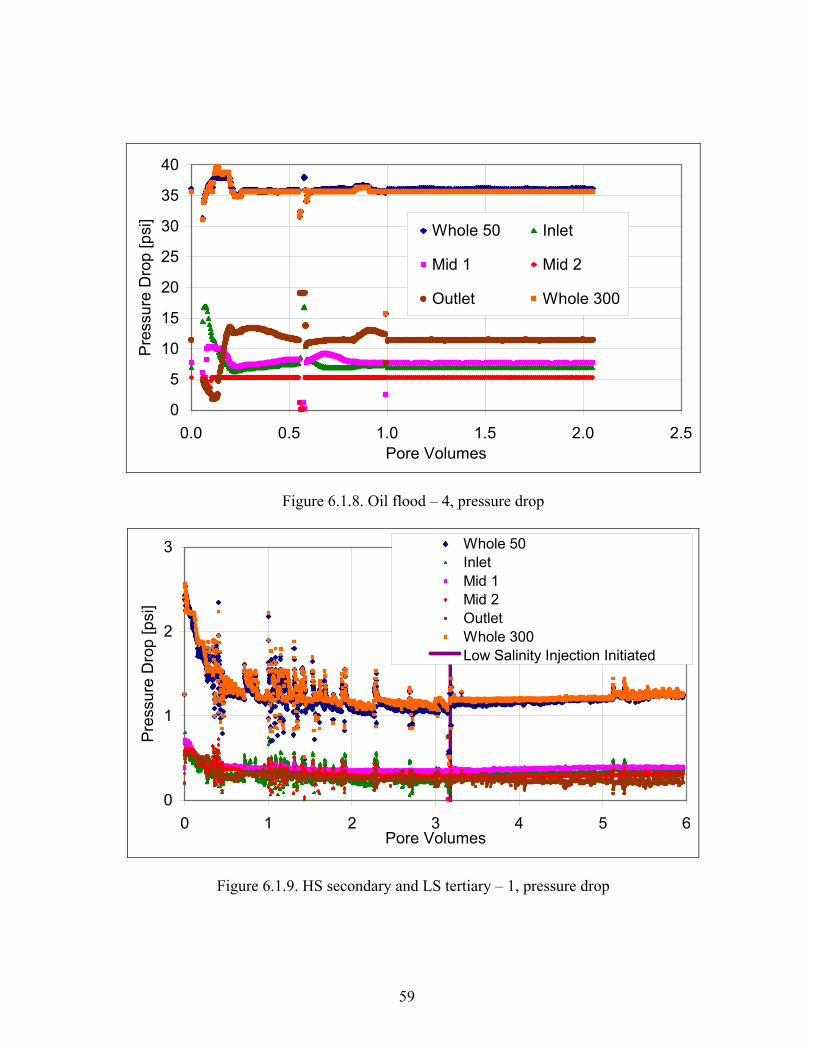
Five oil floods were conducted: the pre-age oil flood and oil floods 1 – 4. The
pressure drops during the oil floods are displayed in Figures 6.1.4 – 6.1.8.
Pressure data during most of oil flood – 2 was inadvertently unrecorded. Four
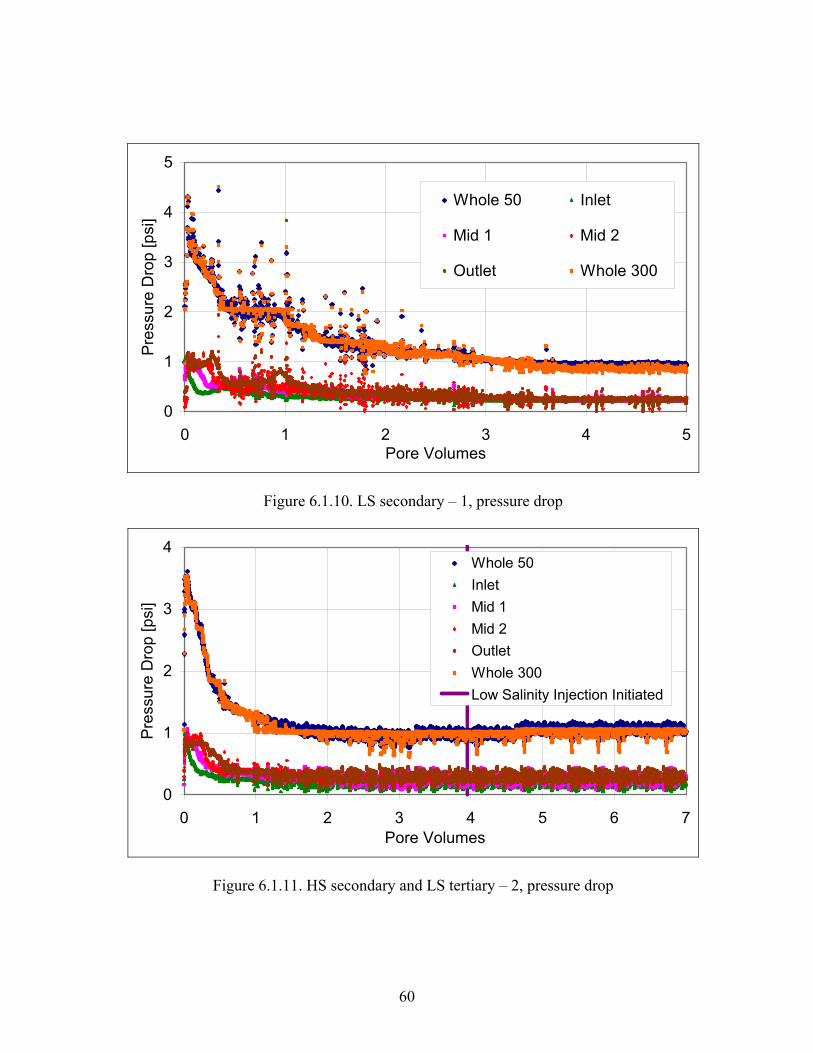
waterfloods were conducted: HS secondary and LS tertiary – 1 and 2, and LS
secondary – 1 and 2. The pressure drops during the waterfloods are in Figure
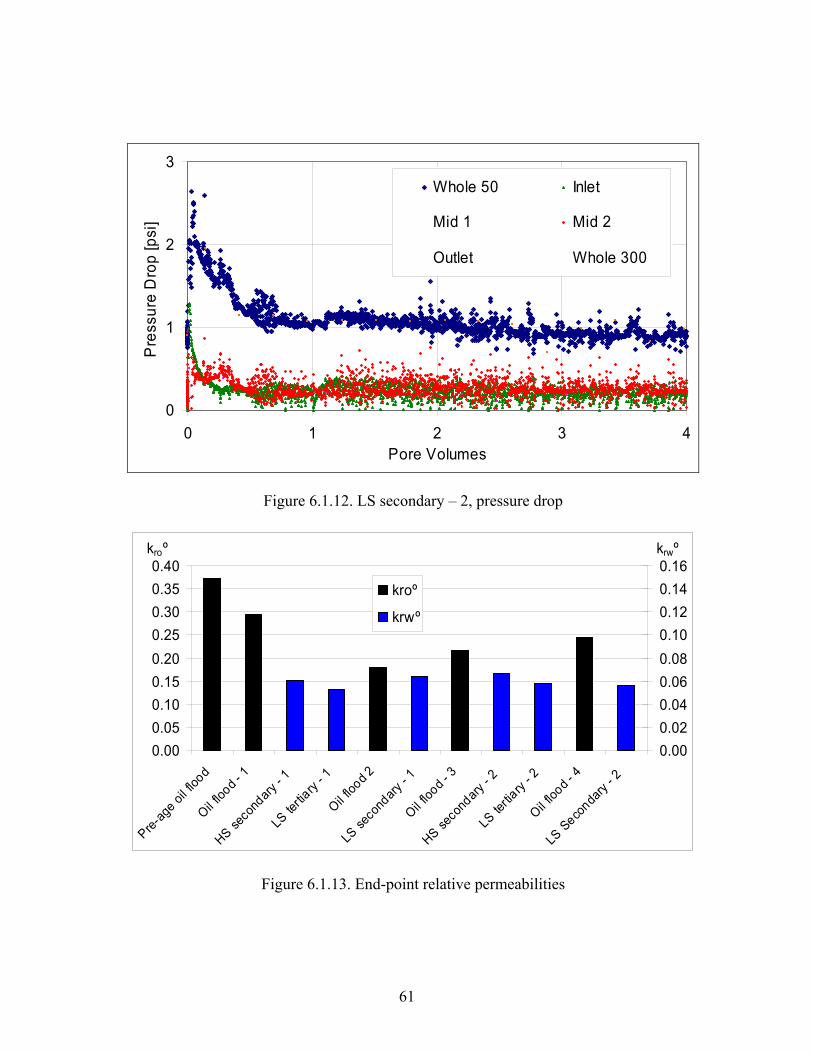
6.1.9 – 6.1.12. The end-point relative permeabilities to water and oil are in
Figure 6.1.13.
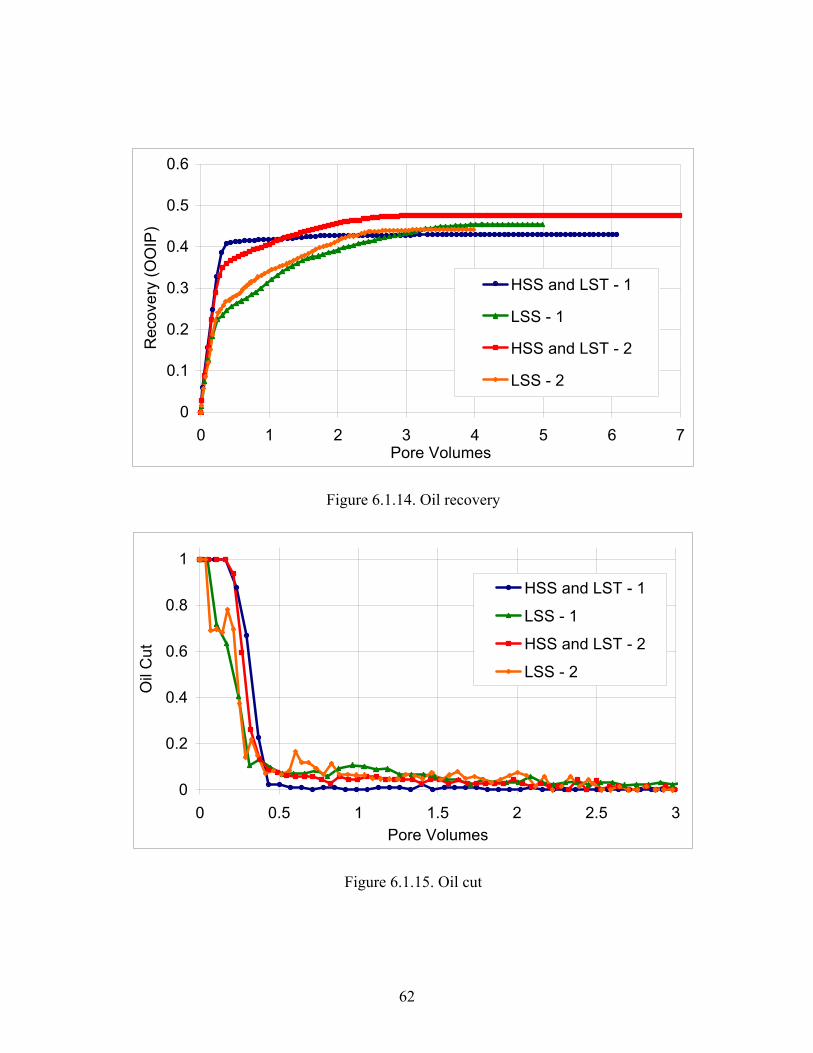
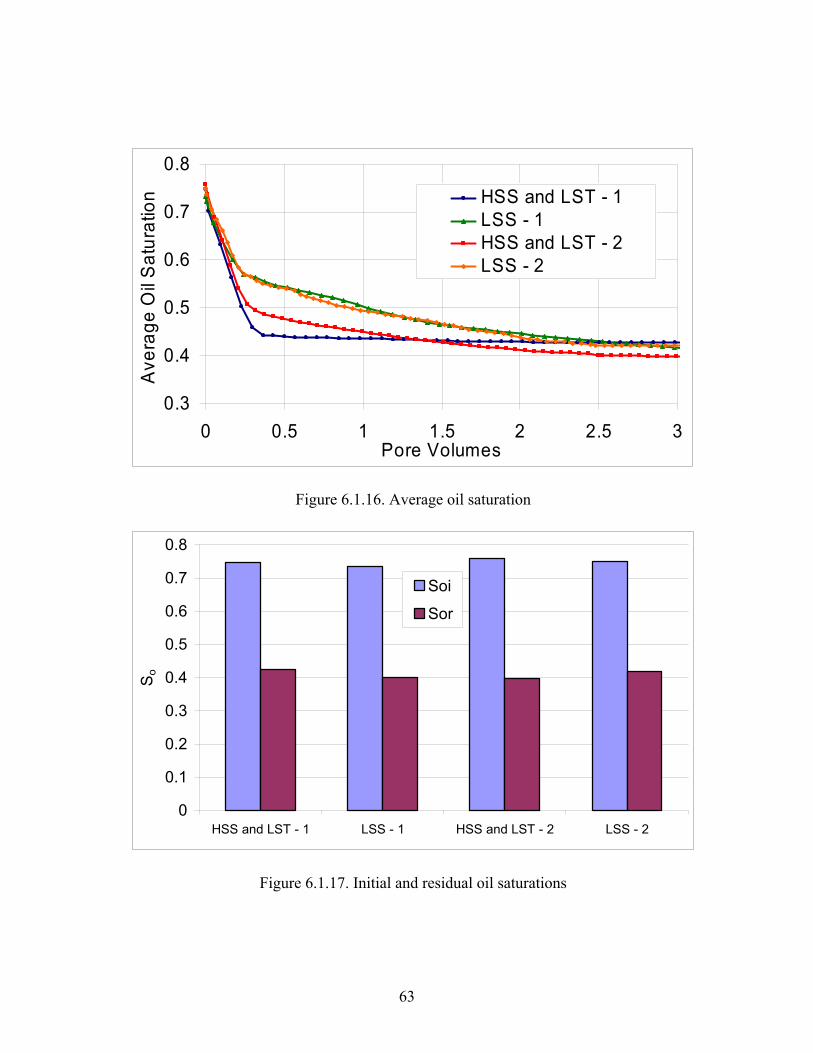
Graphs of oil recovery, oil cut and average oil saturation from all four floods
are in Figures 6.1.14 – 6.1.16. The initial and residual oil saturations are in
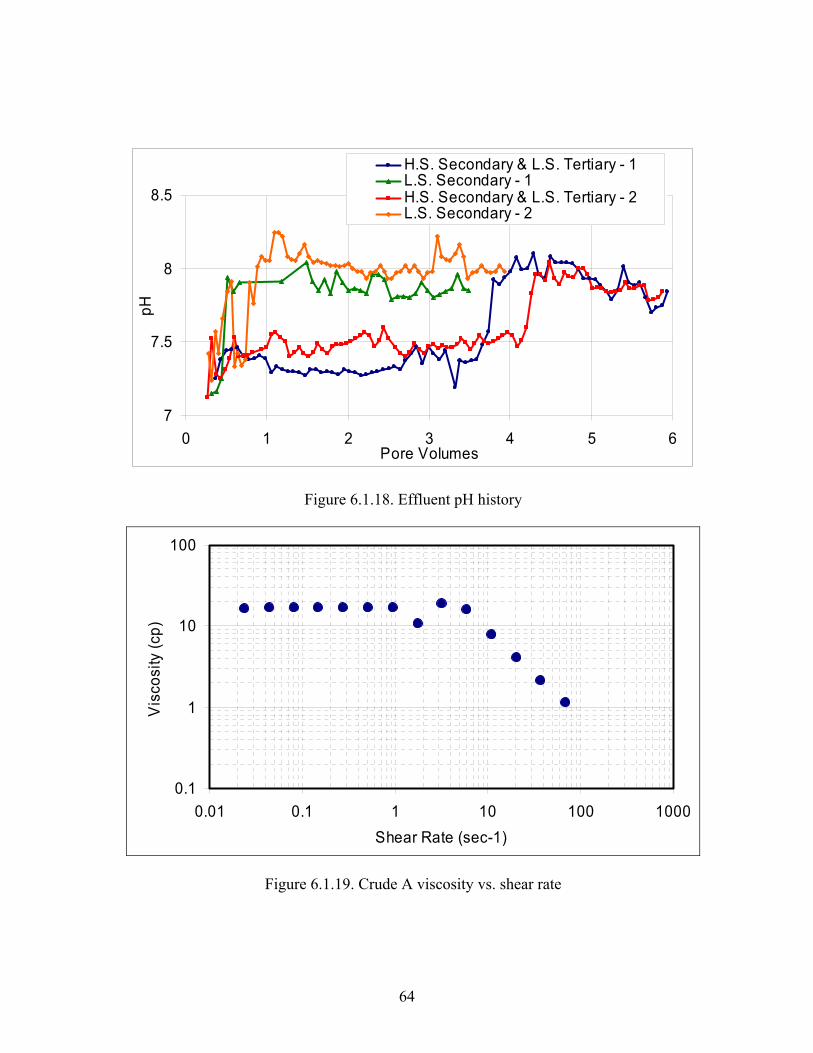
Figure 6.1.17. All four effluent pH histories are in Figure 6.1.18. In all cases

49
the arrival of the LSB at the outlet was signaled by an increase in pH.
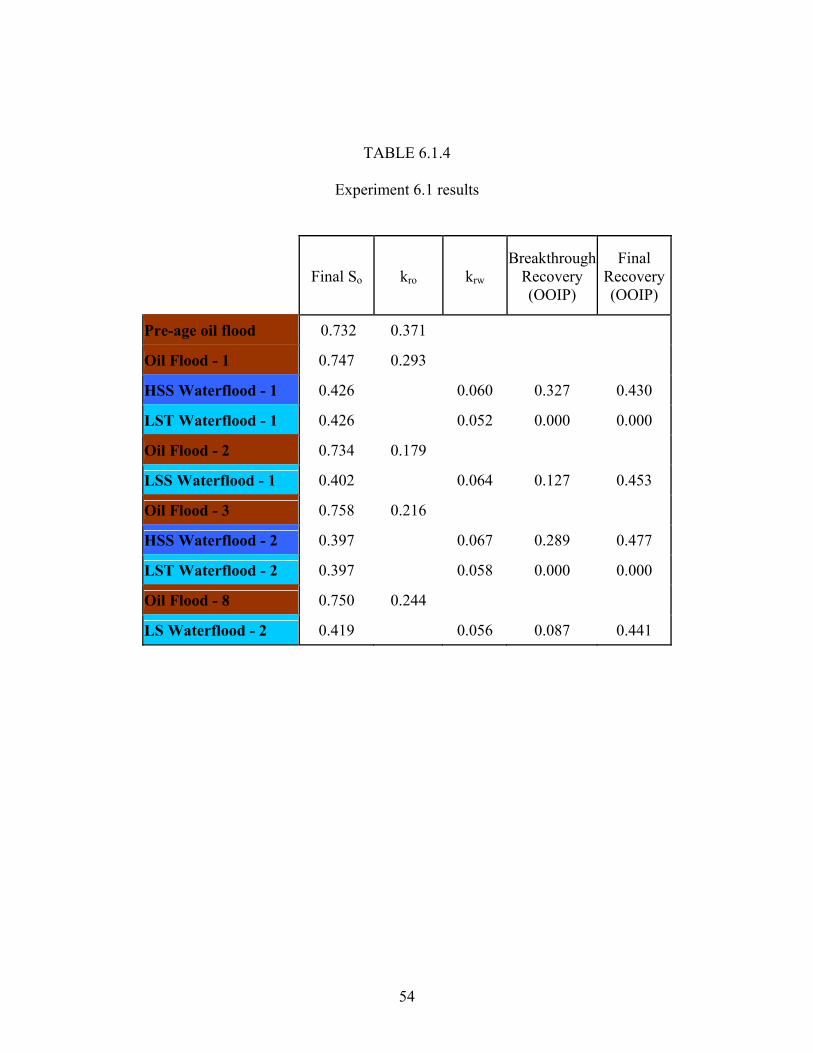
Experimental results are available in Table 6.1.4.
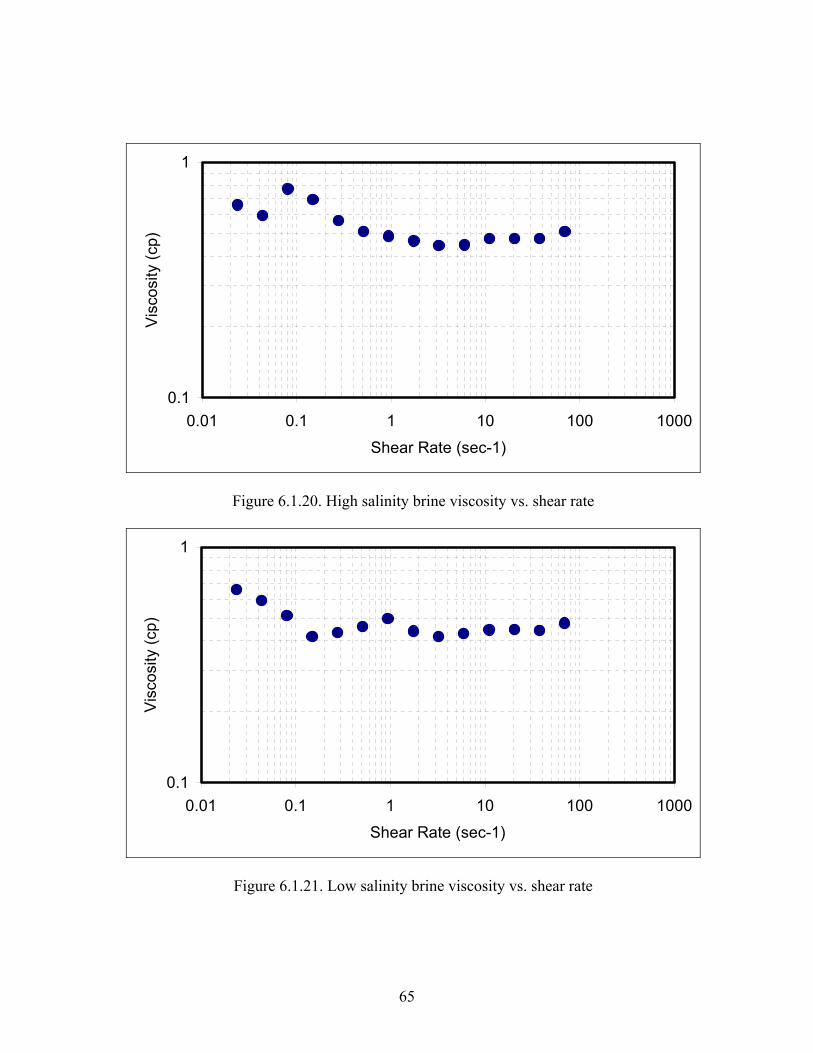
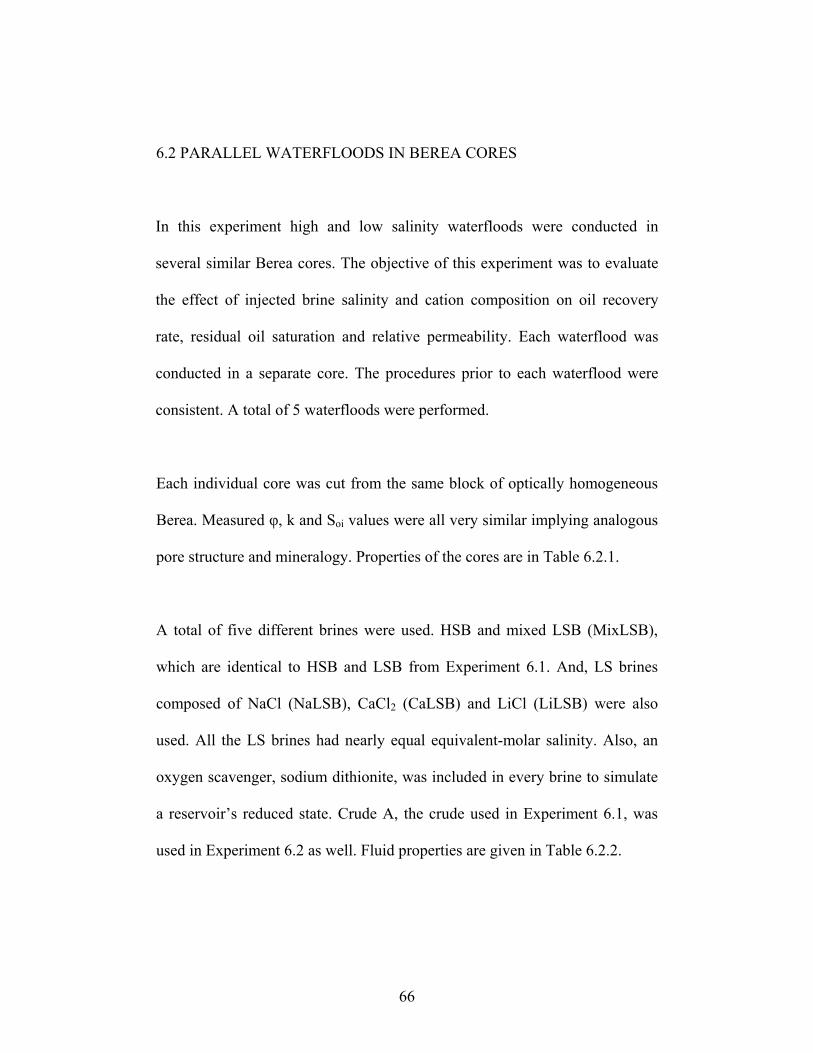
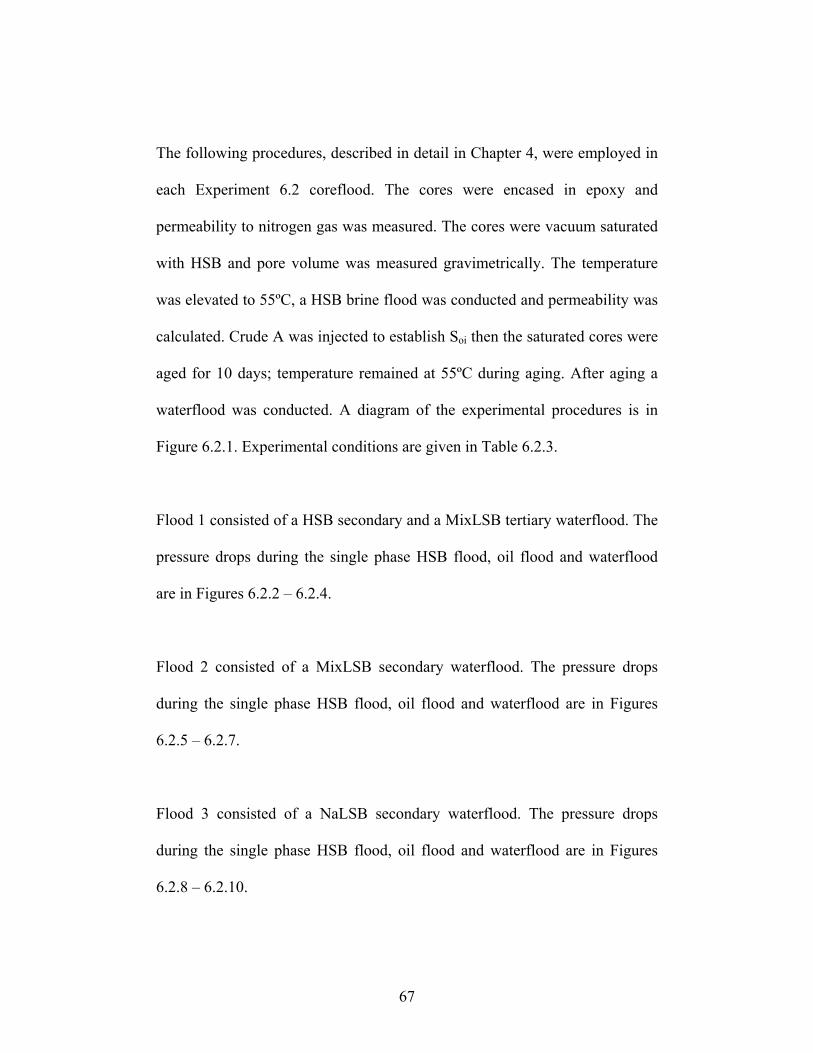
Viscosity vs. shear rate at 55ºC for Crude A, HSB and LSB are graphed in
Figures 6.1.19 – 6.1.21, respectively.
HSS and LST – 1 is a piston-like displacement, with most of the ultimate
recovery achieved at breakthrough. In the other three waterfloods
breakthrough occurred sooner but oil production persisted for longer resulting
in a higher ultimate recovery. Contrary to expectation, HSS and LST – 2
produced the lowest residual oil saturation. HSS and LST – 1’s residual oil
saturation was the highest and LSS 1 and 2’s were indistinguishable. Neither
of the LS tertiary injections recovered incremental oil.
The results of the two HSS and LST waterfloods contrast considerably. The
core had never been exposed to LS brine before to HSS and LST – 1, but had
been exposed before HSS and LST – 2. The two LS secondary waterfloods
produced very similar recovery curves and residual oil saturations. The core
had been exposed to LS brine before to both these floods.
50
Generally, end-point water relative permeability decreased during LS
waterfloods, but the reductions were small and permeability was restored by
injecting HSB. krwº was smallest during the first exposure to LSB. End-point
oil relative permeability decreased during aging, decreased further after HSS
and LST – 1 and from then on rose after each subsequent flood.
The considerable contrast between HSS and LST – 1 and 2 and the similarity
between LSS – 1 and 2 suggest that the LS tertiary injection at the end of HSS
and LST – 1 produced an irreversible wettability alteration that persisted
throughout subsequent floods. Researchers must bear this in mind when
making comparisons. Nonetheless, based on the reductions in end-point oil
relative permeability and residual oil saturation, this crude oil/rock/brine
system was more mixed-wet after being exposed to LSB.
This case is a poor candidate for LS EOR. LSS – 1’s ultimate oil recovery was
slightly higher then HSS and LST – 1’s ultimate oil recovery. However 90%
of HSS and LST – 1’s ultimate oil recovery was achieved after only 0.3 pore
volumes while almost 2.4 pore volumes were required to reach the same
recovery during LSS – 1. The tertiary oil production reported by other
researchers16, 25, 36 was never observed.
51
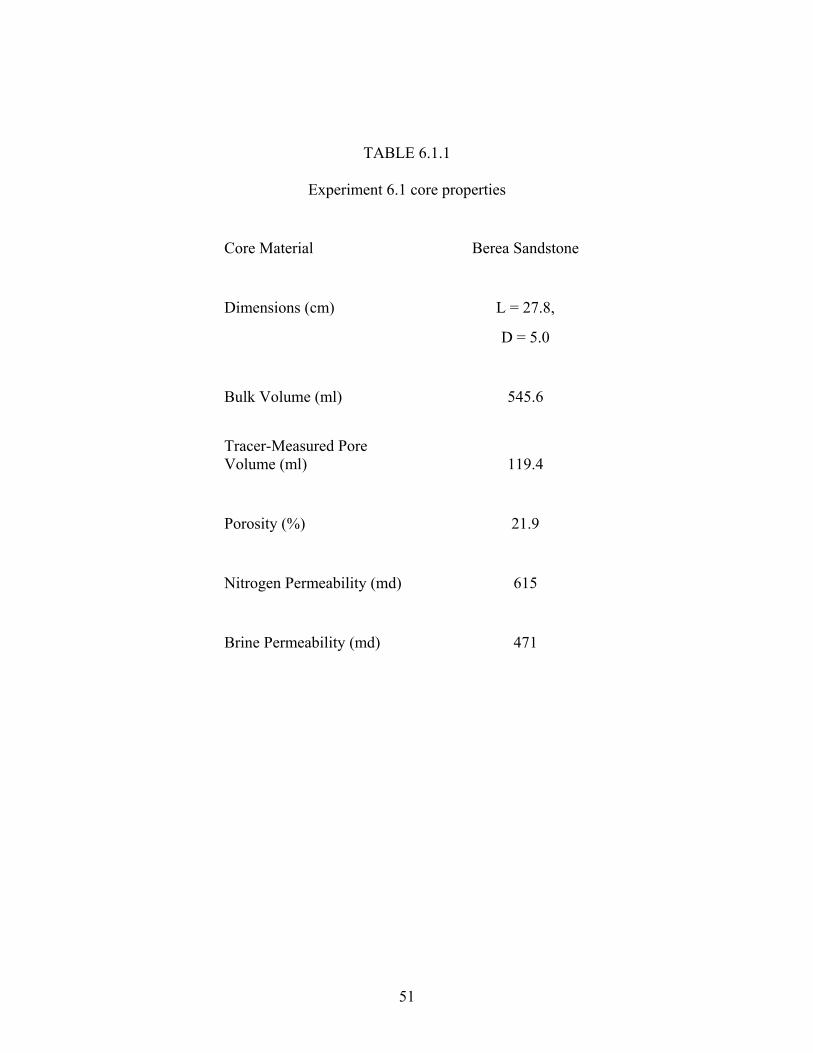
TABLE 6.1.1
Experiment 6.1 core properties
Core Material Berea Sandstone
Dimensions (cm) L = 27.8,
D = 5.0
Bulk Volume (ml) 545.6
Tracer-Measured Pore Volume (ml) 119.4
Porosity (%) 21.9
Nitrogen Permeability (md) 615
Brine Permeability (md) 471
52
TABLE 6.1.2
Experiment 6.2 fluid properties
HSB Concentration (g/L)
24.19 NaCl, 6.18 CaCl2,
0.14 Na2S2O4
HSB Viscosity (cp) 0.47
LSB Concentration (g/L)
0.79 NaCl, 0.21 CaCl2,
0.14 Na2S2O4
LSB Viscosity (cp) 0.45
Crude Oil Crude A
Crude Oil Viscosity (cp) 7.93
Temperature (ºC) 55
53
TABLE 6.1.3
Experiment 6.1 conditions
Injection
Rate (ft/day)
Pressure Drop (psi)
Pore Volumes Injected
Temperature (ºC)
Aging Time (days)
Brine Permeability 48.6 1.5 5.6 55
Pre-age oil flood 25.2 36.0 3.7 55
Age 75 2.2
Oil Flood - 1 20.3 36.7 2.0 55
HSS Waterflood - 1 2.0 1.1 3.2 55
LST Waterflood - 1 2.0 1.2 2.9 55
Oil Flood - 2 12.2 36.1 3.0 55
LSS Waterflood - 1 2.0 1.0 5.0 55
Oil Flood - 3 14.3 35.0 2.3 55
HSS Waterflood - 2 2.0 1.0 4.0 55
LST Waterflood - 2 2.0 1.0 3.0 55
Oil Flood - 8 16.6 36.1 2.2 55
LS Waterflood - 2 2.0 1.1 4.0 55
54
TABLE 6.1.4
Experiment 6.1 results
Final So kro krw Breakthrough
Recovery (OOIP)
Final Recovery (OOIP)
Pre-age oil flood 0.732 0.371
Oil Flood - 1 0.747 0.293
HSS Waterflood - 1 0.426 0.060 0.327 0.430
LST Waterflood - 1 0.426 0.052 0.000 0.000
Oil Flood - 2 0.734 0.179
LSS Waterflood - 1 0.402 0.064 0.127 0.453
Oil Flood - 3 0.758 0.216
HSS Waterflood - 2 0.397 0.067 0.289 0.477
LST Waterflood - 2 0.397 0.058 0.000 0.000
Oil Flood - 8 0.750 0.244
LS Waterflood - 2 0.419 0.056 0.087 0.441
55
Figure 6.1.1. Experimental procedure
HSS waterflood - 1
Brine permeability
Oil flood - 1
Pre-age oil flood
2 day age
Oil flood - 2
LSS waterflood - 1
HS brine restoration
Oil flood - 3
Oil flood - 4
LSS waterflood - 2
HS brine restoration
PV Tracer
LST waterflood - 2
LST waterflood - 1
HS brine restoration
HSS waterflood - 2
56
00.10.20.30.40.50.60.70.80.9
1
0 20 40 60 80 100 120 140 160 180
Volume Injected (ml)
Nor
mal
ized
Con
duct
ivity
Figure 6.1.2. Effluent conductivity history
0.0
0.5
1.0
1.5
2.0
2.5
3.0
0 1 2 3 4Pore Volumes
Pre
ssur
e D
rop
[psi
]
Whole 50 Inlet
Mid 1 Mid 2
Outlet Whole 300
Figure 6.1.3. Brine permeability, pressure drop
57
0
5
10
15
20
25
30
35
40
0 1 2 3 4Pore Volumes
Pre
ssur
e D
rop
[psi
] Whole 50InletMid 1Mid 2OutletWhole 300
Figure 6.1.4. Pre-age oil flood, pressure drop
0
5
10
15
20
25
30
35
40
0.0 0.5 1.0 1.5 2.0Pore Volumes
Pre
ssur
e D
rop
[psi
] Whole 50InletMid 1Mid 2OutletWhole 300
Figure 6.1.5. Oil flood – 1, pressure drop
58
0
5
10
15
20
25
30
35
40
2.90 2.95 3.00Pore Volumes
Pre
ssur
e D
rop
[psi
] Whole 50InletMid 1Mid 2OutletWhole 300
Figure 6.1.6. Oil flood – 2, pressure drop
0
5
10
15
20
25
30
35
40
0.0 0.5 1.0 1.5 2.0 2.5Pore Volumes
Pres
sure
Dro
p [p
si]
Whole 50 Inlet
Mid 1 Mid 2
Outlet Whole 300
Figure 6.1.7. Oil flood - 3, pressure drop
59
0
5
10
15
20
25
30
35
40
0.0 0.5 1.0 1.5 2.0 2.5Pore Volumes
Pre
ssur
e D
rop
[psi
]
Whole 50 Inlet
Mid 1 Mid 2
Outlet Whole 300
Figure 6.1.8. Oil flood – 4, pressure drop
0
1
2
3
0 1 2 3 4 5 6Pore Volumes
Pre
ssur
e D
rop
[psi
]
Whole 50InletMid 1Mid 2OutletWhole 300Low Salinity Injection Initiated
Figure 6.1.9. HS secondary and LS tertiary – 1, pressure drop
60
0
1
2
3
4
5
0 1 2 3 4 5Pore Volumes
Pre
ssur
e D
rop
[psi
]
Whole 50 Inlet
Mid 1 Mid 2
Outlet Whole 300
Figure 6.1.10. LS secondary – 1, pressure drop
0
1
2
3
4
0 1 2 3 4 5 6 7Pore Volumes
Pre
ssur
e D
rop
[psi
]
Whole 50InletMid 1Mid 2OutletWhole 300Low Salinity Injection Initiated
Figure 6.1.11. HS secondary and LS tertiary – 2, pressure drop
61
0
1
2
3
0 1 2 3 4Pore Volumes
Pre
ssur
e D
rop
[psi
]
Whole 50 Inlet
Mid 1 Mid 2
Outlet Whole 300
Figure 6.1.12. LS secondary – 2, pressure drop
0.000.050.100.150.200.250.300.350.40
Pre-ag
e oil f
lood
Oil floo
d - 1
HS seco
ndary
- 1
LS te
rtiary
- 1
Oil floo
d 2
LS se
cond
ary - 1
Oil floo
d - 3
HS seco
ndary
- 2
LS te
rtiary
- 2
Oil floo
d - 4
LS Seco
ndary
- 2
kroº
0.000.020.040.060.080.100.120.140.16krwº
kroº
krwº
Figure 6.1.13. End-point relative permeabilities
62
0
0.1
0.2
0.3
0.4
0.5
0.6
0 1 2 3 4 5 6 7Pore Volumes
Rec
over
y (O
OIP
)
HSS and LST - 1
LSS - 1
HSS and LST - 2
LSS - 2
Figure 6.1.14. Oil recovery
0
0.2
0.4
0.6
0.8
1
0 0.5 1 1.5 2 2.5 3Pore Volumes
Oil
Cut
HSS and LST - 1
LSS - 1
HSS and LST - 2
LSS - 2
Figure 6.1.15. Oil cut
63
0.3
0.4
0.5
0.6
0.7
0.8
0 0.5 1 1.5 2 2.5 3Pore Volumes
Ave
rage
Oil
Sat
urat
ion HSS and LST - 1
LSS - 1HSS and LST - 2LSS - 2
Figure 6.1.16. Average oil saturation
0
0.1
0.2
0.3
0.4
0.5
0.6
0.7
0.8
HSS and LST - 1 LSS - 1 HSS and LST - 2 LSS - 2
So
Soi
Sor
Figure 6.1.17. Initial and residual oil saturations
64
7
7.5
8
8.5
0 1 2 3 4 5 6Pore Volumes
pHH.S. Secondary & L.S. Tertiary - 1L.S. Secondary - 1H.S. Secondary & L.S. Tertiary - 2L.S. Secondary - 2
Figure 6.1.18. Effluent pH history
0.1
1
10
100
0.01 0.1 1 10 100 1000Shear Rate (sec-1)
Vis
cosi
ty (c
p)
Figure 6.1.19. Crude A viscosity vs. shear rate
65
0.1
1
0.01 0.1 1 10 100 1000
Shear Rate (sec-1)
Vis
cosi
ty (c
p)
Figure 6.1.20. High salinity brine viscosity vs. shear rate
0.1
1
0.01 0.1 1 10 100 1000
Shear Rate (sec-1)
Vis
cosi
ty (c
p)
Figure 6.1.21. Low salinity brine viscosity vs. shear rate
66
6.2 PARALLEL WATERFLOODS IN BEREA CORES
In this experiment high and low salinity waterfloods were conducted in
several similar Berea cores. The objective of this experiment was to evaluate
the effect of injected brine salinity and cation composition on oil recovery
rate, residual oil saturation and relative permeability. Each waterflood was
conducted in a separate core. The procedures prior to each waterflood were
consistent. A total of 5 waterfloods were performed.
Each individual core was cut from the same block of optically homogeneous
Berea. Measured φ, k and Soi values were all very similar implying analogous
pore structure and mineralogy. Properties of the cores are in Table 6.2.1.
A total of five different brines were used. HSB and mixed LSB (MixLSB),
which are identical to HSB and LSB from Experiment 6.1. And, LS brines
composed of NaCl (NaLSB), CaCl2 (CaLSB) and LiCl (LiLSB) were also
used. All the LS brines had nearly equal equivalent-molar salinity. Also, an
oxygen scavenger, sodium dithionite, was included in every brine to simulate
a reservoir’s reduced state. Crude A, the crude used in Experiment 6.1, was
used in Experiment 6.2 as well. Fluid properties are given in Table 6.2.2.
67
The following procedures, described in detail in Chapter 4, were employed in
each Experiment 6.2 coreflood. The cores were encased in epoxy and
permeability to nitrogen gas was measured. The cores were vacuum saturated
with HSB and pore volume was measured gravimetrically. The temperature
was elevated to 55ºC, a HSB brine flood was conducted and permeability was
calculated. Crude A was injected to establish Soi then the saturated cores were
aged for 10 days; temperature remained at 55ºC during aging. After aging a
waterflood was conducted. A diagram of the experimental procedures is in
Figure 6.2.1. Experimental conditions are given in Table 6.2.3.
Flood 1 consisted of a HSB secondary and a MixLSB tertiary waterflood. The
pressure drops during the single phase HSB flood, oil flood and waterflood
are in Figures 6.2.2 – 6.2.4.
Flood 2 consisted of a MixLSB secondary waterflood. The pressure drops
during the single phase HSB flood, oil flood and waterflood are in Figures
6.2.5 – 6.2.7.
Flood 3 consisted of a NaLSB secondary waterflood. The pressure drops
during the single phase HSB flood, oil flood and waterflood are in Figures
6.2.8 – 6.2.10.
68
Flood 4 consisted of a CaLSB secondary waterflood. The pressure drops
during the single phase HSB flood, oil flood and waterflood are in Figures
6.2.11 – 6.2.13.
Flood 5 consisted of a LiLSB secondary waterflood. The pressure drops
during the single phase HSB flood, oil flood and waterflood are in Figures
6.2.14 – 6.2.16.
The end-point relative permeabilities to water and oil are in Figure 6.2.17.
Graphs of oil recovery, oil cut and average oil saturation from all five floods
are in Figures 6.2.18 – 6.2.20. Initial and residual oil saturations are in Figure
6.2.21. All five effluent pH histories are in Figure 6.2.22. The arrival of LSB
at the outlet was signaled by an increase in pH, as in Experiment 6.1.
Experimental results are available in Table 6.2.4.
Viscosity vs. shear rate at 55ºC for Crude A, HSB and MixLSB are graphed in
Figures 6.1.17 – 6.1.19, respectively. MixLSB, NaLSB, CaLSB and LiLSB
were assumed to have equal viscosity.
69
Dramatically different oil recoveries were observed simply by changing the
injected brine’s cation composition. The MixLSB waterflood produced the
best results while the LiLSB waterflood produced the worst. The HSB,
NaLSB and CaLSB waterfloods all produced very similar oil recoveries.
These results clearly demonstrate the importance of cation selection.
Oil recoveries strong sensitivity to the injected brine’s cation composition is
likely the result of cation exchange. According to Lake18, clay particles
possess a negative charge, “which must be countered by cations from the fluid
if the clay is to remain electrically neutral. The bonds between the clay
exchange sites and the cations are chemical, but they are readily reversible.
The relative ease of replacement of one cation by another is
Li+ < Na+ < K+ <Rb+ <Cs+ < Mg+ < Ca2+ < Sr2+ < Ba2+ < H+ ”
The MixLSB waterflood’s recovery was 15% higher then the HSB
waterflood. The NaLSB and CaLSB waterflood’s oil recoveries were very
similar to the HSB waterflood’s oil recovery. The disruption of the clay
particles was minimized during the MixLSB waterflood suggesting that cation
exchange during the NaLSB and CaLSB waterfloods cancelled or disrupted
the mechanism(s) that imparted the oil recovery enhancement observed during
MixLSB.
70
The contrast in oil recoveries between the NaLSB and the LiLSB waterfloods
was especially surprising. These results were expected to be very similar. In
both cases clays originally equilibrated to highly saline Na-Ca brine were
exposed to low salinity Na or Li brine. The clays begrudgingly surrendered
their divalent Ca ions for monovalent Na or Li ions. The Na ions, which
replaced the Ca just slightly more easily, produced dramatically higher oil
recovery. The Li waterflood’s low recovery could be the result of channelized
flow due to a heterogeneous pore structure or micro fractures.
Researchers29 have proposed that LSB strips mixed-wet fines from the pore
walls, liberating trapped oil. Dramatic permeability damage was not observed
during any of the waterfloods; precluding the assumption of major clay
swelling or clay detachment and migration. The improved oil recovery
observed in the MixLSB waterflood, apparently achieved without stripping of
fines, suggests a different mechanism(s) is responsible.
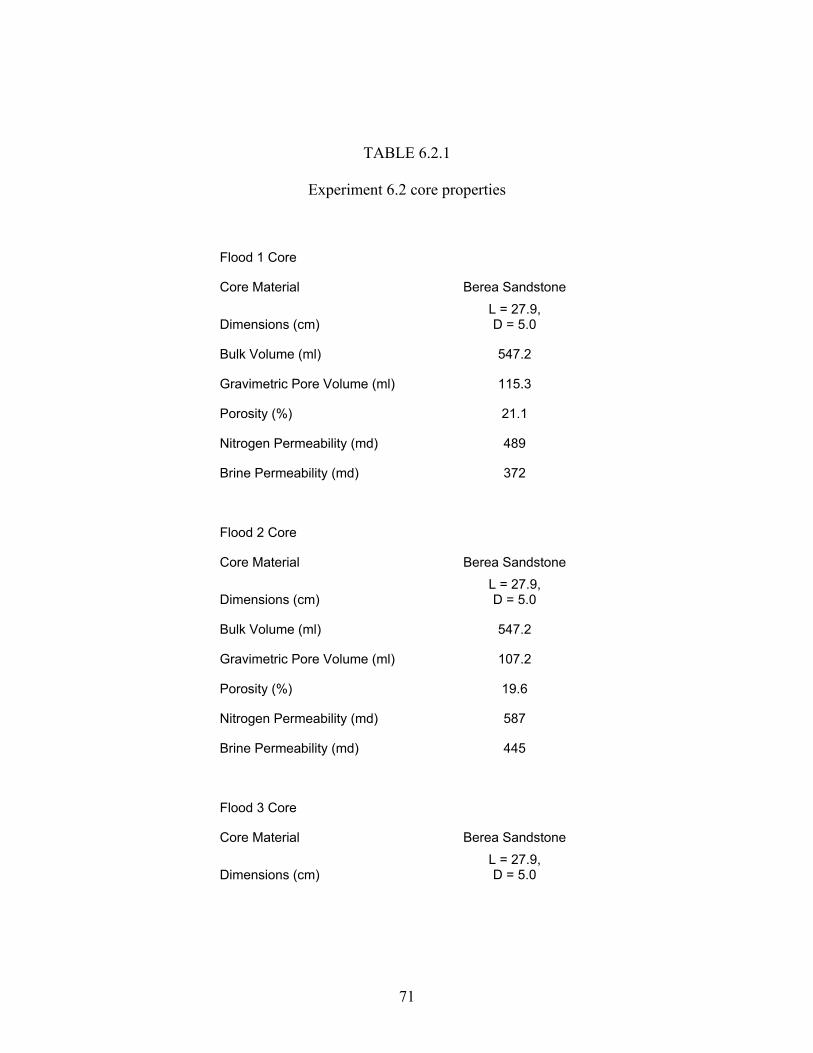
71
TABLE 6.2.1
Experiment 6.2 core properties
Flood 1 Core
Core Material Berea Sandstone
Dimensions (cm) L = 27.9, D = 5.0
Bulk Volume (ml) 547.2
Gravimetric Pore Volume (ml) 115.3
Porosity (%) 21.1
Nitrogen Permeability (md) 489
Brine Permeability (md) 372
Flood 2 Core
Core Material Berea Sandstone
Dimensions (cm) L = 27.9, D = 5.0
Bulk Volume (ml) 547.2
Gravimetric Pore Volume (ml) 107.2
Porosity (%) 19.6
Nitrogen Permeability (md) 587
Brine Permeability (md) 445
Flood 3 Core
Core Material Berea Sandstone
Dimensions (cm) L = 27.9, D = 5.0
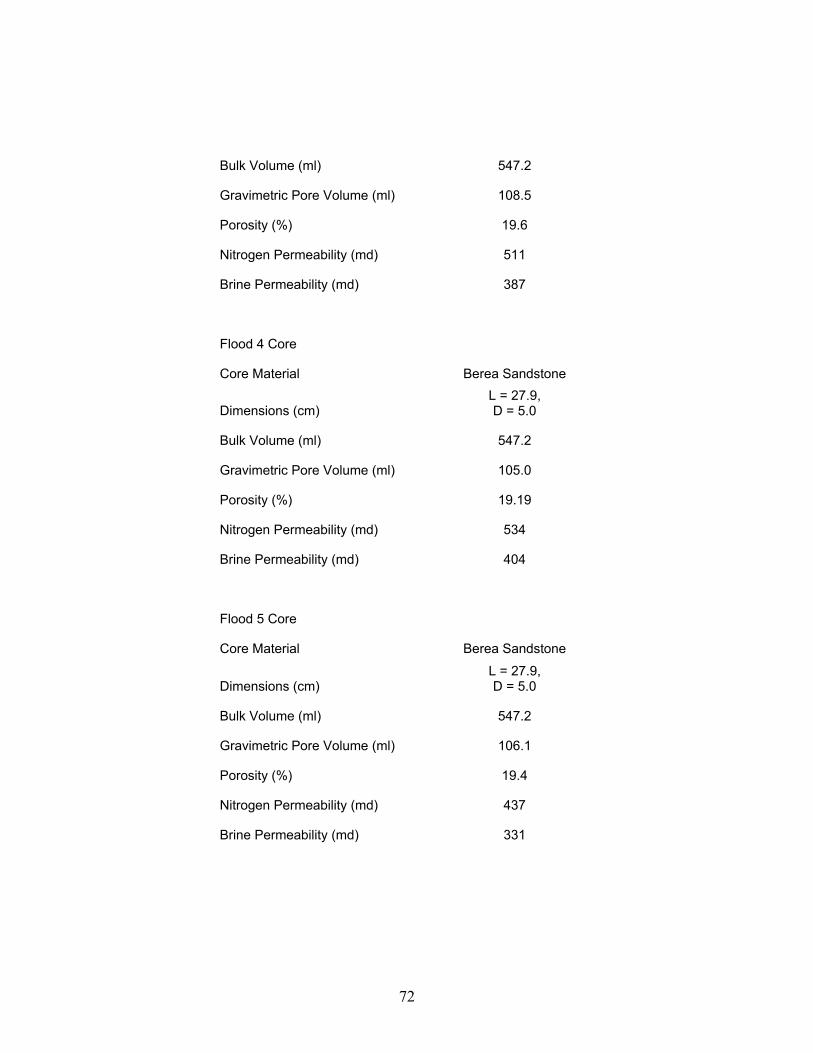
72
Bulk Volume (ml) 547.2
Gravimetric Pore Volume (ml) 108.5
Porosity (%) 19.6
Nitrogen Permeability (md) 511
Brine Permeability (md) 387
Flood 4 Core
Core Material Berea Sandstone
Dimensions (cm) L = 27.9, D = 5.0
Bulk Volume (ml) 547.2
Gravimetric Pore Volume (ml) 105.0
Porosity (%) 19.19
Nitrogen Permeability (md) 534
Brine Permeability (md) 404
Flood 5 Core
Core Material Berea Sandstone
Dimensions (cm) L = 27.9, D = 5.0
Bulk Volume (ml) 547.2
Gravimetric Pore Volume (ml) 106.1
Porosity (%) 19.4
Nitrogen Permeability (md) 437
Brine Permeability (md) 331
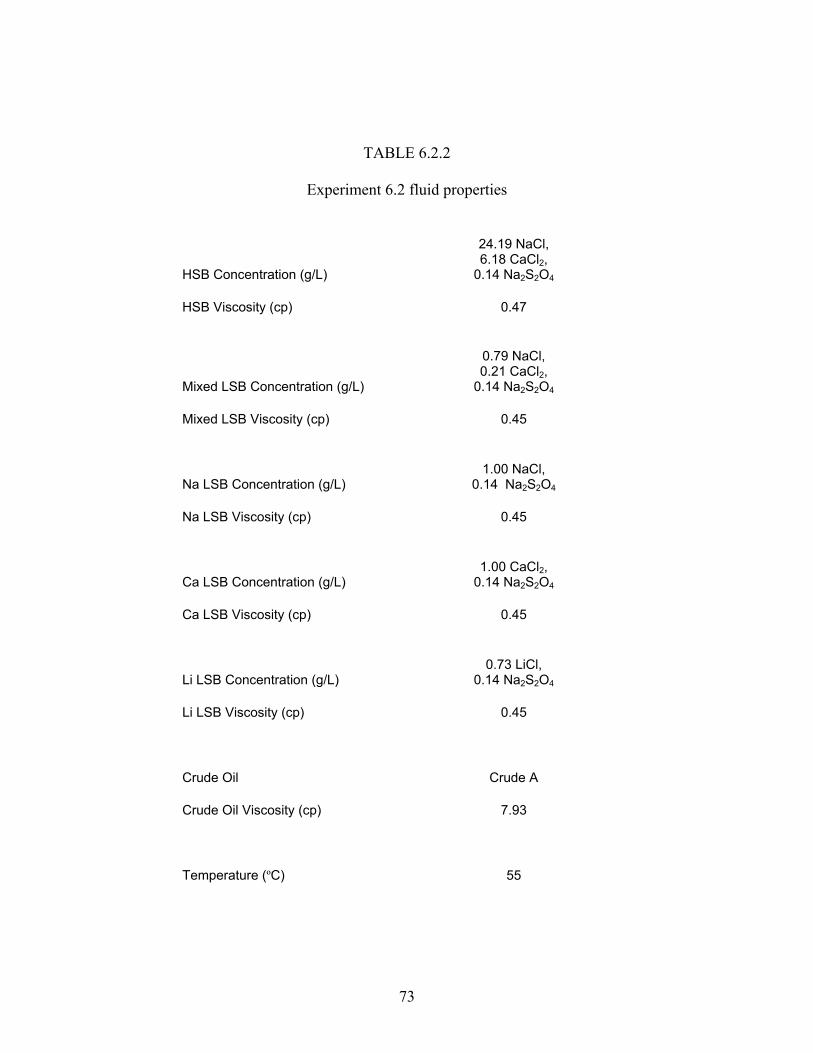
73
TABLE 6.2.2
Experiment 6.2 fluid properties
HSB Concentration (g/L)
24.19 NaCl, 6.18 CaCl2,
0.14 Na2S2O4
HSB Viscosity (cp) 0.47
Mixed LSB Concentration (g/L)
0.79 NaCl, 0.21 CaCl2,
0.14 Na2S2O4
Mixed LSB Viscosity (cp) 0.45
Na LSB Concentration (g/L) 1.00 NaCl,
0.14 Na2S2O4
Na LSB Viscosity (cp) 0.45
Ca LSB Concentration (g/L) 1.00 CaCl2,
0.14 Na2S2O4
Ca LSB Viscosity (cp) 0.45
Li LSB Concentration (g/L) 0.73 LiCl,
0.14 Na2S2O4
Li LSB Viscosity (cp) 0.45
Crude Oil Crude A
Crude Oil Viscosity (cp) 7.93
Temperature (ºC) 55
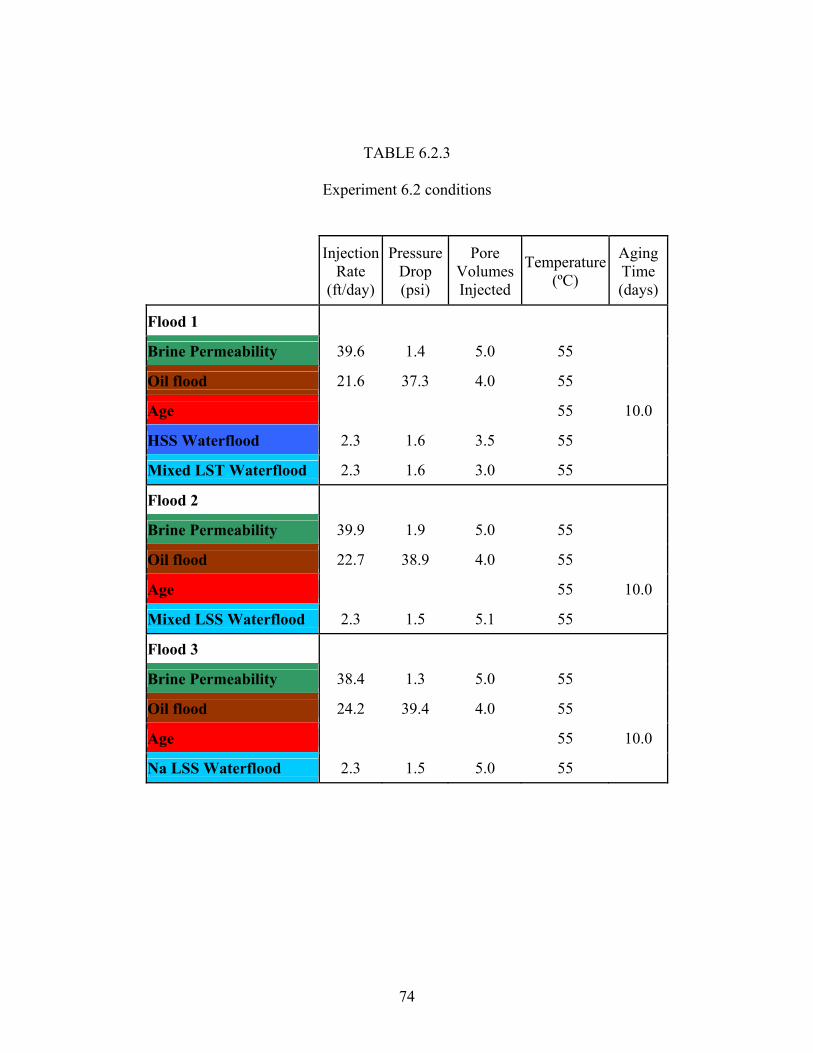
74
TABLE 6.2.3
Experiment 6.2 conditions
Injection
Rate (ft/day)
Pressure Drop (psi)
Pore Volumes Injected
Temperature (ºC)
Aging Time (days)
Flood 1
Brine Permeability 39.6 1.4 5.0 55
Oil flood 21.6 37.3 4.0 55
Age 55 10.0
HSS Waterflood 2.3 1.6 3.5 55
Mixed LST Waterflood 2.3 1.6 3.0 55
Flood 2
Brine Permeability 39.9 1.9 5.0 55
Oil flood 22.7 38.9 4.0 55
Age 55 10.0
Mixed LSS Waterflood 2.3 1.5 5.1 55
Flood 3
Brine Permeability 38.4 1.3 5.0 55
Oil flood 24.2 39.4 4.0 55
Age 55 10.0
Na LSS Waterflood 2.3 1.5 5.0 55

75
TABLE 6.2.3 continued
Injection
Rate (ft/day)
Pressure Drop (psi)
Pore Volumes Injected
Temperature (ºC)
Aging Time (days)
Flood 4
Brine Permeability 41.1 1.3 5.0 55
Oil flood 18.4 34.9 4.0 55
Age 55 10.0
Ca LSS Waterflood 2.3 1.2 5.0 55
Flood 5
Brine Permeability 40.7 1.6 5.0 55
Oil flood 23.1 41.2 4.0 55
Age 55 10.0
Li LSS Waterflood 2.3 1.3 5.0 55
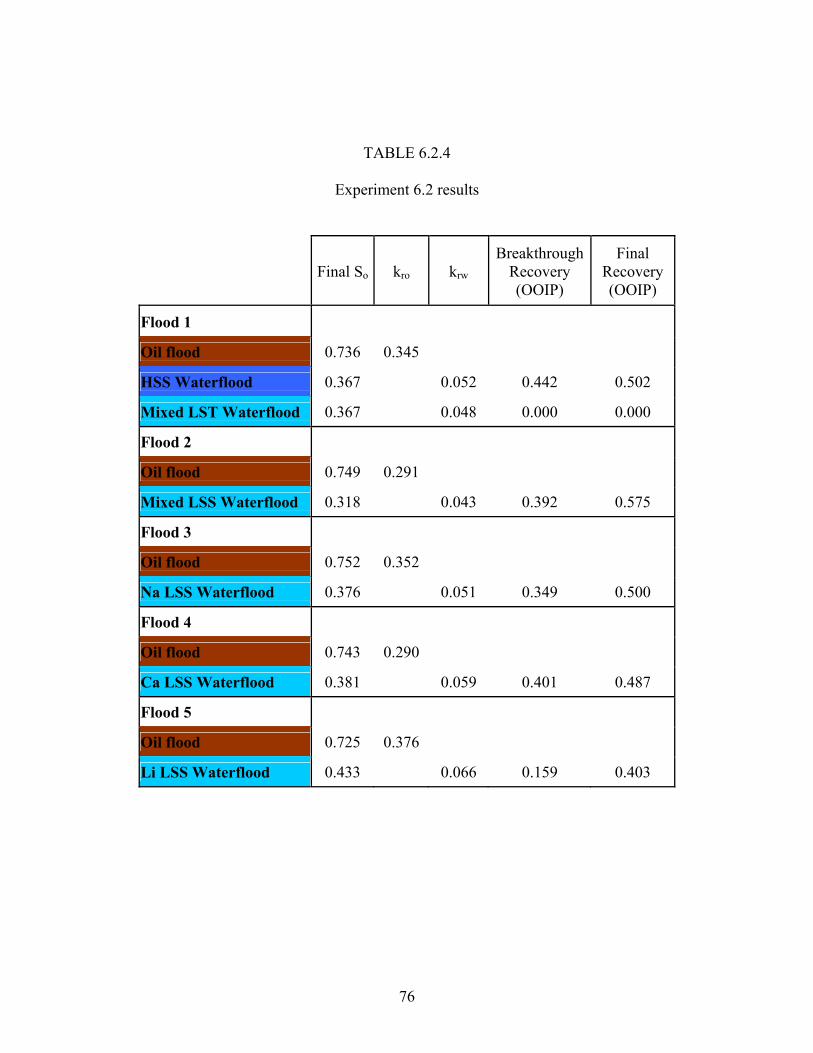
76
TABLE 6.2.4
Experiment 6.2 results
Final So kro krw Breakthrough
Recovery (OOIP)
Final Recovery (OOIP)
Flood 1
Oil flood 0.736 0.345
HSS Waterflood 0.367 0.052 0.442 0.502
Mixed LST Waterflood 0.367 0.048 0.000 0.000
Flood 2
Oil flood 0.749 0.291
Mixed LSS Waterflood 0.318 0.043 0.392 0.575
Flood 3
Oil flood 0.752 0.352
Na LSS Waterflood 0.376 0.051 0.349 0.500
Flood 4
Oil flood 0.743 0.290
Ca LSS Waterflood 0.381 0.059 0.401 0.487
Flood 5
Oil flood 0.725 0.376
Li LSS Waterflood 0.433 0.066 0.159 0.403

77
Figure 6.2.1. Experimental procedure
0
0.4
0.8
1.2
1.6
0 1 2 3 4 5Pore Volumes
Pre
ssur
e D
rop
[psi
]
Whole 50 InletMid 1 Mid 2Oulet
Figure 6.2.2. Flood 1, brine flood pressure drop
HS waterflood
Brine permeability
Oil flood
10 day age
Mixed LS waterflood
Mixed LS waterflood
Na LS waterflood
Ca LS waterflood
Li LS waterflood
Gravimetric PV
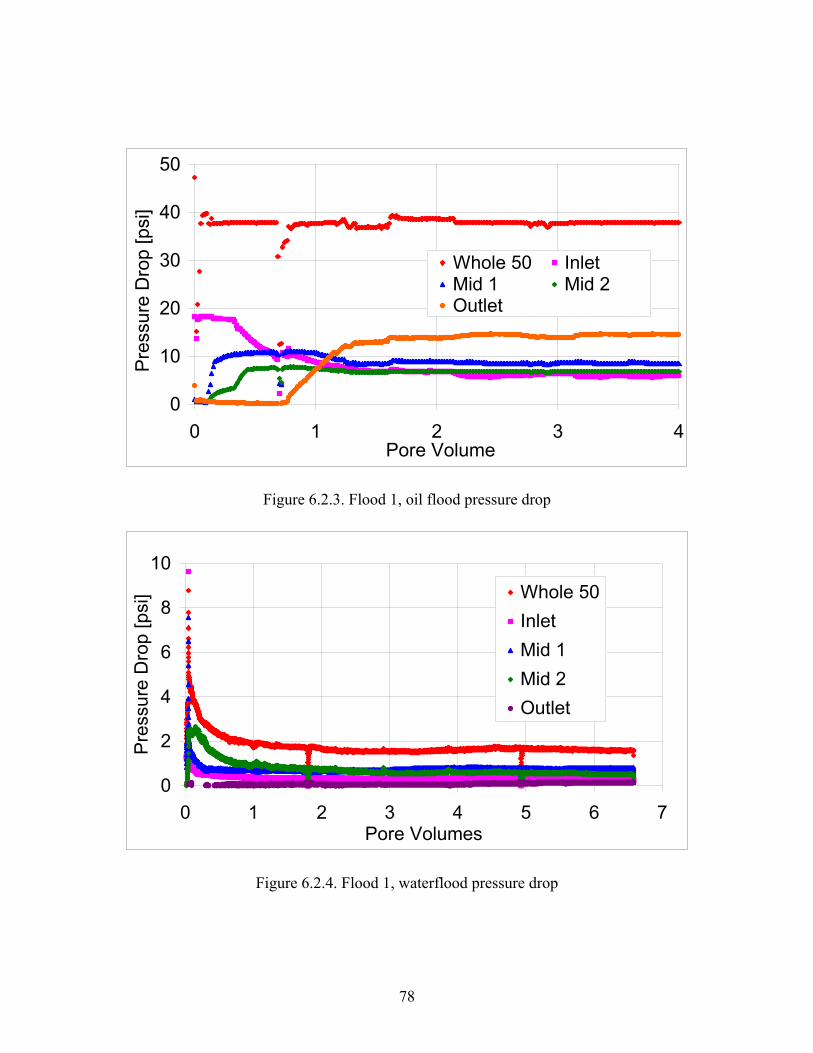
78
0
10
20
30
40
50
0 1 2 3 4Pore Volume
Pre
ssur
e D
rop
[psi
]
Whole 50 Inlet Mid 1 Mid 2Outlet
Figure 6.2.3. Flood 1, oil flood pressure drop
0
2
4
6
8
10
0 1 2 3 4 5 6 7Pore Volumes
Pre
ssur
e D
rop
[psi
] Whole 50InletMid 1Mid 2Outlet
Figure 6.2.4. Flood 1, waterflood pressure drop
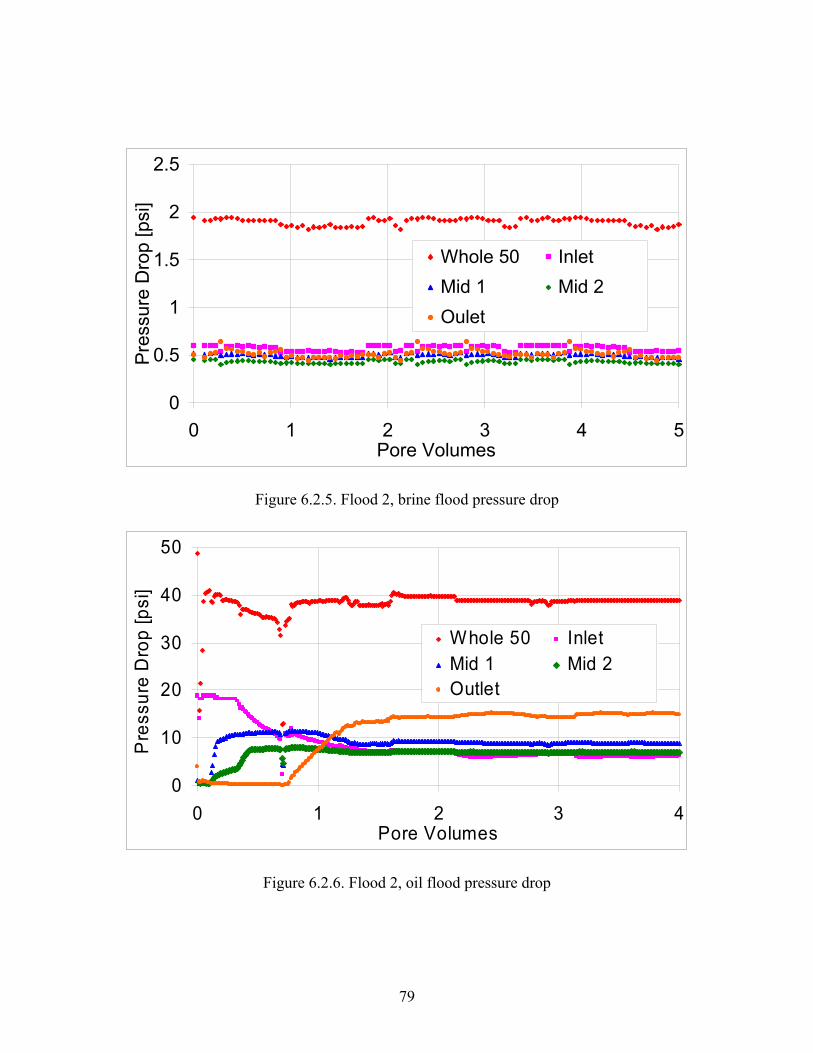
79
0
0.5
1
1.5
2
2.5
0 1 2 3 4 5Pore Volumes
Pres
sure
Dro
p [p
si]
Whole 50 InletMid 1 Mid 2Oulet
Figure 6.2.5. Flood 2, brine flood pressure drop
0
10
20
30
40
50
0 1 2 3 4Pore Volumes
Pre
ssur
e D
rop
[psi
]
Whole 50 InletMid 1 Mid 2Outlet
Figure 6.2.6. Flood 2, oil flood pressure drop
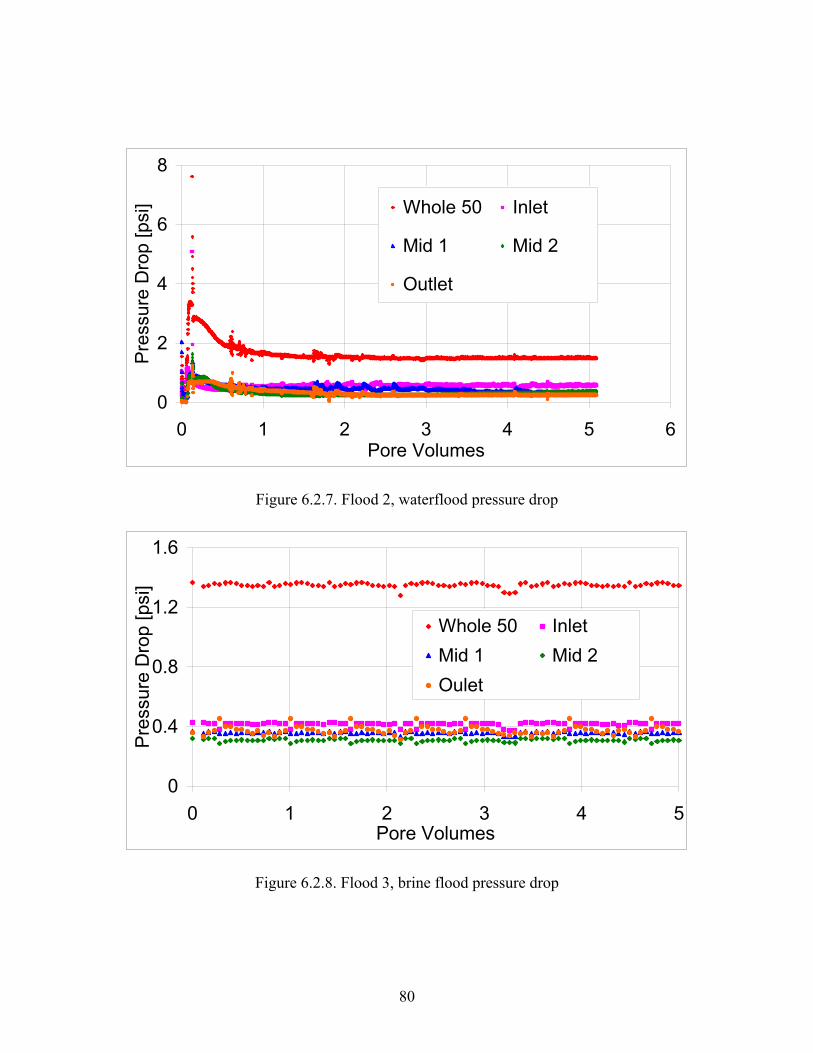
80
0
2
4
6
8
0 1 2 3 4 5 6Pore Volumes
Pre
ssur
e D
rop
[psi
] Whole 50 Inlet
Mid 1 Mid 2
Outlet
Figure 6.2.7. Flood 2, waterflood pressure drop
0
0.4
0.8
1.2
1.6
0 1 2 3 4 5Pore Volumes
Pre
ssur
e D
rop
[psi
]
Whole 50 InletMid 1 Mid 2Oulet
Figure 6.2.8. Flood 3, brine flood pressure drop
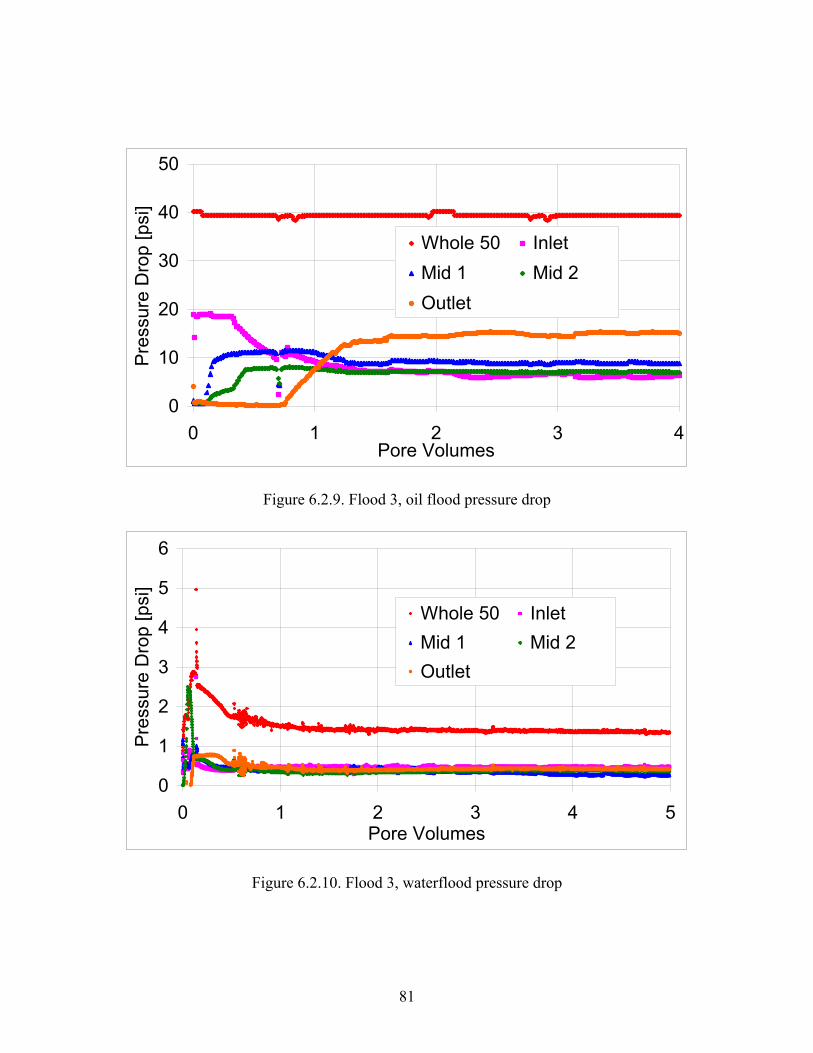
81
0
10
20
30
40
50
0 1 2 3 4Pore Volumes
Pre
ssur
e D
rop
[psi
]
Whole 50 Inlet Mid 1 Mid 2Outlet
Figure 6.2.9. Flood 3, oil flood pressure drop
0
1
2
3
4
5
6
0 1 2 3 4 5Pore Volumes
Pre
ssur
e D
rop
[psi
]
Whole 50 InletMid 1 Mid 2Outlet
Figure 6.2.10. Flood 3, waterflood pressure drop
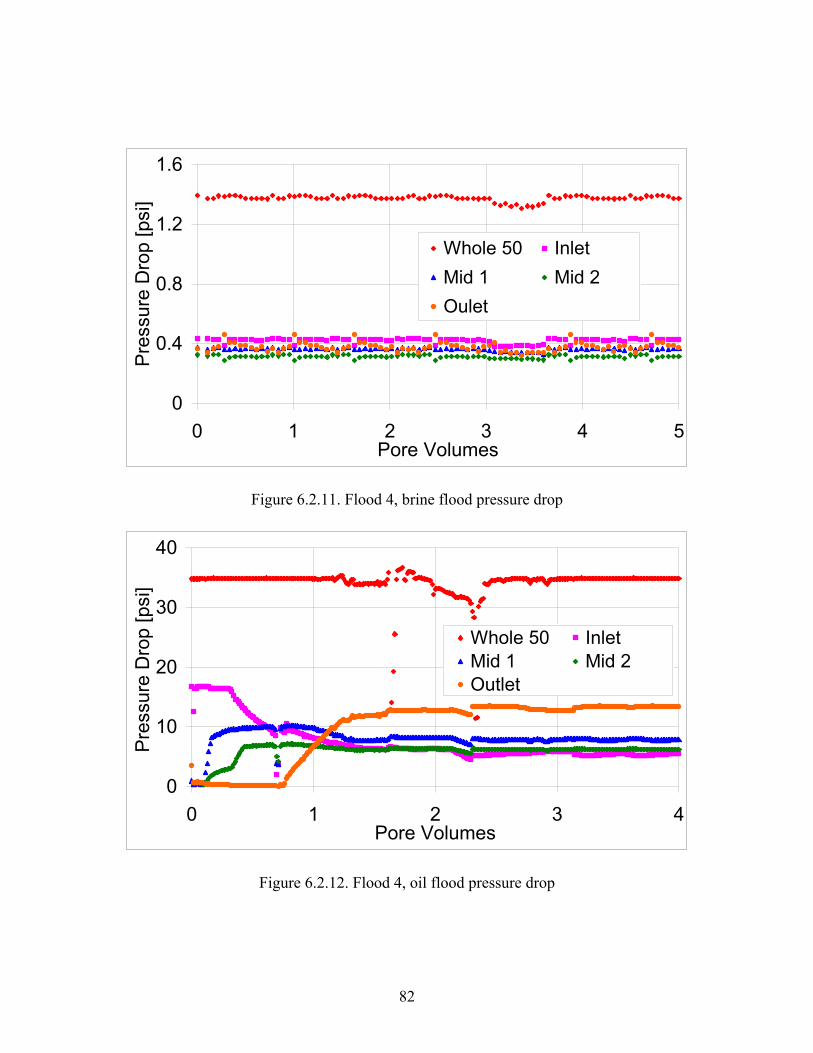
82
0
0.4
0.8
1.2
1.6
0 1 2 3 4 5Pore Volumes
Pres
sure
Dro
p [p
si]
Whole 50 InletMid 1 Mid 2Oulet
Figure 6.2.11. Flood 4, brine flood pressure drop
0
10
20
30
40
0 1 2 3 4Pore Volumes
Pres
sure
Dro
p [p
si]
Whole 50 Inlet Mid 1 Mid 2Outlet
Figure 6.2.12. Flood 4, oil flood pressure drop
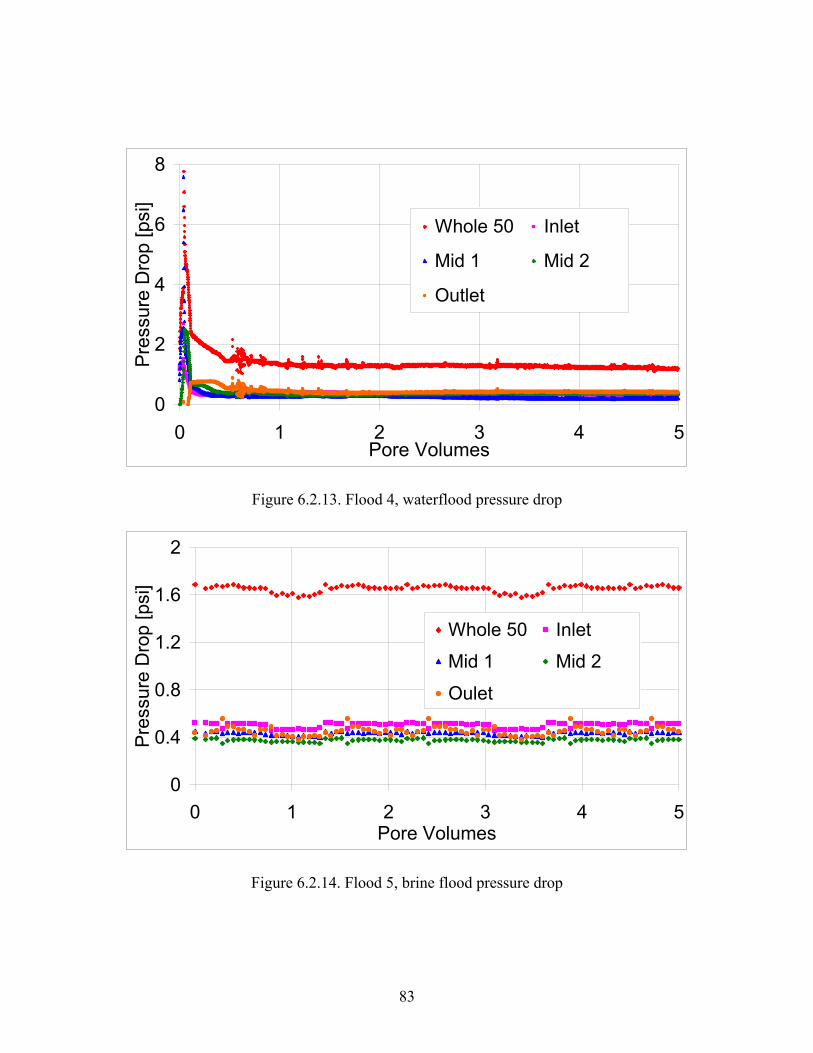
83
0
2
4
6
8
0 1 2 3 4 5Pore Volumes
Pres
sure
Dro
p [p
si]
Whole 50 Inlet
Mid 1 Mid 2
Outlet
Figure 6.2.13. Flood 4, waterflood pressure drop
0
0.4
0.8
1.2
1.6
2
0 1 2 3 4 5Pore Volumes
Pre
ssur
e D
rop
[psi
]
Whole 50 Inlet
Mid 1 Mid 2
Oulet
Figure 6.2.14. Flood 5, brine flood pressure drop
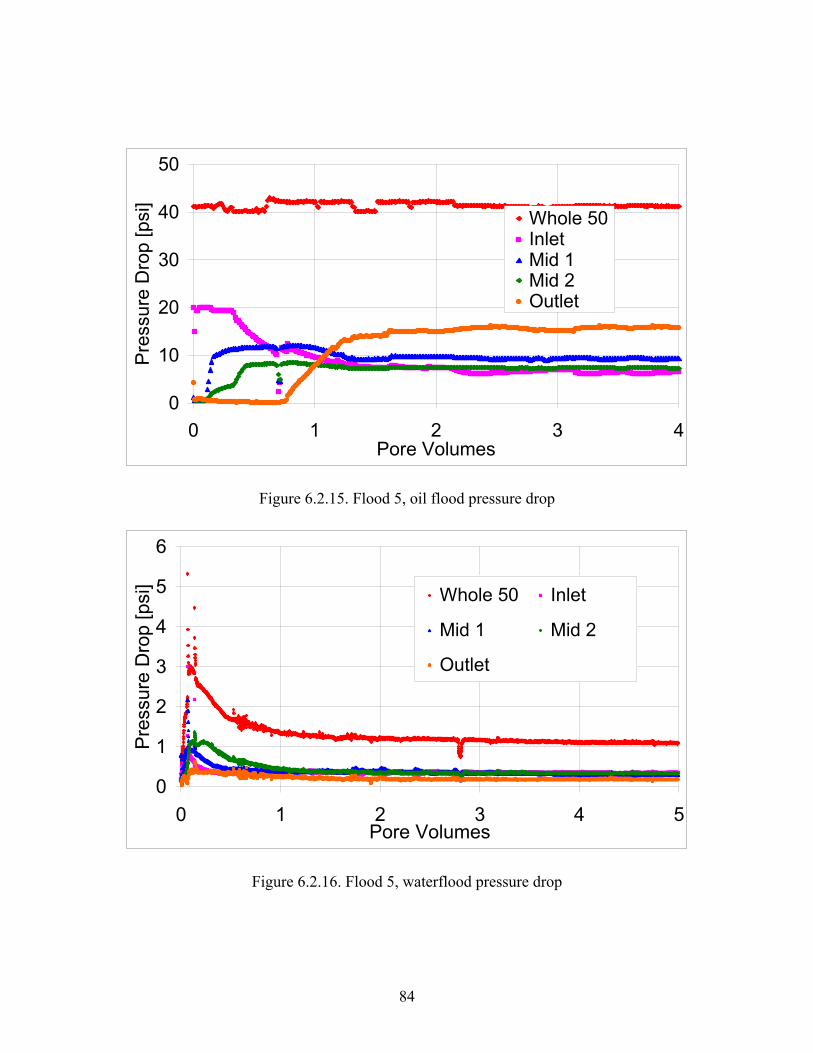
84
0
10
20
30
40
50
0 1 2 3 4Pore Volumes
Pre
ssur
e D
rop
[psi
]
Whole 50Inlet Mid 1Mid 2Outlet
Figure 6.2.15. Flood 5, oil flood pressure drop
0
1
2
3
4
5
6
0 1 2 3 4 5Pore Volumes
Pres
sure
Dro
p [p
si] Whole 50 Inlet
Mid 1 Mid 2
Outlet
Figure 6.2.16. Flood 5, waterflood pressure drop
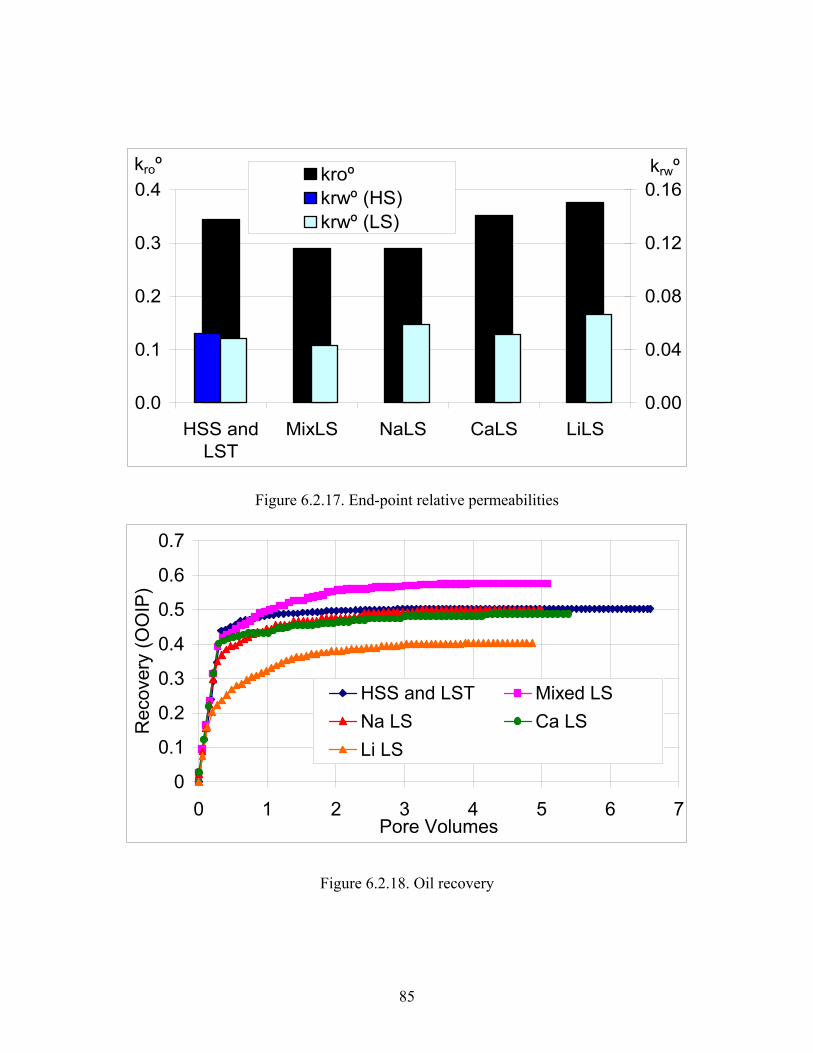
85
0.0
0.1
0.2
0.3
0.4
HSS andLST
MixLS NaLS CaLS LiLS
kroº
0.00
0.04
0.08
0.12
0.16krwºkroº
krwº (HS)krwº (LS)
Figure 6.2.17. End-point relative permeabilities
0
0.1
0.2
0.3
0.4
0.5
0.6
0.7
0 1 2 3 4 5 6 7Pore Volumes
Rec
over
y (O
OIP
)
HSS and LST Mixed LSNa LS Ca LSLi LS
Figure 6.2.18. Oil recovery
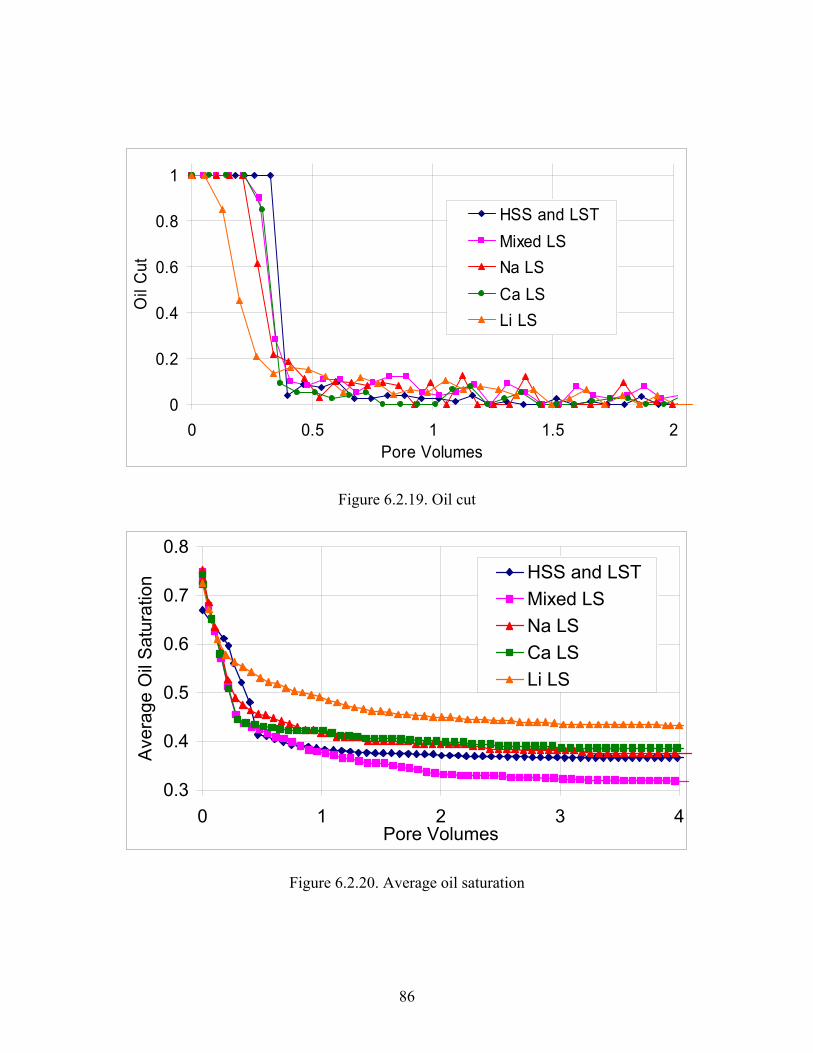
86
0
0.2
0.4
0.6
0.8
1
0 0.5 1 1.5 2Pore Volumes
Oil
Cut
HSS and LSTMixed LSNa LSCa LSLi LS
Figure 6.2.19. Oil cut
0.3
0.4
0.5
0.6
0.7
0.8
0 1 2 3 4Pore Volumes
Ave
rage
Oil
Sat
urat
ion HSS and LST
Mixed LSNa LSCa LSLi LS
Figure 6.2.20. Average oil saturation
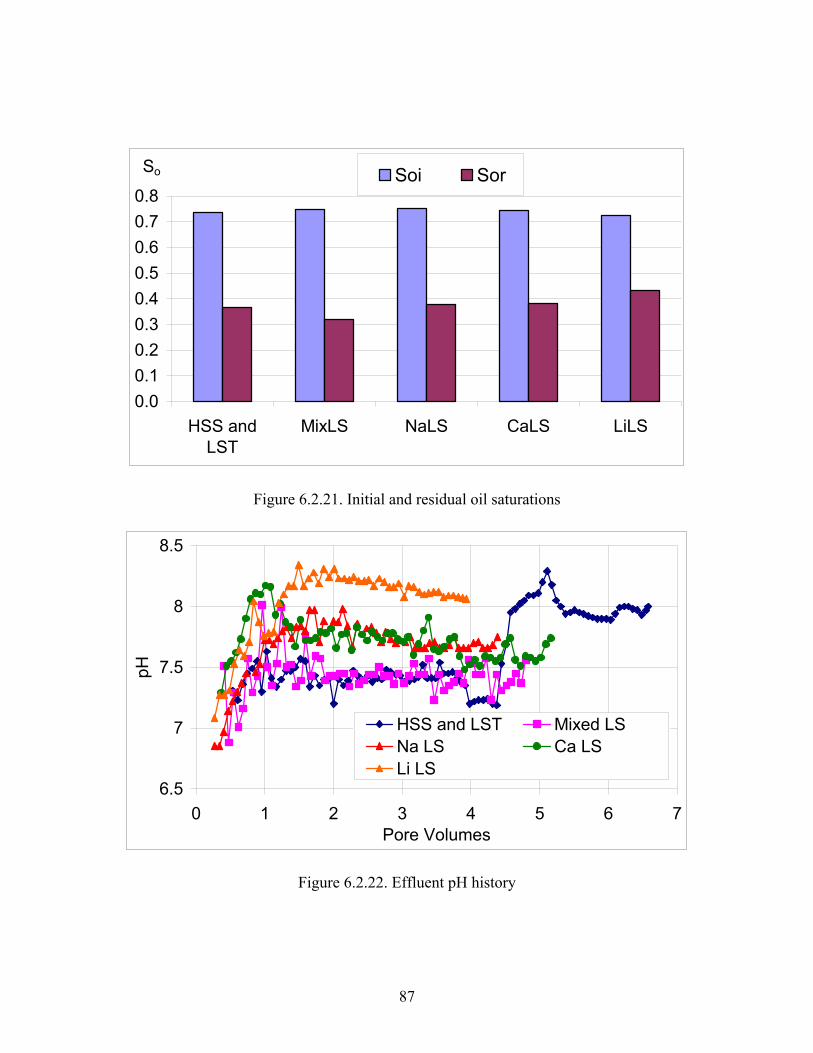
87
0.00.10.20.30.40.50.60.70.8
HSS andLST
MixLS NaLS CaLS LiLS
So Soi Sor
Figure 6.2.21. Initial and residual oil saturations
6.5
7
7.5
8
8.5
0 1 2 3 4 5 6 7Pore Volumes
pH
HSS and LST Mixed LSNa LS Ca LSLi LS
Figure 6.2.22. Effluent pH history

88
6.3 SERIAL WATERFLOODS IN RESERVOIR B CORE
In this experiment a sequence of high and low salinity secondary waterfloods
were conducted in a single reservoir core. The objective of this experiment
was to evaluate the effect of low salinity injection on oil recovery rate,
residual oil saturation and relative permeability. The waterfloods were
conducted in the same core, serially, to eliminate the possibility that natural
variations between cores were responsible for any contrasts between the high
and low salinity results.
The core consisted of a stack of 5 core plugs. The plugs came from a
consolidated sandstone oil reservoir, henceforth referred to as Reservoir B.
The plugs were ordered by their air permeability, with the most permeable
plug at the inlet and the least at the outlet. The plugs possess a clay wt% of
less then 5 according to XRD analysis performed the field’s operator. Dark
striations were visible with the naked eye; photos of the core plugs are
available in Figure 6.3.1. Properties of the core and the plugs are given in
Tables 6.3.1.
Two brines were used during waterflood experiments. Synthetic Reservoir B
formation brine (SRBFB), with 65,000 ppm TDS, as the high salinity brine
89
and Synthetic lake B water (SLBW), with 200 ppm TDS, as the low salinity
brine. Fluid properties are given in Table 6.3.2.
The core plugs required cleaning upon arrival. The cores were first restored
using an extractor. The extractor reservoir was filled with an azeotropic
mixture of toluene and chloroform. The core plugs were positioned above the
mixture. A heating plate under the extractor boiled the toluene/chloroform
mixture and solvent vapors traveled through the plugs. The vapors condensed
at the top of the extractor and dripped back down into the liquid reservoir. The
plugs were cleaned in the extractor for about a week. Every two days the
solvent was replaced. Initially the 2-day-old solvent was dark when replaced,
but after 4 to 5 days it became very clear. After the extractor restoration the
plugs were placed in a 98ºC oven for about a day.
Next, the plugs were stacked and placed in a core holder then vacuum
saturated with methanol. Then, about 5 pore volumes of toluene were injected.
The effluent toluene was clear after 2 pore volumes of injection. Next about 5
pore volumes of methanol were injected followed by several pore volumes of
compressed air. The plugs were then removed from the core holder and placed
in a 98ºC oven for almost 2 days; the atmospheric boiling point of methanol is
90
64.7ºC. Toluene and methanol were injected using the oil reservoir
arrangement described in Chapter 3.1.3.
After cleaning, Experiment 6.3 preceded much like Experiment 6.1. A
detailed description of each procedure is available in Chapter 4. The plugs
were stacked and confined inside a core holder and permeability to nitrogen
gas was measured. Pore volume was measured with a salinity tracer. The core
was vacuum saturated with tracer brine then several additional pore volumes
of tracer brine were injected. SRBFB was injected, the effluent was sampled
and pore volume and permeability were calculated. Crude B was injected to
establish Soi then the saturated core was aged for 2 days at 68ºC.
Temperature was reduced to room temperature, the approximate temperature
of Reservoir B, and the following floods were conducted:
• Oil flood – 1
• High salinity waterflood – 1 (HS – 1)
• Oil flood – 2
• Low salinity waterflood – 1 (LS – 1)
• High salinity connate brine restoration
• Oil flood – 3
91
• High salinity waterflood – 2 (HS – 1)
• Oil flood – 4
• Low salinity waterflood – 2 (LS – 1)
A diagram of the experimental procedures is in Figure 6.3.2. Experimental
conditions are in Table 6.3.3.
Figure 6.3.3 displays the effluent conductivity history. Figure 6.3.4 displays
the pressure drop during the SRBFB flood. Porosity and permeability were
19.1% and 181 md, respectively. The pressure drop across the inlet section,
originally the most permeable section, is anomalously high. The permeability
damage probably occurred during cleaning with toluene and methanol and
unfortunately persists throughout Experiment 6.3.
Five oil floods were conducted. The pressure drops during the oil floods are
displayed in Figures 6.3.5. Four waterfloods were conducted. The pressure
drops during the waterfloods are in Figure 6.3.6 – 6.3.9. The end point relative
permeabilities to water and oil are in Figure 6.3.10.
Graphs of oil recovery, oil cut and average oil saturation from all four floods
are in Figures 6.3.11 – 6.3.13. Initial and residual oil saturations are in Figure
92
6.3.14. All four effluent pH histories are in Figure 6.3.15. Experimental
results are available in Table 6.3.4.
Viscosity vs. shear rate at room temperature for Reservoir B crude, SRBFB
and SLBW are graphed in Figures 6.3.16 – 6.3.18, respectively.
All the waterfloods are relatively piston-like displacements with most of the
ultimate recovery achieved at breakthrough. Comparing the recovery curves is
difficult because the initial saturations are different. Nonetheless the first HS
waterflood recovered the largest percentage of original oil in place. The first
low salinity waterflood reduced Sor by 0.9 saturation units however Soi was
4.7 saturation units lower. The second high and low salinity waterfloods
compare in much the same way.
The first low salinity waterflood caused severe permeability damage, reducing
end-point water relative permeability by a factor of 3. The damage was also
permanent as HS – 2 restored krwº to only 56% of the value observed at the
end of HS – 1. The permeability damage was worst during the first lake water
exposure and was less severe during the second lake water exposure.
93
Injecting Lake B water into Reservoir B would be entirely detrimental. No
recovery benefit was observed and the lake water caused severe permeability
damage. The Lake B water was the least saline LSB used in this research.
Based on the results of Experiments 6.1, 6.2 and 6.4 the permeability damage
could be mitigated by increasing the brine’s TDS to above 1,000 ppm.
However, because Reservoir B possessed very little clay, the literature29, 36, 37
suggests that there is limited potential for improved recovery with low salinity
waterflooding.
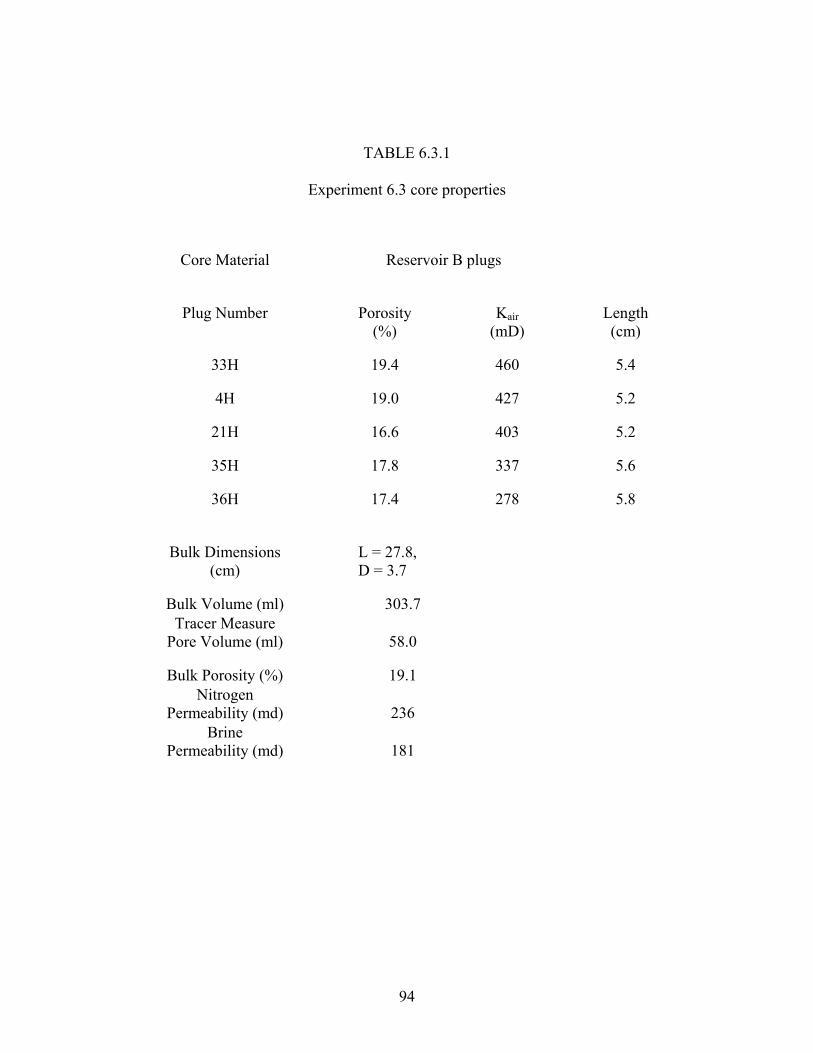
94
TABLE 6.3.1
Experiment 6.3 core properties
Core Material Reservoir B plugs
Plug Number
Porosity
(%) Kair
(mD) Length (cm)
33H 19.4 460 5.4
4H 19.0 427 5.2
21H 16.6 403 5.2
35H 17.8 337 5.6
36H 17.4 278 5.8
Bulk Dimensions
(cm) L = 27.8, D = 3.7
Bulk Volume (ml) 303.7 Tracer Measure
Pore Volume (ml) 58.0
Bulk Porosity (%) 19.1 Nitrogen
Permeability (md) 236 Brine
Permeability (md) 181
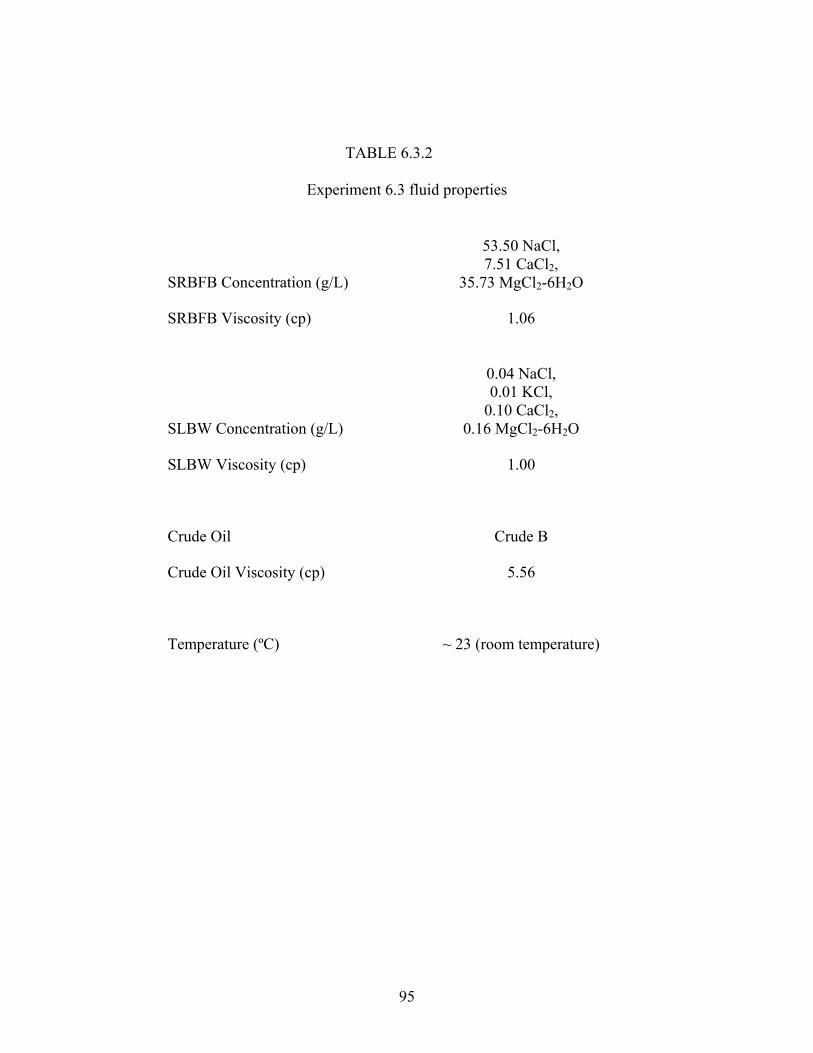
95
TABLE 6.3.2
Experiment 6.3 fluid properties
SRBFB Concentration (g/L)
53.50 NaCl, 7.51 CaCl2,
35.73 MgCl2-6H2O
SRBFB Viscosity (cp) 1.06
SLBW Concentration (g/L)
0.04 NaCl, 0.01 KCl,
0.10 CaCl2, 0.16 MgCl2-6H2O
SLBW Viscosity (cp) 1.00
Crude Oil Crude B
Crude Oil Viscosity (cp) 5.56
Temperature (ºC) ~ 23 (room temperature)
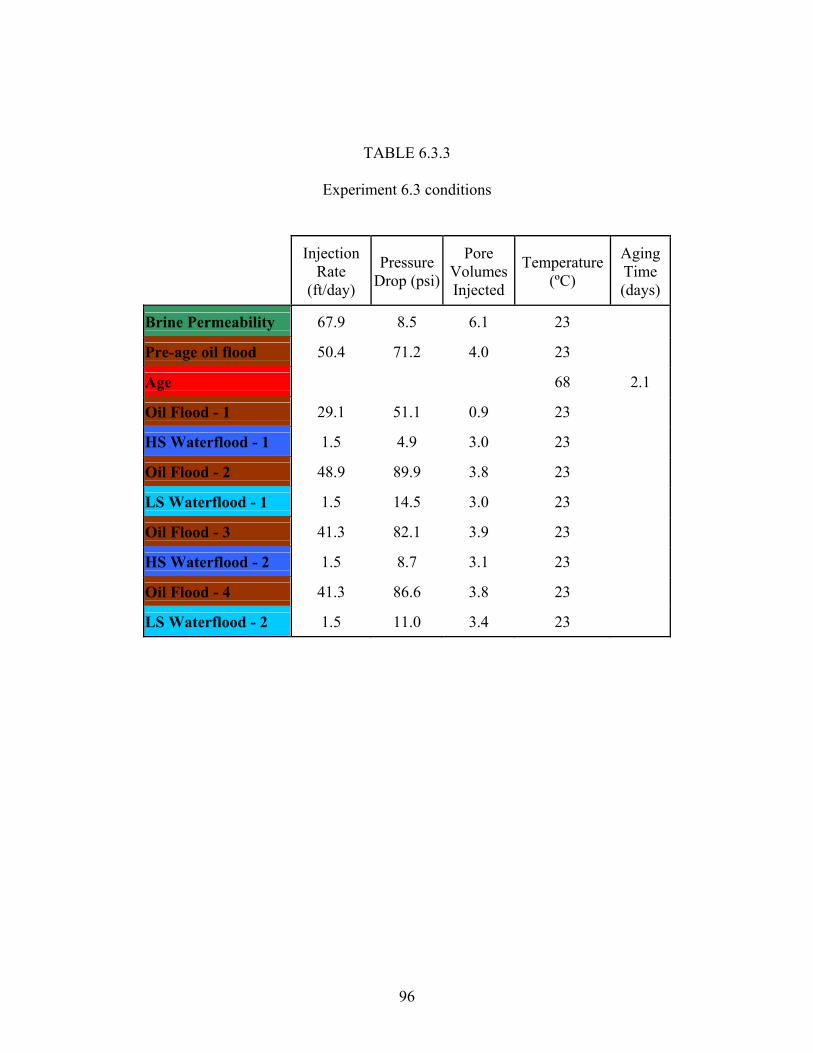
96
TABLE 6.3.3
Experiment 6.3 conditions
Injection
Rate (ft/day)
Pressure Drop (psi)
Pore Volumes Injected
Temperature (ºC)
Aging Time (days)
Brine Permeability 67.9 8.5 6.1 23
Pre-age oil flood 50.4 71.2 4.0 23
Age 68 2.1
Oil Flood - 1 29.1 51.1 0.9 23
HS Waterflood - 1 1.5 4.9 3.0 23
Oil Flood - 2 48.9 89.9 3.8 23
LS Waterflood - 1 1.5 14.5 3.0 23
Oil Flood - 3 41.3 82.1 3.9 23
HS Waterflood - 2 1.5 8.7 3.1 23
Oil Flood - 4 41.3 86.6 3.8 23
LS Waterflood - 2 1.5 11.0 3.4 23
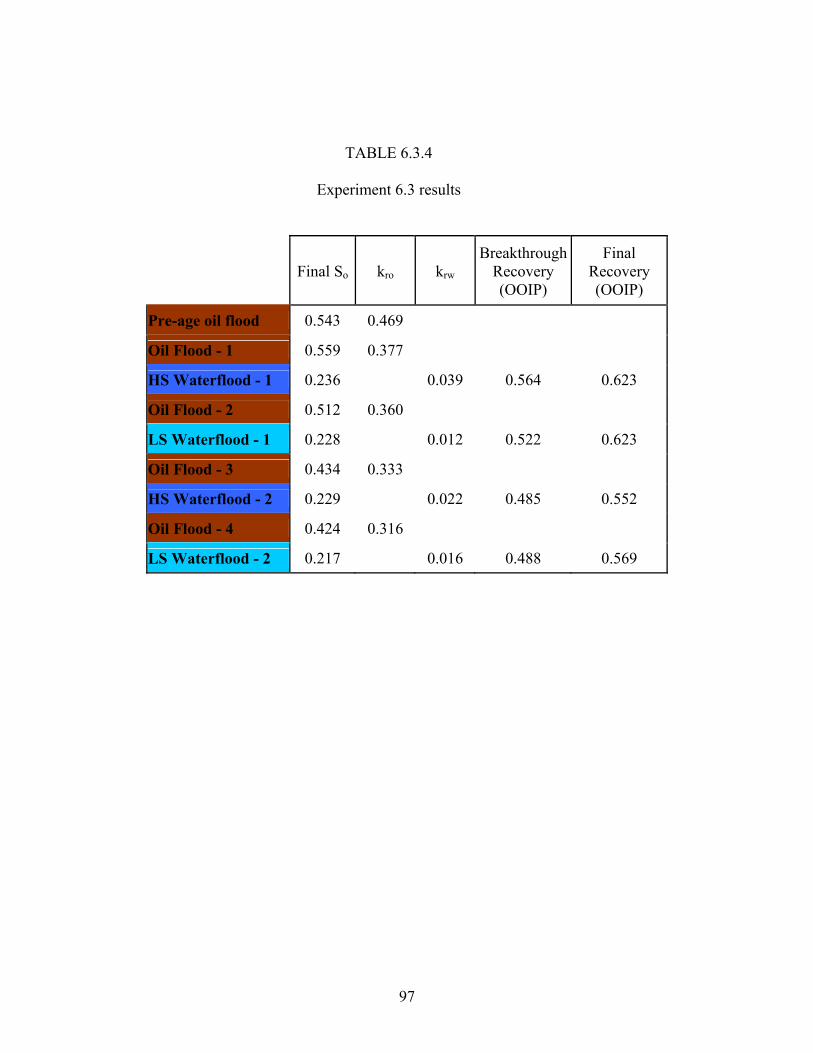
97
TABLE 6.3.4
Experiment 6.3 results
Final So kro krw Breakthrough
Recovery (OOIP)
Final Recovery (OOIP)
Pre-age oil flood 0.543 0.469
Oil Flood - 1 0.559 0.377
HS Waterflood - 1 0.236 0.039 0.564 0.623
Oil Flood - 2 0.512 0.360
LS Waterflood - 1 0.228 0.012 0.522 0.623
Oil Flood - 3 0.434 0.333
HS Waterflood - 2 0.229 0.022 0.485 0.552
Oil Flood - 4 0.424 0.316
LS Waterflood - 2 0.217 0.016 0.488 0.569
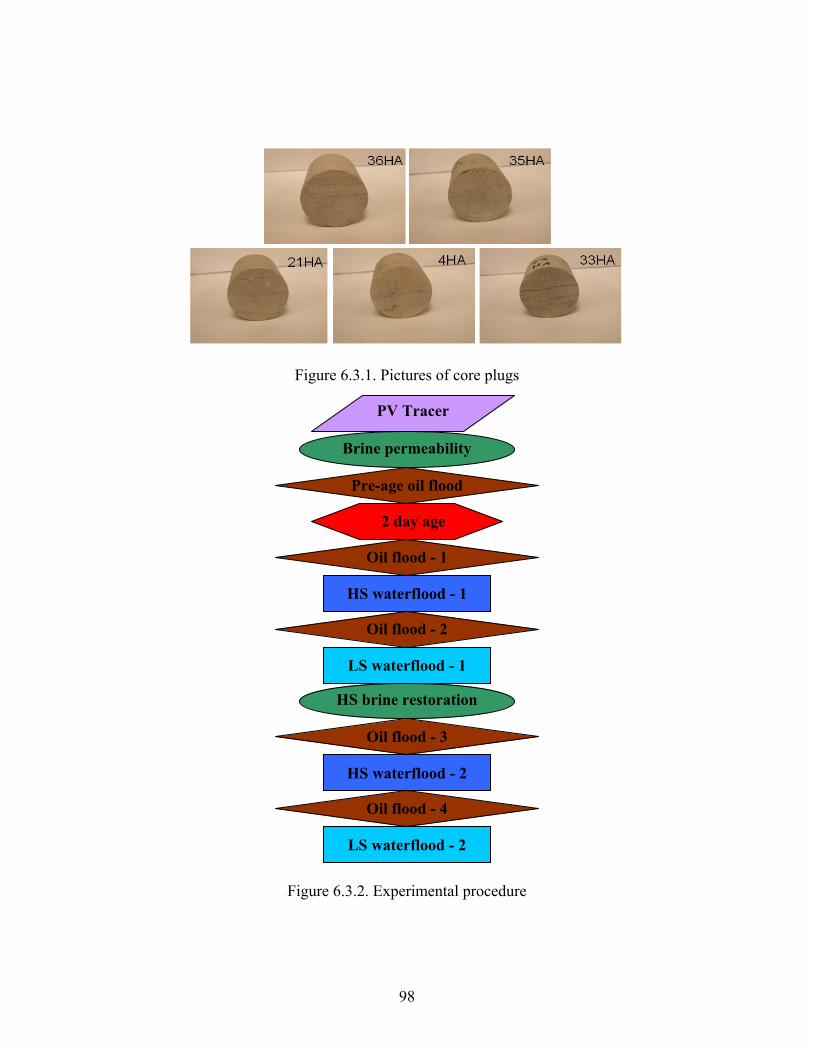
98
Figure 6.3.1. Pictures of core plugs
Figure 6.3.2. Experimental procedure
HS waterflood - 1
Brine permeability
Oil flood - 1
Pre-age oil flood
2 day age
Oil flood - 2
LS waterflood - 1
Oil flood - 3
Oil flood - 4
LS waterflood - 2
PV Tracer
HS brine restoration
HS waterflood - 2
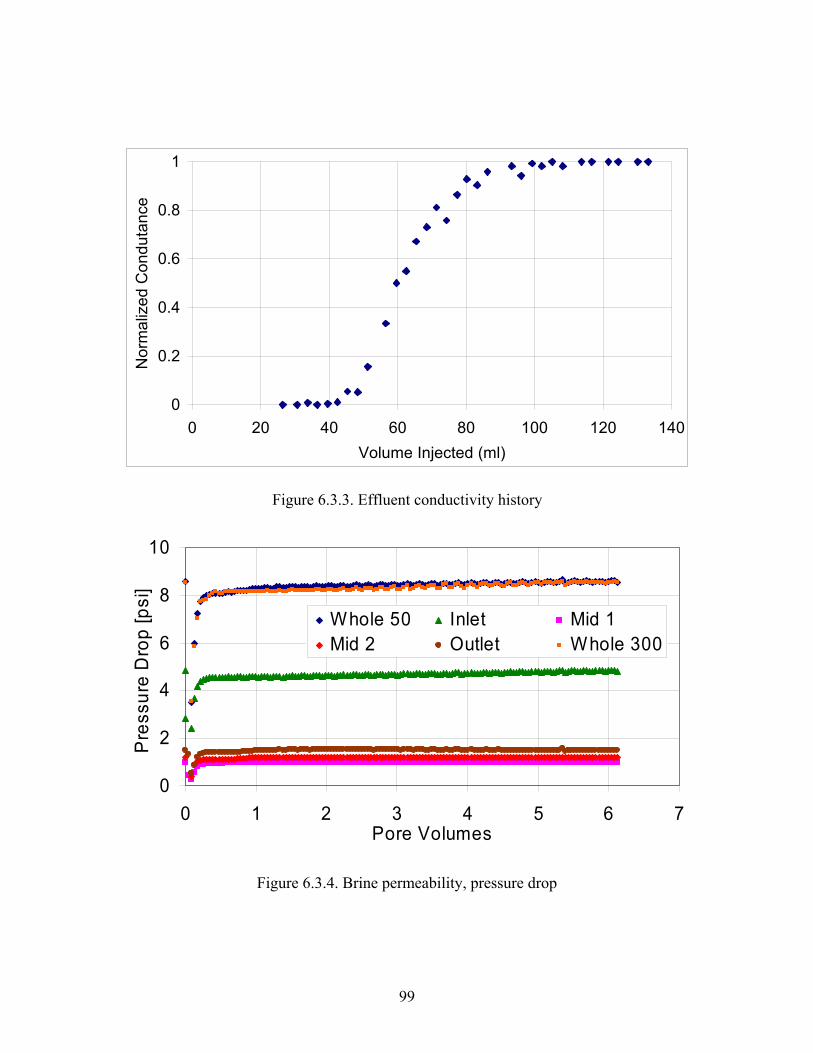
99
0
0.2
0.4
0.6
0.8
1
0 20 40 60 80 100 120 140Volume Injected (ml)
Nor
mal
ized
Con
duta
nce
Figure 6.3.3. Effluent conductivity history
0
2
4
6
8
10
0 1 2 3 4 5 6 7Pore Volumes
Pre
ssur
e D
rop
[psi
]
Whole 50 Inlet Mid 1Mid 2 Outlet Whole 300
Figure 6.3.4. Brine permeability, pressure drop

100
0
20
40
60
80
100
0 1 2 3 4Pore Volumes
Pre
ssur
e D
rop
[psi
]
Pre-age oil floodOil flood - 1Oil flood - 2Oil flood - 3Oil flood - 4
Figure 6.3.5. Oil floods, pressure drops
0
1
2
3
4
5
6
0 0.5 1 1.5 2 2.5 3Pore Volumes
Pre
ssur
e D
rop
[psi
]
Whole 50 Inlet Mid 1Mid 2 Outlet Whole 300
Figure 6.3.6.High salinity waterflood – 1, pressure drop
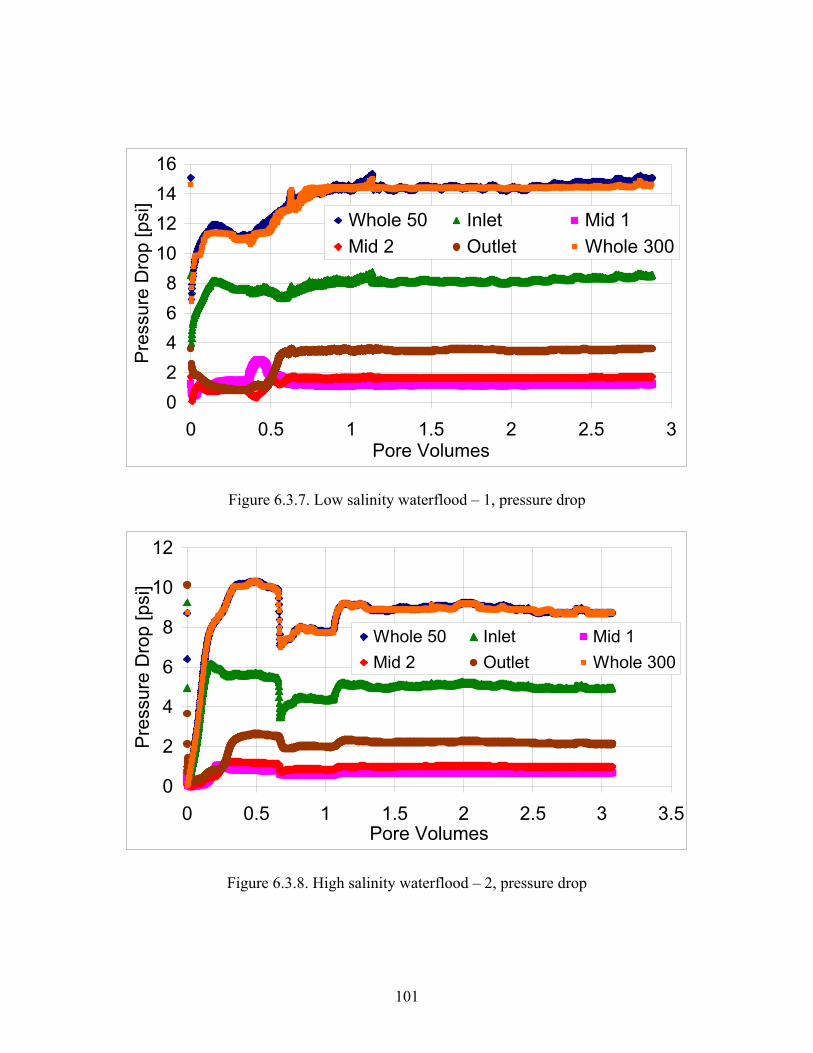
101
02468
10121416
0 0.5 1 1.5 2 2.5 3Pore Volumes
Pre
ssur
e D
rop
[psi
]
Whole 50 Inlet Mid 1Mid 2 Outlet Whole 300
Figure 6.3.7. Low salinity waterflood – 1, pressure drop
0
2
4
6
8
10
12
0 0.5 1 1.5 2 2.5 3 3.5Pore Volumes
Pre
ssur
e D
rop
[psi
]
Whole 50 Inlet Mid 1Mid 2 Outlet Whole 300
Figure 6.3.8. High salinity waterflood – 2, pressure drop
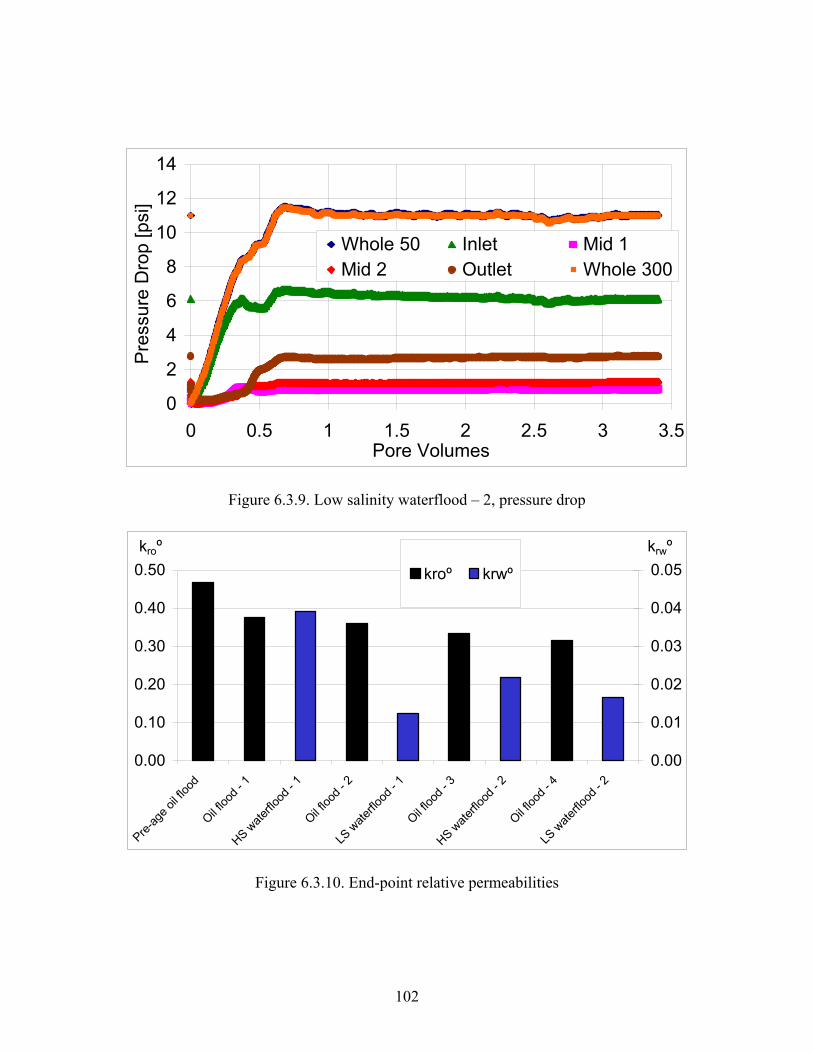
102
0
2
4
6
8
10
12
14
0 0.5 1 1.5 2 2.5 3 3.5Pore Volumes
Pre
ssur
e D
rop
[psi
]
Whole 50 Inlet Mid 1Mid 2 Outlet Whole 300
Figure 6.3.9. Low salinity waterflood – 2, pressure drop
0.00
0.10
0.20
0.30
0.40
0.50
Pre-ag
e oil f
lood
Oil floo
d - 1
HS wate
rflood
- 1
Oil floo
d - 2
LS w
aterflo
od - 1
Oil floo
d - 3
HS wate
rflood
- 2
Oil floo
d - 4
LS w
aterflo
od - 2
kroº
0.00
0.01
0.02
0.03
0.04
0.05krwº
kroº krwº
Figure 6.3.10. End-point relative permeabilities
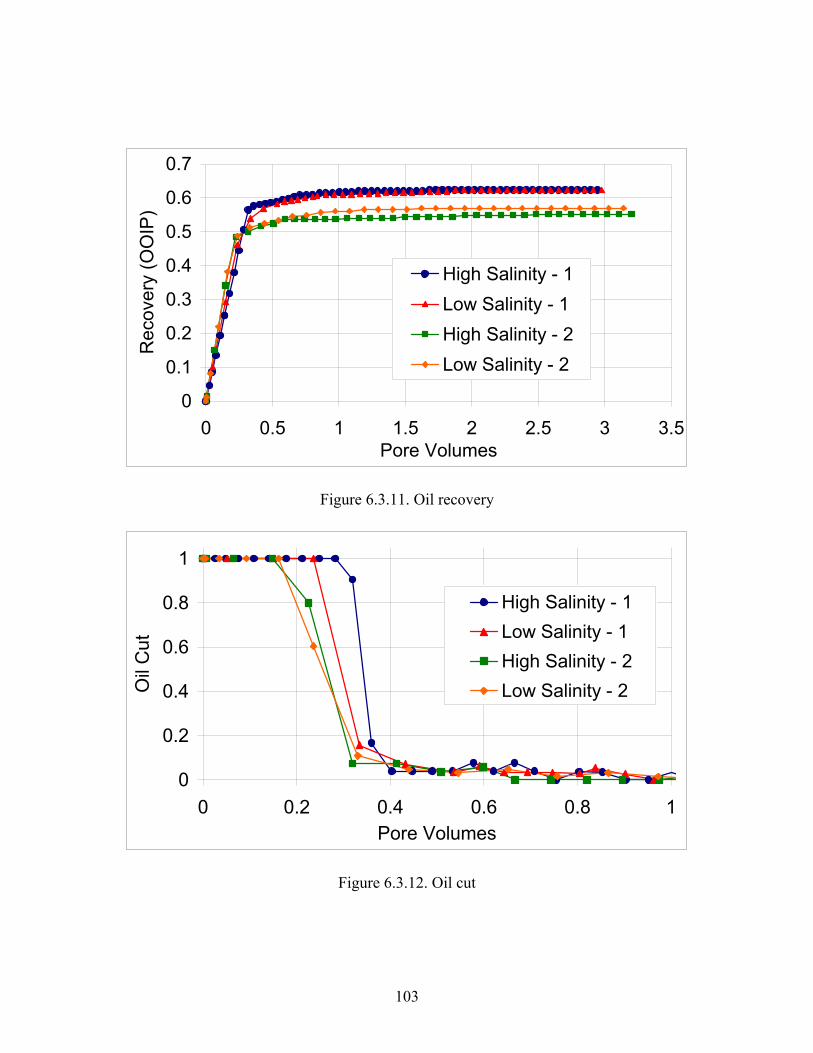
103
0
0.1
0.2
0.3
0.4
0.5
0.6
0.7
0 0.5 1 1.5 2 2.5 3 3.5Pore Volumes
Rec
over
y (O
OIP
)
High Salinity - 1Low Salinity - 1High Salinity - 2Low Salinity - 2
Figure 6.3.11. Oil recovery
0
0.2
0.4
0.6
0.8
1
0 0.2 0.4 0.6 0.8 1Pore Volumes
Oil
Cut
High Salinity - 1Low Salinity - 1High Salinity - 2Low Salinity - 2
Figure 6.3.12. Oil cut
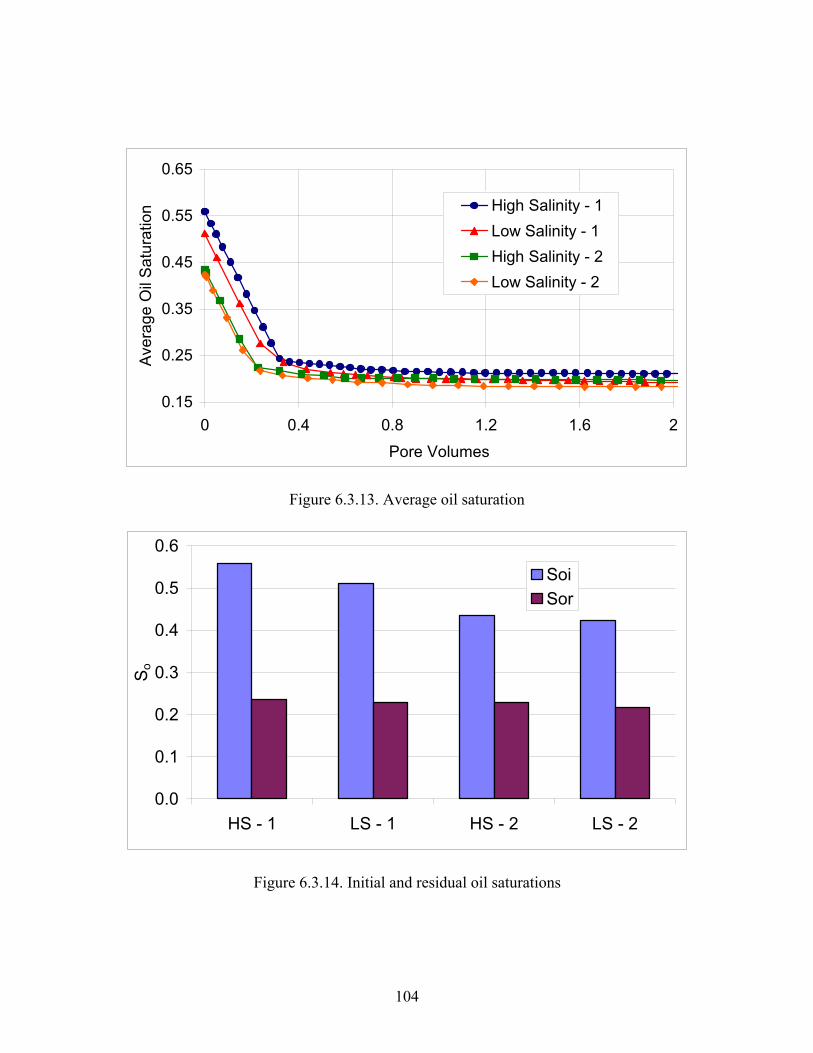
104
0.15
0.25
0.35
0.45
0.55
0.65
0 0.4 0.8 1.2 1.6 2
Pore Volumes
Ave
rage
Oil
Sat
urat
ion High Salinity - 1
Low Salinity - 1High Salinity - 2Low Salinity - 2
Figure 6.3.13. Average oil saturation
0.0
0.1
0.2
0.3
0.4
0.5
0.6
HS - 1 LS - 1 HS - 2 LS - 2
So
SoiSor
Figure 6.3.14. Initial and residual oil saturations
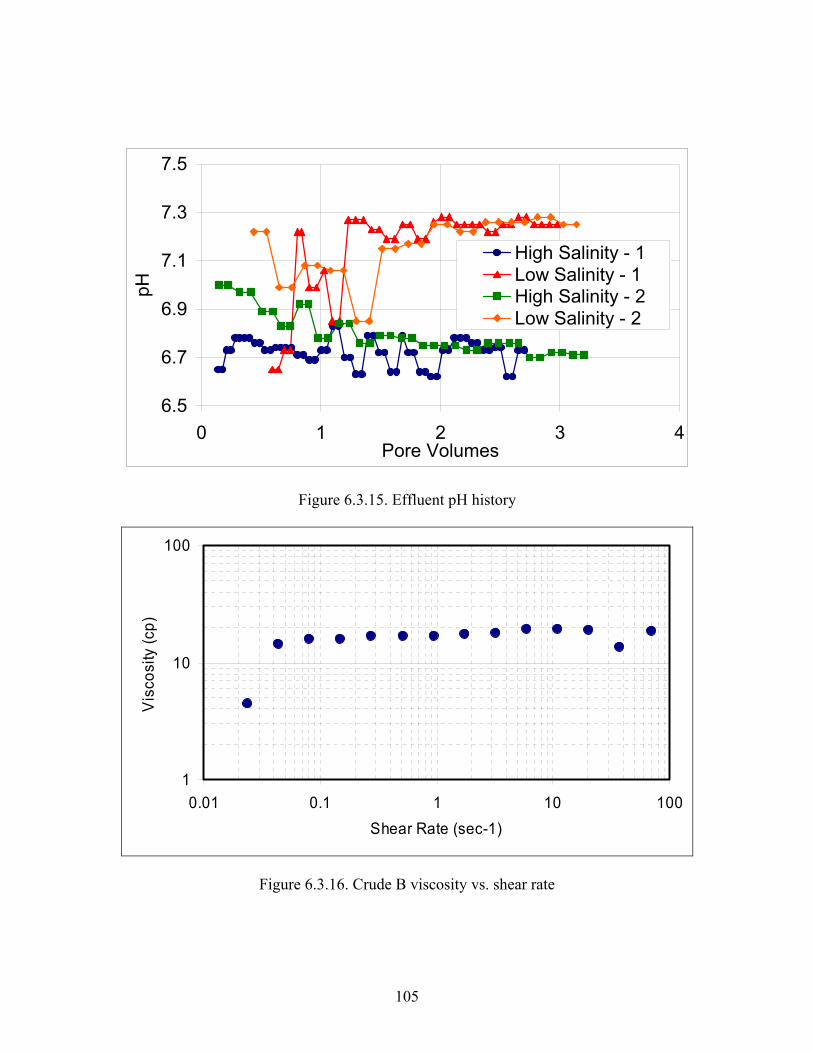
105
6.5
6.7
6.9
7.1
7.3
7.5
0 1 2 3 4Pore Volumes
pH
High Salinity - 1Low Salinity - 1High Salinity - 2Low Salinity - 2
Figure 6.3.15. Effluent pH history
1
10
100
0.01 0.1 1 10 100Shear Rate (sec-1)
Vis
cosi
ty (c
p)
Figure 6.3.16. Crude B viscosity vs. shear rate
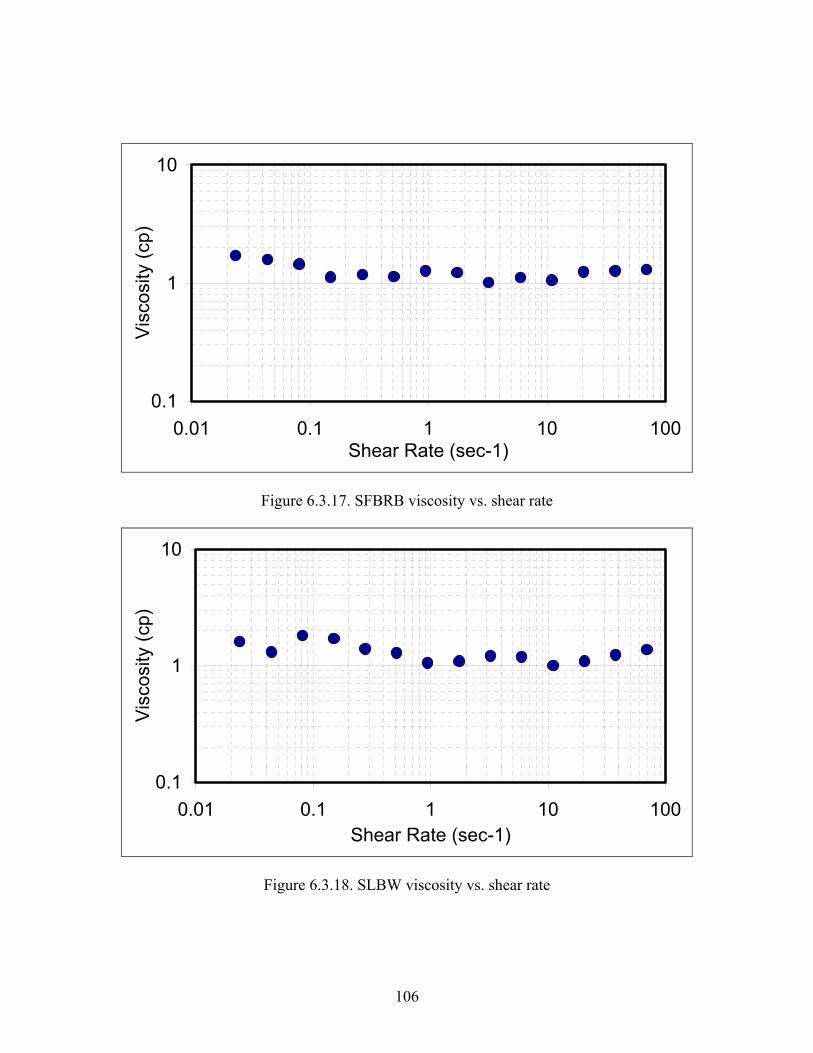
106
0.1
1
10
0.01 0.1 1 10 100Shear Rate (sec-1)
Vis
cosi
ty (c
p)
Figure 6.3.17. SFBRB viscosity vs. shear rate
0.1
1
10
0.01 0.1 1 10 100Shear Rate (sec-1)
Visc
osity
(cp)
Figure 6.3.18. SLBW viscosity vs. shear rate
107
6.4 SERIAL WATERFLOODS IN RESERVOIR C CORE
In this experiment a sequence of high and low salinity secondary waterfloods
were conducted in a single reservoir core. The objective of this experiment
was to evaluate the effect of low salinity injection on recovery rate, residual
oil saturation and relative permeability. The waterfloods were conducted in
the same core, one after another, to eliminate the possibility that natural
variations between cores were responsible for any contrasts between the high
and low salinity results.
The core consisted of a stack of 6 core plugs. The plugs came from an
unconsolidated sandstone oil reservoir, henceforth referred to as Reservoir C.
The plugs were ordered by their air permeability, with the most permeably
plug at the inlet and the least at the outlet. The plugs possess a clay wt% of
about 20 according to XRD analysis performed the field’s operator. The core
looked and felt like a very tightly packed column of medium sand sized grains
and occasional very fine gravel sized grains. The cores were cleaned at an
external core lab. Properties of the core are given in Tables 6.4.1.
Two brines were used during waterflood experiments. Synthetic Reservoir C
formation brine (SRCFB), with 31,000 ppm TDS, as the high salinity brine
108
and Synthetic lake C water (SLCW), with 1075 ppm TDS, as the low salinity
brine. Fluid properties are given in Table 6.4.2.
The following procedures, described in detail in Chapter 4, were employed.
The plugs were stacked and confined inside a core holder and permeability to
nitrogen gas was measured. Pore volume was measured with a salinity tracer.
The core was vacuum saturated with tracer brine then several additional pore
volumes of tracer brine were injected. Temperature was elevated to 85ºC, the
temperature of Reservoir C. SRCFB was injected, the effluent was sampled
and pore volume and permeability were calculated. Crude C was injected to
establish Soi then the saturated core was aged for 25 days at 85ºC.
After aging the following floods were conducted:
• Oil flood – 2
• High salinity waterflood – 1 (HS – 1)
• Oil flood – 3
• 12 hour age
• Oil flood – 4
• Low salinity waterflood – 1 (LS – 1)
• High salinity connate brine restoration
109
• Oil flood – 5
• 12 hour age
• Oil flood – 6
• High salinity waterflood – 2 (HS – 2)
• Oil flood – 7
• 12 hour age
• Oil flood – 8
• Low salinity waterflood – 2 (LS – 2)
Next, another conductivity tracer was conducted to confirm the material
balance oil saturation. SRCFB was again injected and the effluent was
sampled. Then Crude C was injected, Soi was reestablished and the core was
aged for 25 additional days. This was done to determine if the initial, pre-LS
exposure, wettability could be restored by aging. After the second long age the
following floods were conducted:
• Oil flood – 10
• High salinity waterflood – 3 (HS – 3)
• Oil flood – 11
• 12 hour age
110
• Oil flood – 12
• Low salinity waterflood – 3 (LS – 3)
• Oil flood – 13
A diagram of the experimental procedures is in Figure 6.4.1. Experimental
conditions are in Table 6.4.3.
Figure 6.4.2 displays the pore volume tracer effluent conductivity history.
Figure 6.4.3 displays the pressure drop during the single phase brine flood.
Porosity and permeability were 26.8% and 236 md, respectively.
Thirteen oil floods were conducted. Pressure drops during the oil floods are
all displayed in Figures 6.4.4. Six waterfloods were conducted. Pressure drops
during the waterfloods are in Figure 6.4.5 – 6.3.10. End-point relative
permeabilities to water and oil are in Figure 6.3.11.
Graphs of oil recovery, oil cut and average oil saturation from the waterfloods
are in Figures 6.3.12 – 6.3.14. Initial and residual oil saturations are in Figure
6.3.15. Effluent pH histories are in Figure 6.3.16.

111
Residual saturation after low salinity waterflood – 2 was confirmed with a
tracer experiment. Figure 6.4.17 displays the Sor tracer effluent conductivity
history. Tracer measured Sor was 0.225. Material balance Sor was .220.
Viscosity vs. shear rate at room temperature for Reservoir C crude, SRCFB
and SLCW are graphed in Figures 6.4.18 – 6.4.20, respectively.
Low salinity waterflood – 1 recovered 14% more oil then high salinity
waterflood – 1. LS – 1 also reduced Sor by 6.5 saturation units, decreased end-
point water relative permeability by 18% and increased end-point oil relative
permeability by 9%.
After the core was exposed to low salinity brine the system’s recovery was no
longer sensitive to injected brine salinity. High and low salinity waterflood –
2 produced very similar oil recoveries. Sor. kroº and krwº were also less
sensitive.
Salinity sensitivity was restored by re-aging the core for 25 days. Low salinity
waterflooding – 3’s oil recovery was 7% higher then high salinity
waterflooding – 3’s. Sor was reduced by 3.0 saturation units, krwº decreased by
8% and kroº increased by 8%.

112
These results suggest a strong relationship between low salinity improved
recovery and wettability alteration. When low salinity improved recovery was
observed water relative permeability increased and oil relative permeability
decreased implying a shift from mix-wet to water-wet wettability. Also,
injecting low salinity brine improved recovery by delaying breakthrough,
suggesting an improvement in displacement stability. Oil displacement
mobility is more favorable if a crude oil/rock/brine system is water-wet.
After the first exposure to low salinity brine the core was no longer sensitive
to injected brine salinity. However, recovery-salinity sensitivity was restored
by re-aging. During the second 25 day age, kro decreased and krw increased,
suggesting a shift toward mix-wetness.
The core was made mixed-wet during the first 25 day age. Then, during the
first low salinity brine exposure, wettability was shifted to water-wet and
recovery was improved. Water-wetness persisted during high and low
waterflood – 2. Therefore low salinity brine produced no benefit because no
wettability alteration was possible. Then a mix-wet state was restored by the
second 25 day age. Following the age, low salinity waterflood – 3 again
shifted the core toward water-wet and improved oil recovery.
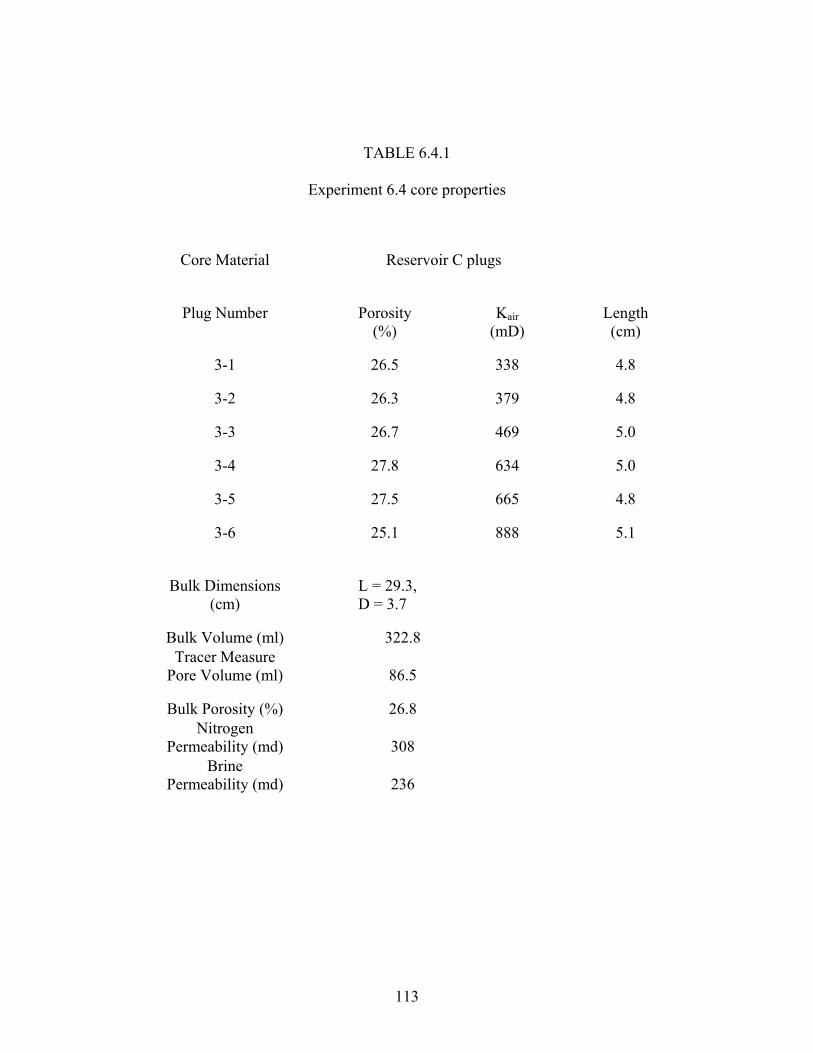
113
TABLE 6.4.1
Experiment 6.4 core properties
Core Material Reservoir C plugs
Plug Number
Porosity
(%) Kair
(mD) Length (cm)
3-1 26.5 338 4.8
3-2 26.3 379 4.8
3-3 26.7 469 5.0
3-4 27.8 634 5.0
3-5 27.5 665 4.8
3-6 25.1 888 5.1
Bulk Dimensions
(cm) L = 29.3, D = 3.7
Bulk Volume (ml) 322.8 Tracer Measure
Pore Volume (ml) 86.5
Bulk Porosity (%) 26.8 Nitrogen
Permeability (md) 308 Brine
Permeability (md) 236
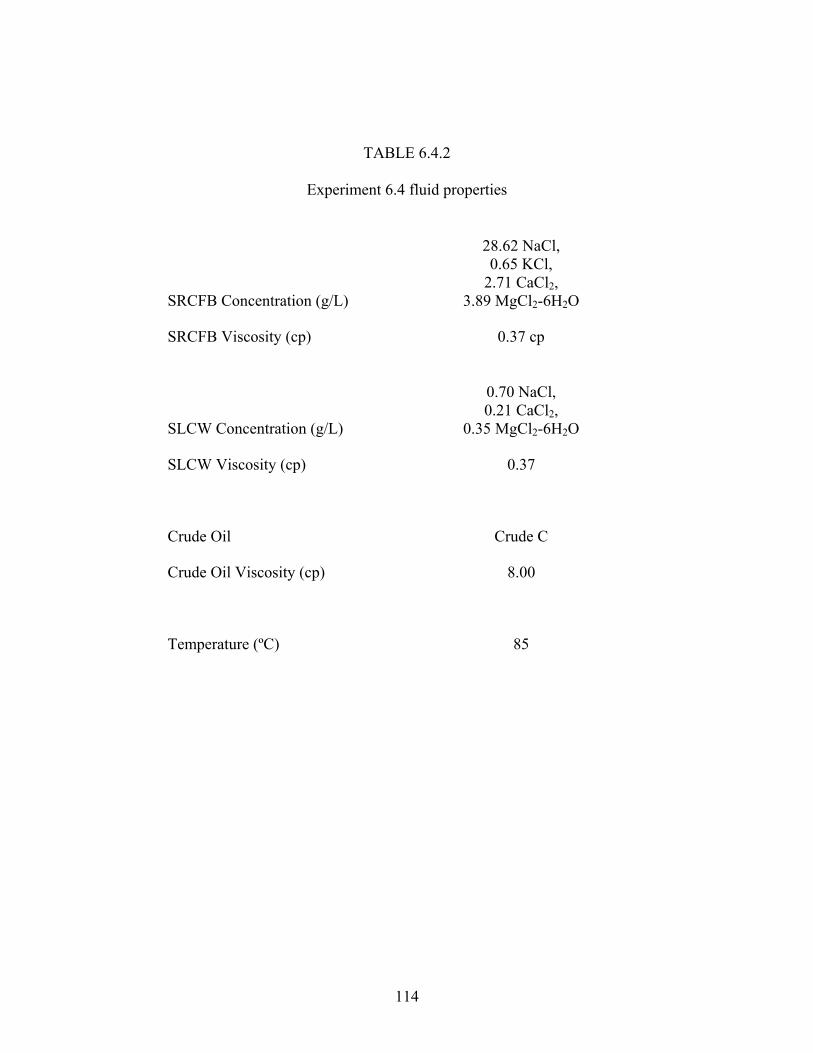
114
TABLE 6.4.2
Experiment 6.4 fluid properties
SRCFB Concentration (g/L)
28.62 NaCl, 0.65 KCl,
2.71 CaCl2, 3.89 MgCl2-6H2O
SRCFB Viscosity (cp) 0.37 cp
SLCW Concentration (g/L)
0.70 NaCl, 0.21 CaCl2,
0.35 MgCl2-6H2O
SLCW Viscosity (cp) 0.37
Crude Oil Crude C
Crude Oil Viscosity (cp) 8.00
Temperature (ºC) 85
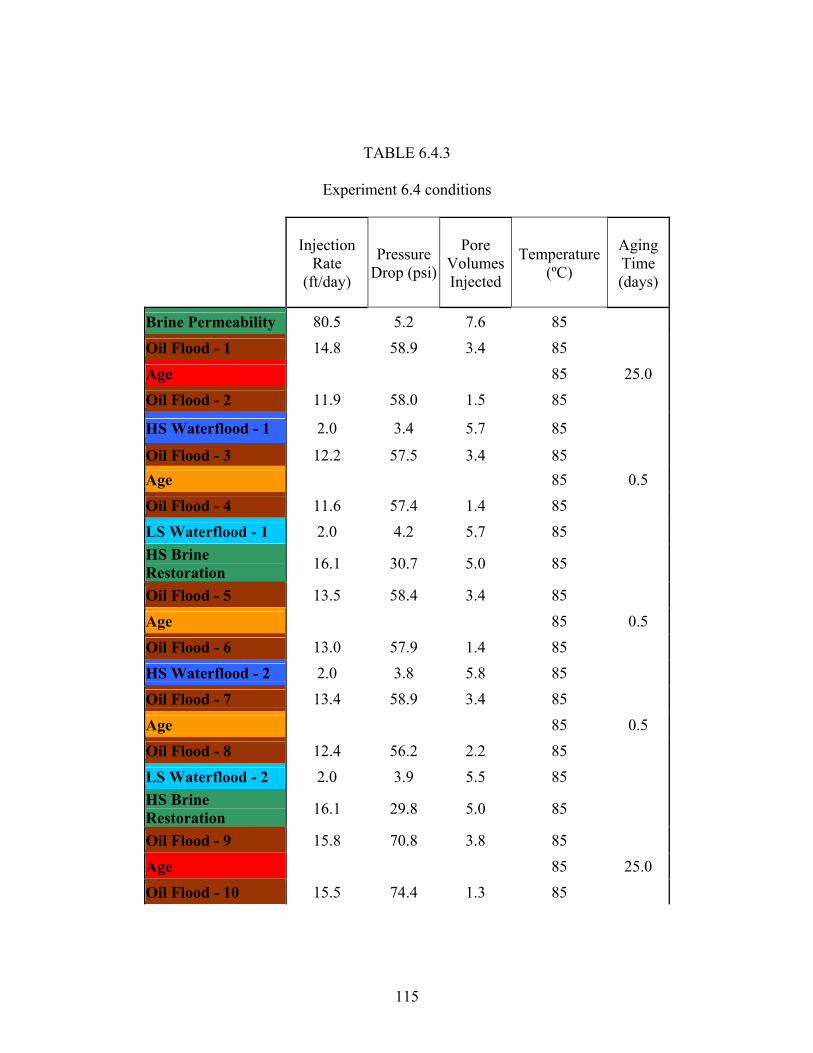
115
TABLE 6.4.3
Experiment 6.4 conditions
Injection
Rate (ft/day)
Pressure Drop (psi)
Pore Volumes Injected
Temperature (ºC)
Aging Time (days)
Brine Permeability 80.5 5.2 7.6 85
Oil Flood - 1 14.8 58.9 3.4 85 Age 85 25.0 Oil Flood - 2 11.9 58.0 1.5 85
HS Waterflood - 1 2.0 3.4 5.7 85
Oil Flood - 3 12.2 57.5 3.4 85 Age 85 0.5 Oil Flood - 4 11.6 57.4 1.4 85 LS Waterflood - 1 2.0 4.2 5.7 85 HS Brine Restoration 16.1 30.7 5.0 85
Oil Flood - 5 13.5 58.4 3.4 85 Age 85 0.5 Oil Flood - 6 13.0 57.9 1.4 85 HS Waterflood - 2 2.0 3.8 5.8 85 Oil Flood - 7 13.4 58.9 3.4 85 Age 85 0.5 Oil Flood - 8 12.4 56.2 2.2 85 LS Waterflood - 2 2.0 3.9 5.5 85 HS Brine Restoration 16.1 29.8 5.0 85
Oil Flood - 9 15.8 70.8 3.8 85 Age 85 25.0 Oil Flood - 10 15.5 74.4 1.3 85
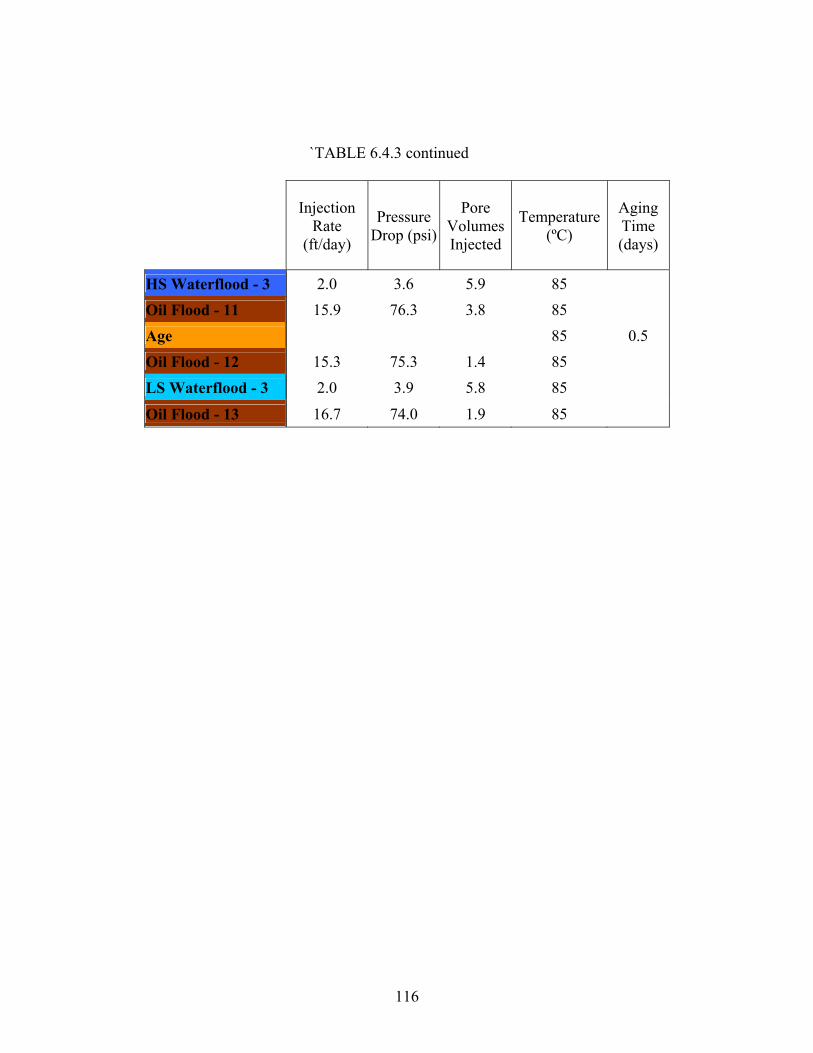
116
`TABLE 6.4.3 continued
Injection
Rate (ft/day)
Pressure Drop (psi)
Pore Volumes Injected
Temperature (ºC)
Aging Time (days)
HS Waterflood - 3 2.0 3.6 5.9 85 Oil Flood - 11 15.9 76.3 3.8 85 Age 85 0.5 Oil Flood - 12 15.3 75.3 1.4 85 LS Waterflood - 3 2.0 3.9 5.8 85
Oil Flood - 13 16.7 74.0 1.9 85
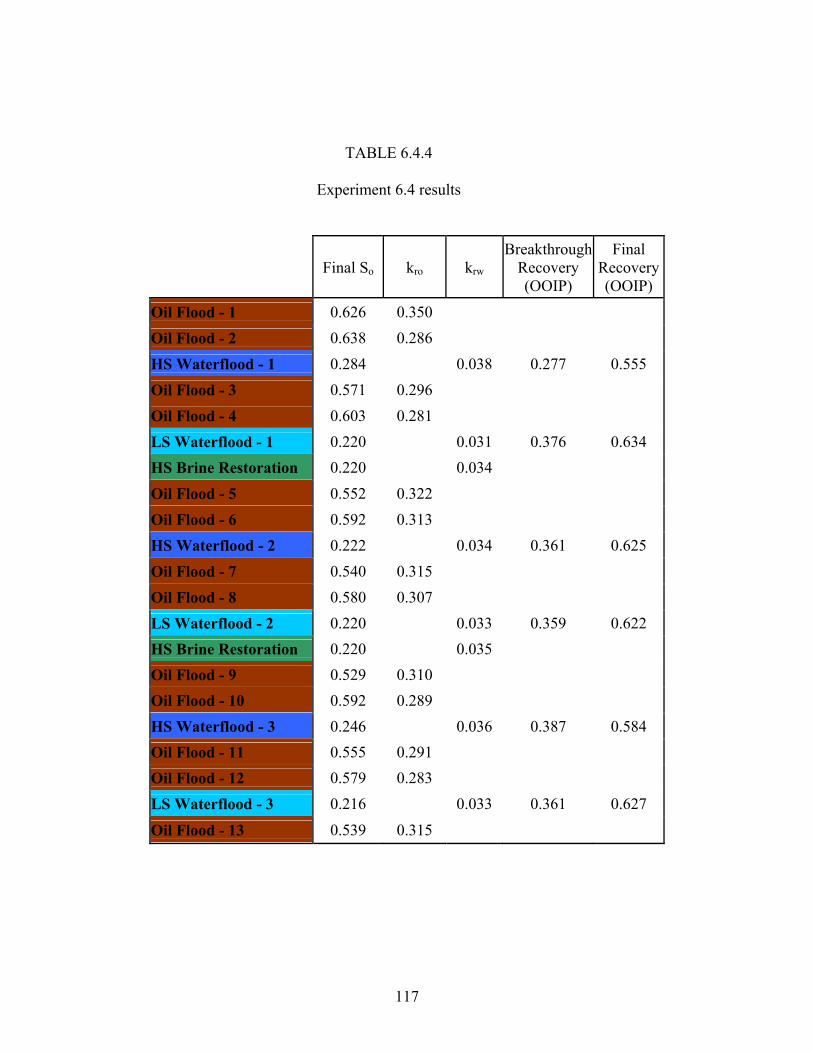
117
TABLE 6.4.4
Experiment 6.4 results
Final So kro krw Breakthrough
Recovery (OOIP)
Final Recovery (OOIP)
Oil Flood - 1 0.626 0.350 Oil Flood - 2 0.638 0.286 HS Waterflood - 1 0.284 0.038 0.277 0.555 Oil Flood - 3 0.571 0.296 Oil Flood - 4 0.603 0.281 LS Waterflood - 1 0.220 0.031 0.376 0.634 HS Brine Restoration 0.220 0.034 Oil Flood - 5 0.552 0.322 Oil Flood - 6 0.592 0.313 HS Waterflood - 2 0.222 0.034 0.361 0.625 Oil Flood - 7 0.540 0.315 Oil Flood - 8 0.580 0.307 LS Waterflood - 2 0.220 0.033 0.359 0.622 HS Brine Restoration 0.220 0.035 Oil Flood - 9 0.529 0.310 Oil Flood - 10 0.592 0.289 HS Waterflood - 3 0.246 0.036 0.387 0.584 Oil Flood - 11 0.555 0.291 Oil Flood - 12 0.579 0.283 LS Waterflood - 3 0.216 0.033 0.361 0.627
Oil Flood - 13 0.539 0.315
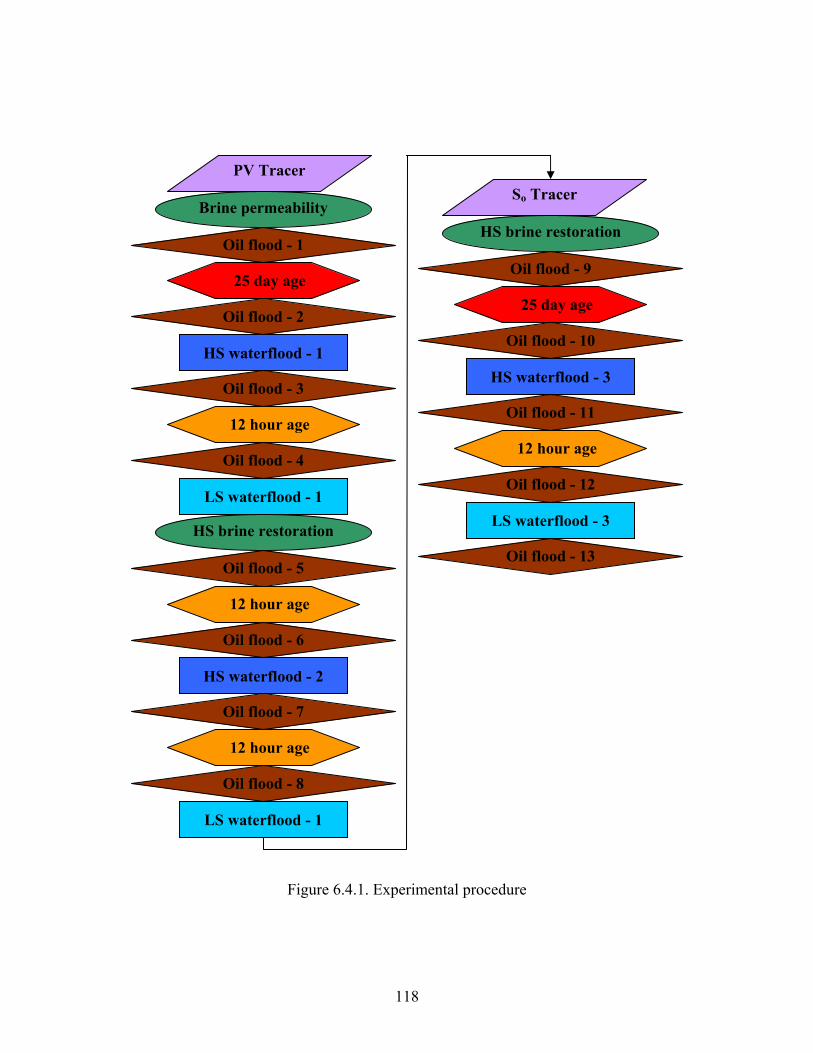
118
Figure 6.4.1. Experimental procedure
HS waterflood - 1
Brine permeability
Oil flood - 2
12 hour age
Oil flood - 1
25 day age
Oil flood - 3
Oil flood - 4
LS waterflood - 1
HS brine restoration
12 hour age
Oil flood - 5
Oil flood - 6
HS waterflood - 2
12 hour age
Oil flood - 7
Oil flood - 8
LS waterflood - 1
HS brine restoration
PV Tracer
So Tracer
Oil flood - 10
Oil flood - 9
25 day age
HS waterflood - 3
Oil flood - 13
Oil flood - 12
Oil flood - 11
12 hour age
LS waterflood - 3
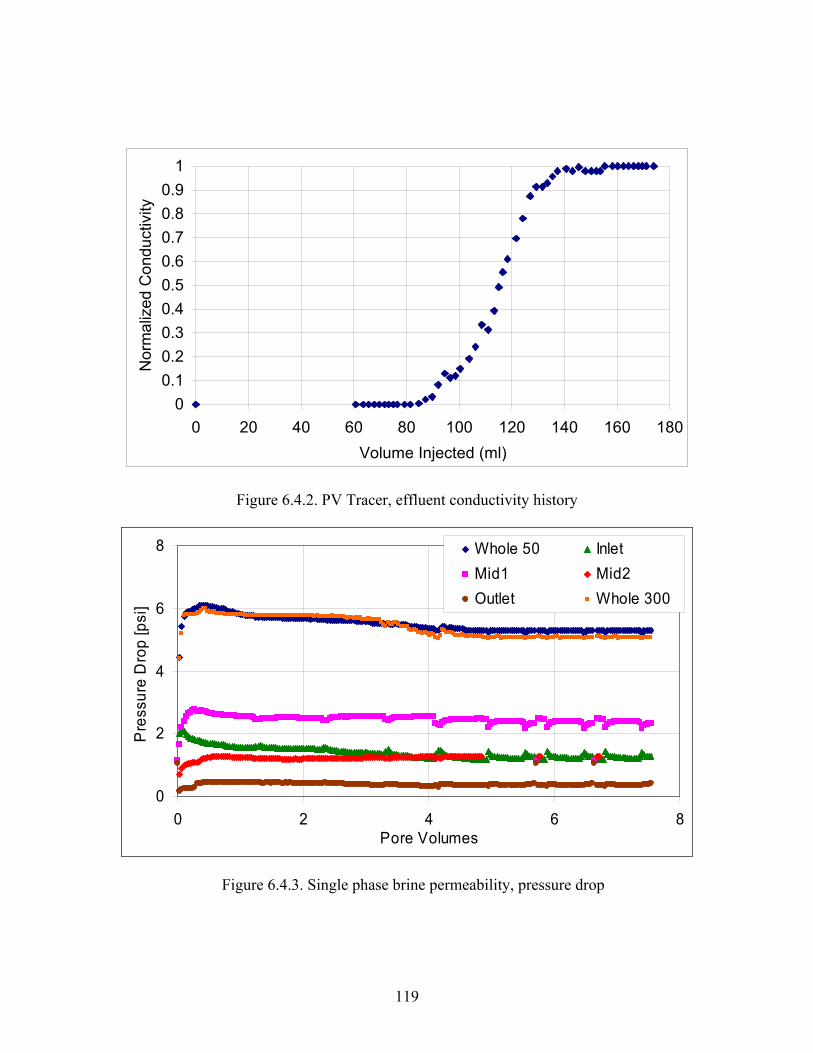
119
00.10.20.30.40.50.60.70.80.9
1
0 20 40 60 80 100 120 140 160 180Volume Injected (ml)
Nor
mal
ized
Con
duct
ivity
Figure 6.4.2. PV Tracer, effluent conductivity history
0
2
4
6
8
0 2 4 6 8Pore Volumes
Pre
ssur
e D
rop
[psi
]
Whole 50 InletMid1 Mid2Outlet Whole 300
Figure 6.4.3. Single phase brine permeability, pressure drop
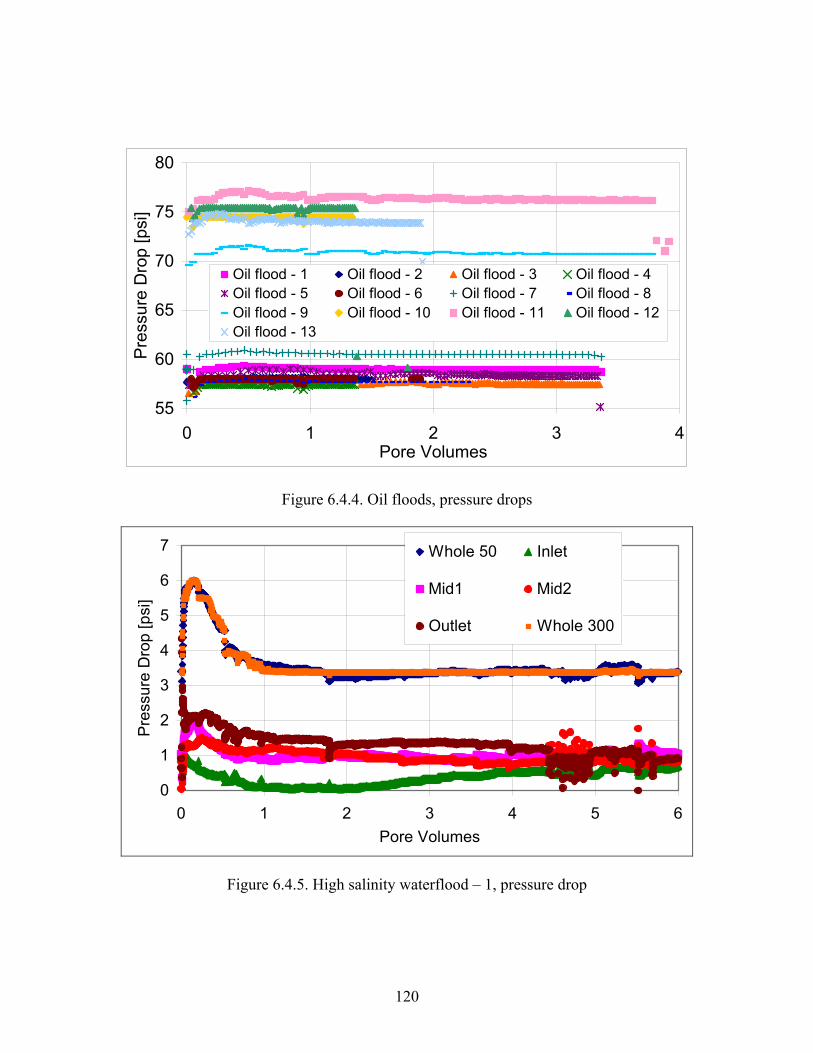
120
55
60
65
70
75
80
0 1 2 3 4Pore Volumes
Pre
ssur
e D
rop
[psi
]
Oil flood - 1 Oil flood - 2 Oil flood - 3 Oil flood - 4Oil flood - 5 Oil flood - 6 Oil flood - 7 Oil flood - 8Oil flood - 9 Oil flood - 10 Oil flood - 11 Oil flood - 12Oil flood - 13
Figure 6.4.4. Oil floods, pressure drops
0
1
2
3
4
5
6
7
0 1 2 3 4 5 6Pore Volumes
Pre
ssur
e D
rop
[psi
]
Whole 50 Inlet
Mid1 Mid2
Outlet Whole 300
Figure 6.4.5. High salinity waterflood – 1, pressure drop
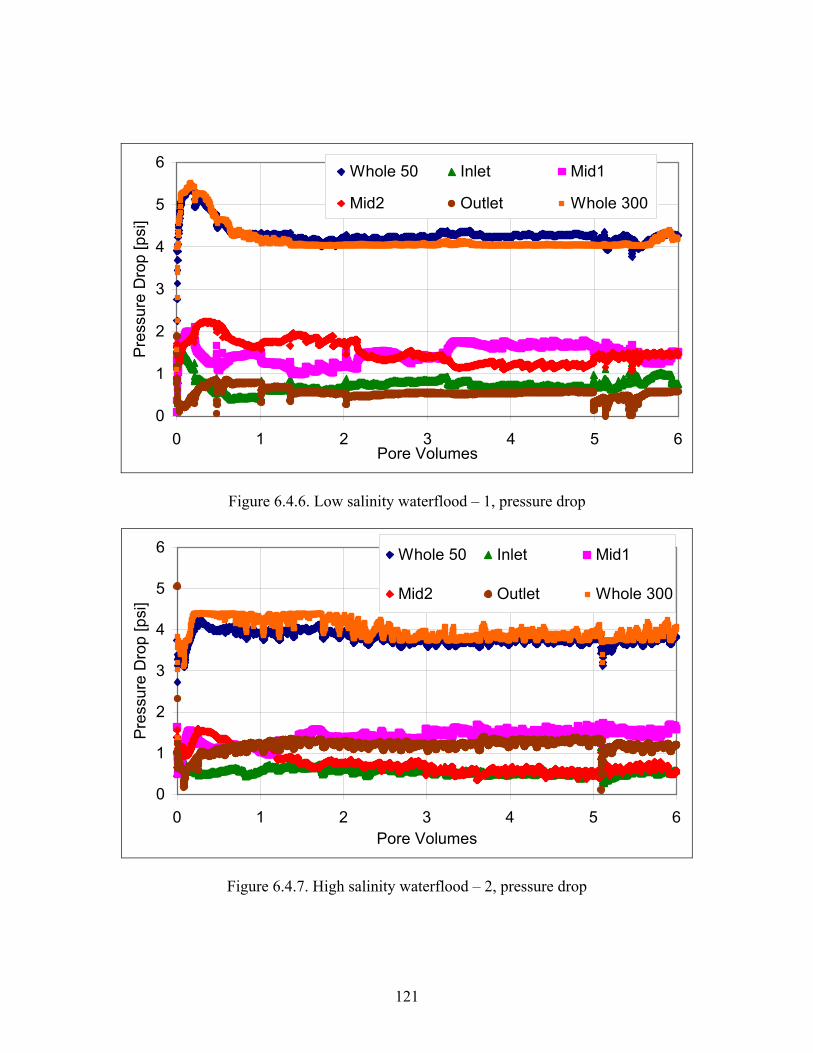
121
0
1
2
3
4
5
6
0 1 2 3 4 5 6Pore Volumes
Pre
ssur
e D
rop
[psi
]
Whole 50 Inlet Mid1
Mid2 Outlet Whole 300
Figure 6.4.6. Low salinity waterflood – 1, pressure drop
0
1
2
3
4
5
6
0 1 2 3 4 5 6Pore Volumes
Pre
ssur
e D
rop
[psi
]
Whole 50 Inlet Mid1
Mid2 Outlet Whole 300
Figure 6.4.7. High salinity waterflood – 2, pressure drop
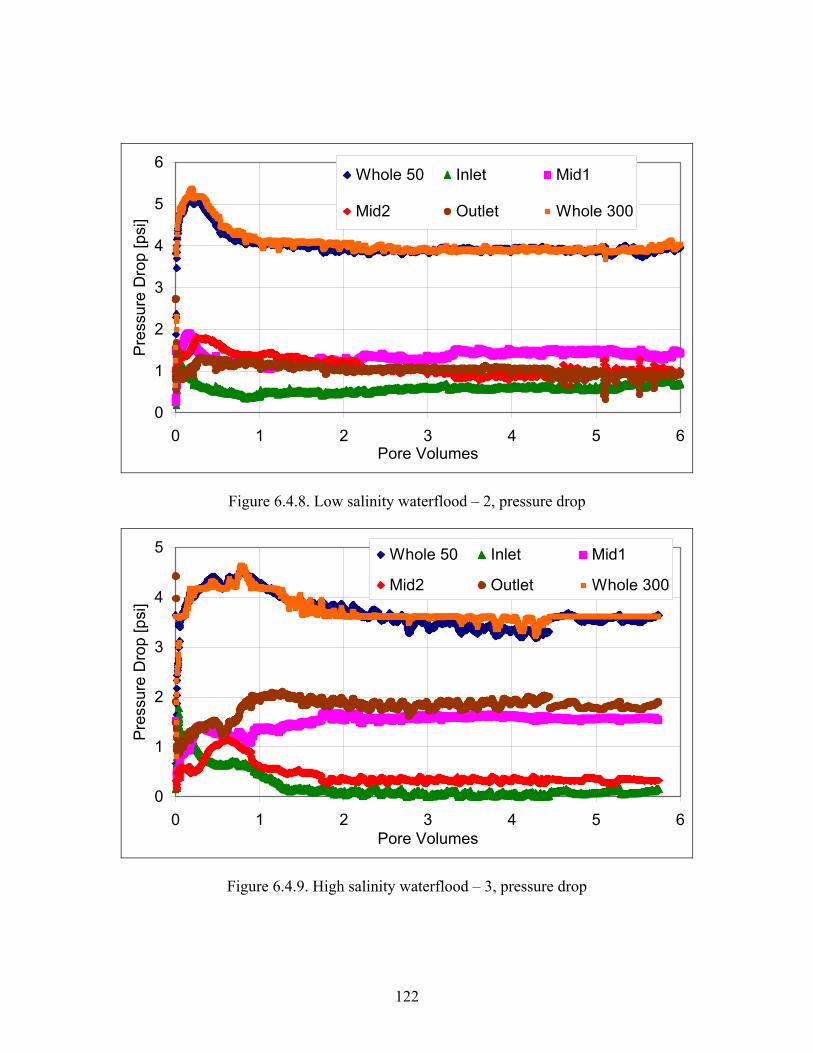
122
0
1
2
3
4
5
6
0 1 2 3 4 5 6Pore Volumes
Pre
ssur
e D
rop
[psi
]
Whole 50 Inlet Mid1
Mid2 Outlet Whole 300
Figure 6.4.8. Low salinity waterflood – 2, pressure drop
0
1
2
3
4
5
0 1 2 3 4 5 6Pore Volumes
Pre
ssur
e D
rop
[psi
]
Whole 50 Inlet Mid1
Mid2 Outlet Whole 300
Figure 6.4.9. High salinity waterflood – 3, pressure drop
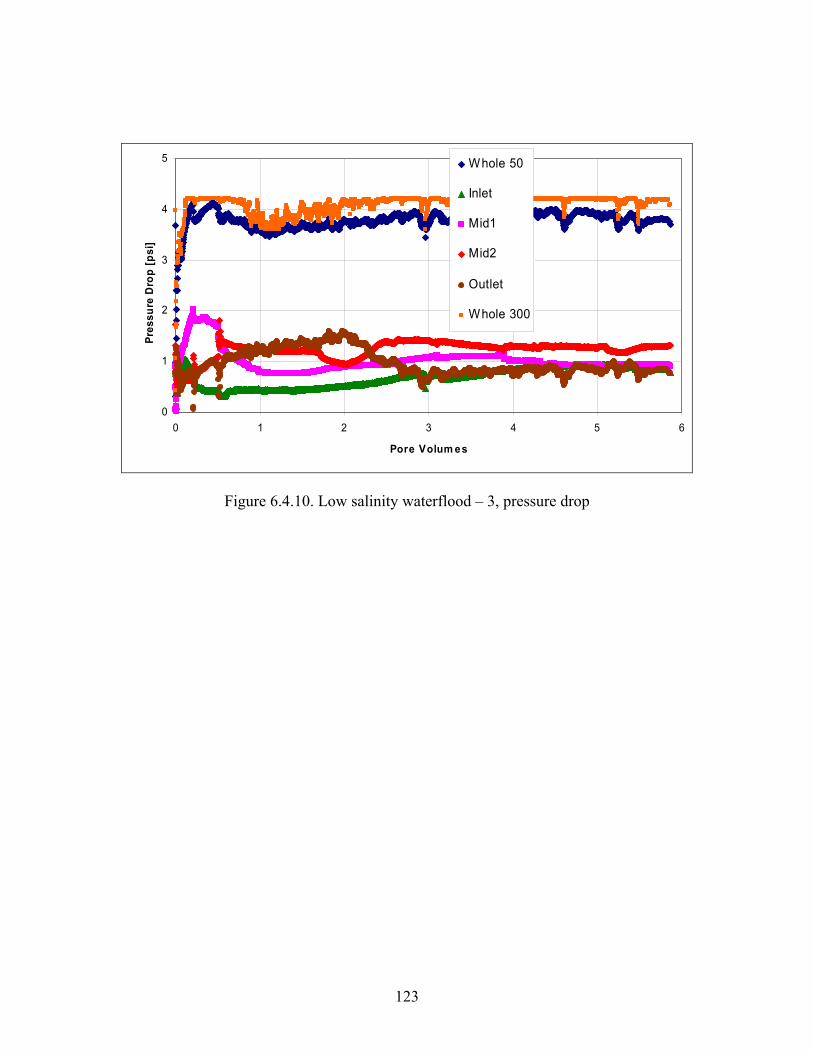
123
0
1
2
3
4
5
0 1 2 3 4 5 6
Pore Volum es
Pres
sure
Dro
p [p
si]
Whole 50
Inlet
Mid1
Mid2
Outlet
Whole 300
Figure 6.4.10. Low salinity waterflood – 3, pressure drop
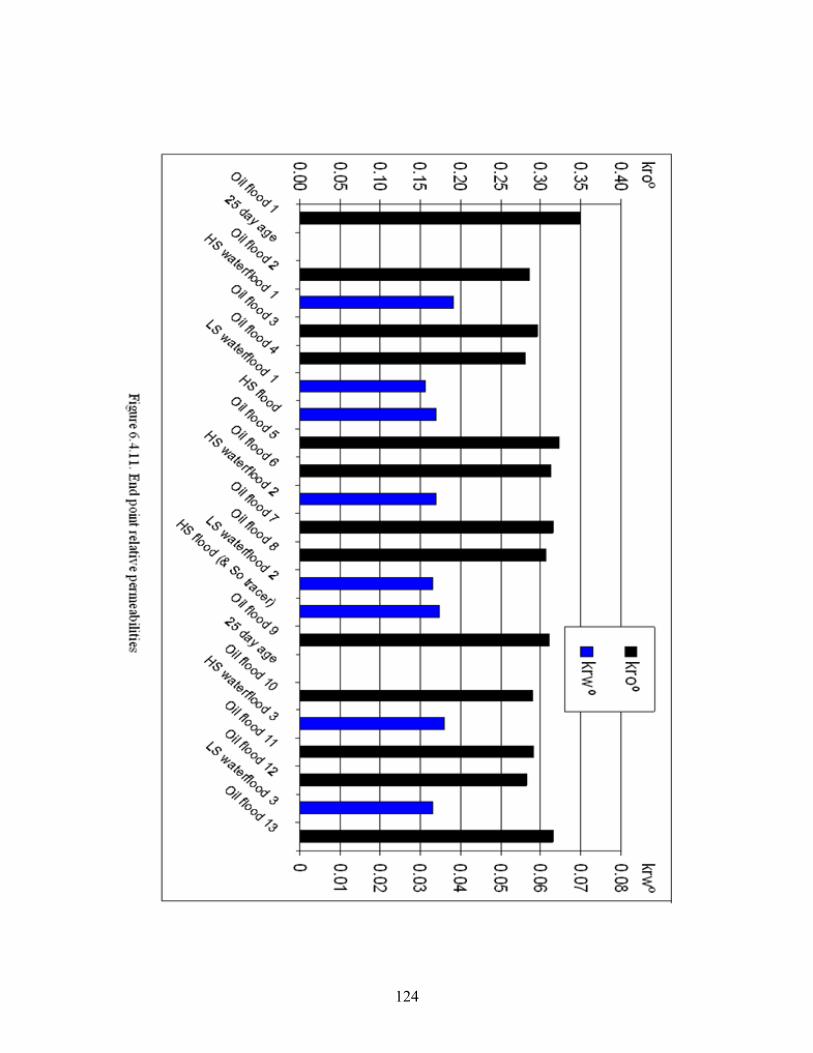
124
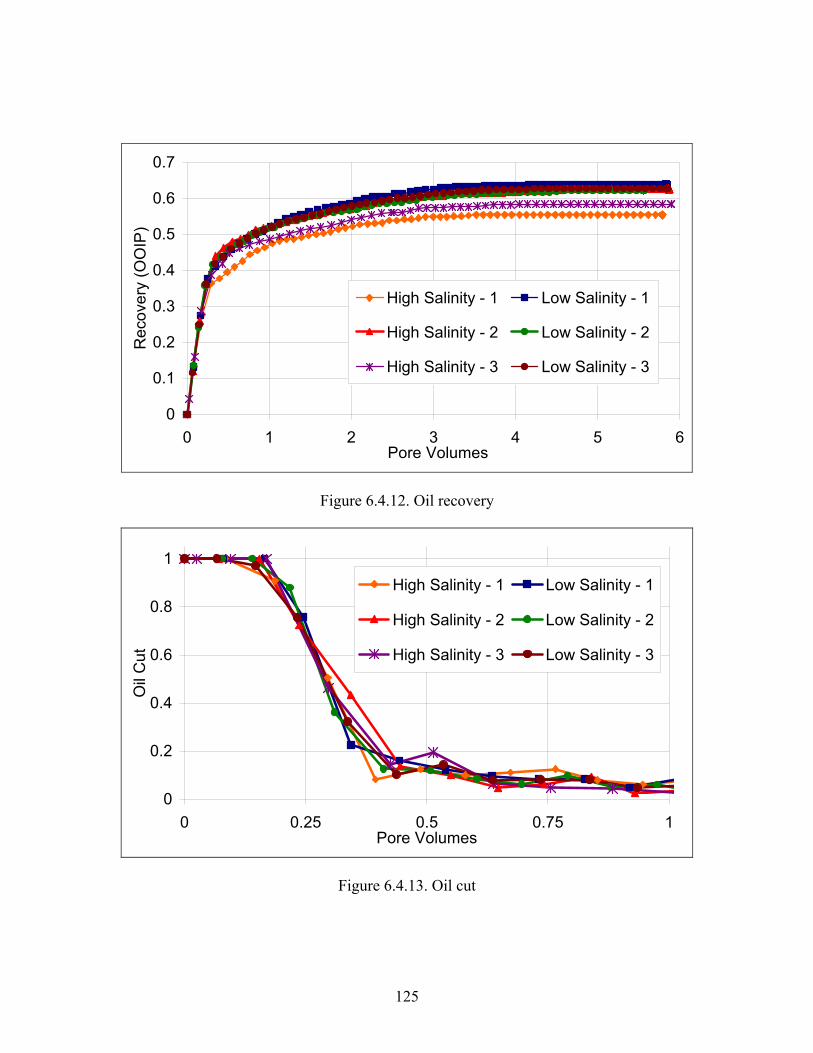
125
0
0.1
0.2
0.3
0.4
0.5
0.6
0.7
0 1 2 3 4 5 6Pore Volumes
Rec
over
y (O
OIP
)
High Salinity - 1 Low Salinity - 1
High Salinity - 2 Low Salinity - 2
High Salinity - 3 Low Salinity - 3
Figure 6.4.12. Oil recovery
0
0.2
0.4
0.6
0.8
1
0 0.25 0.5 0.75 1Pore Volumes
Oil
Cut
High Salinity - 1 Low Salinity - 1
High Salinity - 2 Low Salinity - 2
High Salinity - 3 Low Salinity - 3
Figure 6.4.13. Oil cut
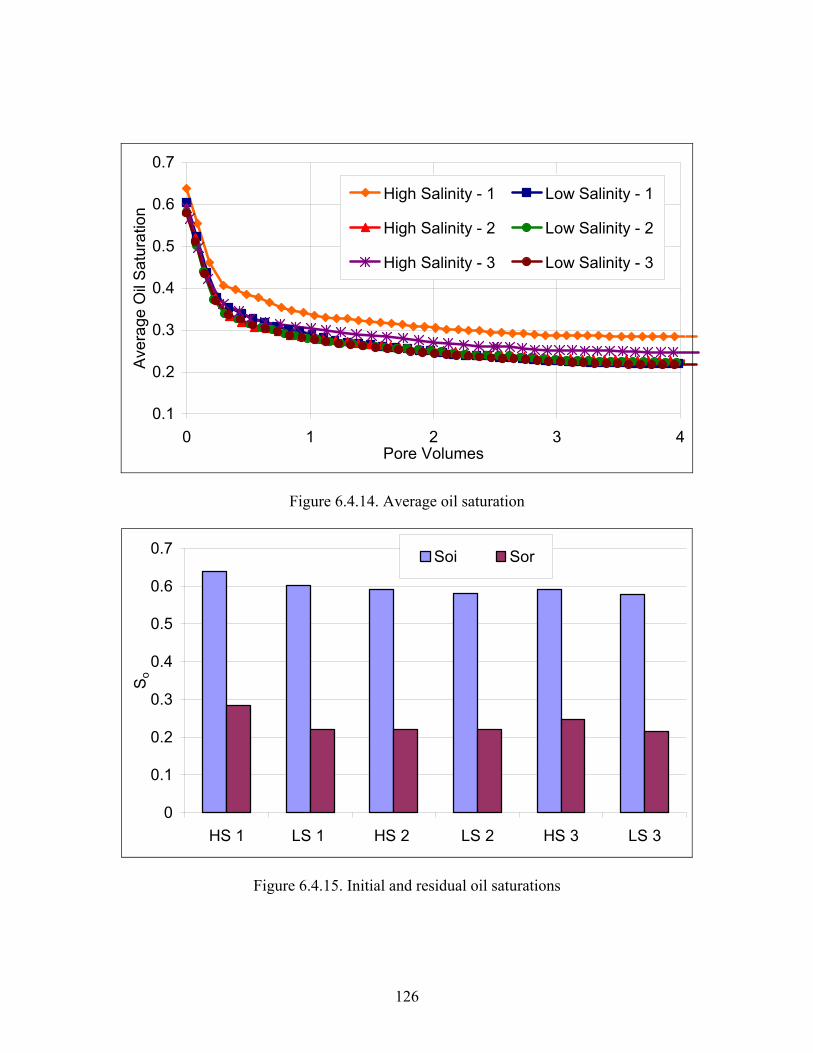
126
0.1
0.2
0.3
0.4
0.5
0.6
0.7
0 1 2 3 4Pore Volumes
Ave
rage
Oil
Sat
urat
ion
High Salinity - 1 Low Salinity - 1
High Salinity - 2 Low Salinity - 2
High Salinity - 3 Low Salinity - 3
Figure 6.4.14. Average oil saturation
0
0.1
0.2
0.3
0.4
0.5
0.6
0.7
HS 1 LS 1 HS 2 LS 2 HS 3 LS 3
So
Soi Sor
Figure 6.4.15. Initial and residual oil saturations
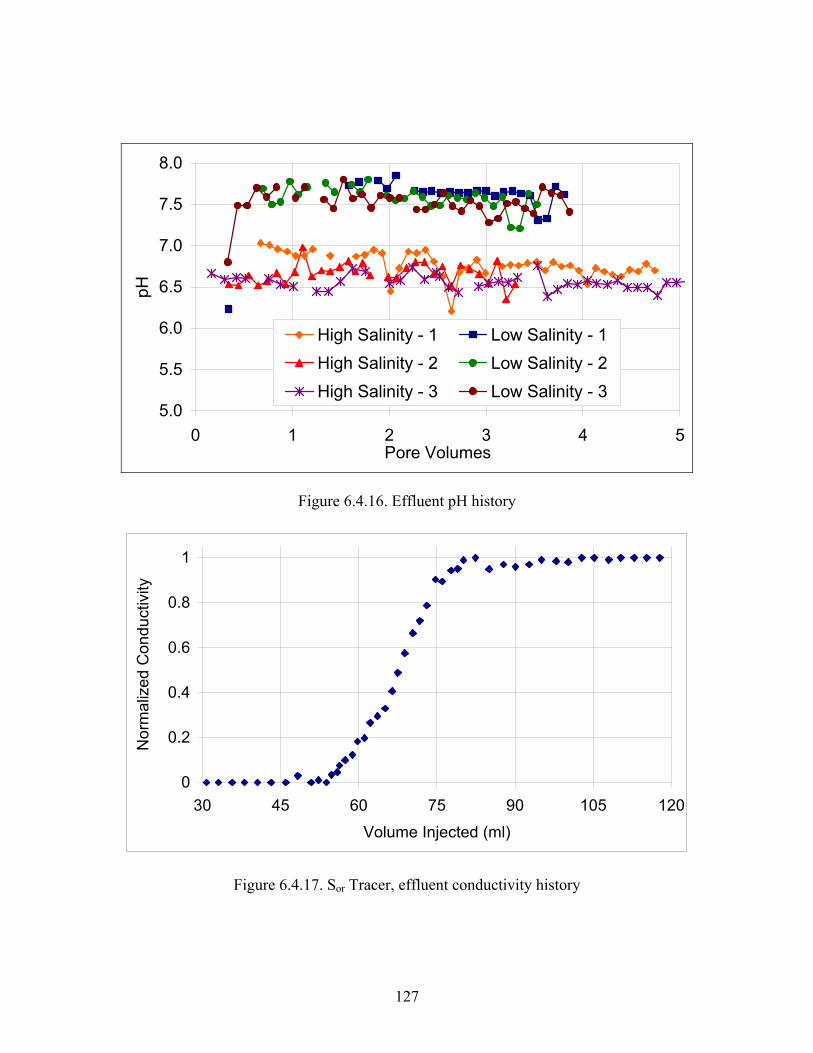
127
5.0
5.5
6.0
6.5
7.0
7.5
8.0
0 1 2 3 4 5Pore Volumes
pH
High Salinity - 1 Low Salinity - 1High Salinity - 2 Low Salinity - 2High Salinity - 3 Low Salinity - 3
Figure 6.4.16. Effluent pH history
0
0.2
0.4
0.6
0.8
1
30 45 60 75 90 105 120
Volume Injected (ml)
Nor
mal
ized
Con
duct
ivity
Figure 6.4.17. Sor Tracer, effluent conductivity history
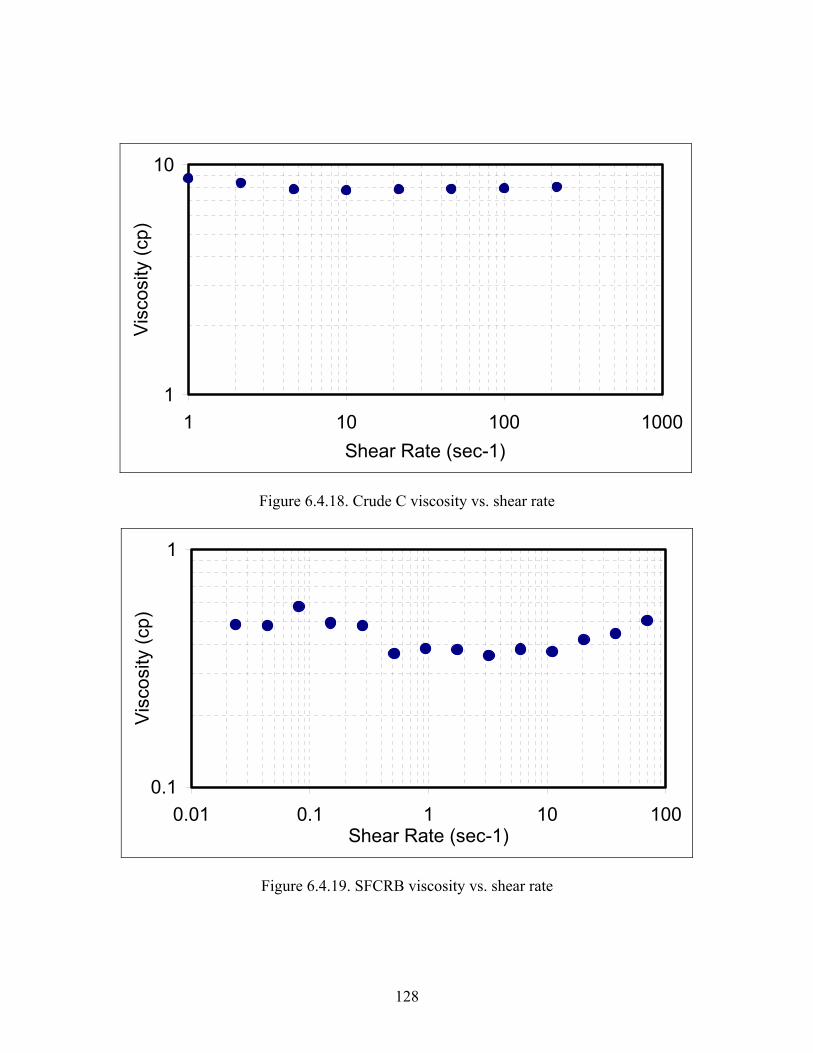
128
1
10
1 10 100 1000Shear Rate (sec-1)
Visc
osity
(cp)
Figure 6.4.18. Crude C viscosity vs. shear rate
0.1
1
0.01 0.1 1 10 100Shear Rate (sec-1)
Visc
osity
(cp)
Figure 6.4.19. SFCRB viscosity vs. shear rate
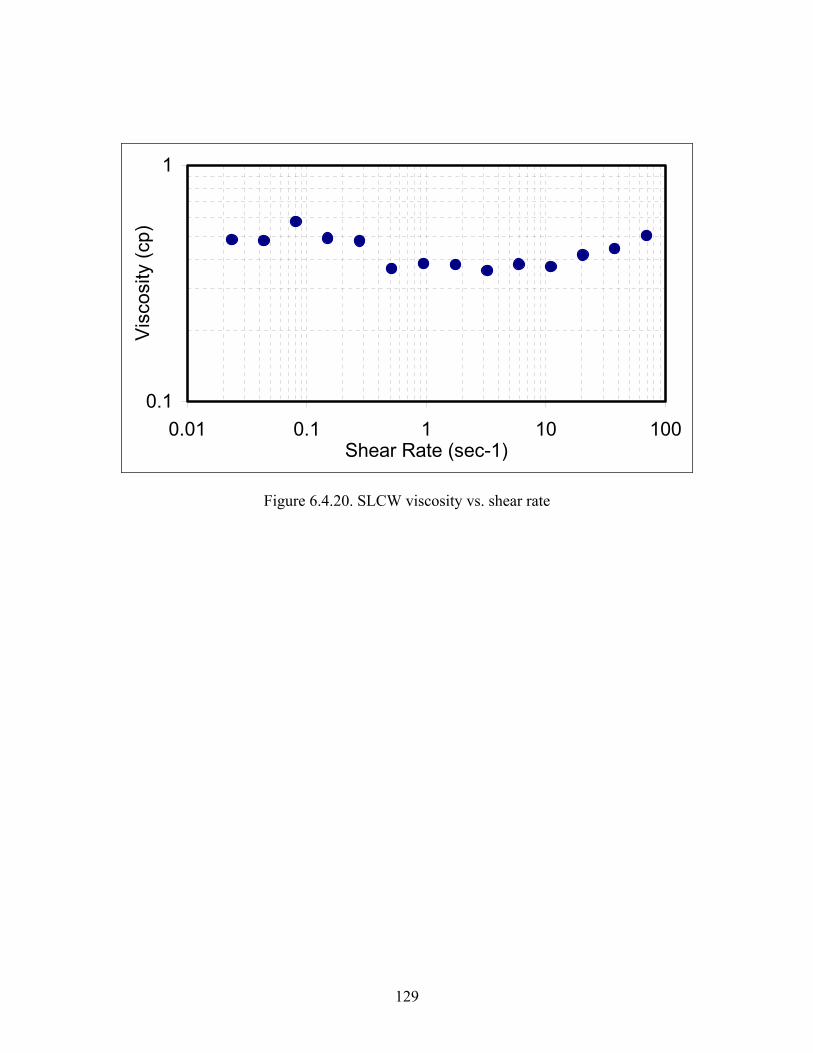
129
0.1
1
0.01 0.1 1 10 100Shear Rate (sec-1)
Vis
cosi
ty (c
p)
Figure 6.4.20. SLCW viscosity vs. shear rate
130
CHAPTER 7
SUMMARY AND CONCLUSIONS
This research effort was undertaken to study the effect of low salinity
waterflooding on recovery rate, residual oil saturation and relative
permeability. Four sets of experiments were performed: Serial floods in Berea
core, Parallel floods in Berea cores, Serial floods in Reservoir B core and
Serial floods in Reservoir C core.
In Experiment 6.1, Serial floods in Berea core, injecting low salinity brine
reduced residual oil saturation by 2.4 saturation units. However oil recovery
was very slow. 90% of the high salinity waterflood’s ultimate oil recovery
was achieved after 0.3 pore volumes while almost 2.4 pore volumes were
required to reach the same oil recovery during the low salinity waterflood.
End-point water relative permeability to low salinity brine was about 10%
lower then for high salinity brine. End-point oil relative permeability
decreased after the core was exposed to low salinity brine.
Experiment 6.2, Parallel floods in Berea cores, demonstrated the importance
of cation selection. Ultimate oil recovery was very similar during the high
salinity, Na-only low salinity and Ca-only low salinity waterfloods. Ultimate
131
recovery was 15% higher during the Na-Ca low salinity waterflood and 20%
lower during the Li-only low salinity waterflood; both relative to the high
salinity waterflood. The improved ultimate recovery observed during the
mixed Na-Ca low salinity waterflood was accompanied by a 17% reduction in
end-point water relative permeability. While in the less effective Li-only low
salinity waterflood the end point water relative permeability increased by
27%. The Na and Li low salinity results were expected to be very similar. The
Li waterflood’s low recovery could be the result of channelized flow because
a heterogeneous pore structure or micro fractures.
In Experiment 6.3, Serial floods in Reservoir B core, high and low salinity
brines produced very similar ultimate oil recovery. The first low salinity
injection produced a massive 68% reduction in end-point water relative
permeability. The end-point oil relative permeability decreased slightly after
the cores exposure to low salinity brine.
In Experiment 6.4, Serial floods in Reservoir C core, the ultimate oil recovery
during the low salinity waterflood was 14% higher then during the high
salinity waterflood. The low salinity end-point water relative permeability
decreased by 18% while end-point oil relative permeability increased by 9%.
Oil recovery was insensitive to brine salinity after the first low salinity
132
injection; however recovery-salinity sensitivity was restored by re-aging.
After re-aging the core, ultimate oil recovery from low salinity waterflooding
was 7% higher then from high salinity waterflooding. In both successful low
salinity waterfloods, improved recovery was achieved by delaying
breakthough.
These results indicate that low salinity improved recovery is a result of a
wettability alteration from mixed-wet to water-wet. This conclusion is
supported by the following observations:
(1) Low salinity brine improved recovery in three cases: the mixed Na-Ca low
salinity waterflood in Experiment 6.2, the first low salinity waterflood in
Experiment 6.4 and the post-re-age low salinity waterflood also in
Experiment 6.4. In all these cases end-point water relative permeability
decreased during the low salinity injection and in Experiment 6.4 end-
point oil relative permeability increased after the low salinity waterflood.
Post waterflood kroº was not measured in Experiment 6.2. In cases where
low salinity injection was detrimental, oil relative permeability decreased
after low salinity exposure.
(2) Injecting low salinity brine produces a dramatic and persistent wettability
alteration. This is clearly evident in Experiment 6.4, where high and low
133
salinity waterfloods – 1 and 3 produced very contrasting recovery
histories; however, the high and low salinity waterfloods – 2 produced
almost exactly the same recovery. A similar alteration is evident in
Experiment 6.1, where the two high salinity waterfloods contrast but the
two low salinity waterfloods do not. The system had never been exposed
to low salinity brine before the first high salinity waterflood but had
before the second high salinity waterflood and both of the low salinity
waterfloods.
(3) The wettability alteration noted in (2) was reversed by extended aging. In
Experiment 6.4, oil recovery’s salinity sensitivity was eliminated after the
first low salinity injection. However, after re-aging the core 25 days, the
high and low salinity waterfloods again produced contrasting oil
recoveries.
(4) Injecting low salinity brine improved oil recovery only in mixed-wet
systems. The crude oil/rock/brine system studied during Experiment 6.3
was the most water-wet because of low clay content, low reservoir
temperature and a short aging time. In this system injecting low salinity
brine had no effect on recovery. Experiment 6.4, which possessed the
most clay rich core, the highest reservoir temperature and the longest
aging time, exhibited the most dramatic low salinity improved recovery.
134
(5) Injecting low salinity brine in Experiments 6.2 and 6.4 improved recovery
by delaying breakthrough, suggesting an improvement in displacement
stability.
Wettability effects the location of fluids within a rock’s pore space. The fluid
location dramatically impacts residual oil saturation and relative permeability.
The literature2, 12, 26 shows that the waterflood residual oil saturation is lowest
when a rock is mixed-wet. However, the mobility ratio is the most favorable
when a rock is water-wet because krw is depressed and kro is increased.
A successful low salinity waterflood leverages the advantage of both water
and mixed-wetness. The low salinity brine induces a wettability alteration
from mixed-wet to water-wet. However this alteration is localized and it is not
instantaneous. It occurs when an individual pore is contacted by low salinity
brine, not before. When low salinity brine invades a mixed-wet pore it first
displaces any oil occupying the center of the pore. The oil film become
unstable when contacted by low salinity brine and the aqueous phase is
allowed to contact the rock surface. As the pore becomes water-wet, the oil
touching the pore wall is also displaced. Also as krw increases and kro
decreases and the displacement becomes more stable, each pore is swept more
135
efficiently and snap off of oil ganglia is delayed. A summary of the
experimental data is in Table 7.1.
Bucklet-Leverett19 theory was used to demonstrate the benefit of low salinity
induced wettability alteration. Experimentally measured end-point relative
permeabilities, initial and residual oil saturations and water and oil viscosity
from Experiment 6.4 were used. Corey water and oil relative permeability
exponents were assumed. This method was also applied to predict high and
low salinity polymer flood performance. Input data is in Table 7.2. Graphs of
relative permeability vs. water saturation, fractional flow vs. water saturation,
oil recovery and oil cut are in Figures 7.1 – 7.4.
Several different mechanisms have been proposed to explain the wettability
alteration.
Lager et al.16 proposed that low salinity induced multi-component ionic
exchange causes a reduction in ion binding between the crude oil and the rock
surface. Oil-rock bond help stabilize the oil films in mix-wet pores but are
removed when contacted by low salinity brine. After the bonds are removed
the oil films become unstable and the brine comes in contact with the rock
surface. This hypothesis is primarily based on an experiment in which a core
136
was repeatedly flooded with NaCl-only brine then oil flooded and aged. After
aging, the core was insensitive to injected brine salinity. It is the authors
understanding that this mechanism implies injecting soft low salinity brine
would maximize oil recovery. This implication is refuted by the results from
Experiment 6.2, Parallel floods in Berea core, and by Zhang et al.37
Tang and Morrow29 hypothesized heavy polar components in the crude oil
adsorb onto fine particles along the pore walls and that these mixed-wet fines
are striped by low salinity brine. This hypothesis is based on the following
observations: a salinity depended recovery requires clay and reactive crude,
salinity dependence increases with increasing clay content, injection of low
salinity brine induces production of fines in the effluent fluid and low salinity
brine dramatically reduces water relative permeability. Dramatic permeability
damage was never observed during any of this work’s successful low salinity
waterfloods precluding the assumption of major clay swelling or clay
detachment and migration. Also, tertiary low salinity waterfloods never
produced incremental oil. Fines were never observed in effluent fluid samples.
And finally, fines detachment and migration is irreversible; however, re-aging
a core exposed and thus desensitized to low salinity brine restored the core
recovery-salinity sensitivity.
137
In almost all of the low salinity EOR literature reviewed in this paper small
core were used. Other researchers16, 25, 29, 36, 37 generally used cores which
were three inches long and one inch in diameter. In this work, cores eleven
inches or longer were used exclusively. Using longer cores decreases oil and
water phase saturation uncertainty because pore volume is larger, reduces the
impact of capillary end effect and allows the measurement of intermediate
(inlet, outlet, etc.) pressure drops. These new results are thus more reliable
than the data reported in the literature on short core plugs that are typically
only 3 inches long. Some of the experiments reported in the literature showed
a significant pressure drop increase where the experiments in longer cores
showed little or none.
More work is required to validate these results. Any attempts to definitively
show the benefit of low salinity waterflooding and to identify the mechanism
responsible will require a great deal more research.
The most important observations of this study are that the beneficial effects of
low salinity brine are observed only in experiments using cores with a high
clay content that have been aged with an active crude oil for a sufficiently
long time to convert them to a mixed-wet state. All of the successful
experiments were done at either 55 or 85 °C. Little additional information can
138
be learned by injecting low salinity brine into a low clay cores at low
temperature like in Experiment 6.3. However, even though the core used in
Experiment 6.3 had little clay, injecting 200 ppm TDS brine caused severe
permeability damage. Low salinity brines containing at least 1,000 ppm TDS
never caused severe permeability damage even if they contained no hard
cations. Also, when investigating low salinity EOR, aging can not be rushed.
The most dramatic result of this work is undoubtedly Experiment 6.4;
however, Experiment 6.2 demonstrated that primarily quartzose Berea, if aged
for at least 10 days, will possess salinity sensitivity.
Several different experiments should be considered in the future. Experiment
6.4 provides valuable insights into low salinity EOR. The reestablishment of
recovery-salinity sensitivity by re-aging highlights the profound importance
wettability. Additional attention to the effects of aging and re-aging is
warranted. However, it is worth noting that Tang and Morrow30 reported more
dramatic wettability alterations when changing temperature then when
changing aging time. Perhaps wettability could be more efficiently controlled
in future experiments by changing the experimental temperature. Preliminary
Buckley-Leverett calculations predict a contrast between high and low salinity
polymer floods. Polymer experiments may help to confirm the proposal that
low salinity waterflooding induces a more favorable displacement mobility.

139
Also, low salinity polymer flooding is attractive because reducing salinity will
increase polymer yield and reduce chemical costs.
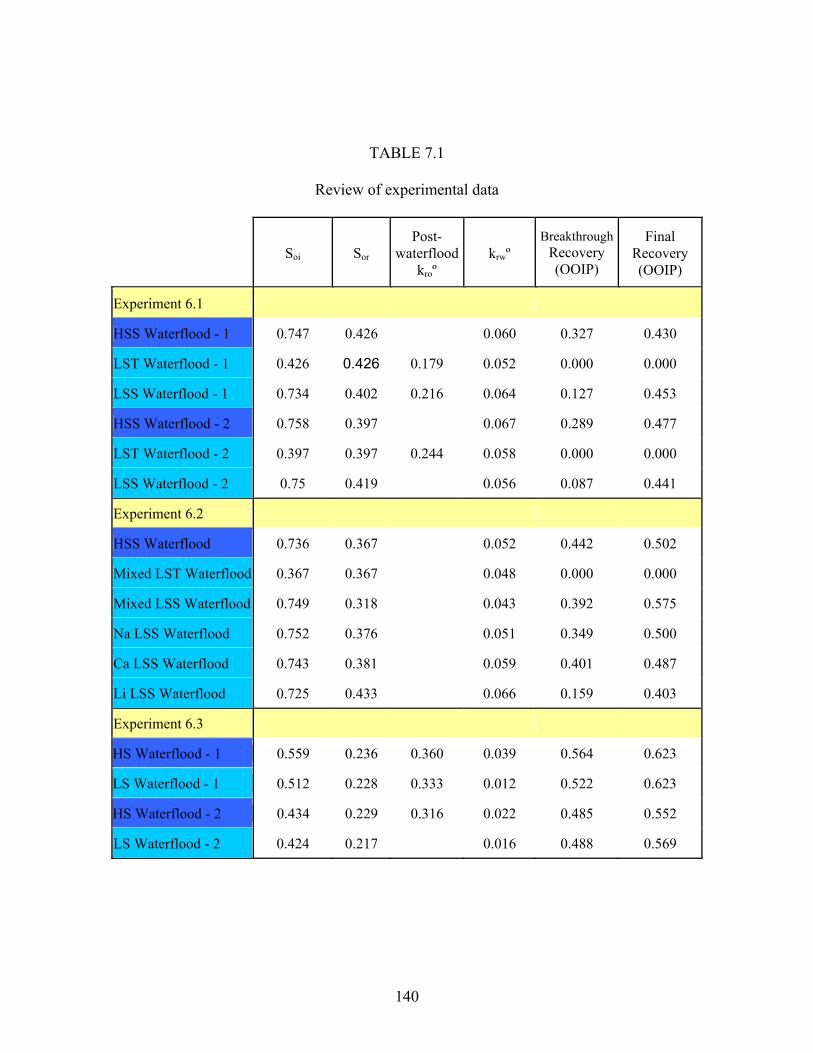
140
TABLE 7.1
Review of experimental data
Soi Sor Post-
waterflood kroº
krwº Breakthrough
Recovery (OOIP)
Final Recovery (OOIP)
Experiment 6.1
HSS Waterflood - 1 0.747 0.426 0.060 0.327 0.430
LST Waterflood - 1 0.426 0.426 0.179 0.052 0.000 0.000
LSS Waterflood - 1 0.734 0.402 0.216 0.064 0.127 0.453
HSS Waterflood - 2 0.758 0.397 0.067 0.289 0.477
LST Waterflood - 2 0.397 0.397 0.244 0.058 0.000 0.000
LSS Waterflood - 2 0.75 0.419 0.056 0.087 0.441
Experiment 6.2
HSS Waterflood 0.736 0.367 0.052 0.442 0.502
Mixed LST Waterflood 0.367 0.367 0.048 0.000 0.000
Mixed LSS Waterflood 0.749 0.318 0.043 0.392 0.575
Na LSS Waterflood 0.752 0.376 0.051 0.349 0.500
Ca LSS Waterflood 0.743 0.381 0.059 0.401 0.487
Li LSS Waterflood 0.725 0.433 0.066 0.159 0.403
Experiment 6.3
HS Waterflood - 1 0.559 0.236 0.360 0.039 0.564 0.623
LS Waterflood - 1 0.512 0.228 0.333 0.012 0.522 0.623
HS Waterflood - 2 0.434 0.229 0.316 0.022 0.485 0.552
LS Waterflood - 2 0.424 0.217 0.016 0.488 0.569
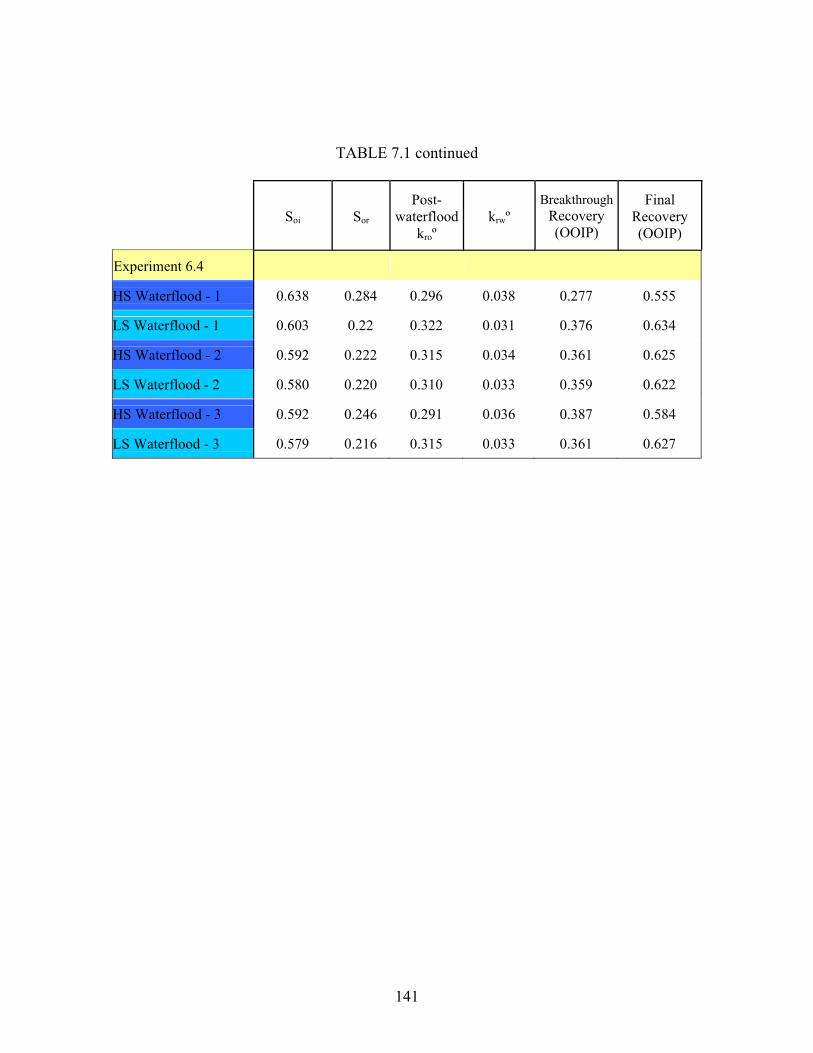
141
TABLE 7.1 continued
Soi Sor Post-
waterflood kroº
krwº Breakthrough
Recovery (OOIP)
Final Recovery (OOIP)
Experiment 6.4
HS Waterflood - 1 0.638 0.284 0.296 0.038 0.277 0.555
LS Waterflood - 1 0.603 0.22 0.322 0.031 0.376 0.634
HS Waterflood - 2 0.592 0.222 0.315 0.034 0.361 0.625
LS Waterflood - 2 0.580 0.220 0.310 0.033 0.359 0.622
HS Waterflood - 3 0.592 0.246 0.291 0.036 0.387 0.584
LS Waterflood - 3 0.579 0.216 0.315 0.033 0.361 0.627
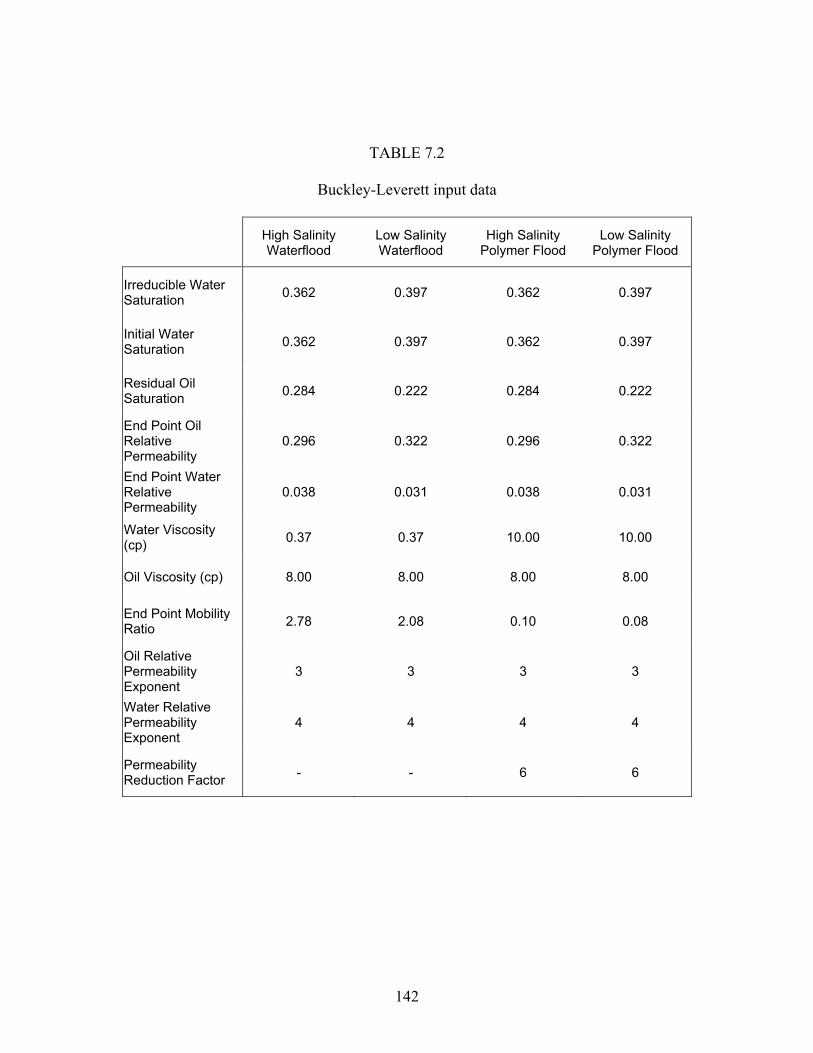
142
TABLE 7.2
Buckley-Leverett input data
High Salinity Waterflood
Low Salinity Waterflood
High Salinity Polymer Flood
Low Salinity Polymer Flood
Irreducible Water Saturation 0.362 0.397 0.362 0.397
Initial Water Saturation 0.362 0.397 0.362 0.397
Residual Oil Saturation 0.284 0.222 0.284 0.222
End Point Oil Relative Permeability
0.296 0.322 0.296 0.322
End Point Water Relative Permeability
0.038 0.031 0.038 0.031
Water Viscosity (cp) 0.37 0.37 10.00 10.00
Oil Viscosity (cp) 8.00 8.00 8.00 8.00
End Point Mobility Ratio 2.78 2.08 0.10 0.08
Oil Relative Permeability Exponent
3 3 3 3
Water Relative Permeability Exponent
4 4 4 4
Permeability Reduction Factor - - 6 6
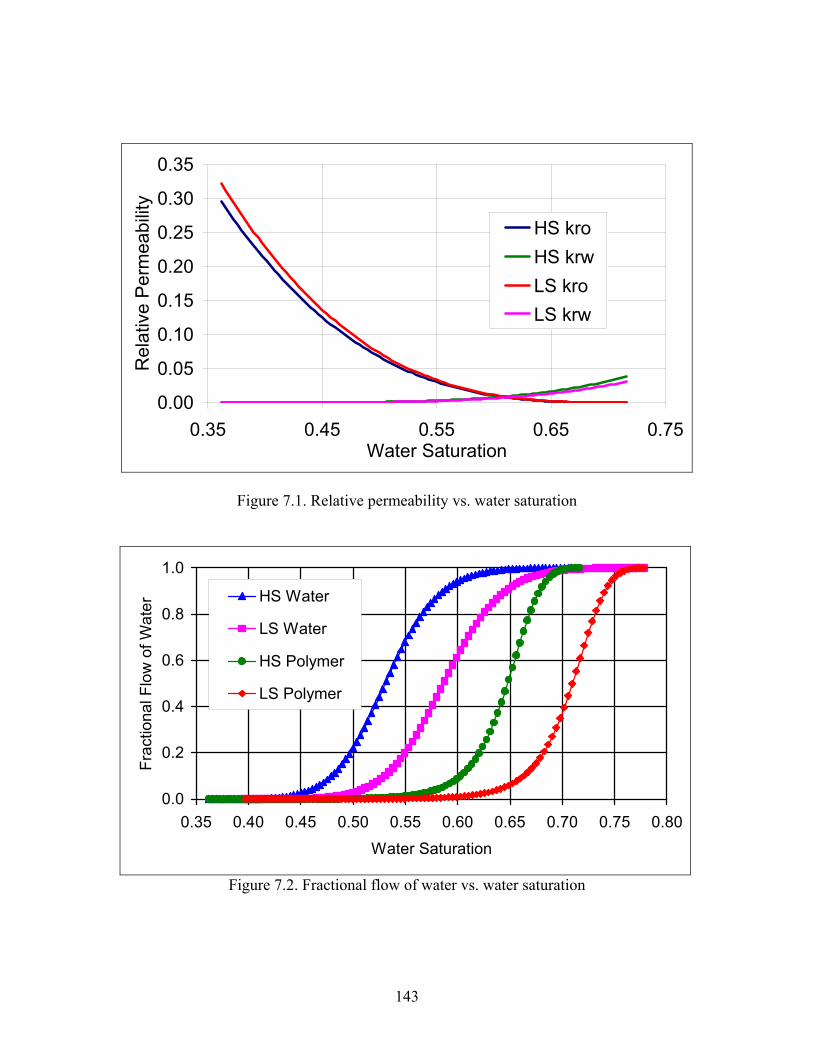
143
0.00
0.05
0.10
0.15
0.20
0.25
0.30
0.35
0.35 0.45 0.55 0.65 0.75Water Saturation
Rel
ativ
e P
erm
eabi
lity
HS kroHS krwLS kroLS krw
Figure 7.1. Relative permeability vs. water saturation
0.0
0.2
0.4
0.6
0.8
1.0
0.35 0.40 0.45 0.50 0.55 0.60 0.65 0.70 0.75 0.80
Water Saturation
Frac
tiona
l Flo
w o
f Wat
er HS Water
LS Water
HS Polymer
LS Polymer
Figure 7.2. Fractional flow of water vs. water saturation
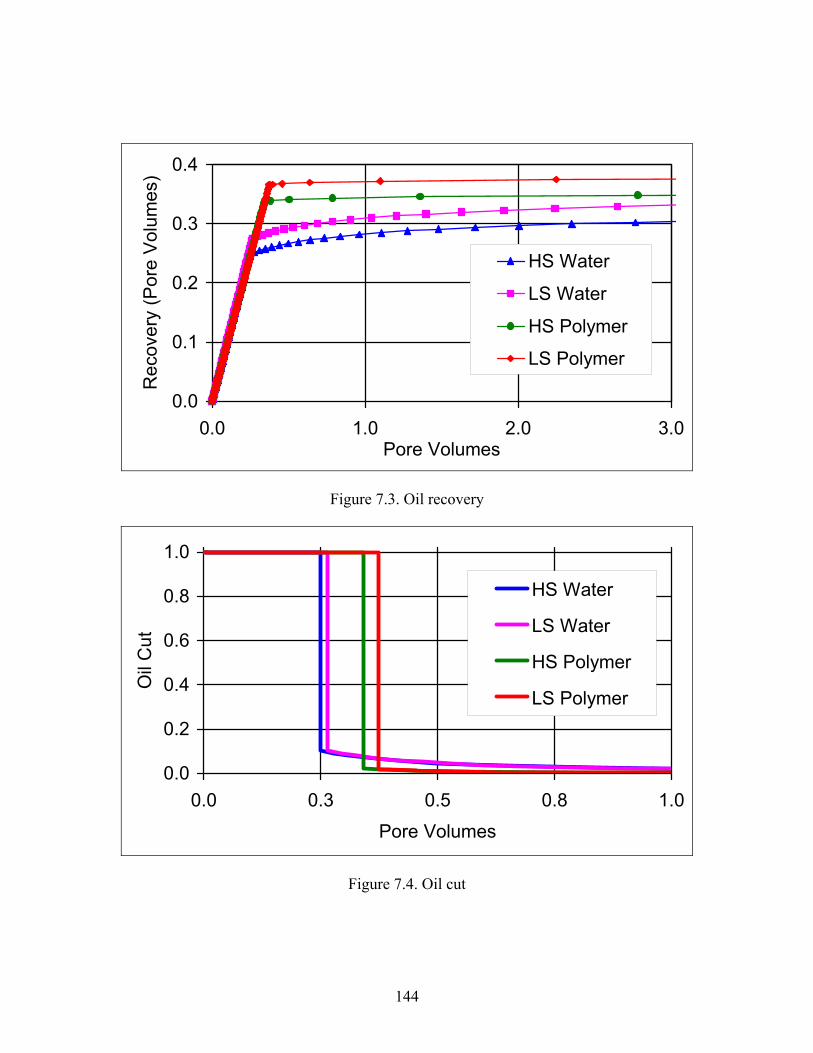
144
0.0
0.1
0.2
0.3
0.4
0.0 1.0 2.0 3.0Pore Volumes
Rec
over
y (P
ore
Vol
umes
)
HS Water
LS Water
HS Polymer
LS Polymer
Figure 7.3. Oil recovery
0.0
0.2
0.4
0.6
0.8
1.0
0.0 0.3 0.5 0.8 1.0
Pore Volumes
Oil
Cut
HS Water
LS Water
HS Polymer
LS Polymer
Figure 7.4. Oil cut
145
WORKS CITED
1. Amott, E.: “Observations Relating to Wettability of Porous Rock,” Trans.,
AIME (1959) 216, 156-162.
2. Anderson, G.A.: “Simulation of Chemical Flood Enhanced Oil Recovery
Processes Including the Effects of Reservoir Wettability”. MS Thesis, The
University of Texas at Austin, May 2006
3. Agbalaka, C.C., Abhijit, Y.D., Patil, S.L., Khataniar, S. & Hemsath, J.R.:
“Coreflooding Studies to Evaluate the Impact of Salinity and Wettability on
Oil Recovery Efficiency” Transport in Porous Media (76) 77-94. May 2008.
4. Bernard, G.G.: “Effect of Floodwater Salinity on Recovery of Oil from
Cores Containing Clays” SPE 1725: Los Angeles, California. Oct. 26-27,
1967.
5. Bhuyan, D., “Effect of Wettability on Capillary Desaturation Curves,” M.S.
Thesis, The University of Texas at Austin, 1986.
6. Buckley, S. E. and Leverett, M. C.: “Mechanism of Fluid Displacements in
Sands”, Trans., AIME (1942) 146, 107-116.
7. Chen, J., Hirasaki, G. and Flaum, M.: “Study of Wettability Alteration
From NMR: Effect of OBM on Wettability and NMR Responses,” 8th
International Sympsium on Reservoir Wettability, May 2004.
146
8. Craig, F. F. Jr.: The Reservoir Engineering Aspects of Waterflooding.
Society of Petroleum Engineers of AIME: New York, NY, 1971.
9. Graue, A., Bogno, T., Moe, R.W., Baldwin, B.A., Spinler, E.A., Maloney,
D. and Tobola, D.P.: “Impacts of Wettability on Capillary Pressure and
Relative Permeability”, Society of Core Analysis, 07, 1999.
10. Hamon, G. and Bennes, M.: “Two-Phase Flow Rock Typing: Another
Approach”, Society of Core Analysis, 13, 2003.
11. Jadhunandan, P.P. and Morrow, N.R.: “Effect of Wettability on
Waterflood Recovery for Crude-Oil/Brine/Rock Systems,” SPE Paper 22597,
66th Annual Technical Conference, Dallas, TX October 1991.
12. Jarrell, P.M., Fox, C.E., Stein, M.H., Webb, S.L.: “Pratical Aspects of CO2
Flooding,” Johns, R.T. (editor), Monograph Series, SPE (2002) 22.
13. Jerauld, G.R., Lin, C.Y., Webb, K.J. & Seccombe, J.C.: “Modeling Low-
Salinity Waterflooding” SPE 102239: Sept. 2006.
14. Kamath, Jairam, Meyer, Robert, Nakagawa and Frank: “Understanding
Waterflood Residual Saturation of Four Carbonate Rock Types”, SPE Paper
71505, 2001 Annual Technical Conference, New Orleans, LA October 2001.
15. Klinkenberg, L.J.: “The Permeability of Porous Media to Liquids and
Gases,” Drilling and Production Practises, American Petroleum Institute
(1941) 200.
147
16. Lager, A., Webb, K.J., Black, C.J.J., Singleton, M. & Sorbie, K.S.: “Low
Salinity Recovery – An Experimental Investigation” SCA2006-36: Presented
at the International Symposium of the Society of Core Analysts in Trondheim,
Norway 12-16 Sept. 2006.
17. Lager, A., Webb, K.J., Collins, I.R. & Richmond, D.M.: “LoSalTM
Enhanced Oil Recovery: Evidence of Enhanced Oil Recovery at the Reservoir
Scale” SPE 113976: Apr. 2008.
18. Lake, L. W.: Enhanced Oil Recovery. Prentice-Hall, Inc.: Upper Saddle
River, New Jersey, 1989.
19. Leverett, M. C.: “Capillary Behavior in Porous Solids”, Trans., AIME
(1942) 142, 152-169.
20. Lewis, J. A.: History of Petroleum Engineering, API, Dallas, TX. (1961)
21. Martin, J.C.: “The Effects of Clay on the Displacement of Heavy Oil by
Water” SPE 1411-G: Caracas, Venezuela. Oct. 14-16, 1957.
22. McGuire, P.L., Chatham, J.R., Pahvan, F.K., Sommer, D.M. & Carini
F.H.: “Low Salinity Oil Recovery: An Exciting New EOR Oppurtunity for
Alaska’s North Slope” SPE 93903: Mar. 2005.
23. Morrow, N.R.: “Capillary Pressure Correlations for Uniformly Wetted
Porous Media”, J.Cdn. Pet. Tech. (Oct. – Dec. 1976), 15, No. 4, 49 – 69.
24. Owolabi, O.O. and Watson, R.W.: “Effects of Rock-Pore Characteristics
on Oil Recovery at Breakthrough and Ultimate Oil Recovery in Water-Wet
148
Sandstones,” SPE Paper 26935, Eastern Regional Conference, Pittsburg, PA
November 1993.
25. Pu, H., Xie, X., Yin, P. & Morrow, N.R.: “Application of Coalbed
Methane Water to Oil Recovery by Low Salinity Waterflooding” SPE
113410: Tulsa, Oklahoma. 19-23 Apr. 2008.
26. Salathiel, R.A.: “Oil Recovery by Surface Film Drainage in Mixed-
Wettability Rocks,” JPT, October 1973, pg 1216 – 1224.
27. Sharma, M.M. & Filoco, P.R.: “Effect of Brine Salinity and Crude-Oil
Properties on Oil Recovery and Residual Saturations” SPE 65402: Sept. 2000,
5 (3) 293-300.
28. Skauge, A. and Ottesen, B.: “A Summary of Experimentally Derived
Relative Permeability and Residual Saturation on North Sea Reservoir Cores”,
Society of Core Analysis, 12, 2002.
29. Tang, G.Q. & Morrow N.R.: “Influence of brine composition and fines
migration on crude oil/brine/rock interactions and oil recovery” Journal of
Petroleum Science and Engineering 24 (1999) 99-111.
30. Tang, G.Q. & Morrow, N.R.: “Salinity, Temperature, Oil Composition
and Oil Recovery by Waterflooding” SPE 36680: Nov. 1997, 12 (4) 269-276.
31. Tie, H. and Morrow, N.R.: “Low Flood Rate Residual Saturations in
Carbonate Rocks”, International Petroleum Technology Company, IPCT
10470, November 2005.
149
32. Webb, K.J., Black, C.J.J. & Al-Ajell, H.: “Low Salinity Oil Recovery –
Log-Inject-Log” SPE 81460: Apr. 2003.
33. Welge, H.J.: “A Simplified Method for Computing Oil Recovery by Gas
and Water Drive”, Trans., AIME (1952) 195, 91-98.
34. Willhite, G.P., Waterflooding, Society of Petroleum Engineers, Vol. 3,
Testbook Series, Richardson, TX., 1956.
35. Yildiz, H.O. & Morrow, N.R., 1996: “Effect of Brine Composition on
Recovery of Moutray Crude Oil by Waterflooding” Journal of Petroleum
Science and Engineering 14 (1996) 159-168.
36. Zhang, Y. & Morrow N.R.: “Comparison of Secondary and Tertiary
Recovery With Change in Injection Brine Composition for Crude
Oil/Sandstone Combinations” SPE 99757: Apr. 2006.
37. Zhang, Y., Xie, X. & Morrow, N.R.: “Waterflood Performance by
Injection of Brine With Different Salinity for Reservoir Cores” SPE 109849:
Nov. 2007.
150
VITA
Scott Rivet was born in Austin, Texas on September 17th 1984 to Robert and
Cynthia Rivet. After graduating from Lake Travis High School, he entered
Trinity University. There he received a Bachelor in Science degree in
Engineering Science in May 2007. Scott continued his studies at The
University of Texas, where he received a Master in Science degree in
Petroleum and Geosystems Engineering in December 2009. Scott will begin a
career with Shell in 2010.