Early Old Kingdom rock circle tombs, rock-cut mastabas and rock tombs in Middle Egypt
Upload
khangminh22Category
view
0download
0
University of Calgary
PRISM: University of Calgary's Digital Repository
Graduate Studies The Vault: Electronic Theses and Dissertations
2019-04-24
Geochemical Modeling of Oil-Brine-Rock Interactions
during Brine-Dependent and Brine-CO2 Recovery
Technique in Carbonate Petroleum Reservoirs
Awolayo, Adedapo Noah
Awolayo, A. N. (2019). Geochemical modeling of oil-brine-rock interactions during
brine-dependent and brine-CO2 recovery technique in carbonate petroleum reservoirs
(Unpublished doctoral thesis). University of Calgary, Calgary, AB.
http://hdl.handle.net/1880/110237
doctoral thesis
University of Calgary graduate students retain copyright ownership and moral rights for their
thesis. You may use this material in any way that is permitted by the Copyright Act or through
licensing that has been assigned to the document. For uses that are not allowable under
copyright legislation or licensing, you are required to seek permission.
Downloaded from PRISM: https://prism.ucalgary.ca

UNIVERSITY OF CALGARY
Geochemical Modeling of Oil-Brine-Rock Interactions during Brine-Dependent and Brine-CO2
Recovery Technique in Carbonate Petroleum Reservoirs
by
Adedapo Noah Awolayo
A THESIS
SUBMITTED TO THE FACULTY OF GRADUATE STUDIES
IN PARTIAL FULFILMENT OF THE REQUIREMENTS FOR THE
DEGREE OF DOCTOR OF PHILOSOPHY
GRADUATE PROGRAM IN CHEMICAL AND PETROLEUM ENGINEERING
CALGARY, ALBERTA
APRIL 2019
© Adedapo Noah Awolayo 2019
ii
Abstract
The brine-dependent recovery process involves the tweaking of the ionic composition and strength
of the injected water compared to the initial in-situ brine to improve oil production. The type of
brines used during the recovery process is often generated through the dilution or addition or
removal of ions to/from the available injection water. The recovery process has seen much global
research efforts in the past two decades because of its benefits over other oil recovery methods. In
recent years, several studies, ranging from laboratory coreflood experiments to field trials, admit
to the potential of recovering additional oil in sandstone and carbonate reservoirs and has been
well explored on two frontlines, namely, brine dilution and compositional variation. However,
many challenges have saddled the recovery process, such as disputes over the fundamental
chemical mechanisms; difficulty with construction of a representative model to give reliable
interpretation and prediction of the process; and these necessitate applicable solution.
Therefore, this study explores the formulation of theory based on experimentally observed
behavior to couple equations of multicomponent transport and geochemical reactions.
Mechanisms such as dispersion/diffusion, advection, instantaneous equilibrium reactions and non-
equilibrium rate-controlled reactions are captured in the construction of the numerical models. The
DLVO theory of surface forces was also applied to rationalize potential determining ion
interactions and to evaluate the contribution of each force component to the wettability change in
the oil-brine-rock system and the characteristic oil recovery improvement. The model was applied
to interpret recently published results on the different approaches that have been explored in the
application of brine-dependent recovery process in carbonate reservoir rocks. The focus being that
identifying the dominant mechanisms responsible for the observed improved recovery will help
substantiate the field application of the process.
Hence, the model was utilized to explore brine-dependent recovery application beyond the lateral
propagation that could be achieved in 1D coreflood experiments by considering an areal
propagation of a 2D large-scale model with similar properties as reported in the published
experimental experiments. Analysis of sensitive parameters like thermodynamic constants, rock
surface site density and area, the viable link between wettability alteration and oil recovery,
mineralogical content variation, injection strategies and pore volumes, were carried out to

iii
determine their influence on the process performance. Then, the model was extended to investigate
the intrinsic oil-brine-rock interaction during a system of combining low saline brine and CO2
injection.
The study demonstrates that injected brines, containing potential determining ions depleted in
NaCl, are more effective at improving recovery when it, and wettability alteration is much more
pronounced at high temperatures. It was also illustrated that potential determining ion
concentrations play a more significant role as compared to brine salinity reduction. The magnitude
of the contribution of the electrostatic force to sustaining a stable water film increases with
decreasing ionic strength, either through reduction of NaCl, Ca2+ or brine dilution, or increasing
SO42- concentration. Mineral dissolution/precipitation is necessary for the pursuit of re-
establishing equilibrium and should not be ignored in modeling different mineralogical carbonate
rocks. The derived optimized thermodynamic parameters are demonstrated to be widely
applicable. Although chalk and limestone differ by surface area and reactivity, the same
thermodynamic parameters are applicable in modeling the recovery process in their respective
reservoir rocks. There is a significant increase in relative injectivity for brine-CO2 recovery mainly
due to more exposure to a higher amount of CO2-saturated-brine.
Overall, brine-dependent recovery is relatively inexpensive and environmentally friendly, offers
more advantage than other chemical EOR methods in terms of operating costs, field
implementation and environmental assessment, even though it might recover comparably less
additional oil. Additionally, low saline brine can serve as pre-conditioner for other EOR methods,
as most of the injected chemical/gas performs better under low saline brine.
Keywords: smart waterflooding; low salinity waterflooding; potential determining ions; interfacial
mechanisms; carbonate rocks; wettability alteration; oil-brine-rock interactions, surface sorption
and complexation, water film stability, geochemical modeling, low-salinity-water-CO2

iv
Preface
This thesis is submitted to the University of Calgary in partial fulfillment of the requirements for
the degree of Doctor of Philosophy.
The work presented in this thesis was conducted at the Chemical and Petroleum Engineering
Department, the University of Calgary and the computational facility was provided by Research
& Development Division of Computer Modelling Group (CMG) Ltd., Calgary. Many of the
numerical model development was carried out in CMG’s compositional simulator GEMTM. The
substance of this thesis is the original work of the author and due reference and acknowledgement
has been made, whenever necessary, to the work of others cited in this thesis. Dr. Hemanta Sarma
was the main supervisor, and Dr. Long Nghiem from CMG was the co-supervisor.
The research work was funded by the University of Calgary, with additional financial support from
Vanier Canada Graduate Scholarship and Killam Memorial Trust.

v
Acknowledgements
The Ph.D. journey is merely a rugged road filled with many dead-ends, often skimming the
brink of uncertainty. One cannot always tell which path to take, let alone where one is headed.
Enveloped with seemingly Herculean tasks, the only thrust forward is often powered by caffeine
and the apprehension of quitting after going several miles down the road. However, just like
Frodo had Sam, T'Challa (Black Panther) had Shuri, Django had Dr. Schultz, and Sherlock had
Watson, the learning experience is that purportedly challenging pursuits have a better chance of
success when one does not navigate unaccompanied. In that case, I am very appreciative to have
so many people support me on this journey. It is one of the most electrifying and terrifying
moments of my life, though it took about three (3) years in humans’ time, it was about three
hundred (300) years in my mind.
Thank you to my advisor Dr. Hemanta Sarma, who has been my mentor for the past five years.
I am highly thankful for your willingness to provide the needed help each time I knocked on your
door, irrespective of the time and day. The countless scholarships and awards I received would
not have been possible without your great recommendations. I am also thankful that you gave
me the privilege to be independent while pursuing the research objectives, helped me set
boundaries for this research work and focus on writing these past few months. I would likely still
be wandering if not for your encouragement. I would like to acknowledge my co-advisor, Dr.
Long Nghiem of CMG, for your irreplaceable contributions and that you always made time to
help me find answers to my many questions and granted me unrestricted access to CMG facilities
to aid in completing this study within the stipulated timeline. I appreciate the time and effort
both of my supervisors, Dr. Sarma and Dr. Nghiem, have expended on my behalf, in developing,
analyzing, and solving the problems posed in the research statement. It is with certainty that,
without their support and constant motivation, it would have been an extremely difficult journey.
A special thanks to my committee members, Dr. Ian Gates and Dr. Mingzhe Dong, and
examiner, Dr. Laurence Lines, Dr. Zhangxing Chen and Dr. Seung Kam (Louisiana State
University), for providing detailed and intuitive feedback that had a significant impact on the
definitive version of this thesis. I am particularly grateful to Dr. Brij Maini for his constant support
in providing me with great recommendations, especially for the prestigious Vanier Canadian
Graduate Scholarship and Killam Memorial Pre-Doctoral Scholarship. He was part of my
committee members until the last moment. I am also thankful to my candidacy examiners, Dr.
Ayodeji Jeje and Dr. Gopal Achari for their valuable time and providing significant feedback to

vi
improve this research study. Thank you to Dr. Alex De Visscher, now with Concordia University,
for introducing me to countless opportunities at the department and for your support throughout
the initial stages of the program, especially writing a great letter of support for Vanier Canadian
Graduate Scholarship.
I appreciate the financial support from the prestigious Vanier Canadian Graduate Scholarship
administered by the Government of Canada and Killam Doctoral Memorial Scholarship
administered through the Killam Trusts Funds at the University of Calgary. I am thankful to Dr.
Emre Gorucu of CMG for his many assistance with the simulation work and Dr. Vijay Shrivastava
of CMG for his support and valuable comments on this research, and the R&D Department of
CMG for providing the necessary facilities and conducive environment for the successful
completion of this research work. A word of appreciation goes to every administrative staff of
Faculty of Graduate Studies, Graduate Student Association and Department of Chemical and
Petroleum Engineering, especially Suha Abusalim and Arthur de Vera, for their help in
coordinating various academic logistical matters.
The Ph.D. is just a small part of my life, and I sincerely appreciate the support of my friends,
here in Calgary and abroad, various dialogues and assistance made my studies even more
enjoyable. The wonderful families that helped my family settle down and identify with us in
Calgary, especially the Jaiyeolas, Okanlawons and Kunderts, thank you for your continual
support. I would not have gotten this far without you all. Thank you to my loving parents and
my parents-in-law. My parents, Olusola and Mojirade Awoloyo, have always been there to
encourage my growth and development and support every decision I have made and direction I
have taken about my education and career paths. Most importantly, thank you to my adorable
wife, Adura Oluwaseyanu Awolayo, and our amazing princess, Zion Nifemi Awolayo, for
providing unfailing support and encouragement. You have helped me carry the burden of this
Doctoral program without protest, and I know you are just as glad as I am that this journey has
finally come to an end.

vii
Dedication
This thesis is dedicated to:
• the maker of heaven and earth, the creator of all that lives, the Almighty GOD
• my earthly gods, my parents, for their unconditional love and support and
• my loving wife and daughter.

viii
Table of Contents
Preface ................................................................................................................................ iv
Acknowledgements ..............................................................................................................v
Dedication ......................................................................................................................... vii
List of Tables ..................................................................................................................... xi
List of Figures and Illustrations ....................................................................................... xiii
List of Symbols, Abbreviations and Nomenclature ...........................................................xx
Introduction .........................................................................................................1
Problem Statement ..................................................................................................1
Research Justification .............................................................................................6
Research Goals/Hypothesis ....................................................................................7
Research Objectives ................................................................................................8
Outline of the Dissertation ......................................................................................9
Publication ............................................................................................................10
Background and Integrative Review .................................................................12
Introduction ...........................................................................................................12
Laboratory Experimental Studies .........................................................................13
2.2.1 Connate water content and saturation ...........................................................16
2.2.2 Crude oil composition ..................................................................................18
2.2.3 Rock mineral composition ............................................................................21
2.2.4 Temperature and pressure .............................................................................24
2.2.5 Injected brine composition and salinity ........................................................28
Field Application Studies .....................................................................................34
Proposed Underlying Recovery Mechanisms .......................................................37
2.4.1 Rock dissolution ...........................................................................................37
2.4.2 Multi-ion exchange (MIE) ............................................................................39
2.4.3 Electrical double layer expansion (DLE) .....................................................41
Modeling of Brine-Dependent Recovery ..............................................................43
2.5.1 Analytical approach ......................................................................................44
2.5.2 Numerical approach ......................................................................................46
2.5.2.1 Sandstone rocks. ................................................................................46
2.5.2.2 Carbonate rocks. ................................................................................51
Injection Water Issues and Remediation ..............................................................55
Chapter Summary .................................................................................................60
Surface Forces and Water Film Prediction .......................................................62
Introduction ...........................................................................................................62
Theory of Water Film Stability .............................................................................65
Interaction Force and Energy Calculations ...........................................................68
Zeta Potential Calculation .....................................................................................73

ix
Water Chemistry Effect on Disjoining Pressure and Potential Barrier Height ....77
Chapter Summary .................................................................................................83
Reactive Transport Model Description and Validation .....................................85
Introduction ...........................................................................................................85
Model Formulation ...............................................................................................87
4.2.1 Hydrocarbon solubility .................................................................................87
4.2.2 Aqueous-Species reactions ...........................................................................88
4.2.3 Aqueous-Minerals reactions .........................................................................90
4.2.4 Carbonate rock system modeling .................................................................92
4.2.4.1 Surface sorption reactions ..................................................................94
4.2.4.2 Surface complexation reactions. ........................................................99
Coupled Flow and Reaction Model ....................................................................101
Summary of Experimental Data .........................................................................107
Validation of Surface Sorption Model ................................................................110
4.5.1 Temperature-Dependent Competition between PDI cations: .....................110
4.5.2 Competition between PDI cations in the presence of PDI anion: ..............114
4.5.3 Competition between PDIs in the presence of oil ......................................118
Validation of Surface Complexation Model .......................................................119
4.6.1 Surface chemistry prediction comparison with zeta potential experiments120
4.6.2 Comparison of surface chemistry prediction to single-phase flooding experiments
....................................................................................................................127
Chapter Summary ...............................................................................................132
Prediction of Brine-Dependent Recovery .......................................................134
Geochemical Interactions and Wettability Modification Relationship ..............134
Oil Recovery Prediction for Brine Dilution Approach .......................................137
5.2.1 Simulation portfolio for different mineralogical carbonate rocks ..............142
5.2.2 Laboratory simulation results .....................................................................145
5.2.2.1 Core material with calcite and dolomite minerals ...........................145
5.2.2.2 Core material with calcite and anhydrite minerals. .........................149
5.2.2.3 Core material with calcite, dolomite, and anhydrite minerals .........152
5.2.3 Field-scale simulation .................................................................................154
Oil Recovery Prediction for Compositional Variation Approach ......................158
5.3.1 Laboratory scale simulation........................................................................160
5.3.1.1 Single−phase modeling. ...................................................................160
5.3.1.2 Two-phase modeling ........................................................................163
5.3.2 Field−scale modeling ..................................................................................166
Chapter Summary ...............................................................................................170
Prediction of Low-Salinity-Water-CO2 Recovery Process .............................173
Introduction .........................................................................................................173
Simulation of LSWCO2 ......................................................................................176

x
Chapter Summary ...............................................................................................185
Conclusions and Recommendations ................................................................186
Conclusions .........................................................................................................186
Recommendations for Further Study ..................................................................187
Appendix A: Aqueous Reaction Thermodynamic Parameters ........................................189
Appendix B: Supplementary Material (Journal Permission License) ..............................190
References ........................................................................................................................197
Curriculum Vitae .............................................................................................................221

xi
List of Tables
Table 2.1—Salinity and composition of formation water and seawater in different regions
(adapted from [23, 57, 133, 134]) ......................................................................................... 17
Table 2.2—Summary of successful field implementations of brine-dependent recovery in
sandstone and carbonate reservoirs (adapted from Awolayo et al. [62]).............................. 36
Table 2.3—Summary of technology selection criteria, key attributes and capabilities of both
current and emerging water treatment technologies (adapted from Ayirala and Yousef
[235]) ..................................................................................................................................... 59
Table 3.1—Approximate characteristic radii of ions in water [130, 246] .................................... 67
Table 3.2—Compositions of the brines used in the interaction force and energy calculations
consisting of synthetic formation brine (FB) and natural Arabian Gulf seawater (SW),
with their various versions. ................................................................................................... 71
Table 3.3—Rock-Brine and Oil-Brine zeta and surface potentials in aqueous electrolyte
solutions at pH 8.4 ................................................................................................................ 75
Table 4.1—Reaction pathways considered during simulation, where > is the prefix for surface
species ................................................................................................................................... 86
Table 4.2—Summary of core properties used in simulating different single-phase flow through
experiments to retrieve thermodynamic parameters for intact carbonate rocks. ................ 108
Table 4.3—Fluid compositions and properties used in the simulation. ...................................... 109
Table 4.4—Surface reactions and summary of equilibrium constants at different temperatures.
These values were obtained from the best-matched simulation run after conducting a
series of simulation ............................................................................................................. 112
Table 4.5—Reported stability constants for the rock−brine surface reactions at room
temperature ......................................................................................................................... 120
Table 4.6—Optimized stability constants derived from fitting pulverized carbonate ζ-potential
............................................................................................................................................. 122
Table 4.7—Optimized stability constants derived from fitting natural intact carbonate ζ-
potential ............................................................................................................................... 126
Table 4.8—Corresponding equilibrium constants at various temperatures and pressure of 7 bar
............................................................................................................................................. 129
Table 5.1—Reservoir core properties used for simulating the different core experiments. ....... 142
Table 5.2—Fluid compositions and Properties used in the simulation ...................................... 144
Table 5.3—Mineralogical content for various cases simulated .................................................. 157
Table 5.4—Summary of fluid and core compositions and properties used in the simulation.
Site capacity; was assumed as 3 sites/nm2. I represents ionic strength and TDS represents
total dissolved solids. .......................................................................................................... 161
Table 5.5—Input parameters for the 2D synthetic simulation model ......................................... 166

xii
Table 6.1—Summary of fluid and core compositions and properties used in the LSBCO2
simulation. The total dissolved solids is denoted as TDS, ionic strength (M) is denoted as
I, reservoir oil is denoted as RO and injected gas is denoted as IG .................................... 177

xiii
List of Figures and Illustrations
Figure 2.1— R&D-to-Field sketch of the systematic investigation for brine-dependent
recovery design and implementation (adapted from Sarma [126], Awolayo et al. [62]). .... 15
Figure 2.2—Effect of acid number (AN) on spontaneous imbibition of brine into chalk cores
saturated with different crude oil (reproduced from Standnes and Austad [116] with
permission). The imbibition rate and water-wetness decrease as the AN increases in the
absence of initial water ......................................................................................................... 20
Figure 2.3—Comparison between ζ–potential of chalk, calcite, limestone and dolomite in
different brine at reservoir pH of 7 (left) and in 25 times diluted seawater at pH range 6 –
11 (right) (reproduced from Mahani et al. [120] with permission) ...................................... 23
Figure 2.4—Comparison of spontaneous imbibition rates of PDIs in chalk conducted at 70,
100 and 130 °C with a back-pressure of 88 psi. Modified seawater without Ca2+ and Mg2+
was initially imbibed, and Mg2+ or Ca2+ was later added in a systematic variation of PDI
concentrations (reproduced from Zhang et al. [32] with permission) .................................. 29
Figure 2.5—An illustration of the proposed mechanism of wettability alteration by
“dissolution” showing an oil-wetting state with oil attachment before dissolution (top)
and the water-wetting state after dissolution (bottom). (adapted from Hiorth et al. [47]) .... 38
Figure 2.6—A schematic illustration of the proposed mechanism of wettability alteration by
“MIE” in carbonate reservoirs showing the oil component displacement from the
carbonate rock surface through PDIs competition. Original state (left), Low temperature
state (right upper) and High temperature state above 100 °C (left lower) (adapted from
Zhang et al. [32]) .................................................................................................................. 40
Figure 2.7—An illustration of the proposed mechanism for wettability alteration by “DLE” in
oil-brine-carbonate rock system with DLVO disjoining pressure showing transition from
an oil wetting state (left upper) with crowded double layer-filled non-active ions (right
upper) to water wetting state (left lower) with double-layer depleted non-active ions (right
lower) (reproduced from Fathi et al. [38], Awolayo et al. [65]) ........................................... 42
Figure 3.1—Schematic illustration of the EDL and electrical potential at the rock–brine
interface: The sketch shows the variation of electrical potential as a function of distance
from the rock surface, partitioned by charged planes— inner Helmholtz plane (IHP), outer
Helmholtz plane (OHP) and slipping plane. The potential developed within the EDL
declines with distance linearly through the Stern layer, exponentially through the diffuse
layer and drops to zero in the bulk electrolyte solution. The partial charge on the dangling
surface ions left behind at the bulk solid is represented by ψb; ψo represents the potential
of the surface; ψd stands for the potential at the Stern layer and ζ represents zeta potential.
While σo and σd are the surface and diffuse layer charge density (C/m2) respectively. The
Stern layer potential difference is characterized by constant capacitance, Cs while the
diffuse layer has variable capacitance, Cd. At plane x = 0, which corresponds to the
hydrolysis layer, H and OH of the water molecules are chemibonded to the dangling
surface ions. At x < 0, the potential is so high that attaching ions do not bond to the
surface ions. The inner-Stern layer is characterized by d1 length; the outer-Stern layer is
xiv
characterized by d2 length, and the electrical double layer is characterized by κ-1 length,
also known as Debye-Hückel screening length [130, 170]. ................................................. 64
Figure 3.2—Schematic of Oil-Brine-Rock system at different wettability conditions: oil-
wetting (top) and water-wetting (bottom) states. Interfaces exhibit a very strong repulsion
(Born repulsion) upon contact; the surface interaction energy curve shows two potential
minima: a deep primary minimum appearing at a small separation distance and a shallow
secondary minimum appearing at a larger separation distance. ............................................ 66
Figure 3.3—Individual contributions from van der Waals, electrical double layer and structural
force (left) to the total disjoining pressure (right) as a function of the thickness of the water
film layer for the oil-brine-rock system (seawater, composition listed in Table 3.2). The
positive half of the disjoining pressure represents the repulsive force required to separate
two interacting interfaces, which is dominated by electrical double layer and structural
force; while the negative half represent the attraction dominated by van der Waals. Dotted
line is for CSC, dashed line for LSA and solid line for CSP; while, dashed blue line is for
non-retarded van der Waals force. Unit conversion 1 atm = 101.325 kPa. .......................... 69
Figure 3.4—Interaction energy with individual contributions from van der Waals—ωA and
EDL—ωR (left) and the net interaction energy (right) as a function of dimensionless film
thickness (κh at a value of 1 implies that the separation distance is equivalent to the EDL
thickness, which is 0.342 nm for seawater). Considering figure on the left, since ωR varies
exponentially with thickness (eq. 3.12) and ωA varies with the square of thickness (eq.
3.10), ωA surpasses ωR at short and long distances, thus producing attraction between the
two interacting interfaces and energy barrier at intermediate distance. ................................ 73
Figure 3.5—Comparison of calculated and measured ζ–potential of the oil-brine system as a
function of pH and brine ionic strength for Moutray oil (left-top), Leduc oil (right-top)
and ST86 oil (right-bottom). The markers are the experimental data; dashed lines
represent calculations with Δ = 0.6 nm and solid lines for Δ = 1.0 nm. Calculated
surface potential for the oil-brine system (right-bottom) is shown with dash lines
representing eq. 3.14 and solid lines for eq. 3.13. The ionic strength is expressed in terms
of NaCl brine, experimental data from Buckley et al. [251] varies from 0.1M to 0.001M.
The trend for 0.5M and 1M has been included for comparison of the increasing ζ–potential
with increased salinity. .......................................................................................................... 76
Figure 3.6—Net disjoining pressure as a function of film thickness (left) and interaction energy
as a function of dimensionless separation distance (right) between the interacting
interfaces with SO42- concentration (expressed as pSO4) in two different brine salinity
(0.05M and 0.5M NaCl). The term pSO4 is equivalent to -log10SO42- , which implies
that pSO4 reduces as the concentration of SO42- increases, i.e., pSO4 of 1.9 equals
0.0117M (half SO42- in natural seawater), 1.5 equals 0.0329M (same SO4
2- as in natural
seawater) and 1.0 equals 0.0969M (thrice SO42- in natural seawater). The solid lines
indicate curves for lower salinity (0.05M NaCl) and dash lines (0.5M NaCl) indicate
curves for higher salinity. Unit conversion 1 atm = 101.325 kPa ......................................... 78
Figure 3.7—Net disjoining pressure as a function of film thickness (left) and interaction energy
as a function of the dimensionless separation distance between the interacting interfaces
(right) with pCa in two different saline brines (0.5M and 2M NaCl). The pCa of 1.3 is

xv
equivalent to 0.0495M (quadruple Ca2+ as in natural seawater), 2.0 is equivalent 0.0102M
(same Ca2+ as in natural seawater), 2.6 is equivalent 0.002M and 2.8 is equivalent
0.0015M SO42- concentration. Unit conversion 1 atm = 101.325 kPa .................................. 79
Figure 3.8—Relationship between net disjoining pressure as a function of film thickness (left),
interaction energy as a function of the dimensionless separation distance between the
interacting interfaces (right) and brine compositions derived from seawater with
increasing SO42- concentration. Unit conversion 1 atm = 101.325 kPa ................................ 80
Figure 3.9—Net disjoining pressure as a function of film thickness (left) and interaction energy
as a function of the dimensionless separation distance between the interacting interfaces
(right) for seawater-derived brines with increasing SO42- concentration and same ionic
strength (0.7850). Unit conversion 1 atm = 101.325 kPa ..................................................... 81
Figure 3.10—Net disjoining pressure as a function of film thickness (left) and interaction
energy as a function of the dimensionless separation distance between the interacting
interfaces (right) with varying brine dilutions derived from seawater. Unit conversion 1
atm = 101.325 kPa ................................................................................................................ 82
Figure 4.1—Schematic representation of the cross-section of the surface layer. In the presence
of water, carbonate surfaces are generally covered with surface hydroxyl groups .............. 94
Figure 4.2—Simulated and experimental breakthrough curves of Ca2+ and Mg2+ from CF-M
brine on limestone core 2-21 at various experimental temperatures: 20 °C (top left), 70 °C
(top right), 100 °C (bottom left), and 130 °C (bottom right). Data points connote measured
datasets, and solid-lines represent the model results; subscripts “exp” and “mod” in the
legend are the experimental (Strand et al. [53]) and predicted values ................................ 111
Figure 4.3—Relationship of exchange and isotherm coefficients with temperature .................. 112
Figure 4.4—Simulated surface fractions of Ca2+ (> CaX2) and Mg2+ (> MgX2) along the mid-
section of the limestone core 2-21 at various experimental temperatures: 20 °C (top left),
70 °C (top right), 100 °C (bottom left), and 130 °C (bottom right) .................................... 113
Figure 4.5—Simulated and experimental breakthrough curves of Ca2+ and Mg2+ from CF-M
brine on chalk core CM-1 23 °C (left) and 130 °C (right). Data points connote measured
datasets from Zhang et al. [32], and lines represent the model results. .............................. 114
Figure 4.6—Simulated and experimental breakthrough curves of Ca2+, Mg2+ and SO42- at room
temperature from SW-½M brine on limestone core 2-21 (top left), SW-M brine on chalk
core ¼ (bottom left), and simulated surface fractions of Ca2+ (> CaX2), Mg2+ (> MgX2)
and SO42- (> XSO4-) along the core mid-section of the limestone core 2-21 (top right)
and chalk core ¼ (bottom right). Data points connotes measured datasets from Strand et
al. [53] as plotted in the top left panel and from Strand et al. [127] as plotted in the top
right panel, lines represent the model results and the dotted lines represent the first attempt
at modeling the experimental data ...................................................................................... 115
Figure 4.7—Flow chart algorithm used to investigate thermodynamic parameters ................... 116
Figure 4.8—Simulated and experimental breakthrough curves of Ca2+, Mg2+, SCN-, and SO42-
from SW-M brine on chalk core 7/1 at various experimental temperatures: 40 °C (top left),

xvi
70 °C (top right), 100 °C (bottom left), and 130 °C (bottom right). Experimental data are
taken from Strand et al. [54]. .............................................................................................. 117
Figure 4.9—Simulated and experimental breakthrough curves of SCN- and SO42- at room
temperature from SW-1T brine flood (left). Simulated surface fractions of Ca2+ (> CaX2),
Mg2+ (> MgX2) and SO42- (> XSO4-) along the mid-section (right), on aged chalk core
LSSK#5 (with oil at Sorm = 0.29) and unaged chalk core SCC#1 (with no oil present). Data
points connotes measured datasets (Fathi et al. [38]) and lines represent the model results.
............................................................................................................................................. 119
Figure 4.10—Comparison of measured and predicted ζ-potential for all PDI concentrations
and varying surface site densities (top left) and 3 sites/nm2, showing the variation with
PDIs (top right), the contrast between the prediction from this model and PHREEQC
reaction module (bottom left). The solid black diagonal line is 1:1 zero error line, i.e.
ζ i, exp = ζ i, mod, which shows the contrast between measured and predicted values.
ζ-potential measured by Austad and colleagues [32, 55] with stepwise addition of MgCl2,
CaCl2 or Na2SO4 to 0.573 M NaCl brine solution in 4 wt.% pulverized chalk suspension
with pH maintained at 8.4, compared against the predicted ζ-potential from SCM with
optimized stability constants for 3 sites/nm2 as shown by solid lines (bottom right). The
top (squares and circles) curves and data points is for Mg2+ and Ca2+ additions,
respectively; the bottom (diamonds) curve and data points is for SO42- additions.
PHREEQC prediction was plotted in dotted lines. ............................................................. 123
Figure 4.11—Comparison of ζ-potential measured and predicted for PDI concentrations with
optimized stability constants for surface site densities of 3 sites/nm2 (left). ζ-potential
predicted by optimized stability constants for intact rock compared against measured ζ-
potential (right) by Alroudhan et al. [104] with PDI variations in 0.5M (red lines and data
points) and 0.5M (other colored lines aside red) NaCl brine. EPM data for Ca2+ variation
in 0.05M NaCl brine is plotted in “light-blue“ on the right graph. The concentration is
plotted in terms of negative logarithmic value (pPDI) instead of molar concentrations.
The specific surface area was taken 0.29 m2/g. The fixed pH of cation and anion variation
was taken as 7.2 and 7.9, respectively. ............................................................................... 125
Figure 4.12—Optimized ζ-potential predicted against measured ζ-potential for pH of 7.2 and
7.9 (left) and 7.9 and 8.1 (right) for PDI cations and anions additions, respectively.
Experimental data are taken from Alroudhan et al. [104]. ................................................. 126
Figure 4.13—Predicted compared against experimental breakthrough curves of SCN-, Ca2+ and
Mg2+ from CF-M brine flow through limestone core 2-21 at various experimental
temperatures: 20 °C (top left), 70 °C (top right), 100 °C (bottom left), and 130 °C (bottom
right). Experimental data are taken from Strand et al. [53]. ............................................... 128
Figure 4.14—Predicted surface fractions of >CO3-, >CO3Ca+ and >CO3Mg+ along the mid-
section of the limestone core 2-21 at various experimental temperatures: 20 °C (top left),
70 °C (top right), 100 °C (bottom left), and 130 °C (bottom right). ................................... 129
Figure 4.15—Predicted compared against experimental breakthrough curves of SCN-, Ca2+ and
Mg2+ from CF-M brine flow through chalk core (CM-1) at 20 °C (top left) and 130 °C
(top right). Predicted surface fractions of >CO3-, >CO3Ca+ and >CO3Mg+ along the mid-
xvii
section of the core at 20 °C (bottom left) and 130 °C (bottom right). Experimental data
are taken from Zhang et al. [32]. ........................................................................................ 130
Figure 4.16—Predicted and experimental breakthrough curves of SCN- and SO42- from SW-M
brine flow through chalk core (7/1) at various experimental temperatures: 23 °C (top left),
70 °C (top right), 100 °C (bottom left), and 130 °C (bottom right). Experimental data are
taken from Strand et al. [54]. .............................................................................................. 131
Figure 4.17—Predicted surface fractions of >CaOH2+, >CaSO4
-, >CaOH0, >CO3-, >CO3Ca+
and >CO3Mg+ along the mid-section of the limestone core (7/1) at various experimental
temperatures: 23 °C (top left), 70 °C (top right), 100 °C (bottom left), and 130 °C (bottom
right) ................................................................................................................................... 132
Figure 5.1—Relative permeabilities (top panels) and capillary pressure (bottom panels) used
in simulating core flooding experiment of Chandrasekhar [275] (left), Austad et al. [48]
(middle), Yousef et al. [57] (right). The solid lines with markers correspond to the relative
permeability to oil while the solid lines without markers correspond to relative
permeability to water. The initial flow functions (set 1) correspond to the initial wetting
state, and the subsequent flow functions correspond to cases where the wetting state has
shifted towards more water wetness. The changes in krj, Pc and sor values in middle
panel is smaller than in left panel and right panel because the cores used by Austad et al.
[48] is more water-wet than those used by Chandrasekhar [275] and Yousef et al. [57]. .. 143
Figure 5.2—Core flood experiment design Vertical (left) and Horizontal (right) simulation
model ................................................................................................................................... 144
Figure 5.3—Simulated and experimental breakthrough curves of Mg2+, Ca2+ and SO42- (left)
and Na+ and Cl- (right). Experimental data obtained from Chandrasekhar [275] .............. 146
Figure 5.4—Sim A prediction at the center of the simulation domain for exchangeable fraction
of Ca2+ (> CaX2), Mg2+ (> MgX2), free anionic site > NaX, and amount of SO42-
adsorbed (left); mineral volume alteration and simulated and experimental pH comparison
(right) .................................................................................................................................. 146
Figure 5.5—Comparison between simulated and experimental oil recovery and pressure
differential. Experimental data obtained from Chandrasekhar [275] ................................. 148
Figure 5.6—Comparison of predicted and experimental breakthrough curves of SO42-, Mg2+,
and Ca2+ (left) and oil recovery and pressure differential (right). Experimental data
obtained from Austad et al. [48] ......................................................................................... 150
Figure 5.7—Sim A predictions at the center of the simulation domain for exchangeable fraction
of Ca2+ (> CaX2), Mg2+ (> MgX2), free anionic site > NaX, and amount of SO42-
adsorbed (left); mineral volume alteration and pH (right) .................................................. 151
Figure 5.8—Comparison between simulated and experimental oil recovery, and pressure
differential (left). Simulated breakthrough curves of SO42-, Mg2+, and Ca2+ (right).
Experimental data obtained from Yousef et al. [57] ........................................................... 153
Figure 5.9—Simulation results at the center of the simulation domain for an exchangeable
fraction of Ca2+ (> CaX2) and Mg2+ (> MgX2), free anionic site > NaX, and amount of
sulfate adsorbed (left); mineral volume alteration (right) ................................................... 154
xviii
Figure 5.10—Simulation model for the quarter of a five-spot pattern used in this research
showing oil saturation after about 1 PV injection (left) and grid-block - 60 × 60 × 1 with
a block size of 3.35 m (left). The green dot at the upper-left corner is the producer while
the injector is represented by the red dot at the lower-right. The diagonal blue line is the
shortest streamline between the injector and producer, about 284 m long. ........................ 155
Figure 5.11—Predicted oil recovery and water cut for the quarter of a five-spot pattern with
the different grid-block cells (900, 3600 and 10000) using core, flow and reaction
parameters of Yousef et al. [57] ......................................................................................... 156
Figure 5.12—Profiles along the diagonal streamline of the quarter five-spot pattern for the
different grid-block sizes after each injection cycle: adsorbed SO42- (left) and free anionic
surface site (right). .............................................................................................................. 156
Fig. 5.13—Oil recovery and water cut fractions comparison of varying mineralogical contents
with a collapsed view (left) and expanded view (right) ...................................................... 158
Figure 5.14—Water-oil relative permeability curves for in-situ and injected smart brines used
in simulating the flooding experiments of S#42 (left) and S#9 (right). Broken lines
indicate relative permeability to water and solid lines indicate relative permeability to oil.
............................................................................................................................................. 160
Figure 5.15—Comparison between observed and simulated normalized breakthrough curves
for all ions (left) and relative breakthrough curves for PDIs (right) during seawater
flooding. Experimental data obtained from Chandrasekhar et al. [196]. ............................ 162
Figure 5.16—Comparison between observed and simulated [a] normalized breakthrough
curves for all ions (left) and relative breakthrough curves for PDIs (right) during seawater
with 4xSO42- flooding. Experimental data obtained from Chandrasekhar et al. [196]. ...... 162
Figure 5.17—Results of formation water, seawater and seawater with 4xSO42- flooding
sequence comparison between two-phase simulated and experimental oil recovery, and
simulated mineral volume changes (top left); simulated and experimental effluent ions
concentration of PDIs (top right); simulated surface and equivalent fractions of PDIs
along the mid-section of core S#42 (bottom left) and simulated and experimental effluent
ions concentration of Na+ and Cl- (bottom right). Data-points indicate measured datasets
(Awolayo et al. [29]), broken lines indicate injection concentration, and solid lines
indicate the simulation results. ............................................................................................ 164
Figure 5.18—Prediction of formation water, seawater and seawater with 0.5xSO42- flooding
sequence: comparison between two-phase simulated and experimental oil recovery (top
left); simulated and experimental effluent ions concentration of PDIs (top right);
simulated surface and equivalent fractions of PDIs along the mid-section of core S#9
(bottom left); and simulated and experimental effluent ions concentration of Na+ and Cl-
(bottom right). Experimental data obtained from Awolayo et al. [29]. .............................. 165
Figure 5.19—Simulation of 2-D synthetic quarter five-spot pattern with permeability
distribution map (top left), porosity distribution map (top right) and permeability-porosity
cross-plot (bottom) [277]. The block size is 15 ft. in every direction. The black dot at the
upper-right corner is the producer, while the black dot with an arrow at the lower-left
corner is the injector ............................................................................................................ 167

xix
Figure 5.20—Comparison of oil recoveries by formation water and seawater in secondary
mode .................................................................................................................................... 168
Figure 5.21—Comparison of the evolution of water saturation during secondary injection
mode of formation water, seawater and seawater with 4×SO42- ......................................... 169
Figure 5.22—Evolution of equivalent fractions of unoccupied sites during secondary injection
mode of seawater with 4×SO42- .......................................................................................... 169
Figure 5.23—Oil recovery comparison between secondary and tertiary injection mode of
formation water and seawater (left), and formation water and seawater with 4xSO42-
(right) .................................................................................................................................. 170
Figure 6.1—CO2 solubility in different brine salinity brine at 195 ºF (90.5 ºC) and a wide range
of pressure using Li and Nghiem [287] solubility model in CMG WINPROPTM .............. 175
Figure 6.2—Estimation of CO2 MMP from slim tube simulations with different number of
cells ..................................................................................................................................... 178
Figure 6.3—Water-oil relative permeability curves (left) and gas-oil relative permeability
curves (right) used in simulating the flooding experiments of Teklu et al. [88]. Broken
lines indicate final-wetting state relative permeability and solid lines indicate initial
wetting relative permeability .............................................................................................. 180
Figure 6.4—Comparison of experimental and simulated oil recovery and pressure differential.
Experimental data obtained from Teklu et al. [88] ............................................................. 181
Figure 6.5—Simulation profiles at the mid-section of the flow domain for surface fractions of
Ca2+ (>CO3Ca+), SO42- (>CaSO4
-) and Mg2+ (>CO3Mg+) and surface charge density (left)
and fractional amounts of mineral volume alteration (right) .............................................. 182
Figure 6.6—Predicted oil density and viscosity at the injection grid block (left); relative
injectivity and the total amount of CO2 dissolved in the aqueous brine solution (right) .... 183
Figure 6.7—Predicted oil recovery for different injection schemes in a quarter of a five-spot
pattern (left), comparison of injectivity and amount of dissolvable CO2 (top right) and oil
density and viscosity (bottom right). Here, carbonated water injection is compared with
low saline brine and seawater injection in terms of oil recovery, injectivity and CO2
solubility. ............................................................................................................................ 184
Figure 6.8—Predicted oil recovery comparison for LSWACO2, conventional seawater WAG
and normal waterflooding (left); comparison of their relative injectivity (right) ............... 184

xx
List of Symbols, Abbreviations and Nomenclature
Symbol Definition
Abbreviations:
AFM atomic force microscopy
AN acid number
ARDE advection-reaction-dispersion equation
ASP alkaline-surfactant-polymer
BN base number
BPS bond product sum
CEC cation exchange capacity
CSC constant surface charge
CSP constant surface potential
DLE electrical double layer expansion
DLVO Derjaguin–Landau–Verwey–Overbeek
EDL electrical double layer
EOR enhanced oil recovery
EPM electrophoretic mobility measurement
FB formation brine
GOR gas-oil ratio
HS high salinity
IFT interfacial tension
IG Injected Gas
IHP inner Helmholtz plane
LS low salinity
LSA linear superposition approximation
MIE multi-ion exchange
NF nanofiltration
NMR nuclear magnetic resonance
OHP outer Helmholtz plane
OOIP original oil in place
PBE Poisson-Boltzmann equation
PDE partial differential equation
PDI potential determining ions
ppm part per million
PR-EOS Peng-Robinson equation of state
RO reverse osmosis
ROS residual oil saturation
SCM surface complexation model
SEM scanning electron microscopy
SPM streaming potential measurement
SRB sulfate-reducing bacteria
SSM surface sorption model

xxi
SW seawater
SW/10 ten times diluted seawater
SW/2 Twice diluted seawater
SW/20 twenty times diluted seawater
SWCT single well chemical tracer
WA wettability alteration
WAG water alternating gas
Notations:
𝑎𝑖 activity of the i-th component
𝑎�� ion size of the i-th component
𝑎(𝑖) activity of the i-th surface species
𝐴 Hamaker constant
A𝛽 reactive surface area
𝐴𝑜 magnitude of the structural interaction
𝐴𝛽 specific surface area of the mineral 𝛽
𝑏 correction constant to the non-retarded Hamaker expression
𝑏�� ion-specific parameter for the i-th component
𝐶s Stern layer constant capacitance
𝐶𝑑 diffuse layer variable capacitance
𝐶𝛽 total concentration of dissolved ion components
𝑑𝑜 decay length for the structural interaction
𝐷𝑎𝛽 Damkohler number for the mineral reaction 𝛽
𝐷𝑖𝑗 dispersion coefficients of the i-th component in the j-th phase
𝑒 electronic charge
𝐸𝑎𝛽 activation energy
𝑓𝑖𝑗 fugacity of the i-th component in the j-th phase
ℎ water film thickness
𝐻𝑖 Henry’s constant for the i-th component
𝐼 ionic strength
𝑘𝐵 Boltzmann constant
𝑘𝑟𝑙 relative permeability to phase 𝑙
𝑘𝛽 reaction rate constants
𝐾𝐴 apparent stability constant
𝐾𝐴𝐷𝑆 isotherm coefficient
𝐾𝑒𝑞,𝛼 equilibrium constant of the aqueous reaction α
𝐾𝑒𝑞,𝛽 equilibrium constant of the mineral reaction 𝛽
𝐾𝑒𝑥,𝛿 selectivity coefficients for the exchange reaction 𝛿
𝐾𝑖𝑛𝑡 intrinsic-reaction stability constant
𝐿 characteristic flow length
𝑚𝑖 molality of the i-th component
𝑛 exponent

xxii
𝑛 ionic density in the aqueous solution
𝑁[>𝑖] number of sorbed moles per unit volume
𝑁𝐴 Avogadro’s number
𝑁𝑎 aqueous components
𝑁𝑎𝑞 total components in the aqueous phase
𝑁𝑐 total number of soluble hydrocarbon components
𝑁𝑒𝑥 number of surface exchangeable species
𝑁𝑖𝑎 Primary aqueous components
𝑁𝑚 mineral components
𝑁𝑡 total number of components/species
𝑃 pressure
𝑃𝑐𝑜𝑤 oil-water capillary pressure
𝑞𝑖 molar rate of source/sink term for the i-th component
𝑄𝑒𝑥,𝛿 activity quotient for the exchange reaction 𝛿
𝑄𝛼 activity product of the aqueous reaction α
𝑄𝛽 activity product of the mineral reaction 𝛽
𝑟𝛽 rate of reaction
𝑅 universal gas constant
𝑅𝑎𝑞 total number of aqueous reactions
𝑅𝑒𝑥 number of exchange reactions
𝑅𝑖 residual function of the i-th component
𝑅𝑚 number of mineral surface reactions
𝑠𝑗 saturation of the j-th phase
𝑆𝑑 site density
𝑆𝑜𝑟 residual oil saturation to waterflood
𝑆𝑜𝑟𝑤 residual oil saturation
𝑆𝑤 water saturation
𝑆𝑤 water saturation
𝑆𝑤𝑖 irreducible water saturation
𝑆𝑤𝑛 normalized water saturation
𝑇 absolute temperature
𝑉𝑏 bulk volume
𝑉𝑏 bulk volume
𝑢𝑗 Darcy velocity of the j-th phase
𝑦𝑖𝑗 mole fractions of the i-th component in the j-th phase
𝑧𝑖 ion valence
∏ disjoining pressure
∏𝐷 electrical double-layer forces
∏𝑆 structural forces
∏𝑉 London–van der Waals forces
ℱ Faraday constant

xxiii
Greek Letters:
𝛼𝑜 power-law indices for oil
𝛼𝑤 power-law indices for water
𝛽𝑖 mole fractions of the surface sorbed species 𝑖
𝛾𝑖 activity coefficient of the i-th component
𝛾𝑟𝑜 rock/oil interfacial energies
𝛾𝑟𝑏 rock/brine interfacial energies
𝛾𝑏𝑜 brine/oil interfacial energies
𝛿𝑠 total surface site capacity
Δ shear/slip plane position
휀 dielectric constant of water
휀0 free space permittivity
ζ zeta
ζ zeta potential
κ Debye-Hückel reciprocal length
𝜅ℎ dimensionless water film thickness
𝜆𝑐 interaction characteristic wavelength
𝜇𝑖 chemical potential of the i-th surface species
𝜈 transport velocity
𝜈𝑖𝛼 stoichiometry coefficient of the i-th component in reaction α
𝜈𝑖𝛿 stoichiometry coefficient of specie 𝑖 in exchange reaction 𝛿
𝜉𝑖 equivalent fractions of specie 𝑖
𝜉𝑗 molar densities of the j-th phase
𝜌𝑏 rock bulk density
𝜎𝑑 diffuse layer charge density
𝜎𝑖,𝑒𝑞 net moles per unit bulk volume due to equilibrium-controlled reactions
𝜎𝑖,𝑚 net moles per unit bulk volume due to kinetic-controlled reactions
𝜎𝑜 surface layer charge density
𝜙 porosity
Φ𝑗 pressure potential of the j-th phase
𝜒 electrostatic interaction term (Boltzmann factor)
𝜓 electrostatic potential
𝜓𝑑 Stern layer potential
𝜓𝑜 surface potential
𝜓𝑟 reduced surface potential
𝜔 interpolation parameter
ω𝐴 van der Waals attraction energy
ω𝑅 double layer repulsion energy
Ω𝛽 saturation index

1
Introduction
This Chapter presents a description of the research problem, discusses the justification and
hypothesis proposed for this research, and lists the research objectives. The contents of each
Chapter are also presented to provide an overview of this dissertation.
Problem Statement
The life cycle of petroleum reservoirs typically undergoes three modes of oil recovery: primary
recovery utilizes the reservoir natural energy; secondary recovery mainly utilizes an injection of
water or gas for maintenance of pressure; while tertiary or enhanced oil recovery (EOR) utilizes
diverse forms of injection fluid [1, 2]. The recovery performance depends on several factors like
fluid type, reservoir management, reservoir heterogeneity, and drive mechanisms [3]. Almost all
light-to-medium gravity oil reservoirs go through a water injection cycle to produce some portions
of the oil left behind after the depletion of the reservoir natural energy due to the ease of water
injection, water availability, small capital investment, and operating costs among other benefits
[4]. It is estimated that after the first two stages of production, the average oil recovery can only
reach 10–50% of the original oil in place (OOIP) and a considerable amount remains trapped
underground [5, 6].
Waterflooding has been widely used as a secondary recovery process to supplement the reservoir’s
natural energy and displaces more oil because of increased viscous force. Ever since the reported
improved oil recovery as a result of the accidental water injection in some fields in Pithole City,
Pennsylvania, waterflooding has been generally considered as a relatively low-cost and simple oil
recovery technique used in recovering hydrocarbons left after primary recovery process [7].
Several researchers have made numerous attempts to investigate the fundamental mechanism to
understand, design and optimize the displacement process [8, 9]. The driving mechanism of the
injected brine was seen more like a physical process, and less attention was paid to the process
chemistry. The nearest accessible water supply has always been sourced for water injection, which
implies that seawater is often used for offshore applications. The brine is usually selected based
on the project’s economic evaluation along with its compatibility with existing formation water.

2
It was not until the late 1950s when some researchers noted an improved production after fresh
water injection during core experiments, which they credited to sweep efficiency as a result of clay
swelling and pore throat plugging [10, 11]. However, the process chemistry considering the quality
of the injected brine has generated a lot of significant attention in the last three decades. This
upsurge came by when Morrow’s research group [12, 13, 14, 15, 16, 17] reported improved oil
recovery in experiments conducted on clay-rich outcrop and Berea sandstone rocks. Meanwhile,
the recovery process was only identified in carbonate rocks when an unexpected, remarkable
success was reported during seawater injection into the Ekofisk mixed-wet fractured chalk
reservoir, significantly leading to high oil recovery [18, 19, 20, 21]. Consequently, extensive
research work at laboratory-scale and fairly at field-scale [22, 23, 24], in both sandstones [15, 25,
26] and carbonates [24, 27, 28, 29, 30, 31, 32, 33], confirmed that the process has a higher potential
to improve oil recovery compared to conventional waterflooding.
Though many published studies showed a positive response, which translates into additional oil
production as high as 30% in laboratory experiments and a decrease in residual oil saturation
ranging from 2-50% in field trials, but a few others showed no significant benefit [34, 35, 36, 37,
38, 39, 40]. Despite this discrepancy, the brine-dependent recovery process has gained recognition
as an emerging improved and enhanced oil recovery (I/EOR) technique to extract more oil in
sandstone and carbonate reservoirs. The process has drawn industry attention not only because it
is virtually identical to conventional waterflooding but also serves an upgrade as it delivers higher
recovery and displacement efficiency. While the process necessitates additional surface facilities
for water sourcing and disposal, it has more favourable economics and environmentally friendlier
than other I/EOR techniques. This brine-dependent recovery technique is also referred to as “smart
or low salinity waterflooding” by various researchers, “LoSal EOR” by BP [41], “Designer
Waterflood” by Shell, and “Advanced Ion Management” by ExxonMobil [42].
In sandstone rocks, there are several requirements, like the presence of clay in the rock, polar
components in oil, divalent/multicomponent ions in the formation water, that are necessary to
observe an improved oil recovery [43]. Reduction of injected brine salinity, as low as 2000 ppm
and as high as 7,000 ppm, and selective removal of divalent cations has proved successful,

3
whereas, carbonate rocks seem to be exempted from such requirements and approaches. The
mineralogical differences between sandstone and carbonate rocks appear to dictate the
performance of brine-dependent recovery in the different rocks. Different studies have shown that
the recovery process is more complex in carbonate rocks than in sandstones [44]. The complexity
is essentially because the bonding energy between the carboxylic component (RCOOH) of oil and
carbonates is always higher than for sandstones. Hence, carbonate rocks are often characterized as
mixed-wet to oil-wet, which is due to the collapse of the water film preventing the carboxylic
component in the oil from adhering to the rock surface. In an oil-wet state, a higher negative
capillary pressure is developed during conventional waterflooding. More oil is trapped as a result,
ensuing in an ineffective displacement process due to low oil recovery and high water cut.
However, the brine-dependent recovery process in the salinity range between 20,000–33,000 ppm
has been reported to alter the carbonate rock wettability by restoring stability to the water film,
thereby overcoming the negative capillary pressure and increasing water imbibition leading to
higher recovery.
Despite its success, the recovery process has been explored on two major frontlines, each
supported by experimental evidence of improved recovery [29]:
a. Reduction of injected brine salinity or ionic strength
i. Brine dilution.
ii. Reduction of water hardness (Ca2+ and Mg2+)
iii. Non-active ions (Na+ and Cl-) removal or reduction
b. Brine ion modification
i. Potential determining ions (PDIs - SO42-, Mg2+, Ca2+) concentrations
ii. Surface interacting ions (PO43- and BO4
3-) concentration.
This study “brines with modified ions and not necessarily salinity change” are referred to as “smart
brines” and “brines with reduced salinity” as “low saline brines”. Brine-dependent recovery
processes could also be combined with other recovery techniques such as chemical flooding or
water alternating gas (WAG). However, a thorough understanding of the mechanisms at play
during any recovery process is crucial for its successful implementation as well as reliable

4
production modeling, optimization and forecasting. The different frontlines as mentioned above
that have been applied on carbonate rocks have led to the postulation of various mechanisms
responsible for the improved oil recovery observed during its application. The widely acceptable
mechanism among many researchers is wettability alteration, however, there is quite a debate as
to the process by which the rock wetting state is changed by low saline/smart brine. Several
different mechanisms have been proposed to justify the wettability as will be extensively discussed
further in Chapter 2. Among the proposed mechanisms are reduction of interfacial tension [45,
46], mineral dissolution [31, 47, 48, 49], multi-ion exchange [32, 33, 44, 50, 51, 52, 53, 54, 55],
and surface charge alteration/electrical double layer (EDL) expansion [27, 31, 56].
However, the decrease in interfacial tension (IFT) observed in several studies [45, 57, 58, 59, 60]
was considerably less, which is not ample to cause such a high incremental recovery as compared
to ultra-low values associated with gas-dependent recovery processes and alkaline flooding.
Similar observations made by authors (such as Yousef et al. [31], Mahani et al. [56], Gupta et al.
[61]) showed a small effect of injected brines on IFT, and no correlation could be established
between the improved recovery and IFT. Hence, brine-dependent recovery influence on capillary
forces is mainly seen in wettability alteration rather than IFT alteration. Several studies showed
evidence to support rock dissolution mechanism, such as anhydrite dissolution contributing to the
in-situ generation of sulfate as observed in produced brine [48, 49], increase in pressure drop
resulting in fines migration [30, 36], improved connectivity between micropores and macropores
during NMR experiments[31]. Contrarily, several researchers (such as Mahani et al. [56] and
Chandrasekhar and Mohanty [27]) believed that mineral dissolution should be considered rather
as a secondary recovery mechanism, relevant only at lab-scale and not field-scale.
Meanwhile, surface charge alteration indicates that the charge at the rock-brine interface is
changed to less positive (which is strongly positive for calcite minerals) as compared to the
negatively charge brine-oil interface. This alteration creates a repulsive electrostatic force that
maintains a high disjoining pressure and expands the EDL. The water film thickness is related to
the EDL, such that once the EDL expands, the thickness of the water film becomes stable and vice
versa. The approach that involved ion modification and reduction or removal of monovalent salts

5
(consisting of Na+ and Cl-) has been proven to favorably decrease the rock-brine interfacial charge,
creating repulsive forces necessary to expand the EDL [7, 38, 54, 56] . While the approach with
brine dilution, where PDIs are relatively low, is presently debated to be due to surface charge
alteration as the fundamental mechanism rather than dissolution [27, 56, 57].
A more comprehensive review of published research studies is presented in Chapter 2. However,
from extensive research studies conducted thus far, it seems quite difficult to adjudicate which
mechanism dominates, especially given that no consensus has been reached except that every
proposed explanation has some form of wettability alteration [62]. The main cause for such could
be because most result interpretation did not consider all factors influencing the oil-brine-rock
interaction such brine content (connate and injected), rock mineralogy, oil type and structure, and
temperature. During the recovery process, the already established equilibrium among oil, brine
and rock is disturbed, and so it is envisaged that the underlying mechanisms behind this process
would be related to a thorough geochemical interpretation of the process.
Reliable optimization of any recovery process requires the availability of a predictive tool. This
tool is a necessity to understand the principal mechanisms driving the recovery process. For such
a tool to be developed to simulate the recovery process, the mechanisms at play need to be well
grasped. However, irrespective of not reaching a consensus over the proposed recovery
mechanisms, few modeling works [47, 63, 64, 65, 66, 67, 68, 69, 70, 71, 72, 73, 74] have been
performed to simulate pore-to-surface-scale mechanisms that have been proposed to explain the
complex oil-brine-rock interactions. Most modeling attempts to present solutions to the
mathematical equations describing brine-dependent recovery process have explored numerical
approximations, while a few have attempted the application of analytical solutions [71, 72, 75, 76].
The bulk of the numerical black-oil models used salinity-dependent flow functions, while some of
the compositional models used empirical correlations. Meanwhile, the complex interaction needs
to be predicted by using either of surface sorption and complexation geochemical models that
allows the investigation of rock mineralogical contents, brine compositions and polar oil materials,
which are significant in electrostatic interactions at both rock−brine and oil−brine interfaces.

6
Research Justification
In recent times, with fluctuations in oil price, the cost of exploring new oil fields and
unconventional oil becomes a very high-risk venture, fraught with uncertainties. Therefore, an
approach to lessen such risks and uncertainties will be to target the residual oil in already
discovered and proven reserves by developing cost-effective techniques/processes to improve
recovery. The brine-dependent recovery process has proved effective in achieving such hurdle just
as discussed above. However, many challenges have saddled the process which necessitates
solution for prolific implementation:
• Disputed fundamental chemical mechanisms: As discussed above, conflicts exist among
various researchers on the plausible mechanisms responsible for the observed improved
recovery. Though wettability alteration has been agreed as the main effect, the path through
which this is achieved remains disputed. The different proposed hypotheses are mineral
alteration, surface charge alteration, multi-ion exchange and double layer expansion. Without
a thorough understanding of the mechanisms at play, there will be a setback in its
implementation. Therefore, this research is intended to develop a tool to closely evaluate the
dominant chemical mechanism at play in the complex interactions among ion species in the
aqueous, oil and rock surfaces.
• Modeling challenges: Different numerical modeling approaches have been used to evaluate
this recovery technique. Few have extended black-oil models [68, 77, 78] by incorporating
additional component in the aqueous phase without tracking the individual ionic species. Some
tried empirical correlations and data matching, which is only peculiar to the condition where
such correlations were developed [63, 79]. Few others assumed adsorption of a single
wettability alteration agent to modify the flow functions, which is not enough to accurately
capture the complexity of the process [64, 80]. Other two-phase models assumed either calcite
dissolution or cation exchange [67, 69, 81], again not accounting for the interaction of
hydrocarbon species with the brine and rock surface. Few compositional models developed
either coupled a geochemical-transport model [82] with huge computation time or were
designed for only sandstones [83]. There are others that used the surface complexation model

7
without applying thermodynamic parameters appropriate for natural reservoir rocks [70, 84].
There are simplified assumptions in many of these models that are not representative. It is
therefore imperative to have a compositional multicomponent geochemical model that captures
rock/brine/oil interaction with reliable interpretation and validation of reported experimental
observations. The model should be able to perform fast and reliable numerical simulations of
coreflood experiments as well as field scale studies. Also, the sensitivity of controlling
parameters that could have a positive effect on oil recovery needs to be evaluated which could
help provide equitable prediction at field-scale.
• Benefits of combining brine-dependent recovery with other EOR techniques: oil mobilization
is improved through wettability alteration during the brine-dependent recovery process, and
there are feasibilities of combining other processes which are capable of further reducing the
capillary force responsible for oil trapping. Then, the combined system tends to benefit from
the symbiotic effects of the combinations of the various processes. Encouraging results in
carbonate reservoirs have been demonstrated through laboratory and numerical studies in low-
salinity-water-CO2 [83, 85, 86, 87, 88, 89], low-salinity-water-polymer flooding [90, 91, 92,
93], low-salinity-water-surfactant flooding [94, 95]. Hence, there is a need to further improve
these processes.
Research Goals/Hypothesis
Based on existing literature, complexities in brine-dependent recovery in carbonates pose
challenges to its field-scale application. However, certain questions that have come to mind with
the work done so far will be addressed in this research. These questions are:
1. What are the dominant mechanisms at play considering the different approaches that are
proven in carbonate reservoirs? How do these mechanisms interplay to achieve the reported
experimental successes?
2. How realistic are these numerical models? Do they fully replicate the thermodynamic
interaction between oil-brine-rock system during low saline/smart brine injection into
carbonate reservoirs? How will the process behave in field-scale?

8
3. Many studies considered brine-CO2 recovery, how will CO2 perform in a low saline
environment? What different injection approaches will excel using CO2? How will the
process behave in field-scale?
In this research study, “the hypothesis for the main underlying chemical mechanism behind brine-
dependent recovery is wettability alteration from oil-wet towards water-wet”. Its modeling can be
quite challenging due to complex, coupled intra-aqueous, aqueous/oleic and aqueous/solid
reactions. These reactions and transport of the resulting ions would have such a significant impact
on oil recovery; hence, a robust model is required. Then, a native approach will be to distinguish
various chemical interactions occurring because of the introduction of brine with a different
composition into the core containing brine with compositions that is already in thermodynamic
equilibrium with the core. Such would result in destabilization of the existing equilibrium state,
triggering chemical reactions between ions in the aqueous phase as well as between ions in the
aqueous and those dissolved or precipitated to the rock regarding mineral dissolution/precipitation
and those attached to the rock surface due to various surface reactions. This fact, if proven, will
lead to corresponding changes in the rock wetting nature as represented by flow functions like
relative permeability and capillary pressure. The most important variable is the process-dependent
interpolating parameter which captures wettability alteration through the interpolation of the flow
functions as a function of different parameters as will be discussed later.
Research Objectives
Sequel to completing this study, which is to fill existing gaps in the literature, unravel the
discrepancy between different studies, further implement representative modeling techniques and
evaluate benefits of the brine-CO2 recovery system, the following research objectives are
proposed:
• In small scale, identifying the dominant chemical mechanisms behind the improved
recovery observed during the brine-dependent recovery process and understanding the
interplay between these mechanisms are the key objectives, on which other objectives rely.
No reliable prediction or optimization can be achieved without this.

9
• Developing a comprehensive model that captures the dominant mechanisms and exploring
different parameters relating the possible link between geochemical changes in the oil-
brine-rock system. The model is employed to discuss recently published lab experiments
where various experimental approaches in carbonates are proven.
• In large scale, evaluating low saline/smart waterflood beyond core-scale by extending
recently published coreflood properties to a quarter of five-spot field model and comparing
its performance under different operational and design strategies. Parametric sensitivity
analysis is performed to highlight the impact of various variables.
• Developing a model that can capture oil recovery from the combination of low saline/smart
brine and gas injection. Symbiotic benefits of low saline/smart brine and CO2 is modeled,
and different injection strategies are explored.
Outline of the Dissertation
This thesis describes the interpretation and validation of thermodynamic modeling of oil-brine-
rock interactions during the brine-dependent and brine-CO2 recovery for oil production
enhancement in petroleum reservoirs. The scope of work extends from an extensive integrated
review on systematic laboratory and field studies, interfacial mechanisms and modeling attempts
to theoretical/numerical approaches to wettability evaluation at core-to-field scale based on the
balance of the surface forces and geochemical modeling. The target of this work is to understand
fluid physics during brine-dependent recovery, associate the dominant physics with rock
wettability in terms of surface forces, predict the oil recovery and identify sensitive parameters
that can influence the process performance. The rest of the thesis is structured as follows:
Chapter 2 presents an integrative literature review on the different systematic observations from
laboratory experiments and field studies, taking into consideration the critical factors affecting the
process performance. The proposed fundamental mechanisms with its associated contradiction and
resolutions, as well as the major modeling attempts, including their potential challenges and
lessons learned, were discussed. Besides, a summary of the major compatibility issues associated
with the injection water and the possible remediation were presented. Chapter 3 discusses the
theory of surface forces and water film stability, and mineral-scale investigation of wettability

10
alteration during brine-dependent recovery due to variation in PDI and NaCl concentrations, and
brine dilution. The wetting state of carbonate rocks and the relationship of their wettability to oil
recovery characteristics are also rationalized.
The description of the numerical model is given in Chapter 4 by presenting a general formulation
of the system of mass action laws and flow equations for the reactive multiphase multicomponent
transport applicable in multiple dimensions and describe the numerical approaches that are
implemented in this modeling work. The model was validated using zeta potential and single-
phase flow through experiments to acquire important thermodynamic parameters describing
various surface reactions. Chapter 5 presents the investigation of the oil recovery characteristics
by applying the numerical model developed in Chapter 4. The changes in oil recovery
characteristics were described by developing a controlling parameter to alter flow functions as an
indication of the wettability alteration process. Chapter 6 presents the investigation of the synergy
between brine-dependent recovery and CO2 flooding on improving oil recovery at both core-scale
and field-scale. Finally, the major scientific findings of this study and several technical suggestions
for future studies are presented in Chapter 7.
Publication
The work performed during this research study has led to several publications so far. The portions
of the introductory text in Chapter 1 and the review of the systematic investigation of brine-
dependent recovery presented in Chapter 2 have resulted in the following article:
Adedapo Awolayo, Hemanta Sarma, and Long Nghiem. Brine-Dependent Recovery
Processes in Carbonate and Sandstone Petroleum Reservoirs: Review of Laboratory-Field
Studies, Interfacial Mechanisms and Modeling Attempts. Energies, 11 (11): 3020, 2018
A portion of Chapter 3 on surface chemistry and prediction of water film stability and the
validation work on surface sorption model presented in Chapter 4 has been published as:
11
Adedapo Awolayo, Hemanta Sarma, and Long Nghiem. Modeling the characteristic
thermodynamic interplay between potential determining ions during brine-dependent
recovery process in carbonate rocks. Fuel, 224: 701–717, 2018.
The work presented in Chapter 4 on the development of the reactive transport modeling and part
of the work presented in Chapter 5 on the prediction of brine-dilution dependent oil recovery
approach led to the publication of the following article:
Adedapo Awolayo, Hemanta Sarma, and Long Nghiem. Thermodynamic Modeling of
Brine Dilution-Dependent Recovery in Carbonate Rocks with Different Mineralogical
Content. Energy & Fuels, 32: 8921–8943, 2018.
Part of the work presented in Chapter 5 on the prediction of brine-dependent oil recovery through
composition-variation approach has been presented and included in the following conference
proceedings:
Adedapo Awolayo, Hemanta Sarma, Long Nghiem and Emre Gorucu. A Geochemical
Model for Investigation of Wettability Alteration during Brine-Dependent Flooding in
Carbonate Reservoirs. In: Proceedings of 2017 Abu Dhabi International Petroleum
Exhibition & Conference (Paper SPE-188219), Abu Dhabi, UAE, 13-16 November 2017.
The work presented in Chapter 4 on surface complexation modeling and validation and Chapter 6
on the prediction of the low-saline-water-CO2 recovery process has been presented and included
in the following conference proceedings:
Adedapo Awolayo, Hemanta Sarma, Long Nghiem and Emre Gorucu. Numerical
Modeling of Fluid-Rock Interactions during Low-salinity-brine-CO2 Flooding in
Carbonate Reservoirs. In: Proceedings of the 2019 SPE Reservoir Simulation Conference
(Paper SPE-193815), Galveston, Texas, April 10 - 11, 2019.

12
Background and Integrative Review
This Chapter presents a comprehensive review on the established features and major progress
made in the systematic investigation of brine-dependent recovery across the different scale of
investigations from laboratory experiments to field studies, various proposed fundamental
mechanisms, the major modeling attempts and water injection compatibility issues. Meanwhile,
major attention is paid to studies conducted in carbonate rocks.
Introduction
As highlighted in Chapter 1, the brine-dependent recovery process has been explored on two major
frontlines: ionic strength and composition modification [29]. For sandstone rocks, the presence of
clay minerals and injected water salinity level as low as 2000 ppm and as high as 7,000 ppm gives
optimum performance [96, 97, 98, 99, 100]. Meanwhile, a salinity range between 20,000–33,000
ppm appears to work well in carbonate rocks [44]. There were cases where the salinity range of
5,000–10,000 ppm resulted in improved oil recovery [30, 31, 36, 48, 101], but this has been
attributed to the presence of dissolvable minerals [48, 102]. In addition, on the composition
modification front, the process performance is optimum using injected water with less multivalent
ions for sandstone reservoirs and more PDIs for carbonate reservoirs. PDIs are classified as those
ions whose concentration in the aqueous solution controls the polarity and density of electrical
charge on the mineral surface and influence interactions between oil and the rock surface [103].
Most experimental studies focused on, besides reporting oil recovery factors and residual oil
saturation from displacement and imbibition tests, collection of a plethora of laboratory data (such
as, produced brine composition and pH, pressure differential, water cut and breakthrough, contact
angle/wettability index, zeta (ζ) potential, oil-brine interfacial tension, surface relaxation and
adhesion, etc.) to explain the recovery mechanisms [29, 32, 54, 56, 57, 61, 104, 105, 106, 107,
108]. There have been inconsistencies in the report of many experimental studies. The major
consensus reached is that “wettability alteration is considered as a consequence rather than as a
cause of the processes” underlying brine-dependent recovery process. Several different
mechanisms have been proposed to justify the wettability shift towards less oil-wetness; however,

13
there appears to be no unanimity about the recovery mechanism. Besides, some of the proposed
mechanisms could only explain cases that showed a positive response and failed to explain cases
with no significant benefit.
Few modeling attempts [47, 63, 64, 65, 66, 67, 68, 69, 70, 71, 72] have been made to simulate the
proposed mechanisms to interpret the complex oil-brine-rock interactions, through the application
of either numerical approximations or analytical solutions [71, 72, 75, 76]. Even so, a correct
representation of the pertinent mechanisms in a mathematical model is required for an accurate
prediction of fluid flow. Most modeling attempts to present solutions to the mathematical
equations describing brine-dependent recovery process have explored numerical approximations,
while a few have attempted the application of analytical solutions [71, 72, 75, 76]. The practical
value of these models lies in the fact that they aid to improve interpretations of the process and
help conduct fast sensitivity computations. This review addresses the subjects of current interests
about comparing past and recent developments, and challenges of brine-dependent recovery
processes in carbonate rocks. A detailed review highlighting the similarities and differences
between the recovery process in sandstone and carbonate rocks is presented by Awolayo et al.
[62].
Laboratory Experimental Studies
Ever since waterflooding has been introduced to recuperate hydrocarbons left after the primary
recovery process, numerous attempts to investigate the fundamental mechanism have been made
to understand, design and optimize the displacement process [8, 9]. The driving mechanism was
then seen more like a physical process, and less attention was paid to the process chemistry. It was
not until 1950 when some researchers [10, 11] noted an improved production after freshwater
injection during core experiments, which they credited to sweep efficiency as a result of clay
swelling and pore throat plugging. However, the process chemistry considering the quality of the
injected brine did not generate significant attention until the 1990s. The earliest comprehensive
study undertaken by Morrow and colleagues [13, 14, 15, 16, 109, 110] demonstrated the effect of
oil-brine-rock interactions on improving oil recovery in a clay-rich rock formation and presented
additional oil recovery from the brine-dependent process due to salinity gradient and wettability

14
shift. Since then, numerous studies have been conducted with most tests showing positive results
[15, 23, 29, 30, 33, 38, 49, 52, 57, 60, 99, 100, 111, 112], while no response was observed in other
tests [35, 36, 37, 38, 39, 40].
Because of the large size of subsurface rocks with diverse mineralogical contents occupied by
complex reservoir fluids, systematic investigations are usually conducted at all levels (from the
molecular scale to macro-scale, see Figure 2.1) in no particular order to completely understand
and reliably predict subsurface processes. The scale of investigation often determines the type and
degree of effects that are observed about gaining complete knowledge of the process. As such, a
systematic investigation of brine-dependent recovery has been explored at the molecular scale
(from atomic to nanometric level) through atomic force microscopy (AFM), scanning electron
microscopy (SEM), nuclear magnetic resonance (NMR) and ζ–potential. At micro-scales,
experiments (such as coreflooding, spontaneous imbibition, chromatographic and contact angle
tests) typically investigate crude oil and brine flowing through or occupying pore spaces in the
order of micrometres up to centimetres. Then, mechanisms and integrated effects can be further
examined in a more magnified view at the macro-scale level through field trials and
implementation.
Most of the laboratory evidence to support improvement in oil recovery during the brine-dependent
process is mostly presented at different reservoir conditions through coreflood experiments (at
micro-scale), in both secondary and tertiary mode, and augmented by spontaneous imbibition
experiments. Some of the coreflood experiments are performed at low flooding velocity on short
core samples, which often results in the erroneous estimation of residual oil saturation, because
the fluid movement and production are susceptible to capillary end-effects [113]. Meanwhile,
increasing the injection rates to reduce the capillary end-effects did not lead to remobilization of
trapped oil in many studies [57, 114, 115], which emphasized the positive impacts of the injected
brine on improved oil recovery. Spontaneous imbibition, on the other hand, is not only used to
determine the initial wetting state but also to quantify the associated wettability changes when
invading brine enters the pore-space [13, 116, 117]. It has been reported to yield higher imbibition
rate and total oil production with the invading brine in both secondary and tertiary mode [13, 15,

15
50, 52, 102]. Moreover, for wettability assessment, a lower rate and smaller extent of imbibition
often indicate oil-wetting nature, while higher rate and larger extent of imbibition are indicative of
water-wetness [15]. Determination of the rock surface wettability inferred/directly measured
through different techniques at both molecular and micro scales such as contact angle
measurements [7, 30, 46, 57, 118], chromatographic test [32, 53, 54], electrokinetic (ζ-potential)
measurements [104, 107, 119, 120, 121], NMR [57, 122, 123], AFM [106, 124, 125] , etc., has
reported data consistent with a change to more water-wet conditions.
Figure 2.1— R&D-to-Field sketch of the systematic investigation for brine-dependent recovery design and
implementation (adapted from Sarma [126], Awolayo et al. [62]).
The chromatographic test is a technique centred on the chromatographic partitioning of two water-
soluble compounds, an adsorbing ion (like PDIs) and a non-adsorbing tracer ion (like SCN-), with
the aim to calculate the water-wet fraction after the rock samples are exposed to various brines.
The ratio of the area between the relative effluent concentration of the two water-soluble
compounds and the corresponding area of completely water-wet cores are then related to the
wetting conditions (0 - oil-wet and 1 - water-wet) of the rock samples [127]. The contact angle

16
measurement is used to quantitatively express the degree of wetting when a solid surface is in
contact with two fluids as measured through the denser fluid. The oil-wetting condition is often
considered to be greater than 115o, water-wetting as less than 75o while intermediate/neutral
wetting is considered to be between both extremes [128]. AFM is used to directly measure
intermolecular adhesion forces between two surfaces by generating force-distance curves, which
provide valuable information about hydrodynamic interactions between deformable surfaces, the
nature of each force, surface energies and indirect clues of surface mineral chemistry [129]. The
ζ-potential measurement is used to evaluate the electrokinetic behaviour of two interfaces in
contact; the positive magnitude of one interface as compared to the negative magnitude of the other
interface often result in electrostatic attraction between the two interfaces and consequently rupture
the thin water film layer and lead to less water-wetness, and vice versa [130]. NMR is often based
on T2 relaxation time and surface relaxivity of fluid samples in a porous rock to determine different
rock properties, especially pore occupancy and wettability because the relaxation time of the
wetting phase is shorter than the bulk fluid phase [31, 122, 123]. These different scales of
investigation have been well tested, though some were more tested compared to others, many of
which will be discussed below.
Based on these previous studies, various aspects of the experimental method have been
investigated, including reservoir and the injected brine parameters, to identify the optimum
condition for brine-dependent process performance. The important parameters which have been
given much attention in the literature in recent years, include the injection brine composition and
ionic strength, connate water composition and saturation, rock type, clay content and type of clays
present in the rock material, temperature, initial wettability of the rock surface, and crude oil
composition and its acid/base number, as discussed below.
2.2.1 Connate water content and saturation
Most oil reservoirs initially contain formation water, which is highly saline and more often
contains a high concentration of multivalent ions. Table 2.1 compares the variation in water
compositions in different regions with successful brine-dependent recovery field application, such
as the Endicott, Ekofisk and Arabian Gulf. The Ca2+ concentration is usually high in the formation

17
water and can be a factor of more than ten as compared to that of Mg2+ [131, 132]. The
composition, salinity and saturation of the connate reservoir water can significantly influence the
initial rock wetting state, which in turn based on its interactions with the injected water affects the
efficiency of oil recovery.
Table 2.1—Salinity and composition of formation water and seawater in different regions (adapted from
[23, 57, 133, 134])
Ions
Seawater (ppm) Formation water (ppm)
Endicott Ekofisk North
Sea Arabian Gulf Endicott
Ekofisk North
Sea Arabian Gulf
Na+ 10812 10345 18043 11850 15748 59491
K+ 386 391 0 110 0 0
Ca2+ 402 521 652 320 9258 19040
Mg2+ 1265 1093 2159 48 607 2439
Ba2+ 0 0 0 7 0 0
Sr2+ 7 0 11 24 0 0
Fe2+ 0 0 0 10 0 0
Cl- 18964 18719 31808 17275 42437 132060
HCO3- 147 122 119 2000 0 350
SO42- 2645 2305 4450 63 0 354
CO32- 0 0 27 0 0 0
TDS 34628 33498 57269 31707 68051 213734
Ionic Strength 0.688 0.659 1.146 0.541 1.453 4.317
It was documented that an increase in initial water saturation up to 34% leads to an increase in
imbibition rate in Chalk as reported by Viksund et al. [135]. The authors claimed that the scaled
imbibition curves for chalk in the absence of initial saturation closely agrees with that of sandstone
rock. Strand et al. [53] reported twice the oil recovery observed using similar salinity brine in the
core with the initial saturation of 9.1% than that of 14.8% initial water saturation, even though
much of the improved recovery was attributed to the presence of sulfate in water injected into
14.8% water saturated cores. Similarly, Puntervold et al. [136] compared the effect of a range of
initial water saturations (high – 30-50%, low – 10% and No water saturation – 0%) on oil recovery
and observed that the cores became less water-wet as the water saturation decreases. The

18
wettability change led to a reduction in the imbibition rate, and it was proposed that at low water
saturation, high oil saturation increases the amount of crude oil surface-active materials such that
the oil can easily adsorb on the rock surface.
In a subsequent study, Puntervold et al. [137] observed no difference in oil recovery when two
cores were initially saturated with deionized water at 22% and 10% water saturation, respectively
and flooded with similar brines at 90 °C and 130 °C. The authors further proved through
chromatographic tests and spontaneous imbibition that a small amount of sulfate in the formation
brine can significantly improve the rock water wetness and oil recovery. A similar study conducted
on Stevns outcrop chalk reported that when initial sulfate was removed from the core by flooding
with distilled water prior to aging, the effect of sulfate on the oil recovery was greater compared
with core plugs where the sulfate was initially present [138]. Furthermore, Shariatpanahi et al.
[131] conducted additional studies on impacts of sulfate present in the initial brine on the initial
wetting state and confirmed that increasing sulfate concentration to 2 mmol/L increased oil
recovery and decreased water-wetness. The improvement in oil recovery and water-wetness was
reported to increase as the aging temperature decreased (130 – 50 °C), while no noticeable
improvement was observed as the sulfate concentration was increased beyond 2 mmol/L in the
initial brine. In addition, Zhang et al. [50] reported that increasing Ca2+ concentration in the initial
brine has a very marginal effect on the rock wetting condition. In a recent study by Shariatpanahi
et al. [139], it was shown that increasing Ca2+ concentration decreased the water-wetness while
Mg2+ in the formation brine makes the rock more water wet.
2.2.2 Crude oil composition
Crude oil usually contains both acids and bases that are ionizable and exhibit surface activity [140].
The ionizable acidic and basic surface-active groups of the crude oil form as a result of the presence
of typical heteroelements (like nitrogen, oxygen, and sulfur) found in oil [141]. Petroleum bases
are identified as heterocyclic aromatics with the nitrogen atom, quantified by base number (BN);
while the number of carboxylic materials in crude oil is used in characterizing petroleum acids,
quantified by acid number (AN). The carboxylic group and the nitrogen-containing bases, as
mostly found in crude oil heavy end fractions, i.e. asphaltene and resins, plays such a vital role on

19
the rock initial wetting. The polarity and the chemical properties of crude oil as determined by its
ionizable acidic and basic surface groups can influence rock wettability [142].
Various earlier studies [141, 143, 144, 145, 146] have described the role of heavy fractions,
asphaltenes or acid and basic components in crude oil on rock wetting state. However, not all crude
components have been reported to be influential in altering the preference of the rock towards oil
wetting. Denekas et al. [141] presented that sandstones seem not to have any selective affinity for
a specific type of polar product, as both the acidic and basic components of the crude oil alter the
rock wettability. In contrast, the authors claimed that limestone rocks are more sensitive to basic
products containing nitrogen. Many other authors [147, 148, 149] have given contradictory
opinions about the above assertion that indicate the possibility of the chemisorption of the acid
components (most notably naphthenic acids) of crude oils on the basic carbonate surface. The
differences in opinions could be as a result of increased decarboxylation of carboxylic material in
crude oil at elevated temperatures, catalyzed by the presence of formation itself (CaCO3), and
leading to a reduction in acid number compared to basic number over geological time [150].
In a different study, Standnes and Austad [116] reported that acid number is a crucial wettability
factor for carbonate rocks as the imbibition rate and water-wetness was observed to decrease as
the AN increased in the absence of initial water (see Figure 2.2). The authors did not observe any
correlation between the imbibition rates and the asphaltene content and stated that the functional
acid groups did not dominate the asphaltene fraction of the oil. In several tests performed on chalk
wetting properties using oils with different AN (0.17 – 2.07 mg KOH/g) and synthetic seawater,
an increased water-wetness as the AN decreased was reported by Zhang and Austad [151]. Austad
et al. [48] also compared imbibition rate of limestone cores aged in two different crude oils,
imbibed in formation water and reported that the imbibition rate decreased as the AN increased,
while the contribution from BN was ignored. In a similar study, the imbibition rate was observed
to increase further as the brine was switched to a brine of higher sulfate concentration with
increased AN [152].

20
Figure 2.2—Effect of acid number (AN) on spontaneous imbibition of brine into chalk cores saturated with
different crude oil (reproduced from Standnes and Austad [116] with permission). The imbibition rate and
water-wetness decrease as the AN increases in the absence of initial water
A wider range of organic compounds was investigated for carbonate rock adsorption and
wettability by Thomas et al. [153]. Fatty acids were observed to strongly and nearly irreversibly
adsorb to the carbonate surface, whereas aromatic and branched carboxylates and long chain acids
were moderately adsorbed and alcohols, amines, short-chain acids were weakly-adsorbed/non-
adsorbed. It was also stated that the overall structure of the compound determined its adsorption
strength, for example, the small size of the carboxyl group and long straight chains of the fatty
acids lead to the formation of a closely-packed hydrophobic layer, thereby providing multiple
attachment sites to stabilize the adsorption and make the carbonate surfaces oil-wet. Standnes and
Austad [116] also claim that carboxyl groups are the most active polar functional groups of crude
oil in adsorbing organic material onto the chalk surface. Several other authors [154, 155, 156, 157,
158] have shown that long-chain acids are the most effective among researched acidic species to
alter the carbonate rock to a more oil-wet state. Despite that the effect of basic materials on
wettability was not widely studied, Puntervold et al. [136], observed that an increase in the amount
of natural bases led to decrease in water-wetness as AN was held constant. It was suggested that

21
the natural base forms a large molecular weight acid-base complex to be in equilibrium with the
carboxylic materials in the oil, thereby preventing the carboxylates from adsorbing to the rock. In
many of the discussed studies, it is well agreed that the AN and BN of the crude oil, associated
with the presence of long chain acids, play a significant role in wettability alteration of carbonate
surfaces.
2.2.3 Rock mineral composition
Different rock types have varying mineral compositions that affect the rock’s surface area, grain
structure, crystalline texture, and reactivity towards diverse ions in brines and this reflects the
heterogeneous nature of the reservoir and difference in their responses towards brine-dependent
recovery processes. Therefore, understanding the effect of rock properties as it influences the
initial wetting state and response to brine-dependent recovery is essential for a valid comparison.
Carbonate rocks are primarily composed of calcite (CaCO3) and dolomite (CaMg(CO3)2), with a
variety of other minerals like anhydrite/gypsum (CaSO4), magnesite (MgCO3), aragonite (CaCO3),
apatite (phosphate source), quartz, siderite (FeCO3), evaporite, pyrite, etc. [159, 160]. Carbonate
rocks often experience different post-depositional chemical/physical changes, which results in
corresponding changes in rock properties, such as surface area, reactivity, permeability, porosity,
faults, fractures, and wettability.
Studies by various authors (like [161, 162, 163]) have shown that mechanical properties (such as
strength, yield and bulk modulus) of chalk is weakened (decreased) when flooded with seawater
containing SO42− ions, which can enhance compaction and cause a minor change in permeability
as compared to distilled water and seawater without sulfate. The resulting large-scale heterogeneity
often generates complex fluid flow paths, which has been shown to increase oil displacement
through smart brine injection from the matrix blocks by well-connected induced fractures [164],
compared with non-connected fractured cores. Meanwhile, it has been shown that the surface area
and the reactivity towards PDIs in the injected brine vary for different carbonates.
Several parametric studies have demonstrated that chalk (a pure biogenic calcite) is highly reactive
to PDIs as their adsorption can change the surface charge of the rock and alter rock wettability [32,

22
50, 51, 52, 54, 55, 127, 152, 165]. The degree of sulfate ions adsorption was found to be different
depending on the chalk type [138, 161, 166] and proportional to the surface area of the specific
chalk [161]. Further studies by Fathi et al. [38] suggested that NaCl-depleted seawater is more
reactive to the chalk surface as its imbibition rate and ultimate oil recovery increased relative to
ordinary seawater and further improvement was observed when NaCl–depleted seawater was
spiked by sulfate [167], while increasing NaCl concentration led to a decrease in oil recovery.
However, limestone, which is less homogeneous than chalk with smaller surface area, has been
reported to have a similar affinity towards PDIs, although the reactivity is less than it is chalk [29,
53, 99, 112]. As for chalk, NaCl–depleted seawater appeared to be an even better wettability
modifier in limestone than ordinary seawater [39, 112].
On the other hand, the injection of low saline brine in chalk cores did not result in additional
recovery [36, 38, 48]. In the same study, Austad et al. [48] reported oil recovery improvement
when limestone cores containing anhydrite was flooded with low saline brine. The study indicated
that the improvement in oil recovery recorded by Yousef et al. [31] on limestone core was as a
result of anhydrite dissolution that led to the in-situ generation of SO42- ions. The authors claimed
that the presence of anhydrite is essential for the success of brine-dependent recovery in cases
where injected brine contains little/no SO42- ions. Meanwhile, Romanuka et al. [101] conducted
spontaneous imbibition experiments on limestone cores (primarily calcite) and showed that brine
dilution contributed to an incremental recovery up to 2–4% OOIP, whereas NaCl–depleted
seawater had no recovery benefit. Zahid et al. [36] also reported a substantial increase in oil
recovery with diluted seawater on carbonate cores free of dolomite/anhydrite and suggested that
rather than anhydrite dissolution, calcite mineral rock dissolution leading to fines migration was
the plausible mechanism for the incremental recovery.
Dolomite core, which predominantly contains dolomite minerals, has been reported to have a
similar surface reactivity towards PDIs in the injected brines, however, is weaker compared to
chalk and limestone cores [101, 120, 139, 168]. Shariatpanahi et al. [139] reported that the
presence of sulfate ions (either through the injected brine or anhydrite dissolution [101]) is
essential to observe oil recovery benefits and the brine salinity was suggested to be low to increase
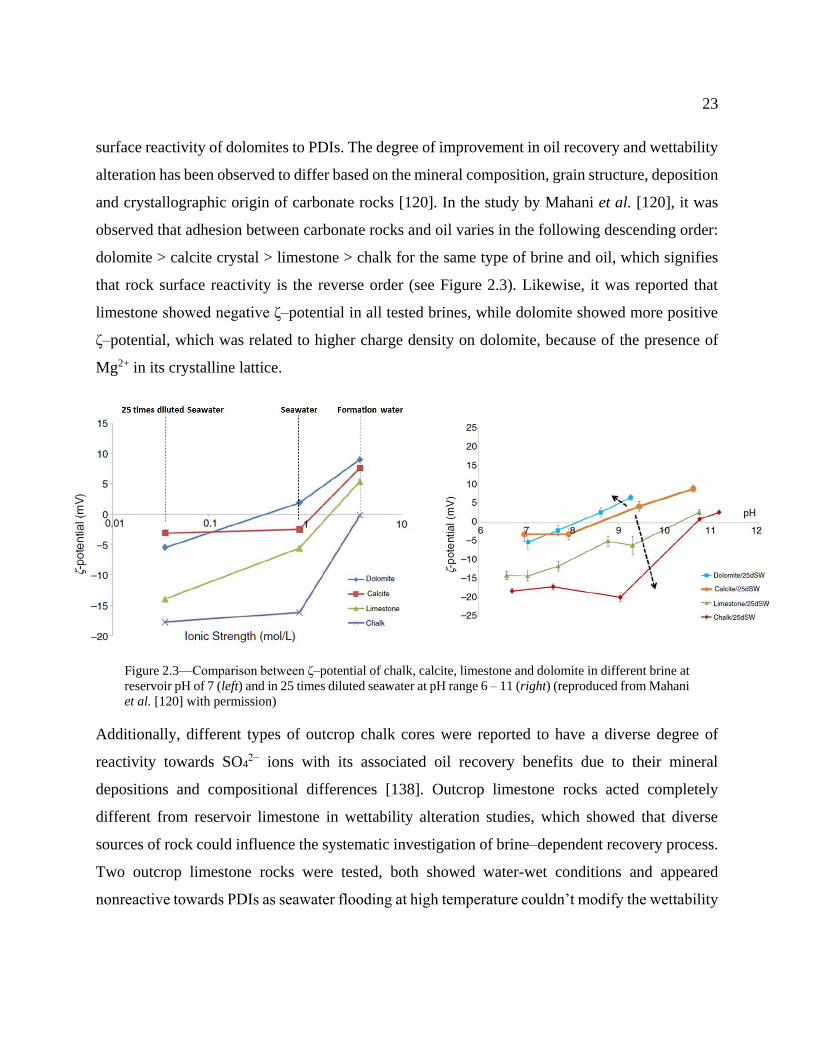
23
surface reactivity of dolomites to PDIs. The degree of improvement in oil recovery and wettability
alteration has been observed to differ based on the mineral composition, grain structure, deposition
and crystallographic origin of carbonate rocks [120]. In the study by Mahani et al. [120], it was
observed that adhesion between carbonate rocks and oil varies in the following descending order:
dolomite > calcite crystal > limestone > chalk for the same type of brine and oil, which signifies
that rock surface reactivity is the reverse order (see Figure 2.3). Likewise, it was reported that
limestone showed negative ζ–potential in all tested brines, while dolomite showed more positive
ζ–potential, which was related to higher charge density on dolomite, because of the presence of
Mg2+ in its crystalline lattice.
Figure 2.3—Comparison between ζ–potential of chalk, calcite, limestone and dolomite in different brine at
reservoir pH of 7 (left) and in 25 times diluted seawater at pH range 6 – 11 (right) (reproduced from Mahani
et al. [120] with permission)
Additionally, different types of outcrop chalk cores were reported to have a diverse degree of
reactivity towards SO42− ions with its associated oil recovery benefits due to their mineral
depositions and compositional differences [138]. Outcrop limestone rocks acted completely
different from reservoir limestone in wettability alteration studies, which showed that diverse
sources of rock could influence the systematic investigation of brine–dependent recovery process.
Two outcrop limestone rocks were tested, both showed water-wet conditions and appeared
nonreactive towards PDIs as seawater flooding at high temperature couldn’t modify the wettability

24
and improve oil recovery [169]. Contrary to outcrop limestones, outcrop dolomite responds to low
saline/smart brine in the same way as reservoir dolomite cores [139].
In an electrokinetic study by Al Mahrouqi et al. [170], it was reported that natural carbonate
yielded a more negative ζ–potential than synthetic calcite, due to the presence of impurities (such
as clays, organic matter, anhydrite apatite, or quartz), which yield a negative ζ–potential compared
to pure calcite. Similarly, it was reported that synthetic calcite and pre-aged calcite rock exhibited
positive ζ–potential at low pH range and negative potential at a higher pH (above pH of 10), which
was attributed to positive species (like Ca2+ and CaHCO3+) and negative species (like CO3
2−)
prevalence at the rock surface at lower and high pH respectively. Meanwhile, natural calcite and
post-aged calcite rock exhibited negative ζ–potential, which was attributed to the organic material's
adsorption on the calcite surface, giving it the negatively charge surface [171, 172].
2.2.4 Temperature and pressure
Due to the reactive nature of the brine-dependent recovery process, reservoir temperature is a key
factor that affects the activation energy required for the chemical reaction at the oil–brine and
brine−rock interfaces leading to the wettability alteration process. The influence of temperature
can be categorized as two-folds, as it affects rock wettability through the interaction of oil polar
organic compounds and the reactivity of ionic species in the brine or sensitivity of the ionic
strength with the rock surface. Pressure is mostly identified to impact the oil polar organic
compounds interaction with the rock surface due to changes in the solubility of the asphaltenic
content of the crude oil. As the reservoir pressure reduces towards bubble point pressure, the
asphaltene solubility decreases, resulting in surface precipitation and adsorption of the crude oil
onto the rock surface [142, 173].
The thermal degradation of crude oil is more promoted in the presence of calcite as substantially
greater amounts of a lower carbon number hydrocarbon is formed at high temperature [150]. Over
geological time, the thermo-catalytic effect of calcite on the decomposition of carboxylic acids in
crude oil will significantly result in a reduction in AN as the temperature increases. Because of the
affinity of the carboxylic materials to carbonate surfaces compared to other polar materials that

25
are naturally present in crude oil, the AN strongly dictates the wettability state of carbonate rocks,
which implies that the water-wetness increases as the temperature increases. This logic might
explain the reason why high-temperature carbonate reservoirs appear to be more water-wet
compared to low-temperature reservoirs, contrarily to most sandstone reservoirs [174]. However,
Zhang and Austad [151] argued that the observation is not a temperature effect; rather it is the
reduction in carboxylic acids. Typical reservoir examples mentioned by Zhang and Austad [151]
in decreasing order of water wetness are: Yates dolomite Texas field (30 °C, AN – 1.0 mg KOH/g)
> Valhall chalk North sea field (90 °C, AN – 0.3-0.5 mg KOH/g) > Ekofisk chalk North sea field
(130 °C, AN – 0.1 mg KOH/g). It was further reported that cores aged at three different
temperatures (40, 80 and 120 °C) with similar AN crude oil show insignificant differences in
chromatographic wettability test, which suggests that aging temperature have a minor impact on
chalk rock wettability, provided the oil–rock–brine system reaches chemical equilibrium during
aging [151]. The authors claimed that decarboxylation is a slow process and cannot be achieved
in the aging period considered in their experiments. Like observations made in sandstone rocks,
aging temperature has been observed to affect the wetting conditions of carbonate surface aged at
25 and 50 °C [175]. The core aged at 50 °C was observed to reach an intermediate wetting state
earlier compared to the core aged at 25 °C in a contact angle measurement conducted using a
synthetic brine solution (1 wt.% NaCl). Another factor where temperature plays a role in brine-
dependent recovery is the dependence of the reactivity of brine ionic species on temperature.
A systematic series of studies has been conducted by Austad and colleagues [33, 50, 52, 54, 55,
127] to investigate the effect of temperature on the activity of PDIs in the injected brine. The
reactivity of SO42- towards the chalk surface was observed to increase in a chromatographic
wettability test due to increased sulfate adsorption as temperature increased from 20 – 130 °C,
with a linear increase between 40 and 100 °C and drastic increase above 100 °C [33, 52]. The
authors further support the improvement in water-wetness by reporting an increase in oil recovery
by spontaneous imbibition as the temperature increases for experiments with the same sulfate
concentration in the injected brine. The ultimate oil recovery from spontaneous imbibition of chalk
cores at two different temperatures (100 and 130 °C) for a fixed condition (same oil AN, initial
water and varying sulfate concentration in seawater) was observed to be smaller at 100°C

26
compared to 130 °C. It was stated that a further increase in the amount of sulfate in the imbibing
brine at 100 °C could only partly compensate for the significant difference in recovery [55]. Strand
et al. [54] investigated the effect of Ca2+ and SO42- ions on wettability modification of chalk
surfaces at varying temperatures (90 and 130 °C) and reported an increase in both imbibition rate
and oil recovery as the temperature increased. The improvement in recovery was further verified
through a chromatographic wettability test performed at varying temperature (23 – 130 °C), where
adsorption of SO42- and co-adsorption of Ca2+ increased as the temperature increased, while at any
given Ca2+/SO42- ratio, sulfate adsorption as well as the front dispersion increases with
temperature. It was also reported that beyond 100 °C the sulfate adsorption reduces as the
Ca2+/SO42- ratio increases. The given explanation is that the solubility of CaSO4 drastically reduces
above 100 °C, possibly because of a decrease in hydrogen bonding between the sulfate ions and
water molecules. Therefore, as the bond breaks, sulfate tends to leave the aqueous phase either by
adsorption onto rock or precipitation of CaSO4. With a decrease in solubility and increase in Ca2+
ion, sulfate will precipitate above 100 °C.
Zhang et al. [50] showed, in a similar study, that increasing Ca2+ concentration increased oil
recovery as temperature increased from 70 to 100 °C and further when the temperature was
increased to 130 °C, however, the impact was reduced and even vanished due to precipitation of
CaSO4. The overall theme in these studies [33, 52, 54, 55] is that higher affinity of sulfate observed
at higher temperatures results in the displacement of the negatively charged carboxylic oil groups
on the rock surface, alters the wettability to more water-wetness and increases the degree of the
water-wetness. In another study conducted by Zhang et al. (2007), the interplay between Ca2+ and
Mg2+ was investigated through the chromatographic wettability technique at different temperatures
and reported that affinity of Ca2+ towards the chalk surface was higher compared to Mg2+ at low
temperatures. However, Mg2+ strongly adsorbed and even substituted Ca2+ at higher temperatures,
and the degree of substitution increased with temperature, with 70 °C appearing as the threshold
temperature for Ca2+/Mg2+ substitution. Besides, spontaneous imbibition experiments showed that
adding Mg2+ ions resulted in a higher incremental oil recovery than by adding Ca2+ ions at 100 and
130 °C. The reactivity of Mg2+ observed at 130 °C significantly surpassed the effect of spiking
sulfate in the injected brine with Ca2+. It was then proposed that instead of Ca2+ co-adsorbing with

27
SO42- at the chalk surface, Mg2+ becomes active and less hydrated at a higher temperature, and
displaces Ca2+ to bound to the surface, because Mg2+ has a smaller ionic radius and larger hydrated
radius compared to Ca2+ [32, 33, 51, 65]. An identical temperature-dependent interaction was
reported between PDIs and limestone, though the reactivity was less than for chalk surfaces as
previously mentioned [53, 112].
Another temperature-dependent effect was observed for the non-active salt (NaCl) on oil recovery
by Fathi et al. [38] using NaCl-depleted seawater while maintaining the concentration of PDIs. It
was reported that as the elevated temperature increased (from 100 – 120 °C), imbibition rate and
oil recovery significantly increased for NaCl-depleted seawater compared to when NaCl was
spiked four times in the seawater. In a later study, it was reported that spiking sulfate concentration
in NaCl-depleted seawater increased oil recovery as the temperature increased (70 – 120 °C) while
spiking Ca2+ above 100 °C did not result in additional recovery [167]. Like the electrokinetic study
in sandstones, the measured ζ-potential of intact carbonate rocks in low saline brine environments
was reported to increase with temperature; however, the pH remained constant irrespective of
temperature or ionic strength. Instead, the equilibrium concentration of calcium resulting from
carbonate dissolution was observed to increase as temperature increased with low saline brine and
remained constant with high saline brine, while equilibrium concentration of other PDIs remained
constant irrespective of temperature. Hence, the temperature dependence of the ζ-potential is
correlated to have a Nernstian linear relationship with the temperature dependence of the
equilibrium calcium concentration (PDI for the calcite surface) [103].
Similarly, Mahani et al. [176] reported that as temperature increases in the range of 25 – 70 °C for
low saline brine, the oil and rock ζ–potentials shift towards the point of zero potential (either from
more positive to less positive values or from more negative to less negative values). This shift with
increasing temperature was negligible for higher salinity. The increasing trend of rock ζ–potentials
towards a less negative value for low salinity brine was ascribed to more presence of divalent
cations adsorbing to the rock surface. Meanwhile, for low saline brine injection that depended on
the presence of the anhydrite minerals because of little/no sulfate ions in the injected brine, it has
been shown that the dissolution of anhydrite decreases with temperature [48, 112]. While the

28
surface reactivity leading to wettability alteration as well as imbibition rate and ultimate oil
recovery increases as temperature increases, which could somewhat be counterbalanced by a lesser
amount of sulfate available for adsorption due to reduced dissolution. For this reason, Austad [134]
proposed that the optimum temperature window for the success of low salinity brine injection is
probably between 90 - 110 °C. In addition, Zhang and Sarma [30] studied the effect of lowering
brine salinity and spiking SO42- ions concentration on wettability alteration and oil recovery of
reservoir limestone rocks at varying temperatures (70, 90, 120 °C). The authors argued that at 70
°C, lowering brine salinity is more efficient than increasing the SO42- ions concentration, while at
90 and 120 °C, reducing brine salinity and increasing SO42- concentration resulted in a similar
magnitude of wettability alteration and higher oil recovery.
2.2.5 Injected brine composition and salinity
The effect of injected brine salinity and composition on wettability alteration and oil recovery
improvement has been studied using both ionically-tuned and diluted versions of formation water
or seawater (common injection water sources as shown in Table 2.1). Extensive laboratory studies,
especially coreflooding and spontaneous imbibition, from carbonate cores have shown that
increasing divalent ions (particularly PDIs, see Figure 2.4) and decreasing monovalent ion (Na+
and Cl-) concentrations in the injected brine lead to an increase in the rate and extent of oil recovery
[32, 33, 38, 50, 52, 54, 55, 165]. The existence of an interdependent interaction among multivalent
ions in brine (Ca2+, Mg2+, SO42-, PO4
3- and BO33-) at the rock-brine interface has been emphasized
that can bring the rock-brine interface into a new equilibrium state, thus improving water-wetness
and recovery through various interfacial phenomena.
Earlier studies [52, 151, 165, 166] have shown that SO42- can act as surface active agents that can
lower the surface charge of carbonate surface, facilitate the removal of negatively charged polar
components and change the contact angle to more water-wetness and improve oil recovery by
spontaneous imbibition. A significant increase in oil recovery was observed as the SO42-
concentration in injected brine is increased from 0 to 4 times the concentration in ordinary
seawater, and the affinity of SO42- towards chalk surface is temperature dependent [52, 152]. The
impact of sulfate, as a PDI and wettability modifier on increased oil recovery, has been well

29
examined and reported by other researchers (such as [27, 29, 30, 53, 101, 112, 177, 178]). Besides,
several of these studies have proved that a high SO42- concentration did not offer improved
recovery; rather an upper limit existed beyond which no improved recovery could be observed [7,
46, 52, 138].
Figure 2.4—Comparison of spontaneous imbibition rates of PDIs in chalk conducted at 70, 100 and 130
°C with a back-pressure of 88 psi. Modified seawater without Ca2+ and Mg2+ was initially imbibed, and
Mg2+ or Ca2+ was later added in a systematic variation of PDI concentrations (reproduced from Zhang et
al. [32] with permission)
Similarly, Ca2+ and Mg2+ are considered to be active towards the carbonate rock surface [165].
Strand et al. [54] observed that the efficiency of the wettability alteration due to brine-dependent
recovery is governed by the relative concentration of Ca2+ and SO42- in the injected brine. The
authors reported that increasing the Ca2+/SO42- ratio between 0.25 and 3 times the concentration in
ordinary seawater led to increased adsorption of SO42- but decreased as temperature exceeded
100oC. Zhang et al. [50] also presented spontaneous imbibition of oil as evidence to show the
symbiotic interaction between Ca2+ and SO42- and the temperature-dependency of the interaction.
Increasing Ca2+ led to strong imbibition and increase in oil recovery, and beyond 100oC, the
recovery is less due to precipitation of CaSO4. According to these studies, SO42- adsorbed onto the

30
chalk surface, lowers the positive surface charge resulting in lesser electrostatic repulsion.
Meanwhile, Ca2+ would gain greater access to approach the surface to balance the electric charge
as well as bind to the negatively charged oil acidic groups. This interaction helps to release the oil
from the chalk surface.
On the other hand, Zhang et al. [32] presented ζ–potential experimental evidence to prove that
Mg2+ has the potential to increase positive surface charge like Ca2+ and investigation of the
interplay between Ca2+ and Mg2+ through a chromatographic test at different temperatures shows
that Mg2+ substituted Ca2+at higher temperatures. It was then proposed that instead of Ca2+ co-
adsorbing with SO42- at the chalk surface, Mg2+ becomes active and less hydrated at a higher
temperature and displaces Ca2+ bound to the surface. In contact angle measurement, it was shown
that SO42- and Mg2+ were more efficient in altering wettability and improving oil recovery [7, 27,
30, 114]. The significant conclusion from the systematic series of studies conducted to investigate
the impact of PDIs on oil recovery is that none of the PDIs could act alone in improving water-
wetness, although in the different combinations, SO42- was found to be present in the imbibing
fluid [27, 30, 52].
The significance of polyatomic anions (e.g., phosphate−PO43− and borate−BO3
3−) as a possible
replacement for sulfate has been investigated due to their higher ion valence to lower surface
charge compared to sulfate SO42−. Researchers at ExxonMobil [42, 61] found that replacing SO4
2−
in the injected brine by BO33− in coreflooding experiments performed on several limestone and
dolomite cores in tertiary mode resulted in higher recovery, whereas replacing with PO43− gave
even higher recovery. Meanwhile, softening the injected brine by depleting Ca2+ and Mg2+ in the
formation water also resulted in an increase in recovery due to rock dissolution. In addition, Meng
et al. [58] demonstrated that high concentration of PO43− in the injected brine could induce larger
contact angle alteration of limestone cores to a more water-wet condition, which was more
pronounced when the brine was ten times diluted. However, the effect of polyatomic anions has
not been further investigated due to the limitation of a higher likelihood of formation of precipitate
that could potentially damage the reservoir.

31
Aside the PDIs, Na+ and Cl− have been identified as non-active ions that are indifferent toward
carbonate surfaces. Fathi et al. [38] discovered that NaCl–depleted seawater gave a higher
imbibition rate and recovery relative to seawater while spiking NaCl concentration in seawater by
4 times gave a lower recovery. Furthermore, chromatographic tests showed that the water-wet
fraction further increased for chalk cores imbibed in NaCl–depleted seawater relative to seawater.
In a later study, it was reported that spiking SO42- concentration in NaCl–depleted seawater
significantly increased recovery and water-wetness, however spiking Ca2+ had no significant effect
because the experiments were conducted above 100°C [167]. Awolayo and Sarma [39] have also
shown that NaCl–depleted seawater alters wettability towards more water-wetness relative to
seawater in a contact angle measurement, which was supported by improved tertiary oil recovery
in coreflooding experiments on limestone cores. These studies highlighted the impact both SO42-
and the indifferent ions (Na+ and Cl−) have on the injected brine to modify rock wettability. All
charged surfaces in contact with brine will have an excess of ions close to the surface, which is
usually called the double layer. If the double layer consists of a lot of ions not active in the
wettability alteration process like NaCl, the access of the PDIs (Ca2+, Mg2+ and SO42-) to the
surface is partly prevented. This approach of depleting NaCl from seawater results in total brine
salinity reduction because of a high concentration of the indifferent ions in most brines. Another
approach of reducing total salinity through brine dilution, which failed to work in chalk cores [38,
48, 101], has shown tremendous positive benefits in a series of experiments with middle-eastern
limestone cores containing small amounts of anhydrite conducted by Yousef and colleagues [57,
102]. Seawater was diluted up to 100 times, and the sequential flooding experiments showed that
the highest recovery was achieved by twice diluted seawater, followed by 10 times dilution,
whereas 20 and 100 times dilution resulted in little/marginal recovery. The authors reported a total
incremental recovery of up to 19% OOIP and indicated that surface charge alteration was more
important than dissolution in the wettability alteration process.
Elsewhere, Austad et al. [48] injected sulfate-free diluted brine into carbonate cores containing
anhydrite and reported an incremental recovery up to 5% OOIP. The authors explained that sulfate
was continually generated in-situ because of anhydrite dissolution, which led to the wettability
alteration process. Romanuka et al. [101] carried out spontaneous imbibition experiments on
32
different mineralogical carbonate cores with/without evaporites and showed that brine dilution
contributed to an additional recovery of up to 20% OOIP. Zahid et al. [36] conducted another
series of experiments on carbonate cores free of dolomite/anhydrite, and observed no incremental
recovery at room temperature and reported additional recovery up to 18% OOIP at 90°C. The
authors proposed fines migration and rock material dissolution as the plausible mechanisms for
wettability alteration. Zhang and Sarma [30] and Chandrasekhar and Mohanty [27] observed that
the multi-ion exchange between the active multivalent ions and mineral dissolution was the
mechanism responsible for wettability alteration when the brine dilution approach was applied to
middle-eastern carbonate cores. However, in a few other cases [39, 114] in limestones, very little
or negligible results were observed during brine dilution. Results of lower/decrease in contact
angle have also suggested that the wettability of carbonate rocks is altered by either a reduction in
the brine salinity or increasing PDI concentrations [7, 27, 30, 31, 56, 58, 118].
Nyström et al. [179] carried out an electrokinetic study on the influence of the concentration of
monovalent (Na+) and multivalent (Ca2+, Ba2+ and La3+) cations on calcite particles. It was reported
that Na+ acted indifferent towards calcite surface, Ba2+ exhibited similar behaviour to that of Ca2+
but of greater magnitude as the ζ–potential increased with concentration, while La3+ exhibited an
opposite trend to that of the other divalent cations. In a different study, Jackson and colleagues
[104, 170] reported that both Ca2+ and Mg2+ exhibited identical behavior, linearly increasing the
ζ–potential of intact limestones as their concentrations increased in the different NaCl brine
solutions. While increasing SO42- concentration reduced the magnitude of the ζ–potential,
however, the gradient of the linear trend is observed to be lower than shown for both Ca2+ and
Mg2+. The gradient of the linear trend between ζ–potential and Ca2+/SO42- decreases with
increasing brine salinity (NaCl), though at Ca2+ concentration, the ζ–potential becomes less
sensitive to increase in brine salinity. The ζ–potential of natural carbonate was observed to linearly
increase as the concentrations of indifferent ions (Na+ and Cl−) were increased. It was suggested
that the presence of the indifferent ions could change the magnitude, but not the polarity of the ζ–
potential [170]. It was shown that diluting seawater and adding SO42- to seawater as a way of
modifying the injected brine decreases the ζ–potential by double layer expansion and increasing
negative charge on the calcite surface, which was correlated to incremental recovery [104].

33
Kasha et al. [168] observed similar trends for the PDIs with ζ–potential during an electrokinetic
study on calcite and dolomite particles, though Mg2+ had a stronger effect on surface charges
compared to Ca2+ in high salinity brines and suggested that the point of zero charge of carbonate
rocks is not only a function of electrolyte pH but also PDI concentrations. Yousef et al. [102]
demonstrated that ζ–potential of the rock-brine interface decreases as the brine salinity decreases
and suggested that Ca2+ ions leave the rock surface in the form of mineral dissolution and enter the
brine solution to re-establish chemical equilibrium. Jackson et al. [119] correlated improved oil
recovery to ζ–potential of rock–brine and oil–brine interfaces using a reservoir limestone core, and
different crude oils and brine solutions. The authors concluded that the potential for improved oil
recovery by low saline brine injection is increased when both interfaces possess the same polarity
(ζ–potential sign), such that the electrostatic repulsive force generated between the interfaces
stabilizes the water film on the rock surface. It was suggested that for a negatively charged oil-
water interface, diluting the brine salinity to produce a more negative/less positive rock–brine
interface would be successful at improving oil recovery. While for a positively charged oil-water
interface, increasing the rock–brine interface surface charge by increasing the PDI cation
concentration would increase recovery, which would have been responsible for the failure of low
saline brine to improve recovery in such cases.
Mahani et al. [56] investigated the importance of brine composition, salinity and pH on oil-brine-
rock systems on different carbonate rock particles in different brine solutions. They observed
positive ζ–potential for formation water, negative for seawater, and more negative for diluted
seawater, which increased with increase in pH in the range 6.5 – 11. The low saline brine was
influenced by a large shift in ζ–potential with pH because of the presence of fewer concentrations
of PDIs compared to the concentration of H+ and OH-, which means any changes in later ion
concentrations, would strongly impact the EDL and ζ–potential. The changes in rock-brine ζ–
potential from positive to more negative was consistent with the observed decrease in contact angle
and concluded that these changes are predominantly due to phenomena occurring at the rock–brine
interface and to a lesser extent at the oil–brine interface. Meanwhile, the authors further claimed
that pH does not directly control the ζ–potential, but rather equilibrium concentration of Ca2+,
because of the established relationship between ζ–potential and concentration of Ca2+.

34
Other experimental evidence such as NMR has been used to test the hypothesis of improved water-
wetness by low saline brine injection. Yousef et al. [57] performed NMR measurements on
reservoir limestone cores, before and after low saline brine treatment, and reported a significant
shift in T2 distribution and surface relaxation by various versions of diluted brines. The influence
of pore cleaning was also investigated to solely ascertain the observed shift in T2 distribution to
brine dilution. An improvement in connectivity among macro and micropores as a result of rock
dissolution was associated with the observed shift. In contrast, in an NMR experiment conducted
with different diluted seawaters, Zahid et al. [36] observed no significant changes in surface
relaxation and no shift in T2 distribution.
Field Application Studies
Promising achievements from laboratory studies have been the background for some pilot scale
field trials of brine-dependent recovery process during the past years. The encouraging feature of
the systematic experimental studies, as discussed in the previous section, has been reflected in the
observations from several near-wellbore tests (like log-inject-log and single well chemical tracer
(SWCT)), inter-well scale tests and multi-well field scale, which emphasize on the overall
consistency between laboratory and field observations, as summarized in Table 2.2 for sandstone
and carbonate reservoirs. However, there are a few field-scale projects in carbonate reservoirs that
are reported in the literature. The fractured chalk Ekofisk reservoir, North Sea, has been flooded
with seawater since 1987 following a successful waterflood pilot [19, 180]. Over the first three
years, oil production steadily increased from 70,000 – 140,000 barrels/day, with an increasing
trend and after ten years production level reached 290,000 barrels/day. The significant increase in
oil rates has been accompanied by a drop in producing gas-oil ratio (GOR) and reduced water
breakthrough [20, 181]. About two-thirds of the increase in production was ascribed to seawater
injection response and the recent prognosis estimated recovery to be slightly above 50% of OOIP
[18, 51, 134, 181]. The tremendous success recorded till date shows the potential for seawater to
improve water-wetness of chalk through spontaneous imbibition and viscous displacement. This
positive response seen in Ekofisk stimulated interest to investigate the potential of brine-dependent
recovery in the fractured chalk Valhall field, North Sea.

35
A single injector waterflood pilot test was implemented by early 1990 to evaluate the potential of
seawater injection, and its success recommended the feasibility of an economic waterflood
scheme. Seawater injection only began in 2006, and the response revealed a varying performance
in different parts of the reservoir. Some wells showed no oil production benefit with rapid water
breakthrough and increase in water-cut, while others showed an increase in oil production,
decrease in GOR and reduced water cut [182, 183]. This regional response was attributed to
matrix/fracture dominance on water movement. A systematic study conducted by Webb et al.
[177] on Valhall core showed that seawater improved water-wetness and oil recovery significantly
compared with formation water. A further comparison between both brine-dependent field
applications revealed that seawater injection performed less for Valhall as compared to Ekofisk.
The difference in performance was ascribed to temperature and wetting conditions, as the
wettability alteration process is temperature-dependent. The deeper Ekofisk field reservoir (130
˚C) has a significantly higher reservoir temperature than Valhall (90 ˚C) [184]. Besides, Ekofisk
field is more oil-wet compared to Valhall field as reflected by the acid numbers of their crude oils,
about 0.35 and 0.1 mg KOH/g for Valhall and Ekofisk, respectively [51, 184].
The above-listed field projects have majorly explored the ionic composition modification, while
the only field application of ionic salinity reduction was reported in Saudi Arabia Upper Jurassic
carbonate reservoirs by Yousef and co-workers [24, 31]. Yousef et al. [24] reported two field trials
with two single well chemical tracer (SWCT) tests using various dilutions of field seawater. The
distance of investigation for the SWCT was considered as up to 20 ft. around the wellbore. For
well A, a slug of seawater and twice diluted seawater was sequentially injected, while for well B,
a slug of seawater, twice diluted and ten-times diluted seawater was sequentially injected and after
each injection cycle, three different tracers were injected to estimate the residual oil saturation
(ROS). They observed from the two field trials that diluted seawater gave 7% ROS reduction at
well A beyond conventional seawater injection. While at well B, 3% reduction in ROS beyond
conventional seawater was achieved by twice-diluted seawater and a further 3% reduction beyond
twice-diluted seawater was achieved by ten-times diluted seawater injection. They concluded that
the total reductions in ROS from well A and B are comparable and the field trials are in agreement
with their previous experimental studies [31].
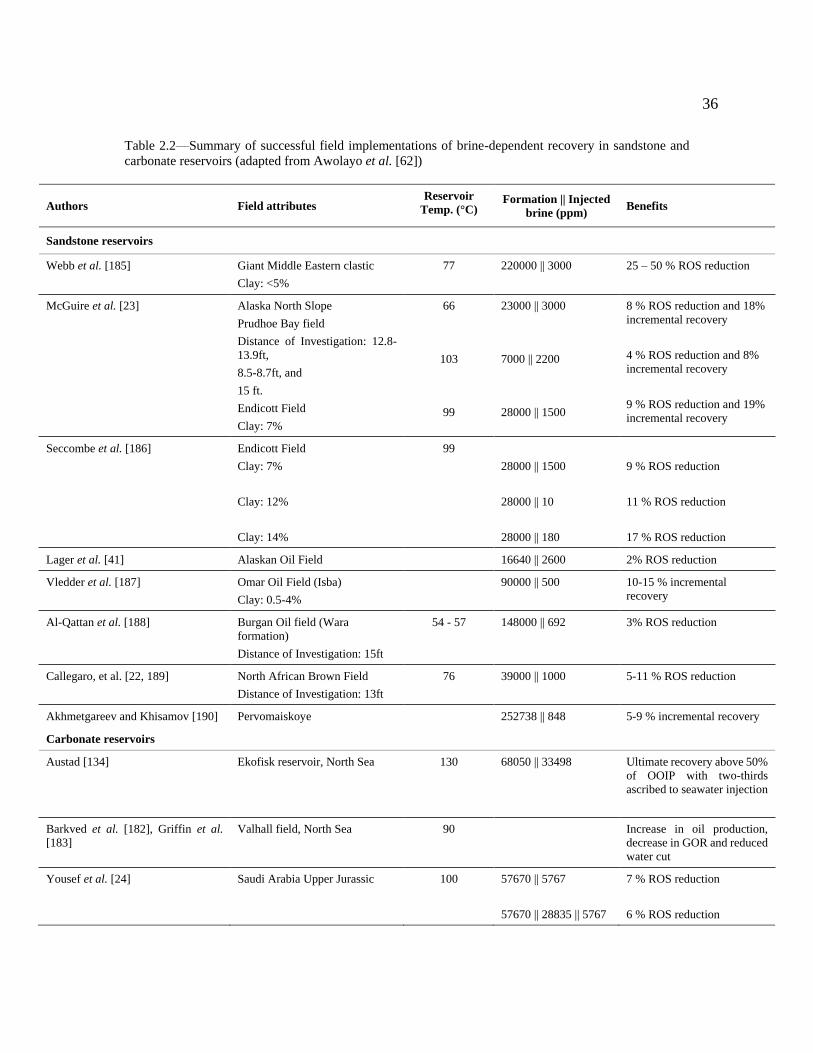
36
Table 2.2—Summary of successful field implementations of brine-dependent recovery in sandstone and
carbonate reservoirs (adapted from Awolayo et al. [62])
Authors Field attributes Reservoir
Temp. (°C) Formation || Injected
brine (ppm) Benefits
Sandstone reservoirs
Webb et al. [185] Giant Middle Eastern clastic
Clay: <5%
77 220000 || 3000 25 – 50 % ROS reduction
McGuire et al. [23] Alaska North Slope
Prudhoe Bay field
Distance of Investigation: 12.8-
13.9ft,
8.5-8.7ft, and
15 ft.
Endicott Field
Clay: 7%
66
103
99
23000 || 3000
7000 || 2200
28000 || 1500
8 % ROS reduction and 18%
incremental recovery
4 % ROS reduction and 8%
incremental recovery
9 % ROS reduction and 19%
incremental recovery
Seccombe et al. [186] Endicott Field
Clay: 7%
Clay: 12%
Clay: 14%
99
28000 || 1500
28000 || 10
28000 || 180
9 % ROS reduction
11 % ROS reduction
17 % ROS reduction
Lager et al. [41] Alaskan Oil Field 16640 || 2600 2% ROS reduction
Vledder et al. [187] Omar Oil Field (Isba)
Clay: 0.5-4%
90000 || 500 10-15 % incremental
recovery
Al-Qattan et al. [188] Burgan Oil field (Wara
formation)
Distance of Investigation: 15ft
54 - 57 148000 || 692 3% ROS reduction
Callegaro, et al. [22, 189] North African Brown Field
Distance of Investigation: 13ft
76 39000 || 1000 5-11 % ROS reduction
Akhmetgareev and Khisamov [190] Pervomaiskoye 252738 || 848 5-9 % incremental recovery
Carbonate reservoirs
Austad [134] Ekofisk reservoir, North Sea 130 68050 || 33498 Ultimate recovery above 50%
of OOIP with two-thirds
ascribed to seawater injection
Barkved et al. [182], Griffin et al.
[183]
Valhall field, North Sea 90 Increase in oil production,
decrease in GOR and reduced
water cut
Yousef et al. [24] Saudi Arabia Upper Jurassic 100 57670 || 5767
57670 || 28835 || 5767
7 % ROS reduction
6 % ROS reduction

37
Proposed Underlying Recovery Mechanisms
Considering the huge number of research studies, several physicochemical recovery mechanisms
have been proposed, while the majority of the observed trends attributed the primary cause to
wettability modification, either to a more water-wetting or mixed wetting state [34, 46, 77, 191]
by varying PDIs and/or decreasing injected brine salinity. There is a lack of consensus on the
prevalent mechanism responsible for changing the wettability. This is because of the complex
nature of the oil-brine-rock interaction, as well as several conflicting observations from various
suggested mechanisms. It is quite apparent from these studies that either there are several
mechanisms synergistically involved to increase the oil recovery or the right mechanism has not
yet been identified. However, the inclination of this research study based on reviewed papers is
that the primary cause of improved oil recovery is directly or indirectly linked to the wettability
alteration.
2.4.1 Rock dissolution
The rock dissolution theory postulates that reduced concentration of PDIs (such as Ca2+, Mg2+ and
SO42-) in the injected brine compared to the initial high saline brine disturbed the existing
equilibrium and causes dissolution of these PDI source-rock minerals like CaCO3, CaMg(CO3)2
and CaSO4, thereby re-establishing a new equilibrium with the injected brine. During this process,
the release of adsorbed polar components accompanies the dissolved minerals, which consequently
result in increased water-wetness and improved oil recovery as illustrated in Figure 2.5. This
concept was proposed by Hiorth et al. [47] through geochemical thermodynamic modelling of
various experimental studies (such as spontaneous imbibition and electrokinetic tests, see [32, 50,
54, 55, 192]) on chalk that the surface charge dependence of disjoining pressure could not describe
the oil recovery improvement observed in relation to pore water chemistry and temperature. They
argued that PDI cations would promote oil wetting because they increased the rock surface charge
while SO42- did not show the strong temperature-dependence that was observed in many studies.
Then, they reiterated that due to the calcite surface being thermodynamically unstable, dissolution
occurs, and the amount dissolved correlates linearly with the improved production, particularly
when the calcite was preferentially dissolved exactly where the oil wets the calcite. In a study with

38
limestone cores, Yousef et al. [31, 57] attributed the improved connectivity between micropores
and macropores during NMR experiments on low saline brine injection at reservoir conditions to
the microscopic dissolution of anhydrite. Austad et al. [48] injected sulphate-free diluted brine into
limestone cores containing anhydrite and reported an incremental recovery of 5% OOIP. They
explained that sulphate was continually generated in-situ because of anhydrite dissolution, and this
led to the wettability alteration process. Several other experimental studies have ascribed the
observed improved recovery in carbonates during low saline brine injection to rock dissolutions
of different minerals [27, 36, 49, 61].
Figure 2.5—An illustration of the proposed mechanism of wettability alteration by “dissolution” showing
an oil-wetting state with oil attachment before dissolution (top) and the water-wetting state after dissolution
(bottom). (adapted from Hiorth et al. [47])
Austad et al. [193] strongly opposed the calcite dissolution mechanism proposed by Hiorth et al.
[47] by questioning the applicability of the geochemical model to calculate the chemical
equilibrium between calcite and seawater and the corresponding compositions at the considered
temperature range. It was argued that calcite dissolution is contradictory to published experimental
results, where it was discussed that an increase in aqueous Ca2+ increases oil recovery and will
suppress chalk dissolution due to common ion effect, which means that decreased dissolution
increases oil recovery, and then at high temperature, there is no increase in oil recovery with
increased dissolution. Furthermore, it was argued that wettability alteration does not depend on
the bulk mineral dissolution due to buffering of aqueous solution and equilibration at field-scale.
This implied mineral dissolution is not considered to be contributing at a reservoir scale, hence
ranked as a secondary cause [56, 120, 194, 195]. Despite these studies, Awolayo et al. [159]
claimed, by using a geochemical model to predict performance history of low saline brine injection
Carbonate rock
Aqueous brine
Crude oil

39
into different rock minerals, that the interplay between mineral dissolution and surface charge
alteration is vital to the improved recovery, and their relative contribution depends on brine
composition, mineral constituents, and temperature. Aqueous pH was also reported to be
controlled by the interaction between injected brine and minerals present, majorly the resultant
effect of mineral dissolution and precipitation. The authors concluded that mineral
dissolution/precipitation could not be exempted in modelling low saline brine injection at both
core and field scale as it affects the concentrations of the PDIs available to adsorb.
2.4.2 Multi-ion exchange (MIE)
The pristine structure of carbonate mineral surfaces is composed of metal ions (such as Ca2+, Mg2+,
etc.) coordinated to oxygen atoms from carbon atoms (such as CO32-). Because of the reactive
nature of the carbonate mineral surface, the surface is hydrated by the dissociation of chemisorbed
water molecules resulting in a surface composed of hydroxylated cationic sites and protonated
anionic sites, which are stabilized by the dissociated hydroxyl ions (OH-) and protons (H+)
respectively. The stabilization of the surface site depends on the brine composition as well as the
pH. At pH below 6-8, the excess H+ ions and probable dissolution will make the positively charged
cationic sites dominate and the overall surface positively charged. Meanwhile at a high enough
pH, excess OH- ions will change the surface to more negative charge. In representative reservoir
conditions, carbonate rock surface is positively charged in the pH range (6.5 – 7.5) of the
surrounding high saline formation brine (consisting low concentration of negatively charged ions
like CO32- and SO4
2- and high amount of positively charged Ca2+) while the polar components of
oil have a predominantly negative surface charge, resulting in a high bonding energy between polar
carboxylic materials and carbonates [53]. The adsorption of the negatively charged carboxylic
component of crude oil onto the mineral surface causes a change in the rock wettability
(preferentially oil/mixed-wet).
Under the influence of modified brine with more PDIs, SO42- competes with the polar component,
and adsorb onto the carbonate rock surface, lowering the rock surface charge. This creates an
electrostatic repulsion and causes the bond between the rock-brine interface and oil-brine interface
to rupture. Then, Ca2+ ions are co-adsorbed to the rock surface and its excess concentration at the

40
site bind to the negatively charged carboxylic groups in oil and release the oil in the form of Ca2+-
carboxylate complexes, resulting in improved water-wetness and oil recovery (Figure 2.6). This
mechanism is analogous to the MIE described by Lager et al. [111] for sandstone reservoirs, except
for sandstone rocks, the organic material or organo-metallic complexes that are attached to the
clay minerals in the presence of divalent cations in high saline formation brine, are removed and
replaced during injection of low saline brine by cationic ion exchange of un-complexed cations at
the clay surface. The MIE was first proposed by Austad and colleagues [32, 33, 44, 50, 51, 52, 53,
54, 55] in different carbonate rocks and several others have presented evidence to support this
mechanism [27, 28]. As discussed earlier, the temperature seems to influence the activity of these
PDIs. At higher temperature (above 100C), Mg2+ has higher activity and could substitute Ca2+ at
the rock surface and cause the oil to be released as Ca2+-complexes. This mechanism has also been
linked with rock dissolution as sufficient SO42- is produced by dissolution of anhydrite while Mg2+
is produced by dolomite dissolution. Similarly, this mechanism is somewhat related to DLE as will
be discussed below.
Figure 2.6—A schematic illustration of the proposed mechanism of wettability alteration by “MIE” in
carbonate reservoirs showing the oil component displacement from the carbonate rock surface through
PDIs competition. Original state (left), Low temperature state (right upper) and High temperature state
above 100 °C (left lower) (adapted from Zhang et al. [32])
𝐶𝑎
𝐶𝑎
𝐶𝑎𝐶 (𝑠)
+ + + + + + + + + + + + + + +
- -𝑆
𝐶𝑎 𝐶𝑎
𝑆
𝑆 𝑆
𝐶𝑎
𝐶𝑎
𝐶𝑎 𝐶𝑎
𝐶𝑎𝐶 (𝑠)
+ + + + + + + + + + + + + + +
- -
𝐶𝑎 𝑆
𝑆 𝑆
𝑆
𝐶𝑎
𝐶𝑎
𝐶𝑎𝐶 (𝑠)
+ + + + + + + + + + + + + + +
- -
𝑆
𝑆
𝐶𝑎
𝑆 𝑆
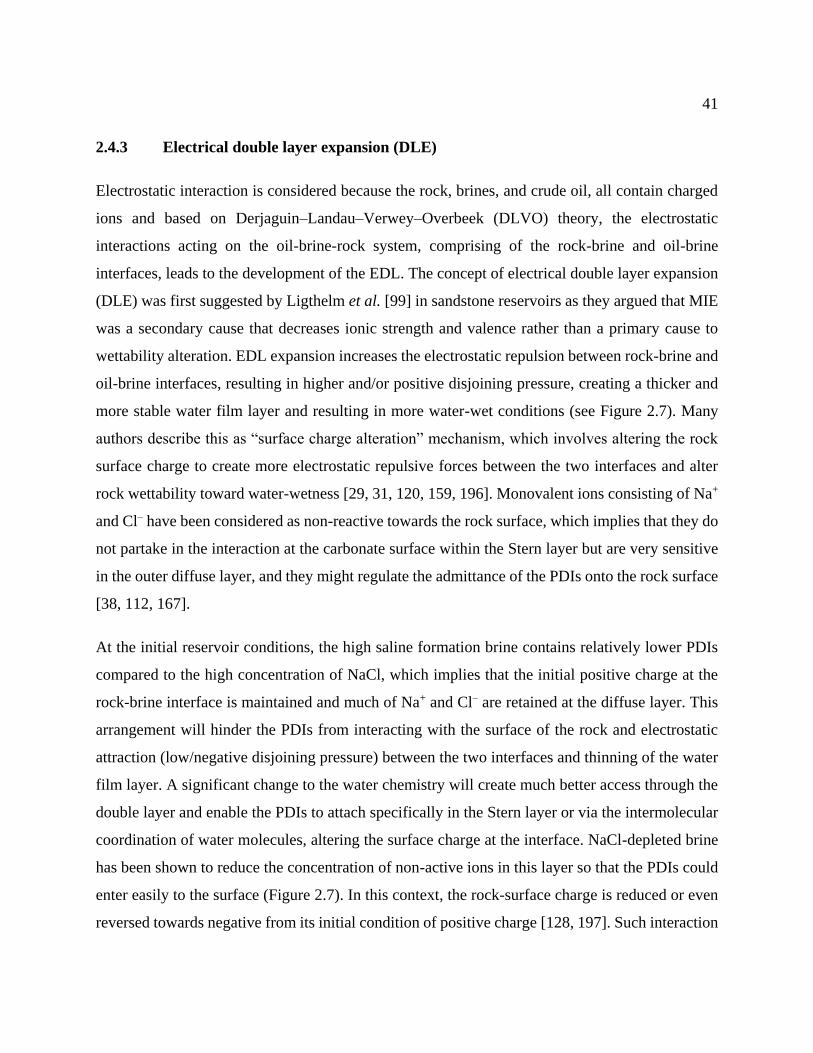
41
2.4.3 Electrical double layer expansion (DLE)
Electrostatic interaction is considered because the rock, brines, and crude oil, all contain charged
ions and based on Derjaguin–Landau–Verwey–Overbeek (DLVO) theory, the electrostatic
interactions acting on the oil-brine-rock system, comprising of the rock-brine and oil-brine
interfaces, leads to the development of the EDL. The concept of electrical double layer expansion
(DLE) was first suggested by Ligthelm et al. [99] in sandstone reservoirs as they argued that MIE
was a secondary cause that decreases ionic strength and valence rather than a primary cause to
wettability alteration. EDL expansion increases the electrostatic repulsion between rock-brine and
oil-brine interfaces, resulting in higher and/or positive disjoining pressure, creating a thicker and
more stable water film layer and resulting in more water-wet conditions (see Figure 2.7). Many
authors describe this as “surface charge alteration” mechanism, which involves altering the rock
surface charge to create more electrostatic repulsive forces between the two interfaces and alter
rock wettability toward water-wetness [29, 31, 120, 159, 196]. Monovalent ions consisting of Na+
and Cl– have been considered as non-reactive towards the rock surface, which implies that they do
not partake in the interaction at the carbonate surface within the Stern layer but are very sensitive
in the outer diffuse layer, and they might regulate the admittance of the PDIs onto the rock surface
[38, 112, 167].
At the initial reservoir conditions, the high saline formation brine contains relatively lower PDIs
compared to the high concentration of NaCl, which implies that the initial positive charge at the
rock-brine interface is maintained and much of Na+ and Cl– are retained at the diffuse layer. This
arrangement will hinder the PDIs from interacting with the surface of the rock and electrostatic
attraction (low/negative disjoining pressure) between the two interfaces and thinning of the water
film layer. A significant change to the water chemistry will create much better access through the
double layer and enable the PDIs to attach specifically in the Stern layer or via the intermolecular
coordination of water molecules, altering the surface charge at the interface. NaCl-depleted brine
has been shown to reduce the concentration of non-active ions in this layer so that the PDIs could
enter easily to the surface (Figure 2.7). In this context, the rock-surface charge is reduced or even
reversed towards negative from its initial condition of positive charge [128, 197]. Such interaction
42
can release adsorbed oil acidic components from the surface sites because of the more stable water
film layer that is developed due to a lesser attraction (higher disjoining pressure) between the two
interfaces. This logic was first proposed in chalk by Fathi and colleagues [38, 167] and later in
limestone rocks [39, 112].
Figure 2.7—An illustration of the proposed mechanism for wettability alteration by “DLE” in oil-brine-
carbonate rock system with DLVO disjoining pressure showing transition from an oil wetting state (left
upper) with crowded double layer-filled non-active ions (right upper) to water wetting state (left lower)
with double-layer depleted non-active ions (right lower) (reproduced from Fathi et al. [38], Awolayo et al.
[65])
In addition, Yousef et al. [57] associated wettability changes to surface charge alteration in
combination with rock dissolution through electrokinetic and NMR analysis. NMR showed fast
surface relaxation and ζ–potential shifted towards more negative with a successive dilution of
seawater. Alroudhan et al. [104] also observed a shift towards more negative when injected brine
was diluted or SO42– was added to the injected brine. They confirmed that both cases could improve
oil recovery by altering the surface charge and expanding the EDL. Similarly, Mahani et al. [56]
conducted ζ–potential and contact angle measurements on different carbonate rocks and stated that
the observed wettability changes and improved recovery are primarily driven by surface-charge
alteration due to electrostatic interactions between crude oil and rock. Moreover, the phenomena
𝑆
𝐶𝑎
𝑁𝑎 𝐶𝑙
𝑁𝑎 𝑁𝑎
𝐶𝑙
𝐶𝑙
𝑁𝑎 𝐶𝑙 𝑁𝑎
𝐶𝑙
𝐶𝑎𝐶 (𝑠)
+ + + + + + + + + +-
𝑆 𝐶𝑎
𝐶𝑎𝐶 (𝑠)
+ + + + + + + + + +-
𝑆
𝐶𝑎
𝑁𝑎 𝐶𝑙
𝐶𝑎 𝑆
OilWater Film
Rock Surface
Rock-Brine interface
Oil-Brine interface
Water film thickness (nm)D
isjo
inin
g Pr
essu
re (a
tm)
Strong Attraction
Rock Surface
Oil
Water Film
Rock-Brine interface
Oil-Brine interfaceWater film thickness (nm)
Dis
join
ing
Pres
sure
(atm
)
Weak Attraction

43
are predominantly occurring at the rock-brine interface. In place of sorption of SO42- to the rock
surface, Brady and Thyne [198] suggested, based on work of Goldberg and Forster [199] that
maximum boron sorption to calcite occurs at a pH of 9.5, that BO43- can coordinate with calcite
positive surface site [>CaOH2+], locally decrease the charge to decrease oil adhesion through an
electrostatic attraction bridge and thicken the water film layer. In the same way, PO43- can also
link and reduce oil adhesion, which was observed by Sø et al. [200]. At relatively low
concentrations, PO43- can electrostatically sorb to calcite surfaces to convert the positively charged
surface sites into neutral/negative, whereas at high concentrations, it can precipitate as calcium
phosphate. These studies further acknowledge the improved recovery observed and water wetness
using PO43- and BO4
3- by various researchers and their likelihood to precipitate at higher
concentrations [42, 58, 61].
Modeling of Brine-Dependent Recovery
Reliable optimization of any recovery process requires the availability of a predictive tool, which
is a necessity to understand completely the principal mechanisms driving the recovery process.
For such a tool to be developed to simulate the recovery process, the mechanisms at play need to
be well grasped. However, despite various inconsistencies in the process mechanisms, several
attempts have been made to model this process and outlined below are the relevant works done
thus far. The phenomena of fluid flow during the brine-dependent recovery process are often
mathematically described by a partial differential equation (PDE) or a system of several PDEs,
with associated boundary and initial conditions. The PDE describing process can be solved either
analytically or numerically. Majorly, the PDE solution is linked to the observed improved recovery
by considering the influence of capillary forces as a driver for wettability alteration, particularly,
an increase in flow oil functions (e.g. relative permeability, capillary pressure and residual oil
saturation and a corresponding decrease in water flow functions, are used to calculate the flow of
each phase. Here, the methodologies and application of analytical and numerical approaches that
are often made in modeling the brine-dependent recovery process in sandstone and carbonate
reservoirs are summarized.
44
2.5.1 Analytical approach
Most of the recent modeling efforts have attempted capturing the brine-dependent recovery
process through numerical approximations, and as far as one can tell from the literature, very few
studies have explored the application of analytical solutions. The reason is because analytical
solutions are often applied to many practical problems of fluid flow, with certain simplifying
conditions, involving insufficient experimental data that could justify the use of a numerical model.
Besides, analytical solutions can guide in the design of experiments and benchmark the numerical
models. In addition, the practical advantage of analytical solutions lies in the fact that they offer
quick estimation, improve interpretations and are useful in conducting sensitivity analysis and
computations of different displacement behavior for different injection brine salinity and
compositions.
Lemon et al. [201] captured the fine migration effects and permeability reduction by providing a
simple analytical induced-fines migration model to justify improved oil production associated with
low saline brine injection. The authors implemented a modified particle-detachment model, which
considered maximum retention function as related to the ratio of detaching and attaching torques,
into the quasi-2D Dietz model for waterflooding in a layered-cake reservoir and was validated
using single flow laboratory coreflooding experiments. They suggested that fines migration effects
on oil recovery are more pronounced with increased viscosity ratio and reservoir heterogeneity.
Zeinijahromi et al. [72] opined that this model considered single-phase environment with
mobilization caused by an increase in flow velocity and extended the model to capture 3D
modeling of fines-assisted waterflooding by introducing two-phase flow equations with fines
lifting and migration in the aqueous phase and fines size-exclusion. The fines lifting are caused by
water salinity changes and the alterations in particle equilibrium by changes in both fluid velocity
and salinity were captured, resulting in the reduction of relative permeability to water. The model
typically involved integrating fines migration and permeability reduction into a two-phase black-
oil model and was used to model fines-assisted waterflooding in two heterogeneous formations. It
was highlighted that induced-fines migration was more effective in improving sweep efficiency
for large-scale heterogeneity with highly correlated flow paths. This model has been applied to

45
interpreting and predicting fines-assisted waterflooding in many oil fields (such as Pervomaiskoye,
Zichebashskoe, and Bastrykskoye fields) in Russia [190, 202, 203]. On the other hand, Borazjani
et al. [76] extended this model by simultaneously accounting for wettability alteration and fines
mobilization, migration, and straining, solved by using splitting procedure for hyperbolic systems.
It was proposed that wettability alteration reduces residual oil and increased oil displacement from
the swept area, while induced-fines migration with permeability reduction in the swept area
decreased water flux and diverts the injected brine to unswept zones. The collective effects were
observed to improve oil recovery much more than their individual effects.
Venkatraman et al. [71] used the hyperbolic theory of conservation laws to develop analytical
solutions to the Riemann problem to explain the displacement process observed during fluid flow
and cation exchange reactions between flowing aqueous phase and solid sandstone phase. The
analytical solutions were used to predict effluent profiles of specific cases of three heterovalent
cations (Na+, Ca2+ and Mg2+) and an anion (Cl-) for any constant initial and injection brine
composition by using mass equilibrium action laws, charge conservation equation and the cation
exchange capacity equation. The number and nature of shocks or rarefaction waves in the
displacement as well as when they occur was predicted to a reasonable accuracy, which becomes
increasingly complex as the number of cations in the system increases. The theoretical predictions
compared well with experimental data available at both the laboratory scale and the field scale and
showed reasonable agreement with numerical model predictions, developed using finite
differences. Awolayo and Sarma [75] derived an analytical expression based on the advection-
reaction-dispersion equation (ARDE) theory for 1-D single-phase flow, which considered linear
adsorption (retardation) to capture changes between ions in the aqueous phase and stationary solid
phase in terms of sorption and surface complexation reactions. The model was used to replicate
histories of effluent ions from single-phase experiments and the reactivity of PDIs towards
carbonate rock surface was emphasized. The authors also predicted the breakthrough composition
of different ions during oil-brine displacement experiments and stated that the wettability change
was observed with high retardation for PDIs, which resulted in improved oil recovery. Various
researchers have created a theoretical model based on the DLVO theory of surface forces to
estimate the rock surface wettability through the stability of the water film layer separating the

46
rock and oil phase. The theoretical model evaluates the stability of the film by calculating
disjoining pressure isotherm and interaction potential that influences the water film thickness and
the energy barrier needed to be overcome to rupture the water film [65, 121, 176, 178, 204, 205,
206, 207]. Alshakhs and Kovscek [178] further estimated contact angle from the disjoining
pressure and compared with that from contact angle measurements.
2.5.2 Numerical approach
As discussed above, analytical solutions are often difficult to obtain because of several
complexities that might be encountered during many practical applications of fluid flow in porous
media. The shapes of the reservoir boundaries might be irregular, the dependent variables in the
governing equations, initial and boundary conditions might be space-variant and non-uniformly
distributed, while the sink/source term in the governing equations might be a non-analytic function.
Hence, the numerical technique provides a convenient, flexible, and sophisticated tool for solving
fluid flow problems in complex realistic situations as it is the case for brine-dependent recovery,
which combines multiple mechanisms. These mechanisms include processes such as convection,
advection, diffusion/dispersion, sorption (adsorption/ion-exchange), surface complexation,
mineral reactions, zero/first order production, and decay. The widely used numerical modeling
method for brine-dependent recovery is based on black-oil and compositional reservoir simulation
with or without coupling either of these two types of models: the surface sorption models (SSMs)
and surface complexation models (SCMs). The SSM captures sorption reactions like adsorption,
ion-exchange, where the electrical interaction is integrated into the equilibrium constants for the
reactions and SCM captures similar surface reactions, except the sorption process depends on the
interaction surface charges that are simultaneously calculated with the surface species.
2.5.2.1 Sandstone rocks.
Jerauld et al. [68] made the earliest attempt to model brine-dependent recovery process in
sandstone reservoir through the adoption of the existing waterflood model. They implemented the
fractional flow theory to describe the process and treated salt as a single-lumped component in the
aqueous phase. The relative permeability and capillary pressure were considered a function of
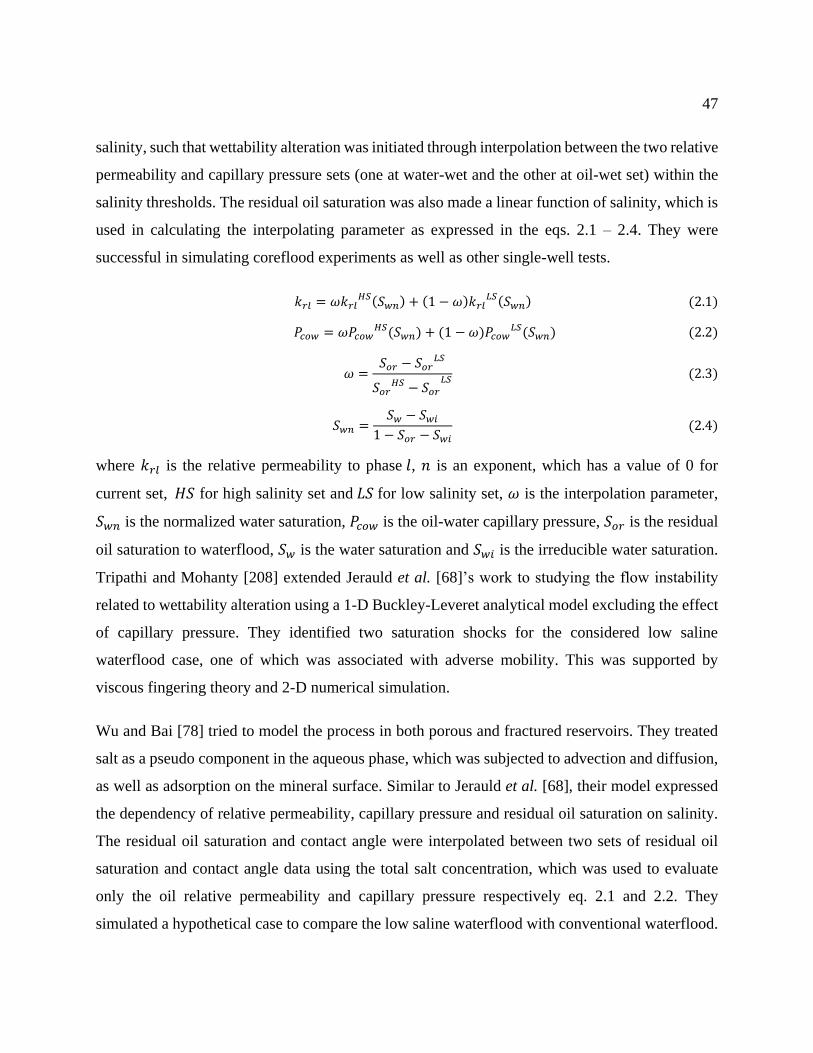
47
salinity, such that wettability alteration was initiated through interpolation between the two relative
permeability and capillary pressure sets (one at water-wet and the other at oil-wet set) within the
salinity thresholds. The residual oil saturation was also made a linear function of salinity, which is
used in calculating the interpolating parameter as expressed in the eqs. 2.1 – 2.4. They were
successful in simulating coreflood experiments as well as other single-well tests.
𝑘𝑟𝑙 = 𝜔𝑘𝑟𝑙𝐻𝑆(𝑆𝑤𝑛) + (1 − 𝜔)𝑘𝑟𝑙
𝐿𝑆(𝑆𝑤𝑛) (2.1)
𝑃𝑐𝑜𝑤 = 𝜔𝑃𝑐𝑜𝑤𝐻𝑆(𝑆𝑤𝑛) + (1 − 𝜔)𝑃𝑐𝑜𝑤
𝐿𝑆(𝑆𝑤𝑛) (2.2)
𝜔 =𝑆𝑜𝑟 − 𝑆𝑜𝑟
𝐿𝑆
𝑆𝑜𝑟𝐻𝑆 − 𝑆𝑜𝑟
𝐿𝑆 (2.3)
𝑆𝑤𝑛 =𝑆𝑤 − 𝑆𝑤𝑖
1 − 𝑆𝑜𝑟 − 𝑆𝑤𝑖 (2.4)
where 𝑘𝑟𝑙 is the relative permeability to phase 𝑙, 𝑛 is an exponent, which has a value of 0 for
current set, 𝐻𝑆 for high salinity set and 𝐿𝑆 for low salinity set, 𝜔 is the interpolation parameter,
𝑆𝑤𝑛 is the normalized water saturation, 𝑃𝑐𝑜𝑤 is the oil-water capillary pressure, 𝑆𝑜𝑟 is the residual
oil saturation to waterflood, 𝑆𝑤 is the water saturation and 𝑆𝑤𝑖 is the irreducible water saturation.
Tripathi and Mohanty [208] extended Jerauld et al. [68]’s work to studying the flow instability
related to wettability alteration using a 1-D Buckley-Leveret analytical model excluding the effect
of capillary pressure. They identified two saturation shocks for the considered low saline
waterflood case, one of which was associated with adverse mobility. This was supported by
viscous fingering theory and 2-D numerical simulation.
Wu and Bai [78] tried to model the process in both porous and fractured reservoirs. They treated
salt as a pseudo component in the aqueous phase, which was subjected to advection and diffusion,
as well as adsorption on the mineral surface. Similar to Jerauld et al. [68], their model expressed
the dependency of relative permeability, capillary pressure and residual oil saturation on salinity.
The residual oil saturation and contact angle were interpolated between two sets of residual oil
saturation and contact angle data using the total salt concentration, which was used to evaluate
only the oil relative permeability and capillary pressure respectively eq. 2.1 and 2.2. They
simulated a hypothetical case to compare the low saline waterflood with conventional waterflood.

48
Al-adasani et al. [77] extended Wu and Bai [78]’s work by generating different correlations for
residual oil saturation, contact angle and IFT as a function of salt concentration. These correlations
were used to evaluate the oil relative permeability, water relative permeability, and capillary
pressure. They successfully simulated a series of experimental data and concluded that the increase
in oil relative permeability because of wettability change was the core element of the modeling
approach. However, at weakly water-wet conditions, improved recovery is controlled by low
capillary pressure.
Omekeh et al. [43] were the first to construct a more comprehensive model that takes into
consideration the geochemical interpretation of low saline waterflood process in sandstones. They
formulated a Buckley-Leveret two-phase model that accounted for MIE as the sole explanation for
wettability alteration. The MIE was expressed using Gapon convention where cations are involved
in a fast exchange process with the negative clay surface (eq. 2.5). They proposed modeling the
transition between two relative permeability sets by using a weighting function which considered
the amount of divalent cations (Ca2+ and Mg2+) desorbed from the mineral surface. The model was
successfully used to do several sensitivity checks on Berea sandstone cores using brines with
different ion compositions. They observed the sensitivity of the desorption fronts speed to the
injected brine composition and oil recovery to the composition of the formation water relative to
the injected brine composition. They later coupled mineral dissolution into the model [69]. They
obtained a good agreement between the model and experimental recovery and effluent
concentration from a reported North Sea coreflood experiment.
1 2⁄ 𝐶𝑎 + 𝑁𝑎 − 𝑋 ⇄ 𝑁𝑎 + 𝐶𝑎1 ⁄ − 𝑋 (2.5)
1 2⁄ + 𝑁𝑎 − 𝑋 ⇄ 𝑁𝑎 + 1 ⁄ − 𝑋
Similarly, Dang et al. [66] used CMG GEMTM, a compositional simulator of Computer Modeling
Group, to simulate low saline brine injection in sandstones by constructing a comprehensive multi-
phase multi-component geochemical model. In their work, the multi-ion exchange was expressed
using Gaines–Thomas convention as highlighted in eq. 2.6. They modeled the transition between
the two-relative permeability sets as a function of equivalent Ca2+ fraction on the mineral surface,
which was contrary to Omekeh et al. [43]’s viewpoint with regards to recovery mechanism in

49
sandstones. However, wettability alteration was captured as they successfully simulated coreflood
experiments conducted on cores from the North Sea and Texas reservoirs [40, 209]. They validated
the model by obtaining good agreement between experimental and model effluent ion
concentrations, effluent pH and recovery. Besides, they extended the model to capture the
combination of brine-dependent recovery and CO2 flood [83]. They observed that such
combination is a very promising recovery technique that promoted the synergy between the two
processes in ensuring the capillary force is fully captured via wettability and IFT alteration.
𝑁𝑎 + 1 2⁄ 𝐶𝑎 − 𝑋 ⇄ 1 2⁄ 𝐶𝑎 + 𝑁𝑎 − 𝑋 (2.6)
𝑁𝑎 + 1 2⁄ − 𝑋 ⇄ 1 2⁄ + 𝑁𝑎 − 𝑋
Korrani et al. [82] coupled a geochemical package and compositional simulator to obtain an
integrated tool in UTCOMP-IPHREEQC capable of executing a geochemical-based modeling of
complex processes like low saline brine injection, alkaline-surfactant-polymer (ASP) flooding and
formation damage with sensitivity to hydrocarbon interactions. They modeled the transition from
oil-wet to the water-wet region by considering different interpolation parameters, like total ionic
strength and ion exchange through organometallic components surface complexation. The model
was then used in matching histories of produced ions as well as the oil recovery of coreflood
experiments and the Endicott field trial conducted by BP [41].
Brady and colleagues [206, 210, 211] constructed a batch SCM for sandstones having two surface
charge sites; namely, clay edge and basal plane. Meanwhile, the charges at these sites are
controlled by pH-dependent protonation/deprotonation reactions at the clay edge and heterovalent
substitution in the lattice of the basal plane. Four electrostatic attraction bridges were identified as
important in modifying rock wettability. At pH<5.5, [>Al:SiO−↔+HN<] and [>AlOH2+↔-OOC<]
attraction bridges are dominant while at higher pH, [>Al:SiO−↔+CaOOC<] attraction bridge
dominates while [>Al:SiOCa+↔-OOC<] attraction bridge only important at pH>8. The authors
showed that low Ca2+ injected brine, and low saline brine can both decrease
[>Al:SiO−↔+CaOOC<] attraction bridge at higher pH and explained that at low acid numbers, low
saline brine can decrease , [>Al:SiO−↔+HN<] and [>AlOH2+↔-OOC<] attraction bridges,
resulting in improved recovery [210]. It was also identified that, for kaolinite-containing
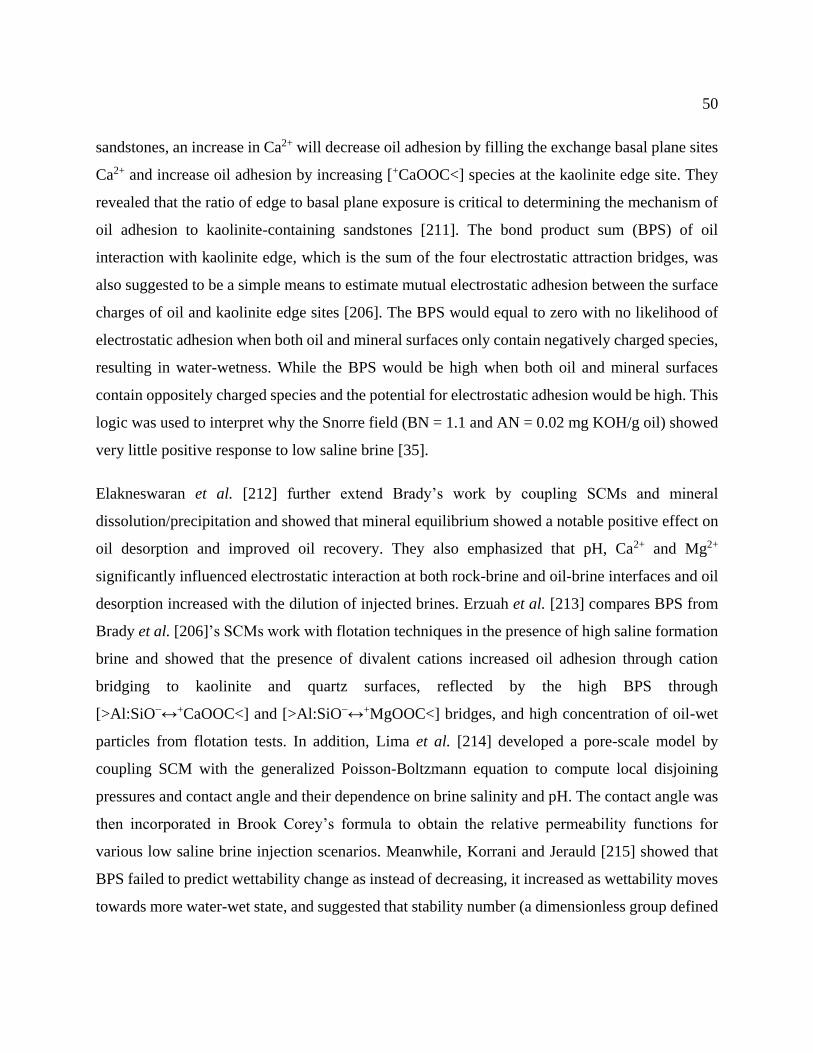
50
sandstones, an increase in Ca2+ will decrease oil adhesion by filling the exchange basal plane sites
Ca2+ and increase oil adhesion by increasing [+CaOOC<] species at the kaolinite edge site. They
revealed that the ratio of edge to basal plane exposure is critical to determining the mechanism of
oil adhesion to kaolinite-containing sandstones [211]. The bond product sum (BPS) of oil
interaction with kaolinite edge, which is the sum of the four electrostatic attraction bridges, was
also suggested to be a simple means to estimate mutual electrostatic adhesion between the surface
charges of oil and kaolinite edge sites [206]. The BPS would equal to zero with no likelihood of
electrostatic adhesion when both oil and mineral surfaces only contain negatively charged species,
resulting in water-wetness. While the BPS would be high when both oil and mineral surfaces
contain oppositely charged species and the potential for electrostatic adhesion would be high. This
logic was used to interpret why the Snorre field (BN = 1.1 and AN = 0.02 mg KOH/g oil) showed
very little positive response to low saline brine [35].
Elakneswaran et al. [212] further extend Brady’s work by coupling SCMs and mineral
dissolution/precipitation and showed that mineral equilibrium showed a notable positive effect on
oil desorption and improved oil recovery. They also emphasized that pH, Ca2+ and Mg2+
significantly influenced electrostatic interaction at both rock-brine and oil-brine interfaces and oil
desorption increased with the dilution of injected brines. Erzuah et al. [213] compares BPS from
Brady et al. [206]’s SCMs work with flotation techniques in the presence of high saline formation
brine and showed that the presence of divalent cations increased oil adhesion through cation
bridging to kaolinite and quartz surfaces, reflected by the high BPS through
[>Al:SiO−↔+CaOOC<] and [>Al:SiO−↔+MgOOC<] bridges, and high concentration of oil-wet
particles from flotation tests. In addition, Lima et al. [214] developed a pore-scale model by
coupling SCM with the generalized Poisson-Boltzmann equation to compute local disjoining
pressures and contact angle and their dependence on brine salinity and pH. The contact angle was
then incorporated in Brook Corey’s formula to obtain the relative permeability functions for
various low saline brine injection scenarios. Meanwhile, Korrani and Jerauld [215] showed that
BPS failed to predict wettability change as instead of decreasing, it increased as wettability moves
towards more water-wet state, and suggested that stability number (a dimensionless group defined

51
as the ratio of electrostatic to van der Waals force) gave a better prediction of coreflood
experiments and the Endicott field trial conducted by BP [41].
2.5.2.2 Carbonate rocks.
Similar to modeling attempts in sandstones, there have been quite a few modeling studies
conducted on carbonate rocks. Hiorth et al. [47] were the first to attempt to develop a model to
better understand the published experimental results, especially in chalk formations. They coupled
bulk aqueous, SCM with two sites (>Ca+ and >CO3−) and mineral reactions in a geochemical
model, calculated the surface speciation, charge, and potential with temperature and tried to
calculate the water film stability and oil wettability, the result of which was compared with
spontaneous imbibition experiments on Stevns Klint outcrop chalk. They found that the negatively
charged surface promotes water-wetness, while the positively charged surface promotes oil-
wetness. They reported that the experimental observation could not be fully explained by surface
potential changes and only calcite dissolution could account for the improved recovery. They
concluded that the unstable equilibrium that resulted in calcite dissolution has a strong dependence
on temperature and pH conditions.
Yu et al. [80] presented a 1-D two-phase model to simulate a waterflood spontaneous imbibition
tests conducted on core plugs from Stevns Klint Chalk formation. They considered a wettability
alteration [WA] agent (sulfate ions) as the second component in the aqueous phase, which was
used along with the adsorption isotherm to imitate the transition between the two-relative
permeability and capillary pressure sets representing the oil-wetting and water-wetting state. The
model accounted for molecular diffusion, capillary force, gravity and adsorption. However, it did
not capture the influence of WA agent adsorption on rock permeability and porosity. A reasonable
match was achieved between the model and experimental results. They emphasized dynamic and
fixed wettability alteration, with the dynamic alteration depending on the salt concentration to
capture the gradual transition period and gave a better match.
Evje et al. [216] constructed a 1-D model to describe water-rock interactions by coupling
convection-diffusion equations with geochemical (equilibrium and non-equilibrium) reaction
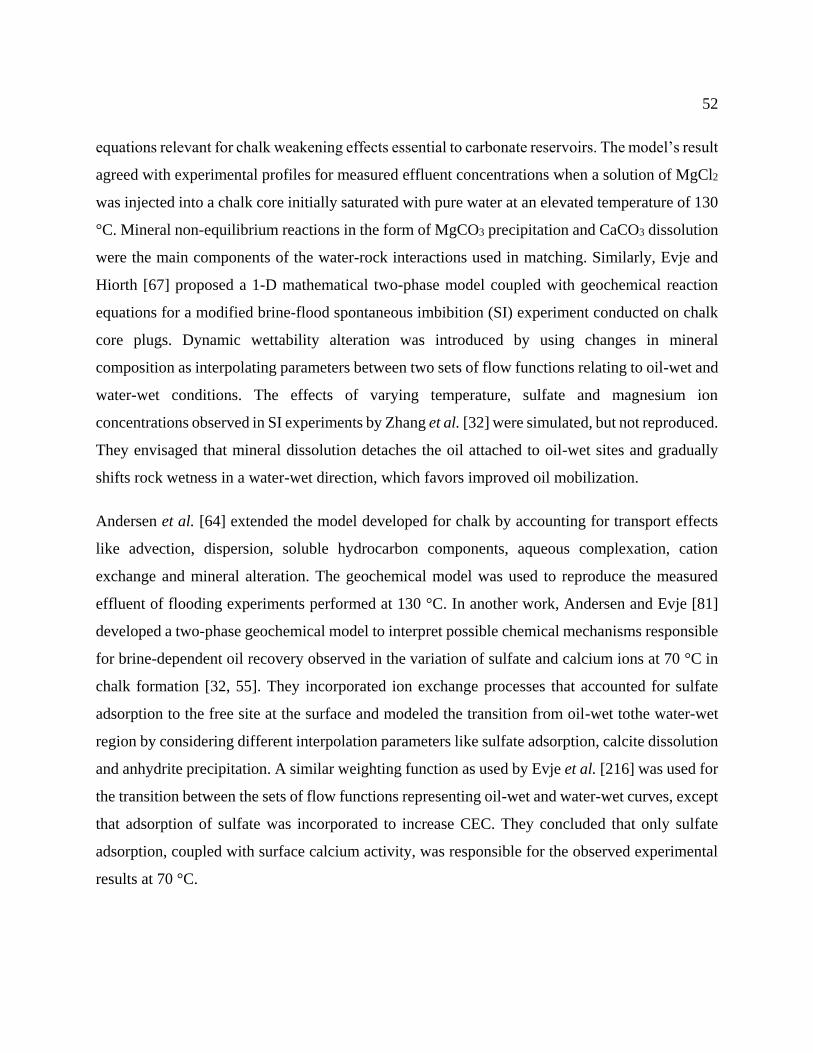
52
equations relevant for chalk weakening effects essential to carbonate reservoirs. The model’s result
agreed with experimental profiles for measured effluent concentrations when a solution of MgCl2
was injected into a chalk core initially saturated with pure water at an elevated temperature of 130
°C. Mineral non-equilibrium reactions in the form of MgCO3 precipitation and CaCO3 dissolution
were the main components of the water-rock interactions used in matching. Similarly, Evje and
Hiorth [67] proposed a 1-D mathematical two-phase model coupled with geochemical reaction
equations for a modified brine-flood spontaneous imbibition (SI) experiment conducted on chalk
core plugs. Dynamic wettability alteration was introduced by using changes in mineral
composition as interpolating parameters between two sets of flow functions relating to oil-wet and
water-wet conditions. The effects of varying temperature, sulfate and magnesium ion
concentrations observed in SI experiments by Zhang et al. [32] were simulated, but not reproduced.
They envisaged that mineral dissolution detaches the oil attached to oil-wet sites and gradually
shifts rock wetness in a water-wet direction, which favors improved oil mobilization.
Andersen et al. [64] extended the model developed for chalk by accounting for transport effects
like advection, dispersion, soluble hydrocarbon components, aqueous complexation, cation
exchange and mineral alteration. The geochemical model was used to reproduce the measured
effluent of flooding experiments performed at 130 °C. In another work, Andersen and Evje [81]
developed a two-phase geochemical model to interpret possible chemical mechanisms responsible
for brine-dependent oil recovery observed in the variation of sulfate and calcium ions at 70 °C in
chalk formation [32, 55]. They incorporated ion exchange processes that accounted for sulfate
adsorption to the free site at the surface and modeled the transition from oil-wet tothe water-wet
region by considering different interpolation parameters like sulfate adsorption, calcite dissolution
and anhydrite precipitation. A similar weighting function as used by Evje et al. [216] was used for
the transition between the sets of flow functions representing oil-wet and water-wet curves, except
that adsorption of sulfate was incorporated to increase CEC. They concluded that only sulfate
adsorption, coupled with surface calcium activity, was responsible for the observed experimental
results at 70 °C.
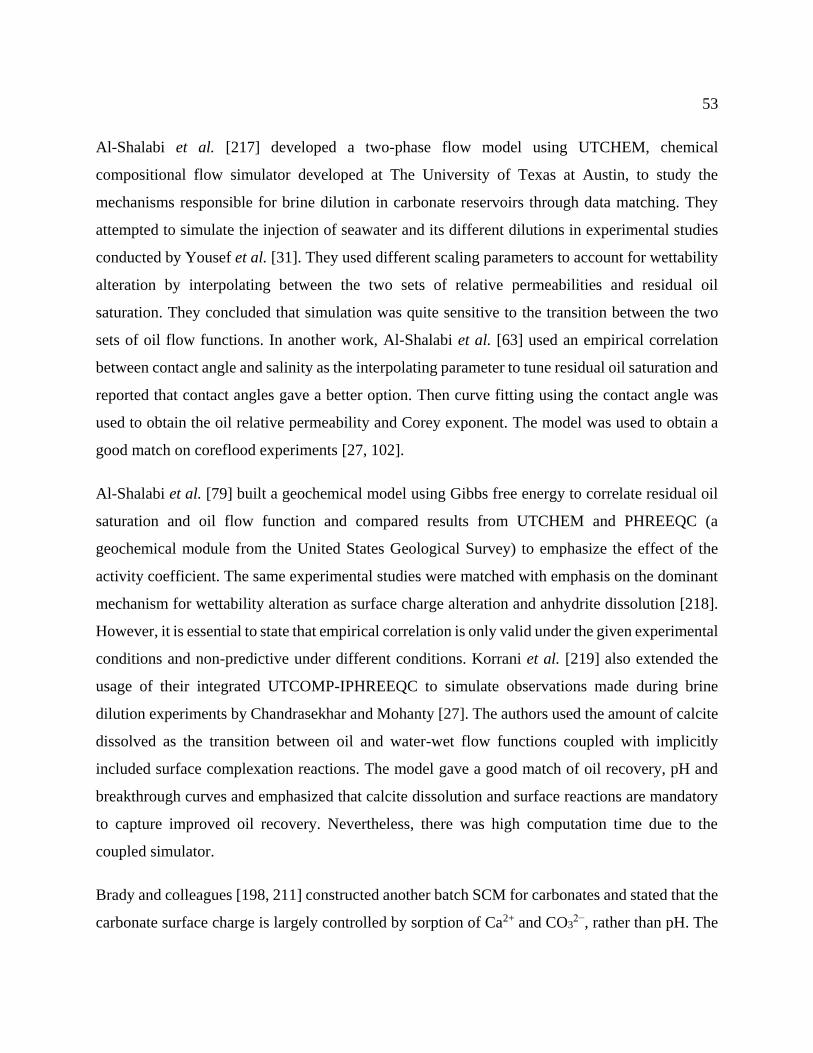
53
Al-Shalabi et al. [217] developed a two-phase flow model using UTCHEM, chemical
compositional flow simulator developed at The University of Texas at Austin, to study the
mechanisms responsible for brine dilution in carbonate reservoirs through data matching. They
attempted to simulate the injection of seawater and its different dilutions in experimental studies
conducted by Yousef et al. [31]. They used different scaling parameters to account for wettability
alteration by interpolating between the two sets of relative permeabilities and residual oil
saturation. They concluded that simulation was quite sensitive to the transition between the two
sets of oil flow functions. In another work, Al-Shalabi et al. [63] used an empirical correlation
between contact angle and salinity as the interpolating parameter to tune residual oil saturation and
reported that contact angles gave a better option. Then curve fitting using the contact angle was
used to obtain the oil relative permeability and Corey exponent. The model was used to obtain a
good match on coreflood experiments [27, 102].
Al-Shalabi et al. [79] built a geochemical model using Gibbs free energy to correlate residual oil
saturation and oil flow function and compared results from UTCHEM and PHREEQC (a
geochemical module from the United States Geological Survey) to emphasize the effect of the
activity coefficient. The same experimental studies were matched with emphasis on the dominant
mechanism for wettability alteration as surface charge alteration and anhydrite dissolution [218].
However, it is essential to state that empirical correlation is only valid under the given experimental
conditions and non-predictive under different conditions. Korrani et al. [219] also extended the
usage of their integrated UTCOMP-IPHREEQC to simulate observations made during brine
dilution experiments by Chandrasekhar and Mohanty [27]. The authors used the amount of calcite
dissolved as the transition between oil and water-wet flow functions coupled with implicitly
included surface complexation reactions. The model gave a good match of oil recovery, pH and
breakthrough curves and emphasized that calcite dissolution and surface reactions are mandatory
to capture improved oil recovery. Nevertheless, there was high computation time due to the
coupled simulator.
Brady and colleagues [198, 211] constructed another batch SCM for carbonates and stated that the
carbonate surface charge is largely controlled by sorption of Ca2+ and CO32−, rather than pH. The

54
authors used the calculated surface speciation to consider individual coordination between calcite
and oil at 25−130 °C. They identified several possible electrostatic attraction bridges. The
strongest oil-calcite attraction bridge at reservoir pH is considered as [>CaOH2+↔-OOC<], which
could be reduced by increasing Ca2+ and/or Mg2+ to reverse the charge of [<COO-] specie, and/or
increasing SO42− to coordinate with [>CaOH2
+] and eliminate the positive charge to produce a
negative surface. The model was used to predict the injection of various versions of diluted brines
used in the experimental study by Yousef et al. [31] on limestone rocks. The authors claimed that
the decreased salinity decreased the oil-calcite BPS, which resulted in reduced oil adhesion and
increased oil recovery; however diminishing returns was observed beyond ten times dilution.
Qiao et al. [70] developed a multiphase multicomponent reactive transport model that captured the
SCMs of surface reactions among carboxylic groups, cations, and sulfate. The model was used to
interpret the oil recovery from the spontaneous imbibition experiments conducted on chalk by
using brine with selective removal of non-active ions [38]. The water-wetting fractions, controlled
by the proportion of the carboxylic group desorbed from the surface sites, were used as the
interpolating parameter to transit between the two sets of capillary pressure, relative permeability,
and residual oil saturations. The model showed good consistency with experimental observations,
and through sensitivity studies, they concluded that ion species, ionic strength and parameters, like
oil acidity, reaction equilibrium constants, total surface sites and diffusion coefficient, play such a
key role in the wettability alteration mechanisms. They extended the model by including limestone
mineral dissolution/precipitation reactions [84]. Here, the interpolation was carried out using
surface concentrations of desorbed carboxylic acid. They introduced changes in surface potential
in the equilibrium constant calculations. The model was consistent with experimental observations
using brine dilution approach on limestone [31, 48, 53] and chalk outcrop [38].
Mahani et al. [120] developed a batch SCM to elucidate and correlate ζ-potential results under
varying brine salinity (synthetic seawater, with 25 and 100 times dilution) and pH conditions. They
made changes to the reaction of SO4- with the calcite sites to match the ζ-potential results and
observed that ζ-potential increased with pH, which was caused by the formation of surface species
coordinating with the PDIs. Brine dilution was observed to lead to more negative surface charge

55
due to the resultant effect of an increase in the concentration of negatively charged species,
decrease in positively charged species concentration and formation of neutral species. As the
surface charge is modified, the wetting condition is influenced towards improved water-wetness.
Eftekhari et al. [220] developed an SCM reactive transport model to derive the reaction
equilibrium constant for natural carbonates by using a non-linear optimization technique to fit the
model with ζ-potential and single-phase breakthrough curves data on intact chalk cores. The
authors used the tuned model to suggest a correlation existing between the remaining oil in several
chalk imbibition tests and [>CaOH2+↔-OOC<], which was estimated with equilibrium constants
analogous to aqueous acid-base reactions.
Awolayo et al. [65] developed a reactive transport model considering adsorption and ion exchange
and obtained temperature-dependent equilibrium constants for the two reactions by fitting with the
single-phase breakthrough curves of different ions, temperature and intact carbonate minerals. The
optimized model was used to simulate oil recovery and breakthrough curves from different
experiments. In another study, the contribution of dissolution and precipitation of different
minerals as they contribute to the distribution of PDIs available for surface sorption were captured
and simulated. The fraction of the free surface sites that could adhere to oil was observed to reduce
as the brine salinity reduced and sulfate concentration in injected water increased, which was used
to transit between two sets of flow functions [159, 207].
Injection Water Issues and Remediation
In most published literature, it is evident that the properties of the formation fluids vary depending
on different parameters, including mineral diagenesis, its pressure and temperature history and the
other complex alterations experienced as reservoir fluid flow and mix over geological time [221].
As a result, typical formation water is highly saline and enriched in divalent ions. Sandstone
formation water often contains an abundance of Ba2+ and Sr2+ cations, while carbonate and calcite-
cemented sandstone formations usually contain a substantial amount of Ca2+ and Mg2+ cations
[222]. Seawater is also rich in ions (higher SO42- than in formation fluids) that form from marine
sediments and water evaporation. These two fluids are the major sources of water injected (diluted
seawater or formation water) during brine-dependent recovery, and the mixing of both
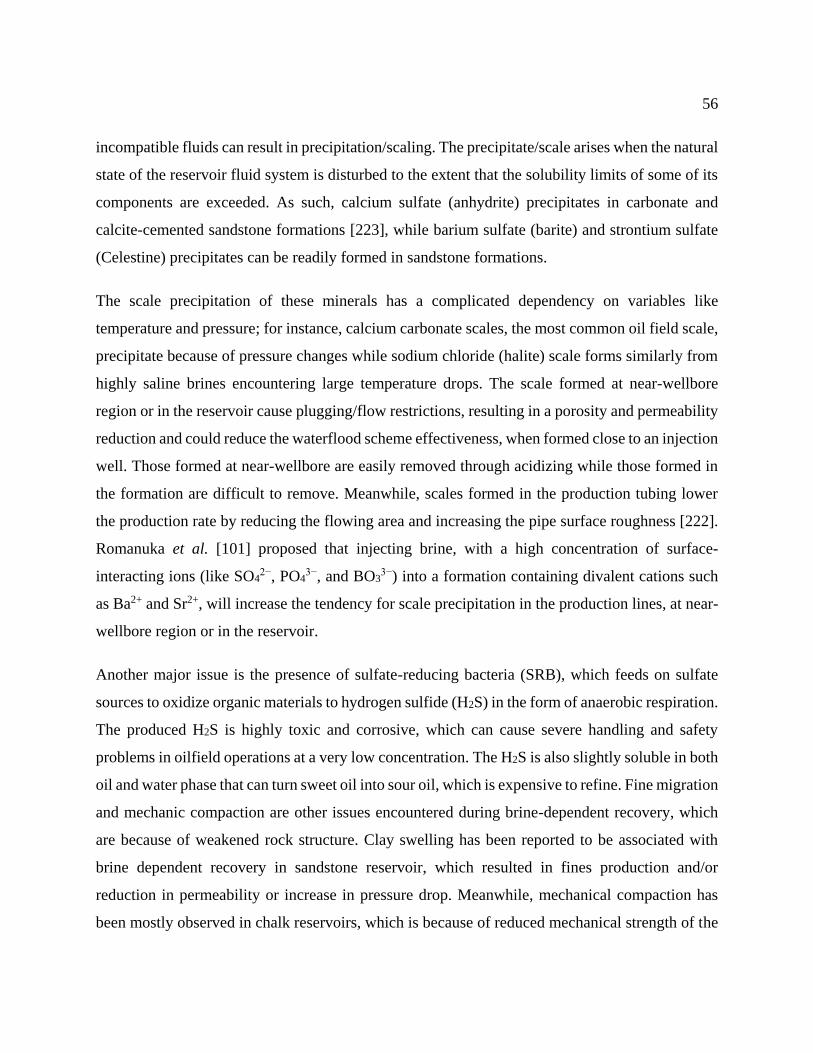
56
incompatible fluids can result in precipitation/scaling. The precipitate/scale arises when the natural
state of the reservoir fluid system is disturbed to the extent that the solubility limits of some of its
components are exceeded. As such, calcium sulfate (anhydrite) precipitates in carbonate and
calcite-cemented sandstone formations [223], while barium sulfate (barite) and strontium sulfate
(Celestine) precipitates can be readily formed in sandstone formations.
The scale precipitation of these minerals has a complicated dependency on variables like
temperature and pressure; for instance, calcium carbonate scales, the most common oil field scale,
precipitate because of pressure changes while sodium chloride (halite) scale forms similarly from
highly saline brines encountering large temperature drops. The scale formed at near-wellbore
region or in the reservoir cause plugging/flow restrictions, resulting in a porosity and permeability
reduction and could reduce the waterflood scheme effectiveness, when formed close to an injection
well. Those formed at near-wellbore are easily removed through acidizing while those formed in
the formation are difficult to remove. Meanwhile, scales formed in the production tubing lower
the production rate by reducing the flowing area and increasing the pipe surface roughness [222].
Romanuka et al. [101] proposed that injecting brine, with a high concentration of surface-
interacting ions (like SO42−, PO4
3−, and BO33−) into a formation containing divalent cations such
as Ba2+ and Sr2+, will increase the tendency for scale precipitation in the production lines, at near-
wellbore region or in the reservoir.
Another major issue is the presence of sulfate-reducing bacteria (SRB), which feeds on sulfate
sources to oxidize organic materials to hydrogen sulfide (H2S) in the form of anaerobic respiration.
The produced H2S is highly toxic and corrosive, which can cause severe handling and safety
problems in oilfield operations at a very low concentration. The H2S is also slightly soluble in both
oil and water phase that can turn sweet oil into sour oil, which is expensive to refine. Fine migration
and mechanic compaction are other issues encountered during brine-dependent recovery, which
are because of weakened rock structure. Clay swelling has been reported to be associated with
brine dependent recovery in sandstone reservoir, which resulted in fines production and/or
reduction in permeability or increase in pressure drop. Meanwhile, mechanical compaction has
been mostly observed in chalk reservoirs, which is because of reduced mechanical strength of the

57
chalk. The weakening of chalk is caused by the replacement of Ca2+ at the biogenic chalk surface
by Mg2+ in the injected water through chemical substitution at elevated temperatures. After water
breakthrough, another environmental issue might be the content of the produced water, which will
include an added cost for treating the water. The produced water from reservoir undergoing brine
dependent recovery process will contain a low concentration of PDIs because of their adsorption
to the rock. Hence, injecting an appropriate mixture of this produced water and freshly prepared-
injection water has been proposed to also trigger wettability alteration and better recovery [224].
Even though preceding issues exist, success reported in various brine dependent recovery projects
conducted in many fields (notably Alaska and the North Sea) for years did not report much
encounter with precipitation/scaling, souring and fines production, except compaction which was
prevalent in North Sea Chalk reservoirs. Various authors have highlighted optimum sulfate
concentration to avoid precipitation of sulfate scales. Furthermore, in any waterflood project, the
choice of water treatment method is a key factor that significantly affects project success.
Treatment and reinjection of produced brine have been reported to be possibly cheaper than its
transportation and disposal [225, 226, 227]. Desalination is the water treatment process readily
used to remove selected dissolved ions in water to provide safe drinking water and treated injection
water for improving oil recovery. There are two main methods for water treatment/desalination:
thermal-based, which involves heating the feed water and collecting the condensed vapor from the
distillation column and membrane-based, which involves applying pressure to force the water feed
through the member, thereby leaving the selective salts. Membrane-based methods are often
preferred over the thermal methods due to space limitation and energy requirements [228]. The
two widely used membrane-based desalination methods are nanofiltration (NF) and reverse
osmosis (RO), which is often used as either standalone or hybrid configuration. During the
nanofiltration process, the divalent ions are selectively removed, decreasing water hardness, and
leading to monovalent-ion rich effluent water (permeate stream), and divalent ion-rich rejected
water (retentate stream). Meanwhile, in the reverse osmosis process, both monovalent and divalent
ions are selectively removed to reduce the permeate stream water salinity. Essentially the permeate
stream water from RO is fresh with negligible amounts of salt, and this is possible because RO has
a much tighter pore size than NF.

58
Several published patents [229, 230, 231, 232, 233] have been proposed that the desired water
quality can be generated through the blending of the effluent permeate streams from the different
NF/RO application (standalone, hybrid configuration either parallel or series and plurality)
schemes to satisfy brine-dependent recovery requirements in sandstone reservoirs. As such,
Yousef and Ayirala [234] proposed a desalination optimization technique based on a parallel
configuration of NF/RO that blends both the permeate and retentate water streams to cover the
entire range of ionic salinity and composition appropriate for both sandstone and carbonate rocks,
which also considered the minimization/prevention of clay swelling, reservoir souring, corrosion
and aerobic bacterial issues. The authors emphasized that the availability of these multiple water
streams provides the flexibility of customizing the desired ionic content and salinity not just for
brine-dependent recovery process but also as a good pre-conditioner for combining with other
EOR applications such as miscible gas flood, carbonated waterflood, polymer flood, ASP flood,
and as boiler feed water in thermal floods.
Meanwhile, Ayirala and Yousef [235] recently reviewed different chemical extraction and
desalination technologies and reported that current desalination technology has limitations to treat
high saline water and produced water. They claimed that no current proven commercial technology
could selectively remove specific ions in one step to optimally meet the desired water requirement,
but a combination of all current technologies. Forward osmosis and membrane distillation are
reported to offer cost-effective potential alternatives to reverse osmosis with the availability of
low-grade waste heat and well suited to treat very high salinity water. Dynamic vapour
recompression and Carrier-Gas extraction are identified as well suited to treat high saline water,
and hyper-saline produced water from oil and gas production for zero liquid discharge. This is
critically important in locations where disposal facilities are not available, which can become an
effective water management strategy during field implementation by converting the produced
water into the desired water quality for reinjection. However, the two technologies are reportedly
not cost-effective for water desalination, and their footprints and energy requirements are not well
defined as they are still in the development stage. The comparison of the features and capability
of all current and emerging water desalination technology are given in Table 2.3.

59
Table 2.3—Summary of technology selection criteria, key attributes and capabilities of both current and
emerging water treatment technologies (adapted from Ayirala and Yousef [235])
Water treatment
process
Desalination
Methods
Technology
Maturity
Selective
ion
removal
Treatment Capability
Comparable features High saline
water
Produced
water
Nanofiltration Membrane-based High Yes No No
• water recovery efficiency of 90-99%:
• More open pores leading to higher flux:
• Low operation pressure and energy
consumption over RO
Reverse Osmosis Membrane-based High No No No
• Minimal footprint and energy requirement:
• cost effective as its widely used with water
recovery efficiency greater than 99%
Chemical
Precipitation Pretreatment
Medium -
High Yes No No
• Remove scaling and fouling in
desalination pre-treatment
• Upfront chemical costs and additional
facility requirements for sludge handling
and disposal
Salt Extraction Pretreatment Low Maybe Yes Maybe
• No scaling and lower energy requirements:
• details on cost and chemical solvents not
well known
Forward Osmosis Membrane-based Low -
Medium No Yes Yes
• Lower energy requirements:
• cost-effective compared to widely-used
desalination method:
• can treat high-saline water:
Membrane
Distillation
Combo
Membrane &
thermal based
Medium No Yes No
• Cost-effective compared to widely-used
desalination method:
• can treat high-saline water:
• low-grade waste heat requirements
Carrier-Gas
Extraction
Humidification /
Dehumidification Medium No Yes Yes
• Provide zero liquid discharge solution up
to 85-90% water recoveries:
• treating both high saline water and
produced water:
• non-cost-effective compared to widely-
used desalination method:
• footprints and energy requirements not
well-defined:
Dynamic Vapor
Recompression Thermal-based Medium Maybe Yes Yes
• Minimal pre-treatment and no scaling:
• provide zero liquid discharge solution up
to 97% water recoveries:
• treating both high saline water and
produced water:
• non-cost-effective compared to widely-
used desalination method:
• costs, footprints and energy requirements
not well-defined
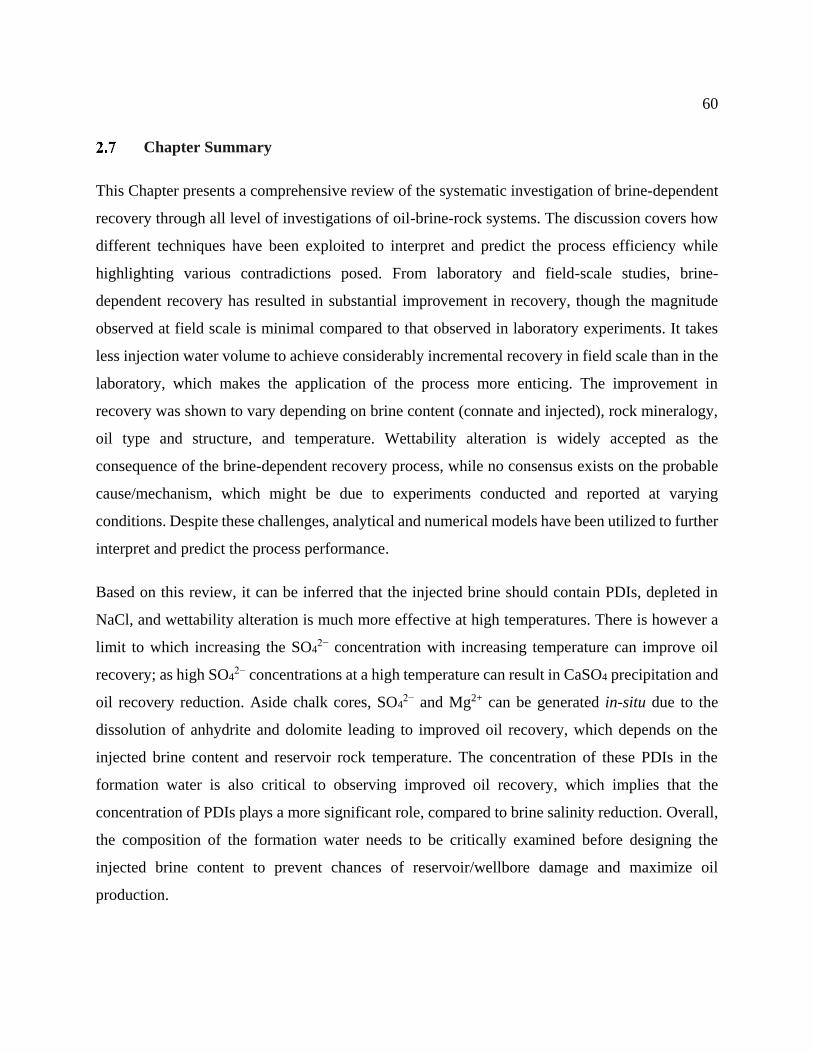
60
Chapter Summary
This Chapter presents a comprehensive review of the systematic investigation of brine-dependent
recovery through all level of investigations of oil-brine-rock systems. The discussion covers how
different techniques have been exploited to interpret and predict the process efficiency while
highlighting various contradictions posed. From laboratory and field-scale studies, brine-
dependent recovery has resulted in substantial improvement in recovery, though the magnitude
observed at field scale is minimal compared to that observed in laboratory experiments. It takes
less injection water volume to achieve considerably incremental recovery in field scale than in the
laboratory, which makes the application of the process more enticing. The improvement in
recovery was shown to vary depending on brine content (connate and injected), rock mineralogy,
oil type and structure, and temperature. Wettability alteration is widely accepted as the
consequence of the brine-dependent recovery process, while no consensus exists on the probable
cause/mechanism, which might be due to experiments conducted and reported at varying
conditions. Despite these challenges, analytical and numerical models have been utilized to further
interpret and predict the process performance.
Based on this review, it can be inferred that the injected brine should contain PDIs, depleted in
NaCl, and wettability alteration is much more effective at high temperatures. There is however a
limit to which increasing the SO42− concentration with increasing temperature can improve oil
recovery; as high SO42− concentrations at a high temperature can result in CaSO4 precipitation and
oil recovery reduction. Aside chalk cores, SO42− and Mg2+ can be generated in-situ due to the
dissolution of anhydrite and dolomite leading to improved oil recovery, which depends on the
injected brine content and reservoir rock temperature. The concentration of these PDIs in the
formation water is also critical to observing improved oil recovery, which implies that the
concentration of PDIs plays a more significant role, compared to brine salinity reduction. Overall,
the composition of the formation water needs to be critically examined before designing the
injected brine content to prevent chances of reservoir/wellbore damage and maximize oil
production.

61
The effect of different minerals on the performance of brine-dependent recovery has been well
investigated in carbonate rocks with high degree of repeatability and the observed trend is that
presence of different kind of minerals helps the two approaches of ionic strength, and composition
modification performs better through the in-situ generation of PDIs. Improving on the
development of the analytical models can be quite difficult, because of the complexity of the
process mechanisms. The bulk of the numerical black-oil models used salinity-dependent flow
functions, while some of the compositional models used empirical correlations. Meanwhile, the
complex interaction can be well represented by the using surface sorption and complexation
geochemical models, which allows the investigation of rock mineralogical contents, brine
compositions and polar oil materials, which are significant in electrostatic interactions at both
rock−brine and oil−brine interfaces. However, if DLE is to be accepted as the cause of wettability
alteration, then SCM would be the ultimate approach at generating a numerical model to predict
the process performance at all level of investigation. Another area for further investigation will be
to obtain thermodynamic parameters describing the surface sorption, and complexation models for
natural rocks, instead of the current practise of applying aqueous thermodynamic parameters. It is
also critical that the premise through which wettability alteration occur as reflected by the
interpolation parameters used in the simulation is identified with a high confidence level before
being considered in modeling to avoid contradictions.
Finally, brine-dependent recovery is relatively inexpensive and environmentally friendly,
particularly with various emerging cost-effective water treatment technologies. It has more
advantage than other chemical EOR methods in terms of operating costs, field implementation and
environmental assessment, even though it might recover comparably less additional oil.
Meanwhile, modification of the injected brine composition (like adding more PDIs) can be more
expensive than brine dilution. The recovery benefits from both approaches can further outweigh
any potential damages that could be caused to the reservoir or near-wellbore region. Additionally,
low saline brine can serve as pre-conditioner for other EOR methods, as most of the injected
chemical/gas performs better under low saline brine.

62
Surface Forces and Water Film Prediction
This Chapter proposed that the geochemical interactions acting between the two interacting
interfaces (rock−brine and oil−brine) in a three-phase system launch various intermolecular forces
that govern the rock surface wettability. Therefore, a theoretical DLVO model was utilized to
discuss the significance of the nature and magnitude of interaction force and energy between the
interacting interfaces on rock wettability condition. The measured ζ–potentials at respective brine
concentrations and pH, from individually-sourced experiments, were used as model inputs.
Introduction
A major thrust in various research efforts on brine–dependent recovery has been to tweak and
optimize the brine chemistry that delivers more effective and efficient oil-brine-rock interactions
leading to improved oil recovery. The effectiveness of the recovery process is mostly governed by
the composition of flowing fluids in the porous media and the mass transfer between such flowing
(aqueous/oleic) fluids and the immobile (rock) phase. To date, a significant volume of research
studies has been conducted to resolve pending arguments about the applicability of the process in
sandstones; however, research on carbonates reservoirs still lies in its emerging phase [44, 62].
Results from most experimental studies in carbonate rocks (for example, displacement tests,
spontaneous imbibition, contact angle, NMR, ζ–potential, effluent analysis tests) point to the
ability of the process to shift rock wettability towards water wetness as the principal fundamental
mechanism.
However, there appears to be no unanimity as to how the wettability alteration occurs, and hence,
this remains a gray area and needs to be studied. A review of mechanisms that influence wettability
changes has been presented in Chapter 2, including electrostatic interactions between rock-brine
and oil-brine interfaces, multi-ion exchanges between surface PDIs, rock mineral alteration in
terms of dissolution/precipitation, complexation between oil phase components, multivalent ions
and rock surface [7, 30, 32, 48, 56, 57, 236]. It is important to note that the magnitude of the forces
existing between reservoir fluids (with their dissolved constituents) and the rock surface often
controls wettability. Hence, the wettability changes can only be fully understood by considering a

63
detailed account of the intermolecular interactions between fluids in contact with the rock surfaces
[237].
Moreover, many of these mechanisms combine to launch various interfacial phenomena occurring
concurrently during fluid flow in porous rock. These phenomena involve intermolecular forces
acting on the oil-brine-rock system, which is composed of rock-brine and oil-brine interfaces
interacting through the water film layer. A significant feature of these interfaces is the electrical
charge separation that occurs at the interface, and this plays a decisive role in the stability of the
water film. The probable origin of the electrical charge separation at the interface could be due to
either or a combination of the following: surface functional groups ionization, specific/preferential
adsorption/desorption of ions, isomorphic substitution at the crystal lattice, and electron
accumulation/depletion. Meanwhile, at the interface between a charged surface and an electrolyte
solution, an electrical potential is developed such that the surface charge is neutralized via
columbic interaction with oppositely charged ions (counter-ions) attracted to the surface from the
adjacent solution. Subsequently, layers of ions are developed separating the charged surface from
the bulk solution in a special arrangement known as the electrical double layer (EDL; shown in
Figure 3.1).
The first region next to the charged surface is the Stern layer with a typical thickness of 1 nm; the
counter-ions are specifically attached in the inner Stern layer defined by the inner Helmholtz plane
(IHP). The hydrated counter-ions that do not specifically attach are in the outer Stern layer (also
defined by outer Helmholtz plane – OHP). The second layer, known as the diffuse layer, contains
ions of the same sign (co-ions) and counter-ions that are loosely associated with the surface and
move freely under the influence of thermal motion and electric attraction [130, 170, 238, 239]. The
diffuse layer has a thickness between 1 to 500 nm depending on the surface charge and the ionic
strength of the aqueous solution. The ions in this layer are present to ensure electrical neutrality of
the EDL, at any circumstances that the Stern layer failed to neutralize the surface charge. The
diffuse layer extends from the OHP to a point where ions in the bulk electrolyte solution do not
feel the electric attraction, and the thickness of this diffuse layer is termed Debye length (𝜅 1).
The shear or slipping plane, to which measured ζ–potentials are attributed, are often displaced by

64
a distance Δ from the OHP into the diffuse layer [240]. This specific distance is unknown and
generally used as an adjustable parameter to fit ζ–potential data, within 0.245 - l nm has been
reported [104, 197, 241, 242]. The distribution of ions in the region displaced by the distance Δ in
the diffuse layer (see region I in Figure 3.1) is not influenced by tangential stress arising from bulk
fluid flow while ions in the second region (see region II in Figure 3.1) of the diffuse layer are
distributed based on fthe low of the bulk fluid.
Figure 3.1—Schematic illustration of the EDL and electrical potential at the rock–brine interface: The
sketch shows the variation of electrical potential as a function of distance from the rock surface, partitioned
by charged planes— inner Helmholtz plane (IHP), outer Helmholtz plane (OHP) and slipping plane. The
potential developed within the EDL declines with distance linearly through the Stern layer, exponentially
through the diffuse layer and drops to zero in the bulk electrolyte solution. The partial charge on the
dangling surface ions left behind at the bulk solid is represented by 𝜓𝑏; 𝜓𝑜 represents the potential of the
surface; 𝜓𝑑 stands for the potential at the Stern layer and ζ represents zeta potential. While 𝜎𝑜 and 𝜎𝑑 are
the surface and diffuse layer charge density (C/m2) respectively. The Stern layer potential difference is
characterized by constant capacitance, 𝐶𝑠 while the diffuse layer has variable capacitance, 𝐶𝑑. At plane x =0, which corresponds to the hydrolysis layer, H and OH of the water molecules are chemibonded to the
dangling surface ions. At x < 0, the potential is so high that attaching ions do not bond to the surface ions.
The inner-Stern layer is characterized by d1 length; the outer-Stern layer is characterized by d length, and
the electrical double layer is characterized by κ 1 length, also known as Debye-Hückel screening length
[130, 170].

65
Theory of Water Film Stability
When two interfaces approach and interact with each other, the distance separating them is
considered to influence the energy of the oil-brine-rock system and as a result, the stability of the
water-film layer between the interfaces. These interactions are mostly dictated by the resultant
effect of the intermolecular forces considered as disjoining pressure. The disjoining pressure is the
system Gibbs free energy change per unit area with a corresponding change in distance, which is
also a measure of the force that separates the cross-sectional area of the two interfaces. Typically,
a low or negative disjoining pressure will attract the two interfaces, destabilize and eventually
weaken the water-film layer to cause polar components in the oil to interact directly with the rock
and reverse the wettability towards oil-wetness, as in Figure 3.2. On the contrary, a high or positive
disjoining pressure would indicate an energy barrier that would be too high for the interface to
overcome (Figure 3.2), thereby thickening the water-film layer [130, 243]. Then, the water film
becomes stable and the rock surface water-wet. The wettability shift towards water-wetness
observed during brine-dependent recovery can then be associated with maintaining a stable water-
film by increasing the disjoining pressure between the interfaces.
The three main force components of the disjoining pressure are Van der Waals, structural and
electrostatic as described by the DLVO theory. This theory was mainly introduced to evaluate the
stability of the colloid system to withstand aggregation due to the net contribution of attractive van
der Waals forces and repulsive electrostatic forces generated by ions in the vicinity of charged
colloidal surface in an electrolyte solution. The theory has been further extended to describe the
stability of wetting film in the oil-brine-rock system (Buckley et al., 1989 and Hirasaki, 1991). The
summation of the three surface forces is expressed as total disjoining pressure of the water film
layer. These forces have diverse impacts at short (very close to molecular contact, <1 nm) and long
(less than 100 nm) separation distances [130, 243]. Schematic representation of the disjoining
pressure isotherm in an oil-brine-rock system is shown in Figure 3.2 as a function of the water-
film thickness. Here, both van der Waals and electrostatic forces account for interactions among
counter-ions, the charged surface and the ions beyond the OHP, whereas, structural forces account
for the orientation of the charged surface within the hydrolysis layer (see Figure 3.1).

66
Figure 3.2—Schematic of Oil-Brine-Rock system at different wettability conditions: oil-wetting (top) and
water-wetting (bottom) states. Interfaces exhibit a very strong repulsion (Born repulsion) upon contact; the
surface interaction energy curve shows two potential minima: a deep primary minimum appearing at a
small separation distance and a shallow secondary minimum appearing at a larger separation distance.
The Van der Waals force components are always present to describe the interactions between all
atoms and molecules and are central in all phenomena involving intermolecular forces at small
and large separations. Their contribution to disjoining pressure may be repulsive or attractive as
dictated by Hamaker constant. Hamaker constants are experimentally obtained or theoretically
calculated from dielectric constants, refractive indices and absorption frequencies of the
interacting medium [243]. Generally, van der Waals forces are usually attractive because of
positive Hamaker constant as the dielectric constant and refractive index of the intervening
medium (water) are generally higher and lower respectively than those of the interacting media
(oil and rock), respectively. When the dielectric properties of the intervening medium are
intermediate between that for the two interacting media, the Hamaker constant will be negative,
resulting in repulsion, which will act to thicken the water film to raise its energy barrier [130, 243].
The electrostatic force components are effectively long ranged because electrostatic interaction is
weaker near to the charged surface in a polar medium due to the high dielectric constant and the
electro-neutrality requirement. They are rather stronger in the diffuse layer beyond the OHP as a
result of two different additional forces exerted by the excess counter-ions in the double layer,
creating an electrical potential gradient within the EDL. The additional osmotic pressure is exerted
Rock Surface
Oil
Water Film
OilWater Film
Rock Surface
Rock-Brine interface
Oil-Brine interface
Rock-Brine interface
Oil-Brine interfaceWater film thickness (nm)
Dis
join
ing
Pres
sure
(at
m)
Repulsion
Water film thickness (nm)
Dis
join
ing
Pres
sure
(at
m)
Strong Attraction
Water film thickness (nm)
Surf
ace
Int
era
ctio
n E
ne
rgy
(N/m
)
Repulsion
Energy Barrier
Secondary minimum
Water film thickness (nm)
Surf
ace
In
tera
ctio
n E
ne
rgy
(N/m
)
Attraction
Energy Barrier
Secondary minimum
Weak Attraction
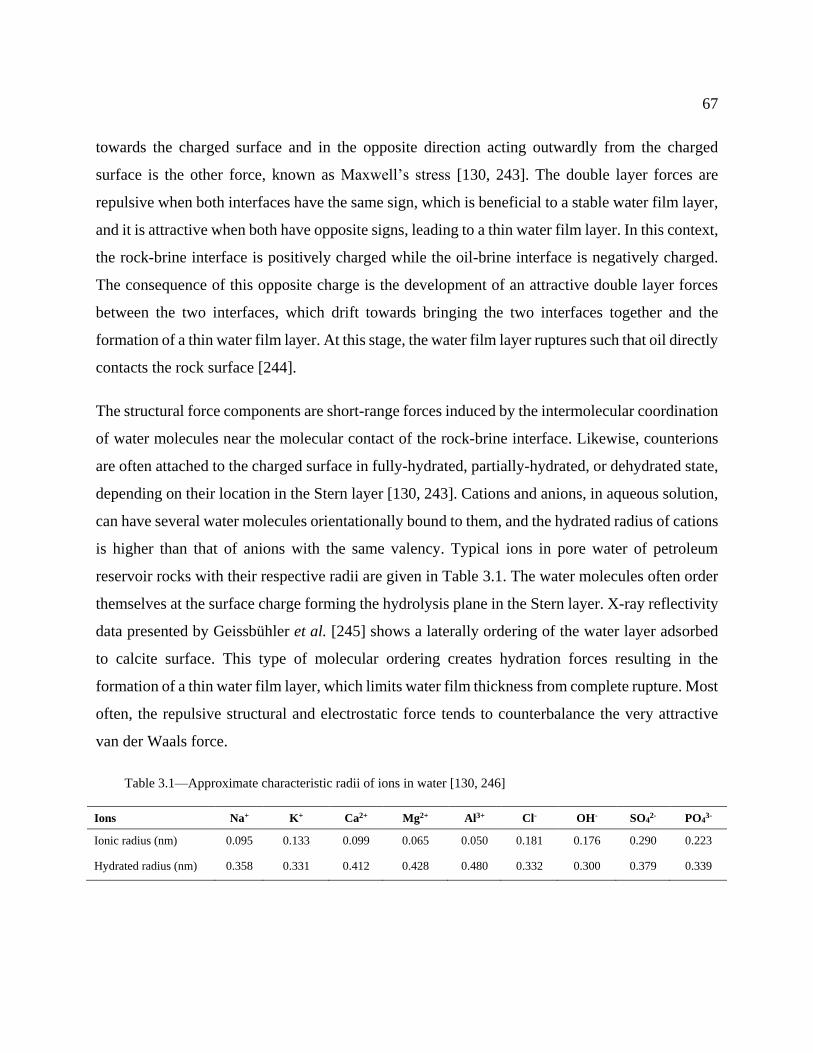
67
towards the charged surface and in the opposite direction acting outwardly from the charged
surface is the other force, known as Maxwell’s stress [130, 243]. The double layer forces are
repulsive when both interfaces have the same sign, which is beneficial to a stable water film layer,
and it is attractive when both have opposite signs, leading to a thin water film layer. In this context,
the rock-brine interface is positively charged while the oil-brine interface is negatively charged.
The consequence of this opposite charge is the development of an attractive double layer forces
between the two interfaces, which drift towards bringing the two interfaces together and the
formation of a thin water film layer. At this stage, the water film layer ruptures such that oil directly
contacts the rock surface [244].
The structural force components are short-range forces induced by the intermolecular coordination
of water molecules near the molecular contact of the rock-brine interface. Likewise, counterions
are often attached to the charged surface in fully-hydrated, partially-hydrated, or dehydrated state,
depending on their location in the Stern layer [130, 243]. Cations and anions, in aqueous solution,
can have several water molecules orientationally bound to them, and the hydrated radius of cations
is higher than that of anions with the same valency. Typical ions in pore water of petroleum
reservoir rocks with their respective radii are given in Table 3.1. The water molecules often order
themselves at the surface charge forming the hydrolysis plane in the Stern layer. X-ray reflectivity
data presented by Geissbühler et al. [245] shows a laterally ordering of the water layer adsorbed
to calcite surface. This type of molecular ordering creates hydration forces resulting in the
formation of a thin water film layer, which limits water film thickness from complete rupture. Most
often, the repulsive structural and electrostatic force tends to counterbalance the very attractive
van der Waals force.
Table 3.1—Approximate characteristic radii of ions in water [130, 246]
Ions Na+ K+ Ca2+ Mg2+ Al3+ Cl- OH- SO42- PO4
3-
Ionic radius (nm) 0.095 0.133 0.099 0.065 0.050 0.181 0.176 0.290 0.223
Hydrated radius (nm) 0.358 0.331 0.412 0.428 0.480 0.332 0.300 0.379 0.339

68
Interaction Force and Energy Calculations
The three main contributors to the total disjoining pressure acting between the two interfaces are
London van der Waals, electrostatic, and structural forces. Figure 3.3 shows a comparison between
the three forces as a function of the water film thickness. A brief introduction of these force
components has been presented earlier, and their calculation procedures are presented below
through the DLVO theory. As earlier mentioned, the stability of the wetting film on the rock and
competition among oil and brine to wet the rock surface is strongly governed by the force balance
present among non-wetting and wetting phase, and the rock surface. Hence, the net interaction
force can be expressed as:
∏(ℎ) = ∏𝑉(ℎ) + ∏𝐷(ℎ) + ∏𝑆(ℎ) (3.1)
where ∏, ∏𝑉, ∏𝑆, ∏𝐷 and ℎ are the disjoining pressure of the intermolecular interactions,
London–van der Waals forces, structural forces, electrical double-layer forces, and the separation
distance (signifying water film thickness) between the two interfaces respectively. The
contribution from the van der Waals force between two parallel bodies is calculated using a simple
approximation based on Lifshitz theory as given below:
∏𝑉(ℎ) = −𝐴
6𝜋ℎ (3.2)
where 𝐴 is the Hamaker constant of the oil-brine-rock system. However, van der Waals interaction
can be lessened owing to retardation caused when the separation distance existing between these
interfaces becomes comparable with the London frequency electromagnetic wavelength during the
time of propagation [247] . Hence, the retarded van der Waals force is expressed as:
∏𝑉(ℎ) = −𝐴
12𝜋ℎ
(
3𝑏
ℎ𝜆𝑐
+ 2
(1 + 𝑏ℎ𝜆𝑐
)
)
(3.3)
where 𝜆𝑐 is the interaction characteristic wavelength (often assumed as 100 nm [247]) and 𝑏 is the
correction constant to the non-retarded Hamaker expression (a fitting value of 5.32 is often used
[247]). Meanwhile, the Hamaker constant can be calculated as by assuming pairwise summation
and geometric mean interactions:

69
𝐴 = [𝐴𝑠1 ⁄ − 𝐴𝑤
1 ⁄ ][𝐴𝑜1 ⁄ − 𝐴𝑤
1 ⁄ ] (3.4)
where subscripts 𝑠, 𝑤 and 𝑜 indicate Hamaker constant for single component pairs of calcite, water
and oil in vacuum. Using values of 𝐴𝑠, 𝐴𝑤, and 𝐴𝑜 of 0.101, 0.037 and 0.06 aJ (attojoules)
respectively [130, 248], eq. 3.4 yielded Hamaker constant of 0.0066 aJ for the oil-brine-rock
system interactions. The comparison between the retarded (solid blue line) and non-retarded
(dashed blue line) van der Waals attractive force is shown in Figure 3.3, the reduced interaction
was not very significant, notwithstanding retarded van der Waals attractive force expression was
used in the rest of the interacting force and energy calculations in this study.
Figure 3.3—Individual contributions from van der Waals, electrical double layer and structural force (left)
to the total disjoining pressure (right) as a function of the thickness of the water film layer for the oil-brine-
rock system (seawater, composition listed in Table 3.2). The positive half of the disjoining pressure
represents the repulsive force required to separate two interacting interfaces, which is dominated by
electrical double layer and structural force; while the negative half represent the attraction dominated by
van der Waals. Dotted line is for CSC, dashed line for LSA and solid line for CSP; while, dashed blue line
is for non-retarded van der Waals force. Unit conversion 1 atm = 101.325 kPa.
The contribution from electrostatic forces can be obtained from the solution to the nonlinear
Poisson-Boltzmann equation (PBE), which is quite complicated, involving elliptical integrals and
requires numerical solutions. The general one-dimensional form of the PBE is expressed as:
𝑑 𝜓
𝑑ℎ = −
𝑒
휀휀0∑𝑧𝑖𝑛𝑖
𝑁
𝑖=1
𝑒 𝑧𝑖 𝑒 𝜓𝑘𝐵𝑇 (3.5)

70
where 𝜓 is the electrostatic potential (mV), 𝑒 is the electronic charge (1.602×10⁻¹⁹ C), 휀 is the
water dielectric constant (temperature-dependent correlation by [249]), 휀0 is the free space
permittivity (8.854×10⁻¹² C2/J.m), 𝑘𝐵 is the Boltzmann constant (1.381×10⁻²³ J/K), 𝑇 is the
absolute temperature (K), 𝑧𝑖 and 𝑛𝑖 are the i-th ionic mobile species valence and bulk concentration
and the summation term sums up all concentration of cations and anions around the charged
surface. However, it is more convenient to use approximate analytical solutions of the linearized
PBE rather than the complicated numerical approaches, especially for low surface potentials
(|𝜓𝑟| ≪ 1). These solutions are easily obtained for different boundary conditions — the constant
surface potential (CSP) or the constant surface charge (CSC) as presented by eq. 3.6. At smaller
separation distance, CSP underestimates while CSC overestimates the interactions between the
interfaces due to charge regulation when the interacting interfaces approach each other. Generally,
neither the potential nor charge remain constant as the two interfaces approach each other and this
forces the true exact solution to lie somewhere between both solution limits [130, 250].
∏𝐷(ℎ) = 𝑛𝑘𝐵𝑇 (2𝜓𝑟1𝜓𝑟 𝑐𝑜𝑠ℎ 𝜅ℎ ± [𝜓𝑟1
+ 𝜓𝑟 ]
𝑠𝑖𝑛ℎ 𝜅ℎ) (3.6)
where 𝜓𝑟1 and 𝜓𝑟 are the reduced surface potential for the rock-brine and oil-brine interfaces
respectively, (i.e. 𝜓𝑟 = 𝑒𝜓𝑜 𝑘𝐵𝑇⁄ ), 𝜅 is the Debye-Hückel reciprocal length (estimated as κ =
√2000𝑒 𝑛 휀휀0𝑘𝐵𝑇⁄ ), 𝜓𝑜 is the surface potential (mV), 𝑛 is the ionic density in the aqueous
solution (𝑛 = 𝑁𝐴𝐼), where 𝑁𝐴 is the Avogadro’s number (6.022×10²³ /mol.) and 𝐼 is the ionic
strength (mol/kg water, also referred to as M) of the aqueous solution. While the plus sign in eq.
3.6 applies for CSC and the minus sign applies for CSP. On the other hand, linear superposition
approximation (LSA) is the widely used asymptotic form for high surface potential cases, which
holds irrespective of the type of boundary conditions (either CSP or CSC) on the interacting
surfaces and gives intermediate results between CSP and CSC at smaller separation distances.
Meanwhile, at large separation distances, all interactions merge and are well described by the three
solutions as shown in Figure 3.3.
∏𝐷(ℎ) = 64𝑛𝑘𝐵𝑇𝛾1𝛾 𝑒 𝜅ℎ (3.7)

71
where 𝛾 = 𝑡𝑎𝑛ℎ (𝜓𝑟
). The last contribution to disjoining pressure is estimated from structural
interaction, which has been found to decay exponentially as:
∏𝑆(ℎ) = 𝐴𝑜𝑒
ℎ𝑑𝑜 (3.8)
where 𝐴𝑜 and 𝑑𝑜 are the magnitude and decay length for the structural interaction. This interaction
has been extensively studied for only mica and, silica surfaces and those of calcite surfaces are not
known. Meanwhile, a sharply rising model of magnitude 148038 atm and decay length of 0.05 nm
[243] was assumed to estimate the structural force presented in Figure 3.3. The disjoining pressure
contribution from van der Waals and structural forces are always considered fixed because they
are insensitive to variations in brine salinity, composition, and solution pH [130]. However, in this
current study, the contribution from structural force to the disjoining pressure was considered zero
(i.e., ∏𝑆(ℎ) = 0) for all pH values and brine concentrations. The total disjoining pressure for all
the three cases of electrostatic interaction with retarded van der Waals attractive force is presented
in Figure 3.3 for seawater brine concentration The LSA expression is seen to give intermediate
results between those of CSP and CSC.
Table 3.2—Compositions of the brines used in the interaction force and energy calculations consisting of
synthetic formation brine (FB) and natural Arabian Gulf seawater (SW), with their various versions.
Ions (M) FB SW SW/2 SW/10 SW/20 SW2S SW3S SW4S
Na+ 2.0066 0.5660 0.2830 0.0566 0.0283 0.6320 0.6980 0.7640
Ca2+ 0.4200 0.0120 0.0060 0.0012 0.0006 0.0120 0.0120 0.0120
Mg2+ 0.0700 0.0500 0.045 0.045 0.045 0.0500 0.0500 0.0500
HCO3- 0 0 0 0 0 0 0 0
Cl- 2.9800 0.6240 0.3120 0.0624 0.0312 0.6240 0.6240 0.6240
SO42- 0.0033 0.0330 0.0165 0.0033 0.0016 0.0660 0.0990 0.1320
TDS (g/L) 170.63 40.001 20.000 4.0001 2.0000 44.688 49.375 54.062
Ionic Strength 3.4799 0.7850 0.3925 0.0785 0.0393 0.8840 0.9830 1.0820
pH 7.15 8 8 8 8 8 8 8
The various dilutions of seawater considered are twice diluted seawater (SW/2), ten times diluted seawater (SW/10),
and twenty times diluted seawater (SW/20). The concentration of SO42- was also varied in the seawater, SW2S implies
seawater with twice SO42-, SW3S implies seawater with thrice SO4
2- and SW4S implies seawater with quadruple SO42-
. Sources: Data retrieved from Alroudhan et al. [104].

72
On the other hand, the interaction energy per unit area can be obtained by taking integration of
interacting force (disjoining pressure) with respect to film thickness in the direction normal to that
of the interacting interfaces [250]. The resulting equation can be used to estimate the energy barrier
needed to achieve a thicker water film or the stability of the water film layer. As shown in Figure
3.2, similar to the surface interaction energy generated as a result of interacting force plays a vital
role in determining the stability of the water film layer, hence rock wettability. The main
components are the van der Waals energy of attraction (ω𝐴) and double layer energy of repulsion
(ω𝑅). Depending on the surface potential of the interfaces and brine concentration, ω𝑅 can
dominate over ω𝐴, thereby creating a potential energy barrier. When the magnitude of this barrier
height is large enough as compared to the thermal energy of the interacting interfaces, the
interfaces are not able to overcome the barrier and, no overlapping can be achieved. However,
when ω𝐴 surpasses ω𝑅 as a result of double layer contraction, the interfaces can overlap to fall
into the primary minimum by van der Waals energy, resulting in oil-wetness.
ω(ℎ) = ω𝐴(ℎ) + ω𝑅(ℎ) = ∫−∏𝑉(ℎ) 𝑑ℎ
ℎ
∞
+ ∫−∏𝑉(ℎ) 𝑑ℎ
ℎ
∞
(3.9)
The retarded van der Waals interacting surface energy per unit area between two interfaces
separated by distance h can be calculated as:
ω𝐴(ℎ) = −𝐴
12𝜋ℎ (
1
1 + 𝑏ℎ𝜆𝑐
) (3.10)
While for double layer energy of repulsion, it can be expressed, similar to the disjoining pressure,
by CSP, CSC and LSA as given by eqs. 3.11 (the plus sign applies to CSC, and the minus sign
applies to CSP) and 3.12 respectively. The individual interaction energy calculations are also
compared in Figure 3.4, while the LSA approach showed intermediate results between CSP and
CSC.
ω𝑅(ℎ) =𝑛𝑘𝐵𝑇
𝜅[2𝜓𝑟1𝜓𝑟 𝑐𝑠𝑐ℎ 𝜅ℎ ± (𝜓𝑟1
+ 𝜓𝑟 )(𝑐𝑜𝑡ℎ 𝜅ℎ − 1)] (3.11)
ω𝑅(ℎ) =64𝑛𝑘𝐵𝑇
𝜅𝛾1𝛾 𝑒
𝜅ℎ (3.12)

73
where 𝜅ℎ is the dimensionless thickness of the water film between the interacting interfaces. Based
on the comparisons shown in Figures 3.3 and 3.4 for CSP, LSA and CSC interaction forces and
energy, respectively, this study was focused on using a simplistic approach considering the
analytical solution for the linear superposition approximation to estimate the double-layer
interaction forces and energies.
Figure 3.4—Interaction energy with individual contributions from van der Waals—ωA and EDL—ωR (left)
and the net interaction energy (right) as a function of dimensionless film thickness (κh at a value of 1
implies that the separation distance is equivalent to the EDL thickness, which is 0.342 nm for seawater).
Considering figure on the left, since ωR varies exponentially with thickness (eq. 3.12) and ωA varies with
the square of thickness (eq. 3.10), ωA surpasses ωR at short and long distances, thus producing attraction
between the two interacting interfaces and energy barrier at intermediate distance.
Zeta Potential Calculation
Zeta potentials are often measured in the laboratory through two major electrokinetic measuring
technique: streaming potential measurement (SPM) and electrophoretic mobility measurement
(EPM). SPM determines the ζ–potential by measuring the streaming potential induced by the flow
of the electrolyte across the intact sample, while EPM determines the ζ–potential by measuring the
electrophoretic mobility of the rock suspension. The surface and ζ–potential, at any distance Δ
from the surface in the diffuse layer, are related nearly exponentially (eq. 3.13) or exactly
exponentially (eq. 3.14) by considering Gouy-Chapman theory as below.

74
ζ = 𝜓𝑜(Δ) =2𝑘𝐵𝑇
𝑒ln
1 + 𝛾 𝑒 𝜅Δ
1 − 𝛾 𝑒 𝜅Δ (3.13)
The expression in eq. 3.13 assumes that the slip plane is located at distance Δ from the surface
(OHP) into the diffuse layer, where ζ is the zeta potential. The simple form of eq. 3.13 can be
expressed by the solution of the linearized PBE describing the electrical potential distribution for
the condition of small charge density or low surface potentials (|𝜓𝑟| ≪ 1) [242]:
ζ = 𝜓𝑜(Δ) = 𝜓𝑜𝑒 𝜅Δ (3.14)
The expression in eq. 3.14 shows that ζ–potential decays from 𝜓𝑜 at the surface to 𝜓𝑜 𝑒⁄ at Δ =
𝜅 1 (i.e., wall of the electrical double layer). In many cases, it is assumed that the slipping plane
and OHP are identical, which considers that the surface is locally flat, and it implies that laboratory
measured ζ–potential of rock-brine and oil-brine interfaces represent their surface potentials, 𝜓𝑜 =
ζ. Alroudhan et al. [104] compared the differences between the two ζ-potential measuring
techniques for rock-brine interface and reported that the shear plane corresponds to the Stern plane
for EPM, which implies that Δ = 0 and ζ = 𝜓𝑜, while it was found out that Δ =0.245 nm for SPM
and eq. 3.14 remains valid to obtain ζ–potential from surface potential. However, in this study, the
surface potential for the rock-brine interface are calculated using eq. 3.14 by taking the slip plane
distance as 0.245 nm as obtained with the experimental data from [54, 104] as listed in Table 3.3.
However, for the oil-brine interface, an approach used by Buckley et al. [251] was adapted to
replicate their experimental data. Based on the ionizable surface-group model by Takamura and
Chow [197], the charge at the oil-brine interface develops because of the dissociation of carboxyl
groups, which indicates that the relative concentration of charges at the oil-brine surface sites
depends on the relative concentration of protons (H+) in solution. This means that H+ behaves as
PDI towards the oil-brine surface, and therefore, it is very common to plot surface or ζ–potential
as a function of pH, with the isoelectric point often quoted as a pH value. As such, the chemical
potentials at this interface depend upon only temperature and pressure so that the surface potential
are related to the activity of H+ ion with a Nernstian form of:
Δ𝜓𝑜 = −2.303𝑘𝐵𝑇
𝑒Δ𝑝𝐻 (3.15)
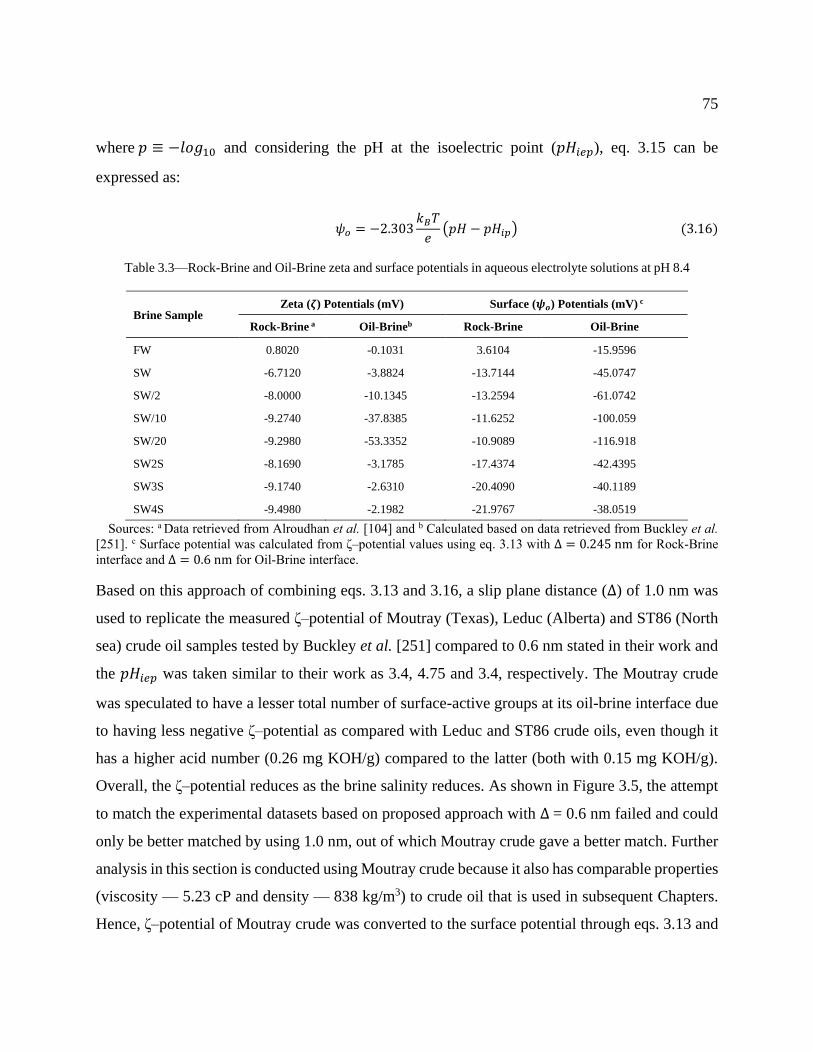
75
where 𝑝 ≡ −𝑙𝑜 10 and considering the pH at the isoelectric point (𝑝𝐻𝑖𝑒𝑝), eq. 3.15 can be
expressed as:
𝜓𝑜 = −2.303𝑘𝐵𝑇
𝑒(𝑝𝐻 − 𝑝𝐻𝑖𝑝) (3.16)
Table 3.3—Rock-Brine and Oil-Brine zeta and surface potentials in aqueous electrolyte solutions at pH 8.4
Brine Sample Zeta (𝜻) Potentials (mV) Surface (𝝍𝒐) Potentials (mV) c
Rock-Brine a Oil-Brineb Rock-Brine Oil-Brine
FW 0.8020 -0.1031 3.6104 -15.9596
SW -6.7120 -3.8824 -13.7144 -45.0747
SW/2 -8.0000 -10.1345 -13.2594 -61.0742
SW/10 -9.2740 -37.8385 -11.6252 -100.059
SW/20 -9.2980 -53.3352 -10.9089 -116.918
SW2S -8.1690 -3.1785 -17.4374 -42.4395
SW3S -9.1740 -2.6310 -20.4090 -40.1189
SW4S -9.4980 -2.1982 -21.9767 -38.0519
Sources: a Data retrieved from Alroudhan et al. [104] and b Calculated based on data retrieved from Buckley et al.
[251]. c Surface potential was calculated from ζ–potential values using eq. 3.13 with Δ = 0.245 nm for Rock-Brine
interface and Δ = 0.6 nm for Oil-Brine interface.
Based on this approach of combining eqs. 3.13 and 3.16, a slip plane distance (Δ) of 1.0 nm was
used to replicate the measured ζ–potential of Moutray (Texas), Leduc (Alberta) and ST86 (North
sea) crude oil samples tested by Buckley et al. [251] compared to 0.6 nm stated in their work and
the 𝑝𝐻𝑖𝑒𝑝 was taken similar to their work as 3.4, 4.75 and 3.4, respectively. The Moutray crude
was speculated to have a lesser total number of surface-active groups at its oil-brine interface due
to having less negative ζ–potential as compared with Leduc and ST86 crude oils, even though it
has a higher acid number (0.26 mg KOH/g) compared to the latter (both with 0.15 mg KOH/g).
Overall, the ζ–potential reduces as the brine salinity reduces. As shown in Figure 3.5, the attempt
to match the experimental datasets based on proposed approach with Δ = 0.6 nm failed and could
only be better matched by using 1.0 nm, out of which Moutray crude gave a better match. Further
analysis in this section is conducted using Moutray crude because it also has comparable properties
(viscosity — 5.23 cP and density — 838 kg/m3) to crude oil that is used in subsequent Chapters.
Hence, ζ–potential of Moutray crude was converted to the surface potential through eqs. 3.13 and

76
3.14, with Δ taken as 0.6 nm as predicted by Buckley et al. [251] to be the slip plane distance. The
comparison of eqs. 3.13 and 3.14 shown in Figure 3.5 confirms that eq. 3.14 holds only at low
potential (|𝜓𝑟| ≪ 1) as there are no significant difference in the predicted potentials. In contrast,
at high potential, eq. 3.14 largely underestimates the potential and any attempt to use the equation
to describe surface potential at high potential will result in huge error. For this reason, eq. 3.13
was used for oil-brine interfacial calculations and either of the equations work for rock-brine
interfacial calculations because they are low potential as tabulated in Table 3.3.
Figure 3.5—Comparison of calculated and measured ζ–potential of the oil-brine system as a function of
pH and brine ionic strength for Moutray oil (left-top), Leduc oil (right-top) and ST86 oil (right-bottom).
The markers are the experimental data; dashed lines represent calculations with Δ = 0.6 nm and solid lines
for Δ = 1.0 nm. Calculated surface potential for the oil-brine system (right-bottom) is shown with dash
lines representing eq. 3.14 and solid lines for eq. 3.13. The ionic strength is expressed in terms of NaCl
brine, experimental data from Buckley et al. [251] varies from 0.1M to 0.001M. The trend for 0.5M and
1M has been included for comparison of the increasing ζ–potential with increased salinity.

77
Water Chemistry Effect on Disjoining Pressure and Potential Barrier Height
The net disjoining pressure and interaction energy of the water film between the rock and oil
surfaces was calculated at ambient temperature using eqs. 3.1 and 3.9, respectively, using the rock-
brine and oil-brine ζ–potential pairs at a typical reservoir pH range of 7.1 – 8 (see Table 3.3). The
disjoining pressure has been estimated as a function of the film thickness, while the interaction
energy was estimated as a function of the dimensionless separation distance. Figures 3.6 – 3.10
shows the total disjoining pressure and interaction energy for brines used in the study to evaluate
the significance of PDIs and brine dilution on the stability of the water film layer. For all cases,
the disjoining pressure becomes negative for film thickness lesser than 0.75nm due to the dominant
effect of the attractive van der Waals force component over small separation distances. The peak
of interaction energy curve is known as the potential barrier height, which gives the amount of
energy per unit area in mJ/m2 that the interacting interface needs to overcome to become attracted.
This energy barrier is observed to be within a dimensionless distance of 1, when the separation
distance is equivalent to 𝜅 1. The net disjoining pressure and interaction energy in initial formation
brine was found to be negative, indicating a high attraction between the two interfaces, thereby
resulting into an oil-wetting state. This is consistent with the observations that carbonate reservoirs
are often mixed-wettability or oil-wet, and that the rock surfaces in carbonate reservoirs containing
typical formation brine often possess a positive ζ–potential. The ζ–potential of the rock in crude
oil was not measured, but the dependence of oil-brine ζ–potential with ionic strength as presented
by Buckley et al. [251] was used in this work. The oil-brine interface has a negative ζ–potential,
which becomes less negative as the brine ionic strength increases (see Figure 3.5).
Alroudhan et al. [104] reported that the ζ–potential of an intact carbonate rock in NaCl brine
becomes increasingly negative and decreasingly negative with increasing SO42- and Ca2+
concentration, respectively. The behavior was reported to show a linear trend, though, the ζ–
potential of the rock remained negative irrespective of the SO42-, while Mg2+ behaved identically
with Ca2+. As seen in Figure 3.6, the disjoining pressure shifted to more positive values with
increased SO42- concentration in the two different NaCl brines. Similarly, the interaction energy
shifted to more positive, thereby increasing the energy barrier needed to be overcome for the

78
interacting interfaces to attract/overlap. Considering the EDL thickness, when the dimensionless
distance is 1, the higher the SO42- concentration the higher is the potential barrier height created
between the interfaces. The shift became more pronounced over a larger proportion of the water
layer as the salinity of the brine was reduced from 0.5M to 0.05M. Because the energy barrier
increases as SO42- concentration increases, it becomes harder for the interacting interfaces to attract
due to formation of a more stable and thick wetting-water film, which enhances the rock wettability
towards a more water-wetting tendency. At such distances away in the bulk electrolyte solution,
where the interaction energy or disjoining pressure becomes zero or less as captured in Figure 3.6,
the two interfaces would not have the tendency to attract because of the thick water film.
Figure 3.6—Net disjoining pressure as a function of film thickness (left) and interaction energy as a function
of dimensionless separation distance (right) between the interacting interfaces with SO42- concentration
(expressed as pSO4) in two different brine salinity (0.05M and 0.5M NaCl). The term pSO4 is equivalent
to −log10[SO ], which implies that pSO4 reduces as the concentration of SO4
2- increases, i.e., pSO4 of
1.9 equals 0.0117M (half SO42- in natural seawater), 1.5 equals 0.0329M (same SO4
2- as in natural seawater)
and 1.0 equals 0.0969M (thrice SO42- in natural seawater). The solid lines indicate curves for lower salinity
(0.05M NaCl) and dash lines (0.5M NaCl) indicate curves for higher salinity. Unit conversion 1 atm =
101.325 kPa
In contrast, the disjoining pressure monotonically shifts to less positive/more negative as the Ca2+
concentration increases in the different NaCl brines shown in Figure 3.7. At low Ca2+
concentration, the energy barrier peaked and weakened towards the primary minimum as the
concentration further increases, which would result in more attraction and enhances the rock
wettability alteration toward a more oil-wetting state. The disjoining pressure and interaction

79
energy profiles are negative for high saline brine (2M NaCl) and monotonically decrease as Ca2+
concentration increases. From this discussion, it is obvious to acknowledge that increasing SO42-,
decreasing Ca2+/Mg2+ and reducing NaCl concentration are capable of increasing the tendency to
achieve more stable and thick water film to improve rock water-wetness. This is similar to many
observations made by various authors that alteration of these ions in the injected brines is capable
of improving the oil recovery. Similarly, Awolayo et al. [65] stated that unstable water films are
instigated as the ratio of [SO42-]/[Ca2+] reduces, which will bring the oil and rock together, resulting
in the rock to be preferentially oil-wet. Whereas, some other studies (like Zhang et al. [50] and
Zhang et al. [32]) have shown that increasing the concentration of Ca2+/Mg2+ leads to improved
water-wetness and oil recovery, contrary to above observations. This is because the oil-brine
interface considered in this study is negatively charged, however, in cases where the interface is
positively charged, modifying the ζ–potential of the rock-brine interface to yield more positive
values by increasing concentration of Ca2+/Mg2+ can result in improved recovery as presented by
Jackson et al. [119]. As earlier stated, when the ζ–potential of the two interacting interfaces
possesses the same polarity, then the electrical double layer force becomes repulsive, so the
disjoining pressure and energy barrier shifts to more positive, stabilizing the water film and
reversing the wettability towards water-wetness.
Figure 3.7—Net disjoining pressure as a function of film thickness (left) and interaction energy as a function
of the dimensionless separation distance between the interacting interfaces (right) with pCa in two different
saline brines (0.5M and 2M NaCl). The pCa of 1.3 is equivalent to 0.0495M (quadruple Ca2+ as in natural
seawater), 2.0 is equivalent 0.0102M (same Ca2+ as in natural seawater), 2.6 is equivalent 0.002M and 2.8
is equivalent 0.0015M SO42- concentration. Unit conversion 1 atm = 101.325 kPa
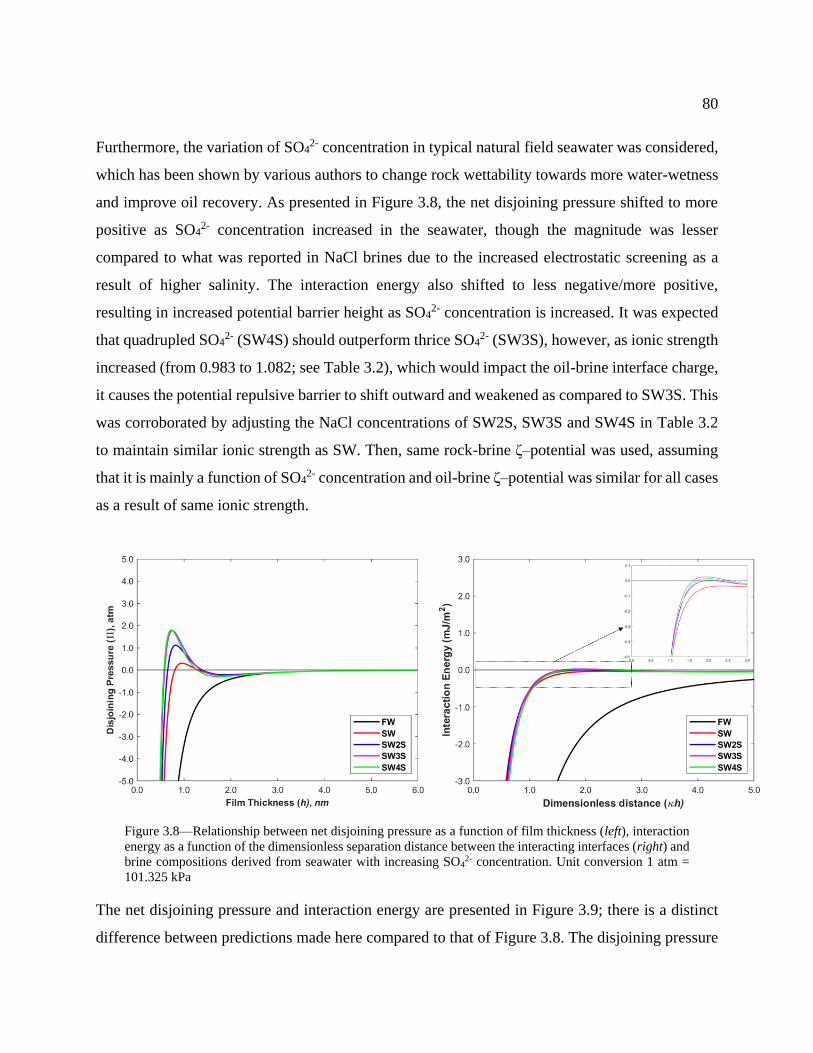
80
Furthermore, the variation of SO42- concentration in typical natural field seawater was considered,
which has been shown by various authors to change rock wettability towards more water-wetness
and improve oil recovery. As presented in Figure 3.8, the net disjoining pressure shifted to more
positive as SO42- concentration increased in the seawater, though the magnitude was lesser
compared to what was reported in NaCl brines due to the increased electrostatic screening as a
result of higher salinity. The interaction energy also shifted to less negative/more positive,
resulting in increased potential barrier height as SO42- concentration is increased. It was expected
that quadrupled SO42- (SW4S) should outperform thrice SO4
2- (SW3S), however, as ionic strength
increased (from 0.983 to 1.082; see Table 3.2), which would impact the oil-brine interface charge,
it causes the potential repulsive barrier to shift outward and weakened as compared to SW3S. This
was corroborated by adjusting the NaCl concentrations of SW2S, SW3S and SW4S in Table 3.2
to maintain similar ionic strength as SW. Then, same rock-brine ζ–potential was used, assuming
that it is mainly a function of SO42- concentration and oil-brine ζ–potential was similar for all cases
as a result of same ionic strength.
Figure 3.8—Relationship between net disjoining pressure as a function of film thickness (left), interaction
energy as a function of the dimensionless separation distance between the interacting interfaces (right) and
brine compositions derived from seawater with increasing SO42- concentration. Unit conversion 1 atm =
101.325 kPa
The net disjoining pressure and interaction energy are presented in Figure 3.9; there is a distinct
difference between predictions made here compared to that of Figure 3.8. The disjoining pressure

81
shifted more upward and outward covering larger proportion of the pore surfaces due to increased
SO42- concentration in natural seawater. The magnitude of the potential energy barrier height was
even higher as a result of increased SO42-. Thus, injecting brine with a higher sulfate concentration
has the tendency to create higher energy barrier that can increase repulsion between the interacting
interfaces and alter the wettability towards water-wetness. During typical displacement
experiments, such as that investigated by several authors [7, 46, 52, 138], as will be discussed in
subsequent Chapters, in which formation brine was replaced by seawater and then sequence of
various seawater-derived brines (such as SW2S, SW3S and SW4S). The ζ–potential at the rock-
brine interface in formation brine was positive, becomes negative in contact with seawater and
more negative as various seawater-derived brines comes in contact with the rock. Consequently,
the electrostatic force becomes repulsive and increases in magnitude, leading to a higher disjoining
pressure and potential barrier height, and increasingly stable water film layer. The wettability is
altered towards more water-wet conditions; oil previously adsorbed on the rock surfaces is released
and incremental oil recovery can be observed.
Figure 3.9—Net disjoining pressure as a function of film thickness (left) and interaction energy as a function
of the dimensionless separation distance between the interacting interfaces (right) for seawater-derived
brines with increasing SO42- concentration and same ionic strength (0.7850). Unit conversion 1 atm =
101.325 kPa
Another consideration for typical natural field seawater is the reduction of brine salinity through
brine dilution. The net disjoining pressure and interaction energy calculation for the variation

82
dilutions of seawater is presented in Figure 3.10. The trend that appears suggests the ζ–potential
decreases as the brine salinity is reduced and disjoining pressure shifts to more positive and
outward, which develops more stable water films over a large separation distance. The potential
barrier height was also higher covering a larger proportion as brine salinity reduces. It is well
established that reduction in ionic strength can expand the double layer thickness, due to reduced
electrostatic screening and thereby causing an outward increase in disjoining pressure. This more
positive shift would result in the reduction of the attractive forces that enhances wettability changes
towards a more water-wetting state in a displacement process involving sequential dilutions of
injected brine.
Figure 3.10—Net disjoining pressure as a function of film thickness (left) and interaction energy as a
function of the dimensionless separation distance between the interacting interfaces (right) with varying
brine dilutions derived from seawater. Unit conversion 1 atm = 101.325 kPa
For such displacement experiments, in which formation brine is replaced by seawater and then
various dilutions of seawater, the magnitude of the repulsive electrostatic force increases, leading
to a higher disjoining pressure and potential energy across a larger proportion, thereby increasingly
stabilizing the water film. Many experiments carried out with the approach of diluting the injected
brine has been successful, however, in cases with no success, Jackson et al. [119] demonstrated
that the diluting the injected brines in the presence of positively charged oil-brine interface, which
would lead to less positive/more negative ζ–potential at the rock-brine interface, will increase the
magnitude of the attractive electrostatic force, leading to a more negative disjoining pressure and

83
lower the energy barrier to primary minimum. This will increasingly thin and rupture the water
film. Reducing the NaCl and/or Ca2+ concentration in the injected brine has a similar effect to
simple dilution as discussed above because varying their concentration changes the ζ–potential of
the rock-brine interface, thus affecting the electrostatic contribution to the disjoining pressure and
potential barrier height. However, changes in ζ–potential in response to changes in NaCl
concentration were more pronounced for the experimental dataset investigated here than the
changes in ζ–potential observed during conventional brine dilution. Thus, improved oil recovery
would be more pronounced.
Chapter Summary
In this Chapter, the improved recovery associated with brine-dependent recovery has been
rationalized at the surface-scale by considering changes to rock wettability due to the stability of
the water film layer that wets and separates the rock surface from the oil phase. The DLVO theory
for colloidal surfaces has been applied in linking wettability changes to the stability of the water
film layer. The stability of this wetting film depends on the disjoining pressure and the energy
barrier height developed from interaction energy calculation. The interaction force or disjoining
pressure is the net contributions from van der Waals, electrostatic and structural forces, however
contribution from structural forces was not included here as little is known about their existence
at carbonate rock surfaces. The contribution from the attractive Van der Waals force to the
interaction force/energy is always negative, which acts to destabilize the water film. Meanwhile,
the contribution of the electrostatic force can be either positive or negative depending upon the ζ–
potential of the interface, which is influenced by pH, brine compositions and mineral contents.
The disjoining pressure relates to the presence and thickness of water film separating the coming
together of rock and oil. While the energy barrier height predicted from the interaction energy per
unit area relates to the potential energy required to compress the double layer and thin the water
film. The interacting interfaces become more attracted because of negative disjoining pressure and
primary minimum interaction energy between the two interfaces. This would mean more oil-
wetting or less water-wetting state. Meanwhile, the less negative the interaction forces and energies
become, the higher are the repulsion between the two interfaces. This potentially creates an energy
84
barrier, which needs to be overcome for the interacting interfaces to attract. This would mean a
less oil-wet or more water-wet system.
The DLVO predicts attraction between the interacting interfaces that implies oil-wet tendency as
expected for carbonate rocks containing typical formation brine. The magnitude of the contribution
of the electrostatic force increases with decreasing ionic strength, either through reduction of NaCl,
Ca2+ or brine dilution, and/or increasing SO42- concentration, which improves the trend/profile
towards less attraction or more repulsion. The energy barrier required to be overcome for the
interfaces to attract increases as a result, which can reverse the pre-existing oil-wetting condition
as increased electrostatic repulsion generate a more stable water film between the two interfaces
and consequently, improve the oil recovery as widely documented in literature. The surface
forces/energies integration is the hidden features of the PDI interaction at the interfaces, which is
well captured in the numerical model, presented in subsequent Chapters, to predict wettability
alteration and the associated improved oil recovery.

85
Reactive Transport Model Description and Validation
In this Chapter, the approach used to develop a reactive transport model, incorporating the
interfacial phenomena responsible for improved recovery, obtain the numerical scheme and
validate the model using independently-sourced experimental data were described.
Introduction
In previous Chapters, many interfacial phenomena that are observed during brine-dependent
recovery process were discussed. More importantly, it was established that a combination of all
these phenomena is involved in improving oil production as observed from the available
experimental data. However, surface forces/energies developed from electrostatic interaction
seemed to be very critical. Hence, the focus in this Chapter is to state the reactions describing these
electrostatic interactions and formulate equations coupling their effect with fluid transport
equations. During low saline/smart brine injection, the thermodynamic equilibrium existing among
the ion species dissolved in the water film layer, ion species adsorbed on the rock surface and the
ion species that form the rock matrix are disturbed. This triggers a reaction involving connate-
waterflood mixing, mineral dissolution/precipitation, surface sorption and complexation, while
trying to establish a new equilibrium state, and favorably alters rock wettability from an initial oil-
wetting state to a water-wetting state and improves oil recovery.
The modeling of reactive components transport can be quite tedious without simplified
assumptions, and the only way to solve these equations is through numerical approximations. In
this case, the formulation of this model considers a porous rock initially saturated with crude oil
and formation brine. The rock is assumed to comprise of different minerals responsive to the
injected brine composition. Injecting brine of different salinities and compositions than those of
the initial brine often disturbs the existing thermodynamic equilibrium. As the process becomes
intense, it is expected that both the flow functions and reservoir rock parameters are transformed.
Therefore, the sets of equations that depict this recovery process involve the transport of species
by bulk phase advection, dispersion/diffusion, phase equilibrium reactions between gaseous, oleic
and aqueous phases, equilibrium and rate dependent reactions between solid and aqueous phase.

86
Table 4.1—Reaction pathways considered during simulation, where > is the prefix for surface species
Hydrocarbon solubility
𝐶 (𝑜) ⟺ 𝐶 (𝑔) ⟺ 𝐶 (𝑎𝑞) (𝑅1)
𝐶 (𝑎𝑞) + 𝐻 ⟺ 𝐻 + 𝐻𝐶 (𝑅2)
Aqueous reactions
𝐻 ⟺ 𝐻 + 𝐻 (𝑅3)
𝐻𝐶 ⟺ 𝐻 + 𝐶
(𝑅4)
𝐶𝑎𝑆 ⟺ 𝐶𝑎 + 𝑆 (𝑅5)
𝑆 ⟺ + 𝑆 (𝑅6)
𝑁𝑎𝑆 ⟺ 𝑁𝑎 + 𝑆
(𝑅7)
𝐶𝑎𝐶 + 𝐻 ⟺ 𝐶𝑎 + 𝐻𝐶 (𝑅8)
𝐶 + 𝐻 ⟺ + 𝐻𝐶 (𝑅9)
𝐶𝑎𝐻𝐶 ⟺ 𝐶𝑎 + 𝐻𝐶
(𝑅10)
𝐻𝐶 ⟺ + 𝐻𝐶
(𝑅11)
𝑁𝑎𝐻𝐶 ⟺ 𝑁𝑎 + 𝐻𝐶
(𝑅12)
Mineral reactions
𝐶𝑎𝑙𝑐𝑖𝑡𝑒 + 𝐻 ⟺ 𝐶𝑎 + 𝐻𝐶 (𝑅13)
𝐷𝑜𝑙𝑜𝑚𝑖𝑡𝑒 + 2𝐻 ⟺ 𝐶𝑎 + 2𝐻𝐶 + (𝑅14)
𝐴𝑛ℎ𝑦𝑑𝑟𝑖𝑡𝑒 + 𝐻 ⟺ 𝐶𝑎 + 𝑆 (𝑅15)
Surface adsorption reactions
> 𝑋 + 𝑆 ⟺ > 𝑋𝑆
(𝑅16)
Surface ion exchange reactions
𝑁𝑎 +1
2> 𝐶𝑎𝑋 ⟺
1
2𝐶𝑎 + > 𝑁𝑎𝑋 (𝑅17)
𝑁𝑎 +1
2> 𝑋 ⟺
1
2 + > 𝑁𝑎𝑋 (𝑅18)
Surface complexation reactions
> 𝐶 𝐻𝑜 ⟺ > 𝐶
+ 𝐻 (𝑅19)
> 𝐶𝑎 𝐻𝑜 + 𝐻 ⟺ > 𝐶𝑎 𝐻 (𝑅20)
> 𝐶 𝐻𝑜 + 𝐶𝑎 ⟺ > 𝐶 𝐶𝑎 + 𝐻 (𝑅21)
> 𝐶 𝐻𝑜 + ⟺ > 𝐶 + 𝐻 (𝑅22)
> 𝐶𝑎 𝐻 + 𝑆
⟺ > 𝐶𝑎𝑆 + 𝐻 (𝑅23)
> 𝐶𝑎 𝐻 + 𝐶
⟺ > 𝐶𝑎𝐶 + 𝐻 (𝑅24)
The typical chemical reactions considered in this model are summarized in Table 4.1.

87
Model Formulation
The descriptions of the equations and assumptions are highlighted below.
4.2.1 Hydrocarbon solubility
Oil and gas are mixtures of different hydrocarbon and non-hydrocarbon components, whereas
some hydrocarbons are soluble in the aqueous phases. The dissolution rates of these soluble
hydrocarbon components are fast and presumed to be in thermodynamic equilibrium at a specific
pressure, composition, and temperature. Their solubilities are modeled using the phase equilibrium
concept, which necessitates that, in a mixture of 𝑁𝑐 hydrocarbon components when an oleic phase,
a gaseous phase and aqueous phase coexist, each component must maintain equal fugacity in all
phases. For example, CO2 at equilibrium (in reaction R1 of Table 4.1) possesses equal fugacity in
all three phases as shown in eq. 4.1.
𝑓𝑖𝑔(𝑃, 𝑦𝑖𝑔, 𝑇) ≡ 𝑓𝑖𝑜(𝑃, 𝑦𝑖𝑜, 𝑇) ≡ 𝑓𝑖𝑤(𝑃, 𝑦𝑖𝑤, 𝑇) 𝑓𝑜𝑟 𝑖 = 1,… . . , 𝑁𝑐 (4.1)
where 𝑓𝑖𝑗 and 𝑦𝑖𝑗 are the fugacity (kPa) and mole fractions of the i-th component in the j-th
phase, 𝑃 is the pressure (kPa) and 𝑁𝑐 is the total number of soluble hydrocarbon components. The
fugacities 𝑓𝑖𝑔 and 𝑓𝑖𝑜 are computed from the equation of state, in this case, Peng-Robinson (PR-
EOS) using the following expression:
ln𝑓𝑖
𝑦𝑖𝑃=
𝑏𝑖
𝑏𝑚
(𝑍 − 1) − ln(𝑍 − 𝐵) −𝐴
𝐵(𝛿1 − 𝛿 )(2∑ 𝑦𝑖√𝛼𝑖𝛼𝑘(1 − 𝑑𝑖𝑘)
𝑁𝑐𝑘=1
𝑎𝑚−
𝑏𝑖
𝑏𝑚) ln (
𝑍 + 𝛿 𝐵
𝑍 + 𝛿1𝐵) (4.2)
with
𝑎𝑚 = ∑ ∑ 𝑦𝑖𝑦𝑗√𝛼𝑖𝛼𝑘(1 − 𝑑𝑖𝑘)
𝑁𝑐
𝑘=1
𝑁𝑐
𝑖=1
; 𝑏𝑚 = ∑𝑦𝑖𝑏𝑖
𝑁𝑐
𝑖=1
; 𝐴 =𝑎𝑚𝑃
(𝑅𝑇) ; 𝐵 =
𝑏𝑚𝑃
𝑅𝑇
where 𝑏𝑖 and 𝛼𝑖 are the two pure components EOS parameters for the i-th component related to
molecule size and measure of attractive forces between molecules respectively; 𝑍 is the
compressibility factor; 𝛿1 and 𝛿 are EOS constants, where 𝛿1 = 1 + √2 and 𝛿 = 1 − √2 for PR-
EOS. While 𝑓𝑖𝑎𝑞 is computed through Henry’s law, as in eq. 4.3 [252, 253]:
88
𝑓𝑖𝑤 = 𝑦𝑖𝑤𝐻𝑖 𝑓𝑜𝑟 𝑖 = 1,… . . , 𝑁𝑐 (4.3)
where 𝐻𝑖 is the Henry’s constant for the i-th component. For three-phase flash calculation, the
equilibrium equations (eq. 4.1) are often written in terms of equilibrium ratios (𝐾𝑖) as:
𝑅𝑖 = ln𝐾𝑖𝑔 + ln𝑓𝑖𝑔
𝑦𝑖𝑔𝑃− ln
𝑓𝑖𝑜𝑦𝑖𝑜𝑃
= 0 𝑓𝑜𝑟 𝑖 = 1,… . . , 𝑁𝑐 (4.4)
𝑅𝑖 = ln𝐾𝑖𝑎𝑞 + ln𝑓𝑖𝑎𝑞
𝑦𝑖𝑎𝑞𝑃− ln
𝑓𝑖𝑜𝑦𝑖𝑜𝑃
= 0 𝑓𝑜𝑟 𝑖 = 1,… . . , 𝑁𝑐 (4.5)
where 𝑅𝑖 is the expression for the residual function of the i-th component. The hydrocarbon
components in the oleic, gaseous, and aqueous phases can be derived from the phase calculation
such that the following moles summation is achieved:
𝑁𝑖 = 𝑁𝑖𝑜 + 𝑁𝑖𝑔 + 𝑁𝑖𝑎𝑞 𝑓𝑜𝑟 𝑖 = 1,… . . , 𝑁𝑐 (4.6)
4.2.2 Aqueous-Species reactions
These are fast and homogenous chemical reactions occurring among components in the aqueous
phase and are modeled with an equilibrium mass action law using the stoichiometry approach. The
total components (𝑁𝑎𝑞) in the aqueous phase consist of 𝑁𝑐 soluble hydrocarbon components plus
components (𝑁𝑎) that only exist in the aqueous phase. These aqueous components are further
divided into primary (independent) and secondary (dependent) components, which are defined
as (𝑁𝑖𝑎) and (𝑁𝑎 − 𝑁𝑖𝑎) respectively. A typical example is shown in reaction R8 of Table 4.1
involving the dissociation of 𝐶𝑎𝐶 , where individual primary species (𝐻 , 𝐶𝑎 ) are linked
with secondary species (𝐶𝑎𝐶 , 𝐻𝐶 ) in a chemical reaction by an equilibrium constant 𝐾𝑒𝑞.
For chemical reactions in thermodynamic equilibrium, the rate of the forward reactions is
equivalent to that of the backward reactions:
𝑄𝛼 − 𝐾𝑒𝑞,𝛼 = 0 𝑓𝑜𝑟 𝛼 = 1,… . . , 𝑅𝑎𝑞 (4.7)
where 𝑄𝛼 and 𝐾𝑒𝑞,𝛼 are the activity product and equilibrium constant of the aqueous reaction α
respectively and 𝑅𝑎𝑞 is the total number of aqueous reactions. The activity product can be
expressed as:

89
𝑄𝛼 = ∏(𝑎𝑖)𝜈𝑖𝛼
𝑁𝑎𝑞
𝑖=1
𝑓𝑜𝑟 𝛼 = 1,… . . , 𝑅𝑎𝑞 (4.8)
where 𝑎𝑖 is the activity of the i-th component, 𝜈𝑖𝛼 is the stoichiometry coefficient of the i-th
component in reaction α, and 𝑁𝑎𝑞 is the total number of components in the aqueous phase. The
equilibrium constant values are tabulated as a function of temperature in several geochemical
databases [254, 255, 256]. Alternatively, the values are calculated using an analytical polynomial
expression (eq. 4.9) to define the temperature dependence of the equilibrium constants.
log𝐾𝑒𝑞 = 𝐴0 + 𝐴1𝑇 +𝐴
𝑇+ 𝐴 log𝑇 +
𝐴
𝑇 + 𝐴5𝑇
(4.9)
where 𝑇 is the absolute temperature (K) and 𝐴0. . . . . . 𝐴5 are the empirical parameters that can be
found in several databases for various chemical reactions (see Appendix A). The activity of each
component 𝑖 is related to its molality as follows:
𝑎𝑖 = 𝛾𝑖𝑚𝑖 𝑓𝑜𝑟 𝑖 = 1,… . . , 𝑁𝑎𝑞 (4.10)
where 𝛾𝑖 and 𝑚𝑖 are the activity coefficient (kg-water/mol.) and molality (mol./kg-water) of the i-
th component. The activity coefficients, 𝛾𝑖, for ideal solutions can be taken as unity. This implies
that the activities of such species are equal to their molalities. For solutions that deviate from the
ideal conditions, this model considers the WATEQ Debye-Hückel equation, also known as B.dot
activity model [257], to compute the activity coefficients as presented below.
log 𝛾𝑖 = −𝐴(𝑇)𝑧𝑖
√𝐼
1 + 𝑎��𝐵(𝑇)√𝐼+ 𝑏��𝐼 𝑓𝑜𝑟 𝑖 = 1,… . . , 𝑁𝑎𝑞 (4.11)
where 𝐴(𝑇) and 𝐵(𝑇) are the temperature-dependent parameters, 𝑎��, 𝑧𝑖 and 𝑏�� are the ion size, ion
valence and ion-specific parameter for the i-th component respectively, and 𝐼 is the ionic strength
(mol./kg water) of the solution, which can be estimated as 𝐼 =1
∑ 𝑧𝑖
𝑚𝑖𝑁𝑎𝑞
𝑖=1. In this model, the
aqueous reactions mainly explored the most relevant aqueous complexes that can be formed
between Na+, SO42−, HCO3
-, Mg2+ and Ca2+ through reactions R2-R12 in Table 4.1. Their
formations are more pronounced at high temperatures and can significantly affect the activity of
the PDIs towards the rock surface sites. Higher concentrations of non-active ions in the imbibing

90
brine will result in higher ionic strength and lower activity coefficients of aqueous components
especially the PDIs involved in the surface sorption reactions.
4.2.3 Aqueous-Minerals reactions
These are slow and heterogeneous reactions involving aqueous and mineral components. These
reactions somehow influence the distribution of the aqueous components across the characteristic
length and time-scale. The magnitude of their effects is determined by the Damkohler number,
which dictates whether the reaction is modeled by either a kinetic-rate law or an equilibrium law.
Damkohler number (𝐷𝑎) is the ratio of the reaction rates to the transport rates (eq. 4.12) and mostly
depends on reaction rate constants, characteristic flow distance and transport velocity.
𝐷𝑎𝛽 =𝐿𝑘𝛽A𝛽
𝜈𝐶𝛽 𝑓𝑜𝑟 𝛽 = 1, … . . , 𝑅𝑚 (4.12)
where 𝐿 is characteristic flow length (m), 𝑘𝛽 is the reaction rate constants (mol./m2s), A𝛽 is the
reactive surface area (m2/m3), 𝜈 is the transport velocity (m/s) and 𝐶𝛽 is the total concentration of
dissolved ion components (mol./m3). At very high Damkohler numbers (𝐷𝑎 ≫ 1), the reaction
rate is large, and reaction becomes instantaneous, which means that equilibrium concentration is
achieved before the flux distribution of components. Meanwhile, at very low Damkohler numbers
(𝐷𝑎 ≪ 1), fluid transport occurs faster than mineral reactions, which means that the components
distribution is similar to that of inert chemical or molecule (tracer). Intermediate values of
Damkohler numbers are of particular interest in this study, as they represent a non-ideal system
where component distributions are influenced by these reaction sets. A quick estimation of 𝐷𝑎 for
reaction R13 in Table 4.1, for the different waterfloods considered in this study, shows that 𝐷𝑎 is
less than unity. Moreover, in many published studies, a few of which will be discussed in
subsequent Chapters, some of the PDIs reached their injected level after more than 1 PV and others
never returned. For this reason, mineral reactions are modeled as rate-dependent reactions.
Most often, the mineral components (𝑁𝑚) are not in thermodynamic equilibrium with the aqueous
components, which inevitably result in either mineral dissolution or precipitation. Reaction R13

91
shows an example of calcite dissolution/precipitation, where a mineral component (𝐶𝑎𝑙𝑐𝑖𝑡𝑒) is
involved in a reaction with only aqueous components (𝐶 , 𝐻𝐶 , 𝐻 ) and no other mineral
components. The law of mass action governing such reactions is written based on transition state
theory as stated as:
𝑟𝛽 = 𝑘𝛽A𝛽 (1 −𝑄𝛽
𝐾𝑒𝑞,𝛽) 𝑓𝑜𝑟 𝛽 = 1,… . . , 𝑅𝑚 (4.13)
where 𝑟𝛽 is the rate of reaction (mol./m3s), 𝑄𝛽 is the activity product, 𝑅𝑚 is the number of mineral
surface reactions and 𝐾𝑒𝑞,𝛽 is the equilibrium constant. The activity product, 𝑄𝛽, for the
reaction, 𝛽, is similar to that expressed in eq. 4.8, except that activities of mineral species equal
unity. The equilibrium constant values, 𝐾𝑒𝑞 for aqueous mineral reaction, 𝛽 are also well
documented in the different geochemical databases (see Appendix A). The natural log of the last
term in the bracket in eq. 4.13 is also known as the saturation index, Ω𝛽 = 𝑙𝑜 (𝑄𝛽 𝐾𝑒𝑞,𝛽⁄ ), and
indicates the deviation of the reaction from equilibrium. If Ω𝛽 > 0, the aqueous solution is
supersaturated leading to mineral precipitation characterized by positive reaction rate. While
for Ω𝛽 < 0, the aqueous solution is under-saturated leading to mineral dissolution, which is also
characterized by negative reaction rate. At equilibrium, the saturation index and the reaction rate
is equal to zero, Ω𝛽 = 0. Most often the rate constants in eq. 4.13 are always reported at a
reference temperature, 𝑇0 which can be converted to any temperature, 𝑇 using the modified
Arrhenius’ equation below:
𝑘𝛽 = 𝑘𝛽,0𝑒𝑥𝑝 (−𝐸𝑎𝛽
𝑅[1
𝑇−
1
𝑇0]) (4.14)
where 𝑘𝛽,0 is the reaction rate constants for mineral surface reaction 𝛽 at the reference
temperature 𝑇0 (mol./m2s) and 𝐸𝑎𝛽 is the activation energy (J/mol.). In this model, the inclusion
of reaction R13-R15 is contingent on the dominant minerals in carbonate rocks — calcite, as well
as other important minerals that can be found together in a typical carbonate reservoir. More
importantly, calcite dissolution serves as an essential source/sink for Ca2+ components and buffers
aqueous pH. Other viable sources/sinks for Ca2+ are dolomite and anhydrite dissolution, which are
also considered as a source/sink for Mg2+ and SO42- components respectively. Nghiem et al. [252]
92
proposed that some properties of the rock, such as reactive surface area (A𝛽), porosity and
permeability, changes as the mineral dissolves or precipitates. The equation employed in making
the necessary adjustments at each time step can be found in Dang et al. [66], Nghiem et al. [252].
4.2.4 Carbonate rock system modeling
As discussed in Chapter 2, extensive laboratory studies on chalk, dolomite and limestone outcrop
and reservoir cores have established the existence of an interdependent interaction among
multivalent ions in brine (Ca2+, Mg2+, and SO42- in addition to CO3
2-, though they are of lower
concentration in most reservoir fluids, and PO43- and BO3
3-) at the rock-brine interface. Such
interactions can bring an existing oil−brine−rock system into a new equilibrium system during the
introduction of low saline/smart brine, which in turns favorably cause the rock-brine interface to
become less positively charged and repel the negatively charged oil-brine interface.
At the oil-brine interface, the polarity of crude oil is associated with the presence of acidic and
basic surface groups dictating the rock wettability. The dominance of either of the surface groups
is pH-dependent and determines the charge at the interface. At low pH (pH<3.5) the basic group
is protonated at the interface resulting in a positively charged interface. Meanwhile, as pH
increases, the acid group becomes deprotonated dropping the surface charge below zero and
resulting in a strongly negatively charged interface at higher pH [197, 210, 251, 258]. The surface
charge of the oil-brine interface is often strongly negative at the typical reservoir pH ranging from
7 to 9. Various studies have shown that the carboxylic acids mostly dominate the acidic groups
while long-chain carboxylic acids are responsible for reversing surface wettability towards oil-
wetness compared to short-chain acids [154, 251].
At the initial reservoir condition, the formation brine contains relatively lower PDI concentrations
compared to Na and Cl, which implies that the initial positive charge at the rock-brine interface is
maintained for pure calcite rock. This results in attraction (low/negative disjoining pressure)
between the two interfaces and thin water film layer. Thus, oil acidic components majorly occupy
the rock surface sites, and PDIs compete with the oil components for the surface sites. A significant
change to the water chemistry enables the PDIs to attach specifically in the Stern layer or via the

93
intermolecular coordination of water molecules, altering the surface charge at the interface. In this
context, the rock-surface charge is reduced or even reversed towards negative from its initial
condition of positive charge [128, 197]. Such interaction can release adsorbed oil acidic
components from the surface sites because of the more stable water film layer that is developed
due to a lesser attraction (higher disjoining pressure) between the two interfaces.
The thermodynamic model for carbonates-aqueous interface postulates the formation of two
primary surface sites, present in equal numbers (having a 1:1 stoichiometry) upon hydration of the
calcite surface. Calcite contains an equal number of calcium (Ca2+) and carbonate (CO32-) ions
held together by ionic bonding to ensure electrical neutrality. On fresh calcite surface exposed to
water, the Ca2+ and CO32- sites are coordinated to oxygen atoms (OH-) and dissociated protons
(H+) groups from the chemisorbed water molecules (Figure 4.1). This originates from the
assumption that during hydration of calcite mineral surface, the oxygen atoms of chemisorbed
water molecules fill the vacant coordination sites of the surface cations (Ca2+). Meanwhile, the
surface anions (CO32-) are stabilized by the transfer of dissociated protons from the chemisorbed
water molecules. The hydroxylation of the Ca2+ surface site and the protonation of the CO32-
surface site create two primary surface sites: hydroxylated cation site (>CaOHo) and protonated
anion site (>CO3Ho) at the hydrated calcite surface as evident through observations made from X-
ray photoelectron and infrared spectroscopic measurements [238, 239, 259, 260]. Calcite surface
in contact with aqueous solution develops electric charges due to reactions between the surface
and aqueous components dissolved in an electrolyte solution. The resulting electric potential at the
OHP and similarly the ζ–potential, as described in Chapter 3, are controlled by the PDIs adsorption
in the Stern layer [238, 239]. There are two possible approaches of modeling PDIs reaction in the
Stern layer, which are the surface sorption models (SSMs) and surface complexation models
(SCMs). The SSM is a more simplistic approach that captures the MIE mechanisms by considering
sorption reactions like adsorption, ion-exchange, where the electrical interaction is integrated into
the reaction equilibrium constants, while SCM captures DLE mechanism and similar surface
reactions as SSM, except that the sorption process depends on the interaction surface charges and
electrical potential, which are simultaneously calculated with the surface components.

94
Figure 4.1—Schematic representation of the cross-section of the surface layer. In the presence of water,
carbonate surfaces are generally covered with surface hydroxyl groups
4.2.4.1 Surface sorption reactions
Sorption involves reactions between aqueous components and the surface, often considered as a
fast reaction process and controls the interactions at the fluid-rock interface during the early stages
of flooding experiment. As previously mentioned, carbonate rocks are predominantly composed
of calcite mineral, with large surface area and typically of high reactivity. A considerable amount
of aqueous components can sorb to the rock surface site, having an equal number of positively
(cationic - > 𝑋 ) and negatively (anionic - > 𝑋 ) charged surface sites, in a 1:1 stoichiometry
[261]. The constant capacity of the carbonate surface sites can be obtained as:
𝛿𝑠 =𝑆𝑑
𝑁𝐴 (4.15)
where 𝑆𝑑 is the site density, i.e. number of surface sites per unit area of the chalk surface and has
been estimated to be between 2 and 8 sites/nm2 for carbonate rocks [261, 262], 𝑁𝐴 is the
Avogadro’s constant (6.022×10²³ sites/mol.) and 𝛿𝑠 is the total surface site capacity in mol./m2 or
eq/m2 (assuming 1 mol. ≡ 1 eq.), typically between 3.32 and 13.28 μmol../m2 for the estimated site
density. A large value of surface site capacity indicates that the surface could accommodate
substantial amounts of adsorbed components, which can strongly influence the distribution of
aqueous components.
The choice of specific aqueous components interacting with the surface sites is based on the
remarks made from published studies. Various delays observed in some specific produced ions

95
concentration profiles during coreflood experiments were indications that such ions had sorbed to
the surface site. In this regard, Ca2+, Mg2+ and SO42- have been documented to be the PDIs towards
the surface site during the sorption process. Injection of brines that has the tendency to decrease
surface electrostatic charges will enable the oil to desorb. The surface components of these PDIs
were considered by combining equilibrium adsorption and ion exchange reactions (reaction R16-
R18 in Table 4.1) to replicate the complex interactions at the aqueous-rock interface.
Adsorbed-Species Reactions: Active anions like sulfate ions can adsorb to the surface cationic sites
and reduce the surface charge to a more negative magnitude. With lesser charge at the surface site,
the electrostatic attractions between the negatively charged carboxylic components in the oil and
the surface sites are reduced, such that oil could be easily desorbed. In this regard, a surface
reaction in the form of reaction R16 was considered, where the surface cationic site is brought in
contact with the sulfate component in the aqueous solution, resulting into a surface complex ( >
𝑋𝑆 ). Hence, the mass action equation can be expressed as:
𝐾𝐴 =𝑎(>𝑋𝑆𝑂4
−)
𝑎(>𝑋+) 𝑎𝑆𝑂42−
(4.16)
where 𝑎(𝑖) is the activity of the i-th surface species and 𝐾𝐴 is the apparent stability constant.
Surface equilibrium reactions are often characterized by apparent-reaction stability constants due
to the difficulty in the direct quantification of interfacial activities of free species and surface
complexes through experiments [263]. The attraction or repulsion of aqueous components from
the carbonate surface site is triggered by the columbic interaction between the components and the
charged surface sites. The interaction reflects the amount of electrostatic work needed to transport
these components via the interfacial potential gradient. This gradient exists because of ion transfer
between the bulk solution and the surface sites. Therefore, the apparent-reaction stability constant
of a surface complex is related to its intrinsic-reaction stability constant by:
𝐾𝐴 = 𝐾𝑖𝑛𝑡 𝜒 (4.17)
where 𝐾𝑖𝑛𝑡 is the intrinsic-reaction stability constant and 𝜒 is the electrostatic interaction term
(Boltzman factor) and can be expressed as:

96
𝜒 = 𝑒𝑥𝑝 (−𝑧ℱ𝜓𝑜
𝑅𝑇) (4.18)
where ℱ is the Faraday constant (96490 C/mol.), 𝑅 is the universal gas constant (8.3143 J/mol./K)
and 𝑧 is the net charge over the reaction of the surface complex (which is -2 for reaction R16 in
Table 4.1). The surface and ζ-potential, at any distance Δ from the shear plane in the diffuse layer,
is related by the simple form of linearized PBE as discussed in Chapter 3: ζ = 𝜓𝑜(Δ) = 𝜓𝑜𝑒 𝜅Δ.
The reciprocal Debye length which determines the size of the double layer is referred to as 𝜅 and
is related to ionic strength via κ = √2000ℱ 𝐼 휀휀0𝑅𝑇⁄ . As discussed in Chapter 3, most electrical
potential drop occurs in the diffuse layer, which implies that the system can be approximated by
assuming 𝜓𝑜 = 𝜓𝑑. Meanwhile, the surface charge density, 𝜎𝑜 must be balanced by the double
layer charge density, 𝜎𝑑 to ensure electrical neutrality at the interface and thus, a direct relationship
exist between surface potential and surface charge given by Grahame equation, which is derived
from the Gouy-Chapman theory [130], as follows;
𝜎𝑜 = −𝜎𝑑 = √8000휀휀0𝑅𝑇𝐼 𝑠𝑖𝑛ℎ (𝑧𝑤ℱ𝜓𝑜
2𝑅𝑇) (4.19)
where 𝜎𝑜 and 𝜎𝑑 are the surface and diffuse layer charge density (the charge per unit area of the
surface site, C/m2), respectively, 휀 is the dielectric constant of water, 휀0 is the permittivity of the
free space (8.854×10⁻¹² C2/J/m), and 𝑧𝑤 is the charge on the background solute (often assumed to
be unity). The dielectric constant of water, 휀 varies with temperature and brine ionic strength. The
variation with temperature is from 78.5 at 25 °C to 50 at 130 °C using the empirical correlation
derived by Malmberg and Maryott [249] as: 휀 = 87.74 − 0.4008𝑇 + 9.4 × 10 𝑇 − 1.41 ×
10 6𝑇 , in this empirical expression 𝑇 is the temperature in °C. The capacity for the positive
calcium surface sites is considered as the anion exchange capacity and can be obtained in mol/kg
through:
A𝐸𝐶 = 𝛿𝑠 𝐴𝛽 (4.20)
where 𝐴𝛽 is the specific surface area of the mineral (m2/kg). For surface equilibrium reactions,
surface species activities are replaced by surface species concentration and can be expressed in
terms of the surface species mole fractions:

97
𝛽𝑖 =𝑁[>𝑖]
𝛿𝑠𝐴𝛽𝜌𝑏 (4.21)
where 𝛽𝑖 is the mole fractions of the surface sorbed species 𝑖, 𝜌𝑏 is the rock bulk density (kg/m3)
and 𝑁[>𝑖] is the number of sorbed moles per unit volume (mol./m3) of the i-th surface species. For
the surface cationic sites, the summation of the mole fractions of the free and the occupied site
species must be equal to one.
∑𝛽𝑖
𝑖
= 𝛽(>𝑋+) + 𝛽(>𝑋𝑆𝑂4−) = 1 (4.22)
The electrostatic term in eq. 4.18 accounts for the interactions of the ions with the charged surface,
such that the mass action equation in eq. 4.16 can be rewritten with surface mole fractions for the
surface complex as.
𝐾𝑖𝑛𝑡 =𝛽(>𝑋𝑆𝑂4
−)
𝛽(>𝑋+) 𝑎𝑆𝑂42−
𝜒 1 (4.23)
Combining eqs. 4.22 and 4.23, eq. 4.24 can be obtained as:
1 + 𝐾𝑖𝑛𝑡 𝜒 𝑎𝑆𝑂42−
𝐾𝑖𝑛𝑡 𝜒 𝑎𝑆𝑂42−
𝛽(>𝑋𝑆𝑂4−) = 1 (4.24)
Considering a constant surface potential, the fraction of surface sites covered with SO42- can be
rewritten as eq. 4.25 such that the electrostatic term is lumped into the isotherm coefficient, 𝐾𝐴𝐷𝑆.
Whereas the fraction of the surface sites that are free and not covered can be estimated by inserting
the solution of eq. 4.25 into eq. 4.26.
𝛽(>𝑋𝑆𝑂4−) =
𝐾𝐴𝐷𝑆 𝑎𝑆𝑂42−
1 + 𝐾𝐴𝐷𝑆 𝑎𝑆𝑂42−
(4.25)
𝑅 = 𝛽(>𝑋𝑆𝑂4−) −
𝐾𝐴𝐷𝑆 𝑎𝑆𝑂42−
1 + 𝐾𝐴𝐷𝑆 𝑎𝑆𝑂42−
Exchangeable-Species Reactions: These types of reactions occur when a charged surface achieves
local electrical charge balance by accumulating a particular amount of charge. Then, the
exchangeable species (𝑁𝑒𝑥) attached to the surface sites exist in equilibrium with those species in
the neighboring aqueous phase. As discussed above, the adsorption of sulfate reduces the surface

98
charge to allow the surface anionic sites to adsorb a given amount of equivalence of cations from
the aqueous phase. Thus, the exchange-species reaction equation is regarded as one exchangeable
species replacing another exchangeable species. This exchangeable-species reaction formulation
follows the Gaines-Thomas Convention as given by Appelo and Postma [264] for clay mineral
(reactions R17 and R18), supposing that Mg2+, Ca2+, and Na+ are all involved in the reactions.
These reactions are characterized by selectivity coefficients, 𝐾𝑒𝑥𝑐ℎ, like chemical equilibrium
constants in aqueous species reactions, such that similar equilibrium conditions must be satisfied:
𝐾𝑒𝑥,𝛿 = 𝑄𝑒𝑥,𝛿 = ∏ (𝑎𝑖)𝜈𝑖𝛿
𝑁𝑒𝑥 𝑁𝑎𝑞
𝑖=1
𝑓𝑜𝑟 𝛿 = 1,… . . , 𝑅𝑒𝑥 (4.26)
where 𝐾𝑒𝑥,𝛿 and 𝑄𝑒𝑥,𝛿 are the selectivity coefficients and activity quotient for the exchange
reaction 𝛿, 𝑁𝑒𝑥 is the number of surface exchangeable species, 𝑅𝑒𝑥 is the number of exchange
reactions, and 𝜈𝑖𝛿 is the stoichiometry coefficient of specie 𝑖 in exchange reaction 𝛿. The selectivity
coefficients values, 𝐾𝑒𝑥𝑐ℎ, for the surface sites are uncertain unlike for clay surface sites. Using
the mass action law, the selectivity coefficients for the exchanged reactions R17 and R18 can be
written as:
𝐾𝑁𝑎\𝐶𝑎 =𝑎(>𝑁𝑎𝑋) [𝑎𝐶𝑎2+]0.5
[𝑎(>𝐶𝑎𝑋2)]0.5
𝑎𝑁𝑎+ (4.27)
𝐾𝑁𝑎\𝑀𝑔 =𝑎(>𝑁𝑎𝑋) [𝑎𝑀𝑔2+]
0.5
[𝑎(>𝑀𝑔𝑋2)]0.5
𝑎𝑁𝑎+
(4.28)
From eqs. 4.27 and 4.28, the activities of the aqueous species can be easily computed using eq.
4.10, whereas since Gaines-Thomas Convention was used for the exchange reaction formulations,
the equivalent fractions, 𝜉𝑖, are considered as the activities of the exchangeable species. Thus, the
selectivity coefficients can be rewritten as:
𝐾𝑁\𝐶𝑎 =𝜉(>𝑁𝑎𝑋)𝛾𝐶𝑎
0.5𝑚𝐶𝑎0.5
𝜉(>𝐶𝑎𝑋2)0.5 𝛾𝑁𝑎𝑚𝑁𝑎
(4.30)
𝐾𝑁𝑎\𝑀𝑔 =𝜉(>𝑁𝑎𝑋)𝛾𝑀𝑔
0.5𝑚𝑀𝑔0.5
𝜉(>𝑀𝑔𝑋2)0.5 𝛾𝑁𝑎𝑚𝑁𝑎
(4.31)
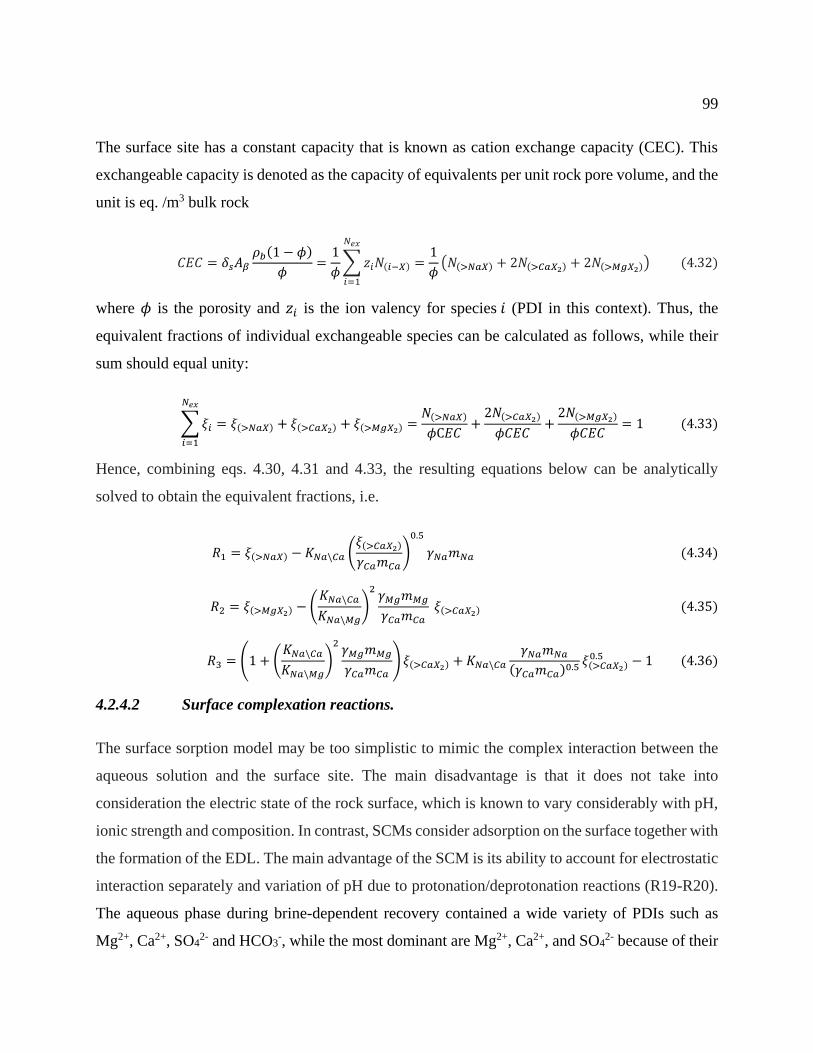
99
The surface site has a constant capacity that is known as cation exchange capacity (CEC). This
exchangeable capacity is denoted as the capacity of equivalents per unit rock pore volume, and the
unit is eq. /m3 bulk rock
𝐶𝐸𝐶 = 𝛿𝑠𝐴𝛽
𝜌𝑏(1 − 𝜙)
𝜙=
1
𝜙∑𝑧𝑖𝑁(𝑖 𝑋)
𝑁𝑒𝑥
𝑖=1
=1
𝜙(𝑁(>𝑁𝑎𝑋) + 2𝑁(>𝐶𝑎𝑋2) + 2𝑁(>𝑀𝑔𝑋2)) (4.32)
where 𝜙 is the porosity and 𝑧𝑖 is the ion valency for species 𝑖 (PDI in this context). Thus, the
equivalent fractions of individual exchangeable species can be calculated as follows, while their
sum should equal unity:
∑𝜉𝑖
𝑁𝑒𝑥
𝑖=1
= 𝜉(>𝑁𝑎𝑋) + 𝜉(>𝐶𝑎𝑋2) + 𝜉(>𝑀𝑔𝑋2) =𝑁(>𝑁𝑎𝑋)
𝜙C𝐸𝐶+
2𝑁(>𝐶𝑎𝑋2)
𝜙𝐶𝐸𝐶+
2𝑁(>𝑀𝑔𝑋2)
𝜙𝐶𝐸𝐶= 1 (4.33)
Hence, combining eqs. 4.30, 4.31 and 4.33, the resulting equations below can be analytically
solved to obtain the equivalent fractions, i.e.
𝑅1 = 𝜉(>𝑁𝑎𝑋) − 𝐾𝑁𝑎\𝐶𝑎 (𝜉(>𝐶𝑎𝑋2)
𝛾𝐶𝑎𝑚𝐶𝑎)
0.5
𝛾𝑁𝑎𝑚𝑁𝑎 (4.34)
𝑅 = 𝜉(>𝑀𝑔𝑋2) − (𝐾𝑁𝑎\𝐶𝑎
𝐾𝑁𝑎\𝑀𝑔)
𝛾𝑀𝑔𝑚𝑀𝑔
𝛾𝐶𝑎𝑚𝐶𝑎 𝜉(>𝐶𝑎𝑋2) (4.35)
𝑅 = (1 + (𝐾𝑁𝑎\𝐶𝑎
𝐾𝑁𝑎\𝑀𝑔)
𝛾𝑀𝑔𝑚𝑀𝑔
𝛾𝐶𝑎𝑚𝐶𝑎)𝜉(>𝐶𝑎𝑋2) + 𝐾𝑁𝑎\𝐶𝑎
𝛾𝑁𝑎𝑚𝑁𝑎
(𝛾𝐶𝑎𝑚𝐶𝑎)0.5
𝜉(>𝐶𝑎𝑋2)0.5 − 1 (4.36)
4.2.4.2 Surface complexation reactions.
The surface sorption model may be too simplistic to mimic the complex interaction between the
aqueous solution and the surface site. The main disadvantage is that it does not take into
consideration the electric state of the rock surface, which is known to vary considerably with pH,
ionic strength and composition. In contrast, SCMs consider adsorption on the surface together with
the formation of the EDL. The main advantage of the SCM is its ability to account for electrostatic
interaction separately and variation of pH due to protonation/deprotonation reactions (R19-R20).
The aqueous phase during brine-dependent recovery contained a wide variety of PDIs such as
Mg2+, Ca2+, SO42- and HCO3
-, while the most dominant are Mg2+, Ca2+, and SO42- because of their

100
relatively higher concentrations. When the aqueous solutions contact the rock surface sites, the
typical surface reactions that are to be considered are protonation/deprotonation (reactions R19
and R20), cations affinity (reactions R21 and R22) and anions affinity (reactions R23 and R24),
leading to formation of surface species, such as >CO3-, >CaOH2
+, >CO3Ca+, >CO3Mg+, >CaSO4-
, and >CaCO3-. Each of these reactions has a corresponding mass action equation as below:
𝐾𝐶1 =𝑎[>𝐶𝑂3
−] 𝑎𝐻+
𝑎[>𝐶𝑂3𝐻𝑜]
𝜒 1 =𝛽[>𝐶𝑂3
−] 𝑎𝐻+
𝛽[>𝐶𝑂3𝐻𝑜]
𝜒 1 (4.37)
𝐾𝐶 =𝑎[>𝐶𝑎𝑂𝐻2
+]
𝑎[>𝐶𝑎𝑂𝐻0] 𝑎𝐻+𝜒 1 =
𝛽[>𝐶𝑎𝑂𝐻2+]
𝛽[>𝐶𝑎𝑂𝐻𝑜] 𝑎𝐻+𝜒 1 (4.38)
𝐾𝐶 =𝑎[>𝐶𝑂3𝐶𝑎+] 𝑎𝐻+
𝑎[>𝐶𝑂3𝐻𝑜] 𝑎𝐶𝑎2+
𝜒 1 =𝛽[>𝐶𝑂3𝐶𝑎+] 𝑎𝐻+
𝛽[>𝐶𝑂3𝐻𝑜] 𝑎𝐶𝑎2+
𝜒 1 (4.39)
𝐾𝐶 =𝑎[>𝐶𝑂3𝑀𝑔+] 𝑎𝐻+
𝑎[>𝐶𝑂3𝐻𝑜] 𝑎𝑀𝑔2+
𝜒 1 =𝛽[>𝐶𝑂3𝑀𝑔+] 𝑎𝐻+
𝛽[>𝐶𝑂3𝐻𝑜] 𝑎𝑀𝑔2+
𝜒 1 (4.40)
𝐾𝐶5 =𝑎[>𝐶𝑎𝑆𝑂4
−] 𝑎𝐻2𝑂
𝑎[>𝐶𝑎𝑂𝐻2+] 𝑎𝑆𝑂4
2−𝜒 1 =
𝛽[>𝐶𝑎𝑆𝑂4−] 𝑎𝐻2𝑂
𝛽[>𝐶𝑎𝑂𝐻2+] 𝑎𝑆𝑂4
2− 𝜒 1 (4.41)
𝐾𝐶6 =𝑎[>𝐶𝑎𝐶𝑂3
−] 𝑎𝐻2𝑂
𝑎[>𝐶𝑎𝑂𝐻0] 𝑎𝐻𝐶𝑂3−
𝜒 1 =𝛽[>𝐶𝑎𝐶𝑂3
−] 𝑎𝐻2𝑂
𝛽[>𝐶𝑎𝑂𝐻𝑜] 𝑎𝐻𝐶𝑂3−
𝜒 1 (4.42)
where 𝐾C1, 𝐾C , 𝐾C , 𝐾C , 𝐾C5, and 𝐾𝐶6 are temperature-dependent stability constants for surface
complexation reactions R19-R24. In eqs. 4.37-4.42, the surface species activities are also expressed
in terms of the surface mole fractions, which are defined as:
𝛽𝑖 =𝑁[>𝑖]
𝜙𝐶𝐸𝐶 (4.43)
Moreover, the summation of the surface species mole fractions with the free species mole fractions
must equal unity on each surface site. Particularly, eq. 4.44 sums up surface mole fractions for the
hydroxylated cationic surface site, while eq. 4.45 sums up those at the protonated anionic surface
site:
∑𝛽𝑖
𝑖
= 𝛽>𝐶𝑎𝑂𝐻𝑜 + 𝛽>𝐶𝑎𝑂𝐻2+ + 𝛽>𝐶𝑎𝑆𝑂4
− + 𝛽>𝐶𝑎𝐶𝑂3− = 1 (4.44)
∑𝛽𝑖
𝑖
= 𝛽>𝐶𝑂3𝐻𝑜 + 𝛽>𝐶𝑂3
− + 𝛽>𝐶𝑂3𝐶𝑎+ + 𝛽>𝐶𝑂3𝑀𝑔+ = 1 (4.45)

101
Similar to SSM, the surface potential is related to the rock surface charge by the Grahame equation
(eq. 4.19) derived from the Gouy-Chapman theory. If the rock surface has a positive potential, as
it is the case for purely calcite carbonate rock, then negatively charged aqueous species, such as
SO42-, will have a higher activity close to the surface and vice versa. Meanwhile, the electrostatic
term, 𝜒 = exp (−𝑧ℱ𝜓𝑜 𝑅𝑇⁄ ), will decrease the activities of ions having the same sign as the charge
at the surface, and increase the activities of ions with opposite charge. The presence of charged
complexes on the surface site results in non-zero surface charge density, which is the summation
of the charge of all the surface complexes as:
𝜎𝑜 =ℱ𝜙𝐶𝐸𝐶
𝐴𝛽𝜌𝑏∑𝑧𝑖𝛽𝑖
𝑖
=ℱ𝜙𝐶𝐸𝐶
𝐴𝛽𝜌𝑏(𝛽>𝐶𝑎𝑂𝐻2
+ + 𝛽>𝐶𝑂3𝐶𝑎+ + 𝛽>𝐶𝑂3𝑀𝑔+ − 𝛽>𝐶𝑂3− − 𝛽>𝐶𝑎𝑆𝑂4
− − 𝛽>𝐶𝑎𝐶𝑂3−) (4.46)
Combining eqs. 4.37 – 4.42, the equations to solve can be expressed as:
𝑅𝑗 = − log𝐾𝑗 + log𝑄𝑗+ log 𝜒−1 = − log𝐾𝑗 + log𝑄
𝑗+
𝑧ℱ𝜓𝑜
ln 10 𝑅𝑇 𝑓𝑜𝑟 𝑗 = 1, … . . , 𝑁𝑥 (4.47)
where 𝑗 is the j-th equation representing mass action equation for 𝑁𝑥 surface reactions, 𝑄𝑗 is the
activity product for the j-th mass action equation and 𝜓𝑜 in eq. 4.47 can be expressed in the form
of eq. 4.19 and 4.46 as:
𝜓𝑜 =2𝑅𝑇
ℱ𝑠𝑖𝑛ℎ 1 [
ℱ𝜙𝐶𝐸𝐶
𝐴𝛽𝜌𝑏√8000휀휀0𝑅𝑇𝐼(𝛽>𝐶𝑎𝑂𝐻2
+ + 𝛽>𝐶𝑂3𝐶𝑎+ + 𝛽>𝐶𝑂3𝑀𝑔+ − 𝛽>𝐶𝑂3− − 𝛽>𝐶𝑎𝑆𝑂4
− − 𝛽>𝐶𝑎𝐶𝑂3−)] (4.48)
Coupled Flow and Reaction Model
In this section, all equations that describe all the identified effects are coupled and a numerical
solution is provided.
Governing equations: For this isothermal process, the number of moles, 𝑁𝑖, of each species is
characterized as a function of the gradients in terms of the advective-dispersion transfer, chemical
reaction rate variables analogous to the various reactions given in Table 4.1 and external
sources/sinks given by the rate of change in the number of moles of species added or subtracted.
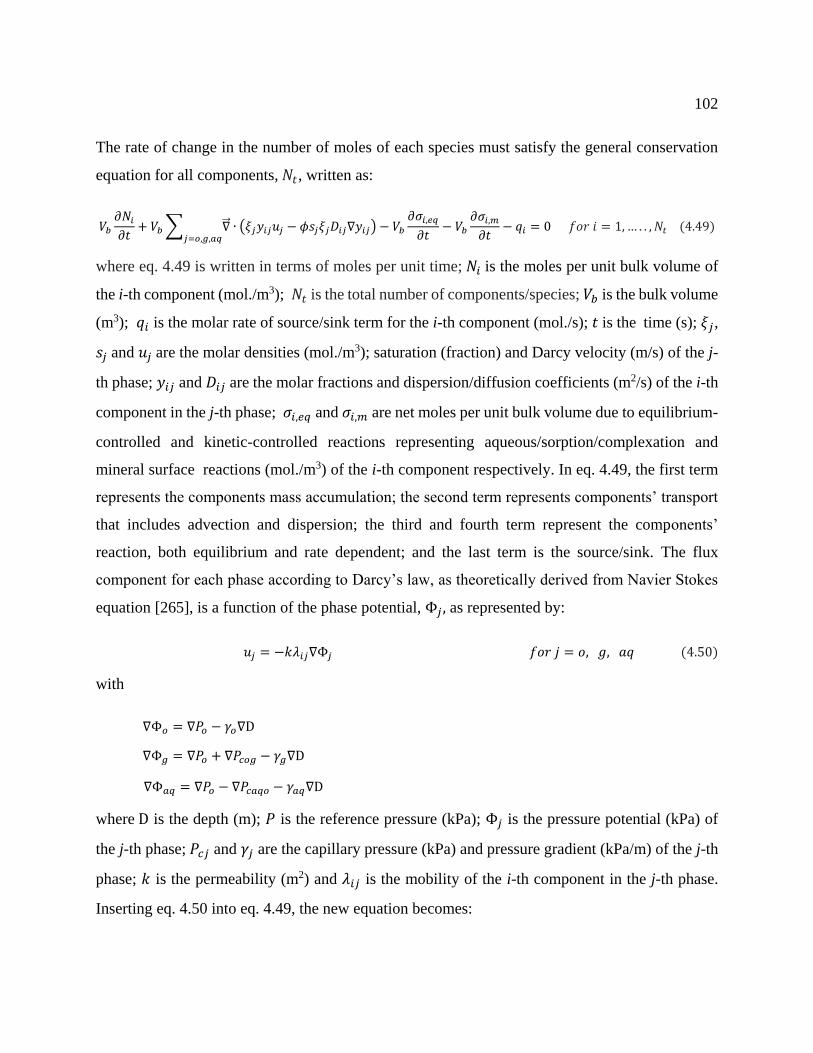
102
The rate of change in the number of moles of each species must satisfy the general conservation
equation for all components, 𝑁𝑡, written as:
𝑉𝑏
𝜕𝑁𝑖
𝜕𝑡+ 𝑉𝑏 ∑ ∇ ∙ (𝜉𝑗𝑦𝑖𝑗𝑢𝑗 − 𝜙𝑠𝑗𝜉𝑗𝐷𝑖𝑗∇𝑦𝑖𝑗)
𝑗=𝑜,𝑔,𝑎𝑞− 𝑉𝑏
𝜕𝜎𝑖,𝑒𝑞
𝜕𝑡− 𝑉𝑏
𝜕𝜎𝑖,𝑚
𝜕𝑡− 𝑞𝑖 = 0 𝑓𝑜𝑟 𝑖 = 1,… . . , 𝑁𝑡 (4.49)
where eq. 4.49 is written in terms of moles per unit time; 𝑁𝑖 is the moles per unit bulk volume of
the i-th component (mol./m3); 𝑁𝑡 is the total number of components/species; 𝑉𝑏 is the bulk volume
(m3); 𝑞𝑖 is the molar rate of source/sink term for the i-th component (mol./s); 𝑡 is the time (s); 𝜉𝑗,
𝑠𝑗 and 𝑢𝑗 are the molar densities (mol./m3); saturation (fraction) and Darcy velocity (m/s) of the j-
th phase; 𝑦𝑖𝑗 and 𝐷𝑖𝑗 are the molar fractions and dispersion/diffusion coefficients (m2/s) of the i-th
component in the j-th phase; 𝜎𝑖,𝑒𝑞 and 𝜎𝑖,𝑚 are net moles per unit bulk volume due to equilibrium-
controlled and kinetic-controlled reactions representing aqueous/sorption/complexation and
mineral surface reactions (mol./m3) of the i-th component respectively. In eq. 4.49, the first term
represents the components mass accumulation; the second term represents components’ transport
that includes advection and dispersion; the third and fourth term represent the components’
reaction, both equilibrium and rate dependent; and the last term is the source/sink. The flux
component for each phase according to Darcy’s law, as theoretically derived from Navier Stokes
equation [265], is a function of the phase potential, Φ𝑗 , as represented by:
𝑢𝑗 = −𝑘𝜆𝑖𝑗∇Φ𝑗 𝑓𝑜𝑟 𝑗 = 𝑜, , 𝑎𝑞 (4.50)
with
∇Φ𝑜 = ∇𝑃𝑜 − 𝛾𝑜∇D
∇Φ𝑔 = ∇𝑃𝑜 + ∇𝑃𝑐𝑜𝑔 − 𝛾𝑔∇D
∇Φ𝑎𝑞 = ∇𝑃𝑜 − ∇𝑃𝑐𝑎𝑞𝑜 − 𝛾𝑎𝑞∇D
where D is the depth (m); 𝑃 is the reference pressure (kPa); Φ𝑗 is the pressure potential (kPa) of
the j-th phase; 𝑃𝑐𝑗 and 𝛾𝑗 are the capillary pressure (kPa) and pressure gradient (kPa/m) of the j-th
phase; 𝑘 is the permeability (m2) and 𝜆𝑖𝑗 is the mobility of the i-th component in the j-th phase.
Inserting eq. 4.50 into eq. 4.49, the new equation becomes:

103
𝑉𝑏
𝜕𝑁𝑖
𝜕𝑡− 𝑉𝑏 ∑ ∇ ∙ (𝜉𝑗𝑦𝑖𝑗𝑘𝜆𝑖𝑗∇Φ𝑗 + 𝜙𝑠𝑗𝜉𝑗𝐷𝑖𝑗∇𝑦𝑖𝑗)
𝑗=𝑜,𝑔,𝑎𝑞− 𝑉𝑏
𝜕𝜎𝑖,𝑒𝑞
𝜕𝑡− 𝑉𝑏
𝜕𝜎𝑖,𝑚
𝜕𝑡− 𝑞𝑖 = 0 (4.51)
The above equation is solved by splitting the whole system into finite numbers of spatially discrete
subsystems. Large spatial dimensions of each subsystem were applied to capture the macroscopic
properties such as the number of moles of each species, saturation, pressure, porosity,
permeability, though small enough to avoid characteristic changes in properties of these physical
variables within each subsystem. Then, eq. 4.51 can be discretized using finite-difference
techniques to provide the solution to the equation in an adaptive-implicit approach. The following
general discretized conservation equation can be derived from eq. 4.51.
𝑉𝑏
∇𝑡(𝑁𝑖
𝑛 1 − 𝑁𝑖𝑛) − ∑ [∆𝑇𝑗
𝑢𝑦𝑖𝑗𝑢∆Φ𝑗
𝑢 + ∆𝐷𝑖𝑗𝑢∆𝑦𝑖𝑗
𝑢]𝑗=𝑜,𝑔,𝑎𝑞
− 𝑉𝑏𝑟𝑖,𝑒𝑞𝑛 1 − 𝑉𝑏𝑟𝑖,𝑚
𝑛 1 − 𝑞𝑖𝑛 1
= 0 𝑓𝑜𝑟 𝑖 = 1,… ,𝑁𝑡 (4.52)
with
∆Φ𝑜𝑢 = ∆𝑃𝑜
𝑛 1 − 𝛾𝑜𝑢∆D
∆Φ𝑔𝑢 = ∆𝑃𝑜
𝑛 1 + ∆𝑃𝑐𝑜𝑔𝑢 − 𝛾𝑔
𝑢∆D
∆Φ𝑎𝑞𝑢 = ∆𝑃𝑜
𝑛 1 − ∆𝑃𝑐𝑎𝑞𝑜𝑢 − 𝛾𝑎𝑞
𝑢∆D
where 𝑇𝑗 is the transmissibility of j-th phase (mol./kPa/s); 𝑟𝑖,𝑒𝑞 and 𝑟𝑖,𝑚 are the equilibrium and
mineral surface reaction rates (mol./m3s) of the i-th component, respectively. The
subscript 𝑛 implies the old time step; 𝑛 + 1 denotes the new time step; when 𝑢 = 𝑛, it denotes
explicit gridblocks; while when 𝑢 = 𝑛 + 1, it denotes implicit gridblocks. The discretized equation
for hydrocarbon components is expressed as follows:
𝑅𝑖 =𝑉𝑏
∇𝑡(𝑁𝑖
𝑛 1 − 𝑁𝑖𝑛) − ∑ [∆𝑇𝑗
𝑢𝑦𝑖𝑗𝑢∇Φ𝑗
𝑢 + ∆𝐷𝑖𝑗𝑢∆𝑦𝑖𝑗
𝑢]𝑗=𝑜,𝑔,𝑎𝑞
− 𝑉𝑏𝑟𝑖,𝑒𝑞𝑛 1
− 𝑞𝑖𝑛 1 𝑓𝑜𝑟 𝑖 = 1,… . . , 𝑁𝑐 (4.53)
The discretized equation for aqueous components is:
𝑅𝑖 =𝑉𝑏
∇𝑡(𝑁𝑖
𝑛 1 − 𝑁𝑖𝑛) − ∆𝑇𝑎𝑞
𝑢𝑦𝑖𝑎𝑞𝑢(∆𝑃𝑛 1 − ∆𝑃𝑐𝑎𝑞𝑜
𝑢 − 𝛾𝑎𝑞𝑢∆D) − ∆𝐷𝑖𝑗
𝑢∆𝑦𝑖𝑎𝑞𝑢 − 𝑉𝑏𝑟𝑖,𝑒𝑞
𝑛 1
− 𝑉𝑏𝑟𝑖,𝑚𝑛 1 − 𝑞𝑖
𝑛 1 𝑓𝑜𝑟 𝑖 = 1,… . . , 𝑁𝑎 (4.54)

104
The solid phase is considered immobile and hence, the flux of components (transport term) at the
surface by surface sorption or complexation reactions is zero. The discretized equation for
components at the surface site is expressed as:
𝑅𝑖 =𝑉𝑏
∇𝑡(𝑁𝑖
𝑛 1 − 𝑁𝑖𝑛) − 𝑉𝑏𝑟𝑖,𝑒𝑞
𝑛 1 − 𝑞𝑖𝑛 1 𝑓𝑜𝑟 𝑖 = 1,… . . , 𝑁𝑥 (4.55)
where 𝑁𝑥 is the number of surface reactions either surface sorption (4 reactions) or complexation
(6 reactions). The rate of formation or consumption of different aqueous component during mineral
dissolution or precipitation is given by:
𝑟𝑖,𝑚 = 𝑠𝑤 ∑ 𝜈𝑖𝛽 𝑟𝛽
𝑅𝑚
𝛽=1
𝑓𝑜𝑟 𝑖 = 1,… . . , 𝑁𝑚 + 𝑁𝑎𝑞 (4.56)
where 𝑠𝑤 is the water saturation (fraction) and 𝜈𝑖𝛽 is the the stoichiometry coefficient of the i-th
component in mineral reaction 𝛽. The same equation as eq. 4.56 can be written for the rate of
production or destruction of an aqueous component from an equilibrium reaction, 𝛼. However, the
rate law in eq. 4.56 does not directly apply to equilibrium reactions because they are considered
extremely fast. An approximate description of the equilibrium reaction would require an infinite
rate constant. The application of eq. 4.56 will result in an infinite reaction rate for the components
engaged in equilibrium reactions. Therefore, the equilibrium term, 𝑟𝑖,𝑎𝑞, in eq. 4.52 is often handled
by the application of a linear transformation known as Equilibrium Rate Annihilation (ERA)
matrix. Application of ERA matrix eliminates the equilibrium reaction terms and reduces the
number of equations sets by the number of equilibrium reactions. Detailed explanation can be
found in Nghiem et al. [252] and Nghiem et al. [253]. The discretized equation for mineral
components can be expressed as:
𝑅𝑖 =𝑉𝑏
∇𝑡(𝑁𝑖
𝑛 1 − 𝑁𝑖𝑛) − 𝑉𝑏𝑠𝑤
𝑛 1 ∑ 𝜈𝑖𝛽
𝑅𝑚
𝛽=1
𝑟𝛽𝑛 1 𝑓𝑜𝑟 𝑖 = 1,… . . , 𝑁𝑚 (4.57)
It is crucial to ensure that the difference between the sum of phase volumes and the pore volumes
be equal to zero by employing the volume constraint equation

105
∑ [∑ 𝑁𝑖𝑗
𝑁𝑡𝑖=1
𝑛 1
(𝜌𝑗 𝑠𝑗)𝑛 1 ]
𝑗=𝑜,𝑔,𝑎𝑞− 𝜙𝑛 1 = 0 (4.58)
The phase saturation is calculated using eq. 4.59 while satisfying the normalization condition in
eq. 4.60.
𝑠𝑗 =
∑ 𝑁𝑖𝑗𝑁𝑡𝑖=1
𝜌𝑗
∑ [∑ 𝑁𝑖𝑗
𝑁𝑡
𝑖=1𝜌𝑗
]𝑗=𝑜,𝑔,𝑎𝑞
(4.59)
∑ 𝑠𝑗𝑗=𝑜,𝑔,𝑎𝑞
= 1 (4.60)
Initial and Boundary Conditions: The initial conditions are set by an appropriate choice of
variables such as pressure, saturation, and concentrations at the initial time. A typical choice of the
initial conditions representing a laboratory water flood test is homogeneous initial saturation,
pressure and species concentrations. The boundary conditions are specified such that the reservoir
is surrounded by impermeable sides and no flow boundary condition applies. Meanwhile, the inner
boundary conditions can be specified as injection/production rates or inlet well pressure, and the
outer boundary condition is usually given by the outlet well pressure. For a typical laboratory test
domain with a cylindrical shape, one facet corresponds to the injection surface (inlet), the other
facet corresponds to the production surface (outlet), and the side surface is impermeable.
Numerical Solution Approach: The total components in the aqueous phase (𝑁𝑎𝑞) consist of soluble
hydrocarbon components (𝑁𝑐) and aqueous components (𝑁𝑎). The elimination of the equilibrium
reactions term from eq. 4.54 using ERA matrix reduces the discretized for aqueous components to
only primary aqueous components. Then, the number of all conservation equations including
hydrocarbon and aqueous components becomes 𝑁𝑖𝑎 + 𝑁𝑐. The addition of 𝑁𝑥 conservation
equations for 𝑁𝑘 surface sorbed/complexed species given by eq. 4.55 and 𝑁𝑖𝑎 + 𝑁𝑐 conservation
equations eliminates the equilibrium term accounting for sorption/complexation reaction rates.
Hence, the discretized equation for 𝑁𝑖𝑎 + 𝑁𝑐 components can be expressed as:

106
𝑅𝑖 = 𝑉𝑏
∇𝑡((𝑁𝑖 + ∑ 𝜈𝑖𝛼 𝑁𝛼
𝑁𝑎
𝛼=𝑁𝑖𝑎 1
+ ∑ 𝜈𝑖𝑘 𝑁𝑘
𝑁𝑥
𝑘=1
)
𝑛 1
− (𝑁𝑖 + ∑ 𝜈𝑖𝛼 𝑁𝛼
𝑁𝑎
𝛼=𝑁𝑖𝑎 1
+ ∑ 𝜈𝑖𝑘 𝑁𝑘
𝑁𝑥
𝑘=1
)
𝑛
)
− ∑ [∆𝑇𝑗𝑢 (𝑦𝑖𝑗 + ∑ 𝜈𝑖𝛼 𝑦𝛼𝑗
𝑁𝑎
𝛼=𝑁𝑖𝑎 1
)
𝑢
∆Φ𝑗𝑢
𝑗=𝑜,𝑔,𝑎𝑞
− ∆𝐷𝑖𝑗𝑢 (∆𝑦𝑖𝑗 + ∑ 𝜈𝑖𝛼 ∆𝑦𝛼𝑗
𝑁𝑎
𝛼=𝑁𝑖𝑎 1
)
𝑢
] − 𝑉𝑏𝑠𝑤𝑛 1 ∑ 𝜈𝑖𝛽
𝑅𝑚
𝛽=1
𝑟𝛽𝑛 1
− 𝑞𝑖𝑛 1 𝑓𝑜𝑟 𝑖 = 1,… . . , 𝑁𝑖𝑎 + 𝑁𝑐 (4.61)
There are 𝑁 = 𝑁𝑖𝑎 + 3𝑁𝑐 + 𝑁𝑥 + 𝑅𝑎𝑞 + 𝑁𝑚 + 1 nonlinear algebraic differential equations that
can be used to find solutions to the same number of unknown variables as summarized below:
• 2𝑁𝑐 phase-equilibrium equations [eqs. 4.4 and 4.5]
• 𝑅𝑎𝑞 chemical equilibrium equations [eq. 4.7]
• 𝑁𝑥 surface sorption [eqs. 4.25, 4.34 – 4.36] or complexation equations [eq. 4.47]
• 𝑁𝑖𝑎 + 𝑁𝑐 hydrocarbon and aqueous component conservation equations [eq. 4.61]
• 𝑁𝑚 mineral component conservation equations [eq. 4.57]
• Volume-constraint equation [eq. 4.58]
The identified primary unknown variables are:
• Pressure
• Summed number of moles of hydrocarbon components in all phases, 𝑁𝑖 𝑓𝑜𝑟 𝑖 = 1,… . . , 𝑁𝑐
• Number of moles of aqueous (primary and secondary) components, 𝑁𝑖 𝑓𝑜𝑟 𝑖 = 1,… . . , 𝑁𝑎
• Number of moles of hydrocarbon components soluble in the aqueous phase, 𝑁𝑖,𝑎𝑞
• Number of moles of hydrocarbon components in the gaseous phase, 𝑁𝑖,𝑔 𝑓𝑜𝑟 𝑖 = 1,… . . , 𝑁𝑐
• Number of moles of minerals, 𝑁𝑖 𝑓𝑜𝑟 𝑖 = 1,… . . , 𝑁𝑚
• Number of moles of sorbed or complexed species, 𝑁𝑖 𝑓𝑜𝑟 𝑖 = 1,… . . , 𝑁𝑥
For more detailed information about the numerical solution approach used to solve the non-linear
systems of algebraic equations, reference is made to the work of Behie et al. [266], Nghiem and

107
Rozon [267] and Nghiem et al. [252]. This solution method allows simultaneous convergence of
the transport, phase-equilibrium, chemical equilibrium, reaction kinetic equations using Newton’s
iteration method at each time step of the form:
𝜉 (𝑘 1) = 𝜉 (𝑘) − 𝐽�� 1 (𝑅(𝜉) )
(𝑘)
(4.62)
where 𝑅(𝜉) is the vector of all grid-block system of 𝑁 algebraic equations including well
constraints; 𝜉 is the vector of 𝑁 reservoir unknown variables including bottom-hole flowing
pressure; 𝐽�� = (𝜕𝑅(𝜉)
𝜕�� )𝑘
is the Jacobian matrix of the system of 𝑁 algebraic equations. The
Jacobian matrix in eq. 4.62 is a sparse matrix that is solved by a preconditioned Incomplete LU
(ILU) factorization method followed by the GMRES iterative method until the iterations
converged. The convergence is achieved when the residual norm is less than the desired tolerance
value. The development of this numerical model was carried out in CMG GEMTM. The usage of
an adaptive-implicit method for discretization means that some grid blocks are treated as implicit
pressure, explicit compositions and saturations (IMPECS) blocks and others are treated as fully
implicit. For both cases, the phase equilibrium equations (eq. 4.4 and 4.5), the chemical
equilibrium equations (eq. 4.7), sorption/complexation reaction equations (eqs. 4.25, 4.34 – 4.36,
4.47), mineral material balance equations (eq. 4.57) and the volume constraint equation (eq. 4.58)
do not involve variables in neighboring grid blocks and they are eliminated in a pre-processing
step through a partial Gaussian elimination. The partial Gaussian elimination decouples all
equations except the conservation equation to solve pressure and moles of 𝑁𝑖𝑎 + 𝑁𝑐 components
for implicit blocks, while other variables are calculated through back substitution. In the case of
IMPECS blocks, only the pressure variable is solved from the conservation equations and other
variables are explicitly calculated. During each time step calculation, the phase saturations are
calculated using eq. 4.60, while the flow functions are updated as described below.
Summary of Experimental Data
The model was validated by comparing its performance with independently-sourced experimental
data. Here, single-phase flow-through tests conducted on similar rock type were used to study the

108
surface chemistry and retrieve thermodynamic parameters. The linear 1-D simulations considered
for all core experiments were discretized uniformly into 200 × 1 × 1 grid blocks to reduce
numerical dispersion effects with the properties described in Table 4.2. As previously mentioned,
one major challenge is the uncertainty in the input parameters for the surface reactions and to
overcome this challenge, validation of the model with the observed experimental trend was
conducted, and the output was used in predicting different brine-dependent recovery cases in
Chapter 5. The reported effluent concentrations of PDIs were used to track surface composition
changes with fluid compositions listed in Table 4.3.
Table 4.2—Summary of core properties used in simulating different single-phase flow through experiments
to retrieve thermodynamic parameters for intact carbonate rocks.
Property Core 2-21a Core CM-1b Core 1/4a Core 7/1c LSSK#5d SCC#1d
Core type material
Middle Eastern
reservoir
limestone
Stevns Klint
outcrop chalk
Stevns Klint
outcrop chalk
Stevns Klint
outcrop chalk
Stevns Klint
outcrop chalk
Stevns Klint
outcrop chalk
Porosity (%)f 24.7 47.1 45 48.9 46 45
Mineral Volume (%)
Calcite
Dolomite
69.2
6.1
52.9
55
51
54
55
Permeability (mD) 2.7 1.2 2.5 2.5 2 2
Saturation fluids
Initial water
Saturation (%)
AN (mg KOH/g oil)
ZP
100
ZP
100
SW-U
100
SW-U
100
SW-0T
10
1.90
SW-0T
100
Operating conditions
Pressure (psi)
Temperature (ºC)
Flow Rate (cm3/min)
101.5
20,70,100,130
0.1
101.5
23, 130
0.2
101.5
23
0.2
101.5
23,70,100,130
0.2
101.5
23
0.2
101.5
23
0.2
Core Dimensions
Diameter (cm)
Length (cm)
Pore Volume (cm3)
3.78
4.91
13.6
3.57
6.23
29.3
3.78
7.30
36.9
3.81
8.00
44.7
3.81
7.00
36.7
3.81
7.00
35.9
Note: The specific surface area for calcite in limestone and chalk cores were retrieved from Shariatpanahi et al.
[112] as 0.29 m2/g and 1.70 m2/g respectively. Sources: a Data retrieved from Strand et al. [53], b Data retrieved from
Zhang et al. [32], c Data retrieved from Strand et al. [54], and d Data retrieved from Fathi et al. [38]. f The porosity
values used for simulating chalk experiments were approximated from the range of porosity given in the respective
references.

109
With the intention of analyzing the interplay between the PDI cations (Ca2+ and Mg2+), the data
reported by Strand et al. [53] and Zhang et al. [32] at different temperatures was examined, even
though they belong to different rock lithology. In the work by Zhang et al. [32] on outcrop chalk
cores, core plugs were initially fully saturated with ZP brine and flooded with CF-M brine at 23
and 130 °C. It was emphasized that production of both ions was delayed as compared to the tracer
ion (SCN-), and Ca2+ was adsorbed more on the surface at 23 °C, while at 130°C, Mg2+ was
adsorbed more and it substituted Ca2+ at the surface. Likewise, Strand et al. [53] used similar brines
at a lower injection rate on Middle Eastern limestone cores at 20, 70, 100 and 130 °C. More
comprehensive observations were made similar to that of Zhang et al. [32], where Mg2+ adsorbed
more than Ca2+, and no substitution at the surface was reported. However, this interplay was
reported to behave differently in the presence of PDI anion (SO42-).
Table 4.3—Fluid compositions and properties used in the simulation.
Ions (M) ZP CF-M SW-U SW-½M SW-M SW-0T SW-1T
Na+ 0.573 0.504 0.500 0.475 0.450 0.460 0.393
K+ 0 0 0.010 0.022 0.034 0.010 0.034
Li+ 0 0 0 0 0 0 0.024
Ca2+ 0 0.013 0.013 0.013 0.013 0.013 0.013
Mg2+ 0 0.013 0.045 0.045 0.045 0.045 0.045
HCO3- 0 0 0.002 0.002 0.002 0.002 0.002
Cl- 0.573 0.556 0.623 0.574 0.525 0.583 0.492
SCN- 0 0.013 0 0.012 0.024 0 0.024
SO42- 0 0 0 0.012 0.024 0 0.024
TDS (g/L) 33.39 33.40 35.71 35.68 35.72 33.39 33.39
Ionic Strength 0.573 0.589 0.684 0.680 0.682 0.644 0.649
Note: ZP brine contains 0.573M NaCl—similar ionic strength with seawater (SW); CF-M brine contains equal
amount of Ca2+ and Mg2+ and SCN-—also similar ionic strength with SW; SW-U/SW-0T, seawater-like brine with no
SO42- and SCN-; SW-½M, seawater-like brine with equal amount of SO4
2- and SCN-, but half of SO42- in SW; SW-
M/SW-1T, seawater-like brine with equal amounts of SO42- and SCN-, but same amount as SO4
2- in SW; and CF-M,
NaCl solution with equal amounts of Ca2+, Mg2+ and SCN−, but same amount as Ca2+ in SW. Sources: Data with ZP,
CF-M retrieved from Zhang et al. [32] and Strand et al. [53]; SW-U, SW-M retrieved from Strand et al. [54]; SW-0T
and SW-1T retrieved from Fathi et al. [38]. The pH was not reported in these studies references, but was adapted after
pH values reported for brines with similar ionic strength in the work of Gupta et al. [61] at 95 ºC, pH 6 — ionic
strength of about 3.63 for a typical reservoir FW and pH of 6.7 — ionic strength about 0.66 for typical SW.
In the work of Strand et al. [54], the cores initially saturated with SW-U were flooded with SW-
M at 23, 40, 70, 100 and 130 °C to evaluate the inherent behavior in the presence of SO42-. A delay

110
in the concentration of SO42- in the effluent was observed as compared to the tracer ion and the
delay increased with temperature. Meanwhile, in the presence of increased SO42- adsorption, Ca2+
concentration in the effluent also decreased with temperature (though Mg2+ effluent concentrations
were not reported). This trend indicates that the interplay between the PDI cations is reversed as
compared to the trend observed in the absence of PDI anion. On the contrary, considering other
studies by Zhang et al. [32], Strand et al. [53] and Shariatpanahi et al. [112], where changes in
molar concentrations of PDIs were monitored with temperature during seawater flooding in
seawater-saturated cores. It was observed that SO42- affinity and PDI cations interplay (where Mg2+
adsorbed more than Ca2+) increased with temperature. However, it was only evident, at
temperatures above 100 °C, that Mg2+ substituted Ca2+.
Validation of Surface Sorption Model
For the wide range values for site capacity, 3 sites/nm2 equivalent to 4.98 μmol./m2 or μeq/m2 was
assumed in this validation. Therefore, all obtained thermodynamic parameters are based on this
specific value of site capacity. The dispersion/diffusion coefficient was determined by reproducing
the effluent concentration curves of the tracer ions (SCN-) from each flow-through experiment.
4.5.1 Temperature-Dependent Competition between PDI cations:
Limestone: At first, the competition between Ca2+ and Mg2+ in the absence of PDI anion
documented in the study by Strand et al. [53] was modeled at different temperatures with
experimental details as listed in Table 4.2. The results, in terms of relative concentrations of the
effluent to those injected, are shown in Figure 4.2, where the simulated concentration profiles fit
well with that of the experiments. The simulated profiles were obtained without considering the
surface adsorption reaction R16 and mineral reactions R13-R15. The fact that the relative
concentrations of Ca2+ and Mg2+ reached one later than that of SCN- at all considered temperature
indicates that SCN- did not participate in the surface chemistry and it behaved as inert. The tracer
ion travels with no retention as it breakthroughs sooner compared to the retarded PDI cations. At
the low temperatures of 20 and 70 °C, both Ca2+ and Mg2+ showed nearly similar affinity towards
the rock surface; however, Ca2+ adsorbed more at 20 °C while Mg2+ adsorbed more at 70 °C.

111
Figure 4.2—Simulated and experimental breakthrough curves of Ca2+ and Mg2+ from CF-M brine on
limestone core 2-21 at various experimental temperatures: 20 °C (top left), 70 °C (top right), 100 °C (bottom
left), and 130 °C (bottom right). Data points connote measured datasets, and solid-lines represent the model
results; subscripts “𝑒𝑥𝑝” and “𝑚𝑜𝑑” in the legend are the experimental (Strand et al. [53]) and predicted
values
When the temperature was increased to 100 and 130 °C, Mg2+ became more strongly adsorbed
compared to Ca2+ as indicated by the larger adsorption area in Figures 4.2. This trend was captured
by interpolating between exchange coefficients ratios (ratio of exchange coefficient for reaction
R17 over that of R18) reported in Table 4.4 for the considered temperature. The exchange
coefficient ratio is less than one at 20 °C because Ca2+ adsorbed comparably more than Mg2+ and
exponentially increased as temperature increased indicating increased Mg2+ adsorption (see Figure
4.3). Consequently, the set of exchange coefficients so obtained has been proven to be valid by
perfectly reproducing the breakthrough curves at 100 °C. Similarly, the areas between Ca2+ and
Mg2+ simulated curves and SCN- simulated curve (known as the adsorption area) was also
calculated at the different temperatures. It was noted that when the temperature is increased, an
increase in the Mg2+ adsorption area is accompanied by a simultaneous decrease in the adsorption
area for Ca2+ (see the calculated areas in Figure 4.2). The impact of the increased exchange
0
0.2
0.4
0.6
0.8
1
1.2
0 0.5 1 1.5 2
C/C
0
Pore Volume Injected
Ca_expMg_expSCN_expCa_modMg_modSCN_mod
0
0.2
0.4
0.6
0.8
1
1.2
0 0.5 1 1.5 2
C/C
0
Pore Volume Injected
Ca_expMg_expSCN_expCa_modMg_modSCN_mod
0
0.2
0.4
0.6
0.8
1
1.2
0 0.5 1 1.5 2
C/C
0
Pore Volume Injected
Ca_expMg_expSCN_expCa_modMg_modSCN_mod
0
0.2
0.4
0.6
0.8
1
1.2
0 0.5 1 1.5 2
C/C
0
Pore Volume Injected
Ca_expMg_expSCN_expCa_modMg_modSCN_mod
𝐴𝐶𝑎 𝐴𝑀𝑔
0.187 0.1255
𝐴𝐶𝑎 𝐴𝑀𝑔
0.134 0.154
𝐴𝐶𝑎 𝐴𝑀𝑔
0.127 0.272
𝐴𝐶𝑎 𝐴𝑀𝑔
0.109 0.288

112
coefficient ratios with temperature could also be seen on the equivalent fractions of Ca2+ and Mg2+
on the rock surface in Figure 4.4. The difference between the two ions adsorbed on the rock
becomes larger as temperature increased beyond 70 °C. As previously highlighted in Chapter 3
(see Table 3.1), Mg2+ has a lower ionic radius and it becomes strongly hydrated because of its
lower hydration energy compared to Ca2+, which is why at an elevated temperature Mg2+ partly
dehydrates and becomes more reactive.
Table 4.4—Surface reactions and summary of equilibrium constants at different temperatures. These values
were obtained from the best-matched simulation run after conducting a series of simulation
Surface Sorption Reactions
𝐋𝐨𝐠𝑲𝒆𝒙
𝑻 = 𝟐𝟎 ℃ 𝑻 = 𝟕𝟎 ℃ 𝑻 = 𝟏𝟑𝟎 ℃
𝑁𝑎 +1
2> 𝐶𝑎𝑋 ⟺
1
2𝐶𝑎 + > 𝑁𝑎𝑋 (1) -1.208 -1.444 -1.237
𝑁𝑎 +1
2> 𝑋 ⟺
1
2 + > 𝑁𝑎𝑋 (2) -1.125 -1.468 -1.398
Exchange coefficient ratios 0.833 1.058 1.450
Exchange coefficient ratios with maximum sulfate adsorbed 0.416 0.417 1.000
> 𝑋 + 𝑆 ⟺ > 𝑋𝑆
(3) 2.477 2.778 3.130
Figure 4.3—Relationship of exchange and isotherm coefficients with temperature
Kratio = 0.7366e0.0055T
Kratio = 9E-05T2 - 0.0082T + 0.5447
KS3 = 2.3814e0.0021T
0
0.5
1
1.5
2
2.5
3
3.5
0
0.2
0.4
0.6
0.8
1
1.2
1.4
1.6
1.8
0 20 40 60 80 100 120 140
Log
arithm
ic Isoth
erm
Co
efficie
ntE
xch
ang
e C
oe
ffic
ien
t rat
ios
Temperature (oC)
Exch_ratio
Exch_ratio_SO4
Isotherm

113
Figure 4.4—Simulated surface fractions of Ca2+ (> 𝐶𝑎𝑋 ) and Mg2+ (> 𝑋 ) along the mid-section of
the limestone core 2-21 at various experimental temperatures: 20 °C (top left), 70 °C (top right), 100 °C
(bottom left), and 130 °C (bottom right)
Chalk: Chalks are often considered to have a higher surface area and reactivity compared to
limestones. A similar study conducted on Stevns Klint chalk by Zhang et al. [32] was examined
to see if similar exchange coefficients listed in Table 4.4 could be used to replicate the
experimental concentration profiles. Figure 4.5 shows that the experimental data at 23 and 130 °C
could be fitted into the model with similar exchange coefficient values and ratios, which further
validates the exchange coefficient. The breakthrough curve of chalk at 23 °C showed a wider gap
between Ca2+ and Mg2+ curves compared to the limestone breakthrough curve at 20 °C in Figure
4.2. The systematic differences between the predicted and experimental curves (Figure 4.5) could
be because the exact porosity for this experiment was not reported, hence the exact exchange
capacity could not be used. However, the breakthrough curve of chalk in Figure 4.5 was
nevertheless fairly reproduced by the same exchange coefficients. Meanwhile, the breakthrough
curve at 130 °C showed a much more Mg2+ adsorption and possible substitution of Ca2+ by Mg2+,
which the model captured reasonably well. Modeling of different rock lithologies with same
exchange coefficients suggests that there is no significant discrepancy with respect to the interplay
0
0.1
0.2
0.3
0.4
0.5
0.6
0 0.5 1 1.5 2
Eq
uiv
ale
nt
Frac
tio
ns
Pore Volume Injected
Ca_modMg_mod
0
0.1
0.2
0.3
0.4
0.5
0.6
0 0.5 1 1.5 2
Eq
uiv
ale
nt
Frac
tio
ns
Pore Volume Injected
Ca_mod
0
0.1
0.2
0.3
0.4
0.5
0.6
0 0.5 1 1.5 2
Eq
uiv
ale
nt
Frac
tio
ns
Pore Volume Injected
Ca_modMg_mod
0
0.1
0.2
0.3
0.4
0.5
0.6
0 0.5 1 1.5 2
Eq
uiv
ale
nt
Frac
tio
ns
Pore Volume Injected
Ca_modMg_mod

114
between Ca2+ and Mg2+ at the different rock surfaces even though they have different diagenesis
and surface area.
Figure 4.5—Simulated and experimental breakthrough curves of Ca2+ and Mg2+ from CF-M brine on chalk
core CM-1 23 °C (left) and 130 °C (right). Data points connote measured datasets from Zhang et al. [32],
and lines represent the model results.
4.5.2 Competition between PDI cations in the presence of PDI anion:
The next step in the surface chemistry study was to consider the interplay between the cations in
the presence of SO42-. It was further demonstrated that no significant difference exists between the
interplay at chalk and limestone surfaces by analyzing the room-temperature data of Strand et al.
[127] on chalk cores and Strand et al. [53] on limestone cores. It is to be noted that in both sets of
experiments, the rock was initially saturated with SW-U. In the study by Strand et al. [53], the
pore fluid was displaced by SW-½M, which is a similar seawater-like brine but containing 0.012M
of SO42- and SCN-. As shown in Figure 4.6, the concentration of Ca2+ and Mg2+ were comparably
close to the initial pore fluid concentration, and both concentrations remained consistent until the
breakthrough of SO42- at the core outlet. It is noted yet again that SO4
2- is delayed compared to the
tracer ion SCN- indicating the affinity of SO42- to the rock surface. Because of SO4
2- adsorption,
Ca2+ was co-adsorbed, resulting in its decreased effluent concentration as compared to Mg2+. The
interplay observed between the PDI cation is quite like what was observed when both ions were
present in equal concentrations at 20 C (see Figure 4.2). Therefore, the first modeling attempt was
to use the exchange coefficients previously established. However, as evident from Figure 4.6
(dotted line), this attempt failed to replicate the experiment results. This suggests that the
0
0.2
0.4
0.6
0.8
1
1.2
0 0.2 0.4 0.6 0.8 1 1.2 1.4 1.6 1.8 2
C/C
0
Pore Volume Injected
Ca_expMg_expSCN_expCa_modSCN_modMg_mod
0
0.2
0.4
0.6
0.8
1
1.2
1.4
1.6
1.8
2
0 0.5 1 1.5 2 2.5 3 3.5
C/C
0
Pore Volume Injected
Ca_expMg_expSCN_expCa_modMg_modSCN_mod

115
established exchange coefficients used were not enough to capture the dynamic interplay triggered
by the presence of SO42-. However, SO4
2- and SCN- breakthrough curves were reasonably
replicated using isotherm coefficient reported in Table 4.4.
Figure 4.6—Simulated and experimental breakthrough curves of Ca2+, Mg2+ and SO42- at room temperature
from SW-½M brine on limestone core 2-21 (top left), SW-M brine on chalk core ¼ (bottom left), and
simulated surface fractions of Ca2+ (> 𝐶𝑎𝑋 ), Mg2+ (> 𝑋 ) and SO42- (> 𝑋𝑆
) along the core mid-
section of the limestone core 2-21 (top right) and chalk core ¼ (bottom right). Data points connotes
measured datasets from Strand et al. [53] as plotted in the top left panel and from Strand et al. [127] as
plotted in the top right panel, lines represent the model results and the dotted lines represent the first attempt
at modeling the experimental data
On further consideration, an interpolation technique was used where the upper boundary is the
established exchange coefficients when SO42- is absent and the lower boundary is the exchange
coefficient ratios at maximum SO42- adsorption as illustrated in Figure 4.3. The corresponding
exchange coefficient ratio is obtained by interpolation between these boundary values using the
corresponding amount of adsorbed SO42- (see Table 4.4). Key steps adopted in obtaining the
representative thermodynamic parameters are explained using below conceptual flow diagram.
0
0.2
0.4
0.6
0.8
1
1.2
0 0.5 1 1.5 2
C/C
0
Pore Volume Injected
Ca_expMg_expSO4_expSCN_expCa_mod1Mg_mod1Ca_mod2Mg_mod2SO4_modSCN_mod
0
0.01
0.02
0.03
0.04
0.05
0
0.1
0.2
0.3
0.4
0.5
0.6
0 0.5 1 1.5 2
So
rbe
d Factio
ns
Eq
uiv
ale
nt
Frac
tio
ns
Pore Volume Injected
Ca_mod1
Mg_mod1
Ca_mod2
Mg_mod2
0
0.01
0.02
0.03
0.04
0.05
0.06
0.07
0.08
0
0.1
0.2
0.3
0.4
0.5
0.6
0.7
0 0.5 1 1.5 2
So
rbe
d Factio
ns
Eq
uiv
ale
nt
Frac
tio
ns
Pore Volume Injected
Ca_modMg_modSO4_mod
0
0.2
0.4
0.6
0.8
1
1.2
0 0.5 1 1.5 2
C/C
0
Pore Volume Injected
Ca_expMg_expSO4_expSCN_expCa_modMg_modSO4_modSCN_mod
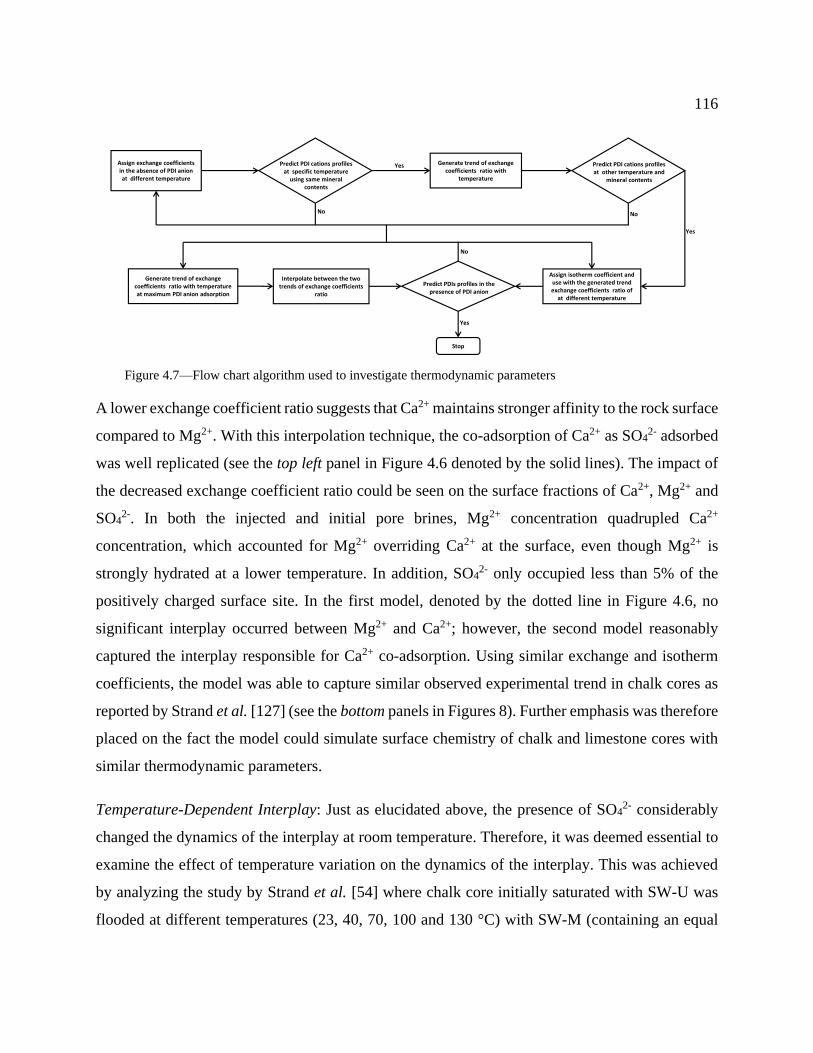
116
Figure 4.7—Flow chart algorithm used to investigate thermodynamic parameters
A lower exchange coefficient ratio suggests that Ca2+ maintains stronger affinity to the rock surface
compared to Mg2+. With this interpolation technique, the co-adsorption of Ca2+ as SO42- adsorbed
was well replicated (see the top left panel in Figure 4.6 denoted by the solid lines). The impact of
the decreased exchange coefficient ratio could be seen on the surface fractions of Ca2+, Mg2+ and
SO42-. In both the injected and initial pore brines, Mg2+ concentration quadrupled Ca2+
concentration, which accounted for Mg2+ overriding Ca2+ at the surface, even though Mg2+ is
strongly hydrated at a lower temperature. In addition, SO42- only occupied less than 5% of the
positively charged surface site. In the first model, denoted by the dotted line in Figure 4.6, no
significant interplay occurred between Mg2+ and Ca2+; however, the second model reasonably
captured the interplay responsible for Ca2+ co-adsorption. Using similar exchange and isotherm
coefficients, the model was able to capture similar observed experimental trend in chalk cores as
reported by Strand et al. [127] (see the bottom panels in Figures 8). Further emphasis was therefore
placed on the fact the model could simulate surface chemistry of chalk and limestone cores with
similar thermodynamic parameters.
Temperature-Dependent Interplay: Just as elucidated above, the presence of SO42- considerably
changed the dynamics of the interplay at room temperature. Therefore, it was deemed essential to
examine the effect of temperature variation on the dynamics of the interplay. This was achieved
by analyzing the study by Strand et al. [54] where chalk core initially saturated with SW-U was
flooded at different temperatures (23, 40, 70, 100 and 130 °C) with SW-M (containing an equal
Assign exchange coefficients in the absence of PDI anion at different temperature
Generate trend of exchange coefficients ratio with
temperature
Yes
No
Predict PDI cations profiles at specific temperature
using same mineral contents
No
Assign isotherm coefficient and use with the generated trend exchange coefficients ratio of
at different temperature
Stop
Yes
Predict PDI cations profiles at other temperature and
mineral contents
Predict PDIs profiles in the presence of PDI anion
Interpolate between the two trends of exchange coefficients
ratio
No
Yes
Generate trend of exchange coefficients ratio with temperature at maximum PDI anion adsorption

117
amount of SO42- and SCN-). At 23 °C, the observed trend is similar to that reported by Strand et
al. [127], which the model excellently captured in Figure 4.6. The experimental and simulated
breakthrough curves at various temperatures (40, 70, 100 and 130 °C) are shown in Figure 4.8.
The areas between the tracer and SO42- breakthrough curves (known as SO4
2- adsorption area)
increased as the temperature increased, which indicates that SO42- adsorption to the positively
charged surface site steadily increased with temperature. This increase in SO42- adsorption appears
to be more pronounced as the temperature is raised above 100 °C. The trend of increased SO42-
adsorption is captured by the increasing isotherm coefficient presented in Figure 4.3.
Figure 4.8—Simulated and experimental breakthrough curves of Ca2+, Mg2+, SCN-, and SO42- from SW-M
brine on chalk core 7/1 at various experimental temperatures: 40 °C (top left), 70 °C (top right), 100 °C
(bottom left), and 130 °C (bottom right). Experimental data are taken from Strand et al. [54].
A similar approach used to capture the interplay between PDI cations at room temperature was
also applied to capture the interplay at 70 °C. This was also tested to predict the interplay at 40 °C.
The resulting simulated breakthrough curves perfectly reproduced the experimental curves as
shown in Figure 4.8. Same exchange coefficient ratio was maintained to capture the increased co-
adsorption of Ca2+ as SO42- adsorption increased with temperature. However, at higher
0
0.2
0.4
0.6
0.8
1
1.2
0 0.5 1 1.5 2
C/C
0
Pore Volume Injected
Ca_expSO4_expSCN_expCa_ModMg_ModSO4_Mod
0
0.2
0.4
0.6
0.8
1
1.2
0 0.5 1 1.5 2 2.5
C/C
0
Pore Volume Injected
Ca_expSO4_expSCN_expCa_ModMg_ModSO4_ModSCN_Mod
0
0.2
0.4
0.6
0.8
1
1.2
0 0.5 1 1.5 2 2.5
C/C
0
Pore Volume Injected
Ca_expSO4_expSCN_expCa_modMg_modSO4_ModSCN_Mod
0
0.2
0.4
0.6
0.8
1
1.2
0 0.5 1 1.5 2 2.5
C/C
0
Pore Volume Injected
Ca_expSO4_expSCN_expCa_modMg_modSO4_ModSCN_Mod

118
temperature, it has been reported that Mg2+ adsorbed more and even substituted Ca2+ at the rock
surface [32, 53, 112], an observation not captured by Strand et al. [54] in their study. Furthermore,
the authors mentioned that the co-adsorption of Ca2+ decreased as temperature goes beyond 70 °C.
Accordingly, an exchange coefficient ratio of one was maintained to imply that both Ca2+ and
Mg2+ have a similar affinity towards the rock surface because Mg2+ is strongly dehydrated and
becomes reactive at higher temperatures. This is validated by predicting the experimental
breakthrough curves at 100 and 130 °C as presented in the bottom panels of Figure 4.8, where a
reduced co-adsorption of Ca2+ was observed as mentioned by Strand et al. [54]. With this
conjecture, the model provides a solution with a reasonable agreement to other experimental
datasets as will be discussed subsequently.
4.5.3 Competition between PDIs in the presence of oil
Having obtained a complete set of thermodynamic parameters to describe the surface sorption
reactions, the effect of oil saturation on the interplay between the PDIs was then analyzed. In a
chromatographic wettability experiment conducted by Fathi et al. [38], a reference water-wet core
(SCC#1) was flooded with seawater (I = 0.657M) and the oil-wet core (LSSK#5) aged in oil of
acid number 1.90 mg of KOH/g initially saturated with Valhall formation water (I = 1.112M).
Afterwards, both cores were flooded with SW0T, and residual oil saturation was established in the
oil-wet core. For the wettability comparison, SW1T was flooded through both saturated cores
containing no SO42- and tracer ions (SCN- and Li+).
Using this data, two models were constructed to account for both cases using the established set
of thermodynamic parameters. As shown in Figure 4.9, a good agreement was obtained with the
experimental result. Surface sorption reactions, as well as other geochemical reactions considered
in this model, occurred only at the rock-brine interface. Therefore, the presence of oil was not
anticipated to influence the final aqueous phase composition, but the transport of PDIs back and
forth the rock-brine interface through the water film layer keeping the oil-brine interface apart. As
it is the case presented here in Figure 4.9, the oil-aged core gave an earlier breakthrough of SO42-
and SCN-, and a smaller adsorption area compared to the reference core because of the presence
of oil competing with the adsorbed PDIs at the rock surface. Their predicted Mg2+ and Ca2+
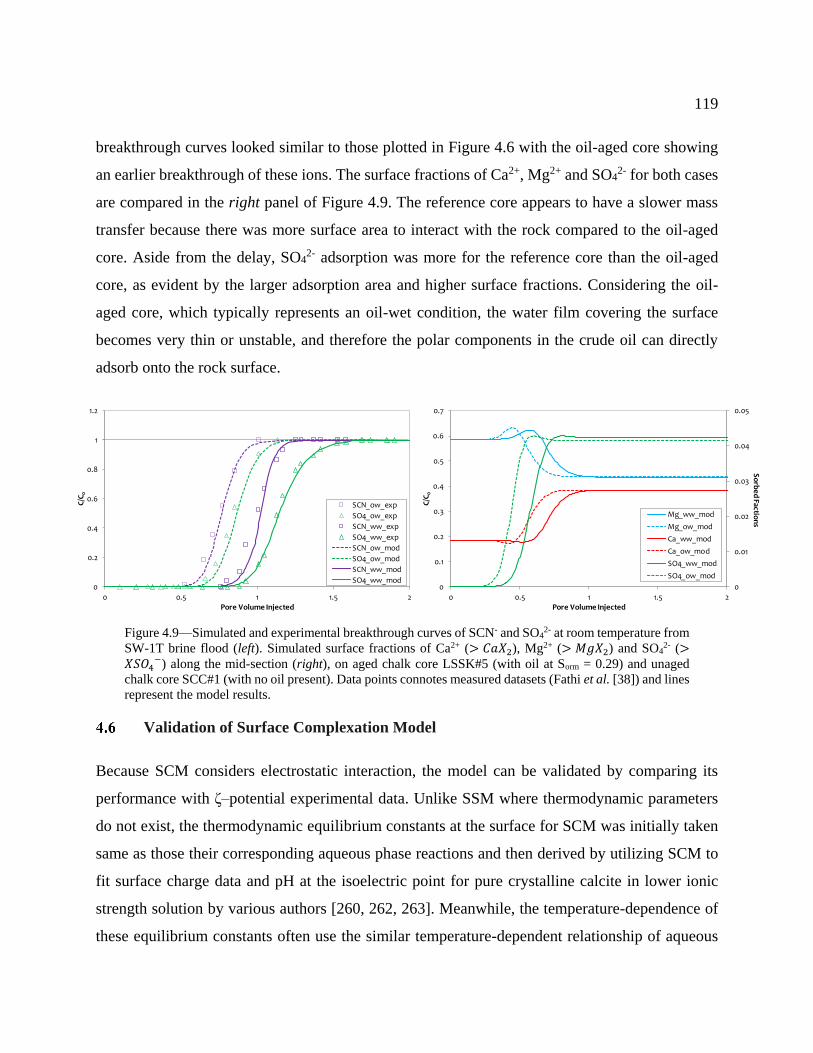
119
breakthrough curves looked similar to those plotted in Figure 4.6 with the oil-aged core showing
an earlier breakthrough of these ions. The surface fractions of Ca2+, Mg2+ and SO42- for both cases
are compared in the right panel of Figure 4.9. The reference core appears to have a slower mass
transfer because there was more surface area to interact with the rock compared to the oil-aged
core. Aside from the delay, SO42- adsorption was more for the reference core than the oil-aged
core, as evident by the larger adsorption area and higher surface fractions. Considering the oil-
aged core, which typically represents an oil-wet condition, the water film covering the surface
becomes very thin or unstable, and therefore the polar components in the crude oil can directly
adsorb onto the rock surface.
Figure 4.9—Simulated and experimental breakthrough curves of SCN- and SO42- at room temperature from
SW-1T brine flood (left). Simulated surface fractions of Ca2+ (> 𝐶𝑎𝑋 ), Mg2+ (> 𝑋 ) and SO42- (>
𝑋𝑆 ) along the mid-section (right), on aged chalk core LSSK#5 (with oil at Sorm = 0.29) and unaged
chalk core SCC#1 (with no oil present). Data points connotes measured datasets (Fathi et al. [38]) and lines
represent the model results.
Validation of Surface Complexation Model
Because SCM considers electrostatic interaction, the model can be validated by comparing its
performance with ζ–potential experimental data. Unlike SSM where thermodynamic parameters
do not exist, the thermodynamic equilibrium constants at the surface for SCM was initially taken
same as those their corresponding aqueous phase reactions and then derived by utilizing SCM to
fit surface charge data and pH at the isoelectric point for pure crystalline calcite in lower ionic
strength solution by various authors [260, 262, 263]. Meanwhile, the temperature-dependence of
these equilibrium constants often use the similar temperature-dependent relationship of aqueous
0
0.2
0.4
0.6
0.8
1
1.2
0 0.5 1 1.5 2
C/C
0
Pore Volume Injected
SCN_ow_exp
SO4_ow_exp
SCN_ww_exp
SO4_ww_exp
SCN_ow_mod
SO4_ow_mod
SCN_ww_mod
SO4_ww_mod0
0.01
0.02
0.03
0.04
0.05
0
0.1
0.2
0.3
0.4
0.5
0.6
0.7
0 0.5 1 1.5 2
So
rbe
d Factio
ns
C/C
0
Pore Volume Injected
Mg_ww_mod
Mg_ow_mod
Ca_ww_mod
Ca_ow_mod
SO4_ww_mod
SO4_ow_mod

120
phase reactions [47]. Table 4.5 shows various widely-used equilibrium stability constants for the
surface reactions R19-R24 reported in the literature at room temperature.
Table 4.5—Reported stability constants for the rock−brine surface reactions at room temperature
Stability Constants
𝐋𝐨𝐠𝑲𝒆𝒙 𝟐𝟓 ℃
Van Cappellen et al.
[262]
Pokrovsky et al.
[263] Hiorth et al. [47]
Brady and
Thyne [198] Qiao et al. [84] Mean ± SD
𝐾C1 -4.9 -5.1 -4.9 -5.1 -5.1 -5.02 ± 0.11
𝐾C 12.2 11.5 12.9 11.85 11.8 12.05 ± 0.54
𝐾C -2.8 -1.7 -3.16a -2.6 -2.6a -2.57 ± 0.54
𝐾C N/R -2.2 -3.17a -2.6 -2.6a -2.64 ± 0.40
𝐾C5 N/R N/R 2.1 2.1 2.1 2.1
𝐾𝐶6 3.35a 5.6a 3.32a 4.28a 6 4.51 ± 1.25
aNote: these constant values are not exactly reported in the cited publications but were estimated from the
combination of surface and aqueous reactions reported in these references. “N/R” connotes “no value is reported or
could be estimated” and SD connotes standard deviation.
4.6.1 Surface chemistry prediction comparison with zeta potential experiments
However, carbonate reservoir rocks are composed of calcite and other impurities and in a slightly
higher saline environment, which tends to affect the stability constants for surface complexation
reactions. Therefore, a more representative stability constant need to be derived for the SCM to
represent the carbonate rock-brine interactions. To begin with, the stability constants of the surface
reactions R19-R24 were optimized to fit the measured ζ–potential data of suspension of pulverized
Stevns Klint chalk reported by Austad and colleagues [32, 55]. The chalk suspension was prepared
by mixing 4 wt.% pulverized chalk with 0.573M NaCl solution and PDI concentrations in the
suspension were adjusted by gradually adding CaCl2, MgCl2, or Na2SO4 concentrated solutions.
The authors did not specify the pre-equilibration procedures, however, the equilibrium between
calcite in carbonate minerals and aqueous solution exposed to CO2 is achieved when most of the
carbonate ions (CO32-) formed during calcite dissolution are turned into bicarbonate ions (HCO3
-
), according to eqs. 4.63 and 4.64. For carbonate/water/CO2 equilibrium conditions, the aqueous
pH increases as hydroxide (OH-) ions are formed (eq. 4.63), and decreases as the hydroxide ions
are used up (eq. 4.64) until an equilibrium pH is achieved. Hence, in a simple open system, aqueous

121
solutions exposed to CO2 in the presence of calcite at 25 °C is reported to have an equilibrium pH
of 8.3–8.4 [104, 268].
𝐶𝑎𝐶 (𝑠) + 𝐻 ⟺ 𝐶𝑎 + 𝐻𝐶 + 𝐻 (4.63)
𝐶 2 + 𝐻 ⟺ 𝐻𝐶 (4.64)
Instead, Austad and colleagues [32, 54, 55] fixed the pH at 8.4 by the addition of HCl or NaOH
concentrated solutions to ensure the rock suspension achieve equilibrium prior to starting the
experimental measurements. For this reason, dissolution of atmospheric CO2 was not considered
because the pH was kept constant throughout the experimental measurement. For the fact that
pulverized samples were used, to eliminate rock porosity, the rock site capacity according to eq.
4.32 was taken as:
𝐶𝐸𝐶 = 𝛿𝑠𝐴𝛽𝜌𝑏 (4.65)
As earlier stated, the surface potential is directly calculated from the SCM, and the ζ-potential can
be indirectly calculated through: ζ = 𝜓𝑜(Δ) = 𝜓𝑜𝑒 𝜅Δ. Meanwhile, various authors [32, 55, 104,
120, 170] have shown that ζ-potential obtained from using particles suspension with
electrophoretic mobility measurement (EPM) differed from that obtained from intact rock cores
with streaming potential measurement (SPM). The contrast is associated with the difference in the
shear plane relative position to the charged mineral surface of particle suspension and natural
porous media [104]. For EPM with pulverized rock suspension, it has been demonstrated that the
shear plane corresponds to the Stern plane, hence 𝜉 = 𝜓𝑜 [104, 170]. With the intention of fitting
the predicted ζ-potential from SCM to ζ-potential experimental data, the objective function is
minimized such that:
min𝑥
‖𝑓(𝑥)‖ , 𝑥 ∈ ℱ = {𝑥 ∶ 𝑙 < 𝑥 < 𝑢} (4.66)
with
𝑓(𝑥) = ∑(ζ 𝑖, 𝑒𝑥𝑝 − ζ 𝑖, 𝑚𝑜𝑑)
𝑖
𝑓𝑜𝑟 𝑖 = 1,… . . , 𝑁ζ (4.67)
where 𝑁ζ is the total number of ζ-potential data points, 𝑙 and 𝑢 are the lower and upper bounds on
the stability constants and the subscripts “𝑒𝑥𝑝” and “𝑚𝑜𝑑” are the experimental and predicted ζ

122
potential values, respectively. The objective function with the batch calculation of the SCM by
solving eq. 4.47 using Newton’s iteration method is programmed in MATLAB. The output of the
batch calculation also compared well with same calculation conducted with PHREEQC reaction
module, as illustrated below. For the minimization of the objective function (eq. 4.66), the Trust-
region-reflective algorithm was utilized for nonlinear unconstrained optimization from the
MATLAB Optimization Toolbox package.
Similar to SSM, a wide range of surface site densities exist for SCM ranging from 2 to 8 sites/nm2
for carbonate rocks [261, 262]. Hiorth et al. [47] and Eftekhari et al. [220] stated that 2 sites/nm2
gave a better fit to the measured ζ-potential while Megawati et al. [161] stated that using 5
sites/nm2 gave a much better fit for all tested core types as compared to 2 sites/nm2. Hence, in this
research study, the effect of site densities on the stability constant optimization was tested by
utilizing 2—6 sites/nm2. The specific surface area of chalk is reported as about 2.0 m2/g in the
study by Zhang and Austad [55], but Shariatpanahi et al. [112] gave the exact value as 1.7 m2/g.
The upper and lower bounds of the stability constant for the minimization operation was taken as
no more than twice of the standard deviations of the mean values reported in Table 4.5. Since
CO32- and CO2 are not included in the aqueous solution, the equilibrium constants for reactions
R24, 𝐾C6, is not modified by the optimization operation. The stability constant results of fitting
the SCM to the ζ-potential data for varying site densities are compared in Table 4.6.
Table 4.6—Optimized stability constants derived from fitting pulverized carbonate ζ-potential
𝑺𝒅 (sites/nm2)
𝐋𝐨𝐠𝑲𝒆𝒙 𝟐𝟓 ℃
2 3 4 5 6
𝐾C1 -3.95 -3.85 -3.76 -3.72 -3.77
𝐾C 9.97 10.16 10.29 10.39 10.57
𝐾C -3.14 -3.23 -3.26 -3.33 -3.50
𝐾C -2.73 -2.82 -2.86 -2.93 -3.09
𝐾C5 1.63 1.44 1.31 1.21 1.20
Residual Norma 85.313 83.967 83.339 82.975 95.531
Relative Resnorma 0.984 0.977 0.973 1.119
aNote: The norm of the residuals is the measure of the deviation between the estimated value and the experimental
data. The relative residual norm is calculated as the deviation of estimated and experimental value relative to the site
density of 2 sites/nm2.

123
It can be observed that from Table 4.3 that as the site density increased, the measure of deviation
between measured and predicted ζ-potential values (also referred to as residual norm) decreased,
while the relative value of the residual norm compared to the residual norm at 2 sites/nm2 reduced
as the site density increased. This implies that increasing site density slightly decreased the
deviations but did not significantly improved the fit to the experimental data. As such, the relative
residual norm for 3 sites/nm2 was much higher as compared to other higher site densities, implying
that 3 sites/nm2 gave a better and optimized fit to the data as presented in Figure 4.10.
Figure 4.10—Comparison of measured and predicted ζ-potential for all PDI concentrations and varying
surface site densities (top left) and 3 sites/nm2, showing the variation with PDIs (top right), the contrast
between the prediction from this model and PHREEQC reaction module (bottom left). The solid black
diagonal line is 1:1 zero error line, i.e. ζ 𝑖, 𝑒𝑥𝑝 = ζ 𝑖, 𝑚𝑜𝑑, which shows the contrast between measured and
predicted values. ζ-potential measured by Austad and colleagues [32, 55] with stepwise addition of MgCl2,
CaCl2 or Na2SO4 to 0.573 M NaCl brine solution in 4 wt.% pulverized chalk suspension with pH maintained
at 8.4, compared against the predicted ζ-potential from SCM with optimized stability constants for 3
sites/nm2 as shown by solid lines (bottom right). The top (squares and circles) curves and data points is for
Mg2+ and Ca2+ additions, respectively; the bottom (diamonds) curve and data points is for SO42- additions.
PHREEQC prediction was plotted in dotted lines.
-30
-20
-10
0
10
20
30
-30 -20 -10 0 10 20 30
Pre
dic
ted
ζ-p
ote
nti
al (
mV
)
Experimental ζ-potential (mV)
2 sites/nm2
3 sites/nm2
4 sites/nm2
5 sites/nm2
-30
-20
-10
0
10
20
30
-30 -20 -10 0 10 20 30
Pre
dic
ted
ζ-p
ote
nti
al (
mV
)
Experimental ζ-potential (mV)
SO4
Ca
Mg
-30
-20
-10
0
10
20
30
-30 -20 -10 0 10 20 30
Pre
dic
ted
ζ-p
ote
nti
al (
mV
)
Predicted ζ-potential (mV)
SO4
Ca
Mg
-30
-20
-10
0
10
20
30
0 0.02 0.04 0.06 0.08 0.1 0.12
ζ-p
ote
nti
al (
mV
)
PDI Concentrations, mol/L
SO4 expCa expMg expSO4 modCa modMg modCa PhreeqcSO4 Phreeqc

124
There is no much difference in the variation observed for the considered site densities in Figure
4.10, which implies that site densities do not significantly affect the surface potential inasmuch the
corresponding stability constants are applied. Figure 4.10 also presents the variation in the
measured and predicted ζ-potential as the PDI compositions in the aqueous solution is changed.
The increment of SO42- resulted in more negatively charged carbonate surface while the addition
of Ca2+ and Mg2+ led to a positive surface and ζ-potential. The fit between the compared values in
Figures 4.10 is excellent, showing that the optimized stability constants at 3 sites/nm2 can predict
PDI adsorption and the surface potential of calcite very well.
Considering that the experiments carried out by Austad and colleagues [32, 54, 55] were conducted
using pulverized samples and mostly chalk formation, which is pure calcite, the obtained
thermodynamic constants might not be necessarily applicable to rock-brine interactions in natural
intact carbonates. This is because natural carbonates are often composed of various forms of
mineral impurities. In order to confirm this theory, the experimental data of Alroudhan et al. [104]
was utilized, where the ζ-potential of natural intact carbonate rock (limestone) was measured in
NaCl brine with different ionic strength and compositions. A pre-equilibration step was carried
out in an open system, as discussed above, where the core sample was saturated with the aqueous
solution as exposed to atmospheric CO2 to achieve equilibrium pH of 8.2±0.2 for 0.05 M and 0.5
M NaCl brines. After that, the ζ-potential measurement was carried out in a closed system where
the brine solution was repeatedly pumped through the sample until a new equilibrium is
established.
This study considered PDI cations variation in 0.05M NaCl brine conducted with both EPM and
SPM technique and PDI anions in 0.5M NaCl brine with SPM technique. Alroudhan et al. [104]
claimed that increment in injected concentrations of Ca2+ or Mg2+ reduced the pH to the range 7.2–
8, while SO42- caused a smaller change in the pH range of 7.9–8.1. For the SCM, the pH was
assumed to remain constant in the range specified above, as the experiments were conducted under
closed conditions. Besides, the pH was varied during the optimization operation to study the effect
of pH variation on stability constants. The specific surface area of limestone is reportedly less than
that of chalk, and Shariatpanahi et al. [112] reported a value of 0.29 m2/g. However, the effect of
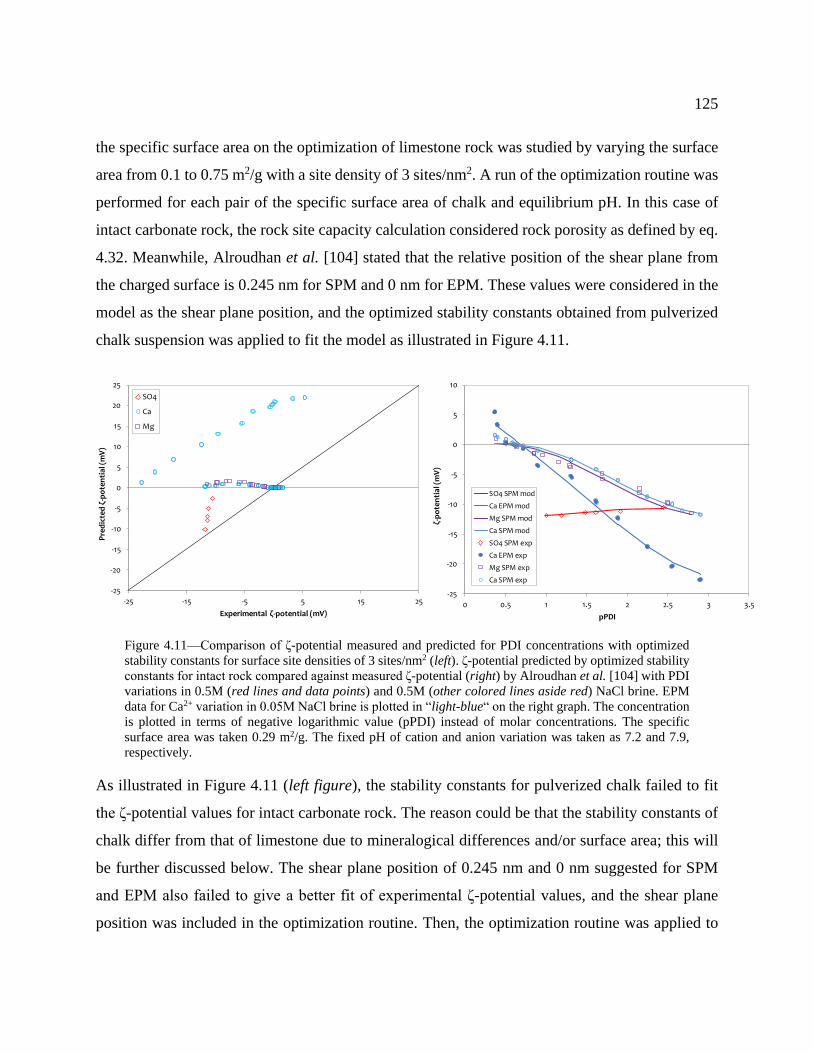
125
the specific surface area on the optimization of limestone rock was studied by varying the surface
area from 0.1 to 0.75 m2/g with a site density of 3 sites/nm2. A run of the optimization routine was
performed for each pair of the specific surface area of chalk and equilibrium pH. In this case of
intact carbonate rock, the rock site capacity calculation considered rock porosity as defined by eq.
4.32. Meanwhile, Alroudhan et al. [104] stated that the relative position of the shear plane from
the charged surface is 0.245 nm for SPM and 0 nm for EPM. These values were considered in the
model as the shear plane position, and the optimized stability constants obtained from pulverized
chalk suspension was applied to fit the model as illustrated in Figure 4.11.
Figure 4.11—Comparison of ζ-potential measured and predicted for PDI concentrations with optimized
stability constants for surface site densities of 3 sites/nm2 (left). ζ-potential predicted by optimized stability
constants for intact rock compared against measured ζ-potential (right) by Alroudhan et al. [104] with PDI
variations in 0.5M (red lines and data points) and 0.5M (other colored lines aside red) NaCl brine. EPM
data for Ca2+ variation in 0.05M NaCl brine is plotted in “light-blue“ on the right graph. The concentration
is plotted in terms of negative logarithmic value (pPDI) instead of molar concentrations. The specific
surface area was taken 0.29 m2/g. The fixed pH of cation and anion variation was taken as 7.2 and 7.9,
respectively.
As illustrated in Figure 4.11 (left figure), the stability constants for pulverized chalk failed to fit
the ζ-potential values for intact carbonate rock. The reason could be that the stability constants of
chalk differ from that of limestone due to mineralogical differences and/or surface area; this will
be further discussed below. The shear plane position of 0.245 nm and 0 nm suggested for SPM
and EPM also failed to give a better fit of experimental ζ-potential values, and the shear plane
position was included in the optimization routine. Then, the optimization routine was applied to
-25
-20
-15
-10
-5
0
5
10
15
20
25
-25 -15 -5 5 15 25
Pre
dic
ted
ζ-p
ote
nti
al (
mV
)
Experimental ζ-potential (mV)
SO4
Ca
Mg
-25
-20
-15
-10
-5
0
5
10
0 0.5 1 1.5 2 2.5 3 3.5
ζ-p
ote
nti
al (
mV
)
pPDI
SO4 SPM mod
Ca EPM mod
Mg SPM mod
Ca SPM mod
SO4 SPM exp
Ca EPM exp
Mg SPM exp
Ca SPM exp

126
capture the stability constant and a much better fit is presented in 4.11 (right figure). The sensitivity
of stability constants and shear plane position with the specific surface area of chalk and
equilibrium pH are presented in Table 4.7 and illustrated in Figure 4.12.
Table 4.7—Optimized stability constants derived from fitting natural intact carbonate ζ-potential
𝑨𝜷 (m2/g)
𝐋𝐨𝐠𝑲𝒆𝒙 𝟐𝟓 ℃
0.1 0.29 0.75 0.1 0.29 0.75
pH cationsa 7.2 7.2 7.2 8 8 8
pH anionsa 7.9 7.9 7.9 8.1 8.1 8.1
𝐾C1 -3.07 -3.07 -3.07 -3.10 -3.10 -3.17
𝐾C 8.42 8.42 8.42 9.21 9.21 9.20
𝐾C -3.21 -3.21 -3.21 -3.22 -3.22 -3.28
𝐾C -3.45 -3.45 -3.45 -3.46 -3.46 -3.44
𝐾C5 1.72 1.72 1.71 1.20 1.20 1.21
Δ (nm) 0.05M 0.695 0.695 0.694 0.708 0.707 0.702
0.5M 0.399 0.398 0.398 0.170 0.166 0.172
Resnorm 50.4214 50.4467 50.5095 57.8744 57.9371 59.1544
aNote: pH sensitivity due to changes in cations and anions in the injected brine solution; the upper and lower limit
of the pH changes was used as a fixed pH in the optimization routine. The residual norm is as described in Table 4.6.
Figure 4.12—Optimized ζ-potential predicted against measured ζ-potential for pH of 7.2 and 7.9 (left) and
7.9 and 8.1 (right) for PDI cations and anions additions, respectively. Experimental data are taken from
Alroudhan et al. [104].
-25
-20
-15
-10
-5
0
5
10
-25 -20 -15 -10 -5 0 5 10
Pre
dic
ted
ζ-p
ote
nti
al (
mV
)
Experimental ζ-potential (mV)
0.10 m2/g
0.29 m2/g
0.75 m2/g
-25
-20
-15
-10
-5
0
5
10
-25 -20 -15 -10 -5 0 5 10
Pre
dic
ted
ζ-p
ote
nti
al (
mV
)
Experimental ζ-potential (mV)
0.10 m2/g
0.29 m2/g
0.75 m2/g

127
The variation in the surface area of the intact limestone rock did not have a significant effect on
the stability constants as much as the variation in equilibrium pH, though using 0.75 m2/g resulted
in the higher residual norm as compared to other surface areas. The slight change in equilibrium
pH for SO4 addition slightly worsen the fit as illustrated in Figure 4.12 and influenced the stability
constants values for reactions R20 (𝐾C ) and R23 (𝐾C5) with higher residual norm reported in
Table 4.7. Meanwhile, every attempt to use the same shear plane position for both brine ionic
strength failed, and the experimental ζ-potential could only be replicated by a higher shear plane
position as the brine salinity decreased. This implies that the relative position of the shear plane is
a function of the brine salinity, which is in contrary to Alroudhan et al. [104] but in agreement
with Korrani and Jerauld [215]. This could be related to increased double layer thickness with
reduced brine salinity, which could result in an increase in the shear plane relative position. The
fact that the optimized stability constants for pulverized chalk could not fit ζ-potential for intact
limestone will be further evaluated by comparing both stability constants to fitting single-phase
flow through experiments below.
4.6.2 Comparison of surface chemistry prediction to single-phase flooding experiments
The experimental breakthrough data obtained from single-phase flooding experiments were also
used to investigate the interface chemistry and compare with reactive-transport parameters
retrieved using ζ-potential. The competition between Ca2+ and Mg2+ as documented in the study
by Strand et al. [53] was modeled at various temperatures with experimental details as listed in
Table 4.2. The comparison between the predicted and measured relative effluent ion
concentrations to injected ion concentrations is shown in Figure 4.13. For all temperatures,
predicted breakthrough profiles fit well with the experimental profiles. Similar to earlier
explanation, the involvement of Ca2+ and Mg2+ in the surface chemistry compared to the tracer ion
(SCN-) triggered their retention and delayed their breakthrough in the effluent. At lower
temperatures of 20 and 70 °C, both Ca2+ and Mg2+ showed similar affinity towards the rock surface.
However, Ca2+ adsorbed more at 20 °C while Mg2+ adsorbed more at 70 °C, as highlighted by the
surface fractions presented in Figure 4.14. Meanwhile, at higher temperatures above 100 °C, Mg2+

128
became dehydrated, highly reactive and strongly adsorbed to the rock surface in comparison to
Ca2+ as evident by the higher surface fractions in Figures 4.14.
Neither of the optimized stability constants for pulverized chalk nor intact limestone could provide
the best fit for the experimental breakthrough profiles as indicated by the corresponding stability
constants obtained for reactions at the protonated anion site (𝐾C1, 𝐾C and 𝐾C ) during the flow
through the experiment (see Table 4.8). The temperature-dependent competition between Ca2+ and
Mg2+ was also evident in the stability constants derived for their corresponding surface
complexation reactions. The stability constants for R21 (𝐾C ) increased with temperature and that
of R22 (𝐾C ) decreased with temperature, the difference between the stability constants became
larger with temperature.
Figure 4.13—Predicted compared against experimental breakthrough curves of SCN-, Ca2+ and Mg2+ from
CF-M brine flow through limestone core 2-21 at various experimental temperatures: 20 °C (top left), 70
°C (top right), 100 °C (bottom left), and 130 °C (bottom right). Experimental data are taken from Strand et
al. [53].
0
0.2
0.4
0.6
0.8
1
1.2
0 0.5 1 1.5 2
C/C
0
Pore Volume Injected
Ca expMg expSCN expCa modMg modSCN mod
0
0.2
0.4
0.6
0.8
1
1.2
0 0.5 1 1.5 2
C/C
0
Pore Volume Injected
Ca exp
Mg exp
SCN exp
Ca mod
Mg mod
SCN mod
0
0.2
0.4
0.6
0.8
1
1.2
0 0.5 1 1.5 2
C/C
0
Pore Volume Injected
Ca expMg expSCN expCa modMg modSCN mod
0
0.2
0.4
0.6
0.8
1
1.2
0 0.5 1 1.5 2
C/C
0
Pore Volume Injected
Ca_expMg expSCN expCa modMg modSCN mod

129
Table 4.8—Corresponding equilibrium constants at various temperatures and pressure of 7 bar
𝐋𝐨𝐠𝑲𝒆𝒙 Temperature-dependent Empirical Parameters
20 ℃ 70 ℃ 100 ℃ 130 ℃ 𝐴0 𝐴1 𝐴 (10 ) 𝐴 𝐴 (106) 𝐴5 (10 )
𝐾C1 -5.10 -5.80 -5.85 -6.00 278.85 0.401 -4.106 -115.71 6.609 -4.194
𝐾C 11.60 10.00 9.75 9.50 293.22 -0.141 3.208 -129.61 -6.325 3.873
𝐾C -1.25 -1.35 -1.50 -2.00 277.36 0.341 -3.490 -118.19 5.030 -3.512
𝐾C -1.50 -1.30 -1.25 -1.20 282.94 0.345 -3.366 -116.10 4.299 -3.965
𝐾C5 1.25 1.60 1.75 2.30 287.11 0.120 -0.354 -122.54 -0.580 -0.323
Note: these are the adjusted stability constant values that match the produced ion histories from the chromatographic
experiments by Austad and colleagues [32, 53, 54]. The temperature-dependent empirical parameters are developed
based on the analytical polynomial expression defined by eq. 4.9 to obtain stability constants at various temperatures.
Figure 4.14—Predicted surface fractions of >CO3-, >CO3Ca+ and >CO3Mg+ along the mid-section of the
limestone core 2-21 at various experimental temperatures: 20 °C (top left), 70 °C (top right), 100 °C (bottom
left), and 130 °C (bottom right).
The stability constants derived for limestones were also applied to simulate the flow-through
experiment conducted by Zhang et al. [32] using Stevns Klint chalk with similar initial and injected
brines as used by Strand et al. [53]. Figure 4.15 shows that the SCM predictions with similar
stability constants fit well with experimental data at 23 and 130 °C, which further proves the
0
0.2
0.4
0.6
0.8
1
0 0.5 1 1.5 2
Surf
ace
Frac
tio
ns
Pore Volume Injected
>CO3->CO3Ca+>CO3Mg+
0
0.2
0.4
0.6
0.8
1
0 0.5 1 1.5 2
Surf
ace
Frac
tio
ns
Pore Volume Injected
>CO3->CO3Ca+>CO3Mg+
0
0.2
0.4
0.6
0.8
1
0 0.5 1 1.5 2
Su
rfac
e F
ract
ion
s
Pore Volume Injected
>CO3->CO3Ca+>CO3Mg+
0
0.2
0.4
0.6
0.8
1
0 0.5 1 1.5 2
Su
rfac
e F
ract
ion
s
Pore Volume Injected
>CO3->CO3Ca+>CO3Mg+
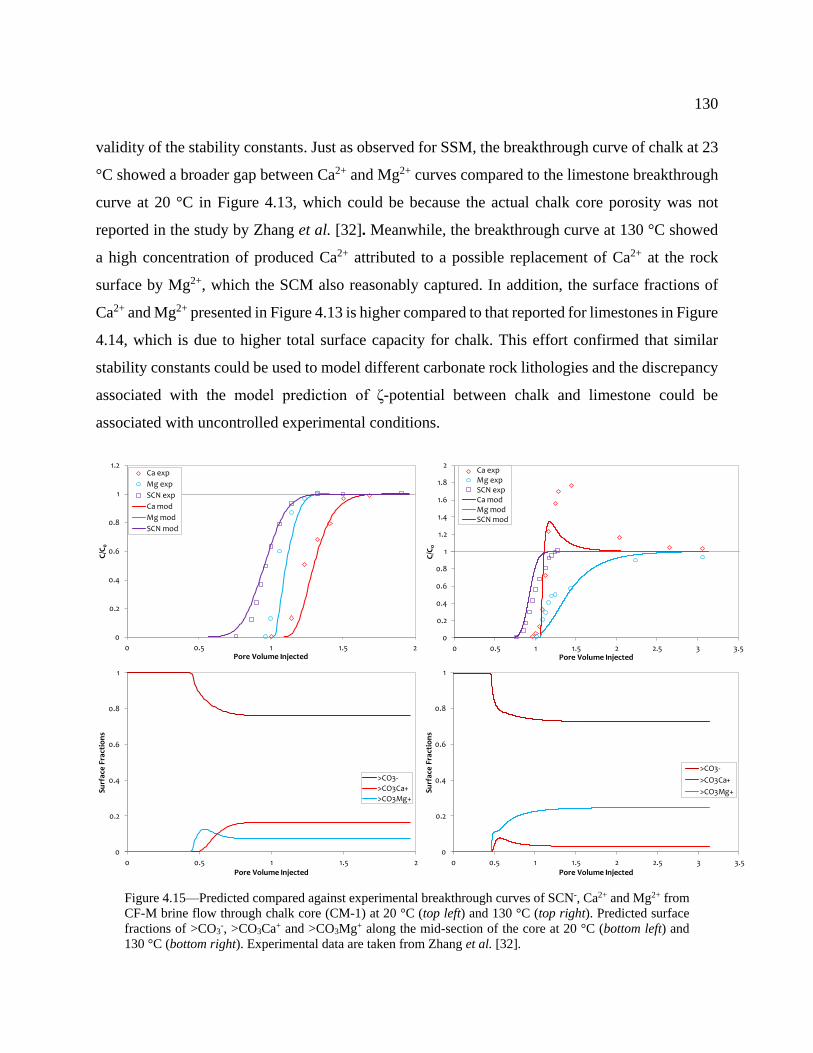
130
validity of the stability constants. Just as observed for SSM, the breakthrough curve of chalk at 23
°C showed a broader gap between Ca2+ and Mg2+ curves compared to the limestone breakthrough
curve at 20 °C in Figure 4.13, which could be because the actual chalk core porosity was not
reported in the study by Zhang et al. [32]. Meanwhile, the breakthrough curve at 130 °C showed
a high concentration of produced Ca2+ attributed to a possible replacement of Ca2+ at the rock
surface by Mg2+, which the SCM also reasonably captured. In addition, the surface fractions of
Ca2+ and Mg2+ presented in Figure 4.13 is higher compared to that reported for limestones in Figure
4.14, which is due to higher total surface capacity for chalk. This effort confirmed that similar
stability constants could be used to model different carbonate rock lithologies and the discrepancy
associated with the model prediction of ζ-potential between chalk and limestone could be
associated with uncontrolled experimental conditions.
Figure 4.15—Predicted compared against experimental breakthrough curves of SCN-, Ca2+ and Mg2+ from
CF-M brine flow through chalk core (CM-1) at 20 °C (top left) and 130 °C (top right). Predicted surface
fractions of >CO3-, >CO3Ca+ and >CO3Mg+ along the mid-section of the core at 20 °C (bottom left) and
130 °C (bottom right). Experimental data are taken from Zhang et al. [32].
0
0.2
0.4
0.6
0.8
1
1.2
0 0.5 1 1.5 2
C/C
0
Pore Volume Injected
Ca exp
Mg exp
SCN exp
Ca mod
Mg mod
SCN mod
0
0.2
0.4
0.6
0.8
1
1.2
1.4
1.6
1.8
2
0 0.5 1 1.5 2 2.5 3 3.5
C/C
0
Pore Volume Injected
Ca expMg expSCN expCa modMg modSCN mod
0
0.2
0.4
0.6
0.8
1
0 0.5 1 1.5 2
Surf
ace
Frac
tio
ns
Pore Volume Injected
>CO3-
>CO3Ca+
>CO3Mg+
0
0.2
0.4
0.6
0.8
1
0 0.5 1 1.5 2 2.5 3 3.5
Surf
ace
Frac
tio
ns
Pore Volume Injected
>CO3-
>CO3Ca+
>CO3Mg+

131
The stability constants describing the reactions at the hydroxylated cation site (𝐾C and 𝐾C5) was
derived by predicting flow-through experiments by on chalk core saturated initially with SW-U
and flooded with SW-M at 23, 70, 100 and 130 °C. The comparison between the predicted and
experimental breakthrough profiles demonstrates a good fit at various temperatures as shown in
Figure 4.16. As stated earlier, SO42- adsorption to the positively charged surface site increased as
the temperature increased and the increase in adsorption becomes more pronounced as the
temperature is raised above 100 °C. The trend is well captured by the increasing stability
constants, 𝐾C5 as presented in Table 4.8. The delayed production of SO42- as compared to SCN-
indicate the affinity of SO42- to the rock surface, which increased as the temperature increased as
evident in surface fraction of SO42- plotted in Figure 4.17. The derived stability constants for 𝐾C
and 𝐾C5 are within the range of optimized predicted stability constants for intact limestone rock.
Figure 4.16—Predicted and experimental breakthrough curves of SCN- and SO42- from SW-M brine flow
through chalk core (7/1) at various experimental temperatures: 23 °C (top left), 70 °C (top right), 100 °C
(bottom left), and 130 °C (bottom right). Experimental data are taken from Strand et al. [54].
0
0.2
0.4
0.6
0.8
1
0 0.5 1 1.5 2 2.5
C/C
0
Pore Volume Injected
SO4 exp
SCN exp
SO4 mod
SCN mod0
0.2
0.4
0.6
0.8
1
0 0.5 1 1.5 2 2.5
C/C
0
Pore Volume Injected
SO4 exp
SCN exp
SO4 mod
SCN mod
0
0.2
0.4
0.6
0.8
1
0 0.5 1 1.5 2 2.5
C/C
0
Pore Volume Injected
SO4 exp
SCN exp
SO4 mod
SCN mod0
0.2
0.4
0.6
0.8
1
0 0.5 1 1.5 2
C/C
0
Pore Volume Injected
SO4 exp
SCN exp
SO4 mod
SCN mod

132
Figure 4.17—Predicted surface fractions of >CaOH2+, >CaSO4
-, >CaOH0, >CO3-, >CO3Ca+ and >CO3Mg+
along the mid-section of the limestone core (7/1) at various experimental temperatures: 23 °C (top left), 70
°C (top right), 100 °C (bottom left), and 130 °C (bottom right)
Hitherto, it has been shown that the coupled transport and geochemical model can predict PDI
adsorption and interplay at the rock surface irrespective of the rock lithology, and surface and ζ-
potential, as there are excellent agreements between predicted and experimental results. The model
with its derived thermodynamic parameters will be used extensively in subsequent Chapters to
investigate diverse brine-dependent recovery processes.
Chapter Summary
This Chapter presents the approaches used for numerical modeling of the problems associated with
coupled multicomponent transport and geochemical interactions. The governing system of
equations is represented by a set of material balance equations for the phases and chemical species.
The numerical model was developed to account for the interactions between the PDIs at the rock
0
0.2
0.4
0.6
0.8
1
0 0.5 1 1.5 2
Su
rfac
e F
ract
ion
s
Pore Volume Injected
>CO3Ca+>CO3Mg+>CaSO4->CaOH2+>CO3->CaOH
0
0.2
0.4
0.6
0.8
1
0 0.5 1 1.5 2 2.5
Surf
ace
Frac
tio
ns
Pore Volume Injected
>CO3Ca+>CO3Mg+>CaSO4->CO3->CO3->CaOH
0
0.2
0.4
0.6
0.8
1
0 0.5 1 1.5 2 2.5
Su
rfac
e F
ract
ion
s
Pore Volume Injected
>CO3Ca+>CO3Mg+>CaSO4->CaOH2+>CO3->CaOH
0
0.2
0.4
0.6
0.8
1
0 0.5 1 1.5 2 2.5
Su
rfac
e F
ract
ion
s
Pore Volume Injected
>CO3Ca+
>CO3Mg+
>CaSO4-
>CaOH2+
>CO3-
>CaOH

133
surface during brine-dependent recovery processes. The results presented in this study shows that
this model can quantitatively reproduce the interplay between ions and rock surface during brine-
dependent recovery in different carbonate lithologies. This study identifies and establishes a
unique set of thermodynamic parameters that can model brine-dependent recovery processes by
fitting ζ-potential data and produced ion histories. Hence, the following conclusions are drawn
from this study:
• The transient period, as well as the late steady-state period of single-phase flow experiments
were captured by the model and the important thermodynamic equilibrium constants, were
captured.
• The relative interplay between Ca2+, Mg2+, and SO42- varies with temperature. Although there
are inconsistencies in the experimental datasets with respects to Ca2+ and Mg2+, the model
indicates that Ca2+ is strongly adsorbed at temperatures below 100 °C in the presence of sulfate.
• Produced ion histories during the two-phase experiments exhibited a trend similar to that of
single-phase experiments, except that the presence of oil impacts ion transports. This rationale
suggests that surface composition changes can be tracked efficiently by analyzing single-phase
flow experiments.
• The mostly used equilibrium constants for the surface complexation reactions reported in the
literature are not suitable to replicate the experimental ζ-potential of intact limestone rock and
pulverized chalk suspension. The equilibrium constants that fit the measured ζ-potential of
chalks differ from those that fit intact limestone ζ-potential, and neither is suited to predict the
reactive transport of brine in chalk and limestone.
• Though chalk and limestones differ by surface area and reactivity, the same thermodynamic
parameter can be used in modeling brine-dependent recovery in the respective reservoirs.
• The presence of either Ca2+ and SO42- or Mg2+ and SO4
2- in the injection brine can modify
wettability towards water-wetness during brine-dependent recovery processes.

134
Prediction of Brine-Dependent Recovery
This Chapter demonstrates the investigation of brine-dependent recovery explored on two-major
frontlines, including brine-dilution and compositional variation, by utilizing the surface sorption
model developed and validated in Chapter 4. At first, the link between the geochemical changes
with wettability alteration leading to oil recovery improvement needed to be established; in so
doing, various governing parameters were described to link the observed interfacial phenomenon
to changes in oil recovery characteristics.
Geochemical Interactions and Wettability Modification Relationship
Generally, wettability alteration is modeled in EOR processes through the interpolation of flow
functions, particularly the relative permeability and capillary pressure, based on a controlling
parameter. Meanwhile, in laboratory water flood experiments cases where high pressure-drop
drives fluid flow, capillary pressure becomes negligible and can be ignored. One important
technique to control the flow functions is to establish the relationship that exists between the
surface energies, wettability indicator (contact angle) and the surface specie fractions. Wettability
of the rock surface is often quantified by the contact angle of the liquid drop resting on the surface.
Hence, the contact angle can be derived from surface force balance and relates to the surface
tensions between rock/brine/oil as described by Young’s equation:
cos =𝛾𝑟𝑜 − 𝛾𝑟𝑏
𝛾𝑏𝑜 (5.1)
where 𝛾𝑟𝑜, 𝛾𝑟𝑏, and 𝛾𝑏𝑜 are the rock/oil, rock/brine and brine/oil interfacial energies (mN/m)
respectively. Many studies [45, 57, 58, 59, 60] have shown that the change in 𝛾𝑏𝑜 is not considered
significant during brine-dependent recovery process. Meanwhile the change in either 𝛾𝑟𝑜 or 𝛾𝑟𝑏 is
related to the changes in surface component fractions through the Gibbs adsorption isotherm for
multicomponent systems:
𝑑𝛾 = −∑ Γ𝑖𝑑𝜇𝑖𝑖
(5.2)

135
where Γ𝑖 and 𝜇𝑖 are the surface excess and chemical potential of the i-th component, respectively.
As a typical example, the surface excess can be taken as the i-th surface species fractions, i.e. Γ𝑖 =
𝜉i, in eq. 5.2. While, the chemical potential of the i-th surface species depends on the surface
fractions as follows:
𝜇𝑖 = 𝜇𝑖0 + 𝑅𝑇 ln 𝜉i (5.3)
where 𝜇𝑖0 is the chemical potential of the i-th surface species at a reference state. Then
differentiation of eq. 5.3 with respect to surface fraction becomes:
𝑑𝜇𝑖 = 𝑅𝑇𝑑𝜉𝑖
𝜉𝑖 (5.4)
Replacing 𝑑𝜇𝑖 in eq. 5.2 with eq. 5.4 gives:
𝑑𝛾 = −∑ 𝜉𝑖 𝑅𝑇𝑑𝜉𝑖
𝜉𝑖𝑖= −∑ 𝑅𝑇 𝑑𝜉𝑖
𝑖 (5.5)
Eq. 5.5 demonstrates the linear dependence of the changes in interfacial energies on the changes
in the i-th surface species fractions. Then considering the relationship of contact angle with
interfacial energies as stated in eq. 5.1, changes in the contact angle of the liquid drop on the
surface can be expressed as:
𝑑cos =𝑑(𝛾𝑟𝑜 − 𝛾𝑟𝑏)
𝛾𝑏𝑜=
𝑅𝑇
𝛾𝑏𝑜∑ 𝑑𝜉𝑖
𝑖 (5.6)
The expression in eq. 5.6 shows that changes in wettability indicator do have a linear relationship
with changes in the fractions of surface species. This implies that a linear dependency can be used
to modify the flow functions based on surface species fractions on the water-wet and oil-wet
surfaces. The modification of the flow function can be used to capture the wettability alteration
from oil-wetting towards water-wetting. Hence, linear interpolation, as will be utilized later, can
be used to model the flow function to capture wettability alteration. For multiphase transport, the
dimensionless form of Brooks-Corey’s type correlation can be used to describe the relative
permeability functions (eqs. 5.7 and 5.8), and simplified power-law form of Brooks and Corey is
used to describe the capillary pressure functions (eq. 5.9) [269] for 𝑠𝑤𝑟 ≤ 𝑠𝑤 ≤ 1 − 𝑠𝑜𝑟 as:

136
𝑘𝑟𝑜𝑤 = 𝑘𝑟𝑜𝑤∗ (
1 − 𝑠𝑤 − 𝑠𝑜𝑟
1 − 𝑠𝑜𝑟 − 𝑠𝑤𝑟)𝑛𝑜
(5.7)
𝑘𝑟𝑤 = 𝑘𝑟𝑤∗ (
𝑠𝑤 − 𝑠𝑤𝑟
1 − 𝑠𝑜𝑟 − 𝑠𝑤𝑟)𝑛𝑤
(5.8)
𝑃𝑐 =𝑃𝑡ℎ,𝑤
(𝑠𝑤 − 𝑠𝑤𝑟1 − 𝑠𝑤𝑟
)𝛼𝑤
+𝑃𝑡ℎ,𝑜
(1 − 𝑠𝑤 − 𝑠𝑜𝑟
1 − 𝑠𝑜𝑟)𝛼𝑜
(5.9)
where 𝑘𝑟𝑤 and 𝑘𝑟𝑜𝑤 are the relative permeabilities to water and oil in water-oil displacement,
respectively; 𝑠𝑤𝑟 and 𝑠𝑜𝑟 are the irreducible water saturation and residual oil saturation
respectively; 𝑘𝑟𝑜𝑤∗ and 𝑘𝑟𝑤
∗ are the endpoint relative permeabilities to oil and water
respectively; 𝑃𝑡ℎ,𝑤 and 𝑃𝑡ℎ,𝑜 are the entry pressures to (positive) water and (negative) oil
respectively; 𝑛𝑜 and 𝑛𝑤 are the Corey exponents for oil and water respectively; and 𝛼𝑜 and 𝛼𝑤 are
the power-law indices for oil and water respectively.
In most water flood cases considered in this study, the endpoint water relative permeabilities were
obtained when the differential pressure stabilized towards the end of each flooding cycle.
Meanwhile, the residual oil saturation was determined by taking the material balance of both the
remaining and recovered fluid. This is because the flow functions were not measured in many of
the independently-sourced data that have been used in this study. For this reason, the following
workflow was used to obtain the relative permeability and capillary pressure functions to simulate
core flooding experiments:
• Use the predetermined 𝑠𝑜𝑟, 𝑘𝑟𝑜∗ and 𝑘𝑟𝑤
∗ , tune 𝑛𝑜 and 𝑛𝑤 at the original state to fit measured
oil recovery of the injection cycle where wettability alteration has not occurred.
• Tune 𝑃𝑡ℎ,𝑤, 𝑃𝑡ℎ,𝑜, 𝛼𝑜 and 𝛼𝑤 at the original state to fit measured pressure differential of the
injection cycle where wettability alteration has not occurred.
• Adjust the relative permeability and capillary pressure obtained through steps 1 and 2, by
tuning the 𝑛𝑜, 𝑛𝑤 and 𝑃𝑡ℎ,𝑜 to fit the measured oil recoveries and capillary pressure to
determine flow functions for the new wetting state. Skjaeveland et al. [270] reported that
𝑃𝑡ℎ,𝑜 is an important parameter that account for the change in wettability in capillary
imbibition process.

137
Unlike chemical flooding, the identification of the specific parameter to control the interpolation
of the flow functions is quite a challenge in modeling brine dependent-recovery processes. In an
attempt to overcome this hurdle, the geochemical response of the different experimental system
was investigated to determine which mechanism(s) would better correlate with the available results
in terms of oil recovery profiles, pressure differential and breakthrough curves. Linear
interpolation was employed, as stated in eqs. 5.10 - 5.22, to estimate the altered relative
permeability, capillary pressure and residual oil saturation functions at every time step based on
the extent of the alteration in geochemical properties, akin to the fact that these flow functions are
shifting from the initial oil-wetting state towards water wetness. Such a shift can only be achieved
by defining a process dependent interpolation function, which depends on the geochemical
properties.
𝑘𝑟𝑗𝑎𝑙𝑡𝑒𝑟𝑒𝑑 = 𝜔𝑘𝑟𝑗
𝑖𝑛𝑡𝑖𝑎𝑙 + [1 − 𝜔]𝑘𝑟𝑗𝑓𝑖𝑛𝑎𝑙 (5.10)
𝑃𝑐𝑎𝑙𝑡𝑒𝑟𝑒𝑑 = 𝜔𝑃𝑐
𝑖𝑛𝑡𝑖𝑎𝑙 + [1 − 𝜔]𝑃𝑐𝑓𝑖𝑛𝑎𝑙 (5.11)
𝑠𝑜𝑟𝑎𝑙𝑡𝑒𝑟𝑒𝑑 = 𝜔 𝑠𝑜𝑟
𝑖𝑛𝑡𝑖𝑎𝑙 + [1 − 𝜔]𝑠𝑜𝑟𝑓𝑖𝑛𝑎𝑙 (5.12)
where 𝜔 is the process dependent interpolation function and 𝑘𝑟𝑗 is the relative permeability for the
j-th phase. Hence, when 𝜔 = 1, it implies that 𝑘𝑟𝑙𝑎𝑙𝑡𝑒𝑟𝑒𝑑 = 𝑘𝑟𝑙
𝑖𝑛𝑡𝑖𝑎𝑙, 𝑃𝑐
𝑎𝑙𝑡𝑒𝑟𝑒𝑑 = 𝑃𝑐𝑖𝑛𝑡𝑖𝑎𝑙
and 𝑠𝑜𝑟𝑎𝑙𝑡𝑒𝑟𝑒𝑑 = 𝑠𝑜𝑟
𝑖𝑛𝑡𝑖𝑎𝑙, which reflects the initial wetting conditions. However, as 𝜔 reduces, it
implies that wettability alteration is taking place until it has completely taken place when 𝜔 ≈ 0,
i.e. 𝑘𝑟𝑙𝑎𝑙𝑡𝑒𝑟𝑒𝑑 = 𝑘𝑟𝑙
𝑓𝑖𝑛𝑎𝑙, 𝑃𝑐
𝑎𝑙𝑡𝑒𝑟𝑒𝑑 = 𝑃𝑐𝑓𝑖𝑛𝑎𝑙 and 𝑠𝑜𝑟
𝑎𝑙𝑡𝑒𝑟𝑒𝑑 = 𝑠𝑜𝑟𝑓𝑖𝑛𝑎𝑙 as the new more water-
wetting state is reached. For the process dependent interpolation function, different scenarios were
considered and tested in different simulations runs as will be discussed below.
Oil Recovery Prediction for Brine Dilution Approach
The brine dilution approach, widely known as “low-salinity-waterflooding”, has shown
remarkable improvement in oil recovery in experimental studies with clay-rich sandstone rocks.
Many studies reported an incremental recovery as high as 30% oil-originally-in-place (OOIP) [13,
23, 41, 271]. Although, similar improvements (up to 19% OOIP) have been observed in carbonate
rocks at much higher salinities compared to sandstones. The term “low salinity” is still applied

138
because the injected brines are generally of lower salinity compared to the initial reservoir brine.
Brine dilution approach with its fundamental physicochemical mechanisms has been reported to
have a higher order of complexity in carbonate rocks than sandstone rocks [30, 36, 48, 57, 101].
Carbonate rocks often undergo diagenesis and different post-depositional chemical and physical
changes, which varies with respect to pore pressure, temperature, and fluid chemistry [272]. This
results in corresponding changes in the rock petrophysical properties, such as permeability,
porosity, faults, fractures, and wettability. The resulting large-scale heterogeneity often generates
complex fluid flow paths, which is one of the major challenges encountered in managing and
exploiting such reservoirs.
Furthermore, carbonate rocks are positively charged over a wide range of pH, while heavy
carboxylic fractions (such as resin and asphaltene) present in crude oil, makes the oil surface
strongly negatively charged at higher pH, especially typical reservoir pH (7-9) [65]. Thus,
adsorption of the negatively charged oil polar component onto the positively charged carbonate
rock, cause the oil to cover the rock surface and create higher bonding energy between the oil and
carbonate rocks that often renders the rocks oil-wet to mixed-wet [29]. The relative contribution
of rock wettability dictates the corresponding flow functions, like relative permeability, capillary
pressure and residual oil saturation, which impact the amount of oil recovered [273]. In this
context, water-wet rocks benefit from faster oil recovery over oil-wet because of increased oil
mobility resulting from the lower affinity of oil to the rock surface. Thus, the combination of these
factors is the primary possible explanation for the differences in the reported oil recovery range
and physicochemical mechanisms between carbonate and sandstone rocks.
Various published results suggest that diluted brine can change the rock wettability toward the
more water-wetting state. The wettability alteration process in sandstone rocks has been associated
with the presence of clay minerals and the injected water salinity level as less as 2000 ppm [14,
56]. However, the alteration process was not anticipated in carbonate rocks as they lack or has a
minute amount of clay minerals. Instead, carbonate rocks are purely calcite (calcium carbonate)
and dolomite with/without other minerals like magnesite (magnesium source), gypsum/anhydrite
(sulfate source), apatite (phosphate source), glauconite, quartz, ankerite, pyrite, siderite, etc. These
139
mineralogical differences between sandstone and carbonate rock is another possible explanation
for the differences in the reported oil recovery range [274]. For instance, chalk is purely calcite,
and no incremental oil recovery was observed with brine dilution; whereas limestones (mostly
calcite with dolomite/magnesite/anhydrite/pyrite) and dolomites demonstrated considerable
variance in the magnitude of incremental oil recovery [36, 101]. Consequently, brine dilution-
dependent recoveries for carbonate rocks vary greatly depending on the injected brine salinity and
the rock mineralogy.
A series of experiments on middle-eastern carbonate cores containing about 5% anhydrite was
carried out to unravel the positive effects of brine dilution [57, 102]. The authors reported an
incremental recovery up to 19% OOIP and indicated that surface charge alteration was more
important than dissolution in the wettability alteration process. Elsewhere, Austad et al. [48]
injected sulfate-free diluted brine into carbonate cores containing anhydrite and reported an
incremental recovery of 5% OOIP. The authors explained that sulfate was continually generated
in-situ because of anhydrite dissolution and this led to the wettability alteration process. Romanuka
et al. [101] carried out spontaneous imbibition experiments on different mineralogical carbonate
cores and showed that brine dilution contributed to an incremental recovery up to 20% OOIP. In
the same way, Zahid et al. [36] conducted another series of experiment on carbonate cores free of
dolomite/anhydrite and reported incremental recovery up to 18% OOIP. The authors proposed
fines migration and rock material dissolution as the plausible mechanisms for wettability
alteration. Chandrasekhar [275] observed that the multi-ion exchange between the active
multivalent ions (Ca2+, Mg2+ and SO42-) and mineral dissolution was the mechanism responsible
for wettability alteration when the brine dilution approach was applied to carbonate cores
containing dolomite. However, in a few other cases, very little or negligible results were observed
during brine dilution as highlighted in Chapter 2. Furthermore, several authors suggested that
wettability alteration could not depend on the bulk mineral dissolution due to aqueous solution
buffering and equilibration on field-scale [194, 195]. Though incremental oil recoveries as
measured in the laboratory core experiments are usually greater than those from the field pilot
tests, a single-well tracer test conducted by Yousef et al. [24] using diluted seawater indicates a
decrease in the residual oil saturation by about 7%.

140
It is clear from the published studies that the brine chemistry, especially the PDIs, plays a more
essential role than its level of salinity in carbonates. A probable explanation for the observed
wettability alteration is that the PDIs are higher in the imbibing brine compared to the formation
brine and molecularly diffuse into the water film separating the crude oil and the rock. This leads
to a non-equilibrium state in the oil-brine-rock interaction that prompts aqueous phase reactions
along with likely rock-brine reactions in the form of surface interactions and/or mineral
dissolution/precipitation. More dilution of the imbibing brine would lead to the reduction in the
amount of non-active ions and increased activity of the PDIs that would make this interplay more
effective. This is coupled with the fact that brine dilution increases the size of the double layer,
thereby thickening the water film layer between oil/rock. Consequently, this leads to alterations in
the rock wettability to less oil wetting state. The different mechanisms that have been proposed [7,
32, 47, 56] can be expressed as:
• Dissolution of in-situ rock minerals can expose fresh water-wet sites by removing oil-
wet sites and/or precipitation of new rock minerals with water-wet properties can overlay
the surface.
• Surface interaction with PDIs can increase the electrostatic repulsive forces between
oil/rock leading to the substitution of attached oil polar components at the surface.
In this case, the predictive model was developed on the basis that the specific brine composition
is highly essential, especially when the total brine salinity is reduced in the presence of different
mineralogical content. In an attempt to use this tool to explain how various features identified
above influence oil recovery by changes in water chemistry, the model was launched to investigate
how the different phenomena relate to brine dilutions. For the process dependent interpolating
parameter to estimate the altered relative permeability, capillary pressure and residual oil
saturation functions through linear interpolation as stated in eq. 5.10 – 5.12, two different scenarios
were considered and tested in different simulations runs.
Sim A: Just as previously mentioned, the exchange reactions are involved in wettability alteration
towards the less oil-wet state. During diluted brine injection, the initial equilibrium established
between crude oil/brine/rock is disturbed, such that the carboxylic components attached to the rock
surface are desorbed as a result of sulfate ions adsorption and exchange between the divalent
cations on the rock surface sites. This exchange eventually results in the increase in surface

141
equivalent fractions of either or both Ca2+ and Mg2+, leading to a reduction in the concentration of
the free charged surface anionic sites (> 𝑁𝑎𝑋). This concept is captured by using the equivalent
fraction of the free charged anionic surface as the interpolant:
𝜔(𝜓𝑁𝑎 𝑋) =𝜓(>𝑁𝑎𝑋)
𝑓𝑖𝑛𝑎𝑙 − 𝜓(>𝑁𝑎𝑋)(𝑥, 𝑦, 𝑧, 𝑡)
𝜓(>𝑁𝑎𝑋)𝑓𝑖𝑛𝑎𝑙 − 𝜓(>𝑁𝑎𝑋)
𝑖𝑛𝑖𝑡𝑖𝑎𝑙 (5.13)
The initial equivalent fractions, 𝜓(>𝑁𝑎𝑋)𝑖𝑛𝑖𝑡𝑖𝑎𝑙
, at the beginning of the injection period, which is
the fraction of the charged anionic surface when there was no wettability alteration and the final
equivalent fractions, 𝜓(>𝑁𝑎𝑋)𝑓𝑖𝑛𝑎𝑙
, at the end of the injection period, which signifies the fractions
at which enough alteration has occurred are the parameters on which the interpolation is calculated
based on the equivalent fractions at any point with time, 𝜓(>𝑁𝑎𝑋)(𝑥, 𝑦, 𝑧, 𝑡). When 𝜔 = 1, it
implies no exchange had taken place and the fractions of the charged anionic surface remained the
same while when 𝜔 ≈ 0, this implies that there had been a sorbed process.
Sim B: As diluted brine is injected with lower salinity and different ionic compositions as
compared to the initial formation brine, the ions are transported such that the equilibrium state
between the mineral and the aqueous phase is disturbed. Consequently, rate-dependent chemical
reactions evolved in the form of mineral dissolution/precipitation that changes the rock surface
and as a result alter the porosity as earlier mentioned. As the mineral dissolves, the absorbed oil is
liberated from the surface while fresh water wet surface sites are created. This simulation scenario
did not consider the surface sorption reactions, because changes at the rock surface in terms of
dissolution/precipitation was dynamically linked to altering the wetting state by:
𝜔(Δ𝜙) = 1 −∆𝜙𝑓𝑖𝑛𝑎𝑙 − ∆𝜙(𝑥, 𝑦, 𝑧, 𝑡)
∆𝜙𝑓𝑖𝑛𝑎𝑙 − ∆𝜙𝑖𝑛𝑖𝑡𝑖𝑎𝑙 (5.14)
Δ𝜙 = 𝜙𝑖𝑛𝑖𝑡𝑖𝑎𝑙 − 𝜙𝑎𝑙𝑡𝑒𝑟𝑒𝑑𝑛 (5.15)
The porosity modification, Δ𝜙, is used as a measure for the dissolved and/or precipitated minerals,
which can be calculated by subtracting the initial porosity, 𝜙𝑖𝑛𝑖𝑡𝑖𝑎𝑙, from the altered
porosity, 𝜙𝑎𝑙𝑡𝑒𝑟𝑒𝑑, at time 𝑛. Then, the initial porosity modification, ∆𝜙𝑖𝑛𝑖𝑡𝑖𝑎𝑙, at the beginning of
the injection cycle, which is the value at which no wettability alteration has occurred and the final
porosity modification, ∆𝜙𝑓𝑖𝑛𝑎𝑙, at the end of the injection cycle, which is the value at which

142
enough minerals have dissolved to create more water-wet surfaces are the matching parameters.
When 𝜔 = 1, it implies that no mineral alteration has taken place while when 𝜔 ≈ 0, this implies
that enough minerals have dissolved, and new equilibrium state is established.
Table 5.1—Reservoir core properties used for simulating the different core experiments.
Property Chandrasekhar [275] Austad et al. [48] Yousef et al. [57]
Porosity 26.4% 18% 25.1%
Mineral Volume Fraction 70% Calcite, 3.6%
Dolomite
79% Calcite, 3%
Anhydrite
64% Calcite, 10% Dolomite,
2% Anhydrite
Permeability (mD) 7.60 1.20 39.60
Diameter (cm) 3.79 3.80 3.80
Length (cm) 5.81 8.10 16.24
Pore Volume (cm3) 17.3 16.5 36.6
Cross Sectional Area (cm2) 11.28 11.34 11.34
Initial water saturation 0.32 0.07 0.10
Initial pressure (psi) 50 145 3000
Reservoir temperature (°C) 120 110 100
Injection Sequence SW→SW/2 FW→FW/100 SW→SW/2→SW/10
Injection Rate (cm3/min) 0.045 0.01 1.0
5.2.1 Simulation portfolio for different mineralogical carbonate rocks
Different cases of linear one-dimensional (1-D) simulations were run with the various core and
flow parameters, and mineralogical contents listed in Table 5.1. The relative permeability and
capillary pressure functions are also presented in Figure 5.1. The carbonate cores used by
Chandrasekhar [275] contained calcite with 5% rock volume fractions of dolomite. While
carbonate cores from Austad et al. [48] contained calcite and 3% rock volume fractions of
anhydrite, in contrast to that of Yousef et al. [57] containing calcite, dolomite and anhydrite. The
specific surface area considered for calcite, dolomite and anhydrite are 0.29 m2/g, 2.8 m2/g and 1
m2/g respectively [70, 112]. Various sorption capacities, equilibrium constants, rate constants,
selectivity factors, and isotherm coefficients for all reactions were kept constant as discussed in
Chapter 4. The flow domain was uniformly discretized into 100 grid blocks. A horizontal
configuration was utilized for simulation of all experiments except for Chandrasekhar [275] where

143
the vertical configuration was used similar to their experimental flooding configuration with the
producer at the top and injector at the bottom (Figure 5.2). Table 5.2 lists the properties of the
crude oil, formation and injected brine compositions. More detailed explanation about these
experiments can be found in the references cited in Table 5.1. A synthetic oil composition was
used which reproduced the reported oil viscosity listed in Table 5.2. The dispersion/diffusion
coefficient (8.13 x 10⁻⁵ cm2/s) was determined by reproducing the effluent concentration curves of
the non-active ions (Na+ and Cl-) from the experiment by Chandrasekhar [275]. Similarly, the
reaction sets, and tuned reaction and transport parameters obtained from the 1-D core simulations
was used to simulate and evaluate a two-dimensional (2-D) quarter of a five-spot pattern.
Figure 5.1—Relative permeabilities (top panels) and capillary pressure (bottom panels) used in simulating
core flooding experiment of Chandrasekhar [275] (left), Austad et al. [48] (middle), Yousef et al. [57]
(right). The solid lines with markers correspond to the relative permeability to oil while the solid lines
without markers correspond to relative permeability to water. The initial flow functions (set 1) correspond
to the initial wetting state, and the subsequent flow functions correspond to cases where the wetting state
has shifted towards more water wetness. The changes in 𝑘𝑟𝑗, 𝑃𝑐 and 𝑠𝑜𝑟 values in middle panel is smaller
than in left panel and right panel because the cores used by Austad et al. [48] is more water-wet than those
used by Chandrasekhar [275] and Yousef et al. [57].
0.00
0.05
0.10
0.15
0.20
0.25
0 0.2 0.4 0.6 0.8 1
Rel
ativ
e P
erm
eab
ility
Water Saturation
Set 1Set 2
-8
-6
-4
-2
0
2
4
6
8
10
0 0.2 0.4 0.6 0.8 1
Ca
pill
ary
Pre
ssu
re (
psi
a)
Water Saturation
Set 1Set 2
0.00
0.20
0.40
0.60
0.80
1.00
0 0.2 0.4 0.6 0.8 1
Re
lati
ve
Pe
rme
abil
ity
Water Saturation
Set 1
Set 2
0.00
0.10
0.20
0.30
0.40
0.50
0 0.2 0.4 0.6 0.8 1
Rel
ativ
e P
erm
eab
ility
Water Saturation
Set 1Set 2Set 3
-6
-4
-2
0
2
4
6
8
10
0 0.2 0.4 0.6 0.8 1
Cap
illa
ry P
ress
ure
(p
sia)
Water Saturation
Set 1Set 2Set 3
-6
-4
-2
0
2
4
6
8
0 0.2 0.4 0.6 0.8 1
Cap
illar
y P
ress
ure
(p
sia)
Water Saturation
Set 1
Set 2

144
Figure 5.2—Core flood experiment design Vertical (left) and Horizontal (right) simulation model
Table 5.2—Fluid compositions and Properties used in the simulation
Chandrasekhar [275]
Brine (mg/L) Na+ Ca2+ Mg2+ SO42- HCO3
- Cl- Total
Salinity
Ionic
Strength (M)
Debye Length
𝜅 1 (nm)
Formation Water 49933 14501 3248 234 - 111810 179726 3.161 0.158
Seawater 13700 521 1620 3310 - 24468 43619 0.757 0.323
Twice Diluted Seawater 6850 260.5 810 1655 - 12234 21809.5 0.379 0.456
Viscosity (cP) at 120 °C Oil Formation water Seawater Twice Diluted Seawater
Acid number of 2.45 mg KOH/g 1.05 0.3382 0.2505 0.2418
Austad et al. [48]
Brine (mg/L) Na+ Ca2+ Mg2+ SO4
2- HCO3- Cl-
Total
Salinity
Ionic
Strength (M)
Debye Length
𝜅 1 (nm)
Formation Water 60168 17468 1814 0 183 129308 208942 3.664 0.149
Diluted Formation water 601.68 174.68 18.14 0 1.83 1293.08 2089.42 0.036 1.486
Viscosity (cP) at 110 °C Oil Formation water Diluted Formation water
Acid number of 0.70 mg KOH/g 0.76 0.39 0.26
Yousef et al. [57]
Brine (mg/L) Na+ Ca2+ Mg2+ SO42- HCO3
- Cl- Total
Salinity
Ionic
Strength (M)
Debye Length
𝜅 1 (nm)
Formation Water 59491 19040 2439 350 354 132060 213734 3.764 0.148
Seawater 18300 650 2110 4290 120 32200 57670 1.008 0.285
Twice Diluted Seawater 9150 325 1055 2145 60 16100 28835 0.504 0.404
Ten times Diluted Seawater 1830 65 211 429 12 3220 5767 0.101 0.903
Viscosity (cP) at 100 °C Oil Formation water Seawater Twice Diluted Seawater
Acid number of 0.25 mg KOH/g 0.691 0.476 0.321 0.304

145
5.2.2 Laboratory simulation results
For the investigation of laboratory brine-dependent recovery, not only ultimate oil recovery was
considered, but also other available data, most notably, the effluent ion concentrations and pressure
differential. The analysis of the produced ions was also performed to give a robust understanding
of the thermodynamic parameters used in describing the complex oil-brine-rock interactions. It is
worth mentioning that the comparison between the simulated and experimental breakthrough
curves of the produced ions is plotted on a semi-log scale due to the order of magnitude difference
between initial and injected brine concentrations. Furthermore, the final recovery and the shape of
recovery for each core simulation differed due to the degree of oil/mixed wettability of the core as
represented by the relative permeability curves in Figure 5.1. The reaction sets considered for Sim
B excluded surface reactions, while Sim A considered all reactions.
5.2.2.1 Core material with calcite and dolomite minerals
Chandrasekhar [275] reported several coreflood experiments investigating brine dilution on
carbonate cores at a reservoir temperature of 120 °C and atmospheric pressure. In one of the
vertical corefloods, the core was saturated with formation water and aged in dead oil at the initial
water saturation. Then, the core was first flooded with seawater followed by various dilutions
(twice, 10 times, and 20 times diluted) of seawater. Seawater (SW) injection was reported to
recover 47% OOIP after 5 PV injections and during the first 3 PV injection of twice diluted
seawater (SW/2), an additional 10% OOIP was recovered. The rock lithology is composed of
calcite (95%) and dolomite (5%). They presented associated mechanisms supported through the
effluent ion and pH analysis. Here, the focus was to model these two injection cycles. Figures
5.3—5.5 compare the simulated and experimental results of the effluent ion concentration, oil
recovery, pressure differential and pH, and a good agreement is evident among these results, which
indicates that this model could capture the slow and fast transient responses observed during the
flooding experiments. The model replication of the reported Mg2+ was initially poor and every
attempt to do so tend to poorly replicate the reported Ca2+. The process involves dolomite
precipitation, which requires the consumption of Mg2+ and Ca2+ as indicated by reaction R14 in
Chapter 4. It was suspected that either there was an experimental error in the reported values or
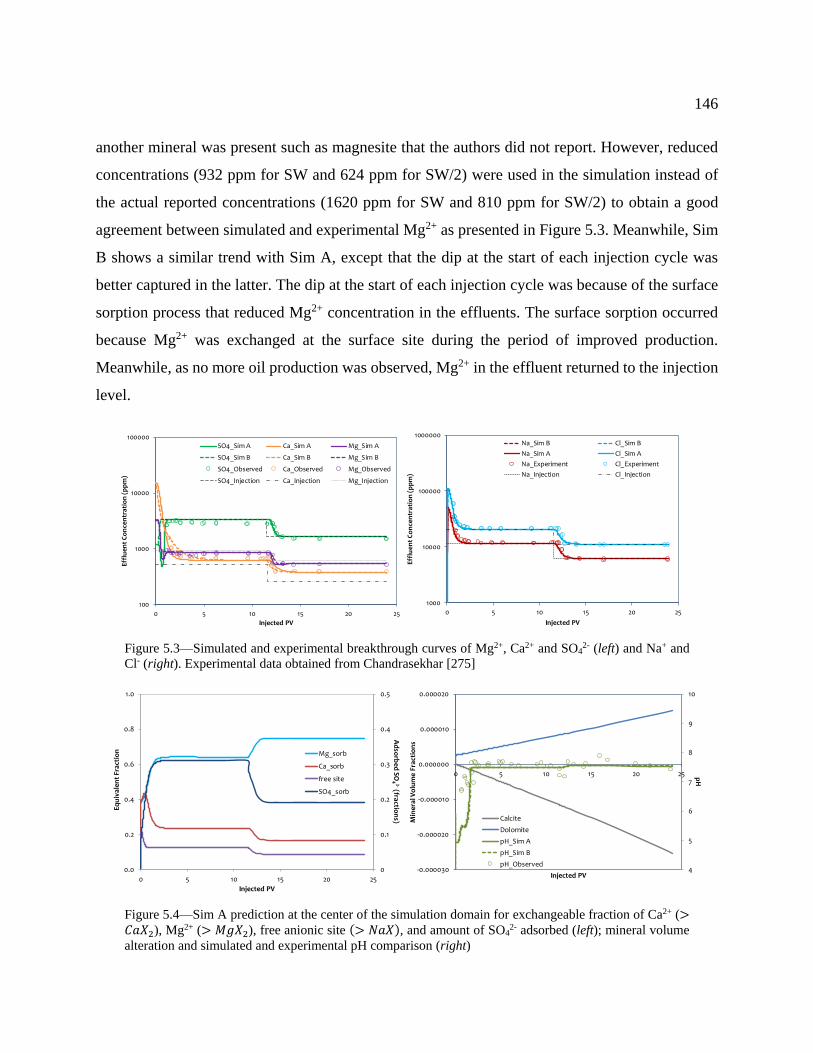
146
another mineral was present such as magnesite that the authors did not report. However, reduced
concentrations (932 ppm for SW and 624 ppm for SW/2) were used in the simulation instead of
the actual reported concentrations (1620 ppm for SW and 810 ppm for SW/2) to obtain a good
agreement between simulated and experimental Mg2+ as presented in Figure 5.3. Meanwhile, Sim
B shows a similar trend with Sim A, except that the dip at the start of each injection cycle was
better captured in the latter. The dip at the start of each injection cycle was because of the surface
sorption process that reduced Mg2+ concentration in the effluents. The surface sorption occurred
because Mg2+ was exchanged at the surface site during the period of improved production.
Meanwhile, as no more oil production was observed, Mg2+ in the effluent returned to the injection
level.
Figure 5.3—Simulated and experimental breakthrough curves of Mg2+, Ca2+ and SO42- (left) and Na+ and
Cl- (right). Experimental data obtained from Chandrasekhar [275]
Figure 5.4—Sim A prediction at the center of the simulation domain for exchangeable fraction of Ca2+ (>𝐶𝑎𝑋 ), Mg2+ (> 𝑋 ), free anionic site (> 𝑁𝑎𝑋), and amount of SO4
2- adsorbed (left); mineral volume
alteration and simulated and experimental pH comparison (right)
1000
10000
100000
1000000
0 5 10 15 20 25
Eff
lue
nt
Co
nce
ntr
ati
on
(p
pm
)
Injected PV
Na_Sim B Cl_Sim B
Na_Sim A Cl_Sim A
Na_Experiment Cl_Experiment
Na_Injection Cl_Injection
100
1000
10000
100000
0 5 10 15 20 25
Eff
lue
nt
Co
nce
ntr
ati
on
(p
pm
)
Injected PV
SO4_Sim A Ca_Sim A Mg_Sim A
SO4_Sim B Ca_Sim B Mg_Sim B
SO4_Observed Ca_Observed Mg_Observed
SO4_Injection Ca_Injection Mg_Injection
0
0.1
0.2
0.3
0.4
0.5
0.0
0.2
0.4
0.6
0.8
1.0
0 5 10 15 20 25
Ad
sorb
ed SO
42-(fra
ction
s)
Equ
ival
ent
Frac
tio
n
Injected PV
Mg_sorb
Ca_sorb
free site
SO4_sorb
4
5
6
7
8
9
10
-0.000030
-0.000020
-0.000010
0.000000
0.000010
0.000020
0 5 10 15 20 25 pH
Min
eral
Vo
lum
e Fr
acti
on
s
Injected PV
Calcite
Dolomite
pH_Sim A
pH_Sim B
pH_Observed

147
Likewise, in Figure 5.3, calcite dissolution, which had spiked Ca2+ in the effluent, and adsorption
of SO42- were captured as both models replicated the reported concentrations from the experiments.
However, Sim A better captured the earlier dip in SO42- concentration when SW flooding was
conducted with higher SO42- content than in the initial formation water. It is well documented that
there is a high tendency for Mg2+ to displace Ca2+ from the surface site at a high temperature [53,
55], which is the case presented here based on further analysis of Sim A predictions in Figure 5.4.
The inclusion of surface sorption reactions only in Sim A captured this fact that was further
supported by the evidence that more Ca2+ (abundant due to calcite dissolution) and less Mg2+ was
found in the effluent at the point where improved production was observed. Similarly, SW
contained less Ca2+ and more Mg2+ compared to the initial formation water, as and when SW had
contacted the surface site, more Mg2+ had adsorbed and replaced the adsorbed Ca2+. This led to a
reduction in the concentration of free anionic surface site, and because SW contained more SO42-,
there was also an increased SO42- adsorption on the surface site (Figure 5.4). Lower concentration
of Ca2+ in SW increased calcite dissolution to compensate for less Ca2+ in the aqueous phase, which
consequently resulted in dolomite precipitation because of excess Ca2+ in the aqueous phase (see
Figure 5.4). In this regard, Sim A and Sim B showed a similar trend in terms of
dissolution/precipitation because they both account for rate-dependent reactions.
However, as SW/2 was injected with less SO42-, there was less SO4
2- adsorption as emphasized by
Sim A predictions in Figure 5.4. A high sulfate adsorption has occurred in the previous cycle and
introduction of diluted brine with reduced salinity led to an increase in the double layer thickness
(evident from Table 5.2 as Debye length increased from 0.32 to 0.46) which enabled cations co-
adsorption. The reduced concentration of Ca2+, Mg2+ and Na+ in SW/2 was expected to result in
less formation of aqueous complexes of CaSO4, MgSO4 and NaSO4− according to reactions R5–
R7 in Chapter 4. Because of the available surface site previously created by sulfate adsorption,
increased double layer thickness and reduced surface charge, Mg2+ continued to be exchanged
until a new equilibrium was reached and adsorbed oil continued to desorb until no more oil
recovery (Figure 5.5). It is worth mentioning that the initial Na+ and Cl- concentration of the
seawater is 13,700 ppm and 24,468 ppm, respectively, however, the concentration produced was
less (12,100 ppm and 21,090 ppm) as shown in Figure 5.3. Both Na+ and Cl- are considered non-

148
active ions towards the carbonate rock surface, hence, they are not involved in any reaction that
could reduce or decrease their concentration in the effluent. No substantial explanation was given
by the authors to be responsible as such. Moreover, a similar observation was made during SW/2
injection, and the difference is not too large, which can be interpreted as an experimental error.
Hence, the reduced concentration was considered rather than the actual reported concentration
because using a higher concentration than observed in the effluent would increase the ionic
strength, which would consequently decrease the activity of other ions. As shown in Figure 5.3,
the predicted concentrations from both simulation scenarios gave a similar trend with
concentrations from the experiments since Na+ and Cl- were non-active ions. Then, reduction of
Na+ and Cl- in the injected brines resulted in lower total ionic strength and increased double layer
thickness, such that surface reactivity of the PDIs leading to wettability alteration increased as
discussed above.
Figure 5.5—Comparison between simulated and experimental oil recovery and pressure differential.
Experimental data obtained from Chandrasekhar [275]
Both simulation scenarios captured the experimental pH, which is predominantly dictated by the
mineral alteration in terms of dissolution and precipitation. As calcite dissolution and dolomite
precipitation occurred, there were loss and gain of H+ protons respectively that influenced the
0
5
10
15
20
25
0
10
20
30
40
50
60
0 5 10 15 20 25
Pressu
re Differen
tial (p
si)O
il R
eco
very
(%)
Injected PV
Recovery_Sim A
Recovery_Sim B
Recovery_Observed
ΔP_Sim A
ΔP_Sim B
ΔP_Observed

149
aqueous pH. However, a slight increase in effluent pH as seen in Figure 5.4 is the resultant effect
which signifies that the dissolution occurred more than the precipitation. The slight increase in the
pH as reported by the authors is not the mechanism responsible for the improved recovery as it
would require a very high pH – exceeding 10 to generate a significant amount of in-situ surfactant
that could improve recovery [56]. The process-dependent interpolation parameter was tuned using
maximum and minimum thresholds to reproduce the reported oil recovery and pressure
differential. Both simulation scenarios reproduced the experimental pressure differential.
Considering Sim B with its effect on wettability, the simulation model could not capture the
observed improved recovery as shown in the contrasts between the simulated and experimental oil
recovery in Figure 5.5. The simulated oil recovery was more than the experimental values at the
first injection cycle, though later replicated the ultimate cumulative oil recovery that is mainly
dictated by the residual oil saturation. However, sim A showed a good match of cumulative oil
recovery with wettability alteration as a function of the exchangeable fractions of the free anionic
surface. The exchange of the divalent cations enhanced by adsorption of SO42- was responsible for
the alteration of the wetting state towards water-wetness and the resulting improved oil recovery
was excellently reproduced similar to the experimental oil recovery in Figure 5.5.
5.2.2.2 Core material with calcite and anhydrite minerals.
A study was conducted by Austad et al. [48] to investigate brine dilution effects on carbonates as
observed by Yousef et al. [57]. In their study, a carbonate core plug was saturated and aged in oil
with an acid number of 0.7 mg KOH/g. Then, flooded with 6 PV of formation water (FW) followed
by diluted formation water (FW/100), both without sulfate, and observed an incremental recovery
of 5% OOIP at reservoir temperature of 110 °C. After that, the presence of anhydrite was
confirmed by flooding the saturated core with deionized water, of which SO42- production was
observed in the effluent. They concluded that the continuous presence of SO42- in the aqueous
phase, due to anhydrite dissolution, was the key factor responsible for wettability alteration and
improved recovery. The two simulation model scenarios were also implemented to test the
hypothesis presented by Austad et al. [48] using a horizontal coreflood configuration with
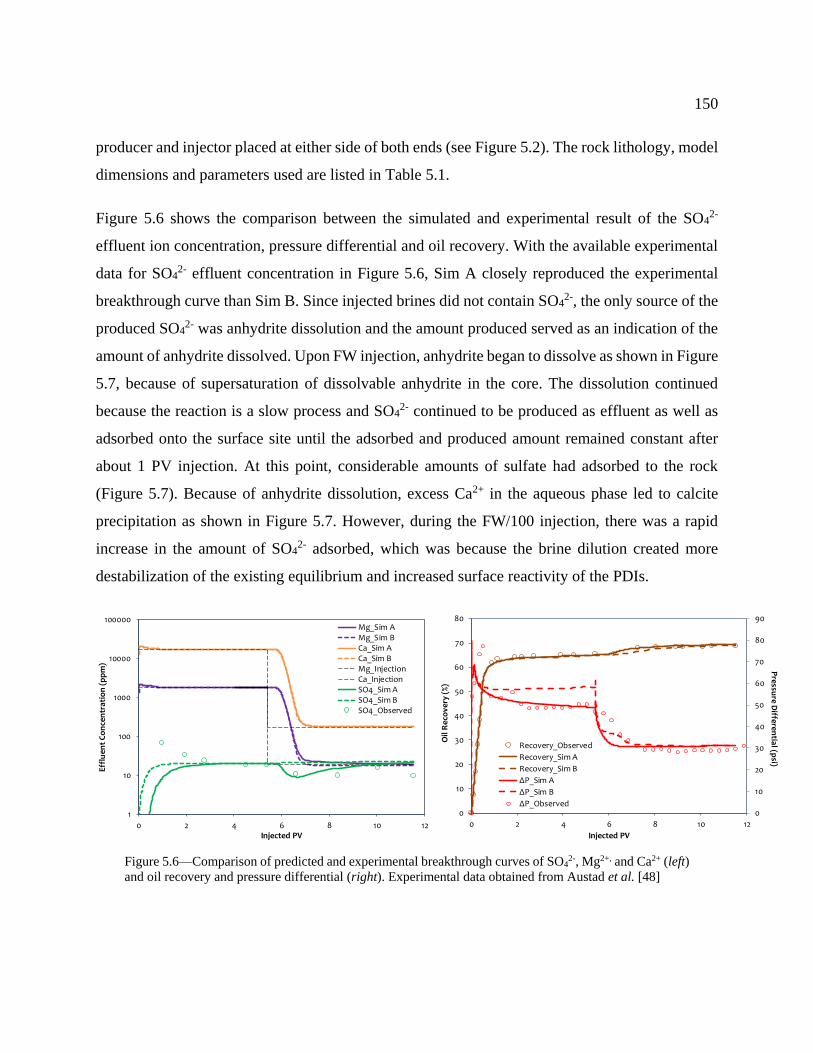
150
producer and injector placed at either side of both ends (see Figure 5.2). The rock lithology, model
dimensions and parameters used are listed in Table 5.1.
Figure 5.6 shows the comparison between the simulated and experimental result of the SO42-
effluent ion concentration, pressure differential and oil recovery. With the available experimental
data for SO42- effluent concentration in Figure 5.6, Sim A closely reproduced the experimental
breakthrough curve than Sim B. Since injected brines did not contain SO42-, the only source of the
produced SO42- was anhydrite dissolution and the amount produced served as an indication of the
amount of anhydrite dissolved. Upon FW injection, anhydrite began to dissolve as shown in Figure
5.7, because of supersaturation of dissolvable anhydrite in the core. The dissolution continued
because the reaction is a slow process and SO42- continued to be produced as effluent as well as
adsorbed onto the surface site until the adsorbed and produced amount remained constant after
about 1 PV injection. At this point, considerable amounts of sulfate had adsorbed to the rock
(Figure 5.7). Because of anhydrite dissolution, excess Ca2+ in the aqueous phase led to calcite
precipitation as shown in Figure 5.7. However, during the FW/100 injection, there was a rapid
increase in the amount of SO42- adsorbed, which was because the brine dilution created more
destabilization of the existing equilibrium and increased surface reactivity of the PDIs.
Figure 5.6—Comparison of predicted and experimental breakthrough curves of SO42-, Mg2+, and Ca2+ (left)
and oil recovery and pressure differential (right). Experimental data obtained from Austad et al. [48]
1
10
100
1000
10000
100000
0 2 4 6 8 10 12
Eff
lue
nt
Co
nce
ntr
atio
n (
pp
m)
Injected PV
Mg_Sim AMg_Sim BCa_Sim ACa_Sim BMg_InjectionCa_InjectionSO4_Sim ASO4_Sim BSO4_Observed
0
10
20
30
40
50
60
70
80
90
0
10
20
30
40
50
60
70
80
0 2 4 6 8 10 12
Pre
ssure
Diffe
ren
tial (p
si)
Oil
Rec
ove
ry (
%)
Injected PV
Recovery_Observed
Recovery_Sim A
Recovery_Sim B
ΔP_Sim A
ΔP_Sim B
ΔP_Observed

151
Figure 5.7—Sim A predictions at the center of the simulation domain for exchangeable fraction of Ca2+ (>𝐶𝑎𝑋 ), Mg2+ (> 𝑋 ), free anionic site (> 𝑁𝑎𝑋), and amount of SO4
2- adsorbed (left); mineral volume
alteration and pH (right)
Once flooding commences, SO42- in the effluent decreased as an indication of increased SO4
2-
adsorption. The dissolution rate of anhydrite remained constant and calcite precipitation slightly
reduced to produce enough Ca2+ to compensate for the low Ca2+ in the injected brine. The net result
is seen as SO42- remained constant after about 1 PV until the end of the injection cycle. At the start
of the injection cycle, SO42- was lesser in Sim A as compared to Sim B (same with experiments),
enabling SO42- to adsorb more, reduce the surface charge, and replace adsorbed oil at the surface
site. In another test, Austad et al. [48] injected deionized water into a core saturated with FW and
reported production of Ca2+ and SO42-. This means that anhydrite dissolution was responsible for
the Ca2+ and SO42- production while slight calcite dissolution added to the effluent concentration
of Ca2+. This explanation is synonymous to the author’s claim as they observed that there was the
dissolution of anhydrite in addition to that of calcite. In this present case, the dissolution of calcite
is not as evident compared to that in the work of Chandrasekhar [275] because anhydrite
dissolution compensated for the low Ca2+ during diluted brine injection. Figure 5.7 also presents
the equivalent exchangeable cations and free anionic site for Sim A at the surface sites. An increase
in sorbed Ca2+ was observed when more sulfate adsorbed because of the increased amount of Ca2+
in the aqueous phase. An improved recovery was achieved during the FW/100 injection cycle (see
Figure 5.6) because of the co-adsorption process of the PDIs, which led to a reduction free anionic
site concentration.
0
0.001
0.002
0.003
0
0.2
0.4
0.6
0.8
1
0 2 4 6 8 10 12
Ad
sorb
ed
SO
42-fra
ction
sEq
uiv
ale
nt
Frac
tio
ns
Injected PV
Ca_sorb
Mg_sorb
free site
SO4_sorb
4
5
6
7
8
9
10
-0.0000007
-0.0000006
-0.0000005
-0.0000004
-0.0000003
-0.0000002
-0.0000001
0.0000000
0.0000001
0.0000002
0.0000003
0 2 4 6 8 10 12
pH
Min
era
l Vo
lum
e F
ract
ion
s
Injected PV
Anhydrite
Calcite
pH
152
There is a good agreement between the Sim A and Sim B results for effluent concentration of Mg2+
and Ca2+. The effluent concentration of Mg2+ remained same as injected because Ca2+ was the
major ion exchanged. Since Na+ and Cl- are considered as non-active ions, their concentration in
the effluent remained similar to the injected concentration. They had a similar trend with those
plotted for the previous case in Figure 5.3. However, their reduction in the injected brine decreased
the ionic strength, increased the double layer thickness (from 0.15 to 1.49 as reported in Table 5.2
for reciprocal Debye length) and increased the activity coefficients of PDIs so they could easily
promote wettability alteration through improved surface reactivity. From Figure 5.6, Sim A
excellently reproduced the oil recovery and pressure differential than Sim B, with an indication
that the process of exchange of Mg2+ and Ca2+ enhanced by the adsorption of SO42- was responsible
for the wettability alteration. Sim B reproduced the oil recovery but gave an underestimation of oil
recovery during the FW/100 injection cycle and could not replicate the pressure differential. This
signifies that dissolution alone, cannot explain the improved recovery observed during brine
dilution: rather a process that integrates dissolution with surface sorption resulting in wettability
alteration. The predicted pH is similar for both simulation scenarios (Figure 5.7), though slightly
higher than what was obtained in the simulation of the experiment by Chandrasekhar [275]. This
is because both calcite (slight) and anhydrite dissolution took place consecutively as compared to
the resultant effect of dissolution and precipitation in the latter.
5.2.2.3 Core material with calcite, dolomite, and anhydrite minerals
Yousef et al. [57] conducted a series of study to investigate brine dilution effects on carbonates
and reported about 20% incremental recovery on successful seawater dilution. In their experiment,
the composite core plug was saturated and aged in live oil, and flooded with 10 PV of field
seawater (SW) followed by 10 PV of various seawater dilutions at typical middle eastern reservoir
conditions. In this case, the first three injection cycles were considered, which included seawater
(SW), twice-diluted seawater (SW/2) and ten times diluted seawater (SW/10). The composite core
comprised of four core plugs of average permeability of 36.5 mD. Each core plug was represented
in the simulation by twenty-five (25) grid-blocks, making a hundred grid-blocks in total. The core
is comprised of 85% calcite, 12% dolomite, and 3% anhydrite [102]. The authors highlighted

153
surface charge alteration as the key mechanism responsible for wettability alteration and improved
recovery. Figure 5.8 shows that both simulation scenarios closely reproduced the experimental oil
recovery and pressure differential, though Sim A gave better result than Sim B.
Figure 5.8—Comparison between simulated and experimental oil recovery, and pressure differential (left).
Simulated breakthrough curves of SO42-, Mg2+, and Ca2+ (right). Experimental data obtained from Yousef
et al. [57]
For the simulated breakthrough curves also presented in Figure 5.8, the trend is practically similar
for both simulation scenarios except at the start of the injection cycle. The injected brine contained
higher SO42- than in the initial formation water, resulting in more adsorption of SO4
2-. Sulfate
adsorption desorbed the oil by altering the surface charge such that more cations were exchanged,
leading to a reduction in the free surface site. At a high temperature, 100 °C, more Mg2+ exchanged
than Ca2+ (Figure 5.9). Reduced concentration of Ca2+ in the aqueous phase due to brine injection
with less Ca2+ resulted in both calcite and anhydrite dissolution and consequent dolomite
precipitation (Figure 5.9), which continued through the injection of various diluted brines. Though
the changes in mineral volumes were lower compared to what was obtained in previous simulation
cases where either anhydrite or dolomite was absent. As mentioned earlier, it can be seen here that
subsequent dilutions increased the double layer thickness and the reactivity of the PDIs such that
they exchanged/adsorbed more at the surface sites and reduced the concentration of the free anionic
surface site (Figure 5.9). In furtherance to the authors’ conclusion, it can be stated here that
injecting diluted brine destabilized the existing equilibrium and caused dissolution and/or
10
100
1000
10000
100000
0 5 10 15 20 25 30
Effl
uen
t C
on
cen
trat
ion
(p
pm
)
Injected PV
Mg_Sim A Ca_Sim A SO4_Sim A
Mg_Sim B Ca_Sim B SO4_Sim B
Mg_Injection Ca_Injection SO4_Injection
0
5
10
15
20
25
0
10
20
30
40
50
60
70
80
90
0 5 10 15 20 25 30
Pressu
re Dro
p, p
siOil
Rec
ove
ry (
%)
Injected PV
Recovery_Observed
Recovery_Sim A
Recovery_Sim B
ΔP_Sim A
ΔP_Sim B
ΔP_Observed

154
precipitation of some minerals, to re-establish equilibrium with the new brine. Even though the
mineral alteration in terms of dissolution/precipitation could be microscopic, their effects are still
felt with other corresponding process mechanisms.
Figure 5.9—Simulation results at the center of the simulation domain for an exchangeable fraction of Ca2+
(> 𝐶𝑎𝑋 ) and Mg2+ (> 𝑋 ), free anionic site (> 𝑁𝑎𝑋), and amount of sulfate adsorbed (left); mineral
volume alteration (right)
In the majority of the simulated experiments, the injected brine contained more SO42-, which
speedily adsorbed at early times and became relaxed at later periods. This adsorption results in a
reduction of surface site charge and consequential desorption of oil as well as enhancing the co-
adsorption of the potential determining cations, and continual dilution increased the double layer
size and correspondingly increased the reactivity of the PDIs to co-adsorbed, leading to alteration
of the wetting state.
5.2.3 Field-scale simulation
To this end, it has been proved that the model based on the hypothesis of integrating all surface
interactions, can interpret brine dilution experimental results. In these flooding experiments, cores
with different mineralogy have been used, all exhibiting varying improved recoveries. At this
stage, investigation of the possibility of achieving similar incremental recovery with lower pore
volume injected on field scale as achieved in the core scale flooding was proposed and to further
examine the impact of different mineralogical content on the field production.
-0.0000004
-0.0000003
-0.0000002
-0.0000001
0.0000000
0.0000001
0 5 10 15 20 25 30
Min
era
l Vo
lum
e F
ract
ion
s
Injected PV
Calcite
Anhydrite
Dolomite0
0.1
0.2
0.3
0.4
0.5
0
0.2
0.4
0.6
0.8
1
0 5 10 15 20 25 30
Ad
sorb
ed SO
42-fra
ction
sEqu
ival
ent
Frac
tio
ns
Injected PV
Ca_sorb
Mg_sorb
free site
SO4_sorb
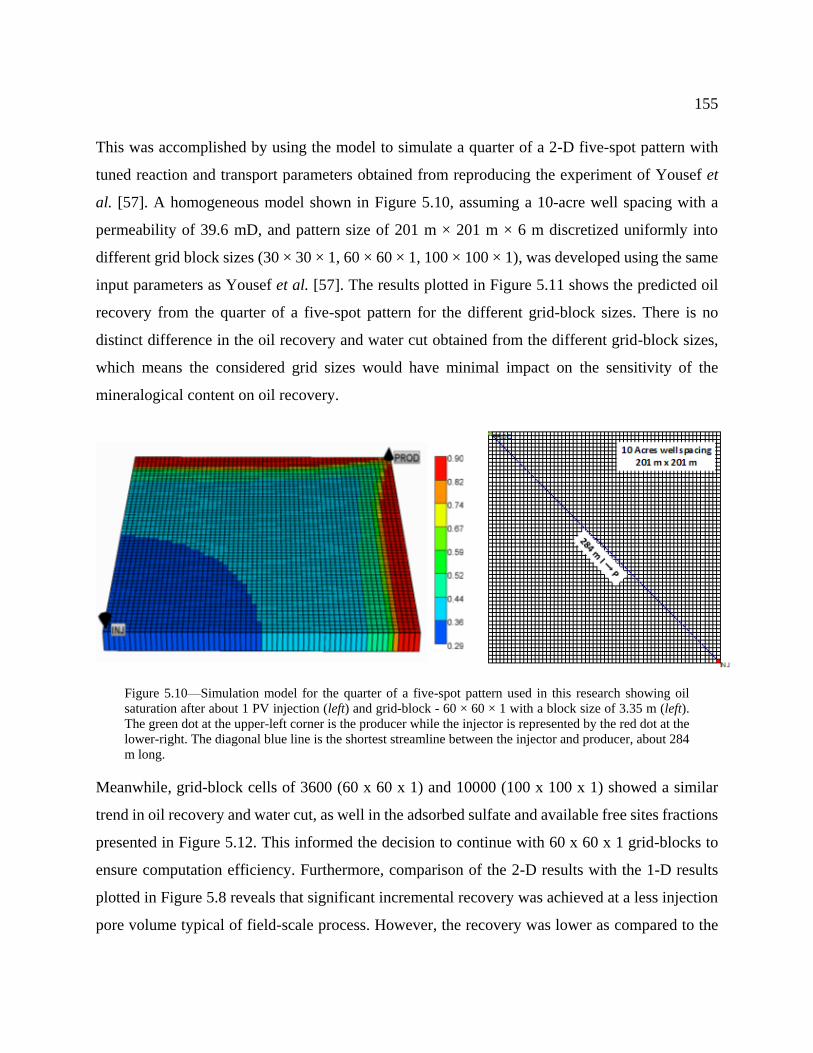
155
This was accomplished by using the model to simulate a quarter of a 2-D five-spot pattern with
tuned reaction and transport parameters obtained from reproducing the experiment of Yousef et
al. [57]. A homogeneous model shown in Figure 5.10, assuming a 10-acre well spacing with a
permeability of 39.6 mD, and pattern size of 201 m × 201 m × 6 m discretized uniformly into
different grid block sizes (30 × 30 × 1, 60 × 60 × 1, 100 × 100 × 1), was developed using the same
input parameters as Yousef et al. [57]. The results plotted in Figure 5.11 shows the predicted oil
recovery from the quarter of a five-spot pattern for the different grid-block sizes. There is no
distinct difference in the oil recovery and water cut obtained from the different grid-block sizes,
which means the considered grid sizes would have minimal impact on the sensitivity of the
mineralogical content on oil recovery.
Figure 5.10—Simulation model for the quarter of a five-spot pattern used in this research showing oil
saturation after about 1 PV injection (left) and grid-block - 60 × 60 × 1 with a block size of 3.35 m (left).
The green dot at the upper-left corner is the producer while the injector is represented by the red dot at the
lower-right. The diagonal blue line is the shortest streamline between the injector and producer, about 284
m long.
Meanwhile, grid-block cells of 3600 (60 x 60 x 1) and 10000 (100 x 100 x 1) showed a similar
trend in oil recovery and water cut, as well in the adsorbed sulfate and available free sites fractions
presented in Figure 5.12. This informed the decision to continue with 60 x 60 x 1 grid-blocks to
ensure computation efficiency. Furthermore, comparison of the 2-D results with the 1-D results
plotted in Figure 5.8 reveals that significant incremental recovery was achieved at a less injection
pore volume typical of field-scale process. However, the recovery was lower as compared to the

156
core-scale because of early water breakthrough and poorer areal sweep as indicated in the curvature
of the oil recovery curves. The field water cut was also presented to illustrate the immediate
response of the injected diluted brines to improve oil recovery. The response was such that water
production reduced as significant incremental recovery was obtained.
Figure 5.11—Predicted oil recovery and water cut for the quarter of a five-spot pattern with the different
grid-block cells (900, 3600 and 10000) using core, flow and reaction parameters of Yousef et al. [57]
Figure 5.12—Profiles along the diagonal streamline of the quarter five-spot pattern for the different grid-
block sizes after each injection cycle: adsorbed SO42- (left) and free anionic surface site (right).
0
0.2
0.4
0.6
0.8
1
0
10
20
30
40
50
60
70
80
90
100
0 1 2 3 4 5 6 7 8 9
Wate
r cut, fractio
nsO
il R
eco
ve
ry (
%)
Injected PV
Recovery_30x30
Recovery_60x60
Recovery_100x100
Water cut_30x30
Water cut_60x60
Water cut_100x100
0
0.05
0.1
0.15
0.2
0.25
0.3
0.35
0.4
0.45
0.5
0 50 100 150 200 250 300
Ad
sorb
ed S
O4
2-, f
ract
ion
s
Diagonal distance (m)
SO4_sorb_3PV_30x30SO4_sorb_3PV_60x60SO4_sorb_3PV_100x100SO4_sorb_6PV_30x30SO4_sorb_6PV_60x60SO4_sorb_6PV_100x100SO4_sorb_9PV_30x30SO4_sorb_9PV_60x60SO4_sorb_9PV_100x100SO4_sorb_initial
0
0.05
0.1
0.15
0.2
0.25
0.3
0.35
0 50 100 150 200 250 300
Equ
ival
ent
frac
tio
ns
Diagonal distance (m)
free site_3PV_30x30 free site_3PV_60x60free site_3PV_100x100 free site_6PV_30x30free site_6PV_60x60 free site_6PV_100x100free site_9PV_30x30 free site_9PV_60x60free site_9PV_100x100 free site_initial

157
Similarly, using the same injection schemes and water compositions with varying rock mineral
compositions, the predicted oil recovery was compared using the cases presented in Table 5.3. The
base case contained the same proportion of minerals reported by Yousef et al. [57], and for other
cases, the mineral proportions were slightly varied. Figure 5.13 compares the oil recoveries from
different simulation cases. All the cases have similar ultimate oil recovery, however, during the
first two injection cycles, their recovery trend deviated. The different responses of the different
mineralogical contents to the same injected water indicate the significance of incorporating
mineral alteration into the modeling of brine dilution-dependent recovery processes. Comparing
the cases where anhydrite was absent, i.e. Case 1, the oil recovery was low compared to the other
cases, because of less SO42- adsorption. The cases that showed slightly higher recovery/lower water
cut trend compared with the base case, i.e. Case 2, Case 3 and Case 4, was because of high presence
of SO42-, triggered by anhydrite dissolution, that could be adsorbed and enhanced the exchange of
the cations at the surface site. This analysis is not intended to be quantitative but to emphasize the
importance of rock mineralogical contents during brine-dilution dependent recoveries, which is
consistent with various core experimental observations discussed previously. Hence, the
kinetically controlled mineral reaction should not be discarded when modeling brine dilution.
Table 5.3—Mineralogical content for various cases simulated
Field Scale Cases Calcite Dolomite Anhydrite
Base case 85% 12% 3%
Case 1 85% 15% 0%
Case 2 85% 0% 15%
Case 3 85% 7.5% 7.5%
Case 4 97% 0% 3%
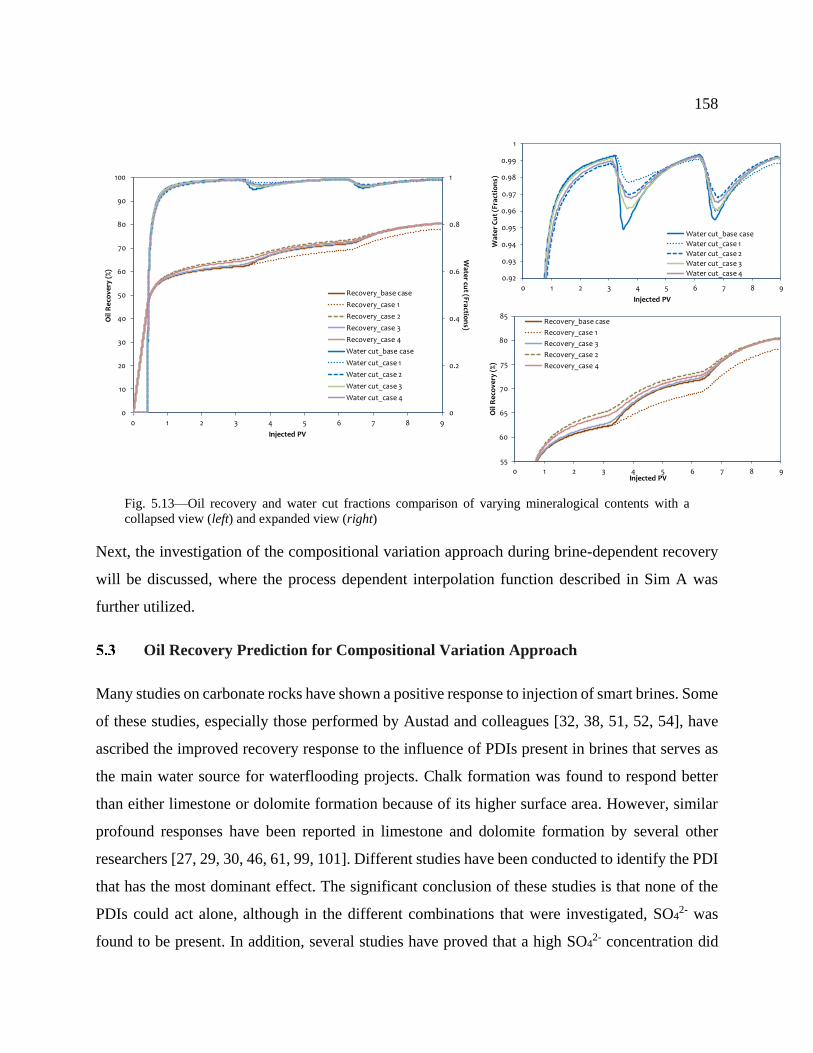
158
Fig. 5.13—Oil recovery and water cut fractions comparison of varying mineralogical contents with a
collapsed view (left) and expanded view (right)
Next, the investigation of the compositional variation approach during brine-dependent recovery
will be discussed, where the process dependent interpolation function described in Sim A was
further utilized.
Oil Recovery Prediction for Compositional Variation Approach
Many studies on carbonate rocks have shown a positive response to injection of smart brines. Some
of these studies, especially those performed by Austad and colleagues [32, 38, 51, 52, 54], have
ascribed the improved recovery response to the influence of PDIs present in brines that serves as
the main water source for waterflooding projects. Chalk formation was found to respond better
than either limestone or dolomite formation because of its higher surface area. However, similar
profound responses have been reported in limestone and dolomite formation by several other
researchers [27, 29, 30, 46, 61, 99, 101]. Different studies have been conducted to identify the PDI
that has the most dominant effect. The significant conclusion of these studies is that none of the
PDIs could act alone, although in the different combinations that were investigated, SO42- was
found to be present. In addition, several studies have proved that a high SO42- concentration did
0
0.2
0.4
0.6
0.8
1
0
10
20
30
40
50
60
70
80
90
100
0 1 2 3 4 5 6 7 8 9
Water cu
t (Fraction
s)
Oil
Rec
ove
ry (
%)
Injected PV
Recovery_base case
Recovery_case 1
Recovery_case 2
Recovery_case 3
Recovery_case 4
Water cut_base case
Water cut_case 1
Water cut_case 2
Water cut_case 3
Water cut_case 4
55
60
65
70
75
80
85
0 1 2 3 4 5 6 7 8 9
Oil
Rec
ove
ry (
%)
Injected PV
Recovery_base case
Recovery_case 1
Recovery_case 3
Recovery_case 2
Recovery_case 4
0.92
0.93
0.94
0.95
0.96
0.97
0.98
0.99
1
0 1 2 3 4 5 6 7 8 9
Wat
er C
ut
(Fra
ctio
ns)
Injected PV
Water cut_base case
Water cut_case 1
Water cut_case 2
Water cut_case 3
Water cut_case 4

159
not offer improved recovery; rather an upper limit existed beyond which no improved recovery
could be observed [7, 46, 52, 138].
In some of these studies, it was hypothesized that wettability alteration is a consequence of a multi-
ion exchange process that involves the PDI interactions with the rock surface. It was proposed that
SO42- is attached to the rock−brine interface, reducing or reversing the positive charge. This leads
to the reduction of the electrostatic attraction between the interacting interfaces. Consequently,
Ca2+ and Mg2+ adsorb more to the interacting interfaces because of reduced charge. Some ions
combine with the carboxylic component at the oil−brine interface to release the oil, while others
attach to the rock−brine interface to balance the electric charge. Meanwhile, another hypothesis
suggests that the cause of the wettability alteration is mineral alteration in terms of dissolution and
precipitation [47], even though, a few have classified this cause as more of a secondary mechanism
[27, 56]. Recent work by Awolayo et al. [276] proved that both causes should be integrated in
modeling the wettability alteration process as both are involved in re-establishing the new
equilibrium state. In this section, the surface sorption model was used to investigate wettability
alteration during smart brine injection at the core-scale. Single-phase flooding experiments that
were reported in the literature were modeled and compared with the measured produced ion
histories. Two-phase water-oil displacement tests were also modeled and compared with
experimental data. Lastly, the model was utilized to demonstrate the potential of smart brine
flooding at field-scale.
The descriptions of the equations and assumptions made in developing this SSM model are
provided in Chapter 4. The model assumes that rock−brine interface becomes initially attracted to
oil−brine interface because of the presence of the positively charged surface site (> 𝑋 ) that can
attach to the oil acid-group. Meanwhile the surface fraction of > 𝑋 is reduced due to geochemical
interactions between the interacting interfaces in the presence of smart brines. As previously
explained, SO42- interaction decreases the charge of the positive charge site, and consequently
detaches the oil acid group and enables adsorption of Ca2+ and Mg2+. This results in the reduction
of surface fractions of > 𝑋 and > 𝑁𝑎𝑋. Then, the flow functions, in this case relative
permeability (see Figure 5.14), were made to reflect wettability alteration by their dependency on

160
the fraction of unoccupied surface site using the linear interpolation technique proposed in eq.
5.10. This hypothesis was tested by predicting different smart brine flooding cases from
independently-sourced experiments. The linear 1-D simulations for all core experiments were
discretized uniformly into 100 × 1 × 1 grid blocks to reduce numerical dispersion effects with
different core properties described in Table 5.4.
Figure 5.14—Water-oil relative permeability curves for in-situ and injected smart brines used in simulating
the flooding experiments of S#42 (left) and S#9 (right). Broken lines indicate relative permeability to water
and solid lines indicate relative permeability to oil.
5.3.1 Laboratory scale simulation
5.3.1.1 Single−phase modeling.
In furtherance to the testing of the hypothesis and, the established set of surface sorption
parameters, single phase flow experiments using smart brines conducted by Chandrasekhar et al.
[196] was evaluated. The experiment was carried out on a composite core initially equilibrated
with formation water at 120 ºC. In the first experiment, the in-situ brine was displaced by about
two pore volumes of seawater (SO42- in seawater was ten times greater than that in formation
water). While, for the second experiment, the in-situ brine was displaced with the same pore
volumes of seawater with 4×SO42-. The compositions of different brines in-situ and injected are
given in Table 5.4. The experimental and simulated normalized ion concentration profiles are
0.00
0.05
0.10
0.15
0.20
0.25
0.30
0 0.2 0.4 0.6 0.8 1
Rel
ativ
e P
erm
eab
ility
Water Saturation
Formation water
Seawater
0.00
0.05
0.10
0.15
0.20
0.25
0.30
0.35
0 0.2 0.4 0.6 0.8 1
Rel
ativ
e P
erm
eab
ility
Water Saturation
Formation water
Seawater
Seawater with 4xSO4

161
presented in Figures 5.15 and 5.16 for the seawater and seawater with 4×SO42- displacement,
respectively. In both cases, until about 0.6 pore volume injection (PVI), the concentration of the
in-situ brine was maintained. This concentration changed significantly until about 1.8 PVIs, which
was captured by the model using a dispersion coefficient of 1.95×10⁻⁵ cm2/s. Aside from the
dispersion effect, the model captured the evolution of the ion profile excellently. Further delay in
the production of the PDIs using the established surface sorption parameters in Chapter 4 was well
captured as presented in Figures 5.15 and 5.16.
Table 5.4—Summary of fluid and core compositions and properties used in the simulation. Site capacity;
was assumed as 3 sites/nm2. I represents ionic strength and TDS represents total dissolved solids.
Chandrasekhar et al. [196] — 120 ºC
Brine (M) Ca2+ Mg2+ SO42- Na+ Cl- HCO3
- I TDS (g/L)
Formation Water 0.280 0.116 0.002 1.752 4.627 0.000 3.986 218.588
Seawater 0.013 0.063 0.036 0.561 0.750 0.000 0.878 44.981
Seawater with 4xSO42- 0.006 0.060 0.126 0.423 0.379 0.000 0.785 36.957
Rock properties
Length
(cm)
Diameter
(cm)
Mineral volume
fraction
Permeability
(mD)
Porosity
(fraction)
Swi (%) Flow rate
(ml/min)
15.3 3.80 0.81 Calcite
0.02 Dolomite 25 0.17 100 0.02
Awolayo et al. [29] — 110 ºC
Brine (M) Ca2+ Mg2+ SO42- Na+ Cl- HCO3
- I TDS (g/L)
Formation Water 0.477 0.138 0.001 3.335 4.564 0.001 5.183 261.135
Seawater with 0.5xSO42 0.013 0.067 0.017 0.639 0.701 0.000 0.864 43.365
Seawater with 1xSO42- 0.010 0.071 0.030 0.593 0.695 0.000 0.865 43.267
Seawater with 2xSO42- 0.014 0.077 0.069 0.531 0.573 0.000 0.873 43.877
Seawater with 4xSO42- 0.016 0.083 0.148 0.521 0.423 0.000 0.966 43.877
Rock properties
Oil viscosity (1.93 cP)
Core S#9
Core S#42
Length
(cm)
Diameter
(cm)
Mineral volume
fraction
Permeability
(mD)
Porosity
(fraction)
Swi (%) Flow rate
(ml/min)
6.22 3.84 0.67 Calcite
0.08 Dolomite 7.31 0.25 21.42 0.25
9.93 3.86 0.71 Calcite
0.09 Dolomite 1.61 0.20 20.44 0.25

162
Figure 5.15—Comparison between observed and simulated normalized breakthrough curves for all ions
(left) and relative breakthrough curves for PDIs (right) during seawater flooding. Experimental data
obtained from Chandrasekhar et al. [196].
Figure 5.16—Comparison between observed and simulated [a] normalized breakthrough curves for all ions
(left) and relative breakthrough curves for PDIs (right) during seawater with 4xSO42- flooding.
Experimental data obtained from Chandrasekhar et al. [196].
The results in the right panel of Figures 5.15 and 5.16 were plotted to reproduce the normalized
ion profile relative to the in-situ concentrations. The delay in the transport of SO42-, reaching a
value of 1 later than other PDI cations, implied that SO42- was sorbed to the rock−brine interface.
A reduced interfacial charge enabled the competitive adsorption of Mg2+ and Ca2+ as earlier
theorized. It is expected that Mg2+ should be more adsorbed than Ca2+ at this high temperature
[32], however, because of very high Ca2+ concentration in-situ, their adsorption is more or less the
same. Although SO42- showed a similar delay in both experimental cases, the delay in the PDI
cations was more in the second case (Figure 5.15) as compared to the first case (Figure 5.16). This
0.01
0.1
1
10
100
0 0.5 1 1.5 2
C/C
0
Pore Volume Injected
Ca_exp Mg_exp SO4_exp Na_exp Cl_exp
Ca_Mod Mg_Mod SO4_Mod Na_Mod Cl_Mod0
0.2
0.4
0.6
0.8
1
1.2
0 0.5 1 1.5 2
C-C
i/C0-C
i
Pore Volume Injected
Ca_exp Mg_exp SO4_exp
Ca_Mod Mg_Mod SO4_Mod
0
0.2
0.4
0.6
0.8
1
1.2
0 0.5 1 1.5 2
C-C
i/C0-C
i
Pore Volume Injected
Ca_exp Mg_exp SO4_exp
Ca_Mod Mg_Mod SO4_Mod
0.01
0.1
1
10
100
0 0.5 1 1.5 2
C/C
0
Pore Volume Injected
Ca_exp Mg_exp
SO4_exp Na_exp
Cl_exp Ca_Mod
Mg_Mod SO4_Mod
Na_Mod Cl_mod

163
showed that with more SO42- injected, more electrostatic repulsion consequently occurred, which
enabled more PDI cation adsorption. A good agreement observed between various single-phase
experimental ion profiles, and that of the simulation results suggests that the model accurately
capture the rock−brine interactions. The simulation of these single-phase experiments showed
preferential SO42- adsorption to the core when flooded with sulfate-rich brines.
5.3.1.2 Two-phase modeling
It is expedient to evaluate the influence of smart brine on oil-water displacement experiments to
investigate the changes in rock wettability. In the two-phase displacement experiments conducted
by Awolayo et al. [29] at 110 ºC, the carbonate cores were initially saturated with the formation
water and later displaced by dead oil to irreducible water saturation. Then, the reservoir in-situ
brine was injected followed by different smart brines in the tertiary mode. More details about the
experiment are discussed in the cited reference. The brine compositions and core properties used
in modeling these experiments are presented in Table 5.4. In both experiments, relative
permeability was not measured but rather inferred from the observed experimental recovery and
pressure data with the method highlighted earlier in this Chapter.
In the composite coreflood test labelled as “S#42”, the in-situ formation water was first injected
and recovered 71.13% oil−originally−in−core (OOIC). This flooding cycle was followed by an
injection of seawater, which recovered an additional 5.7% OOIC. Lastly, SO42- concentration was
further spiked by the injection of seawater with 4×SO42- and additional recovery of 3.09% OOIC
was observed. The authors emphasized that the additional oil could be observed when PDI
concentrations in the injected brine are favorably modified while maintaining similar ionic
strength. This trend was well captured by the model as presented in Figure 5.17. In addition,
simulated changes in mineral volume fractions are reported alongside the oil recovery data plotted
in Figure 5.17. The result showed that no significant mineral dissolution occurred during the in-
situ brine injection. However, as brines of lower salinities were injected, the calcite dissolved to
maintain the equilibrium concentration of Ca2+ in the aqueous solution. This effect can be seen in
the comparison between simulated and experimental effluent concentration profiles plotted in
Figure 5.17, where Ca2+ effluent concentration was continually higher than the injected

164
concentration during the tertiary injection mode. Meanwhile, SO42- was quite higher in the
subsequent injected cycle compared to the preceding cycle. As a result, increased SO42- adsorption
to the rock-brine interface was evident in sorbed fractions of sulfate. The resultant effect is an
increased repulsion between the interacting media, enabling Mg2+ and Ca2+ to be co-adsorbed and
thereby reducing the fractions of the free unoccupied site (> 𝑁𝑎𝑋) as presented in the bottom left
panel of Figure 5.17. Hence, the model interpolated the relative permeability with respect to the
> 𝑁𝑎𝑋 fractions to capture the wettability alteration leading to improved recovery. The simulated
effluent concentration profile of Na+ and Cl- matched with the experimental data as both ions were
not involved in any reaction at the interface, though present in the bulk electrolyte solution.
Figure 5.17—Results of formation water, seawater and seawater with 4xSO42- flooding sequence
comparison between two-phase simulated and experimental oil recovery, and simulated mineral volume
changes (top left); simulated and experimental effluent ions concentration of PDIs (top right); simulated
surface and equivalent fractions of PDIs along the mid-section of core S#42 (bottom left) and simulated
and experimental effluent ions concentration of Na+ and Cl- (bottom right). Data-points indicate measured
datasets (Awolayo et al. [29]), broken lines indicate injection concentration, and solid lines indicate the
simulation results.
-0.000003
-0.000002
-0.000001
0.000000
0.000001
0.000002
0.000003
0
10
20
30
40
50
60
70
80
90
0 5 10 15 20 25
Min
era
l Vo
lum
e F
ractio
ns
Oil
Rec
ove
ry %
Pore Volume Injected
RF_Mod RF_exp
Calcite Dolomite
0.001
0.01
0.1
1
10
0 5 10 15 20 25
Ion
ic C
on
cen
trat
ion
(M)
Pore Volume Injected
Ca_exp Mg_exp SO4_expCa_Mod Mg_Mod SO4_ModCa_Inj Mg_Inj SO4_Inj
0.1
1
10
0 5 10 15 20 25
Ion
ic C
on
cen
trat
ion
(M)
Pore Volume Injected
Na_exp Cl_exp
Na_Mod Cl_mod
Na_Inj Cl_Inj
0
0.1
0.2
0.3
0.4
0.5
0.6
0.7
0.8
0.9
0 5 10 15 20 25
Eq
uiv
ale
nt/
So
rbe
d F
ract
ion
s
Pore Volume Injected
Ca_Mod
Mg_Mod
X_Mod
SO4_Mod

165
Figure 5.18—Prediction of formation water, seawater and seawater with 0.5xSO42- flooding sequence:
comparison between two-phase simulated and experimental oil recovery (top left); simulated and
experimental effluent ions concentration of PDIs (top right); simulated surface and equivalent fractions of
PDIs along the mid-section of core S#9 (bottom left); and simulated and experimental effluent ions
concentration of Na+ and Cl- (bottom right). Experimental data obtained from Awolayo et al. [29].
Meanwhile, for the flood test S#9, the in-situ formation water recovered 75.6% OOIC, followed
by an additional 6.86% OOIC recovered by injection of seawater. Lastly, seawater with 0.5×SO42-
was flooded through the core and no additional recovery was observed. The comparison between
the simulated and experimental oil recovery is presented in Figure 5.18. Similar observation as
highlighted earlier could be noted during seawater injection. Because of mineral dissolution, Ca2+
effluent concentration remained higher than injected. The adsorption of SO42- increased and
decreased during seawater and seawater with 0.5×SO42- injection, respectively (see the bottom left
panel of Figure 5.18). The impact of reduced sulfate adsorption was an increased electrostatic
attraction between the interacting interfaces. This resulted in a slight increase in equivalent
fractions of the free unoccupied site, which implied that no further wettability alteration towards
0
10
20
30
40
50
60
70
80
90
0 5 10 15 20 25 30
Oil
Rec
ove
ry %
Pore Volume Injected
RF_Mod
RF_exp
0.001
0.01
0.1
1
0 5 10 15 20 25 30
Ion
ic C
on
cen
trat
ion
(M)
Pore Volume Injected
Ca_exp Mg_exp SO4_exp
Ca_Mod Mg_Mod SO4_Mod
Ca_Inj Mg_Inj SO4_Inj
0.1
1
10
0 5 10 15 20 25 30
Ion
ic C
on
cen
trat
ion
(M)
Pore Volume Injected
Na_exp Cl_exp
Na_Mod Cl_mod
Na_Inj Cl_Inj
0
0.1
0.2
0.3
0.4
0.5
0.6
0.7
0.8
0.9
0 5 10 15 20 25 30
Equ
ival
ent/
Sorb
ed F
ract
ion
s
Pore Volume Injected
Ca_Mod
Mg_Mod
X_Mod
SO4_Mod

166
less oil-wetting state could occur. Hence, the model predicted no additional recovery during
seawater with 0.5×SO42- flooding cycle. This analysis showed that no additional oil could be
recovered when PDI concentration in the injected brine is reduced, while similar ionic strength is
maintained.
Table 5.5—Input parameters for the 2D synthetic simulation model
Parameters Values
Well pattern Quarter five-spot
Pattern size 183 m × 183 m × 10 m
Rock mineral volume 71% calcite, 9% dolomite and 20% pore space
Initial pressure 4695 psia
Reservoir temperature 110 ºC
Depth 2970 m
Average porosity 0.197
Average permeability 180 mD
Permeability anisotropy (KV/KH) 0.1
Oil viscosity at reservoir temperature 0.560 cP
Initial water saturation 0.214
Well injection rate 160 m3/d
Well production condition Constant bottom-hole pressure of 4600 psia
5.3.2 Field−scale modeling
In this section, 2D field-scale simulations were performed to illustrate the possible recovery
improvement due to smart brine injection using a quarter five-spot waterflood pattern. Fluid
properties and compositions of different injected brines are based on the previous laboratory
coreflood (see Table 5.5 for the other input data). The sector is 183 m × 183 m × 10 m discretized
into 40 × 40 × 1 grid cells. The reservoir is assumed heterogeneous and anisotropic in porosity and
permeability with an arithmetic mean of 0.197 and 180 mD, respectively. The porosity and
permeability are within the measured range for many carbonate reservoirs. Figure 5.19 shows the
permeability field for the quarter five-spot reservoir model containing patches of high permeability
channel. While the porosity field is normally distributed with a mean of 0.2 and a standard
deviation of 0.029. The permeability-porosity correlation was taken from a typical carbonate

167
reservoir as shown in Figure 5.19 [277, 278]. The initial pressure is 4695 psi, and the temperature
is 110 ºC. The well-to-well distance is 260 m. The injection well in the quarter five-spot is in the
lower-left corner with a constant-reservoir volumetric rate of 160 m3/d. The simulation of
formation water, seawater and seawater with 4×SO42- flooding was conducted using the relative
permeability curves as shown in Figure 5.14 to account for the wettability alteration process.
Figure 5.19—Simulation of 2-D synthetic quarter five-spot pattern with permeability distribution map (top
left), porosity distribution map (top right) and permeability-porosity cross-plot (bottom) [277]. The block
size is 15 ft. in every direction. The black dot at the upper-right corner is the producer, while the black dot
with an arrow at the lower-left corner is the injector
A simulation run was conducted at secondary recovery mode, where 3 PV of in-situ and smart
brines were separately injected as shown in Figure 5.20. Seawater and seawater with 4×SO42-
recovered about 8% and 13% additional oil, respectively, compared to formation waterflooding.
The simulation results prove that the benefits of smart brine injection in the full field scale are very
Injector
Producer
1,200 1,300 1,400 1,500 1,600 1,700 1,800 1,900
1,200 1,300 1,400 1,500 1,600 1,700 1,800 1,900
-1,5
00
-1,4
00
-1,3
00
-1,2
00
-1,1
00
-1,5
00
-1,4
00
-1,3
00
-1,2
00
-1,1
00
-1,0
00
0.00 95.00 190.00 feet
0.00 30.00 60.00 meters
File: abudhabi_model_sw.irf
User: adedapo
Date: 08/09/2017
Scale: 1:1445
Y/X: 1.00:1
Axis Units: ft
0
91
182
272
363
454
545
636
726
817
908
Permeability I (md) 2050-01-01 K layer: 1
Injector
Producer
1,200 1,300 1,400 1,500 1,600 1,700 1,800 1,900
1,200 1,300 1,400 1,500 1,600 1,700 1,800 1,900
-1,5
00
-1,4
00
-1,3
00
-1,2
00
-1,1
00
-1,5
00
-1,4
00
-1,3
00
-1,2
00
-1,1
00
-1,0
00
0.00 95.00 190.00 feet
0.00 30.00 60.00 meters
File: abudhabi_model_sw.irf
User: adedapo
Date: 08/09/2017
Scale: 1:1445
Y/X: 1.00:1
Axis Units: ft
0.040
0.061
0.082
0.103
0.124
0.145
0.166
0.187
0.208
0.229
0.250
Porosity 2050-01-01 K layer: 1
0.01
0.1
1
10
100
1000
0 0.05 0.1 0.15 0.2 0.25 0.3
Pe
rme
abil
ity,
mD
Porosity, %
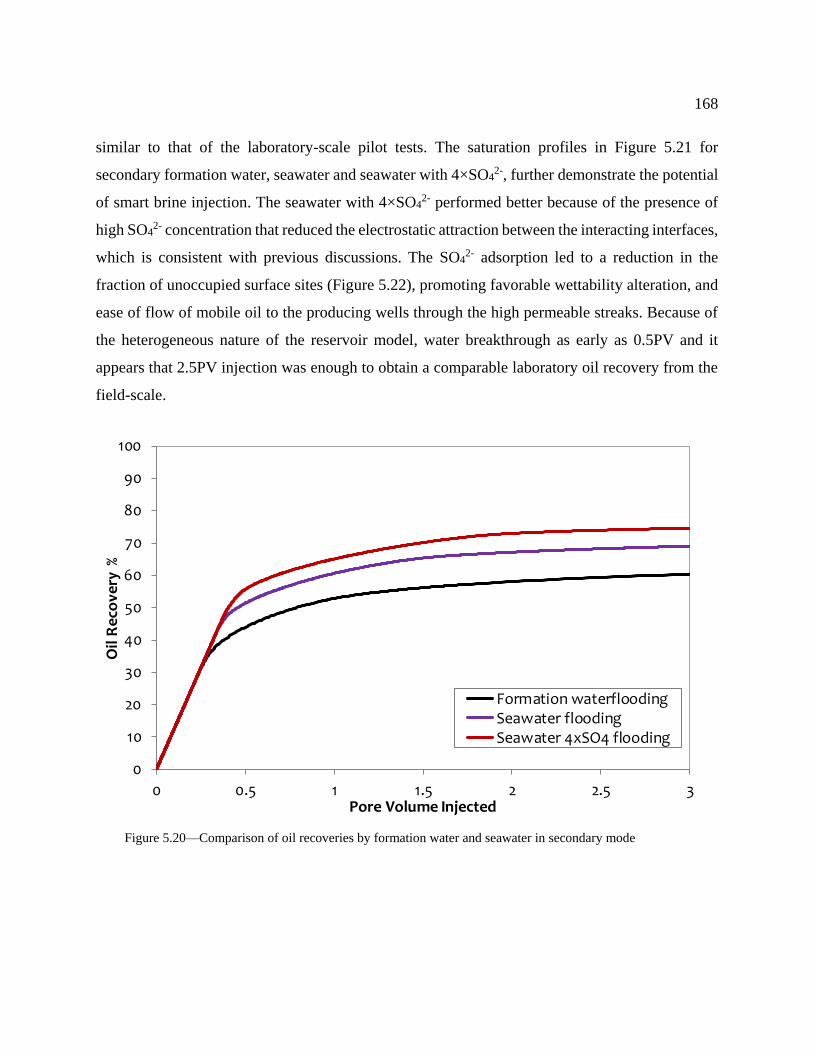
168
similar to that of the laboratory-scale pilot tests. The saturation profiles in Figure 5.21 for
secondary formation water, seawater and seawater with 4×SO42-, further demonstrate the potential
of smart brine injection. The seawater with 4×SO42- performed better because of the presence of
high SO42- concentration that reduced the electrostatic attraction between the interacting interfaces,
which is consistent with previous discussions. The SO42- adsorption led to a reduction in the
fraction of unoccupied surface sites (Figure 5.22), promoting favorable wettability alteration, and
ease of flow of mobile oil to the producing wells through the high permeable streaks. Because of
the heterogeneous nature of the reservoir model, water breakthrough as early as 0.5PV and it
appears that 2.5PV injection was enough to obtain a comparable laboratory oil recovery from the
field-scale.
Figure 5.20—Comparison of oil recoveries by formation water and seawater in secondary mode
0
10
20
30
40
50
60
70
80
90
100
0 0.5 1 1.5 2 2.5 3
Oil
Re
cove
ry %
Pore Volume Injected
Formation waterfloodingSeawater floodingSeawater 4xSO4 flooding

169
Figure 5.21—Comparison of the evolution of water saturation during secondary injection mode of
formation water, seawater and seawater with 4×SO42-
Figure 5.22—Evolution of equivalent fractions of unoccupied sites during secondary injection mode of
seawater with 4×SO42-
0.25 PVI Formation water 0.5 PVI Formation water 1 PVI Formation water 3 PVI Formation water
Injector
Producer
1,200 1,300 1,400 1,500 1,600 1,700 1,800 1,900
1,200 1,300 1,400 1,500 1,600 1,700 1,800 1,900
-1,5
00
-1,4
00
-1,3
00
-1,2
00
-1,1
00
-1,0
00
-1,5
00
-1,4
00
-1,3
00
-1,2
00
-1,1
00
-1,0
00
0.00 95.00 190.00 feet
0.00 30.00 60.00 meters
File: abudhabi_model.irfUser: adedapoDate: 18/09/2017
Scale: 1:1445Y/X: 1.00:1Axis Units: ft
0.00
0.10
0.20
0.30
0.40
0.50
0.60
0.70
0.80
0.90
1.00
Water Saturation 2011-12-25.7117616460 K layer: 1
Injector
Producer
1,200 1,300 1,400 1,500 1,600 1,700 1,800 1,900
1,200 1,300 1,400 1,500 1,600 1,700 1,800 1,900
-1,5
00
-1,4
00
-1,3
00
-1,2
00
-1,1
00
-1,0
00
-1,5
00
-1,4
00
-1,3
00
-1,2
00
-1,1
00
-1,0
00
0.00 95.00 190.00 feet
0.00 30.00 60.00 meters
File: abudhabi_model.irfUser: adedapoDate: 18/09/2017
Scale: 1:1445Y/X: 1.00:1Axis Units: ft
0.00
0.10
0.20
0.30
0.40
0.50
0.60
0.70
0.80
0.90
1.00
Water Saturation 2014-04-01 K layer: 1
Injector
Producer
1,200 1,300 1,400 1,500 1,600 1,700 1,800 1,900
1,200 1,300 1,400 1,500 1,600 1,700 1,800 1,900
-1,5
00
-1,4
00
-1,3
00
-1,2
00
-1,1
00
-1,0
00
-1,5
00
-1,4
00
-1,3
00
-1,2
00
-1,1
00
-1,0
00
0.00 95.00 190.00 feet
0.00 30.00 60.00 meters
File: abudhabi_model.irfUser: adedapoDate: 18/09/2017
Scale: 1:1445Y/X: 1.00:1Axis Units: ft
0.00
0.10
0.20
0.30
0.40
0.50
0.60
0.70
0.80
0.90
1.00
Water Saturation 2018-05-01 K layer: 1
Injector
Producer
1,200 1,300 1,400 1,500 1,600 1,700 1,800 1,900
1,200 1,300 1,400 1,500 1,600 1,700 1,800 1,900
-1,5
00
-1,4
00
-1,3
00
-1,2
00
-1,1
00
-1,0
00
-1,5
00
-1,4
00
-1,3
00
-1,2
00
-1,1
00
-1,0
00
0.00 95.00 190.00 feet
0.00 30.00 60.00 meters
File: abudhabi_model.irfUser: adedapoDate: 18/09/2017
Scale: 1:1445Y/X: 1.00:1Axis Units: ft
0.00
0.10
0.20
0.30
0.40
0.50
0.60
0.70
0.80
0.90
1.00
Water Saturation 2033-11-20.8752395511 K layer: 1
Injector
Producer
1,200 1,300 1,400 1,500 1,600 1,700 1,800 1,900
1,200 1,300 1,400 1,500 1,600 1,700 1,800 1,900
-1,500-1,400
-1,300-1,200
-1,100-1,000
-1,5
00-1
,400
-1,3
00-1
,200
-1,1
00-1
,000
0.00 95.00 190.00 feet
0.00 30.00 60.00 meters
File: abudhabi_model.irfUser: adedapoDate: 18/09/2017
Scale: 1:1445Y/X: 1.00:1Axis Units: ft0.0 0.1 0.2 0.3 0.4 0.5 0.6 0.7 0.8 0.9 1.0
Water Saturation 2033-11-20.8752395511 K layer: 1
0.25 PVI Seawater 0.5 PVI Seawater 1 PVI Seawater 3 PVI Seawater
Injector
Producer
1,200 1,300 1,400 1,500 1,600 1,700 1,800 1,900
1,200 1,300 1,400 1,500 1,600 1,700 1,800 1,900
-1,5
00
-1,4
00
-1,3
00
-1,2
00
-1,1
00
-1,0
00
-1,5
00
-1,4
00
-1,3
00
-1,2
00
-1,1
00
-1,0
00
0.00 95.00 190.00 feet
0.00 30.00 60.00 meters
File: abudhabi_model_sw.irfUser: adedapoDate: 18/09/2017
Scale: 1:1445Y/X: 1.00:1Axis Units: ft
0.00
0.10
0.20
0.30
0.40
0.50
0.60
0.70
0.80
0.90
1.00
Water Saturation 2011-12-15.4124683514 K layer: 1
Injector
Producer
1,200 1,300 1,400 1,500 1,600 1,700 1,800 1,900
1,200 1,300 1,400 1,500 1,600 1,700 1,800 1,900
-1,5
00
-1,4
00
-1,3
00
-1,2
00
-1,1
00
-1,0
00
-1,5
00
-1,4
00
-1,3
00
-1,2
00
-1,1
00
-1,0
00
0.00 95.00 190.00 feet
0.00 30.00 60.00 meters
File: abudhabi_model_sw.irfUser: adedapoDate: 18/09/2017
Scale: 1:1445Y/X: 1.00:1Axis Units: ft
0.00
0.10
0.20
0.30
0.40
0.50
0.60
0.70
0.80
0.90
1.00
Water Saturation 2014-03-05.8053460196 K layer: 1
Injector
Producer
1,200 1,300 1,400 1,500 1,600 1,700 1,800 1,900
1,200 1,300 1,400 1,500 1,600 1,700 1,800 1,900
-1,5
00
-1,4
00
-1,3
00
-1,2
00
-1,1
00
-1,0
00
-1,5
00
-1,4
00
-1,3
00
-1,2
00
-1,1
00
-1,0
00
0.00 95.00 190.00 feet
0.00 30.00 60.00 meters
File: abudhabi_model_sw.irfUser: adedapoDate: 18/09/2017
Scale: 1:1445Y/X: 1.00:1Axis Units: ft
0.00
0.10
0.20
0.30
0.40
0.50
0.60
0.70
0.80
0.90
1.00
Water Saturation 2018-05-20.6126723215 K layer: 1
Injector
Producer
1,200 1,300 1,400 1,500 1,600 1,700 1,800 1,900
1,200 1,300 1,400 1,500 1,600 1,700 1,800 1,900
-1,5
00
-1,4
00
-1,3
00
-1,2
00
-1,1
00
-1,0
00
-1,5
00
-1,4
00
-1,3
00
-1,2
00
-1,1
00
-1,0
00
0.00 95.00 190.00 feet
0.00 30.00 60.00 meters
File: abudhabi_model_sw.irfUser: adedapoDate: 18/09/2017
Scale: 1:1445Y/X: 1.00:1Axis Units: ft
0.00
0.10
0.20
0.30
0.40
0.50
0.60
0.70
0.80
0.90
1.00
Water Saturation 2033-10-01.1841425598 K layer: 1
0.25 PVI Seawater with 4xSO42- 0.5 PVI Seawater with 4xSO4
2- 1 PVI Seawater with 4xSO42- 3 PVI Seawater with 4xSO4
2-
Injector
Producer
1,200 1,300 1,400 1,500 1,600 1,700 1,800 1,900
1,200 1,300 1,400 1,500 1,600 1,700 1,800 1,900
-1,5
00
-1,4
00
-1,3
00
-1,2
00
-1,1
00
-1,0
00
-1,5
00
-1,4
00
-1,3
00
-1,2
00
-1,1
00
-1,0
00
0.00 95.00 190.00 feet
0.00 30.00 60.00 meters
File: abudhabi_model_sw4s.irfUser: adedapoDate: 18/09/2017
Scale: 1:1446Y/X: 1.00:1Axis Units: ft
0.00
0.10
0.20
0.30
0.40
0.50
0.60
0.70
0.80
0.90
1.00
Water Saturation 2011-11-07.7112037241 K layer: 1
Injector
Producer
1,200 1,300 1,400 1,500 1,600 1,700 1,800 1,900
1,200 1,300 1,400 1,500 1,600 1,700 1,800 1,900
-1,5
00
-1,4
00
-1,3
00
-1,2
00
-1,1
00
-1,0
00
-1,5
00
-1,4
00
-1,3
00
-1,2
00
-1,1
00
-1,0
00
0.00 95.00 190.00 feet
0.00 30.00 60.00 meters
File: abudhabi_model_sw4s.irfUser: adedapoDate: 18/09/2017
Scale: 1:1446Y/X: 1.00:1Axis Units: ft
0.00
0.10
0.20
0.30
0.40
0.50
0.60
0.70
0.80
0.90
1.00
Water Saturation 2013-11-15.1542687304 K layer: 1
Injector
Producer
1,200 1,300 1,400 1,500 1,600 1,700 1,800 1,900
1,200 1,300 1,400 1,500 1,600 1,700 1,800 1,900
-1,5
00
-1,4
00
-1,3
00
-1,2
00
-1,1
00
-1,0
00
-1,5
00
-1,4
00
-1,3
00
-1,2
00
-1,1
00
-1,0
00
0.00 95.00 190.00 feet
0.00 30.00 60.00 meters
File: abudhabi_model_sw4s.irfUser: adedapoDate: 18/09/2017
Scale: 1:1446Y/X: 1.00:1Axis Units: ft
0.00
0.10
0.20
0.30
0.40
0.50
0.60
0.70
0.80
0.90
1.00
Water Saturation 2017-10-05.8759318814 K layer: 1
Injector
Producer
1,200 1,300 1,400 1,500 1,600 1,700 1,800 1,900
1,200 1,300 1,400 1,500 1,600 1,700 1,800 1,900
-1,5
00
-1,4
00
-1,3
00
-1,2
00
-1,1
00
-1,0
00
-1,5
00
-1,4
00
-1,3
00
-1,2
00
-1,1
00
-1,0
00
0.00 95.00 190.00 feet
0.00 30.00 60.00 meters
File: abudhabi_model_sw4s.irfUser: adedapoDate: 18/09/2017
Scale: 1:1446Y/X: 1.00:1Axis Units: ft
0.00
0.10
0.20
0.30
0.40
0.50
0.60
0.70
0.80
0.90
1.00
Water Saturation 2032-02-09.2295903414 K layer: 1
0.25 PVI Seawater with 4xSO42- 0.5 PVI Seawater with 4xSO4
2- 1 PVI Seawater with 4xSO42- 3 PVI Seawater with 4xSO4
2-
Injector
Producer
1,200 1,300 1,400 1,500 1,600 1,700 1,800 1,900
1,200 1,300 1,400 1,500 1,600 1,700 1,800 1,900
-1,5
00
-1,4
00
-1,3
00
-1,2
00
-1,1
00
-1,0
00
-1,5
00
-1,4
00
-1,3
00
-1,2
00
-1,1
00
-1,0
00
0.00 95.00 190.00 feet
0.00 30.00 60.00 meters
File: abudhabi_model_sw4s.irfUser: adedapoDate: 18/09/2017
Scale: 1:1446Y/X: 1.00:1Axis Units: ft
0.066
0.086
0.105
0.125
0.145
0.164
0.184
0.203
0.223
0.243
0.262
IonExch Eqv Fraction(Na-X) 2011-11-07.7112037241 K layer: 1
Injector
Producer
1,200 1,300 1,400 1,500 1,600 1,700 1,800 1,900
1,200 1,300 1,400 1,500 1,600 1,700 1,800 1,900
-1,5
00
-1,4
00
-1,3
00
-1,2
00
-1,1
00
-1,0
00
-1,5
00
-1,4
00
-1,3
00
-1,2
00
-1,1
00
-1,0
00
0.00 95.00 190.00 feet
0.00 30.00 60.00 meters
File: abudhabi_model_sw4s.irfUser: adedapoDate: 18/09/2017
Scale: 1:1446Y/X: 1.00:1Axis Units: ft
0.066
0.085
0.105
0.125
0.144
0.164
0.184
0.203
0.223
0.243
0.262
IonExch Eqv Fraction(Na-X) 2013-11-15.1542687304 K layer: 1
Injector
Producer
1,200 1,300 1,400 1,500 1,600 1,700 1,800 1,900
1,200 1,300 1,400 1,500 1,600 1,700 1,800 1,900
-1,5
00
-1,4
00
-1,3
00
-1,2
00
-1,1
00
-1,0
00
-1,5
00
-1,4
00
-1,3
00
-1,2
00
-1,1
00
-1,0
00
0.00 95.00 190.00 feet
0.00 30.00 60.00 meters
File: abudhabi_model_sw4s.irfUser: adedapoDate: 18/09/2017
Scale: 1:1446Y/X: 1.00:1Axis Units: ft
0.065
0.085
0.105
0.125
0.144
0.164
0.184
0.203
0.223
0.243
0.262
IonExch Eqv Fraction(Na-X) 2017-10-05.8759318814 K layer: 1
Injector
Producer
1,200 1,300 1,400 1,500 1,600 1,700 1,800 1,900
1,200 1,300 1,400 1,500 1,600 1,700 1,800 1,900
-1,5
00
-1,4
00
-1,3
00
-1,2
00
-1,1
00
-1,0
00
-1,5
00
-1,4
00
-1,3
00
-1,2
00
-1,1
00
-1,0
00
0.00 95.00 190.00 feet
0.00 30.00 60.00 meters
File: abudhabi_model_sw4s.irfUser: adedapoDate: 18/09/2017
Scale: 1:1446Y/X: 1.00:1Axis Units: ft
0.065
0.085
0.105
0.125
0.144
0.164
0.184
0.203
0.223
0.243
0.262
IonExch Eqv Fraction(Na-X) 2032-02-09.2295903414 K layer: 1
Injector
Producer
1,200 1,300 1,400 1,500 1,600 1,700 1,800 1,900
1,200 1,300 1,400 1,500 1,600 1,700 1,800 1,900
-1,5
00
-1,4
00
-1,3
00
-1,2
00
-1,1
00
-1,0
00
-1,5
00
-1,4
00
-1,3
00
-1,2
00
-1,1
00
-1,0
00
0.00 95.00 190.00 feet
0.00 30.00 60.00 meters
File: abudhabi_model_sw.irfUser: adedapoDate: 13/09/2017
Scale: 1:1445Y/X: 1.00:1Axis Units: ft
0.080
0.099
0.118
0.136
0.155
0.173
0.192
0.210
0.229
0.247
0.266
IonExch Eqv Fraction(Na-X) 2033-11-01.0639628507 K layer: 1

170
Meanwhile, in many cases, producing oil reservoirs are flooded conventionally with high saline
formation water right after the primary production stage. This implies that smart brines would
rather be injected as a tertiary recovery fluid. Hence, another simulation run was conducted to
explore the potential of smart brine by first injecting the formation water for about 2.5 PV,
followed by another 2.5 PV of smart brine injection. Figure 5.23 demonstrates that the tertiary
flooding of seawater and seawater with 4×SO42- gave an additional oil recovery of 6% and 9%
respectively, after the high saline formation waterflood. Besides, continuous injection of secondary
mode seawater, seawater with 4×SO42- and formation water were presented in Figure 5.23 to
compare with the tertiary injection mode. The comparison shows that continuously injecting a
higher pore volume of formation water would not significantly improve recovery. Meanwhile,
replacing the formation water with smart brine showed a higher recovery. Overall, the continuous
injection of both seawater and seawater with 4×SO42- in secondary mode appears to be much more
effective in terms of the waterflood project timeline and oil recovery. This option gives better oil
recovery as well as lesser cost and complexity of the new operation and facility.
Figure 5.23—Oil recovery comparison between secondary and tertiary injection mode of formation water
and seawater (left), and formation water and seawater with 4xSO42- (right)
Chapter Summary
In this Chapter, the brine dilution dependent-oil recovery was investigated by applying the
multicomponent multiphase geochemical model developed and validated in Chapter 4, to interpret
ion transport and oil recovery behavior during core experiments, understand the dominant
0
10
20
30
40
50
60
70
80
90
100
0 1 2 3 4 5
Oil
Rec
ove
ry %
Pore Volume Injected
Tertiary flooding
Formation waterflooding
Seawater flooding
0
10
20
30
40
50
60
70
80
90
100
0 1 2 3 4 5
Oil
Rec
ove
ry %
Pore Volume Injected
Tertiary flooding
Formation waterflooding
Seawater 4xSO4 flooding

171
mechanisms and their interplay. For the two-phase flow, the model justified that the reduction of
the free surface site fractions and/or co-adsorption of PDIs can improve recovery by modifying
flow functions, like relative permeability and capillary pressure. The model with previously
established thermodynamic parameters was further validated with independently-sourced single-
phase and two-phase flow experiments. These thermodynamic parameters can be used to predict
various brine-dependent recovery processes as illustrated in this Chapter. Based on the results of
this validation, a field-scale prediction was made, hence, the following conclusions are drawn:
• Single-phase and two-phase displacement experiments were simulated. The predicted effluent
concentrations were consistent with experimental measurements. Moreover, the predicted oil
recoveries matched well with the experimental measurements. The thermodynamic parameters
that were utilized are widely applicable.
• It is proved that incorporating surface interactions in terms of surface adsorption reaction to
capture SO42- and the use of fractions of the free anionic surface site as the interpolant is
sufficient to excellently reproduce the experimental data. In many cases, Mg2+ exchanged more
than Ca2+ because of its high reactivity at high temperature and high concentration in the
injected brine.
• It is evident that the model can replicate the early transient as well as the late steady-state trend
noticed in the effluent concentrations. The reactivity of the PDIs increased with increased
double layer thickness as the brine salinity is reduced and this became significant during the
wettability alteration process.
• Mineral dissolution/precipitation is obvious at both core and lab scale in the pursuit of re-
establishing equilibrium during diluted brine injection. The effect of carbonate mineral
variation was explored, and the impact can be seen on the process mechanisms leading to
improved recovery for different mineralogical carbonate rocks.
• In cases where sulfate was present in the injected brine, with reduced ion strength due to brine
dilution, less aqueous complexes of sulfate with cations were formed. While the absence of
sulfate, caused anhydrite dissolution from cores containing anhydrite. The resultant effect was
that free SO42- was available to adsorb, thereby improved the oil recovery.
172
• The model aptly explained the link between brine-dependent recovery process and wettability
alteration on the two major frontlines involving brine-dilution and compositional variation in
reference to the extent at which cations exchanged at the surface due to enhanced surface
interaction enhanced by the adsorbed sulfate. The prediction of wettability alteration is linked
to the relative permeability using the fractions of the occupied surface sites. This fraction is
reduced as the adsorption of PDIs increases
• The interplay between surface charge alteration and mineral dissolution is vital to the improved
recovery observed. Therefore, the relative contribution of these two depends on brine
composition, mineral constituents, and temperature.
• Aqueous pH is controlled by the interaction between injected brine and minerals present. The
pH may reach up to 8-9 in core experiments because of the resultant effect of mineral
dissolution and precipitation.
• The simplistic field simulation study has demonstrated oil recovery similar to those of the 1D
core simulation, using sequential seawater dilutions and PDI anions additions. However, it is
a function of the number of pore volumes of brine injected. The field-scale model confirmed
that significant incremental recovery could be obtained at representative field pore volumes
injected.
• Further and more detailed site-specific field-scale simulation studies are needed to firm up the
above observations made from the limited simulation study.

173
Prediction of Low-Salinity-Water-CO2 Recovery Process
In this Chapter, the investigation of low-salinity-water-CO2 (LSWCO2) recovery by utilizing the
surface complexation model (SCM) developed and validated in Chapter 4 was presented. Carbon
dioxide flooding is the most viable enhanced oil recovery (EOR) process in intermediate
and light oil reservoirs, both in sandstone and carbonate reservoirs. While low-salinity waterflood
is an emerging new EOR process. By combining the two EOR processes, the possibility of
additional oil mobilization by LSWCO2 was investigated.
Introduction
The key to the success of the design, evaluation and implementation of various EOR projects
around the globe is dictated by the favorable economics in the availability of suitable injection
fluids [2, 4]. In this regard, brine-dependent recovery process appears to have a better advantage
compared to other EOR techniques in terms of environmental footprints, costs, and field
implementation [62]. Several pieces of evidence have been presented to suggest that there are even
more significant advantages in the combination of brine-dependent recovery with other proven
EOR techniques, like chemical and gas flooding, which tends to benefit from synergies between
these different techniques. While low saline/smart brines improve recovery by alteration of rock
wettability; chemicals like polymer improves recovery by increasing the sweep efficiency;
surfactant and alkali by reduction of IFT; and gases like CO2, N2, hydrocarbon, etc., improves
recovery by increasing oil mobility either through first or multiple contact process resulting in IFT
reduction, oil swelling and viscosity reduction [88, 279].
However, chemical flooding appears to be comparatively uneconomical because some of these
chemicals are lost due to either retention or adsorption to the rock. Remarkably, high salinity
conditions have been reported to lead to higher polymer adsorption and negatively influence
polymer gel strength [280]. The earliest attempt at combining several EOR technique was to
combine low salinity waterflooding with low-tension surfactant flooding. Surfactant solubility are
improved as surfactant are less retained in low salinity brine [93]. A significant incremental
recovery was obtained by Kozaki [93] during the low-salinity-water-surfactant flooding in
174
sandstone rocks, and the proposition was that the surfactant formed micro-emulsion in the aqueous
phase as opposed to being trapped at high salinity conditions. Similarly, with low-salinity-water-
polymer flooding, coreflood experiments showed significant improvements in oil recovery with
fairly lower polymer quantity required for the target viscosity [93]. This was reported to
consequently reduce the costs of chemical required to improve recovery.
On the other hand, gas flooding is a commercially proven EOR technique to recover light oil,
however, gravity segregation, viscous fingering, early gas breakthrough and rock heterogeneity
are factors that tend to decrease oil displacement efficiency [1]. A technique that has been
developed to ensure mobility control and reduce the required quantity of injected gas is water
alternating gas (WAG) which alternates cycles of water and gas injection. The primary purpose of
WAG is to increase the sweep efficiency by reducing mobility ratio between the reservoir oil and
the injected fluids. Residual oil saturation in WAG process is always lower compared to that in
gas flooding because of higher trapped gas saturation, which results in less water blocking and oil
trapping [281]. WAG operates similar to gas flooding in miscible, immiscible or near-miscible
recovery mode, and the process can fluctuate between these modes in the reservoir production life
depending on reservoir oil properties, temperature, and pressure. The preferred mode is miscible
process because of its potential to achieve higher hydrocarbon recoveries compared to the other
modes. Though, one key issue associated with WAG in field application is reduced injectivity
caused by the presence of more than two phases near the wellbore and the associated pressure drop
and relative permeability effects [282]. Hence, low-saline-water-alternating-gas (LSWAG)
flooding promotes the synergy between mechanisms of wettability alteration and mobility control.
LSWAG is also capable of overcoming the issue of injectivity associated with WAG as will be
discussed below.
Decades of research and field experiences have attested to the success of CO2 injection. CO2
behaves uniquely compared to other injection gases due to its special properties. It can coexist as
liquid and gas at its critical temperature and pressure and above this critical condition, exist in a
supercritical state. At its supercritical state, it assumes a dense phase with a density as close to that
of a liquid with low viscosity and mostly injected into the reservoir in this form [283]. Unlike other

175
gases, CO2 undergoes both vaporization gas-drive process – where intermediate-weight
hydrocarbons vaporize into the injected gas from the reservoir oil and condensation gas-drive
process – where the injected gas dissolves in the oil to achieve dynamic miscibility such that the
two fluids become completely miscible. Then oil recovery is improved by oil swelling, viscosity
reduction and IFT reduction. In an immiscible mode, the injected gas and reservoir oil will not
mix, though the gas will still dissolve in the oil leading to oil swelling and viscosity reduction
[284]. However, optimal mobilization of the residual oil only occurs when the injected gas and
the reservoir oil becomes miscible. In comparison to available commercial injected gases, such as
nitrogen and light-weight hydrocarbon, CO2 is reported to have a lower minimum miscibility
pressure (MMP) with any reservoir oil [2, 285, 286]. On the grounds of its lower MMP, CO2 is
often preferred to other injection gases and also offers a better economic advantage as it is less
costly compared to hydrocarbon gases, and environmentally advantageous by sequestering a
significant amount of greenhouse gases.
Figure 6.1—CO2 solubility in different brine salinity brine at 195 ºF (90.5 ºC) and a wide range of pressure
using Li and Nghiem [287] solubility model in CMG WINPROPTM
0
0.2
0.4
0.6
0.8
1
1.2
0 1000 2000 3000 4000 5000
CO
2 S
olu
bili
ty in
Bri
ne
(m
ol/
kg
)
Pressure (psia)
1.64 mol/kg
0.41 mol/kg
3.46 mol/kg
176
Unlike other gases, CO2 is soluble in brine and its solubility increases slightly linearly as brine
salinity reduces (Figure 6.1), which implies that more CO2 could be lost to the brine during
LSWCO2 injection. Similarly, its increased amount in the aqueous phase could enhance CO2
diffusion and increase brine acidity. Because of this acidity, CO2 can react with rock minerals like
limestone and dolomite, resulting in either higher or lower permeability as the case may be either
dissolution or precipitation. The density of CO2 also increases linearly with brine salinity. The
implication is that during LSWCO2 injection, the reduction in IFT between CO2 and brine as brine
salinity reduces would diminish the gravity difference between reservoir fluids, and lead to low
flow resistance and enhanced injectivity [88, 288].
Simulation of LSWCO2
In the case of LSWCO2, the mechanism has been documented to be as a result of the formation of
in-situ carbonated water with increased saturation of CO2 in the aqueous phase. Experimental
findings have shown that the process is a highly effective and significant improvement in recovery
has been recorded compared to the conventional high-salinity-brine-gas flooding in sandstone and
carbonate reservoirs [85, 86, 87, 88]. Meanwhile, simulation studies conducted by researchers,
such as Dang et al. [83], Al-Shalabi et al. [89], Qiao et al. [289] and Lee et al. [279], have provided
further proof through synthetic cases and there has not been any such study that has predicted
experimental LSBCO2. This is what this study hopes to achieve and further evaluate the process
by considering different injection strategies. The performance of LSWCO2 in terms of oil
production, relative injectivity, and CO2 storage was further evaluated on a quarter of a five-spot
pattern (same as shown in Figure 5.10) using field-specific injection parameters. With the aim of
evaluating the synergy between low saline brine and CO2, a coreflood experiment conducted by
Teklu et al. [88] was simulated with reservoir fluid and rock properties listed in Table 6.1. The
middle-eastern carbonate core was flooded with a sequential dilution of seawater at a reservoir
temperature of 195 ºF and a pressure of 1800 psi. Then, the waterflooding was followed by CO2
injection at an injection pressure of 2500 psi to achieve a miscible flood process. The oil sample
was characterized with the Peng Robinson EOS, which was tuned to match oil sample properties
as in Table 6.1.

177
Table 6.1—Summary of fluid and core compositions and properties used in the LSBCO2 simulation. The
total dissolved solids is denoted as TDS, ionic strength (M) is denoted as I, reservoir oil is denoted as RO
and injected gas is denoted as IG
Brine (M) Ca2+ Mg2+ SO42- Na+ Cl- HCO3
- I TDS (g/L) pH
Formation Water 0.15265 0.050595 0.009052 1.41104 1.839111 0.001 2.050 105.92 7.170
Seawater 0.01725 0.142315 0.034434 0.59913 0.849403 0.000 1.112 51.35 6.600
Twice diluted seawater 0.00863 0.07116 0.01722 0.29957 0.42470 0.000 0.556 25.67 6.53
Four times diluted seawater 0.00431 0.03558 0.00861 0.14978 0.21235 0.000 0.278 12.84 6.31
Fifty times diluted seawater 0.00035 0.00285 0.00069 0.01198 0.01699 0.000 0.022 1.03 6
Rock properties
Oil viscosity (3 cP)
Length
(cm)
Diameter
(cm)
Mineral volume
fraction
Permeability
(mD)
Porosity
(fraction)
Swi (%)
Flow rate (ml/min)
13.87 3.81 0.698 Calcite
0.078 Dolomite 1.49 0.221 0.296 0.1 0.3
Components Mole %
(RO)
Mole %
(IG) Model dimension:
Δx=0.23cm
Δy=3.37cm
Δz=3.37cm
MMP,
psia 2470
CO2 1.05 100
C1 13.78 0
C2 5.46 0
C3 6.58 0
C4 5.72 0
C5 5.27 0
C6+ 62.14 0
The MMP of CO2 gas is estimated to ensure that the CO2 injected at reservoir pressure of 2500 psi
achieve miscibility with the reservoir oil as carried out in the experimental work of Teklu et al.
[88]. The miscibility calculation is performed with WINPROP using the method of multicell EOS-
based MMP calculation. The input for calculations is PR-EOS, reservoir oil and injected gas
compositions listed in Table 6.1, and temperature of 195 ºF (90.5 ºC). For this method, the results
showed condensing/vaporizing drive for miscibility developed between the reservoir fluid and
injected gas with MMP of 2450 psia. In addition, displacement of reservoir oil by CO2 in a slim
tube was simulated using GEM; the length and porosity of the slim tube was taken as in Table 6.1
and discretized into different grid block sizes – 500 cells, 1000 cells and 2000 cells. The model
was designed in such a way that during gas injection the pressure drop along the tube is less than
5 psia, as such the displacement and multi-contact miscibility can occur at the specific constant
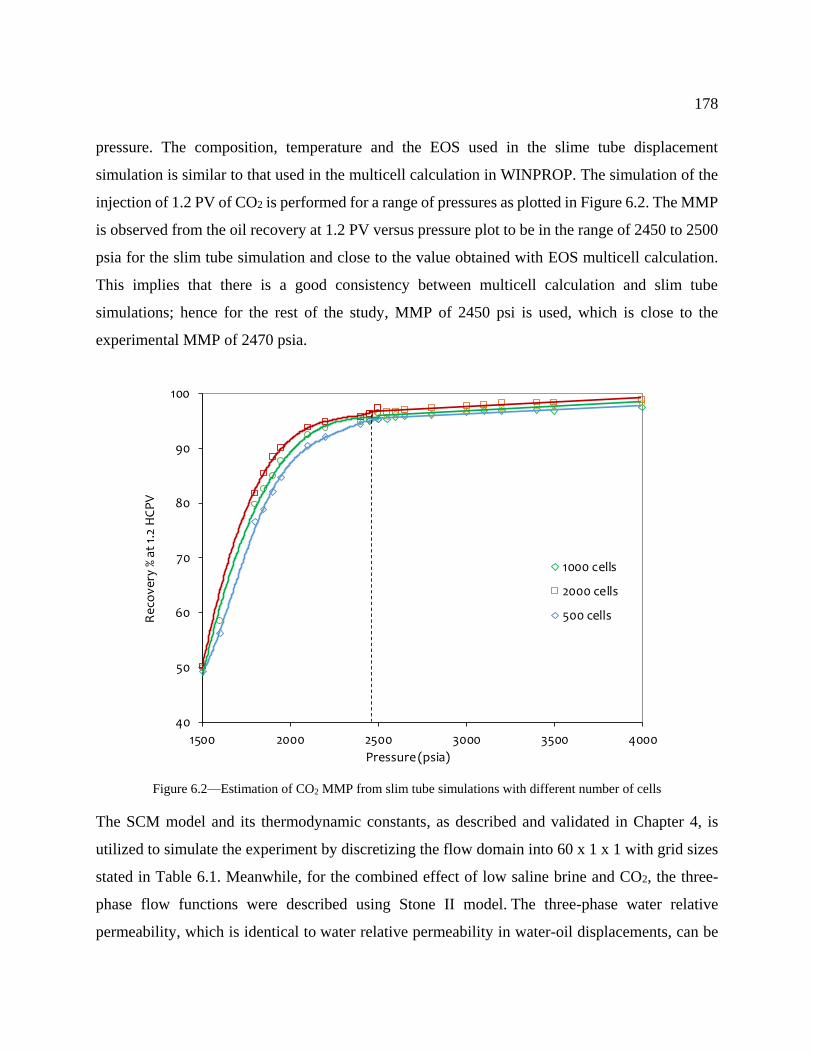
178
pressure. The composition, temperature and the EOS used in the slime tube displacement
simulation is similar to that used in the multicell calculation in WINPROP. The simulation of the
injection of 1.2 PV of CO2 is performed for a range of pressures as plotted in Figure 6.2. The MMP
is observed from the oil recovery at 1.2 PV versus pressure plot to be in the range of 2450 to 2500
psia for the slim tube simulation and close to the value obtained with EOS multicell calculation.
This implies that there is a good consistency between multicell calculation and slim tube
simulations; hence for the rest of the study, MMP of 2450 psi is used, which is close to the
experimental MMP of 2470 psia.
Figure 6.2—Estimation of CO2 MMP from slim tube simulations with different number of cells
The SCM model and its thermodynamic constants, as described and validated in Chapter 4, is
utilized to simulate the experiment by discretizing the flow domain into 60 x 1 x 1 with grid sizes
stated in Table 6.1. Meanwhile, for the combined effect of low saline brine and CO2, the three-
phase flow functions were described using Stone II model. The three-phase water relative
permeability, which is identical to water relative permeability in water-oil displacements, can be
40
50
60
70
80
90
100
1500 2000 2500 3000 3500 4000
Re
cov
ery
% a
t 1.
2 H
CP
V
Pressure (psia)
1000 cells
2000 cells
500 cells

179
described by eq. 5.8. Similarly, the three-phase gas relative permeability, which is also identical
to gas relative permeability in gas-oil displacements at an irreducible water saturation, can be
expressed as:
𝑘𝑟𝑔 = 𝑘𝑟𝑔∗ (
𝑠𝑔 − 𝑠𝑔𝑟
1 − 𝑠𝑜𝑟𝑔 − 𝑠𝑤𝑟 − 𝑠𝑔𝑟)
𝑛𝑔
(6.1)
where 𝑠𝑔, 𝑠𝑔𝑟 and 𝑠𝑜𝑟𝑔 are the gas saturation, residual gas saturation and residual oil saturation for
a gas-oil displacement, respectively; 𝑘𝑟𝑔∗ and 𝑛𝑔 are the endpoint relative permeability to gas and
Corey exponent for gas in gas-oil displacements, respectively. While the three-phase oil relative
permeability, which depends nonlinearly on water and gas saturations, can be expressed as:
𝑘𝑟𝑜 = 𝑘𝑟𝑜𝑤∗ [(
𝑘𝑟𝑜𝑤
𝑘𝑟𝑜𝑤∗
+ 𝑘𝑟𝑤) (𝑘𝑟𝑜𝑔
𝑘𝑟𝑜𝑤∗
+ 𝑘𝑟𝑔) − (𝑘𝑟𝑤 + 𝑘𝑟𝑔)] (6.2)
where 𝑘𝑟𝑜𝑔 is the relative permeability for oil in gas-oil displacement, which is expressed as:
𝑘𝑟𝑜𝑔 = 𝑘𝑟𝑜𝑔∗ (
1 − 𝑠𝑔 − 𝑠𝑤𝑟 − 𝑠𝑜𝑟𝑔
1 − 𝑠𝑜𝑟𝑔 − 𝑠𝑤𝑟 − 𝑠 𝑟)
𝑛𝑜𝑔
(6.3)
where 𝑘𝑟𝑜𝑔∗ is the endpoint relative permeability to oil in gas-oil displacement and 𝑛𝑜𝑔 is the Corey
exponent for oil in gas-oil displacement. The three-phase oil relative permeability is calculated
using eq. 6.2 with water-oil and gas-oil relative permeabilities plotted in Figure 6.3. The same
linear interpolation of the flow functions in terms of relative permeability was used here as
described by eq. 5.10 – 5.12. However, for SCM, the surface charge density was used as the
interpolating parameter, defined by eq. 6.4. The rationale for such is that the model assumes that
the rock−brine interface becomes initially attracted to oil−brine interface because of a high amount
of the positively charged surface sites (such as >CaOH2+, >CO3Ca+, and >CO3Mg+) in the presence
of high saline water, which can attach to the negatively charged oil acid-group. Then, as low
saline/smart brine approach the surface, the PDIs present engage with the surface in such a way as
to reduce the surface charge and allow the desorption of adsorbed oil acid.

180
Figure 6.3—Water-oil relative permeability curves (left) and gas-oil relative permeability curves (right)
used in simulating the flooding experiments of Teklu et al. [88]. Broken lines indicate final-wetting state
relative permeability and solid lines indicate initial wetting relative permeability
𝜔(𝜓𝑁𝑎 𝑋) =𝜎𝑠
𝑓𝑖𝑛𝑎𝑙 − 𝜎𝑠(𝑥, 𝑦, 𝑧, 𝑡)
𝜎𝑠𝑓𝑖𝑛𝑎𝑙 − 𝜎𝑠
𝑖𝑛𝑖𝑡𝑖𝑎𝑙 (6.4)
Similarly, the initial surface charge density, 𝜎𝑠𝑖𝑛𝑖𝑡𝑖𝑎𝑙, at the beginning of the injection period,
which is the amount of charge at the surface due to different surface reactions when there was no
wettability alteration and the final surface charge density, 𝜎𝑠𝑓𝑖𝑛𝑎𝑙, at the end of the injection period,
which signifies the amount of charge at which enough alteration has occurred are the parameters
on which the interpolation is calculated based on the surface charge at any point and
time, 𝜎𝑠(𝑥, 𝑦, 𝑧, 𝑡). When 𝜔 = 1, it implies the surface has maintained its original surface charge
and the surface charge density remained the same while when 𝜔 ≈ 0, this implies that the surface
charge has been reduced because of the surface interaction of the PDIs as well as double layer
expansion. Another performance indicator used to evaluate LSWCO2 is injectivity, which can be
defined in various ways, however in this Chapter, it is calculated as:
𝐼𝑛𝑗𝑒𝑐𝑡𝑖𝑣𝑖𝑡𝑦 =𝑄𝑖𝑛𝑗
𝑃𝑏ℎ − 𝑃𝑎𝑣𝑔 (6.5)
where 𝑄𝑖𝑛𝑗 is the injection rate (ft3), 𝑃𝑏ℎ is the bottom-hole pressure (psia) of the injection well
and 𝑃𝑎𝑣𝑔 is the domain average pressure (psia). The definition given in eq. 6.5 is to ensure that the
injectivity is considered as a global effect on the reservoir domain. The relative magnitude between
0
0.1
0.2
0.3
0.4
0.5
0.6
0.7
0.8
0.9
1
0 0.2 0.4 0.6 0.8 1
Rel
ativ
e P
erm
eab
ility
Water Saturation
krw_owkrow_owkrw_wwkrow_ww
0
0.1
0.2
0.3
0.4
0.5
0.6
0.7
0.8
0.9
1
0 0.2 0.4 0.6 0.8 1
Re
lati
ve P
erm
eab
ility
Gas Saturation
krg
krog

181
injectivity in tertiary and secondary injection modes is calculated by normalizing injectivity at any
time with the injectivity at the end of the secondary waterflood as:
𝑅𝑒𝑙𝑎𝑡𝑖𝑣𝑒 𝐼𝑛𝑗𝑒𝑐𝑡𝑖𝑣𝑖𝑡𝑦 =𝐼𝑛𝑗𝑒𝑐𝑡𝑖𝑣𝑖𝑡𝑦
𝑆𝑒𝑐𝑜𝑛𝑑𝑎𝑟𝑦 𝑊𝑎𝑡𝑒𝑟𝑓𝑙𝑜𝑜𝑑 𝐼𝑛𝑗𝑒𝑐𝑡𝑖𝑣𝑖𝑡𝑦 (6.6)
The simulation of the experiment follows a similar procedure on which the experiments were
carried out. The experiment was performed on a composite of three carbonate cores with a total
length of 13.8 cm and a pore volume of 30 cm3. The flooding sequence was – seawater, twice
diluted seawater, four times diluted seawater, and fifty times diluted seawater, followed by
miscible CO2 flood. The comparison between the experimental and simulated oil recovery and
pressure drop is presented in Figure 6.4. The model gave an excellent reproduction of the
experimental curves, where seawater recovered 52.8% OOIC, and sequential brine dilution
resulted in the additional recovery of 5.6% OOIC. The authors only reported the final recovery of
the CO2 miscible flood, which the model also replicated as 25% OOIC after 10 PV continuous
injection of CO2.
Figure 6.4—Comparison of experimental and simulated oil recovery and pressure differential.
Experimental data obtained from Teklu et al. [88]
0
10
20
30
40
50
60
70
80
90
0
10
20
30
40
50
60
70
80
90
0 5 10 15 20 25 30 35
Pre
ssure
Diffe
ren
tial, p
siaD
isp
lace
men
t Ef
fici
ency
%
Pore Volume Injected
RecoveryΔPRecoveryΔP

182
The model prediction for surface fractions is presented in Figure 6.5, surface fractions of SO42- is
reduced while surface fractions of Mg2+ and Ca2+ varied because of their reduced concentrations
through the sequential injection process. Despite the variation in the surface fractions of the PDI,
the surface charge continued to decrease as a result of reduced monovalent ions and ionic strength
of the injected brine, leading to double layer expansion. The reduction in surface charge was
utilized to excellently reproduce the experimental oil recovery and pressure differential dataset
shown in Figure 6.4. As brine salinity reduces, calcite dissolution compensated for reduced Ca2+
in the injected brines and further dissolution can be seen in Figure 6.5 due to increased CO2
solubility in the aqueous phase (see Figure 6.6). The relative injectivity shown in Figure 6.6
increased as the brine salinity reduced but became more pronounced during CO2 injection.
Similarly, oil density and viscosity reduced during CO2 injection due to higher CO2 diffusion into
the oil phase. The simulation results show that the incremental recovery can be associated with
increased CO2 solubility leading to the in-situ formation of carbonated water to alter wettability
and reduce interfacial tension.
Figure 6.5—Simulation profiles at the mid-section of the flow domain for surface fractions of Ca2+
(>CO3Ca+), SO42- (>CaSO4
-) and Mg2+ (>CO3Mg+) and surface charge density (left) and fractional amounts
of mineral volume alteration (right)
0
0.05
0.1
0.15
0.2
0.25
0.3
0
0.1
0.2
0.3
0.4
0.5
0.6
0.7
0.8
0.9
0 5 10 15 20 25 30 35
Su
rface
cha
rge
de
nsity
(C/m
2)
Su
rfac
e F
ract
ion
s
Pore Volume Injected
>CO3Ca+CO3Mg+>CaSO4SCD
-0.00006
-0.00005
-0.00004
-0.00003
-0.00002
-0.00001
0
0.00001
0 5 10 15 20 25 30 35
Min
eral
Vo
lum
e Fr
acti
on
s
Pore Volume Injected
Calcite
Dolomite
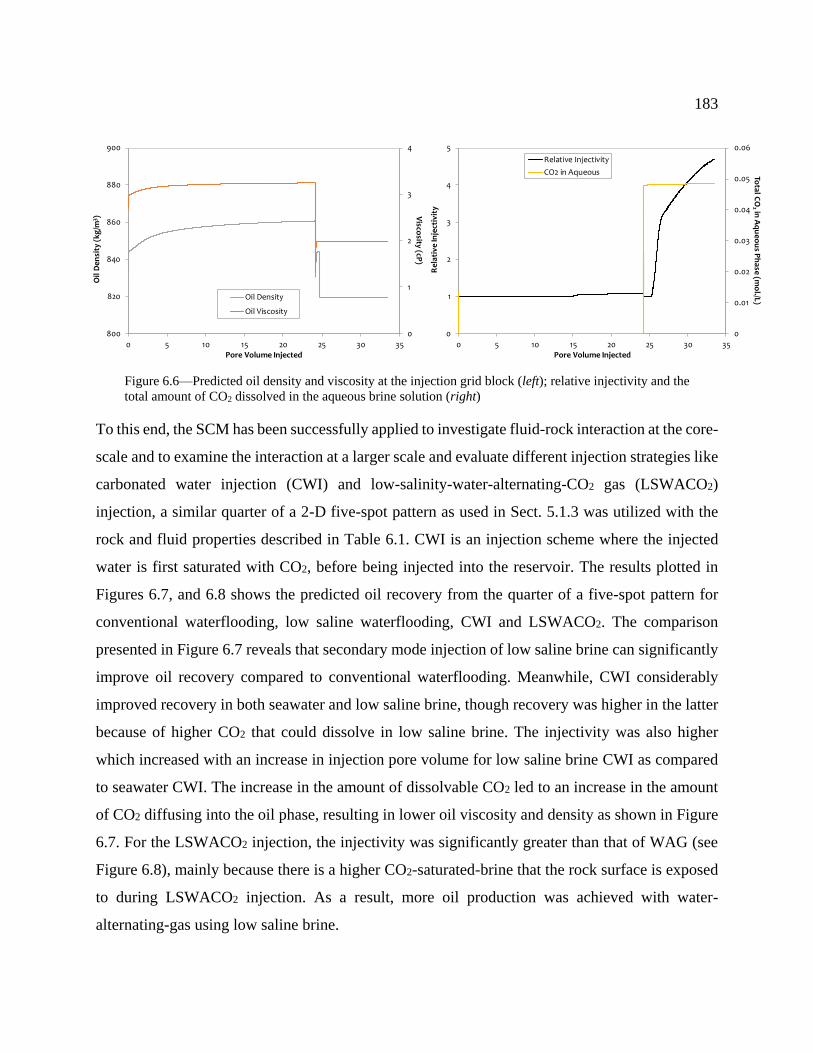
183
Figure 6.6—Predicted oil density and viscosity at the injection grid block (left); relative injectivity and the
total amount of CO2 dissolved in the aqueous brine solution (right)
To this end, the SCM has been successfully applied to investigate fluid-rock interaction at the core-
scale and to examine the interaction at a larger scale and evaluate different injection strategies like
carbonated water injection (CWI) and low-salinity-water-alternating-CO2 gas (LSWACO2)
injection, a similar quarter of a 2-D five-spot pattern as used in Sect. 5.1.3 was utilized with the
rock and fluid properties described in Table 6.1. CWI is an injection scheme where the injected
water is first saturated with CO2, before being injected into the reservoir. The results plotted in
Figures 6.7, and 6.8 shows the predicted oil recovery from the quarter of a five-spot pattern for
conventional waterflooding, low saline waterflooding, CWI and LSWACO2. The comparison
presented in Figure 6.7 reveals that secondary mode injection of low saline brine can significantly
improve oil recovery compared to conventional waterflooding. Meanwhile, CWI considerably
improved recovery in both seawater and low saline brine, though recovery was higher in the latter
because of higher CO2 that could dissolve in low saline brine. The injectivity was also higher
which increased with an increase in injection pore volume for low saline brine CWI as compared
to seawater CWI. The increase in the amount of dissolvable CO2 led to an increase in the amount
of CO2 diffusing into the oil phase, resulting in lower oil viscosity and density as shown in Figure
6.7. For the LSWACO2 injection, the injectivity was significantly greater than that of WAG (see
Figure 6.8), mainly because there is a higher CO2-saturated-brine that the rock surface is exposed
to during LSWACO2 injection. As a result, more oil production was achieved with water-
alternating-gas using low saline brine.
0
1
2
3
4
800
820
840
860
880
900
0 5 10 15 20 25 30 35
Visco
sity (cP)
Oil
De
nsi
ty (
kg
/m3 )
Pore Volume Injected
Oil Density
Oil Viscosity
0
0.01
0.02
0.03
0.04
0.05
0.06
0
1
2
3
4
5
0 5 10 15 20 25 30 35
Total C
O2
in A
qu
eo
us P
hase
(mo
l./L)
Rel
ativ
e In
ject
ivit
y
Pore Volume Injected
Relative Injectivity
CO2 in Aqueous

184
Figure 6.7—Predicted oil recovery for different injection schemes in a quarter of a five-spot pattern (left),
comparison of injectivity and amount of dissolvable CO2 (top right) and oil density and viscosity (bottom
right). Here, carbonated water injection is compared with low saline brine and seawater injection in terms
of oil recovery, injectivity and CO2 solubility.
Figure 6.8—Predicted oil recovery comparison for LSWACO2, conventional seawater WAG and normal
waterflooding (left); comparison of their relative injectivity (right)
0
10
20
30
40
50
60
70
0 1 2 3 4 5 6
Dis
pla
cem
ent
Effi
cie
ncy
%
Pore Volume Injected
LSB
SW
LSB_CWI
SW_CWI
0
0.1
0.2
0.3
0.4
0.5
0.6
0.7
0
1
2
3
0 1 2 3 4 5 6
Total C
O2 in
Aq
ue
ou
s Ph
ase
(mo
l/L)
Inje
ctiv
ity
(ft
3 /psi
)
Pore Volume Injected
Injectivity_LSB_CWI
Injectivity_SW_CWI
Injectivity_SW
CO2 in Oil_LSB
CO2 in Oil_SW
0
1
2
3
4
5
6
600
620
640
660
680
700
0 1 2 3 4 5 6
Visco
sity (cP)
Oil
Den
sity
(kg
/m3 )
Pore Volume Injected
Oil Density_SWOil Density_LSBOil Viscosity_SWOil Viscosity_LSB
0
50
100
150
200
250
300
350
400
450
0
10
20
30
40
50
60
70
80
90
100
0 1 2 3 4 5 6
Water In
jectio
n R
ate, ft3/d
Dis
pla
cem
en
t E
ffic
ien
cy %
Pore Volume Injected
LSB_WAGSW_WAGSWLSBWater Rate
0
1
2
3
4
5
6
7
8
0 1 2 3 4 5 6
Re
lati
ve
Inje
ctiv
ity
Fa
cto
r
Pore Volume Injected
SW_WAG
LSB_WAG
185
Chapter Summary
This Chapter demonstrates the significance of modeling fluid-rock interactions in investigating,
designing and optimizing schemes for low saline water-CO2 flooding as an enhanced oil recovery
candidate in carbonate reservoirs. The profound influence of low salinity brine flooding is
primarily based on wettability alteration, while that of CO2 flooding is based on oil swelling,
viscosity reduction, and interfacial tension reduction. Low saline brine, when combined with CO2,
leads to higher CO2 solubility and diffusion, and increases brine acidity. Hence, the following
conclusions are drawn:
• The mechanistic model captures the trends observed during the oil-brine-rock interactions in
laboratory tests by providing an excellent match with the experiment.
• Simulation results show that the incremental recovery can be associated with increased CO2
solubility leading to the formation of carbonated water in-situ to alter wettability and reduce
interfacial tension.
• The increased CO2 solubility as salinity reduces, increase mineral dissolution and CO2
diffusion in the oil phase to reduce oil viscosity and density.
• The injectivity was significant for LSWACO2 injection, mainly because there is an increase in
the amount of CO2 dissolved and exposure time on the rock surface to CO2-saturated-brine.
• Though the amount of CO2 that can dissolve in carbonated water is small, CWI shows greater
injectivity compared to seawater and low-salinity-brine.
186
Conclusions and Recommendations
Conclusions
The main aim of this research is to fill existing gaps in the literature, unravel the discrepancy
between different studies, further implement representative modeling techniques and evaluate the
benefits of the brine-CO2 recovery system. This was achieved by first providing an integrative
review on the systematic investigation of brine-dependent recovery across the different scale of
investigations from laboratory experiments to field studies, various proposed fundamental
mechanisms, the major modeling attempts and water injection compatibility issues. This was
followed by the application of the theory of surface forces and water film stability to rationalize
the relationship between carbonate rocks wetting state and the corresponding oil recovery
characteristics. After developing a comprehensive understanding of the process mechanisms, a
numerical model that which considered various reaction mechanisms was developed, in particular,
the two distinct surface reactions, surface sorption and complexation reactions. The numerical
model was validated against independently sourced electrokinetic and single-phase experimental
data and was further used to investigate brine-dependent recovery and the brine-CO2 process.
Therefore, based on the various data analyzed and assumptions made, the following conclusions
have been drawn:
• The injected brine is more effective at improving recovery when it contains potential
determining ions, depleted in NaCl, and wettability alteration is much more effective at high
temperatures.
• Though brine-dependent recovery has been explored on two frontlines, potential determining
ion concentrations play a more significant role as compared to brine salinity reduction.
• Although the wettability alteration is widely accepted as the consequence of the brine-
dependent recovery process, this study proves that a combination of surface charge and mineral
alteration is the probable cause.
• The magnitude of the contribution of the electrostatic force to sustaining a stable water film
increases with decreasing ionic strength (either through reduction of NaCl, Ca2+ or brine
dilution) and/or increasing SO42- concentration.

187
• When the energy barrier, required to be overcome for the interacting interfaces to attract,
increases as a result of potential determining ion interactions or ionic strength reduction, the
pre-existing oil-wetting condition is reversed to generate a more stable water film between the
two interfaces, leading to improvements in oil recovery.
• The reported equilibrium constants for the surface complexation reactions in the literature are
not able to predict the zeta potential and single-phase flow-through experiments. The optimized
equilibrium constants are derived from fitting the produced ion history of the reactive transport
of brine in chalk and limestone and have been demonstrated to be widely applicable.
• Though chalk and limestone differ by surface area and reactivity, the same thermodynamic
parameters can be used in modeling brine-dependent recovery in their respective reservoir
rocks
• Mineral dissolution/precipitation is obvious at both core and lab scale in the pursuit of re-
establishing equilibrium during brine-dilution dependent recovery and should not be ignored
in modeling different mineralogical carbonate rocks.
• Fluid-rock interaction during brine-CO2 recovery results in increased CO2 solubility as brine
salinity reduces, increase in brine acidity and causing mineral dissolution, and higher CO2
diffusion in the oil phase to reduce oil viscosity and density.
• There is a significant increase in relative injectivity for brine-CO2 recovery, either carbonated
water or low-salinity-water-alternating-CO2 gas injection, mainly due to more exposure to a
higher amount of CO2-saturated-brine
Recommendations for Further Study
Based on the findings from this research, the following recommendations are made for further
study:
• Hitherto, the models developed have been effective in interpreting the process mechanisms
during brine-dependent recoveries. These models do have a few limitations that may affect its
predictive capability, particularly because only a few of the independently source experimental
data used in this study had the detailed geochemical data on the produced brine. Likewise,

188
further understanding of wettability alteration mechanisms can be achieved by more robust
interpretation and measurements of the chemical composition of injected and effluent brines.
• In addition, measurement of the flow functions data, particularly the relative permeability and
capillary pressure at the initial and final wetting state, specific to the core experiments will also
lead to more conclusive model validation.
• The inconsistencies in modeling zeta potential data for pulverized suspension and intact rocks
could be resolved by conducting experiments at controlled conditions. In addition, while
conducting single phase flooding with different potential determining ion variations, the zeta
potential could be measured, and both datasets used to improve the calibrating of the surface
complexation model thermodynamic constants.
• Many studies quantified polar oil components using acid and base number, which might not
be able to give a robust description for type and structure of polar oil components contributing
to increased oil adhesion. This is one of the reasons why less emphasis is placed on oil surface
interaction.
• More detailed site-specific field-scale simulation studies are recommended to firm up the
observations made from the limited field-scale simulation study carried out.
• There are various other operational parameters and design strategies for field application of the
process that were not explored in this study; incorporation of such aspects will complement
this study.
• As with most enhanced oil recovery project evaluations, a pilot test is recommended with
brine-dependent and brine-CO2 recovery process before full field implementation. The
application of this simulation model to the different single-well chemical tracer tests will
improve the predictability of the model.
• Brine-dependent recovery has proved effective in carbonate reservoirs, and most carbonates
are highly heterogeneous and naturally fractured. Therefore, it is vital to extend this model to
accurately capture individual species interactions in fractured carbonate reservoirs.

189
Appendix A: Aqueous Reaction Thermodynamic Parameters
This Appendix presents the temperature-dependence analytical empirical parameters for the
estimation of reaction thermodynamic constant as found in Lawrence Livermore National
Laboratory (LLNL) database using eq. 4.9 in Section 4.2.2.
Aqueous reactions 𝐴0 𝐴1 𝐴 (10 ) 𝐴 𝐴 (10 ) 𝐴5 (10 5)
𝐶 (𝑎𝑞) + 𝐻 ⟺ 𝐻 + 𝐻𝐶 682.16 0.1143 -3.8165 -246.59 2513.64
𝐻 ⟺ 𝐻 + 𝐻 293.29 0.1361 -1.0577 -123.73 0.0000 -6.9965
𝐻𝐶 ⟺ 𝐻 + 𝐶
-69.96 -0.0335 -0.0071 28.22 -0.0011
𝐶𝑎𝑆 ⟺ 𝐶𝑎 + 𝑆 286.18 0.0841 -0.7688 -114.49 -0.1201
𝑆 ⟺ + 𝑆 1692.30 0.2670 -9.1846 -614.81 5309.20
𝑁𝑎𝑆 ⟺ 𝑁𝑎 + 𝑆
935.88 0.1444 -5.3023 -338.40 3306.39
𝐶𝑎𝐶 + 𝐻 ⟺ 𝐶𝑎 + 𝐻𝐶 695.43 0.1163 -3.6153 -256.84 174.026
𝐶 + 𝐻 ⟺ + 𝐻𝐶 234.65 0.0555 -0.8395 -93.10 0.0002
𝑁𝑎𝐶 + 𝐻 ⟺ 𝑁𝑎 + 𝐻𝐶
169.39 0.0005 -0.7677 -62.08 -0.0120
𝐶𝑎𝐻𝐶 ⟺ 𝐶𝑎 + 𝐻𝐶
868.61 0.1458 -4.8281 -316.73 308.32
𝐻𝐶 ⟺ + 𝐻𝐶
38.46 0.0301 0.0098 -18.87 0.0002
𝑁𝑎𝐻𝐶 ⟺ 𝑁𝑎 + 𝐻𝐶
-90.67 -0.0299 0.2795 36.52 0.0047
𝐶𝑎𝐶𝑙 ⟺ 𝐶𝑎 + 𝐶𝑙 81.49 0.0384 -0.1376 -35.97 -0.0022
𝐶𝑙 ⟺ + 𝐶𝑙 43.36 0.0329 0.0119 -21.69 0.0002
Mineral reactions
𝐶𝑎𝑙𝑐𝑖𝑡𝑒 + 𝐻 ⟺ 𝐶𝑎 + 𝐻𝐶 -149.78 -0.0484 0.4897 60.46 0.0076
𝐷𝑜𝑙𝑜𝑚𝑖𝑡𝑒 + 2𝐻 ⟺ 𝐶𝑎 + 2𝐻𝐶 + -317.82 -0.0982 1.0845 126.57 0.0169
𝐴𝑛ℎ𝑦𝑑𝑟𝑖𝑡𝑒 + 𝐻 ⟺ 𝐶𝑎 + 𝑆 -209.86 -0.0788 0.5097 85.64 0.0080

190
Appendix B: Supplementary Material (Journal Permission License)
This Appendix presents permission/license for reuse of the published work included in this
dissertation.

191

192

193

194

195

196

197
References
[1] Green, D. W., and Willhite, G. P. (1998). Enhanced oil recovery. Henry L. Doherty
Memorial Fund of AIME, Society of Petroleum Engineers: Richardson, TX.
[2] Alvarado, V., and Manrique, E. (2010). Enhanced oil recovery: an update review. Energies,
3(9), 1529-1575. doi: 10.3390/en3091529
[3] Rod, S. (2003). Quantification of uncertainty in recovery efficiency predictions: lessons
learned from 250 mature carbonate fields. In Proceedings of the SPE Annual Technical
Conference and Exhibition, Denver, Colorado, 5-8 October.
[4] Sheng, J. (2013). Enhanced oil recovery field case studies. Gulf Professional Publishing.
[5] Muggeridge, A., Cockin, A., Webb, K., Frampton, H., Collins, I., Moulds, T., and Salino,
P. (2014). Recovery rates, enhanced oil recovery and technological limits. Phil. Trans. R.
Soc. A, 372(2006), 20120320. doi: 10.1098/rsta.2012.0320
[6] Kokal, S., and Al-Kaabi, A. (2010). Enhanced oil recovery: challenges & opportunities.
World Petroleum Council: Official Publication, 64-69.
[7] Awolayo, A. N., Sarma, H. K., and Al-sumaiti, A. M. (2014). A Laboratory Study of Ionic
Effect of Smart Water for Enhancing Oil Recovery in Carbonate Reservoirs. In Proceedings
of the SPE EOR Conference at Oil and Gas West Asia, Muscat, Oman, 31 March-2 April.
[8] Buckley, S. E., and Leverett, M. C. (1942). Mechanism of fluid displacement in sands.
Transactions of the AIME, 146(01), 107-116. doi: 10.2118/942107-g
[9] Welge, H. J. (1952). A simplified method for computing oil recovery by gas or water drive.
Journal of Petroleum Technology, 4(04), 91-98. doi: 10.2118/124-g
[10] Bernard, G. (1967). Effect of floodwater salinity on recovery of oil from cores containing
clays. In Proceedings of the SPE California Regional Meeting, Los Angeles, California,
26-27 October.
[11] Martin, J. (1959). The Effects of Clay on the Displacement of Heavy Oil by Water. In
Proceedings of the Venezuelan Annual Meeting.
[12] Jadhunandan, P. P. (1990). Effects of brine composition, crude oil, and aging conditions
on wettability and oil recovery. Department of Petroleum Engineering, New Mexico
Institute of Mining & Technology.
[13] Jadhunandan, P. P., and Morrow, N. R. (1995). Effect of wettability on waterflood recovery
for crude-oil/brine/rock systems. SPE Reservoir Eval. Eng., 10(1), 40-46. doi:
10.2118/22597-PA
[14] Tang, G. Q., and Morrow, N. R. (1997). Salinity, temperature, oil composition, and oil
recovery by waterflooding. SPE Reservoir Eval. Eng., 12(4), 269-276. doi: 10.2118/36680-
PA

198
[15] Tang, G. Q., and Morrow, N. R. (1999). Influence of brine composition and fines migration
on crude oil/brine/rock interactions and oil recovery. Journal of Petroleum Science and
Engineering, 24(2), 99-111. doi: 10.1016/s0920-4105(99)00034-0
[16] Yildiz, H. O., and Morrow, N. R. (1996). Effect of brine composition on recovery of
Moutray crude oil by waterflooding. Journal of Petroleum Science and Engineering, 14(3),
159-168. doi: 10.1016/0920-4105(95)00041-0
[17] Zhou, X., Morrow, N. R., and Ma, S. (2000). Interrelationship of wettability, initial water
saturation, aging time, and oil recovery by spontaneous imbibition and waterflooding. SPE
Journal, 5(02), 199-207. doi: 10.2118/62507-pa
[18] Sulak, R. (1991). Ekofisk field: the first 20 years. Journal of Petroleum Technology,
43(10), 1265-1271. doi: 10.2118/20773-pa
[19] Sylte, J., Hallenbeck, L., and Thomas, L. (1988). Ekofisk formation pilot waterflood. In
Proceedings of the SPE Annual Technical Conference and Exhibition, Houston, Texas, 2-
5 October.
[20] Hallenbeck, L. D., Sylte, J. E., Ebbs, D. J., and Thomas, L. K. (1991). Implementation of
the Ekofisk field waterflood. SPE Formation Evaluation, 6(03), 284-290. doi:
10.2118/19838-pa
[21] Hermansen, H., Thomas, L., Sylte, J., and Aasboe, B. (1997). Twenty five years of Ekofisk
reservoir management. In Proceedings of the SPE Annual Technical Conference and
Exhibition, San Antonio, Texas, US, 5-8 October.
[22] Callegaro, C., Masserano, F., Bartosek, M., Buscaglia, R., Visintin, R., Hartvig, S. K., and
Huseby, O. K. (2014). Single Well Chemical Tracer Tests to Assess Low Salinity Water
and Surfactant EOR Processes in West Africa. In Proceedings of the International
Petroleum Technology Conference, Kuala Lumpur, Malaysia, 2014/12/10/.
[23] McGuire, P., Chatham, J., Paskvan, F., Sommer, D., and Carini, F. (2005). Low Salinity
Oil Recovery: An Exciting New EOR Opportunity for Alaska's North Slope. In Proceedings
of the SPE Western Regional Meeting, Irvine, California, 30 March-1 April.
[24] Yousef, A., Liu, J., Blanchard, G., Al-Saleh, S., Al-Zahrani, T., Al-Zahrani, R., Tammar,
H., and Al-Mulhim, N. (2012). Smart Waterflooding: Industry's First Field Test in
Carbonate Reservoirs. In Proceedings of the SPE Annual Technical Conference and
Exhibition, San Antonio, Texas, USA, 8-10 October.
[25] Lager, A., Webb, K. J., and Black, C. J. J. (2007). Impact of brine chemistry on oil recovery.
In Proceedings of the 14th European Symposium on Improved Oil Recovery, Cairo, Egypt,
22–24 April.
[26] Tang, G. Q., and Morrow, N. R. (1999). Oil recovery by waterflooding and imbibition—
invading brine cation valency and salinity. In Proceedings of the International Symposium
of the Society of Core Analysts, Golden, Colorado, USA, 1–4 August

199
[27] Chandrasekhar, S., and Mohanty, K. (2013). Wettability Alteration with Brine Composition
in High Temperature Carbonate Reservoirs. In Proceedings of the SPE Annual Technical
Conference and Exhibition, New Orleans, Louisiana, USA, 30 September - 2 October.
[28] Awolayo, A. N., Sarma, H. K., and AlSumaiti, A. M. (2014). Impact of Ionic Exchanges
between Active and Non-active Ions on Displacement Efficiency in Smart Waterflood
Application. In Proceedings of the 76th EAGE Conference and Exhibition 2014,
Amsterdam, Netherlands, 16 - 19 June.
[29] Awolayo, A. N., Sarma, H. K., and AlSumaiti, A. M. (2015). An Experimental
Investigation into the Impact of Sulfate Ions in Smart Water to Improve Oil Recovery in
Carbonate Reservoirs. Transport in Porous Media, 111(3), 649-668. doi: 10.1007/s11242-
015-0616-4
[30] Zhang, Y., and Sarma, H. (2012). Improving Waterflood Recovery Efficiency in Carbonate
Reservoirs through Salinity Variations and Ionic Exchanges: A Promising Low-Cost"
Smart-Waterflood" Approach. In Proceedings of the Abu Dhabi International Petroleum
Conference and Exhibition, Abu Dhabi, UAE, 11-14 November.
[31] Yousef, A., Al-Saleh, S., Al-Kaabi, A., and Al-Jawfi, M. (2010). Laboratory investigation
of novel oil recovery method for carbonate reservoirs. In Proceedings of the Canadian
Unconventional Resources and International Petroleum Conference, Calgary, Alberta,
Canada, 19-21 October.
[32] Zhang, P., Tweheyo, M. T., and Austad, T. (2007). Wettability alteration and improved oil
recovery by spontaneous imbibition of seawater into chalk: Impact of the potential
determining ions Ca2+, Mg2+, and SO42−. Colloids and Surfaces A: Physicochemical and
Engineering Aspects, 301(1), 199-208. doi: 10.1016/j.colsurfa.2006.12.058
[33] Austad, T., Strand, S., Høgnesen, E. J., and Zhang, P. (2005). Seawater as IOR fluid in
fractured chalk. In Proceedings of the SPE International Symposium on Oilfield
Chemistry, The Woodlands, Texas, 2-4 February.
[34] Sharma, M. M., and Filoco, P. R. (2000). Effect of Brine Salinity and Crude-Oil Properties
on Oil Recovery and Residual Saturations. SPE Journal, 5(3), 293-300. doi:
10.2118/65402-pa
[35] Skrettingland, K., Holt, T., Tweheyo, M. T., and Skjevrak, I. (2011). Snorre Low-Salinity-
Water Injection — Coreflooding Experiments and Single-Well Field Pilot. SPE Reservoir
Eval. Eng., 14(02), 182-192. doi: 10.2118/129877-pa
[36] Zahid, A., Shapiro, A., and Skauge, A. (2012). Experimental studies of low salinity water
flooding in carbonate reservoirs: A new promising approach. In Proceedings of the SPE
EOR Conference at Oil and Gas West Asia, Muscat, Oman, 16-18 April.
[37] Winoto, W., Loahardjo, N., Xie, S., Yin, P., and Morrow, N. (2012). Secondary and
Tertiary Recovery of Crude Oil from Outcrop and Reservoir Rocks by Low Salinity
Waterflooding. In Proceedings of the SPE Improved Oil Recovery Symposium, Tulsa,
Oklahoma, USA, 14-18 April.

200
[38] Fathi, S. J., Austad, T., and Strand, S. (2010). “Smart Water” as a Wettability Modifier in
Chalk: The Effect of Salinity and Ionic Composition. Energy & Fuels, 24(4), 2514-2519.
doi: 10.1021/ef901304m
[39] Awolayo, A. N., and Sarma, H. K. (2016). Impact of Multi-ion Interactions on Oil
Mobilization by Smart Waterflooding in Carbonate Reservoirs. Journal of Petroleum &
Environmental Biotechnology, 7(278), 1-8. doi: 10.4172/2157-7463.1000278
[40] Rivet, S., Lake, L. W., and Pope, G. A. (2010). A coreflood investigation of low-salinity
enhanced oil recovery. In Proceedings of the SPE Annual Technical Conference and
Exhibition Florence, Italy, 19-22 September.
[41] Lager, A., Webb, K. J., Collins, I., and Richmond, D. (2008). LoSal enhanced oil recovery:
Evidence of enhanced oil recovery at the reservoir scale. In Proceedings of the SPE/DOE
Symposium on Improved Oil Recovery, Tulsa, Oklahoma, USA, 20-23 April.
[42] Vo, L. T., Gupta, R., and Hehmeyer, O. J. (2012). Ion Chromatography Analysis of
Advanced Ion Management Carbonate Coreflood Experiments. In Proceedings of the Abu
Dhabi International Petroleum Conference and Exhibition, Abu Dhabi, UAE, 11-14
November.
[43] Omekeh, A. V., Evje, S., and Friis, H. A. (2012). Modeling of low salinity effects in
sandstone oil rocks. International Journal of Numerical Analysis and Modelling, 1(1), 1-
18.
[44] RezaeiDoust, A., Puntervold, T., Strand, S., and Austad, T. (2009). Smart water as
wettability modifier in carbonate and sandstone: A discussion of similarities/differences in
the chemical mechanisms. Energy & Fuels, 23(9), 4479-4485. doi: 10.1021/ef900185q
[45] Okasha, T. M., and Alshiwaish, A. (2009). Effect of brine salinity on interfacial tension in
Arab-D carbonate reservoir, Saudi Arabia. In Proceedings of the SPE Middle East Oil and
Gas Show and Conference, Manama, Bahrain, 15-18 March.
[46] Al-Attar, H. H., Mahmoud, M. Y., Zekri, A. Y., Almehaideb, R., and Ghannam, M. (2013).
Low-salinity flooding in a selected carbonate reservoir: experimental approach. Journal of
Petroleum Exploration and Production Technology, 3(2), 139-149. doi: 10.1007/s13202-
013-0052-3
[47] Hiorth, A., Cathles, L. M., and Madland, M. V. (2010). The impact of pore water chemistry
on carbonate surface charge and oil wettability. Transport in Porous Media, 85(1), 1-21.
doi: 10.1007/s11242-010-9543-6
[48] Austad, T., Shariatpanahi, S. F., Strand, S., Black, C. J. J., and Webb, K. J. (2011).
Conditions for a Low-Salinity Enhanced Oil Recovery (EOR) Effect in Carbonate Oil
Reservoirs. Energy & Fuels, 26(1), 569-575. doi: 10.1021/ef201435g
[49] Pu, H., Xie, X., Yin, P., and Morrow, N. R. (2010). Low-salinity waterflooding and mineral
dissolution. In Proceedings of the SPE Annual Technical Conference and Exhibition,
Florence, Italy, Sept 19−22.

201
[50] Zhang, P., Tweheyo, M. T., and Austad, T. (2006). Wettability alteration and improved oil
recovery in chalk: The effect of calcium in the presence of sulfate. Energy & Fuels, 20(5),
2056-2062. doi: 10.1021/ef0600816
[51] Austad, T., Strand, S., Madland, M. V., Puntervold, T., and Korsnes, R. I. (2008). Seawater
in Chalk: An EOR and Compaction Fluid. SPE Journal Paper, 11(04), 648 - 654. doi:
10.2118/118431-PA
[52] Høgnesen, E., Strand, S., and Austad, T. (2005). Waterflooding of preferential oil-wet
carbonates: Oil recovery related to reservoir temperature and brine composition. In
Proceedings of the SPE Europec/EAGE Annual Conference, Madrid, Spain, 13-16 June.
[53] Strand, S., Austad, T., Puntervold, T., Høgnesen, E. J., Olsen, M., and Barstad, S. M. F.
(2008). “Smart Water” for Oil Recovery from Fractured Limestone: A Preliminary Study.
Energy & Fuels, 22(5), 3126-3133. doi: 10.1021/ef800062n
[54] Strand, S., Høgnesen, E. J., and Austad, T. (2006). Wettability alteration of carbonates—
Effects of potential determining ions (Ca2+ and SO42-) and temperature. Colloids and
Surfaces A: Physicochemical and Engineering Aspects, 275(1), 1-10. doi:
10.1016/j.colsurfa.2005.10.061
[55] Zhang, P., and Austad, T. (2006). Wettability and oil recovery from carbonates: Effects of
temperature and potential determining ions. Colloids and Surfaces A: Physicochemical and
Engineering Aspects, 279(1), 179-187. doi: 10.1016/j.colsurfa.2006.01.009
[56] Mahani, H., Keya, A. L., Berg, S., Bartels, W.-B., Nasralla, R., and Rossen, W. R. (2015).
Insights into the mechanism of wettability alteration by low-salinity flooding (LSF) in
carbonates. Energy & Fuels, 29(3), 1352-1367. doi: 10.1021/ef5023847
[57] Yousef, A. A., Al-Saleh, S. H., Al-Kaabi, A., and Al-Jawfi, M. S. (2011). Laboratory
investigation of the impact of injection-water salinity and ionic content on oil recovery
from carbonate reservoirs. SPE Reservoir Eval. Eng., 14(05), 578-593. doi:
10.2118/137634-PA
[58] Meng, W., Haroun, M. R., Sarma, H. K., Adeoye, J. T., Aras, P., Punjabi, S., Rahman, M.
M., and Al Kobaisi, M. (2015). A Novel Approach of Using Phosphate-spiked Smart Brines
to Alter Wettability in Mixed Oil-wet Carbonate Reservoirs. In Proceedings of the Abu
Dhabi International Petroleum Exhibition and Conference, Abu Dhabi, UAE, 9-12
November.
[59] Lashkarbolooki, M., Ayatollahi, S., and Riazi, M. (2014). Effect of salinity, resin, and
asphaltene on the surface properties of acidic crude oil/smart water/rock system. Energy &
Fuels, 28(11), 6820-6829. doi: 10.1021/ef5015692
[60] Alameri, W., Teklu, T. W., Graves, R. M., Kazemi, H., and AlSumaiti, A. M. (2014).
Wettability alteration during low-salinity waterflooding in carbonate reservoir cores. In
Proceedings of the SPE Asia Pacific Oil & Gas Conference and Exhibition, Adelaide,
Australia, 14–16 October.
202
[61] Gupta, R., Smith Jr, P., Willingham, T., Lo Cascia, M., Shyeh, J., and Harris, C. (2011).
Enhanced Waterflood for Middle East Carbonate Cores–Impact of Injection Water
Composition. In Proceedings of the SPE Middle East Oil and Gas Show and Conference,
Manama, Bahrain, 25-28 September.
[62] Awolayo, A., Sarma, H., and Nghiem, L. (2018). Brine-Dependent Recovery Processes in
Carbonate and Sandstone Petroleum Reservoirs: Review of Laboratory-Field Studies,
Interfacial Mechanisms and Modeling Attempts. Energies, 11(11). doi:
10.3390/en11113020
[63] Al-Shalabi, E. W., Sepehrnoori, K., Delshad, M., and Pope, G. (2014). A Novel Method to
Model Low-Salinity-Water Injection in Carbonate Oil Reservoirs. SPE Journal, 20(05),
1,154 - 151,166. doi: 10.2118/169674-PA
[64] Andersen, P. Ø., Evje, S., Madland, M. V., and Hiorth, A. (2012). A geochemical model
for interpretation of chalk core flooding experiments. Chemical engineering science, 84,
218-241. doi: 10.1016/j.ces.2012.08.038
[65] Awolayo, A. N., Sarma, H. K., and Nghiem, L. X. (2018). Modeling the characteristic
thermodynamic interplay between potential determining ions during brine-dependent
recovery process in carbonate rocks. Fuel, 224, 701-717. doi: 10.1016/j.fuel.2018.03.070
[66] Dang, C. T. Q., Nghiem, L. X., Chen, Z. J., and Nguyen, Q. P. (2013). Modeling Low
Salinity Waterflooding: Ion Exchange, Geochemistry and Wettability Alteration. In
Proceedings of the SPE Annual Technical Conference and Exhibition, New Orleans,
Louisiana, USA, 30 September-2 October.
[67] Evje, S., and Hiorth, A. (2010). A mathematical model for dynamic wettability alteration
controlled by water-rock chemistry. Networks and Heterogenous Media, 5(2), 217-256.
doi: 10.3934/nhm.2010.5.217
[68] Jerauld, G. R., Webb, K. J., Lin, C.-Y., and Seccombe, J. C. (2008). Modeling low-salinity
waterflooding. SPE Reservoir Eval. Eng., 11(06), 1,000-001,012. doi: 10.2118/102239-PA
[69] Omekeh, A. V., Friis, H. A., Fjelde, I., and Evje, S. (2012). Modeling of Ion-Exchange and
Solubility in Low Salinity Water Flooding. In Proceedings of the SPE Improved Oil
Recovery Symposium, Tulsa, Oklahoma, USA, 214-18 April.
[70] Qiao, C., Li, L., Johns, R. T., and Xu, J. (2015). A Mechanistic Model for Wettability
Alteration by Chemically Tuned Waterflooding in Carbonate Reservoirs. SPE Journal,
20(04), 767 - 783. doi: 10.2118/170966-PA
[71] Venkatraman, A., Hesse, M. A., Lake, L. W., and Johns, R. T. (2014). Analytical solutions
for flow in porous media with multicomponent cation exchange reactions. Water Resources
Research, 50(7), 5831-5847. doi: 10.1002/2013wr015091
[72] Zeinijahromi, A., Nguyen, T. K. P., and Bedrikovetsky, P. (2013). Mathematical Model
for Fines-Migration-Assisted Waterflooding With Induced Formation Damage. SPE
Journal, 18(03), 518-533. doi: 10.2118/144009-PA

203
[73] Adegbite, J. O., Al-Shalabi, E. W., and Ghosh, B. (2018). Geochemical modeling of
engineered water injection effect on oil recovery from carbonate cores. Journal of
Petroleum Science and Engineering, 170, 696-711. doi: 10.1016/j.petrol.2018.06.079
[74] Chandrasekhar, S., Sharma, H., and Mohanty, K. K. (2018). Dependence of wettability on
brine composition in high temperature carbonate rocks. Fuel, 225, 573-587. doi:
10.1016/j.fuel.2018.03.176
[75] Awolayo, A. N., and Sarma, H. K. (2018). An analytical solution to interpret active ion
transport during chemically‐tuned waterflooding process in high‐temperature carbonate
rocks. The Canadian Journal of Chemical Engineering. doi: 10.1002/cjce.23183
[76] Borazjani, S., Behr, A., Genolet, L., Van Der Net, A., and Bedrikovetsky, P. (2017). Effects
of fines migration on low-salinity waterflooding: analytical modelling. Transport in
Porous Media, 116(1), 213-249. doi: 10.1007/s11242-016-0771-2
[77] Al-adasani, A., Bai, B., and Wu, Y.-S. (2012). Investigating low-salinity waterflooding
recovery mechanisms in sandstone reservoirs. In Proceedings of the SPE Improved Oil
Recovery Symposium, Tulsa, Oklahoma, USA, 14–18 April.
[78] Wu, Y.-S., and Bai, B. (2009). Efficient simulation for low salinity waterflooding in porous
and fractured reservoirs. In Proceedings of the SPE Reservoir Simulation Symposium, The
Woodlands, Texas, 2-4 February.
[79] Al-Shalabi, E. W., Sepehrnoori, K., and Pope, G. (2015). Mechanistic Modeling of Oil
Recovery Due to Low Salinity Water Injection in Oil Reservoirs. In Proceedings of the SPE
Middle East Oil & Gas Show and Conference, Manama, Bahrain, 8-11 March.
[80] Yu, L., Evje, S., Kleppe, H., Kårstad, T., Fjelde, I., and Skjaeveland, S. M. (2009).
Spontaneous imbibition of seawater into preferentially oil-wet chalk cores—Experiments
and simulations. Journal of petroleum science and engineering, 66(3), 171-179. doi:
10.1016/j.petrol.2009.02.008
[81] Andersen, P., and Evje, S. (2012). A Mathematical Model for Interpretation of Brine-
Dependent Spontaneous Imbibition Experiments. In Proceedings of the ECMOR XIII-13th
European Conference on the Mathematics of Oil Recovery, Biarritz, France, 10–13
September
[82] Korrani, A. K. N., Jerauld, G. R., and Sepehrnoori, K. (2014). Coupled Geochemical-Based
Modeling of Low Salinity Waterflooding. In Proceedings of the SPE Improved Oil
Recovery Symposium, Tulsa, Oklahoma, USA, 12-16 April.
[83] Dang, C. T. Q., Nghiem, L. X., Chen, Z., Nguyen, N. T. B., and Nguyen, Q. P. (2014). CO2
Low Salinity Water Alternating Gas: A New Promising Approach for Enhanced Oil
Recovery. In Proceedings of the SPE Improved Oil Recovery Symposium, Tulsa,
Oklahoma, USA, 12-16 April.
[84] Qiao, C., Johns, R. T., and Li, L. (2016). Modeling Low Salinity Waterflooding in Chalk
and Limestone Reservoirs. Energy & Fuels, 30 (2), pp 884-895. doi:
10.1021/acs.energyfuels.5b02456

204
[85] Zolfaghari, H., Zebarjadi, A., Shahrokhi, O., and Ghazanfari, M. H. (2013). An
Experimental Study of CO2-low Salinity Water Alternating Gas Injection in Sandstone
Heavy Oil Reservoirs. Iranian Journal of Oil & Gas Science and Technology, 2(3), 37-47.
[86] Kilybay, A., Ghosh, B., Thomas, N. C., and Aras, P. (2016). Hybrid EOR Technology:
Carbonated Water and Smart Water Improved Recovery in Oil Wet Carbonate Formation.
Paper Volume presented at the SPE Annual Caspian Technical Conference & Exhibition,
Astana, Kazakhstan, 1-3 November https://doi.org/10.2118/182567-MS
[87] Ruidiaz, E. M., Winter, A., and Trevisan, O. V. (2018). Oil recovery and wettability
alteration in carbonates due to carbonate water injection. Journal of Petroleum Exploration
and Production Technology, 8(1), 249-258. doi: 10.1007/s13202-017-0345-z
[88] Teklu, T. W., Alameri, W., Graves, R. M., Kazemi, H., and AlSumaiti, A. M. (2016). Low-
salinity water-alternating-CO2 EOR. Journal of Petroleum Science and Engineering, 142,
101-118. doi: https://doi.org/10.1016/j.petrol.2016.01.031
[89] Al-Shalabi, E. W., Sepehrnoori, K., and Pope, G. A. (2014). Modeling the Combined Effect
of Injecting Low Salinity Water and Carbon Dioxide on Oil Recovery from Carbonate
Cores. In Proceedings of the International Petroleum Technology Conference, Kuala
Lumpur, Malaysia, 10–12 December.
[90] Khorsandi, S., Qiao, C., and Johns, R. T. (2016). Displacement Efficiency for Low Salinity
Polymer Flooding Including Wettability Alteration. In Proceedings of the SPE Improved
Oil Recovery Conference, Tulsa, Oklahoma, USA, 2016/4/11/.
[91] Mohammadi, H., and Jerauld, G. (2012). Mechanistic modeling of the benefit of combining
polymer with low salinity water for enhanced oil recovery. In Proceedings of the SPE
Improved Oil Recovery Symposium.
[92] Shaker , S. B., and Skauge, A. (2013). Enhanced oil recovery (EOR) by combined low
salinity water/polymer flooding. Energy & Fuels, 27(3), 1223-1235.
[93] Kozaki, C. (2012). Efficiency of low salinity polymer flooding in sandstone cores. (Masters
Thesis), University of Texas, Austin.
[94] Standnes, D. C., Nogaret, L. A. D., Chen, H.-L., and Austad, T. (2002). An evaluation of
spontaneous imbibition of water into oil-wet carbonate reservoir cores using a nonionic
and a cationic surfactant. Energy & Fuels, 16(6), 1557-1564.
[95] Tavassoli, S., Korrani, K. N. A., Pope, G. A., and Sepehrnoori, K. (2015). Low-Salinity
Surfactant Flooding—A Multimechanistic Enhanced-Oil-Recovery Method. SPE Journal
Paper. doi: 10.2118/173801-PA
[96] Aksulu, H., Hamsø, D., Strand, S., Puntervold, T., and Austad, T. (2012). Evaluation of
low-salinity enhanced oil recovery effects in sandstone: Effects of the temperature and pH
gradient. Energy & Fuels, 26(6), 3497-3503. doi: 10.1021/ef300162n
[97] Rezaeidoust, A., Puntervold, T., and Austad, T. (2010). A Discussion of the Low-Salinity
EOR Potential for a North Sea Sandstone Field. In Proceedings of the SPE Annual
Technical Conference and Exhibition, Florence, Italy, 19-22 September.

205
[98] Boussour, S., Cissokho, M., Cordier, P., Bertin, H. J., and Hamon, G. (2009). Oil Recovery
by Low-Salinity Brine Injection: Laboratory Results on Outcrop and Reservoir Cores. In
Proceedings of the SPE Annual Technical Conference and Exhibition, New Orleans,
Louisiana, USA, 4-7 October.
[99] Ligthelm, D., Gronsveld, J., Hofman, J., Brussee, N., Marcelis, F., and van der Linde, H.
(2009). Novel Waterflooding Strategy By Manipulation Of Injection Brine Composition. In
Proceedings of the EUROPEC/EAGE Conference and Exhibition, Amsterdam, The
Netherlands, 8-11 June.
[100] Loahardjo, N., Xie, X., Yin, P., and Morrow, N. R. (2007). Low salinity waterflooding of
a reservoir rock. In Proceedings of the International Symposium of the Society of Core
Analysts, Calgary, Canada, 10-12 September.
[101] Romanuka, J., Hofman, J., Ligthelm, D., Suijkerbuijk, B., Marcelis, F., Oedai, S., Brussee,
N., van der Linde, H., Aksulu, H., and Austad, T. (2012). Low Salinity EOR in Carbonates.
In Proceedings of the SPE Improved Oil Recovery Symposium, Tulsa, Oklahoma, USA,
14-18 April.
[102] Yousef, A., Al-Saleh, S., and Al-Jawfi, M. (2012). Improved/Enhanced Oil Recovery from
Carbonate Reservoirs by Tuning Injection Water Salinity and Ionic Content. In
Proceedings of the SPE Improved Oil Recovery Symposium, Tulsa, Oklahoma, USA, 14-
18 April.
[103] Al Mahrouqi, D., Vinogradov, J., and Jackson, M. D. (2016). Temperature dependence of
the zeta potential in intact natural carbonates. Geophysical Research Letters, 43(22). doi:
10.1002/2016gl071151
[104] Alroudhan, A., Vinogradov, J., and Jackson, M. (2016). Zeta potential of intact natural
limestone: Impact of potential-determining ions Ca2+, Mg2+ and SO42-. Colloids and
Surfaces A: Physicochemical and Engineering Aspects, 493, 83-98. doi:
10.1016/j.colsurfa.2015.11.068
[105] Austad, T., RezaeiDoust, A., and Puntervold, T. (2010). Chemical mechanism of low
salinity water flooding in sandstone reservoirs. In Proceedings of the SPE Improved Oil
Recovery Symposium, Tulsa, Oklahoma, USA, 24-28 April.
[106] Hilner, E., Andersson, M. P., Hassenkam, T., Matthiesen, J., Salino, P. A., and Stipp, S. L.
S. (2015). The effect of ionic strength on oil adhesion in sandstone–the search for the low
salinity mechanism. Scientific reports, 5, 9933. doi: 10.1038/srep09933
[107] Nasralla, R. A., and Nasr-El-Din, H. A. (2011). Impact of Electrical Surface Charges and
Cation Exchange on Oil Recovery by Low Salinity Water. In Proceedings of the SPE Asia
Pacific Oil and Gas Conference and Exhibition, Jakarta, Indonesia, 20-22 September.
[108] Vinogradov, J., Jaafar, M. Z., and Jackson, M. D. (2010). Measurement of streaming
potential coupling coefficient in sandstones saturated with natural and artificial brines at
high salinity. Journal of Geophysical Research: Solid Earth, 115(B12). doi:
10.1029/2010jb007593

206
[109] Morrow, N. R., Tang, G. Q., Valat, M., and Xie, X. (1998). Prospects of improved oil
recovery related to wettability and brine composition. Journal of Petroleum science and
Engineering, 20(3-4), 267-276. doi: 10.1016/s0920-4105(98)00030-8
[110] Morrow, N. R. (1990). Wettability and Its Effect on Oil Recovery. Journal of Petroleum
Technology, 42(12), 1,476-471,484. doi: 10.2118/21621-pa
[111] Lager, A., Webb, K. J., Black, C. J. J., Singleton, M., and Sorbie, K. S. (2008). Low Salinity
Oil Recovery - An Experimental Investigation 1. Petrophysics, 49(01).
[112] Shariatpanahi, S. F., Strand, S., and Austad, T. (2010). Evaluation of water-based enhanced
oil recovery (EOR) by wettability alteration in a low-permeable fractured limestone oil
reservoir. Energy & Fuels, 24(11), 5997-6008. doi: 10.1021/ef100837v
[113] Masalmeh, S. K. (2012). Impact of capillary forces on residual oil saturation and flooding
experiments for mixed to oil-wet carbonate reservoirs. In Proceedings of the International
Symposium of the Society of Core Analysts, Aberdeen, Scotland, UK, 27-30 August.
[114] Shehata, A. M., Alotaibi, M. B., and Nasr-El-Din, H. A. (2014). Waterflooding in
carbonate reservoirs: Does the salinity matter? SPE Reservoir Eval. Eng., 17(03), 304-313.
doi: 10.2118/170254-pa
[115] Al Harrasi, A., Al-maamari, R. S., and Masalmeh, S. K. (2012). Laboratory investigation
of low salinity waterflooding for carbonate reservoirs. In Proceedings of the Abu Dhabi
International Petroleum Conference and Exhibition, Abu Dhabi, UAE, 11-14 November.
[116] Standnes, D. C., and Austad, T. (2000). Wettability alteration in chalk: 1. Preparation of
core material and oil properties. Journal of Petroleum Science and Engineering, 28(3),
111-121. doi: 10.1016/s0920-4105(00)00083-8
[117] Xie, X., and Morrow, N. R. (2001). Oil recovery by spontaneous imbibition from weakly
water-wet rocks. Petrophysics, 42(04).
[118] Alotaibi, M. B., Azmy, R., and Nasr-El-Din, H. A. (2010). A comprehensive EOR study
using low salinity water in sandstone reservoirs. In Proceedings of the SPE Improved Oil
Recovery Symposium, Tulsa, Oklahoma, USA, 24-28 April.
[119] Jackson, M. D., Al-Mahrouqi, D., and Vinogradov, J. (2016). Zeta potential in oil-water-
carbonate systems and its impact on oil recovery during controlled salinity water-flooding.
Scientific reports, 6, 37363. doi: 10.1038/srep37363
[120] Mahani, H., Keya, A. L., Berg, S., and Nasralla, R. (2017). Electrokinetics of
carbonate/brine interface in low-salinity waterflooding: Effect of brine salinity,
composition, rock type, and pH on ζ-potential and a surface-complexation model. SPE
Journal, 22(01), 53-68. doi: 10.2118/181745-pa
[121] Xie, Q., Liu, Y., Wu, J., and Liu, Q. (2014). Ions tuning water flooding experiments and
interpretation by thermodynamics of wettability. Journal of Petroleum Science and
Engineering, 124, 350-358. doi: 10.1016/j.petrol.2014.07.015

207
[122] Chen, Q., Mercer, D., and Webb, K. (2010). NMR study on pore occupancy and wettability
modification during low salinity waterflooding. In Proceedings of the 2010 International
Symposium of Core Analysts, Halifax, Canada, 4-7 October.
[123] Looyestijn, W. J., and Hofman, J. (2006). Wettability-Index Determination by Nuclear
Magnetic Resonance. SPE Reservoir Eval. Eng., 9(02), 146-153. doi: 10.2118/93624-PA
[124] Hassenkam, T., Mitchell, A. C., Pedersen, C. S., Skovbjerg, L. L., Bovet, N., and Stipp, S.
L. S. (2012). The low salinity effect observed on sandstone model surfaces. Colloids and
Surfaces A: Physicochemical and Engineering Aspects, 403, 79-86. doi:
10.1016/j.colsurfa.2012.03.058
[125] Lebedeva, E., Senden, T. J., Knackstedt, M., and Morrow, N. (2009). Improved Oil
Recovery from Tensleep Sandstone–Studies of Brine-Rock Interactions by Micro-CT and
AFM. In Proceedings of the IOR 2009-15th European Symposium on Improved Oil
Recovery, Paris, France, 27-29 April.
[126] Sarma, H. K. (2015). SPE Training Course on Chemical Enhanced Oil Recovery Methods.
Kuala Lumpur, Malaysia.
[127] Strand, S., Standnes, D. C., and Austad, T. (2006). New wettability test for chalk based on
chromatographic separation of SCN− and SO42−. Journal of Petroleum Science and
Engineering, 52(1), 187-197. doi: 10.1016/j.petrol.2006.03.021
[128] Anderson, W. (1986). Wettability literature survey-part 1: rock/oil/brine interactions and
the effects of core handling on wettability. Journal of Petroleum Technology, 38(10), 1125-
1144. doi: 10.2118/13932-pa
[129] Ding, H., and Rahman, S. (2017). Experimental and theoretical study of wettability
alteration during low salinity water flooding-an state of the art review. Colloids and
Surfaces A: Physicochemical and Engineering Aspects, 520, 622-639. doi:
10.1016/j.colsurfa.2017.02.006
[130] Israelachvili, J. N. (2011). Intermolecular and surface forces: revised third edition.
Academic press: New York City.
[131] Shariatpanahi, S. F., Strand, S., and Austad, T. (2011). Initial wetting properties of
carbonate oil reservoirs: effect of the temperature and presence of sulfate in formation
water. Energy & fuels, 25(7), 3021-3028. doi: 10.1021/ef200033h
[132] Suijkerbuijk, B., Hofman, J., Ligthelm, D., Romanuka, J., Brussee, N., van der Linde, H.,
and Marcelis, F. (2012). Fundamental investigations into wettability and low salinity
flooding by parameter isolation. In Proceedings of the SPE Improved Oil Recovery
Symposium, Tulsa, Oklahoma, USA, 14-18 April.
[133] Lindlof, J. C., and Stoffer, K. G. (1983). A Case Study of Seawater Injection
Incompatibility. SPE Journal, 35(07), 1256 - 1262. doi: 10.2118/9626-PA
[134] Austad, T. (2013). Water-Based EOR in Carbonates and Sandstones: New Chemical
Understanding of the EOR Potential Using “Smart Water”. In J. Sheng (Ed.), Enhanced

208
Oil Recovery Field Case Studies (1st ed., pp. 301-335). Waltham: Gulf Professional
Publishing Elsevier
[135] Viksund, B. G., Morrow, N. R., Ma, S., Wang, W., and Graue, A. (1998). Initial water
saturation and oil recovery from chalk and sandstone by spontaneous imbibition. In
Proceedings of the International Symposium of Society of Core Analysts, The Hague, The
Netherlands, 26–30 August.
[136] Puntervold, T., Strand, S., and Austad, T. (2007). Water flooding of carbonate reservoirs:
Effects of a model base and natural crude oil bases on chalk wettability. Energy & fuels,
21(3), 1606-1616. doi: 10.1021/ef060624b
[137] Puntervold, T., Strand, S., and Austad, T. (2007). New method to prepare outcrop chalk
cores for wettability and oil recovery studies at low initial water saturation. Energy &
Fuels, 21(6), 3425-3430. doi: 10.1021/ef700323c
[138] Fernø, M. A., Grønsdal, R., Åsheim, J., Nyheim, A., Berge, M., and Graue, A. (2011). Use
of sulfate for water based enhanced oil recovery during spontaneous imbibition in chalk.
Energy & fuels, 25(4), 1697-1706. doi: 10.1021/ef200136w
[139] Shariatpanahi, S. F., Hopkins, P., Aksulu, H., Strand, S., Puntervold, T., and Austad, T.
(2016). Water based EOR by wettability alteration in dolomite. Energy & Fuels, 30(1),
180-187. doi: 10.1021/acs.energyfuels.5b02239
[140] Dubey, S. T., and Doe, P. H. (1993). Base number and wetting properties of crude oils.
SPE Reservoir Eval. Eng., 8(03), 195-200. doi: 10.2118/22598-pa
[141] Denekas, M. O., Mattax, C. C., and Davis, G. T. (1959). Effects of Crude Oil Components
on Rock Wettability. Petroleum Transactions, AIME 216, 330-333.
[142] Buckley, J. S., Liu, Y., and Monsterleet, S. (1998). Mechanisms of wetting alteration by
crude oils. SPE Journal, 3(01), 54-61. doi: 10.2118/37230-PA
[143] Cuiec, L. (1984). Rock/Crude-Oil Interactions and Wettability: An Attempt To Understand
Their Interrelation. In Proceedings of the SPE Annual Technical Conference and
Exhibition, Houston, Texas, 16-19 September.
[144] Ehrlich, R. (1974). Wettability alteration during displacement of oil by water from
petroleum reservoir rock. Paper Volume presented at the 48th National Colloid
Symposium ACS preprints, Austin, Texas, 24-26 June.
[145] Block, A., and Simms, B. B. (1967). Desorption and exchange of adsorbed octadecylamine
and stearic acid on steel and glass. Journal of Colloid and Interface Science, 25(4), 514-
518. doi: 10.1016/0021-9797(67)90062-8
[146] Strassner, J. E. (1968). Effect of pH on interfacial films and stability of crude oil-water
emulsions. Journal of Petroleum Technology, 20(03), 303-312. doi: 10.2118/1939-pa
[147] Lowe, A. C., Phillips, M. C., and Riddiford, A. C. (1973). On the wetting of carbonate
surfaces by oil and water. Journal of Canadian Petroleum Technology, 12(02). doi:
10.2118/73-02-04

209
[148] Benner, F. C., and Bartel, F. E. (1941). The effect of polar impurities upon capillary and
surface phenomena in petroleum production. In Proceedings of the Drilling and production
practice, New York, USA, 1 January.
[149] Morrow, N. R., Cram, P. J., and McCaffery, F. G. (1973). Displacement Studies in
Dolomite With Wettability Control by Octanoic Acid. Society of Petroleum Engineers
Journal, 13(04), 221-232. doi: 10.2118/3993-PA
[150] Shimoyama, A., and Johns, W. D. (1972). Formation of alkanes from fatty acids in the
presence of CaCO3. Geochimica et Cosmochimica Acta, 36(1), 87-91. doi: 10.1016/0016-
7037(72)90122-6
[151] Zhang, P., and Austad, T. (2005). The relative effects of acid number and temperature on
chalk wettability. In Proceedings of the SPE International Symposium on Oilfield
Chemistry, The Woodlands, Texas, 2-4 February.
[152] Zhang, P., and Austad, T. (2005). Waterflooding in chalk: Relationship between oil
recovery, new wettability index, brine composition and cationic wettability modifier. In
Proceedings of the SPE Europec/EAGE Annual Conference, Madrid, Spain, 2005/1/1/.
[153] Thomas, M. M., Clouse, J. A., and Longo, J. M. (1993). Adsorption of organic compounds
on carbonate minerals: 1. Model compounds and their influence on mineral wettability.
Chemical geology, 109(1), 201-213. doi: 10.1016/0009-2541(93)90070-y
[154] Mwangi, P., Thyne, G., and Rao, D. (2013). Extensive Experimental Wettability Study in
Sandstone and Carbonate-Oil-Brine Systems: Part 1–Screening Tool Development. In
Proceedings of the International Symposium of the Society of Core Analysts, Napa Valley,
California, USA, 16-19 September.
[155] Mwangi, P., Brady, P. V., Radonjic, M., and Thyne, G. (2018). The effect of organic acids
on wettability of sandstone and carbonate rocks. Journal of Petroleum Science and
Engineering, 165, 428-435. doi: 10.1016/j.petrol.2018.01.033
[156] Gomari, K. R., and Hamouda, A. A. (2006). Effect of fatty acids, water composition and
pH on the wettability alteration of calcite surface. Journal of petroleum science and
engineering, 50(2), 140-150. doi: 10.1016/j.petrol.2005.10.007
[157] Fathi, S. J., Austad, T., Strand, S., and Puntervold, T. (2010). Wettability alteration in
carbonates: The effect of water-soluble carboxylic acids in crude oil. Energy & Fuels,
24(5), 2974-2979. doi: 10.1021/ef901527h
[158] Fathi, S. J., Austad, T., and Strand, S. (2011). Effect of water-extractable carboxylic acids
in crude oil on wettability in carbonates. Energy & fuels, 25(6), 2587-2592. doi:
10.1021/ef200302d
[159] Awolayo, A., Sarma, H., and Nghiem, L. (2018). Thermodynamic Modeling of Brine
Dilution-Dependent Recovery in Carbonate Rocks with Different Mineralogical Content.
Energy & Fuels, 32(9), 8921–8943. doi: 10.1021/acs.energyfuels.8b01080

210
[160] Mazzullo, S. J., Chilingarian, G. V., and Bissell, H. J. (1992). Carbonate rock
classifications. Developments in petroleum science, 30, 59-108. doi: 10.1016/s0376-
7361(09)70125-6
[161] Megawati, M., Hiorth, A., and Madland, M. V. (2013). The impact of surface charge on
the mechanical behavior of high-porosity chalk. Rock mechanics and rock engineering,
46(5), 1073-1090. doi: 10.1007/s00603-012-0317-z
[162] Korsnes, R. I., Madland, M. V., Austad, T., Haver, S., and Røsland, G. (2008). The effects
of temperature on the water weakening of chalk by seawater. Journal of Petroleum Science
and Engineering, 60(3-4), 183-193. doi: 10.1016/j.petrol.2007.06.001
[163] Korsnes, R. I., Strand, S., Hoff, Ø., Pedersen, T., Madland, M. V., and Austad, T. (2006).
Does the chemical interaction between seawater and chalk affect the mechanical
properties of chalk. In Proceedings of the International Symposium of the International
Society for Rock Mechanics, Liège, Belgium, 9-12 May.
[164] Awolayo, A. N., Sarma, H. K., and AlSumaiti, A. M. (2014). An Experimental Study of
Smart Waterflooding on Fractured Carbonate Reservoirs. In Proceedings of the ASME
2014 33rd International Conference on Ocean, Offshore and Arctic Engineering, San
Francisco, USA, 8 - 12 June.
[165] Pierre, A., Lamarche, J. M., Mercier, R., Foissy, A., and Persello, J. (1990). Calcium as
potential determining ion in aqueous calcite suspensions. Journal of Dispersion Science
and Technology, 11(6), 611-635. doi: 10.1080/01932699008943286
[166] Strand, S., Standnes, D. C., and Austad, T. (2003). Spontaneous imbibition of aqueous
surfactant solutions into neutral to oil-wet carbonate cores: Effects of brine salinity and
composition. Energy & fuels, 17(5), 1133-1144. doi: 10.1021/ef030051s
[167] Fathi, S. J., Austad, T., and Strand, S. (2011). Water-based enhanced oil recovery (EOR)
by “smart water”: Optimal ionic composition for EOR in carbonates. Energy & fuels,
25(11), 5173-5179. doi: 10.1021/ef201019k
[168] Kasha, A., Al-Hashim, H., Abdallah, W., Taherian, R., and Sauerer, B. (2015). Effect of
Ca2+, Mg2+ and SO42− ions on the zeta potential of calcite and dolomite particles aged with
stearic acid. Colloids and Surfaces A: Physicochemical and Engineering Aspects, 482, 290-
299. doi: 10.1016/j.colsurfa.2015.05.043
[169] Ravari, R. R., Strand, S., and Austad, T. (2010). Care must be taken to use outcrop
limestone cores to mimic reservoir core material in SCAL linked to wettability alteration.
In Proceedings of the 11th Intenational Symposium on Reservoir Wettability, Calgary,
Canada, 7 - 9 September.
[170] Al Mahrouqi, D., Vinogradov, J., and Jackson, M. D. (2016). Zeta potential of artificial
and natural calcite in aqueous solution. Advances in Colloid and Interface Science, 240,
60-76. doi: 10.1016/j.cis.2016.12.006

211
[171] Vdović, N., and Bišćan, J. (1998). Electrokinetics of natural and synthetic calcite
suspensions. Colloids and Surfaces A: Physicochemical and Engineering Aspects, 137(1-
3), 7-14. doi: 10.1016/s0927-7757(97)00179-9
[172] Karimi, M., Al-Maamari, R. S., Ayatollahi, S., and Mehranbod, N. (2015). Mechanistic
study of wettability alteration of oil-wet calcite: The effect of magnesium ions in the
presence and absence of cationic surfactant. Colloids and Surfaces A: Physicochemical and
Engineering Aspects, 482, 403-415. doi: 10.1016/j.colsurfa.2015.07.001
[173] Buckley, J. S., and Liu, Y. (1998). Some mechanisms of crude oil/brine/solid interactions.
Journal of Petroleum Science and Engineering, 20(3), 155-160. doi: 10.1016/s0920-
4105(98)00015-1
[174] Rao, D. N. (1999). Wettability Effects in Thermal Recovery Operations. SPE Reservoir
Eval. Eng., 2(05), 420-430. doi: 10.2118/57897-PA
[175] Heidari, M. A., Habibi, A., Ayatollahi, S., Masihi, M., and Ashoorian, S. (2014). Effect of
time and temperature on crude oil aging to do a right surfactant flooding with a new
approach. In Proceedings of the Offshore Technology Conference-Asia, Kuala Lumpur,
Malaysia, 25-28 March.
[176] Mahani, H., Menezes, R., Berg, S., Fadili, A., Nasralla, R., Voskov, D., and Joekar-Niasar,
V. (2017). Insights into the impact of temperature on the wettability alteration by low
salinity in carbonate rocks. Energy & Fuels, 31(8), 7839-7853. doi:
10.1021/acs.energyfuels.7b00776
[177] Webb, K., Black, C., and Tjetland, G. (2005). A laboratory study investigating methods for
improving oil recovery in carbonates. In Proceedings of the International Petroleum
Technology Conference, Doha, Qatar, 21-23 November.
[178] Alshakhs, M. J., and Kovscek, A. R. (2016). Understanding the role of brine ionic
composition on oil recovery by assessment of wettability from colloidal forces. Advances
in colloid and interface science, 233, 126-138. doi: 10.1016/j.cis.2015.08.004
[179] Nyström, R., Lindén, M., and Rosenholm, J. B. (2001). The Influence of Na+, Ca2+, Ba2+,
and La3+ on the ζ-Potential and the Yield Stress of Calcite Dispersions. Journal of colloid
and interface science, 242(1), 259-263. doi: 10.1006/jcis.2001.7766
[180] Thomas, L. K., Dixon, T. N., Evans, C. E., and Vienot, M. E. (1987). Ekofisk waterflood
pilot. Journal of petroleum technology, 39(02), 221-232. doi: 10.2118/13120-pa
[181] Hermansen, H., Landa, G. H., Sylte, J. E., and Thomas, L. K. (2000). Experiences after 10
years of waterflooding the Ekofisk Field, Norway. Journal of Petroleum Science and
Engineering, 26(1-4), 11-18. doi: 10.1016/s0920-4105(00)00016-4
[182] Barkved, O., Heavey, P., Kjelstadli, R., Kleppan, T., and Kristiansen, T. G. (2003). Valhall
field-still on plateau after 20 years of production. In Proceedings of the Offshore Europe,
Aberdeen, United Kingdom, 2-5 September.

212
[183] Griffin, T. A., Best, K. D., Thingvoll, T. T., Stockden, I. L., and Tjetland, G. (2007).
Monitoring Waterflood Performance in a Depleted Fractured Chalk Reservoir. In
Proceedings of the Offshore Europe.
[184] Tjetland, G., Kristiansen, T. G., and Buer, K. (2007). Reservoir management aspects of
early waterflood response after 25 years of depletion in the Valhall field. In Proceedings
of the International Petroleum Technology Conference, Dubai, U.A.E., 4-6 December.
[185] Webb, K. J., Black, C. J. J., and Al-Ajeel, H. (2004). Low Salinity Oil Recovery-Log-Inject-
Log. In Proceedings of the SPE/DOE Symposium on Improved Oil Recovery, Tulsa,
Oklahoma, USA, 17-21 April.
[186] Seccombe, J. C., Lager, A., Webb, K. J., Jerauld, G., and Fueg, E. (2008). Improving
wateflood recovery: LoSalTM EOR field evaluation. In Proceedings of the SPE Symposium
on Improved Oil Recovery, Tulsa, Oklahoma, USA, 20-23 April.
[187] Vledder, P., Gonzalez, I., Carrera Fonseca, J., Wells, T., and Ligthelm, D. (2010). Low
Salinity Water Flooding: Proof Of Wettability Alteration On A Field Wide Scale. In
Proceedings of the SPE Improved Oil Recovery Symposium, Tulsa, Oklahoma, USA, 24-
28 April.
[188] Al-Qattan, A., Sanaseeri, A., Al-Saleh, Z., Singh, B. B., Al-Kaaoud, H., Delshad, M.,
Hernandez, R., Winoto, W., Badham, S., Bouma, C., et al. (2018). Low Salinity Waterflood
and Low Salinity Polymer Injection in the Wara Reservoir of the Greater Burgan Field. In
Proceedings of the SPE EOR Conference at Oil and Gas West Asia, Muscat, Oman, 26-28
March.
[189] Callegaro, C., Bartosek, M., Nobili, M., Masserano, F., Pollero, M., Baz, D. M. M., and
Kortam, M. M. (2015). Design and Implementation of Low Salinity Waterflood in a North
African Brown Field. In Proceedings of the Abu Dhabi International Petroleum Exhibition
and Conference, Abu Dhabi, UAE, 2015/11/9/.
[190] Akhmetgareev, V., and Khisamov, R. (2015). 40 Years of Low-Salinity Waterflooding in
Pervomaiskoye Field, Russia: Incremental Oil. In Proceedings of the SPE European
Formation Damage Conference and Exhibition, Budapest, Hungary, 3-5 June.
[191] Agbalaka, C. C., Dandekar, A. Y., Patil, S. L., Khataniar, S., and Hemsath, J. R. (2009).
Coreflooding studies to evaluate the impact of salinity and wettability on oil recovery
efficiency. Transport in Porous Media, 76(1), 77-94. doi: 10.1007/s11242-008-9235-7
[192] Karoussi, O., and Hamouda, A. A. (2007). Imbibition of sulfate and magnesium ions into
carbonate rocks at elevated temperatures and their influence on wettability alteration and
oil recovery. Energy & fuels, 21(4), 2138-2146. doi: 10.1021/ef0605246
[193] Austad, T., Strand, S., and Puntervold, T. (2009). Is wettability alteration of carbonates by
seawater caused by rock dissolution. In Proceedings of the International Symposium of the
Society of Core Analysts, Noordwijk, The Netherlands, 27-30 September, 2009.
[194] Den Ouden, L., Nasralla, R., Guo, H., Bruining, H., and van Kruijsdijk, C. (2015). Calcite
dissolution behaviour during low salinity water flooding in carbonate rock. In Proceedings

213
of the IOR 2015-18th European Symposium on Improved Oil Recovery, Dresden,
Germany, 14 April.
[195] Nasralla, R. A., Snippe, J. R., and Farajzadeh, R. (2015). Coupled Geochemical-Reservoir
Model to Understand the Interaction Between Low Salinity Brines and Carbonate Rock. In
Proceedings of the SPE Asia Pacific Enhanced Oil Recovery Conference, Kuala Lumpur,
Malaysia, 11–13 August.
[196] Chandrasekhar, S., Sharma, H., and Mohanty, K. K. (2016). Wettability Alteration with
Brine Composition in High Temperature Carbonate Rocks. In Proceedings of the SPE
Annual Technical Conference and Exhibition, Dubai, UAE, 26-28 September
[197] Takamura, K., and Chow, R. S. (1985). The electric properties of the bitumen/water
interface Part II. Application of the ionizable surface-group model. Colloids and surfaces,
15, 35-48. doi: 10.1016/0166-6622(85)80157-8
[198] Brady, P. V., and Thyne, G. (2016). Functional wettability in carbonate reservoirs. Energy
& Fuels, 30(11), 9217-9225. doi: 10.1021/acs.energyfuels.6b01895
[199] Goldberg, S., and Forster, H. S. (1991). Boron sorption on calcareous soils and reference
calcites. Soil Science, 152(4), 304-310. doi: 10.1097/00010694-199110000-00009
[200] Sø, H. U., Postma, D., Jakobsen, R., and Larsen, F. (2011). Sorption of phosphate onto
calcite; results from batch experiments and surface complexation modeling. Geochimica
et Cosmochimica Acta, 75(10), 2911-2923. doi: 10.1016/j.gca.2011.02.031
[201] Lemon, P., Zeinijahromi, A., Bedrikovetsky, P., and Shahin, I. (2011). Effects of injected-
water salinity on waterflood sweep efficiency through induced fines migration. Journal of
Canadian Petroleum Technology, 50(9/10), 82-94. doi: 10.2118/140141-pa
[202] Zeinijahromi, A., Ahmetgareev, V., Badalyan, A., Khisamov, R., and Bedrikovetsky, P.
(2015). Case study of low salinity water injection in Zichebashskoe field. Journal of
Petroleum Science Research. doi: 10.12783/jpsr.2015.0401.03
[203] Zeinijahromi, A., Ahmetgareev, V., and Bedrikovetsky, P. (2015). Case Study of 25 Years
of Low Salinity Water Injection. In Proceedings of the SPE/IATMI Asia Pacific Oil & Gas
Conference and Exhibition, Nusa Dua, Bali, Indonesia, 2015/10/20/.
[204] Rahbar, M., Ayatollahi, S., and Ghatee, M. H. (2010). The Roles of Nano-Scale
Intermolecular Forces on the Film Stability during Wettability Alteration Process of the
Oil Reservoir Rocks. In Proceedings of the Trinidad and Tobago Energy Resources
Conference, Port of Spain, Trinidad, 2010/1/1/.
[205] Xie, Q., Saeedi, A., Pooryousefy, E., and Liu, Y. (2016). Extended DLVO-based estimates
of surface force in low salinity water flooding. Journal of Molecular Liquids, 221, 658-
665. doi: 10.1016/j.molliq.2016.06.004
[206] Brady, P. V., Morrow, N. R., Fogden, A., Deniz, V., and Loahardjo, N. (2015).
Electrostatics and the low salinity effect in sandstone reservoirs. Energy & Fuels, 29(2),
666-677. doi: 10.1021/ef502474a

214
[207] Awolayo, A., Sarma, H., Nghiem, L., and Emre, G. (2017). A Geochemical Model for
Investigation of Wettability Alteration during Brine-Dependent Flooding in Carbonate
Reservoirs. In Proceedings of the SPE Abu Dhabi International Petroleum Exhibition &
Conference Abu Dhabi, UAE, 13-16 November.
[208] Tripathi, I., and Mohanty, K. K. (2008). Instability due to wettability alteration in
displacements through porous media. Chemical Engineering Science, 63(21), 5366-5374.
doi: 10.1016/j.ces.2008.07.022
[209] Fjelde, I., Asen, S. M., and Omekeh, A. V. (2012). Low salinity water flooding experiments
and interpretation by simulations. In Proceedings of the SPE Improved Oil Recovery
Symposium, Tulsa, Oklahoma, USA, 14-18 April.
[210] Brady, P. V., and Krumhansl, J. L. (2012). A surface complexation model of oil–brine–
sandstone interfaces at 100 °C: Low salinity waterflooding. Journal of Petroleum Science
and Engineering, 81, 171-176. doi: 10.1016/j.petrol.2011.12.020
[211] Brady, P. V., Krumhansl, J. L., and Mariner, P. E. (2012). Surface Complexation Modeling
for Improved Oil Recovery. In Proceedings of the SPE Improved Oil Recovery
Symposium, Tulsa, Oklahoma, USA, 14-18 April.
[212] Elakneswaran, Y., Shimokawara, M., Nawa, T., and Takahashi, S. (2017). Surface
Complexation and Equilibrium Modelling for Low Salinity Waterflooding in Sandstone
Reservoirs. In Proceedings of the Abu Dhabi International Petroleum Exhibition &
Conference, Abu Dhabi, UAE, 2017/11/13/.
[213] Erzuah, S., Fjelde, I., and Omekeh, A. V. (2017). Wettability Estimation by Surface
Complexation Simulations. In Proceedings of the SPE Europec featured at 79th EAGE
Conference and Exhibition, Paris, France, 2017/6/12/.
[214] Lima, S. A., Murad, M. A., and Domingues, R. (2017). A New Multiscale Computational
Model for Low Salinity Alkaline Waterflooding in Clay-Bearing Sandstones. In
Proceedings of the SPE Reservoir Simulation Conference, Montgomery, Texas, USA, 20–
22 February.
[215] Korrani, A. K. N., and Jerauld, G. R. (2018). Modeling Wettability Change in Sandstones
and Carbonates Using a Surface-Complexation-Based Method. In Proceedings of the SPE
Improved Oil Recovery Conference, Tulsa, Oklahoma, USA, 2018/4/14/.
[216] Evje, S., Hiorth, A., Madland, M. V., and Korsnes, R. I. (2009). A mathematical model
relevant for weakening of chalk reservoirs due to chemical reactions. Networks and
Heterogenous Media, 4(4), 755-788. doi: 10.3934/nhm.2009.4.755
[217] Al-Shalabi, E. W., Delshad, M., and Sepehrnoori, K. (2013). Does the Double Layer
Expansion Mechanism Contribute to the LSWI Effect on Hydrocarbon Recovery from
Carbonate Rocks? In Proceedings of the SPE Reservoir Characterization and Simulation
Conference and Exhibition, Abu Dhabi, UAE, 16–18 September.

215
[218] Al-Shalabi, E. W., Sepehrnoori, K., and Pope, G. (2015). Geochemical Interpretation of
Low-Salinity-Water Injection in Carbonate Oil Reservoirs. SPE Journal, 20(06), 1,212 -
211,226. doi: 10.2118/169101-PA
[219] Korrani, A. K. N., Fu, W., Sanaei, A., and Sepehrnoori, K. (2015). Mechanistic Modeling
of Modified Salinity Waterflooding in Carbonate Reservoirs. In Proceedings of the SPE
Annual Technical Conference and Exhibition, Houston, Texas, USA, 28–30 September.
[220] Eftekhari, A. A., Thomsen, K., Stenby, E. H., and Nick, H. M. (2017). Thermodynamic
Analysis of Chalk–Brine–Oil Interactions. Energy & Fuels, 31(11), 11773-11782. doi:
10.1021/acs.energyfuels.7b02019
[221] Abdou, M., Carnegie, A., Mathews, S. G., McCarthy, K., O’Keefe, M., Raghuraman, B.,
Wei, W., and Xian, C. (2011). Finding value in formation water. Oilfield Review, 23(1),
24-35.
[222] Crabtree, M., Eslinger, D., Fletcher, P., Miller, M., Johnson, A., and King, G. (1999).
Fighting scale—removal and prevention. Oilfield review, 11(3), 30-45.
[223] Vetter, O. J., Farone, W. A., Veith, E., and Lankford, S. (1987). Calcium carbonate scale
considerations: A practical approach. In Proceedings of the SPE Production Technology
Symposium, Lubbock, Texas, 16-17 November.
[224] Puntervold, T., Strand, S., and Austad, T. (2009). Coinjection of seawater and produced
water to improve oil recovery from fractured North Sea chalk oil reservoirs. Energy &
Fuels, 23(5), 2527-2536. doi: 10.1021/ef801023u
[225] Kajenthira, A., Siddiqi, A., and Anadon, L. D. (2012). A new case for promoting
wastewater reuse in Saudi Arabia: Bringing energy into the water equation. Journal of
environmental management, 102, 184-192. doi: 10.1016/j.jenvman.2011.09.023
[226] Burnett, D. (2005). Desalinating brine from oil and gas operations in Texas. Southwest
Hydrology, 24-25.
[227] Burnett, D. B., and Siddiqui, M. (2006). Recovery of fresh water resources from
desalination of brine produced during oil and gas production operations. College Station,
TX, USA: Texas Engineering Experiment Station.
[228] Ayirala, S. C., Uehara-Nagamine, E., Matzakos, A. N., Chin, R. W., Doe, P. H., and van
den Hoek, P. J. (2010). A designer water process for offshore low salinity and polymer
flooding applications. In Proceedings of the SPE Improved Oil Recovery Symposium,
Tulsa, Oklahoma, USA, 24-28 April.
[229] Collins, I. R. (2008). United States Patent No. US7455109B2. U.S. Patent and Trademark
Office.
[230] Henthorne, L., and Movahed, B. (2013). United States Patent No. US 20130213892A1 U.
S Patent.
[231] Curole, M. A., and Greene, E. B. (2014). United States Patent No. US008 789594B2 U.S.
Patent and Trademark Office.

216
[232] Ligthelm, D. J., Romanuka, J., and Suijkerbuijk, B. M. J. M. (2012). United States Patent
No. US 20120090833A1. U.S. Patent.
[233] Ayirala, S. C. B., Chin, R. W.-Y., Matzakos, A. N., and Uehara-Nagamine, E. (2016).
United States Patent No. US9234413B2. U.S. Patent.
[234] Yousef, A. A., and Ayirala, S. C. (2014). A novel water ionic composition optimization
technology for SmartWater flooding application in carbonate reservoirs. In Proceedings
of the SPE Improved Oil Recovery Symposium, Tulsa, Oklahoma, USA, 12-16 April.
[235] Ayirala, S. C., and Yousef, A. A. (2016). A Critical Review of Alternative Desalination
Technologies for Smart Waterflooding. Oil and Gas Facilities. doi: 10.2118/179564-PA
[236] Sohal, M. A., Thyne, G., and Søgaard, E. G. (2016). Review of recovery mechanisms of
ionically modified waterflood in carbonate reservoirs. Energy & Fuels, 30(3), 1904-1914.
doi: 10.1021/acs.energyfuels.5b02749
[237] Drummond, C., and Israelachvili, J. (2004). Fundamental studies of crude oil–surface water
interactions and its relationship to reservoir wettability. Journal of Petroleum Science and
Engineering, 45(1), 61-81.
[238] Stipp, S. L. S. (1999). Toward a conceptual model of the calcite surface: hydration,
hydrolysis, and surface potential. Geochimica et Cosmochimica Acta, 63(19), 3121-3131.
doi: 10.1016/S0016-7037(99)00239-2
[239] Wolthers, M., Charlet, L., and Van Cappellen, P. (2008). The surface chemistry of divalent
metal carbonate minerals; a critical assessment of surface charge and potential data using
the charge distribution multi-site ion complexation model. American journal of science,
308(8), 905-941. doi: 10.2475/08.2008.02
[240] Foxall, T., Peterson, G. C., Rendall, H. M., and Smith, A. L. (1979). Charge determination
at calcium salt/aqueous solution interface. Journal of the Chemical Society, Faraday
Transactions 1: Physical Chemistry in Condensed Phases, 75, 1034-1039. doi:
10.1039/F19797501034
[241] Smith, A. L. (1976). Electrokinetics of the oxide — solution interface. Journal of Colloid
and Interface Science, 55(3), 525-530. doi: 10.1016/0021-9797(76)90062-X
[242] Revil, A., Pezard, P. A., and Glover, P. W. J. (1999). Streaming potential in porous media:
1. Theory of the zeta potential. Journal of Geophysical Research: Solid Earth (1978–2012),
104(B9), 20021-20031. doi: 10.1029/1999JB900089
[243] Hirasaki, G. J. (1991). Wettability: fundamentals and surface forces. SPE Formation
Evaluation, 6(02), 217-226.
[244] Hirasaki, G., and Zhang, D. L. (2004). Surface chemistry of oil recovery from fractured,
oil-wet, carbonate formations. SPE Journal, 9(02), 151-162. doi: 10.2118/88365-PA
[245] Geissbühler, P., Fenter, P., DiMasi, E., Srajer, G., Sorensen, L. B., and Sturchio, N. C.
(2004). Three-dimensional structure of the calcite–water interface by surface X-ray
scattering. Surface Science, 573(2), 191-203.
217
[246] Tansel, B. (2012). Significance of thermodynamic and physical characteristics on
permeation of ions during membrane separation: Hydrated radius, hydration free energy
and viscous effects. Separation and purification technology, 86, 119-126.
[247] Gregory, J. (1981). Approximate expressions for retarded van der waals interaction.
Journal of Colloid and Interface Science, 83(1), 138-145. doi: 10.1016/0021-
9797(81)90018-7
[248] Bergström, L. (1997). Hamaker constants of inorganic materials. Advances in colloid and
interface science, 70, 125-169. doi: 10.1016/S0001-8686(97)00003-1
[249] Malmberg, C. G., and Maryott, A. A. (1956). Dielectric Constant of Water from 0 to 100 oC. Journal of research of the National Bureau of Standards, 56(1), 1-8.
[250] Gregory, J. (1975). Interaction of unequal double layers at constant charge. Journal of
Colloid and Interface Science, 51(1), 44-51. doi: 10.1016/0021-9797(75)90081-8
[251] Buckley, J. S., Takamura, K., and Morrow, N. R. (1989). Influence of electrical surface
charges on the wetting properties of crude oils. SPE Reservoir Eval. Eng., 4(03), 332-340.
doi: 10.2118/16964-pa
[252] Nghiem, L., Sammon, P., Grabenstetter, J., and Ohkuma, H. (2004). Modeling CO2 storage
in aquifers with a fully-coupled geochemical EOS compositional simulator. In Proceedings
of the SPE/DOE symposium on improved oil recovery, Tulsa, Oklahoma, 17-21 April.
[253] Nghiem, L. X., Shrivastava, V. K., and Kohse, B. F. (2011). Modeling aqueous phase
behavior and chemical reactions in compositional simulation. In Proceedings of the SPE
Reservoir Simulation Symposium, The Woodlands, Texas, USA, 21–23 February.
[254] Bethke, C. (1996). Geochemical reaction modeling: Concepts and applications. Oxford
University Press Inc.: New York.
[255] Kharaka, Y. K., Gunter, W. D., Aggarwal, P. K., Perkins, E. H., and DeBraal, J. D. (1988).
SOLMINEQ. 88: A computer program for geochemical modeling of water-rock
interactions US Geological Survey Water-Resources Investigations Report (Vol. 88-4227,
pp. 420). Menlo Park, California.
[256] Delany, J. M., and Lundeen, S. R. (1990). The LLNL thermochemical database. Lawrence
Livermore National Laboratory Report UCRL-21658. Lawrence Livermore National
Laboratory.
[257] Helgeson, H. C., Brown, T. H., and Leeper, R. H. (1969). Handbook of theoretical activity
diagrams depicting chemical equilibria in geologic systems involving an aqueous phase at
one Atm and 0to 300C. Freeman Cooper & Co.
[258] Takamura, K., and Chow, R. S. (1983). A mechanism for initiation of bitumen
displacement from oil sand. Journal of Canadian Petroleum Technology, 22(06).
[259] Stipp, S. L., and Hochella, M. F. (1991). Structure and bonding environments at the calcite
surface as observed with X-ray photoelectron spectroscopy (XPS) and low energy electron
diffraction (LEED). Geochimica et Cosmochimica Acta, 55(6), 1723-1736.

218
[260] Pokrovsky, O. S., Mielczarski, J. A., Barres, O., and Schott, J. (2000). Surface speciation
models of calcite and dolomite/aqueous solution interfaces and their spectroscopic
evaluation. Langmuir, 16(6), 2677-2688.
[261] Pokrovsky, O. S., and Schott, J. (2002). Surface chemistry and dissolution kinetics of
divalent metal carbonates. Environmental science & technology, 36(3), 426-432.
[262] Van Cappellen, P., Charlet, L., Stumm, W., and Wersin, P. (1993). A surface complexation
model of the carbonate mineral-aqueous solution interface. Geochimica et Cosmochimica
Acta, 57(15), 3505-3518. doi: 10.1016/0016-7037(93)90135-j
[263] Pokrovsky, O. S., Schott, J., and Thomas, F. (1999). Dolomite surface speciation and
reactivity in aquatic systems. Geochimica et Cosmochimica Acta, 63(19), 3133-3143. doi:
10.1016/s0016-7037(99)00240-9
[264] Appelo, C. A. J., and Postma, D. (2005). Geochemistry, groundwater and pollution
(Second ed.). CRC press: Boca Raton, FL, USA.pp. 668.
[265] Hubbert, M. K. (1957). Darcy's law and the field equations of the flow of underground
fluids. Hydrological Sciences Journal, 2(1), 23-59. doi:
https://doi.org/10.1080/02626665709493062
[266] Behie, A., Collins, D., Forsyth Jr, P. A., and Sammon, P. H. (1985). Fully coupled
multiblock wells in oil simulation. SPE Journal, 25(04), 535-542. doi: 10.2118/11877-PA
[267] Nghiem, L. X., and Rozon, B. J. (1989). A Unified and Flexible Approach for Handling
and Solving Large Systems of Equations in Reservoir Simulation. In Proceedings of the
First and Second International Forum on Reservoir Simulation, Alpbach, Austria,
September 1988 and I989.
[268] Stumm, W., and Morgan, J. J. (2012). Aquatic chemistry: chemical equilibria and rates in
natural waters (3rd edition ed. Vol. 126). John Wiley & Sons: New York,.Vol. 126.
[269] Brooks, R. H., and Corey, A. T. (1966). Properties of porous media affecting fluid flow.
Journal of the Irrigation and Drainage Division, 92(2), 61-90.
[270] Skjaeveland, S. M., Siqveland, L. M., Kjosavik, A., Hammervold, W. L., and Virnovsky,
G. A. (2000). Capillary pressure correlation for mixed-wet reservoirs. SPE Reservoir Eval.
& Eng, 3(1), 60-67.
[271] Webb, K., Black, C., and Edmonds, I. (2005). Low salinity oil recovery-The role of
reservoir condition corefloods. In Proceedings of the 13th EAGE Symposium on Improved
Oil Recovery, Budapest, Hungary.
[272] Akbar, M., Vissapragada, B., Alghamdi, A. H., Allen, D., Herron, M., Carnegie, A., Dutta,
D., Olesen, J.-R., Chourasiya, R., and Logan, D. (2000). A snapshot of carbonate reservoir
evaluation. Oilfield Review, 12(4), 20-41.
[273] Anderson, W. (1987). Wettability literature survey part 5: The effects of wettability on
relative permeability. Journal of Petroleum Technology, 39(11), 1453-1468. doi:
10.2118/16323-PA
219
[274] Awolayo, A. N., Sarma, H. K., and Nghiem, L. X. (2017). A Comprehensive Geochemical-
Based Approach at Modeling and Interpreting Brine Dilution in Carbonate Reservoirs. In
Proceedings of the SPE Reservoir Simulation Conference, Montgomery, Texas, USA, 20-
22 February.
[275] Chandrasekhar, S. (2013). Wettability alteration with brine composition in high
temperature carbonate reservoirs. (Masters), The University of Texas at Austin, Austin.
Retrieved from http://hdl.handle.net/2152/22657
[276] Awolayo, A. N., Sarma, H., and Nghiem, L. (2017). A Comprehensive Geochemical-based
Approach at Modeling and Interpreting Brine Dilution in Carbonate Reservoirs. In
Proceedings of the SPE Reservoir Simulation Conference, Montgomery, TX, USA, 20-22
February.
[277] Awolayo, A., Ashqar, A., Uchida, M., Salahuddin, A. A., and Olayiwola, S. O. (2017). A
cohesive approach at estimating water saturation in a low-resistivity pay carbonate
reservoir and its validation. Journal of Petroleum Exploration and Production Technology,
7(3), 637-657. doi: 10.1007/s13202-017-0318-2
[278] Salahuddin, A. A., Al-Seiari, J. M., and Al-Hammadi, K. E. (2016). Hybrid Stochastic
Algorithms: A Novel Application in Modeling Facies Cycles and Properties of Carbonate
Platform, Onshore Abu Dhabi. In Proceedings of the Abu Dhabi International Petroleum
Exhibition & Conference, Abu Dhabi.
[279] Lee, J. H., Jeong, M. S., and Lee, K. S. (2017). Geochemical Modelling of Carbonated
Low Salinity Water Injection CLSWI to Improve Wettability Modification and Oil Swelling
in Carbonate Reservoir. Paper Volume presented at the SPE Latin America and Caribbean
Mature Fields Symposium, Salvador, Bahia, Brazil, 15-16 March.
https://doi.org/10.2118/184915-MS
[280] Sheng, J. J. (2013). Review of Surfactant Enhanced Oil Recovery in Carbonate Reservoirs.
Advances in Petroleum Exploration and Development, 6(1), 1-10.
[281] Skauge, A., and Sorbie, K. (2014). Status of Fluid Flow Mechanisms for Miscible and
Immiscible WAG. In Proceedings of the SPE EOR Conference at Oil and Gas West Asia,
Muscat, Oman.
[282] Christensen, J. R., Stenby, E. H., and Skauge, A. (2001). Review of WAG Field
Experience. SPE Reservoir Evaluation & Engineering, 4(02), 97 - 106. doi:
10.2118/71203-PA
[283] Verma, M. K. (2015). Fundamentals of Carbon Dioxide-enhanced Oil Recovery (CO2-
EOR): A Supporting Document of the Assessment Methodology for Hydrocarbon Recovery
Using CO2-EOR Associated with Carbon Sequestration. US Department of the Interior,
US Geological Survey.
[284] Stalkup, F. I. (1983). Status of miscible displacement. Journal of Petroleum Technology,
35(04), 815-826.

220
[285] Christensen, J. R., Stenby, E. H., and Skauge, A. (1998). Review of WAG field experience.
In Proceedings of the International Petroleum Conference and Exhibition of Mexico,
Villahermosa, Mexico, 3-5 March.
[286] Stalkup, F. I. (1987). Displacement behavior of the condensing/vaporizing gas drive
process. In Proceedings of the SPE Annual Technical Conference and Exhibition, Dallas,
Texas, 27-30 September.
[287] Li, Y. K., and Nghiem, L. X. (1986). Phase equilibria of oil, gas and water/brine mixtures
from a cubic equation of state and Henry's law. The Canadian Journal of Chemical
Engineering, 64(3), 486-496.
[288] Zhang, Y., and Sarma, H. K. (2013). Modelling of Possible Impact of Reservoir Brine
Salinity During CO2 Injection. In Proceedings of the SPE Enhanced Oil Recovery
Conference, Kuala Lumpur, Malaysia.
[289] Qiao, C., Li, L., Johns, R. T., and Xu, J. (2016). Compositional modeling of dissolution-
induced injectivity alteration during CO2 flooding in carbonate reservoirs. SPE journal,
21(03), 809-826. doi: https://doi.org/10.2118/170930-PA

221
Curriculum Vitae
Awolayo, Adedapo Noah
Dapo is a versatile and results-driven engineer/scientist with years of experience in oil and gas industry and research.
He has continued to demonstrate success in using applied research and analytical skills to provide solutions to complex
engineering problems as shown through independent innovation and multidisciplinary collaborations. He possesses
excellent communication skills with proven ability to succinctly articulate technical issues and recommendations to
relevant disciplines, through presentations, technical reports and published articles in recognized journals.
EDUCATION
Doctor of Philosophy (Ph.D.) Candidate in Petroleum Engineering Sept. 2015 – Dec. 2018
University of Calgary, Calgary, Canada
Master of Science (M.Sc.) in Petroleum Engineering Sept. 2012 – May 2014
Petroleum Institute, Abu Dhabi, U.A.E.
Bachelor of Technology (B.Tech.) in Chemical Engineering Sept. 2005 – Dec. 2010
Ladoke Akintola University of Technology (LAUTECH), Nigeria
INDUSTRIAL & RESEARCH EXPERIENCE
Doctoral Research Scientist (Subsurface Tools Development) Sept. 2015 – Dec. 2018
University of Calgary with Computer Modelling Group Ltd. (CMG), Calgary, Canada
Reservoir Engineer (Reservoir Strategy and Onshore Operations Team) July 2014 – Sept. 2015
Abu Dhabi Company for Onshore Operations Petroleum Ltd. (ADCO), Abu Dhabi, U.A.E.
Research Assistant (Subsurface Tools Development) Aug. 2012 – July 2014
Petroleum Institute, Abu Dhabi, U.A.E.
Facility Quality Control Chemist (Internship) Apr. 2009 – Sep. 2009
Total Nigeria Plc. Lagos, Nigeria
TEACHING EXPERIENCE
Laboratory Instructor & Teaching Assistant Jan. 2016 – Dec. 2017
University of Calgary, Calgary, Canada
Teaching Assistant Aug. 2013 – May 2014
Petroleum Institute, Abu Dhabi, U.A.E.
HONORS AND AWARDS
Vanier Canada Graduate Scholarship - Most prestigious national Ph.D. scholarship in Canada May 2017, 2018
Killam Doctoral Memorial Scholarship, Killam Trusts through University of Calgary May 2017, 2018
1st Place Winner, SPE Canada Regional Student’s Paper Contest (Ph.D. division) Mar. 2017
Graduate Excellence Award, Chem. and Pet. Engineering Department, University of Calgary Mar. 2016
222
Dean’s Entrance Scholarship, Faculty of Graduate Studies, University of Calgary Jan. 2016
Eyes High International Recruitment Scholarship, Faculty of Graduate Studies, University of Calgary Sept. 2015
SELECTED PUBLICATION
Awolayo, A.N., Sarma, H.K., and Nghiem L.X. Modeling the Characteristic Interplay between Potential Determining
Ions during Brine-Dependent Recovery Process in Carbonate Rocks. Fuel, 224: 701 - 717, (2018).
DOI:10.1016/j.fuel.2018.03.070
Awolayo, A.N., Sarma, H.K., and Nghiem L.X. Thermodynamic Modeling of Brine Dilution-Dependent Recovery in
Carbonate Rocks with Different Mineralogical Content. Energy & Fuels Journal, 32(9): 8921 – 8943, (2018).
DOI:10.1021/acs.energyfuels.8b01080.
Awolayo, A.N., Sarma, H.K., and Nghiem L.X. "Brine-Dependent Recovery Processes in Carbonate and Sandstone
Petroleum Reservoirs: Review of Laboratory-Field Studies, Interfacial Mechanisms and Modeling Attempts." Energies
Journal, 11(11): 3020, (2018). DOI:10.3390/en11113020
Awolayo, A.N., Sarma, H.K. and Nghiem L.X. Numerical Modeling of Fluid-Rock Interactions during Low-salinity-
brine-CO2 Flooding in Carbonate Reservoirs. In: Proceedings of the 2019 SPE Reservoir Simulation Conference, April
10 - 11, 2019. SPE Paper #193815
Awolayo, A.N., Sarma, H.K., Nghiem L.X. and Emre, G.A. Geochemical Model for Investigation of Wettability Alteration
during Brine-Dependent Flooding in Carbonate Reservoirs. In: Proceedings of the 2017 Abu Dhabi International
Petroleum Exhibition & Conference (ADIPEC 2017), November 13 - 16, 2017. DOI: 10.2118/188219-MS
Awolayo, A.N. Geochemical Modeling of the Interplay between Potential Determining Ions during Brine-Dependent
Recovery in Carbonate Rocks. In: Proceedings of the 2017 SPE Annual Technical Conference and Exhibition (SPE ATCE
2017), October 9 - 11, 2017. DOI: 10.2118/189280-STU
Awolayo, A.N., Sarma, H.K. and Nghiem L.X. A Comprehensive Geochemical-based Approach at Modeling and
Interpreting Brine Dilution in Carbonate Reservoirs. In: Proceedings of the 2017 SPE Reservoir Simulation Conference,
February 20 - 22, 2017. DOI: 10.2118/182626-MS
Awolayo, A.N., Sarma, H.K., and Nghiem L.X. Mechanistic Modeling of Hybrid Low-Salinity-Brine-CO2 Injection in
Carbonate Reservoirs. In: Global Petroleum Show - North America’s Leading Exhibition & Conference, Calgary,
Canada, June 12 - 14, 2018.
Awolayo, A.N. Geochemical modeling of brine dilution-dependent recovery in Carbonate Reservoirs. In: SPE Canada
2017 Regional Student Paper Contest, Vancouver, Canada, Feb. 25, 2017. First Place for Best Paper at PhD Category
Awolayo, A.N. and Sarma, H.K. An Analytical Solution to Interpret Active Ion Transport during Chemically-Tuned
Waterflooding Process in High-Temperature Carbonate Rocks. The Canadian Journal of Chemical Engineering, (2018).
DOI:10.1002/cjce.23183
Awolayo, A.N., Sarma, H.K., and AlSumaiti, A.M. An Experimental Investigation into the Impact of Sulfate ion in Smart
Water to Improve Oil Recovery in Carbonate Reservoirs. Transport in Porous Media, 111(3) : 649 - 668, (2015).
DOI:10.1007/s11242-015-0616-4
Copyright © 2022 FDOKUMEN