Permanent joints (Assemblages permanents ) _Course - ISET ...
Upload
khangminh22Category
view
3download
0
REVIEW
Non-linear shear strength for rock, rock joints, rockfilland interfaces
Nick Barton1
Received: 10 May 2016 / Accepted: 12 May 2016 / Published online: 17 August 2016
� Springer International Publishing Switzerland 2016. This article is published with open access at Springerlink.com
Abstract Although intact rock is frequently represented by
linear Mohr–Coulomb shear strength envelopes, the actual
true behaviour, if taken over a wide range of confining stress,
is extremely non-linear. Why is this important? Probably
because the real stress across points of contact in both rockfill
and rock joints is approaching (or trying to exceed) the
crushing strength, and if local confined stresses are equally
high, strong non-linearity will be experienced. If we utilize
the unconfined compression strength of the rockfill, or of the
rock joint surfaces, suitably scaled-down due to size effects,
we are part way towards a useful strength criterion. In fact, as
we will see, we are ‘‘one-third’’ of the way, as the roughness
(of particles and asperities) and a measure of the non-dilatant
(residual) frictional strengths are also needed for what we
will see are two very closely related strength criteria.
Keywords Joints � Rockfill � Interfaces � Shear strength �Asperities � Dilation
Quotation
Terzaghi (1920) quoted by Marsal [18]
The fundamental error was introduced by Coulomb,
who purposely ignored the fact that sand consists of
individual grains, and who dealt with the sand as if it
were a homogeneous mass with certain mechanical
properties. Coulomb’s idea … developed into an
obstacle against further progress as soon as its
hypothetical character came to be forgotten by Cou-
lomb’s successors.
The response in 2016
The ‘Coulomb error’ is still present in rock
mechanics. In fact most rock-related strength envel-
opes are non-linear, the exception being planar rock
joints. Even rough-surfaced rock joints have no
cohesion unless with actual steps preventing shear-
ing. If a rock mass has a cohesive component due to
intact ‘bridges’ (or such steps) it is not correct to add
the cohesive and frictional components: they are
mobilized at successively larger shear strain or dis-
placement. Rock masses are also ‘particulate’ media,
with blocks instead of sand grains or gravel or stones.
Use of linear Mohr–Coulomb is a tragic error per-
vading structural geology, petroleum engineering and
a lot of rock mechanics. It gives many misleading
results in relation to reality, including an exaggera-
tion of petroleum reservoir production potential in the
weaker rock types.
Dedication
Thirty-five years ago, while preparing a paper sum-
marizing some work on the shear strength of rockfill
[13], the writer came across some of the work by the
person we are now honouring. With degrees from
MIT and Harvard and lectures from Terzaghi and
Casagrande, and more importantly a distinguished
career in famous institutes in Mexico City, it is very
clear that Raul Marsal was a person whose work had
a high status in the world of rockfill and embankment
dam engineering.
One of his landmark papers was the following:
Marsal, R.J. ‘Mechanical Properties of Rockfill’,
Embankment-Dam Engineering, Casagrande Vol-
ume, R.C. Hirshfeld and S.J. Poulos, eds., John Wiley
& Nick Barton
1 Nick Barton and Associates, Oslo, Norway
123
Innov. Infrastruct. Solut. (2016) 1:30
DOI 10.1007/s41062-016-0011-1

and Sons, Inc., New York, N.Y., 1973, pp. 109–200.
Note the large number of pages: this was a major
chapter by Dr. Marsal, honouring Casagrande. I quote
from part of his abstract:
The analysis and measurement are described of par-
ticle breakage, which is a function of the contact
forces and the crushing strength of the particles. The
devices developed to investigate the shear strength
and stress–strain characteristics of rockfills and the
techniques for preparation of specimens are descri-
bed, as well as the measurement of shear strength of
rockfill in the triaxial and plane-strain apparatus
(Fig. 1).
Introduction
Although intact rock is frequently represented by linear
Mohr–Coulomb shear strength envelopes, the actual true
behaviour, if taken over a wide range of confining stress, is
extremely non-linear. Why is this important? Probably
because the real stress across points of contact in both
rockfill and rock joints is approaching (or trying to exceed)
the crushing strength, and if locally confined stresses are
equally high, strong non-linearity will be experienced. If
we utilize the unconfined compression strength of the
rockfill, or of the rock joint surfaces, suitably scaled-down
due to size effects, we are part way towards a useful
strength criterion. In fact, as we will see, we are ‘one-third’
of the way, as the roughness (of particles and asperities)
and a measure of the non-dilatant (residual) frictional
strengths are also needed for what we will see are two very
closely related strength criteria.
Figure 2 is a representation of the complete shear
strength envelope for intact rock, as suggested by Barton
[5] following a wide review of other researchers’ high-
pressure triaxial data for intact rock, in particular the well-
known and numerous studies of Byerlee and Mogi from the
1960s. Both these researchers were concerned with the
brittle–ductile transition. The present author suggested a
simple ‘definition’ of the top (horizontal) part of the
strength envelopes—in rock mechanics terminology called
the ‘critical state’. The complete shear strength envelopes
of rock, and how much they deviate from linear Mohr–
Coulomb have recently been quantified in a new criterion
which may become known as the Singh–Singh criterion
[21].
The horizontal part of the shear strength envelopes for a
large group of silicate and carbonaceous rocks, suggested
the following simple relation:
r1 max ¼ 3 r3 critical: ð1Þ
Fig. 1 The significantly non-linear shear strength of various rockfills,
as interpreted by Marsal [18]. These simple curves were immediately
a source of inspiration to the writer, because they looked just like the
shear strength of rock joints [4]. There are several reasons why this is
so, and these will be detailed in this paper. It obviously has to do with
the highly stressed points of contact in both cases
Fig. 2 When tested over a wide range of confining stress, the non-
linearity of the shear strength envelopes for rock is very marked. Note
the closeness of Mohr circles #2 and #4 [5]
30 Page 2 of 19 Innov. Infrastruct. Solut. (2016) 1:30
123

It will be noted that the uniaxial (unconfined) circle (#2)
and the critical confining pressure circle (#4) are drawn as
nearly tangent to one another. This potential simplicity has
recently been confirmed by Singh et al. [21], who found
that the majority of rocks exhibited this tendency, i.e.
r3critical � rc. This actually implies that if we reach a
confining pressure (over the small area/volume in contact)
approximately equal to UCS or rc, a local critical state may
potentially be reached if (less confined) crushing has not
already occurred. The maximum local rock strength will
likely have been exceeded, both for the case of rock joint
asperities and the contacting areas/volumes of rockfill
particles/stones.
In Fig. 3, we see the near ‘super-position’ of two
envelopes (rock joints and rockfill). It should be noted
that the top three envelopes, together with the fifth
(lowest) envelope, symbolize the four components of the
shear strength of rock masses. For the last 50 years,
since the beginning of rock mechanics, this important
in situ strength has been assumed to consist of the
Mohr–Coulomb s ¼ cþ r0n tan u0 (or more recently as
the non-linear complex-algebra GSI-based Hoek–Brown
criterion). In reality, contrary to the M–C or H–B
assumptions, the shear strength of rock masses consists
of the degradation of the cohesion (the intact ‘bridges’)
followed at larger strain by the mobilization of friction
and roughness causing dilation. At still greater shear
‘strain’, any clay-filled discontinuities present may also
be mobilized. The failure is, therefore, a progression of
components mobilized at different levels of shear ‘strain’
(or displacement).
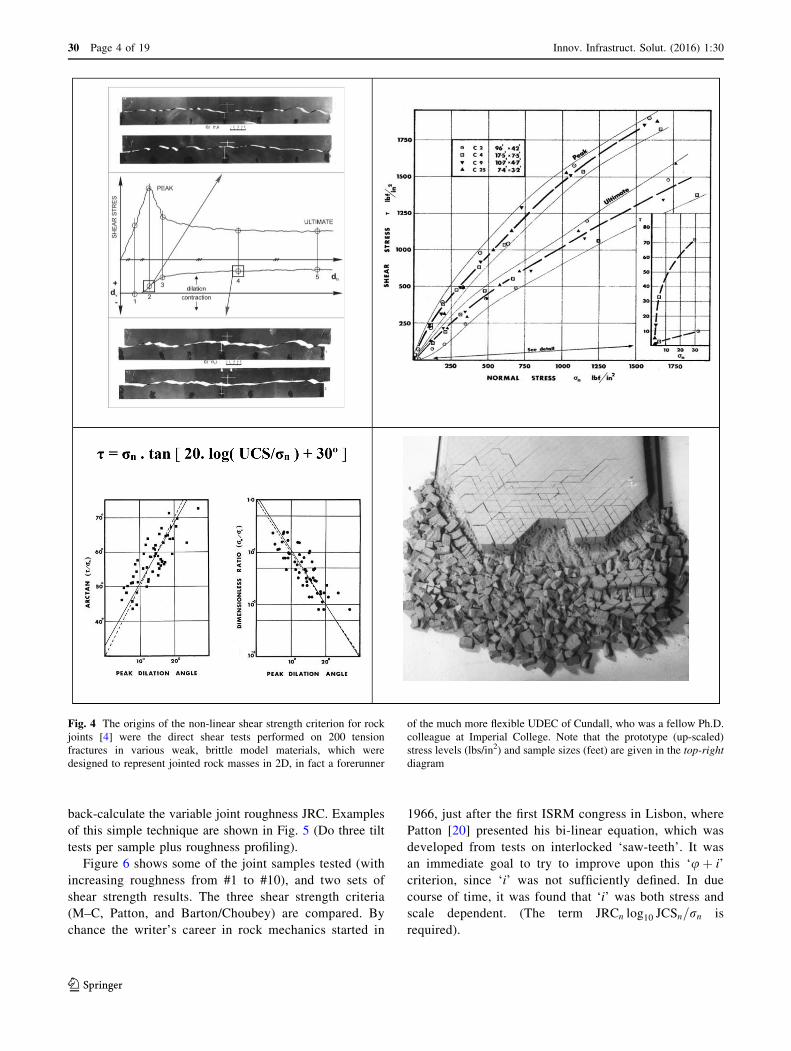
From tension fractures to rock joints
A promising start to an understanding of the shear strength
of rough rock surfaces with opposed asperities in contact
was experienced by the writer in about 1968, while devel-
oping a method to create ‘2D’ models of variously jointed
(fractured) rock masses. Figure 4 (top-left) shows shear-
displaced roughness profiles of brittle tension fractures
which have been sheared and dilated exactly as measured in
direct shear tests of the same (2D profiled) samples. Very
small areas of contact (and, therefore, high contact stresses)
are seen as a result of the pre-peak and post-peak shearing.
The direct shear tests produced strongly curved peak
strength envelopes, especially at very low normal stresses, as
shown in the top-right diagram. (Such results were the
forerunner of tilt tests developed 10 years later, illustrated in
Fig. 5). The two sets of experimental data with results
expressed as a function of peak dilation angles (bottom-left)
required a small rotation to the dotted lines, to produce the
forerunner of the Barton [4] non-linear peak strength crite-
rion. In 1968, ‘JRC’ was 20 (very rough tension fractures),
‘JCS’ was UCS (due to no weathering), and ub was 30�(also due to no weathering).
The terms JRC (joint roughness coefficient) and JCS
(joint-wall compression strength) were first used in Barton
[4]. In subsequent experimental work with fresh and partly
weathered rock joints (130 samples), acquired from road
cuttings in the Oslo area, Barton and Choubey [12] showed
that ub should be replaced by ur which could be several
degrees lower in cases with weathered joint surfaces. The
writer developed the tilt test at this time, as a formal way to
Fig. 3 The basic non-linearity
of rock, rock fractures, rock
joints, and rockfill. Note the
deliberate ‘super-position’ of
the strength envelopes for the
rock joints and rockfill [11]
Innov. Infrastruct. Solut. (2016) 1:30 Page 3 of 19 30
123
back-calculate the variable joint roughness JRC. Examples
of this simple technique are shown in Fig. 5 (Do three tilt
tests per sample plus roughness profiling).
Figure 6 shows some of the joint samples tested (with
increasing roughness from #1 to #10), and two sets of
shear strength results. The three shear strength criteria
(M–C, Patton, and Barton/Choubey) are compared. By
chance the writer’s career in rock mechanics started in
1966, just after the first ISRM congress in Lisbon, where
Patton [20] presented his bi-linear equation, which was
developed from tests on interlocked ‘saw-teeth’. It was
an immediate goal to try to improve upon this ‘uþ i’
criterion, since ‘i’ was not sufficiently defined. In due
course of time, it was found that ‘i’ was both stress and
scale dependent. (The term JRCn log10 JCSn=rn is
required).
Fig. 4 The origins of the non-linear shear strength criterion for rock
joints [4] were the direct shear tests performed on 200 tension
fractures in various weak, brittle model materials, which were
designed to represent jointed rock masses in 2D, in fact a forerunner
of the much more flexible UDEC of Cundall, who was a fellow Ph.D.
colleague at Imperial College. Note that the prototype (up-scaled)
stress levels (lbs/in2) and sample sizes (feet) are given in the top-right
diagram
30 Page 4 of 19 Innov. Infrastruct. Solut. (2016) 1:30
123
Scale effects for rock joints
A ‘final’ stage concerning the writer’s non-linear shear
strength criterion was the correction of the input parame-
ters JRC and JCS for scale. As we shall see later, a similar
scale correction was also necessary for rockfill. The
impetus for scale corrections was the result of a milestone
series of direct shear tests on joint replicas of different size.
By happy coincidence, Bandis started his Ph.D. studies just
after the work of Barton and Choubey [12], and made
active use of JRC and JCS to record strong scale effects.
Figures 7b and 8 summarize what Bandis found. As may
be noted from Fig. 7a, performing tilt tests on jointed
blocks is also a scale-dependent process.
The various stages of development of the shear strength
criterion for rock joints, starting with artificial tension
fractures, and ending with weathering and scale corrections
are listed below. As we shall see, the proposed empirical
equation for the shear strength of rock fill and for rockfill/
rock-foundation interfaces have their origin in the highly
stressed asperities shown in Fig. 4a.
s ¼ r0n tan ½20 log10ðUCS=r0nÞ þ 30�� Barton ½3�ð Þ ð2Þ
s ¼ r0n tan ½JRC log10ðJCS=r0nÞ þ ub� Barton ½4�ð Þ ð3Þ
s ¼ r0n tan ½JRC log10ðJCS=r0nÞþ ur� Barton and Choubey ½12�ð Þ ð4Þ
s ¼ r0n tan JRCn log10 JCSn=r0n
� �þ ur
� �Bandis et al. ½2�ð Þ
ð5Þ
The collection of simple index tests for obtaining
input data for fractures or joints, using tests on core or
on samples sawn or drilled from outcrops is shown in
Fig. 10. In the left-hand column, direct shear tests are
also illustrated, which can be used to verify the results
from the empirically developed index tests. Note that the
Schmidt hammer should be used on clamped pieces of
core to estimate the uniaxial compression strength UCS
or rc. This is done on dry pieces of core (rebound R, use
top 50 % of results). For the joint-wall strength JCS, this
is done on saturated samples (rebound r, use top 50 % of
results). These samples also need to be clamped (e.g. to
a heavy metal base). Three methods of joint-wall or
fracture-wall roughness (JRC) can be used: tilt tests to
measure tilt angle a (i.e. Fig. 5), or a/L (amplitude/
length) measurement, or roughness profile matching; the
latter obviously more subjective.
From rock joints to rockfill
As indicated in the Dedication to this article, the non-
linear shear strength envelopes for rockfills (see Fig. 1)
presented by Marsal [18] made a strong impression when
these were first seen by the writer in about 1979. Non-
linear strength envelopes were also the dominant theme
for rock joints, in the author’s work since about 1967:
first with artificial tension fractures (in brittle model
materials) then with rock joints, with the latter
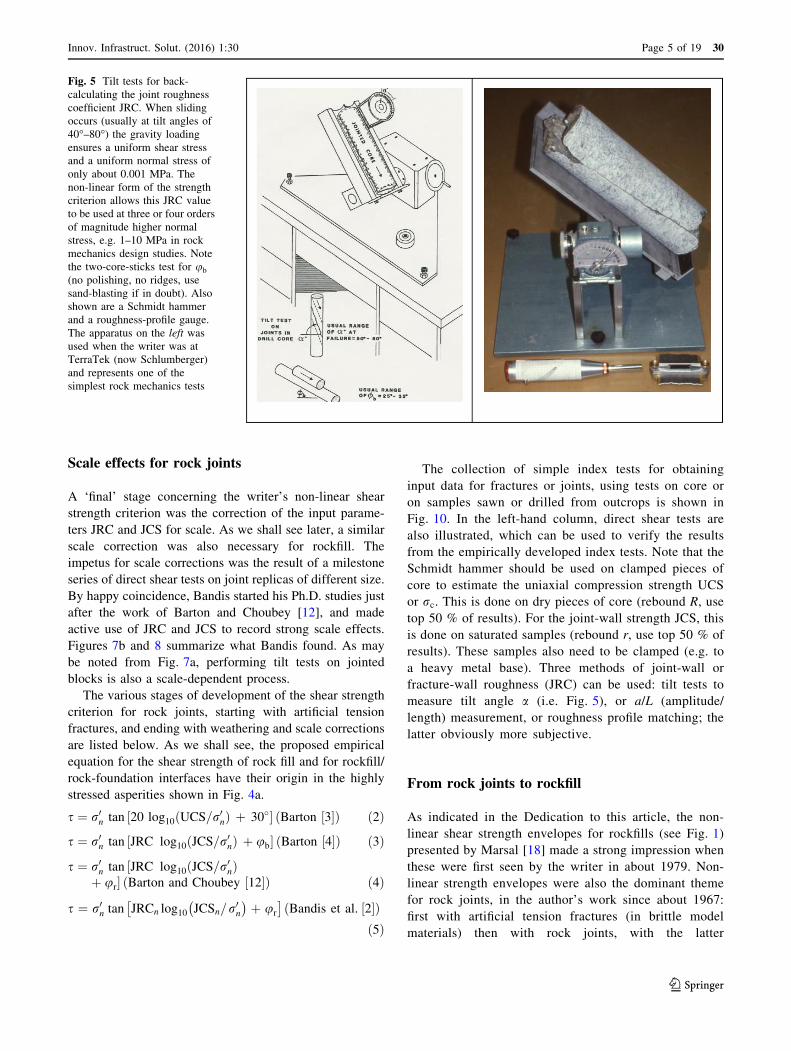
Fig. 5 Tilt tests for back-
calculating the joint roughness
coefficient JRC. When sliding
occurs (usually at tilt angles of
40�–80�) the gravity loading
ensures a uniform shear stress
and a uniform normal stress of
only about 0.001 MPa. The
non-linear form of the strength
criterion allows this JRC value
to be used at three or four orders
of magnitude higher normal
stress, e.g. 1–10 MPa in rock
mechanics design studies. Note
the two-core-sticks test for ub
(no polishing, no ridges, use
sand-blasting if in doubt). Also
shown are a Schmidt hammer
and a roughness-profile gauge.
The apparatus on the left was
used when the writer was at
TerraTek (now Schlumberger)
and represents one of the
simplest rock mechanics tests
Innov. Infrastruct. Solut. (2016) 1:30 Page 5 of 19 30
123

contributions starting in Barton [4]. In fact, it is inter-
esting to reproduce one of the early diagrams when JRC
and JCS were first suggested, since six of the curved
envelopes (Fig. 12) contain within their range,
something similar to the shear strength of rockfill. It
seems that non-linearity was a common but independent
pre-occupation in Mexico (for rockfill) and in Norway
(for rock joints) in the early 1970s (Fig. 11).
Fig. 6 A brief summary of Barton and Choubey [12]. Examples of
the 130 joint samples are shown top-left. (However, sample #10 was
one of six artificial tension fractures). Top-right shows peak friction
angles measured in DST compared with the prediction based on
gravity-loaded tilt tests and push tests. Good correlation is shown in
general, over a wide range of peak shear strengths. The results are
also plotted as s versus rn (bottom-right), and three strength
envelopes are drawn (dashed-lines) using maximum strength
(JRC = 16.9), mean values of JRC, JCS and ur), and minimum
values. The non-linear criterion (#3) is compared with Mohr–
Coulomb and with Patton [20] (bottom-left). Note that rock joints
do not have cohesion unless steep steps are sheared through. But peak
total friction angles (including friction, dilation and the asperity
strength component) can be very high at low normal stress
30 Page 6 of 19 Innov. Infrastruct. Solut. (2016) 1:30
123

Figure 12 shows that there are strong similarities
between the shear strength of rockfill and that of rock
joints. This is because they both have ‘points in contact’,
i.e. highly stressed contacting asperities or opposing stones.
In fact, these contacting points may be close to their
crushing strength, such that similar shear strength
Fig. 7 Left tilt tests performed on a joint in granite by Barton and
Choubey [12]. Right direct shear tests of joint replicas by Bandis [1]
performed during his Ph.D. studies, published in Bandis et al. [2].
Each of the above indicates that block size-dependent scale correc-
tions are needed for JRC
Fig. 8 Two of the key angular components of the shear strength of
rock joints (SA = asperity failure component, and dn = peak dilation
angle) were shown by Bandis et al. [2] to be scale dependent. The
parameters JRC and JCS are involved in both these parameters. This
figure illustrates why it is not correct to subtract the dilation angle to
obtain a ‘basic friction angle’, as proposed many times by Hencher,
because peak strength includes an asperity strength component. This
error can amount to 10� as Hencher proposes ‘basic friction angles’ as
high as 40� for rock slope design, on to which roughness is added.
The problem is these so-called ‘basic friction angles’ are (uninten-
tionally) scale dependent, as clearly shown in this figure from Bandis.
Scaling rules for JRC and JCS to obtain JRCn and JCSn are shown in
Fig. 9. They were published in Bandis et al. [2]
Innov. Infrastruct. Solut. (2016) 1:30 Page 7 of 19 30
123

Fig. 10 The index tests required to characterize rock joints, also used to obtain input for shear strength. The tests were introduced by Barton and
Choubey [12] and Barton [7] proposed the a/L method for JRC. The present format of tests was presented in Barton [10]
Fig. 11 Empirically derived index properties for rock joints (JRC and JCS) from Barton [4] are the source of the equivalent parameters (R and
S) for rockfill, used by Barton and Kjærnsli [13]
Fig. 9 An empirical-based method to correct JRC and JCS for the effect of block size. Note that L0 is the nominal lab-scale value, while Ln is the
spacing of cross-joints defining the block size in question
30 Page 8 of 19 Innov. Infrastruct. Solut. (2016) 1:30
123

Fig. 12 Top-left part of the suggested method to estimate the peak
shear strength envelopes for rock joints of different roughness, from
Barton [4]. Bottom-left the addition of estimated peak dilation angles
is shown, for three strength envelopes, from Barton [9]. Envelopes #2
and #3 also resemble the rockfill strengths: Right the complete set of
Mohr envelopes for various granular materials given at the end of the
Marsal [18] ‘Casagrande’ book chapter
Innov. Infrastruct. Solut. (2016) 1:30 Page 9 of 19 30
123

equations to those used for rock joints can apply to rockfill,
and indeed to rockfill/rock interfaces. This can be seen in
the progression of equations.
The three equations to be utilized in the remainder of
this paper have the shear strength of rock joints as a starting
point. The first equation listed was Eq. 4:
1. s=rn¼ tan½JRC:logðJCS=rnÞþur�... for rock joints
2. s=rn ¼ tan½R: log ðS=rnÞ þ ub�. . .for rockfill ð6Þ3. s=rn ¼ tan½JRC: log ðS=rnÞ þ ur� . . . for interfaces
ðsee later): ð7Þ
The equation to be used for a rockfill/rock-foundation
interface will depend on whether there is ‘JRC’ control, or
‘R’ control. This distinction: preferential sliding on the
interface or shearing within the rockfill is described and
illustrated later.
Concerning the potentially very high friction angles at
low stress levels, or close to the surface of a rockfill dam
embankment (e.g. Fig. 13), Marsal [18] makes mention of
a basalt rockfill having u0 of up to 70� under a normal
effective stress of only 0.1 MPa. Although the ‘asperity
strength’ component (Fig. 8) is uncertain for rockfill, if it
were of similar magnitude to the peak dilation angle (dn -
peak), as in the case of rock joints, then the latter could be in
the region of 20� at similarly low stress, compatible with
the low stress predictions of peak dilation given in Fig. 12
(bottom-left) and in Table 1. Marsal [18] considered that
within a rockfill dam, the friction angle of the materials
within the range of confining stresses of interest was usu-
ally less than the 40�–45� previously assumed, due to the
effect of the confining pressure and the non-linearity. This
will be explored further.
The non-linearity implied by the rockfill data assembled
by Leps [16] shown in the left diagram of Fig. 15 is pro-
vided by the linear-phi and log-stress format, which is
exactly consistent with the experiences of the shear
strength of rock joints shown in the diagram on the right
side of Fig. 15. Note the direct ‘substitution’ of R for JRC
and S for JCS, to demonstrate similarity to the data for
rockfill. A similar gradient to that drawn by Leps (the
middle-of-the-data line) seems to be provided by R = 7.5
and S = 45 MPa.
Large-scale vacuum triaxial cylinders as seen in Fig. 16
have a limit of confinement of \100 kPa. Somewhat
smaller but higher pressure triaxial cells, as also used by
Marsal [18], and by many others during several decades,
were also used in these studies, to reach the higher con-
fining pressures. Of particular note, besides the non-linear
stress-dependent friction angles, is the steepness of their
decline with increasing stress.
Simple inspection of one order of magnitude stress
change, from 0.16 to 1.6 MPa, bringing u0 from 51� down
to almost 39� suggests an equivalent R value as much as
10.5, even steeper (rougher) than the highlighted data
Assuming the source of confining stress is primarily theresult of vertical stress increase with depth, these two models for respectively loose and well-compacted rockfill show friction angles below 45° at depths greater than about 30m. Note the assumed input data for these two demonstrations of the variation of friction angle with depth. The link between the porosity and the estimate of equivalent particle roughness R (the rockfill equivalent of JRC) is explained in Figure 14, and an alternative way of estimating R is shown in Figure 15.
Fig. 13 Two estimates of the stress dependence of friction angles for prospective loose and dense rockfill, using (vertical) depth within a dam
slope as a simplified model of confining stress increase
Table 1 The complete set of estimated peak dilation angles, for the
three envelopes in Fig. 12 (bottom-left). Note the extremely high
values of dn peak predicted when stress levels are low. This resembles
rockfill
Curve no. Effective normal stress (MPa)
0.1 0.5 1.0 2.0 4.0 6.0 8.0 10.0
1 24.7 19.5 17.2 15.0 12.7 11.4 10.5 9.7
2 15.0 11.5 10.0 8.5 7.0 6.1 5.5 5.0
3 6.0 4.2 3.5 2.7 2.0 1.5 1.2 1.0
30 Page 10 of 19 Innov. Infrastruct. Solut. (2016) 1:30
123

shown in Fig. 15. [If smaller particle gradings had been
used at the higher stresses, the decline would be much
reduced due to higher S values (see Fig. 17)]. Note from
Fig. 14 that if quarried rock could be so well graded
(thereby filling its voids) and so well compacted that a
porosity of 20 % was reached, then an R value as high as
10 can be predicted (close to the ‘Q’ of quarried rock in
Fig. 14). Beneath 500 m of cover all is possible.
The necessity to have a scale-effect adjustment for the
uniaxial compressive strength of rockfill, following
approximately the trend obtained in rock mechanics studies
is clear. For simplicity and consistent reference, the
strength of the d50 size is recommended. In the case of the
UCS of rock, the following equation suggests itself, based
on an averaging of Hoek and Brown and Wagner versions
with their slightly diverging exponents of 0.18 and 0.22:
rc ¼ rc50 50=d50ð Þ0:2. The term rc50 is the standard (50 mm
diameter) size of UCS specimens. The diameter d50 is the
stone size. The way that R (or JRC) causes a change of R�(or JRC�) (i.e. change of angular degrees) per decade
change of effective stress or equivalent overburden depth is
demonstrated in Table 2. It seems logical to assume that
20, and JRC (and JRCn) seen earlier in Eqs. 1 through 6
actually have units of degrees, as in the case of Patton’s ‘i’
Fig. 14 A simple empirical model from Barton and Kjærnsli [13] for
obtaining a preliminary estimate of equivalent roughness R for
rockfill materials of different origin, roundedness and porosity. The
workings of R (and S) as equivalent rock joint parameters JRC (and
JCS) are demonstrated in parallel to the rockfill data assembled by
Leps [16], in Fig. 15
Fig. 15 Left assembly of peak shear strength data for rockfills, from
Leps [16]. The logarithmic scale of effective normal stress is further
confirmation of the similarity of rockfill and rock joints. Right
comparative JRC or R, and JCS or S values used to generate similar
gradients to [16] data for rockfill. R = 5–10, and S = 10–100 MPa
appear to cover the range of strengths assembled by Leps
Innov. Infrastruct. Solut. (2016) 1:30 Page 11 of 19 30
123

Fig. 16 In Chile, there are plans for mine-operations rock dumps with
thicknesses far exceeding even the highest rockfill dams. A figure of
500 m has been seen. Consequently, some large-scale investigations
of rockfill have been performed, one of which by SRK is reproduced
with permission from Linero and Palma [17]. Note that Marsal [18]
obtained comparable ranges of u0max = 46�–53�, and u0
min = 34�–39�
from the lowest r03 of about 0.04 to 0.09 MPa up to the highest r03 of
about 2.4 to 2.5 MPa. There were some exceptions to this for the case
of tests on mixtures of schist and (partly weathered) granitic gneiss for
the Mica dam, with minimum values at the highest stress down to 28�,29� and 30�
Fig. 17 An empirically developed way to estimate the approximate
scale effect on particle strength (S), based on the d50 particle size.
Note the differentiation of triaxial test data and the more realistic in-
dam plane test data, which results in a few degrees higher frictional
strength, as demonstrated in Table 2
30 Page 12 of 19 Innov. Infrastruct. Solut. (2016) 1:30
123

value shown in Fig. 6 (bottom-left diagram). The log10
(strength/stress) adjustment factor determines how many
decades (or fractions of a decade) the change of stress
‘multiplier’ of R (and JRC) will be.
For example, a large-scale tilt test (as in Figs. 18,
19) with a normal stress at failure of about 0.01 MPa,
using a rockfill material having a scaled compressive
strength of 10 MPa for the d50 particle size, involves
Fig. 18 Barton and Kjærnsli [13] suggested that full-scale tests could
be made on rockfill, without needing to use parallel grading curves.
The sequence of diagrams and accompanying texts by the writer were
designed to be self-explanatory. Note that one ‘error’ discovered
some years later when performing such tests at a dam site in Italy at
2 9 2 9 5 m scale (Fig. 19) was that the ‘shear plane stiffener’
which is to be moved before the test was too wide: material was lost
from the outer parts of the shear plane during tilt testing, unless the
gap was reduced to some 10 cm
Table 2 In the same manner as
JRC for rock joints, a given
R value, such as 6 in this
example, causes the predicted
frictional strength to change by
6� for each decade change in
effective normal stress, when
using the proposed non-linear
shear strength criterion
r0n, in MPa (1) Equivalent overburden (2) /0 plane (3) /0 triaxial (4)
0.0001 5 mm 67� 65�0.001 50 mm 61� 59�0.01 500 mm 55� 53�0.1 5 m 49� 47�1.0 50 m 43� 41�10.0 500 m 37� 35�
Note 25.4 mm = 1 in; 1 MPa = 145 psi
(This table was presented by Barton and Kjærnsli [13]). An exactly equivalent table was presented by
Barton and Bandis [14] when presenting the effect of, e.g. 1000 times higher stress when progressing from
a small-scale tilt test on a rock joint (Fig. 5), in which r0n � 0:001 MPa at failure, to the much higher
stresses (&1 MPa) 40 m beneath a rock slope
Innov. Infrastruct. Solut. (2016) 1:30 Page 13 of 19 30
123

log10 (10/0.01) = 3 (9R) for the case of the tilt test,
while it will be log10 (10/1) = 1 (9R) inside the dam
at, e.g. 45 m depth. If we assumed R = 7, there would,
therefore, be a 14� lower friction angle inside the dam
than in the tilt test: for instance 48� in the tilt test,
reducing to 34� inside the dam where the confining
Fig. 19 Tilt testing of ‘as-built’ rockfill, as suggested in Barton and
Kjærnsli [13], with performance of ten tests at a rockfill dam in Italy.
The tilt-shear box measures 5 m 9 2 m 9 2 m. Three tests are
shown, using pairs of photographs. The top-left pair shows the
horizontal condition: a 10–15-cm gap is advised. The sheared ‘detail’
shows the displaced instrumentation (shear and dilation) in the post-
peak (ultimate) condition. Note the relative absence of non-parallel
shear (or ‘toppling’) due to uniform gravity loading
30 Page 14 of 19 Innov. Infrastruct. Solut. (2016) 1:30
123

stress is assumed to be 1 MPa, or 100 times higher than
in the tilt test.
Figure 18 shows the Barton and Kjærnsli [13] sugges-
tion for large-scale tests on dams under construction. By
chance, NGI staff had arranged for such tests in Italy, just
before the writer returned to NGI after 4 years in the USA
in 1984. Due to pressing new administrative duties, the
writer was not able to physically accompany the testing in
Italy. The sequence of photographs later shown to the
writer (some examples are given in Fig. 19) suggest that
the Italian contractor at the dam did not follow the rec-
ommendation of ‘standard compaction’ within the ‘next
lift’ of the dam, followed by ‘excavation’ of the tilt-shear
box. Possibly they found this to be too burdensome. So it
appears that other, probably less efficient methods may
have been used to compact the rockfill before tilt testing. A
bulldozer on a ramp is seen in one of the photographs. It
appears that the tilt angles were mostly in the range of 45�–50�.
A particular feature of these large-scale tests is that the
gravity loading provides a much more uniform loading
than the usual top-platten-and-end-loading in a standard
shear box. The relative absence of any tendency to rotate
when tilted is easy to see. [In the case of some very rough
rock joints, the top half of the tilt test sample needs to be
made slender (low H/L ratio) to prevent toppling (rotating)
instead of parallel sliding. There seems to be no such
problem with the 1/5 ratio seen in Fig. 19].
From rockfill to interfaces
Because some dam sites in glaciated mountainous coun-
tries like Norway, Switzerland, and Austria have insuffi-
cient foundation roughness to prevent preferential shearing
along the rockfill/rock-foundation interface, artificial
‘trenching’ is needed. Various scales of investigation of
interface strength have been published, and these were
synthesized by Barton [6]. The physical reality of a rock-
fill/rock interface is illustrated in Fig. 20, and potentially
correct input parameters for estimating the shear strength
are suggested.
Figure 21 illustrates two rockfill dams with moraine
cores, while they were under construction. Both appear to
be on relatively smooth rock foundations, in particular the
Norwegian example on the left. Here, it is uncertain if the
foundation is rough enough to prevent the interface from
being ‘the weakest link’.
Figure 22 illustrates examples of these two categories of
shearing, in which the ‘weakest link’ determines the mode
of sliding: whether the interface is smooth enough and the
particles big enough to prevent good interlock (JRC-con-
trolled), or the opposite R-controlled behaviour, with
preferential failure within the rockfill, due to good inter-
lock across the interface. Numerous cases reported in the
Fig. 20 The rockfill/rock-foundation interface problem includes the
likelihood of a lightly weathered surface (even in glaciated terrain), so
it is appropriate to suggest ur (implying ur \ub and r\R when
using a Schmidt hammer in Fig. 10). The choice of JRC (meaning the
interface is weakest) instead of R (meaning that the interface is
strongest) provides the test of whether shear failure may occur
preferentially through the rockfill (or not at all) because of a strongly
‘interlocked’ foundation
Fig. 21 Left The Svartevann dam in Norway appears to have limited
roughness in parts of its steep (U-shaped valley) glaciated rock-
foundation abutments. Right As will be demonstrated in Fig. 22, the
(discarded) boulders seen in the foreground of the Brazilian dam
(Camargo Correa photo) are obviously too large to interlock with the
relatively smooth rock foundation
Innov. Infrastruct. Solut. (2016) 1:30 Page 15 of 19 30
123

literature were analysed in unpublished research performed
by the author, and can be summarized by the data points
plotted in Fig. 22 (left). The a/L versus d50 ratios for the
Norwegian dam shown in Fig. 21 are not known. However,
JRC-controlled interface behaviour seems likely in places.
The (discarded) boulders in the foreground of the Brazilian
dam (right) would give JRC-controlled behaviour. They are
too big to interlock with the smooth rock surface.
Discussion
This paper has seen an attempt to link the shear strengths of
rockfill—with its many possible varieties, materials,
porosities, stress levels—to the shear strength of rock and
rock joints. Naturally, the key to such a linkage is the
highly stressed points of contacts. Of course, in 1967, when
the writer started experimenting with the shear strength of
rough tension fractures, in an attempt to improve upon
Mohr–Coulomb and Patton for describing rock joints, the
full significance of the asperities in contact as seen in
Fig. 4 (top-left) was not understood. Nevertheless, the first
shear strength criterion involving the ratio of material
compressive strength and effective normal stress was pro-
duced, and 10 years later, even for the case of weathered
joints, this ratio continued to be a central part of the
strength criterion, in the form JCS=rn. For rockfill, we have
found that S=rn, with both JCS and S corrected for block
size (Ln) or particle size (d50), has strong relevance to the
understanding of peak shear strength.
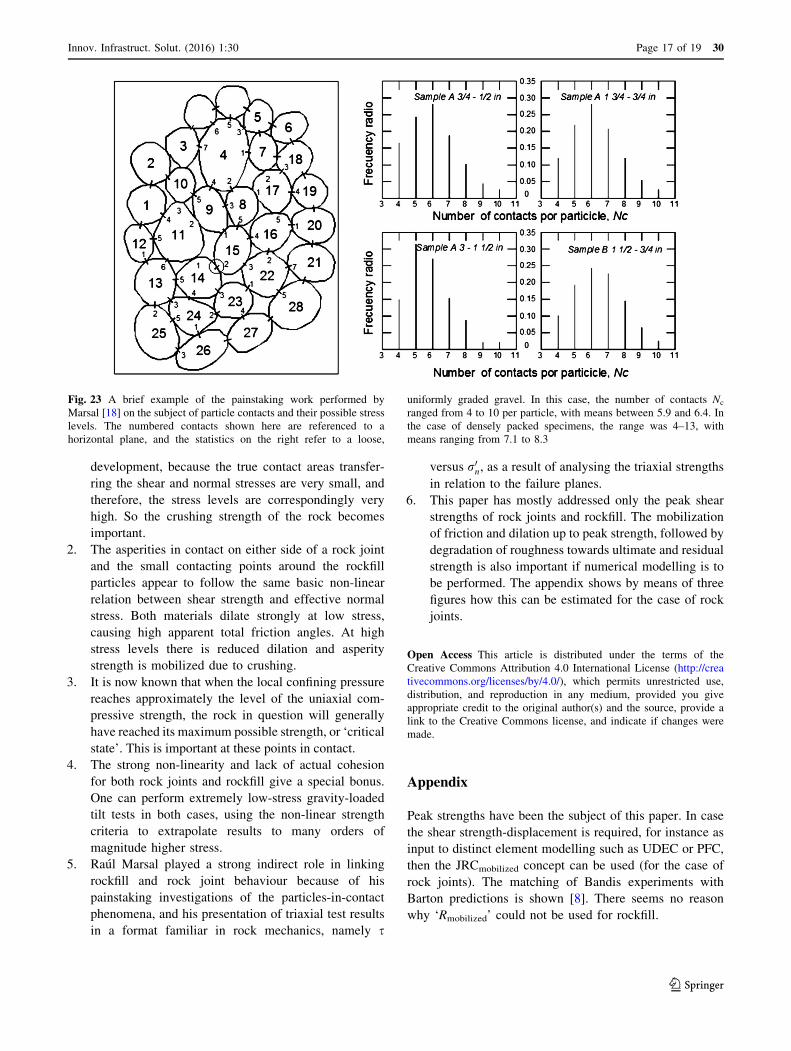
In remarkably painstaking work by Marsal [18], pre-
occupation with particle contacts and particle contact for-
ces is reflected by the drawing of particle contacts in
Fig. 23, and by an example of the statistics Raul Marsal
produced, with observations of particle contacts numbering
in their thousands.
The method used by Marsal to record the (undisturbed)
number of contacts was novel in the extreme. He flooded
the rockfill or gravel samples from the bottom upwards
with paint, allowed it to dry for 24 h, and then began the
careful work of ‘excavating’ up to several thousand grains
counting the paint-coated contacts as he progressed. This
deserves our strong admiration.
Of course, Marsal was characteristically modest in his
conclusions about work remaining to be done. Presumably,
due to capillary effects, the paint-covered contacts, while
an accurate reflection of numbers, must have presented a
remaining question about actual areas in contact and,
therefore, actual stress levels. In work on rock joints, the
writer has assumed that the small percentage of asperities
in contact must raise actual stress levels up to UCS or JCS
levels. Whether this could hold for rockfill is less certain,
as too much particle adjustment is possible.
Conclusions
1. Rock material, which inevitably controls the behaviour
of rock joints and the particulate components of
rockfill, plays an extra sensitive role in shear strength
Fig. 22 Left The results of interface/rockfill and interface/sand (and
gravel) direct shear tests can be separated by means of the ratio a/d50,
into R-controlled and JRC-controlled categories. The transition occurs
at a/d50 & 7. Right Four examples of a/d50 which demonstrate either
preference for interface sliding or preference for internal shearing in
the rockfill. This can be verified (at low stress) by tilt testing
30 Page 16 of 19 Innov. Infrastruct. Solut. (2016) 1:30
123
development, because the true contact areas transfer-
ring the shear and normal stresses are very small, and
therefore, the stress levels are correspondingly very
high. So the crushing strength of the rock becomes
important.
2. The asperities in contact on either side of a rock joint
and the small contacting points around the rockfill
particles appear to follow the same basic non-linear
relation between shear strength and effective normal
stress. Both materials dilate strongly at low stress,
causing high apparent total friction angles. At high
stress levels there is reduced dilation and asperity
strength is mobilized due to crushing.
3. It is now known that when the local confining pressure
reaches approximately the level of the uniaxial com-
pressive strength, the rock in question will generally
have reached its maximum possible strength, or ‘critical
state’. This is important at these points in contact.
4. The strong non-linearity and lack of actual cohesion
for both rock joints and rockfill give a special bonus.
One can perform extremely low-stress gravity-loaded
tilt tests in both cases, using the non-linear strength
criteria to extrapolate results to many orders of
magnitude higher stress.
5. Raul Marsal played a strong indirect role in linking
rockfill and rock joint behaviour because of his
painstaking investigations of the particles-in-contact
phenomena, and his presentation of triaxial test results
in a format familiar in rock mechanics, namely s
versus r0n, as a result of analysing the triaxial strengths
in relation to the failure planes.
6. This paper has mostly addressed only the peak shear
strengths of rock joints and rockfill. The mobilization
of friction and dilation up to peak strength, followed by
degradation of roughness towards ultimate and residual
strength is also important if numerical modelling is to
be performed. The appendix shows by means of three
figures how this can be estimated for the case of rock
joints.
Open Access This article is distributed under the terms of the
Creative Commons Attribution 4.0 International License (http://crea
tivecommons.org/licenses/by/4.0/), which permits unrestricted use,
distribution, and reproduction in any medium, provided you give
appropriate credit to the original author(s) and the source, provide a
link to the Creative Commons license, and indicate if changes were
made.
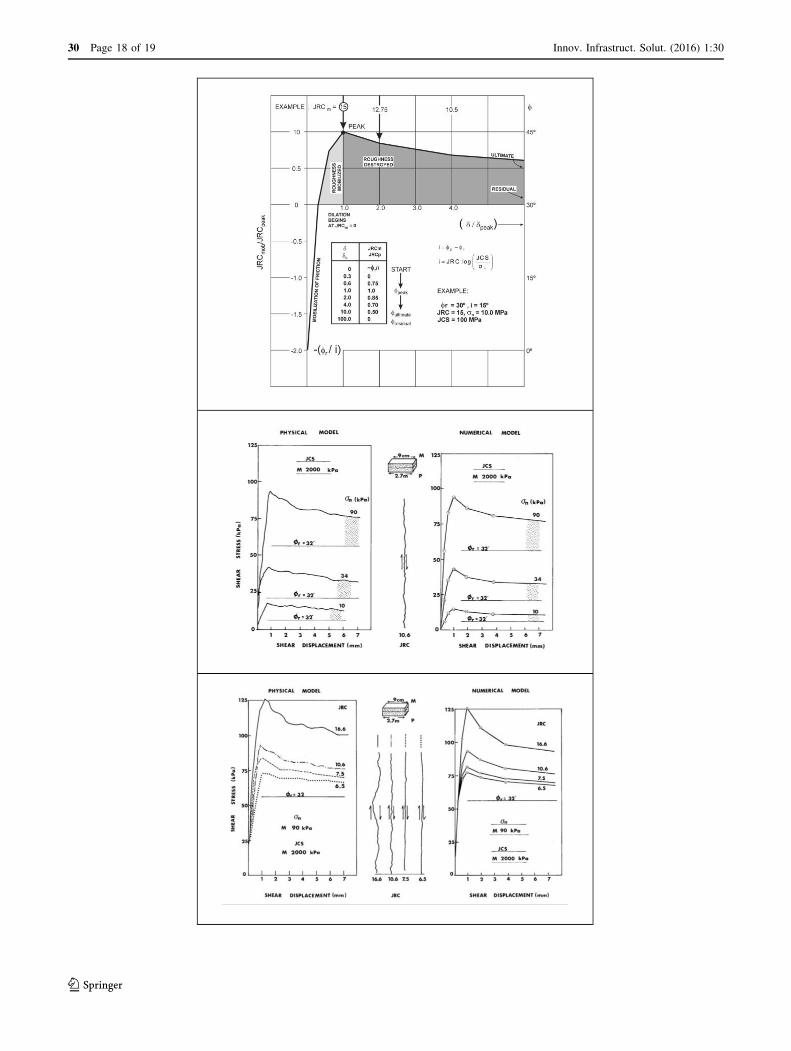
Appendix
Peak strengths have been the subject of this paper. In case
the shear strength-displacement is required, for instance as
input to distinct element modelling such as UDEC or PFC,
then the JRCmobilized concept can be used (for the case of
rock joints). The matching of Bandis experiments with
Barton predictions is shown [8]. There seems no reason
why ‘Rmobilized’ could not be used for rockfill.
Fig. 23 A brief example of the painstaking work performed by
Marsal [18] on the subject of particle contacts and their possible stress
levels. The numbered contacts shown here are referenced to a
horizontal plane, and the statistics on the right refer to a loose,
uniformly graded gravel. In this case, the number of contacts Nc
ranged from 4 to 10 per particle, with means between 5.9 and 6.4. In
the case of densely packed specimens, the range was 4–13, with
means ranging from 7.1 to 8.3
Innov. Infrastruct. Solut. (2016) 1:30 Page 17 of 19 30
123
30 Page 18 of 19 Innov. Infrastruct. Solut. (2016) 1:30
123

References
1. Bandis S (1980) Experimental studies of scale effects on shear
strength and deformation of rock joints. Ph.D. Thesis, Univ. of
Leeds, England.
2. Bandis S, Lumsden A, Barton N (1981) Experimental studies of
scale effects on the shear behaviour of rock joints. Int J Rock
Mech Min Sci Geomech Abstr 18:1–21.
3. Barton N (1971) A model study of the behaviour of steep exca-
vated rock slopes. Ph.D. Thesis, Univ. of London.
4. Barton N (1973) Review of a new shear strength criterion for rock
joints. Eng Geol (Elsevier, Amsterdam) 7:287–332 (Also NGIPubl. 105, 1974).
5. Barton N (1976) The shear strength of rock and rock joints. Int J
Rock Mech Min Sci Geomech Abstr 13(9):255–279 (Also NGIPubl. 119, 1978).
6. Barton N (1980) Evaluation of shear strength in rockfill and
between rockfills and rock foundations. NGI report 53101–2:67
(in Norwegian).7. Barton N (1981) Shear strength investigations for surface mining.
In: 3rd international conference on stability in surface mining,
Vancouver, Ch 7. AIME, pp 171–192.
8. Barton N (1982) Modelling rock joint behaviour from in situ
block tests: implications for nuclear waste repository design.
Office of Nuclear Waste Isolation, Columbus, OH, p 96, ONWI-
308, September 1982.
9. Barton N (1993) Physical and discrete element models of exca-
vation and failure in jointed rock. In: Keynote lecture presented at
ISRM international symposium on assessment and prevention of
failure phenomena in rock engineering, 5–7 April, Istanbul,
Turkey.
10. Barton N (1999) General report concerning some 20th century
lessons and 21st century challenges in applied rock mechanics,
safety and control of the environment. In: Proceedings of 9th
ISRM congress, Paris, vol 3, pp 1659–1679, Balkema,
Netherlands.
11. Barton N (2006) Rock quality, seismic velocity, attenuation and
anisotropy. Taylor & Francis, UK & Netherlands, p 729.
12. Barton N, Choubey V (1977) The shear strength of rock joints in
theory and practice. Rock Mech 10(1–2):1–54 (Vienna:Springer. Also NGI Publ. 119, 1978).
13. Barton N, Kjærnsli B (1981) Shear strength of rockfill. J Geotech
Eng Div Proc ASCE 107(GT7):873–891 (Proc. Paper 16374,July).
14. Barton N, Bandis SC (1990) Review of predictive capabilities of
JRC-JCS model in engineering practice. In: Proceedings of
International Symposium on Rock Joints. Loen 1990,
pp 603–610.
15. Becker E (1972) Strength and deformation characteristics of
rockfill materials under plane strain conditions. Ph.D. Thesis,
Univ. of California, Berkeley.
16. Leps TM (1970) Review of the shearing strength of rockfill.
J Soil Mech Found Div ASCE 96(SM4):1159–1170 (Proc. Paper7394, July 1970).
17. Linero S, Palma C (2006) Caracterizacion geotecnica de mate-
riales esteriles para diseno de depositos mineros de gran altura
(Geotechnical characterization of rock materials for design of
high rock dumps). In: Proceedings of 6th South American Rock
Mechanics Congress, Cartagena, Colombia.
18. Marsal RJ (1973) Mechanical properties of rockfill. In: Hirschfeld
RC, Poulos SJ (eds) Embankment-dam engineering, Casagrande
volume. Wiley, New York, pp 109–200.
19. Marachi ND, Chan CK, Seed HB, Duncan JM (1969) Strength
and deformation characteristics of rockfill materials. Dept. of Civ.
Eng., Univ. of California, Berkeley, p 139.
20. Patton FD (1966) Multiple modes of shear failure in rock. In:
Proceedings of 1st ISRM Congress, Lisbon, vol 1, pp 509–513.
21. Singh M, Raj A, Singh B (2011) Modified Mohr–Coulomb cri-
terion for non-linear triaxial and polyaxial strength of intact
rocks. Int J Rock Mech Mining Sci 48(4):546–555.
Innov. Infrastruct. Solut. (2016) 1:30 Page 19 of 19 30
123
Copyright © 2022 FDOKUMEN