Shifts in picophytoplankton community structure influenced by changing upwelling conditions
Upload
khangminh22Category
view
0download
0
University of Wollongong University of Wollongong
Research Online Research Online
Faculty of Engineering and Information Sciences - Papers: Part A
Faculty of Engineering and Information Sciences
1-1-2014
Shear strength of rock joints influenced by compacted infill Shear strength of rock joints influenced by compacted infill
Buddhima Indraratna University of Wollongong, [email protected]
Wuditha N. Premadasa University of Wollongong, [email protected]
Edwin T. Brown Golder Associates Pty Ltd
Antonio Gens Universitat Politecnica de Catalunya, SPAIN
Ana Heitor University of Wollongong, [email protected]
Follow this and additional works at: https://ro.uow.edu.au/eispapers
Part of the Engineering Commons, and the Science and Technology Studies Commons
Recommended Citation Recommended Citation Indraratna, Buddhima; Premadasa, Wuditha N.; Brown, Edwin T.; Gens, Antonio; and Heitor, Ana, "Shear strength of rock joints influenced by compacted infill" (2014). Faculty of Engineering and Information Sciences - Papers: Part A. 2503. https://ro.uow.edu.au/eispapers/2503
Research Online is the open access institutional repository for the University of Wollongong. For further information contact the UOW Library: [email protected]

Shear strength of rock joints influenced by compacted infill Shear strength of rock joints influenced by compacted infill
Abstract Abstract Discontinuities such as fault planes, joints and bedding planes in a rock mass may be filled with different types of fine-grained material that are either transported or accumulated as gouge due to weathering or joint shearing. Previous laboratory studies have mainly examined the role of saturated infill that exhibits the minimum shear strength. However, in practice, the infill materials are often partially saturated generating matric suction within the joint that can contribute to increased shear strength. To the authors' knowledge this is the first study to examine the influence of compacted (unsaturated) infill on the joint shear strength. A series of laboratory triaxial tests on idealised model joints and imprinted natural joint profiles was carried out, with constant water contents of the infill being maintained. From the laboratory results, it is observed that the peak shear strength of infilled joints increased with the decrease of degree of saturation from 85% to 35% for both idealised joints and replicated natural joints. Based on the laboratory observations an empirical model for describing the infilled joint shear strength was developed.
Keywords Keywords infill, joints, compacted, influenced, rock, strength, shear
Disciplines Disciplines Engineering | Science and Technology Studies
Publication Details Publication Details Indraratna, B., Premadasa, W., Brown, E. T., Gens, A. & Heitor, A. (2014). Shear strength of rock joints influenced by compacted infill. International Journal of Rock Mechanics and Mining Sciences, 70 296-307.
This journal article is available at Research Online: https://ro.uow.edu.au/eispapers/2503

SHEAR STRENGTH OF ROCK JOINTS INFLUENCED BY COMPACTED INFILL
Buddhima Indraratna†
Professor of Civil Engineering, Director, Centre for Geomechanics and Railway Engineering,
Faculty of Engineering, University of Wollongong, Wollongong, NSW 2522, Australia
Wuditha Premadasa
PhD Candidate, Centre for Geomechanics and Railway Engineering, Faculty of Engineering,
University of Wollongong, Wollongong, NSW 2522, Australia
Edwin T. Brown
Emeritus Professor, University of Queensland and Senior Consultant, Golder Associates Pty
Ltd, PO Box 1734, Milton, Q 4064, Australia
Antonio Gens
Professor of Geotechnical Engineering Department of Geotechnical Engineering and
Geosciences, Universitat Politècnica de Catalunya, Jordi Girona 1-3, Edifici D-2, 08034
Barcelona, Spain
Ana Heitor
Lecturer, Centre for Geomechanics and Railway Engineering, Faculty of Engineering,
University of Wollongong, Wollongong, NSW 2522, Australia
†Author for correspondence:
Prof. Buddhima Indraratna
Professor of Civil Engineering and Research director
Centre for Geomechanics and Railway Engineering, University of Wollongong
Wollongong, NSW 2522, AUSTRALIA
Ph: +61 2 4221 3046
Fax: +61 2 4221 3238
Email: [email protected]
To be submitted to: International Journal of Rock Mechanics and Mining Sciences

2
SHEAR STRENGTH OF ROCK JOINTS INFLUENCED BY COMPACTED INFILL
Buddhima Indraratna0F
1, Wuditha Premadasa, 1F
2, Edwin T. Brown 2F
3, Antonio Gens3F
4, Ana
Heitor4F
5
ABSTRACT
Discontinuities such as fault planes, joints and bedding planes in a rock mass may be filled
with different types of fine-grained material that are either transported or accumulated as
gouge due to weathering or joint shearing. Depending on the degree of saturation and the
thickness of the infill, the shear strength of the rock mass can be adversely affected. Previous
laboratory studies have mainly examined the role of saturated infill that exhibits the
minimum shear strength. However, in practice, the infill materials are often partially
saturated generating matric suction within the joint that can contribute to increased shear
strength. To the authors’ knowledge this is the first study to examine the influence of
compacted (unsaturated) infill on the joint shear strength. A series of laboratory triaxial tests
on idealised model joints and imprinted natural joint profiles was carried out, with constant
water contents of the infill being maintained. From the laboratory results, it is observed that
the peak shear strength of infilled joints increased with the decrease of degree of saturation
from 85% to 35% for both idealised joints and replicated natural joints. Based on the
laboratory observations an empirical model for describing the infilled joint shear strength
was. As no current standards are available for such joint testing, it is anticipated that this
laboratory attempt will provide a useful platform towards establishing a more accurate
estimation of infilled joint strength in rock masses.
KEYWORDS: compacted infill; rock joint; rock mechanics; shear strength, Unsaturation
1 Professor of Civil Engineering and Research director, Centre for Geomechanics and Railway Engineering; University of Wollongong, Wollongong, NSW 2522, Australia (corresponding Author); email: [email protected] 2 PhD candidate, Centre for Geomechanics and Railway Engineering; University of Wollongong, Wollongong, NSW 2522, Australia; email: [email protected] 3 Emeritus Professor, University of Queensland and Senior Consultant, Golder Associates Pty Ltd, PO Box 1734, Milton, Q 4064, Australia; email: [email protected] 4 Professor of Geotechnical Engineering Department of Geotechnical Engineering and Geosciences, Universitat Politècnica de Catalunya, Jordi Girona 1-3, Edifici D-2, 08034 Barcelona, Spain; email: [email protected] 5 Lecturer, School of Civil, Mining and Environmental Engineering, Faculty of Engineering, University of Wollongong, Wollongong, NSW 2522, Australia; email: [email protected]

3
1. INTRODUCTION
Generally rock masses present in nature are characterised by discontinuities such as
joints, fractures and other planes of weakness. Discontinuities that are infilled with fine-
grained material which is either transported or appears as a result of weathering or joint
shearing, will adversely affect the behaviour of the rock mass. These fine infill materials
may drastically reduce the shear strength of the rock joints compared to an unfilled or clean
joint, because they may prevent the walls of the rock joint from coming into contact during
shear.
The degree of saturation of the infill is a governing parameter of the shear strength of
a filled joint, and it can vary noticeably, depending on the groundwater and climate patterns.
Barton [1] carried out an extensive study of filled discontinuities in rock in which the in-situ
water content of the infill was found to be a principal parameter controlling the shear strength
of a filled joint. Furthermore, for adverse climatic conditions, i.e. heavy precipitation and
long periods of rainfall, Barton [1] has reported that the joints may act as conduits of water,
leaving the fine infill material basically in near saturated conditions. Most rock masses
contain complex, interconnected networks of joints filled with gouge material and because of
their high transmissivity, joints are often conduits for fluid flow [2]. Laboratory testing of
infill materials from a rock mass failure site at Kangaroo Valley, New South Wales,
Australia, confirmed that the soil can reach more than 95% of saturation after a period of
heavy rainfall. During dry seasons, the infill saturation will gradually decrease, contributing
to an increase in the overall shear strength of the jointed rock mass. While studies have been
carried out to investigate the behaviour of infilled rock joints (e.g., Ladanyi & Archambault
[3], Lama [4], Pereira[5], de Toledo & de Freitas [6], Indraratna et al. [7], [8], [9]), the
majority have considered either a fully saturated infill condition or a specified saturation
level.. Recently, Alonso et al. [10], and Zandarin et al. [11] conducted a study on partially
saturated bare rock joints, but the role of infill within the joint was not considered. From a
practical perspective, most infill materials will likely be compressed over time and remain
typically in an unsaturated state, unless the joints are submerged by groundwater which may
happen in the event of groundwater inflows occurring through specific discontinuities. In this
instance, grouting of the joints may be considered as a method to prevent the infill materials
from reaching full saturation, thus reducing the probability of catastrophic rock slides
occurring.
The shear strength of a filled joint is often assumed to be that of the infill material

4
alone. While this assumption may be acceptable if the infill thickness is higher than a certain
critical value, for smaller values of infill thickness in relation to the joint roughness or
asperities it neglects the possibility of rock-to-rock contact taking place. In these conditions,
the rock-to-rock contact influence becomes increasingly prominent. In contrast, the effect of
infill saturation can be distinctly observed for a thicker infill where the strength is governed
by the infill alone. This effect decreases as the infill becomes thinner, because in such
conditions the shear strength of the joint is basically governed by the shear behaviour of the
surfaces of the rock.
In this study, a series of constant water content undrained triaxial tests on idealised
models of rock joints and replicated natural joints has been conducted to investigate the effect
of infill saturation on the shear strength of filled joints. Although the shear strength of soil at
constant water conditions has been studied in the past (e.g., Thu et al. [12], Hamid & Miller
[13]), no literature is available on infilled joints tested under unsaturated infill conditions.
This study proposes a novel approach for laboratory testing of infilled joints under different
initial degree of saturation of compacted infill.
2. LABORATORY INVESTIGATION
2.1 Specimen preparation
Calibration of any shear strength model requires a series of identical joint specimens,
and this surely restricts the use of real joint surfaces. Therefore, for reasons of simplicity and
reproducibility, idealised model rock joints with regular saw toothed surfaces were cast with
a mean dip angle of 60o [8]. The jointed specimens were 54 mm in diameter with an asperity
height of 2 mm and an initial asperity angle of 18o. Fig. 1 shows the mould used to prepare
the specimens and a specimen obtained after casting. Indraratna [14] proposed the use of
gypsum cement (CaSO4.H2O hemihydrates, 98%) to model soft sedimentary rocks and to
prepare idealised joints. This material is readily available and relatively inexpensive and can
be moulded into any shape when mixed with water. The unconfined compressive strength is
independent of time once the chemical hydration is complete. The properties of the material
depend on the gypsum cement to water ratio used to mix it. A consistent unconfined
compressive strength (σc) of 65-70 MPa was obtained for a plaster to water ratio of 7:2 by
weight after two weeks of curing. After being removed from the mould, the plaster specimens
were cured for two weeks in an oven at a controlled temperature of 40o – 45oC. The plaster
specimens were immersed in water for at least 72 hours, and subsequently an organic

5
waterproof sealant was applied over the surfaces of the joints to ensure that the infill water
content remained constant throughout shearing. Indraratna et al. [8] has shown that this thin
layer of waterproofing sealant has negligible effect on the shearing resistance of the joint
surface. Additional specimens replicating the roughness profiles of natural joints were also
prepared. The details of the preparation method are given in the subsequent sections.
A silty clay (25% fine sand and 75% kaolinite) with a liquid limit of 39 and a plastic
limit of 20 was used as the infill material. The shear strength behaviour of the infill material
under saturated conditions was studied using a direct shear box apparatus (AS 1289.6.2.2
[15]), and a friction angle of 'φ = 21o and a cohesion intercept (c’) of 13.4 kPa were obtained.
The infill material was mixed in the laboratory to known moisture contents and then spread
over the surfaces of the joints with a spatula. The joints were then statically compacted to a
given infill thickness to asperity height (t/a) ratio with an infill dry density of 1250 kg/m3.
Note that despite having infill specimens prepared with varying (t/a) ratios, the initial dry
unit weight remained the same, and thus different water content resulted in initial degree of
saturations varying from 35% to 85%, corresponding to a suction varying from 860 kPa to
165 kPa (see soil water characteristic curve later). An example of the final joint profile
obtained once the infill was spread to a certain thickness is shown in Fig. 1c. Although the
behaviour of the joints with infill is studied for a wide range of the infill initial degree of
saturation, fully saturated conditions were not considered. This is owing to the difficulty in
preparing viable specimens using this procedure, that is, because the infill became slurry-like
when it approached saturation. After assembly the infilled joint specimens were wrapped in a
thin neoprene (impervious) membrane. During testing, the sealant applied on the surfaces of
the joint and the impervious membrane ensured that the clay infilled joints maintained
constant water content conditions. Furthermore, as the permeability of the model rock is
much lower than that of the infill (kinfill/krock > 1000), it could be assumed that undrained
conditions would still prevail.
2.2 Testing procedure
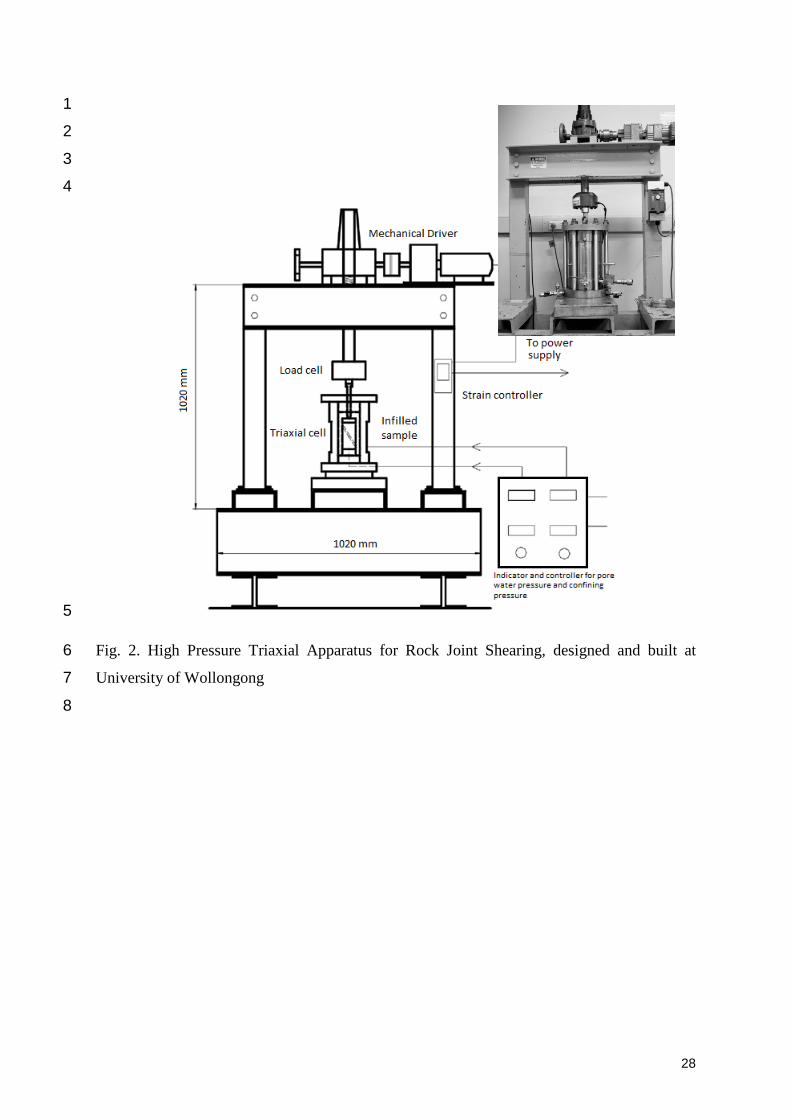
The high-pressure two-phase triaxial apparatus (Fig. 2) developed at the University of
Wollongong [16] was customised for this study. The cylindrical chamber can accommodate
samples of 54 mm and 60 mm in diameter with a height-to-diameter ratio up to 2.0. Silicon
oil was used as the confining fluid as it does not react with the steel cell or with the latex
membrane. A variable constant strain mechanical driving system was installed to apply a

6
constant strain rate. Vertical displacement was measured using a Linear Variable Differential
Transformer (LVDT) with an accuracy of 0.001 mm while a system with laser beams with
accuracy of 0.001 mm was used to measure the horizontal movement of the joint. All the
measuring devices were connected to a data-logger which was then connected to a computer
for continuous data logging.
Although the testing was carried out adopting undrained conditions for the water
phase, the air phase remained drained throughout the test. The specimen of infill was tested at
its initial water content. While the change in suction could not be monitored during the
compression stage, its value at the beginning of the shearing stage could be captured
following the procedure outlined by Oloo & Fredlund [17]. A strain rate of 0.01 millimetres
per minute was adopted for the test series. This shearing rate is consistent with those adopted
for constant water conditions in the previous studies (i.e. Fredlund et al. [18] and Thu et al.
[12]).
The infilled jointed specimen with known moisture content (or initial degree of
saturation) was assembled inside the cell and the confining pressure was applied. Three
different confining pressures of 300 kPa, 500 kPa and 900 kPa were used in this study to
investigate the effect of normal stress (or the confining pressure) on shear strength. As
shown in Fig. 1c, the mean joint plane is inclined at 600 to the horizontal plane, and the
normal stress acting on the joint plane varies during shearing even though the confining
pressure is kept constant. A series of tests was carried out for (t/a) ratios of 0.5, 1.0 and 3.0
and a starting infill saturation of 35%, 50%, 60%, 70% and 85% corresponding to water
contents of 15%, 20%, 25%, 30%, and 35%, respectively. The stress-strain and dilation
responses were observed and the peak shear strength was considered as the maximum shear
strength obtained on the stress-strain curve. Dilation of the joint was calculated normal to the
joint surface using independent measurements of axial and horizontal displacements. At the
end of each test, the moisture content of the infill was measured and compared with the initial
value. The difference between the two measurements was typically less than 0.1, which
indicates that constant water conditions were attained.
To adequately describe the hydraulic properties of a material under unsaturated
conditions, it is necessary to establish a relationship between suction and the amount of water
present, which can be expressed in terms of either water content also known as gravimetric
water content (mass), volumetric water content, or degree of saturation (volume). This
relationship is often referred as the soil-water characteristic curve or SWCC. The soil-water
characteristic curve for the infill material prepared at the same dry unit weight was developed

7
using test data obtained from the pressure plate apparatus and chilled mirror hygrometer,
according to the standard procedure described in ASTM [19]. Two distinct data sets obtained
from the pressure plate and chilled mirror hygrometer are shown in Fig. 3 for a wide range of
matric suction that defines the SWCC. Pressure plate apparatus was used to obtain data under
matric suctions up to 1000 kPa and the chilled mirror hygrometer was used for the range
above 1000 kPa. The pressure plate extractor consists of a saturated high air entry value
(HAEV) ceramic disk contained in an air pressure chamber. In this study, two ceramic disks
with HAEVs of 500 kPa and 1500 kPa were used. The HAEV ceramic disk was saturated and
was in contact with water in a compartment below the disk that was connected to an exterior
burette. The infill material was then prepared in a retaining cell to a dry density of 1250
kg/m3 and was saturated by inundation in a tray. After saturation the sample weight was
measured and it was placed inside the pressure chamber. Then the desired suction was
applied to the system by the pressure differential of air and water phases (i.e. ua – uw; air
pressure was increased while the water pressure was kept at atmospheric pressure) that was
maintained until the specimens reached equilibrium. The equilibrium state can be identified
by observing the air-water interface of the burette attached to the water compartment of the
pressure chamber. Once the equilibrium state was established (typically after seven days or
when the air-water interface changed less than 1 ml over a period of 48 hours), the pressure
chamber was opened and the specimens and their retaining rings weighed to determine the
corresponding water content. The specimens were then placed back on the porous plate and
the next increment of suction was applied by increasing the air pressure. The process was
continued until the required matric suction increment was reached.
For the matric suction values exceeding the air entry values of the pressure plate
ceramic disk, alternative techniques such as the chilled mirror hygrometer can be used. Note
that while the chilled mirror hygrometer apparatus measures total suction, the osmotic
component should be negligible as there are no salts present in the infill material. The chilled
mirror hygrometer consists of sealed chamber with a fan, a mirror, a photoelectric cell, and an
infrared thermometer. In this case, the infill material is placed in a plastic container with a
diameter of 40 mm, which is then placed on a tray and inserted in to a temperature controlled
chamber at which point, the infill material reaches equilibrium with the chamber environment
in a matter of minutes. Inside the chamber the temperature is reduced until it the material
reaches its dew-point. At this time, the chilled mirror hygrometer computes the total suction
based on the vapour pressures and temperature inside the chamber using Kelvin’s equation.
Prior to the suction measurements the device was calibrated using a solution of 0.5 M KCL

8
provided by the manufacturer (Decagon Devices).
The data obtained by the two methods (i.e. pressure plate and chilled mirror
hygrometer) was interpolated using the well-known van Genuchten [20] relationship fitted to
the experimental data using the least square method. The interpolated best fit parameters are
shown in Fig. 3 along with the experimental data.
The silty clay seam inside the rock joint that was tested varied from 1 mm to 6 mm in
thickness (corresponding to t/a ratios of 0.5 to 3.0). Since this was a relatively thin seam, it
was not feasible to install a pore water pressure or a suction probe inside the joint to measure
the negative pore pressures, as there was a distinct possibility of it being damaged during
shearing. It was therefore not feasible to monitor the change in the matric suction while the
joint was being sheared. The direct shear tests conducted on statically compacted kaolin
reported by Tarantino & Tombolato [21] show that for applied vertical stresses of 300 and
600 kPa the changes in suction monitored during direct shearing were generally small.
Limited variations of suction during the shear stage under constant water content conditions
have also been reported by Thu et al. [12] and Rahardjo et al. [22] for tests of the same
material. Therefore, the value of suction at the start of testing incorporated in the current
shear strength analysis is reasonable. In addition, during the shearing process, the broken
asperities commonly contaminate the infill material due to asperity overriding in thin infill
seams. In this instance, the final value of suction computed using methods such as the filter
paper technique may not be realistic. Therefore, in subsequent sections of this paper the
shear strength behaviour of the infilled joints is modelled considering the initial suction of the
infill computed at the start of test as a reference value.
3. RESULTS AND DISCUSSION
Forty eight undrained triaxial tests were carried out on idealised saw-tooth joints for
confining pressures of 300, 500 and 900 kPa, and at initial degrees of saturation of 35%,
50%, 60%, 70%, 85% with the t/a ratios of 0.5, 1.0 and 3.0. Test results for 63 triaxial tests
on replicated natural joint surfaces were also carried out and will be discussed later in this
paper. An example of the test results obtained from the undrained triaxial testing of infilled,
idealised rock joints is presented and discussed here. Fig. 4 illustrates the selected plots of
deviator stress and dilation against axial strain for varying values of infill thickness and initial
degrees of saturation for the specimens tested under a confining pressure of 900 kPa for t/a
ratios varying from 0.5 to 3.0. For the purpose of brevity, only the typical results for the

9
degree of saturation of 50% and 85% are shown in Figs. 4 (a) and (b) The associated dilation
was measured as a function of the normal displacement of the joint with respect to the shear
plane, considering both the horizontal and vertical components of the joint displacement
vector, as presented in Figs. 4(c) and (d). The shear stress of an infilled joint depends mainly
on the thickness of the infill. When the infill is comparatively thin (i.e., t/a = 0.5, 1.0), the
stress - strain plot exhibits two distinct stages of change in curvature (Indraratna et al. [8]).
The first stage corresponds to the yielding of the soil infill. Beyond this stage asperity
interference starts to prevail causing a significant increase in dilation. This is particularly
evident in the t/a = 0.5 data shown in Fig. 4 for an axial strain of approximately 0.5%. The
second stage corresponding to the peak deviator stress is largely influenced by rock-rock
contact (albeit some effect of the infill is still present). This double-stage phenomenon
becomes less pronounced as the infill increases in thickness. When t/a reaches a value of 3.0,
there is no noticeable double-stage response in deviator stress, which implies that the shear
behaviour is largely controlled by the soil infill alone. This is also confirmed by the dilation
response since fully compressional behaviour was observed with thicker infill. When the
normal stress or confining pressure increased from 300 kPa to 900 kPa, the deviator stress
increased as expected showing a higher peak shear stress.
When the degree of saturation of the infill increased from 50% to 85%, the deviator
stress was reduced and the axial strain required to reach peak deviator stress increased
slightly (Figs. 4, 5). In addition, the volumetric behaviour observed is mainly compressive
when the degree of saturation of the infill is relatively high whereas specimens with a lower
degree of saturation exhibit predominantly dilative behaviour. This is owing to the fact that
when matric suction increases, the infill becomes stiffer (compressibility reduced) as
‘bonding’ of infill material particles is enhanced. Similar experimental observations have
been made in constant water content tests of residual soil [12]. The predominately dilative
behaviour observed after the initial compression is due to both asperity interference (i.e.,
local sliding and overriding) and some asperity degradation.
To better understand the shear strength behaviour of the infill material alone, a series
of undrained triaxial tests was conducted on specimens compacted with different initial water
contents yielding the same dry densities and initial degrees of saturation adopted for the joint
testing. As expected, the peak shear stress of the silty-clay infill material was observed to
decrease with an increase in the initial degree of saturation (S0). In Fig. 5 the behaviour of
infill alone is contrasted to that of the infilled joints. It is observed that the ductile infill
specimens continue to shear at high axial strains to attain the peak deviator stresses (>15%),
10
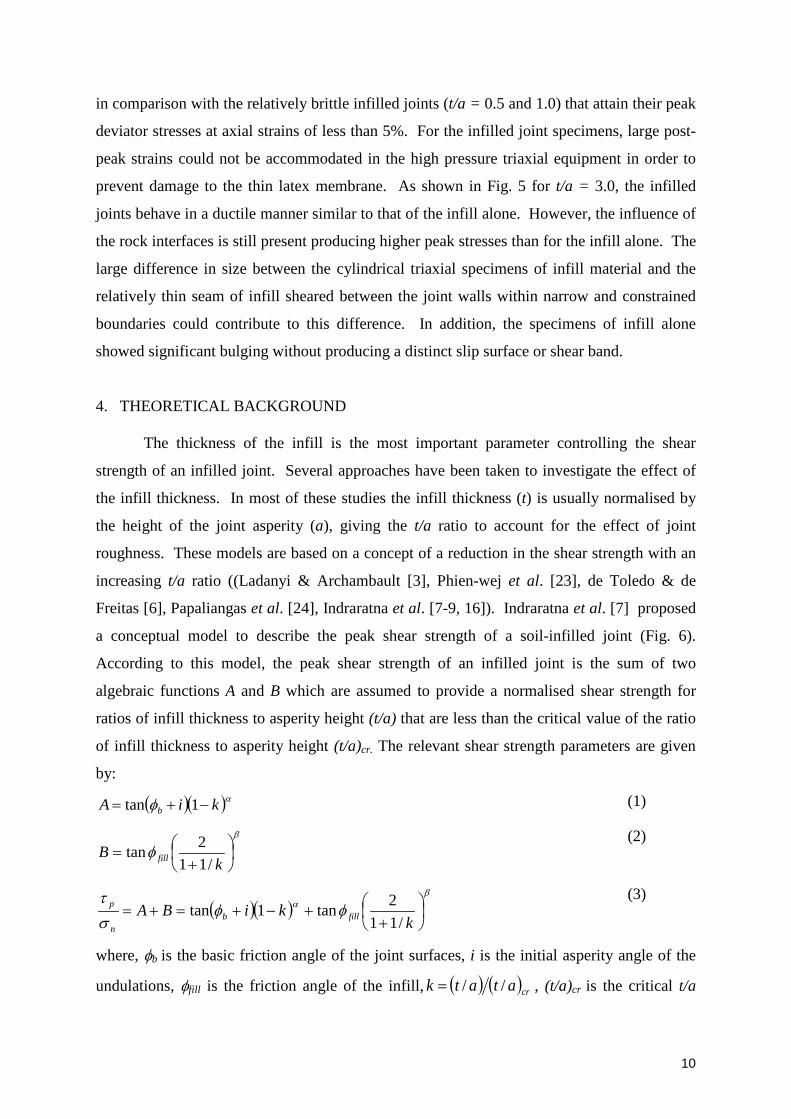
in comparison with the relatively brittle infilled joints (t/a = 0.5 and 1.0) that attain their peak
deviator stresses at axial strains of less than 5%. For the infilled joint specimens, large post-
peak strains could not be accommodated in the high pressure triaxial equipment in order to
prevent damage to the thin latex membrane. As shown in Fig. 5 for t/a = 3.0, the infilled
joints behave in a ductile manner similar to that of the infill alone. However, the influence of
the rock interfaces is still present producing higher peak stresses than for the infill alone. The
large difference in size between the cylindrical triaxial specimens of infill material and the
relatively thin seam of infill sheared between the joint walls within narrow and constrained
boundaries could contribute to this difference. In addition, the specimens of infill alone
showed significant bulging without producing a distinct slip surface or shear band.
4. THEORETICAL BACKGROUND
The thickness of the infill is the most important parameter controlling the shear
strength of an infilled joint. Several approaches have been taken to investigate the effect of
the infill thickness. In most of these studies the infill thickness (t) is usually normalised by
the height of the joint asperity (a), giving the t/a ratio to account for the effect of joint
roughness. These models are based on a concept of a reduction in the shear strength with an
increasing t/a ratio ((Ladanyi & Archambault [3], Phien-wej et al. [23], de Toledo & de
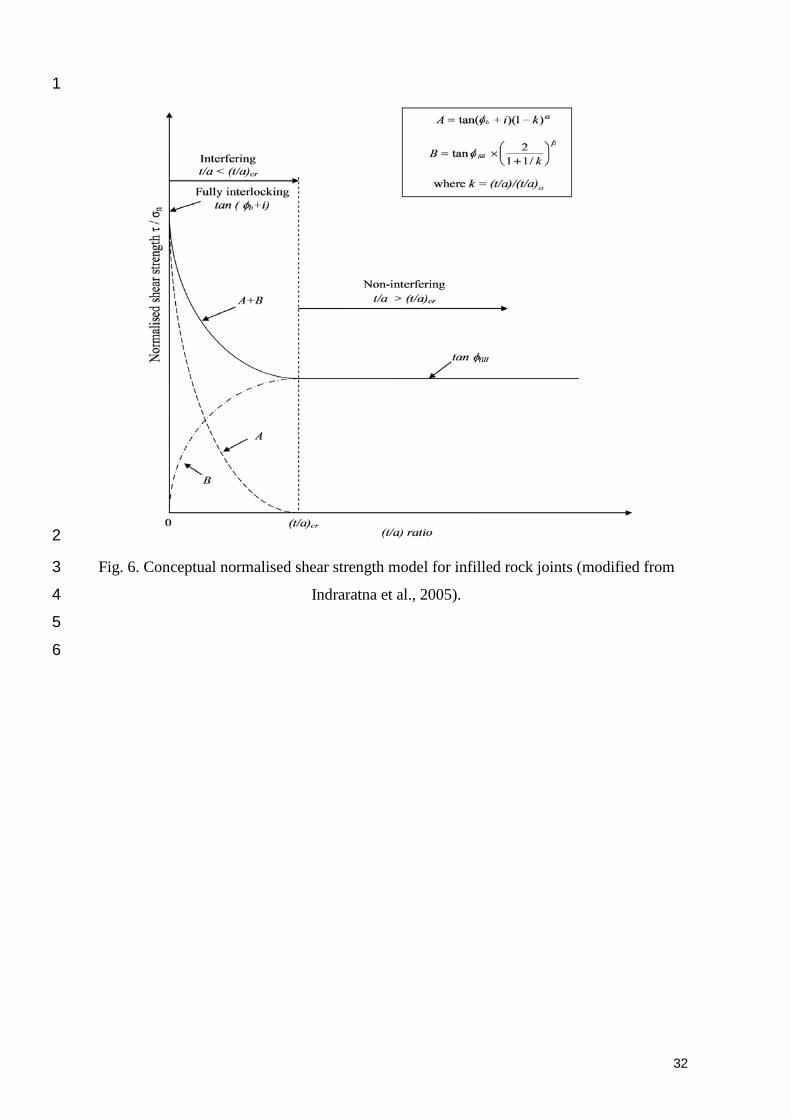
Freitas [6], Papaliangas et al. [24], Indraratna et al. [7-9, 16]). Indraratna et al. [7] proposed
a conceptual model to describe the peak shear strength of a soil-infilled joint (Fig. 6).
According to this model, the peak shear strength of an infilled joint is the sum of two
algebraic functions A and B which are assumed to provide a normalised shear strength for
ratios of infill thickness to asperity height (t/a) that are less than the critical value of the ratio
of infill thickness to asperity height (t/a)cr. The relevant shear strength parameters are given
by:
( )( )αφ kiA b −+= 1tan (1)
β
φ
+=
kB fill /11
2tan (2)
( )( )β
α φφστ
++−+=+=
kkiBA fillb
n
p
/112tan1tan
(3)
where, φb is the basic friction angle of the joint surfaces, i is the initial asperity angle of the
undulations, φfill is the friction angle of the infill, ( ) ( )cratatk //= , (t/a)cr is the critical t/a

11
ratio of the joint, σn is the normal stress and α and β are empirical constants defining
geometric loci of the functions A and B.
For rough joints without infill, the normalised shear strength is equivalent
to ( )( )ib +φtan , as proposed by Patton [25] for clean joints. Function A models the decrease in
the influence of rock-to-rock contact with an increasing (t/a) ratio, while Function B
gradually increases the frictional component of the infill strength until the critical thickness to
asperity height ratio (t/a)cr is reached [7]. Depending on the critical t/a ratio, two main
regions can be identified in the model: the ‘zone of interference’ (t/a < (t/a)cr) and the ‘zone
of non-interference’ (t/a > (t/a)cr) (Fig. 6). In the non-interference zone the shear strength is
governed by infill only as no rock-to-rock contact occurs during shearing. Therefore, the
normalised shear strength is given by the peak friction angle of the infill ( )fillφtan in that zone.
In this model, the infill was not considered to be partially saturated in which case the matric
suction plays a significant role. Moreover, the cohesion of the infill was ignored by
Indraratna et al. [7]. The model proposed in the present study considers both the cohesion
and the effect of matric suction for unsaturated infill material.
5. SHEAR STRENGTH MODEL WITH UNSATURATED INFILL
Even though the shear strength of an infilled joint is primarily governed by the infill
thickness, the infill properties such as the degree of saturation can also be expected to have an
influence on its strength. It is possible that the dilation of the joint and the critical t/a ratio
will also be influenced by the extent to which the infill has been saturated. To incorporate the
effect of infill saturation, the peak shear strength model proposed earlier by Indraratna et al.
[7] is modified in this study. For a general soil-infilled joint, the peak unsaturated shear
strength (τp,unsat) can be expressed as:
τp,unsat = A’+B’ (4)
where, A’ is the strength contribution of the joint surfaces and B’ is the strength contribution
of the infill material.
Function A’ will have an optimum value equivalent to the shear strength of a clean
joint when there is no infill in the joint, and a minimum value of zero where there is no
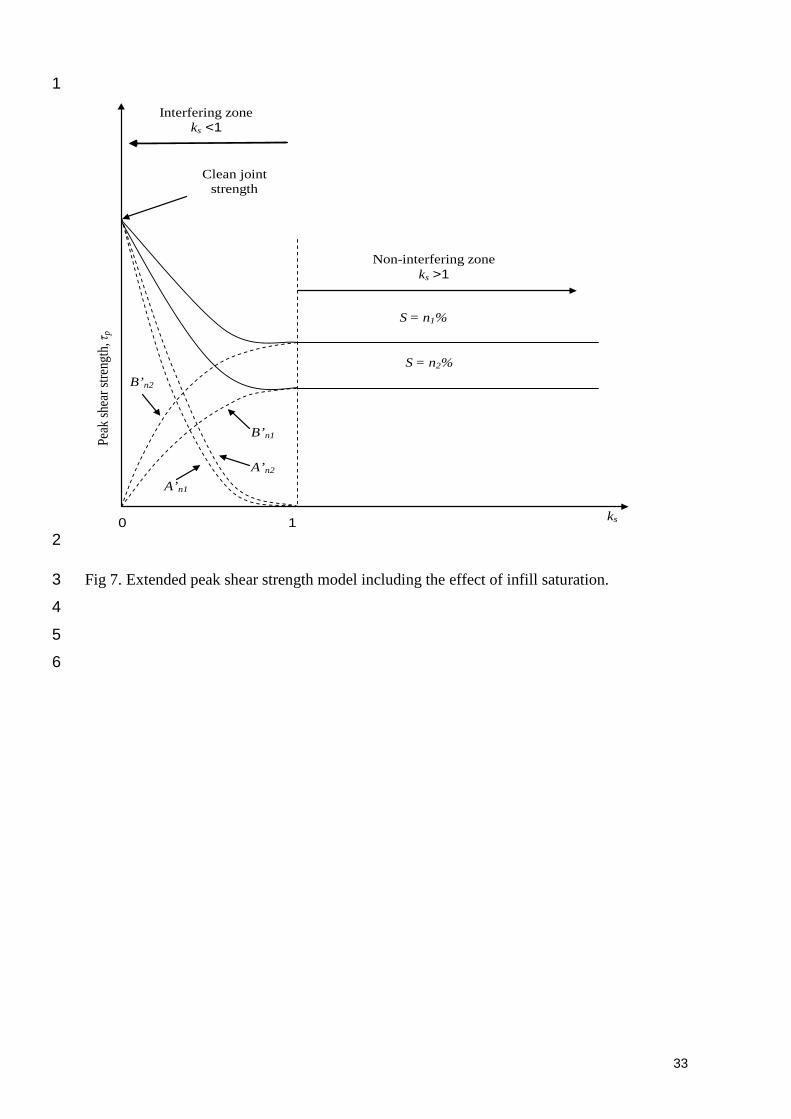
contact with the rock wall. Function B’ increases from zero to its maximum value (i.e., the
shear strength of the infill alone) with infill thickness increasing up to the critical t/a ratio
(Fig. 7). The change in degree of saturation of the infill only affects the shear strength of the
infill material, and therefore will not impact on function A’ which will remain exactly the

12
same as in the conceptual model (Eq. 1) of Indraratna et al. [7]. In contrast, function B’
needs to be modified as it models the variation in the shear strength of the infill material
which will vary with the degree of infill saturation. The shear strength of a partially saturated
soil includes a strength contribution from the matric suction in addition to the strength of a
soil in a fully saturated state. The shear strengths of partially saturated soils have been
studied in the past (e.g., Bishop et al. [26], Fredlund et al. [18], Vanapalli et al. [27], Sheng et
al. [28]), and these studies have proposed a range of models. A comprehensive review of
unsaturated soil models has been presented by Gens [29]. The model proposed by Vanapalli
et al. [27] predicts the shear strength using the soil-water characteristic curve. The revised
model capturing the degree of saturation can be expressed by:
( ) ( ) ( )
−−
−+−+=res
resrwaanunsatp S
SSuuuc
100'tan'tan'. φφστ
(5)
where τp.unsat is the shear strength of an unsaturated soil, c’ is the effective cohesion of
saturated soil, (σn - ua) is the net normal stress, φ’ is the effective angle of shearing resistance
for a saturated soil, (ua – uw) is matric suction of the soil, Sr is the degree of saturation of the
soil, and Sres is the residual degree of saturation of the soil.
The conceptual development of the shear strength model for partially saturated
infilled joints is illustrated in Fig. 7. This model defines two different zones distinguished by
the thickness of the infill, the ‘interference zone’ and the ‘non-interference zone’. For
convenience in modelling, a ratio ks is introduced so that the boundaries of the zone can be
clearly expressed, i.e., ks = (t/a)s / (t/a)cr,s, where (t/a)cr,s is the critical t/a ratio of an infilled
joint with a degree of saturation of s, and (t/a)s is the t/a ratio of a given infilled joint with an
infill saturation of s.
For ks < 1 in the ‘interference zone’, the function A’ based on rock joint surfaces is
given by:
( ){ }( ) AkiA nsbn σφσ α =−+= 1tan' (6)
where α is an empirical constant and A is the original parameter from Eq. (1).
The unsaturated shear strength equation given by Eq. (5) is used to develop the
function B’. The algebraic component, ( ) ( )( )[ ]resresrwa SSSuuc −−−+ 100'tan' φ of Eq. (5) is a
constant for a given initial degree of saturation of the infill according to the soil water
characteristic curve. This will be referred to here as the total cohesion intercept (ct) given by:

13
( ) ( )
−−
−+=res
resrwat S
SSuucc
100'tan' φ
(7)
Equation (5) can then be re-written as:
( ) 'tan. φστ antunsatp uc −+= (8)
The second function B’, influenced by infill is given by:
( )[ ]β
φσ
+
−+=s
ant kucB
/112'tan'
(9)
If the infill is saturated, tn cBB +⋅= σ' , where B is the original parameter in Equation (2).
For ks = 0, there is no infill material in the joint and the equation is simplified to the shear
strength of a clean joint,
( )ibn +⋅= φστ tan (10)
For the rock-infill interference zone (0 < ks < 1),
( ) ( ){ }( ) ( )[ ]β
α φσφστ
+
−++−+−=s
antsban kuckiu
/112'tan1tan
(11)
For the non-interference zone (ks > 1), where the shear strength is governed only by the infill
material,
( )[ ]'tanφστ ant uc −+= (12)
The above equations can be simplified when the infill is fully saturated (i.e., ua -
uw=0). In this case Eqs. 11 and 12 revert back to those proposed earlier by Indraratna et al.
[7], except for the addition of the cohesion term.
5.1 Verification of the shear strength model
The peak shear strength of a joint was taken as the point at which the maximum
deviator stress was reached. It was noted that when the t/a ratio increased, the peak shear
strength decreased rapidly until a critical t/a was reached, beyond which any further decline
in strength was insignificant. This observation leads us to hypothesise that beyond this
critical ratio (t/a)cr the shear strength is exclusively a function of the infill properties [8].
The results of 48 undrained triaxial tests conducted on silty clay-infilled saw toothed joints
were used to validate the shear strength model presented earlier. Test data for five different
initial degrees of saturation were collected for joints having infills that varied in thickness
from 1 mm to 8 mm, corresponding to t/a ratios of 0.5 to 4.0. With close observation of the

14
shear strength data with corresponding t/a ratios, it was noted that the critical t/a differs with
the tested water contents. The variation of the critical t/a ratio with the initial degree of
saturation of the infill is illustrated in Fig. 8 for wetting conditions. These critical values were
obtained from the diminishing trends of peak shear stress with increasing t/a ratio, for
instance, as shown in Fig. 9. Idealised joints tested with critical t/a values of 1.7 to 2.5 gave a
slightly non-linear relationship (3rd order polynomial) between the critical t/a ratio and the
initial degree of saturation of the infill, for the range of t/a values tested.
As (t/a)cr varies with the initial degree of saturation for the infilled joint, the
parameter ks was introduced to better describe the interference and non-interference zones.
Asperity interference occurs when the infill thickness ratio is less than the critical thickness
ratio (i.e., ks < 1). When ks > 1, the shear behaviour is governed solely by the infill material.
The decrease in peak shear strength with increasing t/a ratio is represented quite well by the
‘decay function’ introduced in Eqs. (6) and (9). As shown by Fig. 9, the laboratory test data
for the silty clay-infilled saw toothed joints with different initial degrees of saturation verifies
the mathematical model represented by Eqs. (10) to (12). The algebraic function A’
represents the decay of the maximum joint friction, while function B’ models the increasing
role of the infill angle of friction. The empirical parameters α and β for different initial
degrees of saturation determined using a regression analysis are tabulated with the respective
critical t/a ratios in Table 1.
The proposed peak shear strength model allows the shear strength of a given
combination of infill-joint profile at any t/a ratio and initial degree of saturation to be
determined, as long as the empirical constants α and β in Eqs. (6) and (9) can be evaluated
from the results of undrained laboratory tests. The required values of the basic friction angle
of the joint surfaces and the properties of the infill material can be determined by laboratory
tests, if estimates cannot be made from the available literature. The initial matric suction and
residual degree of saturation can be obtained using the soil-water characteristic curve of the
infill material.
6. SHEAR BEHAVIOUR OF REPLICATED NATURAL JOINTS AND MODEL
APPLICATION
The idealised joint profile used to develop the shear strength model has obvious
limitations when compared to natural joint behaviour. This section compares the relative
differences briefly, and offers an extension of the idealised joint model that can be applied to

15
natural joint profiles having a joint roughness coefficient (JRC) of 10 – 12. These joints were
obtained from the rock slide at Kangaroo Valley, New South Wales, and were replicated on
to gypsum plaster using silicone rubber (Fig. 10). The samples were 54 mm in diameter (as
were the idealised specimens) and a mean asperity amplitude (a) of 3.91 mm was measured
from the joint surface. The roughness amplitude or asperity height of the natural joint was
determined according to the ISRM [30] recommendations. Infill thickness (t) was measured
at least at ten points along the surface to obtain the mean infill thickness. Infill thickness to
asperity height ratio (t/a) was then determined using the mean values of asperity amplitude
and infill thickness. A series of constant water content triaxial tests was conducted on infilled
joints with natural roughness similar to that of the idealised filled joints at confining pressures
of 300, 500 and 900 kPa for (t/a) ratios of from 0.26 to 2.05, and water content from 35% to
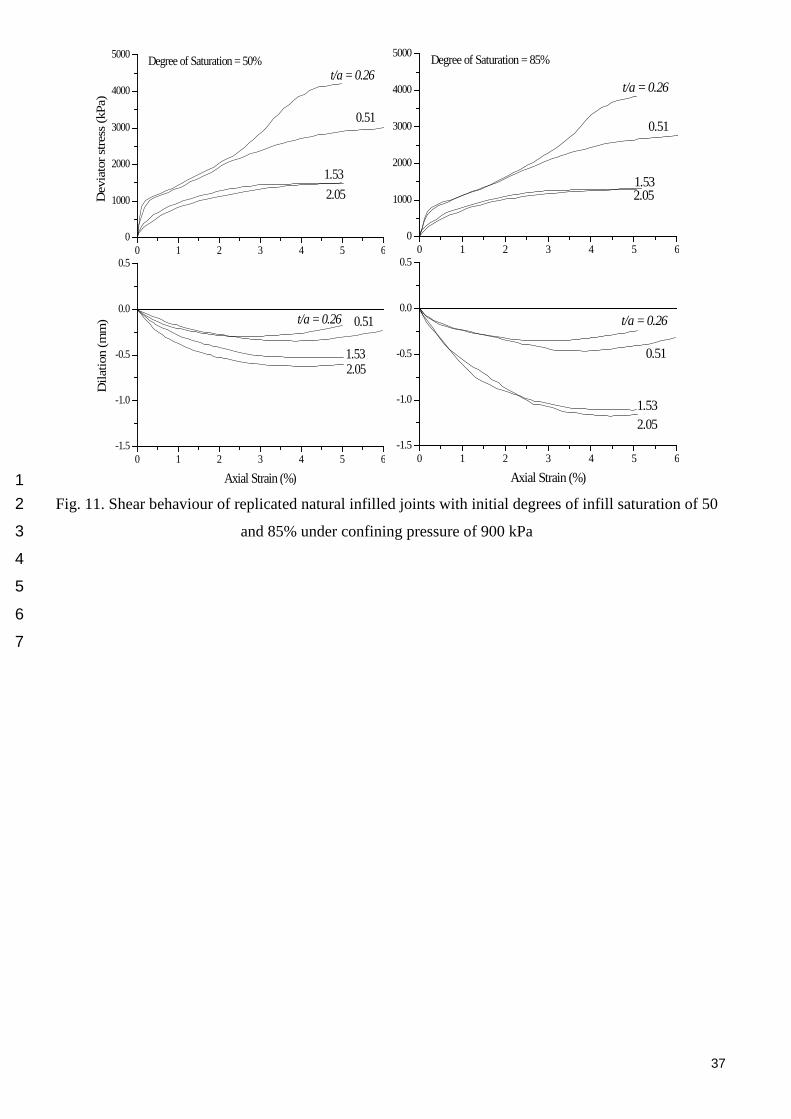
85%, giving a total of 63 tests. Since the shear strength and volumetric data for all confining
pressures showed similar trends, only the results for a confining pressure of 900 kPa are
given here as an example (Fig. 11).
Compared to the idealised shear strength data, a key feature of the replicated natural
joint testing is that the laboratory data does not show a distinct peak deviator stress even after
5% strain. This is because the shearing of the triangular asperities in the idealised joints
corresponds to a noticeable drop in the shear stress, while the spatially distributed asperities
of the natural joint profile do not show this marked strength drop. At lower normal stresses,
the asperities can mobilize the peak strength by sliding over each other. When the steepest
asperity is sheared off, the contacts will be moved to the next steepest asperity, and this
process will continue until a condition is reached where both sliding and shearing of
asperities occur simultaneously [31]. However, if the infill thickness is higher than a critical
value, the natural joints follow a similar trend to idealised joints, when the shear behaviour is
governed by the infill alone. For the natural joint with JRC = 10 -12, the (t/a)cr values varied
from 1.0 to 1.4 (Fig. 8). It is observed that the critical t/a ratios for both idealised joints and
natural joints with JRC = 10 – 12 show a slightly non-linear relationship (3rd order
polynomial) with the initial degree of saturation for the same infill material. At any given
confining pressure, the critical t/a ratios for idealised and natural joint profiles are different.
This is not surprising, because these ratios are governed by the joint characteristics,
especially the heights and distributions of the asperities. Idealised saw-tooth joints consisted
of an asperity height of 2 mm giving critical t/a ratios of from 1.7 to 2.5, corresponding to an
infill thickness varying from about 3.4 to 5.0 mm. In contrast, the replicated natural joints of
irregular profile had a mean asperity amplitude approaching 4 mm (i.e., almost double that of

16
idealised joints for similar infill thickness), corresponding to critical t/a ratios in the narrower
range of 1.0 – 1.4. It is also noteworthy that for the silty-clay infill, the critical t/a ratios
(Tables 1 and 2) are mainly dependent on the joint profile and the degree of infill saturation,
and less dependent on the applied confining pressure.
The peak shear strength of a filled joint having a natural profile can be predicted using
the model developed for idealised joints with a subtle extension. For a general soil infilled
joint with partially saturated infill, the peak unsaturated shear strength (τp,unsat) can be
expressed as:
'''', BAunsatp +=τ (13)
where, A” is the strength contribution of the joint surfaces and B” is the strength contribution
of the infill material.
The function A’ in the idealised model that reflects Patton’s [25] equation for a clean
idealised joint can be modified by introducing the joint roughness characteristics proposed by
Barton & Choubey [32]. For an irregular clean joint Barton & Choubey [32] proposed a
model to predict its peak shear strength using the Joint roughness coefficient:
( )( )nbnp JCSJRC σφστ /logtan +=
(14)
where, τp is the peak shear strength, σn is the normal stress, JRC is the joint roughness
coefficient, JCS is the Joint wall compressive strength and ϕb is the basic friction angle. This
equation gives a better application than to Patton’s [25] equation as the term “i” in Patton’s
equation does not account for the irregularity of the joint profile.
For ks < 1 in the ‘interference zone’, the function A’ of the idealised model is
extended to A” to capture the natural joint profile as:
( )( )[ ] ( )ασφσ snbn kJCSJRCA −+= 1/logtan" (15)
where, JRC is the Joint roughness coefficient and JCS is the joint wall compressive strength.
Function B” is only dependent on soil parameters and it is not dependent on the joint
surface profile. Hence, the function B” would be the same as function B’ of the original
model.
( )[ ]β
φσ
+
−+=s
ant kucB
/112'tan"
(16)
where, ( ) ( )
−−
−+=res
reswat S
SSruucc
100'tan' φ
(17)

17
( )( )[ ] ( ) ( )[ ]β
α φσσφστ
+
−++−+=s
antsnbnunsatp kuckJCSJRC
/112'tan1/logtan,
(18)
For the non-interference zone (ks > 1), where the shear strength is governed only by the infill
material,
( )[ ]'tan, φστ antunsatp uc −+= (19)
Fig. 12 shows the validation of the model over an irregular (natural) joint profile with
JRC of 10 – 12 for different degrees of infill saturation. It can be observed that the proposed
model (Eqs 18-19) gives a good agreement with the laboratory triaxial data obtained for
natural joint replicas. The empirical parameters α and β for different degrees of saturation
were determined by multiple regression analysis similar with the idealised joints and are
presented in Table 2.
7. PRACTICAL IMPLICATIONS: JOINTED ROCK SLOPE STABILITY
The use of the proposed model for natural joint profiles in a practical situation is
illustrated using a simplified slope analysis problem as presented in Fig. 13 (a), where a
potentially unstable rock wedge from Kangaroo Valley, New South Wales, Australia, is
considered with simplified boundaries. The rock strata consisted mainly of sandstone and the
joint infill was primarily composed of sandy silt and/or sandy clay depending on the elevation
above the ground level below the slope. The strata close to the ground level were
significantly wetter than the upper slopes. More information on Kangaroo Valley jointed rock
is given by Indraratna & Haque [33]. In the current analysis, an irregular rock joint of JRC =
11 defining a wedge of weight W (simplified to 2D plane strain) with a slope angle of λ and
height H was considered, having a sediment-infilled joint at a dip angle of θ (Fig. 13a). For a
unit length normal to the plane of Fig. 13 (a), the weight of the wedge W with unit weight γ
can be simplified to:
( ) ( )[ ]λθγ cotcot5.0 2 −= HW (20)
Considering a surcharge load F applied to the upper boundary of the wedge, the factor
of safety (FS) for sliding can be found by limit equilibrium as:
( )[ ]( ) ( )θθ
θτsinsin
sin/FW
HFS+
=
(21)
where, τ is the resisting shear stress along the joint described by Eq. 18. The geometry of this
particular rock wedge is approximated by H = 30.5 m, γ = 27.5 kN/m3, λ = 80o and θ = 45o
[33]. As the length of the wedge is large compared to its width and height, the wedge stability

18
can be conveniently analysed assuming 2D (plane strain).
The clay-infilled joint model for a t/a = 0.7 with the corresponding model parameters
given in Table 2 was used to calculate the FS for different infill saturation of the wedge
subjected to a surcharge load F = 245 kN applied by the passage of a typical freight train. The
value of FS increased significantly from 1.07 to 1.34 with the decrease of infill saturation
from 85% to 35% (Fig. 13b). If the joint infill is fully saturated, the wedge is unstable as FS
approaches unity, and the joint plane would require stabilisation, for example by rock bolting.
In the case of relatively dry infill (Sr < 40%), the wedge would have a FS > 1.3. Not
surprisingly, the FS of the wedge becomes asymptotic between the upper bound at which the
infill is totally dry and the lower bound where the infill is fully saturated. This simplified
example of the Kangaroo Valley rock wedge demonstrates the benefits of unsaturated infill
existing within joints compared to the conservative assumption of fully saturated joints that is
often adopted in the design of jointed rock slopes. In actual practice, the sandy clay infill in
Kangaroo Valley had degrees of saturation varying for 100% in the lower most terrain to
40% in joints at higher elevations of the sandstone rock stratum.
8. MODEL LIMITATIONS
• The use of idealised saw toothed joint profiles in the experimental program was justified
by the need to carry out repetitive, reproducible tests with simple geometric profiles, in
order to understand and formulate a conceptual model. Even though meaningful data
could be obtained from these idealised profiles, they do not accurately represent the shear
behaviour of natural joint surfaces that may be irregular and or wavy. Although some
steps have been taken by the authors to replicate and test natural joint profiles, there are
still limitations due to the narrow range of JRC (10-12) examined in this study.
Therefore, further testing of different irregular joint profiles with different natural infills
is required to validate the proposed models more comprehensively.
• Scale effects (the effects of changes in joint surface wave length and asperity height) were
not studied.
• The effects of different infill material, parent rock type and the extent of joint weathering
were not considered in this study.
• The roughness of the joints were characterised using JRC considering the 2D roughness
only. An additional design parameter should be introduced for a comprehensive 3D shear
analysis of rock joints

19
The joints with silty clay infill alone cannot represent the entire range of joint types
and infill materials represented in nature. Despite the advances the proposed model has
demonstrated over previously existing models of infilled joints by capturing the role of infill
unsaturation, its application is still constrained by the limitations summarised above.
9. CONCLUSIONS
This paper has discussed the influence of the initial degree of saturation of the infill
and the ratio of infill thickness to asperity height (t/a) on the shear strength of idealised saw
toothed and natural silty clay-infilled joints. The experimental results obtained highlight how
the t/a ratio contribute to a reduction of the shear strength from the maximum value
associated with clean rough joints. The shear strength behaviour is governed by t/a up to a
critical thickness after which there is no significant change in strength. Further, for infill
thickness exceeding this critical thickness, the influence of asperities is suppressed and the
shear behaviour is mainly governed by the infill.
The effect of initial degree of saturation of the infill material also has an important
effect on the shear strength. Indeed, it was observed that as the degree of saturation increases,
both the shear strength and the joint dilation decrease. The effect of the confining pressure is
also shown by the test data obtained under three different confining pressures, 300 kPa, 500
kPa, and 900 kPa. There is an apparent increase in shear strength when the confining pressure
is increased. When the thickness of the infill is very low (ks < 1), the stress-strain behaviour is
influenced by asperity interference and the peak shear strength is governed by rock-to-rock
contact. Due to asperity interference, joint dilation can be observed in the interference zone.
The ratio (t/a)cr varies with the initial degree of saturation of the infill. It ranges from 1.7 to
2.5 as the initial degree of saturation increases from 35% to 85%. For relatively thick infills
(ks > 1), the influence of the asperities is suppressed and shearing takes place only through the
infill. Therefore, no dilation was observed in the laboratory for the non-interference zone.
Additional tests were performed to evaluate the similarity of the shear strength data obtained
with idealised saw-tooth joints to replicated natural joints (JRC = 10- 12). The results
indicated that similar trends are obtained for both types of joints except that a clear second
stage is absent for the natural joints. This is attributed to the spatial variation of asperities
over the natural profile. As for idealised joints, the peak shear strength of natural joints
decreases with an increase in the initial degree of saturation Also, for the same variation of
degree of saturation, the critical (t/a) ratio varies from 1.0 to 1.4 in a similar manner to the

20
idealised joints. For both idealised and natural joints, critical (t/a) ratios show a slightly non-
linear relationship with the degree of saturation. The current study proposed a conceptual
model initially developed for idealised joints with varying degrees of saturation, that could be
conveniently modified to suit the natural joint profile of JRC = 10-12. In addition, the
stability study of potential rock wedge of Kangaroo Valley showed that the degree of
saturation of the infill governs the stability, highlighting important practical implications of
compacted infill rock joints. While this study provides insightful results of the behaviour of
infill saturation on the overall rock joint shear strength behaviour further studies with
different infill materials that may yield different water retention characteristics are
recommended.
ACKNOWLEDGEMENT
The Authors wish to acknowledge the contributions of Alan Grant (Technical Officer,
University of Wollongong) during the laboratory testing program. The second author would
like to thank the Endeavour Postgraduate Awards program for their financial support. The
previous research in this area conducted by former PhD candidates at University of
Wollongong (Dr. A. Haque, Dr. H.S. Welideniya, Dr. M. Jayanathan and Dr. D.A.F.
Oliveira) is gratefully acknowledged. Support from the ARC Centre of Excellence for
Geotechnical Science and Engineering is also acknowledged.

21
REFERENCES
[1] Barton N. A review of the shear strength of filled discontinuities in rock. Norwegian
Geotechnical Institute Publication 1974.
[2] Elsworth D. A model to evaluate the transient hydraulic response of three‐dimensional
sparsely fractured rock masses. Water Resources Research 1986; 22:1809-1819.
[3] Ladanyi B, Archambault G. Shear strength and deformability of filled indented joints.
Proc International Symposium on the Geotechnics of Structurally Complex Formations.
Capri 1977; 317-326.
[4] Lama RD. Influence of clay fillings on shear behaviour of joints. Proc 3rd Int Assoc
Engng Geol Madrid 1978: . 27-34.
[5] Pereira JP. Mechanics of filled discontinuities. Proceedings of the International
Conference on Mechanics of Jointed and Faulted Rock 1990:375-380.
[6] de Toledo PEC, de Freitas MH. Laboratory testing and parameters controlling the shear-
strength of filled rock joints. Géotechnique 1993; 43:1-19.
[7] Indraratna B, Welideniya HS, Brown ET. A shear strength model for idealised infilled
joints under constant normal stiffness. Géotechnique 2005; 55:215-226.
[8] Indraratna B, Jayanathan M, Brown ET. Shear strength model for overconsolidated clay-
infilled idealised rock joints. Géotechnique 2008; 58:55-65.
[9] Indraratna B, Oliveira DAF, Brown ET. A shear-displacement criterion for soil-infilled
rock discontiinuities. Géotechnique 2010; 60:623-633.
[10] Alonso E, Zandarín M, Olivella S. Joints in unsaturated rocks: thermo-hydro-mechanical
formulation and constitutive behaviour. J Rock Mech and Geotech Eng 2013; 5:200-213.
[11] Zandarin MT, Alonso E, Olivella S. A constitutive law for rock joints considering the
effects of suction and roughness on strength parameters. Int J Rock Mech Min Sci 2013;
60:333-344.
[12] Thu TM, Rahardjo H, Leong E-C. Shear strength and pore-water pressure characteristics
during constant cater content triaxial tests. J Geotech and Geoenvir Eng, ASCE 2006;
132:411-419.
[13] Hamid TB, Miller GA. Shear strength of unsaturated soil interfaces. Can Geotech J
2009; 46:595-606.
[14] Indraratna B., Development and applications of a synthetic material to simulate soft
sedimentary rocks. Géotechnique 1990; 40:189-200.
[15] Standards Australia. Soil strength and consolidation tests - Determination of the shear
strength of a soil - Direct shear test using a shear box. AS 12896221998.

22
[16] Indraratna B, Haque A, Aziz NI. Shear behaviour of idealised infilled joints under
constant normal stiffness. Géotechnique 1999; 49:331-355.
[17] Oloo SY, Fredlund DG. A method for determination of phi(b) for statically compacted
soils. Can Geotech J 1996; 33:272-280.
[18] Fredlund DG, Rahardjo H, Fredlund MD. Unsaturated soil mechanics in engineering
practice. 1st ed. New York: Wiley-Interscience; 2012.
[19] ASTM. Standard Test Methods for Determination of the Soil Water Chararcteristic
Curve for Desorption Using a Hanging Column, Pressure Extractor, Chilled Mirror
Hygrometer, and/or Centrifuge. West Conshohocken, PA: ASTM International; 2008.
[20] van Genuchten MT. A closed-form equation for predicting the hydraulic conductivity of
unsaturated soils Soil Sci Soc Am J 1980; 44:892-898.
[21] Tarantino A, Tombolato S. Coupling of hydraulic and mechanical behaviour in
unsaturated compacted clay. Géotechnique 2005; 55:307-317.
[22] Rahardjo H, Heng OB, Choon LE. Shear strength of a compacted residual soil from
consolidated drained and constant water content triaxial tests. Canadian Geotechnical Journal.
2004; 41:421-436.
[23] Phien-wej N, Shrestha U, Rantucci G. Effect of infill thickness on shear behaviour of
rock joints. In: Barton NR, Stephansson O, editors. Rock Joints: Proceedings of the
international conference on rock joints: Balkema; 1990: 289-294.
[24] Papaliangas T, Hencher SR, Lumsden AC, Manolopoulou S. The effect of frictional fill
thickness on the shear strength of rock discontinuities. Int J Rock Mech Min Sci & Geomech
Abstr 1993; 30:81-91.
[25] Patton FD. Multiple modes of shear failure in rock and related materials. PhD thesis,
Urbana: University of Illinois; 1966.
[26] Bishop AW, Alpan I, Blight GE, Donald IB. Factors controlling the shear strength of
partly saturated cohesive soils. Proceedings, ASCE research conference on shear strength of
cohesive soils. University of Colarado, Boulder, CO., 1960: 503-532.
[27] Vanapalli SK, Fredlund DG, Pufahl DE. The relationship between the soil-water
characteristic curve and the unsaturated shear strength of a compacted glacial till. Geotech
Testing J 1996; 19:259-268.
[28] Sheng D, Fredlund DG, Gens A. A new modelling approach for unsaturated soils using
independent stress variables. Can Geotech J 2008; 45:511-534.
[29] Gens, A. Soil-environment interaction in geotechnical engineering. Géotechnique 2010;
60: 3-74.

23
[30] ISRM (International Society for Rock Mechanics). Suggested methods for the
quantitative description of discontinuites in rock masses. Rock characterisation, testing and
monitoring – ISRM suggested methods, E. T. Brown ed., Pergamon: Oxford; 1981: 319-368.
[31] Kimura T, Esaki T. A new model for the shear strength of rock joints with irregular
surfaces. In: Rossmanith HP, editor. Mechanics of jointed and faulted rock. Rotterdam:
Balkema; 1995: 133-137.
[32] Barton N, Choubey V. The shear strength of rock joints in theory and practice. Rock
Mech Rock Eng 1977; 10:1-54.
[33] Indraratna B, Haque A. Shear behaviour of rock joints. Rotterdam: Balkema; 2000.

24
LIST OF TABLES 1
Table 1. Empirical constants and critical t/a ratios for different infill saturations for idealised 2
saw-tooth joints 3
Table 2. Empirical constants and critical t/a ratios for different infill saturations for replicated 4
natural joints 5
6
LIST OF FIGURES 7
Fig. 1. . (a) The mould and (b) simulated joint surface profile of the idealised saw toothed 8
joint (c) with the infill material 9
Fig. 2. High Pressure Triaxial Apparatus for Rock Joint Shearing, designed and built at 10
University of Wollongong 11
Fig.3. Soil-water characteristic curve for the infill material 12
Fig. 4. Shear behaviour of idealised infilled joints with different initial degrees of infill 13
saturation under confining pressure of 900 kPa 14
Fig. 5. Comparison of shear behaviour of infilled rock joints and infill alone at a confining 15
pressure of 900 kPa 16
Fig. 6. Conceptual normalised shear strength model for infilled rock joints (modified from 17
Indraratna et al., 2005) 18
Fig 7. Extended peak shear strength model including the effect of infill saturation 19
Fig. 8. Variation of critical (t/a) ratio with initial degree of saturation 20
Fig. 9. Verification of shear strength model with experimental data for infill saturations of (a) 21
50%, (b) 85% 22
Fig. 10 (a). Natural joint profile used for laboratory testing, (b) Section A-A: (Arrow indicates 23
the shearing direction), (c) Section B-B 24
Fig. 11. Shear behaviour of replicated natural infilled joints with different initial degrees of 25
infill saturation under confining pressure of 900 kPa 26
Fig. 12. Validation of shear strength model with experimental data for replicated natural joint 27
profiles for infill saturations of (a) 50%, (b) 85% 28
Fig. 13 (a) Rock slope with a soil infilled discontinuity, (b) Factor of safety with the degree of 29
saturation of the infill and initial matric suction 30
31

25
1
Table 1. Empirical constants and critical t/a ratios for different infill
saturations for idealised saw-tooth joints
Degree of saturation
(water content, %)
(t/a)cr α β
35% (15%) 1.7 1.2 2.5
50% (20%) 1.9 1.4 2.2
60% (25%) 2.1 1.6 1.9
70% (30%) 2.3 1.8 1.7
85% (35%) 2.5 2.0 1.5
2
3
4
5
6

26
Table 2. Empirical constants and critical t/a ratios for different infill saturations for 1
replicated natural joints 2
Degree of saturation
(water content, %)
(t/a)cr α β
35% (15%) 1.0 1.3 3.0
50% (20%) 1.1 1.5 2.6
60% (25%) 1.2 1.7 2.3
70% (30%) 1.3 2.0 1.8
85% (35%) 1.4 2.2 1.5
3
4
5

27
1
2
3
4 (a) (b) (c) 5
Fig. 1. (a) The mould and (b) simulated joint surface profile of the idealised saw toothed joint 6
(c) with the infill material. 7
8
9
10
11
60o
28
1
2
3
4
5
Fig. 2. High Pressure Triaxial Apparatus for Rock Joint Shearing, designed and built at 6
University of Wollongong 7
8

29
1 10 100 1000 10000
0
20
40
60
80
100( )
328.0245.2004.0
11
===
+=Θ
mn
kPa
s
m
n
α
α
Chilled mirror hygrometer
Degr
ee o
f sat
urat
ion
(%)
Matric suction,s (kPa)
Pressure plate Chilled mirror hygrometer
Pressure plate
1 Fig.3. Soil-water characteristic curve for the infill material. 2
3
4
5
6

30
0 1 2 3 4 50
1000
2000
3000
4000
5000
6000
0 1 2 3 4 5-1.5
-1.0
-0.5
0.0
0.5
1.0
1.5
Degree of saturation = 50%D
evia
tor S
tress
(kPa
)
Axial Strain (%)
t/a = 0.5
1.0
3.0
(a)
t/a = 0.5
Dila
tion
(mm
)
Axial Strain (%)
1.0
3.0
(d) 1
Fig. 4. Shear behaviour of idealised infilled joints with different initial degrees of infill saturation 2
under confining pressure of 900 kPa. 3
4 5 6 7 8 9 10 11
(b)
(c) (d)

31
0 5 10 150
1000
2000
3000
4000
5000
6000
t/a = 0.5 50% 70% 85% 100%
t/a = 3.0
t/a = 1.0
Devi
ator S
tress
(kPa
)
Axial Strain (%)
Infill alone
Degree of saturation (S)
1 Fig. 5. Comparison of shear behaviour of infilled rock joints and infill alone at a confining 2
pressure of 900 kPa. 3
4
5
32
1
2
Fig. 6. Conceptual normalised shear strength model for infilled rock joints (modified from 3
Indraratna et al., 2005). 4
5
6
33
1
ks 1 0
B’n2
A’n1
A’n2
B’n1
S = n1%
S = n2%
Clean joint strength
Peak
shea
r stre
ngth
, τp
Non-interfering zone ks >1
Interfering zone ks <1
2
Fig 7. Extended peak shear strength model including the effect of infill saturation. 3
4
5
6

34
1
Fig. 8. Variation of critical (t/a) ratio with initial degree of saturation
2
0.4 0.5 0.6 0.7 0.8 0.9
1.0
1.2
1.4
1.6
1.8
2.0
2.2
2.4
2.6
(t/a)cr=1.4 - 3.08 S0+6.86 S 20-3.81 S 3
0
(t/a)cr=2.5 - 6.15 S0+13.71 S 20-7.62 S 3
0
(t/a)
cr
Initial degree of saturation (S0)
Idealised saw-tooth
Natural

35
1
0 0.5 1.0 1.5 2.0 2.5
500
1000
1500
2000
2500
3000
3500
4000
4500
5000
5500
300 kPa 500 kPa 900 kPa
Peak
she
ar s
tress
(kPa
)
ks
Degree of Saturation = 50%α = 1.4β = 2.2(t/a)cr=1.9Asperity
Interference zone
Non-interference zone
Experimental dataPredicted curve
900 kPa
500 kPa
300 kPa
(a)
2
0 0.5 1.0 1.5 2.0 2.5
500
1000
1500
2000
2500
3000
3500
4000
4500
5000
5500
300 kPa 500 kPa 900 kPa
Peak
she
ar s
tress
(kPa
)
ks
Degree of Saturation = 85%α = 2.0β = 1.5(t/a)cr= 2.5Asperity
Interference zone
Non-interference zone
Experimental dataPredicted curve
900 kPa
500 kPa
300 kPa
(b)
3 Fig. 9. Verification of shear strength model with experimental data for infill saturations of (a) 4
50%, (b) 85% 5
6

36
1
A
A
B B
2
(a) (b) (c) 3
Fig. 10(a). Natural joint profile used for laboratory testing, (b) Section A-A: (Arrow 4
indicates the shearing direction), (c) Section B-B 5
6
7
8
9
37
0 1 2 3 4 5 60
1000
2000
3000
4000
5000
0 1 2 3 4 5 6-1.5
-1.0
-0.5
0.0
0.5
Degree of Saturation = 50%
Dev
iato
r stre
ss (k
Pa)
t/a = 0.26
0.51
1.532.05
0.51t/a = 0.26
1.532.05
Dila
tion
(mm
)
Axial Strain (%)
0 1 2 3 4 5 60
1000
2000
3000
4000
5000
0 1 2 3 4 5 6-1.5
-1.0
-0.5
0.0
0.5
Degree of Saturation = 85%
0.51
t/a = 0.26
1.532.05
Axial Strain (%)
0.51
t/a = 0.26
1.532.05
1 Fig. 11. Shear behaviour of replicated natural infilled joints with initial degrees of infill saturation of 50 2
and 85% under confining pressure of 900 kPa 3
4
5
6
7

38
1
0 0.5 1.0 1.5 2.0 2.5
500
1000
1500
2000
2500
3000
3500
4000
4500
5000
300 kPa 500 kPa 900 kPa
Peak
She
ar S
tress
(kPa
)
ks
Non-interference zone
Asperity Interference zone
Degree of Saturation = 50%α = 1.5β = 2.6(t/a)cr=1.1
Experimental dataPredicted curve
900 kPa
500 kPa
300 kPa
(a)
2
0 0.5 1.0 1.5 2.0 2.5
500
1000
1500
2000
2500
3000
3500
4000
4500
5000
300 kPa 500 kPa 900 kPa
(d)
Peak
She
ar S
tress
(kPa
)
ks
Degree of Saturation = 85%α = 2.2β = 1.5(t/a)cr=1.4Asperity
Interference zone
Non-interference zone
Experimental dataPredicted curve
900 kPa
500 kPa
300 kPa
3 4
Fig. 12. Validation of shear strength model with experimental data for replicated natural joint 5
profiles for infill saturations of (a) 50%, (b) 85% 6
7
8
9
10
(b)

39
1
2
H = 30.5 m N
S W
𝜆𝜆
𝜃𝜃
Soil-infilled joint (JRC=11)
F
25.13 m
3
Fig. 13 (a) Rock slope with a soil infilled discontinuity 4
0 1000 2000 3000 4000
1
1.1
1.2
1.3
1.4
0.2 0.4 0.6 0.8 1
Fact
or o
f saf
ety
Degree of infill saturation, Sr
Initial matric suction (kPa)
Joints with dry infill (Sr =0)
Joints with fully saturated infill
2120 0200390780
5
Fig. 13 (b) Factor of safety with the degree of saturation of the infill and initial matric suction 6
7
8
9
Copyright © 2022 FDOKUMEN