Investigation on Functional, Thermo-Mechanical, and Bread ...
Upload
independentCategory
view
3download
0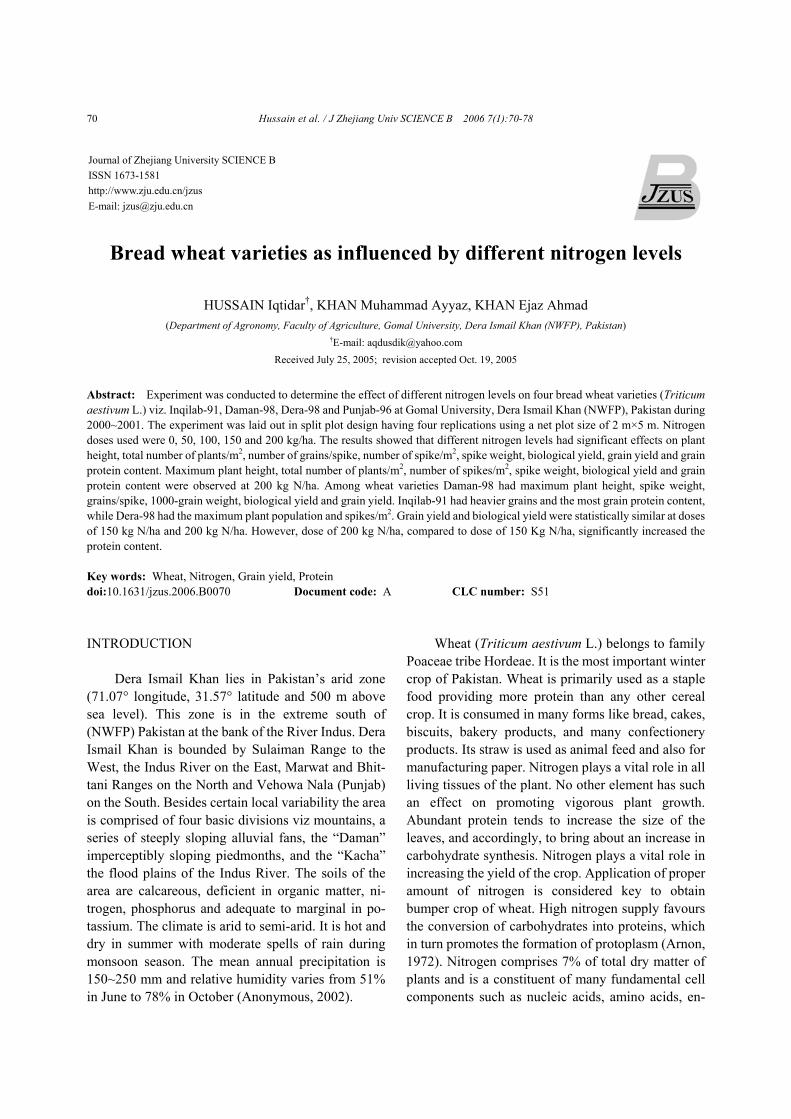
Hussain et al. / J Zhejiang Univ SCIENCE B 2006 7(1):70-78 70
Bread wheat varieties as influenced by different nitrogen levels
HUSSAIN Iqtidar†, KHAN Muhammad Ayyaz, KHAN Ejaz Ahmad (Department of Agronomy, Faculty of Agriculture, Gomal University, Dera Ismail Khan (NWFP), Pakistan)
†E-mail: [email protected] Received July 25, 2005; revision accepted Oct. 19, 2005
Abstract: Experiment was conducted to determine the effect of different nitrogen levels on four bread wheat varieties (Triticum aestivum L.) viz. Inqilab-91, Daman-98, Dera-98 and Punjab-96 at Gomal University, Dera Ismail Khan (NWFP), Pakistan during 2000~2001. The experiment was laid out in split plot design having four replications using a net plot size of 2 m×5 m. Nitrogen doses used were 0, 50, 100, 150 and 200 kg/ha. The results showed that different nitrogen levels had significant effects on plant height, total number of plants/m2, number of grains/spike, number of spike/m2, spike weight, biological yield, grain yield and grain protein content. Maximum plant height, total number of plants/m2, number of spikes/m2, spike weight, biological yield and grain protein content were observed at 200 kg N/ha. Among wheat varieties Daman-98 had maximum plant height, spike weight, grains/spike, 1000-grain weight, biological yield and grain yield. Inqilab-91 had heavier grains and the most grain protein content, while Dera-98 had the maximum plant population and spikes/m2. Grain yield and biological yield were statistically similar at doses of 150 kg N/ha and 200 kg N/ha. However, dose of 200 kg N/ha, compared to dose of 150 Kg N/ha, significantly increased the protein content. Key words: Wheat, Nitrogen, Grain yield, Protein doi:10.1631/jzus.2006.B0070 Document code: A CLC number: S51 INTRODUCTION
Dera Ismail Khan lies in Pakistan’s arid zone (71.07° longitude, 31.57° latitude and 500 m above sea level). This zone is in the extreme south of (NWFP) Pakistan at the bank of the River Indus. Dera Ismail Khan is bounded by Sulaiman Range to the West, the Indus River on the East, Marwat and Bhit-tani Ranges on the North and Vehowa Nala (Punjab) on the South. Besides certain local variability the area is comprised of four basic divisions viz mountains, a series of steeply sloping alluvial fans, the “Daman” imperceptibly sloping piedmonths, and the “Kacha” the flood plains of the Indus River. The soils of the area are calcareous, deficient in organic matter, ni-trogen, phosphorus and adequate to marginal in po-tassium. The climate is arid to semi-arid. It is hot and dry in summer with moderate spells of rain during monsoon season. The mean annual precipitation is 150~250 mm and relative humidity varies from 51% in June to 78% in October (Anonymous, 2002).
Wheat (Triticum aestivum L.) belongs to family Poaceae tribe Hordeae. It is the most important winter crop of Pakistan. Wheat is primarily used as a staple food providing more protein than any other cereal crop. It is consumed in many forms like bread, cakes, biscuits, bakery products, and many confectionery products. Its straw is used as animal feed and also for manufacturing paper. Nitrogen plays a vital role in all living tissues of the plant. No other element has such an effect on promoting vigorous plant growth. Abundant protein tends to increase the size of the leaves, and accordingly, to bring about an increase in carbohydrate synthesis. Nitrogen plays a vital role in increasing the yield of the crop. Application of proper amount of nitrogen is considered key to obtain bumper crop of wheat. High nitrogen supply favours the conversion of carbohydrates into proteins, which in turn promotes the formation of protoplasm (Arnon, 1972). Nitrogen comprises 7% of total dry matter of plants and is a constituent of many fundamental cell components such as nucleic acids, amino acids, en-
Journal of Zhejiang University SCIENCE B ISSN 1673-1581 http://www.zju.edu.cn/jzus E-mail: [email protected]
Hussain et al. / J Zhejiang Univ SCIENCE B 2006 7(1):70-78 71
zymes, and photosynthetic pigments (Bungard et al., 1999). Ayoub et al.(1994) reported that spilt N ap-plication had little effect on yield, but decreased lodging and spike population, while grain weight increased. Nitrogen application at 120 kg/ha for wheat has been recommended by various research workers (Lathwal et al., 1992; Das et al., 1993). Ge-leto et al.(1995) reported that spike numbers and grain weight were increased with high level of ni-trogen. Singh and Uttam (1992) recorded increased grain yield with increase in nitrogen level.
The author is not aware of any reports of re-search on the effect of allelopathy of Eucalyptus camaldulensis on protein content of wheat under the climatic conditions of Dera Ismail Khan (NWFP) Pakistan. However, various research workers had shown the allelopathic effects on gain yield and yield components of wheat. Putname (1984) reported that Eucalyptus species released volatile compounds such as benzoic, cinnamic, and phenolic acids, which in-hibit growth of crops and weeds growing near it. Bisal et al.(1992), Lisanework and Michelson (1993), Schuman et al.(1995) reported that Eucalyptus camaldulensis has harmful effects on germination, and seedling growth of wheat, barley, chickpea, mustard and many weeds.
In view of the above findings it was imperative to conduct experiment involving different wheat va-rieties with regard to their response to low and high nitrogen levels in order to obtain the potential grain yield of these varieties. Another objective was to ascertain the effect of nitrogen application on the protein contents of the tested varieties in the fields surrounded by Euclyptus camaldulensis trees since 1967 in Dera Ismail Khan (NWFP) Pakistan’s cilmate. It was very important to know whether the behaviour of nitrogen and/or the wheat grain protein content are adversely affected or not under the above mentioned conditions. MATERIALS AND METHODS
A field experiment was conducted under the shade of Euclyptus camaldulensis trees to determine the effect of different nitrogen doses on four varieties of wheat viz. Daman-98, Punjab-96, Dera-98, and Inqilab-91 at the agronomic research area of the
Faculty of Agriculture, Gomal University, Dera Is-mail Khan (NWFP) Pakistan during 2000~2001. The design used was split plot with four replications. The sub-plot size was 2 m×5 m. Nitrogen was applied at the rate of 0 (control), 50, 100, 150 and 200 kg/ha. Half of the nitrogen was applied at the time of sowing, with the remaining half applied during the initial irrigation. A basal 55 kg/ha dose of phosphorus was applied to all treatment plots before sowing. The crop received five irrigations in all. The crop was irrigated first at the time of tillering and formation of adventi-tious roots followed by a second irrigation at anthesis stage, a third irrigation at milking stage, a fourth ir-rigation at the time of spike emergence and a last irrigation at dough stage. The amount of each irriga-tion was four acre inches, so twenty acre inches of water was applied throughout the growing period of wheat. Weedicide namely, “Quatro”, at the rate of 1.8 liter per hectare was sprayed before the tillering stage of wheat to control weeds. Urea and single super phosphate were used as source of nitrogen, and phosphorus, respectively. All other agronomic prac-tices were kept uniform for all treatments.
Parameters observed during the course of study were:
1. Final plant height (cm) at maturity Twenty tillers were selected at random from
each plot at 3 places, their heights were measured in cm and means were taken.
2. Number of plants/m2 and spikes/m2
An area of 1 m2 was selected at random at 3 places in each plot to count total number of plants and spikes, average was used in the statistical analysis.
3. Spike length (cm) and grains per spike (No.) Ten spikes were randomly selected from each
unit area in each plot. Each spike was measured with scale from the base to the apex to record the spike length in cm. To record the grains per spike, each spike was threshed separately and grains of each spike were counted and averaged.
4. 1000-grain weight (g) Thousand grains were counted at random from
each plot and their weights were taken with a spring balance.
5. Biological yield (t/ha) and grain yield (t/ha) Whole plots were harvested and tied into bun-
dles. Biological yield was recorded by weighing the bundles of each plot with spring balance.
Hussain et al. / J Zhejiang Univ SCIENCE B 2006 7(1):70-78 72
The bundles were first sun-dried and then threshed by a thresher. The grain weight was recorded in kg and then subsequently converted into t/ha.
6. Grain protein content (%) Grain protein contents were determined by Mi-
crokjeldahl method by taking sample of 500 seeds from each plot and grinding them. The digestion was done by Gunning and Hibherds H2SO4 method (Ahmad et al., 2001) and distillation was done by Microkjeldahl apparatus (Jackson, 1962) to determine seed nitrogen contents. Thereafter protein content was calculated by multiplying nitrogen contents in seed with a constant factor of 5.71 (Peter and Young, 1980).
Data recorded were analyzed using ANOVA technique (Steel and Torrie, 1984).
RESULTS AND DISCUSSION Plant height (cm)
Table 1 data show that there were significant differences in plant height among the four wheat cultivars i.e. Daman-98, Punjab-96, Dera-98 and Inqilab-91. The amount of nitrogen also significantly affected plant height. Interaction was non-significant among the four cultivars and the five nitrogen doses. Plant height increased, with increasing nitrogen level from the control level to 200 kg/ha. Maximum plant
height (82.2 cm) was recorded when nitrogen dose was 200 kg/ha, while minimum plant height (65.6 cm) was recorded in the control. The plant height for the four cultivars averaged over doses of nitrogen showed that Daman-98 had maximum plant height (87.4 cm) while Dera-98 had the minimum plant height (63.3 cm). The interaction between nitrogen and the culti-vars was found to be non-significant. However, maximum plant height (92.8 cm) was recorded for Daman-98 when nitrogen dose was 150 kg/ha, while Dera-98 had minimum plant height (53.5 cm) with 0 kg/ha N was applied. These results are supported by the findings of Saleem (1987) and Khan et al.(2000) who reported that increasing the level of nitrogen increased the plant height. Plant population per meter square
Table 2 data show that there were significant differences in plants per meter square of the four wheat cultivars. The amount of nitrogen also signifi-cantly affected the number of plants per meter square. Interaction among the four cultivars and the five ni-trogen doses was non-significant. Number of plants per meter square increased from the control level of nitrogen to 200 kg/ha. Maximum number of plants per meter square (351.4) was recorded when dose was 200 kg/ha. While the minimum number of plants per meter square (189.8) was recorded in control. The tillers per meter square for the four cultivars averaged
Table 1 Plant height (cm) in wheat varieties as affected by different nitrogen levels Nitrogen levels (kg/ha) Daman-98 Punjab-96 Dera-98 Inqilab-91 Means
0 78.5* 64.9 53.5 65.7 65.6c 50 86.7 80.4 60.6 77.6 76.3b 100 91.0 85.9 68.7 82.6 82.0a 150 92.8 81.0 65.7 84.8 81.1a 200 87.8 85.9 67.8 87.2 82.2a
Means 87.4a 79.6b 63.3c 79.6b *Non-significant; CV.=8.15%; Means not sharing a letter in common differ significantly at 5% level of probability
Table 2 Plant population/m2 of wheat varieties as affected by different nitrogen levels Nitrogen levels (kg/ha) Daman-98 Punjab-96 Dera-98 Inqilab-91 Means
0 158.3* 152.8 211.8 236.5 189.8c 50 219.5 234.3 306.0 323.3 270.8b 100 267.5 315.5 373.3 310.3 316.6ab 150 279.3 278.8 333.5 336.5 307.0ab 200 281.6 299.0 456.8 368.5 351.4a
Means 241.2 b 256.1b 336.3a 315.0ab *Non-significant; CV.=20.51%; Means not sharing a letter in common differ significantly at 5% level of probability
Hussain et al. / J Zhejiang Univ SCIENCE B 2006 7(1):70-78 73
over doses of nitrogen showed that Dera-98 produced the maximum number of plants per meter square (336.3) followed by Inqilab-91 (315) and Punjab-96 (256.1). Daman-98 produced the lowest number of plants per meter square (241.2).
Interaction between the nitrogen and the culti-vars was found to be non-significant. However, maximum number of plants per meter square (456.8) was produced by Dera-98 when the dose was 200 kg/ha, while Punjab-96 grown with 0 kg N/ha pro-duced the lowest number of fertile tillers per meter square (152.8). Tiller production is considered as an inherent genotype features but Bhorghi (2000) re-ported that by increasing nitrogen at plant level, the biomass increase is associated with larger leaves that stay green longer, tall stems and a large number of tillers surviving to maturity. Number of spikes per meter square
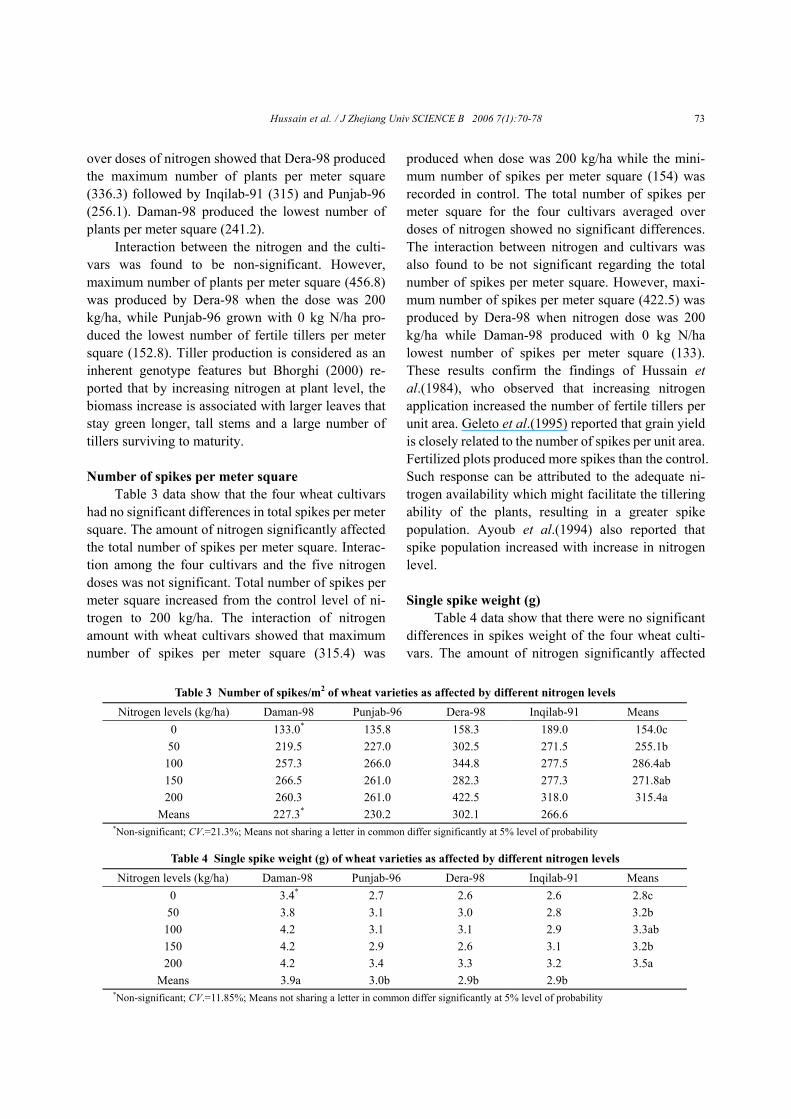
Table 3 data show that the four wheat cultivars had no significant differences in total spikes per meter square. The amount of nitrogen significantly affected the total number of spikes per meter square. Interac-tion among the four cultivars and the five nitrogen doses was not significant. Total number of spikes per meter square increased from the control level of ni-trogen to 200 kg/ha. The interaction of nitrogen amount with wheat cultivars showed that maximum number of spikes per meter square (315.4) was
produced when dose was 200 kg/ha while the mini-mum number of spikes per meter square (154) was recorded in control. The total number of spikes per meter square for the four cultivars averaged over doses of nitrogen showed no significant differences. The interaction between nitrogen and cultivars was also found to be not significant regarding the total number of spikes per meter square. However, maxi-mum number of spikes per meter square (422.5) was produced by Dera-98 when nitrogen dose was 200 kg/ha while Daman-98 produced with 0 kg N/ha lowest number of spikes per meter square (133). These results confirm the findings of Hussain et al.(1984), who observed that increasing nitrogen application increased the number of fertile tillers per unit area. Geleto et al.(1995) reported that grain yield is closely related to the number of spikes per unit area. Fertilized plots produced more spikes than the control. Such response can be attributed to the adequate ni-trogen availability which might facilitate the tillering ability of the plants, resulting in a greater spike population. Ayoub et al.(1994) also reported that spike population increased with increase in nitrogen level. Single spike weight (g)
Table 4 data show that there were no significant differences in spikes weight of the four wheat culti-vars. The amount of nitrogen significantly affected
Table 3 Number of spikes/m2 of wheat varieties as affected by different nitrogen levels Nitrogen levels (kg/ha) Daman-98 Punjab-96 Dera-98 Inqilab-91 Means
0 133.0* 135.8 158.3 189.0 154.0c 50 219.5 227.0 302.5 271.5 255.1b
100 257.3 266.0 344.8 277.5 286.4ab 150 266.5 261.0 282.3 277.3 271.8ab 200 260.3 261.0 422.5 318.0 315.4a
Means 227.3* 230.2 302.1 266.6 *Non-significant; CV.=21.3%; Means not sharing a letter in common differ significantly at 5% level of probability
Table 4 Single spike weight (g) of wheat varieties as affected by different nitrogen levels Nitrogen levels (kg/ha) Daman-98 Punjab-96 Dera-98 Inqilab-91 Means
0 3.4* 2.7 2.6 2.6 2.8c 50 3.8 3.1 3.0 2.8 3.2b
100 4.2 3.1 3.1 2.9 3.3ab 150 4.2 2.9 2.6 3.1 3.2b 200 4.2 3.4 3.3 3.2 3.5a
Means 3.9a 3.0b 2.9b 2.9b *Non-significant; CV.=11.85%; Means not sharing a letter in common differ significantly at 5% level of probability

Hussain et al. / J Zhejiang Univ SCIENCE B 2006 7(1):70-78 74
spike weight. Interaction among the four cultivars and the five nitrogen doses was non-significant. Spike weight increased as amount of nitrogen was increased from the control level to 200 kg/ha. Table 4 shows that maximum spike weight (3.5 g) was produced when the nitrogen dose was 200 kg/ha while the minimum spike weight (2.8 g) was recorded in the control. The spike weight of the four wheat cultivars averaged over doses of nitrogen showed that Da-man-98 produced the heaviest spike (3.9 g) while Dera-98 produced the lowest spike weight (2.9 g). The nitrogen levels and wheat cultivars did not in-teract positively because all nitrogen doses were not significantly different from the spike weight in the control treatment, but these results are in conformity with Khan et al.(2000) regarding the effect of nitro-gen on the varietal means of spike weight. Number of grains per spike
Table 5 data show that there were no significant differences in number of grains per spike of the four wheat cultivars. Nitrogen at 0 to 200 kg/ha signifi-cantly affected the number of grains per spike. In-teraction among the four cultivars and the five nitro-gen doses was significant. Application of nitrogen resulted in more grain production per spike as com-pared to the control. But at higher doses, grain pro-duction per spike did not differ significantly from that of the non-fertilized plots. The number of grains per
spike of the four wheat cultivars averaged over doses of nitrogen also showed no significant effect. Pun-jab-96 produced the maximum number of grains per spike (51.8) followed by Dera-98 (51.8) and In-qilab-91 (51.6) while Daman-98 produced the lowest number of grains per spike (50.0). Maximum number of grains per spike (59.1) was produced by Inqilab-91 when dose was 200 kg/ha while Inqilab-91 at 0 kg N/ha also produced the lowest number of grains per spike (43.0 g). These results coincide with the results of Ashraf (1986) who concluded that nitrogen in-creased the number of grains per spike. Meynard (1987) reported that the number of grains per spike is the best indicator of wheat response to nitrogen and that grains per spike is negatively affected by nitrogen deficiency. Thousand grain weight (g)
Thousand grain weight is an important yield parameter. Table 6 data show that there were no sig-nificant differences in the 1000-grain weight of the four wheat cultivars. The nitrogen levels significantly affected 1000-grain weight. Interaction among the four cultivars and the five nitrogen doses was also found not significant. Nitrogen at high rate produced heavier grains. The thousand grain weight of four wheat cultivars averaged over doses of nitrogen showed no significant differences. These results showed that the 1000 g weight of the four wheat cul-
Table 5 Number of grain/spike of wheat varieties as affected by different nitrogen levels Nitrogen levels (kg/ha) Daman-98 Punjab-96 Dera-98 Inqilab-91 Means
0 47.3cd 46.7cd 47.0cd 43.0d 46.0c 50 48.5cd 48.7bcd 48.9bcd 49.7abcd 48.9bc 100 50.7abcd 53.0abc 51.2abcd 53.0abc 51.9ab 150 52.3abcd 58.1ab 55.4bc 53.0abc 54.7a 200 53.4abc 52.8abc 56.2ab 59.1a 55.4a
Means 50.0* 51.8 51.7 51.6 *Non-significant; CV.=10.86%; Means not sharing a letter in common differ significantly at 5% level of probability
Table 6 1000-grain weight (g) of wheat varieties as affected by different nitrogen levels Nitrogen levels (kg/ha) Daman-98 Punjab-96 Dera-98 Inqilab-91 Means
0 40.5* 42.5 39.0 42.0 41.0c 50 45.3 46.3 45.8 46.3 45.9ab 100 45.4 45.0 46.2 46.0 45.6ab 150 46.3 46.5 45.9 49.0 46.9a 200 47.2 46.3 46.4 47.0 46.7a
Means 44.9* 45.3 44.7 46.1 *Non-significant; CV.=7.83%; Means not sharing a letter in common differ significantly at 5% level of probability
Hussain et al. / J Zhejiang Univ SCIENCE B 2006 7(1):70-78 75
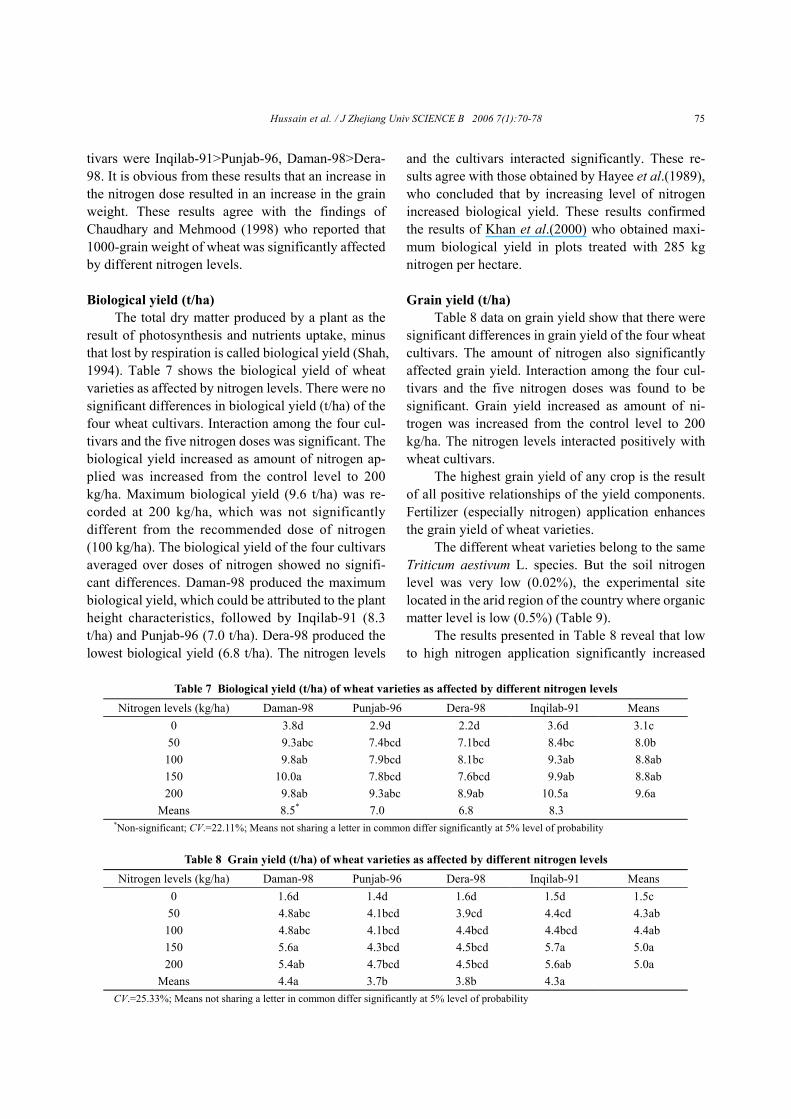
tivars were Inqilab-91>Punjab-96, Daman-98>Dera- 98. It is obvious from these results that an increase in the nitrogen dose resulted in an increase in the grain weight. These results agree with the findings of Chaudhary and Mehmood (1998) who reported that 1000-grain weight of wheat was significantly affected by different nitrogen levels. Biological yield (t/ha)
The total dry matter produced by a plant as the result of photosynthesis and nutrients uptake, minus that lost by respiration is called biological yield (Shah, 1994). Table 7 shows the biological yield of wheat varieties as affected by nitrogen levels. There were no significant differences in biological yield (t/ha) of the four wheat cultivars. Interaction among the four cul-tivars and the five nitrogen doses was significant. The biological yield increased as amount of nitrogen ap-plied was increased from the control level to 200 kg/ha. Maximum biological yield (9.6 t/ha) was re-corded at 200 kg/ha, which was not significantly different from the recommended dose of nitrogen (100 kg/ha). The biological yield of the four cultivars averaged over doses of nitrogen showed no signifi-cant differences. Daman-98 produced the maximum biological yield, which could be attributed to the plant height characteristics, followed by Inqilab-91 (8.3 t/ha) and Punjab-96 (7.0 t/ha). Dera-98 produced the lowest biological yield (6.8 t/ha). The nitrogen levels
and the cultivars interacted significantly. These re-sults agree with those obtained by Hayee et al.(1989), who concluded that by increasing level of nitrogen increased biological yield. These results confirmed the results of Khan et al.(2000) who obtained maxi-mum biological yield in plots treated with 285 kg nitrogen per hectare. Grain yield (t/ha)
Table 8 data on grain yield show that there were significant differences in grain yield of the four wheat cultivars. The amount of nitrogen also significantly affected grain yield. Interaction among the four cul-tivars and the five nitrogen doses was found to be significant. Grain yield increased as amount of ni-trogen was increased from the control level to 200 kg/ha. The nitrogen levels interacted positively with wheat cultivars.
The highest grain yield of any crop is the result of all positive relationships of the yield components. Fertilizer (especially nitrogen) application enhances the grain yield of wheat varieties.
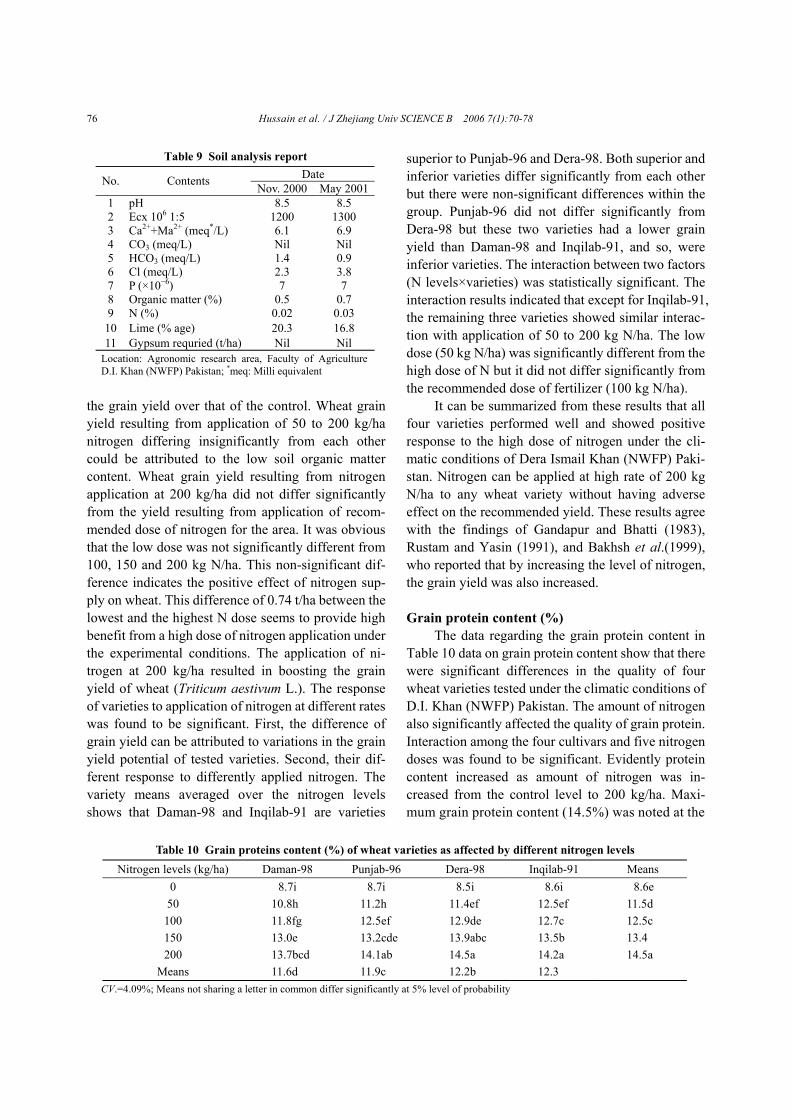
The different wheat varieties belong to the same Triticum aestivum L. species. But the soil nitrogen level was very low (0.02%), the experimental site located in the arid region of the country where organic matter level is low (0.5%) (Table 9).
The results presented in Table 8 reveal that low to high nitrogen application significantly increased
Table 7 Biological yield (t/ha) of wheat varieties as affected by different nitrogen levels Nitrogen levels (kg/ha) Daman-98 Punjab-96 Dera-98 Inqilab-91 Means
0 3.8d 2.9d 2.2d 3.6d 3.1c 50 9.3abc 7.4bcd 7.1bcd 8.4bc 8.0b 100 9.8ab 7.9bcd 8.1bc 9.3ab 8.8ab 150 10.0a 7.8bcd 7.6bcd 9.9ab 8.8ab 200 9.8ab 9.3abc 8.9ab 10.5a 9.6a
Means 8.5* 7.0 6.8 8.3 *Non-significant; CV.=22.11%; Means not sharing a letter in common differ significantly at 5% level of probability
Table 8 Grain yield (t/ha) of wheat varieties as affected by different nitrogen levels Nitrogen levels (kg/ha) Daman-98 Punjab-96 Dera-98 Inqilab-91 Means
0 1.6d 1.4d 1.6d 1.5d 1.5c 50 4.8abc 4.1bcd 3.9cd 4.4cd 4.3ab 100 4.8abc 4.1bcd 4.4bcd 4.4bcd 4.4ab 150 5.6a 4.3bcd 4.5bcd 5.7a 5.0a 200 5.4ab 4.7bcd 4.5bcd 5.6ab 5.0a
Means 4.4a 3.7b 3.8b 4.3a CV.=25.33%; Means not sharing a letter in common differ significantly at 5% level of probability
Hussain et al. / J Zhejiang Univ SCIENCE B 2006 7(1):70-78 76
the grain yield over that of the control. Wheat grain yield resulting from application of 50 to 200 kg/ha nitrogen differing insignificantly from each other could be attributed to the low soil organic matter content. Wheat grain yield resulting from nitrogen application at 200 kg/ha did not differ significantly from the yield resulting from application of recom-mended dose of nitrogen for the area. It was obvious that the low dose was not significantly different from 100, 150 and 200 kg N/ha. This non-significant dif-ference indicates the positive effect of nitrogen sup-ply on wheat. This difference of 0.74 t/ha between the lowest and the highest N dose seems to provide high benefit from a high dose of nitrogen application under the experimental conditions. The application of ni-trogen at 200 kg/ha resulted in boosting the grain yield of wheat (Triticum aestivum L.). The response of varieties to application of nitrogen at different rates was found to be significant. First, the difference of grain yield can be attributed to variations in the grain yield potential of tested varieties. Second, their dif-ferent response to differently applied nitrogen. The variety means averaged over the nitrogen levels shows that Daman-98 and Inqilab-91 are varieties
superior to Punjab-96 and Dera-98. Both superior and inferior varieties differ significantly from each other but there were non-significant differences within the group. Punjab-96 did not differ significantly from Dera-98 but these two varieties had a lower grain yield than Daman-98 and Inqilab-91, and so, were inferior varieties. The interaction between two factors (N levels×varieties) was statistically significant. The interaction results indicated that except for Inqilab-91, the remaining three varieties showed similar interac-tion with application of 50 to 200 kg N/ha. The low dose (50 kg N/ha) was significantly different from the high dose of N but it did not differ significantly from the recommended dose of fertilizer (100 kg N/ha).
It can be summarized from these results that all four varieties performed well and showed positive response to the high dose of nitrogen under the cli-matic conditions of Dera Ismail Khan (NWFP) Paki-stan. Nitrogen can be applied at high rate of 200 kg N/ha to any wheat variety without having adverse effect on the recommended yield. These results agree with the findings of Gandapur and Bhatti (1983), Rustam and Yasin (1991), and Bakhsh et al.(1999), who reported that by increasing the level of nitrogen, the grain yield was also increased. Grain protein content (%)
The data regarding the grain protein content in Table 10 data on grain protein content show that there were significant differences in the quality of four wheat varieties tested under the climatic conditions of D.I. Khan (NWFP) Pakistan. The amount of nitrogen also significantly affected the quality of grain protein. Interaction among the four cultivars and five nitrogen doses was found to be significant. Evidently protein content increased as amount of nitrogen was in-creased from the control level to 200 kg/ha. Maxi-mum grain protein content (14.5%) was noted at the
Table 9 Soil analysis report Date No. Contents Nov. 2000 May 2001
1 pH 8.5 8.5 2 Ecx 106 1:5 1200 1300 3 Ca2++Ma2+ (meq*/L) 6.1 6.9 4 CO3 (meq/L) Nil Nil 5 HCO3 (meq/L) 1.4 0.9 6 Cl (meq/L) 2.3 3.8 7 P (×10−6) 7 7 8 Organic matter (%) 0.5 0.7 9 N (%) 0.02 0.03
10 Lime (% age) 20.3 16.8 11 Gypsum requried (t/ha) Nil Nil
Location: Agronomic research area, Faculty of Agriculture D.I. Khan (NWFP) Pakistan; *meq: Milli equivalent
Table 10 Grain proteins content (%) of wheat varieties as affected by different nitrogen levels Nitrogen levels (kg/ha) Daman-98 Punjab-96 Dera-98 Inqilab-91 Means
0 8.7i 8.7i 8.5i 8.6i 8.6e 50 10.8h 11.2h 11.4ef 12.5ef 11.5d 100 11.8fg 12.5ef 12.9de 12.7c 12.5c 150 13.0e 13.2cde 13.9abc 13.5b 13.4 200 13.7bcd 14.1ab 14.5a 14.2a 14.5a
Means 11.6d 11.9c 12.2b 12.3 CV.=4.09%; Means not sharing a letter in common differ significantly at 5% level of probability
Hussain et al. / J Zhejiang Univ SCIENCE B 2006 7(1):70-78 77
highest dose of 200 kg/ha in variety Dera-98. The minimum grain protein content (8.5%) was recorded in the control for variety Dera-98.
The grain protein content of the four wheat cul-tivars averaged over doses of nitrogen showed that grains of Inqilab-91 contained maximum grain pro-tein content (12.3%) followed by Dera-98 (12.2%) and Punjab-96 (11.9%). Daman-98 produced the lowest grain protein content. These results agree with the findings of Chaudhary and Mehmood (1998) who reported that grain protein content was significantly affected by levels of nitrogen. Guaer et al.(1992) concluded that application of N fertilizer increased grain protein content compared with the control in all cultivars. Positive responses to increasing nitrogen have been associated with increase in grain protein content. Inqilab-91 proved to be the best in protein content which might be due to its better genetic re-sponse to the applied nitrogen. This was confirmed by Banziger et al.(1992), who reported that genotypic variability in grain protein content may be affected not only by physiological traits but also by N supply in the soil. Our finding that protein content varied among the tested varieties confirms the findings of Zhu et al.(1991), who reported variation of protein content in seven wheat varieties.
It can be concluded from these results that In-qilab-91 is richer in protein, compared to Daman-98, Punjab-96 and Dera-98 wheat varieties. The results showed that high quality grains of wheat i.e., rich in protein and high grain yield can be obtained only by application of nitrogen at high rates especially in fields surrounded by Eucalyptus camaldulensis as its allelopathy had no ill effect on the protein content of wheat. References Ahmad, I., Farooq, M.R., Yousaf, Q., Shah, S.A.H., 2001.
Quantitative and qualitative response of wheat to NP levels and seed rates. Pak. J. Bio. Sci., 4(4):394-396.
Anonymous, 2002. Annual Progress Report. Agriculture Re-search Institute, Dera Ismail Khan (NWFP), Pakistan, p.ii.
Arnon, I., 1972. Plant Population and Distribution Patterns in Corp Production in Dry Regions, Vol.1. National Book Foundation, Islamabad, Pakistan, p.443-456, 359-360.
Ashraf, A.H., 1986. Studies on Interaction Relationship of Two Wheat Genotype and N.P.K. Application under Late Sown Condition. MS Thesis, Agronomy Department, University of Agriculture, Faisalabad.
Ayoub, M., Guertin, S., Lussier, S., Smith, D.L., 1994. Timing
and levels of nitrogen fertility effects on spring wheat. Crop Sci., 34:748-750.
Bakhsh, A., Gurmani, A.H., Bhatti, A.U., Rehman, H., 1999. Effect of balanced application of N, P and K on the grain yield of wheat. Sarhad. J. Agri., 15:453-457.
Banziger, M., Feil, B., Stanp, P., 1992. Effect of nitrogen supply on genotypic variability in grain protein content of wheat. Crop Sci., 34:446-450.
Bhorghi, B., 2000. Nitrogen as Determinant of Wheat Growth and Yield in Wheat Ecology and Physiology of Yield Determination. Viva Books Private Limited, India, p.71-74.
Bisal, S.S., Nandal, D.P.S.S., Narwal, S.S., 1992. Influence of Aqueous Leaf Extracts of Eucalyptus and Poplar on the Germination and Seedling Growth of Winter Crops. In: Tauro, P., Narwal, S.S. (Eds.), Proceedings of the First National Symposium on Allelopathy in Agroecosystems, Indian Society of Allelopathy, CCS Haryana Agricultural University, Hisar, India, p.95-97.
Bungard, R.A., Wingler, A., Morton, J.D., Andrews, M., 1999. Ammonium can stimulate nitrate and nitrite reductase in the absence of nitrate in Clematis vitalba. Plant Cell and Environment, 22:859-866. [doi:10.1046/j.1365-3040.1999. 00456.x]
Chaudhary, A.U., Mehmood, R., 1998. Determination of optimum level of fertilizer nitrogen for varieties of wheat. Pak. J. Bio. Sci., 4:351-353.
Das, D.K., Rao, T.V., Das, D.K., 1993. Growth and spectral response of wheat as influence by varying nitrogen levels and plant densities. Annual of Agric. Res., 14:421-425.
Gandapur, M.A., Bhatti, A.K., 1983. Effect of nitrogen and phosphorus levels on the yield of wheat cultivars. Pak. J. Agric. Res., 4(3):141-144.
Geleto, T., Tanner, D.G., Mamo, T., Gebeyehu, G., 1995. Response of rain fed bread and durum wheat to source level and timing of nitrogen fertilizer on two Ethiopian vertisole S. I. yield and yield components. Comm. in Soil Sci. and Plant Analysis, 26:1773-1794.
Guaer, M.C., Gupta, A.P., Petkov, M., 1992. Effect of in-creasing nitrogen fertilization rates on grain yield and quality of winter soft wheat cultivars. Soils and Fert., 45:722.
Hayee, M.A., Shah, S.H., Malik, M.A., Rafiq, M., Ali, A., 1989. Effect of different levels of NPK on the growth and grain yield of two wheat varieties, Pak-81 and Punjab-85. Pak. J. Agri. Sci., 26(3):236.
Hussain, M.M., Ibrahim, S.A., Zaitoon, M.I., 1984. Effect of nitrogen levels on the growth, yield and mineral compo-sition of wheat crop under different seed rates. Egypt. J. Sci., 24(1):7-18.
Jackson, M.L., 1962. Soil Chemical Analysis. Prentice Hall, Inc. Wood Cliffs. N.J.R. New Jersey, USA, p.129.
Khan, M.A., Hussain, I., Baloch, M.S., 2000. Wheat yield potential current status and future strategies. Pak. J. Bio. Sci., 3:82-86.
Lathwal, O.P., Tej, S., Singh, T., 1992. Effect of irrigation and
Hussain et al. / J Zhejiang Univ SCIENCE B 2006 7(1):70-78 78
nitrogen levels on yield attributions and yield of wheat. Haryana J. Agron., 8:69-70.
Lisanework, N., Michelson, A., 1993. Allelopathy in agrofor-estry systems. The effects of leaf extract of Eucalyptus species on wheat, Barley and Mustard Chick pea, and many weeds. Agroforestory Systems, 21(1):63-74. [doi:10.1007/BF00704926]
Meynard, J.M., 1987. The analysis development for the effi-ciency of essays about nitrogen fertilization. Perspectives Agric., 115:76-83.
Peter, L.P., Young, V.R., 1980. Nutritional Evaluation of Protein Foods. The United Nations University, Japan, p.8.
Putname, A.R., 1984. Allelopathic chemicals can natural plant herbicides help to control weeds. Weeds Today, 5:6-8.
Rustam, A., Yasin, M., 1991. Response of wheat to nitrogen and phosphorus fertilization. Pak. J. Agri. Res., 12: 130-133.
Saleem, A.N., 1987. Effect of nitrogen and seed rate on
agronomic parameters of wheat. J. Agri. Res., 18(2):34-38.
Schuman, A.W., Little, K.M., Eccles, N.S., 1995. Suppression of seed germination and early seedling growth by planta-tion harvest residues. South African J. Plant and Soil, 12:170-172.
Shah, P., 1994. Cereal Crop, Rabi. In: Nazir, S., Bashir, E., Bantel, R. (Eds.), Crop Production. National Book Foun-dation, Islamabad, p.238-245, 499.
Singh, V.P.N., Uttam, S.K., 1992. Response of wheat cultivars to different N levels under early sown conditions. Crop Res., 5:82-86.
Steel, R.G.D., Torrie, J.H., 1984. Principles and Procedures of Statistics. Mc Graw Hill Inc., New York, USA.
Zhu, M.N., Pandey, S.K., Ray, R.K., 1991. Effect of nitrogen on morphology and agro-physiological traits in wheat varieties, their grain yield and protein content. Annals. of Agric. Res., New Delhi. India, 10:493-497.
SCIENCE B Journal of Zhejiang University
Editors-in-Chief: Pan Yun-he & Peter H. Byers (ISSN 1673-1581, Monthly)
http://www.zju.edu.cn/jzus
JZUS-B focuses on “Biomedicine, Biochemistry & Biotechnology”
Welcome Your Contributions to JZUS-B
Journal of Zhejiang University SCIENCE B warmly and sincerely welcome scientists all over the world to contribute to JZUS-B in the form of Review, Article and Science Letters focused on Bio-medicine, Biochemistry and Biotechnology areas. Especially, Science Letters (3−4 pages) would be published as soon as about 30 days (Note: detailed research articles can still be published in the pro-fessional journals in the future after Science Letters is published by JZUS-B.
Contributions requests
(1) Electronic manuscript should be sent to [email protected] only. If you have any question, please feel free to visit our website: http://www.zju.edu.cn/jzus, and hit “For Authors”.
(2) English abstract should include Objective, Method, Result and Conclusion. (3) Tables and figures could be used to prove your research result. (4) Full text of the Science Letters should be in 3−4 pages. The length of articles and reviews are
not limited. (5) Please visit our website (http://www.zju.edu.cn/jzus/pformat.htm) to see paper format.
Copyright © 2022 FDOKUMEN