Sediment Transport and Trapping in the Hudson River Estuary
10
670 Q 2001 Estuarine Research Federation Estuaries Vol. 24, No. 5, p. 670–679 October 2001 Sediment Transport and Trapping in the Hudson River Estuary W. ROCKWELL GEYER*, JONATHAN D. WOODRUFF, and PETER TRAYKOVSKI Woods Hole Oceanographic Institution, Woods Hole, Massachusetts 02543 ABSTRACT: The Hudson River estuary has a pronounced turbidity maximum zone, in which rapid, short-term depo- sition of sediment occurs during and following the spring freshet. Water-column measurements of currents and sus- pended sediment were performed during the spring of 1999 to determine the rate and mechanisms of sediment transport and trapping in the estuary. The net convergence of sediment in the lower estuary was approximately 300,000 tons, consistent with an estimate based on sediment cores. The major input of sediment from the watershed occurred during the spring freshet, as expected. Unexpected, however, was that an even larger quantity of sediment was transported landward into the estuary during the 3-mo observation period. The landward movement was largely accomplished by tidal pumping (i.e., the correlation between concentration and velocity at tidal frequencies) during spring tides, when the concentrations were 5 to 10 times higher than during neap tides. The landward flux is not consistent with the long- term sediment budget, which requires a seaward flux at the mouth to account for the excess input from the watershed relative to net accumulation. The anomalous, landward transport in 1999 occurred in part because the freshet was relatively weak, and the freshet occurred during neap tides when sediment resuspension was minimal. An extreme freshet occurred during 1998, which may have provided a repository of sediment just seaward of the mouth that re-entered the estuary in 1999. The amplitude of the spring freshet and its timing with respect to the spring-neap cycle cause large interannual variations in estuarine sediment flux. These variations can result in the remobilization of previously deposited sediment, the mass of which may exceed the annual inputs from the watershed. Introduction Meade (1969) noted that estuaries slowly fill up with fluvial sediment until they are shallow enough to reach an equilibrium condition in which the sediment supply is matched by the export to the sea. He also noted that during average conditions, riverine sediment may be completely trapped with- in an estuary due to the landward bottom flow of the estuarine circulation, which also carries sedi- ment into the estuary from the sea. Thus, the ex- port of sediment required for the long-term mass balance may be accomplished only during extreme events when the saline wedge is pushed to the mouth of the estuary and the near-bottom flow be- comes seaward throughout the estuary. Other es- tuarine observations (e.g., Migniot 1971; Grabe- mann et al. 1997) indicate that increased river flow shifts the zone of sediment trapping seaward. Cas- taing and Allen (1981) provide an example of the export of sediment to the sea during high flow. The Hudson River valley was carved by glaciers during the Pleistocene (Neuman et al. 1969), and its estuary was originally a fjord with depths of 30– 200 m. This glacial trough is now mostly filled with estuarine sediment (Weiss 1974), and the estuary is 10–20-m deep (Fig. 1). The estuarine structure is partially mixed with moderate vertical stratifica- tion and tidal currents of 100 cm s 21 (Abood 1974; Geyer et al. 2000). There is an estuarine turbidity * Corresponding author; tele: 508/289-2868; fax: 508/457- 2194; e-mail: [email protected]. maximum (ETM) zone in the lower estuary 10–25 km north of The Battery (Fig. 2) where suspended sediment concentrations can reach more than 1,000 mg l 21 (Geyer et al. 1998). Sedimentological observations by Olsen et al. (1978) showed depo- sition rates of up to 30 cm yr 21 in certain parts of the ETM on timescales of 5–10 yr. Woodruff et al. (in press) found deposits of light brown mud in the ETM as much as 40 cm thick. The presence of Be-7 at the base of these deposits revealed that they had been deposited no more than 6-mo prior to sampling and most likely had been deposited over a timescale of several months. Woodruff et al. (in press) also showed that there are large seasonal variations in the spatial distributions and thickness of these mud deposits. During the spring freshet in April 1998, the mud deposits are absent from the ETM zone at km 12–25, but there are fresh mud deposits closer to the mouth at km 1–5. Two months after the spring freshet, the lower estuary deposits have vanished, and thick deposits are ob- served within the ETM zone. The long-term sediment accumulation rate in the Hudson estuary is only 1–3 mm yr 21 (Olsen et al. 1978); the rapid, short-term deposition appears to be roughly balanced by erosion on longer time scales. The local, long-term rate of sea-level rise is approximately 2–3 mm yr 21 , based on salt marsh accretion at Piermont Marsh, 5 km north of the study site (Peteet and Wong 2000). It appears that the system is in approximate equilibrium with sea- level rise at this time. Averaged over the 100 km
-
Upload
independent -
Category
Documents
-
view
4 -
download
0
Transcript of Sediment Transport and Trapping in the Hudson River Estuary
670Q 2001 Estuarine Research Federation
Estuaries Vol. 24, No. 5, p. 670–679 October 2001
Sediment Transport and Trapping in the Hudson River Estuary
W. ROCKWELL GEYER*, JONATHAN D. WOODRUFF, and PETER TRAYKOVSKI
Woods Hole Oceanographic Institution, Woods Hole, Massachusetts 02543
ABSTRACT: The Hudson River estuary has a pronounced turbidity maximum zone, in which rapid, short-term depo-sition of sediment occurs during and following the spring freshet. Water-column measurements of currents and sus-pended sediment were performed during the spring of 1999 to determine the rate and mechanisms of sediment transportand trapping in the estuary. The net convergence of sediment in the lower estuary was approximately 300,000 tons,consistent with an estimate based on sediment cores. The major input of sediment from the watershed occurred duringthe spring freshet, as expected. Unexpected, however, was that an even larger quantity of sediment was transportedlandward into the estuary during the 3-mo observation period. The landward movement was largely accomplished bytidal pumping (i.e., the correlation between concentration and velocity at tidal frequencies) during spring tides, whenthe concentrations were 5 to 10 times higher than during neap tides. The landward flux is not consistent with the long-term sediment budget, which requires a seaward flux at the mouth to account for the excess input from the watershedrelative to net accumulation. The anomalous, landward transport in 1999 occurred in part because the freshet wasrelatively weak, and the freshet occurred during neap tides when sediment resuspension was minimal. An extreme freshetoccurred during 1998, which may have provided a repository of sediment just seaward of the mouth that re-entered theestuary in 1999. The amplitude of the spring freshet and its timing with respect to the spring-neap cycle cause largeinterannual variations in estuarine sediment flux. These variations can result in the remobilization of previously depositedsediment, the mass of which may exceed the annual inputs from the watershed.
IntroductionMeade (1969) noted that estuaries slowly fill up
with fluvial sediment until they are shallow enoughto reach an equilibrium condition in which thesediment supply is matched by the export to thesea. He also noted that during average conditions,riverine sediment may be completely trapped with-in an estuary due to the landward bottom flow ofthe estuarine circulation, which also carries sedi-ment into the estuary from the sea. Thus, the ex-port of sediment required for the long-term massbalance may be accomplished only during extremeevents when the saline wedge is pushed to themouth of the estuary and the near-bottom flow be-comes seaward throughout the estuary. Other es-tuarine observations (e.g., Migniot 1971; Grabe-mann et al. 1997) indicate that increased river flowshifts the zone of sediment trapping seaward. Cas-taing and Allen (1981) provide an example of theexport of sediment to the sea during high flow.
The Hudson River valley was carved by glaciersduring the Pleistocene (Neuman et al. 1969), andits estuary was originally a fjord with depths of 30–200 m. This glacial trough is now mostly filled withestuarine sediment (Weiss 1974), and the estuaryis 10–20-m deep (Fig. 1). The estuarine structureis partially mixed with moderate vertical stratifica-tion and tidal currents of 100 cm s21 (Abood 1974;Geyer et al. 2000). There is an estuarine turbidity
* Corresponding author; tele: 508/289-2868; fax: 508/457-2194; e-mail: [email protected].
maximum (ETM) zone in the lower estuary 10–25km north of The Battery (Fig. 2) where suspendedsediment concentrations can reach more than1,000 mg l21 (Geyer et al. 1998). Sedimentologicalobservations by Olsen et al. (1978) showed depo-sition rates of up to 30 cm yr21 in certain parts ofthe ETM on timescales of 5–10 yr. Woodruff et al.(in press) found deposits of light brown mud inthe ETM as much as 40 cm thick. The presence ofBe-7 at the base of these deposits revealed that theyhad been deposited no more than 6-mo prior tosampling and most likely had been deposited overa timescale of several months. Woodruff et al. (inpress) also showed that there are large seasonalvariations in the spatial distributions and thicknessof these mud deposits. During the spring freshetin April 1998, the mud deposits are absent fromthe ETM zone at km 12–25, but there are freshmud deposits closer to the mouth at km 1–5. Twomonths after the spring freshet, the lower estuarydeposits have vanished, and thick deposits are ob-served within the ETM zone.
The long-term sediment accumulation rate inthe Hudson estuary is only 1–3 mm yr21 (Olsen etal. 1978); the rapid, short-term deposition appearsto be roughly balanced by erosion on longer timescales. The local, long-term rate of sea-level rise isapproximately 2–3 mm yr21, based on salt marshaccretion at Piermont Marsh, 5 km north of thestudy site (Peteet and Wong 2000). It appears thatthe system is in approximate equilibrium with sea-level rise at this time. Averaged over the 100 km

Sediment Transport and Trapping 671
Fig. 1. Map of the study area, showing the northern, ETM,and southern sections. The positions of the sections are 1.5, 14,and 35 km north of the Battery. The 10-m isobath is indicated.The inset sections show the locations of the bottom tripods.
Fig. 2. Salinity contours and suspended sediment concentra-tions from a survey of the Hudson River estuary during mod-erate discharge and spring-tide conditions in May 1993. Thehigh suspended sediment concentrations within the ETM zoneare evident.
length of the estuary, approximately 3 3 105 m3
yr21 or roughly 1.5 3 105 tons yr21 of sediment arerequired to maintain the estuary at a constantdepth. Including the entire river area below thedam at Troy (the landward limit of tidal influ-ence), this number increases to 3 3 105 tons yr21.
Woodruff et al. (in press) estimate that on av-erage the watersheds of the Hudson River and itstributaries presently supply 4 3 105 tons yr21 ofsediment to the estuary, based on 18 yr of sedimentdischarge data between 1976 and 1994. The pre-sent supply from the watershed provides 30% moresediment than is required to maintain equilibriumconditions based on sea-level rise. This suggeststhat in the present regime, the estuary should ex-port roughly 100,000 tons of sediment per year ona long-term average basis to maintain morpholog-ical equilibrium with sea level rise.
Based on previous observations of the predom-inance of fine-grained sediments in the ETM de-posits (Olson et al. 1978; Woodruff et al. in press),this study focused only on suspended sediment
transport. There are bedforms in the lower Hud-son River estuary indicating bedload transport(Flood and Bokuniewicz 1986), although thecoarse sediment transport appears to be associatedwith the reworking of older deposits rather thanthe input of new sediment.
Whereas the sediment mass balance of the es-tuary suggests that there should be significant sed-iment export from the estuary, previous observa-tions do not provide an adequate indication of themechanisms of sediment transport within the sys-tem to determine how that export may take place.This issue motivated a study of sediment flux inthe lower Hudson River estuary to determine themechanisms of sediment flux and possible export.These new observations in turn provide a perspec-tive on the long-term evolution of the estuarinesedimentological regime.
MethodsMoorings and tripods were deployed from
March to June 1999 to document the mechanismsof sediment transport and trapping in the HudsonRiver estuary during and following the springfreshet. Cross-estuary arrays were deployed land-ward and seaward of the ETM zone, and a tripodand mooring were deployed within the ETM. Thecross-estuary arrays included bottom tripods at twocross-estuary locations and nearby taut-line moor-ings. The tripods in the thalweg had upward-look-ing, RDI workhorse acoustic doppler current pro-filers (ADCP). The frequency of the ADCP at thesouthern transect was 600 kHz, and the ETM andnorthern transects had 1,200 kHz ADCP. In addi-tion to water-column velocity profiles, the ADCPprovided acoustic backscatter measurements thatwere used to estimate suspended sediment concen-tration (Thorne 1993). Currents were measured atother locations with S4 and Marsh-McBirney elec-tromagnetic current meters (see Fig. 1). Optical
672 W. R. Geyer et al.
backscatterance sensors (OBS) were deployed onall of the bottom tripods at 50, 100, and 200 cmabove the bottom. Additional OBS were deployedat 100, 200, and 300 cm above bottom on themoorings. Salinity and temperature were measuredwith Seabird Seacats on all of the tripods andmoorings. Surface salinity and backscatterancewere measured with a Seacat and OBS at the sur-face mooring at the ETM.
Instruments were deployed on March 9–10,1999, recovered for cleaning and redeployed onApril 14–15, and finally recovered on June 17,1999. Fouling of salinity sensors due to cloggingwith sediment occurred at several of the bottomtripod locations. Some of the OBS sensors showedevidence of fouling starting in the middle of May.
Lab calibration of all of the OBS sensors was per-formed prior to the deployment using Hudson Riv-er mud. In situ calibrations were performed dur-ing shipboard surveys using an OBS on an OceanSensors CTD and a 1.8-l Nisken bottle. The Niskenbottle was tripped by a bottom-actuated trigger at1 m above the bottom. Samples taken during pe-riods of low near-bottom concentration indicatedthat there was no contribution of resuspension bythe instrument in the water samples. The watersamples were filtered in the lab with an 8-mm glass-fiber filter, dried, and weighed to determine totalsuspended solids. A total of 50 samples with con-centrations ranging from 10 to 1,000 mg l21 pro-vided calibration for the OBS on the CTD. Theuncertainty of the OBS estimates in comparisonwith the bottle samples was around 20%. Compar-ison of the moored instruments with the profilerindicated that these measurements were also con-sistent with an uncertainty of 20–30%, some of theuncertainty owing to slight differences in time andspace of the samples.
The OBS time series were used to calibrate theADCP backscattered intensity for sediment concen-tration. A non-linear regression was used to relatethe lowest bins of the ADCP data (located at 3 mabove bottom) to the highest tripod OBS. Errorbounds on this regression are approximately 30%to 40%. At the northern and southern tripods thehighest OBS was at the same elevation as the lowestADCP bin, while at the ETM tripod the highestOBS was located 2 m above bottom. At this site avertical extrapolation based on an exponential fitto the 3 OBS sensors was used to estimate concen-tration at the lowest ADCP bin. The vertical de-pendence of the calibration coefficients at theETM site was determined by using an OBS locatedon a surface mooring nearby. The vertical decay ofacoustic energy spreads geometrically as rangesquared, and there is an additional exponential de-cay due to attenuation both from water and sus-
pended sediment (Thorne 1993). Applying thisgeometric decay to the ADCP data resulted in con-centration estimates that were too low at the sur-face compared to the OBS that had been calibrat-ed with in-situ bottle samples. In order to generateACDP concentration estimates that were consistentwith the OBS data, an exponent of 21.4 ratherthan 22 was used for the range-dependent decay.There are two possible reasons for the discrepancybetween the theoretical decay factor and the oneactually used. The ADCP backscattering data is re-turned as a number that is proportional to deci-bels. The manufacturer suggests a coefficient toscale this number into actual decibels, but this co-efficient may be incorrect. This would result in abackscattered intensity that is not actual acousticintensity, but intensity raised to some undeter-mined power. A second possible factor is that thereis consistent grain size variation with height. A low-er than expected decay, based on OBS measure-ments, is consistent with finer sediments higher inthe water column, because the OBS is more sen-sitive to fine particles than the acoustics. Becausethere were no surface moorings at the northern orsouthern ADCP tripods this same decay factor wasapplied to these data.
The time series data at the northern and south-ern transects were used to estimate the cross-sec-tionally integrated sediment flux for the deploy-ment period of March 10 to June 15, 1999. Directestimates of both concentration and velocity wereobtained in the bottom boundary layer (0.5–3 mabove bottom) at the tripod locations. Velocity andconcentration (based on acoustic backscatter)through the whole water column were obtained atthe eastern tripod at each site. In order to obtaincross-sectional average estimates based on the tri-pod measurements, both lateral and vertical ex-trapolation were performed. Vertical extrapolationof the suspended sediment data at the western tri-pods was performed by assuming an exponentialreduction in concentration beyond 3-m, as indi-cated by the ADCP data as well as the shipboardprofiles. The shipboard ADCP profiles indicatemean e-folding scales of 10-m for both sites, al-though there was considerable variability amongindividual profiles. A range of 5-m to 15-m wasused to bracket the uncertainty in the estimate ofthe vertical structure.
The velocity above the boundary layer at thewestern tripods was assumed to have the same ver-tical structure as the eastern tripods with a shift inthe mean flow based on the difference in record-length means between the bottom currents at theeastern and western sites. The assumption of thesimilarity in vertical structure was based on priorshipboard observations (Nepf and Geyer 1996),
Sediment Transport and Trapping 673
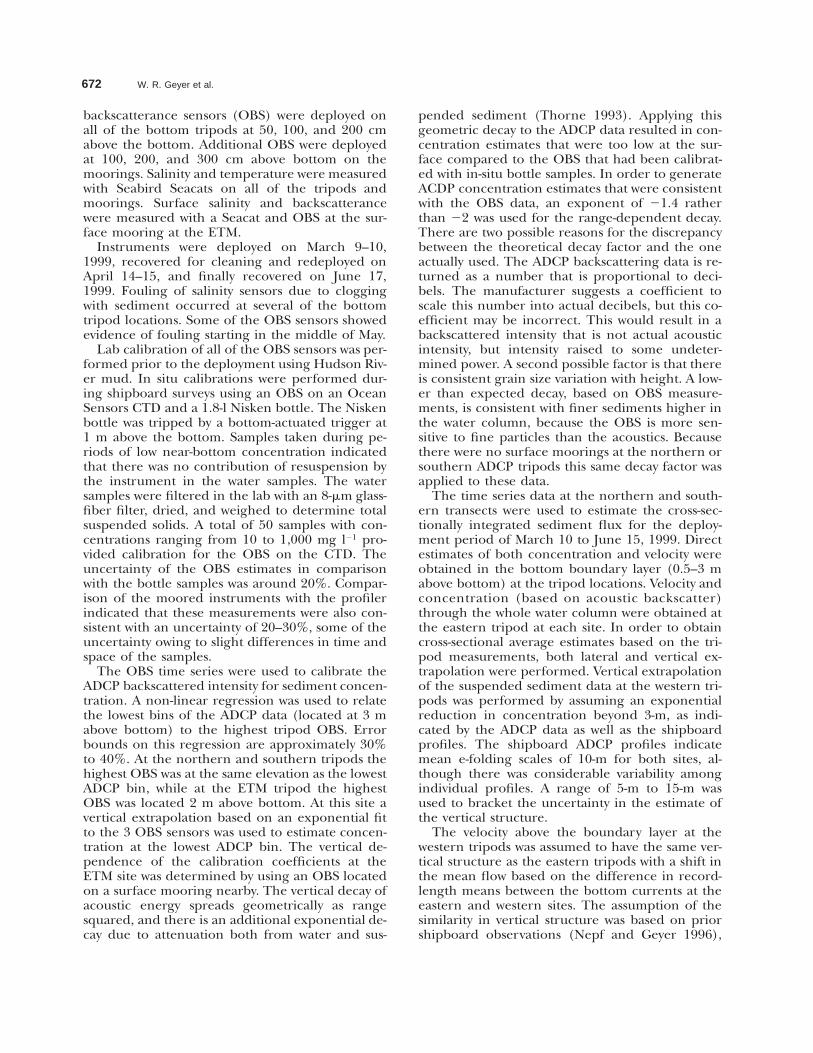
Fig. 3. Cross-sections of suspended sediment at the northernand southern sections during maximum ebb and maximumflood. The northern section data were obtained on year day105, and the southern section data were obtained on year day104 (spring tide conditions).
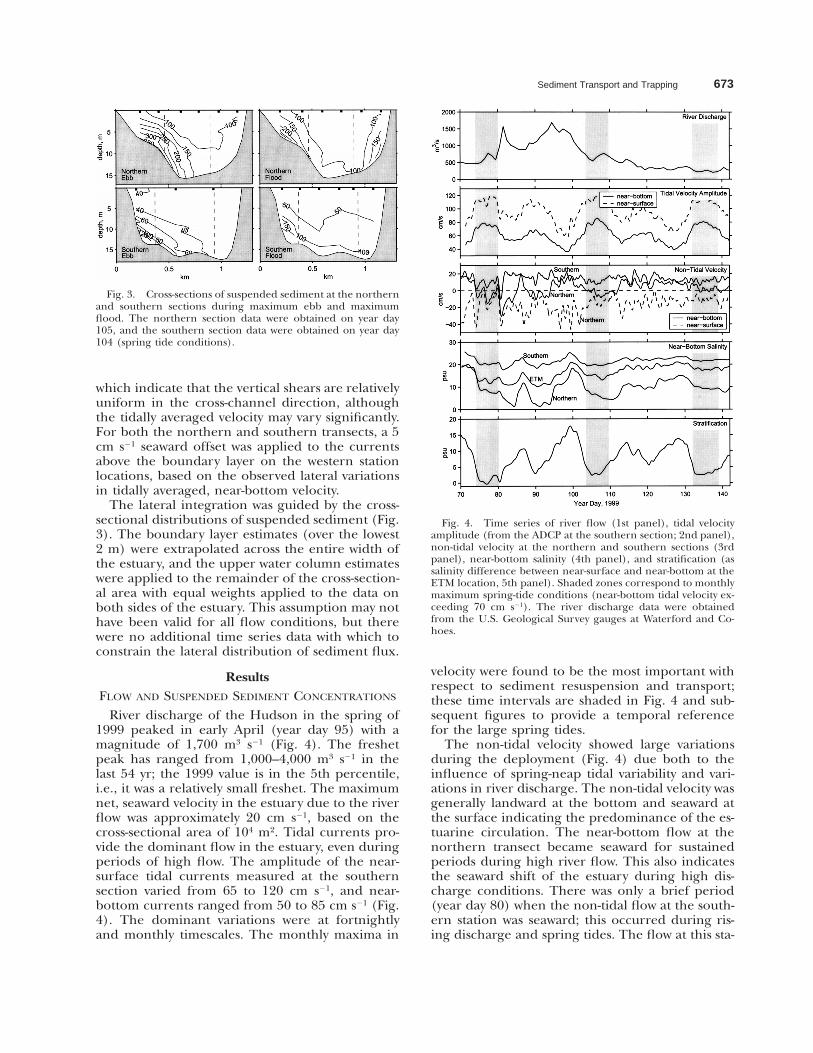
Fig. 4. Time series of river flow (1st panel), tidal velocityamplitude (from the ADCP at the southern section; 2nd panel),non-tidal velocity at the northern and southern sections (3rdpanel), near-bottom salinity (4th panel), and stratification (assalinity difference between near-surface and near-bottom at theETM location, 5th panel). Shaded zones correspond to monthlymaximum spring-tide conditions (near-bottom tidal velocity ex-ceeding 70 cm s21). The river discharge data were obtainedfrom the U.S. Geological Survey gauges at Waterford and Co-hoes.
which indicate that the vertical shears are relativelyuniform in the cross-channel direction, althoughthe tidally averaged velocity may vary significantly.For both the northern and southern transects, a 5cm s21 seaward offset was applied to the currentsabove the boundary layer on the western stationlocations, based on the observed lateral variationsin tidally averaged, near-bottom velocity.
The lateral integration was guided by the cross-sectional distributions of suspended sediment (Fig.3). The boundary layer estimates (over the lowest2 m) were extrapolated across the entire width ofthe estuary, and the upper water column estimateswere applied to the remainder of the cross-section-al area with equal weights applied to the data onboth sides of the estuary. This assumption may nothave been valid for all flow conditions, but therewere no additional time series data with which toconstrain the lateral distribution of sediment flux.
ResultsFLOW AND SUSPENDED SEDIMENT CONCENTRATIONS
River discharge of the Hudson in the spring of1999 peaked in early April (year day 95) with amagnitude of 1,700 m3 s21 (Fig. 4). The freshetpeak has ranged from 1,000–4,000 m3 s21 in thelast 54 yr; the 1999 value is in the 5th percentile,i.e., it was a relatively small freshet. The maximumnet, seaward velocity in the estuary due to the riverflow was approximately 20 cm s21, based on thecross-sectional area of 104 m2. Tidal currents pro-vide the dominant flow in the estuary, even duringperiods of high flow. The amplitude of the near-surface tidal currents measured at the southernsection varied from 65 to 120 cm s21, and near-bottom currents ranged from 50 to 85 cm s21 (Fig.4). The dominant variations were at fortnightlyand monthly timescales. The monthly maxima in
velocity were found to be the most important withrespect to sediment resuspension and transport;these time intervals are shaded in Fig. 4 and sub-sequent figures to provide a temporal referencefor the large spring tides.
The non-tidal velocity showed large variationsduring the deployment (Fig. 4) due both to theinfluence of spring-neap tidal variability and vari-ations in river discharge. The non-tidal velocity wasgenerally landward at the bottom and seaward atthe surface indicating the predominance of the es-tuarine circulation. The near-bottom flow at thenorthern transect became seaward for sustainedperiods during high river flow. This also indicatesthe seaward shift of the estuary during high dis-charge conditions. There was only a brief period(year day 80) when the non-tidal flow at the south-ern station was seaward; this occurred during ris-ing discharge and spring tides. The flow at this sta-
674 W. R. Geyer et al.
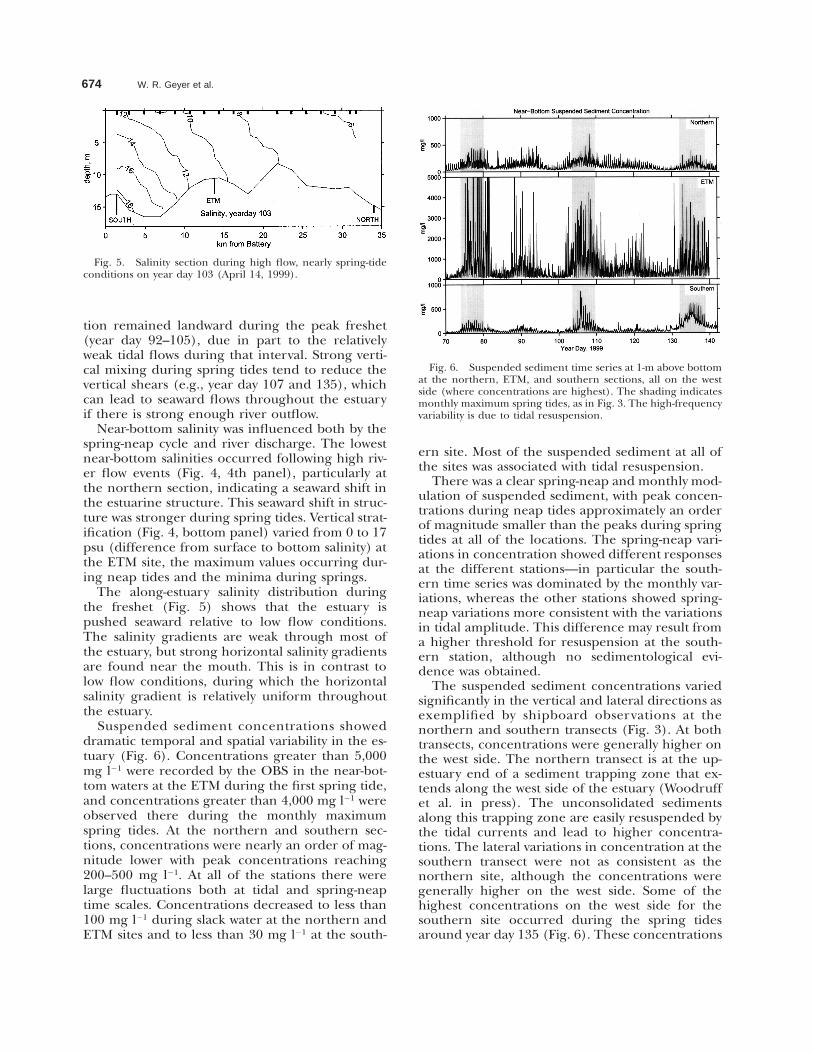
Fig. 5. Salinity section during high flow, nearly spring-tideconditions on year day 103 (April 14, 1999).
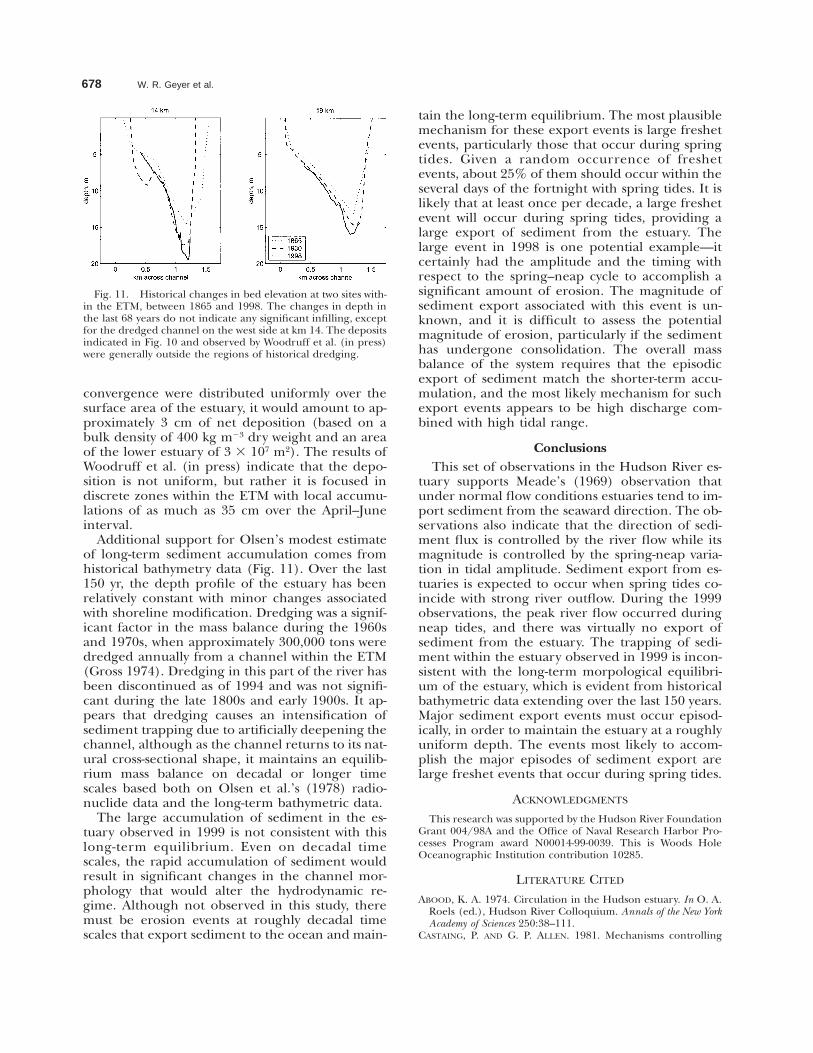
Fig. 6. Suspended sediment time series at 1-m above bottomat the northern, ETM, and southern sections, all on the westside (where concentrations are highest). The shading indicatesmonthly maximum spring tides, as in Fig. 3. The high-frequencyvariability is due to tidal resuspension.
tion remained landward during the peak freshet(year day 92–105), due in part to the relativelyweak tidal flows during that interval. Strong verti-cal mixing during spring tides tend to reduce thevertical shears (e.g., year day 107 and 135), whichcan lead to seaward flows throughout the estuaryif there is strong enough river outflow.
Near-bottom salinity was influenced both by thespring-neap cycle and river discharge. The lowestnear-bottom salinities occurred following high riv-er flow events (Fig. 4, 4th panel), particularly atthe northern section, indicating a seaward shift inthe estuarine structure. This seaward shift in struc-ture was stronger during spring tides. Vertical strat-ification (Fig. 4, bottom panel) varied from 0 to 17psu (difference from surface to bottom salinity) atthe ETM site, the maximum values occurring dur-ing neap tides and the minima during springs.
The along-estuary salinity distribution duringthe freshet (Fig. 5) shows that the estuary ispushed seaward relative to low flow conditions.The salinity gradients are weak through most ofthe estuary, but strong horizontal salinity gradientsare found near the mouth. This is in contrast tolow flow conditions, during which the horizontalsalinity gradient is relatively uniform throughoutthe estuary.
Suspended sediment concentrations showeddramatic temporal and spatial variability in the es-tuary (Fig. 6). Concentrations greater than 5,000mg l21 were recorded by the OBS in the near-bot-tom waters at the ETM during the first spring tide,and concentrations greater than 4,000 mg l21 wereobserved there during the monthly maximumspring tides. At the northern and southern sec-tions, concentrations were nearly an order of mag-nitude lower with peak concentrations reaching200–500 mg l21. At all of the stations there werelarge fluctuations both at tidal and spring-neaptime scales. Concentrations decreased to less than100 mg l21 during slack water at the northern andETM sites and to less than 30 mg l21 at the south-
ern site. Most of the suspended sediment at all ofthe sites was associated with tidal resuspension.
There was a clear spring-neap and monthly mod-ulation of suspended sediment, with peak concen-trations during neap tides approximately an orderof magnitude smaller than the peaks during springtides at all of the locations. The spring-neap vari-ations in concentration showed different responsesat the different stations—in particular the south-ern time series was dominated by the monthly var-iations, whereas the other stations showed spring-neap variations more consistent with the variationsin tidal amplitude. This difference may result froma higher threshold for resuspension at the south-ern station, although no sedimentological evi-dence was obtained.
The suspended sediment concentrations variedsignificantly in the vertical and lateral directions asexemplified by shipboard observations at thenorthern and southern transects (Fig. 3). At bothtransects, concentrations were generally higher onthe west side. The northern transect is at the up-estuary end of a sediment trapping zone that ex-tends along the west side of the estuary (Woodruffet al. in press). The unconsolidated sedimentsalong this trapping zone are easily resuspended bythe tidal currents and lead to higher concentra-tions. The lateral variations in concentration at thesouthern transect were not as consistent as thenorthern site, although the concentrations weregenerally higher on the west side. Some of thehighest concentrations on the west side for thesouthern site occurred during the spring tidesaround year day 135 (Fig. 6). These concentrations

Sediment Transport and Trapping 675
Fig. 7. Sediment flux estimates at the northern and south-ern sections. The solid lines correspond to the west side andthe dashes to the east side. Positive values indicate sediment fluxinto the estuary. Tidal fluctuations have been filtered out ofthese time series. Shading is the same as Fig. 3.
Fig. 8. Sediment flux at the western side of the northernand southern sections divided into non-tidal advection (solidlines) and tidal pumping (dashed lines). Shading is the sameas Fig. 3.
of around 500 mg l21 compare to only 100 mg l21
at the eastern tripod at the same time. This mayreflect lateral differences in local erodibility, butgiven the mass of sediment transported at thesouthern transect, it more likely reflects lateral dif-ferences in the sediment supply from the harbor.
SEDIMENT FLUXES
The estimated sediment flux at the northerntransect (Fig. 7, upper panel) was seaward duringmost of the freshet period, consistent with the sea-ward flow in the bottom boundary layer at this site.Transport on the west side was larger, particularlyduring the freshet. This was due both to increasedconcentrations and increased seaward velocities onthe shallower west side. Following the freshet, sed-iment flux was generally northward due to thenorthward-directed flow in the bottom boundarylayer. At the southern transect, sediment flux wassignificantly higher during spring-tide intervalswhen resuspension was highest. Transport was gen-erally landward on the west side and seaward onthe east side, but the higher concentrations on thewest side caused these fluxes to dominate.
The sediment flux was divided into two compo-nents: an advective flux and a tidal pumping flux.The advective flux is due to tidally averaged veloc-ity and concentration
¯Q 5 u(y, z)C(y, z) dy dz (1)a EEwhere u is the along-channel velocity, C is the con-centration, and the overbars indicate tidal averages
(the tides are removed using a 35-h filter). Thetidal pumping flux is due to the correlation of tidalfluctuations of velocity and concentrations
Q 5 u9(y, z)C9(y, z) dy dz (2)t EEwhere the primes indicate temporal deviationsfrom the tidal averages.
The contributions of the mean advective and tid-al pumping sediment flux for the western stations(which dominated the overall sediment flux) areshown in Fig. 8. At the northern transect, the ad-vective flux was generally seaward, with the largestcontribution coming during the freshet. Thepumping term was generally northward indicatinghigher concentrations during flood than ebb tides.This flux might be explained by higher concentra-tions of sediment to the south of this transect con-sistent with the position of the ETM.
At the southern transect, the advective sedimentflux was variable, but generally northward duringneap tides and southward during spring tides. Thisreflects the variability of the estuarine circulationwith the strongest bottom inflow occurring duringneap tides. The tidal pumping term showed amuch larger spring-neap cycle, with strong pulsesof inflow during large spring tides. This patternsuggests intense resuspension during floodingspring tides to the south of this station within theharbor producing the large northward flux at thistransect. The spring-tide pumping signal may beexplained by a large source of easily erodible sed-iment in the harbor, which would have been de-posited during an earlier freshet event, perhaps in

676 W. R. Geyer et al.
Fig. 9. Integrated sediment flux at the northern and south-ern sections for the period of reliable suspended sediment data.Positive values indicate northward (landward) flux. The shadedarea on either side of the solid lines indicates the uncertaintyof the estimate associated with different assumptions about thevertical distribution of sediment on the west side (see text). Atthe northern section, the net sediment flux was southward (sea-ward) during the freshet (year day 80–100), but the northwardtransport later in the record exceeded the initial southwardmass flux. At the southern section, the net flux was northwardthroughout the record, with maximum sediment influx occur-ring during the large spring tides.
1998. There was only modest evidence of pumpingon the east side at the Battery, and concentrationsthere were significantly lower; apparently thissource of sediment was confined to the west sideof the upper harbor.
The sediment fluxes were integrated over thelength of the deployment to determine the totalmass of sediment transported past each section(Fig. 9). The uncertainty associated with the verti-cal distribution of sediment is reflected in theshaded region in each plot. The upper limit as-sumes an e-folding scale of 15 m, and the lowerlimit an e-folding scale of 5 m, corresponding withthe 95% confidence limits of the observed verticaldistributions. The errors associated with lateral var-iability are not readily estimated, because therewere too few realizations of the lateral suspendedsediment structure to obtain meaningful statistics.As a consequence, the values of net sediment fluxshould be treated with caution, acknowledging thatthe time variation of transverse suspended sedi-ment structure augments the uncertainty of thenet flux estimates.
Even in light of the uncertainty of the measure-ments, the net flux estimates shown in Fig. 9 clear-ly deviate from the expectation of a net southwardsediment flux through the estuary. The northerntransect had a net seaward flux during the freshet(day 80–105) as expected, but the southern tran-sect exhibited a net landward flux even during thisperiod. After the freshet, the net flux was landwardat both transects. The integrated transport at thenorthern transect over the period carried a massof 65,000 6 30,000 tons to the northward. At thesouthern transect, the integrated transport totaled280,000 6 70,000 tons northward. Even with the
large uncertainty of these flux calculations, theflux at both stations was clearly landward, andthere was a significant net convergence into theestuary of roughly 200,000 tons over the interval.The fluxes at the southern transect were particu-larly enhanced during the two large spring tidesfollowing the freshet. These two intervals providedroughly half of the net northward flux.
Discussion
SEDIMENT INPUT FROM THE WATERSHED
Woodruff et al. (in press) calculated based onhistorical sediment load data and river dischargeobservations that 90,000 tons of sediment were de-livered from the Hudson River watershed betweenJanuary and June 1999. During the deployment pe-riod between March and June, approximately50,000 tons of sediment were delivered. Themoored flux calculations at the northern transectindicate a net seaward flux of approximately thatmagnitude during the freshet period (until yearday 90; Fig. 9). Following the freshet, the directionof transport reversed producing a net landwardflux of more than 50,000 tons over the observationperiod. It appears that in 1999, there was a nettrapping of at least 100,000 tons of sediment in theupper estuary and river during the observation pe-riod. Although small relative to the 200,000 tonsthat was trapped in the estuary (based on theabove flux calculations), the Hudson River was par-ticularly ineffective at transporting sediment sea-ward during the spring of 1999.
The spring freshet of 1999 was relatively smallcompared to the long-term average, falling withinthe lowest 5th percentile with respect to peak flowbased on the last 54 years of data. 1998 was in thehighest 10th percentile, with a major flood occur-ring in January 1998. The high peak flow in 1998would have been much more effective at trans-porting sediment seaward than the modest dis-charge of 1999 due both to the direct influence ofthe strong seaward advection and the indirect ef-fect of pushing the salinity intrusion seaward. Asindicated in both the time series data (Fig. 4) andthe salinity section (Fig. 5), the salinity intrusionwas displaced seaward during periods of high riveroutflow. As the salt was pushed seaward, the netnear-bottom flow would become seaward throughmost or perhaps the entire lower estuary due tothe higher flows and longer persistence of the1998 freshet. This seaward, near-bottom flow couldhave produced a net seaward sediment fluxthroughout the freshet in 1998. A large export ofsediment during the freshet of 1998 may help ex-plain the large input of sediment from the harborin 1999. An estimated 500,000 tons of sediment

Sediment Transport and Trapping 677
Fig. 10. Short-term bed sediment accumulation observed inApril 1999 (upper panel) and June 1999 (lower panel), basedon Be-7 data from Woodruff et al. (in press). The numbersindicate inventories and integrated fluxes in thousands of tons.The integrated fluxes for the upper panel represent the intervalof year days 70–105 and for the lower panel year days 105–165.
entered from the watershed between January andJune in 1998 (Woodruff et al. in press), a signifi-cant fraction of which may have settled in the har-bor. Some of this newly deposited sediment wasthen remobilized in 1999 providing the source forthe landward transport observed at the southerntransect during the spring of 1999.
THE COMBINED EFFECT OF TIDES AND DISCHARGE
One factor contributing to the weak sedimentexport during the 1999 freshet was the timing ofthe freshet relative to the spring-neap cycle. Thepeak of the freshet occurred during neap tides,which effectively minimized the seaward export ofsediment due to two effects. There is almost anorder-of-magnitude variation in suspended sedi-ment concentration between neap and springtides, so the seaward advection associated with thefreshet would have the least impact on sedimenttransport during neap conditions. The greateramount of mixing during spring tides tends to re-duce the magnitude of the estuarine circulation(Geyer et al. 2000), which leads to a stronger sea-ward component of the near-bottom flow if thefreshet occurs during spring tides. Even with therelatively small river outflow observed in 1999, sig-nificant export of sediment would have occurredif the peak of the freshet had occurred duringspring tides.
SEDIMENT TRAPPING IN THE LOWER ESTUARY
The sedimentological studies by Woodruff et al.(in press) indicate a seasonal variation of sedimenttrapping in the lower Hudson River estuary, shownschematically in Fig. 10. Recent sediment deposi-tion was identified by the presence of Be-7 (half-life 53 d) in the surficial sediment. During thefreshet period of 1999, approximately 100,000 tonsof sediment were found in the seaward portion ofthe estuary in the region of maximum horizontalsalinity gradient during that high-flow period (cf.,Fig. 5), and no new sediment was found in theETM zone except a localized deposit near thebank. In June 1999, a much larger deposit, totaling300,000 tons, was found in the ETM zone, and theseaward reach was now devoid of sediment. Thisseasonal shift in deposition is consistent with theobserved variations in sediment flux with more sea-ward transport during freshet conditions and land-ward transport in the subsequent low flow. Thisseasonal pattern of sediment deposition has alsobeen observed in the Gironde estuary by Migniot(1971), and similar movement of the ETM was ob-served in the Tamar and Weser estuaries by Gra-bemann et al. (1997). The changes in position ofsediment trapping principally reflect the change inposition of near-bottom convergence due to vari-
ations in position of the salinity intrusion as a func-tion of discharge.
The new sediment that was deposited in theHudson River did not necessarily come from out-side the estuary—it could have been eroded withinthe estuary and exposed to Be-7 in the water col-umn before being re-deposited. A significant frac-tion of the observed deposition appears to haveentered from the harbor. Approximately 280,000tons were transported into the estuary from theharbor between year day 70 and 140, and another100,000 tons were probably transported over thenext 24 d preceding the coring study, although thefouling of the OBS sensors precluded the accurateestimate of this latter flux. Virtually all of the newlyaccumulated sediment within the estuary could bethe result of the input from the harbor. This find-ing is consistent with the analysis of Feng et al.(1999) of Be-7 and Th-234 ratios in the HudsonRiver estuary, which suggests that the sediment ac-cumulating in the ETM of the Hudson originatedfrom the Harbor. This approximate mass balancealso provides some support for the quantitative as-sessments of sediment flux presented here.
SHORT-TERM DEPOSITION VERSUS LONG-TERMACCUMULATION
The rate of sediment deposition derived both bythe flux measurements and by the Woodruff et al.(in press) estimates of new sedimentation greatlyexceed the estimates by Olsen et al. (1978) of long-term sediment accumulation based on Pb-210 andCs-137 of 1–2 mm yr21. If the observed sediment
678 W. R. Geyer et al.
Fig. 11. Historical changes in bed elevation at two sites with-in the ETM, between 1865 and 1998. The changes in depth inthe last 68 years do not indicate any significant infilling, exceptfor the dredged channel on the west side at km 14. The depositsindicated in Fig. 10 and observed by Woodruff et al. (in press)were generally outside the regions of historical dredging.
convergence were distributed uniformly over thesurface area of the estuary, it would amount to ap-proximately 3 cm of net deposition (based on abulk density of 400 kg m23 dry weight and an areaof the lower estuary of 3 3 107 m2). The results ofWoodruff et al. (in press) indicate that the depo-sition is not uniform, but rather it is focused indiscrete zones within the ETM with local accumu-lations of as much as 35 cm over the April–Juneinterval.
Additional support for Olsen’s modest estimateof long-term sediment accumulation comes fromhistorical bathymetry data (Fig. 11). Over the last150 yr, the depth profile of the estuary has beenrelatively constant with minor changes associatedwith shoreline modification. Dredging was a signif-icant factor in the mass balance during the 1960sand 1970s, when approximately 300,000 tons weredredged annually from a channel within the ETM(Gross 1974). Dredging in this part of the river hasbeen discontinued as of 1994 and was not signifi-cant during the late 1800s and early 1900s. It ap-pears that dredging causes an intensification ofsediment trapping due to artificially deepening thechannel, although as the channel returns to its nat-ural cross-sectional shape, it maintains an equilib-rium mass balance on decadal or longer timescales based both on Olsen et al.’s (1978) radio-nuclide data and the long-term bathymetric data.
The large accumulation of sediment in the es-tuary observed in 1999 is not consistent with thislong-term equilibrium. Even on decadal timescales, the rapid accumulation of sediment wouldresult in significant changes in the channel mor-phology that would alter the hydrodynamic re-gime. Although not observed in this study, theremust be erosion events at roughly decadal timescales that export sediment to the ocean and main-
tain the long-term equilibrium. The most plausiblemechanism for these export events is large freshetevents, particularly those that occur during springtides. Given a random occurrence of freshetevents, about 25% of them should occur within theseveral days of the fortnight with spring tides. It islikely that at least once per decade, a large freshetevent will occur during spring tides, providing alarge export of sediment from the estuary. Thelarge event in 1998 is one potential example—itcertainly had the amplitude and the timing withrespect to the spring–neap cycle to accomplish asignificant amount of erosion. The magnitude ofsediment export associated with this event is un-known, and it is difficult to assess the potentialmagnitude of erosion, particularly if the sedimenthas undergone consolidation. The overall massbalance of the system requires that the episodicexport of sediment match the shorter-term accu-mulation, and the most likely mechanism for suchexport events appears to be high discharge com-bined with high tidal range.
ConclusionsThis set of observations in the Hudson River es-
tuary supports Meade’s (1969) observation thatunder normal flow conditions estuaries tend to im-port sediment from the seaward direction. The ob-servations also indicate that the direction of sedi-ment flux is controlled by the river flow while itsmagnitude is controlled by the spring-neap varia-tion in tidal amplitude. Sediment export from es-tuaries is expected to occur when spring tides co-incide with strong river outflow. During the 1999observations, the peak river flow occurred duringneap tides, and there was virtually no export ofsediment from the estuary. The trapping of sedi-ment within the estuary observed in 1999 is incon-sistent with the long-term morpological equilibri-um of the estuary, which is evident from historicalbathymetric data extending over the last 150 years.Major sediment export events must occur episod-ically, in order to maintain the estuary at a roughlyuniform depth. The events most likely to accom-plish the major episodes of sediment export arelarge freshet events that occur during spring tides.
ACKNOWLEDGMENTS
This research was supported by the Hudson River FoundationGrant 004/98A and the Office of Naval Research Harbor Pro-cesses Program award N00014-99-0039. This is Woods HoleOceanographic Institution contribution 10285.
LITERATURE CITED
ABOOD, K. A. 1974. Circulation in the Hudson estuary. In O. A.Roels (ed.), Hudson River Colloquium. Annals of the New YorkAcademy of Sciences 250:38–111.
CASTAING, P. AND G. P. ALLEN. 1981. Mechanisms controlling

Sediment Transport and Trapping 679
seaward escape of suspended sediment from the Gironde: Amacrotidal estuary in France. Marine Geology 40:101–118.
FENG, H., J. K. COCHRAN, AND D. J. HIRSCHBERG. 1999. 234Th and7Be as tracers for the transport and dynamics of suspendedparticles in a partially mixed estuary. Geochimica et Cosmochim-ica Acta 63:2487–2505.
FLOOD, R. D. AND H. J. BOKUNIEWICZ. 1986. Bottom morphologyin the Hudson River Estuary and New York Harbor. North-eastern Geology 8:130–140.
GEYER, W. R., R. P. SIGNELL, AND G. C. KINEKE. 1998. Lateraltrapping of sediment in a partially mixed estuary, p. 115–126.In 8th Biennial Conference on Physics of Estuaries and Coast-al Seas, 1996. A. A. Balkema, Rotterdam, The Netherlands.
GEYER, W. R., J. T. TROWBRIDGE, AND M. M. BOWEN. 2000. Thedynamics of a partially mixed estuary. Journal of Physical Ocean-ography 30:2035–2048.
GRABEMANN, I., R. J. UNCLES, G. KRAUSE, AND J. A. STEPHENS.1997. Behavior of turbidity maxima in the Tamar (U.K) andWeser (F.R.G.) estuaries. Estuarine, Coastal and Shelf Science 45:235–246.
GROSS, M. G. 1974. Sediment and waste deposition in New YorkHarbor. Annals of the New York Academy of Sciences 250:112–128.
MEADE, R. H. 1969. Landward transport of bottom sediments ofthe Atlantic Coastal Plain. Journal of Sedimentary Petrology 39:222–234.
MIGNIOT, C. 1971. L’evolution de la Gironde ou cours destemps. Bulletin Institute Geolique Bassin d’Aquitaine 11:211–281.
NEPF, H. M. AND W. R. GEYER. 1996. Intratidal variations in strat-ification and mixing in the Hudson estuary. Journal of Geo-physical Research 101:12079–12086.
NEUMAN, W. S., D. H. THURBER, H. S. ZEISS, A. ROKACH, AND L.MUSICH. 1969. Late Quaternary geology of the Hudson Riverestuary: A preliminary report. New York Academy of SciencesTransactions Series II 31:548–570.
OLSEN, C. R., H. J. SIMPSON, R. F. BOPP, S. C. WILLIAMS, T. H.PENG, AND B. L. DECK. 1978. A geochemical analysis of thesediments and sedimentation in the Hudson Estuary. Journalof Sedimentary Petrology 48:401–418.
PETEET, D. M. AND J. K. WONG. 2000. Late Holocene environ-mental changes from NY-NJ estuaries. Proceedings GeologicalSociety of America, Northeastern Section Meeting, page A-65.EDITORS, PUB, AND PLACE.
THORNE, P. D. 1993. Analysis of acoustic measurements of sus-pended sediments. Journal of Geophysical Research 98:899–910.
WEISS, D. 1974. Late Pleistocene stratigraphy and paleoecologyof the lower Hudson River estuary. Geological Society of AmericaBulletin 85:1561–1570.
WOODRUFF, J. D., W. R. GEYER, C. K. SOMMERFIELD, AND N. W.DRISCOLL. In press. Seasonal variation of sediment depositionin the Hudson River estuary. Marine Geology.
Received for consideration, August 25, 2000Accepted for publication, April 23, 2001