Subneolithic Fishery in the Iijoki River Estuary, Northern Ostrobothnia, Finland

Estuarine, Coastal and Shelf Science 62 (2005) 301–312
www.elsevier.com/locate/ECSS
Geomorphologic and physical characteristics ofa human impacted estuary: Quequen Grande River
Estuary, Argentina
Gerardo M.E. Perilloa,b,*, Daniel E. Perezc, M. Cintia Piccoloa,d,Elbio D. Palmaa,e, Diana G. Cuadradoa,b
aInstituto Argentino de Oceanografıa, CC 804, Florida 4000 Edificio E1, 8000 Bahıa Blanca, ArgentinabDepartamento de Geologıa, Universidad Nacional del Sur, San Juan 670, 8000 Bahıa Blanca, Argentina
cDepartamento de Ingenierıa, Universidad Nacional del Sur, Av. Alem 1253, 8000 Bahıa Blanca, ArgentinadDepartamento de Geografıa, Universidad Nacional del Sur, 12 de Octubre y San Juan, 8000 Bahıa Blanca, Argentina
eDepartamento de Fısica, Universidad Nacional del Sur, Av. Alem 1253, 8000 Bahıa Blanca, Argentina
Received 17 May 2004; accepted 17 September 2004
Abstract
Even though the Quequen Grande River Estuary has economic and strategic importance from an oceanographic point of view, ithas been ignored until recently. Nevertheless, many anthropogenic modifications (i.e., dredging, jetty and harbour construction,etc.) have taken place in the last 100 years which, most of them, have resulted in significative economic expenses to the harbour and
city authorities due to the lack of adequate prior studies. The purpose of this article is to provide a review of the present status of thegeomorphology and main physical characteristics of the estuary and describe the effects of these man-made modifications uponthe estuary. Data were gathered in several field cruises from 1994 to 2000 plus from continuous recording devices installed at or nearthe estuary directed to define the present geomorphologic and oceanographic conditions of the estuary and to establish a monitoring
program. The ultimate goal is to provide some practical solutions in diminishing the maintenance of the harbour and to providepollution-control devices.
The estuary is classified as a microtidal, primary, coastal-plain system. It can be considered as a partly-mixed system 2 km from
the mouth up to its head (15 km inland). Artificial dredging to accommodate the Quequen harbour in the last 2 km of the estuaryhas induced a highly stratified water column where the upper 2–3 m concentrates low salinity water and the lower layer is filled bywater of the same or slightly higher salinity than the inner shelf waters. Due to the presence of a step at the head of the harbour,
water circulation is very reduced and in some cases nonexistent, producing strong reductive and even anoxic conditions. The foot ofthe step is a sediment and organic matter trap that must be dredged periodically to insure adequate navigability.� 2004 Elsevier Ltd. All rights reserved.
Keywords: anthropogenic impact; estuarine geomorphology; Quequen Grande Estuary; Argentina
1. Introduction
In general, estuaries occupy the coastal areas leastexposed to marine action allowing the development of
* Corresponding author.
E-mail address: [email protected] (G.M.E. Perillo).
0272-7714/$ - see front matter � 2004 Elsevier Ltd. All rights reserved.
doi:10.1016/j.ecss.2004.09.018
harbours, recreational facilities, or aquiculture initia-tives (Perillo, 1995). These same circumstances haveinduced human occupation along estuarine shores. Infact, most coastal cities in the world are located alongan estuary having the multiple advantage of allowingcommunications both to the hinterland, through theriver, and overseas. Even though there are historical

302 G.M.E. Perillo et al. / Estuarine, Coastal and Shelf Science 62 (2005) 301–312
examples in where some estuaries have been modified by,for instance, diking (i.e., Bay of Fundy), filling of tidalflats and salt marshes (Seine River, France, Avoine et al.,1981) or merging of lagoon–marsh systems (ManzalaLagoon, Egypt, Randazzo et al., 1998), most of thegeomorphological and physical changes that occurred inhuman impacted estuaries started at the end of the 19thCentury and increased exponentially to the present.
Anthropogenic changes in estuaries have been mostlyinfluenced by the shipping industry as cargo vessels haveincreased their sizes by several orders of magnitude since1800s. The increment in length and tonnage is concomitantwith larger draft and, consequently, the need of deepernavigation channels and harbours. Then dredging becomesa major necessity for port authorities who have also beencompelled to find ways to dispose off the material.Sometimes these sediments could be polluted and requirespecial treatment rising themaintenance costof theharbour.
The Charleston Harbour (US) is a clear example thathuman modifications in the fluvial discharge into anestuary can have a strong impact of the estuarinecirculation and hence on the sedimentation rate withinthe harbour. Either reducing river input by dammingupstream (Syvistki et al., in press) or increasing riveroutflow, as in the indicated case, have major impacts onthe geomorphological, physical, chemical and ulti-mately, on the biological characteristics of an estuary.Most of the anthropogenic changes are rather drastic intime. The slow evolving equilibrium that exists in anestuary suffers the impact and can hardly react toaccommodate to the new conditions. Therefore, in mostcases, the impact is negative and results in moreinconveniences than originally expected.
In areas where littoral sediment transport is veryactive, preservation of the inlet from both drifting andinfilling requires the construction of jetties, a factcommonly found along the southeastern coast of theUnites States. Furthermore, inlets protect the harbourentrance from wave activity. However, jetties have thedisadvantage of disrupting the littoral circulation in-ducing sedimentation on the net upstream side anderosion on the net downstream one.
The Quequen Grande River Estuary (Fig. 1) is anexample where all of the human impacts describedbefore converge in the modification of the original es-tuarine characteristics. It is our objective to describe thegeomorphologic and physical characteristics of theQuequen Grande River Estuary, Argentina, and focusattention on the salient processes and their variability onthis particular environment.
1.1. Description of the Quequen GrandeRiver Estuary
The Quequen Grande River Estuary (QGE hence-forth) is the third largest estuary in the Buenos Aires
Province, second only to the Rıo de la Plata andBahıa Blanca (Piccolo and Perillo, 1999). In spite of itseconomic and strategic importance, from an oceano-graphic point of view, it has been ignored. Nevertheless,many anthropogenic modifications were effected in thelast 100 years and have resulted in significative economicexpenses in maintenance and pollution control to theharbour and city authorities due to the lack of adequateprior studies.
The Necochea–Quequen (Fig. 1) area has received anextraordinary economic advance within the last 20 yearsdue to a strong touristic influence and the improvementof the Quequen harbour. Although there are no majorindustries located along the Quequen Grande River,most of the city sewages are discharged directly intothe system, especially those derived from the cities ofNecochea and Quequen. The latter do so within the es-tuarine part of the river. Also on the Necochea (SW)side of the estuary, there is a large thermoelectric plantthat uses the estuary water for the cooling system.
The Quequen harbour (Fig. 1B) is located in the last2 km of the estuary and covers both margins modifyingthe original geomorphology of the mouth completely.Because of its activity and draft, the harbour is thesecond largest deep water system in Argentina. Mostof its activities are related to the exportation of grains(especially wheat, corn and sunflower) and to coastaland inner shelf fisheries. During ship loading, it iscommon to see wind-blown grains that are dispersed onthe estuarine surface which then settle at the bottom,developing the basis for a reduction zone at the bottom.
Geomorphologic and physical studies on this estuary(and the whole river as well) are very few. Sediment grainsize distributions were described originally by Wright(1968) indicating that bottom sediments along the thalwegwere constituted by sands, silty sands and silty clays withmean grain size decreasing inland. The bottom sedimentswithin the estuary reflect the influence of the Pleistoceneloess sediments of the adjacent area as most of thematerials foundhave a relatedmineralogical composition.However, at the head of the harbour, and due to itsparticular dynamics, sediments are very fine and theconditions are highly reductive (Piccolo andPerillo, 1999).
The first references to salinity distribution wereprovided by Boltovskoy and Boltovskoy (1968) andWright (1968) as a complement to their study offoraminifera. Wright (1968) indicated that maximumsalinities (O30) were found in the first 2–3 km of theestuary whereas at 15 km from the mouth valuesdiminish to only 1 or less.
The Franzius Institut (1964) made a study of theharbour area prior to its last major dredging. Itsfindings, published in a technical report, were completefor that time but physical data were gathered at variabletide phases which made it very difficult to correlate thevarious information. However, it provided some ideas of

303G.M.E. Perillo et al. / Estuarine, Coastal and Shelf Science 62 (2005) 301–312
Fig. 1. General morphology of the Quequen Grande River Estuary (B) on the coast of Argentina (A). The last portion of the estuary (C) corresponds
to the harbour. The location of the various stations is indicated. Coordinates in Gauss–Kruger projection are in km.
water and sediment circulation when the harbour hadcompletely different characteristics from the presentone. Also the Area Hidraulica Marıtima (1988) madea statistical study and numerical modelling of the waveconditions at the mouth of the harbour to design theextension of the southwestern jetty.
A brief description of the general hydrography ofthe estuary was provided by Piccolo and Perillo (1997a,1999). A preliminary analysis of the tidal characteristicsin the harbour area was presented by Piccolo and Perillo(1997b). Campo de Ferrera (1998) described in detail forthe first time the general river basin.
Despite the reported studies, the basic properties ofthe geomorphology and physical oceanography of the
QGE and their relation with the mixing processes arepoorly understood. Thus, a review of the present statusof knowledge of these variables is provided. A numberof salient features of the estuarine dynamics is presentedespecially relative to salinity and current distributionsand tidal behaviour. A better understanding of both,geomorphology and hydrography of the estuary willcertainly be useful in solving its pollution and dredgingproblems.
1.2. General setting
The Quequen Grande River basin is located in ahighly developed farming zone of Argentina and it has

304 G.M.E. Perillo et al. / Estuarine, Coastal and Shelf Science 62 (2005) 301–312
a total area of 9370 km2. The river is 173 km long witha dendritic pattern (Campo de Ferrera, 1998). Alltributaries, except the Arroyo Seco Creek, join the riverupstream at a distance of 36 km from the mouth. TheArroyo Seco Creek does it at 15 km from the mouthcoinciding with the last minor falls (Las Cascadas)observed. This point is also where the maximum tidalpropagation is detected. Thus, Las Cascadas Falls(Fig. 1C) marks the head of the estuary following theestuarine definition criteria proposed by Perillo (1995).
Most of the river runs on Pleistocene, partly-cemented (CaCO3) loess sediments. Due to the sedimentcharacteristics, large portions of the river flows withina canyon whose walls may reach up to 12 m high(Campo de Ferrera, 1998). The cemented sediments thatcut across the river channel provide the conditions todevelop small falls and rapids of which Las CascadasFalls is the last example. Along the estuarine reach ofthe river, navigation at low tide allowed us to observeseveral of these rock-crossing that on occasions madenavigation risky.
The river itself, and mainly the estuary, has ameandering pattern which originally ended in a coastalplain dominated by a coastal dune system on theNecochea side and a cliffy coast with extended beacheson the Quequen side. However, these last features havebeen lost with the development of the harbour in 1908and the initial construction of the jetties in 1915. Due tothe prevailing SW–NE littoral drift along the coast, theeffect of the jetties was to impound sand on theNecochea side and to provoke a strong erosion processof the Quequen beaches. The situation nowadays is suchthat Quequen (which was the original resort for thearea) has lost practically all its beaches and dunes, andpresently its coast is formed by 1–8 m cliffs that are incontinuous retreat. Descriptions made by Suarez Garcıa(1940) indicated the presence of an outer shoal (maybea spit) that shifted the estuary mouth northeastwardfollowing the typical littoral drift.
Although the construction of the jetties was promp-ted by the embankment of the harbour mouth by littoraldrift and designed to reduce wave activity within, theresults along the years have been very poor. Even today,high waves may affect harbour activity (specially for thefishing fleet) even 48 h after a storm hits the coast(Campo de Ferrera 1998). Also, a bank still forms at thetip of the southern (S) jetty (Fig. 1B) that requiresperiodic dredging to maintain adequate navigability con-ditions. Plans are being made to prolong the S jettya further 500 m.
Mean river discharge has varied along the yearsfrom 20 m3 s�1 (1918) to 5.25 m3 s�1 (1992). Campode Ferrera (1998) has estimated that the mean annualrunoff at the Las Cascadas gauging station is 8.1 m3 s�1.However, mean monthly values vary along the yearfrom a minimum of 5.3 m3 s�1 in February to a
maximum of 11.4 m3 s�1 in November. Nevertheless,very large flash floods have been registered during thelast century; the most important ones in 1905, 1913,1915, and the largest one ever in 1980, which reachedover 200 m3 s�1, and destroyed three major bridgeswithin the estuarine reach. Unfortunately, the gaugingstation at Las Cascadas was discontinued in 2000, sodata concerning a very large flood that occurred inNovember 2002 were not available, but unpublisheddata gathered at the peak of the flood let us estimate itto be on the order of 150 m3 s�1.
To provide deep water conditions for the harbouractivities, the last 2 km of the estuary are kept at12 m depth to the Tidal Datum by continuous dredging(Fig. 2). However, further upstream the thalweg hasa depth of 2–4 m (Fig. 1C).
Lanfredi et al. (1988) have studied the variations ofthe mean sea level in Quequen harbour. They analysed64 years of hourly tidal heights and obtained the positivelong term trend of 1.6 mm yr�1, which is in generalagreement with similar variations worldwide. The tideis mixed, predominantly semi-diurnal (FormzhalNumberZ 0.72), with a mean tidal range of 1.03 m.With an estimated total surface of 1.99 km2, the meantidal prism is 2.05! 106 m3. Yearly maximum tideswere analysed by Piccolo and Perillo (1997a) for theperiod 1958–1994. The highest values were registered in1962 and 1979 with 3.1 m. The most importantastronomical components are the M2, O1 and K1.Restricting the analysis to the period 1989–1993 andto the three main constants, Table 1 shows significantannual variations in amplitude and phase.
Piccolo and Perillo (1997a) have also studied thehourly departures of observed tides from predicted ones(storm surges). They presented maximum values of1.5 m and �1.66 m in the period 1989–1994. Spectralanalysis of the storm surges showed significant energypeaks in 60, 21, 10, 5.6 and 0.5 days. These periodsindicate that the fluctuations are produced by meteoro-logical processes in macro, synoptic and microscales.The 10-day peak corresponds to the frequency of stormpassage for the study zone and the 5.6 days peak char-acterizes the synoptic scale. These periods are typical ofhigh and mid-latitudes. The 12-h peak corresponds tothe local wind circulation: the sea breeze. Therefore, thesea level variations of the QGE are mostly due to theeffect of meteorological forcing.
Wave action along the coast is very high. In fact,almost 100 days a year the harbour does not presentadequate navigation conditions and must be closed bythe harbour authorities. Combined visual-estimationand wave gage data obtained from 1929 to 1969 pro-vided by the harbour authorities showed a mean sig-nificative wave height of 1.4 m with a maximum heightof 5 m, a mean period of 5.8 s and maximum of 10.8 s.Although significative wave height seems small, peak

305G.M.E. Perillo et al. / Estuarine, Coastal and Shelf Science 62 (2005) 301–312
5731.0
5730.5
5730.0
5729.5
5729.0
5612.0 5613.0 5614.0
A
B
km
km
12
12
12
10
10
10
6
6
2
4
120
QUEQUEN
NECOCHEA
2
Fig. 2. Bathymetric and sedimentologic map of the harbour area (last 2 km of the estuary). Notice the strong step from the river to the harbour vessel.
Insert is a bathymetric profile along the center line of the map. Coordinates in Gauss–Kruger are in km.
waves of the order of 5 m are very common, especiallyduring the typical southeastern winds that hit the coastof the Buenos Aires Province frequently (on average 5–10 times a year during late summer and autumn) withhigh intensity winds (up to 100 km h�1).
Mid-latitude westerly winds and the influence of theSubtropical South Atlantic High dominate the typicalweather pattern of the region. The resulting circulationinduces strong NW and N winds with a mean velocity of15.7 km h�1. Since the installation of the weather station,the maximum gust measured reached 158.8 km h�1.Average temperature at the harbour area is 11.8 �Cvarying from maximum values of the order of 35 �C insummer (December–February) to 0 �C in winter (June–August). Mean annual precipitation for the period1995–2002 is 743 mm.
Table 1
Amplitude and local phase angles for the principal tidal component at
QGE
Year M2 K1 O1
A (m) G ( �) A (m) G ( �) A (m) G ( �)
1989 0.4378 178 0.1738 74.7 0.1755 3.7
1990 0.4387 75.1 0.1725 72.2 0.169 265.1
1991 0.4401 333 0.1607 69.5 0.1642 169
1992 0.4001 249 0.1434 258 0.1372 266.2
1993 0.3626 165 0.1452 78.7 0.1366 3.4
Significant changes occur in both variables.
2. Methodology
Within the period April 1994–August 1998, six sur-veys covering all seasons and spring–neap conditionswere carried out in the QGE to provide basic in-formation to characterize the system. These surveyscomprised geomorphological, hydrographic and meteo-rologic data gathering. The bathymetry was carried outusing a 208-kHz Raytheon echosounder and a Differen-tial, real time GPS (DGPS) for positioning. The coastsof the estuary were mapped in detail by walking alongthe edge of the water or the cliffs with a DGPS. In allcases, coordinates were logged at 1 s/position. Depthdata were later corrected in the office to the local DatumPlane with tidal data obtained at the harbour tide gage(Fig. 1B) and a bathymetric chart of the whole estuarywas drawn (Figs. 1C and 2). Furthermore, a side scansonar (SSS) was used to map the geomorphology of theharbour area including the entrance channel.
A total of 40 sediment samples was taken witha Snapper grab sampler at a series of cross-sectionsalong the estuary to describe the general sedimentdistribution on the system. In each cross-section threesamples were gathered from both sides and the centreof the channel and positioned by DGPS. Within theharbour, 20 samples were also taken as a function ofthe information gathered by the SSS. Samples wereanalysed for grain size following standard laboratoryprocedures.

306 G.M.E. Perillo et al. / Estuarine, Coastal and Shelf Science 62 (2005) 301–312
Physical information consisted in tide, salinity,temperature, current velocity and direction as well asmeteorological data. A standard tide gage (Fig. 1B) hasbeen operational since 1918 within the harbour area.This gage has been considered by Lanfredi et al. (1988)as the only long term tide series in the country that allowthe adequate conditions to estimate mean sea levelvariations. A specific study of short term sea levelfluctuations within the harbour was made by placingtwo InterOcean WTG904/2 tide/wave gages at twoextreme points within the harbour (Sites S and N,Fig. 1B). Water level data were sampled at 1-mininterval for a total of two months (August andSeptember 1998).
Salinity and temperature information was obtainedfollowing a series of longitudinal surveys at high andlow water in each cruise to determine maximum salinityintrusion within the estuary compared to river dis-charge. In every survey, 13–15 stations were sampled bymaking continuous vertical profiles using an InterOceanMiniCTD. Unfortunately, during the field work periodsriver discharge did not vary significantly from the meanvalue.
Within the harbour area, four stations (1 through 4,Fig. 1B) were monitored for over one tidal cycle each(14 h) in every cruise. At half hour intervals verticalprofiles of salinity and temperature were obtained usingthe MiniCTD InterOcean and current velocity anddirection using a Valeport BMF108 current metre. Inthe case of the current metre data, five levels at 0.6, 1.2,2.0 m above the bottom, at 1.8 m below the surface andat mid level between the 2 m above the bottom and1.8 m below the surface were sampled. Obviously thisintermediate level varied with tidal conditions. Furtherdetails on the methodology employed are describedelsewhere (Perillo and Piccolo, 1993). Data processingto insure error-free estimation of residual fluxes weremade by employing the method proposed by Perilloand Piccolo (1991, 1993, 1998). An automatic weatherstation was installed within 200 m of the harbour inAugust 1995. All data including wind, air temperatureand pressure, and precipitation are being registered sincethen at half hour intervals.
3. Results
3.1. Geomorphology
Based on the surveys made with echosounder andDGPS, a bathymetric map (Fig. 1) of the whole estuaryup to Las Cascadas Falls was drawn. Fig. 2 shows themap of the last portion of the estuary that includes theharbour and a portion of the river. The width ofthe channel upstream of the harbour is quite regular onthe order of 200–220 m. Only in the harbour does it
increase to about 250 m, reaching its maximum of 900 min the ship maneuvering portion near the mouth.
Cross-section profiles have, in general, a rather wideV-shape. Since the channel is meandering, the thalwegfollows the standard meander pattern. Maximumthalweg depths are 2–4 m. However, depth in the lastreach of the estuary changes dramatically (Fig. 2).Withinthe harbour, depth is maintained artificially at 12 m byperiodical dredging. This depth is kept up to a distance of1950 m from the mouth. Between the harbour and theriver reaches the difference in depth is of the order of 8 mwith a slope of 2.6 �. We further refer to this abrupt depthdifference as ‘‘the step’’. A survey made with SSS of theharbour and the entrance channel did not show anybedforms except for those originated by the dredging.
The step was made artificially by dredging whichmodified the original morphology of the coastal-plainestuary. A small channel cuts through the step on theQuequen side but there is no clear reason as to how itwas formed since the strongest currents in the lastmeander occurs along the outer (Necochea side) bank.Although there is no official information from the PortAuthorities, we suspect that this channel was formedartificially during the dredging. Depth reductions areobserved in the ship maneuvering area behind the Njetty and along the coast at the start of the S jetty.Meanwhile, in the other much smaller sector, a sandybeach has developed by littoral transport along the Sjetty (waves actually diffract and move inshore along thejetty) and its expansion is controlled by dredging.
Sediment distribution within the harbour (samplestaken 5 months after a dredging) indicated that thecentral part of the harbour is dominated by very finesediments, mostly silty clays with low percentages ofsand. The distribution of mean size higher than 44 (silt-clay, Fig. 2) forms a band that extends from the step tothe mouth of the harbour. The only parts that havesand-dominated sediments are at the mouth and alongthe right margin of the harbour. Finest sediments arefound just at the bottom of the step and behind the Njetty on the left margin of the harbour. Above the step,the bottom material is fine to medium sand. The bottommaterial taken at the lower portion of the step is highlyreductive which shows that the sector concentratesorganic material and tends to become anoxic.
3.2. Longitudinal distribution of salinity
A series of 12 longitudinal profiles was made along thethalweg of the estuary following conditions of high andlow tides. As the discharge conditions along the yearvaries very little, except for exceptional floods, thegeneral distribution was similar in all surveys varyingonly in the length of the salt intrusion as a function oftidal stage. One example is presented in Fig. 3 for low tideconditions and average runoff. A certain stratification
307G.M.E. Perillo et al. / Estuarine, Coastal and Shelf Science 62 (2005) 301–312
is evident with fresher water overlying sea water andconcentrated toward the head of the estuary. The generalsalinity structure of the estuary resembles a typicalpartially mixed estuary and even in the maximum pointof salt intrusion the partially mixed structure persists. Inno case we found a salt wedge development. However,within the harbour area, we observed in all thelongitudinal surveys and tidal-cycle stations that a strongstratification occurs; meaning that the upper 1–3 m of thewater column is fresh water and a halocline developsreaching salinities of over 30 being homogeneous downto the bottom. In some surveys, especially thoseassociated with lower river discharge, below haloclinesalinities reached up to 33 which is the typical valuefound along the inner continental shelf adjacent to theestuary (Piccolo, 1998; Perillo et al., in press).
3.3. Temporal variations of temperature, salinityand density
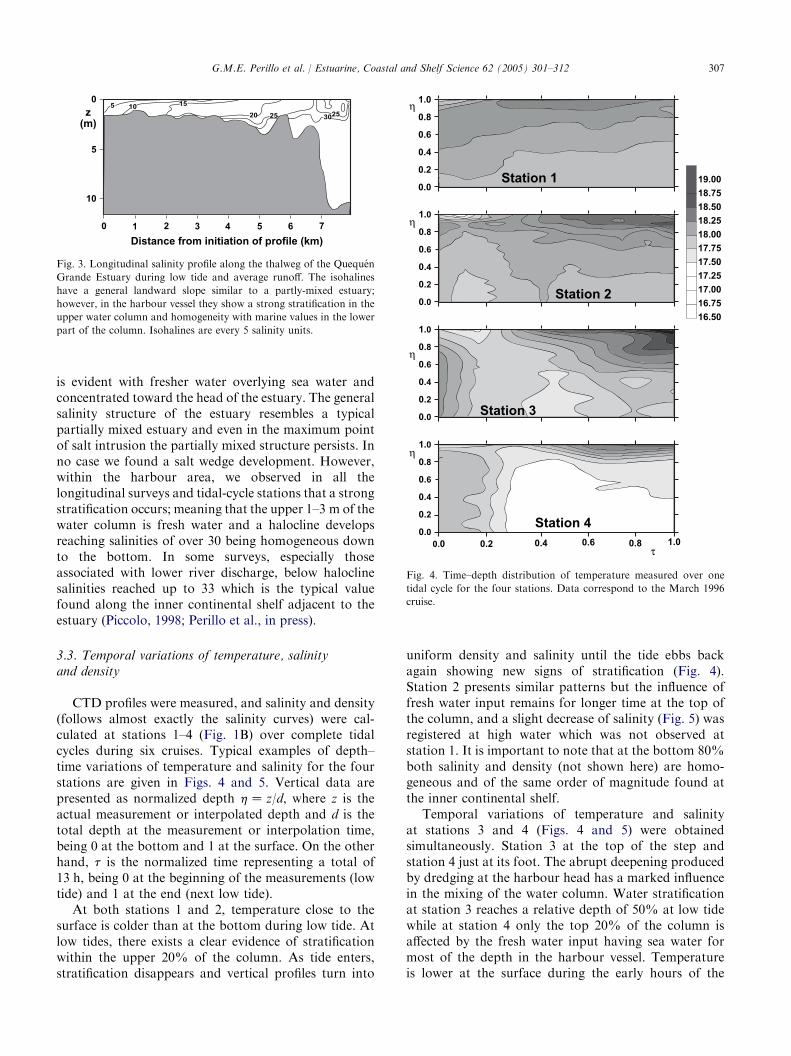
CTD profiles were measured, and salinity and density(follows almost exactly the salinity curves) were cal-culated at stations 1–4 (Fig. 1B) over complete tidalcycles during six cruises. Typical examples of depth–time variations of temperature and salinity for the fourstations are given in Figs. 4 and 5. Vertical data arepresented as normalized depth hZ z/d, where z is theactual measurement or interpolated depth and d is thetotal depth at the measurement or interpolation time,being 0 at the bottom and 1 at the surface. On the otherhand, t is the normalized time representing a total of13 h, being 0 at the beginning of the measurements (lowtide) and 1 at the end (next low tide).
At both stations 1 and 2, temperature close to thesurface is colder than at the bottom during low tide. Atlow tides, there exists a clear evidence of stratificationwithin the upper 20% of the column. As tide enters,stratification disappears and vertical profiles turn into
Distance from initiation of profile (km)
0 1 32 54 76
z
(m)
0
5
10
25302520
1015
5
Fig. 3. Longitudinal salinity profile along the thalweg of the Quequen
Grande Estuary during low tide and average runoff. The isohalines
have a general landward slope similar to a partly-mixed estuary;
however, in the harbour vessel they show a strong stratification in the
upper water column and homogeneity with marine values in the lower
part of the column. Isohalines are every 5 salinity units.
uniform density and salinity until the tide ebbs backagain showing new signs of stratification (Fig. 4).Station 2 presents similar patterns but the influence offresh water input remains for longer time at the top ofthe column, and a slight decrease of salinity (Fig. 5) wasregistered at high water which was not observed atstation 1. It is important to note that at the bottom 80%both salinity and density (not shown here) are homo-geneous and of the same order of magnitude found atthe inner continental shelf.
Temporal variations of temperature and salinityat stations 3 and 4 (Figs. 4 and 5) were obtainedsimultaneously. Station 3 at the top of the step andstation 4 just at its foot. The abrupt deepening producedby dredging at the harbour head has a marked influencein the mixing of the water column. Water stratificationat station 3 reaches a relative depth of 50% at low tidewhile at station 4 only the top 20% of the column isaffected by the fresh water input having sea water formost of the depth in the harbour vessel. Temperatureis lower at the surface during the early hours of the
16.50
16.75
17.00
17.25
17.50
17.75
18.00
18.25
18.50
18.75
19.00
1.0
0.8
0.6
0.4
0.2
0.0
Station 1
1.0
0.8
0.6
0.4
0.2
0.0
Station 2
1.0
0.8
0.6
0.4
0.2
0.0Station 3
Station 4
1.0
0.8
0.6
0.4
0.2
0.0
0.0
0.2
0.4 0.6 0.8 1.0
η
τ
η
η
η
Fig. 4. Time–depth distribution of temperature measured over one
tidal cycle for the four stations. Data correspond to the March 1996
cruise.

308 G.M.E. Perillo et al. / Estuarine, Coastal and Shelf Science 62 (2005) 301–312
morning due to the low temperatures registered duringthe night before. Similar to stations 1 and 2, this effectdisappears as the sun heats the surface. Salinity at eachstation has strong gradients between bottom andsurface. Salinity distribution over station 4 suggeststhat sea water invades the lower portion of the watercolumn having very little exchange with the fresh waterinput.
Station 3 has the lowest average salinity whichdenotes a stronger river fresh water presence but at allstations minimum values of salinity have the same orderof magnitude. The distribution of the time-averagedsalinity along the harbour is given in Fig. 6a. River inputis observed very near the top and there is a downwardplume right after the crest of the step. A strongstratification is observed at the river portion of the step,being reduced seaward. Salinity at the step reachesvalues closer to those at the inner shelf. In the harbour,salinity is rather constant and there is no sign of verticalmixing with the upper layer.
1.0
0.8
0.6
0.4
0.2
0.0
Station1
1.0
0.8
0.6
0.4
0.2
0.0
Station 2
1.0
0.8
0.6
0.4
0.2
0.0
Station 3
Station 4
1.0
0.8
0.6
0.4
0.2
0.0
0.0
0.2
0.4 0.6 0.8 1.0
η
τ
η
η
η
14
18
22
26
30
34
Fig. 5. Time–depth distribution salinity measured over one tidal cycle
the four stations. Data correspond to the March 1996 cruise.
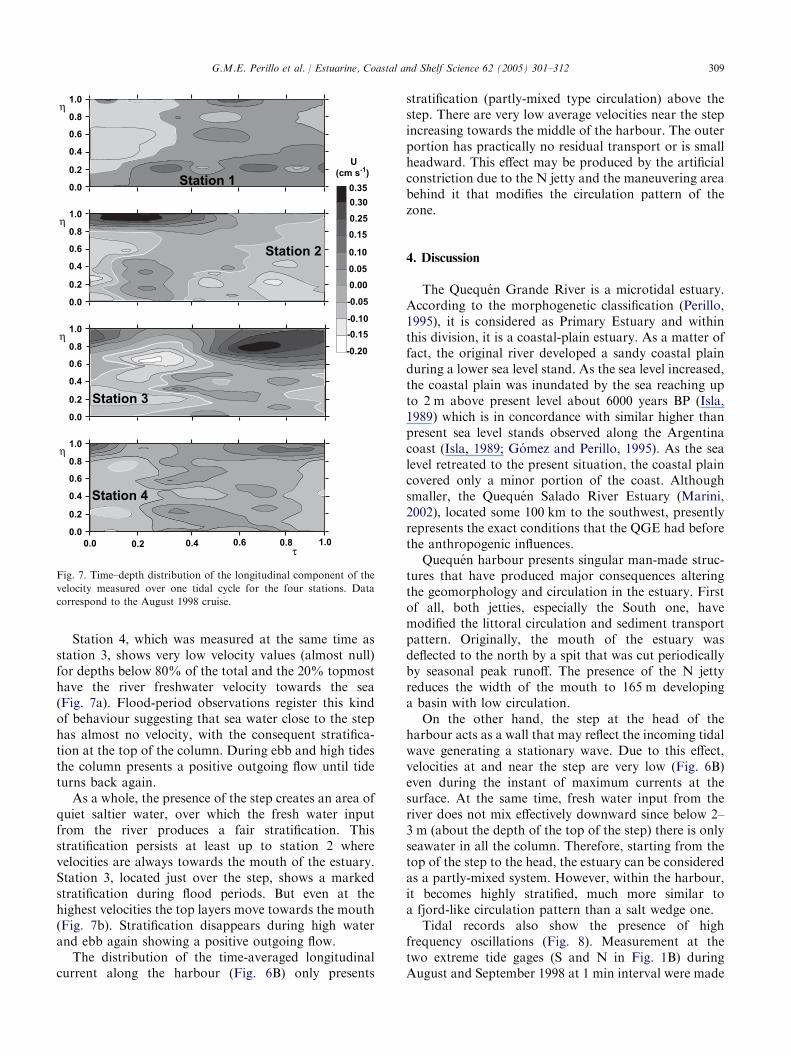
3.4. Current velocity
Current velocity profiles were obtained simulta-neously with the CTD profiles. Maximum velocities atall stations were measured near the surface reaching upto 0.40 m. In the present analysis we worked mostly withthe longitudinal component of velocity (U ) as thetransversal component was very small in most cases.At the surface maximum ebb-directed (U positive)values of the order of 0.35 m s�1 were observed, but inmost cases, values were below 0.1 m s�1. Depth and timevariations of U for stations 3 and 4 are given here(Fig. 7) for the August 1998 cruise. During the first floodmeasured at station 1 (not shown), U presents an in-coming component in all the column but as soon as thehigh water slack is reached, a stratification becomesevident and is also maintained for the rest of the tidalcycle. The topmost layer of the column has an outwardvelocity while the bottom layer shows an inwardvelocity, but with high vertical variability at differentdepths. This stratification has some concordance withdensity and salinity (Fig. 5).
At station 2 (not shown), river influence becomesmore evident. During the flood period, stratificationpersists and there is almost a predominant outgoingflow. The proximity to the step concentrates the flux atthe topmost (20% from the surface) layer at this stationshowing a considerable stratification during the flood.For high water and ebb, the whole section has anoutgoing component of water until low tide is reachedagain. Also the lowest speed values were found belowthe level of the step, creating an area of tranquil waterswith velocities very close to zero.
34
30
32
20
22
24
26
28
5
15
20
25
10
-5
0
cm s-1
Z
(m)
12
2
8
6
4
10
0
Z
(m)
12
2
8
6
4
10
0
Distance from station 4 (km)
1.00.80.60.40.2 1.2 1.4
A
B
Salinity
Velocity
Fig. 6. Tide-averaged distribution along the harbour of the (A) salinity,
and (B) longitudinal velocity component. Data correspond to the
August 1998 cruise.
309G.M.E. Perillo et al. / Estuarine, Coastal and Shelf Science 62 (2005) 301–312
Station 4, which was measured at the same time asstation 3, shows very low velocity values (almost null)for depths below 80% of the total and the 20% topmosthave the river freshwater velocity towards the sea(Fig. 7a). Flood-period observations register this kindof behaviour suggesting that sea water close to the stephas almost no velocity, with the consequent stratifica-tion at the top of the column. During ebb and high tidesthe column presents a positive outgoing flow until tideturns back again.
As a whole, the presence of the step creates an area ofquiet saltier water, over which the fresh water inputfrom the river produces a fair stratification. Thisstratification persists at least up to station 2 wherevelocities are always towards the mouth of the estuary.Station 3, located just over the step, shows a markedstratification during flood periods. But even at thehighest velocities the top layers move towards the mouth(Fig. 7b). Stratification disappears during high waterand ebb again showing a positive outgoing flow.
The distribution of the time-averaged longitudinalcurrent along the harbour (Fig. 6B) only presents
1.0
0.8
0.6
0.4
0.0
0.2
η
1.0
0.8
0.6
0.4
0.2
0.0
0.2
0.4 0.6 0.8 1.0
η
τ0.0
1.0
0.8
0.6
0.4
0.0
0.2
η
1.0
0.8
0.6
0.4
0.0
0.2
η
-0.10
0.05
0.00
-0.05
0.15
0.10
0.35
0.30
0.25
-0.15
-0.20
U
(cm s-1
)
Station 1
Station 2
Station 3
Station 4
Fig. 7. Time–depth distribution of the longitudinal component of the
velocity measured over one tidal cycle for the four stations. Data
correspond to the August 1998 cruise.
stratification (partly-mixed type circulation) above thestep. There are very low average velocities near the stepincreasing towards the middle of the harbour. The outerportion has practically no residual transport or is smallheadward. This effect may be produced by the artificialconstriction due to the N jetty and the maneuvering areabehind it that modifies the circulation pattern of thezone.
4. Discussion
The Quequen Grande River is a microtidal estuary.According to the morphogenetic classification (Perillo,1995), it is considered as Primary Estuary and withinthis division, it is a coastal-plain estuary. As a matter offact, the original river developed a sandy coastal plainduring a lower sea level stand. As the sea level increased,the coastal plain was inundated by the sea reaching upto 2 m above present level about 6000 years BP (Isla,1989) which is in concordance with similar higher thanpresent sea level stands observed along the Argentinacoast (Isla, 1989; Gomez and Perillo, 1995). As the sealevel retreated to the present situation, the coastal plaincovered only a minor portion of the coast. Althoughsmaller, the Quequen Salado River Estuary (Marini,2002), located some 100 km to the southwest, presentlyrepresents the exact conditions that the QGE had beforethe anthropogenic influences.
Quequen harbour presents singular man-made struc-tures that have produced major consequences alteringthe geomorphology and circulation in the estuary. Firstof all, both jetties, especially the South one, havemodified the littoral circulation and sediment transportpattern. Originally, the mouth of the estuary wasdeflected to the north by a spit that was cut periodicallyby seasonal peak runoff. The presence of the N jettyreduces the width of the mouth to 165 m developinga basin with low circulation.
On the other hand, the step at the head of theharbour acts as a wall that may reflect the incoming tidalwave generating a stationary wave. Due to this effect,velocities at and near the step are very low (Fig. 6B)even during the instant of maximum currents at thesurface. At the same time, fresh water input from theriver does not mix effectively downward since below 2–3 m (about the depth of the top of the step) there is onlyseawater in all the column. Therefore, starting from thetop of the step to the head, the estuary can be consideredas a partly-mixed system. However, within the harbour,it becomes highly stratified, much more similar toa fjord-like circulation pattern than a salt wedge one.
Tidal records also show the presence of highfrequency oscillations (Fig. 8). Measurement at thetwo extreme tide gages (S and N in Fig. 1B) duringAugust and September 1998 at 1 min interval were made

310 G.M.E. Perillo et al. / Estuarine, Coastal and Shelf Science 62 (2005) 301–312
to evaluate these oscillations observed originally on theharbour tidal records. The estimated periods for theseoscillations are between 3 and 25 min, although thelatter are predominant. Even though normal oscillationshave amplitudes of the order of 10 cm, oscillations ofup to 1.5 m often appear. Normally, the oscillationsincrease in size suddenly and inexplicably. When theyoccur, the strong oscillations induce serious consequen-ces for the navigation of large cargo vessels. At least twovessels departing from the harbour with full loads havehit the bottom due to the occurrence of sudden largeoscillations; fortunately without damage. The resonanceperiods for the harbour, calculated with Merian’s andHelmholz’s equations (Neumann and Pierson, 1966)show theoretical values of 3.3 and 6.4 min, which arewell below the typical 25 min.
One possible explanation for the fluctuations is thatthey are produced by internal waves generated at theinterface, a process that is presently under study. On theother hand, preliminary comparison of the datagathered simultaneously at the tide gages located atthe mouth (N in Fig. 1B) and at the foot of the step (S inFig. 1B) show that the phase lag of just the fluctuationsis of the order of 1 min but with the S station leading.This means that the fluctuations may be due to a highfrequency wave which is propagating from the head ofthe harbour out produced by the reflection against thestep. Trying to identify and possibly predict the cause ofthe fluctuations, including the meteorological forcing, isa study in progress.
Fig. 8. Typical tidal record from the harbour tide gage (e.g., period 19–
24 October 1998). (a) Original record, (b) high-pass filtered, (c)
elevation fluctuations (H# ZH � CHD). The oscillations are a common
feature in this harbour and strong peaks appear unexpectedly as the
one observed in October 22.
The extremely low velocities found at the foot of thestep create the condition for an intense sedimentationarea. This part of the port has to be dredged frequentlyand the sediments dredged have highly reduced and evenanoxic characteristics. The circulation measured sug-gests that at least two macro vortexes may be occurringduring floods at the harbour. Velocity profiles showincoming and outgoing velocities at the same columnwhich correspond to horizontal vortex axes. Part of thewater jet coming from the river curls down and producesa contrary velocity component at different heights.
Because of the strong influence of the step, we havemodelled the circulation at the head of the harbour. Themodel employed is a 2D version of the Princeton OceanModel (POM). The full 3D model has been describedin detail by Blumberg and Mellor (1987). Briefly, themodel has a free-surface, a bottom that follows a sigmacoordinate system and splits the time integration intobarotropic and baroclinic modes. It also includesa turbulence closure model (Mellor and Yamada,1982) to provide vertical-mixing coefficients. In thepresent study, particular care was given to the in-corporation of the freshwater river discharge (Kuorafa-lou et al., 1996) and the specification of open (seaward)boundary conditions (Palma and Matano, 2000). Themodel resolution is 100 m in the horizontal and it has 28levels in the vertical, with variable thicknesses at thesurface and bottom boundary layers. To drive the modelwe prescribed the free-surface elevation at the openboundary and the freshwater river discharge at the head,both obtained from measurements. We started from restand ran the simulation for 90 days till the area-averagedsalinity attained a tidal-average steady state and the fol-lowing tidal period was used for analysis.
Currents and salinity distribution obtained with themodel show a two-layer circulation pattern whererelatively low salinity water flows out at the surfaceand compensating high salinity waters from the shelfflows at the bottom (Fig. 9). However, the model resultsalso show that the presence of the step can generateinternal waves that modified the two-layer circulationmode. Sensitivity experiments conducted by changingthe step position and depth confirm its strong influenceon the harbour dynamics. During slack water time themodel results show a re-circulation pattern at the base ofthe step (Fig. 9). Further numerical experiments in-cluding passive tracers in the model (not shown here)indicate that this re-circulation modifies the verticaldistribution of dissolved and suspended estuarineconstituents.
5. Conclusions
Although the original objective of our research was toprovide a general overview of the geomorphologic and

311G.M.E. Perillo et al. / Estuarine, Coastal and Shelf Science 62 (2005) 301–312
Fig. 9. Salinity field and velocity vectors obtained from the model simulation at day 90. (a) Flood tide, (b) high tide, (c) ebb tide, and (d) low tide.
Salinity contour interval is 0.5. Vertical velocity is augmented 1000 times.
physical characteristics of the QGE, our studies havedemonstrated that the anthropogenic changes inducedat the mouth of the estuary have produced strongmodifications in the circulation pattern of the environ-ment. Furthermore, the way the harbour was dredged isthe very precise motive why sedimentation has beenenhanced and why the harbour authorities must expendlarge amounts of money to maintain operationalnavigability. Even though we have not yet proved thereason for the formation of the high frequency fluctua-tions on the tidal records, there are data and modellingevidences of the presence of internal waves which maybe closely related to the fluctuations.
The step acts as a reflection wall that inducesa secondary standing wave. At the wall itself, veloci-ties are extremely small producing very poor circulation.
Thus any sediment particle or contaminant that dropsbelow the interface becomes trapped and settle at thefoot of the step. Based on our sampling, this sector ofthe harbour is clearly very reductive and even anoxic attimes, further demonstrating the lack of circulation and,obviously, oxygenation of the deeper water. In a way,the step may be the counterpart of a high sill in a fjord,inducing a low or even null circulation in the deep lowerlayer and the estuarine circulation is only restricted tothe depth of the crest of the step.
Acknowledgments
Partial funds for the various studies dealing with thisarticle have been provided by Agencia Nacional de

312 G.M.E. Perillo et al. / Estuarine, Coastal and Shelf Science 62 (2005) 301–312
Promocion Cientıfica y Tecnologıa (ANPCYT),CONICET, and Universidad Nacional del Sur. Theauthors are grateful to the authorities of the Direc-cion Nacional de Construcciones Portuarias y VıasNavegables, Delegacion Quequen, particularly Ing. A.Perez de la Sierra and Mr H. Gimenez for their constantsupport through our studies. We also wish to thank thetwo reviewers who provided helpful comments andsuggestions.
References
Area Hidraulica Marıtima, 1988. Estudio de diversos problemas en el
Puerto Quequen. Direccion de Construcciones Portuarias y Vıas
Navegables. Technical Report, 243 pp.
Avoine, J., Allen, G.P., Nichols, M., Salomon, J., Larsonneur, C.,
1981. Suspended-sediment transport in the Seine estuary, France:
effects of man-made modifications on estuary-shelf sedimentology.
Marine Geology 40, 119–137.
Boltovskoy, E., Boltovskoy, A., 1968. Foraminıferos y tecamebas de la
parte inferior del rıo Quequen Grande. Hidrobiologıa 2, 127–164.
Blumberg, A.F., Mellor, G.L., 1987. A description of a three-
dimensional coastal ocean circulation model. In: Heaps, N.S.
(Ed.), Three Dimensional Coastal Ocean Models, Coastal and
Estuarine Sciences. Springer Verlag, Berlin, pp. 1–16.
Campo de Ferrera, A.M., 1998. Hidrografıa del rıo Quequen Grande.
PhD dissertation, Departamento de Geografıa, Universidad
Nacional del Sur, 141 pp. (unpublished).
Franzius Institut, 1964. Ensayo sobre modelo hidraulico de Puerto
Quequen. Final Technical Report, vols. I–IV, Quequen.
Gomez, E.A., Perillo, G.M.E., 1995. Sediment outcrops underneath
shoreface-connected sand ridges, outer Bahıa Blanca estuary,
Argentina. Quaternary of South America and Antarctica Peninsula
9, 27–42.
Isla, F.I., 1989. Holocene sea-level fluctuations in the Southern
Hemisphere. Quaternary Science Reviews 8, 359–368.
Kuorafalou, V.H., Oey, L.Y., Wang, J.D., Lee, T.N., 1996. The fate of
river discharge on the continental shelf. 1. Modeling the river
plume and the inner shelf coastal current. Journal of Geophysical
Research 101, 3415–3434.
Lanfredi, N.W., D’Onofrio, E.E., Mazio, C.A., 1988. Variations of the
mean sea level in the southwestern Atlantic Ocean. Continental
Shelf Research 3, 1211–1220.
Marini, M.F., 2002. Hidrografıa del rıo Quequen Salado. PhD
dissertation, Departamento de Geografıa, Universidad Nacional
del Sur, 179 pp. (unpublished).
Mellor, G.L., Yamada, T., 1982. Development of a turbulence closure
model for geophysical fluid problems. Review in Geophysics 20,
851–875.
Neumann, G., Pierson, W.J., 1966. Principles of Physical Oceanogra-
phy. Prentice-Hall, Inc, Englewood Cliff, 545 pp.
Palma, E.D., Matano, R.P., 2000. On the implementation of open
boundary conditions for a General Circulation Model: the three
dimensional case. Journal of Geophysical Research 105, 8605–
8627.
Perillo, G.M.E., 1995. Definition and geomorphologic classifications
of estuaries. In: Perillo, G.M.E. (Ed.), Geomorphology and
Sedimentology of Estuaries, Development in Sedimentology,
vol. 53. Elsevier Science BV, Amsterdam, pp. 17–47.
Perillo, G.M.E., Piccolo, M.C., 1991. An interpolation method for
estuarine and oceanographic data. Computers & Geosciences 17,
813–820.
Perillo, G.M.E., Piccolo, M.C., 1993. Methodology to study estuarine
cross-section. Revista Geofisica 38, 189–206.
Perillo, G.M.E., Piccolo, M.C., 1998. Importance of grid-cell area in
estimation of residual fluxes. Estuaries 21, 14–28.
Perillo, G.M.E., Piccolo, M.C., Marcovecchio, J. Coastal Oceanogra-
phy of the Western South Atlantic Continental Shelf (33 �S to
55 �S) (5,W). In: Robinson, A.A., Brink, K. (Eds.), COASTS
Interdisciplinary Global Coastal Ocean Study. The Sea, vol. 14.
J. Wiley & Co., New York, in press.
Piccolo, M.C., 1998. Oceanography of the Western South Atlantic
continental shelf from 33 �S to 55 �S. In: Robinson, A.R.,
Brink, K.H. (Eds.), Coastal Oceanography. The Sea. John Wiley
& Sons, pp. 253–271.
Piccolo, M.C., Perillo, G.M.E., 1997a. Geomorfologıa e hidrografıa de
los estuarios. In: Boschi, E.E. (Ed.), El Mar Argentino y sus
recursos pesqueros. INIDEP Tomo I, Mar del Plata, Argentina,
pp. 133–161.
Piccolo, M.C., Perillo, G.M.E., 1997b. Sea level characteristics in
Puerto Quequen. Geoacta 22, 144–154.
Piccolo, M.C., Perillo, G.M.E., 1999. Estuaries of Argentina: a review.
In: Perillo, G.M.E., Piccolo, M.C., Pino Quivira, M. (Eds.),
Estuaries of South America: Their Geomorphology and Dynamics,
Environmental Science Series. Springer-Verlag, Berlın, pp. 101–
132.
Randazzo, G.S., Stanley, D.J., Di Geronimo, S.I., Amore, C.,
1998. Human-induced sedimentological changes in Manzala
Lagoon, Nile Delta, Egypt. Environmental Geology 36, 235–
258.
Suarez Garcıa, J., 1940. Historia del partido de Loberıa, vols. 1 and 2.
San Pablo, Buenos Aires.
Syvistki, J.M.P., Harvey, N., Wolanski, E., Burnett, W.C., Perillo,
G.M.E., Gornitz, V., Bokuniewicz, H., Huettel, M., Moore, W.S.,
Saito, Y., Taniguchi, M., Hesp, P., Yim, W.W.-S., Salisbury, J.,
Campbell, J., Snoussi, M., Haida, S., Arthurton, R., Gao, S.
Dynamics of the coastal zone. In: LOICZ (Ed.), Coastal Change
and the Anthropocene. Springer-Verlag, Berlın, in press.
Wright, R., 1968. Miliolidae (Foraminıferos) recientes del estuario del
rıo Quequen Grande (provincia de Buenos Aires). Hidrobiologıa 2,
225–256.
Copyright © 2022 FDOKUMEN