Mekong River flow and hydrological extremes under ... - HESS

Estuarine, Coastal and Shelf Science (1996) 43, 565–582
Fine-sediment Dynamics in the MekongRiver Estuary, Vietnam
Eric Wolanskia, Nguyen Ngoc Huanb, Le Trong Daob,Nguyen Huu Nhanc and Nguyen Ngoc ThuydaAustralian Institute of Marine Science, PMB No. 3, Townsville M.C.,Queensland 4810, Australia, bHydrometeorological Service, 4 Dang Thai ThanStreet, Hanoi, Vietnam, cHydrometeorological Service, 19 Nguyen Thi Minh KhaiStreet, 1st District, Ho Chi Minh City, Vietnam and dVietnam Marine Science &Technology Association, 36 Hoang Dieu Street, Hanoi, Vietnam
Received 24 January 1995 and accepted in revised form 11 September 1995
Keywords: Mekong Delta; sediments; salt wedge; turbidity maximum;siltation; salinity intrusion
Field studies of fine-sediment transport were carried out in the Mekong Riverestuary, Vietnam, in the high-flow season of November 1993. In the freshwaterregion, erosion and deposition of suspended sediment occurred at tidalfrequency with a strong down-river transport at a mean velocity of 1 m s"1 andmean suspended-solid concentration of about 250 mg l"1. Also, the suspendedsediment was mostly fine silt, and the clay fraction accounted for only 15%.The suspended sediment was transported either as individual particles oragglomerated with organic detritus. At the mouth of the estuary, a salt wedgewas present but was flushed out of the estuary at low tide. Flow reversaloccurred across the pycnocline. A turbidity maximum zone was present at thetoe of the salt wedge at flood tide. Most of the suspended sediment wascoagulated with little organic matter. The bulk of the suspended sediment wasexported to coastal waters, but some sediment returned to the estuary in the saltwedge. Data for the low-flow season are sparse but suggest that partially wellmixed estuarine conditions prevail, with salinity penetrating about 40 kminland, carrying fine-sediment up-river to a turbidity maximum zone. Most ofthis sediment would have been deposited in shallow coastal waters in theprevious high-flow seasons. The construction of large hydro-electric damsfurther upstream on the Mekong River may exacerbate siltation patterns in theestuary. ? 1996 Academic Press Limited
Introduction
The Mekong River (Figure 1) is 4200 km long, it drains an area of 0·79#106 km2
with a mean annual water discharge of 470 km3 (Borland, 1973; Milliman & Meade,1983). The discharge of the lower Mekong River at Phnom Penh, Cambodia, variesseasonally (United Nations, 1957; Gagliano & McIntire, 1968); it is smallest (typically1700 m3 s"1) in May and largest in October (typically 39 000 m3 s"1). The estuary hasa few major channels, shown in Figure 1, and a large number of smaller channels (notshown), and these form a vast delta (Figure 1). The thalweg in the estuary is typically
0272–7714/96/050565+18 $25.00/0 ? 1996 Academic Press Limited

10 m deep in the freshwater region between 30 and 140 km from the mouth; closer tothe mouth in the dry season saline-intrusion region, the depth decreases to 5 m typically;even shallower waters are found at the mouth (Figure 2). Coastal waters are shallow, the20-m depth contour is located 30 km from the coast (Figure 1).Mixed, macro-tides prevail with a strong diurnal inequality (Nguyen Ngoc Thuy,
1979). At the mouth, the mean maximum and average tidal range are, respectively,c. 3·2 m and 2·2 m. The average tide range decreases with distance upstream (Gagliano&McIntire, 1968; Nguyen Ngoc Thuy, 1988a,b). Indeed at Can Tho (123 km), it is only1·9 m in the low-flow season and 0·7 m in the high-flow season; at Chau Doc (228 km)it is only 0·49 m in the low-flow season and 0·0 m in the high-flow season. The tidaldynamics can be modelled as friction-damped, progressive waves in branched, one-dimensional channels, with the tidal amplitude decreasing and the time lag increasingwith distance from the river mouth (Nguyen Ngoc Huan, 1987a,b; Tingsanchali & Lien,1987; Nguyen Ngoc Thuy, 1989).Data on sediment discharge in the lower Mekong River are even more sparse,
especially over the last 30 years. The sediment discharge may be about 160#106
tonnes year"1 (Milliman & Meade, 1983; Milliman & Syvitski, 1992). To place theMekong in perspective with other major rivers in the world, the Mekong River has (seeTable 1) a smaller drainage area than the Yangtze (41%), the Amazon (12%), theMississippi (24%), and the Ganges/Brahmaputra (53%) Rivers. The sediment load isabout the same as that of the Mississippi River; however, its sediment yield is about twicethat of the Mississippi. The Mekong River sediment yield is equal to about one-sevenththat of the Fly and Ganges/Brahmaputra Rivers, 85% that of the Yangtze River, and itis about 12% larger than that of the Amazon River.Data on salinity are sparse and have been collected mainly near the surface and in the
dry season, in view of the importance of salinity for irrigation. The surface salinity variesseasonally, being maximum in the low-flow season and minimum in the high-flowseason. In the low-flow season, the maximum salinity at 21 km is 20 and at 45 km is 6.In the high-flow season, the water is fresh nearly up to the mouth of the main channels
South China
Sea
106°E
106°E
10°
9°N
0 50 km
Can Tho
Phnom Penh
VungTau
10
10
6
6
6 10
106°E
9°N
11
Can Tho
2010 km
2122
2324 Ca Loc
Mekong RiverDelta
20
South ChinaSea
China
Th
aila
nd
Vietnam
South China SeaFigure 1. Location map and sampling sites ( ), Mekong River estuary.
566 E. Wolanski et al.

of the estuary (Gagliano & McIntire, 1968; Nguyen Ngoc Thuy, 1988a). Data onsuspended sediment are sparse in the estuary (Gagliano & McIntire, 1968; NguyenNgoc Thuy, unpubl. data) and in coastal waters (Anikiyev et al., 1986).About 32#106 people live in the delta in Vietnam and are engaged mainly in rice
farming, artisanal fishing and aquaculture. The estuary is important for transport andshipping, including the export of rice through ports such as Can Tho but this is hinderedby siltation especially in the saline-water region (Figure 2). Irrigation for rice farming ishindered by salt intrusion in the estuary, particularly in the low-flow season. The deltais an important mangrove area (Phan Nguyen Hong, 1991; Le Duc An & Phan TrungLuong, 1993), and these mangroves are used extensively for artisan fisheries and wood.Important questions have been asked about the feasibility of dredging for a seaport(e.g. at Can Tho), the effect of a sea-level rise on the delta, and the effects on the deltafrom the construction of proposed, major hydro-electric dams in Cambodia, Laos andThailand (Lohmann, 1991).
0
40
Dep
th (
m)
80
20
10
30
240 200 160 120 40 0Distance (km)
Rivermouth
(b)
1 km
No data
No data
1
7 7
6
6
12
23
45
(a)
Figure 2. Depth in m (a) in the thalweg (adapted from Gagliano &McIntire, 1968) and(b) at the mouth (Nguyen Ngoc Thuy, unpubl. data).
Fine-sediment dynamics 567

The available hydrodynamic data necessary to help answer some of these questionsremain inadequate. In view of the sparse baseline data, the authors undertook this studyto gain some insight on currents, salinity and suspended-sediment dynamics in theestuary in the high-flow season, to help answer ultimately some of these importantmanagement questions.
Methods
During 15–20 November 1993, vertical profiles of temperature, salinity and suspended-sediment concentration were obtained at stations shown in Figure 1, using a SeabirdCTD. This CTD was fitted with an Analite optical fibre nephelometer which is moresensitive than the Seabird nephelometer. Position fixing was by dead reckoning. AtStations 11 and 24, a 13-h station was maintained from a small, wooden vessel withhourly profiles using the CTD. In addition at these two stations, vertical profiles ofcurrents were measured at about 1 m intervals using a Vertusca current meter suspendedfrom a vessel. The nephelometers were calibrated for suspended-sediment concentrationusing water samples taken in situ and later filtered through 0·45-ìm filters. None of thewater collected using a 5-l Niskin bottle contained sand, although sand was thedominant sediment on the bottom, so that the nephelometer data were not aliased(Ludwig & Hanes, 1990); for the observed variation in floc size, the nephelometercalibration is expected to vary by 20% only (Gibbs & Wolanski, 1992). In situ floccameras were unavailable and could not have been used because the strong tidal currentscaused floc breakage around windows, and the high concentration caused excessive flocoverlap (Eisma et al., 1990). Instead, the technique of Gibbs and Konwar (1986) andGibbs et al. (1989), modified by Wolanski and Gibbs (1995), was used to measure flocsize. In particular, a specially modified, wide mouth 5-l Niskin bottle was used, the waterwas sampled directly in the bottle using a slide with well, avoiding floc breakage in othersampling techniques such as pipettes, pumps, analysers and Niskin bottle ports. Thesample was capped underwater by a glass, and viewed and photographed using anOlympus inverted microscope with a range of magnification from 4 to 800#. For eachwater sample, several images at different magnifications were used to sample the fullrange of floc sizes. The photographs were scanned on an IBM-compatible computer andthe digitized data were used to calculate the floc-size distribution using an image analysissoftware package. The system was calibrated using ragweed pollen and latex particles of
T 1. Comparison of the drainage area, sediment load and yield for the Yangtze,Amazon, Mississippi, Ganges/Brahmaputran, Yangtze, Mekong and Fly Rivers(adapted from Milliman & Meade, 1983; Milliman & Syvitski, 1992; Wolanski &Gibbs, 1995)
RiverArea
(106 km2)Load
(106 tonne year"1)Yield
(tonne km"2 year"1)
Yangtze 1·9 480 252Amazon 6·1 1200 190Mississippi 3·3 210 120Ganges/Brahmaputra 1·48 2180 1670Mekong 0·79 170 215Fly 0·076 116 1500
568 E. Wolanski et al.

median size 17·5 and 40 ìm, respectively. Most samples were taken from 1 m above thebottom, and a few samples were taken from near the surface. Water samples were alsocollected from the Niskin bottles and used to measure the primary (not flocculated)particle-size distributions using a Horiba CAPA-300 gravitational/centrifugal particle-size analyser after pre-processing the samples by treatment with an ultrasonic bath andCalgon-T dispersant and visual examination on a microscope.
Results
Freshwater regionThe freshwater region starts at c. 10 km from the mouth. Spring tides prevailed(Figure 3). Freshwater was found throughout the estuary except at stations 21–24 nearthe mouth. The tides reversed the currents at least up to Can Tho [123 km; Figure 4(a)].A strong inequality of the tidal currents was apparent, the ebb and flood currents peakingat 1·2 and 0·4 m s"1, respectively. A friction-induced vertical velocity shear existed inthe bottom 3 m of the water column.The temperature (not shown) was homogeneous vertically, varying in time between
29·4 and 29·6 )C.The suspended-sediment concentration varied with tidal frequency, and was higher
near the bottom where it reached 0·6 g l"1 at peak ebb currents [Figure 4(b)]. Therealso appeared to be a background concentration of 0·15 g l"1. The reason for thisbackground concentration is to be found in the nature of the suspended sediment in thefreshwater region. The particle-size distribution of the suspended sediment in thefreshwater region of the estuary (Figure 5) varied little with site, depth and tide phase,the median particle size, d50, varying only between 2·5 and 3·9 ìm, characteristic of finesilt. The clay fraction (particle size <2 ìm) accounted for 15–20% (by volume) of thesuspended sediment typically, a result in agreement with data taken at Phnom Penh(338 km; Gagliano & McIntire , 1968). On the other hand, the bottom sediment wasmostly sandy. Some of the suspended sediment was coagulated on organic detritus[Figure 6(a)], while the rest of the sediment, particularly near the surface, remaineduncoagulated and was transported as a ‘ wash load ’ of individual particles [Figure 6(b)].The flocs were quite large, with a floc d50 of about 40 ìm, were most numerous near thebottom, and took the form of loose, seemingly unstructured, filamentous mixtures oftransparent, organic detritus and mineral particles [Figure 6(a)]. Superficially, theseflocs resemble those found in organic-rich rivers elsewhere (e.g. Van Leussen, 1988;
21
5
015
Date (November 1993)
Sea
leve
l (m
)
16
4
3
2
1
17 18 19 20
Figure 3. Time-series plot of the sea level at Vung Tau during the field study.
Fine-sediment dynamics 569
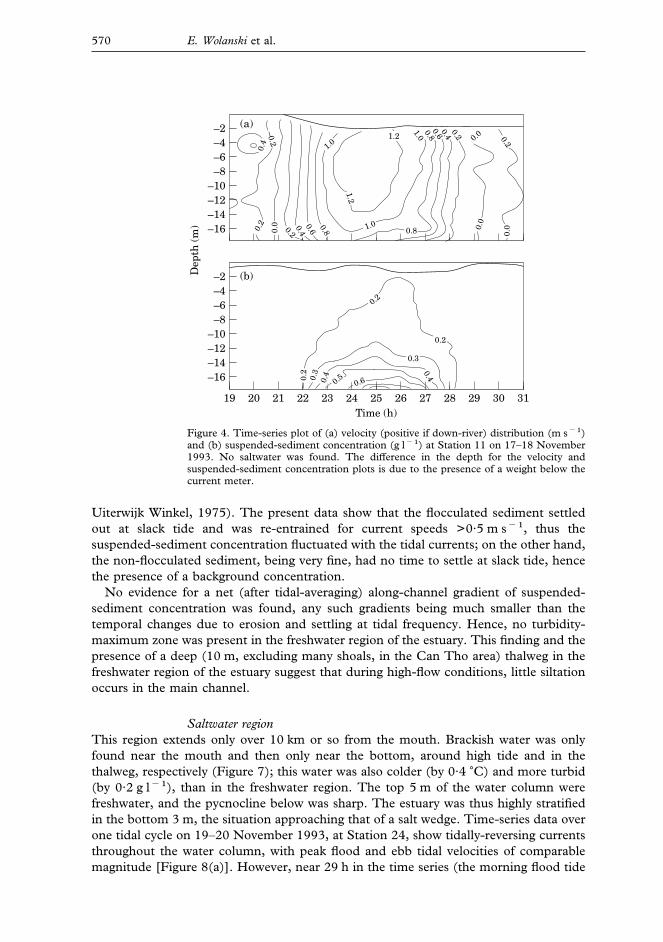
Uiterwijk Winkel, 1975). The present data show that the flocculated sediment settledout at slack tide and was re-entrained for current speeds >0·5 m s"1, thus thesuspended-sediment concentration fluctuated with the tidal currents; on the other hand,the non-flocculated sediment, being very fine, had no time to settle at slack tide, hencethe presence of a background concentration.No evidence for a net (after tidal-averaging) along-channel gradient of suspended-
sediment concentration was found, any such gradients being much smaller than thetemporal changes due to erosion and settling at tidal frequency. Hence, no turbidity-maximum zone was present in the freshwater region of the estuary. This finding and thepresence of a deep (10 m, excluding many shoals, in the Can Tho area) thalweg in thefreshwater region of the estuary suggest that during high-flow conditions, little siltationoccurs in the main channel.
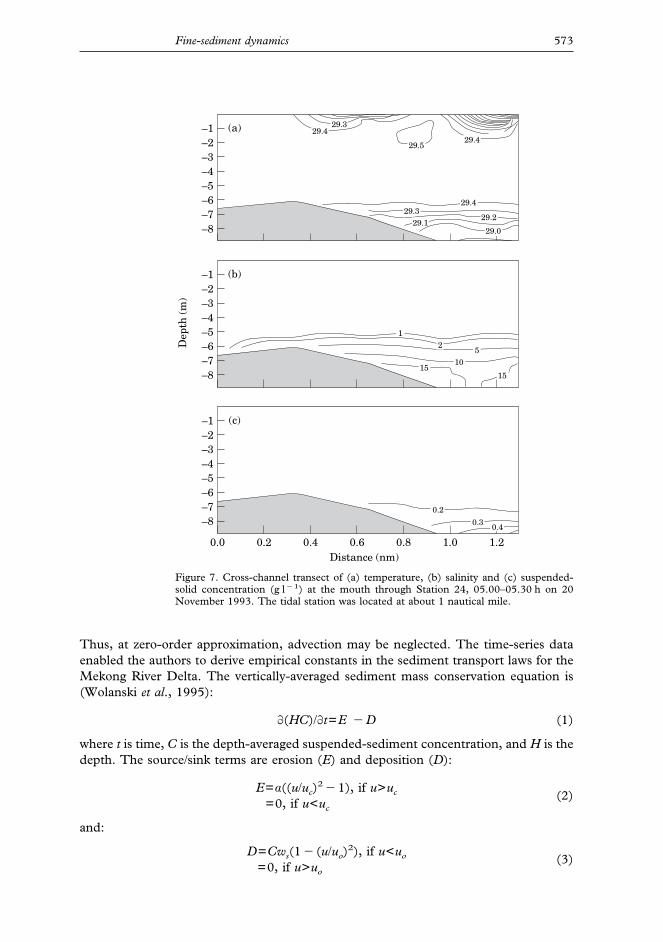
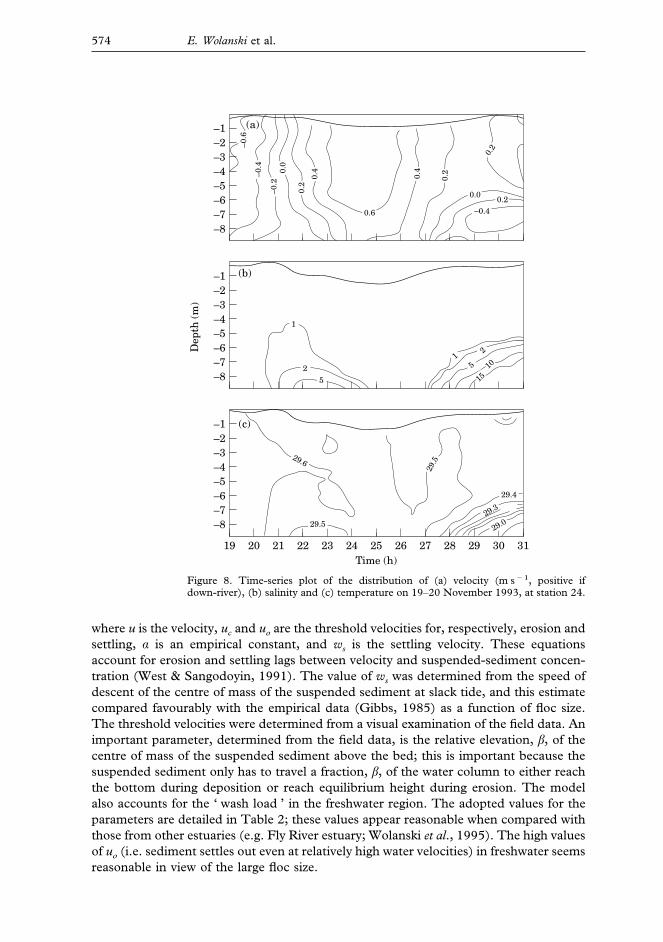
Saltwater regionThis region extends only over 10 km or so from the mouth. Brackish water was onlyfound near the mouth and then only near the bottom, around high tide and in thethalweg, respectively (Figure 7); this water was also colder (by 0·4 )C) and more turbid(by 0·2 g l"1), than in the freshwater region. The top 5 m of the water column werefreshwater, and the pycnocline below was sharp. The estuary was thus highly stratifiedin the bottom 3 m, the situation approaching that of a salt wedge. Time-series data overone tidal cycle on 19–20 November 1993, at Station 24, show tidally-reversing currentsthroughout the water column, with peak flood and ebb tidal velocities of comparablemagnitude [Figure 8(a)]. However, near 29 h in the time series (the morning flood tide
31
–2
–16
19Time (h)
Dep
th (
m)
26
–4–6–8
–10
–14
22 23 24 25 27 28 29 30
–12
2120
(b)
0.3
0.2
0.2
0.4
0.60.2
0.3
0.4
0.5
–2
–16
–4–6–8
–10
–14–12
(a)
0.80.2 0.8 1.0
0.0 0.0
0.4 1.0
1.2
0.6 0.0
0.2
–0.2
1.00.80.6 0.40.2 0.0
0.40.2
1.2
Figure 4. Time-series plot of (a) velocity (positive if down-river) distribution (m s"1)and (b) suspended-sediment concentration (g l"1) at Station 11 on 17–18 November1993. No saltwater was found. The difference in the depth for the velocity andsuspended-sediment concentration plots is due to the presence of a weight below thecurrent meter.
570 E. Wolanski et al.

of 20 November 1993), a strong velocity shear was present [Figure 8(a)] at the elevationof a sharp pycnocline as evidenced by saltier [by 15; Figure 8(b)] and colder [by 0·5 )C;Figure 8(c)] water near the bottom. A salt-wedge estuarine situation was present.Coastal waters are not much saltier than the near-bottom values observed at Station 24at 30–31 h (Anikiyev et al., 1986). While a salt wedge was present, it was unsteady,moving back and forth with the tides; at low tide, it was pushed out of the estuarycompletely [Figure 8(b)].The suspended-sediment concentration varied with tidal frequency, again with a
background of about 0·15 g l"1 [Figure 9(a)]. When the salt wedge was absent, thesalinity stratification was weak and a strong relationship was apparent between velocityand concentration, with a short phase lag due to erosion and deposition. However, whenthe salt wedge was present, the salinity stratification, by inhibiting turbulence, limitedthe resuspension to below the pycnocline. Most noticeable was the high concentrationat the toe of the salt wedge (27–29 h).The near-bottom particle size-distribution [Figure 9(b)] fluctuated slightly with the
tides; the median particle size, d50, was slightly larger than in the freshwater region,varying between 5 and 3·5 ìm [Figure 10(b)], with an unexplained occurrence of a verysmall d50 of 2 ìm at 21 h. Except for that event, the clay fraction (size <2 ìm) accountedfor between 20 and 30% of the sediment (by volume), i.e. somewhat larger than its value(15–20%) in the freshwater region.Most of the near-bottom sediment was flocculated. The flocs generally comprised a
membrane of clay surrounding coarser particles [Figure 6(b)], with no evidence ofbiological detritus forming filamentous structures on which particles were aggregated
500–
1000
70
0
Size (µm)
Fre
quen
cy (
%)
5060
40302010
(b)
250–
500
125–
250
62.5
–125
31.3
–62.
5
15.6
–31.
3
7.81
–15.
6
3.91
–7.8
1
1.95
–3.9
1
0.98
–1.9
5
0.49
–0.9
8
0.24
–0.4
9
0–0.
24
100
0
60
80
40
20
(a)
Figure 5. For the suspended sediment in the freshwater region of the Mekong Riverestuary, typical distribution of (a) particle size at various locations, depths and tidephases, and (b) floc size at the surface ( ) and near the bottom ( ).
Fine-sediment dynamics 571

such as in the freshwater. Due to their high concentration of fine silt and their smallfraction of clay, the flocs were similar in structure to those of the silt-dominant Fly Riverestuary (Wolanski & Gibbs, 1995). These silt-dominant flocs appear structurallydifferent from, and smaller than, the more homogeneous, clay-dominant flocs of theAmazon and Gironde River estuaries (Gibbs & Konwar, 1986; Gibbs et al., 1989).The floc size distribution varied with the tides [Figure 9(c)], the median floc size
varying between 50 and 200 ìm. However, the relationship between tides and floc sizeis not clear. The flocs were larger in freshwater, because of their long, filamentousstructure, than in seawater.
Discussion
Erosion and settling lawsIn both saline and freshwater regions of the estuary, deposition and erosion were thedominant mechanisms controlling fluctuations in suspended-sediment concentration.
Figure 6. Typical microphotographs of suspended sediment flocs near the bottom in(a) the freshwater region and (b) the saltwater region.
572 E. Wolanski et al.
Thus, at zero-order approximation, advection may be neglected. The time-series dataenabled the authors to derive empirical constants in the sediment transport laws for theMekong River Delta. The vertically-averaged sediment mass conservation equation is(Wolanski et al., 1995):
)(HC)/)t=E "D (1)
where t is time, C is the depth-averaged suspended-sediment concentration, and H is thedepth. The source/sink terms are erosion (E) and deposition (D):
E=á((u/uc)2"1), if u>uc
=0, if u<uc(2)
and:
D=Cws(1"(u/uo)2), if u<uo
=0, if u>uo(3)
1.2
–1
–8
0.0Distance (nm)
Dep
th (
m)
0.4
–2–3–4–5
–7
0.2 0.6 0.8 1.0
–6
(c)
0.3
0.2
0.4
–1
–8
–2–3–4–5
–7–6
(b)
15
–1
–8
–2–3–4–5
–7–6
(a)
29.3
10
15
52
1
29.1
29.529.4
29.0
29.2
29.329.4
29.4
Figure 7. Cross-channel transect of (a) temperature, (b) salinity and (c) suspended-solid concentration (g l"1) at the mouth through Station 24, 05.00–05.30 h on 20November 1993. The tidal station was located at about 1 nautical mile.
Fine-sediment dynamics 573
where u is the velocity, uc and uo are the threshold velocities for, respectively, erosion andsettling, á is an empirical constant, and ws is the settling velocity. These equationsaccount for erosion and settling lags between velocity and suspended-sediment concen-tration (West & Sangodoyin, 1991). The value of ws was determined from the speed ofdescent of the centre of mass of the suspended sediment at slack tide, and this estimatecompared favourably with the empirical data (Gibbs, 1985) as a function of floc size.The threshold velocities were determined from a visual examination of the field data. Animportant parameter, determined from the field data, is the relative elevation, â, of thecentre of mass of the suspended sediment above the bed; this is important because thesuspended sediment only has to travel a fraction, â, of the water column to either reachthe bottom during deposition or reach equilibrium height during erosion. The modelalso accounts for the ‘ wash load ’ in the freshwater region. The adopted values for theparameters are detailed in Table 2; these values appear reasonable when compared withthose from other estuaries (e.g. Fly River estuary; Wolanski et al., 1995). The high valuesof uo (i.e. sediment settles out even at relatively high water velocities) in freshwater seemsreasonable in view of the large floc size.
3119Time (h)
Dep
th (
m)
2622 23 24 25 27 28 29 302120
–1
–8
–2–3–4–5
–7–6
(b)
–1
–8
–2–3–4–5
–7–6
(c)
–1
–8
–2–3–4–5
–7–6
(a)
0.6
0.2
0.2
–0.2
0.0
0.4
0.2–0
.4
–0.6
0.4
0.0
–0.40.2
1
25
12
5 10
15
29.5
29.6
29.5
29.4
29.3
29.0
Figure 8. Time-series plot of the distribution of (a) velocity (m s"1, positive ifdown-river), (b) salinity and (c) temperature on 19–20 November 1993, at station 24.
574 E. Wolanski et al.

The comparison between observed and predicted depth-averaged suspended-sediment concentration is encouraging for the freshwater region [Figure 11(a)], suggest-ing that the model has captured the essential dynamics. The comparison for the saltwaterregion is also encouraging [Figure 11(b)], except at 28 h which corresponds to the toe ofthe salt wedge; the model does not account for internal dynamics of a salt wedge. Thehigh concentration at that time was probably due to the high turbulent intensity in the
31
100
019
Time (h)
Vol
um
e (%
)
25
50
90807060
40302010
21 22 23 24 26 27 28 29
Dep
th (
m)
–1
–9
–2–3–4–5
–7–6
(a)
0.22
–8
0.26
0.300.14
0.18
0.22
0.22
0.26
0.22 0.18
0.140.260.30
20 30
(c)
100
0
Vol
um
e (%
)
50
90807060
40302010
(b)
4.0
2.0
0.98
0.49
8.0
63
31
16
8
250
500
125
Figure 9. Same as Figure 7 for (a) suspended-solid concentration (g l"1), (b)particle-size distribution (ìm, % by volume) and (c) floc-size distribution (ìm, % byvolume).
T 2. Parameters in the sediment erosion/deposition model (MKS units)
á uc uo ws â
Freshwater 0·00001 0·5 1·0 0·0004 0·1Saltwater 0·000008 0·4 0·55 0·00025 0·2
See text for definitions of parameters.
Fine-sediment dynamics 575

toe of the salt wedge and to a convergence of bottom currents from either side of the toeas has been demonstrated in laboratory experiments (Simpson, 1972; Jirka, 1990). Thisprocess is quite different from the increased turbulence in a hydraulic jump after riverplume lift-off, such as occurred in the Mississippi River mouth (Wright & Coleman,1974; Eisma, 1993), and does not appear to have been studied previously in the field.
Fate of fine sediment in the Mekong River estuaryThe present data are sparse but nevertheless unique for the Mekong River delta. Theysuggest that, in the high-flow season, the bulk of the fine sediment is made of fine siltand is carried right through the freshwater region of the estuary. A reasonably deepthalweg is maintained (Figure 2). The saline region is restricted to the mouth, which iswhere siltation and navigation problems are most severe. Calculations of the depth-integrated sediment flux suggest that at least 95% of that sediment may be exported tothe sea. This sediment is deposited within 20 km of the coast (Anikiyev et al., 1986).During the high-flow season, a measurable fraction of that sediment (possibly 5%)returns to the estuary with the salt wedge, the majority of this sediment entering theestuary with the toe of the salt wedge at flood tide. The suspended sediment was finer(d50~3 ìm) at ebb tide than at flood tide (d50~5 ìm; Figure 10); since the clay fractionof the suspended sediment is larger (20–30%) in the saline region of the estuary than inthe freshwater region (15–20%), a clay-enrichment sorting mechanism operates whichappears to be similar to that in the Fly River estuary (Wolanski & Gibbs, 1995).In the low-flow season, saltwater penetrates about 40 km up-river in this channel, and
even more in the other channels, and partially well-mixed estuarine conditions prevail
31
6
119
Time (h)25
5
4
3
2
(b)
21 22 23 24 26 27 28 29 3020
0.8
–0.8
(a)
–0.6
–0.4
–0.2
0.0
0.2
0.4
0.6
Flood
Ebb
Figure 10. Time-series plot of the depth-averaged velocity (m s"11, positive ifdown-river) and the median particle size, d50 (ìm), near the bottom at Station 24,19–20 November 1993.
576 E. Wolanski et al.

(Figure 12). Field data on suspended-sediment concentrations in the low-flow seasonare sparse, with occasional spot measurements of near-bottom concentration reaching1 g l"1 (Gagliano & McIntire, 1968; Nguyen Ngoc Thuy, unpubl. data). Also, there isevidence of the lower region of the estuary being slightly flood-dominant (Nguyen NgocThuy, 1989). These findings suggest the presence of a turbidity maximum zone (Eisma,1993). Marine sediment is thus presumably pumped up-river, and much of thissediment may be Mekong River sediment that was deposited in shallow coastal watersduring the previous high-flow season. This intrusion of marine sediment in the estuarywill be facilitated by the effects of waves in coastal waters (Kendrick & Derbyshire,1983). This up-river pumping of sediment in the dry season explains the smaller depthin the lower 20 km of the estuary (Figure 2).
Conclusion
The pathways of fine-sediment in the Mekong River estuary are sketched in Figure 13.In the high-flow season, the sediment is deposited and eroded periodically with thetides in the freshwater region, but is still transported down-river at mean velocities of0·5–1 m s"1. A sizable fraction of the fine suspended sediment in freshwater is
31
0.3
0.119
Time (h)25
0.2
(b)
21 22 23 24 26 27 28 29 3020
Su
spen
ded-
sedi
men
t co
nce
ntr
atio
n (
gl–1
)
0.3
0.0
0.2
(a)
0.1
Figure 11. Time-series plot of the observed ( ) and predicted ( ) depth-averagedsuspended-sediment concentration at (a) Station 11 and (b) Station 24.
Fine-sediment dynamics 577

aggregated in loose, filamentous flocs comprising organic detritus aggregating inorganicsediment. The fraction (c. 15 to 20%) of clay particles (size <2 ìm) is smaller than thatin muddy rivers such as the Amazon and the Gironde Rivers (30%), but is comparableto that (~20%) in silty (as opposed to muddy) rivers such as the Fly and Jiaojiang Rivers(Gibbs et al., 1989; Li et al., 1993; Gibbs & Konwar, 1994; Wolanski & Gibbs, 1995).Most of the sediment is flocculated in brackish water.In the high-flow season, most of this sediment deposits in shallow (depth <20 m)
coastal waters less than 20 km from the coast (Anikiyev et al., 1986). A small fraction(possibly 5%) of this sediment returns to the estuary in the salt wedge. In the low-flowseason, classical, partially well-mixed estuarine dynamics prevail and entrains sediment
(a)0
0
Distance (km)
Dep
th (
m)
2
5
10
10203040
15
1015
0
9°N
10°
106°E
South ChinaSea
Can Tho
April
November
10
610
10
6
6 (b)
Mouth
Figure 12. (a) Typical salinity distribution in the dry season (adapted from NguyenNgoc Thuy, 1988b) and (b) distribution of the 0·4 surface salinity (a salinity valuecritical for irrigation; maximum salinity intrusion occurs in April and minimum inNovember) in waterways in the Mekong River delta (adapted from Gagliano &McIntire, 1968).
578 E. Wolanski et al.

from the coastal zone into the estuary, to a turbidity maximum zone, [Figure 13(b)] Thissediment was deposited there during previous high-flow seasons. This up-river pumpingof sediment will be facilitated by the action of waves in shallow coastal waters (Kendrick& Derbyshire, 1983), the north-east monsoon having a strong cross-slope windcomponent.The return to the estuary in the low-flow season of sediment deposited in shallow
coastal water in the previous high-flow seasons, is made possible by the oceanographicconditions on the inner shelf, the wind driving southward currents in winter andnorthward currents in summer (Gagliano & McIntire, 1968; Anikiyev et al., 1986;Nguyen Ngoc Thuy, 1988a). Thus, there is a reversal of the littoral drift, and sedimentexported longshore northward in summer returns in winter, although there is asuggestion of a net southward drift (Gagliano & McIntire, 1968). Sediment exported tocoastal waters during the high-flow season thus becomes available for entrainment intothe estuary during the low-flow season.The seasonal reversal of the littoral drift is qualitatively similar to that affecting the
Yangtze River (Lazure & Girardot, 1990); it contrasts the Mekong River from theAmazon and the Mississippi Rivers where the sediment travels unidirectionally long-shore away from the estuary (Wright & Coleman, 1974; Curtin & Legeckis, 1986; Geyeret al., 1991) and the Zaire and Ganges-Brahmaputra Rivers, where some of the sediment
Salt wedge
Estuary South China Sea
(a)
Deposition Deposition
~ 5 km
10
(b)
Deposition
~ 30 km
Wind
20 25510
0 5 10
15
Figure 13. Conceptual model of the pathways of fine sediment in the Mekong Riverestuary in (a) the high-flow season and (b) the low-flow season. The low-flow seasonmodel is still very much speculative in view of the paucity of field data in that season.Stippled area, turbidity maximum zone.
Fine-sediment dynamics 579

sinks in the deep ocean via a canyon (Kuehl et al., 1989; Barua et al., 1994). TheMekong River estuary differs also from the Mississippi River in that the Mississippi Riverestuary has a salt wedge throughout the year while in the Mekong River estuary, a saltwedge is only present in the high-flow season, and partially well-mixed estuarineconditions prevail in the low-flow season (Wright & Coleman, 1974).The regularization of the discharge of the Mekong River following the construction of
large, proposed hydro-electric dams further upstream in Cambodia, Laos and Thailand,may have significant effects on the Mekong River estuary. In particular, with decreasedpeak discharges, less riverine sediment will be exported to the sea during the high-flowseason. Also, with decreased high-flows, the salt wedge will be replaced by partiallywell-mixed estuarine conditions within the estuary. This will lead to enhanced tidalpumping of sediment into the estuary from the coastal zone. There is sufficient (oldriverine) sediment available in coastal waters (Anikiyev et al., 1986) to ensure that theMekong River estuary will continue filling with coastal sediment even if the hydro-electric dams trap much of the (new) riverine sediment. Increased siltation in theMekong River estuary is thus likely following the construction of large hydro-electricdams further upstream. At longer time scales, the coastal waters may become depletedof sediment in view of a possible net southward drift (Gagliano & McIntire, 1968) andthis can be expected to lead to coastal erosion. At even longer time scales, salinityintrusion and siltation/erosion problems in the delta may be exacerbated by the relativesea-level rise estimated to be about 0·002 m year"1 (Nguyen Ngoc Thuy et al., 1994).In addition, the rapid economic developments in the Mekong riparian countries, as
well as those in the delta itself, will probably result in increased discharges of pollutants.While a fast degradation of organic pollutants is possible (e.g. the Yangtze River estuary,see Yu et al., 1990), heavy metals and pesticides may accumulate in the mud of theestuary because of their cohesive nature. In the north-east monsoon, the wind has aninshore component and should bring shoreward oil slicks from spills at oil wells on thecontinental shelf offshore from the Mekong River delta; this is of concern because oil hasa long residence time (years) when mixed in mangrove sediments (Burns et al., 1994).Thus an environmental management plan needs to be established for the Mekong
River delta. Due to the importance of the delta, detailed oceanographic, chemical andbiological field studies should be encouraged to provide data to enable wise managementof this important resource. More detailed modelling studies are also needed and somewill be undertaken, made possible by a grant from the IBM International Foundation.
Acknowledgements
This study was supported by the Hydrometeorological Service of Vietnam, the MarineHydrometeorological Center (HYDROMET) and the Australian Institute of MarineScience. This study, undertaken in difficult field conditions, would not have beenpossible without the help, support and generosity of Dr Nguyen Duc Ngu, Dr Phan VanHoac, Mr Ngo Huu Tang, colleagues at the HYDROMET office at Can Tho, thevillagers at Ca Loc and Mr Duncan Galloway; it is a pleasure to thank them all warmly.
References
Anikiyev, V. V., Zaytsev, O. V., Trinh The Hieu, Savil’Yeva, I. I., Starodubtsev, Y. & Shumilin, Y. N. 1986Variation in the time-space distribution of suspended matter in the coastal zone of the Mekong River.Oceanology 26, 725–729.
580 E. Wolanski et al.

Barua, K., Kuehl, S. A., Miller, R. L. & Moore, W. S. 1994 Suspended sediment distribution and residualtransport in the coastal ocean off the Ganges-Brahmaputra river mouth. Marine Geology 120, 41–61.
Borland, W. M. 1973 Pa Mong phase II. Supplement to Main Report (Hydraulics and Sediment Studies). U.S.Bureau Reclamation, Volume 1, 282 pp., Volume 2, 304 pp.
Burns, K. A., Garrity, S. D., Jorissen, D. et al. 1994 The Galetta oil spill. II. Unexpected persistence of oiltrapped in mangrove sediments. Estuarine, Coastal and Shelf Science 38, 349–364.
Curtin, T. B. & Legeckis, R. V. 1986 Physical observations in the plume region of the Amazon River duringpeak discharge—I. Surface variability and II. Water Masses. Continental Shelf Research 6, 31–71.
Eisma, D. 1993 Suspended Matter in the Aquatic Environment. Springer-Verlag, Berlin, 315 pp.Eisma, D., Schumacher, T., Boekel, H. et al. 1990 A camera and image-analysis system for in-situ
observations of flocs in natural waters. Netherlands Journal of Sea Research 27, 43–56.Gagliano, S. M. & McIntire, W. G. 1968 Reports on the Mekong River delta. Coastal Studies Institute
Technical Report No. 57, Louisiana State University, 143 pp.Geyer, W. R., Beardsley, R. C., Candela, J. et al. 1991 The physical oceanography of the Amazon outflow.
Oceanography 4, 8–14.Gibbs, R. J. 1985 Estuarine flocs: their size, settling velocity and density. Journal of Geophysical Research 90,
3249–3251.Gibbs, R. J. & Konwar, L. 1986 Coagulation and settling of Amazon River suspended sediment. Continental
Shelf Research 6, 127–149.Gibbs, R. J., Tshudy, D., Konwar, L. & Martin, J. M. 1989 Coagulation and transport of sediments in the
Gironde estuary. Sedimentology 36, 987–999.Gibbs, R. J. & Wolanski, E. 1992 The effects of flocs on optical backscattering measurements of suspended
material concentration. Marine Geology 107, 289–291.Jirka, G. H. 1990 Circulation in a salt wedge estuary. In Residual Currents and Long-term Transport (Cheng,
R. T., ed.). Springer-Verlag, New York, pp. 223–237.Kendrick, M. P. & Derbyshire, D. V. 1983 Factors affecting the supply and distribution of sediment in some
tropical rivers. Canadian Journal of Fish Aquatic Science 40 (Suppl.), 35–43.Kuehl, S. A., Hariu, T. & Moore, W. 1989 Shelf sedimentation off the Ganges-Brahmaputra river system:
Evidence for sediment bypassing to the Bengal fan. Geology 17, 1132–1135.Lazure, P. & Girardot, J. P. 1990 Hydrodynamics of the Changjiang estuary area. Proceedings of the
International Symposium on Biogeochemical Study of Changjiang Estuary and Adjacent Coastal Waters ofthe East China Sea. China Ocean Press, Hangzhou, pp. 38–61.
Le Duc, An & Phan Trung Luong 1993 Environmental change in southern part of Mekong River delta andproblems of territorial rational use. In Deltas of the World (Kay, R., ed.). American Society of CivilEngineers, New York, pp. 114–121.
Li, Y., Wolanski, E. & Xie, Q. 1993 Coagulation and settling of suspended sediment in the Jiaojiang Riverestuary, China. Journal of Coastal Research 9, 390–402.
Lohmann, L. 1991 Engineers move in on the Mekong. New Scientist 1777, 38–41.Ludwig, K. A. & Hanes, D. M. 1990 A laboratory evaluation of optical backscatterance suspended solids
sensors exposed to sand-mud mixtures. Marine Geology 94, 173–179.Milliman, J. D. & Meade, R. H. 1983 World-wide delivery of river sediment to the oceans. Journal of
Geology 91, 1–21.Milliman, J. D. & Syvitski, J. P. M. 1992 Geomorphic/tectonic control of sediment discharge to the ocean:
The importance of small mountainous rivers. Journal of Geology 100, 525–544.Nguyen Ngoc Huan 1987a Water Regime of Tidal Mekong Delta. Ph.D. dissertation, Moscow University (in
Russian).Nguyen Ngoc Huan 1987b Application of mathematical models for computation of water distribution of
Mekong delta. Journal of Moscow University 3 (in Russian).Nguyen Ngoc Thuy 1979 Tides in the Gulf of Thailand and in the coastal regions of the Mekong delta.
Symposium, Can-Tho Institute (in Vietnamese).Nguyen Ngoc Thuy 1988a Hydrometeorology of Vietnam Sea Waters Volume 1. Marine Hydrometeorological
Center, Science & Technical Publishers, Hanoi (in Vietnamese).Nguyen Ngoc Thuy 1988b Tides in the Vietnam Estuaries. Marine Hydrometeorological Center, Science &
Technical Publishers, Hanoi, 20 pp (in Vietnamese).Nguyen Ngoc Thuy 1989 Hydrodynamic modeling of the propagation of tidal waves in the river system of
the Mekong delta. State Oceanographic Institute, GIMIZ Publ. No. 188, Moscow (in Russian).Nguyen Ngoc Thuy, Pham Hoang Lam & Bui Dinh Khuoc 1994 Global warming, El-Nino phenomenon
and the sea level change in Vietnam and neighboring countries. IOC/WESTPAC Symposium, Bali,Indonesia, 22–26 November 1994, 15 pp.
Phan Nguyen Hong 1991 Status of mangrove ecosystems in Vietnam: some management considerations.Proceedings of Mangrove Genetic Resources Centers project Formulation Workshop, Madras, India, 15–19January 1991. M.S. Swaminathan Research Foundation, Madras, pp. 53–63.
Fine-sediment dynamics 581

Simpson, J. H. 1972 Effects of the lower boundary on the head of a gravity current. Journal of FluidMechanics 53, 759–768.
Tingsanchali, T. & Lien, N. D. 1987 Flood simulation in the tidal delta of the Mekong River by SSARRmodel. Water, Asian Institute of Technology 11, 117–126.
Uiterwijk Winkel, APB 1975 Microbiologische aspecten en het sedimentatie gedrag van rivierslib.Rijkwaterstaat, Direktie Waterhuishounding en Waterbeweging. District Zuidwest, Report No.44.006.001, 60 pp.
United Nations 1957 Development of water resources in the lower Mekong basin. United NationsEconomic Commission for Asia and the Far East. Flood Control Series No. 12, Bangkok, 75 pp.
Van Leussen, W. 1988 Aggregation of particles, settling velocity of mud flocs. A review. In Physical Processesin Estuaries (Dronkers, J. & Van Leussen, W., eds). Springer-Verlag, Berlin, pp. 347–403.
West, J. R. & Sangodoyin, A. 1991 Depth-mean tidal current and sediment concentration relationships inthree partially mixed estuaries. Estuarine, Coastal and Shelf Science 32, 141–159.
Wolanski, E. & Gibbs, R. J. 1995 Flocculation of suspended sediment in the Fly River estuary, Papua NewGuinea. Journal of Coastal Research 11, 754–762.
Wolanski, E., King, B. & Galloway, D. 1995 Dynamics of the turbidity maximum in the Fly River estuary,Papua New Guinea. Estuarine, Coastal and Shelf Science 40, 321–337.
Wright, L. D. & Coleman, L. M. 1974 Mississippi River mouth processes: effluent dynamics andmorphologic developments. Journal of Geology 82, 751–778.
Yu, G., Zhou, J. & Liao, X. 1990 The biogeochemical behaviors of pollutants and nutrients in theChangjiang estuary and its adjacent shelf areas. Proceedings of the International Symposium BiogeochemicalStudy of Changjiang Estuary and Adjacent Coastal Waters of the East China Sea. China Ocean Press,Hangzhou, pp. 1–15.
582 E. Wolanski et al.
Copyright © 2022 FDOKUMEN