ACOUSTIC OBSERVATIONS OF FINE SEDIMENT DISPERSAL AND DEPOSITION DURING DREDGED SEDIMENT RELEASE IN...
10
521 ACOUSTIC OBSERVATIONS OF FINE SEDIMENT DISPERSAL AND DEPOSITION DURING DREDGED SEDIMENT RELEASE IN THE YANGTZE ESTUARY Jiaxue WU Key Laboratory of Marine Geology, Tongji University, Shanghai 200092, China. E-mail: [email protected] Huanting SHEN State Key Laboratory of Estuarine and Coastal Science, East China Normal University, Shanghai 200062, China. E-mail: [email protected] Shuying ZHANG Shanghai Acoustics Laboratory, Academia Sinica, Shanghai 200032, China. E-mail: [email protected] Abstract: ASSM-II Acoustic Concentration Profiler and Acoustic Doppler Profiler were deployed to concurrently observe the concentrated suspension dispersal provided by dredged material in the Changjiang Estuary. Field measurements were conducted at the flood, moderate and neap tides in June 2002, respectively. Results show: (a) Vertical profiles of suspended sediment concentration are serrate curves in three types, i.e. L-shaped, exponential and floating- like. Both deposition from suspension and horizontal advection of dense, high concentration layers contribute to the emplacement of cohesive sediment. (b) Two modes of sediment suspension dispersal and deposition coexist, i.e. the upper low-concentration plumes and the lower high-concentration density currents, and the latter is the major mechanism for suspension dispersal. (c) The low-velocity patches at the local transverse fields become weakly dispersed downstream with little vertical displacement at the moderate tide, whereas at the neap tide they rapidly move down to the bottom. The behavior of upper lutocline layers responds to that of the horizontal dispersal of the low-velocity patches. (d) Two kinds of internal waves are generated by the lutocline interfacial instability and the interaction of tidal flow with subaqueous topography, respectively. The former evolves along the flood currents from instability to stability according to calculated Richardson numbers, and the concentration profiles collapse, forming L- shaped structure and resulted in benthic density currents. Tidal internal waves and surface waves travel at different wavelengths and velocities across the water column, producing different degrees of shear damping for the high-concentration underflow spread. The density current moves far away in the approximate phase between the internal wave and surface wave, whereas it diminishes immediately out of phase. Key words: Acoustic observation, Suspension plume, Lutocline, internal wave, Changjiang Estuary 1. INTRODUCTION Estuarine fine sediment transport is much complicated and different from the coarse- grained sediment transport. The concepts for non-cohesive or low concentration sediments are not surely appropriate to those for cohesive or high concentration sediments (Kirby, 1988; Winterwerp et al., 2002). The fine sediment transport is characterized by flocculation settling, lutocline and concentrated benthic suspension (CBS). A stratified flow system occurs when International Conference on Estuaries and Coasts November 9-11, 2003, Hangzhou, China
-
Upload
independent -
Category
Documents
-
view
3 -
download
0
Transcript of ACOUSTIC OBSERVATIONS OF FINE SEDIMENT DISPERSAL AND DEPOSITION DURING DREDGED SEDIMENT RELEASE IN...

521
ACOUSTIC OBSERVATIONS OF FINE SEDIMENT DISPERSAL AND
DEPOSITION DURING DREDGED SEDIMENT RELEASE IN THE YANGTZE ESTUARY
Jiaxue WU
Key Laboratory of Marine Geology, Tongji University, Shanghai 200092, China. E-mail: [email protected]
Huanting SHEN
State Key Laboratory of Estuarine and Coastal Science, East China Normal University, Shanghai 200062, China. E-mail: [email protected]
Shuying ZHANG
Shanghai Acoustics Laboratory, Academia Sinica, Shanghai 200032, China. E-mail: [email protected]
Abstract: ASSM-II Acoustic Concentration Profiler and Acoustic Doppler Profiler were deployed to concurrently observe the concentrated suspension dispersal provided by dredged material in the Changjiang Estuary. Field measurements were conducted at the flood, moderate and neap tides in June 2002, respectively. Results show: (a) Vertical profiles of suspended sediment concentration are serrate curves in three types, i.e. L-shaped, exponential and floating-like. Both deposition from suspension and horizontal advection of dense, high concentration layers contribute to the emplacement of cohesive sediment. (b) Two modes of sediment suspension dispersal and deposition coexist, i.e. the upper low-concentration plumes and the lower high-concentration density currents, and the latter is the major mechanism for suspension dispersal. (c) The low-velocity patches at the local transverse fields become weakly dispersed downstream with little vertical displacement at the moderate tide, whereas at the neap tide they rapidly move down to the bottom. The behavior of upper lutocline layers responds to that of the horizontal dispersal of the low-velocity patches. (d) Two kinds of internal waves are generated by the lutocline interfacial instability and the interaction of tidal flow with subaqueous topography, respectively. The former evolves along the flood currents from instability to stability according to calculated Richardson numbers, and the concentration profiles collapse, forming L-shaped structure and resulted in benthic density currents. Tidal internal waves and surface waves travel at different wavelengths and velocities across the water column, producing different degrees of shear damping for the high-concentration underflow spread. The density current moves far away in the approximate phase between the internal wave and surface wave, whereas it diminishes immediately out of phase. Key words: Acoustic observation, Suspension plume, Lutocline, internal wave, Changjiang
Estuary
1. INTRODUCTION Estuarine fine sediment transport is much complicated and different from the coarse-
grained sediment transport. The concepts for non-cohesive or low concentration sediments are not surely appropriate to those for cohesive or high concentration sediments (Kirby, 1988; Winterwerp et al., 2002). The fine sediment transport is characterized by flocculation settling, lutocline and concentrated benthic suspension (CBS). A stratified flow system occurs when
International Conference on Estuaries and CoastsNovember 9-11, 2003, Hangzhou, China
522
lutocline and CBS layers come out, and various types of suspension dispersal pattern exist. Laboratory experiments show that sediment-laden flows may produce at least three kinds of density currents (Allen, 1997): (a) an underflow or hyperpycnal flow; (b) an overflow or hypopycnal flow; (c) an interflow. Field measurements show that a surface hypopycline plume occurs in the Amazon river mouth, the Changjiang Estuary, the Columbia Estuary, and a bottom hyperpycline plume does in the Mississippi river mouth, and the Huanghe river mouth (Wright and Nittrouer, 1995). But up till today the third pattern has not been found in-situ. The traditional theory held that the benthic density current is controlled by the gravity and sediment-induced pressure gradient. However, the predominant driving forces in the estuarine and coastal environments are the non-steady flows simultaneously induced by the tides, waves and winds. In fact, these processes probably overrun the gravity-induced effect on the dispersal of density currents on the flat seabed (Wright et al, 2001).
The Deepwater Waterway Regulation Project is under way in the lower Changjiang Estuary. The dredged mud disposal at the storage pool provides a good prototype experiment for the study of the high-concentration sediment dispersal behaviour and patterns. This study has important implication for evaluation of the influence of sediment disposal on the marine environment, and for scientific identification of a pool site and its efficiency. An Eulerian-type monitoring is usually applied to observe the sediment properties both before and after sediment disposal, and to further speculate on the scope of suspension spread and its behaviour. This experiment consumes much effect and high cost since many monitoring apparatus are used at the same time to cover the sediment spread scope. On the contrary, a Lagrangian-type method can be used to dynamically observe the behaviour and extension with less cost.
The objectives of this study are (1)Acoustic observations of high-resolution profiles of suspended sediment concentration of dredged material disposed at a storage pool in the Changjiang Estuary; (2)Concentrated suspension dispersal behaviour and their patterns; (3)Mechanism of suspension dispersal under gravity, flood currents, topography and their interactions.
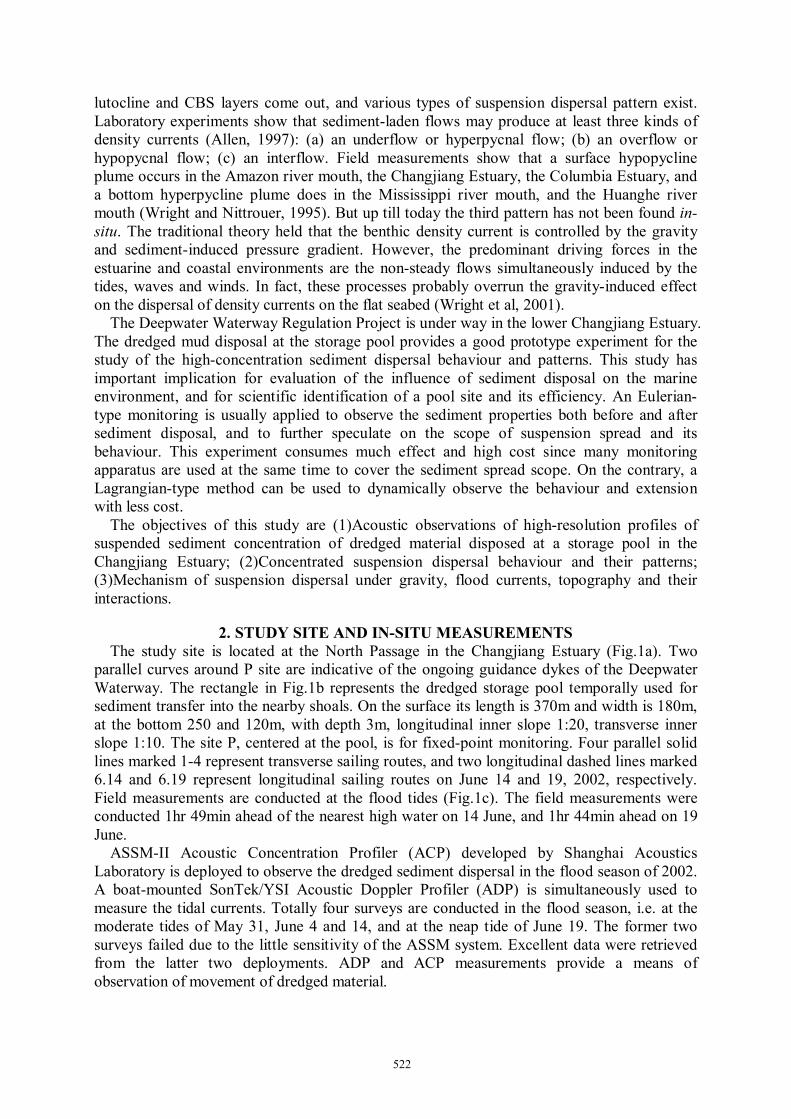
2. STUDY SITE AND IN-SITU MEASUREMENTS The study site is located at the North Passage in the Changjiang Estuary (Fig.1a). Two
parallel curves around P site are indicative of the ongoing guidance dykes of the Deepwater Waterway. The rectangle in Fig.1b represents the dredged storage pool temporally used for sediment transfer into the nearby shoals. On the surface its length is 370m and width is 180m, at the bottom 250 and 120m, with depth 3m, longitudinal inner slope 1:20, transverse inner slope 1:10. The site P, centered at the pool, is for fixed-point monitoring. Four parallel solid lines marked 1-4 represent transverse sailing routes, and two longitudinal dashed lines marked 6.14 and 6.19 represent longitudinal sailing routes on June 14 and 19, 2002, respectively. Field measurements are conducted at the flood tides (Fig.1c). The field measurements were conducted 1hr 49min ahead of the nearest high water on 14 June, and 1hr 44min ahead on 19 June.
ASSM-II Acoustic Concentration Profiler (ACP) developed by Shanghai Acoustics Laboratory is deployed to observe the dredged sediment dispersal in the flood season of 2002. A boat-mounted SonTek/YSI Acoustic Doppler Profiler (ADP) is simultaneously used to measure the tidal currents. Totally four surveys are conducted in the flood season, i.e. at the moderate tides of May 31, June 4 and 14, and at the neap tide of June 19. The former two surveys failed due to the little sensitivity of the ASSM system. Excellent data were retrieved from the latter two deployments. ADP and ACP measurements provide a means of observation of movement of dredged material.
523
Field measurements include (1) fixed-point sampling and monitoring at the site P; and (2) sailing observations along the preassigned routes of transverse and longitudinal sections. A survey boat named Hu Nan Yu 4110 is used for point sampling and monitoring, and a survey boat named Hu Nan Yu 4111 for sailing measurements, dredged sediment disposal is implemented by auto-navigation harrow dredger named Hang Jun 4007 with a storage of 4500m3 owned by Shanghai Waterway Bureau.
Fig. 1 Sampling site and sections in the Yangtze Estuary Contour in meters
3. DATA PROCESSING
3.1 ADP CURRENT DECOMPOSITION Tidal currents can be decomposed into two components, section-parallel and section-
perpendicular components as follows,
−=
180)(cos παiii DVu ;
−=
180)(sin παiii DVv (1)
in which iu and iv are the section-parallel and section-perpendicular components, respectively; iV and iD are the velocity and its direction at each layer, subscript i represents relative depth of each layer, for example, in the six-point method 0=i , 2.0 H, 4.0 H, 6.0 H,
8.0 H, 0.1 H, with H water depth; α is the section direction angle. In the following discussion, section-perpendicular components are used in the analysis of transverse section flow and section-parallel components are in the analysis of longitudinal section flow.
3.2 ASSM PROCESSING AND CALIBRATION In the post-processing procedure, the original data are compensated and calibrated by the
use of the following equation, ( ) ( ) ( ) ( ) rrrn errurKrc )(42 α= (2)
in which ( )rc is the concentration at different ranges or depths; ( )ru is the receiving signal voltage; )(rn is the expansion attenuation factor, which is selected from 1(near field) to 2(far
524
field); )log(10)( er βα = is the absorption factor calculated from the Shulkin-Marsh equation
(Urick,1983); ( )rK is the calibration coefficient determined from such physical characteristics of sediment as diameter, density, and compressibility.
Calibration is very important in the practical application of the ASSM system. To obtain exact calibration coefficients, it is necessary to complete laboratory calibration with a great number of various typical sediment samples in different situations. Obviously the laboratory calibration needs very tedious effect. An in-situ calibration, however, saves a lot of time and efficiency if the calibration coefficients can be obtained through iterative procedure. Eq.2 shows that the concentrations ( )rc are dependent on such parameters as the receiving signal voltage or backscattering ( )ru , the range r , the expansion attenuation factor )(rn , the absorption factor )(rα , and the calibration coefficient ( )rK . Among these parameters, the backscattering and the range are known, whereas the coefficients ( )rK , ( )rn , and )(rα are unknown. So the calibration procedure is to determine these three coefficients so as to approach the field data. It has been estimated that the trial-and-error procedure produces concentrations with about %20± accuracy.
4. RESULTS AND DISCUSSION
4.1 SUSPENDED SEDIMENT CONCENTRATION PROFILE The high-resolution acoustic observations in the Changjiang Estuary show that the profiles
of suspension by the dredged material disposal are serrate curves versus depth (Fig.2C&D), rather than the smooth or stepwise curves as proposed by Kirby (1988). The profile has multi-level lutocline layers, and at least three types of structures as the suspension evolves. Type I is L-shaped, most of SSC are less than 1.0 1gl− , relatively low concentration suspensions. Type II is floating-like, vertical gradients in SSC are large. Type III is characterized by an exponential increase in SSC from surface to bottom. Among those patterns, the L-shaped and exponential structures are stable, with the upper concentration being smaller than the lower one. The floating-like structure is unstable, with the upper concentration being larger than the lower one.
Two basic models can be used to describe suspended sediment concentration profiles, i.e. pure gradient diffusion and convection-diffusion models (Nielsen, 1995). The solution of pure gradient diffusion model can educe the famous Rouse formula describing exponential distribution of sediment concentration versus depth. Both models concern only with settling and vertical convection-diffusion processes for the sediment concentration distribution, but ignore horizontal advection. However, the horizontal advection is a very important process for vertical distribution of high concentration cohesive sediment. Kirby (1988) put forward that settling predominates in non-cohesive sediment transport while dense high concentration horizontal advection in cohesive sediment transport. Low concentration and non-cohesive sediment distributions are characterized by smooth, continuous curves, whereas high-concentration and cohesive sediment distributions by layered stepwise curves. Besides the vertical settling and convection-diffusion processes, the horizontal advection has also contributed to the emplacement of cohesive sediment. Obviously, the Rouse exponential distribution cannot express all these distributions.
4.2 BEHAVIOR OF CONCENTRATED SUSPENSION DISPERSAL AND DEPOSITION
Longitudinal sailing observations by the ASSM system can display instantaneous and quasi-simultaneous sediment concentration profiles. The structure characteristics and their variations can show the suspension dispersal behaviour.

525
A 2002-06-14
B 2002-06-19
a b c
d e f
Seaflo
Seaflo
0.0 2.0 4.0 6.0Concentration (kg/m3)
10
8
6
4
2
0
Dep
th (m
)
0.0 1.0 2.0Velocity (m/s)
0.0 2.0 4.0
0.0 1.0 2.0
0.0 2.0 4.0
0.0 1.0 2.0
a
CACP V CACPV CACP V
0.0 2.0 4.0Concentration (kg/m3)
10
8
6
4
2
0
Dep
th (m
)
0.0 1.0 2.0Velocity (m/s)
0.0 2.0 4.0
0.0 1.0 2.0
0.0 2.0 4.0
0.0 1.0 2.0
V
CACP
V
CACP
VCACP
b c
d e f
SENWflood current
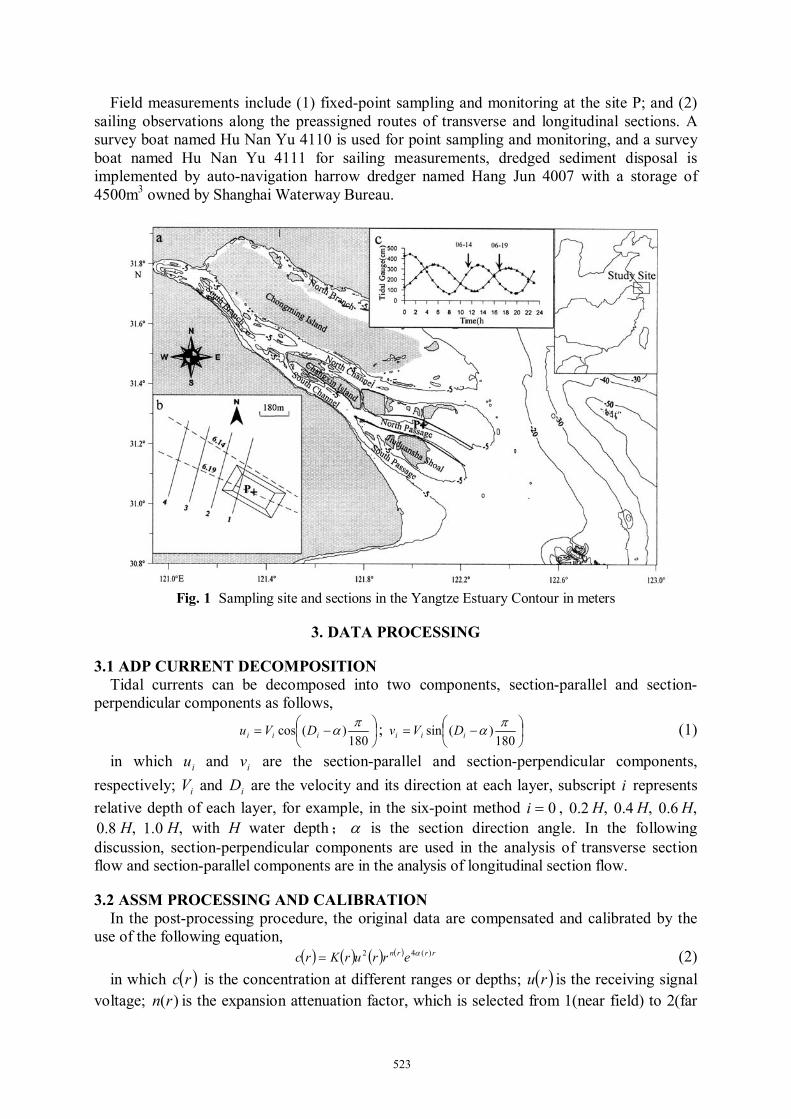
Fig. 2 Suspension dispersal and deposition by the ASSM system. (A-B) Colored images of suspended sediment concentration. Horizontal arrows indicate horizontal advection, and vertical ones settling; (C-D) Vertical profiles of sediments with Columns a-f shown in Fig.2A & B, and arrows pointed to
the lutocline layers
Figs.2A & B show the coloured images of suspended sediment concentrations on the moderate tide of June 14 and on the neap tide of June 19, respectively. Horizontal advection and vertical settling processes co-exist due to flood currents and sediment particle gravity, but two kinds of sediment transport behaviour are different from each other. Tongue-shaped dispersal predominates at the upper layer on the moderate tide whereas wedge-shaped dispersal does at the lower layer on the neap tide.
In order to understand the behaviour of suspension dispersal, it is required to examine in detail the high-resolution vertical distributions of the sediment concentration. Three columns are chosen along the longitudinal section downstream of the flood current (Figs.2C & D). On June 14, lutoclines develop at the middle level of each column, and they are located almost at the same level of ca. 3-5m. But the peak concentrations of the lutoclines gradually decrease from 1.31kg/m3 at Column c to 0.77kg/m3 at Column a. This is the typical behaviour of low-concentration sediment plume, which can move far away. On the other hand, primary lutoclines develop at the bottom level of Columns c and b, and their peak concentrations gradually decrease from 4.24 kg/m3 at Column c to 2.96kg/m3 at Column b. Its vertical level gradually lowers down to the bed since rapid settling of particles makes the primary lutocline lower down. From the respective of vertical structure of concentrations, floating-like pattern at Column c changes to L-shaped pattern at Column a downstream of the flood current, i.e. the concentration profile collapses, and the benthic density current deposits immediately. In a word, suspension dispersal mechanism includes both the low-concentration plume and the high-concentration density current, of which the former can move far away and the latter deposits immediately.
On June 19, primary lutoclines develop at the bottom level of each column and they are located at the same level of ca. 7-8m, but the peak concentrations gradually decrease from 5.1
526
kg/m3 at Column f to 3.69kg/m3 at Column d. This is the typical behavior of high-concentration density current. From the perspective of vertical structure of concentrations, floating-like patterns still exist within the scope although the peak concentration gradually decreases downstream of the flood current, i.e. the concentration profile does not collapse, so the benthic density current can move far away. On the other hand, secondary lutoclines develop at the middle level of each column, and they are located almost at the same level ca. 5m. But the peak concentrations of the lutoclines gradually decrease from 2.36kg/m3 at Column f to 0.95kg/m3 at Column d. This suspension dispersal is controlled by the horizontal advection induced by the flood current, less influenced by the gravity, hence the vertical levels of secondary lutocline layers change less. In a word, the suspension dispersal mechanism at the neap tide includes the high-concentration density current and settling, and sediment dispersal takes the form of density currents, which can extend far away.
4.3 PATTERN AND MECHANISM OF SUSPENSION DISPERSAL AND DEPOSITION
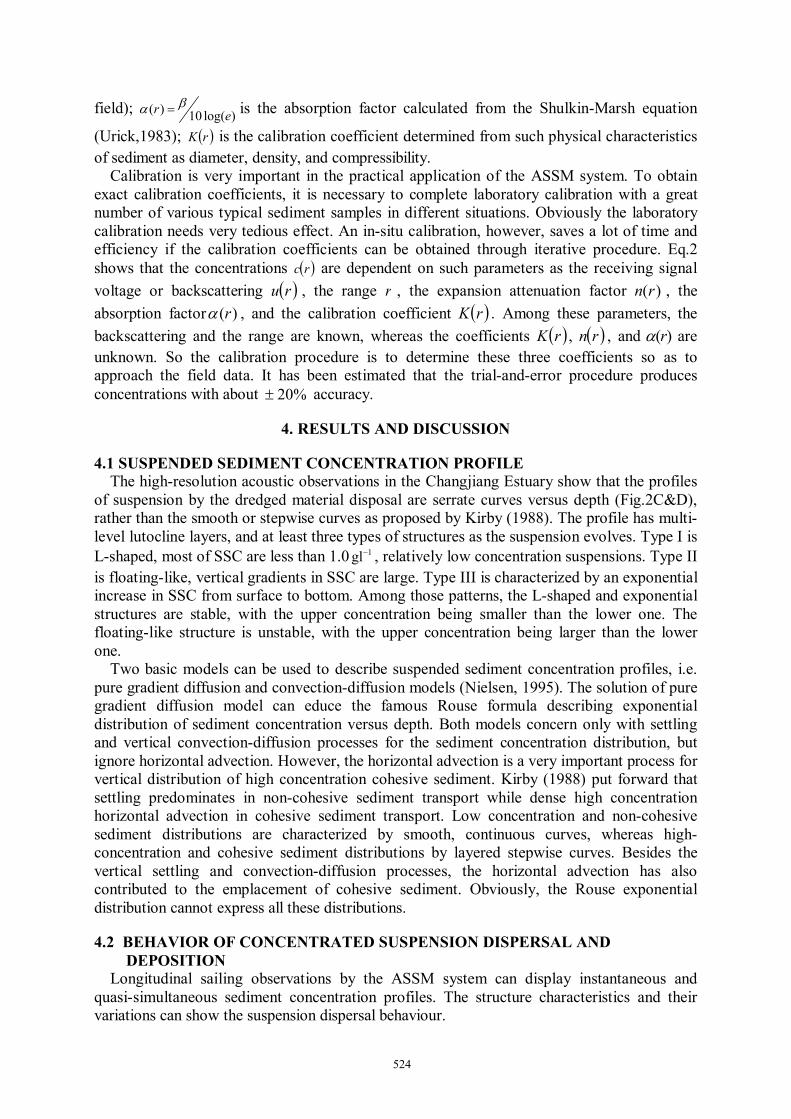
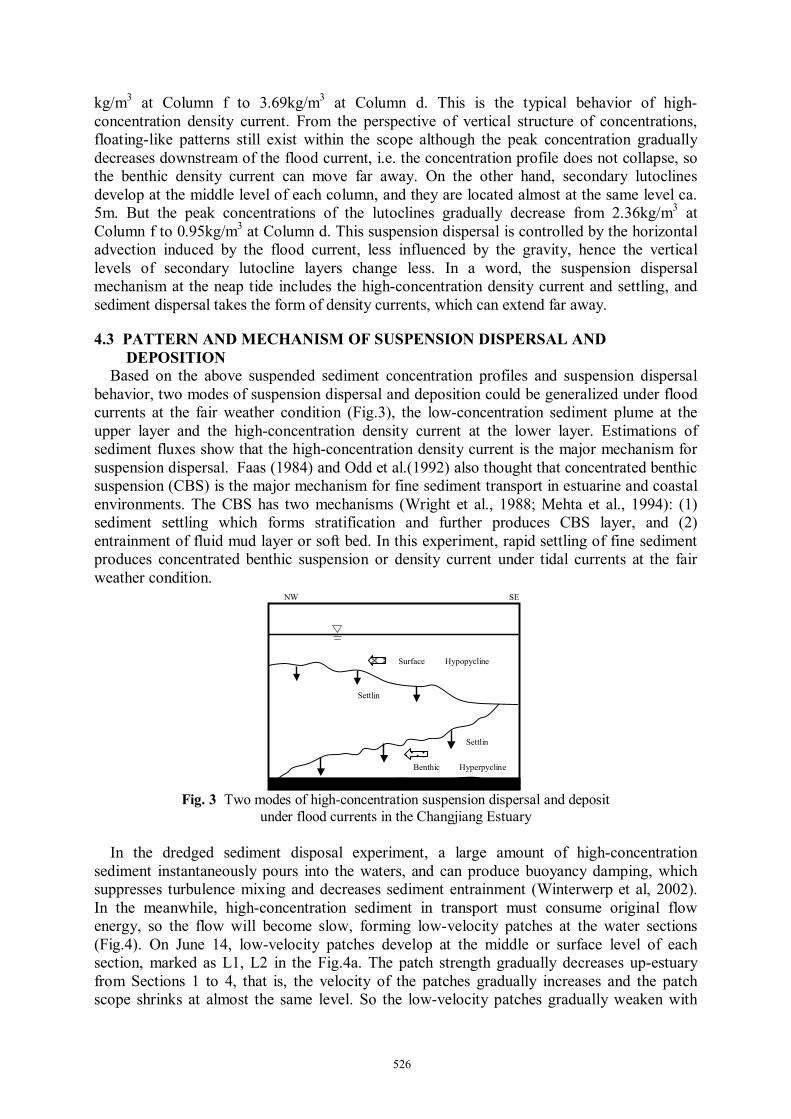
Based on the above suspended sediment concentration profiles and suspension dispersal behavior, two modes of suspension dispersal and deposition could be generalized under flood currents at the fair weather condition (Fig.3), the low-concentration sediment plume at the upper layer and the high-concentration density current at the lower layer. Estimations of sediment fluxes show that the high-concentration density current is the major mechanism for suspension dispersal. Faas (1984) and Odd et al.(1992) also thought that concentrated benthic suspension (CBS) is the major mechanism for fine sediment transport in estuarine and coastal environments. The CBS has two mechanisms (Wright et al., 1988; Mehta et al., 1994): (1) sediment settling which forms stratification and further produces CBS layer, and (2) entrainment of fluid mud layer or soft bed. In this experiment, rapid settling of fine sediment produces concentrated benthic suspension or density current under tidal currents at the fair weather condition.
Surface Hypopycline
Benthic Hyperpycline
Settlin
Settlin
NW SE
Fig. 3 Two modes of high-concentration suspension dispersal and deposit
under flood currents in the Changjiang Estuary In the dredged sediment disposal experiment, a large amount of high-concentration
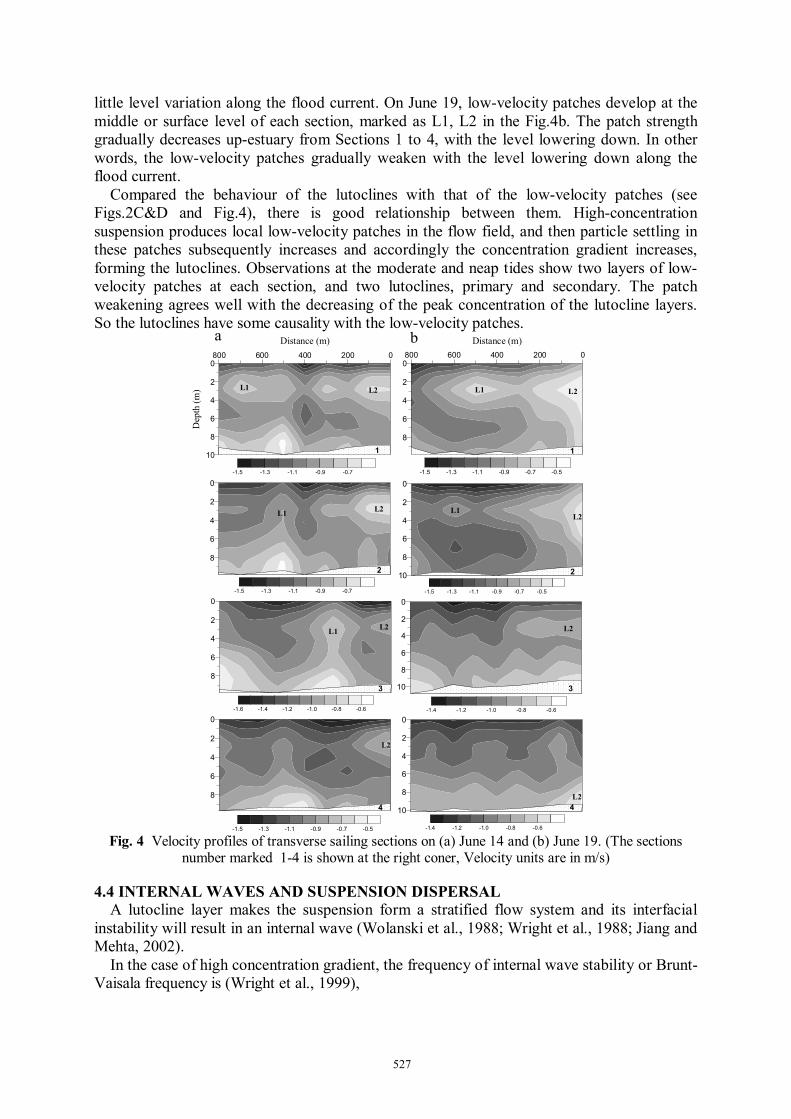
sediment instantaneously pours into the waters, and can produce buoyancy damping, which suppresses turbulence mixing and decreases sediment entrainment (Winterwerp et al, 2002). In the meanwhile, high-concentration sediment in transport must consume original flow energy, so the flow will become slow, forming low-velocity patches at the water sections (Fig.4). On June 14, low-velocity patches develop at the middle or surface level of each section, marked as L1, L2 in the Fig.4a. The patch strength gradually decreases up-estuary from Sections 1 to 4, that is, the velocity of the patches gradually increases and the patch scope shrinks at almost the same level. So the low-velocity patches gradually weaken with
527
little level variation along the flood current. On June 19, low-velocity patches develop at the middle or surface level of each section, marked as L1, L2 in the Fig.4b. The patch strength gradually decreases up-estuary from Sections 1 to 4, with the level lowering down. In other words, the low-velocity patches gradually weaken with the level lowering down along the flood current.
Compared the behaviour of the lutoclines with that of the low-velocity patches (see Figs.2C&D and Fig.4), there is good relationship between them. High-concentration suspension produces local low-velocity patches in the flow field, and then particle settling in these patches subsequently increases and accordingly the concentration gradient increases, forming the lutoclines. Observations at the moderate and neap tides show two layers of low-velocity patches at each section, and two lutoclines, primary and secondary. The patch weakening agrees well with the decreasing of the peak concentration of the lutocline layers. So the lutoclines have some causality with the low-velocity patches.
0200400600800
Distance (m)
0
2
4
6
8
-1.5 -1.3 -1.1 -0.9 -0.7 -0.5
0
2
4
6
8
10
-1.5 -1.3 -1.1 -0.9 -0.7 -0.5
0
2
4
6
8
10
-1.4 -1.2 -1.0 -0.8 -0.6
0
2
4
6
8
10
-1.4 -1.2 -1.0 -0.8 -0.6
1
2
3
4
L1 L2
L1L2
L2
0200400600800
Distance (m)
0
2
4
6
8
10
Dep
th (m
)
-1.5 -1.3 -1.1 -0.9 -0.7
0
2
4
6
8
-1.5 -1.3 -1.1 -0.9 -0.7
0
2
4
6
8
-1.6 -1.4 -1.2 -1.0 -0.8 -0.6
0
2
4
6
8
-1.5 -1.3 -1.1 -0.9 -0.7 -0.5
1
2
3
4
L1 L2
L2L1
L1 L2
L2
L2
a b
Fig. 4 Velocity profiles of transverse sailing sections on (a) June 14 and (b) June 19. (The sections
number marked 1-4 is shown at the right coner, Velocity units are in m/s)
4.4 INTERNAL WAVES AND SUSPENSION DISPERSAL A lutocline layer makes the suspension form a stratified flow system and its interfacial
instability will result in an internal wave (Wolanski et al., 1988; Wright et al., 1988; Jiang and Mehta, 2002).
In the case of high concentration gradient, the frequency of internal wave stability or Brunt-Vaisala frequency is (Wright et al., 1999),
528
( )zcsg
zgN
∂∂
−−=∂∂
−= 12 ρρ
(3)
where g is the gravity acceleration, s( ρρ s= )is the relative density of sediment and
water, z∂∂ρ and z
c∂
∂ are the gradients of water-sediment mixture density and suspended sediment concentration. An important parameter describing interfacial stability of internal waves is the Richardson number,
2
2
∂∂
=
zu
NRi (4)
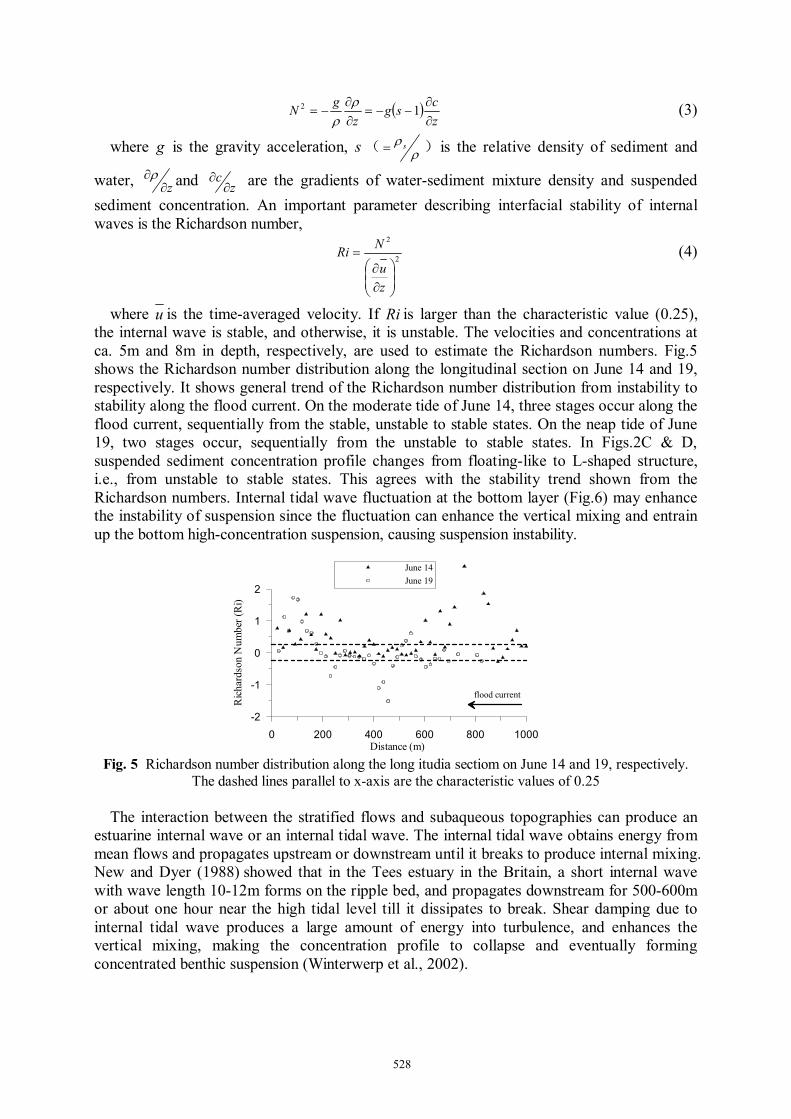
where u is the time-averaged velocity. If Ri is larger than the characteristic value (0.25), the internal wave is stable, and otherwise, it is unstable. The velocities and concentrations at ca. 5m and 8m in depth, respectively, are used to estimate the Richardson numbers. Fig.5 shows the Richardson number distribution along the longitudinal section on June 14 and 19, respectively. It shows general trend of the Richardson number distribution from instability to stability along the flood current. On the moderate tide of June 14, three stages occur along the flood current, sequentially from the stable, unstable to stable states. On the neap tide of June 19, two stages occur, sequentially from the unstable to stable states. In Figs.2C & D, suspended sediment concentration profile changes from floating-like to L-shaped structure, i.e., from unstable to stable states. This agrees with the stability trend shown from the Richardson numbers. Internal tidal wave fluctuation at the bottom layer (Fig.6) may enhance the instability of suspension since the fluctuation can enhance the vertical mixing and entrain up the bottom high-concentration suspension, causing suspension instability.
0 200 400 600 800 1000Distance (m)
-2
-1
0
1
2
Rich
ards
on N
umbe
r (R
i)
June 14June 19
flood current
Fig. 5 Richardson number distribution along the long itudia sectiom on June 14 and 19, respectively.
The dashed lines parallel to x-axis are the characteristic values of 0.25 The interaction between the stratified flows and subaqueous topographies can produce an
estuarine internal wave or an internal tidal wave. The internal tidal wave obtains energy from mean flows and propagates upstream or downstream until it breaks to produce internal mixing. New and Dyer (1988) showed that in the Tees estuary in the Britain, a short internal wave with wave length 10-12m forms on the ripple bed, and propagates downstream for 500-600m or about one hour near the high tidal level till it dissipates to break. Shear damping due to internal tidal wave produces a large amount of energy into turbulence, and enhances the vertical mixing, making the concentration profile to collapse and eventually forming concentrated benthic suspension (Winterwerp et al., 2002).
529
Distance
Dep
th
Dep
th
1002003004005006007008009001000
4
6
8
100200300400500600700800
4
6
8
10
A
B
abc
def
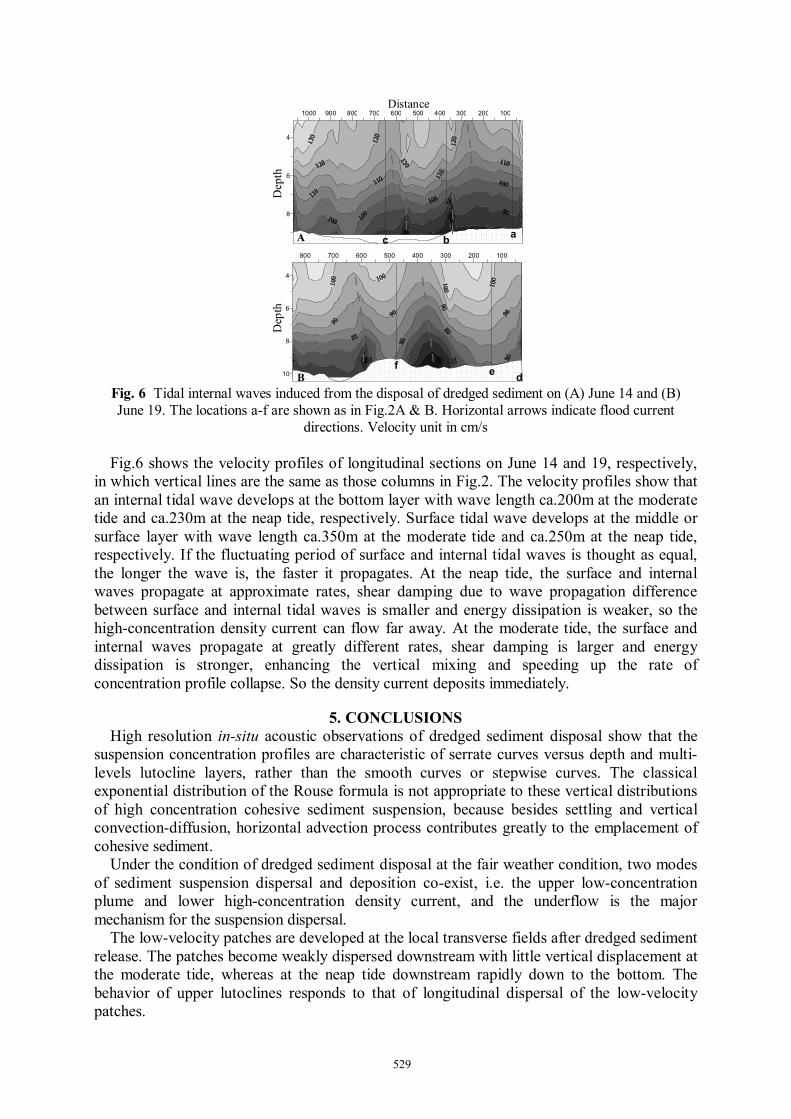
Fig. 6 Tidal internal waves induced from the disposal of dredged sediment on (A) June 14 and (B) June 19. The locations a-f are shown as in Fig.2A & B. Horizontal arrows indicate flood current
directions. Velocity unit in cm/s
Fig.6 shows the velocity profiles of longitudinal sections on June 14 and 19, respectively, in which vertical lines are the same as those columns in Fig.2. The velocity profiles show that an internal tidal wave develops at the bottom layer with wave length ca.200m at the moderate tide and ca.230m at the neap tide, respectively. Surface tidal wave develops at the middle or surface layer with wave length ca.350m at the moderate tide and ca.250m at the neap tide, respectively. If the fluctuating period of surface and internal tidal waves is thought as equal, the longer the wave is, the faster it propagates. At the neap tide, the surface and internal waves propagate at approximate rates, shear damping due to wave propagation difference between surface and internal tidal waves is smaller and energy dissipation is weaker, so the high-concentration density current can flow far away. At the moderate tide, the surface and internal waves propagate at greatly different rates, shear damping is larger and energy dissipation is stronger, enhancing the vertical mixing and speeding up the rate of concentration profile collapse. So the density current deposits immediately.
5. CONCLUSIONS High resolution in-situ acoustic observations of dredged sediment disposal show that the
suspension concentration profiles are characteristic of serrate curves versus depth and multi-levels lutocline layers, rather than the smooth curves or stepwise curves. The classical exponential distribution of the Rouse formula is not appropriate to these vertical distributions of high concentration cohesive sediment suspension, because besides settling and vertical convection-diffusion, horizontal advection process contributes greatly to the emplacement of cohesive sediment.
Under the condition of dredged sediment disposal at the fair weather condition, two modes of sediment suspension dispersal and deposition co-exist, i.e. the upper low-concentration plume and lower high-concentration density current, and the underflow is the major mechanism for the suspension dispersal.
The low-velocity patches are developed at the local transverse fields after dredged sediment release. The patches become weakly dispersed downstream with little vertical displacement at the moderate tide, whereas at the neap tide downstream rapidly down to the bottom. The behavior of upper lutoclines responds to that of longitudinal dispersal of the low-velocity patches.
530
Two kinds of internal waves are generated respectively by the lutocline interfacial instability and the interaction of tidal currents with subaqueous topographies. Interfacial internal waves evolve along the flood current from instability to stability according to calculated Richardson numbers, and concentration profiles collapse, forming L-shaped structure and resulting in benthic density current. Tidal internal waves and surface waves travel at different wavelengths and velocities across the water column, causing different degrees of shear damping for the high-concentration underflow spread. The density current moves far away in the approximate phase between the internal wave and surface wave, whereas it deposits immediately out of phase.
ACKNOWLEDGEMENTS This research was jointly supported by the National Natural Science Foundation of China
under grant No.40231017 and Shanghai Natural Science Foundation under grant No.02G14108.
REFERENCES Allen P A, 1997. Earth Surface Processes. Blackwell Science, 404p. Faas R W, 1984. Time and density-dependent properties of fluid mud suspensions, NE Brazilian
Continental Shelf. Geo-Marine Letter, 4: 147-152. Jiang J and Mehta A J, 2002. Interfacial instabilities at the lutocline in the Jiaojiang estuary, China. J C
Winterwerp and C Kranenburg (eds), Fine Sediment Dynamics in the Marine Environment. Amsterdam: Elsevier Science B V, 125-137.
Kirby R, 1988. High concentration suspension (fluid mud) layers in estuaries. J Dronkers and W van Leussen (eds), Physical Processes in Estuaries. Berlin: Springer-Verlag, 463-487.
Mehta A J, Lee S-C and Li Y, 1994. Fluid mud and water waves: a brief review of interactive processes and simple modeling approaches. Report UFL/COEL/MP-94/01, Coastal and Oceanographic Eng Dept, Univ Florida, Gainesville.
New A L and Dyer K R, 1988. Internal waves and mixing in stratified estuarine flows. J Dronkers and W van Leussen (eds), Physical Processes in Estuaries. Berlin: Springer-Verlag, 239-254.
Nielsen P, 1995. Suspended sediment concentration profiles. Applied Mechanics Reviews, 48(9): 564-569.
Odd N V M, Bentley M A and Waters C B, 1992. Observations and analysis of the movement of fluid mud in estuaries. Mehta A J(ed), Nearshore and estuarine cohesive sediment transport, Coastal and Estuarine Studies, 42: 430-446, AGU, Washington.
Urick R J, 1983. Principles of underwater sound. McGraw-Hill Book Co, New York. Winterwerp J C, Bruens A W, Gratiot N, et al. 2002. Dynamics of concentrated benthic suspension
layers. J C Winterwerp and C Kranenburg (eds), Fine Sediment Dynamics in the Marine Environment. Amsterdam: Elsevier Science B V, 41-55.
Wolanski E, Chappell J, Ridd P, et al. 1988. Fluidization of mud in estuaries. Journal of Geophysical Research, 93(C3): 2351-2361.
Wright L D, Wiseman W J, Bornhold B D, et al. 1988. Marine dispersal and deposition of Yellow River silts by gravity-driven underflows. Nature, 332: 629-632.
Wright L D and Nittrouer C A, 1995. Dispersal of river sediments in coastal seas: six contrasting cases. Estuaries, 18(3): 494-508.
Wright L D, Kim S C and Friederichs C T, 1999. Across-shelf variations in bed roughness, bed stress and sediment suspension on the northern California shelf. Marine Geology, 154: 99-115.
Wright L D, Friedrichs C T, Kim S C, et al. 2001. Effects of ambient currents and waves on gravity-driven sediment transport on continental shelves. Marine Geology, 175: 25-45.