Assessment of Heavy Metal Mobility in Dredged Sediments: Porewater Analysis, Single and Sequential...
18
701 TFJD357-04-150615 December 31, 2005 3:8 Soil & Sediment Contamination, 15:1–18, 2006 Copyright © Taylor & Francis Group, LLC ISSN: 1532-0383 print / 1549-7887 online DOI: 10.1080/15320380500506321 Assessment of Heavy Metal Mobility in Dredged Sediments: Porewater Analysis, Single and Sequential Extractions VAL ´ ERIE CAPPUYNS, RUDY SWENNEN, AND JISKA VERHULST 5 Fysico-Chemische Geologie, Katholieke Universiteit Leuven, Heverlee, Belgium Dredged sediments from the Leie catchment (Belgium) that were deposited on land between 70 and 10 years ago were characterized according to their physico-chemical properties, total metal concentrations and porewater composition. Actual and potential 15 heavy metal availability was assessed by means of single extractions with 0.01 M CaCl 2 , 0.05 M EDTA and 0.43 M acetic acid. A modified version of the BCR (Community Bureau of Reference) extraction procedure, adapted to the elevated acid neutralizing capacity of the sediments, was applied. Information on element mobility was assessed and the used methodologies were critically evaluated. 20 The favorable physico-chemical characteristics of dredged sediments from the catchment of the Leie River (N-Belgium) indicated a rather low actual heavy metal mobility. Based on CaCl 2 and EDTA extractions, the distribution of Cd, Zn and Ni be- tween the solution and sorbed phase could be described as a function of pH and organic carbon content. Cd and Zn were found to be the elements with the highest potential 25 availability, while Cu and Ni displayed a medium availability. It is stressed that dif- ferent types of extractions deal with heavy metal mobility in a different way and that the measurement of “key-factors” such as the pH of the extracts can be helpful for the interpretation of the results. Keywords Heavy metals, extractions, pollution, porewater, sediments 30 1. Introduction Dredging of waterways is necessary to keep waterways navigable and to prevent rivers from flooding. Annually more than 1,300,000 m 3 of sediments are dredged from navigable waterways in Flanders (N-Belgium). In 1995, the Flemish Community started making a systematic inventory of the quality of river sediments in Flanders. Riverbed samples were 35 evaluated on a physico-chemical, biological and ecotoxicological basis according to the TRIADE method (de Deckere et al., 2000). About 35% of the navigable waterways in Flanders displays a poor chemical quality because of elevated concentrations of organic pollutants and heavy metals and 50% have a very bad global (physico-chemical, biological and ecotoxicological) quality. 40 The aim of the present study is to investigate the actual and the long-term heavy metal mobility in dredged sediments that were disposed on land between 1930 and 1994. The Address correspondence to Val´ erie Cappuyns, Fysico-Chemische Geologie, Katholieke Uni- versiteit Leuven, Celestijnenlaan 200C, B-3001 Heverlee, Belgium. E-mail: Valerie.Cappuyns@ geo.kuleuven.be 1
-
Upload
trismegistos -
Category
Documents
-
view
1 -
download
0
Transcript of Assessment of Heavy Metal Mobility in Dredged Sediments: Porewater Analysis, Single and Sequential...

701 TFJD357-04-150615 December 31, 2005 3:8
Soil & Sediment Contamination, 15:1–18, 2006Copyright © Taylor & Francis Group, LLCISSN: 1532-0383 print / 1549-7887 onlineDOI: 10.1080/15320380500506321
Assessment of Heavy Metal Mobility in DredgedSediments: Porewater Analysis, Single and
Sequential Extractions
VALERIE CAPPUYNS, RUDY SWENNEN,AND JISKA VERHULST5
Fysico-Chemische Geologie, Katholieke Universiteit Leuven, Heverlee, Belgium
Dredged sediments from the Leie catchment (Belgium) that were deposited on landbetween 70 and 10 years ago were characterized according to their physico-chemicalproperties, total metal concentrations and porewater composition. Actual and potential15heavy metal availability was assessed by means of single extractions with 0.01 M CaCl2,0.05 M EDTA and 0.43 M acetic acid. A modified version of the BCR (Community Bureauof Reference) extraction procedure, adapted to the elevated acid neutralizing capacityof the sediments, was applied. Information on element mobility was assessed and theused methodologies were critically evaluated.20
The favorable physico-chemical characteristics of dredged sediments from thecatchment of the Leie River (N-Belgium) indicated a rather low actual heavy metalmobility. Based on CaCl2 and EDTA extractions, the distribution of Cd, Zn and Ni be-tween the solution and sorbed phase could be described as a function of pH and organiccarbon content. Cd and Zn were found to be the elements with the highest potential25availability, while Cu and Ni displayed a medium availability. It is stressed that dif-ferent types of extractions deal with heavy metal mobility in a different way and thatthe measurement of “key-factors” such as the pH of the extracts can be helpful for theinterpretation of the results.
Keywords Heavy metals, extractions, pollution, porewater, sediments30
1. Introduction
Dredging of waterways is necessary to keep waterways navigable and to prevent riversfrom flooding. Annually more than 1,300,000 m3 of sediments are dredged from navigablewaterways in Flanders (N-Belgium). In 1995, the Flemish Community started making asystematic inventory of the quality of river sediments in Flanders. Riverbed samples were35evaluated on a physico-chemical, biological and ecotoxicological basis according to theTRIADE method (de Deckere et al., 2000). About 35% of the navigable waterways inFlanders displays a poor chemical quality because of elevated concentrations of organicpollutants and heavy metals and 50% have a very bad global (physico-chemical, biologicaland ecotoxicological) quality.40
The aim of the present study is to investigate the actual and the long-term heavy metalmobility in dredged sediments that were disposed on land between 1930 and 1994. The
Address correspondence to Valerie Cappuyns, Fysico-Chemische Geologie, Katholieke Uni-versiteit Leuven, Celestijnenlaan 200C, B-3001 Heverlee, Belgium. E-mail: [email protected]
1
701 TFJD357-04-150615 December 31, 2005 3:8
2 V. Cappuyns et al.
results of porewater analysis and single and sequential extractions were compared and theuse of different types of extractions as a tool to assess the potential heavy metal availabilityin dredged sediments was evaluated 45
2. Methodology
2.1. Sampling
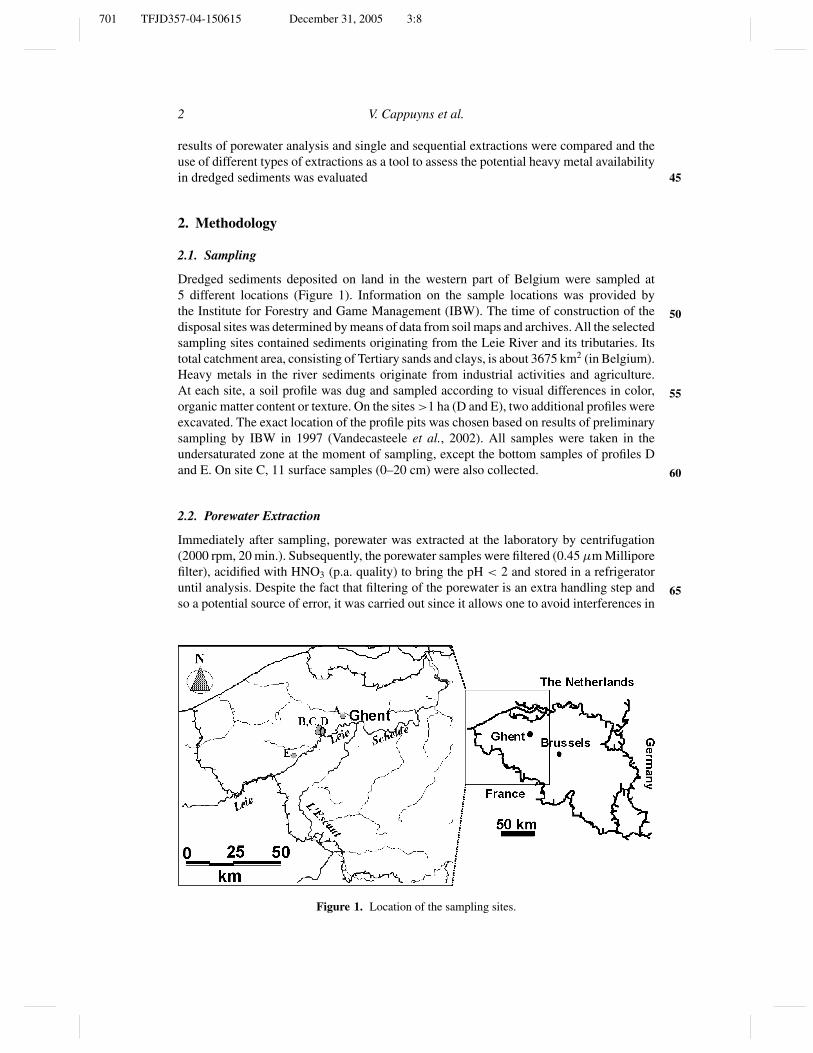
Dredged sediments deposited on land in the western part of Belgium were sampled at5 different locations (Figure 1). Information on the sample locations was provided bythe Institute for Forestry and Game Management (IBW). The time of construction of the 50disposal sites was determined by means of data from soil maps and archives. All the selectedsampling sites contained sediments originating from the Leie River and its tributaries. Itstotal catchment area, consisting of Tertiary sands and clays, is about 3675 km2 (in Belgium).Heavy metals in the river sediments originate from industrial activities and agriculture.At each site, a soil profile was dug and sampled according to visual differences in color, 55organic matter content or texture. On the sites >1 ha (D and E), two additional profiles wereexcavated. The exact location of the profile pits was chosen based on results of preliminarysampling by IBW in 1997 (Vandecasteele et al., 2002). All samples were taken in theundersaturated zone at the moment of sampling, except the bottom samples of profiles Dand E. On site C, 11 surface samples (0–20 cm) were also collected. 60
2.2. Porewater Extraction
Immediately after sampling, porewater was extracted at the laboratory by centrifugation(2000 rpm, 20 min.). Subsequently, the porewater samples were filtered (0.45 µm Milliporefilter), acidified with HNO3 (p.a. quality) to bring the pH < 2 and stored in a refrigeratoruntil analysis. Despite the fact that filtering of the porewater is an extra handling step and 65so a potential source of error, it was carried out since it allows one to avoid interferences in
Figure 1. Location of the sampling sites.
701 TFJD357-04-150615 December 31, 2005 3:8
Porewater Analysis, Single and Sequential Extractions 3
analytical procedures and prevents adsorption on or release of trace metals from suspended
Q1
particles (Bufflap and Allen, 1995).The yield of the porewater extraction was determined by weight difference before and
after centrifugation. Moisture content of the samples was estimated by weight loss from70a subsample dried in the oven at 60◦C. Since redox conditions were oxic for most of thesamples, no special measures were taken to avoid oxidation of the samples.
2.3. General Sediment Characterization
Sediment samples were dried in oven at 30◦C during 5 days. For the physico-chemicalanalysis, part of the soil sample was disaggregated in a porcelain mortar and sieved (<1 mm).75pH(H2O) was measured in a soil/water suspension (1/2.5). Organic carbon was determinedaccording to the Walkley and Black method (Nelson and Somers, 1982). Calcium carbonatecontent was measured with the rapid titration method (Allison and Moodie, 1965). Thesample was treated with 0.2 M HCl, followed by a backtitration of the unreacted HCl with0.1 M NaOH. Total S was determined with the Strohlein Sulfur Analyzer (model S-mat,80Carbolite Co. Ltd., Bamford-Sheffield). Grain size was determined by laser diffractionanalysis (Malvern
©R Mastersizer S long bed) and cation exchange capacity (CEC) wasanalyzed applying the “silver thiourea method” (Van Reeuwijk, 1992).
Total element concentrations (Al, As, Ba, Cd, Co, Cr, Cu, Ni, Pb, Zn, Fe, Mn, K, Pand Ca) were determined in all the samples. The term “total” is used here as the amount85of metals dissolved according to the 3 acid dissolution method. Therefore, one gram ofeach sample was dissolved in a 3-acid mixture (4 ml HClconc, 2 ml HNO3conc and 2 mlHFconc) in a Teflon beaker. The mixture was gently heated on a hot plate until half dryand subsequently reattacked with the same three acids and heated until completely dry.The residue was redissolved with 20 ml 2.5 N HCl and filtered (Whatman 45). Finally,90the solution was diluted to 50 ml with distilled water. Concentrations of major elementsand trace metals were measured with FAAS and ICP-MS (see 2.2.6). A certified referencematerial (GBW07411 Soil) and sample duplicates were used for quality control. Values (inmg/kg) obtained were for Cd 25.9 (certified value 28.2 ± 1.3), Zn: 3630 (certified value3800 ± 300), Ni: 22.3 (certified value: 24.2 ± 2.1), Cu: 62.9 (certified value 65.4 ± 4.7),95Pb: 3010 (certified value 2700 ± 100), Cr: 57.5 (certified value: 59.6 ± 5.0) and As: 193(certified value 205 ± 11). Relative standard deviations on triplicate analysis were below5% for all elements, except Ca, Al and S (below 10%).
2.4. Single Extractions
Single extractions were performed on all the samples. For the EDTA, acetic acid and100CaCl2 extraction the protocol of the SMT (Standards Measurement and Testing) program(Quevauviller, 1998) was followed. For the CaCl2 and EDTA extractions, 20 ml of a 0.01 MCaCl2 or 0.05 M EDTA solution, respectively, was added to 2 g of oven-dried sediment ina centrifuge tube. The suspension was shaken for 3 h or 1 h, respectively, in a reciprocalshaker, centrifuged (3500 rpm, 10 minutes), decanted off and filtered (0.45 µm). For the105acetic acid extraction, 40 ml of a 0.43 M acetic acid solution was added to 1 g of oven-driedsediment. The suspension was shaken for 16 h in a reciprocal shaker, centrifuged (3500 rpm,10 minutes), decanted off and filtered (0.45 µm). After measurement of the pH, the CaCl2and acetic acid extracts were acidified with concentrated HNO3 to bring the pH < 2. TheEDTA extracts were not acidified prior to analysis to prevent precipitation of EDTA salts110

701 TFJD357-04-150615 December 31, 2005 3:8
4 V. Cappuyns et al.
Table 1Comparison of the results of the EDTA-, acetic acid- and CaCl2-extractions ofthe certified reference material CRM 483 with certified and indicative values(Quevauviller et al., 1997). The number of replicates is given between brackets.
Concentrations in mg/kg dry matter
CRM 483 Certified value Certified value Indicative value
0.05 M EDTA 0.43 M acetic acid 0.01 M CaCl2Cd 20.4 ± 1.3 18.3 ± 0.6 0.45 ± 0.05Cr 28.6 ± 2.6 18.7 ± 1.0 0.35 ± 0.09Cu 215 ± 11 33.5 ± 1.6 1.4 ± 0.4Ni 28.7 ± 1.7 25.8 ± 1.0 1.4 ± 0.2Pb 229 ± 8 3.1 ± 0.25 <0.06Zn 612 ± 19 620 ± 24 8.3 ± 0.7
CRM 483 This work
0.05 M EDTA (6) c0.43 M acetic acid (6) c0.01 M CaCl2 (4)Cd 20.6 ± 0.6 15.2 ± 1.48 0.44 ± 0.01Cr 26.4 ± 3.4 13.3 ± 1.95 0.29 ± 0.03Cu 207 ± 4 28.1 ± 0.46 1.3 ± 0.12Ni 26.5 ± 1.78 21.5 ± 0.77 1.4 ± 0.03Pb 202 ± 27 1.7 ± 0.21 0.03 ± 0.03Zn 607 ± 4 556 ± 23 8.9 ± 0.8
at very low pH. Element concentrations in the extracts were measured with ICP-MS. AReference Material (CRM 483) certified for its EDTA-, acetic acid and CaCl2-extractablecontent of Cd, Cr, Cu, Ni, Pb and Zn was also included. For the EDTA and CaCl2-extraction,experimental values always differed less than 1 standard deviation from the certified values(Table 1). The results of the acetic acid extraction, however, were systematically lower than 115the certified values. This can be related to the fact that a reciprocal shaker was used instead ofan end-over-end shaker, as recommended by the SMT program. For the 5 dredged sedimentsamples that were subjected to sequential extractions, 3 replicate extractions were carriedout.
2.5. Sequential Extractions 120
To allow comparison with other sequential extractions executed on dredged sediments(Singh et al., 1998; Stephens et al., 2001), first the original BCR scheme (Table 2) wasapplied (Quevauviller et al., 1994). Five selected samples (Ac, Ba, Cb, D3a and E2b),consisting of dredged material for which the time of disposal is given in Table 1, wereanalyzed. A detailed description of the BCR procedure is given by Quevauviller et al. (1994). 125Briefly, the sequential extraction procedure was performed by sequentially extracting 0.5 gof the sediment samples in a 50 ml centrifuge tube at room temperature using a mechanicalshaker with:
(1) 20 ml 0.11 M acetic acid (CH3COOH) (16 h);(2) 20 ml 0.1 M hydroxylamine hydrochloride (NH2OH.HCl) (16 h); 130

701 TFJD357-04-150615 December 31, 2005 3:8
Porewater Analysis, Single and Sequential Extractions 5
Table 2Original BCR (Community Bureau of Reference) sequential extractionscheme and BCR sequential extraction scheme adapted to CaCO3-rich sam-
ples. L/S = liquid to solid ratio
Reagent L/S Duration
Original BCR extraction schemeStep 1 0.11 M acetic acid 40 16 hStep 2 0.1 M hydroxylamine hydrochloride 40 16 hStep 3 8.8 M H2O2 Heat 2 × at 85◦C
1 M ammonium acetate 50 16 hStep 4 HCl-HNO3-HF
Adapted BCR extraction schemeStep 1a 0.11 M acetic acid 40 16 hStep 1b 0.11 M acetic acid 40 16 hStep 1c 0.11 M acetic acid 40 16 hStep 2 0.1 M hydroxylamine hydrochloride 40 16 hStep 3 8.8 M H2O2 Heat 2 × at 85◦C
1 M ammonium acetate 50 16 hStep 4 HCl-HNO3-HF
(3) a twofold digestion with 5 ml 8.8 M H2O2 at 85◦C, followed by an extraction with25 ml 1 M ammonium acetate (CH3COONH4).
After each extraction, the suspensions were centrifuged (3000 rpm, 20 min), decanted,filtered (0,45 µm) and put aside for analysis. To allow comparison with total concentrationsmeasured in the samples, a fourth extraction (“residual fraction, Step 4”) was added to the135scheme. Before carrying out this fourth step, the residue was dried and weight loss after3 extractions was measured. All extractions were carried out in duplicate and blanks of thedifferent extractants were analyzed.
Subsequently, the BCR scheme was optimized for samples rich in calcium carbonate(Table 2). This was done by repeating the acid-extractable step 3 times. pH and changes in140pH during extractions are key parameters that determine selectivity and the potential redis-tribution of trace elements during extractions (Bermond, 2001). Regarding the importanceof pH towards heavy metal behaviour and reactivity, the pH of the extracts was measuredin Step 1 (a, b and c), 2 and 3.
2.6. Analysis of the Leachates145
The porewater and the solutions from the 3-acids digestions and single and sequentialextractions were analyzed by FAAS (Varian
©R Techtron AA6) for Ca, Fe, K and Al. ForAs, Ba, Cd, Co, Cr, Cu, Ni, Pb, Zn and Mn a multi-element analysis by ICP-MS (HP 4500series) was carried out. In the present paper, the results for As, Cd, Cr, Cu, Ni, Pb and Znwill mainly be discussed.150
If necessary, the samples were diluted just before analysis with 5% HNO3 (ultra-pure). Standard series were made up starting from the “10 ppm Multi-Element CalibrationStandard-2A in 5% HNO3” from Hewlett Packard
©R . For the measurement of the single

701 TFJD357-04-150615 December 31, 2005 3:8
Tabl
e3
Tota
lcon
cent
ratio
nsof
maj
oran
dtr
ace
elem
ents
and
phys
ico-
chem
ical
char
acte
rist
ics
ofth
esa
mpl
esfr
omth
epr
ofile
s.T
hedr
edge
dse
dim
entl
ayer
inea
chso
ilpr
ofile
,whi
chw
asan
alyz
edw
ithse
quen
tiale
xtra
ctio
ns,i
sin
dica
ted
with
∗ .N
A=
Not
Ana
lyze
d
Dep
thY
ear
ofC
rC
uZ
nN
iA
sC
dPb
Mn
KFe
Ca
Al
PS
CaC
O3
CE
CO
Ccl
aysi
ltsa
ndcm
disp
osal
mg/
kgm
g/kg
mg/
kgm
g/kg
mg/
kgm
g/kg
mg/
kgm
g/kg
mg/
kg%
%%
mg/
kgm
g/kg
%pH
cmol
/kg
%vo
l%vo
l%vo
l%
Site
AA
a0–
5019
30 –19
35
186
178
1520
2610
29
626
311
1051
62.
192.
403.
8614
5968
66.
07.
619
4.5
3153
16A
b50
–60
212
177
1885
2796
1262
238
212
500
2.13
3.34
4.83
1615
842
7.7
7.7
144.
830
5515
Ac
60–9
0∗13
613
211
0320
677
428
231
1012
41.
971.
903.
8312
3293
54.
57.
622
5.1
2752
21A
d90
–120
287
609
121
2396
8560
1.39
0.44
2.46
300
283
0.8
7.6
110.
914
5134
Site
BB
a0–
20∗
1965 –
1979
157
7076
729
174
168
411
1062
72.
672.
182.
9920
4820
723.
87.
136
10.4
2759
14B
b20
–75
8640
361
1812
269
126
7003
1.87
1.34
2.17
1219
976
3.5
6.4
3810
.326
5915
Bc
75–9
566
1967
516
116
122
1045
72.
350.
884.
0043
2736
12.
56.
735
5.8
NA
NA
NA
Bd
95–1
1580
2311
252
91
2526
911
320
2.80
0.92
4.12
4324
426
2.8
7.1
375.
021
5327
Be
115–
125
7133
218
6217
165
642
9923
2.95
1.13
3.18
4411
1237
3.0
6.7
346.
527
5517
Site
CC
a0–
3019
65 –19
79
249
105
4991
4158
747
844
012
391
2.52
1.93
3.91
2514
995
7.1
7.6
284.
733
5314
Cb
30–7
0∗20
812
212
6351
687
756
636
1322
63.
192.
154.
5630
0211
187.
77.
730
6.3
3455
11C
c70
–110
5114
7727
111
397
2555
9636
3.41
1.72
3.84
441
214
6.5
7.6
221.
427
6013
Cd
110–
130
429
1229
176
118
210
2195
942.
481.
163.
2931
614
74.
68.
126
0.8
2062
18
6

701 TFJD357-04-150615 December 31, 2005 3:8
Site
DD
1a0–
6519
80–
1983
9648
425
309
410
230
911
400
1.47
4.13
3.53
1745
NA
9.2
7.7
142.
616
6123
D1b
65–2
0082
4336
920
93
9324
711
033
1.28
3.05
3.25
1230
NA
6.8
7.7
132.
118
4537
D2a
0–60
1980 –
1983
133
7265
028
147
9533
311
365
1.82
3.45
3.12
2085
505
8.2
7.7
203.
921
5722
D2b
60–7
515
478
789
2914
910
917
911
168
1.76
3.54
3.12
2048
585
8.3
7.5
152.
926
5915
D2c
75–8
568
3329
418
72
7428
411
415
1.29
4.10
2.56
1219
891
9.0
7.5
111.
810
6327
D2d
85–2
0017
485
763
3515
612
734
612
434
2.11
4.07
3.34
2230
2031
9.6
7.6
134.
815
6025
D3a
0–80
∗19
80 –19
83
432
244
2105
5236
1942
147
812
118
3.33
3.33
3.52
4324
4939
9.6
7.5
245.
235
596
D3b
80–1
4052
926
650
8662
4522
554
452
1233
43.
573.
973.
3944
1149
189.
77.
128
5.4
3760
3D
3c14
0–18
017
112
465
042
205
160
529
1468
93.
673.
693.
6715
4016
4511
.17.
525
2.1
3564
1Si
teE
E1a
0–10
019
9491
7347
428
103
102
165
1004
02.
002.
742.
2624
27N
AN
A8.
020
3.2
2048
32E
1b10
0–13
013
592
678
3411
611
231
910
839
2.61
4.11
2.50
2678
NA
NA
7.6
213.
528
5318
E2a
0–35
1994
182
135
876
4311
913
839
911
231
2.61
4.14
2.86
3351
881.
39.
47.
621
4.6
2761
12E
2b35
–100
∗21
517
712
2656
1610
162
427
1160
53.
093.
813.
4651
3536
168.
57.
328
6.6
3757
6E
2c10
0-v1
3027
755
1343
1815
1830
343
112
251
2.94
2.84
3.78
4132
4285
10.3
7.2
265.
736
577
E3
0–10
019
9434
2216
411
4.44
71
4611
878
357.
011.
771.
4696
8N
AN
AN
A7
0.5
1843
39
7

701 TFJD357-04-150615 December 31, 2005 3:8
8 V. Cappuyns et al.
and sequential extraction leachates, standard solution series were made in such way thatthey contained the same proportion of the respective extraction solution as background. An 155Indium (In) internal standard was applied to both samples and standards. Each ICP-MSmeasurement was carried out with three repetitions holding relative standard deviationsbelow five percent. All reagents used for analysis were of analytical grade. All glasswarewas acid rinsed with 0.2 M HNO3 before usage.
3. Results 160
In the tables, only the results (total concentrations, porewater, CaCl2-, EDTA- and aceticacid-extractions) for the profile samples are presented. In Tables 7 and 8, the results for thesurface samples were also included.
3.1. General Sediment Characteristics and Levels of Contamination
The sediments were generally characterized by a near neutral pH, a clayey texture and an 165elevated calcium carbonate and organic carbon content (Table 3). The most recent sedimentswere characterized by a higher sulfur- and calcium carbonate-content than the sedimentsthat were disposed on land earlier.
High total concentrations of Cd, Zn and Cu were recorded in the sediments (Table 3).In Flanders, Intervention Values for soil contamination (total concentrations) are corrected 170for the organic carbon content and the clay content of soil (Table 4). Intervention Valueswere exceeded for Cd, Zn, Cr and Pb in 32–50% of the samples, while only 2 sedimentsdisplayed As-concentrations above the Intervention Value for soil contamination.
Concentrations of heavy metals and As in the porewater extracted by centrifugationand moisture content of the samples are given in Table 5. Moisture content (weight %) was 175in the range 17.7–47.9% and the yield of the porewater after centrifugation was between1.4 and 15.6% of the moisture content. Since no treshold values for heavy metals in theporewater are available in the environmental legislation in Flanders, Intervention Values forgroundwater are given as a reference (Table 5). Intervention Values are exceeded for Ni inmore than 80% of the porewater samples, whereas Cu- and Cd-concentrations were above 180Intervention Values in 4 and 2 samples, respectively.
Table 4Intervention values for soil contamination for nature areas and agriculturalareas, calculated for a clay content of 20, 30 or 40% and an organic carbon
(OC) content of 5 or 10% (OVAM, 1995)
clay OC Zn Ni Cd Cu As Pb Cr
% % mg/kg mg/kg mg/kg mg/kg mg/kg mg/kg mg/kg20 5 868 146 3.7 235 57 296 15130 5 976 168 4.4 271 69 311 17240 5 1083 190 5.2 306 81 326 19320 10 1075 176 4.8 235 57 401 15130 10 1182 198 5.6 271 69 415 17240 10 1289 220 6.3 306 81 430 193

701 TFJD357-04-150615 December 31, 2005 3:8
Porewater Analysis, Single and Sequential Extractions 9
Table 5Trace metals in the porewater and the CaCl2 extract from the profile samples, moisturecontent (MC, in weight %) and porewater yield (in % of moisture content) in the porewater.For comparison, Intervention Values (I.V.) for heavy metals in groundwater (OVAM, 1995)
are given below
porewater 0.01 M CaCl2
Cr Cu Zn Ni As Cd Pb MC Yield Cr Cu Zn Ni As Cd Pbµg/l µg/l µg/l µg/l µg/l µg/l µg/l % % µg/l µg/l µg/l µg/l µg/l µg/l µg/l pH
Aa 14 203 153 380 42 1 <1 21.5 8.1 5 68 489 13 32 14 15 7.3Ab 13 107 12 166 1 <1 5 28.5 15.6 8 69 714 18 25 18 18 7.7Ac <1 156 130 48 15 <1 <1 29.1 13.9 <1 34 66 7 9 4 0 7.1Ad <1 20 37 101 <1 <1 <1 32.3 12.1 5 20 327 12 10 147 17 7.2Ba NA NA NA NA NA NA NA 17.7 NA 1 39 354 13 4 4 <1 6.1Bb 16 85 331 183 0 1 <1 47.9 7.7 11 45 480 22 10 7 14 6.3Bc 7 235 80 82 14 1 <1 39.3 4.8 1 13 133 10 5 4 8 6.2Bd <1 141 4 32 8 <1 <1 40.4 4.2 1 15 140 10 4 4 8 6.2Be <1 34 <1 16 7 1 <1 43.3 11.2 1 8 49 10 12 2 10 6.5Ca <1 295 296 68 10 6 <1 26.8 4.0 2 105 195 18 21 5 5 7.2Cb <1 166 111 32 17 1 <1 34.9 10.4 1 74 90 15 19 5 1 7.0Cc <1 242 215 112 12 2 <1 28.3 5.3 <1 6 <1 6 2 <1 1 7.6Cd <1 65 145 21 <1 2 <1 23.5 26.7 <1 7 <1 5 16 <1 5 7.7D1a <1 21 31 65 <1 <1 <1 18.3 21.2 <1 21 970 13 4 6 21 7.3D1b <1 <1 259 119 <1 <1 4 34.1 51.7 <1 29 327 28 8 7 6 7.5D2a <1 28 <1 47 <1 <1 <1 32.1 34.1 1 815 829 15 5 6 34 7.3D2b <1 21 20 65 <1 <1 <1 27.8 34.2 <1 144 169 17 4 7 9 7.3D2c <1 <1 78 19 <1 <1 <1 32.6 55.8 <1 16 63 12 5 2 4 7.2D2d <1 9 12 88 <1 <1 <1 42.0 11.8 1 52 412 28 8 8 7 7.3D3a 80 209 495 110 9 8 94 31.6 1.4 <1 270 460 36 5 14 1 6.9D3b 7 64 51 91 <1 1 <1 41.5 9.4 <1 73 1254 35 6 24 5 7.2D3c <1 90 19 176 10 <1 <1 29.3 8.1 1 25 39 8 6 2 5 7.7E1a <1 121 68 60 <1 <1 <1 27.9 10.8 <1 21 18 12 4 2 2 6.6E1b <1 46 47 42 4 <1 <1 31.4 21.0 <1 76 254 33 9 7 1 7.1E2a <1 112 71 43 <1 <1 <1 29.2 12.1 <1 91 70 23 5 3 1 7.1E2b <1 109 71 63 <1 <1 <1 37.3 8.6 <1 86 191 26 6 7 2 7.1E2c <1 105 109 75 <1 2 <1 37.8 10.1 <1 64 327 32 7 17 1 6.9E3 NA NA NA NA NA NA NA 14.9 NA <1 13 <1 6 2 1 <1 7.1I.V. 50 100 500 40 20 5 20 50 100 500 40 20 5 20
3.2. Extractions
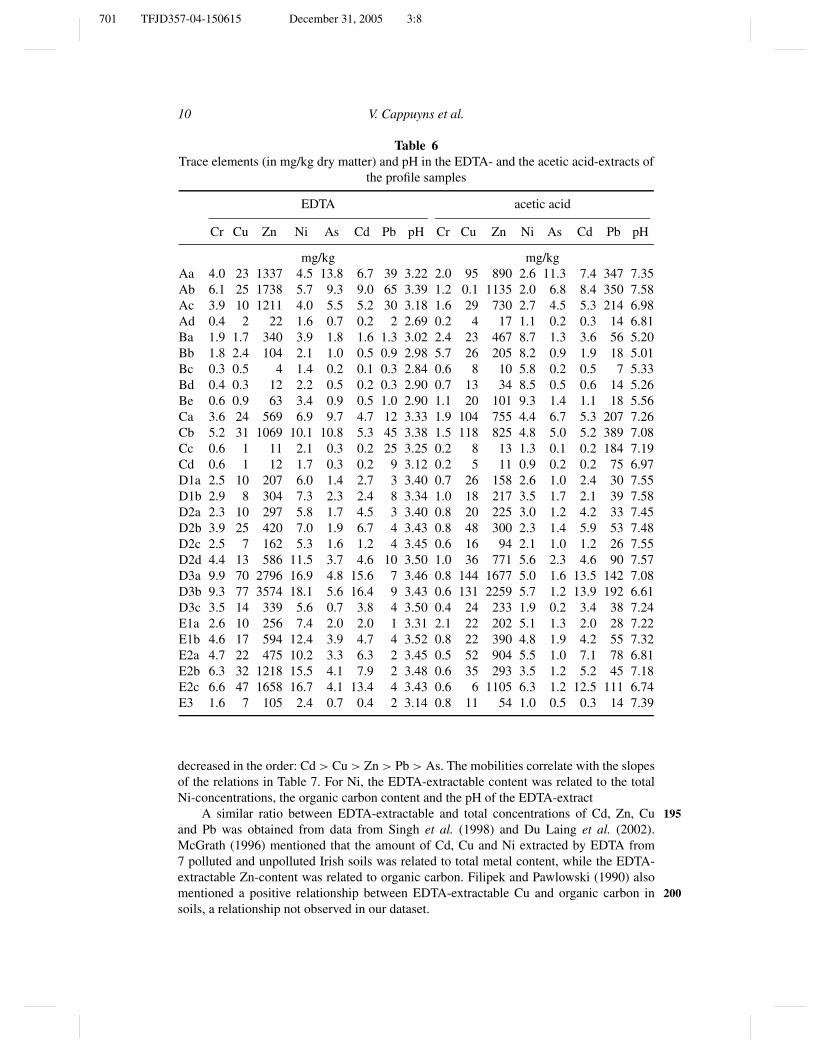
3.2.1. Single Extractions. Absolute concentrations of heavy metals in the CaCl2-extractdecreased in the order: Zn > Cu > Ni > Pb > Cd, As (Table 6). The relative mobility(relative to total metal concentrations) was Cu, Cd > Ni, Zn > As > Pb. A positive linear185correlation was found between the CaCl2-extractable content and total concentration of Cdand As (Table 7).
EDTA extracted elevated concentrations of Cd, Zn, Cu, Ni and Pb, while As andCr were not released in significant amount (Table 6). A significant linear correlation wasfound between EDTA-extractable and total concentrations of Cd, Zn, Cu and Pb (Table 7).190According to this relationship, the “potential mobility” (relative to total concentration)
701 TFJD357-04-150615 December 31, 2005 3:8
10 V. Cappuyns et al.
Table 6Trace elements (in mg/kg dry matter) and pH in the EDTA- and the acetic acid-extracts of
the profile samples
EDTA acetic acid
Cr Cu Zn Ni As Cd Pb pH Cr Cu Zn Ni As Cd Pb pH
mg/kg mg/kgAa 4.0 23 1337 4.5 13.8 6.7 39 3.22 2.0 95 890 2.6 11.3 7.4 347 7.35Ab 6.1 25 1738 5.7 9.3 9.0 65 3.39 1.2 0.1 1135 2.0 6.8 8.4 350 7.58Ac 3.9 10 1211 4.0 5.5 5.2 30 3.18 1.6 29 730 2.7 4.5 5.3 214 6.98Ad 0.4 2 22 1.6 0.7 0.2 2 2.69 0.2 4 17 1.1 0.2 0.3 14 6.81Ba 1.9 1.7 340 3.9 1.8 1.6 1.3 3.02 2.4 23 467 8.7 1.3 3.6 56 5.20Bb 1.8 2.4 104 2.1 1.0 0.5 0.9 2.98 5.7 26 205 8.2 0.9 1.9 18 5.01Bc 0.3 0.5 4 1.4 0.2 0.1 0.3 2.84 0.6 8 10 5.8 0.2 0.5 7 5.33Bd 0.4 0.3 12 2.2 0.5 0.2 0.3 2.90 0.7 13 34 8.5 0.5 0.6 14 5.26Be 0.6 0.9 63 3.4 0.9 0.5 1.0 2.90 1.1 20 101 9.3 1.4 1.1 18 5.56Ca 3.6 24 569 6.9 9.7 4.7 12 3.33 1.9 104 755 4.4 6.7 5.3 207 7.26Cb 5.2 31 1069 10.1 10.8 5.3 45 3.38 1.5 118 825 4.8 5.0 5.2 389 7.08Cc 0.6 1 11 2.1 0.3 0.2 25 3.25 0.2 8 13 1.3 0.1 0.2 184 7.19Cd 0.6 1 12 1.7 0.3 0.2 9 3.12 0.2 5 11 0.9 0.2 0.2 75 6.97D1a 2.5 10 207 6.0 1.4 2.7 3 3.40 0.7 26 158 2.6 1.0 2.4 30 7.55D1b 2.9 8 304 7.3 2.3 2.4 8 3.34 1.0 18 217 3.5 1.7 2.1 39 7.58D2a 2.3 10 297 5.8 1.7 4.5 3 3.40 0.8 20 225 3.0 1.2 4.2 33 7.45D2b 3.9 25 420 7.0 1.9 6.7 4 3.43 0.8 48 300 2.3 1.4 5.9 53 7.48D2c 2.5 7 162 5.3 1.6 1.2 4 3.45 0.6 16 94 2.1 1.0 1.2 26 7.55D2d 4.4 13 586 11.5 3.7 4.6 10 3.50 1.0 36 771 5.6 2.3 4.6 90 7.57D3a 9.9 70 2796 16.9 4.8 15.6 7 3.46 0.8 144 1677 5.0 1.6 13.5 142 7.08D3b 9.3 77 3574 18.1 5.6 16.4 9 3.43 0.6 131 2259 5.7 1.2 13.9 192 6.61D3c 3.5 14 339 5.6 0.7 3.8 4 3.50 0.4 24 233 1.9 0.2 3.4 38 7.24E1a 2.6 10 256 7.4 2.0 2.0 1 3.31 2.1 22 202 5.1 1.3 2.0 28 7.22E1b 4.6 17 594 12.4 3.9 4.7 4 3.52 0.8 22 390 4.8 1.9 4.2 55 7.32E2a 4.7 22 475 10.2 3.3 6.3 2 3.45 0.5 52 904 5.5 1.0 7.1 78 6.81E2b 6.3 32 1218 15.5 4.1 7.9 2 3.48 0.6 35 293 3.5 1.2 5.2 45 7.18E2c 6.6 47 1658 16.7 4.1 13.4 4 3.43 0.6 6 1105 6.3 1.2 12.5 111 6.74E3 1.6 7 105 2.4 0.7 0.4 2 3.14 0.8 11 54 1.0 0.5 0.3 14 7.39
decreased in the order: Cd > Cu > Zn > Pb > As. The mobilities correlate with the slopesof the relations in Table 7. For Ni, the EDTA-extractable content was related to the totalNi-concentrations, the organic carbon content and the pH of the EDTA-extract
A similar ratio between EDTA-extractable and total concentrations of Cd, Zn, Cu 195and Pb was obtained from data from Singh et al. (1998) and Du Laing et al. (2002).McGrath (1996) mentioned that the amount of Cd, Cu and Ni extracted by EDTA from7 polluted and unpolluted Irish soils was related to total metal content, while the EDTA-extractable Zn-content was related to organic carbon. Filipek and Pawlowski (1990) alsomentioned a positive relationship between EDTA-extractable Cu and organic carbon in 200soils, a relationship not observed in our dataset.

701 TFJD357-04-150615 December 31, 2005 3:8
Porewater Analysis, Single and Sequential Extractions 11
Table 7Relationship between CaCl2-extractable metal contents ([X]CaCl2)
and total concentrations ([X]total), n = number of samples
R2
[As]CaCl2 = 0.20 [As]total+ 3.37 0.64 n = 39[Cd]CaCl2 = 0.77 [Cd]total+ 0.86 0.68 n = 39[Cu]CaCl2 = 0.0017 [Cu]2
total + 0.83 n = 350.79[Cu]total — 3.72
[As]EDTA = 0.07 [As]total+ 0.096 0.72 n = 39[Cd]EDTA = 0.64 [Cd]total+ 0.29 0.98 n = 39[Cu]EDTA = 0.50 [Cu]total- 2.66 0.84 n = 39[Pb]EDTA = 0.48[Pb]total- 31.63 0.84 n = 39[Ni]EDTA = 0.34 [Ni]total– 1.76 0.65 n = 39
pH + 0.28 OC + 14.32[Zn]EDTA = 0.34 [Zn]total+ 5.77 0.90 n = 39[As]CH3COOH = 0.12 [As]total+ 0.17 0.86 n = 39[Cd]CH3COOH = 0.76 [Cd]total- 0.25 0.99 n = 39[Cu]CH3COOH = 0.25 [Cu]total– 4.69 0.82 n = 39[Cr]CH3COOH = 0.022 [Cr]total – 0.0001 0.71 n = 39[Ni]CH3COOH = 0.31 [Ni]total – 2.84 0.64 n = 39[Pb]CH3COOH = 0.05 [Pb]total – 3.49 0.80 n = 39[Zn]CH3COOH = 0.82 [Zn]total – 57.10 0.91 n = 39
A positive linear correlation was also observed between acetic acid extractable Cd, Zn,Cu, Ni, Pb, As, Cr and total concentrations (Table 7). The potential heavy metal mobility(as % of total concentration) decreased in the order: Zn > Cd > Cu> Ni > As > Pb > Cr.
3.2.2. Sequential Extraction. Fractionation of heavy metals was assessed by means of205sequential extractions. Sequential extractions were only performed for 5 samples, whichwere subjected to a detailed analysis of acid neutralizing behavior and potential heavymetal release in a previous study (Cappuyns et al., 2004). The 5 samples (Ac, Ba, Cb,D3a and E2b), showed a comparable fractionation of heavy metals, which is rather similarto reported results on dredged sediments from Belgium and the UK (Singh et al., 1998;210Stephens et al., 2001). In the original extraction scheme (Figure 2a), the acid extractablefraction (Step 1) prevailed for Cd, Zn and Ni, whereas the oxidizable (Step 3) and residual(Step 4) fractions were most important for Cu, Pb and Cr. In the improved extractionscheme, Cd and Zn were also mostly extracted in Step 1(a + b + c) (>75% of their totalconcentration) (Figure 2b). Nevertheless, an increase of these elements in the first fraction215(sum of 3 repetitions) was observed compared to the original extraction scheme. Althoughthe repetition of the extraction with acetic acid also resulted in increase of the amount of Pb,Cu and Cr released in Step 1, Step 2, 3 and 4 were still dominant for these elements. WhereasZn-, Cd- and Ni-concentrations decreased in the successive acetic acid extracts (Figure 3a),Pb-, Cu-, and Cr- concentrations increased in the successive extracts (Figure 3b).220
The least contaminated sample (Ba, results not given) had a more important residualfraction for most elements, as was also found by Stephens et al. (2001).

701 TFJD357-04-150615 December 31, 2005 3:8
12 V. Cappuyns et al.
Figure 2. Metal (Zn, Cd, Mn, Ni, Cu, Pb, Cr and As) fractionation in sample Ac according tothe original BCR (Community Bureau of Reference) extraction scheme and according to the BCRextraction scheme adapted for samples with an elevated ANC (acid neutralizing capacity), in whichthe first extraction (acetic acid, step 1) was repeated 3 times.
Since all the dredged sediments were characterized by an elevated organic carboncontent, attention should be paid to the completeness of this extraction too. The color of theresidue after the H2O2-extraction gave an indication about the completeness of the oxidation 225reaction. Samples Ac, Cb and D3a displayed a greenish color (Munsel color 10Y4/1) afterthe oxidation with H2O2. Samples Ba and E2b, however, still were dark-colored (Munselcolor 10Y6/2 and 10Y5/2), suggesting an incomplete oxidation of organic matter. Theincomplete oxidation is thus most pronounced in the samples Ba and E2b, which are indeedcharacterized by an elevated (6,6-10,4 %) organic carbon content. 230
4. Discussion
4.1. Porewater Composition Versus CaCl2 Extraction
Since element uptake by plant roots relates to the liquid phase of the soil, heavy metalconcentrations in the soil solution are of primary concern in risk evaluation of soil contam-ination. Porewater concentrations probably give the best estimate for the actual availability 235
Figure 3. Zn and Pb release in the three consecutive acetic acid extracts of the adapted BCR (Com-munity Bureau of Reference) extraction scheme for the 5 dredged sediment samples (Ac, Ba, Cb,D3a and E2b). Concentrations are given as % of the total concentration in the sample. The pH of eachextract is given by the full line on top of the bars.

701 TFJD357-04-150615 December 31, 2005 3:8
Porewater Analysis, Single and Sequential Extractions 13
of heavy metals. Moreover, the composition of the porewater is also operationally deter-mined since it is influenced by the applied extraction method. Besides the direct extractionof porewater from soil, indirect methods such as extractions with dilute salt solutions arecommonly used to determine the composition of the liquid phase, i.e. the easily mobilizedfraction. A 0.01 M CaCl2 solution gives a good approximation of the soil solution with240respect to pH, concentration and composition (Houba et al., 1990).
In general, less Cd and Zn was measured in the porewater compared to the CaCl2-extract, whereas the porewater contained higher Ni and Cu concentrations than theCaCl2-extract. Cd concentrations in the CaCl2-extract were always higher than porewa-ter concentrations. The complexation of Cd by Cl− can induce an enhanced release of Cd.245Complexation by dissolved organic matter may enhance the mobility of metals, especiallyCu. Cl− can suppress the solubility of dissolved organic carbon in the soil solution, limitingthe solubility of Cu (Lores and Pennock, 1998).
A direct comparison between the composition of the CaCl2-extract and the porewateris, however, not straightforward, since CaCl2-extractions were performed at a solid : liquid250ratio of 1 : 10, while the moisture content of the sediment samples varied between 18.3 and47.9%. Moisture content is an important factor determining heavy metal concentrations inporewater. Tack et al. (1998) measured heavy metal concentrations in consecutive saturationextracts of dredged sediments and noticed an at random variation of metal concentrationswith varying moisture content. The constant liquid-solid ratio at which CaCl2-extractions255are performed allows a better comparison between different samples and it is also easier toobtain a larger volume of liquid.
4.2. Quantification of Metal Partitioning in Sediments Based on EDTA-and CaCl2-Extractions
Heavy metal concentrations in the soil solution are often modelled by assuming that the260ratio between dissolved concentrations and sorbed concentrations is constant:
Kd = S/C (1)
With S = sorbed metal concentration (µg/kg), C= dissolved metal concentration(µg/L)
Modeling of metal sorption using a single-valued Kd appraoch assume that the sorptioncapacity of the material is relatively independent of soil properties (pH, organic matter265content, . . . ). The Freundlich isotherm, which is similar to the singled value Kd approach,introduces a parameter m that allows for variations in the Kd values according to the relativesaturation of sorbing surfaces.
S = k∗Cm (2)
Where S (µg/kg) and C (µg/L) are sorbed and solution phase concentrations, respectively.k∗ (µg1−m/m kg−1) and m (dimensionless) are empirical parameters. k ′ reflects the sorption270variability of the soil, while m is rather constant (van der Zee and van Riemsdijk, 1987).
Metal partitioning in soils can be quantified by models in which metal concentrationsin the porewater are described as a function of metal binding solid phases such as Fe- andAl-(hydr)oxides, organic matter and clay content and as a function of soil characteristicsthat influence heavy metal partitioning, such as pH. To take into account the influence of275pH and organic carbon (OC, %) content, the equation can be extended according to Streck

701 TFJD357-04-150615 December 31, 2005 3:8
14 V. Cappuyns et al.
Table 8Parameters from the fitting of equation (4): Log S = log(k*) + blog(OC) + apH+m log C, with S (µg/kg) and C (µg/L) are sorbed and solution phase concen-trations, respectively, OC is the organic carbon content and k∗ (µg1−m/mkg−1) andm (dimensionless) are empirical parameters. Confidence interval for α = 0.05.
n = number of samples
Cd Zn Ni Cu
a 0.51 ± 0.11 0.71 ± 0.11 −0.29 ± 0.06 0.27 ± 0.18b 0.70 ± 0.19 0.70 ± 0.19 0.33 ± 0.08 0.66 ± 0.25m 0.71 ± 0.11 0.51 ± 0.11 0.39 ± 0.10 0.42 ± 0.14logk∗ −0.92 ± 0.84 −0.90 ± 0.84 5.00 ± 0.41 1.59 ± 1.25n 39 38 39 39R2 0.85 0.75 0.81 0.51
and Richter (1997):
S = k∗OC(H+)−aCn (3)
Introducing an exponent (b) for OC and transforming to logarithms yields:
Log S = log(k∗) + b log(OC) + a pH + m log C (4)
Porewater concentrations were estimated by equivalent concentrations measured in0,01 M CaCl2. According to Schulte and Beese (1994), EDTA-extractable concentrations 280represent the heavy metals participating in sorption-desorption reactions. The sorbed phaseconcentrations can be calculated from a mass balance:
S = CT − θ/ρC (5)
CT (µg/kg) denotes the total EDTA-extractable concentration while θ /ρ (kg/L) is thesoil/solution ratio used for the determination of the solution phase concentration. Parametersin (4) were estimated by linear regression (Table 8). 285
CEC displayed a linear correlation with the organic carbon content (R2 = 0.73). Takinginto account clay and calcium carbonate content did not significantly improve the predictionof sorbed phase concentrations.
A reasonable fit was obtained for Cd, Zn and Ni, but the fit was not very significant forCu. Taking into account dissolved organic carbon (DOC), which was not measured in the 290porewaters and CaCl2-extracts, might improve the relationship between sorbed and solutionphase concentrations, especially for Cu.
With the parameters k′ and m, the sorbed phase concentration can be expressed as afunction of solution phase concentration, which can be used in models that describe metaltransport in soils (e.g. the convection dispersion equation). 295
4.3. Evaluation of the Adapted BCR Scheme
When the acetic acid extraction was repeated three times, a decrease in the concentrations ofCd, Zn and Ni in the three consecutive acetic acid-extracts was noticed, while Pb- Cu- and Cr-concentrations increased after each extraction with acetic acid (Figure 3). The modification
701 TFJD357-04-150615 December 31, 2005 3:8
Porewater Analysis, Single and Sequential Extractions 15
of the BCR extraction scheme was particularly important for Cd and Zn, which principally300(>75% of their total concentration) occur as an “acid extractable” species (Figure 2 a andb).
The pH-buffering effect explains the gradual increase in Pb-, Cr- and Cu-concentrationsin the acetic acid-extracts since more Pb, Cr and Cu are released as the pH of the successiveextracts decreases. This result also suggests a considerable readsorption of Pb, Cr and Cu305during the first acetic acid extraction (Step 1a). Chomchoei et al. (2002) found a highdegree of readsorption of Pb in Step 1, which was recovered in Step 2 (NH2OH.HClextraction). Cu has a high affinity for organic matter, resulting in the readsorption of Cuduring the CH3COOH-extraction (Chomchoei et al., 2002). Arsenic was mostly recovered inthe “oxidizable” and “residual” fraction, pointing to a low availability of this element under310prevailing environmental conditions (Figure 2b). The BCR extraction scheme, however, isnot suitable for As since As is present in the soil as anionic species (AsO3−
4 and AsO3−3 )
(Van Herreweghe et al., 2003). It is furthermore likely that the acid pH of the reagents usedwill promote readsorption of As on positively charges soil particles (Gruebel et al., 1988).
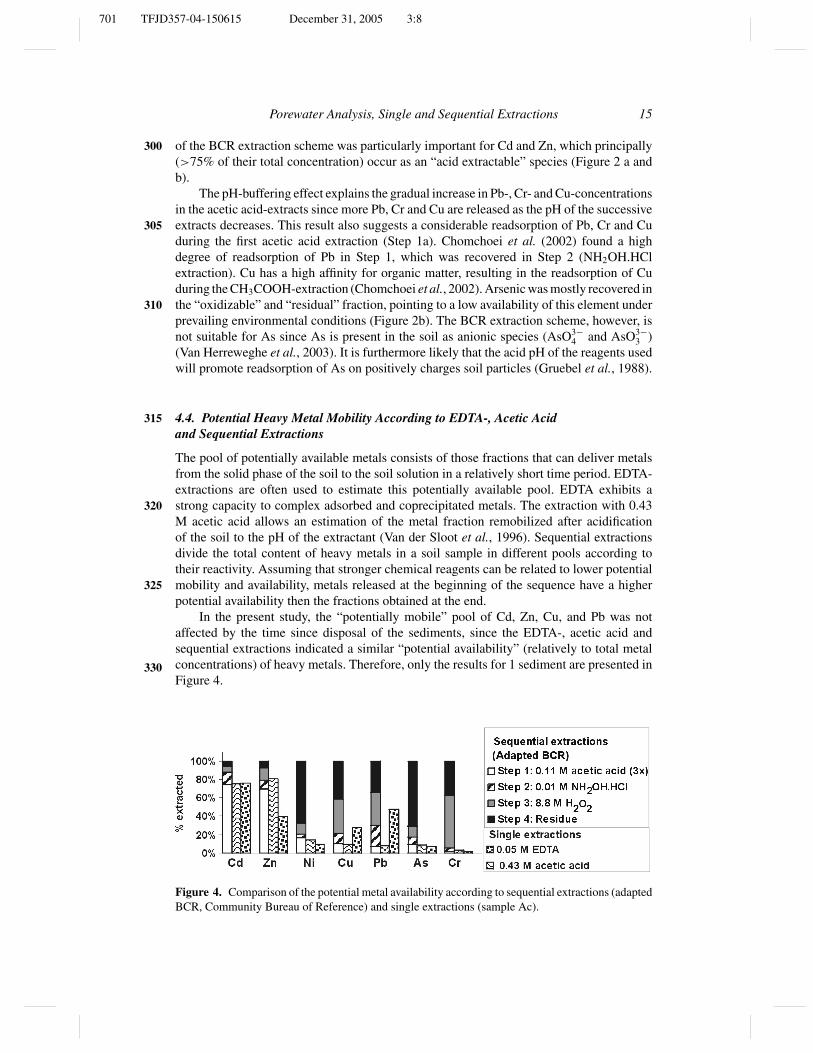
4.4. Potential Heavy Metal Mobility According to EDTA-, Acetic Acid315and Sequential Extractions
The pool of potentially available metals consists of those fractions that can deliver metalsfrom the solid phase of the soil to the soil solution in a relatively short time period. EDTA-extractions are often used to estimate this potentially available pool. EDTA exhibits astrong capacity to complex adsorbed and coprecipitated metals. The extraction with 0.43320M acetic acid allows an estimation of the metal fraction remobilized after acidificationof the soil to the pH of the extractant (Van der Sloot et al., 1996). Sequential extractionsdivide the total content of heavy metals in a soil sample in different pools according totheir reactivity. Assuming that stronger chemical reagents can be related to lower potentialmobility and availability, metals released at the beginning of the sequence have a higher325potential availability then the fractions obtained at the end.
In the present study, the “potentially mobile” pool of Cd, Zn, Cu, and Pb was notaffected by the time since disposal of the sediments, since the EDTA-, acetic acid andsequential extractions indicated a similar “potential availability” (relatively to total metalconcentrations) of heavy metals. Therefore, only the results for 1 sediment are presented in330Figure 4.
Figure 4. Comparison of the potential metal availability according to sequential extractions (adaptedBCR, Community Bureau of Reference) and single extractions (sample Ac).
701 TFJD357-04-150615 December 31, 2005 3:8
16 V. Cappuyns et al.
Table 9Formation constants (log K) for 1:1 metal EDTA-complexes at ionic strength
0.01 (after Norvell, 1991)
Cd Cu Pb Zn Ni
Slope in equation in Table 8 0.64 0.50 0.48 0.34 0.34Log K 17.4 19.7 19.0 17.5 19.5
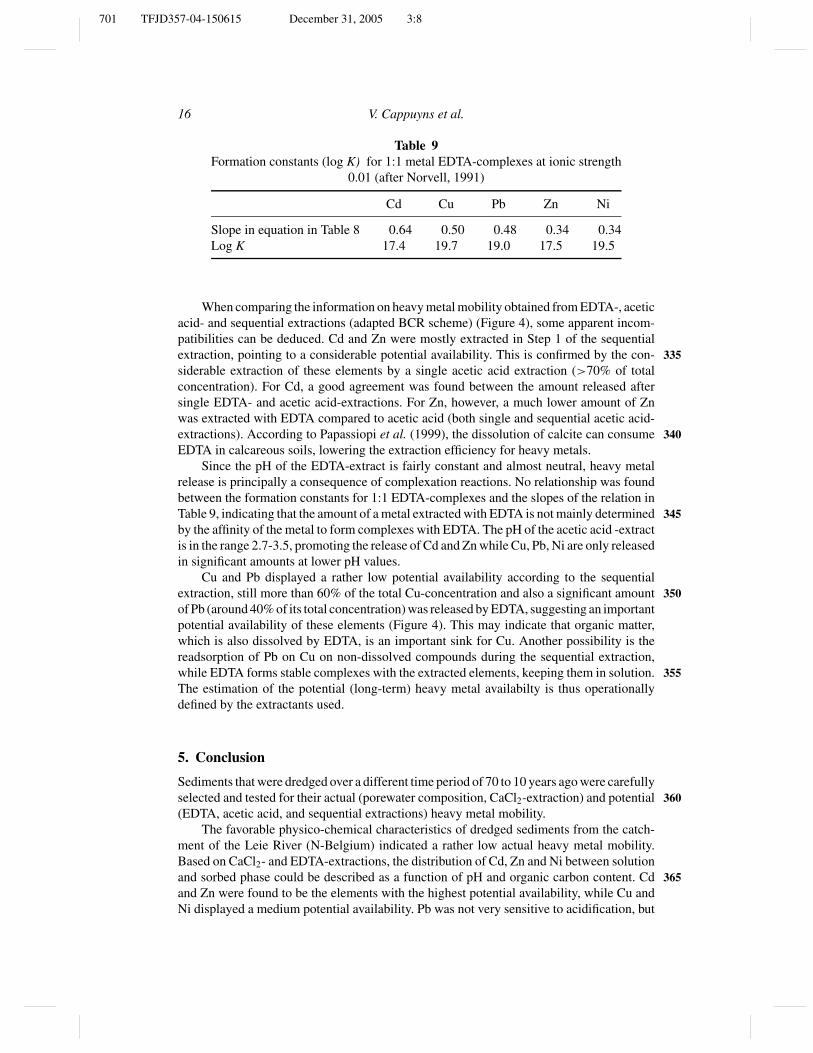
When comparing the information on heavy metal mobility obtained from EDTA-, aceticacid- and sequential extractions (adapted BCR scheme) (Figure 4), some apparent incom-patibilities can be deduced. Cd and Zn were mostly extracted in Step 1 of the sequentialextraction, pointing to a considerable potential availability. This is confirmed by the con- 335siderable extraction of these elements by a single acetic acid extraction (>70% of totalconcentration). For Cd, a good agreement was found between the amount released aftersingle EDTA- and acetic acid-extractions. For Zn, however, a much lower amount of Znwas extracted with EDTA compared to acetic acid (both single and sequential acetic acid-extractions). According to Papassiopi et al. (1999), the dissolution of calcite can consume 340EDTA in calcareous soils, lowering the extraction efficiency for heavy metals.
Since the pH of the EDTA-extract is fairly constant and almost neutral, heavy metalrelease is principally a consequence of complexation reactions. No relationship was foundbetween the formation constants for 1:1 EDTA-complexes and the slopes of the relation inTable 9, indicating that the amount of a metal extracted with EDTA is not mainly determined 345by the affinity of the metal to form complexes with EDTA. The pH of the acetic acid -extractis in the range 2.7-3.5, promoting the release of Cd and Zn while Cu, Pb, Ni are only releasedin significant amounts at lower pH values.
Cu and Pb displayed a rather low potential availability according to the sequentialextraction, still more than 60% of the total Cu-concentration and also a significant amount 350of Pb (around 40% of its total concentration) was released by EDTA, suggesting an importantpotential availability of these elements (Figure 4). This may indicate that organic matter,which is also dissolved by EDTA, is an important sink for Cu. Another possibility is thereadsorption of Pb on Cu on non-dissolved compounds during the sequential extraction,while EDTA forms stable complexes with the extracted elements, keeping them in solution. 355The estimation of the potential (long-term) heavy metal availabilty is thus operationallydefined by the extractants used.
5. Conclusion
Sediments that were dredged over a different time period of 70 to 10 years ago were carefullyselected and tested for their actual (porewater composition, CaCl2-extraction) and potential 360(EDTA, acetic acid, and sequential extractions) heavy metal mobility.
The favorable physico-chemical characteristics of dredged sediments from the catch-ment of the Leie River (N-Belgium) indicated a rather low actual heavy metal mobility.Based on CaCl2- and EDTA-extractions, the distribution of Cd, Zn and Ni between solutionand sorbed phase could be described as a function of pH and organic carbon content. Cd 365and Zn were found to be the elements with the highest potential availability, while Cu andNi displayed a medium potential availability. Pb was not very sensitive to acidification, but
701 TFJD357-04-150615 December 31, 2005 3:8
Porewater Analysis, Single and Sequential Extractions 17
can be mobilized by complexing substances in the soil. Finally, the long-term availabilityseems to be very low for As and Cr.
Although the BCR extraction scheme is applicable on various types of soils and sed-370iments, it is clear from our results that different sample compositions ask for a differentinterpretation of sequential extractions. The monitoring of additional parameters such aspH, release of major elements and oxidation of organic matter allowed a better understand-ing of the reactions occurring during the sequential extractions. The repetition of extractionsteps is probably not very practical for routine analysis. It is nevertheless advisable to at375least mention the pH of the acetic acid-extract. Moreover, it also gives an idea of the acidneutralizing capacity of a soil or sediment sample.
Comparison of results of sequential extractions with data from single extractions alsowas helpful for the assessment of heavy metal speciation and for the evaluation of thedifferent steps in the sequential extractions. Different “pools” or “sinks” of heavy metals380with a different reactivity could be distinguished. However, it should be kept in mind thatdifferent types of extractions can not simply be related to each other and that each type ofextraction deals with heavy metal mobility in a different way.
Acknowledgements
Grateful acknowledgements are made to Bart Vandecasteele for information and help with385the selection of sampling sites, to Prof. Dr. N. Vandenberghe for the use of the MalvernMastersizer. The research is financed by the Flemish Institute for the promotion of Scientific-Technological research in the industry (IWT) and by the Fund for Scientific Research-Flanders (FWO-Vlaanderen; onderzoeksproject G.0327.98N)
References390
Allison, L.E. and Moodie, C.D. 1965. In: Methods of Soil Analysis. Part 2: Chemical and Microbi-ological Properties. (Black, C.A., Ed.). Agronomy Monograph 9, 2nd edition, ASA, Madison,Wisconsin, pp. 1379–1396.
Bermond, A. 2001. Limits of sequential extraction procedures re-examined with emphasis on the roleof H+ ion reactivity. Anal. Chim. Acta 445, 79–88.395
Bufflap, S.E. and Allen, H.E. 1995. Sediment pore water collection methods for trace metal analysis:a review. Wat. Res. 29 (1), 165–177.
Cappuyns, V., Swennen, R., and Verhulst, J. 2004. Assessment of acid neutralizing capacity andpotential mobilisation of trace metals from land-disposed dredged sediments. Sci. Total Environ.333(1–3), 233–247.400
Chomchoei, R., Shiowatana, J., and Pongsakul, P. 2002. A continuous-flow system for reduction ofmetal readsorption during sequential extraction of soil. Anal. Chim. Acta 472, 147–159.
De Deckere, E., De Cooman, W., Florus, M., and Devroede-Vander Linden, M.P. 2000. Karakterisatievan de bodems van de bevaarbare Vlaamse waterlopen. Ministerie van de Vlaamse Gemeen-schap, Departement Leefmilieu en Infrastructuur. Administratie Milieu-, Natuur-, Land-, en405Waterbeheer.
Du Laing, G., Bogaert, N., Tack, F.M.G., Verloo, M.G., and Hendrickx, F. 2002. Heavy metal contents(Cd, Cu, Zn) in spiders (Pirata piraticus) living in intertidal sediments of the river Scheldt estuaryas affected by substrate characteristics. Sci. Total Env. 289, 71–81.
Filipek, T. and Pawlowski, L. 1990. Total and extractable heavy metal content of some soils of the410Lublin coal mining region. Sci Total Environ. 96, 131–137.
Gruebel, K.A., Davis, J.A., and Leckie, J.O. 1988. The feasibility of using sequential extractiontechniques for arsenic and selenium in soils and sediments. Soil Sci. Soc. Am. J. 52, 390–397.
701 TFJD357-04-150615 December 31, 2005 3:8
18 V. Cappuyns et al.
Houba, V.J.G., Novozamsky, I., Lexmond, Th.M., and van der Lee, J.J. 1990. Applicability of 0.01M CaCl2 as a single extraction solution for the assessment of the nutrient status of soils and 415diagnostic puposes. Comm. Soil. Sci. Plant Anal. 21, 743–752.
Lores, E.M. and Pennock, J.R. 1998. The effect of salinity on binding of Cd, Cr, Cu and Zn to dissolvedorganic matter. Chemosphere 37(5), 861–874.
McGrath, D. 1996. Application of single and sequential extraction procedures to polluted and unpol-luted soils. Sci. Total Environ. 178, 37–44. 420
Norvell, W.A. 1991. Reactions of metal chelates in soil and nutrient solutions. In: Mortvedt, J.J.,Cox, F.R., Shuman, L.M., and Welch, R.M. (Eds.), Microelements in Agriculture, 2nd Edition,Soil Science Society of America, Wiscosin, Madison, pp. 187–227.
Nelson, D.W. and Sommers, L.E. 1982. Total carbon, organic carbon and organic matter. In: Methodsof Soil Analysis. Part 2: Chemical and Microbiological Properties (A.L. Page, R.H. Miller, and 425D.R. Keeney, Eds.), 2nd Edition, American Society of Agronomy, Madison, pp. 516–593.
OVAM. 1995. Vlaams reglement betreffende de bodemsanering—VLAREBO. Openbare afvalstof-fenmaatschappij voor het Vlaamse Gewest., Publicatienummer D/1995/5024/5.
Quevauviller, Ph., Rauret, G., Munteau, H., Ure, A.M., Rubio, R., Lopez-Sanchez, J.F., Fiedler, H.D.,and Griepink, B. 1994. Evaluation of a sequential extraction procedure for the determination of 430extractable trace metal contents in sediments. Fres. J. Anal. Chem. 349, 808–814.
Quevauviller, Ph., Rauret G., Ure, A., Bacon, J., and Muntau, H. 1997. The certification of theEDTA and acetic acid-extractable contents (mass fractions) of Cd, Cr, Cu, Pb and Zn in sewagesludge amended soils CRMs 484 and 484. European Commision, BCR information, Referencematerials. EUR 17127 EN. 435
Quevauviller, Ph. 1998. Operationally defined extraction procedures for soil and sediment analysis:I. Standardization. Trends in Analytical Chemistry 17(5), 289–298.
Papassiopi, N., Tambouris, S., and Kontopoulos, A. 1999. Removal of heavy metals from calcareouscontaminated soils by EDTA leaching. Water Air and Soil Pollut 104(1–4), 1–15.
Schulte, A. and Beese, F. 1994. Isotherms of cadmium sorption density. J. Environ. Qual. 23, 712–718. 440Singh, S.P., Tack, F.M., and Verloo, M.G. 1998. Heavy metal fractionation and extractability in
dredged sediments deriverd surface soils. Water, Air and Soil Pollut. 102, 313–328.Stephens, S.R., Alloway, B.J., Cater, J.E., and Parker, A. 2001. Towards the characterisation of heavy
metals in dredged canal sediments and an appreciation of “availability”: two examples from theUK. Env. Poll. 113, 395–401. 445
Streck, T. and Richter, J. 1997. Heavy metal displacement in a sandy soil at the field scale: I. Mea-surements and parameterization of sorption. J. Environ. Qual. 26: 49–56.
Tack, F.M.G., Singh, S.P., and Verloo, M.G. 1998. Heavy metal concentrations in consecutive satu-ration extracts of dredged sediment derived surface soils. Env. Poll. 103: 109–115.
Vandecasteele, B., De Vos, B., and Tack, F.M.G. 2002. Identification of dredged sediment-derived 450soils in the alluvial plains of the Leie and the Upper and Sea Scheldt rivers (Belgium) based onphysico-chemical soil properties. J. Environ. Monit. 4, 306–312.
Van der Sloot, H.A., Comans, R.N.J., and Hjelamr, O. 1996. Similarities in the leaching behaviourof trace contaminants from waste, stabilized waste, construction materials and soils. Sci. TotalEnviron. 178, 111–126. 455
van der Zee, S.E.A.T.M., and van Riemsdijk, W.H. 1987. Transport of reactive solute in spatiallyvariable soil systems. Wat. Resour. Res. 23, 2059–2069.
Van Herreweghe, S., Swennen, R., Cappuyns, V., and Vandecasteele, C. 2003. Solid phase speciationof arsenic by sequential extraction in standard reference materials and industrially contaminatedsoil samples. Env. Poll. 122(3), 323–342. 460
Van Reeuwijk, L.P. 1992. Procedures for Soil Analysis, Third Edition. ISRIC, Wageningen, TheNetherlands.