Porewater Extraction from - Nuclear Energy Agency
190
P orewater Extraction from Argillaceous Rocks for Geochemical Characterisation T he definition of the chemical and isotopic composition of the groundwater present in argillaceous formations, which are considered as potential host rocks for radioactive waste disposal, is crucial for establishing their barrier properties. Therefore, a critical review of the relevant literature on the current methods applied to extract water and solutes and on the various approaches to the interpretation of their results was commissioned to the Laboratoire d’hydrologie et de géochimie isotopique (Université de Paris-Sud, France). The present document provides a synthesis of available extraction methods, assesses their respective advantages and limitations, identifies key processes that may influence the composition of the extracted water, describes modelling approaches that are used to determine in situ porewater composition, and highlights, wherever possible, some of the unresolved issues and recommendations on ways to address them. (66 2000 02 1 P) FF 380 ISBN 92-64-17181-9 -:HSTCQE=V\V]V\:
-
Upload
khangminh22 -
Category
Documents
-
view
3 -
download
0
Transcript of Porewater Extraction from - Nuclear Energy Agency

Porewater Extraction fromArgillaceous Rocks for GeochemicalCharacterisation
The definition of the chemical and isotopic composition of the groundwater present in argillaceousformations, which are considered as potential host rocks for radioactive waste disposal, is crucial
for establishing their barrier properties. Therefore, a critical review of the relevant literature on thecurrent methods applied to extract water and solutes and on the various approaches to theinterpretation of their results was commissioned to the Laboratoire d’hydrologie et de géochimieisotopique (Université de Paris-Sud, France).
The present document provides a synthesis of available extraction methods, assesses theirrespective advantages and limitations, identifies key processes that may influence the composition ofthe extracted water, describes modelling approaches that are used to determine in situ porewatercomposition, and highlights, wherever possible, some of the unresolved issues and recommendationson ways to address them.
(66 2000 02 1 P) FF 380ISBN 92-64-17181-9
-:HSTCQE=V\V]V\:

© OECD, 2000.
© Software: 1987-1996, Acrobat is a trademark of ADOBE.
All rights reserved. OECD grants you the right to use one copy of this Program for your personal use only. Unauthorised reproduction,lending, hiring, transmission or distribution of any data or software is prohibited. You must treat the Program and associated materialsand any elements thereof like any other copyrighted material.
All requests should be made to:
Head of Publications DivisionPublic Affairs and Communication Directorate2, rue André-Pascal, 75775 ParisCedex 16, France.

Radioactive Waste Management
Porewater Extraction from Argillaceous Rocks
for Geochemical Characterisation
Methods and Interpretation
NUCLEAR ENERGY AGENCYORGANISATION FOR ECONOMIC CO-OPERATION AND DEVELOPMENT

ORGANISATION FOR ECONOMIC CO-OPERATION AND DEVELOPMENT
Pursuant to Article 1 of the Convention signed in Paris on 14th December 1960, and which came into force on 30thSeptember 1961, the Organisation for Economic Co-operation and Development (OECD) shall promote policies designed:
– to achieve the highest sustainable economic growth and employment and a rising standard of living in Membercountries, while maintaining financial stability, and thus to contribute to the development of the world econ-omy;
– to contribute to sound economic expansion in Member as well as non-member countries in the process of eco-nomic development; and
– to contribute to the expansion of world trade on a multilateral, non-discriminatory basis in accordance withinternational obligations.
The original Member countries of the OECD are Austria, Belgium, Canada, Denmark, France, Germany, Greece,Iceland, Ireland, Italy, Luxembourg, the Netherlands, Norway, Portugal, Spain, Sweden, Switzerland, Turkey, the UnitedKingdom and the United States. The following countries became Members subsequently through accession at the dates indi-cated hereafter: Japan (28th April 1964), Finland (28th January 1969), Australia (7th June 1971), New Zealand (29th May1973), Mexico (18th May 1994), the Czech Republic (21st December 1995), Hungary (7th May 1996), Poland (22ndNovember 1996) and the Republic of Korea (12th December 1996). The Commission of the European Communities takes partin the work of the OECD (Article 13 of the OECD Convention).
NUCLEAR ENERGY AGENCY
The OECD Nuclear Energy Agency (NEA) was established on 1st February 1958 under the name of the OEECEuropean Nuclear Energy Agency. It received its present designation on 20th April 1972, when Japan became its firstnon-European full Member. NEA membership today consists of 27 OECD Member countries: Australia, Austria, Belgium,Canada, Czech Republic, Denmark, Finland, France, Germany, Greece, Hungary, Iceland, Ireland, Italy, Japan, Luxembourg,Mexico, the Netherlands, Norway, Portugal, Republic of Korea, Spain, Sweden, Switzerland, Turkey, the United Kingdom andthe United States. The Commission of the European Communities also takes part in the work of the Agency.
The mission of the NEA is:
– to assist its Member countries in maintaining and further developing, through international co-operation, thescientific, technological and legal bases required for a safe, environmentally friendly and economical use ofnuclear energy for peaceful purposes, as well as
– to provide authoritative assessments and to forge common understandings on key issues, as input to govern-ment decisions on nuclear energy policy and to broader OECD policy analyses in areas such as energy andsustainable development.
Specific areas of competence of the NEA include safety and regulation of nuclear activities, radioactive waste man-agement, radiological protection, nuclear science, economic and technical analyses of the nuclear fuel cycle, nuclear law andliability, and public information. The NEA Data Bank provides nuclear data and computer program services for participatingcountries.
In these and related tasks, the NEA works in close collaboration with the International Atomic Energy Agency inVienna, with which it has a Co-operation Agreement, as well as with other international organisations in the nuclear field.
© OECD 2000Permission to reproduce a portion of this work for non-commercial purposes or classroom use should be obtained through the Centre françaisd’exploitation du droit de copie (CCF), 20, rue des Grands-Augustins, 75006 Paris, France, Tel. (33-1) 44 07 47 70, Fax (33-1) 46 34 67 19,for every country except the United States. In the United States permission should be obtained through the Copyright Clearance Center,Customer Service, (508)750-8400, 222 Rosewood Drive, Danvers, MA 01923, USA, or CCC Online: http://www.copyright.com/. All otherapplications for permission to reproduce or translate all or part of this book should be made to OECD Publications, 2, rue André-Pascal,75775 Paris Cedex 16, France.

FOREWORD
Throughout the OECD Member countries, many national programmes on radioactive wastemanagement are considering geological disposal in argillaceous media. In order to determine theirsuitability for waste disposal, it is necessary to evaluate of the potential migration of radionuclides fromsuch a disposal system to the accessible environment. Those evaluations require not only the site-specific data of a site-programme, but also a sound general understanding of the basic physical andchemical processes that govern solute transport through those formations.
In that context, the NEA Working Group on Measurement and Physical Understanding ofGroundwater Flow Through Argillaceous Media (informally called the “Clay Club”) has beenestablished to address the many issues associated with that subject. The Working Group promotes aconstant intercomparison of the properties of the different argillaceous media under consideration forgeological disposal, as well as an exchange of technical and scientific information by means ofmeetings, workshops and written overviews on relevant subjects.
The definition of the chemical and isotopic composition of groundwater present inargillaceous formations considered as potential host rock for radioactive waste disposal is crucialnotably for:
i) establishing their properties as a barrier to radionuclide migration;
ii) understanding the disturbances that may be induced during the excavation of therepository facility and by the presence of the waste and the engineered-barrier system;
iii) defining the type of water that will interact with the engineered-barrier system.
The lack of standard protocols and certified standards on how to perform porewaterextractions from argillaceous formations has led the “Clay Club” to launch a critical review of therelevant literature on the current methods applied to extract water and solutes and on the variousavailable approaches to interpret their results. That desk study was commissioned to the Laboratoired’Hydrologie et de Géochimie Isotopique (UMR OrsayTerre, CNRS–Université de Paris-Sud, France)by a consortium of national organisations represented within the “Clay Club”.
This document provides a synthesis of available porewater extraction methods, assesses theirrespective advantages and limitations, identifies key processes that may influence the composition ofthe extracted water, describes modelling approaches used to determine in situ porewater composition,and highlights, wherever possible, some unresolved issues and recommendations on ways to addressthem.
The opinions and conclusions expressed are those of the authors only, and do not necessarilyreflect the views of the funding organisations, any OECD Member country or international organisation.This report is published on the responsibility of the Secretary General of the OECD.
3


ACKNOWLEDGEMENTS
The national organisations represented within the NEA Working Group on Measurement andPhysical Understanding of Groundwater Flow Through Argillaceous Media (“Clay Club”) and the NEAwish to express their gratitude to the authors of this report, E. Sacchi and J.-L. Michelot from theLaboratoire d’Hydrologie et de Géochimie Isotopique (Université de Paris-Sud, France). They also wishto commend the special contribution of H. Pitsch from the French Atomic Energy Commission (CEA),whose laboratory hosted E. Sacchi for the duration of the project.
This document has been jointly supported by a consortium of national organisationsrepresented within the “Clay Club”:
• ANDRA, France (National Radioactive Waste Management Agency);
• CEA, France (Atomic Energy Commission);
• CEN/SCK, Belgium (Nuclear Energy Research Centre).
• ENRESA, Spain (Spanish National Agency for Radioactive Waste);
• GRS, Germany (Company for Reactor Safety)
• IPSN, France (Atomic Energy Commission/Nuclear Protection and Safety Institute);
• NAGRA, Switzerland (National Co-operative for the Disposal of Radioactive Waste); and
• ONDRAF/NIRAS, Belgium (Belgian Organisation for Radioactive Waste and FissileMaterials).
All those organisations are sincerely thanked for their support and for their valuable reviewsand comments.
We also wish to acknowledge for their contribution and helpful discussion: A.M. Fernández(CIEMAT, Spain), M. Hagwood (Schlumberger, The Hague) and M. Dusseault (PMRI, Canada).
J.F. Aranyossy (ANDRA, France) has been the promoter, within the “Clay Club”, of this studyproject.
P. Lalieux has been in charge of the co-ordination of this report on behalf of the NEA(Radiation Protection and Waste Management Division).
5


TABLE OF CONTENTS
FOREWORD ..........................................................................................................................................3
ACKNOWLEDGEMENTS ...................................................................................................................5
TABLE OF CONTENTS .......................................................................................................................7
EXECUTIVE SUMMARY ....................................................................................................................9
PREFACE – SCOPE, OBJECTIVES AND LIMITS OF THE STUDY .........................................25
PART I – INTRODUCTION TO THE CLAY-WATER SYSTEM ..................................................27
1. Clay minerals..................................................................................................................................271.1 Definition and structure ...................................................................................................................271.2 Chemical properties .........................................................................................................................30
2. Interactions between water, solutes and clay ..............................................................................322.1 Water molecule structure and cation hydration ...............................................................................322.2 Clay-water interaction......................................................................................................................342.3 Clay-solute interaction.....................................................................................................................39
3. Porosity, salinity and hydration....................................................................................................453.1 High water content systems.............................................................................................................453.2 Low water content systems..............................................................................................................463.3 Chemical porosity ............................................................................................................................49
4. Organic matter ...............................................................................................................................504.1 Definition, origins and composition of the organic matter .............................................................504.2 Organic matter properties ................................................................................................................51
5. Clay environments of interest for the present study ..................................................................53
PART II – EXPERIMENTAL METHODS .......................................................................................55
1. Field techniques for fluid extraction and characterization .......................................................551.1 Piezometer and borehole drilling.....................................................................................................551.2 Piezometers and boreholes equipment ............................................................................................561.3 Field techniques for fluid extraction................................................................................................571.4 In-situ physico-chemical measurements..........................................................................................611.5 Field techniques for indirect fluid characterization.........................................................................65
2. Rock sampling, storage and preservation ...................................................................................692.1 Evidence for artefacts ......................................................................................................................692.2 In-situ freezing and coring...............................................................................................................712.3 Noble gases sampling procedure .....................................................................................................71
7

3. On sample laboratory techniques ................................................................................................723.1 Centrifugation ..................................................................................................................................723.2 Pressure filtering or squeezing.........................................................................................................793.3 Leaching...........................................................................................................................................943.4 Distillation technique for stable isotope analysis ..........................................................................1013.5 Direct analysis of water isotope contents ......................................................................................1133.6 Other techniques ............................................................................................................................1163.7 Organic matter extraction ..............................................................................................................118
PART III – PROCESSES AND CURRENT INTERPRETATIONS .............................................123
1. Extraction techniques ..................................................................................................................1231.1 Performances of the extraction techniques....................................................................................1231.2 Processes related to water and solute extraction ...........................................................................1251.3 Current understanding....................................................................................................................135
2. Geochemical modelling................................................................................................................1382.1 Dissolution-precipitation................................................................................................................1382.2 Sorption..........................................................................................................................................1392.3 Requirements for geochemical modelling.....................................................................................1442.4 Computer codes .............................................................................................................................144
3. Indirect approach to porewater composition using geochemical modelling..........................145
4. Conclusions, recommendations and topics for further investigation .....................................1504.1 Chemical studies ............................................................................................................................1524.2 Isotopic studies ..............................................................................................................................1534.3 Guidelines for benchmark experiments .........................................................................................153
GLOSSARY AND FREQUENTLY USED ABREVIATIONS .......................................................155
REFERENCES ...................................................................................................................................163
8

EXECUTIVE SUMMARY
This Executive Summary is a synopsis of the report “Extraction of Water and Solutes fromArgillaceous Rocks for Geochemical Characterisation: Methods and Critical Evaluation”commissioned by the OECD/Nuclear Energy Agency Working Group on Measurement and PhysicalUnderstanding of Groundwater Flow Through Argillaceous Media (“Clay Club”) to the Laboratoired’Hydrologie et de Géochimie Isotopique (UMR OrsayTerre CNRS-Université de Paris-Sud, France).Yet, it may also be considered as an independent document accessible to the non-specialised, technicalreader. The references quoted in the Executive Summary are the most representative of the issuediscussed in the text.
INTRODUCTION
The definition of the chemical and isotopic composition of the groundwater present inargillaceous formations that are considered as potential host rock for radioactive waste disposal, iscrucial notably for establishing their properties as a barrier to radionuclide migration, for understandingthe disturbances that may be induced during the excavation of the repository and later by the presenceof the waste and the engineered barrier system, and for defining the type of water that will interact withthe latter.
Historically, water and solute extraction techniques for geochemical characterisation havebeen developed for petroleum geology, pedology and unsaturated and saturated zone hydrology. Theirapplication to fine-grained sediments, especially if rich in clay minerals and low in water content, isdelicate. That has been shown by comparative studies (see for example Walker et al., 1994) usingdifferent techniques on the same sample or the same technique on different types of sample. In fact,chemical and isotope fractionation is very often observed and those effects are poorly reproducible.Thus, fundamental questions arise, such as: what is the degree of representativity of the measuredcomposition? Does it account for the whole porewater or only part of it? Furthermore, standardprotocols and certified norms on how to perform porewater extractions from argillaceous formations aremissing. Hence, the decision by the “Clay Club” to launch a critical review of the relevant literature oncurrently applied porewater extraction methods and on the various approaches to the interpretation oftheir results.
The critical review report provides a synthesis of available porewater extraction methods,assesses their respective advantages and limitations, identifies key processes that may influence thecomposition1 of the extracted water, describes modelling approaches that are used to determine in-situporewater composition, and highlights, wherever possible, some unresolved issues andrecommendations on ways to address them. The report is intended to cover work published or submitted
9
1. In this Executive Summary and the review report, the term “composition” refers to both the chemical and isotopiccomposition of the porewater sample, except if otherwise mentioned.

for publication before January 1999, but conclusions also take into account results from internal reportsand unpublished work known to the authors.
The first part of the report is a review of the fundamental clay properties that are consideredas responsible for the non-linear response of the clay/water/solute system during the extraction of thesolution. The second part is based on an exhaustive bibliographical study of the available extractiontechniques, with a focus on applications to clay-rich media. For each method, description and examplesof applications are presented, in order to determine the advantages and problems of each technique asa function of the purpose of the investigation. The aim of the third part of the report is to analyse themechanisms involved in water and solute extraction processes and the possible consequences on theisotopic and chemical composition of the extracted clay porewater. An indirect derivation approach,extensively based on geochemical modelling, is presented at the end of that chapter. Finally, in theconclusions, indications are given for further experiments, both for the definition of clay/water/soluteinteractions and for intercomparative studies.
The report covers the whole range of argillaceous media currently considered for deepdisposal, i.e., from soft, potentially plastic clays with relatively high water content, to hard, potentiallyfractured mudrocks with low to very low water content. Targeted applications are the marls of the Palfrisformation (Wellenberg, Switzerland), the Opalinus clay (Switzerland), the Boom clay (Mol, Belgium),the Jurassic mudrocks of the Paris Basin (France) and the Toarcian argillites crossed by the Tournemiretunnel (France).
A. THE CLAY/WATER SYSTEM
The word “clay” has been generally used for indicating fine-grained sediments (particle sizeless than 2 µm) with particular attributes of plasticity (Guggenheim and Martin, 1995). Clays are mainlyconstituted by a specific group of aluminosilicates, consisting in alternations of tetrahedral andoctahedral sheet structures, held together by electrostatic forces. Most of the properties displayed byclay minerals are due to their small grain size and their sheet-like shape, both factors causing a veryhigh surface area compared to the mass of material (Van Olphen, 1963).
A.1 Interactions between water, solutes and clay
The water molecule owes most of its solvent efficiency to its polarity. In order to minimise theenergy of the dipole, the water molecule tends to rotate and create bonds with other ions, molecules andmineral surfaces. The number of water molecules that may be attracted by an ion in the solution and thestrength of the established bonds vary according to the ratio of the cation radius and its charge. Thestability of the hydration complex may be measured by the exchange rate and/or the mobility of thewater molecule in the hydration shell of the ion. Some of them, especially those of high-charge, low-radius ions are to be considered rather stable (e.g., magnesium).
Clay particles, like all colloids, tend to develop electric charges when in contact with a liquidphase. In addition, a deficit of positive charge caused by isomorphic substitutions inside the clay latticeis frequently found. As a consequence, positive ions and water molecules are attracted towards the claysurface. The arrangement of the water molecules in the neighbouring region may be disturbed by theelectric field, and differ from that of bulk water. Thus, the thermodynamic, hydrodynamic andspectroscopic properties of water in clays may differ from those of pure water (Sun et al., 1986).
10

The effect of cation hydration is very important for the structure and properties of hydratedclays: cations with a low hydration energy, such as K+, NH4
+, Rb+ and Cs+ produce interlayerdehydration and layer collapse, and are therefore fixed in the interlayer positions. Conversely, cationswith high hydration energy such as Ca2+, Mg2+ and Sr2+ produce expanded layers and are more easilyexchanged (Sawhney, 1972).
Clay hydration involves adsorption of a number of water molecules on the exposed surfacesof clay particles. Three adsorption processes seem to take place with the increase in water content,corresponding to different types of water:
(a) adsorption of water in the interlayer space, inside clay particles (Type I), called“interlamellar water”;
(b) continuous hydration related to unlimited adsorption of water around primary clayparticles (Type II), called “intraparticle water”;
(c) free-water condensation in micropores (Type III), called “interparticle water”.
The first hydration stage, corresponding to very low water contents, occurs on the hydrophilicsites of the clay surface. Kaolinite group minerals develop low surface charges, and therefore onlyadsorb up to a monolayer of water molecules in the interlayers. At higher water contents, the monolayerof water molecules is formed, and bonds may be established between the water molecules. Given theconstraints of the silicate structure, bonds have to adjust by stretching and rotating, consequentlyslowing the motion of water molecules. In smectites, the presence of a cation adsorbed on the surfaceto balance electric-charge deficiencies is extremely important (Anderson and Low, 1958). In fact, itappears that the first hydration stage proceeds through cation hydration.
Capillary condensation at the contact points between particles and/or grains constitutes themain adsorption mechanism in the previously defined second domain, giving rise to Type-II water inthe interparticle pores. That water is still bound to the clay particles and forms layers of water moleculeswhose thickness is proportional to the water activity. As the total water content increases, free-watercondenses in the pores (Type-III water).
Another fundamental property of clays is the cation selectivity (Thomas, 1977). When asolution and clay come into contact and reach equilibrium, some ions are adsorbed preferably to others.In general, divalent ions are preferred in swelling-clay interlayers over monovalent ions, while theopposite may be true for some high-charge clays. Cation partitioning depends on many parameters, suchas the charge unbalance with respect to the charge of the ion, the interlayer spacing or the dimension ofthe adsorbing site (surface functional group) with respect to the ionic radius, the composition of thesolution and temperature. As clay particles normally develop a negative charge, anions will tend to berepulsed. That phenomenon is known as anion exclusion. Anion retention, especially for phosphate,fluorine and sulphate ions, may occur on particular reactive sites. In addition, natural organic mattershows a strong affinity for clay minerals (Theng, 1974; Maurice et al., 1998).
In summary, the position, size and charge of interlamellar exchangeable cations largelydetermine the spatial arrangement of the water molecules. Recent studies on the water mobility in clay-rich systems support the notion that the water is more influenced by the saturating cation than by theparticular clay (Weiss and Gerasimowicz, 1996).
11

A.2 Porosity in clays
Studies on the size distribution and accessibility of pores to solutions showed that the degreeof water “immobilisation” is greater near the pore walls than in the centre of the pore. If pores are lessthan a few tens of nanometres in diameter, the water and the solutes cannot flow unless a thresholdpressure gradient is exceeded. In addition, because of the negative charges developed by the claymineral surfaces, some regions of the pores may be precluded access to negative ions.
As a consequence, beside the physical porosity, that is the ratio of the void volume to the totalvolume, other types of porosity may be defined (Pearson, in press). In particular, the porosity of thewater volume effectively available for the migration of each ion or molecule is called “geochemicalporosity”, and represents the fluid volume in which reactions occur. It is required for geochemical andreactive transport modelling. It is similar to transport porosities and, in clay-rich materials, is close todiffusion porosity.
In coarse-grained rocks, all porosity types are approximately equal because of the lack or theminor influence of attractive and repulsive forces exerted by the solid phase. Pearson (1998) reportsestimates of those different porosity types for clay-rich rocks (London clay, clay-rich Canadian tills,Boom clay, Opalinus clay and Palfris marl). According to those calculations, geochemical and diffusionporosities for water molecules are the same and are equal to water-content porosity. Geochemical anddiffusion porosities for solutes that do not have access to interlayer or surface sorbed waters constituteonly one-third to one-half of the water content porosity. Those porosity values are shown to vary withthe salinity of the solution (Karnland, 1997).
A.3 Organic matter
Various types of organic substances may be found in sediments, including aliphatic andaromatic hydrocarbons and non-hydrocarbons geopolymers known as bitumen and kerogen (Yariv andCross, 1979). The organic matter characterisation of rocks may provide information on the biologicalinput, the palaeodepositional environment, and the degree of maturity and degradation. Three fractionsmay be distinguished within the organic matter: the soluble fraction (dissolved organic carbon, DOC),that may be found in porewaters, the solvent extractable fraction (bitumen) and the non-extractablefraction (kerogen). Those three fractions show different properties and relate in different ways to themain topic of this study.
Humic substances, representing most of the soluble organic matter, display a variety offunctional groups with different reactivities. They may develop an anionic character, tend to form stronghydrogen bonds with water molecules and may associate intermolecularly, changing molecularconformation in response to changes in pH, redox conditions, electrolyte concentration and functionalgroup binding. The degree of complexity resulting from those properties is much larger for humicsubstances than for other biomolecules, as they reflect the behaviour of interacting polymeric moleculesinstead of the behaviour of a structurally well-defined single type of molecule.
The soluble organic matter is known to form strong complexes with metal ions (Yong et al.,1992). Organic matter bound to clay particles presents a reactive surface to solutes. As a consequence,it may play a role in the buffering of proton and metal cation concentration in the porewater solutionvia cation exchange. The association between the solid phases and the insoluble organic matter is notvery well understood because of the poor definition of the organic matter structure. Nevertheless, thesame functional groups responsible for cation exchange are also thought to be responsible for the
12

binding of the organic matter to the clay particle. A review of the clay/organic matter interactions maybe found in Theng (1974).
A.4 Conclusions
The studied system is constituted by clay minerals, water molecules, dissolved ions andmolecules, and the organic matter. All those components interact with each other, creating bonds ofdifferent energies. When trying to extract the porewater solution, the applied energy will need to breakthose bonds. The extraction conditions will, in most cases, not be uniform throughout the sample, butwill depend on the local desaturation level. While the water content decreases, new bonds between thecomponents may be created, and other strengthened. An additional problem is the reduced porosity ofthe system, acting as a filter and thus accelerating or retarding the ions according to their radius andcharge. All those effects, combined together, are responsible for the non-linear response of the system,and for the chemical and isotopic fractionation effects observed during the extraction procedures.Therefore, a quantitative description of those effects remains a complex and, in most cases, unresolvedproblem.
B. EXPERIMENTAL METHODS
B.1 Field techniques for fluid extraction and characterisation
B.1.1 Piezometer and borehole drilling
In-situ water-extraction techniques normally involve drilling. Drilling operations should becarefully planned in order to avoid long-lasting contamination of the environment with drilling fluids(Tshibangu et al., 1996). In fact, in very low water-content systems, long delays are required beforepurging the system from that type of contamination, and cases have been reported where arepresentative formation fluid could never be recovered (NAGRA, 1997).
In order to reduce and limit contamination, a few suggestions to consider include:
– Using an “equilibrated” drilling fluid to which a tracer may be added to follow the extentand duration of the contamination;
– Using air drilling instead of conventional drilling, especially for short dedicatedboreholes;
– Avoiding, whenever possible, the use of casing and backfill material. If necessary,consider PVC and stainless-steel casings. In soft clays, self-sealing piezometers may beinstalled, exploiting the natural convergence of the clay.
– Enhancing the collection of the solution in the piezometers by sealing it with a packer andslightly underpressurising the borehole. The types of piezometers installed at Mont Terriare good examples of non-contaminating water-sampling devices.
In-situ physico-chemical measurements (pH, Eh and T)
Ion-selective electrodes have been extensively studied for the determination of the fluidcomposition in high water-content systems (see Frant, 1997 for a review). Recent developments ofmicroelectrodes (De Wit, 1995; Kappes et al., 1997) have not yet found widespread application in lowwater-content systems. They are rather used for establishing “in-situ” profiles in sediments (Hales et al.,
13

1994; Hales and Emerson, 1996) or for measuring pH and other parameters on very small quantities ofextracted water (e.g., on water extracted from squeezing cells).
Among the numerous physico-chemical parameters to be considered, pH is of particularinterest for the chemistry regulation of interstitial fluids. Early attempts of in-situ measurements usingglass electrodes directly in the piezometers failed because of pressure problems (glass electrodes arevery fragile) and calibration problems (Griffault et al., 1996). Electrodes installed outside the boreholewith a circulation pump homogenising the fluid may be easily isolated from the circuit for calibration,without inducing major disturbances of the system (see e.g., Mont Terri project). pH measurementwithin the borehole may also be obtained using a fibre-optic pH sensor (Motellier et al., 1995). Thatsystem was tested against other pH measurement techniques (batch and in-flow with a glass electrode)at the HADES facility (Pitsch et al., 1995b) and showed a very good agreement with them. In additionto its pressure resistance, the device has a good response even if the water around the sensing tip is notrenewed. Consequently, it may also be used in situations where discharge is lower than 1 ml/h (Pitschet al., 1995b).
Attempts to obtain an in-situ Eh measure have been made, but results seem to be mainlyrestricted to fluids that display a measurable equilibrium potential imposed by a dissolved redox couple(buffered solutions) or a stable mixed potential imposed by two different redox couples. In the absenceof electroactive species, the measured potential is unstable because very small disturbances(concentration fluctuations, electrode surface modifications) cause the potential to change abruptlyfrom one value to the other (Pitsch et al., 1995a). A flow cell technique tested on samples collected indifferent clay/water environments proved to be more reliable than batch measurements, even forreducing environments, provided that anaerobic conditions are respected. More reliable Eh values maybe obtained by modelling and/or extrapolating the data obtained for the redox couples that are knownto be present in the fluid, even if not in sufficient quantity to provide a stable electrode potential(< ~5 µM) (Beaucaire et al., 1998).
The use of an optical fibre for borehole-temperature logging is reported by Förster et al.(1997). Although resolution is 5 to 10 times lower than conventional techniques, that system quicklyresponds and is not affected by problems related to variations in cable resistance, that disturb electriccurrents, and to improper isolation.
Field techniques for indirect fluid characterisation
Borehole-logging tools represent a mature technology that is widely used in oil and gasexploration (Schlumberger, 1997). The application of those techniques to radioactive-waste repositoriesassessment is currently being investigated. A combination of wireline logging, seismic, hydrologic andgeomechanical testing techniques may provide valuable information for site characterisation. Thatincludes fracture and fault detection and mapping, the physical properties of the rock (lithology,stratigraphy, porosity), geochemistry (rock-forming elements), hydrologic properties (conductivity,transmissivity), in-situ stress and geomechanical properties.
Since the 1960s, Schlumberger and other service companies (Kenyon et al., 1995) haveapplied nuclear magnetic resonance (NMR) to the in-situ determination of rock porosity, moisturecontent and amount of free and bound water. The in-situ NMR technique has also been appliedsuccessfully to the oil industry and seems to give very promising results, even for fine-grainedsediments. That technique is currently undergoing testing on low-permeability clay formations at theONDRAF and NAGRA sites (Win et al., 1998; Strobel et al., 1998). Uncertainties are related to the
14

estimation of constants necessary to calculate permeability; those constants are based on semi-empiricaltest results established for sandstones. An accurate calibration of field NMR data to core permeabilities,together with grain size analysis, may improve the tool ability to log those parameters on a continuousbasis. Finally, the integration of that tool with the other logging tools should successfully quantifyhydrologic properties and detect heterogeneities in argillaceous formations. It may be considered as analternative or complement to additional coring (Croussard et al., 1998).
B.2 Rock sampling, storage and preservation
The Eh and pH conditions existing in any deep rock formation have a significant influence onalmost all critical parameters determining the system behaviour with respect to radionuclide migration.The process of sampling, that isolates portions of rock or fluid from their environment, may inducechanges in the sample characteristics that may be virtually impossible to estimate with any certainty.Closely associated with that problem are the issues of long-term storage, handling and preparation ofsamples.
In low water-content systems, artefacts seem to proceed very slowly, due to the low diffusioncoefficients of the species in the small porosity. Effects such as dehydration and oxidation may beprevented with some simple precautions: isolating as soon as possible the sample from the atmosphere,performing all the pre-treatment operations (crushing, sieving, etc.), by minimising the contact timewith the atmosphere and the use of potentially contaminating tools or devices. Sample may beconditioned by wrapping the rock in aluminium foil and beeswax, or coating it directly with paraffin.Aluminium-plastic bags or foils that may be flushed with nitrogen or mixtures of inert gases, thenevacuated and thermally welded may also be used. That type of conditioning seems adequate to preservesamples for mineralogical and chemical analyses, but does not entirely protect the solution from the riskof evaporation. Wrapping the rock in aluminium is highly recommended if the organic matter has to beanalysed.
It is recommended, in order to eliminate the possibility of a contamination from the drillingfluid, that the outside rim of the cores is trimmed and discarded.
B.3 On-sample laboratory techniques
The most important techniques considered in the study are:
– Centrifugation: the sample is placed in a closed container, then spun in a centrifuge at agiven number of rotations per minute (rpm). The pressure difference developed across thesample exceeding the capillary tension holding the water in the pores causes the water tobe extracted (Batley and Giles, 1979). Additionally, heavy liquids immiscible with thesolution, may be used. They percolate through the pores, pushing out the solution foundfloating on the top of the sample.
– Squeezing: in most cases, the sample is crushed, then placed in a hydraulic press andsqueezed. The pore fluid is expelled through a stainless-steel filter and collected outsidethe press with a syringe.
– Leaching: the crushed sample is placed in contact with deionised water or anothersolution, at a given solid/liquid ratio. After establishing equilibrium, the solid phase isseparated and the liquid phase is analysed. The resulting composition is interpreted with
15

different modelling levels (from simple mixing between deionised water and porewater tomore complex models).
– Vacuum distillation: the crushed rock sample is placed in a preparation line that isevacuated and heated. The water is extracted by evaporation and the released watermolecules are collected in frozen traps.
– Azeotropic distillation: that process is based on the observation that some solvents(toluene, xylene, petroleum ether, etc.) form an azeotropic mixture with water, featuring aboiling point lower than the boiling points of the two end members. The crushed sampleis placed in a flask, immersed in the selected solvent and gradually heated. At the boilingpoint of the azeotrope, the mixture evaporates, recondensing in the funnel with a cloudyappearance. At room temperature, the two liquids (water and solvent) separate.
– Direct equilibration: those techniques are based on the equilibrium established betweenthe porewater in the rock sample and a known amount of a given substance with a knownisotopic composition. It does not involve the physical extraction of the porewater, butsimply an equilibration through the gaseous phase.
As different extracting principles are used, not all the techniques may provide solutions forboth chemical and isotopic analyses. In the following table (Table A), the techniques are listed, togetherwith indications (based on bibliography) on their suitability for chemical and isotopic analyses.
Each technique is extensively discussed in the text, with particular reference to the technicalspecifications, the percentage of recovered water, application examples and artefacts mentioned in theliterature. All those data are summarised in Table B. In addition, the maximum applied suction,measuring the bond-breaking strength and expressed in pF2, is reported. As a reference, it should beremembered that, beyond 11 layers of adsorbed water molecules, the properties of water resemble those
16
Technique Specifications Chemical analysis Isotopic analysis
Centrifugation Low/high speed Major and trace elements 18O and 2H
Heavy liquids Major and trace elements Not investigated
Squeezing Major and trace elements 18O and 2H
Leaching Major and trace elements 2H and 3H
Distillation Under vacuum Impossible 18O and 2H
Azeotropic Impossible 18O and 2H
Direct equilibration With CO2 Impossible 18O only
With water Impossible 18O and 2H
Table A. Use of different water extraction techniques for chemical and isotopic analyses
2. pF is the decimal logarithm of the suction expressed in centimetres (head) of water.

17
Technique SpecificationsMaximum.
Recognised artefactsAdvantages and possible
applied suction applications
Table B. List of water-extraction techniques and their known artefacts
Centrifugation
Squeezing
Leaching
Distillation
Directequilibration
Low speed (2,500 rpm)
High speed (14,000 rpm)
Ultracentrifugation(20,000 rpm) + solventdisplacement
Low pressure (5 MPa)
High pressure (70 MPa)
High pressure (552 MPa)
Deionised water
High selectivity complexes
Vacuum distillation
Azeotropic distillation
With CO2
With water
pF 3
pF 4.8
pF 4.4
pF 4.7
pF < 5.8
pF < 6.7
–
–
pF 7
pF 7
–
–
Solution oxidation
Solution oxidation; decrease inconcentration of the extracted solutionwith increasing extraction
Danger of organic-matter destruction
Small or undetectable
According to different authors, small orundetectable up to 60-100 MPa; withincreasing pressure, both concentrationincreases and decreases of solutes arereported
Dissolution of minerals; cation exchangewith the clay
Complete exchange with the adsorbedcations
Possibly incomplete extraction; non-reliable 18O values
Possibly incomplete extractions;systematic depletion of deuterium values
Possibly incomplete equilibration, asequilibration times are difficult to estimate
Suitable for high water contentsediments
Better controlling redox sensitiveelements
Suitable for high water-contentsediments and clays
To be validated
Not completely validated
Possibly good for obtaining chloridefrom highly saline porewaters
If coupled with modelling, mayprovide cation occupancies on the clay
If the extraction is complete, deuteriummay provide useful information as awater-molecule tracer
Not completely validated
18O only. Apparently reliable
Promising technique, needs validation

of bulk water (Swartzen-Allen and Matijevic, 1974; Sposito and Prost, 1982). In addition, according toVan Olphen (1965), five layers of water on montmorillonite display a suction potential correspondingto a pF of 4.7, two layers to a pF of 6.4, and one layer to a pF of 6.7. The air-inlet point, correspondingto the beginning of desaturation, for a clay such as Boom clay is situated at a pF of approximately 4(Horseman et al., 1996). Logically, that value should be higher for indurated clays with lower watercontent.
According to the calculated suction values, apart from low pressure squeezing andcentrifugation, all the techniques should be able to extract free water from clays, and most of thetechniques are likely to affect also any water strongly bound to the clay surfaces. The possibility ofextracting not only free water, but also to some extent strongly bound water, is a crucial issue. In fact,the impossibility to extract all the solution or to control the relative amounts prevents the derivation ofa “true” porewater composition.
Useful information on the amount of different types of water, together with the suctionparameters to be considered for extracting only the free water, may be derived from various studies onadsorption-desorption isotherms (Decarreau, 1990), nuclear magnetic resonance (NMR), infraredspectroscopy (IRS) (Prost, 1975; Sposito and Prost, 1982) and dielectric relaxation. That type ofinvestigation should be routinely performed in order to characterise the clay/water environment.
C. PROCESSES AND CURRENT INTERPRETATIONS
The disturbance-inducing processes related to water and solute extractions are reviewed in thissection of the report, together with the recognised artefacts and the attempts made to correct them. Allthose effects, although they concern in theory all the extraction techniques, are more relevant to someof them. In Table C, all the data are reported, together with an estimate of their influence on theextracted solution and the possibility to correct them. The table shows clearly that there is a risk ofobtaining a non-representative sample in most of the techniques. As a consequence, there is little doubtthat many arguments may be raised against all the investigations conducted with those methods and theresults obtained.
The basic problem relates obviously to the presence of different types of water in theclay/water system. From the hydrogeological point of view, only the free water (in amount andcomposition) is of interest, because it represents the fraction possibly mobilised under given hydraulicconditions. Nevertheless, in the type of rocks considered in this review, with low water content, theamount of free water is probably so small that each attempt to extract it may involve having to deal withthe strongly bound water as well. That may be due to the dishomogeneity of the water distribution insidethe sample, affecting the local conditions of water availability, as well as to the slow movement, due todiffusion of the water molecule itself.
Ideally, the approaches adopted so far have either claimed to extract only the requested typeof water, or tried to extract all the water and calculate the porewater composition, assuming thebehaviour of the water/rock system. Unfortunately, both those options are not verified, and in each studycase we have evidence of partial extraction of different solution types, the relative amounts of which areunknown.
What information may we consider as reliable then? In our opinion, very few. Those aremainly distribution profiles across the studied clay formations of chloride obtained by leaching,deuterium obtained by distillation (provided that no serious salinity differences are detected in the
18

19
Physical process Techniques Major effects Possible corrections
Table C. List of processes occurring during water extraction and possible corrections of their effects on water composition
Increase inpressure
Decrease inpressure
Oxidation
Change intemperature
Ion exchange
Salt dissolution
Salt precipitation
Incomplete waterextraction
Squeezing, centrifugation
Mainly related to sampling andconditioning
Related to bad sampling and condi-tioning; also induced by centrifu-gation, leaching, and to a minorextent by squeezing if the operationsare not conducted in a controlledatmosphere.
All techniques. Most of the squeezingand centrifugation devices arecurrently equipped with temperaturecontrols.
Mainly leaching, but possibly inducedby all techniques.
Potentially all techniques increasingpressure and water to rock ratio,especially leaching.
Potentially all techniques decreasingwater to rock ratio.
All techniques except leaching
Decrease in concentration of the extractedsolution with increasing pressure; modifiedsolubility of the solid phases; possibleeffects also on the isotopic composition ofthe solution.
Degassing of the solution, possibly leadingto the precipitation of carbonates and thereduction of porosity.
Oxidation of solid phases, mainly sulphides;change in pH of the solution; dissolution ofcarbonate minerals; modified stability ofother phases; cation exchange with claysand organic matter.
No major consequences if the temperaturedifferences are low (< 10°C); modifiedstability of the solid phases if greater.
Major changes in the solution composition;dissolution and precipitation of solid phases.
Major changes in the solution composition;cation exchange.
Major changes in the solution composition;cation exchange; possible modification ofthe isotopic composition if hydrated phasesare precipitated.
Non-representativity of the chemical andisotopic composition of the solution.
At present, no satisfactory model allows thecorrection of the data. More detailedexperiments (ongoing) are needed tovalidate the technique.
Thermodynamic modelling of the carbonatesystem allows an estimation of the artefacts.
Impossible to correct because of thecomplexity of the system. Data shouldbe discarded.
Apparently, most of the effects are reversiblewith storage at the original temperature.
May be evaluated and possibly corrected viageochemical modelling.
May be evaluated if the mineralogy is wellknown.
May be estimated by geochemical modellingand by the mineralogical observation of thedry sample.
Difficult to estimate without a deeper under-standing of the clay/water system. May bemodelled and corrected for stable isotopes.

porewaters) or equilibration, and to some extent, noble gas measurements. An extensive discussion isconducted in the text to justify those statements.
C.1 Geochemical modelling
An interesting new approach to obtain information on the porewater composition has beendeveloped and is extensively based on thermodynamic modelling. The continuous development andrefinement of the thermodynamic data bases, coupled with the increasing performances of computercodes, allows at present the modelling of most of the dissolution/precipitation reactions and part of thecation-exchange reactions.
Two experimental approaches are currently adopted in the framework of the investigations inclay-rich environments. One, suggested by Bradbury et al. (1990) is an experimental procedureextensively based on rock-sample leaching with different solutions (deionised water, high affinitycomplexes) and on the thermodynamic processing of the data. On the basis of the considerations madeon all the ions in the aqueous and the high-affinity complex solution extracts, the quantity of highlysoluble salts (sodium chloride, potassium chloride) is derived, together with the cation-exchangecapacity of the rock and the ion occupancy on the exchange sites. Subsequently, the calculation of thecation ratios in the liquid phase, that are in equilibrium with known occupancies, is performed, knowingthe selectivity coefficients for the different cations. That methodological approach is completelydifferent as it encompasses both the technical problem of water extraction and the definition of theamount and characteristics of the “free” and “bound” solution. Since its design, it has been applied onsamples of the Palfris marl (Baeyens and Bradbury, 1991; 1994), and is currently used in the frameworkof the investigations for the Mont Terri project (Bradbury and Baeyens, 1997; Bradbury et al., 1997;Bradbury and Baeyens, 1998; Pearson et al., in preparation). Although uncertainties remain because theclay/water system is not univocally defined, reasonable assumptions on porewater composition may bemade and checked with in-situ equilibration.
Another modelling approach that has been proven valid for clay environments has beenproposed by Beaucaire et al. (1995; in press) on the Boom clay. Their approach relies on the regionalgroundwater characterisation (Boom-clay porewater and groundwater from the Rupelian aquifer). Theacquisition and regulation mechanisms of the groundwater and porewater compositions at the regionalscale are considered to be the same, and the fluids to have a common origin. By a careful observationof the correlation between major cations and anions, a mixing process between porewater and a marinesolution may be identified. However, a simple mixing model between those two end members does notdescribe the system precisely, suggesting that exchange and equilibration with the host rock also occur.Beaucaire et al. used a dissolution-precipitation model, considering a mineral assemblage of solidphases that have all been identified in the Boom clay and whose dissolution equilibria are wellestablished, in order to predict the water composition. The model seems to describe accurately thevariability of the recognised types of water within the regional scale. Discrepancies between predictedand measured concentrations of major elements are within analytical uncertainties except for very dilutespecies; as for pH, the deviation is less than 0.3 unit. That good predictivity induced De Windt et al.(1998b) to test the model on the Tournemire water collected from a draining fracture of the site andresulted in a quite satisfactory agreement between modelled and analysed water compositions.
Ion-exchange and dissolution/precipitation processes are both known to occur duringwater/rock interaction, but at different timescales: ion exchanges are quickly established, whileequilibrium is more slowly attained for dissolution/precipitation reactions. Of course, both aspects needto be considered in the safety assessment procedure for waste-disposal sites. This means that a
20

considerable work of thermodynamic-data generation is to be carried out in order to reach definiteconclusions and to elaborate models that take into account simultaneously both aspects of thewater/rock interaction.
C.2 Conclusions, recommendations and topics for further investigation
The problem of extracting solutions from argillaceous formations for geochemical andisotopic characterisations is complex, as expected. For the time being, the presence of different forcesarising from the clay/water interaction and influencing the movement of water molecules and solutesprevents the possibility to define experimentally the “true” porewater composition. That composition isneeded for several objectives:
– To perform corrosion calculations for canisters and matrices where radioactive waste willbe contained.
– To evaluate the age and the natural movement of water and solutes across the formation.
– To calculate the speciation and the solubility of phases in order to evaluate the water/rockinteraction phenomena affecting radionuclide migration.
– To foresee the effect of the site water on the engineered barriers of the repository.
Fortunately, not all those objectives require the same degree of knowledge of the porewatercomposition.
For corrosion studies, the main parameters needed are the total salinity, the oxidising orreducing properties of the solution and the speciation of particular elements (e.g., sulphur). In the hostrock, it may be reasonably assumed that, given the low solid/water ratio, the solution composition wouldsoon be controlled by the minerals in the material of interest, the composition and reactivity of whichis fairly well known.
For tracing the water age and movement, a few techniques have proven reliable. Noble gasesmeasurements may provide information on groundwater age. Deuterium and chloride, provided thatthey are interpreted in relative, rather than in absolute, terms and that porosity characteristics are wellknown, allow for an estimation of the time required to establish the distribution profile, as long as themovement is diffusion-dominated. Tritium may be used for tracer experiments, as apparently it may beeasily extracted by vacuum distillation and measured accurately by radioactive counting.
Speciation studies are the most affected by the analytical problems we have encountered.Here, the whole task of characterising the water content and composition relies on the absence of a cleardefinition of which part of the cations and anions belongs to the clay surface (being adsorbed andstrongly bound) and which part belongs to the bulk solution. So far, that problem has been neglected ortreated in terms of total water content. Without that definition, the question would turn up as to whichtotal suction needs to be applied to our sample in order to extract even more water, that is actually noporewater at all. As a consequence, future investigations should aim at a better understanding of thefundamental properties of the clay/water system: thermodynamics of pore-confined water is still acritical issue.
Table D summarises those concluding remarks.
21

More fundamental research is needed to understand the physico-chemical processes involvedduring water extraction. Information may be obtained by:
– Coupling the mechanical behaviour with the mineralogical and chemical characteristics ofthe system. Macroscopic properties, such as swelling and mechanical strength, depend onthe water content but also on the type of saturating cation on the clay surface andconsequently on the porewater composition.
– Conducting rigorous physical studies on the pore size and distribution, using relatively“soft” techniques, that reduce to the extent possible pore-size modifications during thestudy.
– Evaluating the amount of free and bound water. That should be achieved through indirecttechniques such as NMR, IRS and dielectric relaxation spectroscopy (DRS). Thosetechniques have the advantage to cause fewer disturbances to the clay sample. In addition,recent technical developments allow the use of those techniques directly insideexploratory boreholes, bypassing all the artefacts related to sample collection andpreservation.
– Validating some new and promising techniques through the design of experiments on avariety of clay environments and testing their applicability to different mixtures of clayminerals and different salinities of the interstitial solutions.
Other specific topics where further investigation is needed concern the behaviour of chlorineduring the extraction by leaching, the rock characterisation by its ion-exchange isotherms and theproduction of reliable exchange constants for thermodynamic modelling, as well as the definition of thewater-movement mechanisms within the sample during the extraction by squeezing. Furthermore, agreat amount of work needs to be done in the field of organic-matter extraction, characterisation andevaluation of its retention role.
22
Critical issues of Information Reliable analytical
Limitationsradioactive wasteprovided by techniques
management
Interaction with the Solid phases + Leaching + geochemical Potentially not so predictable forbarriers thermodynamic data modelling short term effects
Age and groundwater Noble gases Diffusion in evacuated Nonemovement containers
Deuterium distribution Vacuum distillation Careful check of all parameters:profiles Equilibration interpretation in relative terms
Chloride distribution Leaching Potentially not suitable for lowprofiles + isotopes salinity systems: interpretation in
relative terms
Speciation and Solution composition Geochemical modelling/ Check with in-situ equilibrationradionuclide migration + rock properties + leaching
Table D. Examples of reliable information according to the investigation

Considering isotopic studies, an improvement of existing techniques and/or the developmentof new techniques, such as direct equilibration, seem possible. A validation of the squeezing techniquefor isotopic analysis of the extracted solutions is also necessary.
However, more essentially, the critical issue in water extraction for geochemical interpretationis to relate accurately the chemical and isotopic composition of the extracted water to the in-situ water.Due to the complexity of the processes involved in each method, the extracted water is always an image,and only an image, of the porewater. It is therefore a challenge for the physicochemist to explain thefluid transformations during extraction, in order to back-calculate the in-situ water from its image andprovide the geochemist with the needed tools.
An intercomparison of analytical techniques on clays has already been organised by the NEA(Van Olphen and Fripiat, 1979) and a second one was launched by the IAEA on isotope analysis(Walker et al., 1994). In agreement with what is previously stated, there is little doubt in our minds that,if those benchmark experiments were conducted again today, the results would not be anything else butthe same. At the present stage, intercomparisons must only be considered as one of the many tools forunderstanding better the phenomenology of each analytical method. No conclusion on reliability maybe drawn from any intercomparison exercise as long as no fundamental knowledge may assess theaccuracy of one or another method.
23


PREFACE
SCOPE, OBJECTIVES AND LIMITS OF THE STUDY
The need to obtain information on the porewater composition of sedimentary rocks, especiallythose targeted for waste isolation purposes, has been clear since the beginning of the investigations onthat type of formations. Firstly, the distribution of dissolved constituents in the formation results fromthe geologic history of the massif, the transport processes affecting the fluids and the water/rockinteraction. The discrimination between those different processes, when possible, enables to establishthe boundary conditions of the system. Secondly, the definition of a groundwater in chemicalequilibrium with the host rock, is a prerequisite for beginning any credible sorption study (Baeyens andBradbury, 1991). Besides, that composition will most probably constitute an end-member of any mixingwith fluids (shallow waters, drilling fluids, etc.) that will most likely occur during the excavation of arepository. Consequently, porewater composition is needed in all studies concerning the disturbance ofthe deep environment before the waste isolation and the calculations of the time required to restore theinitial conditions. Finally, that will represent the type of water that will be in contact with theengineered-barrier system (e.g., concrete lining, backfill materials, metallic waste packages, glass) and,after interaction with the latter, it may be responsible for the leaching and transport of the radionuclidespresent in the waste.
Historically, water and solute extraction techniques from sedimentary rocks for chemical andisotopic analyses have been developed for petroleum geology, pedology and unsaturated and saturatedzone hydrology. Their application to fine-grained sediments, especially if rich in clay minerals and lowin water content, is delicate. That has been shown by comparative studies (see for example Walker etal., 1994) using different techniques on the same sample or the same technique on different sampletypes. In fact, chemical and isotope fractionation is very often observed when the soil or rock is rich inclay minerals and very poor in interstitial water. Besides, those fractionation effects are poorlyreproducible. Thus, the question of sample representativity arises: different types of solutions arepresent in the clayey rock, corresponding to different types of bonding between water molecules,dissolved ions and clay particles. The issue of sample representativity is crucial in the framework of theassessment of the performances of a repository located in argillaceous host rocks as isotopic andgeochemical data, for example, are used to support and test flow models in those geological media.
Numerous papers on the topic have been published, but attempts of synthesis are very rare andmainly concern applications to soils.
This report aims to be a comprehensive critical review of the extraction techniques of waterand solutes from argillaceous rocks, for chemical and isotopic analyses, and the available approaches tointerpret their results. The study is subdivided in three main parts.
Following a first part reviewing the fundamental of clay properties, the second part of thereport is based on an exhaustive bibliographical study of the available extraction techniques, with a
25

focus on applications to clay-rich media. Both in-situ techniques (from piezometers, boreholes orspecial underpressurised equipment) and laboratory techniques on sample (centrifugation, squeezing,leaching, distillation, etc.) are considered. For each water extraction method, description and examplesof applications are presented. Chemical and isotopic data obtained in each case are examined in orderto determine the advantages and problems of each technique in relation to the investigation.
The third part of the report aims to analyse the mechanisms involved in water and solutesextraction processes, as well as the possible consequences on the isotopic and chemical composition ofthe extracted clay porewater. Finally, short indications are given for further experiments, both for thedefinition of clay/water/solute interactions and for intercomparative studies.
This document attempts to set a basis for an international methodological effort on resultsobtained from different investigation sites. It covers the whole range of argillaceous media currentlyconsidered for deep disposal, i.e., from soft, potentially plastic clays with relatively high water content,to hard, potentially fractured mudrocks with low to very low water content. Targeted applications arethe Palfris formation (Wellenberg, Switzerland), the Opalinus clay (Switzerland) the Boom clay (Mol,Belgium), the Jurassic mudrocks of the Paris Basin (France) and the Toarcian formation crossed by theTournemire Tunnel (France).
The work has been conducted in close link with the French Atomic Energy Commission(CEA/LIRE) for the critical interpretation of chemical results. Discussion with other scientistscommonly using those techniques within the framework of their investigations allowed for an overviewof the problems and difficulties most commonly encountered. It also helped to focus the objectives ofthe study, identify the areas where more investigations are needed and widen the perspective to a moregeneral international concern. Contacts were also taken with the organisations represented within the“Clay Club” and with practical activities in that field. That helped assessing the current state of the art.In an early phase, those organisations have been requested to provide their input to the list ofbibliographic references serving as a basis for the project.
This report is intended to cover all the relevant work known to the authors and available inreferenced form at the end of 1998. It is not intended to substitute for the original published material,but to contribute to a critical assessment of the state of the art in the field. Relevant but unpublishedinformation was also provided directly by the funding organisations and by other researchorganisations. In those cases, information is quoted as personal communication, with the agreement ofthe source. In addition, this report does not provide an ultimate series of recommendations on how tocarry out porewater extractions in argillaceous media, but stresses the confidence limits that may beattributed to the results obtained through the different techniques and shows the areas where furtherinvestigation is needed.
26

PART I
INTRODUCTION TO THE CLAY/WATER SYSTEM
1. CLAY MINERALS
It is not the purpose of this study to provide a detailed description of the mineralogy andstructure of the clay minerals. The interested reader will find comprehensive treatises in the mineralogyliterature (Bayley, 1988; Brindley and Brown, 1980; Brown et al., 1978; Dixon and Weed, 1977;Nemecz, 1981; Velde, 1992). Besides, a detailed summary of the relevant issues may be found in thefirst report of that series (Horseman et al., 1996). However, a short summary of the main chemical andstructural characteristics is necessary for the comprehension of the mechanisms of water and soluteinteractions with solid phases. Those mechanisms will in fact play a prevailing role during the liquid-extraction procedure.
1.1 Definition and structure
The word “clay” has been generally used for indicating fine-grained sediments (particle sizeless than 2 µm) with particular attributes of plasticity (Guggenheim and Martin, 1995). Thatgranulometric definition of clays does not take into account the mineralogy of the particles. It appearsfrom X-ray diffraction patterns that clays are mainly constituted, among other minerals such ascarbonates, silicates and oxi-hydroxides, by a specific group of aluminosilicates called “clay minerals”.
Clay minerals are aluminosilicates consisting of alternating tetrahedral (T) and octahedral (O)sheet structures.
Sheets co-ordinating four oxygen atoms are formed by silicon in a tetrahedral arrangement.The basal oxygen atoms are shared between adjacent tetrahedra as shown in Figure 1. The basic unitformula is therefore Si2O5
2–. Rings of tetrahedra linked together form an hexagonal pattern, named“siloxane cavity”, whose form and electric charge is very important in determining the clay properties,as shown later in this report.
Similarly, octahedral sheets are formed by a cation co-ordinating six negative ions (oxygen orOH) and sharing some of those with adjacent octahedra (Figure 1). Two basic types of octahedral sheetsmay be distinguished: if the central cation is trivalent (e.g., Al3+ or Fe3+), only two-thirds of theoctahedral sites are occupied, originating the so-called dioctahedral sheet (basic formula Al2(OH)4
2+).If the cation is bivalent (e.g., Mg2+), all the octahedral sites may be occupied, giving rise to thetrioctahedral structure (Mg3(OH)4
2+).
Clay minerals are formed by more or less organised alternations of those basic sheets, boundtogether by electrostatic forces. The origin of the electric charge on the clay surface is investigated in a
27

number of studies on colloid chemistry and properties. Besides, cation substitutions in the basic unitsof the sheets also give rise to an electrical unbalance. For example, silicon in tetrahedra may besubstituted by aluminium, leaving an unbalanced negative charge. Any unbalance will be compensatedby attracting a positively charged layer or ion close to the surface. The most important clay mineralgroups are shown in Figure 2 and are here briefly described.
The kaolinite group minerals display a simple alternation of tetrahedral and octahedral sheets(TO structure or 1:1-layer silicates). In that group, cation substitutions in the basic sheet are not verycommon, and kaolinites show an almost stoichiometric formula of:
Al2(OH)42++Si2O5
2– = Al2Si2O5(OH)4
If magnesium is present instead of aluminium, a trioctahedral series is obtained, namely theserpentine subgroup, whose formula is Mg3Si2O5(OH)4. Both those subgroups show an interlamellarspacing (i.e., the distance between two TO groups), of approximately 0.7 nm.
A second group of clay minerals, both di- and trioctahedral, consists of alternating TOT layers(or 2:1 structure), where a substitution of aluminium in the tetrahedral layer is possible. That leaves anegative unbalanced charge that is compensated by the adsorption, between the lamellae, of cationssuch as K+. The basic formula of those minerals, named illites and micas, is therefore:
K(1-X)Al2 {Al(1-X)Si(3+X)} O10(OH)2
28
Figure 1. Clay structures: tetrahedral (SiO4) and octahedral (e.g., Al(OH)6) sheets (after Sposito, 1984)
TETRAHEDRAL SHEET
DIOCTAHEDRAL SHEET
O2
Si4+
Xb –
Mm+

The interlamellar distance is approximately 1 nm.
The smectite and vermiculite groups are very similar, but usually adsorbing different more orless hydrated cations. The interlamellar spacing is variable, depending on the adsorbed species. Thatswelling property according to the degree of hydration is very important, as we will see later. Smectitesand vermiculites are basically distinguished by their permanent structural charge, the latter having agreater one.
29
Figure 2. Clay structures: TO, TOT and TOT O alternations (modified after Millot, 1964)

Finally, the chlorite group of clay minerals displays a TOT O TOT structure (also called“2:1:1 structure”). The excess of negative charges is balanced by a positive charge on the interlayerhydroxide sheet. That group is highly variable in chemical composition, depending on the possiblecationic substitutions in the octahedral and tetrahedral sheet. The structure thickness is approximately1.4 nm and displays no swelling.
Other minerals such as talc, pyrophyllite, sepiolite and palygorskite belong to the clay-mineralgroup, but will not be described in detail because of their limited occurrence in the clay environmentsof interest. The complete clay classification is summarised in Table 1.
Those end-members are not readily found in nature as pure and well-crystallised structures.Clays known as “mixed-layer type” are common; they alternate either regularly or irregularly differentsequences of structures. Local changes of structures, tetrahedral and octahedral-cation substitutions andinterlayer adsorption are extremely common. Nevertheless, those physical mixtures may be identifiedby using a number of techniques, including elemental analysis, X-ray diffraction, Infra-RedSpectroscopy (IRS), thermogravimetric analysis, and electronic microscopy. Some authors (Aja et al.,1991; Garrels, 1984; May et al., 1986) treat them as separate, well-defined phases, for whichthermodynamic constants are hard to determine, while others prefer to treat them as solid solutions ofthe described end-members (Fritz, 1975).
1.2 Chemical properties
Most of the properties displayed by clay minerals are due to their small grain size and theirsheet-like shape. Both factors cause a very high surface area relative to the mass of material (VanOlphen, 1963).
All clays attract water to their surface (adsorption) and some of them include it in theirstructure (absorption). A possible classification of clays is based on the way they absorb water (see alsoTable 1). Smectites are swelling clays, as they increase volume when incorporating water molecules.Other clays, like sepiolite and palygorskite, whose habit is more needle-like, have important sorptioncapacities, but not the property of swelling. A third group of clays, including kaolinite and chlorite, hasneither of those properties.
A related important feature concerns the way clays develop electric charge on the surface. Twomain mechanisms are responsible: isomorphic substitution among ions of different charge within thelayers and deprotonation of silanol and aluminol groups.
According to the surface charge, clays may be classified in:
– Neutral-lattice structures, both 1:1 and 2:1 where linked tetrahedra and octahedra have anet charge of 0. The substitutions within the sheets are cancelled electrostatically, andlayers are bound in the crystal by van-der-Waals-type forces. Talc, pyrophyllite, kaolinite,serpentine and chlorite have that type of structure.
– High-charge structures (0.9-1.0) are observed for micas. The charge unbalance is due toionic substitutions in the tetrahedral and octahedral sheet, and is balanced by a strongadsorption of cations (mainly K+) to the surface.
– Low-charge structures (0.2-0.9), where the imbalance is compensated by weakly held ionsin the interlayer position that may be readily exchanged in aqueous solution
30

(e.g., smectites and vermiculites). That type of clays swells, incorporating ions, complexesand molecules between the layers. The interlayer spacing will be determined by thehydration state and the type of ion adsorbed between layers.
31
OctahedralPermanent
Swelling/ InterlayerGroup Structurelayer
structuralSorbing3 spacing
Examplescharge
Kaolinite 1:1 Dioctahedral ~ 0 None 7 Kaolinite, dickite,nacrite, halloysite
Serpentine 1:1 Trioctahedral ~ 0 None 7 Chrysotile, antigorite,lizardite, amesite
Pyrophyllite 2:1 Dioctahedral ~ 0 None Pyrophyllite
Talc 2:1 Trioctahedral ~ 0 None Talc, willemseite
Mica 2:1 Dioctahedral ~ 1 None 10 Muscovite, paragonite
2:1 Trioctahedral ~ 1 None 10 Phlogopite, biotite,lepidolite
Hard mica 2:1 Dioctahedral ~ 2 None 10 Margarite
2:1 Trioctahedral ~ 2 None 10 Clintonite, anandite
Chlorite 2:1:1 Dioctahedral Variable None 14 Donbassite
2:1:1 Di-trioctahedral Variable None 14 Cookeite, sudoite
2:1:1 Trioctahedral Variable None 14 Clinochlore,chamosite, nimite
Smectite 2:1 Dioctahedral ~ 0.2 - 0.6 SW Variable Montmorillonite,beidellite, nontronite
2:1 Trioctahedral ~ 0.2 - 0.6 SW Variable Saponite, hectorite,sauconite
Vermiculite 2:1 Dioctahedral ~ 0.6 - 0.9 SW Variable Dioctahedralvermiculite
2:1 Trioctahedral ~ 0.6 - 0.9 SW Variable Trioctahedral vermiculite
Palygorskite 2:1 Variable SO Palygorskite
Sepiolite 2:1 Variable SO Sepiolite
Table 1. Clay structure parameters (after Decarreau, 1990 and Velde, 1992)
3. SW: swelling; SO: sorbing.

The amount of charge per kilogram (molc·kg–1) created by isomorphic substitutions is calledpermanent structural charge (σS). It may be calculated from the layer charge (x) and the relativemolecular mass (Mr) of the mineral:
σS = –(x/Mr) ·103
σS ranges between –0.7 and –1.7 molc·kg–1 for smectites, –1.9 and –2.8 molc·kg–1 for illites and –1.6 and –2.5 molc·kg–1 for vermiculites.
Another property is the cation selectivity (Thomas, 1977). When a solution and clay come intocontact and are allowed to establish an equilibrium, some ions will be sorbed preferably to others. Ingeneral, divalent ions are preferred in swelling-clay interlayers over monovalent ions, while theopposite may be true for some high charge clays. Cation partitioning depends on many parameters, suchas the charge unbalance with respect to the ion charge, the interlayer spacing or the dimension of theadsorbing site (surface functional group) with respect to the ionic radius, the composition of the solutionand temperature. As clay particles normally develop a negative charge, anions will tend to be repulsed.That phenomenon is known as “anion exclusion”. Anion retention, especially for phosphate, fluorineand sulphate ions, may be observed, and is believed to occur on particular adsorption sites. In addition,natural organic matter shows a strong affinity for clay minerals (Theng, 1974; Maurice et al., 1998).
2. INTERACTIONS BETWEEN WATER, SOLUTES AND CLAY
2.1 Water-molecule structure and cation hydration
The water molecule owes most of its solvent efficiency to its polarity. In fact, the arrangementof the electronic orbitals and the bonds with hydrogen is almost tetrahedral. The angle between the twohydrogen atoms is slightly greater than a pure tetrahedral angle, due to the strong repulsion of thehydrogen atoms. On the opposite side, the two lone pair of electrons form a negative end of themolecule (Figure 3a). In order to minimise the energy of the dipole, the water molecule tends to rotateand create bonds with other ions and molecules. That behaviour is responsible for the excellent solventcapacity of water.
The “structure” of liquid water is not known in detail, but it seems that it is mainly made ofsmall clusters of hydrogen-bonded molecules whose lifetime is approximately 10–11 s. At roomtemperature, an average cluster contains about 40 molecules. With decreasing temperatures, moleculestend to arrange in a structure resembling that of tridymite, a silica polymorph, known as the “icestructure” (an hexagonal network structure, Figure 3b)).
Cation hydration has been deeply investigated (see for example Taube, 1954; Conway, 1981;Marcus, 1985; Burgess, 1988; Neilson and Enderby, 1989; Friedman 1985; Franks, 1985, Güven, 1992and the review by Ohtaki and Radnai, 1993), and only the most relevant facts to our study will bereported here.
The hydration complexes formed by ions in solution are defined by:
– the distance between the ion and the water molecule;
– the distance between the ion and the protons of the water molecule;
– the time-averaged number of water molecules around the ion in the inner hydration shell(also known as “mean co-ordination number”);
32

– the mean tilt angles formed by the water molecule to minimise energy.
Neutron diffraction and X-ray powder diffraction may be used to determine those parametersfor salt solid samples. The co-ordination number (CN) only gives an indication of the number of watermolecules in contact with the cation, regardless of their true interaction with it. The hydration number(HN) is the number of water molecules electrically influenced by the presence of the ion. Those twonumbers may differ significantly according to the ratio of the cation radius and its charge. Formonovalent ions, CN is greater than HN. For trivalent ions, HN may be greater than CN, suggesting thatthose ions strongly interact with water molecules beyond their first hydration shell. CN for some ionsmay vary inversely with the ionic strength of the solution.
33
Figure 3. (a) Structure of the water molecule (after Hochella and White, 1990)(b) Molecular structure of adsorbed water in the interlayers of halloysite
(kaolinite group)(after Sposito, 1984)
104.5°
1.4
0.96
1.2
3.3 Å
H H
O
+
=
+Dipole
H H
O
H2O
b
a

Studies on the mobility of water molecules in the hydration complex have been conducted byspectroscopic methods having the same timescales as the lifetime of those hydration complexes. Thestability of the hydration complex may be measured by the exchange rate and/or the mobility of thewater molecule in the hydration shell of the ion. The reciprocal value of the exchange rate gives themean residence time (τ) of a water molecule in the first co-ordination shell of the ion. Those may varyfrom picoseconds to days. Güven (1992) compiled the mean lifetimes of different hydration complexesand compared them with the lifetime of the water molecule in the liquid and solid phases. He pointedout that hydration complexes with mean residence time close to that of ice are to be considered as ratherstable (Figure 4).
Figure 4. Mean lifetimes of different hydration complexes (after Güven, 1992)
2.2 Clay/water interaction
Some solid particle surfaces tend to develop electric charges when in contact with a liquidphase. As a consequence, the structure of the water molecules in the neighbouring region may be
34
Methods andTime Domains
Infraredand Raman
Spectroscopy
10–9
10–6
10
103
106
109
1 fs
1 ps
1 ns
1 �s
1 ms
1 second
1 hour
1 day
Rh3+
Al3+
V3+Ga3+Fe3+
In3+Ti3+
U3+
La3+
Gd3+Ti3+
Cl–K+
Na+F–
Li+
Pb2+
Cu2+
Cd2+
Mn2+
Co2+
Ba2+
Ca2+
Zn2+
Fe2+
Mg2+
Ni2+
Be2+
V2+
Ru2+
Pt2+
Ru3+Cr3+
Residence Time (Lifetime)
OH Vibrations of Liquid Water
Liquid Water
Ice
OH Vibrations of Liquid Water
Liquid Water
Ice
� (s) �10–15–15
10–12–12
10–3–3
10–15
10–12
10–3
NeutronScattering
ESR
XRD andNeutron
Diffraction
NMR
Die
lect
ric
Rel
axat
ion
Spec
tros
copy

disturbed and differ from that of bulk water (Anderson and Low, 1958; Eger et al., 1979; Cases andFrançois, 1982; Fripiat et al., 1984). The region in which water molecule arrangements differ from thatof bulk water is defined as the region of adsorbed water.
2.2.1 Properties of adsorbed water
Low (1982) reviewed several thermodynamic properties of clay/water systems andqualitatively derives that the hydrogen bonds established between the solid and water are moreextensible and compressible, but also less deformable than the hydrogen bonds in the liquid structure.Thus, the thermodynamic, hydrodynamic and spectroscopic properties of water in clays differ fromthose of pure water (Sun et al., 1986). Low (1982) showed, for any thermodynamic property Ji near theclay, that:
where J0i is the same property of pure water, β is a constant and mw and mm are the mass of water and
the mass of clay respectively. That relationship seems to hold for high water content media, but cannotbe extrapolated to very low water content systems (Sposito and Prost, 1982).
2.2.2 Potential energy of soil and clay water
Water in contact with a solid phase, if in non-equilibrium conditions, will tend to move froma given point in a direction resulting from the combined effects of gravity, hydrostatic pressure and otherpossible forces, towards a position of lower energy. A number of potentials (pressure, matrix, osmotic,gravitational) of soil water are defined, according to all the possible forces acting on the water (Marshalland Holmes, 1979).
The combination of matrix and osmotic potential is called the “water potential”. The matrixpotential arises from the interaction of water with the solid particles in which it is embedded (capillaryand surface adsorption). The osmotic potential is due to the presence of solutes in porewater. The waterpotential is measured from the vapour pressure of porewater (e); since it is adsorbed by the matrix andcontains solutes, it is lower than that of pure, free water at the same temperature (e0). The quantity ofwater on which potentials are based may be a mass, a volume or a weight. The water potential expressedper unit mass (in joules per kilogram, J · kg-1) is equal to:
water potential = RTM–1ln (e/e0)
where R is the gas constant (8.3143 J·K–1·mol–1), T is the temperature in kelvins, M is the mass inkilograms of 1 mole of water (0.018015).
Potentials may also be expressed per unit volume in newtons per square metres (N·m2) orpascals (Pa), or per unit weight as lengths (head) in metres. The bar (102 kPa), whose magnitude is about1 atmosphere, and the unit pF, equivalent to the decimal logarithm of the suction expressed incentimetres, have been used in the past, and will be sometimes used in this study, although they are notpart of the International System. The values of the matrix potential in different situations, expressed inthose units, are indicated in Table 2.
Ji = Ji0exp β
mm
mw
35

When the influence of soluble salts may be neglected, the difference in water vapour pressuree/e0 may be used to calculate the matrix potential through the relationship:
ψ = RTM–1ln (e/e0)
Figure 5 shows the curves displayed by various clay minerals when reporting the watercontent versus the relative vapour pressure (or the matrix potential). As a reference, for values of e/e0higher than 0.989 corresponding to a matrix potential of –1.5 MPa, soil is moist enough to support plantlife, and water shows the same properties as bulk water.
Figure 5. Adsorption of water vapour by different clays (after Marshall and Holmes, 1979).Considering that the density of water is close to 1,000 kg·m–3, values expressed
per unit mass (kJ·kg–1) or per unit volume (kPa) are approximately equal
36
Conditions at
Matrix potential
the quoted potentialPer unit volume Per unit mass Per unit weight
kPa bar J·kg–1 m pF
Saturated or nearly saturated 10–1 10–3 10–1 10–2 0.0
Near field capacity 10 10–1 10 1 2.0
Near permanent wilting point 1.5·103 15 1.5·103 1.5·102 4.2
Air dry at relative vapour pressure of 0.48 105 103 105 104 6.0
Conversion from a matrix potential of h metres 9.8 h 0.098 h 9.8 h h log 100 h
Table 2. Matrix potential in different units for soil water(modified after Marshall and Holmes, 1979)
0.000.0 0.2 0.4 0.6 0.8 1.0
–218 –124 –69 –30 0
0.05
0.10
0.15
0.20
0.25
Kaolinite
Illite
Na-Montmorillo
nite
Ca-Montm
orillonit
e
Matric Potential, kJ kg–1 or MPa*
Wat
er C
onte
nt, g
g–1
Cla
y
Relative Vapour Pressure, e /e0

The notion of water potential, and its measurement, has been developed for systems notsaturated with water. In our case studies, a priori, the deep clays are fully saturated, but the process ofwater extraction involves in most cases the desaturation of the sample. That concept has beenintroduced, to show, as we will see later, that the total amount of water is not the prevailing parameter,but rather the strength with which the water is attracted to the solid surface. It is consequently assumedthat the same type and entity of forces between clay and water are acting in both the unsaturated and inthe saturated medium. A detailed discussion on the validity of that assumption may be found inHorseman et al. (1996).
2.2.3 Types of water in the clay/water system
Clay hydration involves adsorption of a number of water molecules on the exposed surfacesof clay particles. As a consequence, the specific surface area will influence the amount of adsorbedwater. Smectite, with its expanding crystal lattice, adsorbs much more water at a given value e/e0 thankaolinite, displaying larger crystals and a smaller specific surface area available for adsorption(Figure 5). Illite has an intermediate position.
Three adsorption processes seem to take place with the increase in water content (Figure 6):
a) Adsorption of water in the interlamellar space, inside clay particles (Type I), named“interlamellar water” (see also Figure 2);
b) Continuous hydration related to unlimited adsorption of water around primary clayparticles (Type II), named “intraparticle water”;
c) Free-water condensation in micropores (Type III), named “interparticle water”.
Figure 6. Different types of water (modified after Allen et al., 1988)
In a water-content versus pF plot (Figure 7), the three above-mentioned types may bedistinguished. Each of the adsorption stages involves different types of forces and water movementmechanisms (Güven, 1992). The first two fields strongly relate to the clay structure itself, and we willexamine them in more detail.
37
Type IInterlamellar Water
Type IIIntraparticle Pores
Type IIILarge Irregular Voidsand Interparticle PoresDomain of the "Free" Water

Figure 7. Water adsorption isotherms (after Decarreau, 1990)
In the first region, corresponding to very low water contents, adsorption occurs on thehydrophilic sites of the clay surface. Kaolinite-group minerals develop low surface charges, andtherefore only adsorb up to a monolayer of water molecules in the interlayers. A hydrogen bond is firstestablished between the water molecules and the basal oxygen atoms of the tetrahedral layer. At higherwater contents, the monolayer of water molecules is formed and bonds may be established between thewater molecules (Figure 3b). Given the constraints of the silicate structure, bonds have to adjust bystretching and rotating in order to minimise their energy. That results in a configuration that resemblesthat of bulk liquid water, as a compromise between the disorder of the liquid phase and the rigidarrangement imposed by the solid structure. Motion of the water molecules is consequently sloweddown because of the enhancement of the hydrogen bonding.
In 2:1-type clays, the presence of a cation adsorbed on the surface to balance electric chargedeficiencies is extremely important (Anderson and Low, 1958). In fact, it appears that the first stage of
38
0.01 2 3 4 5 6 7
1.0
2.0
3.0
0.5
1.5
2.5
3.5
4.0
log
[Wat
er C
onte
nt (
mg/
g)]
pF
IIIIII
a Kaolinite : and = Grain Size > 5 �m ; = > 2 �m
= Hectorite ; = Ca-Montmorillonite ; = Na-Montmorilloniteb
0.01 2 3 4 5 6 7
1.0
2.0
3.0
0.5
1.5
2.5
3.5
4.0
4.5
5.0
log
[Wat
er C
onte
nt (
mg/
g)]
pF
IIIIII

hydration proceeds through cation hydration. Water molecules are co-ordinated in a single solvationshell for monovalent cations and in a double shell for divalent cations. Hydrated vermiculites containinterlayer ionic solutions (De La Calle et al., 1985). Smectites hydrate in a very similar way: watermolecules tend to arrange around cations adsorbed in the siloxane cavities, and subsequently form amonolayer with a strained, ice-like structure.
Prost (1975) conducted an extensive study on the smectite hydration using IRS onprogressively deuteriated samples. He examined both the arrangement of the water molecules aroundthe clay particle and the disturbance induced on the clay structure by the presence of a water molecule.He distinguished three types of water molecules with different symmetries and links: those solvatingcations, those present around the clay particles and those not in contact with the solid. At very low watercontent (less than 10% weight, approximately equal to a water monolayer between clay layers)smectites only display the first two types of water molecules. Adsorbed water molecules show adifferent arrangement if the charge deficiency originated in the octahedral or tetrahedral layer. In thefirst case, as the permanent structural charge is lower and diffuse, one of the hydrogen atoms of thewater molecule is oriented towards the centre of the siloxane cavity, thus disturbing their OH functionalgroups (see later discussion). In the second case, hydrogen bonds are established between the watermolecule and the oxygen atom on the surface of the layer.
Another mechanism that seems to occur in the first hydration stage is capillary condensationat the contact points between particles and/or grains. Capillary condensation will continue andconstitutes the main adsorption mechanism in the previously defined second domain. That gives rise toType-II water in the interparticle pores. That water is still bound to the clay particles and formsmonolayers of water molecules, whose thickness is proportional to the water activity.
For values of e/e0 corresponding to pF < 3.5 for montmorillonites and 4 for kaolinites, we arein the third domain, corresponding approximately to the field of free water (Type III).
It is worth noticing that adsorption and desorption of water onto clays are often affected byhysteresis phenomena (Sposito and Prost, 1982). It is impossible to extrapolate information derivedfrom an adsorption isotherm to water desorption. That observation is normally justified in soils by theso-called “ink-bottle” effect, (Marshall and Holmes, 1979) a capillary effect arising from the differencein diameter of the pores and their openings. In clays, hysteresis is observed even if the clay remainssaturated during the cycle, and a capillary effect cannot be held responsible for that observation. Apossible explanation relies on particle rearrangement and pore-distribution changes during swelling andshrinking. That phenomenon has been extensively studied (Boek et al., 1995) and must be rememberedbecause of its possible consequences on the isotopic composition of the interstitial solutions.
2.3 Clay/solute interaction
Reactions between the solid and the solution involving mass transfer from the latter to theformer may be of three different types: adsorption, absorption and precipitation. Adsorption is definedas the process through which a net accumulation of a substance occurs at the common boundary of twophases (Sposito, 1984). It is essentially a two-dimensional process. Absorption corresponds to thediffusion of the adsorbed species into the solid-phase crystal lattice. Precipitation leads to the formationof a new bulk solid phase and is a three-dimensional process. All processes imply the loss of materialfrom an aqueous solution phase, and often may not be very clearly distinguished, especially in naturalsystems. In fact, the chemical bonds involved are sometimes similar and mixed precipitates may displaya component restricted to the surface because of poor diffusion. When no specific data are available, the
39

generic term “sorption” should be used. Laboratory studies often concentrate on a single type of clayand the reactions may be more readily identified. Cations adsorbed as inner-sphere complexes arecommonly designated as “specifically sorbed” or “chemi-sorbed”. Monovalent cations usually displaydifferences in the selectivity, mainly reflecting the formation of inner-sphere complexes. Eachmonovalent cation is settled into a siloxane ditrigonal cavity. Experimental differences may be relatedto the facility with which a monovalent ion may loose its hydration shell to fit into the siloxane cavity.Ions found in outer-sphere complexes or in the diffused ion swarm are non-specifically sorbed. That isthe case of most divalent cations, although it is proven that divalent cations may also form inner-spherecomplexes. The distinction also relates to the strength of the bonds linking the ions to the clay surfaces:outer-sphere ions exchange more readily than inner-sphere ions.
2.3.1 Sorption mechanisms
The effect of cation hydration is very important for the structure and properties of hydratedclays, especially regarding sorption by compensation of structural charge unbalance: cations with a lowhydration energy, such as K+, NH4
+, Rb+ and Cs+ produce interlayer dehydration and layer collapse, andare therefore fixed in the interlayer positions. Conversely, cations with high hydration energy such asCa2+, Mg2+ and Sr2+ produce expanded layers and are more readily exchanged (Sawhney, 1972). Thatdifference may be also regarded as the tendency of a given cation to form “inner sphere” or “outersphere” complexes (see next paragraph).
A second sorption mechanism on clays may be described in terms of reactions betweendissolved solutes and surface functional groups. The latter are reactive molecular units that protrudefrom the solid adsorbent into the liquid (Sposito, 1984). Analytical methods for their investigation aredescribed in Davis and Hayes (1986).
Clays display proton-bearing surface functional groups (Brönsted acids like OH). Hence,adsorption on those sites is pH-dependent. Different types of surface hydroxyl groups may bedistinguished, with different reactivities, depending on the co-ordination environment of the oxygen(Figure 8). Those are designated A, B, or C depending on whether the oxygen is co-ordinated with1, 3 or 2 cations, respectively. A sites are amphoteric (i.e., they may act as proton donors or else as basicsites forming a complex with H+). B and C type hydroxyls are considered as non-reactive, but may beturned into A type, depending on the pH of the solution.
A third type of sorption site results from the Lewis acidity of the metallic cation, enabling itto exchange an OH– ligand with a stronger Lewis base, such as F–, for example (Mortland and Raman,1968).
Densities of surface hydroxyl groups may be measured by IRS, isotopic exchange,thermogravimetry and reaction with OH labile compounds (James and Parks, 1982), while densities ofproton donors and acceptors are calculated from crystallographic considerations (Sposito, 1984).
The plane of oxygen atoms bounding a tetrahedral silica sheet in a silicate layer is called a“siloxane surface”. The functional group associated with the siloxane surface is called the “siloxanecavity”, formed by six corner-sharing silica tetrahedra. Thus, phyllosilicate minerals display, in additionto the previously described surface functional groups, rings of siloxane group located on the tetrahedralbasal plane. Linkage of the tetrahedral to the octahedral plane causes the distortion of the cavity fromhexagonal to ditrigonal. The reactivity of the siloxane cavity depends on the nature of the electroniccharge distribution in the phyllosilicate structure (Sposito, 1984). Cation substitutions within the layers
40

create permanent structural charges compensated by the complexation of mono or divalent cations intothose cavities.
In summary:
– Kaolinite has five types of surface functional groups: (1) the siloxane cavities on the facesof the tetrahedral sheets, (2) the aluminols (≡ AlOH–) on the faces of the octahedral sheets,and (3) silanols (≡ SiOH–), (4) aluminols and (5) Lewis acid sites on the edges of the claycrystal. In kaolinite, the degree of ionic substitution in the lattice is very low (< 0.01 ionper unit cell). As a consequence, the siloxane cavities are almost non-reactive. They will
41
Figure 8. Surface functional groups: a) Surface hydroxyls and Lewis acid sites ongoethite; b) Aluminols and silanols; c) The siloxane cavity (after Sposito, 1984; 1989)
A B C
H2O
OH
Lewis Acid Site
H2OLewis Acid Site
Aluminol
Silanols
b
a
c
Surface Hydroxyls
Kaolinite Surface Hydroxyls

therefore act as mild electron donors, binding only neutral and dipole molecules likewater. The most important surface complexation sites will be silanols, aluminols andLewis acid sites on the edges of the crystal. All of them are proton donors and may formcomplexes with metal ions. Aluminols are also proton acceptors and will be able tocomplex anions.
– Smectites, vermiculites and illitic micas have a significant permanent charge due to ionicsubstitutions. If those occur in the octahedral layer, the charge deficiency is distributed onten surface oxygen atoms of the tetrahedral sheet, belonging to four tetrahedra linked tothe site. The charge is diffuse and leads to the formation of outer-sphere complexes(Figure 9). If the substitution is directly in the tetrahedral sheet, the siloxane cavity bearsa localised charge deficiency. That enhances the formation of inner-sphere complexes.Since the K+ radius is very close to the diameter of the siloxane cavity (0.26 nm), it mayform a very stable complex.
Figure 9. Inner sphere and outer sphere complexes (after Sposito, 1984; 1989)
Clay minerals forming outer-sphere complexes have readily accessible siloxane cavities: as aconsequence, those cations are readily exchangeable. The clay in contact with the solution will tend toreact, thus populating those sites with the dominant cation of the solution (generally Ca2+, regardingabundance and affinity). Anion binding on clays occurs predominantly along the edges of the crystals.
42
Outer-SphereComplex Diffuse Ion
Inner-Sphere Complex
K+
H2O
Ca2+
Inner-Sphere Surface Complex :K+ on Vermiculite
Outer-Sphere Surface Complex :Ca (H2O)26
+ on Montmorillonite

2.3.2 Electric double layer
As we have already seen, clays develop an electric charge when in contact with a solution. Thenet total surface particle charge σP [C·m–2] is defined as:
σP = σS + σ0
where σS is the permanent structural charge, arising from cation substitutions in the clay lattice, and σ0is the co-ordinative surface charge, associated with the reaction of potential-determining ions with thesurface functional groups. The co-ordinative surface charge σ0 may be distinguished according todifferent contributions:
σP = σS + σH + σis + σos
σH is called the net proton charge: it is the difference between the specific charges of protonsand hydroxide ions complexed by the surface functional groups:
σH = qH – qOH
Values for σH are measured by titration as a function of the pH of the solution. σS and σH formthe intrinsic surface charges of clays, as they arise mainly from structural components.
The two other terms, σis and σos come from the inner and outer sphere complexes respectively.Their sum arise solely from the solution ions adsorbed on the surface (excluding H+ and OH–). Theymay be measured with specific ion-selective electrodes or by ion displacement methods. They aredistinguished based on the established links with the clay mineral: covalent bonding retains inner-sphere complexes, while outer-sphere complexes show only weak electrostatic bonding. For example,K+ in the inner sphere will contribute +1 molc, and Ca2+ in the outer sphere will contribute +2 molc tothose terms.
While σS is almost always negative, σH, σis, σos and the net particle charge σP may be eitherpositive, zero or negative, depending on the surrounding solution composition. If σP is not equal to zero,another balancing charge must be accounted for to preserve electroneutrality in the clay/water system.That arises from the ions that are not bound to the surface, but yet adsorbed in the diffusion ion swarm(σD). In that case, the sum of σP and σD is equal to zero.
Gouy (1910) and Chapman (1913) derived equations for describing the distribution of thecounterions in the diffuse ion swarm formed by a charged planar surface. The detailed derivation anddiscussion of the equation is given in Bolt (1982) and Sposito (1984). In the model, all the counterioncharge σD is present as dissociated charge, and electroneutrality is given by:
σP + σD = σ0 + σS + σD = 0
while σD for a symmetrical electrolyte with ions of charge z at 25°C is derived from the Poisson-Boltzmann equation:
σD = –0.1174 I ⋅ sinhzeψ0
2kT
43

ψ0 being the electric potential at the surface. Thus, the calculated potential decays exponentially withthe distance from the clay particle surface (Figure 10). That relation is valid for symmetricalelectrolytes, while for asymmetrical ones, a different charge/potential relationship is involved (Hunter,1989).
Figure 10. Schematic drawings of the electric double layer according to the Gouy-Chapman and Stern-Grahame models (after Hochella and White, 1990).
The relationships shown assume σS = 0
The Gouy-Chapman theory was found to be in poor agreement with experimental data. Stern(1924) and Grahame (1947) introduced a few modifications taking ion size into account. In their model,some ions may be bound to the surface by specific adsorption on a plane very close to the chargedsurface. As a consequence, the particle surface charge is balanced by the charge in the “Stern layer”(β plane) and the dissociated charge:
σP + σβ + σD = 0
The potential decays linearly between the planes of the Stern layer (also known as “innerHelmholtz plane” and “outer Helmholtz plane”) and then exponentially, according to the Gouy-Chapman equation (Figure 10).
Points of zero charge are pH values at which some of those contributions to the particle chargeturn to zero (Table 3). In particular, at the point of zero charge when σP is equal to zero, clay particlesdo not move in an applied electric field. That may also cause settling and flocculation, enhancing thecoagulation effects.
44
++
Localized NegativeSurface Charge
++
++
+
+
SolidSolution
Diffuse Layerof PositiveCounterion
Charge
σdσo
ψo
0
Positive
Negative
++
++
++
+
+
Solution
σd
Solid
σo σβ
o dβ
Compact orStern Layer
ψo ψβ
ψd
0
σo + σd = O
ψo = ψd
σd = – 0.1174 l sinhze ψo2kT
Gouy-Chapman Model
σo + σβ + σd = O
σd = – 0.1174 l sinhze ψd2kT
ψo – ψβ = σoC1
σdC2
ψβ – ψd = = –σo + σβ
C2
Stern-Grahame Model
Distributionof Charge
Distributionof Potential

2.3.3 Dissolution and precipitation
In the presence of an aggressive fluid (e.g., fresh water), clay minerals may dissolve and theamount of resulting species in the water increase. At a given level of concentration, some of them maycombine chemically, and neo-formed phases may precipitate. The saturation effect is responsible for thelimitation of the concentration of the geochemically controlled elements in natural fluids. Thatphenomenon is very important for modelling the groundwater chemistry (see Chapter III).
3. POROSITY, SALINITY AND HYDRATION
3.1 High-water content systems
Porosity has been studied extensively, especially during the clay evolution from sedimentaryto low metamorphic through diagenesis (see Horseman et al., 1996 for a good review).
In very dilute solutions, clay particles tend to aggregate, in particular conditions, into stacksof roughly-parallel single layers, called “quasi-crystals” (Quirk and Aylmore, 1971). That particlestructure is stabilised by the attractive forces between the basal planes of single-layer platelets mediatedby adsorbed cations and water (Sposito, 1984). Quasi-crystals appear to form from any bivalent cationand any smectite (Sposito and Prost, 1982; Sposito, 1992): montmorillonite forms quasi-crystalscomprising stacks of four to seven layers. Ca2+ ions, solvated by six water molecules (outer-spherecomplex), serve as molecular cross-links to help the clay layers bind together through electrostaticforces. Large monovalent (K+, Cs+) ion-containing smectites may also form quasi-crystals, butinterlamellar hydrates may be limited to one or less layers (Güven, 1988). When sodium and lithiuminterlayer cations are immersed in an aqueous solution, the clay is often dissociated in individual silicatelayers, whose hydration complexes consist of a continuous diffuse double layer. Such a set of smectitelayers that are separated by their overlapping double layer is called “tactoid”. That type of hydration isnot limited as for quasi-crystals; it is named “osmotic swelling” and is found to be inverselyproportional to the square root of the salt concentration of the solution (Norrish, 1954). The existenceof sodium-saturated smectite quasi-crystals in stacks of two single-layer platelets with three layers ofwater molecules between them has also been indirectly reported (Sposito, 1989).
At very low densities of the clay/water system, there seems to be evidence of an edge/facemode of flake association, while, as density increases, the face/face mode of association is more likely.Water and solutes are then retained as interlamellar solutions (or internal water) or in the voids betweenstacks (external solutions) (Pusch and Karnland, 1986; Pusch et al. 1990). As permeability decreases
45
Definition Charge properties
pH point of zero charge (pHPZC) σP = 0
pH point of zero net proton charge (pHPZNPC) σH = 0
pH point of zero net charge (pHPZNC) σis + σos + σD = 0
pH isoelectric point (pHIEP) σD = 0
Table 3. Points of zero charge (modified from Sposito, 1989)

(i.e., the large pores are compressed and water expelled), the ratio of external to internal waterdecreases.
Many studies have been conducted on the chemistry of solutions expelled by compactingclays during diagenesis to explain the high salinities found in those formations (Engelhardt and Gaida,1963; Chilingarian et al., 1973; Rosenbaum, 1976; Lawrence and Gieskes, 1981). Those studies showeda concentration decrease of the expelled solutions with increasing pressure. Compaction rate and claytexture are influenced by the salinity of the solution: compaction would proceed more rapidly and clayplatelets would be less arranged in the presence of an electrolyte. Those phenomena are not observedfor kaolinite, indicating that the cation exchange capacity of the clay would be responsible for them. Amodel based on the Donnan principle (Appelo, 1977) was found to describe adequately the expulsionmechanism. The anion concentration should be lower next to the particle surface, and consequently theliquid immediately surrounding a clay particle should contain fewer electrolytes than the free solution.During compaction, the free solution would be removed and the electrolyte-poor solution of the electricdouble layer left behind. High salinities in the free porewater would prevent clay platelets to come tooclose to each other, thus increasing the permeability and the disorder of the structures. Compactionwould proceed more rapidly because of the higher permeability maintained (Hardcastle and Mitchell,1974).
In normally compacted zones, shale porosity and porewater salinity are reciprocal. If no saltwere lost by fluid expulsion, a unit volume of shale after compaction would contain more salt thanbefore compaction. It is found (Magara, 1974 for the Gulf Coast) that the salt content is approximatelythe same before and after compaction. As a consequence, calculated salinity of expelled fluid accountsfor about one-third of the original salt content. In undercompacted zones, porewater salinities are lower,but the product salinity-porosity decreases, indicating an additional “refreshening” of the solution. Inalternating clay/sand sequences, the distribution of porosities and salinities within the clay layers showsthe presence of additional mass transport mechanisms, such as osmotic flow (Hall, 1993). Besides,laboratory experiments showed a semi-permeable behaviour of clay membranes with respect to solutesand isotopes (Coplen and Hanshaw, 1973; Hanshaw and Coplen, 1973; Kharaka and Berry, 1973;Kharaka and Smalley, 1976; Charles et al., 1986; Phillips and Bentley, 1987; Demir, 1988). Thatmechanism would enhance transport across the clay for divalent cation over monovalent in a selectivitysequence approximately related to their ionic radius. We will not review in more detail the flow andtransport mechanisms within and across clay formations. Horseman et al. (1996) produced a verydetailed and updated monograph on that topic.
3.2 Low water-content systems
At the other end of the hydration spectrum, studies have been conducted on dry clays,especially smectites, incorporating water molecules. The interlamellar hydration of clays by a water-vapour phase has been well documented by Hendricks et al. (1940), Mooney et al. (1952 a; b), Norrish(1954), van Olphen (1965; 1969), McEwan and Wilson (1980), Suquet et al. (1975; 1977), Suquet andPezerat (1987), Kraehenbuehl et al. (1987), Kahr et al. (1990) and Yormah and Hayes., 1993. Theinterlamellar-hydration phase generally begins with the formation of primary hydration shells of theinterlayer cations, prior to the monolayer coverage of the clay surface.
Prost (1975) combined his observations obtained with IRS on hectorite with structural dataand computed, for low water-content systems (< 10%) the percentages of the clay surfaces covered bywater and the percentage of water not in contact with the clay as a function of the clay water content.He found that those percentages were very different for the same clay, depending on the type of
46

saturating cation. According to those observations, the hydration energies of cations play a prevailingrole in defining the amount of adsorbed water (Figure 11).
Figure 11. Evolution of the water content of a smectite as a function of the saturating cation(after Decarreau, 1990)
Sposito and Prost (1982) concluded from IRS studies, that solvation of the exchangeablecations either by three (monovalent ions) or more (bivalent ions) water molecules forms the first stageof water adsorption on smectites. As a consequence, interlamellar spacing has to expand in order toaccommodate water molecules (Karaborni et al., 1996). Additional hydration results in the formation ofsolvation complexes or sheaths for the exchangeable cations. Besides, investigations of the dielectric-relaxation properties of montmorillonite saturated with monovalent exchangeable cations indicate thatwater in the interlamellar space is arranged in a monolayer with an ice-like structure: some of the watermolecules are thought to be strongly associated with the oxygen atoms on the silicate surface. Instead,in calcium-saturated montmorillonite, the cation tends to bind the solvation shell strongly, eventuallydisturbing the water lattice.
Pusch and Karnland (1986) and Pusch et al. (1989, 1990) attempted, based on microstructuralanalysis, to evaluate the porosity and discriminate between internal (interlamellar) and external water.It is concluded that smectite-rich materials hold an amount of internal water that mostly depend on thebulk density of the clay/water system. Tardy and Touret (1987) found that the water content of smectitesincreases exponentially as the relative vapour pressure is increased from 0.96 to 1.0. Upon saturation ofclay, the microstructure of clays appears to be the main factor in the hydration process. High-resolutiontransmission electron microscope (TEM) and small-angle neutron-scattering studies by Tessier andPedro (1987), Ben-Rhaiem et al. (1987) and Touret et al. (1990) also documented the water partitionover three kinds of pores (interaggregate, intra-aggregate and interlamellar) (Table 4). They concludedthat in saturated clays most of the water seems to occur in the inter and intra-aggregate pores, whosedimensions are determined by the morphologic features of smectite particles, such as lateral extensionand flexibility of smectite films. On the other hand, since an increase of the ionic strength of the solutionproduces coagulation of the particles, for any particular porewater salinity there is a unique relationshipbetween internal and external water (Pusch and Karnland, 1986) (Figure 12).
47
00.01 0.1 1.0 10 100 1 000
5
10
15
20
0
2.5
5
7.5
Wat
er In
dex
� (
% V
olum
e)
Wat
er C
onte
nt (
% W
eigh
t)
P (bar)
Béthonvilliers Smectite 10–3 M1st Drying
NaKMgCa
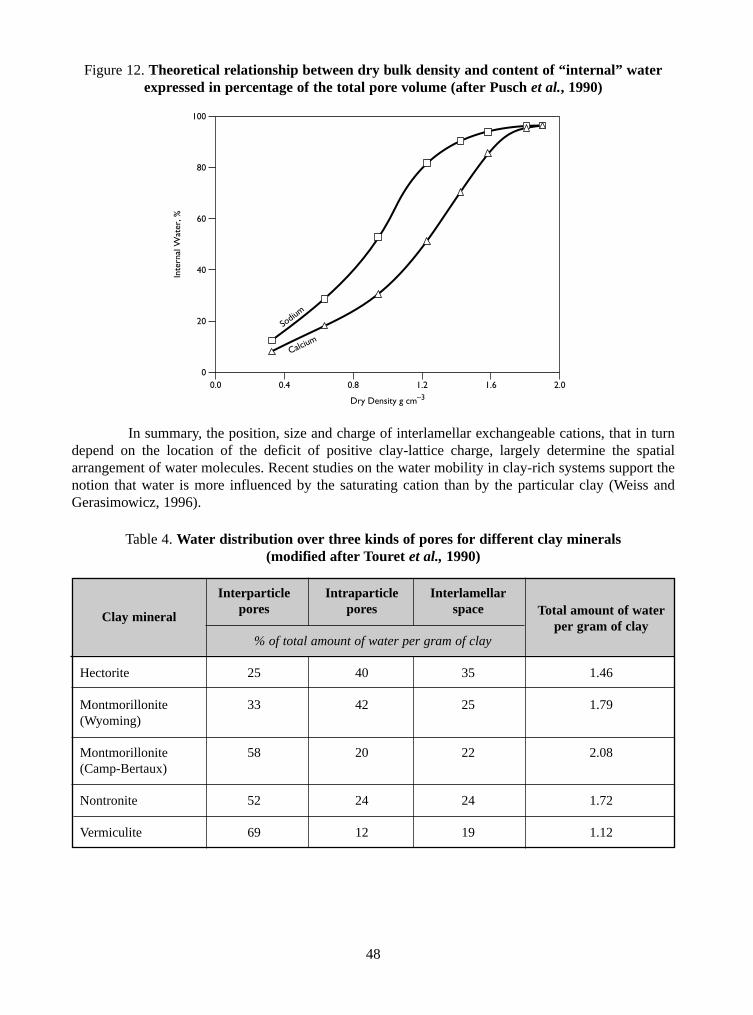
Figure 12. Theoretical relationship between dry bulk density and content of “internal” waterexpressed in percentage of the total pore volume (after Pusch et al., 1990)
In summary, the position, size and charge of interlamellar exchangeable cations, that in turndepend on the location of the deficit of positive clay-lattice charge, largely determine the spatialarrangement of water molecules. Recent studies on the water mobility in clay-rich systems support thenotion that water is more influenced by the saturating cation than by the particular clay (Weiss andGerasimowicz, 1996).
48
00.0 0.4 0.8 1.2 1.6 2.0
20
40
60
80
100
Inte
rnal
Wat
er, %
Dry Density g cm–3
Calcium
Sodiu
m
Clay mineral
Interparticle Intraparticle InterlamellarTotal amount of waterpores pores space
per gram of clay% of total amount of water per gram of clay
Hectorite 25 40 35 1.46
Montmorillonite 33 42 25 1.79 (Wyoming)
Montmorillonite 58 20 22 2.08 (Camp-Bertaux)
Nontronite 52 24 24 1.72
Vermiculite 69 12 19 1.12
Table 4. Water distribution over three kinds of pores for different clay minerals (modified after Touret et al., 1990)

3.3 Chemical porosity
A few interesting studies relate to pore-size distribution and to pore accessibility to solutions.Unless organic hydrophobic matter coats the pore walls, water usually wets their surface. As thehydration boundary may extend as far as 10 nm (Yariv and Cross, 1979), the degree of water“immobilisation” is greater near the pore walls than in the centre of the pore. If pores are less than afew tens of nanometres in diameter, the water and the solutes cannot flow unless a threshold pressuregradient is exceeded. In addition, because of the negative charges developed by the clay mineralsurfaces, some regions of the pores may be precluded access to negative ions.
As a consequence, different types of porosity may be defined (Pearson, in press):
– Physical porosity is the ratio of void volume to total volume. For fully saturated clays,total physical porosity (nt) may be calculated from the dry bulk density ρb and the averagegrain density of the mineral solids ρs:
That porosity includes isolated pores and fluid inclusions.
– Water content porosity (nwc), describing the connected, rather than the total, porosity isdetermined by the difference in weight between the dry sample and the water-saturatedsample. It is important to notice that, for mudrocks, the amount of water loss depends onthe drying conditions, which will in turn determine the amount of interlamellar waterremoved from the sample. In general, the total physical porosity is greater or equal to thewater-content porosity:
nwc ≤ nt
– Transport porosities refer to the velocity of a substance in a fluid. As a consequence, theyare not only a property of the rock but also of the substance being transported. Thoseporosities are derived from tracing experiments and may be distinguished, based on themain transport mechanisms, as advection porosity (nadv) and diffusion porosity (ndiff). Forits definition, advection porosity does not take into account isolated pores and poresopened only at one end. In mudrocks, it is normally found, for the water molecule itselfthat:
nadv ≤ ndiff ≈ nwc ≤ nt
while for any other substance:
nadv < ndiff < nwc ≤ nt
– Geochemical porosity (Pearson, 1998; in press) represents the fluid volume in whichreactions occur. It is required for geochemical and reactive transport modelling. It issimilar to transport porosities, and in clay-rich materials is closer to diffusion porosity.
nt = 1 –ρb
ρs
49

In coarse-grained rocks, all porosity types are approximately equal because of the lack or theminor influence of attractive and repulsive forces exerted by the solid phase. Pearson (1998) reportedestimates of those different porosity types for clay-rich rocks (London clay, clay-rich Canadian tills,Boom clay, Opalinus clay and Palfris marl). According to those calculations, geochemical and diffusionporosities for water molecules are the same and are equal to water-content porosity. Geochemical anddiffusion porosities for solutes that do not have access to interlayer or surface sorbed waters are onlyone-third to one-half of the water content porosity. Those values vary with the salinity of the solution,since that is shown to modify the thickness of the double layer and the pore-size distribution due toosmotic swelling (Karnland, 1997). That observation is of primary importance for the calculation of theporewater composition derived from leaching experiments.
4. ORGANIC MATTER
4.1 Definition, origins and composition of the organic matter
Organic matter has been the focus of special attention since its importance as sink for tracemetals and radionuclides was established (Sposito, 1984; Buffle, 1984; 1988; Yong et al., 1992). Theorganic-matter content of a soil or sediment originates from the biological activity hosted by theenvironment. In soils, humic substances are the major organic constituents, arising from the chemicaland biological degradation of plant and animal residues (Schnitzer, 1978). Various types of organicsubstances may be found in sediments, including aliphatic and aromatic hydrocarbons and non-hydrocarbons geopolymers known as bitumen and kerogen (Yariv and Cross, 1979). The organic-mattercharacterisation of rocks may provide information on the biological input, the palaeodepositionalenvironment, and the degree of maturity and degradation. In our discussion, we will try to define anddistinguish within the organic matter, the soluble fraction, that may be found in porewaters, from thesolvent extractable fraction (bitumen) and the non-extractable fraction (kerogen). Those three fractionsshow different properties and are related in different manners to the main topic of this study.
In surface waters and groundwaters, the total organic carbon (TOC) includes the particulateorganic carbon or POC (size > 0.45 µm) and the dissolved organic carbon or DOC (size < 0.45 µm),the latter representing in most natural water systems more than 90% of the total (Thurman, 1985a).Plant or animal debris, bacteria and mineral particles, like clays coated with adsorbed organicsubstances, make the POC.
Most of the efforts in recent years have been put in the isolation, purification andcharacterisations of the different forms of DOC. Some components, approximately 20% of the DOC,may be identified by using specific techniques such as gas and liquid chromatography coupled withmass spectrometry or spectrophotometry. However, because of the complexity of their structure, theother fractions may only be defined as a function of the technique used to separate them. Leenheer(1981) proposed analytical procedures to fractionate the bulk DOC, according to which DOC isconstituted by:
– Humic substances including fulvic and humic acids;
– Non-humic substances, including hydrophilic acids, carbohydrates, carboxyl acids, aminoacids and hydrocarbons.
Their proportions vary in different environments: in surface and subsurface waters, humicsubstances represent 40 to 60% of the DOC, while in deep groundwaters hydrophilic acids account for
50

more than 50% of the DOC. Humic substances are divided in fulvic acids that remain in solution overthe whole range of pH, and humic acids that precipitate at low pH (Thurman, 1985b).
The chemical structure of humic substances is not completely defined, even if a number ofmodels are proposed in the literature (Schnitzer, 1978; Hayes, 1985). They may be regarded as three-dimensional polymers with a high molecular mass, and a more or less aromatic character.Schematically, they are constituted by an aromatic polycyclic nucleus at which lateral chains of proteinsor polypeptides are fixed through amino-acid bindings. There is no clear structural separation betweenfulvic and humic acids, nor a clear idea of their relationship (i.e., whether fulvic acids are the precursorsof humic acids or vice versa) (Andreux and Munier-Lamy, 1994). Hydrosoluble acids may be regardedas low molecular mass compounds of the hydrophilic fraction, in contrast to humic substances showinga higher molecular mass. The difficulties met in their isolation and purification in a sufficient amounthas prevented up to now a reliable study of their behaviour with respect to radionuclides. However, arecently developed extraction method (Dierckx et al., 1996; Devol-Brown et al., 1998) offers interestingnew perspectives.
Two main origins for the DOC are possible (Thurman, 1985b). A pedogenetic origin leads tothe formation of humic substances via the decomposition of plant and animal debris by micro-organisms that transform them into sugars, polyphenols and modified lignin (humification). Theremaining part is the lignin itself. Those four types of compounds, in combination with aminocompounds, form humic substances through four different reaction pathways (Felbeck, 1971; Schnitzer,1978; Beaufays et al., 1994), that account for the variety of the final product. Water percolating throughthe soil is then responsible for the transport of soluble fractions into the aquifer. A sedimentary originof the DOC is also possible. Recent sediments contain organic products very close to those that may befound in soils, corresponding to the decomposition of plant and animal debris. Organic matter tends toevolve during diagenesis, catagenesis and metagenesis, forming kerogens and oils (Figure 13). Theultimate stage is reached during metagenesis with methane formation (see Yariv and Cross 1979, for amore detailed summary). If, later, the sediment becomes an aquifer, the water will leach the remainingorganic products. According to the chemical conditions, especially redox level, humic and fulvic acidsthat may be released by the sediment will vary in proportions with the maturity of the sediment (Oremand Hatcher, 1987).
4.2 Properties of the organic matter
Humic substances, like all biopolymers (proteins, polysaccharides, etc.) show four propertiesthat account for their behaviour (Sposito, 1984):
– Polyfunctionality: the existence of a variety of functional groups and a broad range offunctional group reactivity;
– Macromolecular charge: the development of an anionic character on a macromolecularframework, with the resultant effects on functional group reactivity through molecularconformation;
– Hydrophilicity: the tendency to form strong hydrogen bonds with water moleculessolvating polar functional groups like COOH and OH;
– Structural liability: the capacity to associate intermolecularly and to change molecularconformation in response to changes in pH, redox condition, electrolyte concentration andfunctional-group binding.
51

The degree of complexity resulting from those four properties is much larger for humicsubstances than for other biomolecules, as they reflect the behaviour of interacting polymeric moleculesinstead of the behaviour of a structurally well-defined single type of molecule.
The soluble organic matter is known to form strong complexes with metal ions. It is heldresponsible for the modification of toxicity in heavy metals by changing their bioavailability throughthe formation of either soluble or insoluble complexes (Yong et al., 1992). That property also influencesthe trace elements of the porewater chemistry.
Organic matter bound to clay particles presents a reactive surface to dissolved solutes in thesolution. As a consequence, it may play a role in the buffering of proton and metal cation concentrationin the porewater solution. That is achieved via cation exchange, involving proton-bearing surfacefunctional groups and dissolved cations. The most important functional groups in soil humus and theirstructural formulae are shown in Figure 14.
The association between the solid phases and the insoluble organic matter is not very wellunderstood because the structure of the organic matter is poorly defined. Nevertheless, the samestructural groups, as defined in Figure 14, are also responsible for the binding of the organic matter andthe clay particle. That may be due to many mechanisms, including cation exchange, protonation, anionexchange, water bridging, cation bridging, ligand exchange, hydrogen bonding and van-der-Waalsinteractions. Because of the complexity of the subject, a review of the clay/organic-matter interactionsis beyond the scope of this report (see e.g., Theng, 1974).
52
Figure 13. Evolution of the organic matter during diagenesis (after Tissot and Welte, 1978)
LivingOrganisms
RecentSediment
Principal Zoneof Oil Formation
Diagenesis
Catagenesis
Zone ofGas FormationMetagenesis
Lignin Carbo-hydrates Proteins Lipids
Fulvic AcidsHumic Acids
Humin
Kerogen
Thermal Degradation
Craking Craking
HydrocarbonsLow to Medium MW High MW
Methane +Light Hydrocarbons
Gas
Carbon Residue

5. CLAY ENVIRONMENTS RELEVANT TO THIS STUDY
This report aims to review the possible artefact related to the extraction of water and solutesfrom clay-rich environments with low water content. The targeted applications are a number of sitescurrently under investigation in different countries. Throughout the report, cases where the examinedtechniques have been applied to such environments are reported. Table 5 summarises the maincharacteristics of those study sites in order to provide a quick reference to their properties.
53
Figure 14. The organic surface functional groups in soil clays (after Yong et al., 1992)
O
O
CH+3
O+OH–
Phenolic
C C C C CCarbon Skeleton
Methoxyl
AmineNH+
x
CarboxylCOOH–
HydroxylOH–
Quinone
CarbonylCO+

54
Site nameStratigraphic Stratigraphic
Clay mineralogy (% weight)4 CEC Water content Water TDSReferences
unit (name) unit (age) (meq/100g) (% dry weight) type mg/l
Tournemire Toarcian/ Jurassic Clay min. 20-50% (I 15-25, C 2-5, K 5-20, 8-12 total rock 1-4 Na Cl ~ 1,300 NEA/SEDE, 1998;(France) Domerian (Lias) I/S 0-15); Qz 10-25%; Cc 10-52%; Py 0-3%; 12-25 < 2 µm (HCO3) Boisson et al., 1998
Org. C 0-6% fraction
Haute Callovo- Jurassic Clay min. 40-45% (I 0-30, S 10-20, C 5-20, 10-20 4-8 Na Cl > 4,000 NEA/SEDE, 1998Marne/Meuse Oxfordian (Dogger/ K 20-30, I/S 5-10, C/S 5-10); Qz 25-30%; (SO4) (France) Malm) Cc 25-30%; Py < 1.5%
Gard Albian/Aptian Cretaceous Clay min. 30-40% (S 30-40); Qz 30-50%; 20-40 < 2 µm < 10 Na Cl > 10,000 NEA/SEDE, 1998(France) KF traces; Cc 10-25%; Org. C <1% fraction (SO4)
Mont Terri Opalinus ton, Aalenian Clay min. 40-80% (I 12-25, C 3-18, K 15-37, 10-14.5 3-7.5 NaCl SO4 10,000- NEA/SEDE, 1998;(Switzerland) Opalinus clay I/S 5-20); Qz 10-32%; KF 0-6%; Ab 0-3%; 20,000 Pearson et al.
Cc 4-22%; Py 0-3%; Org. C 0-0.5% (in preparation)
Wellenberg Palfris Berriasian/ Clay min. 10-50% (I 3-20, C 2-12, K 0-15, 8.5 0.5-1.5 NaHCO3 2,000 NAGRA, 1997(Switzerland) formation Valanginian I/S 2-17); Qz 5-21%; Ab 0-2%; Cc 20-80%; Na Cl ~12,000 NEA/SEDE, 1998
Py < 2%; Org. C 0.2-1.4%
Serrata Pliocene Clay min. 93% (S 93%); Qz 2%; Pl 3%; 110 25-28 Na Cl 4,000 ENRESA, 1998;(Spain) Cr 2%; KF traces; Cc traces (SO4) Fernández et al., 1998
Mol Boom clay Rupelian Clay min. 50-60% (I 20-30, S 10-20, C 5-20, 30 ± 3.9 (Ag-TU) 19-24 Na HCO3 1,500 NEA/SEDE, 1998(Belgium) K 20-30, I/S 5-10, C/S 5-10); Qz 20-30%; 24.4 ± 3.4 (Sr)
KF 5-10%; Cc 1-5%; Py 1-5%; Org. C 1-5% 23.3 ± 3.1 (Ca)
(United Oxford Clay Upper/Middle Clay min. 40-58% (I 14-33, C < 5, K 14-33, 9-20 Na Cl SO4 27,000 NEA/SEDE, 1998Kingdom) Jurassic I/S traces); Qz 11-28%; KF traces; Cc 0-2%;
Py 0-3%; Org. C 1-5%
Table 5. Summary of the main characteristics of the study sites mentioned in this report
4. C = chlorite; Cc = carbonates; Cr = cristobalite; C/S = interstratified chlorite/smectite; I = illite; I/S = interstratified illite/smectite; K = kaolinite; KF = K feldspar;Org. C. = organic carbon; Pl = plagioclase; Py = pyrite; Qz = quartz; S = smectite.

PART II
EXPERIMENTAL METHODS
1. FIELD TECHNIQUES FOR FLUID EXTRACTION AND CHARACTERISATION
1.1 Piezometer and borehole drilling
In-situ water-extraction techniques normally involve drilling. A good review of the availabledrilling tools for unconsolidated and consolidated sediments is reported in Wijland et al. (1991).Drilling operations should be carefully planned in order to avoid a permanent contamination of theenvironment from drilling fluids (Tshibangu et al., 1996). In fact, in very low water-content systems,long delays are required before purging the system from that type of contamination, and cases arereported where a representative formation fluid could never be recovered (NAGRA, 1997). In principle,the use of an “equilibrated” fluid would be recommended, to which a tracer may be added. In practice,solutions are selected based on their availability and normally consist of surface waters. The waterflowing from the Cernon fault, a major discontinuity intersecting the formation, has been used in mostdrilling work in the Tournemire Tunnel. That water naturally contains tritium, and that component isconsequently considered the reference tracer. It is worth noticing that, in the absence of intersectingfracture systems, no water flowing from boreholes could even be collected in the Tournemire claystone.All investigations are conducted using core samples. Contamination of those samples is restricted to theouter rim, and may easily be eliminated.
An alternative to the use of drilling fluid is air drilling. That solution is considered in anincreasing number of studies (Yang et al., 1990; Griffault et al., 1996; Thury and Bossart, inpreparation), at least for relatively short boreholes. It has the advantage of being far less contaminatingand allowing to see actually humid zones intersected by drilling. On the other hand, drilling has toproceed slowly and costs are considerably increased. The main disturbance consists of a desaturation ofthe environment, and consequently, in the increase of oxidation processes. Besides, the lack of addedtracers does not allow understanding of the entity and of the duration of the induced disturbance. Asmall contamination from hydrocarbons, possibly coming from the compressor oil used for air drilling,has been detected in the organic matter extracted from the clay samples of the Mont Terri Tunnel (Thuryand Bossart, in preparation). On the other hand, no contamination of the water collected in the boreholesor squeezed from the rock samples has been observed.
One of the main objectives of the ARCHIMEDE project at the HADES facility (Mol,Belgium), was to obtain mechanically, thermally and physico-chemically undisturbed clay samples.Some piezometers have been introduced by pushing a set of stainless-steel cutting bits into the clayformation at elevated pressure (20 MPa). That technique, although only applicable in “soft clays”,allows the recovery of clay samples without torsion or rotational movements causing fracturation andlocal heating of the clay. The main disturbance is the high compression of the clay at the cutting edge.
55

In order to eliminate the strongly compressed clay debris, the borehole had to be rebored after eachsample collection, thus partially limiting the core recovery.
1.2 Piezometers and borehole equipment
Boreholes to be used in investigations in low-permeability media may be divided into twogroups, based on the technical requirements for different depths (Wijland et al., 1991). Shallowboreholes, up to 600 m deep, may be drilled without the use of casing, with the exception of the stove-pipe, to be placed in the upper part in order to prevent flushing of the superficial sediments. The use ofPVC tubing, chemically inert with respect to the solutions is suggested. Minimum diameters forobservation wells are 1 inch, while 2-inch diameters at least are required to perform production tests.Deeper boreholes have to be protected by steel casing and require additional backfill material (gravel orcement) to fill the space between the rock wall and the casing. If steel and concrete are used, that willcause an important contamination of water samples. If a stainless-steel well casing is used, thecontamination is reduced and mainly concerns trace elements, but costs are increased.
Most of the in-situ migration studies performed at the HADES facility (Mol, Belgium) wereperformed using piezometers. That allowed the SCK staff to acquire an impressive expertise in thatfield. Geochemical investigations through piezometers were selected mainly because early attempts toobtain porewater from the clays via ultracentrifugation or squeezing had failed, despite the rather highwater content of the formation (~ 20% weight) (Beaufays et al., 1994). In addition to conventionalpiezometers using a backfill material, self-sealing piezometers have been installed, relying on thenatural convergence of the Boom clay. The main advantages of those piezometers consist in the absenceof filling material, the possibility of drilling in all directions, minimising contamination and a smalldead volume allowing a relatively fast water renewal in the piezometer. More than 100 piezometers ofdifferent types (single-screen, multi-screen, long cylindrical screen, flat-screen) were installed, inaddition to piezometer-nests (Figure 15) with 19 filters each. Piezonests are based on the same self-sealing principle and allow to determine the porewater pressure as a function of the distance from thegallery and to run simple migration experiments. Besides, they allow sampling of porewater forchemical and isotopic analyses.
The piezometers are used to measure the porewater pressure and flow rate in order todetermine the hydraulic conductivity. The values found for the different set-ups are in good agreement,despite the large difference in geometry and size of the filters (up to four orders of magnitude). Inaddition, in-situ values for hydraulic conductivity are the same as those obtained on small-scalelaboratory experiments, in contrast with what is reported in current literature (Beaufays et al., 1994).
Samples collected in the self-sealing boreholes are considered fairly representative of theporewater chemistry, allowing the description and modelling of the solid/water interaction (Griffault etal., 1996). Stable isotopes instead appear to be affected by a fractionation very similar to that observedfor water samples obtained from the clays by sample squeezing. That similarity is not surprising if weconsider that, because of the hydraulic and lithostatic pressure, the plastic clay around the piezometeractually squeezes the waters into the collecting cells. The data points plot below the global meteoricwater line.
In the frame of the ARCHIMEDE project funded by the European Community, a big efforthas been put in the installation of seven especially designed boreholes, among which two sterilepiezometers for porewater sampling and a 20-m borehole for clay sampling in aseptic and anaerobicconditions for microbiological investigation.
56

The design of sterile borehole drilling required a very careful examination of the sterilisingprocedure for drilling and sampling tools (Griffault et al., 1996). When possible, tools were sterilisedwith a 1.5% formaldehyde solution. The borehole for clay collection was drilled using sterilised cuttingbits to preserve the sample from external microbial contamination. Piezometers for porewater samplingwere air-drilled. Air represented a possible source of contamination, since it could not be filtered. Testswere conducted to check the degree of air penetration in the cores. Those showed little contaminationbut, for more precaution, the outside rim of the samples was trimmed before packing. Piezometers werepreserved with previously sterilised castings, and included five filters each. The seals of the castingswere welded with a blowpipe. In one of the piezometers, the tubing was heated at approximately 180°Cbefore emplacement, thus sterilising locally the external surface of the borehole. That sterilising methoddrastically increased the pyrite oxidation, due to the elevated temperature and the presence of oxygenduring the piezometer conditioning. Five years later, the effects of the chemical disturbance were stilldetectable (H. Pitsch, CEA, personal communication).
1.3 Field techniques for fluid extraction
1.3.1 Under-vacuum water extraction
Under-vacuum samplers were mainly developed for the collection of soil solutions. We willnot describe those devices in detail, as their design cannot be adapted directly to the relevant clayenvironment. Nevertheless, some global considerations on the disturbance induced by those techniquesmay also apply to our case studies. Litaor (1988) reviewed all the available types of soil-watercollectors. The problem of the disturbance of the medium is considered, since the water movement maybe easily disturbed in soil by the preferential path created during the installation and by the modifiedsuction gradient. The main conclusion of his review concerning under-vacuum ceramic cups is that theapplied suction should not exceed the soil suction, in order to minimise the loss of volatile compounds.Important changes are observed in pH and redox potentials of the collected solutions, and eventually a
57
������@@@@@@������ÀÀÀÀÀÀ������@@@@@@������ÀÀÀÀÀÀ������@@@@@@������ÀÀÀÀÀÀ������@@@@@@������ÀÀÀÀÀÀ������@@@@@@������ÀÀÀÀÀÀ������@@@@@@������ÀÀÀÀÀÀ������@@@@@@������ÀÀÀÀÀÀ������@@@@@@������ÀÀÀÀÀÀ������@@@@@@������ÀÀÀÀÀÀ������@@@@@@������ÀÀÀÀÀÀ������@@@@@@������ÀÀÀÀÀÀ������@@@@@@������ÀÀÀÀÀÀ������@@@@@@������ÀÀÀÀÀÀ������@@@@@@������ÀÀÀÀÀÀ������@@@@@@������ÀÀÀÀÀÀ������QQQQQQ¢¢¢¢¢¢����@@@@����ÀÀÀÀ����@@@@����ÀÀÀÀ����@@@@����ÀÀÀÀ����@@@@����ÀÀÀÀ����@@@@����ÀÀÀÀ����@@@@����ÀÀÀÀ����@@@@����ÀÀÀÀ����@@@@����ÀÀÀÀ����@@@@����ÀÀÀÀ����@@@@����ÀÀÀÀ����@@@@����ÀÀÀÀ����@@@@����ÀÀÀÀ����@@@@����ÀÀÀÀ����@@@@����ÀÀÀÀ����@@@@����ÀÀÀÀ����QQQQ¢¢¢¢
������������
@@@@@@@@@@@@
������������
ÀÀÀÀÀÀÀÀÀÀÀÀ
������������
@@@@@@@@@@@@
������������
ÀÀÀÀÀÀÀÀÀÀÀÀ
������������
@@@@@@@@@@@@
������������
ÀÀÀÀÀÀÀÀÀÀÀÀ
������������
@@@@@@@@@@@@
������������
ÀÀÀÀÀÀÀÀÀÀÀÀ
������������
@@@@@@@@@@@@
������������
ÀÀÀÀÀÀÀÀÀÀÀÀ
������������
@@@@@@@@@@@@
������������
ÀÀÀÀÀÀÀÀÀÀÀÀ
������������
@@@@@@@@@@@@
������������
ÀÀÀÀÀÀÀÀÀÀÀÀ
������������
@@@@@@@@@@@@
������������
ÀÀÀÀÀÀÀÀÀÀÀÀ
������������
@@@@@@@@@@@@
������������
ÀÀÀÀÀÀÀÀÀÀÀÀ
������������
@@@@@@@@@@@@
������������
ÀÀÀÀÀÀÀÀÀÀÀÀ
������������
@@@@@@@@@@@@
������������
ÀÀÀÀÀÀÀÀÀÀÀÀ
������������
@@@@@@@@@@@@
������������
ÀÀÀÀÀÀÀÀÀÀÀÀ
������������
@@@@@@@@@@@@
������������
ÀÀÀÀÀÀÀÀÀÀÀÀ
������������
@@@@@@@@@@@@
������������
ÀÀÀÀÀÀÀÀÀÀÀÀ
������������
@@@@@@@@@@@@
������������
ÀÀÀÀÀÀÀÀÀÀÀÀ
������������
QQQQQQQQQQQQ
¢¢¢¢¢¢¢¢¢¢¢¢
������@@@@@@������ÀÀÀÀÀÀ������@@@@@@������ÀÀÀÀÀÀ������@@@@@@������ÀÀÀÀÀÀ������@@@@@@������ÀÀÀÀÀÀ������@@@@@@������ÀÀÀÀÀÀ������@@@@@@������ÀÀÀÀÀÀ������@@@@@@������ÀÀÀÀÀÀ������@@@@@@������ÀÀÀÀÀÀ������@@@@@@������ÀÀÀÀÀÀ������@@@@@@������ÀÀÀÀÀÀ������@@@@@@������ÀÀÀÀÀÀ������@@@@@@������ÀÀÀÀÀÀ������@@@@@@������ÀÀÀÀÀÀ������@@@@@@������ÀÀÀÀÀÀ������@@@@@@������ÀÀÀÀÀÀ������QQQQQQ¢¢¢¢¢¢
8.5 cm4.6 cm
2 m 10 m
90 cm
FilterConcreteConcrete
GalleryGallery
Cast Iron LiningCast Iron Lining
ManometerManometer
Boom Clay
Figure 15. Schematic design of a piezometer nest at the HADES facility (Mol, Belgium) (after Beaufays et al., 1994)

precipitation of carbonates within the cups may occur. Besides, ceramics seems to influence byretention or release a number of chemical constituents (nitrates, phosphates, potassium, aluminium andcalcium). Other materials (porous Teflon, fritted glass) are also considered.
The principle of slightly underpressurising the device in order to increase fluid recovery inlow-permeability environments has been applied to many installations. That aims also to reduce theeffects of oxygen on the collected solution. In highly-indurated rocks, the borehole end may be isolatedwith a packer and slightly underpressurised. That solution has been adopted for example, in the MontTerri Tunnel where boreholes are drilled almost vertically and their end is isolated with a packer (Thuryand Bossart, in preparation). The borehole is purged with nitrogen and slightly underpressurised. Thedraining water is collected after several weeks, using an inert type of tubing connected to a funnellocated inside the borehole chamber. The installation also allows the gas sampling in the headspace,possibly enabling the recalculation of the modifications of the water chemistry due to degassing.
Within the framework of the investigations on the Tournemire site, B.A.-Tortensson (BAT)sampling devices (Torstensson, 1984; Torstensson and Petsonk, 1985) were installed (Boisson et al.,1998). Those consist in three basic components:
– A permanently installed sealed filter tip attached to an extension pipe (A). Filter tips areof different shapes and materials depending on their use (Figure 16). The body may be inthermoplastic, stainless steel or brass, while the filter is made of high-densitypolyethylene, sintered ceramic or porous polytetrafluorethylene (PTFE).
– A disposable double-ended hypodermic needle (B).
– A pre-sterilised evacuated sample vial of glass (C).
Both the filter tip and the vial are sealed with a pre-stressed disk of resilient material,e.g., synthetic rubber. The sampling vial and the needle are mounted on a sampling probe that is loweredin the pipe. Here the probe connects to the cap of the filtering tip, the double-ended needle providing atemporary leak-proof connection to the sampling vial. Due to the vacuum in the vial, both water anddissolved gases may be sampled in the in-situ conditions. Filter tips may be installed in boreholes, andmay be placed under vacuum. The same filtering tip may be used for measuring pore pressure andtension. In that case, a pressure transducer is connected to the water-filled chamber via a needle. BATdevices are mainly designed for soils and soft rocks. In the case of Tournemire, the installed devicesproved unable to recover water samples, because depth and pressures were too large (Boisson et al.,1998).
1.3.2 Under vacuum gas extraction
In-situ devices for soil-moisture extraction have been developed, based on the assumptionthat, in the unsaturated zone, water vapour and liquid should be in equilibrium. Thoma et al. (1978)described a soil-air suction probe, consisting of a stainless-steel tip that is hammered down to theselected depth in the soil. The tip is connected to a pumping system (flow rate ~ 30 l/min), that pumpsthe moisture-saturated soil air through a molecular sieve (0.4 nm). The soil moisture is later re-extractedquantitatively in laboratory by heating the molecular sieve to 400°C in a vacuum system and by freezingthe released water in a dry-ice cold trap. That device has been first applied for tritium peak detectionand deuterium analysis in a sand dune. The resolution of that method, compared to the auger-samplingmethod, was surprisingly high (a few centimetres), considering that 300 l of soil air had to be pumpedin order to obtain enough water for the analysis. Assuming a porosity of 0.25, that would correspond to
58

the amount of air contained in a 1-m radius spherical volume of soil around the suction tip. The authorsexplained the phenomenon by an extremely rapid water/vapour molecular exchange occurring in theproximity of the tip. That assumption was also confirmed by laboratory experiments. Tests using a verysimilar probe on tritium-tagged plots were reported by Saxena and Dressie (1983). Comparison betweensoil-air suction and coring data showed an agreement in the distribution along the profile, but lowerconcentrations were obtained with the former technique. That is attributed to field variability and/ordilution of the tritium activity by atmospheric moisture leaking during the sampling. Finally, Allison etal. (1987) conducted a very careful field and laboratory study on both oxygen-18 and deuterium,comparing water extracted by soil coring and vacuum distillation, with water vapour collected with aprobe. Additionally carbon dioxide of the soil gas was sampled and analysed, as another tool forobtaining the oxygen-18 value of soil water (see Chapter II § 3.5.1). They showed that, although profilesdisplayed the same trends, isotopic fractionation factors would vary considerably. Laboratory dataconfirmed that the equilibrium assumption was verified and that the fractionation factor did not depend
59
Figure 16. BAT Points (after Torstensson and Petsonk, 1985)
����������
�������������
���
PressureTransducer
Water/GasContainer
Double-SidedHypodermicNeedle
Filter Tip
P0
P1
��
�������
�� Septum
Septum
A
B
C

on the soil-matrix suction. They demonstrated that discrepancies were due to imperfect samplingtechniques, but that those artefacts may not easily be overcome. They reported those results “becausethey show sufficient agreement to warrant further study”.
As an application to saturated clay environments (Tournemire formation), Moreau-Le Golvan(1997) reported an attempt of in-situ carbon dioxide extraction for carbon-14 analysis. Two freshly air-drilled boreholes were equipped with a double-packer system (Figure 17). The first chamber was filledwith an overpressure of nitrogen to prevent leakage from the atmosphere in the sampling cavity.Pumped carbon dioxide was trapped using liquid nitrogen, both in static and dynamic vacuums. Priorto the installation of packers, the hole was flushed with argon and pumping was performed for 1 hbefore collecting samples to eliminate possible contamination from air-drilling. Despite thoseprecautions, results showed a low, but detectable carbon-14 content in all samples. A high fractionationof carbon dioxide was obviously observed, as proven by the variation in stable isotopes.
Figure 17. Schematic drawing of the in situ gas extraction experience (after Moreau-Le Golvan, 1997)
1.3.3 Dialysis cells
In-situ equilibrium dialysis samplers, also called “peepers”, were first described by Hesslein(1976) and are now widely used for porewater sampling in sediments. They have replaced the originalidea of directly using dialysis bags (Mayer, 1976) that proved too long to equilibrate. They rely on theequilibration established between de-oxygenated, de-ionised water contained in the sampler and thesediment porewater through a dialysis membrane. Teasdale et al. (1995) reviewed their design, thematerials and membranes used, and the physical process affecting the equilibration. Sampler design hasto be a compromise between several requirements, including the sample volume, the time required forreaching equilibrium and the need to cause minimal disturbance when inserted in the sediment.Normally, volumes range between a few millilitres and 30 ml. Application to sampling anoxicporewaters for trace-element analysis is reported in a number of papers (see e.g., Apte et al., 1989;Steinmann and Shotyk, 1996; Azcue et al., 1996; Urban et al., 1997). The low sample volumescombined with the low concentrations of many metals makes that analysis extremely challenging.
60
VacuumPump
Cold Trap
Cold Trap
SampleVial
PressureGauge
Nitr
ogen
Borehole Screen Chamber Sampling Chamber
CO2
Packer 2 Packer 1
1.3 m 1 m 1.3 m 2 m
Gallery

The use of thin films (Davison et al., 1991) rely on the same diffusive equilibration principle.In that case, rather than confining the solution to a compartment, a thin-film or gel is used to providethe medium for solution equilibration. That has the advantage of much faster equilibration times andhigher resolution, but needs to be analysed in its solid form by proton-induced X-ray emission (PIXE).
Dialysis membranes may readily prevent oxidation of the water sample when isolated from itsmedium. The rate of oxygen diffusion from the atmosphere into the chambers is quite high(4 µmol/minute, in the referred experimental conditions; see Carignan, 1984), and that may result iniron-hydroxide precipitation. The chambers must therefore be subsampled as soon as possible (within20 min).
Although reported studies focus on the application to high water-content systems, an attemptto transpose that technique to clay-rich environments has been performed in the framework of theARCHIMEDE project in Mol. The purpose of the experiment was to install a device completely metal-free for heavy-metal analysis in collected samples. An especially designed borehole (Figure 18) wasinitially conceived in reinforced and vulcanised rubber. That design did not prove resistant enough tothe pressure, and the tube was squeezed soon after its emplacement. A second borehole in more rigid,pressure-resistant material (such as PVC) was installed. A screen in porous ceramics was adopted inorder to minimise the risk of collapse and the possibility of clay intrusion in the dialysis chamber, whilemaintaining its inert characteristics. The dialysis cell was placed into that filter chamber, located at theend of a 5-m long nylon tubing. The system was isolated with inflatable packers in order to allow apartial restoration of the in-situ conditions. The main problem was the high-pressure difference betweenthe fluid in the screen chamber and the equilibrating fluid in the dialysis cell. The packer wouldautomatically open or close in order to regulate the pressure inside the borehole preventing themembrane from tearing. Unfortunately, only one water sample could be obtained, and analysis couldnot completely validate the installation for trace metals. Fractionation is thought to occur when waterpasses through the pores of the ceramic filter, before crossing the dialysis membrane. On the other hand,the use of dialysis membranes directly in contact with the clay is not possible because of their lowmechanical strength.
1.4 In-situ physico-chemical measurements
Ion-selective electrodes have been extensively studied for the determination of the fluidcomposition in high water-content systems (see Frant, 1997 for a review). Recent developments ofmicroelectrodes (De Wit, 1995; Kappes et al., 1997) have not yet found an application in low water-content systems. They are rather used for establishing “in-situ” profiles in sediments (Hales et al., 1994;Hales and Emerson, 1996), or for measuring pH and other parameters on very small quantities ofextracted water (e.g., water extracted from squeezing cells).
1.4.1 pH measurements
Among the numerous physical and chemical parameters to be considered, pH is of particularinterest for the chemistry regulation of pore fluids since it appears in most element-speciation equilibria.Sampling techniques with postponed analysis raise the problem of pollution risks. Possiblemodifications of the characteristics by induced disturbances are particularly relevant for fluids that arepoorly buffered when they are no longer in contact with the mineral assemblage of the formation. In thecase of clay formations, low water content and high interstitial pressure are additional constraints. As aconsequence, in-situ measurements have been designed using different techniques.
61

Early attempts to use glass electrodes directly in the piezometers failed because of pressureproblems (glass electrodes are very fragile) and calibration problems (Griffault et al., 1996). In fact,the impossibility of extracting the electrode from the borehole to check calibration without heavilydisturbing the system, combined with the long amount of time required for pH equilibration, producedunreliable results.
Installing the electrode outside the borehole is another option, provided that a circulationpump homogenises the fluid. In that case, the electrode may be easily isolated from the circuit for
62
Figure 18. Installation of the dialysis cell borehole at the HADES facility(Mol, Belgium) (after Griffault et al., 1996)
CEN GalleryMol
Borehole Position
Piezometer details
Sampling System Details
Dialysis Cell Details
16.6 m (pht Filter of 0.6 m)
PackerInflation-Deflation
Non-DialysedSample Collection
Stainless Steel TubingStainless SteelNylon Joint
PVC CarryingTube
Nylon Tubing CeramicFilter
Rubber Packer Dialysis Cell Fixing Screw
0.11 m
InflationDeflation
Cell Holder Fixedon PVC Tubing
0.04 m
Cross Section Top View
0.055 m
HoldingRing
Cell phtWall
O Ring
pht Stopped

calibration without inducing major disturbances of the system. In the framework of the Mont Terriproject, that solution was adopted (Thury and Bossart, in preparation). A dedicated borehole was filledwith a synthetic solution close to equilibrium with the rock (see Chapter III § 3). pH is continuouslymonitored on the circulating fluid until it reaches a constant value.
pH measurement within the borehole may be obtained using a fibre-optic pH sensor (Motellieret al., 1995). That approach has been especially developed by the French Atomic Energy Commission(Commissariat à l’Énergie Atomique – CEA). pH is measured via the absorbance of a light signal sentby an optical fibre (Figure 19). The sensing tip (optode) is composed of a semi-bead of resinimpregnated with phenol red and immobilised at the distal end of a 1 mm per 20-m optical fibre(Motellier et al., 1993). The optode is connected to an emitter-receiver apparatus (Optolec H). Thatconsists in three modulated light-emitting diodes (LED) of monochromatic light that are set to avoidany interference with the surrounding light. λ1 is set at the wavelength of the isosbestic point. The signalrecorded corresponds to the reference for the quantity of indicator located at the end of the optode andaccounts for the degradation or the unsteady binding of the indicator. λ2 is the measuring wavelengthand is set at the maximum absorptivity of the alkaline form of the indicator. λ3 is chosen close to theinfrared in a region where the indicator is non-absorbent, whatever the pH value might be. That signalallows for the correction of the noise or drift of the optical line, the change in the position of the beador the torsion of optical fibres.
Figure 19. Fibre-optic pH sensor (after Griffault et al., 1996)
63
3.1
2.5
4.0
6.57.7
Thermo-Retractable Sheath
Stainless Steel Sheath
Resin Semi-BeadBead Positioning Window
Fixing Screw
Measures are in mm
SynchronousDemodulation
Amplification
Photodiode
Modulated SourcesLEDs
�1 �2 �3
OptodeOptic Fibers
ResinSemi-Bead
Measurement(Adsorbance)
Optolec H

That system has been tested against other pH-measurement techniques (batch and in-flowwith glass electrode) at the HADES facility (Pitsch et al., 1995b). The interstitial fluid is non-bufferedwith respect to acidity and is subject to degassing when sampled. The optode was introduced in theborehole via a stainless steel guideline in the chamber of a 15-m long piezometer equipped with astainless-steel filter. The guideline was tightly closed in order to allow the pressure restoration to itsnominal value of 17 bars. The data acquisition lasted about 200 h, with one acquisition per hour. ThepH value (8.21), compared with that obtained using an in-flow glass electrode (8.19), showed a verygood agreement. In addition to its pressure resistance, the device had a good response even if the wateraround the sensing tip was not renewed. It may consequently be used also in situations where dischargeis lower than 1 l/h (Pitsch et al., 1995b).
1.4.2 Eh measurements
Attempts to obtain an in-situ Eh measure have been performed, but results seem to be mainlyrestricted to fluids that display a measurable equilibrium potential imposed by a dissolved redox couple(buffered solutions) or a stable mixed potential imposed by two different redox couples.
In the framework of the CERBERUS project (Boom clay), the water flowing from twopiezometers installed close to the radiation source was analysed in-situ for its pH and Eh (Noynaert etal., 1997). Both values were measured in a cell kept at 80°C, the in-situ temperature of the water, toavoid gypsum precipitation. Results were compared to those obtained in-situ at 22°C and thosemeasured in the lab at 22°C. Eh values were also calculated from the Nernst law5, knowing the pH andH2 concentrations that were independently measured. The comparison shows that Eh calculated valuesare systematically lower than the measured ones. That may reflect the fact that the hydrogen producedduring the experiment is not the species controlling the Eh. In addition, the high-temperature Eh valuesare higher than the low-temperature ones, that behaviour being in contradiction with the Nernstequation. That is explained by the intervention of other electroactive species, such as thiosulphate, freesulphide and Fe2+/Fe3+, arising from pyrite oxidation.
In the absence of electroactive species, the measured potential is unstable since very smalldisturbances (concentration fluctuations, electrode surface modifications) cause the potential to changeabruptly from one value to the other (Pitsch et al., 1995a). A flow-cell technique tested on samples takenfrom different clay/water environments proved to be more reliable than batch measurements, even in thecase of reducing environments, provided that the anaerobic conditions are respected. More reliable Ehvalues may be obtained by modelling and/or extrapolating the data obtained for the redox couples thatare known to be present in the fluid, even if they are not in a sufficient quantity to provide a stableelectrode potential (< ~5 µM) (Beaucaire et al., 1998).
In the near future, a non-metallic piezometer for Eh and trace-element measurements will beinstalled in the underground laboratory in Mol (R. Gens, ONDRAF, personal communication).
1.4.3 Temperature
The use of an optical fibre for borehole-temperature logging is reported by Förster et al.(1997). Although resolution is 5 to 10 times lower than conventional techniques, that system quickly
64
5. E = E0 – 2.3(RT / nF) log PH2– 2.3(RT / 2nF) pH
E = –0.030 log PH2– 0.059pH(25° C)

responds and is not affected by problems related to variations in cable resistance, disturbing electriccurrents and improper isolation.
1.5 Field techniques for indirect fluid characterisation
1.5.1 Wireline logging
Borehole-logging tools represent a mature technology that is widely used in oil and gasexploration (Schlumberger, 1997). The application of those techniques to the assessment of radioactive-waste repositories is currently being investigated. A combination of wireline logging, seismic,hydrologic and geomechanical testing techniques may provide valuable information for sitecharacterisation. That includes fracture and fault detection and mapping, the physical properties of therock (lithology, stratigraphy, porosity), geochemistry (rock-forming elements), hydrologic properties(conductivity, transmissivity), in-situ stress and geomechanical properties.
Since the 1960s, Schlumberger and other service companies (Kenyon et al., 1995) have beenapplying nuclear magnetic resonance (NMR) to the in-situ determination of rock porosity, moisturecontent and amount of free and bound water. That technique is currently undergoing testing on low-permeability clay formations at the ONDRAF and NAGRA sites (Win et al., 1998; Strobel et al., 1998).
NMR has been widely used to determine the properties of adsorbed water on clays (Spositoand Prost, 1982). The hydrogen atom has a magnetic moment that may be oriented by a strong magneticfield. The combinable magnetic resonance (CMR™6) tool developed by Schlumberger is constituted bya powerful permanent magnet that polarises the non-lattice bound hydrogen atoms within the pore fluidsof the formation. In addition, a directional antenna emits tuned radio pulses at right angles to the mainpolarisation field. When the pulsed radio signal is turned on, the free hydrogen atoms align with amagnetic field transverse to the polarising field of the permanent magnets. When the pulsed radio signalis turned off, the hydrogen atoms attempt to realign with the polarising field of the permanent magnets.Those atoms precess as they try to return to their original orientation, emitting a radio signal that ismeasured by the CMR tool. The amplitude of the signal is proportional to the number of hydrogennuclei. The associated decay rate, known as “transverse relaxation time” (T2) is related to three mainmechanisms: collisions of the protons with the pore surfaces, molecular diffusion in magnetic-fieldgradients and bulk-fluid relaxation. Since the two last mechanisms may usually be neglected or takeninto account in any correction calculations, the amplitude of the signal is proportional to porosity,assuming that all the pores are saturated with water, and the overall decay rate reflects pore-sizedistribution.
In Figure 20, the recorded signal amplitude may be separated in a time-series-dependent T2values by a mathematical inversion process, producing the T2 distribution. The curve shape representsthe pore-size distribution, while the area under the curve represents the CMR porosity. Laboratoryexperiments on core samples may help in selecting a T2 cut-off delineating water bound to the solidphases from free water. Typical cut-off values for clastic rocks are around 33 msec for T2.
The CMR tool is designed for borehole logging. Its position is constrained to the side of theborehole by an excentralising spring permitting investigation of the formation that should be lessdisturbed by drilling effects. Data may be compared with hydraulic conductivities, grain-sizedistributions and other parameters obtained both on core and on borehole logging (Figure 21).
65
6. Trademark of Schlumberger.

The in-situ NMR technique has been successfully applied to the oil industry and seems to givevery promising results, even for fine-grained sediments. Uncertainties are related to the estimation ofT2-derived free fluid line and the estimation of constants necessary to calculate permeability, both ofwhich are based on semi-empirical test results established for sandstones. An accurate calibration ofCMR data to core permeabilities, together with grain-size analysis, may improve the tool ability to logthose parameters on a continuous basis. Finally, the integration of CMR with other logging tools, suchas the accelerator porosity tool (APT™), an epithermal neutron tool used to estimate total porosity, theelemental capture spectrometer (ECS™), a geochemical logging tool that calculates elementalconcentrations for silicon, calcium, iron, sulphur, titanium and gadolinium, and other tools (Croussardet al., 1998) should successfully quantify hydrologic properties and detect heterogeneities inargillaceous formations. It may be considered as an alternative or complement to additional coring.
1.5.2 Monitoring of the drilling fluids
Monitoring of the drilling fluids is a technique that has been developed for crystalline rocks,mainly in order to identify water-bearing fractures (Vuataz, 1987; Vuataz et al., 1990). Its applicationto sedimentary rocks was reported by Aquilina et al. (1993a; 1993b; 1994; 1995; 1996) as a tool for the
66
Figure 20. CMR signal amplitude processed to provide T2 distribution and its interpretation interms of porosity and types of water (modified after Kenyon et al., 1995)
0 100 200 300 400
Sign
al A
mpl
itude
Time , msec
0.1 1.0 10 100 1 000
Sign
al D
istr
ibut
ion
T2 , msec
1
0
0.03
0.00
0.3 3.0 33 3 000
Sign
al A
mpl
itude
T2 , msecT2 , msec
SignalDistribution
Sandstone
ClayBoundWater
CapillaryBoundWater
Producible Fluids
Total CMR Porosity
CMR Porosity_3 ms
CMR Free-Fluid Porosity

Couleur: Composite / page: 1 / Date: 11/13/2002 / 20*27

Figure 22. Schematic layout of the continuous chemical logging operation (after Aquilina et al., 1996)
Monitoring of the drilling fluids may be compared to the leaching of the drilled rock column(see Chapter II § 3.3). However, parameters differ substantially from on-core leaching, as dilutions aremade with surface water containing bentonite, polymers and sodium hydroxide instead of distilledwater. In addition, the interaction time is shorter and occurs at an uncertain solid/liquid ratio. Dataobtained by on-core laboratory leaching with deionised water are compared with WELCOM chemicalinputs. Despite the number of assumptions and corrections to apply, authors reported a fairly goodagreement between the two methods, and even a higher sensitivity for the latter (Aquilina et al., 1995;1996). Uncertainties arise from the difficulty to control the volume of rock leached by drilling and thefluid/clay interactions. Since pore fluids show much contrasted compositions and the internalconsistency of the data is assured, the authors concluded that results might be used for qualitativeinterpretation. In our opinion, the type of drilling fluid used in that study is extremely aggressive anddisturbing, and should be avoided if geochemical considerations have to be made. Its use may alsodisturb solid samples, thus preventing their use for geochemical analysis. That system is not adapted tovery low water-content systems.
68
Gas Analysis :CO2 , CH4 , O2 , He, Rn
Continuous Monitoring of PhysicochemicalParameters : Conductivity, Temperature, pH, Eh
Depth RelatedTime Related
Data Acquisition Stations
Discontinuous Measurementson the Samples
(T °C, Cond, Eh, pH,Ca, Cl, SiO2)
are done in a Field Laboratory
CL-88 LutzRecording of Well
Parameters as aFunction of Depth
Drilling Machine
Rotation Head
HQ Rods
8"1/2 Casing
Sump
Mud Line
Injection Line(Inflow)
Return Line(Outflow)
PiranaFiltration + Analyser
Mud Tank
Mud Degasser
Gas Line

2. ROCK SAMPLING, STORAGE AND PRESERVATION
2.1 Evidence of artefacts
The Eh and pH conditions existing in any deep rock formation have a significant influence onalmost all the critical parameters determining the behaviour of the system with respect to radionuclidemigration. The sampling process, isolating portions of rock or fluid from its environment, may inducechanges in the sample characteristics that may be virtually impossible to estimate with any certainty.Closely associated with that problem are the issues of long-term storage, handling and preparation ofsamples.
A large amount of the literature has dealt with the changes in porewater compositions of soilsand marine sediments. Effects of changing temperature, pH (mainly due to degassing) and Eh arereported with a view to evaluating their importance and consequences (Hulbert and Brindle, 1975;Lyons et al., 1979; Ross and Barlett, 1990; de Lange et al., 1992; You et al., 1996). In low water-contentsystems, artefacts seem to proceed much slower, due to the lower diffusion coefficients of water andgases in the small porosity.
Other effects, such as dehydration and oxidation, should be prevented with some simpleprecautions. The main objective is to isolate as soon as possible the sample from the atmosphere. Thatoperation should consequently be performed on site, soon after core retrieval. Air-tight aluminium orstainless-steel cans are commonly used in soil sampling (see e.g., Saxena and Dressie, 1983; Allison etal., 1987). The application to indurated clays is not straightforward, mainly because the hardness of therock does not allow to fill the container properly and some air may be trapped inside. That is a minorproblem in the case of soils because the unsaturated zone is an oxidising environment.
Sample conditioning may be performed by wrapping the rock in aluminium foil and beeswax(Brightman et al., 1985; Yang et al., 1990) or by coating it directly with paraffin (see e.g., Ricard, 1993and Moreau-Le Golvan, 1997). Another increasingly used solution involves aluminium-plastic bags orfoils that may be thermally welded. The sample is introduced in the bag, flushed with nitrogen ormixtures of inert gases, then evacuated and sealed. That type of conditioning seems adequate to preserveof samples for mineralogical and chemical analyses. Despite that, the danger of evaporation is notexcluded. In fact, if the atmosphere around the sample is dehydrated, that will create a gradient drivingthe moisture out. Wrapping the rock in aluminium is highly recommended if the organic matter has tobe analysed. Polyethylene bags were found highly contaminating by phtalate release (Griffault et al.,1996).
If the sample needs pre-treatment prior to analysis (crushing, sieving, etc.), those operationsshould be conducted by minimising both the contact time with the atmosphere and the use of potentiallycontaminated tools or devices. In order to eliminate the possibility of a contamination from the drillingfluid, it is recommended to trim the outside rim of the cores and discard it. Edmunds and Bath (1976)used a lithium-chloride tracer added to the drilling mud to investigate the extent of fluid invasion intothe cores. They showed that for chalk the invasion was limited to the outer 1-1.5 cm, while, in the caseof a highly permeable sandstone, samples still showed more than 2% fluid replacement after the outer2 cm had been removed. They concluded that air-flush drilling methods were more suitable forpermeable material investigations. Moreau-Le Golvan (1997) conducted vacuum distillations onTournemire-claystone samples that had been sealed with wax after recovery and found no change in theisotopic composition between the outer and inner parts of the core, but for more precaution he stilldiscarded the outer 0.5 cm of each sample prior to crushing.
69

Yiechiely et al. (1993) found that the main factors controlling the moisture content of soilscollected close to the Dead Sea (Israel) were the percentage of fine-grained material and the saltconcentration. The former would limit the evaporative loss of the original solution and enhance wateradsorption from the atmosphere. Laboratory experiments conducted on oven dried sediments showedthe importance of the salt content in air moisture re-adsorption. The good correspondence between themoisture fluctuations of the laboratory air and the sample is shown in Figure 23. The same samplesleached with deionised water to lower their salt content show a much lower uptake of air moisture andalmost no fluctuations.
Figure 23. Air moisture uptake after oven-dried Dead Sea sediments. Sample 1 = 143 mg Cl/g of sediment; sample 2 = 102 mg/g;
sample 1a and 2a are the same, leached down to 1 mg Cl/g of sediment (after Yiechieli et al., 1993)
Moreau-Le Golvan (1997) also showed an isotopic effect related to the contact time with theatmosphere, during and after crushing, for the Tournemire-claystone samples. For time intervals rangingfrom 15 to 60 min, an enrichment in both isotopes is observed. Results, in the deuterium versus oxygen-18 plot, fall on a line displaying the typical slope of evaporation lines (Figure 24). Unfortunately, noindications are given on the laboratory air-moisture content, to help evaluate if evaporation prevails overair-moisture uptake for clay-rich materials.
70
00 20 40 60 80 100
10
Moi
stur
e (%
)
Time (Days)
50
60
70
80
Roo
m M
oist
ure
(%)
1
2
1a + 2a

2.2 In-situ freezing and coring
In the framework of the ARCHIMEDE project (Griffault et al., 1996), an in-situ freezing testhas been conducted. The aim of the experiment was to define possible hydrochemical changes in thecase where freezing before the repository excavation would be considered. In addition, alternativetechniques of water extraction from the cores have been attempted (see Chapter II § 3.6).
One cubic metre of clay was frozen using six 3-m long freezing elements inserted in the rockin a hexagonal arrangement. The rock prism was frozen at –10°C during two weeks, after which twocores were taken from the central part of the frozen formation. The first core, 48 mm in diameter, wasparticularly difficult to obtain and a 50-cm sample cut in four pieces was recovered. The second core,100 mm in diameter, provided two samples from 0 to 0.75 m and from 0.75 to 2 m inside the formation.
Partial defreezing of the samples cannot be excluded because of the temperature increase atthe contact point between the drilling head and the formation. Nevertheless, it seems that its extent wasvery limited. Samples obtained from cores were kept in dry ice before shipping to the laboratory, wherethey were stored in a freezer at –18°C. Subsequent analysis of water contents and stable-isotopecompositions indicate that ice sublimation may have occurred. Unfortunately, no indications are givenon the storing conditions inside the freezer and the storage time prior to analysis.
2.3 Noble-gas sampling procedure
For noble-gas analysis, Osenbrück (1996) has designed a new sampling and preservationmethod (see also Osenbrück and Sonntag, 1995). A piece of rock is taken from a freshly drilled core asquickly as possible. The outer parts of the sample are trimmed over 2 cm in order to eliminate a possiblecontamination due to the drilling fluid and the degassing effects during core lifting and handling.Samples are placed in a vacuum-tight brass container, then evacuated with a rotary pump and flushedtwice in between with pure nitrogen. After four weeks, the noble gases are completely extracted from
71
Figure 24. Influence of the contact time with the atmosphere(after Moreau-Le Golvan et al., 1997)
– 80– 10 – 9.0 – 8.0 – 7.0– 9.5 – 8.5 – 7.5 – 6.5 – 6.0
– 75
– 65
– 55
– 70
– 60
– 50
– 45
– 40
� D
(‰
vs
V-S
MO
W)
�18 O (‰ vs V-SMOW)
1530
60
Y = 2.7 * X –41.1(R-Squared = 0.99)
The Label Represents theContact Time in Minutes
Between the Sampleand the Atmosphere
MWL
Sample ID 0 1700

the porewater into the vacuum by molecular diffusion. They are directly transferred to the massspectrometer for analysis, the accuracy being about 5-10% for all of them.
3. ON-SAMPLE LABORATORY TECHNIQUES
In the following section, we will examine all the techniques that have been used for extractingwater from soil and rock samples. The choice has been made to describe the different techniques,regardless of their application to specific chemical or isotopic analyses. Table 6 lists the techniquesunder review. Indications on the suitability of a given technique for chemical and isotopic analyses aregiven, based on the existence of published studies in the field. It is also stated when the use of a giventechnique is impossible based on the physical principle used.
3.1 Centrifugation
The use of a centrifuge to extract water from porous media started at the beginning of thiscentury (Briggs and McLane, 1907). It was used mainly for establishing the “moisture equivalent” of asoil, that is the moisture content of a sample after the excess water has been reduced by centrifugationand brought to a state of capillary equilibrium with the applied force. However, early workers (Thomas,1921; Joseph and Martin, 1923) observed a lack of homogeneity in the water content depending on thesize of the samples, and Veihmeyer et al. (1924) observed that the moisture content of a specimen wouldincrease with the distance from the axis of the rotation. Those discoveries led to the first attempts of amathematical formulation of the driving force for water extrusion.
3.1.1 Low-speed and high-speed centrifugation
3.1.1.1 Physical basis and design of the technique
The centrifuge technique relies upon the pressure difference developed across the sampleexceeding the capillary tension holding the water in the pores (Batley and Giles, 1979). The physics of
72
Technique Specifications Chemical analysis Isotopic analysis
Centrifugation Low/high speed Major and trace elements 18O and 2H
Heavy liquids Major and trace elements Not investigated
Squeezing Major and trace elements 18O and 2H
Leaching Major and trace elements 2H and 3H
Distillation Under vacuum Impossible 18O and 2H
Microdistillation Impossible 2H only
Azeotropic Impossible 18O and 2H
Direct equilibration With CO2 Impossible 18O only
With water Impossible 18O and 2H
Table 6. Use of different water extraction techniques for chemical and isotopic analyses

fluid removal is fairly well understood, but the exact force distribution within the sample is difficult todetermine.
Considering a column of water-saturated sediment under centrifugation, the applied tensionTa developed at a point within the column (r2 [m] from the centre of rotation) will be given by theexpression:
where Ta is in metres of water; ω is the radial velocity in radians per second; g is the acceleration dueto gravity [m sec–2], and r1 [m] is the distance from the base of the column to the centre of rotation.
The applied tension is consequently a function of the distance from the rotor and the speed ofcentrifugation. However, it will not depend on the density and the nature of the centrifuged material(Edmunds and Bath, 1976).
The removed interstitial water will depend on the pore-size distribution in the material. In fact,the capillary pressure in a pore will be:
where Tc is the tension [Nm–2]; σ is the surface tension; ϑ is the contact angle between the porous solidand the liquid; ρ is the specific gravity, and d [m] is the pore-channel diameter.
That formulation implies that it is not possible a priori to specify the size of the drained pores,since that parameter will vary within the sample. Edmunds and Bath (1976) (Figure 25) calculated somecurves showing the relationship between rotation velocities and minimum drained capillary size, for thetop and the middle of the centrifuged sample. In fact, for the balance between centrifugal and capillaryforces, smaller pores should be emptied at the bottom rather than at the top of the column.
Figure 25. Relationship between rotation velocities and minimum drained capillary size.Constructed assuming ϑ = 0°, σ = 0.07 Nm–1, ρ = 1, height of the sample = 6 cm,base of the column to the rotation centre = 11.1 cm. A = midpoint of the sample;
B = top of the sample (after Edmunds and Bath, 1976)
Tc =4σ cos ϑ
ρd
Ta =ω2
2gr12 – r2
2
73
00.01 0.1 1.0 10 100
2
8
4
10
12
6
14
16
0
2
8
4
10
12
6
14
16
Spee
d of
Rot
atio
n, r
pm x
10–3
Ang
ular
Vel
ocity
, rad
s se
c–1 x
10
–2
Capillary Diameter, d (�m)
B A

3.1.1.2 Conventional and basal cup arrangements: the distribution of water in the sample
For the same size grains, two possible cases must be taken into account: incompressiblesediment grains and compressible sediment grains.
In the case of incompressible grains, if a conventional centrifuge tube is used, more watershould remain where the centrifugal pressure is less (i.e., at the top of the column). If grains arecompressible, pores will be squeezed during the process, thus driving water to the top of the column. Ifthat water is removed and centrifugation continues, a higher water content will result at the base of thecolumn. That is why a basal cup arrangement (Figure 26) of centrifuge tubes (Schaffer et al., 1937;Davies and Davies, 1963) may facilitate water drainage from the “bottom” of the sample, unless forvery-fine-grained sediments where compaction may effectively block the water movement.
Figure 26. Basal-cup arrangements (after Davies and Davies, 1963 and Edmunds and Bath, 1976)
Batley and Giles (1979) compared the water distribution of different samples (sands, clays andmangroves) after centrifugation using those two centrifuge arrangements. They concluded that watercollection at the top and/or the bottom of the sample depended on the specimen’s grain size andcompressibility, and may not be easily predicted.
3.1.1.3 Ultracentrifugation
With the advent of ultracentrifuges, the recoveries may be improved. On the other hand,however, ultracentrifuges commonly may treat only small amounts of samples and grain compaction isdrastically increased. Batley and Giles (1979) found a small increase in recoveries for sandy sediments,while for clay sediments, the use of a high-speed centrifuge allowed to double the amount of recoveredwater.
Recently, that technique has been applied successfully for extracting water from unsaturatedtuffs with fairly low-water content (7-30%) (Yang et al., 1990). The extraction was performed both on
74
���
������������������
���������������
��
��
SoilSolution
Bottle "a" GlassWool Pad
PolytheneCentrifuge
Tube
Filter PaperPacking
Bottle "b"
Soil
���
���
����
��yy���� �
��
������
����
100 ml
30 ml
Low Speed High Speed
32 ml
6 ml
Aluminium - AlloyCentrifuge Cup
Delrin LinerAssembly
Whatman 41Filter Paper
Stainless Steelor Titanium
Support Screen

intact samples (8,000 rpm, maximum weight of 780 g) and crushed samples (18,000 rpm, maximumweight of 115 g). The centrifuge is thermostatically controlled (25°C) and its chamber may be purgedwith dry nitrogen to prevent the sample from coming in contact with air when spinning. The percentageof recovery is approximately 75% for crushed samples and much lower (10%?) for intact cores(Figure 27). Chemical analysis, including pH, was performed on the collected water, and comparisonswere made with the data obtained on similar samples by triaxial compression. A good correspondence,within 15%, was observed. The authors concluded that ultracentrifugation may provide samples fromnon-welded tuffs with initial moisture content greater than 11%. The use of intact cores isrecommended, because core crushing exposes excess surfaces, eventually leading to a contamination ofthe sample if it comes in contact with air.
Figure 27. Volume of water collected versus centrifugation time (after Yang et al., 1990)
3.1.1.4 Evidence of artefacts
Since the beginning of the application of that technique, it appeared that it was necessary toprevent the evaporation of the sample during centrifugation by using closed tubes and to control thesample temperature for avoiding changes in porewater compositions (Schaffer et al., 1937). Besides,even if it is not stated clearly, the impossibility to control redox conditions seems to limit the applicationof the technique to trace-element analysis and, more generally, to the extraction of representativeporewater from anoxic samples.
Edmunds and Bath (1976) examined the composition change of the solutions extracted fromchalk samples, as a function of the percentage of pore fluid removed (Figure 28). For sodium andpotassium, they demonstrated a progressive depletion as a greater proportion of fluid is extracted, withan upturn or levelling-off over the last 10-20% (it should be noted that those trends are extrapolatedfrom the general tendency for the last 10%). On the other hand, calcium showed a continuous depletionwhile magnesium and strontium showed no appreciable fractionation. As a possible explanation for that
75
00 40 80 120 200160 240 280
5
10
15
20
25
30
35
Vol
ume
Wat
er E
xtra
cted
, in
Mill
ilite
rs
Time of Centrifugation, in Minutes
Core Size : 6.0 cm in Diameter, 10.8 cm Long[%] is Initial Moisture Content
of Rock in Weight Percent
Nonwelded Intact Rock :
Nonwelded Crushed Rock :
Tiva Canyon UE-25 UZ # 5Bedded Tuff UE-25 UZ # 4
Tiva Canyon UE-25 UZ # 5Bedded Tuff UE-25 UZ # 4
[23.6 %]
[21.8 %]
[26.9 %]
[23.2 %]
[22.0 %]

behaviour, they evoked a hydraulic drag effect on hydrated cations.7 As their study was conducted onsamples featuring a low percentage of clay minerals, they also noticed that the effect was unknown inlithologies not dominated by clays.
Figure 28. Evolution of cumulative composition of extracted fluids after chalk samples (after Edmunds and Bath, 1976)
76
0 20 40 8060 100
0.3
0.4
0.5
mg/
l
% Pore Fluid Removed
60
70
80
2.0
3.0
4.0
2.0
2.5
16
18
20Na
K
Mg
Ca
Sr
7. A fluid moving against a rigid boundary exerts a dynamic force on it, caused by shear stresses and pressure-intensity variations along the surface. The component of that force in the direction of the relative velocity past thebody is called the “hydraulic drag”. According to the formulation given by the Stokes equation (Robinson andStokes, 1970), the hydraulic drag would be much larger on divalent than on monovalent cations (Kharaka andBerry, 1973).

Recent studies (Zabowski and Sletten, 1991; Dahlgren et al., 1997) showed the effect ofcarbon dioxide degassing on pore solution chemistry. Both studies were conducted on non-calcareoussoils, thus minimising or controlling the artefacts induced by sampling and storage. They observedchanges in dissolved organic carbon and major elements, leading to a general decrease in the ionicstrength of the solution. The mechanism evoked is a cation adsorption on the clays for balancing thedecrease on dissolved inorganic carbon (DIC) of the pore solution. On the other hand, minor changeswere observed for the pH, probably controlled by other factors such as the buffering capacity of the clayminerals or the presence of organic acids in the soil solution.
3.1.1.5 Centrifugation of frozen samples
Within the framework of the ARCHIMEDE project, frozen samples were obtained by one ofthe involved teams (Bureau de Recherches Géologiques et Minières – BRGM). A test to verify if corefreezing would increase water recovery during centrifugation was designed, based on the assumptionthat pore-size distribution should be modified in order to accommodate the ice-volume change. Samplesof the frozen cores were carefully crushed trying to keep the pieces frozen, then placed in conventionalclosed centrifuge tubes and spun at 20°C for 2 h at 5,000 rpm.
No samples provided enough water to be collected. A thin mud film covering the centrifugetubes would immediately solidify in contact with the atmosphere. The selected centrifugationparameters were probably not adapted. In addition, a water-content analysis of one of the samples usedfor the experiment prior to centrifugation showed that the parameter was sensibly lower than the normalone. Some problems of water-content modification (up to 30% loss) may have arisen from the collectionand storage conditions (sublimation?) (see Chapter II § 2).
3.1.2 Solvent displacement
In 1976, Mubarak and Olsen suggested the use of a heavy immiscible liquid (CCl4) in orderto improve the recovery of the solution from dry-moist soils. The solvent (or “displacent”) is put incontact with the solid sample in a conventional centrifuge tube. Since the solvent is immiscible withwater and of greater density than water, the soil solution is displaced during centrifugation and rises tothe surface where it may be collected for analysis (Figure 29). An attempt to describe mathematicallythe process is reported in Kinninburgh and Miles (1983).
Tests with different displacing liquids were performed, in order to verify any possibleinfluence on porewater chemistry (Whelan and Barrow, 1980). Kittrick (1983) reported tests with fourliquids (CCl4, tetrachloroethylene, 1,1,1-trichlorethane and fluorocarbon FC70) and found them allsuitable except for trichlorethane, significantly decreasing the pH of displaced solutions from calcite.Due to its toxicity, CCl4 has currently been abandoned and Arklone (trichloro-trifluoro-ethane,density = 1.57) is the most commonly used (Kinninburgh and Miles, 1983; Moss and Edmunds, 1992).
Batley and Giles (1979) compared extraction yields obtained with low-speed and high-speedcentrifugation, using or not using a displacent. They claimed a recovery increase of up to 5-10% for clayand mangrove sediments, but also noticed that the use of a heavy liquid as displacent may increasecompaction in compressible sediments. Whelan and Barrow (1980) examined the retention curvesdisplayed by different soils with variable clay contents (Figure 30). The authors showed a thresholdwater content below which no water may be displaced for a given set of centrifuging and displacementconditions. Above that threshold, there is a 1:1 relation between initial soil-water content and displaced
77

water. The threshold depends on the texture of the soil (as reflected by the clay + silt percentage), thesoil-water potential and the applied centrifugation.
Figure 30. Water recovery from a range of soils with different initial water tensions (after Whelan and Barrow, 1980)
78
r2 r r1
Pc2 Pc Pc1
P
v
Centre ofRotation
Sample
DetachableCollecting Cup
DisplacedWater
PerforatedDisc
r1 r r2
Pv
Centrifuge Bottle
Displaced Water
Displacent
Pc2PcPc1
Sample
Immiscible Liquid Displacement Methodb
Drainage Methoda
Figure 29. Conventional centrifugation and heavy-liquid displacement (after Kinninburgh and Miles, 1983)
00 10 20 30 40 50 60
10
20
30
Vol
ume
of W
ater
Dis
plac
ed (
ml 1
00 g
–1)
Initial Soil Water Content (% H2O at 105 °C)
100
%Re
cove
ryLin
e
123456
Soil
1.25.3
20.430.458.667.0
Silt and Clay %

Whelan and Barrow (1980) also examined changes in solution composition as a function ofcentrifugation time. They detected only small changes for the considered species (NH4
+, NO3–, P and
Cl–). Complete chemical analyses were not reported and tests were conducted on soils with more than60% sand.
That technique proved better for controlling the redox conditions of the system for trace-element analysis and has been applied for that purpose in a number of studies (Batley and Giles, 1979;Kittrick, 1980; Kinninburgh and Miles, 1983; Moss and Edmunds, 1992; Edmunds et al., 1992). On theother hand, a danger exists of extracting significant quantities of organic matter and associated metalsfrom soils and waters. Batley and Giles found that the fluorocarbon FC78 extracted only 1-3% of DOCfrom groundwaters (and consequently associated metals), but that should be checked for every solventprior to use.
3.1.3 Stable-isotope analysis
Only very few studies make use of the centrifugation technique for stable isotope analysis.Jusserand (1980) tested low-speed centrifugation, among other methods, for extracting water foroxygen-18 analysis. Reported results seem in fairly good agreement with data obtained by directequilibration with carbon dioxide and vacuum distillation. The comparative study of Walker et al.(1994) (see Chapter II § 3.4.3) reported the use of high-speed centrifugation combined with Arklonedisplacement. Unfortunately, that technique was only able to provide a sample from a gypseous sand.The result showed no interaction with gypsum crystallisation water, but was affected by a rather highshift in isotopic composition with respect to dope water.
3.1.4 Overall performance of the technique
In the following table (Table 7), we have compiled some relevant porewater studies usingcentrifugation, in order to provide a synoptic summary of the performances of that technique.
3.2 Pressure filtering or squeezing
This section is extensively based on a recent review of the squeezing technique and itsapplication to clayey sediments, carried out by the British Geological Survey (Reeder et al., 1998) onbehalf of GRS (Company for Reactor Safety, Germany). It has been integrated with some new data andcomments mainly from CIEMAT (Energy, Environment and Technology Research Centre, Spain).
Pore-fluid extraction by squeezing or pressuring is the most widely used sampling techniquefor seabed sediments, especially those from water depth exceeding 1,000 m. It is also a method ofextracting pore fluids from low-permeability clays and mudstones. Squeezing is analogous to thenatural process of consolidation, caused by the deposition of material during geological times, but at agreatly accelerated rate.
3.2.1 Theory
The squeezing process involves the expulsion of pore fluids from the sediments beingcompressed. The sediments consist of solid particles (i.e., the mineral phase) and spaces or voids thatare filled with water in saturated rocks. When a squeezing stress is applied to a water-saturated material,its volume decreases due to three main mechanisms:
(i) compression of the solid phase;
79

80
Reference Method MaterialInitial water % of
Chemical analysis / Notescontent recovery
Sholkowitz, Not specified Marine sediments Not specified Not specified Major elements1973
Edmunds and Bath, Low-speed and/or high-speed Chalk Not specified ~ 90% Major elements1976 centrifugation
Mubarak and Olsen, Solvent displacement (CCl4, Clay soils (43% clay, 30% silt) 25% 50% None
1976 1,1,2-trichloroethane) Sandy loam (17% clay, 18% silt) 25% 52%
Batley and Giles, Comparison of low / high Clay pit 30% 38-40% Heavy metals 1979 speed centrifugation and (with chloroform
solvent displacement Mangrove 48% 35-40% and FC78)(chloroform and FC78)
Sand 23-29% 53-80%
Whelan and Barrow, Solvent displacement (CCl4, Soils with different clay contents 12-65% See text NH4+, NO3
–, P, Cl– as 1980 1,1,1-trichloroethane, (0-47%) a function of centrifugation
tetrachloroethylene) time
Jusserand, Low-speed centrifugation Marine sediments (85% clay, 40-75% Not specified Test for 18O analysis1980 10% CaCO3) (comparison with other
methods)Lake sediments (30% clay,40% silt, 20-25% CaCO3 60-87%and 5-10% organic matter)
Kittrick, 1980 Solvent displacement (CCl4) Gibbsite and kaolinite Not specified Not specified pH, Al (test for checkingmineral solubilities)
Bath and Edmunds, High-speed centrifugation Chalk 15-25% 40-50% Major elements, Li, Br, F,1981 18O, 2H, but no alkalinity
and pH (possibility of artefacts)
Table 7. Case studies using the centrifugation technique

81
Reference Method MaterialInitial water % of
Chemical analysis / Notescontent recovery
Swalan and Murray, High-speed centrifugation Marine sediments Not specified Not specified Trace metals. T and O21983 controlled centrifugation
Kittrick, 1983 Solvent displacement (CCl4, Gibbsite and calcite Not specified Not specified Test for mineral solubilitiestetrachloroethylene,1,1,1-trichloroethane, FC70)
Kinninburgh and Miles, Solvent displacement Chalk 20% (wet) 80-85% Major elements and1983 (Arklone) heavy metals
Soils Variable variable
Clay 20-40% (wet) 19-40%
Zabowski and Sletten, Low / high-speed Spodsol soil Not specified Not specified pH, DIC (test for CO21991 centrifugation degassing effect)
Walker et al., 1994 High-speed centrifuge + Gypseous sand 10.2% Not specified 2H and 18OSolvent displacement (intercomparative with(Arklone) other techniques)
Moss and Edmunds, Solvent displacement Sands, sandstones 8.3-12.5% 30-60% Major elements, pH, Al1992 (Arklone)
Edmunds et al., 1992 Solvent displacement (Arklone) Sands, sandstones Not specified ~ 50% Major and trace elements
Leaney et al., 1993 High-speed centrifuge Xeralf soils 20-40% Not specified 2H, cross check forazeotropic distillation
Yang et al., 1995 High-speed centrifuge Non-welded tuffs 7-30% Not specified Some major elements
Dahlgren et al., 1997 High-speed centrifuge Non-calcareous grey-wacke, Saturated 25% pH, major elements (testsands, mudstones for CO2 degassing effect)
Table 7. Case studies using the centrifugation technique (continued)

(ii) compression of the porewater between the solid phase; and
(iii) escape of water from the voids.
In most circumstances, the compression of the solid and liquid phases is negligible and mostof the change in volume is caused by the escaping porewater. That may be illustrated by ahydromechanical analogy for load changing and squeezing, known as the “spring” analogy, as shownin Figure 31 (after Lambe and Whitman, 1979).
Figure 31. A hydromechanical analogy for load changes during squeezing (after Lambe and Whitman, 1979)
The strength of the solid phase during compression is represented by a spring and the rate atwhich the pore fluid flows depends upon the size of the valve aperture. In (a), the valve is closed and inequilibrium. When a load or stress is added (b), the piston load is apportioned by the water and thespring in relation to the stiffness of each. There is little movement in the piston because the water isrelatively incompressible. Most of the load is carried by the water, and that increases the water pressure.
When the valve is opened (c), the excess pore pressure dissipates by water escaping throughthe valve (d). The piston drops and the volume of the chamber decreases until there is a new equilibriumwhen the applied load is carried by the spring and water pressure has returned to the original hydrostatic
82

condition (e). The gradual load transfer from the water to the spring is shown in (f). The dissipation ofthe porewater is called “primary consolidation”.
The change in volume is related to the stress applied and the difference between the stress andthe pore pressure (Yong and Warkentin, 1975). The difference is the effective stress, σ', given by:
σ' = σ – u
where σ is the total stress and u is the pore pressure.
In non-fissured material, the expulsion rate of the pore fluid is related to the length of thesample and the pore size. A graph of the settlement rate after the addition of a load (Figure 32), andtherefore of pore-fluid extraction, shows both primary and secondary consolidations.
Figure 32. The settlement rate for increasing stress (Reeder et al., 1998)
Most of the excess pore pressure dissipates during primary consolidation, while secondaryconsolidation involves the movement of particles as they adjust to the increase in effective stress andthe dissipation of excess pore pressure from very small pores. The porewater extracted during squeezingis mainly due to primary consolidation.
The reduction in void volume (i.e., pore size) with increasing stress reduces the permeabilityand, therefore, the rate of consolidation. The water extracted during each load increment or in total maybe related to the change in void ratio, e, by the formula:
where Vv is the volume of voids and Vs is the volume of solids. Void ratio and porosity are related toporosity, φ, by:
e =φ
1 – φ
e =Vv
Vs
83

Theoretically, at stresses above the yield stress (sometimes identified as the “pre-consolidationstress”) the rate of change in void ratio decreases constantly with increasing log stress. Figure 33 showsvoid ratio versus log stress for an idealised unidimensional consolidation test.
Figure 33. Typical relationship between void ratio and log effective stress for an idealisedunidimensional consolidation test of a clay material (Reeder et al., 1998).
The gradient of the virgin compression curve is the compression index, Cc , that may be relatedto the liquid limit, PL (a commonly measured geotechnical parameter) by the following equation(Skempton, 1944):
Cc = 0.009 (PL – 10)
That equation may be used to estimate the maximum volume of porewater that may beextracted, although the value of Cc is usually overestimated for overconsolidated clay and mudstones.Figure 33 also indicates that there may be little advantage in squeezing samples to very high stresses,as the increased volume of porewater extracted will be small.
3.2.2 Squeezing apparatus and practical applications
3.2.2.1 Overview
Pore fluids have been extracted from soils and rocks early on in this century. Ramann et al.(1916) and Lipman (1918) both used hydraulic squeezers. It was not until the 1940s when Kriukov
84

(1947) designed an easy-to-use, high-load compression device that pore fluids could be easily extractedfrom sediments. In the late 1950s, a filter press was adapted so that a direct pressure may be applied tothe sediment (Lusczynski, 1961). Since then, two types of squeezing apparatus have developed: a low-pressure apparatus for sea or lake-floor sediments, capable of providing a maximum stress of about1.5 MPa; and a high-pressure apparatus capable of squeezing fluids from a wide range of materials. Thelow-pressure types include gas pressure (Presley et al., 1967), gas-mechanical action (Siever, 1962;Reeburgh, 1967) and hydraulic jacks (Kalil and Goldhaber, 1973). Most high-pressure systems use ahydraulic press and are similar to those designed by Kriukov (1947) and adapted by Manheim (1966).Those generated a maximum pressure of 5,000 kg cm–2, equivalent to 480 MPa. A detailed review ofpore-fluid extraction techniques, including pressure filtration and squeezing, was carried out byKriukov and Manheim (1982).
3.2.2.2 Low-pressure squeezing apparatus
The low-pressure squeezing apparatus is specifically designed to extract water from highmoisture-content materials such as marine and lacustrine sediments. Most modern designs are cheapand simple to use, thus allowing a number of tests to be performed at the same time. A detailed pore-fluid characterisation at a water/sediment interface may be carried out as a matter of routine with samplespacing of about 100 mm. Using non-metallic cells and filters minimises contamination, thus providingaccurate measurements of trace elements. More recently, whole-core squeezers (Bender et al., 1987;Jahnke, 1988) were designed for even closer sampling, and results with a resolution of 10 mm have beenreported (Koike and Terauchi, 1996).
Early low-pressure systems were based on gas-displacement methods that have been usedextensively to remove mud filtrate from oil-field drilling muds since their introduction by Richards(1941). Commercial mud presses use compressed gas from cylinders or cartridges to force filtratethrough filter paper. Lusczynski (1961) used that method to study fresh/salt groundwater interfaces.
The extraction of porewater from seabed sediments was described by Siever (1962) who usedrelatively simple equipment. A filter press was modified to make it easy to load, clean and portable. Theparts were all made of stainless steel except for the bronze piston and the neoprene O-rings and gaskets.The stainless-steel filter plate included many small holes and provided support for the filter paper. Theload was applied by a turn screw attached to the upper plate or by a gas-driven piston, usually usingnitrogen. The squeezer could accept a 76.2 mm-diameter core. The working pressure was between 700and 1,400 kPa (100 to 200 psi) and between 20 and 30 ml of pore fluid were extracted from 100 g of60-70% moisture-content clay in about 15 min. The composition of the fluid was not affected by thoselow-pressure conditions.
Hartmann (1965) described a gas-mechanical apparatus with a PVC membrane separating theconfining gas from the sample. Nitrogen gas at a pressure of about 1,000 kPa (about 10 kg·cm-2) passedthrough the PVC membrane, increasing pore-fluid recovery. In incompressible sediments, such assands, the pore fluid was extracted mainly by the passage of gas but, in fine-grained clayey materials,the extraction was mainly due to compression of the membrane. The technique was used to extractabout 95% of the water from a beach sand, yielding 50 ml in about 5 min. Finer-grained material fromthe Baltic Sea yielded up to 30 ml of water in up to 3 h; most of the pore fluid was extracted in the first30 min. For those materials, about 40 to 60% of the water were extracted. Some of the pore fluids werecloudy and an extra filter was used after the water had come out of the press.
85

A non-metallic squeezer was developed for trace-metal studies at the Department ofOceanography of The John Hopkins University, in Baltimore, Maryland, USA (Reeburgh, 1967). It hasno moving parts and, like the Hartmann type, the gas pressure acts on a diaphragm compressing thesediment and forcing out the porewater through filters into a sample bottle. The sample cell is about50 mm in height and 50 mm in diameter, and all the components are made of Delrin, nylon or dental-dam rubber. The cell is held together with a slightly modified C-clamp. The resulting apparatus is easyto clean up, but the gas pressure is limited to 1,400 kPa. A single gas cylinder has been used to extractporewater from up to 20 cells simultaneously via a manifold (Kriukov and Manheim, 1982). Nitrogen,carbon dioxide and helium have been used as the pressurising gas. The pore fluid extraction was carriedout using gradual increases of pressure over about 30 min and about 25 ml of pore fluid per 100 g ofsediment were recovered. Since the system does not contain metal parts, it is ideal when investigatingtrace metals and labile constituents.
A system slightly modified from the Reeburgh-type squeezers was described by de Lange(1992). In that case, the supporting screen was made of Teflon with 0.2-mm cellulose-acetate membranefilter. The membrane was glued to the O-ring providing a quick and secure sealing system. Thesupporting screen reduces dead volume. The squeezers were fixed with slide-rod clamps, and three-waystopcocks allowed the squeezers to be used independently. The tests were carried out in a nitrogenanaerobic box. The working pressure was applied gradually up to 1,500 kPa. Squeezing times variedbetween 15 min and 4 h depending on the type of sample. About 150 cm3 of sediment were squeezedand were sufficient to produce between 15 and 60 ml of pore fluid. Up to 300 cm3 of sediment may behandled, if required.
Patterson et al. (1978) described a non-metallic mechanical squeezer based on the Kriukov-Manheim design to be used on compressible, fine-grained or organic-rich sediments. The maximumstress applied was 5 MPa.
3.2.2.3 Whole-core squeezers
Whole-core squeezers were designed to reduce handling time and to minimise coredisturbance and the introduction of oxygen to anoxic core samples. The different apparatus devised byBender et al. (1987) and Jahnke (1988) allow for a very detailed sampling. The Bender system wassuccessfully applied by Koike and Terauchi (1996) to assess the fine-scale vertical profiles of nitrousoxide in near-shore sediments.
The basic design of the instrument detailed in Bender et al. (1987) comprised a lucite pistonwith a narrow hole through the centre, a filter or fine mesh screen (10-µm polyester) taped to the bottomof the piston and an O-ring in grooves on the side of the piston to provide a seal. A stationary pistonwith an O-ring sealed the bottom of the core liner. Stress was applied via a rod attached to the upperpiston with a vice. The upper piston was placed above the sediment column in the bottom water sampler.As the piston was lowered, water was forced out into a sampling tube. At the water/sediment boundary,the water extraction continued, but pore fluid was extracted this time. The water was collected inapproximately 3-ml aliquots that equated to water from every millimetre, thus providing goodresolution. Pore fluid from the top 20 mm typically took between 30 to 60 min to collect, but below thatlevel, extraction was very slow due to the compaction of the sediment.
Several problems may be expected with that technique, such as contamination of the sedimentby the bottom waters, internal mixing of the porewaters during extrusion, and solid/solution reactionsas the pore fluid is expressed through the overlying sediment. Bender et al. (1987) detailed the
86

techniques used to test each of those possible artefacts. Tracer experiments indicated that any mixingassociated with squeezing did not smear profiles by more than a few millimetres. However, thesqueezed porewaters were very susceptible to rapid alteration by solid/solution reactions, and it wasconcluded that the technique was not suitable for trace metals and other particle-reactive chemicals.
The whole-core squeezer devised by Jahnke (1988) was similar in concept to that of Benderet al. (1987), except that the pore fluids were expelled out of a number of sampling ports when a littlepressure was added. That technique was devised to be used at sea and allowed the sampling of porefluids from as little as 10-mm spacing without sectioning the core.
Holes at the required sampling distance were drilled into an acrylic core barrel, tapped andsealed with nylon screws. The device was inserted into the sample core box and a subsample was taken.The ends were capped with O-ringed pistons so that there was sufficient water above the sediment toprevent any air from being trapped. The cell was placed into the pressuring system comprising twoangle braces attached to a unistrut and two threaded rods with nuts screwed directly into the pistons.Pressure was applied by screwing the threaded rods into the nuts, thereby moving the pistons into thecore barrel. The lower nut was turned until the sediment surface was at the desired sampling levelrelative to the sampling ports. Once the core was in position, the nylon screws were removed andreplaced with luer fittings equipped with a 0.45-µm filter and plastic disposable syringe. The bottom ortop nut was then periodically turned to pressurise the core, forcing out pore fluid into the syringe.Alternatively, the core may be pressurised with gas. A pressure of 300-400 kPa was generally used.
The results of that technique were compared with those of an adjacent core that was sectionedand centrifuged in a glove box with a nitrogen atmosphere. The results were similar apart from the ironprofile and the lower surface values of phosphate, silicate and iron for the squeezed test. The latter isprobably due to the movement of the sediment relative to the sampling points during squeezing. Thatdiscrepancy may be reduced by squeezing from the top and the bottom, thus reducing the 1-2-mmsmearing of the profile. However, the apparatus was easy and inexpensive to build and the techniqueless invasive than sectioning. With proper care, there was no need for glove boxes, and the assemblycould be fitted into a large refrigerator. Experience showed that about 10 ml of pore fluid may beextracted from 10 depth intervals in less than 1.5 h, and that several may be performed simultaneously.
3.2.2.4 Heavy-duty squeezing apparatus
Heavy-duty squeezing apparatus is capable of recovering pore fluid from stiff, firm or evenhard, low-porosity materials. Early on in this century, “hydrostatic presses” were used to extract porefluid from soils (Ramann et al., 1916; Lipman, 1918). In the 1940s, a practical stainless-steel squeezingdevice with a self-sealing free gasket was designed by Kriukov (1947) and used for agronomic andgeological purposes. More recent applications to soil-solution studies were reported in Heinrichs et al.,1996 and Böttcher et al., 1997.
Manheim (1966) described a hydraulic squeezer based on that of Kriukov with a fewalterations. The apparatus was constructed mainly from commercially available parts and used astandard press. It was designed to extract water from small quantities of mostly Recent to Palaeocenesediments. Extraction took as little as 3 min. Similar equipment has been used by many others,including: Jones et al. (1969), to extract water from saline lake and playa deposits at Abert Lake,Oregon; and Morgenstern and Balasubramonian (1980) to investigate the swelling characteristics andthe chemistry of pore fluids extracted from Bearpaw shale in Saskatchewan and Morden shale inManitoba (Canada).
87

That squeezing apparatus had a cylinder and ram construction, using a standard 10-t loadframe and press to apply the load. The original squeezer used a metal cylinder of 28.6-mm insidediameter, 50.8-mm outside diameter and 76.2-mm height. The cylinder fitted onto a machined base. Thefilter units comprised stainless-steel screens and a perforated steel plate or a sintered disc fitted into afilter holder. The seals at the base and ram end were provided by a rubber or neoprene washer with aTeflon disc at the top. All the metal parts were manufactured out of ISI No. 303 stainless steel. The 10-tpress could exert a maximum pressure of about 150 MPa on the sediment. A larger squeezer with aninternal bore of about 57 mm was also constructed with a thicker filter plate for greater strength. Themaximum stress on the sample using the 10-t press was about 35 MPa.
A larger version of that design was manufactured for the British Geological Survey(Brightman et al., 1985) to obtain porewater samples from the Mesozoic mudstones at the HarwellResearch Site. Those compacted mudstones had typically 14 to 25% moisture content by dry weight.The cell was 75-mm inside diameter and could accommodate samples up to about 100 mm long. Themaximum working load of the cell was supposed to be 200 MPa. Since calculations by the AtomicEnergy Research Establishment showed that stainless steel did not have the required characteristics, anickel/chrome/molybdenum alloy (BS970/PE2 826 M40) was used.
The apparatus based on Manheim (1966) required a number of modifications. The neopreneseals extruded under high loads and were replaced with perbunam rubber seals. Unfortunately, thosestill extruded through the drain hole at stresses greater than 110 MPa. During early tests, particles wereextruded from the sample through the drilled plate and mesh filter that was replaced with a sinteredbronze filter disc. Those filters were used only once as they deformed under load. The filter support waschanged to a flat upper plate easing the removal of the deformed filter. The base plate was changed tostainless-steel one after the original base plate showed signs of corrosion. A large concrete 2,000-kNpress provided the load. Test specimens varied between 430 and 740 g, and most of the samples hadmoisture contents varying between 10 and 29%. Porewater flowed through a 0.45-µm Acrodisc© filterand collected in plastic syringes. The quantity of pore fluid extracted depended on the type and size ofthe initial sample, its moisture content and the amount of water required. Most tests produced between30 to 50 g of pore fluid within 5 to 7 d.
The Kriukov-Manheim design was modified by Nagender Nath et al. (1988) by the additionof a Teflon inner-cell liner to ensure that the sample and pore fluid did not come in contact with metal.The maximum volume of the sample chamber was 80 cm3. A system of perforated Teflon filter discswith offset holes was used at the bottom of the sample to overcome the movement of sediment throughthe filter paper. The base of the squeezer had a vertical slot in which the sample collectors (plastic vials)were housed so the pore fluid did not come in contact with the atmosphere.
Fontanive et al. (1985) used a Kriukov/Manheim type cell and an oedometer press for loadsup to 3.3 MPa to extract pore fluids from Italian Plio-Pleistocene formations. The cell containing thesample was then transferred to a hydraulic press with a maximum stress of 104 MPa. The samples were50 mm in diameter and had a maximum height of 45 mm. Initial moisture contents of the samples variedbetween 11.7 and 34.9%. Samples with initial moisture contents of 29.6% and 19.1% produced 23.16and 12.00 ml, respectively.
A new cell was developed at the British Geological Survey in the late 1980s (Entwisle andReeder, 1993) to extract pore fluid from glacial tills as well as Mesozoic and Tertiary mudstones. Awide range of chemical tests was required, including minor elements and isotopes. Relatively largequantities of pore fluids were thus needed: up to 80 g per test from materials with moisture contents of
88

about 20%, and reasonable quantities of at least 20 ml from materials with moisture contents around10%. Experience from the earlier Kriukov-Manheim type apparatus (Brightman et al., 1985) indicatedthat large samples of up to 800 g and long test times were required.
The new squeezing apparatus used commercially available hydraulic pumps with a maximumoutput stress of 70 MPa and a capability to maintain constant stress over a number of weeks. A 50-tlong-stroke hydraulic ram transferred the stress to the sample and provided a maximum workingpressure of 70 MPa. The long stroke allowed the test sample to be extruded from the cell afterwards.
The main body of the cell and other metal parts in contact with the test sample or pore fluidwere made of Type-316 stainless steel that was selected for its resistance to corrosion and high tensilestrength. The sample chamber was 75 mm in diameter and 100 mm in height. A spiral groove machinedinto the outside of the cell was covered with a plastic jacket to take a temperature controlling fluid, thusenabling squeezing tests to be conducted under controlled temperatures between 0°C and 50°C. Aschematic diagram of the cell is presented in Figure 34.
The bottom platen of the apparatus screwed to the top of the hydraulic ram was sealed with12V Pack Seal™ containing a nylon packer in order to stop any fluid leakage from the bottom of thesample and to scrape clean the inner wall of the cell as it moved up. The top platen screwed to the topof the cell and was sealed with an O-ring. A separate pore-fluid pipe screwed to the top platen wassealed with an O-ring. That enabled easy cleaning access and reduced the dead volume. A paper filterwas placed onto the sample and supported with a stainless-steel filter. The apparatus may be used withan anaerobic chamber, thus enabling samples to be prepared and squeezed in a very low oxygenatmosphere (minimum 2 ppm of oxygen).
The apparatus has been used to extract pore fluid from materials with moisture contentslightly below 7%. Only a few grams of pore fluid may be extracted from mudstones with less than 9%moisture content. Unsuccessful tests tend to concern highly cemented, hard material. Porewater obtainedusing that apparatus has been analysed for up to 51 chemical species and the isotopes of seven elements.
Yang et al. (1995) described the pore-fluid extraction from welded and non-welded tuffs usinga high-pressure unidimensional compression apparatus for samples with initial moisture content greaterthan 6.5% and using a triaxial system for samples with greater than 8% moisture content.
The unidimensional compression apparatus was based on a compression machine designedfor research on concrete (Barneyback and Diamond, 1981). It was simple to operate and provided awide range of stresses. The main components were made of 4340-alloy steel. The inner-sample sleeveand the drainage plates were made of Monel K500 nickel alloy. Core samples were wrapped in a Teflonsheet and confined in the sample tube. The sample chamber was sealed with O-rings and a Teflonwasher. Fluids were collected in syringes at both ends of the rig. That closed system prevented anycontact between the expelled water and the atmosphere. The maximum sample size was 61 mm indiameter by 110 mm in length. Samples shorter than 55 mm were accommodated by inserting steelspacers beneath the base plate. The apparatus had a maximum stress of 552 MPa and required acompression machine with a capacity of 1.6 MN. Stresses were added in stages. It was found that theporosity decreased by 36 to 79% for non-welded tuffs and by 25 to 49% for densely-welded tuffs.
The triaxial compression machine was modified from a standard, commercially availabletriaxial cell. The cell and end caps were made of 4140-alloy steel and the lateral stress was appliedthrough a urethane membrane. The maximum sample size was 61 mm in diameter by 113 mm in length.
89

The fluids were collected at both ends of the rig in plastic syringes. A hydrostatic stress of 68 MPa wasapplied and then a maximum axial stress of 193 MPa was applied in four stages.
Dry nitrogen was injected into the sample after fluid had been collected from the last loadingstage for both techniques described by Yang et al. (1995). Pressures varying between 0.3 and 9.7 MPawere used for the triaxial test and between 1.4 to 10.3 MPa for the unidimensional test. The injectioncontinued until no more water was forced out. The unidimensional method produced more water andfrom lower moisture content samples than the triaxial method. The porewater compositions from bothtriaxial compression and high-speed centrifugation were comparable.
90
Figure 34. Schematic diagram of the squeezing cell described by Entwisle and Reeder (1993)

A system similar to the unidimensional squeezing apparatus described by Yang et al. (1995)was used by Cuevas et al. (1997) on bentonite from Serrata (Almería, Spain). The compaction of thesample was carried out by a hydraulic press that provided a maximum stress of 3,000 kN. Thecompaction chamber was made of type AISI 329 stainless steel (due to high tensile strength andresistance to corrosion). The maximum sample size was 70 mm in diameter and 118 mm in length.A maximum working pressure of 60 MPa was applied to the sample and that stress was maintainedconstant over a number of weeks. The drainage system allowed for the extraction of porewater at eachend of the sample through a 0.45 mm sintered AISI 316L stainless-steel filter disc, and the porewaterwas collected in a polypropylene syringe.
That squeezing apparatus was designed to study the behaviour of a Spanish bentonitesubjected to simultaneous heating and hydration in a thermohydraulic cell. A sample of bentonitecompacted at 1.62 g/cm3 and 11.2% of water content was simultaneously heated at 100°C at the top andhydrated at the bottom of the sample for three months. At the end of the test, the compacted sample wastaken out and sliced in five horizontal sections (section 1 being the closest to the heater and section 5,the closest to the water source). The final temperature reached ranged from 100 to 60°C and the finalwater content ranged from 14 to 24%. Each of the sliced samples (700-900 g) was introduced in thesqueezing chamber and compacted at 64 MPa to study the changes in porewater composition due totemperature gradient and water saturation, the transport mechanism of salts and possibleprecipitation/dissolution processes. Porewater was only obtained from three sections (those with a watercontent over 20%) at a pressure of 64 MPa.
It was proven that all squeezed bentonite samples always reached a final dry density of about1.72 g/cm3 at a pressure of 64 MPa. The water collected corresponds to the amount of excess watercompared to that of saturated clay at a density of 1.72 g/cm3 for a 64 MPa pressure.
A new squeezing chamber (type AISI 329 stainless steel) was designed by CIEMAT to studythe changes in solution chemistry with applied pressure. That cell endured a working pressure varyingfrom 25 to 200 MPa. The water coming out of the compaction chamber was first channelled in a Teflontube and then passed through different microelectrodes, where pH, Eh, electrical conductivity andtemperature were measured and the values stored in a multiparametric data-acquisition system. Finally,the water was collected in a syringe (Fernández et al., 1996; in preparation).
3.2.2.5 Whole-core sampler and squeezer
A robust whole-core sampler was designed for field work at the British Geological Survey(Kinniburgh et al., 1996). It successfully extracted pore fluids from partially saturated chalk, forbiological-oxygen-demand (BOD) analysis. The sampler was an especially prepared, steel U100 corebarrel with small water-sampling holes drilled into the side and sealed with a grub screw. A drill rigdrove the U100 into the chalk. Upon return to the surface, the U100 containing sample was placed intoa horizontal-load frame with a 30-t, long-stroke hydraulic jack. Pistons with O-rings were placed at eachend of the sample. The stress was applied with a 25-t hydraulic pump providing a maximum stress ofabout 30 MPa. The water was collected via a screening system into plastic syringes.
3.2.3 Squeezing technique
3.2.3.1 Porewater extraction
A typical working procedure for squeezing marine samples with pressure-filtration systems isdetailed in de Lange (1992). After core collection, the PVC liner is cut into 1-m sections, tightly sealed
91

and stored horizontally at 3 to 4°C. The pore fluid is extracted within 24 h of core collection. The core-section is split lengthways into two parts: one is transferred into an anaerobic glove bag, and smallsubsamples are taken from the other for various tests, including moisture content. The samples to besqueezed are put into beakers and placed in a glove box. The sediments are transferred into the pressure-filtration cells. Squeezing starts at low pressure, that is gradually increased up to 1.5 MPa in order toreduce the possibility that a dry sediment cake forms above the filter. The test rate and the fluid volumeproduced depends upon the type of sediment and its initial moisture content. After the required amountof water has been squeezed out of the sample, the sediment is subsampled to determine the remainingmoisture content.
Sample preparation is important to prevent oxidation and other disturbances. For tests whereoxygen-sensitive species are important, core handling should be carried out in a controlled anoxicenvironment. At the British Geological Survey in Keyworth, samples are prepared and tested in anatmosphere of about 100 ppm of oxygen or lower. The oxygen content of the chamber usually riseswhen the core samples are opened.
Where possible, at least 10 mm should be removed from the outer annulus of the core materialprior to testing to reduce the possibility of contamination with drilling fluids. Disturbed surface samplesreceived in bags may be tested directly. Stiffer core materials, such as overconsolidated clays andmudstones, may be prepared as cylinders in a soil lathe using a knife, soil saw or scalpel. Harder, moreindurated materials are broken up with a sturdy knife and hammer. The outer part of the core is removedand the inner material is placed into the cell. Clean disposable gloves should be worn during samplepreparation.
The initial weight of the squeeze sample should be measured in order to determine theextraction efficiency. The moisture content of the sample should also be determined using off-cutscollected during the sample preparation. Clays and mudstones usually take a few days to squeeze andthe initial moisture content may serve as a useful guide to the stress regime, or, in the case of low-moisture content samples, a guide to whether the test is likely to produce porewater.
Operation of the Kriukov-Manheim-type squeezing apparatus is as follows. The filter holderwith its rubber or neoprene gasket is placed in the recess of the filter base. The porous disc or screenand filter papers are placed on top. The sample, of known weight, is rapidly transferred into the cylinder.The upper seal, Teflon and rubber disc are placed on top of the sample and the piston is placed into thecylinder and depressed as far as it will go. The unit is transferred to the press. Larger cells are assembledin the press. Pressure is applied gradually until the first drops of water are expelled, then a syringe ofknown weight is placed into the pore fluid port. When the required amount of liquid has been collected,the syringe is removed, weighed and capped. The syringe is then placed into a refrigerator prior topreservation of the porewater and subsequent chemical analysis. If a number of pore-fluid samples arerequired, a syringe tap is pushed into the port in order to be able to stop the flow of liquid while syringesare being changed.
Pressure is added gradually so that fluids are not extracted too rapidly in order to prevent theproduction of a cloudy liquid containing colloids or even clay particles. It may take from a few days toa few weeks to produce pore fluid from moderate to low moisture-content clays and mudrocks. Whenseveral subsamples of pore fluid are required from the same squeezed sample, the extraction time of thelater samples increases as the hydraulic conductivity of the sample decreases.
92

The squeezing temperature may be controlled by conducting the test in a temperature-controlled room or with a temperature-controlled fluid circulating between the cell and an insulatingjacket.
After the test is completed, the squeezed sample is removed from the cell, weighed andusually oven-dried in order to ascertain the original moisture content of the test specimen. Based on thatinformation, it is possible to calculate the water content of the sample at the start and the end of the test.The moisture content may also be calculated before and after each fluid sample is taken.
The record of the pore-fluid extraction should include information on the apparatus, the testsample, the test method, the mass or volume of water extracted and the stress history of each extraction.
3.2.3.2. Determination of moisture content and extraction efficiency
Duplicate samples of the geological material should be taken at the same time as the sampleis prepared for the determination of moisture content. At least 50 g of original sample should be testedby determining its exact weight before and after heating at approximately 105 to 110°C for a minimumof 24 h.
The moisture-content percentage with respect to dry weight, Mw, is determined as:
where Ww is the weight of the wet sample, and Wd is the weight of the dry sample. Reporting moisturecontent with respect to dry weight is standard in squeezing tests.
The percentage of the available porewater extracted during squeezing, E, (the “extractionefficiency”) may be determined by:
where Wp is the weight of the collected porewater, Wsi is the weight of the sample initially tested, andWsd is the post-squeezing weight of the sample after oven-drying at 105 to 110°C for a minimum of24 h.
3.2.4 Squeezing artefacts
The effects of pressure filtration were considered early in the development of the technique.Northrup (1918) thought that high stresses may affect the physico-chemical equilibrium in the soil. Insome experiments, the ionic content of the pore fluid increases (Kharaka and Berry 1973). However, intests on sodium-chloride solution mixed with Askangel clay and Oglalinski bentonite, Kriukov et al.(1962) observed marked decreases in solute concentration with increasing pore-fluid extraction. Thedecreases started at about 70% moisture content for the Askangel clay and at about 47% moisturecontent for the Oglalinski bentonite. Squeezing ion-exchange columns containing the sodium-chloridesolution gave similar results. The pore-fluid chemistry of a saline mix with Glukhovetsk kaoliniteshowed little change when extraction increased. It was thought that the high-salinity water was removedfrom the clays at high moisture content and the lower concentration of the later samples was due to thelower-salinity solution remaining in the compacted clays.
E =Wp
Wsi – Wsd100%
Mw =Ww – Wd
Wd100%
93


Extensive studies of pore-fluid chemistry on marine sediments indicates good reproducibility(Manheim, 1974). Pore-fluid chemistry of marine sediments is very sensitive to sampling, storage andtest method. Manheim (1974) considered that the variability of results reported for interstitial solutionsfrom the Gulf of Mexico (Parashiva Murthy and Ferrell, 1972; 1973) arose from problems of technique.Absolute composition of interstitial solutions from sediments near the sediment/water interface may becompared to that of seawater. Pore fluid from sediments just below the water/sediment interface oughtto have similar composition to the local bottom water. For chloride, agreement may be within 1%. Theunderstanding of the diagenesis of minerals in marine sediments is aided by information about changesin pore-fluid chemistry at depths below the seabed. In marine core, the pore-fluid chemistry usuallychanges gradually and smoothly with depth due to diffusion (Manheim, 1974; Bender et al., 1987;Jahnke, 1988). The porewater composition changes with depth below seabed; sodium and magnesiumtend to decrease, and calcium increases. The response of different chemical species varies with the typeof sediment, the organic content and the deposition rate and diagenesis. Boron was found verytemperature-sensitive, but that may be compensated for.
Squeezing tests in overconsolidated clays, mudstones and tills have also shown smoothconcentration profiles across the formation for the more conservative species, especially chloride (e.g.,Bath et al., 1988; Metcalfe et al., 1990; Reeder et al., 1997). Increases in calcium, magnesium, sulphateand a number of other ions have indicated the presence of gypsum or higher concentrations of oxidisingpyrite. Recent work has shown that the diffusion patterns down a hillside of Pliocene mudstones in Italywas a function of solute movement driven by surface evaporation. Comparison of pore-fluid chemistryof chalk from squeezing and centrifugation showed many similarities (Bath et al., 1988). Tests carriedout on adjacent samples of London clay, with an initial moisture content of about 19%, showed goodreproducibility when calculated back to the moisture content of each pore-fluid sample.
Manheim (1974) suggested that the threshold of pressure influence above which there was areduced ionic strength should be established. Chilingarian et al. (1973) observed that the concentrationsof porewaters squeezed from montmorillonite clay were slightly higher than the porewater presentduring the early compaction stages, but then started to drop when the overburden pressure increased.Morgenstern and Balasubramonian (1980) similarly observed a reduction in total cation content whenstress rose beyond 20.7 MPa. That was considered to be due to dilution by water from the double layer,and by low-porosity clayey sediments exhibiting a membrane effect.
For lower moisture-content clays and mudstones, sequential pore-fluid samples show changesin pore-fluid chemistry (Entwisle and Reeder, 1993). For many samples, there is a decrease inmonovalent species with increasing pore-fluid extraction and an increase in divalent and then trivalentspecies. The stress level used to extract the pore fluid may be an indicator of changing chemistry, butthe change is more likely to be due to the reduction in moisture content, pore size and void ratio as theparticles move closer together. Recent work at the British Geological Survey using both squeezing andleaching techniques suggests chloride exclusion from the micropores of very low-porosity mudstone.
3.3 Leaching
3.3.1 Principle of the technique
Multiple washing of soil specimens and sediments was at first designed to obtain informationon the ions that may be released by the solid phase (Gedroiz, 1906, Cameron, 1911; Parker, 1921). In1969, Mangelsdorf et al. suggested the use of such a technique to evaluate the artefacts induced bytemperature changes over porewater chemistry in a seawater/montmorillonite mixture. Schmidt (1973)and Lisitsyn et al. (1984) also suggested the use of that technique to obtain information on groundwatercomposition from sidewall and borehole cores.
94

Parshiva Murthy and Ferrell (1972; 1973) started from the observation that porewatersqueezed out at 100 psi was enriched in ionic constituents relative to the solution obtained by a multiple-washing technique. For their experience, they used freshwater sediments and freshly boiled deionisedwater. The sediments were mixed with a varying amount of water (1:2; 1:5; 1:10) and the two phasesseparated by centrifugation. They observed an increase in the calculated concentrations of cations in thewater extract with a decrease in the sediment/water ratio. Besides, since monovalent ions wouldincrease more than divalent ions, that result would be in general agreement with the prediction of theDonnan principle. They also stated that the “in-place” values of ions in the interstitial solution may bederived by the extrapolation of the dilution data to the observed moisture content of the sedimentsample, the Donnan equilibrium being the major control on the distribution of ions in the clay/watersystem.
A more detailed theoretic approach to leaching is reported in Devine et al. (1973). In theiropinion, the clay/water system is composed of an inner solution that is in contact with the clay particleand an outer solution. The exchange between both solutions is due to Donnan-equilibrium interactions.In order to obtain the composition of the outer solution, several aliquots of the solid sample should bediluted with deionised water, and the solution separated by centrifugation. During washing, both theouter and the inner-solution compositions would be affected, while the activity of the metal ion on theclay particle would remain constant (Figure 35). In order to obtain reliable results, sediment sampleswithout readily-soluble salts should be selected. In-situ concentrations would then be obtained byextrapolating the ion concentrations of the leachates to the in-situ water content of the specimen(Figure 36). The authors suggested, as also shown by Mangelsdorf et al. (1969), that the relationshiplog (water/sediment) to log (activity of the ion) should be linear. According to Devine et al., the methodis suitable for obtaining the concentration of the ions in the outer solution. The composition of the innersolution should be obtained by extracting the total pore solution from an unprocessed aliquot of thesediment (no method is specified) and calculating it by difference with the outer solution.
Schmidt (1973) used leaching to derive the porewater composition of shales, using sidewallcores. In his procedure, samples were oven-dried, crushed, placed in a stainless-steel centrifuge tubewith 50% ethanol/distilled-water solution. The sample was dispersed ultrasonically for 1 h and thenultracentrifuged. The extraction procedure was repeated three more times, combining the extracts. Inaddition, the author carefully measured the exchange capacity of shales as a function of depth forsodium, potassium and lithium (CEC ranging from 140 to 20 meq/100 g). Despite those measurements,as there was “a close agreement of the milliequivalents per litre of the cations and an(t)ions”, heconcluded that cations were actually soluble cations and not cations on the exchange sites of any excessclay in the solution. Hence, the extraction procedure is valid for estimating soluble salts in shales. Fromthe discussion, it appears that the author had not a clear idea of the significance of the cation-exchangeprocess. In addition, the electroneutrality of the extracted solutions is in no way a means of detectingreleased cations from the solid and only indicates the error in the analysis.
Leaching has not been investigated in detail for isotopic analysis, as it requires labelledcompounds. Zimmermann et al. (1967) reported on the use of that technique combined withcentrifugation to obtain deuterium profiles in the unsaturated zone. The use of that isotope involves aconversion from weight per cent to volume per cent of the original moisture content. That step is nottrivial, because the conversion needs either the bulk density of the soil profile (that may be easilydisturbed during sampling) or the volume of the solid sample. The possible error is estimated to belower than 10%. Hence, tritium is used instead, because it is much more inexpensive and may bemeasured by liquid-scintillation counting, thus avoiding the conversion step.
95

96
Figure 35. Processes occurring at the vicinity of a clay surface during dilution of the interstitial solution (after Devine et al., 1973)
���������������������
Z(M
+H) + Y
H
Z(M
+H) + Y
H
��
������������������������������������
������������
ZM + YM
ZM
YA
Ion
Act
ivity
Distance from Clay Particle Surface
XM , XA
Inner(Micellar)Solution
Outer(Intermicellar)
Solution
�����������������������������������
������������
Ion
Act
ivity
Distance from Clay Particle Surface
Y(A + OH)Y(A + OH)
Z(M
+
H) + Y(M + H)
Z(M
+
H) + Y(M + H)
Z(M
+
H) X(A + OH) Y(M + H)
1 Dilution of Outer Solutionby distilled Water Washing.
3 HydrolysisRM + HOH = RH + M+ + OH–
2 Migration of Ions to OuterSolution to Maintain equilibrium.Monovalent Ions Dominate Exodus.
������
Z(M
+
H)
YOH
Ion
Act
ivity
Distance from Clay Particle Surface
XH XOH
During Washingb
Unprocessed Sedimenta
After Several Washingsc

3.3.2 The problem of the solid/water interaction
Since its publication, the work of Parshiva Murthy and Ferrel (1972) was strongly criticised,both for its approach and for the total lack of supporting data. That led the authors to publish in 1973 acompilation of the data obtained by leaching with deionised water (providing interstitial ions), byleaching with a 1N ammonium-acetate solution (providing exchangeable cations), and by acid attack onNH4-saturated samples (providing non-exchangeable cations). They suggested that the multiple-dilutiontreatment was the best method to obtain the distribution of the ions between the interstitial andexchangeable positions in sediments, and should be adopted as a uniform standard to report results ofsediment-water analysis. As reactions other than dilution and dissolution of sparingly-soluble salts areinvolved at high water/sediment ratios, thus resulting in a rearrangement of exchangeable and non-exchangeable ions, the abundance of interstitial ions should be determined by a one-step dilutionmethod. Despite that clarification attempt, the concept of their approach is, in our opinion, confused andbased on wrong premises.
Walters (1967) found that eight to five boiling leaches and ultrasonic treatments werenecessary to remove all the chloride from his samples, and suggested that some anion exchange mayretain chloride ions on the clays. That possibility was also raised by Bischoff et al. (1970), and recentwork on indurated clays also show some difficulties in chloride extraction by leaching (Moreau-LeGolvan, 1997). Experiments on marine sediments may not detect that effect, probably because of twomain reasons: the high chloride content of the sediments and the pH range at which the leaching isconducted (Kriukov and Manheim, 1982).
Manheim (1974) claimed that the leaching technique, although possibly good for chloride,does not provide reliable results for cations. Those are more influenced, and often in a complex manner,by the type of sediment, dilution, temperature, duration of leaching, as well as dissolution orprecipitation of phases. Besides, the extrapolation of leaching data to obtain the composition ofinterstitial solutions is a difficult matter, mainly because of the lack of behaviour linearity of thesediment/water system and because of the difficulties in achieving equilibrium in leaching solutions.
97
Figure 36. Graphic method for determining the outer solution concentration. The original Figure has been modified because the graphical construction
was incorrect (modified after Devine et al., 1973)
Ion
Con
cent
ratio
n (lo
g Sc
ale)
Water Percentage (log Scale)
Sediment Percentage
In Situ IonConcentration
in Outer Solution
In Situ WaterContent

In 1985, Fontanive et al. tested the leaching method against the squeezing method on anumber of Italian clays. They dispersed the sample in deionised water, with water/clay ratios rangingfrom 1.46 to 49, and separated the solution after a few minutes by filtration. By plotting the data, assuggested by Devine et al. (1973), they noticed that Ca2+, Mg2+, K+ and HCO3
– showed a non-linearbehaviour (Figure 37). The extrapolation to the initial moisture content would provide anunderestimation of the HCO3
– content. A few tests conducted with longer equilibration times, up to oneyear, produced solutions with a higher dissolved salt content than squeezed waters. The conclusion oftheir study was that the method was time-consuming and unreliable, mainly because of the presence ofreadily-soluble salts in the natural clay samples.
Figure 37. Washing-water compositions in relation to water/clay ratios:N = extrapolated porewater composition (after Fontanive et al., 1985, 1993)
98
Cond.Cond.
0.1 N 1.0
10–6
10–5
10–4
Ca
– M
g (e
q/I)
SO4
– K
(eq
/I)
Cl –
Na
– H
CO
3 (e
q/I)
Water/Clay
10 100
10–3
10–4
10–3
10–2
10–1
10–5
10–4
10–3
10–2
SO4
HCO3
Na
Mg
Ca
Cl
K
Ca
MgCond.KNaSO4HCO3
Cl

Iyer (1990) also reported a non-linearity of the dissolved species with increasing watercontents, as well as higher concentrations in leachates with respect to solutions obtained by squeezing.
The studies of Fontanive et al. (1985; 1993) had pointed out the necessity of having reliablemineralogical data to interpret the leaching data. Von Damm and Johnson (1988) conducted anexperiment reacting twelve shales with deionised water at 20° and 100°C. They checked both thesolution chemistry and the mineralogical composition before and after the reaction with water. Theyused a fixed water/rock ratio of 1:4 and reaction times ranging from 38 to 43 d. Besides, the headspaceof the bottles was purged with nitrogen prior to the reaction. Despite that precaution, oxygen maydiffuse through the walls of the bottles. No attempt was made to control pH, resulting in very acidicsolutions sometimes. They noticed that the sulphate ion was the major anion in every case, and sodiumor calcium the major cations. They compared their results with the groundwaters found in the analysedformations. They concluded that sulphates were an experimental artefact resulting from the oxidationof pyrite, shales with no pyrite also showing the lowest sulphate contents of leachates. Themineralogical changes showed a loss of calcite and the formation of limonite at the higher temperature.The mineralogy was then compared with the minerals in equilibrium with the leachates using ageochemical modelling code. That helped them in trying to determine which minerals may becontrolling the solution composition. They especially noticed that there was a strict relationshipbetween the pH of the leachate and the occurrence of carbonates in the shales. pH in shales havingcarbonates, either observed in X-ray diffraction patterns or predicted thermodynamically, was close toneutrality. The authors concluded that the occurrence of pyrite was the most critical parameter indetermining the solution acidity, while the presence of carbonates was critical to the buffering of thesolution.
Oscarson and Dixon (1989) conducted a very similar experiment, checking both the solutionsand the mineralogical composition of their clay samples. As they observed the presence of gypsum butnot of pyrite in their samples, they postulated that the sulphate content of leachates derived from thedissolution of gypsum. On the other hand, the high sodium content would result from an uptake ofcalcium on the clay surface. They tried to recalculate the ionic strength of the pore solution,extrapolating the results obtained with different water/sediment ratios.
Those two studies helped in focusing the problem of the solid/water interactions duringleaching. Both stressed the importance of an accurate determination of the mineralogy of the sampleand the necessity of taking into account the dissolution of minerals and the exchange with clays. Theyalso showed the necessity of controlling some parameters, such as the presence of free oxygen duringleaching experiments.
Aquilina et al. (1994) reported the investigations of the Deep Geology of France Programme(Géologie profonde de France), in which aqueous leaching of core samples was conducted in order toconstrain the data obtained from chemical monitoring of the drilling fluids (see Chapter II § 1.5.2).Freyssinet and Degranges (1989) presented the full details of the leaching experiments. They testeddifferent parameters on some clay-rich materials, including the shaking time and method, thesolid/liquid ratio and the sample hydration (leaching conducted on hydrated and dehydrated samples).They found that:
– No difference in concentrations was due to differences in the shaking method.
– Dehydration of the sample prior to leaching did not affect the composition of the calculatedporewaters for a solid/liquid ratio of 1:2, but increased them for a solid/liquid ratio of 1:10.
99

– A decrease in the solid/liquid ratio would increase all the chemical elements, as would anincrease in shaking time.
From those preliminary experiments, they concluded that the more “aggressive” the leaching,the more concentrated would be the leachate. Consequently, they selected a 4-h leaching time with asolid/liquid ratio of 1:2, hoping that those parameters would prevent “leaching due to cation-exchangeproblems”. We have already discussed the basic problems involved in that approach, and we will notcome back to them. Also, the chloride value in leachates is subsequently used to calculate the amountof rock leached by the drilling fluid at depth (see Chapter II § 1.5.2); that extrapolation is not valid ifthe kinetic evolution of concentrations during leaching is not well understood.
3.3.3 Modelling the solid/water interactions
Since it was shown that the chemical composition of the leachates may not be interpretwithout modelling the solid/water interactions, leaching has been used straightforwardly in some casestudies only with regard to conservative elements, e.g. chlorine and bromine (Cave et al., 1994).
An attempt to reconstruct the porewater composition from data obtained by aqueous leachingusing multivariate statistical deconvolution was reported by Cave et al., (1995) and Cave and Reeder(1995) on the previously considered data set. No specific information is provided on the mineralogy ofthe samples (Permo-Triassic red beds and Ordovician volcanic rocks). In their approach, theyconsidered that solutes in leachates arise from a combination of sources, including residual solutes fromporewaters, from contaminating drilling fluid, from fluid inclusions, as well as from the dissolution ofminerals and non-linear water/rock interactions (e.g., ion exchange). If the leachate is derivedpredominantly from a linear combination of components and if non-linear interactions are minimal, thedata may be modelled by principal-component analysis (PCA). They assumed that chloride andbromide are derived solely from the porewater component and that lithium, added as a tracer to thedrilling fluid, allows the calculation of the drilling-fluid contamination. PCA is used to determine thenumber of components in a chemical data set derived from a number of different chemical sources.Besides, it allows the set-up of an abstract model of the components that may be used to test whethergiven components fit the data, according to a procedure known as “target factor analysis” (TFA). In thecase study, the composition of the components was not known, but derived from the geologicalknowledge of the system and the estimation of some individual constituents of the test factors.Consequently, they first applied that deconvolution method on a simulated data set in order to verify themethodology, and secondly they used it on the real data set of aqueous leachates from the Sellafieldborehole. As a result, the method applied to the real data set produced data that were consistent withindependently derived groundwater data from the borehole for most determinants (hydrogen carbonate,calcium, barium, strontium, total inorganic carbon [TIC]). Potassium, silicon, sulphate, and aluminiumshowed instead values significantly different from the corrected values. As a conclusion, that methodseems to have a potential application in a wide range of studies, but further work is needed to understandfully the limitations of the procedure.
That approach has been recently applied for the investigations on the Gard and Meuse sites(Reeder et al., 1997), the Tournemire site (Cave et al., 1997) and the Mont Terri project (Thury andBossart, in preparation). It should be noted that, in all cases, the attribution of a given solution chemistryto a solution type (porewater, readily-soluble salts, contamination, etc.) is completely arbitrary andwithout any physical meaning. Besides, that approach completely neglects cation-exchange phenomenathat are very important in clayey systems, as we have seen before. The use of very refined statistics doesnot provide reliable results if data are obtained using such a heavily disturbing technique.
100

Finally, in 1990, Bradbury et al. proposed to investigate the water chemistry, sorption andtransport properties of marls using a leaching procedure. Their concept was applied to the Palfris marl(Baeyens and Bradbury, 1991; 1994) and to the Opalinus clay (Bradbury and Baeyens, 1997). In theirapproach, different leaching solutions are to be used, thus controlling alternatively a series ofparameters (calcite saturation, pH, pCO2, etc.). Basically, two types of ion extractions are conducted.The first is an aqueous extraction with different solid/liquid ratios, while the second usesnickelethylenediammine, a highly selective complex displacing all exchangeable cations from the clayminerals to the solution. The aim is to separate the contribution of soluble salts from the cationexchange on clays. The main objective of those studies is to calculate the composition of a syntheticsolution, the laboratory standard marl solution (LSM) that would be in “chemical equilibrium” with thesolid phase. That is a totally different approach, encompassing both the problem of water extraction andthe quantitative definition of the abundance and characteristics of the “inner” and the “outer” solutions.The method relies extensively on geochemical modelling; as a result, it is only mentioned here, but itwill be discussed in detail in Chapter III § 3.
3.4 Distillation technique for stable isotope analysis
The set of techniques described in this section uses the principle of distillation for extractingwater from solid samples. Those techniques are consequently only to be used for isotopicmeasurements, since solutes are left behind in the matrix.
3.4.1 Vacuum distillation
3.4.1.1 Historic development
The vacuum-distillation technique has been set up since the beginning of isotopicmeasurements by mass spectrometry. It was first designed for extracting water from hydrous solidphases, such as volcanic glasses (Friedman and Smith, 1958), gypsum (Gonfiantini and Fontes, 1963)or phyllosilicates (Godfrey, 1962). The application of that technique to soil-water extraction wasdeveloped in the 1960s, when the IAEA initiated a project aiming to establish the relationship betweenthe concentration of environmental isotopes (deuterium, oxygen-18 and tritium) in rain and infiltrationwater (Sauzay, 1974). Naturally, investigations turned on arid-zone hydrology (Allison et al., 1983;Barnes and Allison, 1983; 1984; Aranyossy and Gaye, 1992) and consequently to low water-contentsystems. Recent developments of the studies for nuclear waste disposal sites focused on clay-richenvironments with very low water contents. The design of the extraction did not undergo drasticchanges, but the procedure parameters have been adapted to the different needs and interests.
3.4.1.2 Set up and extraction procedures
Basically, the solid sample is placed in a vacuum line (Figure 38) and heated: the releasedwater molecules are trapped with liquid nitrogen. The water obtained is then used in conventionalpreparation lines for isotopic analysis.
In early studies, as the structural water was of interest, special care was devoted to thedegassing of the sample in order to eliminate adsorbed water. That was achieved by preheating thesample at 100°C or more under vacuum. Then the extraction stage made use of a temperature accordingto selected minerals or materials, normally higher than 1,400°C for silicates. The evolution towardsunsaturated-zone hydrology changed the focus from crystallisation water to porewater. The authorsdirectly transposed the technique by selecting a lower extraction temperature. That may lead to
101

incomplete recovery of the water, and consequently, as we will see later, induce fractionation.Unfortunately, early work somehow masked the problem for a few years due to many reasons:
– Studies mainly focused on tritium and stable isotopes (Zimmermann et al., 1966; 1967;Smith et al., 1970), establishing depth profiles in soils. The tritium peak was easy to detectand samples needed electrolytic enrichment prior to analysis. The error is consequentlymuch more difficult to show. In addition, the establishment of depth profiles using onlyone isotope may give consistent data, but not necessarily precise ones.
– The application to soils, where evaporation is one of the major natural process affecting theisotopic composition of water, did not allow to reveal artefacts due to the extraction andconditioning
In order to check for possible artefacts related to incomplete extraction, a simple calculationof the extraction yield may be used. Jusserand (1980) defined the extraction yield as:
where m1 is the mass of water extracted by distillation and m2, the loss of weight of the distilled samplewhen placed in an oven at 105°C (m1 + m2 being the total water content of the sample).
The temperature at which distillation is performed and the extraction yield are two essentialparameters that should always be specified when describing the extraction procedure. While there is aninternational agreement on the need to control the extraction yield, each laboratory seems to select adistillation temperature that normally ranges from 50° to 110°C (Walker et al., 1994). Many otherparameters may vary according to different laboratories in the sampling, sample conditioning and waterextraction procedures. Some case studies are reported in Table 8, to give an idea of their variability.Those data are reported also because, while a number of authors consider that the extraction yield is theonly parameter affecting the isotopic composition of extracted solutions, others think that, especially inclay-rich media, the performance of the technique may also be affected by the sample pre-treatment andother factors.
France-Lanord and Sheppard (1992) and France-Lanord (1997) have performed distillationextractions at different temperature stages (0°-120°C, 120°-200°C and 200°-1,100°C). Thosetemperature stages have been selected in order to extract respectively the free porewater, the strongly
R =m1
m1 + m2* 100
102
Figure 38. Soil vacuum distillation line (after Jusserand, 1980) 1 = 10–3m Hg vacuum;2 = vacuum pump; 3 = traps; 4 = liquid nitrogen;
5 = 100°C heater; 6 = sample; 7 = thermostated bath
����
1
2
46
5
73

103
Reference MaterialTemperature Duration Check
Pre-treatment Notes/Commentsof extraction (hours) for yield
Friedman and Volcanic 1,450°C 1 Not Sample degassing in the line Traps with liquid N2Smith, 1958 glasses specified at 110°C for 30-60 min
Godfrey, 1962 Hydrous 1,300-1,600°C 1-2 Not Sample degassing at 458°C Samples are crushed, sieved and mineralssilicates specified for 90 min (165°C for biotite) are separated with heavy liquids
Gonfiantini and Gypsum 400°C Not Yes Not specified Gypsum crystallisation waterFontes, 1963 specified
Smith et al., 1970 Soils 100°C (chalk) 24 Not Samples are isolated from Tritium110-150°C (clays) 12 specified the atmosphere in the field
Gouvea da Silva, Soils 70°C Not Yes Samples are frozen to –80°C1980 specified and pumped
Saxena and Soils 50-60°C 5 Yes Samples are placed in the line Traps at –60°C Dressie, 1983 with their cans
Allison et al., Soils 50°C Not Not Not specified Traps with liquid N21987 specified specified
Ingraham and Soils 110°C 7 Yes Dried and doped with Traps with liquid N2Shadel, 1992 known water Dynamic vacuum?
Araguas-Araguas Soils 100°C 7 Yes Brief degassing of the system Study on partial recovery, differentet al., 1995 temperatures and times used resulting
in incomplete extractions
Mathieu and Soils 70°C Not Yes Not specified Incomplete extraction is corrected using Bariac, 1995 specified the Rayleigh equation
Ricard, 1993 Clays 60°C 14 Yes Samples are crushed, frozen toMoreau-Le Golvan, –80°C and pumped for degassing1997
Pearson et al., Clays 105°C 48 Yes Samples are crushed and in preparation lightly pumped
France-Lanord, Clays 0°-120°C Variable Samples are crushed, frozen Study on the isotopic composition 1997 120°-200°C to –180°C and pumped of the different types of water
200°-1,100°C
Table 8. Parameters used in different studies for vacuum distillation

absorbed water and the crystallisation water. The isotopic analysis (especially deuterium) performed oneach fraction show appreciable differences in composition. Nevertheless, due to the very low amount ofthe two last types of water, their contribution to the cumulated isotopic composition is almost negligible.
3.4.1.3 Microdistillation
Microdistillation with zinc is a variant of vacuum distillation, and does only providedeuterium values. A small soil sample is placed under vacuum in a side arm of a reaction vesselcontaining zinc. The zinc is heated to 450°C, while the soil is heated to a temperature comprisedbetween 100 and 200°C. The water vapour extracted from the soil reacts readily with zinc to formhydrogen used for mass spectrometry (Turner and Gailitis, 1988).
3.4.1.4 Evidence of artefacts
Since the comparative study of Walker et al. (1994) (see Chapter II § 3.4.3) a big effort hasbeen made to describe the possible artefacts induced by vacuum distillation in order to make theappropriate corrections due to their effects. In this section, incomplete distillation is not considered.
Ricard (1993) tested different grain sizes, distillation times and distillation temperatures onsamples coming from the Tournemire formation.
Grain sizes smaller than 2 mm and comprised between 2 and 5 mm were considered. Thesamples with a water content of 3.1% displayed no fractionation as a function of the particledimensions. Another test using bigger (1-2 cm) and smaller (mortar pestle) grain sizes showed morevariable results, both in water and in isotope contents. No indication was given if the sample wasconditioned in a controlled atmosphere.
Distillation times, ranging from 20 to 48 h, did not seem to affect the isotopic composition.Instead, temperature effects were observed. If a sample has been distilled at 60°C and is brought up to100°C, the last extracted water droplets are heavily enriched in deuterium. That value does not seem tocorrespond to clay-crystallisation water that is usually much more depleted (Sheppard and Gilg, 1996).According to the author, it may represent water strongly bound to the clay. Nevertheless, that water hasa negligible effect on the global isotopic composition of the sample, since it is only present in very lowamounts.
Moreau-Le Golvan et al. (1997) also found on Tournemire samples a grain size effect, mostlyinfluencing oxygen-18, but also deuterium to a lesser extent (Figure 39). The extracted water is enrichedin oxygen-18 as the grain size decreases, with discrepancies reaching 3‰. For deuterium, discrepanciesremain within the bounds of analytical uncertainty. An extensive discussion on the possible origin ofthat artefact (access to a different type of porewater, exchange with atmospheric carbon dioxide oroxygen) is conducted, but is not conclusive.
The results of those experiments show that the technique may be biased by a number ofartefacts. It is extremely important, in order to obtain consistent results, that a maximum of parametersbe controlled during the sample conditioning (especially the grain size and the contact time with theatmosphere). For the consistency of the results, the set of parameters should be the same for all samples.As we have already stressed in the sample conditioning (Chapter II § 2), the use of an inert atmosphereto prevent evaporation is not suitable because pure gases are anhydrous.
3.4.2 Azeotropic distillation
104

Azeotropic distillation was first used for extracting water from soils, adapting the methoddesigned by Dewar and McDonald (1961). The technique is based on the observation that some solventsform an azeotropic mixture with water, showing a boiling point lower than the boiling points of the twoend members. Different solvents have been used such as toluene (Allison and Hughes, 1983), xylene(Hendry, 1983) or petroleum ether (Shatkay and Magaritz, 1987). In the case of toluene (boiling point110°C), the azeotropic mixture with water boils at 84.1°C.
Revesz and Woods (1990) carefully described the technique and the apparatus used(Figure 40). The soil was placed in a flask and covered with toluene. The temperature was raised to theboiling point of the azeotrope that evaporated, recondensing in the funnel with a cloudy appearance. Atroom temperature, the two liquids (water and toluene) separated. The temperature was gradually
105
Figure 39. Grain-size effect (after Moreau-Le Golvan et al., 1997)
– 80– 10.5 – 10.0 – 9.5 – 9.0 – 8.5 – 8.0 – 7.5 – 7.0 – 6.5
– 75
– 70
– 60
– 65
– 55
– 50
– 45
– 40
� 2
H (
‰ v
s V
-SM
OW
)
�18 O (‰ vs V-SMOW)
[3.15:5][2.5:3.15]
[1.6:1.25]
[0.6:1] [1:1.6]
[0.63:1.25][2.5:5]
>5
>5
[Grain Size Range]
MWL
Sample ID 180 6790
Sample ID 270 2400
– 10.5
0.0 0.5 1.0 1.5 2.0 2.5 3.0 3.5 4.0
– 10.0
– 9.5
– 8.5
– 9.0
– 8.0
– 7.5
– 7.0
4.5 5.0 5.5 6.0 6.5 7.0
– 6.5
�18
O (
‰ v
s V
-SM
OW
)
Grain Size (mm)
Sample ID 180 6790
Sample ID 270 2400
Grain Size : Mean Values(the Horizontal Bar Correspondsto the Size Range)

increased up to the boiling point of toluene. The latter condensed in the funnel with a clear appearance,indicating that the extraction was complete. The time required was usually much shorter that vacuumdistillation, approximately 1.5 h. The collected water needed subsequently to be purified for traces ofsolvent. That was performed by adding wax to the solution and heating the mixture in a closed vessel.The wax dissolved the solvent and solidified on top of the sample at room temperature, allowingsimultaneously to prevent evaporation from the vial during storage.
Figure 40. Azeotropic distillation apparatus for soil-water extraction (after Revesz and Woods, 1990)
3.4.3 Evidence of artefacts
106
��
Corner 2
Corner 1 > 90°
Water DropsWide Area
Toluene
Water Level
Toluene Level
Clear Appearance
Opaque Appearance
Cooling Water
Cooling Water
TolueneToluene
HeatingElement
Soil Sample
Water
SamplingBottle

Revesz and Woods (1990) tested the technique for different soil types, variation in soil/tolueneratio, variation in grain size of the soil, dependence on the isotopic composition of the water, memoryeffects between successive samples, variability in water content and use of kerosene instead of toluene.No fractionation was observed, except in two cases:
– In gypsum-bearing soils, hydration water usually shows different isotopic compositions.8
The authors suggest a simple method to check for the presence of sources of “water” i.e.,to compare the isotopic composition obtained by azeotropic distillation with the isotopiccomposition of a small amount of water added to the wet soil and extracted by decantationor centrifugation. If the two do not agree, then the azeotropic composition does not reflectthe composition of the soil solution. If gypsum is present, the isotopic composition of thesoil water must be obtained by isotopic-mass balance of the gypsum crystallisation waterand the soil water.
– In soils with very low water contents, water is strongly bound to the particles and 100%yields are difficult to obtain. The authors tested clean sand with gravimetric water contentof 3% and found that it was enriched compared to the conditioning water by +2.6‰ indeuterium and +0.56‰ in oxygen-18.
They concluded that the technique was simple, fast, inexpensive and suitable for any type ofsoil, providing good reproducible results (± 2‰ and ± 0.2‰ for deuterium and oxygen-18,respectively). Accuracy declines with low water contents.
Leaney et al. (1993) reported an important deuterium fractionation for soil samples previouslyconditioned. They chose two drying temperatures, 105° and 250°C, and after letting the samples cooldown in sealed bags, they doped them with different amounts of isotopically-determined water(Figure 41). It appeared that fractionation was less important for samples dehydrated at 250°C. Besides,it increases as the clay content increased, reaching more than 10‰ in samples with 50% clay content.A comparison with porewater obtained by centrifugation again revealed a discrepancy of at least 3‰along the depth profile. The authors consequently attributed a systematic depletion in deuterium of 3‰to a fractionation of the azeotropic technique, while the rest of the discrepancy observed was attributedto the evaporation of the sample during the centrifugation extraction. It is interesting to notice that, incontrast with the results obtained by Revesz and Woods (1990), extracted water was systematicallydepleted with respect to doping water. Unfortunately, the study only concerns deuterium values anddoes not report the water/solid ratio used for the experiments.
3.4.3 Comparative studies: the effect of incomplete extraction
In 1994, Walker et al. launched an international comparison of methods to determine thestable-isotope composition of soil water. Four different types of soils (sand, gypseous sand, clay withlow and high water contents) were prepared and distributed to 14 laboratories. Granulometry was lessthan 2 mm for all samples. With the exception of the gypseous sand, that was dried at room temperaturein a dessiccator under vacuum, soils were oven-dried at 105°C. Bulk samples were allowed toequilibrate with atmospheric water vapour, and the average total “dry” gravimetric content wascarefully determined. A predetermined water amount was then added to the solid samples in closedcontainers and shaken. Sample-to-sample variability was carefully tested using one extraction
107
8. Gypsum (CaSO4*2H2O) contains crystallisation water with a different isotopic composition (Sofer, 1978). Thatwater may be released at atmospheric pressure and in a hydrated environment at 42°C (D’Ans, 1968).

technique. Laboratories involved use a variety of water-extraction techniques, including azeotropicdistillation, vacuum distillation, microdistillation with zinc and centrifugation.
The results obtained (Figure 42) show a large variation between laboratories in the isotopiccomposition of extracted water (up to 30‰ in deuterium and 3.4‰ in oxygen-18). The spread of resultsis most significant for the dry clay and the gypseous sand. Results are not randomly dispersed: they aresystematically depleted with respect to the doping water and lie near a Rayleigh line for distillation at35°C. In the case of gypseous sand, a shift towards the isotopic composition of gypsum crystallisationwater is clear. Besides, a correlation with the final extraction temperature exists for all soils, especiallyfor oxygen-18. The suggested cause of those variations is incomplete extraction, a phenomenon thattends to produce isotopically-depleted waters. The correlation with temperature suggests that heating(100-150°C) may be a necessary component for acceptable distillation results, especially whenextracting water from clays.
That study highlighted the need to develop standard protocols for the extraction of water fromsoils. Besides, it started a serious effort aiming to understand the mechanism of distillation and todescribe and model the influence of incomplete extraction. Gouvea da Silva (1980) had already noticedthat incomplete extractions would lead to isotopically-depleted results. However, when she tried tomodel that depletion, she found that data would not follow the theoretic Rayleigh distillation process,
108
Figure 41. Isotopic fractionation as a function of clay content (after Leaney et al., 1993)
– 350 10 20 4030 50 60 70
– 34
– 33
– 32
– 30
– 31
– 29
– 27
– 25
– 28
– 26
– 24
– 23
�2 H
Soi
l Wat
er (
‰ V
.SM
OW
)
% Clay Content
Dope Water Std Error for Clay Analysis
Experiment 1Soil Heated to 105 °C
Experiment 2Soil Heated to 250 °C
1 S.D. = 1.0 ‰ for�2 H Analysis
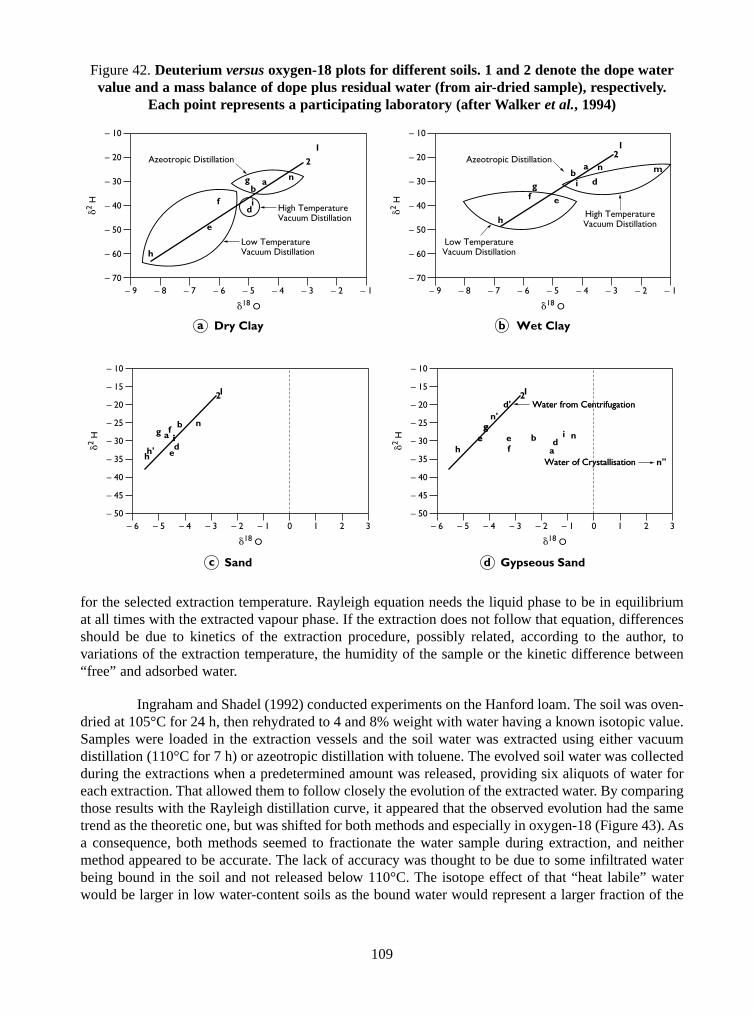
for the selected extraction temperature. Rayleigh equation needs the liquid phase to be in equilibriumat all times with the extracted vapour phase. If the extraction does not follow that equation, differencesshould be due to kinetics of the extraction procedure, possibly related, according to the author, tovariations of the extraction temperature, the humidity of the sample or the kinetic difference between“free” and adsorbed water.
Ingraham and Shadel (1992) conducted experiments on the Hanford loam. The soil was oven-dried at 105°C for 24 h, then rehydrated to 4 and 8% weight with water having a known isotopic value.Samples were loaded in the extraction vessels and the soil water was extracted using either vacuumdistillation (110°C for 7 h) or azeotropic distillation with toluene. The evolved soil water was collectedduring the extractions when a predetermined amount was released, providing six aliquots of water foreach extraction. That allowed them to follow closely the evolution of the extracted water. By comparingthose results with the Rayleigh distillation curve, it appeared that the observed evolution had the sametrend as the theoretic one, but was shifted for both methods and especially in oxygen-18 (Figure 43). Asa consequence, both methods seemed to fractionate the water sample during extraction, and neithermethod appeared to be accurate. The lack of accuracy was thought to be due to some infiltrated waterbeing bound in the soil and not released below 110°C. The isotope effect of that “heat labile” waterwould be larger in low water-content soils as the bound water would represent a larger fraction of the
109
Figure 42. Deuterium versus oxygen-18 plots for different soils. 1 and 2 denote the dope watervalue and a mass balance of dope plus residual water (from air-dried sample), respectively.
Each point represents a participating laboratory (after Walker et al., 1994)
– 70– 9 – 8 – 6 – 4 – 2– 7 – 5 – 3 – 1
– 50
– 20
– 60
– 30
– 40
– 10
�2 H
�18 O
f
e
dib
ag n
h
2
1
High TemperatureVacuum Distillation
Azeotropic Distillation
Low TemperatureVacuum Distillation
– 70– 9 – 8 – 6 – 4 – 2– 7 – 5 – 3 – 1
– 50
– 20
– 60
– 30
– 40
– 10
�2 H
�18 O
f e
dm
ib
a
g
n
h
21
High TemperatureVacuum Distillation
Azeotropic Distillation
Low TemperatureVacuum Distillation
– 50– 6 – 5 – 4 – 2 0 2– 3 – 1 1 3
– 40
– 15
– 45
– 25
– 20
– 30
– 35
– 10
�2 H
�18 O
f
edii
bag
n
hh'
21
– 50– 6 – 5 – 4 – 2 0 2– 3 – 1 1 3
– 40
– 15
– 45
– 25
– 20
– 30
– 35
– 10
�2 H
�18 O
fe d
iba
n
n'
n''h
21d'
eg
eg
Water from Centrifugation
Water of Crystallisation
Water from Centrifugation
Water of Crystallisation
Wet ClaybDry Claya
Gypseous SanddSandc

total. Experiments conducted at very low water contents (3.6% and 5.2%) showed that extracted waterwas more enriched in oxygen-18 (up to 2‰) than doping water, while no effect was observed ondeuterium. The change in oxygen-isotope composition was suggested to be the result of a hydrationdependence of the oxygen isotope of soil water.
Figure 43. Deuterium and oxygen-18 plots for (a) vacuum distillation and (b) azeotropic distillation (after Ingraham and Shadel, 1992)
In order to test that hypothesis, a second set of experiments was designed, where soil waspreconditioned with the same doping water, then dried and rehydrated. That way, the “heat labile water”in the soil should be in isotopic equilibrium with the test water, but not fractionated at its expense.Extractions performed with the two methods gave good results for the azeotropic distillation, while noimprovement was observed for vacuum distillation. The authors came to the conclusion that, although
110
– 1200 20 6040 80 100
– 80
– 100
– 40
– 60
– 20
�2 H
SMO
W
Amount Distilled, Percent
Single-Stage Rayleigh Distillation
– 1600 20 6040 80 100
– 80
– 120
40
0
– 40
– 100
– 140
20
– 20
– 60
60
�2 H
SMO
W
Amount Distilled, Percent
– 200 20 6040 80 100
– 5
– 10
– 15
5
0
10
�18
OSM
OW
Amount Distilled, Percent
Single-Stage Rayleigh Distillation– 20
0 20 6040 80 100
– 15
5
– 5
10
0
– 10
15
�18
OSM
OW
Amount Distilled, Percent
ba

neither method appeared to be accurate, azeotropic distillation should be preferred as only extracting“hydrologically active” soil water and not heat labile water.
Partisans of the vacuum distillation struck back in 1995. Araguas-Araguas et al. conducted anextensive study using the technique on different soil types with different clay contents. An oven-driedclean sand was doped with water and distilled with different duration times and temperatures, resultingin different extraction yields. Results showed that complete recovery of soil water may be obtained,with standard deviations for duplicate samples reaching about 1.3‰ and 0.14‰ for deuterium andoxygen-18, respectively. Those errors were only slightly higher than the analytical errors. Incompleteextraction (Figure 44) resulted in isotopic depletion: on the deuterium versus oxygen-18 plot, data fellaround the meteoric water line, suggesting equilibrium conditions during the extraction of soil moisture.Using the Rayleigh equation, trends indicated that most of the extraction was obtained between 10° and50°C, much lower temperatures than the ones used. The authors justified that as a delay in reaching thefinal distillation temperature, indicating that most of the water was extracted at the initial stage of theprocess. the authors concluded that vacuum distillation was reliable for sandy soils with high watercontents, provided that the extraction was more than 98% of the original water.
Figure 44. Deuterium and oxygen-18 plots for soil water extracted from sand (after Araguas-Araguas et al., 1995)
111
– 140– 18 – 17 – 15 – 13 – 11– 16 – 14 – 12 – 10
– 120
– 100
– 110
– 130
– 80
– 90
– 70
�2 H
[‰
] SM
OW
�18 O [‰]SMOW
GMWL
Recovery 50-60 %
Recovery 80-90 %
Recovery > 98 %
Dope Water
– 120 10 50 70 903020 40 60 80 100
– 8
– 4
– 6
– 10
0
– 2
2
��
18 O
[‰
] SM
OW
Recovery [%]
50 °C
25 °C7 °C
0 °C
b
a

Percolation tests were conducted on a Brazilian soil (75% kaolinite, 80% clay content,42-44% volume water content) and on an Austrian soil (50% clay including kaolinite, illite and chlorite,34-34% volume water content). The innovative aspect of that approach was that the soils were not driedand conditioned, but flushed with the doping solution. The procedure avoided artefacts that may arisefrom drying and rewetting (see Chapter I). Soils were packed in columns and percolated with a knownsolution (Figure 45), the percolate being sampled at regular intervals (percolate I). The columns werethen dismantled and part of the soil was distilled for 8 h at 100°C (soil water I). The rest of the soil wasoven-dried at 70°C overnight to remove free water, then repacked in columns and percolated again(percolate II). Soils were distilled once more (soil water II) and redistilled at 350°C to remove all thewater (high-temperature distillation). Results for the high clay-content soil indicated that the percolatingdope water gradually replaced porewater, but, when extracted with vacuum distillation, the true isotopiccomposition of dope water could not be recovered. In the second percolation test, the significantisotopic shift would correspond to the water fractionation during the rehydration of the clay. On adeuterium versus oxygen-18 diagram, the data plot on a line that crosses the area of the water extractedat high temperatures. Those results indicated the presence of a pool of weakly bound water in the clay,which should be slightly depleted in both isotopes when compared to the free water (percolate). In thecase of the Austrian soil, results did not show a clear trend as in the previous case, but formed a clusterdepleted in oxygen-18 (0.26‰) and enriched in deuterium (3‰). In that case, the weakly-bound waterin the soil should be enriched in oxygen-18 and depleted in deuterium with respect to free water.
The authors identified the reservoir of bound water in the hydration sphere of “cations of theclay particles” (interlayer water). That reservoir largely remained unaffected during the water extractionat 100°C. Bound water should be isotopically depleted in deuterium. That conclusion would be inagreement with the results obtained by Stewart (1972), who showed that water bound on kaoliniticmineral surfaces displayed approximately the same deuterium content than the vapour phase of bulkwater in the reactor. In other words, the fractionation between free and bound water would be the sameas the one existing between free water and its vapour phase in equilibrium. The observed shift inoxygen-18 would depend on the type of soil. The observation that vacuum extractions always providedresults that shifted from the isotopic composition of dope water led the authors to suggest to use lowextraction temperatures (< 100°C) for both vacuum and azeotropic distillations, if only free water wasrelevant.
Finally, Moreau-Le Golvan (1997) examined the effect of incomplete water extraction onTournemire clay samples (Figure 46). Data did not follow the Rayleigh distillation curve for the selectedtemperature (60°C), or curves for lower temperatures. Besides, the regression line on the deuteriumversus oxygen-18 plot indicated that the extraction proceeds out of equilibrium. Kinetic effects weretaken into account using the model established by Gonfiantini (1986). In that case, the slope of theregression line agreed with the measured values, but the isotopic fractionation did not. The effect ofisotopic fractionation was less than expected from both the Rayleigh and the Gonfiantini models. Theauthor attributed that discrepancy to other factors that are not accounted for, namely the influence ofwater bonding on the kinetic fractionation factor and the diffusion coefficients used (established in airand not in vacuum).
Moreau-Le Golvan (1997) also pointed out that, in order to establish the extraction yield, thedefinition of the temperature at which all the water was released was of primary importance. The totalwater content is normally measured by oven-drying at 105°C for 24 h. In the case of the Tournemireargillites, thermogravimetric analysis showed a major weight loss before 100°C (2.6%), normallyattributed to the extraction of free and adsorbed water. Nevertheless, between 100° and 400°C a smallerweight loss seemed to occur (1.39%). That weight loss might still be due to water loss, and in the case
112

of very low water-content systems, it is of great importance for the definition of the total water content,and consequently the extraction yield.
3.5 Direct analysis of the isotopic content of water
In this section, we will consider techniques that do not involve the extraction of the aqueousphase from the solid sample, but the reaction with an external component leading, through somecorrections, to the evaluation of the isotopic content of the water.
3.5.1 Equilibration with carbon dioxide (oxygen-18 analysis)
The conventional technique for oxygen-18 analysis of water samples involves an equilibrationat 25°C with carbon dioxide, with a known isotopic composition. The isotopic exchange occurs throughdissolution of the carbon dioxide in water. Equilibrium is known to be reached in a few hours (Epsteinand Mayeda, 1953) according to the reaction:
113
– 100– 13 – 12 – 8 – 6 – 4– 10– 11
– 13 – 12 – 11
– 9 – 7 – 5 – 3
– 80
– 60
– 70
– 90
– 30
– 40
– 50
– 20
�2 H
[‰
] SM
OW
�18 O [‰]SMOW
GMWL
Percolate
I
Percolate II
– 100– 15 – 10 100– 5 5 15 20
– 40
0
– 20
– 60
– 80
40
20
60
�2 H
[‰
] SM
OW
�18 O [‰]SMOW
b
a
����
��
– 80
– 90
DopeWater
DopeWater
SoilWater
SoilWater
Initial IsotopicComposition ofthe Soil Water
Percolate IPercolate IISoil Water ISoil Water II
GMW
L
HighTemperature
Extraction
Figure 45. Results of the column experiment with the Brazilian soil (after Araguas-Araguas et al., 1995)

C16,16 O2 + H218O ↔ C16,18 O2 + H2
16O
Jusserand (1979) suggested that a direct equilibration of the solid sample with the carbondioxide may provide the oxygen-18 values of porewater. For his experiments, he used five types of soilswith variable clay contents (4-98%) and variable clay types (illite, chlorite, kaolinite and interstratifiedclays). The soil samples were previously dried at 105°C and rehydrated with different amounts ofisotopically-known water. In addition, two water densities were selected (1.021 and 1.015). Watercontents ranged from 9.26 to 33.80%. A known amount of isotopically-determined carbon dioxide wasput in contact with the sediment for 7 d at 25°C, and subsequently extracted and analysed byconventional mass spectrometry.
Raw results needed a correction, based on the equation established by Craig (1957) for mass-spectrometry measurements adapted to the experimental conditions used:
δc = 1.092 Vw– 0.047 ⋅ δm + 2.990 Vw
– 0.0033
114
Figure 46. Effects of incomplete distillation (after Moreau-Le Golvan, 1997)
– 75– 9.5 – 9.0 – 8.5 – 8.0 – 7.5 – 7.0 – 6.5
– 70
– 65
– 55
– 60
– 50
– 45
�2 H
(‰
vs
SMO
W)
�18 O (‰ vs SMOW)
Numbers Correspond to Extraction Yields
Gonfiantini's Modeln = 1
T = 60 °Ch = 0 %
Equation :Y = 3.7 * X – 28.4
R2 = 0.65
78.8
94.8
97.4 100.1 99.7
92.9
– 10060 65 70 75 80 85 90 95 100
– 90
– 80
– 60
– 70
– 50
�2 H
(‰
vs
SMO
W)
Extraction Yield
°Rayleigh's Model T = 60 °C
°Gonfiantini's Model n = 1 ; T = 60
°C; h
=
0%
– 2860 65 70 75 80 85 90 95 100
– 26
– 24
– 20
– 22
– 18
– 16
– 14
– 10
– 12
– 8
– 6
�18
O (
‰ v
s SM
OW
)
Extraction Yield
°Rayleigh's Model T = 60 °C
°Gonfiantini's Model n
= 1 ; T= 60
°C; h
=0 %
ba
c
GMWL

where δc and δm are the corrected and measured deltas (in permil versus SMOW), and Vw, the volumeof water used (i.e., in that case, the volume of water injected in the solid sample). Consequently, thesmaller the amount of water, the greater the correction. Corrected deltas were systematically moreenriched (0.15 to 0.9‰) than the injected water: discrepancies were larger for low water contents andfine-grained sediments. Those samples also showed poor reproducibility. That behaviour was attributednot only to uncertainties related to the approximations used to define the parameters of the experiment,but also possibly to a fractionation effect existing for that type of clay-rich soils. Nevertheless, thetechnique of direct equilibration is considered reliable for samples showing relative humidity greaterthan 9%, with an uncertainty of ±0.5‰. No systematic effects were observed with changing waterdensities, and no tests have been performed with longer equilibration times.
Additional results were reported by Jusserand (1980) on natural and artificially-preparedsamples. In that study, the technique was compared with centrifugation, vacuum distillation and low-pressure squeezing. Again, enriched values were reported and attributed, at least partially, to anoverestimation of the applied correction.
Ricard (1993) tried the direct equilibration with carbon dioxide on some Tournemire claystonesamples. Two tests were made. The first test was performed with a clay sample, dried at 100°C andrehydrated with isotopically-determined water. The sample was split in three subsamples, each of themanalysed after different equilibration times (7, 18, 27 d). Results showed a depletion in oxygen-18 (upto five deltas) compared to the doping water used. On the other hand, it appeared that the solid sampleshad a higher water content than expected, possibly indicating that, after drying, the samples hadadsorbed air moisture during the conditioning process. A second attempt made use of three differentnatural samples from Tournemire. Each was split in two, one part used for vacuum distillation and thesecond for direct equilibration. In that case, direct equilibration produced more enriched values,approaching within the error, after five months of equilibration time, the values obtained by vacuumdistillation. It was not stated if any type of correction of the raw results had been applied, according tothe Jusserand (1980) equations. From those results, the author considered direct equilibration as avaluable technique for the isotopic determination of porewater in that type of rocks, provided that theequilibration times were carefully checked. Nevertheless, the duration of the equilibration would makethe use of that technique difficult on a routine basis.
3.5.2 Direct equilibration with water (oxygen-18 and deuterium)
That technique has been very recently developed at the University of Heidelberg and has onlybeen presented at informal meetings or used in preliminary investigations (Rübel et al., 1998). It relieson the isotopic equilibrium established in a closed container between the porewater of the sample anda known amount of isotopically well-defined water. Two experiments need to be run: one using a testwater with an isotopic composition close to that of the porewater, the other with an isotopic compositionsignificantly different. Sodium chloride is added to the test water samples (conc. 20 g/l) to avoidcondensation on the walls of the container. The exchange is obtained through the vapour phase, bymolecular diffusion. Equilibrium is reached within 10 d, and the test water is analysed with theconventional method of carbon-dioxide equilibration. The two values obtained allow to solve the twoequations relating the isotopic composition and the volumes of porewater and test water. Results appearto provide a good estimate of the porewater isotopic value, with an uncertainty of 1.5‰ in δ2H and0.4‰ in δ18Ο, while the porewater content may be obtained within an error of 5%.
The technique has been applied within the framework of the investigations in the Lauenburgerclay (Gorleben, Germany) and in the Opalinus clay (Mont Terri, Switzerland). In the latter case, isotopic
115

results obtained were compared with the values of water flowing from boreholes and with porewaterextracted with the vacuum-distillation method at 105°C for 48 h. Direct-equilibration data were in goodagreement with borehole-water data and were heavily enriched with respect to vacuum-distillation data.The interpretation attributed the isotopic discrepancy of –7.0‰ in δ2H and –2.13‰ in δ18O to anartefact caused by the distillation process (Pearson et al., in prep.).
3.6 Other techniques
In this section, we will consider isolated attempts of water and solute-extraction techniquesthat were not found very suitable.
3.6.1 Microwave extraction
An attempt of water extraction for isotopic analysis using a microwave oven has beenperformed on frozen samples within the framework of the ARCHIMEDE project. Very few details ofthe experience have been reported in the final European Community report (Griffault et al., 1996). δ18Ovalues appeared to be at least 3‰ enriched with respect to water extracted by conventional techniques.According to the authors, that enrichment may be explained either by interactions with decomposingorganic matter or with clay minerals, or by condensation of the atmospheric vapour contained in themicrowave oven, despite the fact that the experiment was conducted under nitrogen flow. The lack ofdeuterium analysis does not allow to discriminate between the possible explanations. The authorsclaimed a recovery corresponding to the moisture content of the sample. Despite that, an evaporation ofthe sample prior to the treatment may also explain the isotopic enrichment (Pitsch, personalcommunication).
3.6.2 Lyophilisation
Two frozen samples of the ARCHIMEDE project were treated by lyophilisation. The collectedwater samples showed an oily consistency and a strong smell of hydrogen sulphide. The aspect of thewater sample already showed that the experience was not carefully conducted, as lyophilisation shouldonly provide pure-water samples. Oxyen-18 values were again heavily enriched for the small-diametercore sample, but only slightly enriched for the larger-core sample. Oxidation of pyrite and reaction withwater (in absence of free oxygen, as in the case of lyophilisation) may occur, according to the followingreactions:
FeS2 + 2H2O + e– → H2S + FeIIIO(OH) + HS–
HS– + H2O → H2S + OH–
leading to an isotopic change in the water sample. Nevertheless, according to the mass balance, thecomplete oxidation of the pyrite would only affect 10% of the extracted water. Consequently, otherwater/rock interactions have to be considered in order to explain the isotopic shift. Again, the lack ofdeuterium data only allows speculating about possible explanations. Besides, the highest shift isobtained for the small-core sample, that may have been affected by a partial defreezing during thecoring process. According to the authors, the isotopic shift would then be somehow related to thethermal history and the storing conditions of the samples, because of possible ice sublimation. Oncemore, a problem of sample conditioning seems to have occurred. Lyophilisation may then be consideredagain for isotopic measurements, provided that special care is taken for the cold chain not to be broken.Besides, for very low water-content samples, pyrite oxidation may increasingly affect the water isotopiccomposition (especially for deuterium, that has not been addressed in this report).
116

3.6.3 Carbon-13 and carbon-14 on-core extractions
Vacuum distillation was used to obtain carbon-13 and carbon-14 analysis from dissolvedinorganic carbon in rock porewaters (Davidson et al., 1995). Samples used consisted of variably-saturated tuffs, that were isolated upon removal from the core barrel by plastic sheeting and heat-sealable aluminium/plastic laminate, and then flushed with pure nitrogen in order to preventatmospheric contamination. The samples were placed inside a cell connected to the cold traps, andheated at 150-180°C. Distillation lasted 4 to 15 h per sample. Results were compared with thoseobtained by core squeezing, according to the procedure described by Peters et al. (1992) and by vacuumacid leaching of the previously distilled cores.
Data suggested that the carbon recovery from the cores was far from complete. In fact,vacuum distillation lowered the porewater content, resulting in a precipitation of calcite in the matrix.About 15-60% of the inorganic carbon was recovered by distillation, the remainder precipitating in thepores as solid carbonate or being left behind as adsorbed carbon. If no primary calcite is present, thecombination of gas extraction and acid leaching should allow reconstructing the porewater isotopiccontent. Carbon mass balance in the extracted porewater indicated DIC contents significantly higherthan values obtained by core squeezing. That is apparently not due to incomplete distillation, sincewater contents were carefully checked. That suggests the presence of an additional reservoir of carbondioxide in the rock, represented by adsorbed carbon.
Incomplete recovery results in an isotopic fractionation, favouring light isotopes in theextracted phase. That effect is too variable to allow corrections to be made for carbon-13, and attemptsto reconstruct the original composition of porewaters were inconclusive. On the other hand, the impactof fractionation on carbon-14 measurements was significantly lower. The maximum fractionationcomputed using stable-isotope data, indicate a possible error within 4%. A comparison with dataobtained with other techniques (squeezing and air measurements in the formation) were in goodagreement. It should be noted that the samples used show quite a high carbon-14 activity (85-90 pMC),possibly masking the effects of an atmospheric contribution at some stages of the sampling andextraction procedure.
Moreau-Le Golvan (1997) set up a very similar vacuum distillation line for dissolved carbonextractions from the Tournemire argillites. In that case, the sample is previously crushed in a controlledatmosphere and is not heated. The extraction of substances other than pure carbon dioxide (kerogen?)interfered with the mass spectrometric measurements of stable-isotope contents. Carbon-14 results weresignificantly higher than background, indicating a possible contamination of the sample. Unfortunately,the impossibility to run an appropriate blank prevents the identification of the contamination source.
3.6.4 Radial diffusion method
Van der Kamp et al. (1996) described a method using a radial diffusion cell obtained fromintact cores for determining the isotopic composition, the chemistry of porewaters and the effectiveporosity in aquitards. The diffusion cell consisted of a cylindrical sample of saturated porous materialencased in a rigid, impermeable tube, with rigid impermeable seals at the top and at the bottom, toprevent water loss by evaporation and mechanical swelling of the sample. A hole drilled along the axiscreated a central reservoir, that was filled with a suitable test fluid (de-aired deionised water withappropriate tracers). The equilibration between the fluid in the central reservoir and the sample occurredby molecular diffusion: hence, successive episodes of water addition, equilibration and sampling,allowing the determination of the initial concentrations in the porewater and of the effective porosity ofthe material.
117

The method has only been tested in cores of Canadian clay-rich tills for chloride and sulphateions, as well as deuterium, that are believed to be conservative and non-reactive. Water was injected fivetimes in the central reservoir, and each injection included a waiting period until equilibration wasreached. Electric-conductivity measurements show that the process was completed within 56 d. Acareful measurement of the amount and composition of the water injected and withdrawn allowed toplot the concentration of solute removed to the net mass added to the solid sample. In fact, it was foundthat, for deuterium, the net mass added was positive, being the initial solution artificially enriched inheavy isotopes. Chlorine and sulphate ions diffused instead from the solid to the water, and the net massadded was thus negative. A linear regression, on the plots of concentration versus net mass added,provided values for the original porewater concentration directly as “y intercept”.
A comparison of those values with the groundwater composition obtained from boreholesshowed a good agreement for deuterium, within the range of analytical error. Chloride values weresystematically higher (approximately 30%): the authors explained that the discrepancy was due to acontamination of the diffusion cell. Sulphate contents were also slightly different, but do not show anysystematic variation. That indicates that, if they were influenced by oxidation and reduction phenomena,those effects were not very significant.
In our opinion, despite the very promising title of the paper, the technique seems valid onlyfor obtaining deuterium values and possibly chloride contents, but it should not be used for derivingporewater compositions. In fact, it only considers diffusion from and to the pores, neglecting saltdissolution and exchange/adsorption phenomena. In that respect, the approach is biased by the sameconceptual errors of deionised-water leaching, as shown by the results obtained even for the mostconservative ions. The performance of the technique for obtaining deuterium values should be tested onother types of clay-rich materials, since it assumes no swelling in the inside hole and consequently nochange in the pore size and access.
In a companion paper, the concentration change in the reservoir during equilibration,adequately modelled using Laplace transform method for both finite and semi-infinite domains, wasused to derive the effective diffusion coefficients, as well as adsorption and effective porosity(Novakowski and van der Kamp, 1996).
3.7 Organic-matter extraction
Mostly soil scientists and petroleum geologists have designed procedures for extractingorganic matter from clay-rich samples. Those procedures vary according to the type of relevant organicmatter: the water-soluble fraction, the solvent-extractable fraction or the non-extractable fraction.
As we have seen in Chapter I, water-soluble organic matter is mostly made of humicsubstances. Investigations have concentrated on the extraction, purification and characterisation of thosesubstances, mainly because they are the easiest to process. In addition, humic substances are most likelypresent in clay porewaters and are considered responsible for the complexation and transport of someradionuclides.
Despite the efforts made, there is still a lack of agreement on the structure of humicsubstances, that reflects the complex processes responsible of their formation (Schnitzer, 1978; Sposito,1984). The aim of the extraction procedure is to break the bonds between the humic substances and thesolid particles without changing the structure and the functional groups of the organic matter itself, inorder to use the extracted substances for speciation studies. According to Hayes (1985), water is an
118

excellent solvent for humic substances when the acid groups on the macromolecules are dissociated andtheir structures expand to allow the solvation of the polar moieties in the structures. The dissociation isbest accomplished with the use of strong basic aqueous solutions, but those may to some extent degradethe macromolecules and lead to the formation of artefacts. When the charges on the humic moleculesare neutralised by polyvalent cations, dissolution in water may be inhibited, because cations tend tocondense the structures by forming short bridges between charges on adjacent strands of themacromolecule. In that case, the use of neutral-salt solutions that complex and remove polyvalentcations may help in the extraction of humic substances.
A standard procedure has not been designed yet, and an international study group (theInternational Humic Substances Society) is currently working on it. The most commonly usedprocedure is summarised in Figure 47 and involves washing the sediment with a mild alkaline solution(e.g., 0.1 M of sodium hydroxide) in order to dissolve humic substances. The insoluble fraction,including the inorganic fraction, the non-humic substances and humin, is separated by centrifugationand discarded. The solution is then acidified to a pH of 2 (e.g., with hydrochloric acid), to separateprecipitating humic acids from fulvic acids, that is, the low molecular fraction that is soluble at any pH.
Figure 47. Extraction procedure adopted for the separation and purification of humicsubstances (modified, after Testini and Gessa, 1989)
Humic acid may be further treated with alcohol to dissolve imatomelanic acid. The insolublehumic acids still may be separated into brown humic acids (soluble) and grey humic acids (insoluble)by processing them with a neutral salt like sodium chloride. Fulvic acid may be purified by raising thepH to 4.8 to separate a component called “humus β ”. The purification is usually obtained by repeatingthe acid-base treatment several times and combining the different fractions, or by performingultrafiltration at selected molecular cut-offs. Characterisation of the extracted compounds is performedthrough elemental analysis (carbon/hydrogen/nitrogen ratios), ultraviolet-visible spectroscopy and IRS,NMR and electron-spin resonance (ESR).
119
Solid Sample
Extraction with Alkaline Solution(NaOH 0.1 N)
Acidification to pH = 1
Basification to pH = 4.8 Treatment with Alcohol
Treatment with Neutral Salt(NaCl)
Extraction with Alkaline Solution(NaOH 0.1 N)
Soluble Fraction(Humic Compounds)
Insoluble fraction(Inorganic Fraction
+ non-Humic Compounds+ Humin)
Acidification to pH = 1
Soluble Fraction(Fulvic Acids)
Insoluble Fraction(Humic Acids)
Soluble Fraction(Fulvic Acids)
Insoluble Fraction(Humus �)
Soluble Fraction(Imatomelanic Acid)
Insoluble Fraction(Humic Acids)
Soluble Fraction(Brown Humic Acids)
Insoluble Fraction(Grey Humic Acids)
Basification to pH = 4.8 Treatment with Alcohol
Treatment with Neutral Salt(NaCl)

The first investigations on the Boom clay (Beaufays et al., 1994) focused on the isolation,purification and characterisation of humic and fulvic acids in order to test their complexation propertieswith respect to europium (taken as analogue to americium) and the effects of radiolysis oncomplexation. The organic matter was extracted both under oxidising and reducing conditions. Theextraction procedure was initiated by suspending the clay in a carbonate buffer (1:1 ratio), consisting ina chemical analogue of the Boom-clay interstitial solution. The slurries, equilibrated for 2 d, wereseparated by centrifugation, and the supernatants containing humic acids were collected. The procedurewas repeated three times, and the extraction yield ranged between 4 and 10% of the total organic-matterpool. The reduced organic matter was further purified by high-speed centrifugation and kept undernitrogen atmosphere. If necessary, excess salt would be eliminated by dialysis or ultrafiltration with aselected molecular cut-off range. The oxidised organic matter was more drastically purified by loweringthe pH to 1 with nitric acid, leading to a quantitative coagulation of humic acids. The supernatantcontaining fulvic acids was decanted, and the humic acid fraction redispersed in a 0.1 N HNO3. Thatprocedure was repeated, normally twice, until the supernatant was clear, thus confirming the absence offulvics. Humic acids were finally separated by centrifugation, followed by redispersion in distilledwater, then dialysed until the pH reached approximately 5.6. The suspension was then stored in the darkat 1-2°C. According to the authors, those rather mild working conditions should ensure that only minorchanges are caused to the organic matter and guarantee the representativity of the in-situ conditions. Thecharacterisation that followed made use of potentiometric titrations, ultraviolet-visiblespectrophotometry and CEC measurements (by saturation with trivalent cobaltihexammine labelledwith cobalt-60).
In the framework of the ARCHIMEDE project (Griffault et al., 1996), the extraction of thesoluble fraction of the organic matter has been performed using a 0.2‰ solution of an alkaline detergent(RBS™), at a pH close to neutrality and a clay/water ratio of 1:5. All operations were conducted in aninert atmosphere. The solution was shaken for 13 d at 20°C and separated in a centrifuge. A secondhigh-speed centrifugation stage allowed the separation of a black liquid from a black solid. Since nocharacterisation was conducted onto those two organic fractions, their representativity is uncertain. Theextraction yield was 30 times greater than the extraction with deionised water, but no calculation on theextraction yield are reported. Cation-exchange capacities measured with cobaltihexammine chloride onthe black-solid residue showed to be approximately double the values obtained in the previous study(Beaufays et al., 1994). That discrepancy clearly indicates that different fractions of extractable organicmatter have been separated according to the adopted extraction procedure, and that more effort has tobe put in the formulation of a standard procedure to allow the intercomparison of results.
More recently, repeated extraction cycles with acidic (pH = 2) and basic (pH = 12) solutionsprovided a high recovery yield of organic matter from Boom clay, with the separation of the water-soluble and non-extractable fraction (Dierckx et al., 1996; Devol-Brown et al., 1998).
The water-insoluble fraction of the organic matter (bitumen) may be obtained using organicsolvents, such as heptane, cyclohexane, toluene or chloroform (Griffault et al., 1996). Extractedproducts may be identified by gas chromatography and mass spectrometry. Finally, the non-extractableorganic fraction may only be obtained by destruction of the inorganic particles by strong acid attack.That fraction may be characterised to provide information on the origin of the organic matter (marineor continental), its maturity, the thermal history and the petroleum potential, and ultimately, someindication on the possibility of fluid migration (oil and water) occurring in the formation. Elementalanalysis indicates which type of degradation affected the organic-matter pool and which organisms wereresponsible for it.
120

A complete organic matter characterisation, including petrological, bulk organic geochemical,aromatic and aliphatic biomarkers and light hydrocarbon (LHC) has been conducted in the frameworkof the Mont Terri project. LHC-distribution analysis may shed some light on the migration andsubsurface redistribution of those very mobile compounds. LHC cannot be extracted using solvents, butneed to be released by a mild thermal treatment in a headspace apparatus or by gas stripping. Thatcharacterisation allowed to differentiate three main sources of organic matter in Opalinus clay (Pearsonet al., in preparation). Due to their very low quantity, humic substances could not be extracted fromborehole-water or squeezed-water samples. Nevertheless, they are believed to constitute the bulk of thetotal organic carbon (TOC).
121


PART III
PROCESSES AND CURRENT INTERPRETATIONS
1. EXTRACTION TECHNIQUES
In the previous chapter, we examined the available techniques for extracting water from clay-rich sediments and rocks, discussing the possible artefacts that have been evidenced for each technique.This section aims to bring an insight on the processes that are likely to occur when disturbing theclay/water interface by subtracting or adding solvents, applying or eliminating pressure, etc.
This third chapter of the report is based on the available comparative studies, that use differenttechniques on samples with controlled mineralogy and water content. Studies of that type are very rare,and synthesis mainly concern applications to soils (Adams et al., 1980; Jusserand, 1980; Litaor, 1988;Iyer, 1990; de Lange et al., 1992; Walker et al., 1994; Angelidis, 1997). The review is also based on anumber of internal reports concerning investigations conducted on low water-content clay formations(Gard, Meuse, Mol, Mont Terri, Tournemire) for the definition of their geochemical characteristics(Bath et al., 1989a; 1989b; Blackwell et al., 1995a; 1995b; Brightman et al., 1985; Cave et al., 1997;De Windt et al., 1998b; Griffault et al., 1996; Reeder et al., 1992; 1993; 1997; Thury and Bossart, inpreparation). In some of those cases, the same technique has been applied to obtain solutions from quitedifferent types of clays (see Chapter I § 5 for the site description).
This section focus on processes occurring at the solid/water interface and relies on the reviewof the fundamental properties of the clay/water interactions that was made in Chapter I, in order tocompile a list of possible artefacts related to extraction techniques. Firstly, processes that may bedemonstrated in experimental studies are described. Secondly, the attempts to correct the artefact effectsthat were found in the literature are reported. Finally unsolved questions and problems are highlighted,stressing the areas where further investigation is needed.
1.1 Performances of the extraction techniques
A first indication on the performance of a given technique to extract water from a givensample is based on the force used to break the bonds between the water molecules and the solid. In otherwords, we should examine the problem from the energetic point of view, without considering, for themoment, the solute/clay interactions.
In Chapter I, we defined the matrix, osmotic and water potentials. We have also seen that claysshow different matrix-potential curves, according to the surface charge they develop and to the cationpopulation on the adsorption sites (Figures 5 and 11). Spectroscopic studies have demonstrated that,beyond 11 layers of water molecules, the properties of water resemble those of bulk water, while, closerto the surface of the clay particles, properties may vary significantly (Swartzen-Allen and Matijevic,
123

1974; Sposito and Prost, 1982). According to Van Olphen (1965), five layers of water onmontmorillonite show a suction potential corresponding to a pF of 4.7, two layers to a pF of 6.4, andone layer to a pF of 6.7. The air-inlet point, corresponding to the beginning of desaturation for a claylike the Boom clay, for example, is situated at a pF of approximately 4 (Horseman et al., 1996).Logically, that value should be higher for indurated clays with lower water content.
A simple approximate calculation allows to determine the suction potentials for eachextraction technique (Table 9).
According to those values, apart from low-pressure squeezing and centrifugation, all thetechniques should be able to extract free water from clays, and most of the techniques are likely to affectalso any water strongly bound to the clay surfaces.
The possibility of extracting not only free water, but also to some extent, strongly bound wateris an important issue, especially for isotopic analysis. Indications on the behaviour of clay samples withrespect to water extraction may be obtained by adsorption-desorption isotherms (Decarreau, 1990). It isnormally observed that those show hysteresis phenomena, most likely because of the changes in the claystructure due to desaturation (layer collapsing, grain-size modifications, deswelling) (Boek et al., 1995).
124
Technique SpecificationsApplied suction
ReferenceMPa pF
Oven-drying at 105°C 1,000 7 Studer, 1961
Low-pressure squeezing 4 bars 3.6 Jusserand, 1980
Squeezing9 70 < 5.8
110 < 6
552 < 6.7
Low-speed centrifugation 2,500 rpm for 20 min 3 Jusserand, 1980
Centrifugation10 7,500 rpm 1.8 4.3 Edmunds and Bath, 1976
20,000 rpm with 2.3 4.4immiscible displacent
Vacuum distillation11 complete extraction 7 Studer, 1961
Table 9. Suctions applied by different water-extraction techniques
9. Those suction values are calculated assuming that the applied squeezing pressure tranfers directly and completelyto the porewater. They consequently represent a maximum value.
10. Those values are calculated using the equation reported by Edmunds and Bath, 1976, for describing the suctionapplied at the midpoint of the centrifuged sample (see Chapter III § 3.1).
11. That suction value is assumed, since the complete water extraction is checked by oven-drying the sample at 105°C.

Nevertheless, useful information on the amount of different types of water may be derived together withsuction parameters, that should be considered only to extract free water. That type of analysis is notroutinely applied in the investigations on indurated clays.
1.2 Processes related to water and solute extraction
1.2.1 Effect of increasing pressure
Squeezing and, to some extent, centrifugation involve a pressure increase in the interstitialsolutions caused by the applied external force (piston or centrifuge). That may influence the chemicaland isotopic composition of extruded solutions.
The effect of that pressure change has been extensively studied for high water-content, highsalinity-systems (marine sediments). For that type of samples, the increased pressure effect isconsidered to be small or undetectable for pressures below 600 kg cm–2 (59 MPa) (Manheim, 1966) or1 kbar (100 MPa) (Manheim and Sayles, 1974; Manheim, 1976). For higher pressures, bothconcentration decreases and increases are reported (Kharaka and Berry, 1973; see the review in Kriukovand Manheim, 1982). Those pressure limitations seem to apply also to high water-content, low-salinityenvironments (lake sediments) (Patterson et al., 1978). In all those cases, the ion concentration in theextruded pore fluids is constant for most of the squeezing sequence (down to a water content of 50%per dry weight), and the electrolyte concentration is close to the in-situ value as measured with selectiveelectrodes (Kriukov and Manheim, 1982).
On the other hand, in case studies on low water-content and clay-rich rocks, high squeezingpressures need to be applied to drive water out. Important changes in the porewater chemistry haveconsequently been detected (Brightman et al., 1985; Reeder et al., 1992; Böttcher et al., 1997).
Two additional phenomena may take place simultaneously: oxygen intrusion in the porespaces leading to a change in redox conditions, and a temperature-induced modification of mineralsolubilities. Recent squeezing devices are equipped with a temperature-control system and theextraction is performed in anaerobic conditions (Reeder et al., 1998). Nevertheless, the solutioncomposition still seems to change with the increasing stress, indicating that water/rock interactions arestill occurring.
Only in a few studies on clays was water actually collected at different stages of increasedpressure (Brightman et al., 1985; Rodvang, 1987), mainly because the low water content does not allowthat type of investigation. Results normally show a decrease in concentration of major ions; in addition,small monovalent ions are more affected than large divalent ions. Reeder et al. (1992) squeezed, bothaerobically and anaerobically, some Boom-clay samples. All elements (major and trace) displayed asharp decrease in concentrations, except for magnesium, nitrate, bromide, TIC, TOC and silicon, thatshow anomalous tendencies and are first depleted, then enriched. Unfortunately, those results were notcompared with those obtained by other techniques in the final report of the ARCHIMEDE project(Griffault et al., 1996). Nevertheless, Beaucaire et al. (in press) showed that squeezed samples, althoughhaving chloride levels comparable with those obtained in piezometers, have lower bromide content,concluding that the observed fractionation must be related to the ionic radius of the considered species.
Porewater extrusion by increasing pressure is normally considered analogous to the naturalprocess of compaction occurring in sedimentary basins (Reeder et al., 1998). Nevertheless, theextrapolation of the natural system to the artificial one is not straightforward, mainly because squeezing
125

pressures are relatively high and applied in a short period of time, not allowing water to move withinthe pores in the same fashion (Magara, 1976). When expanded layers are compressed, the total cationexchange capacity of the clay formation decreases. With compaction pressures up to 20,000 psi(138 MPa), divalent cations are released to a greater extent than monovalent cations (Weaver and Beck,1971). Other studies on compacted clays, showed that the compaction pressure has no influence on thesorption thermodynamics of the material (J. Ly, CEA, personal communication)
Studies on compacted clay layers have shown, under laboratory conditions, the existence ofan ion-filtration effect (Kharaka and Berry, 1973; Kharaka and Smalley, 1976; Graf, 1982). Accordingto those studies, the anionic and cationic concentrations of extruded solutions are lower than in inputsolutions. The following retention sequence has been established from the most retained to the leastretained:
Cs+ > Rb+ > K+ > NH3+ > Na+ > Li+ > Ba2+ > Sr2+ > Ca2+ > Mg2+
While some authors consider that phenomenon to occur during squeezing at high pressures(Rodvang, 1987), Kriukov and Manheim (1982) stated that it does not occur because the residualporewater shows an even lower electrolyte concentration than the extracted porewater. Unfortunately,the latter do not specify the method used to extract the residual porewater.
In other studies, the Donnan principle causing anion exclusion is considered responsible forthe relatively high salinity of the first extracted solution drops (Kriukov and Manheim, 1982; Brightmanet al., 1985). According to that principle, free porewater should have a higher dissolved salt content thanwater close to the clay surfaces, because in that region, the amount of ions is imposed by the surfacecharge of the clay particle. When the clay particles are compressed, their electric-influence regionsoverlap. That especially affects anions, since they are excluded from that double layer region. As aconsequence, anions will be extruded first and will carry a sufficient amount of cations with them topreserve the electric neutrality of the solution. As the porewater is eliminated, the water in overlappingdouble layers would progressively dilute it.
According to that explanation, chloride obtained by squeezing and by leaching should displaycomparable values. In fact, it is assumed that squeezing only affects free porewater, while leachingaffects both pore and interlayer water, but may be recalculated back to free porewater, if the moisturecontent of the sample is known. Chloride is assumed to be only present in the free porewater.Nevertheless, results are not directly comparable for indurated clays (Blackwell et al., 1995a, 1995b)and chloride contents are higher for squeezed samples than for leached samples. It should be noted thatleaching data normally display higher ionic content than squeezing data, because of the dissolution ofsoluble salts. The reason for that discrepancy is not clear, but may be explained by the difficulty to back-calculate leaching data to the free porewater composition, or by an increased salinity of the waterobtained by squeezing, or by a positive anion sorption on clays during leaching. That anomalousbehaviour of chloride (and to a minor extent bromide) is not at present explained and may be related toa change in the alkalinity to keep the ionic balance.
Reeder et al. (1992) and Pearson et al., (in preparation) showed that an increase of the externalpressure leads to a loss of dissolved gases.
Another possible explanation, that is rarely considered to justify the salinity changes of thesqueezed solution, is a modified solubility of solid phases due to compression. Two contrasting forcesparticularly affect the carbonate system. On one hand, carbon-dioxide degassing of the porewater
126

solution may lead to calcite precipitation (Pearson et al., 1978); on the other hand, the pressure increaseshould thermodynamically cause calcite dissolution. The net effect of those two driving forces will mostlikely depend on the local (within the sample) conditions (Fritz and Eady, 1985).
There is a great interest in the evaluation of the effects of pressure differences on waterchemistries. Preliminary results on artificial systems (compacted MX80 bentonite and experimentalsolutions) indicate that the concentrations of the squeezed porewaters are clearly lower than theequilibrated “external” solutions and tend to decrease with increasing density during squeezing(Muurinen and Lehikoinen, 1998). Ongoing research at CIEMAT (Villar et al., 1997; AITEMIN et al.,1998) within the framework of the European Community’s FEBEX project, is dealing with changes insolution chemistry with the applied pressure. The clay sample in the squeezing cell is allowed to standfor one week after each step of increased stress. It was observed in some cases that water starts tooutflow only a few days after the pressure increase due to the slow movement of the water in the pores(A.M. Fernández, CIEMAT, personal communication.). Analysis of the solution chemistry after eachstage will be performed. In addition, the squeezed core will be dissected and analysed for moisture anddissolved-salt distribution, as well as for changes in the mineralogy. A detailed study on the topic is alsoforeseen among the investigations at the Mont Terri site (Thury and Bossart, in preparation).
Recent work on highly-indurated clays (Reeder et al., 1997; Cave et al., 1997) used a mixedtechnique to extract water, consisting in a partial rehydration of the sample prior to squeezing. Reederet al. (1997) concluded that, for most elements, the average concentration found in the rehydratedsqueezed water was in reasonable agreement with that found for non-treated samples. Exceptions to thatwere chloride, potassium and pH. Chloride was found to be depleted in rehydrated samples in anamount proportional to the ratio of the moisture content of the rehydrated sample to the natural moistureof the sample. Potassium was found to be enhanced in rehydrated cores, and pH increased, on average,by 0.5 unit. In our opinion, the results obtained by using such combined techniques should be cautiouslyconsidered, since the artefacts induced by both techniques are still poorly controlled.
Very few studies (Brightman et al., 1985; Reeder et al., 1992; Beaucaire et al., in press) alsoexamine the effects of an increase of the external pressure on the isotopic composition of the extrudedsolutions. Theoretically, a small membrane effect should be expected (Coplen and Hanshaw, 1973; Yeh,1980; Benzel and Graf, 1984). The variability of the values seems more important for oxygen-18 thanfor deuterium, but the small amount of available data does not allow to draw any conclusion on thetopic.
1.2.2 Effect of decreasing pressure
The decrease in external pressure and its consequences has been extensively studied. It isusually observed that the lack of confining pressure, such as the one encountered in the formation(lithostatic pressure) induces a decompaction of the rock sample materialised by the formation ofmicrofractures, through which gas migration is increased. An immediate observed effect is thedegassing of the sample (Zabowski and Sletten, 1991), together with the input of atmospheric gases.Incoming oxygen causes oxidation reactions to increase, and its effect will be addressed in the nextsection.
Degassing may occur whenever the gas partial pressures in the porewater are higher than thesurrounding ones. The use of a controlled atmosphere will consequently not solve the problem, unlessdisplaying the same gas partial pressures. Degassing has been detected during sampling, transport andcentrifugation of soil samples (Dahlgren et al., 1997), despite of all the efforts made to minimise
127

carbon-dioxide loss with careful sampling in closed, centrifuge tubes. Between 86 and 99% of the totalcarbonate concentration were lost, resulting in a reduction of bicarbonate concentration up to 0.67 mMin 24 h. That phenomenon does not seem to be restricted to that extraction technique, and is alsoobserved during squeezing.
Carbon-dioxide degassing is a relatively serious problem since it affects the carbonate system.Carbon-dioxide escape will lead to the loss of total dissolved carbonates, the precipitation of carbonatesin the pore spaces, the subtraction of calcium from the solution and ultimately the increase of cationexchanges with clays. Calcite precipitation depends on the presence of calcium-carbonatecrystallisation nuclei, and is consequently reported to occur mainly in carbonate-rich sediments (deLange et al., 1992). Manganese is very sensitive to carbonate precipitation: negative “spikes” in themanganese content of porewaters from marine sediments coinciding with intervals of enhanced calciumcarbonate content have been attributed to a decompressional effect (de Lange, 1986). Carbonateprecipitation may lower the effective porosity and help trapping the solutions inside the core sample.
That degassing phenomenon is very rapid and is thought to affect also water sampling fromboreholes (Pearson et al., 1978). In addition, as long as water is in contact with the clay, the pH will bebuffered by water/rock interaction, but as soon as it is separated, the pH will start rising (Pitsch et al.,1995b; Beaucaire et al., in press). As a consequence, even pH measurements in the field are not reliable.
Carbon-dioxide loss alone has no effect on total alkalinity, but decreases the TIC, while calciteprecipitation affects both parameters (Stumm and Morgan, 1996). Some authors overcame the problemof carbon-dioxide degassing by performing total alkalinity analysis immediately after porewatercollection (Berner et al., 1970; Patterson et al., 1978; Emerson et al., 1980).
Attempts to evaluate and correct water chemistries and carbon isotopic composition for theeffects of carbon-dioxide degassing have been made, based on thermodynamic modelling. Pearson etal. (1978), using carbon-dioxide partial-pressure field measurements, back-calculated an estimate offield pH and carbon isotopic composition of water samples before degassing. Two methods weredescribed, using computer codes and isotopic-fractionation factors and assuming that degassing occursat equilibrium. The effects of carbon dioxide degassing or ingassing on pH and calcite saturation indicesare shown in Figure 48 for the calcite/carbon-dioxide/water system at 25°C.
For a given total alkalinity and initial calcite saturation index, the diagram provides the changein pH and the saturation index resulting from the carbon-dioxide addition or loss. Because alkalinity isindependent of pCO2, carbon-dioxide ingassing and degassing follow paths at constant alkalinity (solidlines). As an example, solution A (2.27 meq/kg alkalinity and –0.15 calcite-saturation index) loosing4% of carbon dioxide will result in solution B, supersaturated in calcite (S.I. = +0.2) and with a higherpH (0.35 unit) than the original pH. Although that diagram only applies straightforwardly to simplecalcium-bicarbonate water, it gives indications on how to proceed to evaluate carbon-dioxide-degassingartefacts.
Degassing also affects noble-gas measurements, despite the great care taken in conditioningthe rocks as soon as they are cored (see Chapter II § 2). Neon, krypton and xenon, having anatmospheric origin, are less affected by degassing due to their higher solubilities in the porewater andlower diffusion coefficients. Helium is estimated to be lost in a proportion equal or less than 30% duringhandling (Pearson et al., in preparation). It is not stated if that degassing may influence helium’sisotopic ratios as well.
128

1.2.3 Effect of changing redox conditions
The effects of changes in redox conditions mainly concern sample oxidation, since that is themost currently encountered problem. The phenomenon may occur in all the phases of the sampletreatment, from core sampling to water extraction, and even before water analysis. The stability of theredox potential depends on the amount and type of potential determining redox couples (Pitsch et al.,1995a). In sedimentary systems, the redox buffering capacity of the rock may be attributed to iron-bearing minerals (Beaucaire et al., 1998). As soon as water is isolated, the solution might be poorlybuffered and, consequently, very sensitive to environmental oxygen.
We have already examined the effects related to the bad conditioning of samples duringstorage (see Chapter II § 2). Most of the water-extraction methods are now used in a nitrogenatmosphere. Some squeezing-cell chambers are completely built in a nitrogen chamber. Simplecentrifugation is also subject to increase oxidation, while the centrifugation with heavy immiscibleliquids protects the sample far better and is most suitable for trace-element analysis (Batley and Giles,1979). Leaching first showed which were the serious consequences of oxidation, namely a sulphateincrease if pyrite is present, and a lowering of the pH, thus affecting the carbonate system (Oscarsonand Dixon, 1989).
Two major consequences are related to oxidation. One concerns the solid phases that areoxidised (generally all sulphides are very sensitive), or whose solubility changes. In fact, the sulphate
129
Figure 48. Summary of pH uncertainties and calcite-saturation index in calcium-bicarbonatewaters open to carbon-dioxide gas at 25°C (after Pearson et al., 1978)
– 1.00.0 0.2 0.4 0.6 1.00.8 1.2 1.4
– 0.6
– 0.2
0.2
0.6
– 0.8
– 0.4
0
0.4
0.8
1.0
� p
H (
pH –
pH
eq)
(� S
l c)
Total Inorganic Carbon (log mmoles per Liter)
Alkalinity
=1.51
Alkalinity
=2.27
Alkalinity
=3.39
Alkalinity
=5.12
Alkalinity
=7.78
Alkalinity
=11.88
Alkalinity
=1.51
Alkalinity
=2.27
Alkalinity
=3.39
Alkalinity
=5.12
Alkalinity
=7.78
Alkalinity
=11.88
–30
%
–20
%
–10
%–
8%
–
6 %
– 4 %– 2 %
+ 2 %
+ 4 % + 6 %
+ 8 %
+ 10%
+ 20%
+ 30%
+40
%
+50
%
–30
%
–20
%
–10
%–
8%
–
6 %
– 4 %– 2 %
+ 2 %
+ 4 % + 6 %
+ 8 %
+ 10%
+ 20%
+ 30%
+40
%
+50
%
A
B
Calcite SaturationSaturationSaturationP C
O2 =
10–3
.0 10–2.5 10–2.0 10–1.5–1.5 10–0.5–0.510–1.0–1.010–1.5 10–0.510–1.0

increase tends to lower the pH, thus affecting the carbonate system (solution degassing, calcitedissolution) and the clay minerals (modifying their stability). The second is related to a change in thefunctional groups on the organic matter and a modification of sorbed ions on clay surfaces, leading toa different behaviour with respect to the ions and metals in solution (Sposito, 1984). The processes arewell explained, but their effects are difficult to evaluate quantitatively, due to the lack of thermodynamicdata.
Oxidation artefacts are very well documented in high water-content systems, such as marineand lake sediments. Those seem to affect primarily trace elements (phosphates and iron are stronglydepleted in the solution) and, to a minor extent, silica (Bray et al., 1973). The decrease in PO4
2– andFe2+ are related to the precipitation of vivianite in iron-rich sediments or to the precipitation of ironhydroxides with subsequent phosphate adsorption, while for silica, it should be related to changes in theadsorption of silica on the clay particles. According to Lyons et al. (1979), the changes in pH, SO4
2–,Ca2+, Mn2+ and alkalinity were not significant. On the other hand, de Lange et al. (1992) reported anoxidation artefact for K+ and possibly B–, the nature of which is discussed without reaching a definiteconclusion.
Lessard and Mitchell (1985) observed on quick clays that, even if the water content stayedconstant, calcium, magnesium and sulphate contents increased by several folds. The oxidation of ironsulphide would result in the formation of iron hydroxides and sulphuric acid, while the oxidation of theorganic matter would produce carbonic acid. That would lead to the dissolution of calcium carbonate.One final effect would be the increase in sodium and potassium in porewater through cation-exchangeprocesses, in response to the input of divalent cations.
In indurated clays, due to the very low permeability, oxidation artefacts seem to proceed muchslower. Nevertheless, the water/rock ratio being lower, their effects on the water composition are veryimportant. Due to the number of reactions that might be involved, it is virtually impossible to correctthe water compositions obtained in oxidised conditions (Pearson et al., in preparation), and data arenormally discarded. That is why special attention should be paid to avoid that artefact, if reliable resultsare to be expected.
1.2.4 Effect of changing temperature conditions
The influence of changes in temperature on the solution composition were first demonstratedin the framework of deep-sea drillings, where samples where subject to ~ 20°C warming from theirinitial conditions before being squeezed. That temperature effect seemed related to the type of sedimentinvolved, clays and marly sediments being the more sensitive (Sayles et al., 1976).
Temperature was shown to increase potassium concentrations in the extracted solutions at arate of 1% per 1.5°C (Mangelsdorf et al., 1969). Bischoff et al. (1970) also found a decrease ofmagnesium and calcium (1.4% and 2.8% respectively each 10°C), and an increase of chlorine (0.8% per10°C) with temperature, suggesting in addition a change in the bicarbonate content to balance theelectroneutrality of the solution. The authors explained the phenomenon by a modification of thecation/anion exchange capacity of the clay in relation with temperature. Silica (Fanning and Pilson,1971) was also found to increase rapidly (2.6% per degree), while pH seemed to increase much less inthe same conditions and no change was observed for interstitial phosphate and salinity. In that case, achange in mineral solubilities or a release of adsorbed silica had to be evoked to explain the observation,as also suggested by the reversibility of the reaction.
130

According to Kriukov and Manheim (1982), most of the observed changes in composition arereversible and may be corrected by storage for a couple of hours at in-situ temperature prior to waterextraction. Nevertheless, if calcite precipitation occurs, the temperature-re-equilibration may not besufficient to restore initial conditions (de Lange, 1992).
De Lange et al. (1992) compiled a comprehensive review of the possible artefacts related totemperature and storage conditions of marine sediments. In that study, the authors interpolated the dataobtained on piston cores based on concentration differences of samples squeezed at 4 and 22°C. Thatwas based on the assumption that the boron content of sea porewater is conservative and its deviationis linear with the encountered temperature increase. If the temperature dependency of cations were dueto temperature-dependent cation-exchange equilibria between the sediment and the porewater, then, foreach cation, it should be possible to correct the measured composition taking into account the calculatedtemperature deviations. After an extensive discussion, the authors concluded that that correction maynot be readily made for sediments of highly-variable composition.
An attempt to determine the temperature-induced artefacts has been recently conducted tocorrect boron content and isotopic data (You et al., 1996). The study showed that the partitioncoefficient of boron is a function of temperature, pH and sediment mineralogy. Using a barium-10-spiked synthetic solution with major-element composition similar to that of in-situ porewater, samplesof sediment mainly composed of clay minerals were processed in a rocking autoclave over atemperature range from 25° to 350°C at 800 bars. Kd values were determined for boron andbarium-10/barium-11 distribution in the extracted solutions. That allowed to derive empirical equationsrelating Kd to temperature and pH for different mineralogies, while the δ11B of porewaters wascorrected assuming the fractionation factors at different temperatures. Although that study concernedparticular conditions of high temperature and pressure, it highlighted a possible method to correcttemperature induced artefacts.
The issue of changing temperatures for low water-content systems has not been consideredyet, although the differences in temperature are not as serious as in the case of marine sediments.Nevertheless, most of the squeezing cells and centrifuges are currently equipped with temperature-control devices ensuring that the extraction procedure is conducted at least at a constant temperature.
Core freezing to preserve water-sample compositions has been proven useful (Griffault et al.,1996), provided that special attention is paid to control the cold chain and avoid ice sublimation byprotecting the sample with appropriate coating. It should be remembered that biological activity isstrongly increased by defrosting, and that may lead very quickly to the modification of the originalcontent and type of organic matter.
1.2.5 Ion exchanges
Ion-exchange processes are launched whenever the solution composition in the clay/watersystem is modified. That may happen following the introduction or loss of gases (oxidation, degassingof CO2), a change in temperature, a change in the water/rock ratio, the dissolution or precipitation ofsoluble phases, the decomposition of the organic matter, etc. It is obvious that the phenomenon has tobe considered in each extraction procedure, and may not be excluded a priori. In order to evaluate andpossibly correct ion exchanges, either the “true” interstitial-solution composition is needed (e.g., bycomparing it with piezometer flowing water), or the ion occupancies on the adsorption sites and the waythose sites react to the induced disturbance need to be known.
131

A first approach to the problem consists in evaluating the clay surface charge and the ion-exchange capacity (Sposito, 1984; Hochella and White, 1990). As we have seen in Chapter I, theexistence of negative charges on the clay surfaces leading to cation adsorption is due to isomorphicsubstitutions within the structure, broken bonds at the edges and external surfaces, and dissociation ofhydroxyl groups. Anion retention may occur due to the replacement of hydroxyl groups and adsorptionon the edges of the minerals. In general, ion-exchange processes are pH– and ionic-strength dependent.
The CEC and the anion-exchange capacity (AEC) measurements usually involve saturationwith an index cation or anion and determination of the amount adsorbed. The measurement is performedat a given pH of 7, and results are expressed in milliequivalents (meq) per 100 g of rock (Rhoades, 1982;Wilson, 1987). A number of cations have been used (ammonium, calcium, barium, silver-thiourea,cobalt-hexamine, ethylenediammine, and others) leading sometimes to very different results. In fact, thenegatively-charged surface does not display the same affinity for all cations, but exhibits selectivitydepending on the ionic charge, size and state of hydration. In general, it is observed that cation-exchange selectivity increases with cation charge, and, for a given charge, with ionic radius. As aconsequence, the order of increasing affinity, according to Swartzen-Allen and Matijevic (1974), is:
– for alkali-metal ions: lithium < sodium < potassium < rubidium < caesium,
– for alkaline earth ions: magnesium < calcium < strontium < barium.
AEC measurements are even more subject to experimental artefacts, as anions normally showa negative adsorption (de Haan, 1965). Measurements indicate that, depending on the type of clay andon the pH of the solution, the selectivity sequence for anions is:
nitrate < chloride < fluoride = sulphate < molybdenate < selenite < arsenate < phosphate
The measurement is complicated by the fact that aluminium and iron may form insoluble saltswith the exchanging anions, making it uncertain whether the depletion in the solution is due toadsorption or precipitation. Solutions of barium chloride (Gillman, 1979) or ammonium chloride (Wadaand Okamura, 1977) allow the simultaneous measurement of CEC and AEC. For the large uncertaintiesin the results obtained with different solutions (Van Olphen and Fripiat, 1979), the type of measuringmethod used to evaluate ion-exchange capacity should always be specified together with the results.
Those characteristic parameters proceed from a very simple representation of the clay surfaceas an ion exchanger of a single type. The variability of the experimental values for the same materialmay be explained by the fact that various types of exchanging sites actually exist on the clay surface(see Chapter I § 2.3.1). Even if in restricted application fields a simplified model may provideinteresting information (Pitsch et al., 1992; Bradbury and Bayaens, 1998), recent work on pure clayeyphases showed that the multi-site character of the clay surface may be evidenced by the thermodynamicmodelling of sorption isotherms (Gorgeon, 1994; Gaucher et al., 1998). Using that approach, cation-exchange capacities and selectivity may be determined for each site.
1.2.6 Effect of salt dissolution and precipitation
Dissolution or precipitation of solid phases may be observed when parameters such astemperature, pressure and water content change in the clay/water system. As a consequence, all theextraction techniques may be affected by those phenomena.
132

The dissolution of soluble salts has been extensively studied for leaching, and constitutes oneof the major arguments against the use of that technique (Manheim, 1974). In fact, it has been proventhat, as soon as the interstitial solution is modified by dilution or addition of ions, ions start to exchangewith the solid surface, with largely unpredictable consequences on porewater chemistry, unless adetailed sorption study has been previously conducted.
The solid phase may be characterised to some extent by X-ray diffractometry andmicroanalysis. Those techniques, provided that the sample preparation is not introducing artefacts(Wilson, 1987), may provide reliable information on the presence of soluble salts in the rock matrix.The effects of dissolution may be partially corrected if the thermodynamic properties of the dissolvingphases are known and the ion-exchange processes mastered (Bayens and Bradbury, 1991).
Salt precipitation, on the other hand, has been poorly studied because of the difficulty todetermine newly-formed phases, often in very small amounts and sometimes poorly crystallised. Thatphenomenon is potentially very active and may have serious consequences on both the chemistry andthe isotopic composition of the extracted solutions. That argument is supported by the strong salinitiesobserved in porewater chemistries (I = 0.4 mol kg–1 at Mont Terri), that are likely to increase even morewhen water is extracted. In addition, salt precipitation is likely to occur depending on the local (withinthe sample) conditions of supersaturation (Fritz and Eady, 1985). Ongoing research at CIEMAT, in theframework of the FEBEX project of the European Community, will try to observe that phenomenon byscanning-electron-microprobe (SEM) examination on squeezed core samples.
Evidence of an isotopic shift most probably related to the precipitation of newly-formedphases was reported in Poutoukis (1991). Isotopic analyses were performed on naturally-dripping waterin a potash mine in France, and on porewater extracted by vacuum distillation from marly layersinterbedded in the salt formation. The salt content of those solutions was extremely high: they werebrines saturated with respect to halite and sylvite. According to the data interpretation, the isotopic shiftobserved between vacuum-distilled porewaters and corresponding dripping waters may be related to theprecipitation of highly hydrated salts (carnallite [MgKCl3 · 6H20], bischofite [MgCl2 · 6H20]) duringdistillation, all leading to a depletion in heavy isotopes of the extracted solution (Figure 49). Thatexample might seem far-removed from what is likely to be found in clay rocks, but it showed aphenomenon that may potentially occur at different scales and with more limited effects.
France-Lanord (1997) found, for samples coming from the Meuse investigation site, thatstrongly-bound water had a deuterium value enriched of approximately 10‰ with respect to free water.On Tournemire samples, Ricard (1993) reported a deuterium enrichment exceeding 60‰ of strongly-bound water (recovered by distillation at 100°C of a rock sample previously distilled at 60°C) withrespect to water obtained by distillation at 60°C. Nevertheless, due to the small quantities of the first,the cumulative isotopic composition would not be sensitive to that contribution. In both cases, the smallamount of strongly-bound water extracted did not allow the simultaneous measurement of the oxygenisotopic composition. In the case of the Meuse samples, it was also observed that the porewaterrepresentative data fall above the meteoric water line. Mineral neoformation was evoked as a possiblephenomenon causing the observed isotopic shift: possible newly-formed phases are smectite, silica,carbonates or hydroxides, all affecting the oxygen isotopic composition to a greater extent thanhydrogen. France-Lanord (1997) calculated that the recrystallisation of 2% of smectite may induce theobserved shift off the meteoric water line.
A similar shift off the meteoric water line was also observed at the Mont Terri site and was,in that case, attributed to an artefact of the vacuum-distillation technique (Pearson et al., in preparation).
133

Although the precipitation of minerals during the extraction may be evoked to explain the shift, it isunlikely that clay precipitation be responsible for it. A simple calculation using porewater chemistryshowed that the salinity would not be sufficient to precipitate enough clay minerals to account for theobserved isotopic shift; it would therefore be necessary to consider other precipitating phases displayinga much higher fractionation factor (Zheng, 1993).
Precipitation of newly-formed phases or recrystallisation and re-equilibration of clay mineralsare known to occur during diagenesis. Hower et al. (1976) studied the mechanism of burialmetamorphism of a type of shale. They found the fine fraction (< 100 nm) of the shale to be constitutedby almost pure illite/smectite, whose composition would change with depth from a 20% illite to an 80%illite. That change was also detected in the mineralogical composition, where calcium and sodium,present as exchange ions, would decrease with depth in accordance with the reduced exchange capacityof the smectite when converted to illite. Magnesium, iron and silicon, present in the smectite, woulddecrease with increasing depth. The authors also suggested that magnesium and iron lost from thesmectite fraction would take part in the formation of chlorite, as burial depths increase.
In summary, a precipitation or recrystallisation of clay minerals, most likely occurring duringdiagenetic processes may be responsible for the observed isotopic shift above the meteoric water line insome indurated clays. In our opinion, that topic requires more investigation, since it may be anindication of a naturally-occurring phenomenon that prevents the interpretation of the porewaterisotopic compositions in terms of origin and age.
1.2.7 Incomplete water extraction
Incomplete water extraction is a phenomenon mainly affecting the isotopic composition of thesolutions. We have already discussed that effect when addressing the vacuum and azeotropic distillationtechniques. We have seen that the observed effects may be sometimes corrected, provided that a
134
Figure 49. Isotopic composition of brines and porewaters extracted from marls by vacuum distillation (after Poutoukis, 1991)
– 80– 10 – 6 – 2 2 6 10– 8 – 4 0 4 8
– 60
– 40
– 20
0
20
�2 H
(H
2O)
‰ S
MO
W
�18 O (H2O) ‰ SMOW
GM
WL
SMOW
Brines
Water Extractedby Vacuum Distillation

satisfactory model describing the fractionation during extraction is developed. In fact, it is observed inmost cases that incomplete extraction does not follow a simple Rayleigh distillation model (seeChapter II § 3.4 for more detailed discussion).
Also associated with that topic, but much less investigated, is the possibility that incompletewater extraction may be related to the salinity of the interstitial solution, via two main mechanisms:precipitation of newly-formed (hydrated) phases, and water retention in the hydration sphere of thecations. The first topic has already been discussed.
We have seen in Chapter I that some cations form very stable hydration complexes. There isconsiderable evidence of the reduced mobility of the water molecules in saline solutions. From thethermodynamic point of view, brines display a water activity that differs from unity12. The relevance ofthat phenomenon has been studied especially from the isotopic point of view (Sofer and Gat, 1972;1975; Yechieli et al., 1993). The conventional carbon-dioxide-equilibration procedure for oxygen-18analysis in aqueous solutions yields δ18O values that depend on the water activity of the solution. Fordilute solutions, activity and concentration are very close and the measured delta values do not need tobe corrected (Jusserand, 1979). For brines, it is necessary to introduce a correction related to the salting-out effect of different cations (Sofer and Gat, 1972):
where δO is the value on the concentration scale, δm is the measured value, and M is the molality of theion. From that expression, it is clearly seen that the magnesium concentration plays a significant role inthe deviation of water from the ideal behaviour. That is because magnesium forms a very stablehydration complex with water molecules (Taube, 1954; Ohtaki and Radnai, 1994).
A simple calculation for the most saline porewaters (Opalinus clay) shows that the correctionfor oxygen-18 would be within the analytical error for the analysis. Nevertheless, it is suggested that thesalinity found in interstitial solution may be responsible for the difficulty to strip water moleculessurrounding cations. In addition, it may also be responsible for some fractionation affecting the differentcations during solute extraction, their mobility being more related to their hydration radii that to thedimension of the cation itself. That subject has been poorly studied, both from the experimental and thetheoretical point of view, and in our opinion, should be addressed in the near future.
1.3 Current understanding
After having discussed all the extraction methods, their known artefacts and the physicalprinciples that may lead to chemical and isotopic fractionations during the water-sample collection,there is little doubt that many arguments may be raised against all the investigations conducted withthose methods and the results obtained.
δO – δm
δm + 1000* 103 = 1.11 MMg + 0.47 MCa – 0.16MK
135
12. The activity ai characterises the chemical reactivity of the i species. For a solute i, the relationship with themeasured concentration is ai = ciγi, where ci is the concentration in mol·l-1 and γi is the ionic activity coefficient.That coefficient may be related to the ionic strength of the solution. For the solvent (i.e., the water), the activity isthe relationship between the actual partial water pressure over the solution and the partial water pressure over purewater at the same temperature. Its activity in a solution is therefore always lower than 1.

Naturally, the basic problem relates to the presence of different types of water in theclay/water system. From the hydrogeological point of view, only the free water (in amount andcomposition) is relevant, because it represents the fraction possibly mobilised under given hydraulicconditions. Nevertheless, in the type of rocks considered in this review and featuring very high claycontent and very low water content, the amount of free water is probably so very small that each attemptto extract it will inevitably have to deal with the strongly bound water as well. That may be due to thedishomogeneity of the water distribution inside the sample, affecting the local conditions of wateravailability, as well as to the slow movement, due to the diffusion of the water molecules themselves.Attempts to evaluate quantitatively the amounts of free versus bound water, also using adsorption-desorption isotherms, are not routinely conducted.
Ideally, the approaches that have been adopted so far either claim to extract only the relevanttype of water or try to extract all the water and calculate the composition of porewater, assuming thebehaviour of the water/rock system. Unfortunately, both those options are not verified, and in each studycase we have evidence of the chapterial extraction of different types of solutions, the relative amountsof which remain unknown.
What information may we consider as reliable then? In our opinion, very few. Those aremainly distribution profiles across the studied clay formations for chloride obtained by leaching,deuterium obtained by distillation (provided that no serious salinity differences are detected in theporewaters) and, to some extent, noble gas measurements. We will try to justify our statements.
Chloride has always been considered the only ion that may be obtained in correctconcentrations by leaching, provided that the absence of soluble salts containing chloride is proven.That is the common case, as chloride is rarely included in the mineral crystal lattice, except in evaporitesoriginating at high brine concentrations. That is why that ion, coupled with bromide, is used todistinguish between primary brines (deriving from evaporated seawater) from secondary brines (derivedfrom evaporite leaching). Chloride is also not extensively adsorbed by clay, as most of the negative ions,especially at basic pH (de Haan, 1965). The leaching should be conducted carefully, avoidingenvironmental contamination or loss of fairly volatile chloride, especially if isotopic studies areplanned. Chloride is released quite slowly in the leaching solution, and that process should be checkedby testing the electric conductivity of the solution, or ensuring better that no more chloride is released.According to the granulometry of the sample, chloride extraction should take only a few days.
Some cases have been reported where chloride leached from the rock seemed to be dependenton the selected solid/liquid ratio (Figure 50). That was observed especially in environments displayinga low chloride content in porewater (Moreau-Le Golvan, 1997; Cave et al., 1997). The reason for thatbehaviour is not quite well understood, since no fluid inclusions were observed in the rock. Chlorideanalyses of the whole rock (15 times greater than porewater values) suggested that chloride may beretained at the clay surface by adsorption and only released with difficulty. If that is verified for the casestudy, the same solid/liquid ratio should be used on all samples in order to draw the distribution profileacross the formation. In that case, chloride data have to be interpreted in relative rather than in absoluteterms.
Recent studies on chloride distribution in indurated clay formations show that the content mayoften be explained by using a diffusion model (Gard, Meuse, Mont Terri). Coupling of the distributiondata with chlorine-36 and chlorine-37 isotopic data may provide additional information. Chlorine-36may be used to evaluate the chloride residence time (Moreau-Le Golvan, 1997) and to check its“secular” equilibrium with the in-situ neutron flux calculated for the formation rocks (Andrews et al.,
136

1989). The distribution of chlorine stable isotopes is increasingly studied because of the informationthat may be deduced about the origins of the chloride source and processes affecting the movement ofchloride ions. Diffusion seems to be the predominant mechanism, but chloride is known to fractionateduring ultrafiltration (Kaufman et al., 1984; Phillips and Bentley, 1987). The “age” of chlorine in theformation may be calculated, assuming the porosity and tortuosity parameters of the matrix, bycomputer codes. Those data may be compared with the calculations performed for deuterium-distribution profiles, remembering that, according to some experimental data (Gvirtzman and Gorelick,1991) and the Donnan principle, chloride is possibly moving inside the formation much faster thanwater molecules.
Concerning isotopic data, only deuterium-distribution profiles may be considered as quitereliable, provided that no major changes in the porewater salinities across the formation are observed,that the same preparation and distillation procedure has been used for all samples and that the extractionyield is carefully checked. It has been proven, in fact, that deuterium is much less affected by water-extraction artefacts than oxygen-18 (Moreau-Le Golvan, 1997). In addition, the possible modificationsdue to incomplete water extraction, either related to the precipitation of newly-formed phases, or to thehydration sphere of cations are less influent on the deuterium values, and usually fall within theanalytical error. Even if those phenomena cannot be excluded a priori, they are likely to affect all thesamples the same way, if salinities do not differ substantially. Results may only be interpreted in relativeterms. In other words, the obtained values should not be considered as the “true” porewater values, butbe compared to each other. Distribution profiles across the formation may be drawn (Cherry et al., 1979;Desaulnier et al., 1981; Falck et al., 1990; Moreau-Le Golvan, 1997), and computer codes allow tocalculate the time required to establish that profile (based on the porosity and tortuosity data of the clayrock) and the predominant water-movement mechanism (Neuzil, 1995; Darling et al., 1995).
Finally, noble-gas measurement and distribution profiles are potentially very informative.Fewer artefacts may affect those measurements, provided that special attention is paid to the carefulconditioning of the sample soon after drilling. Noble-gas content and isotopic distribution allow oncemore to provide an age estimate (Osenbrück et al., 1998).
137
Figure 50. Chloride contents back-calculated to porewater content as a function of the solid/liquid ratio (after Moreau-Le Golvan, 1997)
0100 200 300 400
100
200
300
400
Cl (
ppm
)
Solid / Liquid Ratio
GE 1580 Berne
GE 1580 BGS
ID 180 B
ID 180 B
ID 180 A
ID 135
ID 135
ID 90
ID 90
GE 1600
Water LeachingEthanol LeachingSamples Analysed by other Labs

We are conscious of that rather restrictive interpretation. On the other hand, we haveextensively discussed all the possible artefacts, and until a deeper comprehension of the clay/watersystem exists or that new techniques eliminate artefacts, the amount of actual data that may be readilycollected and interpreted is very limited. Nevertheless, all the studies that have been conducted up tonow on clay-rich media should not be discarded, since useful information on porewater chemistries maystill be obtained from them through extensive modelling based on the thermodynamic properties of theclay/water system.
2. GEOCHEMICAL MODELLING
2.1 Dissolution-precipitation
Since the compilation of computer codes with thermodynamic databases for aqueousspeciation and mineral solubilities, geochemical modelling has been recognised as a very powerful toolin hydrogeochemical investigations. Three main objectives may be pursued, that are, in increasing orderof complexity, the evaluation of the chemical data, the identification of factors controlling the watercomposition, and the behaviour prediction of the water/rock system.
The first check on the quality of chemical data is normally performed using theelectroneutrality equation, stating that:
∑[A–] = ∑[C+]
where [A–] and [C+] are the anions and cations concentrations expressed on the equivalent scale. It isgenerally accepted that a complete chemical analysis ranges in the ± 5% error, but “extreme” solutions(very low or very high in TDS, very high in organic-matter content, etc.) may fall outside the range.That is mainly because analytical uncertainties are greater and/or because other unaccounted forcharged species are present (e.g., organic acids). The electroneutrality equation is used by mostcomputer codes for compensating analytical data.
Besides analytical difficulties, data errors may also be due to artefacts related to sampling andwater-extraction stages. That aspect has already been discussed, when appropriate, for each case studyand each technique used.
Dissolved elements in natural waters may be divided into two categories:
– “free” elements, like chlorine, whose concentration is not limited by any chemicalequilibrium, because they do not react with insoluble organic matter and may only beincorporated in very soluble salts;
– “controlled” elements, whose solubility is limited by the precipitation of a poorly-solublemineral: for example, the calcium concentration is often limited by the solubility ofcalcite.
The identification of the controlling solid phases is achieved through the calculation of thesaturation indexes. Schematically, for each dissolving salt or mineral, an equilibrium constant(solubility product) is defined for each temperature:
An Bm ⇔ nA– + mB+
138

Ks(T) = (A–)n . (B+)m
where the activities of the different species are shown in parentheses. When a mineral or a salt is incontact with water, it will dissolve until reaching its solubility product. During that process, its ion-activity product (IAP) is defined as:
IAP = (A–)n . (B+)m
As long as IAP is lower than Ks, the solution is undersaturated with respect to the solid phase(i.e., the solid will keep dissolving until IAP is equal to Ks). When saturation is reached, the activitiesin the solution will stay constant. A third case may be observed where IAP is higher than Ks,corresponding to a metastable condition where precipitation should occur in order to lower IAP.
The saturation index (S.I.):
indicates the degree of saturation of the solution with respect to the considered solid phase, 0corresponding to the saturation point. In other words, unity saturation indexes point at the solid phasescontrolling the water composition. Besides, oversaturation may not indicate a metastable in-situcondition, but may be due to analytical and/or computation artefacts, possibly related to aninconsistency in the data set. For example, degassing of carbon dioxide normally leads to anoversaturation in carbonate phases (Pearson et al., 1978), due to the retardation of carbonateprecipitation. Once again, when that type of artefact was known to be related to the extraction techniqueapplied, it was described in the relevant section of Chapter II of this report and will not be discussedagain. However, if no artefacts may be detected, an oversaturation may indicate that the assumption ofequilibrium existing in the system is not valid. In fact, in natural systems, precipitation may be inhibitedby a number of factors, including kinetics and the presence of complexing organic matter that is oftennot taken into account in data computing.
Once the data set and the calculation agree, modelling allows for different prediction levels.Those range from the evaluation of unmeasured properties of the system (e.g., oxido-reductionpotential), to the evaluation of the effects of an induced disturbance (e.g., heating, freshwater orcontaminant intrusion). That ultimately points in the direction of the safety assessment, allowing theprediction of the radionuclide behaviour in the considered water/rock system.
2.2 Sorption
Models have been established to analyse and quantify the adsorption at the clay/solutioninterface, according to the different parameters of the system considered. Empirical adsorption models,based on mathematical fitting of sorption isotherms, as well as thermodynamic models, such as thesurface complexation or ion-exchange models, are described in the literature. It is not the purpose ofthis report to review all of them, and we will only briefly describe some basic principles. A good reviewmay be found in Sposito (1984) with an accurate mathematical treatment of the different models.
Empirical models are based on the concept of surface excess (q) (i.e., the number of moles ofthe substance sorbed per unit mass of clay). Batch experiments are carried out with the solid immersedin an aqueous solution containing a number of moles of the sorbing substance at controlled temperatureand pressure. The resulting adsorption data may be plotted against each other, with q as a dependent
S.I. = logIAPKs
139

variable of c, the concentration in the solution, in graphs known as “adsorption isotherms”. The graphsmay be classified according to their initial slope (S–, L–, H–, C–curves) reflecting the substance affinityfor the solid phase at various concentrations in the contacting solution (Travis and Etnier, 1981). Themost common isotherm in soil chemistry is the L–curve (Figure 51), characterised by an initial slopethat does not increase with the concentration of the substance in the solution. That property is the resultof a high relative affinity of the solid phases for the substance in solution, coupled with a decreasingamount of adsorbing surface since it is saturated. Mathematically, that curve can be described by theLangmuir equation:
where b and K are adjustable parameters, b representing the value of q, that is asymptomaticallyapproached when c becomes large. K determines the magnitude of the initial slope of the isotherm.Those two parameters may be obtained accurately by plotting the distribution coefficient Kd:
against the surface excess q in a linear graph with a slope of –K and an x-axis intercept equal to b(Figure 51).
It is not uncommon to observe that the graph is not a straight line, but a curve with a negativeconcavity. That can be described as fitting with a two-term series of Langmuir equations:
where b1, b2, K1 and K2 are adjustable parameters (Veith and Sposito, 1977).
Alternatively, the van Bemmelen-Freundlich isotherm equation may be used, as follows:
q = Acβ
where A and β are positive, adjustable parameters and β is forced to lie between 0 and 1 (Sposito, 1980).
Surface-complexation models and ion-exchange models are based on thermodynamics. Thefirsts are also called “microscopic models” or “molecular models”, because they make hypotheses onthe charge distribution at the clay/water interface, concerning the chemical reactivity of the solidsurface. On the other hand, ion-exchange models are also defined as “macroscopic models”, becausethey describe the distribution of the elements considering that the counterion/clay system is electricallyneutral. It can therefore be described as a whole, without specifically accounting for interfacialprocesses. Both types of models consider a limited number of reactive sites on the clay surfaces, thatare responsible for ion retention. We will not derive the complete mathematical expressions for thosemodels, but we will briefly describe some of them.
In surface-complexation models, the clay surface is modelled as a plane, with electric chargesdistributed on its surface according to Gouy-Chapman and Stern-Grahame’s double-layer theory. Theelectric layer may be subdivided in a compact layer associated with an external diffuse layer. In orderto balance the solid-surface charge, counterions accumulate in the diffuse double layer. Only ionsshowing a very strong affinity for the surface may be specifically adsorbed, thus loosing part of their
q =b1K1c
1 + K1c+
b2K2c1 + K2c
Kd =qc
= bK – Kq
q =bKc
1 + Kc
140

hydration shell. The other counterions are located far from the surface, either in the plane separating thecompact from the diffuse layer, also called the “outer Helmholtz plane”, or in the diffuse layer. Threemodels are the most currently used and depicted in Figure 52, together with the potential variation as afunction of the distance from the solid.
141
00 4 8 12 16
10
20
30
40
q Cu
(mm
ol k
g–1)
CuT (mmol m–3)
S - Curve
Altamont Clay LoampH 5.1 25 °C
I = 0.01 M
00 50 100 150 200
1
2
3
4
5
q P (
mm
ol k
g–1)
PT (mmol m–3)
L - Curve
Anderson SandyClay Loam
pH 6.2 25 °CI = 0.02 M
00 0.05 0.10 0.15 0.20
0.2
0.4
0.6
0.8
q Cd
(mm
ol k
g–1)
CdT (mmol m–3)
H - Curve
Boomer IoampH 7.0 25 °CI � 0.005 M
00 10 20 30 40
50
100
150
200
q (�
mol
kg–1
)
c (mmol m–3)
C - Curve
Har-Barqan ClayParathion Adsorption
from Hexane50 % RH Hydratation
00 0.5 1.0 1.5
0.5
1.0
1.5
Kd
(m3 k
g–1)
q (mol kg–1)
Langmuir PlotCPB AdsorptionUrrbrae Ioam
Slope = – K
Intercept = b
Figure 51. General classes of adsorption isotherms and calculation of the b and –K parametersaccording to the Langmuir equation (modified after Sposito, 1984)

Figure 52. Surface complexation models: (a) = diffuse layer; (b) = constant capacitance;(c) = triple layer (after Gorgeon, 1994)
The diffuse-layer model (Stumm et al., 1970) considers that specifically sorbed ions arelocated on the solid surface (plane 0) and contribute to the surface charge, σ0 . That charge iscompensated by the counterions in the diffuse layer, and the compact layer does not include ions. Thepotential decay in the diffuse layer follows an exponential curve. The existing relationship between σ0and the surface potential Ψ0 takes into account the ionic strength of the solution.
The constant-capacitance model (Schlinder and Kamber, 1968; Schlinder and Gamsjager,1972) considers that the double-layer thickness may be described as a plane, corresponding to the outerHelmholtz plane. Consequently, the charge density at the surface is proportional to the potentialσ0 = CΨ0, where C is the condenser capacity. That relationship is only valid for solutions with high ionicstrenghts or solids with low surface potential (< 25 mV).
142
OHO–OH+
2OHOHOMe+
OHO–LOH
H2O
Cat+
An–
An–
H2O
H2O
Cat+
Cat+
An–
An–
H2O
Cat+
Cat+Cat+
An–
An–
H2O
H2O
H2O
H2O
H2O
Cat+
Cat+
Cat+
Cat+
Cat+
An–
An–An–
An–
An–
Cat+
An–
ψo
ψ
Distance x0
ψd
ψβ
(o) ( β) (d )
OHO–OH+
2OHOHOMe+
OHO–LOH
H2O
H2O
Cat+
Cat+
Cat+
Cat+
Cat+
Cat+
An– An–
An–
An–
An–
An–
ψo
ψ
ψd = ψo
Distance x0
OHO–OH+
2OHOHOMe+
OHO–LOH
H2O
H2O
Cat+
Cat+
Cat+
Cat+
Cat+
An–An–
An–
An–
An–
ψo
ψ
Distance x0
ba
c

Both those models only consider inner-sphere complexes. In addition, the influence of theionic strength is not very well accounted for. The triple-layer model (Hayes and Leckie, 1987) considersanother plane (β), also called the “inner Helmoltz plane”, where ions showing lower affinity with thesolid and forming outer-sphere complexes are located. That model also describes the stronger influenceof ionic strength on outer-sphere than on inner-sphere complexes, as shown experimentally.
Ion-exchange models have been established to describe the behaviour of synthetic ion-exchange resins and further extended to natural inorganic exchangers, like zeolites and clays. Accordingto that theory, a solid phase immersed into a liquid phase develops a positive or negative electric chargethat is exactly compensated by adsorbed ions. The solid/counterion pair is considered as the ionexchanger and shows no net electric charge. Under those premises, modelling does not require anyknowledge of the actual charge distribution at the solid/liquid interface, nor needs extra-thermodynamichypothesis. The model considers those surface regions, where electric charges are located, as the ionexchange sites. Since different types of exchange sites may be identified on a clay surface, as describedin Chapter I of this work, the correct modelling of ion-exchange properties of a clayey materialtherefore implies to consider them as multi-site exchangers. For example, a cation exchange reaction onthe Xi sites is written as follows:
m{(Xi–)n Nn+} + nMm+ = n{(Xi–)m Mm+} + mNn+
where Xi– is a site with one negative charge, while Nn+ and Mm+ are the exchanging ions and thecorresponding equilibrium constant, respectively:
If activities are replaced by concentrations in both phases, the following selectivity coefficientbetween Nn+ and Mm+ is obtained:
Each site on the clay is characterised by an individual cation-exchange capacity (CECi), andthe total capacity of the material is the sum of those individual capacities:
CEC = ∑ CECi
Those capacities are intrinsic parameters of each specific mineral.
The model appears suitable to describe metal-ion adsorption. It reduces the number ofassumptions needed for modelling because of the electroneutrality assumption for both phases(Gorgeon, 1994), but it does not obviously account for the electrokinetic properties of the clay particles.
KNn + / Mm +i =
Xi–m
Mm +n
Nn + m
Xi–n
Nn+m
Mm + n
KNn + / Mm +io =
Xi–m
Mm +n
Nn + m
Xi–n
Nn+m
Mm + n
143

2.3 Requirements for geochemical modelling
In order to perform geochemical modelling, a conceptual model is needed. Computer codesare mathematical tools based on pre-existing concepts of chemistry solutions and/or water/rock-interaction schemes. Each model and its corresponding computing code require different parameters,depending on their objectives (McEwen et al., 1990). Basically, water analysis and mineralogicalcomposition of the host rock are concerned.
For a reliable aqueous speciation, water analysis should be as complete as possible andinclude pH and Eh measurements. Water composition should be checked for possible analytical errors.That is why repetitive analyses are useful for detecting the influence of time, space or the sampling andanalytical method used. Internal consistency is also checked by redundancy. For example, the carbonatesystem is defined by different interrelated parameters, (pH, total inorganic carbon, and carbonatealkalinity) that may be analysed separately and cross-checked. Eh as well may be computed startingfrom different redox couples.
For predictive modelling, information on the water environment is required. That includes themineral phases that are present and/or reactive with water. Data include the chemical composition ofmineral phases or solid solutions, corresponding solubility products, sorption parameters like exchangeconstants and site capacities. Isotopic compositions, fractionation factors and amounts may also beneeded. In order to allow modelling, a number of codes require the solid phases and the dissolvedconstituents to be the same in number. Information is also required on those ions whose abundance isnormally not controlled by a solid phase (i.e., Cl–, Br–). Those help in making consistency tests of themeasurements and in identifying problems related to the water extraction technique used. In addition,they serve for defining the geochemical porosity and eventually for reconstructing the geological historyof the system (e.g. chloride/bromide ratios).
If the measurements and the calculations agree, then the sampling and analytical methodstogether with the conceptual model are verified as an integrated tool and the parameters may be usedfor predictive purposes. Validation of the model and the methods requires at least verification on variouswater/rock systems.
2.4 Computer codes
Plummer (1992) has recently reviewed computer codes for geochemical modelling. Besidessimple solution-speciation software like MINEQL (Westall et al., 1976), there are two types ofapproaches for modelling water/rock interactions.
Forward modelling predicts water compositions and mass transfers resulting fromhypothesised reactions. It generally begins with a defined water composition and simulates theevolution of water and rock for a set of specified reactions. Recognised codes of that type arePHREEQE (Parkhurst et al., 1980), PHREEQC (Parkhurst, 1995) and EQ3/6 (Wolery et al., 1990). Allcodes include the possibility to calculate pH and Eh in response to chemical reactions. That isperformed by using, in addition to the mass balance and the mass action equations of the speciationcalculations, additional assumptions, such as charge balance, conservation of electrons or constant massof water. If appropriate thermodynamic data are available for the considered environment, forwardmodelling is well suited for predicting water compositions, mineral solubilities and mass transfers inresponse to reversible and irreversible reactions, reaction paths, as well as changes in compositionresulting from pressure and temperature changes.
144

Inverse modelling defines the mass transfer from observed chemical and isotopic data. Itproduces mineral mass transfers that account for the compositional variations observed in the aqueoussystem. The equations of mass-balance modelling include element mass-balance, electron conservationand possibly isotope mass-balance. The data needed are analytical data for two evolutionary waters anda set of mineral or gaseous phases that are assumed to include all reactants and products in the system.During calculations, the concentration changes in the elements in the evolutionary waters are used tocalculate the masses of plausible minerals and gases that enter or leave the aqueous phase to accountfor the observed changes in composition. Classical examples of such codes are NETPATH (Plummer etal., 1992) and PHREEQC (Parkhurst, 1995).
The use of forward or inverse-modelling codes depends normally on the purpose of the studyand on the type of available data. Forward modelling may be used even if there are no aqueous or soliddata for the system. It should be selected, for example, when data are available on mineralogy, chemicaland isotopic composition of the solid phases, and mineral parageneses are known, but little informationis available on the fluid in contact with the mineral assemblage. Alternatively, in the study of deepaquifers, little or no information may be available on mineral transfers, gases and organic matter. In thatcase, inverse modelling is more appropriate.
In principle, all computer codes should reach the same results, providing that the input dataand the thermodynamic database are the same. Inconsistencies in the databases are often evoked as apossible source of discrepancies in the computed models. That derives from the fact that mineral-stability data are usually obtained from various sources and may be inconsistent with the aqueousmodel. That is why NAGRA, for example, has made a big effort in the implementation of an internally-consistent thermochemical database to be used for all modelling performed in the framework of itsinvestigations (Pearson and Berner, 1991; Pearson et al., 1992).
Even so, unfortunately, discrepancies may be observed in the results obtained on the same dataset modelled by different computer codes. That may be due to the fact that both forward and inversemodelling require considerable insight concerning the problem of selecting appropriate reactant andproduct phases. As an example, Pearson et al. (in preparation) report, for the calculation of theporewater composition for the Mont Terri project, that the unique modelled composition of low pH andhigh pCO2 was a modelling artefact due to the use of a given computer code. The re-examination of thetheory underlying the calculation procedure showed that the procedure was only able to determine arange of water compositions.
3. INDIRECT APPROACH TO POREWATER COMPOSITION USING GEOCHEMICAL MODELLING
In 1990, Bradbury et al. suggested an experimental procedure to investigate the waterchemistry, sorption and transport properties of marls. Their idea was to design a set of experiments thatmay help to derive indirectly the composition of the pore fluid. A synthetic solution, called the LSMsolution, would be created to result in “chemical equilibrium” with the rock. The term “chemicalequilibrium” indicates, in that case, that the water/rock system would have reached a steady-statecondition. Besides, at the timescale of the experiment, neither the state of the rock nor the waterchemistry should be a function of time and of the quantity of rock and volume of the solution used forthe experiment (Baeyens and Bradbury, 1991).
Ideally, the LSM water should have the same chemistry as the formation water. However, inrocks with very low water content, it is difficult to understand the real meaning of “in-situ composition”,
145

when “free” water is present in far lesser amount than “bound” water. That methodological approach iscompletely different from what we have described so far since it encompasses both the technicalproblem of water extraction and the definition of the amount and characteristics of “inner” and “outer”solutions. Since its design, the approach has been applied on samples of the Palfris marl (Baeyens andBradbury, 1991; 1994), and is currently used in the framework of the investigations in the Mont Terriproject (Bradbury and Baeyens, 1997; Bradbury et al., 1997; Bradbury and Baeyens, 1998; Pearson etal., in preparation).
Basically, Bradbury et al. (1990) started from the observation that, although marls were richin calcite, the aqueous leachate was of the sodium/bicarbonate type. That might be due either to thepresence of a soluble sodium-carbonate salt, or to an exchange process occurring with the clay, takingup calcium and releasing sodium. Consequently, they designed a set of experiments consisting of aseries of leaching tests, in order to determine the presence of highly-soluble salts (sodium chloride,sodium bicarbonate, sodium carbonate), the CEC of the clays and the ion occupancies on the exchangesites. Two types of extraction experiments were used. One was aqueous leaching performed in a glovebox with controlled atmosphere (pCO2 ~ 10–2, O2 < 5 ppm), using liquid/solid ratios of 1:1 and 1:2. Theother utilised a calcite-saturated solution containing nickelethylenediammine (Ni-en), a high-selectivitycomplex that displaces all exchangeable cations from the clay to the solution. That inhibited thecalcium/sodium exchange and allowed simultaneously to measure the cation-exchange capacity. Thereason for pre-saturating the solution with calcite was that information should be obtained on the originof some cations such as sodium, by comparing the pH, inorganic carbon and calcium concentrations inthe marl-extraction experiments with their respective values in the leaching solution. Some of the resultsobtained on the Palfris marl (Baeyens and Bradbury, 1991) were briefly summarised in order to give anexample of the modelling approach.
By plotting the calcium concentration versus the liquid/solid ratio on a logarithmic scale(Figure 53), for both the aqueous leachates and the Ni-en extracts, the following considerations weremade:
– Calcium entered the Ni-en solution. Since the solution is pre-saturated with calcite,calcium may only have been displaced from the clays by the affinity complex. That allowsthe calculation of the quantity of exchangeable calcium present in the marl, by calculatingthe release at different liquid/solid ratios (0.9 meq /100 g).
– As a comparison, the aqueous leachate, showing much lower values than expected for asolution in equilibrium with calcite, indicated that, in that case, an exchange with clayswas operating. Calcium was provided by the dissolution of calcite, but was immediatelytaken up by the clay, releasing sodium. That in turn caused a further dissolution of calcite,and consequently a further exchange, until the system reached equilibrium.
For the other elements, if a logarithmic scale is adopted for their concentration as well, a plotwith a slope of –1 would indicate pure-dilution effects (Figure 54). A greater slope (i.e., less negative)would be indicative of precipitation and/or sorption effects, and a smaller slope, of dissolution and/ordesorption processes. As an example, sodium shows a slope of –1, which is interpreted as adisplacement from the clay component of the marl by the Ni-en solution, except for a small fractionresulting from the dissolution of sodium chloride. Aqueous leachates show a lower sodium content,indicating that not all the exchangeable sodium is displaced, in that case, from the clay to the distilledwater.
146

Figure 54. Measured sodium concentrations in Ni(en)n extracts (full circles) and in aqueousextracts (open circles) (after Baeyens and Bradbury, 1991)
On the basis of the considerations made on all the ions in the aqueous and the Ni-en solutionextracts, the quantity of highly-soluble salts (sodium chloride, potassium chloride) is derived, togetherwith the cation-exchange capacity of marl and the ion occupancy on the exchange sites.
One more step is needed in order to obtain an LSM solution that will not change theoccupancies on the clay: the calculation of the cation ratios in the liquid phase, that are in equilibrium
147
Figure 53. Measured calcium concentrations in Ni(en)n extracts (full circles) and in aqueousextracts (open circles). The hatched region represents the range of calcium concentration
of the Ni(en)n standard solution (after Baeyens and Bradbury, 1991)
01 10 100
2
8
10
4
6
12
14
Ca
Con
cent
ratio
n [m
eq 1
–1]
Liquid / Solid Ratio
0
1
10
100
1 10 100
Na
Con
cent
ratio
n [m
eq 1
–1]
Liquid / Solid Ratio

with known occupancies. That calculation may be achieved using semi-empirical Gapon equations(Baeyens and Bradbury, 1991) or by calculating the selectivity coefficients for sodium and potassium(Baeyens and Bradbury, 1991; Baeyens and Bradbury, 1994). The first approach, based on a very coarseempirical correlation observed in soils (Richards, 1954), leads to rather unsatisfactory results. Thesecond, even if it is based on a quite simplified representation of the clay as a mono-exchanger, is muchmore satisfactory.
Selectivity-coefficient calculations are based on the reasonable assumption that bivalent ionswill exhibit similar affinities for clay and may be treated consequently as being equivalent. Theselectivity coefficient of Na+ with respect to the sum of bivalent cations M2+ is defined by the authors,for the given exchange equation, as follows:
where the bar denotes the ion adsorbed on the solid phase, aNa and aM are respectively the activity inthe solution of Na+ and the sum of the activities of the bivalent ions (aM = aMg + aCa + aSr), and NNa andNM are the equivalent fractional occupancies i.e., the equivalents of sodium (or M) sorbed per unit mass,divided by the cation-exchange capacity, in equivalents per unit mass. As a result:
NNa + NK + NM = 1
The exchange with potassium is treated in the same manner. If sodium and potassium arepredominantly present as exchangeable cations on the clay minerals (i.e., if the contribution of solublesalts is negligible), then the sodium and potassium final occupancies at any solid/liquid ratio may beeasily calculated from the difference between their initial occupancies and their equilibriumconcentrations in the aqueous leachate. Selectivity coefficients with respect to the sum of bivalentcations may then be obtained using the above equations. The calculation of the actual LSM compositionis performed using an iterative approach. A complete example of the calculation for the Palfris marl wasreported in Baeyens and Bradbury (1994).
The calculations of the LSM composition appear to be relatively sensitive to the selected pH(and pCO2): an uncertainty of 0.5 pH unit leads generally to 50% changes in ion concentrations. Thoseparameters should consequently be better controlled, both during in-situ and laboratory experiments.Besides, while those calculations are relatively easy and possibly well constrained for major elements,it is difficult to obtain reliable data for minor and trace elements, that, on the other hand, may play adeterminant role in radionuclide migration and sorption. For the determination of those elements, theauthors suggested to proceed through equilibration tests, readjusting progressively the solutioncomposition. That may also be done for obtaining more reliable pH values (see e.g., the “in-situ” pHequilibration test that is currently being performed in the framework of the Mont Terri project).
That modelling approach has been used to obtain porewater compositions in the Opalinus clay(Bradbury and Baeyens, 1998). In that case, the aqueous leachates were conducted with deionised,degassed water at different solid/liquid ratios. The Ni-en extraction solution was no longer saturatedwith respect to calcite as a result of the difficulty in controlling the calcite precipitation that might occurdue to the release of calcium from the exchange complex. Two different cases were examined whencalculating the cation occupancies on the clay and selectivity coefficients. In the first case, all the
2Na+ + M2 + ↔ 2Na+ + M2 +
MNaKc =
NNa2
NM*
aM
aNa2
148

sodium was considered to be associated with the chloride in porewater, and all the calcium with thesulphates. In the second case, sodium was associated with both the dominant anions. The two data setswere not significantly different. Assuming the saturating mineral phases to be calcite, dolomite,chalcedony and fluorite, the calculated fractional cation occupancies and the chloride and sulphatecontents (that depend on the assumed porosity value) (Pearson, 1998), one degree of freedom stillexisted; which implies that a unique porewater composition cannot be calculated. The missingcomponent was pH, or alternatively pCO2, both of which may be estimated based on an additionalreaction. The systems did not seem to be highly affected by the selected value of pCO2, except for pHand bicarbonate content. The highest degree of uncertainty in the modelled porewater composition wasassociated with the selected porosity.
The same modelling approach applied to the indurated clays of the Tournemire site allowedthe estimation of a porewater composition, that may not be obtained by direct means due to theextremely low water content of the formation (Boisson et al., 1998; De Windt et al., 1998a; Waber andMazurek, 1998). While in that case, porosity was better defined, the interpretation of the aqueousleachates to determine the readily-soluble salts was not unique. As a consequence, there were someproblems in defining the mineral phases controlling the porewater composition, and sulphates were nottaken into account in the calculation. In addition, the Tournemire case was very different from thepreviously-examined Swiss cases in that it has a calcium and magnesium-dominated exchangepopulation, which makes it even more difficult to constrain the system. Nevertheless, the calculatedporewater-composition range was in reasonable agreement with the groundwater obtained from afracture in the Tournemire shale.
In any case, it is worth observing that, even if the simplified clay-surface representation maybe accepted to a certain degree for modelling in a very narrow pH range, neglecting H+ sorption seemsto be a much more risky hypothesis, which may explain certain limitations in the predictivity of themodel. Indeed, when applying ion-exchange concepts to freshening of aquifers, Appelo (1994) used asimple mono-site model, but had to include proton exchange in order to get representative results.
Another modelling approach that has been proven valid for clay environments was proposedby Beaucaire et al. (1995; in press) on the Boom clay, within the work of the ARCHIMEDEprogramme. Their study relied on regional-groundwater characterisation (Boom-clay porewater andgroundwaters from the Rupelian aquifer). The acquisition and regulation mechanisms of thegroundwater compositions at the regional scale were considered to be the same, and the fluids to havea common origin. By a careful observation of the correlation between major cations and anions, amixing between recharge porewater and a marine solution may be identified. However, a simple mixingmodel between those two end members did not describe the system accurately, thus suggesting thatexchange and equilibration with the host rock also occurred. Referring to Giggenbach and Michard’sisochemical recrystallisation model successfully applied to the modelling of granitic waters (Grimaudet al., 1990), Beaucaire et al. used a dissolution-precipitation model considering a mineral assemblageconstituted by kaolinite, chalcedony, calcite, dolomite, albite and microcline in order to predict thewater composition. Those phases had all been identified during the mineralogical analysis of the Boomclay. They were not all known to be present in the aquifer matrix, but could be reasonably suspectedsince the aquifer is located in clayey sands of the same geological group. Those minerals were alsoselected because their dissolution equilibria are well established. Clay minerals instead may be treatedeither as defined phases or as solid solutions, thus making it difficult to define thermodynamicconstants.
149

The external variables of the model are temperature and the concentrations of the “free”elements that do not participate in any dissolution-precipitation equilibrium: chlorine as chloride andsulphur as sulphate. At that stage of the modelling, the total inorganic carbon concentration was alsoconsidered as non-controlled, because no satisfactory mineral buffer could be identified.
The model seemed to describe accurately the variability of the recognised types of waterwithin the regional scale. Discrepancies between predicted and measured concentrations of majorelements were within analytical uncertainties, except for very dilute species; with regard to pH, thedeviation was less than 0.3 unit. That good predictivity induced De Windt et al. (1998b) to test themodel on the Tournemire water collected from a draining fracture of the site and resulted in a quitesatisfactory agreement between modelled and analysed water compositions.
Regarding trace elements, that modelling approach proved to be quite impressive inexplaining the low oxido-reduction potential in the Rupelian aquifer by a geochemical control throughgoethite and siderite. In the Boom clay, Eh, iron and sulphur concentrations were determined by anassemblage of pyrite, siderite and goethite: the Eh value calculated by that model only differed by20 mV from the measured one (Beaucaire et al., 1998).
In the ARCHIMEDE programme, surface-solution equilibrium was also tested on Boom clayand porewater, using the exchange constants defined for pure clay minerals in the natural assemblage(Gorgeon, 1994) and assuming additivity of the exchange properties, including mixed layers. Thatmodel allowed to describe the metal-cation fixation on one illite and one smectite site, and thecalculation of calcium and magnesium concentrations in the porewater. The computed values weresomewhat higher than the measured values, but that modelling approach seems reasonable (Beaucaireet al., in press). Ongoing work on Boom clay is devoted to characterise more accurately its sorptionproperties in order to refine the model. Besides, the same authors modelled the reaction of theclay/water system to an oxidising disturbance by a combination of dissolution and ion-exchangeprocesses. The latter are easily shown in such a case due to their high velocity.
In fact, both phenomena are known to occur during water/rock interaction, but at differenttimescales: ion exchanges are quickly established while equilibrium is more slowly attained indissolution-precipitation reactions. As a consequence, if a groundwater is equilibrated with the hostrock, it is necessarily in equilibrium with the rock surface. A second consequence is that disturbancesinduce immediate surface reactions: for example, water intrusions or leaching experiments may only becorrectly interpreted if those processes are taken into account. On the other hand, a pure ion-exchangemodel of groundwater cannot be totally constrained, since it would involve the exact knowledge of thechemical composition of the rock surface. Conversely, a dissolution-precipitation model only needs totake into account the nature of the dissolving solid phases. Naturally, both aspects need to be consideredin the safety-assessment procedure for waste-disposal sites, which means that a considerable work ofthermodynamic-data generation has to be done in order to reach reliable conclusions.
4. CONCLUSIONS, RECOMMENDATIONS AND TOPICS FOR FURTHER INVESTIGATION
The problem of extracting solutions from argillaceous formations for geochemicalcharacterisation is a complex one, as expected. For the time being, the presence of different forcesarising from the clay/water interaction and influencing the movement of water molecules and solutesprevents the possibility to define experimentally the “true” porewater composition. That composition isneeded for several purposes:
150

– To calculate the corrosion of the canisters and the matrices where radioactive waste willbe confined.
– To evaluate the origin, the residence time and the natural processes of water and solutemovement through the formation.
– To calculate the speciation and the solubility of phases in order to evaluate the water/rock-interaction phenomena affecting radionuclide migration.
– To foresee the effect of the site water on the engineered barriers of the repository.
Fortunately, not all those purposes require the same knowledge of the porewater composition.
For corrosion studies, the main parameters needed are the total salinity, the oxidising orreducing properties of the solution and the speciation of particular elements (e.g., sulphur). In the hostrock, it may be reasonably assumed that, given the high solid/water ratio, the solution compositionwould soon be controlled by the minerals in the matrix, the composition and reactivity of which arefairly well known.
For tracing back the origin, age and movement of the water, a few techniques have provenreliable. Noble-gas measurements may provide information on groundwater age. Deuterium andchloride, provided that they are interpreted in relative rather than in absolute terms and that porositycharacteristics are well known, allow an estimation of the time required to establish the distributionprofile, as long as the movement is diffusion-dominated. Tritium may also be used for tracingexperiments, since it apparently may be readily extracted by vacuum distillation and measuredaccurately by radioactive counting.
Speciation studies are the most affected by the analytical problems that we have pointed out.Here, the whole task of characterising the water content and composition relies on the absence of a cleardefinition of which part of the cations and anions belongs to the adsorbed and strongly bound claysurface, and which part belongs to the bulk solution. That problem has been neglected so far or treatedin terms of total water content. Without that definition, the question would turn up to which total suctionneeds to be applied to the sample in order to extract even more water, that would actually be noporewater at all. As a consequence, future investigations should aim at a better understanding of thefundamental properties of the clay/water system: thermodynamics of pore-confined water is still acritical issue.
There is a considerable amount of information to be gained by coupling the mechanicalbehaviour of the system with its mineralogical and chemical characteristics. Macroscopic properties,such as swelling and mechanical strength, depend on the water content, but also on the type ofsaturating cation on the clay surface and, consequently, on the porewater composition. Theestablishment of water adsorption-desorption isotherms shows the importance of hysteresis phenomenaand may help in the comprehension of the disturbance induced by water extraction.
A rigorous physical study on the size and distribution of pores is needed. The use of differentanalytical techniques is suggested to define the different porosities (Pearson, in press). Attention shouldbe paid to use relatively “soft” techniques, trying to avoid pore-size modifications related to the forceapplied to have the fluid permeate through the system. When possible, microscopic observationscoupled with the statistic processing of data should be used to evaluate three-dimensionally the rockfabric and the anisotropy of the pore shape. The in-situ use of tracers should provide additional andcomplementary information.
151

Finally, water-content studies should be performed to evaluate the amount of free and boundwater. That should be achieved using NMR, IRS and DRS. Those techniques have the advantage todisturb less the clay sample. In addition, recent technical developments allow the use of thosetechniques directly inside explorative boreholes, bypassing all the artefacts related to sample collectionand preservation
Some new and promising water-extraction techniques have been proposed recently forargillaceous materials. Those are the direct equilibration for isotopic analysis (see Chapter II § 3.5.2)and the radial-diffusion method for conservative and non-reactive tracers (mainly deuterium andchloride) (see Chapter II § 3.6.4). Those techniques still need validation on a variety of clayenvironments to test their applicability to different mixtures of clay minerals and different salinities ofthe interstitial solutions.
Other topics where further investigation is needed are highlighted in the following paragraphs,and, if possible, the way to proceed to obtain the information.
4.1 Chemical studies
Considering the limited number of reliable tracers available in the relevant clay environments,it may be worth trying to understand better the behaviour of chlorine during extraction by leaching. Wehave stressed that reproducible results may be obtained for high chloride-content porewaters, while inlow-chlorine environments, difficulties appear during extraction. In those cases there seems to be adependence on the used solid/liquid ratio (see Chapter III § 1.3). That phenomenon may be due to anionadsorption on particular sites under given leaching conditions (pH and salinity of the leaching solution),or be related to porosity-access difficulties. A better understanding of that issue is crucial for theinterpretation of leaching data, especially for modelling purposes, and for the definition of effective andgeochemical porosity. It may possibly be accomplished by studying the chloride distribution onto andin the solid phase (adsorption sites, fluid inclusions) through mineral and surface analyses.
Although classical CEC measurements are commonly used to define the ion-exchangecapacity of clays, the values obtained display high variability depending on the high-affinity cation orcomplex used (Van Olphen and Fripiat, 1979). There is still a lack of comprehension of the real meaningof that parameter. We have already stressed the importance of always specifying under which conditionsthe CEC has been measured. An alternative based on thermodynamics consists in characterising therock by its ion-exchange isotherms, thus enabling to identify specific sites, each having a definedcation-exchange capacity and a selectivity coefficient for each pair of cations. It is only through a multi-site representation (corresponding to the rock structure) and fully taking into account proton sorption,that current ambiguities may be resolved.
Thermodynamic modelling currently seems a promising indirect approach to porewatercomposition, but more analytical work is needed to determine reliable exchange constants. Acidity andoxido-reduction levels may be readily predicted, but the robustness of the modelling still has to beproven, especially at varying temperatures. In addition, the models should be validated on the researchsites, for example, by allowing the in-situ equilibration of injected water with the calculatedcomposition with the host rock (see e.g., the pH equilibration experiment conducted at Mont Terri).
Considering the limitations of the available techniques for water extraction, efforts need to bemade towards a better understanding of the water-movement mechanisms within the sample that mayinfluence the composition of the extracted water. That requires not only the analysis of the extracted
152

fluids, but also the careful examination of the solid phase prior and after extraction. In that perspective,the ongoing investigations at CIEMAT within the framework of the FEBEX project are extremelyinteresting, even if they only involve a synthetic system.
Finally, although a leading work has been performed especially on the Boom clay withindifferent projects, a huge amount of study still has to be performed on organic-matter characterisationand the evaluation of its retention role. Organic-matter behaviour may be examined using two verydifferent approaches: ion exchanger or complexing agent. The CEC of organic matter is normallyincluded in the total rock CEC measurements. Few data are available on the organic matter itself,especially if extracted from natural environments. On the other hand, the complexing properties are alsorelatively unknown. The comparison between values obtained on untreated clay samples and on purifiedclay fractions may provide useful information regarding the real buffering capability of the organicmatter.
4.2 Isotopic studies
Considering isotopic studies, an improvement of existing techniques and/or the developmentof new techniques, such as direct equilibration, seem possible. That may be achieved via a closecoupling with other techniques such as NMR, IRS and DRS, that allow the understanding of the water-type partitioning. In addition, much information may be gained, by the study of homoionic clays, on therole of specific cations in the isotopic fractionation over different types of water. That may be performedby coupling differential thermal analysis with isotopic measurements over the different collected waterfractions.
A lack of experimental data on the pressure effect over the isotopic composition of watersextracted by squeezing does not allow a validation of that technique for isotopic analysis. That topicmay be further investigated, as that technique, at low pressures, is supposed to affect only freeporewater.
4.3 Guidelines for benchmark experiments
At this stage, very few benchmark experiments may be planned. Our suggestions pointtowards a better integration of the techniques and the knowledge of the fundamental properties of water,organic matter and clay interactions. The scientific community is currently very much aware of theproblems involved in water extraction and of the significance of the information to be derived from it.
An intercomparison over analytical techniques on clays has already been organised by theNEA (Van Olphen and Fripiat, 1979) and a second one was launched by the IAEA on isotope analysis(Walker et al., 1994). There is little doubt in our minds that, if those benchmark experiments were to beconducted again today, the results would be anything else but the same.
Nevertheless, a formal organisation of a sample interchange, selecting both plastic andindurated clays with varying water and salinity contents, may be useful. That exchange is actuallyalready going on at a confidential level between different analytical laboratories. That would allow, asfar as isotopic techniques are concerned at least, to obtain a clear picture of the extraction techniquevariability versus the sample variability. Teams involved should already have some knowledge of theproblem with water extraction from clay-rich environments in order to avoid a large spread of data. Theintercomparison may focus as well on the determination of the amount of chloride in porewater, on thedetermination of the cation-exchange properties (or alternatively, on cation occupancies) and on the
153

isotopic composition of porewater. In any case, it is worth stressing that, for the time being,intercomparisons must only be considered as one of the many tools to understanding better thephenomenology of each analytical method. No intercomparison exercise will provide reliableconclusions as long as no fundamental knowledge exists to assess the accuracy of any method.
154

GLOSSARY AND FREQUENTLY USED ABBREVIATIONS
absorption1 The penetration of a substance into the inner structure of another, as opposed toadsorption, where one substance is attracted to and held on the surface of another.
acidity Of a species, its ability to release protons in a solution; of a solution the protonactivity in it.
activity A magnitude characterising the chemical reactivity of a species or component,equivalent to the chemical potential.
adsorption1 The adhesion of atoms, ions or molecules of a gas or liquid to the surface of anothersubstance, called the “adsorbent”.
AEC Anion-exchange capactiy
aliphatic Used to describe an organic compound with only single-bound carbon atoms.
alkalinity Of a solution, the concentration of bases that are titrated by a strong acid at theequivalent point corresponding to carbonic acid (Morel).
aluminol An OH group bound to surface aluminium atoms in a mineral.
aluminosilicate3 A silicate in which aluminium substitutes for silicon in the SiO4 tetrahedra.
amino acid1 An organic acid containing both a basic amino group (NH2) and an acidic carboxylgroup (COOH).
ANDRA National Radioactive Waste Management Agency, France
anion An ion having a negative charge.
APTTM Accelerator porosity tool (Schlumberger)
aromatic Used to describe an organic compound having unsaturated six-carbon rings withthree delocalised double bonds.
auger3 A screw-like boring tool (resembling a carpenter’s auger bit but much larger),usually motor driven, designed for clay, soils and other relatively-unconsolidatednear-surface materials.
azeotrope1 A liquid mixture of two or more substances behaving like a single substance in thesense that the vapour produced by the partial evaporation of liquid has the samecomposition as the liquid.
bentonite3 (a) A soft, plastic, porous, light coloured rock composed essentially of clay mineralsof the montmorillonite (smectite) group plus colloidal silica. The rock commonlyhas the ability to absorb large quantities of water and to increase in volume by about8 times. The term was first used by Knight (1898) for the argillaceous Cretaceousdeposits occurring in the Benton formation in eastern Wyoming.
155

(b) A commercial term applied to any of the numerous variously coloured claydeposits containing montmorillonite (smectite) as the essential mineral andpresenting a very large total surface area, characterised either by the ability to swellin water or to be stacked and to be activated by acid, and used chiefly (at aconcentration of about 3 lb/ft3 of water) to thicken oil-well drilling muds.
BGS Britsh Goelogical Survey, United Kingdom
biomarker3 An organic compound with a specific structure that may be related to a particularsource organism.
bitumen2 A native solid or semi-solid hydrocarbon (naphta or asphalt), soluble in carbondisulphate, rich in carbon and hydrogen.
capillarity3 The action by which a fluid, such as water, is drawn up (or depressed) in smallinterstices or tubes as a result of surface tension.
carboxylic acid An organic molecule having at least one carboxyl group (COOH).
casing3 A heavy, large diameter metal pipe, lowered into a borehole during or after drillingand cemented to the sides of the wall. It prevents the sides of the hole from caving,prevents loss of drilling muds or other fluids into porous formations and preventsunwanted fluids from entering the hole.
cation1 An ion having a positive charge. Cations in a liquid subjected to an electric potentialcollect at the negative pole or cathode.
CEA Atomic Energy Commission, France
CEC Cation-exchange capacity
CEN/SCK Nuclear Energy Research Centre, Belgium
chalk3 A soft, pure, earthy, fine-textured, usually white to light grey or bluff limestone ofmarine origin, consisting almost wholly (90-98%) of calcite, formed mainly byshallow water accumulation of calcareous test of floating micro-organisms andcalcareous algae, set in a structureless matrix of very finely crystalline calcite. Therock is porous, somewhat friable and only slightly coherent.
colloid2 A state of subdivision of matter, comprising either single large molecules oraggregation of smaller molecules. The particles (are) of ultramicroscopic scale. Sizerange from 10–7 to 10–5 cm.
CMRTM Combinable magnetic resonance (Schlumberger)
compaction3 A reduction in the bulk volume or thickness of, or the pore space within, a body offine-grained sediments in response to the increasing weight of overlying materialthat is continuously being deposited or to the pressures resulting from earthmovements within the crust. In addition, the process whereby fine-grained sedimentis converted to consolidated rock such as clay lithified to a shale.
co-ordination In crystallography, the number of nearest neighbour ions that surround a given ion (number)3 in a crystal structure, e.g., four, six or eight.
covalent (bond)1 Homopolar. The sharing of electrons by a pair of atoms.
delrinTM2 A trademark for a linear polyoxymethylene-type acetal resin, having a high strengthand solvent resistance. It is mouldable.
156

desorption1 The process of removing an adsorbed material from the solid on which it isadsorbed.
diagenesis3 All the chemical, physical and biologic changes undergone by a sediment after itsinitial deposition and during and after its lithification, excluding surficial alterationand metamorphism. It embraces those processes (such as compaction, cementation,reworking, authigenesis, replacement, crystallisation, leaching, hydration, bacterialaction and formation of concretion) that occur under conditions of pressure (up to1 kbar) and temperature (maximum range of 100° to 300°C) that are normal in thesurficial or outer part of the Earth’s crust. There is no universally accepted definitionof the term and no delimitation (such as the boundary with metamorphism).
dialysis3 A method of separating compounds in solution or suspension by their differing ratesof diffusion through a semi-permeable membrane, some species not moving throughat all, some moving slowly, and other diffusing quite readily. Cf. osmosis.
DIC Dissolved inorganic carbon
dielectric (ε0) the “absolute” permittivity of a dielectric, being the ratio of the electricpermittivity2 displacement to the electric-field strength at the same point. Its value for free space
is 8.854185·10–12 F m–1. The real component of the complex relative permittivity isan important diagnostic parameter when considering the high- and low-frequencyvalues for zero dielectric loss. It relates to grain size, packing variations and densityof the material.
dipole, electric1 An assemblage of atoms or subatomic particles having equal electric charges ofopposite sign separated by a finite distance; for instance, the hydrogen and chlorineatoms of a hydrogen-chloride molecule.
DOC Dissolved organic carbon
DRS Dielectric relaxation spectroscopy
Eh3 The potential of a half-cell, measured against the standard hydrogen half-cell. Syn.: oxido-reduction potential.
electric conductivity3 A measure of the ease with which a conduction current can be caused to flow
through a material under the influence of an applied electric field. It is the reciprocalof resistivity and is measured in siemens per metre.
electrolyte2 A substance that dissociates into two or more ions, to some extent, in water.Solutions of electrolytes thus conduct an electric current and may be decomposedby electrolysis.
ENRESA Spanish National Agency for Radioactive Waste, Spain
ethylenediammine1 NH2CH2CH2NH2.
GRS Company for Reactor Safety, Germany
flocculation2 The coagulation of a finely divided precipitate.
fractionation1 In general, the separation or isolation of components of a mixture. In distillation,that is done by means of a tower or column in which rising vapour and descendingliquid are brought into contact (counter-current flow). Isotopic fractionation changesin isotope ratios occurring for low atomic-number elements that display a largeproportional difference in atomic mass between stable isotopes.
157

fulvic acid3 The pigmented organic matter of indefinite composition that remains in solutionwhen an aqueous alkaline extract of soil is acidified by removal of humic acid. It isseparated from the fulvic-acid fraction by adsorption on a hydrophilic resin at lowpH values.
functional group A reactive molecular unit that protrudes from a solid adsorbent surface into anaqueous solution (Sposito, 1984).
humic acid1 A brown, polymeric constituent of soils, lignite and peat. It is soluble in bases, butinsoluble in mineral acids and alcohols. It is not a well-defined compound, but amixture of polymers containing aromatic and heterocyclic structures, carboxylgroups and nitrogen.
humification3 The process whereby the carbon of organic residues is transformed and converted tohumic substances through biochemical and abiotic processes.
hydration2 The combination with water.
hydrocarbon1 An organic compound consisting exclusively of the elements carbon and hydrogen.Derived mainly from petroleum, coal tar and plant sources.
hydrophilic2 Lyophilic. Used to describe a substance that readily associates with water.
hydrophobic2 Used to describe a substance that does not associate with water.
hysteresis2 The lag or retardation of an effect behind its cause, such as (1) the magnetic lag orretention of the magnetic state of iron in a changing magnetic field; (2) theretardation of a chemical system to reach equilibrium.
IAEA International Atomic Energy Agency
IPSN Nuclear Protection and Safety Institute, France
IRS Infrared spectroscopy
isomorphic3 Used to described a substance having identical or similar form to another.
isotherm1 A constant-temperature line used on climatic maps or in graphs of thermodynamicrelations, particularly the graph of pressure/volume relations at constanttemperature.
isotope1 One of two or more forms or species of an element that have the same atomicnumber, i.e., the same position in the periodic table, but different masses. Thedifference in mass is due to the presence of one or more extra neutrons in thenucleus.
kerogen1 The organic component of oil shale, it is a bitumen-like solid whose approximatecomposition is 75-80% carbon, 10% hydrogen, 2.5% nitrogen, 1% sulphur and thebalance oxygen. It is a mixture of aliphatic and aromatic compounds of humic andalgal origin.
kerosene2 A mixture of hydrocarbons, boiling at 150-280°C; the fraction in the distillation ofpetroleum between gasoline and the oils.
lattice1 The structural arrangement of atoms in a crystal.
ligand1 A molecule, ion or atom that is attached to the central atom of a co-ordinationcompound, a chelate or other complex. Ligands are also called “complexing agents”.
158

lignin1 A phenylpropane polymer of amorphous structure comprising 17-30% of wood.
LSM Laboratory strandard marl
luciteTM2 A trademark for plastic based on polymerised methyl methacrilate resin.
lyophilisation1 A method of dehydration or of separating water from solid materials. The materialis first frozen and then placed in a high vacuum in order for the water (ice) tovaporise in the vacuum (sublimes) without melting and for the non-watercomponents to be left behind in an undamaged state.
mole2 An SI base unit. The amount of substance of a system containing the same number(i.e., the Avogadro constant) of elementary entities (must specify which; e.g., atoms,molecules, ions, electrons, or other particles) as there are atoms in exactly 0.012 kgof 12C.
monovalent, Cf. valence.divalent,trivalent
mudstone3 An indurated mud having the texture and composition of shale, but lacking its finelamination or fissility; a blocky or massive, fine-grained sedimentary rock in whichthe proportions of clay and silt are approximately equal.
NAGRA National Co-operative for the Disposal of Radioactive Waste, Switzerland
NEA Nuclear Energy Agency
neoprene2 Polychloroprene. The generic name for synthetic rubber made by polymerisation of2-chloro-1,3-butadiene. Neoprene vulcanisates are resistant to oils, chemicals,sunlight, ozone and heat.
NMR Nuclear magnetic resonance
oedometer4 An instrument for testing consolidation of small samples, including thecompressibility and consolidation coefficients. The sample is compressed in acylinder allowing only vertical consolidation; the resulting changes in volume overa specific time are measured.
ONDRAF/ National Organisation for Radioactive Waste and Fissile Materials, BelgiumNIRAS
opt(r)ode A component of fibre-optical analytical systems that is analogous to an electrode. Itcomprises a sensor tip and an optical fibre to conduct the light beam carrying theanalytical signal.
orbital1 The area in space about an atom or molecule in which the probability of finding anelectron is greatest.
osmosis3 The movement of a solvent through a semi-permeable membrane, that usuallyseparates the solvent and a solution, or a dilute solution from a more concentratedone, until the solutions on both sides of the membrane are equally strong.Cf. dialysis.
oxydation The loss of electrons.
159

peptide2 A component of 2 to 10 amino acids joined through the main (not side) chain by thepeptide amine bond, –C(:O)NH–. Polypeptides contain 10 to 100 amino-acidresidues and resemble peptones and proteins.
perbunamTM2 The trademark for a copolymer of butadiene and styrene.
permeability3 The property or capacity of a porous rock, sediment or soil, to transmit a fluid. It isa measure of the relative ease of fluid flow under unequal pressure and is a functiononly of the medium. The customary unit of measurement is the millidarcy.
pH The symbol for the logarithm of the reciprocal of the hydrogen-ion activity; hence,pH = log (1/(H+)).
phenol2 A compound containing one or more hydroxyl groups attached to an aromatic ring.Polyphenols contain four or more –OH groups.
phtalate2 A salt of phtalic acid containing the ion C6H4(COO)22-, used for buffers and standard
solutions, and in vacuum pumps.
piezometer3 An instrument for measuring pressure heads in a conduit, tank or soil. It usuallyconsists of a small pipe or tube tapped into the side of a container, with its inside endflush with, and perpendicular to, the water face of the container and connected to amanometer pressure gage, or mercury, or water column.
playa3 A term used in the southwestern United States for a dry, vegetation-free, flat area atthe lowest part of an non-drained desert basin, underlain by stratified clay, silt orsand, and commonly by soluble salts.
polar1 Used to describe a molecule in which the positive and negative electric charges arepermanently separated, as opposed to non-polar molecules, in which the chargescoincide.
polymer A macromolecule formed by the chemical union of at least two identical units called“monomers”. In most cases, the number of monomers is quite large (3,500 for purecellulose), and often is not precisely known.
porosity3 The percentage of the bulk volume of a rock or soil that is occupied by interstices,whether isolated or connected.
potash3 a) Potassium carbonate, K2CO3; b) A term that is loosely used for potassium oxide,potassium hydroxide or even for potassium in such informal expressions as potashspar; c) An industry term for a group of potassium-bearing salts, that includespotassium chloride, and may also refer to potassium sulphate, nitrate and oxide.
potential2 Any stored-up energy capable of performing work. “Chemical potential” is ameasure of the tendency of a chemical reaction to take place. Directly related toactivity. “Electric potential” is the electromotive force.
precipitate1 A set of small particles that have settled out of a liquid or gaseous suspension bygravity, or that results from a chemical reaction.
proton1 A fundamental unit of matter having a positive charge and a mass number of 1,equivalent to 1.67·10–24 grams. A proton is identical to a hydrogen ion (H+).
quasi-crystal An aggregate structure in coagulated clay minerals (2:1 layer types), in particularsmectite, comprising parallel alignments of unit layers.
160

quick clay3 A clay that loses all or nearly all its shear strength after being disturbed; a clay thatshows no appreciable regain in strength after remoulding.
redox1 The short form of the term “oxidation-reduction”, as in redox reactions, redoxconditions, etc. Cf. oxidation.
sandstone3 A medium-grained, clastic sedimentary rock composed of abundant rounded orangular fragments of sand size with or without a fine-grained matrix (silt or clay)and more or less firmly united by cementing material (commonly silica, iron oxideor calcium carbonate). The sand particles are predominantly quarts and the term“sandstone”, when used without qualification, indicates a rock containing about85-90% quartz.
saturation1 (1) The state in which all available bonds of an atom are attached to other atoms. (2) The state of a solution when it holds the maximum equilibrium quantity ofdissolved matter at a given temperature.
selenite3 The clear, colourless variety of gypsum, occurring (e.g., in clays) in distinct,transparent, monoclinic crystals or in large crystalline masses that easily cleave intobroad folia.
S.I. Saturation index
silanol An OH group attached to surface silicon atoms in a mineral
siloxane cavity A surface functional group constituted by a roughly hexagonal cavity formed by sixcorner-sharing silica tetrahedra. The cavity has a diameter of about 0.26 nm and isbordered by six sets of electron orbitals emanating from the surrounding ring ofoxygen atoms (Sposito, 1989).
solid solution3 A single crystalline phase that may be continuously varied in composition withinfinite limits without the appearance of an additional phase.
solvation2 Any stabilising interaction between solute and solvent; if the latter is water, hydratesor hydrated ions are formed, e.g., M(H2O)n.
sorption1 A generic, independent of the mechanism, surface phenomenon that may be eitherabsorption or adsorption, or a combination of both. The term is often used when thespecific mechanism is not known.
stoichiometric3 Of a compound or phase, pertaining to the exact proportions of its constituentsspecified by its chemical formula.
suction2 The effect of sucking. The operation of drawing fluid into a pipe.
TDS Total dissolved solids
TIC Total inorganic carbon
till3 A dominantly unsorted and non-stratified drift, generally unconsolidated anddeposited directly by and beneath a glacier without subsequent reworking by meltwater. It consists in a heterogeneous mixture of clay, silt, sand, gravel and bouldersranging widely in size and shape.
TO Tetrahedral-octahedral layer structure
TOC Total organic carbon
161

toluene2 C6H5·CH3. Colourless liquid; density13: 0.871; melting point: –93°C; boiling point:111°C; insoluble in water, but soluble in alcohol or ether.
TOT Tetrahedral-octahedral-tetrahedral layer structure
tracer3 Any substance that is used in a process to trace its course, specifically radioactivematerial introduced into a chemical, biological or physical reaction.
transmissivity3 The rate at which water is transmitted through a unit width of the aquifer under aunit hydraulic gradient. Transmissivity is equal to the product of hydraulicconductivity and aquifer thickness.
tritium2 T or 3H. A radioactive isotope of hydrogen; half-life: 12.5 a, decaying with theemission of β particles.
tuff3 A consolidated or cemented volcanic ash.
Urethane1 Ethyl carbamate; ethyl urethane; CO(NH2)OC2H5. Its structure is typical of therepeating unit in polyurethane resins.
Valence2 (1) The capacity of an atom to combine with others in definite proportions. (2) Alsoapplied by analogy, to radicals and atomic groups. The combining capacity of anhydrogen atom is taken as unity, values are integers 1-8.
Van der Waals forces2
The weak forces between atoms and molecules, being other than forces due tocovalent bonds or ionic attraction.
Vivianite3 A mineral Fe32+ (H2O)8 (PO4)2.
Xylene2 C6H4Me2. Colourless liquid, density: 0.881; melting point: –28°C; boiling point:144°C; insoluble in water.
Glossary sources:
Definition have been obtained and freely adapted from:1. Lewis, 1993;2. Grant and Grant, 1987;3. Jackson, 1997;4. Allaby and Allaby, 1990.
162

REFERENCES
ADAMS, F., BURMESTER, C., HUE, N.V. and LONG, F.L. (1980) “A comparison of column-displacement and centrifuge methods for obtaining soil solutions”. Soil Sci. Soc. Am. J.,44:733-735.
AITEMIN, CIEMAT, CSIC-Zaidin, DM Iberia, ULC, UPC-DIT, UPM and TECNOS (1998) “FEBEX:Full-scale engineered barriers experiment in crystalline host rock. Pre-operational stage SummaryReport”. ENRESA, Publ. Tecn. 01/98:185.
AJA, S.U., RESENBERG, P.E. and KITTRICK J.A. (1991) “Illite equilibria in solutions: I. Phaserelationships in the system K2O-Al2O3- SiO2-H2O between 25 and 250 °C”. Geoch. Cosmoch.Acta, 55:1353-1364.
ALLABY, A. and ALLABY, M. (1990) The concise Oxford Dictionary of Earth Sciences. OxfordUniversity Press, Oxford, 410.
ALLEN, A.J., BASTON, A.H., BOURKE, P.J. and JEFFERIES, N.L. (1988) “Small angle neutronscattering studies of diffusion and permeation through pores in clays”. Nirex Safety Studies Rep.,NSS/R160:38.
ALLISON, G.B., BARNES, C.J. and HUGHES, M.W. (1983) “The distribution of deuterium and 18Oin dry soils: 2. Experimental”. J. Hydrol., 64:377-397.
ALLISON, G.B., COLIN-KACZALA, C., FILLY, A. and FONTES, J.Ch. (1987) “Measurement ofisotopic equilibrium between water, water vapour and soil CO2 in arid zone soils”. J. Hydrol.,95:131-141.
ALLISON, G.B. and HUGHES, H.W. (1983) “The use of natural tracers as indicators of soil watermovement in a temperate semi-arid region”. J. Hydrol., 60:157-173.
ANDERSON, D.M. and LOW, P.F. (1958) “The density of water adsorbed on lithium-, sodium-andpotassium-bentonite”. Soil Sci. Soc. Amer Proc., 22:99-103.
ANDREUX, F. and MUNIER-LAMY, C. (1994) “Genèse et propriétés des molécules humiques”. In:Pédologie, constituants et propriétés du sol (Bonneau M. and Soucher B., Eds.), Masson,2:109-142.
ANDREWS, J.N., DAVIS, S.N., FABRYKA-MARTIN, J., FONTES, J.C., LEHMANN, B.E.,LOOSLI, H.H., MICHELOT, J.-L., MOSER, H., SMITH, B. and WOLF, M. (1989) “The in-situproduction of radioisotopes in rock matrices, with particular reference to the Stripa granite”.Geoch. Cosmoch. Acta, 53:1803-1815.
ANGELIDIS, T.N. (1997) “Comparison of sediment porewater sampling for specific parameters usingtwo techniques”. Water, air, and soil poll., 99:179-185.
APPELO, C.A.J. (1977) “Chemistry of water expelled from compacting clay layers: a model based onDonnan equilibrium”. Chem. Geol., 19:91-98.
163

APPELO, C.A.J. (1994) “Cation and proton exchange, pH variations and carbonate reactions in afreshening aquifer”. Water Res. Res., 30/10:2793-2805.
APTE, S.C., GARDNER, M.J. and HUNT, T.E. (1989) “An evaluation of dialysis as a size-basedseparation method for the study of trace metal speciation in natural waters”. Environ. Techn. Lett.,10:201-210.
AQUILINA, L., BOULÈGUE, J., PINAULT J.-L. and SUREAU J.-F. (1993b) “WELCOM (WellChemical On-line-Monitoring) II: Chemical interpretation of WELCOM, Balazuc-1 well, ArdècheFrance”. Scient. Drilling, 4:13-22.
AQUILINA, L., BOULÈGUE, J., SUREAU, J.-F., BARIAC, T. and GPF TEAM (1994) “Evolution ofinterstitial waters along the passive margin of the Southeast Basin of France: WELCOM (WellChemical On-line Monitoring) applied to Balazuc-1 well (Ardèche)”. Appl. Geoch., 9:657-675.
AQUILINA, L., CÉCILE J.-L., SUREAU J.-F. and DEGRANGES P. (1993a) “WELCOM (WellChemical On-line-Monitoring) I: Technical and economic aspects”. Scient. Drilling, 4:5-12.
AQUILINA, L., DELAY, J. and MERCERON, T. (1995) “Characterisation of interstitial water and ionicexchange in the clay formation through monitoring of drilling fluids”. Proc. of an Int. Workshop on“Hydraulic and hydrochemical characterisation of argillaceous rocks”, U.K.,7-9 June 1994, OECD/NEA, 119-131.
AQUILINA, L., EBERSCHWEILER, C., PERRIN, J. and DEEP GEOLOGY OF FRANCE TEAM(1996) “Comparison of hydrogeochemical logging of drilling fluid during coring with the resultsfrom geophysical logging and hydraulic testing. Example of the Morte-Mérie scientific borehole,Ardèche, France, Deep Geology of France Programme”. J. Hydrol., 185:1-21.
ARAGUAS ARAGUAS, L., ROZANSKI, K., GONFIANTINI, R. and LOUVAT, D. (1995) “Isotopeeffects accompanying vacuum extraction of soil water for stable isotope analyses”. Journ. Hydrol.,168:159-171.
ARANYOSSY, J.-F. and GAYE, C.B. (1992) “La recherche du pic de tritium en zone non saturéeprofonde sous climat semi-aride pour la mesure de la recharge des nappes: première application auSahel”. C.R. Acad. Sci. Paris, 315, II, 637-643.
AZCUE, J.M.A., ROSA, F. and LAWSON, G. (1996) “An improved dialysis sampler for the in situcollection of larger volumes of sediment porewaters”. Environ. Techn., 17:95-100.
BAEYENS, B. and BRADBURY, M.H. (1991) “A physico-chemical characterisation technique fordetermining the porewater chemistry in argillaceous rocks”. NAGRA Tech. Rep., 90-40, 61.
BAEYENS, B. and BRADBURY, M.H. (1994) “Physico-chemical characterisation and calculated insitu porewater chemistries for a low permeability Palfris Marl sample from Wellenberg”. NAGRATech. Rep., 94-22, 30.
BARNES, C.J. and ALLISON, G.B. (1983) “The distribution of deuterium and 18O in dry soils:1. Theory”. J. Hydrol., 60:151-156.
BARNES, C.J. and ALLISON, G.B. (1984) “The distribution of deuterium and 18O in dry soils:3. Theory for non isothermal water movement”. J. Hydrol., 74:119-155.
BARNEYBACK, R.S. Jr. and DIAMOND, S. (1981) “Expression and analysis of pore fluids fromhardened cement pastes and mortars”. Cement and Concrete Research, 11:279-285.
BATH, A.H. and EDMUNDS, W.M. (1981) “Identification of connate water in interstitial solution ofchalk sediment”. Geoch. Cosmoch. Acta, 45:1449-1461.
164

BATH, A.H., ENTWISLE, D., ROSS, C.A.M., CAVE, M.R., FALCK, W.E., FRY, M., REEDER, S.,GREEN, K.A., McEWEN, T.J. and DARLING, W.G. (1988) “Geochemistry of porewaters inmudrock sequences: evidence for groundwater and solute movements. Proc. of the Int. Symp. on“Hydrogeology and safety of radioactive and industrial hazardous waste disposal”, IAH, BRGMDoc. 160, 1, 87-97.
BATH, A.H., ROSS, C.A.M., ENTWISLE, D., CAVE, M.R., FRY, M.B., GREEN, K.A. andREEDER, S. (1989a) “Hydrochemistry of porewaters from Lower Lias Siltstones and limestonesat the Fulbeck site”. B.G.S. Fluid Processes Group Tech. Rep., WE/89/27, 44.
BATH, A.H., ROSS, C.A.M., ENTWISLE, D., CAVE, M.R., GREEN, K.A., REEDER, S. andFRY, M.B. (1989b) “Hydrochemistry of porewaters from London Clay Lower London Tertiariesand Chalk at the Bradwell Site”. B.G.S. Fluid Processes Group Tech. Rep., WE/89/26, 131.
BATLEY, G.E. and GILES, M.S. (1979) “Solvent displacement of sediment interstitial waters beforetrace metal analysis”. Wat. Res., 13:879-886.
BAYLEY S.W. (Ed.) (1988) “Hydrous phyllosilicates (exclusive of micas)”, Reviews in Mineralogy,19:725.
BEAUCAIRE, C., PITSCH, H. and BOURSAT, C. (1998) “Modelling of redox conditions and controlof trace elements in clayey groundwater”. Water Rock Interaction WRI 9, Taupo, New Zealand,30 March-3 April 1998 (Arehart, G.B. and Huston, J.R., Eds.), 141-144.
BEAUCAIRE, C., PITSCH, H., TOULHOAT, P., MOTELLIER, S. and LOUVAT, D. “Regional fluidcharacterisation and modelling of water-rock equilibria in the Boom clay formation and in theRupelian aquifer at Mol, Belgium”. Applied Geochemistry. (in press)
BEAUCAIRE, C., TOULHOAT, P. and PITSCH, H. (1995) “Chemical characterisation and modellingof the interstitial fluid in the Boom clay formation”. Proc. of the VIII Int. Symp. on Water-RockInteraction WRI-8 (Kharala, Y.K., Chudae,v O.V. Eds) Vladivostok, Russia, 15-19 August 1995,Balkema, 789-782.
BEAUFAYS, R., BLOOMAERT, W., BRONDERS, P., DE CANNIÈRE, P., DELMARMOL, P.,HENRION, P., MONSECOUR, M., PATYN, J. and PUT, M. (1994) “Characterisation of the Boomclay and its multilayered hydrogeological environment. Final Report”. EUR 14961, 340.
BENDER, M., MARTIN, W., HESS, J., SAYLES, F., BALL, L. and LAMBERT, C. (1987) “A whole-core squeezer for interfacial porewater sampling”. Limnol. Oceanogr., 32/6:1214-1225.
BEN-RHAIEM, H., PONS, C.H. and TESSIER, D. (1987) “Factors affecting the macrostructure ofsmectites. Role of cation and history of applied stresses”. Proc. of the Int. Clay Conf. 1985(Schultz, L.G., Van Olphen, H. and Mumpton, F.A,. Eds.), Clay Minerals Soc. Bloomington,Indiana, 292-297.
BENZEL, W.M. and GRAF, D.L. (1984) “Studies of smectite membrance behaviour: importance oflayer thickness and fabrics in experiments at 20°C”. Geoch. Cosmoch. Acta, 48:1769-1778.
BERNER, R.A., SCOTT, M.R. and THOMLINSON, C. (1970) “Carbonate alkalinity in the porewatersof anoxic marine sediments”. Limn. Oceanog., 15:544-549.
BISCHOFF, J.L., GREER, R.E. and LUISTRO, A.O. (1970) “Composition of interstitial waters ofmarine sediments: temperature of squeezing effect”. Science, 167:1245-1246.
165

BLACKWELL, P.A., REEDER, S., CAVE, M.R., ENTWISLE, D.C., TRICK, J.K., HUGHES, C.D.,GREEN, K.A. and WRAGG, J. (1995a) “Clay porewater and gas analysis preliminary investigationprogramme at Haute Marne, France”. ANDRA, BRP0BGS 95.001
BLACKWELL, P.A., REEDER, S., CAVE, M.R., ENTWISLE, D.C., TRICK, J.K., HUGHES, C.D.,GREEN, K.A. and WRAGG, J. (1995b) “Clay porewater and gas analysis preliminary investigationprogramme at Meuse, France”. ANDRA, BRP0BGS 95.002
BOEK, E.S., COVENEY, P.V. and SKIPPER, N.T. (1995) “Molecular modeling of clay hydration: astudy of hysteresis loops in the swelling curves of sodium montmorillonites”. Langmuir, 11:4629-4631.
BOISSON, J.-Y., CABRERA, J and DE WINDT, L. (1998) “Étude des écoulements dans un massifargileux: laboratoire souterrain de Tournemire”. CEC EUR, 18338 FR, 300.
BOLT, G.H. (Ed.) (1982) Soil chemistry. Developments in soil science, 5A-5B, Elsevier, Amsterdam.
BÖTTCHER, G., BRUMSACKS, H.J., HEINRICHS, H. and POHLMANN, M. (1997) “A new high-pressure squeezing technique for pore-fluid extraction from terrestrial soils”. Water, Air and SoilPoll., 94:289-296.
BRADBURY, M.H. and BAEYENS, B. (1997) “Derivation of in situ Opalinus clay porewatercompositions from experimental and geochemical modelling studies”. NAGRA Tech. Rep. NTB97-07:50.
BRADBURY, M.H. and BAEYENS, B. (1998) “A physicochemical characterisation and geochemicalmodelling approach for determining porewater chemistries in argillaceous rocks”. Geoch.Cosmoch. Acta, 62/5:783-795.
BRADBURY, M.H., BAEYENS, B. and ALEXANDER, W.R. (1990) “Experimental proposals forprocedures to investigate the water chemistry, sorption and transport properties of marl”. NAGRATech. Rep., 90-16:67.
BRADBURY, M.H., BAEYENS, B., PEARSON, F.J and BERNER, U. (1997) “Addendum toderivation of in situ Opalinus clay porewater compositions from experimental and geochemicalmodelling studies”. NAGRA, Tech. Rep. NTB 97-07/ADD, 13.
BRAY, J.T., BRICKER, O.P. and TROUP, B.N. (1973) “Phosphate in interstitial waters of anoxicsediments: oxidation effects during sampling procedure”. Science, 180:1362-1364.
BRIGGS, L.J. and McLANE, J.W. (1907) “The moisture equivalent of soils”. U.S. Dept. Agriculture,Bureau of Soils Bull., 45:1-23.
BRIGHTMAN, M.A., BATH, A.H., CAVE, M.R. and DARLING W.G. (1985) “Pore fluids from theargillaceous rocks of the Harwell region”. British Geological Survey Rep., FLPU 85-6:77.
BRINDLEY, G.W. and BROWN, G. (1980) “Crystal structures of clay minerals and their X-rayidentification”. Mineralogical Society, London, 495.
BROWN, G., NEWMAN, A.C.D., RAYNER, J.H. and WEIR, A.H. (1978) “The structure andchemistry of soil clay minerals”. In: The chemistry of soil constituents (Greenland D.J. and HayesM.B.H. Eds.), Wiley, Chichester, 29-178.
BUFFLE, J. (1984) “Natural organic matter and metal-organic interactions in aquatic systems”. MetalIons Biol. Systems, 18:165.
166

BUFFLE, J. (1988) Complexation reactions in aquatic systems: an analytical approach. Ellis Horwoodseries in Analytical Chemistry, Wiley.
BURGESS, J. (1988) Ions in solution: basic principles of chemical interactions. Ellis HorwoodPublisher, 192.
CAMERON, F.K. (1911) The soil solution: the nutrient medium for plants. Easton, Pa., cited in Kriukovand Manheim, 1982.
CARIGNAN, R. (1984) “Interstitial water sampling by dialysis. Methodological notes”. Limnol.Oceanogr., 29/3:667-670.
CASES, J. and FRANÇOIS, M. (1982) “Étude des propriétées thermodynamiques de l’eau au voisinagedes interfaces”. Agronomie, 2/10:931-938.
CAVE, M.R. and REEDER, S. (1995) “Reconstruction on in situ porewater compositions obtained byaqueous leaching of drill core: an evaluation using multivariate statistical deconvolution”. TheAnalyst, 120/5:1341-1351.
CAVE, M.R., REEDER, S. and ARTAZ, J. (1995) “Preliminary evaluation of physical and statisticalmethods to determine the chemical composition of clay porewaters”. In: Hydraulic andhydrochemical characterisation of argillaceous rocks, OECD/NEA, Paris, 235-246.
CAVE, M.R., REEDER, S., ENTWISLE, D.C., BLACKWELL P.A., TRICK J.K., WRAGG J. andBURDEN S.R. (1997) “Chemical characterisation of squeezed porewaters and aqueous leachatesin Shales from the Tournemire tunnel, France”. Brit. Geol. Surv. Techn. Rep., WI/97/6C, 26.
CAVE, M.R., REEDER, S. and METCALFE, R. (1994) “Chemical characterisation of core porewatersfor deep borehole investigations at Sellafield, Cumbra”. Mineralogical Magazine, 58A:158-159.
CHAPMAN, D.L. (1913) “A contribution to the theory of electrocapillarity”. Phil. Mag., 25:475-481.
CHARLES, R.J., COOK, A.J. and ROSS, C.A.M. (1986) “Solute transport processes in a saturatedclay”. Brit. Geol. Surv. Fluid Processes Group Report, WE/FL/86/11:27.
CHARLTON, S.R., MACKLIN, C.L. and PARKHURST, D.L. (1997) “PHREEQCI: a graphical userinterface for the geochemical computer program PHREEQC”. US Geol. Serv. Water-ResourcesInvestigations, 97-4222:9.
CHERRY, J.A., DESAULNIERS, D.E., FRIND, E.O., FRITZ, P., GEVAERT, D.M., GILLHAM, R.W.and LELIEVRE, B. (1979) “Hydrogeologic properties and porewater origin and age: clayey till andclay in South Central Canada”. Proc. of the Workshop on “Low flow, low permeabilitymeasurements in largely impermeable rocks”, Paris, 19-21/03/1979, NEA, 31-46.
CHILINGARIAN, G.V., SAWABINI, C.T. and RIEKE, H.H. (1973) “Effect of compactation onchemistry of solutions expelled from the montmorillonite clay saturated in seawater”.Sedimentology, 20:391-398.
COPLEN, T.B. and HANSHAW, B.B. (1973) “Ultrafiltration by a compacted clay membrane I. Oxygenand Hydrogen isotopic fractionation”. Geoch. Cosmoch. Acta, 37:2295-2310.
CONWAY, B.E. (1981) Ionic hydration in Chemistry and Biophysics. Elsevier, 741.
CRAIG, H. (1957) “Isotopic standards for carbon and oxygen and correction factors for massspectrometric analysis of carbon dioxide”. Geoch. Cosmoch. Acta, 12:133-149.
CROUSSARD, P., WIN, P., HAGOOD, M., LEWIS, R. and STROBEL, J. (1998) “Applications of highresolution borehole geophysical logging to argillaceous forrmations pertinent to nuclear repository
167

siting”. In: “Detection of sedimentary and structural heterogeneitites and discontinuities withargillaceous formations”. NEA Clay Club Topical Session, Brussels, Belgium, 03/06/98,NEA/SEDE/DOC(98)4,29-32.
CUEVAS, J., VILLAR, M.V., FERNÁNDEZ, A.M., GOMEZ, P. and MARTIN, P.L. (1997)“Porewaters extracted from compacted bentonite subjected to simultaneous heating and hydration”.Appl. Geochem., 12:473-481.
DAHLGREN, R.A., PERCIVAL, H.J. and PARFITT, R.L. (1997) “Carbon dioxide degassing effects onsoil solutions collected by centrifugation”. Soil Science, 162/9:648-655.
D’ANS, J. (1968) “Der Ubergangspunkt Gips-Anhydrite”. Kali Steinsaltz Heft, 3, 109.
DARLING, W.G., METCALFE, R., CRAWFORD, M.B. and HOOKER, P.J. (1995) “The estimation ofsolute and groundwater residence times in different lithologies: a review of applications ofmethods”. Brit. Geol. Serv. Fluid Processes Group Tech. Rep., WE/94/43:120.
DAVIES, B.E. and DAVIES, R.J. (1963) “A simple centrifugation method for obtaining small samplesof soil solution”. Nature, 198/4876:216-217.
DAVIDSON, G.R., HARDIN, E.L. and BASSETT, R.L. (1995) “Extraction of 14C from porewater inunsaturated rock using vacuum distillation”. Radiocarbon, 37:861-874.
DAVIS J.A. and HAYES K.F. (Eds.) (1985) “Geochemical processes at mineral sufaces”. Am. Chem.Soc. Symp. Ser., 323, The American Chemical Society.
DAVISON, W., GRIME, G.W., MORGAN, J.A.W. and CLARKE, K. (1991) “Distribution of dissolvediron in sediment porewaters at submillimetre resolution”. Nature, 352:323-325.
DECARREAU, A. (Ed.) (1990) “Matériaux argileux. Structure, propriétés et applications”. SociétéFrançaise de Minéralogie et de Cristallographie, Groupe français des argiles, 586.
DE HAAN, F.A.M. (1965) “The interaction of certain inorganic anions with clays and soils”.Agricultural Research Reports 655, Centre for Agricultural Publications and Documentation,Wageningen, 167.
DE LA CALLE, C., SUQUET, H. and PEZERAT, H. (1985) “Vermiculites hydratées à une couche”.Clay Min., 20:221-230.
DE LANGE, G.J. (1986) “Early diagenetic reactions in interbedded pelagic and turbiditic sediments inthe Nares Abyssal Plain (Western North Atlantic): consequences for the composition of sedimentand interstitial water”. Geoch. Cosmoch. Acta, 50:2543- 2561.
DE LANGE, G.J. (1992) “Shipboard routine and pressure-filtration system for porewater extractionfrom suboxic environments”. Mar. Geol., 109:77-81.
DE LANGE, G.J., CRANSTON, R.E., HYDES, D.H. and BOUST, D. (1992) “Extraction of porewaterfrom marine sediments: A review of possible artifacts with pertinent examples from the NorthAtlantic”. Mar. Geol., 109:53-76.
DEMIR I. (1988) “Studies of smectite membrane behaviour: electrokinetic, osmotic and isotopicfractionation at elevated pressures”. Geoch. Cosmoch. Acta, 52:727-737.
DESAULNIERS, D.E., CHERRY, J.A. and FRITZ, P. (1981) “Origin, age and movement of porewaterin the argillaceous Quaternary deposits at four sites in southwestern Ontario”. J. Hydrol.,50:231-257.
168
DEVINE, S.B., FERREL, R.E. and BILLINGS, G.K. (1973) “The significance of ion exchange tointerstitial solutions in clayey sediments”. Chem. Geol., 12:219-228.
DEVOL-BROWN, I., PITSCH, H., LY, S., MEIER, P. and BEAUCAIRE, C. (1998) “ Séparation etpurification des fractions organique et argileuse d’une roche alumino-silicatée ”. Réunionspécialisée ASF-SGF Argile : sédimentologie, diagenèse, environnement, Lille, France.
DEWAR, W.A. and McDONALD, P. (1961) “Determination of dry matter in silage by distillation withtoluene”. J. Sci. Food Agric., 12:790-795.
DE WINDT, L., CABRERA, J. and BOISSON, J.-Y. (1998a) “Hydrochemistry in an induratedargillaceous formation (Tournemire tunnel site, France)”. Water Rock Interaction WRI 9, Taupo,New Zealand, 30 March –3 April 1998 (Arehart, G.B. and Huston, J.R., Eds.), 145-148.
DE WINDT, L., CABRERA, J. and BOISSON, J.-Y. (1998b) “Radioactive waste containement inindurated claystones: comparison between the chemical containment properties of matrix andfractures”. Geological Society of London, Spec. Publ. on Chemical Containment of Waste in theGeosphere, in press, 20.
DE WIT, R. (1995) “Measurements of sedimentary gradients of porewater species, by use ofmicroelectrodes. Calculation of microbial metabolic processes in the sediments”. Oceanis,21/1:287-297.
DIERCKX, A., MAES, A., HENRION, P. and DE CANNIÈRE, P. (1996) “Potentiometric titrations ofhumic substances extracted from Boom clay”. Proc. 8th Int. Symp Humic Substances Soc.,Wroclaw, Poland.
DIXON, J.B. and WEEDS, B. (1977) Minerals in soil environments. Soil Sci Soc. Am., Madison,Wisconsin.
EDMUNDS, W.M. and BATH, A.H. (1976) “Centrifuge extraction and chemical analysis of interstitialwaters”. Environ. Sci. Technol., 10/5:467-472.
EDMUNDS, W.M., KINNINBURGH, D.G. and MOSS, P.D. (1992) “Trace metals in interstitial watersfrom sandstones: acidic inputs to shallow groundwaters”. Env. Poll., 77:129-141.
EGER, I., CRUZ-CUMPLIDO, M.I. and FRIPIAT, J.-J. (1979) “Quelques données sur la capacitécalorifique et les propriétés de l’eau dans différents systèmes poreux”. Clay Min., 14:161-172.
EMERSON, S., JAHNKE, R., BENDER, M., FROELICH, P., KLINKHAMMER, G., BOWSER, C.and SETLOCK, G. (1980) “Early diagenesis in sediments from the Eastern equatorial pacific. I. Porewater nutrient and carbonate results”. Earth Planet. Sci. Lett., 49:57-80.
ENGELHARDT W. and GAIDA K.H. (1963) “Concentration changes of pore solutions during thecompactation of clay sediments”. J. Sedim. Petr., 33/4:919-930.
ENTWISLE, D.C. and REEDER, S. (1993) “New apparatus for pore fluid extraction from mudrocksfor geochemical analysis”. In: Geochemistry of Clay-Pore fluid interactions (Manning, D.A.C.,Hall, P.L. and Hugues, C.R,. Eds.), The Mineralogical Society Series 84:365-388.
EPSTEIN, S. and MAYEDA, T.K. (1953) “Variation in 18O content of waters from natural sources”.Geoch. Cosmoch. Acta, 4:213-224.
FALCK, W.E., BATH, A.H. and HOOKER, P.J. (1990) “Long term solute migration profiles in claysequences”. Zeitschrift der Deutschen Geologischen Gesellschaft, 141, 415-426.
169

FANNING, K.A. and PILSON, M.E.Q. (1971) “Interstitial silica and pH in marine sediments: someeffects of sampling procedures”. Science, 173:1228-1231.
FELBECK, G.T. (1971) “Chemical and biological characterization of humic matter”. In: Soilbiochemistry (McLaren, A.D.R. and Skujins, J., Eds.), 2, Marcel Dekker, New York, 36-59.
FERNÁNDEZ, A.M., CUEVAS, J. and MARTÍN, P.L. (1996) “Equipo para la extracción ydeterminación de parámetros químicos en aguas intersticiales de bentonitas obtenidas porcompactación”. FEBEX Project, Int. Rep. CIEMAT/IMA/54A40/5/96.
FERNÁNDEZ, A.M., et al. (in prep.) “Study of the porewaters of the FEBEX bentonite”. FEBEXProject.
FONTANIVE, A., GRAGANI, R., MIGNUZZI, C. and SPAT G. (1985) “Determinazione dellecaratteristiche geochimiche delle acque interstiziali di argille plio-quaternarie italiane”. ENEA,Rapp. Fin., 151-81-7 WASI, 42.
FONTANIVE, A., GRAGNANI, R., MIGNUZZI, C. and SPAT G. (1993) “Chemical composition ofporewaters in Italian Plio-Pleistocene clayey formations”. In: Geochemistry of Clay-Pore fluidinteractions (Manning D.A.C., Hall P.L. and Hugues C.R. Eds.), The Mineralogical Society Series84:389-411.
FÖRSTER, A., SCHÖTTER, J., MERRIAM, D.F. and BLACKWELL, D.D. (1997) “Application ofoptical-fiber temperature logging. An example in sedimentary environment”. Geophysics,62/4:1107-1113.
FRANCE-LANORD, C. (1997) “Bilan isotopique de l’oxygène et de l’hydrogène de l’eau dans desformations argileuses du forage Est 104 de l’ANDRA”. ANDRA, BRP O CRP 97-001
FRANCE-LANORD, C. and SHEPPARD, S.M.F. (1992) “Hydrogen isotope composition ofporewaters and interlayer water in sediments from the Central Western Pacific”. Proc. ODP, Sci.Res. 129:295-302.
FRANKS, F. (1985) “Water”. Royal Soc. Chem. London, 96.
FRANT, M.S. (1997) “Where did ion selective electrodes come from? The story of their developmentand commercialization”. J. Chem. Education, 74/2:159-166.
FREYSSINET, P. and DEGRANGES, P. (1989) “Étude préliminaire concernant le conditionnement etl’extraction des eaux interstitielles des échantillons du forage A901”. BRGM Rep., SGN 391 STO.
FRIEDMAN, H.L. (1985) “Hydration complexes: some firm results and some pressing questions”.Chemica Scripta, 25:42-48.
FRIEDMAN, I. and SMITH, R.L. (1958) “The deuterium content of water in some volcanic glasses”.Geoch. Cosmoch. Acta, 15:218-228.
FRIPIAT, J.J., LETELLIER and M., LEVITZ, P. (1984) “Interaction of water with clay surfaces”. Phil.Trans. R. Soc. Lond., A 331, 287-299.
FRITZ, B. (1975) “Étude thermodynamique et simulation des réactions entre minéraux et solutions.Application à la géochimie des altérations et des eaux continentales”. Sciences Géologiques, Mém.41, Un. Louis Pasteur, Strasbourg, 152.
FRITZ, S.J. and EADY, C.D. (1985) “Hyperfiltration-induced precipitation of calcite”. Geoch.Cosmoch. Acta, 49:761-768.
170

GARRELS, R. M. (1984) “Montmorillonite/illite stability diagrams”. Clay and Clay Min.,32/3:161-163.
GAUCHER, E.C., CLAUDE, L. and PITSCH, H., LY, J. (1998) “Influence of temperature on thesorption isotherm of potassium on a montmorillonite”. Water Rock Interaction WRI 9, Taupo, NewZealand, 30 March-3 April 1998 (Arehart, G.B. and Huston, J.R., Eds.), 931-934.
GEDROIZ, K.K. (1906) “On the changeability of composition of soil solution”. Zhurnal Opyt. Agron.,7/5:521-545. (in Russian, cited in Kriukov and Manheim, 1982)
GILLMAN, G.P. (1979) “A proposed method for the measurement of exchange properties in highlyweathered soils”. Australian J. Soil Res., 17:129-139.
GODFREY, J.D. (1962) “The deuterium content of hydrous minerals from the East-Central SierraNevada and Yosemite National Park”. Geoch. Cosmoch. Acta, 26:1215-1245.
GONFIANTINI, R. (1986) “Environmental isotopes in lake studies”. In: “Handbook of environmentalisotope geochemistry” (Fritz P. and Fontes J.C. Eds.), 2:113-168, Elsevier, Amsterdam.
GONFIANTINI, R. and FONTES, J.C. (1963) “Oxygen isotopic fractionation in the water ofcrystallization of gypsum”. Nature, 200:644-646.
GORGEON, L. (1994) Contribution à la modélisation physico-chimique de la retention deradioéléments à vie longue par des matériaux argileux. Thesis, Université de Paris 6, 201.
GOUVEA DA SILVA, R. (1980) Migration des sels et des isotopes lourds à travers des colonnes desédiments non saturés sous climat semi-aride. Thesis, Université de Paris-Sud.
GOUY, G. (1910) “Sur la constitution de la charge électrique à la surface d’un électrolyte”. J. Phys.,9:457-468.
GRAF, D.L. (1982) “Chemical osmosis, reverse chemical osmosis, and the origin of subsurface brines”.Geoch. Cosmoch. Acta, 46:1431-1448.
GRAHAME, D.C. (1947) “The electric double layer and the theory of electrocapillarity”. Chem. Rev.,41:441
GRANT, R. and GRANT, C. (1987) Grant and Hackh’s Chemical Dictionary. McGraw-Hill BookCompany, V Ed., 641.
GRIFFAULT, L., MERCERON, T., MOSSMAN, J.R., NEERDAEL, B., DE CANNIÈRE, P.,BEAUCAIRE, C., DAUMAS, S., BIANCHI, A. and CHRISTEN, R. (1996) “Acquisition etrégulation de la chimie des eaux en milieu argileux pour le projet de stockage de déchets radioactifsen formation géologique. Projet Archimede-Argile”. CEC, EUR 17454, 176.
GRIMAUD, D., BEAUCAIRE and C., MICHARD, G. (1990) “Modelling the evolution of groundwaters in a granite system at low temperature: the Stripa ground waters, Sweden”. Appl. Geoch.,5:515-525.
GUGGENHEIM, S. and MARTIN, R.T. (1995) “Definition of clay and clay mineral: joint report of theAIPEA and CMS nomenclature committees”. Clay Min., 30:257-259.
GÜVEN, N. (1988) “Smectites”. In: “Hydrous phyllosilicates (exclusive of micas)”, Reviews inMineralogy (Bailey S.W. Ed.), 19:497-559.
GÜVEN, N. (1992) “Molecular aspects of clay-water interactions. In: Clay water interface and itsrheological implications”. CMS Workshop Lectures vol. 4 (Güven N. and Pollastro R.M. Eds.), TheClay Minerals Society, 1-80.
171

GVIRTZMAN, H. and GORELICK, S.M. (1991) “Dispersion and advection in unsaturated porousmedia enhanced by anion exclusion”. Nature, 352:793-795.
HALES, B. and EMERSON, S. (1996) “Calcite dissolution in sediments of the Ontong-Java Plateau: insitu measurements of porewater O2 and pH”. Global Biogeochem. Cycles, 10/3:527-541.
HALES, B., EMERSON, S. and ARCHER, D. (1994) “Respiration and dissolution in the sediments ofthe western North Atlantic: estimates from models of in situ microelectrode measurements ofporewater oxygen and pH”. Deep-Sea Res. I, 41/4:695-719.
HALL, P.L. (1993) “Mechanisms of overpressuring: an overview”. In: Geochemistry of Clay-Pore fluidinteractions (Manning D.A.C., Hall P.L. and Hugues C.R. Eds.) The Mineralogical Society Series84:265-315.
HANSHAW, B.B. and COPLEN, T.B. (1973) “Ultrafiltration by a compacted clay membrane.II, Sodium ion exclusion at various ionic strenghts”. Geoch. Cosmoch. Acta, 37:2311-2327.
HARDCASTLE, J.H. and MITCHELL, J.K. (1974) “Electrolyte concentration-permeabilityrelationships in sodium illite-silt mixtures”. Clays and Clay Min., 22:143-154.
HARTMANN, M. (1965) “An apparatus for the recovery of interstitial water from Recent sediments”.Deep-Sea Res., 12:225-226.
HAYES, M.H.B. (1985) “Extraction of humic substances from soils”. In: Humic substances in soil,sediment and water, John Wiley, New York, 329-362.
HAYES, K.F. and LECKIE, J.O. (1987) “Modeling ionic strenght effects on cation adsorption athydrous oxide/solution interfaces”. J. Coll. Interf. Sci., 115:564-572.
HEINRICHS, H., BÖTTCHER, G., BRUMSACK, H.J. and POHLMANN, M. (1996) “Squeezed soil-pore solutions. A comparison to lysimeter samples and percolation experiments”. Water, Air andSoil Poll., 89:189-204.
HENDRICKS, S.B., NELSON, R.A. and ALEXANDER, L.T. (1940) “Hydration mechanism of theclay mineral montmorillonite saturated with different cations”. J. Amer. Chem. Soc., 62:1457-1464.
HENDRY, M.J. (1983) “Groundwater recharge through a heavy textured soil”. J. Hydrol., 63:201-209.
HESSLEIN, R.H. (1976) “An in situ sampler for close interval porewater studies”. Limnol. Oceanogr.,21:912-914.
HOCHELLA, M.F. and WHITE, A.F. (Eds.) (1990) “Mineral-water interface geochemistry”. Reviewsin Mineralogy, 23, The Mineralogical Society of America, 603.
HORSEMAN, S.T., HIGGO, J.J.W., ALEXANDER, J. and HARRINGTON, J.F. (1996) “Water, gasand solute movement through argillaceous media”. OECD/NEA, CC-96/1:290.
HOWER, J., ESLINGER, E.V., HOWER, M.E. and PERRY, E.A. (1976) “Mechanism of burialmetamorphism of argillaceous sediment. I. Mineralogical and chemical evidences”. Geol. Soc. Am.Bull., 87:725-736.
HULBERT, M.H. and BRINDLE, M.P. (1975) “Effects of sample handling on the composition ofmarine sedimentary porewater”. Geol. Soc. of Amer. Bull., 86:109-110.
HUNTER, R.J. (1989) Foundation of colloid science. Vol.1, Clarendon Press.
INGRAHAM, N.L. and SHADEL, C. (1992) “A comparison of the toluene distillation and vacuum/heatmethods for extracting soil water for stable isotopic analysis”. J.Hydrol., 140:371-387.
172

IYER, B. (1990) “Porewater extraction: comparison of saturation extract and high pressure squeezing”.In: “Physico-chemical aspects of soil and related materials”, ASTM Spec. Publ. 1095:159-170.
JACKSON, J.A. (Ed.) (1997) Glossary of Geology. American Geological Institute, Alexandria, Virginia,IV Ed., 769.
JAHNKE, R. A. (1988) “A simple, reliable, and inexpensive porewater sampler”. Limn. and Ocean.,33:483-487.
JAMES, R.O. and PARKS, G.A. (1982) “Characterisation of aqueous colloids by their electric doublelayer and intrinsic surface chemical properties”. Surf. and Coll. Sci., 12:119-216.
JONES, B. F., VANDENBURGH, A. S., TRUESDELL, A. H. and RETTIG, S. L. (1969) “Interstitialbrines in playa sediments”. Chem. Geol., 4:253-262.
JOSEPH, A.F. and MARTIN, F.J. (1923) “The moisture equivalent of heavy soils” J. Agr. Sci.,13:49-59.
JUSSERAND, C. (1979) “Une nouvelle technique pour l’étude isotopique de l’oxygène-18 des eauxprésentes dans les sédiments et les sols”. C. R. Acad. Sci. Paris, 228 série D:1027-1030.
JUSSERAND, C. (1980) “ Extraction de l’eau interstitielle des sédiments et des sols. Comparaison desvaleurs de l’oxygène-18 par différentes méthodes. Premiers résultats”. Catena, 7:87-96.
KAHR, G., KRAEHENBUEHL, F., STOECKLI, H.F. and MULLER-VONMOOS, M. (1990) “Studyof the water-bentonite system by vapor adsorption, immersion calorimetry and X-ray techniques:II. Heats of immersion, swelling pressures and thermodynamic properties”. Clay Min., 25:499-506.
KALIL, E.K. and GOLDHABER, M. (1973) “A sediment squeezer for removal of porewater withoutair contact”. J. Sedim. Petrol., 43/2:553-557.
KAPPES, T., SCHNIERLE, P. and HAUSER, P.C. (1997) “Potentiometric detection of inorganic anionsand cations in capillary electrophoresis with coated-wire ion-selective electrodes”. Anal. Chim.Acta, 350:141-147.
KARABORNI, S., SMIT, B., HEIDUG, W., URAI, J. and VAN OORT, E. (1996) “The swelling ofclays: molecular simulations of the hydration of montmorillonite”. Science, 271:1102-1104.
KARNLAND O. (1997) “Bentonite swelling pressure in strong NaCl solutions. Correlation betweenmodel calculations and experimentally determined data”. SKB, TR 97-31:30.
KAUFMAN, R., LONG, A., BENTLEY, H.W. and DAVIS, S.N. (1984) “Natural chlorine isotopevariations”. Nature, 309:338-340.
KENYON, B., KLEINBERG, R., STRALEY, C., GUBELIN, G. and MORRIS C. (1995) “NuclearMagnetic Resonance imaging, Technology for the 21st century”. Oilfield Review, 19-33.
KHARAKA, Y.K. and BERRY, F.A.F. (1973) “Simultaneous flow of water and solutes throughgeological membranes, I. Experimental investigation”. Geoch. Cosmoch. Acta, 37:2577-2603.
KHARAKA, Y.K. and SMALLEY, W.C. (1976) “Flow of water and solutes through compacted clays”.A.A.P.G. Bull., 60/6:973-980.
KINNIBURGH, D.G., GALE, I.N., GOODDY, D.C., DARLING, W.G., MARKS, R.J., GIBBS, B.R.,COLEBY, L.M., BIRD, M.J. and WEST, J.M. (1996) “Denitrification in the unsaturated zone”.Brit. Geol. Surv. Tech. Rep. WD/96/63.
173

KINNIBURGH, D.G. and MILES, D.L. (1983) “Extraction and chemical analysis of interstitial waterfrom soils and rocks”. Environ. Sci. Technol., 17:362-368.
KITTRICK, J.A. (1980) “Gibbsite and kaolinite solubilities by immiscible displacement of equilibriumsolutions”. Soil Sci. Soc. Am. J., 44:139-142.
KITTRICK, J.A. (1983) “Accuracy of several immiscible displacement liquids”. Soil Sci. Soc. Am. J.,47:1045-1047.
KOIKE, I. and TERAUCHI, K. (1996) “Fine scale distribution of nitrous oxide in marine sediments”.Mar. Chem., 52:185-193.
KRAEHENBUEHL, F., STOECKLI, H.F., BRUMMER, F., KAHR, G. and MULLER-VONMOOS, M.(1987) “Study of the water-bentonite system by vapor adsorption, immersion calorimetry and x-raytechniques: I. Micropore volumes and internal surface areas, following Dubinin’s theory”. ClayMin., 22:1-10.
KRIUKOV, P.A. (1947) “Recent methods for physicochemical analysis of soils: Methods for separatingsoil solution”. In: Rukovodstvo dlya polevykh I laboratornykh issledovanii pochv, Moscow Izdat,Akad, Nauk, SSSR, 3-15. (in Russian, cited in Kriukov and Manheim, 1982)
KRIUKOV, P.A. and MANHEIM, F.T. (1982) “Extraction and investigative techniques for study ofinterstitial waters of unconsolidated sediments: A review”. In: The Dynamic Environment of theOcean Floor (Fanning, K. A. and Manheim, F. T. Eds.), Heath,1-26.
KRIUKOV, P.A., ZHUCHKOVA, A.A. and RENGARTEN, E.V. (1962) “Change in the composition ofsolution preserved from clays and ion exchange”. Earth Science, 144:167-169.
LAMBE, T. W. and WHITMAN, R.V. (1979) Soil Mechanics, SI Version. John Wiley and Sons, NewYork.
LAWRENCE, J.R. and GIESKES, J.M. (1981) “Constraints on water transport and alteration in theoceanic crust from the isotopic composition of porewater”. J. Geophys. Res, 86/B9:7924-7934.
LEANEY, F.W., SMETTEM, K.R.J. and CHITTLEBOROUGH, D.J. (1993) “Estimating thecontribution of preferential flow to subsurface runoff from a hill slope using deuterium andchloride”. J. of Hydrol., 147:83-103.
LEENHEER, J.A. (1981) “Comprehensive approach to preparative isolation and fractionation ofdissolved organic carbon from natural waters and waste waters”. Environ. Sci. and Techn.,15:578-587.
LESSARD, G. and MITCHELL, J.K. (1985) “The causes and effect of ageing in quick clays”. Can.Geotech. J., 22:335- 346.
LEWIS, R.J. Jr. (1993) Hawley’s Condensed Chemical Dictionary. Van Norstrand Reinhold Company,New York, XII Ed., 1275.
LIPMAN, C. P. (1918) “A new method of extracting the soil solution”. University of California Publ.on Agricultural Science, 3:131-134.
LISITSYN, A.K., KIREEV, A.M., SOLODOV, I.N. and TOKAREV, N.I.(1984) “Using borehole coresfor detailed investigation of the composition and properties of groundwater solutions”. Lith. andMin. Res., 19/3:260-270.
LITAOR, M.I. (1988) “Review of soil solution samplers”. Wat. Res. Res., 24/5:727-733.
LOW, P.F. (1982) “Water in clay-water systems”. Agronomie, 2/10:909-914.
174

LUSCZYNSKI, N. J. (1961) “Filter-press method of extracting water samples for chloride analysis”.US Geol. Surv., Water Supply Paper 1544-A, 1-8.
LYONS, W.B., GAUDETTE, H.E. and SMITH, G.M. (1979) “Porewater sampling in anoxic carbonatesediments: oxidation artefacts”. Nature, 277:48-49.
MAGARA, K. (1974) “Compactation, ion filtration and osmosis in shale and their significance inprimary migration”. A.A.P.G. Bull., 58/2:283-290.
MAGARA, K. (1976) “Water expulsion from clastic sediments during compaction, directions andvolumes”. A.A.P.G. Bull., 60:543-553.
MANGELSDORF, P.C., WILSON, T.R.S. and DANIELL, E. (1969) “Potassium enrichments ininterstitial waters of recent marine sediments”. Science, 165:171-174.
MANHEIM, F.T. (1966) “A hydraulic squeezer for obtaining interstitial water from consolidated andunconsolidated sediments”. US Geol. Surv. Prof. Pap. 550-C:256.
MANHEIM, F.T. (1974) “Comparative studies on extraction of sediment interstitial waters: discussionand comment on the current state of interstitial water studies”. Clays and Clay Min., 22:337-343.
MANHEIM, F.T. (1976) “Interstitial waters from marine sediments”. In: Chemical Oceanography(Riley J.P. and Chester R. Eds.), Academic Press, New York, 115-186.
MANHEIM, F.T. and SAYLES, F.L. (1974) “Composition and origin of interstitial waters of marinesediments, based on Deep Sea Drilling cores”. In: The Sea (Goldberg, E.D. Ed.) Wiley-Interscience, New York, 527-568.
MARSHALL, T.J. and HOLMES, J.W. (1979) Soil physics. Cambridge University Press, 374.
MARCUS, Y. (1985) Ion solvation. John Wiley and Sons, 306.
MATHIEU, R. and BARIAC, T. (1995) “Étude isotopique de l’évaporation de l’eau dans un solargileux, expérimentation et modélisation”. Hydrogéologie, 4:85-97.
MAURICE, P., NAMJESNIK-DEJANOVIC, K., LOWER, S., PULLIN, M., CHIN, Y.P. andAIKEN, G.R. (1998) “Sorption and fractionation of natural organic matter on kaolinite andgoethite”. Water Rock Interaction WRI 9 New Zealand, 30 March-3 April 1998 (Arehart G.B. andHuston J.R. Eds.), 109-113.
MAY, H.M., KINNIBURGH, D.G., HELMKE, P.A. and JACKSON, M.L. (1986) “Aqueous dissolution,solubilities and thermodynamic stabilities of common aluminosilicate clay minerals: Kaolinite andsmectites”. Geoch. Cosmoch. Acta, 50:1667-1677.
MAYER, L.M. (1976) “Chemical water sampling in lakes and sediments with dialysis bags”. Limnol.Oceanogr., 21:909-912.
McEWAN, D.M.C. and WILSON, M. (1980) “Interlayer and intercalation complexes of clay minerals”.In: Crystal Structures of Clay Minerals and their X-ray Identification. Mineral Soc. Monogr., 5(Brindley G.W. and Brown G. Eds.), 197-248.
McEWEN, T., CHAPMAN, N. and ROBINSON, P. (1990) “Review of data requirements forgroundwater flow and solute transport modelling and the ability of site investigation methods tomeet these requirements”. DOE Rep., DOE/HIMP IG 2405-1.
METCALFE, R., ROSS, C.A.M., CAVE, M.R., GREEN, K.A., REEDER, S. and ENTWISLE, D.C.(1990) “Porewater and groundwater geochemistry at the Down Ampney fault research site”. Brit.Geol. Surv. Tech. Rep, WE/90/46:52.
175

MILLOT, G. (1964) Géologie des argiles; altérations, sédimentologie, géochimie. Masson, Paris.
MOONEY, R.W., KENNAN, A.G. and WOOD, L.A. (1952a) “Adsorption of water vapor bymontmorillonite. I. Heat of adsorption and application of the BET theory”. J. Amer. Chem. Soc.,74:1367-1371.
MOONEY, R.W., KENNAN, A.G. and WOOD, L.A. (1952b) “Adsorption of water vapor bymontmorillonite. II. Effect of exchangeable ions and lattice swelling as measured by X-raydiffraction”. J. Amer. Chem. Soc., 74:1371-1374.
MOREAU-LE GOLVAN, Y. (1997) Traçage isotopique naturel des transferts hydriques dans un milieuargileux de très faible porosité: les argilites de Tournemire (France). Thesis, Université de Paris-Sud, 170.
MOREAU-LE GOLVAN, Y., MICHELOT, J.-L. and BOISSON, J.-Y. (1997) “Stable isotope contentsof porewater in a claystone formation (Tournemire, France): assessment of the extraction techniqueand preliminary results”. Appl. Geoch., 12/6:739-745.
MORGENSTERN, N.R. and BALASUBRAMONIAN, B.I. (1980) “Effects of pore fluid on theswelling of clay shale”. In: Proc. of the Fourth International Conference on Expansive Soils,Denver, 1, 190-205.
MORTLAND, M.M. and RAMAN, K.V. (1968) “Surface acidity of smectites in relation to hydration,exchangeable cation and structure”. Clays and Clay Min., 16:393-398.
MOSS, D.P. and EDMUNDS, W.M. (1992) “Processes controlling acid attenuation in the unsaturatedzone of a Triassic sandstone aquifer (U.K.) in the absence of carbonate minerals”. Appl. Geoch.,7:573-583.
MOTELLIER, S., MICHELS, M.H., DUREAULT, B. and TOULHOAT, P. (1993) “Fiber optic pHsensors for in situ applications”. Sensors and actuators B, 11:467-473.
MOTELLIER, S., NOIRE, M.H., PITSCH, H. and DUREAULT, B. (1995) “pH determination of clayinterstitial water using a fiber-optic sensor”. Sensors and actuators B, 29:105-115.
MUBARAK, A. and OLSEN, R.A. (1976) “Immiscible displacement of the soil solution bycentrifugation”. Soil Sci. Soc. Am. J., 40:329-331.
MUURINEN, A. and LEHIKOINEN, J. (1998) “Evolution of the porewater chemistry in compactedbentonite”. In: Scientific Basis for Nuclear Waste Management XXI, Mat. Res. Soc. Symp. Proc.,506:415-422.
NAGENDER NATH, B., RAJARAMAN, V.S. and MUDHOLKAR, A.V. (1988) “Modified interstitialwater squeezer for trace metal analysis”. Indian J. of Mar. Sci., 17:71-72.
NAGRA (1997) “Geosynthese Wellenberg 1996: Ergebnisse der Untersuchungsphasen I und II”.NAGRA, NTB 96-01.
NEA/SEDE (Working Group on measurement and Physical understanding of Groundwater flowthrough argillaceous media) (1998) “Catalogue of Characteristics of Argillaceous rocks”. Int. Doc.,Cd Rom publication.
NEILSON, G.W. and ENDERBY, J.E. (1989) “The coordination of metal aquaions”. In: Advances inInorganic Chemistry, 34 (Sykes A.G. Ed.), Academic Press, 195-218.
NEMECZ, E. (1981) Clay Minerals. Akademiai Kiado, Budapest Hungary.
176

NEUZIL, C.E. (1995) “Characterisation of flow properties, driving forces and porewater chemistry inthe ultra-low permeability Pierre Shale, North America”. Proc. of an Int. Workshop on “Hydraulicand hydrochemical characterisation of argillaceous rocks”, Nottingham, U.K., 7-9 June 1994,OECD/NEA, 65-74.
NORRISH, K. (1954) “The swelling of montmorillonite”. Trans. Faraday Soc., 18:120-133.
NORTHRUP, Z. (1918) “The true soil solution”. Science, 47:638-639.
NOYNAERT, L., VOLCKAERT, G., DE CANNIÈRE, P., MEYNENDONCKX, P., LABAT, S.,BEAUFAYS, R., PUT, M., AERTSENS, M., FONTEYNE, A. and VANDERVOORT, F. (1997)“The CERBERUS Project. A demonstration test to study the near field effects of a HLW-canisterin an argillaceous formation”. ONDRAF/NIRAS Nirond, 97-03.
NOVAKOWSKI, K.S. and VAN DER KAMP, G. (1996) “The radial diffusion method. 2. Asemianalytical model for the determination of effective diffusion coefficients, porosity andadsorption”. Wat. Res. Res., 32/6:1823-1830.
OHTAKI, H. and RADNAI, T. (1993) “Structure and dynamics of hydrated ions”. Chem. Rev.,93/3:1157-1204.
OREM, W.H. and HATCHER, P.G. (1987) “Solid state 13C NMR studies of dissolved organic matter inporewaters from different depositional environments”. Org. Geochem., 11:73-82.
OSCARSON, D.W. and DIXON, D.A. (1989) “Elemental, mineralogical and pore-solutioncompositions of selected Canadian clays”. AECL-9891:18.
OSENBRÜCK, K. (1996) Age and dynamics of deep groundwater: a new method to analyse noblegases in the porewater of rock samples. Thesis, University of Heidelberg (in German).
OSENBRÜCK, K. and SONNTAG, C. (1995) “A new method for the investigation of noble gasesdissolved in porewater of sedimentary rocks. First results from coal and salt mines in Germany”.In: Isotope techniques in water resources management, Proc. of a Symp., Vienna, 20-24 March1995, IAEA, Vol.1, SM336/101P, 106-107.
OSENBRÜCK, K., LIPPMANN, J. and SONNTAG, C. (1998) “Dating very old porewaters inimpermeable rocks by noble gas isotopes”. Geoch. Cosmoch. Acta, 62:3041-3045.
PARKER, F.W. (1921) “Methods of studying the concentration and composition of soil solution”. SoilScience, 12:209.
PARKHURST, D.L. (1995) “User’s guide to PHREEQC: a computer program for speciation, reaction-path, advective transport, and inverse geochemical calculations”. US Geol. Surv. Water ResourcesInvestigations, 95-4227:143.
PARKHURST, D.L., THORSTENSON, D.C. and PLUMMER, L.N. (1980) “PHREEQE: a computerprogram for geochemical calculations”. US Geol. Surv. Water Resources Investigations, 80-96,210.
PARSHIVA MURTHY, A.S. and FERREL, R.E. Jr. (1972) “Comparative chemical composition ofsediment interstitial waters”. Clays and Clay Min., 20:317-321.
PARSHIVA MURTHY, A.S. and FERREL, R.E. Jr. (1973) “Distribution of major cations in estuarinesediments”. Clays and Clay Min., 21:161-165.
PATTERSON, R. J., FRAPE, S. K., DYKES, L. S. and McLEOD, R. A. (1978) “A coring and squeezingtechnique for the detailed study of subsurface chemistry”. Can. J. of Earth Sci., 15:162-169.
177

PEARSON, F.J. (1998) “Geochemical and other porosity types in clay-rich rocks”. Water RockInteraction WRI 9, New Zealand, 30 March-3 April 1998 (Arehart G.B. and Huston J.R. Eds.),259-262.
PEARSON, F.J. (in press) “What is the porosity of a mudrock?”. In: Muds and mudstones: Physical andfluid flow properties. Geological Society, Special Publication, (Aplin A.C., Fleet A.F. andMacquaker J. Eds.), London, 158, 9-21.
PEARSON, F.J. and BERNER, U. (1991) “Nagra thermochemical database I. Core data”. NAGRA,NTB 91-17.
PEARSON, F.J., BERNER, U. and HUMMEL, W. (1992) “Nagra thermochemical database II”.Supplemental data 05/92. NAGRA, NTB 91-18.
PEARSON, F.J., et al. (in preparation) “Hydrochemistry”. In: Mont Terri Rock Laboratory: Results ofthe hydrogeological, geochemical and geotechnical experiments performed in 1996 and 1997.Landeshydrologie und -geologie, Geologische Berichte, (Thury, M. and Bossart, P. Eds.), 23.
PEARSON, F.J., FISHER, D.W. and PLUMMER, L.N. (1978) “Correction of ground-water chemistryand carbon, isotopic composition for effects of CO2 outgassing”. Geoch. Cosmoch. Acta,42:1799-1807.
PETERS, C.A., YANG, I.C., HIGGINS, J.D. and BURGER, P.A. (1992) “A preliminary study of thechemistry of porewater extracted from tuff by one dimensional compression”. Water-RockInteraction WRI-7 (Kharaka, Y.K. and Maest, A., Eds.), 1:741-745.
PHILLIPS, F.M. and BENTLEY, H.W. (1987) “Isotopic fractionation during ion filtration: I. Theory”.Geoch. Cosmoch. Acta, 51:683-695.
PITSCH, H., L’HENORET, P., BOURSAT, C., DE CANNIÈRE, P. and FONTEYNE, A. (1995a)“Characterization of deep underground fluids, Part II: Redox potential measurements”. Proc. of the8th Int. Symp. on Water-Rock Interaction WRI 8, Vladivostok, Russia, 15-19 August 1995(Kharaka, Y.K. and Chudaev, O.V. Eds.), Balkema, Rotterdam, 471-475.
PITSCH, H., MOTELLIER, S., L’HENORET, P. and BOURSAT, C. (1995b) “Characterization of deepunderground fluids, Part I: pH determination in a clayey formation”. Proc. of the 8th Int. Symp. onWater-Rock Interaction WRI-8, Vladivostok, Russia, 15-19 August 1995 (Kharaka Y.K. andChudaev O.V. Eds.), Balkema, Rotterdam, 467-470.
PITSCH, H., STAMMOSE, D., KABARE, I. and LEFEVRE, I. (1992) “Sorption of major cations onpure and composite clayey materials”. Appl. Clay Sci., 7:239-243.
PLUMMER, L.N. (1992) “Geochemical modeling of water-rock interaction: past, present, future”.Water-Rock Interaction WRI-7 (Kharaka, Y.K. and Maest, A., Eds.), 1, Balkema, Rotterdam, 23-33.
PLUMMER, L.N., PRESTEMON, E.C. and PARKHURST, D.L. (1992) “NETPATH: an interactivecode for interpreting NET geochemical reactions for chemical and isotopic data along a flowPATH”. Water-Rock Interaction WRI-7, (Kharaka, Y.K. and Maest, A., Eds.), Balkema, Rotterdam,239-242.
POUTOUKIS, D. (1991) Hydrochimie, teneurs isotopiques et origine des saumures associées auxgisements de potasse d’Alsace. Thesis, Université de Paris-Sud, 140.
PRESLEY, B.J., BROOKS, R.R. and KAPPEL, H.M. (1967) “A simple squeezer for removal ofinterstitial water from ocean sediments”. J. Mar. Res., 25:355-357.
178

PROST, R. (1975) Étude de l’hydratation des argiles: interaction eau-minéral et mécanisme de laretention de l’eau. Thesis, Université Pierre et Marie Curie, Paris, 535.
PUSCH, R. and KARNLAND, O. (1986) “Aspects of the physical state of smectite adsorbed water”.SKB Tech. Rep., 86-25.
PUSCH, R., KARNLAND, O. and HOKMARK, H. (1990) “GMM: A general microstructural modelfor qualitative and quantitative studies of smectite clays”. SKB Tech. Rep., 90-43.
PUSCH, R., KARNLAND, O. and MUURINEN, A. (1989) “Transport and microstructural phenomenain bentonite clay with respect to the behaviour and influence of Na, Cu and U”. SKB Tech. Rep.,89-34.
QUIRK, J.P. and AYLMORE, L.A.G. (1971) “Domains and quasi-crystalline regions in clay systems”.Soil Sci. Soc. Am. J., 35:652-654.
RAMANN, E., MÄRZ, S. and BAUER, H. (1916) “Uber boden-press-säfte”. Int. Mitt. für Bodenkunde,6:1:27-34.
REEBURGH, W. S. (1967) “An improved interstitial water sampler”. Limn. and Ocean., 12:163-165.
REEDER, S., CAVE, M.R., BATH, A.H., ENTWISLE, D.C., INGLETHORPE, S.J., PEARCE, J.M.,TRICK, J.K., BLACKWELL, P.A. and GREEN, K.A. (1993) “A study of the Boom clay drillcorefrom Mol in Belgium. Chemical and isotopic characterisation of porewater and clay mineralogy”.Brit. Geol. Surv. Tech. Rep. WI/93/12C
REEDER, S., CAVE, M.R., ENTWISLE, D.C., TRICK, J.K., HARMON, K.A., BLACKWELL, P.A.,MITCHELL, N. and COOK, J.M. (1992) “The extraction and analysis of pore fluids from theBoom clay drillcore, Mol, Belgium”. Brit. Geol. Surv. Tech. Rep. WI/92/7C
REEDER, S., CAVE, M.R., ENTWISLE, D.C. and TRICK, J.K. (1998) “Extraction of water andsolutes from clayey material: a review and critical discussion of available techniques”. Brit. Geol.Surv. Tech. Rep., WI/98/4C, 60.
REEDER, S., CAVE, M.R., ENTWISLE, D.C., TRICK, J.K., BLACKWELL, P.A., WRAGG, J. andBURDEN, S. (1997) “Clay porewater characterisation: New investigations at the Gard MAR 402site”. ANDRA Tech. Rep. D RP O BGS 97-002.
REVESZ, K. and WOODS, P.H. (1990) “A method to extract soil water for stable isotope analysis”.Journ. Hydrol.,115:397-406.
RHOADES, J.D. (1982) “Cation exchange capacity”. In: Methods for soil analysis (Agronomy)9:149-157.
RICARD, P. (1993) Étude isotopique des fluides interstitiels et des minéraux de fracture dans lesargilites toarciennes de Tournemire (Aveyron). Thesis, Université de Paris-Sud.
RICHARDS, L.A. (1941) “A pressure-membrane extraction apparatus for soil solutions”. Soil Sci.,51:377-386.
RICHARDS, L.A. (Ed.) (1954) “Diagnosis and improvement of saline and alkali soils”. U.S.D.A.Agriculture Handbook 60, US Government Printing Office, Washington.
ROBINSON, R.A. and STOKES, R.H. (1970) Electrolyte solutions, 2nd ed. Academic Press, New York,559.
RODVANG, S.J. (1987) Geochemistry of the weathered zone of a fractured clayey deposit inSouthwestern Ontario. M.Sc. thesis, University of Waterloo, Ontario, 177.
179

ROSENBAUM, M. (1976) “Effect of compactation on the pore fluid chemistry of montmorillonite”.Clays and Clay Min., 24:118-121.
ROSS, D.S. and BARTLETT, R.J. (1990) “Effects of extraction methods and sample storage onproperties of solutions obtained from forested spodsols”. J. Environ. Qual., 19:108-113.
RÜBEL, A., ROGGE, T., LIPPMANN, J. and SONNTAG, C. (1998) “Two methods to extractporewater of clay stones for stable isotope analysis and the determination of water content: vacuumdistillation and direct equilibration”. Abs. Atelier thématique 98/1, GdR ForPro, Grenoble, France,27/02/98.
SAUZAY, G. (1974) “Sampling of lysimeters for environmental isotopes of water”. Proc. Symp. IsotopeTechniques in Groundwater Hydrology, IAEA, Vienna, 11-15/03/1974, II, 61-68.
SAWHNEY, B.L. (1972) “Selective sorption and fixation of cations by clay minerals: a review”. Claysand Clay Min., 20:93-100.
SAXENA, R.K. and DRESSIE, Z. (1983) “Estimation of groundwater recharge and moisture movementin sandy formations by tracing natural oxygen-18 and injected tritium profiles in the unsaturatedzone”. Proc. of a Meeting “Isotope Hydrology 1983”, IAEA, Vienna, 12-16 September 1983.
SAYLES, F.L., MANGELSDORF, P.C., WILSON, T.R.S. and HUME, D.N. (1976) “A sampler for thein situ collection of marine sedimentary porewater”. Deep-sea Res., 23:259-264.
SCHAFFER, R.J., WALLACE, J. and GARWOOD, F. (1937) “The centrifuge method of investigatingthe variation of hydrostatic pressures with water content in porous materials”. Trans. Faraday Soc.,33:723-734.
SCHLINDER, P.W. and GAMSJAGER, H. (1972) “Acid base reactions of the TiO2 (Anatase) waterinterface and the point of zero charge of TiO2 suspensions”. Kolloid Z. Z. Polymere, 250:759-763.
SCHLINDER, P.W. and KAMBER, H.R. (1968) “Die acidität von silanolgruppen”. Helv. Chim. Acta,51:1781-1786.
SCHLUMBERGER (1997) Italy 2000. CD Rom publication, 124.
SCHMIDT, G.W. (1973) “Interstitial water composition and geochemistry of deep Gulf Coast shalesand sandstones”. A.A.P.G. Bull., 57/2:321-337.
SCHNITZER, M. (1978) “Humic substances: chemistry and reactions”. In: Soil organic matter,Developments in soil science, 8, Elsevier, 1-64.
SHATKAY, M. and MARGARITZ, M. (1987) “Dolomitization and sulphate reduction in the miningzone between brine and meteoric water in the newly exposed shores of the Dead Sea”. Geoch.Cosmoch. Acta, 51:1135-1141.
SHEPPARD, S.M.F. and GILG, H.A. (1996) “Stable isotope geochemistry of clay minerals”. ClayMinerals, 31:1-24.
SHOLKOVITZ, E. (1973) “Interstitial water chemistry of the Santa Barbara Basin sediments”. Geoch.Cosmoch. Acta, 37:2043-2073.
SIEVER, R. (1962) “A squeezer for extracting interstitial water”. J. Sedim. Petrol., 32:329-331.
SKEMPTON, A.W. (1944) “Notes on the compressibility of clays”. Quart. J. of the Geol. Society,100:119-135.
180

SMITH, D.B., WEARN, P.L., RICHARDS, H.J. and ROWE, P.C. (1970) “Water movement in theunsaturated zone of high and low permeability strata by measuring natural tritium”. Proc. of theSymp. “Isotope Hydrology 1970”, IAEA, Vienna, 73-87.
SOFER, Z. (1978) “Isotopic composition of hydration water in gypsum”. Geoch. Cosmoch. Acta,42:1141-1149.
SOFER, Z. and GAT, J.R. (1975) “The isotope composition of evaporating brines: effect of the isotopicactivity ratio in saline solutions”. Earth Plant. Sci. Lett, 26:179-186.
SOFER, Z. and GAT, J.R. (1972) “Activities and concentrations of Oxygen-18 in concentrated aqueoussalt solutions: analytical and geophysical implications”. Earth Plant. Sci. Lett, 15:232-238.
SPOSITO, G. (1980) “Derivation of the Freundlich equation for ion exchange reactions in soils”. SoilSci. Soc. Am. J., 44:652.
SPOSITO, G. (1984) The surface chemistry of soils. Oxford University Press, New York, 234.
SPOSITO, G. (1989) The chemistry of soils. Oxford University Press, 277.
SPOSITO, G. (1992) “The diffuse-ion swarm near smectite particles suspended in 1:1 electrolytesolutions: modified Gouy-Chapman theory and quasicrystal formation”. In: Clay water interfaceand its rheological implications, CMS Workshop Lecures Vol. 4 (Güven N. and Pollastro R.M.Eds.), The Clay Minerals Society, 127-156.
SPOSITO, G. and PROST, R. (1982) “Structure of water adsorbed on smectites”. Chem. Reviews,82/6:553-573.
STEINMANN, P. and SHOTYK, W. (1996) “Sampling anoxic porewaters in peatlands using “peeper”for in situ filtration”. Fresenius J. Anal. Chem., 354:708-713.
STERN, O. (1924) “Zur Theorie der Elektrolytischen Doppleschriht”. Zietsch. Elektrochem.,30:508-516.
STEWART, G.L. (1972) “Clay-water interaction, the behaviour of 3H and 2H in adsorbed water and theisotope effect”. Soil Sci. Soc. Am. Proc., 36:421-426.
STROBEL, J., WIN, P., WOUTERS, L. and HAGOOD, M. (1998) “Groundwater permeabilitycorrelations in the Boom clay using wireline logs”. In: Proc. of the Int. High-Level Nuclear WasteConference, Las Vegas (in press).
STUDER, R. (1961) “Méthode de détermination des réserves hydriques des sols”. Ann. Agron.,12/6:599- 608.
STUMM, W., HUANG, C.P. and JENKINS, S.R. (1970) “Specific chemical interactions affecting thestability of dispersed systems”. Croat. Chem. Acta, 42:223-244.
STUMM, W. and MORGAN, J.J. (1996) Aquatic chemistry. Chemical equilibria and rates in naturalwaters. Wiley Interscience, III Ed., 1022.
SUN, Y., LIN, H. and LOW, P.F. (1986) “The non specific interaction of water with the surfaces of clayminerals”. J. Coll. Interf. Sci., 112/2:556-564.
SUQUET, H., DE LA CALLE, C. and PEZERAT, H. (1975) “Swelling and structural organization ofsaponite”. Clays and Clay Min., 23:1-9.
SUQUET, H., IIYAMA, J.T., KODAM, H. and PEZERAT, H. (1977) “Synthesis and swelling propertiesof saponites with increasing layer charge”. Clays and Clay Min., 25:231-242.
181

SUQUET, H. and PEZERAT, H. (1987) Parameters influencing layer stacking types in saponite andvermiculite: a review”. Clays and Clay Min., 35:353-362.
SWALAN, J.J. and MURRAY, J.W. (1983) “Trace metal remobilization in the interstitial water of redclay and hemipelagic marine sediments”. Earth and Planet. Sci. Lett., 64:213-230.
SWARTZEN-ALLEN, S.L. and MATIJEVIC, E. (1974) “Surface and colloid chemistry of clays”.Chem. Rev., 74:385-400.
TARDY, Y. and TOURET, O. (1987) “Hydration energies of smectites: a model for glauconite, illite,and corrensite formation”. In: Proc. of the Int. Clay Conf. 1985 (Schultz L.G., Van Olphen H. andMumpton F.A. Eds.), Clay Minerals Soc., Bloomington, Indiana, 46-52.
TAUBE, H. (1954) “Use of oxygen isotope effects in the study of hydration of ions”. J. Phys. Chem.,58:523-528.
TEASDALE, P.R., BATLEY, G.E., APTE, S. and WEBSTER, I.T. (1995) “Porewater sampling withsediment peepers”. Trends in Analytical Chem., 14/6:250-256.
TESSIER, D. and PEDRO, G. (1987) “Mineralogical characterisation of 2:1 clays in soils: Importanceof the clay structure”. In: Proc. of the Int. Clay Conf. 1985 (Schultz L.G., Van Olphen H. andMumpton F.A. Eds.), Clay Minerals Soc., Bloomington, Indiana, 78-84.
TESTINI, C. and GESSA, C. (1989) “Le fasi solide”. In: Chimica del suolo, Patron, Bologna, 627.
THENG, B.K.G. (1974) The chemistry of Clay-Organic reactions. John Wiley and Sons, 343.
THOMA, G., ESSER, N., SONNTAG, C., WEISS, W., RUDOLPH, J. and LÉVÊQUE, P. (1978) “Newtechnique of in-situ soil-moisture sampling for environmental analysis applied at Pilat sand dunenear Bordeaux: HETP modelling of bomb tritium propagation in the unsaturated sand zones”.Isotope Hydrology 1978, 2, IAEA, Vienna, 753-768.
THOMAS, G.W. (1977) “Historical developments in soils chemistry: ion exchange”. Soil Sci. Soc. Am.J., 41:230 -238.
THOMAS, M.D. (1921) “Aqueous vapour pressure of soils” Soil Science, 11:409
THURMAN, E.M. (1985a) Organic geochemistry of natural waters. Martinus Nijhoff/Dr. W. JunkPubl., The Hague.
THURMAN, E.M. (1985b) “Humic substances in groundwater”. In: Humic substances, I. Geochemis-try, characterisation and isolation, John Wiley, New York, 87-103.
THURY, M. and BOSSART, P. (Eds.) “Mont Terri Rock Laboratory: Results of the hydrogeological,geochemical and geotechnical experiments performed in 1996 and 1997”. Landeshydrologie und -geologie, Geologische Berichte, 23 (in preperation).
TISSOT, B. and WELTE, D.H. (1978) Petroleum formation and occurrence. Springer Verlag.
TORSTENSSON, B.A. (1984) “A new system for groundwater monitoring”. Ground Water Mon. Rev.,4/4:131-138.
TORSTENSSON, B.A. and PETSONK, A.M. (1985) “A hermetically isolated sampling method forgroundwater investigations”. ASTM Symp. of Field Methods for Ground Water ContaminationStudies and their Standardisation, Cocoa Beach, Florida, 2-7 Feb. 1985, 35.
TOURET, O., PONS, C.H., TESSIER, D. and TARDY, Y. (1990) “Étude de la répartition de l’eau dansdes argiles saturées Mg2+ aux fortes teneurs en eau”. Clay Minerals, 25:217-233.
182

TRAVIS, C.C. and ETNIER, E.L. (1981) “A survey of sorption relationships for reactive solutes insoils”. J. Environ. Qual., 10:8.
TSHIBANGU, J.-P., SARDA, J.-P. and, AUDIBERT-HAYET, A. (1996) “Étude des interactionsmécaniques et physicochimiques entre les argiles et les fluides de forage. Application à l’argile deBoom (Belgique)”. Rev. Inst. Franç. Pétrole, 51/4:497-526.
TURNER, J.V. and GAILITIS, V. (1988) “Single step method for hydrogen isotope ratio measurementof water in porous media”. Anal. Chem., 60:1244-1246.
URBAN, N.R., DINKEL, C. and WEHRLI, B. (1997) “Solute transfer across the sediment surface of aeutrophic lake: I. Porewater profiles from dialysis samplers”. Aquatic Sci., 59:1-25.
VAN DER KAMP, G., STEMPVOORT, D.R., WASSENAAR, L.I. (1996) “The radial diffusion method.1. Using intact cores to determine isotopic composition, chemistry, and effective porosities forgroundwater in aquitards”. Wat. Res. Res., 32/6:1815-1822.
VAN OLPHEN, H. (1963) An introduction to clay colloid chemistry for clay technologists, geologistsand soil scientists. Interscience Publishers, 301.
VAN OLPHEN, H. (1965) “Thermodyamics of interlayer adsorption of water in clays. I. Sodiumvermiculite”. J. Collois Sci., 20:822-837.
VAN OLPHEN, H. (1969) “Thermodyamics of interlayer adsorption of water in clays. II. Magnesianvermiculite”. In: Proc. of the Int. Clay Conference, Tokyo. Israel University Press, 1, 649-657.
VAN OLPHEN, H. and FRIPIAT, J.J. (Eds.) (1979) Data handbook for clay materials and other non-metallic minerals, providing those involved in clay research ans industrial application with sets ofauthoritative data describing the physical and chemical properties and mineralogical compositionof the available reference materials. Pergamon Press, 346.
VEIHMEYER, F.J., ISRAELSON, O.W. and CONRAD, J.P. (1924) Agr. Exper. Station, BerkeleyCalifornia, Tech. Paper 16 (cited in Schaffer et al., 1937)
VEITH, J.A. and SPOSITO, G. (1977) “The use of the Langmuir equation in the interpretation of“adsorption” phenomena”. Soil Sci. Soc. Am. J., 41:679.
VELDE, B. (1992) Introduction to clay minerals. Chemistry, origins, uses and environmentalsignificance. Chapman and Hall, 198.
VILLAR, M.V., LLORET, A., CUEVAS, J., YLLERA, A., FERNÁNDEZ, A.M. and JIMINEZ DECISNEROS, C. (1997) “FEBEX project: laboratory experiments. In situ testing in undergroundresearch laboratories for radioactive waste”. Proc. of a cluster seminar, Alden Biesen, Belgium,10-11 December 1997, DOC XII/015/98, EN, 247-261.
VON DAMM, K.L. and JOHNSON, K.O. (1988) “Geochemistry of shale groundwaters: results ofpreliminary leaching experiments”, ORNL/TM 10535, NTIS.
VUATAZ, F.D. (1987) “ Diagraphie et suivis géochimiques des eaux souterraines: exemple de sondagesdans le socle cristallin ”. Géothermie Actualités, 4/2:25-33.
VUATAZ, F.D., BRACH, M., CRIAUD, A. and FOUILLAC, C. (1990) “Geochemical monitoring ofdrilling fluids: a powerful tool to forecast and detect formation waters”. Soc. Pet. Eng., FormationEvaluation June, 177-184.
WABER, H.N. and MAZUREK, M. (1998) “Tournemire shale porewater composition: derivation fromgeochemical modeling”. University of Bern, Switzerland, Int. Rep., 29.
183

WADA, K. and OKAMURA, Y. (1977) “Measurements of exchange capacitites and hydrolysis as ameans of characterizing cation and anion retention by soils.” In: Proc. Intern. Seminar on SoilEnviron. and Fertility Management in Intensive Agriculture, Society of Scientific Soil Manure,Tokyo, Japan, 811-815.
WALKER, G.R., WOODS, P.H. and ALLISON, G.B. (1994) “Interlaboratory comparison of methodsto determine the stable isotope composition of soil water”. Chem. Geol., 111:297-306.
WALTERS, L.J. Jr. (1967) Bound halogens in sediments. Doctoral Thesis, Massachusetts Institute ofTechnology (cited in Kriukov and Manheim, 1982).
WEAVER, C.E. and BECK, K.C. (1971) “Clay water diagenesis during burial: how mud becomesgneiss”. G.S.A. Spec. Publ., 134:96.
WEISS, C.A. Jr. and GERASIMOWICZ, W.V. (1996) “Interaction of water with clay minerals asstudied by 2H nuclear magnetic resonance spectroscopy”. Geoch. Cosmoch. Acta, 60:265-275.
WESTALL, J., ZACHARY, J.L. and MOREL, F.M.M. (1976) “MINEQL, A computer code for thecalculation of chemical equilibrium composition of aqueous systems”. MIT Techn. Note No. 18,Boston, USA.
WHELAN, B.R. and BARROW, N.J. (1980) “A study of a method for displacing soil solution bycentrifuging with an immiscible liquid”. J. Environ. Qual., 9/2:315-319.
WIJLAND, G.C., LANGEMEIJER, H.D., STAPPER, R.A.M., MICHELOT, J.-L. andGLASBERGEN, P. (1991) “Evaluation and development of hydrological and geochemicalinvestigation methods for aquifers of low permeability”. CEC EUR 13125 EN, 96.
WILKINSON, M., FALLICK, A.E., KEANEY, G.M.J., HASZELDINER, S. and McHARDY, W.J.(1994) “Stable isotopes in illite: the case for meteoric water flushing within the upper JurassicFulmar Formation sandstones, U.K. North Sea”. Clay Minerals, 29:567-574.
WILSON, M.J. (Ed.) (1987) A handbook of determinative methods in clay mineralogy. Blackie, 308.
WIN P., STROBEL J., WOUTERS, L. and HAGOOD, M. (1998) “Definition of clay-silt sequencesusing wireline logs”. In: Proc. of the Int. High-Level Nuclear Waste Conference, Las Vegas (inpress).
WOLERY, T.J., JACKSON, K.J., BOURCIER, W.L., BRUTON, C.J., VIANI, B.E., KNAUSS, K.G.and DELANY, J.M. (1990) “Current status of the EQ3/6 software package for geochemicalmodeling”. In: Chemical modeling in aqueous systems II (Melchior D.C. and Basset R.L. Eds.),Am. Chem. Soc. Symp. Ser., 416:104-116.
YANG, I.C., DAVIS, G.S. and SAYRE, T.M. (1990) “Comparison of porewater extraction by triaxialcompression and high speed centrifugation methods”. Proc. Conf. on Minimizing Risk to theHydrologic Environment, American Institute of Hydrology, 250-259.
YANG, I.C., HIGGINS, J.D. and HAYES, L.R. (1995) “Porewater extraction from unsaturated tuffusing triaxial and one-dimensional compression methods”. Proc. of an Int. Workshop on“Hydraulic and hydrochemical characterisation of argillaceous rocks”, Nottingham, U.K.,7-9 June 1994, OECD/NEA, 137-155.
YARIV, S. and CROSS, H. (1979) Geochemistry of colloid systems for earth scientists. Springer-Verlag,Berlin, 450.
184

YECHIELI, Y., MAGARITZ, M., SHATKAY, M., RONEN, D. and CARMI, I. (1993) “Processesaffecting interstitial water in the unsaturated zone at the newly exposed shore of the Dead Sea,Israel”. Chem. Geol. (Isotope Geosc.), 103:207-225.
YEH, H.W. (1980) “D/H ratios and late stage dehydration of shales during burial”. Geoch. Cosmoch.Acta, 44:341-352.
YONG, R.N., MOHAMED, A.M.O., and WARKENTIN, B.P. (1992) “Principles of contaminanttransport in soils”. Developments in Geotechnical Engineering, Elsevier, 73:327.
YONG, R. N. and WARKENTIN, B.P. (1975) “Soil properties and behaviour”. In: Developments inGeotechnical Engineering, 5, Elsevier, Amsterdam.
YORMAH, T.B.R. and HAYES, M.H.B. (1993) “Sorption of water vapour by the Na+-exchanged clay-sized fractions of some tropical soil samples”. International Center for Theoretical Physics, Trieste(Italy) IC/93/334:15.
YOU, C.F., SPIVACK, A.J., GISKES, J.M., MARTIN, J.B. and DAVISSON, M.L. (1996) “Boroncontents and isotopic compositions in porewaters: a new approach to determine temperatureinduced artifacts. Geochemical implications”. Marine Geol., 129:351-361.
ZABOWSKI, D. and SLETTEN, R.S. (1991) “Carbon dioxide degassing effects on the pH of spodosolsoil solutions”. Soil Sci. Soc. Am. J., 55:1456-1461.
ZHENG, Y.-F. (1993) “Calculation of oxygen isotope fractionation in hydroxyl-bearing silicates”. Earthand Planet. Sci. Lett., 120:247-263.
ZIMMERMANN, U., EHHALT, D. and MÜNNICH, K.O. (1966) “Soil-water movement andevapotranspiration: changes in the isotopic composition of the water”. Proc. of the Symp. “Isotopesin Hydrology”, IAEA, Vienna, 567-585.
ZIMMERMANN, U., MÜNNICH, K.O. and ROETHER, W. (1967) “Downward movement of soilmoisture traced by means of hydrogen isotopes”. Geophys. Monogr., 11:28-36.
185


OECD PUBLICATIONS, 2, rue André-Pascal, 75775 PARIS CEDEX 16
PRINTED IN FRANCE
(66 2000 02 1 P) ISBN 92-64-17181-9 – No. 51451 2000