Mathematics - Texas Education Agency
257
GRADE A Student and Family Guide Mathematics Revised Based on TEKS Refinements Revised 2007
-
Upload
khangminh22 -
Category
Documents
-
view
0 -
download
0
Transcript of Mathematics - Texas Education Agency
Texas Education Agency
GRADE
GR
AD
ES
TU
DY
GU
IDE
TTXX0000002233663377
Math
em
atics
A Student and Family GuideMathematics
Revised Based on TEKS Refinements
Revise
d2
00
7
Revised 2007
Grade 10
Mathematics
A Student and Family Guide
Copyright © 2007, Texas Education Agency. All rights reserved. Reproduction of all or portions of this work is prohibited without express written permission from the Texas Education Agency.
Texas AssessmentSTUDY GUIDE
Texas Assessment of Knowledge and Skills

Cover photo credits: Top left © Ariel Skelley/CORBIS; Top right © Royalty-Free/CORBIS; Bottom right © Jose Luis Pelaez, Inc./CORBIS; Bottom left © Royalty-Free/CORBIS.
3
Dear Student and Parent:
The Texas Assessment of Knowledge and Skills (TAKS) is a comprehensive testingprogram for public school students in grades 3–11. TAKS, including TAKS(Accommodated) and Linguistically Accommodated Testing (LAT), has replaced theTexas Assessment of Academic Skills (TAAS) and is designed to measure to whatextent a student has learned, understood, and is able to apply the important conceptsand skills expected at each tested grade level. In addition, the test can providevaluable feedback to students, parents, and schools about student progress from gradeto grade.
Students are tested in mathematics in grades 3–11; reading in grades 3–9; writing ingrades 4 and 7; English language arts in grades 10 and 11; science in grades 5, 8, 10,and 11; and social studies in grades 8, 10, and 11. Every TAKS test is directly linkedto the Texas Essential Knowledge and Skills (TEKS) curriculum. The TEKS is thestate-mandated curriculum for Texas public school students. Essential knowledge and skills taught at each grade build upon the material learned in previous grades. By developing the academic skills specified in the TEKS, students can build a strongfoundation for future success.
The Texas Education Agency has developed this study guide to help studentsstrengthen the TEKS-based skills that are taught in class and tested on TAKS. Theguide is designed for students to use on their own or for students and families towork through together. Concepts are presented in a variety of ways that will helpstudents review the information and skills they need to be successful on TAKS. Everyguide includes explanations, practice questions, detailed answer keys, and studentactivities. At the end of this study guide is an evaluation form for you to complete andmail back when you have finished the guide. Your comments will help us improvefuture versions of this guide.
There are a number of resources available for students and families who would likemore information about the TAKS testing program. Information booklets are availablefor every TAKS subject and grade. Brochures are also available that explain the StudentSuccess Initiative promotion requirements and the new graduation requirements foreleventh-grade students. To obtain copies of these resources or to learn more aboutthe testing program, please contact your school or visit the Texas Education Agencywebsite at www.tea.state.tx.us/student.assessment.
Texas is proud of the progress our students have made as they strive to reach theiracademic goals. We hope the study guides will help foster student learning, growth,and success in all of the TAKS subject areas.
Sincerely,
Gloria ZyskowskiDeputy Associate Commissioner for Student AssessmentTexas Education Agency
A Letter from the Deputy Associate Commissioner for Student Assessment
4
Contents
Introduction. . . . . . . . . . . . . . . . . . . . . . . . . . . . . . . . 5
Mathematics Chart . . . . . . . . . . . . . . . . . . . . . . . . . . . 8
Objective 1: Functional Relationships . . . . . . . . . . . . . . 10
Practice Questions . . . . . . . . . . . . . . . . . . . . . . . . . . . . . . . . . . 24
Objective 2: Properties and Attributes of Functions. . . . . 30
Practice Questions . . . . . . . . . . . . . . . . . . . . . . . . . . . . . . . . . . 57
Objective 3: Linear Functions . . . . . . . . . . . . . . . . . . . 62
Practice Questions . . . . . . . . . . . . . . . . . . . . . . . . . . . . . . . . . . 89
Objective 4: Linear Equations and Inequalities . . . . . . . . 94
Practice Questions . . . . . . . . . . . . . . . . . . . . . . . . . . . . . . . . . 107
Objective 5: Quadratic and Other Nonlinear Functions . . 110
Practice Questions . . . . . . . . . . . . . . . . . . . . . . . . . . . . . . . . . 133
Objective 6: Geometric Relationships and
Spatial Reasoning . . . . . . . . . . . . . . . . . . . . . . . . . . 139
Practice Questions . . . . . . . . . . . . . . . . . . . . . . . . . . . . . . . . . 153
Objective 7: Two-Dimensional and Three-Dimensional
Representations . . . . . . . . . . . . . . . . . . . . . . . . . . . 157
Practice Questions . . . . . . . . . . . . . . . . . . . . . . . . . . . . . . . . . 164
Objective 8: Measurement and Similarity . . . . . . . . . . . 168
Practice Questions . . . . . . . . . . . . . . . . . . . . . . . . . . . . . . . . . 188
Objective 9: Percents, Proportions, Probability,
and Statistics . . . . . . . . . . . . . . . . . . . . . . . . . . . . . 192
Practice Questions . . . . . . . . . . . . . . . . . . . . . . . . . . . . . . . . . 211
Objective 10: Mathematical Processes and Tools . . . . . 217
Practice Questions . . . . . . . . . . . . . . . . . . . . . . . . . . . . . . . . . 231
Mathematics Answer Key . . . . . . . . . . . . . . . . . . . . . 235
Mathematics
5
MATHEMATICSMATHEMATICS
What Is This Book?This is a study guide to help you strengthen theskills tested on the Grade 10 Texas Assessment ofKnowledge and Skills (TAKS). TAKS is a state-developed test administered with no time limit.It is designed to provide an accurate measure oflearning in Texas schools.
By acquiring all the skills taught in tenth grade,you will be better prepared to succeed on theGrade 10 TAKS test and during the next schoolyear.
What Are Objectives?Objectives are goals for the knowledge and skillsthat you should achieve. The specific goals forinstruction in Texas schools were provided bythe Texas Essential Knowledge and Skills (TEKS).The objectives for TAKS were developed basedon the TEKS.
How Is This Book Organized?This study guide is divided into the tenobjectives tested on TAKS. A statement at thebeginning of each objective lists the mathematicsskills you need to acquire. The study guidecovers a large amount of material. You shouldnot expect to complete it all at once. It may bebest to work through one objective at a time.
Each objective is organized into review sectionsand a practice section. The review sectionspresent examples and explanations of themathematics skills for each objective. Thepractice sections feature mathematics problemsthat are similar to the ones used on the TAKStest.
How Can I Use This Book?First look at your Confidential Student Report.This is the report the school gave you thatshows your TAKS scores. This report will tellyou which TAKS subject-area test(s) you passedand which one(s) you did not pass. Use yourreport to determine which skills needimprovement. Once you know which skills need to be improved, you can read through theinstructions and examples that support thoseskills. You may also choose to work through allthe sections. Pace yourself as you work throughthe study guide. Work in short sessions. If youbecome frustrated, stop and start again later.
6
● There are several words in this study guidethat are important for you to understand.These words are boldfaced in the text andare defined when they are introduced.Locate the boldfaced words and reviewthe definitions.
● Examples are contained inside shadedboxes.
● Each objective has “Try It” problemsbased on the examples in the reviewsections.
● A Mathematics Chart for the Grade 10TAKS test is included on pages 8–9 and also as a tear-out page in the back of the book. This chart includes usefulmathematics information. The tear-outMathematics Chart in the back of thebook also provides both a metric and acustomary ruler to help solve problemsrequiring measurement of length.
How Should the “Try It” Problems BeUsed? “Try It” problems are found throughout thereview sections of the mathematics study guide.These problems provide an opportunity for youto practice skills that have just been covered inthe instruction. Each “Try It” problem featureslines for your responses. The answers to the “TryIt” problems are found immediately followingeach problem.
While completing a “Try It” problem, cover upthe answer portion with a sheet of paper. Thencheck the answer.
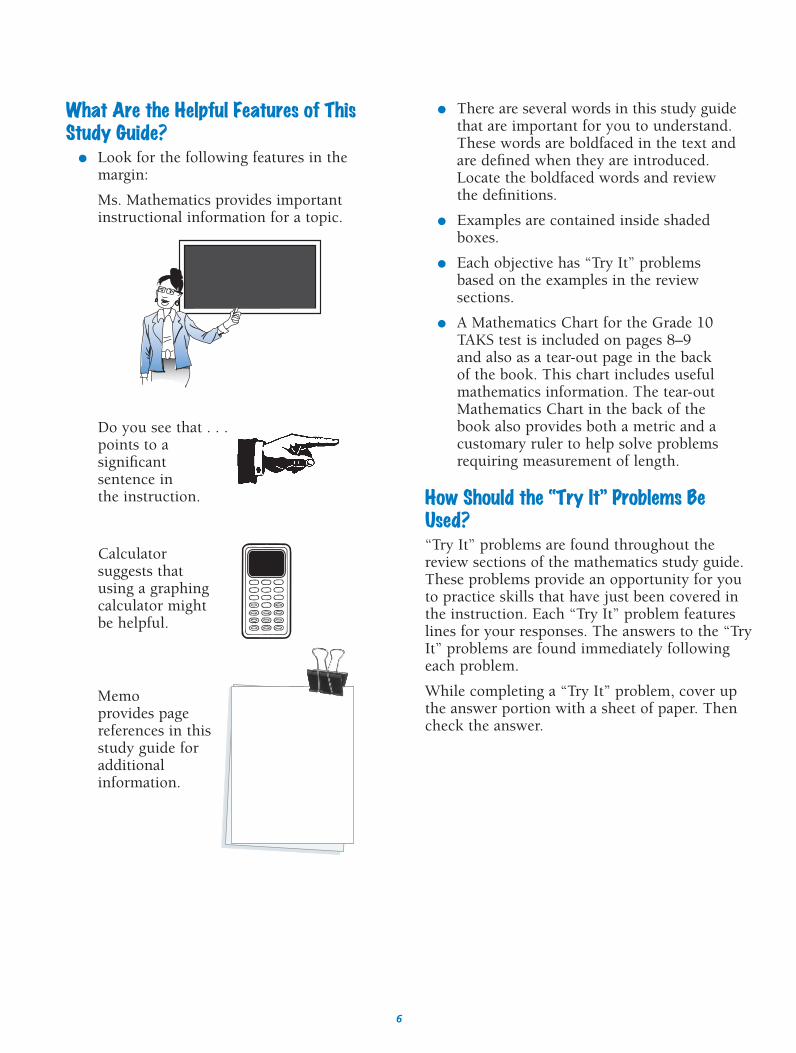
What Are the Helpful Features of ThisStudy Guide?
● Look for the following features in themargin:
Ms. Mathematics provides importantinstructional information for a topic.
Do you see that . . .points to a significant sentence in the instruction.
Calculator suggests that using a graphing calculator might be helpful.
Memoprovides page references in this study guide for additional information.
7
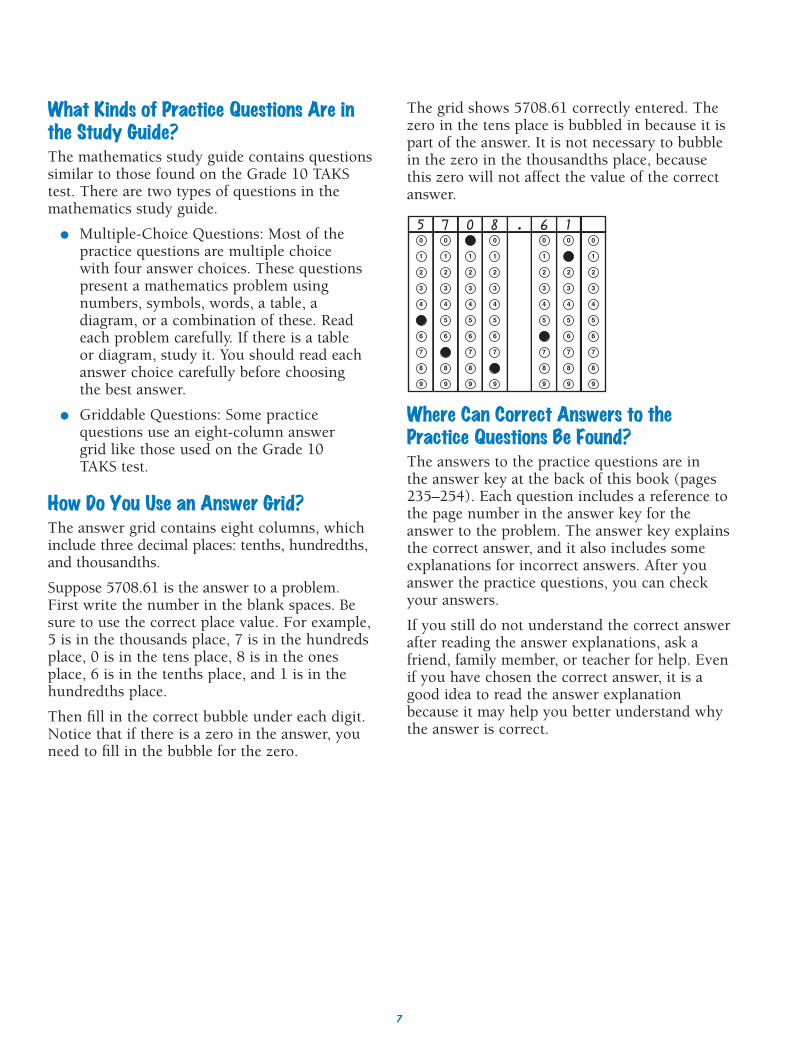
The grid shows 5708.61 correctly entered. Thezero in the tens place is bubbled in because it ispart of the answer. It is not necessary to bubblein the zero in the thousandths place, becausethis zero will not affect the value of the correctanswer.
Where Can Correct Answers to thePractice Questions Be Found?The answers to the practice questions are in the answer key at the back of this book (pages235–254). Each question includes a reference tothe page number in the answer key for theanswer to the problem. The answer key explainsthe correct answer, and it also includes someexplanations for incorrect answers. After youanswer the practice questions, you can checkyour answers.
If you still do not understand the correct answerafter reading the answer explanations, ask afriend, family member, or teacher for help. Evenif you have chosen the correct answer, it is agood idea to read the answer explanationbecause it may help you better understand whythe answer is correct.
0
1
2
3
4
5
6
7
8
9
0
1
2
3
4
5
6
7
8
9
0
1
2
3
4
5
6
7
8
9
0
1
2
3
4
5
6
7
8
9
0
1
2
3
4
5
6
7
8
9
0
1
2
3
4
5
6
7
8
9
0
1
2
3
4
5
6
7
8
9
5 7 80 16
What Kinds of Practice Questions Are inthe Study Guide?The mathematics study guide contains questionssimilar to those found on the Grade 10 TAKStest. There are two types of questions in themathematics study guide.
● Multiple-Choice Questions: Most of thepractice questions are multiple choicewith four answer choices. These questionspresent a mathematics problem usingnumbers, symbols, words, a table, adiagram, or a combination of these. Readeach problem carefully. If there is a tableor diagram, study it. You should read eachanswer choice carefully before choosingthe best answer.
● Griddable Questions: Some practicequestions use an eight-column answergrid like those used on the Grade 10TAKS test.
How Do You Use an Answer Grid?The answer grid contains eight columns, whichinclude three decimal places: tenths, hundredths,and thousandths.
Suppose 5708.61 is the answer to a problem.First write the number in the blank spaces. Besure to use the correct place value. For example,5 is in the thousands place, 7 is in the hundredsplace, 0 is in the tens place, 8 is in the onesplace, 6 is in the tenths place, and 1 is in thehundredths place.
Then fill in the correct bubble under each digit.Notice that if there is a zero in the answer, youneed to fill in the bubble for the zero.
8
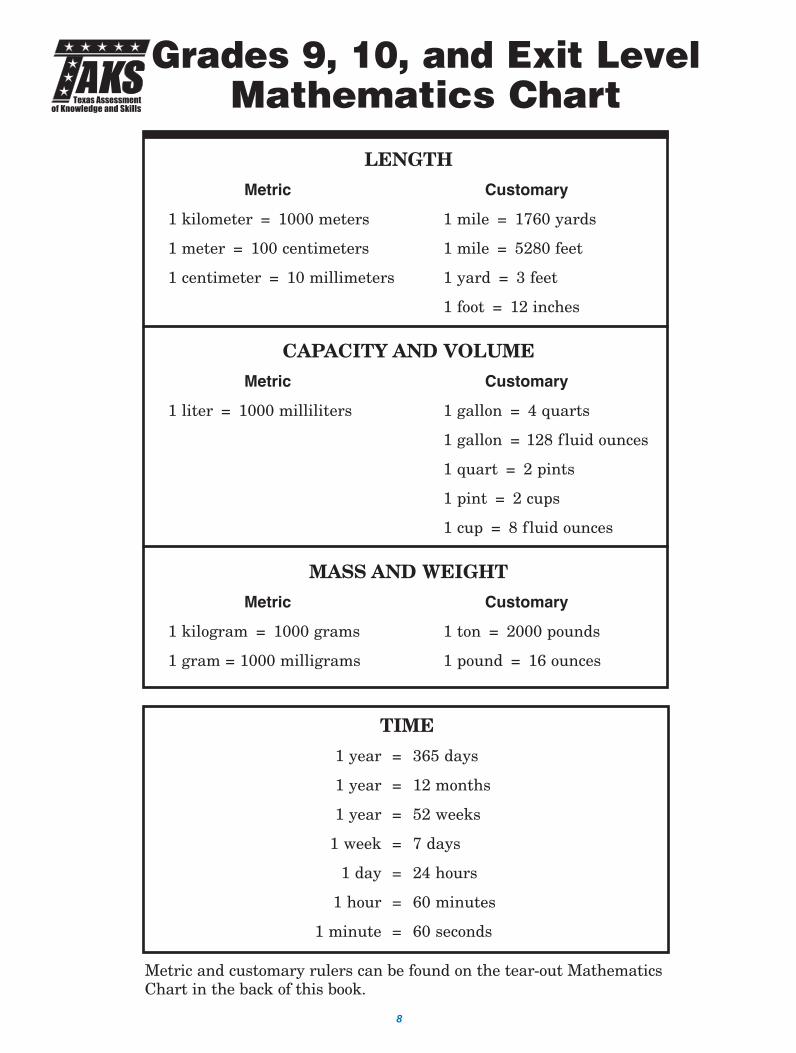
Metric and customary rulers can be found on the tear-out MathematicsChart in the back of this book.
LENGTH
Metric Customary
1 kilometer = 1000 meters 1 mile = 1760 yards
1 meter = 100 centimeters 1 mile = 5280 feet
1 centimeter = 10 millimeters 1 yard = 3 feet
1 foot = 12 inches
CAPACITY AND VOLUME
Metric Customary
1 liter = 1000 milliliters 1 gallon = 4 quarts
1 gallon = 128 fluid ounces
1 quart = 2 pints
1 pint = 2 cups
1 cup = 8 fluid ounces
MASS AND WEIGHT
Metric Customary
1 kilogram = 1000 grams 1 ton = 2000 pounds
1 gram = 1000 milligrams 1 pound = 16 ounces
Grades 9, 10, and Exit LevelMathematics Chart
TIME
1 year = 365 days
1 year = 12 months
1 year = 52 weeks
1 week = 7 days
1 day = 24 hours
1 hour = 60 minutes
1 minute = 60 seconds
Texas Assessment of Knowledge and Skills
9
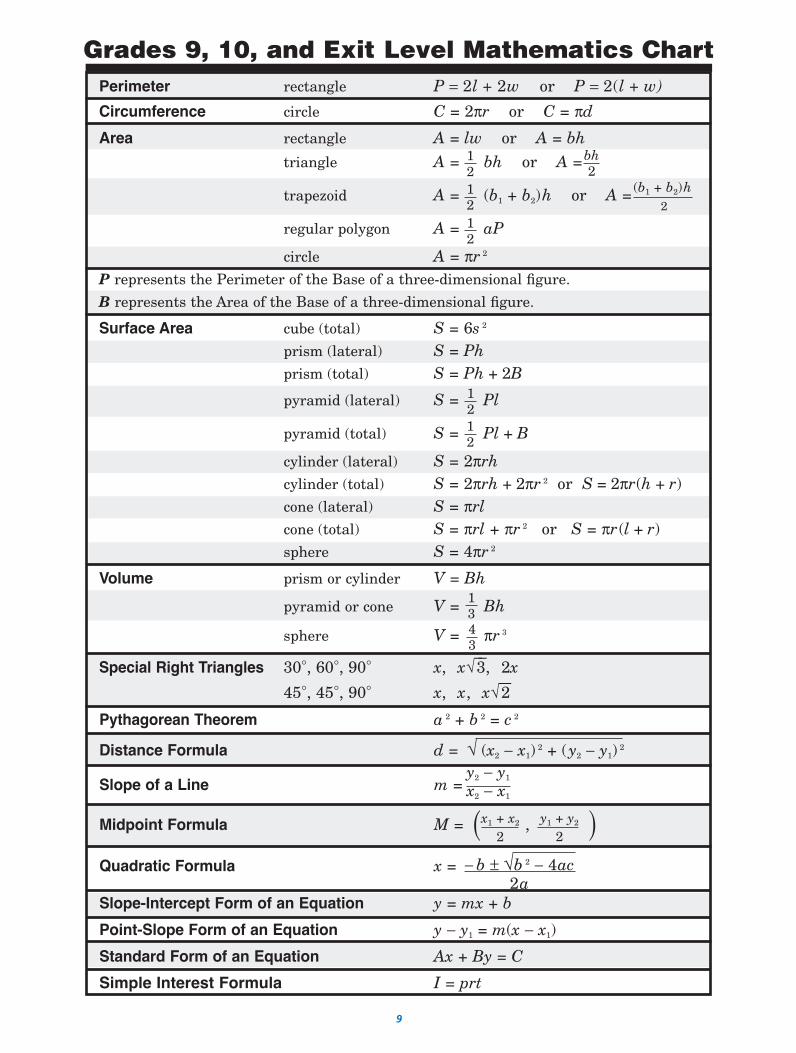
Grades 9, 10, and Exit Level Mathematics ChartPerimeter rectangle P = 2l + 2w or P = 2(l + w)
Circumference circle C = 2πr or C = πd
Area rectangle A = lw or A = bhtriangle A = bh or A =
trapezoid A = (b1 + b2)h or A =
regular polygon A = aP
circle A = πr 2
P represents the Perimeter of the Base of a three-dimensional figure.
B represents the Area of the Base of a three-dimensional figure.
Surface Area cube (total) S = 6s 2
prism (lateral) S = Phprism (total) S = Ph + 2B
pyramid (lateral) S = Pl
pyramid (total) S = Pl + B
cylinder (lateral) S = 2πrhcylinder (total) S = 2πrh + 2πr 2 or S = 2πr(h + r)cone (lateral) S = πrlcone (total) S = πrl + πr 2 or S = πr(l + r)sphere S = 4πr 2
Volume prism or cylinder V = Bh
pyramid or cone V = Bh
sphere V = πr 3
Special Right Triangles 30°, 60°, 90° x, x√__3, 2x
45°, 45°, 90° x, x, x√__2
12
1343
bh2
12
(b1 + b2)h2
Pythagorean Theorem a 2 + b 2 = c 2
Distance Formula d = √ (x2 − x1) 2 + (y2 − y1) 2
Slope of a Line m =
Midpoint Formula M = ( , )Quadratic Formula x =
Slope-Intercept Form of an Equation y = mx + b
Point-Slope Form of an Equation y − y1 = m(x − x1)
Standard Form of an Equation Ax + By = C
Simple Interest Formula I = prt
y2 − y1
x2 − x1
x1 + x2
2y1 + y2
2
− b ± √b 2 − 4ac2a
12
12
12
10
The student will describe functional relationships in a variety of ways.
Objective 1
For this objective you should be able to recognize that a functionrepresents a dependence of one quantity on another and can bedescribed in a number of ways.
What Is a Function?A function is a set of ordered pairs (x, y) in which each x-coordinate ispaired with only one y-coordinate. In a list of ordered pairs belongingto a function, no x-coordinate is repeated.
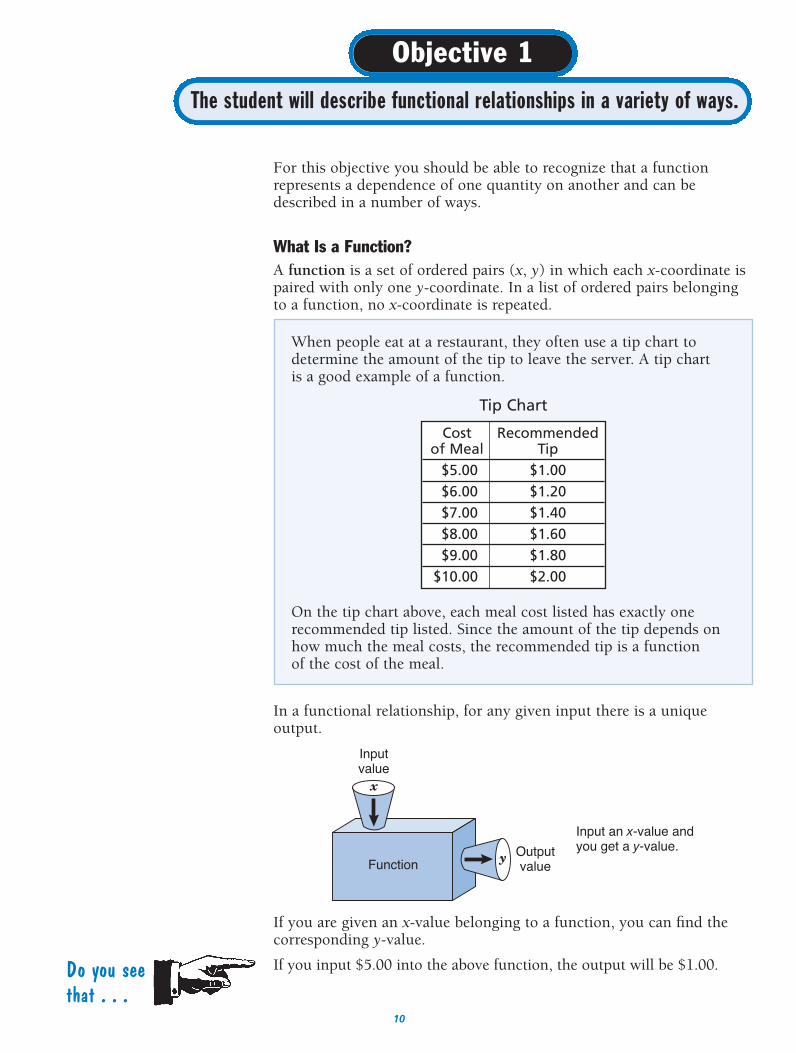
When people eat at a restaurant, they often use a tip chart todetermine the amount of the tip to leave the server. A tip chart is a good example of a function.
Tip Chart
On the tip chart above, each meal cost listed has exactly onerecommended tip listed. Since the amount of the tip depends on how much the meal costs, the recommended tip is a function of the cost of the meal.
Cost Recommended of Meal Tip
$5.00 $1.00$6.00 $1.20$7.00 $1.40$8.00 $1.60$9.00 $1.80
$10.00 $2.00
Do you seethat . . .
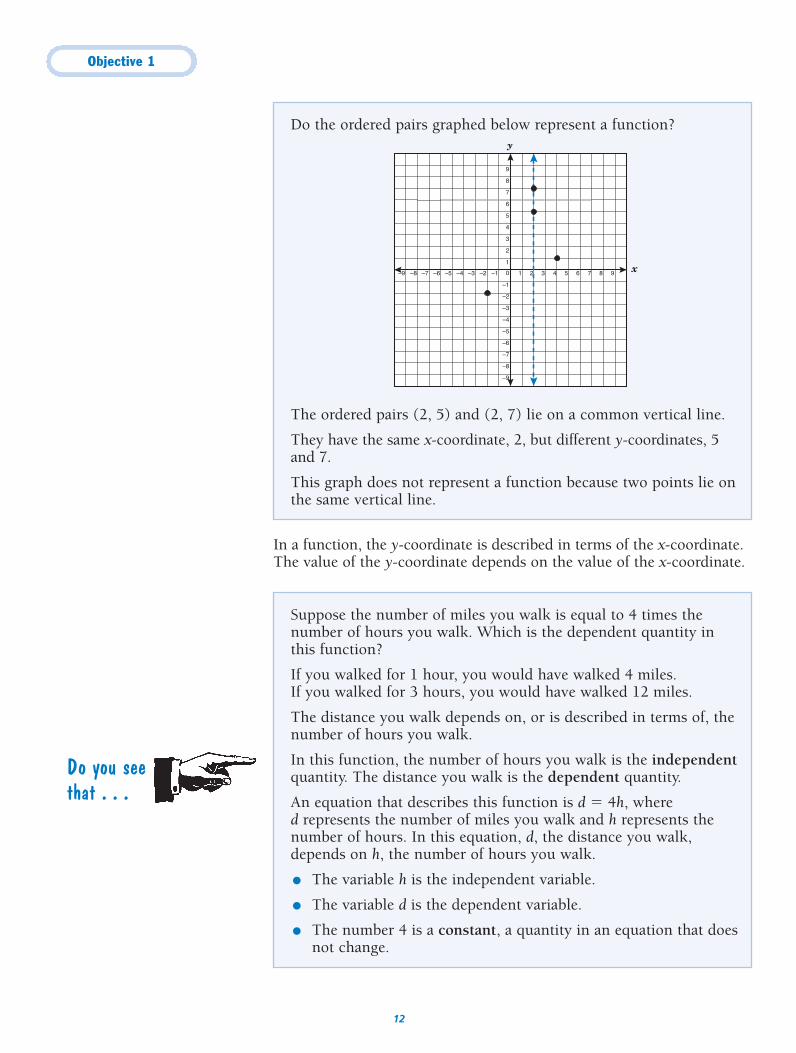
In a functional relationship, for any given input there is a uniqueoutput.
If you are given an x-value belonging to a function, you can find thecorresponding y-value.
If you input $5.00 into the above function, the output will be $1.00.
x
yFunction
Inputvalue
Input an x-value and you get a y-value.Output
value
Objective 1
11
There are two ways to test a set of ordered pairs to see whether it is afunction.
Examine the list of ordered pairs.
If a set of ordered pairs is a function, no x-coordinate in the set isrepeated. No x-coordinate should be listed with two different y-coordinates.
Is this set of ordered pairs a function?
{(1, 4), (5, 7), (�1, 7), (10, 12)}
Examine the set of ordered pairs.
● None of the x-coordinates in the set are repeated.
● Two ordered pairs, (5, 7) and (�1, 7), have the same y-coordinate but different x-coordinates. This does not preventthis set of ordered pairs from being a functional relationship.
This set of ordered pairs is a function.
Examine a graph of a set of ordered pairs.
Use a vertical line to determine whether two points have the same x-coordinate. If two points in the graph of a function lie on the samevertical line, then they have the same x-coordinate, and the set ofordered pairs is not a function.
Is this set of ordered pairs a function?
{(–2, 5), (0, 7), (1, 4), (–2, 6)}
● The number –2 is paired with 5; 0 is paired with 7; 1 is pairedwith 4; and –2 is paired with 6.
● Two ordered pairs, (–2, 5) and (–2, 6), have the same x-coordinate. In a functional relationship, no x-coordinateshould repeat.
This set of ordered pairs is not a function.
Do you seethat . . .
Objective 1
12
In a function, the y-coordinate is described in terms of the x-coordinate.The value of the y-coordinate depends on the value of the x-coordinate.
Do you seethat . . .
Suppose the number of miles you walk is equal to 4 times thenumber of hours you walk. Which is the dependent quantity inthis function?
If you walked for 1 hour, you would have walked 4 miles. If you walked for 3 hours, you would have walked 12 miles.
The distance you walk depends on, or is described in terms of, thenumber of hours you walk.
In this function, the number of hours you walk is the independentquantity. The distance you walk is the dependent quantity.
An equation that describes this function is d � 4h, where d represents the number of miles you walk and h represents thenumber of hours. In this equation, d, the distance you walk,depends on h, the number of hours you walk.
● The variable h is the independent variable.
● The variable d is the dependent variable.
● The number 4 is a constant, a quantity in an equation that doesnot change.
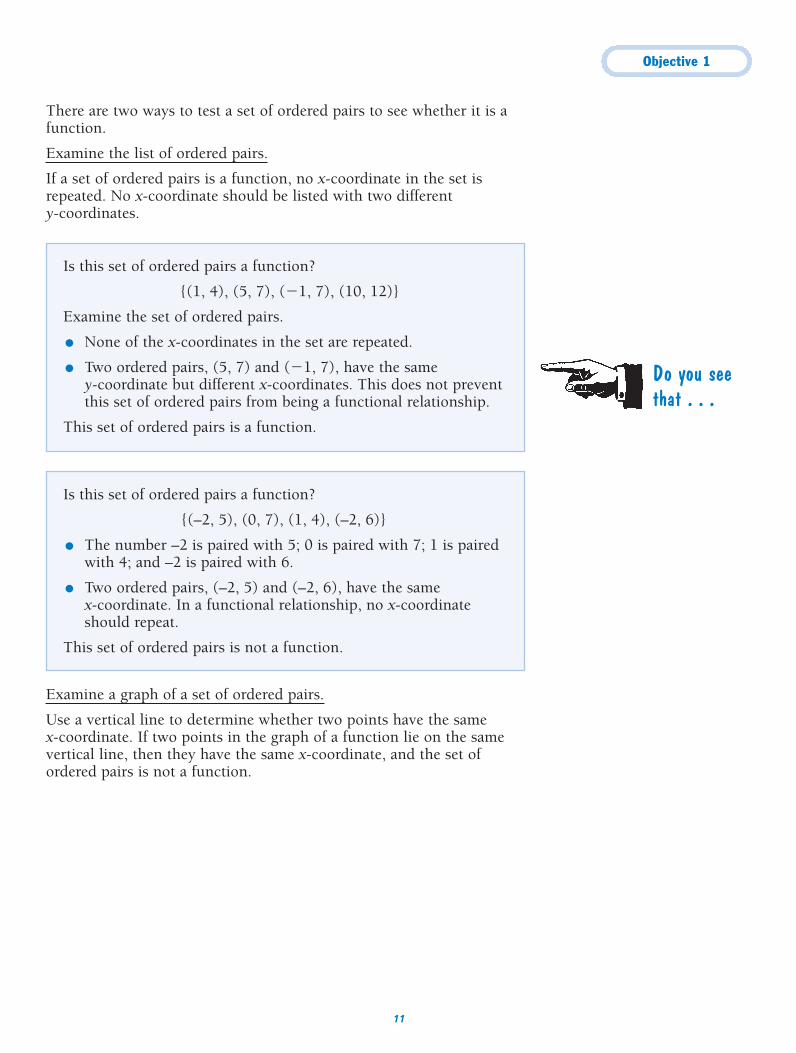
Do the ordered pairs graphed below represent a function?
The ordered pairs (2, 5) and (2, 7) lie on a common vertical line.
They have the same x-coordinate, 2, but different y-coordinates, 5and 7.
This graph does not represent a function because two points lie onthe same vertical line.
y
x
–5
–4
–6
–7
–8
–9
–3
–2
–1
0
1
2
3
4
5
6
7
8
9
–1 1–2–3–4–5–6–7–8–9 2 3 4 5 6 7 8 9
Objective 1
13
Suppose the equation c � 0.07m � 0.25 describes c, the cost of aphone call, in terms of m, the number of minutes the phone calllasts.
In this function, c is the dependent variable, m is the independentvariable, and 0.07 and 0.25 are constants.
Jeremy works at an appliance store. He is paid $180.00 a week forhis base salary plus a commission equal to 5% of his total sales.The equation s � 180 � 0.05d represents Jeremy’s weekly salary,s, in terms of d, his total weekly sales in dollars.
Which variable is the dependent variable in this equation? Whatare the constants?
● Jeremy’s weekly salary, s, is the dependent quantity because itdepends on d, his total sales.
● The constants are 180, Jeremy’s base salary, and 0.05,his commission, because these numbers do not change.
Try ItCara buys milk for her scout camp each morning. The functionbelow shows the relationship between c, the total cost of the milkshe buys, and n, the number of quarts she purchases.
c � 1.25n
In this functional relationship, which value is the dependent quantity?
The __________________________________ quantity is the numberof quarts of milk Cara purchases.
The __________________________________ quantity is the totalcost of the milk because the cost depends on the number of quarts ofmilk Cara buys.
The independent quantity is the number of quarts of milk Cara purchases.The dependent quantity is the total cost of the milk because the costdepends on the number of quarts of milk Cara buys.
Objective 1
14
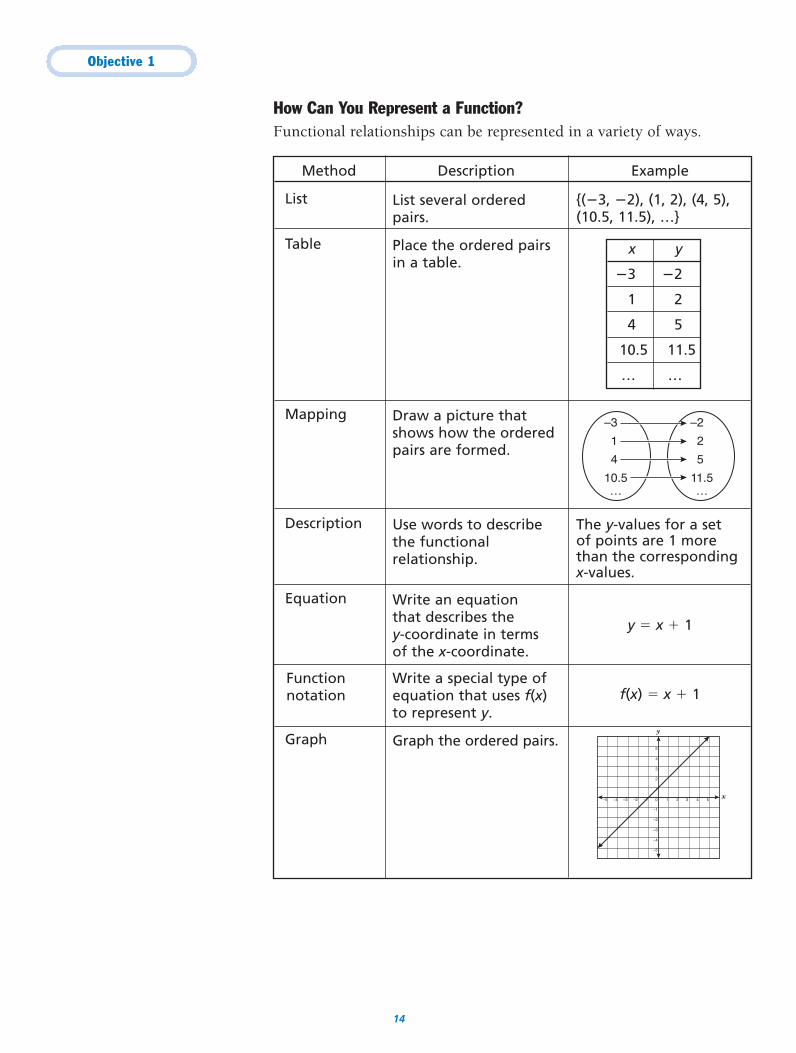
How Can You Represent a Function?Functional relationships can be represented in a variety of ways.
Method Description Example
List
Table
Mapping
Description
Equation
y � x � 1
f(x) � x � 1
Graphy
x
–5
–4
–3
–2
–1
1
2
3
4
5
0–1–2–3–4–5 1 2 3 4 5
Graph the ordered pairs.
Write a special type ofequation that uses f(x) to represent y.
Functionnotation
Write an equation that describes the y-coordinate in terms of the x-coordinate.
The y-values for a set of points are 1 morethan the corresponding x-values.
Use words to describethe functionalrelationship.
–3
1
4
10.5…
–2
2
5
11.5…
Draw a picture thatshows how the orderedpairs are formed.
Place the ordered pairsin a table.
{(�3, �2), (1, 2), (4, 5),(10.5, 11.5), …}
List several orderedpairs.
x y
�3 �2
1 2
4 5
10.5 11.5
… …
Objective 1
15
To use function notation to describe a function, give the function a name, typically a letter such as f, g, or h. Then use an algebraicexpression to describe the y-coordinate of an ordered pair.
Suppose f(x) � 3x � 1.
● This function is read as “f of x equals 3 times x minus 1.”
● If you input x, the output will be 3x � 1.
● The y-coordinate of the ordered pair is 3x � 1.
The function described by f(x) � 3x � 1 is the same as thefunction described by y � 3x � 1. In this function, an ordered pair looks like this: (x, 3x � 1).
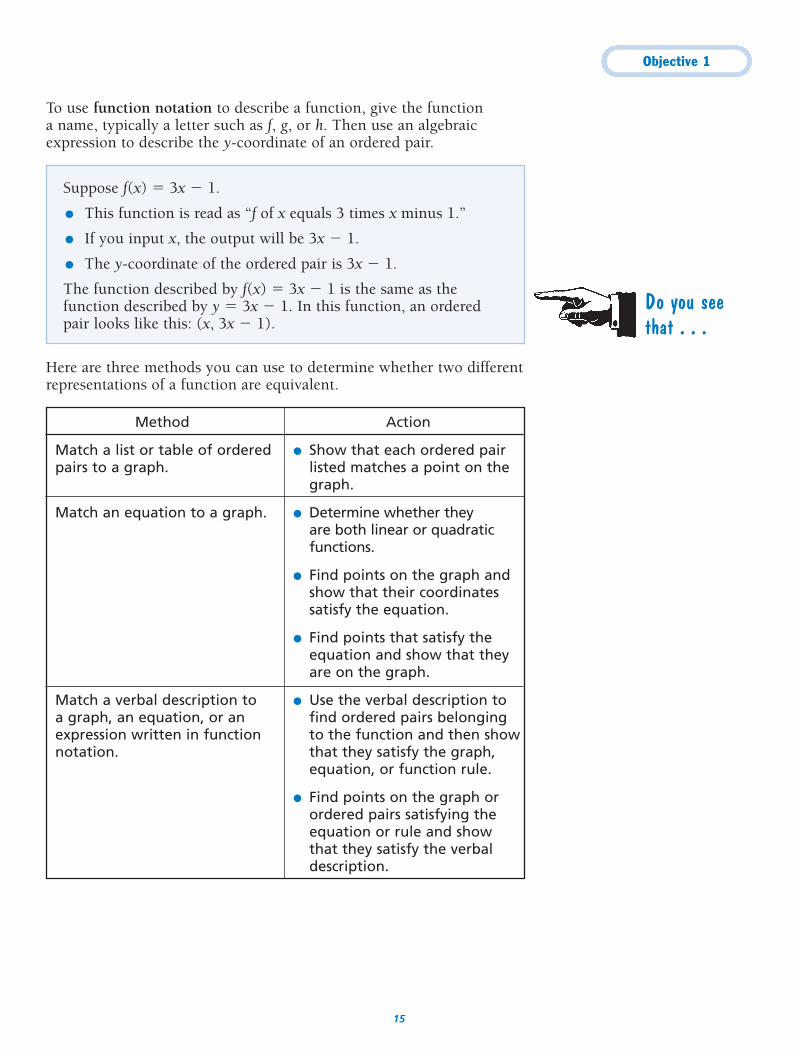
Here are three methods you can use to determine whether two differentrepresentations of a function are equivalent.
Method
Match a list or table of orderedpairs to a graph.
Match an equation to a graph.
Match a verbal description to a graph, an equation, or anexpression written in functionnotation.
Action
● Show that each ordered pairlisted matches a point on thegraph.
● Determine whether they are both linear or quadraticfunctions.
● Find points on the graph andshow that their coordinatessatisfy the equation.
● Find points that satisfy theequation and show that theyare on the graph.
● Use the verbal description tofind ordered pairs belongingto the function and then showthat they satisfy the graph,equation, or function rule.
● Find points on the graph orordered pairs satisfying theequation or rule and showthat they satisfy the verbaldescription.
Do you seethat . . .
Objective 1
16
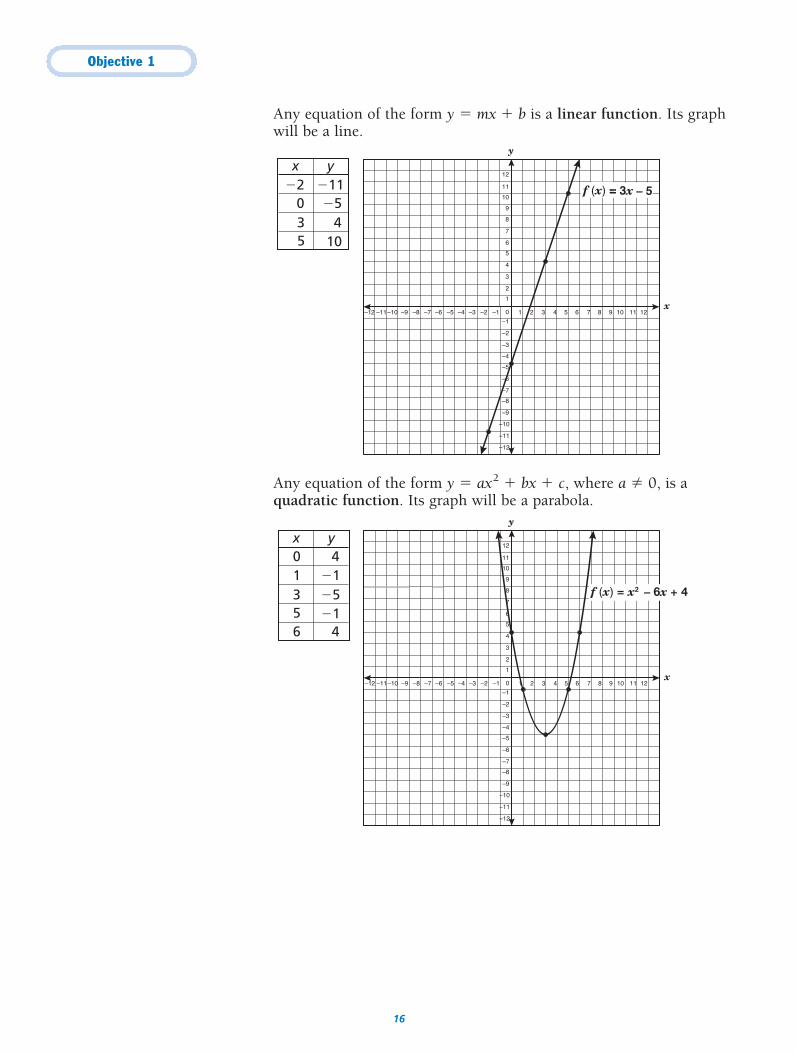
Any equation of the form y � mx � b is a linear function. Its graphwill be a line.
Any equation of the form y � ax2 � bx � c, where a � 0, is aquadratic function. Its graph will be a parabola.
y
x
–5
–4
–6
–7
–8
–9
–10
–11
–12
–3
–2
–1
0
1
2
3
4
5
6
7
8
9
10
11
12
–1 1–2–3–4–5–6–7–8–9–10–11–12 2 3 4 5 6 7 8 9 10 11 12
x y01356
4�1
�1�5
4
f (x) = x2 – 6x + 4
y
x
–5
–4
–6
–7
–8
–9
–10
–11
–12
–3
–2
–1
0
1
2
3
4
5
6
7
8
9
10
11
12
–1 1–2–3–4–5–6–7–8–9–10–11–12 2 3 4 5 6 7 8 9 10 11 12
f (x) = 3x – 5
x y
035
�5�2 �11
10 4
Objective 1
17
Which ordered pair, (7, 11) or (�4, �1), belongs to the functionin which the y-coordinate is 3 more than the x-coordinate?
Match the ordered pairs to the verbal description.
● For the ordered pair (7, 11), the y-coordinate should be3 more than 7.
7 � 3 � 10, not 11
The ordered pair (7, 11) does not belong to this function.
● For the ordered pair (�4, �1), the y-coordinate should be 3 more than �4.
�4 � 3 � �1
The ordered pair (�4, �1) belongs to this function.
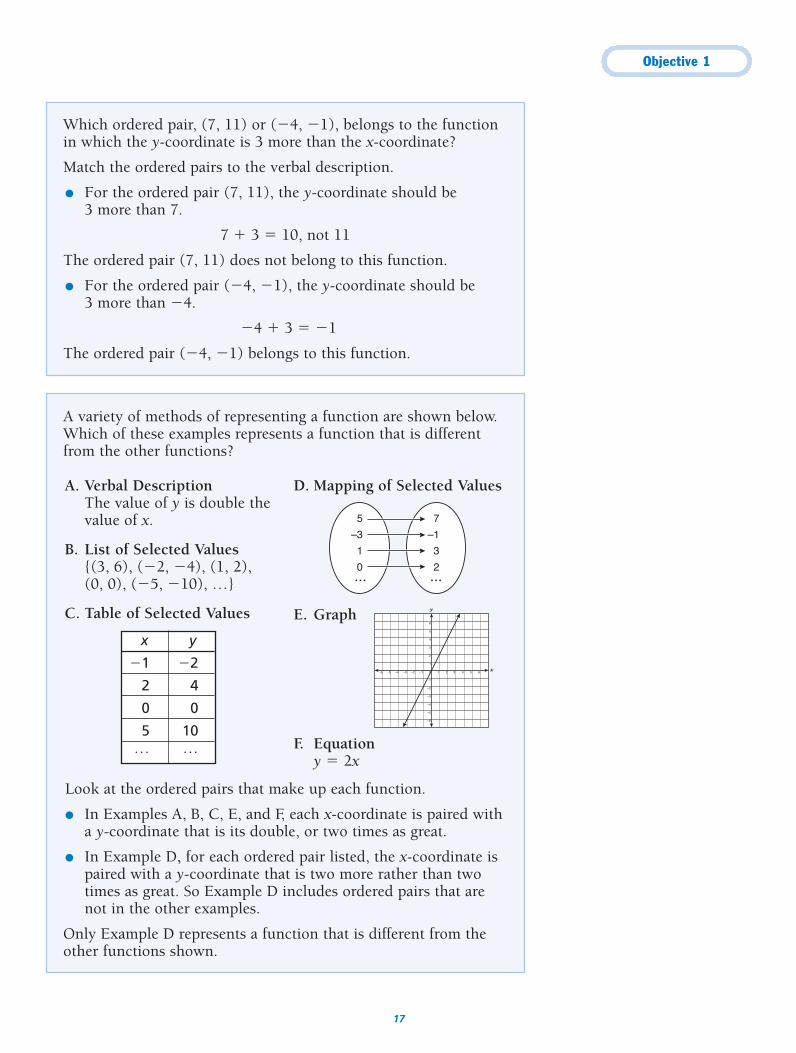
A variety of methods of representing a function are shown below.Which of these examples represents a function that is differentfrom the other functions?
Look at the ordered pairs that make up each function.
● In Examples A, B, C, E, and F, each x-coordinate is paired witha y-coordinate that is its double, or two times as great.
● In Example D, for each ordered pair listed, the x-coordinate ispaired with a y-coordinate that is two more rather than twotimes as great. So Example D includes ordered pairs that arenot in the other examples.
Only Example D represents a function that is different from theother functions shown.
A. Verbal Description The value of y is double thevalue of x.
B. List of Selected Values {(3, 6), (�2, �4), (1, 2), (0, 0), (�5, �10), …}
C. Table of Selected Values
D. Mapping of Selected Values
E. Graph
F. Equationy � 2x
x y
�1 �2
2 4
0 0
5 10… …
5
–3
1
0
7
–1
3
2... ...
–6
6
6
y
x
–5
–4
–3
–2
–1
1
2
3
4
5
0–1–2–3–4–5–6 1 2 3 4 5
Objective 1
18
The table below presents selected values in a functional relationship.
Write an equation that describes this functional relationship.
● Look for a pattern in the ordered pairs that belong to the function.The y-coordinate appears to be 5 more than the x-coordinate,so x � 5 � y should represent the pattern.
● Check this equation for each pair.
x � 5 � y
For x � �2 �2 � 5 � 3For x � 1 1 � 5 � 6For x � 5 5 � 5 � 10For x � 7 7 � 5 � 12
The y-coordinate in each ordered pair is 5 more than the x-coordinate.
The rule for this function can be represented by the equation x � 5 � y or by the equation y � x � 5.
x �2 1 5 7
y 3 6 10 12
The table on the right presents selected values in afunctional relationship between x and y.
Using function notation, write a rule that representsthe relationship.
● Look for a pattern in the function’s orderedpairs.The y-coordinate appears to be 5 times the x-coordinate plus 2.
● Check this pattern for each pair.
5x � 2 � y
(�1, �3) 5 • �1 � 2 � �3(1, 7) 5 • 1 � 2 � 7(3, 17) 5 • 3 � 2 � 17(8, 42) 5 • 8 � 2 � 42
The y-coordinate is equal to 5 times the x-coordinate plus 2.
The rule for this function can be represented by the equation y � 5x � 2.Replace y with f(x) to express the rule in function notation: f(x) � 5x � 2.Do you see
that . . .
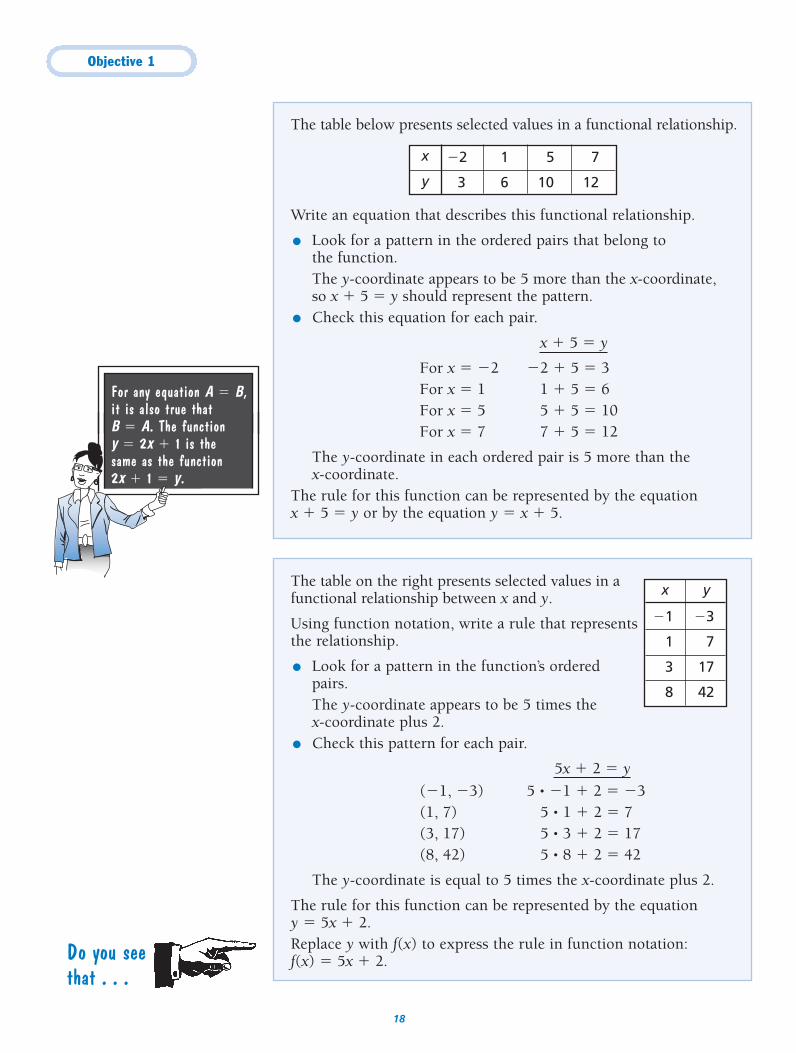
For any equation A � B,it is also true that B � A. The function y � 2x � 1 is the same as the function 2x � 1 � y.
x y
�1 �3
1 7
3 17
8 42
Objective 1
19
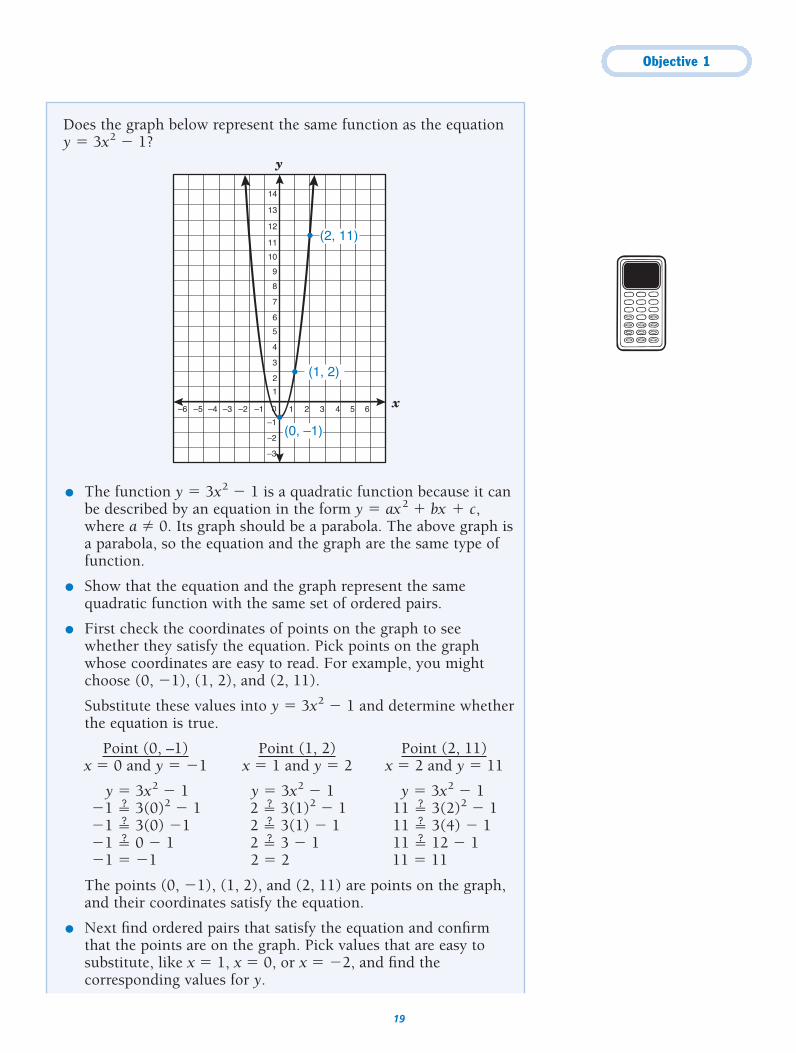
Does the graph below represent the same function as the equationy � 3x2 � 1?
● The function y � 3x2 � 1 is a quadratic function because it canbe described by an equation in the form y � ax2 � bx � c,where a � 0. Its graph should be a parabola. The above graph isa parabola, so the equation and the graph are the same type offunction.
● Show that the equation and the graph represent the samequadratic function with the same set of ordered pairs.
● First check the coordinates of points on the graph to seewhether they satisfy the equation. Pick points on the graphwhose coordinates are easy to read. For example, you mightchoose (0, �1), (1, 2), and (2, 11).
Substitute these values into y � 3x2 � 1 and determine whetherthe equation is true.
Point (0, –1) Point (1, 2) Point (2, 11)x � 0 and y � �1 x � 1 and y � 2 x � 2 and y � 11
y � 3x2 � 1 y � 3x2 � 1 y � 3x2 � 1�1 � 3(0)2 � 1 2 � 3(1)2 � 1 11 � 3(2)2 � 1�1 � 3(0) �1 2 � 3(1) � 1 11 � 3(4) � 1�1 � 0 � 1 2 � 3 � 1 11 � 12 � 1�1 � �1 2 � 2 11 � 11
The points (0, �1), (1, 2), and (2, 11) are points on the graph,and their coordinates satisfy the equation.
● Next find ordered pairs that satisfy the equation and confirmthat the points are on the graph. Pick values that are easy tosubstitute, like x � 1, x � 0, or x � �2, and find thecorresponding values for y.
y
x
–3
–2
–1
0
1
2
3
4
5
6
7
8
9
10
13
14
11
12
–1 1–2–3–4–5–6 2 3 4 5 6
(2, 11)
(1, 2)
(0, –1)
Objective 1
20
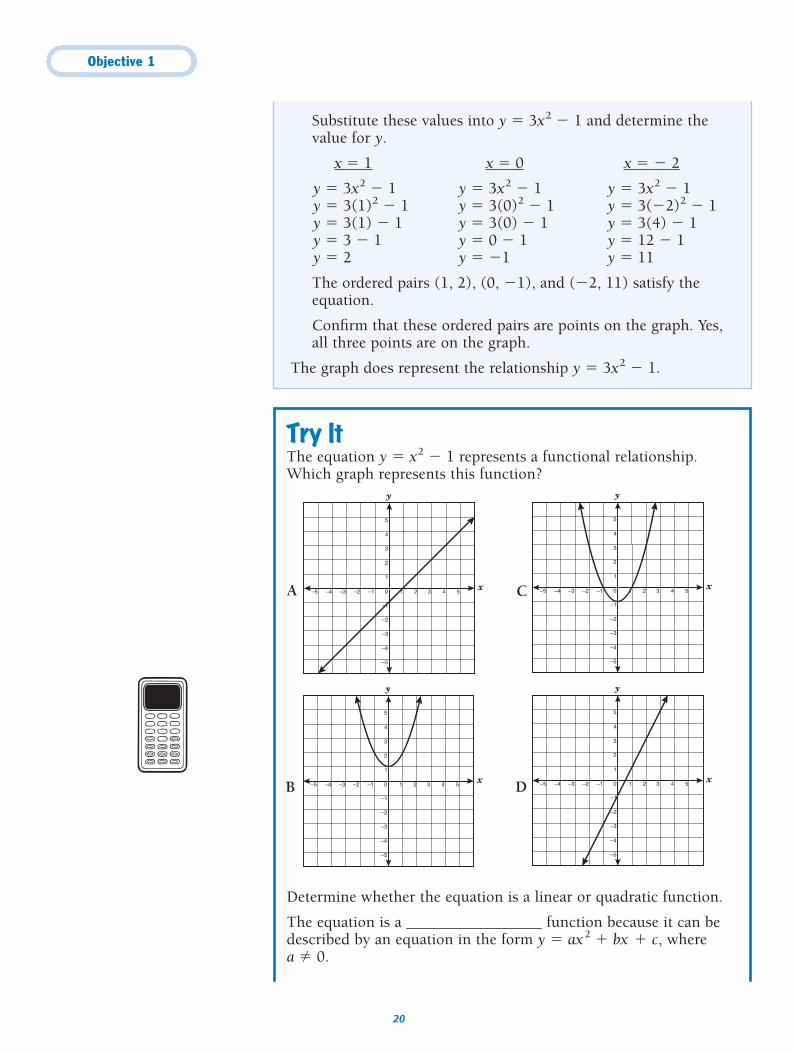
Try ItThe equation y � x2 � 1 represents a functional relationship.Which graph represents this function?
Determine whether the equation is a linear or quadratic function.
The equation is a _________________ function because it can bedescribed by an equation in the form y � ax2 � bx � c, where a � 0.
y
x
–5
–4
–3
–2
–1
1
2
3
4
5
0–1–2–3–4–5 1 2 3 4 5
y
x
–5
–4
–3
–2
–1
1
2
3
4
5
0–1–2–3–4–5 1 2 3 4 5
y
x
–5
–4
–3
–2
–1
1
2
3
4
5
0–1–2–3–4–5 1 2 3 4 5
y
x
–5
–4
–3
–2
–1
1
2
3
4
5
0–1–2–3–4–5 1 2 3 4 5
Substitute these values into y � 3x2 � 1 and determine thevalue for y.
x � 1 x � 0 x � � 2
y � 3x2 � 1 y � 3x2 � 1 y � 3x2 � 1y � 3(1)2 � 1 y � 3(0)2 � 1 y � 3(�2)2 � 1y � 3(1) � 1 y � 3(0) � 1 y � 3(4) � 1y � 3 � 1 y � 0 � 1 y � 12 � 1y � 2 y � �1 y � 11
The ordered pairs (1, 2), (0, �1), and (�2, 11) satisfy theequation.
Confirm that these ordered pairs are points on the graph. Yes,all three points are on the graph.
The graph does represent the relationship y � 3x2 � 1.
A C
B D
Objective 1
21
Its graph must be a _________________.
Answer choices _______ and _______ cannot be the graph of this
function because they are _________________.
Determine which parabola is the correct graph.
See whether the point (0, 1) in answer choice B satisfies the
equation y � x2 � 1.
When x � 0 and y � _______, is the equation y � x2 � 1 true?
Does _______ � _______ � _______?
No, _______ � _______.
Answer choice B is _________________.
See whether the point (0, �1) in answer choice C satisfies the
equation y � x2 � 1.
When x � _______ and y � _______, is the equation y � x2 � 1
true?
Does _______ � _______ � _______?
Yes, _______ � _______.
Answer choice C is _____________________.
The equation is a quadratic function because it can be described by anequation in the form y � ax2 � bx � c, where a � 0. Its graph must be aparabola. Answer choices A and D cannot be the graph of this functionbecause they are lines. When x � 0 and y � 1, is the equation y � x2 � 1true? Does 1 � 02 � 1? No, 1 � �1. Answer choice B is not correct. Whenx � 0 and y � �1, is the equation y � x2 � 1 true? Does �1 � 02 � 1? Yes,�1 � �1. Answer choice C is correct.
Objective 1
22
How Can You Draw Conclusions from a Functional Relationship?Use these guidelines when interpreting functional relationships in areal-life problem.
● Understand the problem.
● Identify the quantities involved and any relationships between them.
● Determine what the variables in the problem represent.
● For graphs: Determine what quantity each axis on the graphrepresents. Look at the scale that is used on each axis.
● For tables: Determine what quantity each column in the tablerepresents.
● Look for trends in the data. Look for maximum and minimumvalues in graphs.
● Look for any unusual data. For example, does a graph start at a nonzero value? Is one of the problem’s variables negative atany point?
● Match the data to the equations or formulas in the problem.
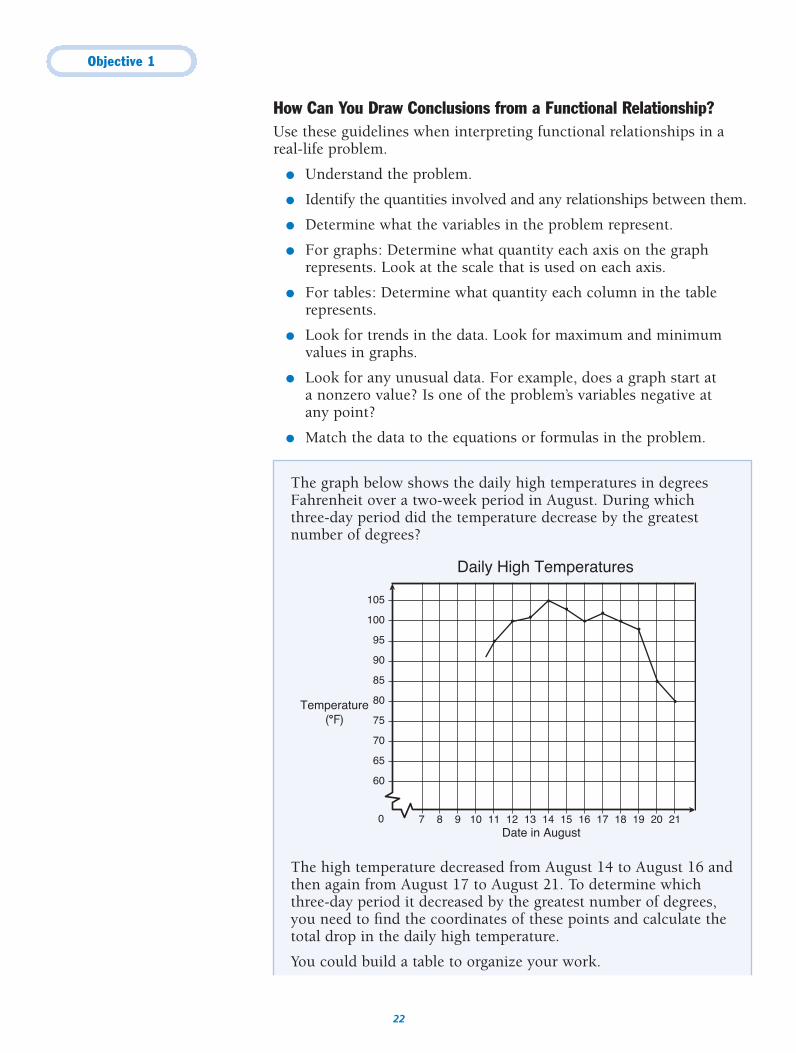
The graph below shows the daily high temperatures in degreesFahrenheit over a two-week period in August. During which three-day period did the temperature decrease by the greatestnumber of degrees?
The high temperature decreased from August 14 to August 16 andthen again from August 17 to August 21. To determine whichthree-day period it decreased by the greatest number of degrees,you need to find the coordinates of these points and calculate thetotal drop in the daily high temperature.
You could build a table to organize your work.
Temperature(°°F)
Daily High Temperatures
Date in August7 9 11 13 15 17 198 10 12 14 16 18 20 21
60
65
70
75
80
85
90
95
100
105
0
Objective 1
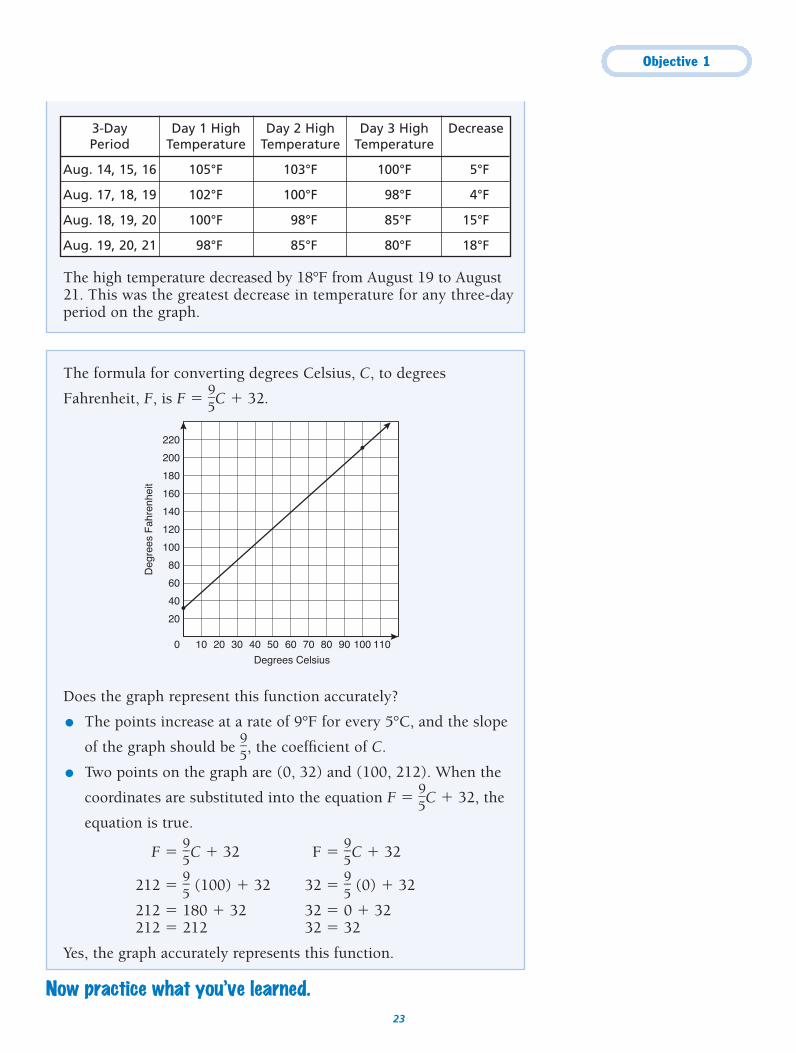
The high temperature decreased by 18°F from August 19 to August21. This was the greatest decrease in temperature for any three-dayperiod on the graph.
3-Day Day 1 High Day 2 High Day 3 High DecreasePeriod Temperature Temperature Temperature
Aug. 14, 15, 16 105°F 103°F 100°F 5°F
Aug. 17, 18, 19 102°F 100°F 98°F 4°F
Aug. 18, 19, 20 100°F 98°F 85°F 15°F
Aug. 19, 20, 21 98°F 85°F 80°F 18°F
23
The formula for converting degrees Celsius, C, to degrees
Fahrenheit, F, is F � �95
�C � 32.
Does the graph represent this function accurately?
● The points increase at a rate of 9°F for every 5°C, and the slope
of the graph should be �95
�, the coefficient of C.
● Two points on the graph are (0, 32) and (100, 212). When the
coordinates are substituted into the equation F � �95
�C � 32, the
equation is true.
F � �95
�C � 32 F � �95
�C � 32
212 � �95
� (100) � 32 32 � �95
� (0) � 32
212 � 180 � 32 32 � 0 � 32212 � 212 32 � 32
Yes, the graph accurately represents this function.
90 100 1100
20
40
60
80
100
120
140
160
180
200
220
10 20 30 40 50 60 70 80
Degrees Celsius
Deg
rees
Fah
renh
eit
Now practice what you’ve learned.
Objective 1
24
Answer Key: page 235
Answer Key: page 235
Answer Key: page 235Answer Key: page 235
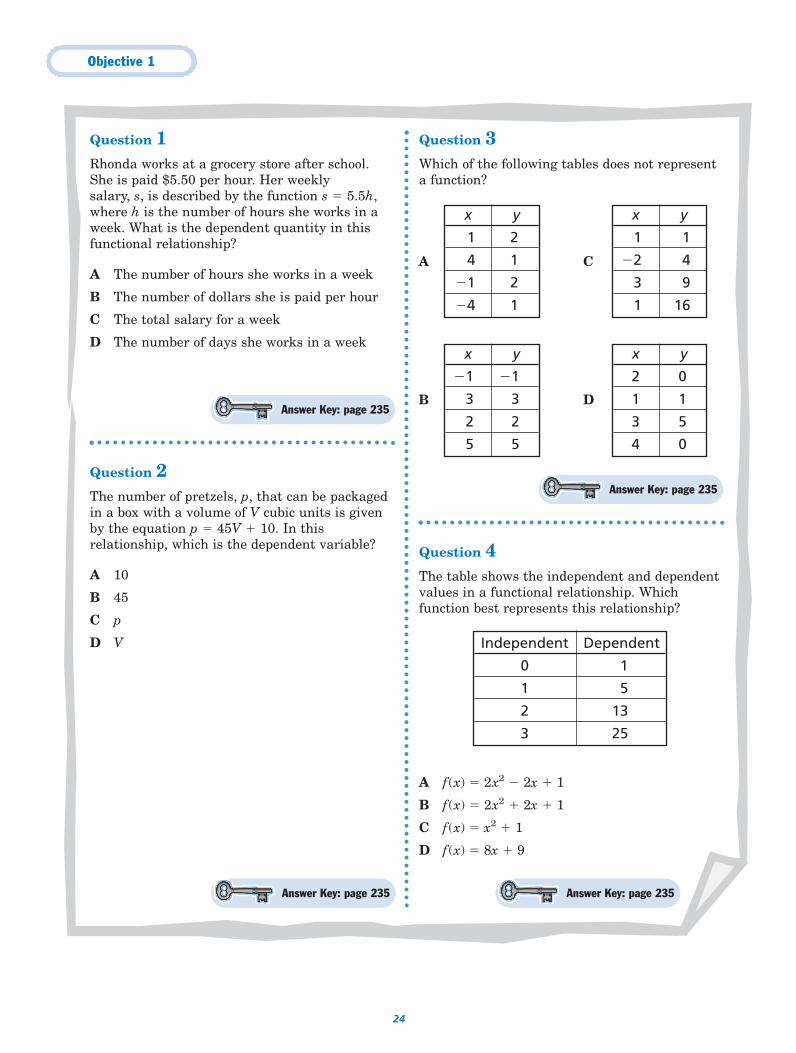
Independent Dependent
0 1
1 5
2 13
3 25
A C
B D
x y
1 2
4 1
�1 2
�4 1
x y
�1 �1
3 3
2 2
5 5
x y
1 1
�2 4
3 9
1 16
x y
2 0
1 1
3 5
4 0
Question 1Rhonda works at a grocery store after school.She is paid $5.50 per hour. Her weekly salary, s, is described by the function s � 5.5h,where h is the number of hours she works in aweek. What is the dependent quantity in thisfunctional relationship?
A The number of hours she works in a week
B The number of dollars she is paid per hour
C The total salary for a week
D The number of days she works in a week
Question 2The number of pretzels, p, that can be packagedin a box with a volume of V cubic units is givenby the equation p � 45V � 10. In thisrelationship, which is the dependent variable?
A 10
B 45
C p
D V
Question 3Which of the following tables does not representa function?
Question 4The table shows the independent and dependentvalues in a functional relationship. Whichfunction best represents this relationship?
A f(x) � 2x2 � 2x � 1
B f(x) � 2x2 � 2x � 1
C f(x) � x2 � 1
D f(x) � 8x � 9
Objective 1
25
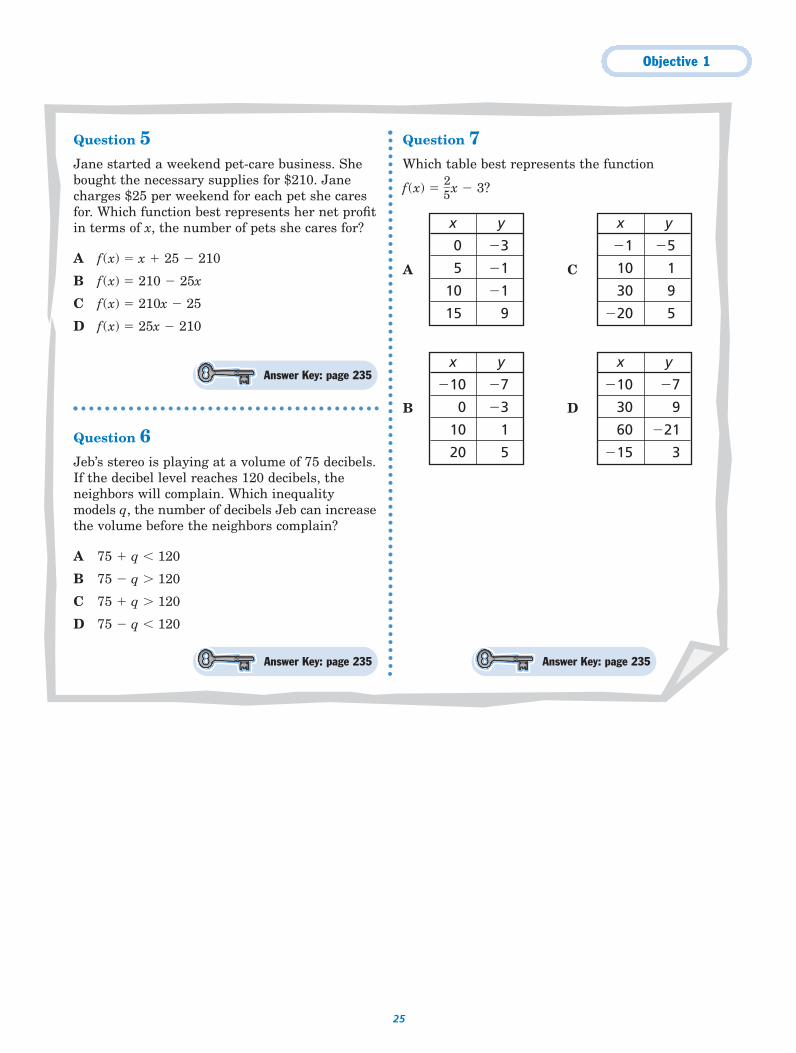
Question 5Jane started a weekend pet-care business. Shebought the necessary supplies for $210. Janecharges $25 per weekend for each pet she caresfor. Which function best represents her net profitin terms of x, the number of pets she cares for?
A f(x) � x � 25 � 210
B f(x) � 210 � 25x
C f(x) � 210x � 25
D f(x) � 25x � 210
Question 6Jeb’s stereo is playing at a volume of 75 decibels.If the decibel level reaches 120 decibels, theneighbors will complain. Which inequalitymodels q, the number of decibels Jeb can increasethe volume before the neighbors complain?
A 75 � q � 120
B 75 � q � 120
C 75 � q � 120
D 75 � q � 120
Question 7Which table best represents the function
f(x) � �25
�x � 3?
Answer Key: page 235Answer Key: page 235
Answer Key: page 235
A C
B D
x y
0 �3
5 �1
10 �1
15 9
x y
�10 �7
0 �3
10 1
20 5
x y
�1 �5
10 1
30 9
�20 5
x y
�10 �7
30 9
60 �21
�15 3
Objective 1
26
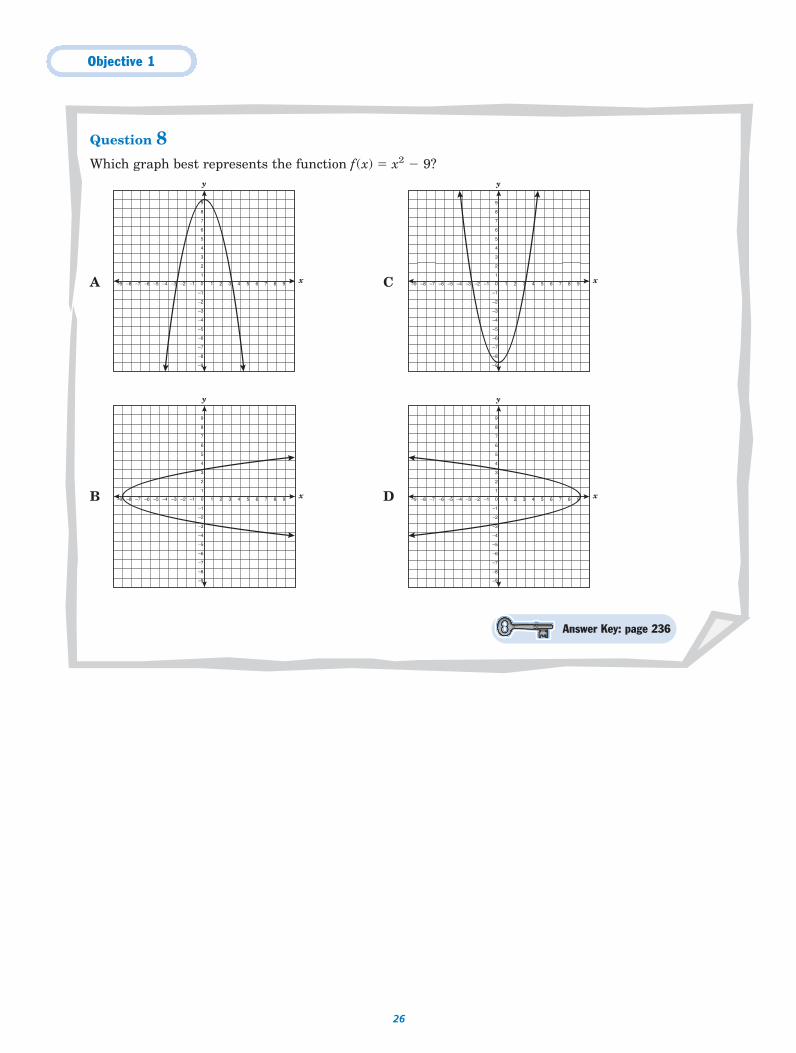
Question 8Which graph best represents the function f(x) � x2 � 9?
A C
B D
Answer Key: page 236
y
x
–5
–4
–6
–7
–8
–9
–3
–2
–1
0
1
2
3
4
5
6
7
8
9
–1 1–2–3–4–5–6–7–8–9 2 3 4 5 6 7 8 9
y
x
–5
–4
–6
–7
–8
–9
–3
–2
–1
0
1
2
3
4
5
6
7
8
9
–1 1–2–3–4–5–6–7–8–9 2 3 4 5 6 7 8 9
y
x
–5
–4
–6
–7
–8
–9
–3
–2
–1
0
1
2
3
4
5
6
7
8
9
–1 1–2–3–4–5–6–7–8–9 2 3 4 5 6 7 8 9
y
x
–5
–4
–6
–7
–8
–9
–3
–2
–1
0
1
2
3
4
5
6
7
8
9
–1 1–2–3–4–5–6–7–8–9 2 3 4 5 6 7 8 9
Objective 1
27
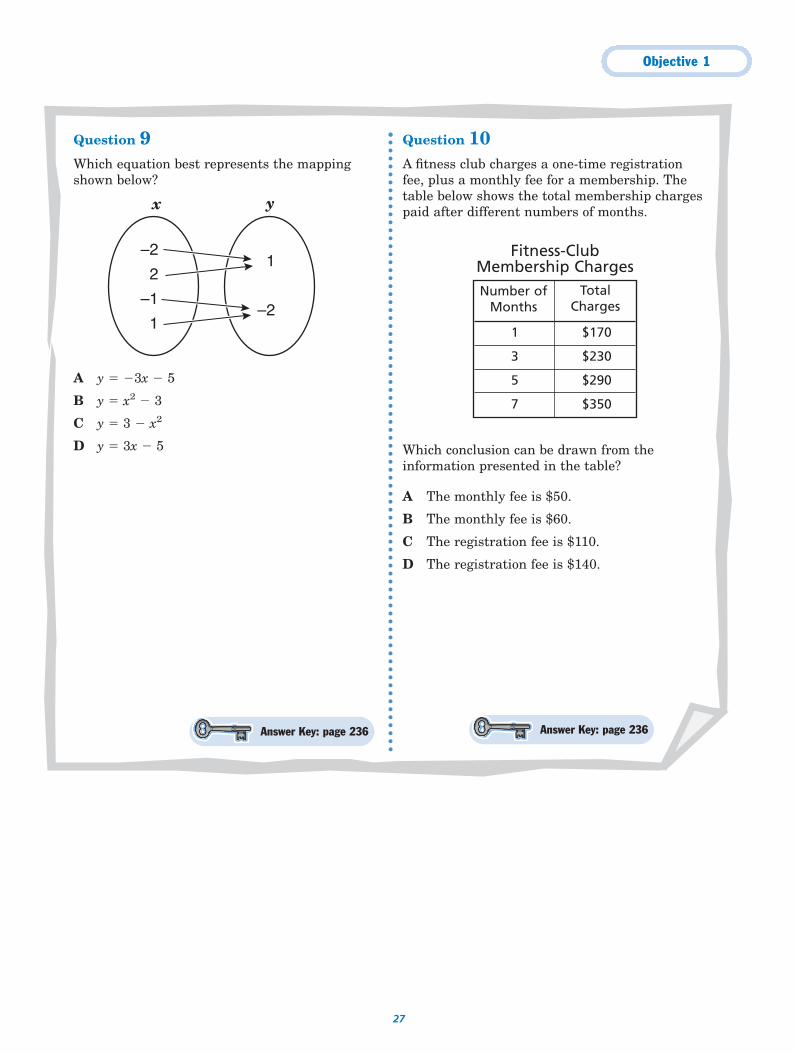
Question 9Which equation best represents the mappingshown below?
A y � �3x � 5
B y � x2 � 3
C y � 3 � x2
D y � 3x � 5
Question 10A fitness club charges a one-time registrationfee, plus a monthly fee for a membership. Thetable below shows the total membership chargespaid after different numbers of months.
Which conclusion can be drawn from theinformation presented in the table?
A The monthly fee is $50.
B The monthly fee is $60.
C The registration fee is $110.
D The registration fee is $140.
1 $170
3 $230
5 $290
7 $350
Answer Key: page 236Answer Key: page 236
–2
2
–1
1
1
–2
x y
Number ofMonths
Fitness-ClubMembership Charges
TotalCharges
Objective 1
28
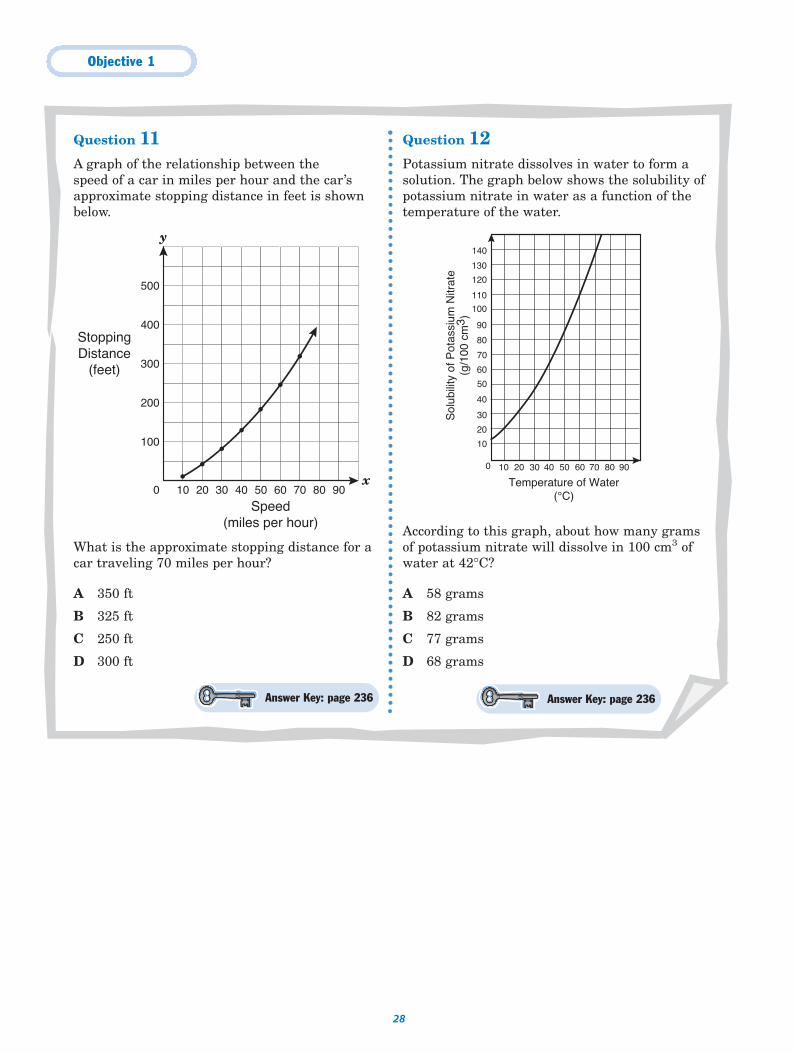
Question 11A graph of the relationship between the speed of a car in miles per hour and the car’sapproximate stopping distance in feet is shownbelow.
What is the approximate stopping distance for acar traveling 70 miles per hour?
A 350 ft
B 325 ft
C 250 ft
D 300 ft
Question 12Potassium nitrate dissolves in water to form asolution. The graph below shows the solubility ofpotassium nitrate in water as a function of thetemperature of the water.
According to this graph, about how many gramsof potassium nitrate will dissolve in 100 cm3 ofwater at 42°C?
A 58 grams
B 82 grams
C 77 grams
D 68 grams
9010 20 30 40 50 60 70 80
Temperature of Water(°C)
Sol
ubili
ty o
f Pot
assi
um N
itrat
e(g
/100
cm
3 )0
20
40
60
80
100
120
140
130
110
90
70
50
30
10
0
100
200
300
400
10 20 30 40 50 60 70 80
500
90
y
x
Speed(miles per hour)
StoppingDistance
(feet)
Answer Key: page 236 Answer Key: page 236
Objective 1
29
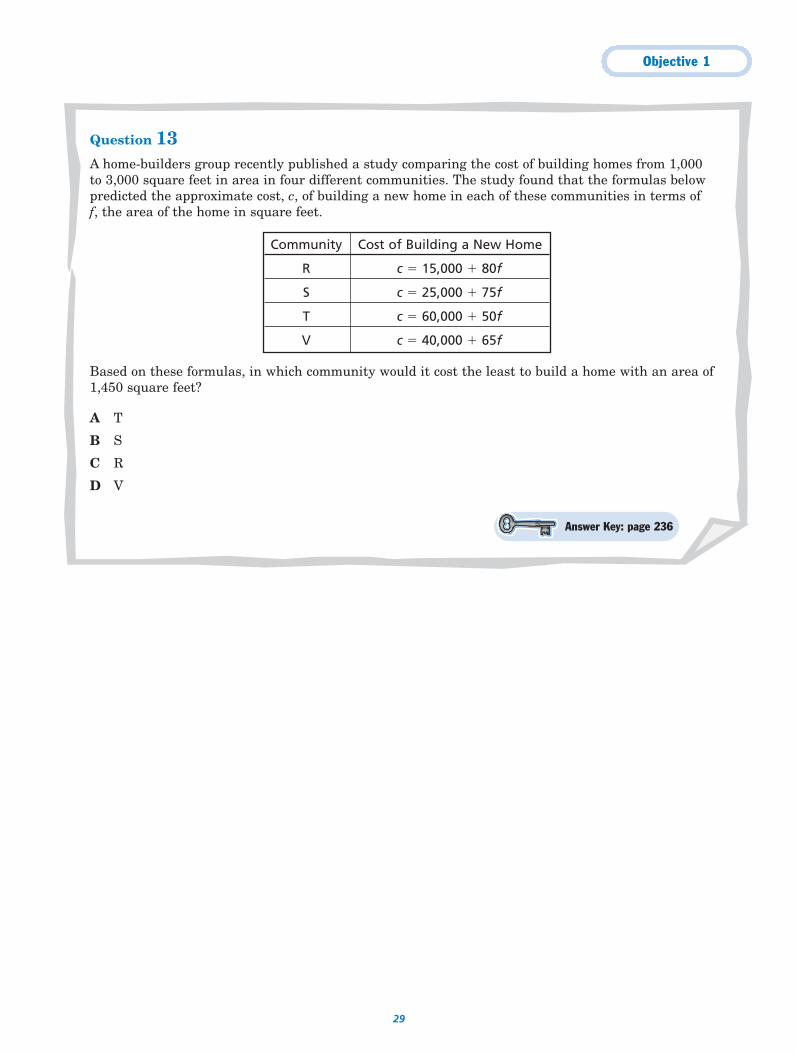
Question 13A home-builders group recently published a study comparing the cost of building homes from 1,000 to 3,000 square feet in area in four different communities. The study found that the formulas belowpredicted the approximate cost, c, of building a new home in each of these communities in terms of f, the area of the home in square feet.
Based on these formulas, in which community would it cost the least to build a home with an area of1,450 square feet?
A T
B S
C R
D V
Community Cost of Building a New Home
R c � 15,000 � 80f
S c � 25,000 � 75f
T c � 60,000 � 50f
V c � 40,000 � 65f
Answer Key: page 236
30
The student will demonstrate an understanding of the properties and attributes of functions.
Objective 2
For this objective you should be able to
● use the properties and attributes of functions;
● use algebra to express generalizations and use symbols torepresent situations; and
● manipulate symbols to solve problems and use algebraic skills tosimplify algebraic expressions and solve equations andinequalities in problem situations.
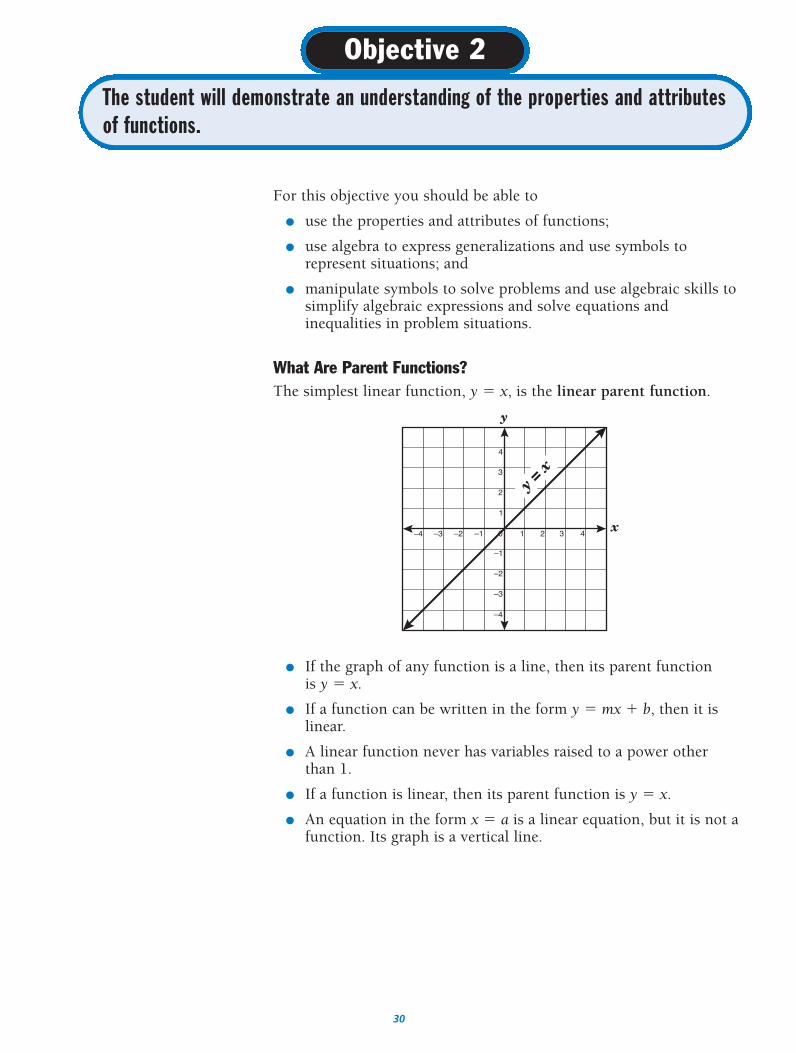
What Are Parent Functions?The simplest linear function, y � x, is the linear parent function.
● If the graph of any function is a line, then its parent function is y � x.
● If a function can be written in the form y � mx � b, then it islinear.
● A linear function never has variables raised to a power otherthan 1.
● If a function is linear, then its parent function is y � x.
● An equation in the form x � a is a linear equation, but it is not afunction. Its graph is a vertical line.
y
x
–4
–3
–2
–1
1
2
3
4
0–1–2–3–4 1 2 3 4
y = x
Objective 2
31
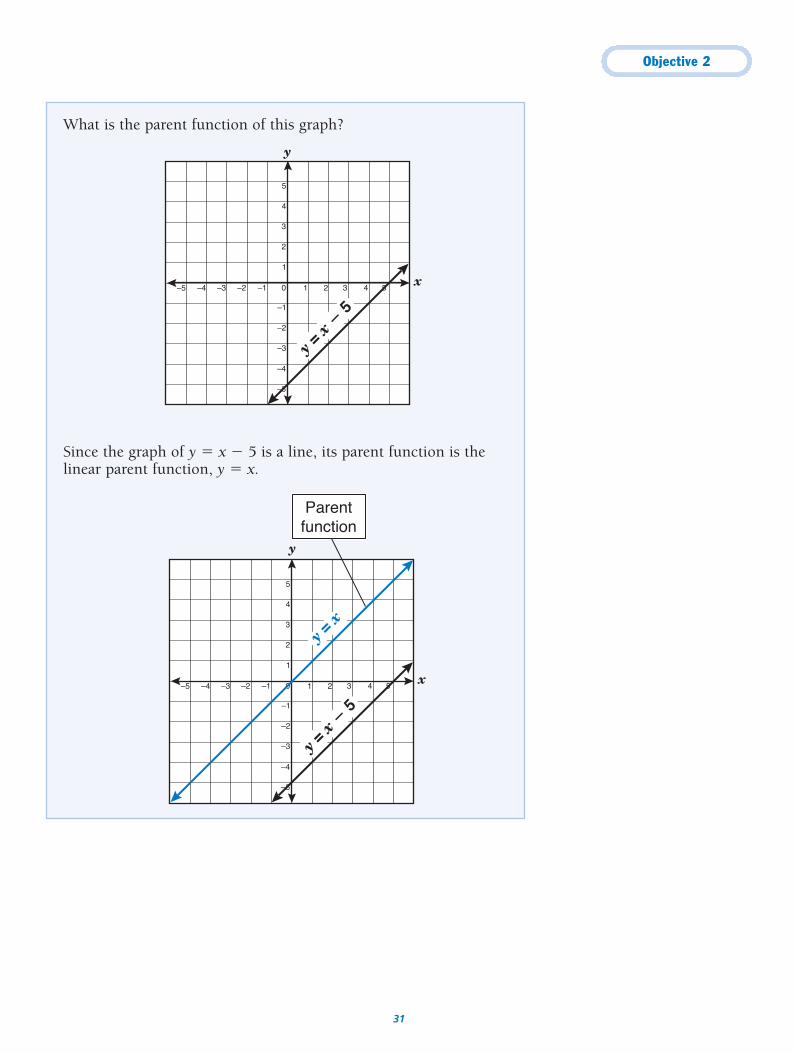
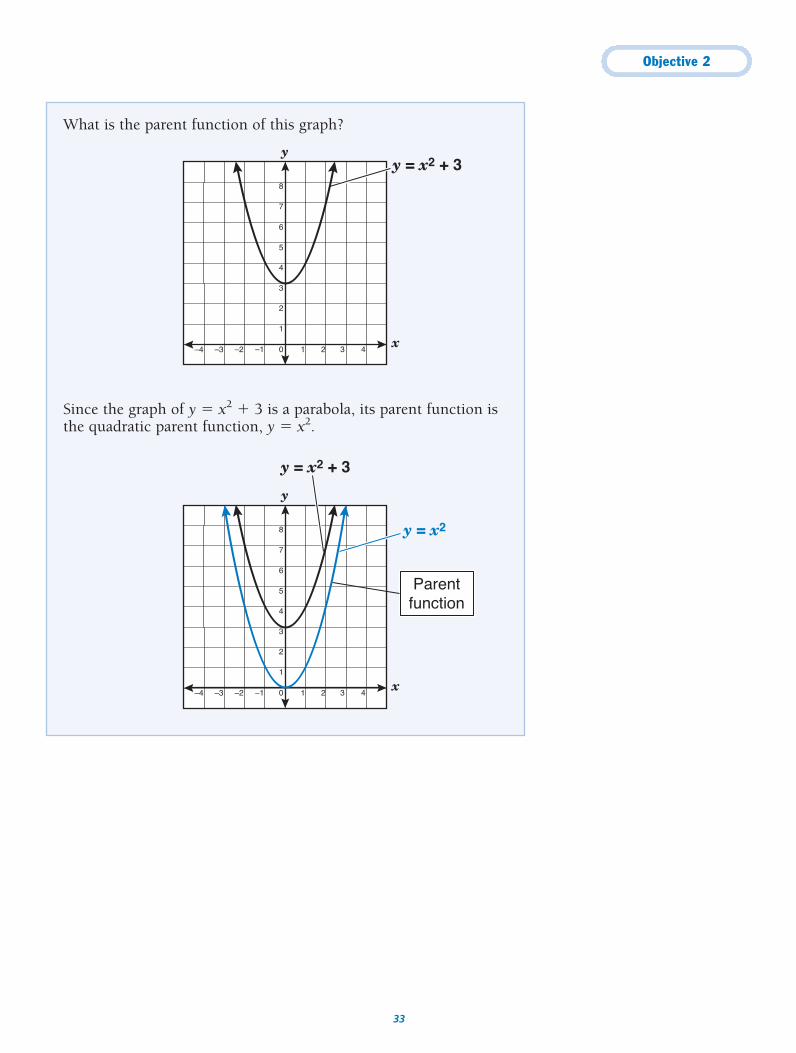
What is the parent function of this graph?
Since the graph of y � x � 5 is a line, its parent function is thelinear parent function, y � x.
x
–4
–5
–3
–2
–1
1
2
3
4
5
0–1–2–3–4–5 1 2 3 4
y = x
y = x
� 5
Parentfunction
5
y
x
–4
–5
–3
–2
–1
1
2
3
4
5
0–1–2–3–4–5 1 2 3 4
y = x
� 5
5
y
Objective 2
32
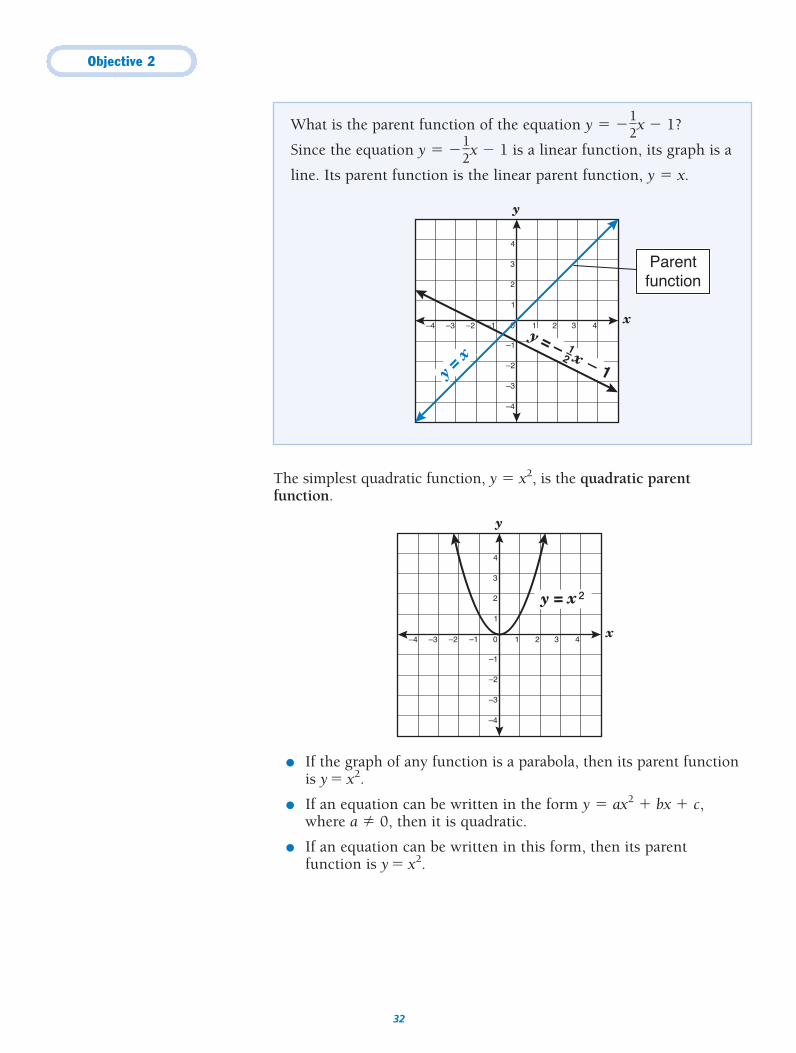
The simplest quadratic function, y � x2, is the quadratic parentfunction.
● If the graph of any function is a parabola, then its parent functionis y� x2.
● If an equation can be written in the form y � ax2 � bx � c,where a � 0, then it is quadratic.
● If an equation can be written in this form, then its parentfunction is y � x2.
y
x
–4
–3
–2
–1
1
2
3
4
0–1–2–3–4 1 2 3 4
y = x 2
What is the parent function of the equation y � ��12
�x � 1?
Since the equation y � ��12
�x � 1 is a linear function, its graph is a
line. Its parent function is the linear parent function, y � x.
y
x
–4
–3
–2
–1
1
2
3
4
0–1–2–3–4 1 2 3 4
y = x
y = – x � 1
Parentfunction
1–2
Objective 2
33
What is the parent function of this graph?
Since the graph of y � x2 � 3 is a parabola, its parent function isthe quadratic parent function, y � x2.
y
x
6
7
8
1
2
3
5
4
0–1–2–3–4 1 2 3 4
y = x2 + 3
y = x2
Parentfunction
y
x
6
7
8
1
2
3
5
4
0–1–2–3–4 1 2 3 4
y = x2 + 3
Objective 2
34
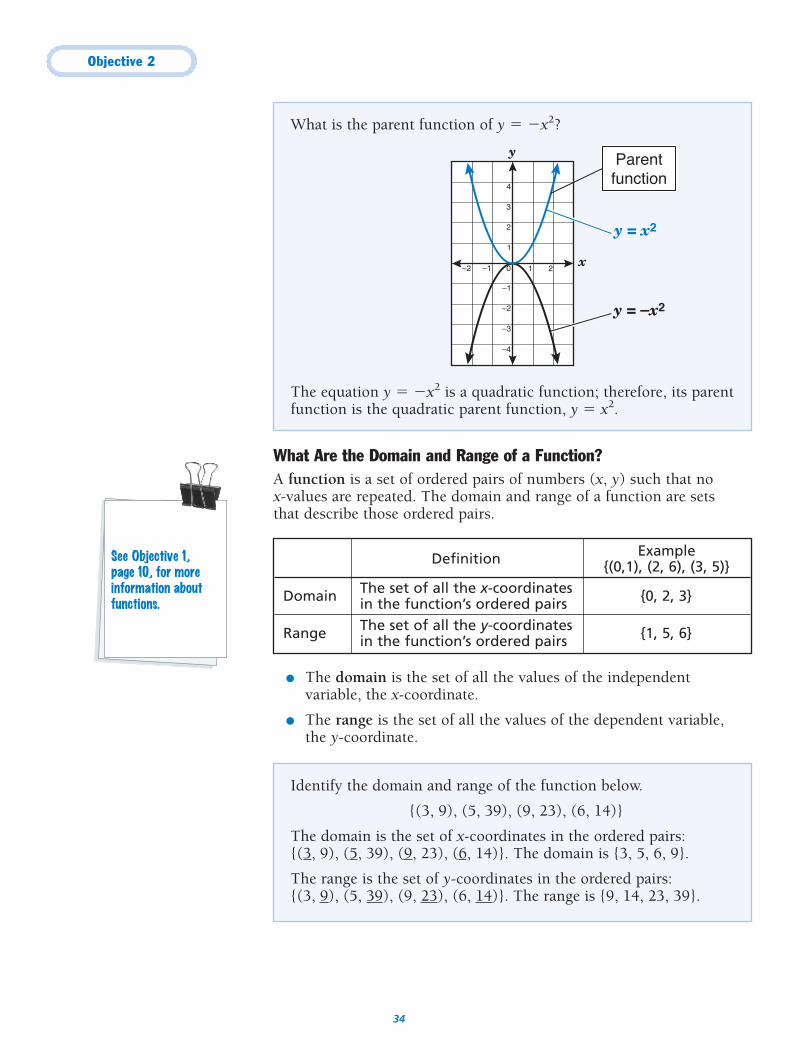
What Are the Domain and Range of a Function?A function is a set of ordered pairs of numbers (x, y) such that no x-values are repeated. The domain and range of a function are sets that describe those ordered pairs.
● The domain is the set of all the values of the independentvariable, the x-coordinate.
● The range is the set of all the values of the dependent variable,the y-coordinate.
Definition Example{(0,1), (2, 6), (3, 5)}
Domain The set of all the x-coordinates {0, 2, 3}in the function’s ordered pairs
Range The set of all the y-coordinates {1, 5, 6}in the function’s ordered pairs
What is the parent function of y � �x2?
The equation y � �x2 is a quadratic function; therefore, its parentfunction is the quadratic parent function, y � x2.
y
x
–4
–3
–2
–1
1
2
3
4
0–1–2 1 2
Parentfunction
y = –x2
y = x2
Identify the domain and range of the function below.
{(3, 9), (5, 39), (9, 23), (6, 14)}
The domain is the set of x-coordinates in the ordered pairs: {(3, 9), (5, 39), (9, 23), (6, 14)}. The domain is {3, 5, 6, 9}.
The range is the set of y-coordinates in the ordered pairs: {(3, 9), (5, 39), (9, 23), (6, 14)}. The range is {9, 14, 23, 39}.
See Objective 1,page 10, for moreinformation aboutfunctions.
Objective 2
35
The domain and range of algebraic functions are usually assumed to be the set of all real numbers. In some cases, however, the domain orrange of a function may be a subset of the real numbers because certainnumbers would not make sense in a real-life problem situation.
Try ItWhat are the domain and range of the function below?
{(4, 9), (�5, 16), (6, 25), (7, �36)}
The domain of a function is the set of all _____-coordinates.
The domain of this function is {_____, _____, _____, _____}.
The range of a function is the set of all _____-coordinates.
The range of this function is {_____, _____, _____, _____}.
The domain of a function is the set of all x-coordinates. The domain ofthis function is {�5, 4, 6, 7}. The range of a function is the set of all y-coordinates. The range of this function is {�36, 9, 16, 25}.
Consider the function l � 4h, in which l equals the number of legson h horses. Are there any values that would not be reasonable toinclude in the domain or range of this function?
● The domain of this function is the set of values you may choosefor h, the independent variable. Would it be reasonable to let h � 1.2? No. The variable h represents a number of horses; itmust be a nonnegative integer. The domain is the set ofnonnegative integers, {0, 1, 2, 3, …}.
It would not be reasonable to include any other numbers in the domain.
● The range of this function is the set of values you will obtain for the dependent variable, l, the number of legs for a group ofh horses. Is it possible to get 6 as a value for l? Could a group ofhorses normally have 6 legs? No, 6 is not a reasonable value forthe range of this function. Since 1 horse has 4 legs, 2 horseshave 8 legs, and so on, the range of this function is the set ofmultiples of 4, or {0, 4, 8, 12, …}.
It would not be reasonable to include any other numbers in the range.
Objective 2
36
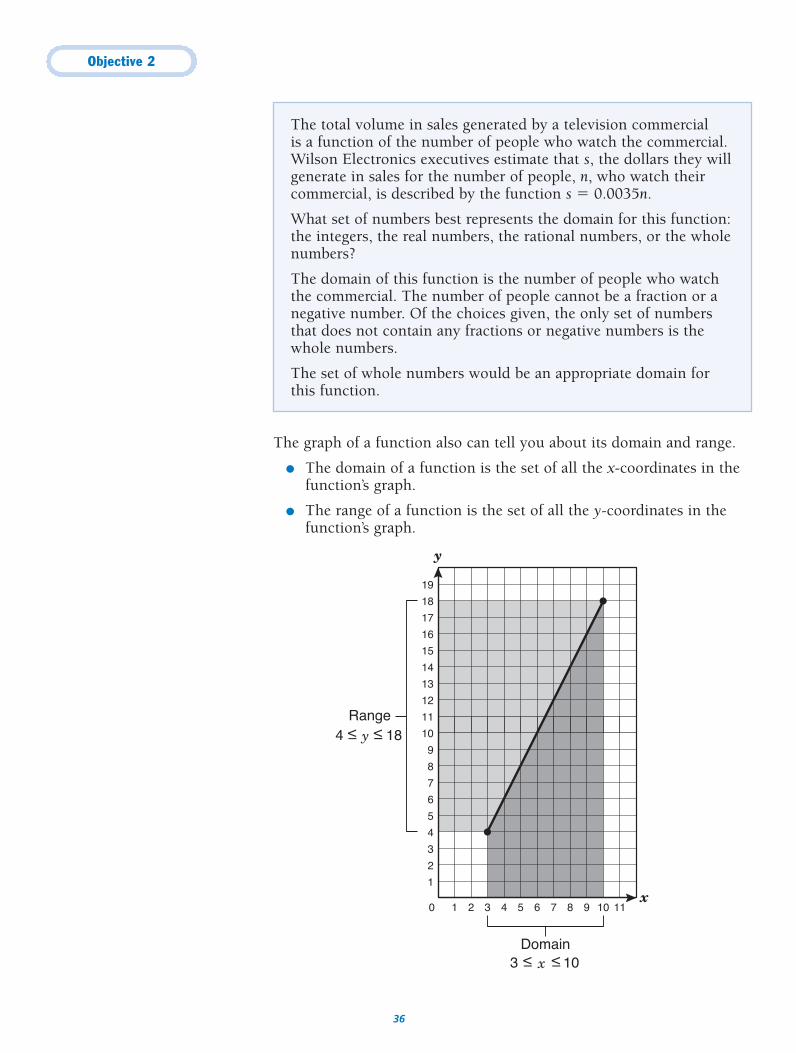
The graph of a function also can tell you about its domain and range.
● The domain of a function is the set of all the x-coordinates in thefunction’s graph.
● The range of a function is the set of all the y-coordinates in thefunction’s graph.
9 10 11
19
11
12
13
14
15
16
17
18
9
10
1
2
3
4
5
6
7
8
0 1 2 3 4 5 6 7 8
y
x
Domain
Range4 <– y <– 18
3 <– x <– 10
The total volume in sales generated by a television commercial is a function of the number of people who watch the commercial.Wilson Electronics executives estimate that s, the dollars they willgenerate in sales for the number of people, n, who watch theircommercial, is described by the function s � 0.0035n.
What set of numbers best represents the domain for this function:the integers, the real numbers, the rational numbers, or the wholenumbers?
The domain of this function is the number of people who watchthe commercial. The number of people cannot be a fraction or anegative number. Of the choices given, the only set of numbersthat does not contain any fractions or negative numbers is thewhole numbers.
The set of whole numbers would be an appropriate domain for this function.
Objective 2
37
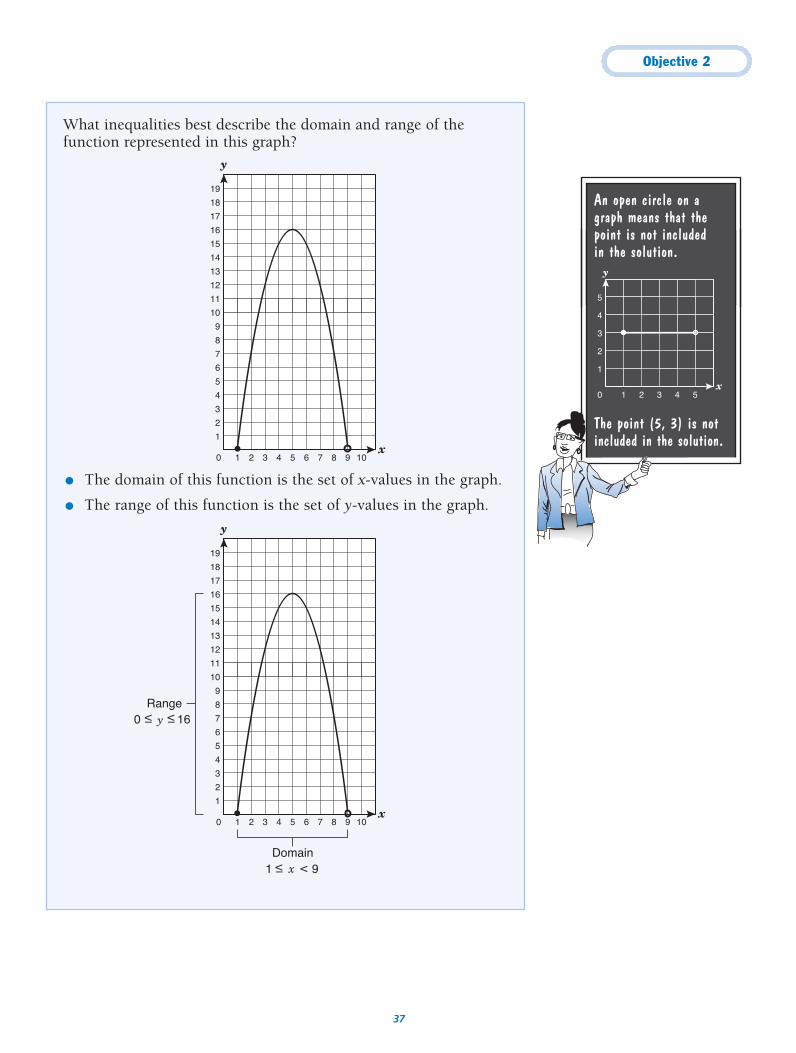
What inequalities best describe the domain and range of thefunction represented in this graph?
● The domain of this function is the set of x-values in the graph.
● The range of this function is the set of y-values in the graph.
Domain
Range
9 10
19
11
12
13
14
15
16
17
18
9
10
1
2
3
4
5
6
7
8
0 1 2 3 4 5 6 7 8
y
x
0 <– y <– 16
1 <– x < 9
9 10
19
11
12
13
14
15
16
17
18
9
10
1
2
3
4
5
6
7
8
0 1 2 3 4 5 6 7 8
y
x
An open circle on agraph means that thepoint is not included in the solution.
The point (5, 3) is notincluded in the solution.
0
1
2
3
4
5
1 2 3 4 5
y
x
Objective 2
38
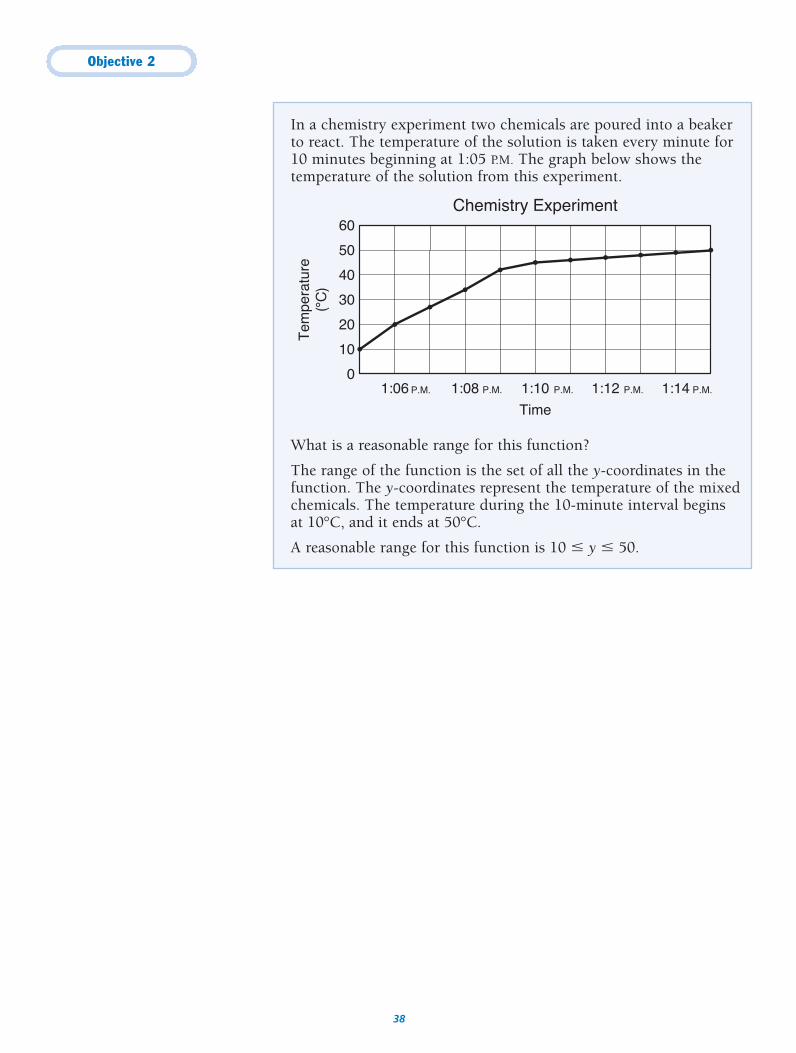
In a chemistry experiment two chemicals are poured into a beakerto react. The temperature of the solution is taken every minute for10 minutes beginning at 1:05 P.M. The graph below shows thetemperature of the solution from this experiment.
What is a reasonable range for this function?
The range of the function is the set of all the y-coordinates in thefunction. The y-coordinates represent the temperature of the mixedchemicals. The temperature during the 10-minute interval beginsat 10°C, and it ends at 50°C.
A reasonable range for this function is 10 y 50.
10
20
0
30
40
50
60
1:06 1:141:08 1:10 1:12
Time
Chemistry Experiment
Tem
pera
ture
(°°C
)
P.M. P.M. P.M. P.M. P.M.
Objective 2
39
Try ItThe number of pounds of potato salad, p, that will be needed for acompany picnic is given by the function p � 0.25n � 4, in which n equalsthe number of people who will attend the picnic. Each employee in thecompany can attend the picnic, and each can bring 3 guests. A total of12 employees and guests have already signed up to attend the picnic. If the company employs a total of 40 people, what is a reasonable range forthis function?
The range of the function is the set of all the possible values for the
____________________ variable in the function, the amount of potato salad
to be purchased.
To determine the range of the function, first determine the minimum and
____________________ number of people who will attend the picnic.
The minimum number of people is __________, since that many people have
already signed up.
The company has __________ employees. If every employee attends and
brings 3 guests, then the maximum number of people is __________
because 40 • __________ � __________.
Use the function p � __________________________________________ to find
the number of pounds of potato salad that will be needed.
If 12 people attend, then p � __________ • __________ � 4;
__________ pounds of potato salad will be needed.
If 160 people attend, then p � __________ • __________ � 4;
__________ pounds of potato salad will be needed.
The number of pounds of potato salad that will be needed is between
__________ pounds and __________ pounds.
A reasonable range for this function is __________ p __________.
The range of the function is the set of all the possible values for the dependentvariable in the function, the amount of potato salad to be purchased. Todetermine the range of the function, first determine the minimum and maximumnumber of people who will attend the picnic. The minimum number of people is12, since that many people have already signed up. The company has40 employees. If every employee attends and brings 3 guests, then the maximumnumber of people is 160 because 40 • 4 � 160. Use the function p � 0.25n � 4 tofind the number of pounds of potato salad that will be needed. If 12 people attend,then p � 0.25 • 12 � 4; 7 pounds of potato salad will be needed. If 160 peopleattend, then p � 0.25 • 160 � 4; 44 pounds of potato salad will be needed. Thenumber of pounds of potato salad that will be needed is between 7 pounds and 44 pounds. A reasonable range for this function is 7 p 44.
Objective 2
40
How Can You Interpret a Problem Situation from a Graph?To interpret a problem situation described in terms of a graph, followthese guidelines.
● Identify the quantities that are being compared.
● Understand what relationship the graph is describing.
● Look at the scales used on the axes of the graph.
● Identify the domain or range of the function graphed.
● Look for patterns in the data—increases, decreases, or data thatremain constant.
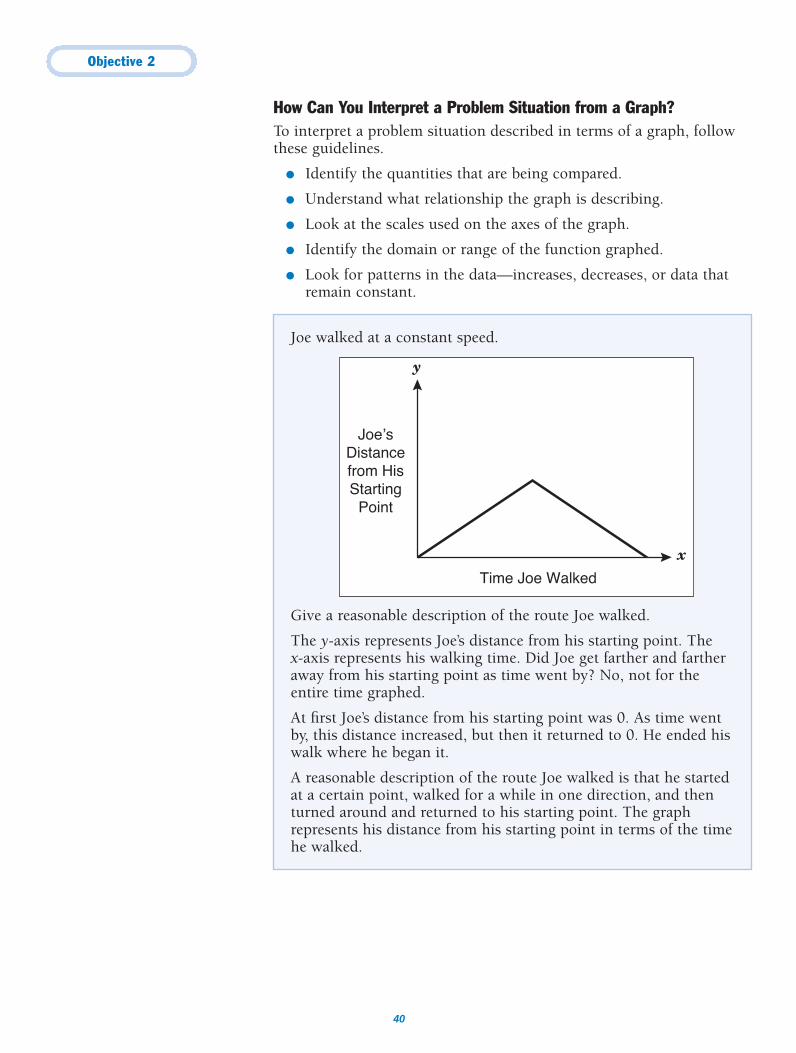
Joe walked at a constant speed.
Give a reasonable description of the route Joe walked.
The y-axis represents Joe’s distance from his starting point. The x-axis represents his walking time. Did Joe get farther and fartheraway from his starting point as time went by? No, not for theentire time graphed.
At first Joe’s distance from his starting point was 0. As time wentby, this distance increased, but then it returned to 0. He ended hiswalk where he began it.
A reasonable description of the route Joe walked is that he startedat a certain point, walked for a while in one direction, and thenturned around and returned to his starting point. The graphrepresents his distance from his starting point in terms of the timehe walked.
Time Joe Walked
Joe’sDistancefrom HisStarting
Point
y
x
Objective 2
41
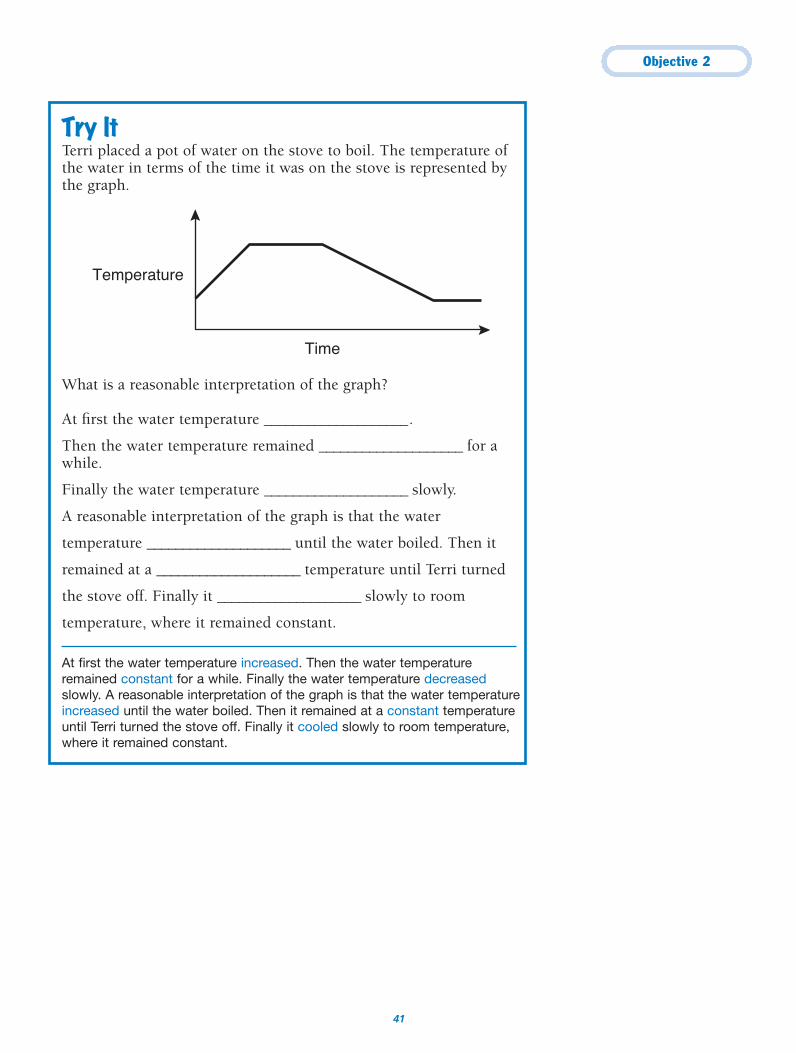
Try ItTerri placed a pot of water on the stove to boil. The temperature ofthe water in terms of the time it was on the stove is represented bythe graph.
What is a reasonable interpretation of the graph?
At first the water temperature ____________________.
Then the water temperature remained ____________________ for a while.
Finally the water temperature ____________________ slowly.
A reasonable interpretation of the graph is that the water
temperature ____________________ until the water boiled. Then it
remained at a ____________________ temperature until Terri turned
the stove off. Finally it ____________________ slowly to room
temperature, where it remained constant.
At first the water temperature increased. Then the water temperatureremained constant for a while. Finally the water temperature decreasedslowly. A reasonable interpretation of the graph is that the water temperatureincreased until the water boiled. Then it remained at a constant temperatureuntil Terri turned the stove off. Finally it cooled slowly to room temperature,where it remained constant.
Time
Temperature
Objective 2
42
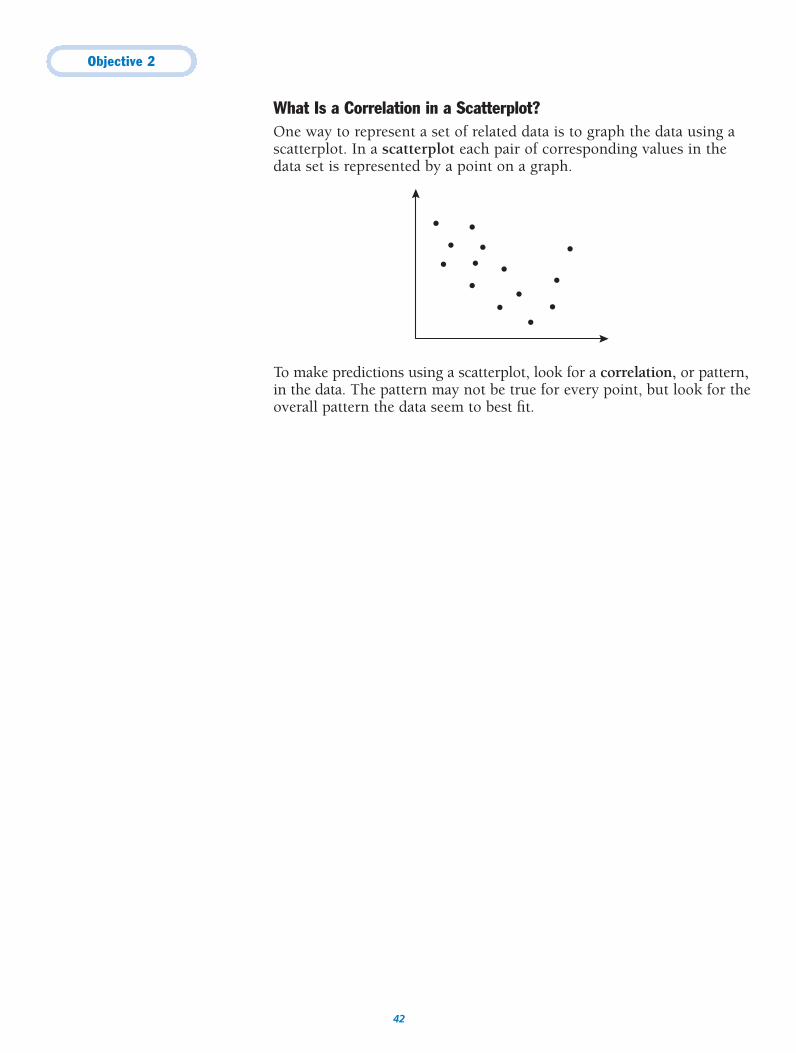
What Is a Correlation in a Scatterplot?One way to represent a set of related data is to graph the data using ascatterplot. In a scatterplot each pair of corresponding values in thedata set is represented by a point on a graph.
To make predictions using a scatterplot, look for a correlation, or pattern,in the data. The pattern may not be true for every point, but look for theoverall pattern the data seem to best fit.
Objective 2
43
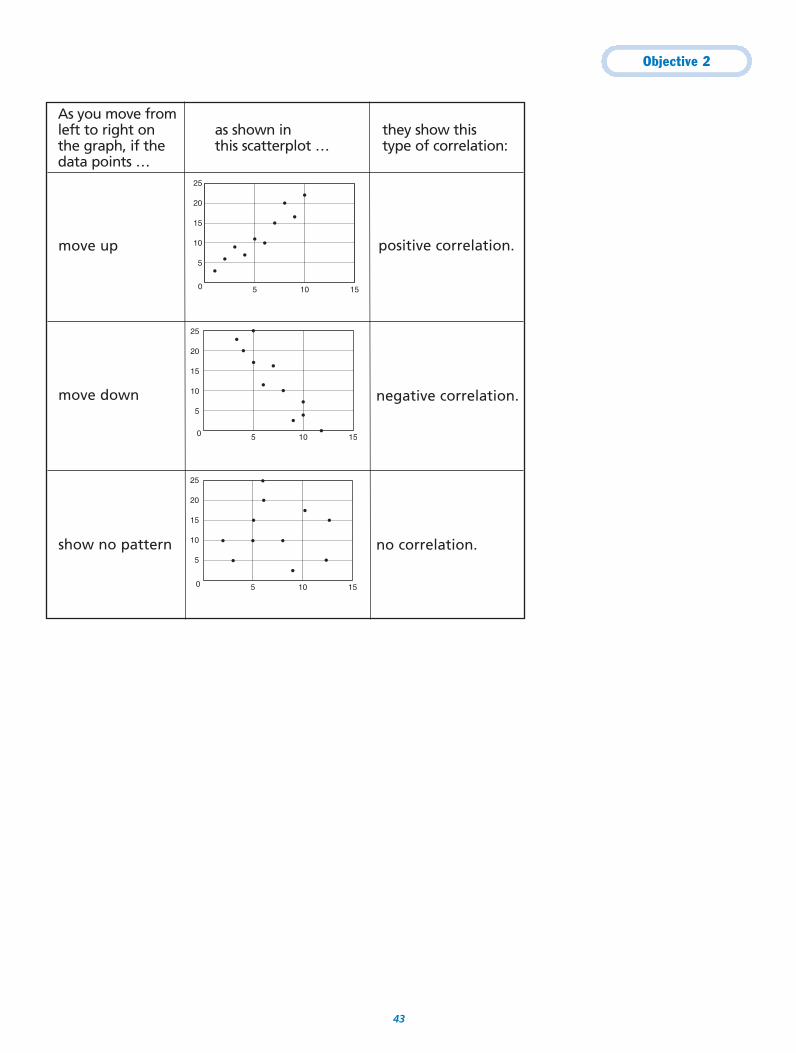
As you move from left to right on as shown in they show thisthe graph, if the this scatterplot … type of correlation:data points …
positive correlation.
negative correlation.
no correlation.
5 10 150
5
10
15
20
25
5 10 150
5
10
15
20
25
5 10 150
5
10
15
20
25
show no pattern
move down
move up
Objective 2
44
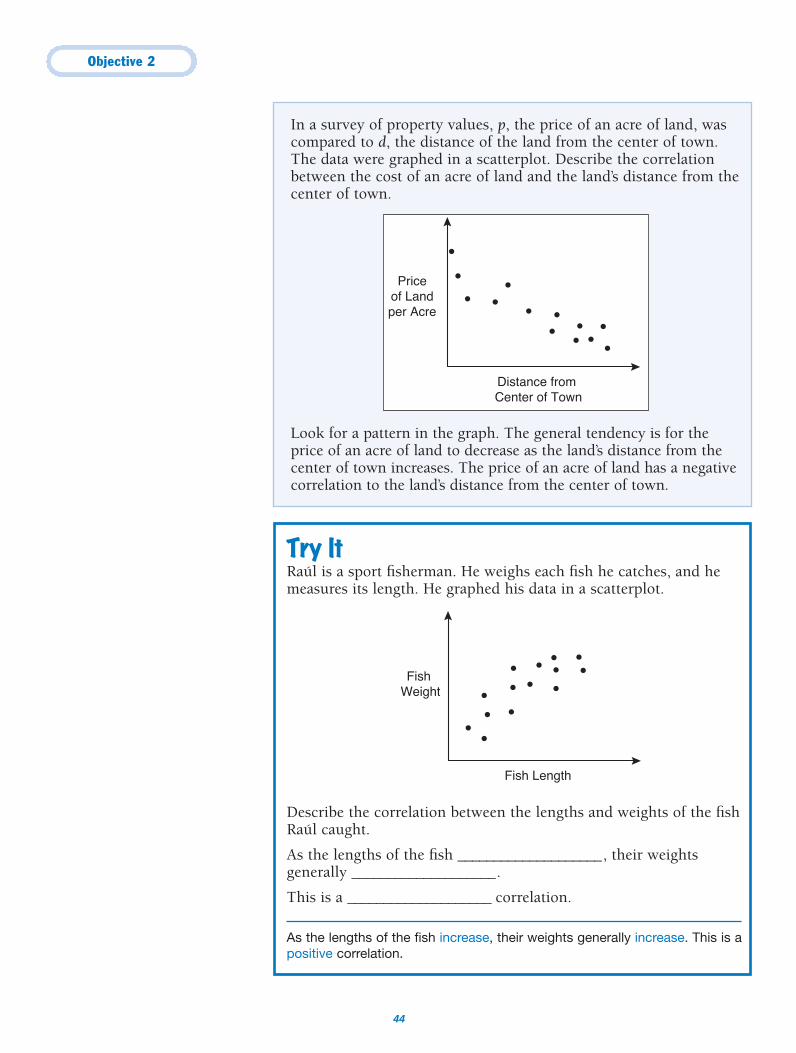
In a survey of property values, p, the price of an acre of land, wascompared to d, the distance of the land from the center of town.The data were graphed in a scatterplot. Describe the correlationbetween the cost of an acre of land and the land’s distance from thecenter of town.
Look for a pattern in the graph. The general tendency is for theprice of an acre of land to decrease as the land’s distance from thecenter of town increases. The price of an acre of land has a negativecorrelation to the land’s distance from the center of town.
Distance from Center of Town
Priceof Landper Acre
Try ItRaúl is a sport fisherman. He weighs each fish he catches, and hemeasures its length. He graphed his data in a scatterplot.
Describe the correlation between the lengths and weights of the fishRaúl caught.
As the lengths of the fish ____________________, their weightsgenerally ____________________.
This is a ____________________ correlation.
As the lengths of the fish increase, their weights generally increase. This is apositive correlation.
Fish Weight
Fish Length
Objective 2
45
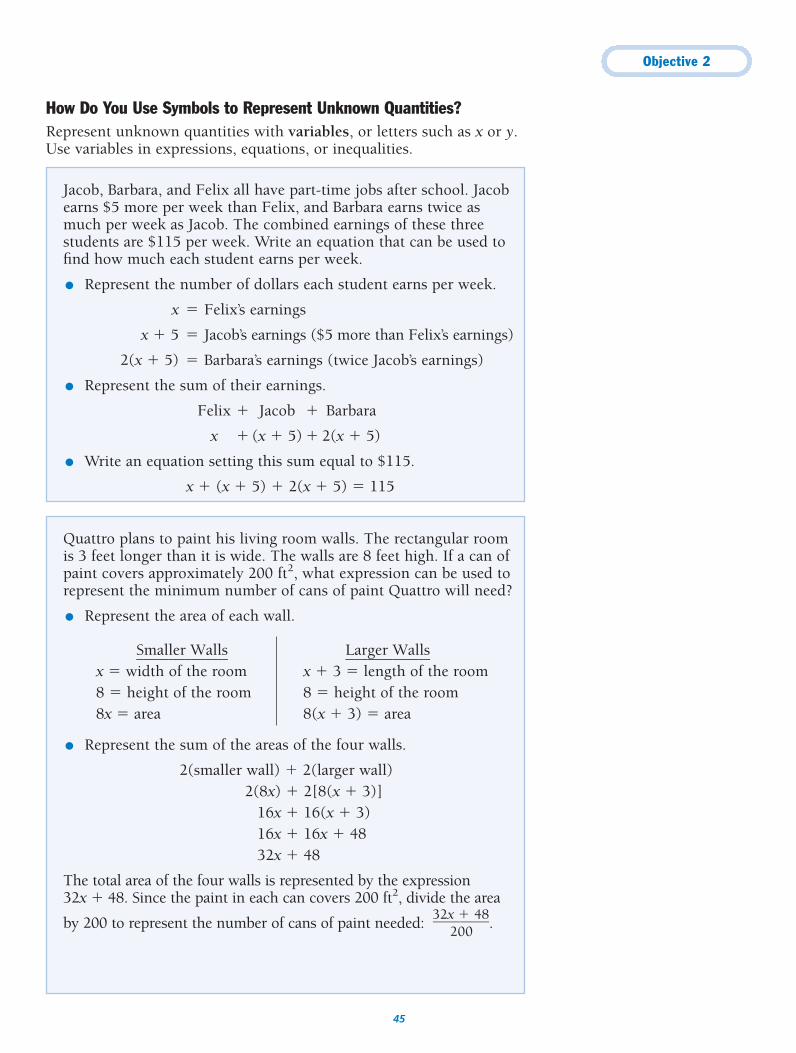
How Do You Use Symbols to Represent Unknown Quantities?Represent unknown quantities with variables, or letters such as x or y.Use variables in expressions, equations, or inequalities.
Jacob, Barbara, and Felix all have part-time jobs after school. Jacobearns $5 more per week than Felix, and Barbara earns twice asmuch per week as Jacob. The combined earnings of these threestudents are $115 per week. Write an equation that can be used tofind how much each student earns per week.
● Represent the number of dollars each student earns per week.
x � Felix’s earnings
x � 5 � Jacob’s earnings ($5 more than Felix’s earnings)
2(x � 5) � Barbara’s earnings (twice Jacob’s earnings)
● Represent the sum of their earnings.
Felix � Jacob � Barbara
x � (x � 5) � 2(x � 5)
● Write an equation setting this sum equal to $115.
x � (x � 5) � 2(x � 5) � 115
Quattro plans to paint his living room walls. The rectangular roomis 3 feet longer than it is wide. The walls are 8 feet high. If a can ofpaint covers approximately 200 ft2, what expression can be used torepresent the minimum number of cans of paint Quattro will need?
● Represent the area of each wall.
● Represent the sum of the areas of the four walls.
2(smaller wall) � 2(larger wall)2(8x) � 2[8(x � 3)]
16x � 16(x � 3)16x � 16x � 4832x � 48
The total area of the four walls is represented by the expression32x � 48. Since the paint in each can covers 200 ft2, divide the area
by 200 to represent the number of cans of paint needed: �32x
20�0
48�.
S�m�
a�l�l�e�r��
W�
a�l�l�s�
L�
a�r�g�e�r��
W�
a�l�l�s�
x � width of the room x � 3 � length of the room8 � height of the room 8 � height of the room8x � area 8(x � 3) � area
Objective 2
46
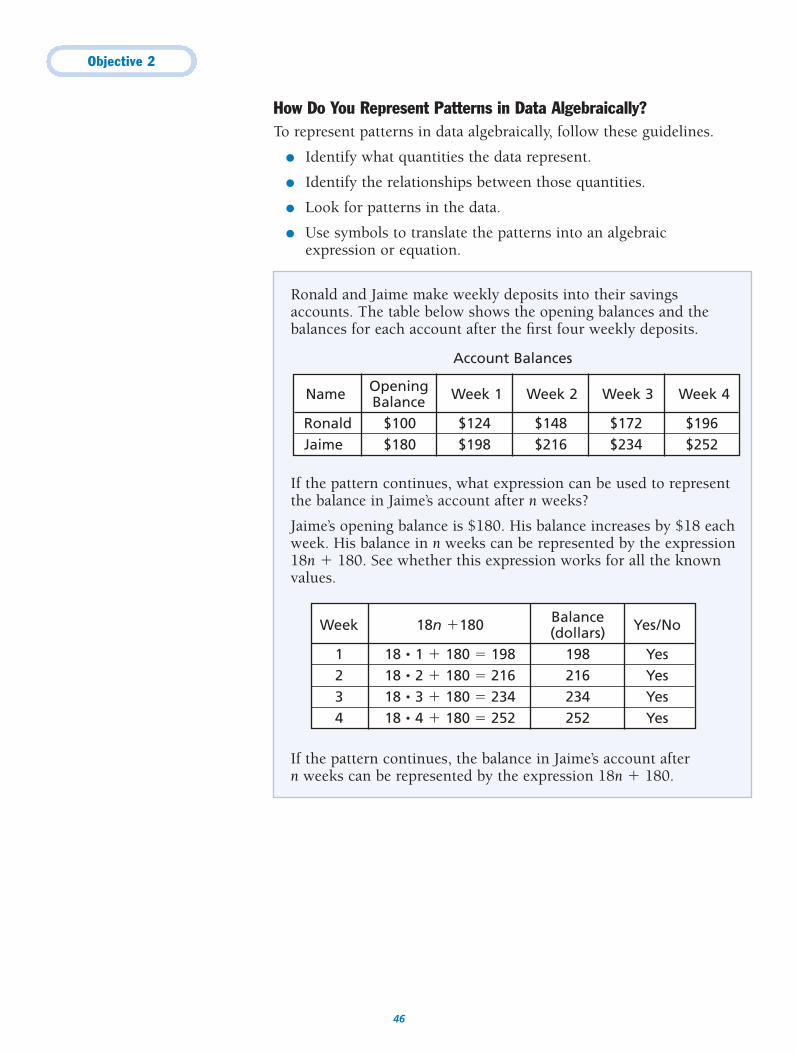
How Do You Represent Patterns in Data Algebraically?To represent patterns in data algebraically, follow these guidelines.
● Identify what quantities the data represent.
● Identify the relationships between those quantities.
● Look for patterns in the data.
● Use symbols to translate the patterns into an algebraicexpression or equation.
Ronald and Jaime make weekly deposits into their savingsaccounts. The table below shows the opening balances and thebalances for each account after the first four weekly deposits.
Account Balances
If the pattern continues, what expression can be used to representthe balance in Jaime’s account after n weeks?
Jaime’s opening balance is $180. His balance increases by $18 eachweek. His balance in n weeks can be represented by the expression18n � 180. See whether this expression works for all the knownvalues.
If the pattern continues, the balance in Jaime’s account after n weeks can be represented by the expression 18n � 180.
Name Opening Week 1 Week 2 Week 3 Week 4BalanceRonald $100 $124 $148 $172 $196Jaime $180 $198 $216 $234 $252
Week 18n �180 Balance Yes/No(dollars)1 18 • 1 � 180 � 198 198 Yes2 18 • 2 � 180 � 216 216 Yes3 18 • 3 � 180 � 234 234 Yes4 18 • 4 � 180 � 252 252 Yes
Objective 2
47
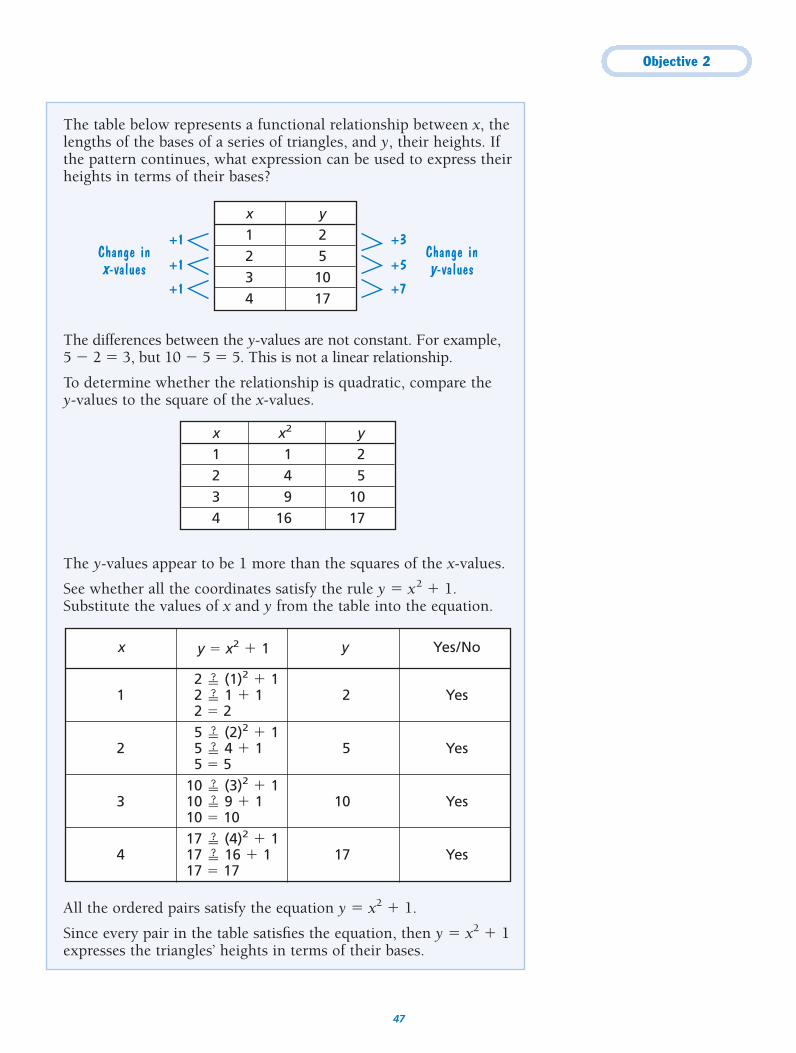
The table below represents a functional relationship between x, thelengths of the bases of a series of triangles, and y, their heights. Ifthe pattern continues, what expression can be used to express theirheights in terms of their bases?
The differences between the y-values are not constant. For example,5 � 2 � 3, but 10 � 5 � 5. This is not a linear relationship.
To determine whether the relationship is quadratic, compare the y-values to the square of the x-values.
The y-values appear to be 1 more than the squares of the x-values.
See whether all the coordinates satisfy the rule y � x2 � 1.Substitute the values of x and y from the table into the equation.
All the ordered pairs satisfy the equation y � x2 � 1.
Since every pair in the table satisfies the equation, then y � x2 � 1expresses the triangles’ heights in terms of their bases.
x y1 22 53 104 17
Change in x-values
Change in y-values
+1
+1
+1
+3
+5
+7
x x2 y1 1 22 4 53 9 104 16 17
x y � x2 � 1 y Yes/No
2 � (1)2 � 11 2 � 1 � 1 2 Yes
2 � 2 5 � (2)2 � 1
2 5 � 4 � 1 5 Yes5 � 5
10 � (3)2 � 13 10 � 9 � 1 10 Yes
10 � 10 17 � (4)2 � 1
4 17 � 16 � 1 17 Yes17 � 17
Objective 2
48
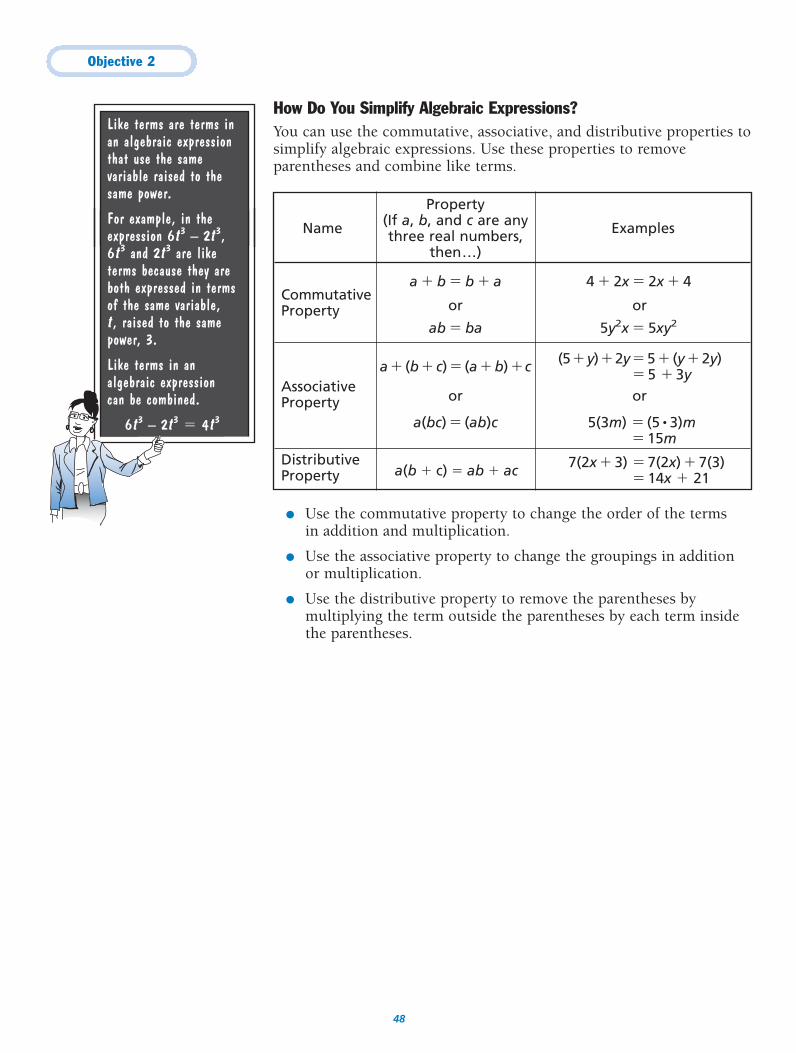
● Use the commutative property to change the order of the termsin addition and multiplication.
● Use the associative property to change the groupings in additionor multiplication.
● Use the distributive property to remove the parentheses bymultiplying the term outside the parentheses by each term insidethe parentheses.
Like terms are terms inan algebraic expressionthat use the samevariable raised to thesame power.
For example, in theexpression 6t3 – 2t3,6t3 and 2t3 are liketerms because they areboth expressed in termsof the same variable,t , raised to the samepower, 3.
Like terms in analgebraic expressioncan be combined.
6t3 – 2t3 � 4t3
Property
Name (If a, b, and c are any Examplesthree real numbers, then…)
a � b � b � a 4 � 2x � 2x � 4CommutativeProperty or or
ab � ba 5y2x � 5xy2
a� (b� c)� (a�b)�c (5�y)�2y�5� (y�2y)
Associative� 5 � 3y
Property or or
a(bc) � (ab)c 5(3m) � (5 • 3)m � 15m
Distributive 7(2x � 3) � 7(2x) � 7(3)Property � 14x � 21a(b � c) � ab � ac
How Do You Simplify Algebraic Expressions?You can use the commutative, associative, and distributive properties tosimplify algebraic expressions. Use these properties to removeparentheses and combine like terms.
Objective 2
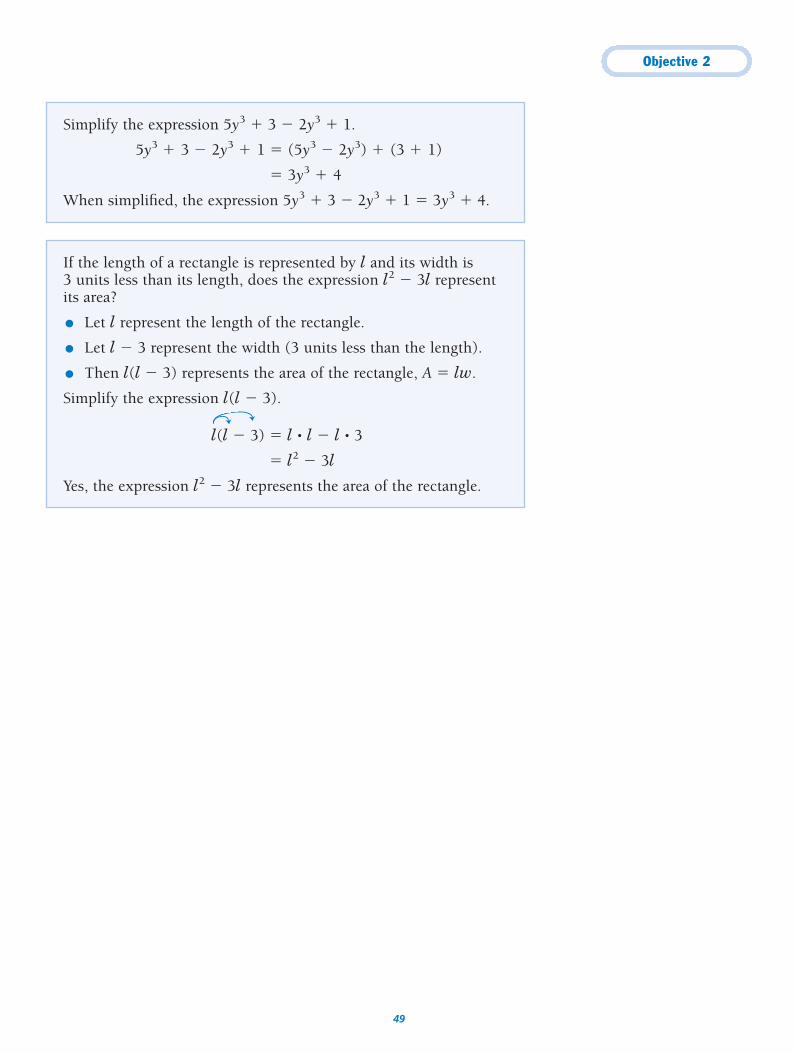
49
If the length of a rectangle is represented by l and its width is3 units less than its length, does the expression l2 � 3l representits area?
● Let l represent the length of the rectangle.
● Let l � 3 represent the width (3 units less than the length).
● Then l(l � 3) represents the area of the rectangle, A � lw.
Simplify the expression l(l � 3).
l(l � 3) � l • l � l • 3
� l2 � 3l
Yes, the expression l2 � 3l represents the area of the rectangle.
Simplify the expression 5y3 � 3 � 2y3 � 1.
5y3 � 3 � 2y3 � 1 � (5y3 � 2y3) � (3 � 1)
� 3y3 � 4
When simplified, the expression 5y3 � 3 � 2y3 � 1 � 3y3 � 4.
Objective 2
50
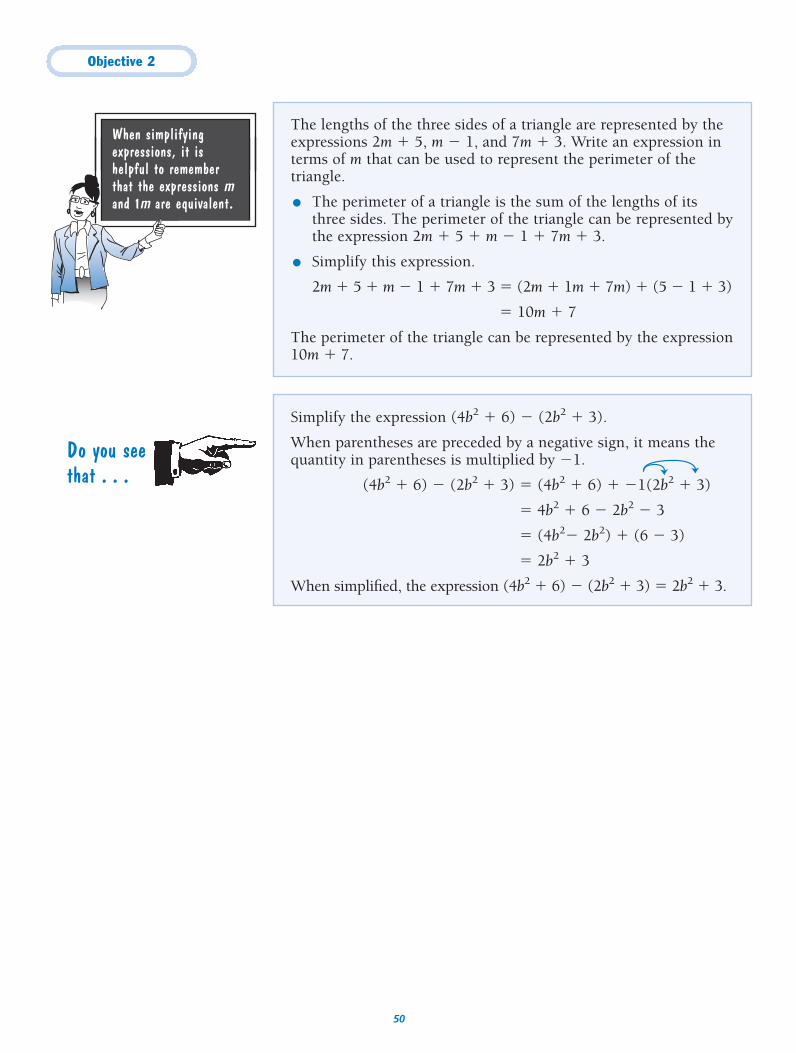
When simplifyingexpressions, it ishelpful to rememberthat the expressions mand 1m are equivalent.
The lengths of the three sides of a triangle are represented by theexpressions 2m � 5, m � 1, and 7m � 3. Write an expression interms of m that can be used to represent the perimeter of thetriangle.
● The perimeter of a triangle is the sum of the lengths of itsthree sides. The perimeter of the triangle can be represented bythe expression 2m � 5 � m � 1 � 7m � 3.
● Simplify this expression.
2m � 5 � m � 1 � 7m � 3 � (2m � 1m � 7m) � (5 � 1 � 3)
� 10m � 7
The perimeter of the triangle can be represented by the expression10m � 7.
Simplify the expression (4b2 � 6) � (2b2 � 3).
When parentheses are preceded by a negative sign, it means thequantity in parentheses is multiplied by �1.
(4b2 � 6) � (2b2 � 3) � (4b2 � 6) � �1(2b2 � 3)
� 4b2 � 6 � 2b2 � 3
� (4b2� 2b2) � (6 � 3)
� 2b2 � 3
When simplified, the expression (4b2 � 6) � (2b2 � 3) � 2b2 � 3.
Do you seethat . . .
Objective 2
51
See Objective 5, page 125, for moreinformation about the FOIL method.
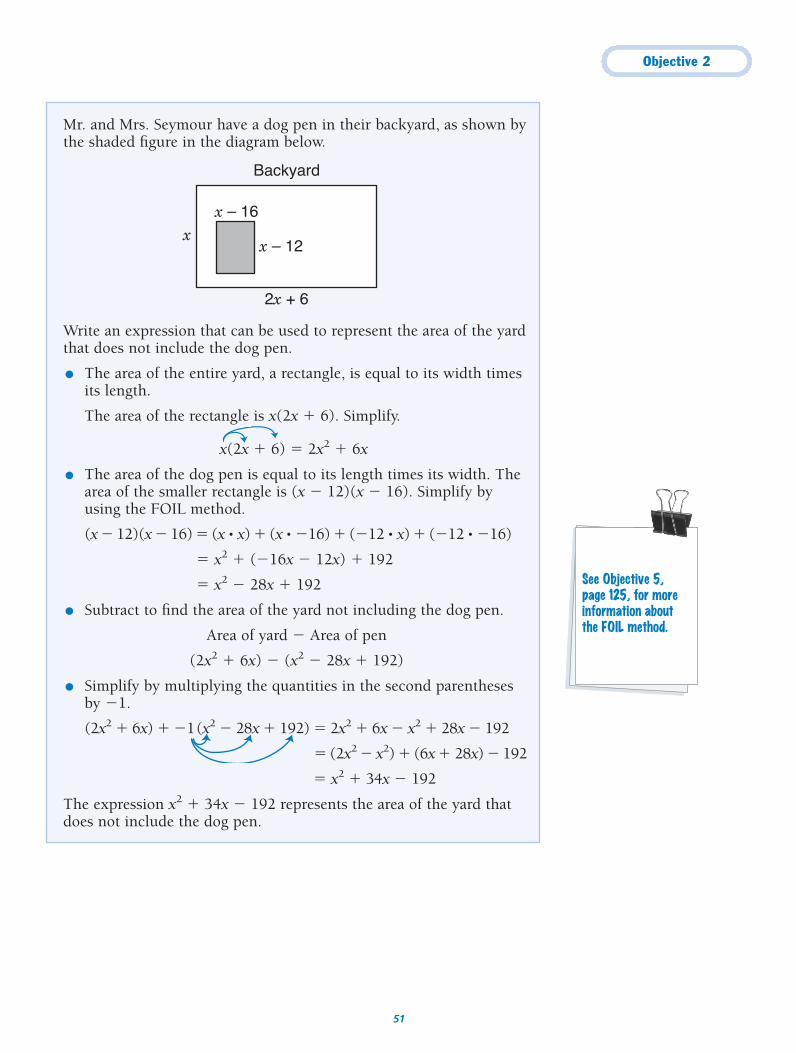
Mr. and Mrs. Seymour have a dog pen in their backyard, as shown bythe shaded figure in the diagram below.
Write an expression that can be used to represent the area of the yardthat does not include the dog pen.
● The area of the entire yard, a rectangle, is equal to its width timesits length.
The area of the rectangle is x(2x � 6). Simplify.
x(2x � 6) � 2x2 � 6x
● The area of the dog pen is equal to its length times its width. Thearea of the smaller rectangle is (x � 12)(x � 16). Simplify byusing the FOIL method.
(x � 12)(x � 16) � (x • x) � (x • �16) � (�12 • x) � (�12 • �16)
� x2 � (�16x � 12x) � 192
� x2 � 28x � 192
● Subtract to find the area of the yard not including the dog pen.
Area of yard � Area of pen
(2x2 � 6x) � (x2 � 28x � 192)
● Simplify by multiplying the quantities in the second parenthesesby �1.
(2x2 � 6x) � �1(x2 � 28x � 192) � 2x2 � 6x � x2 � 28x � 192
� (2x2 � x2) � (6x � 28x) � 192
� x2 � 34x � 192
The expression x2 � 34x � 192 represents the area of the yard thatdoes not include the dog pen.
2x + 6
x – 16
x – 12x
Backyard
Objective 2
52
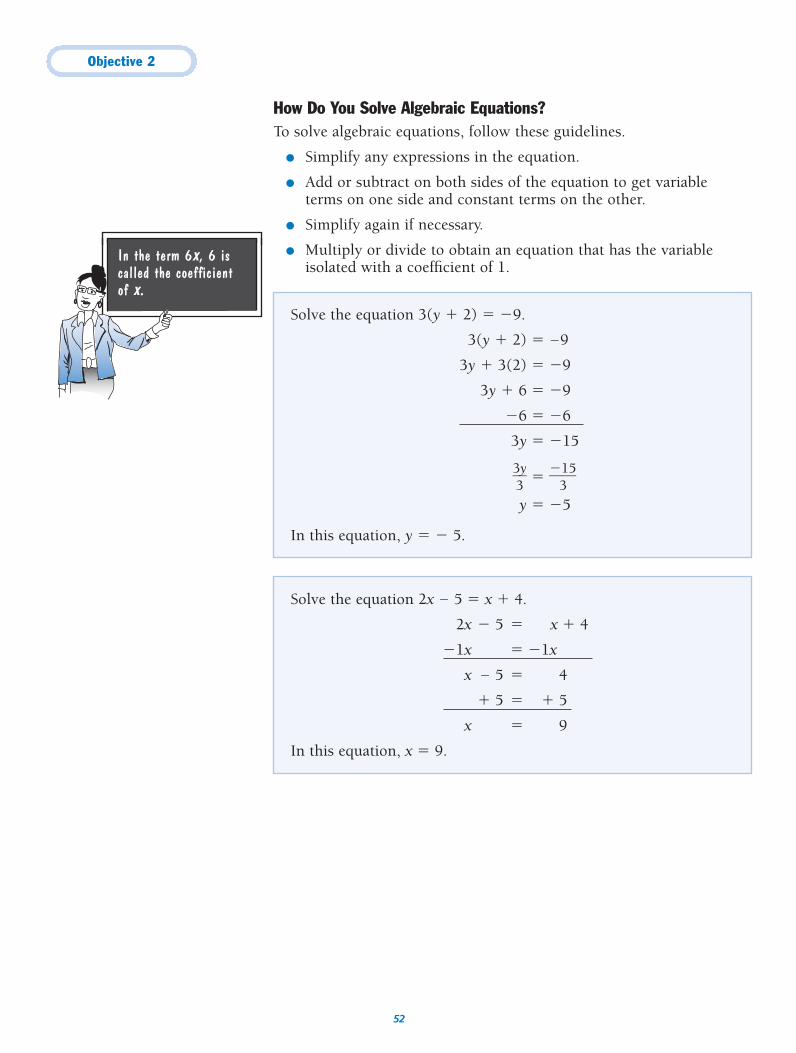
Solve the equation 3(y � 2) � �9.
3(y � 2) � �9
3y � 3(2) � �9
3y � 6 � �9
�6 � �6
3y � �15
�33y� � �
�315�
y � �5
In this equation, y � � 5.
Solve the equation 2x � 5 � x � 4.
2x � 5 � x � 4
�1x � �1x
x � 5 � 4
� 5 � � 5
x � 9
In this equation, x � 9.
How Do You Solve Algebraic Equations?To solve algebraic equations, follow these guidelines.
● Simplify any expressions in the equation.
● Add or subtract on both sides of the equation to get variableterms on one side and constant terms on the other.
● Simplify again if necessary.
● Multiply or divide to obtain an equation that has the variableisolated with a coefficient of 1.
In the term 6x, 6 iscalled the coefficient of x.
Objective 2
53
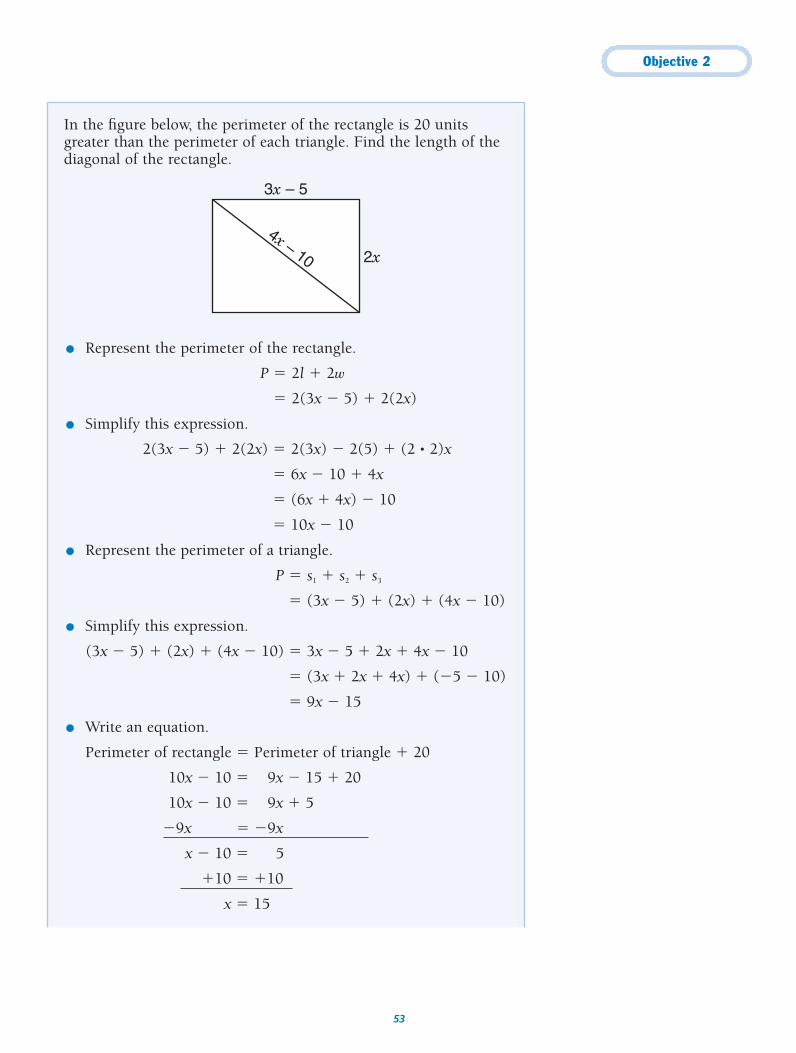
In the figure below, the perimeter of the rectangle is 20 unitsgreater than the perimeter of each triangle. Find the length of thediagonal of the rectangle.
● Represent the perimeter of the rectangle.
P � 2l � 2w
� 2(3x � 5) � 2(2x)
● Simplify this expression.
2(3x � 5) � 2(2x) � 2(3x) � 2(5) � (2 • 2)x
� 6x � 10 � 4x
� (6x � 4x) � 10
� 10x � 10
● Represent the perimeter of a triangle.
P � s1 � s2 � s3
� (3x � 5) � (2x) � (4x � 10)
● Simplify this expression.
(3x � 5) � (2x) � (4x � 10) � 3x � 5 � 2x � 4x � 10
� (3x � 2x � 4x) � (�5 � 10)
� 9x � 15
● Write an equation.
Perimeter of rectangle � Perimeter of triangle � 20
10x � 10 � 9x � 15 � 20
10x � 10 � 9x � 5
�9x � �9x
x � 10 � 5
�10 � �10
x � 15
3x – 5
4x – 10 2x
Objective 2
54
● Use this value for x to find the length of the diagonal of therectangle. The diagonal is represented by the expression4x � 10. Replace x with 15.
4x � 10 � 4(15) � 10
� 60 � 10
� 50
The diagonal of the rectangle is 50 units long.
Objective 2
55
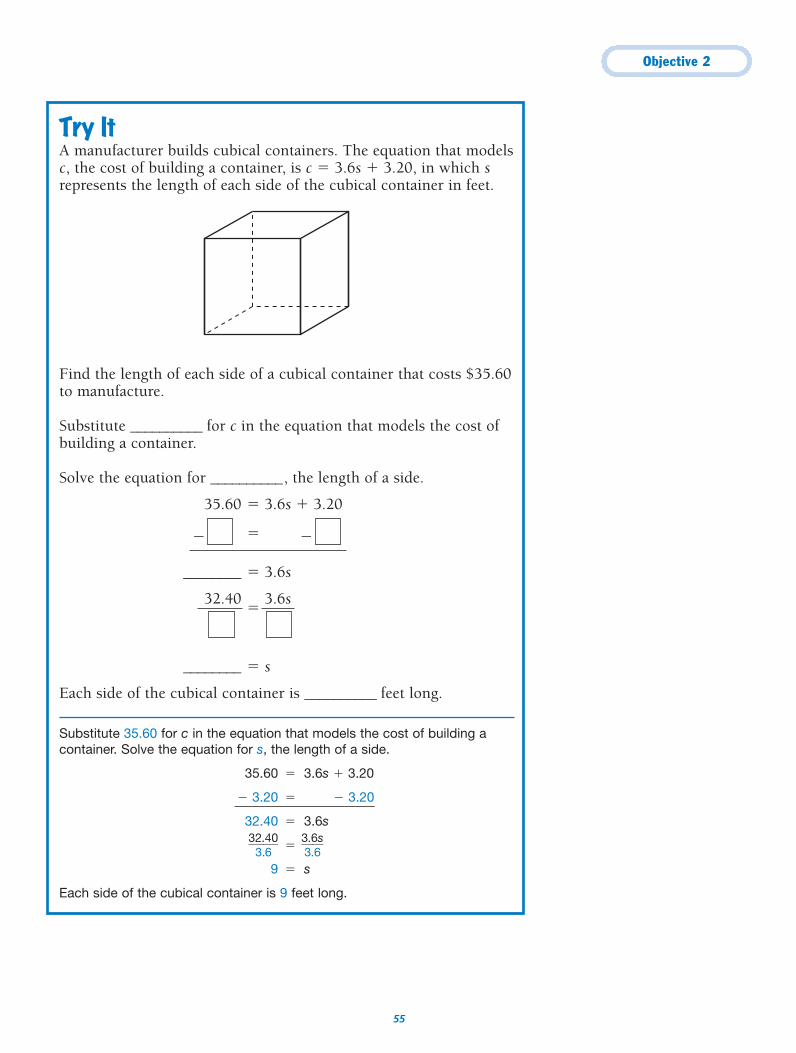
Try ItA manufacturer builds cubical containers. The equation that modelsc, the cost of building a container, is c � 3.6s � 3.20, in which srepresents the length of each side of the cubical container in feet.
Find the length of each side of a cubical container that costs $35.60to manufacture.
Substitute __________ for c in the equation that models the cost of building a container.
Solve the equation for __________, the length of a side.
35.60 � 3.6s � 3.20
�
________ � 3.6s
32.40�
3.6s
________ � s
Each side of the cubical container is __________ feet long.
Substitute 35.60 for c in the equation that models the cost of building acontainer. Solve the equation for s, the length of a side.
35.60 � 3.6s � 3.20
� 3.20 � � 3.20
32.40 � 3.6s
�32
3..460
� � �33.6.6
s�
9 � s
Each side of the cubical container is 9 feet long.
� �
Objective 2
56
As was mentioned earlier, function notation can be used to describe a function: f (x) � 3x � 2 represents the same relationship as y � 3x � 2 does. For any x, the function f creates ordered pairs (x, 3x � 2). The y-value in these ordered pairs is 3x � 2, thus theequation y � 3x � 2 also represents this function.
Look at this function:
y � x2 � 4
Can we rewrite this equation in function notation?
The equation tells us that for any ordered pair (x, y) belonging to
this function, the y-coordinate can be represented by x2 � 4.
(x, y)
(x, x2 � 4)
f (x) � x2 � 4
Thus, this function consists of ordered pairs (x, x2 � 4).
Therefore f (x) � x2 � 4 represents the same relationship that
y � x2 � 4 does.12
12
12
12
12
12
12
Now practice what you’ve learned.
Objective 2
57
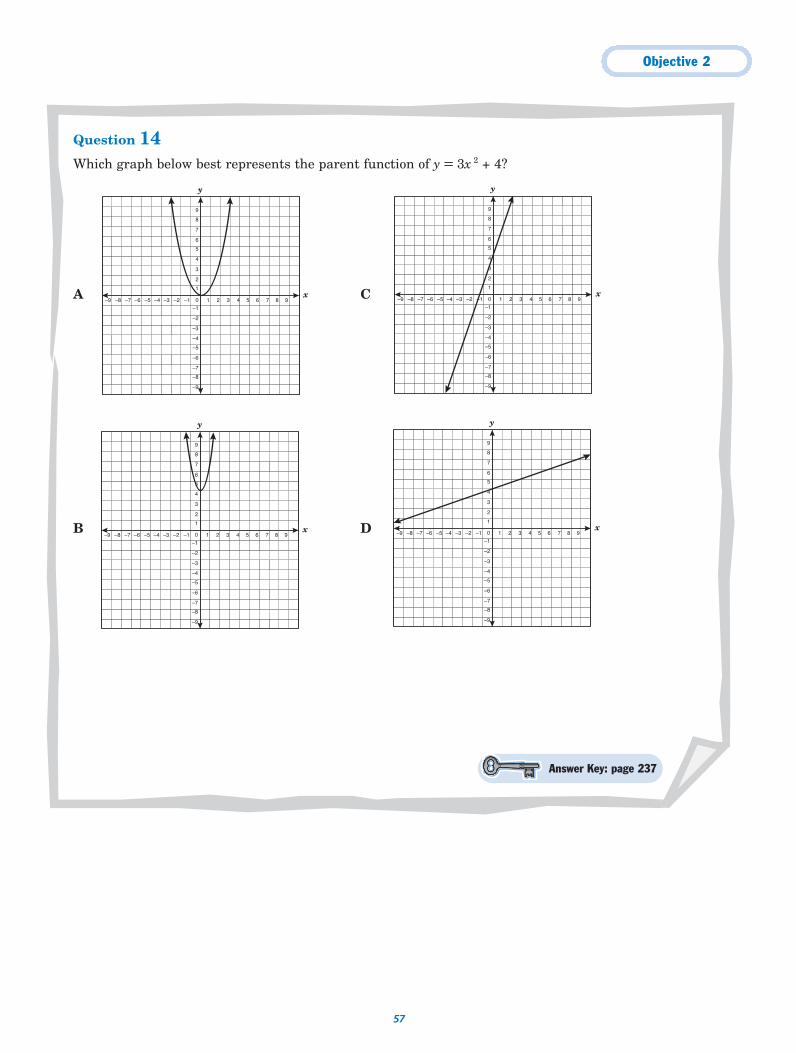
Question 14Which graph below best represents the parent function of y = 3x 2 + 4?
A C
B D
Answer Key: page 237
y
x
–5
–4
–6
–7
–8
–9
–3
–2
–1
0
1
2
3
4
5
6
7
8
9
–1 1–2–3–4–5–6–7–8–9 2 3 4 5 6 7 8 9
y
x
–5
–4
–6
–7
–8
–9
–3
–2
–1
0
1
2
3
4
5
6
7
8
9
–1 1–2–3–4–5–6–7–8–9 2 3 4 5 6 7 8 9
y
x
–5
–4
–6
–7
–8
–9
–3
–2
–1
0
1
2
3
4
5
6
7
8
9
–1 1–2–3–4–5–6–7–8–9 2 3 4 5 6 7 8 9
y
x
–5
–4
–6
–7
–8
–9
–3
–2
–1
0
1
2
3
4
5
6
7
8
9
–1 1–2–3–4–5–6–7–8–9 2 3 4 5 6 7 8 9
Objective 2
58
Question 15Marcy deposits $550 in a savings account at 3% simple annual interest. The value of this account, v, is given by the function v � 550 � 16.5t, in which t is the number of years the money is in the bank. What is therange of this function?
A 0 v 550
B v 550
C v 550
D 0 v 16.5
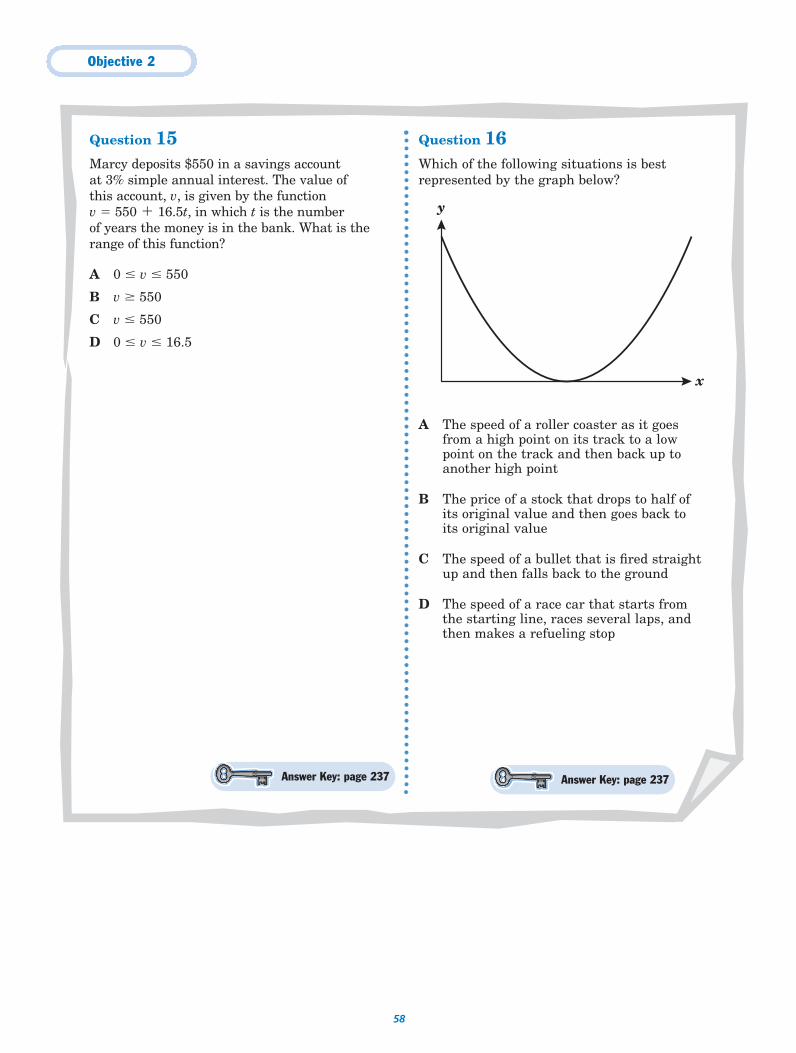
Question 16Which of the following situations is bestrepresented by the graph below?
A The speed of a roller coaster as it goes from a high point on its track to a low point on the track and then back up toanother high point
B The price of a stock that drops to half of its original value and then goes back to its original value
C The speed of a bullet that is fired straight up and then falls back to the ground
D The speed of a race car that starts from the starting line, races several laps, and then makes a refueling stop
y
x
Answer Key: page 237 Answer Key: page 237
Objective 2
59
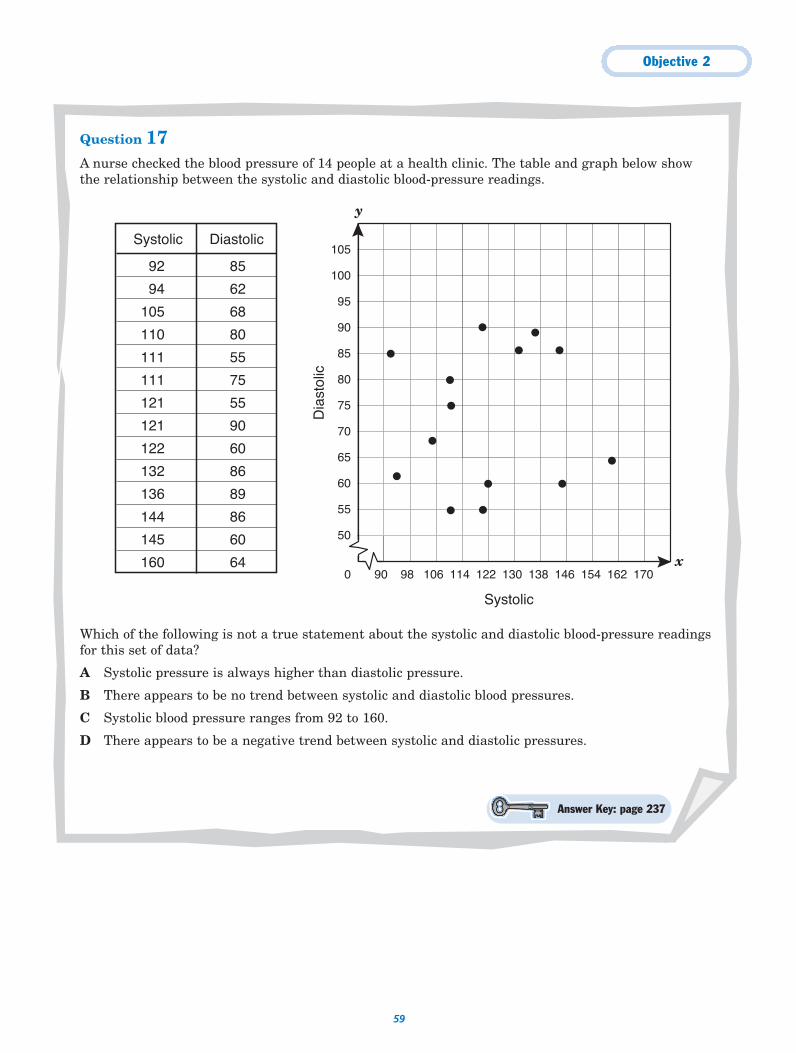
Question 17A nurse checked the blood pressure of 14 people at a health clinic. The table and graph below showthe relationship between the systolic and diastolic blood-pressure readings.
Which of the following is not a true statement about the systolic and diastolic blood-pressure readingsfor this set of data?
A Systolic pressure is always higher than diastolic pressure.
B There appears to be no trend between systolic and diastolic blood pressures.
C Systolic blood pressure ranges from 92 to 160.
D There appears to be a negative trend between systolic and diastolic pressures.
Answer Key: page 237
95
100
105
0
50
55
60
65
70
75
90 98 106 114 122 130 138 146 154 162 170
80
85
90
Systolic
Systolic
92
94
105
110
111
111
121
121
122
132
136
144
145
160
85
62
68
80
55
75
55
90
60
86
89
86
60
64
Diastolic
Dia
stol
ic
y
x
Objective 2
60
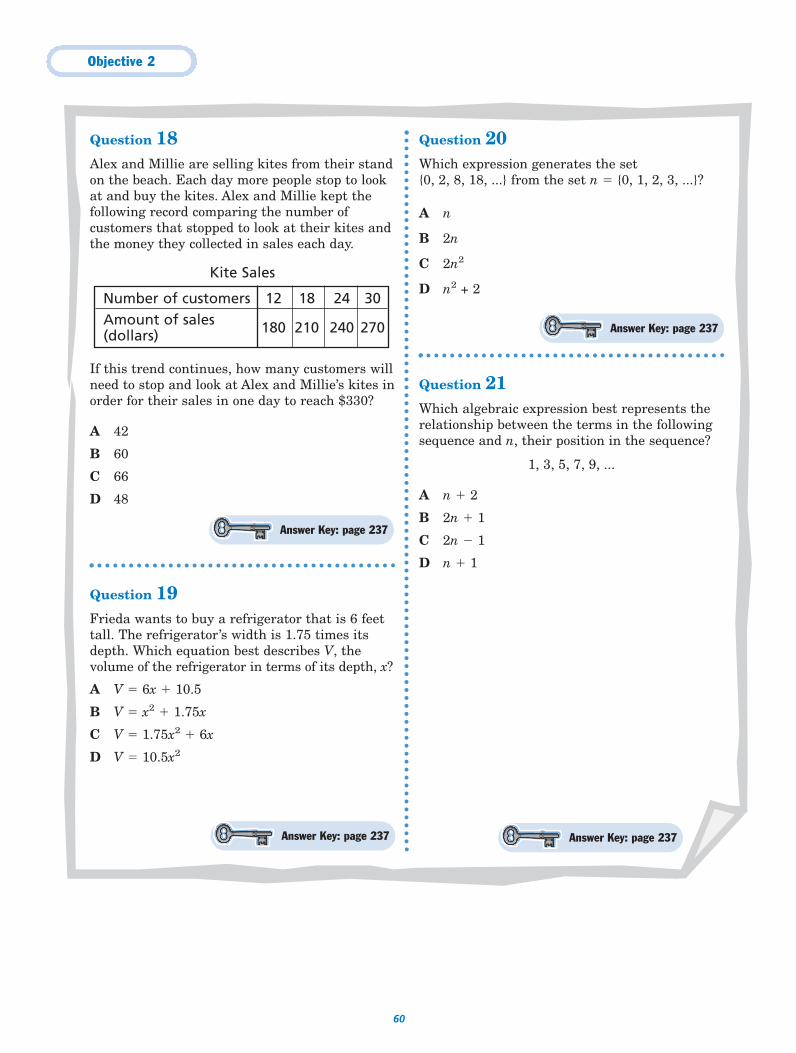
Question 18Alex and Millie are selling kites from their standon the beach. Each day more people stop to lookat and buy the kites. Alex and Millie kept thefollowing record comparing the number ofcustomers that stopped to look at their kites andthe money they collected in sales each day.
Kite Sales
If this trend continues, how many customers willneed to stop and look at Alex and Millie’s kites inorder for their sales in one day to reach $330?
A 42
B 60
C 66
D 48
Question 19Frieda wants to buy a refrigerator that is 6 feettall. The refrigerator’s width is 1.75 times itsdepth. Which equation best describes V, thevolume of the refrigerator in terms of its depth, x?
A V � 6x � 10.5
B V � x2 � 1.75x
C V � 1.75x2 � 6x
D V � 10.5x2
Question 20Which expression generates the set {0, 2, 8, 18, ...} from the set n � {0, 1, 2, 3, ...}?
A n
B 2n
C 2n2
D n2 + 2
Question 21Which algebraic expression best represents therelationship between the terms in the followingsequence and n, their position in the sequence?
1, 3, 5, 7, 9, ...
A n � 2
B 2n � 1
C 2n � 1
D n � 1
Number of customers 12 18 24 30Amount of sales (dollars) 180 210 240 270
Answer Key: page 237
Answer Key: page 237
Answer Key: page 237
Answer Key: page 237
Objective 2
61
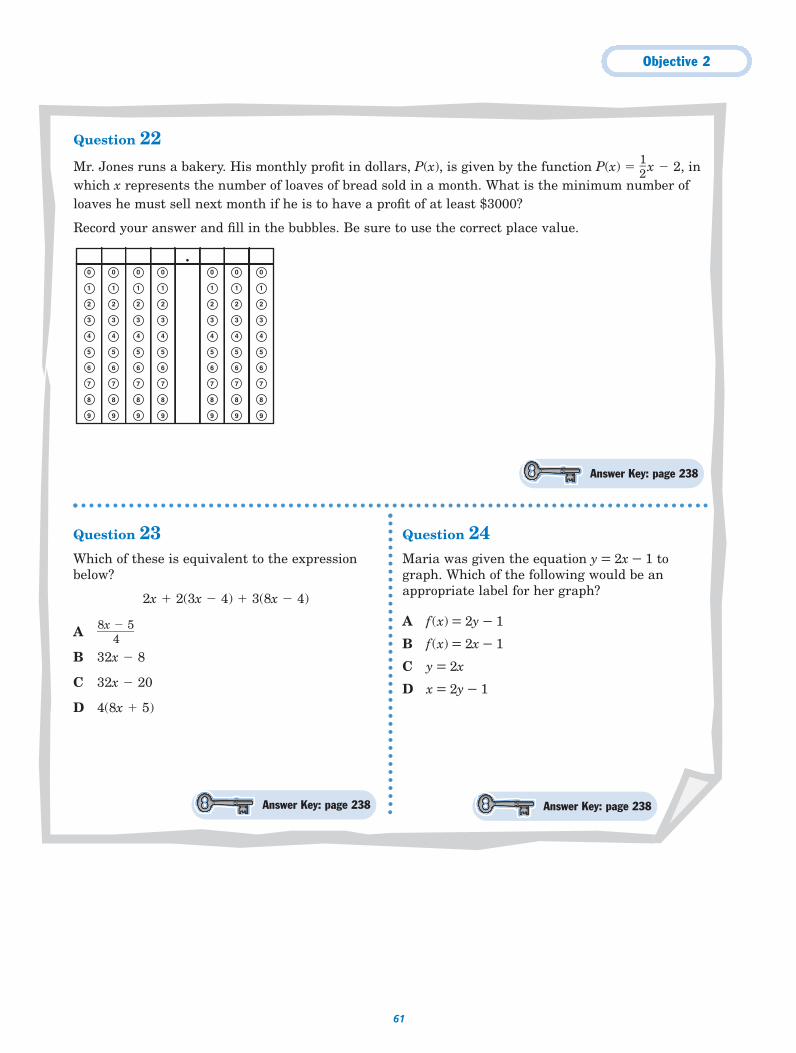
Question 22Mr. Jones runs a bakery. His monthly profit in dollars, P(x), is given by the function P(x) � �
12
� x � 2, inwhich x represents the number of loaves of bread sold in a month. What is the minimum number ofloaves he must sell next month if he is to have a profit of at least $3000?
Record your answer and fill in the bubbles. Be sure to use the correct place value.
0
1
2
3
4
5
6
7
8
9
0
1
2
3
4
5
6
7
8
9
0
1
2
3
4
5
6
7
8
9
0
1
2
3
4
5
6
7
8
9
0
1
2
3
4
5
6
7
8
9
0
1
2
3
4
5
6
7
8
9
0
1
2
3
4
5
6
7
8
9
Answer Key: page 238
Answer Key: page 238 Answer Key: page 238
Question 23Which of these is equivalent to the expressionbelow?
2x � 2(3x � 4) � 3(8x � 4)
A �8x
4� 5�
B 32x � 8
C 32x � 20
D 4(8x � 5)
Question 24Maria was given the equation y = 2x − 1 tograph. Which of the following would be anappropriate label for her graph?
A f(x) = 2y − 1
B f(x) = 2x − 1
C y = 2x
D x = 2y − 1
62
The student will demonstrate an understanding of linear functions.
Objective 3
For this objective you should be able to
● represent linear functions in different ways and translate amongtheir various representations; and
● interpret the meaning of slope and intercepts of a linear functionand describe the effects of changes in slope and y-intercept inreal-world and mathematical situations.
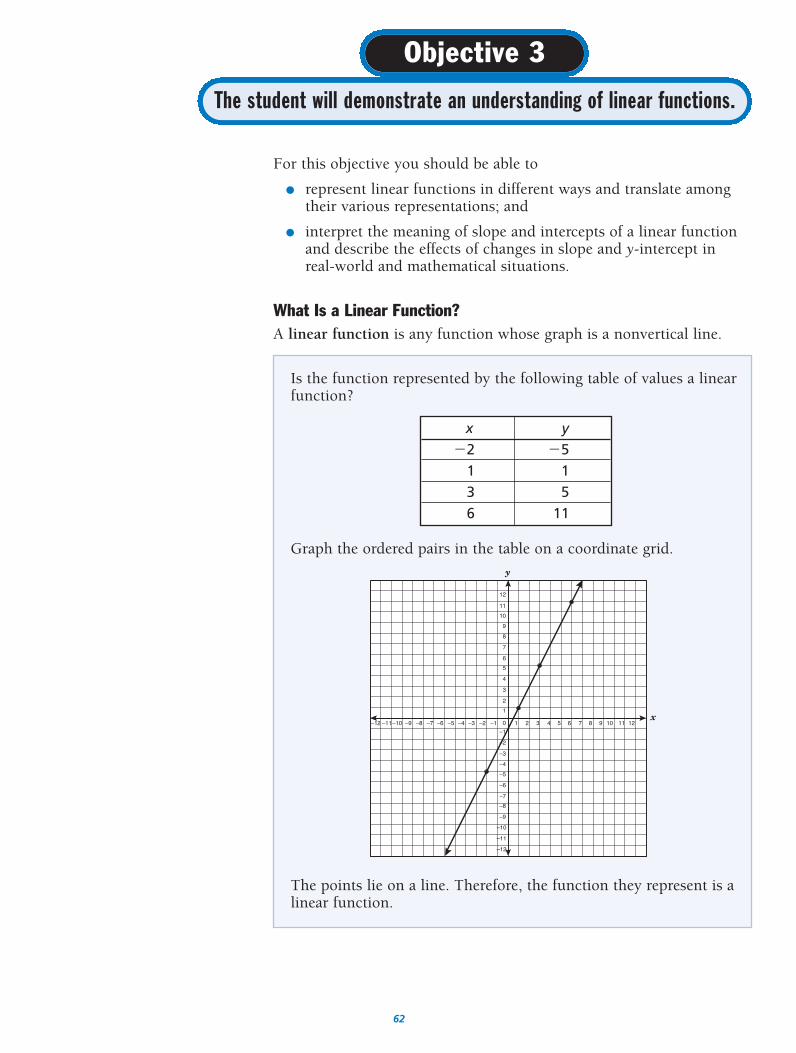
What Is a Linear Function?A linear function is any function whose graph is a nonvertical line.
Is the function represented by the following table of values a linearfunction?
Graph the ordered pairs in the table on a coordinate grid.
The points lie on a line. Therefore, the function they represent is alinear function.
y
x
–5
–4
–6
–7
–8
–9
–10
–11
–12
–3
–2
–1
0
1
2
3
4
5
6
7
8
9
10
11
12
–1 1–2–3–4–5–6–7–8–9–10–11–12 2 3 4 5 6 7 8 9 10 11 12
x y�2 �5
1 13 56 11
Objective 3
63
�53
�
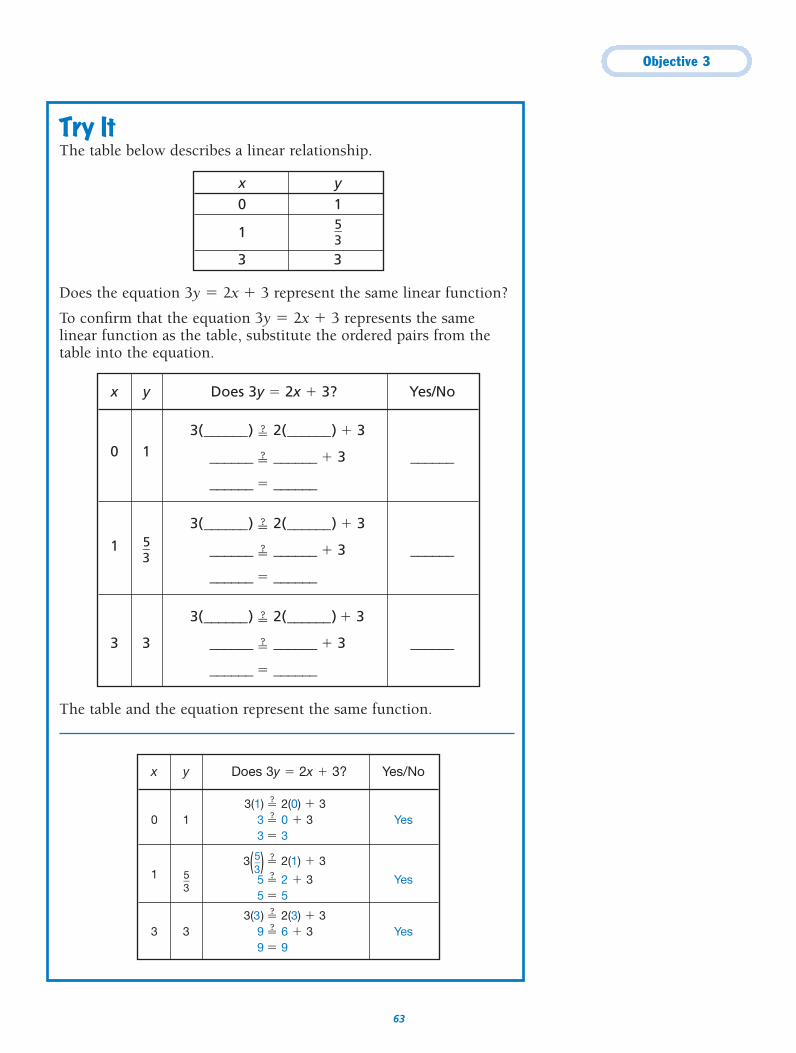
Try ItThe table below describes a linear relationship.
Does the equation 3y � 2x � 3 represent the same linear function?
To confirm that the equation 3y � 2x � 3 represents the same linear function as the table, substitute the ordered pairs from thetable into the equation.
The table and the equation represent the same function.
x y Yes/NoDoes 3y � 2x � 3?
3(1) � 2(0) � 30 1 3 � 0 � 3 Yes
3 � 3
3( �53
�) � 2(1) � 31 5 � 2 � 3 Yes
5 � 5
3(3) � 2(3) � 33 3 9 � 6 � 3 Yes
9 � 9
x y Yes/NoDoes 3y � 2x � 3?
3(______) � 2(______) � 30 1 ______ � ______ � 3 ______
______ � ______
3(______) � 2(______) � 3
1 �53
� ______ � ______ � 3 ______
______ � ______
3(______) � 2(______) � 3
3 3 ______ � ______ � 3 ______
______ � ______
x y0 1
1 �53
�
3 3
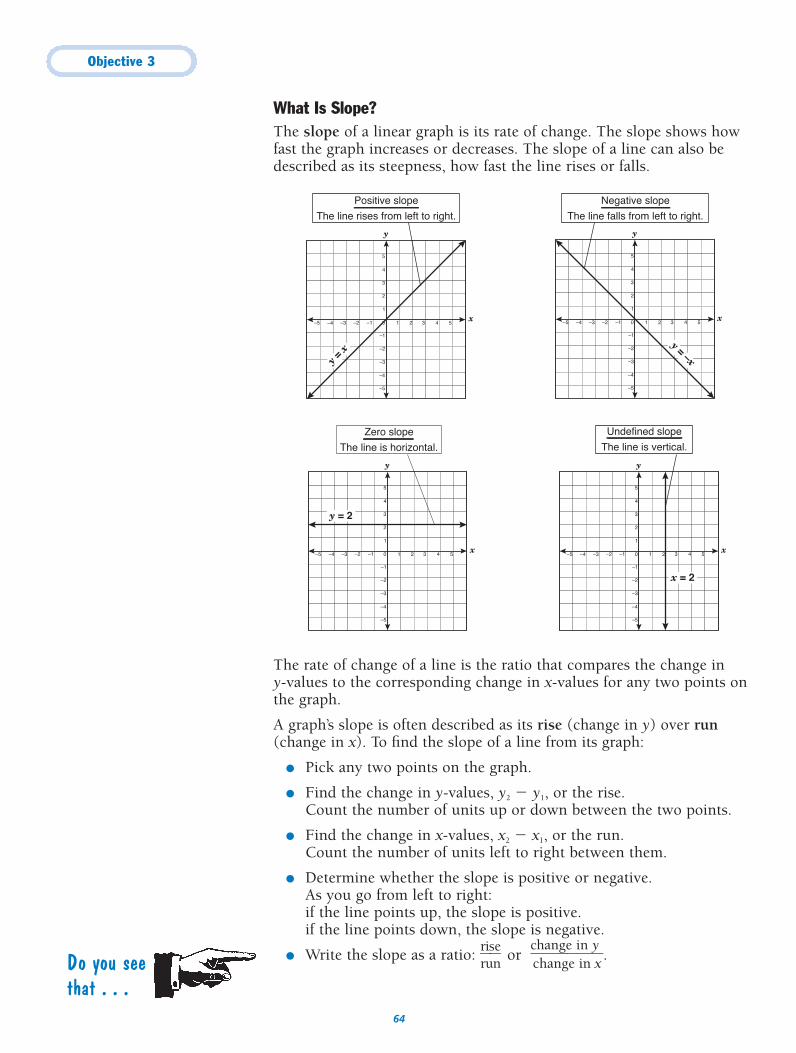
Objective 3
64
What Is Slope?The slope of a linear graph is its rate of change. The slope shows howfast the graph increases or decreases. The slope of a line can also bedescribed as its steepness, how fast the line rises or falls.
The rate of change of a line is the ratio that compares the change in y-values to the corresponding change in x-values for any two points onthe graph.
A graph’s slope is often described as its rise (change in y) over run(change in x). To find the slope of a line from its graph:
● Pick any two points on the graph.
● Find the change in y-values, y2 � y1, or the rise.Count the number of units up or down between the two points.
● Find the change in x-values, x2 � x1, or the run. Count the number of units left to right between them.
● Determine whether the slope is positive or negative. As you go from left to right:if the line points up, the slope is positive. if the line points down, the slope is negative.
● Write the slope as a ratio: �rriusne
� or �cchhaannggee
iinn
yx
�.
y
x
–5
–4
–3
–2
–1
1
2
3
4
5
0–1–2–3–4–5 1 2 3 4 5
x = 2
Undefined slope
The line is vertical.
y
x
–5
–4
–3
–2
–1
1
2
3
4
5
0–1–2–3–4–5 1 2 3 4 5
y = 2
Zero slope
The line is horizontal.
y
x
–5
–4
–3
–2
–1
1
2
3
4
5
0–1–2–3–4–5 1 2 3 4 5
y = –x
Negative slope
The line falls from left to right.
y
x
–5
–4
–3
–2
–1
1
2
3
4
5
0–1–2–3–4–5 1 2 3 4 5
y = x
Positive slope
The line rises from left to right.
Do you seethat . . .
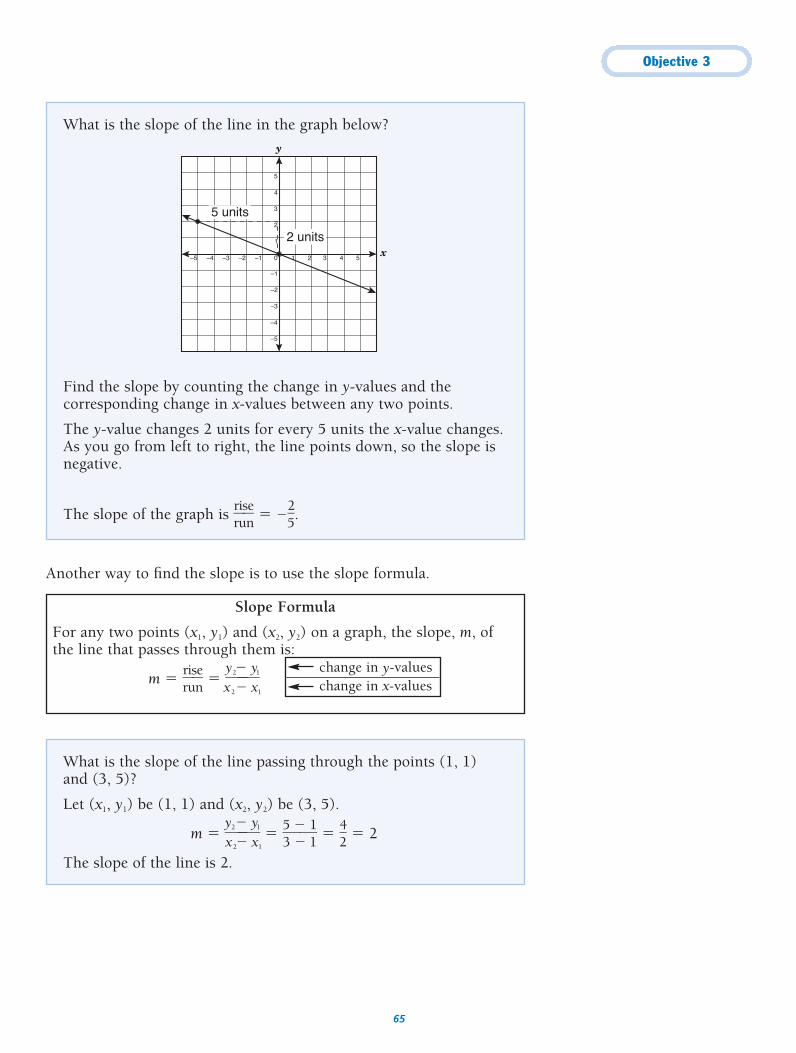
Objective 3
65
What is the slope of the line in the graph below?
Find the slope by counting the change in y-values and thecorresponding change in x-values between any two points.
The y-value changes 2 units for every 5 units the x-value changes.As you go from left to right, the line points down, so the slope isnegative.
The slope of the graph is �rriusne
� � ��25
�.
y
x
–5
–4
–3
–2
–1
1
2
3
4
5
0–1–2–3–4–5 1 2 3 4 5
5 units
2 units
What is the slope of the line passing through the points (1, 1) and (3, 5)?
Let (x1, y1) be (1, 1) and (x2, y2) be (3, 5).
m � �yx
2
2
�
�
yx1
1� � �
53
��
11
� � �42
� � 2
The slope of the line is 2.
Slope Formula
For any two points (x1, y1) and (x2, y2) on a graph, the slope, m, ofthe line that passes through them is:
m � �rriusne
� � �yx
2
2
�
�
yx1
1�
change in y-valueschange in x-values
Another way to find the slope is to use the slope formula.
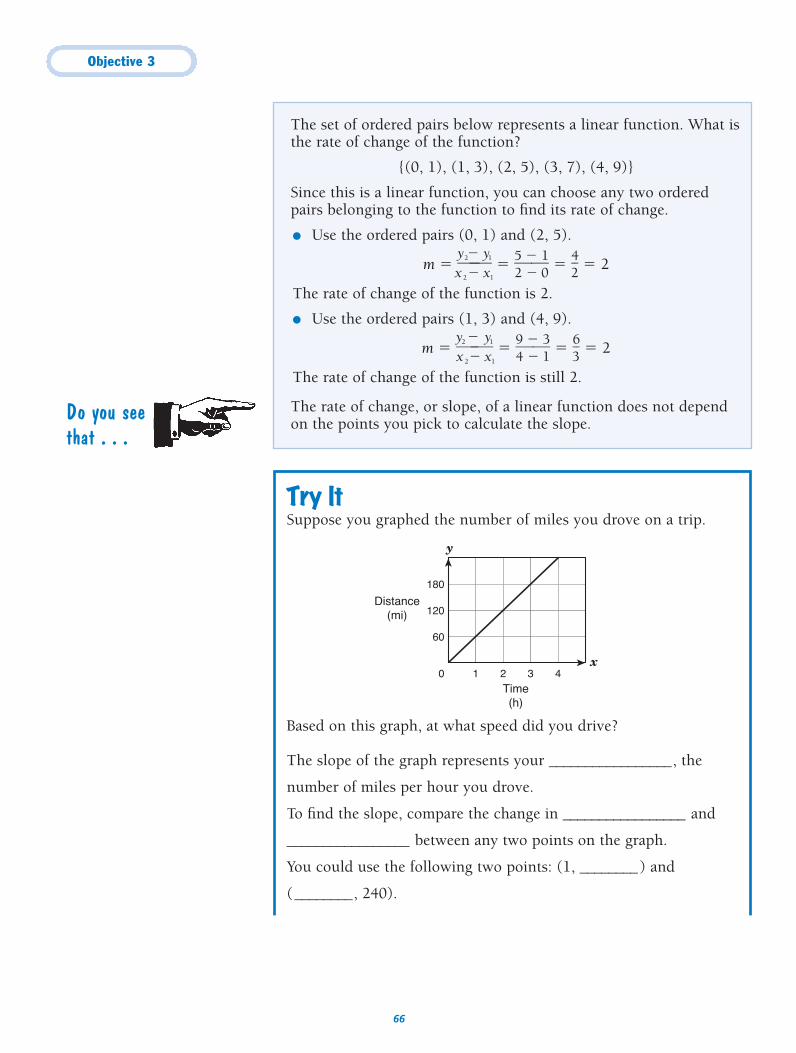
Objective 3
66
The set of ordered pairs below represents a linear function. What isthe rate of change of the function?
{(0, 1), (1, 3), (2, 5), (3, 7), (4, 9)}
Since this is a linear function, you can choose any two orderedpairs belonging to the function to find its rate of change.
● Use the ordered pairs (0, 1) and (2, 5).
m � �yx
2
2
�
�
yx1
1� � �
52
��
10
� � �42
� � 2
The rate of change of the function is 2.
● Use the ordered pairs (1, 3) and (4, 9).
m � �yx
2
2
�
�
yx1
1� � �
94
��
31
� � �63
� � 2
The rate of change of the function is still 2.
The rate of change, or slope, of a linear function does not dependon the points you pick to calculate the slope.
Try ItSuppose you graphed the number of miles you drove on a trip.
Based on this graph, at what speed did you drive?
The slope of the graph represents your _________________, the
number of miles per hour you drove.
To find the slope, compare the change in _________________ and
_________________ between any two points on the graph.
You could use the following two points: (1, ________) and
(________, 240).
60
120
0
180
1 32 4
Time(h)
Distance(mi)
y
x
Do you seethat . . .
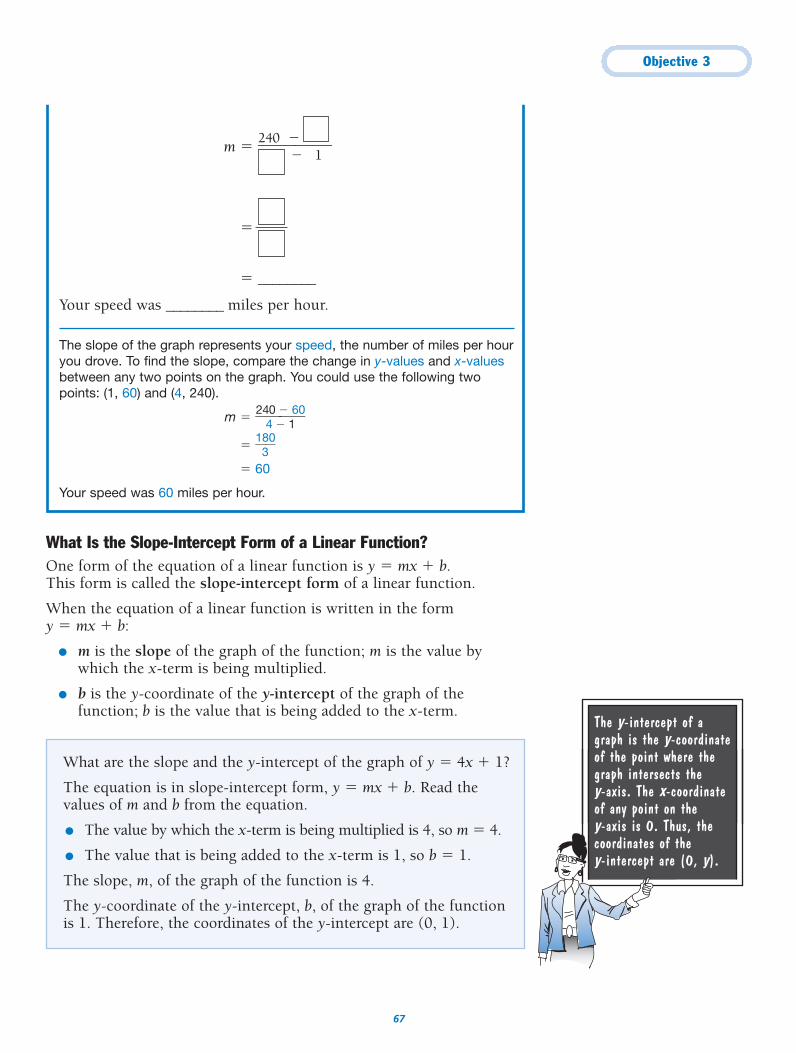
Objective 3
67
The y-intercept of agraph is the y-coordinateof the point where thegraph intersects the y-axis. The x-coordinateof any point on the y-axis is 0. Thus, thecoordinates of the y-intercept are (0, y).
m � �24
X0X
��
XX1
X�
�
� ________
Your speed was ________ miles per hour.
The slope of the graph represents your speed, the number of miles per houryou drove. To find the slope, compare the change in y-values and x-valuesbetween any two points on the graph. You could use the following twopoints: (1, 60) and (4, 240).
m � �24
40
��
160
�
� �183
0�
� 60
Your speed was 60 miles per hour.
What Is the Slope-Intercept Form of a Linear Function?One form of the equation of a linear function is y � mx � b. This form is called the slope-intercept form of a linear function.
When the equation of a linear function is written in the form y � mx � b:
● m is the slope of the graph of the function; m is the value bywhich the x-term is being multiplied.
● b is the y-coordinate of the y-intercept of the graph of thefunction; b is the value that is being added to the x-term.
What are the slope and the y-intercept of the graph of y � 4x � 1?
The equation is in slope-intercept form, y � mx � b. Read thevalues of m and b from the equation.
● The value by which the x-term is being multiplied is 4, so m � 4.
● The value that is being added to the x-term is 1, so b � 1.
The slope, m, of the graph of the function is 4.
The y-coordinate of the y-intercept, b, of the graph of the functionis 1. Therefore, the coordinates of the y-intercept are (0, 1).
Objective 3
68
While the point (0, b) is the y-intercept of thegraph of the equation y = mx + b, it iscommon to refer to bas the y-intercept of the graph.
What are the slope and y-intercept of the graph of 6x � y � 10?
● To determine the slope and y-intercept, transform the equation6x � y � 10 into slope-intercept form, y � mx � b.
6x � y � 10
�6x � �6x
y � �6x � 10
The equation is now in the form y � mx � b.
● Read the values of m and b from the revised equation. For thisfunction, m � �6, and b � 10.
The slope, m, of the graph of the function is �6.
The y-intercept, b, of the graph of the function is 10.
Try ItFind the slope and y-intercept of the graph of 3y � 6x � 9.
To determine the slope and y-intercept of the graph, transform theequation 3y � 6x � 9 into slope-intercept form, y � mx � b.
3y � 6x � 9
3y�
6x�
9
y � ______ x � ______
Read the values of ______ and ______ from the revised equation.
For this function, m � ______ and b � ______.
The slope, m, of the graph of the function is ______.
The y-coordinate of the y-intercept, b, of the graph of the function
is ______.
3y � 6x � 9
�33y� � �
63x� � �
93
�
y � 2x � 3
Read the values of m and b from the revised equation. For this function, m � 2 and b � �3. The slope, m, of the graph of the function is 2. The y-coordinate of the y-intercept, b, of the graph of the function is �3.
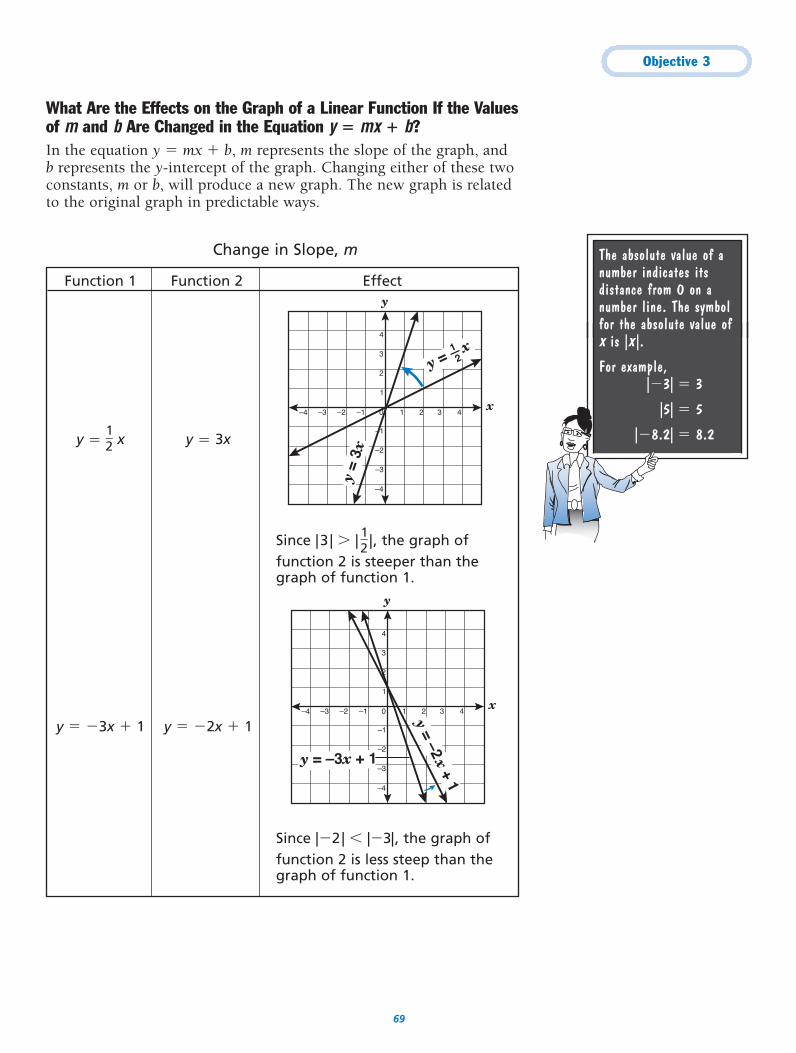
Objective 3
69
The absolute value of anumber indicates itsdistance from 0 on anumber line. The symbolfor the absolute value ofx is |x |.
For example, |�3| � 3
|5| � 5
|�8.2| � 8.2
Function 1 Function 2 Effect
y � �12
� x y � 3x
Since |3 | � | �12
� |, the graph of function 2 is steeper than the graph of function 1.
y � �3x � 1 y � �2x � 1
Since |�2| � |�3|, the graph offunction 2 is less steep than thegraph of function 1.
y
x
–4
–3
–2
–1
1
2
3
4
0–1–2–3–4 1 2 3 4
y = –3x + 1
y = –2x + 1
y
x
–4
–3
–2
–1
1
2
3
4
0–1–2–3–4 1 2 3 4
y = x12
y =
3x
What Are the Effects on the Graph of a Linear Function If the Valuesof m and b Are Changed in the Equation y � mx � b?In the equation y � mx � b, m represents the slope of the graph, andb represents the y-intercept of the graph. Changing either of these twoconstants, m or b, will produce a new graph. The new graph is relatedto the original graph in predictable ways.
Change in Slope, m
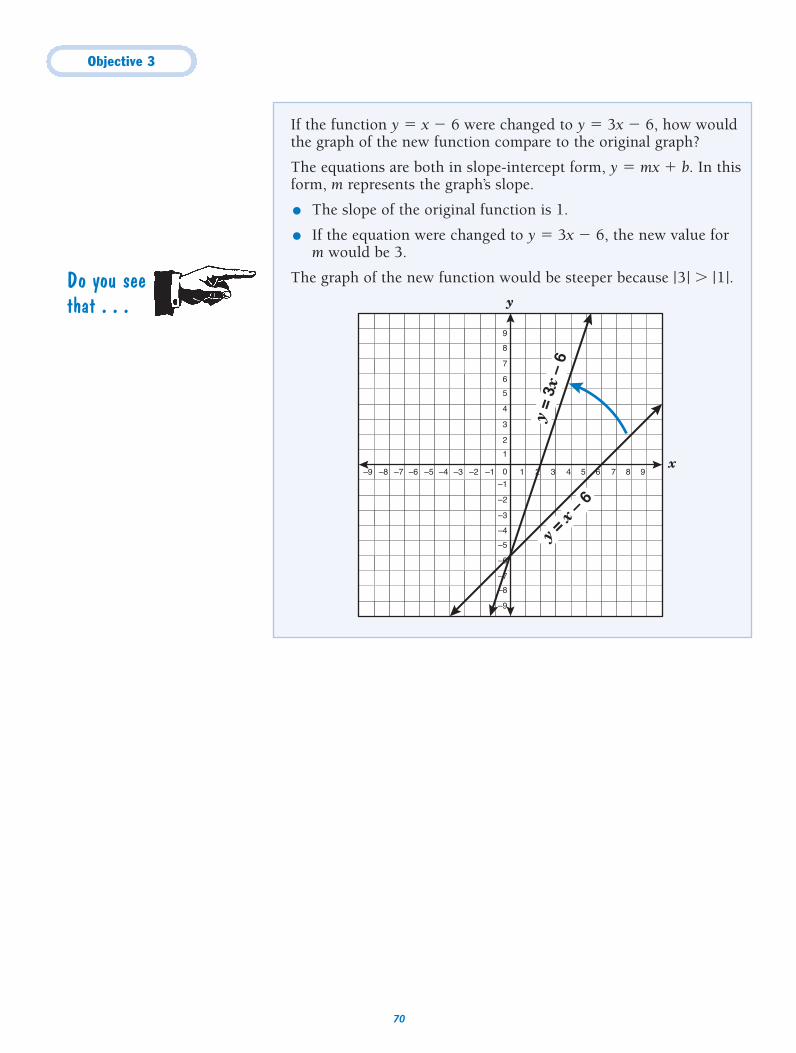
Objective 3
70
If the function y � x � 6 were changed to y � 3x � 6, how wouldthe graph of the new function compare to the original graph?
The equations are both in slope-intercept form, y � mx � b. In thisform, m represents the graph’s slope.
● The slope of the original function is 1.
● If the equation were changed to y � 3x � 6, the new value form would be 3.
The graph of the new function would be steeper because |3| � |1|.
y
x
–5
–4
–6
–7
–8
–9
–3
–2
–1
0
1
2
3
4
5
6
7
8
9
–1 1–2–3–4–5–6–7–8–9 2 3 4 5 6 7 8 9
y =
3x –
6y =
x – 6
Do you seethat . . .
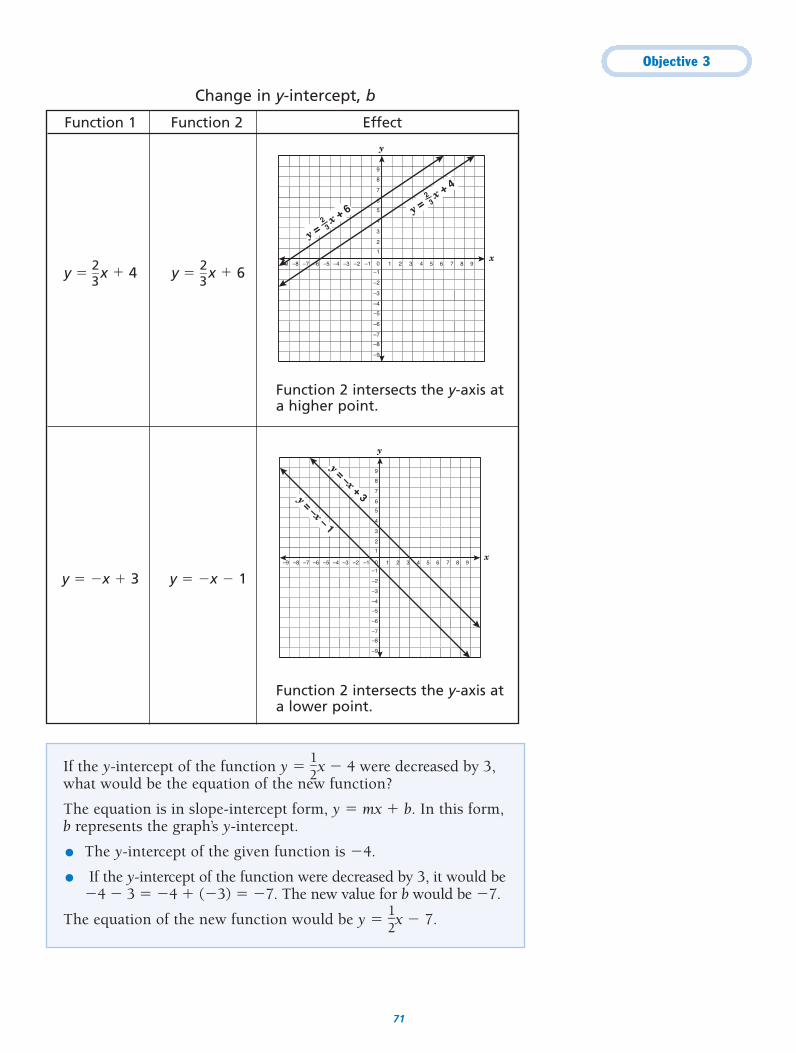
Objective 3
71
Function 1 Function 2 Effect
y � �23
� x � 4 y � �23
� x � 6
Function 2 intersects the y-axis at a higher point.
y � �x � 3 y � �x � 1
Function 2 intersects the y-axis at a lower point.
y
x
–5
–4
–6
–7
–8
–9
–3
–2
–1
0
1
2
3
4
5
6
7
8
9
–1 1–2–3–4–5–6–7–8–9 2 3 4 5 6 7 8 9
y = –x + 3y = –x – 1
y
x
–5
–4
–6
–7
–8
–9
–3
–2
–1
0
1
2
3
4
5
6
7
8
9
–1 1–2–3–4–5–6–7–8–9 2 3 4 5 6 7 8 9
y = x + 4
23
y = x + 6
23
Change in y-intercept, b
If the y-intercept of the function y � �12
�x � 4 were decreased by 3,what would be the equation of the new function?
The equation is in slope-intercept form, y � mx � b. In this form,b represents the graph’s y-intercept.
● The y-intercept of the given function is �4.
● If the y-intercept of the function were decreased by 3, it would be�4 � 3 � �4 � (�3) � �7. The new value for b would be �7.
The equation of the new function would be y � �12
�x � 7.
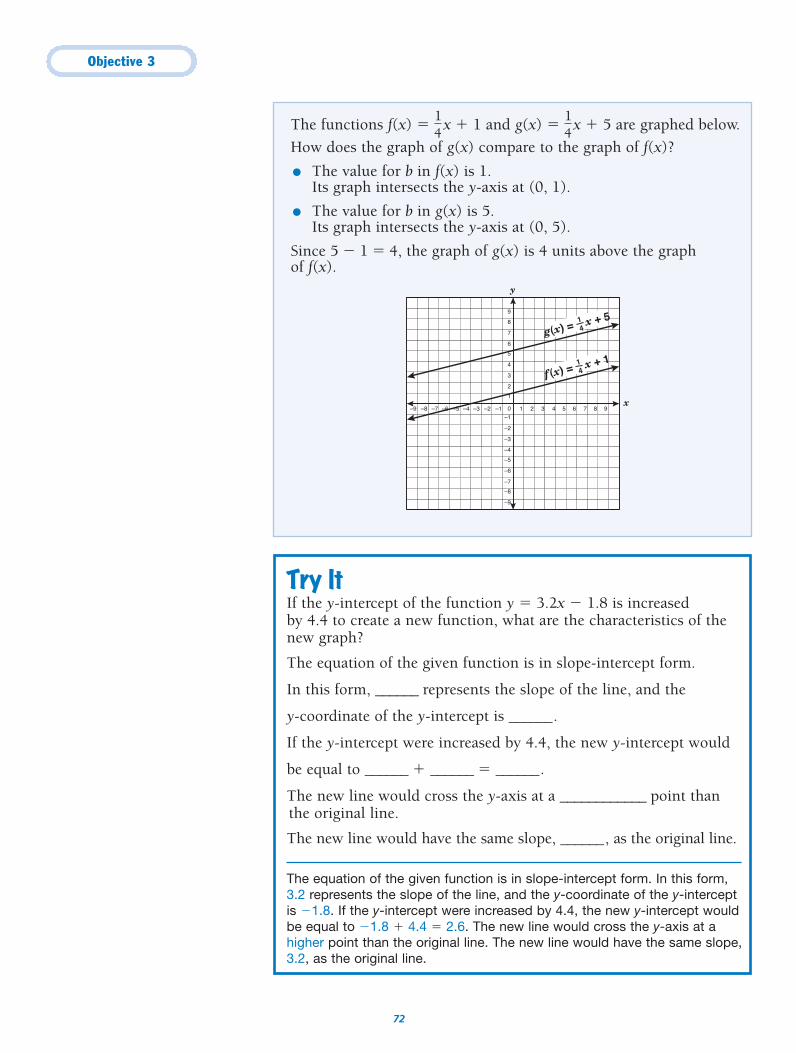
Objective 3
72
The functions f(x) � �14
� x � 1 and g(x) � �14
� x � 5 are graphed below.
How does the graph of g(x) compare to the graph of f(x)?
● The value for b in f(x) is 1.Its graph intersects the y-axis at (0, 1).
● The value for b in g(x) is 5. Its graph intersects the y-axis at (0, 5).
Since 5 � 1 � 4, the graph of g(x) is 4 units above the graph of f(x).
y
x
–5
–4
–6
–7
–8
–9
–3
–2
–1
0
1
2
3
4
5
6
7
8
9
–1 1–2–3–4–5–6–7–8–9 2 3 4 5 6 7 8 9
f (x) = x + 114
g(x) = x + 514
Try ItIf the y-intercept of the function y � 3.2x � 1.8 is increased by 4.4 to create a new function, what are the characteristics of thenew graph?
The equation of the given function is in slope-intercept form.
In this form, ______ represents the slope of the line, and the
y-coordinate of the y-intercept is ______.
If the y-intercept were increased by 4.4, the new y-intercept would
be equal to ______ � ______ � ______.
The new line would cross the y-axis at a ____________ point than the original line.
The new line would have the same slope, ______, as the original line.
The equation of the given function is in slope-intercept form. In this form,3.2 represents the slope of the line, and the y-coordinate of the y-interceptis �1.8. If the y-intercept were increased by 4.4, the new y-intercept wouldbe equal to �1.8 � 4.4 � 2.6. The new line would cross the y-axis at ahigher point than the original line. The new line would have the same slope,3.2, as the original line.
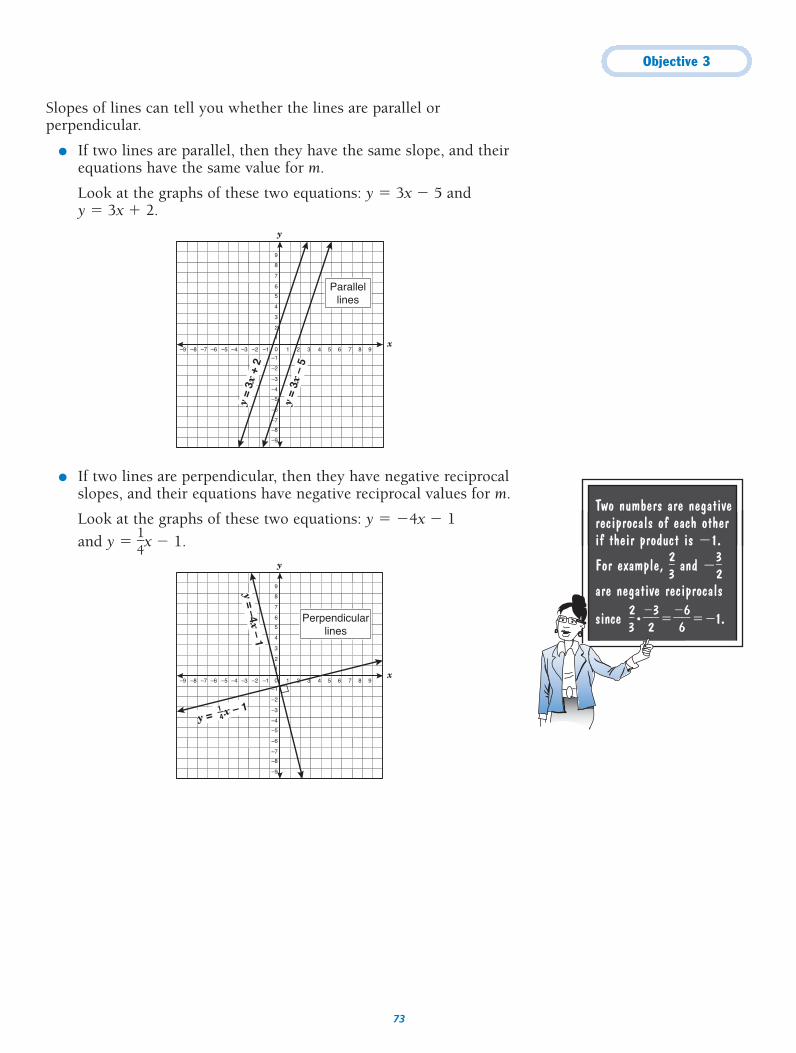
Objective 3
73
Slopes of lines can tell you whether the lines are parallel orperpendicular.
● If two lines are parallel, then they have the same slope, and theirequations have the same value for m.
Look at the graphs of these two equations: y � 3x � 5 andy � 3x � 2.
● If two lines are perpendicular, then they have negative reciprocalslopes, and their equations have negative reciprocal values for m.
Look at the graphs of these two equations: y � �4x � 1
and y � �14
�x � 1.y
x
–5
–4
–6
–7
–8
–9
–3
–2
–1
0
1
2
3
4
5
6
7
8
9
–1 1–2–3–4–5–6–7–8–9 2 3 4 5 6 7 8 9
Perpendicularlines
y = –4x – 1
y = x – 114
y
x
–5
–4
–6
–7
–8
–9
–3
–2
–1
0
1
2
3
4
5
6
7
8
9
–1 1–2–3–4–5–6–7–8–9 2 3 4 5 6 7 8 9
y =
3x –
5
y =
3x +
2
Parallellines
Two numbers are negativereciprocals of each otherif their product is �1.
For example, �23
� and ��23
�
are negative reciprocals
since �23
� • ��23
� ���66� ��1.
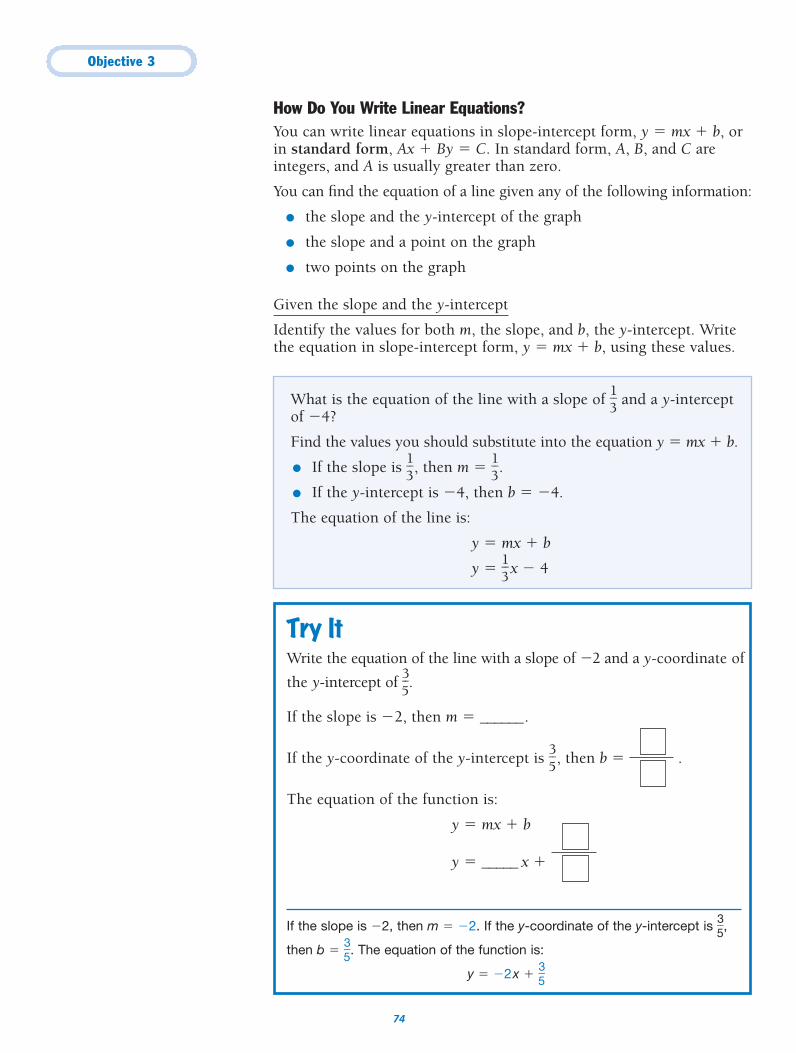
Objective 3
74
How Do You Write Linear Equations?You can write linear equations in slope-intercept form, y � mx � b, orin standard form, Ax � By � C. In standard form, A, B, and C areintegers, and A is usually greater than zero.
You can find the equation of a line given any of the following information:
● the slope and the y-intercept of the graph
● the slope and a point on the graph
● two points on the graph
Given the slope and the y-intercept
Identify the values for both m, the slope, and b, the y-intercept. Writethe equation in slope-intercept form, y � mx � b, using these values.
What is the equation of the line with a slope of �13
� and a y-intercept of �4?
Find the values you should substitute into the equation y � mx � b.
● If the slope is �13
�, then m � �13
�.
● If the y-intercept is �4, then b � �4.
The equation of the line is:
y � mx � b
y � �13
� x � 4
Try ItWrite the equation of the line with a slope of �2 and a y-coordinate of
the y-intercept of �35
�.
If the slope is �2, then m � ______.
If the y-coordinate of the y-intercept is �35
�, then b � .
The equation of the function is:
y � mx � b
y � _____ x �
If the slope is �2, then m � �2. If the y-coordinate of the y-intercept is �35
�,
then b � �35
�. The equation of the function is:
y � �2x � �35
�
Objective 3
75
You can also use thepoint-slope form to writethe equation of a line.
y – y1 = m(x – x1)
Given the slope and a point on the graph
● Substitute the given values (the x- and y-coordinates of the given point and m, the slope) into the slope-intercept form ofthe equation, y � mx � b.
● Solve the equation for b.
● Substitute the values for m and b into the slope-intercept form, y � mx � b.
What is the equation of a line with a slope of 9, passing throughthe point (3, 4)?
● Substitute x � 3, y � 4, and m � 9 into the slope-interceptform of the equation.
y � mx � b
4 � 9(3) � b
● Solve for b.
4 � 9(3) � b
4 � 27 � b�27 ��27
�23 � b
● Substitute the given value for m, 9, and the value you found for b, �23, into the slope-intercept form of the equation.
y � mx � b
y � 9x � 23
The equation of the line is y � 9x � 23.
This equation could also be written in standard form,Ax � By � C, in which A is usually positive.
y � 9x � 23�9x ��9x
�9x � y � �23
To change �9 to a positive value, multiply both sides of theequation by �1.
9x � y � 23
In standard form, the equation of this line is 9x � y � 23.
Do you seethat . . .
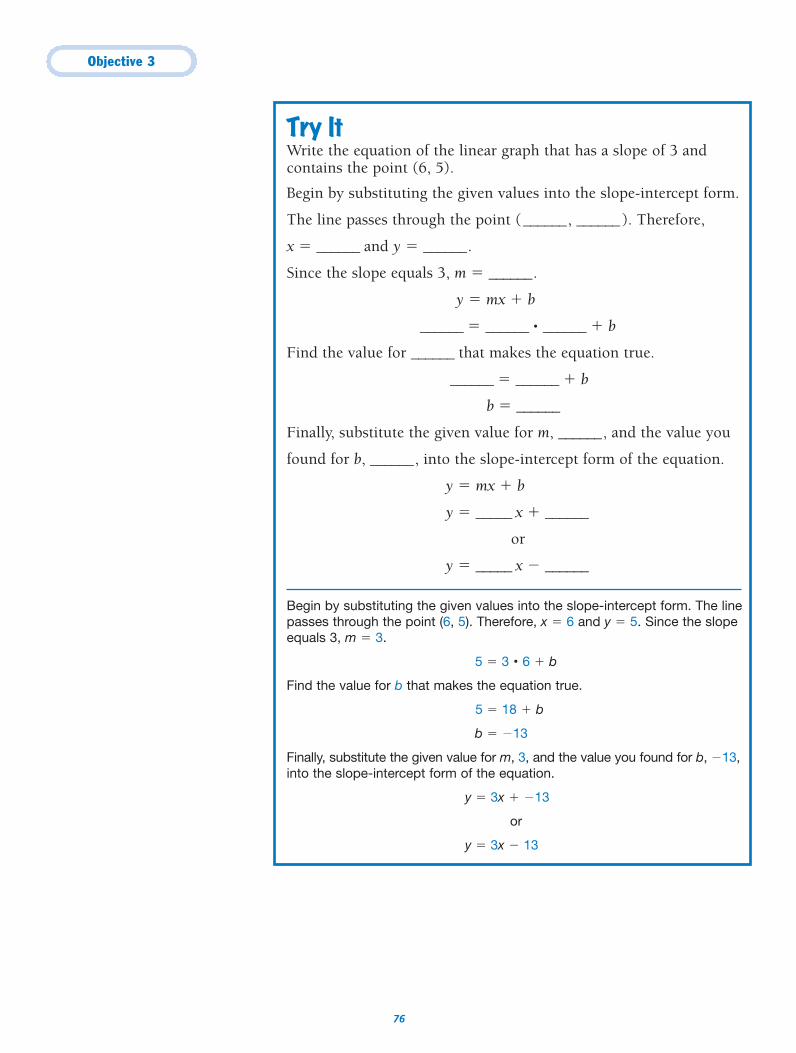
Objective 3
76
Try ItWrite the equation of the linear graph that has a slope of 3 andcontains the point (6, 5).
Begin by substituting the given values into the slope-intercept form.
The line passes through the point (______, ______). Therefore,
x � ______ and y � ______.
Since the slope equals 3, m � ______.
y � mx � b
______ � ______ • ______ � b
Find the value for ______ that makes the equation true.
______ � ______ � b
b � ______
Finally, substitute the given value for m, ______, and the value you
found for b, ______, into the slope-intercept form of the equation.
y � mx � b
y � _____ x � ______
or
y � _____ x � ______
Begin by substituting the given values into the slope-intercept form. The linepasses through the point (6, 5). Therefore, x � 6 and y � 5. Since the slopeequals 3, m � 3.
5 � 3 • 6 � b
Find the value for b that makes the equation true.
5 � 18 � b
b � �13
Finally, substitute the given value for m, 3, and the value you found for b, �13,into the slope-intercept form of the equation.
y � 3x � �13
or
y � 3x � 13
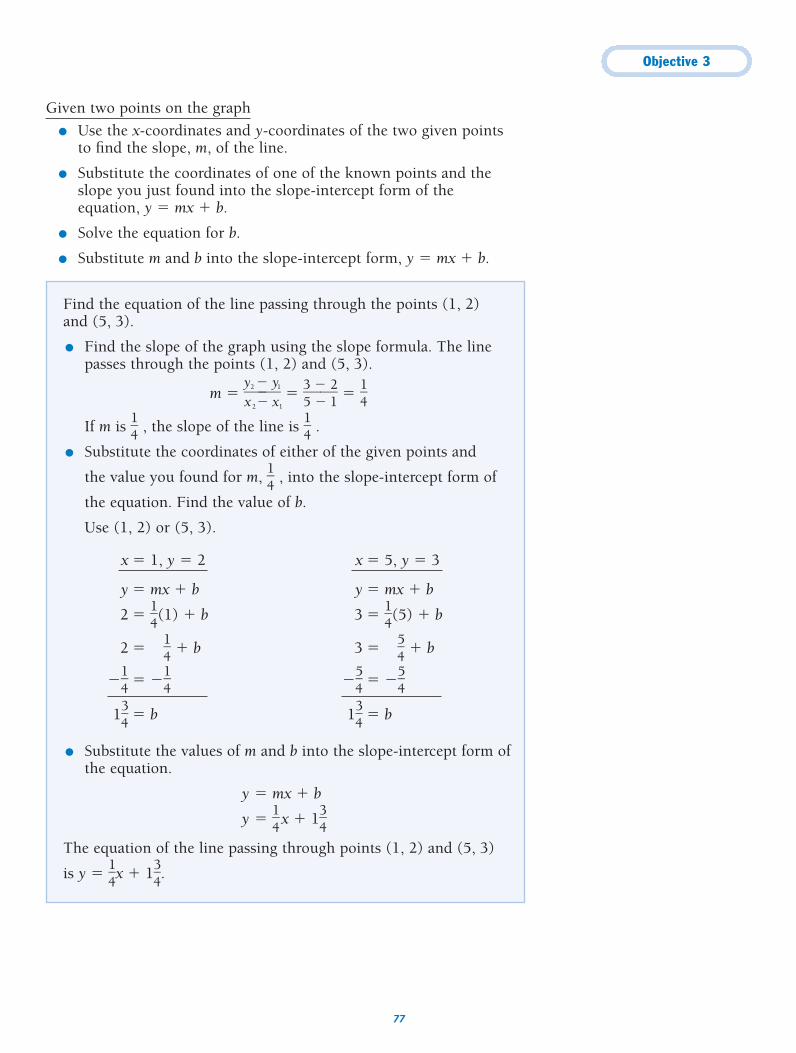
Objective 3
77
Given two points on the graph
● Use the x-coordinates and y-coordinates of the two given pointsto find the slope, m, of the line.
● Substitute the coordinates of one of the known points and theslope you just found into the slope-intercept form of theequation, y � mx � b.
● Solve the equation for b.
● Substitute m and b into the slope-intercept form, y � mx � b.
Find the equation of the line passing through the points (1, 2) and (5, 3).
● Find the slope of the graph using the slope formula. The linepasses through the points (1, 2) and (5, 3).
m � �yx
2
2
�
�
yx1
1� � �
35
��
21
� � �14
�
If m is �14
� , the slope of the line is �14
� .
● Substitute the coordinates of either of the given points and
the value you found for m, �14
� , into the slope-intercept form of
the equation. Find the value of b.
Use (1, 2) or (5, 3).
● Substitute the values of m and b into the slope-intercept form ofthe equation.
y � mx � b
y � �14
� x � 1�34
�
The equation of the line passing through points (1, 2) and (5, 3)
is y � �14
�x � 1�34
�.
x � 1, y � 2
y � mx � b
2 � �14
�(1) � b
2 � �14
� � b
��14
� � ��14
�
1�34
� � b
x � 5, y � 3
y � mx � b
3 � �14
�(5) � b
3 � �54
� � b
��54
� � ��54
�
1�34
� � b
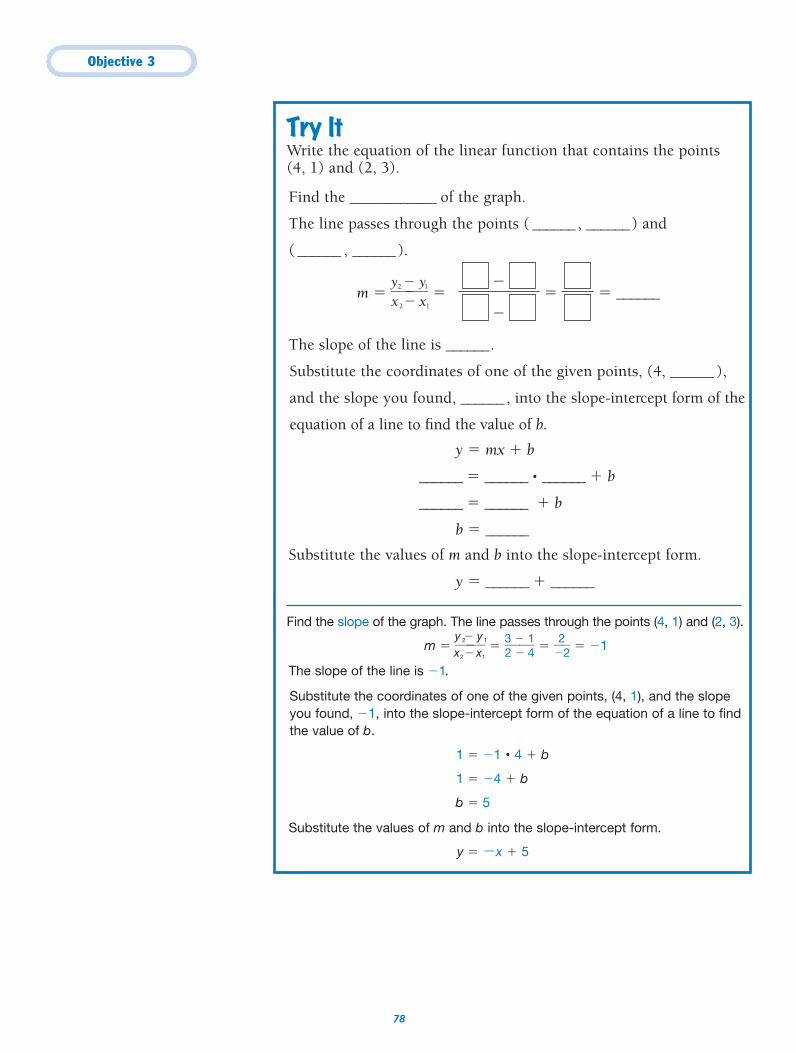
Objective 3
78
Try ItWrite the equation of the linear function that contains the points (4, 1) and (2, 3).
Find the ____________ of the graph.
The line passes through the points ( ______, ______) and
( ______ , ______).
m � �yx
2
2
�
�
yx1
1� � � � ______
The slope of the line is ______.
Substitute the coordinates of one of the given points, (4, ______ ),
and the slope you found, ______, into the slope-intercept form of the
equation of a line to find the value of b.
y � mx � b
______ � ______ • ______ � b
______ � ______ � b
b � ______
Substitute the values of m and b into the slope-intercept form.
y � ______ � ______
Find the slope of the graph. The line passes through the points (4, 1) and (2, 3).
m � �yx
2
2
�
�
yx
1
1
� � �32
��
14
� � ��22� � �1
The slope of the line is �1.
Substitute the coordinates of one of the given points, (4, 1), and the slopeyou found, �1, into the slope-intercept form of the equation of a line to findthe value of b.
1 � �1 • 4 � b
1 � �4 � b
b � 5
Substitute the values of m and b into the slope-intercept form.
y � �x � 5
�
�
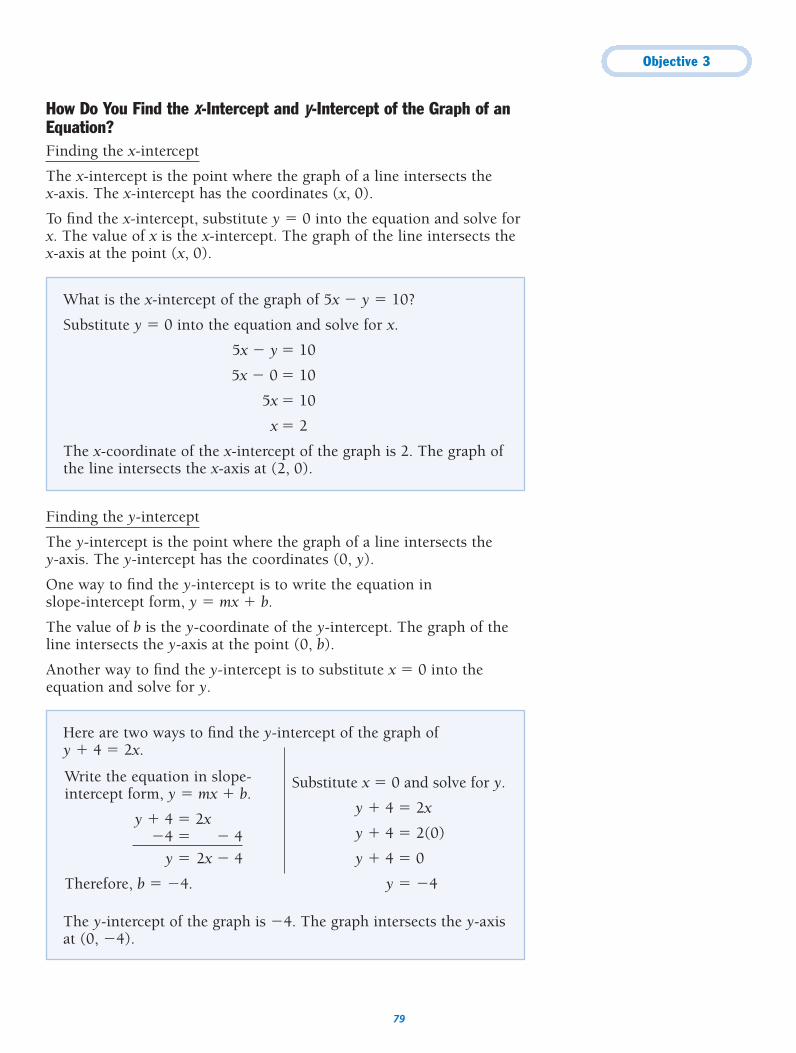
Objective 3
79
How Do You Find the x-Intercept and y-Intercept of the Graph of anEquation?Finding the x-intercept
The x-intercept is the point where the graph of a line intersects the x-axis. The x-intercept has the coordinates (x, 0).
To find the x-intercept, substitute y � 0 into the equation and solve forx. The value of x is the x-intercept. The graph of the line intersects the x-axis at the point (x, 0).
Finding the y-intercept
The y-intercept is the point where the graph of a line intersects they-axis. The y-intercept has the coordinates (0, y).
One way to find the y-intercept is to write the equation inslope-intercept form, y � mx � b.
The value of b is the y-coordinate of the y-intercept. The graph of theline intersects the y-axis at the point (0, b).
Another way to find the y-intercept is to substitute x � 0 into theequation and solve for y.
Here are two ways to find the y-intercept of the graph ofy � 4 � 2x.
The y-intercept of the graph is �4. The graph intersects the y-axisat (0, �4).
Write the equation in slope-intercept form, y � mx � b.
y � 4 � 2x�4 � � 4
y � 2x � 4
Therefore, b � �4.
Substitute x � 0 and solve for y.
y � 4 � 2x
y � 4 � 2(0)
y � 4 � 0
y � �4
What is the x-intercept of the graph of 5x � y � 10?
Substitute y � 0 into the equation and solve for x.
5x � y � 10
5x � 0 � 10
5x � 10
x � 2
The x-coordinate of the x-intercept of the graph is 2. The graph ofthe line intersects the x-axis at (2, 0).
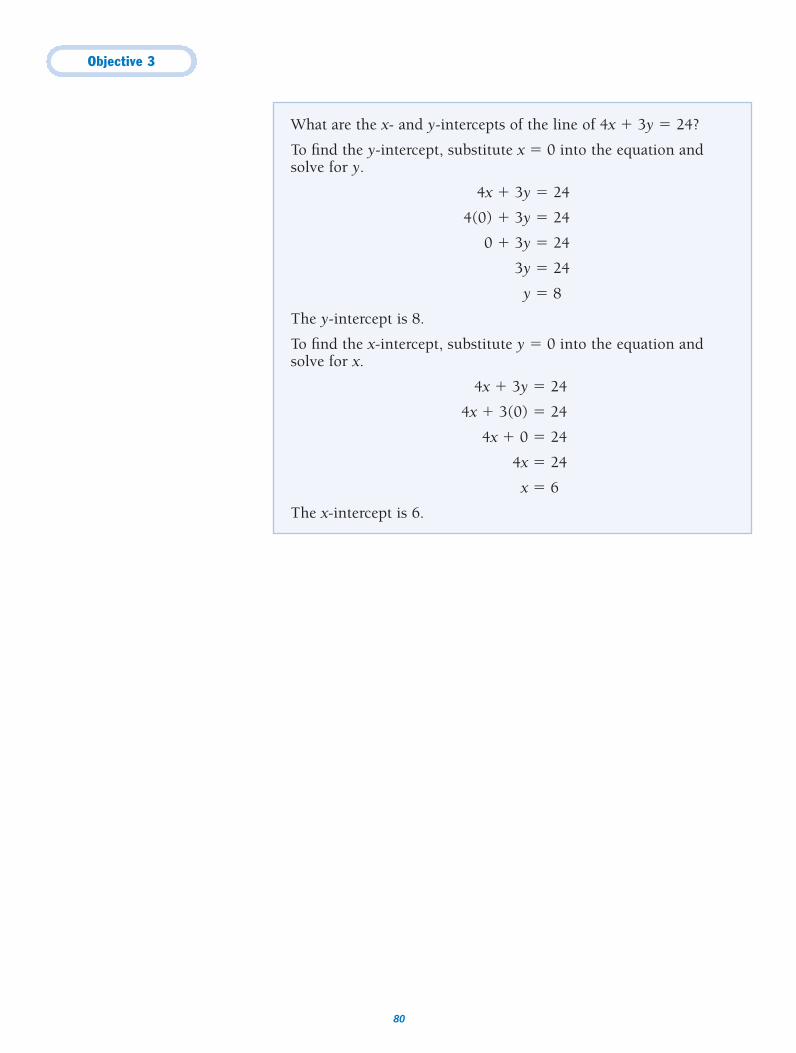
Objective 3
80
What are the x- and y-intercepts of the line of 4x � 3y � 24?
To find the y-intercept, substitute x � 0 into the equation andsolve for y.
4x � 3y � 24
4(0) � 3y � 24
0 � 3y � 24
3y � 24
y � 8
The y-intercept is 8.
To find the x-intercept, substitute y � 0 into the equation andsolve for x.
4x � 3y � 24
4x � 3(0) � 24
4x � 0 � 24
4x � 24
x � 6
The x-intercept is 6.
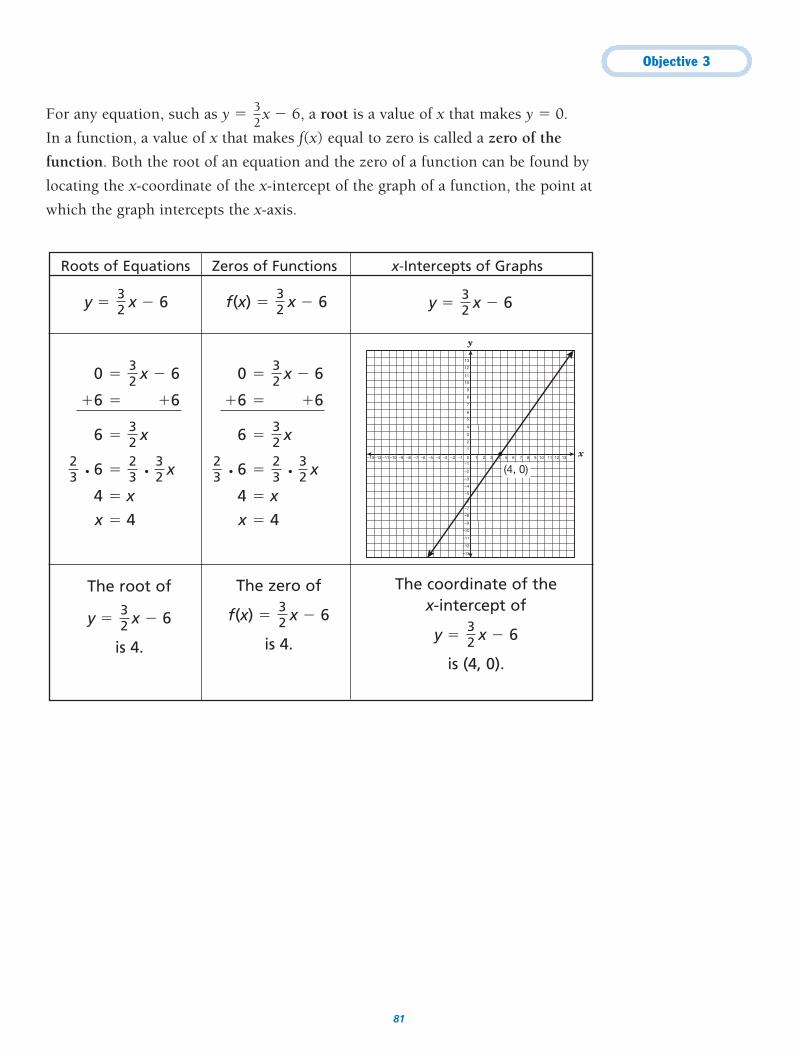
Objective 3
81
For any equation, such as y � x � 6, a root is a value of x that makes y � 0.
In a function, a value of x that makes f(x) equal to zero is called a zero of the
function. Both the root of an equation and the zero of a function can be found by
locating the x-coordinate of the x-intercept of the graph of a function, the point at
which the graph intercepts the x-axis.
32
Roots of Equations Zeros of Functions x-Intercepts of Graphs
y � x � 632
0 � x � 6
�6 � �6
6 � x
· 6 � · x
4 � x
x � 4
32
23
23
32
32
The root of
y � x � 6
is 4.
32
The zero of
f(x) � x � 6
is 4.
32
The coordinate of thex-intercept of
y � x � 6
is (4, 0).
32
y � x � 632f(x) � x � 63
2
y
x
–5
–4
–6
–7
–8
–9
–10
–11
–12
–13
–3
–2
–1
0
1
2
3
4
5
6
7
8
9
10
11
12
13
–1 1–2–3–4–5–6–7–8–9–10–11–12–13 2 3 4 5 6 7 8 9 10 11 12 13
(4, 0)
0 � x � 6
�6 � �6
6 � x
· 6 � · x
4 � x
x � 4
32
23
23
32
32
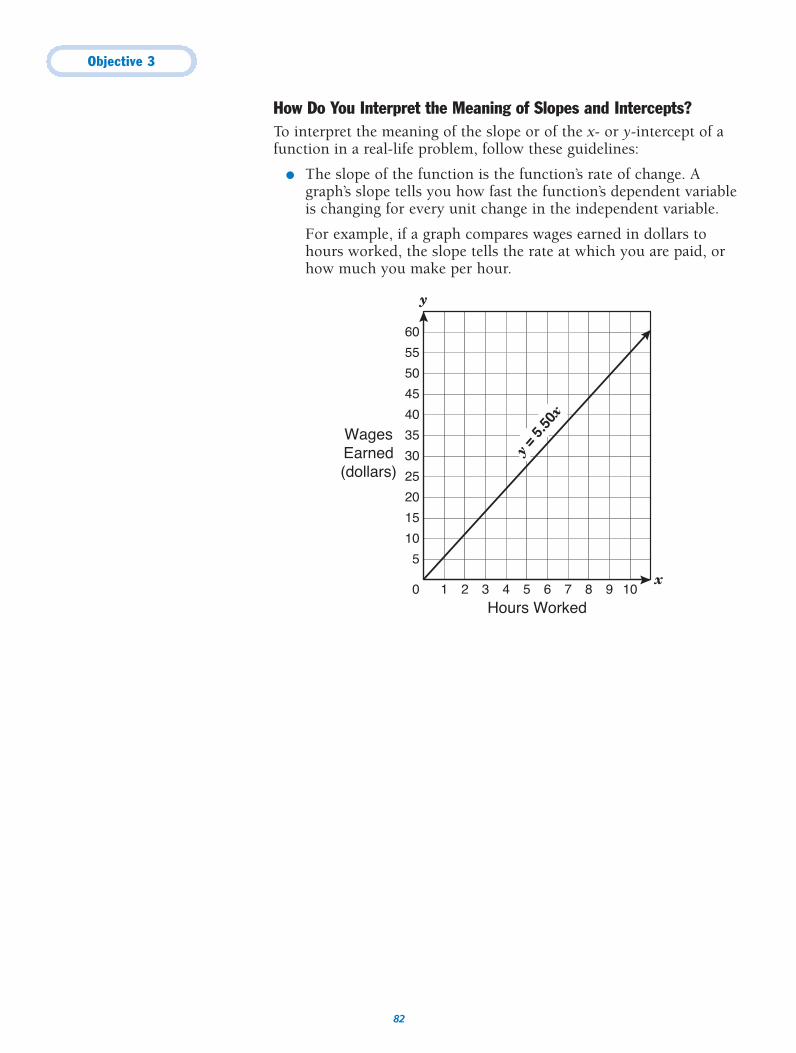
Objective 3
82
How Do You Interpret the Meaning of Slopes and Intercepts?To interpret the meaning of the slope or of the x- or y-intercept of afunction in a real-life problem, follow these guidelines:
● The slope of the function is the function’s rate of change. Agraph’s slope tells you how fast the function’s dependent variableis changing for every unit change in the independent variable.
For example, if a graph compares wages earned in dollars tohours worked, the slope tells the rate at which you are paid, orhow much you make per hour.
0
5
10
15
20
25
30
35
40
1 2 3 4 5 6 7 8
45
50
55
60
9 10
y
x
Hours Worked
WagesEarned(dollars)
y = 5
.50x
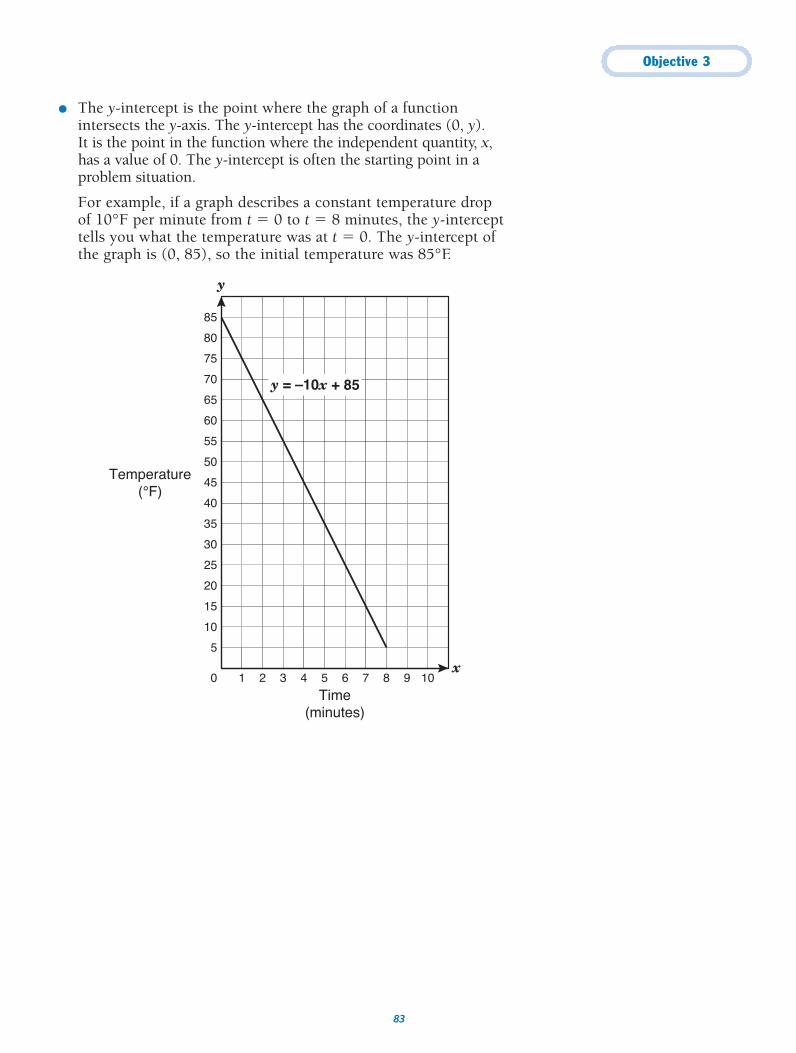
Objective 3
83
● The y-intercept is the point where the graph of a functionintersects the y-axis. The y-intercept has the coordinates (0, y). It is the point in the function where the independent quantity, x,has a value of 0. The y-intercept is often the starting point in aproblem situation.
For example, if a graph describes a constant temperature drop of 10°F per minute from t � 0 to t � 8 minutes, the y-intercepttells you what the temperature was at t � 0. The y-intercept ofthe graph is (0, 85), so the initial temperature was 85°F.
0
5
10
15
20
25
30
35
40
1 2 3 4 5 6 7 8
45
50
55
60
65
70
75
80
85
9 10
y
x
Time(minutes)
Temperature(°F)
y = –10x + 85
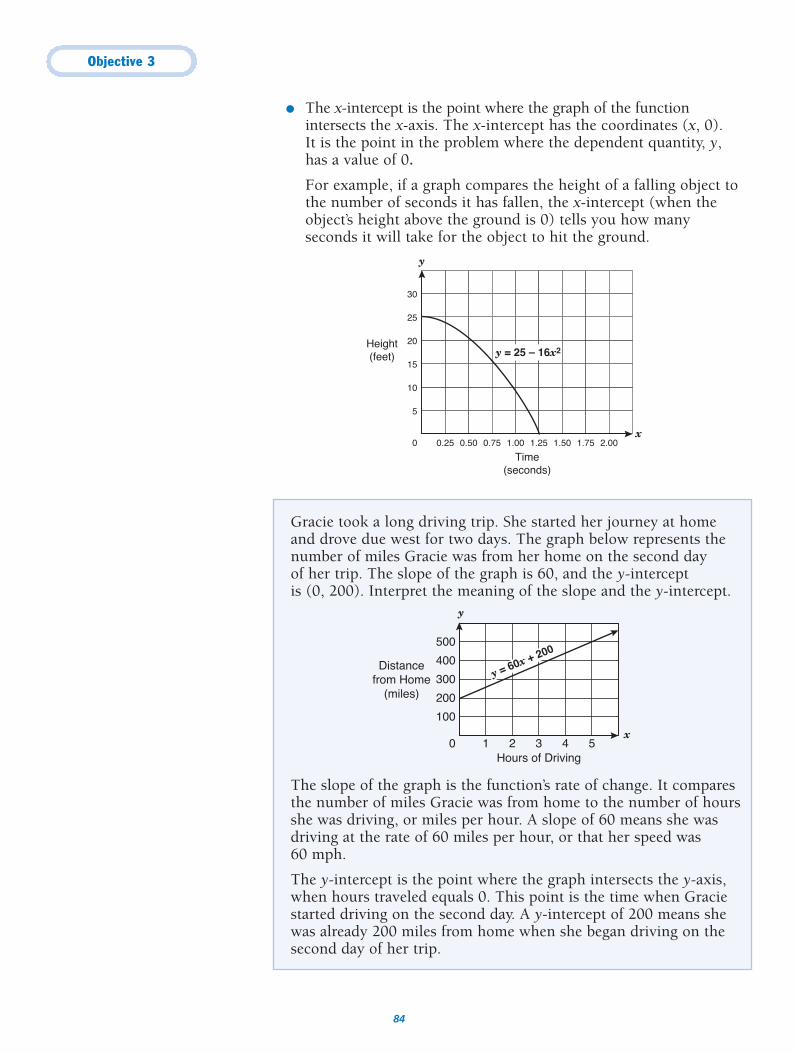
Objective 3
84
Gracie took a long driving trip. She started her journey at homeand drove due west for two days. The graph below represents thenumber of miles Gracie was from her home on the second day of her trip. The slope of the graph is 60, and the y-intercept is (0, 200). Interpret the meaning of the slope and the y-intercept.
The slope of the graph is the function’s rate of change. It comparesthe number of miles Gracie was from home to the number of hoursshe was driving, or miles per hour. A slope of 60 means she wasdriving at the rate of 60 miles per hour, or that her speed was60 mph.
The y-intercept is the point where the graph intersects the y-axis,when hours traveled equals 0. This point is the time when Graciestarted driving on the second day. A y-intercept of 200 means shewas already 200 miles from home when she began driving on thesecond day of her trip.
200
0
400
500
100
300
2 4 51 3Hours of Driving
Distancefrom Home
(miles)
y = 60x + 200
y
x
● The x-intercept is the point where the graph of the functionintersects the x-axis. The x-intercept has the coordinates (x, 0). It is the point in the problem where the dependent quantity, y,has a value of 0.
For example, if a graph compares the height of a falling object tothe number of seconds it has fallen, the x-intercept (when theobject’s height above the ground is 0) tells you how manyseconds it will take for the object to hit the ground.
0
5
10
15
20
25
30
0.25 0.50 0.75 1.00 1.25 1.50 1.75 2.00
Time(seconds)
Height(feet) y = 25 – 16x2
y
x
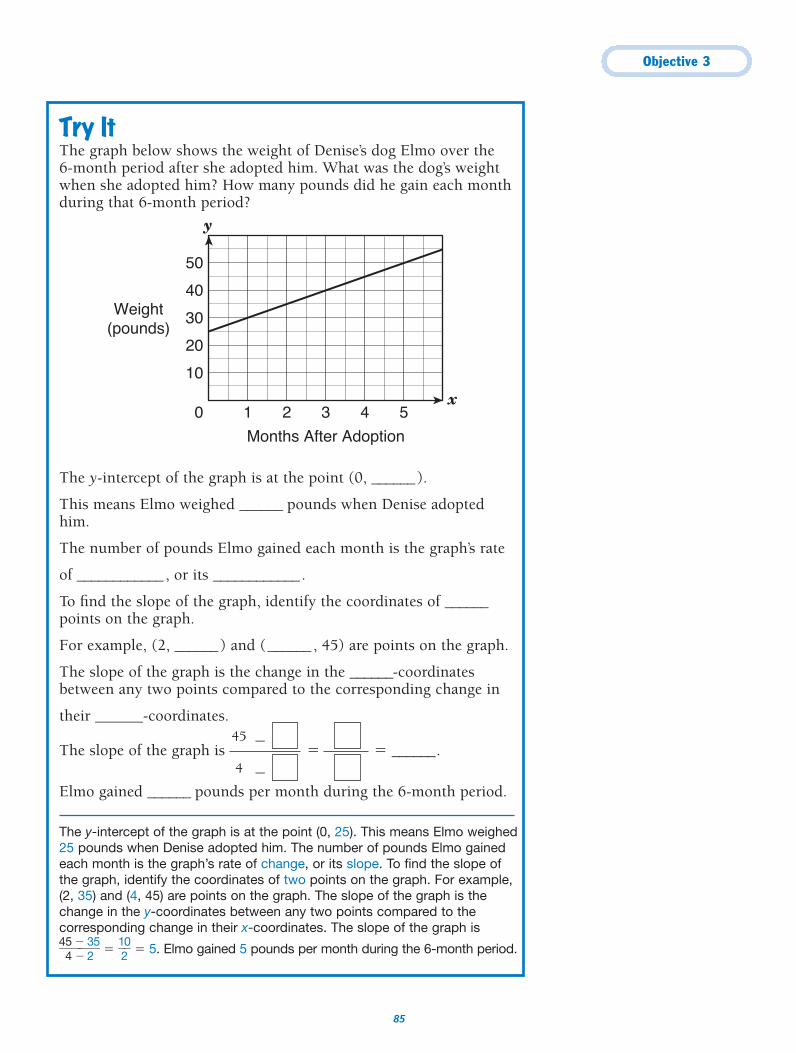
Objective 3
85
Try ItThe graph below shows the weight of Denise’s dog Elmo over the 6-month period after she adopted him. What was the dog’s weightwhen she adopted him? How many pounds did he gain each monthduring that 6-month period?
The y-intercept of the graph is at the point (0, ______).
This means Elmo weighed ______ pounds when Denise adopted him.
The number of pounds Elmo gained each month is the graph’s rate
of ____________, or its ____________.
To find the slope of the graph, identify the coordinates of ______points on the graph.
For example, (2, ______) and (______, 45) are points on the graph.
The slope of the graph is the change in the ______-coordinates between any two points compared to the corresponding change in
their ______-coordinates.
The slope of the graph is � � ______.
Elmo gained ______ pounds per month during the 6-month period.
The y-intercept of the graph is at the point (0, 25). This means Elmo weighed25 pounds when Denise adopted him. The number of pounds Elmo gainedeach month is the graph’s rate of change, or its slope. To find the slope ofthe graph, identify the coordinates of two points on the graph. For example,(2, 35) and (4, 45) are points on the graph. The slope of the graph is thechange in the y-coordinates between any two points compared to thecorresponding change in their x-coordinates. The slope of the graph is
�454
��
325
� � �120� � 5. Elmo gained 5 pounds per month during the 6-month period.
y
x
20
0
40
50
10
30
2 4 51 3
Months After Adoption
Weight(pounds)
45
4
�
�
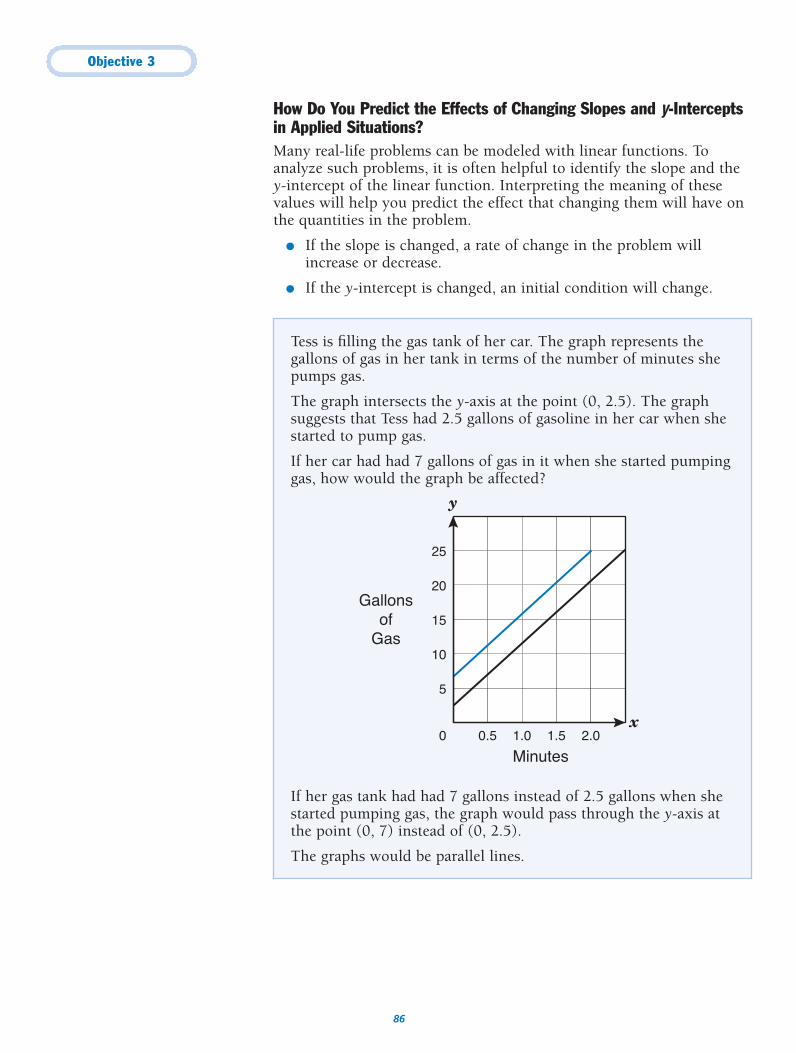
Objective 3
86
Tess is filling the gas tank of her car. The graph represents thegallons of gas in her tank in terms of the number of minutes shepumps gas.
The graph intersects the y-axis at the point (0, 2.5). The graphsuggests that Tess had 2.5 gallons of gasoline in her car when shestarted to pump gas.
If her car had had 7 gallons of gas in it when she started pumpinggas, how would the graph be affected?
If her gas tank had had 7 gallons instead of 2.5 gallons when shestarted pumping gas, the graph would pass through the y-axis atthe point (0, 7) instead of (0, 2.5).
The graphs would be parallel lines.
0
5
10
15
20
25
0.5 1.0 1.5 2.0
Minutes
Gallonsof
Gas
y
x
How Do You Predict the Effects of Changing Slopes and y-Interceptsin Applied Situations?Many real-life problems can be modeled with linear functions. Toanalyze such problems, it is often helpful to identify the slope and they-intercept of the linear function. Interpreting the meaning of thesevalues will help you predict the effect that changing them will have onthe quantities in the problem.
● If the slope is changed, a rate of change in the problem willincrease or decrease.
● If the y-intercept is changed, an initial condition will change.
Objective 3
87
Try ItZippy’s, a package-delivery service, charges $12 plus $0.08 per mileto deliver a package within the city. How would the graph of thecost of delivering a package change if Zippy’s increased its mileagecharge to $0.09 per mile?
Write an equation that represents the cost, c, of delivering a packagen miles.
c � ______ n � ______
In this equation 0.08 represents the ____________ of the graph of the equation.
If the mileage charge were changed from 0.08 to 0.09, the slope of
the graph would ____________.
The new line will be ____________.
Write an equation that represents the cost, c, of delivering a packagen miles.
c � 0.08n � 12
In this equation 0.08 represents the slope of the graph of the equation. If themileage charge were changed from 0.08 to 0.09, the slope of the graphwould increase. The new line will be steeper.
Objective 3
88
How Do You Solve Problems Involving Direct Variation or ProportionalChange?If a quantity y varies directly with a quantity x, then the linear equationrepresenting the relationship between the two quantities is y � kx. Inthis equation, k is called the proportionality constant.
To say “y varies directly with x” is to say “y is directly proportional to x.”
If the equation y � kx were graphed, k would be the slope of the graph.
The price of milk varies directly with the number of quarts of milkpurchased. If 5 quarts of milk cost $6.25, what would 3 quarts ofmilk cost?
● Write an equation that compares the number of quartspurchased to the cost.
Let q � the number of quarts purchased.
Let c � the cost.
The direct variation equation is c � kq.
● Substitute the known values for c and q to find the proportionalityconstant, k. Five quarts of milk (q � 5) cost $6.25 (c � 6.25).
c � kq
6.25 � k(5)
1.25 � k
If k � 1.25, then the proportionality constant is $1.25. If k � 1.25, then the slope of the graph is 1.25.
● Find the cost of 3 quarts of milk by substituting k � 1.25 andq � 3 into the equation c � kq.
c � kq
c � 1.25(3)
c � 3.75
Three quarts of milk cost $3.75.
Now practice what you’ve learned.
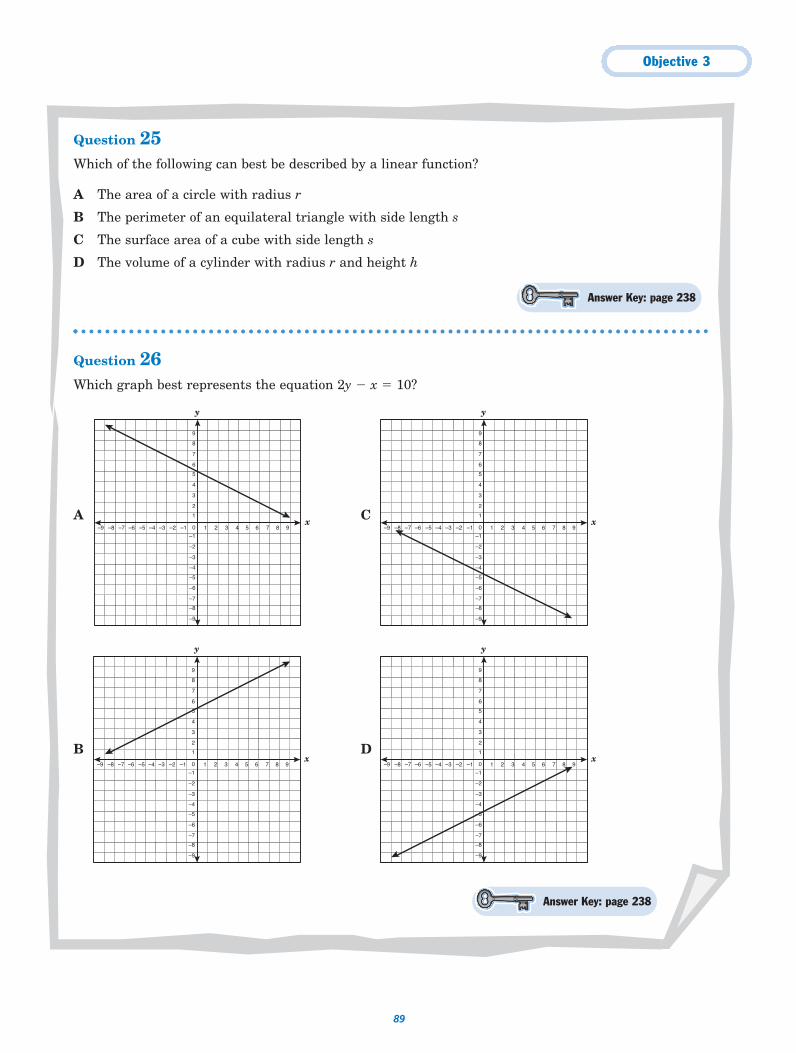
Objective 3
89
Question 25Which of the following can best be described by a linear function?
A The area of a circle with radius r
B The perimeter of an equilateral triangle with side length s
C The surface area of a cube with side length s
D The volume of a cylinder with radius r and height h
Question 26Which graph best represents the equation 2y � x � 10?
A C
B D
y
x
–5
–4
–6
–7
–8
–9
–3
–2
–1
0
1
2
3
4
5
6
7
8
9
–1 1–2–3–4–5–6–7–8–9 2 3 4 5 6 7 8 9
y
x
–5
–4
–6
–7
–8
–9
–3
–2
–1
0
1
2
3
4
5
6
7
8
9
–1 1–2–3–4–5–6–7–8–9 2 3 4 5 6 7 8 9
y
x
–5
–4
–6
–7
–8
–9
–3
–2
–1
0
1
2
3
4
5
6
7
8
9
–1 1–2–3–4–5–6–7–8–9 2 3 4 5 6 7 8 9
y
x
–5
–4
–6
–7
–8
–9
–3
–2
–1
0
1
2
3
4
5
6
7
8
9
–1 1–2–3–4–5–6–7–8–9 2 3 4 5 6 7 8 9
Answer Key: page 238
Answer Key: page 238
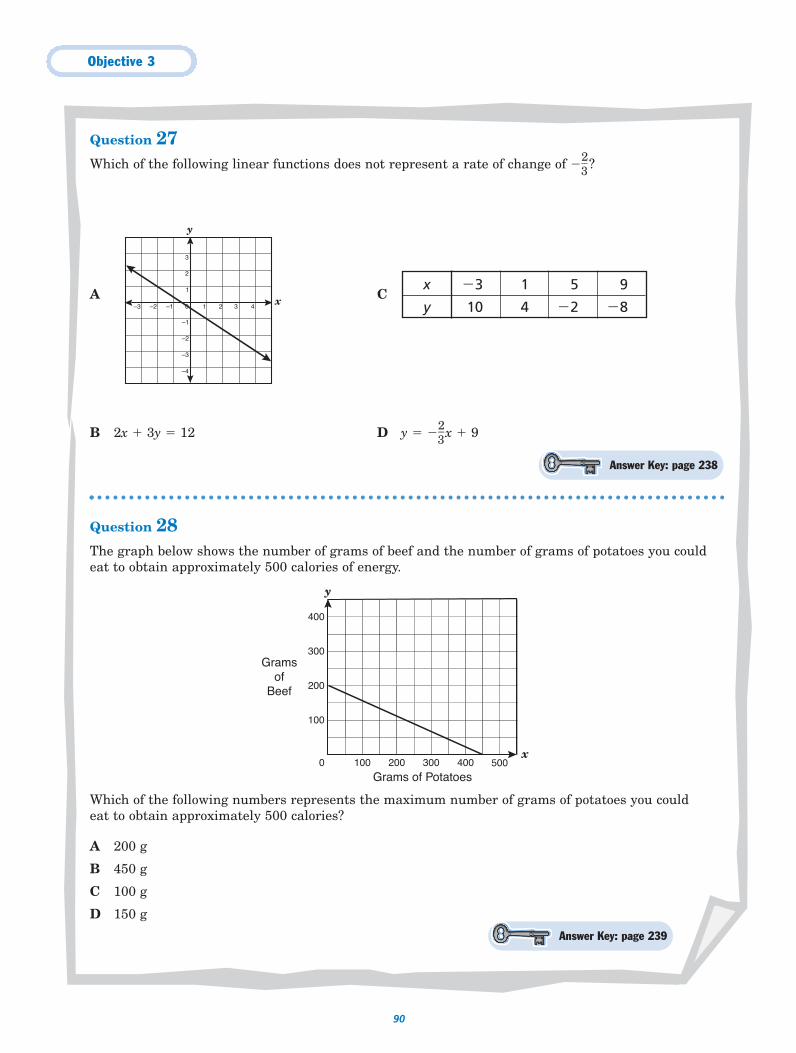
Objective 3
90
Question 27Which of the following linear functions does not represent a rate of change of ��
23
� ?
A C
B 2x � 3y � 12 D y � ��23
� x � 9
Question 28The graph below shows the number of grams of beef and the number of grams of potatoes you couldeat to obtain approximately 500 calories of energy.
Which of the following numbers represents the maximum number of grams of potatoes you couldeat to obtain approximately 500 calories?
A 200 g
B 450 g
C 100 g
D 150 g
0
100
200
300
100 200 300 400
400
y
Grams of Potatoes
Gramsof
Beef
x500
x �3 1 5 9
y 10 4 �2 �8
y
x
–4
–3
–2
–1
1
2
3
0–1–2–3 1 2 3 4
Answer Key: page 238
Answer Key: page 239
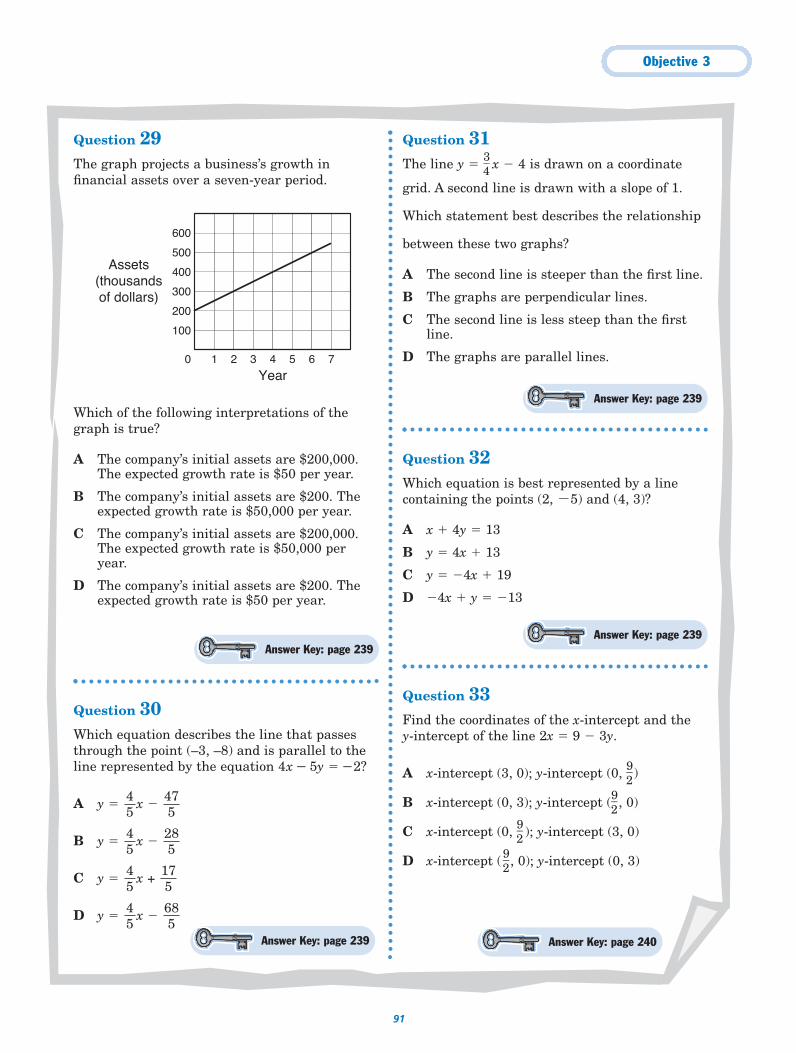
Objective 3
91
Answer Key: page 239
Answer Key: page 239
Answer Key: page 239
Answer Key: page 239 Answer Key: page 240
Question 29The graph projects a business’s growth infinancial assets over a seven-year period.
Which of the following interpretations of thegraph is true?
A The company’s initial assets are $200,000.The expected growth rate is $50 per year.
B The company’s initial assets are $200. Theexpected growth rate is $50,000 per year.
C The company’s initial assets are $200,000.The expected growth rate is $50,000 peryear.
D The company’s initial assets are $200. Theexpected growth rate is $50 per year.
Question 30Which equation describes the line that passesthrough the point (–3, –8) and is parallel to theline represented by the equation 4x − 5y � − 2?
A y � x �
B y � x �
C y � x +
D y � x �
Question 31The line y � �
34
� x � 4 is drawn on a coordinate
grid. A second line is drawn with a slope of 1.
Which statement best describes the relationship
between these two graphs?
A The second line is steeper than the first line.
B The graphs are perpendicular lines.
C The second line is less steep than the firstline.
D The graphs are parallel lines.
Question 32Which equation is best represented by a linecontaining the points (2, �5) and (4, 3)?
A x � 4y � 13
B y � 4x � 13
C y � �4x � 19
D �4x � y � �13
Question 33Find the coordinates of the x-intercept and the y-intercept of the line 2x � 9 � 3y.
A x-intercept (3, 0); y-intercept (0, �92
� )
B x-intercept (0, 3); y-intercept (�92
� , 0)
C x-intercept (0, �92
� ); y-intercept (3, 0)
D x-intercept ( �92
� , 0); y-intercept (0, 3)
685
45
175
45
285
45
475
45
0
100
200
300
400
500
1 2 3 4 5 6 7
Year
Assets(thousandsof dollars)
600
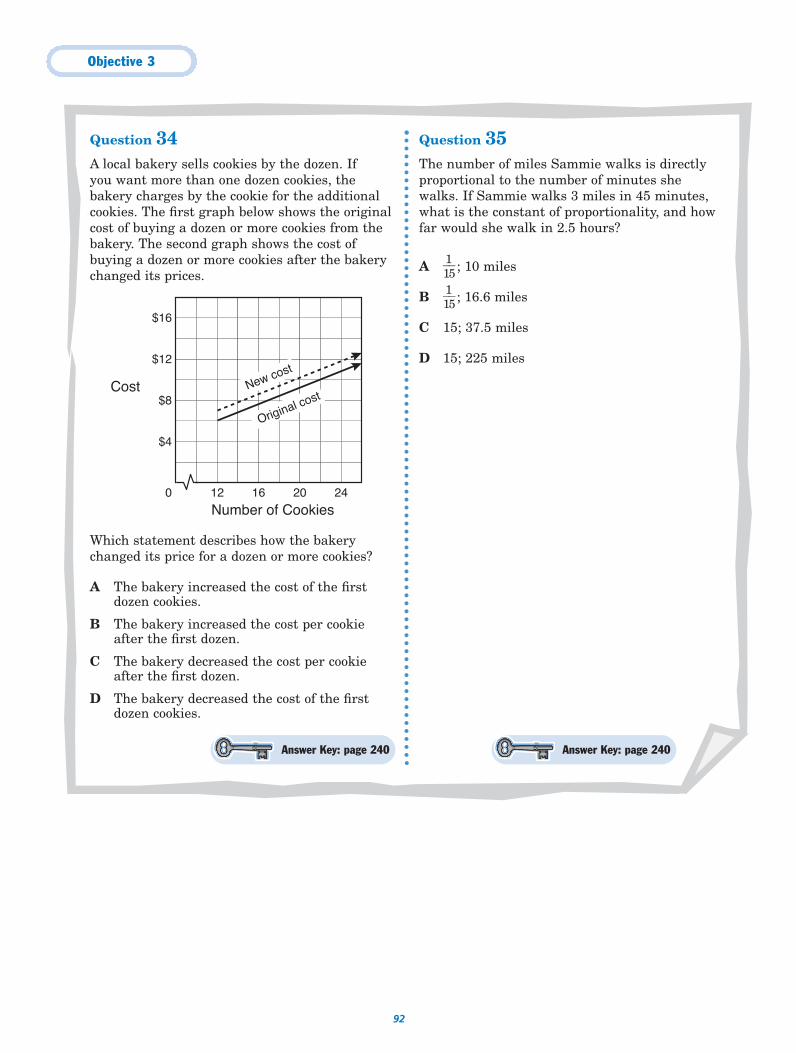
Objective 3
92
Question 34A local bakery sells cookies by the dozen. If you want more than one dozen cookies, thebakery charges by the cookie for the additionalcookies. The first graph below shows the originalcost of buying a dozen or more cookies from thebakery. The second graph shows the cost ofbuying a dozen or more cookies after the bakerychanged its prices.
Which statement describes how the bakerychanged its price for a dozen or more cookies?
A The bakery increased the cost of the firstdozen cookies.
B The bakery increased the cost per cookieafter the first dozen.
C The bakery decreased the cost per cookieafter the first dozen.
D The bakery decreased the cost of the firstdozen cookies.
Question 35The number of miles Sammie walks is directlyproportional to the number of minutes shewalks. If Sammie walks 3 miles in 45 minutes,what is the constant of proportionality, and howfar would she walk in 2.5 hours?
A �115� ; 10 miles
B �115� ; 16.6 miles
C 15; 37.5 miles
D 15; 225 miles
0
$4
$8
$12
$16
12 16 20 24
Number of Cookies
Cost
Original costNew cost
Answer Key: page 240 Answer Key: page 240
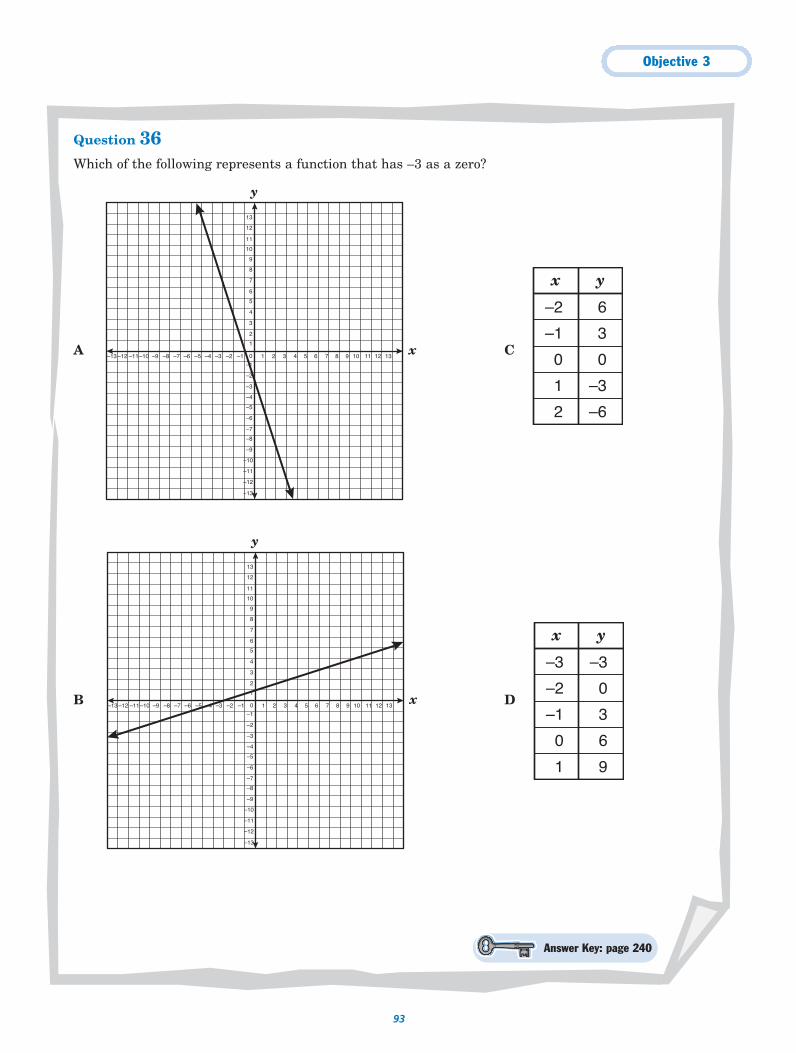
Objective 3
93
Question 36Which of the following represents a function that has –3 as a zero?
A C
B D
Answer Key: page 240
y
x
–5
–4
–6
–7
–8
–9
–10
–11
–12
–13
–3
–2
–1
0
1
2
3
4
5
6
7
8
9
10
11
12
13
–1 1–2–3–4–5–6–7–8–9–10–11–12–13 2 3 4 5 6 7 8 9 10 11 12 13
x y
–2 6
–1 3
0 0
1 –3
2 –6
y
x
–5
–4
–6
–7
–8
–9
–10
–11
–12
–13
–3
–2
–1
0
1
2
3
4
5
6
7
8
9
10
11
12
13
–1 1–2–3–4–5–6–7–8–9–10–11–12–13 2 3 4 5 6 7 8 9 10 11 12 13
x y
–3 –3
–2 0
–1 3
0 6
1 9
94
The student will formulate and use linear equations and inequalities.
Objective 4
The combined weight of 3 people in a small plane cannot safely
exceed 620 pounds. The pilot weighs 185 pounds, and Ramon
weighs 1�12
� times as much as his wife Grace. Altogether they do
not exceed the weight limit. Write an inequality that could be used
to find Grace’s maximum possible weight.
● Represent the quantities involved with variables or expressions.You know that Ramon’s weight is 1.5 times Grace’s weight.Represent Grace’s weight with g. Ramon weighs 1.5 times his wife’s weight, or 1.5g.
For this objective you should be able to
● formulate linear equations and inequalities from problemsituations, use a variety of methods to solve them, and analyzethe solutions; and
● formulate systems of linear equations from problem situations,use a variety of methods to solve them, and analyze the solutions.
How Do You Solve Problems Using Linear Equations or Inequalities?Many real-life problems can be solved using either a linear equation oran inequality. To solve the equation or inequality, follow these steps:
● Simplify the expressions in the equation or inequality byremoving parentheses and combining like terms.
● Isolate the variable as a single term on one side of the equationby adding or subtracting expressions on both sides of theequation or inequality.
● Use multiplication or division to produce a coefficient of 1 forthe variable term.
● When solving an inequality, you must reverse the inequalitysymbol if you multiply or divide both sides by a negative number.
�2x � 10
���
22x
� � ��10
2� Divide both sides by a negative number.
x � �5
The inequality symbol reversed; it went from � to �.
● Use the solution of the equation or inequality to find the answerto the question asked.
● See whether your answer is reasonable.
An algebraic sentencewritten using the symbol�, , �, or iscalled an inequality.
Do you seethat . . .
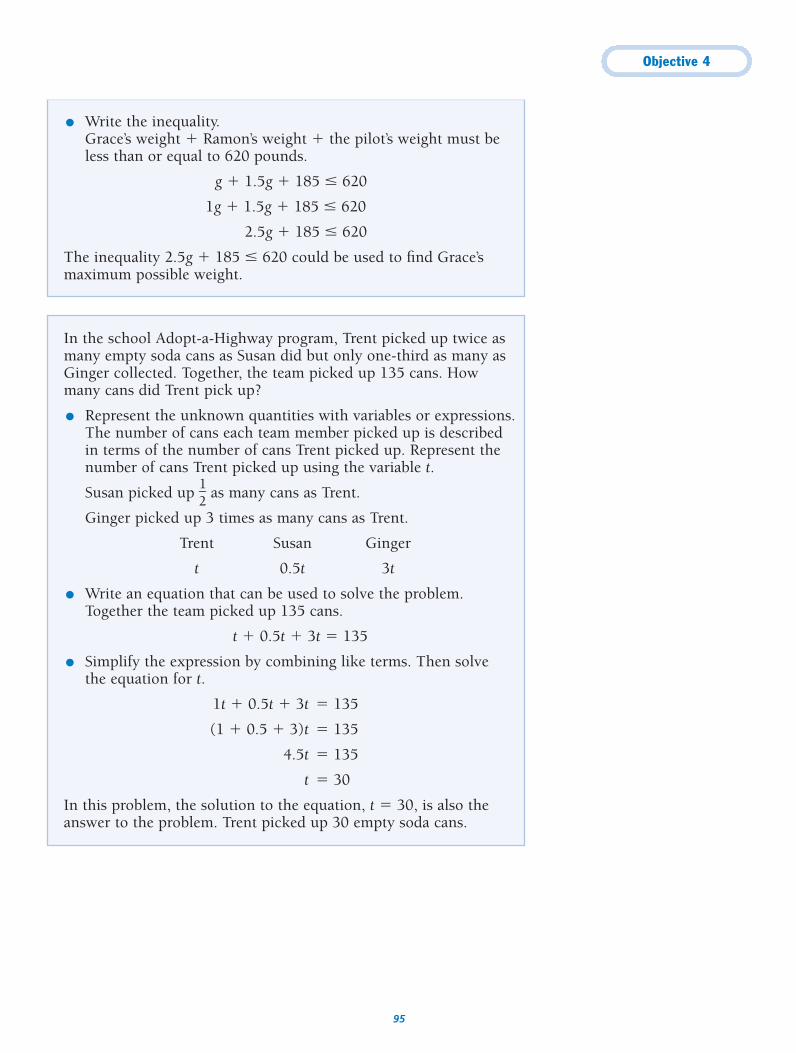
Objective 4
95
● Write the inequality.Grace’s weight � Ramon’s weight � the pilot’s weight must beless than or equal to 620 pounds.
g � 1.5g � 185 620
1g � 1.5g � 185 620
2.5g � 185 620
The inequality 2.5g � 185 620 could be used to find Grace’smaximum possible weight.
In the school Adopt-a-Highway program, Trent picked up twice asmany empty soda cans as Susan did but only one-third as many asGinger collected. Together, the team picked up 135 cans. Howmany cans did Trent pick up?
● Represent the unknown quantities with variables or expressions.The number of cans each team member picked up is describedin terms of the number of cans Trent picked up. Represent thenumber of cans Trent picked up using the variable t.
Susan picked up �12
� as many cans as Trent.
Ginger picked up 3 times as many cans as Trent.
Trent Susan Ginger
t 0.5t 3t
● Write an equation that can be used to solve the problem.Together the team picked up 135 cans.
t � 0.5t � 3t � 135
● Simplify the expression by combining like terms. Then solve the equation for t.
1t � 0.5t � 3t � 135
(1 � 0.5 � 3)t � 135
4.5t � 135
t � 30
In this problem, the solution to the equation, t � 30, is also theanswer to the problem. Trent picked up 30 empty soda cans.
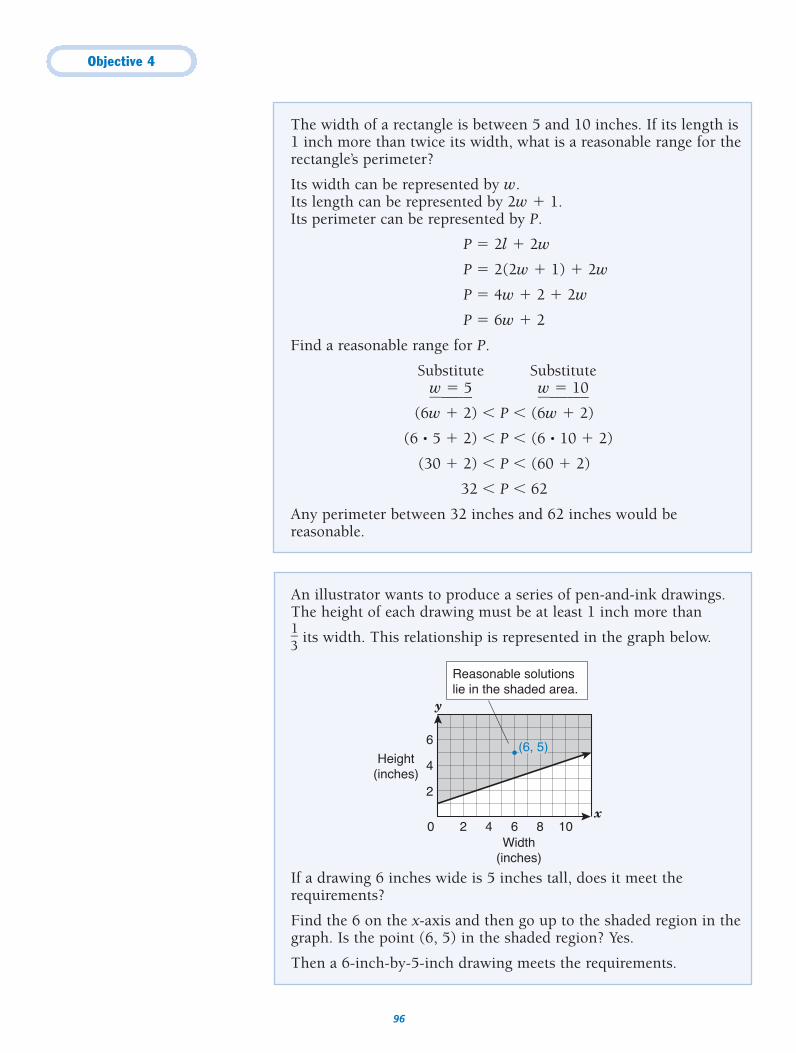
Objective 4
96
The width of a rectangle is between 5 and 10 inches. If its length is1 inch more than twice its width, what is a reasonable range for therectangle’s perimeter?
Its width can be represented by w.Its length can be represented by 2w � 1.Its perimeter can be represented by P.
P � 2l � 2w
P � 2(2w � 1) � 2w
P � 4w � 2 � 2w
P � 6w � 2
Find a reasonable range for P.
Substitute Substitute w��
���
5�
w��
���
1�
0�
(6w � 2) � P � (6w � 2)
(6 • 5 � 2) � P � (6 • 10 � 2)
(30 � 2) � P � (60 � 2)
32 � P � 62
Any perimeter between 32 inches and 62 inches would bereasonable.
An illustrator wants to produce a series of pen-and-ink drawings.The height of each drawing must be at least 1 inch more than
�13
� its width. This relationship is represented in the graph below.
If a drawing 6 inches wide is 5 inches tall, does it meet therequirements?
Find the 6 on the x-axis and then go up to the shaded region in thegraph. Is the point (6, 5) in the shaded region? Yes.
Then a 6-inch-by-5-inch drawing meets the requirements.
0
2
4
6
2 4 6 8 10
Height(inches)
Width(inches)
Reasonable solutionslie in the shaded area.
y
x
(6, 5)
Objective 4
97
Try ItThe length of a rectangle is 5 inches greater than its width. If thewidth of the rectangle is represented by w and its perimeter isrepresented by P, write an equation in terms of P and w that couldbe used to find the dimensions of the rectangle.
Represent the width of the rectangle by w.
The length of the rectangle is 5 inches __________________________ its width.
Represent the length by w � __________.Write an equation and simplify it.
P � 2l � 2w
P � 2(w � __________) � 2w
P � 2w � __________ � 2w
P � __________w � __________
The equation P � __________w � __________ could be used to findthe dimensions of the rectangle.
The length of the rectangle is 5 inches greater than its width. Represent thelength by w � 5.
P � 2l � 2w
P � 2(w � 5) � 2w
P � 2w � 10 � 2w
P � 4w � 10
The equation P � 4w � 10 could be used to find the dimensions of therectangle.
Objective 4
98
Try ItSaul used two different types of trim molding on a woodworkingproject. He used 6 feet more of the molding that cost $2.50 per footthan he used of the molding that cost $1.50 per foot. If the combinedcost of the molding used to complete his project was $55, how manyfeet of each type of molding did Saul use?
Represent the number of feet of $1.50-per-foot molding with m.
Represent the number of feet of $2.50-per-foot molding with
m � __________.
Represent the cost of the $1.50 molding used.
__________
Represent the cost of the $2.50 molding used.
2.50(__________ � __________)
Write an equation that shows the total cost as $55 and solve for m.
1.50m � 2.50(__________ � __________) � 55
1.50m � 2.50m � __________ � 55
__________m � 15 � 55
__________m � __________
m � __________
Saul used __________ feet of molding that cost $1.50 per foot.
He used m � 6 � __________ � 6 � __________ feet of molding that cost $2.50 per foot.
Represent the number of feet of $2.50-per-foot molding with m � 6.Represent the cost of the $1.50 molding used: 1.50m. Represent the cost of the $2.50 molding used: 2.50(m � 6).
1.50m � 2.50(m � 6) � 55
1.50m � 2.50m � 15 � 55
4m � 15 � 55
4m � 40
m � 10
Saul used 10 feet of molding that cost $1.50 per foot. He used m � 6 � 10 � 6 � 16 feet of molding that cost $2.50 per foot.
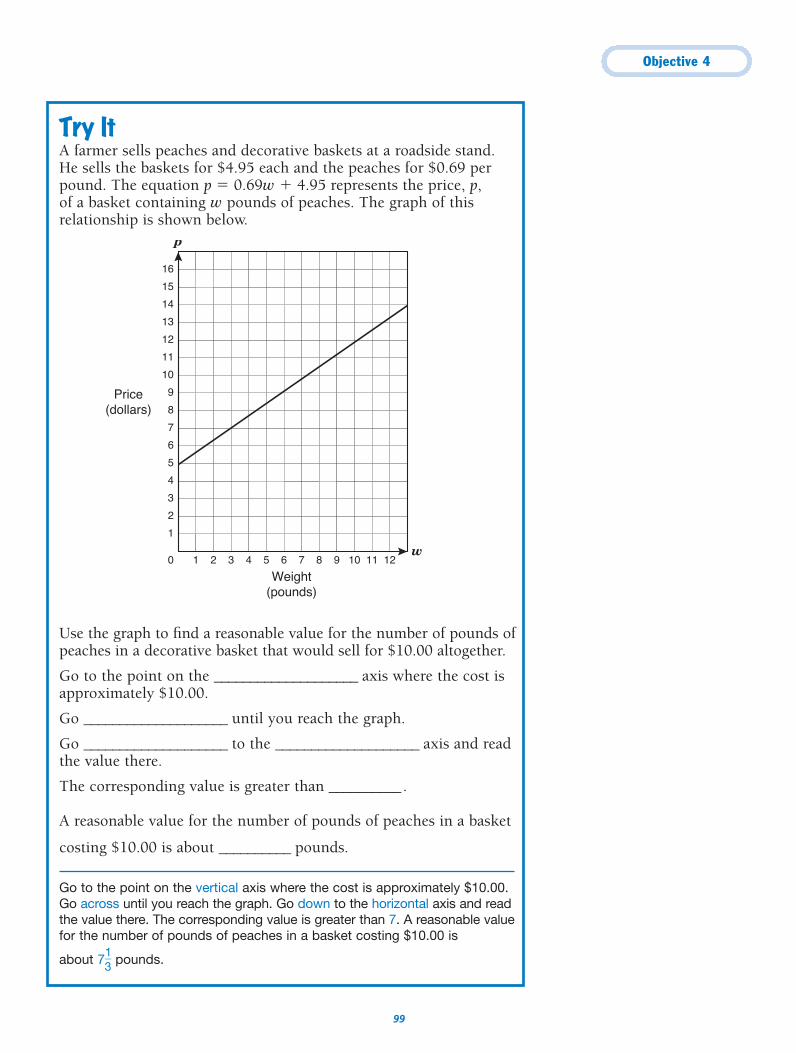
Objective 4
99
Try ItA farmer sells peaches and decorative baskets at a roadside stand.He sells the baskets for $4.95 each and the peaches for $0.69 perpound. The equation p � 0.69w � 4.95 represents the price, p, of a basket containing w pounds of peaches. The graph of thisrelationship is shown below.
Use the graph to find a reasonable value for the number of pounds ofpeaches in a decorative basket that would sell for $10.00 altogether.
Go to the point on the ____________________ axis where the cost isapproximately $10.00.
Go ____________________ until you reach the graph.
Go ____________________ to the ____________________ axis and readthe value there.
The corresponding value is greater than __________.
A reasonable value for the number of pounds of peaches in a basket
costing $10.00 is about __________ pounds.
Go to the point on the vertical axis where the cost is approximately $10.00.Go across until you reach the graph. Go down to the horizontal axis and readthe value there. The corresponding value is greater than 7. A reasonable valuefor the number of pounds of peaches in a basket costing $10.00 is
about 7�13
� pounds.
16
10
15
11
12
13
14
0
1
2
3
4
5
6
1 2 3 4 5 6 7 8 9 10 11
7
8
9
12
Weight(pounds)
Price(dollars)
p
w
Objective 4
100
How Do You Represent Problems Using a System of Linear Equations?Many real-life problems can be solved using a system of two or morelinear equations.
To represent a problem using a system of linear equations, follow theseguidelines.
● Identify the quantities involved and the relationships betweenthem.
● Represent the quantities involved with two different variables orwith expressions involving two variables.
● Write two independent equations that can be used to solve theproblem.
The sum of two numbers is 100. Twice the first number plus threetimes the second number is 275. Write a system of two equationsin two unknowns that could be used to find the two numbers.
The problem involves two numbers. One number is not describedin terms of the other number, so it makes sense to represent themusing two different variables.
● Represent the first number with the variable x.
● Represent the second number with the variable y.
You know two different relationships between the numbers.
● Their sum is 100.
x � y � 100
● Twice the first number plus three times the second number is 275.
twice the first � three times the second � 275
2x � 3y � 275
The following system of linear equations could be used to find thetwo numbers.
x � y � 100
2x � 3y � 275
A system of linearequations is two or morelinear equations that usetwo or more variables.For example,
2x � y � 10
x � 3y � 9
is a system of two linear equations in two unknowns.
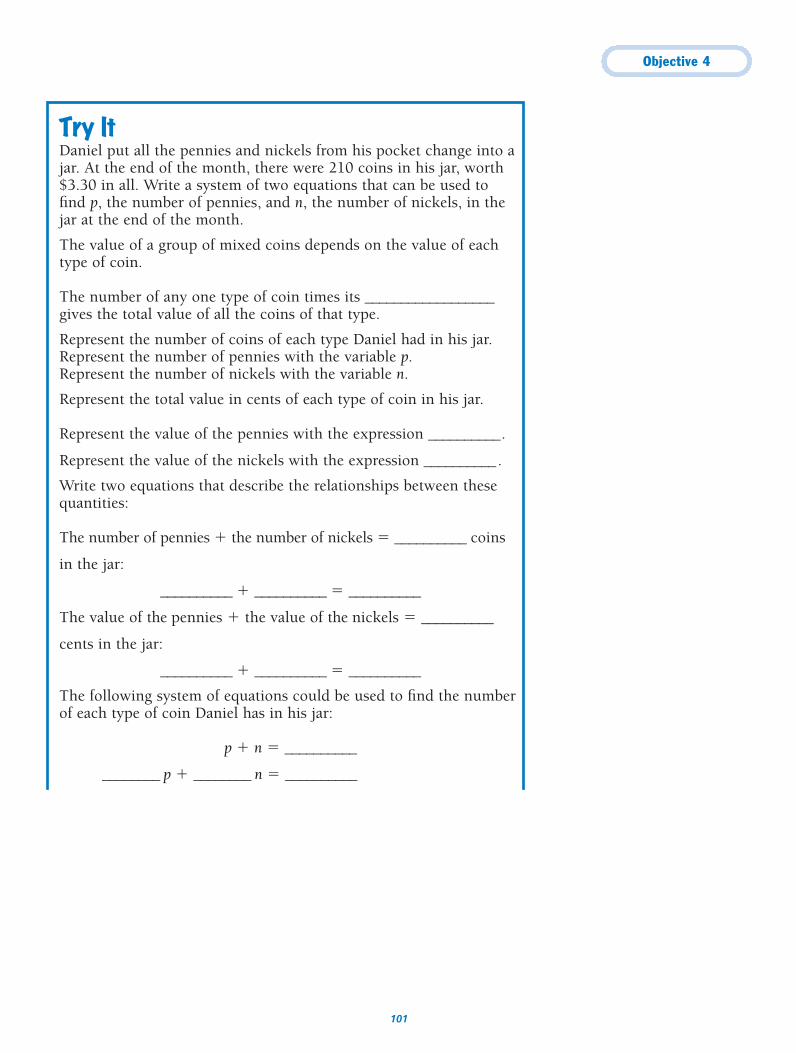
Objective 4
101
Try ItDaniel put all the pennies and nickels from his pocket change into ajar. At the end of the month, there were 210 coins in his jar, worth$3.30 in all. Write a system of two equations that can be used tofind p, the number of pennies, and n, the number of nickels, in thejar at the end of the month.
The value of a group of mixed coins depends on the value of eachtype of coin.
The number of any one type of coin times its __________________gives the total value of all the coins of that type.
Represent the number of coins of each type Daniel had in his jar.Represent the number of pennies with the variable p.Represent the number of nickels with the variable n.
Represent the total value in cents of each type of coin in his jar.
Represent the value of the pennies with the expression __________.
Represent the value of the nickels with the expression __________.
Write two equations that describe the relationships between thesequantities:
The number of pennies � the number of nickels � __________ coins
in the jar:
__________ � __________ � __________
The value of the pennies � the value of the nickels � __________
cents in the jar:
__________ � __________ � __________
The following system of equations could be used to find the numberof each type of coin Daniel has in his jar:
p � n � __________
________ p � ________ n � __________
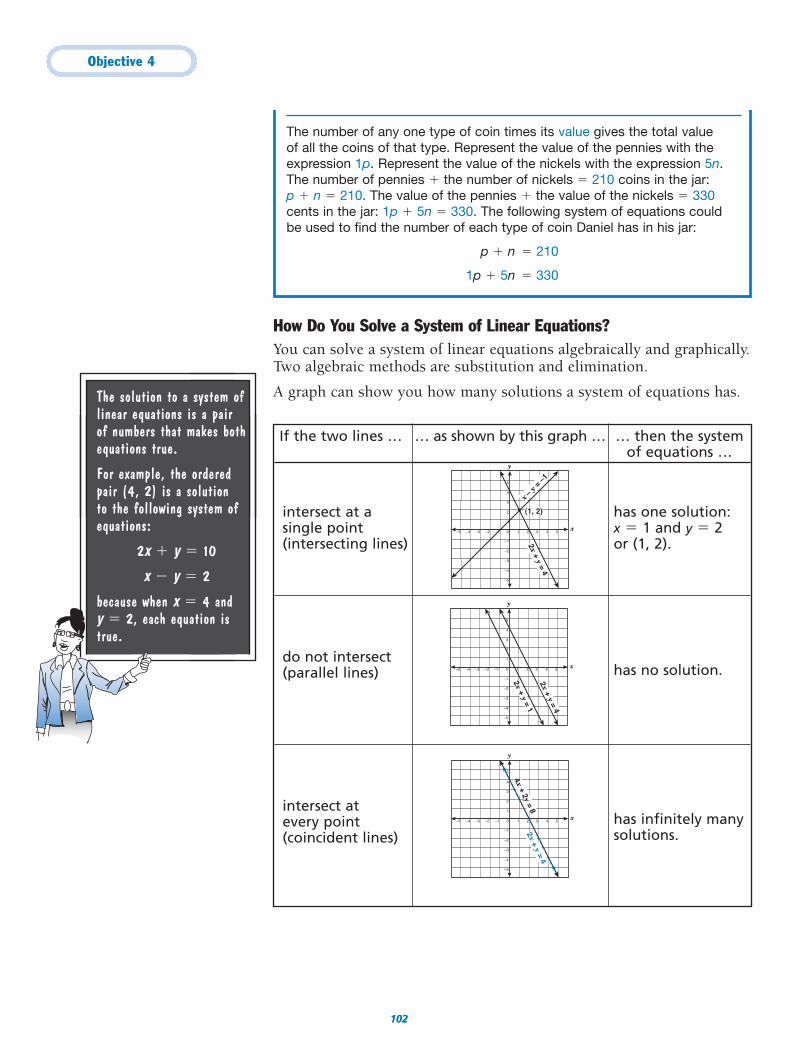
Objective 4
102102
The solution to a system oflinear equations is a pair of numbers that makes bothequations true.
For example, the orderedpair (4, 2) is a solution to the following system ofequations:
2x � y � 10
x � y � 2
because when x � 4 and y � 2, each equation istrue.
The number of any one type of coin times its value gives the total value of all the coins of that type. Represent the value of the pennies with theexpression 1p. Represent the value of the nickels with the expression 5n.The number of pennies � the number of nickels � 210 coins in the jar: p � n � 210. The value of the pennies � the value of the nickels � 330cents in the jar: 1p � 5n � 330. The following system of equations could be used to find the number of each type of coin Daniel has in his jar:
p � n � 210
1p � 5n � 330
If the two lines … … as shown by this graph … … then the system of equations …
intersect at a has one solution:single point x � 1 and y � 2(intersecting lines) or (1, 2).
do not intersect (parallel lines) has no solution.
intersect at every point has infinitely many(coincident lines) solutions.
y
x
–5
–4
–3
–2
–1
1
2
3
4
5
0–1–2–3–4–5 1 2 3 4 5
2x + y = 4
4x + 2y = 8
y
x
–5
–4
–3
–2
–1
1
2
3
4
5
0–1–2–3–4–5 1 2 3 4 5
2x + y = 4
2x + y = 1
How Do You Solve a System of Linear Equations?You can solve a system of linear equations algebraically and graphically.Two algebraic methods are substitution and elimination.
A graph can show you how many solutions a system of equations has.
y
x
–5
–4
–3
–2
–1
1
2
3
4
5
0–1–2–3–4–5 1 2 3 4 5
2x + y = 4
x – y
= –1
(1, 2)
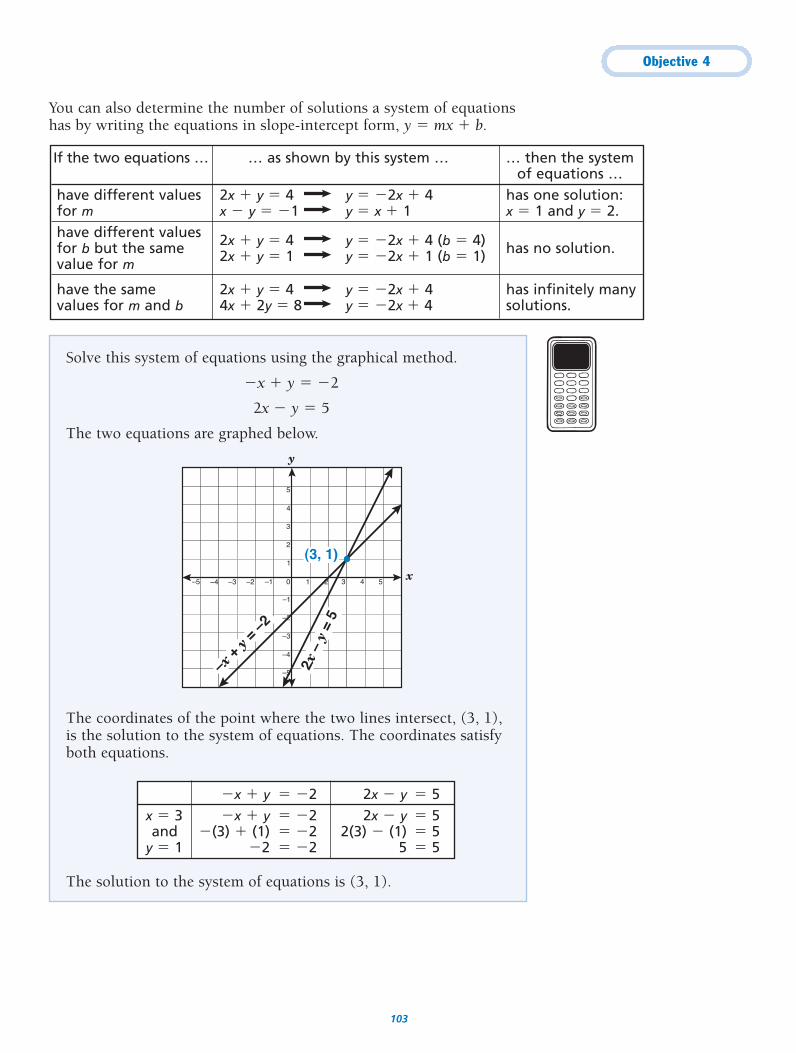
Objective 4
103
You can also determine the number of solutions a system of equationshas by writing the equations in slope-intercept form, y � mx � b.
Solve this system of equations using the graphical method.
�x � y � �2
2x � y � 5
The two equations are graphed below.
The coordinates of the point where the two lines intersect, (3, 1),is the solution to the system of equations. The coordinates satisfyboth equations.
The solution to the system of equations is (3, 1).
y
x
–5
–4
–3
–2
–1
1
2
3
4
5
0–1–2–3–4–5 1 2 3 4 5
–x +
y = –
2
2x –
y =
5
(3, 1)
�x � y � �2 2x � y � 5x � 3 �x � y � �2 2x � y � 5and �(3) � (1) � �2 2(3) � (1) � 5
y � 1 �2 � �2 5 � 5
If the two equations … … as shown by this system … … then the system of equations …
have different values 2x � y � 4 y � �2x � 4 has one solution:for m x � y � �1 y � x � 1 x � 1 and y � 2.have different valuesfor b but the same 2x � y � 4 y � �2x � 4 (b � 4) has no solution.value for m 2x � y � 1 y � �2x � 1 (b � 1)
have the same 2x � y � 4 y � �2x � 4 has infinitely many values for m and b 4x � 2y � 8 y � �2x � 4 solutions.
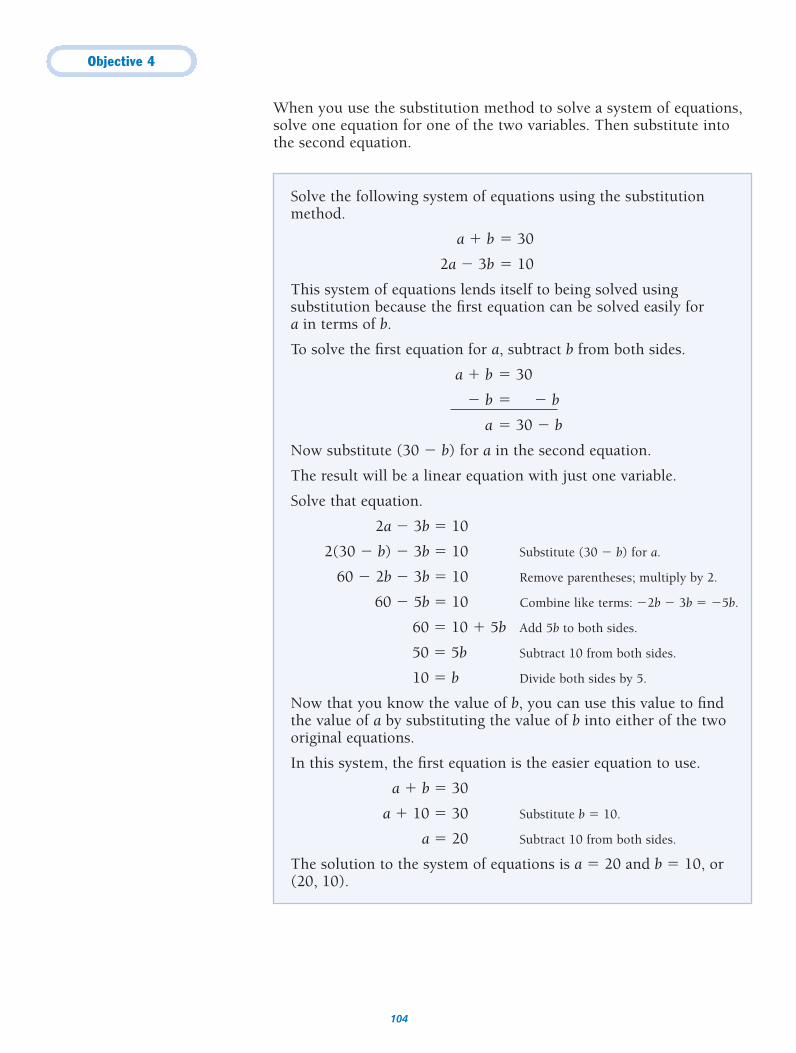
Objective 4
104
Solve the following system of equations using the substitutionmethod.
a � b � 30
2a � 3b � 10
This system of equations lends itself to being solved usingsubstitution because the first equation can be solved easily for a in terms of b.
To solve the first equation for a, subtract b from both sides.
a � b � 30
� b � � b
a � 30 � b
Now substitute (30 � b) for a in the second equation.
The result will be a linear equation with just one variable.
Solve that equation.
2a � 3b � 10
2(30 � b) � 3b � 10 Substitute (30 � b) for a.
60 � 2b � 3b � 10 Remove parentheses; multiply by 2.
60 � 5b � 10 Combine like terms: �2b � 3b � �5b.
60 � 10 � 5b Add 5b to both sides.
50 � 5b Subtract 10 from both sides.
10 � b Divide both sides by 5.
Now that you know the value of b, you can use this value to findthe value of a by substituting the value of b into either of the twooriginal equations.
In this system, the first equation is the easier equation to use.
a � b � 30
a � 10 � 30 Substitute b � 10.
a � 20 Subtract 10 from both sides.
The solution to the system of equations is a � 20 and b � 10, or(20, 10).
When you use the substitution method to solve a system of equations,solve one equation for one of the two variables. Then substitute intothe second equation.
Objective 4
105
Solve the same system of equations using the elimination method.
a � b � 30
2a � 3b � 10
In the given system of equations, if you multiply both sides of thefirst equation by 3, you get the following equations:
3(a � b) � 3(30) 3a � 3b � 90
2a � 3b � 10 2a � 3b � 10
The variable b has a coefficient of 3 in the new equation and anopposite coefficient of �3 in the original second equation. Whenyou add those two equations, the term containing b will disappearbecause it will have a 0 coefficient.
3a � 3b � 90
� 2a � 3b � 10
5a � 100
a � 20
To find b, substitute 20 for a into the first equation.
a � b � 30
20 � b � 30
b � 10
The solution to the system of equations is a � 20 and b � 10, or(20, 10). This is the same solution obtained by using thesubstitution method.
The elimination method is also called the addition method because youeliminate one of the variables by adding. Before you add, you may needto multiply one or both equations so that one of the variables hasopposite coefficients.
Do you seethat . . .
Objective 4
106
Try ItAt the concession stand a can of soda costs $0.25 more than a bottleof water. If John bought 3 bottles of water and 2 cans of soda for $8, how much did each type of drink cost?
Let s represent the cost of a can of soda.Let w represent the cost of a bottle of water.
If a can of soda costs $0.25 more than a bottle of water, then anequation that can be used to represent this is
s � w � __________.
If 3 bottles of water and 2 cans of soda cost $8, then an equationthat can be used to represent this is
3__________ � 2__________ � 8.
Solve the system of equations using the substitution method.Substitute w � 0.25 for s in the second equation and solve.
3w � 2s � 8.00
3w � 2(__________ � __________) � 8.00
3w � __________ w � __________ � 8.00
__________ w � 0.50 � 8.00
__________ w � 7.50
w � __________
A bottle of water costs $__________.
A can of soda costs s � w � 0.25 � _________� 0.25 � $_________.
If a can of soda costs $0.25 more than a bottle of water, then an equationthat can be used to represent this is s � w � 0.25. If 3 bottles of water and2 cans of soda cost $8, then an equation that can be used to represent thisis 3w � 2s � 8.
3w � 2s � 8.00
3w � 2(w � 0.25) � 8.00
3w � 2w � 0.50 � 8.00
5w � 0.50 � 8.00
5w � 7.50
w � 1.50
A bottle of water costs $1.50.A can of soda costs s � w � 0.25 � 1.50 � 0.25 � $1.75.
Now practice what you’ve learned.
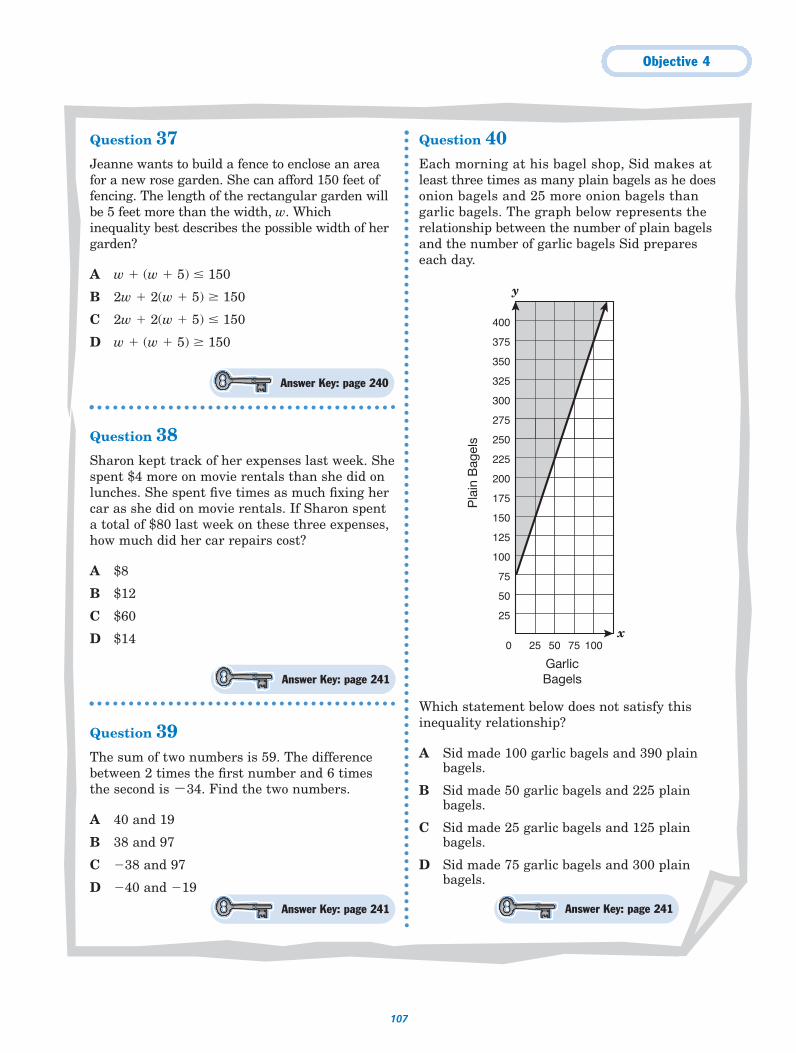
Objective 4
107
Question 37Jeanne wants to build a fence to enclose an areafor a new rose garden. She can afford 150 feet offencing. The length of the rectangular garden willbe 5 feet more than the width, w. Whichinequality best describes the possible width of hergarden?
A w � (w � 5) 150
B 2w � 2(w � 5) 150
C 2w � 2(w � 5) 150
D w � (w � 5) 150
Question 38Sharon kept track of her expenses last week. Shespent $4 more on movie rentals than she did onlunches. She spent five times as much fixing hercar as she did on movie rentals. If Sharon spenta total of $80 last week on these three expenses,how much did her car repairs cost?
A $8
B $12
C $60
D $14
Question 39The sum of two numbers is 59. The differencebetween 2 times the first number and 6 timesthe second is �34. Find the two numbers.
A 40 and 19
B 38 and 97
C �38 and 97
D �40 and �19
Question 40Each morning at his bagel shop, Sid makes atleast three times as many plain bagels as he doesonion bagels and 25 more onion bagels thangarlic bagels. The graph below represents therelationship between the number of plain bagelsand the number of garlic bagels Sid prepareseach day.
Which statement below does not satisfy thisinequality relationship?
A Sid made 100 garlic bagels and 390 plainbagels.
B Sid made 50 garlic bagels and 225 plainbagels.
C Sid made 25 garlic bagels and 125 plainbagels.
D Sid made 75 garlic bagels and 300 plainbagels.
275
300
325
350
375
400
225
250
25
50
75
100
125
150
175
200
0 25 50 75 100
y
x
Garlic Bagels
Pla
in B
agel
s
Answer Key: page 240
Answer Key: page 241
Answer Key: page 241 Answer Key: page 241
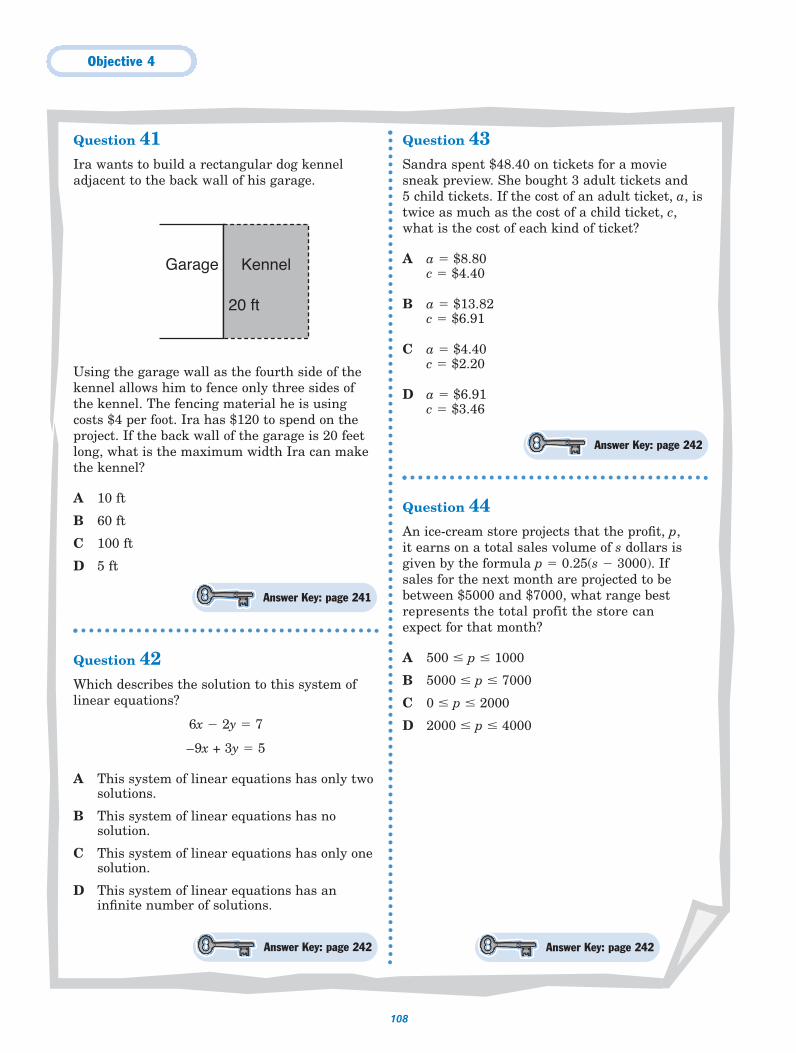
Objective 4
108
Question 41Ira wants to build a rectangular dog kenneladjacent to the back wall of his garage.
Using the garage wall as the fourth side of thekennel allows him to fence only three sides ofthe kennel. The fencing material he is usingcosts $4 per foot. Ira has $120 to spend on theproject. If the back wall of the garage is 20 feetlong, what is the maximum width Ira can makethe kennel?
A 10 ft
B 60 ft
C 100 ft
D 5 ft
Question 42Which describes the solution to this system oflinear equations?
6x � 2y � 7
–9x + 3y � 5
A This system of linear equations has only twosolutions.
B This system of linear equations has nosolution.
C This system of linear equations has only onesolution.
D This system of linear equations has aninfinite number of solutions.
Question 43Sandra spent $48.40 on tickets for a movie sneak preview. She bought 3 adult tickets and 5 child tickets. If the cost of an adult ticket, a, istwice as much as the cost of a child ticket, c,what is the cost of each kind of ticket?
A a � $8.80c � $4.40
B a � $13.82c � $6.91
C a � $4.40c � $2.20
D a � $6.91c � $3.46
Question 44An ice-cream store projects that the profit, p, it earns on a total sales volume of s dollars isgiven by the formula p � 0.25(s � 3000). If sales for the next month are projected to bebetween $5000 and $7000, what range bestrepresents the total profit the store can expect for that month?
A 500 p 1000
B 5000 p 7000
C 0 p 2000
D 2000 p 4000
20 ft
KennelGarage
Answer Key: page 242 Answer Key: page 242
Answer Key: page 241
Answer Key: page 242
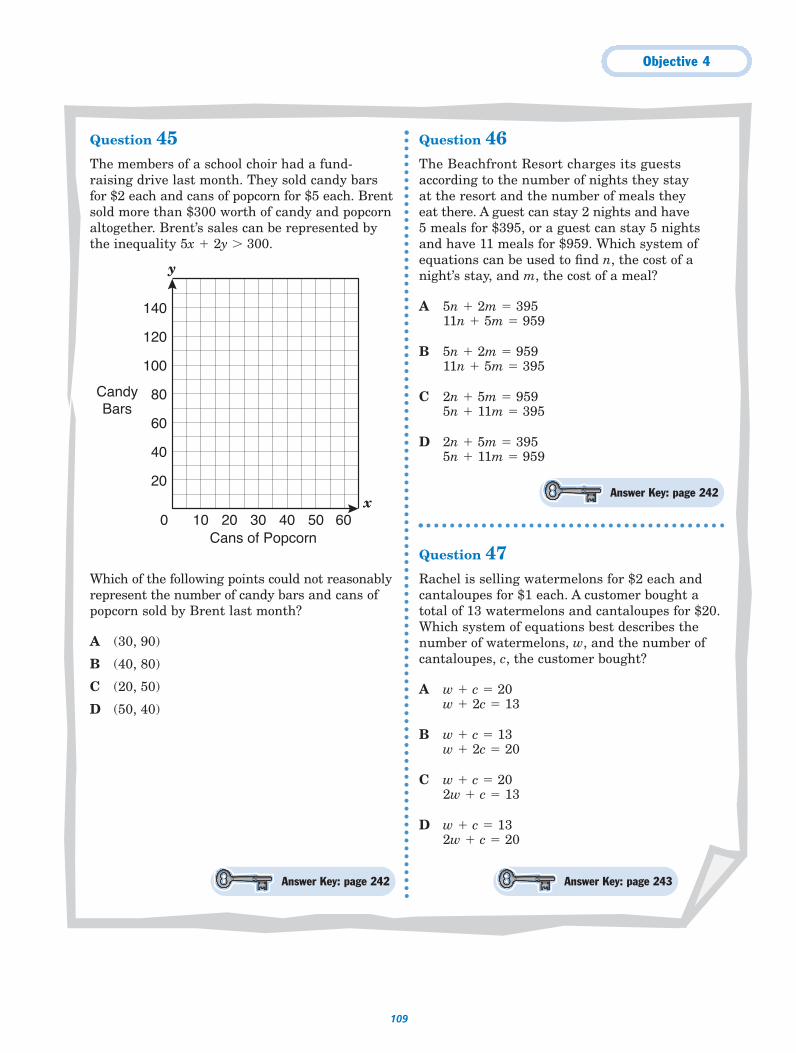
Objective 4
109
Question 45The members of a school choir had a fund-raising drive last month. They sold candy barsfor $2 each and cans of popcorn for $5 each. Brentsold more than $300 worth of candy and popcornaltogether. Brent’s sales can be represented bythe inequality 5x � 2y � 300.
Which of the following points could not reasonablyrepresent the number of candy bars and cans ofpopcorn sold by Brent last month?
A (30, 90)
B (40, 80)
C (20, 50)
D (50, 40)
Question 46The Beachfront Resort charges its guestsaccording to the number of nights they stay at the resort and the number of meals they eat there. A guest can stay 2 nights and have 5 meals for $395, or a guest can stay 5 nightsand have 11 meals for $959. Which system ofequations can be used to find n, the cost of anight’s stay, and m, the cost of a meal?
A 5n � 2m � 39511n � 5m � 959
B 5n � 2m � 95911n � 5m � 395
C 2n � 5m � 9595n � 11m � 395
D 2n � 5m � 3955n � 11m � 959
Question 47Rachel is selling watermelons for $2 each andcantaloupes for $1 each. A customer bought atotal of 13 watermelons and cantaloupes for $20.Which system of equations best describes thenumber of watermelons, w, and the number ofcantaloupes, c, the customer bought?
A w � c � 20w � 2c � 13
B w � c � 13w � 2c � 20
C w � c � 202w � c � 13
D w � c � 132w � c � 20
0
20
40
60
80
100
120
140
10 20 30 40 50 60
CandyBars
Cans of Popcorn
x
y
Answer Key: page 243Answer Key: page 242
Answer Key: page 242
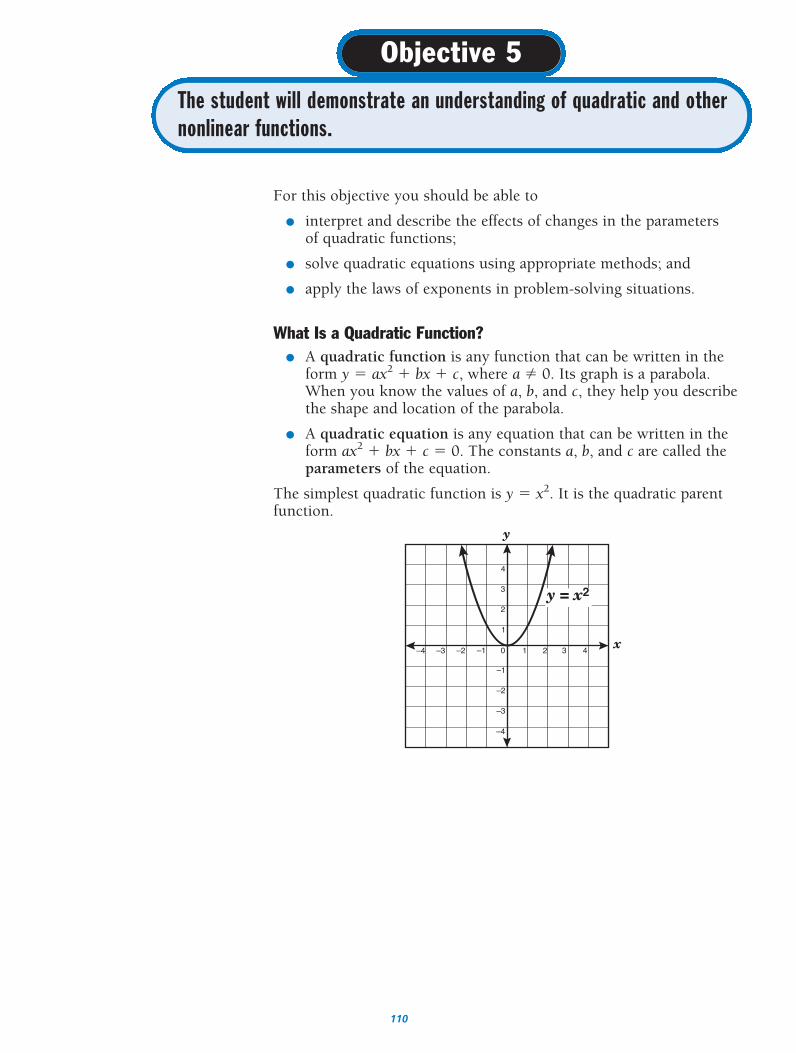
110
The student will demonstrate an understanding of quadratic and othernonlinear functions.
Objective 5
For this objective you should be able to
● interpret and describe the effects of changes in the parameters of quadratic functions;
● solve quadratic equations using appropriate methods; and
● apply the laws of exponents in problem-solving situations.
What Is a Quadratic Function?● A quadratic function is any function that can be written in the
form y � ax2 � bx � c, where a � 0. Its graph is a parabola.When you know the values of a, b, and c, they help you describethe shape and location of the parabola.
● A quadratic equation is any equation that can be written in theform ax2 � bx � c � 0. The constants a, b, and c are called theparameters of the equation.
The simplest quadratic function is y � x2. It is the quadratic parentfunction.
y
x
–4
–3
–2
–1
1
2
3
4
0–1–2–3–4 1 2 3 4
y = x2
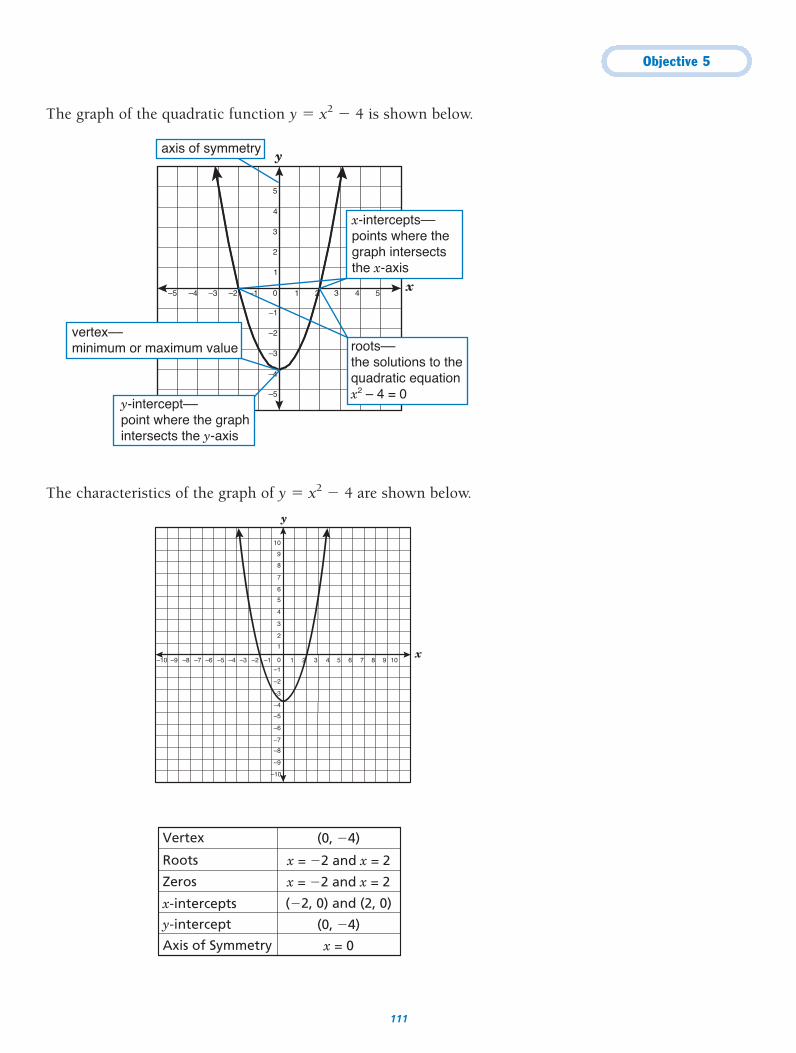
Objective 5
111
The graph of the quadratic function y � x2 � 4 is shown below.
The characteristics of the graph of y � x2 � 4 are shown below.
y
x
–5
–4
–6
–7
–8
–9
–10
–3
–2
–1
0
1
2
3
4
5
6
7
8
9
10
–1 1–2–3–4–5–6–7–8–9–10 2 3 4 5 6 7 8 9 10
Roots
Vertex
Zeros
x-intercepts
y-intercept
Axis of Symmetry
x = �2 and x = 2
(0, �4)
x = �2 and x = 2
(0, �4)
(�2, 0) and (2, 0)
x = 0
y
x
–5
–4
–3
–2
–1
1
2
3
4
5
0–1–2–3–4–5 1 2 3 4 5
y-intercept––point where the graph intersects the y-axis
axis of symmetry
roots–– the solutions to the quadratic equationx2 – 4 = 0
x-intercepts––points where thegraph intersectsthe x-axis
vertex–– minimum or maximum value
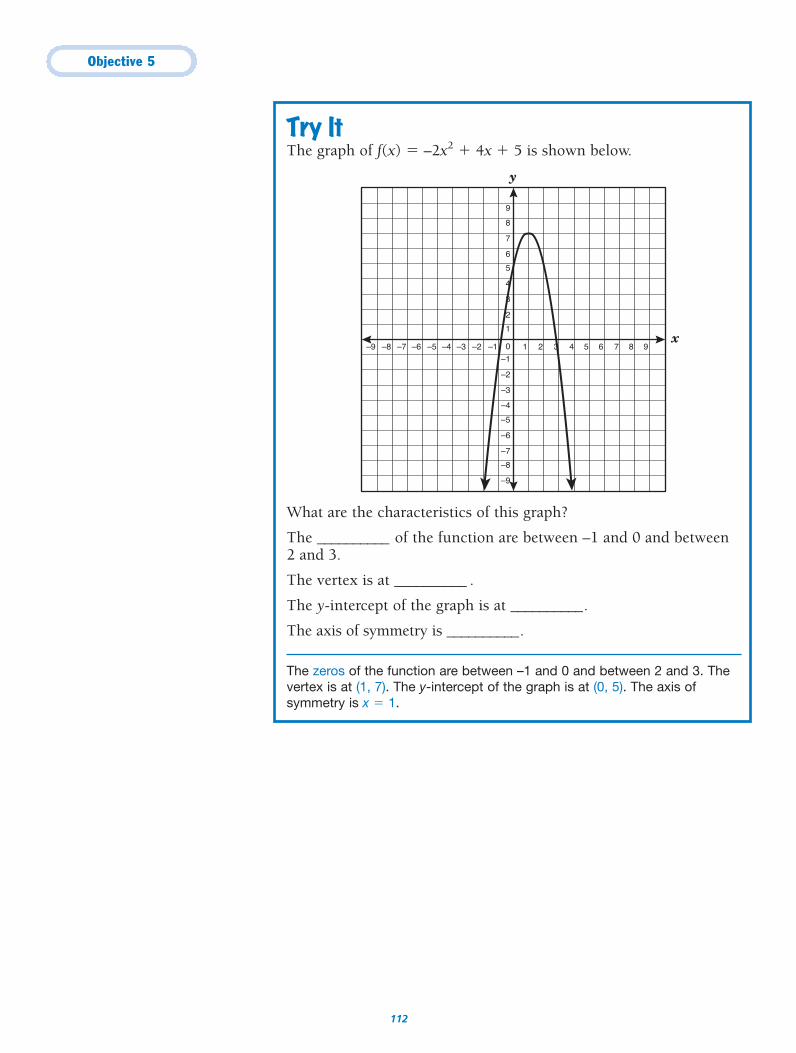
Objective 5
112
Try ItThe graph of f(x) � –2x2 � 4x � 5 is shown below.
What are the characteristics of this graph?
The __________ of the function are between –1 and 0 and between 2 and 3.
The vertex is at __________ .
The y-intercept of the graph is at __________.
The axis of symmetry is __________.
The zeros of the function are between –1 and 0 and between 2 and 3. Thevertex is at (1, 7). The y-intercept of the graph is at (0, 5). The axis ofsymmetry is x � 1.
y
x
–5
–4
–6
–7
–8
–9
–3
–2
–1
0
1
2
3
4
5
6
7
8
9
–1 1–2–3–4–5–6–7–8–9 2 3 4 5 6 7 8 9
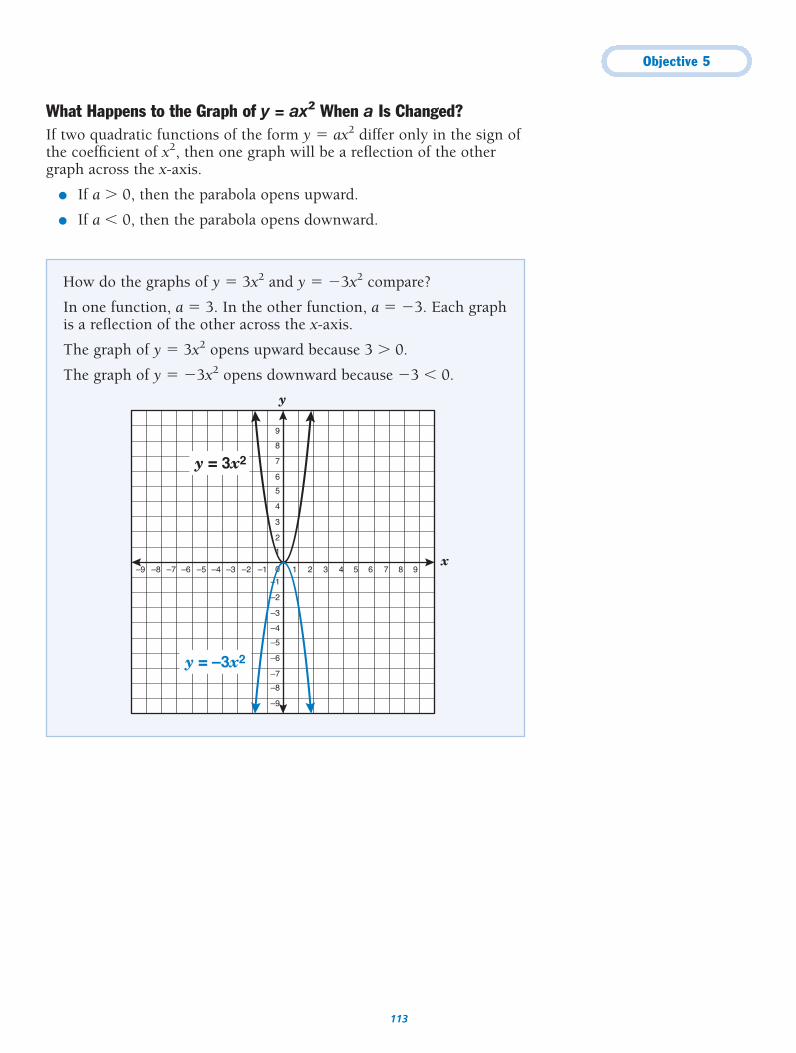
Objective 5
113
What Happens to the Graph of y = ax2 When a Is Changed?If two quadratic functions of the form y � ax2 differ only in the sign ofthe coefficient of x2, then one graph will be a reflection of the othergraph across the x-axis.
● If a � 0, then the parabola opens upward.
● If a � 0, then the parabola opens downward.
How do the graphs of y � 3x2 and y � �3x2 compare?
In one function, a � 3. In the other function, a � �3. Each graphis a reflection of the other across the x-axis.
The graph of y � 3x2 opens upward because 3 � 0.
The graph of y � �3x2 opens downward because �3 � 0.
y
x
–5
–4
–6
–7
–8
–9
–3
–2
–1
0
1
2
3
4
5
6
7
8
9
–1 1–2–3–4–5–6–7–8–9 2 3 4 5 6 7 8 9
y = –3x2
y = 3x2
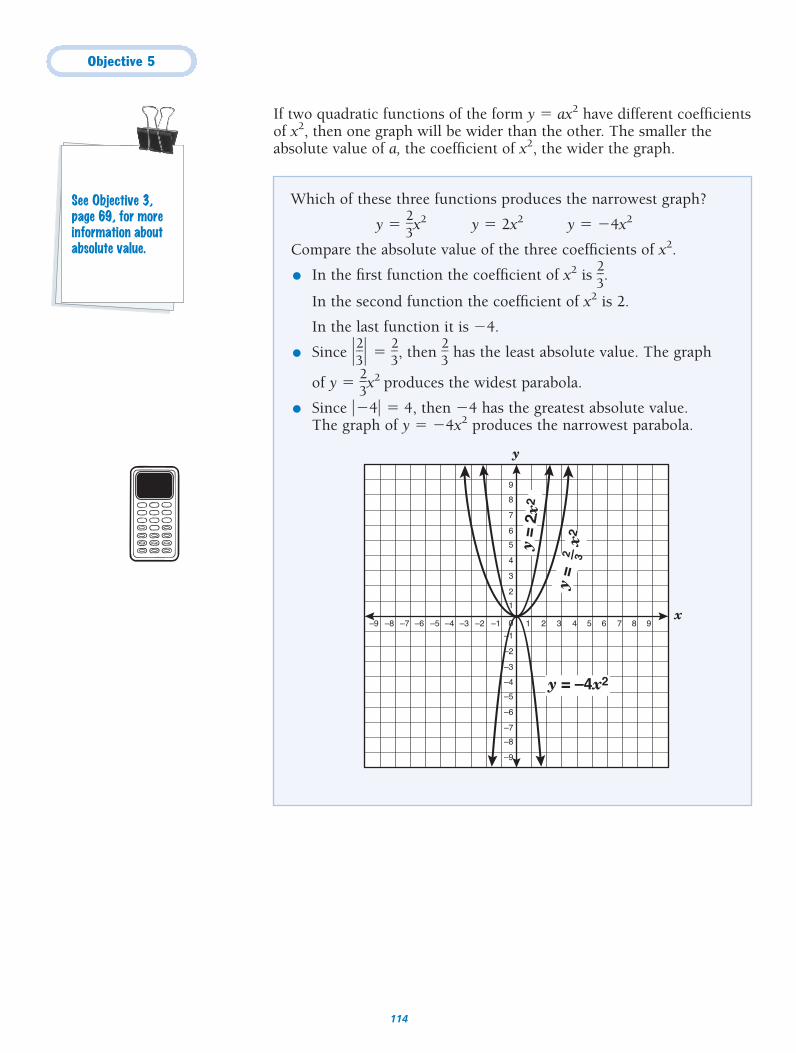
Objective 5
114
If two quadratic functions of the form y � ax2 have different coefficientsof x2, then one graph will be wider than the other. The smaller theabsolute value of a, the coefficient of x2, the wider the graph.
Which of these three functions produces the narrowest graph?
y � �23
�x2 y � 2x2 y � �4x2
Compare the absolute value of the three coefficients of x2.
● In the first function the coefficient of x2 is �23
�.
In the second function the coefficient of x2 is 2.
In the last function it is �4.
● Since ��23
�� � �23
�, then �23
� has the least absolute value. The graph
of y � �23
�x2 produces the widest parabola.
● Since ��4� � 4, then �4 has the greatest absolute value. The graph of y � �4x2 produces the narrowest parabola.
y
x
–5
–4
–6
–7
–8
–9
–3
–2
–1
0
1
2
3
4
5
6
7
8
9
–1 1–2–3–4–5–6–7–8–9 2 3 4 5 6 7 8 9
y = –4x2
y =
2x2
y =
x
22 3
See Objective 3, page 69, for moreinformation aboutabsolute value.
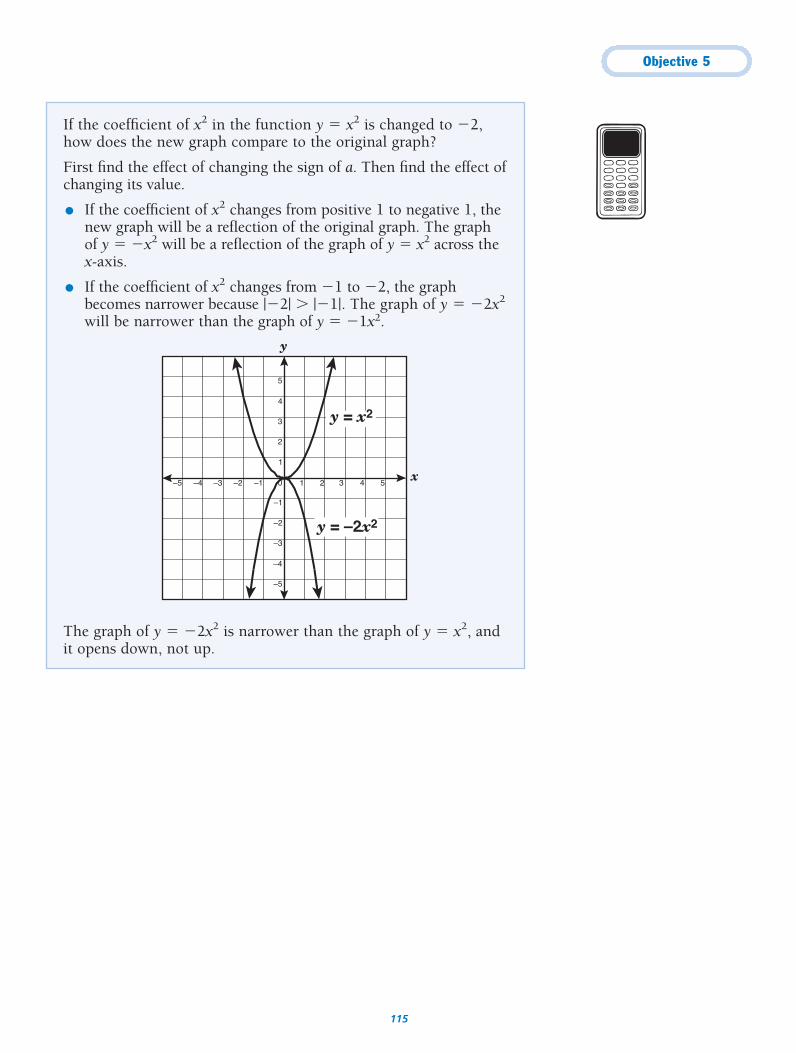
Objective 5
115
If the coefficient of x2 in the function y � x2 is changed to �2,how does the new graph compare to the original graph?
First find the effect of changing the sign of a. Then find the effect ofchanging its value.
● If the coefficient of x2 changes from positive 1 to negative 1, thenew graph will be a reflection of the original graph. The graph of y � �x2 will be a reflection of the graph of y � x2 across thex-axis.
● If the coefficient of x2 changes from �1 to �2, the graphbecomes narrower because |�2| � |�1|. The graph of y � �2x2
will be narrower than the graph of y � �1x2.
The graph of y � �2x2 is narrower than the graph of y � x2, andit opens down, not up.
y
x
–5
–4
–3
–2
–1
1
2
3
4
5
0–1–2–3–4–5 1 2 3 4 5
y = –2x2
y = x2
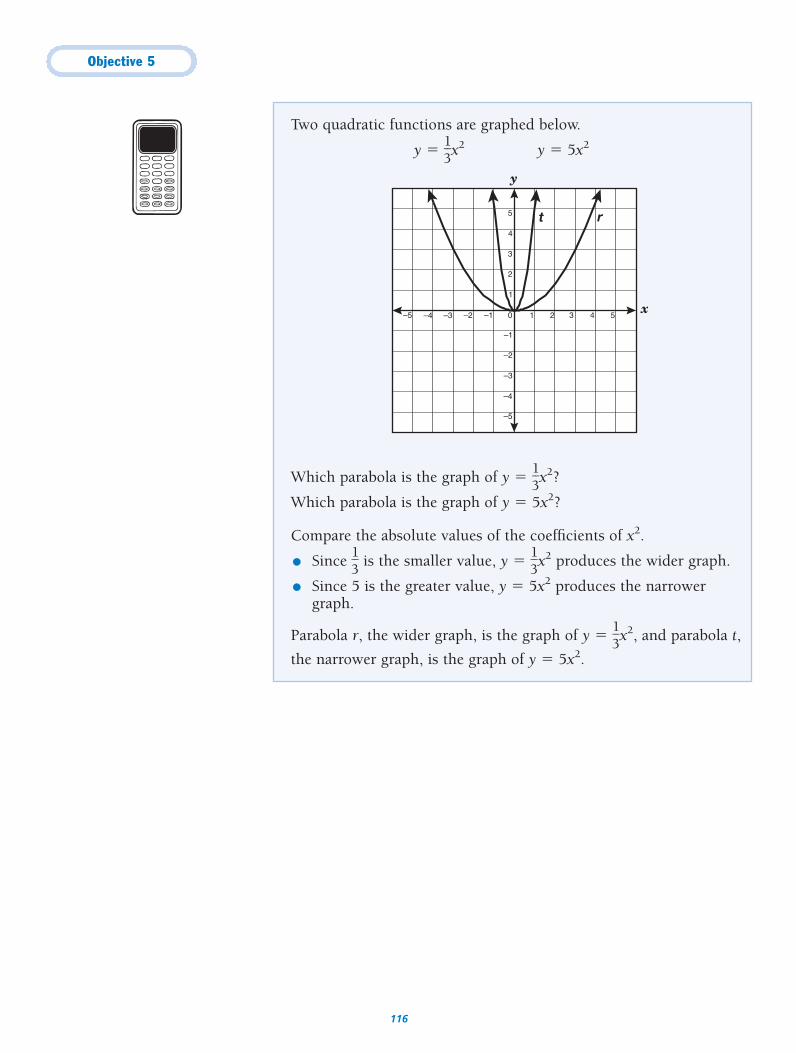
Objective 5
116
Two quadratic functions are graphed below.
y � �13
�x2 y � 5x2
Which parabola is the graph of y � �13
�x2?
Which parabola is the graph of y � 5x2?
Compare the absolute values of the coefficients of x2.
● Since �13
� is the smaller value, y � �13
�x2 produces the wider graph.
● Since 5 is the greater value, y � 5x2 produces the narrowergraph.
Parabola r, the wider graph, is the graph of y � �13
�x2, and parabola t,
the narrower graph, is the graph of y � 5x2.
y
x
–5
–4
–3
–2
–1
1
2
3
4
5
0–1–2–3–4–5 1 2 3 4 5
r t

Objective 5
117
What Happens to the Graph of y � x2 � c When c Is Changed?If two quadratic functions of the form y � x2 � c have differentconstants, c, then one graph will be a translation up or down of theother graph.
How does the graph of y � x2 � 4 compare to the graph of y � x2?
In the function y � x2 � 4, the constant 4 has been added to theparent function y � x2.
The graph of y � x2 � 4 is 4 units above the graph of y � x2.
y
x
–5
–4
–6
–7
–8
–9
–3
–2
–1
0
1
2
3
4
5
6
7
8
9
–1 1–2–3–4–5–6–7–8–9 2 3 4 5 6 7 8 9
y = x2 + 4
y = x2
How does the graph of y � x2 � 2 compare to the graph of y � x2?
In the function y � x2 � 2, the constant �2 has been added to theparent function y � x2.
The graph of y � x2 � 2 is 2 units below the graph of y � x2.
y
x
–5
–4
–6
–7
–8
–9
–3
–2
–1
0
1
2
3
4
5
6
7
8
9
–1 1–2–3–4–5–6–7–8–9 2 3 4 5 6 7 8 9
y =
x2
y = x2 – 2
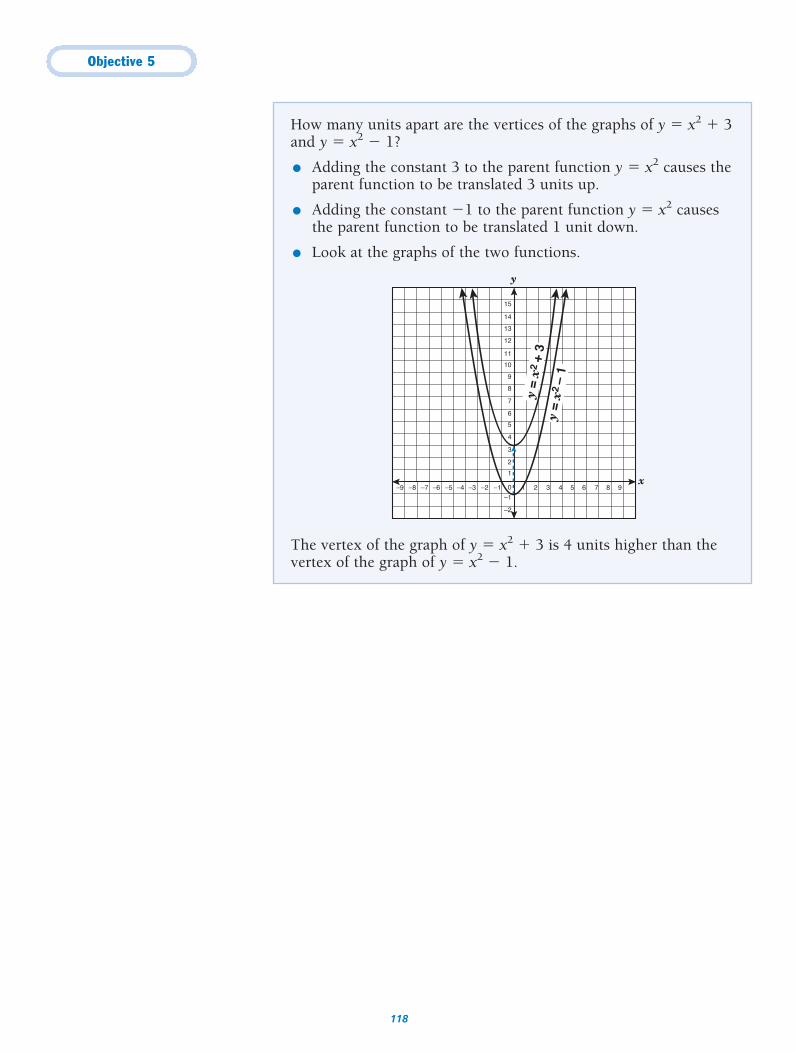
Objective 5
118
How many units apart are the vertices of the graphs of y � x2 � 3and y � x2 � 1?
● Adding the constant 3 to the parent function y � x2 causes theparent function to be translated 3 units up.
● Adding the constant �1 to the parent function y � x2 causesthe parent function to be translated 1 unit down.
● Look at the graphs of the two functions.
The vertex of the graph of y � x2 � 3 is 4 units higher than thevertex of the graph of y � x2 � 1.
y
x
–2
–1
0
1
2
3
4
5
6
7
8
9
10
11
12
13
14
15
–1 1–2–3–4–5–6–7–8–9 2 3 4 5 6 7 8 9
y =
x2 –
1
y =
x2 +
3
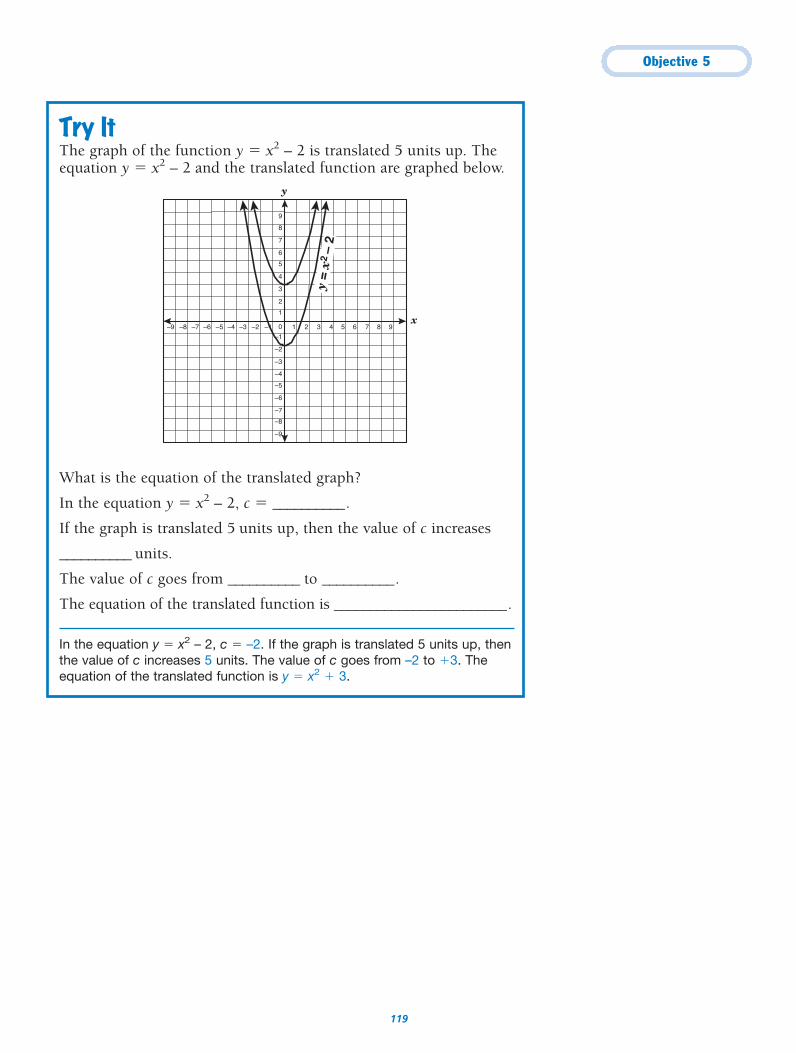
Objective 5
119
Try ItThe graph of the function y � x2 – 2 is translated 5 units up. Theequation y � x2 – 2 and the translated function are graphed below.
What is the equation of the translated graph?
In the equation y � x2 – 2, c � __________.
If the graph is translated 5 units up, then the value of c increases
__________ units.
The value of c goes from __________ to __________.
The equation of the translated function is ________________________.
In the equation y � x2 – 2, c � –2. If the graph is translated 5 units up, thenthe value of c increases 5 units. The value of c goes from –2 to �3. Theequation of the translated function is y � x2 � 3.
y
x
–5
–4
–6
–7
–8
–9
–3
–2
–1
0
1
2
3
4
5
6
7
8
9
–1 1–2–3–4–5–6–7–8–9 2 3 4 5 6 7 8 9y
= x2
– 2
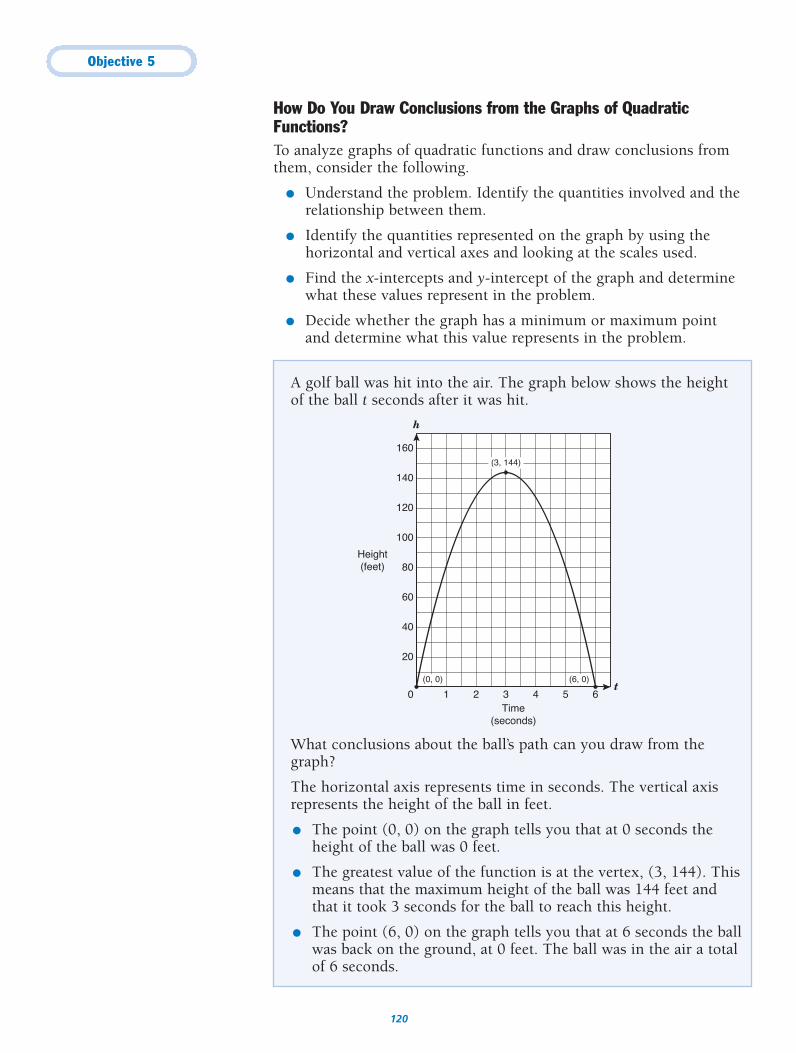
Objective 5
120
How Do You Draw Conclusions from the Graphs of QuadraticFunctions?To analyze graphs of quadratic functions and draw conclusions fromthem, consider the following.
● Understand the problem. Identify the quantities involved and therelationship between them.
● Identify the quantities represented on the graph by using thehorizontal and vertical axes and looking at the scales used.
● Find the x-intercepts and y-intercept of the graph and determinewhat these values represent in the problem.
● Decide whether the graph has a minimum or maximum pointand determine what this value represents in the problem.
A golf ball was hit into the air. The graph below shows the heightof the ball t seconds after it was hit.
What conclusions about the ball’s path can you draw from thegraph?
The horizontal axis represents time in seconds. The vertical axisrepresents the height of the ball in feet.
● The point (0, 0) on the graph tells you that at 0 seconds theheight of the ball was 0 feet.
● The greatest value of the function is at the vertex, (3, 144). Thismeans that the maximum height of the ball was 144 feet andthat it took 3 seconds for the ball to reach this height.
● The point (6, 0) on the graph tells you that at 6 seconds the ballwas back on the ground, at 0 feet. The ball was in the air a totalof 6 seconds.
0
20
40
1 2 3
60
80
100
120
140
160
4 5 6
h
t
Time(seconds)
Height(feet)
(3, 144)
(6, 0)(0, 0)
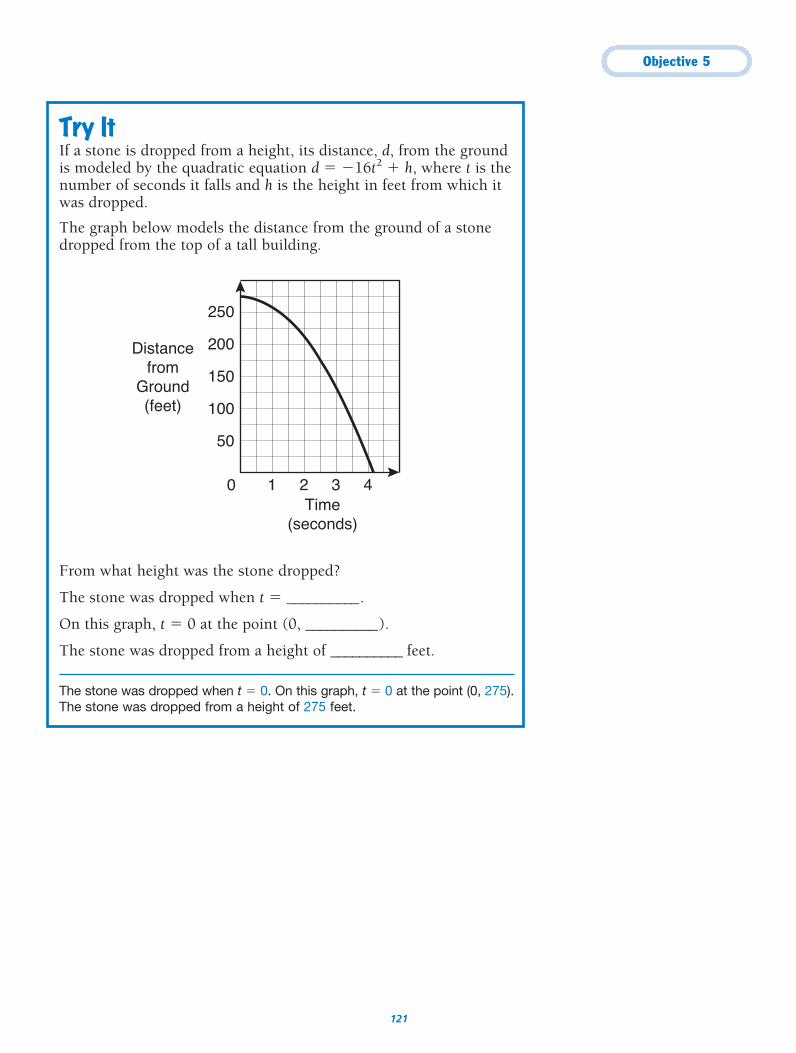
Objective 5
121
Try ItIf a stone is dropped from a height, its distance, d, from the groundis modeled by the quadratic equation d � �16t2 � h, where t is thenumber of seconds it falls and h is the height in feet from which itwas dropped.
The graph below models the distance from the ground of a stonedropped from the top of a tall building.
From what height was the stone dropped?
The stone was dropped when t � __________.
On this graph, t � 0 at the point (0, __________).
The stone was dropped from a height of __________ feet.
The stone was dropped when t � 0. On this graph, t � 0 at the point (0, 275).The stone was dropped from a height of 275 feet.
0
50
100
150
200
250
1 2 3 4
Distancefrom
Ground(feet)
Time(seconds)
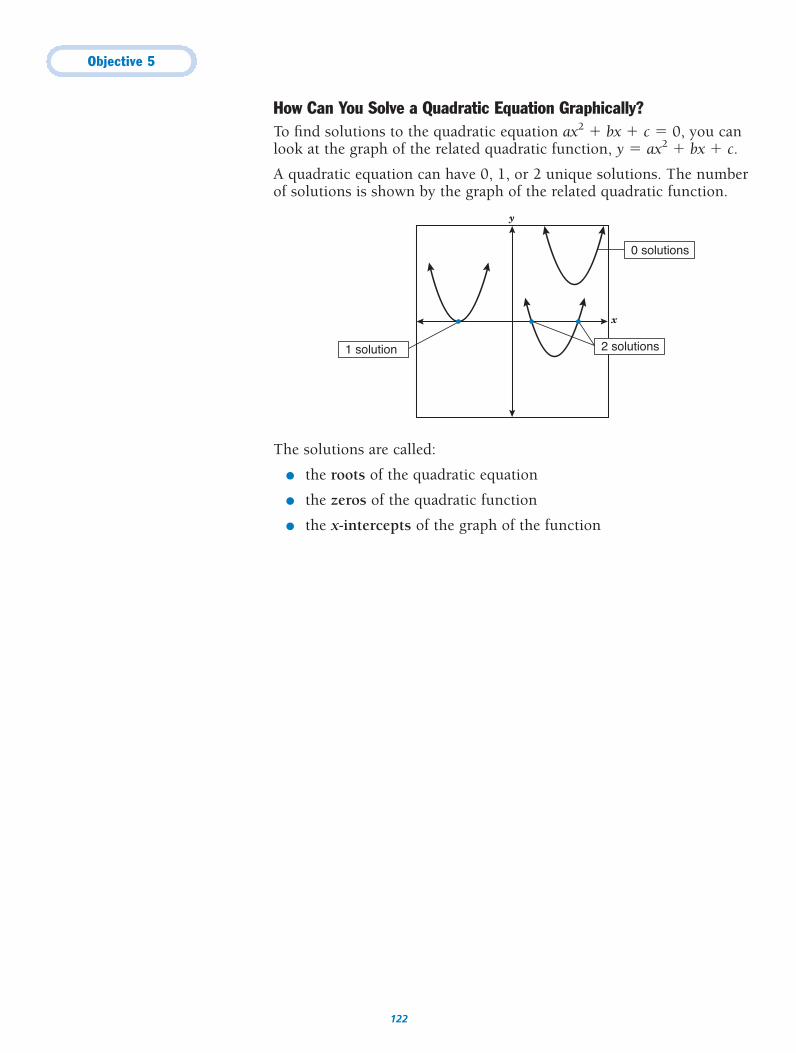
Objective 5
122
How Can You Solve a Quadratic Equation Graphically?To find solutions to the quadratic equation ax2 � bx � c � 0, you canlook at the graph of the related quadratic function, y � ax2 � bx � c.
A quadratic equation can have 0, 1, or 2 unique solutions. The numberof solutions is shown by the graph of the related quadratic function.
The solutions are called:
● the roots of the quadratic equation
● the zeros of the quadratic function
● the x-intercepts of the graph of the function
y
x
0 solutions
1 solution
x
2 solutions
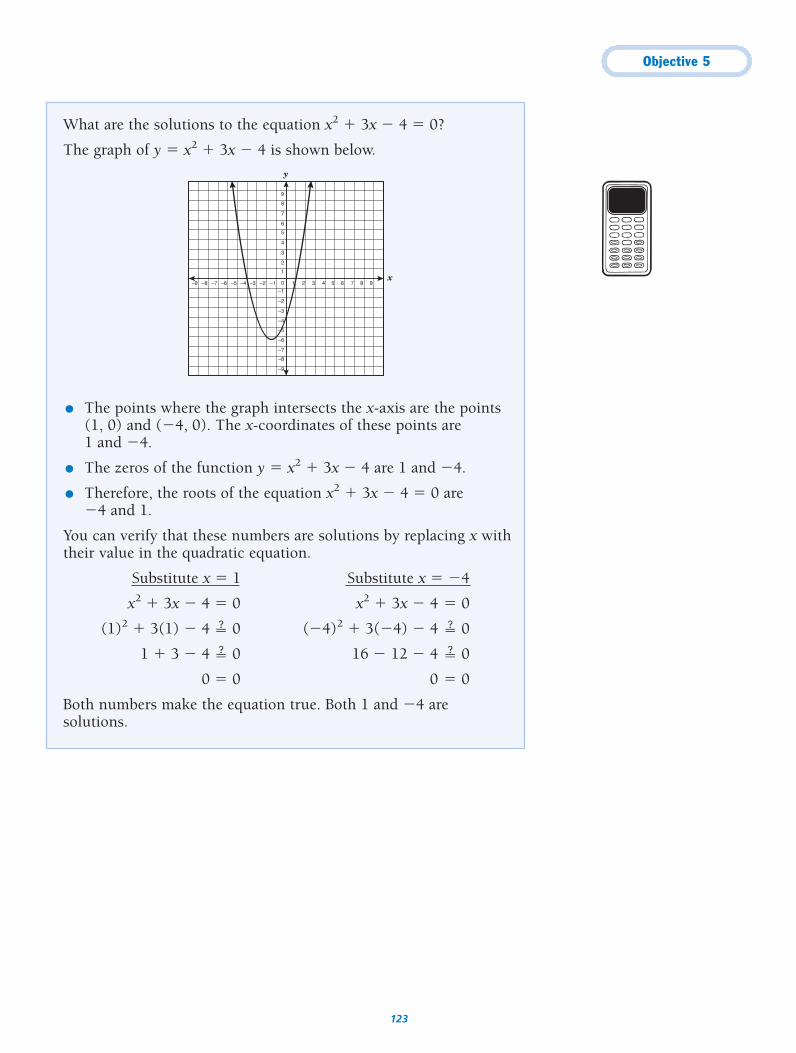
Objective 5
123
What are the solutions to the equation x2 � 3x � 4 � 0?
The graph of y � x2 � 3x � 4 is shown below.
● The points where the graph intersects the x-axis are the points(1, 0) and (�4, 0). The x-coordinates of these points are1 and �4.
● The zeros of the function y � x2 � 3x � 4 are 1 and �4.
● Therefore, the roots of the equation x2 � 3x � 4 � 0 are �4 and 1.
You can verify that these numbers are solutions by replacing x withtheir value in the quadratic equation.
Substitute x � 1 Substitute x � �4
x2 � 3x � 4 � 0 x2 � 3x � 4 � 0
(1)2 � 3(1) � 4 � 0 (�4)2 � 3(�4) � 4 � 0
1 � 3 � 4 � 0 16 � 12 � 4 � 0
0 � 0 0 � 0
Both numbers make the equation true. Both 1 and �4 aresolutions.
y
x
–5
–4
–6
–7
–8
–9
–3
–2
–1
0
1
2
3
4
5
6
7
8
9
–1 1–2–3–4–5–6–7–8–9 2 3 4 5 6 7 8 9
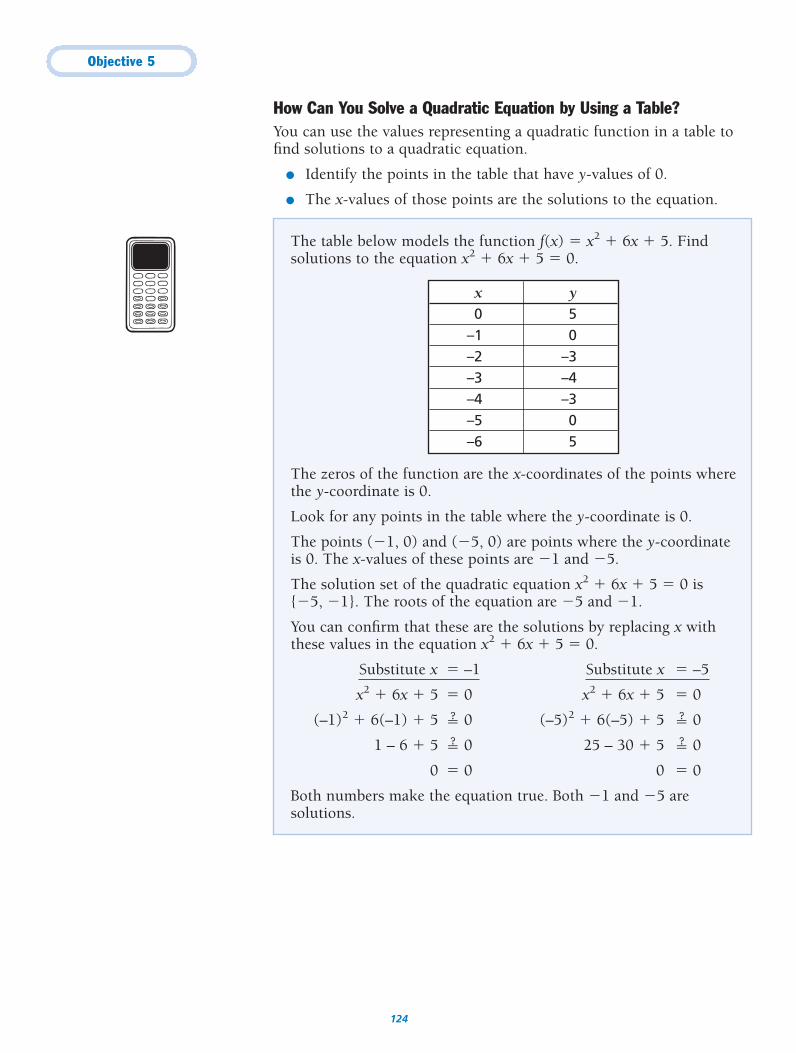
Objective 5
124
How Can You Solve a Quadratic Equation by Using a Table?You can use the values representing a quadratic function in a table tofind solutions to a quadratic equation.
● Identify the points in the table that have y-values of 0.
● The x-values of those points are the solutions to the equation.
The table below models the function f(x) � x2 � 6x � 5. Findsolutions to the equation x2 � 6x � 5 � 0.
The zeros of the function are the x-coordinates of the points wherethe y-coordinate is 0.
Look for any points in the table where the y-coordinate is 0.
The points (�1, 0) and (�5, 0) are points where the y-coordinateis 0. The x-values of these points are �1 and �5.
The solution set of the quadratic equation x2 � 6x � 5 � 0 is {�5, �1}. The roots of the equation are �5 and �1.
You can confirm that these are the solutions by replacing x withthese values in the equation x2 � 6x � 5 � 0.
Substitute x � –1 Substitute x � –5
x2 � 6x � 5 � 0 x2 � 6x � 5 � 0
(–1)2 � 6(–1) � 5 � 0 (–5)2 � 6(–5) � 5 � 0
1 – 6 � 5 � 0 25 – 30 � 5 � 0
0 � 0 0 � 0
Both numbers make the equation true. Both �1 and �5 aresolutions.
x y0 5
–1 0–2 –3–3 –4–4 –3–5 0–6 5
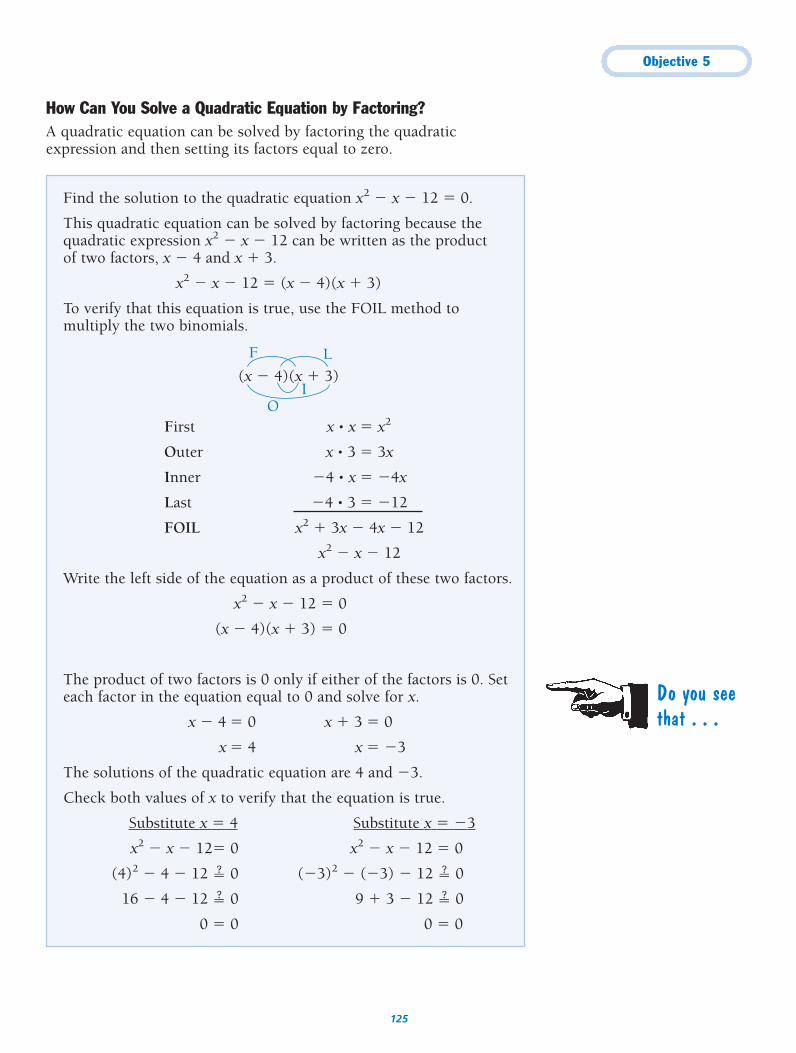
Find the solution to the quadratic equation x2 � x � 12 � 0.
This quadratic equation can be solved by factoring because thequadratic expression x2 � x � 12 can be written as the product of two factors, x � 4 and x � 3.
x2 � x � 12 � (x � 4)(x � 3)
To verify that this equation is true, use the FOIL method tomultiply the two binomials.
(x � 4)(x � 3)
First x • x � x2
Outer x • 3 � 3x
Inner �4 • x � �4x
Last �4 • 3 � �12
FOIL x2 � 3x � 4x � 12
x2 � x � 12
Write the left side of the equation as a product of these two factors.
x2 � x � 12 � 0
(x � 4)(x � 3) � 0
The product of two factors is 0 only if either of the factors is 0. Seteach factor in the equation equal to 0 and solve for x.
x � 4 � 0 x � 3 � 0
x � 4 x � �3
The solutions of the quadratic equation are 4 and �3.
Check both values of x to verify that the equation is true.
Substitute x � 4 Substitute x � �3
x2 � x � 12� 0 x2 � x � 12 � 0
(4)2 � 4 � 12 � 0 (�3)2 � (�3) � 12 � 0
16 � 4 � 12 � 0 9 � 3 � 12 � 0
0 � 0 0 � 0
Objective 5
125
How Can You Solve a Quadratic Equation by Factoring?A quadratic equation can be solved by factoring the quadraticexpression and then setting its factors equal to zero.
F L
OI
Do you seethat . . .
Objective 5
126
A rectangular garden is 1 foot longer than it is wide. Find thelength and width of the garden if its area is 42 square feet.
● If the width is represented by w, then the length can berepresented by w � 1.
● Substitute these expressions into the formula for the area of arectangle to model the problem situation with an equation.
A � lw
42 � (w � 1)w
● To find the width of the garden, solve this equation for w. First write the equation in standard quadratic form, ax2 � bx � c � 0.
w(w � 1) � 42
w2 � w � 42
w2 � w � 42 � 0
● The quadratic expression w2 � w � 42 can be factored.
w2 � w – 42 � (w � 7)(w � 6)
Rewrite the equation with the quadratic expression factored.
(w � 7)(w � 6) � 0
● Set each factor equal to 0 and solve for w.
w � 7 � 0 w � 6 � 0
w � �7 w � 6
● Width cannot be a negative value, so the solution w � �7 is not used. Use w � 6 as the solution to the equation.
The width of the garden is 6 feet. The length is w � 1, which isequal to 6 � 1, or 7 feet.
In real-life problems modeled by quadratic equations, not all thesolutions of the equation may make sense in the problem.
Do you seethat . . .
Objective 5
127
How Can You Solve a Quadratic Equation by Using the Quadratic Formula?Another method used to solve quadratic equations is the quadraticformula. This method can be used to solve all quadratic equations.
The Quadratic Formula
The solutions to a quadratic equation in the standard formax2 � bx � c � 0 are given by the formula
x � �–b � �
2ba
2 – 4a�c��
where a, b, and c are the parameters of the quadratic equation.
Find the solutions to the equation x2 � x � 2 � 0.
● The quadratic equation x2 � x � 2 � 0 is written in standardform. Identify the values of the constants a, b, and c.
a � 1
b � 1
c � �2
● Substitute these values for a, b, and c in the quadratic formula,simplify the expression, and represent the two solutionsseparately.
x �
x �
�
� ��1
2� 3�
x � ��1
2� 3� � �
22
� � 1 and x � ��1
2� 3� � �
�24
� � �2
The solutions to the equation are 1 and �2.
�1 � �9��
2
�1 � �12 � 4�(1)(�2�)����
2(1)
�b � �b2 � 4�ac����
2a
When you find the square root of a number,remember to add the �symbol in front of thesquare root symbol, �–
.
For example,
x2 � 9
�x2� � ��9�x � �3
shows that (�3)2 � 9and (�3)2 � 9.
Objective 5
128
Find the solutions to the equation 2x2 � 4x � 3 � 0.
● The quadratic equation 2x2 � 4x – 3 � 0 is written in standardform. The values of the constants a, b, and c are its parameters.
a � 2
b � 4
c � �3
● Substitute these values for a, b, and c in the quadratic formula,simplify the expression, and represent the two roots separately.
x �
x �
x � �–4 �
4�40��
x � ��4 �
4�40�� and x � �
�4 �4�40��
● To approximate the roots of the equation, evaluate the finalexpressions using �40� � 6.32.
x � ��4 �4
6.32� � 0.58
x � ��4 �
46.32� � –2.58
The roots of the equation are x � 0.58 and x � �2.58.
–4 ��42 – 4(�2)(–3)����
2(2)
�b � ��b2 � 4�ac���
2a
Objective 5
129
Try ItEstimate the roots of the equation 4x2 � 1 � 8x.
Write the quadratic equation in standard form.
__________ x2 � __________ x � __________ � 0In the equation above,
a � __________, b � __________, and c � __________.Substitute the values of a, b, and c into the quadratic formula.
x � �–b � �
2ba
2 – 4a�c���
x �� ��
——2�—
4 •
——•
——
2 •
x ���
———————8
x ���
——8
x � 8 � � _______ and x �
8 � � _______8 8
The approximate roots of the equation are _______ and _______.
4x2 � 8x � 1 � 0
In the equation above, a � 4, b � �8, and c � 1.
x � �b � �b2 � 4�ac�2a
x � �(�8) � �(�8)2�� 4 •�4 • 1�2 • 4
x � 8 � �64 ��16�8
x � 8 � �48�8
x � �8 �
8�48�� � 1.87 and x � �
8 �
8�48�� � 0.13
The approximate roots of the equation are 1.87 and 0.13.
�
Objective 5
130
How Do You Apply the Laws of Exponents in Problem-SolvingSituations?When simplifying an expression with exponents, there are severalrules, known as the laws of exponents, which must be followed.
● When multiplying terms with like bases, add the exponents.
xa • xb � x(a�b)
Example: x4 • x2 � x(4�2) � x6
(x • x • x • x) • (x • x) � x x xx x x � x6
● When dividing terms with like bases, subtract the exponents.
�xx
a
b� � x(a�b)
Example: �xx
8
3� � x(8�3) � x5
�x x x
xxxxxx x x
� � x5
Sometimes dividing variables with exponents produces negative exponents.
Example: �xx
3
5� � x(3�5) � x�2
�x
xx
xx
xx x
� � �x12� � x�2
● A term with a negative exponent is equal to the reciprocal of that term with a positive exponent.
x�a � �x1a�
Example: x�5 � �x15�
● When raising a term with an exponent to a power, multiply theexponents.
(xa)b � xab
Example: (x2)7 � x2 • 7 � x14
(x2)7 � (x x) • (x x) • (x x) • (x x) • (x x) • (x x) • (x x)(x2)7 � (x x x x x x x x x x x x x x)(x2)7 � x14
● Any base other than zero raised to the zero power equals one.
x0 � 1
Example: 80 � 1
All variables have anexponent. When anexponent is not given, itis understood to be 1.
x = x 1
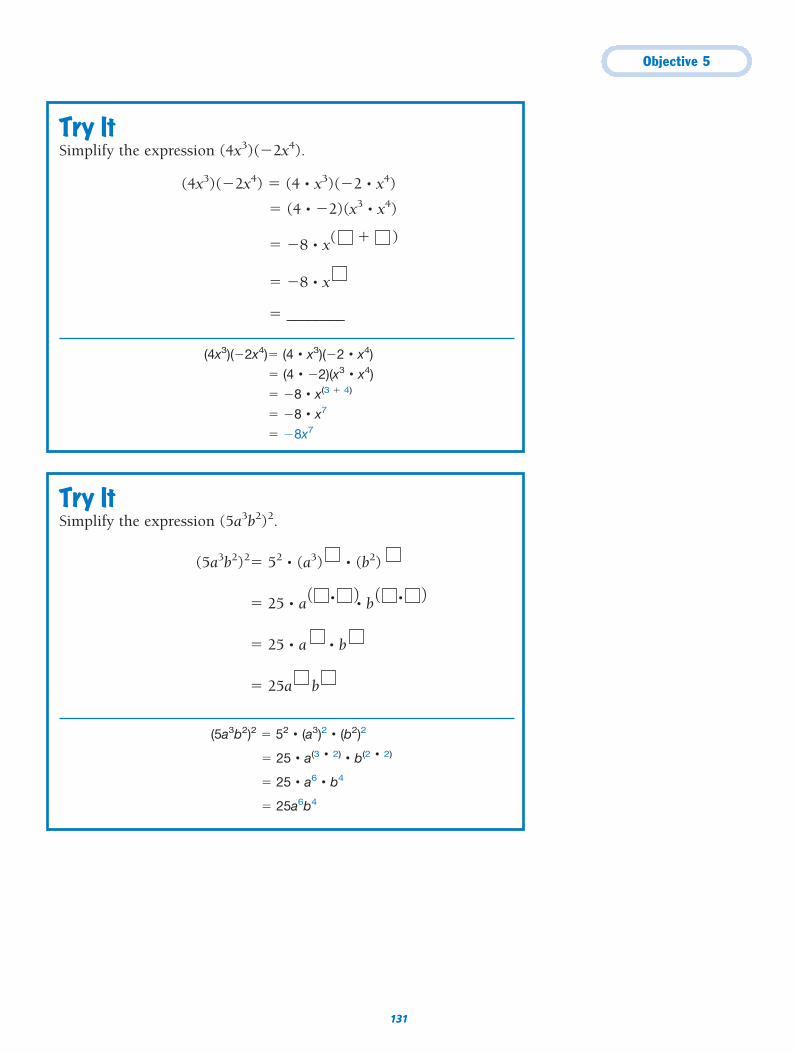
Objective 5
131
Try ItSimplify the expression (4x3)(�2x4).
(4x3)(�2x4) � (4 • x3)(�2 • x4)
� (4 • �2)(x3 • x4)
� �8 • x( � )
� �8 • x
� ________
(4x3)(�2x4)� (4 • x3)(�2 • x4)
� (4 • �2)(x3 • x4)
� �8 • x(3 � 4)
� �8 • x7
� �8x7
131
Try ItSimplify the expression (5a3b2)2.
(5a3b2)2� 52 • (a3) • (b2)
� 25 • a • b
� 25 • a • b
� 25a b
(5a3b2)2 � 52 • (a3)2 • (b2)2
� 25 • a(3 • 2) • b(2 • 2)
� 25 • a6 • b4
� 25a6b4
••( ) ( )
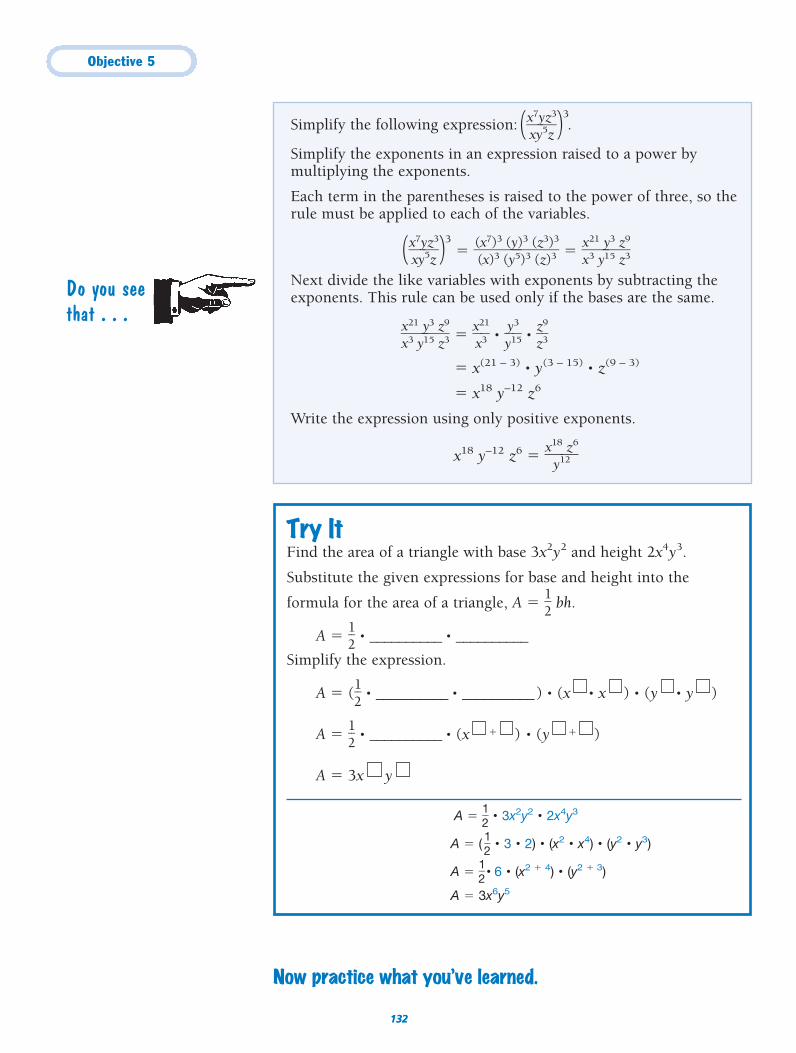
Objective 5
132
Simplify the following expression: .
Simplify the exponents in an expression raised to a power bymultiplying the exponents.
Each term in the parentheses is raised to the power of three, so therule must be applied to each of the variables.
(�xx
7
yy5zz
3
�)3� �
((xx
7
))3
3
((yy5))
3
3((zz
3
))3
3
� � �xx3
21
yy15
3
zz
3
9
�
Next divide the like variables with exponents by subtracting theexponents. This rule can be used only if the bases are the same.
�xx3
21
yy15
3
zz
3
9
� � �xx
2
3
1
� • �yy1
3
5� • �zz
9
3�
� x(21 – 3) • y(3 – 15) • z(9 – 3)
� x18 y–12 z6
Write the expression using only positive exponents.
x18 y–12 z6 � �x1
y
8
12z6
�
(�xx
7
yy5zz
3
�)3
Try ItFind the area of a triangle with base 3x2y2 and height 2x4y3.
Substitute the given expressions for base and height into the
formula for the area of a triangle, A � �12
� bh.
A � �12
� • __________ • __________
Simplify the expression.
A � (�12
� • __________ • __________) • (x • x ) • (y • y )
A � �12
� • __________ • (x ) • (y )
A � 3x y
A � �12
� • 3x2y2 • 2x4y3
A � ( �12
� • 3 • 2) • (x2 • x4) • (y2 • y3)
A � �12
� • 6 • (x2 � 4) • (y2 � 3)
A � 3x6y5
�
Now practice what you’ve learned.
�
132
Do you seethat . . .
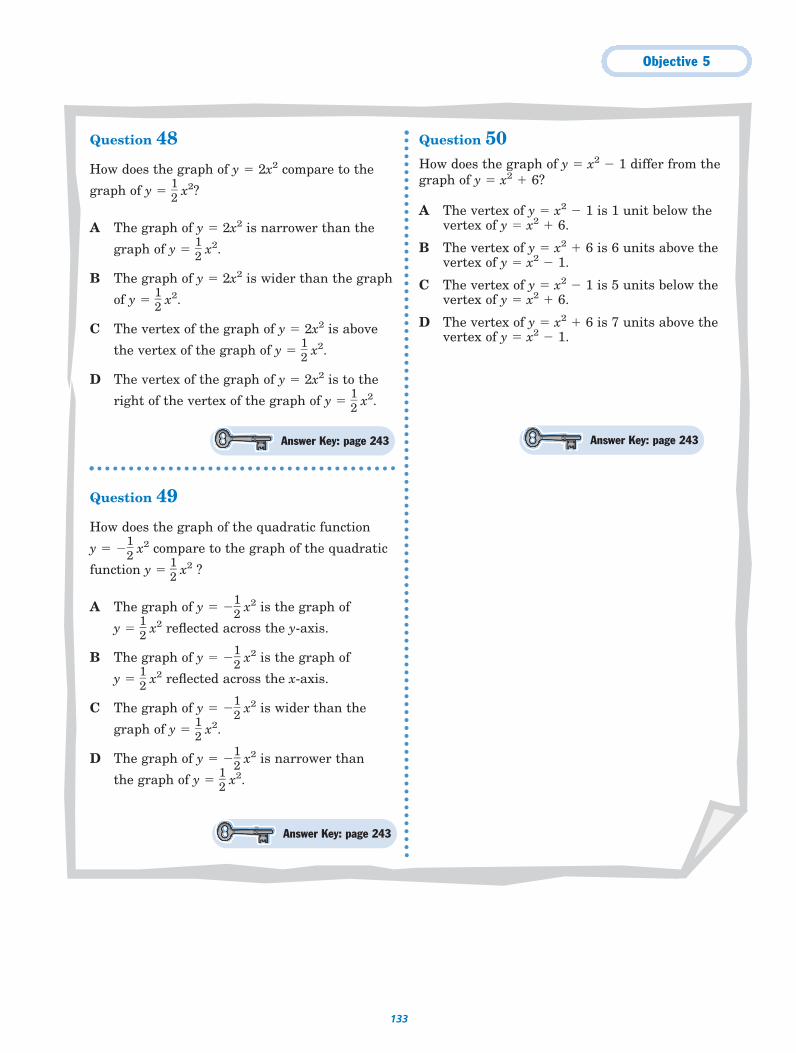
Objective 5
133
Question 48
How does the graph of y � 2x2 compare to the
graph of y � �12
� x2?
A The graph of y � 2x2 is narrower than the
graph of y � �12
� x2.
B The graph of y � 2x2 is wider than the graph
of y � �12
� x2.
C The vertex of the graph of y � 2x2 is above
the vertex of the graph of y � �12
� x2.
D The vertex of the graph of y � 2x2 is to the
right of the vertex of the graph of y � �12
� x2.
Question 49
How does the graph of the quadratic function
y � ��12
� x2 compare to the graph of the quadratic
function y � �12
� x2 ?
A The graph of y � ��12
� x2 is the graph of
y � �12
� x2 reflected across the y-axis.
B The graph of y � ��12
� x2 is the graph of
y � �12
� x2 reflected across the x-axis.
C The graph of y � ��12
� x2 is wider than the
graph of y � �12
� x2.
D The graph of y � ��12
� x2 is narrower than
the graph of y � �12
� x2.
Question 50How does the graph of y � x2 � 1 differ from thegraph of y � x2 � 6?
A The vertex of y � x2 � 1 is 1 unit below thevertex of y � x2 � 6.
B The vertex of y � x2 � 6 is 6 units above thevertex of y � x2 � 1.
C The vertex of y � x2 � 1 is 5 units below thevertex of y � x2 � 6.
D The vertex of y � x2 � 6 is 7 units above thevertex of y � x2 � 1.
Answer Key: page 243 Answer Key: page 243
Answer Key: page 243
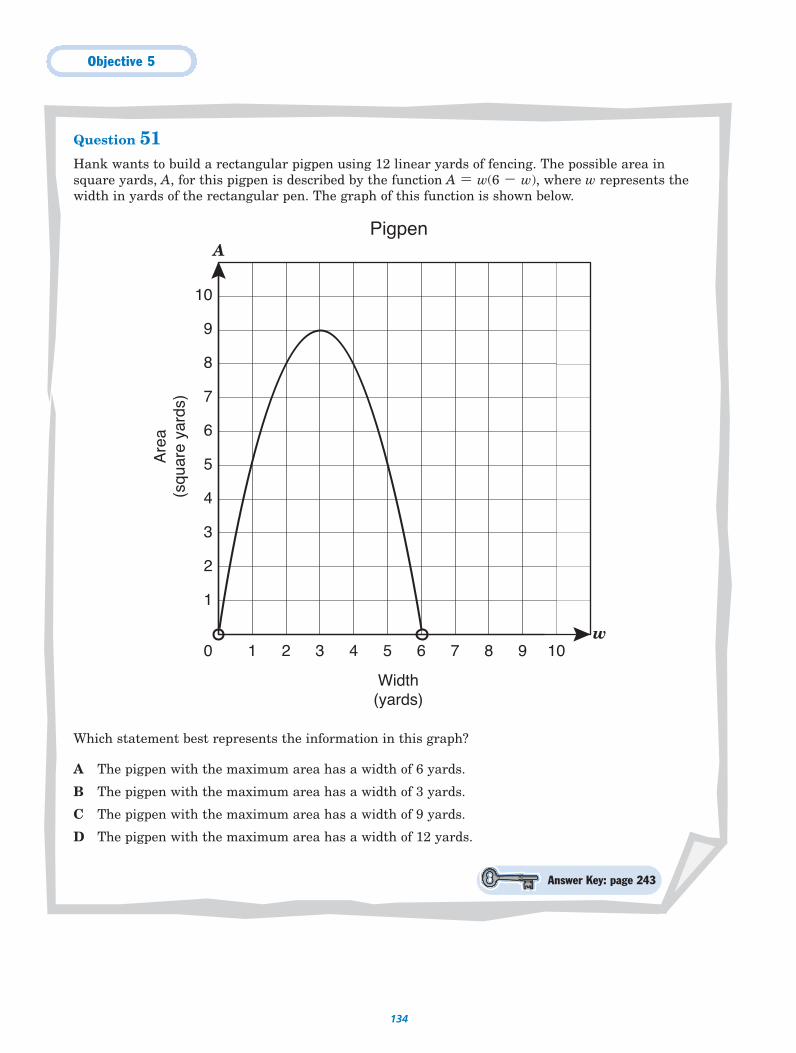
Objective 5
134
Question 51Hank wants to build a rectangular pigpen using 12 linear yards of fencing. The possible area insquare yards, A, for this pigpen is described by the function A � w(6 � w), where w represents thewidth in yards of the rectangular pen. The graph of this function is shown below.
Which statement best represents the information in this graph?
A The pigpen with the maximum area has a width of 6 yards.
B The pigpen with the maximum area has a width of 3 yards.
C The pigpen with the maximum area has a width of 9 yards.
D The pigpen with the maximum area has a width of 12 yards.
0
1
2
1 2 3
3
4
5
6
7
8
9
10
4 5 6 7 8 9 10
A
w
Width(yards)
Pigpen
Are
a(s
quar
e ya
rds)
Answer Key: page 243
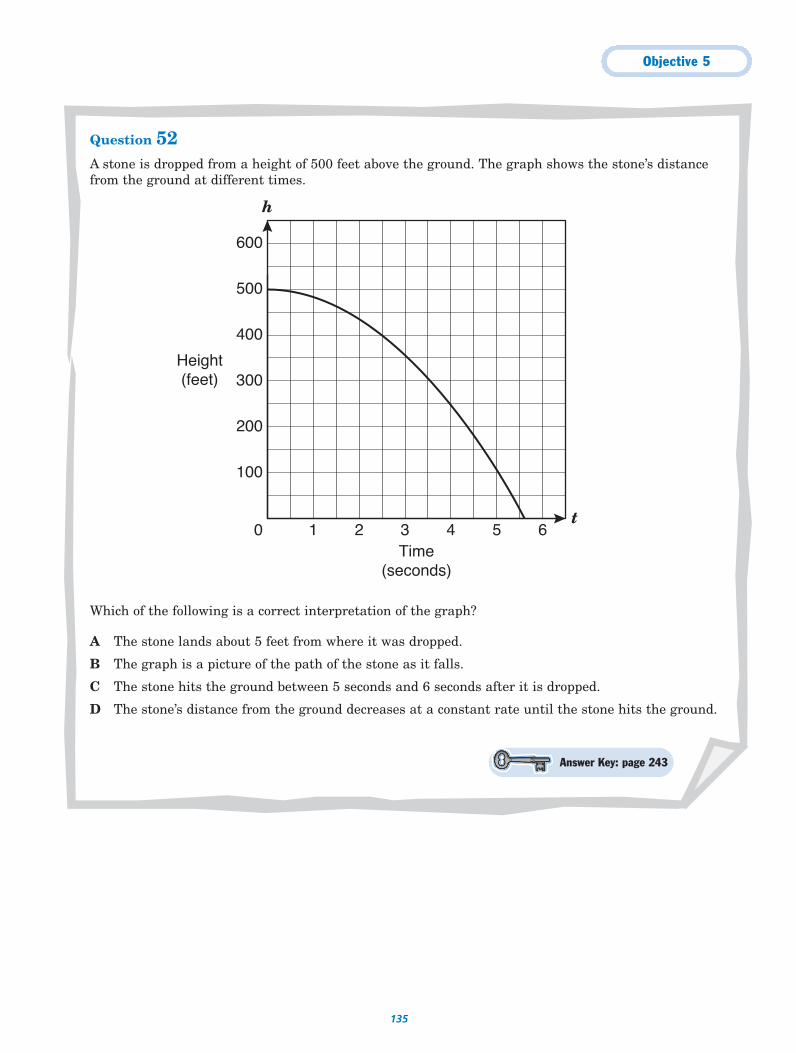
Objective 5
135
Question 52A stone is dropped from a height of 500 feet above the ground. The graph shows the stone’s distancefrom the ground at different times.
Which of the following is a correct interpretation of the graph?
A The stone lands about 5 feet from where it was dropped.
B The graph is a picture of the path of the stone as it falls.
C The stone hits the ground between 5 seconds and 6 seconds after it is dropped.
D The stone’s distance from the ground decreases at a constant rate until the stone hits the ground.
0
100
200
1 2 3
300
400
500
600
4 5 6
h
t
Time(seconds)
Height(feet)
Answer Key: page 243
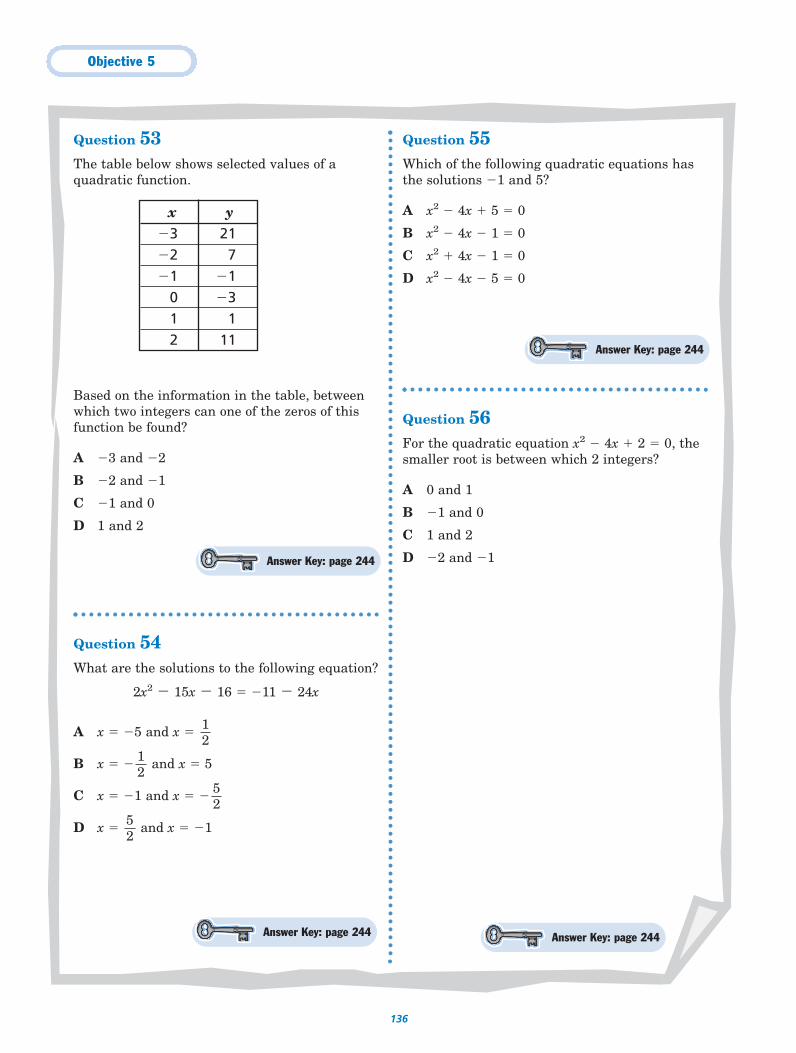
Objective 5
136
Question 53The table below shows selected values of aquadratic function.
Based on the information in the table, betweenwhich two integers can one of the zeros of thisfunction be found?
A �3 and �2
B �2 and �1
C �1 and 0
D 1 and 2
Question 54What are the solutions to the following equation?
2x2 � 15x � 16 � �11 � 24x
A x � �5 and x �
B x � � and x � 5
C x � �1 and x � �
D x � and x � �1
Question 55Which of the following quadratic equations hasthe solutions �1 and 5?
A x2 � 4x � 5 � 0
B x2 � 4x � 1 � 0
C x2 � 4x � 1 � 0
D x2 � 4x � 5 � 0
Question 56For the quadratic equation x2 � 4x � 2 � 0, thesmaller root is between which 2 integers?
A 0 and 1
B �1 and 0
C 1 and 2
D �2 and �1
52
52
12
12
x y�3 21�2 7�1 �1
0 �31 12 11
Answer Key: page 244
Answer Key: page 244
Answer Key: page 244 Answer Key: page 244
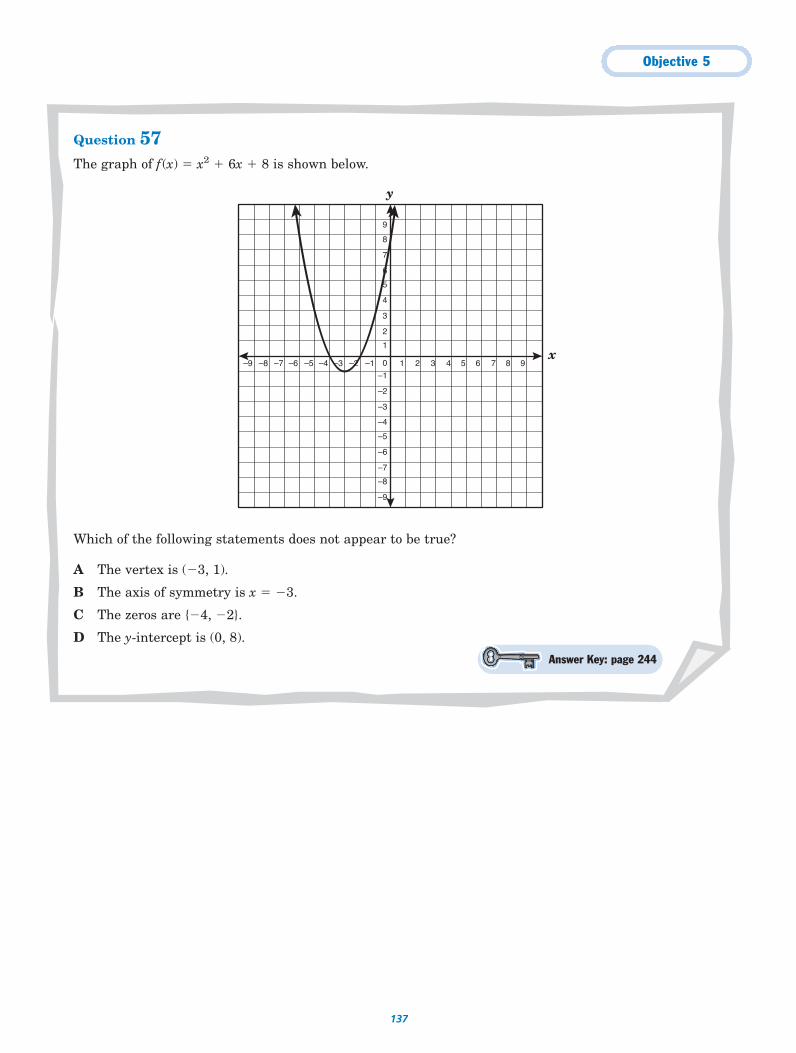
Objective 5
137
Question 57The graph of f(x) � x2 � 6x � 8 is shown below.
Which of the following statements does not appear to be true?
A The vertex is (�3, 1).
B The axis of symmetry is x � �3.
C The zeros are {�4, �2}.
D The y-intercept is (0, 8).
y
x
–5
–4
–6
–7
–8
–9
–3
–2
–1
0
1
2
3
4
5
6
7
8
9
–1 1–2–3–4–5–6–7–8–9 2 3 4 5 6 7 8 9
Answer Key: page 244
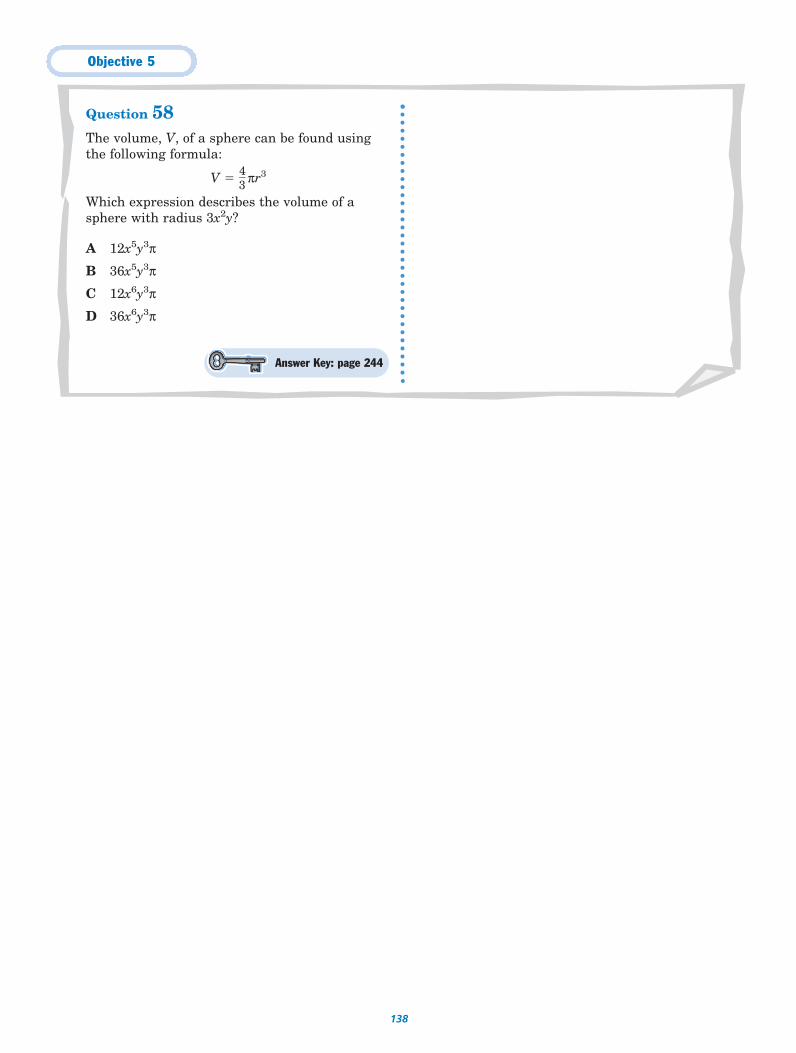
Objective 5
138
Question 58The volume, V, of a sphere can be found usingthe following formula:
V � �43
� πr3
Which expression describes the volume of asphere with radius 3x2y?
A 12x5y3π
B 36x5y3π
C 12x6y3π
D 36x6y3π
Answer Key: page 244
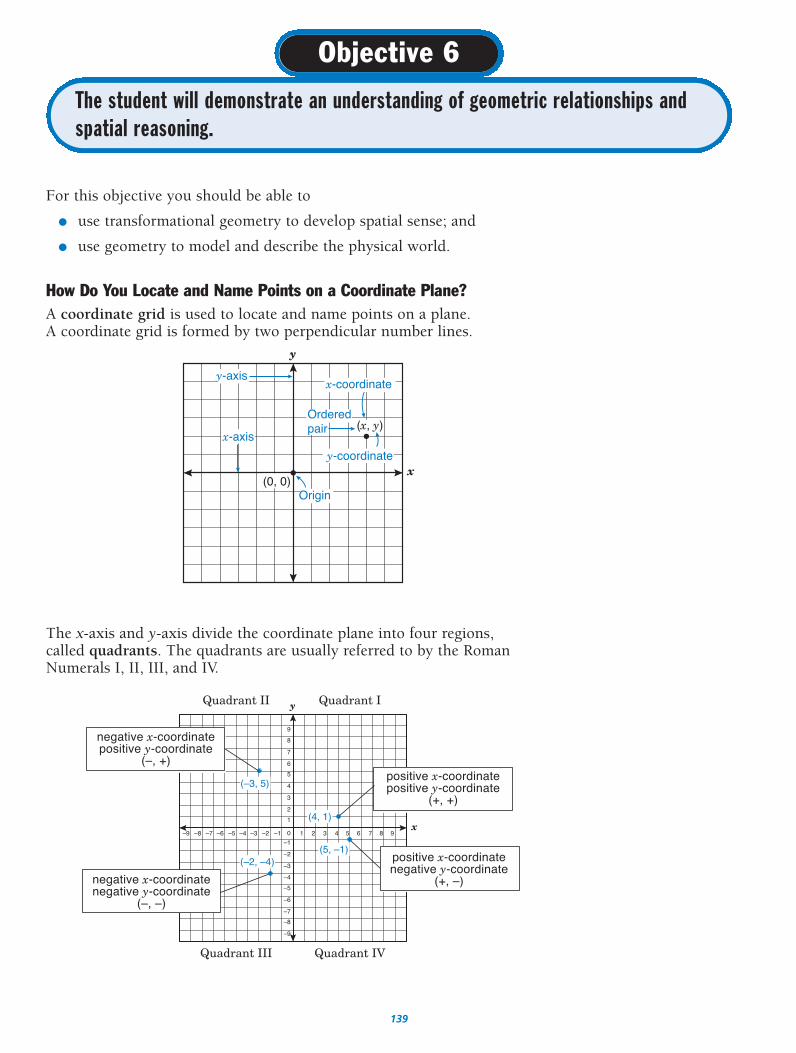
139
The student will demonstrate an understanding of geometric relationships andspatial reasoning.
Objective 6
For this objective you should be able to
● use transformational geometry to develop spatial sense; and
● use geometry to model and describe the physical world.
How Do You Locate and Name Points on a Coordinate Plane?A coordinate grid is used to locate and name points on a plane. A coordinate grid is formed by two perpendicular number lines.
The x-axis and y-axis divide the coordinate plane into four regions,called quadrants. The quadrants are usually referred to by the RomanNumerals I, II, III, and IV.
y
x
–5
–4
–6
–7
–8
–9
–3
–2
–1
0
1
2
3
4
5
6
7
8
9
–1 1–2–3–4–5–6–7–8–9 2 3 4 5 6 7 8 9
positive x-coordinatepositive y-coordinate
(+, +)
(–2, –4)
(–3, 5)
(4, 1)
(5, –1)
Quadrant IQuadrant II
Quadrant IVQuadrant III
positive x-coordinatenegative y-coordinate
(+, –)negative x-coordinatenegative y-coordinate
(–, –)
negative x-coordinatepositive y-coordinate
(–, +)
y
x
Origin(0, 0)
(x, y)x-axis
y-coordinate
y-axisx-coordinate
Orderedpair
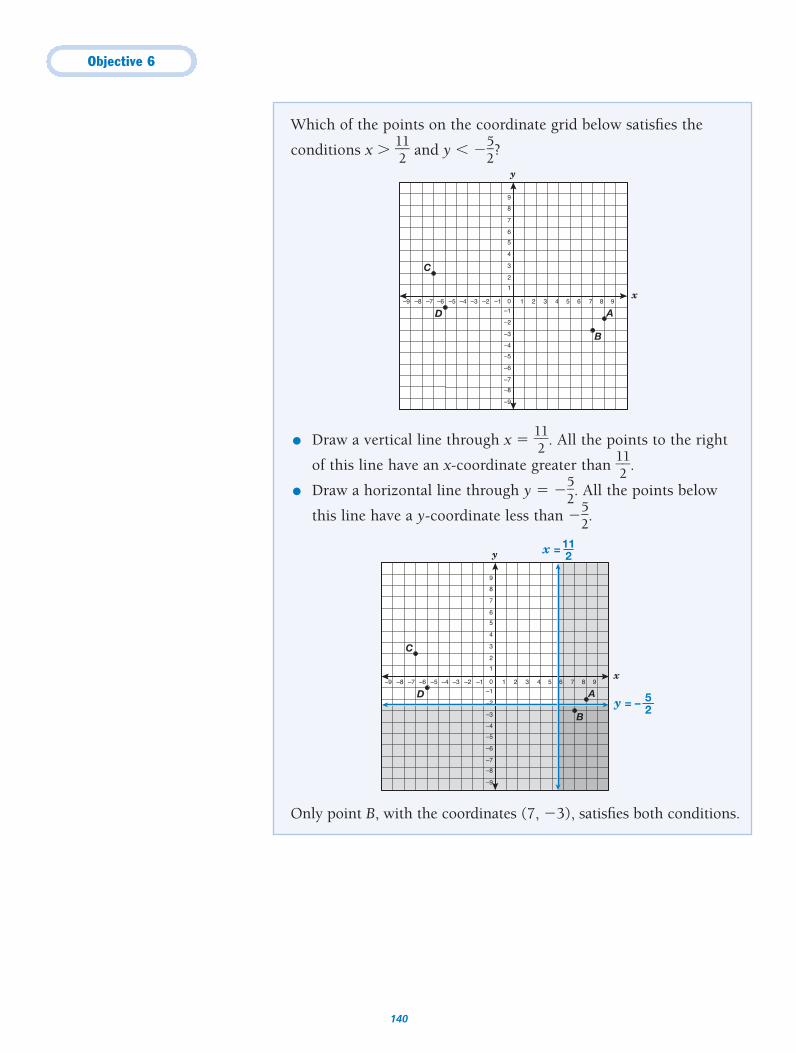
Objective 6
140
Which of the points on the coordinate grid below satisfies the
conditions x � �121� and y � ��
52
�?
● Draw a vertical line through x � �121�. All the points to the right
of this line have an x-coordinate greater than �121�.
● Draw a horizontal line through y � ��52
�. All the points below
this line have a y-coordinate less than ��52
�.
Only point B, with the coordinates (7, �3), satisfies both conditions.
y
x
–5
–4
–6
–7
–8
–9
–3
–2
–1
0
1
2
3
4
5
6
7
8
9
–1 1–2–3–4–5–6–7–8–9 2 3 4 5 6 7 8 9
A
B
C
D
x = 112
y = – 52
y
x
–5
–4
–6
–7
–8
–9
–3
–2
–1
0
1
2
3
4
5
6
7
8
9
–1 1–2–3–4–5–6–7–8–9 2 3 4 5 6 7 8 9
A
B
C
D
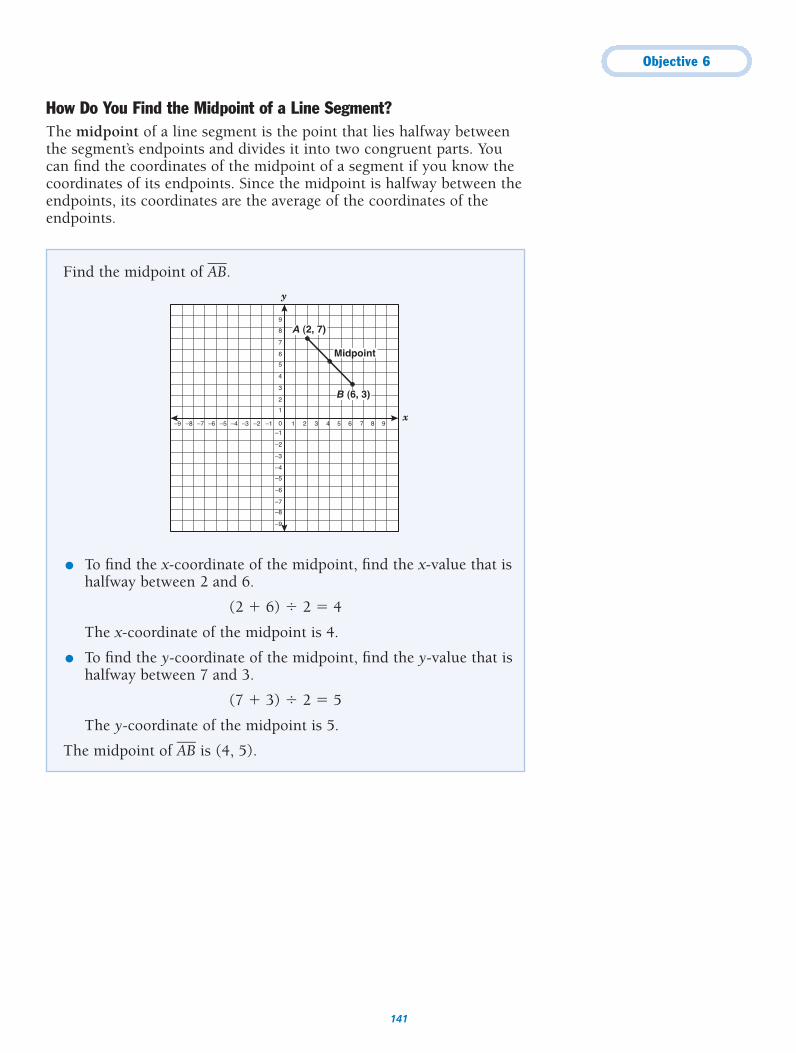
Objective 6
141
Find the midpoint of A�B�.
● To find the x-coordinate of the midpoint, find the x-value that ishalfway between 2 and 6.
(2 � 6) � 2 � 4
The x-coordinate of the midpoint is 4.
● To find the y-coordinate of the midpoint, find the y-value that ishalfway between 7 and 3.
(7 � 3) � 2 � 5
The y-coordinate of the midpoint is 5.
The midpoint of A�B� is (4, 5).
y
x
–5
–4
–6
–7
–8
–9
–3
–2
–1
0
1
2
3
4
5
6
7
8
9
–1 1–2–3–4–5–6–7–8–9 2 3 4 5 6 7 8 9
A (2, 7)
Midpoint
B (6, 3)
How Do You Find the Midpoint of a Line Segment? The midpoint of a line segment is the point that lies halfway betweenthe segment’s endpoints and divides it into two congruent parts. Youcan find the coordinates of the midpoint of a segment if you know thecoordinates of its endpoints. Since the midpoint is halfway between theendpoints, its coordinates are the average of the coordinates of theendpoints.
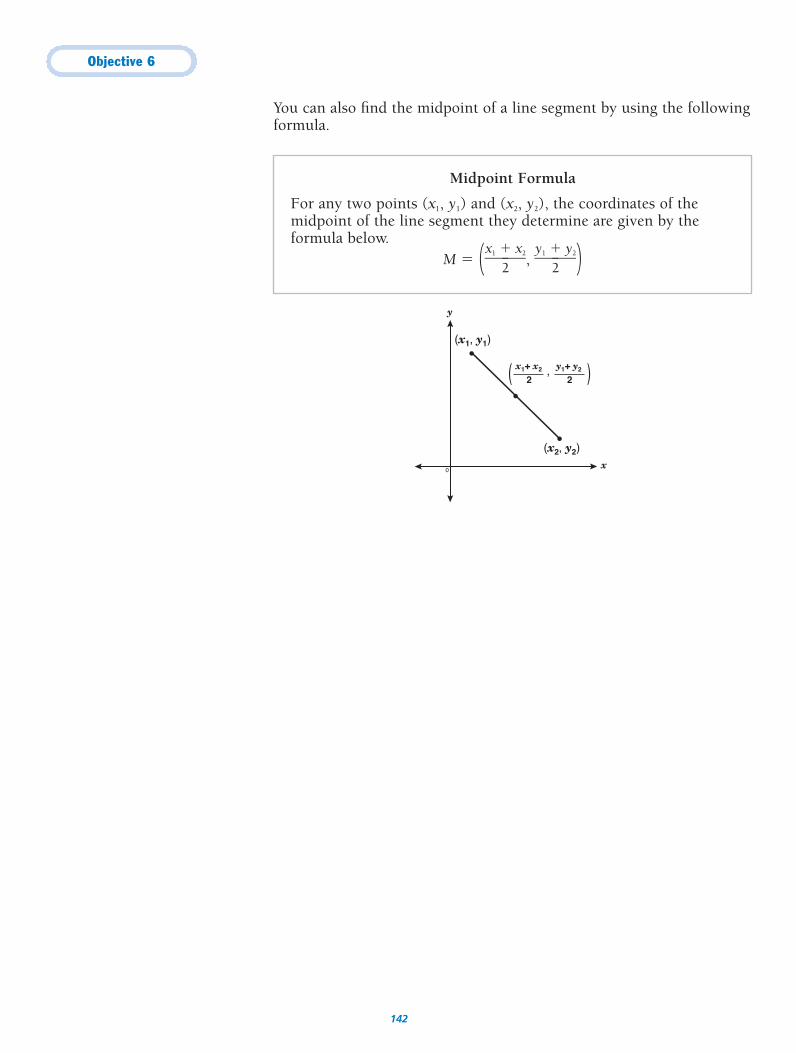
Objective 6
142
Midpoint Formula
For any two points (x1, y1) and (x2, y2), the coordinates of themidpoint of the line segment they determine are given by theformula below.
M � (�x1 �
2x2
�, �y1 �
2y2
�)
You can also find the midpoint of a line segment by using the followingformula.
y
x0
(x1, y1)
x1+ x2
(x2, y2)
2y1+ y2
2,
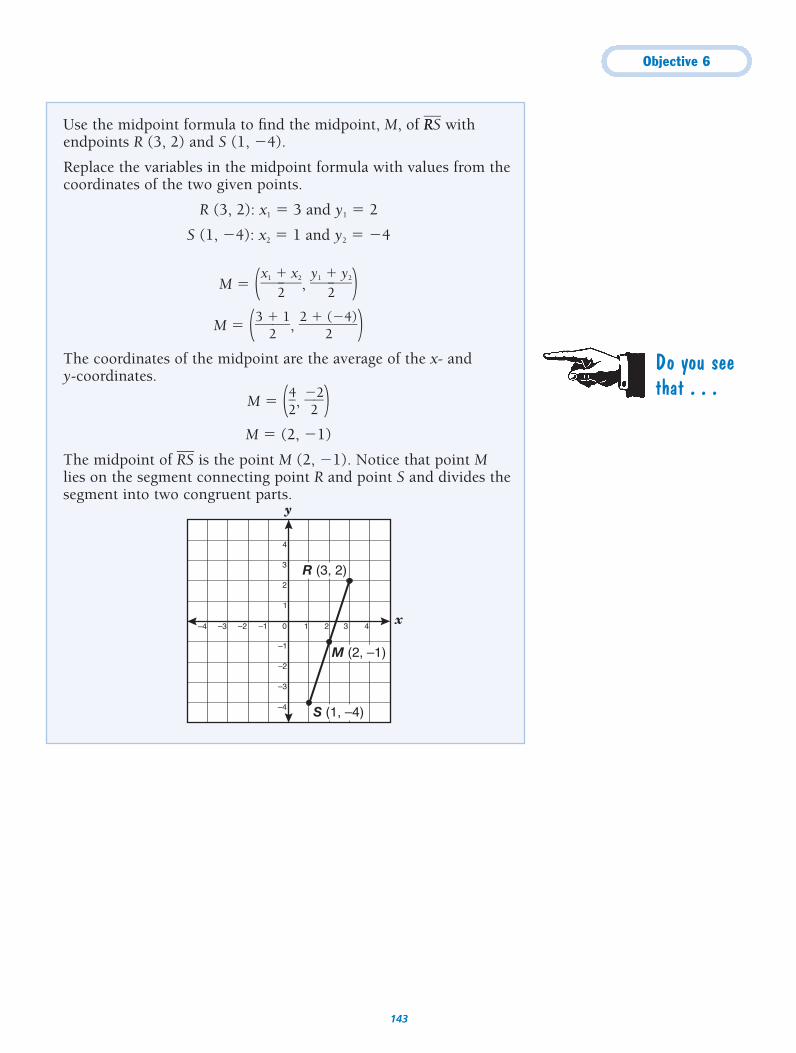
Objective 6
143
Use the midpoint formula to find the midpoint, M, of RR�S� withendpoints R (3, 2) and S (1, �4).
Replace the variables in the midpoint formula with values from thecoordinates of the two given points.
R (3, 2): x1 � 3 and y1 � 2
S (1, �4): x2 � 1 and y2 � �4
M � (�x1 �
2x2
�, �y1 �
2y2
�)M � (�3 �
21
�, �2 �
2(�4)�)
The coordinates of the midpoint are the average of the x- and y-coordinates.
M � (�42
�, ��22
�)M � (2, �1)
The midpoint of R�S� is the point M (2, �1). Notice that point Mlies on the segment connecting point R and point S and divides thesegment into two congruent parts.
y
x
–4
–3
–2
–1
1
2
3
4
0–1–2–3–4 1 2 3 4
R (3, 2)
M (2, –1)
S (1, –4)
Do you seethat . . .
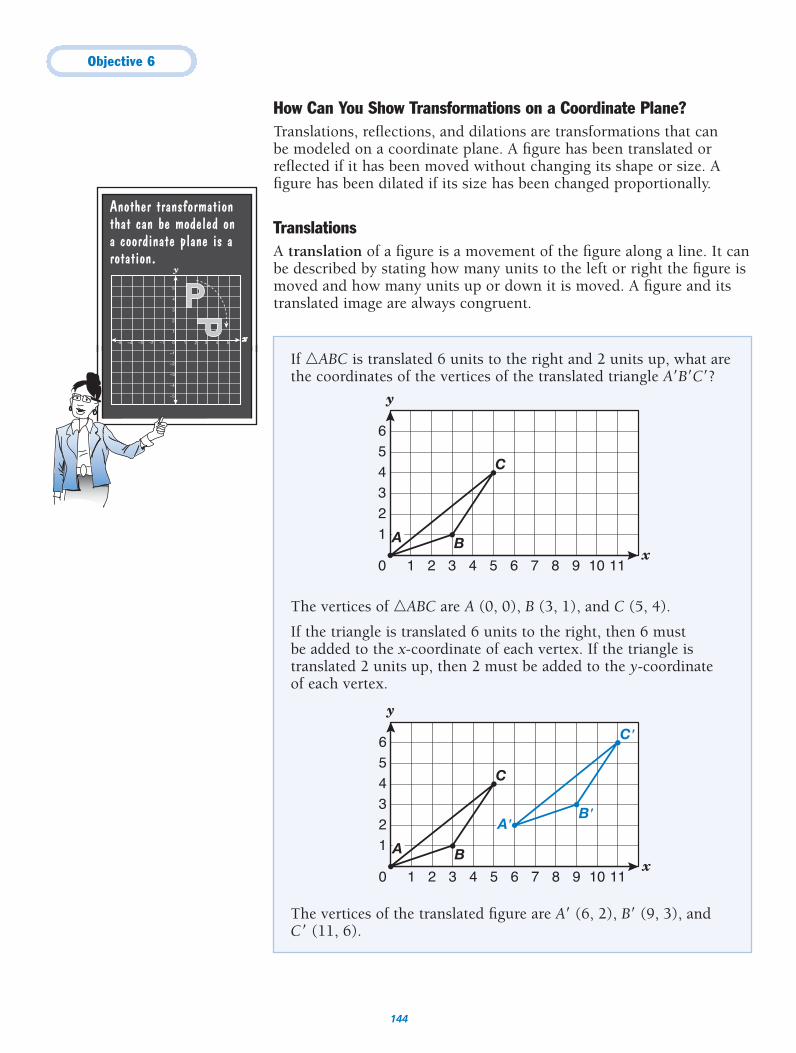
Objective 6
144
If �ABC is translated 6 units to the right and 2 units up, what arethe coordinates of the vertices of the translated triangle A B C ?
The vertices of �ABC are A (0, 0), B (3, 1), and C (5, 4).
If the triangle is translated 6 units to the right, then 6 must be added to the x-coordinate of each vertex. If the triangle istranslated 2 units up, then 2 must be added to the y-coordinate of each vertex.
The vertices of the translated figure are A (6, 2), B (9, 3), and C (11, 6).
0
123456
1 2 3 4 5 6 7 8 9 10 11
y
xA B
C
A'B'
C'
0
123456
1 2 3 4 5 6 7 8 9 10 11
y
xA B
C
How Can You Show Transformations on a Coordinate Plane?Translations, reflections, and dilations are transformations that can be modeled on a coordinate plane. A figure has been translated orreflected if it has been moved without changing its shape or size. Afigure has been dilated if its size has been changed proportionally.
TranslationsA translation of a figure is a movement of the figure along a line. It canbe described by stating how many units to the left or right the figure ismoved and how many units up or down it is moved. A figure and itstranslated image are always congruent.
Another transformationthat can be modeled on a coordinate plane is arotation.
–5
–4
–3
–2
–1
1
2
3
4
5
0–1–2–3–4–5 1 2 3 4 5
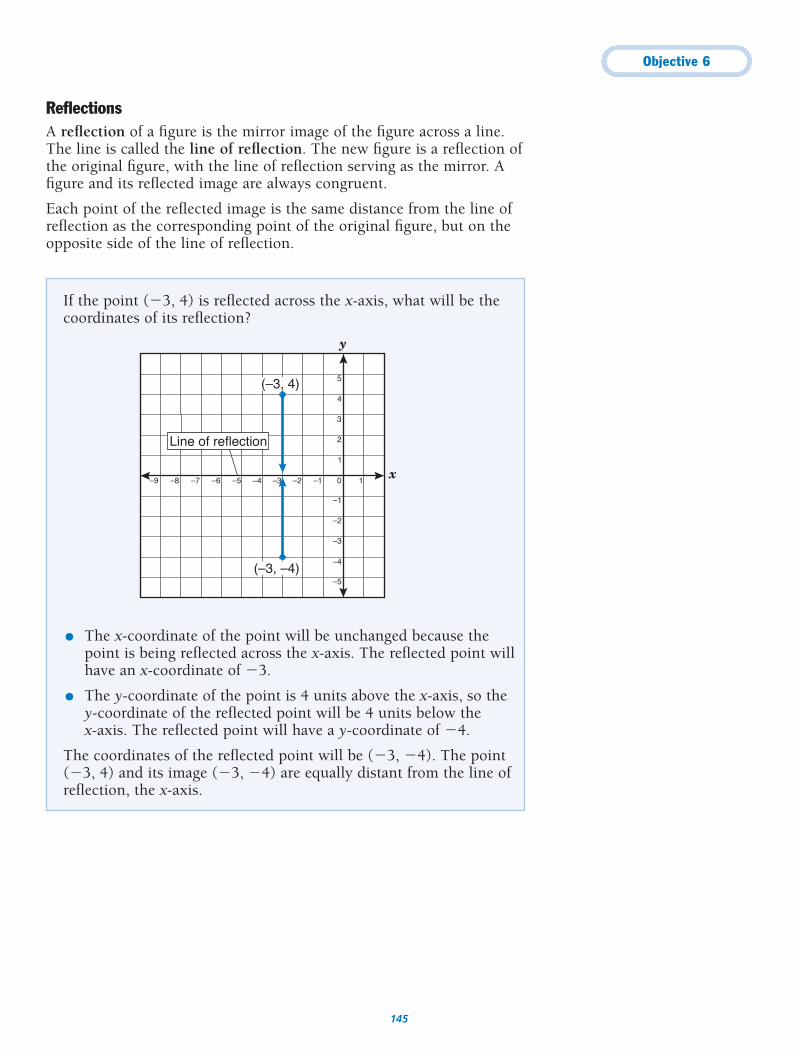
Objective 6
145
ReflectionsA reflection of a figure is the mirror image of the figure across a line.The line is called the line of reflection. The new figure is a reflection ofthe original figure, with the line of reflection serving as the mirror. Afigure and its reflected image are always congruent.
Each point of the reflected image is the same distance from the line ofreflection as the corresponding point of the original figure, but on theopposite side of the line of reflection.
If the point (�3, 4) is reflected across the x-axis, what will be thecoordinates of its reflection?
● The x-coordinate of the point will be unchanged because thepoint is being reflected across the x-axis. The reflected point willhave an x-coordinate of �3.
● The y-coordinate of the point is 4 units above the x-axis, so the y-coordinate of the reflected point will be 4 units below the x-axis. The reflected point will have a y-coordinate of �4.
The coordinates of the reflected point will be (�3, �4). The point(�3, 4) and its image (�3, �4) are equally distant from the line ofreflection, the x-axis.
y
x
–5
–3
–4
–2
–1
1
2
3
4
5
0–1–2–3–4–5–6–7–8–9 1
(–3, –4)
(–3, 4)
Line of reflection
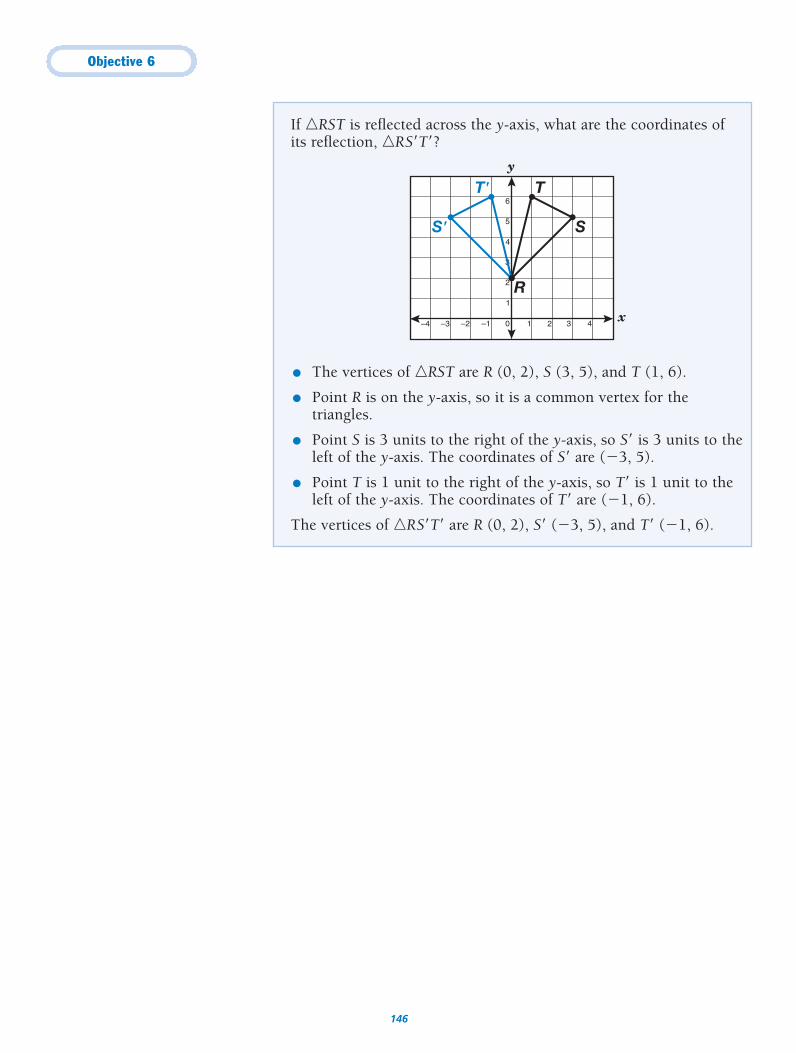
Objective 6
146
If �RST is reflected across the y-axis, what are the coordinates ofits reflection, �RS T ?
● The vertices of �RST are R (0, 2), S (3, 5), and T (1, 6).
● Point R is on the y-axis, so it is a common vertex for thetriangles.
● Point S is 3 units to the right of the y-axis, so S is 3 units to theleft of the y-axis. The coordinates of S are (�3, 5).
● Point T is 1 unit to the right of the y-axis, so T is 1 unit to theleft of the y-axis. The coordinates of T are (�1, 6).
The vertices of �RS T are R (0, 2), S (�3, 5), and T (�1, 6).
y
x1
2
3
4
5
6
0–1–2–3–4 1 2 3 4
R
S
T
S'
T'
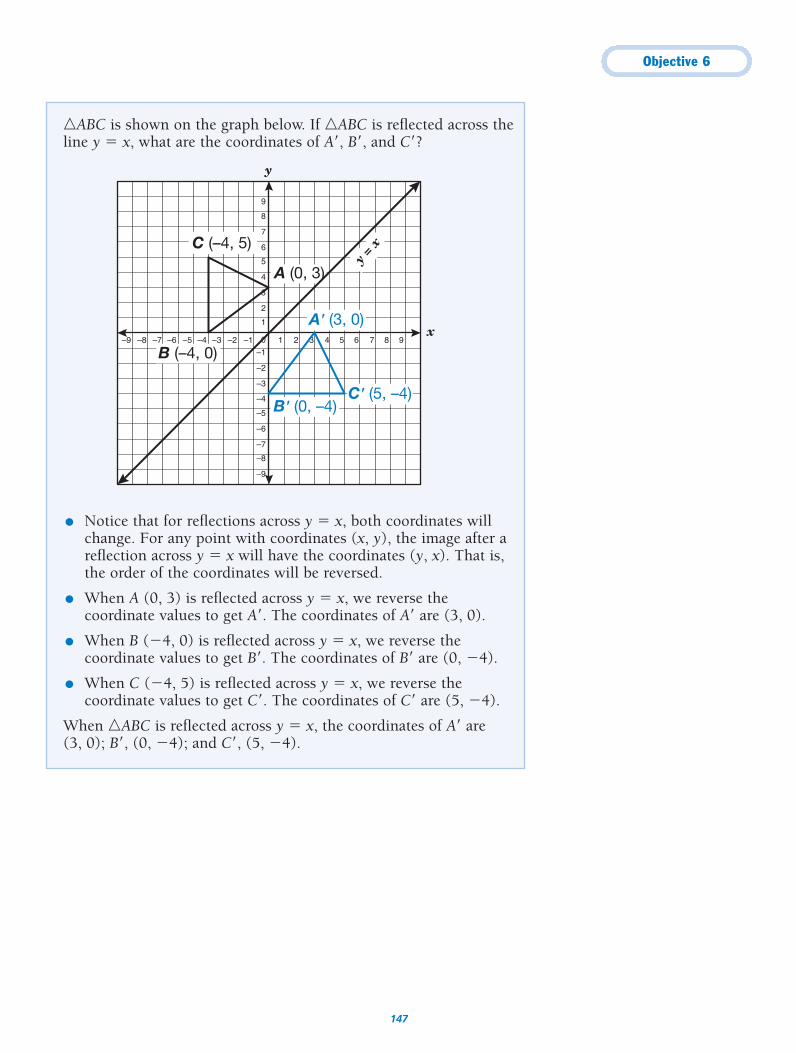
Objective 6
147
�ABC is shown on the graph below. If �ABC is reflected across theline y � x, what are the coordinates of A , B , and C ?
● Notice that for reflections across y � x, both coordinates willchange. For any point with coordinates (x, y), the image after areflection across y � x will have the coordinates (y, x). That is,the order of the coordinates will be reversed.
● When A (0, 3) is reflected across y � x, we reverse thecoordinate values to get A . The coordinates of A are (3, 0).
● When B (�4, 0) is reflected across y � x, we reverse thecoordinate values to get B . The coordinates of B are (0, �4).
● When C (�4, 5) is reflected across y � x, we reverse thecoordinate values to get C . The coordinates of C are (5, �4).
When �ABC is reflected across y � x, the coordinates of A are (3, 0); B , (0, �4); and C , (5, �4).
y
x
–5
–4
–6
–7
–8
–9
–3
–2
–1
0
1
2
3
4
5
6
7
8
9
–1 1–2–3–4–5–6–7–8–9 2 3 4 5 6 7 8 9
C (–4, 5)
B (–4, 0)
A (0, 3)
C' (5, –4)B' (0, –4)
A' (3, 0)
y = x
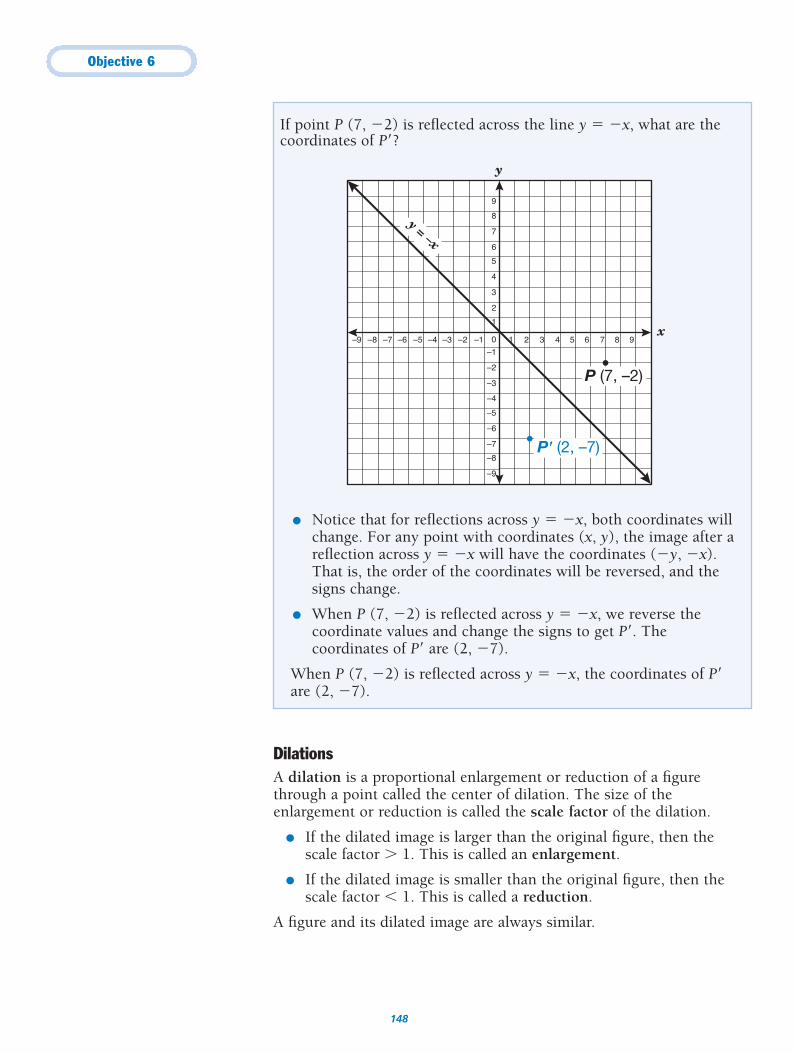
Objective 6
148
DilationsA dilation is a proportional enlargement or reduction of a figurethrough a point called the center of dilation. The size of theenlargement or reduction is called the scale factor of the dilation.
● If the dilated image is larger than the original figure, then thescale factor � 1. This is called an enlargement.
● If the dilated image is smaller than the original figure, then thescale factor � 1. This is called a reduction.
A figure and its dilated image are always similar.
If point P (7, �2) is reflected across the line y � �x, what are thecoordinates of P ?
● Notice that for reflections across y � �x, both coordinates willchange. For any point with coordinates (x, y), the image after areflection across y � �x will have the coordinates (�y, �x).That is, the order of the coordinates will be reversed, and thesigns change.
● When P (7, �2) is reflected across y � �x, we reverse thecoordinate values and change the signs to get P . Thecoordinates of P are (2, �7).
When P (7, �2) is reflected across y � �x, the coordinates of P are (2, �7).
y
x
–5
–4
–6
–7
–8
–9
–3
–2
–1
0
1
2
3
4
5
6
7
8
9
–1 1–2–3–4–5–6–7–8–9 2 3 4 5 6 7 8 9
P (7, –2)
P' (2, –7)
y = –x
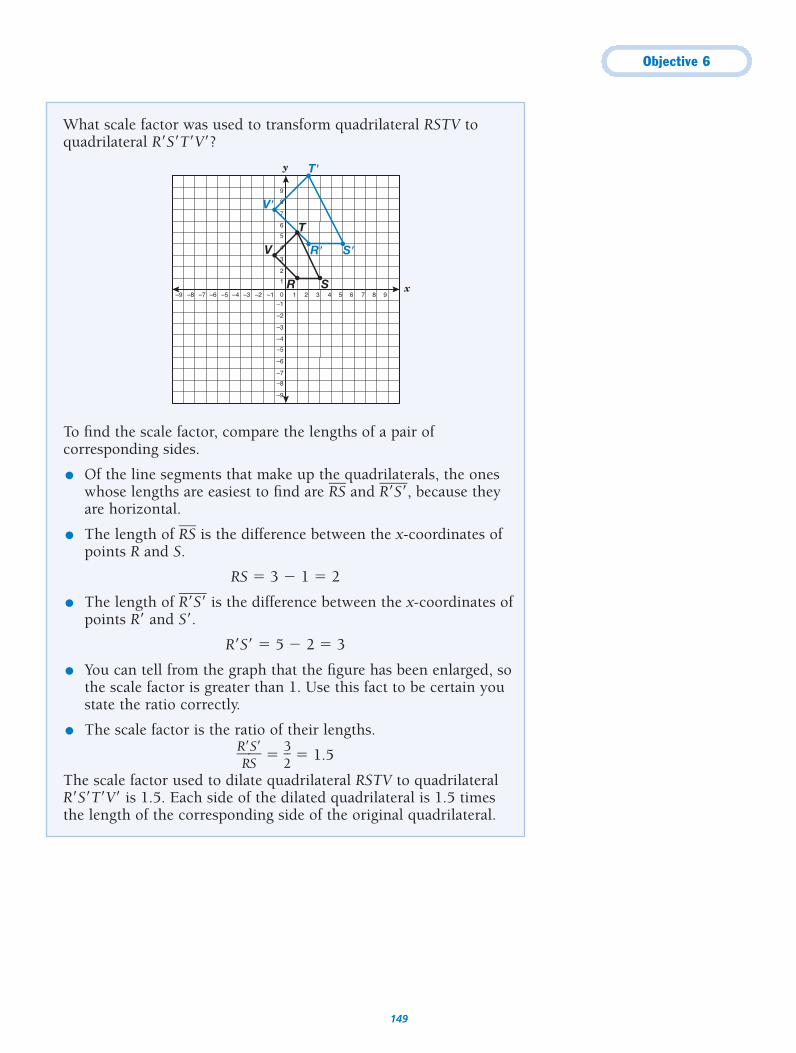
Objective 6
149
What scale factor was used to transform quadrilateral RSTV toquadrilateral R S T V ?
To find the scale factor, compare the lengths of a pair ofcorresponding sides.
● Of the line segments that make up the quadrilaterals, the oneswhose lengths are easiest to find are R�S� and R� �S� �, because theyare horizontal.
● The length of R�S� is the difference between the x-coordinates ofpoints R and S.
RS � 3 � 1 � 2
● The length of R� �S� � is the difference between the x-coordinates ofpoints R and S .
R S � 5 � 2 � 3
● You can tell from the graph that the figure has been enlarged, sothe scale factor is greater than 1. Use this fact to be certain youstate the ratio correctly.
● The scale factor is the ratio of their lengths.
�RR SS
� � �32
� � 1.5
The scale factor used to dilate quadrilateral RSTV to quadrilateralR S T V is 1.5. Each side of the dilated quadrilateral is 1.5 timesthe length of the corresponding side of the original quadrilateral.
y
x
–5
–4
–6
–7
–8
–9
–3
–2
–1
0
1
2
3
4
5
6
7
8
9
–1 1–2–3–4–5–6–7–8–9 2 3 4 5 6 7 8 9
V
R S
T
R'
T'
S'
V'
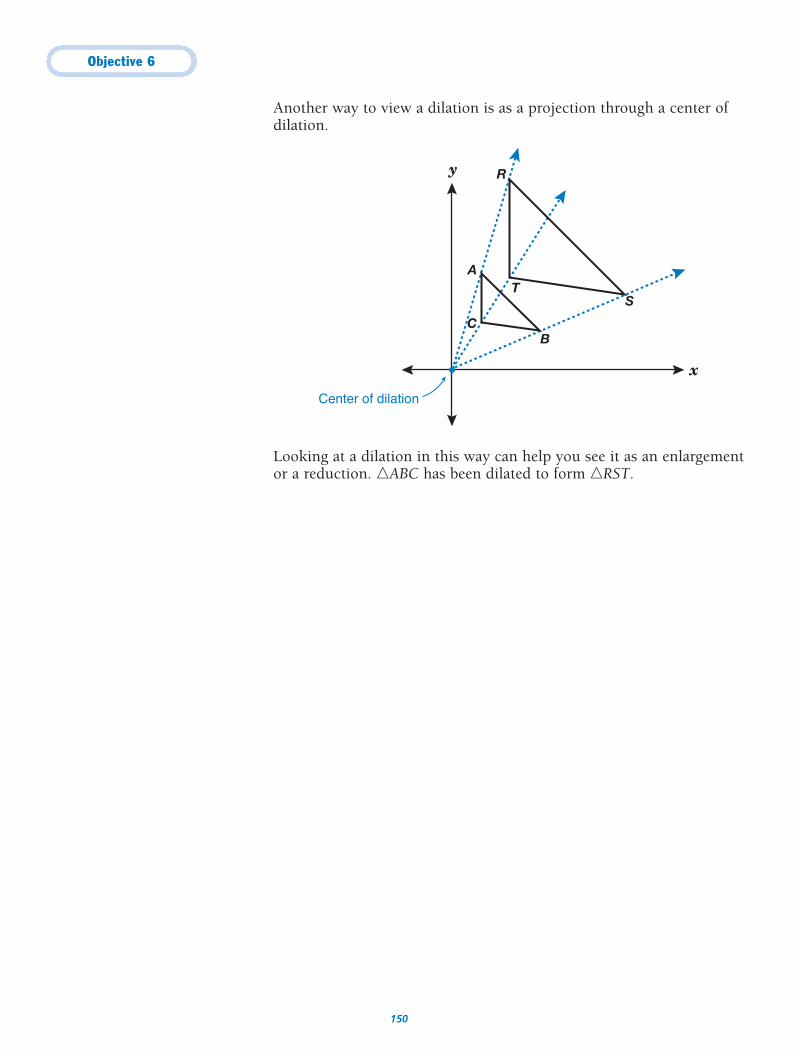
Objective 6
150
Another way to view a dilation is as a projection through a center ofdilation.
Looking at a dilation in this way can help you see it as an enlargementor a reduction. �ABC has been dilated to form �RST.
y
x
CB
T S
Center of dilation
R
A
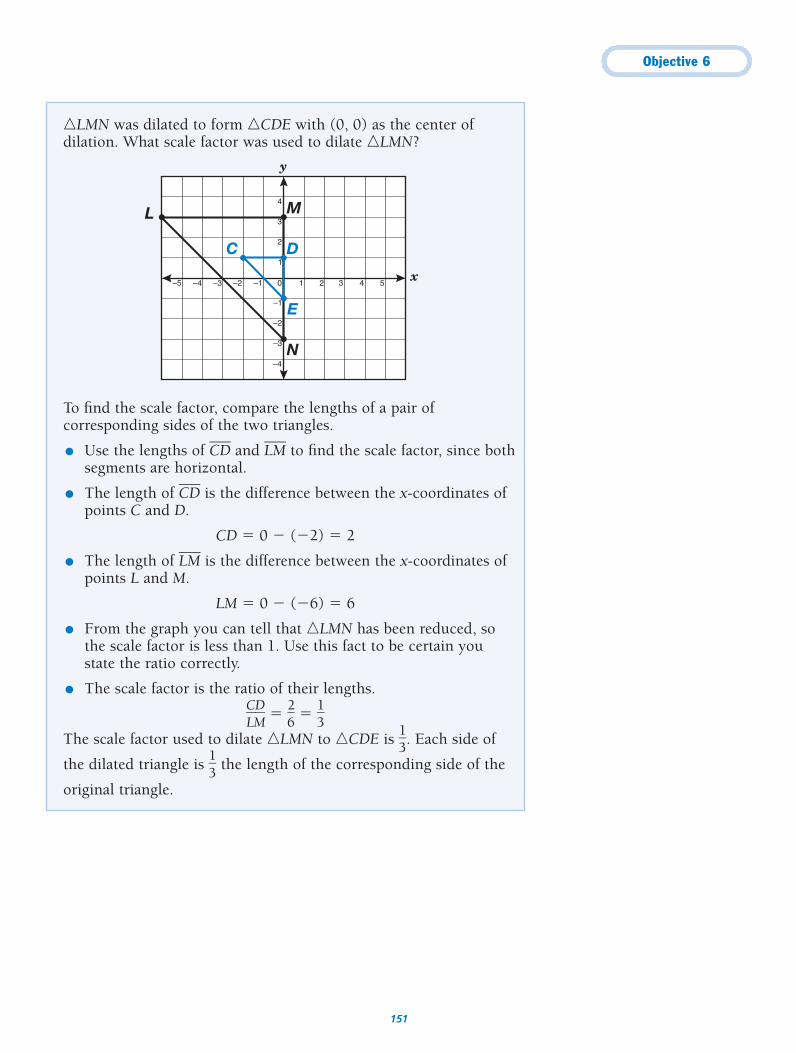
Objective 6
151
�LMN was dilated to form �CDE with (0, 0) as the center ofdilation. What scale factor was used to dilate �LMN?
To find the scale factor, compare the lengths of a pair ofcorresponding sides of the two triangles.
● Use the lengths of C�D� and L�M� to find the scale factor, since bothsegments are horizontal.
● The length of C�D� is the difference between the x-coordinates ofpoints C and D.
CD � 0 � (�2) � 2
● The length of L�M� is the difference between the x-coordinates ofpoints L and M.
LM � 0 � (�6) � 6
● From the graph you can tell that �LMN has been reduced, sothe scale factor is less than 1. Use this fact to be certain youstate the ratio correctly.
● The scale factor is the ratio of their lengths.
�LC
MD� � �
26
� � �13
�
The scale factor used to dilate �LMN to �CDE is �13
�. Each side of
the dilated triangle is �13
� the length of the corresponding side of the
original triangle.
y
x
–4
–3
–2
–1
1
2
3
4
0–1–2–3–4–5 1 2 3 4 5
E
C D
N
L M
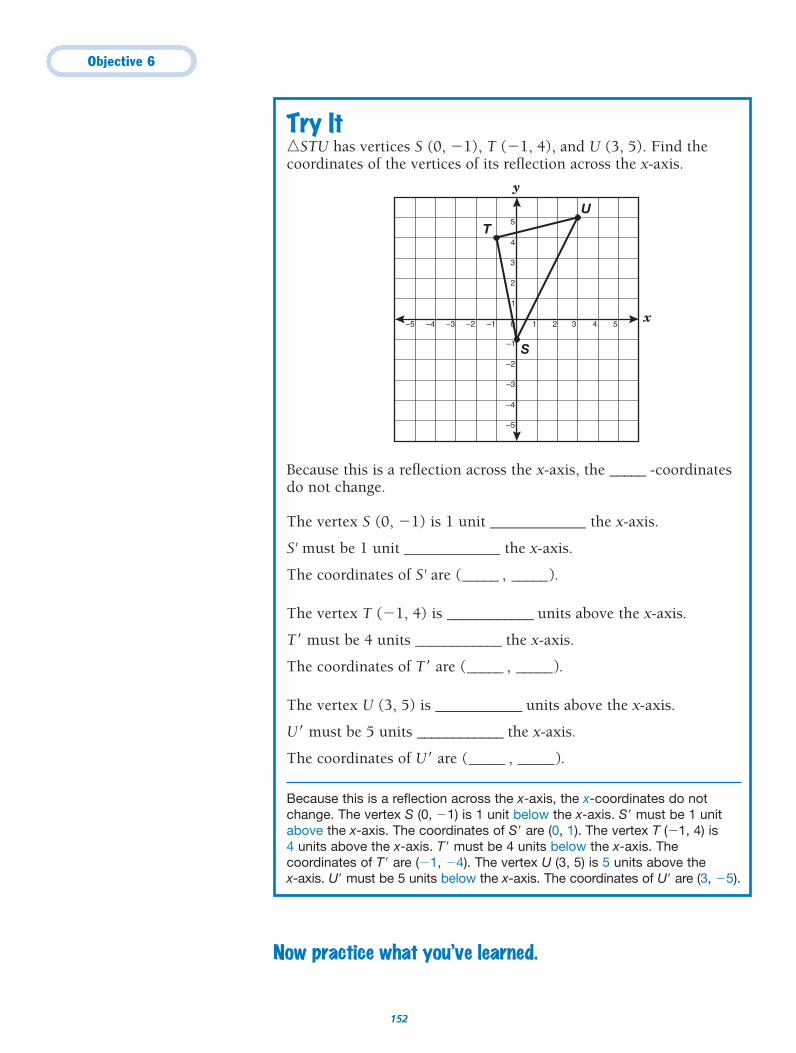
Objective 6
152
Try It�STU has vertices S (0, �1), T (�1, 4), and U (3, 5). Find thecoordinates of the vertices of its reflection across the x-axis.
Because this is a reflection across the x-axis, the _____ -coordinatesdo not change.
The vertex S (0, �1) is 1 unit ____________ the x-axis.
S' must be 1 unit ____________ the x-axis.
The coordinates of S' are (_____ , _____).
The vertex T (�1, 4) is ____________ units above the x-axis.
T must be 4 units ____________ the x-axis.
The coordinates of T are (_____ , _____).
The vertex U (3, 5) is ____________ units above the x-axis.
U must be 5 units ____________ the x-axis.
The coordinates of U are (_____ , _____).
Because this is a reflection across the x-axis, the x-coordinates do notchange. The vertex S (0, �1) is 1 unit below the x-axis. S must be 1 unitabove the x-axis. The coordinates of S are (0, 1). The vertex T (�1, 4) is4 units above the x-axis. T must be 4 units below the x-axis. Thecoordinates of T are (�1, �4). The vertex U (3, 5) is 5 units above the x-axis. U must be 5 units below the x-axis. The coordinates of U are (3, �5).
y
x
–5
–4
–3
–2
–1
1
2
3
4
5
0–1–2–3–4–5 1 2 3 4 5
S
T
U
Now practice what you’ve learned.
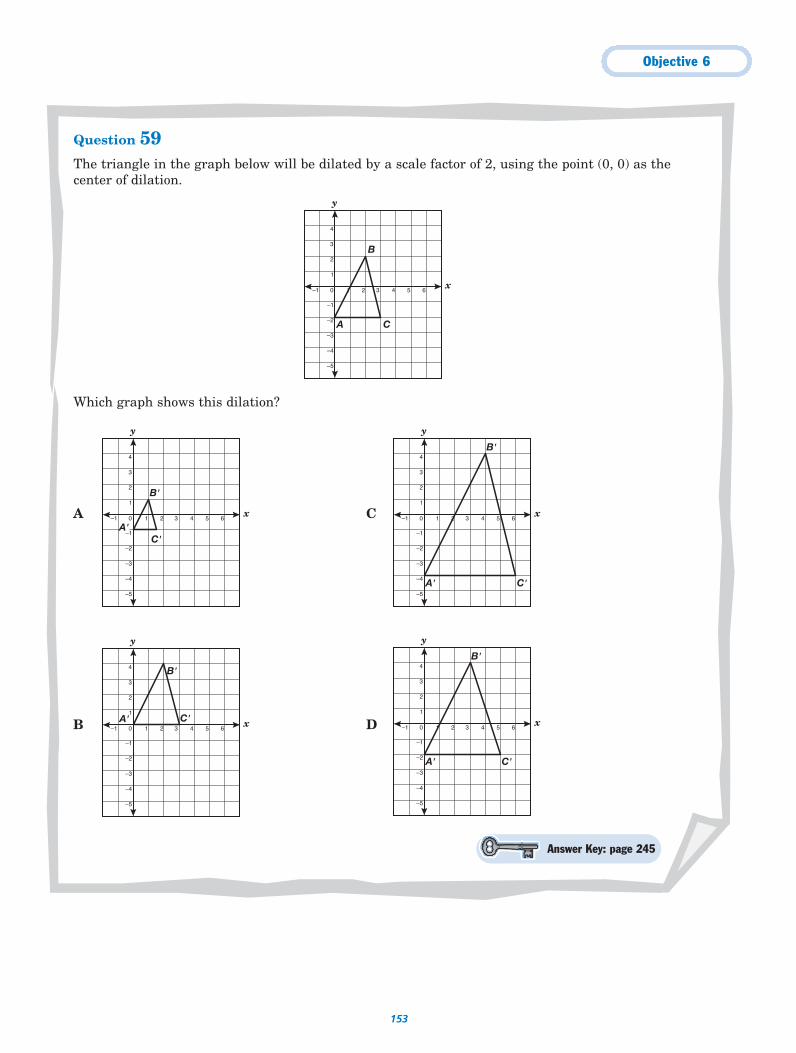
Objective 6
153
Question 59The triangle in the graph below will be dilated by a scale factor of 2, using the point (0, 0) as thecenter of dilation.
Which graph shows this dilation?
y
x
–3
–5
–2
–4
–1
1
2
3
4
0–1 1 2 3 4 5 6
A'
B'
C'
y
x
–3
–5
–2
–4
–1
1
2
3
4
0–1 1 2 3 4 5 6A'
B'
C'
y
x
–3
–5
–2
–4
–1
1
2
3
4
0–1 1 2 3 4 5 6
A'
B'
C'
y
x
–3
–5
–2
–4
–1
1
2
3
4
0–1 1 2 3 4 5 6
A'
B'
C'
y
x
–3
–5
–2
–4
–1
1
2
3
4
0–1 1 2 3 4 5 6
A
B
C
Answer Key: page 245
A
B
C
D
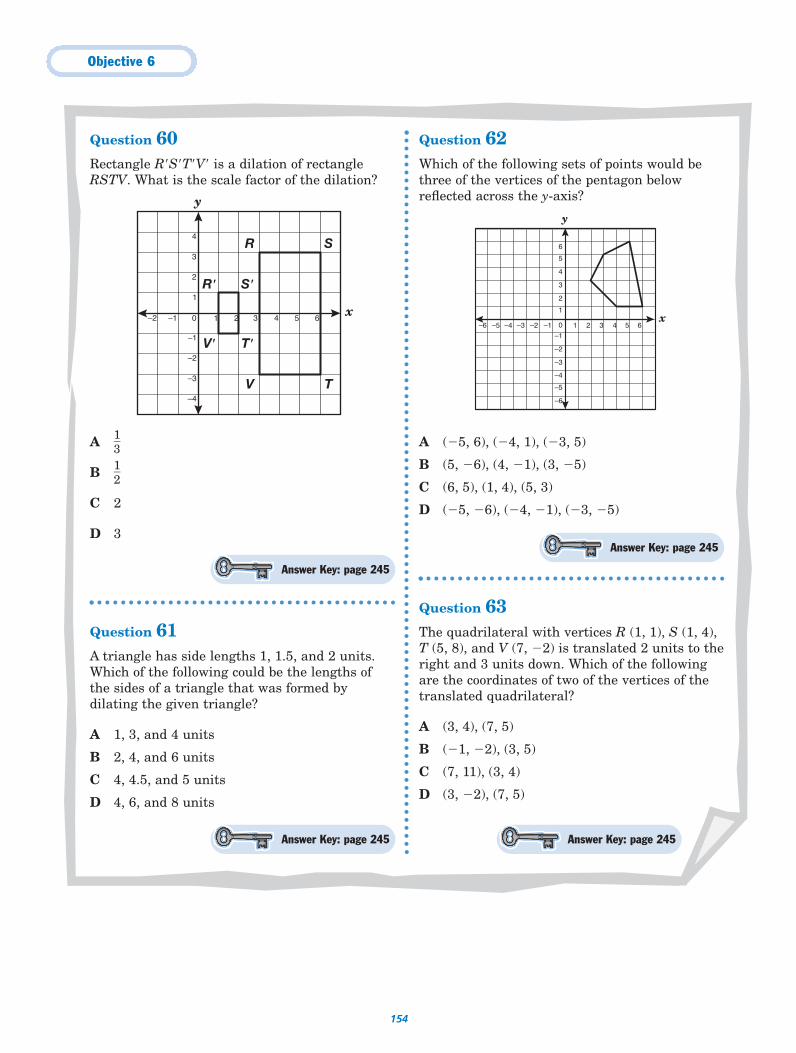
Objective 6
154
Question 60Rectangle R S T V is a dilation of rectangleRSTV. What is the scale factor of the dilation?
A �13
�
B �12
�
C 2
D 3
Question 61A triangle has side lengths 1, 1.5, and 2 units.Which of the following could be the lengths ofthe sides of a triangle that was formed bydilating the given triangle?
A 1, 3, and 4 units
B 2, 4, and 6 units
C 4, 4.5, and 5 units
D 4, 6, and 8 units
Question 62Which of the following sets of points would bethree of the vertices of the pentagon belowreflected across the y-axis?
A (�5, 6), (�4, 1), (�3, 5)
B (5, �6), (4, �1), (3, �5)
C (6, 5), (1, 4), (5, 3)
D (�5, �6), (�4, �1), (�3, �5)
Question 63The quadrilateral with vertices R (1, 1), S (1, 4),T (5, 8), and V (7, �2) is translated 2 units to theright and 3 units down. Which of the followingare the coordinates of two of the vertices of thetranslated quadrilateral?
A (3, 4), (7, 5)
B (�1, �2), (3, 5)
C (7, 11), (3, 4)
D (3, �2), (7, 5)
y
x
–5
–4
–6
–3
–2
–1
0
1
2
3
4
5
6
–1 1–2–3–4–5–6 2 3 4 5 6
y
x
–3
–2
–4
–1
1
2
3
4
0–1–2 1 2 3 4 5 6
R
V
S
T
R' S'
V' T'
Answer Key: page 245
Answer Key: page 245
Answer Key: page 245
Answer Key: page 245
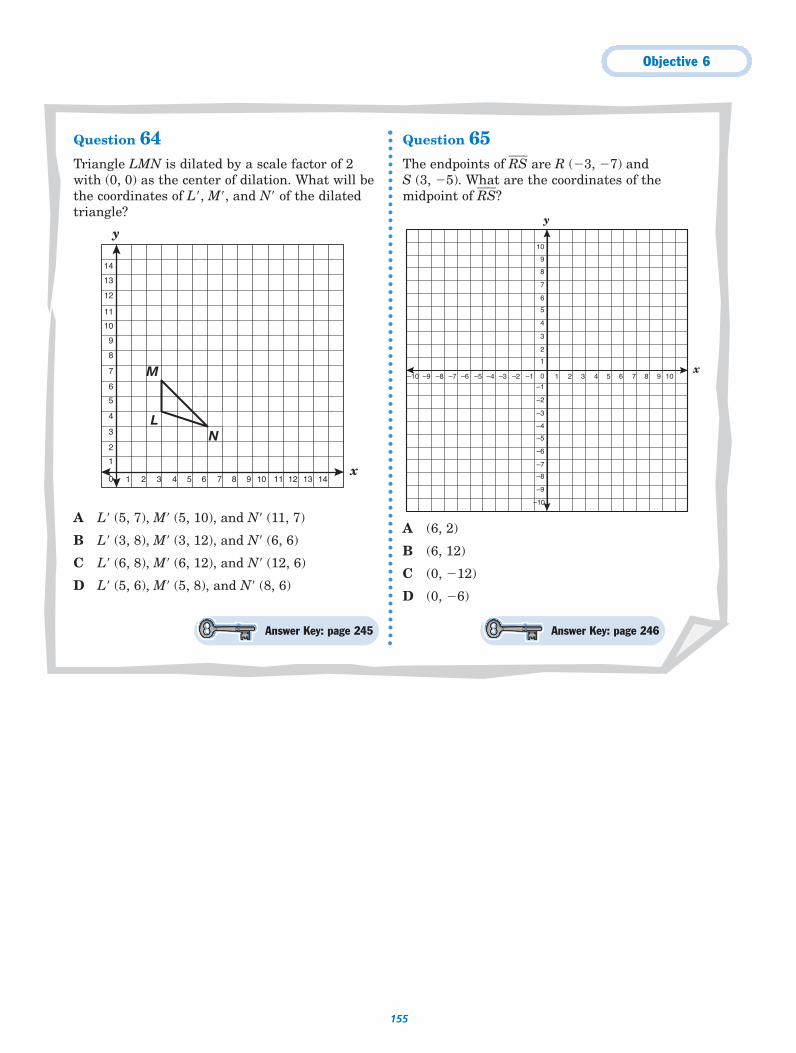
Objective 6
155
Question 64Triangle LMN is dilated by a scale factor of 2with (0, 0) as the center of dilation. What will bethe coordinates of L , M , and N of the dilatedtriangle?
A L (5, 7), M (5, 10), and N (11, 7)
B L (3, 8), M (3, 12), and N (6, 6)
C L (6, 8), M (6, 12), and N (12, 6)
D L (5, 6), M (5, 8), and N (8, 6)
Question 65The endpoints of R�S� are R (�3, �7) and S (3, �5). What are the coordinates of themidpoint of R�S�?
A (6, 2)
B (6, 12)
C (0, �12)
D (0, �6)
y
x
–5
–4
–6
–7
–8
–9
–10
–3
–2
–1
0
1
2
3
4
5
6
7
8
9
10
–1 1–2–3–4–5–6–7–8–9–10 2 3 4 5 6 7 8 9 10
L
M
N
y
x0
1
2
3
4
5
6
7
8
9
10
11
12
13
14
1 2 3 4 5 6 7 8 9 10 11 12 13 14
Answer Key: page 245 Answer Key: page 246
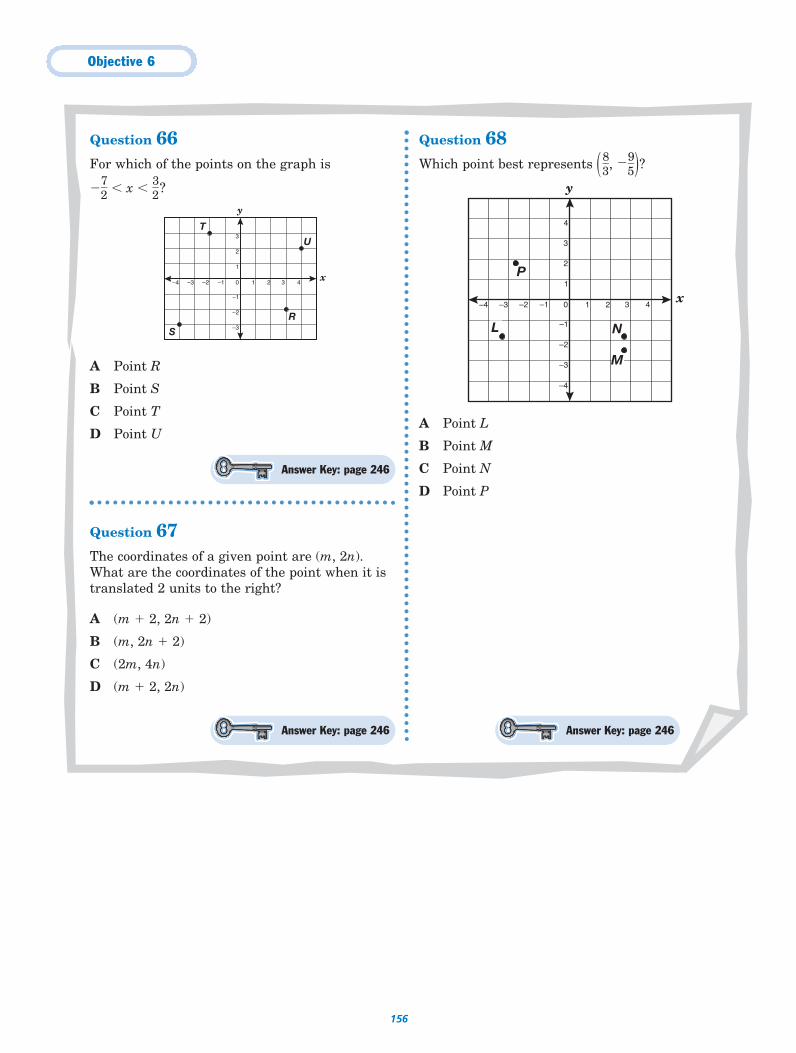
Objective 6
156
Question 66For which of the points on the graph is
��72
� � x � �32
� ?
A Point R
B Point S
C Point T
D Point U
Question 67The coordinates of a given point are (m, 2n).What are the coordinates of the point when it istranslated 2 units to the right?
A (m � 2, 2n � 2)
B (m, 2n � 2)
C (2m, 4n)
D (m � 2, 2n)
Question 68Which point best represents ( �
83
�, ��95
�)?
A Point L
B Point M
C Point N
D Point P
y
x
–4
–3
–2
–1
1
2
3
4
0–1–2–3–4 1 2 3 4
L
P
M
N
y
x
–3
–2
–1
1
2
3
0–1–2–3–4 1 2 3 4
R
S
T
U
Answer Key: page 246
Answer Key: page 246 Answer Key: page 246
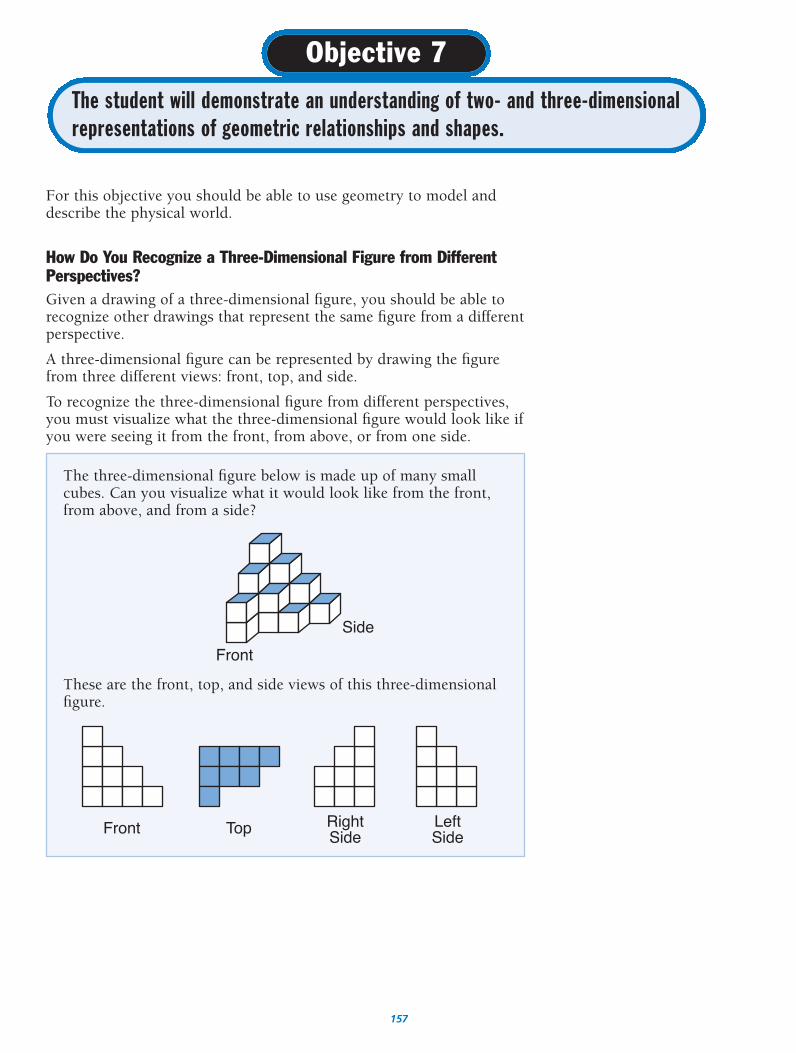
157
The student will demonstrate an understanding of two- and three-dimensionalrepresentations of geometric relationships and shapes.
Objective 7
For this objective you should be able to use geometry to model anddescribe the physical world.
How Do You Recognize a Three-Dimensional Figure from DifferentPerspectives?Given a drawing of a three-dimensional figure, you should be able torecognize other drawings that represent the same figure from a differentperspective.
A three-dimensional figure can be represented by drawing the figurefrom three different views: front, top, and side.
To recognize the three-dimensional figure from different perspectives,you must visualize what the three-dimensional figure would look like ifyou were seeing it from the front, from above, or from one side.
The three-dimensional figure below is made up of many smallcubes. Can you visualize what it would look like from the front,from above, and from a side?
These are the front, top, and side views of this three-dimensionalfigure.
Front Top RightSide
LeftSide
Front
Side
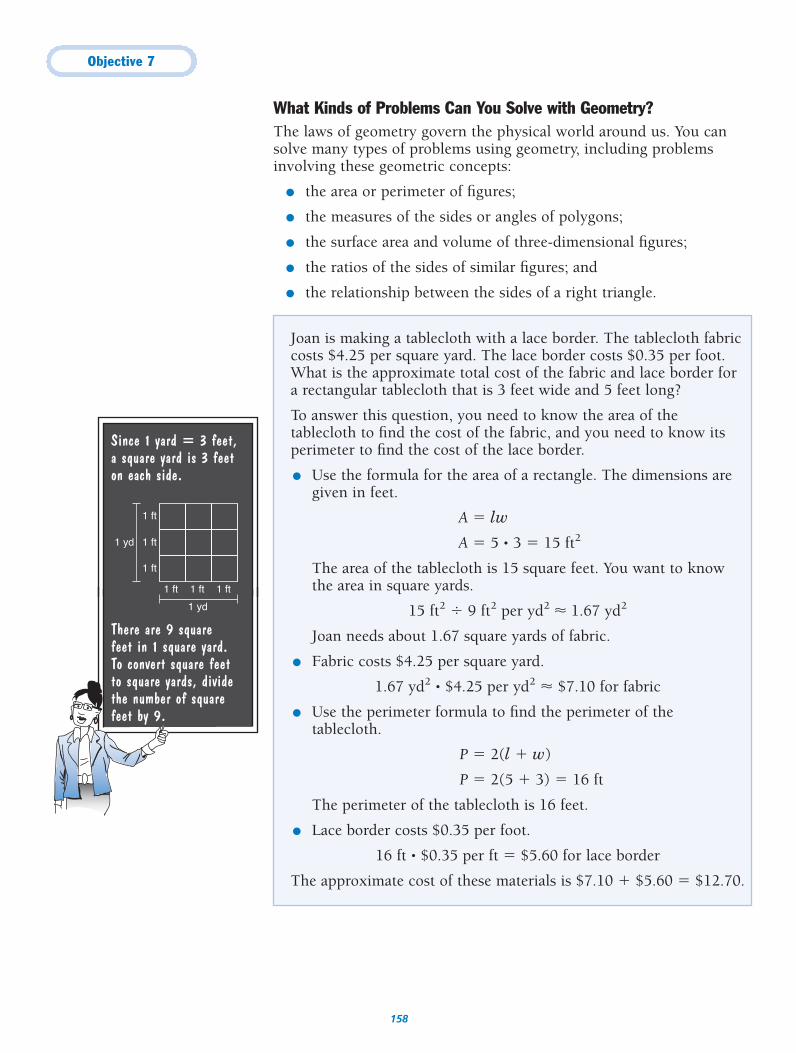
Objective 7
158
Joan is making a tablecloth with a lace border. The tablecloth fabriccosts $4.25 per square yard. The lace border costs $0.35 per foot.What is the approximate total cost of the fabric and lace border fora rectangular tablecloth that is 3 feet wide and 5 feet long?
To answer this question, you need to know the area of thetablecloth to find the cost of the fabric, and you need to know itsperimeter to find the cost of the lace border.
● Use the formula for the area of a rectangle. The dimensions aregiven in feet.
A � lw
A � 5 • 3 � 15 ft2
The area of the tablecloth is 15 square feet. You want to knowthe area in square yards.
15 ft2 � 9 ft2 per yd2 � 1.67 yd2
Joan needs about 1.67 square yards of fabric.
● Fabric costs $4.25 per square yard.
1.67 yd2 • $4.25 per yd2 � $7.10 for fabric
● Use the perimeter formula to find the perimeter of thetablecloth.
P � 2(l � w)
P � 2(5 � 3) � 16 ft
The perimeter of the tablecloth is 16 feet.
● Lace border costs $0.35 per foot.
16 ft • $0.35 per ft � $5.60 for lace border
The approximate cost of these materials is $7.10 � $5.60 � $12.70.
Since 1 yard � 3 feet, a square yard is 3 feeton each side.
There are 9 square feet in 1 square yard. To convert square feet to square yards, divide the number of squarefeet by 9.
1 ft 1 ft 1 ft
1 yd
1 ft
1 ft
1 ft
1 yd
What Kinds of Problems Can You Solve with Geometry?The laws of geometry govern the physical world around us. You cansolve many types of problems using geometry, including problemsinvolving these geometric concepts:
● the area or perimeter of figures;
● the measures of the sides or angles of polygons;
● the surface area and volume of three-dimensional figures;
● the ratios of the sides of similar figures; and
● the relationship between the sides of a right triangle.
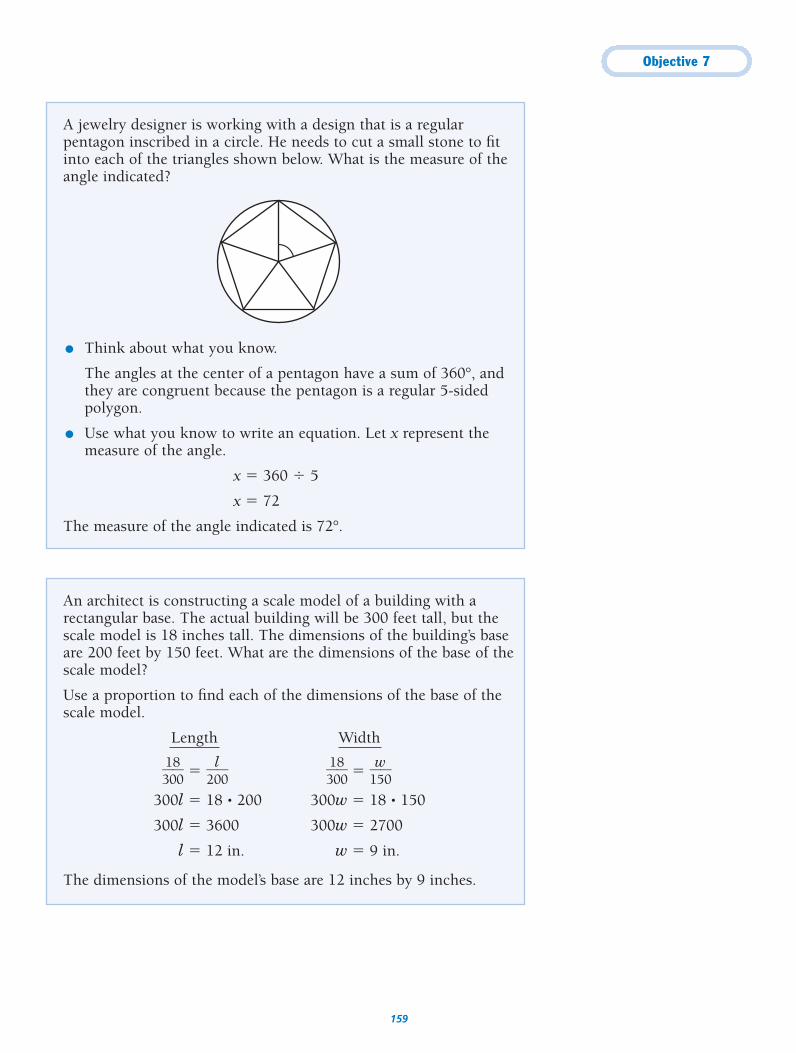
Objective 7
159
A jewelry designer is working with a design that is a regularpentagon inscribed in a circle. He needs to cut a small stone to fitinto each of the triangles shown below. What is the measure of theangle indicated?
● Think about what you know.
The angles at the center of a pentagon have a sum of 360°, andthey are congruent because the pentagon is a regular 5-sidedpolygon.
● Use what you know to write an equation. Let x represent themeasure of the angle.
x � 360 � 5
x � 72
The measure of the angle indicated is 72°.
An architect is constructing a scale model of a building with arectangular base. The actual building will be 300 feet tall, but thescale model is 18 inches tall. The dimensions of the building’s baseare 200 feet by 150 feet. What are the dimensions of the base of thescale model?
Use a proportion to find each of the dimensions of the base of thescale model.
Length Width
�31080
� � �20
l0
� �31080
� � �1w50�
300l � 18 • 200 300w � 18 • 150
300l � 3600 300w � 2700
l � 12 in. w � 9 in.
The dimensions of the model’s base are 12 inches by 9 inches.
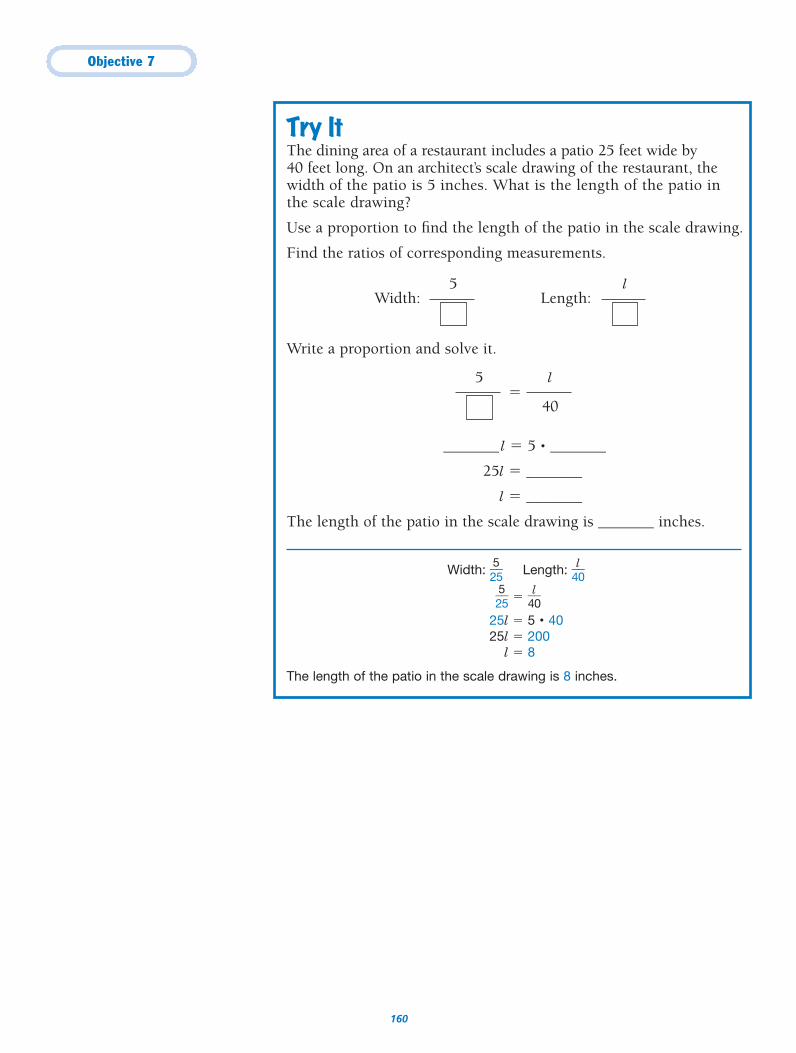
Objective 7
160
Try ItThe dining area of a restaurant includes a patio 25 feet wide by 40 feet long. On an architect’s scale drawing of the restaurant, thewidth of the patio is 5 inches. What is the length of the patio inthe scale drawing?
Use a proportion to find the length of the patio in the scale drawing.
Find the ratios of corresponding measurements.
Width: Length:
Write a proportion and solve it.
�
_______ l � 5 • _______
25l � _______
l � _______
The length of the patio in the scale drawing is _______ inches.
Width: �255� Length: �
4l0�
�255� � �
4l0�
25l � 5 • 4025l � 200
l � 8
The length of the patio in the scale drawing is 8 inches.
5 l
l
40
5
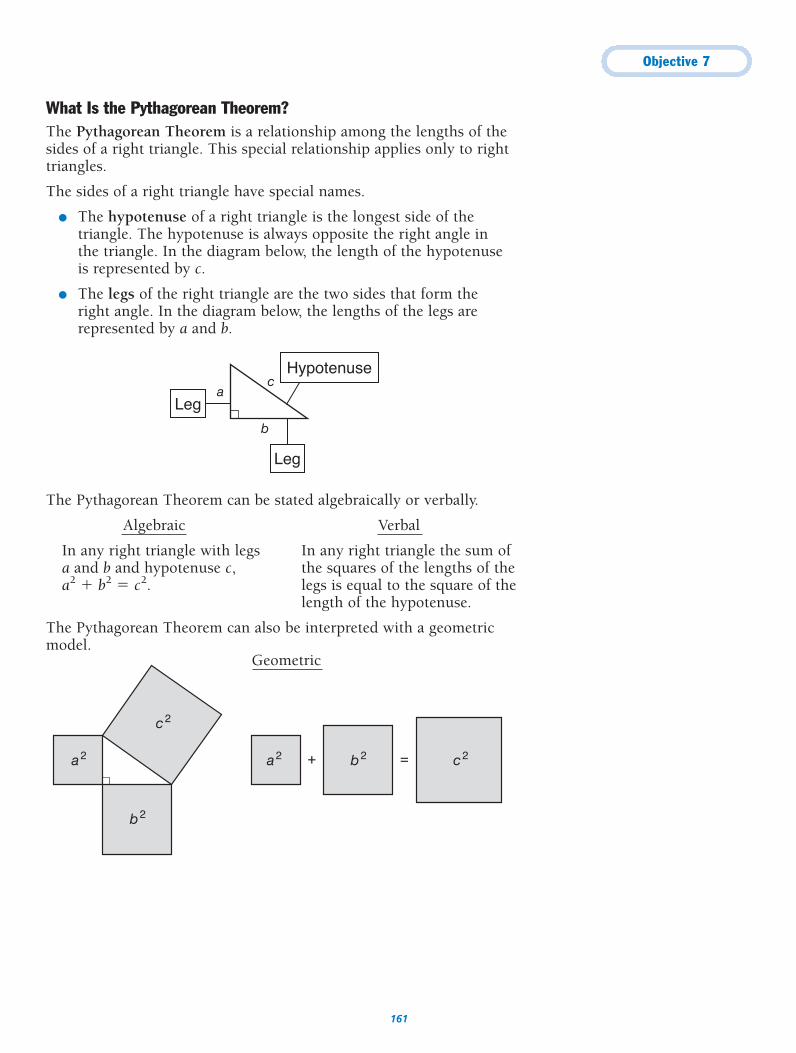
Objective 7
161
What Is the Pythagorean Theorem?The Pythagorean Theorem is a relationship among the lengths of thesides of a right triangle. This special relationship applies only to righttriangles.
The sides of a right triangle have special names.
● The hypotenuse of a right triangle is the longest side of thetriangle. The hypotenuse is always opposite the right angle inthe triangle. In the diagram below, the length of the hypotenuseis represented by c.
● The legs of the right triangle are the two sides that form theright angle. In the diagram below, the lengths of the legs arerepresented by a and b.
The Pythagorean Theorem can be stated algebraically or verbally.
Algebraic Verbal
In any right triangle with legs In any right triangle the sum ofa and b and hypotenuse c, the squares of the lengths of the a2 � b2 � c2. legs is equal to the square of the
length of the hypotenuse.
The Pythagorean Theorem can also be interpreted with a geometricmodel.
a2
b2
c2
a2 b2 c2+ =
ca
b
Leg
Hypotenuse
Leg
Geometric
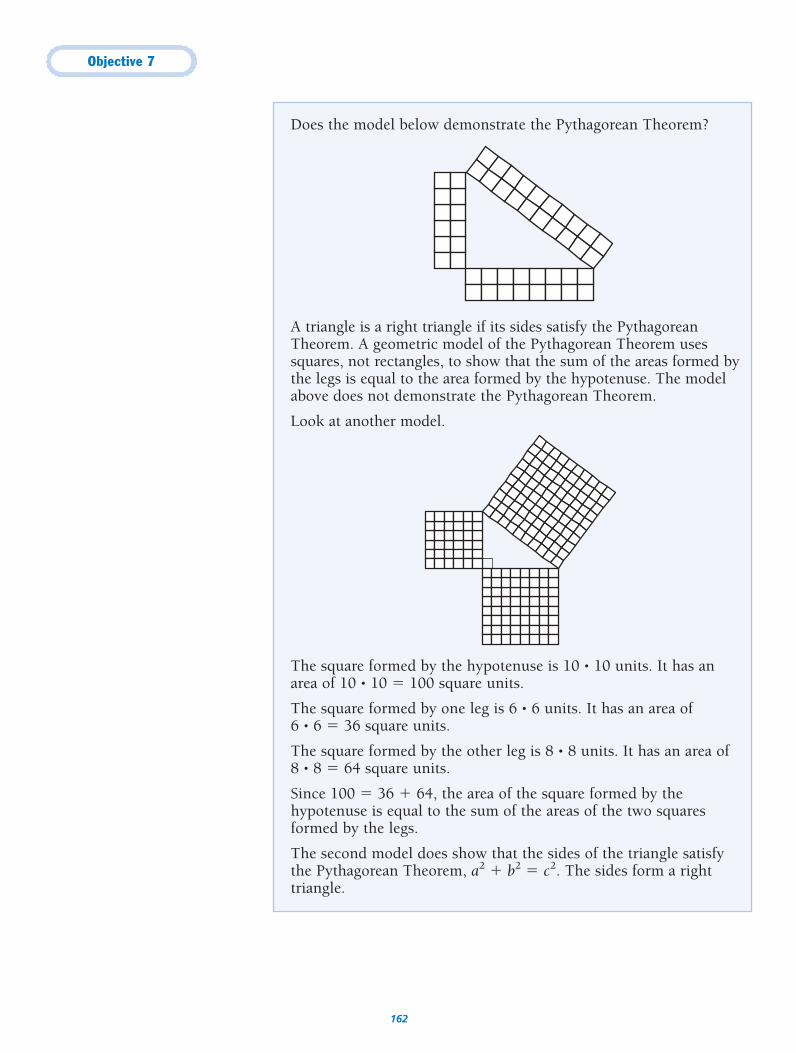
Objective 7
162
Does the model below demonstrate the Pythagorean Theorem?
A triangle is a right triangle if its sides satisfy the PythagoreanTheorem. A geometric model of the Pythagorean Theorem usessquares, not rectangles, to show that the sum of the areas formed bythe legs is equal to the area formed by the hypotenuse. The modelabove does not demonstrate the Pythagorean Theorem.
Look at another model.
The square formed by the hypotenuse is 10 • 10 units. It has anarea of 10 • 10 � 100 square units.
The square formed by one leg is 6 • 6 units. It has an area of 6 • 6 � 36 square units.
The square formed by the other leg is 8 • 8 units. It has an area of8 • 8 � 64 square units.
Since 100 � 36 � 64, the area of the square formed by thehypotenuse is equal to the sum of the areas of the two squaresformed by the legs.
The second model does show that the sides of the triangle satisfythe Pythagorean Theorem, a2 � b2 � c2. The sides form a righttriangle.
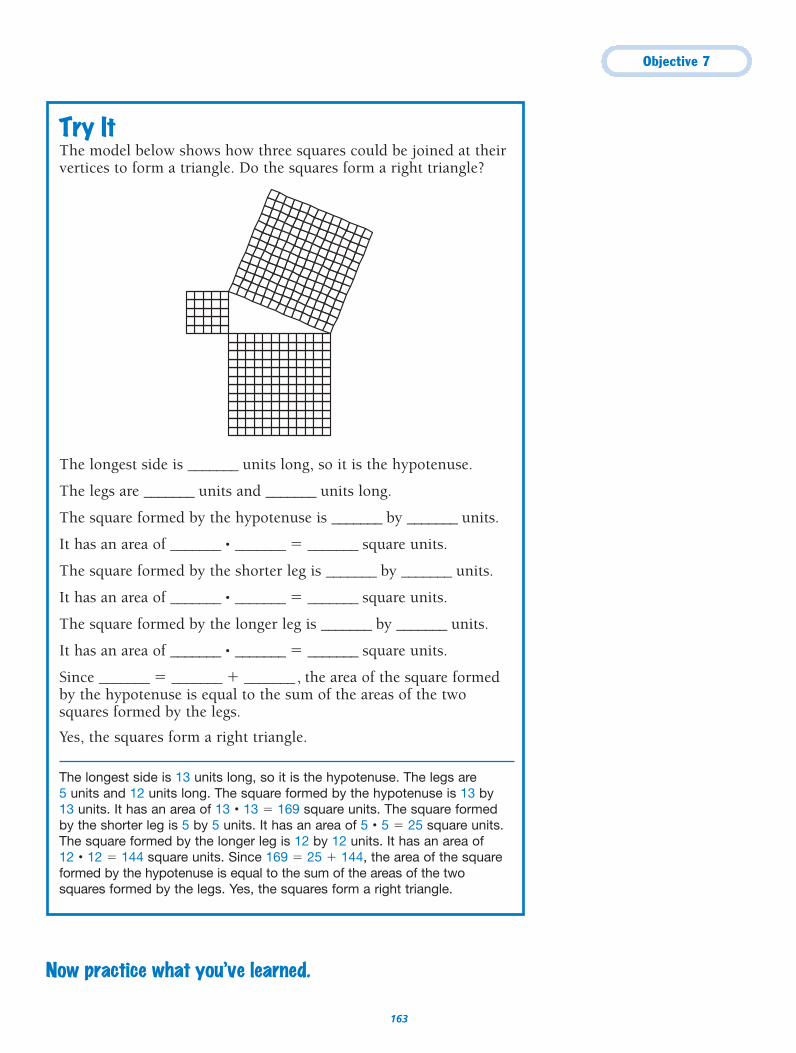
Objective 7
163
Try ItThe model below shows how three squares could be joined at theirvertices to form a triangle. Do the squares form a right triangle?
The longest side is _______ units long, so it is the hypotenuse.
The legs are _______ units and _______ units long.
The square formed by the hypotenuse is _______ by _______ units.
It has an area of _______ • _______ � _______ square units.
The square formed by the shorter leg is _______ by _______ units.
It has an area of _______ • _______ � _______ square units.
The square formed by the longer leg is _______ by _______ units.
It has an area of _______ • _______ � _______ square units.
Since _______ � _______ � _______, the area of the square formed by the hypotenuse is equal to the sum of the areas of the twosquares formed by the legs.
Yes, the squares form a right triangle.
The longest side is 13 units long, so it is the hypotenuse. The legs are 5 units and 12 units long. The square formed by the hypotenuse is 13 by 13 units. It has an area of 13 • 13 � 169 square units. The square formed by the shorter leg is 5 by 5 units. It has an area of 5 • 5 � 25 square units.The square formed by the longer leg is 12 by 12 units. It has an area of 12 • 12 � 144 square units. Since 169 � 25 � 144, the area of the squareformed by the hypotenuse is equal to the sum of the areas of the two squares formed by the legs. Yes, the squares form a right triangle.
Now practice what you’ve learned.
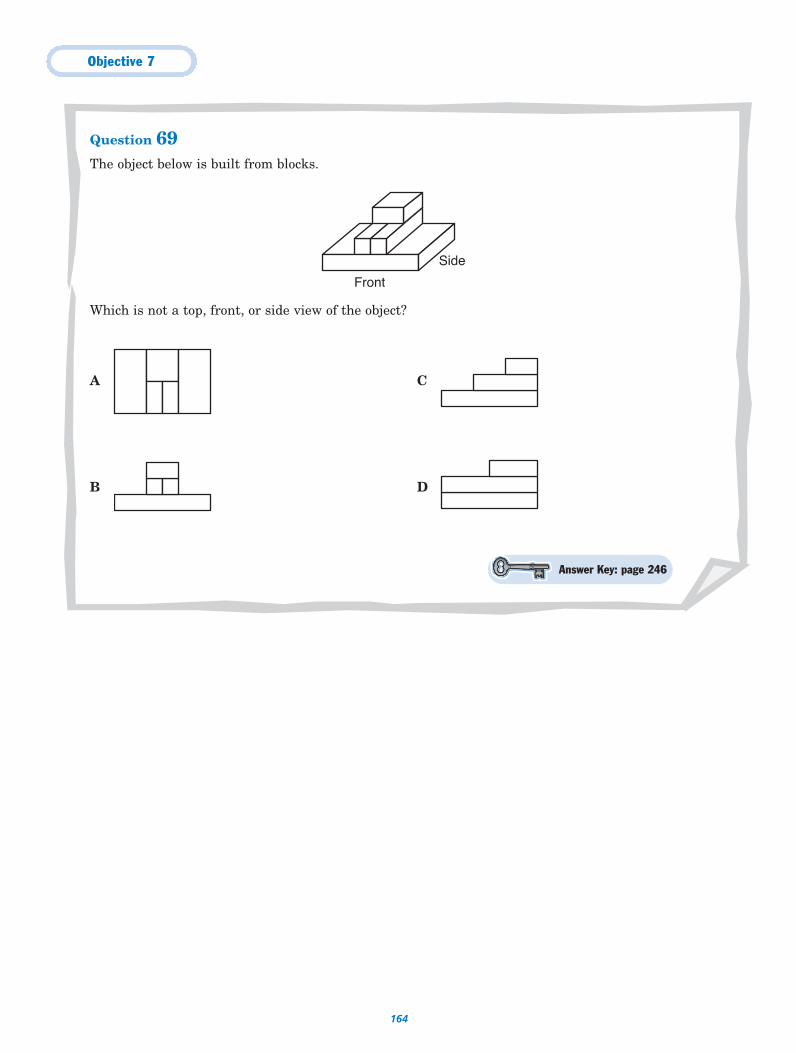
Objective 7
164
Question 69The object below is built from blocks.
Which is not a top, front, or side view of the object?
A C
B D
Front
Side
Answer Key: page 246
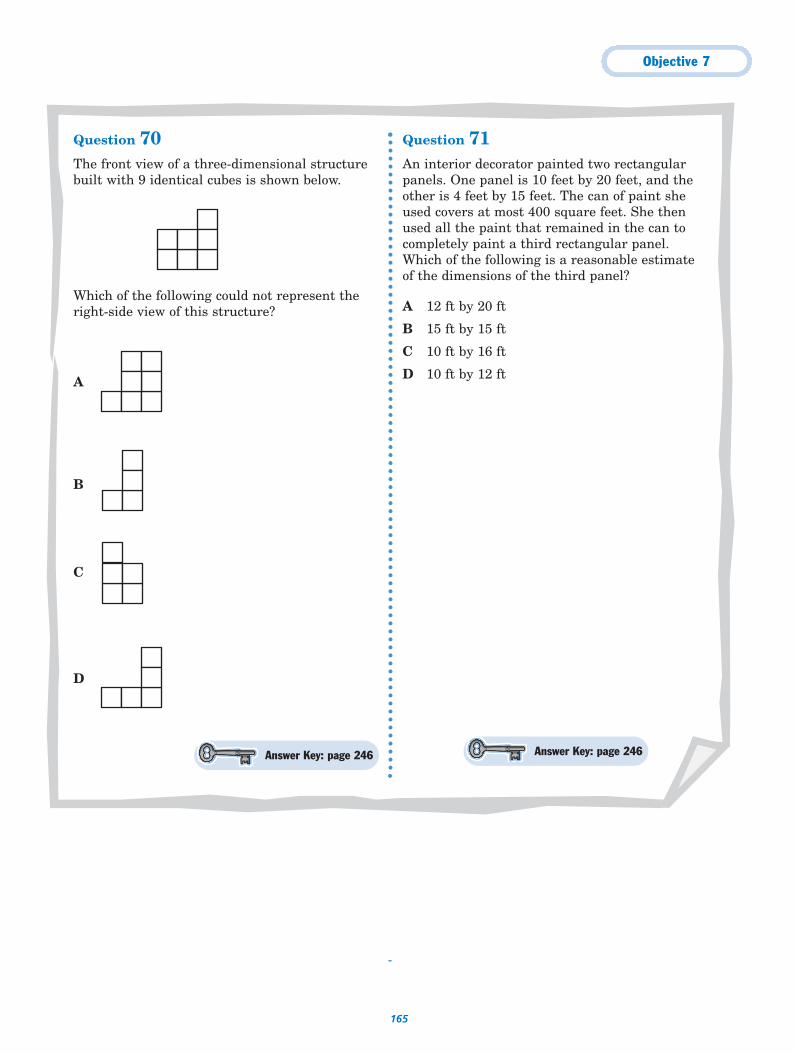
Objective 7
165
Answer Key: page 246Answer Key: page 246
Question 70The front view of a three-dimensional structurebuilt with 9 identical cubes is shown below.
Which of the following could not represent theright-side view of this structure?
A
B
C
D
Question 71An interior decorator painted two rectangularpanels. One panel is 10 feet by 20 feet, and theother is 4 feet by 15 feet. The can of paint sheused covers at most 400 square feet. She thenused all the paint that remained in the can tocompletely paint a third rectangular panel.Which of the following is a reasonable estimateof the dimensions of the third panel?
A 12 ft by 20 ft
B 15 ft by 15 ft
C 10 ft by 16 ft
D 10 ft by 12 ft
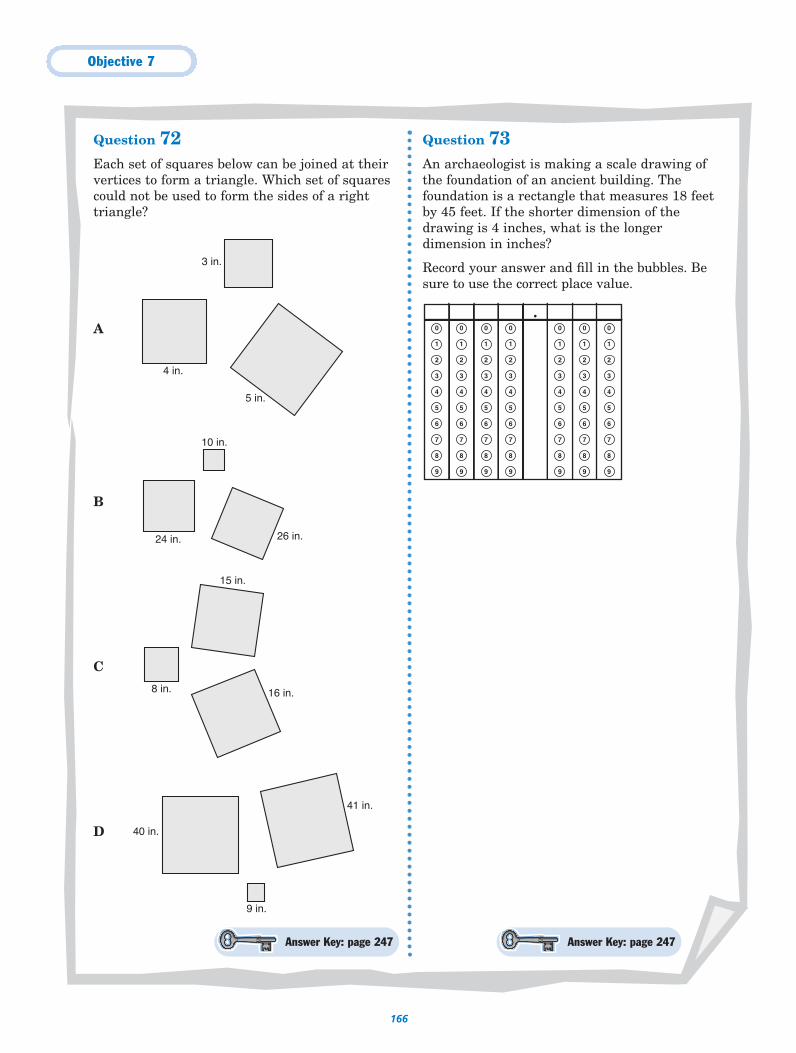
Objective 7
166
Question 72Each set of squares below can be joined at theirvertices to form a triangle. Which set of squarescould not be used to form the sides of a righttriangle?
A
B
C
D
Question 73An archaeologist is making a scale drawing ofthe foundation of an ancient building. Thefoundation is a rectangle that measures 18 feetby 45 feet. If the shorter dimension of thedrawing is 4 inches, what is the longerdimension in inches?
Record your answer and fill in the bubbles. Besure to use the correct place value.
0
1
2
3
4
5
6
7
8
9
0
1
2
3
4
5
6
7
8
9
0
1
2
3
4
5
6
7
8
9
0
1
2
3
4
5
6
7
8
9
0
1
2
3
4
5
6
7
8
9
0
1
2
3
4
5
6
7
8
9
0
1
2
3
4
5
6
7
8
9
40 in.
9 in.
41 in.
15 in.
8 in. 16 in.
10 in.
24 in. 26 in.
3 in.
4 in.
5 in.
Answer Key: page 247Answer Key: page 247
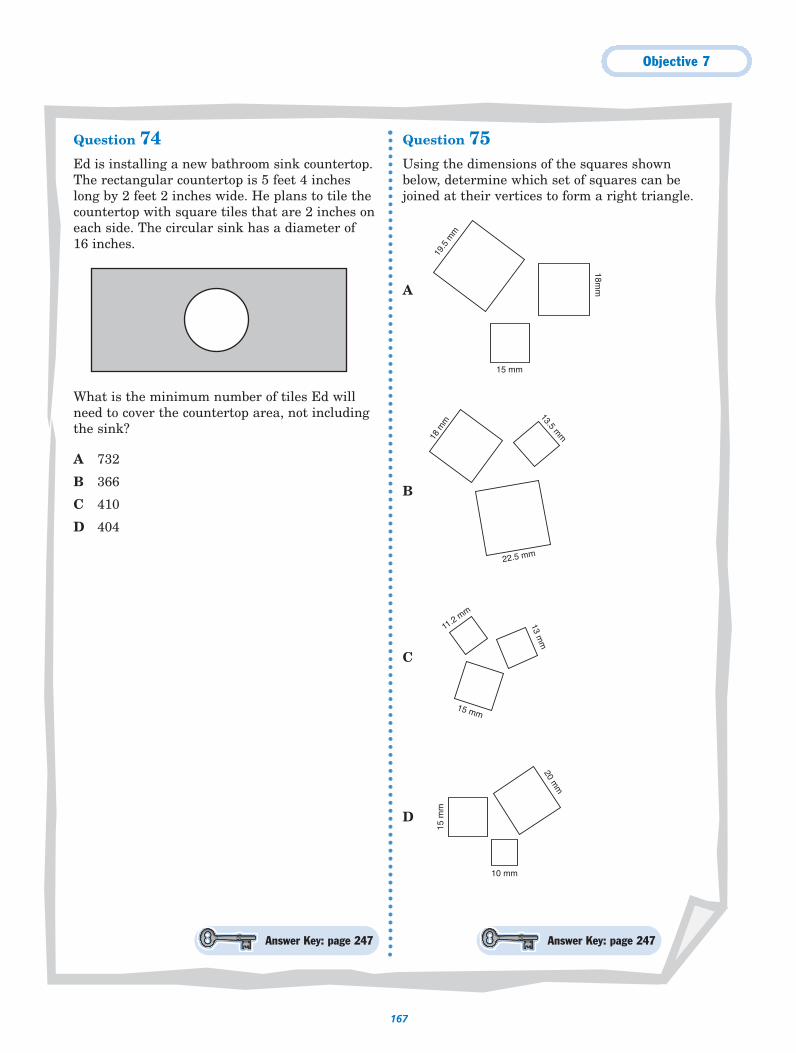
Objective 7
167
Answer Key: page 247Answer Key: page 247
Question 74Ed is installing a new bathroom sink countertop.The rectangular countertop is 5 feet 4 incheslong by 2 feet 2 inches wide. He plans to tile thecountertop with square tiles that are 2 inches oneach side. The circular sink has a diameter of 16 inches.
What is the minimum number of tiles Ed willneed to cover the countertop area, not includingthe sink?
A 732
B 366
C 410
D 404
Question 75Using the dimensions of the squares shownbelow, determine which set of squares can bejoined at their vertices to form a right triangle.
A
B
C
D
13 mm
11.2 m
m
15 mm
15 mm
18mm
19.5
mm
13.5 mm
22.5 mm
18 m
m15
mm
10 mm
20 mm
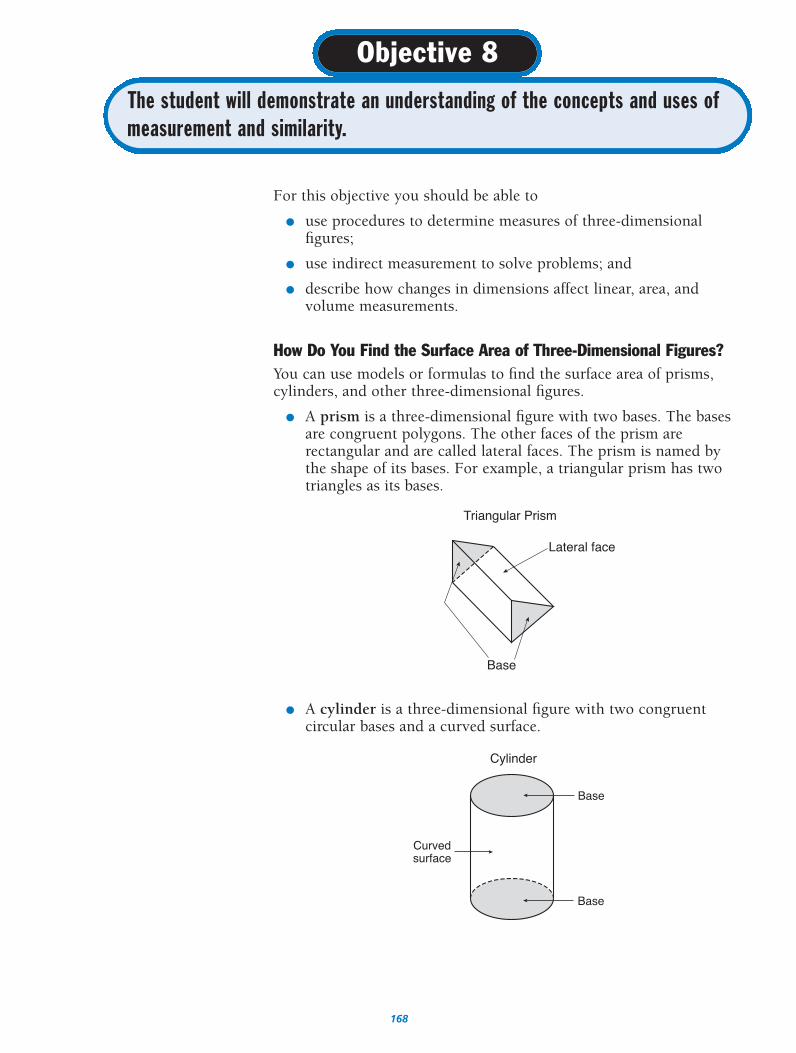
168
For this objective you should be able to
● use procedures to determine measures of three-dimensionalfigures;
● use indirect measurement to solve problems; and
● describe how changes in dimensions affect linear, area, andvolume measurements.
How Do You Find the Surface Area of Three-Dimensional Figures?You can use models or formulas to find the surface area of prisms,cylinders, and other three-dimensional figures.
● A prism is a three-dimensional figure with two bases. The basesare congruent polygons. The other faces of the prism arerectangular and are called lateral faces. The prism is named bythe shape of its bases. For example, a triangular prism has twotriangles as its bases.
● A cylinder is a three-dimensional figure with two congruentcircular bases and a curved surface.
Curvedsurface
Base
Cylinder
Base
Lateral face
Base
Triangular Prism
The student will demonstrate an understanding of the concepts and uses ofmeasurement and similarity.
Objective 8
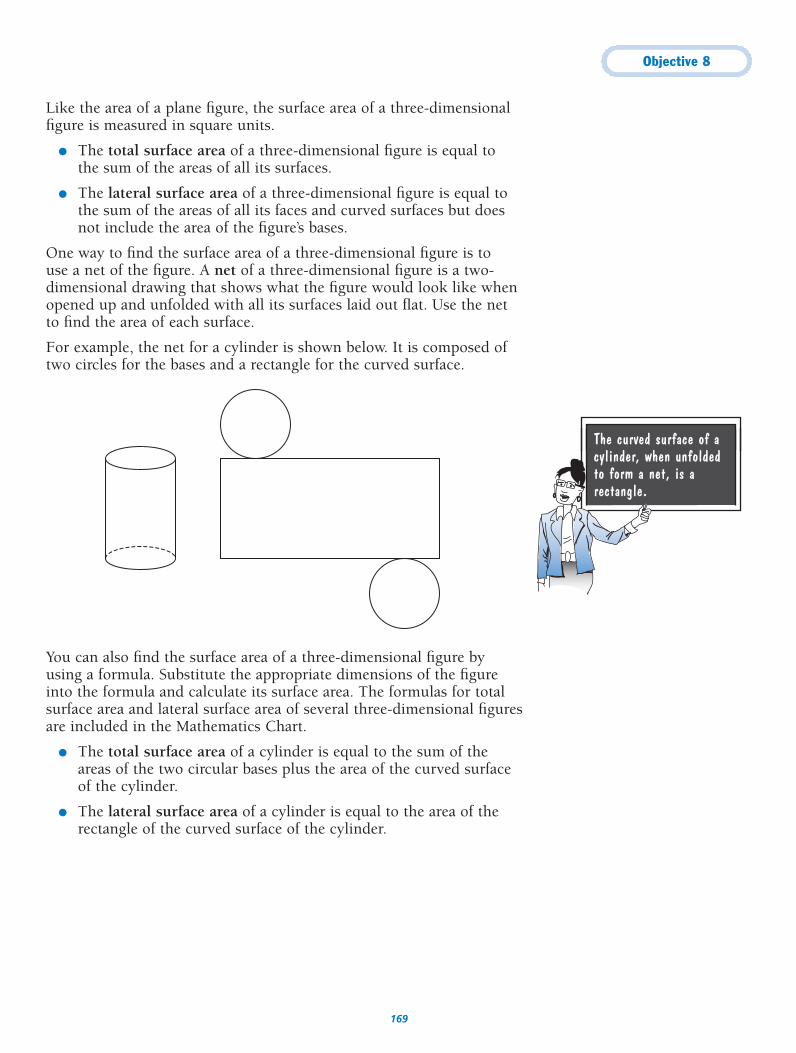
Objective 8
169
Like the area of a plane figure, the surface area of a three-dimensionalfigure is measured in square units.
● The total surface area of a three-dimensional figure is equal tothe sum of the areas of all its surfaces.
● The lateral surface area of a three-dimensional figure is equal tothe sum of the areas of all its faces and curved surfaces but doesnot include the area of the figure’s bases.
One way to find the surface area of a three-dimensional figure is to use a net of the figure. A net of a three-dimensional figure is a two-dimensional drawing that shows what the figure would look like whenopened up and unfolded with all its surfaces laid out flat. Use the netto find the area of each surface.
For example, the net for a cylinder is shown below. It is composed oftwo circles for the bases and a rectangle for the curved surface.
You can also find the surface area of a three-dimensional figure byusing a formula. Substitute the appropriate dimensions of the figureinto the formula and calculate its surface area. The formulas for totalsurface area and lateral surface area of several three-dimensional figuresare included in the Mathematics Chart.
● The total surface area of a cylinder is equal to the sum of theareas of the two circular bases plus the area of the curved surfaceof the cylinder.
● The lateral surface area of a cylinder is equal to the area of therectangle of the curved surface of the cylinder.
The curved surface of acylinder, when unfoldedto form a net, is arectangle.
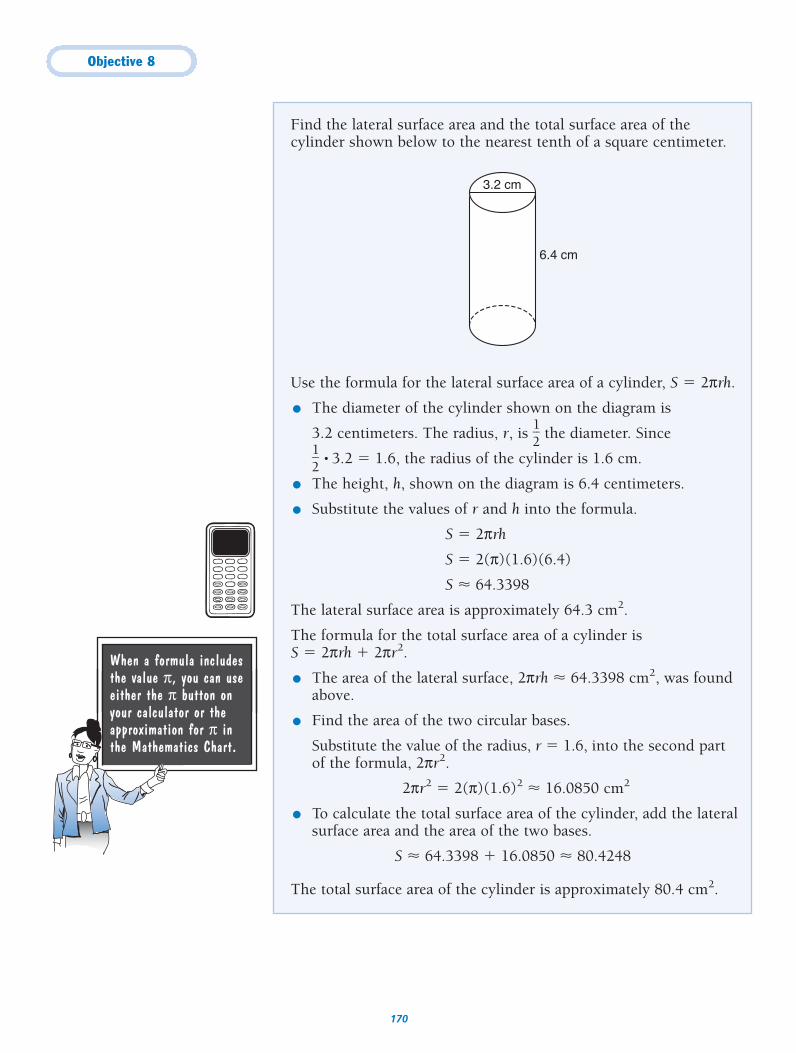
Objective 8
170
Find the lateral surface area and the total surface area of thecylinder shown below to the nearest tenth of a square centimeter.
Use the formula for the lateral surface area of a cylinder, S � 2πrh.
● The diameter of the cylinder shown on the diagram is
3.2 centimeters. The radius, r, is �12
� the diameter. Since
�12
� • 3.2 � 1.6, the radius of the cylinder is 1.6 cm.
● The height, h, shown on the diagram is 6.4 centimeters.
● Substitute the values of r and h into the formula.
S � 2πrh
S � 2(π)(1.6)(6.4)
S � 64.3398
The lateral surface area is approximately 64.3 cm2.
The formula for the total surface area of a cylinder isS � 2πrh � 2πr2.
● The area of the lateral surface, 2πrh � 64.3398 cm2, was foundabove.
● Find the area of the two circular bases.
Substitute the value of the radius, r � 1.6, into the second partof the formula, 2πr2.
2πr2 � 2(π)(1.6)2 � 16.0850 cm2
● To calculate the total surface area of the cylinder, add the lateralsurface area and the area of the two bases.
S � 64.3398 � 16.0850 � 80.4248
The total surface area of the cylinder is approximately 80.4 cm2.
6.4 cm
3.2 cm
When a formula includesthe value π, you can useeither the π button onyour calculator or theapproximation for π inthe Mathematics Chart.
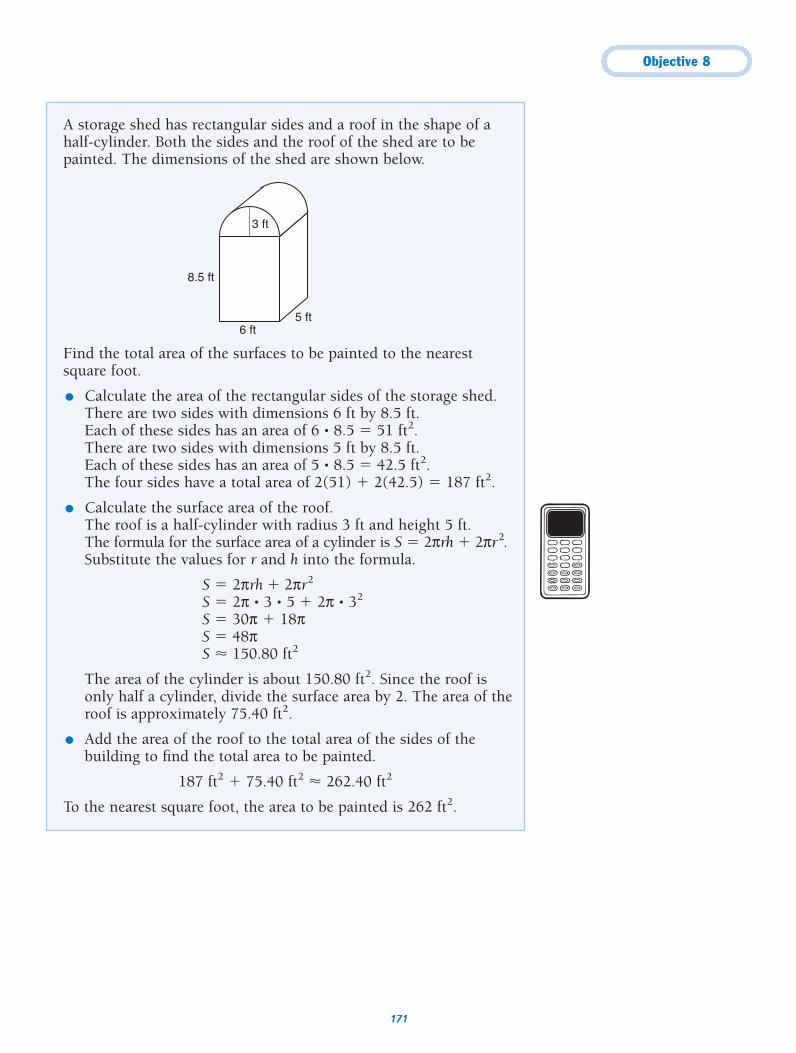
Objective 8
171
A storage shed has rectangular sides and a roof in the shape of ahalf-cylinder. Both the sides and the roof of the shed are to bepainted. The dimensions of the shed are shown below.
Find the total area of the surfaces to be painted to the nearestsquare foot.
● Calculate the area of the rectangular sides of the storage shed.There are two sides with dimensions 6 ft by 8.5 ft.Each of these sides has an area of 6 • 8.5 � 51 ft2.There are two sides with dimensions 5 ft by 8.5 ft.Each of these sides has an area of 5 • 8.5 � 42.5 ft2.The four sides have a total area of 2(51) � 2(42.5) � 187 ft2.
● Calculate the surface area of the roof. The roof is a half-cylinder with radius 3 ft and height 5 ft.The formula for the surface area of a cylinder is S � 2πrh � 2πr2.Substitute the values for r and h into the formula.
S � 2πrh � 2πr2
S � 2π • 3 • 5 � 2π • 32
S � 30π � 18πS � 48πS � 150.80 ft2
The area of the cylinder is about 150.80 ft2. Since the roof isonly half a cylinder, divide the surface area by 2. The area of theroof is approximately 75.40 ft2.
● Add the area of the roof to the total area of the sides of thebuilding to find the total area to be painted.
187 ft2 � 75.40 ft2 � 262.40 ft2
To the nearest square foot, the area to be painted is 262 ft2.
8.5 ft
6 ft5 ft
3 ft
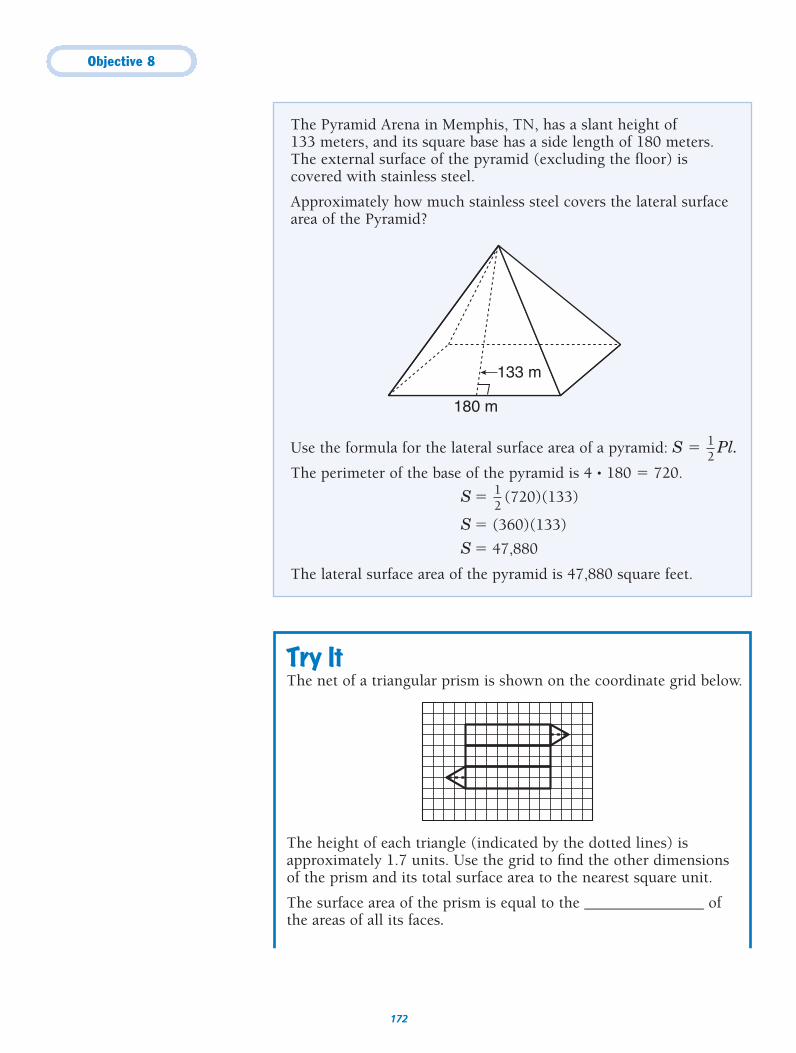
Objective 8
172
Try ItThe net of a triangular prism is shown on the coordinate grid below.
The height of each triangle (indicated by the dotted lines) isapproximately 1.7 units. Use the grid to find the other dimensionsof the prism and its total surface area to the nearest square unit.
The surface area of the prism is equal to the _______________ ofthe areas of all its faces.
The Pyramid Arena in Memphis, TN, has a slant height of 133 meters, and its square base has a side length of 180 meters.The external surface of the pyramid (excluding the floor) iscovered with stainless steel.
Approximately how much stainless steel covers the lateral surfacearea of the Pyramid?
Use the formula for the lateral surface area of a pyramid: S � Pl.
The perimeter of the base of the pyramid is 4 • 180 � 720.
S � (720)(133)
S � (360)(133)
S � 47,880
The lateral surface area of the pyramid is 47,880 square feet.
12
12
180 m
133 m
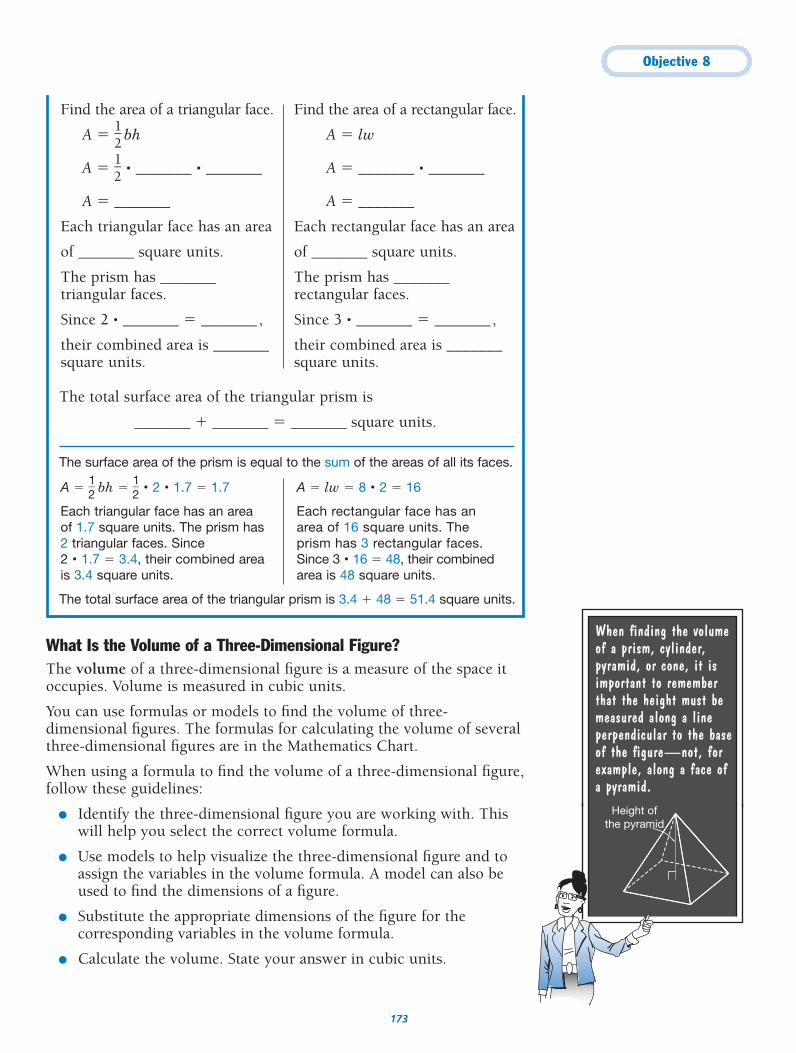
Objective 8
173
What Is the Volume of a Three-Dimensional Figure?The volume of a three-dimensional figure is a measure of the space itoccupies. Volume is measured in cubic units.
You can use formulas or models to find the volume of three-dimensional figures. The formulas for calculating the volume of severalthree-dimensional figures are in the Mathematics Chart.
When using a formula to find the volume of a three-dimensional figure,follow these guidelines:
● Identify the three-dimensional figure you are working with. Thiswill help you select the correct volume formula.
● Use models to help visualize the three-dimensional figure and toassign the variables in the volume formula. A model can also beused to find the dimensions of a figure.
● Substitute the appropriate dimensions of the figure for thecorresponding variables in the volume formula.
● Calculate the volume. State your answer in cubic units.
When finding the volumeof a prism, cylinder,pyramid, or cone, it isimportant to rememberthat the height must bemeasured along a lineperpendicular to the baseof the figure—not, forexample, along a face ofa pyramid.
The total surface area of the triangular prism is
_______ � _______ � _______ square units.
The surface area of the prism is equal to the sum of the areas of all its faces.
The total surface area of the triangular prism is 3.4 � 48 � 51.4 square units.
A � �12
� bh � �12
� • 2 • 1.7 � 1.7
Each triangular face has an area of 1.7 square units. The prism has 2 triangular faces. Since2 • 1.7 � 3.4, their combined area is 3.4 square units.
A � lw � 8 • 2 � 16
Each rectangular face has an area of 16 square units. The prism has 3 rectangular faces.Since 3 • 16 � 48, their combinedarea is 48 square units.
Find the area of a triangular face.
A � �12
� bh
A � �12
� • _______ • _______
A � _______
Each triangular face has an area
of _______ square units.
The prism has _______triangular faces.
Since 2 • _______ � _______,
their combined area is _______square units.
Find the area of a rectangular face.
A � lw
A � _______ • _______
A � _______
Each rectangular face has an area
of _______ square units.
The prism has _______rectangular faces.
Since 3 • _______ � _______,
their combined area is _______square units.
Height ofthe pyramid
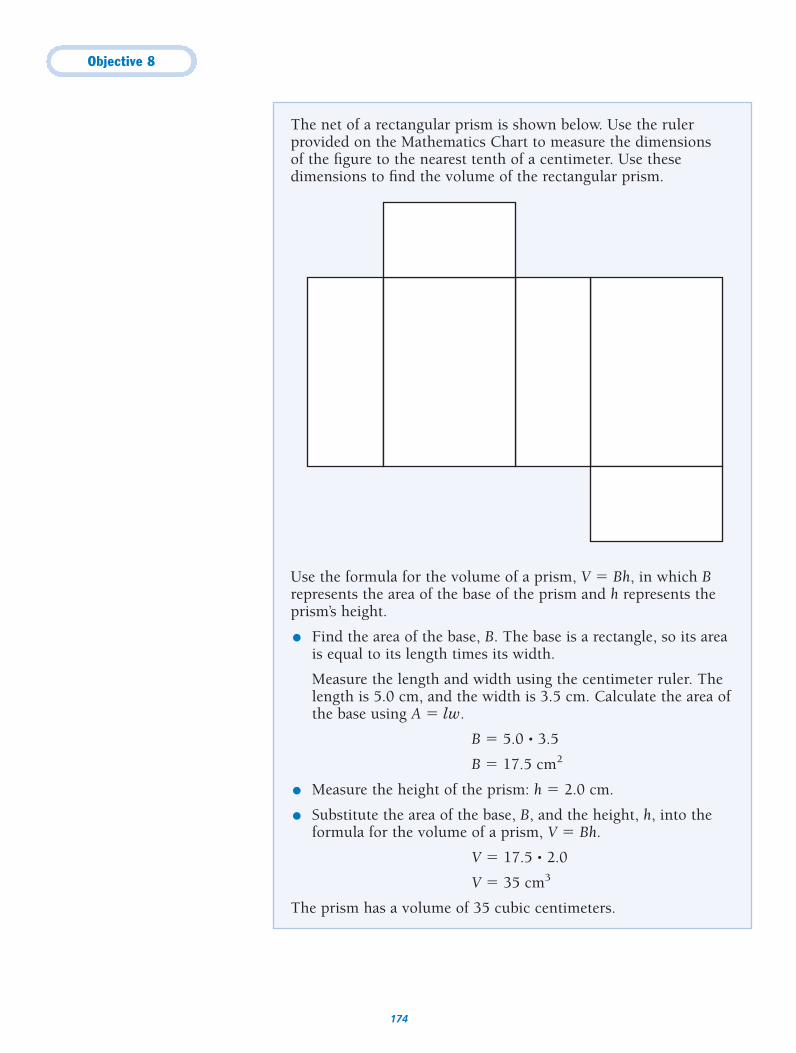
Objective 8
174
The net of a rectangular prism is shown below. Use the rulerprovided on the Mathematics Chart to measure the dimensions of the figure to the nearest tenth of a centimeter. Use thesedimensions to find the volume of the rectangular prism.
Use the formula for the volume of a prism, V � Bh, in which Brepresents the area of the base of the prism and h represents theprism’s height.
● Find the area of the base, B. The base is a rectangle, so its area is equal to its length times its width.
Measure the length and width using the centimeter ruler. Thelength is 5.0 cm, and the width is 3.5 cm. Calculate the area ofthe base using A � lw.
B � 5.0 • 3.5
B � 17.5 cm2
● Measure the height of the prism: h � 2.0 cm.
● Substitute the area of the base, B, and the height, h, into theformula for the volume of a prism, V � Bh.
V � 17.5 • 2.0
V � 35 cm3
The prism has a volume of 35 cubic centimeters.
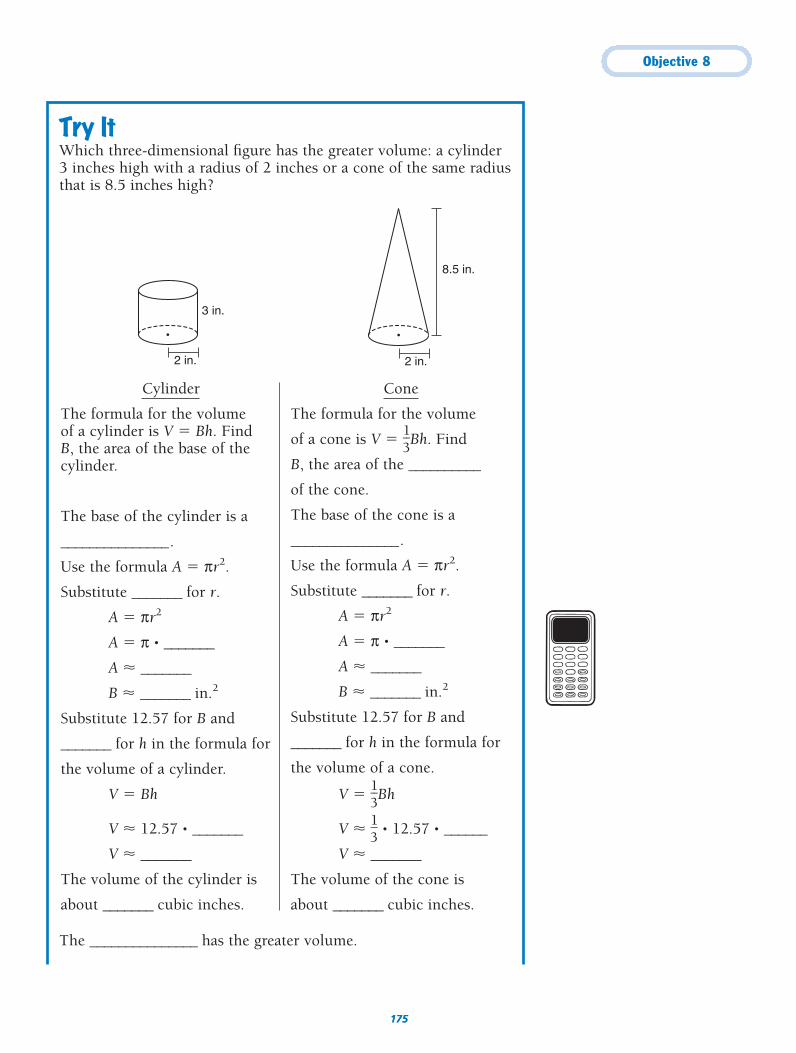
Objective 8
175
Try ItWhich three-dimensional figure has the greater volume: a cylinder 3 inches high with a radius of 2 inches or a cone of the same radiusthat is 8.5 inches high?
The _______________ has the greater volume.
Cylinder
The formula for the volume of a cylinder is V � Bh. Find B, the area of the base of thecylinder.
The base of the cylinder is a
_______________.
Use the formula A � πr2.
Substitute _______ for r.
A � πr2
A � π • _______
A � _______
B � _______ in.2
Substitute 12.57 for B and
_______ for h in the formula for
the volume of a cylinder.
V � Bh
V � 12.57 • _______
V � _______
The volume of the cylinder is
about _______ cubic inches.
Cone
The formula for the volume
of a cone is V � �13
�Bh. Find
B, the area of the __________
of the cone.
The base of the cone is a
_______________.
Use the formula A � πr2.
Substitute _______ for r.
A � πr2
A � π • _______
A � _______
B � _______ in.2
Substitute 12.57 for B and
_______ for h in the formula for
the volume of a cone.
V � �13
�Bh
V � �13
� • 12.57 • ______
V � _______
The volume of the cone is
about _______ cubic inches.
2 in.
8.5 in.
2 in.
3 in.
175
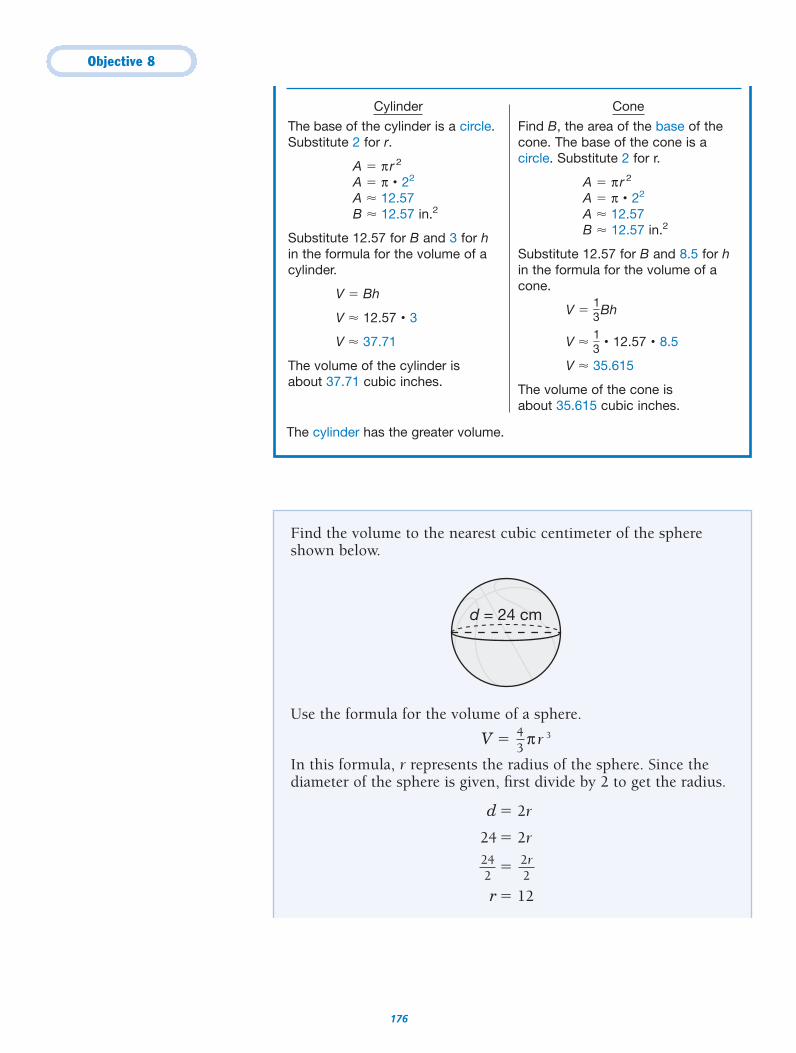
Objective 8
176
The cylinder has the greater volume.
Cylinder
The base of the cylinder is a circle.Substitute 2 for r.
A � πr 2
A � π • 22
A � 12.57B � 12.57 in.2
Substitute 12.57 for B and 3 for hin the formula for the volume of acylinder.
V � Bh
V � 12.57 • 3
V � 37.71
The volume of the cylinder is about 37.71 cubic inches.
Cone
Find B, the area of the base of thecone. The base of the cone is acircle. Substitute 2 for r.
A � πr 2
A � π • 22
A � 12.57B � 12.57 in.2
Substitute 12.57 for B and 8.5 for hin the formula for the volume of acone.
V � �13
� Bh
V � �13
� • 12.57 • 8.5
V � 35.615
The volume of the cone is about 35.615 cubic inches.
Find the volume to the nearest cubic centimeter of the sphereshown below.
Use the formula for the volume of a sphere.
V � π r 3
In this formula, r represents the radius of the sphere. Since thediameter of the sphere is given, first divide by 2 to get the radius.
d � 2r
24 � 2r
�
r � 12
2r2
242
43
d = 24 cm
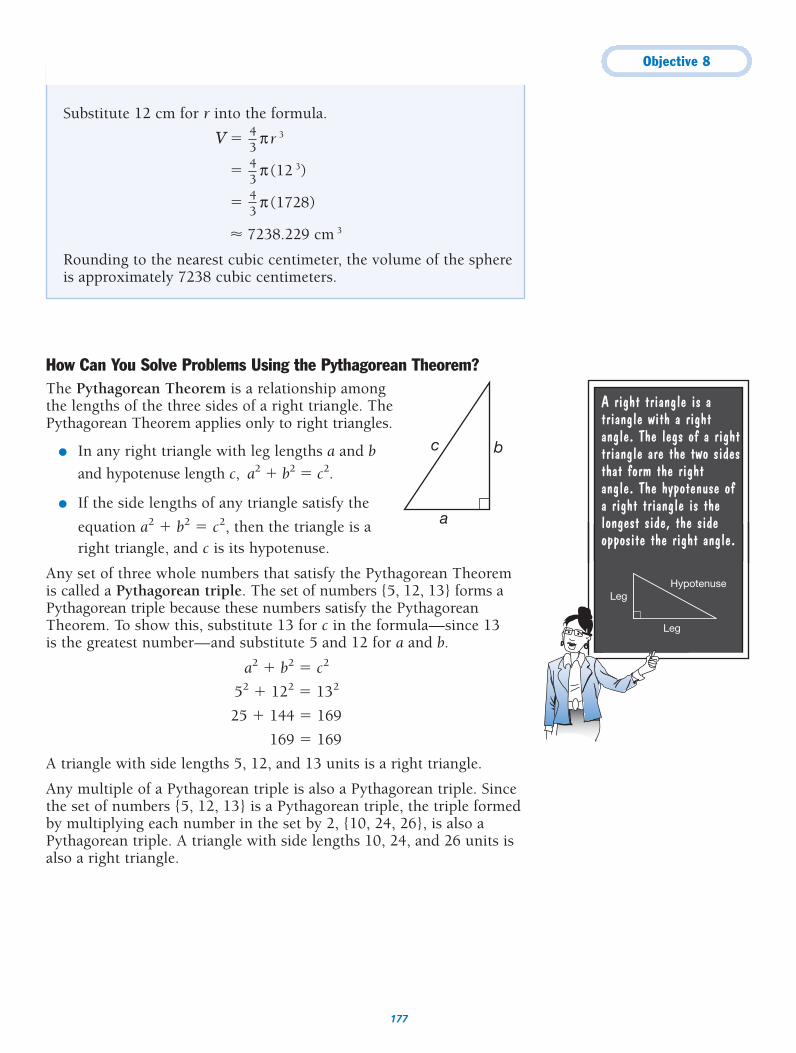
Objective 8
177
Substitute 12 cm for r into the formula.
V � π r 3
� π (12 3)
� π (1728)
� 7238.229 cm 3
Rounding to the nearest cubic centimeter, the volume of the sphereis approximately 7238 cubic centimeters.
43
43
43
How Can You Solve Problems Using the Pythagorean Theorem?The Pythagorean Theorem is a relationship among the lengths of the three sides of a right triangle. ThePythagorean Theorem applies only to right triangles.
● In any right triangle with leg lengths a and b
and hypotenuse length c, a2 � b2 � c2.
● If the side lengths of any triangle satisfy the
equation a2 � b2 � c2, then the triangle is a right triangle, and c is its hypotenuse.
Any set of three whole numbers that satisfy the Pythagorean Theoremis called a Pythagorean triple. The set of numbers {5, 12, 13} forms aPythagorean triple because these numbers satisfy the PythagoreanTheorem. To show this, substitute 13 for c in the formula—since 13 is the greatest number—and substitute 5 and 12 for a and b.
a2 � b2 � c2
52 � 122 � 132
25 � 144 � 169
169 � 169
A triangle with side lengths 5, 12, and 13 units is a right triangle.
Any multiple of a Pythagorean triple is also a Pythagorean triple. Sincethe set of numbers {5, 12, 13} is a Pythagorean triple, the triple formedby multiplying each number in the set by 2, {10, 24, 26}, is also aPythagorean triple. A triangle with side lengths 10, 24, and 26 units isalso a right triangle.
c
a
b
A right triangle is atriangle with a rightangle. The legs of a righttriangle are the two sidesthat form the rightangle. The hypotenuse ofa right triangle is thelongest side, the sideopposite the right angle.
Leg
HypotenuseLeg
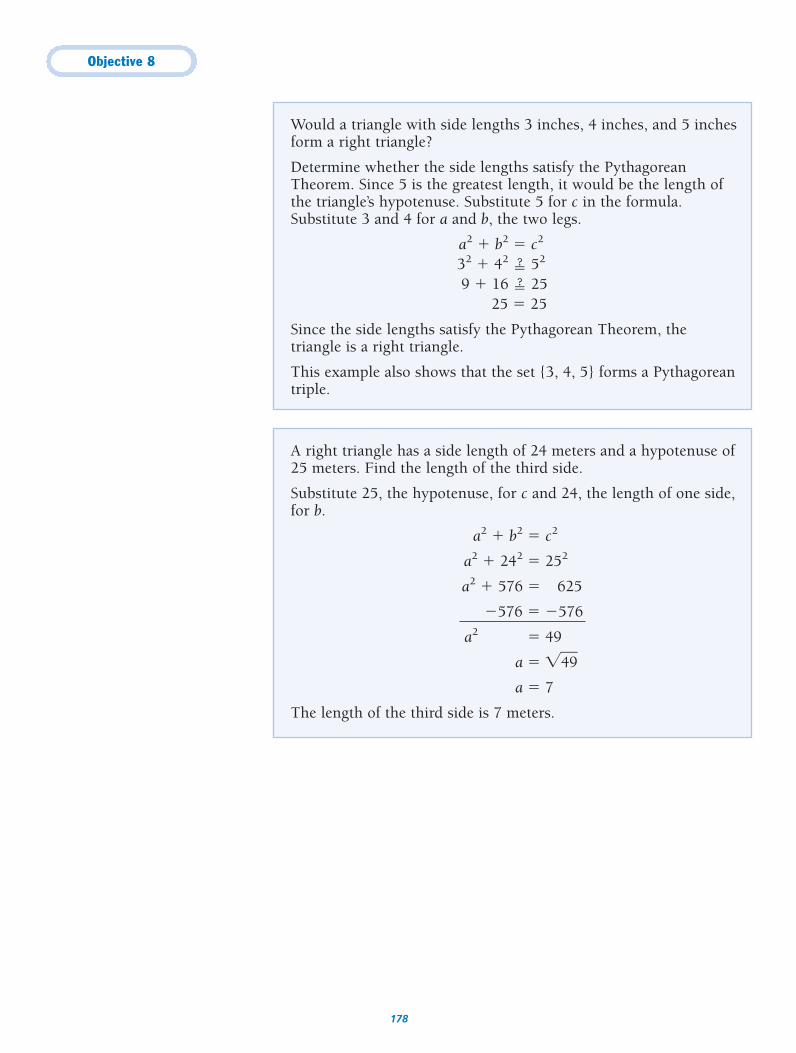
Objective 8
178
Would a triangle with side lengths 3 inches, 4 inches, and 5 inchesform a right triangle?
Determine whether the side lengths satisfy the PythagoreanTheorem. Since 5 is the greatest length, it would be the length ofthe triangle’s hypotenuse. Substitute 5 for c in the formula.Substitute 3 and 4 for a and b, the two legs.
a2 � b2 � c2
32 � 42 � 52
9 � 16 � 2525 � 25
Since the side lengths satisfy the Pythagorean Theorem, thetriangle is a right triangle.
This example also shows that the set {3, 4, 5} forms a Pythagoreantriple.
A right triangle has a side length of 24 meters and a hypotenuse of25 meters. Find the length of the third side.
Substitute 25, the hypotenuse, for c and 24, the length of one side,for b.
a2 � b2 � c2
a2 � 242 � 252
a2 � 576 � 625
�576 � �576
a2 � 49
a � �49�a � 7
The length of the third side is 7 meters.
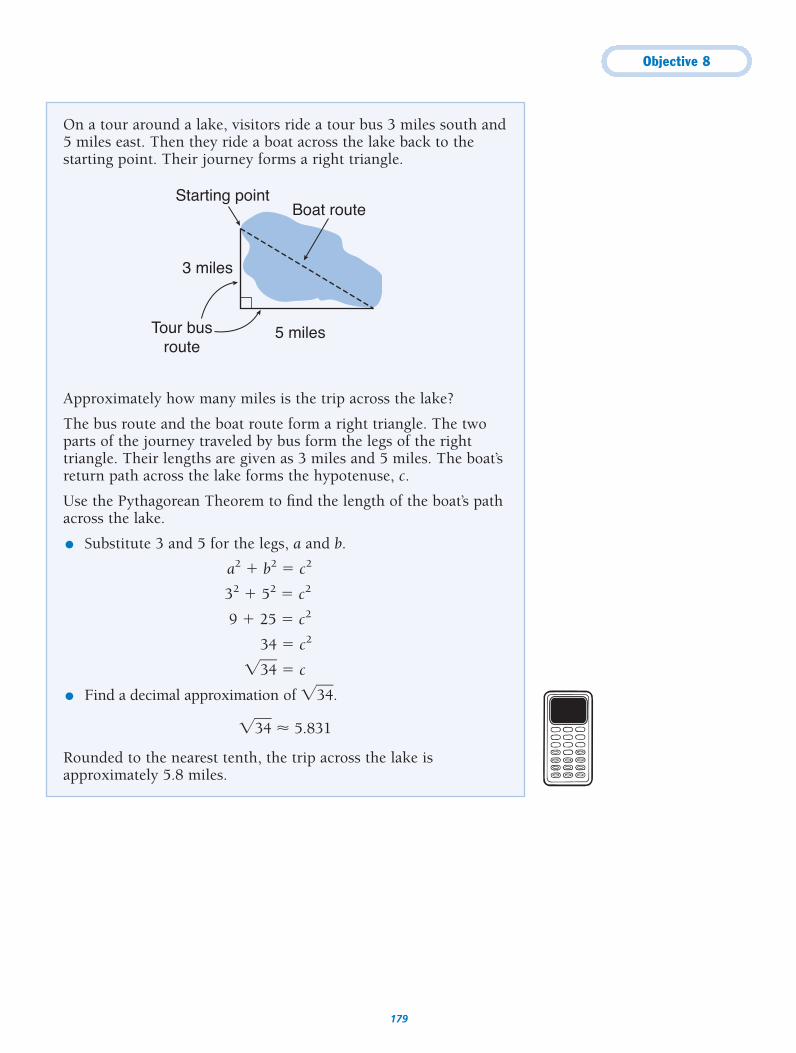
Objective 8
179
On a tour around a lake, visitors ride a tour bus 3 miles south and5 miles east. Then they ride a boat across the lake back to thestarting point. Their journey forms a right triangle.
Approximately how many miles is the trip across the lake?
The bus route and the boat route form a right triangle. The twoparts of the journey traveled by bus form the legs of the righttriangle. Their lengths are given as 3 miles and 5 miles. The boat’sreturn path across the lake forms the hypotenuse, c.
Use the Pythagorean Theorem to find the length of the boat’s pathacross the lake.
● Substitute 3 and 5 for the legs, a and b.
a2 � b2 � c2
32 � 52 � c2
9 � 25 � c2
34 � c2
�34� � c
● Find a decimal approximation of �34�.
�34� � 5.831
Rounded to the nearest tenth, the trip across the lake isapproximately 5.8 miles.
5 milesTour busroute
Boat route
3 miles
Starting point
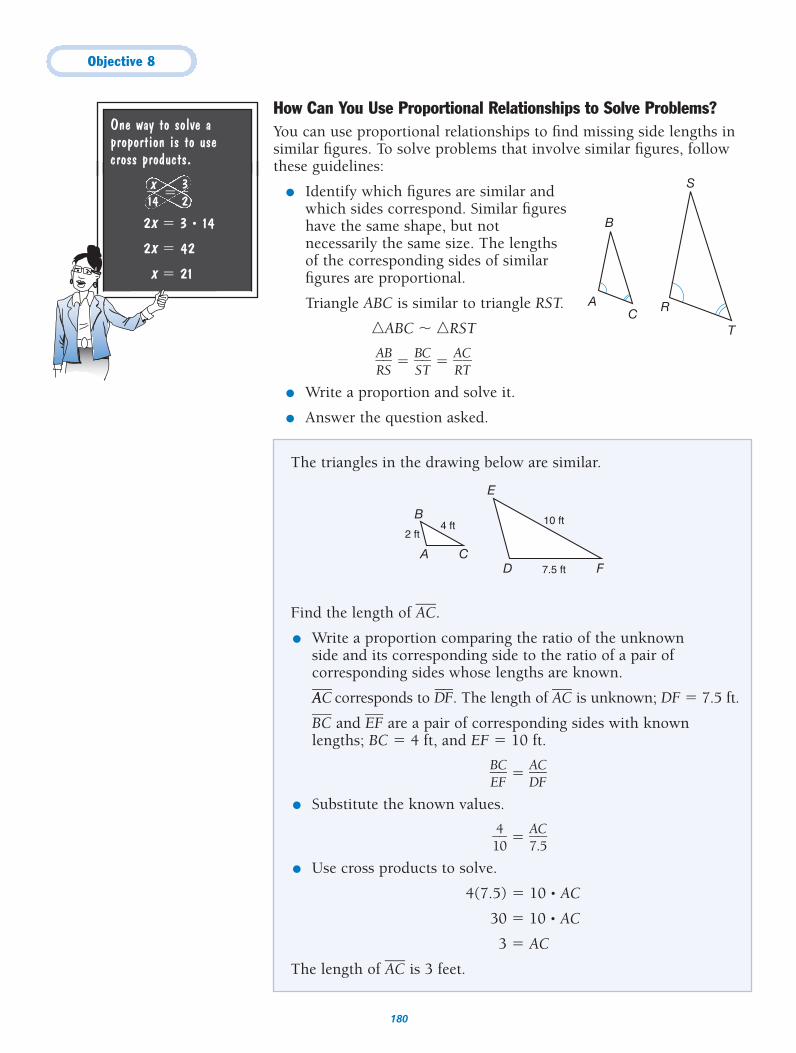
Objective 8
180
How Can You Use Proportional Relationships to Solve Problems?You can use proportional relationships to find missing side lengths insimilar figures. To solve problems that involve similar figures, followthese guidelines:
● Identify which figures are similar andwhich sides correspond. Similar figureshave the same shape, but notnecessarily the same size. The lengthsof the corresponding sides of similarfigures are proportional.
Triangle ABC is similar to triangle RST.
�ABC � �RST
�AR
BS� � �
BSTC� � �
AR
CT�
● Write a proportion and solve it.
● Answer the question asked.
The triangles in the drawing below are similar.
Find the length of A�C�.
● Write a proportion comparing the ratio of the unknown side and its corresponding side to the ratio of a pair ofcorresponding sides whose lengths are known.
AA�C� corresponds to D�F�. The length of A�C� is unknown; DF � 7.5 ft.
B�C� and E�F� are a pair of corresponding sides with knownlengths; BC � 4 ft, and EF � 10 ft.
�BE
CF� � �
AD
CF�
● Substitute the known values.
�140� � �
7A.C5�
● Use cross products to solve.
4(7.5) � 10 • AC
30 � 10 • AC
3 � AC
The length of A�C� is 3 feet.
A
B
CD F
E
2 ft4 ft 10 ft
7.5 ft
One way to solve aproportion is to use cross products.
�1x4� � �
32
�
2x � 3 • 14
2x � 42
x � 21
AC
B
R
T
S
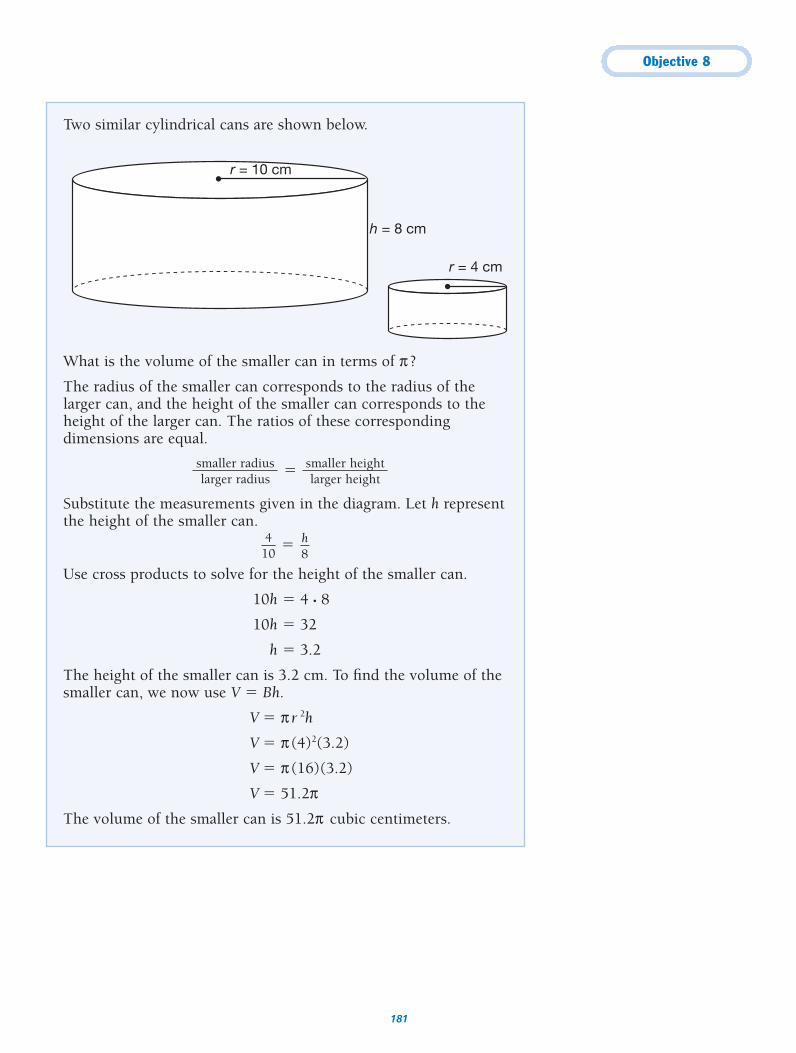
Objective 8
181
Two similar cylindrical cans are shown below.
What is the volume of the smaller can in terms of π ?
The radius of the smaller can corresponds to the radius of thelarger can, and the height of the smaller can corresponds to theheight of the larger can. The ratios of these correspondingdimensions are equal.
�
Substitute the measurements given in the diagram. Let h representthe height of the smaller can.
�
Use cross products to solve for the height of the smaller can.
10h � 4 · 8
10h � 32
h � 3.2
The height of the smaller can is 3.2 cm. To find the volume of thesmaller can, we now use V � Bh.
V � π r 2h
V � π (4)2(3.2)
V � π (16)(3.2)
V � 51.2πThe volume of the smaller can is 51.2π cubic centimeters.
h8
410
smaller heightlarger height
smaller radiuslarger radius
h = 8 cm
r = 4 cm
r = 10 cm
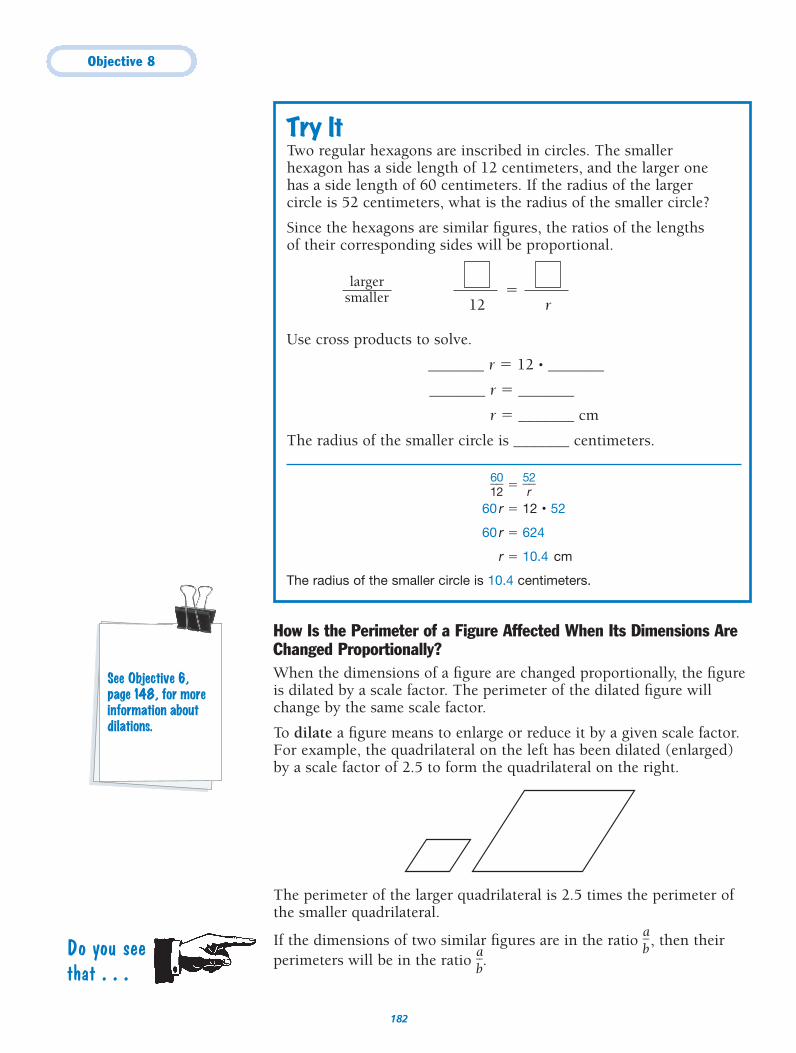
Objective 8
182
Try ItTwo regular hexagons are inscribed in circles. The smaller hexagon has a side length of 12 centimeters, and the larger one has a side length of 60 centimeters. If the radius of the larger circle is 52 centimeters, what is the radius of the smaller circle?
Since the hexagons are similar figures, the ratios of the lengths of their corresponding sides will be proportional.
�
Use cross products to solve.
_______ r � 12 • _______
_______ r � _______
r � _______ cm
The radius of the smaller circle is _______ centimeters.
�6102� � �
5r2�
60 r � 12 • 52
60 r � 624
r � 10.4 cm
The radius of the smaller circle is 10.4 centimeters.
largersmaller r12
How Is the Perimeter of a Figure Affected When Its Dimensions AreChanged Proportionally?When the dimensions of a figure are changed proportionally, the figureis dilated by a scale factor. The perimeter of the dilated figure willchange by the same scale factor.
To dilate a figure means to enlarge or reduce it by a given scale factor.For example, the quadrilateral on the left has been dilated (enlarged)by a scale factor of 2.5 to form the quadrilateral on the right.
The perimeter of the larger quadrilateral is 2.5 times the perimeter ofthe smaller quadrilateral.
If the dimensions of two similar figures are in the ratio �ab
� , then theirperimeters will be in the ratio �
ab
�.Do you seethat . . .
See Objective 6, page 148, for moreinformation aboutdilations.
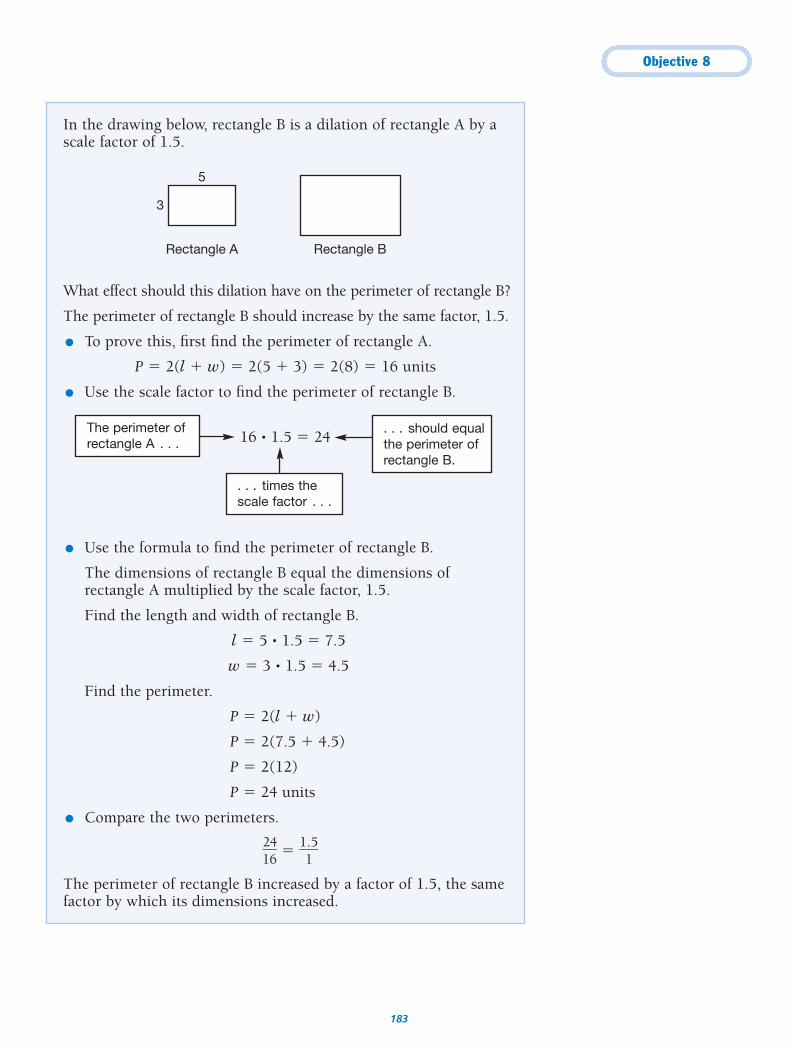
Objective 8
183
In the drawing below, rectangle B is a dilation of rectangle A by ascale factor of 1.5.
What effect should this dilation have on the perimeter of rectangle B?
The perimeter of rectangle B should increase by the same factor, 1.5.
● To prove this, first find the perimeter of rectangle A.
P � 2(l � w) � 2(5 � 3) � 2(8) � 16 units
● Use the scale factor to find the perimeter of rectangle B.
16 • 1.5 � 24
● Use the formula to find the perimeter of rectangle B.
The dimensions of rectangle B equal the dimensions ofrectangle A multiplied by the scale factor, 1.5.
Find the length and width of rectangle B.
l � 5 • 1.5 � 7.5
w � 3 • 1.5 � 4.5
Find the perimeter.
P � 2(l � w)
P � 2(7.5 � 4.5)
P � 2(12)
P � 24 units
● Compare the two perimeters.
�21
46� � �
11.5�
The perimeter of rectangle B increased by a factor of 1.5, the samefactor by which its dimensions increased.
5
Rectangle A
3
Rectangle B
The perimeter ofrectangle A . . .
. . . should equalthe perimeter ofrectangle B.
. . . times thescale factor . . .
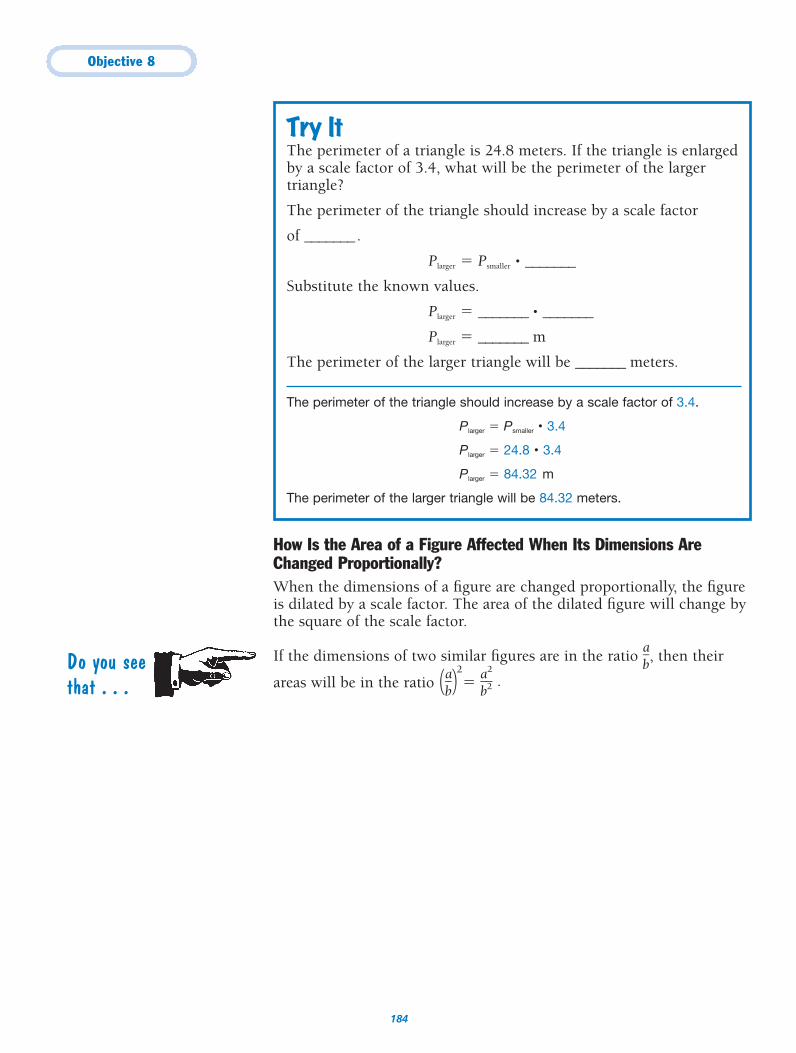
Objective 8
184
How Is the Area of a Figure Affected When Its Dimensions AreChanged Proportionally?When the dimensions of a figure are changed proportionally, the figureis dilated by a scale factor. The area of the dilated figure will change bythe square of the scale factor.
If the dimensions of two similar figures are in the ratio �ab
�, then their
areas will be in the ratio (�ab
�)2
� �ab
2
2� .
Try ItThe perimeter of a triangle is 24.8 meters. If the triangle is enlargedby a scale factor of 3.4, what will be the perimeter of the largertriangle?
The perimeter of the triangle should increase by a scale factor
of _______.
Plarger � Psmaller • _______
Substitute the known values.
Plarger � _______ • _______
Plarger � _______ m
The perimeter of the larger triangle will be _______ meters.
The perimeter of the triangle should increase by a scale factor of 3.4.
Plarger � Psmaller • 3.4
Plarger � 24.8 • 3.4
Plarger � 84.32 m
The perimeter of the larger triangle will be 84.32 meters.
Do you seethat . . .
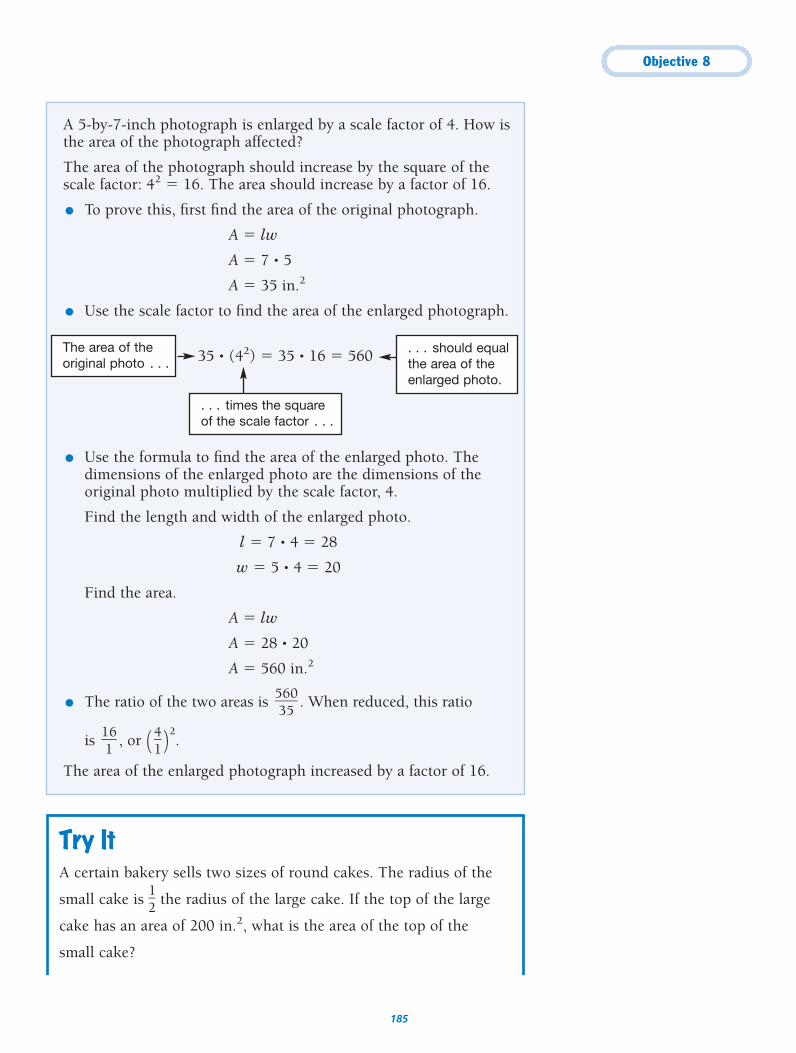
Objective 8
185
A 5-by-7-inch photograph is enlarged by a scale factor of 4. How isthe area of the photograph affected?
The area of the photograph should increase by the square of thescale factor: 42 � 16. The area should increase by a factor of 16.
● To prove this, first find the area of the original photograph.
A � lw
A � 7 • 5
A � 35 in.2
● Use the scale factor to find the area of the enlarged photograph.
35 • (42) � 35 • 16 � 560
● Use the formula to find the area of the enlarged photo. Thedimensions of the enlarged photo are the dimensions of theoriginal photo multiplied by the scale factor, 4.
Find the length and width of the enlarged photo.
l � 7 • 4 � 28
w � 5 • 4 � 20
Find the area.
A � lw
A � 28 • 20
A � 560 in.2
● The ratio of the two areas is . When reduced, this ratio
is , or ( )2.
The area of the enlarged photograph increased by a factor of 16.
4�1
16�1
560�35
The area of theoriginal photo . . .
. . . should equal the area of theenlarged photo.
. . . times the squareof the scale factor . . .
Try ItA certain bakery sells two sizes of round cakes. The radius of the
small cake is �12
� the radius of the large cake. If the top of the large
cake has an area of 200 in.2, what is the area of the top of the
small cake?
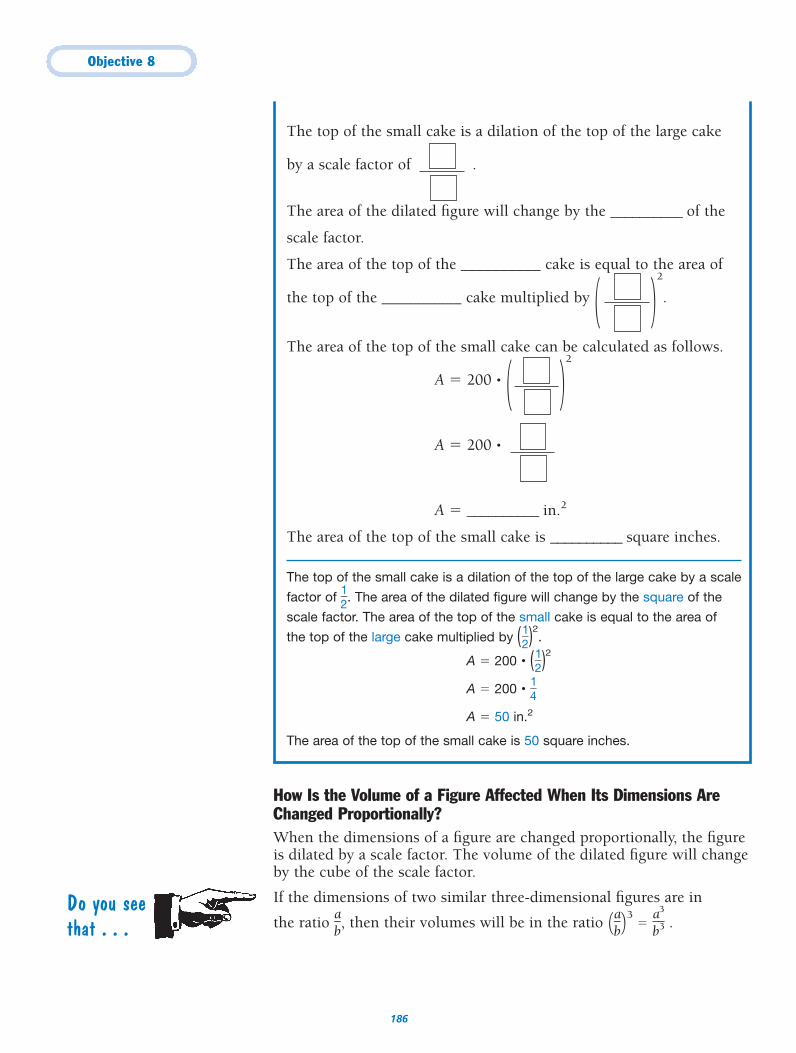
Objective 8
186
How Is the Volume of a Figure Affected When Its Dimensions AreChanged Proportionally?When the dimensions of a figure are changed proportionally, the figureis dilated by a scale factor. The volume of the dilated figure will changeby the cube of the scale factor.
If the dimensions of two similar three-dimensional figures are in
the ratio �ab
�, then their volumes will be in the ratio (�ab
�)3� �
ab3
3
� .
The top of the small cake is a dilation of the top of the large cake
by a scale factor of .
The area of the dilated figure will change by the __________ of the
scale factor.
The area of the top of the __________ cake is equal to the area of
the top of the __________ cake multiplied by ( )2
.
The area of the top of the small cake can be calculated as follows.
A � 200 • ( )2
A � 200 •
A � __________ in.2
The area of the top of the small cake is __________ square inches.
The top of the small cake is a dilation of the top of the large cake by a scale
factor of �12
�. The area of the dilated figure will change by the square of the
scale factor. The area of the top of the small cake is equal to the area of
the top of the large cake multiplied by ( �12
�)2.
A � 200 • ( �12
�)2
A � 200 • �14
�
A � 50 in.2
The area of the top of the small cake is 50 square inches.
Do you seethat . . .
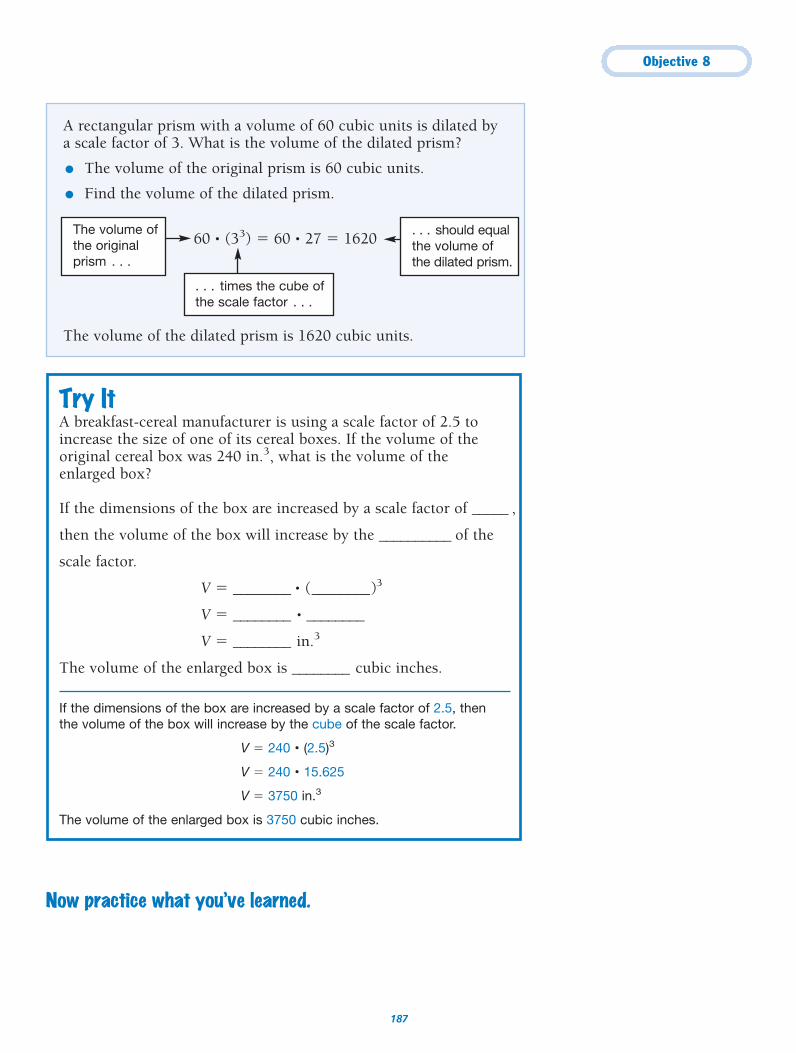
Objective 8
187
A rectangular prism with a volume of 60 cubic units is dilated by a scale factor of 3. What is the volume of the dilated prism?
● The volume of the original prism is 60 cubic units.
● Find the volume of the dilated prism.
60 • (33) � 60 • 27 � 1620
The volume of the dilated prism is 1620 cubic units.
The volume ofthe originalprism . . .
. . . should equalthe volume ofthe dilated prism.
. . . times the cube ofthe scale factor . . .
Try ItA breakfast-cereal manufacturer is using a scale factor of 2.5 toincrease the size of one of its cereal boxes. If the volume of theoriginal cereal box was 240 in.3, what is the volume of the enlarged box?
If the dimensions of the box are increased by a scale factor of _____ ,
then the volume of the box will increase by the __________ of the
scale factor.
V � ________ • (________)3
V � ________ • ________
V � ________ in.3
The volume of the enlarged box is ________ cubic inches.
If the dimensions of the box are increased by a scale factor of 2.5, then the volume of the box will increase by the cube of the scale factor.
V � 240 • (2.5)3
V � 240 • 15.625
V � 3750 in.3
The volume of the enlarged box is 3750 cubic inches.
Now practice what you’ve learned.
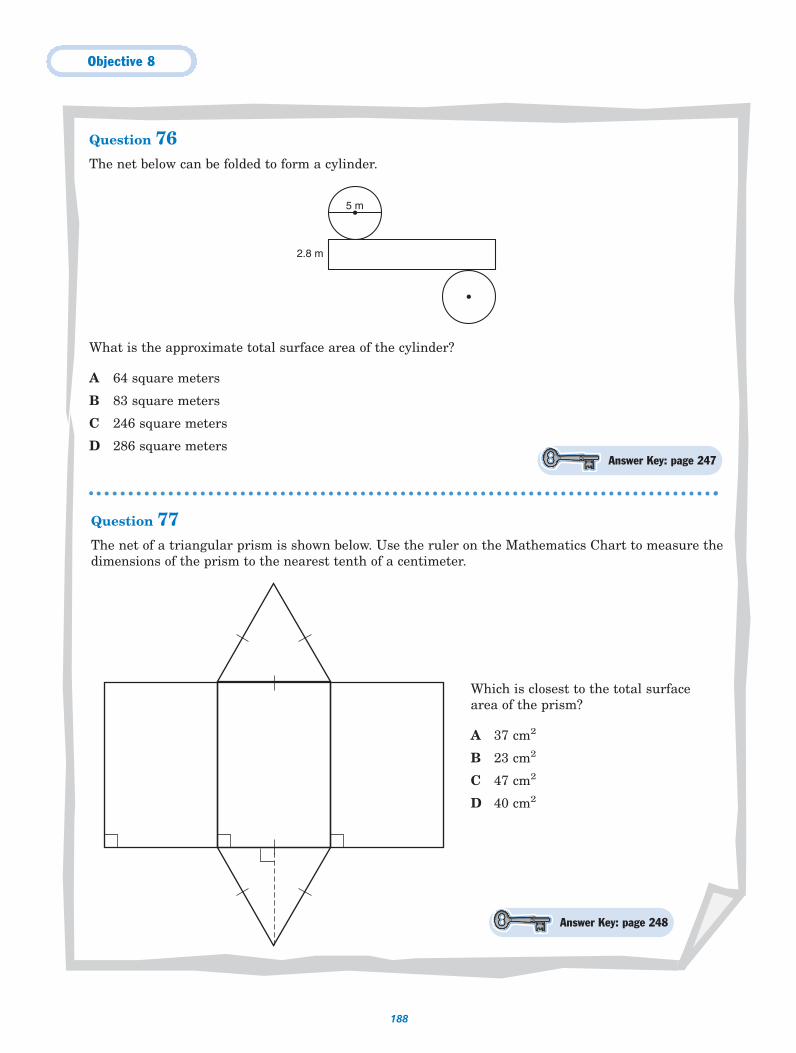
Objective 8
188
Answer Key: page 247
Answer Key: page 248
Question 77The net of a triangular prism is shown below. Use the ruler on the Mathematics Chart to measure thedimensions of the prism to the nearest tenth of a centimeter.
Which is closest to the total surface area of the prism?
A 37 cm2
B 23 cm2
C 47 cm2
D 40 cm2
Question 76The net below can be folded to form a cylinder.
What is the approximate total surface area of the cylinder?
A 64 square meters
B 83 square meters
C 246 square meters
D 286 square meters
5 m
2.8 m
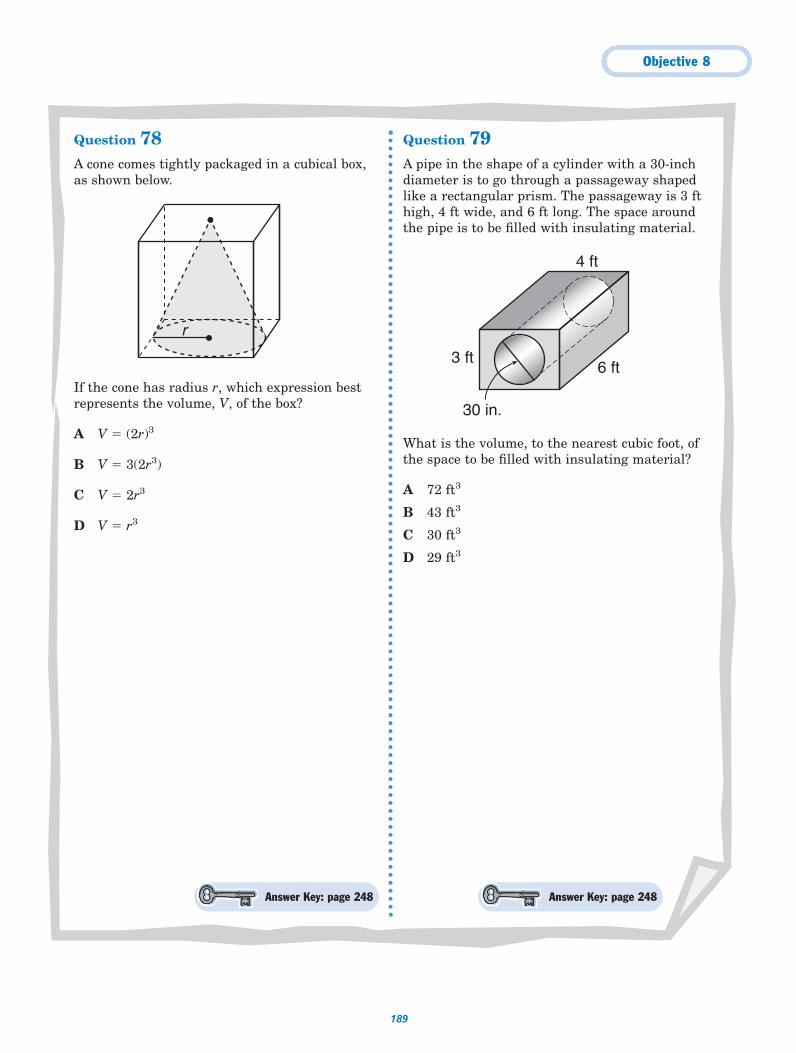
Objective 8
189
Question 78A cone comes tightly packaged in a cubical box,as shown below.
If the cone has radius r, which expression bestrepresents the volume, V, of the box?
A V � (2r)3
B V � 3(2r3)
C V � 2r3
D V � r3
Question 79A pipe in the shape of a cylinder with a 30-inchdiameter is to go through a passageway shapedlike a rectangular prism. The passageway is 3 fthigh, 4 ft wide, and 6 ft long. The space aroundthe pipe is to be filled with insulating material.
What is the volume, to the nearest cubic foot, ofthe space to be filled with insulating material?
A 72 ft3
B 43 ft3
C 30 ft3
D 29 ft3
3 ft
4 ft
6 ft
30 in.
r
Answer Key: page 248 Answer Key: page 248
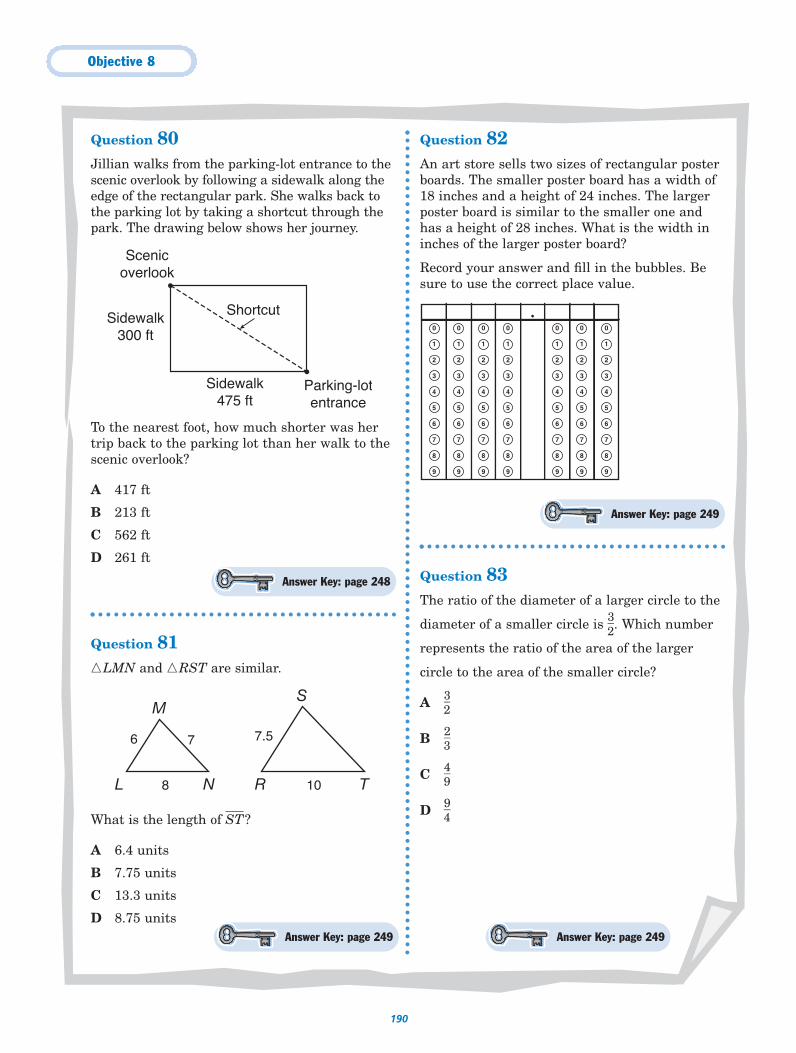
Objective 8
190
Question 80Jillian walks from the parking-lot entrance to thescenic overlook by following a sidewalk along theedge of the rectangular park. She walks back tothe parking lot by taking a shortcut through thepark. The drawing below shows her journey.
To the nearest foot, how much shorter was hertrip back to the parking lot than her walk to thescenic overlook?
A 417 ft
B 213 ft
C 562 ft
D 261 ft
Question 81�LMN and �RST are similar.
What is the length of S�T�?
A 6.4 units
B 7.75 units
C 13.3 units
D 8.75 units
Question 82An art store sells two sizes of rectangular posterboards. The smaller poster board has a width of18 inches and a height of 24 inches. The largerposter board is similar to the smaller one andhas a height of 28 inches. What is the width ininches of the larger poster board?
Record your answer and fill in the bubbles. Besure to use the correct place value.
Question 83The ratio of the diameter of a larger circle to the
diameter of a smaller circle is �32
�. Which number
represents the ratio of the area of the larger
circle to the area of the smaller circle?
A �32
�
B �23
�
C �49
�
D �94
�
0
1
2
3
4
5
6
7
8
9
0
1
2
3
4
5
6
7
8
9
0
1
2
3
4
5
6
7
8
9
0
1
2
3
4
5
6
7
8
9
0
1
2
3
4
5
6
7
8
9
0
1
2
3
4
5
6
7
8
9
0
1
2
3
4
5
6
7
8
9
L
MS
N R T
6
8 10
7 7.5
Scenicoverlook
Parking-lotentrance
Sidewalk300 ft
Sidewalk475 ft
Shortcut
Answer Key: page 249 Answer Key: page 249
Answer Key: page 248
Answer Key: page 249
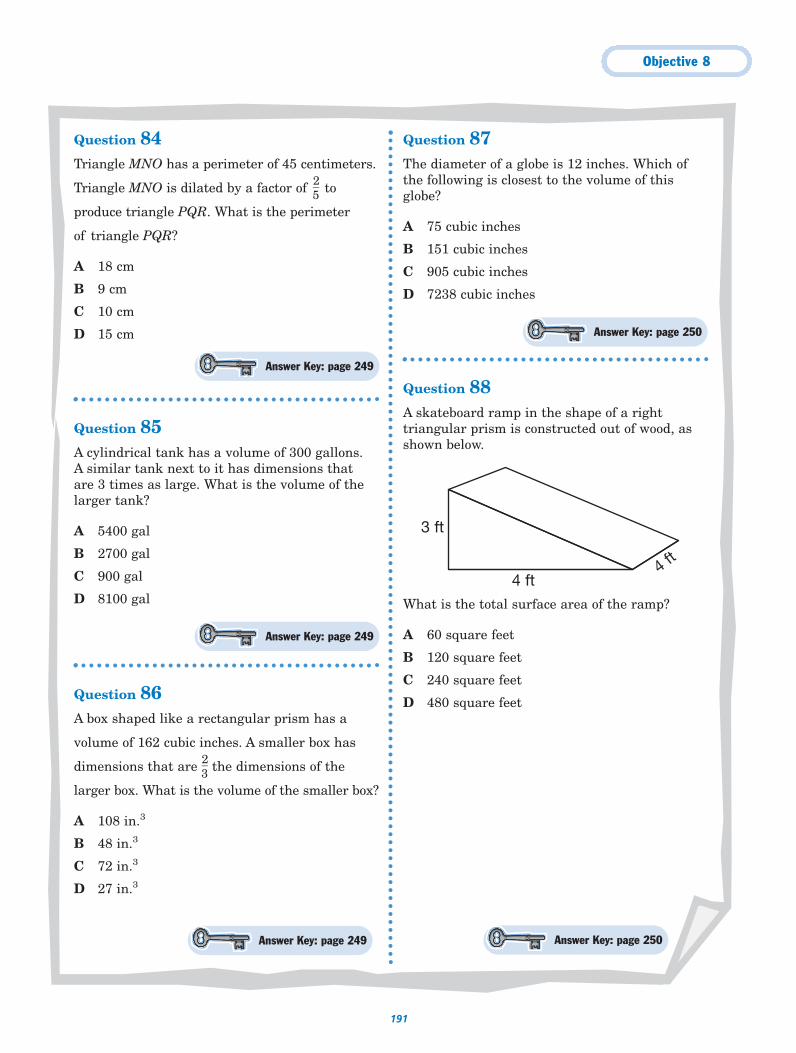
Objective 8
191
Question 84Triangle MNO has a perimeter of 45 centimeters.
Triangle MNO is dilated by a factor of �25
� to
produce triangle PQR. What is the perimeter
of triangle PQR?
A 18 cm
B 9 cm
C 10 cm
D 15 cm
Question 85A cylindrical tank has a volume of 300 gallons. A similar tank next to it has dimensions that are 3 times as large. What is the volume of thelarger tank?
A 5400 gal
B 2700 gal
C 900 gal
D 8100 gal
Question 86A box shaped like a rectangular prism has a
volume of 162 cubic inches. A smaller box has
dimensions that are �23
� the dimensions of the
larger box. What is the volume of the smaller box?
A 108 in.3
B 48 in.3
C 72 in.3
D 27 in.3
Question 87The diameter of a globe is 12 inches. Which ofthe following is closest to the volume of thisglobe?
A 75 cubic inches
B 151 cubic inches
C 905 cubic inches
D 7238 cubic inches
Question 88A skateboard ramp in the shape of a righttriangular prism is constructed out of wood, asshown below.
What is the total surface area of the ramp?
A 60 square feet
B 120 square feet
C 240 square feet
D 480 square feet
4 ft
3 ft
4 ft
Answer Key: page 249
Answer Key: page 250
Answer Key: page 250
Answer Key: page 249
Answer Key: page 249
192
For this objective you should be able to
● identify proportional relationships in problem situations andsolve problems;
● apply concepts of theoretical and experimental probability tomake predictions;
● use statistical procedures to describe data; and
● evaluate predictions and conclusions based on statistical data.
How Do You Solve Problems Involving Proportional Relationships?A ratio is a comparison of two quantities. A proportion is a statementthat two ratios are equal. There are many real-life problems that involveproportional relationships. For example, you use proportions whenconverting units of measurement. You also use proportions to solveproblems involving percents and rates.
To solve problems that involve proportional relationships, follow theseguidelines:
● Identify the ratios to be compared. Be certain to compare thecorresponding quantities, in the same order.
● Write a proportion, an equation in which the two ratios are setequal to each other.
● Solve the proportion. Use the fact that the cross products in aproportion are equal.
On a game show Mr. Williams answered 12 out of 15 questionscorrectly. What percent of the questions did Mr. Williams answerincorrectly?
● Mr. Williams answered 12 questions correctly. Therefore, heanswered 15 � 12 � 3 questions incorrectly.
● Write a ratio that compares the number of questions answered
incorrectly to the total number of questions: �135�.
● To find the percent of questions answered incorrectly, find the
part of 100, or the ratio �10
n0
�, that is equivalent to �135�.
● Write a proportion.�10
n0
� � �135�
The student will demonstrate an understanding of percents, proportionalrelationships, probability, and statistics in application problems.
Objective 9
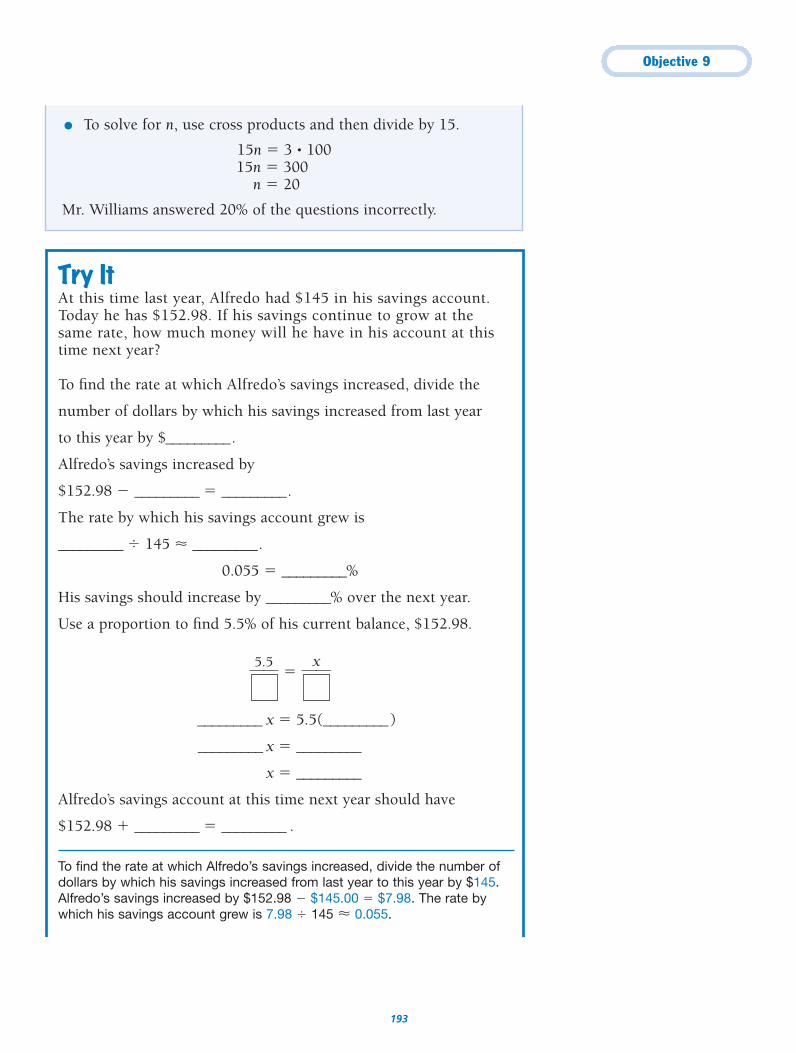
Objective 9
193
● To solve for n, use cross products and then divide by 15.
15n � 3 • 10015n � 300
n � 20
Mr. Williams answered 20% of the questions incorrectly.
Try ItAt this time last year, Alfredo had $145 in his savings account.Today he has $152.98. If his savings continue to grow at the same rate, how much money will he have in his account at this time next year?
To find the rate at which Alfredo’s savings increased, divide the
number of dollars by which his savings increased from last year
to this year by $_________.
Alfredo’s savings increased by
$152.98 � _________ � _________.
The rate by which his savings account grew is
_________ � 145 � _________.
0.055 � _________%
His savings should increase by _________% over the next year.
Use a proportion to find 5.5% of his current balance, $152.98.
�050.050
� � �00000000
�x
_________ x � 5.5(_________)
_________ x � _________
x � _________
Alfredo’s savings account at this time next year should have
$152.98 � _________ � _________ .
To find the rate at which Alfredo’s savings increased, divide the number ofdollars by which his savings increased from last year to this year by $145.Alfredo’s savings increased by $152.98 � $145.00 � $7.98. The rate bywhich his savings account grew is 7.98 � 145 � 0.055.
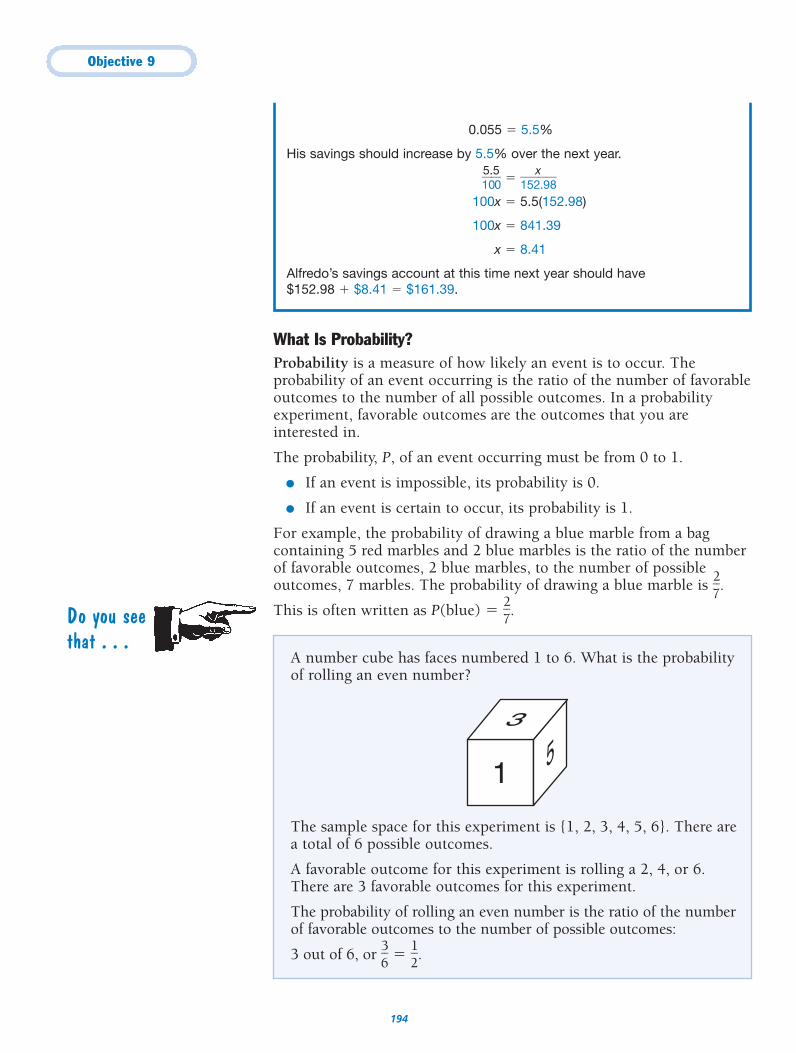
Objective 9
194
0.055 � 5.5%
His savings should increase by 5.5% over the next year.
�150.50
� � �152
x.98�
100x � 5.5(152.98)
100x � 841.39
x � 8.41
Alfredo’s savings account at this time next year should have $152.98 � $8.41 � $161.39.
What Is Probability?Probability is a measure of how likely an event is to occur. Theprobability of an event occurring is the ratio of the number of favorableoutcomes to the number of all possible outcomes. In a probabilityexperiment, favorable outcomes are the outcomes that you areinterested in.
The probability, P, of an event occurring must be from 0 to 1.
● If an event is impossible, its probability is 0.
● If an event is certain to occur, its probability is 1.
For example, the probability of drawing a blue marble from a bagcontaining 5 red marbles and 2 blue marbles is the ratio of the numberof favorable outcomes, 2 blue marbles, to the number of possibleoutcomes, 7 marbles. The probability of drawing a blue marble is �
27
�.
This is often written as P(blue) � �27
�.
A number cube has faces numbered 1 to 6. What is the probabilityof rolling an even number?
The sample space for this experiment is {1, 2, 3, 4, 5, 6}. There area total of 6 possible outcomes.
A favorable outcome for this experiment is rolling a 2, 4, or 6.There are 3 favorable outcomes for this experiment.
The probability of rolling an even number is the ratio of the numberof favorable outcomes to the number of possible outcomes:
3 out of 6, or �36
� � �12
�.
1 53
Do you seethat . . .
Objective 9
195
A probability experiment consists of rolling a number cube withfaces numbered 1 through 6 and then tossing a coin. What is theprobability of rolling a 3 on the number cube and tossing tails onthe coin?
● There are 6 possible outcomes for rolling the number cube: 1, 2, 3, 4, 5, and 6. There is only one favorable outcome, rolling
a 3. The probability of rolling a 3 on the number cube is �16
�.
P(3) � �16
�
How Do You Find the Probability of Compound Events?An event made up of a sequence of simple events is called a compoundevent. For example, flipping a coin and then rolling a number cube is acompound event.
One way to find the probability of a compound event is to multiply theprobabilities of simple, mutually exclusive events that make up thecompound event.
If P(A) represents the probability of event A and P(B) represents theprobability of event B, then the probability of the compound event (A and B) can be represented algebraically.
P(A and B) � P(A) • P(B)
For example, the probability of a coin landing heads up on one toss
is P(H) � �12
�. The probability of a coin landing heads up on two
tosses can be found as follows:
P(H and H) � P(H) • P(H) � �12
� • �12
� � �14
�
When finding the probability of a compound event, you should firstdetermine whether the simple events included are dependent orindependent events.
● If the outcome of the first event affects the possible outcomes forthe second event, the events are called dependent events.
Suppose you draw 2 marbles, one at a time, from a bag with 4 white marbles and 1 red marble in it. You draw the secondmarble without replacing the first one you drew. Does theoutcome of the first draw affect the likelihood of drawing a redmarble on the second draw? Yes, because there were 5 marblesin the bag on the first draw, but only 4 on the second draw. Theevents are dependent.
● If the outcome of the first event does not affect the possibleoutcomes for the second event, the events are calledindependent events.
Suppose you spin a spinner with the numbers 1 through 4written on it, and then you spin it again. Does the outcome ofthe first spin affect the likelihood of spinning a 3 on the secondspin? No. The events are independent.
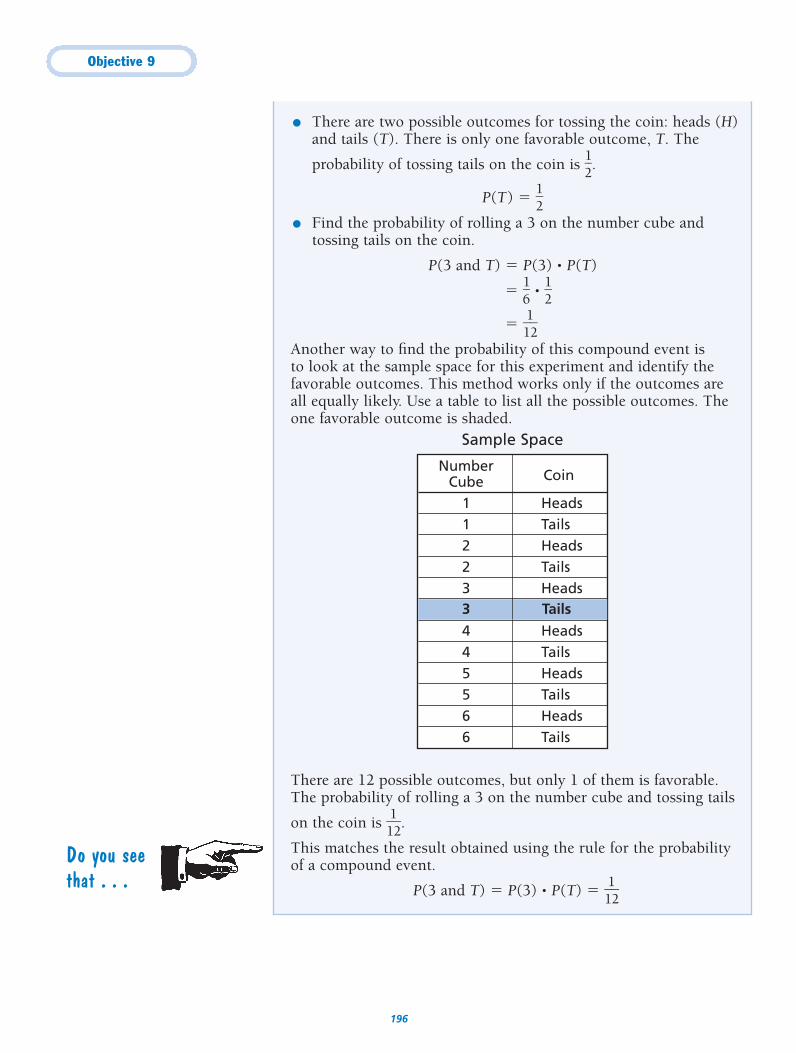
Objective 9
196
● There are two possible outcomes for tossing the coin: heads (H)and tails (T). There is only one favorable outcome, T. The
probability of tossing tails on the coin is �12
�.
P(T) � �12
�
● Find the probability of rolling a 3 on the number cube andtossing tails on the coin.
P(3 and T) � P(3) • P(T)
� �16
� • �12
�
� �112�
Another way to find the probability of this compound event is to look at the sample space for this experiment and identify thefavorable outcomes. This method works only if the outcomes areall equally likely. Use a table to list all the possible outcomes. Theone favorable outcome is shaded.
There are 12 possible outcomes, but only 1 of them is favorable.The probability of rolling a 3 on the number cube and tossing tails
on the coin is �112�.
This matches the result obtained using the rule for the probabilityof a compound event.
P(3 and T) � P(3) • P(T) � �112�
Do you seethat . . .
NumberCoinCube
1 Heads1 Tails2 Heads2 Tails3 Heads3 Tail4 Heads4 Tails5 Heads5 Tails6 Heads6 Tails
Sample Space
3 Tails
Objective 9
197
Do you seethat . . .
A jar contains 4 red balls, 5 green balls, and 3 black balls. A ball isdrawn, and then a second ball is drawn without replacing the firstone. What is the probability of drawing two red balls in a row?
There are 12 balls in the jar on the first draw, and 11 balls in thejar on the second draw. The two events are dependent. Theoutcome of the first ball drawn affects the possible outcome of thesecond ball drawn.
● Find the probability of drawing a red ball on the first draw.There are 12 possible outcomes for the first draw. There are 4 favorable outcomes, 4 red balls.
P(redfirst) � �142� � �
13
�
● Find the probability of drawing a red ball on the second draw.There are now only 11 balls in the jar, so there are 11 possibleoutcomes for the second draw. Assume the first ball drawn wasred. There are 3 favorable outcomes, 3 red balls left in the jar.
P(redsecond) � �131�
● Find the compound probability.
P(redfirst and redsecond) � P(redfirst) • P(redsecond)
� �13
� • �131� � �
333� � �
111�
The probability of drawing two red balls in a row is �111�.
What Is the Difference Between Theoretical and ExperimentalProbability?The theoretical probability of an event occurring is the ratio comparingthe number of ways the favorable outcomes should occur to the numberof all possible outcomes. If you toss a coin, theoretically the coin
should land on heads �12
� of the time.
P(H) � �12
� � 0.5
The experimental probability of an event occurring is the ratiocomparing the actual number of times the favorable outcome occurs in aseries of repeated trials to the total number of trials. If you toss a coin100 times, it is possible that the coin will land heads up 48 times and tailsup 52 times. The experimental probability of the coin landing heads up
in this situation would be �14080
�.
P(H) � �14080
� � 0.48
The two types of probabilities, theoretical and experimental, are notalways equal. In this case the theoretical probability is 0.5, but theexperimental probability is 0.48.
For a given situation the experimental probability is usually close to,but slightly different from, the theoretical probability. The greater thenumber of trials, the closer the experimental probability should be tothe theoretical probability.
Objective 9
198
How Do You Use Probability to Make Predictions and Decisions?You can use either theoretical or experimental probabilities to makepredictions. If you know the probability of an event occurring and youalso know the total number of trials, then you can predict the likelynumber of favorable outcomes.
● Write a ratio that represents the probability of an event occurring.
● Write a ratio that compares the number of favorable outcomes tothe number of trials.
● Write a proportion.
● Solve the proportion.
A spinner in a game has 4 equal-sized regions: red, green, blue, and yellow. A group of players makes 40 trial spins and creates the table below.
How does the theoretical probability of landing on green compareto the experimental results?
● Since the colored regions are of equal size, the spinner is equallylikely to land on any one of the colored regions. There are fourpossible outcomes for this experiment: red, green, blue, andyellow. There is one favorable outcome: green. The theoretical
probability of landing on the green is �14
�, or P(green) � 0.25.
● The experimental probability of landing on green is the ratio of the number of times the spinner landed on green in theexperiment to the total number of spins. The spinner landed on green 12 times out of 40 spins. The experimental probability
of landing on green is �14
20� � �
130�, or P(green) � 0.3.
The experimental probability, 0.3, and the theoretical probability,0.25, are close to each other but not equal.
Color FrequencyRed 9Green 12Blue 10Yellow 9
The number of trials inan experiment is thenumber of times theexperiment is repeated.If you toss a coin 100 times, you willcomplete 100 trials of a coin-toss experiment.
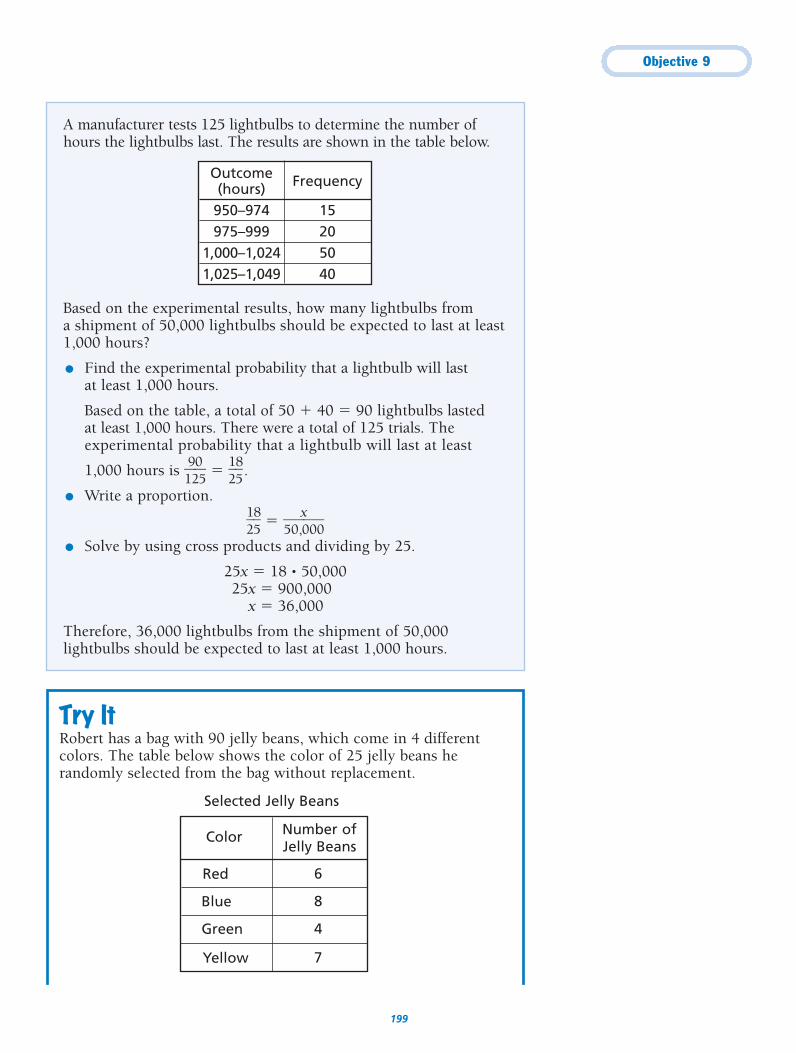
Objective 9
199
A manufacturer tests 125 lightbulbs to determine the number ofhours the lightbulbs last. The results are shown in the table below.
Based on the experimental results, how many lightbulbs from a shipment of 50,000 lightbulbs should be expected to last at least 1,000 hours?
● Find the experimental probability that a lightbulb will last at least 1,000 hours.
Based on the table, a total of 50 � 40 � 90 lightbulbs lasted at least 1,000 hours. There were a total of 125 trials. Theexperimental probability that a lightbulb will last at least
1,000 hours is �19205
� � �12
85�.
● Write a proportion.
�12
85� � �
50,x000�
● Solve by using cross products and dividing by 25.
25x � 18 • 50,00025x � 900,000
x � 36,000
Therefore, 36,000 lightbulbs from the shipment of 50,000lightbulbs should be expected to last at least 1,000 hours.
Outcome Frequency(hours)950–974 15975–999 20
1,000–1,024 501,025–1,049 40
Try ItRobert has a bag with 90 jelly beans, which come in 4 differentcolors. The table below shows the color of 25 jelly beans herandomly selected from the bag without replacement.
Selected Jelly Beans
Color
Red
Blue
Green
Yellow
6
8
4
7
Number ofJelly Beans
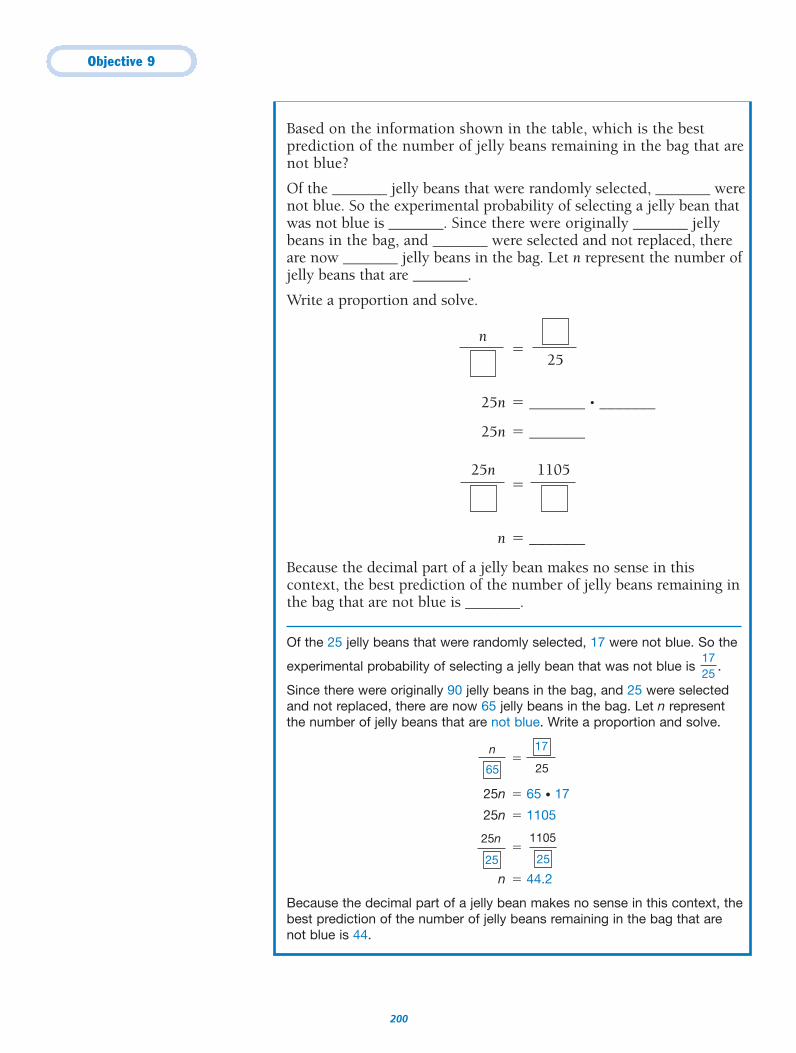
Objective 9
200
Based on the information shown in the table, which is the bestprediction of the number of jelly beans remaining in the bag that arenot blue?
Of the _______ jelly beans that were randomly selected, _______ werenot blue. So the experimental probability of selecting a jelly bean thatwas not blue is _______. Since there were originally _______ jellybeans in the bag, and _______ were selected and not replaced, thereare now _______ jelly beans in the bag. Let n represent the number ofjelly beans that are _______.
Write a proportion and solve.
�
25n � _______ • _______
25n � _______
�
n � _______
Because the decimal part of a jelly bean makes no sense in thiscontext, the best prediction of the number of jelly beans remaining inthe bag that are not blue is _______.
Of the 25 jelly beans that were randomly selected, 17 were not blue. So the
experimental probability of selecting a jelly bean that was not blue is .
Since there were originally 90 jelly beans in the bag, and 25 were selectedand not replaced, there are now 65 jelly beans in the bag. Let n representthe number of jelly beans that are not blue. Write a proportion and solve.
�
25n � 65 • 17
25n � 1105
�
n � 44.2
Because the decimal part of a jelly bean makes no sense in this context, thebest prediction of the number of jelly beans remaining in the bag that arenot blue is 44.
1725
n
25
25n 1105
n
25
17
65
25n
25
1105
25
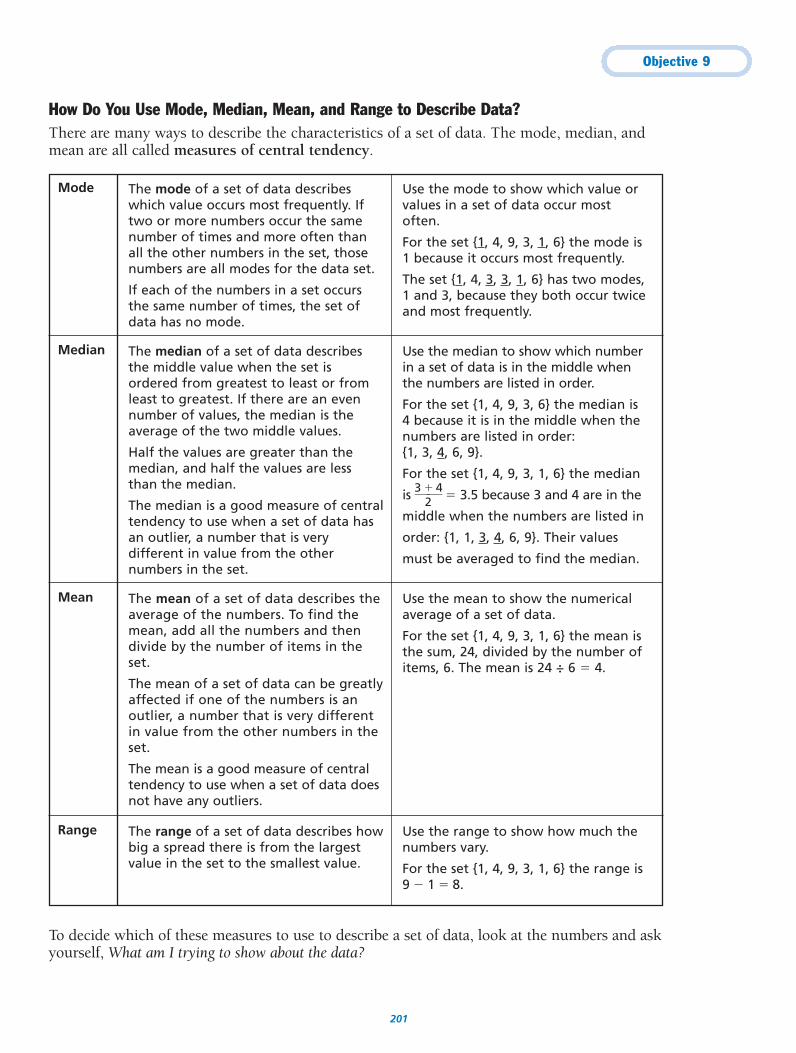
Objective 9
201
Mode
Median
Mean
Range Use the range to show how much thenumbers vary.
For the set {1, 4, 9, 3, 1, 6} the range is9 � 1 � 8.
The range of a set of data describes howbig a spread there is from the largestvalue in the set to the smallest value.
Use the mean to show the numericalaverage of a set of data.
For the set {1, 4, 9, 3, 1, 6} the mean isthe sum, 24, divided by the number ofitems, 6. The mean is 24 ÷ 6 � 4.
The mean of a set of data describes theaverage of the numbers. To find themean, add all the numbers and thendivide by the number of items in theset.
The mean of a set of data can be greatlyaffected if one of the numbers is anoutlier, a number that is very differentin value from the other numbers in theset.
The mean is a good measure of centraltendency to use when a set of data doesnot have any outliers.
Use the median to show which numberin a set of data is in the middle whenthe numbers are listed in order.
For the set {1, 4, 9, 3, 6} the median is4 because it is in the middle when thenumbers are listed in order: {1, 3, 4, 6, 9}.
For the set {1, 4, 9, 3, 1, 6} the median
is �3 �2
4� � 3.5 because 3 and 4 are in the
middle when the numbers are listed in
order: {1, 1, 3, 4, 6, 9}. Their values
must be averaged to find the median.
The median of a set of data describesthe middle value when the set isordered from greatest to least or fromleast to greatest. If there are an evennumber of values, the median is theaverage of the two middle values.
Half the values are greater than themedian, and half the values are lessthan the median.
The median is a good measure of centraltendency to use when a set of data hasan outlier, a number that is verydifferent in value from the othernumbers in the set.
Use the mode to show which value orvalues in a set of data occur mostoften.
For the set {1, 4, 9, 3, 1, 6} the mode is1 because it occurs most frequently.
The set {1, 4, 3, 3, 1, 6} has two modes,1 and 3, because they both occur twiceand most frequently.
The mode of a set of data describeswhich value occurs most frequently. Iftwo or more numbers occur the samenumber of times and more often thanall the other numbers in the set, thosenumbers are all modes for the data set.
If each of the numbers in a set occursthe same number of times, the set ofdata has no mode.
How Do You Use Mode, Median, Mean, and Range to Describe Data?There are many ways to describe the characteristics of a set of data. The mode, median, andmean are all called measures of central tendency.
To decide which of these measures to use to describe a set of data, look at the numbers and askyourself, What am I trying to show about the data?
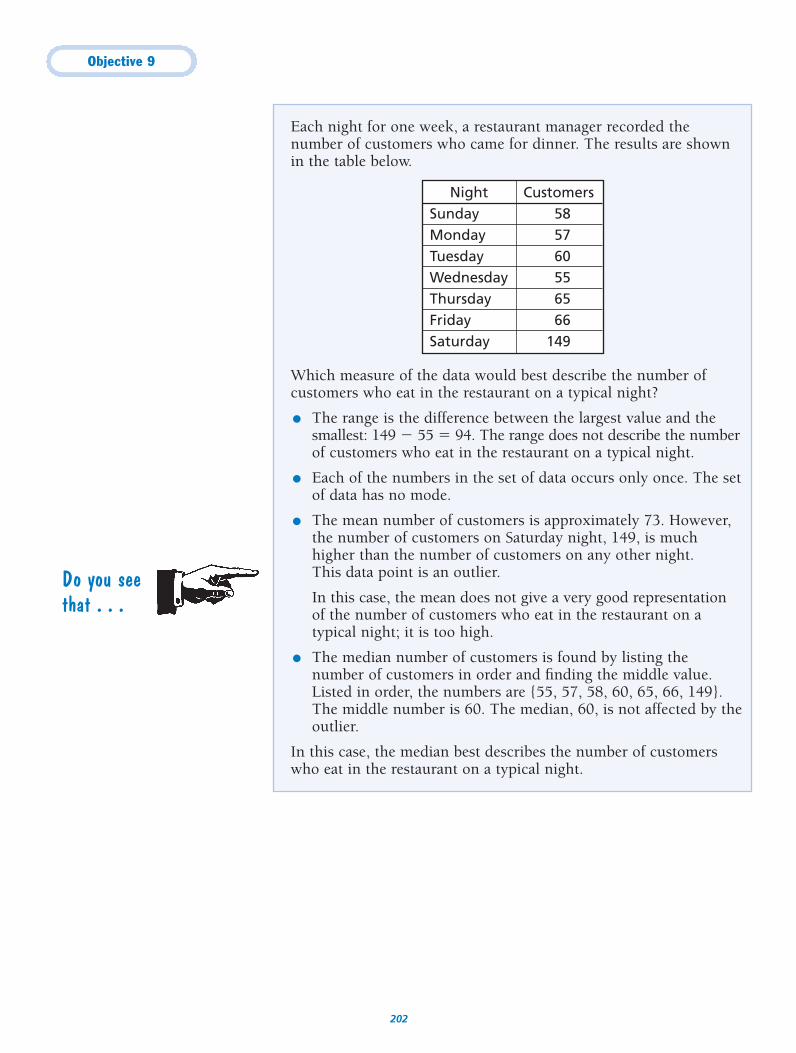
Objective 9
202
Each night for one week, a restaurant manager recorded thenumber of customers who came for dinner. The results are shownin the table below.
Which measure of the data would best describe the number ofcustomers who eat in the restaurant on a typical night?
● The range is the difference between the largest value and thesmallest: 149 � 55 � 94. The range does not describe the numberof customers who eat in the restaurant on a typical night.
● Each of the numbers in the set of data occurs only once. The setof data has no mode.
● The mean number of customers is approximately 73. However,the number of customers on Saturday night, 149, is muchhigher than the number of customers on any other night. This data point is an outlier.
In this case, the mean does not give a very good representationof the number of customers who eat in the restaurant on atypical night; it is too high.
● The median number of customers is found by listing thenumber of customers in order and finding the middle value.Listed in order, the numbers are {55, 57, 58, 60, 65, 66, 149}.The middle number is 60. The median, 60, is not affected by theoutlier.
In this case, the median best describes the number of customerswho eat in the restaurant on a typical night.
Night CustomersSunday 58Monday 57Tuesday 60Wednesday 55Thursday 65Friday 66Saturday 149
Do you seethat . . .
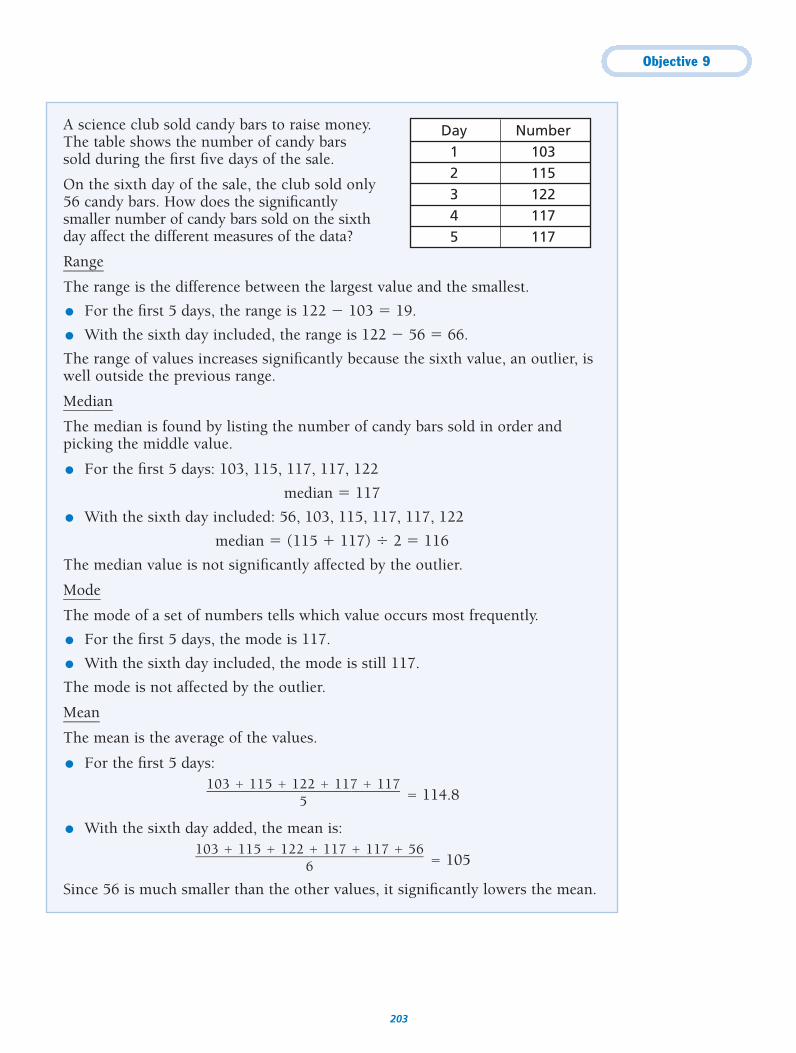
Objective 9
203
A science club sold candy bars to raise money. The table shows the number of candy barssold during the first five days of the sale.
On the sixth day of the sale, the club sold only 56 candy bars. How does the significantlysmaller number of candy bars sold on the sixthday affect the different measures of the data?
R�
a�n�
g�e�
The range is the difference between the largest value and the smallest.
● For the first 5 days, the range is 122 � 103 � 19.
● With the sixth day included, the range is 122 � 56 � 66.
The range of values increases significantly because the sixth value, an outlier, iswell outside the previous range.
M�
e�d�
i�a�n�
The median is found by listing the number of candy bars sold in order andpicking the middle value.
● For the first 5 days: 103, 115, 117, 117, 122
median � 117
● With the sixth day included: 56, 103, 115, 117, 117, 122
median � (115 � 117) � 2 � 116
The median value is not significantly affected by the outlier.
M�
o�
d�
e�
The mode of a set of numbers tells which value occurs most frequently.
● For the first 5 days, the mode is 117.
● With the sixth day included, the mode is still 117.
The mode is not affected by the outlier.
M�
e�a�n�
The mean is the average of the values.
● For the first 5 days:
� 114.8
● With the sixth day added, the mean is:
� 105
Since 56 is much smaller than the other values, it significantly lowers the mean.
103 � 115 � 122 � 117 � 117 � 56����
6
103 � 115 � 122 � 117 � 117����
5
Day Number1 1032 1153 1224 1175 117
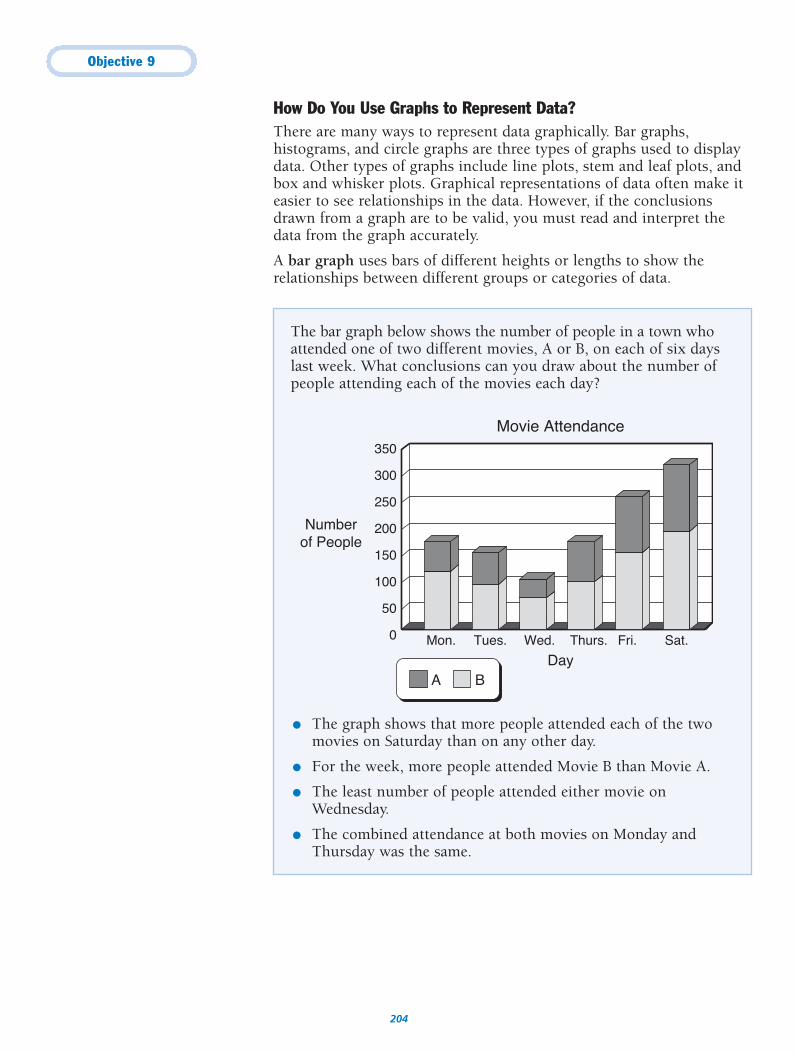
Objective 9
204
How Do You Use Graphs to Represent Data?There are many ways to represent data graphically. Bar graphs,histograms, and circle graphs are three types of graphs used to displaydata. Other types of graphs include line plots, stem and leaf plots, andbox and whisker plots. Graphical representations of data often make iteasier to see relationships in the data. However, if the conclusionsdrawn from a graph are to be valid, you must read and interpret thedata from the graph accurately.
A bar graph uses bars of different heights or lengths to show therelationships between different groups or categories of data.
The bar graph below shows the number of people in a town whoattended one of two different movies, A or B, on each of six dayslast week. What conclusions can you draw about the number ofpeople attending each of the movies each day?
● The graph shows that more people attended each of the twomovies on Saturday than on any other day.
● For the week, more people attended Movie B than Movie A.
● The least number of people attended either movie onWednesday.
● The combined attendance at both movies on Monday andThursday was the same.
Numberof People
Movie Attendance
DayMon. Tues. Wed. Thurs. Fri. Sat.0
50
100
150
200
250
300
350
A B
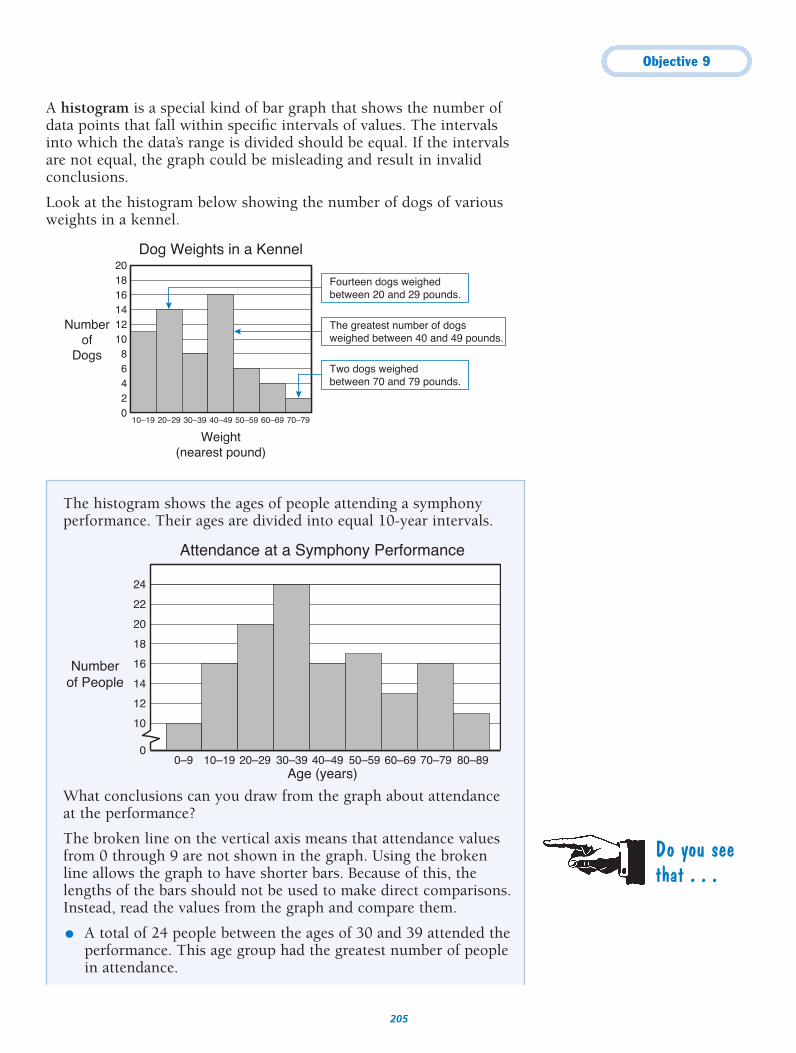
Objective 9
205
The histogram shows the ages of people attending a symphonyperformance. Their ages are divided into equal 10-year intervals.
What conclusions can you draw from the graph about attendanceat the performance?
The broken line on the vertical axis means that attendance valuesfrom 0 through 9 are not shown in the graph. Using the brokenline allows the graph to have shorter bars. Because of this, thelengths of the bars should not be used to make direct comparisons.Instead, read the values from the graph and compare them.
● A total of 24 people between the ages of 30 and 39 attended theperformance. This age group had the greatest number of peoplein attendance.
Numberof People
Attendance at a Symphony Performance
Age (years)0–9 10–19 20–29 30–39 40–49 50–59 60–69 70–79 80–89
0
10
12
14
16
18
20
22
24
A histogram is a special kind of bar graph that shows the number ofdata points that fall within specific intervals of values. The intervalsinto which the data’s range is divided should be equal. If the intervalsare not equal, the graph could be misleading and result in invalidconclusions.
Look at the histogram below showing the number of dogs of variousweights in a kennel.
Numberof
Dogs
Dog Weights in a Kennel
Weight(nearest pound)
10–19 20–29 30–39 40–49 50–59 60–69 70–7902468
101214161820
Fourteen dogs weighedbetween 20 and 29 pounds.
Two dogs weighedbetween 70 and 79 pounds.
The greatest number of dogsweighed between 40 and 49 pounds.
Do you seethat . . .
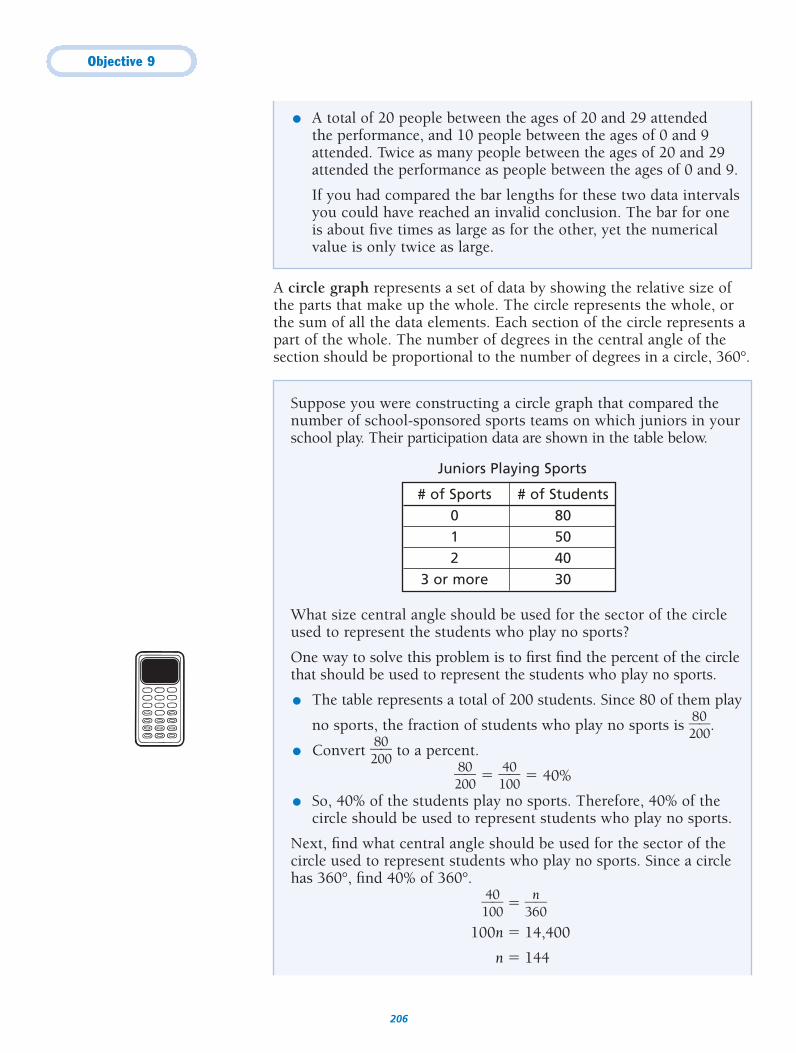
Objective 9
206
● A total of 20 people between the ages of 20 and 29 attended the performance, and 10 people between the ages of 0 and 9attended. Twice as many people between the ages of 20 and 29attended the performance as people between the ages of 0 and 9.
If you had compared the bar lengths for these two data intervalsyou could have reached an invalid conclusion. The bar for oneis about five times as large as for the other, yet the numericalvalue is only twice as large.
A circle graph represents a set of data by showing the relative size ofthe parts that make up the whole. The circle represents the whole, orthe sum of all the data elements. Each section of the circle represents apart of the whole. The number of degrees in the central angle of thesection should be proportional to the number of degrees in a circle, 360°.
Suppose you were constructing a circle graph that compared thenumber of school-sponsored sports teams on which juniors in yourschool play. Their participation data are shown in the table below.
What size central angle should be used for the sector of the circleused to represent the students who play no sports?
One way to solve this problem is to first find the percent of the circlethat should be used to represent the students who play no sports.
● The table represents a total of 200 students. Since 80 of them play
no sports, the fraction of students who play no sports is �28000
�.
● Convert �28000
� to a percent.
�28000
� � �14000
� � 40%
● So, 40% of the students play no sports. Therefore, 40% of thecircle should be used to represent students who play no sports.
Next, find what central angle should be used for the sector of thecircle used to represent students who play no sports. Since a circlehas 360°, find 40% of 360°.
�14000
� � �3
n60�
100n � 14,400
n � 144
# of Sports # of Students0 801 502 40
3 or more 30
Juniors Playing Sports
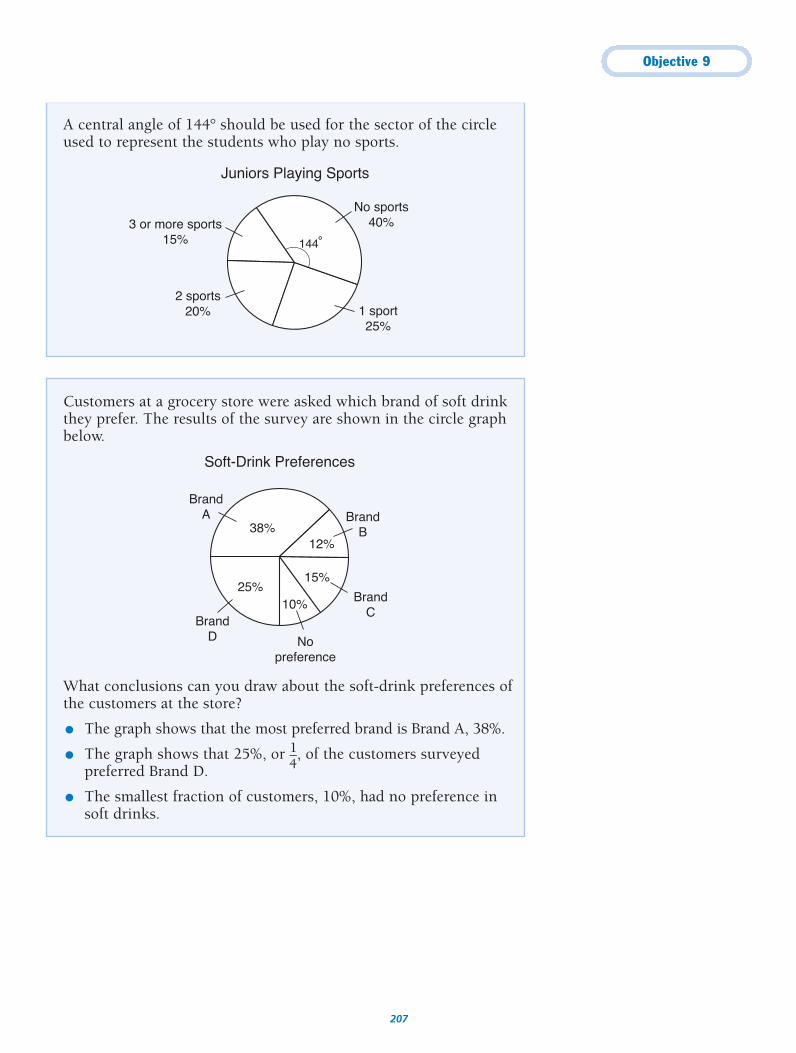
Objective 9
207
Customers at a grocery store were asked which brand of soft drinkthey prefer. The results of the survey are shown in the circle graphbelow.
What conclusions can you draw about the soft-drink preferences ofthe customers at the store?
● The graph shows that the most preferred brand is Brand A, 38%.
● The graph shows that 25%, or �14
�, of the customers surveyedpreferred Brand D.
● The smallest fraction of customers, 10%, had no preference insoft drinks.
Soft-Drink Preferences
BrandA Brand
B
BrandC
Nopreference
BrandD
38%12%
15%
10%25%
A central angle of 144° should be used for the sector of the circleused to represent the students who play no sports.
Juniors Playing Sports
No sports40%
1 sport25%
2 sports20%
3 or more sports15% 144˚
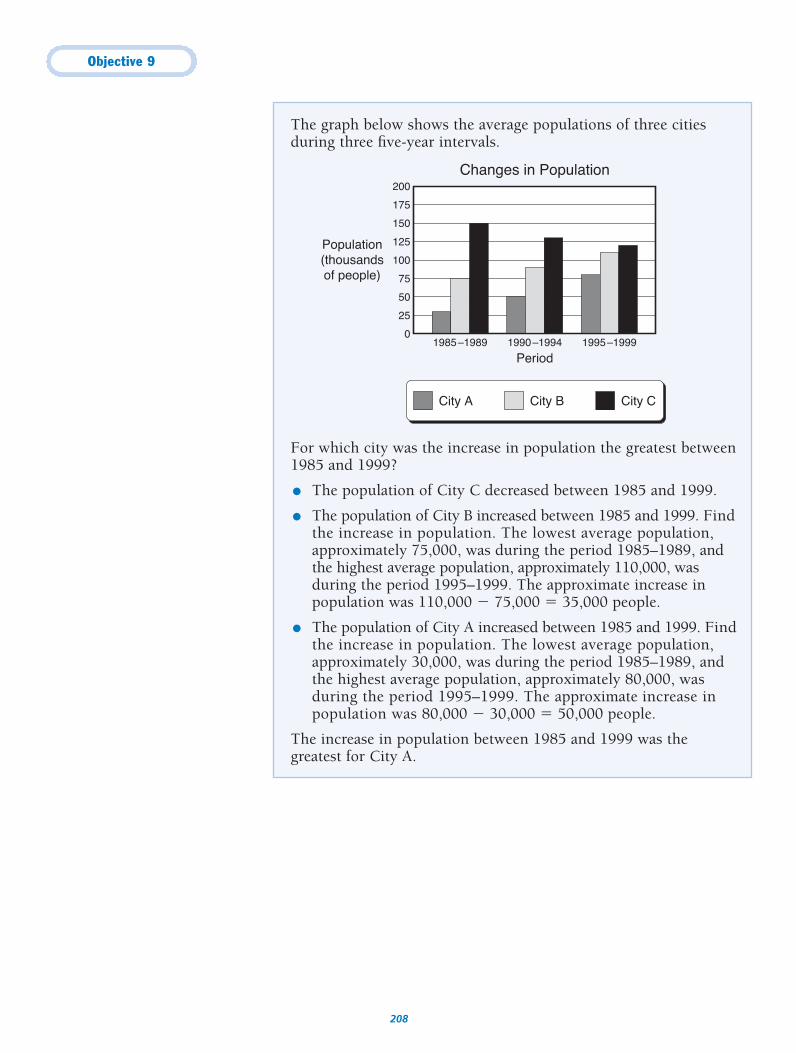
Objective 9
208
The graph below shows the average populations of three citiesduring three five-year intervals.
For which city was the increase in population the greatest between1985 and 1999?
● The population of City C decreased between 1985 and 1999.
● The population of City B increased between 1985 and 1999. Findthe increase in population. The lowest average population,approximately 75,000, was during the period 1985–1989, andthe highest average population, approximately 110,000, wasduring the period 1995–1999. The approximate increase inpopulation was 110,000 � 75,000 � 35,000 people.
● The population of City A increased between 1985 and 1999. Findthe increase in population. The lowest average population,approximately 30,000, was during the period 1985–1989, andthe highest average population, approximately 80,000, wasduring the period 1995–1999. The approximate increase inpopulation was 80,000 � 30,000 � 50,000 people.
The increase in population between 1985 and 1999 was thegreatest for City A.
Population(thousandsof people)
Changes in Population
Period1985–1989
0
City A City B City C
1990–1994 1995–1999
25
50
75
100
125
150
175
200
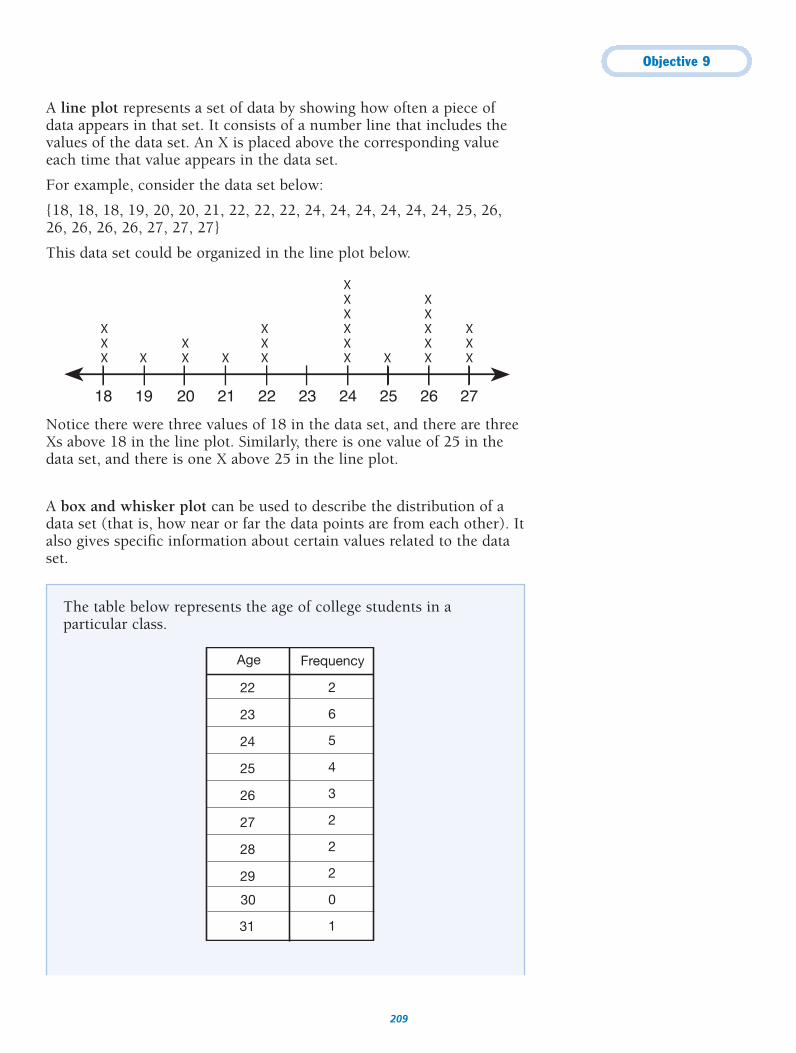
Objective 9
209
A line plot represents a set of data by showing how often a piece ofdata appears in that set. It consists of a number line that includes thevalues of the data set. An X is placed above the corresponding valueeach time that value appears in the data set.
For example, consider the data set below:
{18, 18, 18, 19, 20, 20, 21, 22, 22, 22, 24, 24, 24, 24, 24, 24, 25, 26,26, 26, 26, 26, 27, 27, 27}
This data set could be organized in the line plot below.
Notice there were three values of 18 in the data set, and there are threeXs above 18 in the line plot. Similarly, there is one value of 25 in thedata set, and there is one X above 25 in the line plot.
XXXXXX
18 19 20 21 22 23 24 25 26 27
XXXXX
XXX
XXXX XX
XX
XXX
A box and whisker plot can be used to describe the distribution of adata set (that is, how near or far the data points are from each other). Italso gives specific information about certain values related to the dataset.
The table below represents the age of college students in aparticular class.
Age
22
Frequency
2
623
24 5
25 4
26 3
27 2
28 2
29 2
30 0
31 1
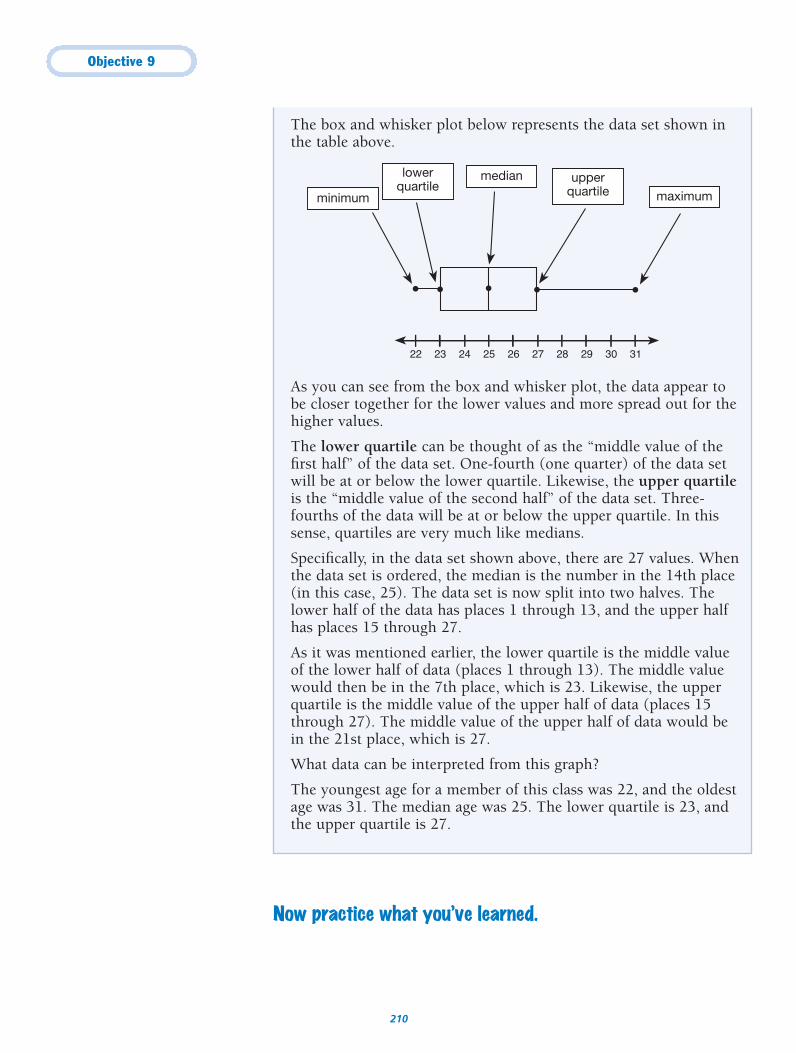
Objective 9
210
Now practice what you’ve learned.
The box and whisker plot below represents the data set shown inthe table above.
As you can see from the box and whisker plot, the data appear tobe closer together for the lower values and more spread out for thehigher values.
The lower quartile can be thought of as the “middle value of thefirst half” of the data set. One-fourth (one quarter) of the data setwill be at or below the lower quartile. Likewise, the upper quartileis the “middle value of the second half” of the data set. Three-fourths of the data will be at or below the upper quartile. In thissense, quartiles are very much like medians.
Specifically, in the data set shown above, there are 27 values. Whenthe data set is ordered, the median is the number in the 14th place(in this case, 25). The data set is now split into two halves. Thelower half of the data has places 1 through 13, and the upper halfhas places 15 through 27.
As it was mentioned earlier, the lower quartile is the middle valueof the lower half of data (places 1 through 13). The middle valuewould then be in the 7th place, which is 23. Likewise, the upperquartile is the middle value of the upper half of data (places 15through 27). The middle value of the upper half of data would bein the 21st place, which is 27.
What data can be interpreted from this graph?
The youngest age for a member of this class was 22, and the oldestage was 31. The median age was 25. The lower quartile is 23, andthe upper quartile is 27.
minimum
median
maximum
lowerquartile
upperquartile
22 23 24 25 26 27 28 29 30 31
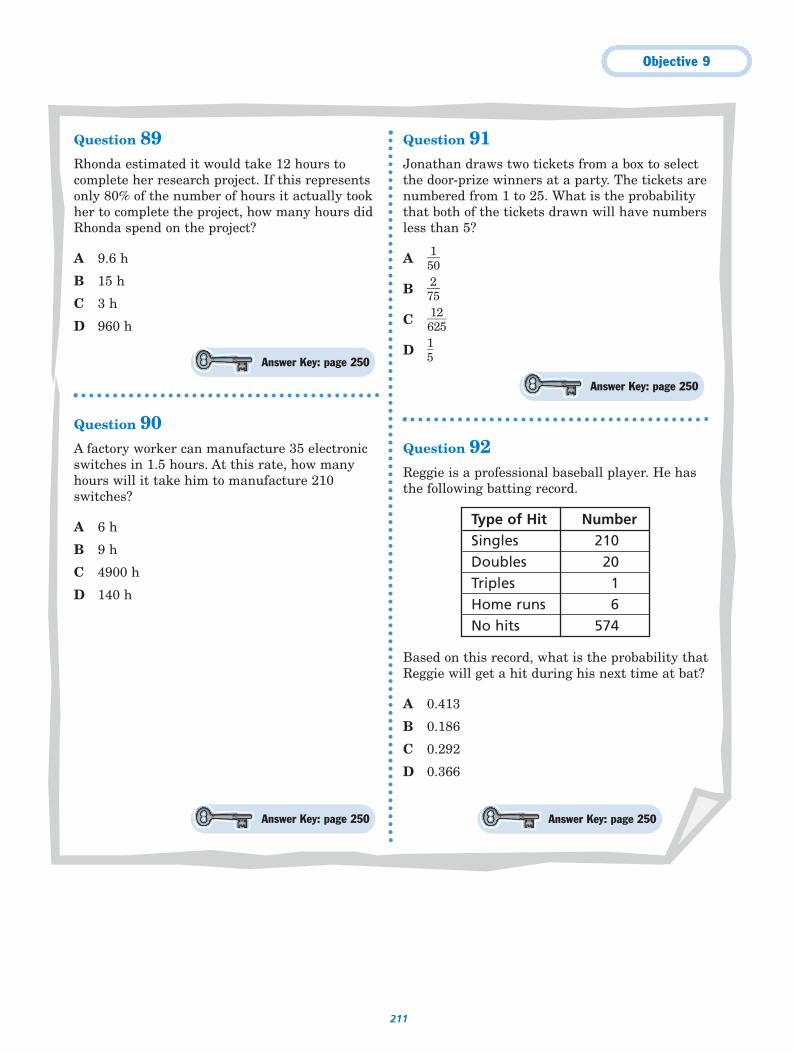
Objective 9
211
Question 89Rhonda estimated it would take 12 hours tocomplete her research project. If this representsonly 80% of the number of hours it actually tookher to complete the project, how many hours didRhonda spend on the project?
A 9.6 h
B 15 h
C 3 h
D 960 h
Question 90A factory worker can manufacture 35 electronicswitches in 1.5 hours. At this rate, how manyhours will it take him to manufacture 210switches?
A 6 h
B 9 h
C 4900 h
D 140 h
Question 91Jonathan draws two tickets from a box to selectthe door-prize winners at a party. The tickets arenumbered from 1 to 25. What is the probabilitythat both of the tickets drawn will have numbersless than 5?
A �510�
B �725�
C �61225
�
D �15
�
Question 92Reggie is a professional baseball player. He hasthe following batting record.
Based on this record, what is the probability thatReggie will get a hit during his next time at bat?
A 0.413
B 0.186
C 0.292
D 0.366
Type of Hit NumberSingles 210Doubles 20Triples 1Home runs 6No hits 574
Answer Key: page 250
Answer Key: page 250
Answer Key: page 250Answer Key: page 250
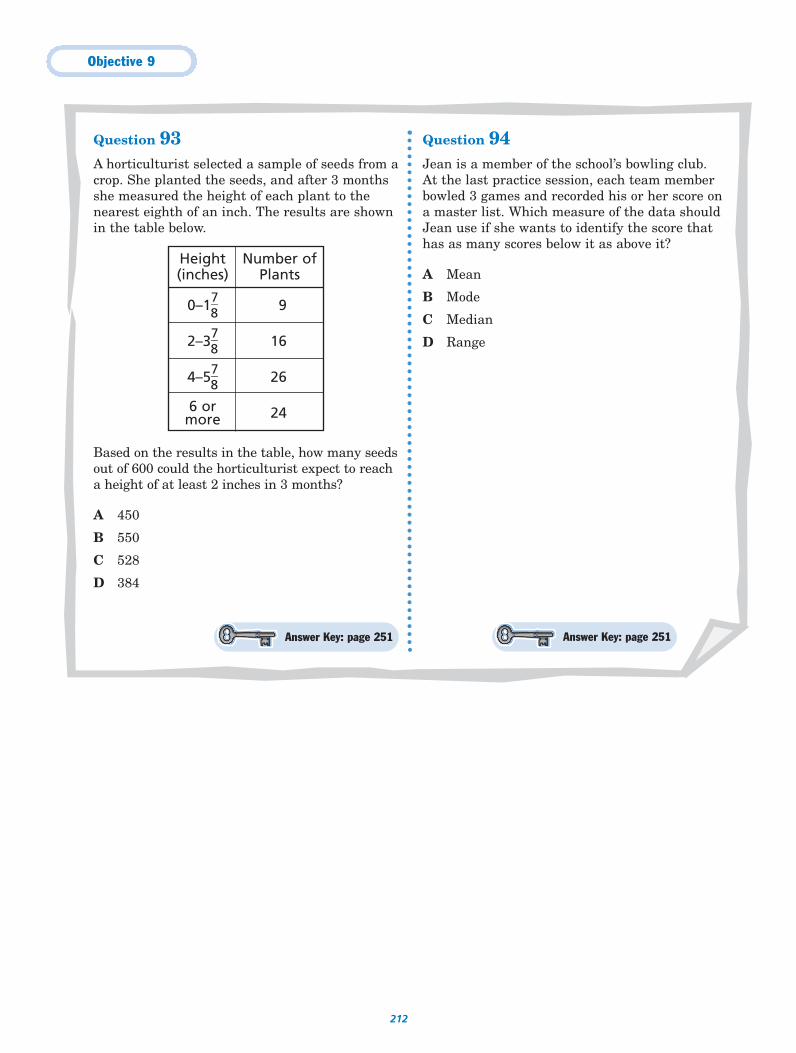
Objective 9
212
Question 93A horticulturist selected a sample of seeds from acrop. She planted the seeds, and after 3 monthsshe measured the height of each plant to thenearest eighth of an inch. The results are shownin the table below.
Based on the results in the table, how many seedsout of 600 could the horticulturist expect to reacha height of at least 2 inches in 3 months?
A 450
B 550
C 528
D 384
Question 94Jean is a member of the school’s bowling club. At the last practice session, each team memberbowled 3 games and recorded his or her score ona master list. Which measure of the data shouldJean use if she wants to identify the score thathas as many scores below it as above it?
A Mean
B Mode
C Median
D Range
Height Number of(inches) Plants
0–1�78
� 9
2–3�78
� 16
4–5�78
� 26
6 or 24more
Answer Key: page 251 Answer Key: page 251
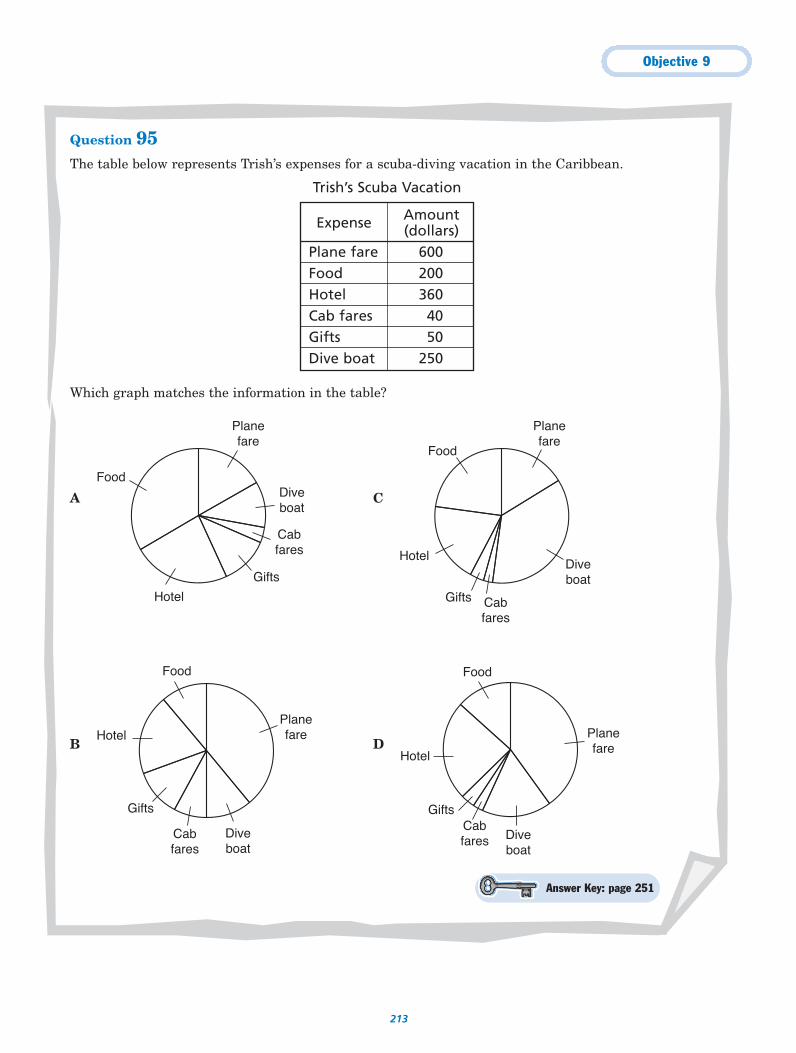
Objective 9
213
Question 95The table below represents Trish’s expenses for a scuba-diving vacation in the Caribbean.
Trish’s Scuba Vacation
Which graph matches the information in the table?
Planefare
Diveboat
Cabfares
Gifts
Hotel
Food
Planefare
Diveboat
Cabfares
Gifts
Hotel
Food
Planefare
Diveboat
Cabfares
Gifts
Hotel
Food
Planefare
Diveboat
Cabfares
Gifts
Hotel
Food
Expense Amount(dollars)
Plane fare 600Food 200Hotel 360Cab fares 40Gifts 50Dive boat 250
Answer Key: page 251
A C
B D
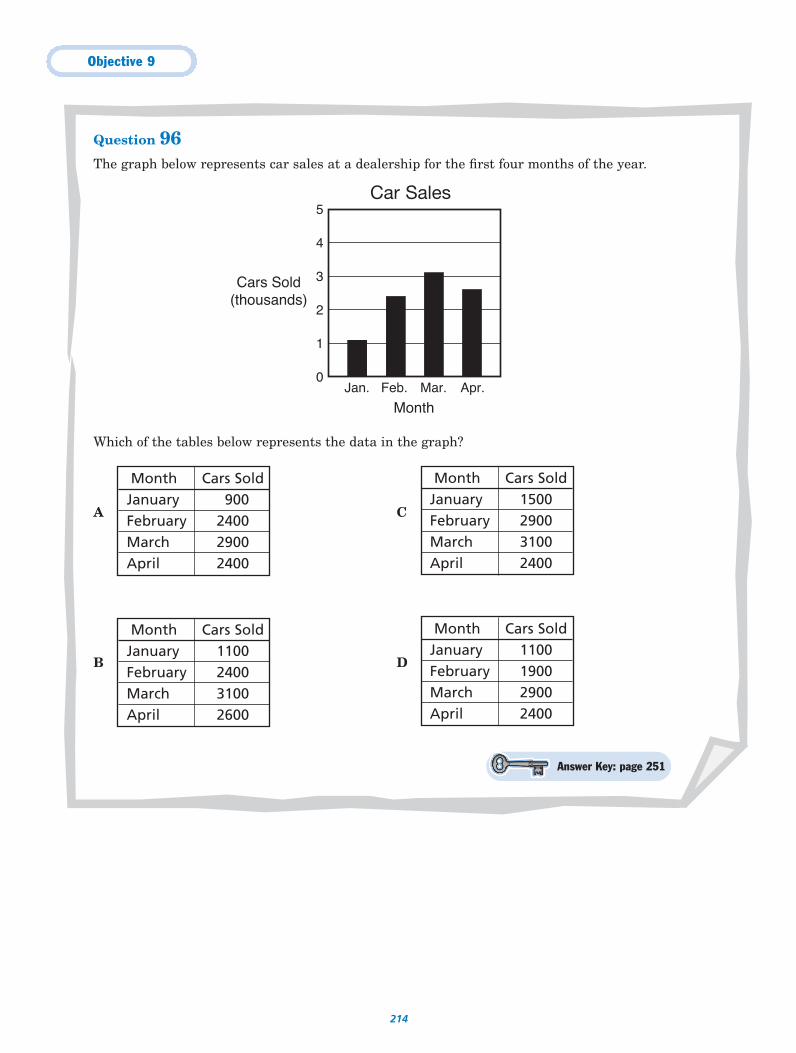
Objective 9
214
Question 96The graph below represents car sales at a dealership for the first four months of the year.
Car Sales
Which of the tables below represents the data in the graph?
A C
B D
Month Cars SoldJanuary 1100February 1900March 2900April 2400
Month Cars SoldJanuary 1100February 2400March 3100April 2600
Month Cars SoldJanuary 1500February 2900March 3100April 2400
Month Cars SoldJanuary 900February 2400March 2900April 2400
Cars Sold(thousands)
MonthJan. Feb. Mar. Apr.
5
1
0
2
3
4
Answer Key: page 251
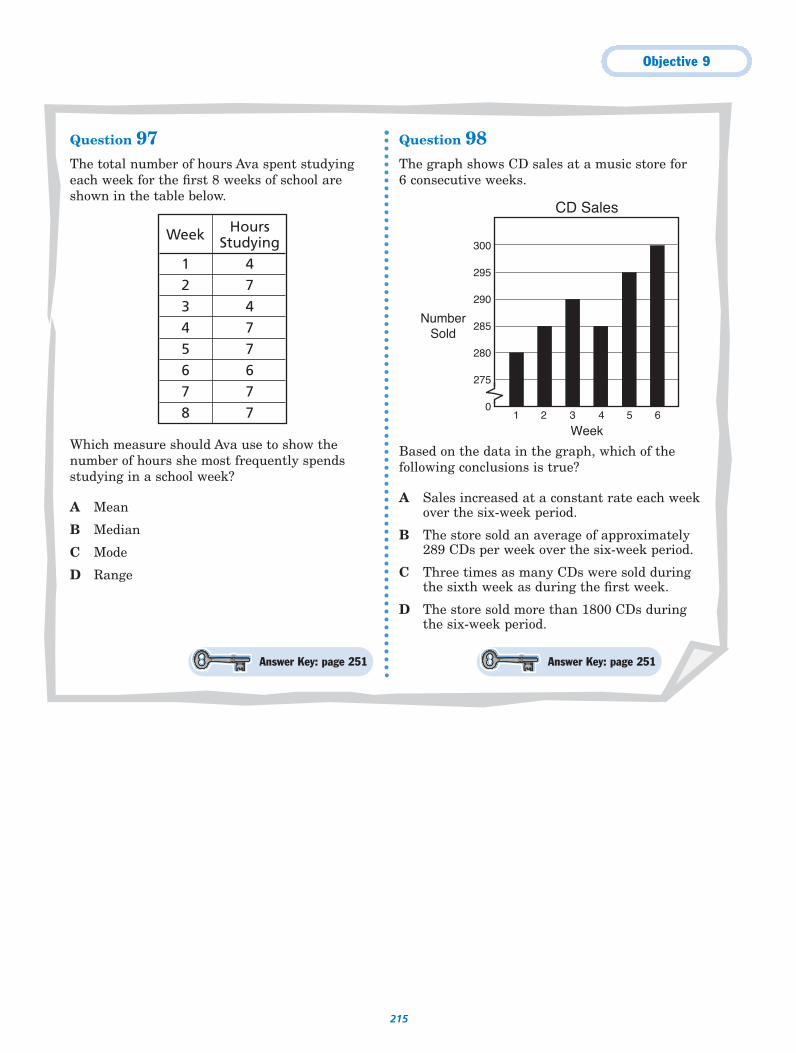
Objective 9
215
Question 97The total number of hours Ava spent studyingeach week for the first 8 weeks of school areshown in the table below.
Which measure should Ava use to show thenumber of hours she most frequently spendsstudying in a school week?
A Mean
B Median
C Mode
D Range
Question 98The graph shows CD sales at a music store for 6 consecutive weeks.
Based on the data in the graph, which of thefollowing conclusions is true?
A Sales increased at a constant rate each weekover the six-week period.
B The store sold an average of approximately289 CDs per week over the six-week period.
C Three times as many CDs were sold duringthe sixth week as during the first week.
D The store sold more than 1800 CDs duringthe six-week period.
NumberSold
Week
CD Sales
1 2 3 4
295
300
275
0
280
285
290
5 6
Week HoursStudying
1 42 73 44 75 76 67 78 7
Answer Key: page 251Answer Key: page 251
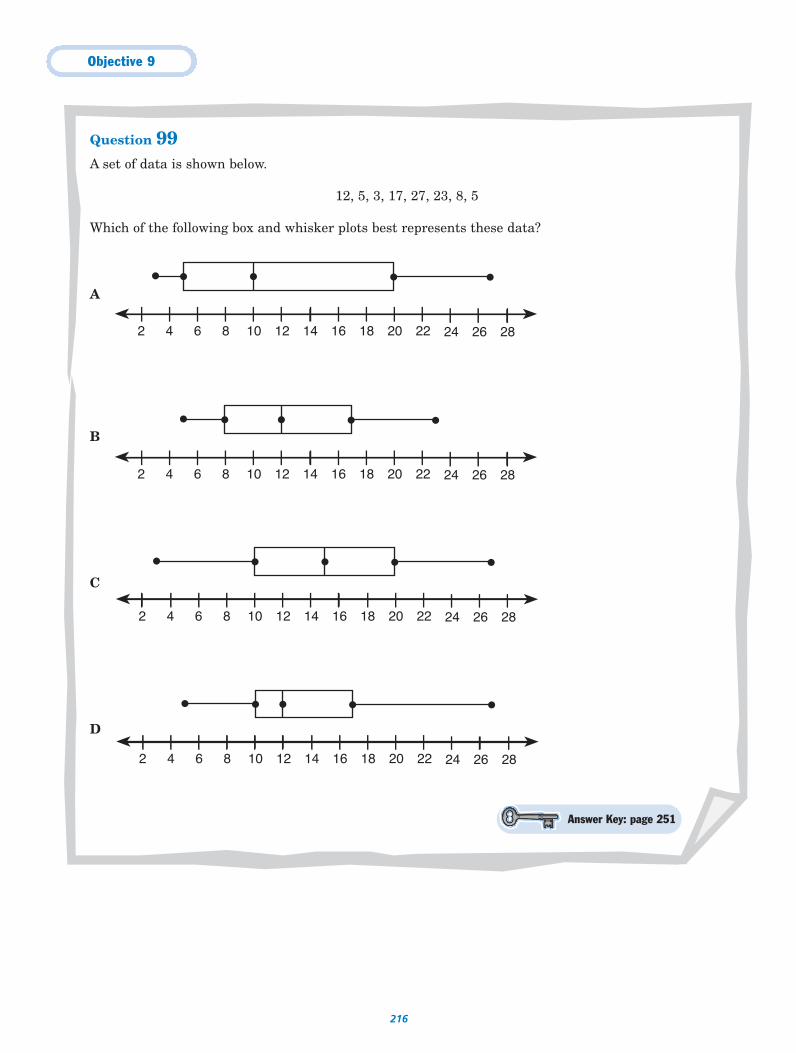
Objective 9
216
Question 99A set of data is shown below.
12, 5, 3, 17, 27, 23, 8, 5
Which of the following box and whisker plots best represents these data?
A
B
C
D
Answer Key: page 251
2 4 6 8 1210 14 16 18 20 22 24 26 28
2 4 6 8 1210 14 16 18 20 22 24 26 28
2 4 6 8 1210 14 16 18 20 22 24 26 28
2 4 6 8 1210 14 16 18 20 22 24 26 28
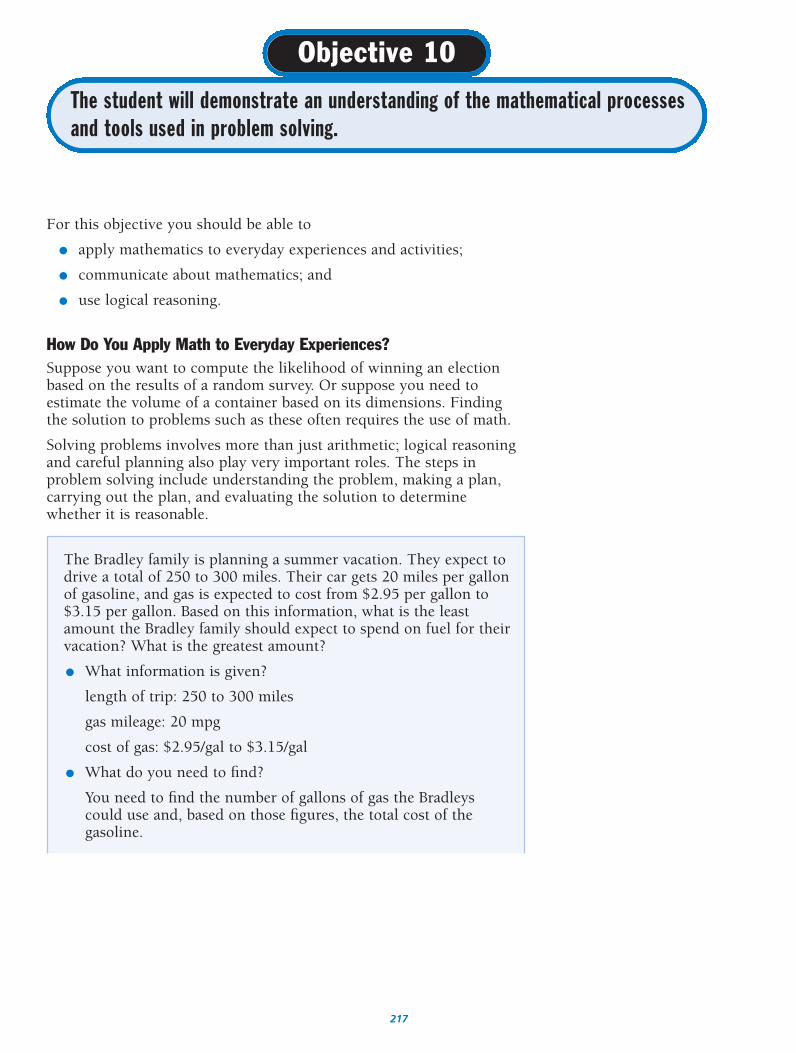
217
The Bradley family is planning a summer vacation. They expect todrive a total of 250 to 300 miles. Their car gets 20 miles per gallonof gasoline, and gas is expected to cost from $2.95 per gallon to$3.15 per gallon. Based on this information, what is the leastamount the Bradley family should expect to spend on fuel for theirvacation? What is the greatest amount?
● What information is given?
length of trip: 250 to 300 miles
gas mileage: 20 mpg
cost of gas: $2.95/gal to $3.15/gal
● What do you need to find?
You need to find the number of gallons of gas the Bradleyscould use and, based on those figures, the total cost of thegasoline.
For this objective you should be able to
● apply mathematics to everyday experiences and activities;
● communicate about mathematics; and
● use logical reasoning.
How Do You Apply Math to Everyday Experiences?Suppose you want to compute the likelihood of winning an electionbased on the results of a random survey. Or suppose you need toestimate the volume of a container based on its dimensions. Findingthe solution to problems such as these often requires the use of math.
Solving problems involves more than just arithmetic; logical reasoningand careful planning also play very important roles. The steps inproblem solving include understanding the problem, making a plan,carrying out the plan, and evaluating the solution to determinewhether it is reasonable.
The student will demonstrate an understanding of the mathematical processesand tools used in problem solving.
Objective 10
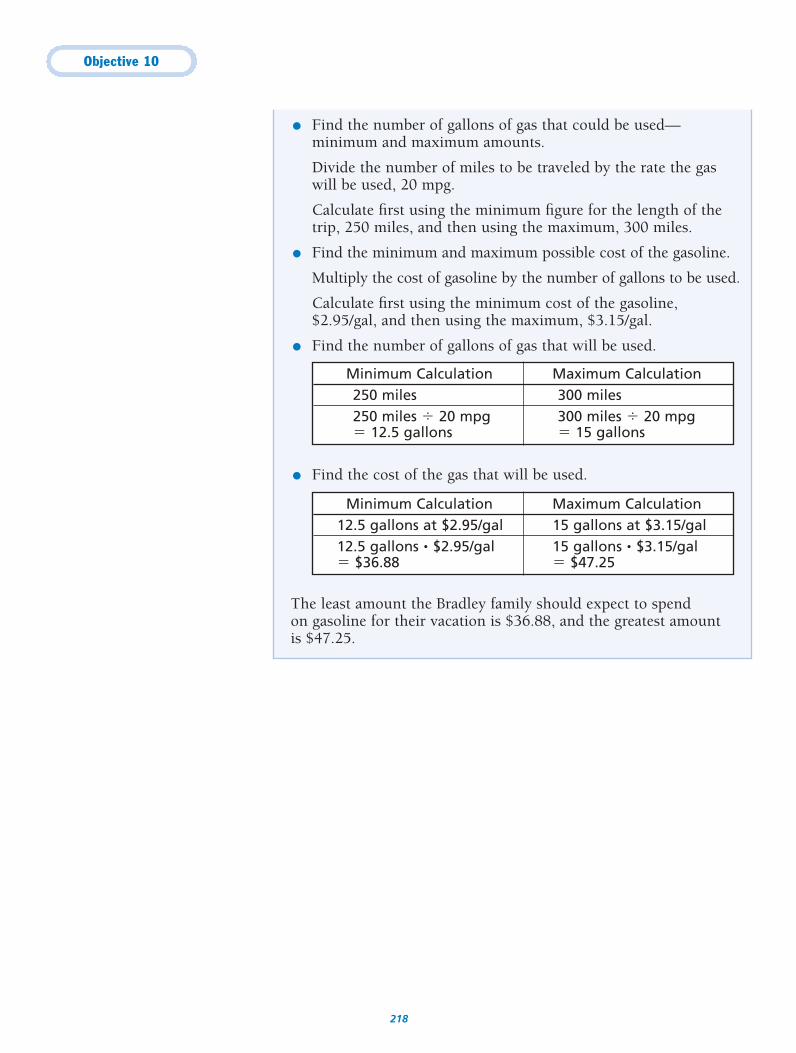
Objective 10
218
● Find the number of gallons of gas that could be used—minimum and maximum amounts.
Divide the number of miles to be traveled by the rate the gaswill be used, 20 mpg.
Calculate first using the minimum figure for the length of thetrip, 250 miles, and then using the maximum, 300 miles.
● Find the minimum and maximum possible cost of the gasoline.
Multiply the cost of gasoline by the number of gallons to be used.
Calculate first using the minimum cost of the gasoline,$2.95/gal, and then using the maximum, $3.15/gal.
● Find the number of gallons of gas that will be used.
● Find the cost of the gas that will be used.
The least amount the Bradley family should expect to spend on gasoline for their vacation is $36.88, and the greatest amount is $47.25.
Minimum Calculation Maximum Calculation250 miles 300 miles250 miles � 20 mpg 300 miles � 20 mpg� 12.5 gallons � 15 gallons
Minimum Calculation Maximum Calculation12.5 gallons at $2.95/gal 15 gallons at $3.15/gal12.5 gallons • $2.95/gal 15 gallons • $3.15/gal� $36.88 � $47.25
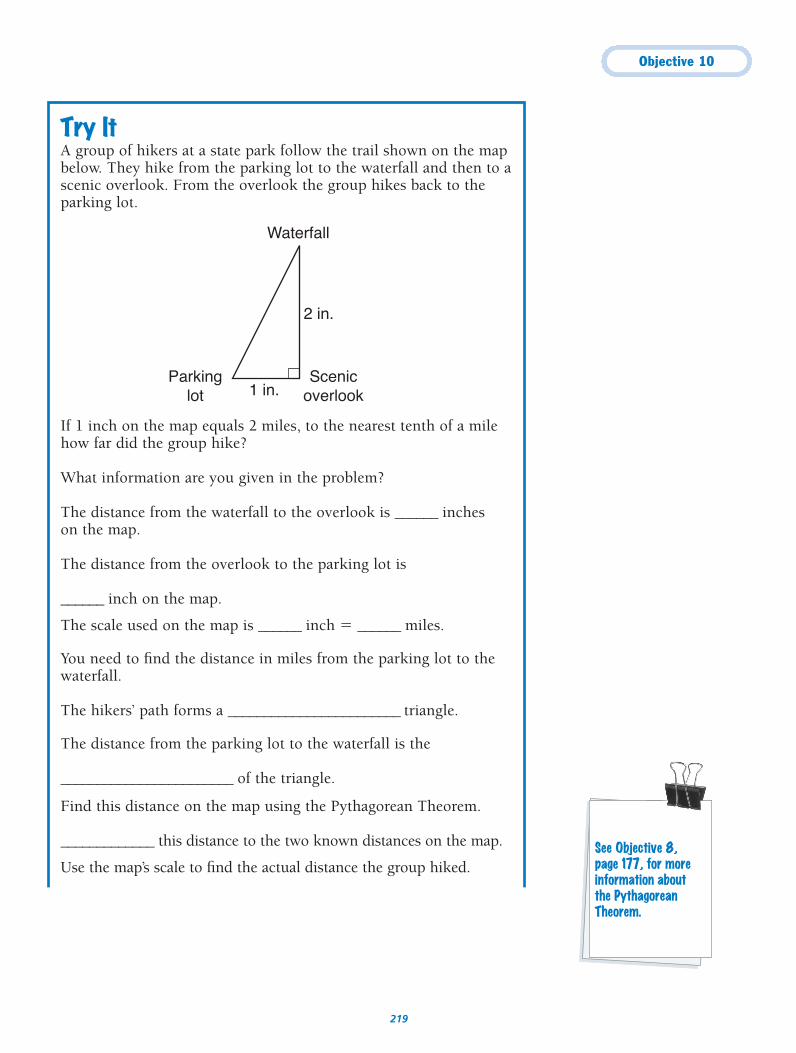
Objective 10
219
Try ItA group of hikers at a state park follow the trail shown on the mapbelow. They hike from the parking lot to the waterfall and then to ascenic overlook. From the overlook the group hikes back to theparking lot.
If 1 inch on the map equals 2 miles, to the nearest tenth of a milehow far did the group hike?
What information are you given in the problem?
The distance from the waterfall to the overlook is ______ inches on the map.
The distance from the overlook to the parking lot is
______ inch on the map.
The scale used on the map is ______ inch � ______ miles.
You need to find the distance in miles from the parking lot to the waterfall.
The hikers’ path forms a ________________________ triangle.
The distance from the parking lot to the waterfall is the
________________________ of the triangle.
Find this distance on the map using the Pythagorean Theorem.
_____________ this distance to the two known distances on the map.
Use the map’s scale to find the actual distance the group hiked.
Waterfall
Parkinglot
Scenicoverlook1 in.
2 in.
See Objective 8,page 177, for moreinformation aboutthe PythagoreanTheorem.
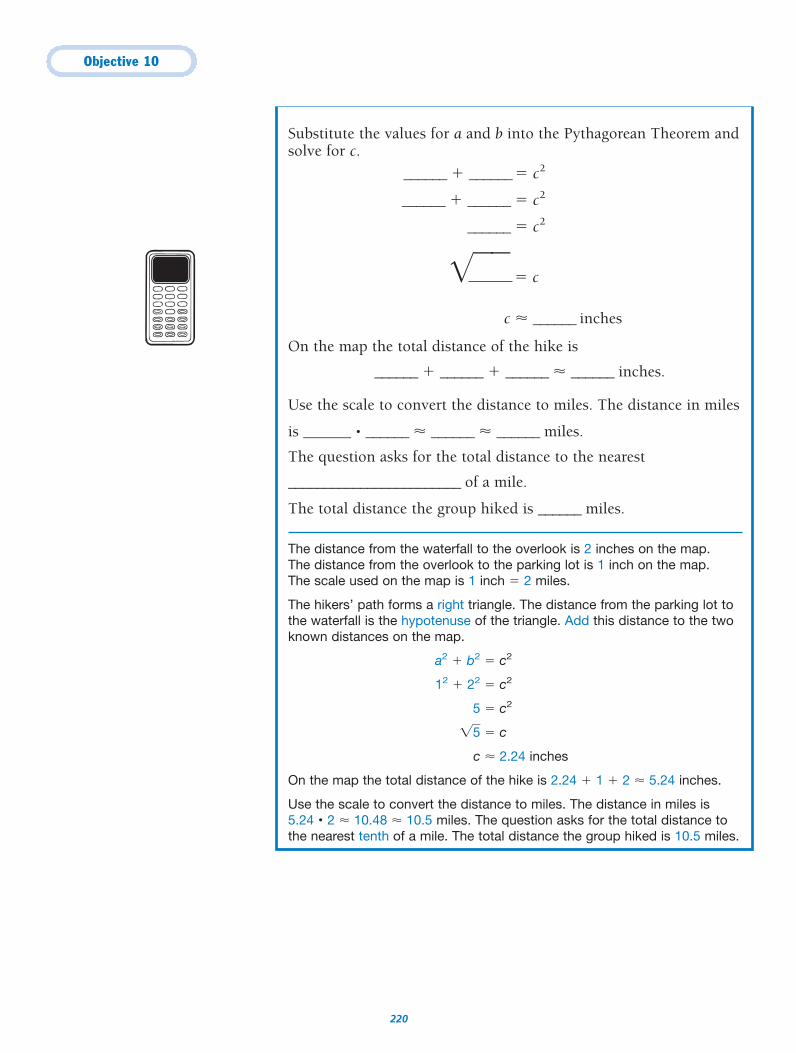
Objective 10
220
Substitute the values for a and b into the Pythagorean Theorem andsolve for c.
______ � ______ � c2
______ � ______ � c2
______ � c2
�——� c
c � ______ inches
On the map the total distance of the hike is
______ � ______ � ______ � ______ inches.
Use the scale to convert the distance to miles. The distance in miles
is ______ • ______ � ______ � ______ miles.
The question asks for the total distance to the nearest
________________________ of a mile.
The total distance the group hiked is ______ miles.
The distance from the waterfall to the overlook is 2 inches on the map. The distance from the overlook to the parking lot is 1 inch on the map. The scale used on the map is 1 inch � 2 miles.
The hikers’ path forms a right triangle. The distance from the parking lot tothe waterfall is the hypotenuse of the triangle. Add this distance to the twoknown distances on the map.
a2 � b2 � c2
12 � 22 � c2
5 � c2
�5� � c
c � 2.24 inches
On the map the total distance of the hike is 2.24 � 1 � 2 � 5.24 inches.
Use the scale to convert the distance to miles. The distance in miles is 5.24 • 2 � 10.48 � 10.5 miles. The question asks for the total distance tothe nearest tenth of a mile. The total distance the group hiked is 10.5 miles.
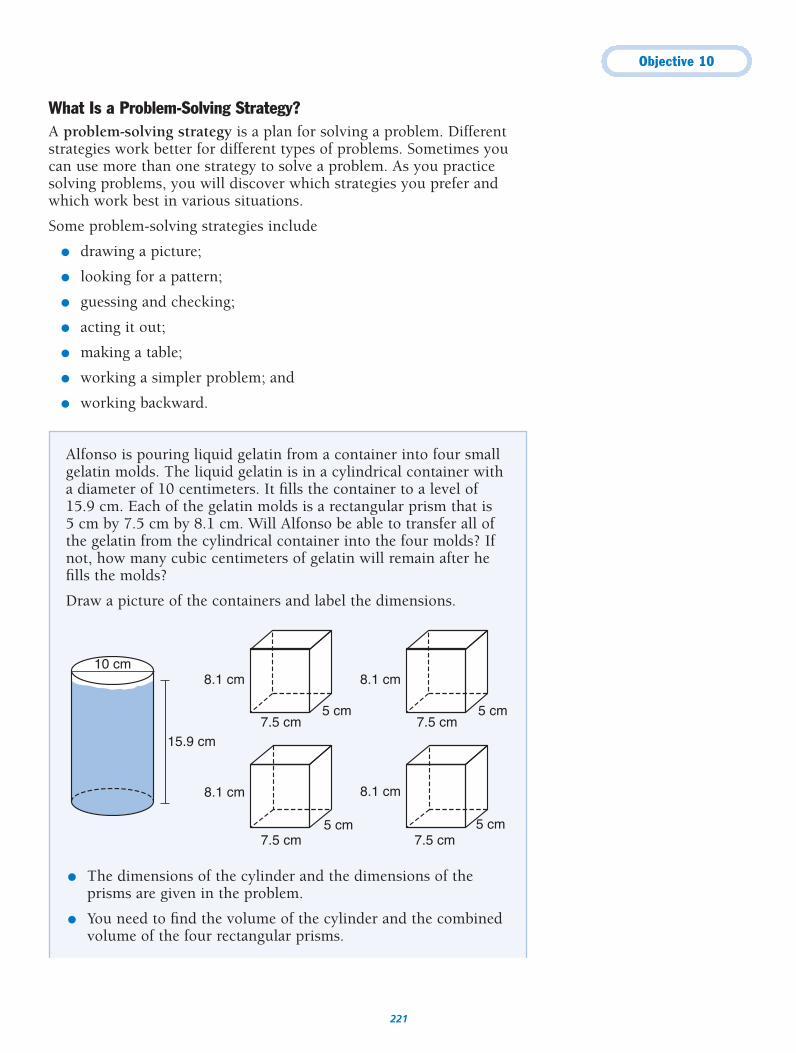
Objective 10
221
What Is a Problem-Solving Strategy?A problem-solving strategy is a plan for solving a problem. Differentstrategies work better for different types of problems. Sometimes youcan use more than one strategy to solve a problem. As you practicesolving problems, you will discover which strategies you prefer andwhich work best in various situations.
Some problem-solving strategies include
● drawing a picture;
● looking for a pattern;
● guessing and checking;
● acting it out;
● making a table;
● working a simpler problem; and
● working backward.
Alfonso is pouring liquid gelatin from a container into four smallgelatin molds. The liquid gelatin is in a cylindrical container with a diameter of 10 centimeters. It fills the container to a level of 15.9 cm. Each of the gelatin molds is a rectangular prism that is 5 cm by 7.5 cm by 8.1 cm. Will Alfonso be able to transfer all ofthe gelatin from the cylindrical container into the four molds? Ifnot, how many cubic centimeters of gelatin will remain after hefills the molds?
Draw a picture of the containers and label the dimensions.
● The dimensions of the cylinder and the dimensions of theprisms are given in the problem.
● You need to find the volume of the cylinder and the combinedvolume of the four rectangular prisms.
15.9 cm
10 cm
7.5 cm5 cm
8.1 cm
7.5 cm5 cm
8.1 cm
7.5 cm5 cm
8.1 cm
7.5 cm5 cm
8.1 cm
Objective 10
222
● Find the volume of the cylinder. Use the formula for the area of acircle, A � πr2, to find the area of the circular base. The diameteris 10 cm, so the radius, r, is 5 cm. Use the area of the base tocalculate the volume of the gelatin using the formula V � Bh.
A � πr2 V � BhA � π • 52 V � 78.5 • 15.9A � π • 25 V � 1248.15 cm3
A � 78.5 cm2
The volume of the gelatin is approximately 1248 cm3.
● Find the combined volume of the four rectangular prisms. The area of the rectangular base equals its length times its width.
B � 5 • 7.5 � 37.5 cm2
V � BhV � 37.5 • 8.1V � 303.75 cm3
The total volume of the four smaller containers is 4 • 303.75 � 1215 cm3.
Since 1215 � 1248, the liquid gelatin will not fit in the fourcontainers. There will be about 33 cubic centimeters (1248 � 1215)of liquid gelatin remaining.
At a business meeting each person in the room shakes hands withevery other person. If there are 5 people at the meeting, how manyhandshakes take place?
One way to solve this problem is to draw a picture.
Draw 5 points representing the 5 people.
To model the handshakes, draw a line segment connecting eachpoint to the four other points. Each point represents one person.
Count the number of line segments. There are 10 line segments.
At the meeting, ten handshakes take place.
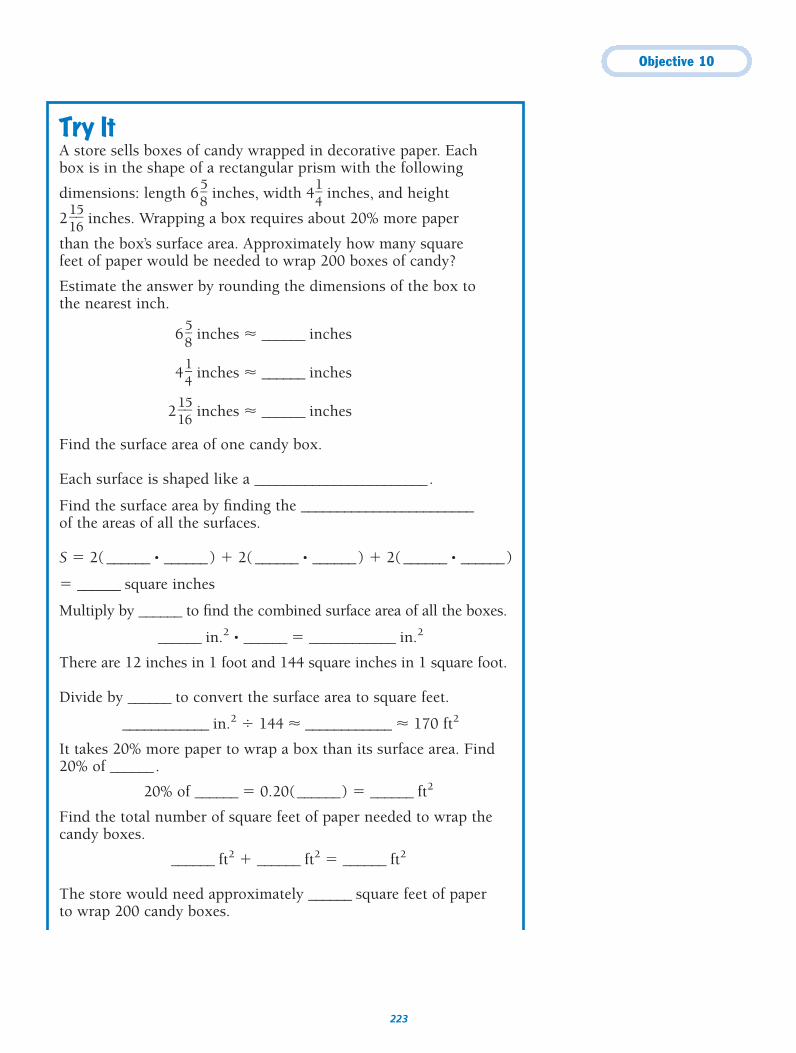
Objective 10
223
Try ItA store sells boxes of candy wrapped in decorative paper. Each box is in the shape of a rectangular prism with the following
dimensions: length 6 �58
� inches, width 4�14
� inches, and height
2 �11
56� inches. Wrapping a box requires about 20% more paper
than the box’s surface area. Approximately how many square feet of paper would be needed to wrap 200 boxes of candy?
Estimate the answer by rounding the dimensions of the box to the nearest inch.
6 �58
� inches � ______ inches
4 �14
� inches � ______ inches
2 �11
56� inches � ______ inches
Find the surface area of one candy box.
Each surface is shaped like a ________________________.
Find the surface area by finding the ________________________of the areas of all the surfaces.
S � 2( ______ • ______) � 2( ______ • ______) � 2( ______ • ______)
� ______ square inches
Multiply by ______ to find the combined surface area of all the boxes.
______ in.2 • ______ � ____________ in.2
There are 12 inches in 1 foot and 144 square inches in 1 square foot.
Divide by ______ to convert the surface area to square feet.
____________ in.2 � 144 � ____________ � 170 ft2
It takes 20% more paper to wrap a box than its surface area. Find20% of ______.
20% of ______ � 0.20(______) � ______ ft2
Find the total number of square feet of paper needed to wrap thecandy boxes.
______ ft2 � ______ ft2 � ______ ft2
The store would need approximately ______ square feet of paper to wrap 200 candy boxes.
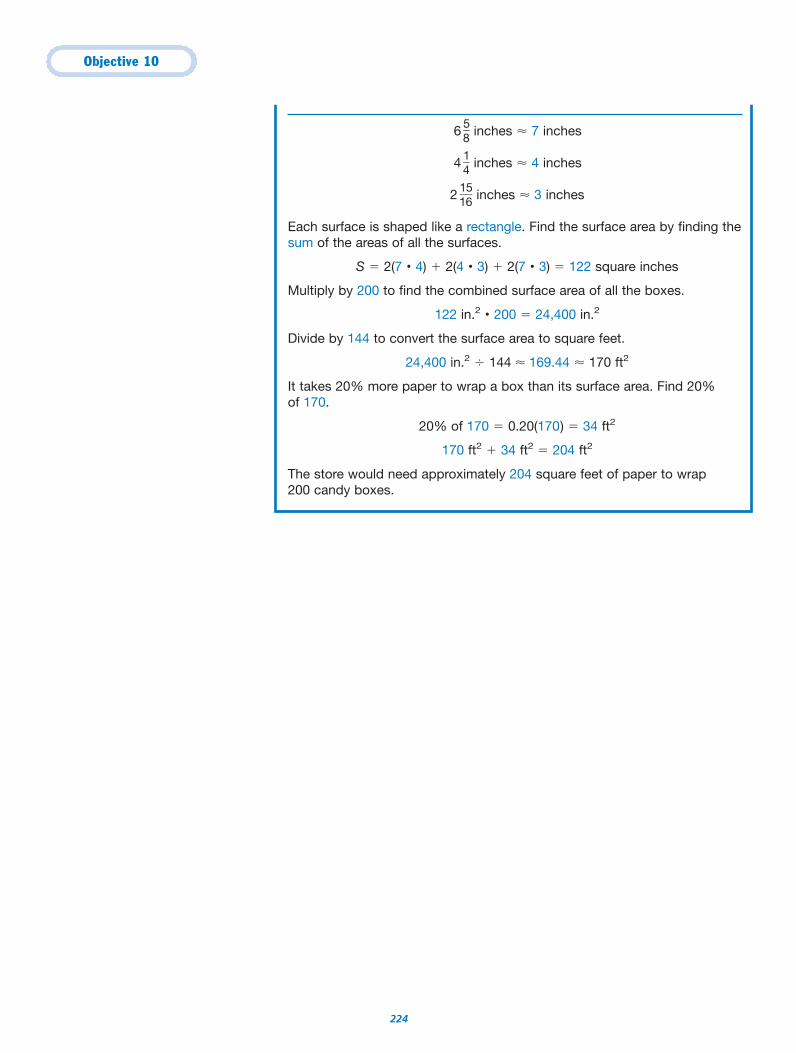
Objective 10
224
6 �58
� inches � 7 inches
4 �14
� inches � 4 inches
2 �1156� inches � 3 inches
Each surface is shaped like a rectangle. Find the surface area by finding thesum of the areas of all the surfaces.
S � 2(7 • 4) � 2(4 • 3) � 2(7 • 3) � 122 square inches
Multiply by 200 to find the combined surface area of all the boxes.
122 in.2 • 200 � 24,400 in.2
Divide by 144 to convert the surface area to square feet.
24,400 in.2 � 144 � 169.44 � 170 ft2
It takes 20% more paper to wrap a box than its surface area. Find 20%of 170.
20% of 170 � 0.20(170) � 34 ft2
170 ft2 � 34 ft2 � 204 ft2
The store would need approximately 204 square feet of paper to wrap 200 candy boxes.
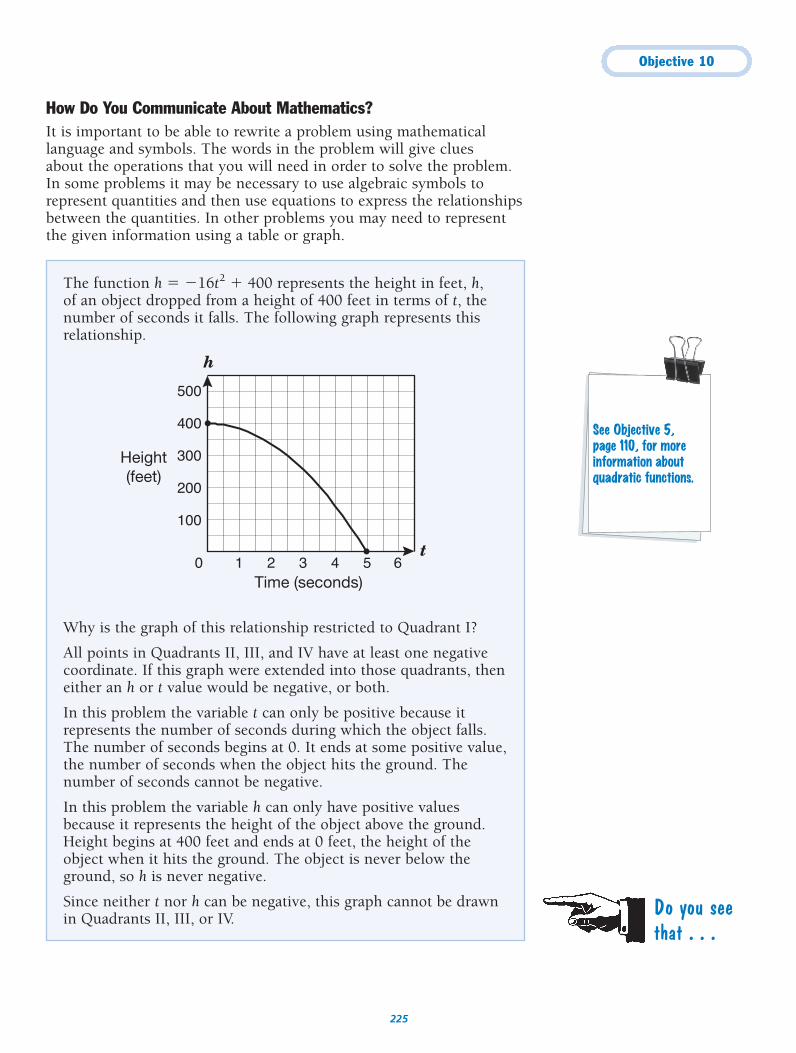
Objective 10
225
How Do You Communicate About Mathematics?It is important to be able to rewrite a problem using mathematicallanguage and symbols. The words in the problem will give clues about the operations that you will need in order to solve the problem.In some problems it may be necessary to use algebraic symbols torepresent quantities and then use equations to express the relationshipsbetween the quantities. In other problems you may need to representthe given information using a table or graph.
The function h � �16t2 � 400 represents the height in feet, h, of an object dropped from a height of 400 feet in terms of t, thenumber of seconds it falls. The following graph represents thisrelationship.
Why is the graph of this relationship restricted to Quadrant I?
All points in Quadrants II, III, and IV have at least one negativecoordinate. If this graph were extended into those quadrants, theneither an h or t value would be negative, or both.
In this problem the variable t can only be positive because itrepresents the number of seconds during which the object falls.The number of seconds begins at 0. It ends at some positive value,the number of seconds when the object hits the ground. Thenumber of seconds cannot be negative.
In this problem the variable h can only have positive valuesbecause it represents the height of the object above the ground.Height begins at 400 feet and ends at 0 feet, the height of theobject when it hits the ground. The object is never below theground, so h is never negative.
Since neither t nor h can be negative, this graph cannot be drawnin Quadrants II, III, or IV.
0
100
200
300
400
500
1 2 3 4 5 6
h
t
Height(feet)
Time (seconds)
See Objective 5,page 110, for moreinformation aboutquadratic functions.
Do you seethat . . .
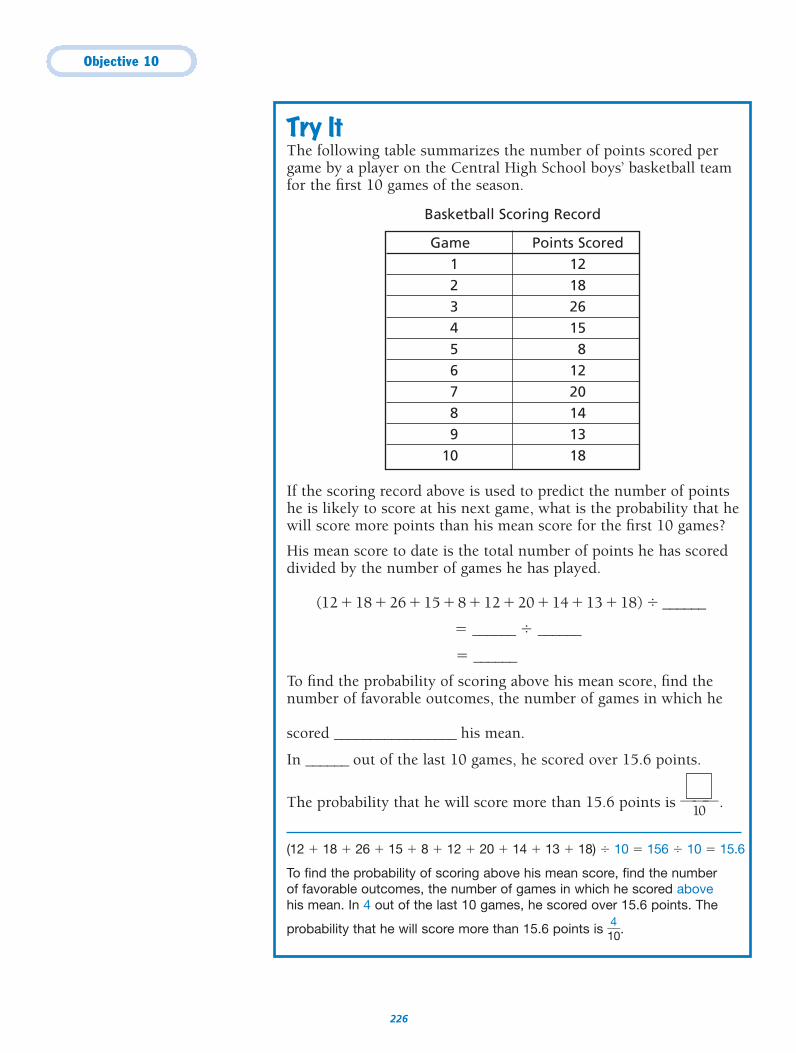
Objective 10
226
Try ItThe following table summarizes the number of points scored pergame by a player on the Central High School boys’ basketball teamfor the first 10 games of the season.
Basketball Scoring Record
If the scoring record above is used to predict the number of pointshe is likely to score at his next game, what is the probability that hewill score more points than his mean score for the first 10 games?
His mean score to date is the total number of points he has scoreddivided by the number of games he has played.
(12 � 18 � 26 � 15 � 8 � 12 � 20 � 14 � 13 � 18) � ______
� ______ � ______
� ______
To find the probability of scoring above his mean score, find thenumber of favorable outcomes, the number of games in which he
scored _________________ his mean.
In ______ out of the last 10 games, he scored over 15.6 points.
The probability that he will score more than 15.6 points is ��10
�.
(12 � 18 � 26 � 15 � 8 � 12 � 20 � 14 � 13 � 18) � 10 � 156 � 10 � 15.6
To find the probability of scoring above his mean score, find the number of favorable outcomes, the number of games in which he scored abovehis mean. In 4 out of the last 10 games, he scored over 15.6 points. The
probability that he will score more than 15.6 points is �140�.
Game Points Scored1 122 183 264 155 86 127 208 149 13
10 18
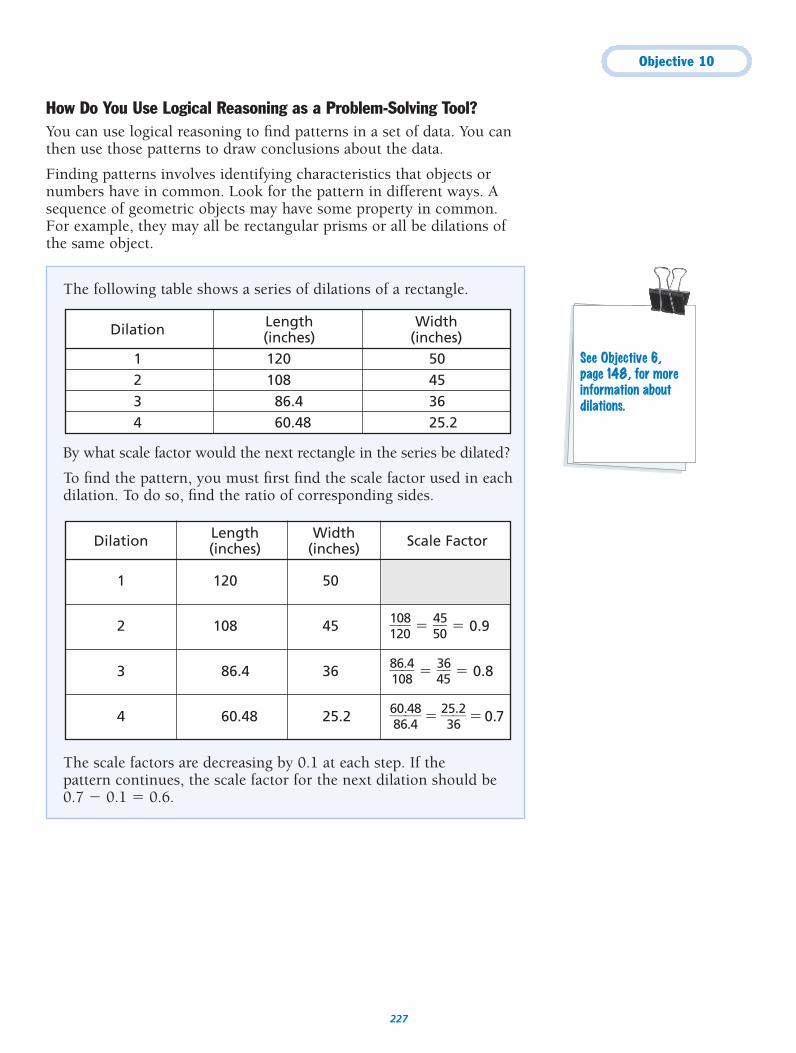
Objective 10
227
How Do You Use Logical Reasoning as a Problem-Solving Tool?You can use logical reasoning to find patterns in a set of data. You canthen use those patterns to draw conclusions about the data.
Finding patterns involves identifying characteristics that objects ornumbers have in common. Look for the pattern in different ways. Asequence of geometric objects may have some property in common.For example, they may all be rectangular prisms or all be dilations ofthe same object.
The following table shows a series of dilations of a rectangle.
By what scale factor would the next rectangle in the series be dilated?
To find the pattern, you must first find the scale factor used in eachdilation. To do so, find the ratio of corresponding sides.
The scale factors are decreasing by 0.1 at each step. If the pattern continues, the scale factor for the next dilation should be0.7 � 0.1 � 0.6.
Dilation Length Width(inches) (inches)
1 120 502 108 453 86.4 364 60.48 25.2
Dilation Length Width Scale Factor(inches) (inches)
1 120 50
2 108 45 �110280
� � �4550� � 0.9
3 86.4 36 �8160.84
� � �3465� � 0.8
4 60.48 25.2 �6806..448
� � �2356.2� � 0.7
See Objective 6, page 148, for moreinformation aboutdilations.
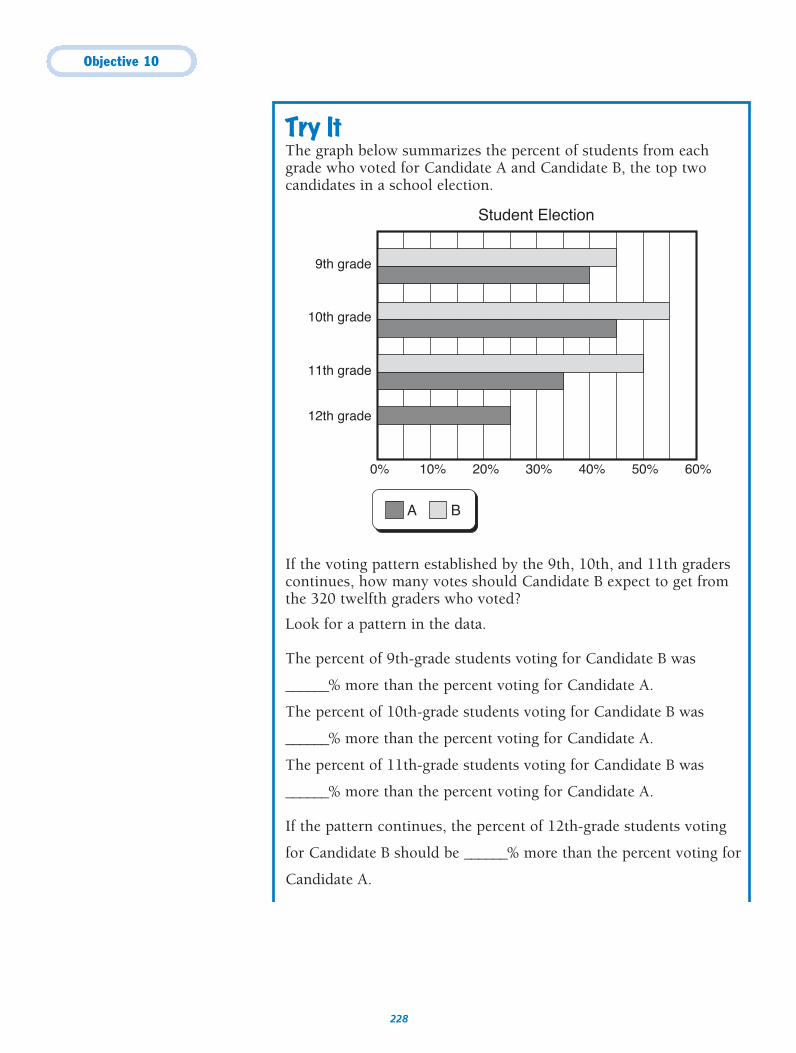
Objective 10
228
Try ItThe graph below summarizes the percent of students from eachgrade who voted for Candidate A and Candidate B, the top twocandidates in a school election.
If the voting pattern established by the 9th, 10th, and 11th graderscontinues, how many votes should Candidate B expect to get fromthe 320 twelfth graders who voted?
Look for a pattern in the data.
The percent of 9th-grade students voting for Candidate B was
______% more than the percent voting for Candidate A.
The percent of 10th-grade students voting for Candidate B was
______% more than the percent voting for Candidate A.
The percent of 11th-grade students voting for Candidate B was
______% more than the percent voting for Candidate A.
If the pattern continues, the percent of 12th-grade students voting
for Candidate B should be ______% more than the percent voting for
Candidate A.
Student Election
10% 20% 30% 40% 50%0% 60%
A B
12th grade
11th grade
10th grade
9th grade
Objective 10
229
If ______% of the 12th graders voted for Candidate A, then
______% � 20% � ______% should vote for Candidate B.
Find ______% of 320 students. Write a proportion.
��100
� � ���x��
100x � ______ • ______
100x � ______
x � ______
Candidate B should get ______ votes from the 12th graders.
The percent of 9th-grade students voting for Candidate B was 5% morethan the percent voting for Candidate A. The percent of 10th-grade studentsvoting for Candidate B was 10% more than the percent voting for CandidateA. The percent of 11th-grade students voting for Candidate B was 15% morethan the percent voting for Candidate A.
If the pattern continues, the percent of 12th-grade students voting forCandidate B should be 20% more than the percent voting for Candidate A.If 25% of the 12th graders voted for Candidate A, then 25% � 20% � 45%should vote for Candidate B. Find 45% of 320 students.
�14050
� � �32
x0
�
100x � 45 • 320
100x � 14,440
x � 144
Candidate B should get 144 votes from the 12th graders.
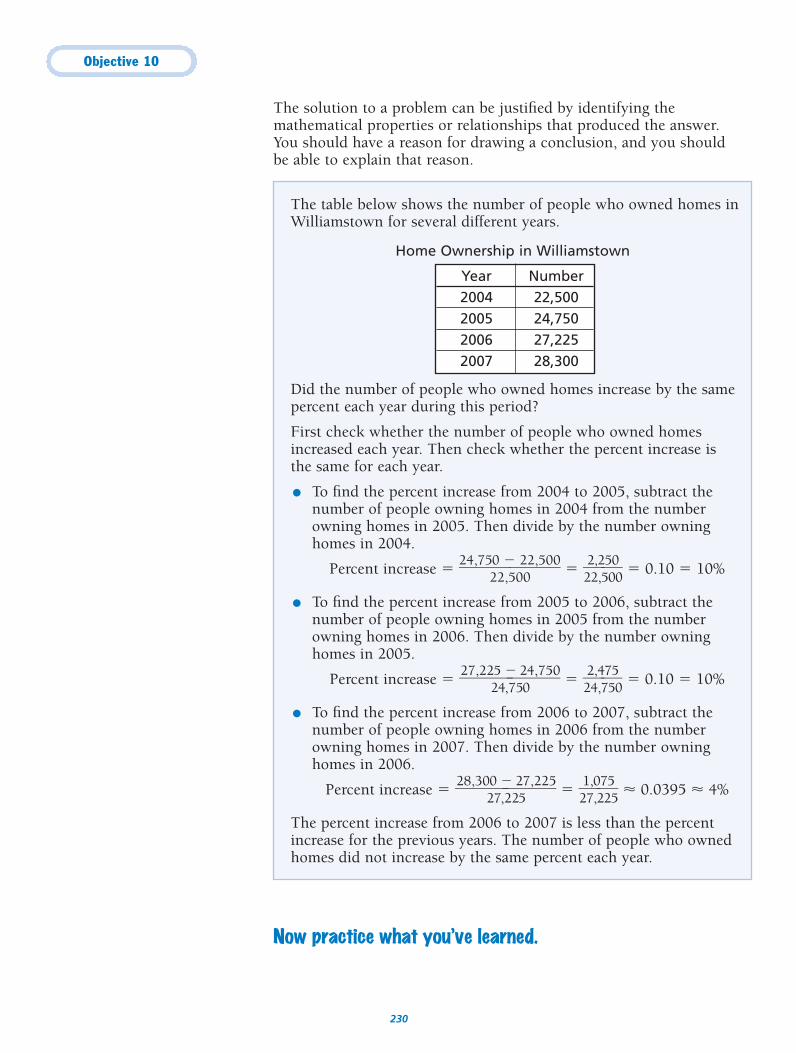
Objective 10
230
The solution to a problem can be justified by identifying themathematical properties or relationships that produced the answer. You should have a reason for drawing a conclusion, and you shouldbe able to explain that reason.
The table below shows the number of people who owned homes inWilliamstown for several different years.
Home Ownership in Williamstown
Did the number of people who owned homes increase by the samepercent each year during this period?
First check whether the number of people who owned homesincreased each year. Then check whether the percent increase isthe same for each year.
● To find the percent increase from 2004 to 2005, subtract thenumber of people owning homes in 2004 from the numberowning homes in 2005. Then divide by the number owninghomes in 2004.
Percent increase � �24,75
202�,50
202,500
� � �222,,255000
� � 0.10 � 10%
● To find the percent increase from 2005 to 2006, subtract thenumber of people owning homes in 2005 from the numberowning homes in 2006. Then divide by the number owninghomes in 2005.
Percent increase � �27,22
254�,75
204,750
� � �224,,477550
� � 0.10 � 10%
● To find the percent increase from 2006 to 2007, subtract thenumber of people owning homes in 2006 from the numberowning homes in 2007. Then divide by the number owninghomes in 2006.
Percent increase � �28,30
207�,22
257,225
� � �217,,027255
� � 0.0395 � 4%
The percent increase from 2006 to 2007 is less than the percentincrease for the previous years. The number of people who ownedhomes did not increase by the same percent each year.
Year Number2004 22,5002005 24,7502006 27,2252007 28,300
Now practice what you’ve learned.
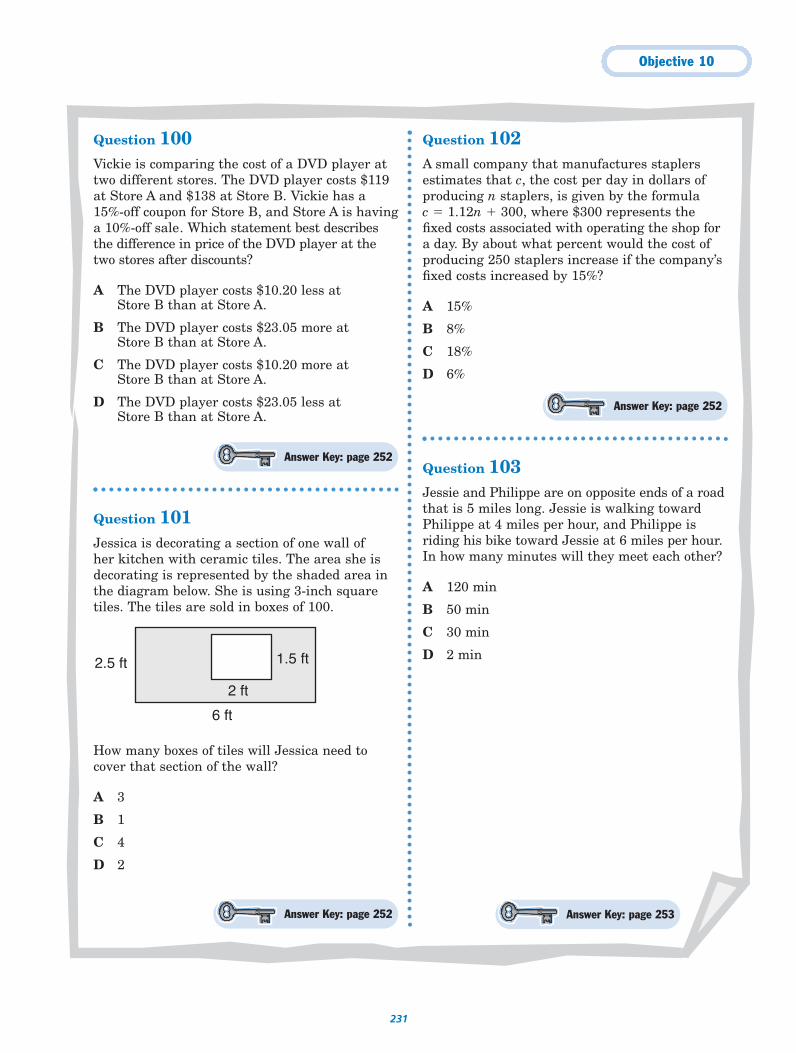
Objective 10
231
Question 100Vickie is comparing the cost of a DVD player attwo different stores. The DVD player costs $119at Store A and $138 at Store B. Vickie has a 15%-off coupon for Store B, and Store A is havinga 10%-off sale. Which statement best describesthe difference in price of the DVD player at thetwo stores after discounts?
A The DVD player costs $10.20 less at Store B than at Store A.
B The DVD player costs $23.05 more atStore B than at Store A.
C The DVD player costs $10.20 more at Store B than at Store A.
D The DVD player costs $23.05 less at Store B than at Store A.
Question 101Jessica is decorating a section of one wall of her kitchen with ceramic tiles. The area she isdecorating is represented by the shaded area inthe diagram below. She is using 3-inch squaretiles. The tiles are sold in boxes of 100.
How many boxes of tiles will Jessica need tocover that section of the wall?
A 3
B 1
C 4
D 2
Question 102A small company that manufactures staplersestimates that c, the cost per day in dollars ofproducing n staplers, is given by the formula c � 1.12n � 300, where $300 represents thefixed costs associated with operating the shop fora day. By about what percent would the cost ofproducing 250 staplers increase if the company’sfixed costs increased by 15%?
A 15%
B 8%
C 18%
D 6%
Question 103Jessie and Philippe are on opposite ends of a roadthat is 5 miles long. Jessie is walking towardPhilippe at 4 miles per hour, and Philippe isriding his bike toward Jessie at 6 miles per hour.In how many minutes will they meet each other?
A 120 min
B 50 min
C 30 min
D 2 min1.5 ft2.5 ft
2 ft
6 ft
Answer Key: page 252
Answer Key: page 252 Answer Key: page 253
Answer Key: page 252
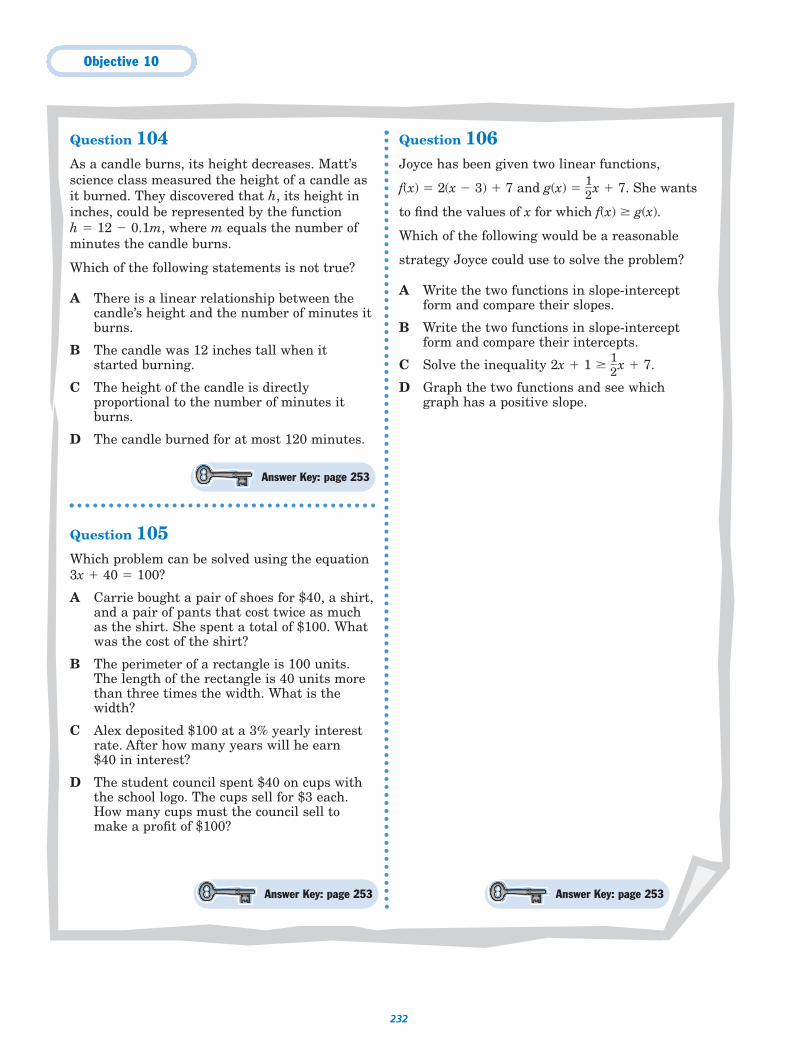
Objective 10
232
Question 104As a candle burns, its height decreases. Matt’sscience class measured the height of a candle asit burned. They discovered that h, its height ininches, could be represented by the function h � 12 � 0.1m, where m equals the number ofminutes the candle burns.
Which of the following statements is not true?
A There is a linear relationship between thecandle’s height and the number of minutes itburns.
B The candle was 12 inches tall when itstarted burning.
C The height of the candle is directlyproportional to the number of minutes itburns.
D The candle burned for at most 120 minutes.
Question 105Which problem can be solved using the equation3x � 40 � 100?
A Carrie bought a pair of shoes for $40, a shirt,and a pair of pants that cost twice as muchas the shirt. She spent a total of $100. Whatwas the cost of the shirt?
B The perimeter of a rectangle is 100 units.The length of the rectangle is 40 units morethan three times the width. What is thewidth?
C Alex deposited $100 at a 3% yearly interestrate. After how many years will he earn$40 in interest?
D The student council spent $40 on cups withthe school logo. The cups sell for $3 each.How many cups must the council sell tomake a profit of $100?
Question 106Joyce has been given two linear functions,
f(x) � 2(x � 3) � 7 and g(x) � �12
�x � 7. She wants
to find the values of x for which f(x) g(x).
Which of the following would be a reasonable
strategy Joyce could use to solve the problem?
A Write the two functions in slope-interceptform and compare their slopes.
B Write the two functions in slope-interceptform and compare their intercepts.
C Solve the inequality 2x � 1 �12
�x � 7.
D Graph the two functions and see whichgraph has a positive slope.
Answer Key: page 253
Answer Key: page 253Answer Key: page 253
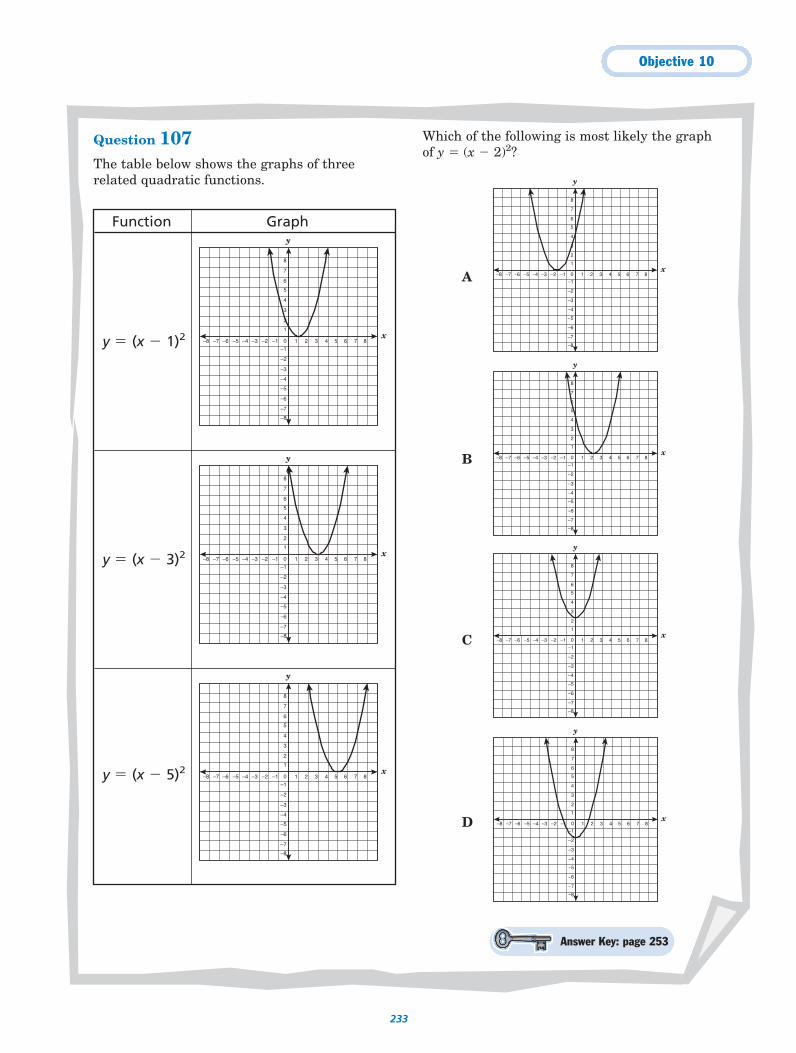
Objective 10
233
Question 107The table below shows the graphs of threerelated quadratic functions.
Which of the following is most likely the graph of y � (x � 2)2?
y
–5
–4
–6
–7
–8
–3
–2
–1
1
2
3
4
5
6
7
8
x0–1 1–2–3–4–5–6–7–8 2 3 4 5 6 7 8
y
–5
–4
–6
–7
–8
–3
–2
–1
1
2
3
4
5
6
7
8
x0–1 1–2–3–4–5–6–7–8 2 3 4 5 6 7 8
y
–5
–4
–6
–7
–8
–3
–2
–1
1
2
3
4
5
6
7
8
x0–1 1–2–3–4–5–6–7–8 2 3 4 5 6 7 8
y
–5
–4
–6
–7
–8
–3
–2
–1
1
2
3
4
5
6
7
8
x0–1 1–2–3–4–5–6–7–8 2 3 4 5 6 7 8
Function Graph
y � (x � 1)2
y � (x � 3)2
y � (x � 5)2
y
–5
–4
–6
–7
–8
–3
–2
–1
1
2
3
4
5
6
7
8
x0–1 1–2–3–4–5–6–7–8 2 3 4 5 6 7 8
y
–5
–4
–6
–7
–8
–3
–2
–1
1
2
3
4
5
6
7
8
x0–1 1–2–3–4–5–6–7–8 2 3 4 5 6 7 8
y
–5
–4
–6
–7
–8
–3
–2
–1
1
2
3
4
5
6
7
8
x0–1 1–2–3–4–5–6–7–8 2 3 4 5 6 7 8
Answer Key: page 253
A
B
C
D
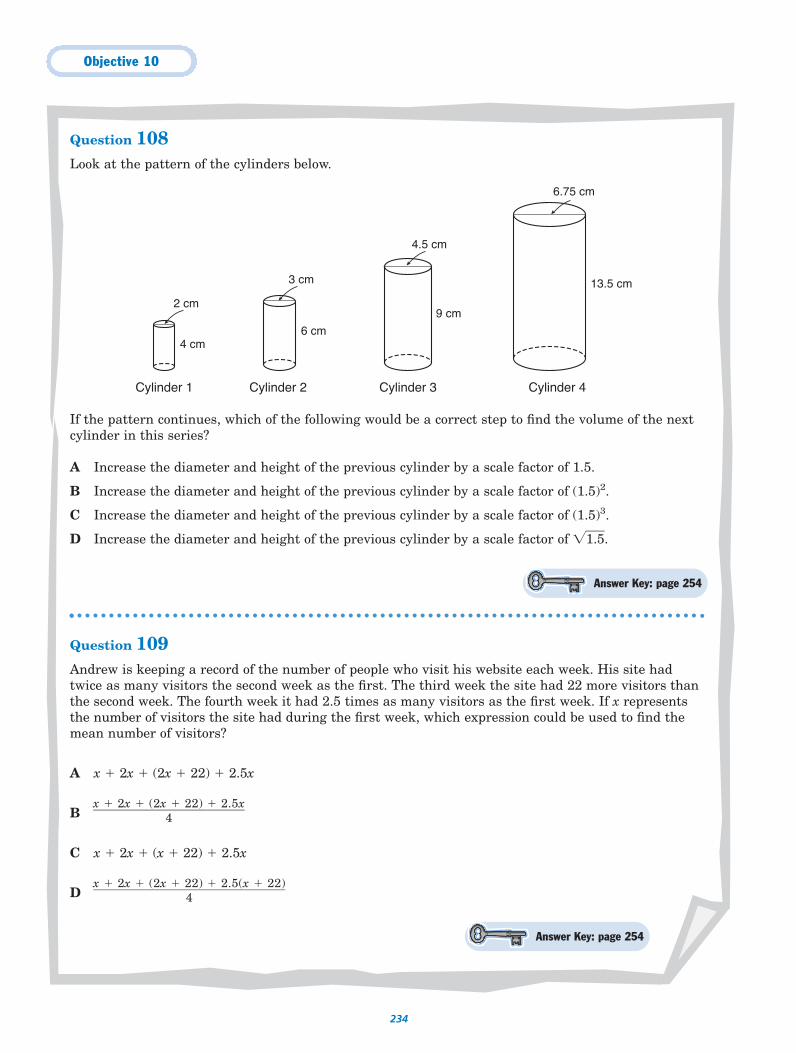
Objective 10
234
Question 108Look at the pattern of the cylinders below.
If the pattern continues, which of the following would be a correct step to find the volume of the nextcylinder in this series?
A Increase the diameter and height of the previous cylinder by a scale factor of 1.5.
B Increase the diameter and height of the previous cylinder by a scale factor of (1.5)2.
C Increase the diameter and height of the previous cylinder by a scale factor of (1.5)3.
D Increase the diameter and height of the previous cylinder by a scale factor of �1.5�.
Question 109Andrew is keeping a record of the number of people who visit his website each week. His site hadtwice as many visitors the second week as the first. The third week the site had 22 more visitors thanthe second week. The fourth week it had 2.5 times as many visitors as the first week. If x representsthe number of visitors the site had during the first week, which expression could be used to find themean number of visitors?
A x � 2x � (2x � 22) � 2.5x
B
C x � 2x � (x � 22) � 2.5x
Dx � 2x � (2x � 22) � 2.5(x � 22)�����
4
x � 2x � (2x � 22) � 2.5x����
4
Cylinder 1 Cylinder 2 Cylinder 3 Cylinder 4
4 cm
2 cm
3 cm
6 cm
6.75 cm
13.5 cm
4.5 cm
9 cm
Answer Key: page 254
Answer Key: page 254
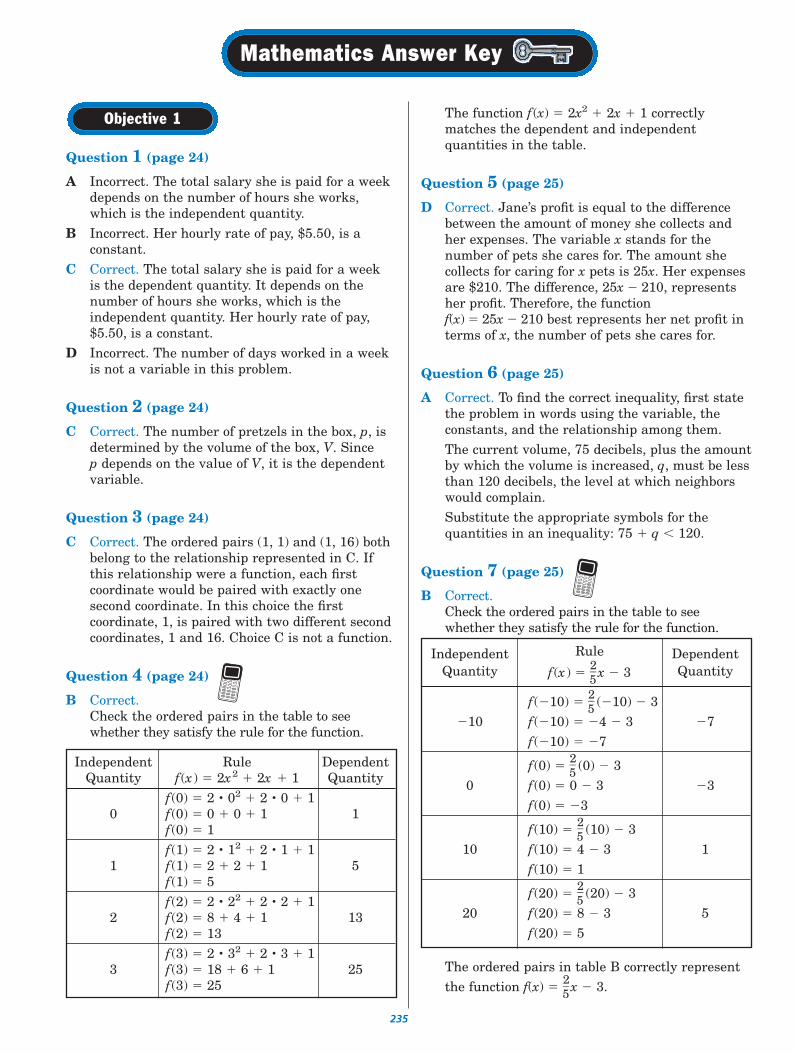
235
Question 1 (page 24)
A Incorrect. The total salary she is paid for a weekdepends on the number of hours she works,which is the independent quantity.
B Incorrect. Her hourly rate of pay, $5.50, is aconstant.
C Correct. The total salary she is paid for a week is the dependent quantity. It depends on thenumber of hours she works, which is theindependent quantity. Her hourly rate of pay,$5.50, is a constant.
D Incorrect. The number of days worked in a weekis not a variable in this problem.
Question 2 (page 24)
C Correct. The number of pretzels in the box, p, isdetermined by the volume of the box, V. Sincep depends on the value of V, it is the dependentvariable.
Question 3 (page 24)
C Correct. The ordered pairs (1, 1) and (1, 16) bothbelong to the relationship represented in C. Ifthis relationship were a function, each firstcoordinate would be paired with exactly onesecond coordinate. In this choice the firstcoordinate, 1, is paired with two different secondcoordinates, 1 and 16. Choice C is not a function.
Question 4 (page 24)
B Correct.Check the ordered pairs in the table to seewhether they satisfy the rule for the function.
The function f(x) � 2x2 � 2x � 1 correctlymatches the dependent and independentquantities in the table.
Question 5 (page 25)
D Correct. Jane’s profit is equal to the differencebetween the amount of money she collects andher expenses. The variable x stands for thenumber of pets she cares for. The amount shecollects for caring for x pets is 25x. Her expensesare $210. The difference, 25x � 210, representsher profit. Therefore, the function f(x) � 25x � 210 best represents her net profit interms of x, the number of pets she cares for.
Question 6 (page 25)
A Correct. To find the correct inequality, first statethe problem in words using the variable, theconstants, and the relationship among them.The current volume, 75 decibels, plus the amountby which the volume is increased, q, must be lessthan 120 decibels, the level at which neighborswould complain.Substitute the appropriate symbols for thequantities in an inequality: 75 � q � 120.
Question 7 (page 25)
B Correct.Check the ordered pairs in the table to seewhether they satisfy the rule for the function.
The ordered pairs in table B correctly represent the function f(x) � �
25
� x � 3.
Objective 1
Independent Rule Dependent Quantity f(x ) � 2x2 � 2x � 1 Quantity
f(0) � 2 • 02 � 2 • 0 � 10 f(0) � 0 � 0 � 1 1
f(0) � 1f(1) � 2 • 12 � 2 • 1 � 1
1 f(1) � 2 � 2 � 1 5f(1) � 5f(2) � 2 • 22 � 2 • 2 � 1
2 f(2) � 8 � 4 � 1 13f(2) � 13f(3) � 2 • 32 � 2 • 3 � 1
3 f(3) � 18 � 6 � 1 25f(3) � 25
Mathematics Answer Key
Independent Rule DependentQuantity f(x ) � �
25
� x � 3 Quantity
f(�10) � �25
� (�10) � 3�10 f(�10) � �4 � 3 �7
f(�10) � �7
f(0) � �25
� (0) � 30 f(0) � 0 � 3 �3
f(0) � �3
f(10) � �25
� (10) � 310 f(10) � 4 � 3 1
f(10) � 1
f(20) � �25
� (20) � 320 f(20) � 8 � 3 5
f(20) � 5
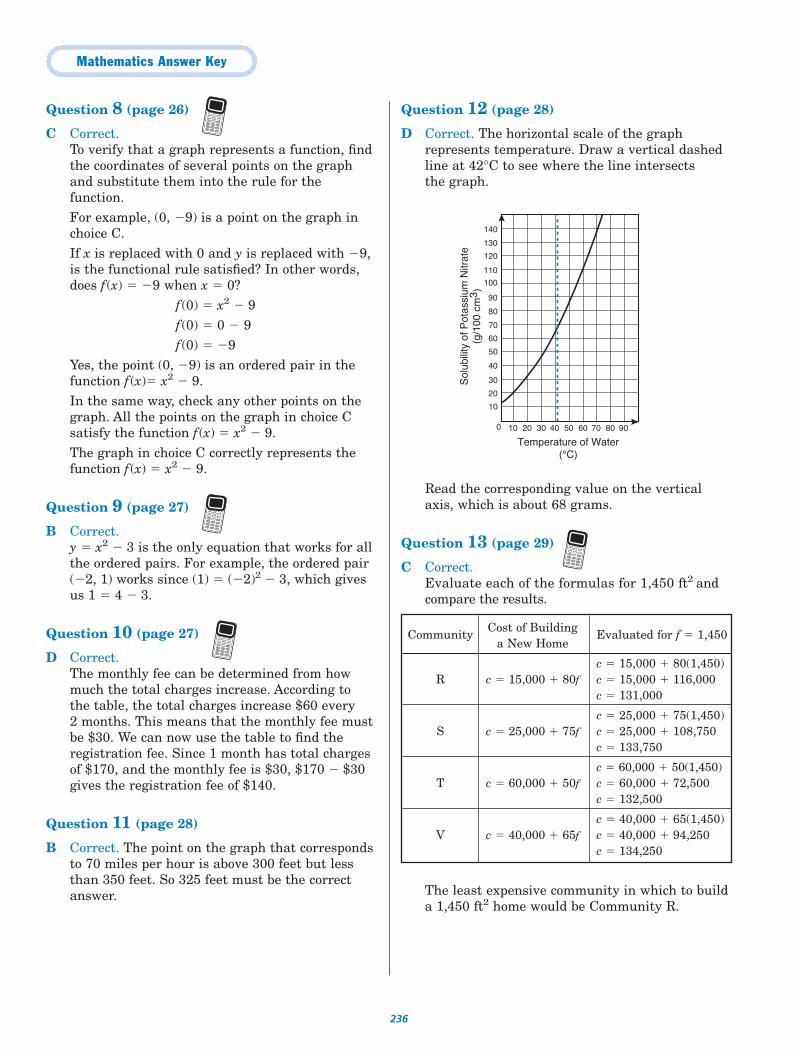
Mathematics Answer Key
236
Community Cost of Building Evaluated for f � 1,450a New Home
c � 15,000 � 80(1,450) R c � 15,000 � 80f c � 15,000 � 116,000
c � 131,000
c � 25,000 � 75(1,450) S c � 25,000 � 75f c � 25,000 � 108,750
c � 133,750
c � 60,000 � 50(1,450) T c � 60,000 � 50f c � 60,000 � 72,500
c � 132,500
c � 40,000 � 65(1,450) V c � 40,000 � 65f c � 40,000 � 94,250
c � 134,250
Question 8 (page 26)
C Correct.To verify that a graph represents a function, findthe coordinates of several points on the graphand substitute them into the rule for thefunction. For example, (0, �9) is a point on the graph inchoice C. If x is replaced with 0 and y is replaced with �9,is the functional rule satisfied? In other words,does f(x) � �9 when x � 0?
f(0) � x2 � 9f(0) � 0 � 9f(0) � �9
Yes, the point (0, �9) is an ordered pair in thefunction f(x)� x2 � 9.In the same way, check any other points on thegraph. All the points on the graph in choice Csatisfy the function f(x) � x2 � 9.The graph in choice C correctly represents thefunction f(x) � x2 � 9.
Question 9 (page 27)
B Correct.y � x2 � 3 is the only equation that works for allthe ordered pairs. For example, the ordered pair(�2, 1) works since (1) � (�2)2 � 3, which givesus 1 � 4 � 3.
Question 10 (page 27)
D Correct.The monthly fee can be determined from howmuch the total charges increase. According to the table, the total charges increase $60 every 2 months. This means that the monthly fee mustbe $30. We can now use the table to find theregistration fee. Since 1 month has total chargesof $170, and the monthly fee is $30, $170 � $30gives the registration fee of $140.
Question 11 (page 28)
B Correct. The point on the graph that correspondsto 70 miles per hour is above 300 feet but lessthan 350 feet. So 325 feet must be the correctanswer.
Question 12 (page 28)
D Correct. The horizontal scale of the graphrepresents temperature. Draw a vertical dashedline at 42°C to see where the line intersects the graph.
Read the corresponding value on the verticalaxis, which is about 68 grams.
Question 13 (page 29)
C Correct.Evaluate each of the formulas for 1,450 ft2 andcompare the results.
The least expensive community in which to builda 1,450 ft2 home would be Community R.
9010 20 30 40 50 60 70 80
Temperature of Water(°C)
Sol
ubili
ty o
f Pot
assi
um N
itrat
e(g
/100
cm
3 )
0
20
40
60
80
100
120
140
130
110
90
70
50
30
10
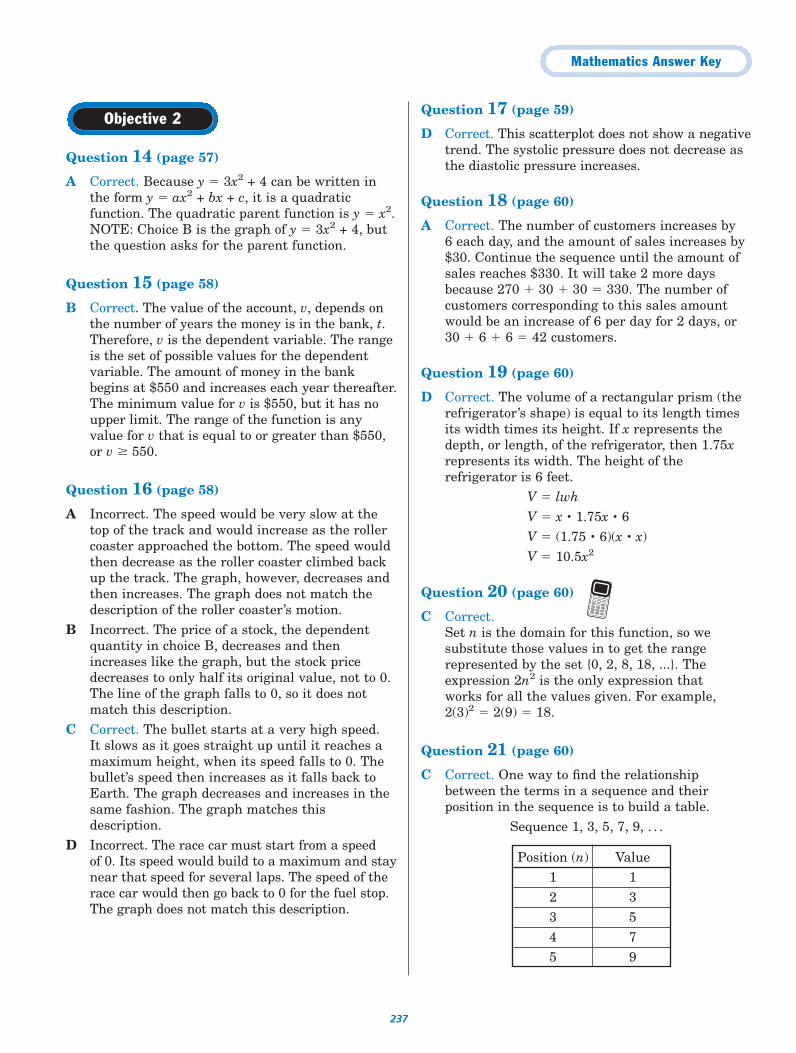
Mathematics Answer Key
237
Question 14 (page 57)
A Correct. Because y � 3x2 + 4 can be written inthe form y � ax2 + bx + c, it is a quadraticfunction. The quadratic parent function is y � x2.NOTE: Choice B is the graph of y � 3x2 + 4, butthe question asks for the parent function.
Question 15 (page 58)
B Correct. The value of the account, v, depends onthe number of years the money is in the bank, t.Therefore, v is the dependent variable. The rangeis the set of possible values for the dependentvariable. The amount of money in the bankbegins at $550 and increases each year thereafter.The minimum value for v is $550, but it has noupper limit. The range of the function is anyvalue for v that is equal to or greater than $550,or v 550.
Question 16 (page 58)
A Incorrect. The speed would be very slow at thetop of the track and would increase as the rollercoaster approached the bottom. The speed wouldthen decrease as the roller coaster climbed backup the track. The graph, however, decreases andthen increases. The graph does not match thedescription of the roller coaster’s motion.
B Incorrect. The price of a stock, the dependentquantity in choice B, decreases and thenincreases like the graph, but the stock pricedecreases to only half its original value, not to 0.The line of the graph falls to 0, so it does notmatch this description.
C Correct. The bullet starts at a very high speed. It slows as it goes straight up until it reaches amaximum height, when its speed falls to 0. Thebullet’s speed then increases as it falls back toEarth. The graph decreases and increases in thesame fashion. The graph matches thisdescription.
D Incorrect. The race car must start from a speed of 0. Its speed would build to a maximum and staynear that speed for several laps. The speed of therace car would then go back to 0 for the fuel stop.The graph does not match this description.
Question 17 (page 59)
D Correct. This scatterplot does not show a negativetrend. The systolic pressure does not decrease asthe diastolic pressure increases.
Question 18 (page 60)
A Correct. The number of customers increases by6 each day, and the amount of sales increases by$30. Continue the sequence until the amount ofsales reaches $330. It will take 2 more daysbecause 270 � 30 � 30 � 330. The number ofcustomers corresponding to this sales amountwould be an increase of 6 per day for 2 days, or30 � 6 � 6 � 42 customers.
Question 19 (page 60)
D Correct. The volume of a rectangular prism (therefrigerator’s shape) is equal to its length timesits width times its height. If x represents thedepth, or length, of the refrigerator, then 1.75xrepresents its width. The height of therefrigerator is 6 feet.
V � lwhV � x • 1.75x • 6V � (1.75 • 6)(x • x)V � 10.5x2
Question 20 (page 60)
C Correct.Set n is the domain for this function, so wesubstitute those values in to get the rangerepresented by the set {0, 2, 8, 18, ...}. Theexpression 2n2 is the only expression that works for all the values given. For example, 2(3)2 � 2(9) � 18.
Question 21 (page 60)
C Correct. One way to find the relationshipbetween the terms in a sequence and theirposition in the sequence is to build a table.
Sequence 1, 3, 5, 7, 9, . . .
Objective 2
Position (n) Value1 12 33 5 4 75 9
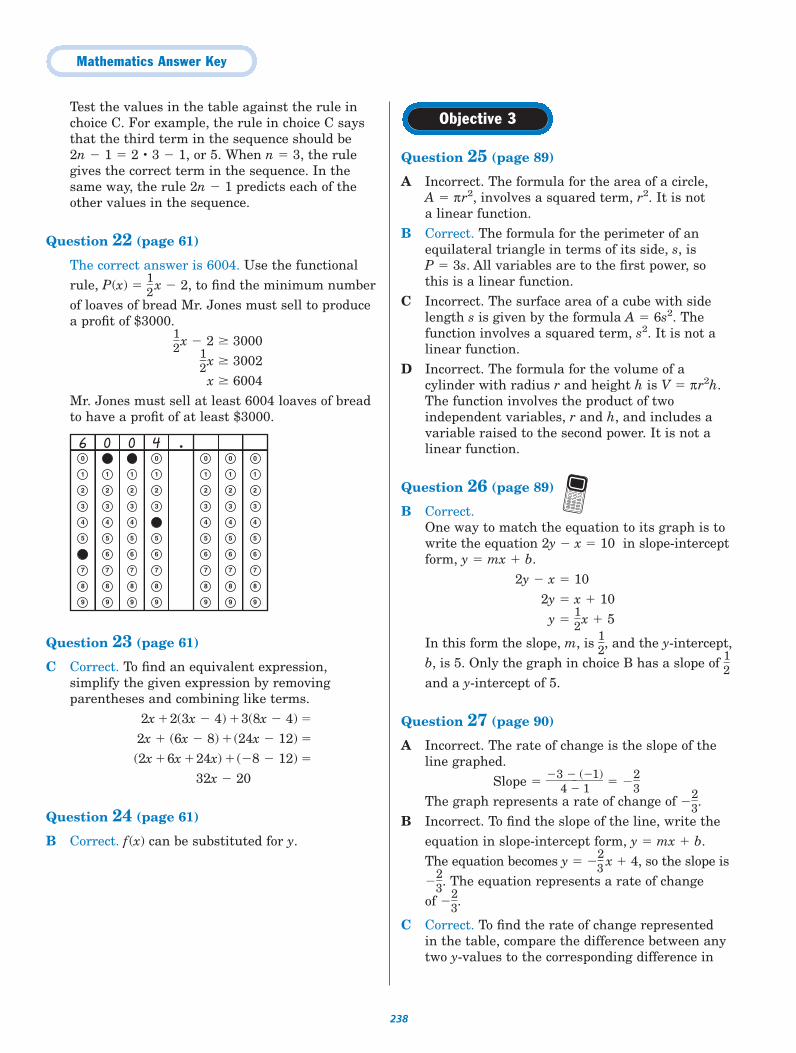
Mathematics Answer Key
238
Test the values in the table against the rule inchoice C. For example, the rule in choice C saysthat the third term in the sequence should be2n � 1 � 2 • 3 � 1, or 5. When n � 3, the rulegives the correct term in the sequence. In thesame way, the rule 2n � 1 predicts each of theother values in the sequence.
Question 22 (page 61)
The correct answer is 6004. Use the functional rule, P(x) � �
12
� x � 2, to find the minimum number of loaves of bread Mr. Jones must sell to producea profit of $3000.
�12
� x � 2 3000�12
� x 3002x 6004
Mr. Jones must sell at least 6004 loaves of breadto have a profit of at least $3000.
Question 23 (page 61)
C Correct. To find an equivalent expression,simplify the given expression by removingparentheses and combining like terms.
2x �2(3x � 4) �3(8x � 4) �
2x � (6x � 8) �(24x � 12) �
(2x �6x �24x) �(�8 � 12) �
32x � 20
Question 24 (page 61)
B Correct. f(x) can be substituted for y.
Question 25 (page 89)
A Incorrect. The formula for the area of a circle, A � πr2, involves a squared term, r2. It is not a linear function.
B Correct. The formula for the perimeter of anequilateral triangle in terms of its side, s, is P � 3s. All variables are to the first power, sothis is a linear function.
C Incorrect. The surface area of a cube with sidelength s is given by the formula A � 6s2. Thefunction involves a squared term, s2. It is not alinear function.
D Incorrect. The formula for the volume of acylinder with radius r and height h is V � πr2h.The function involves the product of twoindependent variables, r and h, and includes avariable raised to the second power. It is not alinear function.
Question 26 (page 89)
B Correct. One way to match the equation to its graph is towrite the equation 2y � x � 10 in slope-interceptform, y � mx � b.
2y � x � 102y � x � 10y � �
12
�x � 5
In this form the slope, m, is �12
�, and the y-intercept, b, is 5. Only the graph in choice B has a slope of �
12
�
and a y-intercept of 5.
Question 27 (page 90)
A Incorrect. The rate of change is the slope of theline graphed.
Slope � ��3
4��
(�1
1)� � ��
23
�
The graph represents a rate of change of ��23
�.B Incorrect. To find the slope of the line, write the
equation in slope-intercept form, y � mx � b. The equation becomes y � ��
23
� x � 4, so the slope is��
23
�. The equation represents a rate of change of ��
23
�.
C Correct. To find the rate of change represented in the table, compare the difference between anytwo y-values to the corresponding difference in
Objective 3
0
1
2
3
4
5
6
7
8
9
0
1
2
3
4
5
6
7
8
9
0
1
2
3
4
5
6
7
8
9
0
1
2
3
4
5
6
7
8
9
0
1
2
3
4
5
6
7
8
9
0
1
2
3
4
5
6
7
8
9
0
1
2
3
4
5
6
7
8
9
6 0 40
Mathematics Answer Key
239
x-values. For example, use the two points (1, 4)and (�3, 10).
Rate of change � ��10
3��
41
� � ��64� � ��
32
�
The table does not represent a rate of change of ��23
�.
D Incorrect. The equation is already in slope-intercept form, y � mx � b. The value of m is ��
23
�. Therefore, the slope is ��
23
�. The equation represents a rate of change of ��
23
�.
Question 28 (page 90)
B Correct. To find the maximum number of gramsof potatoes, look at the point on the graph wherethe number of grams of beef equals zero, the x-intercept. The graph intersects the x-axis at thepoint (450, 0). Therefore, the maximum numberof grams of potatoes that you could eat to obtain500 calories is 450 grams.
Question 29 (page 91)
C Correct. The y-intercept is (0, 200). The y-coordinate, 200, represents 200 units on the y-axis. The units on the y-axis are thousands of dollars. The company’s initial assets are 200 • $1,000 � $200,000.The slope, or rate of growth, is 50 units in the y direction for every unit in the x direction. Thus,the slope is �
510�, or 50. The y-axis units are
thousands of dollars, and the x-axis units are years.The expected growth rate is $50,000 per year.
Question 30 (page 91)
B Correct. A line parallel to 4x � 5y � �2 will have thesame slope. Put 4x � 5y � �2 into slope-intercept form:
4x � 5y � � 2�4x �4x
� �
y � x �
So the slope of the line is . This does not
eliminate any choices yet, since all the answers
have a slope of . Now substitute the point
(�3, �8) and the slope into y � mx � b to find
the y-intercept of the line.
(�8) � (�3) � b
�8 � � � b
� �
� � � b
� b
Therefore the correct equation is
y � x � .
Question 31 (page 91)
A Correct. Both graphs are lines. To determine theirrelationship, compare the slope of each graph. The first equation, y � �
34
� x � 4, is written in slope-intercept form, y � mx � b. Its slope is the value of m, or �
34
�. The second equation has a slope of 1. Since �1� � � �
34
� �, the slope of the second line is greater than that of the first line. Therefore, the second line is steeper than the first line.
Question 32 (page 91)
D Correct. Use the slope formula to find the slope of the linethat passes through the two points (2, �5) and(4, 3).
m � ��25��
43
� � ���
82� � 4
The slope of the line is 4. Substitute 4 for m and the coordinates of thepoint (2, �5) for x and y in the slope-interceptform of the equation of a line.
y � mx � b�5 � 4 • 2 � b�5 � 8 � b
b � �13Substituting m � 4 and b � �13 into the slope-intercept form of the equation of a lineresults in y � 4x � 13. The equation y � 4x � 13is equivalent to the equation in choice D.
285
45
�285
125
405
125
125
125
45
45
45
45
25
45
2�5
�4x�5
�5y�5
Mathematics Answer Key
240
y � 4x � 13�4x ��4x
�4x � y � �13
Question 33 (page 91)
D Correct. One way to find the two intercepts is to write theequation in standard form, Ax � By � C. Thenreplace x with 0 to determine the y-intercept andreplace y with 0 to determine the x-intercept.The equation 2x � 9 � 3y in standard form is 2x � 3y � 9. Let y � 0.
2x � 3 • 0 � 92x � 9
x � �92
�
The x-intercept is �92
�. The coordinates of the
x-intercept are (�92
�, 0).In the same way, let x � 0.
2 • 0 � 3y � 93y � 9y � 3
The y-intercept is 3. The coordinates of the y-intercept are (0, 3).
Question 34 (page 92)
A Correct. The slopes of the lines represent theirrate of change, the price per cookie. The slopes of the two lines are equal, so the price peradditional cookie remained the same. The firstgraph contains the point (12, 6), and the secondgraph contains the point (12, 7). The cost of thefirst dozen cookies increased from $6 to $7.
Question 35 (page 92)
A Correct. The number of miles Sammie walks isdirectly proportional to the number of minutesshe walks. Write a direct-proportion equation.
y � kxIn this equation, y is the number of miles and x is the number of minutes. She walks 3 miles in45 minutes. Substitute and solve for k, theproportionality constant.
y � kx
3 � k • 45
�435� � �
k4•
545�
k � �115�
The constant of proportionality is �115�.
The equation describing this situation is
y � �115� x. Find the number of miles walked in
2.5 hours. Convert 2.5 hours to minutes so thatthe units are the same.
2.5 hours • 60 minutes per hour � 150 minutes.Substitute 150 for x in the equation y � �
115� x.
Solve the equation for y.
y � �115� • 150
y � 10At this rate Sammie would walk 10 miles in 2.5 hours.
Question 36 (page 93)
B Correct. The function represented by the graph is
f(x) � x � 1. So x � 1 � 0 when x � �3.
Notice that this is also the x-coordinate of the
x-intercept.
Question 37 (page 107)
C Correct. This is a problem about the perimeterof a rectangle. The width of the rectangle is givenas w. The length will be five feet more than thewidth, so the length can be represented by w � 5.The formula for the perimeter of a rectangle isP � 2w � 2l. The perimeter of the rectangle can berepresented by the equation P � 2w � 2(w � 5). She can afford 150 feet of fencing. The perimetermust be less than or equal to 150 feet. Use thesymbol to write an inequality expressing thisrelationship.
P 1502w � 2(w � 5) 150
Objective 4
13
13
Mathematics Answer Key
241
Question 38 (page 107)
C Correct. Let m represent the amount of moneyshe spent on movie rentals, c the cost of her carrepairs, and l the cost of her lunches. SinceSharon spent five times as much on car repairs, c, as she did on movie rentals, m, youcan write the equation c � 5m. Since she spent$4 less on lunches, l, than on movie rentals, m,you can write the equation l � m � 4. The sum of these expenses is $80, so m � c � l � 80. Substitute the expressions in terms of m for cand l and solve for m.
m � c � l � 80m � 5m � m � 4 � 80
(m � 5m � m) � 4 � 807m � 4 � 80
7m � 84m � 12
Sharon spent $12 on movie rentals. The questionasks how much her car repairs cost. Since c � 5m, her car expenses were 5 • 12 � $60.
Question 39 (page 107)
A Correct. Represent the first number with x andthe second number with y.If the sum of the two numbers is 59, then x � y � 59.If the difference between 2 times the firstnumber, x, and 6 times the second number, y, is�34, then 2x � 6y � �34.Solve the system of equations.
x � y � 592x � 6y � �34
Addition method: Multiply the first equation by 6to obtain two terms with opposite coefficients, 6 and �6.
6x � 6y � 3542x � 6y � �34
Add the two equations to obtain one equationwith one unknown.
8x � 320x � 40
If x � 40, then substitute 40 into the firstequation to find y.
x � y � 5940 � y � 59
y � 19The first number is 40, and the second number is19.
Substitution method: Solve the first equation for y.y � 59 � x
Substitute (59 � x) for y in the second equation.2x � 6y � �34
2x � 6(59 � x) � �342x � 354 � 6x � �34
8x � 354 � �348x � 320x � 40
If x � 40, then substitute 40 into the firstequation, x � y � 59, to find y.
y � 19The first number is 40, and the second number is 19.
Question 40 (page 107)
C Correct. If Sid made 125 plain bagels and25 garlic bagels, it would be represented by thepoint (25, 125). On the graph, the point (25, 125)is not in the shaded region that represents thesolution to this inequality.
Question 41 (page 108)
D Correct. Let w � the width of the kennel. Iramust fence two widths plus the length of thegarage. The total number of feet of fencing Irawill use is w � w � 20 � 2w � 20. The total costof materials can be represented by the number offeet of fencing times the cost per foot of thematerials, 4(2w � 20). If Ira has at most $120 tospend on the project, then the inequality4(2w � 20) 120 can be used to solve theproblem.
4(2w � 20) 1208w � 80 120
8w 40w 5
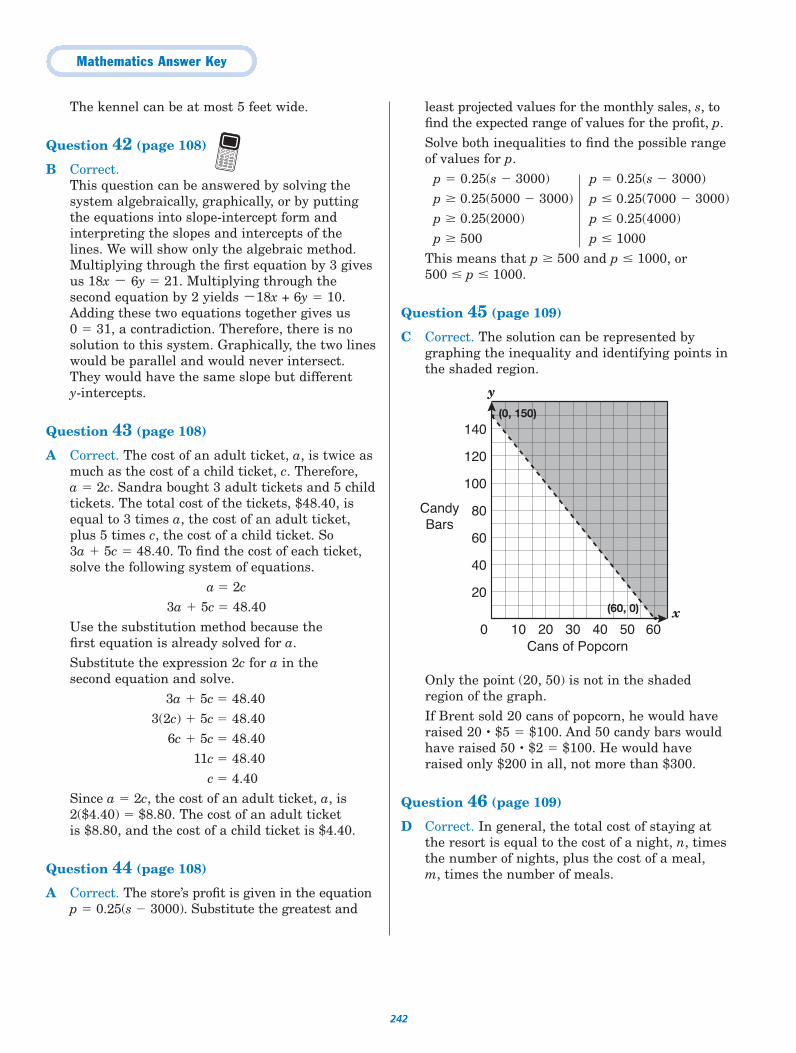
Mathematics Answer Key
242
The kennel can be at most 5 feet wide.
Question 42 (page 108)
B Correct. This question can be answered by solving thesystem algebraically, graphically, or by puttingthe equations into slope-intercept form andinterpreting the slopes and intercepts of thelines. We will show only the algebraic method.Multiplying through the first equation by 3 givesus 18x � 6y � 21. Multiplying through thesecond equation by 2 yields �18x + 6y � 10.Adding these two equations together gives us 0 � 31, a contradiction. Therefore, there is nosolution to this system. Graphically, the two lineswould be parallel and would never intersect.They would have the same slope but different y-intercepts.
Question 43 (page 108)
A Correct. The cost of an adult ticket, a, is twice asmuch as the cost of a child ticket, c. Therefore,a � 2c. Sandra bought 3 adult tickets and 5 childtickets. The total cost of the tickets, $48.40, isequal to 3 times a, the cost of an adult ticket,plus 5 times c, the cost of a child ticket. So3a � 5c � 48.40. To find the cost of each ticket,solve the following system of equations.
a � 2c3a � 5c � 48.40
Use the substitution method because the first equation is already solved for a.Substitute the expression 2c for a in the second equation and solve.
3a � 5c � 48.403(2c) � 5c � 48.40
6c � 5c � 48.4011c � 48.40
c � 4.40Since a � 2c, the cost of an adult ticket, a, is2($4.40) � $8.80. The cost of an adult ticket is $8.80, and the cost of a child ticket is $4.40.
Question 44 (page 108)
A Correct. The store’s profit is given in the equationp � 0.25(s � 3000). Substitute the greatest and
least projected values for the monthly sales, s, tofind the expected range of values for the profit, p.Solve both inequalities to find the possible rangeof values for p.
p � 0.25(s � 3000) p � 0.25(s � 3000)p 0.25(5000 � 3000) p 0.25(7000 � 3000)p 0.25(2000) p 0.25(4000)p 500 p 1000
This means that p 500 and p 1000, or 500 p 1000.
Question 45 (page 109)
C Correct. The solution can be represented bygraphing the inequality and identifying points inthe shaded region.
Only the point (20, 50) is not in the shadedregion of the graph. If Brent sold 20 cans of popcorn, he would haveraised 20 • $5 � $100. And 50 candy bars wouldhave raised 50 • $2 � $100. He would haveraised only $200 in all, not more than $300.
Question 46 (page 109)
D Correct. In general, the total cost of staying atthe resort is equal to the cost of a night, n, timesthe number of nights, plus the cost of a meal, m, times the number of meals.
0
20
40
60
80
100
120
140
10 20 30 40 50 60
CandyBars
Cans of Popcorn
x
y
(60, 0) •
(0, 150) •
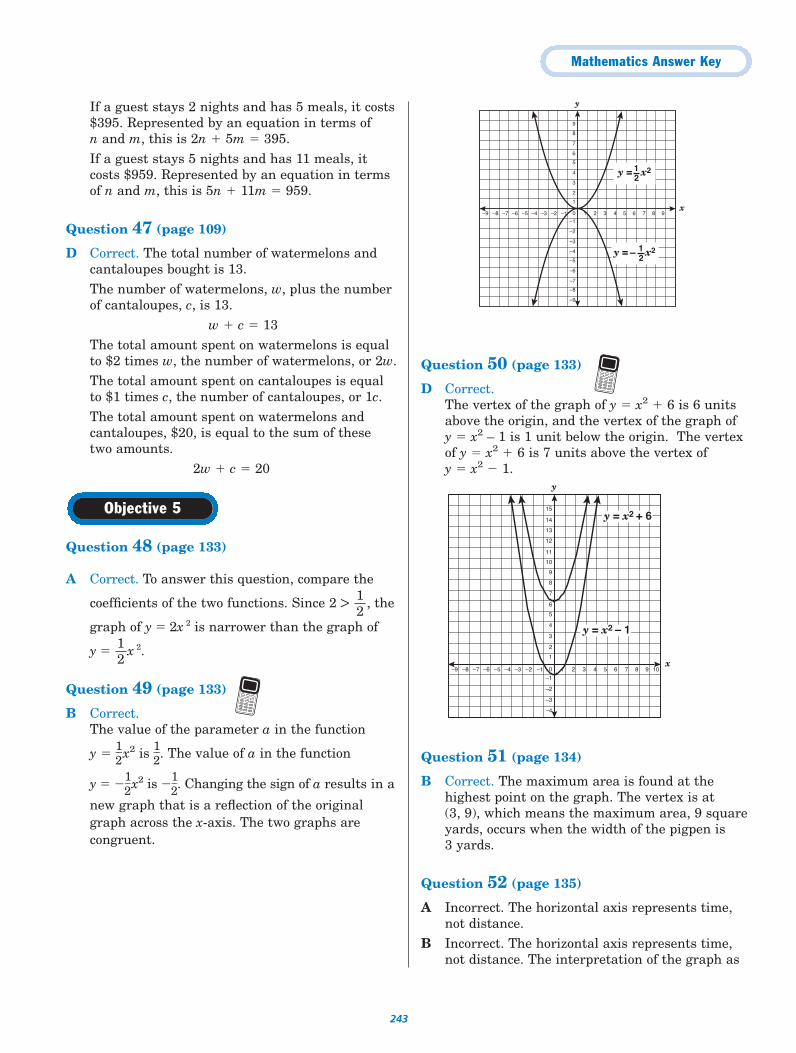
Mathematics Answer Key
243
If a guest stays 2 nights and has 5 meals, it costs$395. Represented by an equation in terms of n and m, this is 2n � 5m � 395.If a guest stays 5 nights and has 11 meals, itcosts $959. Represented by an equation in terms of n and m, this is 5n � 11m � 959.
Question 47 (page 109)
D Correct. The total number of watermelons andcantaloupes bought is 13.The number of watermelons, w, plus the numberof cantaloupes, c, is 13.
w � c � 13The total amount spent on watermelons is equalto $2 times w, the number of watermelons, or 2w.The total amount spent on cantaloupes is equalto $1 times c, the number of cantaloupes, or 1c.The total amount spent on watermelons andcantaloupes, $20, is equal to the sum of thesetwo amounts.
2w � c � 20
Question 48 (page 133)
A Correct. To answer this question, compare the
coefficients of the two functions. Since 2 > , the
graph of y � 2x 2 is narrower than the graph of
y � x 2.
Question 49 (page 133)
B Correct. The value of the parameter a in the function
y � �12
�x2 is �12
�. The value of a in the function
y � ��12
�x2 is ��12
�. Changing the sign of a results in a
new graph that is a reflection of the originalgraph across the x-axis. The two graphs arecongruent.
Question 50 (page 133)
D Correct.The vertex of the graph of y � x2 � 6 is 6 unitsabove the origin, and the vertex of the graph ofy � x2 – 1 is 1 unit below the origin. The vertexof y � x2 � 6 is 7 units above the vertex ofy � x2 � 1.
Question 51 (page 134)
B Correct. The maximum area is found at thehighest point on the graph. The vertex is at (3, 9), which means the maximum area, 9 squareyards, occurs when the width of the pigpen is 3 yards.
Question 52 (page 135)
A Incorrect. The horizontal axis represents time,not distance.
B Incorrect. The horizontal axis represents time,not distance. The interpretation of the graph as
y
x
–4
–3
–2
–1
0
1
2
3
4
5
6
7
8
9
10
11
12
13
14
15
–1 1–2–3–4–5–6–7–8–9 2 3 4 5 6 7 8 9 10
y = x2 + 6
y = x2 – 1
y
x
–5
–4
–6
–7
–8
–9
–3
–2
–1
0
1
2
3
4
5
6
7
8
9
–1 1–2–3–4–5–6–7–8–9 2 3 4 5 6 7 8 9
y = x212
y = x212–
12
12
Objective 5
Mathematics Answer Key
244
the path of the stone is not correct. In thisinstance, the path of the stone would not be acurving path, but a vertical line.
C Correct. The horizontal axis of the graphrepresents time in seconds from the time thestone is dropped. The stone’s distance from theground is 0 feet when the graph intersects thehorizontal axis. The graph intersects this axisbetween 5 and 6, so the stone hits the groundbetween 5 and 6 seconds after it is dropped.
D Incorrect. The stone’s distance from the grounddoes not decrease at a constant rate. If thedistance decreased at a constant rate, the graphwould be linear, not curved.
Question 53 (page 136)
B Correct. A zero of a function means a value of xwhere y equals zero. Looking at the table, noticethat as x goes from �2 to �1, y goes from apositive value to a negative value. So somewherein there, y has to be equal to zero. The other zerooccurs when x is between 0 and 1 (when y goesfrom a negative value to a positive value), butthis is not given as one of the answer choices.
Question 54 (page 136)
A Correct. One way to solve the equation2x2 � 15x � 16 � �11 � 24x is to first set theequation equal to 0.
2x2 � 9x � 5 � 0Factor the equation: (2x � 1)(x � 5) � 0Set each factor equal to 0 and solve.
2x � 1 � 0 and x � 5� 0
2x � 1 x � �5
x �
Question 55 (page 136)
D Correct. In the equation x2 � 4x � 5 � 0, replace x firstwith �1 and then with 5 to see whether theequation is true.Substitute x � �1 Substitute x � 5
x2 � 4x � 5 � 0 x2 � 4x � 5 � 0(�1)2 � 4 • �1 � 5 � 0 (5)2 � 4 • 5 � 5 � 0
1 � 4 � 5 � 0 25 � 20 � 5 � 00 � 0 0 � 0
Both replacements make this equation true. Onlythe equation in choice D has �1 and 5 assolutions.
Question 56 (page 136)
A Correct. Use the quadratic formula to determine the rootsof the equation. Substitute a � 1, b � �4, and c � 2 into the quadratic formula.
The following result is obtained.
Since �8� � 2.8, substitute this value in theformula.
�4 �
22.8� � 3.4 �4 �
22.8� � 0.6
The roots of the equation are approximately 3.4 and 0.6, with 0.6 being the smaller root. The number 0.6 lies between the integers 0 and 1.
Question 57 (page 137)
A Correct. The vertex is the point (�3, �1).
Question 58 (page 138)
D Correct. Substitute the given expression for theradius into the formula for volume of a sphere.
V � �43
� π(3x2y)3
Following the order of operations, first simplifythe expression for the radius cubed, (3x2y)3. Whenraising a term with an exponent to a power,multiply the exponents.
V � �43
�(3x2y)3π
V � �43
� • 33x2 • 3 y3 • π
V � �43
� • 27x6y3 • π
V � 36x6y3π
4 � �8��
2
4 � �16 � 8���
2
�(�4) � �(�4)2�� 4 •� 1 • 2�����
2 • 1
�b � �b2 � 4�ac����
2a
12
Mathematics Answer Key
245
Question 59 (page 153)
C Correct. Use the graph to find the coordinates ofthe triangle: A (0, �2), B (2, 2), and C (3, �2).The length of side AC is 3 � 0 � 3, and thelength of side A C is 6 � 0 � 6. The ratio of these lengths is �
63
� � 2, which is the given dilationfactor. Only the triangle in choice C has its sidelengths in a 2:1 ratio to those of the originaltriangle.
Question 60 (page 154)
A Correct. The side lengths of the originalrectangle and the dilated rectangle are asfollows: RS � TV � 3, ST � RV � 6, R S � T V � 1,and S T � R V � 2.To find the scale factor, choose one pair ofcorresponding sides.Find the ratio of the side length of the dilatedfigure to that of the original figure.
�RR VV
� � �
26
� � �13
�
The side length of the dilated figure is �13
� theside length of the original figure. The scale factor is �
13
�.
Question 61 (page 154)
A Incorrect. If one triangle is a dilation of theother, then the two triangles are similar. Thelengths of the corresponding sides of similartriangles must be in equal ratios.
�11
� � 1 �13.5� � �
12
� �24
� � �12
�
The ratios are not all equal.B Incorrect. If one triangle is a dilation of the
other, then the two triangles are similar. Thelengths of the corresponding sides of similartriangles must be in equal ratios.
�12
� � �12
� �14.5� � �
38
� �26
� � �13
�
The ratios are not all equal.C Incorrect. If one triangle is a dilation of the
other, then the two triangles are similar. Thelengths of the corresponding sides of similartriangles must be in equal ratios.
�14
� � �14
� �14..55� � �
39
� � �13
� �25
� � �25
�
The ratios are not all equal.D Correct. If one triangle is a dilation of the other,
then the two triangles are similar. The lengths ofthe corresponding sides of similar triangles mustbe in equal ratios. Only the side lengths in choiceD form a proportion with the given sides.
�14
� � �14
� �16.5� � �
132� � �
14
� �28
� � �14
�
Question 62 (page 154)
A Correct. The point (5, 6) in the given pentagon is 5 units to the right of the y-axis. The point (�5, 6)is 5 units to the left of the y-axis. The point (�5, 6)is the reflection of the point (5, 6) across the y-axis. The point (4, 1) in the given pentagon is 4 units tothe right of the y-axis. The point (�4, 1) is 4 unitsto the left of the y-axis. The point (�4, 1) is thereflection of the point (4, 1) across the y-axis. The point (3, 5) in the given pentagon is 3 units tothe right of the y-axis. The point (�3, 5) is 3 unitsto the left of the y-axis. The point (�3, 5) is thereflection of the point (3, 5) across the y-axis.
Question 63 (page 154)
D Correct. After a translation of 2 units to the rightand 3 units down, 2 is added to the x-coordinateof each point, and 3 is subtracted from they-coordinate of each point. Point R (1, 1) of the original quadrilateral hascoordinates of x � 1 and y � 1. Under atranslation of 2 units to the right, itsx-coordinate will be (1 � 2) � 3. Under atranslation of 3 units down, its y-coordinate willbe (1 � 3) � �2. Point R will have coordinates (3, �2).Point T (5, 8) of the original quadrilateral hascoordinates of x � 5 and y � 8. Under atranslation of 2 units to the right, itsx-coordinate will be (5 � 2) � 7. Under atranslation of 3 units down, its y-coordinate willbe (8 � 3) � 5. Point T will have coordinates (7, 5).
Question 64 (page 155)
C Correct. The scale factor of the dilation is greaterthan 1. The figure will be enlarged.
The ratios of the lengths of corresponding sides
should be �21
�.
Objective 6
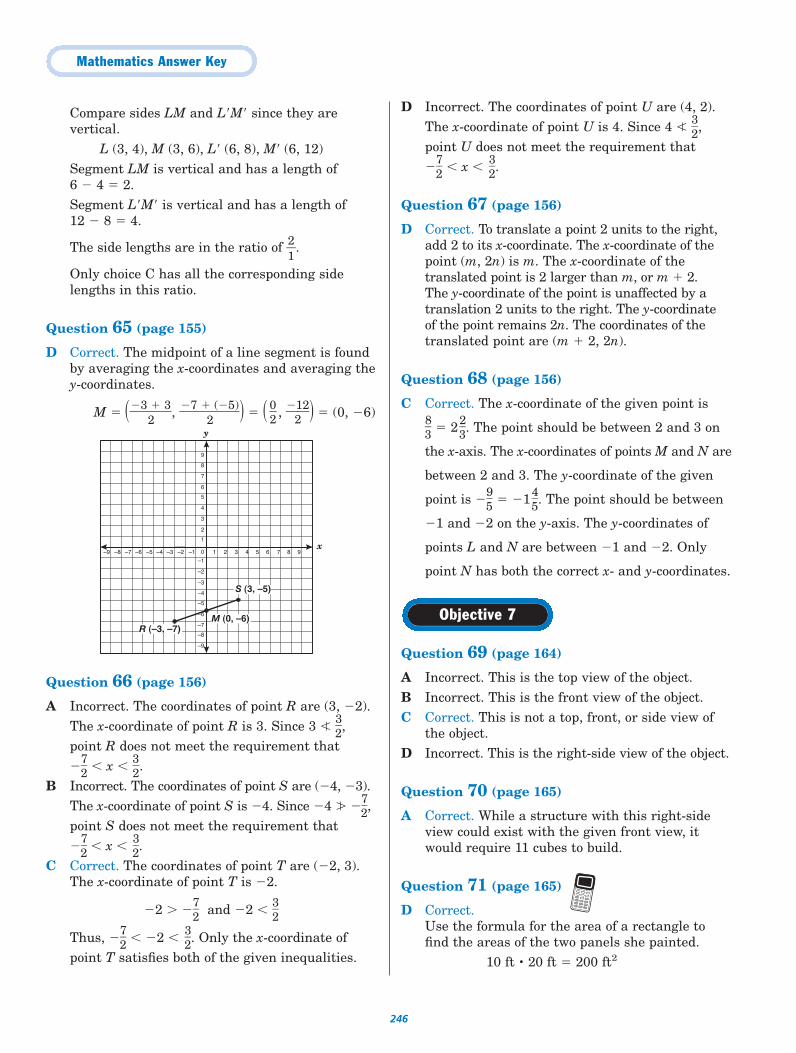
Mathematics Answer Key
246
Compare sides LM and L M since they arevertical.
L (3, 4), M (3, 6), L (6, 8), M (6, 12)Segment LM is vertical and has a length of6 � 4 � 2. Segment L M is vertical and has a length of12 � 8 � 4.
The side lengths are in the ratio of �21
�.
Only choice C has all the corresponding sidelengths in this ratio.
Question 65 (page 155)
D Correct. The midpoint of a line segment is foundby averaging the x-coordinates and averaging they-coordinates.
M � (��32� 3�, ��7 �
2(�5)�) � ( �
02
� , ��212�) � (0, �6)
Question 66 (page 156)
A Incorrect. The coordinates of point R are (3, �2). The x-coordinate of point R is 3. Since 3 � �
32
�, point R does not meet the requirement that ��
72
� � x � �23
�.B Incorrect. The coordinates of point S are (�4, �3).
The x-coordinate of point S is �4. Since �4 � ��72
�, point S does not meet the requirement that��
72
� � x � �32
�.C Correct. The coordinates of point T are (�2, 3).
The x-coordinate of point T is �2.
�2 � ��72
� and �2 � �32
�
Thus, ��72
� � �2 � �32
�. Only the x-coordinate of point T satisfies both of the given inequalities.
D Incorrect. The coordinates of point U are (4, 2). The x-coordinate of point U is 4. Since 4 � �
32
�, point U does not meet the requirement that��
72
� � x � �32
�.
Question 67 (page 156)
D Correct. To translate a point 2 units to the right,add 2 to its x-coordinate. The x-coordinate of thepoint (m, 2n) is m. The x-coordinate of thetranslated point is 2 larger than m, or m � 2. The y-coordinate of the point is unaffected by atranslation 2 units to the right. The y-coordinate of the point remains 2n. The coordinates of thetranslated point are (m � 2, 2n).
Question 68 (page 156)
C Correct. The x-coordinate of the given point is
�83
� � 2 �23
�. The point should be between 2 and 3 on
the x-axis. The x-coordinates of points M and N are
between 2 and 3. The y-coordinate of the given
point is ��95
� � �1 �45
�. The point should be between
�1 and �2 on the y-axis. The y-coordinates of
points L and N are between �1 and �2. Only
point N has both the correct x- and y-coordinates.
Question 69 (page 164)
A Incorrect. This is the top view of the object.B Incorrect. This is the front view of the object.C Correct. This is not a top, front, or side view of
the object.D Incorrect. This is the right-side view of the object.
Question 70 (page 165)
A Correct. While a structure with this right-sideview could exist with the given front view, itwould require 11 cubes to build.
Question 71 (page 165)
D Correct. Use the formula for the area of a rectangle tofind the areas of the two panels she painted.
10 ft • 20 ft � 200 ft2
Objective 7
y
x
–5
–4
–6
–7
–8
–9
–3
–2
–1
0
1
2
3
4
5
6
7
8
9
–1 1–2–3–4–5–6–7–8–9 2 3 4 5 6 7 8 9
R (–3, –7)
S (3, –5)
M (0, –6)
Mathematics Answer Key
247
4 ft • 15 ft � 60 ft2
Find their sum. 200 � 60 � 260 ft2
Then subtract their sum from 400 to find thenumber of square feet that the paint left in thecan will cover.
400 ft2 � 260 ft2 � 140 ft2
The remaining paint will cover at most 140 ft2.Only the rectangle in answer choice D has anarea that is less than or equal to 140 ft2 because10 • 12 � 120, and 120 � 140.
Question 72 (page 166)
C Correct.If the three lengths are to form the sides of a right triangle, then they must satisfy thePythagorean Theorem, a2 � b2 � c2.The greatest number in the set is 16. Thehypotenuse of a right triangle is the longest side.Let c � 16. The lesser numbers are 8 and 15. Leta � 8 and b � 15. Does 82 � 152 � 162? Does 64 � 225 � 256? No, because 64 � 225 � 289. Since 289 � 256,the set of numbers 8, 15, and 16 could not be thesides of a right triangle.
Question 73 (page 166)
The correct answer is 10. Use a proportion to findthe answer.
�
�148� � �
4x5�
18x � 4 • 4518x � 180
x � 10The longer side of the scale drawing is 10 inches.
Question 74 (page 167)
B Correct.Since the tiles are in square inches, find all areasin square inches.The area of the countertop is its length times itswidth.
A � lwA � 5 ft 4 in. • 2 ft 2 in.A � 64 in. • 26 in.A � 1664 in.2
The area of the circular sink equals π times itsradius squared.
A � πr2
A � π • 82
A � 64πA � 201 in.2
The area of the countertop, not including thesink, is equal to the area of the rectangular topminus the area of the circular sink.
1664 – 201 � 1463 in.2
Each tile is 2 in. by 2 in., so it has an area of2 • 2 � 4 in.2.Divide 1463 by 4 to find the number of tilesneeded.
1463 � 4 � 365.75 Ed will need at least 366 tiles.
Question 75 (page 167)
B Correct.If the three lengths are to form the sides of aright triangle, then they must satisfy thePythagorean Theorem (a2 � b2 � c2). Thegreatest number in the set is 22.5, so c � 22.5.Let a � 18 and b � 13.5.
182 � 13.52 � 22.52
324 � 182.25 � 506.25506.25 � 506.25
Therefore 18, 13.5, and 22.5 do form a righttriangle.
Question 76 (page 188)
B Correct.To calculate the total surface area using a net,add the areas of all the surfaces.
Objective 8
0
1
2
3
4
5
6
7
8
9
0
1
2
3
4
5
6
7
8
9
0
1
2
3
4
5
6
7
8
9
0
1
2
3
4
5
6
7
8
9
0
1
2
3
4
5
6
7
8
9
0
1
2
3
4
5
6
7
8
9
0
1
2
3
4
5
6
7
8
9
01
45 ftx in.
18 ft4 in.
Mathematics Answer Key
248
The rectangle forms the curved surface of thecylinder. The length of the rectangle is equal tothe circumference of the circular base.
C � πdC � π • 5C � 15.7
The rectangle has a length of 15.7 m and a width of 2.8 m. The area of the rectangle is15.7 • 2.8 � 43.96 m2.The cylinder has two circular surfaces. Use theformula for the area of a circle. Each circle has adiameter of 5 m. The radius is half the diameter.The radius is 5 � 2 � 2.5 m. Use 2.5 for r.
A � πr2
A � π • (2.5)2 � 19.635 m2
The area of one circular surface is about 19.635 m2.To find the surface area, add the areas of all thesurfaces.
S � 43.96 � 2 • 19.635 � 83.23Rounding to the nearest square meter, thesurface area of the cylinder is 83 m2.
Question 77 (page 188)
C Correct. The surface area of a prism is the sum of the areas of its surfaces.To find the area of the triangular surfaces,measure the length of the base of the triangleand its height. The length of the base is 3 cm,and the height is 2.6 cm.Use the formula for the area of a triangle.
A � �12
�bh
A � �12
� • 3 • 2.6
A � 3.9 cm2
The area of each triangular surface is 3.9 cm2.Find the area of the rectangular surfaces.Measure the length and width of one of therectangles. The length is 4.4 cm, and the width is 3 cm. The area of each rectangular surface is 3 • 4.4, or 13.2 cm2.Find the sum of the areas of all the surfaces tofind the total surface area of the prism. Theprism has 2 triangular surfaces and 3rectangular surfaces. S � 2 • 3.9 � 3 • 13.2 � 7.8 � 39.6 � 47.4 cm2
Choice C, 47 cm2, is closest to this value.
Question 78 (page 189)
A Correct. The edge length of the cubical box isequal to the diameter of the base of the cone,represented by 2r. As the dimensions of the cubeare all 2r, the volume would then be equal to theexpression (2r)3.
Question 79 (page 189)
B Correct.The passageway is a rectangular prism.Calculate the volume of the prism.
V � Bh � (lw)hV � (6 • 4) • 3V � 72 ft3
The part of the pipe that is inside the passagewayis a cylinder that is 6 feet long, h � 6 ft. Theradius, r, of the cylinder is the diameter dividedby 2.
r � 30 � 2 � 15 in.Convert the radius to feet; divide 15 by 12.
r � 15 � 12 � 1.25 feetCalculate the volume of the cylinder.
V � Bh � πr2hV � π • (1.25)2 • 6V � 29.45 ft3
Subtract the volume of the pipe from the volumeof the passageway to find the volume ofinsulating material needed to fill the spacearound the pipe.
72 � 29.45 � 42.55 � 43 ft3
To the nearest cubic foot, the volume of the spaceto be filled with insulating material is 43 cubicfeet.
Question 80 (page 190)
B Correct. On her walk to the scenic overlook, Jillian followsthe sidewalk. She walks 300 � 475 � 775 ft.Compare this distance to the shortcut.Her journey along the sidewalk and her shortcut form a right triangle. The shortcut is the hypotenuse, c, of the right triangle. Use the Pythagorean Theorem to calculate the length of the shortcut.
c � �3002 ��4752� � �90,00�0 � 2�25,62�5�� �315,6�25� � 561.81
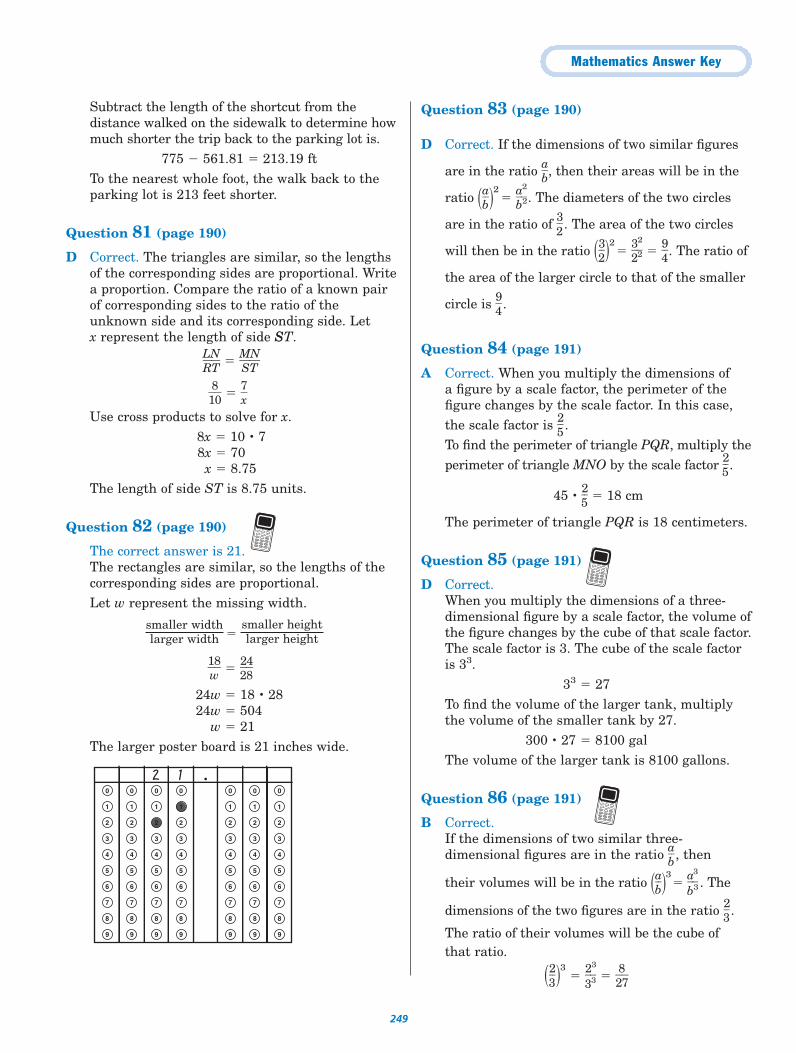
Mathematics Answer Key
249
Subtract the length of the shortcut from thedistance walked on the sidewalk to determine howmuch shorter the trip back to the parking lot is.
775 � 561.81 � 213.19 ft To the nearest whole foot, the walk back to theparking lot is 213 feet shorter.
Question 81 (page 190)
D Correct. The triangles are similar, so the lengthsof the corresponding sides are proportional. Writea proportion. Compare the ratio of a known pairof corresponding sides to the ratio of theunknown side and its corresponding side. Letx represent the length of side SST.
�LR
NT� � �
MST
N�
�180� � �
7x
�
Use cross products to solve for x.8x � 10 • 78x � 70x � 8.75
The length of side ST is 8.75 units.
Question 82 (page 190)
The correct answer is 21.The rectangles are similar, so the lengths of thecorresponding sides are proportional. Let w represent the missing width.
�
�1w8� � �
2248�
24w � 18 • 2824w � 504
w � 21The larger poster board is 21 inches wide.
Question 83 (page 190)
D Correct. If the dimensions of two similar figures
are in the ratio �ab
�, then their areas will be in the
ratio (�ab
�)2 � �ab2
2�. The diameters of the two circles
are in the ratio of �32
� . The area of the two circles
will then be in the ratio (�32
�)2 � �32
2
2� � �94
�. The ratio of
the area of the larger circle to that of the smaller
circle is �94
�.
Question 84 (page 191)
A Correct. When you multiply the dimensions of a figure by a scale factor, the perimeter of thefigure changes by the scale factor. In this case, the scale factor is �
25
� . To find the perimeter of triangle PQR, multiply the perimeter of triangle MNO by the scale factor �
25
�.
45 • �25
� � 18 cm
The perimeter of triangle PQR is 18 centimeters.
Question 85 (page 191)
D Correct.When you multiply the dimensions of a three-dimensional figure by a scale factor, the volume ofthe figure changes by the cube of that scale factor.The scale factor is 3. The cube of the scale factoris 33.
33 � 27 To find the volume of the larger tank, multiplythe volume of the smaller tank by 27.
300 • 27 � 8100 galThe volume of the larger tank is 8100 gallons.
Question 86 (page 191)
B Correct.If the dimensions of two similar three-dimensional figures are in the ratio �
ab
�, then
their volumes will be in the ratio (�ab
�)3� �ab3
3� . The
dimensions of the two figures are in the ratio �23
�.
The ratio of their volumes will be the cube of that ratio.
(�23
�)3� �
23
3
3� � �287�
0
1
2
3
4
5
6
7
8
9
0
1
2
3
4
5
6
7
8
9
0
1
2
3
4
5
6
7
8
9
0
1
2
3
4
5
6
7
8
9
0
1
2
3
4
5
6
7
8
9
0
1
2
3
4
5
6
7
8
9
0
1
2
3
4
5
6
7
8
9
12
smaller heightlarger height
smaller widthlarger width
Mathematics Answer Key
250
To find the volume of the smaller box, multiply the volume of the larger box by �
287� .
162 • �287� � 48 in.3
The volume of the smaller box is 48 cubic inches.
Question 87 (page 191)
C Correct.
Substituting into V � πr3 gives V � π(6)3,
since the radius is 6 inches. Therefore
V � π · 216, which gives a volume of
approximately 904 cubic inches.
Question 88 (page 191)
A Correct. Use the formula for the total surfacearea of a prism: S � Ph � 2B. The height of theprism is 4. The perimeter of the triangular baseis 3 � 4 � 5 � 12. The third side of the righttriangle is 5 since this is a Pythagorean triple.The area of the triangular base is · 3 · 4 � 6.Therefore S � (12)(4) � 2(6), or 60 square feet.
Question 89 (page 211)
B Correct.Use a proportion to determine how many hoursRhonda actually spent on the project. Let n represent the number of hours Rhondaactually spent on the project. Write a proportion.
�1n2� � �
18000
�
80n � 12 • 10080n � 1200
n � 15Rhonda actually spent 15 hours on the project.
Question 90 (page 211)
B Correct.Use a proportion to solve this rate problem.Write two ratios, each of which compares thenumber of switches to the number of hours. Let x equal the number of hours required tomanufacture 210 switches.
�13.55� � �
21x0
�
35x � 1.5 • 21035x � 315
x � 9It will take the worker 9 hours to manufacture210 switches.
Question 91 (page 211)
A Correct. The events are dependent because theoutcome of the first draw affects the outcome ofthe second draw. Find the probability of the firstevent. For the first draw, 4 of the 25 possibleoutcomes are numbers less than five: 1, 2, 3, and4. The probability that the first number drawn will be less than 5 is �
245� .
P(1st � 5) � �245�
Find the probability of the second event. Onenumber was drawn, so now there are only 24numbers in the box. If the first number drawnwas a number less than 5, only 3 of the 24possible outcomes can be numbers less than 5.The probability that the second number drawn will be less than 5 is �
234� .
P(2nd � 5) � �234�
The probability that both numbers will be lessthan 5 is equal to the product of the twoprobabilities.P(1st � 5 and 2nd � 5) � P(1st � 5) • P(2nd � 5)
� �245� • �
234� � �
61020
� � �510�
Question 92 (page 211)
C Correct. In 811 times at bat, Reggie got 210 � 20 � 1 � 6 � 237 hits. The experimentalprobability that Reggie will get a hit during his nexttime at bat is the ratio of the number of times he gota hit (237) to the number of trials (811).
�283171
� � 0.292
The probability that Reggie will get a hit duringhis next time at bat is 0.292.
Objective 9
12
43
43
43
Mathematics Answer Key
251
Question 93 (page 212)
C Correct. Use the experimental probability to predict thenumber of seeds that will be 2 inches or more inheight. There were a total of 9 � 16 � 26 � 24 � 75plants in this experiment. Of these, 16 � 26 � 24 � 66 plants reached a height of atleast 2 inches after 3 months. The experimentalprobability that a plant will reach a height of at least 2 inches is �
6765� , or �
2225�.
Let n represent the number of plants out of 600that will reach a height of at least 2 inches. Write a proportion.
�6n00� � �
2225�
25n � 600 • 2225n � 13,200
n � 528Therefore, 528 plants out of 600 can be expectedto reach a height of at least 2 inches in 3 months.
Question 94 (page 212)
C Correct. The median is the middle value whenthe data elements are listed in order. Half thescores are above the median, and half the scoresare below it. Therefore, Jean should use themedian of the data.
Question 95 (page 213)
D Correct. Trish spent a total of
600 � 200 � 360 � 40 � 50 � 250 � $1500. The plane fare should be �1
650000
� � �25
� � 0.4,or 40% of the graph. This is larger than �
14
�, or 25%,of the graph and less than �
12
�, or 50%, of thegraph. The cost of food should be�1250000
� � �125� � 0.13, or 13% of the graph. Together,
plane fare and food should be 40% � 13% � 53%,or slightly more than half the graph. Hotel costsshould be �1
356000
� � �265� � 0.24, or 24% of the graph.
Hotel costs will be slightly less than �14
�, or 25%, ofthe graph. Only choice D fits these requirements.
Question 96 (page 214)
B Correct. The January bar is slightly above 1000,at approximately 1100. The February bar is less
than halfway between 2000 and 3000, atapproximately 2400. The March bar is slightlyabove 3000, at approximately 3100. The April baris between 2000 and 3000, at approximately2600; it is higher than the February bar.
Question 97 (page 215)
A Incorrect. The mean gives the average of a set ofnumbers, not the most frequently occurring dataelement.
B Incorrect. The median gives the middle value of aset of numbers, not the most frequently occurringdata element.
C Correct. The mode tells which value occurs mostfrequently. In this case the mode is 7. The value 7 occurs 5 out of the 8 times listed. It shows thatAva most frequently spends 7 hours studyingduring a week.
D Incorrect. The range measures the spreadbetween the highest and lowest values in thedata, not the most frequently occurring dataelement.
Question 98 (page 215)
A Incorrect. Sales increased at a constant rate of 5 CDs perweek for the first three weeks, but they thendecreased during the fourth week.
B Correct. Calculate the mean number of CDs soldper week.
� 289.16� � 289
C Incorrect. The length of the bar for Week 6 isthree times the length of the bar for Week 1.However, read the numerical values of the barsfrom the graph. The value for the bar for Week 1is 280. The value of the bar for Week 6 is 300.Since 300 � 3 • 280, one bar is not three times as large as the other.
D Incorrect. Calculate the total number of CDssold.280 � 285 � 290 � 285 � 295 � 300 � 1735Since 1735 � 1800, the store did not sell morethan 1800 CDs during the six-week period.
Question 99 (page 216)
A Correct. The minimum for this data set is 3, andthe maximum is 27. The median is 10, the lowerquartile is 5, and the upper quartile is 20.
280 � 285 � 290 � 285 � 295 � 300�����
6
Mathematics Answer Key
252
Question 100 (page 231)
C Correct. Calculate the cost of the DVD player at Store Awith the 10% discount.Use a proportion to find 10% of 119.
�11000
� � �11x9
�
100x � 1190x � 11.9
10% of $119 is $11.90.$119.00 � $11.90 � $107.10
The cost of the DVD player at Store A with the10% discount is $107.10.Calculate the cost of the DVD player at Store Bwith the 15% off coupon. Use a proportion to find 15% of 138.
�11050
� � �13x8
�
100x � 2070x � 20.7
15% of $138 is $20.70.
$138.00 � $20.70 � $117.30The cost of the DVD player at Store B with the15% discount is $117.30.This is more than the cost at Store A. Subtract tofind the difference.
$117.30 � $107.10 � $10.20The DVD player costs $10.20 more at Store Bthan at Store A.
Question 101 (page 231)
D Correct. One way to solve this problem is to find thenumber of tiles needed to fill the large rectangleand then subtract the number of tiles that wouldhave been needed for the small rectangle thatwill not be tiled.If the tiles are 3 inches on a side, there are 4tiles per foot (3 • 4 � 12).The width of the large rectangle is 2.5 feet.Multiply 4 tiles per foot by 2.5 feet to find thenumber of tiles needed for the width.
4 • 2.5 � 10
The length of the large rectangle is 6 feet.Multiply 4 by 6 to find the number of tilesneeded for the length.
4 • 6 � 24Multiply the number of tiles needed for the widthby the number of tiles needed for the length tofind the number of tiles needed to fill the largerectangle.
10 • 24 � 240In the same way, find the number of tiles neededto fill the small rectangle.Number of tiles needed for the width: 4 • 1.5 � 6Number of tiles needed for the length: 4 • 2 � 8Number of tiles needed to fill the small rectangle: 6 • 8 � 48Subtract the tiles needed to fill the smallrectangle from the tiles needed to fill the largerectangle to find the total number of tiles needed.
240 � 48 � 192 tilesJessica will need 192 tiles. The tiles are sold inboxes of 100 tiles per box; she will need 2 boxesof tiles.
Question 102 (page 231)
B Correct.The cost of producing 250 staplers can be foundby evaluating the original function for n � 250.
c � 1.12n � 300c � 1.12 • 250 � 300c � 280 � 300c � 580
If the fixed costs increase by 15%, use aproportion to find 15% of $300.
�11050
� � �30x0
�
100x � 4500x � 45
If the fixed costs increase from $300 to$300 � $45 � $345, the increased cost per day of producing n staplers is given by the formulac � 1.12n � 345. The increased cost of producing250 staplers can be found by evaluating the newfunction for n � 250.
c � 1.12n � 345c � 1.12 • 250 � 345c � 280 � 345c � 625
Objective 10
Mathematics Answer Key
253
Find the percent by which the cost of producing250 staplers increased.
625 � 580 � 45What percent is 45 of 580? Write a proportion.
�10
x0
� � �54850
�
580x � 4500x � 7.76
The cost of producing 250 staplers increased byabout 8%.
Question 103 (page 231)
C Correct. If Jesse and Philippe start at the sametime and meet along the road, they both travelthe same amount of time. Let t represent thetime each travels. The rate they each travelmultiplied by the time they each travel is equalto the distance they each travel (d � rt). Thedistance Jessie travels plus the distance Philippetravels equals 5 miles. Write an equation thatshows the sum of the distances they travelequals 5 miles.
4t � 6t � 510t � 5
t � 0.5
They will meet in 0.5 hour, or 30 minutes.
Question 104 (page 232)
C Correct. The function h � 12 � 0.1m whenrewritten as h � �0.1m � 12 is in the form y � mx � b, so it is a linear function. To find the height of the candle when it startedburning at m � 0, substitute 0 for m in thefunction.
h � 12 � (0.1)(0)h � 12 � 0h � 12
The candle was 12 inches tall when it startedburning. To find the height of the candle when m � 120minutes, substitute 120 for m in the function.
h � 12 � (0.1)(120)h � 12 � 12h � 0
The candle can burn for at most 120 minutesbecause in that amount of time its height willhave been reduced to 0 inches.
If the height of the candle were directlyproportional to the number of minutes it burned,the function comparing them would be in theform y � kx. The function h � 12 � 0.1m is notin this form.
Question 105 (page 232)
A Correct. Let x represent the cost of the shirt. Then2x represents the cost of the pants. The sum of thecosts of the three items, shirt � pants � shoes,equals the total cost, $100. Use the equation x � 2x � 40 � 100. If like terms are simplified,this is the same equation as 3x � 40 � 100.
B Incorrect. Let x represent the width of therectangle. The length is 40 more than threetimes the width. The length is 3x � 40. To find the perimeter, use the formula P � 2(l � w).
100 � 2(3x � 40 � x) 100 � 2(4x � 40) 100 � 8x � 80
Use the equation 100 � 8x � 80 to solve this problem.
C Incorrect. Let x represent the number of years. To solve this problem, use the simple interestformula I � prt. The interest rate is 3%, or 0.03.Use the equation 40 � 100(0.03)(x), or 40 � 3x,to solve this problem.
D Incorrect. Let x represent the number of cupssold. If the student council earns $3 for each cupsold, 3x represents the amount they earn forselling x cups. To find the profit, subtract theamount they spent on the cups. Use the equation3x � 40 � 100 to solve this problem.
Question 106 (page 232)
C Correct. One way to find the values of x for whichf(x) g(x) is to write the following inequality andsimplify it.
f(x) g(x)
2(x � 3) � 7 �12
� x � 7
2x � 6 � 7 �12
� x � 7
2x � 1 �12
� x � 7
Question 107 (page 233)
B Correct. The graphs show a pattern. All thegraphs are parabolas, and all are congruent. The
Mathematics Answer Key
254
x-intercepts of the graphs equal the value bywhich x is decreased in the function.The function y � (x � 1)2 intersects the x-axis atthe point x � 1.The function y � (x � 3)2 intersects the x-axis atthe point x � 3.The function y � (x � 5)2 intersects the x-axis atthe point x � 5.Based on this pattern, the function y � (x � 2)2
should intersect the x-axis at the point x � 2.
Question 108 (page 234)
A Correct.Look for the pattern. The dimensions of thecylinders are increasing by a scale factor of 1.5.
�32
� � �43.5� � �
64..755
� � 1.5
�64
� � �96
� � �13
9.5� � 1.5
To find the volume of the previous cylinder inthis series, you could increase its dimensions bythe same scale factor, 1.5.
Question 109 (page 234)
B Correct. Represent the number of visitors the sitehad each week in terms of x.
First Week: x
Second Week: 2x(twice as many as the first week)
Third Week: 2x � 22(22 more than the second week)
Fourth Week: 2.5x(2.5 times as many as the first week)
The mean of the number of visitors is equal tothe sum of the number of visitors divided by thenumber of weeks for which records were kept, 4.Represent their sum.1st wk � 2nd wk � 3rd wk � 4th wk �
x � 2x � (2x � 22) � 2.5xRepresent their mean.
x � 2x � (2x � 22) � 2.5x����
4
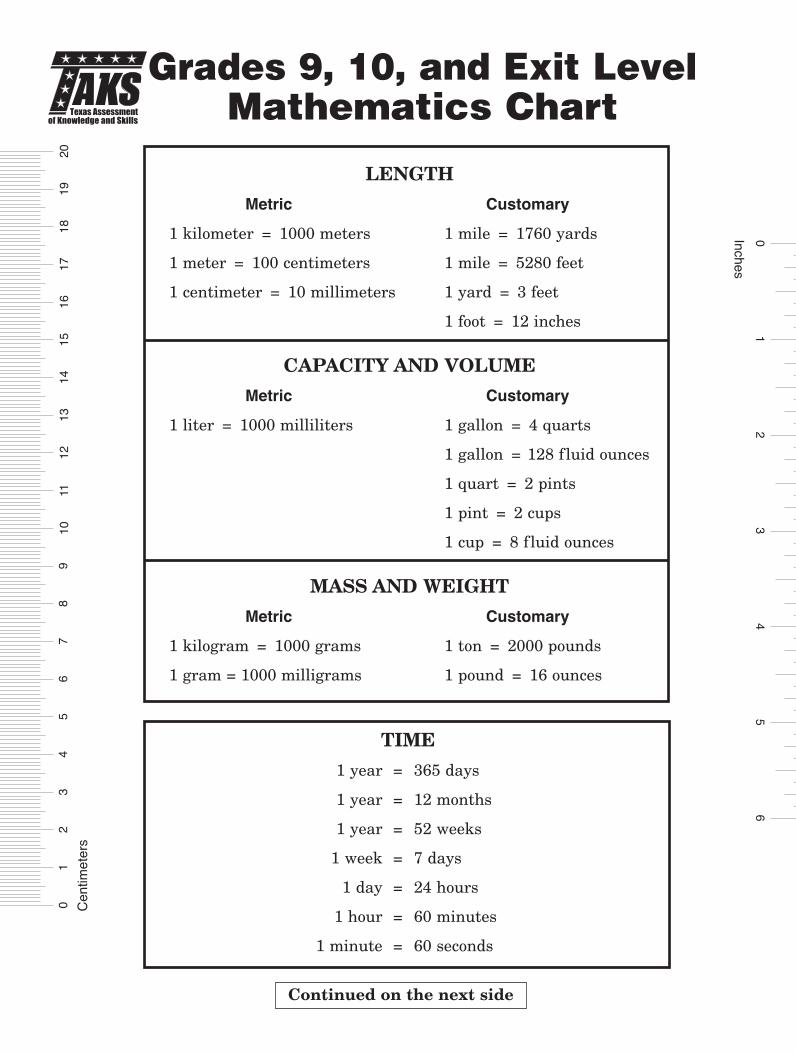
Grades 9, 10, and Exit LevelMathematics Chart
10
23
45
67
89
1011
1213
1415
1617
1819
20
Cen
timet
ers
65
43
21
0Inches
Continued on the next side
Texas Assessment of Knowledge and Skills
LENGTH
Metric Customary
1 kilometer = 1000 meters 1 mile = 1760 yards
1 meter = 100 centimeters 1 mile = 5280 feet
1 centimeter = 10 millimeters 1 yard = 3 feet
1 foot = 12 inches
CAPACITY AND VOLUME
Metric Customary
1 liter = 1000 milliliters 1 gallon = 4 quarts
1 gallon = 128 fluid ounces
1 quart = 2 pints
1 pint = 2 cups
1 cup = 8 fluid ounces
MASS AND WEIGHT
Metric Customary
1 kilogram = 1000 grams 1 ton = 2000 pounds
1 gram = 1000 milligrams 1 pound = 16 ounces
TIME
1 year = 365 days
1 year = 12 months
1 year = 52 weeks
1 week = 7 days
1 day = 24 hours
1 hour = 60 minutes
1 minute = 60 seconds
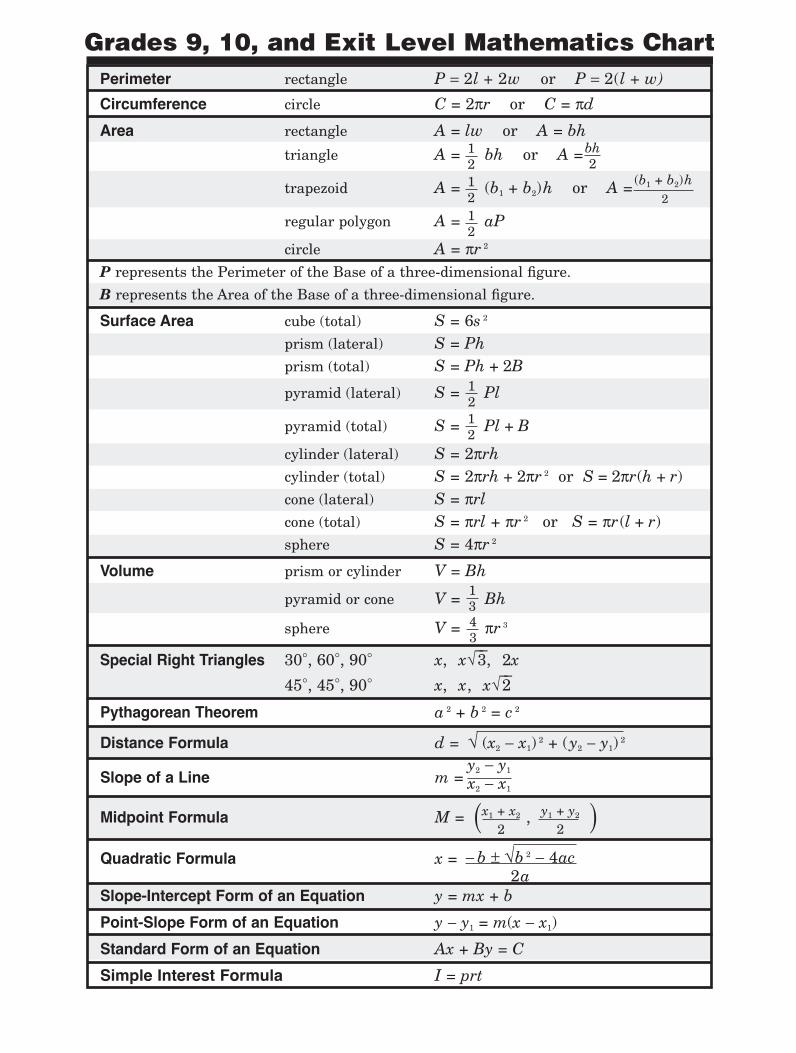
Grades 9, 10, and Exit Level Mathematics ChartPerimeter rectangle P = 2l + 2w or P = 2(l + w)
Circumference circle C = 2πr or C = πd
Area rectangle A = lw or A = bhtriangle A = bh or A =
trapezoid A = (b1 + b2)h or A =
regular polygon A = aP
circle A = πr 2
P represents the Perimeter of the Base of a three-dimensional figure.
B represents the Area of the Base of a three-dimensional figure.
Surface Area cube (total) S = 6s 2
prism (lateral) S = Phprism (total) S = Ph + 2B
pyramid (lateral) S = Pl
pyramid (total) S = Pl + B
cylinder (lateral) S = 2πrhcylinder (total) S = 2πrh + 2πr 2 or S = 2πr(h + r)cone (lateral) S = πrlcone (total) S = πrl + πr 2 or S = πr(l + r)sphere S = 4πr 2
Volume prism or cylinder V = Bh
pyramid or cone V = Bh
sphere V = πr 3
Special Right Triangles 30°, 60°, 90° x, x√__3, 2x
45°, 45°, 90° x, x, x√__2
12
1343
bh2
12
(b1 + b2)h2
Pythagorean Theorem a 2 + b 2 = c 2
Distance Formula d = √ (x2 − x1) 2 + (y2 − y1) 2
Slope of a Line m =
Midpoint Formula M = ( , )Quadratic Formula x =
Slope-Intercept Form of an Equation y = mx + b
Point-Slope Form of an Equation y − y1 = m(x − x1)
Standard Form of an Equation Ax + By = C
Simple Interest Formula I = prt
y2 − y1
x2 − x1
x1 + x2
2y1 + y2
2
− b ± √b 2 − 4ac2a
12
12
12