Entrainment of Bed Sediment into Suspension
22
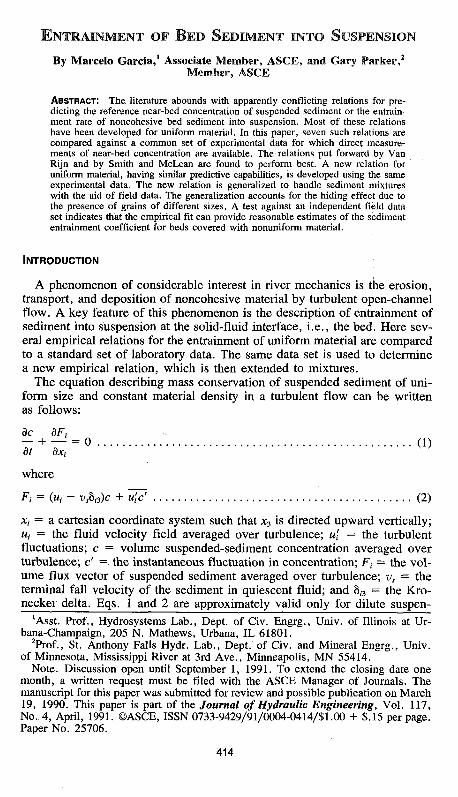
ENTRAINMENT OF BED SEDIMENT INTO SUSPENSION By Marcelo Garcia, 1 Associate Member, ASCE, and Gary Parker, 2 Member, ASCE ABSTRACT: The literature abounds with apparently conflicting relations for pre- dicting the reference near-bed concentration of suspended sediment or the entrain- ment rate of noncohesive bed sediment into suspension. Most of these relations have been developed for uniform material. In this paper, seven such relations are compared against a common set of experimental data for which direct measure- ments of near-bed concentration are available. The relations put forward by Van Rijn and by Smith and McLean are found to perform best. A new relation for uniform material, having similar predictive capabilities, is developed using the same experimental data. The new relation is generalized to handle sediment mixtures with the aid of field data. The generalization accounts for the hiding effect due to the presence of grains of different sizes. A test against an independent field data set indicates that the empirical fit can provide reasonable estimates of the sediment entrainment coefficient for beds covered with nonuniform material. INTRODUCTION A phenomenon of considerable interest in river mechanics is the erosion, transport, and deposition of noncohesive material by turbulent open-channel flow. A key feature of this phenomenon is the description of entrainment of sediment into suspension at the solid-fluid interface, i.e., the bed. Here sev- eral empirical relations for the entrainment of uniform material are compared to a standard set of laboratory data. The same data set is used to determine a new empirical relation, which is then extended to mixtures. The equation describing mass conservation of suspended sediment of uni- form size and constant material density in a turbulent flow can be written as follows: dc dF s — + — = 0 (1) dt dXj where Ft = (M, - v 3 b 0 )c + ~uj? (2) Xj = a cartesian coordinate system such that x 3 is directed upward vertically; M, = the fluid velocity field averaged over turbulence; u[ = the turbulent fluctuations; c = volume suspended-sediment concentration averaged over turbulence; c' = the instantaneous fluctuation in concentration; F, = the vol- ume flux vector of suspended sediment averaged over turbulence; v s = the terminal fall velocity of the sediment in quiescent fluid; and 8, 3 = the Kro- necker delta. Eqs. 1 and 2 are approximately valid only for dilute suspen- 'Asst. Prof., Hydrosystems Lab., Dept. of Civ. Engrg., Univ. of Illinois at Ur- bana-Champaign, 205 N. Mathews, Urbana, IL 61801. 2 Prof., St. Anthony Falls Hydr. Lab., Dept. of Civ. and Mineral Engrg., Univ. of Minnesota, Mississippi River at 3rd Ave., Minneapolis, MN 55414. Note. Discussion open until September 1, 1991. To extend the closing date one month, a written request must be filed with the ASCE Manager of Journals. The manuscript for this paper was submitted for review and possible publication on March 19, 1990. This paper is part of the Journal of Hydraulic Engineering, Vol. 117, No. 4, April, 1991. ©ASCE, ISSN 0733-9429/91/0004-0414/$l.00 + $.15 per page. Paper No. 25706. 414
-
Upload
independent -
Category
Documents
-
view
0 -
download
0
Transcript of Entrainment of Bed Sediment into Suspension
ENTRAINMENT OF B E D SEDIMENT INTO SUSPENSION
By Marcelo Garcia,1 Associate Member , ASCE, and Gary Parker , 2
Member , ASCE
ABSTRACT: The literature abounds with apparently conflicting relations for pre-dicting the reference near-bed concentration of suspended sediment or the entrain-ment rate of noncohesive bed sediment into suspension. Most of these relations have been developed for uniform material. In this paper, seven such relations are compared against a common set of experimental data for which direct measure-ments of near-bed concentration are available. The relations put forward by Van Rijn and by Smith and McLean are found to perform best. A new relation for uniform material, having similar predictive capabilities, is developed using the same experimental data. The new relation is generalized to handle sediment mixtures with the aid of field data. The generalization accounts for the hiding effect due to the presence of grains of different sizes. A test against an independent field data set indicates that the empirical fit can provide reasonable estimates of the sediment entrainment coefficient for beds covered with nonuniform material.
INTRODUCTION
A phenomenon of considerable interest in river mechanics is the erosion, transport, and deposition of noncohesive material by turbulent open-channel flow. A key feature of this phenomenon is the description of entrainment of sediment into suspension at the solid-fluid interface, i.e., the bed. Here sev-eral empirical relations for the entrainment of uniform material are compared to a standard set of laboratory data. The same data set is used to determine a new empirical relation, which is then extended to mixtures.
The equation describing mass conservation of suspended sediment of uni-form size and constant material density in a turbulent flow can be written as follows:
dc dFs — + — = 0 (1) dt dXj
where
Ft = (M, - v3b0)c + ~uj? (2)
Xj = a cartesian coordinate system such that x3 is directed upward vertically; M, = the fluid velocity field averaged over turbulence; u[ = the turbulent fluctuations; c = volume suspended-sediment concentration averaged over turbulence; c' = the instantaneous fluctuation in concentration; F, = the vol-ume flux vector of suspended sediment averaged over turbulence; vs = the terminal fall velocity of the sediment in quiescent fluid; and 8,3 = the Kro-necker delta. Eqs. 1 and 2 are approximately valid only for dilute suspen-
'Asst. Prof., Hydrosystems Lab., Dept. of Civ. Engrg., Univ. of Illinois at Ur-bana-Champaign, 205 N. Mathews, Urbana, IL 61801.
2Prof., St. Anthony Falls Hydr. Lab., Dept. of Civ. and Mineral Engrg., Univ. of Minnesota, Mississippi River at 3rd Ave., Minneapolis, MN 55414.
Note. Discussion open until September 1, 1991. To extend the closing date one month, a written request must be filed with the ASCE Manager of Journals. The manuscript for this paper was submitted for review and possible publication on March 19, 1990. This paper is part of the Journal of Hydraulic Engineering, Vol. 117, No. 4, April, 1991. ©ASCE, ISSN 0733-9429/91/0004-0414/$l.00 + $.15 per page. Paper No. 25706.
414
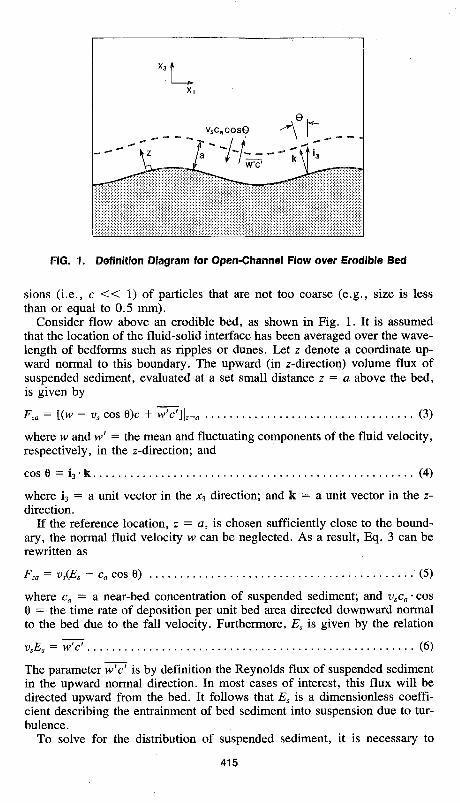
FIG. 1. Definition Diagram for Open-Channel Flow over Erodible Bed
sions (i.e., c « 1) of particles that are not too coarse (e.g., size is less than or equal to 0.5 mm).
Consider flow above an erodible bed, as shown in Fig. 1. It is assumed that the location of the fluid-solid interface has been averaged over the wave-length of bedforms such as ripples or dunes. Let z denote a coordinate up-ward normal to this boundary. The upward (in z-direction) volume flux of suspended sediment, evaluated at a set small distance z = a above the bed, is given by
Fm = [(w - vs cos 9)c + ^7?t=a (3) where w and w' = the mean and fluctuating components of the fluid velocity, respectively, in the z-direction; and
cos 6 = i3 • k (4)
where i3 = a unit vector in the x3 direction; and k = a unit vector in the z-direction.
If the reference location, z = a, is chosen sufficiently close to the bound-ary, the normal fluid velocity w can be neglected. As a result, Eq. 3 can be rewritten as
Fm = vs(Es - ca cos 8) (5) where ca = a near-bed concentration of suspended sediment; and vsca • cos 6 = the time rate of deposition per unit bed area directed downward normal to the bed due to the fall velocity. Furthermore, Es is given by the relation
vsEs = w7? (6)
The parameter w'c' is by definition the Reynolds flux of suspended sediment in the upward normal direction. In most cases of interest, this flux will be directed upward from the bed. It follows that Es is a dimensionless coeffi-cient describing the entrainment of bed sediment into suspension due to tur-bulence.
To solve for the distribution of suspended sediment, it is necessary to
415

specify a value of Es at the boundary. In general, it can be surmised that Es is a function of flow parameters, such as boundary shear stress and the avail-ability of bed sediment to be entrained. If the bed is completely covered with uniform sediment identical to that in suspension, then Es can be ex-pected to be a function of flow parameters only.
It is now assumed that the bed slope is small, from which it follows that cos 0 ss 1 in Eq. 5. In the case of a suspension that is steady in time and uniform in the xrx2 (horizontal) plane, i.e., an equilibrium suspension, the upward normal flux Fza must vanish. It follows from Eq. 5 that Es = cae (7) where cae = the equilibrium near-bed concentration. Eq. 7 provides a means for evaluating the coefficient of entrainment. It is possible to use experi-mental data to determine an empirical functional relationship between Es and flow parameters. It can be surmised that the same relation holds for dis-equilibrium suspensions as well, as long as the disequilibrium is mild in some sense. In such a case, Es {¥= ca) is evaluated as a function of flow parameters from the equilibrium relation, and the net upward flux at the bed Fza (^ 0) is given by the expression vs(Es — ca).
These concepts are set forth in Parker (1978), Van Rijn (1984), and Ikeda and Nishimura (1985); these authors have used them to compute the char-acteristics of disequilibrium suspensions.
PREVIOUS RELATIONS
A wide variety of relations are available in the literature with which to predict Es (= cm for equilibrium suspensions) as a function of flow param-eters and sediment characteristics. Most of them are of the following type: E,~tf ~«i2p ,t (8) where T = the bed shear stress due to skin friction (often called the grain stress); and «i = the associated shear velocity. P takes values between 1 and 15, depending on which formulation is considered (Fig. 2). It is clear that estimates of equilibrium near-bed concentration cae or sediment entrain-ment Es can be quite different depending on which relationship is used.
After a review of various relations, it became apparent that many of them had not been subjected to a sufficiently objective test against data. With this in mind, it was decided to test several of the relations against a common set of data. Seven relations were selected for this purpose; all are applicable to uniform material.
Einstein (1950) The Einstein bed-load function relates the dimensionless bed-load trans-
port rate q* to the dimensionless bed shear stress associated with skin friction
q* = . • • • (9a) VRQD.D,
t.j*—*- : <„ pRgDs RgDs
416

10"
10"
10":
10"'
10-
10";
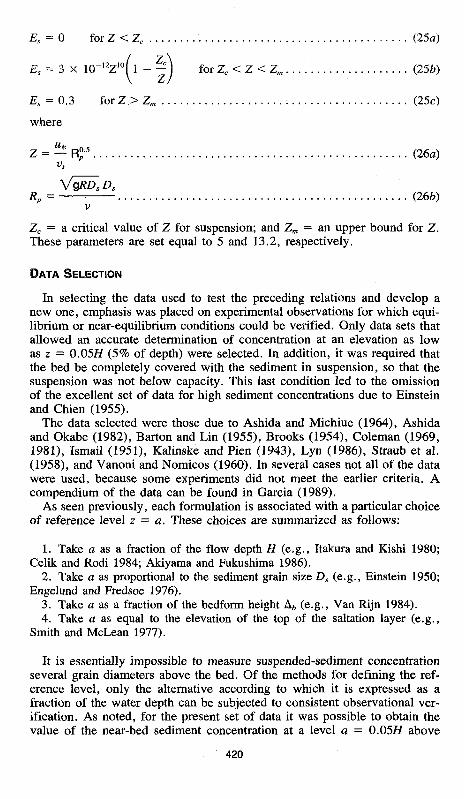
a—@ Einstein o—a Enge lund-Fredsoe A-^i S m i t h - M c L e o n A—A Van Rijn
10- 10L - n — 101 102
u* (cm/s)
FIG. 2. Plot of Different Formulations for Equilibrium Near-Bed Sediment Con-centration as Function of Shear Velocity due to Skin Friction; Calculations Pertain to Grain Size D, of 0.1 mm in Water at 20° C; Curves Are Not Necessarily Com-parable because of Differences in Choice of Reference Elevation z = a
where qb = the volume bed-load transport rate per unit width; g = gravi-tational acceleration; Ds = grain size; R = the submerged specific gravity of the sediment, i.e., the parameter ps/p — 1; ps and p denote sediment and water density, respectively; and tf = the Shields stress based on skin friction (grain stress).
The form of the relation can be found in many texts on sediment transport (e.g., Graf 1971). Once the bed-load discharge per unit width qb is obtained, it is used to compute the reference equilibrium suspended-sediment concen-tration cae at a distance a = 2DS above the bed as follows:
1 <lb 1 <?* 11.6 2 D X 23.2 (Tf)' *x0.5
(10)
Engelund and Fredsoe (1976) The value cae at a distance a = 2DS above the bed is given by
0.65 Cae " (i + x,-1)3 (11)
417

where
T? - 0.06 ppit'
0.021(R + 1)T?
and the quantity p is computed from the relation
(12)
1 + 6
VT* - 0.06/ J (13)
The parameter p was originally set equal to 0.51 (Engelund and Fredsoe 1976), but it was later modified to 1.0 (Engelund and Fredsoe 1982).
Smith and McLean (1977) The equilibrium near-bed volumetric sediment concentration is given by
0.657oS0
1 +7oS0 (14)
where y0 — a constant equal to 2.4 X 10 3; and S0 = a normalized shear stress given by
S0 = n-* »•*
TV ~ %
T*
(15)
where T* = a critical Shields stress associated with the initiation of sediment motion.
This formulation assigns the sediment concentration computed with Eq. 14 to the reference elevation
a = OO(T* - T ? ) D S + ks. (16)
where a0 = 26.3; and ks = the equivalent roughness height for a fixed sed-
iment bed.
Itakura and Kishi (1980) The volumetric sediment concentration cae is evaluated at a distance a =
0.05/ / , where H is the water depth; it is given by
Cae = h [ k i - - - \ ) (17) Vs T '
where
n = — \kA + exp (-A?)
J •Mo
exp (-e)dt-
- 1 (18«)
•Ao — * — ^4 T *
(18b)
418

u-jf = the bed shear velocity based on the total (skin friction plus form drag) boundary shear stress
T* = (19) RQDS
is the corresponding total Shields stress; and kx, k2, k3, and kA = constants with values of 0.008, 0.14, 0.143, and ,2.0, respectively.
Van Rijn (1984) The equilibrium suspended-sediment concentration at reference level z =
a above the bed is given by
D SL5
cae = 0.015 - - ^ (20)
where
£>* = D,\^J (21)
and v = the kinematic viscosity of water. The reference level a is assumed to be equal to half the bed-form height Ab. If the dimensions of the bedforms are not known, the equivalent roughness height ks is taken as the reference level. A minimum value for a is taken to be 0.01//.
Celik and Rodi (1984) The mean transport concentration Cm, i.e., suspended-sediment discharge
per unit width divided by the volume discharge per unit width of water and sediment, is given by
Cm = 0.034 1 "* —— — (22) QRH VS
where Um = the mean flow velocity. Using Eq. 22, the equilibrium sus-pended-sediment concentration at a distance a = 0.05H from the bed can be obtained by
kaCm Cae = — (23)
where r1 i, \ »»/°-4«,
/=[ ( ^ T M ** (24) Jo.05 \ n 1 - T)«/
In Eq. 24, f\ = z/H and T|a = 0.05. In Eq. 23, o is a constant equal to 1.13, which relates the mean transport concentration Cm to the depth-aver-aged value of local concentration.
Akiyama and Fukushima (1986) The sediment entrainment coefficient Es (= cae) at a distance a = 0.05//
above the bed is determined from
419
(25a)
for Zc < Z < Zm {25b)
£s = 0.3 for Z > Z,„ (25c)
where
Z = — R°5 (26a)
V$RDSDS
R„ = = {26b) v
Zc = a critical value of Z for suspension; and Zm = an upper bound for Z. These parameters are set equal to 5 and 13.2, respectively.
DATA SELECTION
In selecting the data used to test the preceding relations and develop a new one, emphasis was placed on experimental observations for which equi-librium or near-equilibrium conditions could be verified. Only data sets that allowed an accurate determination of concentration at an elevation as low as z = 0.05H {5% of depth) were selected. In addition, it was required that the bed be completely covered with the sediment in suspension, so that the suspension was not below capacity. This last condition led to the omission of the excellent set of data for high sediment concentrations due to Einstein and Chien (1955).
The data selected were those due to Ashida and Michiue (1964), Ashida and Okabe (1982), Barton and Lin (1955), Brooks (1954), Coleman (1969, 1981), Ismail (1951), Kalinske and Pien (1943), Lyn (1986), Straub et al. (1958), and Vanoni and Nomicos (1960). In several cases not all of the data were used, because some experiments did not meet the earlier criteria. A compendium of the data can be found in Garcia (1989).
As seen previously, each formulation is associated with a particular choice of reference level z = a. These choices are summarized as follows:
1. Take a as a fraction of the flow depth H (e.g., Itakura and Kishi 1980; Celik and Rodi 1984; Akiyama and Fukushima 1986).
2. Take a as proportional to the sediment grain size Ds (e.g., Einstein 1950; Engelund and Fredsoe 1976).
3. Take a as a fraction of the bedform height A6 (e.g., Van Rijn 1984). 4. Take a as equal to the elevation of the top of the saltation layer (e.g.,
Smith and McLean 1977).
It is essentially impossible to measure suspended-sediment concentration several grain diameters above the bed. Of the methods for defining the ref-erence level, only the alternative according to which it is expressed as a fraction of the water depth can be subjected to consistent observational ver-ification. As noted, for the present set of data it was possible to obtain the value of the near-bed sediment concentration at a level a = 0.05H above
E< = 0 for Z < Zr
£, = 3X 10""Z'"( 1 - —
420
the bed, either by interpolation or with a minimum of extrapolation. Con-centrations determined at this level are tabulated in Garcia (1989).
TEST OF RELATIONS AGAINST OBSERVATIONS
To compare the predictions made by the different relationships with the observations, an effort was made in each case to use the methodology pro-posed by the author or authors of the formula. Before using the data to do any computations, the side-wall correction procedure proposed by Vanoni and Brooks (Vanoni 1975) was used to remove wall effects and obtain the bed shear velocity
«* = (.QRtft5 (27)
where Rb = the hydraulic radius with respect to the bed; and 5 = the energy slope. Some of the details concerning the application of each formula are explained in the following.
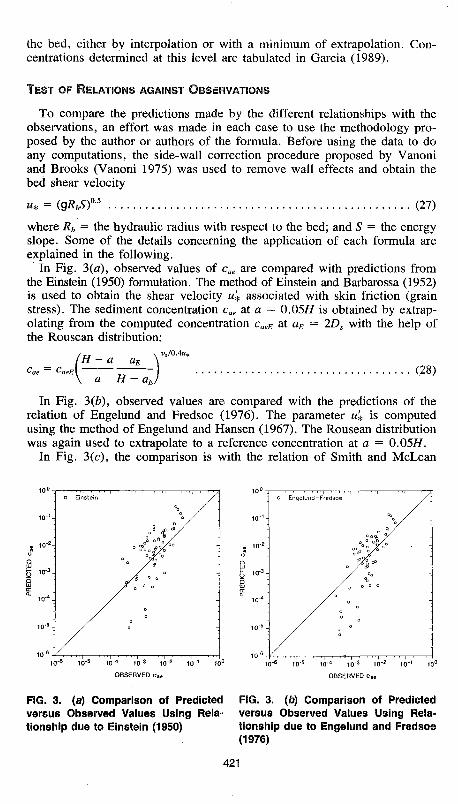
In Fig. 3(a), observed values of cae are compared with predictions from the Einstein (1950) formulation. The method of Einstein and Barbarossa (1952) is used to obtain the shear velocity u* associated with skin friction (grain stress). The sediment concentration cae at a — 0.05H is obtained by extrap-olating from the computed concentration caeE at aE = 2DS with the help of the Rousean distribution:
H aE
H-aE,
vJ0Aut
(28)
In Fig. 3(b), observed values are compared with the predictions of the relation of Engelund and Fredsoe (1976). The parameter u* is computed using the method of Engelund and Hansen (1967). The Rousean distribution was again used to extrapolate to a reference concentration at a = 0.05H.
In Fig. 3(c), the comparison is with the relation of Smith and McLean
itr1-
io-2-
KT3.
10-4-
1 0 5 -
,0-6
o Ei nstein
• ' * . *
j?° o o"
o
'
'
® / -
-
: -
-
lO-6 NT5 10-" 10"3 10"2 10"' 10° OBSERVED c «
FIG. 3. (a) Comparison of Predicted FIG. 3. (b) Comparison of Predicted versus Observed Values Using Rela- versus Observed Values Using Rela-tionship due to Einstein (1950) tionship due to Engelund and Fredsoe
(1976)
421

10" ' -
I t0 '2~ 3 5 10*3-5 n
10 -
i o - 5 .
10 ' 6 -
- :..:.,:o :isi-.;
/
/
,7:
-
-
-
;
10"5 10"4 10'3 10'2 10"1 10° OBSERVED c„e
10"° 1<TS 10-4 10'J 10^ 10"1 10° OBSERVED 0 «
FIG. 3. (c) Comparison of Predicted FIG. 3. (d) Comparison of Predicted versus Observed Values Using Rela- versus Observed Values Using Rela-tionship due to Smith and McLean (1977) tionship due to Itakura and Kishi (1980)
i o - ' -
io- 2 -
10'3-
10""1-
1 0 ' 5 -
m-«-
° Celi -Rodi
*/
• -7.
-
-
-
-
-:
10*6 10"5 10'4 10"3 10-2 10' ' 10° OBSERVED cae
10"6 10'5 10"4 10"3 10"2 10"1 10° OBSERVED c„
FIG. 3. (e) Comparison of Predicted FIG. 3. (f) Comparison of Predicted versus Observed Values Using Rela- versus Observed Values Using Rela-tionship due to Van Rijn (1984) tionship due to Celik and Rodi (1984)
(1977). Due to insufficient information about the bedform dimensions in most of the experimental data sets, the method proposed by these authors to remove the effect of bedforms cannot be used. Instead, the method of Engelund and Hansen (1967) is used to compute u*. The concentration cae at a = 0.05if is again obtained by extrapolating with the aid of the Rousean distribution.
In Fig. 3(d), the comparison is with the relation of Itakura and Kishi (1980). This formulation does not involve the removal of the effect of bed-forms.
In Fig. 3(e), the comparison is with the relation of Van Rijn (1984); the value of a is selected to be 0.05// in Eq. 20. In this formulation it* is ob-tained by means of the following relationships:
422
D 10~2-
10-5 10-4 i o - 3 i<r2 io_ 1 io° OBSERVED c„e
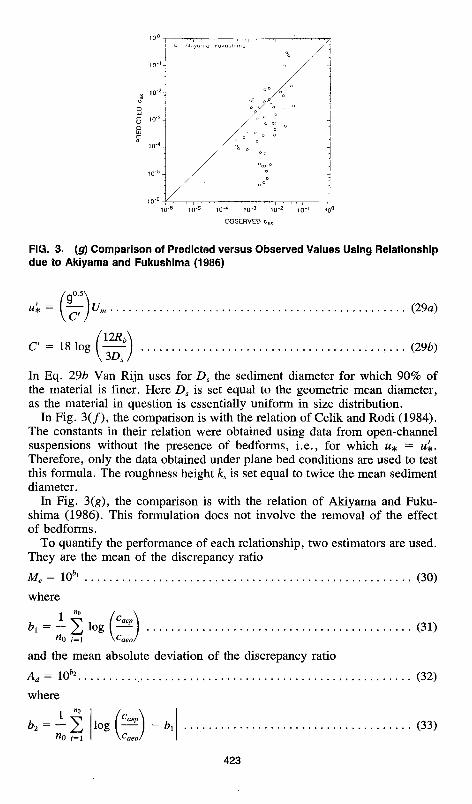
FIG. 3. (g) Comparison of Predicted versus Observed Values Using Relationship due to Akiyama and Fukushima (1986)
K* c v„
C = 18 loe (\2R, \3DS
(29a)
(29b)
In Eq. 29b Van Rijn uses for Ds the sediment diameter for which 90% of the material is finer. Here Ds is set equal to the geometric mean diameter, as the material in question is essentially uniform in size distribution.
In Fig. 3(f), the comparison is with the relation of Celik and Rodi (1984). The constants in their relation were obtained using data from open-channel suspensions without the presence of bedforms, i.e., for which w* = u*. Therefore, only the data obtained under plane bed conditions are used to test this formula. The roughness height ks is set equal to twice the mean sediment diameter.
In Fig. 3(g), the comparison is with the relation of Akiyama and Fuku-shima (1986). This formulation does not involve the removal of the effect of bedforms.
To quantify the performance of each relationship, two estimators are used. They are the mean of the discrepancy ratio Me = 10*' (30) where
fri—SlogM (3D «0 (=1 \caeol
and the mean absolute deviation of the discrepancy ratio Ad = 10"2 (32) where
1 £ /• b2 = - 2 iog(- (33)
423
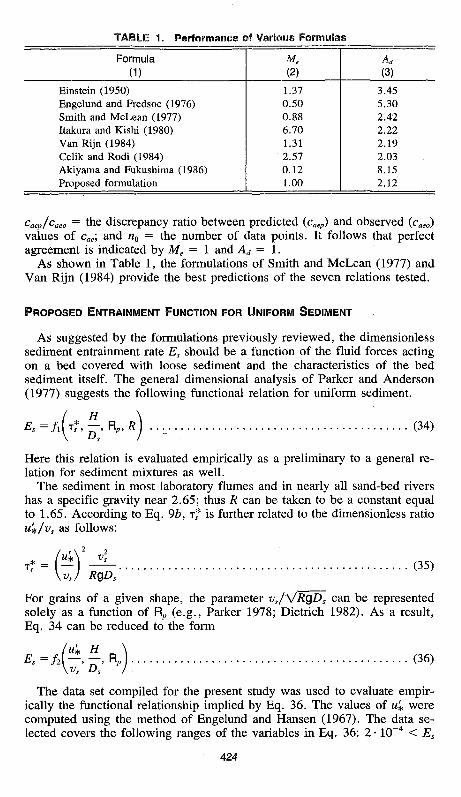
TABLE 1. Performance of Various Formulas
Formula (1)
Einstein (1950) Engelund and Fredsoe (1976) Smith and McLean (1977) Itakura and Kishi (1980) Van Rijn (1984) Celik and Rodi (1984) Akiyama and Fukushima (1986) Proposed formulation
M, (2)
1.37 0.50 0.88 6.70 1.31 2.57 0.12 1.00
Ad
(3)
3.45 5.30 2.42 2.22 2.19 2.03 8.15 2.12
caep/caeo = the discrepancy ratio between predicted (caep) and observed (caeo) values of cae; and n0 = the number of data points. It follows that perfect agreement is indicated by Me = 1 and Ad = 1.
As shown in Table 1, the formulations of Smith and McLean (1977) and Van Rijn (1984) provide the best predictions of the seven relations tested.
PROPOSED ENTRAPMENT FUNCTION FOR UNIFORM SEDIMENT
As suggested by the formulations previously reviewed, the dimensionless sediment entrainment rate Es should be a function of the fluid forces acting on a bed covered with loose sediment and the characteristics of the bed sediment itself. The general dimensional analysis of Parker and Anderson (1977) suggests the following functional relation for uniform sediment.
Es=n H
_. FL> R (34)
Here this relation is evaluated empirically as a preliminary to a general re-lation for sediment mixtures as well.
The sediment in most laboratory flumes and in nearly all sand-bed rivers has a specific gravity near 2.65; thus R can be taken to be a constant equal to 1.65. According to Eq u'*/vs as follows:
9b, T? is further related to the dimensionless ratio
M*
vs/ RgDs (35)
For grains of a given shape, the parameter vs/\/RgDs can be represented solely as a function of Rp (e.g., Parker 1978; Dietrich 1982). As a result, Eq. 34 can be reduced to the form
Es=f2 - - , R p \vs Ds
(36)
The data set compiled for the present study was used to evaluate empir-ically the functional relationship implied by Eq. 36. The values of w* were computed using the method of Engelund and Hansen (1967). The data se-lected covers the following ranges of the variables in Eq. 36: 2 • 10~4 < Es
424

1 0 " -
10"2-
~
10"3--
.
m-4 I U
o o
o % o
o o c a ° 0 ° 0 o o o o
* °o o o ^>u 0 o
<m° o
o ° o
o „ ^ 0
o °o°
°J 0
I I 1 < I 1 1
1 1
o o
-
-"
"
--
_
1
10" 10u
u*/vs
10'
FIG. 4. Plot of Sediment Entrainment Coefficient E, as Function of Dimension-less Shear Velocity u't./vs
= cae < 6-10"2; 0.70 < u'*/vs < 7.50; 240 < H/Ds < 2,400; and 3.50 < Rp < 37.00.
An inspection of the data indicated no clear dependence of Es (= cae) on the values of the relative roughness H/Ds. On the other hand, a clear cor-relation between Es (= cae) and the dimensionless shear velocity u'*/v3 is apparent in Fig. 4. The scatter of the data in this figure motivates the search for an auxiliary dependence in Rp. Thrs is done in a fashion reminiscent of Akiyama and Fukushima (1986).
The following similarity collapse is assumed:
ZU = ^ R " P (37)
where n = an exponent. The data were found to collapse about a coherent line with minimum scatter for a choice of n of 0.6. Plots of Es against Z„ with the power n varying between 0 and 1 show the best collapse of the data for a value of n near 0.6. The resulting relation between Es and Z„ was deduced to be of the form Es ~ Z\.
It has been suggested that cae (= Es) should not exceed a value of 0.3 for
425

10° 10"6 10'5 10"4 NT3 10'2 10"' 10°
OBSERVED c «
FIG. 5. Plot of Proposed Entrainment FIG. 6. Comparison of Predicted and Relationship for Uniform Sediment (Eq. Observed Values of Equilibrium Near-38) and Data Used for Derivation Bed Concentration c« Using Proposed
Formulation (Eq. 38)
the sediment-water mixture to be a true suspension (Engelund and Fredsoe 1976). The data used here do not permit the detection of any particular trend toward a limiting value for high sediment concentrations. To account for the likely existence of an upper limit, however, the following relationship is proposed:
AZl Es = (38)
1 + — Z \ 0.3
In this equation, the constant A was found by enforcing the condition Me = 1, with Me as defined by Eqs. 30 and 31. A value of A of 1.3 • 10~7 was so obtained.
In Fig. 5, Eq. 38 with A = 1.3 • 10~7 is plotted along with the data used in the derivation. For this formulation, the parameter Ad obtained from Eqs. 32 and 33 takes a value of 2.12, as noted in Table 1. For the sake of com-parison, predicted versus observed values are plotted in Fig. 6. The present formulation is seen to perform somewhat better than those of Van Rijn (1984) and Smith and McLean (1977), but this should be expected since the data used to test the formulation is the same as that used for its derivation.
EXTENSION TO NONUNIFORM SEDIMENT
Natural river sediment is often rather poorly sorted. It is of value to extend the formulation obtained in the previous section for uniform sediment to the case of nonuniform sediment.
426
Let the bed be covered by a sediment mixture divided into N size ranges, such that pk denotes the volume fraction of bed material exposed in the sur-face of the Mi range. It is assumed that the samples of bed sediment taken to determinepk are bulk samples obtained from the bed surface, i.e., within the active layer through which dunes migrate. Furthermore, let'£>* denote characteristic grain size of the sediment in the Mi size range.
For the case of mixtures, Eq. 5 generalizes to
Fza,k = vs,k(pkEs<k - caik cos 6) ' (39)
whe r e Fzaik = the net upward volume flux of suspended sediment in the Mi grain size range at the reference elevation z = a; and vSik, EStk, and ca,k = the fall velocity, coefficient of entrainment into suspension, and volume con-centration at the reference level of sediment in the Mi grain size range, respectively. Note that the entrainment coefficient EStk is normalized per unit volume fraction content of material in the Mi size range on the bed surface. If material in a given size range is absent from the bed, then ft = 0 for that range, and no entrainment is predicted.
In the case of an equilibrium suspension, for which c„ik can be set equal to caejk, it is seen from Eq. 39 that for a nearly horizontal bed
Es,k = (40) Pk
A form of Eq. 36 appropriate for mixtures is
/ « i H Dk\ \vs_k D5a Dj
where D50 = the median grain size of the mixture; and RPji is given by the relation
VRgDkDk RP,* = (42)
v Eq. 40 dictates that, to evaluate the functional relation implied by Eq. 41, it is necessary to have both measured sediment concentration profiles for each size range and a complete size distribution of the bed material. Here field data pertaining to near-equilibrium suspensions for two reaches of the Rio Grande (Nordin and Dempster 1963), i.e., the Bernalillo and Socorro reaches, are used to obtain an empirical relation for ESik. This set of field data was found to satisfy the same criteria applied to the selection of ex-perimental data pertaining to uniform material.
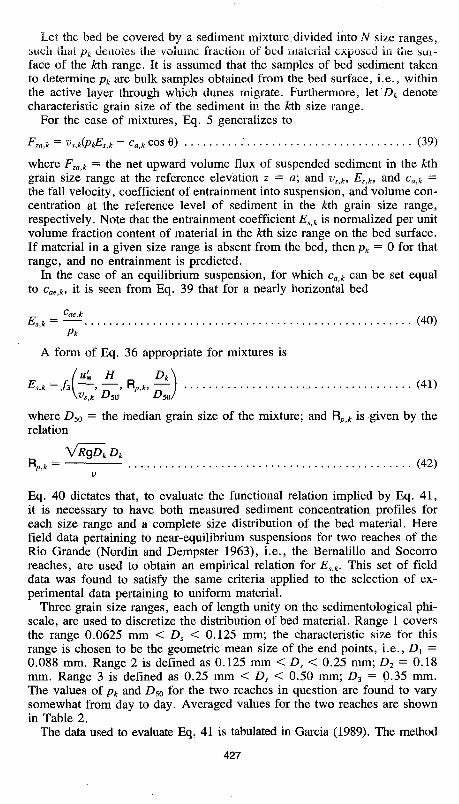
Three grain size ranges, each of length unity on the sedimentological phi-scale, are used to discretize the distribution of bed material. Range 1 covers the range 0.0625 mm < Ds < 0.125 mm; the characteristic size for this range is chosen to be the geometric mean size of the end points, i.e., Dx = 0.088 mm. Range 2 is defined as 0.125 mm < Ds < 0.25 mm; D2 = 0.18 mm. Range 3 is defined as 0.25 mm < Ds < 0.50 mm; D3 = 0-35 mm. The values of pk and D5Q for the two reaches in question are found to vary somewhat from day to day. Averaged values for the two reaches are shown in Table 2.
The data used to evaluate Eq. 41 is tabulated in Garcia (1989). The method
427
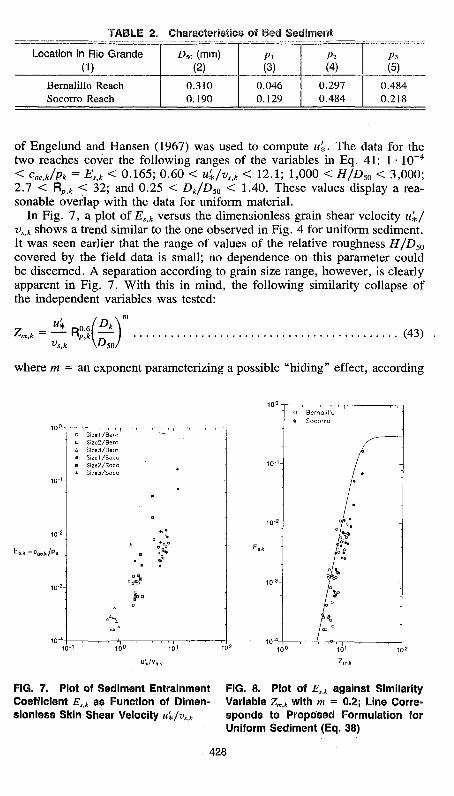
TABLE 2. Characteristics of Bed Sediment
Location in Rio Grande (1)
Bernalillo Reach Socorro Reach
D50 (mm) (2)
0.310 0.190
Pi (3)
0.046 0.129
Pi (4)
0.297 0.484
Pi (5)
0.484 0.218
of Engelund and Hansen (1967) was used to compute u*. The data for the two reaches cover the following ranges of the variables in Eq. 41: 1 • 10~4
< cae,k/pk = E,_k < 0.165; 0.60 < u'*/vs,k < 12.1; 1,000 < H/D50 < 3,000; 2.7 < RPtk < 32; and 0.25 < Dk/D50 < 1.40. These values display a rea-sonable overlap with the data for uniform material.
In Fig. 7, a plot of ESik versus the dimensionless grain shear velocity «*/ vSik shows a trend similar to the one observed in Fig. 4 for uniform sediment. It was seen earlier that the range of values of the relative roughness H/Dso covered by the field data is small; no dependence on this parameter could be discerned. A separation according to grain size range, however, is clearly apparent in Fig. 7. With this in mind, the following similarity collapse of the independent variables was tested:
Vs.k V.* (43)
where m = an exponent parameterizing a possible "hiding" effect, according
io-<-
10-*-
E",k -Ca.*/Pk
10'3-
10-4-
a
Si Si Si Si Si Si
iel/Bern ;e2/Bern e3/Bern el/Soco e2/Soco eVSoco
»s , , ,> ,
_ •
• ,
•
f -
- , T - T - , , 1 r - ^ 10°
"'./v,,k
FIG. 7. Plot of Sediment Entrapment FIG. 8. Plot of E,%k against Similarity Coefficient £,i t as Function of Dimen- Variable Z,„i( with m = 0.2; Line Corre-sionless Skin Shear Velocity »iM,, : sponds to Proposed Formulation for
Uniform Sediment (Eq. 38)
428

to which the presence of grains of differing sizes alters the mobility of a grain of a given size.
As seen in Fig. 8, a remarkable collapse of the data is obtained when ES:k is plotted against Zm<k for the choice for m = 0.2. The scatter in Fig. 8 is comparable to, or perhaps even less than, that in Fig. 5 for the case of uniform material. Of further interest is the fact that the trend line parallels closely that of Eq. 38 obtained for uniform material. The data, however, fall rather consistently to the right of Eq. 38. This implies that if Eq. 38 were used with Zm-k substituted for Z„ to predict entrainment rates of mix-tures, the predicted values would be too high.
It may be surmised that the reason for this is associated with the wide range of available sizes. It follows that the rightward shift evident in Fig. 8 may be in proportion to the standard deviation of the size distribution of the bed material. To test this hypothesis, a straining parameter X is introduced as follows:
Zeff= XZ,„,, (44) The value of X is obtained by fitting the nonuniform sediment data to Eq. 38, i.e. the relation for uniform sediment. The best fits for the Bernalillo and Socorro data yield values of X of 0.847 and 0.775, respectively, as shown in Fig. 9.
Assuming the value of X can be determined independently, the following relation can be used to predict sediment entrainment from a bed covered with nonuniform material:
A(XZ,„,t)5
'* = A 1 + — (XZra kf 0.3
where A = 1.3- 10"7. In the case of uniform material, the value of the straining parameter X is
known to be unity (thus recovering Eq. 38). The lower values for mixtures are now related to the standard deviation o^ on the sedimentological phi-scale of the bed-material size distribution. It can be expected that this pa-rameter characterizes the nonuniformity of the sediment. Here «4 = 2(c)), - ^)2p* (46) the summation being over all grain size ranges. Furthermore
In (Dk) cj> = -log2 (Dk) = — (47a)
5 In (2) * = 24>*P* (476) Note that o^ is related to the more familiar geometric standard deviation crs by the relation <rs = 2a* (48)
Here a simple linear relation for X versus o\j, is proposed:
X = 1 + -^(X0 - 1) (49) o\t>o
429
J

10u
10'
10 ' * -
-s,k
10 '
10"
o Bernalil lo/lam ^ 0.847 ® Socorro/ lam = 0.775
10° 10*
•^eff
FIG. 9. Plot of Est against Similarity Variable Z,# = \Zm; Line Corresponds to Proposed Formulation for Uniform Sediment (Eq. 38)
The normalizing parameters X0 and o o are computed from the average of the observed values for the Bernalillo (X = 0.847, o^ = 0.731) and Socorro (X = 0.775, a^ = 0.615) reaches, yielding the evaluations X0 = 0.811; o ^ = 0.673 (50) Substituting these values into Eq. 49, the following approximate relation is obtained: X = 1 - 0.288o> (51) The paucity of data used to determine Eq. 51 (three known points) renders it rather tentative. The tendency for suppression of mobility as the standard deviation increases has, however, been documented in other contexts (e.g., Parker 1990).
TEST OF NONUNIFORM ENTRAPMENT RELATION
To test the predictive ability of Eqs. 43, 45, and 51 for nonuniform sed-iment, an independent source of data from the Niobrara River (Colby and
430

FIG. 10. Comparison of Observations versus Predictions Using Proposed For-mulation for Nonuniform Sediment (Eq. 45)
Hembree 1955) is used. For this data set, o^ = 0.686, yielding a value of X = 0.802. In Fig. 10, observed and predicted values of caejk are compared.
The overall agreement may be described as moderately good. The exclu-sion of a few outlying points would yield very good agreement [better than that exhibited by any of Figs. 3>{a-g) and 6] for the remaining points.
CONCLUSION
Of seven formulas available in the literature for predicting the entrainment of uniform sediment into suspension, the relationships put forward by Smith and McLean (1977) and Van Rijn (1984) perform best when tested against a standard set of data. Van Rijn's formulation depends on the excess of shear stress associated with skin friction above the threshold value to the power of 1.5; in the case of Smith and McLean, the dependence is to a power of unity.
The same standard data set was used to obtain a new empirical formula, using the similarity variable Z„ = u'*/vs R°6 to collapse the data. This re-lation implies a dependence on the shear stress associated with skin friction to the power of 2.5. The higher value of the exponent relative to the relations of Van Rijn and Smith and McLean reflects the fact that Z„ does not make use of a normalized excess shear stress, and therefore does not represent an excess above a threshold value for sediment motion. The predictive capa-bilities of the new relation are somewhat better than that of the relations of Van Rijn and of Smith and McLean, but this is not surprising since the data used to test the relation is the same as that used in its derivation.
The empirical relation for uniform sediment is generalized in a straight-
431

forward manner for mixtures. The generalization accounts for "hiding," i.e., altered mobility of one grain size in a mixture relative to other sizes, and an overall suppression of mobility associated with increasing standard de-viation of the size distribution. The empirical fit should provide reasonable estimates of the sediment entrainment coefficient for sediment in the size range 0.0625 m m < D , < 0.50 mm.
ACKNOWLEDGMENTS
This research was funded by the National Science Foundation (grant EAR-8517747). The financial support is gratefully acknowledged. A helpful com-ment by M. Sekine led to the omission of the data by Einstein and Chien (1955).
APPENDIX I. REFERENCES
Akiyama, J., and Fukushima, Y. (1986). "Entrainment of noncohesive sediment into suspension." 3rd Int. Symp. on River Sedimentation, S. Y. Wang, H. W. Shen, and L. Z. Ding, eds., Univ. of Mississippi, 804-813.
Ashida, K., and Michiue, M. (1964). Laboratory study of suspended load discharge in alluvial channels. Kyoto Univ., Disaster Prevention Res. Inst., Kyoto, Japan.
Ashida, K., and Okabe, T. (1982). "On the calculation of method of the concen-tration of suspended sediment under non-equilibrium condition." Proc. 26th Conf. on Hydr., Japanese Society of Civil Engineers, 153-158 (in Japanese).
Barton, J. R., and Lin, P. N. (1955). "A study of the sediment transport in alluvial streams." Report 55JRB2, Colorado A & M College, Fort Collins, Colo.
Brooks, N. H. (1954). "Laboratory studies of the mechanics of motion of streams flowing over a movable-bed of fine sand," thesis presented to the California In-stitute of Technology, at Pasadena, Calif., in partial fulfillment of the requirements for the degree of Doctor of Philosophy.
Celik, I., and Rodi, W. (1984). "A deposition entrainment model for suspended sediment transport." Report SFB 210/T/6, Universitat Karlsruhe, Karlsruhe, West Germany.
Colby, B. R., and Hembree, C. H. (1955). "Computations of total sediment dis-charge Niobrara River near Nebraska." Water Supply Paper 1357, U.S. Geological Survey, Washington, D.C.
Coleman, N. L. (1969). "A new examination of sediment suspension in open chan-nels." J. Hydr. Res., 7(1), 67-82.
Coleman, N. L. (1981). "Velocity profiles with suspended sediment." J. Hydr. Res., 19(3), 211-229.
Dietrich, W. E. (1982). "Settling velocity of natural particles." Water Resour. Res., 18(6), 1626-1982.
Einstein, H. A. (1950). "The bed load function for sediment transportation in open channels." Technical Bulletin 1026, U.S. Dept. of Agric, Soil Conservation Ser-vice, Washington, D.C.
Einstein, H. A., and Barbarossa, N. (1952). "River channel roughness." Trans., ASCE, 117, 1121-1146.
Einstein, H. A., and Chien, N. (1955). "Effects of heavy sediment concentration near the bed on velocity and sediment distribution." MRD Series No. 8, Univ. of California/Missouri River Div., Corps of Engrs., Omaha, Neb.
Engelund, F., and Hansen, E. (1967). "A monograph on sediment transport in al-luvial streams." Danish Tech. Press, Copenhagen, Denmark.
Engelund, F., and Fredsoe, J. (1976). "A sediment transport model for straight al-luvial channels." Nordic Hydrol., 7(5), 293-306.
Engelund, F., and Fredsoe, J. (1982). "Hydraulic theory of alluvial rivers." Ad-vances in hydroscience, V. T. Chow, ed., Academic Press, Inc., San Diego, Calif., vol. 13, pp. 187-215.
432
Garcia. M. H. (1989). "Depositing and eroding sediment-driven flows: turbidity cur-rents," thesis presented to the University of Minnesota, at Minneapolis, Minn., in partial fulfillment of the requirements for the degree of Doctor of Philosophy.
Graf, W. H. (1971). Hydraulics of sediment transport. McGraw-Hill Book Co., Inc., New York, N.Y.
Ikeda, S., and Nishimura, T. (1985). "Bed topography in bends of sand-silt rivers." J. Hydr. Engrg., ASCE, 111(11), 1397-1411.
Ismail, H. M. (1951). "Turbulent transfer mechanism and suspended sediments in closed channels." Proc, ASCE, 77, 1-26.
Itakura, T., and Kishi, T. (1980). "Open channel flow with suspended sediments." J. Hydr. Div., 106(8), 1325-1343.
Kalinske, A. A., and Pien, C. L. (1943). "Experiments on eddy-diffusion and sus-pended-material transportation in open channels." Trans., American Geophysical Union, II, 530-534.
Lyn, D. A. (1986). "Turbulence and turbulent transport in sediment-laden open-channel flows." Report KH-R-49, W. M. Keck Lab. of Hydr. and Water Resour., California Inst, of Tech., Pasadena, Calif.
Nordin, C. F . , and Dempster, G. R. (1963). "Vertical distribution of velocity and suspended sediment middle Rio Grande New Mexico." Professional Paper 462-B, U.S. Geological Survey, Washington, D.C.
Parker, G. (1978). "Self-formed straight rivers with equilibrium banks and mobile bed. Part 1. The sand-silt river." J. Fluid Mech., 89(1), 109-125.
Parker, G. (1990). "Surface-based bedload transport relation for gravel rivers." J. Hydr. Res., 28(4), 417-436.
Smith, J. D. , and McLean, S. R. (1977). "Spatially averaged flow over a wavy surface." J. Geophys. Res., 82(12), 1735-1746.
Straub, L. G., Anderson, A. G., and Flammer, G. H. (1958). "Experiments on the influence of the temperature on sediment load." MRD Sediment Series No. 10, St. Anthony Falls Hydr. Lab., Univ. of Minnesota, Minneapolis, Minnesota.
Van Rijn, L. C. (1984). "Sediment transport, Part II: Suspended load transport." J. Hydr. Engrg., 110(11), 1613-1641.
Vanoni, V. A. (1975). Sedimentation engineering, ASCE, New York, N.Y. Vanoni, V. A., and Nomicos, G. N. (1960). "Resistance properties of sediment
laden streams." Trans., ASCE, 125, 1140-1175.
APPENDIX II. NOTATION
The following symbols are used in this paper:
A = constant = 1 . 3 - 1(T7; A 0 = variable in I takura-Kishi relat ionship; A d = mean absolute deviation of discrepancy ratio cmp/caeo;
a — reference level placed at distance z above bed; bi = log (Me); b2 = log (Arf);
Cm = mean transport concentrat ion, i . e . , suspended sediment flux divided by vo lume flux;
C" = Chezy coefficient; c = volumetr ic sediment concentrat ion averaged over turbulence;
c' = instantaneous fluctuation in sediment concentrat ion; ca = near-bed volumetr ic sediment concentrat ion;
cae = equil ibr ium near-bed sediment concentrat ion; Cae.k = equilibrium near-bed concentration of sediment in Mi size range; caeE = computed value of cae at reference level aE;
caeo,caep = observed and predicted values of cae, respectively;
433

caj, = near-bed concentration of sediment in Mi size range; Dso — median grain size of sediment mixture; Z)# = dimensionless sediment diameter; Dk = characteristic size of sediment in M i size range; D„ = sediment grain size; E„ = sediment entrainment coefficient;
ESik = sediment entrainment coefficient for material in Mi size range; Ft = volume flux vector of suspended sediment averaged over tur-
bulence; Fza = net upward volume flux of suspended sediment at reference
elevation z = a; Fza,k = net upward volume flux of suspended sediment in M i grain
size range at reference elevation z = a; g = gravitational acceleration;
H = flow depth; / = integral of Rousean distribution; i3 = unit vector in jc3-direction; k = unit vector in z-direction; ko = constant = 1 . 1 3 ;
fc/</=M> = constants = 0.008, 0.14, 0 .143, and 2.0 , respectively; ks = equivalent bed roughness;
Me = mean value of discrepancy ratio c„p/caeo; m = power in similarity variable for nonuniform sediment; n = power in similarity variable for uniform sediment;
«o = number of data points; P = power of grain shear stress in sediment entrainment relation-
ships; p = parameter in Engelund-Fredsoe relationship;
pk = volume fraction of bed material in M i size range; qb = volume bed-load transport rate per unit width; q* = dimensionless sediment transport rate; R = submerged specific gravity of sediment;
R„ = hydraulic radius with respect to bed; Rp = particle Reynolds number;
Rpjk = particle Reynolds number for sediment with grain size Dk; S = bed slope;
So = normalized excess shear stress; t = t ime;
Um = mean flow velocity; w* = shear velocity; J4 = skin (grain) shear velocity; Uj = fluid velocity field averaged over turbulence; ul = turbulent velocity fluctuations; vs = sediment fall velocity;
vStk = fall velocity of sediment in M i grain size range; w = fluid velocity in z-direction, averaged over turbulence;
w' = fluctuating component of fluid velocity in z-direction; X/ = cartesian coordinate system; Z = similarity variable in Akiyama-Fukushima relationship;
Zc = 5 .0 , critical value of Z for suspension;
434

•7
^m,k Zeff
zu Z
«0
p 7o A, §,3 •n
"<\a
-e-
* <k X
Xo *» V
O P
P* cr*
°"<l>0 °"s T*
TJ T* T*
0 C
— = = = = = = = = = = = = = = = = = = = = = = = = = = = = = =
13.2, upper bound for Z; similarity variable for sediment in kth size range; ^Zmk; similarity variable for uniform sediment; vertical axis, normal to bed; constant = 26.3; parameter in Engelund-Fredsoe relationship; constant = 2.4 • 1CT3; bedform height; Kronecker delta; z/H; 0.05; scale for sediment size; mean value of <|>; value of <j> corresponding to Dk; straining parameter; normalized value of X; variable in Engelund-Fredsoe relationship; kinematic viscosity of water; variable in Itakura-Kishi relationship; water density; sediment density; standard deviation on 4> scale; normalized value of cr ,; geometric standard deviation; total (skin friction plus form drag) Shields stress; bed shear stress due to grain (skin) friction; critical Shields stress for initiation of motion; Shields stress based on skin friction; bed-slope angle; and integration variable in Itakura-Kishi relationship.
435