Assessing Natural Sedimentation Patterns and Impacts of Land Use on Sediment Yield: A...
40
Assessing Natural Sedimentation Patterns and Impacts of Land Use on Sediment Yield: A Lake-sediment–based Approach ERIK SCHIEFER, KEVIN REID, ALAN BURT, AND JAMES LUCE ABSTRACT Lake-sediment records were used to investigate historical sedimentation pat- terns in 70 headwater lake catchments of northwestern British Columbia. Sediment-core chronologies and sedimentation rates were derived from 210 Pb dating methods. Study objectives include the confirmation of lake cor- ing and associated analysis techniques as appropriate methods for reconstructing past sedimentary environments, the assessment of the natural patterns of lake sedimentation, and the determination of the relative impact of forestry and other land-use disturbances on lake sedimentation in context with the naturally observed variability. Several interesting lake-sediment records have been identified and re- viewed. While there is a high degree of variability in the data set, several distinct trends were recognized. Regional analysis has revealed that specific sediment yield spans two orders of magnitude, from 0.55 t/km 2 /y in the Inte- rior Plateau to 52 t/km 2 /y in the Coast Mountains. Lake basins are differentiated by physiography, both in terms of average specific sediment yield and dominant processes of sediment transfer, as indicated in the drainage-basin, area-specific, yield relations. Temporal analysis has indicated a trend towards increasing lacustrine sedimentation rates irrespective of land-use change in the study watersheds. This trend may be related to pre- cipitation increases in the study area over the last several decades. Episodic natural disturbances are very important processes of sediment transfer in headwater lake catchments, especially in mountainous regions. Land-use im- pacts could be only partially separated from natural fluctuations; however, a signature of land use was observed in some of the study lakes that were ex- posed to high levels of land-use disturbance. INTRODUCTION It has long been established that land-use disturbances can induce elevated sediment yields in affected drainage basins. Increased sediment yields caused by forestry-related activities can have adverse effects on aquatic ecosystems in both streams (Scrivener et al. 1998) and lakes (Miller et al. 1997). Domi- nant processes, efficiency, and rates of sediment transfer vary greatly throughout the Pacific Northwest in response to topographic, geologic, and
-
Upload
independent -
Category
Documents
-
view
1 -
download
0
Transcript of Assessing Natural Sedimentation Patterns and Impacts of Land Use on Sediment Yield: A...

Assessing Natural Sedimentation Patterns and Impacts of
Land Use on Sediment Yield: A Lake-sediment–based
Approach
ERIK SCHIEFER, KEVIN REID, ALAN BURT, AND JAMES LUCE
ABSTRACT
Lake-sediment records were used to investigate historical sedimentation pat-
terns in 70 headwater lake catchments of northwestern British Columbia.
Sediment-core chronologies and sedimentation rates were derived from210Pb dating methods. Study objectives include the confirmation of lake cor-
ing and associated analysis techniques as appropriate methods for
reconstructing past sedimentary environments, the assessment of the natural
patterns of lake sedimentation, and the determination of the relative impact
of forestry and other land-use disturbances on lake sedimentation in context
with the naturally observed variability.
Several interesting lake-sediment records have been identified and re-
viewed. While there is a high degree of variability in the data set, several
distinct trends were recognized. Regional analysis has revealed that specific
sediment yield spans two orders of magnitude, from 0.55 t/km2/y in the Inte-
rior Plateau to 52 t/km2/y in the Coast Mountains. Lake basins are
differentiated by physiography, both in terms of average specific sediment
yield and dominant processes of sediment transfer, as indicated in the
drainage-basin, area-specific, yield relations. Temporal analysis has indicated
a trend towards increasing lacustrine sedimentation rates irrespective of
land-use change in the study watersheds. This trend may be related to pre-
cipitation increases in the study area over the last several decades. Episodic
natural disturbances are very important processes of sediment transfer in
headwater lake catchments, especially in mountainous regions. Land-use im-
pacts could be only partially separated from natural fluctuations; however, a
signature of land use was observed in some of the study lakes that were ex-
posed to high levels of land-use disturbance.
INTRODUCTION
It has long been established that land-use disturbances can induce elevated
sediment yields in affected drainage basins. Increased sediment yields caused
by forestry-related activities can have adverse effects on aquatic ecosystems
in both streams (Scrivener et al. 1998) and lakes (Miller et al. 1997). Domi-
nant processes, efficiency, and rates of sediment transfer vary greatly
throughout the Pacific Northwest in response to topographic, geologic, and
climatic factors (Swanson et al. 1987). The complex behaviour of sediment
transfer in the Pacific Northwest holds profound implications in the study of
how forestry affects sediment yield.
A major problem encountered in studying disturbed sediment yields in
the Pacific Northwest is separating the forestry impacts from natural disturb-
ances, given the high degree of natural spatial and temporal variability
encountered. It has been demonstrated that the analysis of lake sediments
can be useful for assessing land-use impacts on sediment yield at the basin
scale, since a long-term sedimentary record can be established that reflects all
of the integrated upstream watershed effects (Arnaud 1997). This is especially
beneficial in remote mountainous regions where stream gauging and long-
term monitoring is non-existent. In this study, lake-sediment records have
been utilized to investigate historical sedimentation patterns in northwestern
British Columbia. The specific project objectives are as follows:
1. Confirm the usefulness of lake coring and associated analysis techniques
as appropriate methods of assessing long-term impacts of forest harvest-
ing and other land-use disturbances on lacustrine sedimentation.
2. Assess the natural patterns of lake sedimentation, including regional
trends, spatial scale effects, and temporal variability.
3. Determine the relative impact of forestry on lake sedimentation in context
with the naturally observed variability.
The key premise of this study is that linkages exist between the inherent
landscape characteristics and terrestrial disturbances (both natural and an-
thropogenic) of lake catchments and the quantity of accumulating lacustrine
sediments. Lake sediments represent a historical record of sediment yield
and sediment characteristics from the contributing drainage basin area. Petts
and Foster (1985), Foster et al. (1987), and Foster et al. (1988) have reviewed
and demonstrated the lake-sediment framework and its application in recon-
structing past catchment conditions. When properly sampled and analyzed,
the information recorded in the sediments can be extracted as profiles of
historical lake sedimentation. Changes in sedimentation associated with
land-use disturbance can then be identified and described.
The primary focus of this research is on the historical rates of lake-sediment
accumulation derived from 210Pb analysis of sediment core samples from the
study lakes. 210Pb dating is a commonly used technique for establishing
sediment chronologies back to 150 years before present. A total of 70 lake
catchments were selected for this study. The development and utilization of
geographic information system () databases has been critical for handling
the large amount of spatial data required for the project. A database was
developed to inventory the landscape data and land-use histories of the lake
catchments. Extracted from this database were variables to describe the nat-
ural landscape and the land-use history for each study lake. These variables
and the lake-sediment data were then analyzed to resolve the three study ob-
jectives listed above. The project can be divided into three phases:
1. Collection and analysis of lake-sediment cores in order to establish histor-
ical rates of sediment accumulation and measure other sediment
parameters for the study lakes.
2. Development of a spatial lake catchment inventory in a environment
suitable for the extraction of required landscape and land-use indices for
analysis.
3. Correlation analysis of -derived indices with sediment accumulation
rates and other sediment parameters in order to interpret regional sedi-
mentation patterns.
This paper presents the key findings of the study to date. A more detailed
examination of the data can be found in Schiefer (1999). Additional analysis
of the data is currently being considered, including empirical modelling of
sediment yield over both time and space using multivariate techniques.
GENERAL STUDY AREA
The study area is situated in northwestern British Columbia between 54° and
56° N and 126° and 131° W (Figure 1). Clague (1984) gives a detailed descrip-
tion of this region in a Geological Survey report on the Quaternary geology
and geomorphology of the area. The study region consists mainly of rugged
mountainous areas cut by deep valleys. The Coast Mountains contain the
most spectacular mountainous terrain in the study area. Moving into the
Nechako Plateau to the east, the terrain becomes more rolling with less
exposed rock outcrops. Topography and the predominant flow of moisture-
laden air from the west control precipitation in the study area, with the Coast
Mountains receiving the highest annual precipitation during frequent mid-
latitude cyclonic storms in the winter months. Most of the area below 1500 m
was forested prior to human settlement, but large sections of accessible val-
leys and plateau areas have been cleared during the 20th century to support
the forest industry and other land-use activities.
METHODS
The British Columbia Ministry of Environment, Lands and Parks provided
a preliminary list of several hundred potential headwater study lakes for this
project. Topographic maps, lake inventory reports, and air photos of the
region were examined in order to reduce the list of candidate lakes. Site
selection involved consideration of lake suitability for a sediment-based,
sediment-yield study based on lake morphometry and landscape characteris-
tics of the lake catchment. Lakes had to be deep enough (preferably >10 m)
to minimize the potential for physical reworking of sediments from waves,
seasonal overturn processes, subaqueous slumping, and bioturbation by bot-
tom-dwelling organisms. Lakes also had to be large enough to be accessible
by floatplane and small enough that a single core will represent a fair and
consistent index of sediment yield to the lake (i.e., approximately 1 km2).
Complex bottom morphology leads to greater within-lake spatial variability
of sedimentation patterns, making estimates of sediment yield using a single
core unreliable. Both landscape and land-use characteristics of the lake
catchments were considered in the lake-selection process in order to ensure
that the study lakes were well representative of lakes in northwestern British
Lake Selection
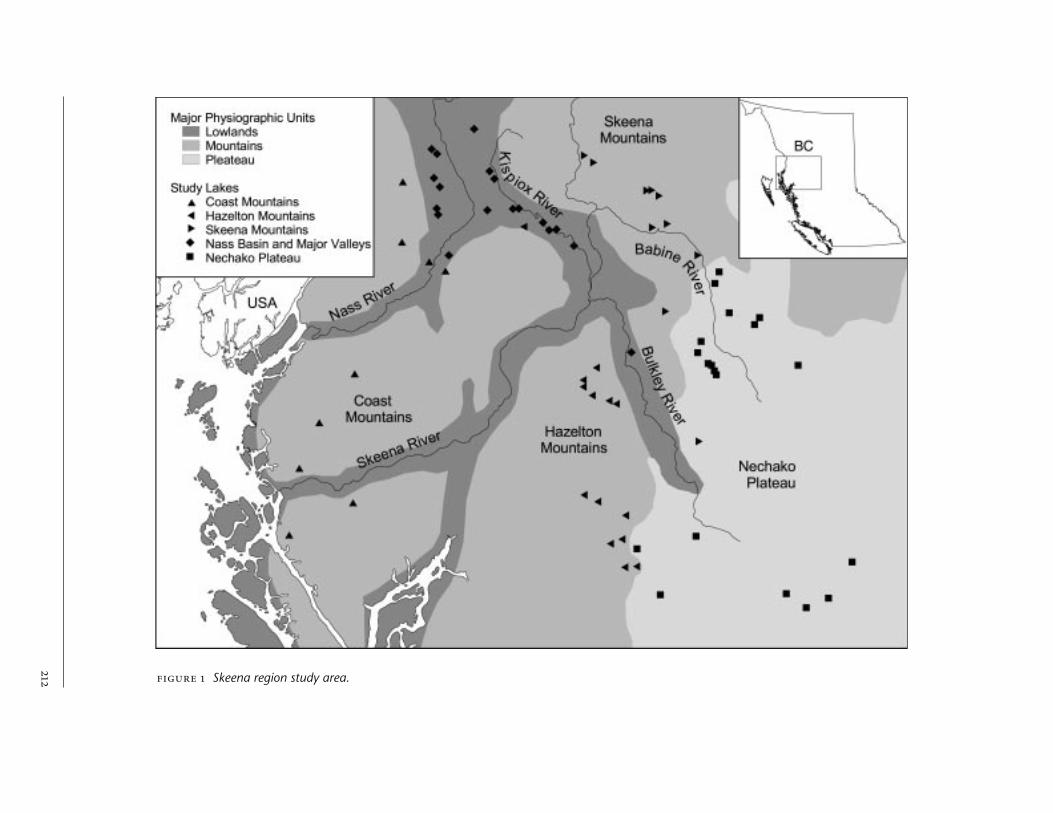
Skeena region study area.
Columbia. First- to third-order catchments were selected from a variety of
physiographic regions in the study area, including coastal, mountainous,
plateau, and major valley regions. Unforested high-alpine and glacier lakes
were not included in this study. Significant effort was also made to include
lakes subjected to a gradient of forestry-related, land-use disturbances. Ulti-
mately, field reconnaissance was used to determine the final list of study
lakes. A total of 70 small lake-catchments (order of 10–100 km2) were select-
ed for the project.
Coring of lake-bottom sediments using a modified Kajak-Brinkhurst ()
gravity corer was a major component of the field work. A detailed descrip-
tion of the corer is provided by Brinkhurst (1974). Upon arrival on each
of the study lakes, depth sounding was conducted along the entire length of
the lake to characterize the basin. Sediment-sampling sites were always situ-
ated at the deepest point of the lake basin. Sediment cores retrieved from
deep and stable sections of the lake bottom usually have the finest strati-
graphic definition as a result of sediment focusing of the fine materials (Pack
et al. 1997). Four cores were collected at each station for dry-bulk density
analysis, 210Pb dating, archiving, and a backup in case of loss. After all of the
cores were collected, they were aligned to ensure that they were consistent in
terms of apparent layering and other sediment characteristics. To visually as-
sess the areal continuity of the lake-bottom sediments, additional cores were
sampled at a variety of other mid-lake locations as time permitted.
Core extrusion and slicing was performed using the Core Extruder.
Sediment samples were extracted from the top of the core using a sectioning
device. The core sub-samples were then washed into pre-labelled sample
bags using distilled water, and submitted for laboratory analysis.
210Pb dating is a widely used technique for establishing chronologies of
lake-sediment cores. The 210Pb analysis and reconstruction of historical sedi-
mentation rates for the project was conducted by MyCore Scientific Limited.
Details of the procedure used are presented by Evans and Rigler (1980), with
modifications described by Cornett et al. (1984) and Rowan et al. (1994).210Pb is a naturally occurring radionuclide in the 238U decay series. 210Pb
formed by in situ decay is termed the supported component and is in ra-
dioactive equilibrium with parent material. The 210Pb activity in excess of the
supported component is primarily derived by direct atmospheric fallout into
the lake, which is scavenged by sediment particles and deposited on the bed
of the lake. The unsupported component decays exponentially in time in ac-
cordance with its half-life (22.26 years). It is this predictable radioactive
decay of excess 210Pb that provides the basis for dating lake sediments. The
concentrations of 210Pb were interpreted using the constant rate of supply
() dating model (Robbins 1978; Appleby and Oldfield 1978). This model
is generally preferred over other interpretation techniques because it allows
for fluctuating rates in sediment deposition over time. The model as-
sumes that the input of excess 210Pb to the sediment-water interface has
remained constant through time and that no post-depositional migration of
the radionuclide has occurred over the dating interval. The total quantity of
excess 210Pb (calculated by numerical integration of the 210Pb profile) is used
in the determination of sediment ages and sediment accumulation rates.
Using the calculated age and rate of sediment accumulation for the core
sections, profiles of historical lake-sedimentation rates at the sampling site
Laboratory Analysisand Yield
Sediment Coring
can be developed. Sedimentation rates are best represented as horizontal
lines plotted over core section intervals since the rate is an averaged measure
across each section (several plots are included in this paper). Using this
graphical representation, background lake-sedimentation rates were estimat-
ed. The background accumulation rate is assumed to be the component of
the sediment load derived from primary denudation processes. Background
sedimentation rates derived from 210Pb dating can be multiplied by lake area
to obtain an index of total sediment yield from the contributing lake catch-
ment area. The assumptions of areal continuity (the measured sedimentary
property should be deposited in similar proportions over the whole lake-
bottom area) and synchroneity (once deposited, the measured property
should be persistent and immobile) must be met for the calculated sediment
yield to be a fair and consistent index of the actual sediment yield to the lake.
The assumptions of continuity and synchroneity of lacustrine sediments are
common in lake-sediment–based literature. Since cores were taken from the
deepest point of the lake, the index will likely be an overestimate of actual
yield because of sediment focusing effects in the lake basin. In lakes with a
flat bottom and less sediment focusing, the sediment-yield index will ap-
proach the actual yield. In order to make lake-to-lake comparisons of
catchment denudation rates, the sediment-yield index can be converted to a
specific sediment yield, or sediment yield per unit of contributing basin area.
Due to the large volume of spatial data used in the project, / technology was used to facilitate data management and queries. Several key
existing databases have been used as basic inputs to the for landscape-
level spatial analysis. The two most important sources of digital data include
the provincial terrain resource information management () maps and
the British Columbia Ministry of Forests forest cover mapping (1). Several
other basic inputs were used to verify the lake inventory, such as: -
recorded, field-sampling locations; aerial photography; available historical
maps (road maps, recreation maps, fishery reports, etc.); and personal com-
munication updates from B.C. Ministry of Forests and B.C. Ministry of
Environment personnel.
Two types of variables were extracted from the database. The first set
of variables are landscape indices, which are considered static over the time
scale of this study. These indices consist of lake-catchment morphometric
parameters that relate to the sediment production, conveyance, and storage
for the basin. Primary landscape variables include: basin area,
lake/wetland/valley areas, stream length, and elevation/slope statistics. The
second set of variables are dynamic (time-dependent) land-use indices.
These indices consist of planimetric parameters of land-use change within
the lake catchment that could relate to anthropogenic modifications to sedi-
ment transfer. The land-use indices are calculated on a yearly basis since the
time of the first land-use disturbance. Primary land-use indices include area
logged and road length (with various slope and distance-to-stream modi-
fiers). Analysis of the landscape data consisted of regression with tests of
statistical significance, which are based on the assumption that variables are
normally distributed. Variables describing natural landscape characteristics
are often log-normally distributed. Based on visual examination of variable
histograms, the log transformation was deemed necessary for all landscape
indices except for lake elevation and drainage density.
GIS DatabaseDevelopment

The first step in investigating trends in the sediment records was to assess the
natural patterns of lake sedimentation by relating the 210Pb-derived sediment
profiles to the landscape indices of the undisturbed lake catchments. This
analysis was comprised primarily of standard linear regressions and analysis
of variance. Secondly, the relative impact of land use on lake sedimentation
was determined by relating the sediment profiles to temporal changes in the
land-use indices for the disturbed lake catchments. This analysis was restrict-
ed to various semi-quantitative techniques, which are described in following
sections. Based on these results, the usefulness of lake coring and associated
analysis techniques as appropriate methods for determining long-term im-
pacts of forest harvesting and other land-use disturbances on lacustrine
sedimentation was assessed. Current knowledge of sediment transfer in
British Columbia, and preliminary results in this study, suggest that sedi-
ment-delivery processes are strongly related to physiography and local
geology. For this reason, most of the data set analyses were stratified for
various physiographic units, as presented in the following section.
RESULTS PRESENTED BY PHYSIOGRAPHIC REGION
Spectacular coastlines, steep-walled fjords, and rugged mountains character-
ize the region. Glaciated mountain peaks reach elevations in excess of 2000 m.
Major rock-outcrop areas show fresh glacial landforms such as cirques,
arêtes, and horns. Where bedrock is not exposed it is commonly thinly man-
tled by soil. Mean annual precipitation exceeds 2500 mm and in some areas
surpasses 3500 mm. The North Coast study lakes were formed by glacial ero-
sion in the mountains bordering the main valleys. They are medium-sized to
large lakes with an elongated shape and very steep-sided bathymetry and im-
mediate shoreline.
Background mid-lake sedimentation rates range from 49 to 2050 g/m2/y.
(Note: units of g/m2/y are used to indicate rates of sedimentation per unit of
lake basin area; units of t/km2/y are used to indicate sediment yield per unit
of the contributing catchment area.) The exceptionally high background sed-
imentation observed in some lakes reflects the large contributing drainage
area, steep surrounding terrain, and close proximity to the Pacific Coast.
Sedimentation rates in the North Coast lakes are highly variable over time.
This reflects the episodic nature of sediment transfer in mountainous water-
sheds of British Columbia. The highest amount of variability is observed in
lake catchments with an average slope greater than 30°. Possible land-use im-
pacts could not be disentangled from the high degree of natural variability
observed in this region.
The Hazelton and Skeena mountain ranges run north-south, parallel to the
Coast Mountains. The Hazelton Mountains are bounded by the Kitsum-
kalum-Kitimat Trough to the west and the Kispiox and Bulkley rivers to the
east. The Skeena Mountains are further inland between the Skeena and Bulk-
ley rivers and the Nechako Plateau. Bedrock intrusions are not as
widespread and relief is more moderate than that observed in the Coast
Mountains. Some lake catchments contain high-alpine areas that remain
snow-covered for most of the year. Precipitation is strongly controlled by
orographic effects in this region. Mean annual precipitation ranges from
Hazelton and SkeenaMountain Regions
North Coast Region
Analysis of SedimentRecords

over 3000 mm on the windward side of the Hazelton Mountains to about
500 mm on the leeward side of the Skeena Mountains. Pleistocene sediments
impound all lakes in this region, although bedrock and active delta areas
along the shorelines are not uncommon. Lake sizes and shapes are highly
variable. Wetland areas are common in close proximity to the study lakes.
Background mid-lake sedimentation rates range from 40 to 600 g/m2/y,
largely controlled by the size of the contributing area. As observed in the
Coast Mountains, episodic events dominate sediment transfer in many of
the lake catchments. Elevated rates of lake sedimentation following land-use
disturbances have been observed in most catchments, up to double the ob-
served background levels. There is no obvious pattern between the degree of
disturbance and the magnitude of the sedimentation increase. In most cases,
sedimentation rates had been increasing before the onset of the land-use dis-
turbances. Furthermore, about half of the control lakes also show a
consistent increasing trend in mid-lake sedimentation rates beginning
around 1950. This natural trend of increasing sedimentation over the last half
of the century confounds the land-use signal, so the degree to which forestry
activities have influenced downstream sedimentation is undetermined.
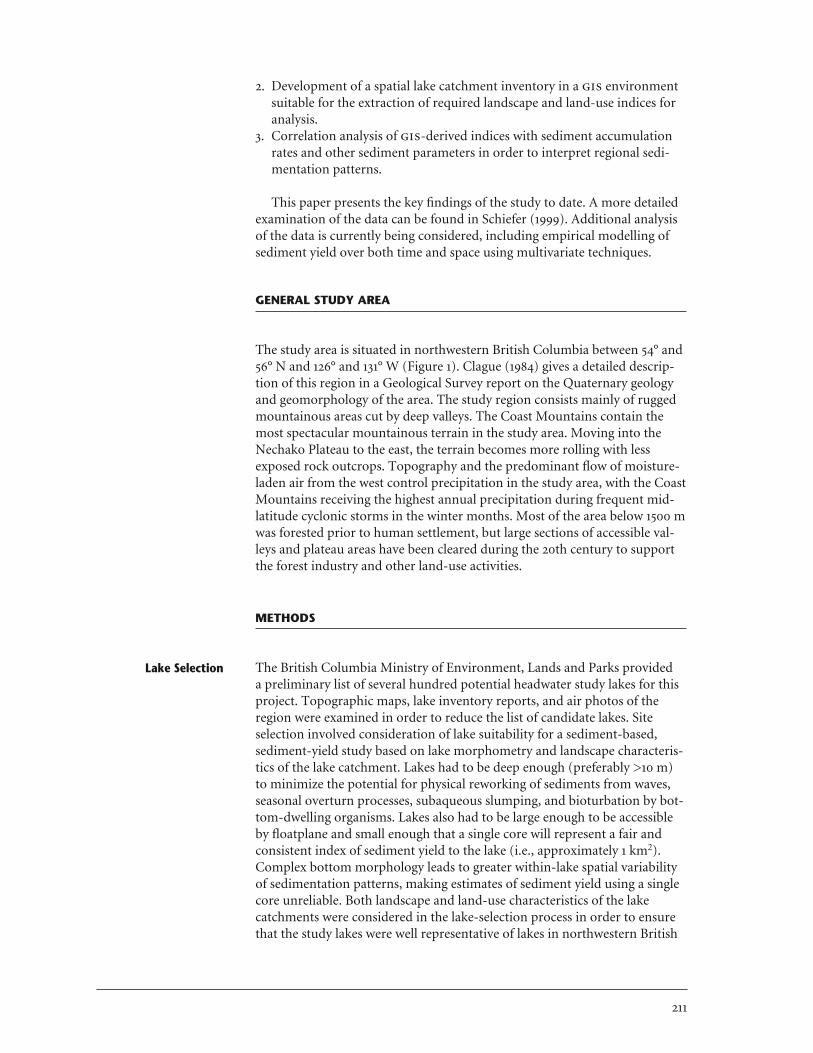
An interesting lake-sediment signature was observed in Aldrich Lake, lo-
cated about 12 km west of Smithers on the opposite side of the Hudson Bay
Range. A watershed map and sedimentation rate profile with the timing of
land-use development in the catchment are included in Figure 2. Road and
mine development began north of Aldrich Lake in the early 1920s. Produc-
tion was intermittent between 1930 and 1940, but by 1950 the mine operated
at its highest production rates. The final year of operation was 1954.
Mid-lake sedimentation rates in Aldrich Lake increased steadily from a
background rate of about 300 g/m2/y to close to 700 g/m2/y during mine op-
eration. Sedimentation rates reached their highest levels of 780 g/m2/y in the
decade following mine production. This peak in sedimentation was likely as-
sociated with road failures and a blowout that occurred in the old tailings
dump. Sedimentation rates dropped in the following years, but then again
started to increase when forestry activities began in 1984.
Areas classified in this region include low-lying depressions and large valley
flats located between major mountain ranges. The Nass Basin and the
Skeena, Bulkley, and Kispiox valleys comprise most of this area. Rivers
presently occupy these regions, but during Pleistocene glaciation they served
as channels down which glacier ice moved. The region contains hummocky,
rolling, and undulating terrain underlain by thick Quaternary sediments.
The broad valley bottoms range from 200 to 500 m in elevation and have
gentle relief. Climate ranges from the maritime environment of the coast to
the continental climate of the interior. Most of this region is road-accessible
and has been subject to timber-harvesting activities. The lakes in this region
are relatively small compared to those in the other study regions. The lakes
located in the major valleys are impounded by thick Pleistocene deposits.
Lakes in the Nass Basin occupy low plateaus in a series of glacially scoured
troughs running northwest-southeast. Wetlands and low-lying swampy areas
are also common around the lakes. Distal to the lakes are high-relief moun-
tainous areas.
Background mid-lake sedimentation rates range from 16 to 186 g/m2/y.
Lakes with larger contributing areas generally have higher sediment-loading
rates, although sedimentation rates are not well predicted by any linear
Nass Basin and MajorValleys Region

Aldrich Lake. SAR is sediment accumulation rate in g/m2/y, road density is given in km/km2, andamount logged is given as a ratio to drainage basin area.
Drainage area = 25.9 km2
Lake area = 0.82 km2
Lake depth = 5.5 mElevation = 1146 mRoad density = 0.99 km/km2
Percent logged = 7.6%
N
d CoreRoadRiverLakeCutWetlandBasin
SAR(g/m2/yr)
Road Density# of Stream Crossings
% Logged
combination of landscape variables. Half of the control lakes show an in-
creasing trend in sedimentation in the latter half of their sediment records
(50–100 years), a similar trend to that observed in the Hazelton/Skeena
region lakes. Most disturbed lakes have experienced an increase in sedimen-
tation coinciding with road construction and timber harvest. The lakes with
the highest number of stream crossings had the greatest increases in sedi-
mentation. Although almost all lakes have higher sedimentation rates
following the forestry activities, several of the control lakes in the region
show a similar trend in recent accumulation rates.
Elizabeth Lake is the only lake that clearly shows a recovery of sedimenta-
tion rates following completion of land-use disturbances back to background
levels. A map of the lake catchment and a plot of sedimentation rates and
land-use history of Elizabeth Lake are shown in Figure 3. Notice that sedi-
mentation rates begin to increase immediately following the initial road
construction in the lake catchment. Sedimentation rates continued to rise
while road construction continued and logging began north of the lake. The
highest sedimentation rate of 374 g/m2/y (307% above background) occurred
2 years following the most major road construction and significant logging in
the catchment in 1980. Sedimentation rates began to recover when road con-
struction in the basin was completed. Some timber-harvesting activities
continued through the falling limb of sedimentation.
The Nechako Plateau is the only extensive plateau region in northwestern
British Columbia. The Bulkley River extends southeastward into the
Nechako Plateau, a rolling region with elevations ranging from 800 to 1200 m.
The Nechako Plateau is bordered on the west by the Hazelton Mountains
and to the north by the Skeena Mountains. The Nechako Plateau makes up
part of the Interior Plateau region of British Columbia. The climate of
Nechako Plateau is continental, and is characterized by seasonal extremes of
temperature and moderate annual precipitation. This region contains the
least dramatic relief of all of the study areas. Flat-lying volcanic strata and
glacial drift overlie older bedrock in this region. Rivers flow in deep, glacially
modified valleys cut into the rolling uplands. Lakes and wetlands dot the
landscape in poorly drained, post-glacial depressions. Most of this region is
road-accessible and has been subject to timber-harvesting activities. The
largest range of lake and lake-catchment sizes is found in this region. Lake
basins are fairly regular in shape and are relatively shallow compared to the
lakes in the other study areas. Low-lying and poorly drained peat bogs,
marshes, and swamp areas are common. Small lakes and ponds are abundant
in the study catchments, many being held behind old beaver dams. There are
no signs of hillslope coupling in the relatively flat terrain of this region.
Background mid-lake sedimentation rates range from 30 to 280 g/m2/y. As
observed in the other regions, lakes with a larger contributing area generally
have higher sediment-loading rates. However, similar to the Nass Basin and
Major Valleys region, background sedimentation rates are not well predicted
by any linear combination of landscape variables. Lakes in the Nechako re-
gion show similar patterns of sedimentation as observed in the Nass Basin
and Major Valleys. Half of the control lakes have had increasing sedimenta-
tion rates over the last several decades. This natural increase in
sedimentation rates has been observed in about half of the control lakes in
this study, making interpretation of the effects of land use on the sediment
signatures significantly more difficult because the timing of this increasing
Nechako PlateauRegion

Elizabeth Lake.
N
d CoreRoadRiverLakeCutWetlandBasin
Drainage area = 21.8 km2
Lake area = 0.46 km2
Lake depth = 11.5 mElevation = 415 mRoad density = 1.23 km/km2
Percent logged = 34.4%
Road Density# of Stream Crossings
SAR(g/m2/yr)
% Logged

trend coincides closely with land-use impacts. Again, all but a couple of the
lakes that have experienced forestry-related, land-use disturbances have co-
inciding increases in their sedimentation rates. Catchments with greater
land-use disturbances generally show greater increases in sedimentation, but
this relation does not hold for all lakes.
Takysie Lake is a large lake located well within the Nechako Plateau in the
southeast corner of the study area. The Takysie catchment has been subject
to a long and diverse land-use history. The lake catchment and sediment
profile are included in Figure 4. Sedimentation rates in Takysie Lake have
been increasing since 1865, the earliest date available from the 210Pb analysis.
Most of the increase has occurred following road construction, timber har-
vest, and other land-use activities, including animal grazing, agriculture,
residential development, and resorts/camping. The time of first land-use dis-
turbance is unknown, but most development is known to have occurred
since 1930, primarily to the west of the lake. The sediment profile does not
reach a level background rate. 210Pb analysis done in a paleolimnological as-
sessment of Takysie Lake by Reavie and Smol (1998) indicated a background
sedimentation rate of about 30 g/m2/y. This background rate fits the trend
observed early in our sediment record. Both results showed a similar increase
in sedimentation rates over the latter part of the century. Our results gave a
higher peak-sedimentation rate of 269 g/m2/y compared to about 210 g/m2/y
in their study. Sedimentation rates have increased 600–800% above back-
ground in Takysie Lake over the last 150 years. Not all of this increase can be
linked to land use because rates were increasing before land-use activities
began in the catchment. However, an increase of this magnitude is unprece-
dented for the lakes in this study. Reavie and Smol (1998) attributed the
increasing sedimentation rates to lake eutrophication caused by elevated
nutrient input from human development surrounding the lake.
REGIONAL PATTERNS OF LACUSTRINE SEDIMENTATION
A minimum of four cores were sampled from the deepest point of the central
basin of each lake. Whenever possible, additional cores were taken at points
located elsewhere in the lake basin. A visual comparison was made in the
field between all the cores taken from each lake. If the sediment cores con-
tained visual markers (event layers, varving, change in sediment character,
etc.), then the assumptions of areal continuity and synchroneity of the lake
sediments could be verified. Lake sediments must have these properties for
cores to be representative of deposition across the entire lake. If the assump-
tions of areal continuity and synchroneity are valid, sediment properties in
order will be consistent and sediment will be deposited in similar propor-
tions over the whole lake area. Cores from the same lake should then all have
a similar and consistent sediment structure. There were no cases where the
assumptions of areal continuity and synchroneity of lake sediment did not
appear to be valid for mid-lake areas. The focusing of sediment to deeper
lake areas was evident because the distance between horizons in the sediment
cores usually decreased as cores were sampled in shallower water. In lakes
with a relatively flat bottom, the distance between horizons would increase as
cores were sampled closer to the main inflow to the lake. The deepest spot in
these lakes would not have been the optimal sampling location for obtaining
the best temporal resolution in the lake-sediment analysis. Cores taken in
Within-lake Variability
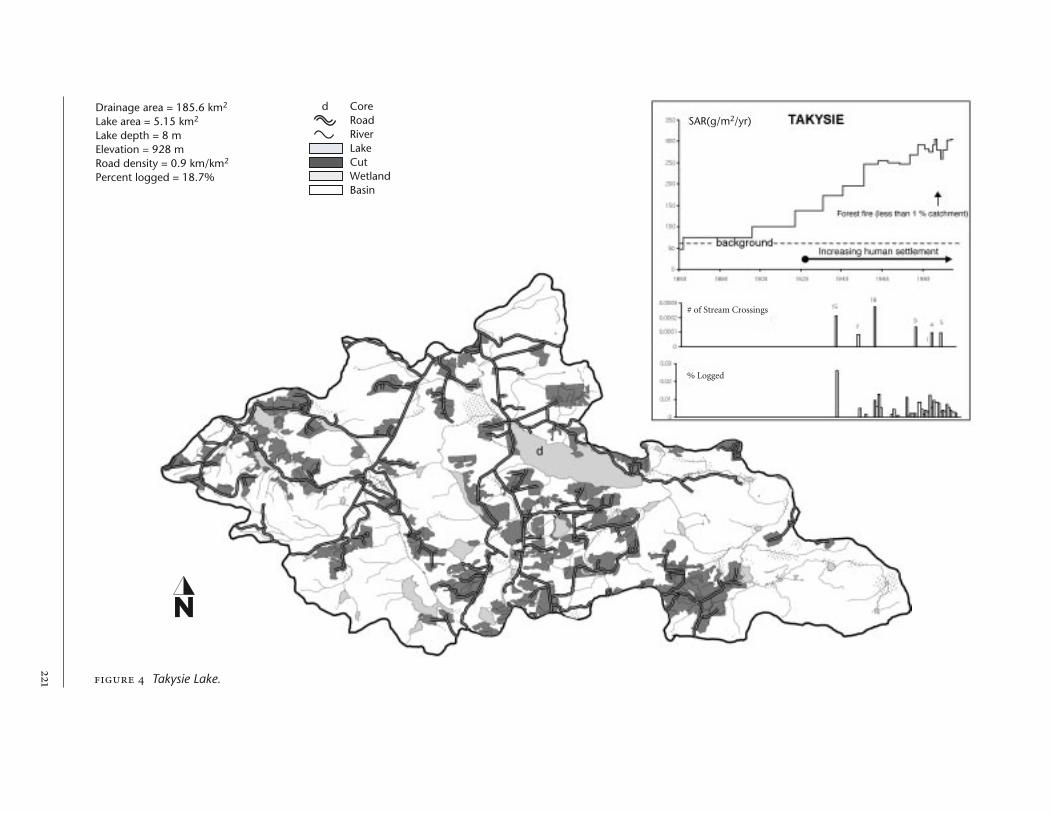
Drainage area = 185.6 km2
Lake area = 5.15 km2
Lake depth = 8 mElevation = 928 mRoad density = 0.9 km/km2
Percent logged = 18.7%
d CoreRoadRiverLakeCutWetlandBasin
Takysie Lake.
N
SAR(g/m2/yr)
# of Stream Crossings
% Logged
shallower water and from near-shore locations would not always have a
stratigraphy similar to that of the mid-lake cores. This was especially true in
cores that were sampled on steep, lake-bottom slopes, above the lake ther-
mocline, or on a delta front. These sediments are subject to re-suspension
and transport by sub-aqueous slumping, water currents, and wind/wave
action. Lakes best suited for this study have a well-defined and deep central
basin, with a relatively flat bottom that is out of the influence of deltaic and
near-shore processes. Lakes were selected that appeared to best meet these
requirements in order to help assure areal continuity and synchroneity of the
lake sediments. This was reflected in the high degree of correlation between
mid-lake sediment cores.
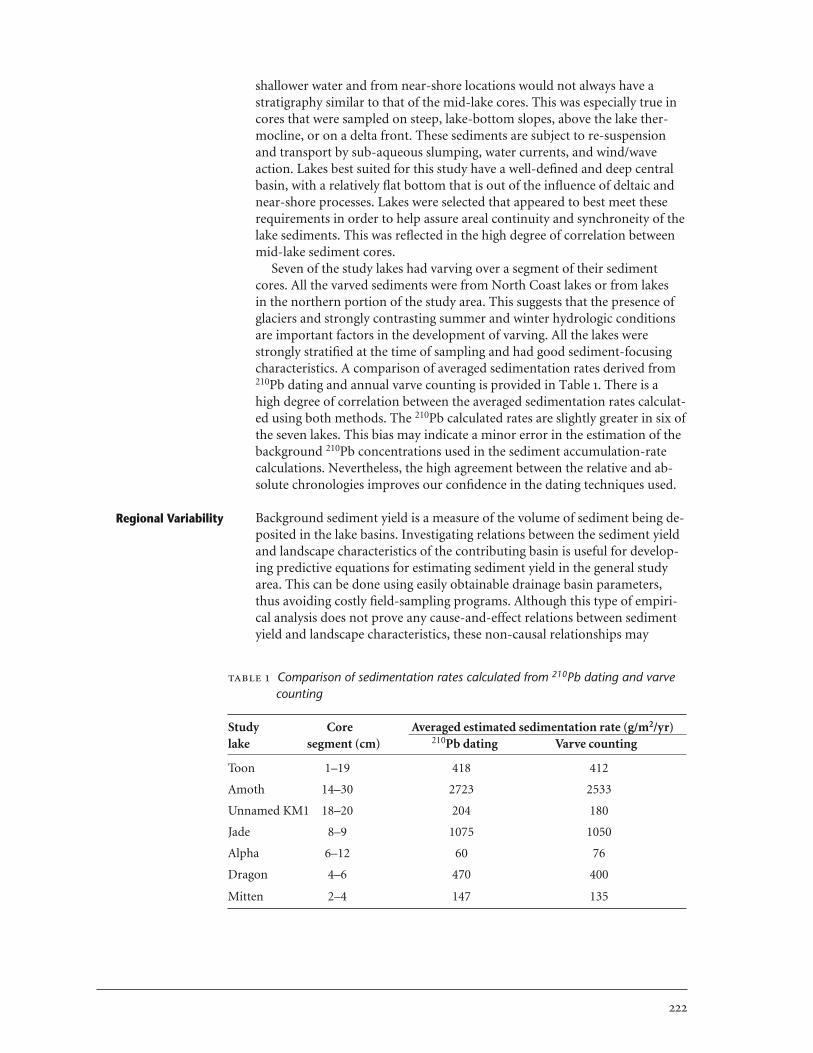
Seven of the study lakes had varving over a segment of their sediment
cores. All the varved sediments were from North Coast lakes or from lakes
in the northern portion of the study area. This suggests that the presence of
glaciers and strongly contrasting summer and winter hydrologic conditions
are important factors in the development of varving. All the lakes were
strongly stratified at the time of sampling and had good sediment-focusing
characteristics. A comparison of averaged sedimentation rates derived from210Pb dating and annual varve counting is provided in Table 1. There is a
high degree of correlation between the averaged sedimentation rates calculat-
ed using both methods. The 210Pb calculated rates are slightly greater in six of
the seven lakes. This bias may indicate a minor error in the estimation of the
background 210Pb concentrations used in the sediment accumulation-rate
calculations. Nevertheless, the high agreement between the relative and ab-
solute chronologies improves our confidence in the dating techniques used.
Background sediment yield is a measure of the volume of sediment being de-
posited in the lake basins. Investigating relations between the sediment yield
and landscape characteristics of the contributing basin is useful for develop-
ing predictive equations for estimating sediment yield in the general study
area. This can be done using easily obtainable drainage basin parameters,
thus avoiding costly field-sampling programs. Although this type of empiri-
cal analysis does not prove any cause-and-effect relations between sediment
yield and landscape characteristics, these non-causal relationships may
Regional Variability
Comparison of sedimentation rates calculated from 210Pb dating and varvecounting
Study Core Averaged estimated sedimentation rate (g/m2/yr)lake segment (cm) 210Pb dating Varve counting
Toon 1–19 418 412
Amoth 14–30 2723 2533
Unnamed KM1 18–20 204 180
Jade 8–9 1075 1050
Alpha 6–12 60 76
Dragon 4–6 470 400
Mitten 2–4 147 135

represent important prologues to further theoretical understanding of the
underlying physical processes of sediment transfer. A stepwise linear regres-
sion was performed with background sediment yield estimated from the 210Pb
dating of the sediment cores (dependent variable) and all the -derived
landscape indices for the lake inventory (independent variables). The regres-
sion was run for each physiographic region and for the entire data set. The
regression results, including the of the regressions, are presented in
Table 2.
All of the regression line slopes are highly significant (P = 0.001). In all
cases the drainage basin area is the most important predictor variable. Sedi-
ment yield in the North Coast region is well predicted by the contributing
drainage-basin area. Total valley-flat area and drainage density were impor-
tant variables in the Hazelton and Skeena mountain regions, respectively.
Valley-flat area is a term describing storage potential in the catchment. Val-
ley-flat area is defined as the sum of continuous, flat-lying (less than 1° slopes)
land and water-body (upstream wetlands and lakes, excluding the study lake)
areas in valley-bottom areas of the lake catchment. These are areas where net
accumulation of sediment occurs. Therefore, catchments with large valley-
flat areas are more likely to have lower sediment yields, hence the negative
influence on yield in the Hazelton Mountains. Conversely, drainage density
had a positive influence on yield in the Skeena Mountains as a term that de-
scribes the transport capacity of a catchment. Since fine sediment is trans-
ported in suspension through stream channels, catchments with greater
stream lengths per unit area will more efficiently transfer mobilized sediment
from the land surface, through the stream network, to the receiving lake
downstream. Sediment yields in the Nass Basin and Major Valleys region and
in the Nechako Plateau region are not well predicted by any linear combina-
tion of the landscape indices. With the complete data set, drainage-basin area
and mean slope of the catchment were the most significant predictor vari-
ables. It is not surprising that slope emerged as a significant variable in the
all-regions regression. Average slope of a catchment relates to both storage
Background sediment yield regression and ANOVA results
North Coast Nass Basin and Major Valleys
log(Y) = 0.76 + 1.38log(Ab) log(Y) = 1.09 + 0.51log(Ab)n = 9, R2 = 0.86 n = 18, R2 =0.46F Value: log(Ab) → 43.5*** F Value: log(Ab) → 13.7**
Hazelton Mountains Nechako Plateaulog(Y) = 0.19 + 1.43log(Ab) – 0.66log(VFA) log(Y) = 1.42 + 0.43log(Ab)n = 16, R2 = 0.83 n = 21, R2 = 0.47F Values: log(Ab) → 50.7***, log(VFA) → 11.2** F Value: log(Ab) →16.6***
Skeena Mountains All Regionslog(Y) = 1.12 + 1.84log(Ab) + 0.62DD log(Y) = 0.59 + 0.77log(Ab) + 0.52log(slope)n = 12, R2 = 0.84 n = 76, R2 = 0.66F Values: log(Ab) → 39.3***, DD → 8.3* F Values: log(Ab) → 134.1***, log(slope) → 8.0**
Where: Y is the background sediment yield (Mg/y) * P < 0.05Ab is the area of the drainage basin (km2) ** P < 0.01VFA is the total valley flat area upstream of lake including water bodies (km2) *** P < 0.001DD is the drainage density (km/km2)Slope is the mean slope of the land surface area (degrees)
potential (negatively—sediment accumulation is more likely in flat-lying
terrain) and transport capacity (positively—steep terrain is more likely the
source or transport area of sediment) of the basin. It is unclear if the regres-
sion results for all regions combined makes sense when the regional
component regressions yield different results, which implies the possibility of
different underlying physical processes in the different regions. It is interest-
ing to note that the R2 values are the highest in the mountainous areas
(North Coast, Hazelton Mountains, and Skeena Mountains). The greater
storage potential of sediment in the flatter catchment areas (Nechako
Plateau, Nass Basin, and Major Valleys) may be confounding the predictabil-
ity of sediment yield.
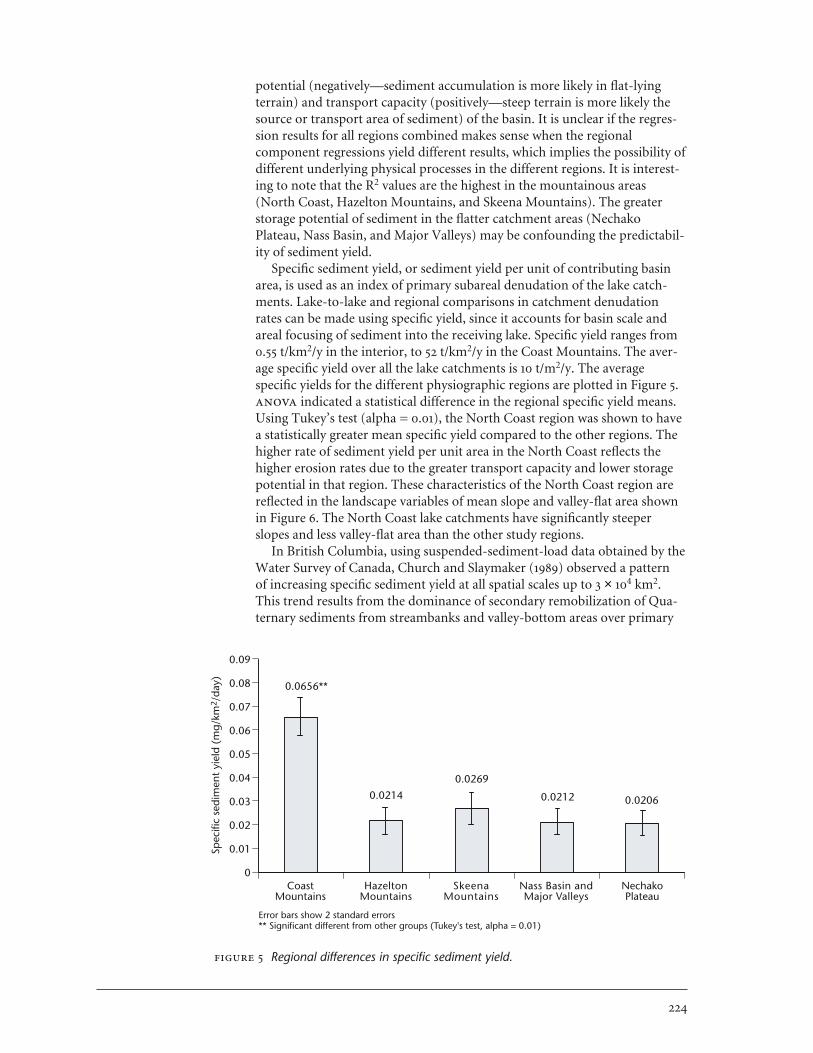
Specific sediment yield, or sediment yield per unit of contributing basin
area, is used as an index of primary subareal denudation of the lake catch-
ments. Lake-to-lake and regional comparisons in catchment denudation
rates can be made using specific yield, since it accounts for basin scale and
areal focusing of sediment into the receiving lake. Specific yield ranges from
0.55 t/km2/y in the interior, to 52 t/km2/y in the Coast Mountains. The aver-
age specific yield over all the lake catchments is 10 t/m2/y. The average
specific yields for the different physiographic regions are plotted in Figure 5.
indicated a statistical difference in the regional specific yield means.
Using Tukey’s test (alpha = 0.01), the North Coast region was shown to have
a statistically greater mean specific yield compared to the other regions. The
higher rate of sediment yield per unit area in the North Coast reflects the
higher erosion rates due to the greater transport capacity and lower storage
potential in that region. These characteristics of the North Coast region are
reflected in the landscape variables of mean slope and valley-flat area shown
in Figure 6. The North Coast lake catchments have significantly steeper
slopes and less valley-flat area than the other study regions.
In British Columbia, using suspended-sediment-load data obtained by the
Water Survey of Canada, Church and Slaymaker (1989) observed a pattern
of increasing specific sediment yield at all spatial scales up to 3 × 10⁴ km2.
This trend results from the dominance of secondary remobilization of Qua-
ternary sediments from streambanks and valley-bottom areas over primary
CoastMountains
HazeltonMountains
SkeenaMountains
Nass Basin andMajor Valleys
NechakoPlateau
Error bars show 2 standard errors** Significant different from other groups (Tukey's test, alpha = 0.01)
0.09
0.08
0.07
0.06
0.05
0.04
0.03
0.02
0.01
0
Spec
ific
sedi
men
t yi
eld
(mg/
km2 /
day) 0.0656**
0.0214
0.0269
0.0212 0.0206
Regional differences in specific sediment yield.

denudation of the land surface. This result indicates that sediment yield of
larger drainage basins remains conditioned by the extraordinary glacial
events of the Quaternary Period, where large quantities of unconsolidated
sediments were delivered to the major valleys of British Columbia (Church
and Ryder 1972). This pattern controverts the conventional model of specific
sediment yield, in which increased sediment storage downstream dominates
sediment-transfer processes. As drainage area increases, a greater proportion
of the mobilized sediment load is supposed to become trapped in the down-
stream cascade of storage zones on footslopes, floodplains, and in low-energy
water bodies such as lakes and wetlands. There is no specific yield–drainage
area relation in the lake-sediment–derived data as a whole. However, some
interesting patterns emerge when the data are stratified physiographically, as
shown in Figure 7.
Plot in Figure 7 shows spatial trends in specific yield for the North Coast
study catchments. These are high-energy systems that contain very steep ter-
rain and receive large amounts of precipitation. Upland slopes are thinly
CoastMountains
HazeltonMountains
SkeenaMountains
Nass Basin andMajor Valleys
NechakoPlateau
30
25
20
15
10
5
0
Mea
n sl
ope
(deg
rees
)
22.3**
10.3
7.79.9
5.6
CoastMountains
HazeltonMountains
SkeenaMountains
Nass Basin andMajor Valleys
NechakoPlateau
Error bars show 2 standard errors** Significant different from other groups (Tukey's test, alpha = 0.01)
12
10
8
6
4
2
0
Perc
ent
valle
y fla
t ar
ea (
km2 )
1.77%
5.76%
6.75%
2.82%
8.22%
Regional differences in mean slope and valley-lat area of study catchments.

1
0.1
0.01
0.001
0.1 1 10 100 1000
(a) Coast Mountains
Y = 0.016Ad0.38
R2 = 0.32n = 9F-value = 3.53
.
Positive allometrySp
ecifi
c se
dim
ent
yiel
d (m
g/km
2 /y)
1
0.1
0.01
0.001
0.1 1 10 100 1000
(b) Hazelton and Skeena mountains
Y = 0.020Ad0.00
R2 = 0.00n = 20F-value = 0.00
Spec
ific
sedi
men
t yi
eld
(mg/
km2 /
y)
1
0.1
0.01
0.001
0.1 1 10 100 1000
(c) Lowlands and Nechako Plateau
Y = 0.037Ad- 0.41
R2 = 0.41n = 33F-value = 22.08
...
Negative allometry
Spec
ific
sedi
men
t yi
eld
(mg/
km2 /
y)
Drainage basin area (km2)
Specific sediment yield as a function of drainage area.
Notes - Catchments from transitional areas have been removed (10 catchments dropped)- Dashed lines are 95% confidence intervals of fit- Significance of F statistic: . p < 10-1,.. p < 10-2,... p< 10-3

mantled, with large areas of exposed bedrock. Storage potential is low, since
there is relatively little flat terrain in the contributing catchments of the lakes.
Sediment yield increases with drainage area for lake catchments in this re-
gion. Sediment yield is roughly proportional to (drainage area)0.4. This fits
the Church and Slaymaker (1989) model of sediment yield where remobiliza-
tion of Quaternary sediment dominates sediment transfer in the basin.
Pleistocene deposits on lower valley slopes (fans and aprons) and valley-bot-
tom areas are likely the predominant sediment sources for lakes in the North
Coast region. Plot in Figure 7 shows spatial trends in specific yield for the
Nechako Plateau, Nass Basin, and Major Valley study catchments. These are
much lower energy systems with gentle relief and a drier continental climate.
Upland slopes are mantled by thick glacial deposits. Lakes, wetlands, and
broad valley-flat areas are common upstream of the study lakes. Storage po-
tential is, therefore, quite high in these areas. Sediment yield decreases with
drainage area for lake catchments in these regions. Sediment yield is roughly
proportional to (drainage area)-0.4. This trend fits the conventional model of
sediment yield where sediment mobilized from upland areas goes back into
storage on footslopes, floodplains, and water bodies further downstream.
Plot in Figure 7 shows the spatial yield pattern for the Skeena and Hazelton
mountain study catchments. The landscape characteristics of this region are
intermediate to the regions discussed above. No scale-related trend in yield
was detected in these catchments; in other words, specific yield is in a state of
constant proportion with drainage area. This pattern of specific sediment
yield does not clearly fit either of the two models mentioned previously. In
all regions the range of specific sediment yield spans an order of magnitude
at all spatial scales, likely the consequence of local geology. The reader is di-
rected to Schiefer (in press) for a more detailed discussion of physiographic
controls on sediment yield in British Columbia.
Sediment transfer in headwater catchments of British Columbia is common-
ly dominated by large-scale episodic events, in which large volumes of
sediment are flushed through the system over relatively short periods of
time. These high-magnitude/low-frequency events include processes such as
mass wasting, streambank failures, and breaking of log jams. In the case of
lake sedimentation, autochthonous processes could also be the cause of large
fluctuations in sedimentation rates, including physical and biological events
such as turbidity currents off a slumping delta front, or changes in lake pro-
ductivity. The analysis of these disturbances is restricted because the
sampling techniques lack the temporal resolution to properly capture these
events, especially if they occur early in the sediment records. Another prob-
lem in dealing with these low-frequency disturbances is that the sedimentary
records are too short to address the overall importance of these events in
drainage basin sediment transfer.
Over a third of the study lakes had a significant peak (any recorded
sedimentation rate approximately 100% or greater above the estimated back-
ground rate) in their sedimentation-rate profile without the influence of any
land-use activities occurring in the basin. While these peaks in the sedimen-
tation rates may be indicators of significant natural disturbances in the lake
catchment, the specific causes of these fluctuations are unknown. These oc-
currences are most common in the mountainous regions, although they are
observed in all regions. A closer look at the sediment profile of Shea Lake, a
lake with a well-captured disturbance event, is made in Figure 8. Over a
19-year period (1929–1948), sedimentation rates in Shea Lake increased to a
Temporal Variability
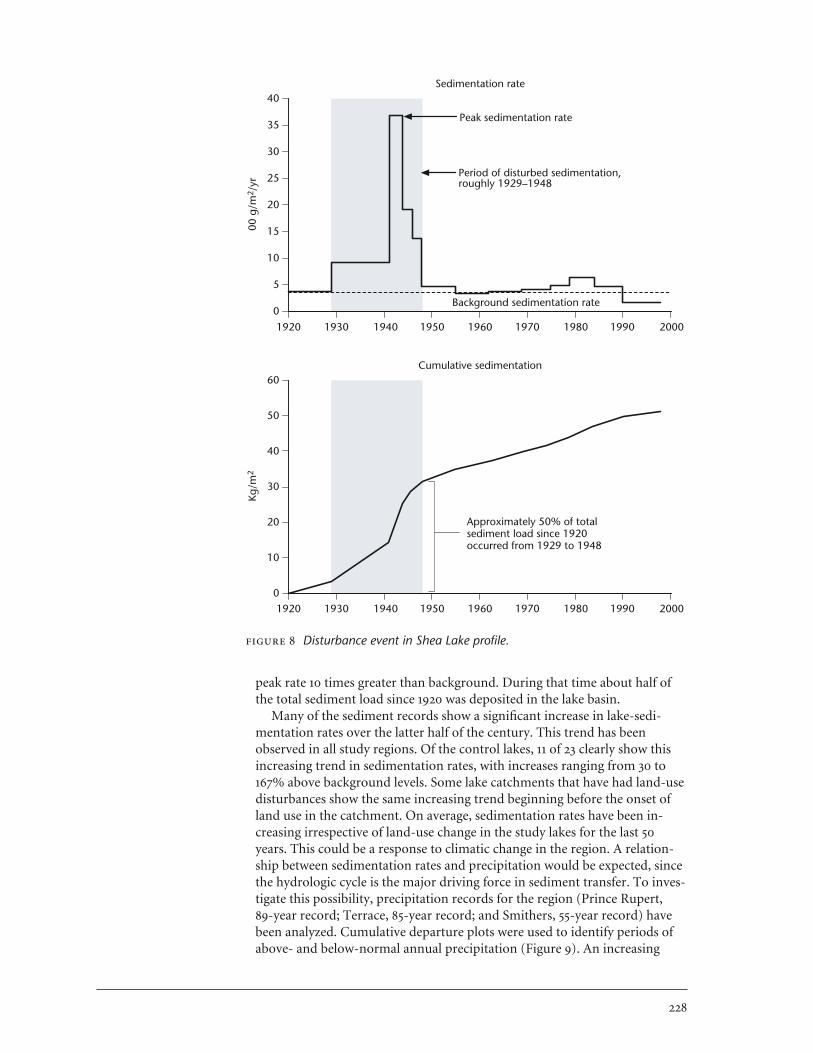
peak rate 10 times greater than background. During that time about half of
the total sediment load since 1920 was deposited in the lake basin.
Many of the sediment records show a significant increase in lake-sedi-
mentation rates over the latter half of the century. This trend has been
observed in all study regions. Of the control lakes, 11 of 23 clearly show this
increasing trend in sedimentation rates, with increases ranging from 30 to
167% above background levels. Some lake catchments that have had land-use
disturbances show the same increasing trend beginning before the onset of
land use in the catchment. On average, sedimentation rates have been in-
creasing irrespective of land-use change in the study lakes for the last 50
years. This could be a response to climatic change in the region. A relation-
ship between sedimentation rates and precipitation would be expected, since
the hydrologic cycle is the major driving force in sediment transfer. To inves-
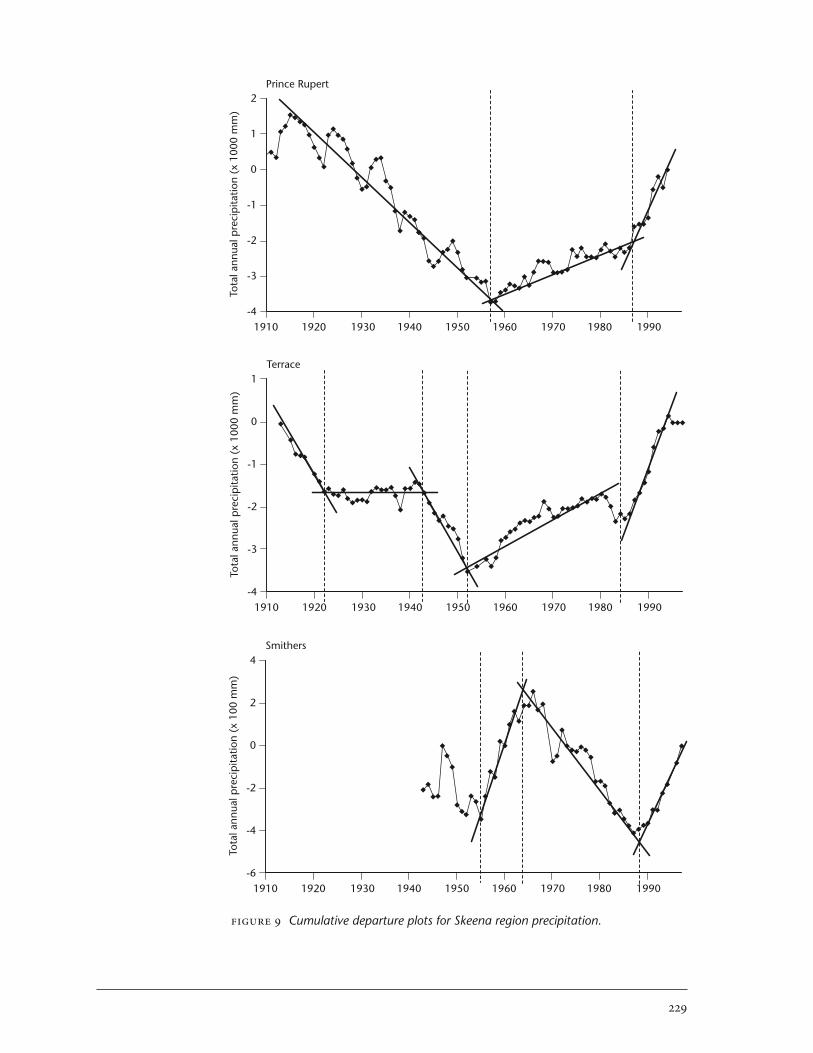
tigate this possibility, precipitation records for the region (Prince Rupert,
89-year record; Terrace, 85-year record; and Smithers, 55-year record) have
been analyzed. Cumulative departure plots were used to identify periods of
above- and below-normal annual precipitation (Figure 9). An increasing
40
35
30
25
20
15
10
5
0
00 g
/m2 /
yr
1920 1930 1940 1950 1960 1970 1980 1990 2000
Peak sedimentation rate
Period of disturbed sedimentation,roughly 1929–1948
Background sedimentation rate
Sedimentation rate
60
50
40
30
20
10
0
Kg/m
2
1920 1930 1940 1950 1960 1970 1980 1990 2000
Approximately 50% of totalsediment load since 1920occurred from 1929 to 1948
Cumulative sedimentation
Disturbance event in Shea Lake profile.
2
1
0
-1
-2
-3
-4
Tota
l ann
ual p
reci
pita
tion
(x 1
000
mm
)
1910 1920 1930 1940 1950 1960 1970 1980 1990
Prince Rupert
1
0
-1
-2
-3
-4
Tota
l ann
ual p
reci
pita
tion
(x 1
000
mm
)
1910 1920 1930 1940 1950 1960 1970 1980 1990
Terrace
4
2
0
-2
-4
-6
Tota
l ann
ual p
reci
pita
tion
(x 1
00 m
m)
1910 1920 1930 1940 1950 1960 1970 1980 1990
Smithers
Cumulative departure plots for Skeena region precipitation.
trend in sedimentation rates would be expected to coincide with above-
average periods of precipitation. The plots for Prince Rupert and Terrace
show a similar pattern of below-average or average precipitation for the first
half of the century followed by above-average precipitation. Both locations
have also experienced precipitation significantly above normal for the last 20
years. Smithers, which is located in the interior portion of the study area,
shows a different pattern in annual precipitation: rates have been above
normal for the periods 1955–1965 and 1987–present, with an intervening
period of below-normal precipitation between 1965 and 1987. These plots
show that precipitation has been above average in the coastal areas for the
last 50 years, and considerably above average over the entire region for the
last 15–20 years. This indicates that the increasing trend in sedimentation
rates may be, at least partially, a consequence of climatic trends in north-
western British Columbia. Storm-frequency analysis has not been carried
out on the precipitation records. Since peak runoff events are often the result
of the combination of complex hydro-climatic processes (including cyclonic
storms, spring snowmelt, and rain-on-snow events), stream discharge
records could be more useful in studying the occurrence of important
sediment-transporting flood events. Unfortunately, few long-term discharge
records are available in the study area, especially in headwater drainage
basins.
The majority of lake catchments in this study have been subject to road con-
struction and timber-harvesting activities. Most of these activities have oc-
curred in the last couple of decades. In most cases a significant increase in
mid-lake sedimentation rates has coincided with these land-use disturbances.
However, since about half of the control lakes have also had an increase in
sedimentation rates over the last few decades, the extent to which forestry
has affected lake sedimentation is uncertain. Of the lakes in the control set,
48% (11 of 24) have had a recent increase in sedimentation rates. The average
increase was 90% above background rates, with a maximum observed in-
crease of 167%. For lakes that have been subject to road construction and
timber harvesting, 84% (32 of 38) have had increasing sedimentation rates.
The average increase was 137% above background rates, with a maximum ob-
served increase of 307%. The largest recent increases in sedimentation rates
have occurred in lakes of the Nechako Plateau and the Nass Basin and Major
Valleys regions. These are the regions that have also experienced the greatest
amount of forestry activity because of their less-rugged terrain and greater
accessibility. Overall, lakes that have had road construction and timber har-
vesting in their watersheds have experienced greater increases in mid-lake
sedimentation rates than the control lakes. In addition to forestry, other
major land-use disturbances have occurred in two of the study catchments.
A mining operation was active north of Aldrich Lake from the early 1920s to
1954. Human settlement began west of Takysie Lake early in the century and
was followed by ranching, agriculture, residential development, and
resort/camping activities. The sediment records for both Aldrich and Takysie
lakes show significant increases in sedimentation over the duration of these
land-use disturbances. Although sedimentation-rate increases coinciding
with land-use disturbances are easily identified, they are well below the maxi-
mum relative increases observed, which are likely associated with natural ge-
omorphic events.
The recent natural trend of increasing sedimentation rates observed in
about half of the control lakes is a major confounding effect in the interpre-
Impacts of Land Use

tation of land-use signals in the sedimentary record. To separate, to some
extent, this trend and natural episodic events from the sedimentation rate
profiles, the graphs in Figure 10 were developed. The first graph plots the
departure of sedimentation rates from background levels for control lakes
using smoothed lines with large peaks filtered out. The remaining profiles
of control lakes were used to define an envelope of naturally occurring sedi-
mentation rates. The wedge-shaped envelope clearly shows the increasing
trend in sedimentation rates observed in many of the control lakes over the
last 50 years. Beyond the envelope limits are regions defined as having un-
usually high and low sediment-accumulation rates. The second graph shows
500
450
400
350
300
250
200
150
100
50
0
-501930 1940 1950 1960 1970 1980 1990
% d
epar
ture
from
bac
kgro
und
Control lakes
- smoothed sedimentation rates since 1930- extreme event peaks filtered out- Jake Lake removed from control set
Unusually high sedimentation
Unusually low sedimentation
Sedimentation rate envelope
500
450
400
350
300
250
200
150
100
50
0
-501930 1940 1950 1960 1970 1980 1990
% d
epar
ture
from
bac
kgro
und
Disturbed lakes
- smoothed sedimentationrates since 1930
- lines plotted for post-disturbance period
McDonell
Flatfish
Elizabeth
Aldrich
Takysie
Expected sedimentation rate envelope
BintaBristolGordeauHorsehoeMcBrideMittenPinetreeTorkelsen
Separating land-use impacts from natural variability.
the departure from background sedimentation for lakes that have had land-
use disturbances in their contributing catchment areas. No disturbed lakes
plotted below the lower envelope limit. Thirteen lakes were identified as hav-
ing unusually high sedimentation rates because they plotted above the upper
envelope limit. These unexpectedly high sedimentation rates are likely relat-
ed, at least partially, to land-use disturbances in the lake catchments. Most of
these lake catchments are relatively small and have been heavily logged (gen-
erally over 20%) and roaded (generally over 1 km/km2) with some harvesting
activities located immediately adjacent to the lake and contributing stream
channels. This is a reasonable expectation—small watershed areas with ex-
tensive land-use coupled to the hydrologic network are the most sensitive to
disturbance, although it should be noted that there were some catchments
fitting these criteria that did not experience an unusually high sedimentation
response.
CONCLUSIONS AND FUTURE WORK
Lake-sediment sampling and analysis has been utilized to investigate histori-
cal lacustrine sedimentation patterns in northwestern British Columbia.
Seventy lake catchments were selected for study that span a range of spatial
scales, physiographic regions, and land-use histories, in order to permit a
comprehensive regional assessment of sedimentation trends and patterns for
the study area. The primary focus in the study has been on historical rates of
lake-sediment accumulation derived from 210Pb analysis of sediment core
samples from the lakes. Variables to describe the landscape and land-use his-
tories were extracted from a database developed to inventory the study
catchments. The key findings are reviewed in the four points below:
• There is a clear trend towards increasing lacustrine sedimentation rates ir-
respective of land-use change in many of the lake catchments. About half
of the control lakes in the study clearly show increasing sedimentation
rates over the last 50 years, with increases ranging from 30 to 167% above
background levels. This natural trend is a major confounding factor in
disentangling land-use impacts on sedimentation patterns. This trend
may be related to precipitation increases undergone in the whole study
area over the last few decades.
• Natural disturbances, such as mass wasting and other geomorphic events,
are important processes of sediment transfer in headwater lake catch-
ments. Sedimentation-rate profiles from all physiographic regions show
some periods of disturbed sediment accumulation where accumulation
rates are temporarily elevated many times above background levels. These
occurrences are most frequent in mountainous regions. A large amount of
the total sediment load delivered to lakes can be deposited over relatively
short periods of time during these episodic events.
• Lake basins are differentiated by physiography, both in terms of average
specific sediment yield and dominant processes of sediment transfer, as
indicated in the relation between drainage basin area and specific sedi-
ment yield. Highest sediment yields were observed in the North Coast
mountains where specific sediment yield increases with increasing
drainage area. This trend is likely associated with the dominance of

secondary remobilization of Quaternary sediments from streambanks and
valley-bottom areas. In the flat-lying plateau and major valley areas, spe-
cific sediment yield decreases with increasing drainage area, thus fitting
the conventional model of sediment delivery where storage efficiency in-
creases downstream. In the Hazelton and Skeena mountains there is no
significant relationship between specific yield and drainage area. These re-
sults suggest that no single sediment-yield model is adequate in describing
the sediment-transfer processes in British Columbia at the sub-regional
scale.
• Superimposed on all of the observed natural variability are some qualita-
tive and semi-quantitative land-use effects on sediment yield. Land-use
impacts could be only partially separated from natural fluctuations; how-
ever, a land-use signature, in the form of increased sedimentation rates,
was observed in some of the study lakes. Largest increases have occurred
in heavily harvested and roaded lake catchments in the Nechako Plateau
and the Nass Basin and Major Valley regions. Significant increases were
observed in basins that were subject to multiple land-use disturbances.
There are many ways in which this current research on lake sedimentation
in northwestern British Columbia could be improved and further expanded.
Temporal trends may be better explained by looking at storm frequency and
flood-discharge records for the region. All of the catchment information in
this study was based on remotely sensed sources, primarily aerial pho-
tographs. It would be useful to expand the field component and include
more detailed aerial-photograph analysis in future projects to conclusively
determine, and perhaps quantify, the sediment sources, transport capacity,
intermediate storage sites, and lake-storage efficiency in the lake-catchment
sedimentary system. This would be beneficial in establishing underlying
physical processes and cause-and-effect relations between catchment condi-
tions and lake-sediment signatures. There would be many advantages in
expanding this project to a multi-core study format for a sub-set of lakes.
A single-core approach was used because the large number of lakes included
in the study would have made a multiple-core approach impractical because
of the much higher associated costs and time requirements. A multiple core
study would enable a better assessment of within-lake spatial variability,
which is important in lakes with more complex morphometries. Errors asso-
ciated with the 210Pb dating and other measurements could be better
described if replicate cores were available. A major advantage with the multi-
ple-core approach is that absolute sediment yields could be estimated to a
much higher degree of accuracy. The study could also be expanded to in-
clude a greater range of spatial scales and physiographic regions. Study
results indicated that the relationship between the drainage basin area and
specific sediment yield is variable in the different physiographic regions in
northwestern British Columbia. This relationship is linked to downstream
storage effects and remobilization of Quaternary sediment deposits, and
holds major implications for geomorphological theory and for studies on
land-use effects on the sedimentary system. It would be useful to expand the
study data set so that the specific sediment-yield models for the province
could be further refined.
The database of lake-sediment–based profiles of sediment yield, coupled
with the operational inventories of the contributing catchment areas, is a
valuable and unique data set. To the knowledge of the authors, a comparable

database of long-term, sediment-yield patterns and historical catchment
conditions does not exist. It is anticipated that additional information about
sediment-transfer processes in lake catchments can be extracted from this
database by the use of more advanced statistical analysis. The next step of
this ongoing research project is to use multivariate techniques to develop
empirical models to predict sediment-loading rates in both the natural and
disturbed state for lake catchments in northwestern British Columbia. The
ultimate goal is to establish a set of tools to be used by operational planners
to help minimize the impact of proposed land-use management activities on
aquatic lake ecosystems.
ACKNOWLEDGEMENTS
Special thanks are due to many people without whose help and support this
research would not have been possible. We would first like to thank Ian
Sharpe, Impact Assessment Biologist, B.C. Ministry of Environment for hav-
ing the foresight to initiate this project, and for his continued guidance. Lisa
Westenhofer provided contract administration and liaison services with the
Forest District offices. We greatly appreciated the assistance of staff in the
Forest District offices of Bulkley/Cassiar, Morice, Kispiox, Kalum, North
Coast, and Lakes; they provided valuable insights that helped in the lake-
selection process and they reviewed mapping materials for accuracy. The
B.C. Ministry of Forests generously provided and 1 data for the pro-
ject, coordinated by Peggy Anderson of B.C. Ministry of Forests Digital Data
Sales. Adam Cottrill, Paul LePage, Solvej Patschke, and Maritta Prent provid-
ed field assistance. Jack Cornett of MyCore Limited carried out the 210Pb
analysis.
Dr. Brian Klinkenberg, Dr. Olav Slaymaker, and Dr. Michael Church, of
the Department of Geography at the University of British Columbia, provid-
ed valuable technical advice and constructive criticism throughout the study.
Financial support from Forest Renewal BC and the Science Council of
British Columbia is greatly appreciated. Editorial comments provided by
David Toews led to improvements in the manuscript.
REFERENCES
Appleby, P.G. and F. Oldfield. 1978. Calculation of lead-210 dates assuming a
constant rate of supply of unsupported 210Pb to the sediment. Catena
5:1–8.
Arnaud, E. 1997. Effects of forestry on lake sedimentation. M.Sc. thesis. De-
partment of Geography, University of British Columbia, Vancouver,
B.C.
Brinkhurst, R.O. 1974. Benthos of lakes. St. Martin’s Press, New York, N.Y.
Church, M. and J.M. Ryder. 1972. Paraglacial sedimentation: a consideration
of fluvial processes conditioned by glaciation. Geological Society of
America Bulletin 83:3059–72.

Church, M. and O. Slaymaker. 1989. Disequilibrium of Holocene sediment
yield in glaciated British Columbia. Nature 337:452–4.
Clague, J.J. 1984. Quaternary geology and geomorphology, Smithers–Ter-
race–Prince Rupert area, British Columbia. Geological Survey of
Canada Memoir 413. Ottawa, Ont.
Cornett, R.J., L.A. Chant, and D. Link. 1984. Sedimentation of Pb-210 in Lau-
rentian shield lakes. Water Pollution Journal of Canada 19:97–109.
Evans, R.D. and F.H. Rigler. 1980. Measurement of whole lake sediment ac-
cumulation and phosphorous retention using lead-210 dating.
Canadian Journal of Fisheries and Aquatic Sciences 37:817–22.
Foster, I.D.L., J.A. Dearing, and R. Grew. 1988. Lake-catchments: an evalua-
tion of their contribution to studies of sediment yield and delivery
processes. In Sediment budgets, publication 174, pp. 413–24.
Foster, I.D.L., J.A. Dearing, R. Grew, and K. Orend. 1987. Sedimentary data
base: an appraisal of lake and reservoir sediment based studies of sedi-
ment yield. In Erosion, transport and deposition processes, publication 189, pp. 19–44.
Miller, L.B., D.J. McQueen, and L. Chapman. 1997. Impacts of forest harvest-
ing on lake ecosystems: a preliminary literature review. B.C.
Environment Wildlife Bulletin -84.
Pack, R.T., C.P. Gubala, and D. Lang. 1997. Assessment of relative sedimenta-
tion impacts, Trout Lake Basin, British Columbia. Terratech
Consulting Ltd. Available from Science Council of B.C., Burnaby, B.C.
Project No. 96041-. Unpublished report.
Petts, G. and I. Foster. 1985. Rivers & landscape. Edward Arnold, London,
U.K.
Reavie, E.D. and J.P. Smol. 1998. Paleolimnological assessment of
Tchesinkut, Takysie and Francois lakes, British Columbia. Prepared by
Paleoecological Environmental Assessment and Research Laboratory,
Department of Biology, Queens University, Kingston, Ont. for B.C.
Ministry of Environment, Smithers, B.C. Unpublished.
Robbins, J.A. 1978. Geochemical and geophysical applications of radioactive
lead. In Biogeochemistry of lead in the environment. J.O. Nriagu (edi-
tor). Elsevier Press, Amsterdam. pp. 285–393.
Rowan, D.J., R.J. Cornett, K.J. King, and B.A. Risto. 1994. Sediment focusing
and “SUP 210” Pb dating: a new approach. Journal of Paleolimnology
13:107–18.
Schiefer, E.K. 1999. Lacustrine sedimentation patterns in northwestern
British Columbia. M.Sc. thesis. Department of Geography, University
of British Columbia, Vancouver, B.C. Unpublished.
______. In press. Physiographically controlled allometry of specific sediment
yield in the Canadian Cordillera. Geografiska Annaler Series A.

Scrivener, J.C., P.J. Tschaplinski, and J.S. MacDonald. 1998. An introduction
to the ecological complexity of salmonid life history strategies and of
forest harvesting impacts in coastal British Columbia. In Carnation
Creek and Queen Charlotte Islands fish/forestry workshop: applying 20
years of coastal research to management solutions. D.L. Hogan, P.J.
Tschaplinski, and S. Chatwin (editors). Research Branch, B.C. Ministry
of Forests, Victoria, B.C. Land Management Handbook 41.
Swanson, F.J., L.E. Benda, S.H. Duncan, G.E. Grant, W.F. Megahan, L.M.
Reid, and R.R. Ziemer. 1987. Mass failures and other processes of sedi-
ment production in Pacific Northwest forest landscapes. In Streamside
management: forestry and fishery interactions. E.O. Salo and T.W.
Cundy (editors). University of Washington, Seattle, Wash. Institute of
Forest Resources Contribution No. 57–1987.
Regional Incidence of Landslides
PETER JORDAN
ABSTRACT
A regional study was made of landslides in portions of the Arrow Forest Dis-
trict and the Kootenay Lake Forest District, which permits some preliminary
conclusions to be made about the areal frequency of landslides, their causes,
and their importance as sediment sources to streams. The study covered all
or parts of 100 map sheets, totaling about one million hectares. Approxi-
mately 1700 landslides were inventoried by air-photo interpretation. A subset
of about one-quarter of this study area, centred on the Slocan Valley, is dis-
cussed in this paper.
The data show that landslide frequencies are typically increased by rough-
ly 10 times by forest development (depending on how one defines the land
base for calculation of areal frequencies). The landslide frequency on private
land is higher than on Crown land. About 95% of development-related land-
slides are due to roads or skid trails. On older roads, road-fill failures are
apparently the most common cause. However, on newer roads, the most
common cause is drainage concentration and diversion by roads. An impor-
tant category of landslides occurs some distance below roads, below a culvert
or a point of accidental drainage discharge. In many of these cases, the road
itself is on gently sloping, low-hazard terrain, and the landslide occurs on
steeper terrain below. This is known as the “gentle-over-steep” situation. The
Forest Practices Code does little to reduce landslide hazard in this situation,
because the need for professional engineering involvement in road design is
triggered by the hazard at the road location, not below the road.
The terrain type most frequently involved in landslides, on an areal basis,
is deep glaciofluvial or other stratified glacial deposits in valley bottoms. Oth-
erwise, there are few generalizations that can be made about terrain factors
contributing to landslide hazard, or about contributions of landslide sedi-
ment to streams. Landslides, like other geomorphic and hydrologic
processes, tend to follow magnitude-frequency relations. Small landslides are
most frequent, and often do not reach a stream. Large landslides are much
less frequent, but often enter streams. In most watersheds, landslides are not
a major component of the sediment budget, but in the rare cases where a
large landslide occurs, it can dominate the sediment regime for 1 or several
years.
INTRODUCTION
A regional study was made of landslides in portions of the Arrow Forest Dis-
trict and the Kootenay Lake Forest District, which permits some preliminary
conclusions to be made about the areal frequency of landslides, their causes,
and their importance as sediment sources to streams. The main purpose of
the study was to determine the terrain attributes most responsible for devel-
opment-related landslides, and to use this information to improve
classification criteria for terrain stability mapping.
The study covered all or parts of 100 map sheets, totalling about one mil-
lion hectares. Approximately 1700 landslides were inventoried by air-photo
interpretation; of these, a subset of about 200 was field checked. These data
were supplemented with information on recent landslide events reported to
the Engineering Section of the Nelson Forest Region of the B.C. Ministry of
Forests.
The landslide inventory includes all landslides visible on air photos, devel-
opment-related or natural, which are of types commonly caused by forest
development. This includes all first-time debris slides, debris avalanches, and
debris flows originating from an identifiable source, as well as slumps and
rockslides that appear to be first-time events. Not included were chronic or
long-lived failures, such as: slump-earthflows, deep-seated bedrock slumps,
repeating debris flows that originate in diffuse channel or rockfall sources,
chronic rockfall and ravelling on obviously unstable, non-forested slopes,
and similar mass movement features.
LANDSLIDE INVENTORY IN ARROW AND KOOTENAY LAKE FOREST DISTRICTS
With the objective of summarizing part of the data that are useful in assess-
ing the risk of landslides affecting populated areas and domestic-use
watersheds, a subset of the data was selected, consisting of 24 map sheets
centred on the Slocan Valley. This study area totals about 386 000 ha, and
includes 582 landslides. Of these, 447, or 77%, are apparently related to
development.
Table 1 is a summary of some of the study area statistics, the apparent
causes of landslides, and estimated landslide densities. The “apparent cause”
is based on air-photo interpretation, and is the apparent primary cause in the
opinion of the mapper. These estimates are only an approximation of the ac-
tual causes of landslides; causes can be obtained for a small proportion of
landslides as derived from engineering reports based on field inspections,
and occasionally from field checks done as part of this study. Data on the
approximate sizes of the landslides are also included. Considering the distri-
bution of landslides by size classes, it is apparent that the number of
landslides in the smallest size class may be underestimated. This is not sur-
prising, as landslides smaller than 0.05 ha are difficult to see on the air
photos, and clearly visible evidence of smaller landslides may disappear after
a few years.
Our database includes more information on each landslide, including the
apparent or known date, slope and aspect, bedrock geology, terrain type

interpreted from air photos, and type of failure. Further and statistical
analyses of the data are in progress.
Although analysis of the data set has not yet been completed, some trends
are apparent from the field checking that was done along with terrain map-
ping in several detailed sub-areas. On older roads, fill failures were the most
important cause of landslides. On newer roads, fill failures are uncommon,
because under the Forest Practices Code there have been significant im-
provements to engineering standards aimed at preventing road-fill failures.
However, on newer roads, drainage concentration and diversion are the pri-
mary causes of landslides. Of the terrain types common in the study area,
deep glaciofluvial deposits and other deep stratified glacial (or kame) de-
posits in valley bottoms appear to be the most susceptible to landslides.
There is apparently a greater frequency of landslides from logging on private
land than on Crown land. This is due to the widespread use of excavated skid
trails on steep slopes, and a lack of drainage control and deactivation on
roads and trails; these practices are not allowed on Crown land.
Map 1 shows the study area and the distribution of landslides. It also
shows “development polygons,” which consist of logged areas, roads, and all
areas below these, down to the nearest water course or valley bottom. In ef-
fect, this is the “hydrologic shadow” of roads and cutblocks. This is a more
meaningful measure of the area of development than the area of harvesting
Summary of data from landslide inventory, Arrow and Kootenay Lakeforest districts
Area statisticsSlocan Valley and adjacent sub-areas: 24 map sheets, total area 386 000 haNet forested area (excluding parks, alpine areas, farmland, etc.) 298 000 haArea included in development polygons 110 000 ha
Landslide statisticsTotal number of landslides 582Natural 135Development-related 447
Distribution by size class
1 (0.02–0.05 ha) 25%2 (0.05–0.2 ha) 43%3 (0.2–1 ha) 30%4 (1–5 ha) 2%5 (> 5 ha) 0%
Distribution by apparent cause
Road fill 36%Drainage diversion, road 25%Drainage diversion, skid trails 8%Road cut 2%Clearcut 2%Other 4%Natural 23%

Map showing the landslide inventory in the Slocan Valley sub-area. The grid outlines the TRIM 6 x 12'map sheets
would be; relatively few landslides occur in cutblocks, but many occur below
cutblocks and roads. The development polygons were identified from a satel-
lite photo, overlain with contours and water courses, using a program
(ArcView).
From the data presented in Table 1, some preliminary estimates of areal
landslide density can be made. The net forest area is approximately 298 000
ha (excluding alpine areas, parks, water bodies, and urban/agricultural
areas). Of this, about 110 000 ha are included in the development polygons.
Roughly one-half of the study area is flat or gently sloping land (less than
about 30%), and therefore is not subject to landslides. It can be assumed
that, very roughly, the total forest land base of steeper land is about 150 000
ha, of which about 50 000 ha are in development polygons. (Stratification of
the data by slope classes has not yet been completed.) Assuming that the data
set represents landslides that have occurred over a 30-year period, this results
in roughly estimated landslide densities of 0.003 natural landslides/km2/y
and 0.03 development-related landslides/km2/y. It is noteworthy that almost
all (at least 95%) of the development-related landslides are due to roads and
skid trails; very few are caused directly by timber harvesting. It can be tenta-
tively concluded that forest development, and in particular roads, increase
landslide frequency by a factor of about 10 over natural rates.
These landslide frequencies are much lower than have been reported in
terrain attribute studies conducted on the coast. Overall, development-
caused landslide frequencies reported by Rollerson and Millard (1998) for
study areas on western Vancouver Island and the Queen Charlotte Islands
are approximately 0.5 and 1.1 landslides/km2/y, respectively (calculated from
the reported frequencies divided by the 15-year time span of the data set).
Similar changes in landslide frequency due to forest development have been
reported in the coastal studies. For example, in studies on the western Queen
Charlotte Islands, post-logging landslide rates were 15 or more times as great
as natural rates (Schwab 1998).
An important concept to understand is that landslides, like other geo-
morphic and hydrologic processes, tend to follow magnitude-frequency
relations. Small landslides are most frequent, and often do not reach a
stream. Large landslides are much less frequent, but often enter streams.
A range of landslide sizes and runout distances is possible, and is often un-
predictable at any given site.
In this study, approximately one-tenth of the landslides can be considered
“very damaging,” which means that they caused major damage to a stream,
or were capable of presenting a risk to downslope inhabited areas. (Most
landslides in the inventory were small, or stopped on a forest road, or
stopped in timber on the lower slope. Obviously, the judgement of how
many landslides are “very damaging” or “significant” is highly subjective.) If
one assumes that each of these landslides contributes about 300 t of fine sedi-
ment to a stream (again, this is very approximate, but reasonable considering
the average size is about 0.2 ha, and the fact that only about one-fifth of the
volume of most landslides is fine sediment) then this would amount to an
average fine sediment yield of about 1 t/km2/y across the landscape. This is,
of course, only an order-of-magnitude estimate. This can be compared to
typical, suspended sediment yields, for low geomorphic activity watersheds
typically used for community water supply, of about 1–20 t/km2/y (Hender-
son and Toews, this publication; Jordan, this publication). Development-

related landslides, therefore, appear on average to be a minor but not incon-
sequential component of the sediment budget of creeks in this region.
However, landslides can be a dominant component of the sediment budget
locally and in certain years, as they are a highly episodic process. For example,
in 1996, a large landslide deposited at least 5000 m3 of sediment in Fortynine
Creek, a 25-km2 watershed near Nelson (Figures 5 and 6). If 1000 m3 or 1500 t
of this was suspended sediment deposited in the creek, and if it is assumed
that the background suspended sediment yield was 5 t/km2/y, then this event
would represent about 12 times the typical annual sediment yield. In fact, in
1997, turbidities of 20–3000 were measured during the peak snowmelt
period, due to reworking of slide debris deposited in the channel and erosion
of disturbed banks (no measurements were taken in 1996). In 1996, water
quality was severely affected, and many water intakes were damaged by chan-
nel changes resulting from the influx of coarse sediment. This is an extreme
and unusual example; however, it illustrates how large landslides, if they
occur, can dominate the sediment budget for several years.
“GENTLE-OVER-STEEP” LANDSLIDES
An important category of landslides in our inventory consists of landslides
that occur on steep or potentially unstable slopes, below a point of drainage
discharge on a road on gentler terrain above. These are known locally as
“gentle-over-steep” landslides. Many of the landslides attributed to road
drainage fall in this category. Most often, they occur below a culvert, but also
often occur below a switchback, a cross-ditch, or a point of unintended
drainage diversion. Typically, the failure occurs at a break in slope, where the
slope increases to about 50–70%, often on terrain that would be mapped by
most terrain mappers as Stability Class III. They are equally likely to occur in
forest as in harvested areas. Usually they occur during the snowmelt season,
at a time when the snow line is close to the elevation of the road, and
snowmelt rates are at their maximum (Toews 1991; Jordan and Toews 1993).
Sometimes, the supply of water is enhanced by more rapid snowmelt in
clearcuts above the road. Many of the largest and most mobile landslides in
our data set are of this “gentle-over-steep” category.
The mechanism responsible for “gentle-over-steep” landslides is shown in
the sketches of Figures 1 and 2. In the absence of defined gullies or other sur-
face drainage pathways, water on a hillside tends to move downslope in a
dispersed matter, often as shallow subsurface stormflow through a thin layer
of weathered till or colluvium overlying relatively impermeable, dense,
glacial till or bedrock. When a road is built across the slope, much of this
flow can be intercepted by the road cut and ditch, and carried to cross-drain
culverts. The water is then concentrated in narrow plumes below the cul-
verts. This has two possible effects. One is that if the concentrated flow of
water happens, by chance, to coincide with a location that is less stable than
average—for example, because of locally steeper slopes, thin soil, or converg-
ing subsurface flow paths—and that has not experienced a high flow of water
in the past, then a landslide is likely. The second effect is that the plume of
water can “pre-soak” a long, narrow triangle of soil, raising the pore water
pressure to near-critical values. If something occurs to trigger a small failure
at a point near the top of the plume, then a very large debris avalanche can
occur.

Figure 2 shows in more detail the topographic conditions that favour such
landslides. Often, the failure point occurs at a break in slope, where the slope
locally increases to some critical value—typically over 60% but occasionally
as low as 45%. Often, these steeper slopes are localized, and do not show up
on contour maps where the average slope is gentler. Also, at a break in slope,
or on a convex slope, the soil depth often decreases downslope, as more
rapid soil creep on the steeper slope causes thinning over time. This results in
Dispersed flow
Road
Flow concentratedin plumes below
culverts
Permeable soil
Impermeable till orbedrock
Road
LandslideRoad
Break in slope
(a) (b)
(c)
Sketch showing the typical effect of roads and culverts on slope hydrology, for uniformslopes with shallow soils and low drainage density.
Sketch showing the typical role of a road drainage diversion in triggering a “gentle-over-steep” landslide. (a) Plan view, landslide below a switchback. (b) Cross-section showingtypical point of landslide initiation. (c) Enlargement, showing convergence of groundwaterdue to thinning soil depth at break in slope.

converging groundwater flow paths, as subsurface flow is squeezed into a
narrower layer of soil, and can result in locally greater pore water pressures
at the break in slope.
Figure 3 illustrates a typical, although larger-than-average, example of a
gentle-over-steep landslide (which occurred outside the study area, southeast
of Nelson). Figure 4 shows a location near Slocan where, in May 1990, several
landslides and debris flows were triggered below an area where extensive
roads and logging covered a gentle plateau above (Curran et al. 1990). The
A “gentle-over-steep” landslide, Shaw Creek, Kootenay Lake ForestDistrict. Note road and skid trails above landslide.
Cape Horn area, Slocan Lake, Arrow Forest District. In 1990, severallandslides and debris flows occurred in the gullies below the loggedarea.

roads and skid trails had not been deactivated, and some local drainage
basins above slide-initiation points had their drainage areas increased by
more than double. Several water intakes and private properties, as well as the
highway, were damaged by the debris flows. This incident, and several others
in the late 1980s (Chow 1988) led to recognition of the “gentle-over-steep”
hazard, and also led to significant improvements in road-engineering stan-
dards, planning, hazard mapping, and deactivation procedures in the region
in the 1990s.
Figures 5 and 6 show the Fortynine Creek landslide of 1996, mentioned
above, which seriously affected an important domestic watershed (over 50
water licenses) near Nelson. This landslide occurred below a culvert, which
carried an unusually large volume of water, and was probably enhanced by
diversion and concentration of water by upslope roads and skid trails. The
failure point occurred where the slope steepened to 60% and the soil thinned
downslope, as shown in Figure 2. On reaching a steep tributary, the landslide
triggered a large debris flow, which continued for 1.2 kilometres until it
reached the main creek channel.
Fortynine Creek landslide. The roadand culvert responsible for the slideare hidden behind the trees belowthe cutblock.
Fortynine Creek landslide, showinglower end of slide, and debris flowthat travelled to the main creek.

A concern regarding risk management of these landslides is that the Forest
Practices Code usually does not require professional field assessments of ter-
rain stability, or any special engineering design, when a “gentle-over-steep”
situation exists. The need for professional assessments or other measures is
triggered by terrain conditions at the site of the road, not on slopes below the
road. Therefore, many potentially hazardous situations, where drainage con-
centrations occur above potentially unstable slopes, go unrecognized.
CONCLUSIONS
Preliminary results of the landslide inventory in Arrow and Kootenay Lake
forest districts show that forest development increases landslide frequency,
probably in the order of 10 times over natural rates. Landslide frequencies in
this region are much lower than those reported in coastal British Columbia.
Most landslides in the region are caused by roads. Clearcuts are not an im-
portant direct cause of landslides. However, clearcuts sometimes indirectly
increase the hazard of landslides caused by drainage concentration, by en-
hancing snowmelt rates.
Drainage diversion and concentration by roads are the most important
causes of landslides on the newer roads. Many landslides are caused by “gen-
tle-over-steep” drainage concentrations; these landslides are significant
because they can be very large and can occur on slopes not suspected of
being potentially unstable, and because the hazardous situation may go un-
recognized, because professional assessments and engineering design are
often not required by the Forest Practices Code.
On a watershed scale, the location of roads is clearly an important factor
in assessing landslide risk, more so than the rate of cut or the equivalent
clearcut area (). In assessing watersheds, either pre-development or for
deactivation planning, an important objective should be to identify high-risk
roads. These are often roads in low-hazard terrain with higher-hazard slopes
below, and not identified as high risk by existing procedures. Planning and
assessments should focus on drainage plans for new roads, or deactivation of
old roads, in these high-risk locations.
REFERENCES
Chow, B. 1988. Review of logging related slope failures of April 1988 in Arrow
Forest District, Nelson Forest Region. Arrow Forest District, B.C. Min-
istry of Forests, Castlegar, B.C. Unpublished report.
Curran, M., B. Chow, D.A.A. Toews, and D. Boyer. 1990. Landslide study -
Cape Horn Bluffs area. B.C. Ministry of Forests and B.C. Ministry of
Environment, Nelson, B.C. Unpublished report.

Henderson, G.S. and D.A.A. Toews. 2001, this publication. Using sediment
budgets to test the watershed assessment procedure in southeastern
British Columbia. In Watershed assessment in the southern interior of
British Columbia. Proceedings of a workshop, March 9 and 10, 2000,
Penticton, B.C. D.A.A. Toews and S. Chatwin (editors). Research
Branch, B.C. Ministry of Forests, Victoria, B.C. Working Paper 57/2001.
Jordan, P. 2001, this publication. Sediment budgets in the Nelson Forest Re-
gion. In Watershed assessment in the southern interior of British
Columbia. Proceedings of a workshop, March 9 and 10, 2000, Pentic-
ton, B.C. D.A.A. Toews and S. Chatwin (editors). Research Branch,
B.C. Ministry of Forests, Victoria, B.C. Working Paper 57/2001.
Jordan, P. and D.A.A. Toews. 1993. Terrain and hydrologic factors influenc-
ing logging-related landslides in south-eastern British Columbia.
Canadian Quaternary Association, biennial meeting, April 18–21, 1993,
Victoria, B.C.
Rollerson, T. and T. Millard. 1998. Landslide-prone locations: the glacial and
northern regions. Landslides and Forestry—Managing the Risk, West-
ern Forestry and Conservation Association, May 6, 1998, Beaverton,
Oreg.
Schwab, J.W. 1998. Landslides on the Queen Charlotte Islands: processes,
rates, and climatic events. In Carnation Creek and Queen Charlotte
Islands fish/forestry workshop: applying 20 years of coastal research to
management solutions. D.L. Hogan, P.J. Tschaplinski, and S. Chatwin
(editors). Research Branch, B.C. Ministry of Forests, Victoria, B.C.
Land Management Handbook 41, pp. 41–7.
Toews, D.A.A. 1991. Climatic and hydrologic circumstances antecedent to
mass wasting events in southeastern British Columbia. Proceedings
59th western snow conference, April 12–15, 1991. 59: 91–101.

Southern InteriorForest Extension andResearch Partnership*
*Registered as Southern Interior Extension and Research Society
Investing in knowledge
Acknowledgements – page iv