Reservoir Sedimentation and Flood Control - MDPI
16
Sustainability 2011, 3, 254-269; doi:10.3390/su3010254 sustainability ISSN 2071-1050 www.mdpi.com/journal/sustainability Article Reservoir Sedimentation and Flood Control: Using a Geographical Information System to Estimate Sediment Yield of the Songwe River Watershed in Malawi Kondwani G. Munthali 1, *, Brian J. Irvine 2 and Yuji Murayama 1 1 Division of Spatial Information Science, Graduate School of Life and Environmental Sciences, University of Tsukuba, 1-1-1 Ten-noudai, Tsukuba, Ibaraki 305-8572, Japan; E-Mail: [email protected] 2 School of Geography, University of Leeds, Leeds LS2 9JT, UK; E-Mail: [email protected] * Author to whom correspondence should be addressed: E-Mail: [email protected]; Tel.: +81-80-3022-0204; Fax: +81-29-853-4211. Received: 8 November 2010; in revised form: 30 December 2010 / Accepted: 6 January 2011 / Published: 14 January 2011 Abstract: Severe watershed degradation continues to occur in the tropical regions of southern Africa. This has raised interest to harness and manipulate the potential of the watershed resources for human benefit as the populations grow. Songwe River is one such degrading watershed causing biennial flooding among other problems. In this study, climatic, land use, topographic and physiographic properties were assembled for this watershed and used in a process-based Geographical Information System (GIS) with the aim of determining the hydrological sediment potential of Songwe River watershed and quantifying possibilities of reservoir sedimentation. The study further aimed at determining the critical sediment generating areas for prioritized conservation management and the relationship between the increasing flood events in the floodplains and the rainfall trends. Based on hydrological runoff processes using the Pan-European Soil Erosion Risk Assessment (PESERA) model, the estimated amount of sediment transported downstream is potentially huge. Most of the sediment generation was established to be occurring in the upper sub-basin and specifically from built up village and degraded natural land. These trends have not only caused the increased flooding events in the lower sub-basin, but also pose a great sustainability risk of sedimentation to the proposed reservoir. Keywords: reservoir; sedimentation; PESERA; conservation; degradation; sustainability OPEN ACCESS
-
Upload
khangminh22 -
Category
Documents
-
view
0 -
download
0
Transcript of Reservoir Sedimentation and Flood Control - MDPI

Sustainability 2011, 3, 254-269; doi:10.3390/su3010254
sustainability ISSN 2071-1050
www.mdpi.com/journal/sustainability
Article
Reservoir Sedimentation and Flood Control: Using a
Geographical Information System to Estimate Sediment Yield of the Songwe River Watershed in Malawi
Kondwani G. Munthali 1,*, Brian J. Irvine
2 and Yuji Murayama
1
1 Division of Spatial Information Science, Graduate School of Life and Environmental Sciences,
University of Tsukuba, 1-1-1 Ten-noudai, Tsukuba, Ibaraki 305-8572, Japan;
E-Mail: [email protected] 2
School of Geography, University of Leeds, Leeds LS2 9JT, UK; E-Mail: [email protected]
* Author to whom correspondence should be addressed: E-Mail: [email protected];
Tel.: +81-80-3022-0204; Fax: +81-29-853-4211.
Received: 8 November 2010; in revised form: 30 December 2010 / Accepted: 6 January 2011 /
Published: 14 January 2011
Abstract: Severe watershed degradation continues to occur in the tropical regions of
southern Africa. This has raised interest to harness and manipulate the potential of the
watershed resources for human benefit as the populations grow. Songwe River is one such
degrading watershed causing biennial flooding among other problems. In this study,
climatic, land use, topographic and physiographic properties were assembled for this
watershed and used in a process-based Geographical Information System (GIS) with the
aim of determining the hydrological sediment potential of Songwe River watershed and
quantifying possibilities of reservoir sedimentation. The study further aimed at determining
the critical sediment generating areas for prioritized conservation management and the
relationship between the increasing flood events in the floodplains and the rainfall trends.
Based on hydrological runoff processes using the Pan-European Soil Erosion Risk
Assessment (PESERA) model, the estimated amount of sediment transported downstream
is potentially huge. Most of the sediment generation was established to be occurring in the
upper sub-basin and specifically from built up village and degraded natural land. These
trends have not only caused the increased flooding events in the lower sub-basin, but also
pose a great sustainability risk of sedimentation to the proposed reservoir.
Keywords: reservoir; sedimentation; PESERA; conservation; degradation; sustainability
OPEN ACCESS

Sustainability 2011, 3
255
1. Introduction
Many river systems in the tropical regions of Africa continue to experience severe and uncontrolled
environmental degradation. This has resulted into enhanced soil erosion in the catchments, thereby
causing a range of problems from considerable loss of soil fertility and eventual desertification to
accelerated river, canal and reservoir sedimentation and flooding [1-3]. In the case of Songwe River,
the declining watershed resources have put great pressure on the agricultural land to support
households [4] with intensified cut-and-burn agricultural practices identified as the main driver of
erosion [5] (Figure 1). Being part of the Lake Malawi ecosystem, degradation of the Songwe River
catchment poses a great risk to the ecosystem as it reportedly delivers the highest sediment load [5].
The river continuously meanders in the lower sub-basin changing course in the process. This unstable
flow of the river causes frequent flood events that cause great danger to life and infrastructure and a
shifting river boundary problem to the neighboring countries of Malawi and Tanzania [6]. Seasonally,
it is estimated that the floods inundate over 9000 hectares of fertile land [7,8].
Being the physical boundary between Malawi to the south and Tanzania on the northern bank, these
trends have forced the authorities to search for solutions. This has since seen the establishment of the
Songwe River Transboundary Catchment Management Project (SRTCMP). SRTCMP, a bilateral and
multi-sectoral collaborative effort within the context of resource conservation and the fight against
poverty, aims to assist the local people to improve their livelihoods while securing natural resource
conservation [9]. The project has since entered its second phase that will see the construction of flood
control dams among other things [6] with potential sites already proposed [8].
Figure 1. Intensive cut-and-burn Agriculture affecting the ecosystem functions in the
Songwe river basin (Data from [9]).

Sustainability 2011, 3
256
2. Background to Flood Control and Reservoir Sedimentation
There are significant precision differences on regulated and natural flow between individual dams
as well as their methods of operation. However, common to them all is that dam construction does
affect the river’s distribution of discharge and its suspended material [10]. It is known that meandering
river flow regimes follow a common evolutionary pattern over time [11]. The key to regularize the
flow is, then, to alter the natural discharge regime that subsequently affects the behavior or the rate of
meander and erosion evolution and hence sedimentation [10].
Environmentally, sediment transportation reflects the distributed erosion processes acting in the
basin, as well as being a measure of the slow process of degradation and sequential loss of one of
agriculture’s critical natural resources, top soil [12]. Erosion processes are generally slow. However,
the annual volumes of sediment load involved are huge [13]. Sediment load is defined as debris eroded
from an area drained by a stream, delivered to and transported by the stream itself [14]. The total
amount of erosional debris exported from such a drainage basin is its sediment yield.
The sediment load measured is usually the rock underlying the drainage basin. Until this rock is
weathered into transportable fragments the sediment yield is low, which prompted [14] to point out
that evaluation of the drainage’s erosion conditions provides a good estimate of the sediment yield. It
is argued further that a more reliable assessment of watershed sediment yield is obtained when a
hydraulic approach is augmented by information on the mechanisms that feed sediments to the
channeled flow [12].
Disturbances in vegetative cover (land use/cover changes due to agriculture, timber and charcoal
harvest, construction and others) leave soils vulnerable to erosion. However, as [15] observed, where
and how much is eroded and transported downstream largely depends on topography and soil
hydrological properties. Once eroded, the sediment’s journey down the catchment depends
significantly on runoff which, over time, reduces in speed resulting in deposition [15]. With a lot of
human activity impacting on river flow, many dams constructed across river systems for various
purposes that include flood control, recreation and power generation have played major roles in
determining sites of sediment deposition. Many of the reservoirs end up holding much of the sediment
load themselves [2,3,14].
With modalities to largely engineer a non-shifting river boundary and control floods through
reservoir construction by the two bordering nations in the study area, [16] and [17] highlight that
success of such engineering work rests in the sustainability of the catchment. The key weakness of
most sediment management programs in the tropics has been their limited capacity to identify and
focus efforts on key problem areas [18]. They continue to advise that if the control of reservoir
sedimentation is the principal reason for such programs, more critical thought must be given to the
description and quantification of major sediment sources. In this study, therefore, climatic, land use,
topographic and physiographic properties of the study area were assembled. A watershed level
analysis was conducted in an erosion-process-based Geographical Information System (GIS) to:
(i) quantify the hydrological sediment potential; and (ii) determine critical areas requiring prioritized
conservation management and the relationship between the increasing flooding events and the
rainfall trends.

Sustainability 2011, 3
257
3. Methodology
3.1. Study Area
The study area is a 4,278 km2 watershed with the 200 km Songwe River forming the physical
boundary between the United Republic of Tanzania and the Republic of Malawi. It is part of the
semi-arid Eastern and Southern African Great Rift Valley and lies between latitudes 9°6’23‖–9°56’17‖
South and longitudes 32°44’34‖–33°56’31‖ East. Slightly over half of its total area falls in the districts
of Ileje, Mbozi, Mbeya and Kyela of the Mbeya Region on the Tanzanian side and the rest in Karonga
and Chitipa districts on the Malawi side. Three physiographic sub-basins (Figure 2) can be identified,
with the upper sub-basin containing the headwaters and major tributaries at elevations ranging from
1,200 to 2,450 m above sea level. The middle sub-basin is comprised of mountains and tributaries that
fall from elevations of 2,100–1,800 m down to 800–700 m at the foot of the escarpments within a
distance of 20–30 km [7]. The lower sub-basin begins on the foothills down to Lake Malawi at 476 m
above sea level. It is this part that dominates the Songwe river floodplain at elevations of mostly less
than 1,000 m above sea level.
Figure 2. Physiographic sub-basins showing elevation distribution above sea level and
proposed reservoir site (Adapted from [8]).

Sustainability 2011, 3
258
3.2. Methods and Database
The Pan-European Soil Erosion Risk Assessment (PESERA), a simplified hydrological
process-based approach [19], was used in this study to combine hydrological surface runoff factors to
estimate sediment yield. By attempting to use advances in the understanding of runoff processes as
opposed to sediment transport, it was only sensible for a forecast of runoff and soil erosion in PESERA
to be built on a hydrological core [19]. While this paper concentrates on calibration, validation and its
scenario application in the tropical region of the study area, a development account of the PESERA
model is provided by [19].
Erosion by running water, resulting from precipitation [15], is the most severe hazard threatening
the protection from soil loss [17,20]. Over time, such erosion-induced drainage basin changes affect
river discharges [21]. With sedimentation being sensitive to both climate and land use, as well as to
detailed conservation practices, temperature and precipitation proxies were used to estimate the
climatic parameters for the model. Evapo-transpiration was partitioned proportionally to vegetative
crown cover and its potential determined using the Hargreaves model.
The monthly rainfall was derived from averaging monthly daily rainfall data for the years 1998
through to 2006 obtained from seven gauging stations, namely: Itungi, Songwe, Kyela, Karonga,
Isangati, Chitipa and Idiwili (Figure 2). Monthly mean rain per rain-day was obtained by averaging all
days with a rain recording of greater than zero for each station to capture the daily storm events that
drive infiltration overland flow and soil erosion. Mean monthly rains were also indicators of the
saturation levels of the soil. It was manually observed that rainfall data for the seven gauging stations
varied with elevation, latitude and longitude; as such, to obtain a realistic monthly distribution
covering the entire study area, regression functions for each month were fitted to interpolate the
rain values.
Infiltration excess overland flow runoff was estimated from storm rainfall and soil moisture. A
Hortonian process of point hydrological balance was then used to estimate sediment transport from the
excess overland flow. This was coupled to a vegetation growth and soil model to: (i) budget for the
living biomass and organic matter subject to the constraints of land use and cultivation choices; and (ii)
estimate the required hydrological variables from moisture, vegetation and seasonal rainfall history,
respectively [19].
Runoff thresholds determine near-surface water store and soil properties constrain its upper
limit [22]. The model parameters of available water storage capacity, crustability and erodibility were,
therefore, obtained from the available soil properties. For agricultural land, full water storage after
ploughing decays exponentially with time, reducing to minimum for vegetated areas [23,24]. This
allows for seasonal response in runoff thresholds, and therefore in infiltration excess overland
flow [19].
Vegetation cover reduces with real time processes of fire, plant gathering and grazing [19]. This
relates empirically to the seasonal cover cycle and/or above-ground biomass of the land use classes [25].
Therefore, the PESERA model estimated subsurface flow, which influences infiltration excess overland
flow, using the TopModel [26]. Topographic properties were estimated from local relief.
Sediment transport was then estimated with sediment yield, Y (kg m−2
year−1
), defined as the
sediment transported to the slope base, averaged over the slope length [19]. That is:

Sustainability 2011, 3
259
(1)
Where is the empirical erodibility value,
is the total slope length (m),
is the dimensionless local slope gradient
indicates evaluation at the slope base,
Ʃ taken over the frequency distribution of daily rainfall storm events in an average year, and
is an estimate of the accumulated runoff.
Table 1. Summary of input datasets (Adapted from [27]).
Model
Parameter
Value
Range Units Description Sources
Monthly climate data
meanrf1301–12 0–992 mm Mean monthly rainfall
[8] meanrf21–12 9–45 mm
Mean monthly rainfall
per rain day
cvrf21–12 - Coefficient of variation of
monthly rainfall per rain day.
mtmean1–12 °C Mean monthly temperature
corrected for altitude [28]
mtrange1–12 °C
Monthly temperature range
(max–min)
meanpet301–12 56–189 mm Mean monthly Potential
Evapo-Transpiration
Hargreaves model.
(Data from [28])
Land use, corrected for crops and planting dates
use - - Land cover type/management
option
[29]
cov_jan–dec 0–100 %
Initial ground cover (updated for
agricultural land with reference to
planting dates)
rough0 0, 5, 10 mm Initial surface storage
roung_red 0, 50 % Surface roughness reduction per
month
root_depth 0–1,000 mm Root depth
Soil parameters
crust_0702 1–5 mm Crust storage
[30]
erod_0702 1–5 mm Sensitivity to erosion
soil-stor 0–205 mm Effective soil water storage
zm 5, 10, 15,
20, 30 mm Scale depth
Topographic data
std_eudem2 476–2,426 m Standard deviation of elevation
within 1.5 km radius [31]

Sustainability 2011, 3
260
With the catchment experiencing seasonal rainfalls, the derived vegetation cover was pegged at
30% for all the months, except the wetter months of February (50%), March (70%) and April (90%)
where the rainfall peaks [27]. The analysis incorporated a 30% [27] reduction in vegetative land cover
due to fire, plant gathering and grazing. The model was corrected for snow fall and melt. Table 1
summarizes the 93 climatic, land use, topographic and physiographic parameters assembled and used
to simulate the 2002/2003 season cycle on a monthly time scale with all parameters prepared at or
re-sampled to 90 m resolution.
Basin storage of sediment is an important variable in reservoir sedimentation management practices
as not all the sediment eroded from uplands is immediately delivered downstream [18]. Drainage
density, which [16] defines as the capability of a stream network to discharge total rainfall and hence
sediment from its watershed, is one indicator of basin storage quantified as:
(2)
where is the drainage density, is the total stream length of the system and is the total area of
the watershed.
A multi-criteria evaluation (MCE) was then run to identify the critical areas requiring prioritized
conservation management on the following factors: (i) distance to the river channel; (ii) slope; and
(iii) the estimated PESERA outputs of runoff as a delivery medium [14] and sediment load. The
estimated monthly sediment was also used to quantify the amount of estimated sediment input into the
proposed reservoir in an assimilated flow accumulation. Using the Statistical Package for Social
Scientists (SPSS), the statistical correlation of the increasing flooding events and the rainfall trends
was determined. Figure 3 below summarizes the procedure.
Figure 3. Summary of the methodology.

Sustainability 2011, 3
261
4. Results and Discussion
4.1. Sediment Generation
Estimated mean annual sediment generation varied considerably in magnitude, but showed no
significant spatial variability. Worrying levels are confined to the upper catchment (Figure 4) with
most of the areas having an estimated sediment potential of over 25 tonnes per hectare per year
(t ha−1
yr−1
). With high topographic percent rises in the upper catchment and extreme magnitude
variability of the rainfall both in space and time, infrequent but heavy rains tend to be responsible for
moving much of the sediment generated in the tropical catchment.
Figure 4. Estimated average annual sediment generation (tonnes/hectare/year).
It is important to verify whether the assumptions made this far are reasonable and whether they
adequately reflect the essential features and behavior of the real system. In modeling, it is important
that input variables can be satisfactorily measured in the field or otherwise and, as such, PESERA
avoided difficult variables, such as the zone depth DF, as much as possible in the ANSWERS model.
Though developed for the temperate regions, the strength of its hydrological base and flexibility of the
model code for corrections and adaptation allowed the PESERA model to be satisfactorily fitted to the
tropical environment for which factors like snow fall and melt are non-existent. With much of the data
on the distributions of the parameters held in raster-based GIS formats, the smooth integration of
PESERA to raster GIS proved very useful in this analysis apart from providing the detailed spatial
output displays that are useful to policy makers.

Sustainability 2011, 3
262
However, a limited number of measured values were used. This necessitated interpolation to fill the
entire study area and it is understood that this may add uncertainties to the measured values due to the
interpolation scheme. Uncertainties are also introduced in the choice of derived vegetation cover for
each month that was based on the author’s knowledge and experience of the study area given
the lack of available monthly land cover data. Again, the data requirements for PESERA are
substantially large to suffice the simulation process. While maintaining to be as physically based as
possible, some empirical relations were inevitable (the Hargreaves and TopModel models) in deriving
some of the parameters.
Sensitivity analysis demands alteration of each individual parameter and observation of the model
output. However, with coded values in the land use and soil parameters (Table 1), increasing or
decreasing such values by some factor would render them meaningless to the model. Again the
substantial computation and time requirements hindered alteration of each of the climatic parameters
to observe its impact on the output. However, assuming 20% [15,27] of the generated sediment is
deliverable to the proposed dam site (see Figure 2), the model response was tested for the real time
processes of fire, plant gathering and grazing. This was considered since
cut-and-burn agricultural practice has intensified [5] recently due to the demand for more agricultural
land [4]. Figure 5 compares the control 5% vegetative cover reduction against the model estimates at
30% vegetative cover reduction. The model responds well to changes in vegetative cover and, as
shown, it is sensitive to the same.
Figure 5. Control and Model sediment yield estimates delivered to the proposed reservoir
site and observed sediment concentration at the Mwandenga Gauging Station just below
the proposed reservoir site.

Sustainability 2011, 3
263
The monthly distribution of the sediment deliverable to the reservoir follows the rainy season
(Figure 5). Observed sediment concentration data for Mwandenga, a gauging station in the lower sub
basin just below the proposed reservoir site, is shown in Table 2. At an average annual maximum
discharge of 713.92 m3/s [8] the observed data was translated into tonnes per year. No vegetative cover
loss (0%) would have been an ideal control but that would not have been realistic. Though the model
has under-estimated the sediment yield (see Figure 5), the results compare very well considering that
the observed sediment yield translation used observed monthly maximum discharge values. The actual
observed sediment is expected to be less than depicted, thereby falling closer to the model estimates.
Despite some observed sediment concentration data missing for the dry months (June to November),
the available data sufficed in this analysis as it was for the critical window period—the rainy season.
The model estimates monthly series translate into an average annual estimated sediment input of
9,000,000 t yr−1
, an equivalent of 3.4 Mm3
yr−1
, which raises concerns of sedimentation. Assessed
against Malawi’s largest 19 Mm3 Kamuzu II dam, a catchment size of 1,800 km
2 (approximately half
that of Songwe), it would represent a substantial 7.5% annual reduction of its current capacity. These
results point to a high sedimentation risk facing the life expectancies of any reservoirs planned for
construction in the catchment, for flood control or otherwise, and the results compare well with
relative sedimentation estimates of similar tropical catchments of India and Philippines [18].
Table 2. Observed sediment concentration for Mwandenga gauging station (Data from [8]).
Date of Observation Sediment concentration (mg/L)
December 31, 2002 1,855
January 21, 2003 1,966
February 14, 2003 2,785
March 28, 2003 2,089
April 24, 2003 3,670
May 24, 2003 235
4.2. Catchment Conservation
Sustainable watershed rehabilitation and management does not only depend on quantified
magnitudes of sediment generated but also on awareness of the sediment residence time in the
catchment [18]. The drainage density was calculated to be very low at 0.1126, signifying that the
available sediment in the watershed has a long residence time. This makes the sediment generated in
the catchment available for transport even after further erosion has been prevented upstream.
Furthermore, the determination of whether sediments are from human or geological origin is of
particular importance to reservoir capacity and storage sustainability [18]. This determines the
expected type of sediment, large from landslides and/or fine from agricultural and built up lands, and
provides for a focused catchment conservation strategy.
Dams are built with a provision for a portion of the reservoir to hold incoming sediment loads
projected to occur during the economic life of the dam, referred to as ―dead storage‖ [2,32]. This
storage is in the deepest portion of the reservoir, usually close to the dam, between the level of the
water intake and the streambed. ―Live storage‖, on the other hand, refers to the stored water that will
actually be used [18]. While fine sediment is carried as suspended load farther into the reservoir and
Sustainability 2011, 3
264
settles into the planned dead storage area, coarse sediment is carried as bed load and is deposited at the
reservoir inlet taking up live storage area [33].
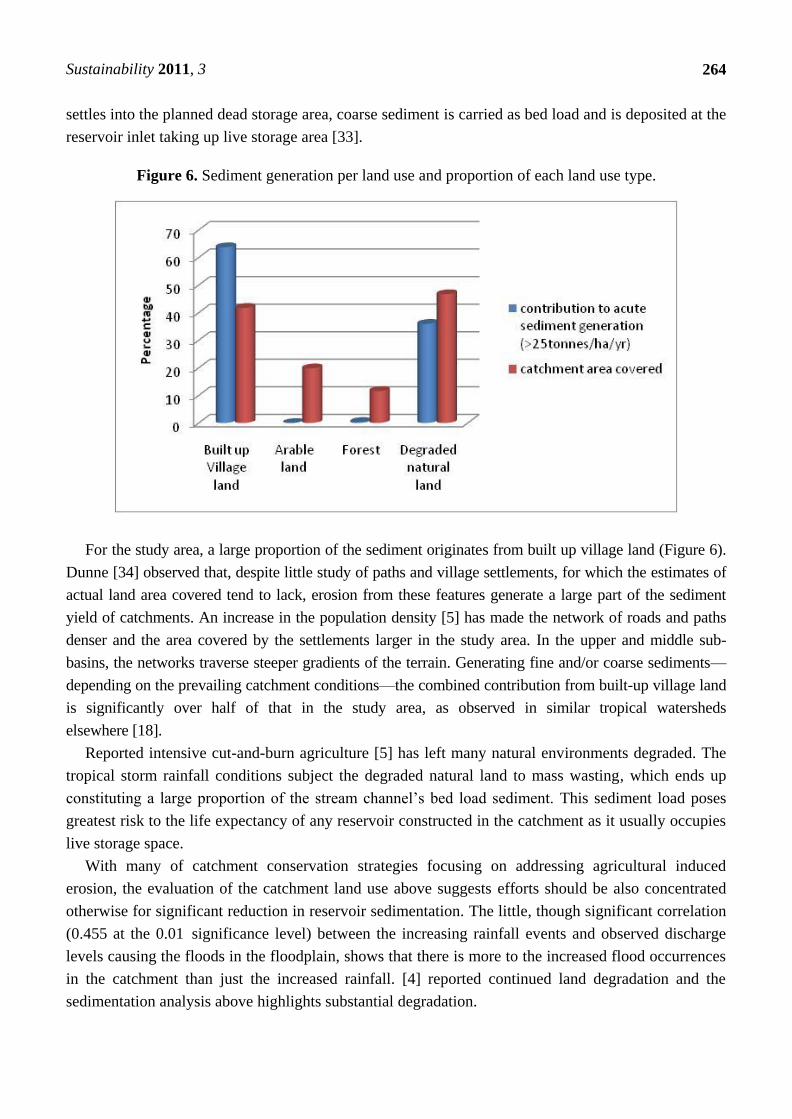
Figure 6. Sediment generation per land use and proportion of each land use type.
For the study area, a large proportion of the sediment originates from built up village land (Figure 6).
Dunne [34] observed that, despite little study of paths and village settlements, for which the estimates of
actual land area covered tend to lack, erosion from these features generate a large part of the sediment
yield of catchments. An increase in the population density [5] has made the network of roads and paths
denser and the area covered by the settlements larger in the study area. In the upper and middle sub-
basins, the networks traverse steeper gradients of the terrain. Generating fine and/or coarse sediments—
depending on the prevailing catchment conditions—the combined contribution from built-up village land
is significantly over half of that in the study area, as observed in similar tropical watersheds
elsewhere [18].
Reported intensive cut-and-burn agriculture [5] has left many natural environments degraded. The
tropical storm rainfall conditions subject the degraded natural land to mass wasting, which ends up
constituting a large proportion of the stream channel’s bed load sediment. This sediment load poses
greatest risk to the life expectancy of any reservoir constructed in the catchment as it usually occupies
live storage space.
With many of catchment conservation strategies focusing on addressing agricultural induced
erosion, the evaluation of the catchment land use above suggests efforts should be also concentrated
otherwise for significant reduction in reservoir sedimentation. The little, though significant correlation
(0.455 at the 0.01 significance level) between the increasing rainfall events and observed discharge
levels causing the floods in the floodplain, shows that there is more to the increased flood occurrences
in the catchment than just the increased rainfall. [4] reported continued land degradation and the
sedimentation analysis above highlights substantial degradation.

Sustainability 2011, 3
265
Reduction of sedimentation is limited if the control measures are implemented in non-principal
origins [18]. Again, with limited funds and technical help in the tropical catchment area, conservation
efforts need to be directed where they will have the greatest impact. Figure 7 highlights the areas
generating high levels of sediment, of which if controlled would have significant impact.
Figure 7. Soil and water conservation requirements for the Songwe River catchment;
(a) settlement and arable land; and (b) degraded natural land.
(a)
(b)

Sustainability 2011, 3
266
Though fraught with limitations even in the best of circumstances, this identification of sources of
sediment serves to avoid guesswork in planning the management programs for sedimentation control
in the watershed. It also develops awareness on whether the sources are amenable and whether the
sedimentation control approaches can produce verifiable results. Figure 7 (a) shows the critical
sediment sources within the built up village and arable land, quantitatively and for prioritization
purposes classified into conservation requirements of high, medium and low (using quantile method).
Similarly, Figure 7 (b) shows those from degraded natural land. Choice of the two categories was
based on not only the fact that they are the dominant land use types in the area (see Figure 6), but more
importantly, also that they have compromised relative roles in controlling sedimentation as they are
disturbed land areas. Beyond the scope of this visualization, however, is an anticipated situation in
which the locations of the engineering work of the dams results into generation of significant amounts
of sediment. Two- to three-fold increases in estimated sedimentation from landslides triggered by
roads cut into the slopes and borrow pits located upstream during construction has been reported [35].
Thus, poor planning and location of borrow pits and roads during construction would render
conservation efforts fruitless.
5. Conclusions
Songwe River is a life line to the rural populations on its banks though its catchment continues to
degrade. The catchment produces large amounts of sediment. Built up village land and degraded
natural land constitute the critical sediment generating areas and this poses a two-tier sustainability
risk to any reservoir constructed in the catchment, in that: (i) there is a direct potential of quick fill-up
of the ―dead‖ storage from the huge amount of fine sediment generated in the case of the built up
village land; and (ii) a shifting sedimentation to ―live‖ rather than ―dead‖ storage due to the coarser
sediment generated from the degraded natural land. Either way, the life expectancy of any reservoir to
be constructed is at stake.
Despite that reducing soil erosion from agricultural land is important for other purposes, focusing
on this would have limited impact on reducing reservoir sedimentation in the study area. This is
largely because in this case, the principal sediment sources are largely non-agricultural and sediment
residence time is long. With limited financial and technical resources, this systematic development and
analysis of sedimentation serves to improve both the planning of the river basin development schemes
and the allocation of resources towards reducing sedimentation. This is achievable by directing the
erosion control methods to the highlighted critical areas where they would be most effective. This is
important especially when the study has determined little significant statistical correlation between the
flood occurrences and the increasing rainfall trends, a scenario that points to catchment degradation as
the main culprit in causing the floods downstream.
Though the computer-based GIS analysis sets the ball rolling in the watershed management process
to reduce reservoir sedimentation, further ground truthing work of the sediment sources is necessary.
This will guarantee the suitability and hence success of any conservation attempt to achieve a
sustainable watershed and fruitful efforts of the engineering work.

Sustainability 2011, 3
267
References
1. Bobrovitskaya, N.N. Erosion and sediment yield modelling in the former USSR. In Modelling
Erosion, Sediment Transport and Sediment Yield; Summer, W., Walling, D.E., Eds.; UNESCO:
Paris, France, 2002; pp. 30-45.
2. Haregeweyn, N.; Poesen, J.; Nyssen, J.; De Wit, J.; Haile, M.; Govers G.; Deckers S. Reservoirs
in Tigray (Northern Ethiopia): Characteristics and sediment deposition problems. Land Degrad.
Dev. 2006, 17, 211-230.
3. Tamene, L.; Park, S.J.; Dikau, R.; Vlek, P.L.G. Reservoir siltation in the semi-arid highlands of
Northern Ethiopia: Sediment yield—catchment area relationship and a semi-quantitative approach
for predicting sediment yield. Earth Surf. Process. Landforms 2006, 31, 1364-1383.
4. Kalindekafe Lake Malawi—Niassa Ecoregion Programme, Development of the Songwe River
Transboundary Catchment Management Project. Natural Resources and Socio-Economic Baseline
Desk Study: The Malawian Perspective; Final Draft Report; Chancellor College, Department of
Biology, University of Malawi: Malawi, South Africa, 2004.
5. Chimphamba, J.B.; Mwakalila, S.; Kanyanga, J. Assessment of Cut-and-Burn farming system on
the management of Songwe River: A trans-boundary watershed between Tanzania, Zambia and
Malawi. Presented at United Nations/Zambia/European Space Agency Regional Workshop on the
Applications of Global Navigation Satellite System Technologies for Sub-Saharan Africa, Lusaka,
Zambia, 26–30 June 2006; Available online: http://www.unoosa.org/pdf/sap/2006/zambia/
presentations/04-01-03.pdf (accessed on 1 June 2009).
6. Chimwala, M. Engineering a non-shifting river boundary between Malawi and Tanzania. Nyasa
Times, 22 February 2009.
7. NORPLAN. A Joint Project between the Government of the Republic of Malawi and the
Government of the United Republic of Tanzania. Final Feasibility Study Report; Preliminary
Environmental Impact Assessment Main Report; Norplan A.S. in Association with COWI, DHI
Water and Environment, W&PES: Oslo, Norway, 2003; Volume 4A.
8. Flood Preparedness Study for the Lower Songwe Basin; Main Report; World Wide Fund (WWF):
Washington, DC, USA, 2009; Volume I.
9. WWF Songwe River Transboundary Catchment Management Project, Karonga, Malawi;
Available online: www.sdc.admin.ch/media/F/ProjectSongeRiver.pdf (accessed on 1 June 2009)
10. Wellmeyer, J.L.; Slattery, M.C.; Phillips, J.D. Quantifying downstream impacts of impoundment on
flow regime and channel planform, lower Trinity River, Texas. Geomorphology 2005, 69, 1-13.
11. Friedkin, J.F. A Laboratory Study of the Meandering of Alluvial Rivers; US Waterways
Experimental Station: Vicksburg, MS, USA, 1945.
12. Pilotti, M.; Bacchi, B. Distributed evaluation of the contribution of soil erosion to the sediment
yield from a watershed. Earth Surf. Process. Landforms 1997, 22, 1239-1251.
13. U.S. Department of Agriculture-Soil Conservation Service. Summary Report: 1992 National
Resources Inventory; Soil Conservation Service: Washington, DC, USA; Statistical Laboratory,
Iowa State University: Ames, IA, USA, 1994.

Sustainability 2011, 3
268
14. Schumm, S.A. Streamflow and Sediment Yield; Encyclopedia Britannica: Chicago, IL, USA, 2009;
Available online: http://www.britannica.com/EBchecked/topic/504801/river/29099/Factors-that-
influence-sediment-yield (accessed on 20 July 2009).
15. Fried, J.S.; Brown, D.G.; Zweifler, M.O.; Gold, M.A. Mapping contributing areas of stormwater
discharge to streams using terrain analysis. In Terrain Analysis, Principles and Applications,
1st ed.; Wilson, J.P., Gallant, J.C., Eds.; John Wiley & Sons: New York, NY, USA, 2000;
pp. 183-203.
16. Bozali, N.; Yüksel, A.; Akay, A.E. Determining the main factors effecting the sediment yield
from derindere watershed of Sir Dam in Kahramanmaras by using GIS techniques. Int. J. Nat. Eng.
Sci. 2008, 2, 29-32.
17. Pandey, A.; Chowdary, V.M.; Mal, B.C.; Billib, M. Runoff and sediment yield modeling from a
small agricultural watershed in India using the WEPP model. J. Hydrol. 2008, 348, 305-319.
18. Nagle, G.N.; Fahey, T.J.; Lassoie, J.P. Management of sedimentation in tropical watersheds.
Environ. Manag. 1999, 23, 441-452.
19. Kirkby, M.J.; Irvine, B.J.; Jones, R.J.A.; Govers, G. The PESERA coarse scale erosion model for
Europe. I—Model rationale and implementation. Eur. J. Soil Sci. 2008, 59, 1293-1306.
20. Proposal for a Directive of the European Parliament and of the Council Establishing a
Framework for the Protection of Soil and Amending; Directive 2004/35/EC; Commission of the
European Communities: Brussels, Belgium, 2006.
21. Mulder, T.; Syvitski, J.P.M. Climatic and morphologic relationships of rivers. Implications of sea
level fluctuations on river loads. J. Geol. 1996, 104, 509-523.
22. European Land Information Systems for Agro-Environmental Monitoring; EUR 16232 EN;
King, D., Jones, R.J.A., Thomasson, A.J., Eds.; Office for Official Publications of the European
Communities: Luxembourg, 1995.
23. Darboux, F.; Gascuel-Odoux, C.; Davy, P. Effects of surface water storage by soil roughness on
overland-flow generation. Earth Surf. Process. Landforms 2002, 27, 223-233.
24. Le Bissonnais, Y.; Cerdan, O.; Lecomte, V.; Benkhadra, H.; Souchere, V.; Martin, P. Variability
of soil surface characteristics influencing runoff and interrill erosion. Catena 2005, 62, 111-124.
25. Haboudane, D.; Bonn, F.; Royer, A.; Sommer, S.; Mehl, W. Land degradation and erosion risk
mapping by fusion of spectrally based information and digital geomorphometric attributes. Int. J.
Rem. Sens. 2002, 23, 3795-3820.
26. Beven, K.J.; Kirkby, M.J. A physically based, variable contributing area model of catchment
hydrology. Hydrol. Sci. J. 1979, 24, 43-69.
27. Irvine, B.; Cosmas, C. Deliverable 15: Pesera User’s Manual (1 April 2000 to 30 September
2003). Pan-European Soil Erosion Risk Assessment, Contract no. QLK5-CT-1999-01323, Key
Action n° 1.1.1.-5.4; The European Commission: Brussels, Belgium.
28. Ministry of Natural Resources, Energy and Environment; Department of Climate Change and
Meteorological Services. Climate of Malawi Temperature Maps Malawi, 2009; Available online:
http://www.metmalawi.com/climate/temperature.php (accessed on 3 June 2009).
29. US Geological Survey, EROS Data Center. Global Land Cover Characterization, 1997; Available
online: http://edcdaac.usgs.gov/glcc/glcc.asp (accessed on 14 July 2009).

Sustainability 2011, 3
269
30. Food and Agricultural Organization of the United Nations, GeoNetwork. Digital Soil Map of the
World 2007; Available online: http://www.fao.org/geonetwork/srv/en/main.home (accessed on 10
July 2009).
31. Jarvis, A.; Reuter H.I.; Nelson A.; Guevara, E. Hole-filled SRTM for the globe Version 4,
available from the CGIAR-CSI SRTM 90m Database, 2008; Available online:
http://srtm.csi.cgiar.org (accessed on 13 June 2009).
32. Robert, S.I. Sedimentation. In Design of Small Dams, United States Department of the Interior
Bureau of Reclamation; Water Resource Technical Publication; Oxford and IBH: New Delhi,
India, 1973.
33. Dunne, T. Geomorphologic contributions to flood control planning. In Flood Geomorphology;
Baker, V.R., Kochel, R.C., Patton, P.C., Eds.; John Wiley & Sons: New York, NY, USA, 1988;
pp. 421-438.
34. Dunne, T. Sediment yield and land use in tropical catchments. J. Hydrol. 1979, 42, 281-300.
35. Gregersen, H.M.; Brooks, K.N.; Dixon, J.A.; Hamilton, L.S. Guidelines for Economic Appraisal
of Watershed Management Projects; FAO Conservation Guide 16; Food and Agricultural
Organization of the United Nations: Rome, Italy, 1987; p. 144.
© 2011 by the authors; licensee MDPI, Basel, Switzerland. This article is an open access article
distributed under the terms and conditions of the Creative Commons Attribution license
(http://creativecommons.org/licenses/by/3.0/).