Phytoplankton and water quality in a Mediterranean drinking-water reservoir (Marathonas Reservoir,...
13
Environ Monit Assess (2011) 181:563–575 DOI 10.1007/s10661-010-1851-3 Phytoplankton and water quality in a Mediterranean drinking-water reservoir (Marathonas Reservoir, Greece) Matina Katsiapi · Maria Moustaka-Gouni · Evangelia Michaloudi · Konstantinos Ar. Kormas Received: 30 June 2010 / Accepted: 17 December 2010 / Published online: 8 January 2011 © Springer Science+Business Media B.V. 2011 Abstract Phytoplankton and water quality of Marathonas drinking-water Reservoir were exam- ined for the first time. During the study period (July–September 2007), phytoplankton composi- tion was indicative of eutrophic conditions al- though phytoplankton biovolume was low (max. 2.7 mm 3 l −1 ). Phytoplankton was dominated by cyanobacteria and diatoms, whereas desmids and dinoflagellates contributed with lower biovolume values. Changing flushing rate in the reservoir (up to 0.7% of reservoir’s water volume per day) driven by water withdrawal and occurring in pulses for a period of 15–25 days was associated with phytoplankton dynamics. Under flushing pulses: (1) biovolume was low and (2) both ‘good’ quality species and the tolerant to flushing M. Katsiapi · M. Moustaka-Gouni (B ) Department of Botany, School of Biology, Aristotle University of Thessaloniki, 541 24, Thessaloniki, Greece e-mail: [email protected] E. Michaloudi Department of Zoology, School of Biology, Aristotle University of Thessaloniki, 541 24, Thessaloniki, Greece K. A. Kormas Department of Ichthyology and Aquatic Environment, School of Agricultural Sciences, University of Thessaly, 384 46, Nea Ionia, Volos, Greece ‘nuisance’ cyanobacterium Microcystis aeruginosa dominated. According to the Water Framework Directive, the metrics of phytoplankton biovol- ume and cyanobacterial percentage (%) contri- bution indicated a moderate ecological water quality. In addition, the total biovolume of cyanobacteria as well as the dominance of the known toxin-producing M. aeruginosa in the reservoir’s phytoplankton indicated a potential hazard for human health according to the World Health Organization. Keywords Drinking-water reservoir · Flushing rate · Cyanobacteria · Ecological water quality · Management · WFD Introduction During the last decades, human activities have deteriorated water quality in a significant number of lakes and reservoirs worldwide. This, along with the growing necessity to meet societal de- mands for both water quantity and water quality (Kennedy 1999), suggests that monitoring the hy- drology and water quality of freshwaters is critical for their proper management in the long term. Reservoirs differ considerably from natural lakes in respect of basic physical, chemical and biolog- ical processes. One of the most striking differ- ences is their hydrological regime (Straškraba and
Transcript of Phytoplankton and water quality in a Mediterranean drinking-water reservoir (Marathonas Reservoir,...
Environ Monit Assess (2011) 181:563–575DOI 10.1007/s10661-010-1851-3
Phytoplankton and water quality in a Mediterraneandrinking-water reservoir (Marathonas Reservoir, Greece)
Matina Katsiapi · Maria Moustaka-Gouni ·Evangelia Michaloudi · Konstantinos Ar. Kormas
Received: 30 June 2010 / Accepted: 17 December 2010 / Published online: 8 January 2011© Springer Science+Business Media B.V. 2011
Abstract Phytoplankton and water quality ofMarathonas drinking-water Reservoir were exam-ined for the first time. During the study period(July–September 2007), phytoplankton composi-tion was indicative of eutrophic conditions al-though phytoplankton biovolume was low (max.2.7 mm3 l−1). Phytoplankton was dominated bycyanobacteria and diatoms, whereas desmids anddinoflagellates contributed with lower biovolumevalues. Changing flushing rate in the reservoir(up to 0.7% of reservoir’s water volume perday) driven by water withdrawal and occurring inpulses for a period of 15–25 days was associatedwith phytoplankton dynamics. Under flushingpulses: (1) biovolume was low and (2) both‘good’ quality species and the tolerant to flushing
M. Katsiapi · M. Moustaka-Gouni (B)Department of Botany, School of Biology,Aristotle University of Thessaloniki,541 24, Thessaloniki, Greecee-mail: [email protected]
E. MichaloudiDepartment of Zoology, School of Biology,Aristotle University of Thessaloniki,541 24, Thessaloniki, Greece
K. A. KormasDepartment of Ichthyology and AquaticEnvironment, School of Agricultural Sciences,University of Thessaly, 384 46,Nea Ionia, Volos, Greece
‘nuisance’ cyanobacterium Microcystis aeruginosadominated. According to the Water FrameworkDirective, the metrics of phytoplankton biovol-ume and cyanobacterial percentage (%) contri-bution indicated a moderate ecological waterquality. In addition, the total biovolume ofcyanobacteria as well as the dominance of theknown toxin-producing M. aeruginosa in thereservoir’s phytoplankton indicated a potentialhazard for human health according to the WorldHealth Organization.
Keywords Drinking-water reservoir · Flushingrate · Cyanobacteria · Ecological water quality ·Management · WFD
Introduction
During the last decades, human activities havedeteriorated water quality in a significant numberof lakes and reservoirs worldwide. This, alongwith the growing necessity to meet societal de-mands for both water quantity and water quality(Kennedy 1999), suggests that monitoring the hy-drology and water quality of freshwaters is criticalfor their proper management in the long term.Reservoirs differ considerably from natural lakesin respect of basic physical, chemical and biolog-ical processes. One of the most striking differ-ences is their hydrological regime (Straškraba and

564 Environ Monit Assess (2011) 181:563–575
Tundisi 1999). Due to an operational manage-ment of their water volume, reservoirs experi-ence shorter retention times compared to thoseof lakes, intense water level fluctuations, as wellas periodic pulses of mixing depending on theiruse (Tundisi et al. 1999). These features haveprofound effects among others on the phytoplank-ton community of a reservoir (Naselli-Flores 2000;Naselli-Flores and Barone 2005).
Phytoplankton can be used as a good indi-cator of water quality changes, given its sensi-tivity and dynamic responses to changes in thesurrounding environment (Padisák et al. 2006).In Europe, after the establishment of the WaterFramework Directive (WFD) in 2000 (EuropeanParliament, Council 2000), phytoplankton is oneof the four biological elements suggested for as-sessing the ecological status/potential of surfacewaters. In addition, the World Health Organi-zation (WHO) has established an Alert Lev-els Framework for drinking-water supplies basedon the cyanobacteria presence in order to de-termine water quality and human health risk(Bartram et al. 1999).
In Greece, several studies have reported pro-longed cyanobacterial dominance (e.g. Moustaka-Gouni et al. 2007) along with the presence oftoxin-producing cyanobacterial species (Vardakaet al. 2005) and considerable concentrations ofcyanotoxins (Cook et al. 2004; Gkelis et al.2005a) in several lakes and reservoirs. However,these water systems lack any management regard-ing cyanobacteria and cyanotoxins (Cook et al.2005). Knowledge on the phytoplankton of Greekdrinking-water reservoirs is scarce (Moustaka-Gouni and Nikolaidis 1992; Chrisostomou et al.2009). Publications on the phytoplankton of theMarathonas Reservoir are completely lacking de-spite the fact that it was created in the 1930sin order to be used as a drinking-water sup-ply for Athens, the capital of Greece. Only onestudy on the phylogenetic diversity of cyanobac-teria of the reservoir has recently been published(Lymperopoulou et al. 2010).
This is the first paper on the phytoplankton andwater quality of Marathonas Reservoir. The aimof this paper was (a) to examine the phytoplank-ton compositional diversity and biovolume undera changing flushing rate and (b) to assess the
reservoir’s water quality according to both WFDand WHO guidelines.
Methods
Study site
Marathonas Reservoir (3809′59′′ N, 2353′58′′ E;Fig. 1) is situated at the northeastern part of theAttica region, Central Greece, at 173 m abovesea level. It was put in operation for supplyingdrinking water to Attica region (including the cityof Athens, the capital of Greece) in 1931. Thereservoir has a mean surface area of 2.45 km2,maximum depth 54 m, mean depth 15 m anda catchment area of 118 km2 drained by fiveperennial inflows. The only outflow of the reser-voir is the water supply tower (Fig. 1). With anoperational volume of 34 million cubic metres,the reservoir was the main source for supplyingdrinking water to Attica region until 1959 (AthensWater Supply and Sewerage Company (EYDAPSA), unpublished data). Nowadays, it operates asa backup source for the water supply system of the
Fig. 1 Map of Marathonas Reservoir. The circle indicatesthe sampling site and the square the reservoir’s watersupply tower. Insert, map of Greece (solid square indicatesthe location of Marathonas Reservoir)

Environ Monit Assess (2011) 181:563–575 565
greater Attica region and as a primary regulatingreservoir.
During the study period (July–September2007), two major decreases in the reservoir’s wa-ter volume were recorded. The first one, in July,was more abrupt and resulted in loss of 8% ofthe reservoir’s water volume. It was character-ized by periodic flushing pulses (0.1–0.7% of thereservoir’s water volume per day) that lasted for25 days. The second one, in late August–earlySeptember, was shorter (15 days) with weakerflushing pulses (0.06–0.6% of the reservoir’s watervolume per day) and resulted in loss of 3% ofthe reservoir’s water volume. The fluctuations ofthe reservoir’s water volume and the flushing rateper day for the period July–September 2007 areshown in Fig. 2. Data on the reservoir’s water vol-ume were provided by the EYDAP SA. Flushingrate (given as % of the reservoir’s water volumeper day) was calculated from the total reservoir’swater volume and its daily changes.
Field work
Sampling covered the warm period of 2007 andwas conducted from July to September biweekly.The sampling station (15 m deep at highest water
level) was located at the area of the reservoir’soutflow (water supply tower) that was stronglyaffected by changing flushing rate (Fig. 1). Depthdiscrete water samples were collected with a2-l Niskin sampler from the surface to the endof the euphotic zone (maximum depth 12.5 m) at2-m intervals. In addition, integrated sampleswere taken from the euphotic zone. Sub-sampleswere preserved in Lugol solution.
Water temperature, pH and dissolved O2 weremeasured in situ using a portable multi-parameteranalyzer WQC-24 (DKK TOA) and transparencywas measured with a Secchi disc. The euphoticzone (zeu) was calculated as 2.5 times the Secchidepth and the mixing zone (zmix) was indentifiedusing temperature profiles. Stratification was con-sidered to occur at the depth where water temper-ature changed by >1C m−1.
Laboratory and data analysis
Fresh and preserved samples were examined un-der a light inverted microscope (Nikon SE 2000),and species were identified using taxonomic keys.Phytoplankton counts were performed using thesedimentation method of Utermöhl (1958). At
Fig. 2 Phytoplankton biovolume and species richness dur-ing the study period (July–September 2007) in MarathonasReservoir. Biovolume values are means and refer to the
euphotic zone. Flushing rate and daily fluctuations of thereservoir’s water volume from early July to late Septemberare shown

566 Environ Monit Assess (2011) 181:563–575
least 400 phytoplankton individuals were countedin each sample. The dimensions of 30 individuals(cells, filaments or colonies) of each species weremeasured using tools of a digital microscope cam-era (Nikon DS-L1). For the colonial cyanobac-terium Microcystis aeruginosa, the number of cellsper colony (y) was determined using the equation:y = 1.475 × (colony diameter)1.55 according toMoustaka (1988). Since colonies were not alwaysspherical, the colony diameter used in the finalcomputation was the diameter of a sphere with anequal colony volume according to Reynolds andJaworski (1978). Mean cell or filament volumeestimates were calculated using appropriate geo-metric formulae (Hillebrand et al. 1999). Speciesand taxonomical groups comprising more than10% (v/v) of the total phytoplankton biovolumewere considered to be dominant. Reynolds etal. (2002) functional groups classification was ap-plied to the phytoplankton species supplementedby the review of Padisák et al. (2009). In thispaper, ‘good quality’ species refer to those phy-toplankton species which are typical for oligo-mesotrophic environments such as species of thegenus Cyclotella and desmids (e.g. species of Cos-marium). The functional group of these speciesgets the highest score when assessing ecologicalwater quality (Padisák et al. 2009).
To assess the ecological water quality, theboundaries of Good/Moderate (G/M) ecologi-cal potential were used, related to total phy-toplankton biovolume and the percentage (%)contribution of cyanobacteria for calcareousMediterranean reservoirs. These boundaries wereproposed by the European Commission inthe Water Framework Directive Intercalibrationtechnical report Part 2: Lakes (JRC EuropeanCommission 2009). To assess the potential healthrisks associated with the presence of cyanobac-teria in the reservoir, the WHO Alert LevelsFramework model (Bartram et al. 1999) for themonitoring and management of cyanobacteria indrinking waters in relation to cyanobacteria bio-volume was used.
In order to identify interrelationships amongsamplings, cluster analysis using the Bray–Curtissimilarity index (Clarke and Warwick 1994) wasapplied to the (biovolume of each species) ×(samples) matrix data. Prior to the analysis, data
were log (x+1) transformed. For the determina-tion of the species responsible for within groupsimilarities and between groups’ dissimilarities(Clarke and Warwick 1994), similarity percentageanalysis (SIMPER) was used.
Results
Environmental parameters
The reservoir’s environmental parameters exam-ined in this study are given in Table 1. Mean watercolumn temperature varied from 25.1C (in July)to 22.6C (in September). Maximum temperaturereached 25.7C (surface layer, in late August),whereas minimum temperature was 22.2C (endof euphotic zone, in late September). Thermalstratification of the water column was observedduring July–August, with an epilimnion of 8 min depth. Secchi disc transparency was relativelyhigh (varied between 3.5 and 5 m) with a decreas-ing tendency in September. The euphotic zoneranged from 8.8 to 12.5 m. It was deeper than themixing zone (zeu/zmix >1) until the end of Augustwhereas in September after the break down of thethermal stratification, the ratio zeu/zmix decreasedto <1. Mean, maximum and minimum values ofdissolved oxygen and pH did not vary consider-ably during the study period. The dissolved O2
ranged between 6.2 and 7.3 mg l−1 and pH valuesranged between 7.8 and 8.7.
Phytoplankton compositional diversityand biovolume
A total of 62 phytoplankton species belonging to16 functional groups were indentified (Table 2)in the reservoir from July to September 2007.The main taxonomic groups were: chlorophytesexhibiting the highest number of species (27),cyanobacteria (nine), diatoms (eight) and desmids(seven) followed by the less diverse dinophytes(five), cryptophytes (two), chrysophytes (two),xanthophytes (one) and prymnesiophytes (one).The more diverse functional groups were J andLo with 15 and eight species, respectively. Speciesrichness was lower (32 species) in late July–earlyAugust, a period of increased periodic flushing

Environ Monit Assess (2011) 181:563–575 567
Table 1 Physical and chemical parameters of Marathonas Reservoir during the study period of July–September 2007
Transparency Temperature Dissolved O2 pH* Zmix(m) Zeu(m) Zmix/Zeu
(m) (C)* (mg l−1)*
25/07/07 A 4 25.1 7.0 8.1 8 10 0.8B 25.5 7.3 8.7C 22.7 6.8 7.8
09/08/07 A 5 24.8 6.6 8.2 8 12.5 0.6B 25.4 6.7 8.4C 23.2 6.2 7.8
22/08/07 A 4.5 25.0 6.9 8.2 8 11.25 0.7B 25.7 7.0 8.4C 22.9 6.4 8.0
06/09/07 A 4.5 24.3 7.0 8.2 14 11.25 1.2B 24.8 7.1 8.3C 23.7 6.8 8.1
20/09/07 A 3.5 22.6 6.9 8.3 14 8.75 1.6B 22.7 7.0 8.5C 22.2 6.8 8.2
*A mean, B maximum, C minimum values
(Fig. 2). It exhibited a maximum of 44 species inlate August after a 14-day period of no flushingand shifted back to similar species number (34species) in September during the second period ofincreased flushing.
Phytoplankton biovolume was low (0.45 ±0.1 mm3 l−1) during the first period of increasedflushing (Fig. 2). A peak value (2.7 mm3 l−1)
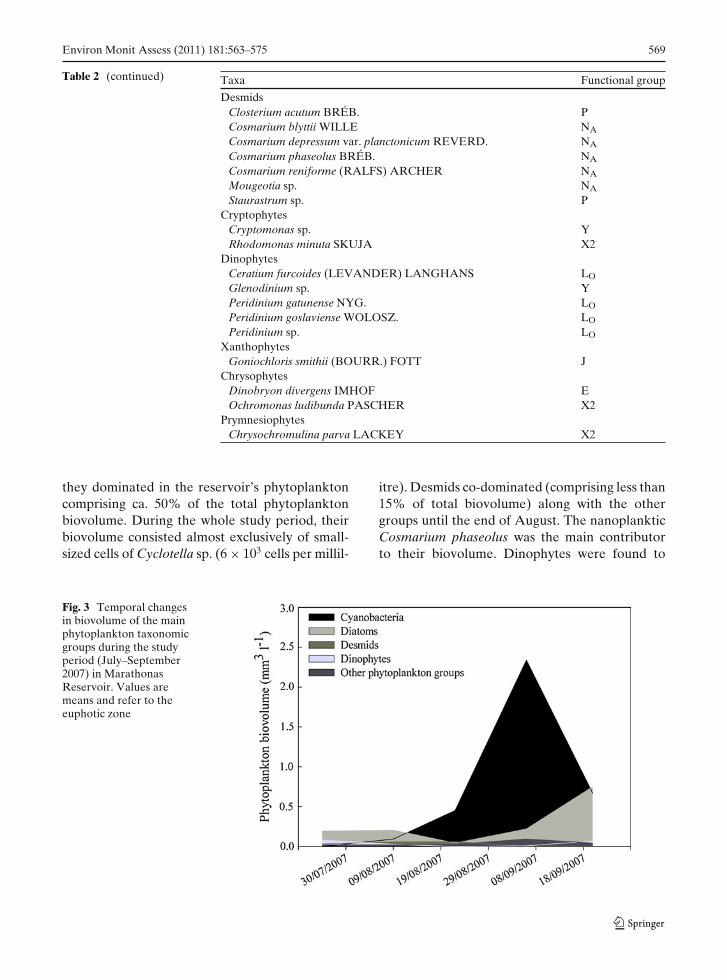
was observed in early September following a 20-day period of very low flushing. After the secondperiod of increased flushing, the biovolume de-creased to almost half (1.5 mm3 l−1) of its peakvalue. The main contributors to phytoplankton(comprising>80% of total biovolume) during thestudy period were cyanobacteria and diatoms andto a lesser extent desmids and dinophytes (Fig. 3).The more diverse in species number chlorophytescontributed less than 5% to the total phytoplank-ton biovolume. Cyanobacteria were observed todominate from early August until the end ofSeptember, forming a peak in the first week ofSeptember when water temperature was still high(25C). The increase in cyanobacterial biovol-ume (Figs. 2 and 3) started only when no wa-ter withdrawal from the reservoir occurred for14 days. Accumulation of cyanobacteria biovol-ume continued until a flushing rate greater than0.5% of the reservoir’s water volume per dayoccurred.
M. aeruginosa was the dominant species consti-tuting 50–88% of the cyanobacterial biovolume.This species was present in low numbers (<300cells per millilitre) in July, started increasing inAugust during the 14-day period with no flushingand dominated exclusively the peak of phyto-plankton biovolume early in September at thebreakdown of the thermal stratification. Duringthe peak, 63% of Microcystis colonies were largerthan 200 μm (range 117–466 μm). Microcystisdecreased when mixing prevailed after the sec-ond flushing period. At that time, most of itscolonies were smaller than 100 μm in maximumdimension. During this period the zooplanktoncommunity was dominated by rotifers, small-sizedcladocera and copepods (Katsiapi et al., unpub-lished data). The other cyanobacteria speciesrecorded in the reservoir did not form substantialamounts of biovolume and did not dominate dur-ing the study period. The filamentous Anabaenabergii and Pseudoanabaena sp. although presentthrough the whole study period, remained in lownumbers (1 filament per millilitre). The chroococ-cal Chroococcus dispersus with a maximum den-sity of 730 cells per millilitre was not dominant,while Limnothrix redekei and Merismopedia sp.were rare in the water samples.
Diatoms, the second most important group interms of biovolume, were the main dominants

568 Environ Monit Assess (2011) 181:563–575
Table 2 List ofphytoplankton speciesand functional groups(according to Reynoldset al. 2002 and Pádisaket al. 2009) identified inwater samples collectedduring the study period(July–September 2007)from MarathonasReservoir
Taxa Functional group
CyanobacteriaAnabaena bergii OSTENF. H1Aphanizomenon sp. H1Aphanocapsa delicatissima W. et G. S. WEST LO
Chroococcus dispersus (KEISSL.) LEMM. LO
Chroococcus limneticus LEMM. LO
Limnothrix redekei (VAN GOOR) MEFFERT S1Merismopedia sp. LO
Microcystis aeruginosa (KÜTZ.) KÜTZ. MPseudoanabaena sp. S1
ChlorophytesChlamydomonas sp. X2Choricystis coccoides (RODHE and SKUJA) FOTT X1Coelastrum astroeideum DE-NOT. JDictyosphaerium pulchellum WOOD FDidymocystis bicellularis (CHOD.) KOM. X1Elakatothrix genevensis (REVERD.) HIND. FHaematococcus sp. X2Kirchneriella contorta (SCHMIDLE) BOHL. FLagerheimia quadriseta (LEMM.) G. M. SMITH JLagerheimia sp. JMonoraphidium komarkovae NYG. X1Monoraphidium minutum (NÄG.) KOM.-LEGN. X1Monoraphidium sp. X1Oocystis sp. FPediastrum duplex MEYEN JPediastrum simplex var. echinulatum WITTR JPediastrum simplex var. simplex MEYEN JScenedesmus acuminatus (LAGERH.) CHOD. JScenedesmus acutus MEYEN JScenedesmus ecornis (EHRENB.) CHOD. JScenedesmus linearis KOM. JScenedesmus sp. JSphaerocystis schroeteri CHOD. FTetraedron caudatum (CORDA) HANSG. JTetraedron minimum (A. BR.) HANSG. sensu SKUJA JTetrastrum triangulare (CHOD.) KOM. JTreubaria triappendiculata BERN. F
DiatomsAsterionella formosa HASSALL CAulacoseira granulata (EHRENB.) RALFS PCyclotella sp. BFragilaria crotonensis KITT. PNitzschia sp. DRhizosolenia eriensis H. L. SMITH ARhizosolenia longiseta ZACHARIAS ASynedra acus KG. D
along with desmids and dinophytes from late Julyto early August, the period of the highest flushingrate and thermal stratification. Nevertheless, theirbiovolume was low (0.2 mg l−1). From late August
to early September, the period of the exclusivedominance of cyanobacteria, diatoms exhibitedeven lower biovolume values. When flushing rateincreased again and turbulent mixing prevailed,
Environ Monit Assess (2011) 181:563–575 569
Table 2 (continued) Taxa Functional group
DesmidsClosterium acutum BRÉB. PCosmarium blyttii WILLE NA
Cosmarium depressum var. planctonicum REVERD. NA
Cosmarium phaseolus BRÉB. NA
Cosmarium reniforme (RALFS) ARCHER NA
Mougeotia sp. NA
Staurastrum sp. PCryptophytes
Cryptomonas sp. YRhodomonas minuta SKUJA X2
DinophytesCeratium furcoides (LEVANDER) LANGHANS LO
Glenodinium sp. YPeridinium gatunense NYG. LO
Peridinium goslaviense WOLOSZ. LO
Peridinium sp. LO
XanthophytesGoniochloris smithii (BOURR.) FOTT J
ChrysophytesDinobryon divergens IMHOF EOchromonas ludibunda PASCHER X2
PrymnesiophytesChrysochromulina parva LACKEY X2
they dominated in the reservoir’s phytoplanktoncomprising ca. 50% of the total phytoplanktonbiovolume. During the whole study period, theirbiovolume consisted almost exclusively of small-sized cells of Cyclotella sp. (6 × 10³ cells per millil-
itre). Desmids co-dominated (comprising less than15% of total biovolume) along with the othergroups until the end of August. The nanoplankticCosmarium phaseolus was the main contributorto their biovolume. Dinophytes were found to
Fig. 3 Temporal changesin biovolume of the mainphytoplankton taxonomicgroups during the studyperiod (July–September2007) in MarathonasReservoir. Values aremeans and refer to theeuphotic zone

570 Environ Monit Assess (2011) 181:563–575
Fig. 4 Dendrogram forclustering of the watersamplings during thestudy period(July–September 2010) inMarathonas Reservoirbased on Bray–Curtissimilarities. Clusteranalysis was applied tothe (biovolume of eachspecies) × (samples)matrix data
Table 3 Results ofSIMPER analysis of thewater samples fromMarathonas Reservoirduring the study period(July–September 2010)
Contribution (%) Cumulative (%)
Group IAverage similarity 72.77
Cyclotella sp. 70.01 70.01Cosmarium phaseolus 12.96 82.97Ceratium furcoides 10.92 93.88
Group IILess than 2 samples in group
Group IIIAverage similarity 52.95
Microcystis aeruginosa 66.82 66.82Cyclotella sp. 27.59 94.41
Groups I and IIAverage dissimilarity 68.09
Microcystis aeruginosa 56.77 56.77Cyclotella sp. 24.43 81.21Ceraium furcoides 7.82 89.03Cryptomonas sp. 2.44 91.47
Groups I and IIIAverage dissimilarity 68.83
Microcystis aeruginosa 65.67 65.67Cyclotella sp. 18.23 83.90Cosmarium phaseolus 3.52 87.42Ceratium furcoides 2.71 90.13
Groups II and IIIAverage dissimilarity 53.62
Microcystis aeruginosa 44.53 44.53Cyclotella sp. 35.67 80.20Cosmarium phaseolus 5.43 85.63Dinobryon sp. 2.93 88.56Peridinium goslaviense 2.69 91.25
Environ Monit Assess (2011) 181:563–575 571
co-dominate with diatoms and desmids only inlate July due to the presence of few (one in-dividual per millilitre) but large-sized Ceratiumfurcoides individuals.
Cluster analysis separated the samplings inthree groups (Fig. 4). Group I consisted of samplescollected in late July and early August, duringthe first period of water withdrawal from thereservoir, Group II of the sample collected in lateAugust when no considerable water withdrawalwas observed, and Group III of samples collectedin September, during the second period of waterwithdrawal from the reservoir. Results of SIM-PER analysis (Table 3) indicated that M. aerug-inosa was the species differentiating the threegroups.
Water quality
Total phytoplankton biovolume exhibited valueslower than the boundary (2.1 mm3 l−1) of G/Mecological potential indicating good ecological wa-ter quality, with the exception of a short shiftto moderate levels in early September when thehighest value (2.7 mm3 l−1) was recorded. On thecontrary, the 88% contribution of cyanobacteriato the phytoplankton biovolume (the compositionmetric of phytoplankton) was much higher thanthe recommended boundary of 28% for G/M eco-logical potential.
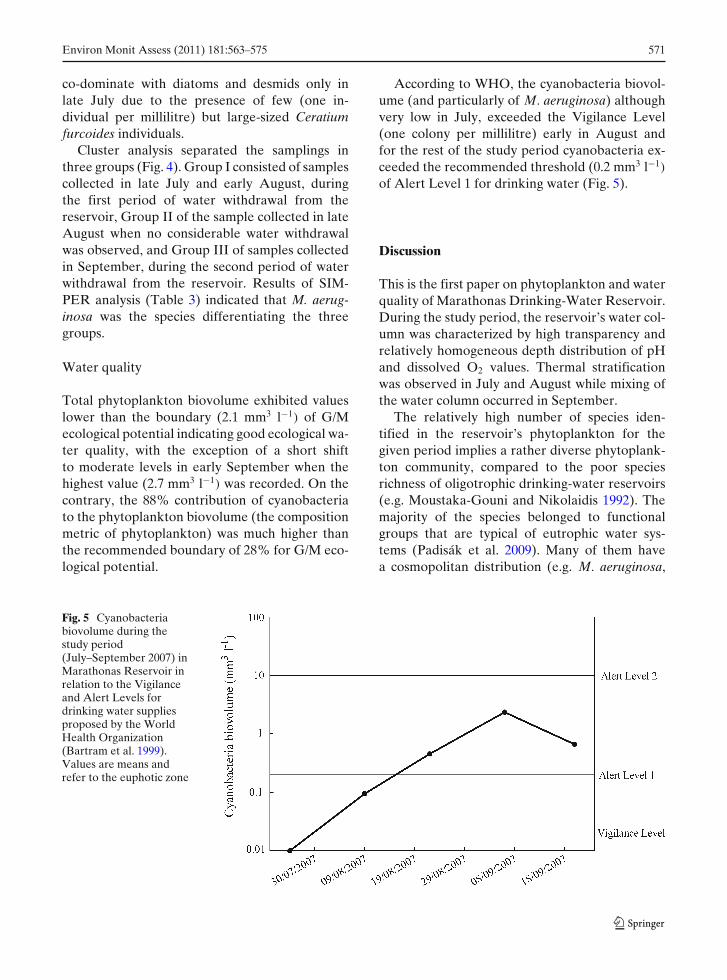
According to WHO, the cyanobacteria biovol-ume (and particularly of M. aeruginosa) althoughvery low in July, exceeded the Vigilance Level(one colony per millilitre) early in August andfor the rest of the study period cyanobacteria ex-ceeded the recommended threshold (0.2 mm3 l−1)
of Alert Level 1 for drinking water (Fig. 5).
Discussion
This is the first paper on phytoplankton and waterquality of Marathonas Drinking-Water Reservoir.During the study period, the reservoir’s water col-umn was characterized by high transparency andrelatively homogeneous depth distribution of pHand dissolved O2 values. Thermal stratificationwas observed in July and August while mixing ofthe water column occurred in September.
The relatively high number of species iden-tified in the reservoir’s phytoplankton for thegiven period implies a rather diverse phytoplank-ton community, compared to the poor speciesrichness of oligotrophic drinking-water reservoirs(e.g. Moustaka-Gouni and Nikolaidis 1992). Themajority of the species belonged to functionalgroups that are typical of eutrophic water sys-tems (Padisák et al. 2009). Many of them havea cosmopolitan distribution (e.g. M. aeruginosa,
Fig. 5 Cyanobacteriabiovolume during thestudy period(July–September 2007) inMarathonas Reservoir inrelation to the Vigilanceand Alert Levels fordrinking water suppliesproposed by the WorldHealth Organization(Bartram et al. 1999).Values are means andrefer to the euphotic zone

572 Environ Monit Assess (2011) 181:563–575
Dinobryon divergens, Synedra acus, C. phaseolus,Tetraedron minimum) while others are of specialinterest regarding their taxonomy and biogeog-raphy such as A. bergii (Gkelis et al. 2005b).Among the species identified, M. aeruginosaand A. bergii are well-known toxin-producingspecies (Schembri et al. 2001; Sivonen and Jones1999). The occurrence of M. aeruginosa is well-documented in many eutrophic Mediterraneanfreshwaters (Cook et al. 2004) whereas A. bergiiis reported in this paper for the first time inGreek freshwaters. Its close taxonomic relativeAphanizomenon ovalisporum has been reportedfrom other Greek freshwaters used for drinking-water supply (Chrisostomou et al. 2009; Gkelis etal. 2005b).
Phytoplankton diversity in the reservoir, asexpressed by species richness, was found to bemaximum at the period of no considerable wa-ter withdrawal that followed pulses of increasedflushing rate. Such flushing pulses with a peakevery 4–7 days might act as intermediate dis-turbances triggering increased diversity as hasbeen documented for intermediate disturbancesin other freshwater systems and phytoplank-ton cultures (e.g. Gaedeke and Sommer 1986;Padisák et al. 1999). Phytoplankton biovolumedid not reach high values during the study pe-riod. Among the 62 species identified, only fourwere dominant, as there was a great numberof rare species (relative biovolume <1%). Thedominance progressed from mid-summer diatoms(with desmids and dinoflagellates as subdomi-nants) to late summer cyanobacteria, with a sud-den shift to an equally shared assemblage of thesetwo groups at the end of September. The sum-mer dominance of cyanobacteria has been com-monly observed in eutrophic lakes in Greece (e.g.Moustaka-Gouni 1993) and worldwide, regardlessof their stratification pattern and geographicallocation (Padisák and Reynolds 1998). However,the change or share in dominance between di-atoms and cyanobacteria implies less stable phys-ical conditions (Reynolds et al. 1993). The shortdominance of desmids on the other hand duringthe stratified period that is common in tropicallakes which exhibit a special mixing pattern re-ferred as atelomixis or partial atelomixis (Barbosaand Padisák 2002; Souza et al. 2008) might be as-
sociated with a partial atelomixis in this Mediter-ranean reservoir.
In reservoirs, phytoplankton can be pro-foundly affected by the rather special hydrologi-cal regime and particularly by changing flushingrate (Naselli-Flores 1999; Padisák et al. 1999).In Marathonas Reservoir, phytoplankton com-position and biovolume appear to be related tochanges in water withdrawal and flushing rate.In July, a flushing rate with a maximum of 0.7%of reservoir’s water volume per day occurring inpulses for a period of 25 days coincided withlow phytoplankton biovolume. This phytoplank-ton biovolume consisted mainly by small, fast-growing species (Cyclotella sp., C. phaseolus).Species with similar life strategies dominated phy-toplankton in another Greek reservoir under asimilar hydrological regime (e.g. Moustaka-Gouniet al. 2000). Phytoplankton biovolume decreasewas observed in late September coinciding withthe lowest observed reservoir’s water volume(Fig. 2). The question was whether inflows sim-ply replaced the water volume by direct displace-ment or by a flushing action, in which the inflowvolume mixed extensively with the standing vol-ume (see Reynolds 2006). In September, phyto-plankton individuals in the reservoir were in amixed water column and were less affected bydilution. Furthermore, the preceding phytoplank-ton increase and cyanobacterial dominance wereobserved when the water volume decreased to thelowest level. This occurred after a period of noflushing in the reservoir indicating the flushingimpact on phytoplankton dynamics.
In the peak of phytoplankton biovolume withthe exclusive dominance of cyanobacteria, M.aeruginosa had the primary role. This species ex-hibited a maximum biovolume of 2.3 mm3 l−1 andwas not observed to increase further when subse-quent flushing pulses persisted for 15–20 days andmixing prevailed. The impact of physical mixingon Microcystis and its replacement by diatoms iswell known (Huisman et al. 2004). The possibleimpact of different flushing rates on Microcystiswas shown by the separation of the samplingsin three groups according to this species: (1) ab-sence, (2) increase and peak and (3) decrease.During the study period, the reservoir’s zooplank-ton (low abundance, rotifers as the dominant
Environ Monit Assess (2011) 181:563–575 573
group; Katsiapi et al. unpublished data) could notaffect Microcystis negatively. Padisák et al. (1999)showed that Microcystis may tolerate flushingeven at a range of 0.5–1% of reservoir’s watervolume per day (persisting for more than a month)when a considerable population biovolume hasalready developed. In the case of the hypertrophicGreek Lake Kastoria, a flushing rate of 0.53% oflake’s volume per day in spring time proved veryeffective in breaking the increase of filamentous(both oscillatorialean and nostocalean)—sensitiveto flushing—cyanobacteria that usually appearedand dominated early in summer (Moustaka-Gouni et al. 2006). Nevertheless, this did not affectM. aeruginosa which appeared late in the succes-sion (Moustaka-Gouni et al. 2007).
The studied phytoplankton parameters are crit-ical for the reservoir’s ecological water quality(European Parliament Council 2000). In terms ofphytoplankton biovolume, water quality was goodwith a slight deviation to moderate. However, thehigh contribution of cyanobacteria in the phyto-plankton biovolume was not indicative of a goodquality. In addition to the above phytoplanktonmetrics, both associated with the same pressure(i.e. eutrophication), species and functional groupcomposition reflected a rather moderate ecologi-cal water quality. This is a first attempt to assessecological water quality since neither the rules forcombining different metrics for a phytoplanktonbiological element index have been establishedat a national and Mediterranean level nor allthe types of Mediterranean reservoirs have beenincluded in the Intercallibration Exercise (JRCEuropean Commission 2009). Though the sam-pling period did not cover a whole year, it wasconcentrated in the period that is considered tobe critical for water quality issues and monitoring(Padisák et al. 2006; Hajnal and Padisák 2008).
The implementation of the Alert LevelsFramework proposed by WHO revealed thatfor a proper management of cyanobacteria inMarathonas Reservoir: (1) a suitable monitoringprogram is required and (2) analysis of cyanotoxinconcentration in raw water is required once thepresence of known toxic species is detected. In2007, the biovolume of M. aeruginosa, knownto produce toxins, exceeded the Alert Level 1threshold in the reservoir. The molecular analysis
of cyanobacterial diversity in the reservoir at thesame period of this study revealed a phylotype re-lated to Microcystis, which was practically identi-cal to a M. aeruginosa strain whose genome bearsthe whole mcy operon of microcystin synthesis(Lymperopoulou et al. 2010). In addition, accord-ing to Kurmayer et al. (2003) larger colonies ofM. aeruginosa, as was our case at the peak, aremore likely to be toxic. Furthermore, Microcystisblooms identified in Greek freshwater systemshave shown to be 100% toxin-containing (Gkeliset al. 2005a). Under such conditions, Microcystisblooms provide a serious threat for the waterquality of Marathonas drinking-water Reservoirand immediate action must take place to minimizethe risk of adverse human health effects.
In conclusion, phytoplankton dynamics duringthe warm period of the year in Marathonas Reser-voir was characterized by shifts between ‘goodquality’ species (small centric diatoms) and ‘nui-sance’ ones (cyanobacteria). These shifts appearto be related to the reservoir’s flushing and mix-ing regime indicating possible powerful tools forimproving the reservoir’s water quality; both bymeans of the implementation of the WFD forsurface waters and for minimizing any potentialhuman health risk.
Acknowledgements We would like to thank the ExternalAquaduct Operations Department (Raw Water Intake Di-vision, EYDAP SA) for providing hydrological data, Mr.Tolis Patousis and all the members of the technical staff ofEYDAP SA for facilitating the sample collection.
References
Barbosa, F. A. R., and Padisák, J. (2002). The forgottenlake stratification pattern: atelomixis, and its ecologi-cal importance. Verhandlungen internationale Vereini-gung für theoretische und angewandte Limnologie, 28,1385–1395.
Bartram, J., Burch, M., Falconer, I. R., Jones, G., &Kuiper-Goodman, T. (1999). Situation assessment,planning and management. In I. Chorus, & J. Bartram(Eds.), Toxic cyanobacteria in water (pp. 179–209).London: E and FN Spon.
Chrisostomou, A., Moustaka-Gouni, M., Sgardelis, S., &Lanaras, T. (2009). Air-dispersed phytoplankton ina Mediterranean River-Reservoir System (Aliakmon-Polyphytos, Greece). Journal of Plankton Research,31, 877–884.

574 Environ Monit Assess (2011) 181:563–575
Clarke, K. R., & Warwick, R. M. (1994). Change in ma-rine communities: An approach to statistical analysisand interpretation. Plymouth: Natural EnvironmentResearch Council, Plymouth Marine Laboratory.
Cook, C. M., Moustaka-Gouni, M., Gkelis, S., &Lanaras, T. (2005). Greece: Cyanotoxin risk assess-ment, risk management and regulation. In I. Chorus(Ed.), Current approaches to cyanotoxin risk assess-ment, risk management and regulations in differentcountries (pp. 69–75). Berlin: Federal EnvironmentalAgency (Umweltbundesamt).
Cook, C. M., Vardaka, E., & Lanaras, T. (2004). Toxiccyanobacteria in Greek Freshwaters, 1987–2000: Oc-currence, toxicity, and impacts in the Mediterraneanregion. Acta Hydrochimica et Hydrobiologica, 32, 107–124.
European Parliament Council (2000). Directive 2000/60/EC of the European Parliament and of the coun-cil of 23 October 2000 establishing a framework forcommunity action in the field of water policy. Of f icialJournal of the European Communities, L327, 1–72.
Gaedeke, A., & Sommer, U. (1986). The influence ofthe frequency of periodic disturbances on the main-tenance of phytoplankton diversity. Oecologia, 71, 25–28.
Gkelis, S., Harjunpää, V., Lanaras, T., & Sivonen, K.(2005a). Diversity of hepatotoxic microcystins andbioactive anabaenopeptins in cyanobacterial bloomsfrom Greek freshwaters. Environmental Toxicology,20, 249–256.
Gkelis, S., Moustaka-Gouni, M., Sivonen, K., & Lanaras,T. (2005b). First report of the cyanobacterium Apha-nizomenon ovalisporum Forti in two Greek lakes andcyanotoxin occurrence. Journal of Plankton Research,27, 1–6.
Hajnal, É., & Padisák, J. (2008). Analysis of long-termecological status of Lake Balaton based on theALMOBAL phytoplankton database. Hydrobiologia,599, 227–237.
Hillebrand, H., Dürselen, C. D., Kirschtel, D., Pollingher,U., & Zohary, T. (1999). Biovolume calculation forpelagic and benthic microalge. Journal of Phycology,35, 403–424.
Huisman, J., Sharples, J., Stroom, J. M., Visser, P. M.,Edwin, W., Kardinaal, A., et al. (2004). Changes inturbulent mixing shift competition for light betweenphytoplankton species. Ecology, 85(11), 2960–2970.
JRC European Commission (2009). Water FrameworkDirective Intercalibration technical report. Part 2:Lakes. Joint Research Centre, European Commission.http://circa.europa.eu/Public/irc/jrc/jrc_eewai/library?l=/intercalibration_2/jrc51340-volumelakespdf/_EN_1.0_and a=d. Accessed 28 June 2010.
Kennedy, R. H. (1999). Reservoir Design and Operation:Limnological implications and management opportu-nities. In J. G. Tundisi, & M. Straškraba (Eds.), Theo-retical reservoir ecology and its applications (pp. 1–28).The Netherlands: Backhuys.
Kurmayer, R., Christiansen, G., & Chorus, I. (2003). Theabundance of microcystin-producing genotypes cor-relates positively with colony size in Microcystis sp.
and determines its microcystin net production in lakeWannsee. Applied Environmental Microbiology, 69,787–795.
Lymperopoulou, D. S., Kormas, K. A., Moustaka-Gouni,M., & Karagouni, A. D. (2010). Diversity of cyanobac-terial phylotypes in a Mediterranean drinking waterreservoir (Marathonas, Greece). Environmental Mon-itoring Assessment. doi:10.1007/s10661-010-1378-7.
Moustaka, M. (1988). Seasonal variations, annual periodic-ity and spatial distribution of phytoplankton in LakeVolvi. Doctoral dissertation. Aristotle University ofThessaloniki, Greece.
Moustaka-Gouni, M. (1993). Phytoplankton successionand diversity in a warm monomictic, relatively shallowlake: Lake Volvi, Macedonia, Greece. Hydrobiologia,249, 33–42.
Moustaka-Gouni, M., Albanakis, K., Mitrakas, M.,& Psilovikos, A. (2000). Planktic autotrophs andenvironmental conditions in the newly-formedhydroelectric Thesaurus reservoir, Greece. Archiv fürHydrobiologie, 149, 507–526.
Moustaka-Gouni, M., & Nikolaidis, G. (1992). Phyto-plankton and physical–chemical features of TavroposReservoir, Greece. Hydrobiologia, 228, 141–149.
Moustaka-Gouni, M., Vardaka, E., Michaloudi, E.,Kormas, K. A., Tryfon, E., Mihalatou, H., et al.(2006). Plankton food web structure in a eutrophicpolymictic lake with a history of toxic cyanobacterialblooms. Limnology and Oceanography, 51, 715–727.
Moustaka-Gouni, M., Vardaka, E., & Tryfon, E. (2007).Phytoplankton species succession in a shallowMediterranean lake (L. Kastoria, Greece): Steady-state dominance of Limnothrix redekei, Microcystisaeruginosa and Cylindrospermopsis raciborskii.Hydrobiologia, 575, 129–140.
Naselli-Flores, L. (1999). Limnological aspects of Sicil-ian reservoirs: A comparative, ecosystem approach.In J. G. Tundisi, & M. Straškraba (Eds.), Theoreticalreservoir ecology and its applications (pp. 283–311).The Netherlands: Backhuys.
Naselli-Flores, L. (2000). Phytoplankton assemblages intwenty-one Sicilian reservoirs: relationships betweenspecies composition and environmental factors. Hy-drobiologia, 424, 1–11.
Naselli-Flores, L., & Barone, R. (2005). Water-levelfluctuations in Mediterranean reservoirs: setting a de-watering threshold as a management tool to improvewater quality. Hydrobiologia, 548, 85–99.
Padisák, J., Borics, G., Grigorszky, I., & Soróczki-Pintér,É. (2006). Use of phytoplankton assemblages for mon-itoring ecological status of lakes within the WaterFramework Directive: The assemblage index. Hydro-biologia, 553, 1–14.
Padisák, J., Crossetti, L. O., & Naselli-Flores, L. (2009).Use and misuse in the application of the phytoplank-ton functional classification: a critical review with up-dates. Hydrobiologia, 621, 1–19.
Padisák, J., Köhler, J., & Hoeg, S. (1999). The effect ofchanging flushing rates on development of late sum-mer Aphanizomenon and Microcystis populations ina shallow lake, Müggelsee, Berlin, Germany. In J. G.

Environ Monit Assess (2011) 181:563–575 575
Tundisi, & M. Straškraba (Eds.), Theoretical reser-voir ecology and its applications (pp. 411–424). TheNetherlands: Backhuys.
Padisák, J., & Reynolds, C. S. (1998). Selection of phyto-plankton associations in Lake Balaton, Hungary, inresponse to eutrophication and restoration measures,with special reference to the cyanoprokaryotes. Hy-drobiologia, 384, 41–53.
Reynolds, C. S. (2006). Ecology of phytoplankton.Cambridge: Cambridge University Press.
Reynolds, C. S., Huszar, V., Kruk, C., Naselli-Flores, L.,& Melo, S. (2002). Towards a functional classificationof the freshwater phytoplankton. Journal of PlanktonResearch, 24, 417–428.
Reynolds, C. S., & Jaworski, G. H. M. (1978). Enumerationof natural Microcystis populations. European Journalof Phycology, 13, 269–277.
Reynolds, C. S., Padisák, J., & Sommer, U. (1993). Inter-mediate disturbance in the ecology of phytoplanktonand the maintenance of species diversity: A synthesis.Hydrobiologia, 249, 183–188.
Schembri, M. A., Neilan, B. A., & Saint, C. P. (2001). Iden-tification of genes implicated in toxin production inthe cyanobacterium Cylindrospermopsis raciborskii.Environmental Toxicology, 16, 413–421.
Sivonen, K., & Jones, G. (1999). Cyanobacterial toxins. InI. Chorus, & J. Bartram (Eds.), Toxic cyanobacteria inwater (pp. 41–110). London: E and FN Spon.
Souza, M. B. G., Barros, G. F. A., Barbosa, F., Hajnal, É., &Padisák, J. (2008). Role of atelomixis in replacementof phytoplankton assemblages in Dom Helvécio Lake,South-East Brazil. Hydrobiologia, 607, 211–224.
Straškraba, M., & Tundisi, J. G. (1999). Reservoir ecosys-tem functioning: Theory and application. In J. G.Tundisi, & M. Straškraba (Eds.), Theoretical reser-voir ecology and its applications (pp. 565–583). TheNetherlands: Backhuys.
Tundisi, J. G., Matsumura-Tundisi, T., & Rocha, O. (1999).Theoretical basis for reservoir management. In J. G.Tundisi, & M. Straškraba (Eds.), Theoretical reser-voir ecology and its applications (pp. 505–528). TheNetherlands: Backhuys.
Utermöhl, H. (1958). Zur Vervollkommnung der quanti-tativen Phytoplanktonmethodik. Mitteilungen Interna-tionale Vereinigung Theorie Angewandte Limnologie,9, 1–38.
Vardaka, E., Moustaka-Gouni, M., Cook, C. M., &Lanaras, T. (2005). Cyanobacterial blooms and waterquality in Greek waterbodies. Journal of Applied Phy-cology, 17, 391–401.