Estimation of reference conditions for phytoplankton in a naturally eutrophic shallow lake
Spatio-temporal variations of phytoplankton structure and water quality inthe eutrophic freshwater reservoir of Macau
Weiying Zhanga, Inchio Loua,*, Wai Kin Ungb, Yijun Kongb, Kai Meng Moka
aFaculty of Science and Technology, Department of Civil and Environmental Engineering, University of Macau, Av. Padre TomasPereira Taipa, Macau SAR, China, Tel. +853 8397 8469; email: [email protected] (W. Zhang), Tel. +853 8397 8469;Fax: +853 2883 8314; email: [email protected] (I. Lou), Tel. +853 8397 4971; email: [email protected] (K.M. Mok)bLaboratory and Research Center, Macao Water Co. Ltd., 718, Avenida do Conselheiro Borja, Macau SAR, China, Tel. +853 8299 0603;email: [email protected] (W.K. Ung), Tel. +853 8299 0652; email: [email protected] (Y. Kong)
Received 13 October 2013; Accepted 29 May 2014
ABSTRACT
In small-scale pumped-storage reservoirs, physical disturbances have been suggested to beone of the main factors influencing phytoplankton structure and water quality. This studypresented data on dynamic changes of the phytoplankton structure and the quality of rawwater sampled monthly from January 2011 to June 2012, in three locations (with two differ-ent water levels each) of a small pumped-storage reservoir of Macau main storage reservoir.The trophic state index, phytoplankton structure indices, and multivariate statisticaltechniques were applied for assessing trophic state, phytoplankton community, and spatio-temporal variations of the reservoir, respectively. The results showed that the reservoir wascategorized as a eutrophic–hypereutrophic reservoir, with the dominance of Cyanophyta in2011, and of Chlorophyta and Bacillariophyta in 2012. Lowest diversity/evenness and highestdominance happened in June 2011, while highest diversity/evenness and lowest dominanceoccurred in May 2012. Principle component analysis identified four factors that can explain80.8% of the total variance of the water quality data, and cluster analysis generated twoclusters of spatial similarity among the six sampling points and two clusters of temporalsimilarity among the 18 months. Discriminant analysis results revealed only three parame-ters (TP, NO3-N, and Chl-a) that could afford 100% correct assignation in temporal analysis,while no spatial variation was found in spatial analysis. This study highlighted the useful-ness of combination of these methods for the evaluation and interpretation of complexwater quality data-sets and assessment of pollution level of small-scale eutrophic reservoirs.The results from the study can be used in developing monitoring program of freshwaterbodies.
Keywords: Spatio-temporal variations; Phytoplankton structure; Water quality; Multivariatestatistical techniques; Freshwater reservoirs
*Corresponding author.
1944-3994/1944-3986 � 2014 Balaban Desalination Publications. All rights reserved.
Desalination and Water Treatment (2014) 1–16
www.deswater.com
doi: 10.1080/19443994.2014.930933
Dow
nloa
ded
by [
Uni
vers
ity o
f M
acau
Lib
rary
] at
20:
59 2
9 Ju
ne 2
014
1. Introduction
Phytoplankton structure and water quality infreshwater eutrophic reservoirs are becoming a seriousconcern, which may lead to proliferation of harmfulphytoplankton (called algal blooms) under favorableconditions. Algal blooms disturb the ecosystem, dete-riorate the water quality, and most importantly pro-duce cyanotoxins that pose a serious health hazard forhumans [1,2]. To better understand the problem ofalgal blooms and prevent their occurrences, it isimperative to analyze the phytoplankton structure andthe corresponding water quality. Understanding thespatial and temporal variations of phytoplankton com-munity and water quality could help in developingregular monitoring program that is a helpful tool notonly to evaluate the impacts of pollution sources butalso to ensure an efficient management of waterresources and the protection of aquatic ecosystems.
Human activities such as periodic pulses of mixinghave influenced reservoirs features including retentiontimes and water level fluctuations [3]. Due to physicaldisturbances in small-scale pumped-storage eutrophicreservoirs, changes of phytoplankton communitystructure in response to water quality tend to be morepronounced [4,5]. These changes can reveal importantaspects of susceptibilities and tolerances of the speciespresent that form the community, which is fundamen-tal to biological monitoring of the reservoirs. Previousstudies on reservoirs have generally dealt with thestructural compositions of the phytoplankton commu-nity, focusing on the taxonomic surveys and ecologicalstudies [6–8]. Diversity and community comparisonindices of Shannon–Wiener diversity, Simpson diver-sity, Pielou’s evenness, Stander’s similarity index(SIMI), and Margalef’s richness have been recognizedas useful ways for analyzing phytoplankton structurein different water bodies all over the world [9–12].
For analyzing the complex data-set obtained fromlarge numbers of samples and water quality parame-ters at different times and places, univariate andbivariate statistical techniques were traditionally used,which could be far from adequate. Recently, multivari-ate statistical techniques including principle compo-nent analysis (PCA), cluster analysis (CA), anddiscriminant analysis (DA) have been proved to bemore helpful in the interpretation of complex datamatrices to better understand the water quality. Thesemethods have been employed to evaluate and exam-ine the spatial and temporal variations and trends inwater bodies [13–15]. PCA is a very powerful tech-nique applied to reduce the dimensionality of a data-set consisting of a large number of inter-relatedvariables, while retaining as much as possible the
variability present in data-set. It uses an orthogonaltransformation to convert a set of observations of pos-sibly correlated variables into a set of values of uncor-related variables called PCs, thus reducing thecomplexity of multidimensional system by maximiza-tion of component loadings variance and eliminationof invalid components. PCA technique was previouslyused alone or in combination with other methods, tosimplify the interpretation of the relationship withincomplex data-set and model aquatic, environmental,and ecological processes [16,17]. In analyzing the tem-poral and spatial difference of the samples, CA andDA analyses were applied. CA can group objects(cases) into classes (clusters) on the basis of similari-ties within a class and dissimilarities between differentclasses, so that the objects in the same cluster are moresimilar to each other than to those in other clusters,helping in mining the data and indicate patterns [18].DA provides statistical classification of samples and itis performed with prior knowledge of membership ofobjects to particular group or cluster (such as temporalor spatial grouping of a sample is known from itssampling time or site). The DA results are able togroup the samples sharing common properties andhelp in prediction [19].
Main storage reservoir (MSR), a small pumpedMSR of Macau, was reported to have experiencedincreasing frequency of algal blooms, with high con-centrations of Cylindrospermopsis spp. and Microcystisspp. which were producing cyanotoxins [20]. However,detailed information about the phytoplankton compo-sition and the spatio-temporal variations in water qual-ity of MSR are still lacking. There is also only sparseliterature integrating phytoplankton structure indicesand multiple statistical analysis for studying the spa-tio-temporal variation of phytoplankton communityand water quality in small-size freshwater reservoirs.We hypothesized that phytoplankton composition andwater quality would be affected greatly in such small-scale ecosystem. The objectives of this study were toanalyze the spatio-temporal variations of phytoplank-ton structure including dominant species, diversity,evenness, and similarity, and to perform multivariatestatistical techniques (PCA, CA, and DA) for dynamicchanges of water quality in MSR. These results will beused in evaluating the pollution level and developinga water monitoring program in the reservoir.
2. Materials and methods
2.1. Site description and sampling
MSR (22º12´12´´N, 113º33´´12´´E), located in the eastpart of Macau peninsula, is the biggest reservoir in
2 W. Zhang et al. / Desalination and Water Treatment
Dow
nloa
ded
by [
Uni
vers
ity o
f M
acau
Lib
rary
] at
20:
59 2
9 Ju
ne 2
014
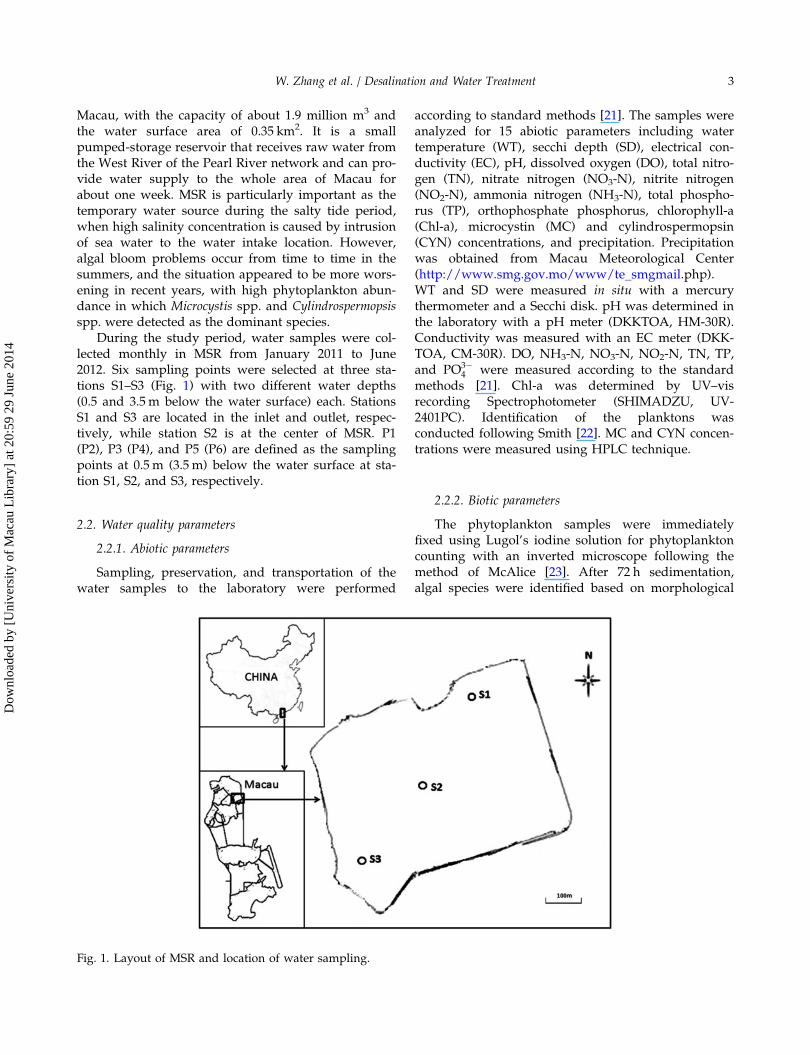
Macau, with the capacity of about 1.9 million m3 andthe water surface area of 0.35 km2. It is a smallpumped-storage reservoir that receives raw water fromthe West River of the Pearl River network and can pro-vide water supply to the whole area of Macau forabout one week. MSR is particularly important as thetemporary water source during the salty tide period,when high salinity concentration is caused by intrusionof sea water to the water intake location. However,algal bloom problems occur from time to time in thesummers, and the situation appeared to be more wors-ening in recent years, with high phytoplankton abun-dance in which Microcystis spp. and Cylindrospermopsisspp. were detected as the dominant species.
During the study period, water samples were col-lected monthly in MSR from January 2011 to June2012. Six sampling points were selected at three sta-tions S1–S3 (Fig. 1) with two different water depths(0.5 and 3.5m below the water surface) each. StationsS1 and S3 are located in the inlet and outlet, respec-tively, while station S2 is at the center of MSR. P1(P2), P3 (P4), and P5 (P6) are defined as the samplingpoints at 0.5 m (3.5 m) below the water surface at sta-tion S1, S2, and S3, respectively.
2.2. Water quality parameters
2.2.1. Abiotic parameters
Sampling, preservation, and transportation of thewater samples to the laboratory were performed
according to standard methods [21]. The samples wereanalyzed for 15 abiotic parameters including watertemperature (WT), secchi depth (SD), electrical con-ductivity (EC), pH, dissolved oxygen (DO), total nitro-gen (TN), nitrate nitrogen (NO3-N), nitrite nitrogen(NO2-N), ammonia nitrogen (NH3-N), total phospho-rus (TP), orthophosphate phosphorus, chlorophyll-a(Chl-a), microcystin (MC) and cylindrospermopsin(CYN) concentrations, and precipitation. Precipitationwas obtained from Macau Meteorological Center(http://www.smg.gov.mo/www/te_smgmail.php).WT and SD were measured in situ with a mercurythermometer and a Secchi disk. pH was determined inthe laboratory with a pH meter (DKKTOA, HM-30R).Conductivity was measured with an EC meter (DKK-TOA, CM-30R). DO, NH3-N, NO3-N, NO2-N, TN, TP,and PO3�
4 were measured according to the standardmethods [21]. Chl-a was determined by UV–visrecording Spectrophotometer (SHIMADZU, UV-2401PC). Identification of the planktons wasconducted following Smith [22]. MC and CYN concen-trations were measured using HPLC technique.
2.2.2. Biotic parameters
The phytoplankton samples were immediatelyfixed using Lugol’s iodine solution for phytoplanktoncounting with an inverted microscope following themethod of McAlice [23]. After 72 h sedimentation,algal species were identified based on morphological
Fig. 1. Layout of MSR and location of water sampling.
W. Zhang et al. / Desalination and Water Treatment 3
Dow
nloa
ded
by [
Uni
vers
ity o
f M
acau
Lib
rary
] at
20:
59 2
9 Ju
ne 2
014

criteria and quantified at ×100 magnification along aSedgewick-Rafter chamber, according to the methoddescribed by Utermohl [24].
2.3. Data analysis
2.3.1. Trophic state index
Trophic status was assessed using trophic stateindex (TSI), the most commonly used index, todescribe trophic levels of lakes and reservoirs. Theoverall TSI was calculated based on TP concentration,Chl-a concentration, and SD, according to the follow-ing equations [25].
TSIðSDÞ ¼ 10� 6� ln SD
ln 2
� �(1)
TSIðTPÞ ¼ 10� 6� ln ð48TPÞln 2
� �(2)
TSIðChlÞ ¼ 10� 6� 2:04� 0:68 lnChl
ln 2
� �(3)
TSIðoverallÞ ¼ TSIðSDÞ þ TSIðTPÞ þ TSIðChlÞ3
(4)
Four classes, oligotrophic, mesotrophic, eutrophic, andhypereutrophic states with the corresponding TSI of< 30–40, 40–50, 50–70, 70–100+ are defined, from lowto high primary productivity.
2.3.2. Community comparison indices
(1) The diversity was estimated using the Shannonand Wiener index [26]:
H0 ¼ �Xs
i¼1
pi log2 pi (5)
where pi is the proportion of individuals in species iand s is the number of species encountered.
(2) The Simpson index (D) of diversity was firstintroduced by Simpson [27], and it is used tomeasure the degree of dominance:
D ¼Xs
i¼1
p2i (6)
(3) The evenness was assessed using H0 [28] asfollows:
J0 ¼ H0
log2 s(7)
where H0 is the Shannon’s index in a sample and s isthe number of species.
(4) Margalef’s richness [29] index:
s� 1
lnNi(8)
where s is the number of species and Ni is the numberof individuals. The richness referred to the number ofalgal taxa registered in each sample. Generally, in ahealthy environment, Margalef’s richness index ishigher in the range of 2.5–3.5 [30].
(5) The Stander’s [31] SIMI is calculated to com-pare two successive phytoplankton communi-ties:
SIMI ¼P
aibiffiffiffiffiffiffiffiffiffiffiffiffiffiffiffiffiffiffiffiffiffiPa2i
Pb2i
q (9)
where ai is the ratio of the number of individuals ofspecies i to the total number of individuals N in sam-ple A; bi is the ratio of the number of individuals ofspecies i to the total number of individuals N in sam-ple B; and s is the total number of species in bothsamples. The range of SIMI value is from 0 (no simi-larity) to 1 (identical). The criteria [32] can be dividedinto five categories to evaluate the meaning of theSIMI index: 0.00–0.199 represents dissimilarity,0.20–0.499 is low similarity, 0.50–0.699 is medium sim-ilarity, 0.70–0.899 is similarity, and 0.90–0.999 is highsimilarity. Our study period was divided into sixgroups (January–Mar 2011, April–June 2011, July–Sep-tember 2011, October–December 2011, January–March2012, and April–June 2012) to compare the similarityand quantify the differences in the kinds of speciespresent and their abundance data.
2.3.3. Statistical analysis
Statistical analyses (PCA, CA and DA) were car-ried out using PASW 19 software package (SPSS Inc.).DA was applied to the raw data, whereas PCA andCA were performed on standardized data throughnormalized transformation due to the wide ranges ofdata dimensionality and different units of measure-ments [15,33,34].
4 W. Zhang et al. / Desalination and Water Treatment
Dow
nloa
ded
by [
Uni
vers
ity o
f M
acau
Lib
rary
] at
20:
59 2
9 Ju
ne 2
014

2.4. Principal component analysis
Kaiser–Meyer–Olkin (KMO) and Bartlett’s spheric-ity tests were performed to examine the suitability ofthe data for PCA [15,19]. KMO is a measure of sam-pling adequacy which indicates the proportion of vari-ance that is common, while Bartlett’s test of sphericityindicates whether a correlation matrix is an identitymatrix, which would indicate that variables are unre-lated. The significance level indicated that whetherthere were significant relationships among the vari-ables. In our case, the selected 14 variables with com-plete data-set were accessed with KMO and Bartlett’stest of sphericity to verify the applicability of PCA.Only parameters with communalities great than 0.5were used for analysis.
2.5. Cluster analysis
The purpose of CA is to group a set of objects intodifferent clusters based on their similarity to eachother. It is the most common approach to decidewhich clusters should be combined or formed. Theclusters are formed sequentially by starting with themost similar pair of objects and grouping higher clus-ters in a step-by-step method. The Ward’s methodwith Euclidean distance [35] is usually applied toshow similarities between two samples, and a “dis-tance” can be represented by the “difference” betweenanalytical values from both of the samples. CA deter-mines the variability of the data-set using the linkagedistance, which is expressed as Dlink/Dmax. It is tra-ditional to use the quotient multiplied by 100 as away to standardize the linkage distance [36]. In ourcase, CA was applied to the water quality data-set togroup the similar spatial (6 points) and temporal (18months) among all the water samples, resulting in thespatial and temporal dendrograms.
2.6. Discriminant analysis
DA is the analysis used to determine which contin-uous variables discriminate between two or more nat-urally occurring groups. The details have beendescribed in previous studies [34,37]. It performs anal-ysis on raw data and its technique set up a discrimi-nant function (DF) for each group, as written by thefollowing equation:
fðGiÞ ¼ ki þXnj¼1
WijPij (10)
where i is the number of groups (G), ki is the constantinherent to each group, n is the number of parametersused to classify a set of data into a given group, Wj isthe weight coefficient, assigned by DA to a givenselected parameters (Pj). However, there is only oneDF for a 2-group DA. Wilk’s lambda is used to test ifthe discriminant model is significant, where “Sig.”p value <0.05 is required. If DA is effective for a set ofdata, the classification table of correct and incorrectestimates will yield a high correct percentage. In thisstudy, DA was performed on grouped periods andsections based on the CA results.
3. Results
3.1. Water quality in MSR
3.1.1. Abiotic parameters
The rainfall in the study period (data not shownhere) was 2,131.8 mm yearly in average, with twopeaks in the summers (June 2011 and April 2012) andnearly no precipitation in the dry and cold seasons.Other water quality parameters were measured andsummarized in Fig. 2. It was showed that the physicalparameters, temperature, SD, conductivity, and Chl-afluctuated from time to time, while DO and pH main-tained relatively stable (Fig. 2(a)). Variations in nitro-gen and phosphorus concentrations (Fig. 2(b) and (c))were observed during the study. High concentrationsof TN and TP were observed from July to January,resulting in high phytoplankton density in summer(Fig. 3). Low phytoplankton abundance from Novem-ber to January was because of the low temperature inwinter which is another more important factor affect-ing the micro-organisms’ growth. Furthermore, lowTN/TP ratio (<10) for most time was found in MSR,thus favored the blue algae (Fig. 3). The concentrationsof CYN and MC (Fig. 2(d)) showed one peak in Febru-ary 2011, after which both concentrations decreased tonearly zero in March and April of 2011. Then both cy-anotoxins showed different behaviors: the CYN dra-matically increased and kept at a high level until theend of 2011, while MC maintained at a low level untilthe April of 2012 and started to increase in May andJune. These results were consistent with the dynamicchanges of the corresponding species, Cylindrospermopsisspp. and Microcystis spp. (Fig. 5), particularlyMicrocystis spp. maintained an extremely low level ofcell number during the whole year of 2011 and gradu-ally increased in 2012, while Cylindrospermopsis spp.had high concentrations in 2011 and dramaticallydecreased in 2012.
W. Zhang et al. / Desalination and Water Treatment 5
Dow
nloa
ded
by [
Uni
vers
ity o
f M
acau
Lib
rary
] at
20:
59 2
9 Ju
ne 2
014

The TSI (SD), TSI (TP), and TSI (Chl) of the reser-voir were calculated as 62–75, 66–96, and 49–74,respectively, from which the overall TSI was estimated
as 65–82 by taking the average of the three values.The results indicated that MSR was categorized as areservoir between eutrophic and hypereutrophicstatus.
3.2. MSR phytoplankton community
3.2.1. Phytoplankton species compositions and densities
Thirty-five taxa from the six divisions includingCyanophyta, Chlorophyta, Bacillariophyta, Cryptophyta,Pyrrophyta, and Euglenophyta were identified andshown in Table 1.
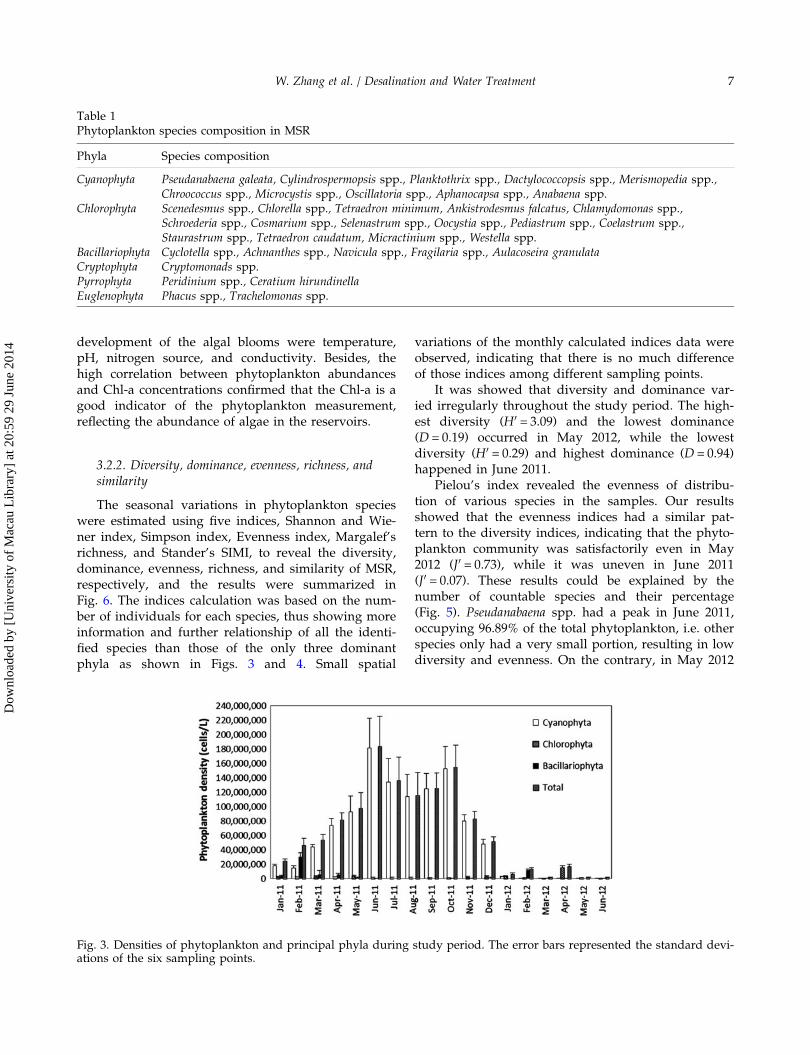
Cyanophyta, Chlorophyta, and Bacillariophyta werethe most important phytoplankton constituents, occu-pying more than 95% of the total phytoplankton, withsmall variations of the monthly counting data amongdifferent sampling points observed (Fig. 3). It shouldbe noted that Cyanophyta was dominant in 2011,especially during the summer and autumn, whileChlorophyta and Bacillariophyta were the dominant con-stitutes in 2012 (Fig. 4). Further species-level micro-scopic counting results indicated that Pseudanabaenaspp., Cylindrospermopsis spp., Dactylococcopsis spp.,Merismopedia spp., Scenedesmus spp., and Chlorella spp.were the dominant species in the study period(Fig. 5). Starting from March 2011, cyanobacteria dom-inated with relative abundances more than 95%. Itbecame dominant very rapidly and remained at highlevel until the end of the year. Though Pseudanabaenaspp. was the dominant species of cyanobacteria formost of the time, it was not considered to be the noto-rious species, as it releases no cyanotoxins, reportedfrom literature, but may only clog the filters duringthe treatment process. Different from Microcystis spp.that was the dominant species causing algal blooms inprevious years, Cylindrospermopsis raciborskii was thedominant toxic species in the study period. It was alsofound that, compared to that of 2011, phytoplanktonabundance in the first half of the year 2012 was dra-matically decreased, which was due to the partialchange of source water from the mainland China. Thischange would definitely affect the water quality, thusresulting in the change of phytoplankton structure, inthe small-scale pumped-storage reservoir.
The total phytoplankton maintained at a high levelduring April–November 2011, which was positivelycorrelated with temperature (rs = 0.58, p < 0.01), pH(rs = 0.73, p < 0.01), NH4-N (rs = 0.74, p < 0.01), and Chl-a (rs = 0.90, p < 0.01), and anti-correlated with SD(rs = −0.56, p < 0.01), conductivity (rs = −0.62, p < 0.01),NO3-N (rs = −0.88, p < 0.01), and NO2-N (rs = −0.76,p < 0.01). These results suggested that the mostimportant water parameters associated with the
Fig. 2. Variations of 14 abiotic water parameters, with (a)temperature, pH, DO, Chl-a, SD, and conductivity; (b) TN,NO�
3 -N, NO�2 -N, and NHþ
4 -N; (c) TP and PO3�4 ; and (d)
CYN and MC. The error bars represented the standarddeviations of the six samples.
6 W. Zhang et al. / Desalination and Water Treatment
Dow
nloa
ded
by [
Uni
vers
ity o
f M
acau
Lib
rary
] at
20:
59 2
9 Ju
ne 2
014
development of the algal blooms were temperature,pH, nitrogen source, and conductivity. Besides, thehigh correlation between phytoplankton abundancesand Chl-a concentrations confirmed that the Chl-a is agood indicator of the phytoplankton measurement,reflecting the abundance of algae in the reservoirs.
3.2.2. Diversity, dominance, evenness, richness, andsimilarity
The seasonal variations in phytoplankton specieswere estimated using five indices, Shannon and Wie-ner index, Simpson index, Evenness index, Margalef’srichness, and Stander’s SIMI, to reveal the diversity,dominance, evenness, richness, and similarity of MSR,respectively, and the results were summarized inFig. 6. The indices calculation was based on the num-ber of individuals for each species, thus showing moreinformation and further relationship of all the identi-fied species than those of the only three dominantphyla as shown in Figs. 3 and 4. Small spatial
variations of the monthly calculated indices data wereobserved, indicating that there is no much differenceof those indices among different sampling points.
It was showed that diversity and dominance var-ied irregularly throughout the study period. The high-est diversity (H0 = 3.09) and the lowest dominance(D = 0.19) occurred in May 2012, while the lowestdiversity (H0 = 0.29) and highest dominance (D = 0.94)happened in June 2011.
Pielou’s index revealed the evenness of distribu-tion of various species in the samples. Our resultsshowed that the evenness indices had a similar pat-tern to the diversity indices, indicating that the phyto-plankton community was satisfactorily even in May2012 (J0 = 0.73), while it was uneven in June 2011(J0 = 0.07). These results could be explained by thenumber of countable species and their percentage(Fig. 5). Pseudanabaena spp. had a peak in June 2011,occupying 96.89% of the total phytoplankton, i.e. otherspecies only had a very small portion, resulting in lowdiversity and evenness. On the contrary, in May 2012
Table 1Phytoplankton species composition in MSR
Phyla Species composition
Cyanophyta Pseudanabaena galeata, Cylindrospermopsis spp., Planktothrix spp., Dactylococcopsis spp., Merismopedia spp.,Chroococcus spp., Microcystis spp., Oscillatoria spp., Aphanocapsa spp., Anabaena spp.
Chlorophyta Scenedesmus spp., Chlorella spp., Tetraedron minimum, Ankistrodesmus falcatus, Chlamydomonas spp.,Schroederia spp., Cosmarium spp., Selenastrum spp., Oocystia spp., Pediastrum spp., Coelastrum spp.,Staurastrum spp., Tetraedron caudatum, Micractinium spp., Westella spp.
Bacillariophyta Cyclotella spp., Achnanthes spp., Navicula spp., Fragilaria spp., Aulacoseira granulataCryptophyta Cryptomonads spp.Pyrrophyta Peridinium spp., Ceratium hirundinellaEuglenophyta Phacus spp., Trachelomonas spp.
Fig. 3. Densities of phytoplankton and principal phyla during study period. The error bars represented the standard devi-ations of the six sampling points.
W. Zhang et al. / Desalination and Water Treatment 7
Dow
nloa
ded
by [
Uni
vers
ity o
f M
acau
Lib
rary
] at
20:
59 2
9 Ju
ne 2
014
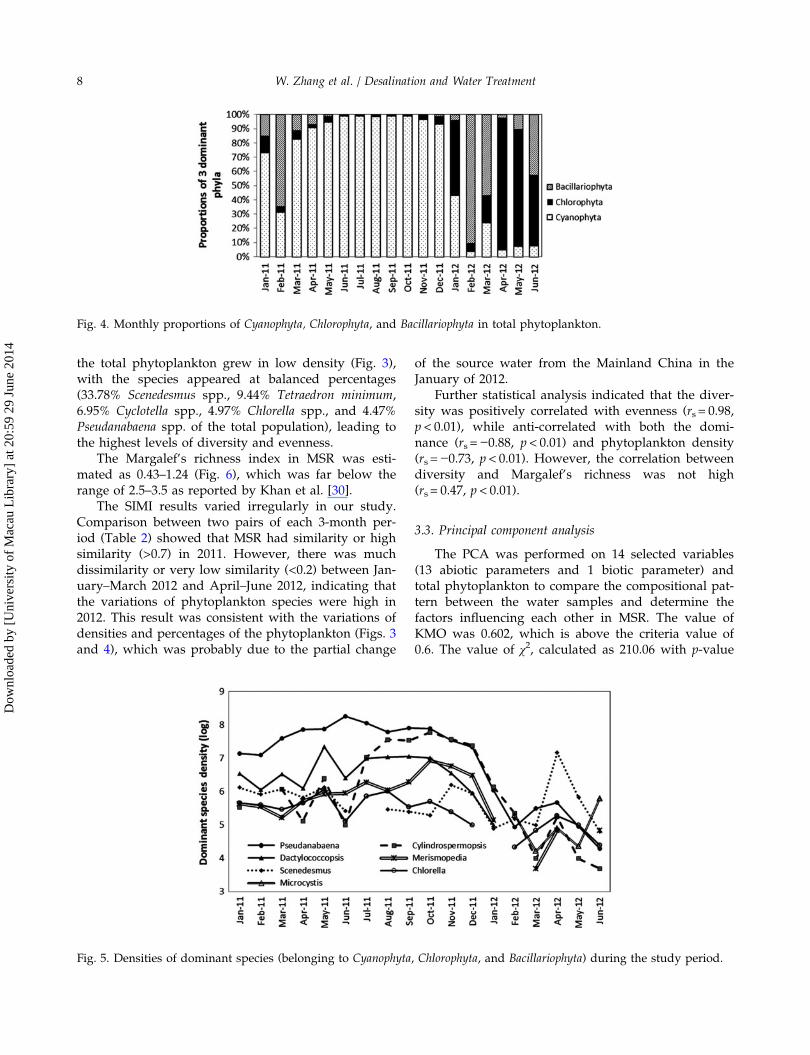
the total phytoplankton grew in low density (Fig. 3),with the species appeared at balanced percentages(33.78% Scenedesmus spp., 9.44% Tetraedron minimum,6.95% Cyclotella spp., 4.97% Chlorella spp., and 4.47%Pseudanabaena spp. of the total population), leading tothe highest levels of diversity and evenness.
The Margalef’s richness index in MSR was esti-mated as 0.43–1.24 (Fig. 6), which was far below therange of 2.5–3.5 as reported by Khan et al. [30].
The SIMI results varied irregularly in our study.Comparison between two pairs of each 3-month per-iod (Table 2) showed that MSR had similarity or highsimilarity (>0.7) in 2011. However, there was muchdissimilarity or very low similarity (<0.2) between Jan-uary–March 2012 and April–June 2012, indicating thatthe variations of phytoplankton species were high in2012. This result was consistent with the variations ofdensities and percentages of the phytoplankton (Figs. 3and 4), which was probably due to the partial change
of the source water from the Mainland China in theJanuary of 2012.
Further statistical analysis indicated that the diver-sity was positively correlated with evenness (rs = 0.98,p < 0.01), while anti-correlated with both the domi-nance (rs = −0.88, p < 0.01) and phytoplankton density(rs = −0.73, p < 0.01). However, the correlation betweendiversity and Margalef’s richness was not high(rs = 0.47, p < 0.01).
3.3. Principal component analysis
The PCA was performed on 14 selected variables(13 abiotic parameters and 1 biotic parameter) andtotal phytoplankton to compare the compositional pat-tern between the water samples and determine thefactors influencing each other in MSR. The value ofKMO was 0.602, which is above the criteria value of0.6. The value of χ2, calculated as 210.06 with p-value
Fig. 4. Monthly proportions of Cyanophyta, Chlorophyta, and Bacillariophyta in total phytoplankton.
Fig. 5. Densities of dominant species (belonging to Cyanophyta, Chlorophyta, and Bacillariophyta) during the study period.
8 W. Zhang et al. / Desalination and Water Treatment
Dow
nloa
ded
by [
Uni
vers
ity o
f M
acau
Lib
rary
] at
20:
59 2
9 Ju
ne 2
014

less than 0.0005 by Bartlett’s test of sphericity test,indicated that the analysis was applicable [38]. Thescree test suggested that there were four components(PC) with the eigen values greater than 1, in which allthe 14 variables were included. PCA explained 80.84%of the variance from the total data in PC1–PC4. Thebiplot (Fig. 7) indicated that PC1 (44.92%) was mainlycomposed of nitrogen sources, physical, and biologicalparameters. PC2 (17.77%) was mostly influenced byclimatic parameters and TN. PC3 (10.13%) and PC4(8.03%) were defined as the phosphorus source andSD (not shown here), respectively. The results fromPCA suggested that most of the variations can beexplained by the nutrients, physical, and soluble salts.Though PCA did not reduce the number of data inthis study (as all the variables were included), itserved as a means to identify those parameters thathad the greatest contribution to variation in the waterquality of reservoirs and indicated possible sets of pol-lutant sources.
3.4. Temporal variations
3.4.1. Cluster analysis
The difference of all the sampling months was rep-resented by the length of each two branch lines asshown in the dendrogram: the greater the length, thegreater the difference. Temporal CA generated thedendrogram (Fig. 8) that grouped the 18months intotwo clusters at (Dlink/Dmax) *100 = 20, with Cluster 1in April–December 2011, and Cluster 2 in January–March 2011 and January–June 2012. The two clustersclassification was in accordance with the cyanobacteria-blooming period and cyanobacteria-depression period(Figs. 3 and 4) and was also consistent with the corre-sponding SD, conductivity, NO3-N, NH4-N, and Chl-a(Fig. 2) in both the periods, implying that samplingonly during these two periods in a year possibly suf-ficed for assessment of temporal variations in waterquality of MSR, assuming that other factors wereinsignificant.
Fig. 6. Indices of diversity, dominance, evenness, and richness over time. The error bars represented the standard devia-tions of the six sampling points.
Table 2SIMI comparisons in the study period
2011 2012
January–March
April–June
July–September
October–December
January–March
April–June
2011 January–March 1April–June 0.910 1July–September 0.873 0.955 1October–December
0.686 0.744 0.906 1
2012 January–March 0.214 0.134 0.155 0.185 1April–June 0.086 0.046 0.042 0.053 0.105 1
W. Zhang et al. / Desalination and Water Treatment 9
Dow
nloa
ded
by [
Uni
vers
ity o
f M
acau
Lib
rary
] at
20:
59 2
9 Ju
ne 2
014

Fig. 7. PCA results in the ordination space of the first and second PCA axis (PC1 and PC2).
Fig. 8. Dendrogram showing hierarchical clustering of monitoring periods according to Ward’s method with Euclideandistance (CA).
10 W. Zhang et al. / Desalination and Water Treatment
Dow
nloa
ded
by [
Uni
vers
ity o
f M
acau
Lib
rary
] at
20:
59 2
9 Ju
ne 2
014

3.4.2. Discriminant analysis
Temporal DA was performed on the two periodclusters (April–December 2011/January–March 2011and January–June 2012). DFs obtained from the stan-dard and stepwise modes of DA were listed in Table 3,in which in the standard mode all water parameterswere included, while in the stepwise mode, only threeparameters were considered, thus reducing variablesin the further analysis. However, whatever the stan-dard mode or stepwise mode was used, it renderedthe corresponding classification matrices (CMs) assign-ing 100% cases correctly. These results showed thatTP, NO3-N, and Chl-a were the most significant vari-ables to discriminate between the two periods, i.e.accounting for most of the expected temporal varia-tions in MSR. Therefore, nitrogen and phosphorussources may contribute to the concentration of Chl-a,the indicator of phytoplankton abundance.
3.5. Spatial variations
3.5.1. Cluster analysis
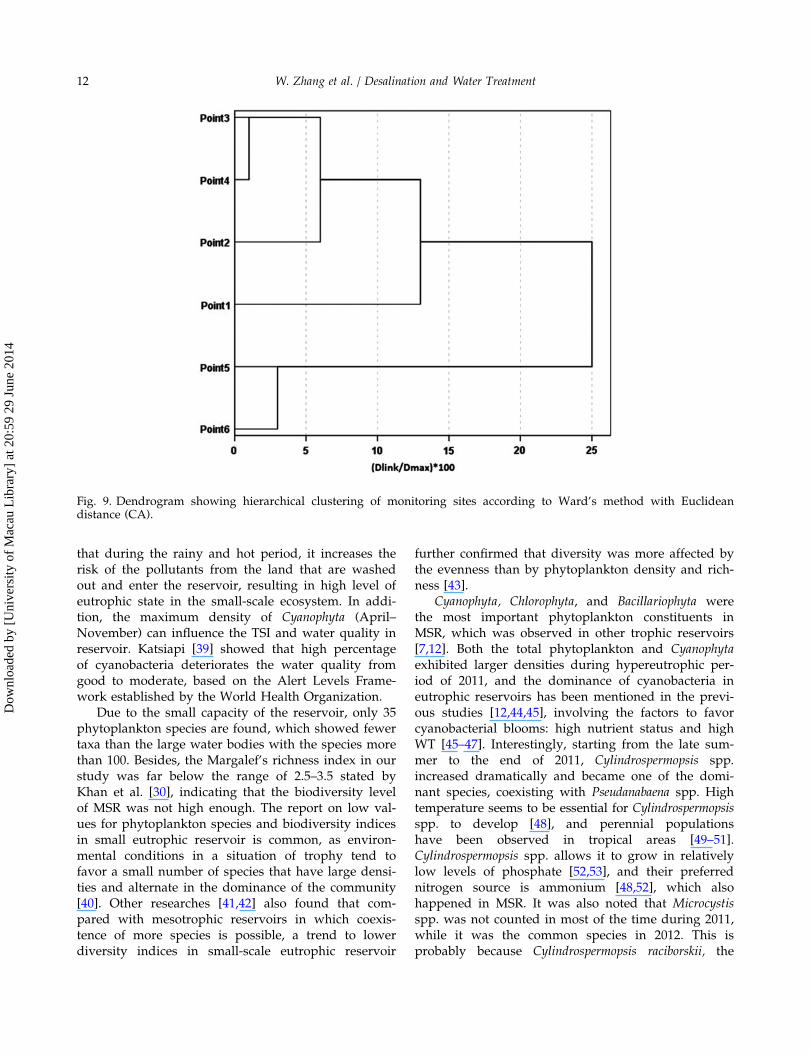
Spatial CA results were shown in a dendrogram(Fig. 9) where all six sampling points on the reservoirswere grouped into two statistically significant clustersat (Dlink/Dmax) *100 = 20. Cluster 1 consisted of foursampling points (p1, p2, p3, and p4, i.e. the center and
the inlet of MSR) and cluster two consisted of theother points (p5 and p6, i.e. the outlet of MSR). Theseresults showed that there was a certain level of spatialfluctuation on the water quality between the inlet/cen-ter and the outlet, in spite of the small-scale reservoirof MSR.
Both Figs. 8 and 9 confirmed that MSR is a smallpumped-storage reservoir with no significant spatialdifference but with high temporal difference. Thus,this information could provide a guide for the MacaoWater Utility to monitor the water quality only atdifferent times without taking samples at differentlocations.
3.5.2. Discriminant analysis
Spatial DA was also performed on the two sectionclusters (p1-p2-p3-p4/p5-p6) using standard and step-wise modes. However, the results using both modesshowed the significance level approaching to 1, i.e.failing to complete DA. The reason was mainlybecause in such a small pumped-reservoir of MSR,water quality characteristics at different points weresimilar. This result was also consistent with that per-formed by CA where the water parameters in MSRare relatively uniform, and nearly no spatial variationswere found between the different sampling points.
Based on the results from CA and DA, we can con-clude that there is no spatial difference for water qual-ity variables, while much difference between differentperiods exists. It is recommended that, in the futurewater quality monitoring program and strategy, moreefforts should be placed to increase the sampling fre-quency at different times, instead of increasing sam-pling points of MSR. Probably a couple of samplingpoints are enough to extract enough information forfurther analysis.
4. Discussion
MSR is a small pumped-storage reservoir with ashort hydraulic retention time (HRT) (~90 d), thus itswater qualities are greatly influenced by the externalsource water and the anthropogenic activities. Due tothe change of source water from the Mainland Chinain the January of 2012, the SD and Chl-a concentrationvaried dramatically from 0.4 to 0.75 m and 45 to10mg/m3, respectively. Our overall monthly TSIresults indicated that MSR was classified as eutrophicreservoir in rainy and cold seasons (December–March)and as hypereutrophic reservoir in rainy and hot sea-sons (April–November). These findings were similarto our previous study [20], which can be explained by
Table 3Classification functions for DA of temporal variations inMSR
Parameters
Coefficient
Standard mode Stepwise modeFunction Function
Temperature 0.709SD 14.159Conductivity 0.173pH 0.748DO 2.430TN 16.720TP 3.582 5.327NO3-N −71.442 −14.276NO2-N 0.023NH4-N 43.465Orthophosphate 148.374Chl-a 0.126 0.046MC 817.505CYN 1.544Rainfall −0.006Phytoplankton 0.000(Constant) −103.023 1.801Sig. 0.005 0.000
W. Zhang et al. / Desalination and Water Treatment 11
Dow
nloa
ded
by [
Uni
vers
ity o
f M
acau
Lib
rary
] at
20:
59 2
9 Ju
ne 2
014
that during the rainy and hot period, it increases therisk of the pollutants from the land that are washedout and enter the reservoir, resulting in high level ofeutrophic state in the small-scale ecosystem. In addi-tion, the maximum density of Cyanophyta (April–November) can influence the TSI and water quality inreservoir. Katsiapi [39] showed that high percentageof cyanobacteria deteriorates the water quality fromgood to moderate, based on the Alert Levels Frame-work established by the World Health Organization.
Due to the small capacity of the reservoir, only 35phytoplankton species are found, which showed fewertaxa than the large water bodies with the species morethan 100. Besides, the Margalef’s richness index in ourstudy was far below the range of 2.5–3.5 stated byKhan et al. [30], indicating that the biodiversity levelof MSR was not high enough. The report on low val-ues for phytoplankton species and biodiversity indicesin small eutrophic reservoir is common, as environ-mental conditions in a situation of trophy tend tofavor a small number of species that have large densi-ties and alternate in the dominance of the community[40]. Other researches [41,42] also found that com-pared with mesotrophic reservoirs in which coexis-tence of more species is possible, a trend to lowerdiversity indices in small-scale eutrophic reservoir
further confirmed that diversity was more affected bythe evenness than by phytoplankton density and rich-ness [43].
Cyanophyta, Chlorophyta, and Bacillariophyta werethe most important phytoplankton constituents inMSR, which was observed in other trophic reservoirs[7,12]. Both the total phytoplankton and Cyanophytaexhibited larger densities during hypereutrophic per-iod of 2011, and the dominance of cyanobacteria ineutrophic reservoirs has been mentioned in the previ-ous studies [12,44,45], involving the factors to favorcyanobacterial blooms: high nutrient status and highWT [45–47]. Interestingly, starting from the late sum-mer to the end of 2011, Cylindrospermopsis spp.increased dramatically and became one of the domi-nant species, coexisting with Pseudanabaena spp. Hightemperature seems to be essential for Cylindrospermopsisspp. to develop [48], and perennial populationshave been observed in tropical areas [49–51].Cylindrospermopsis spp. allows it to grow in relativelylow levels of phosphate [52,53], and their preferrednitrogen source is ammonium [48,52], which alsohappened in MSR. It was also noted that Microcystisspp. was not counted in most of the time during 2011,while it was the common species in 2012. This isprobably because Cylindrospermopsis raciborskii, the
Fig. 9. Dendrogram showing hierarchical clustering of monitoring sites according to Ward’s method with Euclideandistance (CA).
12 W. Zhang et al. / Desalination and Water Treatment
Dow
nloa
ded
by [
Uni
vers
ity o
f M
acau
Lib
rary
] at
20:
59 2
9 Ju
ne 2
014

dominant toxic species in 2011, release high concentra-tion of CYN that reduced the growth of Microcystisspp., as CYN is able to inhibit the protein synthesis ofphytoplankton [54]. Furthermore, the two importantcyanotoxin-producing species, Cylindrospermopsis raci-borskii and Microcystis spp., alternatively became thedominant toxic species in such a relatively simple eco-system as MSR. Though the mechanisms of suchchanges are still unclear, it should be taken into con-sideration when developing the monitoring programof the raw water and treated water, particularly forCylindrospermopsis raciborskii whose releasing toxin(CYN) is not a regulatory parameter.
Phytoplankton experienced low growth rates in Jan-uary–March 2011 and January–June 2012, and the domi-nant organisms changed from Cyanophyta to Chlorophytaand Bacillariophyta, which was also observed in Fernan-dez et al. [12]. However, the explanations for such achange were complicated, and the physical distur-bances due to temperature and partial change of theraw water from the mainland China would probably bethe major two reasons. Generally, Chlorophyta and Bacil-lariophyta favor in the shallow and enriched systems[55], and their dominant species, Scenedesmus spp., Chlo-rella spp., Achnanthes spp., and Fragilaria spp., variedgreatly, which was consistent with the SIMI results indi-cating that the large variations in phytoplankton com-positions happened in 2012.
Shannon index is not only the indicator of diver-sity, but also the indicator of pollution level of waterbodies, with the H´ of 3.0–4.5 as slight, 2.0–3.0 as light,1.0–2.0 as moderate, and 0.1–1 as heavy pollution [56].Our results showed that 12 of 18months in the studywere classified as moderate pollution state, which wassimilar to that in Mumbai coast [56]. This can beexplained by that Macau urban area is densely popu-lated and susceptible to heavy anthropogenic stresses.
To further study on the spatial and temporal varia-tions in water quality, PCA was served as a means toidentify those parameters that had the greatest contri-bution to variation in the water quality of reservoirsand indicated possible sets of pollutant sources[34,57]. In our study, phytoplankton was found to becorrelated with water temperature, pH, DO, NH4-N,and Chl-a, and anti-correlated with conductivity, NO3-N, NO2-N, and SD, suggesting that high temperature,sufficient DO, appropriate alkalinity condition, andsoluble nitrogen sources favor the phytoplanktonabundance. High density of phytoplankton resulted inhigh concentrations of Chl-a, NH4-N, and low SD.
Compared to PCA which is used to identify theprinciple parameters for explaining the variations ofwater qualities, CA is a method to classify the similarand dissimilar groups. It has been successfully applied
in water quality assessment programs and designedthe sampling strategy [19,34,36]. Different from SIMIindex which is calculated based on the phytoplanktonstructure, CA was based on water quality includingabiotic and biotic parameters. In the present temporalanalysis of CA, two periods identified was consistentwith the classification of cyanobacteria-blooming per-iod and cyanobacteria-depression period. In the spatialanalysis of CA, if the criterion of (Dlink /Dmax)*100< 60 in previous studies [34,58] was applied, our sam-pling points did not show any difference, implyingthat only one sampling point may be enough for therapid assessment of water quality in MSR. This isbecause in such a small reservoir with a short HRT,the hydrography is homogenous and the hydraulicexchange is high [59]. The stratification in MSR is thusabsent or very weak, which is likely to have an impacton phytoplankton compositions and water qualityfrom different depths that are sharing the same char-acteristics.
Besides, our DA results suggested that TP, NO3-N,and Chl-a were the most significant variables amongall the water parameters in temporal analysis, whichwas consistent with the PCA results that NO3-N andChl-a were the principle components for explainingthe variations, and the temporal CA study showed thatthe two periods, algal blooms and non-algal bloomsperiods, can be divided. Actually, the TP and Chl-awere parameters used in calculating the TSI of the res-ervoir, while NO3-N is the most important nutrient fac-tor for phytoplankton growth. In spite of TP being arelatively independent factor in MSR, it was oftenselected as one of the most important parameters tomonitor and reported as the environmental factoraffecting the blue-green algae biomass [12,60].
5. Conclusions
In small-scale eutrophic lakes or reservoirs, physi-cal disturbances caused by natural and anthropogenicactivities have great impacts on the variations of phy-toplankton structure and water quality. This studypresented data on dynamic changes of the phyto-plankton structure and water quality of a short HRTreservoir that is experiencing algal blooms in recentyears. The reservoir showed a high TSI level of 65–82and was determined to be in eutrophic–hypereutroph-ic status. Lowest diversity/evenness and highest dom-inance happened in June 2011, while highestdiversity/evenness and lowest dominance occurred inMay 2012, which was consistent with the number ofcountable species and their relative proportions. TheSIMI index revealed that the variations of phytoplank-ton species were significant in 2012, while maintained
W. Zhang et al. / Desalination and Water Treatment 13
Dow
nloa
ded
by [
Uni
vers
ity o
f M
acau
Lib
rary
] at
20:
59 2
9 Ju
ne 2
014

relatively stable in 2011. Margalef’s richness indexrevealed that the overall phytoplankton species rich-ness level of MSR was not too high and within therange of 0.43–1.24.
PCA identified four factors, which were responsi-ble for the data structure explaining 80.84% of thetotal variance of the complete data-set. CA generatedtwo groups of spatial similarity from six samplingpoints and two groups of temporal similarity among18months, and DA provided an important data reduc-tion, with only three parameters (TP, NO3-N, and Chl-a)that could afford 100% right assignations in temporalanalysis. However, there is no spatial variation found,mainly due to the small capacity of the reservoir. Thisstudy highlighted the usefulness of combination ofvarious methods for the evaluation and interpretationof complex water quality data-sets and assessment ofpollution level of small-scale eutrophic reservoirs. Theresults from this study confirmed the variations ofphytoplankton structures and water quality in tempo-ral distribution, as well as relative homogeneity inspatial distribution, which can help in developing afuture plan to determine the optimal samplinglocations and sampling frequency in the monitoringprogram of MSR.
Acknowledgments
We thank the technical staffs at Macao WaterSupply Co. Ltd. for water sampling and measurement.The research project was supported by the Fundo parao Desenvolvimento das Ciencias e da Tecnologia(FDCT) and the Research Committee of University ofMacau, under grant number MYRG106(Y1-L3)-FST12-LIC.
References
[1] K. Sivonen, G. Jones, Cyanobacterial toxins, in: I. Chorus,J. Bartram (Eds.), Toxic Cyanobacteria in Water: A Guideto their Public Health Consequences, Monitoring,Management, E & FN Spoon, London, 1999, pp. 55–71.
[2] H.W. Paerl, J. Huisman, Climate change: A catalyst forglobal expansion of harmful cyanobacterial blooms,Environ. Microbiol. Rep. 1 (2009) 27–37.
[3] J.G. Tundisi, T. Matsumura-Tundisi, O. Rocha,Theoretical basis for reservoir management, in:J.G. Tundisi, M. Straskraba (Eds.), Theoretical Reser-voir Ecology and Its Applications, Backhuys, Leiden,1999, pp. 505–528.
[4] L. Naselli-Flores, Phytoplankton assemblages intwenty-one Sicilian reservoirs: Relationships betweenspecies composition and environmental factors, Hyd-robiologia 424 (2000) 1–11.
[5] L. Naselli-Flores, R. Barone, Water-level fluctuations inMediterranean reservoirs: Setting a dewatering
threshold as a management tool to improve waterquality, Hydrobiologia 548 (2005) 85–99.
[6] M.G. Nogueira, M. Ferrareze, M.L. Moreira, R.M. Gouvea,Phytoplankton assemblages in a reservoir cascade of alarge tropical–subtropical river (SE, Brazil), Braz. J. Biol.70 (2010) 781–793.
[7] G.A.S.T. Lira, E.L. Araujo, M.C. Bittencourt-Oliveira,A.N. Moura, Phytoplankton abundance, dominanceand coexistence in an eutrophic reservoir in the stateof Pernambuco, Northeast Brazil, Ann. Acad. Bras.Cienc. 83 (2011) 1313–1326.
[8] T. Baykal, I. Acikgoz, A.U. Udoh, K. Yildiz, Seasonalvariations in phytoplankton composition and biomassin a small lowland river-lake system (Melen River,Turkey), Turk. J. Biol. 35 (2011) 485–501.
[9] K.W. Pontasch, E.P. Smith, J. Cairns, Diversity indices,community comparison indices and canonical discrim-inant analysis: Interpreting the results of multispeciestoxicity tests, Water Res. 23 (1989) 1229–1238.
[10] G.A.S.T. Lira, M.C. Bittencourt-Oliveira, A.N. Moura,Structure and dynamics of phytoplankton communityin the Botafogo reservoir-Pernambuco-Brazil, Braz.Arch. Biol. Technol. 52 (2009) 493–501.
[11] D.S. Lymperopoulou, K.A. Kormas, M. Moustaka-Gouni,A.D. Karagouni, Diversity of cyanobacterial phylotypesin a Mediterranean drinking water reservoir(Marathonas, Greece), Environ. Monit. Assess. 173 (2011)155–165.
[12] C. Fernandez, E.R. Parodi, E.J. Caceres, Phytoplanktonstructure and diversity in the eutrophic-hypereutroph-ic reservoir Paso de las Piedras, Argentina, Limnology13 (2012) 13–25.
[13] B. Helena, R. Pardo, M. Vega, E. Barrado, J.M. Fernandez,L. Fernandez, Temporal evolution of groundwatercomposition in an alluvial aquifer (Pisuerga river, Spain)by principal component analysis, Water Res. 34 (2000)807–816.
[14] J. Lee, J. Cheon, K. Lee, S. Lee, M. Lee, Statistical eval-uation of geochemical parameter distribution in aground water system contaminated with petroleumhydrocarbons, J. Environ. Qual. 30 (2001) 1548–1563.
[15] S. Shrestha, F. Kazama, Assessment of surface waterquality using multivariate statistical techniques: Acase study of the Fuji river basin, Japan, Environ.Model. Softw. 22 (2007) 464–475.
[16] H. Camdevyren, N. Demyr, A. Kanik, S. Keskyn, Useof principal component scores in multiple linearregression models for prediction of Chlorophyll-a inreservoirs, Ecol. Model. 181 (2005) 581–589.
[17] S.H. Te, K.Y. Gin, The dynamics of cyanobacteria andmicrocystin production in a tropical reservoir of Sin-gapore, Harmful Algae 10 (2011) 319–329.
[18] M. Vega, R. Pardo, E. Barrado, L. Deban, Assessmentof seasonal and polluting effects on the quality ofriver water by exploratory data analysis, Water Res.32 (1998) 3581–3592.
[19] M. Varol, B. Gokot, A. Bekleyen, B. Sen, Spatial andtemporal variations in surface water quality of thedam reservoirs in the Tigris River basin, Turkey,Catena 92 (2012) 11–21.
[20] W. Zhang, I. Lou, Y. Kong, W.K. Ung, K.M. Mok,Eutrophication analyses and principle componentregression for two subtropical storage reservoirs inMacau, Desalin. Water Treat. 51 (2013) 7331–7340.
14 W. Zhang et al. / Desalination and Water Treatment
Dow
nloa
ded
by [
Uni
vers
ity o
f M
acau
Lib
rary
] at
20:
59 2
9 Ju
ne 2
014
[21] APHA, Standard Methods for the Examination ofWater and Wastewater, 21st ed., AWWA and WEF,American Public Health Association, Washington, DC,1999.
[22] G.M. Smith, The Freshwater Algae of the UnitedStates, second ed., McGraw-Hill, New York, NY, 1950.
[23] B.J. McAlice, Phytoplankton sampling with the Sedg-wick-Rafter cell, Limnol. Oceanogr. 16 (1971) 19–28.
[24] H. Utermohl, Zur vervollkommung der quantitativenphytolankton-methodik (Perfectible quantitative phy-toplankton methodology), Mitteilungen InternationaleVereinigung Theorie Angewandte Limnologie 9 (1958)1–39.
[25] R.E. Carlson, A trophic state index for lakes, Limnol.Oceanogr. 22 (1977) 361–369.
[26] C.E. Shannon, A mathematical theory of communica-tion, Bell Syst. Tech. J. 27(4) (1948) 623–656.
[27] E.H. Simpson, Measurement of diversity, Nature 163(1949) 688.
[28] E.C. Pielou, Species-diversity and pattern-diversity inthe study of ecological succession, J. Theor. Biol. 10(1966) 370–383.
[29] R. Margalef, Information theory in ecology, Int. J. Gen.Syst. 3 (1958) 36–71.
[30] S.A. Khan, P. Murugesan, P.S. Lyla, S. Jaganathan, Anew indicator macroinvertebrate of pollution and util-ity of graphical tools and diversity indices in pollutionmonitoring studies, Curr. Sci. 87 (2004) 1508–1510.
[31] J.M. Stander, Diversity and Similarity of BenthicFauna off the Coast of Oregon, MS thesis, OregonState University, Corvallis, 1970.
[32] J.L. Rohr, Changes in Diatom Community StructureDue to Environmental Stress, Dissertation, BowlingGreen State University, Bowling Green, OH, 1977.
[33] C. Liu, K. Lin, Y. Kuo, Application of factor analysisin the assessment of groundwater quality in a black-foot disease area in Taiwan, Sci. Total Environ. 313(2003) 77–89.
[34] K.P. Singh, A. Malik, D. Mohan, S. Sinha, Multivariatestatistical techniques for the evaluation of spatial andtemporal variations in water quality of Gomti River(India)—A case study, Water Res. 38 (2004) 3980–3992.
[35] M. Otto, Multivariate methods, in: R. Kellner, J.M.Mermet, M. Otto, H.M. Widmer (Eds.), AnalyticalChemistry, Wiley-VCH, Weinheim, 1998.
[36] D.A. Wunderlin, M.P. Diaz, M.V. Ame, S.F. Pesce, A.C.Hued, M.A. Bistoni, Pattern recognition techniques forthe evaluation of spatial and temporal variations inwater quality. A case study: Suquia River basin(Cordoba-Argentina), Water Res. 35 (2001) 2881–2894.
[37] R.A. Johnson, D.W. Wichern, Applied MultivariateStatistical Analysis, seventh ed., Prentice-Hall Interna-tional, Englewood Cliffs, NJ, 1992, p. 642.
[38] J. Pallant, I. Chorus, J. Bartram, Toxic Cyanobacteriain Water, SPSS Survival Manual, third ed., Open Uni-versity Press, Berkshire, 2007.
[39] M. Katsiapi, M. Moustaka-Gouni, E. Michaloudi, K.A.Kormas, Phytoplankton and water quality in a Mediter-ranean drinking-water reservoir (Marathonas Reservoir,Greece), Environ. Monit. Assess. 181 (2011) 563–575.
[40] C.C. Figueredo, A. Giani, Seasonal variation in thediversity and species richness of phytoplankton in atropical eutrophic reservoir, Hydrobiologia 445 (2001)165–174.
[41] R. Holzmann, Seasonal fluctuations in the diversityand compositional stability of phytoplankton commu-nities in small lakes in upper Bavaria, Hydrobiologia249 (1993) 101–109.
[42] C.S. Reynolds, Scales of disturbance and their role inplankton ecology, Hydrobiologia 249 (1993) 157–171.
[43] M. Moustaka-Gouni, Phytoplankton succession anddiversity in a warm monomictic, relatively shallowlake: Lake Volvi, Macedonia, Greece, Hydrobiologia249 (1993) 33–42.
[44] A.K.M. Rahman, D. Bakri, P. Ford, T. Church, Limno-logical characteristics, eutrophication and cyanobacte-rial blooms in an inland reservoir, Australia, LakesReserv. Res. Manage. 10 (2005) 211–220.
[45] K.E. Havens, Cyanobacteria blooms: Effects on aquaticecosystems, in: H.K. Hudnell (Ed.), Cyanobacterial Harm-ful Algal Blooms: State of the Science and Research Needs,Springer Science, New York, NY, 2008, pp. 733–747.
[46] H.W. Paerl, Growth and reproductive strategies offreshwater blue-green algae (Cyanobacteria), in: C.D.Sandgren (Ed.), Growth and Reproductive Strategiesof Freshwater Phytoplankton, Cambridge UniversityPress, New York, NY, 1988, pp. 261–315.
[47] K.E. Havens, E.J. Phlips, M.F. Cichra, B. Li, Lightavailability as a possible regulator of cyanobacteriaspecies composition in a shallow subtropical lake,Freshwater Biol. 39 (1998) 547–556.
[48] M.L. Saker, A.D. Thomas, J.H. Norton, Cattle mortal-ity attributed to the toxic cyanobacterium Cylindro-spermopsis raciborskii in an outback region of NorthQueensland, Environ. Toxicol. 14 (1999) 179–182.
[49] L.D. Fabbro, L.J. Duivenvoorden, Profile of a bloom ofthe cyanobacterium Cylindrospermopsis raciborskii(Woloszynska) Seenaya and Subba Raju in the FitzroyRiver in tropical Central Queensland, Mar. FreshwaterRes. 47 (1996) 685–694.
[50] M. Bouvy, R. Molica, S. De Oliveira, M. Marinho, B.Beker, Dynamics of a toxic cyanobacterial bloom(Cylindrospermopsis raciborskii) in a shallow reservoir inthe semi-arid region of northeast Brazil, Aquat.Microb. Ecol. 20 (1999) 285–297.
[51] J. Komarkova, R. Laudares-Silva, P.A.C. Senna,Extreme morphology of Cylindrospermopsis raciborskii(Nostocales, Cyanobacteria) in the Lagoa do Peri, afreshwater coastal lagoon, Santa Catarina, Brazil,Algol. Stud. 94 (1999) 207–222.
[52] C.W.C. Branco, P.A.C. Senna, Factors influencing thedevelopment of Cylindrospermopsis raciborskii andMicrocystis aeruginosa in the Paranoa Reservoir,Brasilia, Brazil, Algol. Stud. 75 (1994) 85–96.
[53] M. Presing, S. Herodek, L. Voros, I. Kobor, Nitrogenfixation, ammonium and nitrate uptake during abloom of Cylindrospermopsis raciborskii in Lake Balaton,Archiv Fur Hydrobiologie 136 (1996) 553–562.
[54] J.S. Metcalf, A. Barakate, G.A. Codd, Inhibition of plantprotein synthesis by the cyanobacterial hepatotoxin, cylin-drospermopsin, FEMSMicrobiol. Lett. 235 (2004) 125–129.
[55] C.S. Reynolds, V. Huszar, C. Kruk, L. Naselli-flores, S.Melo, Towards a functional classification of the freshwa-ter phytoplankton, J. Plankton Res. 24 (2002) 417–428.
[56] S.N. Datta, S.K. Chakraborty, A.K. Jaiswar, G. Ziauddin,A comparative study on intertidal faunal biodiversity ofselected beaches of Mumbai coast, J. Environ. Biol. 31(2010) 981–986.
W. Zhang et al. / Desalination and Water Treatment 15
Dow
nloa
ded
by [
Uni
vers
ity o
f M
acau
Lib
rary
] at
20:
59 2
9 Ju
ne 2
014
[57] K.P. Singh, A. Malik, S. Sinha, Water quality assess-ment and apportionment of pollution sources of Gom-ti river (India) using multivariate statistical techniques—A case study, Anal. Chim. Acta 538 (2005) 355–374.
[58] X. Wang, Q. Cai, L. Ye, X. Qu, Evaluation of spatial andtemporal variation in stream water quality by multivar-iate statistical techniques: A case study of the XiangxiRiver basin, China, Quat. Int. 22 (2012) 137–144.
[59] C.S. Reynolds, Phytoplankton assemblages in reser-voirs, in: J.G. Tundisi, M. Straskraba (Eds.), Theoreti-cal Reservoir and its Application, Backhuys, Leiden,1999, pp. 439–456.
[60] M.C. Calijuri, A.C.A. Santos, S. Jati, Temporal changesin the phytoplankton community structure in a tropicaland eutrophic reservoir (Barra Bonita, S.P.-Brazil), J.Plankton Res. 24 (2002) 617–634.
16 W. Zhang et al. / Desalination and Water Treatment
Dow
nloa
ded
by [
Uni
vers
ity o
f M
acau
Lib
rary
] at
20:
59 2
9 Ju
ne 2
014
Copyright © 2022 FDOKUMEN