Contrasting Canada's Corruption of Foreign Public Officials ...

Chemical Geology 392 (2015) 19–31
Contents lists available at ScienceDirect
Chemical Geology
j ourna l homepage: www.e lsev ie r .com/ locate /chemgeo
Sedimentary iron–phosphorus cycling under contrasting redoxconditions in a eutrophic estuary
Peter Kraal a,⁎, Edward D. Burton a, Andrew L. Rose a, Benjamin D. Kocar b, Robert S. Lockhart c, Kliti Grice c,Richard T. Bush a, Eileen Tan d, Samuel M. Webb e
a Southern Cross GeoScience, Southern Cross University, PO Box 157, Lismore, New South Wales 2480, Australiab Department of Civil and Environmental Engineering, Massachusetts Institute of Technology, Cambridge, MA 02139, United Statesc Western Australian Organic and Isotope Geochemistry Centre (WA-OIGC), Department of Chemistry, The Institute for Geoscience Research, Curtin University, GPO Box U1987, Bentley,Western Australia 6845, Australiad Natural and Agricultural Sciences, Faculty of Science, University of Western Australia, 35 Stirling Highway, Crawley, Western Australia 6009, Australiae Stanford Synchrotron Radiation Lightsource, Menlo Park, CA 94025, United States
⁎ Corresponding author at: Department of Earth ScienGeosciences, Utrecht University, Budapestlaan 4, 3584Tel.: +31 30 2535016.
E-mail address: [email protected] (P. Kraal).
http://dx.doi.org/10.1016/j.chemgeo.2014.11.0060009-2541/© 2014 Elsevier B.V. All rights reserved.
a b s t r a c t
a r t i c l e i n f oArticle history:Received 28 June 2014Received in revised form 7 November 2014Accepted 10 November 2014Available online 15 November 2014
Editor: Carla M. Koretsky
Keywords:BiogeochemistryDiagenesisEutrophicationIron and phosphorus speciationX-ray spectroscopy
Phosphorus (P) is often a limiting nutrient within freshwater and estuarine systems, thus excess inputs of P fromanthropogenic activities (dominantly agriculture) can induce eutrophication in receiving water bodies. The se-questration of P within estuarine sediments is controlled by sorption and precipitation processes, which are im-pacted by local redox conditions and burial environment. Despite the global spread of oxygendepletion in coastalmarine systems, P burial under reducing conditions remains poorly understood. We investigated P cycling in re-lation to iron (Fe) redox chemistry in sediments from the eutrophic Peel-Harvey Estuary in Western Australia,using a combination of porewater analysis, sequential chemical P extractions, synchrotron-based micro-scaleX-ray fluorescence mapping and Fe K-edge X-ray absorption spectroscopy, and PO4
3− sorption experiments.The sediments represented redox regimes varying from strongly reducing, organic-rich sediments with little orno reactive Fe(III) (oxyhydr)oxides to oxygenated sediments that were enriched in reactive Fe(III) phases. Or-ganic P and Fe-associated P were the main P burial phases, and the latter was quantitatively important even insediments with an overall strongly reducing character. We attribute this to adsorption of P onto micro-scaleFe(III) oxyhydroxide enrichments and/or Fe-bearing clay minerals. The organic-rich sediments showed a strongdecline in P contents with depth; Pwas released from organicmatter and Fe phases but apatite precipitation wasapparently inhibited in these sediments. Despite greater and stronger PO4
3− sorption capacity, the oxic sedimentscontained relatively little P due to a lack of the primary P source inmarine sediments: organicmatter. Our resultsprovide detailed insight into P burial in dynamic estuarine sediments and show that micro-scale spectroscopicanalyses greatly advance our understanding of P sequestration processes.
© 2014 Elsevier B.V. All rights reserved.
1. Introduction
Eutrophication adversely affects coastal marine ecosystems on aglobal scale (Diaz and Rosenberg, 2008; Middelburg and Levin, 2009).Estuaries are particularly sensitive to the increasing (anthropogenic)nutrient inputs that can fuel the development of algal blooms andhypoxia. The bioavailable stock of one of the key nutrients in eutrophi-cation, phosphorus (P, primarily as dissolved PO4
3−), is determined byexternal inputs as well as internal recycling from the sediment to thewater column. Iron redox chemistry in surface sediments is known toimpart important controls on benthic P dynamics; ferric iron (Fe(III))
ces — Geochemistry, Faculty ofCD Utrecht, The Netherlands.
(oxyhydr)oxides formed under oxic conditions play a crucial intermedi-ate role in P burial by adsorbing PO4
3− that is released in surfacesediments during early diagenesis. Reductive dissolution of the Fe(III)minerals at greater depth in the sediment results in PO4
3− accumulationin the porewater, potentially triggering the precipitation of authigenicphosphate minerals.
Anoxicmarine sedimentswere generally thought to have diminishedsedimentary P retention capacity, in part because reductive dissolutionof Fe(III) (oxyhydr)oxides under such conditions (Ingall et al., 1993;Rozan et al., 2002). Recent findings have provided more detailed insightinto the relationship between redox conditions, Fe mineralogy and P se-questration. Under anoxic but non-sulfidic conditions, (partially) re-duced Fe minerals such as siderite (FeCO3), magnetite (Fe3O4) andgreen rust (Fe(II)/Fe(III) hydroxides) may form (Berner, 1964; Curtisand Spears, 1968; Hansen et al., 1996). Each of these minerals has ahigh PO4
3− adsorption capacity, be itwith relatively lowbinding strength
20 P. Kraal et al. / Chemical Geology 392 (2015) 19–31
(Barber, 2002). Furthermore, elevated concentrations of dissolved Fe2+
and PO43− may drive precipitation of reduced Fe–P minerals such as
vivianite (Fe(II)3(PO4)2 · 8H2O) (Schulz et al., 1994; Burns, 1997). Incontrast, under euxinic conditions (i.e. in the presence of free sulfide,H2S) the reactive Fe pool is dominated by Fe sulfide minerals that haveminimal affinity for PO4
3− (Krom and Berner, 1980) and the persistenceof non-sulfidic reduced Fe–P minerals is thermodynamically unfavor-able. Therefore, there is a large difference in P retention capacity be-tween anoxic, non-sulfidic sediments and sulfidic sediments.
Nonetheless, ferric and ferrous Fe phases that are able to adsorb PO43
− may survive to some extent during burial in sulfidic sediments.Sedimentary Fe phases show a wide range of reaction rates with dis-solved H2S, with lifetimes ranging from seconds for poorly orderedFe(III) (oxyhydr)oxides to millions of years for Fe in sheet silicates(Canfield et al., 1992). In a recent study, Jilbert and Slomp (2013)presented micro-scale analyses that demonstrated the presence ofFe–P phases in sediments from a sulfidic basin in the Baltic Sea. Theauthors proposed that intense shuttling of Fe(III) phases into the sulfidicbasin may form a (temporary) pool of exogenic Fe(III)–P phases and/orauthigenic Fe(II)–P phases inmicro-environments of the overall sulfidicsediment. In addition, partial preservation of reactive Fe(III) phasesmaybe achieved by Fe sulfide coatings under reducing conditions (Canfieldet al., 1992).
Sedimentary P burial is the main pathway by which bioavailablePO4
3− is removed from water bodies and therefore plays a crucial rolein marine biogeochemistry and primary productivity. This is also ofgreat importance in light of the global increase in the areal extent ofcoastal marine systems that experience oxygen depletion and alter-ations in benthic P cycling in response to eutrophication (Diaz andRosenberg, 2008;Middelburg and Levin, 2009). However, the formationand persistence of the various P reservoirs under reducing conditionsare still poorly understood. This also applies to organic P, which isroutinely determined as P released upon sediment combustion (Aspilaet al., 1976; Ruttenberg, 1992) but rarely accompanied by characteriza-tion of the organic compounds present in the sediment. This is a signif-icant omission, because the C/P ratio of the bulk organic matter(OM) pool is often used as redox indicator, since altered microbialfunctioning under oxygen depletion results in P depletion in OM rela-tive to C (Gächter et al., 1988; Ingall et al., 1993; Hupfer et al., 2004;Steenbergh et al., 2011). However, there are also large differences inC/P ratios of organic compounds between different sources, for instance
Fig. 1. Locations of investigated sites in the Peel-Harvey Estuary, southwest Australia. Sites 2 anestuary. Coordinates: site 2: 32°34′31.5″S, 115°45′28.0″E; site 6: 32°39′59.1″S, 115°39′18.1″E;
fresh algal detritus (C/P ≈ 106) and terrestrial plant material (C/P≫106). To correctly interpret organic C/P ratios, insight into the relativecontribution of these different OM sources to the total sedimentaryOMpool is crucial, especially for estuarine systems that generally expe-rience large influxes of terrestrial material.
In this study,we investigate the sorption and burial of P in sedimentsfrom the Peel-Harvey Estuary in Western Australia (Fig. 1), which hassuffered from eutrophication in recent decades in response to excessPO4
3− input from agriculture (Lukatelich and McComb, 1986; Hodgkinand Hamilton, 1993; McComb and Lukatelich, 1995). As a result, therehas been localized accumulation of strongly reducing organic-rich sedi-ments with abundant Fe (mono)sulfide that act as a net source of PO4
3−
to the water column (Morgan et al., 2012a; Kraal et al., 2013b). Despitethe crucial role of P burial in determining P availability and thus the bio-geochemical functioning of the estuary, the chemical forms of P in thesediments have so far only been quantified in terms of acid-extractable inorganic P (Gerritse et al., 1998). In this study, we haveused a range of analytical techniques to elucidate P cycling in both thestrongly reducing, sulfide-rich sediments and more oxic sedimentsfrom the estuary. The distribution and speciation of Fe andPwere deter-mined using sequential chemical extractions, Fe X-ray absorption spec-troscopy andmicro-scale X-rayfluorescence (XRF) elementmapping. Inaddition, we performed organic geochemical analyses of surface sedi-ment to quantify the relative contributions of terrestrial and marineOM to the sedimentary OM (and organic P) pool. Furthermore, we de-termined PO4
3− sorption curves for both oxic and strongly reducing sur-face sediments to further elucidate the dynamics of PO4
3− exchangeacross the sediment–water interface, and the consequences of oxygendepletion on sedimentary PO4
3− retention capacity in a dynamic, eutro-phic estuary. Our results provide detailed insight into P burial in estua-rine sediments with contrasting geochemical signatures, and highlightconditions under which P is most readily mobilized.
2. Methods and materials
2.1. Field site and sampling
The sediments used in this study were collected during three fieldtrips to the semi-restricted Peel-Harvey Estuary. In total, 4 sites weresampled (Fig. 1): sites 2, 3 and 6 were located in navigation channelsand were characterized by accumulation of organic C-rich (1–6 wt.%)
d 3were similar locations in the areawhere the Serpentine andMurray rivers flow into thesite 8: 32°35′30.0″S, 115°42′50.8″E.
21P. Kraal et al. / Chemical Geology 392 (2015) 19–31
and iron monosulfide-rich (N300 μmol g−1) silts. Site 8, which waslocated in the center of the estuary, represented a control site withslightly coarser estuarine sedimentwith comparably low organic C con-tents (1–2 wt.%) and very low Fe monosulfide concentrations(b20 μmol g−1) (Kraal et al., 2013b). The water depth at the sites wasbetween 1.5 and 2 m.Water column properties including dissolved ox-ygen (DO) were measured at various intervals throughout the watercolumn at each site using a Hydrolab DataSonde 5. Sediment cores be-tween 30 and 70 cm length were collected with a stainless steel hand-held coring device. After verifying that the sediment surface was undis-turbed, the coreswere capped, stored on ice and transported back to theCurtin University laboratory for further processing. Fig. 2 provides agraphical overview of the sampling campaigns, materials and methods.
2.2. Solid-phase organic geochemistry
Surface sediment from sediment cores collected from sites 3 and 6 inMarch 2011 was used for organic geochemical analyses (for details seeLockhart et al. (2013)). In brief, freeze-dried samples were ground tob220 μm particle size and Soxhlet extracted (72 h) to isolate bitumenand kerogen fractions. The bitumens (ca. 10 –20mg) were separatedinto aliphatic, aromatic and polar fractions. An aliquot of the aliphaticand aromatic fractions was analyzed by gas chromatography–massspectrometry (GC–MS). Full scan (50–550 Da) 70 eV mass spectrawere acquired. Compound specific isotopes were determined on aMicromass IsoPrime mass-spectrometer interfaced to an Agilent 6890GC equipped with a 6890 autosampler for carbon isotope analysis.Each sample was analyzed in duplicate and averaged values with stan-dard deviations below 0.4 were reported. Isotopic values are given inthe delta (δ) notation relative to the international standard VPDB.
2.3. Porewater analysis and solid-phase sequential phosphorus extractions
During a second sampling campaign in February 2012, sediment coreswere collected from sites 2, 6 and 8. Within 6 h of collection, water over-lying the sediment surface was removed with a siphon and the sedimentcores were processed as follows: Cores were sectioned into 1 or 2 cm in-tervals and each sample was divided between two polypropylene tubesthat were immediately purged with N2 and capped. One tube with wetsediment was immediately frozen prior to solid-phase analyses(Section 2.3). Porewater was extracted from the second wet sample bycentrifugation at 4000 rpm for 20min and subsequent filtration of the su-pernatant through a 0.45 μm pore-size filter membrane. Porewater
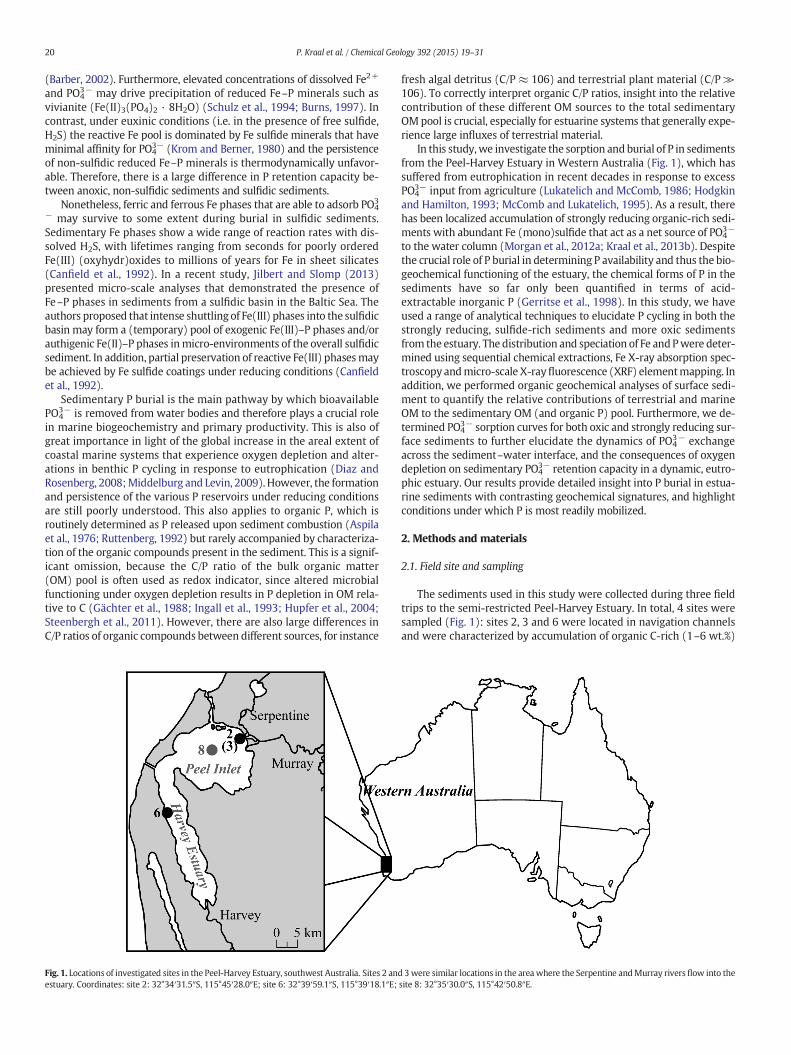
Fig. 2. Flow chart of sampling stra
sulfide was determined by the methylene blue colorimetric method(APHA, 2005), and nutrients (NH4
+, NO2−, NO3
−, PO43−) were measured
by flow injection analysis.The frozen sediment samples were subsequently allowed to thaw in
an anaerobic chamber and subsampled (~2 g wet sediment) for P frac-tionation using the sediment extraction (SEDEX) procedure developedby Ruttenberg (1992), following the modification by Slomp et al.(1996a). This sequential extraction procedure targets four major Pphases (Table 1). Dissolved inorganic phosphate in all extracts was de-termined by the colorimetric molybdenum blue method (Stricklandand Parsons, 1972) except for the dithionite extracts, which were ana-lyzed for Fe and P by inductively-coupled plasma mass spectrometry(ICP-MS). The sum of all extracted P fractions minus detrital P repre-sents biogeochemically reactive P (Ruttenberg, 1992).
2.4. Bulk iron X-ray absorption spectroscopy
Selected subsamples at low vertical resolution from cores collectedfrom sites 2, 6 and 8 in February 2012 were analyzed using Fe K-edgeX-ray absorption spectroscopy (XAS). All sample handling was donein an anaerobic chamber. Frozen sediment samples were allowed tothaw, after which small subsamples were dried at room temperature.The dried samples were then mixed with a small amount of glycerol.The resulting slurries were stored in serum vials with butyl-rubberseals and were transported on ice to the Australian National BeamlineFacility (ANBF) in the Photon Factory, Tsukuba City, Japan. The Fe XASdata were collected at room temperature on bending magnet beamline20B at the ANBF. The samples were protected from oxidation duringdata collection by sealing between layers of Kapton tape. RepeatedX-ray absorption near-edge structure (XANES) scans on mackinawiteand siderite reference standards as well as selected samples verifiedthat oxidation of Fe(II)-bearing phases was negligible during XAS datacollection. Duplicate spectra were collected in fluorescence modeusing a 32 elementGe solid-state detector. Energy calibration andmerg-ing of replicate scans were performed using the Average software(ASRP, 2007). The ATHENA programwas used for standard backgroundsubtraction and edge-height normalization (Ravel and Newville, 2005).Iron speciation in the samples was quantified in two ways: (i) linearcombinationfitting (LCF) of the k3-weighted extendedX-ray absorptionfine structure (EXAFS) oscillations in the 2–12 Å−1 range and (ii) LCF ofthe first derivative of the absorption coefficient for the X-ray absorptionnear-edge structure (XANES, 7100–7160 eV range). Preliminary LCFwith a broad range of Fe reference compounds showed that all sample
tegy, materials and analyses.

Table 1Overview of the sequential phosphorus fractionation procedure by Ruttenberg (1992) used in this study.
Step Extractant, extraction time Target phase Name
1 25 g L−1 Na dithionite buffered to pH 7.3 with Na citrate/NaHCO3, 8 h Fe-associated P Fe–P2 1 mol L−1 Na acetate (buffered to pH 4 with acetic acid), 6 h P in authigenic and biogenic calcium phosphate minerals (authigenic Ca–P) Ca–P3 1 mol L−1 HCl, 24 h Recalcitrant terrestrial P-bearing minerals Detrital P4 1 mol L−1 HCl after ashing at 550 °C (2 h), 24 h P in organic matter Organic P
22 P. Kraal et al. / Chemical Geology 392 (2015) 19–31
spectra could be fitted with the following selection of reference com-pounds: synthetic ferrihydrite (Fh), goethite (Gt), greigite (Fe3S4),mackinawite (FeSm) and pyrite (FeS2), and the illite (IMt-1) andripidolite (CCa-2) reference clays from the Clay Minerals Society(CMS). The Fe minerals were synthesized as described in Burton et al.(2008). Illite is an analog for Fe in silicate minerals (O'Day et al.,2004). The mineralogy of synthesized reference compounds was con-firmed by X-ray diffraction (Bruker D4 Endeavor). All pure Fe mineralphases were diluted to ~5 wt.% Fe with boron nitride to match thetotal Fe content in the samples, and then mixed with glycerol.
2.5. Microprobe X-ray fluorescence mapping and iron X-rayabsorption spectroscopy
Separate subsamples from sites 2 and 6 collected in February 2012were dried in an anaerobic chamber and transported in serum vialswith butyl-rubber seals to the Stanford Synchrotron RadiationLightsource (SSRL). At the SSRL, a small part of the subsample wasdusted onto Scotch tape in an anaerobic chamber. The sample wasplaced in a sample holder that was sealed with Mylar film. During X-ray analysis, the sample holder was continually purged with He to pre-vent sample oxidation. Microprobe XRF mapping was performed atbeamline 2–3, equipped with a Si(110) double-crystal monochromatorand a Vortex fluorescence detector. The spot size was ~2 × 2 μm, andXRF maps were collected at 12,000 eV with a dwell time of 25 ms.After mapping, selected spots rich in Fe (and P) were targeted formicro-focus Fe K-edge XAS. Duplicate XAS spectra were collected influorescencemode. Energy calibrationwas performed using the first in-flection point of a Fe foil spectrum(7112 eV). The ATHENAprogramwasused for standard background subtraction and edge-height normaliza-tion (Ravel and Newville, 2005). Iron speciationwas quantified throughLCF of the normalized XANES first derivative (7105–7155 eV) with thesame standards used for bulk Fe speciation (see Section 2.3). Spectraof Fe(II) phosphates such as vivianite were not used in the LCF proce-dure for either the bulk and micro-focused Fe K-edge XAS, as prelimi-nary XAS data fitting showed no evidence for the presence of Fe(II)phosphates in the investigated sediments.
2.6. Phosphate sorption experiments
2.6.1. Equilibrium phosphate sorption and desorptionSorption experiments were conducted on bulk surface sediment
samples from sites 2 and 8. First, however, Fe, P and S fractionationwas determined in the bulk sediments by chemical methods. Four sub-samples of each of the two bulk samples (sites 2 and 8) collected in No-vember 2012 were taken in an anaerobic chamber. One sample wasused to extract porewater by centrifugation and determine the dis-solved PO4
3− concentration in the bulk samples with the molybdenumblue method. The three remaining subsamples were used in sequentialextraction procedures for P species as described in Section 2.2, highly re-active Fe species (Claff et al., 2010) and acid-volatile sulfide (AVS).The Fe fractionation procedure extracted: (i) acid-extractable Fe(II)and Fe(III) minerals, Fe(II)HCl and Fe(III)HCl, with 1 M HCl (4 h);(ii) organic-bound Fe (Feorg) with 0.1 M Na pyrophosphate (16 h),(iii) Fe(III) in crystalline minerals (Feoxide) with 50 g/L Na dithionite in
0.35 M acetic acid/0.2 M Na citrate (2 h) and (iv) Fe in pyrite (Fepyrite)with concentrated HNO3 (2 h). Iron concentrations in the extractswere measured using the 1,10-phenanthroline colorimetric method(APHA, 2005). Total Fewasmeasured in all extracts as Fe(II) after reduc-tion of Fe(III) by 0.4M hydroxylamine hydrochloride. In the 1MHCl ex-tracts, both Fe(II) and total Fe were immediately measured, and Fe(III)was calculated by difference. The sum of Fe extracted during the foursteps represents highly reactive Fe (FeHR). The AVS pool was deter-mined in a separate sub sample by dissolution in 6 M HCl, and theresulting H2S was trapped as ZnS in an alkaline Zn acetate solution(Burton et al., 2011). The S contentwas determined by iodometric titra-tion (APHA, 2005).
For the sorption experiments, the sealed containers with wet bulksediments were transferred into an anaerobic chamber. For each site,part of the bulk sediment was thoroughly homogenized in anacid-cleaned glass beaker. Subsamples of the homogenized sediment(between1.5 and 4 g dryweight)were transferred to 50mLpolypropyl-ene tubes. To these tubes, 30mL of artificial seawater (ASW)was added,amended with 60–750 μL of a 1 mmol L−1 or 10 mmol L−1 KH2PO4
stock solution to obtain a dissolved PO43− concentration gradient
between 0 and 300 μmol L−1 in triplicate for each site (24 samples persite). The tubes with the PO4
3−-amended slurries were removed fromthe anaerobic chamber and shaken at 100 rpm for 48 h. The tubeswere then centrifuged and transferred back into the anaerobic chamber,where the dissolved PO4
3− concentration in the supernatant was deter-mined using the molybdenum blue method. Controls (ASW+ KH2PO4
without sediment) for all PO43− concentrations were also prepared
and analyzed to assess the potential for PO43− removal by processes
other than adsorption onto the sediment (e.g. precipitation of phos-phate minerals).
After removal of the supernatant, a desorption experiment was con-ducted with the same sediment samples by adding 30 mL of PO4
3−-freeASW to the tubes, which were then removed from the glovebox andshaken at 100 rpm for 48 h. Afterwards, dissolved PO4
3− wasmeasured.The increase in PO4
3− during the desorption experimentwas used to de-termine the reversibility of PO4
3− sorption.Finally, the sediment residues were dried at 105 °C for 48 h to deter-
mine dry sediment weight. The difference in PO43− at the start and end
of the sorption experiment, together with the sediment dry weight,was used to calculate PO4
3− adsorption onto the sediment. Sorptioncurves were obtained by plotting the equilibrium dissolved PO4
3− con-centration after 48 h against the amount of adsorbed PO4
3− per g drysediment, and least-squares fitting of the data with a Freundlich iso-therm following Slomp et al. (1998):
NAPþ Psorbed ¼ KF � Cα ð1Þ
where NAP represents native adsorbed P at the start of the experiment(μmol g−1), Psorbed is the amount of P sorbed during the experiment, KF
and α are empirical constants, and C is the final PO43− concentration
after 48 h. The dissolved PO43− concentration at which there is no net
P exchange between sediment and solution, EPC0, was calculated asthe PO4
3− concentration at Psorbed = 0. Adsorption coefficients (K′) forthe two sediments were calculated from the slope of the isotherms atEPC0.
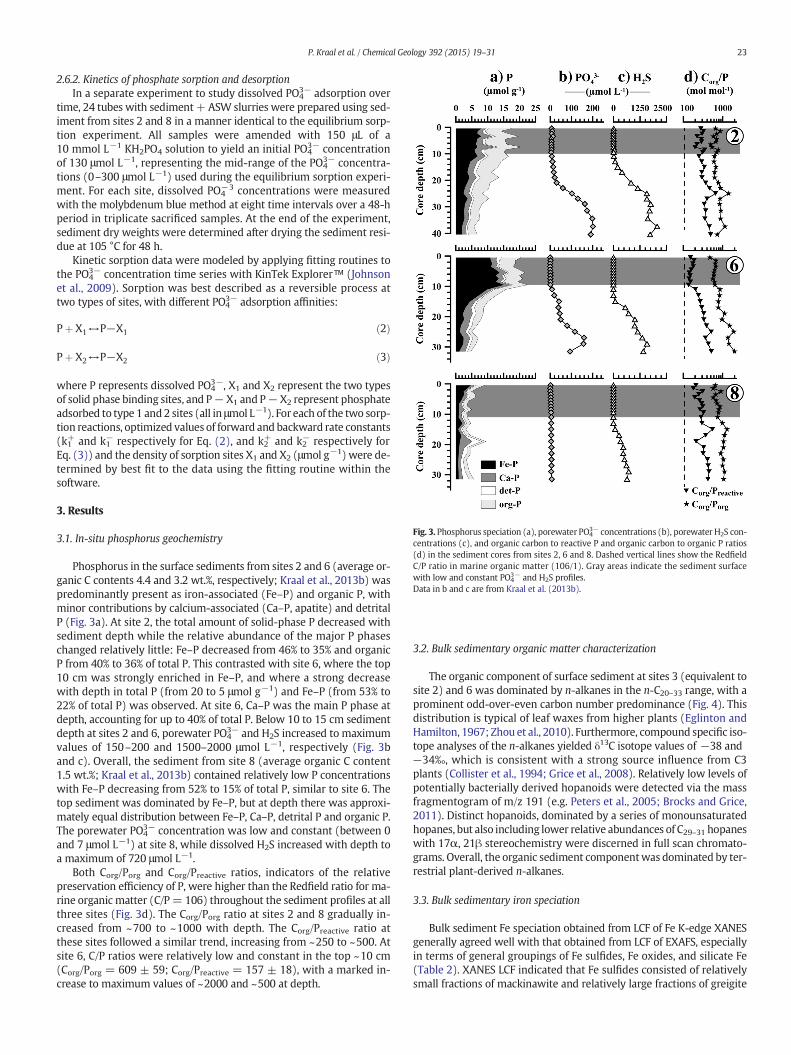
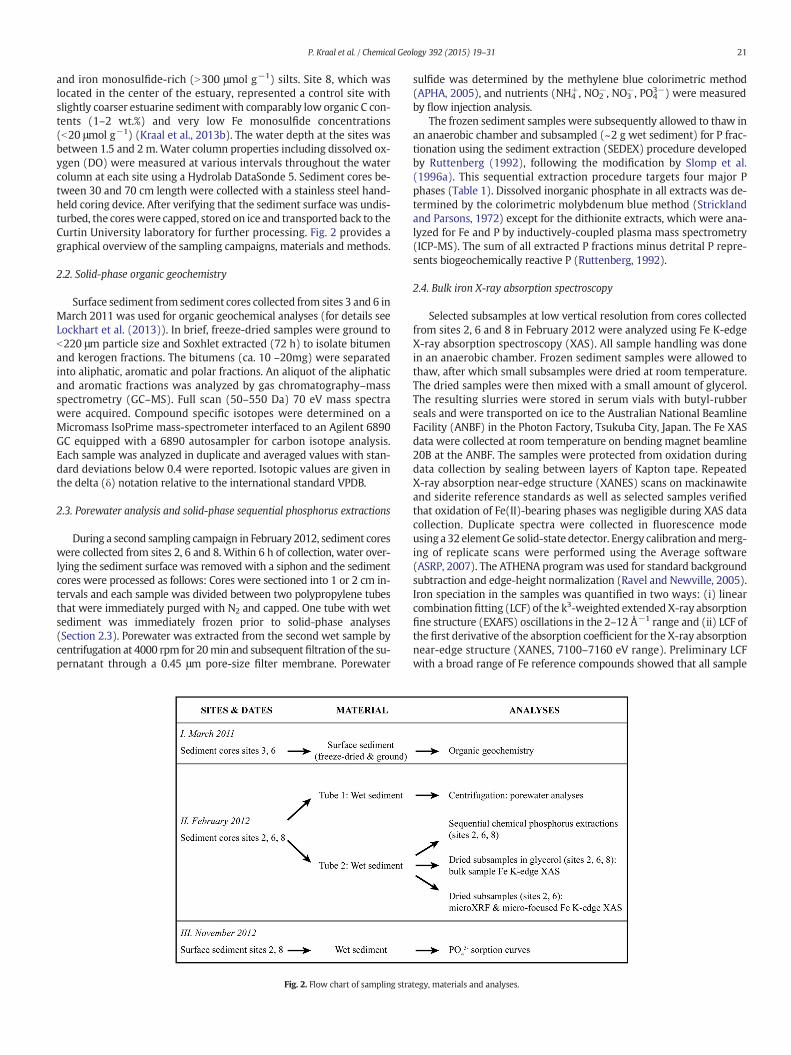
Fig. 3. Phosphorus speciation (a), porewater PO43− concentrations (b), porewater H2S con-
centrations (c), and organic carbon to reactive P and organic carbon to organic P ratios(d) in the sediment cores from sites 2, 6 and 8. Dashed vertical lines show the RedfieldC/P ratio in marine organic matter (106/1). Gray areas indicate the sediment surfacewith low and constant PO4
3− and H2S profiles.Data in b and c are from Kraal et al. (2013b).
23P. Kraal et al. / Chemical Geology 392 (2015) 19–31
2.6.2. Kinetics of phosphate sorption and desorptionIn a separate experiment to study dissolved PO4
3− adsorption overtime, 24 tubes with sediment+ ASW slurries were prepared using sed-iment from sites 2 and 8 in a manner identical to the equilibrium sorp-tion experiment. All samples were amended with 150 μL of a10 mmol L−1 KH2PO4 solution to yield an initial PO4
3− concentrationof 130 μmol L−1, representing the mid-range of the PO4
3− concentra-tions (0–300 μmol L−1) used during the equilibrium sorption experi-ment. For each site, dissolved PO4
−3 concentrations were measuredwith the molybdenum blue method at eight time intervals over a 48-hperiod in triplicate sacrificed samples. At the end of the experiment,sediment dry weights were determined after drying the sediment resi-due at 105 °C for 48 h.
Kinetic sorption data were modeled by applying fitting routines tothe PO4
3− concentration time series with KinTek Explorer™ (Johnsonet al., 2009). Sorption was best described as a reversible process attwo types of sites, with different PO4
3− adsorption affinities:
Pþ X1↔P−X1 ð2Þ
Pþ X2↔P−X2 ð3Þ
where P represents dissolved PO43−, X1 and X2 represent the two types
of solid phase binding sites, and P− X1 and P−X2 represent phosphateadsorbed to type 1 and2 sites (all in μmol L−1). For each of the two sorp-tion reactions, optimized values of forward and backward rate constants(k1+ and k1− respectively for Eq. (2), and k2+ and k2− respectively forEq. (3)) and the density of sorption sites X1 and X2 (μmol g−1) were de-termined by best fit to the data using the fitting routine within thesoftware.
3. Results
3.1. In-situ phosphorus geochemistry
Phosphorus in the surface sediments from sites 2 and 6 (average or-ganic C contents 4.4 and 3.2 wt.%, respectively; Kraal et al., 2013b) waspredominantly present as iron-associated (Fe–P) and organic P, withminor contributions by calcium-associated (Ca–P, apatite) and detritalP (Fig. 3a). At site 2, the total amount of solid-phase P decreased withsediment depth while the relative abundance of the major P phaseschanged relatively little: Fe–P decreased from 46% to 35% and organicP from 40% to 36% of total P. This contrasted with site 6, where the top10 cm was strongly enriched in Fe–P, and where a strong decreasewith depth in total P (from 20 to 5 μmol g−1) and Fe–P (from 53% to22% of total P) was observed. At site 6, Ca–P was the main P phase atdepth, accounting for up to 40% of total P. Below 10 to 15 cm sedimentdepth at sites 2 and 6, porewater PO4
3− and H2S increased to maximumvalues of 150–200 and 1500–2000 μmol L−1, respectively (Fig. 3band c). Overall, the sediment from site 8 (average organic C content1.5 wt.%; Kraal et al., 2013b) contained relatively low P concentrationswith Fe–P decreasing from 52% to 15% of total P, similar to site 6. Thetop sediment was dominated by Fe–P, but at depth there was approxi-mately equal distribution between Fe–P, Ca–P, detrital P and organic P.The porewater PO4
3− concentration was low and constant (between 0and 7 μmol L−1) at site 8, while dissolved H2S increased with depth toa maximum of 720 μmol L−1.
Both Corg/Porg and Corg/Preactive ratios, indicators of the relativepreservation efficiency of P, were higher than the Redfield ratio for ma-rine organic matter (C/P= 106) throughout the sediment profiles at allthree sites (Fig. 3d). The Corg/Porg ratio at sites 2 and 8 gradually in-creased from ~700 to ~1000 with depth. The Corg/Preactive ratio atthese sites followed a similar trend, increasing from ~250 to ~500. Atsite 6, C/P ratios were relatively low and constant in the top ~10 cm(Corg/Porg = 609 ± 59; Corg/Preactive = 157 ± 18), with a marked in-crease to maximum values of ~2000 and ~500 at depth.
3.2. Bulk sedimentary organic matter characterization
The organic component of surface sediment at sites 3 (equivalent tosite 2) and 6 was dominated by n-alkanes in the n-C20–33 range, with aprominent odd-over-even carbon number predominance (Fig. 4). Thisdistribution is typical of leaf waxes from higher plants (Eglinton andHamilton, 1967; Zhou et al., 2010). Furthermore, compound specific iso-tope analyses of the n-alkanes yielded δ13C isotope values of −38 and−34‰, which is consistent with a strong source influence from C3plants (Collister et al., 1994; Grice et al., 2008). Relatively low levels ofpotentially bacterially derived hopanoids were detected via the massfragmentogram of m/z 191 (e.g. Peters et al., 2005; Brocks and Grice,2011). Distinct hopanoids, dominated by a series of monounsaturatedhopanes, but also including lower relative abundances of C29–31 hopaneswith 17α, 21β stereochemistry were discerned in full scan chromato-grams. Overall, the organic sediment componentwas dominated by ter-restrial plant-derived n-alkanes.
3.3. Bulk sedimentary iron speciation
Bulk sediment Fe speciation obtained from LCF of Fe K-edge XANESgenerally agreed well with that obtained from LCF of EXAFS, especiallyin terms of general groupings of Fe sulfides, Fe oxides, and silicate Fe(Table 2). XANES LCF indicated that Fe sulfides consisted of relativelysmall fractions of mackinawite and relatively large fractions of greigite
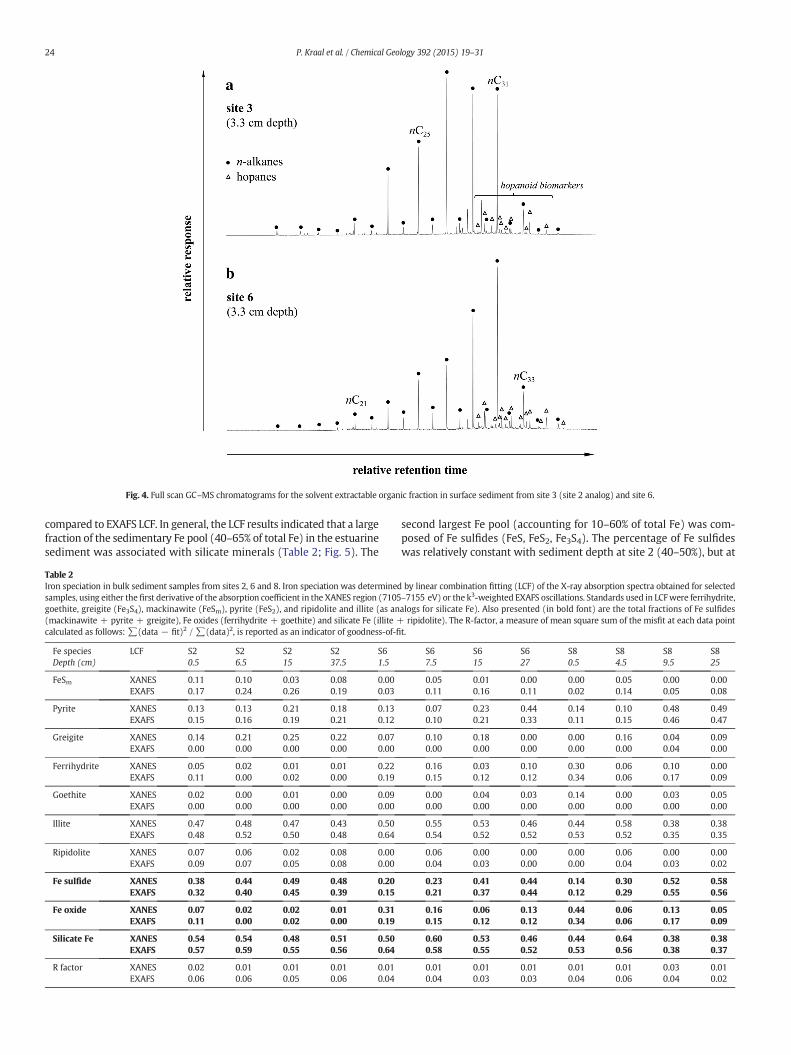
Fig. 4. Full scan GC–MS chromatograms for the solvent extractable organic fraction in surface sediment from site 3 (site 2 analog) and site 6.
24 P. Kraal et al. / Chemical Geology 392 (2015) 19–31
compared to EXAFS LCF. In general, the LCF results indicated that a largefraction of the sedimentary Fe pool (40–65% of total Fe) in the estuarinesediment was associated with silicate minerals (Table 2; Fig. 5). The
Table 2Iron speciation in bulk sediment samples from sites 2, 6 and 8. Iron speciation was determinedsamples, using either the first derivative of the absorption coefficient in the XANES region (7105goethite, greigite (Fe3S4), mackinawite (FeSm), pyrite (FeS2), and ripidolite and illite (as an(mackinawite + pyrite + greigite), Fe oxides (ferrihydrite + goethite) and silicate Fe (illite +calculated as follows: ∑(data − fit)2 / ∑(data)2, is reported as an indicator of goodness-of-fi
Fe speciesDepth (cm)
LCF S20.5
S26.5
S215
S237.5
S61.5
FeSm XANES 0.11 0.10 0.03 0.08 0.00EXAFS 0.17 0.24 0.26 0.19 0.03
Pyrite XANES 0.13 0.13 0.21 0.18 0.13EXAFS 0.15 0.16 0.19 0.21 0.12
Greigite XANES 0.14 0.21 0.25 0.22 0.07EXAFS 0.00 0.00 0.00 0.00 0.00
Ferrihydrite XANES 0.05 0.02 0.01 0.01 0.22EXAFS 0.11 0.00 0.02 0.00 0.19
Goethite XANES 0.02 0.00 0.01 0.00 0.09EXAFS 0.00 0.00 0.00 0.00 0.00
Illite XANES 0.47 0.48 0.47 0.43 0.50EXAFS 0.48 0.52 0.50 0.48 0.64
Ripidolite XANES 0.07 0.06 0.02 0.08 0.00EXAFS 0.09 0.07 0.05 0.08 0.00
Fe sulfide XANES 0.38 0.44 0.49 0.48 0.20EXAFS 0.32 0.40 0.45 0.39 0.15
Fe oxide XANES 0.07 0.02 0.02 0.01 0.31EXAFS 0.11 0.00 0.02 0.00 0.19
Silicate Fe XANES 0.54 0.54 0.48 0.51 0.50EXAFS 0.57 0.59 0.55 0.56 0.64
R factor XANES 0.02 0.01 0.01 0.01 0.01EXAFS 0.06 0.06 0.05 0.06 0.04
second largest Fe pool (accounting for 10–60% of total Fe) was com-posed of Fe sulfides (FeS, FeS2, Fe3S4). The percentage of Fe sulfideswas relatively constant with sediment depth at site 2 (40–50%), but at
by linear combination fitting (LCF) of the X-ray absorption spectra obtained for selected–7155 eV) or the k3-weighted EXAFS oscillations. Standards used in LCFwere ferrihydrite,alogs for silicate Fe). Also presented (in bold font) are the total fractions of Fe sulfidesripidolite). The R-factor, a measure of mean square sum of the misfit at each data point
t.
S67.5
S615
S627
S80.5
S84.5
S89.5
S825
0.05 0.01 0.00 0.00 0.05 0.00 0.000.11 0.16 0.11 0.02 0.14 0.05 0.08
0.07 0.23 0.44 0.14 0.10 0.48 0.490.10 0.21 0.33 0.11 0.15 0.46 0.47
0.10 0.18 0.00 0.00 0.16 0.04 0.090.00 0.00 0.00 0.00 0.00 0.04 0.00
0.16 0.03 0.10 0.30 0.06 0.10 0.000.15 0.12 0.12 0.34 0.06 0.17 0.09
0.00 0.04 0.03 0.14 0.00 0.03 0.050.00 0.00 0.00 0.00 0.00 0.00 0.00
0.55 0.53 0.46 0.44 0.58 0.38 0.380.54 0.52 0.52 0.53 0.52 0.35 0.35
0.06 0.00 0.00 0.00 0.06 0.00 0.000.04 0.03 0.00 0.00 0.04 0.03 0.02
0.23 0.41 0.44 0.14 0.30 0.52 0.580.21 0.37 0.44 0.12 0.29 0.55 0.56
0.16 0.06 0.13 0.44 0.06 0.13 0.050.15 0.12 0.12 0.34 0.06 0.17 0.09
0.60 0.53 0.46 0.44 0.64 0.38 0.380.58 0.55 0.52 0.53 0.56 0.38 0.37
0.01 0.01 0.01 0.01 0.01 0.03 0.010.04 0.03 0.03 0.04 0.06 0.04 0.02
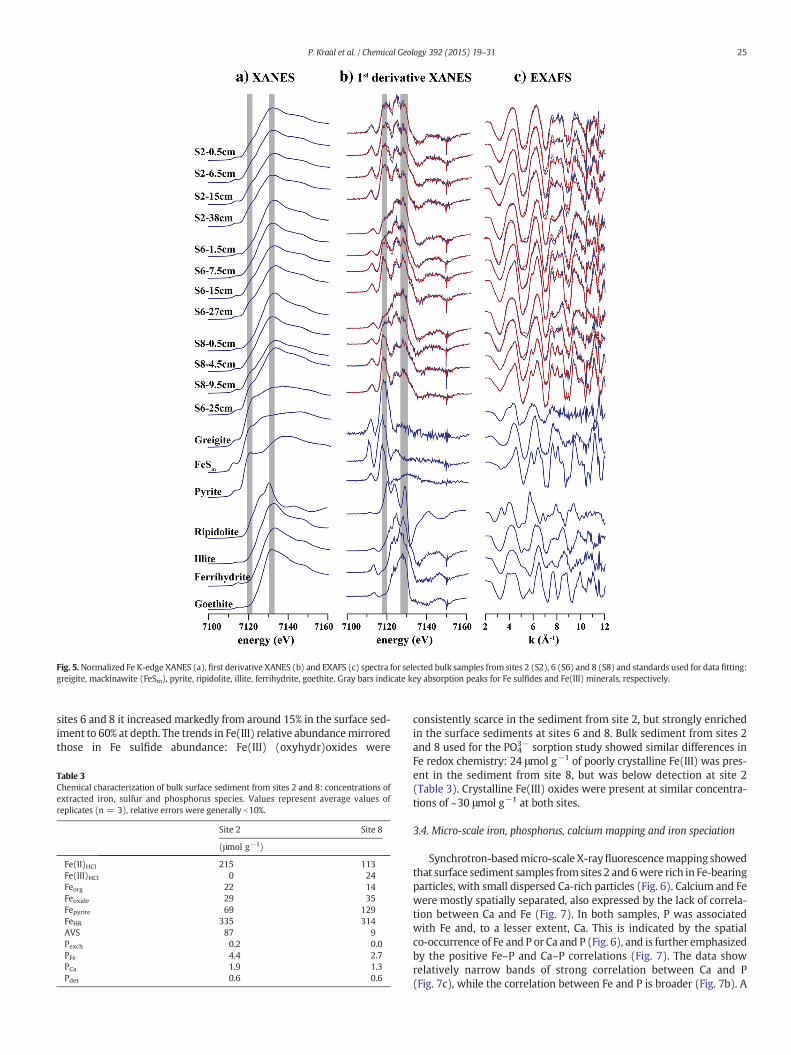
Fig. 5.Normalized Fe K-edge XANES (a), first derivative XANES (b) and EXAFS (c) spectra for selected bulk samples from sites 2 (S2), 6 (S6) and 8 (S8) and standards used for data fitting:greigite, mackinawite (FeSm), pyrite, ripidolite, illite, ferrihydrite, goethite. Gray bars indicate key absorption peaks for Fe sulfides and Fe(III) minerals, respectively.
25P. Kraal et al. / Chemical Geology 392 (2015) 19–31
sites 6 and 8 it increased markedly from around 15% in the surface sed-iment to 60% at depth. The trends in Fe(III) relative abundancemirroredthose in Fe sulfide abundance: Fe(III) (oxyhydr)oxides were
Table 3Chemical characterization of bulk surface sediment from sites 2 and 8: concentrations ofextracted iron, sulfur and phosphorus species. Values represent average values ofreplicates (n = 3), relative errors were generally b10%.
Site 2 Site 8
(μmol g−1)
Fe(II)HCl 215 113Fe(III)HCl 0 24Feorg 22 14Feoxide 29 35Fepyrite 69 129FeHR 335 314AVS 87 9Pexch 0.2 0.0PFe 4.4 2.7PCa 1.9 1.3Pdet 0.6 0.6
consistently scarce in the sediment from site 2, but strongly enrichedin the surface sediments at sites 6 and 8. Bulk sediment from sites 2and 8 used for the PO4
3− sorption study showed similar differences inFe redox chemistry: 24 μmol g−1 of poorly crystalline Fe(III) was pres-ent in the sediment from site 8, but was below detection at site 2(Table 3). Crystalline Fe(III) oxides were present at similar concentra-tions of ~30 μmol g−1 at both sites.
3.4. Micro-scale iron, phosphorus, calcium mapping and iron speciation
Synchrotron-basedmicro-scale X-rayfluorescencemapping showedthat surface sediment samples from sites 2 and 6were rich in Fe-bearingparticles, with small dispersed Ca-rich particles (Fig. 6). Calcium and Fewere mostly spatially separated, also expressed by the lack of correla-tion between Ca and Fe (Fig. 7). In both samples, P was associatedwith Fe and, to a lesser extent, Ca. This is indicated by the spatialco-occurrence of Fe and P or Ca and P (Fig. 6), and is further emphasizedby the positive Fe–P and Ca–P correlations (Fig. 7). The data showrelatively narrow bands of strong correlation between Ca and P(Fig. 7c), while the correlation between Fe and P is broader (Fig. 7b). A

Fig. 6. Synchrotron-based micro-scale X-ray fluorescence maps of iron, calcium and phosphorus in surface sediment samples from site 2 (1.5 cm depth; panels a, b, c) and site 6 (6.5 cmdepth; panels d, e, f). Arrows and numbers in a and d indicate the points where Fe K-edge X-ray absorption spectroscopy spectra were collected (see Fig. 8).
26 P. Kraal et al. / Chemical Geology 392 (2015) 19–31
large majority of points in the Fe–P scatter plots were positivelycorrelated compared to Ca–P scatter plots, with only a relatively smallnumber of points showing variability in P counts without co-variationin Fe counts (Fig. 7a, b).
Iron K-edge XANES spectra collected from Fe-rich spots showed thatboth samples contained various (mixed) Fe phases, that couldbe groupedinto three main categories: Fe sulfide, Fe sulfide/silicate and Fe oxide/silicate (Table 4; Fig. 8). The most marked P enrichments in the site 2surface sediment sample were associated with Fe sulfide. In the samplefrom site 6, P enrichments were found in association with Fe sulfide/sili-cate and Fe oxide/silicate. One Fe K-edge XANES spectrum collectedfrom the site 2 sample could not be characterized using LCF, even whensiderite (to our knowledge, the only Fe mineral with a distinct doublewhite line peak) was included as reference compound in the LCFprocedure.
Fig. 7. Scatter plots of synchrotron μXRF data, showing the correlations between iron and calciumples from site 2 (1.5 cm depth) and site 6 (6.5 cm depth). Data points represent X-ray fluorescespot size) (see text for details).
3.5. Phosphate sorption by surface sediment from sites 2 and 8
Surface sediments from site 2 showed relatively low PO43− binding
capacity, with an EPC0 of 39 μmol L−1 compared to 3 μmol L−1 for site8 surface sediment (Table 5; Fig. 9a). In addition, a greater proportionof PO4
3− adsorbed by site 2 sediment during the adsorption experimentwas released back into solution during the subsequent desorption ex-periment compared to site 8 sediment (Fig. 9b).
In the kinetic experiment, surface sediments from both sites showedrapid initial uptake of phosphate from solution (Fig. 9c). Site 8 sedimentsorbed PO4
3− to a greater extent and removal of phosphate from solutioncontinuedup to 48h,while thedissolvedPO4
3− concentration in the slurrieswith surface sediment from site 2 remained stable after 4 h. The kineticmodel output suggested relatively high densities of both types of sorptionsites for site 8 surface sediment compared to site 2 (Table 5).
(a), iron and phosphorus (b), and calcium and phosphorus (c) for surface sediment sam-nce counts for each element from ~1 × 1 mmmaps analyzed at ~2 × 2 μm resolution (i.e.
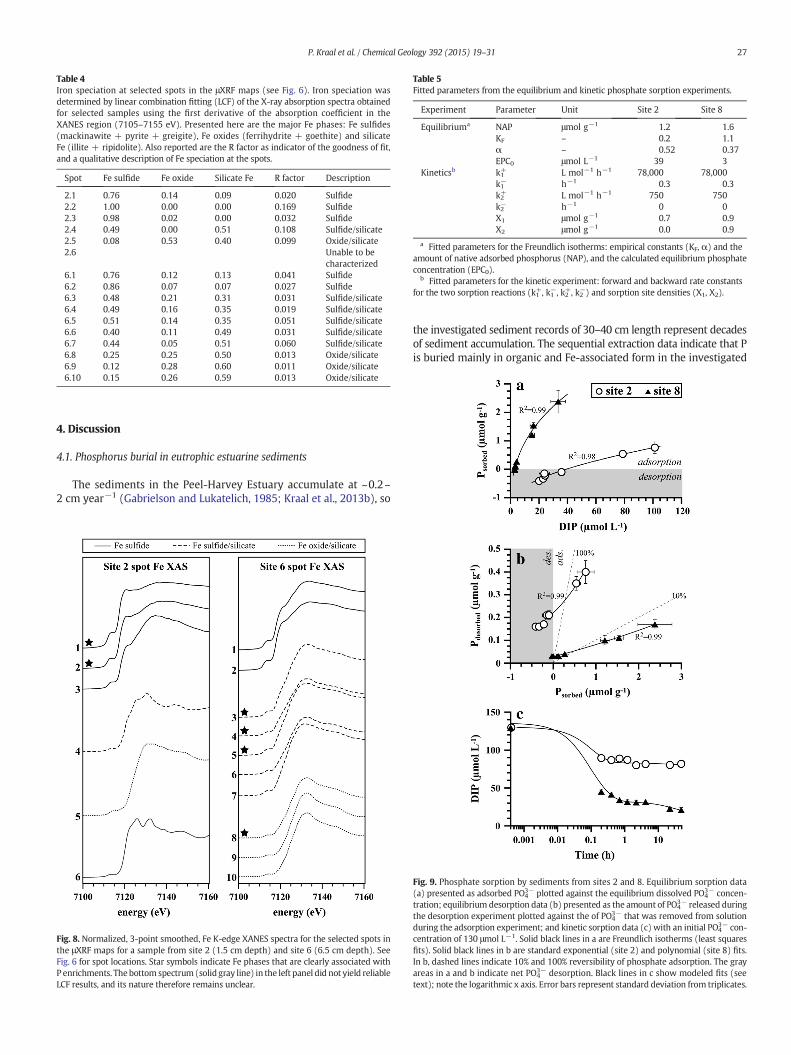
Table 4Iron speciation at selected spots in the μXRF maps (see Fig. 6). Iron speciation wasdetermined by linear combination fitting (LCF) of the X-ray absorption spectra obtainedfor selected samples using the first derivative of the absorption coefficient in theXANES region (7105–7155 eV). Presented here are the major Fe phases: Fe sulfides(mackinawite + pyrite + greigite), Fe oxides (ferrihydrite + goethite) and silicateFe (illite + ripidolite). Also reported are the R factor as indicator of the goodness of fit,and a qualitative description of Fe speciation at the spots.
Spot Fe sulfide Fe oxide Silicate Fe R factor Description
2.1 0.76 0.14 0.09 0.020 Sulfide2.2 1.00 0.00 0.00 0.169 Sulfide2.3 0.98 0.02 0.00 0.032 Sulfide2.4 0.49 0.00 0.51 0.108 Sulfide/silicate2.5 0.08 0.53 0.40 0.099 Oxide/silicate2.6 Unable to be
characterized6.1 0.76 0.12 0.13 0.041 Sulfide6.2 0.86 0.07 0.07 0.027 Sulfide6.3 0.48 0.21 0.31 0.031 Sulfide/silicate6.4 0.49 0.16 0.35 0.019 Sulfide/silicate6.5 0.51 0.14 0.35 0.051 Sulfide/silicate6.6 0.40 0.11 0.49 0.031 Sulfide/silicate6.7 0.44 0.05 0.51 0.060 Sulfide/silicate6.8 0.25 0.25 0.50 0.013 Oxide/silicate6.9 0.12 0.28 0.60 0.011 Oxide/silicate6.10 0.15 0.26 0.59 0.013 Oxide/silicate
Table 5Fitted parameters from the equilibrium and kinetic phosphate sorption experiments.
Experiment Parameter Unit Site 2 Site 8
Equilibriuma NAP μmol g−1 1.2 1.6KF – 0.2 1.1α – 0.52 0.37EPC0 μmol L−1 39 3
Kineticsb k1+ L mol−1 h−1 78,000 78,000k1− h−1 0.3 0.3k2+ L mol−1 h−1 750 750k2− h−1 0 0X1 μmol g−1 0.7 0.9X2 μmol g−1 0.0 0.9
a Fitted parameters for the Freundlich isotherms: empirical constants (KF, α) and theamount of native adsorbed phosphorus (NAP), and the calculated equilibrium phosphateconcentration (EPC0).
b Fitted parameters for the kinetic experiment: forward and backward rate constantsfor the two sorption reactions (k1+, k1−, k2+, k2−) and sorption site densities (X1, X2).
27P. Kraal et al. / Chemical Geology 392 (2015) 19–31
4. Discussion
4.1. Phosphorus burial in eutrophic estuarine sediments
The sediments in the Peel-Harvey Estuary accumulate at ~0.2–2 cm year−1 (Gabrielson and Lukatelich, 1985; Kraal et al., 2013b), so
Fig. 8. Normalized, 3-point smoothed, Fe K-edge XANES spectra for the selected spots inthe μXRF maps for a sample from site 2 (1.5 cm depth) and site 6 (6.5 cm depth). SeeFig. 6 for spot locations. Star symbols indicate Fe phases that are clearly associated withP enrichments. The bottom spectrum (solid gray line) in the left panel did not yield reliableLCF results, and its nature therefore remains unclear.
the investigated sediment records of 30–40 cm length represent decadesof sediment accumulation. The sequential extraction data indicate that Pis buried mainly in organic and Fe-associated form in the investigated
Fig. 9. Phosphate sorption by sediments from sites 2 and 8. Equilibrium sorption data(a) presented as adsorbed PO4
3− plotted against the equilibrium dissolved PO43− concen-
tration; equilibrium desorption data (b) presented as the amount of PO43− released during
the desorption experiment plotted against the of PO43− that was removed from solution
during the adsorption experiment; and kinetic sorption data (c) with an initial PO43− con-
centration of 130 μmol L−1. Solid black lines in a are Freundlich isotherms (least squaresfits). Solid black lines in b are standard exponential (site 2) and polynomial (site 8) fits.In b, dashed lines indicate 10% and 100% reversibility of phosphate adsorption. The grayareas in a and b indicate net PO4
3− desorption. Black lines in c show modeled fits (seetext); note the logarithmic x axis. Error bars represent standard deviation from triplicates.
28 P. Kraal et al. / Chemical Geology 392 (2015) 19–31
eutrophic estuarine surface sediments (Fig. 3). Organic P is generally thedominant source of P to the sediment surface (Froelich et al., 1988;Föllmi, 1996; Ruttenberg et al., 2003) and makes up a significant propor-tion of the sedimentary P reservoir, especially under oxygen-depletedconditions when organic matter degradation is retarded (Ingall et al.,1993; Jilbert et al., 2011). Indeed, thehighest absolute and relative organicP abundances were observed in the organic-rich, strongly reducing sedi-ments at site 2 (average organic C content 4.4 wt.%).
Interestingly, we found that Fe-associated P was an importantfraction of P burial at all investigated sites, irrespective of the markeddifferences in Fe redox chemistry in the surface sediments. Surface sed-iments at sites 6 and 8 experienced more oxidizing conditions, as evi-denced by the presence Fe(III) (oxyhydr)oxides in the top 5–10 cm ofthe sediment (Table 2; see also Kraal et al., 2013b). Under these condi-tions, enrichments in Fe-associated P were formed by PO4
3− adsorptiononto Fe(III) (oxyhydr)oxides. However, ~40% of P was also present asFe-associated P at site 2, where no Fe(III) (oxyhydr)oxides were detect-ed. Bulk Fe EXAFS showed that the sedimentary Fe pool was dominatedby Fe sulfides and clay-associated Fe (Table 2; Fig. 5).
Micro-scale investigations provided further insight into the nature ofthe Fe-associated P pool at site 2.Micro-XRF results showanoverall pos-itive yet diffuse correlation between Fe and P (Fig. 7), which supportsthe hypothesis that Fe-bearing minerals are an important reservoir ofP in the investigated (strongly reducing) eutrophic estuarine sediments.In addition, micro-scale Fe speciation reveals the presence of (mixed)Fe(III) oxide phases in the sediment from site 2 (Fig. 8), which werenot observed in the Fe EXAFS data from bulk sediment samples(Table 2; Fig. 5). In general, minor Fe phases (b5% of total Fe) are hardto discern by LCF analysis of bulk Fe EXAFS data from complexmixturesof Fe phases (O'Day et al., 2004). It is therefore possible that, despite itsoverall reducing nature, the sediment from site 2 harbors Fe(III) oxidephases that make up a small fraction of the total Fe pool, yet play a cru-cial role in sedimentary P sequestration. These oxidized Fe phases maybe formed by incursion of oxygenated bottom waters into the surfacesediment. Exchange between the surficial porewater and the bottomwater is suggested by porewater profiles in the top ~10 cm at sites 6and 8, and has also been reported based on previous geochemical sedi-ment characterization and 210Pb analyses of Peel-Harvey sediments(Kraal et al., 2013b). This implies that despite the prevailing reducingredox conditions observed at site 2, (oxic)micro-domains presentwith-in the sediments harbor Fe(III) (oxyhydr)oxides with associated P. Inthis study, reduced Fe-P minerals such as vivianite (Fe(II))3(PO4)2·8H2O) were not observed at the bulk or micro-scale. Previous workhas indicated that theseminerals can play an important role in P seques-tration in other marine environments such as reducing Baltic Sea sur-face sediments (Jilbert and Slomp, 2013), and deeper (~ 16 m) coldseep sediments offshore Taiwan that are depleted in dissolved sulfideand rich in dissolved Fe2+ (Hsu et al., 2014). In the investigated
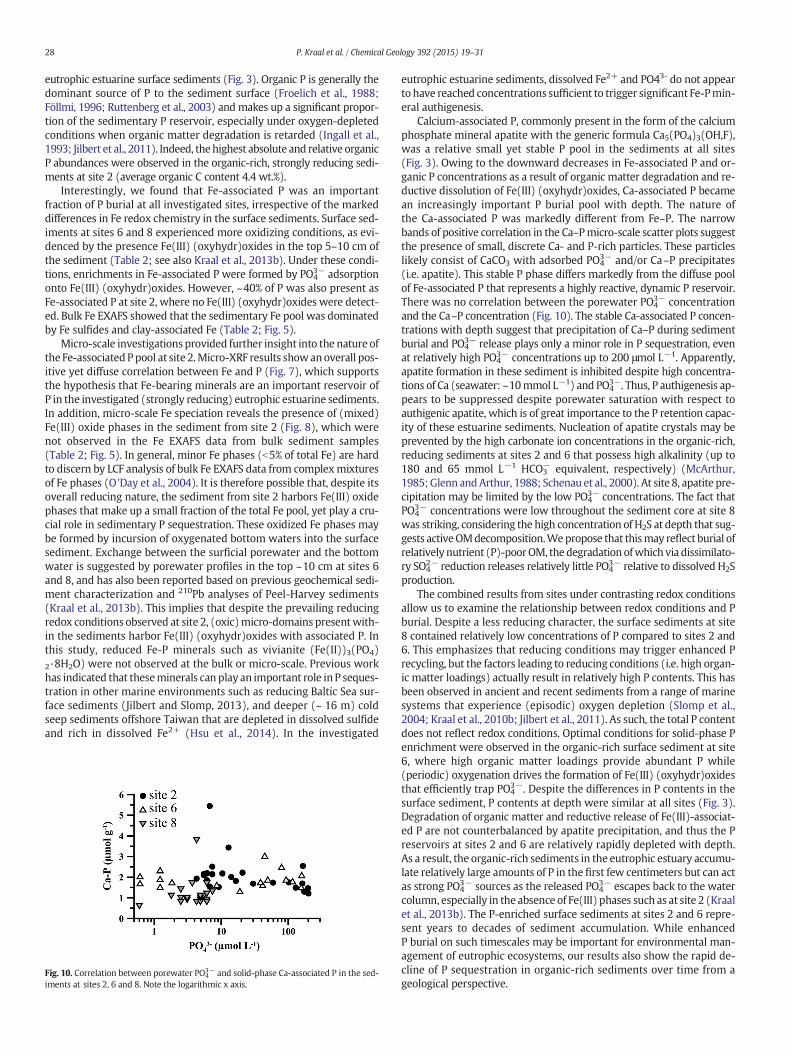
Fig. 10. Correlation between porewater PO43− and solid-phase Ca-associated P in the sed-
iments at sites 2, 6 and 8. Note the logarithmic x axis.
eutrophic estuarine sediments, dissolved Fe2+ and PO43- do not appearto have reached concentrations sufficient to trigger significant Fe-Pmin-eral authigenesis.
Calcium-associated P, commonly present in the form of the calciumphosphate mineral apatite with the generic formula Ca5(PO4)3(OH,F),was a relative small yet stable P pool in the sediments at all sites(Fig. 3). Owing to the downward decreases in Fe-associated P and or-ganic P concentrations as a result of organic matter degradation and re-ductive dissolution of Fe(III) (oxyhydr)oxides, Ca-associated P becamean increasingly important P burial pool with depth. The nature ofthe Ca-associated P was markedly different from Fe–P. The narrowbands of positive correlation in the Ca–Pmicro-scale scatter plots suggestthe presence of small, discrete Ca- and P-rich particles. These particleslikely consist of CaCO3 with adsorbed PO4
3− and/or Ca–P precipitates(i.e. apatite). This stable P phase differs markedly from the diffuse poolof Fe-associated P that represents a highly reactive, dynamic P reservoir.There was no correlation between the porewater PO4
3− concentrationand the Ca–P concentration (Fig. 10). The stable Ca-associated P concen-trations with depth suggest that precipitation of Ca–P during sedimentburial and PO4
3− release plays only a minor role in P sequestration, evenat relatively high PO4
3− concentrations up to 200 μmol L−1. Apparently,apatite formation in these sediment is inhibited despite high concentra-tions of Ca (seawater: ~10mmol L−1) and PO4
3−. Thus, P authigenesis ap-pears to be suppressed despite porewater saturation with respect toauthigenic apatite, which is of great importance to the P retention capac-ity of these estuarine sediments. Nucleation of apatite crystals may beprevented by the high carbonate ion concentrations in the organic-rich,reducing sediments at sites 2 and 6 that possess high alkalinity (up to180 and 65 mmol L−1 HCO3
− equivalent, respectively) (McArthur,1985; Glenn andArthur, 1988; Schenau et al., 2000). At site 8, apatite pre-cipitation may be limited by the low PO4
3− concentrations. The fact thatPO4
3− concentrations were low throughout the sediment core at site 8was striking, considering the high concentration of H2S at depth that sug-gests activeOMdecomposition.Wepropose that thismay reflect burial ofrelatively nutrient (P)-poorOM, thedegradationofwhich via dissimilato-ry SO4
2− reduction releases relatively little PO43− relative to dissolved H2S
production.The combined results from sites under contrasting redox conditions
allow us to examine the relationship between redox conditions and Pburial. Despite a less reducing character, the surface sediments at site8 contained relatively low concentrations of P compared to sites 2 and6. This emphasizes that reducing conditions may trigger enhanced Precycling, but the factors leading to reducing conditions (i.e. high organ-ic matter loadings) actually result in relatively high P contents. This hasbeen observed in ancient and recent sediments from a range of marinesystems that experience (episodic) oxygen depletion (Slomp et al.,2004; Kraal et al., 2010b; Jilbert et al., 2011). As such, the total P contentdoes not reflect redox conditions. Optimal conditions for solid-phase Penrichment were observed in the organic-rich surface sediment at site6, where high organic matter loadings provide abundant P while(periodic) oxygenation drives the formation of Fe(III) (oxyhydr)oxidesthat efficiently trap PO4
3−. Despite the differences in P contents in thesurface sediment, P contents at depth were similar at all sites (Fig. 3).Degradation of organic matter and reductive release of Fe(III)-associat-ed P are not counterbalanced by apatite precipitation, and thus the Preservoirs at sites 2 and 6 are relatively rapidly depleted with depth.As a result, the organic-rich sediments in the eutrophic estuary accumu-late relatively large amounts of P in the first few centimeters but can actas strong PO4
3− sources as the released PO43− escapes back to the water
column, especially in the absence of Fe(III) phases such as at site 2 (Kraalet al., 2013b). The P-enriched surface sediments at sites 2 and 6 repre-sent years to decades of sediment accumulation. While enhancedP burial on such timescales may be important for environmental man-agement of eutrophic ecosystems, our results also show the rapid de-cline of P sequestration in organic-rich sediments over time from ageological perspective.
29P. Kraal et al. / Chemical Geology 392 (2015) 19–31
4.2. Benthic phosphorus dynamics: PO43− sorption under contrasting
redox conditions
The PO43− sorption experiments provided further insight into the po-
tential of the different types of sediments to act as sink for dissolvedPO4
3−, which is released during sediment diagenesis or can be scav-enged from the overlying water. Here, it is important to note that thebulk surface sediment used for the sorption experiments was collectedat a different time (November 2012) than the discrete core samples(February 2012) that were used for the P sequential extractions andsynchrotron-based Fe characterization. As such, caution is requiredwhen attributing the observed sorption behavior of the bulk sedimentto the chemical and mineralogical characteristics of the discrete coresamples. However, we are confident that the main differences betweenthe two sites are reflected in both types of sample; chemical Fe extrac-tion of the bulk sediment (Table 3) and Fe EXAFS analysis of discretecore samples (Table 2) show marked differences in the abundance of(poorly crystalline) Fe(III) (oxyhydr)oxides between sites 2 and 8. Inline with this, there were clear differences in PO4
3− sorption behaviorbetween the surface sediments from sites 2 and 8. The more reducingsediment from site 2, where reactive Fe(III) (oxyhydr)oxides weremostly absent, showed much smaller sorption capacity than sedimentsfrom site 8 (Fig. 9). Furthermore, the high degree of sorption reversibil-ity for site 2 sediment reveals that PO4
3− is only weakly adsorbed inthese sediments. The high EPC0 value for site 2 sediment implies thatthis material can readily act as a source of dissolved PO4
3− to the watercolumn when brought into contact with low-PO4
3− water. This mayoccur when fine-grained sediment is resuspended by bottom currents,or when bottom water penetrates the sediment (Morgan et al.,2012b). Chemical Fe fractionation suggests that the two sediments con-tain comparable amounts of crystalline Fe(III) oxides, and the main dif-ference lies in the amount of poorly crystalline Fe(III) (oxyhydr)oxides(Table 3). Given the clear difference in PO4
3− sorption capacity, this im-plies that poorly crystalline Fe(III) (e.g. ferrihydrite) plays by far themost important role in PO4
3− scavenging (Slomp et al., 1996b). Wepropose that the small amount of reversibly adsorbed PO4
3− observedfor site 2 represents PO4
3− that is weakly bound to clay particlesand crystalline Fe(III) oxides. In contrast, poorly crystalline Fe(III)(oxyhydr)oxides in site 8 surface sediment accommodatemuch greaterPO4
3− sequestration. Overall, sediments at the oxic site 8 had greaterPO4
3− sorption capacity, yet showed relatively low concentrations ofFe-associated P (and total P) compared to organic-rich, reducing sedi-ment at site 2. This reinforces the concept that redox conditions mayhelp control the PO4
3− retention capacity, but that organic-rich reducingsediments receive and sequester larger amounts of P, at least in theshort term.
4.3. Carbon to phosphorus ratios as a redox proxy in estuarine sediments
Weestablished that total sedimentary P contents do not provide accu-rate information on past redox conditions at the sediment–water inter-face, because of the contrasting effects of increased organic matter (andthus P) input and enhanced P recycling under oxygen-depleted condi-tions. However, the ratios betweenorganic carbon andbothorganic phos-phorus (Corg/Porg) and total reactive phosphorus (Corg/Preactive) can beused to infer redox conditions during sediment deposition (Ingall et al.,1993; Kraal et al., 2010a; Jilbert et al., 2011). Enhanced regeneration of Pfrom organic matter under anoxic conditions (Gächter et al., 1988;Hupfer et al., 2004; Steenbergh et al., 2011) in combination with de-creased P retention capacity of reducing sediments leads to elevated C/Pratioswith respect to the Redfield C/P ratio of freshmarine organicmatter(~106; Redfield, 1958) under oxygen-depleted conditions. Our resultsshow that factors other than oxygenation of the bottom waters play animportant role in controlling C/P ratios in near-shore marine sediments.The C/P ratios and especially Corg/Porg ratios were well above the Redfieldratio throughout the sediment profile at all sites (Fig. 3). However, the
water column in the estuary is generally well-oxygenated due to wind-drivenmixing (Hearn andRobson, 2000; Kraal et al., 2013b). Additionally,there are marked differences in the redox conditions in the surfacesediments at the different sites, but the Corg/Porg ratios were similar, alsoarguing against a universal relationship between redox conditions andCorg/Porg. Here, the high Corg/Porg ratios likely result from the high C/Pratio of recalcitrant terrestrial organic matter that makes up the bulk ofthe buried organic matter (Fig. 4), rather than the benthic redoxconditions. Terrestrial organicmatter such as leaf litter can have C/P ratiosof N1000 (McGroddy et al., 2004). The fact that the Corg/Preactive ratios aremuch lower than the Corg/Porg ratios may indicate sequestration of PO4
3−
released during rapid degradation of fresh marine organic matter at thesediment surface. Alternatively, P deposition at the sediment surfacemay largely consist of inorganic reactive P (e.g. PO4
3− adsorbed onto set-tling Fe or clay particles). This would act to decrease the Corg/Preactiveratio but not the Corg/Porg ratio.
Overall, our results indicate that the sedimentary Corg/Porg ratios innear-shore marine environments (e.g. estuaries) can be greatly affectedby the type of organic matter that is buried in the sediment. Therefore,C/P ratios do not necessarily reflect redox conditions during sedimentdeposition, but rather the balance between different C and P sources.Characterization of organic matter in such systems is therefore crucialto correctly interpret the relationship between C/P ratios and other bio-geochemical processes and conditions.
4.4. Temporal and spatial variability in depositional conditions in a dynamicshallow estuary
In Section 4.1, we touched upon the potential role of (periodic)incursions of oxygenated bottom waters into the investigated eu-trophic estuarine sediments. The investigated estuary is a highlydynamic, shallow (1.5–2 m water depth) environment that is sub-ject to both natural (wind-driven mixing, algal growth) and anthro-pogenic (dredging) impacts. The strong similarity in the depthprofiles of Corg and FeS2 from cores collected in 2011 and 2012(data not shown) implies that the surface sediment at the fieldsites was not affected by dredging in the period of sample collection.However, exchange with the overlying water likely caused variationsin surface sediment redox chemistry between the two sampling dates.High concentrations of PO4
3− (up to 600 μmol L−1) and H2S(N2 mmol L−1) were observed in the top 10 cm of sediment at sites 2and 6 in 2011 (Kraal et al., 2013a). In contrast, in 2012 at these sites,PO4
3− and H2S concentrations in the top sediment were low and con-stant (Fig. 3), suggesting that the surface sediments had been oxygenat-ed by the overlying water since 2011. Such variability in surfacesediment oxygenation obviously alters the Fe redox chemistry and Pretention capacity of the sediment. The results from site 2 show thepotential importance of oxic micro-environments to P sequestrationin sediments that are reducing overall. In addition, the (temporarily)oxidizing conditions in the organic-rich sediment at site 6 have led tothe strongest enrichment in solid-phase P; in this case, introduction ofoxygenated bottom water has turned sulfide-rich sediments into anefficient P sink. However, changes in surface sediment oxygenationcan cause rapid switching between net PO4
3− sequestration and releaseby organic-rich surface sediments (Kraal et al., 2013b). These resultsshow the great sensitivity of the P sequestration potential to bottomwater and surface sediment oxygenation. In this respect, it is notewor-thy that wind-driven water column mixing and oxygenation of thebenthic realm shows large diurnal variability, with extensive oxygendepletion in bottom waters at night when wind-driven mixing of thewater column is very sluggish (Hearn and Robson, 2000).
In addition, sedimentation rates in the estuary are spatiallystrongly variable due to the effects of wind-driven sediment resus-pension and deposition (Gabrielson and Lukatelich, 1985). As OMdeposition is one of the governing factors for sediment redox stateand P burial capacity, this variability may lead to a high degree of

30 P. Kraal et al. / Chemical Geology 392 (2015) 19–31
spatial heterogeneity in the P source/sink function of the sediment.Our results show that even in similar depositional environments indifferent parts of the estuary (sites 2 and 6 in navigation channels),there are marked differences in Fe redox chemistry and P sequestra-tion. Although full investigation was beyond the scope of this study,depositional regimes are likely also temporally variable, causinglocal changes over time in sediment geochemistry and benthic Pdynamics. Overall, P sequestration by surface sediments anddissolved PO4
3− availability in the investigated shallow estuary issensitive to spatial and temporal variability in depositional condi-tions on short (diurnal) and long timescales, and is likely to be ex-tremely sensitive to future changes in nutrient availability and(OM) deposition regimes.
5. Conclusions
Organic P and Fe-associated P are themain P burial phases in the eu-trophic sediments of the Peel-Harvey Estuary. Even under overall reduc-ing conditions, Fe-associated P can be quantitatively important, eitherbecause of micro-environments containing Fe(III) (oxyhydr)oxides oradsorption onto Fe-bearing clay minerals. However, PO4
3− sorption byreducing sediments appears to be limited and rather weak. Reducingconditions may lead to decreased P retention capacity due to dimin-ished Fe(III) (oxyhydr)oxide concentrations, but the larger supply of or-ganic matter and thus P to such sediments results in greater P burial, atleast in the short term. Importantly, anoxic diagenesis leads to rapid re-lease of PO4
3− to the porewater, and owing to the inhibition of apatiteformation and inherently low sorption capacity of reduced sediments,this released PO4
3−finds its way back to the water column where it
can fuel further eutrophication. Thus, reducing sediments represent animportant internal source of P to estuaries, and will compound the ef-fects of eutrophication from direct surficial inputs. The dynamic natureof shallow estuaries,which are subject to variable natural and anthropo-genic impacts, may result in rapid switching in the sediment redoxchemistry and P sink/source function of the sediment.
Acknowledgments
This research is part of a Linkage Project (LP0991658) co-funded bythe Australian Research Council. The bulk Fe XAS was conducted at theAustralian National Beamline Facility (Tsukuba, Japan) with supportfrom the Australian Synchrotron organization (grant AS122/ANBF/4816). We thank Dr. Jade Aitken for her technical assistance and expertadvicewith the Fe XAS data collection. Themicrospectroscopywas con-ducted at the Stanford Synchrotron Radiation Lightsource (Menlo Park,USA)with support from the Australian Synchrotron organization (grantAS/IA123/5668). Additionally, E.D.B. acknowledges funding supportfrom ARC project DP110100519, and A.L.R. acknowledges funding sup-port from ARC project DP0987351. We thank the Department of Waterin Western Australia, in particular Zitty Wesolowski and John Pszczola,for their help with the sample collection. Michael D. Cheetham is grate-fully acknowledged for his assistance during the sample collection andprocessing. We thank two anonymous reviewers and Editor Karla M.Koretsky for their insightful comments and suggestions that enhancedthe quality of this article.
Appendix A. Supplementary data
Supplementary data to this article can be found online at http://dx.doi.org/10.1016/j.chemgeo.2014.11.006.
References
APHA, 2005. Standard Methods for the Examination of Water and Wastewater. AmericanPublic Health Association–American Water Works Association–Water EnvironmentFederation.
Aspila, K.I., Agemian, H., Chau, A.S.Y., 1976. A semiautomated method for the deter-mination of inorganic, organic and total phosphate in sediments. Analyst 101,187–197.
ASRP, 2007. Average v 2.0 for Windows. Australian Synchrotron Research Program.Barber, T.M., 2002. Phosphate Adsorption byMixed and Reduced Iron Phases in Static and
Dynamic Systems. (MSc thesis) Stanford University.Berner, R.A., 1964. Stability fields of iron minerals in anaerobic marine sediments. J. Geol.
72, 826–834.Brocks, J.J., Grice, K., 2011. Biomarkers (molecular fossils). In: Reitner, J., Thiel, V. (Eds.),
Encyclopaedia of Geobiology. Springer, pp. 167–182.Burns, S.J., 1997. Early diagenesis in Amazon fan sediments. In: Flood, R.D., Piper, D.J.W.,
Klaus, A., Peterson, L.C. (Eds.), ODP Proc. Sci. Res.Burton, E.D., Bush, R.T., Sullivan, L.A., Johnston, S.G., Hocking, R.K., 2008. Mobility of arse-
nic and selected metals during re-flooding of iron- and organic-rich acid-sulfate soil.Chem. Geol. 253, 64–73.
Burton, E.D., Bush, R.T., Johnston, S.G., Sullivan, L.A., Keene, A.F., 2011. Sulfur biogeochem-ical cycling and novel Fe–S mineralization pathways in a tidally re-flooded wetland.Geochim. Cosmochim. Acta 75, 3434–3451.
Canfield, D.E., Raiswell, R., Bottrell, S.H., 1992. The reactivity of sedimentary iron mineralstoward sulfide. Am. J. Sci. 292, 659–683.
Claff, S.R., Sullivan, L.A., Burton, E.D., Bush, R.T., 2010. A sequential extraction proce-dure for acid sulfate soils: partitioning of iron. Geoderma 155, 224–230.
Collister, J.W., Rieley, G., Stern, B., Eglinton, G., Fry, B., 1994. Compound-specific δ13C anal-yses of leaf lipids from plants with differing carbon dioxide metabolisms. Org.Geochem. 21.
Curtis, C.D., Spears, D.A., 1968. The formation of sedimentary ironminerals. Econ. Geol. 63,257–270.
Diaz, R.J., Rosenberg, R., 2008. Spreading dead zones and consequences for marine ecosys-tems. Science 321, 926–929.
Eglinton, G., Hamilton, R.J., 1967. Leaf epicuticular waxes. Science 156, 1322–1335.Föllmi, K.B., 1996. The phosphorus cycle, phosphogenesis and marine phosphate-rich de-
posits. Earth-Sci. Rev. 40, 55–124.Froelich, P.N., Arthur, M.A., Burnett, W.C., Deakin, M., Hensley, V., Jahnke, R., Kaul, L., Kim,
K.H., Roe, K., Soutar, A., Vathakanon, C., 1988. Early diagenesis of organic-matter inPeru continental-margin sediments — phosphorite precipitation. Mar. Geol. 80,309–343.
Gabrielson, J.O., Lukatelich, R.J., 1985. Wind-related resuspension of sediments in thePeel-Harvey Estuarine System. Estuar. Coast. Shelf Sci. 20, 135–145.
Gächter, R., Meyer, J.S., Mares, A., 1988. Contribution of bacteria to release and fixation ofphosphorus in lake-sediments. Limnol. Oceanogr. 33, 1542–1558.
Gerritse, R.G., Wallbrink, P.J., Murray, A.S., 1998. Accumulation of phosphorus and heavymetals in the Peel-Harvey Estuary in Western Australia: results of a preliminarystudy. Estuar. Coast. Shelf Sci. 47, 679–693.
Glenn, C.R., Arthur, M.A., 1988. Petrology andmajor element geochemistry of Perumarginphosphorites and associated diagenetic minerals: authigenesis in modern organic-rich sediments. Mar. Geol. 80, 231–267.
Grice, K., Lu, H., Zhou, Y., Stuart-Williams, H., Farquhar, G.D., 2008. Biosynthetic and envi-ronmental effects on the stable carbon isotopic compositions of anteiso-(3-methyl)and iso-(2-methyl) alkanes in tobacco leaves. Phytochemistry 69.
Hansen, H.C.B., Koch, C.B., Nancke-Krogh, H., Borggaard, O.K., Sørensen, J., 1996. Abioticnitrate reduction to ammonium: key role of green rust. Environ. Sci. Technol. 30,2053–2056.
Hearn, C.J., Robson, B.J., 2000. Modelling a bottom diurnal boundary layer and its controlof massive alga blooms in an estuary. Appl. Math. Model. 24, 843–859.
Hodgkin, E.P., Hamilton, B.H., 1993. Fertilizers and eutrophication in southwesternAustralia: setting the scene. Nutr. Cycl. Agroecosyst. 36, 95–103.
Hsu, T.-W., Jiang, W.-T., Wang, Y., 2014. Authigenesis of vivianite as influenced by meth-ane-induced sulfidization in cold-seep sediments off southwestern Taiwan. J. AsianEarth Sci. 89, 88–97.
Hupfer, M., Rube, B., Schmieder, P., 2004. Origin and diagenesis of polyphosphate in lakesediments: a 31P-NMR study. Limnol. Oceanogr. 49, 1–10.
Ingall, E.D., Bustin, R.M., Van Cappellen, P., 1993. Influence of water column anoxia on theburial and preservation of carbon and phosphorus in marine shales. Geochim.Cosmochim. Acta 57, 303–316.
Jilbert, T., Slomp, C.P., 2013. Iron and manganese shuttles control the formation ofauthigenic phosphorus minerals in the euxinic basins of the Baltic Sea. Geochim.Cosmochim. Acta 107, 155–169.
Jilbert, T., Slomp, C.P., Gustafsson, B.G., Boer,W., 2011. Beyond the Fe–P-redox connection:preferential regeneration of phosphorus from organic matter as a key control onBaltic Sea nutrient cycles. Biogeosciences 8, 1699–1720.
Johnson, K.A., Simpson, Z.B., Blom, T., 2009. Global Kinetic Explorer: a new computerprogram for dynamic simulation and fitting of kinetic data. Anal. Biochem. 387,20–29.
Kraal, P., Slomp, C.P., de Lange, G.J., 2010a. Sedimentary organic carbon to phosphorus ra-tios as a redox proxy in Quaternary records from theMediterranean. Chem. Geol. 277,167–177.
Kraal, P., Slomp, C.P., Forster, A., Kuypers, M.M.M., 2010b. Phosphorus cycling from themargin to abyssal depths in the proto-Atlantic during oceanic anoxic event 2.Palaeogeogr. Palaeoclimatol. Palaeoecol. 295, 42–54.
Kraal, P., Burton, E.D., Bush, R.T., 2013a. Iron monosulfide accumulation and pyrite forma-tion in eutrophic estuarine sediments. Geochim. Cosmochim. Acta 122, 75–88.
Kraal, P., Burton, E.D., Rose, A.L., Cheetham, M.D., Bush, R.T., Sullivan, L.A., 2013b.Decoupling between water column oxygenation and benthic phosphate dynamicsin a shallow eutrophic estuary. Environ. Sci. Technol. 47, 3114–3121.
Krom, M.D., Berner, R.A., 1980. Adsorption of phosphate in anoxic marine sediments.Limnol. Oceanogr. 25, 797–806.

31P. Kraal et al. / Chemical Geology 392 (2015) 19–31
Lockhart, R.S., Berwick, L.J., Greenwood, P., Grice, K., Kraal, P., Bush, R., 2013. Analytical py-rolysis for determining the molecular composition of contemporary monosulfidicblack ooze. J. Anal. Appl. Pyrolysis 104, 640–652.
Lukatelich, R.J., McComb, A.J., 1986. Nutrient levels and the development of diatomand blue-green algal blooms in a shallow Australian estuary. J. Plankton Res. 8,597–618.
McArthur, J.M., 1985. Francolite geochemistry—compositional controls during for-mation, diagenesis, metamorphism and weathering. Geochim. Cosmochim.Acta 49, 23–35.
McComb, A.J., Lukatelich, R.J., 1995. The Peel-Harvey Estuarine system,Western Australia.In: McComb, A.J. (Ed.), Eutrophic Shallow Estuaries and Lagoons. CRC Press, BatonRouge, pp. 5–18.
McGroddy, M.E., Daufresne, T., Hedin, L.O., 2004. Scaling of C:N:P stoichiometry inforests worldwide: implications of terrestrial Redfield-type ratios. Ecology 85,2390–2401.
Middelburg, J.J., Levin, L.A., 2009. Coastal hypoxia and sediment biogeochemistry. Bioge-osciences 6, 1273–1293.
Morgan, B., Burton, E.D., Rate, A.W., 2012a. Ironmonosulfide enrichment and the presence oforganosulfur in eutrophic estuarine sediments. Chem. Geol. 296–297, 119–130.
Morgan, B., Rate, A.W., Burton, E.D., 2012b. Water chemistry and nutrient release duringthe resuspension of FeS-rich sediments in a eutrophic estuarine system. Sci. TotalEnviron. 432, 47–56.
O'Day, P.A., Rivera, N., Root, R., Carroll, S.A., 2004. X-ray absorption spectroscopic study ofFe reference compounds for the analysis of natural sediments. Am. Mineral. 89,572–585.
Peters, K.E., Walters, C.C., Moldowan, J.M., 2005. The Biomarker Guide: InterpretingMolecular Fossils in Petroleum and Ancient Sediments. Prentice-Hall, New Jersey.
Ravel, B., Newville, M., 2005. Athena, Artemis, Hephaestus: data analysis for X-ray absorp-tion spectroscopy using IFEFFIT. J. Synchrotron Radiat. 12, 537–541.
Redfield, A.C., 1958. The biological control of chemical factors in the environment. Am. Sci.46, 205–222.
Rozan, T.F., Taillefert, M., Trouwborst, R.E., Glazer, B.T., Ma, S., Herszage, J., Valdes, L.M.,Price, K.S., Iii, G.W.L., 2002. Iron–sulfur–phosphorus cycling in the sediments of a
shallow coastal bay: implications for sediment nutrient release and benthicmacroalgal blooms. Limnol. Oceanogr. 47, 1346–1354.
Ruttenberg, K.C., 1992. Development of a sequential extraction method for differentforms of phosphorus in marine sediments. Limnol. Oceanogr. 37, 1460–1482.
Ruttenberg, K.C., Holland, H.D., Turekian, K.K., 2003. The global phosphorus cycle. In:Schlesinger, W.H. (Ed.), Treatise on Geochemistry. Pergamon, Oxford, pp. 585–643.
Schenau, S.J., Slomp, C.P., De Lange, G.J., 2000. Phosphogenesis and active phosphorite forma-tion in sediments from the Arabian Sea oxygen minimum zone. Mar. Geol. 169, 1–20.
Schulz, H., Dahmke, A., Schinzel, U., Wallmann, K., Zabel, M., 1994. Early diagenetic pro-cesses, fluxes, and reaction-rates in sediments of the south-Atlantic Ridge. Geochim.Cosmochim. Acta 58, 2041–2060.
Slomp, C.P., Epping, E.H.G., Helder, W., Van Raaphorst, W., 1996a. A key role for iron-bound phosphorus in authigenic apatite formation in North Atlantic continental plat-form sediments. J. Mar. Res. 54, 1179–1205.
Slomp, C.P., Van der Gaast, S.J., Van Raaphorst, W., 1996b. Phosphorus binding by poorlycrystalline iron oxides in North Sea sediments. Mar. Chem. 52, 55–73.
Slomp, C.P., Malschaert, J.F.P., Van Raaphorst, W., 1998. The role of adsorption insediment–water exchange of phosphate in North Sea continental margin sediments.Limnol. Oceanogr. 43, 832–846.
Slomp, C.P., Thomson, J., De Lange, G.J., 2004. Controls on phosphorus regeneration andburial during formation of easternMediterranean sapropels. Mar. Geol. 203, 141–159.
Steenbergh, A.K., Bodelier, P.L.E., Hoogveld, H.L., Slomp, C.P., Laanbroek, H.J., 2011. Phos-phatases relieve carbon limitation of microbial activity in Baltic Sea sedimentsalong a redox-gradient. Limnol. Oceanogr. 56, 2018–2026.
Strickland, J.D., Parsons, T.R., 1972. A Practical Handbook of Seawater Analysis Bulletin167. Fish. Res. Board Canada, Canada.
Zhou, Y., Grice, K., Stuart-Williams, H., Farquhar, G.D., Hocart, C., Lu, H., Liu, W., 2010.Biosynthetic origin of the saw-toothed profile in δ13C and δ2Η of n-alkanes andsystematic isotopic differences between n-, iso- and anteiso-alkanes in leaf waxesof land plants. Phytochemistry 71, 388–403.
Copyright © 2022 FDOKUMEN