Cycling viability of aqueous superconcentrated electrolytes
250
Sorbonne Université Ecole doctorale 397 - Physique et Chimie des Matériaux Chimie du Solide et Energie, Collège de France, UMR 8260 Vers des électrolytes aqueux superconcentrés pour une application dans les batteries Li-ion Par Léa Droguet Thèse de doctorat de Physique et Chimie des Matériaux Dirigée par Jean-Marie Tarascon, Alexis Grimaud et Olivier Fontaine Présentée et soutenue publiquement le 13 Décembre 2021 Devant un jury composé de : Prof. Rosa Palacín Professeure, ICMAB, Barcelona, Spain Rapporteuse Dr. Mathieu Morcrette Ingénieur de Recherche HDR, LRCS, Amiens Rapporteur Dr. Frédéric Kanoufi Directeur de Recherche, ITODYS, Paris Examinateur Dr. Corsin Battaglia Directeur de Recherche, EMPA, Zürich, Suisse Examinateur Prof. Jean-Marie Tarascon Professeur, Chimie du Solide et Energie, Paris Directeur Dr. Alexis Grimaud Chargé de Recherche, Chimie du Solide et Energie, Paris Encadrant Dr. Olivier Fontaine Maitre de Conférence, ICGM, Montpellier Encadrant
-
Upload
khangminh22 -
Category
Documents
-
view
3 -
download
0
Transcript of Cycling viability of aqueous superconcentrated electrolytes

Sorbonne Université
Ecole doctorale 397 - Physique et Chimie des Matériaux
Chimie du Solide et Energie, Collège de France, UMR 8260
Vers des électrolytes aqueux superconcentrés pour une
application dans les batteries Li-ion
Par Léa Droguet
Thèse de doctorat de Physique et Chimie des Matériaux
Dirigée par Jean-Marie Tarascon, Alexis Grimaud et Olivier Fontaine
Présentée et soutenue publiquement le 13 Décembre 2021
Devant un jury composé de :
Prof. Rosa Palacín Professeure, ICMAB, Barcelona, Spain Rapporteuse
Dr. Mathieu Morcrette Ingénieur de Recherche HDR, LRCS, Amiens Rapporteur
Dr. Frédéric Kanoufi Directeur de Recherche, ITODYS, Paris Examinateur
Dr. Corsin Battaglia Directeur de Recherche, EMPA, Zürich, Suisse Examinateur
Prof. Jean-Marie Tarascon Professeur, Chimie du Solide et Energie, Paris Directeur
Dr. Alexis Grimaud Chargé de Recherche, Chimie du Solide et Energie, Paris Encadrant
Dr. Olivier Fontaine Maitre de Conférence, ICGM, Montpellier Encadrant


Sorbonne Université
Ecole doctorale 397 - Physique et Chimie des Matériaux
Chimie du Solide et Energie, Collège de France, UMR 8260
Towards aqueous superconcentrated electrolytes for Li-ion
battery
By Léa Droguet
Ph.D. thesis of Physics and Chemistry of Materials
Supervised by Jean-Marie Tarascon, Alexis Grimaud and Olivier Fontaine
Presented and defended publicly on December 13th, 2021
In front of the Jury:
Prof. Rosa Palacín Professor, ICMAB, Barcelona, Spain Referee
Dr. Mathieu Morcrette Research Engineer, LRCS, Amiens Referee
Dr. Frédéric Kanoufi Research Director, ITODYS, Paris Examiner
Dr. Corsin Battaglia Research Director, EMPA, Zürich, Switzerland Examiner
Prof. Jean-Marie Tarascon Professor, Chimie du Solide et Energie, Paris Ph.D. director
Dr. Alexis Grimaud Research Scientist, Chimie du Solide et Energie, Paris Supervisor
Dr. Olivier Fontaine Associate Professor, ICGM, Montpellier Supervisor


Acknowledgments 5
Acknowledgements
I would like to express my gratitude to my supervisors in Collège de France, Jean-
Marie Tarascon and Alexis Grimaud for giving me the opportunity to work in this
extraordinary environment. Their energy and availability to students are truly inspiring
and their dedication to science is absolutely impressive. I have learnt a lot from working
with and around them. Farther from Collège de France, I would also like to acknowledge
my supervisor Olivier Fontaine.
After completed this three years, I am grateful to Fanny, Thomas, Nicolas, Pierre,
Damien, Romain, Ivette, Benjamin, Charlotte, Jiaqiang and Laura for the great times
spent during this phd journey in and out the lab. Qing, Linje, Biao, Tuncay, Parth and
Anshuman and are also thanks for the calm but always warm office atmosphere. I also
want to thank all the other talented CSE lab members with whom I shared this journey,
all of you ensured a valuable scientific and friendly atmosphere.
I would also like to thank the collaborators without whom part of this thesis would
not have been the same: Marie-Francine Lagadec (CSE, Collège de France, Paris) for the
E-SEM observations, Thomas Marchandier (CSE, Collège de France) for the time spent
on the XRD trials, Maxime Hallot and Christophe Lethien (IEMN, Université de Lille) for
the Al2O3-ALD, Matthieu Courty (LRCS, Amiens) for the DSC experiments and Steven Le
Vot, Marion Maffre and Mathieu Deschanels (ICGM, Montpellier) for their welcome and
help during my stay in Montpellier. I also truly thank Gustavo Hobold, Rui Guo and Betar
Gallant (Department of mechanical engineering, MIT, Cambridge) for the technical
support (Li/LiF samples, XPS and GC-TCD experiments) and the fruitful discussions.
The French National Research Agency through the Labex STORE-EX project (ANR-10-
LABX-76-01) and the Direction Générale de l’Armement through the Agence innovation
defense are acknowledge for the financial support.
I acknowledge Prof. Rosa Palacín and Dr. Mathieu Morcrette for agreeing to review
this thesis. I also thank Dr. Frédéric Kanoufi and Dr. Corsin Battaglia for accepting to be
part of the jury.
Last but not least, I want to express my immensely gratitude to my friends and family
for their support during both joyful and difficult moments. Their support goes well
beyond these three years.


Table of contents 7
Table of contents
ACKNOWLEDGEMENTS ............................................................................................... 5
GENERAL INTRODUCTION AND THESIS OUTLINE ..................................................... 13
CHAPTER 1 –INTRODUCTION TO AQUEOUS SUPERCONCENTRATED ELECTROLYTE AND THEIR USE IN LI-ION BATTERY (LIB) ........................................................................ 19
FROM AQUEOUS SECONDARY BATTERY TO LI-ION BATTERIES (LIB): LOOKING FOR HIGH-ENERGY DEVICES .................................................................................. 20
AQUEOUS SUPERCONCENTRATED ELECTROLYTE: CAN THE MODIFICATION OF THE PHYSICO-CHEMICAL PROPERTIES AND THE INTERFACIAL REACTIVITY UNLOCK THE COMPETITIVENESS OF AQUEOUS LI-ION BATTERIES? .................... 35
FURTHER IMPROVING AQUEOUS SUPERCONCENTRATED-BASED LIB, EXPANDING THE ESW LIMIT AT THE NEGATIVE ELECTRODE SIDE ........................ 48
CONCLUSION OF THE CHAPTER ....................................................................... 58
CHAPTER 2 – CYCLING VIABILITY OF AQUEOUS SUPERCONCENTRATED ELECTROLYTES BASED ON 20 MOL/KG LITFSI AND 20 MOL/KG LITFSI : 8 MOL/KG LIBETI ........................................................................................................................................ 61
INTRODUCTION ................................................................................................ 62
CYCLING PERFORMANCES IN AQUEOUS SUPERCONCENTRATED ELECTROLYTE ON THE NEGATIVE ELECTRODE SIDE: ROLE OF CONCENTRATION, CYCLING RATE AND TEMPERATURE ...................................................................... 65
ORIGIN OF THE PERFORMANCES DECAY: A GAS MONITORING STUDY ........ 71
SELF-DISCHARGE PROTOCOL TO ASSESS AQUEOUS SUPERCONCENTRATED ELECTROLYTES VIABILITY DURING RESTING PERIOD ............................................ 78
CYCLING VIABILITY ON THE POSITIVE SIDE: A GAS MONITORING STUDY..... 87
CONCLUSION OF THE CHAPTER ....................................................................... 91
CHAPTER 3 – INSTABILITY OF NATIVE SEI LEADS TO THE DRYING OUT OF AQUEOUS SUPERCONCENTRATED LI-ION BATTERY ........................................................................ 95
INTRODUCTION ................................................................................................ 96
PROBING THE SEI INSTABILITY IN AQUEOUS SUPERCONCENTRATED ELECTROLYTES ................................................................ 97

8 Table of content
IMPACT OF WATER CONSUMPTION ON ELECTROLYTE CRYSTALLIZATION 106
ACTIVATION ENERGY OF DIRECT AND INDIRECT HER IN WISE ................... 111
DISCUSSION AND CONCLUSION OF THE CHAPTER ........................................ 119
CHAPTER 4 –MIMICKING INORGANIC-BASED SEI WITH LIF-COATING. UNDERSTANDING OF INORGANIC SEI LIMITATIONS IN WATER-IN-SALT ELECTROLYTE. ...................................................................................................................................... 127
INTRODUCTION .............................................................................................. 128
LIF SOLUBILITY LIMIT IN AQUEOUS SUPERCONCENTRATED ELECTROLYTE 129
USING LI/LIF-COATING TO MIMIC INORGANIC-BASED SEI. EXPOSURE TO ATMOSPHERE ENVIRONMENT, AQUEOUS SUPERCONCENTRATED ELECTROLYTE AND COMPARISON WITH THE BEHAVIOR OBSERVED IN ORGANIC ELECTROLYTE ............................................................................................................................. 134
COMPARISON OF LIF BEHAVIOR WITH AL2O3-COATED LI SAMPLE ............. 140
FILLING THE STRUCTURAL DEFECTS BY PRESOAKING IN ORGANIC ELECTROLYTE: ASSESSMENT OF THE IMPORTANCE OF AN ORGANIC-INORGANIC BASED SEI ............................................................................................................ 144
CONCLUSION OF THE CHAPTER ..................................................................... 150
GENERAL CONCLUSION AND PERSPECTIVES .......................................................... 155
REFERENCES ............................................................................................................. 161
APPENDIX ................................................................................................................ 187
MATERIALS & METHODS ......................................................................................... 209
MATERIAL PREPARATION ............................................................................ 210
ELECTROCHEMICAL CHARACTERIZATIONS .................................................. 214
PHYSICO-CHEMICAL CHARACTERIZATIONS ................................................. 221
DATA TREATMENT ....................................................................................... 228
PYTHON ....................................................................................................... 236
LIST OF ABBREVIATIONS ......................................................................................... 237

Table of contents 9
RÉSUMÉ EN FRANÇAIS ............................................................................................ 243


GENERAL INTRODUCTION AND THESIS OUTLINE

12 General introduction and thesis outline
General introduction
The replacement of fossil fuels by renewable energies is at the center of the energy
transition critically needed to limit climate change. However, limitations of greenhouse
gases emission (carbon dioxide (CO2), methane (CH4), nitrous oxide (N2O) and
fluorinated gases) may be in conflict with the energy demand. Indeed, as calculated by
the International energy agency (IEA), the latter is set to increase by 4.1 % in 2021,
mostly due to the increase in demand from emerging markets and developing
economies. Hence, despite the contraction of the demand due to the Covid 19
pandemic, in 2020 energy consumption exceeds by 4 % the 2019 level, going back to
pre-Covid level. Furthermore, regardless of the scenario taken into account, the energy
demand continuously increases (see Figure Introduction. 1 and the description of the
scenario in the caption of Figure Introduction. 1).
Figure Introduction. 1 (a) Forecast of the global energy demand increase indexed to their level in 2019. Scenario envisioned: (i) pre-Covid scenario, (ii) stated policies which correspond to a situation back to normal, i.e. similar to pre-Covid one, in 2022 and (iii) delayed recovery scenario corresponding to a prolonged crisis which would be back to pre-pandemic level in 2025 with strong impact on the energy demand growth). Adapted from Ref1. (b) Forecast of the worldwide CO2 emissions (in giga ton per year) until 2030. Adapted from Ref2.
As a consequence, impactful policies and major investments in clean energy (up to
four trillion USD a year until 2030, as mentioned in the world energy outlook of 2021)
need to be set up to reach the sustainable development scenario that considers the
fulfillment of the objectives discussed during the Paris agreement (which aim to limit
the increase in temperature to 1.5 °C by the end of the century). Even more challenging
is the Net zero emission scenario by 2050 (rather than 2070 in the sustainable
development scenario). Thus, changes in energy production, reduction in energy
consumption, improvement in energy efficiency and innovation in carbon capture can
be seen as the main pillars to succeed in meeting these goals, as illustrated in Figure

General introduction and thesis outline 13
Introduction. 1b. To succeed in this great challenge, electrification can be seen as one
of the main path to develop, among others such as promoting clean energy innovation
or changing societal behaviors. Indeed, 75 % of the world electricity demand should be
produce from low-carbon energy sources by 2030 (compared to less than 40 % in 2019).
Though, electricity produced by renewable energies such as solar or wind power is
intermittent, therefore the urgent need for storage devices.
Many applications from electrical, thermal, and mechanical to electrochemical
devices can store energy. Among electrochemical ones, batteries market is greatly
increasing within the last ten years and is forecasted to grow up even more with the
development of Li-ion batteries (LIB) in the transportation market, leading to a global
market opportunity to 2050 worth USD 16.2 trillion. Indeed, while Lead-acid battery
used to be the most widely used technology, 2020 has seen LIB to dominate the market.
This trend is confirmed by forecasts that announce that the LIB market will almost
double within the next 10 years, as shown in Figure Introduction. 2a. Such conquest of
the market is enabled by technology advances due to cell chemistry innovation, cell
engineering and optimization and growth of manufacturing volume than enable to
improve performances and reliability while decreasing the cost of the cell (see Figure
Introduction. 2b). Though, as LIB battery market is increasing markedly, the anticipation
of LIB battery recycling as well as the development of more sustainable battery
component is of crucial importance.
Figure Introduction. 2 (a) Battery market demand in the world (in $) from 2015 to 2030. (b) Forecast of global annual Li-ion battery (LIB) deployment in all markets in GWh and LIB cell average cost (in purple) as function of time. The cell is based on a 40 Ah pouch cell made of LiNi0.6Mn0.2Co0.2O2 (NMC622) as positive electrode and graphite as negative. Adapted from Ref3,4.

14 General introduction and thesis outline
Outline of the thesis
Therefore, the aim of this thesis is to study the practicability of developing LIB using
aqueous superconcentrated electrolytes, so-called Water-in-salt electrolytes (WiSE).
Indeed, this technology would enable the use of environmental-friendly solvent, i.e.
water, while achieving performances close to commercial LIB.
The thesis is structured in five chapters detailed as follow.
The first chapter briefly summarizes the Lead-acid, Nickel Cadmium, Nickel Metal
hydride and commercial LIB battery technologies. Then, the concept of aqueous
superconcentrated electrolyte is introduced, giving details on how the solvation
structures of such electrolytes impact their physico-chemical properties and interfacial
reactivity and consequently the battery performances. Eventually, the modifications
regarding electrolyte composition proposed in the literature in the last five years are
detailed.
The second chapter describes a systematic study that assesses the practicability of
WiSE-based LIB by decoupling parasitic reactions at the negative and positive electrodes
and by performing electrochemical characterizations during cycling and self-discharge
tests as well as operando gas monitoring. The stability of these electrolyte was
determined to suffer from water reduction at the negative electrode both during cycling
and resting periods, unlike positive electrode where very limited water oxidation was
observed.
Then, in the third chapter, we analyze the stability of the native solid electrochemical
interphase (SEI) by electrochemical characterizations, using cyclic voltammetry and
impedance spectroscopy. Besides, the irreversible consumption of water which leads to
increase in electrolyte concentration was confirmed by differential scanning
calorimetry. Based on the electrochemical results, the rate of water consumption during
resting period was found to be smaller than the one during cycling, though in the same
order of magnitude. The rate of Li+ delithiation was also found to be different when
comparing constant current continuous cycling and self-discharge experiments. To
understand these observations, the activation energy of self-discharge process and
direct water reduction were determined. Eventually, to summarize and rationalize these
electrochemical results, a figure-of-merit was made to compare the performances of
WiSE-based LIB with that of commercial LIB and other commercial aqueous secondary

General introduction and thesis outline 15
batteries with the largest production volume (Lead-acid, Nickel-Cadmium and Nickel
Metal hydride).
Moreover, as LiF is known to be the SEI component in WiSE, and following the first
two chapters in which the instability of the native SEI was highlighted, LiF solubility
measurements were performed in WiSE electrolyte to determine if LiF dissolution is
responsible for the SEI instability. Then, an artificial LiF conformal layer was deposited
onto metallic Li (Li/LiF) to assess the protective-power of inorganic coatings against
water-based electrolytes. Gas chromatography-mass spectrometry was done to analyze
the reactivity of the Li/LiF sample to WiSE exposure as well as the impact of presoaking
Li/LiF samples in organic electrolyte to improve the efficiency of these coating toward
water reduction. Similar observations were made with conformal Al2O3 coatings
prepared by atomic layer deposition (ALD).
Altogether, this manuscript highlights that despite the formation of a LiF-inorganic
SEI in 20 m LiTFSI, water reduction cannot be avoided at the negative electrode and
artificial inorganic coatings are not sufficient to prevent water to access the negative
interface. Therefore, the cathodic challenge remains unsolved.


CHAPTER 1 –INTRODUCTION TO
AQUEOUS SUPERCONCENTRATED
ELECTROLYTE AND THEIR USE IN LI-ION BATTERY
(LIB)

18 Chapter 1 – Introduction to aqueous superconcentrated electrolyte and their use in LIB
From aqueous secondary battery to Li-ion batteries (LIB): looking for high-energy devices
Secondary or rechargeable batteries are nowadays widely used in many applications,
from grid storage, electrical transportation to portable devices. As any electrochemical
devices, they are made by assembling two electrodes with different redox potentials,
separated by an electrolyte which is generally composed of a solvent and a supporting
salt. The electrons circulate through the external electrical circuit, thus enabling the
reversible energy exchange with the user, as shown in Figure 1. 1.
The history of secondary batteries started more than 150 years ago, in 1859, by the
development of rechargeable Lead-acid batteries by Gaston Planté who designed the
Pb ǁ H2SO4 ǁ PbO2 cell, as described in Figure 1. 1. The associated electrochemical
process is based on a dissolution/precipitation mechanism directly involving the acidic
electrolyte. Thanks to their low cost, low self-discharge, maturity and reliability, Lead-
acid batteries are still widely used for unit power sources (UPS), starting lighting and
ignition in vehicles (SLI) and emergency lighting. However, the specific energy and
energy density - calculated as function of the cell voltage (V) and the cell capacity (Ah/kg)
(see Equation 1. 1) and expressed either in Wh/kgcell or Wh/Lcell - is limited to 60
Wh/kg5,6.
Equation 1. 1:
𝐸𝑠𝑝𝑒𝑐𝑖𝑓𝑖𝑐𝑊ℎ/𝑘𝑔
= 𝑄 (𝐴ℎ
𝑘𝑔) ∙ 𝑉 (𝑉)
Following this pioneering work, Nickel-Cadmium (Ni-Cd) batteries were introduced in
1909. For this technology, the negative electrode (Cd) endorses a conversion reaction
while the positive electrode, NiOOH, is reduced or oxidized upon discharge or charge,
respectively, as illustrated in Figure 1. 1b. Besides, their low cost and high rate
performances favor the use of Ni-Cd batteries for power tools, and they were introduced
in early mobile phone model. However, the “memory effect”, the toxicity of Cd and the
limited specific energy (< 60 Wh/kg) limit the overall performances of this chemistry and
called for the development of other technologies. Therefore, from the mid-80s7, a
second generation of rechargeable batteries was introduced with the design of nickel-
metal hydride (Ni-MH) batteries using alkaline electrolyte. Ni-MH batteries use a similar
positive electrode than Ni-Cd, NiOOH, but the electrochemistry at the negative

Chapter 1 – Introduction to aqueous superconcentrated electrolyte and their use in LIB 19
electrode relies on intercalation mechanism rather than conversion one (see Figure 1.
1c). Indeed, upon discharge the hydrogen de-intercalates from the metal hydride (MH)
to form a metal alloy (M), and combines with hydroxide anions from the electrolyte to
form water. Ni-MH batteries reach high capacity (110 Wh/kg) with a lesser “memory
effect” than in Ni-Cd ones. Therefore, they were implemented in commonly-used AA
and AAA cells for portable devices, as well as in the first hybrid-electric vehicles (Toyota
Prius). Aside from these three chemistries that, until 2015, represented the commercial
batteries with the largest production volume and USD turnover3,4, several other
aqueous systems were developed in the past decades, including Nickel-iron, Silver-zinc
or Silver-cadmium7 batteries, which will not be discussed in this section.
Figure 1. 1 Chemical reactions taking place in (a) Lead-acid, (b) Nickel-Cadmium (Ni-Cd), (c) Nickel-metal hydride (Ni-MH) batteries.
Despite these advances in cell performances, the electrochemical stability window
(ESW) of water, and thus of aqueous devices, is limited to 1.23 V, as shown by the yellow
zone in Figure 1. 2a. Above this limit, the hydrogen evolution reaction (HER) occurs upon
reduction while the oxygen evolution reaction (OER) happens upon oxidation, as
described by Equation 1. 2 and Equation 1. 3, respectively.

20 Chapter 1 – Introduction to aqueous superconcentrated electrolyte and their use in LIB
Equation 1. 2: Hydrogen evolution reaction (HER).
2 ∙ 𝐻2𝑂 + 2 ∙ 𝑒− = 𝐻2 + 2 ∙ 𝐻𝑂− 𝑖𝑛 𝑎𝑙𝑘𝑎𝑙𝑖𝑛𝑒 𝑐𝑜𝑛𝑑𝑖𝑡𝑖𝑜𝑛𝑠 2 ∙ 𝐻+ + 2 ∙ 𝑒− = 𝐻2 𝑖𝑛 𝑎𝑐𝑖𝑑𝑖𝑐 𝑐𝑜𝑛𝑑𝑖𝑡𝑖𝑜𝑛𝑠
Equation 1. 3: Oxygen evolution reaction (OER).
2 ∙ 𝐻2𝑂 = 𝑂2 + 4 ∙ 𝐻+ + 4 ∙ 𝑒−
Cycling aqueous batteries within the thermodynamically stable potential window of
water to avoid these parasitic reactions drastically limits the battery voltage and thus
the specific energy, as shown in Figure 1. 2b. One obvious way to increase the energy
density is to extend the operating voltage beyond the stability window while finding
means to handle the gas generated during cycling, as implemented in Lead-acid, Ni-Cd
and Ni-MH batteries and discussed in greater details in Chapter 3. To overcome the
voltage limitation in aqueous environment, Li-based batteries were introduced using
organic electrolyte to replace aqueous proton-based chemistries. Lithium was chosen
for its light weight (6.94 g/mol), its low redox potential (ELi+/Li0 = -3.04 V vs ESH) and its
high theoretical capacity (3862 mA.h/g), thus promising high energy batteries, as
illustrated in Figure 1. 2b.
Figure 1. 2 (a) Pourbaix diagram representing the operating voltage of Lead-acid, Ni-Cd and Ni-MH batteries and the electrochemical stability window (ESW) of water (yellow zone) defined by the hydrogen evolution reaction (HER) upon water reduction and the oxygen evolution reaction (OER) upon water oxidation. (b) Ragone plot of secondary aqueous batteries and organic Li-ion batteries (LIB). Adapted from Ref5–9.

Chapter 1 – Introduction to aqueous superconcentrated electrolyte and their use in LIB 21
The development of Li-based batteries started in the 1970s with the use of metallic
Li as negative electrode and an intercalation electrode as positive one. This technology
was implemented by coupling the use of metallic Li (see Equation 1. 4) with the
discovery, notably by Stanley Whittingham, of the reversible insertion of Li+ cation into
chalcogenide-based materials such as TiS2 or MoS210–13, as described in Equation 1. 5.
These systems were then commercialized by Exxon in 1972 using TiS2 as positive and
Moli Energy in the late 198014 using MoS2 as positive.
Equation 1. 4: Intercalation of Li+ cation in the positive electrode.
𝐿𝑖+ + 𝑒− 𝐶ℎ𝑎𝑟𝑔𝑒→
𝐷𝑖𝑠𝑐ℎ𝑎𝑟𝑔𝑒←
𝐿𝑖
Equation 1. 5: Reaction at the metallic Li electrode.
𝐿𝑖𝑀𝐴2
𝐶ℎ𝑎𝑟𝑔𝑒→
𝐷𝑖𝑠𝑐ℎ𝑎𝑟𝑔𝑒←
𝑀𝐴2 + 𝐿𝑖+ + 𝑒−
with M, transition metal and A , oxygen or sulfur
Li metal battery behavior upon discharging and charging is illustrated in Figure 1. 3.
The metallic Li negative electrode is separated from the positive electrode by a
separator soaked with the aprotic organic liquid electrolyte. Aluminum is used as current
collector on the positive side while copper is generally used as current collector on the
negative side since metallic Li is known to alloy with Al, inducing a volume change
causing pulverization of Al. As shown in Figure 1. 3b, during charge, metallic Li is plated
at the negative, which can lead to dendrite growth that can short-circuit the cell and
inflame the organic electrolyte, causing severe safety issues15. One way to improve
safety was to replace the liquid flammable electrolyte by a less flammable polymer one
which also prevents dendritic growth. However, to ensure good conductivity (σ) of Li+
cations, polymer electrolytes need to be heated up to ≈ 60 °C, thus limiting the user-
friendliness for portable applications.

22 Chapter 1 – Introduction to aqueous superconcentrated electrolyte and their use in LIB
Figure 1. 3 Scheme of (a-b) a Li metal battery, (c) a Li-ion cell. In this schematic view, only Li+ cations are drawn. Solvent molecules and counter anions are not shown. Ionic and electronic flows are symbolized with arrows. (a) Upon discharge. (b) Upon charge. (c) The metallic Li negative electrode is replaced by an insertion electrode to make a Li-ion cell.
In 1980, John Goodenough and coworkers replaced sulfur-based positive electrode
by oxygen-based one (thus taking advantage of the greater electronegativity of oxygen)
and paved the way for the integration of lithium-containing transition metal oxide Li1-
xCoO2 (LCO) positive electrodes with high potential (ELi insertion > 3 V vs Li+/Li). Following
this pioneering work, numerous studies were carried out, including for reducing the Co
content that has rapidly become a concern for large scale commercialization due to
ethical, cost, and toxicity as well as due to limitations in the reversible capacity achieved
by LCO – reversible discharge capacity of 140 mAh/g is attainable in practice, compared
to 275 mAh/g theoretically available. Therefore, many researches then focused on
partially substituting Co in LiMO2 (M= Co, Ni, Mn, Al ...) layered materials. While Co was
found necessary to stabilize the electrode structure16,17, it was partially substituted with
Ni to achieve greater capacity (> 150 mA.h/g). Besides, the partial substitution of Ni by
Al or Mn was found to thermally stabilize the electrode, thus giving birth to the NCA and
NCM (or NMC)-families in which several ratio of Ni:Co:Al or Ni:Co:Mn were
Chapter 1 – Introduction to aqueous superconcentrated electrolyte and their use in LIB 23
developed18,19. Cobalt-free positive electrodes also emerged relying on cheap and
abundant materials as well as their thermally stable properties, despite their lower
capacity and potential. Mn is generally used in spinel structure20, LiMn2O4 (LMO) and Fe
with polyanionic compounds ((XO4)3- (X=S, P, Si, As, Mo, W)), with the well-known olivine
LiFePO4 (LFP) for example.
Besides achieving greater potential and reversible capacity, the development of
lithiated positive electrode unlocked the use of non-lithiated intercalation electrode to
replace metallic Li as negative material, giving birth to the so-called Li-ion rocking-chair
battery21, as illustrated in Figure 1. 3c. To realize the concept of high potential rocking-
chair battery, intercalation material operating at low potential were required.
Carbonaceous materials (soft or hard carbons) were first envisioned as alkali-ions
intercalation materials. However, Li+ intercalation in these materials (below 1 V vs
Li+/Li)22,23 was initially found to cause electrode exfoliation, owing to the use of
propylene carbonate (PC)-solvent which co-intercalates during charge, thus initially
impeding the commercialization of LIB.
Indeed, commercial electrolyte solvents for aprotic batteries are generally based on
carbonate esters, as they enable high Li-salt dissolution and dissociation. One cyclic and
one linear carbonate are generally mixed to combine their properties. Linear esters such
as dimethyl carbonate (DMC), ethyl methyl carbonate (EMC) or diethyl carbonate (DEC)
have low viscosity (0.59 mPa.s for DMC, 0.65 mPa.s for EMC and 0.75 mPa.s for DEC),
thus enabling good transport properties. In contrast, cyclic ester such as ethylene
carbonate (EC) or propylene carbonate (PC) show high dielectric constant (89.78 for EC
and 64.92 for PC), and thus preferentially solvate Li+ cations. The key to realize
commercial LIB was the replacement of PC co-solvent by EC, preventing solvent co-
intercalation into graphite while forming a stable passivation layer, and thus improving
the reversibility of Li (de)intercalation into graphite24,25.
Eventually, in 1983, Yoshino was able to successfully cycle LCO with a petroleum coke
negative electrode26. Following this demonstration, LCO/petroleum coke cells were
commercialized by Sony in 1991. Then graphite electrodes were developed without
solvent co-intercalation24 and remains widely used thanks to its high capacity (392
mAh/g at low potential (E< 0.3 V vs Li+/Li)) and good battery performances with high
coulombic efficiency27.
Moreover, safety, low cost, environmental friendliness, wide liquid stability
temperature range and a broad electrochemical stability window are essential

24 Chapter 1 – Introduction to aqueous superconcentrated electrolyte and their use in LIB
properties for electrolytes28. Therefore, electrolyte research is tailored by compromises
between all these properties. Moreover, despite the extensive research for enlarging
the ESW, liquid electrolytes are in majority unstable at low and high potentials, i.e. at
potentials at which the negative (< 1 V vs Li+/Li) and positive electrodes (> 4 V vs Li+/Li)
operate. Therefore, the stability of the LIB relies on the formation of a passivating layer
on the electrodes that prevents further electrolyte degradation by being electronically
insulating while preserving Li+ cations conduction. Hence, at the negative
electrode/electrolyte interface, a solid electrolyte interphase (SEI) is formed following
the electrolyte reduction29. The first SEI model was developed in 1979 by Peled et al.30.
Then, Aurbach et al.31 developed a 2D SEI model based on one inorganic inner-layer
close to the electrode surface, containing LiF compounds among others, and a porous
organic outer-layer based on polymeric species. At the positive electrode/electrolyte
interface, a cathode-solid interphase (CEI) was also reported for some
electrode/electrolyte combinations32–34. Besides, these interphases must ideally have a
uniform morphology as well as being able to accommodate volume changes upon Li+
insertion/deinsertion to be efficient.
In order to rationalize the SEI/CEI formation and thus to select the best electrolyte
composition, HOMO/LUMO energy diagrams are widely used. Indeed, a HOMO/LUMO
energy diagram describes the energy level of the highest occupied molecular orbital
(HOMO) and the lowest unoccupied molecular orbital (LUMO) calculated for isolated
molecules, as shown in Figure 1. 4. Thus, one can potentially correlate the energy levels
to oxidation or reduction potentials of the electrolyte that can form the CEI (see yellow
color in Figure 1. 4) or the SEI (see red color in Figure 1. 4), respectively. Following this
framework, the band gap Eg defined by ELUMO-EHOMO would be directly related to the
ESW35. However, the HOMO and LUMO energy levels are calculated for isolated
molecules (solvent molecules or anions). Such calculations do not take into
consideration the interactions between all the molecules contained in the electrolyte
and the solvation structure that will undoubtedly change the electrolyte reactivity, as
discussed in greater details in section 1.3 and 2. Therefore, as mentioned by Peljo et
al.36, the ESW is more accurately defined by the redox potentials of the electrolyte,
which can only be inferred knowing the exact oxidation and reduction reactions and
their associated Gibbs free energies. To illustrate this point (Figure 1. 4 in blue), taking
water as an example, the bang gap of water is calculated to be 8.9 eV37 whereas the
thermodynamic ESW is known to be 1.23 V.

Chapter 1 – Introduction to aqueous superconcentrated electrolyte and their use in LIB 25
Figure 1. 4 Energy diagram (in eV, on the left) and corresponding potentials (in V vs Li+/Li, on the right) of the solid electrolyte interphase (SEI in red) and the cathode electrolyte interphase (CEI in yellow) formation at the surface of negative and positive electrodes during battery charge. Adapted from Ref35,36.
In commercial LIB, diluted electrolytes are generally employed, with concentrations
close to ≈ 1 M. This “optimal” concentration reflects a compromise between viscosity
(ionic mobility) and conductivity (dissociated charge carrier number) to ensure good
transport properties38,39, as shown in Figure 1. 5a.

26 Chapter 1 – Introduction to aqueous superconcentrated electrolyte and their use in LIB
Figure 1. 5 (a) Ionic conductivity (blue) and viscosity (red) at 25 °C as function of the electrolyte concentration (1 mol/L (M), 2 M, 3 M, 4 M, 5 M, 6 M and 7 M LiTFSI in DOL:DME (1:1 vol%)). (b) Li+ transference number as function of the electrolyte concentration. Adapted from Ref40.
Nonetheless, upon increase in concentration and when reaching superconcentration
regime (leading to mass and volume of salt greater than the solvent ones), the solvation
structure of ions changes, thus modifying bulk and interfacial electrolyte properties.
Indeed, a competition takes place for Li+ solvation between scarce organic solvent
molecules and anions, both being Lewis bases (i.e. capable of solvating Li+). Therefore,
ionic association switches from solvent-separated ion pairs (SSIP) in diluted electrolytes
to the formation of contact-ion pairs (CIP) or ionic aggregates (AGG) in
superconcentrated ones, as shown in Figure 1. 6.
Figure 1. 6 Solvation structure from diluted to superconcentrated electrolyte. SSIP corresponds to solvent-separated ion pairs, CIP to contact-ion pairs, AGG to aggregate. Image taken from Ref39.
Consequently, the solvation sheath of Li+ cation that is reported to be fourfold
coordinated in diluted electrolytes41,42, was found to be composed of two aprotic
solvent molecules and two anion molecules in superconcentrated electrolytes43.

Chapter 1 – Introduction to aqueous superconcentrated electrolyte and their use in LIB 27
Moreover, well-dissociated imide-based salts using anions such as TFSI- anion, for
example (see Table A.1. 1 at the end of the manuscript for anion structure), are
preferred for the elaboration of superconcentrated electrolytes as they can be dissolved
in greater amount in all polar solvents, thus reducing the number of free solvent
molecule in the bulk. Regarding the solvent, it must be selected for its strong ability to
solvate Li+ cations.
Looking at bulk properties, in superconcentrated electrolytes, although the overall
conductivity -that is related to the capability of the electrolyte to carry the ionic current-
is lower than in diluted ones, the transference number of Li+ -that considers the
proportion of ionic current taking by each ionic species- can be greater than in diluted
electrolyte, as illustrated in Figure 1. 5b. Indeed, a change in cation motion from
vehicular (related to cation motion with its solvation sheath) to partially structural
(when cations hop via a serial of ion association/dissociation from one anion or solvent
molecule to another) was proposed to explain the increase in transference number39,44.
However, full understanding of ionic transport in superconcentrated electrolyte remains
unclear44. Besides, for superconcentrated electrolytes, the solvent volatility diminishes
and the thermal stability is enhanced44 since the energy needed to desolvate the solvent
molecules becomes greater due to the diminution of free solvent molecules. The later
effect also kinetically prevents electrode and SEI dissolution mechanism to occur45, thus
reducing side reactions. However, the high viscosity of the electrolyte remains a major
drawback as it increases the cell impedance. In addition, from a practical point of view,
the wetting of the electrodes/separators during battery assembly requires a much
longer pre-treatment for this class of electrolytes.
Furthermore, superconcentration modifies the interfacial organization and thus the
reactivity at both the positive and the negative electrodes. At the positive, anions
populate the interface sufficiently to repulse solvent molecules to reach the inner-
Helmholtz layer and thus prevent their oxidation when compared to dilute electrolytes
for which solvent molecules are present in this layer (see Figure 1. 7a and b)46,47.
Moreover, anions are stable enough at high potential not to be oxidized prior to Li+
deintercalation, thus expanding the ESW (≈ 5.2 V vs Li+/Li for TFSI- oxidation48). Besides,
the aforementioned double layer effect coupled with the lower amount of free solvent
molecules reduce the corrosion of the aluminum current collector. Hence, unlike for
diluted imide-based electrolyte that cannot form AlF3 passivating layer that stops the
corrosion, as PF6- does,49 switching to superconcentrated regime allows for using
aluminum current collector. Indeed, the few Al3+ cations formed upon oxidation of the

28 Chapter 1 – Introduction to aqueous superconcentrated electrolyte and their use in LIB
current collector will preferentially interact with the anions to form [Al(anion)x]3-x
complexes. Since the viscosity is high, the complexes diffusion through the bulk
electrolyte is reduced stabilizing the interface46.
Figure 1. 7 Snapshots of the interfacial structure positively polarized from molecular dynamic (MD) simulations of (a) diluted electrolyte based on 1 M LiPF6 in EC:DMC50 (b) superconcentrated electrolyte based on LiTFSI(DMC)1.2 51. Adapted from Ref50,51.
At the negative electrode, upon charge, the inner-Helmholtz layer of
superconcentrated electrolyte is compacted and the anions coordinated to Li+ cations
come closer to the electrode surface, as illustrated in Figure 1. 8a and b. Owing to this
specific double layer structure, a direct reduction mechanism of the anions was
proposed following density functional theory (DFT) calculations. Indeed, a shift of the
anions LUMO to greater energies than the solvent LUMO was calculated. Therefore, a
salt-derived anion-rich SEI was found to be formed at the negative electrode, as
illustrated in Figure 1. 8c. Spectroscopy analysis such as X-ray photoelectron
spectroscopy (XPS) and Fourier-transform infrared spectroscopy (FTIR) show that the SEI
is majorly composed of inorganic compounds such as LiF, SO2 or SOx43,45,52–55 or Li2O56.
Some CF3 compounds were also identified as SEI contributor43. However, as pointed out
by Wang et al.57 and Yamada et al.58, imide-based salts tend to decompose upon Ar+
sputtering or X-ray radiation, thus caution must be exercised when performing SEI
surface analysis. Besides, scanning electron microscopy (SEM), transmission electron
microscopy (TEM) and atomic force microscopy (AFM) observations show a dense and
uniform passivation film53–55.
Chapter 1 – Introduction to aqueous superconcentrated electrolyte and their use in LIB 29
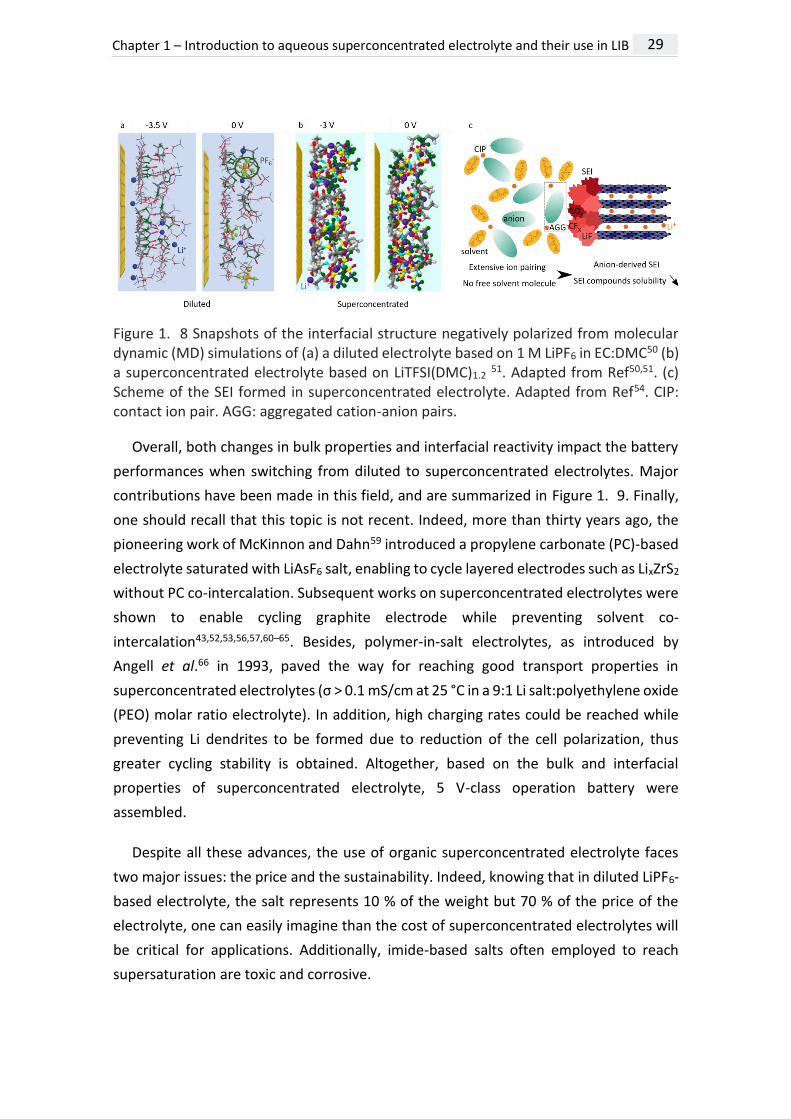
Figure 1. 8 Snapshots of the interfacial structure negatively polarized from molecular dynamic (MD) simulations of (a) a diluted electrolyte based on 1 M LiPF6 in EC:DMC50 (b) a superconcentrated electrolyte based on LiTFSI(DMC)1.2 51. Adapted from Ref50,51. (c) Scheme of the SEI formed in superconcentrated electrolyte. Adapted from Ref54. CIP: contact ion pair. AGG: aggregated cation-anion pairs.
Overall, both changes in bulk properties and interfacial reactivity impact the battery
performances when switching from diluted to superconcentrated electrolytes. Major
contributions have been made in this field, and are summarized in Figure 1. 9. Finally,
one should recall that this topic is not recent. Indeed, more than thirty years ago, the
pioneering work of McKinnon and Dahn59 introduced a propylene carbonate (PC)-based
electrolyte saturated with LiAsF6 salt, enabling to cycle layered electrodes such as LixZrS2
without PC co-intercalation. Subsequent works on superconcentrated electrolytes were
shown to enable cycling graphite electrode while preventing solvent co-
intercalation43,52,53,56,57,60–65. Besides, polymer-in-salt electrolytes, as introduced by
Angell et al.66 in 1993, paved the way for reaching good transport properties in
superconcentrated electrolytes (σ > 0.1 mS/cm at 25 °C in a 9:1 Li salt:polyethylene oxide
(PEO) molar ratio electrolyte). In addition, high charging rates could be reached while
preventing Li dendrites to be formed due to reduction of the cell polarization, thus
greater cycling stability is obtained. Altogether, based on the bulk and interfacial
properties of superconcentrated electrolyte, 5 V-class operation battery were
assembled.
Despite all these advances, the use of organic superconcentrated electrolyte faces
two major issues: the price and the sustainability. Indeed, knowing that in diluted LiPF6-
based electrolyte, the salt represents 10 % of the weight but 70 % of the price of the
electrolyte, one can easily imagine than the cost of superconcentrated electrolytes will
be critical for applications. Additionally, imide-based salts often employed to reach
supersaturation are toxic and corrosive.

30 Chapter 1 – Introduction to aqueous superconcentrated electrolyte and their use in LIB
Figure 1. 9 Historical timeline of organic-based superconcentrated electrolyte highlighting some of their main properties. All references (Ref43,46,52,53,56,57,59–74) are given in Section References at the end of this manuscript. Adapted from Ref44. Abbreviation of salts and solvents are given at the end of the manuscript.

Chapter 1 – Introduction to aqueous superconcentrated electrolyte and their use in LIB 31
The development of aqueous rechargeable Li-ion battery (ARLIB) relies on the
compromise between electrode material performances (specific capacity, intercalation
potential and material stability) and the aqueous electrolyte stability. Though ARLIB are
theoretically cheaper, safer, and less toxic than their organic counterparts. Moreover,
they provide high electrolyte conductivity (σ ≈ 100 mS/cm75) and fast reaction kinetics,
thus reducing the overall cell impedance76. Indeed, the activation energy for charge
transfer in aqueous electrolyte was found to be between 23 and 25 kJ/mol, compared
to ≈ 50 kJ/mol in organic electrolyte75. Thus, high rate capabilities77 are achievable, as
well as good cycling stability78 and greater specific capacity79. Besides, despite a
decrease of conductivity in saturated electrolyte due to lower amount of dissociated
charge carriers, the increase in concentration reduces the water activity, as previously
discussed in LiNO3-80–89 and Li2SO4-based electrolyte77,78,90–96, thus kinetically expanding
the ESW89,92 and promoting Li+ intercalation compared to proton intercalation97 (even
though the later has been recently qualified98).
Positive electrodes for ARLIB must operate in a 3 to 4 V vs Li+/Li potential window to
avoid OER, as shown in Figure 1. 10. Therefore, LMO77,78,80,81,90,91,97,99–103 was extensively
used as well as the well-known LCO82–84,92, LFP85,86,93,104,105 or NCM94. Carbon coating was
reported to improve electrode stability91,104 while oxygen removal was shown to
decrease polarization, cell resistance87,106 and self-discharge107. However, proton
intercalation may occur and compete with Li+ intercalation -though depending on the
electrode structure (favorable in layered structure such as LCO and NCM108 compared
to LFP). Proton and lithium co-intercalation is detrimental to cell performances as it
blocks the Li+ diffusion, thus off-balancing the intercalation of Li+ in the electrodes and
decreasing its related capacity. To avoid proton co-intercalation, adjusting pH to values
greater than pH = 9 was shown to improve cell performances109,110.
Though, the negative electrode is even more challenging as the HER potential
(EHER = - 0.06pH V vs ESH, 2.62 V vs Li+/Li at pH = 7) and the absence of SEI formation in
inorganic-based electrolyte58,76,80,111 prevents the use of low potential negative
electrodes such as graphite or metallic Li (see Figure 1. 10). Thus, vanadium-based
(LiV3O8 82,85,99, VO2
80, V2O5 88) or NASICON polyanionic compounds (LiTi2(PO4)3
91,96,112,
LTP) were majorly reported. As a consequence, the specific energy of ARLIB remains

32 Chapter 1 – Introduction to aqueous superconcentrated electrolyte and their use in LIB
limited to ≈ 50 Wh/kg with a nominal voltage of 1.5 V, far below that of organic-based
LIB (≈ 200 Wh/kgcell and ≈ 4 V). Also problematic, active materials such as vanadium-
based109 negative electrodes (or LMO95 positive one) are prone to dissolution in aqueous
electrolyte. Moreover, passive components (current collectors for instance) can suffer
from corrosion. Titanium and stainless steel were reported to be the most appropriate
ones109 even though stainless steel still suffer from corrosion in acidic media113.
Therefore, ARLIB as introduced as early as 1994 by Jeff Dahn et al.80 using LiMn2O4 as
positive and VO2 as negative electrode and a saturated LiNO3 electrolyte was never
commercialized.
Figure 1. 10 Pourbaix diagram and intercalation potential of some electrodes used in LIB devices. Adapted from Ref83.
In order to overcome voltage limitation, research efforts were focused on the
development of electrode coating to physically impede water to reach the negative
electrode. To do so, a combination of Li-based gel polymer and ionic conductive ceramic
(LISICON) were used to enable cycling metallic Li in aqueous electrolyte112,114–119, as
illustrated in Figure 1. 11a. Diazonium grafting methods were also developed to
covalently bond polyether-moieties known for their ability to conduct Li+ cations to the
negative electrode material120. The nature of the ether group bounded to the phenyl
ring have a great influence on the electrochemical properties by allowing Li+ transport
while preventing water access to the interface121. However, none of the above-
mentioned strategies were commercially successful.

Chapter 1 – Introduction to aqueous superconcentrated electrolyte and their use in LIB 33
Figure 1. 11 (a) Scheme of metallic Li coated with a gel polymer electrolyte (GPE) (PVdF: polyvinylidene fluoride, PMMA: poly(methyl methacrylate) and ceramic layer (LISICON). (b) Principle of grafting consisting of the electrochemical reduction of a diazonium salt produced by nitrosylation of an amine by isoamyl nitrite. Adapted from Ref117,120.
Aqueous superconcentrated electrolyte: can the modification of the physico-chemical properties and the interfacial reactivity unlock the competitiveness of aqueous Li-ion batteries?
Developing stable SEIs in aqueous media has been at the forefront of research for
aqueous Li-ion batteries. Indeed, while limitations are found regarding the cathodic
stability (corresponding to the negative electrode side) of classical diluted organic
electrolytes, no stable SEI components are formed in diluted aqueous electrolytes79.
Therefore, based on the promising properties of superconcentrated electrolyte, Suo et
al.111 developed in 2015 an aqueous superconcentrated electrolyte referred to as
Water-in-salt electrolyte (WiSE), quickly followed by the introduction of Water-in-bisalt
(WiBS) in 2016 by Yamada et al.58 and Suo et al.122. The use of superconcentration in
aqueous based electrolyte was shown to enable enlarging the operating potential
window of aqueous systems up to 3 V thanks to the formation of a SEI at the negative
electrode and double layer effect at the positive electrode, while preserving good
physico-chemical properties due to modification of the electrolyte structure, as
discussed in the following section.

34 Chapter 1 – Introduction to aqueous superconcentrated electrolyte and their use in LIB
Prior to look into greater details to the electrolyte solvation structure, one must
mention that for aqueous superconcentrated electrolyte the salt concentration is
usually express in term of molalities (mol/kg) rather than molarities (mol/L). The Figure
1. 12 shows the corresponding molarities and molalities as function of LiTFSI amount
(the mole and the mass fraction are shown). For instance, 20 mol/kg of LiTFSI
corresponds to ≈ 5 mol/L. Moreover, organic imide-based salts such as LiTFSI are
generally preferred123 as LiTFSI is known to have good electrochemical and chemical
stabilities (towards hydrolysis and in temperature) in aqueous environment124 as well as
keeping good dissociation properties. However, LiFSI is usually avoided as it is prone to
hydrolysis in aqueous environment125.
Figure 1. 12 Molality (mol/kg) (blue crosses) and molarity (orange crosses) as function of mole (bottom x axis) or mass fraction (top x axis). Data extracted from Ref126,127.

Chapter 1 – Introduction to aqueous superconcentrated electrolyte and their use in LIB 35
In a diluted electrolyte (≈ 1 M), ions are almost fully dissociated and water exists as
“free” water, i.e. as non-ion-bounded molecules forming hydrogen-bounding (H-bond)
network128 (see Figure 1. 13a). When concentration increases, the ion-ion interactions
increase as CIP are formed above 3 M (≈ 10 m), leading to 50 % of the TFSI- anions being
directly in contact with Li+ (see Figure 1. 13b)129. Aggregate structure are observed at
superconcentration above 5 M (≈ 20 m)130, as illustrated in Figure 1. 13 and shown by
Raman spectroscopy in Figure 1. 14a.
Figure 1. 13 Scheme of solvation structure of the electrolyte in (a) diluted electrolyte, (b) concentrated electrolyte and (c) superconcentrated electrolyte. Adapted from Ref131.
As shown in Figure 1. 14a, the intensities attributed to H-bond network and related
to OH stretching at 3255.5 cm-1 and 3403 cm-1 diminish when the concentration
increases from 0 to 5 M (> 20 m). This diminution is concomitant with the appearance
of a sharp peak at 3565 cm-1 suggesting the disruption of the H-bond network and the
absence of free water cluster58,123,132, also determined by molecular dynamic (MD)
calculations128,133. Moreover, 7Li and 19F nuclear magnetic resonance spectroscopy
(NMR) analysis showed changes in ionic structure, as shown in Figure 1. 14b and c. The
lowering of the 7Li chemical shift observed upon increasing salt concentration results
from an increase of the electronic density around Li+, suggesting greater amount of Li+-
anions interactions. A shift of the 19F signal was also observed, suggesting greater anion-
anion interactions134.

36 Chapter 1 – Introduction to aqueous superconcentrated electrolyte and their use in LIB
Figure 1. 14 (a) Raman spectra in the range 2800-4000 cm-1 observed for LiTFSI aqueous solutions. 2800-4000 cm-1 range corresponds to O-H stretching vibration restricted in a three-dimensional H-bond network structure. Adapted from Ref130. Normalized NMR spectra of aqueous electrolytes showing the chemical shift of water molecules in the presence of LiTFSI at several molalities (1 m blue, 5 m green, 10 m orange and 20 m red). (b) 7Li (c) 19F. Adapted from Ref134.
Moreover, the structure of aqueous superconcentrated electrolytes was reported to
be an anion TFSI--rich domain that behaves as an immobile matrix in which a water-rich
domain (network domain135 or cluster one136) is interpenetrated, as depicted in Figure
1. 15. Fast Li+ transport is enabled through the water-rich domain thanks to bulk-like
water structure, i.e. water which forms channels to support fast transport, intertwined
in the porous TFSI--rich skeleton137 and interfacial water, i.e., water bounded to Li+ cation
that move through the water bulk-like channels. Though, Li+ transport may also take
place through the TFSI--rich domain136. Altogether, these two networks give a
heterogeneous structure with asymmetric clusters. Based on the identification of these
two domains, the idea that upon increase in salt concentration water is not displaced
from the first solvation sheath is strengthened, suggesting that all water molecules will
preferentially bounds Li+ cation to form Li(H2O)4+ clusters rather than be involved in a
mix first solvation sheath composed of TFSI- anion and water.

Chapter 1 – Introduction to aqueous superconcentrated electrolyte and their use in LIB 37
Figure 1. 15 Schematic diagram of Li+ cation transport in aqueous superconcentrated electrolyte composed of two interpenetrating network: a water-rich one (orange) and an anion-rich one (green/dark-blue). Li+ cationic transport mechanism remains unclear between vehicular mechanism and hoping-type one. Adapted from Ref138.
First, as ionic association is enhanced in superconcentrated electrolytes, the number
of dissociated charge carriers decreases, thus the conductivity, as shown in Figure 1.
16a. However, conductivity values remain rather high (≈ 10 mS/cm in 21 m LiTFSI111)
thanks to the heterogeneous structure previously described that enables fast Li+
transport and provides high Li+ transference number139 (> 0.6135,140,141 and found as high
as 0.73135 depending on the experimental or theoretical method of determination). The
difference in transference number between Li+ and TFSI-, considered as immobile, is
related to the asymmetry between anion and water clusters140. Moreover, as viscosity
is impacted by the concentration and the interaction between ions and solvent
molecules142, its value is found to increase to values greater than 40 mPa.s in WiSE (see
Figure 1. 16.b). Besides, as illustrated in Figure 1. 16c on the Walden plot,
superconcentrated aqueous electrolytes reach the “ideal KCl line” and may even
become superionic solution, i.e., when conductivity and viscosity are decoupled,
especially considering bi-salt media58 which reach concentration above saturation, thus
explaining that good transport properties are preserved.

38 Chapter 1 – Introduction to aqueous superconcentrated electrolyte and their use in LIB
Figure 1. 16 (a) Conductivity measurements for LiTFSI aqueous solutions as function of concentration. (b) Relative viscosities measured for LiTFSI aqueous solutions as function of concentration. Adapted from Ref139. (c) Walden plot for LiTFSI solutions as function of concentration. The Walden plot was generated from the molar conductivities (Λ) and the viscosity (η) of the electrolyte solutions. In a Walden plot, electrolyte solutions can be classified in terms of their performances as ionic conductors: superionic (upper left region above the ideal KCl line) which states a decoupling between viscosity and conductivity, good-ionic (on the ideal line), poor-ionic (bottom right region under the ideal line), or non-ionic (far below the ideal line) liquids. For the LiTFSI/H2O solutions, the plot approaches the ideal line with increasing concentration, and finally joins with the ideal line at saturation. “Superionic” solution are reported for WiBS. Adapted from Ref58,130.
Moreover, the increase of ESW, especially on the positive electrode side, was
partially attributed to a diminution of water reactivity58,134 related to a decrease in water
activity58. Indeed, alike in organic superconcentrated electrolytes, as water is majorly
bounded to ions, the energy required to desolvate water and thus to oxidize it is greater,
thus pushing the onset potential of OER to higher potential143. As an example, the vapor

Chapter 1 – Introduction to aqueous superconcentrated electrolyte and their use in LIB 39
pressure of water was measured to decrease from 4.25 kPa for pure water to 0.50 kPa
at 30°C in Li(TFSI)0.7(BETI)0.3 electrolyte.
However, considering the negative electrode side and thus the HER parasitic reaction,
water molecules bounded to Li+ are more reactive than “free” water molecules upon
reduction, as found by Dubouis et al.144. Moreover, greater activity for protons was
recently reported in superconcentrated electrolyte98. These results suggest that the
overall decrease of water activity is not sufficient to effectively increase the ESW,
especially on the negative electrode side. Finally, upon increase of concentration,
electrolytes become more acidic, thus shifting the onset potential of HER and OER to
greater potential. Eventually, this increase was found to be similar to the increase in Li+
insertion potential resulting from the increase in Li+ activity as function of salt
concentration58. Therefore, shifting to WiSE does not favor Li+ intercalation at the
negative electrode relative to HER, for instance. One has to note that caution must be
taken while conducting pH measurements in superconcentrated electrolyte as pH-meter
with glass probe should be avoided125. Acidification of the electrolyte was found with
pH value as low as 2.8145, even though a recent study determined that such drop was
overestimated and that less than 1 mM of protons are formed in WiSE98.
Eventually, WiSE cannot usually be used at low temperature due to their rapid
crystallization138. Indeed, as shown on the phase diagram (see Figure 1. 17, purple line
for WiSE-region), the liquidus temperature of WiSEs is generally around 20 °C.

40 Chapter 1 – Introduction to aqueous superconcentrated electrolyte and their use in LIB
Figure 1. 17 Liquid-solid phase diagram of LiTFSI-H2O binary system. Adapted from Ref126. The purple line represents the 18.5-21 m LiTFSI concentration considered for aqueous superconcentrated electrolyte.
At the negative electrode side, the origin for the enlarged electrochemical window
(see Figure 1. 18) offered by aqueous superconcentrated electrolytes is ascribed to the
anion degradation that forms a LiF-rich passivating SEI that pushes the HER onset
potential from 2.62 V vs Li+/Li (at pH = 7) in 1 m LiTFSI to 1.9 V vs Li+/Li111 in 21 m LiTFSI
(see Figure 1. 18a). The exact mechanism for the SEI formation is still under debate,
with three mechanisms being proposed, and further detailed in the appendix of the
chapter: (i) the direct electrochemical reduction of anions or anion clusters such as
Li2(TFSI)+ 58,111,146–148, (ii) the chemical degradation of anion by nucleophilic attack
resulting from the HER reaction and the generation of hydroxyls134,149, (iii) the
precipitation/dissolution of LiTFSI salt149. Besides, dissolved gases (O2 or CO2) were also
reported to be involved in SEI formation. Though, despite the differences in SEI
formation mechanism, all are combined with the lower solubility of SEI compounds in
WiSE148.

Chapter 1 – Introduction to aqueous superconcentrated electrolyte and their use in LIB 41
Figure 1. 18 Electrochemical stability window reported by Suo et al.111 in 2015 for several electrolyte ranging from 1 m to 21 m LiTFSI on stainless steel. (a) Zoom on the cathodic stability at the negative electrode side. (b) Zoom on the anodic stability at the positive electrode side. (c) Overall ESW.
Nonetheless, water enrichment following the formation of hydrated cations
([Li(H2O)x]+) is still found below 1.5 V vs Li+/Li Ref 150,151 at the negatively charged interface,
with hydrogen atoms oriented perpendicular to the surface, thus promoting the HER150.
Figure 1. 19 illustrates this enrichment near the negative electrode, often referred to as
the cathodic challenge.

42 Chapter 1 – Introduction to aqueous superconcentrated electrolyte and their use in LIB
Figure 1. 19 (a) Contributions of ions and water to the atom density of the interfacial layer as a function of applied electrode potential assessed by classical molecular dynamics (MD). Blue region represents the interface of a negatively charged electrode mostly populated by water molecules. (b) Cumulative atom number density profiles normalized by bulk density as a function of distance from the electrode (z) and snapshots of the interfacial layer at -2 V vs the PZC (b). Adapted from Ref150.
Moreover, the increase in ESW stability is in reverse order with the intrinsic HER
electrocatalytic activity of the electrode material used to measure it152,153, as illustrated
in Figure 1. 20.
Figure 1. 20 Linear sweep voltammograms for 21 m LiTFSI on platinum, gold, stainless steel (SS), titanium, glassy carbon (GC), and aluminum. The pH of all solutions was adjusted to a value of ≈ 5. Experiments were carried out at room temperature. Adapted from Ref153.
As a conclusion, the SEI stability can be found highly dependent on the electrode
material, the anion chosen and the applied potential148,152–154. Last but not least,
regarding the assessment of the ESW and thus the interfacial reactivity, the ESW can be
Chapter 1 – Introduction to aqueous superconcentrated electrolyte and their use in LIB 43
artificially increased by choosing a high threshold of current density (ithreshold). For
example, the ESW increases from 2.1 V to 3.1 V by selecting a ithreshold of 100 µA/cm²
rather than 2 µA/cm² 153.
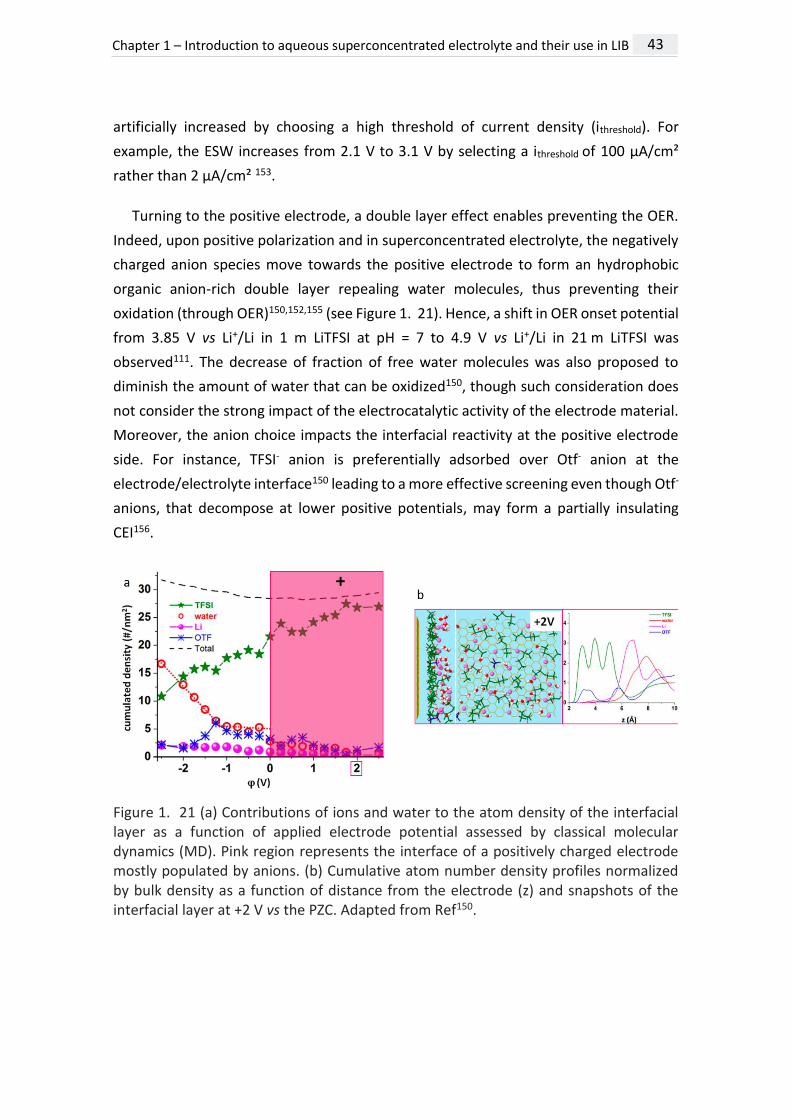
Turning to the positive electrode, a double layer effect enables preventing the OER.
Indeed, upon positive polarization and in superconcentrated electrolyte, the negatively
charged anion species move towards the positive electrode to form an hydrophobic
organic anion-rich double layer repealing water molecules, thus preventing their
oxidation (through OER)150,152,155 (see Figure 1. 21). Hence, a shift in OER onset potential
from 3.85 V vs Li+/Li in 1 m LiTFSI at pH = 7 to 4.9 V vs Li+/Li in 21 m LiTFSI was
observed111. The decrease of fraction of free water molecules was also proposed to
diminish the amount of water that can be oxidized150, though such consideration does
not consider the strong impact of the electrocatalytic activity of the electrode material.
Moreover, the anion choice impacts the interfacial reactivity at the positive electrode
side. For instance, TFSI- anion is preferentially adsorbed over Otf- anion at the
electrode/electrolyte interface150 leading to a more effective screening even though Otf-
anions, that decompose at lower positive potentials, may form a partially insulating
CEI156.
Figure 1. 21 (a) Contributions of ions and water to the atom density of the interfacial layer as a function of applied electrode potential assessed by classical molecular dynamics (MD). Pink region represents the interface of a positively charged electrode mostly populated by anions. (b) Cumulative atom number density profiles normalized by bulk density as a function of distance from the electrode (z) and snapshots of the interfacial layer at +2 V vs the PZC. Adapted from Ref150.

44 Chapter 1 – Introduction to aqueous superconcentrated electrolyte and their use in LIB
As described above, the electrolyte structure of WiSE impacts both bulk and
interfacial properties, and thus the battery performances. Hence, the use of aqueous
superconcentrated electrolyte was proposed to enable cycling negative electrode
materials which Li+ insertion potential lays outside the ESW of water or diluted aqueous
electrolyte (LTO, Mo6S8, TiO2, TiS2, see Figure 1. 10). In Figure 1. 22 is shown the
discharge capacity and the Coulombic efficiency of WiSE-based batteries. As a proof of
concept, a 2.3 V battery using Mo6S8 and LiMn2O4 as negative and positive electrodes,
respectively, was first reported in 2015 by Suo et al.111. Following this demonstration,
Yamada et al.58 then showed that mixing two organic lithium salts
(Li(TFSI)0.7(BETI)0.32∙H2O) increases further the concentration and enables assembling
aqueous batteries with a working potential as high as 3.1 V using LTO in combination
with LiNi0.5Mn1.5O4 or LCO electrodes. Moreover, WiBS electrolyte (21 m LiTFSI : 7 m
LiOtf) was also employed by Suo et al.122 to assemble a 2.5 V TiO2/LiMn2O4 battery.
Furthermore, using TiS2 as negative, a 1.7 V TiS2/LiMn2O4 cell using a 21 m LiTFSI
electrolyte was reported157. However, it was also observed that using LTO as negative
electrode leads to drastic decrease in cell performances (see Figure 1. 22d, from cycle
number 50).
Figure 1. 22 Cycling stability of several aqueous superconcentrated electrolyte based on LiTFSI-salt. (a) Mo6S8/LiMn2O4 in 21 m LiTFSI at 0.15C. (b) TiS2/LiMn2O4 in 21 m LiTFSI at 1C. (c) TiO2/LiMn2O4 in 21 m LiTFSI and 21 m LiTFSI : 8 m LiOtf at 0.5C. (d) Li4Ti5O12/LiNi0.5Mn1.5O4 in 20 m LiTFSI : 8 m LiBETI at 0.5C. The cell capacity is calculated based on the total weight of the positive and negative active materials. Adapted from Ref58,111,122,157.

Chapter 1 – Introduction to aqueous superconcentrated electrolyte and their use in LIB 45
Apart from improving capacity retention and Coulombic efficiency, the use of WiSE is
said to impact solubility equilibrium of SEI or transition metal due to a decrease in water
activity related to lower polar properties of water as most of water molecules are
involved in the solvating sphere158. Moreover, both SEI and electrode dissolution rates
were reported to kinetically decrease as the increase in viscosity reduces the diffusion
of dissolved species in the bulk and confine the dissolved species near the interface. At
the positive electrode side, the smaller electrode area exposed to water due to the
population of the double layer by anions158 also kinetically reduce electrode dissolution
rate. When formed by using Otf- anions or additives such as tris(trimethylsilyl) borate
(TMSB), CEI can also prevent transition metal dissolution such as Co or Mn at the
positive156,159.
Moreover, as pH of WiSE is neutral or mildly acidic, the use of Al current collector at
the negative is enabled. Indeed, Al passivation domain is comprised between pH values
of 4 to 8.5. At the positive electrode, the repulsion of water from the double layer,
combined with the high TFSI- oxidation potential, slows down the kinetics of Al
dissolution160, therefore enabling its use as current collector150. Altogether, the
possibility to use Al current collectors on both sides is of great interest as it has a low
density (light weight), high electronic conductivity, low cost and great ability to process
thin rolls.
As a conclusion, these studies have renewed interest for aqueous systems relying on
the use of superconcentrated electrolytes, which was later on extended to aqueous Na-
ion161–165, K-ion166–169, Zn-ion170,171 based on the promises of extending the ESW, Li-O2172
in which reversible Li2O2 formation is observed unlike in diluted aqueous electrolytes,
Li-S173,174 in which WiSE prevents from polysulfide redox shuttle, Zn metal-based cell
showing reversible Zn plating stripping170,175,176 or dual-ion battery including the halogen
conversion-intercalation177–179. However, several observations such as the fast capacity
decay when using LTO as negative electrode call for further investigations to understand
if the improved of ESW in WiSE is real in practice and to improve the overall
performances of these systems, especially regarding instabilities at the negative
electrode (i.e. the cathodic challenge).

46 Chapter 1 – Introduction to aqueous superconcentrated electrolyte and their use in LIB
Further improving aqueous superconcentrated-based LIB by expanding the ESW limit at the negative electrode side
Several strategies are employed to solve the cathodic challenge. On the one hand,
the tuning of the electrolyte properties with the removal of free water molecules from
the electrolyte149, which would potentially open the path for increased ESW, or the use
of additive to suppress water from Li+ solvation sheath, as reports pointed towards the
greater reactivity of water molecules participating to the Li+ solvation sheath compared
to free water molecules144 are envisioned. On the other hand, several research groups
focused their efforts on the use of coatings capable of preventing water to access the
interface.
In binary mixtures, the electrolyte concentration is found to increase to greater
values than the solubility limit of each of the two salts, thus reducing the amount of free
water. Indeed, a hydrated salt can dissolve a non-hydrated salt which possess similar
chemical properties. Mix-anions WiBS electrolytes58,122,180,181, i.e. two salts based on the
same cation but different anions, were first introduced in 2016 by Suo et al.122 and
Yamada et al.58, using 21 m LiTFSI : 7 m LiOtf and Li(TFSI)0.7(BETI)0.3 2∙H2O, respectively.
These systems are generally based on the use of stable chaotropic anions, i.e. disrupting
the bulk-like water interactions, and good SEI-former anions, as rationalized by Reber et
al.182. However, despite the decrease of free water molecule in the bulk, the increase in
ESW for mix-anion systems is very limited, if not inexistent at the negative electrode
(see Figure 1. 23).

Chapter 1 – Introduction to aqueous superconcentrated electrolyte and their use in LIB 47
Figure 1. 23 Electrochemical stability window of 20 m LiTFSI and 20 m LiTFSI : 8 m LiBETI on stainless steel. Linear sweep voltamogram performed at 0.1 mV/s at room temperature. Adapted from Ref153.
Mix-cation electrolytes183,184, i.e. two salts based on one anion but using two different
cations (Na-Li, K-Li or Na-K-based ones), enable to achieve greater solubility than mix-
anion162, further minimizing the water to salt ratio. Nonetheless, a major drawback of
this strategy is the co-intercalation184 of both alkali cations that leads to fast
performances decay. Thus, ammonium inert co-cations (such as tetraethylammonium
(TEA+) or trimethylethylammonium (Me3EtN+)) with larger radii were used162,183 (see
Table 1. 1, for a comparison of cation radii).
Table 1. 1 Radii of different cations used in WiBS.
Besides, ternary electrolytes -based on the introduction of ionic liquid185 (IL) for
instance- have also been used to further increase the solubility of salts, as the entropy
of mixing increases more in ternary than in binary mixtures. Eventually, to increase the
Alkali metal Li+ Na+ K+ TEA+
Ionic radius (Å) 0.68 0.97 1.33 3.37

48 Chapter 1 – Introduction to aqueous superconcentrated electrolyte and their use in LIB
solubility limit and the thermal stability by shifting the liquidus temperature to lower
temperature163,165,186, the high vibrational mobility and flexibility of asymmetric
moieties of ions is useful as they impede the formation of long range order165,180,181,187.
The asymmetry of the anion, such as FTSI- or PTFSI-, enable the formation of an
asymmetrical solvation sheath of Li+ (see Figure 1. 24a, red circle). Hence,
uncoordinated moieties, freer and more mobile, rotate and disturb the surrounding
solvation structure preventing close packing of anions and cations (see Figure 1. 24a,
purple circle). Furthermore, the asymmetry of the anion itself reduces the probability
for specific rearrangement.
Figure 1. 24 (a) Schematic illustration of the difference in local coordination for symmetric TFSI- and asymmetric FTFSI- anion. (b) The numbers of hydrogen bond and coordination to cations around a water molecule, which were obtained by averaging three trajectories (The geometric criteria of hydrogen bonds were defined by the radial distance between the donor and acceptor oxygen atoms (< 3.5 A) and the angle between the acceptor oxygen atoms and a donor-H-acceptor (135–180°) for a diluted 1 M LiTFSI and a WiBS electrolyte based on Li(PTFSI)0.6(TFSI)0.4). Adapted from Ref181,186.
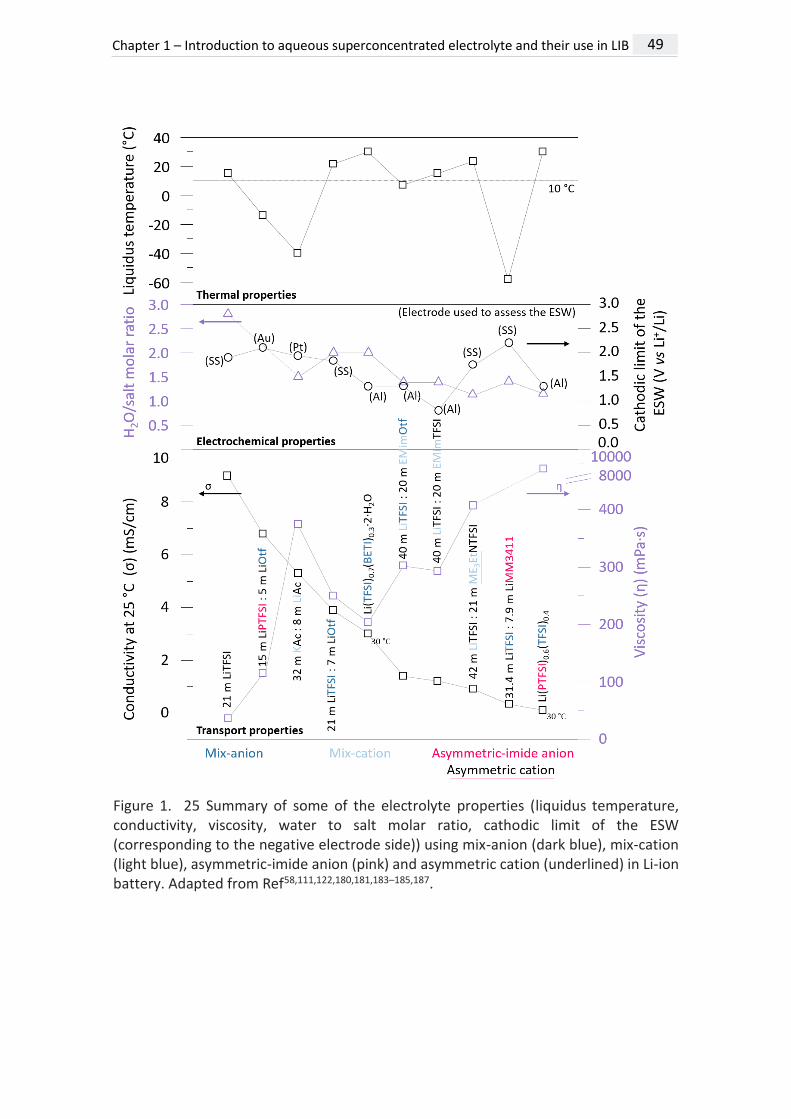
However, even though by using mix-anion, mix-cation or asymmetric ion-based
electrolytes all water molecules are generally bounded to Li+ with negligible H-bonds, as
calculated by MD simulation for mix-asymmetric anion electrolyte (see Figure 1. 24b),
they generally leads to a decrease in conductivity and an increase in viscosity, as shown
in Figure 1. 25 (bottom part) with limited thermal operating range (top part) and
restricted increase in the cathodic limit of the ESW (middle part), restraining the use of
negative electrode to LTO at best. Therefore, while research efforts dedicated to novel
salts need to be continued to further improve electrolyte properties, other solutions are
also investigated. Among them, tuning the solvation sheath of the Li+ cations by using
hybrid organic/aqueous electrolyte to remove water from the first solvation sheath of
Li+ and thus prevent water reduction was proposed.
Chapter 1 – Introduction to aqueous superconcentrated electrolyte and their use in LIB 49
Figure 1. 25 Summary of some of the electrolyte properties (liquidus temperature, conductivity, viscosity, water to salt molar ratio, cathodic limit of the ESW (corresponding to the negative electrode side)) using mix-anion (dark blue), mix-cation (light blue), asymmetric-imide anion (pink) and asymmetric cation (underlined) in Li-ion battery. Adapted from Ref58,111,122,180,181,183–185,187.

50 Chapter 1 – Introduction to aqueous superconcentrated electrolyte and their use in LIB
First, hybrid aqueous/non-aqueous electrolyte reduces water activity in the bulk by
forming H-bonds between non-aqueous solvent and water, as observed in
dimethylsulfoxide (DMSO)-based electrolyte188,189. Moreover, the addition of co-solvent
strongly coordinating Li+ can promote the removal of water from the first solvation
sheath of the alkali ion, or at least decrease its quantity (see Figure 1. 26a), thus
preventing or slowing down water reduction. DMSO, dimethylformamide (DMF) and
urea188–190 were identified as good candidates owing to their greater donor numbers
than water (29.8 for DMSO vs 18 for water). On the contrary, DMC and acetonitrile
addition191,192 impacts the solvation sheath by increasing the fraction of water in Li+ first
solvation sheath, thus promoting the nanophase separation leading to a water-rich
domain and a TFSI-DMC-rich domain, as shown in Figure 1. 26b and c. This promoting
effect will be detrimental for the cathodic stability of WiSE.
Figure 1. 26 (a) Modification of the solvation sheath of Li+ cation upon addition of urea. Adapted from Ref190. (b) Snapshots (including front and right side views) of inner-Helmholtz layer of negatively charged electrodes obtained from molecular dynamics (MD) simulation in 15.3 m LITFSI in water:acetonitrile (1:1 molar ratio). (d) Proportion of the Li+ solvating with 1, 2, 3 and 4 solvent molecules (H2O or DMC), obtained from molecular dynamic (MD) simulations. Adapted from Ref192.
Furthermore, not only the reduction potential of the co-solvent needs to be greater
than the HER to promote the SEI formation, but the reduction product also has to be
insoluble. Besides, as neutral solvents are less sensitive to negative repulsion, their
reduction should be easier than TFSI-based clusters, thus leading to their participation
to the SEI formation. DMC192, acetonitrile192, tetraethylene glycol dimethyl ether193
(TEGDME), polyacrylamide194 (PAM) reduction during first charges were reported to
contribute to the presence of organic components in the SEI, thus enabling to expand
the cathodic limit of ESW below 1 V vs Li+/Li at the negative electrode while LiF is kept

Chapter 1 – Introduction to aqueous superconcentrated electrolyte and their use in LIB 51
in the inner layer due to TFSI- degradation192 (see Figure 1. 27a and b). Upon urea, 1,5-
pentanediol195 or sulfolane196 addition, an organic-inorganic SEI was also identified as
illustrated by the dense SEI majorly composed of Li2CO3 and amorphous polyuria in urea-
based electrolyte (see Figure 1. 27c) but without LiF participation and limited increase
in the cathodic limit of the ESW (see Figure 1. 28).
Figure 1. 27 (a) TEM images of LTO negative electrode after cycling showing the formation of a LiF-based SEI in 15.3 m LiTFSI in H2O:acetonitrile. (b) Intensity changes of XPS analysis of LiF (yellow), C≡N (dark red), R-S-N-S (red) from F 1s and N 1s with various sputtering durations (c) TEM images of Mo6S8 negative electrode after 10 cycles showing the formation of a Li2CO3 SEI in 1:3:2 LiClO4:H2O:urea electrolyte.
Bulk properties, notably the conductivity, the cathodic limit of the ESW
(corresponding to the negative electrode side) and the thermal properties are reported
in Figure 1. 28. The expansion of the ESW enables to cycle LTO negative electrode in a
mixture of water:acetonitrile at 0.2C193, using LiTFSI:H2O (1:2.8 molar ratio) and
LiTFSI:TEGDME (1:0.41 molar ratio) in the proportion 1:1 (mass ratio), though only
charging rates faster than 1C were tested193 or in the sulfolane:water-based
electrolyte196. Other electrolytes are reported to cycle with negative electrode having
greater intercalation potential, such as Mo6S8190,195 or TiO2
194. Moreover, as observed in
Figure 1. 28, the expansion of the ESW is in reverse order with the enhancement of
conductivity (often lower than ≈ 3 mS/cm). Thus, tuning the solvation sheath by adding
non-aqueous solvent, which can be related to the concept of diluted-concentrated
electrolyte, may improve the cell performances by enabling the cycling of LTO electrode
but this approach does not entirely overcome the cathodic challenge yet neither
preserve good physico-chemical properties.

52 Chapter 1 – Introduction to aqueous superconcentrated electrolyte and their use in LIB
Figure 1. 28 Summary of some of the electrolyte properties (conductivity, viscosity, cathodic limit of the ESW and thermal stability) using solvation sheath tuning in Li-ion battery. Adapted from Ref190–196.
The incorporation of WiBS in a polymer matrix enables to reduce water activity197 by
coordinating water with the polymer moieties. UV-curable gel-polymer electrolyte (GPE)
(see Table A.1. 3, at the end of the chapter for details) using low viscosities polymers
was proposed to enable good wetting of the porous electrodes197–199. Moreover, in the
spirit of suppressing the use of fluorinated salts and developing low-cost electrolyte, He
et al.200 reported a Water-in-ionomer electrolyte based on 50 wt% LiPAA but
constraining the negative material selection to the use of TiO2. Furthermore, the
suppression of the classical H2O-H2O H-bonds structure and the reduction of the amount
of free water is promoted upon addition of PEG201,202 or PEO203. Such strategy enables
decreasing the concentration of LiTFSI down to 2 m LiTFSI in a 2 m LiTFSI∙PEGx(H20)(1-x),

Chapter 1 – Introduction to aqueous superconcentrated electrolyte and their use in LIB 53
71 < x (wt%) < 94, leading to a decrease in cost and toxicity, as reported by Xie et al.201
and Li et al.202.
However, alike for classical WiSE, a Li(H2O)4+-rich domain and a polymer-LiTFSI-rich
domain are found, suggesting that the cathodic challenge remains unsolved203. Besides,
in these GPE, alike previously observed for organic/aqueous electrolytes, the ESW and
the transport properties were found to be directly related to the water content201,203.
Indeed, increasing the water concentration from 6 wt% to 29 wt% in a LiTFSI-PEG-based
GPE enhances the conductivity from 0.9 mS/cm to 3.4 mS/cm, while unfortunately
reducing the ESW by ≈ 500 mV201.
Eventually, in 2017, Yang et al.204 reported the assembly of batteries using metallic Li
or graphite in combination with high potential positive electrode using a WiBS-gel
polymer based on 21 m LiTFSI : 7 m LiOtf with 10 wt% of polyvinyl alcohol (PVA).
Nonetheless, these outstanding performances rely more on an extra organic polymer
coating layer used to protect the negative electrode from the HER, as shown in Figure 1.
29, than on the use of WiBS.
Figure 1. 29 Electrochemical stability window (ESW) of WiBS-gel polymer with or without an extra organic coating. Adapted from Ref199.
The use of metallic Li or graphite in WiSE-based electrolyte were shown to be enabled
by the use of organic-coatings that (i) provides good mechanical properties, (ii) prevents

54 Chapter 1 – Introduction to aqueous superconcentrated electrolyte and their use in LIB
water from accessing the interface and (iii) may contribute to the SEI formation. The first
type of organic coating integrates a GPE consisted of a HFE-LiTFSI-PEO GPE (HFE stands
for highly fluorinated ether, here 1,1,2,2-Tetrafluoroethyl 2,2,2-Trifluoroethyl Ether)204.
During first charges, the GPE undergoes reductive decomposition to form a LiF-based
SEI which properties are enhanced by the contribution from organic-based compounds.
Using this system, graphite and metallic Li electrodes were cycled 50 cycles at 0.3C with
≈ 99 % of Coulombic efficiency. Similarly, a UV-induced GPE coating using 1 m LiTFSI in
fluoroethylene carbonate:trifluoroethyl methyl carbonate (FEC:FEMC, 1:1 vol%) was
found to passivate the graphite electrode199. However, the graphite/LCO cell
performances show a rapid capacity decay (see Figure 1. 30). Besides, as proposed by
Dubouis et al.134, TFSI- anions undergo a chemical degradation in presence of HO- anion
to form the SEI. Therefore, Zhang et al.198 cycled a LTO-based cell for 200 cycles at 0.5C
using a strongly basic solid polymer electrolyte (SPE), LiTFSI-PEO-KOH, to enable the
formation of a LiF-Li2CO3-containing SEI that incorporates polymeric decomposition
products.
Figure 1. 30 (a) Scheme of a cell based on an organic coating. (b) Capacity and Coulombic efficiency as a function of cycle number for a graphite/LCO cell cycled in hybrid organic/aqueous electrolyte and using a polymer coating as a protection of the negative electrode. Adapted from Ref199.
Inorganic coatings were also tested in WiSE. The propensity of a coating to suppress
or, at least, reduce HER depends on its intrinsic electrocatalytic activity205. Aluminum
oxide (Al2O3) coating was one of the most widely used205–207 as it shows the lower HER
activity (see Figure 1. 31a.) and it is also known to be insoluble in water. However, LTO-
Al2O3-coated electrodes were found to initially deliver 84.5 % of Coulombic efficiency in
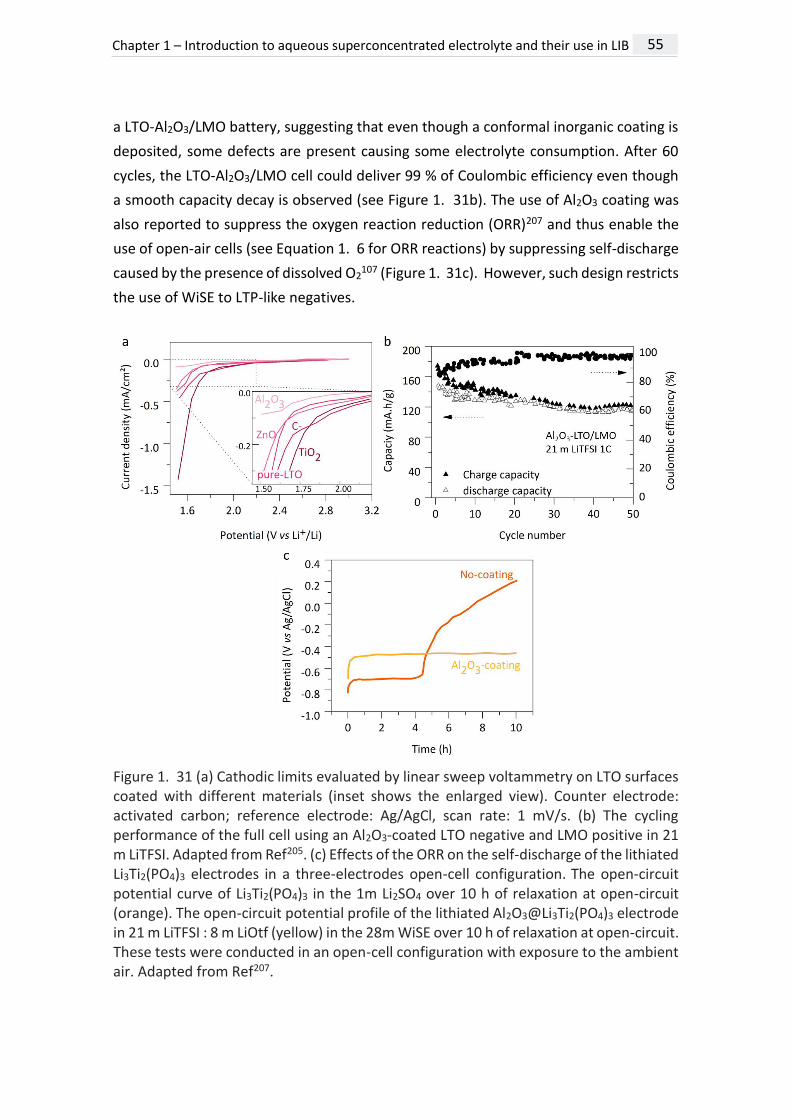
Chapter 1 – Introduction to aqueous superconcentrated electrolyte and their use in LIB 55
a LTO-Al2O3/LMO battery, suggesting that even though a conformal inorganic coating is
deposited, some defects are present causing some electrolyte consumption. After 60
cycles, the LTO-Al2O3/LMO cell could deliver 99 % of Coulombic efficiency even though
a smooth capacity decay is observed (see Figure 1. 31b). The use of Al2O3 coating was
also reported to suppress the oxygen reaction reduction (ORR)207 and thus enable the
use of open-air cells (see Equation 1. 6 for ORR reactions) by suppressing self-discharge
caused by the presence of dissolved O2107 (Figure 1. 31c). However, such design restricts
the use of WiSE to LTP-like negatives.
Figure 1. 31 (a) Cathodic limits evaluated by linear sweep voltammetry on LTO surfaces coated with different materials (inset shows the enlarged view). Counter electrode: activated carbon; reference electrode: Ag/AgCl, scan rate: 1 mV/s. (b) The cycling performance of the full cell using an Al2O3-coated LTO negative and LMO positive in 21 m LiTFSI. Adapted from Ref205. (c) Effects of the ORR on the self-discharge of the lithiated Li3Ti2(PO4)3 electrodes in a three-electrodes open-cell configuration. The open-circuit potential curve of Li3Ti2(PO4)3 in the 1m Li2SO4 over 10 h of relaxation at open-circuit (orange). The open-circuit potential profile of the lithiated Al2O3@Li3Ti2(PO4)3 electrode in 21 m LiTFSI : 8 m LiOtf (yellow) in the 28m WiSE over 10 h of relaxation at open-circuit. These tests were conducted in an open-cell configuration with exposure to the ambient air. Adapted from Ref207.

56 Chapter 1 – Introduction to aqueous superconcentrated electrolyte and their use in LIB
Equation 1. 6:
𝑂2 + 𝐻2𝑂 + 2 ∙ 𝑒− = 𝐻𝑂2− + 𝑂𝐻−
𝐻𝑂2− + 𝐻2𝑂 = 𝐻2𝑂2 + 𝑂𝐻
− 𝐻2𝑂2 + 2 ∙ 𝑂𝐻− + 2 ∙ 𝐿𝑖+ = 𝐿𝑖2𝑂2 + 2 ∙ 𝐻2𝑂
Moreover, AlF3-Al2O3206, LTP208
and carbon 122,208,209 coatings were also reported but
limiting the negative electrode choice to the use of TiO2 electrode, far above graphite or
even LTO ones.
Altogether, polymeric coating was reported to be the most efficient strategy as only
this strategy enabled to cycle metallic Li or graphite negative electrodes.
Conclusion of the chapter
The introduction of superconcentrated aqueous electrolytes was proposed to
overcome safety and environmental issues while keeping high performances. First,
superconcentration enables to increase the ESW. Indeed, thanks to the formation of a
SEI, majorly based on salt-derived compound LiF, negative electrodes with insertion
potential laying outside the usual ESW (< 1.5 V) were implemented. Besides, WiSE-based
battery enables to limit electrode and SEI dissolution while maintaining fast Li+ transport
owing to a high Li+ transference number. As summarized in Figure 1. 32, many
researches and advances have been done since the introduction of the seminal 21 m
LiTFSI WiSE electrolyte developed by Suo et al.111 in 2015, though achieving
performances competitive with commercial-LIB still remains to be shown. Starting from
binary or ternary liquid mixtures using mix-anion or mix-cation with asymmetrical ions,
moving to hybrid aqueous/non-aqueous electrolyte to tune the first solvation sheath of
Li+, using gel-polymer type electrolyte to reduce water activity or using artificial
inorganic SEI on the negative electrode to prevent water to reach the electrode, all were
proposed to partially overcome some limitations.

Chapter 1 – Introduction to aqueous superconcentrated electrolyte and their use in LIB 57
Figure 1. 32 Summary of the innovations developed to improve seminal-21 m LiTFSI aqueous superconcentrated electrolyte.
However, improvements previously observed cannot be directly transposed to
practical devices as the increase of the ESW is strongly related (i) to the electrode
material on which it is assessed and (ii) to the current threshold chosen. Eventually, one
must look not only at the ESW but also at the physico-chemical properties to ensure high
conductivity, low viscosity and wide thermal stability. As a conclusion, many parameters
must be taken into account to assess the performances of one electrolyte. Therefore,
the aim of this thesis is to explore the viability of 20 m LiTFSI as an example of aqueous
superconcentrated electrolyte behavior by assessing key parameters representative of
this chemistry to compete with classical LIB. Thus, Chapter 2 focuses on the
performances obtained during cycling and self-discharge while monitoring parasitic
reactions. Chapter 3 will investigate the instability of the native SEI and its ability to
prevent the HER. Eventually, Chapter 4 will assess the use of LiF-based coating as
artificial SEI for WiSE-based battery.


CHAPTER 2 – CYCLING VIABILITY OF AQUEOUS SUPERCONCENTRATED
ELECTROLYTES BASED ON 20 MOL/KG LITFSI AND 20 MOL/KG LITFSI : 8 MOL/KG
LIBETI 1
1 This chapter is based on the article that I co-authored: Droguet, L.; Grimaud, A.; Fontaine, O.; Tarascon, J. Water‐in‐Salt Electrolyte (WiSE) for Aqueous Batteries: A Long Way to Practicality. Adv. Energy Mater. 2020, 10 (43), 2002440. https://doi.org/10.1002/aenm.202002440.

60 Chapter 2 - Cycling viability of aqueous superconcentrated electrolytes in LIB
Introduction
As described in Chapter 1, the use of superconcentrated aqueous electrolytes was
proposed to widen the electrochemical stability window (ESW) of aqueous-based
electrolytes. Among them, 21 mol/kg (m) LiTFSI Water-in-salt (WiSE) has been widely
used111 since the seminal publication by Suo et al.111 in 2015 reporting an increase in
ESW up to 3 V. Besides, greater salts concentration -thus lesser water content- were
reached by using Water-in-bisalt (WiBS) electrolyte such as Li(TFSI)0.7(BETI)0.3,
potentially enlarging the ESW even more58. Throughout this chapter, two similar
electrolytes (20 m LiTFSI and 20 m LiTFSI : 8 m LiBETI) will be benchmarked as
representative to study aqueous superconcentrated electrolytes practical viability in Li-
ion battery (LIB).
Prior to study the effect of cycling parameters on performances of WiSEs-based
aqueous batteries, proper current collectors must be selected. The ESW widening was
previously assessed using metallic current collectors such as platinum, conductive glassy
carbon or directly with current collectors materials (titanium, stainless steel or
aluminum) with overpotential for the oxygen evolution reaction (OER) greater than 500
mV measured on the oxidation part58,152,160,161,184,210 using superconcentrated
electrolytes. Instead, almost no change is observed for hydrogen evolution reaction
(HER) overpotential (on the reduction part) as function of the metallic current
collector152,210 when increasing the salt concentration, the exception being aluminum
that passivates58,148,153,154,160. However, these potential shifts are determined by cyclic
voltammetry measurements rather than by potentio/galvano-static methods, hence
departing from practical conditions. Indeed, by narrowing down the number of testing
parameters, especially when the threshold current density is not taking into account,
the influence of parasitic reactions such as the HER can be downplayed, as discussed by
Kühnel et al.153 Figure 2. 1 shows the ESW of 20 m LiTFSI on glassy carbon, aluminum,
stainless steel and titanium current collectors. Aluminum and glassy carbon show an
ESW reduction limit at 1.8 V vs Li+/Li for HER (considering a ithreshold = 0.25 mA/cm²)
followed by stainless steel at 2 V vs Li+/li and titanium reduction limit at 3 V vs Li+/Li
(Figure 2. 1b). On the oxidation limit, titanium passivation enables the increase of the
ESW to potentials greater than 4.5 V vs Li+/Li. Therefore, based on both these results
and their relative ease-of-use, stainless steel current collectors were selected for
electrodes which lithium insertion/de-insertion potential lays in the range 2 to 4 V vs

Chapter 2 - Cycling viability of aqueous superconcentrated electrolytes in LIB 61
Li+/Li, and titanium as current collector electrode materials which Li insertion/de-
insertion potential is above 4 V vs Li+/Li.
Figure 2. 1 Electrochemical stability window of 20 m LiTFSI electrolyte assessed at 100 mV/s on glassy carbon (blue), aluminum (orange), stainless steel (yellow) and titanium (green) as working electrodes (WE), Pt wire as counter electrodes (CE) and Ag/AgCl as reference. In (a) is display the full ESW and in (b) and (c) a zoom on the cathodic and anodic stability part, respectively, are provided.
To independently assess the parasitic reactions occurring at the negative electrode
from those at the positive electrode, Mo6S8 negative electrode was chosen as cathode
while NMC622 was chosen as anode to test the ESW. Mo6S8 and NMC622 electrochemical
signatures are shown Figure 2. 2a. One can notice the classical electrochemical signature
of Mo6S8 with four Li+ ions being reversibly inserted, three at 2.3 V vs Li+/Li and one at
2.7 V vs Li+/Li. Moreover, LFP and LTP were selected as counter electrode for Mo6S8 and
NMC622, respectively. Indeed, using a 3-electrodes Swagelok cell with an Ag/AgCl
reference electrode, both LFP and LTP counter electrodes, known to reversibly exchange
Li+ in aqueous electrolytes76,107,112, were found to have their redox potential within the
ESW of the WiSE electrolyte studied in this work (see Figure 2. 2b). Having defined the
proper current collectors and active materials, full cells were thus assembled to study

62 Chapter 2 - Cycling viability of aqueous superconcentrated electrolytes in LIB
the effect of WiSE on the redox properties of both active materials, Mo6S8 and NMC622,
measured against LFP and LTP, respectively (see Figure 2. 2a). Besides, to avoid that LFP
and LTP counter electrodes limit the cell cycling, capacity ratio were set to 4:1 for
LFP/Mo6S8 and 1.1:1 for LTP/NMC622. Eventually, after checking the redox potentials for
LFP and LTP versus the potential of Ag/AgCl reference electrode, the potentials for the
working electrodes were rescaled versus Li+/Li. Doing so, an upshift in ≈ 230 mV is
observed when cycling Mo6S8 and NMC622 in WiSE compared to the organic electrolyte
(1 M LiPF6 in EC:DMC, e.g. LP30). This shift, previously observed, was assigned to the
effect of the salt concentration on the redox potential of the intercalation electrodes58.
Such an upshift of the intercalation potential combined with the use of a fixed cutoff
potential of 4.2 V defined vs Li+/Li in charge explains the lower measured capacity for
NMC622 in WiSE as opposed to non-aqueous electrolytes (see Figure 2. 2a, orange full
and dash line). The importance of adequately selecting this cutoff potential will be
discussed in greater detail in Section 4.
Figure 2. 2 (a) Galvanostatic charge and discharge signatures for electrode materials. Galvanostatic experiment performed at 1C with Mo6S8 measured in LP30 versus metallic Li and 20 m LiTFSI versus LFP on SS current collector (1st cycle). Galvanostatic experiment performed at 0.10C with LiNi0.6Mn0.2Co0.2O2 measured in LP30 versus metallic Li and 20 m LiTFSI versus LTP on Ti current collector (1st cycle). (b) Reversibility of Li+ intercalation/de-intercalation of electrode materials in 20 m LiTFSI. Cyclic voltammograms performed at 1 mV/s on Mo6S8 (dark blue), LFP (light blue), LTP (yellow), NMC622 (orange) as WE, YP50 activated carbon as CE and Ag/AgCl as reference electrode. All experiments were performed at room temperature (RT).

Chapter 2 - Cycling viability of aqueous superconcentrated electrolytes in LIB 63
Cycling performances in aqueous superconcentrated electrolyte on the negative electrode side: role of concentration, cycling rate and temperature
In this section, we will focus on the cycling performances of a Mo6S8/LFP cell using
either 20 m LiTFSI or 20 m LiTFSI : 8 m LiBETI to assess the viability of these aqueous
superconcentrated electrolytes in practice. Cell performances were estimated with
electrochemical tests upon varying concentrations, cycling rate (C-rate defined by 1C
corresponding to one Li+ inserted in one hour) and temperatures.
1.1.1 Influence of concentration and C-rate
The capacities in charge and discharge of a Mo6S8/LFP cell were measured as a
function of the salt concentration from 5 m up to 20 m, corresponding to Water-in-salt
electrolyte. Cell capacity and Coulombic efficiency measured at 1C at room temperature
are shown in Figure 2. 3a and b. The difference between charge and discharge capacities
is becoming greater when lowering the salt concentration, i.e., the Coulombic efficiency
is decreasing. Furthermore, the capacity is found to fade over cycling much faster when
lowering the salt concentration. These results can tentatively be interpreted either as
the sign that no SEI is formed at lower concentrations or by invoking a greater solubility
of inorganic compounds forming the SEI, such as LiF134,146, Li2O146 or LiOH134 previously
observed forming on the surface of negative electrodes, at lower concentrations. Either
way, the continuous parasitic reactions occurring on the surface of Mo6S8 negative
electrode consume Li+ and cause the performances to decay over cycling at low
concentration. Finally, and more interestingly, the initial capacity in charge is found, in
Figure 2. 3a, similar for the different concentrations: 125 mA.h/g at 5 m, 120 mA.h/g at
10 m and 123 mA.h/g at 20 m, suggesting that the nature and the number of parasitic
reactions are independent on the concentration during the first charge, before the
formation of a SEI.

64 Chapter 2 - Cycling viability of aqueous superconcentrated electrolytes in LIB
Figure 2. 3 Effect of concentration for Mo6S8/LFP full cells measured in LiTFSI-based aqueous electrolytes. (a) Capacities of charge and discharge and (b) Coulombic efficiency (CE) as function of cycle number for several concentrations: 5 m LiTFSI (brown square), 10 m LiTFSI (purple square), 20 m LiTFSI (yellow square). Constant current measurements were performed at 1C at room temperature (RT).
Even though the cycling performances improve with concentration, they are
dependent on the C-rate, as shown in Figure 2. 4a and b where the evolution of the
charge capacity (Figure 2. 4a) and the Coulombic efficiency (Figure 2. 4b) are reported
for several C-rates at room temperature. Indeed, it clearly appears that the faster the
cycling rate is, the higher the Coulombic efficiency. However, the absolute value for the
charge capacity is slightly lower, hence leading to significant improvements in the cell
capacity retention. This phenomenon can be related to greater amount of parasitic
reactions occurring as time spent at potential close to the HER potential increases when
lowering the C-rate, thus “artificially” increasing the charge capacity at the expense of
the discharge capacity. As a result, and as often seen in the literature153, one obvious
way to increase the Coulombic efficiency and cycling performances of such systems is
by increasing the C-rate. However, our work reveals that C-rate below 1C must be
employed to accurately evaluate the performances of aqueous systems in this
configuration.

Chapter 2 - Cycling viability of aqueous superconcentrated electrolytes in LIB 65
Figure 2. 4 Effect of C-rate for Mo6S8/LFP full cells measured in LiTFSI-based aqueous electrolytes. Capacity of charge (a) and Coulombic efficiency (b) as function of cycle number for several C-rate: 0.15C, 0.25C, 0.5C, 1C, 2C, 4.5C. Constant current measurements were performed in 20 m LiTFSI electrolyte at room temperature.
1.1.2 Influence of temperature
Figure 2. 5 reveals that the effect of temperature is more pronounced at low C-rate
than at C-rate above 1C. Indeed, an operating temperature of 55 °C leads to a rapid
decay of the reversible capacity and a drastic drop of the Coulombic efficiency, both
leading to a shorter lifetime for the battery at low C-rate. Moreover, we can observe at
55 °C a larger charge capacity at the beginning of cycling associated with lower
Coulombic efficiency (see Figure 2. 5a and Figure 2. 5b), demonstrating a greater amount
of parasitic reactions at higher temperatures. Besides the enhancement of the global
degradation of the cell (loss of electrical contact, faster aging of materials, etc.) at high
temperatures, the origin for this phenomenon can be either kinetics or
thermodynamics. On the kinetics side, a higher temperature will both enhance the HER
kinetics, as well as the SEI degradation rate for SEI-components such as LiF, LiOH or Li2O
as reported in literature134,146. On the thermodynamics side, note that the HER potential
shifts towards lower potential by 160 mV between 25 °C and 55 °C (EHER @25 °C = 2.16 V
vs Li+/Li and EHER @55 °C = 2 V vs Li+/Li), while the Li insertion potential for Mo6S8 only shifts
by 20 mV (see Figure 2. 5b). This difference leads to the appearance of a plateau
attributed to the HER (as proved by gas monitoring) before the cell potential reaches
the cut-off of 1.5 V, again artificially increasing the charge capacity of the LIB while
reducing the lifetime.

66 Chapter 2 - Cycling viability of aqueous superconcentrated electrolytes in LIB
Figure 2. 5 Temperature impact for Mo6S8/LFP full cells measured in 20 m LiTFSI. (a) Charge and discharge capacities as a function of cycle number at 55 °C for several C-rates: 0.15C, 0.25C, 0.5C, 1C, 2C. (b) Potential as function of time for cells cycled at 0.5C at 25 °C and at 55 °C showing the shift of the HER plateau depending on the temperature. (c) Comparison between discharge capacities and Coulombic efficiency as function of cycle number for cells cycled at 0.5C at 25 °C (yellow) and 55 °C (orange).
1.1.3 Reproducibility issue
During the temperature study using the 20 m LiTFSI electrolyte, we could observe for
some cells cycled at 0.5C at 55 °C a large dispersion of charge and discharge capacities
values (see Figure 2. 6a). Our results at 55 °C (capacity vs cycle number) for three
different cells show charge capacity during the first charge ranging from 107 mA.h/g to
142 mA.h/g, far greater than the range for charge capacities determined at room
temperature (112 mA.h/g < Qcharge @RT < 123 mA.h/g) (see Figure 2. 6a). This
phenomenon is rooted in the effect of temperature that exacerbates small variations in
the SEI formation and stability, which in turn leads to different microstructures
(thickness and density) and thus damaging rate when cycled at 55 °C. Such variation is
highlighted in Figure 2. 6b with the appearance of a HER plateau at 55 °C before the cell
cut-off.

Chapter 2 - Cycling viability of aqueous superconcentrated electrolytes in LIB 67
Figure 2. 6 (a) Charge and discharge capacities as function of cycle number for three Mo6S8/LFP cells cycled at 0.5C at 55 °C and range of values for three cells cycled at 0.5C at room temperature that fall with the shaded grey area. (b) Potential as a function of time for three cells cycled in similar conditions, at 0.5C and 55 °C, showing the poor reproducibility of cell performances at elevated temperature.
To further study the viability of aqueous superconcentrated electrolytes, 20 m LiTFSI :
8 m LiBETI Water-in-bisalt electrolyte was then investigated. Indeed, such electrolyte, in
which the water amount is even smaller (salt to water molar ratio is set to 1:2 in 20 m
LiTFSI : 8 m LiBETI compared to 1:2.8 in 20 m LiTFSI), was previously propose to provide
better cycling performances than classical 20 m LiTFSI electrolyte, thus enabling to cycle
low potential negative electrode such as LTO58.
1.2.1 Influence of the C-rate: 0.15C vs 1C at RT and temperature: RT vs 55 °C at 0.15C
Based on the results shown in section 2.1.1, the C-rate study was limited to C-rates
no greater than 1C to accurately evaluate the performances of WiBS. Therefore, two C-
rates of 1C and 0.15C were chosen to illustrate WiBS behavior with cycling rate. Figure
2. 7a shows the evolution of the charge capacity and the Coulombic efficiency with
cycles. The influence of the C-rate for WiBS-based cell performances is in line with the
results previously obtained in WiSE. Indeed, the faster the cycling rate is, the greater the
Coulombic efficiency, the lower the charge capacity. Cycling performances were then
tested at 55 °C (see Figure 2. 7b). Doing so, an increase of temperature was found to
lead to greater capacity in charge (132 mA.h/g at 55 °C compared to 119 mA.h/g at RT)
associated with lower Coulombic efficiency, in agreement with an increased amount of
parasitic reactions occurring at high temperature due to faster HER kinetics, greater HER

68 Chapter 2 - Cycling viability of aqueous superconcentrated electrolytes in LIB
onset potential and faster SEI degradation rate combined with an enhancement of the
global degradation of the cell (loss of electrical contact, faster aging of materials, etc.),
alike previously observed in WiSE.
Figure 2. 7 Effect of C-rate and temperature for Mo6S8/LFP full cells cycled in 20 m LiTFSI : 8 m LiBETI LIB. (a) Capacity of charge and Coulombic efficiency as function of cycle number for two representative C-rates: 0.15C (dark blue) and 1C (light blue). Constant current measurements were performed in 20 m LiTFSI electrolyte at room temperature. (b) Temperature effect on WiBS-based LIB. Comparison between charge capacities and Coulombic efficiency as function of cycle number for cells cycled at 0.15C at room temperature (yellow) and 55°C (red).
1.2.2 Comparison with WiSE-based electrolyte at 55 °C at 0.15C
While all these measurements are very much in line with those previously obtained
for WiSE, the capacity fading is nevertheless found to be much slower when using WiBS
electrolyte than with WiSE (see Figure 2. 8), leading to longer shelf-life. Bearing in mind
that the concentration of water in WiBS is 1.6 times smaller than in WiSE, this
observation could at first be explained by a decrease of the number of water molecules
available for the HER and a decrease of the dissolution rate of the SEI in WiBS148,211.
However, this explanation is contradicted by recent studies showing that water
molecules reduced in the HER process are those solvating lithium cation212 and that the
first solvation sheath of lithium cation is rather similar in WiSE and WiBS, therefore the
reactivity of water in these two electrolytes should be alike. A more likely possibility is
the viscosity difference between both electrolytes that is about 6 times greater for WiBS
(203 mPa.s at 30°C58) than for WiSE electrolyte (36.2 mPa.s at 25°C111). Indeed, a greater
viscosity would limit the HER kinetics and the degradation rate of the SEI, thus enabling
better performances.

Chapter 2 - Cycling viability of aqueous superconcentrated electrolytes in LIB 69
Figure 2. 8 Comparison of WiSE and WiBS performances with cycling. Charge and discharge capacity as function of cycle number for Mo6S8/LFP full cells cycled at 0.15C at 55 °C.
Altogether, studies varying concentration, C-rate and temperature show that 20 m
LiTFSI-based LIB still suffer from damaging parasitic reactions, which will be discussed in
the following section dedicated to the water reduction reaction.
Origin of the performances decay: a gas monitoring study
Having demonstrated the effect of cycling conditions on parasitic reactions, we then
performed operando gas monitoring using a combination of online electrochemical
mass spectrometry (OEMS) and pressure cells (i) to highlight that water reduction takes
place during cycling and (ii) to qualitatively and (iii) quantitatively interrogate the impact
of gas evolution on the battery performances.

70 Chapter 2 - Cycling viability of aqueous superconcentrated electrolytes in LIB
Figure 2. 9a shows the potential and pressure changes as a function of time during
cycling for 20 m LiTFSI electrolyte. The cell pressure is found to increase when the
potential reaches the 2nd lithium insertion plateau of Mo6S8 at 2.3 V vs Li+/Li (≈ 1.4 V in
a complete Mo6S8/LFP cell, see Figure 2. 9b for the definition of the plateau). Strikingly,
the pressure never stops increasing in this configuration during cycling, demonstrating
that parasitic reactions keep occurring, consistent with the low Coulombic efficiency
observed in Figure 2. 4b. Moreover, from OEMS measurements (Figure 2. 9b), we could
deduce the formation of gaseous hydrogen as soon as Mo6S8 reaches its second lithium
insertion plateau. Therefore, water reduction producing hydrogen is responsible for the
pressure increase, and any SEI formed on the electrode at these potentials is not
protective enough to prevent the continuous consumption of WiSE during cycling.
Besides, it is important to notice that hydrogen evolution competes with lithium
insertion, but the former does not prevent the latter. Hence, two rates for the
electrochemical hydrogen evolution were observed in Figure 2. 9b. The first rate starts
concomitantly with the 2nd insertion of lithium around 1.38 V. However, this first rate is
slow compared to the one kicking in once the electrode is fully lithiated, when the
potential goes above 1.4 V and where all electrons are consumed toward the HER.
Moreover, as seen in Table 2. 1, the discharge capacity recorded with a pressure cell
cycled at 0.10C remains stable at ≈ 107.5 mA.h/g during the four first cycles, unlike the
charge capacity which is always greater and varies from 126 to 117 mA.h/g. This result
indicates that lithium insertion into Mo6S8 is not affected by the HER during charge, as
the cell provides the same discharge capacity over the first cycles. However, the
continuous consumption of water via the HER may eventually lead to the crystallization
of the salt and ultimately the drying out of the cell, that will be prejudicial for practical
application153.

Chapter 2 - Cycling viability of aqueous superconcentrated electrolytes in LIB 71
Figure 2. 9 Gas monitoring for a Mo6S8/LFP full cell measured in 20 m LiTFSI. (a) Potential (black line) and pressure (red line) as function of time at 0.10C monitored in a pressure cell. (b) Potential (black line) and hydrogen evolution (red line) as function of time at 0.15C monitored using an online electrochemical mass spectrometry (OEMS) cell. Experiments performed at 25 °C.
Table 2. 1 Discharge and charge capacities and Coulombic efficiency for a Mo6S8/LFP pressure cell cycled at 0.10C and 25 °C in 20 m LiTFSI.
Figure 2. 10 shows the hydrogen evolution recorded during cycling at 0.15C and 55°C
by OEMS. First, these results indicate that, as already observed at 25 °C, hydrogen
production starts on the 2nd Li insertion plateau at 1.37 V at 55 °C. Then, the hydrogen
production is greater as the temperature increase, due to the enhancement of both the
HER kinetics and SEI degradation rate. Indeed, an approximate linear fit of the first slope
-corresponding to hydrogen production during 2nd insertion plateau- is four times
greater at 55 °C than at 25 °C (≈ 3.4 ∙ 10-11 uma/h at 55 °C compared to ≈ 0.81 ∙ 10-11
uma/h at 25 °C). Eventually, as shown in Figure 2. 5, increasing the temperature to 55
°C may lead to the apparition of a 3rd plateau around 1.46 V that can be attributed to
pure HER.
Cycle number Discharge capacity
[mA.h/g] Charge capacity [mA.h/g] CE [%]
1 107.66 126.25 85.2
2 107.62 119.88 89.8
3 107.47 118.53 90.7
4 107.44 117.84 91.2

72 Chapter 2 - Cycling viability of aqueous superconcentrated electrolytes in LIB
Figure 2. 10 Online electrochemical mass spectrometry (OEMS) performed in 20 m LiTFSI for a Mo6S8/LFP full cell at 55 °C. Potential (black line) and hydrogen evolution (red line) as function of time at 0.15C.
The potential and the pressure changes plotted as function of time during cycling in
20 m LiTFSI : 8 m LiBETI (see Figure 2. 11a) show that the cell pressure continuously
increases during cycling, as the result of the evolution of H2 spotted by OEMS
measurement (see Figure 2. 11b). Hence, alike for WiSE electrolyte, continuous water
consumption occurs in parallel with lithium insertion for WiBS electrolyte.
Figure 2. 11 Gas monitoring for a Mo6S8/LFP cell measured in 20 m LiTFSI: 8 m LiBETI WiBS. (a) Potential (black line) and pressure (red line) as function of time at 0.10C monitored using a pressure cell. (b) Potential (black line) and hydrogen (red line)

Chapter 2 - Cycling viability of aqueous superconcentrated electrolytes in LIB 73
evolution as function of time at 0.10C monitored using an online electrochemical mass spectrometry OEMS cell.
When comparing the relative pressure increase for two pressure cells during cycling
in 20 m LiTFSI and 20 m LiTFSI : 8 m LiBETI (see Figure 2. 12), one can observe that alike
for cycling performances, WiBS-based battery gives better results, i.e., less gas
production. However, the use of WiBS does not prevent water reduction to occur.
Figure 2. 12 Comparison of gas evolution and cycling performances at high temperature in Mo6S8/LFP cells using either WiSE or WiBS. (a) Potential (black line) and relative pressure increase (purple line) as function of time at 0.10C monitored using a pressure cell in 20 m LiTFSI electrolyte. (b) Potential (black line) and relative pressure increase (red line) as function of time at 0.10C monitored using a pressure cell in 20 m LiTFSI : 8 m LiBETI electrolyte.
To evaluate further the importance of hydrogen gas release in the total parasitic
reactions, we plotted its amount as a function of irreversible capacity per cycle for
several C-rates (see Figure 2. 13) and note a nearly linear trend with, at 0.1C, an
irreversible capacity of 12 mA.h/g that corresponds mainly to a gas release of 1.4 µmol
in addition to the contribution of other side reactions.

74 Chapter 2 - Cycling viability of aqueous superconcentrated electrolytes in LIB
Figure 2. 13 Amount of gas released per cycle as function of irreversible capacity (dash line is a guide to the eyes). Experiments performed at room temperature using Mo6S8/LFP full cells in 20 m LiTFSI WiSE.
Such an hydrogen evolution originates from the decomposition of H2O that could
proceed either via a direct or indirect process according to Equation 2. 1 and Equation
2. 2, respectively.
Equation 2. 1: Direct HER
2 ∙ 𝐻2𝑂 + 2 ∙ 𝑒− → 2 ∙ 𝐻𝑂− + 𝐻2
Equation 2. 2: Indirect HER
𝐿𝑖4𝑀𝑜6𝑆8 + 𝑥 ∙ 𝐻2𝑂 → 𝐿𝑖4−𝑥𝑀𝑜6𝑆8 + 𝑥 ∙ 𝐿𝑖+ + 𝑥 ∙ 𝐻𝑂− + 𝑥
2∙ 𝐻2
On the basis of the direct mechanism (Equation 2. 1), we can from simple calculations
(based on the ideal gas law) nearly account for the amount of H2 released either during
pressure cells or OEMS experiments (see Table 2. 2 and Table 2. 3 for listed results and
Figure M.M. 11, Figure M.M. 12 and Figure M.M. 13, in Chapter Materials and Methods
for calculation details). The results implies that Equation 2. 1 is by far majority in the
total irreversible capacity (70 % of the irreversible capacity per cycle) regardless the use

Chapter 2 - Cycling viability of aqueous superconcentrated electrolytes in LIB 75
of WiSE or WiBS and the C-rate, suggesting that the nature of parasitic reactions taking
place in WiBS electrolyte is identical to the one in WiSE. Therefore, such a system will
certainly face similar issues to WiSE electrolyte, with nevertheless a decreased amount
of hydrogen evolution (as shown in Figure 2. 12).
Table 2. 2 Coulombic efficiency and gas quantification by operando pressure cells (average value on the first five cycles) as function of C-rate for a Mo6S8/LFP full cell cycled in WiSE or WiBS electrolyte.
Electrolyte C-rate 1st Coulombic efficiency [%] 𝑄𝐻𝐸𝑅
𝑄𝑖𝑟𝑟 [%]
WiSE 0.10C 89.2 67
WiSE 0.15C 92.7 78
WiSE 0.25C 95.8 79
WiSE 1C 98 67
WiBS 0.10C 90.2 71
Table 2. 3 Coulombic efficiency and gas quantification by OEMS (1st cycle) for a Mo6S8/LFP cell cycled in WiSE or WiBS electrolyte.
Electrolyte C-rate Coulombic
efficiency [%]
𝑄𝐻𝐸𝑅
𝑄𝑖𝑟𝑟 [%]
WiSE 0.15C 73.2 79.4
WiBS 0.10C 79.9 86.9
As a conclusion, the study of the impact of concentration, cycling rate and
temperature on the cell performances combined with operando gas monitoring
highlight that water reduction is not prevented during cycling in aqueous
superconcentrated electrolytes. To further explore the practical viability of WiSE and
WiBS, the following section will focus on self-discharge protocol assessing the cell
performances during resting period.

76 Chapter 2 - Cycling viability of aqueous superconcentrated electrolytes in LIB
Self-discharge protocol to assess aqueous superconcentrated electrolytes viability during resting period
The impact of self-discharge on cell performances was estimated using coin cells. Two
cycling protocols were used to assess the cell open circuit voltage (OCV) decay during
self-discharge and thus the SEI stability. The first one, depicted in Figure 2. 14a,
corresponds to a single full charge followed by an OCV period until the cell voltage gets
to 1.31 V (2.34 V vs Li+/Li) where the 2nd plateau is entirely over, i.e. the cell state-of-
charge reaches 25 %. Indeed, as mentioned in the introduction of the chapter, the 2nd
insertion plateau -corresponding to a cell voltage of 1.32 V in discharge- accounts for
three Li+ cations over the four that Mo6S8 can insert/de-insert. Moreover, to be able to
extend the SEI formation time during the first few charges, a second protocol employing
a pre-cycling step consisting of five consecutive charge/discharge cycles followed by one
last charge was used, as displayed in Figure 2. 14b. Alike for the single-charge protocol,
the cell was then discharge at 25 % SOC and several C-rates, from 0.15C to 4.5C, were
tested to vary the SEI formation time.
Figure 2. 14 Illustration of the self-discharge protocols performed in this study. (a) Open circuit voltage (OCV) decay measured upon rest for a cell fully charged at 0.5C. (b) OCV decay measured for a fully charged cell after five pre-cycles at 0.5C at room temperature.

Chapter 2 - Cycling viability of aqueous superconcentrated electrolytes in LIB 77
In Figure 2. 15 is compared the time needed to reach 25 % state-of-charge (SOC)
during self-discharge with the time spent to form the SEI during charge. As discussed in
Chapter 1, the SEI formation either through the direct reduction of TFSI- anions or their
chemical reaction with hydroxide anions produced by HER occurs at cell voltage above
1.3 V (i.e. 2.34 V vs Li+/Li at the negative electrode). Thus, the stability of the SEI must
be dependent on the cycling rate and/or the number of consecutive charges, both
defining its thickness and density. Indeed, one can notice in Figure 2. 15 that the longer
the time spent to form the SEI, the slowest the self-discharge. Moreover, when more
than 20 h are used to form the SEI, the time needed to discharge the cell to 25 % SOC
remains roughly stable (≈ 900 h needed) and no further improvement in the SEI stability
is observed. However, we must acknowledge that reproducibility tests were not
performed. Furthermore, the number of parameters tested is far from being exhaustive.
Therefore, an in-depth study would be needed to draw a solid trend regarding the SEI
stability and identify and optimize the key parameters (absolute time spent on charge
or repeated cycles, temperature etc.) controlling the SEI formation step in aqueous
superconcentrated electrolytes.
Figure 2. 15 Assessment of the SEI stability. Time needed to reach 25 % state-of-charge by resting period as function of the time spent to form SEI during charge at room temperature. Mo6S8/LFP full cells using 20 m LiTFSI were used.

78 Chapter 2 - Cycling viability of aqueous superconcentrated electrolytes in LIB
3.2.1 Long cycling impact on cell performances at room temperature
To assess the battery performances when the cell faces self-discharge period, long
cycling with self-discharge protocol was performed. 0.5C C-rate was chosen as a
compromise between fast experiments to quickly assess the cell performances and
sufficiently slow C-rate to highlight parasitic reactions.
In Figure 2. 16a is shown the protocol, called 20 h OCV protocol, using a 20 h OCV
step at the end of each charge after one cycle of charge/discharge/charge. The second
protocol, called 10 cycles -10 h OCV protocol, (see Figure 2. 16b) consists of a pre-cycling
step of 10 cycles to form the SEI. After that, the cell is let to rest for 10 h every 10 cycles.
Cycling with or without self-discharge step are compared in terms of discharge capacity,
normalized discharge capacity and Coulombic efficiency.
Figure 2. 16 Illustration of the self-discharge protocols performed in this study. (a) 20 h OCV protocol using a 20 h OCV period after each charge. (b) 10 cycles-10 h OCV protocol using a 10 h OCV period after 10 cycles of charge/discharge. All Mo6S8/LFP cells were cycled at 0.5C at room temperature in 20 m LiTFSI.
Clear conclusions can be drawn comparing results obtained with a continuous cycling
protocol, the 20 h OCV protocol and the 10 cycles-10 h OCV protocol. Figure 2. 17 shows
the mean values and the standard deviation (over 3 cells) of discharge capacity,
normalized discharge capacity by the first discharge capacity and the Coulombic
efficiency for each protocol.

Chapter 2 - Cycling viability of aqueous superconcentrated electrolytes in LIB 79
Figure 2. 17 Impact of the self-discharge protocol on the cell performances. Continuous cycling (red), 20 h OCV protocol (light purple), 10 cycles-10 h OCV (dark purple). (a) Mean discharge capacity obtained at 0.5C at room temperature as function of cycle number. (b) Mean normalized discharge capacity by the first discharge capacity obtained as function of cycle number. (c) Mean Coulombic efficiency as function of cycle number. All Mo6S8/LFP cells were cycled at 0.5C at room temperature in 20 m LiTFSI. Three cells were used for each protocol.

80 Chapter 2 - Cycling viability of aqueous superconcentrated electrolytes in LIB
First looking at the discharge capacities (see Figure 2. 17a), a drop of capacity of about
4 mA.h/g is observed for both self-discharge protocols after resting period. Thus, the
use of a resting period leads to a drop of discharge capacity of 4 % (see Figure 2. 17b)
compared to a continuous cycling, regardless the resting protocol. Moreover, for the
20h OCV protocol, after resting both the Coulombic efficiency and the discharge capacity
drop from the first cycle and stabilize at around 96 % and 100 mA.h/g, respectively (see
Figure 2. 17a and c). Hence, while the parasitic reactions occurring during the first charge
are similar (the Coulombic efficiencies being around 95 % during the first cycle for both),
when performing the 20 h OCV protocol, the cell degradation is enhanced as a result of
the extended period spent at OCV. These observations are further confirmed with the
10 cycles-10 h OCV protocol where each resting period is followed by a decrease of
capacity in discharge, normalized capacity of discharge and Coulombic efficiency close
from the values obtained with the 20 h OCV protocol. Altogether, these data suggest a
partial degradation of the SEI or a partially porous SEI. Thus, the SEI cannot fully prevent
the HER, therefore explaining that 98 % Coulombic efficiency cannot be passed with this
system.
Besides, the coupling of self-discharge protocol (as described in Figure 2. 16a) with
pressure cell experiments enable to show that water reduction also happen during
resting period.
Figure 2. 18 Pressure cell assessing gas evolution during 20 h OCV protocol illustrating self-discharge. (a) Potential (black line) and pressure (red line) as function of time for a Mo6S8/LFP cell cycled at 0.5C and 25 °C. (b) Zoom of the pressure evolution (red line) as function of time during resting period.
As shown in Figure 2. 18, when a cell is stored at 100 % SOC, pressure increase takes
place during resting. As described in Chapter Materials and Methods, the application of
the ideal gas law enables to determine a water consumption of 0.13 µmolwater/hself-
discharge (mean value for two pressure cells, cycled at 0.5C, 25 °C with a similar mass of

Chapter 2 - Cycling viability of aqueous superconcentrated electrolytes in LIB 81
active material). Assuming a two electrons reaction for water reduction, one can
calculate the capacity related to such water consumption and compare it to the
discharge capacity loss due to 20h OCV period (as described in Chapter Materials and
Methods). Thus, the proportion of water reduction related to self-discharge is found to
be between 75 % and 100 % of the discharge capacity loss for two pressure cells cycled
in the same conditions.
Nonetheless, these observations contrast with a report published in 2016 by Suo et
al.213 in which self-discharge was assessed using the 10 cycles-10 h OCV protocol at 0.5C.
There, a steady increase of the Coulombic efficiency following each of the 10 hours
resting period was observed, as reproduced in Table 2. 4. First, when reproducing this
protocol, Coulombic efficiency obtained in this work was found to stabilize after 3-4
cycles at values of 98 %, while 30 cycles were required to reach the same Coulombic
efficiency as reported by Suo et al.213. Bearing in mind that cycling protocols are
identical, the SEI stability is expected to be similar. Such differences thus most likely
arise from the morphology of the electrode materials and/or the cell assembly (ratio
mass of active material vs volume of electrolyte, etc.). Second, we found a constant loss
of capacity of about 4 mA.h/g upon rest at room temperature while this capacity loss,
initially of 6 mA.h/g after the first resting period, decreases on the subsequent resting
periods in Suo’s report. In conclusion, our results evidence a continuous loss of capacity
upon subsequent resting highlighted by the discharge capacity that smoothly decays
upon cycling.
Table 2. 4 Comparison of the Coulombic efficiencies and discharge capacities obtained after each 10h resting period at OCV in Ref213 with those experimentally obtained in this work.
Cycle number (following the
10h OCV period)
CE as reported by Suo213 [%]
CE (obtained in this work) [%]
Discharge Capacity (obtained in this work) [mA.h/g]
0 82 94.3 103 ± 2
11th 80.6 95.7 98.9 ± 1.5
21th 84.7 95.8 98.5 ± 1.5
31th 87.6 95.9 97.9 ± 1.6
41th 89.1 95.9 97.2 ± 1.7
Importantly, one can notice that the self-discharge is reversible in terms of lithium
balance. Indeed, both the Coulombic efficiency and the discharge capacity are recovered
upon cycling after a resting time. Indeed, by comparing the discharge capacity obtained

82 Chapter 2 - Cycling viability of aqueous superconcentrated electrolytes in LIB
before and after the 10h OCV period, one can find that discharge capacity recovers from
99.7 % to 100 % even after 13 repetition of the 10 cycles-10 h OCV protocol.
Figure 2. 19 Reversibility of Lithium loss during self-discharge. (a) Illustration of protocol reaching 100 % self-discharge for a Mo6S8/LFP cell fully charged at 0.5C followed by continuous cycling at 0.5C. (b) Charge and discharge capacities as function of cycle number (mean value over three cells for continuous cycling protocol), (c) Coulombic efficiency as function of cycle number capacity obtained for three cells continuously cycled and one cell which endured 100 % self-discharge after the first charge. All Mo6S8/LFP cells were cycled at 0.5C at room temperature in 20 m LiTFSI.

Chapter 2 - Cycling viability of aqueous superconcentrated electrolytes in LIB 83
To confirm that the self-discharge is mostly reversible in terms of Li balance, a unique
charge was performed at 0.5C followed by a complete self-discharge. Once the cell
reaches 0 % SOC, continuous cycling was done at 0.5C. First of all, one can observe in
Figure 2. 19a that the self-discharge process follows the electrochemical signature of
Mo6S8. However, the first plateau (at 0.97 V i.e. 2.7 V vs Li+/Li) is longer than the second
one (at 1.33 V i.e. 2.3 V vs Li+/Li), ≈1400 h and 900 h, respectively. This is in contrast with
the fact that the first plateau accounts for ¼ and the second plateau for ¾ of the Li
insertion/de-insertion. Indeed, during self-discharge, the removal of Li from the
electrode material depends on the kinetics of the reaction (Equation 2. 2), thus the
length of the plateaus may be modified if the water reduction kinetics is different for
each plateau, which will be discussed in greater details in Chapter 3. However, one can
already note that self-discharge is relatively slow since more than three months are
needed to fully self-discharge the cell. Regarding the charge and discharge capacities,
Figure 2. 19b and c compare the performances for 3 cells cycled continuously at 0.5C
with that of a cell that first underwent a 100 % self-discharge after the first charge. Doing
so, one can first observe that the cell which endured a 100 % self-discharge exhibit lower
charge and discharge capacity, the difference being however limited. Moreover, the
Coulombic efficiency is found to stabilize to similar values (between 0.98 and 0.99) after
10 cycles for both protocols (Figure 2. 19c). This confirms that the Li loss underwent
during self-discharge is reversible.
3.2.2 Temperature effect on self-discharge
Acknowledging that temperature will enhance the SEI instability, 55 °C cycling tests
were performed with the 10 cycles-10 h OCV protocol where SEI is expected to be stable.
In Figure 2. 20 is plotted the discharge capacity and Coulombic efficiency as function of
cycles for experiments carried out at room temperature and 55 °C. First, one can observe
that applying 10 h resting period leads to a similar behavior regardless of the
temperature. Indeed, both discharge capacity and Coulombic efficiency fall after the
OCV period. However, as shown in at 0.5C.
Table 2. 5, the drop in capacity is enhanced at 55 °C. This result is consistent with a
faster SEI degradation and an enhanced HER kinetics at 55 °C, both leading to an
increased drop in cell performances.

84 Chapter 2 - Cycling viability of aqueous superconcentrated electrolytes in LIB
Figure 2. 20 Impact of temperature on self-discharge performances using a 10 cycles-10 h OCV protocol. Discharge capacity and Coulombic efficiency as function of cycle number for Mo6S8/LFP full cells cycled at room temperature (yellow) and 55 °C (red) at 0.5C.
Table 2. 5 Capacity loss after 20h OCV resting period for Mo6S8/LFP cells. Comparison at 25 °C and 55 °C.
Having investigating in depth the 20 m LiTFSI WiSE system, our attention then turned
to the stability of the SEI formed in WiBS 20 m LiTFSI : 8 m LiBETI. For that, the same
methodology as previously used for WiSE was employed and similar behavior was
observed for the 20 h OCV protocol. Hence, the loss in discharge capacity observed after
a 20 hours OCV period applied after a first cycle performed at 1C is found identical to
the discharge capacity loss measured in WiSE for the same C-rate, i.e. ≈ 9 mA.h/g.
Temperature RT 55°C
Capacity loss [mA.h/g] 4 16

Chapter 2 - Cycling viability of aqueous superconcentrated electrolytes in LIB 85
Figure 2. 21 Impact of the 20 h OCV protocol on cell performances using WiBS electrolyte. Charge and discharge capacity as function of cycle number for continuous cycling (red) and 20 h OCV protocol (light purple) for Mo6S8/LFP full cells cycled at 1C at room temperature.
As a conclusion, the use of self-discharge protocols enabled us to highlight the
instability and/or the lack of protective power of the SEI formed in aqueous
superconcentrated electrolytes. Therefore, while optimizing the formatting conditions
can help delaying the degradation of the SEI, as intensively experimented in non-
aqueous Li-ion batteries, this certainly will not prevent the drying out of the cell over
prolonged time, especially at temperature greater than room temperature as it will be
discussed in Chapter 3.
Cycling viability on the positive side: a gas monitoring study
Besides the SEI forming at the negative electrode, another important aspect in
selecting electrolytes regards their stability at the positive electrode under highly
oxidizing potentials. Having established that the cycling performances for WiSE-based

86 Chapter 2 - Cycling viability of aqueous superconcentrated electrolytes in LIB
aqueous batteries will certainly be limited by the absence of passivating SEI at the
negative electrode, we focused our attention on gassing experiments rather than on
cycling performances for the positive electrode.
Figure 2. 22a shows the evolution of pressure and potential as a function of time for
a LTP/NMC622 cell using WiSE electrolyte at 25 °C. There, even when pushing the
potential cut-off up to 2 V (4.78 V vs Li+/Li for NMC622), any pressure increase can hardly
be detected, with only a pressure increase of 0.6 mbar (0.22 µmol of gas) being
observed, this amount being within the detection limit of this technique. This absence
of gassing is consistent with the previously reported formation of a TFSI-rich double
layer, preventing water to access the interface, as described in Chapter 1. Furthermore,
this observation is also consistent with the OER kinetics being very sluggish when
compared to the HER, as widely discussed in the electrocatalysis field211. Hence, at 25
°C, WiSE electrolyte seems to be stable and not to face any drastic degradation, in
agreement with the electrochemical stability of superconcentrated aqueous
electrolytes under anodic polarization reported in previous studies58,214.

Chapter 2 - Cycling viability of aqueous superconcentrated electrolytes in LIB 87
Figure 2. 22 Potential (black line) and pressure (orange line) measured as a function of time for NMC622/LTP full cells cycled in (a) Water-in-salt 20 m LiTFSI electrolyte at 25 °C, (b) at 55 °C (*note that the peak observed below 80 hours for the pressure is due to an opening of the oven) and (c) Water-in-bisalt 20 m LiTFSI : 8 m LiBETI at 55 °C.
Following these measurements at 25 °C, the anodic stability of WiSE was assessed at
higher temperature by cycling pressure cells at 55 °C. The evolution of pressure and
potential as a function of time are reported in Figure 2. 22b. Compared to the results
88 Chapter 2 - Cycling viability of aqueous superconcentrated electrolytes in LIB
obtained at room temperature, a significant gas evolution could be spotted during
delithiation/oxidation of NMC622 with two slopes being observed. The first one that
leads to a pressure increase of 4.3 mbar (1.59 µmol) occurs between 1.1 V and 1.4 V,
and can be explained by the competition between the electrochemical Li+ de-
intercalation and the slow parasitic reactions, either direct (OER) or indirect (self-
discharge)215. The second one starting above 1.4 V (4.2 V vs Li+/Li) leads to a greater
production of gases of ≈ 7 mbar (2.59 µmol) and can be mainly attributed to parasitic
reactions, which can also be responsible for the appearance of a plateau at high
potential (≈ 2 V) which is solely present during the first charge. Indeed, NMC is known
to face greater degradation at high temperatures and high potential cut-off216–218.
However, the origin of the gas production certainly arises from the corrosion of the
carbon additive at high potential in aqueous media, as spotted by OEMS measurements
during which CO2 is detected (see Figure 2. 23)219,220. Nonetheless, the detection of more
than one gas, during these measurements, prevents us from performing quantification
to determine the amount of mole produced by each gases. For sake of completion, the
stability of WiBS-based electrolyte was also tested using pressure cells at 55 °C (see
Figure 2. 22c), and similar behavior is observed as for WiSE. Hence, the pressure increase
recorded during the de-insertion plateau between 1.1 V and 1.4 V is ≈ 3 mbar (1.11
µmol) in WiBS, compared to 4 mbar in WiSE. This first gas release is followed by an
additional pressure increase of 8 mbar (2.96 µmol) at greater potential, compared to 7
mbar previously measured for WiSE. Differences in pressure variations were considered
to be within the same ranges. To conclude, at elevated temperature, the stability of the
NMC622 self-standing electrode/superconcentrated aqueous electrolyte assembly is
compromised under anodic polarization when compared to room temperature.

Chapter 2 - Cycling viability of aqueous superconcentrated electrolytes in LIB 89
Figure 2. 23 Online electrochemical mass spectrometry performed on NMC622/LTP full cell using WiSE electrolyte. Potential (black line) and gas evolution (yellow line) as function of time are plotted for carbon dioxide (CO2: m/z=44). Experiment performed at 55 °C, at C/40. Note the gap is attributed to a partial stop of the experiment.
Conclusion of the chapter
In this chapter, an in-depth study of the cathodic and anodic stability of
superconcentrated aqueous electrolytes as function of the operating conditions was
carried out. First, the assessment of the capacity retention and Coulombic efficiency
with increased LiTFSI concentration shows the benefic influence of superconcentration
on cycling performances. However, such improvement was quickly nuanced when
performing tests at different C-rate. Indeed, when cycled at low C-rate (below 1C), the
damaging effect of parasitic reactions such as hydrogen evolution reaction are brought
to light. Their detrimental impact is exacerbated at higher temperature. To determine
the origin of the performances decay, we then performed operando gas monitoring.
Combining pressure cell tests with online electrochemical mass spectrometry, hydrogen
production was detected to start concomitantly with Li insertion at a cell voltage of ≈
1.38 V (2.3 V vs Li+/Li at the negative electrode). This gas evolution never stops during
cycling, testifying of the poor SEI protective power against HER. Eventually, the practical
viability of WiSE electrolyte in LIB was assessed by self-discharge protocols. Several self-

90 Chapter 2 - Cycling viability of aqueous superconcentrated electrolytes in LIB
discharge protocols were thus applied to both assess the SEI stability as a function of its
formation time and the impact of self-discharge during long cycling. Altogether, these
results show that even though self-discharge is partially reversible in terms of lithium
balance, cell life is limited when self-discharge protocols are applied. Furthermore, to
assess the behavior of aqueous superconcentrated electrolyte in LIB, a non-exhaustive
but representative study was performed using 20 m LiTFSI : 8 m LiBETI WiBS electrolyte.
Even though the ESW is larger in WiBS electrolyte, HER was found to occur during
cycling, although less intense. Moreover, discharge capacity loss was observed after
resting period, showing the weak passivation of the SEI. Therefore, WiBS-based LIB faces
critical limitations identical to the ones encountered in WiSE. Finally, studying parasitic
reactions at the positive electrode side show limited evolution of oxygen and only at
elevated temperature damageable parasitic reactions were observed.
Altogether, the results presented in this chapter on the practical viability of aqueous
superconcentrated electrolyte on the negative electrode call for the design of a stable
SEI that will effectively passivate the negative electrode and prevent water reduction.
Indeed, the major drawback of aqueous superconcentrated electrolytes lays in the
continuous water consumption during both cycling and self-discharge, eventually
leading to the drying out of the cell. Therefore, Chapter 3 will first discuss the instability
of the SEI in WiSE. Then the irreversible consumption of water that may cause the
crystallization of the electrolyte, thus the drying out, will be presented. Finally, the
kinetics of water reduction during both self-discharge and cycling will be determined.


CHAPTER 3 – INSTABILITY OF NATIVE SEI LEADS TO
THE DRYING OUT OF AQUEOUS
SUPERCONCENTRATED LI-ION BATTERY

94 Chapter 3 – Instability of native SEI leads to the drying out of the LIB
Introduction
As evidenced in Chapter 2, practical viability of Water-in-salt electrolyte (WiSE) is
limited by continuous parasitic reactions occurring at the negative electrode during
cycling and resting period. Online electrochemical mass spectrometry measurements
and pressure cells tests identified water reduction as the major parasitic reaction
limiting the cell viability. SEI instability and/or specific morphology may explain that
water reaches the electrode interface. Therefore, Chapter 3 will focus on the assessment
of the native SEI stability by electrochemical characterizations, cyclic voltammetry (CV)
and electrochemical impedance spectroscopy (EIS), before to focus on the effect of
water consumption on the cell life by using differential scanning calorimetry (DSC).
Besides, kinetics of water consumption through direct HER (2 ∙ 𝐻2𝑂 + 2 ∙ 𝑒− → 2 ∙
𝐻𝑂− + 𝐻2 ) or indirect self-discharge ( 𝐿𝑖4𝑀𝑜6𝑆8 + 𝑥 ∙ 𝐻2𝑂 → 𝐿𝑖4−𝑥𝑀𝑜6𝑆8 + 𝑥 ∙
𝐿𝑖+ + 𝑥 ∙ 𝐻𝑂− + 𝑥
2∙ 𝐻2) mechanisms are assessed by electrochemical measurements
using CV, continuous cycling protocols and self-discharge tests as function of
temperature. Hence, based on the Arrhenius law, the activation energies of both
mechanisms can be extracted. Figure 3. 1 illustrates the outline of the chapter based on
the results discussed in Chapter 2.
Figure 3. 1 Scheme of the outline of Chapter 3 based on the results discussed in Chapter 2.
Eventually, the figure of merits for WiSE-based aqueous Li-ion batteries is provided
and compared with existing aqueous technologies (Lead-acid, Ni-Cd, Ni-MH) and aprotic
Li-ion batteries to assess the viability of this technology.
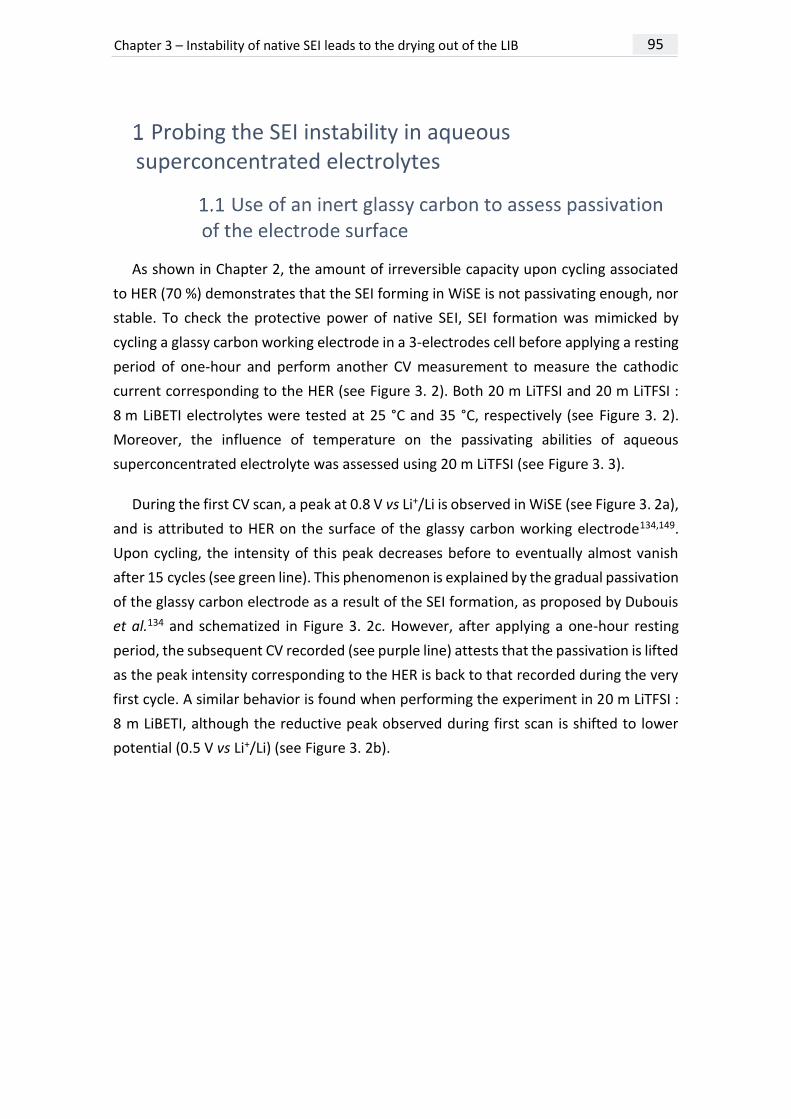
Chapter 3 – Instability of native SEI leads to the drying out of the LIB 95
Probing the SEI instability in aqueous superconcentrated electrolytes
As shown in Chapter 2, the amount of irreversible capacity upon cycling associated
to HER (70 %) demonstrates that the SEI forming in WiSE is not passivating enough, nor
stable. To check the protective power of native SEI, SEI formation was mimicked by
cycling a glassy carbon working electrode in a 3-electrodes cell before applying a resting
period of one-hour and perform another CV measurement to measure the cathodic
current corresponding to the HER (see Figure 3. 2). Both 20 m LiTFSI and 20 m LiTFSI :
8 m LiBETI electrolytes were tested at 25 °C and 35 °C, respectively (see Figure 3. 2).
Moreover, the influence of temperature on the passivating abilities of aqueous
superconcentrated electrolyte was assessed using 20 m LiTFSI (see Figure 3. 3).
During the first CV scan, a peak at 0.8 V vs Li+/Li is observed in WiSE (see Figure 3. 2a),
and is attributed to HER on the surface of the glassy carbon working electrode134,149.
Upon cycling, the intensity of this peak decreases before to eventually almost vanish
after 15 cycles (see green line). This phenomenon is explained by the gradual passivation
of the glassy carbon electrode as a result of the SEI formation, as proposed by Dubouis
et al.134 and schematized in Figure 3. 2c. However, after applying a one-hour resting
period, the subsequent CV recorded (see purple line) attests that the passivation is lifted
as the peak intensity corresponding to the HER is back to that recorded during the very
first cycle. A similar behavior is found when performing the experiment in 20 m LiTFSI :
8 m LiBETI, although the reductive peak observed during first scan is shifted to lower
potential (0.5 V vs Li+/Li) (see Figure 3. 2b).

96 Chapter 3 – Instability of native SEI leads to the drying out of the LIB
Figure 3. 2 Assessment of the SEI stability over time by mimicking its formation on inert material. (a) Cyclic voltammetry performed at 50 mV/s in 20 m LiTFSI in a 3-electrodes cell using glassy carbon as working electrode, Pt wire as counter electrode and silver wire as pseudo-reference. (b) Cyclic voltammetry performed at 35 °C (to avoid crystallization) at 50 mV/s in 20 m LiTFSI : 8 m LiBETI in a 3-electrodes cell using glassy carbon as working electrode, Pt wire as counter electrode and saturated calomel electrode as reference. (a-b) The first (red) and the fifteenth (green) voltammograms are shown, as well as the one recorded after one-hour open circuit voltage (OCV) (purple). (c) Illustration of the SEI formation and its partial degradation after a resting period of 1 h.
Besides, similar experiments were also performed as function of temperature (at
35 °C, 45 °C and 55 °C) in WiSE, as shown in Figure 3. 3, and similar trends were observed
with the passivation of glassy carbon. Thus, the passivating layer is deteriorated during
resting period, further confirming our self-discharge measurements discussed in
Chapter 2. The presence of two peaks in the cyclic voltammetry performed after the
resting period at 35 °C in WiBS (see Figure 3. 2b) and at 55 °C in WiSE (see Figure 3. 3d)
may be attributed to shifts in potential due to the presence of bubbles at the electrode
interface. Moreover, a competition between the precipitation of LiTFSI, as recently
proposed149, and the dissolution of LiF can contribute to this dynamic SEI behavior.
Indeed, bearing in mind that the ratio volume of the electrolyte/active material (several
mL vs 4 mm diameter of glassy carbon) is greater in this experience that in a practical
battery, more than one-hour OCV would certainly be needed to partially dissolve the SEI
and suppress its passivation in a full cell.

Chapter 3 – Instability of native SEI leads to the drying out of the LIB 97
Figure 3. 3 Assessment of the SEI stability as function of temperature over time by mimicking its formation on inert material by cyclic voltammetry performed at 50 mV/s in 20 m LiTFSI in a 3-electrodes cell using glassy carbon as working electrode, Pt wire as counter electrode and silver wire as pseudo-reference. (a) 25 °C, (b) 35 °C, (c) 45 °C, (d) 55 °C.
Hence, prior to study the effect of resting period on the SEI degradation in battery
set-up, the impact of the electrolyte volume on the SEI dissolution was determined by
assessing discharge capacity losses during resting period. To do so, the protocol
illustrated in Figure 3. 4 was applied to check the effect of the initial volume of
electrolyte on the discharge capacity lost during resting period. Normalized discharge
capacity loss as function of electrolyte volume is shown in Figure 3. 5.

98 Chapter 3 – Instability of native SEI leads to the drying out of the LIB
Figure 3. 4 Illustration of the protocol performed to assess the electrolyte volume influence on the SEI stability in a Mo6S8/LFP cell in 20 m LiTFSI. A pre-cycling step of 10 cycles at 1C is applied at room temperature followed by a cycling step at 0.5C with 20 h of open circuit voltage (OCV) after the second charge at room temperature.

Chapter 3 – Instability of native SEI leads to the drying out of the LIB 99
Figure 3. 5 Influence of the electrolyte volume on the SEI stability in a Mo6S8/LFP full cell in 20 m LiTFSI. (a) Coulombic efficiency as function of cycle number. (b) Zoom on the Coulombic efficiency obtained after 20 h open circuit voltage (OCV) as function of the volume of electrolyte. (c) Normalized discharge capacity as function of the cycle number. Normalization by the 1st discharge capacity obtained at 0.5C during cycling step. (d) Zoom on the normalized discharge capacity as function of the volume of electrolyte after 20 h OCV.
While the electrolyte volume is increased from 50 µL up to 600 µL, all cells
components and parameters are kept constant, i.e., the electrode diameter and number
of glass fiber separators. Coin cells were used for electrolyte volume below 200 µL to
ensure good reproducibility of the results as the pressure applied is controlled to 0.8 T.
However, when testing greater electrolyte volumes (above 200 µL), coin cells cannot be
used since the electrolyte overflows in the crimping machine. Thus, Swagelok® design
was used despite lower performances and poorer reproducible results due to the hand-
applied pressure, as highlighted when comparing the results obtained for 500 µL volume
of electrolyte (Figure 3. 5a and c, green crosses).

100 Chapter 3 – Instability of native SEI leads to the drying out of the LIB
First, as shown in Figure 3. 5, Coulombic efficiencies measured throughout the pre-
cycling step show a similar behavior with a steady increase from 0.91 up to 0.98 after 8
cycles, attesting the formation of the SEI regardless of the electrolyte volume. In
contrast, greater disparities are noticed for normalized discharge capacities (see Figure
3. 5c and d). Considering the limited differences observed for the values of capacity
retention obtained for coin cells and the dispersion of values in the case of Swagelok,
one can conclude that these disparities certainly originate from the difference of results
obtained between coin cell and Swagelok formats, rather than from the electrolyte
volume. This assumption is further confirmed by looking at the similar Coulombic
efficiency and normalized discharge capacity estimated after 20 h of OCV regardless of
the electrolyte volume. Moreover, considering a 10 nm thick LiF-based SEI111 forming on
a 1.27 cm diameter electrode, one can estimate the concentration of LiF expected if the
SEI dissolves as function of the electrolyte volume, as shown in Figure 3. 6a (LiF solubility
limit will be discussed in greater details in the next Chapter). Thus, even for a large
volume of electrolyte ≈ 600 µL, the solubility limit is reached and the LiF-based SEI
should not dissolve as a whole.
Figure 3. 6 (a) Estimated LiF concentration for a 10 nm LiF layer as function of the electrolyte volume (from 9.4 µL to 600 µL) considering an electrode surface of 1.27 cm² (details of calculation are given in Chapter Material and Methods). Dash line corresponds to the solubility limit determined using an ion selective electrode to fluoride, as detailed in Chapter 4. (b) Specific energy (red) and maximum number of repeated cycles (blue) (one cycle is defined by one pre-cycling step of 10 cycles performed at 1C followed by a cycling step of charge/discharge and 20 h OCV at 0.5C, as described in Figure 3. 4) before crystallization at 21 m LiTFSI as function of the electrolyte volume (from 9.4 µL to 600 µL). Energy density and specific energy correspond to calculations made with the model developed by Betz et al.221 by changing the electrolyte volume from optimized amount (9.4 µL) up to 600 µL (see Figure A3.1). Details for the calculation are given in the Appendix of this Chapter (see Table A3.6-11).

Chapter 3 – Instability of native SEI leads to the drying out of the LIB 101
The number of repeated cycles (each cycle being composed of 10 pre-cycles at 1C
followed by 20 h OCV at 0.5C) that can be made before reaching 21 m, concentration at
which LiTFSI crystallizes at RT, are estimated as a function of the electrolyte volume. For
this calculation, two hypotheses were made to assess the amount of water consumed
during one cycle, based on the results presented in Chapter 2. First, the HER is
responsible for 70 % of the irreversible capacity during continuous cycling (see Table 2.
2 in Chapter 2). Second, 100 % of the capacity loss during OCV period is due to the HER
(see Figure 2.18 in Chapter 2). Thus, the amount of water available in the cell after each
cycle can be compared to the amount of water expected for a concentration of 21 m.
Obviously, these calculations do not consider the consumption of salt during cycling to
form the SEI. Nonetheless, as shown in Figure 3. 6b, the lower the amount of electrolyte,
the faster the 21 m LiTFSI concentration is reached and thus the faster the cell dies, as
expected. Moreover, to estimate the energy density and the specific energy as function
of the electrolyte volume, the model developed by Betz et al.221 was used. In this
protocol, values are estimated for Li-ion battery based on lab-scale measurements (in
Swagelok or coin cells) by extrapolation of the electrode materials loading and the
electrolyte volume usually employed for 18650 cells. The details for these calculations
are given in the appendix of this Chapter. Hence, increasing the electrolyte volume
obviously lowers the specific energy and the energy density due to the weight and
volume added, as shown in Figure 3. 6b and in Figure A.3.1. One can observe that using
an optimized volume of electrolyte of ≈ 10 µL (based on the electrodes porosity), 55
Wh/kg (161 Wh/L) are estimated for the battery performances. However, the cell would
reach the saturation limit after only one unique protocol of 10 charges/discharges at 1C
followed by 0.5C cycling with 20 h of resting period.
Electrochemical impedance spectroscopy (EIS) was then performed to assess the
formation of the SEI, as proposed by Suo et al.146. Indeed, by fitting the experimental
data with an equivalent circuit taking into account the electrolyte resistance, the
impedances related to the SEI, the double layer and the diffusion contribution, the
authors found an effect of cycling on the SEI formation on Mo6S8 in a 2-electrode full cell
based on Mo6S8/LMO. Unlike Suo et al.146, we used a 3-electrode Swagelok to de-
correlate contributions from both the negative and the positive electrodes. The protocol
illustrated in Figure 3. 7 was employed, using Mo6S8 as counter electrode, LFP as working
electrode and a ring of partially delithiated Li0.5FePO4 deposited on a stainless steel
gauze as reference. The electrochemical signature of the cell is given in Figure 3. 7.
Before analyzing the EIS data, one must acknowledge that faster self-discharge is
measured in this configuration when compared to the coin cell one. Observing that the

102 Chapter 3 – Instability of native SEI leads to the drying out of the LIB
performances obtained during the pre-cycling steps is poor (see Figure 3. 7b), this
behavior certainly originates from a poorly passivating SEI formed in this configuration
which combines more separators and a lower pressure. However, despite these
experimental limitations, this protocol was used to assess the SEI stability. First, we
found that the contribution of the LFP counter electrode to the cell impedance barely
varies throughout the experiment, thus confirming that the influence of high capacity
loading of LFP versus Mo6S8 (4:1) is enough to neglect the impact of the cell state-of-
charge (SOC) on LFP impedance. Moreover, the electrochemical signature and
performances of the 3-electrode cell, despite not being optimized, are reproducible, as
shown in Figure A.3. 2 in the Appendix of Chapter 3.
Figure 3. 7 (a) Illustration of the protocol used to assess SEI stability over self-discharge cycling in a 3-electrodes cell based on Mo6S8 as counter electrode, LFP as working electrode and a ring of electrochemically delithiated Li0.5FePO4 on a stainless steel gauze as reference in 20 m LiTFSI. Cell voltage, i.e. 𝐸𝐿𝐹𝑃 − 𝐸𝑀𝑜6𝑆8, is shown. (b) Cell voltage as
function of capacity (based on Mo6S8 electrode mass).
Figure 3. 8 shows the impedance spectra obtained for Mo6S8 during cycling. First, one
can notice that Mo6S8 impedance spectra are affected by the state-of-charge at low
frequency (see Figure 3. 8b and d), which might be related to changes in diffusion in the
electrode material, among other phenomena. Moreover, the two semi-circles at middle
frequency, defined by the arrows in Figure 3. 8b, could be attributed to SEI and charge
transfer contribution146. Considering either a charged or discharged state, no changes
are visible upon cycling, as shown in Figure 3. 8b and 3. 7c for charged state and in Figure
3. 8d and e for discharged state. Besides, the resting period of 20 h does not seems to
have an influence on the response of the system, as the spectra obtained before and
after the OCV period are similar (yellow and light purple crosses in Figure 3. 8e).
Therefore, using our 3-electrode cell configuration, we conclude that EIS is not an

Chapter 3 – Instability of native SEI leads to the drying out of the LIB 103
appropriate tool to study the SEI formation and its degradation upon cycling, unless
further optimization regarding the cell set up and reference position are made at the
negative electrode. Thus, rather than EIS, we then investigated the SEI stability by
monitoring the impact of water consumption on the electrolyte concentration.
Figure 3. 8 Nyquist plot obtained by electrochemical impedance spectroscopy (EIS) recorded for Mo6S8 upon cycling. (a) Summary of all impedance spectra. (b, c) Impedance spectra obtained in charged state. (d, e) Impedance spectra obtained in discharged state. EIS study was performed with a 20 mV amplitude signal between 1
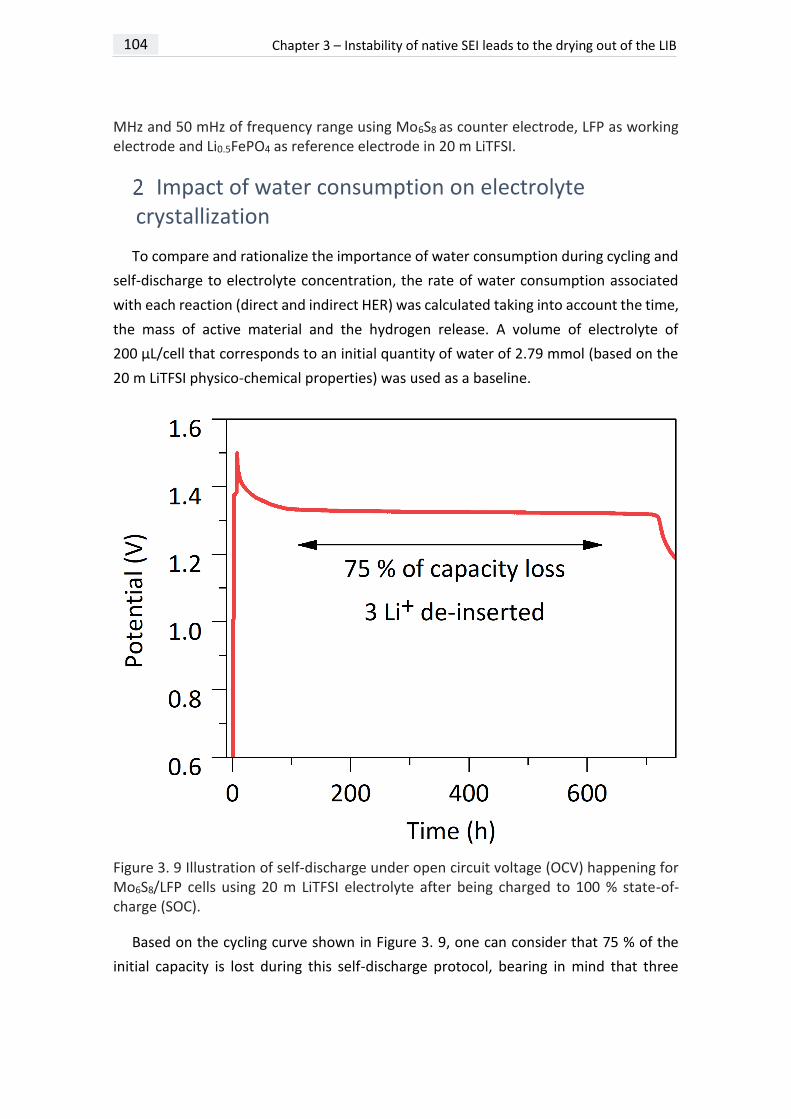
104 Chapter 3 – Instability of native SEI leads to the drying out of the LIB
MHz and 50 mHz of frequency range using Mo6S8 as counter electrode, LFP as working electrode and Li0.5FePO4 as reference electrode in 20 m LiTFSI.
Impact of water consumption on electrolyte crystallization
To compare and rationalize the importance of water consumption during cycling and
self-discharge to electrolyte concentration, the rate of water consumption associated
with each reaction (direct and indirect HER) was calculated taking into account the time,
the mass of active material and the hydrogen release. A volume of electrolyte of
200 µL/cell that corresponds to an initial quantity of water of 2.79 mmol (based on the
20 m LiTFSI physico-chemical properties) was used as a baseline.
Figure 3. 9 Illustration of self-discharge under open circuit voltage (OCV) happening for Mo6S8/LFP cells using 20 m LiTFSI electrolyte after being charged to 100 % state-of-charge (SOC).
Based on the cycling curve shown in Figure 3. 9, one can consider that 75 % of the
initial capacity is lost during this self-discharge protocol, bearing in mind that three

Chapter 3 – Instability of native SEI leads to the drying out of the LIB 105
electrons are exchanged to de-insert three Li+ from Li4Mo6S8 as described by Equation
3. 1. Thus, the self-discharge mechanism can be written as follow.
𝐿𝑖4𝑀𝑜6𝑆8 → 𝐿𝑖𝑀𝑜6𝑆8 + 3 ∙ 𝐿𝑖+ + 3 ∙ 𝑒−
+
2 ∙ 𝐻2𝑂 + 2 ∙ 𝑒− → 2 ∙ 𝐻𝑂− + 1 ∙ 𝐻2
________________________________________________________
Equation 3. 1:
𝐿𝑖4𝑀𝑜6𝑆8 + ∙ 3𝐻2𝑂 → 𝐿𝑖𝑀𝑜6𝑆8 + 3 ∙ 𝐿𝑖+ + 3 ∙ 𝐻𝑂− + 3
2∙ 𝐻2
Moreover, the amount of water consumed (in mole) can be written as function of the
amount of electrode material (see Equation 3. 2 and Equation 3. 3)
Equation 3. 2:
𝑛𝐻2𝑂 𝑐𝑜𝑛𝑠𝑢𝑚𝑒𝑑 𝑏𝑦 𝑠𝑒𝑙𝑓−𝑑𝑖𝑠𝑐ℎ𝑎𝑟𝑔𝑒 = 3 ∙ 𝑛𝐿𝑖4𝑀𝑜6𝑆8
Equation 3. 3:
𝑛𝐻2𝑂 𝑐𝑜𝑛𝑠𝑢𝑚𝑒𝑑 𝑏𝑦 𝑠𝑒𝑙𝑓−𝑑𝑖𝑠𝑐ℎ𝑎𝑟𝑔𝑒 (𝑚𝑜𝑙) = 3 ∙0.75 ∙ 𝑄 (𝐶)𝑐𝑒𝑙𝑙
𝑖𝑛𝑡𝑖𝑎𝑙
𝑧 ∙ 𝐹
with 𝑄𝑐𝑒𝑙𝑙𝑖𝑛𝑡𝑖𝑎𝑙 (𝐶) the initial cell capacity calculated according to the limiting material,
i.e. Mo6S8; z the number of electron transfer to reach 75 % of delithiation, i.e. 3; F the
Faraday constant equal to 96500 C/mol.
Besides, for the direct mechanism, the rate of water consumption can be determined
by calculating the number of moles of water consumed during cycling thanks to pressure
cell experiments. As detailed in Chapter 2, the amount of mole of gas produced during
cycling is determined thanks to the Faraday law. Then, the amount of mole of water
consumed is correlated to the amount of mole of hydrogen through the Equation 3. 4.
Equation 3. 4:
𝑛𝐻2𝑂 𝑐𝑜𝑛𝑠𝑢𝑚𝑒𝑑 𝑏𝑦 𝑐𝑦𝑐𝑙𝑖𝑛𝑔(𝑚𝑜𝑙) = 2 ∙ 𝑛𝑔𝑎𝑠
with ngas (mol), defined by the ideal gas law and 2, the stoichiometric coefficient
between H2 and H2O considering direct HER.
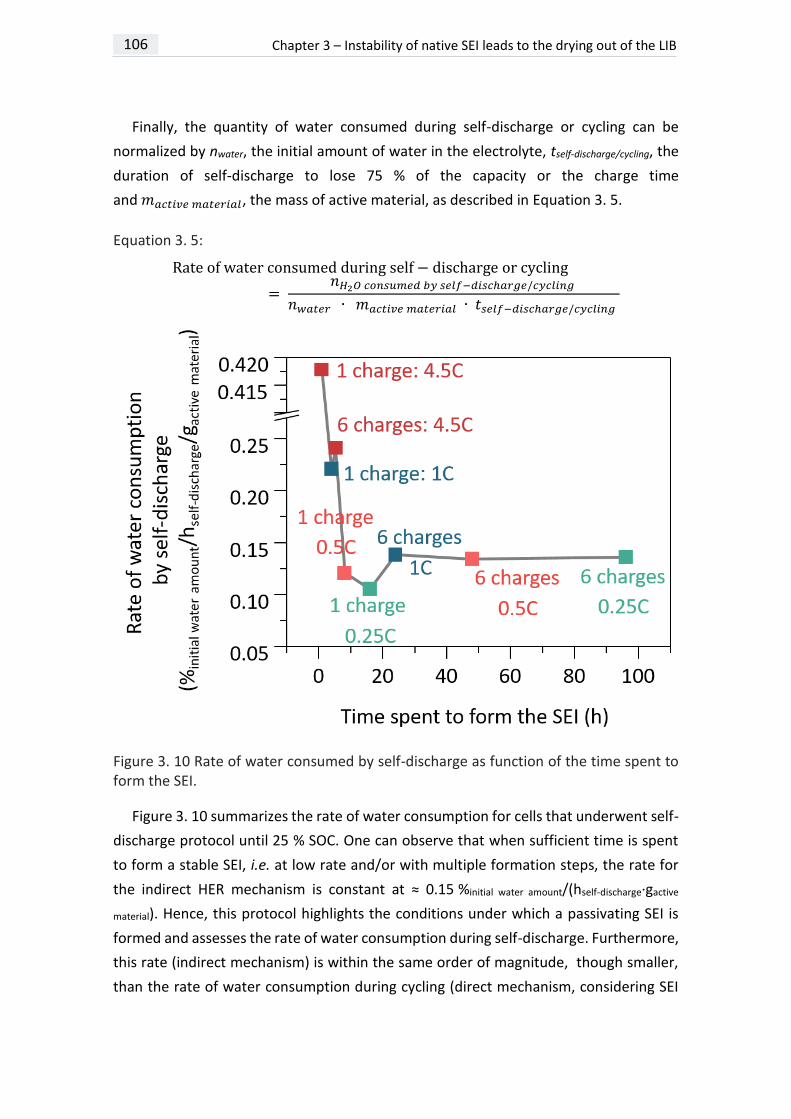
106 Chapter 3 – Instability of native SEI leads to the drying out of the LIB
Finally, the quantity of water consumed during self-discharge or cycling can be
normalized by nwater, the initial amount of water in the electrolyte, tself-discharge/cycling, the
duration of self-discharge to lose 75 % of the capacity or the charge time
and 𝑚𝑎𝑐𝑡𝑖𝑣𝑒 𝑚𝑎𝑡𝑒𝑟𝑖𝑎𝑙, the mass of active material, as described in Equation 3. 5.
Equation 3. 5:
Rate of water consumed during self − discharge or cycling
= 𝑛𝐻2𝑂 𝑐𝑜𝑛𝑠𝑢𝑚𝑒𝑑 𝑏𝑦 𝑠𝑒𝑙𝑓−𝑑𝑖𝑠𝑐ℎ𝑎𝑟𝑔𝑒/𝑐𝑦𝑐𝑙𝑖𝑛𝑔
𝑛𝑤𝑎𝑡𝑒𝑟 ∙ 𝑚𝑎𝑐𝑡𝑖𝑣𝑒 𝑚𝑎𝑡𝑒𝑟𝑖𝑎𝑙 ∙ 𝑡𝑠𝑒𝑙𝑓−𝑑𝑖𝑠𝑐ℎ𝑎𝑟𝑔𝑒/𝑐𝑦𝑐𝑙𝑖𝑛𝑔
Figure 3. 10 Rate of water consumed by self-discharge as function of the time spent to form the SEI.
Figure 3. 10 summarizes the rate of water consumption for cells that underwent self-
discharge protocol until 25 % SOC. One can observe that when sufficient time is spent
to form a stable SEI, i.e. at low rate and/or with multiple formation steps, the rate for
the indirect HER mechanism is constant at ≈ 0.15 %initial water amount/(hself-discharge∙gactive
material). Hence, this protocol highlights the conditions under which a passivating SEI is
formed and assesses the rate of water consumption during self-discharge. Furthermore,
this rate (indirect mechanism) is within the same order of magnitude, though smaller,
than the rate of water consumption during cycling (direct mechanism, considering SEI

Chapter 3 – Instability of native SEI leads to the drying out of the LIB 107
formation time greater than 20 h, see Table 3. 1), suggesting that its irreversible impact
cannot be neglected when assessing the practicability of WiSE. Bearing in mind that a
20 m LiTFSI electrolyte operates close to the limit of solubility of the salt, the combine
direct and indirect water consumption rates can lead to changes in concentration and
eventually to severe drying out of the cell upon cycling and/or storage. Hence, despite
the fact that most of capacity lost during self-discharge is reversible (regarding Li+
balance, see Chapter 2), it will lead to early cell death.
Table 3. 1 Ratio of water consumed during cycling in % initial water amount /(h∙g) assessed by pressure cell measurements.
Moreover, to assess the impact of water consumption, we recorded the evolution of
water content in the electrolyte as function of cycle number and self-discharge period
experienced by a WiSE-based cell. In the literature, NMR, IR or Raman spectroscopy
results were shown to be sensitive to the salt concentration in WiSE. Though, in this
study, the use of differential scanning calorimetry (DSC) was preferred for practical
reasons. Indeed, DSC enables to limit the contamination by moisture before carrying out
the experiments (when no operando spectroscopical cells are available, as it is the case
of us) while showing great sensitivity to changes in concentration, as shown in Figure
A.3. 4.)
First, a calibration curve is determined using reference electrolytes with
concentration of 19.803 m, 20.591 m, 20.910 m, 21.992 m and 22.9983 m. Using the
first crystallization peak of the reference electrolytes (described by the arrow in Figure
A.3. 4b), the following fit 𝑇𝑐𝑟𝑦𝑠𝑡𝑎𝑙𝑙𝑖𝑧𝑎𝑡𝑖𝑜𝑛 𝑝𝑒𝑎𝑘 = 4.68 ∙ 𝐶𝐿𝑖𝑇𝐹𝑆𝐼𝑚𝑜𝑙 𝑘𝑔⁄
− 91.5 (see Figure 3.
11c) is obtained.
Then, DSC experiments were performed on separators collected from aged cells, as
shown in Figure 3. 11c and d. Looking at the exothermic peak corresponding to the
hydrated LiTFSI phase (H2O∙LiTFSI) crystallization, cells can be split into two groups: 1)
those that underwent continuous cycling (yellow and orange curve) at lower
Cycling (results based on pressure cells) 0.1C 0.15C
Mass of active material [mg] 9.63 7.88
Amount of hydrogen produced/cycle [µmol] 1.43 0.978
Duration of cycling (related to SEI formation) [h]
40 26.7
Amount of water consumed during cycling/cycle [µmol]
2.86 1.96
Rate of water consumption [%/h/g] 0.27 0.33

108 Chapter 3 – Instability of native SEI leads to the drying out of the LIB
temperature and 2) the cells that underwent a 20 h OCV step after each charge (pink
and purple line). Based on these results, one can hypothesize that, upon repeated
resting period, the electrolyte salt concentration increases, originating from a non-
negligible amount of water consumed, thus confirming our previous calculation of the
water consumption rate. Eventually, a greater salt concentration is deduced for cells
cycled during 15 cycles suggesting a greater water consumption than in the case of cells
cycled during 100 cycles (see Figure 3. 11c). This observation could originate from partial
water recombination during cycling, however, reproducibility must be verified before
drawing any definitive conclusion. Calibration curves and additional measurements on
cells aged are currently under investigation. To complement these results and accurately
reflect the cell drying off, further measurements can be done by fixing the overall time
of experiment while changing the cycling or self-discharge cycle number.
Finally, one has to acknowledge that assessing water consumption in coin cell devices
still remain far from 18650 or pouch cells in which the design will drastically modify the
electrolyte/electrode ratio and so, the influence of the parasitic reactions.

Chapter 3 – Instability of native SEI leads to the drying out of the LIB 109
Figure 3. 11 Differential scanning calorimetry (DSC) experiments performed at 2 °C/min between 35 °C and -60 °C upon cooling and back to 60 °C on heating. (a) Cells aged for 15 and 100 cycles with continuous cycling protocol or with a 20 h OCV resting period at the end of each charge (b) zoom on the crystallization peak of aged cells. (c) Crystallization peak measured as function of electrolyte concentration obtained from the calibration data (black cross) and linear fit (black line) enabling the calculation of the aged cells concentration (red cross).
Activation energy of direct and indirect HER in WiSE
As shown by self-discharge measurements, the SEI formed upon cycling in WiSE-
based electrolyte does not prevent water to access the interface where it is reduced.
Our results suggest a much higher HER onset potential than the one previously
determined (1.9 V vs Li+/Li)111 by linear scan voltammetry on stainless steel current
collectors. Knowing that the potential for de-intercalation of Li4Mo6S8 is ≈ 2.7 V vs Li+/Li,
the reversible potential for water reduction must be greater than this value to explain
self-discharge observed in this work (see Figure 3. 12a). This conclusion is in line with
the results published by Kühnel et al.153 assessing the ESW as function of the current
density threshold with an onset potential for HER at 2.48 V vs Li+/Li (ithreshold = 2 µA/cm²)

110 Chapter 3 – Instability of native SEI leads to the drying out of the LIB
on stainless steel. Besides, HER potential also depends on the electrode material153. Naik
et al.222 reported a HER onset potential on Mo6S8 to be around -0.2 V vs NHE, i.e. ≈ 2.8 V
vs Li+/Li in diluted media, barely dependent on the pH of the electrolyte.
Furthermore, by normalizing the time needed to fully de-insert Li4Mo6S8 by constant-
current de-insertion or by de-insertion through self-discharge, two de-insertion distinct
rates can be seen (see Figure 3. 12b). Indeed, during self-discharge, three Li+ are de-
inserted in ≈ 1/3 of the overall time during the 2nd plateau while one Li+ is de-inserted in
≈ 2/3 of the time during the first plateau, indicating that the de-intercalation of Li+ is
faster during the second plateau when driven by self-discharge. To explain this
observation, one must first keep in mind that the driving force for de-intercalation is
different between the two plateaus. Hence, the driving force defined by ΔE = EHER – Ede-
intercalation is greater for the second plateau at 2.3 V than the first plateau at 2.7 V vs Li+/Li
(see Figure 3. 12a), which eventually lowers the activation barrier for the indirect HER
associated with the second plateau.
Figure 3. 12 (a) Redox potentials for Mo6S8 and the HER, extracted from the literature111,222. (b) Voltage as function of normalized time for a Mo6S8/LFP cell in 20 m LiTFSI undergoing self-discharge (dotted line) or constant-current continuous cycling (full line). Normalized time is defined by the ratio between evolution of time during discharge and the end of discharge time.
In order to clarify these observations, activation energies for self-discharge
associated with the first and the second intercalation plateau of Mo6S8 in WiSE were
determined using a Mo6S8/LFP cell based on 20 m LiTFSI electrolyte. To perform this
study, (i) the LFP electrode is in large excess compared to the Mo6S8 one, (ii) oxygen is
purged from the electrolyte before assembly and (iii) the contribution of LFP to the self-
discharge is considered negligible, as demonstrated in Chapter 2 where water oxidation

Chapter 3 – Instability of native SEI leads to the drying out of the LIB 111
potential was shown to occur above 4 V vs Li+/Li. In addition, we considered that the
reaction between charged (delithiated) FePO4 and hydrogen produced at the negative
electrode is negligible, as it is controlled by the diffusion of hydrogen across the cell.
To determine these activation energies, the protocol described in Figure 3. 13a and c
was used. First, a pre-cycling step of 10 cycles performed at 1C, 25 °C, was applied to
form a sufficiently stable SEI (as concluded from Figure 3. 10). The cell was then cycled
at 0.5C at different temperatures (15 °C, 25 °C, 35 °C, 45 °C, 55 °C) using a
charge/discharge/charge protocol followed by 20 h OCV. Capacity retention was
calculated by normalizing the discharge capacity obtained after 20 h of resting period to
the one obtained during full cycling. For the 1st plateau of Mo6S8 (2.7 V vs Li+/Li), a cut
off of 1.2 V was set during the cycling step, while a cut off of 1.5 V was used for the 2nd
plateau. Then, following the Arrhenius equation, the normalized loss of discharge
capacity upon self-discharge is plotted as function of the inverse of temperature (Figure
3. 13.b and d), allowing the extraction of the activation energies from Equation 3.6.
Equation 3. 6:
𝑘 = 𝐴 ∙ 𝑒−𝐸𝑎𝑅𝑇
with k, the reaction rate (the unit depends on the reaction considered, no unit for
self-discharge, h-1 for pressure cell and A for CC-CV 2-electrodes coin cell); A the pre-
exponential factor (the unit is defined by the unit of the reaction rate); Ea, the activation
energy (J/mol); R, the universal gas constant (8.314 J/mol/K) and T, the temperature (K).
Almost identical activation energies are extracted following this protocol (19 kJ/mol
for the 2nd plateau and 25 kJ/mol for the 1st plateau), regardless of the potential of the
intercalation plateau (Figure 3. 13), suggesting that self-discharge mechanism is similar
between these two insertion plateaus, the difference of reaction rates being attributed
to difference in driving force (ΔE = EHER – Ede-intercalation).

112 Chapter 3 – Instability of native SEI leads to the drying out of the LIB
Figure 3. 13 Determination of the activation energy of the indirect HER taking place during self-discharge. (a) Potential as function of time for self-discharge experiment performed on the first plateau of Mo6S8 (2.7 V vs Li+/Li). Ten cycles are performed at 1C, 25 °C, followed by cycling at 0.5C at different temperature (15 °C, 25 °C, 35 °C and 45 °C). (b) Arrhenius plot of the normalized discharge capacity loss by indirect HER during self-discharge as function of temperature. Unfortunately, no value was determined at 55 °C for the first plateau, since changes in the electrochemical signature are observed and are currently investigated. (c) Potential as function of time for self-discharge experiment performed on the second plateau of Mo6S8 (2.3 V vs Li+/Li). Ten cycles are performed at 1C, 25 °C, followed by cycling at 0.5C at different temperature (15 °C, 25 °C, 35 °C, 45 °C and 55 °C) (d) Arrhenius plot of the normalized discharge capacity loss by indirect HER during self-discharge as function of temperature. (b, d) Data points represent the mean of three cells, the exception being only one cell at 15 °C during 1st plateau experiment. All cells are based on Mo6S8/LFP cell with 20 m LiTFSI electrolyte.
Moreover, self-discharge reaction (see Equation 3. 7) is a combination of two redox
reactions (see Equation 3. 8 and Equation 3. 9) that comprised multiple steps, as more
than one electron is transferred. Besides, ions exchange (HO- and Li+) can lead to mass
transport limitation in the bulk of the electrolyte, across the SEI and/or in the electrode
material. Therefore, comparison between the activation energy obtained for self-
discharge should be confronted with activation energies for these phenomena.

Chapter 3 – Instability of native SEI leads to the drying out of the LIB 113
Equation 3. 7:
𝐿𝑖4𝑀𝑜6𝑆8 + 𝑥 ∙ 𝐻2𝑂 → 𝐿𝑖4−𝑥𝑀𝑜6𝑆8 + 𝑥 ∙ 𝐿𝑖+ + 𝑥 ∙ 𝐻𝑂− + 𝑥
2∙ 𝐻2
Equation 3. 8:
𝐿𝑖4𝑀𝑜6𝑆8 → 𝐿𝑖4−𝑥𝑀𝑜6𝑆8 + 𝑥 ∙ 𝐿𝑖+ + 𝑥 ∙ 𝑒− 𝑤𝑖𝑡ℎ 𝑥 ≤ 4
Equation 3. 9:
𝑥 ∙ 𝐻2𝑂 + 𝑥 ∙ 𝑒− → 𝑥 ∙ 𝐻𝑂− +𝑥
2∙ 𝐻2 𝑤𝑖𝑡ℎ 𝑥 ≤ 2
Considering the redox reaction associated with lithium de-intercalation (Equation 3.
8), mass transport is usually not considered as rate determining step (for moderate C-
rate such as those used in this study) since Li+ diffusion in Mo6S8 material was reported
to be fast enough during intercalation/de-intercalation process with an activation
energy comprised between 10 to 17 kJ/mol in Mo6S8223,224. Furthermore, diffusion in the
SEI is often considered as fast compared to charge transfer225. Eventually, bulk diffusion
in the electrolyte is generally not limiting the intercalation mechanism at moderate C-
rate due to a rather high conductivity of the electrolyte (≈10 mS/cm at 25 °C for 21 m
LiTFSI). Therefore, the rate-determining step for intercalation reaction in LIB is generally
considered to be the de-solvation step during charge transfer226, which activation
energy largely varies with the solvent. Indeed, it was reported to be much faster in
diluted aqueous-based electrolyte75,227 than in organic based one225,228. Unfortunately,
the impact of superconcentration and thus of solvation sheath on the activation energy
of the de-solvation process is barely studied, with the exception of Hu et al. 229 who
recently reported an activation energy for solvation of 20 kJ/mol in 20 m LiTFSI.
Nonetheless, such value is highly debatable due to questionable experimental methods
that include measurements at 0 °C, temperature at which the electrolyte is crystallized.
Altogether, one can hypothesize that the solvation/desolvation process should limit,
alike in organic based LIB, the intercalation reaction in WiSE-based LIB systems.
However, the determination of the rate-determining step in the overall self-discharge
reaction is not straightforward since both half-redox reactions (see Equation 3. 8 and
Equation 3. 9) may interplay.
Attempts were thus made to determine the activation energy of the HER in a battery
device. To do so, Mo6S8/LFP pressure cells were assembled using 20 m LiTFSI electrolyte.
The SEI was first formed by performing 10 cycles at 1C, 25 °C. The activation energy for
the HER was then extracted by measuring the pressure increase at different
temperatures (25 °C, 35 °C, 45 °C and 55 °C) during the four subsequent continuous

114 Chapter 3 – Instability of native SEI leads to the drying out of the LIB
cycles performed at low C-rate (0.15C), as illustrated in Figure 3. 14a. To determine the
activation energy of the direct/electrochemical HER, the rate of hydrogen production
was determined considering that gas is generated only during charge (see Figure A.3. 5
of the Appendix of this chapter). Such experiments are inspired from the work done by
Ayeb et al.230 who determined by gases measurements the HER activation energy during
overdischarge conditions in Ni-MH battery to be in the range from 50 to 70 kJ/mol.
Figure 3. 14b shows the Arrhenius plot obtained for the direct HER on the surface of
Mo6S8, from which an activation energy of 72 kJ/mol is determined. Unfortunately, no
values for the HER activation energy on Mo6S8 was reported for comparison, to the best
of our knowledge. However, Mo6S8 is reported to be a very promising HER catalyst in
acid222,231,232 with activity reaching the one of Pt -which is known to have an activation
energy of about 10 kJ/mol in acid -, albeit the HER is known to be much slower at pH
higher than 2, corresponding to our experimental conditions233. Thus, one can
hypothesize that the activation energy obtained in this study is rather high and
surprising. This can be explained by the use of pressure cell-type devices, in which the
activation energy extracted from pressure measurements are obtained in a regime in
which with mass transport limitations occur. Moreover, experimentally speaking, due to
the low C-rate used (0.15C), a plateau corresponding to pure direct HER is visible above
1.4 V (and before the 1.5 V cut off) at 45 °C and 55 °C, as shown in the appendix of this
chapter. Finally, and more importantly, as both HER and intercalation reaction take place
simultaneously, the total current is not entirely directed toward the HER.
Figure 3. 14 (a) Illustration of the protocol used to assess the activation energy of direct HER on Mo6S8 in 20 m LiTFSI by pressure cell tests. Potential and pressure as function of time. (b) Arrhenius plot showing the pressure increase as function of temperature.
To circumvent all these uncertainties related to the experimental conditions, we
completed by measuring the activation energy for direct HER in practical conditions
applying a constant current - constant voltage (CCCV) protocol to reach the HER

Chapter 3 – Instability of native SEI leads to the drying out of the LIB 115
potential after full charging of the cell, as illustrated in Figure 3. 15a. In details, 2-
electrodes coin cells were assembled and pre-cycled at 25 °C during 10 cycles at 1C to
form the SEI. The cell was then charged to 100 % SOC with a voltage cut off fixed to
1.4 V, to avoid any pure HER plateau starting below 1.5 V above 45 °C. Once 100 % SOC
is reached, the cell voltage is set to 1.5 V for 20 h. The current density was then
measured as function of temperature (25 °C, 35 °C and 45 °C and 55 °C). The
corresponding Arrhenius plot is shown in Figure 3. 15b and the activation energy for
pure HER on Mo6S8 in 20 m LiTFSI in battery set up is found to be 25.5 kJ/mol.
Figure 3. 15 (a) Protocol used to assess the activation energy of direct HER for Mo6S8 in 20 m LiTFSI in coin cells. Potential as function of time with pre-cyling step performed at 1C at 25 °C in blue, and cycling step based on full charge at 0.5C up to 1.4 V followed by the application of 1.5 V during 20 h as function of temperature (25 °C, 35 °C, 45 °C and 55 °C) in red as well as current response to a 1.5 V voltage applied (in yellow). (b) Arrhenius plot for the current measured at 1.5 V and 100 % state-of-charge as function of temperature (each point is the mean of two cells).
Although the value measured in this study has some uncertainty and the self-
discharge experiments measure a global phenomenon, it represents the actual
activation energies in practical conditions. Comparing the activation energy found for
self-discharge occurring during both plateau with that measured during the CCCV
measurements, values are found very similar (≈ 20 kJ/mol). Therefore, we can conclude
that the kinetics for the self-discharge mechanism is presumably governed by the HER
rate. For the sake of comparison, activation energies determined for self-discharge for
Lead-acid battery and Ni-MH battery (considering self-discharge driven by water
reacting with the positive electrode, see Equation 3. 10: and Equation 3. 11:) or organic-
electrolyte-based LIB, are listed in Table 3. 2 and compared to the experimental value
obtained in this study, regardless of the operating conditions used.

116 Chapter 3 – Instability of native SEI leads to the drying out of the LIB
Table 3. 2 Summary of activation energy corresponding to the overall self-discharge mechanism. Considering Ni-MH and Lead-acid, the reaction taken into account is the reaction with water of the positive electrode at 100 % SOC, as described in Equation 3. 10 and Equation 3. 11. Considering LIB, the positive electrode or the negative electrode are considered as limiting electrode.
Considering lead-acid and Ni-MH devices, the positive electrode is the capacity-
limiting one, unlike in our system where the limiting electrode is the negative. This
technological choice is made such that oxygen is evolved preferentially instead of
hydrogen upon overcharges or self-discharges (see Equation 3. 10 and Equation 3. 11).
Having the OER as the rate-determining step238,239 reduces the self-discharge rate
compared to an HER-driven one since OER kinetics is more sluggish. Hence, the
activation energies measured for WiSE (20 kJ/mol) is much lower than those reported
for Ni-MH and Lead-acid (67 and 40-70 kJ/mol, respectively).
Equation 3. 10:
𝑃𝑏𝑂2 + 2𝐻+ + 𝑆𝑂42− = 𝑃𝑏𝑆𝑂4 + 𝐻2𝑂 +
1
2𝑂2
.
Equation 3. 11:
𝑁𝑖𝑂𝑂𝐻 + 1
2𝐻2𝑂 = 𝑁𝑖(𝑂𝐻)2 +
1
4𝑂2
For the LIB technology, two ranges of values were reported for the activation energy
related to self-discharge: low values of ≈ 20 kJ/mol and greater values up to 80 kJ/mol.
Activation energy of 20 kJ/mol is observed at the negative electrode (synthetic flake
graphite)234 and linked to self-discharge governed by Li+ de-intercalation and SEI growth,
both associated to electrolyte reduction (1.2 M LiPF6 in EC:DEC (1:3 vol%)). The greater
values are related to Li+ intercalation occurring at the positive electrode (LCO) and
associated with electrolyte oxidation. These comparisons have a direct impact on
practicality of the WiSE technology, as it traduces that the shelf-life of systems for which
the self-discharge is governed by reactions at the negative electrode will be greatly
limited. To summarize, for WiSE-based LIB, the self-discharge mechanism seems to be
controlled by fast kinetics reaction occurring at the negative. However, the strategies
employed in other aqueous-based batteries in which the positive produces oxygen and
Technology This work Organic LIB Ni-MH Lead-acid
Activation energy (kJ/mol)
≈ 20 20234 to 80 235,236 67 ref 237 40-70 ref 238

Chapter 3 – Instability of native SEI leads to the drying out of the LIB 117
prevents hydrogen evolution, i.e. Lead-acid and Ni-MH, cannot be transposed as
discussed in the following section.
Discussion and conclusion of the chapter
In this chapter, we monitored the instability of the native SEI formed on negative
electrode when cycled in aqueous superconcentrated electrolyte (20 m LiTFSI). First, as
shown on a model-electrode (glassy carbon) and further confirmed by self-discharge
experiments, parasitic reactions are not prevented during resting period by the
protective passivating layer initially formed. DSC experiments also attest the irreversible
consumption of water during both cycling and self-discharge experiments. In addition,
based on self-discharge and continuous cycling experiments, one can determine that the
rate of water consumption is in the same order of magnitude (in terms of %initial water
amount consumed/(h∙gAM)) during self-discharge at 2.3 V vs Li+/Li than during constant current
continuous cycling, though smaller. Besides, as shown by normalizing the time of Li+ de-
insertion either during cycling or by self-discharge, reaction rates are found different. To
understand this observation, we designed electrochemical protocols to assess the
activation energies associated with self-discharge and direct HER. Experimental results
confirm a similar activation energy for self-discharge on both Mo6S8 plateau, the
difference in reaction rate being explained by differences in driving force. Despite
difficulties in accurately estimating the activation energy for direct HER, our results
suggest that the rate for self-discharge is governed by the generation of hydrogen, and
not by delithiation of Mo6S8, explaining the difference in de-intercalation rate.
Altogether, we highlight the dramatic impact of self-discharge that is driven by parasitic
reactions occurring at the negative electrode on the practicality of this technology.
To conclude on the viability of WiSE-based LIB, the figure of merits for WiSE-based
aqueous Li-ion system is compared to those for classical organic Li-ion
(NMC111 / LP30 / graphite) as well as other aqueous systems (see Figure 3. 16). As
evidenced in our study, WiSE-based aqueous batteries can only safely operate within a
≈ 2 V operating window to avoid parasitic side reactions, unlike organic LIB. To be able
to compare our WiSE or WiBS-based battery to classical Li-ion or commercial aqueous
systems, we estimated both the energy density and the specific energy for WiSE and
WiBS following the protocol proposed by Betz et al.221. In conclusion, both the specific
energy and the energy density at a cell level are twice smaller than for aprotic Li-ion
batteries and eventually similar to the ones achieved by Ni-MH batteries, while being
above those for Ni-Cd or Lead-acid batteries. However, the energy efficiency is

118 Chapter 3 – Instability of native SEI leads to the drying out of the LIB
similar/close to the one obtained for Li-ion (> 90 %), unlike Lead-acid, Ni-Cd, and Ni-MH
batteries that show energy efficiency closer to 80-85 %.
Figure 3. 16 Benchmarking WiSE-based and WiBS-based aqueous batteries against other aqueous systems, namely Lead-acid, Ni-Cd and Ni metal hydrides (Ni-MH) batteries as well as against aprotic Li-ion batteries. The spider-chart at the center compares these systems in terms of six parameters defining the overall performances of these systems. On top is compared the specific energy for these systems, on the left the self-discharge for these systems, on the right the energy density, on the bottom left is represented the specific energy as a function of specific power, on the bottom right is reported the energy efficiency for these systems while on the bottom the operating temperature window for the different technologies. All references are given in the Appendix of the Chapter.
Evidently, cycling batteries within the practical thermodynamically stable potential
window of WiSE (≈ 2 V) drastically limits the energy density, which cannot reach the one
achieved by LIB. The obvious way to increase the energy density would be to further
extend the operating window, by finding chemical-engineering means to handle the gas
generated during cycling, alike in other aqueous batteries (Lead-acid, Ni-Cd or Ni-MH).

Chapter 3 – Instability of native SEI leads to the drying out of the LIB 119
To do so, two cell designs are generally considered for the aqueous technologies:
flooded batteries and sealed ones (that can be vented or not). For flooded batteries,
gases are evacuated away from the electrodes prior to be recombined (H2 + ½ O2 = H2O).
Furthermore, electrolyte (or water) can be added to compensate water consumption.
Regarding vented-sealed batteries, thanks to a pressure valve, the pressure increase
resulting from the HER and/or OER can be regulated by outflowing the gases from the
cell without allowing oxygen to come in. This strategy reduces the pressure build up
during the battery operation. For example, for Lead-acid batteries, the so-called Valve
Regulated Lead Acid (VRLA) sealed batteries were developed. Moreover, a catalyst such
as Pd can be added in the form of a battery plug to catalyze the gas recombination
reaction (H2 + ½ O2 = H2O) and minimize the electrolyte loss and thus the drying-out of
the cell. Hence, vented-WiSE batteries could be envisioned, providing that the salt
crystallization issue discussed by Kühnel et al.153 can be solved for superconcentrated
electrolytes, as upon continuous consumption of water the battery lifetime will rapidly
reduce.
An alternative approach to circumvent the electrolyte drying-out can be the design
of sealed WiSE-based batteries using the oxygen recombination strategy. Indeed,
another mean to control water decomposition is by adjusting the capacity balance to
promote OER compared to HER. For a capacity ratio of negative to positive (N/P) equal
to one, both the OER and the HER take place on the positive electrode and the negative
one, respectively, upon overcharge. In order to limit the hydrogen production, the
positive electrode is set to be the limiting one (N/P > 1), reaching full charge before the
negative faces HER. Hence, only O2 is produced and diffuses through the electrolyte to
recombine into water by reacting with the negative electrode (as described in Figure 3.
17), thus forming the “oxygen cycle”7 that prevents the cell drying off. Altogether, one
should keep in mind that such solution can only be efficient if the O2 production rate is
not faster than the recombination one. In definitive, if no care about the dimensionality
of the electrodes is taken, aqueous-based batteries face an unbalanced generation of
gases and poor recombination efficiency. Eventually, in order to (i) reduce electrolyte
evaporation, (ii) to enhance safety by limiting electrolyte creepage and (iii) to promote
oxygen diffusion to the negative electrode, electrolyte properties can separately be
improved. Porous gel-type electrolytes were implemented to promote the diffusion of
O2 to the negative electrode as gases diffuse faster in gel-type electrolyte than in liquid
aqueous electrolytes. Indeed, water consumption taking place in the electrolyte induces
the formation of cracks thus creating a network for O2 diffusion. Another alternative was

120 Chapter 3 – Instability of native SEI leads to the drying out of the LIB
the use of electrolyte absorptive glass fiber separators, to avoid having excess of
electrolyte in the cells.
Figure 3. 17 Some parasitic reactions taking place in lead-acid, Ni-Cd and Ni-MH batteries. N/P ratio correspond to the capacity balance between the positive and the negative electrode.
However, altogether the development of these different concepts would (i) need
electrolyte refill to avoid drying-out of the cell or (ii) require the use of catalysts to
recombine water from O2(g) and H2(g) and/or (iii) of a gelified electrolyte to improve gas
diffusion. Therefore, these constraints would impose drastic limitations regarding both
the operating voltage as well as the charging rate for WiSE-based aqueous batteries.
Indeed, both increasing the operating voltage and increasing the charging rate would
lead to increased kinetics for gas generation. For instance, as observed for Ni-Cd
batteries, water recombination catalysts can only handle a certain amount of gas, which
limits the charging to 0.1C. Moreover, the water recombination in these aqueous
devices requires a sufficient amount of oxygen to allow recombination. Indeed, these
systems rely on the paradox that a too good positive electrode for which no oxygen is
released would not allow for the water recombination at the negative electrode.
However, as evidenced in our study, while hydrogen is produced in parallel with Li+
intercalation at the negative electrode during charge, almost no oxygen is released at
the positive electrode at room temperature. This unbalanced generation of gases
between the positive and the negative electrode towards the generation of hydrogen,
which is not encountered for other aqueous devices, drastically limits the possibility of
water recombination in WiSE-based aqueous batteries, eventually leading to severe
drying-out issues for the battery.

Chapter 3 – Instability of native SEI leads to the drying out of the LIB 121
Furthermore, another major drawback of WiSE-based batteries is the narrow
operating temperature range. Indeed, crystallization of the electrolyte may occur at
room temperature. Even though several anions have been considered to downshift the
crystallization point180,181,183,187, as discussed in chapter 1, the question of the cost,
scalability and the competitiveness of the superconcentrated aqueous electrolyte will
be raised. With this in mind, reducing further the amount of water by increasing the
amount of lithium salt in the electrolyte does not appear as a viable solution for
applications competing with Li-ion batteries since the SEI instability is not suppressed by
the use of bisalt superconcentrated electrolytes.
Finally, for grid applications, the capacity fading of WiSE-based batteries must be
limited over time. However, as shown in our work, the second intercalation plateau of
Mo6S8 corresponding to 75 % of the total capacity of the material is completely loss after
a resting period of 300 to 800 hours, depending on the C-rate employed during cycling.
Thus, capacity fading in the order of 30 to 75% per month is deduced for this specific
configuration, which must be compared with capacity fading of 2-10 % measured for
aprotic Li-ion batteries, 1-15 % for Lead-acid batteries, 15-30 % for Ni-MH and 10-20 %
for Ni-Cd, bearing in mind than some can be recovered for commercial Ni-Cd and Ni-MH
aqueous systems as well as for WiSE-based system. Thus, without further improvement
to the current technology and the finding of optimized pre-cycling conditions, WiSE-
based aqueous batteries cannot currently be regarded as a viable option for grid
electricity storage.
As a summary, the SEI formed in these superconcentrated electrolytes is not
protective enough to prevent the electrolyte degradation during cycling and resting
period, more specifically to avoid water reduction and hydrogen generation. Based on
these experimental results, we provide the figure or merit for WiSE-based Li-ion battery
that we compared to that of classical Li-ion battery and commercial aqueous system
such as Lead-acid, Ni-Cd or Ni-MH. Doing so, it clearly appears that while WiSE-based
batteries share the energy efficiency of aprotic Li-ion batteries, owing to similar
intercalation reactions, it only offers the energy density and the specific energy of Ni-
MH batteries. However, WiSE-based batteries show poorer temperature stability than
either systems. Furthermore, the continuous electrolyte consumption occurring both on
charge and upon self-discharge for WiSE-based batteries may lead to the drying-out of
the cell. Our analysis further revealed that owing to the lack of oxygen generation upon
charge, the implementation of a gas recombination cycle in WiSE-based cells as used for
other aqueous battery applications might be complex. Therefore, superconcentrated

122 Chapter 3 – Instability of native SEI leads to the drying out of the LIB
aqueous electrolyte are currently not able to compete with commercialized aqueous
systems for grid storage application until means to prevent the HER at the negative
electrode can be found and benchmarked in practical conditions. This calls for the design
of stable SEI as reported. Toward this goal, Chapter 4 will focus on the stability of
artificial SEI based either on inorganic coatings while the perspectives of this thesis will
tackle polymeric ones.


CHAPTER 4 –MIMICKING INORGANIC-BASED SEI
WITH LIF-COATING. UNDERSTANDING OF
INORGANIC SEI LIMITATIONS IN WATER-IN-SALT ELECTROLYTE2.
2 This chapter is based on the article that I co-authored: Droguet, L.; Hobold, G. M.; Lagadec, M. F.; Guo, R.; Lethien, C.; Hallot, M.; Fontaine, O.; Tarascon, J.-M.; Gallant, B. M.; Grimaud, A. Can an Inorganic Coating Serve as Stable SEI for Aqueous Superconcentrated Electrolytes? ACS Energy Lett. 2021, 6 (7), 2575–2583. https://doi.org/10.1021/acsenergylett.1c01097.

126 Chapter 4 – Understanding of inorganic SEI limitations in WiSE
Introduction
Developing stable SEIs in aqueous media has been at the forefront of research for
aqueous Li-ion batteries (LIB) and other aqueous technologies such as electrochemical
capacitors (based on carbon or pseudocapacitive electrodes) or Na-ion
batteries58,111,117,164. As described in Chapter 1, one major advance was the introduction
of superconcentrated aqueous electrolytes in which salt molecules exceed water
molecules both in volume and in mass. Indeed, in these so-called WiSE or WiBS58,122,
almost all water molecules contribute to the solvation sphere of Li+, allowing for a strong
ion-pair interaction between solvated Li+ cations and organic anions such as TFSI- or its
derivatives. However, as shown in Chapter 2 and 3 of this manuscript, the atypical
solvation structure does not suppress the reduction of water at the negative electrode.
Nonetheless, the reactivity of the -CF3 terminal groups of TFSI- anions present at the
interface is unlocked, which triggers the formation of LiF and passivate, at least partially,
the negative electrode134,146–148. Therefore, contrary to organic LIB electrolytes, where
the decomposition of both the solvent molecules and salt anions results in a native SEI
layer containing both inorganic (LiF, Li2CO3, Li2O, etc.) and organic/oligomeric
species240,241, for superconcentrated aqueous electrolytes, the passivation
predominantly relies on LiF.
The SEI thickness and density generally vary with the formation step (cycling rate,
duration, temperature etc.). Moreover, part of the SEI can be dissolved. This raises the
question of whether the water reduction observed in the previous chapters upon rest
originates from the morphology and porosity of the deposited LiF layer or from its
intrinsic solubility and/or instability in aqueous superconcentrated electrolyte. To
decide between these two options, in this Chapter, we first assessed the LiF solubility
limit in aqueous electrolytes as a function of LiTFSI salt concentration. Then, we studied
the stability of a conformal LiF layer deposited onto metallic Li anode as a proxy to mimic
the formation of a native SEI. First, by using environmental scanning electron
microscopy (E-SEM), we tested LiF protection against moisture. Second, we assessed its
stability against two aqueous superconcentrated electrolytes (20 m LiTFSI and 20 m
LiTFSI : 8 m LiBETI) using gas chromatography and compared it to insoluble Al2O3 coating
prepared onto metallic Li. Eventually, by using presoaking step in organic
solvent/electrolyte, we analyzed the importance of salt/solvent-derived species to
ensure self-passivation and maintain stable the SEI. The outline of this chapter is
illustrated in Figure 4. 1.

Chapter 4 – Understanding of inorganic SEI limitations in WiSE 127
Throughout this Chapter, because of practical considerations in terms of energy
density gain, we focused our attention on metallic Li anode rather than on the classically
used Mo6S8 anodes, bearing in mind that the kinetics for electrolyte reduction will be
greatly enhanced together with accompanied gas generation. Hence, it provides an
accelerated approach to pinpoint the weaknesses of any SEI layer composed of LiF which
will eventually appear during cycling of anode materials.
Figure 4. 1 Illustration of the outline of Chapter 4 based on the results discussed in chapter 2 and 3.
LiF solubility limit in aqueous superconcentrated electrolyte
The solubility limit of lithium fluoride is well-known in pure solvents (note that
solubility limit measurements are performed at thermodynamic equilibrium). It is
notably greater in water than in most carbonate solvents, with the exception of EC (see
Table 4. 1).

128 Chapter 4 – Understanding of inorganic SEI limitations in WiSE
Table 4. 1 LiF solubility limit found in literature in various solvents: water, ethylene carbonate (EC), dimethyl carbonate (DMC), propylene carbonate (PC). One can note that the difference in solubility limit of two orders of magnitude in DMC was explained by differences in the protocol, especially regarding the filtration technique as detailed in Chapter Materials and Methods.
Solvent LiF solubility at 25 °C (g/L) LiF solubility at 40 °C (g/L)
H2O 1.11 242 1.20 242
DMC 0.57 242 4 ⋅ 10-3 243
PC 0.14 242 0.21 242
EC 5.52 242
Nonetheless, very little is known regarding the solubility limit of LiF as a function of
salt concentration. The common-ion effect arising from the dissolved Li-salt is believed
to lower the solubility of LiF in superconcentrated aqueous electrolytes. In order to
probe this effect, the solubility limit of LiF was directly measured in aqueous electrolytes
as a function of the LiTFSI salt concentration using a fluoride ion selective electrode (ISE)
and following the protocol developed by Strmcnik et al.244 illustrated in Figure 4. 2a
(details are given in Chapter Materials and Methods). As shown in Figure 4. 2b, the LiF
solubility limit was observed to decrease from pure water (0.93 g/L) down to 1.9 ∙ 10-3
and 1.5 ∙ 10-3 g/L for 20 m LiTFSI and 20 m LiTFSI : 8 m LiBETI aqueous electrolytes at 23
°C, respectively.
Figure 4. 2 (a) Schematic explanation of the protocol used to measure LiF solubility, further details are provided in the chapter Materials and Methods. (b) Solubility limit of LiF in saturated aqueous solutions measured in pure water and at different LiTFSI concentration ranging from 1m to 20m (WiSE) as well as for 20 m LiTFSI : 8 m LiBETI (WiBS). The dashed line is a guide to the eyes.

Chapter 4 – Understanding of inorganic SEI limitations in WiSE 129
Considering the reaction described in Equation 4. 1, the constant of dissolution of LiF
–Ks- in an aqueous solution can be expressed following Equation 4. 2.
Equation 4. 1:
𝐿𝑖𝐹(𝑠) = 𝐿𝑖+ (𝑎𝑞) + 𝐹− (𝑎𝑞)
Equation 4. 2:
𝐾𝑠 = 𝑎𝐿𝑖+𝑎𝐹− = 𝛾𝐿𝑖+ [𝐿𝑖+] ∙ 𝛾𝐹−[𝐹
−] = 𝛾𝐿𝑖+𝛾𝐹− ∙ [𝐿𝑖+][𝐹−]
Due to LiF stoichiometry, the product of the activity coefficients of ions in solution –
𝛾𝐿𝑖+𝛾𝐹− can be defined as the square of the mean ionic activity coefficient of the salt245
i.e. �̅�𝐿𝑖+𝐹−² as expressed in Equation 4. 3. Therefore, Equation 4. 2 becomes Equation 4.
4.
Equation 4. 3:
𝛾𝐿𝑖+𝛾𝐹− = �̅�𝐿𝑖+𝐹−²
Equation 4. 4:
𝐾𝑠 = �̅�𝐿𝑖+𝐹−² ∙ [𝐿𝑖+][𝐹−]
Besides, the fluoride and lithium ions concentration can be expressed according to
Equation 4. 5.
Equation 4. 5
[𝐿𝑖+] = [𝐿𝑖+]𝑒𝑙𝑒𝑐𝑡𝑟𝑜𝑙𝑦𝑡𝑒 + [𝐿𝑖+]𝑙𝑖𝑚 and [𝐹−] = [𝐹−]lim
with [𝐿𝑖+]𝑙𝑖𝑚 = [𝐹−]𝑙𝑖𝑚
where [𝐿𝑖+]𝑒𝑙𝑒𝑐𝑡𝑟𝑜𝑙𝑦𝑡𝑒 (mol/L) is the initial concentration of Li+ cation due to the
LiTFSI concentration in solution (i.e. the molarities corresponding to the following
molalities: 1 m, 3 m, 5 m, 7 m, 10 m, 15 m, 20 m), [F-]lim (mol/L) is the solubility limit of
fluoride measured by the ISE electrode and [Li+]lim (mol/L) is the concentration of Li+
cation added during the LiF dissolution in the electrolyte. Considering the high initial
[Li+]electrolyte in the bulk electrolyte (> 1 m i.e. 0.87 M) and the measured fluoride solubility
limit (< 1 g / L i.e. 0.05 mol / L ), [Li+] can be simplified as follow:
Equation 4. 6:
[𝐿𝑖+] = [𝐿𝑖+]𝑒𝑙𝑒𝑐𝑡𝑟𝑜𝑙𝑦𝑡𝑒
Therefore, Equation 4. 4 is simplified in Equation 4. 7.

130 Chapter 4 – Understanding of inorganic SEI limitations in WiSE
Equation 4. 7:
[𝐹−]𝑙𝑖𝑚 =𝐾𝑠
�̅�𝐿𝑖+𝐹−² ∙ [𝐿𝑖+]𝑒𝑙𝑒𝑐𝑡𝑟𝑜𝑙𝑦𝑡𝑒
with Ks the constant of solubility, �̅�𝐿𝑖+𝐹−the mean activity coefficient of the LiF salt
and [Li+]electrolyte (mol/L) the initial concentration of lithium in the electrolyte.
As theoretically described by McEldrew et al.246, the logarithm of the mean activity
coefficient log(�̅�𝐿𝑖+𝐹−) increases with the molality. Therefore, even without knowing the
effect of the molality and thus of the solvation structure on Ks, the decrease of solubility
limit observed in Figure 4. 2b is consistent with the common ion effect and the increase
of activity coefficient, which are both related to the increase of molality. Moreover,
taking into consideration these theoretical results by McEldrew et al.246, one can rescale
the logarithm of the activity coefficient as function of the molarity rather than the
molality. Doing so, a linear trend is obtained, as shown in Figure 4. 3.
Figure 4. 3 Molarity (mol/Lsolvent) (red line) and molality (mol/kgsolution) (blue line) as function of the logarithm of the activity coefficient of a salt. Data extracted from Ref246 and rescaled vs molarity.
Log(�̅�𝐿𝑖+𝐹−) can thus be expressed according to Equation 4. 8.

Chapter 4 – Understanding of inorganic SEI limitations in WiSE 131
Equation 4. 8:
Log(�̅�𝐿𝑖+𝐹−) = 3.15 ∙ [𝐿𝑖+]𝑒𝑙𝑒𝑐𝑡𝑟𝑜𝑙𝑦𝑡𝑒𝑚𝑜𝑙
𝐿⁄ − 0.29
with 𝑅2 = 0.998
Besides, applying 10log function to Equation 4. 7, one can obtain Equation 4. 9.
Equation 4. 9:
log([𝐹−]𝑙𝑖𝑚) = log(𝐾𝑠) − 2 log(�̅�𝐿𝑖+𝐹−) − log ([𝐿𝑖+]𝑒𝑙𝑒𝑐𝑡𝑟𝑜𝑙𝑦𝑡𝑒)
In Equation 4. 9, considering Ks as a constant and replacing log(�̅�𝐿𝑖+𝐹−) by its
expression described in Equation 4. 8, one can find Equation 4. 10.
Equation 4. 10:
log([𝐹−]𝑙𝑖𝑚) = C − A ∙ [𝐿𝑖+ ]𝑒𝑙𝑒𝑐𝑡𝑟𝑜𝑙𝑦𝑡𝑒−B ∙ log ( [𝐿𝑖+]𝑒𝑙𝑒𝑐𝑡𝑟𝑜𝑙𝑦𝑡𝑒)
where [𝐿𝑖+]𝑒𝑙𝑒𝑐𝑡𝑟𝑜𝑙𝑦𝑡𝑒 is the initial concentration of Li+ in the electrolyte, A, B and C
constant values, C being proportional to Ks.
Thus, comparison between experimental data and fitted ones can be done as shown
in Figure 4. 4a and described in Equation 4. 11. Details of fitted parameters are given in
Chapter Materials and Methods.
Figure 4. 4 Logarithm of the limit of solubility of fluoride as function of initial concentration [Li+]electrolyte (mol/L) in the electrolyte. (a) Comparison between experimental data (black cross) and combination fit (orange). (b) Comparison between three fits: linear fitting (blue), logarithmic fitting (green), combination (orange).

132 Chapter 4 – Understanding of inorganic SEI limitations in WiSE
Equation 4. 11:
𝐿𝑜𝑔([𝐹−]𝑙𝑖𝑚) = −0.206 ∙ [𝐿𝑖+ ]𝑒𝑙𝑒𝑐𝑡𝑟𝑜𝑙𝑦𝑡𝑒 −0.827 log([𝐿𝑖+ ]𝑒𝑙𝑒𝑐𝑡𝑟𝑜𝑙𝑦𝑡𝑒) −2.428
First, fitted values and experimental data are in good agreement, with interception
of their standard deviation range. Besides, Ks that is related to the intercept of the
equation can be determined to be: 𝐾𝑠𝑓𝑖𝑡 = 10−2.428 = 3.7 ∙ 10−3 . This value is
consistent with Ks calculated by approximating the activity coefficients (𝑎𝐿𝑖+ and 𝑎𝐹−)
by [Li+]lim and [F-]lim and taking into account LiF solubility in pure water (0.93 g/mol i.e.
3.7 ∙ 10-2 mol /L) i.e. 𝐾𝑠𝑑𝑖𝑙𝑢𝑡𝑒 𝑠𝑜𝑙𝑢𝑡𝑖𝑜𝑛 = [𝐹−]𝑙𝑖𝑚2 ≈ 1.4 ∙ 10−3.
Nonetheless, although the theoretical relationships can be simplified as a
combination of [𝐿𝑖+]𝑒𝑙𝑒𝑐𝑡𝑟𝑜𝑙𝑦𝑡𝑒 and log [𝐿𝑖+]𝑒𝑙𝑒𝑐𝑡𝑟𝑜𝑙𝑦𝑡𝑒, pure linear (see Equation 4. 12)
or pure logarithmic fits (see Equation 4. 13) as shown in Figure 4. 4b also give good
results with the interception of their standard deviation range and good assessment of
Ks value. Therefore, we must acknowledge that determining an accurate equation for
the expression of the solubility limit as a function of the electrolyte molarity must be
trickier than these simple calculations.
Equation 4. 12:
𝐿𝑜𝑔([𝐹−]𝑙𝑖𝑚) = −0.366 ∙ [𝐿𝑖+]𝑒𝑙𝑒𝑐𝑡𝑟𝑜𝑙𝑦𝑡𝑒 −2.274
𝐾𝑠𝑙𝑖𝑛𝑒𝑎𝑟 𝑓𝑖𝑡 = 10−2.274 = 5.3 ∙ 10−3
Equation 4. 13:
𝐿𝑜𝑔([𝐹−]𝑙𝑖𝑚) = −1.854 ∙ log ([𝐿𝑖+]𝑒𝑙𝑒𝑐𝑡𝑟𝑜𝑙𝑦𝑡𝑒) −2.6426
𝐾𝑠𝑙𝑜𝑔𝑎𝑟𝑖𝑡ℎ𝑚𝑖𝑐 𝑓𝑖𝑡 = 10−2.6426 = 2.3 ∙ 10−3
Using Li/LiF-coating to mimic inorganic-based SEI. Exposure to atmosphere environment, aqueous superconcentrated electrolyte and comparison with the behavior observed in organic electrolyte3
Having established that the LiF solubility limit is drastically decreased in WiSE, we
focused our attention on the ability for LiF to protect a negative electrode against
3 E-SEM images were performed by Marie-Francine Lagadec from Chaire chimie du solide et de l’énergie, Collège de France, Paris. Gustavo M. Hobold and Betar Gallant from the Department of mechanical engineering, MIT, Cambridge, carried out Li/LiF SEM images and GC-TCD/FID experiments.

Chapter 4 – Understanding of inorganic SEI limitations in WiSE 133
reacting with water. To do so, a LiF artificial coating was prepared to mimic the native
LiF-rich SEI formed on the surface of anode materials in WiSE. Briefly, during the Li/LiF
sample preparation, the metallic Li is rolled on a current collector and then exposed to
NF3 gas at 175 °C, just below the melting temperature of Li, under mild conditions
(further details are provided in Chapter Materials and Methods). As shown in Figure 4.
5a by cross section view, the LiF layer thickness is estimated to be ≈ 30 nm. Such a LiF
thickness may be considered as representative of a native SEI. Indeed, as observed by
SEM and TEM experiments111,122,247,248, the thickness of a native LiF-based SEI is ≈ 10 nm.
Moreover, as previously demonstrated249 and observed in Figure 4. 5b and c,
homogenous and conformal deposits are realized. Thus a complete LiF coating is formed
and protects the metallic Li when further exposed to moisture or electrolytes.
Figure 4. 5 Scanning electron microscopy (SEM) images (a) Cross section SEM image of a Li/LiF pristine sample. Top-view SEM images of a Li/LiF pristine sample, (b) high magnification, (c) low magnification.
The thickness of the LiF coating layer as observed by SEM was compared with the
amount of [F-] measured after full dissolution of the LiF layer. Doing so, agreement is
met with a thickness of 30 nm, with a deviation of less than 1 %, as described in Table
4.2 (Calculation and protocol details are provided in Chapter Materials and Methods).

134 Chapter 4 – Understanding of inorganic SEI limitations in WiSE
Table 4. 2 Fluoride concentration measurement after complete dissolution of a Li/LiF sample. Comparison with expected concentration based on SEM observation. Assumptions are the following: Li/LiF sample with 30 nm thickness, 1.27 cm diameter.
Eventually, owing to this nanoscale thickness, the LiF layer cannot be detected by
laboratory XRD. However, previous demonstration was made by our collaborators (see
He et al.249) that thicker layers grown using a similar methodology but with longer
reaction times are polycrystalline.
Besides, Figure 4. 6 compares the solubility limit of LiF in aqueous and organic
electrolytes with the concentration of fluoride calculated for the complete dissolution
of the 30 nm conformal LiF-layer in 250 µL of electrolyte, i.e. a concentration of 2.02 ∙
10-2 g/L. Doing so, one can infer that in diluted aqueous electrolytes, the conformal LiF-
layer would be able to dissolve, unlike in superconcentrated aqueous electrolyte and
(1,3-dioxolane:dimethoxyethane) DOL:DME or EC:DMC-based electrolyte. This trend is
also preserved at 55°C since the LiF solubility increases by less than a factor of 2 (3.7 ±
0.4 ∙ 10-3 g/L in WiSE and 2.9 ∙ 10-3 g/L in WiBS at 55 °C), so the very limited dissolution
still enables practical cycling conditions. This implies that the instability of the LiF-based
SEI -either native or artificial- in WiSE should not arise from the complete dissolution of
the passivating layer.
Volume of the solution in
which sample is dissolved (mL)
[F-] expected
(mg/L)
[F-] measured
by ISE (mg/L)
Relative deviation
(%)
Temperature (°C)
pH of the solution
125 0.0803 0.0805 0.25 19 5.79
150 0.0669 0.0671 0.3 19.3 5.74

Chapter 4 – Understanding of inorganic SEI limitations in WiSE 135
Figure 4. 6 Comparison of the LiF solubility limits measured in different electrolytes: water, 1 m LiTFSI, 20 m LiTFSI, 20 m LiTFSI : 8 m LiBETI, EC:DMC (1:1 vol%), DOL:DME (1:1 vol%). The reference lines indicate the fluoride concentration expected from the complete dissolution of a 0.9 cm diameter and 30 nm thickness layer (dark purple) or a 10 nm thickness (light purple) LiF layer dissolved in 250 µL of electrolyte.
Having established that LiF solubility drastically decreased in WiSE, environmental
scanning electron microscopy (E-SEM) was used to assess the protective power of the
LiF layer against moisture (see Figure 4. 7). In this experiment, the sample is kept at 20
°C while gradually increasing the relative humidity (RH) of the atmosphere in the
chamber from 0 to 90 % RH as illustrated in Figure 4. 7b.
As depicted in Figure 4. 7a, round-shaped particles start forming on the surface of a
metallic Li sample as the chamber’s RH exceeds 0 %, their occurrence increasing with
the increasing RH. On the contrary the LiF-conformal layer protects the metallic Li from
reacting with gaseous water below a threshold of 60 % RH. However, approaching water
condensation (RH ≈ 90 %), the LiF-conformal layer no longer plays a protective role and
similar (but larger) round-shaped particles are observed alike for bare metallic Li.
Interestingly, as observed in Figure 4. 7a and illustrated in Figure 4. 7c, reactivity can
first be observed at cracks and pits formed in the LiF layer, suggesting that
microstructural defects inherently present in the artificial SEI lead to reactions of the

136 Chapter 4 – Understanding of inorganic SEI limitations in WiSE
underlying Li layer with moisture. However, testing Li/LiF samples resistance to moisture
is still far from the potential impact of aqueous superconcentrated electrolyte when in
contact with Li/LiF, therefore Li/LiF behavior in aqueous superconcentrated electrolyte
was then studied.
Figure 4. 7 (a) E-SEM images of bare Li and Li/LiF samples exposed to moisture. (b) Phase diagram for pure water, illustrative scheme of the E-SEM operation. (c) Scheme of an ideal and a real SEI exposed to moisture.
Our attention then turned to the chemical stability of the LiF-coated metallic Li
samples in both superconcentrated electrolytes, 20 m LiTFSI and 20 m LiTFSI : 8 m LiBETI.
For that, Li/LiF samples were exposed to various electrolytes while monitoring the gas
evolution by gas chromatography with thermal conductivity/flame ionization detectors
(GC-TCD/FID), as shown in Figure 4. 8.
First, for comparative purposes, we determine the gas evolution when a Li/LiF sample
is exposed to organic LP30 electrolyte for which the total amount of gas released (Figure
4. 8a) originates from the decomposition of carbonates, i.e. CO, CO2, C2H4 and CH4 as
shown in Figure 4. 8b. It stabilizes after 30 minutes at a very low value of approximately
0.5 ∙ 10-2 % in the headspace (the rest being argon), which is close to the detection limit

Chapter 4 – Understanding of inorganic SEI limitations in WiSE 137
of the GC-FID instrumentation. Hence, even though minute cracks exist in the LiF-
conformal layer, the exposition of bare Li to LP30 eventually leads to the formation of
some polymeric/oligomeric structures that passivate the electrode250,251 and prevent
further gas evolution, explaining the decrease of gas detected over time (inset in Figure
4. 8a).
Figure 4. 8 (a) Gas evolution as a function of time for Li/LiF samples during exposure to 1M LiPF6 in EC:DMC (LP30). The gas evolution is the sum of all gases detected in (b). (b) Concentration in Carbon monoxide (dark brown), ethylene (light brown), acetylene (grey) and methane (flesh color) when exposing Li/LiF or bare metallic Li samples to LP30 electrolyte during 15 min. Hydrogen evolution as a function of time for Li/LiF samples upon exposure to (c) 20 m LiTFSI and (d) 20 m LiTFSI : 8 m LiBETI.
In contrast, a large amount of hydrogen (≈ 8 %) of the sampled gas is detected with a
LiF-protected metallic Li sample exposed to 20 m LiTFSI electrolyte (see Figure 4. 8c).
This amount then stabilizes at ≈ 4% before vanishing after 100 minutes when almost all
the metallic Li is consumed. Indeed, as described in Table 4. 3, a hydrogen molar ratio
of 26.35 % is detected after 120 min, which corresponds to 182 µmol of hydrogen
produced and thus ≈ 80% of total Li consumption (calculation parameters are given in
Table M.M. 5 in Chapter Materials and Methods). Similarly, when exposing the Li/LiF
sample to 20 m LiTFSI : 8 m LiBETI, hydrogen is detected with a concentration of ≈ 1 %.

138 Chapter 4 – Understanding of inorganic SEI limitations in WiSE
Unlike for the 20 m LiTFSI solution, this concentration remains constant throughout the
measurement, leading to a consumption of ≈ 22 % of metallic Li after 2 hours. Eventually,
such continuous hydrogen evolution indicates that, unlike for carbonate-based
electrolytes, no self-passivation occurs in superconcentrated aqueous electrolytes.
Table 4. 3 Consumption of Li after exposure to 20 m LiTFSI (WiSE) or 20 m LiTFSI : 8 m LiBETI for the Li/LiF samples.
Altogether these GC-TCD results indicate that aqueous electrolyte reaches the
underlying metallic Li electrode through microstructural defects, i.e. cracks or grain
boundaries, which have previously being observed for native SEI formed in
superconcentrated aqueous electrolytes by SEM and TEM experiments111,122,247,248.
Moreover, kinetics for water reduction is not drastically impacted by the salt
concentration7 and the amount of water contained in 250 µL of aqueous
superconcentrated electrolytes does not limit the reaction (0.489 mmol of metallic Li
available per Li/LiF sample compared to 3.49 mmol of water, see Chapter Material and
Methods for detailed calculations). Thus, one can hypothesize that the greater the
viscosity of the electrolyte, (ηWiBS = 203 mPa at 30 °C 58 and ηWiSE = 36.2 mPa at 25 °C111),
the slower the electrolyte penetrates through minute cracks present in the LiF layer,
thus explaining the differences of Li-water reactivity between the two
superconcentrated aqueous electrolytes.
Comparison of LiF behavior with Al2O3-coated Li sample4
One legitimate question arising from this study regards the quality of the LiF layer.
We thus compared the protective power of our LiF layer with that of a conformal Al2O3
layer prepared by atomic layer deposition (ALD), previously proposed to allow for
4 Li/Al2O3 coatings were provided by Christophe Lethien and Maxime Hallot from the University of Lille. GC-TCD experiments were done by Gustavo M. Hobold and Betar Gallant from the Department of mechanical engineering, MIT, Cambridge.
Li/LiF pristine exposed to
Molar ratio of H2 (after 120
min) xHydrogen(%)
Amount of H2 released (after
120 min) nHygrogen (µmol)
Ratio of Li consumed
(after 120 min) (%)
20 m LiTFSI 26.35 182 74
20 m LiTFSI : 8 m LiBETI 7.63 53 22

Chapter 4 – Understanding of inorganic SEI limitations in WiSE 139
passivation of anode materials in WiSE as Al2O3 is not soluble in water205,207. Using a
similar approach combining E-SEM (see Figure 4. 9) and GC-TCD (see Figure 4. 10),
evolution of hydrogen upon consumption of the underlying Li electrode is once again
observed as summarized in Table 4. 4.
Table 4. 4 Consumption of Li after exposure of Al2O3-coated metallic Li exposed to 20 m LiTFSI or 20m LiTFSI : 8 m LiBETI.
Molar ratio of H2 (after 120min)
xHydrogen(%)
Amount of H2 released (after
120min) nHygrogen (µmol)
Ratio of Li consumed (after
120min) (%)
Al2O3-coated metallic Li exposed to 20m
LiTFSI 1.15 7.933 18
Al2O3-coated metallic Li exposed to 20m LiTFSI : 8m LiBETI
0.416 2.867 6.4
Environmental-SEM observations were first performed on 2 nm and 10 nm thick Al2O3
layers prepared by ALD on the surface of metallic Li, bearing in mind that the native-SEI
growing in WiSE is itself in the 10 nm thickness range. Figure 4. 9 shows the images
obtained with increasing RH. As seen before exposure to moisture, Al2O3 layers prepared
by ALD forms a granular and textured coating on the surface of Li, alike the
microstructure previously reported elsewhere for a similar coating207. Nevertheless,
when gradually increasing the water partial pressure from 0 to 90 % RH, obvious
degradations are observed starting at 30 % RH for the 2 nm thick coating (see Figure 4.
9, top row). Bearing in mind that Al2O3 does not dissolve in pure water, this change in
microstructure from granular to a cauliflower-like may arise from two effects. First,
Al2O3 can gradually transform to Al(OH)3, this phase transformation inducing a change
in molar volume (from 403 mol/cm3 for Al2O3 to 188.8 mol/cm3 for Al(OH)3, i.e. a
contraction of 7 % in volume). Second, the granular morphology of the Al2O3 coating
itself can induce reactivity of the underlying Li electrode associated with the formation
of LiOH and/or LiOH.H2O upon reaction with water. In other words, the granular
morphology of the 2 nm Al2O3 coating prepared by ALD may not prevent water from
accessing Li. Therefore, a thicker coating of 10 nm was then prepared, but similar
degradation was observed, with a cauliflower-like structure being formed upon
increased relative humidity (see Figure 4. 9, bottom row).

140 Chapter 4 – Understanding of inorganic SEI limitations in WiSE
Figure 4. 9 E-SEM images for 2 nm (top) and 10 nm (bottom) Al2O3 coated metallic Li taken successively at 0, 30, 60 and 90 % RH with zoom-ins.
To further understand the reactivity of Al2O3-coated metallic Li in contact with
superconcentrated aqueous electrolytes, GC-TCD measurements were performed alike
the ones carried out for the Li/LiF-protected samples. Upon exposure to 20 m LiTFSI, a
constant evolution of hydrogen is observed during two hours with a concentration of ≈
0.15 % of hydrogen in the headspace (see Figure 4. 10). While this concentration is much
smaller than the one previously observed with the Li/LiF sample (see Figure 4. 8c), once
normalized by the amount of Li -taking into account the surface and the thickness of the
metallic Li electrode- one can estimate that 18 % of the metallic Li was consumed by
the reaction. Thus, as observed by environmental-SEM, the conformal coating of Al2O3
does not prevent metallic Li from reacting with WiSE aqueous electrolyte but slows
down the reaction. Finally, alike for Li/LiF samples, upon exposure to 20 m LiTFSI : 8 m
LiBETI electrolyte, the concentration of hydrogen measured by GC-TCD is two to three
times lower than that measured in 20 m LiTFSI electrolyte. Nevertheless, the
concentration of gas keeps increasing upon measurement, indicating a continuous
degradation of the coating and a greater reactivity of the underlying Li electrode.
Eventually, 6.4 % of metallic Li is estimated to be consumed after two hours, as
summarized in Table 4. 4.

Chapter 4 – Understanding of inorganic SEI limitations in WiSE 141
Figure 4. 10 Gas evolution as a function of time for 10 nm Al2O3-coated metallic Li samples after exposure to 20m LiTFSI (red) and 20m LiTFSI : 8m LiBETI (pink) aqueous superconcentrated electrolytes.
To summarize, acknowledging that the high-quality LiF layer prepared in this work,
as well as Al2O3 prepared by ALD deposition method, will always exhibit some degree of
structural defects (cracks, microporosity or else) alike a native SEI which consists of a
mosaic of LiF grains111,240, our study highlights that even if the use of superconcentrated
aqueous electrolytes prevents the dissolution of the inorganic SEI compounds, these
electrolytes are deprived of self-passivating ability through the formation of an organic-
inorganic SEI outer layer required to stabilize anode materials.

142 Chapter 4 – Understanding of inorganic SEI limitations in WiSE
Filling the structural defects by presoaking in organic electrolyte: assessment of the importance of an organic-inorganic based SEI5
To overcome the absence of self-passivation, Li/LiF samples were soaked in three
organic-based solutions: pure fluoro-ethylene carbonate (FEC) solvent and two
electrolytes, namely 7 M LiFSI in FEC and 2 M LiFSI : 1 M LiTFSI in DOL:DME (1:1 %vol)
with 3 % LiNO3 additive, both known for forming good elastomeric passivating SEI with
a LiF-rich inner layer and enabling very high Coulombic efficiencies for Li
plating/striping252–254. After soaking, during which any possible defects within the LiF
layer may be further passivated by the formation of an additional organic-inorganic layer
derived from a non-aqueous electrolyte, the samples are exposed to superconcentrated
aqueous electrolyte and hydrogen evolution in measured by GC-TCD (Figure 4. 11).
Figure 4. 11 Illustration of the presoaking step in organic solvent/electrolyte, further exposed to aqueous superconcentrated electrolyte.
Hydrogen concentration is measured over time for pristine Li/LiF sample and samples
presoaked in 50 µL or 2 mL of FEC further exposed to WiBS (see Figure 4. 12a). First, the
5 Gustavo M. Hobold did GC-TCD experiments from the Department of mechanical engineering, MIT, Cambridge. Rui Guo, Gustavo M. Hobold and Betar Gallant from the Department of mechanical engineering, MIT, Cambridge, carried out XPS analysis.

Chapter 4 – Understanding of inorganic SEI limitations in WiSE 143
hydrogen concentration measured after presoaking the sample in 50 µL of pure FEC is
similar than for the pristine LiF-protected Li sample (22 % of metallic Li consumption for
pristine sample vs 19 % for the sample presoaked in 50 µL FEC, see Table 4. 5).
Interestingly, when increasing the volume of FEC during the soaking step (from 50 µL to
2 mL), we observe an increase of hydrogen evolution (≈ 3 % after 15 min compared to ≈
1 % for the pristine Li/LiF as shown in Figure 4. 12a) which is translated into an increased
metallic Li consumption from 22 % to 55 % (see Table 4. 5). Combining this observation
with post soaking XPS analysis (see Figure 4. 12b and c), one can attribute it to the partial
dissolution of the LiF layer in FEC as the intensity of both the F 1s and the Li 1s signals
decreases for the sample presoaked in 2 mL FEC (see signal [1] on Figure 4. 12b and c).
Figure 4. 12 (a) Hydrogen evolution as function of time for pristine Li/LiF sample (pink), presoaked in 2 mL FEC (light blue, empty square), presoaked in 50 µL FEC (light blue, full square) prior to exposure to 20 m LiTFSI : 8 m LiBETI. X-ray photoelectron spectroscopy (XPS) spectrum of (b) F 1s and (c) Li 1s of pristine Li/LiF [0], presoaked Li/LiF sample in 2 mL FEC [1], presoaked Li/LiF sample in 50 µL FEC [2].

144 Chapter 4 – Understanding of inorganic SEI limitations in WiSE
Table 4. 5 Consumption of metallic Li after exposure to 20 m LiTFSI : 8 m LiBETI for the Li/LiF sample: pristine, presoaked in 2 mL FEC, presoaked in 50 µL FEC assuming hydrogen evolution only caused by HER in Li consumption ratio calculation.
Unfortunately, the solubility of the LiF layer in FEC as observed during these
experiments could not be correlated with a greater solubility limit for LiF in FEC, as
determined in Section 0 by ISE methods for other solvents. Indeed, the main advantage
of the fluoride ion selective electrode technique lies in its ability to measure fluoride
concentration in organic solvent/electrolyte diluted in an aqueous ionic strength buffer.
Hence, Strmcnik et al.244 showed that by diluting LP57 (EC/EMC/LiPF6) in ionic aqueous
strength buffer by a factor 100, the hydrolysis of PF6- anions was quenched.
Nonetheless, despite this approach shows good results in LP57, continuous hydrolysis
of FEC was observed in the ionic aqueous strength buffer with a continuous increase of
the probed [F-] concentration for over a week (from ≈ 3 g / L at 23 °C to ≈ 180 g /L at 23
°C for both LiF-saturated or non-LiF-saturated FEC solution after one week). This effect
prevented us to determine the solubility limit of fluoride in pure FEC.
To overcome the dissolution of the LiF coating, samples were then soaked in an ether-
based electrolyte (1 M LiTFSI : 2 M LiFSI in DOL:DME + 3 % LiNO3). As mentioned in
section 4.1 and shown in Figure 4. 2, DOL:DME-based electrolyte should not dissolve LiF
layer. When exposing this sample to WiBS (see Figure 4. 13a, purple dots), the hydrogen
evolution is greater after 15 min (≈ 1.6 %) than for the pristine Li/LiF sample.
Nevertheless, the signal rapidly decreases and stabilizes below 1 % of hydrogen detected
in the headspace. Overall, after this equilibration period, soaking the Li/LiF anode in 1 M
LiTFSI : 2 M LiFSI in DOL:DME + 3% LiNO3 has a slight positive impact on the gassing,
decreasing the metallic Li consumption through hydrogen evolution by 4 % when
compared with the pristine Li/LiF sample (see Table 4. 6).
Exposure to 20 m LiTFSI : 8 m LiBETI
Molar ratio of H2 (after 120min)
xHydrogen(%)
Amount of H2 released (after
120min) nHydrogen (µmol)
Ratio of Li consumed (after
120min) (%)
Li/LiF pristine 7.63 53 22
Li/LiF presoaked in 2 mL pure FEC
19.6 135 55
Li/LiF presoaked in 50 µL pure FEC
6.85 47 19

Chapter 4 – Understanding of inorganic SEI limitations in WiSE 145
To further study the impact of presoaking in organic electrolyte, we then soaked a
Li/LiF sample in an organic superconcentrated electrolyte, namely 7 M LiFSI in FEC,
before exposing it to WiBS (see Figure 4. 13a, yellow dots). This soaking step is found to
have a beneficial impact and diminishes the hydrogen evolution upon exposure to WiBS,
which approaches the detection limit even at the earlier stage of exposure (0.035 % of
the total headspace after 15 min). Furthermore, even if the amount of hydrogen
detected slightly increases with time, it corresponds to a consumption of metallic Li of
only 4 % after two hours considering HER as the sole source for H2 evolution, compared
to 22 % for the pristine Li/LiF sample as described in Table 4. 6.
Figure 4. 13 Hydrogen evolution as function of time for Li/LiF samples. Li/LiF presoaked in pure FEC (light blue), Li/LiF presoaked in 7 M LiFSI in FEC (yellow) or presoaked in 2 M LiFSI : 1 M LiTFSI in DOL:DME (purple) prior to exposure to (a) 20 m LiTFSI : 8 m LiBETI with pristine Li/LiF in pink, (b) 20 m LiTFSI, with pristine Li/LiF in red.
Table 4. 6 Consumption of Li after exposure to 20 m LiTFSI : 8 m LiBETI for the Li/LiF pristine, presoaked in 2 mL FEC, presoaked in 50 µL FEC, presoaked in 7 M LiFSI in FEC or 2 M LiFSI : 1 M LiTFSI in DOL:DME, 3 % LiNO3 assuming hydrogen evolution only caused by HER in metallic Li consumption ratio calculation.
Besides, similar experiments have been performed in WiSE (see Figure 4. 13b). As in
WiBS, the presoaking in 1 M LiTFSI : 2 M LiFSI in DOL:DME + 3 % LiNO3 and in 7 M LiFSI
Exposure to 20 m LiTFSI : 8 m LiBETI
Molar ratio of H2 (after 120min)
xHydrogen(%)
Amount of H2 released (after
120min) nHydrogen (µmol)
Ratio of Li consumed
(after 120min) (%)
Li/LiF pristine 7.63 53 22
Li/LiF presoaked in 50 µL of 2 M LiFSI + 1 M LiTFSI in DOL:DME, 3 % LiNO3
6.44 44 18
Li/LiF presoaked in 50 µL of 7 M LiFSI in FEC
1.41 10 4

146 Chapter 4 – Understanding of inorganic SEI limitations in WiSE
FEC has a beneficial, but reduced, impact on the hydrogen gassing. The metallic Li
consumption of LiF-coated Li samples exposed to WiSE fades from 74 % for the pristine
sample to 27 % in 1 M LiTFSI : 2 M LiFSI in DOL:DME and 33 % in 7 M LiFSI in FEC,
respectively, as described in Table 4. 7. Furthermore, trends observed for both organic
electrolytes are similar than in WiBS. In details, after 15 min exposure to WiSE, the
hydrogen concentration measured for the sample soaked in 1 M LiTFSI : 2 M LiFSI in
DOL:DME increases to ≈ 3 % then stabilizes at ≈ 1 % while it is mostly constant during
the two hours experiment after soaking in 7 M LiFSI in FEC. However, one can notice
that although the decrease of metallic Li consumption is significant, the differences
recorded between these two soaking steps is less remarkable than in WiBS and the
metallic Li consumption is still greater than the one of the sample exposed to WiBS. One
possible explanation would be the difference of kinetics for such electrolyte penetration
being dependent on its viscosity and the mass transport across the microporosity and/or
cracks leading to a faster access of water in the case of WiSE and preventing from greater
performances.
Table 4. 7 Consumption of metallic Li after exposure to 20 m LiTFSI for the Li/LiF samples: pristine, presoaked in 7 M LiFSI in FEC or 2 M LiFSI : 1 M LiTFSI in DOL:DME, 3 % LiNO3 assuming HER as sole source for hydrogen evolution in metallic Li consumption ratio calculation.
Exposure to 20 m LiTFSI
Molar ratio of H2 (after 120 min)
xHydrogen(%)
Amount of H2 released (after 120
min) nHygrogen (µmol)
Ratio of Li consumed (after
120 min) (%)
Li/LiF pristine 26.35 182 74
Li/LiF presoaked in 7 M LiFSI in FEC
11.53 80 33
Li/LiF presoaked in 2 M LiFSI : 1 M LiTFSI in DOL:DME, 3 % LiNO3
7.94 67 27
Based on the decrease of hydrogen gassing observed during GC-TCD measurements,
XPS analysis were performed to analyze the surface of the Li/LiF samples after the
presoaking step. XPS spectrum of C 1s, O 1s, F 1s, Li 1s, N 1s and S 2p are shown in Figure
4. 14. First of all, presoaking step in DOL:DME-based electrolyte or FEC-based electrolyte
almost fully covered the Li/LiF layer with another layer. Indeed, the signal intensity of
LiF is barely visible in F 1s and Li 1S spectrum (Figure 4. 14c and d). Moreover, the nature
of the additional covering layer formed during presoaking step may be attributed to the
formation of a salt-derived layer as shown by LiTFSI or LiFSI signals in Figure 4. 14b, c, e

Chapter 4 – Understanding of inorganic SEI limitations in WiSE 147
and f. Regarding presoaking step in DOL:DME-based electrolyte, C 1s spectra gives a
greater amount of carbonaceous compounds, i.e. more organic-based species deposited
on the Li/LiF sample that can be due to the presence of C-F bound in TFSI salt. Therefore,
one can suspect that the beneficial impact of 7 M LiFSI in FEC and 1 M LiTFSI : 2 M LiFSI
in DOL:DME + 3 % LiNO3 arises from their ability to form an inorganic-organic SEI upon
decomposition on the surface of Li, 71,249 both being able to partially compensate the
microstructural defects of the ex-situ LiF interface. Hence, post-soaking XPS analysis
reveal the formation of a salt-derived inorganic SEI for both electrolytes with an organic
contribution for the DOL:DME-based electrolyte.
Consequently, the beneficial impact on hydrogen gassing when a Li/LiF sample is
exposed to WiBS ranks as follows: pristine Li/LiF < pure FEC < 1 M LiTFSI : 2 M LiFSI in
DOL:DME + 3% LiNO3 < 7 M LiFSI in FEC. From this trend, one can conclude that the
ability of the electrolyte to form and maintain stable a LiF-rich SEI inner layer is of prime
importance to positively stabilize the interface. Additionally, having an organic
contribution to the SEI, as we observe for DOL:DME tends to be beneficial. All of this
without promoting the partial dissolution of the SEI.

148 Chapter 4 – Understanding of inorganic SEI limitations in WiSE
Figure 4. 14 X-ray photoelectron spectroscopy (XPS) spectrum of (a) C 1s, (b) O 1s, (c) F 1s, (d) Li 1s, (e) N 1s, (f) S 2p of pristine Li/LiF [0], presoaked in 50 µL FEC [1], presoaked in 7 M LiFSI [2] and presoaked in 2 M LiFSI : 1 M LiTFSI in DOL:DME, 3% LiNO3 [3].
Conclusion of the chapter
In this Chapter, we first determined the fluoride solubility limit of LiF salt as function
of LiTFSI salt concentration from diluted aqueous media to aqueous superconcentrated
electrolyte. Based on these measurements, one can conclude that LiF-based SEIs is non-
soluble in both 20 m LiTFSI and 20 m LiTFSI : 8 m LiBETI. Therefore, LiF coatings onto
metallic Li were used to mimic LiF-based SEI in aqueous superconcentrated electrolyte.
Combining E-SEM with GC-TCD measurements during Li/LiF samples exposition to
moisture or WiSE/WiBS, respectively, enable to find that unlike in classical organic
electrolyte, aqueous superconcentrated electrolyte cannot self-passivate the interface.
These results are further confirmed by testing insoluble Al2O3 coating resistance to
WiSE/WiBS exposure. Indeed, hydrogen production is also found even though less
intense. Therefore, a presoaking step in organic electrolyte known to form good

Chapter 4 – Understanding of inorganic SEI limitations in WiSE 149
passivating SEI with LiF-rich inner layer and organic outer layer was employed to analyze
the importance of organic-inorganic species in the SEI to maintain it stable. To do so, 1
M LiTFSI : 2 M LiFSI in DOL:DME + 3 % LiNO3 or 7 M LiFSI in FEC were tested. GC-TCD
results show that hydrogen evolution is diminished. This may be explained by the
formation of a salt-derived SEI, as shown by XPS post-soaking analysis, as well as the
presence of organic compounds in the case of the DOL:DME-based electrolyte.
Moreover, combining these analysis and comparing them with those obtained in organic
electrolytes, we conclude on the partially-protective role of both native and artificial LiF-
rich SEI for superconcentrated aqueous electrolytes. More importantly, we demonstrate
that a salt-derived inorganic and solvent-derived organic layers play a crucial role in the
SEI’s ability to self-repair and allow for cycling anode material outside of the
thermodynamic stability window of the electrolyte.
Indeed, as recently demonstrated with the use of organic co-solvents such as
acetonitrile 192, DMC191,255 or ether-based one (TEGDME)193, organic SEI outer layer
seems to be beneficial. Similarly, additives such as urea190,256 were also shown to have
positive effects on the cycling behavior of Li4Ti5O12 anode (1.7 V vs Li+/Li) in WiSE-based
batteries owing to its decomposition in both inorganic (Li2CO3) and amorphous organic
(polyuria) layers. Nevertheless, bearing in mind that in these electrolytes, the first
solvation sheath of Li+ contains both water and organic species, it is tempting to
conclude that both should be simultaneously present at the interface, leading to the
detrimental reduction of water simultaneously to the SEI formation (knowing that
solvating water molecules are more reactive than non-solvating ones144). Moreover,
despite the diminished hydrogen evolution with an artificial inorganic LiF layer
presoaked in 7 M LiFSI in FEC, these ex-situ protections are not sufficient to envision
practical applications. Indeed, considering the electrolyte’s water content as the limiting
factor, in the best-case scenario, fewer than 50 cycles in WiSE and 250 cycles in WiBS
would be achieved before the drying out of a cell cycled at 1C rate (see Table 4. 8).
Furthermore, taking into account the quantity of metallic Li used in this study (489
µmol), only six hours would be needed to fully consume the metallic Li in WiSE, and less
than fifty hours in WiBS. These simple calculations do not take into account electrolyte
crystallization but merely the full consumption of water, thus providing grossly
underestimated numbers that would be even worse in practice. Evidently, using metallic
Li as an anode leads to harsh degradation which could be partially alleviated, or at least
slowed down, by the use of an anode material with a greater redox potential (LTO, TiO2,
Mo6S8, LTP or else). Indeed, around 8750 cycles could be performed using unprotected

150 Chapter 4 – Understanding of inorganic SEI limitations in WiSE
Mo6S8 as negative electrode before the complete drying out of the cell as shown in Table
4. 8, this gain in cycling life coming at the expense of energy density.
Table 4. 8 Estimation of water and metallic Li consumption according to the gassing measured by GC-TCD.
*based on Chapter 2 and 3, rate of water consumption is calculated to be ≈ 0.0005
%initial water amount/hself-discharge for a stable SEI formed and ≈ 0.004 %initial water amount/hcycling at
1C during cycling. Therefore, in this calculation, we only consider cycling data.
As a conclusion, altogether, this work evidences that 1) the use of superconcentrated
aqueous electrolytes does not allow for the self-passivation of the SEI at the anode; 2)
the solubility is not the predominant factor governing the poor stability of such inorganic
coatings. These results are in good agreement with the performances obtained with self-
discharge protocol (drop of discharge capacity and Coulombic efficiency after resting
period) in Chapter 2 and 3. Eventually, while inorganic-rich interphases can physically
impede the reaction and allow for a certain stability over a short period, the aqueous
electrolyte will inherently reaches the underlying anode material owing to extrinsic
defects, which will be present in any practical the SEI. Furthermore, bearing in mind that
cracks and/or microporosity may continuously form upon cycling, triggering their self-
passivation is necessary to protect the underlying electrode. Towards that goal, two
strategies can be envisioned, either with additives or with organic coatings. Regarding
Case Li/LiF, cracks filled with 7M LiFSI in FEC,
exposure to WiSE
Li/LiF, cracks filled with 7M LiFSI in FEC, exposure to
WiBS
Mo6S8 electrode used in WiSE
(based on Chapter 2 and 3)
Water consumption µmo𝑙𝐻20/ℎ
80 10 *0.14
Water amount in 250 µL of electrolyte
(mmol) 3.49 2.48 3.49
Time (h) needed to consume water
44 248 25000
Number of cycle considering 1C C-rate
(1 Li+ inserted / h) <50 <250 <6300
Li amount used in the study (µmol)
489 489
Time (h) needed to consume Li
6.1 48.9

Chapter 4 – Understanding of inorganic SEI limitations in WiSE 151
the use of additives, they must be targeted following their ability to preferentially
solvate Li+ and thus displace water from its solvation sheath. Organic coatings can also
be developed by a grafting strategy or by laminating polymer protective layers, as
previously reported120,204. Towards these goals, the perspectives of this thesis will be
dedicated to polymer layer as artificial SEI for aqueous superconcentrated electrolyte
LIB application.


GENERAL CONCLUSION AND PERSPECTIVES

154 General conclusion
Through this phd thesis, the use of aqueous superconcentrated electrolyte, namely
Water-in-salt, was investigated in LIB. The attraction towards WiSE is explained by
structural and physical modifications arising from the formation of two interpenetrated
networks in these electrolytes, a water-rich network and an anion-rich one. This peculiar
solvation structure was shown to enable fast transport with high Li+ cation transference
number while promoting the formation of a salt-derived inorganic-rich SEI at the
negative interface and preventing water oxidation on the positive side thanks to the
formation of an hydrophobic double-layer. Therefore, the electrochemical stability
window of these electrolytes was reported to increase above 2 V. These changes in
physico-chemical properties and in interfacial reactivity, and the influence of
superconcentrated aqueous electrolytes on LIB performances are described in the first
chapter.
Besides, the set-up of a systematic study on both the anodic and cathodic stability of
20 m LiTFSI was performed as function of the operating conditions to assess the viability
of WiSE electrolyte in LIB. Although the impact of the increase in concentration was
shown to positively impact cell performances at room temperature, by changing the C-
rate, the presence of parasitic reaction is brought to light. These parasitic reactions were
found to be even further damaging at higher temperature. Therefore, operando gas
monitoring experiments were carried out to determine the nature of the parasitic
reactions causing performances decay. Combining pressure cell and online
electrochemical mass spectrometry, hydrogen evolution (HER) was found to occur both
during cycling and resting period, triggering a so-called self-discharge. However, one
must note that self-discharge appears partially reversible in terms of lithium balance,
the major drawback being the irreversible water consumption. Eventually, this study
was completed with the use of 20 m LiTFSI : 8 m LiBETI to illustrate that the
aforementioned limitations are general to aqueous superconcentrated electrolytes used
in LIB. Indeed, alike what was observed in 20 m LiTFSI, this study show that the HER
takes place during cycling and resting period, suggesting a weak passivation of the SEI
formed in these WiSEs, though HER intensity was found much decreased in 20 m LiTFSI
: 8 m LiBETI when compared to 20 m LiTFSI. Besides, on the anodic side, the oxygen
evolution impact was shown to be non-existent at room temperature, and to have
limited impact at higher temperature. Altogether, the results found in Chapter 2 show
that the main issue regarding the use of WiSE regards the negative electrode and the
SEI stability.

General conclusion 155
To understand these limitations, the native SEI stability was investigated by
electrochemical characterizations (cyclic voltammetry and electrochemical impedance
spectroscopy), showing the passivating power of the SEI but its poor efficiency towards
preventing water consumption. The later was further highlighted by differential
scanning calorimetry showing a shift in crystallization peak attesting of an increase in
salt concentration after cycling and resting period. Besides, rate of water consumption
during resting was found in the same order of magnitude than the rate of water
consumption albeit smaller. Moreover, the de-intercalation rates of Li+ during self-
discharge and cycling were found to largely differ. To comprehend this observation, the
activation energy of self-discharge phenomenon occurring during resting was
determined and compared to the activation energy of the HER taking place during
cycling. Experimental results confirmed a similar activation energy (≈ 20 kJ/mol),
suggesting that self-discharge is governed by HER rather than by delithiation of the
negative electrode. Altogether, in Chapter 3 the dramatic impact of water reduction
during self-discharge and cycling is highlighted when relying on the formation of a native
SEI.
To understand the relative instability of the native SEI, the solubility of LiF (the major
contributor to the SEI) was studied in several media, from pure water, 1 m LiTFSI to 20
m LiTFSI and 20 m LiTFSI : 8 m LiBETI WiSEs. Experimental results demonstrate that a
≈ 10 nm LiF thickness (comparable to a native SEI one) should not completely dissolve
in aqueous superconcentrated electrolyte, showing that solubility is not the issue. To
probe if the microstructure of the native SEI is limiting its stability, an artificial LiF SEI
was prepared onto metallic Li (Li/LiF) to assess the efficiency of an inorganic coating to
protect the negative electrode from water reduction. Combining E-SEM and GC-TCD
measurements, the exposure to moisture or aqueous superconcentrated electrolyte
was found to enable water to react with Li, despite the presence of a conformal LiF
coating. More impactful, WiSE or WiBS do not allow for self-passivation unlike what is
observed in organic electrolyte (here, in LP30). The absence of self-passivation was
confirmed using Al2O3 coating, known to be insoluble in water, demonstrating that in
the absence of self-passivation water reacts with the underlying electrode through
surface defects such as micro-porosity or cracks in the SEI. In order to overcome this
limitation, a presoaking step was performed in organic electrolyte known to form good
passivating SEI with LiF-rich inner layer and organic outer layer: 1 M LiTFSI : 2 M LiFSI in
DOL:DME + 3 % LiNO3 or 7 M LiFSI in FEC. GC-TCD measurements show that hydrogen
evolution is diminished when further exposing the electrode to WiSE or WiBS, owing to
the deposition of salt-derived compounds as shown by XPS. As a consequence, the use

156 General conclusion
of artificial inorganic SEI coupled with presoaking in organic electrolyte demonstrates
the need for the SEI to be able to self-repair. It further suggests that the presence of
organic component further promote SEI stability, and that negative electrode may
operate at low potential far below the ESW limit if coated with such organic layer.
The figure-of-merits, as detailed in Chapter 3, compare the performances of WiSE-
based LIB with that of other rechargeable battery technologies such as Lead-acid, Ni-Cd,
Ni-MH and commercial LIB (using diluted organic electrolyte). Evidently, WiSE-based
batteries can only operate within a ≈ 2 V operating window to avoid parasitic reactions,
thus drastically limiting the energy density and specific energy compared to Ni-MH
batteries. Moreover, while the use of chemical-engineering means to handle gas
generated during cycling could be envisioned, alike what is done for other aqueous
secondary battery (Lead-acid, etc.), the superconcentration may cause rapid
crystallization of the electrolyte for vented or flooded-type cells that evacuate gases
produced without compensating water consumption. However, paradoxically, too few
oxygen is produced at the positive while hydrogen production happens concomitantly
with Li+ insertion at the negative, thus preventing the implementation of the “oxygen
cycle” used in sealed-type batteries. Apart from energy consideration, a major drawback
of most of the aqueous superconcentrated electrolytes is their narrow thermal stability
range. Indeed, they often crystallize near room temperature. Several strategies were
previously shown to overcome the operating temperature range limitation by the use
of asymmetric anion and/or the introduction of organic co-solvent that downshift the
melting point, as detailed in the first chapter. Finally, and more critically, while self-
discharge is found reversible in terms of Li+ balance, it is responsible for irreversible
water consumption. Therefore, means need to be found to reduce capacity fading and
prevent electrolyte crystallization for large-scale commercialization.
As a summary, WiSE-based batteries still face many drawbacks that must be
overcome before to attain satisfactory performance when compared with commercial
LIB batteries. Many strategies are envisioned to improve these systems. As detailed in
the first chapter, the introduction of organic-solvent was brought to tune the first
solvation sheath of Li+ promoting the organic co-solvent reduction and thus its
participation to SEI formation while (i) reducing the amount of water in the first
solvation sheath and (ii) disrupting the water H-bonds network. Nonetheless, bearing in
mind that water is still partially involved in the solvation sheath, it is tempting to
conclude that both the organic co-solvent and water will be reduce at low potential,
thus not fully addressing the cathodic challenge. Based on the performances first

General conclusion 157
reported in 2017 by Yang et al.204, the use of organic polymer coating could be seen as
a promising path to develop. Therefore, we tried to reproduce their results and to
assemble a battery, as described in Figure Conclusion. 1. The polymer coating is based
on 0.5 M LiTFSI dissolved in a highly fluorinated ether solvent (HFE): DMC mixture (95:5
vol%) with 10 wt% PEO. Here, DMC is used as a co-solvent to promote LiTFSI and PEO
dissolution in HFE. It is then removed during the fabrication process and does not
participate to the final coating layer. However, during our trials, difficulties to dissolve
LiTFSI and PEO in such low quantity of DMC were encountered, forcing us to move to
acetonitrile as co-solvent to enable the dissolution201. Once the gel is obtained, the
deposition on the negative electrode was found tricky/hard to reproduce. Indeed, the
gel is sticky and need to be heated up to flow in liquid state during coating procedure.
Therefore, no success in cycling such polymer-protected WiSE batteries was obtained
yet, but trials are being performed. As a summary, even though the use of polymer
coating was reported to enable the cycling of metallic Li or graphite, to the best of my
knowledge, its technical implementation requires improvement.
Figure Conclusion. 1 Scheme of a Li-ion battery relying on the use of a polymer coating on the negative electrode. The polymer coating is based on 0.5 M LiTFSI in a highly fluorinated ether (HFE):DMC (95:5 vol%) mixture with 10 wt% polyethylene oxide (PEO).


REFERENCES
(1) International energy agency. World Energy Outlook 2020. 2020.
(2) International energy agency. World Energy Outlook 2021. 2021, 386.
(3) Bloomberg New Energy Finance, “Electric Vehicle Outlook 2020”,
BloombergNEF, New-York. 2020.
(4) Avicenne. Avicenne Energy Report: EU Battery Demand and Supply (2019-2030)
in a Global Context.
(5) Cano, Z. P.; Banham, D.; Ye, S.; Hintennach, A.; Lu, J.; Fowler, M.; Chen, Z.
Batteries and Fuel Cells for Emerging Electric Vehicle Markets. Nat Energy 2018,
3 (4), 279–289. https://doi.org/10.1038/s41560-018-0108-1.
(6) May, G. J.; Davidson, A.; Monahov, B. Lead Batteries for Utility Energy Storage:
A Review. Journal of Energy Storage 2018, 15, 145–157.
https://doi.org/10.1016/j.est.2017.11.008.
(7) Reddy, T.; Linden, D. Linden’s Handbook of Batteries (4th Edition).; McGraw-
Hill Professional Publishing: New York, USA, 2010.
(8) Van den Bossche, P.; Vergels, F.; Van Mierlo, J.; Matheys, J.; Van Autenboer, W.
SUBAT: An Assessment of Sustainable Battery Technology. Journal of Power
Sources 2006, 162 (2), 913–919. https://doi.org/10.1016/j.jpowsour.2005.07.039.
(9) Beck, F.; Rüetschi, P. Rechargeable Batteries with Aqueous Electrolytes.
Electrochimica Acta 2000, 45 (15–16), 2467–2482. https://doi.org/10.1016/S0013-
4686(00)00344-3.
(10) Rouxel, J.; Danot, M.; Bichon, M. Les Composites Intercalaires NaxTiS2. Etude
Gènérale Des Phases NaxTiS2 et KxTiS2. Bulletin de la Société Chimique de France
1971, 11, 3930–3936.
(11) Whittingham, M. S. Intercalation Chemistry and Energy Storage. Journal of Solid
State Chemistry 1979, 29 (3), 303–310. https://doi.org/10.1016/0022-
4596(79)90187-7.
(12) Whittingham, M. S. Electrical Energy Storage and Intercalation Chemistry.
Science 1976, 192 (4244), 1126–1127.
https://doi.org/10.1126/science.192.4244.1126.
(13) Whittingham, M. S. CHALCOGENIDE BATTERY, US4009052A. 1977, 5.

160 References
(14) Lin, D.; Liu, Y.; Cui, Y. Reviving the Lithium Metal Anode for High-Energy
Batteries. Nature Nanotech 2017, 12 (3), 194–206.
https://doi.org/10.1038/nnano.2017.16.
(15) Blomgren, G. E. The Development and Future of Lithium Ion Batteries. J.
Electrochem. Soc. 2017, 164 (1), A5019–A5025.
https://doi.org/10.1149/2.0251701jes.
(16) Kalyani, P.; Kalaiselvi, N. Various Aspects of LiNiO 2 Chemistry: A Review.
Science and Technology of Advanced Materials 2005, 6 (6), 689–703.
https://doi.org/10.1016/j.stam.2005.06.001.
(17) Yabuuchi, N.; Ohzuku, T. Novel Lithium Insertion Material of
LiCo1/3Ni1/3Mn1/3O2 for Advanced Lithium-Ion Batteries. Journal of Power
Sources 2003, 119–121, 171–174. https://doi.org/10.1016/S0378-7753(03)00173-
3.
(18) Noh, H.-J.; Youn, S.; Yoon, C. S.; Sun, Y.-K. Comparison of the Structural and
Electrochemical Properties of Layered Li[NixCoyMnz]O2 (x = 1/3, 0.5, 0.6, 0.7, 0.8
and 0.85) Cathode Material for Lithium-Ion Batteries. Journal of Power Sources
2013, 233, 121–130. https://doi.org/10.1016/j.jpowsour.2013.01.063.
(19) Rozier, P.; Tarascon, J. M. Review—Li-Rich Layered Oxide Cathodes for Next-
Generation Li-Ion Batteries: Chances and Challenges. J. Electrochem. Soc. 2015,
162 (14), A2490–A2499. https://doi.org/10.1149/2.0111514jes.
(20) Thackeray, M. M.; David, W. I. F.; Bruce, P. G.; Goodenough, J. B. Lithium
Insertion into Manganese Spinels. Materials Research Bulletin 1983, 18 (4), 461–
472. https://doi.org/10.1016/0025-5408(83)90138-1.
(21) Lazzari, M.; Scrosati, B. A Cyclable Lithium Organic Electrolyte Cell Based on
Two Intercalation Electrodes. J. Electrochem. Soc. 1980, 127 (3), 773–774.
https://doi.org/10.1149/1.2129753.
(22) Yazami, R.; Touzain, Ph. A Reversible Graphite-Lithium Negative Electrode for
Electrochemical Generators. Journal of Power Sources 1983, 9 (3), 365–371.
https://doi.org/10.1016/0378-7753(83)87040-2.
(23) Basu, S.; Somerset, N. J. US4423125A, Bell Laboratories. 1983, 4.
(24) Fong, R.; von Sacken, U.; Dahn, J. R. Studies of Lithium Intercalation into Carbons
Using Nonaqueous Electrochemical Cells. J. Electrochem. Soc. 1990, 137 (7),
2009–2013. https://doi.org/10.1149/1.2086855.
(25) Fujimoto, M.; Yoshinaga, N.; Furukawa, N.; Nohma, T.; Takahashi, M. LITHIUM
SECONDARY BATTERY, US5686138A. 1994, 55.
(26) Yoshino, A. The Birth of the Lithium-Ion Battery. Angew. Chem. Int. Ed. 2012, 51
(24), 5798–5800. https://doi.org/10.1002/anie.201105006.

References 161
(27) Tarascon, J. M.; Armand, M. Issues and Challenges Facing Rechargeable Lithium
Batteries. Nature 2001.
(28) Xu, K. Nonaqueous Liquid Electrolytes for Lithium-Based Rechargeable Batteries.
Chem. Rev. 2004, 104 (10), 4303–4418. https://doi.org/10.1021/cr030203g.
(29) Peled, E.; Menkin, S. Review—SEI: Past, Present and Future. J. Electrochem. Soc.
2017, 164 (7), A1703–A1719. https://doi.org/10.1149/2.1441707jes.
(30) Peled, E. The Electrochemical Behavior of Alkali and Alkaline Earth Metals in
Nonaqueous Battery Systems—The Solid Electrolyte Interphase Model. J.
Electrochem. Soc. 1979, 126 (12), 2047–2051. https://doi.org/10.1149/1.2128859.
(31) Zaban, A.; Aurbach, D. Impedance Spectroscopy of Lithium and Nickel Electrodes
in Propylene Carbonate Solutions of Different Lithium Salts A Comparative Study.
Journal of Power Sources 1995, 54 (2), 289–295. https://doi.org/10.1016/0378-
7753(94)02086-I.
(32) Edström, K.; Gustafsson, T.; Thomas, J. O. The Cathode–Electrolyte Interface in
the Li-Ion Battery. Electrochimica Acta 2004, 50 (2–3), 397–403.
https://doi.org/10.1016/j.electacta.2004.03.049.
(33) Liu, Y.-M.; G. Nicolau, B.; Esbenshade, J. L.; Gewirth, A. A. Characterization of
the Cathode Electrolyte Interface in Lithium Ion Batteries by Desorption
Electrospray Ionization Mass Spectrometry. Anal. Chem. 2016, 88 (14), 7171–
7177. https://doi.org/10.1021/acs.analchem.6b01292.
(34) Bassett, K. L.; Özgür Çapraz, Ö.; Özdogru, B.; Gewirth, A. A.; Sottos, N. R.
Cathode/Electrolyte Interface-Dependent Changes in Stress and Strain in Lithium
Iron Phosphate Composite Cathodes. J. Electrochem. Soc. 2019, 166 (12), A2707–
A2714. https://doi.org/10.1149/2.1391912jes.
(35) Goodenough, J. B.; Kim, Y. Challenges for Rechargeable Li Batteries. Chem.
Mater. 2010, 22 (3), 587–603. https://doi.org/10.1021/cm901452z.
(36) Peljo, P.; Girault, H. H. Electrochemical Potential Window of Battery Electrolytes:
The HOMO–LUMO Misconception. Energy Environ. Sci. 2018, 11 (9), 2306–
2309. https://doi.org/10.1039/C8EE01286E.
(37) Chen, W.; Ambrosio, F.; Miceli, G.; Pasquarello, A. Ab Initio Electronic Structure
of Liquid Water. Phys. Rev. Lett. 2016, 117 (18), 186401.
https://doi.org/10.1103/PhysRevLett.117.186401.
(38) Borodin, O.; Self, J.; Persson, K. A.; Wang, C.; Xu, K. Uncharted Waters: Super-
Concentrated Electrolytes. Joule 2020, 4 (1), 69–100.
https://doi.org/10.1016/j.joule.2019.12.007.

162 References
(39) Yamada, Y.; Yamada, A. Review—Superconcentrated Electrolytes for Lithium
Batteries. Journal of The Electrochemical Society 2015, 162 (14), A2406–A2423.
https://doi.org/10.1149/2.0041514jes.
(40) Suo, L.; Hu, Y.-S.; Li, H.; Armand, M.; Chen, L. A New Class of Solvent-in-Salt
Electrolyte for High-Energy Rechargeable Metallic Lithium Batteries. Nat
Commun 2013, 4 (1), 1481. https://doi.org/10.1038/ncomms2513.
(41) Seo, D. M.; Boyle, P. D.; Borodin, O.; Henderson, W. A. Li+ Cation Coordination
by Acetonitrile—Insights from Crystallography. RSC Adv. 2012, 2 (21), 8014.
https://doi.org/10.1039/c2ra21290k.
(42) Kunz, W.; Barthel, J.; Klein, L.; Cartailler, T.; Turq, P.; Reindl, B. Lithium
Bromide in Acetonitrile: Thermodynamics, Theory, and Simulation. J Solution
Chem 1991, 20 (9), 875–891. https://doi.org/10.1007/BF01074950.
(43) Yamada, Y.; Furukawa, K.; Sodeyama, K.; Kikuchi, K.; Yaegashi, M.; Tateyama,
Y.; Yamada, A. Unusual Stability of Acetonitrile-Based Superconcentrated
Electrolytes for Fast-Charging Lithium-Ion Batteries. Journal of the American
Chemical Society 2014, 136 (13), 5039–5046. https://doi.org/10.1021/ja412807w.
(44) Yamada, Y.; Wang, J.; Ko, S.; Watanabe, E.; Yamada, A. Advances and Issues in
Developing Salt-Concentrated Battery Electrolytes. Nature Energy 2019.
https://doi.org/10.1038/s41560-019-0336-z.
(45) Sodeyama, K.; Yamada, Y.; Aikawa, K.; Yamada, A.; Tateyama, Y. Sacrificial
Anion Reduction Mechanism for Electrochemical Stability Improvement in Highly
Concentrated Li-Salt Electrolyte. J. Phys. Chem. C 2014, 118 (26), 14091–14097.
https://doi.org/10.1021/jp501178n.
(46) McOwen, D. W.; Seo, D. M.; Borodin, O.; Vatamanu, J.; Boyle, P. D.; Henderson,
W. A. Concentrated Electrolytes: Decrypting Electrolyte Properties and
Reassessing Al Corrosion Mechanisms. Energy Environ. Sci. 2014, 7 (1), 416–426.
https://doi.org/10.1039/C3EE42351D.
(47) Vatamanu, J.; Borodin, O.; Smith, G. D. Molecular Insights into the Potential and
Temperature Dependences of the Differential Capacitance of a Room-Temperature
Ionic Liquid at Graphite Electrodes. J. Am. Chem. Soc. 2010, 132 (42), 14825–
14833. https://doi.org/10.1021/ja104273r.
(48) Jin, J.; Li, H. H.; Wei, J. P.; Bian, X. K.; Zhou, Z.; Yan, J. Li/LiFePO4 Batteries
with Room Temperature Ionic Liquid as Electrolyte. Electrochemistry
Communications 2009, 11 (7), 1500–1503.
https://doi.org/10.1016/j.elecom.2009.05.040.
(49) Yamada, Y.; Chiang, C. H.; Sodeyama, K.; Wang, J.; Tateyama, Y.; Yamada, A.
Corrosion Prevention Mechanism of Aluminum Metal in Superconcentrated
Electrolytes. ChemElectroChem 2015, 2 (11), 1687–1694.
https://doi.org/10.1002/celc.201500235.
References 163
(50) Vatamanu, J.; Borodin, O.; Smith, G. D. Molecular Dynamics Simulation Studies
of the Structure of a Mixed Carbonate/LiPF 6 Electrolyte near Graphite Surface as
a Function of Electrode Potential. J. Phys. Chem. C 2012, 116 (1), 1114–1121.
https://doi.org/10.1021/jp2101539.
(51) Borodin, O.; Ren, X.; Vatamanu, J.; von Wald Cresce, A.; Knap, J.; Xu, K.
Modeling Insight into Battery Electrolyte Electrochemical Stability and Interfacial
Structure. Acc. Chem. Res. 2017, 50 (12), 2886–2894.
https://doi.org/10.1021/acs.accounts.7b00486.
(52) Yamada, Y.; Usui, K.; Chiang, C. H.; Kikuchi, K.; Furukawa, K.; Yamada, A.
General Observation of Lithium Intercalation into Graphite in Ethylene-Carbonate-
Free Superconcentrated Electrolytes. ACS Appl. Mater. Interfaces 2014, 6 (14),
10892–10899. https://doi.org/10.1021/am5001163.
(53) Wang, J.; Yamada, Y.; Sodeyama, K.; Watanabe, E.; Takada, K.; Tateyama, Y.;
Yamada, A. Fire-Extinguishing Organic Electrolytes for Safe Batteries. Nature
Energy 2018, 3 (1), 22–29. https://doi.org/10.1038/s41560-017-0033-8.
(54) Yamada, Y.; Yamada, A. Superconcentrated Electrolytes to Create New Interfacial
Chemistry in Non-Aqueous and Aqueous Rechargeable Batteries. Chemistry
Letters 2017, 46 (8), 1056–1064. https://doi.org/10.1246/cl.170284.
(55) Qian, J.; Henderson, W. A.; Xu, W.; Bhattacharya, P.; Engelhard, M.; Borodin, O.;
Zhang, J.-G. High Rate and Stable Cycling of Lithium Metal Anode. Nat Commun
2015, 6 (1), 6362. https://doi.org/10.1038/ncomms7362.
(56) Alvarado, J.; Schroeder, M. A.; Zhang, M.; Borodin, O.; Gobrogge, E.; Olguin, M.;
Ding, M. S.; Gobet, M.; Greenbaum, S.; Meng, Y. S.; Xu, K. A Carbonate-Free,
Sulfone-Based Electrolyte for High-Voltage Li-Ion Batteries. Materials Today
2018, 21 (4), 341–353. https://doi.org/10.1016/j.mattod.2018.02.005.
(57) Wang, J.; Yamada, Y.; Sodeyama, K.; Chiang, C. H.; Tateyama, Y.; Yamada, A.
Superconcentrated Electrolytes for a High-Voltage Lithium-Ion Battery. Nature
Communications 2016, 7, 12032. https://doi.org/10.1038/ncomms12032.
(58) Yamada, Y.; Usui, K.; Sodeyama, K.; Ko, S.; Tateyama, Y.; Yamada, A. Hydrate-
Melt Electrolytes for High-Energy-Density Aqueous Batteries. Nature Energy
2016, 1 (10). https://doi.org/10.1038/nenergy.2016.129.
(59) McKinnon, W. R.; Dahn, J. R. How to Reduce the Cointercalation of Propylene
Carbonate in Li x ZrS2 and Other Layered Compounds. J. Electrochem. Soc. 1985,
132 (2), 364–366. https://doi.org/10.1149/1.2113839.
(60) Jeong, S.-K.; Inaba, M.; Iriyama, Y.; Abe, T.; Ogumi, Z. Electrochemical
Intercalation of Lithium Ion within Graphite from Propylene Carbonate Solutions.
Electrochem. Solid-State Lett. 2003, 6 (1), A13.
https://doi.org/10.1149/1.1526781.

164 References
(61) Yamada, Y.; Takazawa, Y.; Miyazaki, K.; Abe, T. Electrochemical Lithium
Intercalation into Graphite in Dimethyl Sulfoxide-Based Electrolytes: Effect of
Solvation Structure of Lithium Ion. J. Phys. Chem. C 2010, 114 (26), 11680–
11685. https://doi.org/10.1021/jp1037427.
(62) Yamada, Y.; Yaegashi, M.; Abe, T.; Yamada, A. A Superconcentrated Ether
Electrolyte for Fast-Charging Li-Ion Batteries. Chemical Communications 2013,
49 (95), 11194. https://doi.org/10.1039/c3cc46665e.
(63) Petibon, R.; Aiken, C. P.; Ma, L.; Xiong, D.; Dahn, J. R. The Use of Ethyl Acetate
as a Sole Solvent in Highly Concentrated Electrolyte for Li-Ion Batteries.
Electrochimica Acta 2015, 154, 287–293.
https://doi.org/10.1016/j.electacta.2014.12.093.
(64) Lu, D.; Tao, J.; Yan, P.; Henderson, W. A.; Li, Q.; Shao, Y.; Helm, M. L.; Borodin,
O.; Graff, G. L.; Polzin, B.; Wang, C.-M.; Engelhard, M.; Zhang, J.-G.; De Yoreo,
J. J.; Liu, J.; Xiao, J. Formation of Reversible Solid Electrolyte Interface on
Graphite Surface from Concentrated Electrolytes. Nano Lett. 2017, 17 (3), 1602–
1609. https://doi.org/10.1021/acs.nanolett.6b04766.
(65) Chen, S.; Zheng, J.; Yu, L.; Ren, X.; Engelhard, M. H.; Niu, C.; Lee, H.; Xu, W.;
Xiao, J.; Liu, J.; Zhang, J.-G. High-Efficiency Lithium Metal Batteries with Fire-
Retardant Electrolytes. Joule 2018, 2 (8), 1548–1558.
https://doi.org/10.1016/j.joule.2018.05.002.
(66) Angell, C. A.; Liu, C.; Sanchez, E. Rubbery Solid Electrolytes with Dominant
Cationic Transport and High Ambient Conductivity. Nature 1993, 362, 137–139.
(67) Tamura, T.; Yoshida, K.; Hachida, T.; Tsuchiya, M.; Nakamura, M.; Kazue, Y.;
Tachikawa, N.; Dokko, K.; Watanabe, M. Physicochemical Properties of Glyme–
Li Salt Complexes as a New Family of Room-Temperature Ionic Liquids. Chem.
Lett. 2010, 39 (7), 753–755. https://doi.org/10.1246/cl.2010.753.
(68) Tamura, T.; Hachida, T.; Yoshida, K.; Tachikawa, N.; Dokko, K.; Watanabe, M.
New Glyme–Cyclic Imide Lithium Salt Complexes as Thermally Stable
Electrolytes for Lithium Batteries. Journal of Power Sources 2010, 195 (18),
6095–6100. https://doi.org/10.1016/j.jpowsour.2009.11.061.
(69) Yoshida, K.; Nakamura, M.; Kazue, Y.; Tachikawa, N.; Tsuzuki, S.; Seki, S.;
Dokko, K.; Watanabe, M. Oxidative-Stability Enhancement and Charge Transport
Mechanism in Glyme–Lithium Salt Equimolar Complexes. J. Am. Chem. Soc.
2011, 133 (33), 13121–13129. https://doi.org/10.1021/ja203983r.
(70) Doi, T.; Masuhara, R.; Hashinokuchi, M.; Shimizu, Y.; Inaba, M. Concentrated
LiPF6/PC Electrolyte Solutions for 5-V LiNi0.5Mn1.5O4 Positive Electrode in
Lithium-Ion Batteries. Electrochimica Acta 2016, 209, 219–224.
https://doi.org/10.1016/j.electacta.2016.05.062.

References 165
(71) Suo, L.; Xue, W.; Gobet, M.; Greenbaum, S. G.; Wang, C.; Chen, Y.; Yang, W.;
Li, Y.; Li, J. Fluorine-Donating Electrolytes Enable Highly Reversible 5-V-Class
Li Metal Batteries. Proc Natl Acad Sci USA 2018, 115 (6), 1156–1161.
https://doi.org/10.1073/pnas.1712895115.
(72) Matsumoto, K.; Inoue, K.; Nakahara, K.; Yuge, R.; Noguchi, T.; Utsugi, K.
Suppression of Aluminum Corrosion by Using High Concentration LiTFSI
Electrolyte. Journal of Power Sources 2013, 231, 234–238.
https://doi.org/10.1016/j.jpowsour.2012.12.028.
(73) Shiga, T.; Okuda, C.; Kato, Y.; Kondo, H. Highly Concentrated Electrolytes
Containing a Phosphoric Acid Ester Amide with Self-Extinguishing Properties for
Use in Lithium Batteries. J. Phys. Chem. C 2018, 122 (18), 9738–9745.
https://doi.org/10.1021/acs.jpcc.7b12461.
(74) Hess, S.; Wohlfahrt-Mehrens, M.; Wachtler, M. Flammability of Li-Ion Battery
Electrolytes: Flash Point and Self-Extinguishing Time Measurements. J.
Electrochem. Soc. 2015, 162 (2), A3084–A3097.
https://doi.org/10.1149/2.0121502jes.
(75) Nakayama, N.; Nozawa, T.; Iriyama, Y.; Abe, T.; Ogumi, Z.; Kikuchi, K.
Interfacial Lithium-Ion Transfer at the LiMn2O4 Thin Film Electrode/Aqueous
Solution Interface. Journal of Power Sources 2007, 174 (2), 695–700.
https://doi.org/10.1016/j.jpowsour.2007.06.113.
(76) Sauvage, F.; Laffont, L.; Tarascon, J.-M.; Baudrin, E. Factors Affecting the
Electrochemical Reactivity vs. Lithium of Carbon-Free LiFePO4 Thin Films.
Journal of Power Sources 2008, 175 (1), 495–501.
https://doi.org/10.1016/j.jpowsour.2007.09.085.
(77) Tang, W.; Tian, S.; Liu, L. L.; Li, L.; Zhang, H. P.; Yue, Y. B.; Bai, Y.; Wu, Y. P.;
Zhu, K. Nanochain LiMn2O4 as Ultra-Fast Cathode Material for Aqueous
Rechargeable Lithium Batteries. Electrochemistry Communications 2011, 13 (2),
205–208. https://doi.org/10.1016/j.elecom.2010.12.015.
(78) Qu, Q.; Fu, L.; Zhan, X.; Samuelis, D.; Maier, J.; Li, L.; Tian, S.; Li, Z.; Wu, Y.
Porous LiMn2O4 as Cathode Material with High Power and Excellent Cycling for
Aqueous Rechargeable Lithium Batteries. Energy Environ. Sci. 2011, 4 (10), 3985.
https://doi.org/10.1039/c0ee00673d.
(79) Alias, N.; Mohamad, A. A. Advances of Aqueous Rechargeable Lithium-Ion
Battery: A Review. Journal of Power Sources 2015, 274, 237–251.
https://doi.org/10.1016/j.jpowsour.2014.10.009.
(80) Li, W.; Dahn, J. R.; Wainwright, D. S. Rechargeable Lithium Batteries with
Aqueous Electrolytes. Science 1994, 264 (5162), 1115–1118.
https://doi.org/10.1126/science.264.5162.1115.

166 References
(81) Tian, L.; Yuan, A. Electrochemical Performance of Nanostructured Spinel
LiMn2O4 in Different Aqueous Electrolytes. Journal of Power Sources 2009, 192
(2), 693–697. https://doi.org/10.1016/j.jpowsour.2009.03.002.
(82) Yadegari, H.; Jabbari, A.; Heli, H. An Aqueous Rechargeable Lithium-Ion Battery
Based on LiCoO2 Nanoparticles Cathode and LiV3O8 Nanosheets Anode. J Solid
State Electrochem 2012, 16 (1), 227–234. https://doi.org/10.1007/s10008-011-
1315-x.
(83) Ruffo, R.; Wessells, C.; Huggins, R. A.; Cui, Y. Electrochemical Behavior of
LiCoO2 as Aqueous Lithium-Ion Battery Electrodes. Electrochemistry
Communications 2009, 11 (2), 247–249.
https://doi.org/10.1016/j.elecom.2008.11.015.
(84) Ruffo, R.; La Mantia, F.; Wessells, C.; Huggins, R. A.; Cui, Y. Electrochemical
Characterization of LiCoO2 as Rechargeable Electrode in Aqueous LiNO3
Electrolyte. Solid State Ionics 2011, 192 (1), 289–292.
https://doi.org/10.1016/j.ssi.2010.05.043.
(85) Zhao, M. Excellent Rate Capabilities of (LiFePO4/C)//LiV3O8 in an Optimized
Aqueous Solution Electrolyte. Journal of Power Sources 2013, 6.
(86) Vujković, M.; Stojković, I.; Cvjetićanin, N.; Mentus, S. Gel-Combustion Synthesis
of LiFePO4/C Composite with Improved Capacity Retention in Aerated Aqueous
Electrolyte Solution. Electrochimica Acta 2013, 92, 248–256.
https://doi.org/10.1016/j.electacta.2013.01.030.
(87) Zhao, M.; Huang, G.; Zhang, B.; Wang, F.; Song, X. Characteristics and
Electrochemical Performance of LiFe0.5Mn0.5PO4/C Used as Cathode for Aqueous
Rechargeable Lithium Battery. Journal of Power Sources 2012, 211, 202–207.
https://doi.org/10.1016/j.jpowsour.2012.03.049.
(88) Wang, H.; Zeng, Y.; Huang, K.; Liu, S.; Chen, L. Improvement of Cycle
Performance of Lithium Ion Cell LiMn2O4/LixV2O5 with Aqueous Solution
Electrolyte by Polypyrrole Coating on Anode. Electrochimica Acta 2007, 52 (15),
5102–5107. https://doi.org/10.1016/j.electacta.2007.02.004.
(89) Wessells, C.; Huggins, R. A.; Cui, Y. Recent Results on Aqueous Electrolyte Cells.
Journal of Power Sources 2011, 196 (5), 2884–2888.
https://doi.org/10.1016/j.jpowsour.2010.10.098.
(90) Tang, W.; Liu, L. L.; Tian, S.; Li, L.; Li, L. L.; Yue, Y. B.; Bai, Y.; Wu, Y. P.;
Zhu, K.; Holze, R. LiMn2O4 Nanorods as a Super-Fast Cathode Material for
Aqueous Rechargeable Lithium Batteries. Electrochemistry Communications
2011, 13 (11), 1159–1162. https://doi.org/10.1016/j.elecom.2011.09.008.
(91) Luo, J.-Y.; Xia, Y.-Y. Aqueous Lithium-Ion Battery LiTi2(PO4)3/LiMn2O4 with
High Power and Energy Densities as Well as Superior Cycling Stability**. Adv.
Funct. Mater. 2007, 17 (18), 3877–3884. https://doi.org/10.1002/adfm.200700638.

References 167
(92) Ramanujapuram, A.; Gordon, D.; Magasinski, A.; Ward, B.; Nitta, N.; Huang, C.;
Yushin, G. Degradation and Stabilization of Lithium Cobalt Oxide in Aqueous
Electrolytes. Energy Environ. Sci. 2016, 9 (5), 1841–1848.
https://doi.org/10.1039/C6EE00093B.
(93) Mi, C. H.; Zhang, X. G.; Li, H. L. Electrochemical Behaviors of Solid LiFePO4
and Li0.99Nb0.01FePO4 in Li2SO4 Aqueous Electrolyte. Journal of Electroanalytical
Chemistry 2007, 602 (2), 245–254.
https://doi.org/10.1016/j.jelechem.2007.01.007.
(94) Mahesh, K. C.; Suresh, G. S.; Venkatesha, T. V. Electrochemical Behavior of
Li[Li0.2Co0.3Mn0.5]O2 as Cathode Material in Li2SO4 Aqueous Electrolyte. J Solid
State Electrochem 2012, 16 (11), 3559–3571. https://doi.org/10.1007/s10008-012-
1787-3.
(95) Zhou, D.; Liu, S.; Wang, H.; Yan, G. Na2V6O16·0.14H2O Nanowires as a Novel
Anode Material for Aqueous Rechargeable Lithium Battery with Good Cycling
Performance. Journal of Power Sources 2013, 227, 111–117.
https://doi.org/10.1016/j.jpowsour.2012.11.022.
(96) Liu, X.-H.; Saito, T.; Doi, T.; Okada, S.; Yamaki, J. Electrochemical Properties of
Rechargeable Aqueous Lithium Ion Batteries with an Olivine-Type Cathode and a
Nasicon-Type Anode. Journal of Power Sources 2009, 189 (1), 706–710.
https://doi.org/10.1016/j.jpowsour.2008.08.050.
(97) Manjunatha, H.; Suresh, G. S.; Venkatesha, T. V. Electrode Materials for Aqueous
Rechargeable Lithium Batteries. J Solid State Electrochem 2011, 15 (3), 431–445.
https://doi.org/10.1007/s10008-010-1117-6.
(98) Degoulange, D.; Dubouis, N.; Grimaud, A. Towards the Understanding of Water-
in-Salt Electrolytes: Individual Ion Activities and Liquid Junction Potentials in
Highly Concentrated Aqueous Solutions. Physical Chemistry 2021, 33.
(99) Zhao, M. Electrochemical Performance of High Specific Capacity of Lithium-Ion
Cell LiV3O8//LiMn2O4 with LiNO3 Aqueous Solution Electrolyte. Electrochimica
Acta 2011, 4.
(100) Wang, G. J.; Zhao, N. H.; Yang, L. C.; Wu, Y. P.; Wu, H. Q.; Holze, R.
Characteristics of an Aqueous Rechargeable Lithium Battery (ARLB).
Electrochimica Acta 2007, 52 (15), 4911–4915.
https://doi.org/10.1016/j.electacta.2007.01.051.
(101) Li, W.; McKinnon, W. R.; Dahn, J. R. Lithium Intercalation from Aqueous
Solutions. J. Electrochem. Soc. 1994, 141 (9), 7.
(102) Li, W.; Dahn, J. R. Lithium‐Ion Cells with Aqueous Electrolytes. J. Electrochem.
Soc. 1995, 142 (6), 1742–1746. https://doi.org/10.1149/1.2044187.
168 References
(103) Wang, P.; Yang, H.; Yang, H. Electrochemical Behavior of Li-Mn Spine1
Electrode Material in Aqueous Solution. Journal of Power Sources 1996, 63, 275–
278.
(104) Yu, D. Y. W. Impurities in LiFePO4 and Their Influence on Material
Characteristics. Meet. Abstr. 2007. https://doi.org/10.1149/MA2007-02/10/646.
(105) Manickam, M.; Singh, P.; Thurgate, S.; Prince, K. Redox Behavior and Surface
Characterization of LiFePO4 in Lithium Hydroxide Electrolyte. Journal of Power
Sources 2006, 158 (1), 646–649. https://doi.org/10.1016/j.jpowsour.2005.08.059.
(106) He, P.; Wang, Y.; Zhou, H. The Effect of Alkalinity and Temperature on the
Performance of Lithium-Air Fuel Cell with Hybrid Electrolytes. Journal of Power
Sources 2011, 196 (13), 5611–5616.
https://doi.org/10.1016/j.jpowsour.2011.02.071.
(107) Luo, J.-Y.; Cui, W.-J.; He, P.; Xia, Y.-Y. Raising the Cycling Stability of Aqueous
Lithium-Ion Batteries by Eliminating Oxygen in the Electrolyte. Nature Chem
2010, 2 (9), 760–765. https://doi.org/10.1038/nchem.763.
(108) Manthiram, A.; Choi, J. Chemical and Structural Instabilities of Lithium Ion
Battery Cathodes. Journal of Power Sources 2006, 159 (1), 249–253.
https://doi.org/10.1016/j.jpowsour.2006.04.028.
(109) Bin, D.; Wen, Y.; Wang, Y.; Xia, Y. The Development in Aqueous Lithium-Ion
Batteries. Journal of Energy Chemistry 2018, 27 (6), 1521–1535.
https://doi.org/10.1016/j.jechem.2018.06.004.
(110) Wang, Y.; Luo, J.; Wang, C.; Xia, Y. Hybrid Aqueous Energy Storage Cells Using
Activated Carbon and Lithium-Ion Intercalated Compounds. J. Electrochem. Soc.
2006, 153 (8), A1425. https://doi.org/10.1149/1.2203772.
(111) Suo, L.; Borodin, O.; Gao, T.; Olguin, M.; Ho, J.; Fan, X.; Luo, C.; Wang, C.; Xu,
K. “Water-in-Salt” Electrolyte Enables High-Voltage Aqueous Lithium-Ion
Chemistries. Science 2015, 350 (6263), 938–943.
https://doi.org/10.1126/science.aab1595.
(112) Wang, H.; Huang, K.; Zeng, Y.; Yang, S.; Chen, L. Electrochemical Properties of
TiP2O7 and LiTi2(PO4)3 as Anode Material for Lithium Ion Battery with Aqueous
Solution Electrolyte. Electrochimica Acta 2007, 52 (9), 3280–3285.
https://doi.org/10.1016/j.electacta.2006.10.010.
(113) Wojciechowski, J.; Kolanowski, Ł.; Bund, A.; Lota, G. The Influence of Current
Collector Corrosion on the Performance of Electrochemical Capacitors. Journal of
Power Sources 2017, 368, 18–29. https://doi.org/10.1016/j.jpowsour.2017.09.069.
(114) Hou, Y.; Wang, X.; Zhu, Y.; Hu, C.; Chang, Z.; Wu, Y.; Holze, R. Macroporous
LiFePO4 as a Cathode for an Aqueous Rechargeable Lithium Battery of High

References 169
Energy Density. J. Mater. Chem. A 2013, 1 (46), 14713.
https://doi.org/10.1039/c3ta13472e.
(115) He, K.; Zu, C.; Wang, Y.; Han, B.; Yin, X.; Zhao, H.; Liu, Y.; Chen, J. Stability of
Lithium Ion Conductor NASICON Structure Glass Ceramic in Acid and Alkaline
Aqueous Solution. Solid State Ionics 2014, 254, 78–81.
https://doi.org/10.1016/j.ssi.2013.11.011.
(116) Imanishi, N.; Matsui, M.; Takeda, Y.; Yamamoto, O. Lithium Ion Conducting
Solid Electrolytes for Aqueous Lithium-Air Batteries. Electrochemistry 2014, 82
(11), 938–945. https://doi.org/10.5796/electrochemistry.82.938.
(117) Wang, X.; Qu, Q.; Hou, Y.; Wang, F.; Wu, Y. An Aqueous Rechargeable Lithium
Battery of High Energy Density Based on Coated Li Metal and LiCoO2. Chem.
Commun. 2013, 49 (55), 6179. https://doi.org/10.1039/c3cc42676a.
(118) Chang, Z.; Li, C.; Wang, Y.; Chen, B.; Fu, L.; Zhu, Y.; Zhang, L.; Wu, Y.; Huang,
W. A Lithium Ion Battery Using an Aqueous Electrolyte Solution. Sci Rep 2016,
6 (1), 28421. https://doi.org/10.1038/srep28421.
(119) Wang, X.; Hou, Y.; Zhu, Y.; Wu, Y.; Holze, R. An Aqueous Rechargeable Lithium
Battery Using Coated Li Metal as Anode. SCIENTIFIC REPORTS 5.
(120) Alloin, F.; Crepel, L.; Cointeaux, L.; Leprêtre, J.-C.; Fusalba, F.; Martinet, S. The
Interest of Diazonium Chemistry for Aqueous Lithium-Ion Battery. J.
Electrochem. Soc. 2013, 160 (5), A3171–A3178.
https://doi.org/10.1149/2.026305jes.
(121) Crepel, L.; Alloin, F.; Lepretre, J.-C.; Martinet, S.; Ii, H. (54) ARYL DAZONUMI
SALT AND USE IN AN ELECTROLYTIC SOLUTION OF AN
ELECTROCHEMICAL GENERATOR. 15.
(122) Suo, L.; Borodin, O.; Sun, W.; Fan, X.; Yang, C.; Wang, F.; Gao, T.; Ma, Z.;
Schroeder, M.; von Cresce, A.; Russell, S. M.; Armand, M.; Angell, A.; Xu, K.;
Wang, C. Advanced High-Voltage Aqueous Lithium-Ion Battery Enabled by
“Water-in-Bisalt” Electrolyte. Angewandte Chemie International Edition 2016, 55
(25), 7136–7141. https://doi.org/10.1002/anie.201602397.
(123) Han, S. Anionic Effects on the Structure and Dynamics of Water in
Superconcentrated Aqueous Electrolytes. RSC Adv. 2019, 9 (2), 609–619.
https://doi.org/10.1039/C8RA09589B.
(124) Lux, S. F.; Terborg, L.; Hachmöller, O.; Placke, T.; Meyer, H.-W.; Passerini, S.;
Winter, M.; Nowak, S. LiTFSI Stability in Water and Its Possible Use in Aqueous
Lithium-Ion Batteries: PH Dependency, Electrochemical Window and
Temperature Stability. Journal of The Electrochemical Society 2013, 160 (10),
A1694–A1700. https://doi.org/10.1149/2.039310jes.

170 References
(125) Reber, D.; Figi, R.; Kühnel, R.-S.; Battaglia, C. Stability of Aqueous Electrolytes
Based on LiFSI and NaFSI. Electrochimica Acta 2019, 321, 134644.
https://doi.org/10.1016/j.electacta.2019.134644.
(126) Ding, M. S.; Xu, K. Phase Diagram, Conductivity, and Glass Transition of LiTFSI–
H 2 O Binary Electrolytes. J. Phys. Chem. C 2018, 122 (29), 16624–16629.
https://doi.org/10.1021/acs.jpcc.8b05193.
(127) Dubouis, N.; France-Lanord, A.; Brige, A.; Salanne, M.; Grimaud, A. Anion
Specific Effects Drive the Formation of Li-Salt Based Aqueous Biphasic Systems.
J. Phys. Chem. B 2021, acs.jpcb.1c01750.
https://doi.org/10.1021/acs.jpcb.1c01750.
(128) Zhang, Y.; Lewis, N. H. C.; Mars, J.; Wan, G.; Weadock, N. J.; Takacs, C. J.;
Lukatskaya, M. R.; Steinrück, H.-G.; Toney, M. F.; Tokmakoff, A.; Maginn, E. J.
Water-in-Salt LiTFSI Aqueous Electrolytes. 1. Liquid Structure from Combined
Molecular Dynamics Simulation and Experimental Studies. J. Phys. Chem. B 2021,
125 (17), 4501–4513. https://doi.org/10.1021/acs.jpcb.1c02189.
(129) Lewis, N. H. C.; Zhang, Y.; Dereka, B.; Carino, E. V.; Maginn, E. J.; Tokmakoff,
A. Signatures of Ion Pairing and Aggregation in the Vibrational Spectroscopy of
Super-Concentrated Aqueous Lithium Bistriflimide Solutions. J. Phys. Chem. C
2020, 124 (6), 3470–3481. https://doi.org/10.1021/acs.jpcc.9b10477.
(130) Tsurumura, T.; Hashimoto, Y.; Morita, M.; Umebayashi, Y.; Fujii, K. Anion
Coordination Characteristics of Ion-Pair Complexes in Highly Concentrated
Aqueous Lithium Bis(Trifluoromethanesulfonyl)Amide Electrolytes. Anal. Sci.
2019, 35 (3), 289–294. https://doi.org/10.2116/analsci.18P407.
(131) Liu, X.; Yu, Z.; Sarnello, E.; Qian, K.; Seifert, S.; Winans, R. E.; Cheng, L.; Li, T.
Microscopic Understanding of the Ionic Networks of “Water-in-Salt” Electrolytes.
Energy Material Advances 2021, 2021, 1–9.
https://doi.org/10.34133/2021/7368420.
(132) Watanabe, H.; Arai, N.; Nozaki, E.; Han, J.; Fujii, K.; Ikeda, K.; Otomo, T.; Ueno,
K.; Dokko, K.; Watanabe, M.; Kameda, Y.; Umebayashi, Y. Local Structure of Li + in Superconcentrated Aqueous LiTFSA Solutions. J. Phys. Chem. B 2021, 125
(27), 7477–7484. https://doi.org/10.1021/acs.jpcb.1c04693.
(133) González, M. A.; Borodin, O.; Kofu, M.; Shibata, K.; Yamada, T.; Yamamuro, O.;
Xu, K.; Price, D. L.; Saboungi, M.-L. Nanoscale Relaxation in “Water-in-Salt” and
“Water-in-Bisalt” Electrolytes. J. Phys. Chem. Lett. 2020, 11 (17), 7279–7284.
https://doi.org/10.1021/acs.jpclett.0c01765.
(134) Dubouis, N.; Lemaire, P.; Mirvaux, B.; Salager, E.; Deschamps, M.; Grimaud, A.
The Role of the Hydrogen Evolution Reaction in the Solid–Electrolyte Interphase
Formation Mechanism for “ Water-in-Salt ” Electrolytes. Energy & Environmental
Science 2018, 11 (12), 3491–3499. https://doi.org/10.1039/C8EE02456A.
References 171
(135) Borodin, O.; Suo, L.; Gobet, M.; Ren, X.; Wang, F.; Faraone, A.; Peng, J.; Olguin,
M.; Schroeder, M.; Ding, M. S.; Gobrogge, E.; von Wald Cresce, A.; Munoz, S.;
Dura, J. A.; Greenbaum, S.; Wang, C.; Xu, K. Liquid Structure with Nano-
Heterogeneity Promotes Cationic Transport in Concentrated Electrolytes. ACS
Nano 2017, 11 (10), 10462–10471. https://doi.org/10.1021/acsnano.7b05664.
(136) Yu, Z.; Curtiss, L. A.; Winans, R. E.; Zhang, Y.; Li, T.; Cheng, L. Asymmetric
Composition of Ionic Aggregates and the Origin of High Correlated Transference
Number in Water-in-Salt Electrolytes. J. Phys. Chem. Lett. 2020, 11 (4), 1276–
1281. https://doi.org/10.1021/acs.jpclett.9b03495.
(137) Lim, J.; Park, K.; Lee, H.; Kim, J.; Kwak, K.; Cho, M. Nanometric Water Channels
in Water-in-Salt Lithium Ion Battery Electrolyte. J. Am. Chem. Soc. 2018, 140 (46),
15661–15667. https://doi.org/10.1021/jacs.8b07696.
(138) Tan, P.; Yue, J.; Yu, Y.; Liu, B.; Liu, T.; Zheng, L.; He, L.; Zhang, X.; Suo, L.;
Hong, L. Solid-Like Nano-Anion Cluster Constructs a Free Lithium-Ion-
Conducting Superfluid Framework in a Water-in-Salt Electrolyte. J. Phys. Chem.
C 2021, 125 (22), 11838–11847. https://doi.org/10.1021/acs.jpcc.1c01663.
(139) Zhang, M.; Hao, H.; Zhou, D.; Duan, Y.; Wang, Y.; Bian, H. Understanding the
Microscopic Structure of a “Water-in-Salt” Lithium Ion Battery Electrolyte Probed
with Ultrafast IR Spectroscopy. J. Phys. Chem. C 2020, 124 (16), 8594–8604.
https://doi.org/10.1021/acs.jpcc.0c00937.
(140) McEldrew, M.; Goodwin, Z. A. H.; Bi, S.; Kornyshev, A. A.; Bazant, M. Z. Ion
Clusters and Networks in “Water-in-Salt Electrolytes.” arXiv:2103.04782 [cond-
mat, physics:physics] 2021.
(141) Li, Z.; Bouchal, R.; Mendez-Morales, T.; Rollet, A.-L.; Rizzi, C.; Le Vot, S.;
Favier, F.; Rotenberg, B.; Borodin, O.; Fontaine, O.; Salanne, M. Transport
Properties of Li-TFSI Water-in-Salt Electrolytes. J. Phys. Chem. B 2019, 123 (49),
10514–10521. https://doi.org/10.1021/acs.jpcb.9b08961.
(142) Amiri, M.; Bélanger, D. Physicochemical and Electrochemical Properties of
Water‐in‐Salt Electrolytes. ChemSusChem 2021, 14 (12), 2487–2500.
https://doi.org/10.1002/cssc.202100550.
(143) Zheng, J.; Tan, G.; Shan, P.; Liu, T.; Hu, J.; Feng, Y.; Yang, L.; Zhang, M.; Chen,
Z.; Lin, Y.; Lu, J.; Neuefeind, J. C.; Ren, Y.; Amine, K.; Wang, L.-W.; Xu, K.;
Pan, F. Understanding Thermodynamic and Kinetic Contributions in Expanding
the Stability Window of Aqueous Electrolytes. Chem 2018.
https://doi.org/10.1016/j.chempr.2018.09.004.
(144) Dubouis, N.; Serva, A.; Salager, E.; Deschamps, M.; Salanne, M.; Grimaud, A.
The Fate of Water at the Electrochemical Interfaces: Electrochemical Behavior of
Free Water Versus Coordinating Water. J. Phys. Chem. Lett. 2018, 6.

172 References
(145) Han, M.; Zhang, R.; Gewirth, A. A.; Espinosa-Marzal, R. M. Nanoheterogeneity
of LiTFSI Solutions Transitions Close to a Surface and with Concentration. Nano
Lett. 2021, 21 (5), 2304–2309. https://doi.org/10.1021/acs.nanolett.1c00167.
(146) Suo, L.; Oh, D.; Lin, Y.; Zhuo, Z.; Borodin, O.; Gao, T.; Wang, F.; Kushima, A.;
Wang, Z.; Kim, H.-C.; Qi, Y.; Yang, W.; Pan, F.; Li, J.; Xu, K.; Wang, C. How
Solid-Electrolyte Interphase Forms in Aqueous Electrolytes. Journal of the
American Chemical Society 2017, 139 (51), 18670–18680.
https://doi.org/10.1021/jacs.7b10688.
(147) Steinrück, H.; Cao, C.; Lukatskaya, M. R.; Takacs, C. J.; Wan, G.; Mackanic, D.
G.; Tsao, Y.; Zhao, J.; Helms, B. A.; Xu, K.; Borodin, O.; Wishart, J. F.; Toney,
M. F. Interfacial Speciation Determines Interfacial Chemistry: X‐ray‐Induced
Lithium Fluoride Formation from Water‐in‐salt Electrolytes on Solid Surfaces.
Angew. Chem. Int. Ed. 2020, anie.202007745.
https://doi.org/10.1002/anie.202007745.
(148) Ko, S.; Yamada, Y.; Yamada, A. Formation of a Solid Electrolyte Interphase in
Hydrate-Melt Electrolytes. ACS Appl. Mater. Interfaces 2019, acsami.9b13662.
https://doi.org/10.1021/acsami.9b13662.
(149) Bouchal, R.; Li, Z.; Bongu, C.; Favier, F.; Freunberger, S. A.; Salanne, M.;
Fontaine, O. Competitive Salt Precipitation/Dissolution during Free-Water
Reduction in Water-in-Salt Electrolyte. Angewandte Chemie International Edition
2020, 59, 6.
(150) Vatamanu, J.; Borodin, O. Ramifications of Water-in-Salt Interfacial Structure at
Charged Electrodes for Electrolyte Electrochemical Stability. The Journal of
Physical Chemistry Letters 2017, 8 (18), 4362–4367.
https://doi.org/10.1021/acs.jpclett.7b01879.
(151) Zhang, R.; Han, M.; Ta, K.; Madsen, K. E.; Chen, X.; Zhang, X.; Espinosa-Marzal,
R. M.; Gewirth, A. A. Potential-Dependent Layering in the Electrochemical
Double Layer of Water-in-Salt Electrolytes. ACS Appl. Energy Mater. 2020, 3 (8),
8086–8094. https://doi.org/10.1021/acsaem.0c01534.
(152) Coustan, L.; Shul, G.; Bélanger, D. Electrochemical Behavior of Platinum, Gold
and Glassy Carbon Electrodes in Water-in-Salt Electrolyte. Electrochemistry
Communications 2017, 77, 89–92. https://doi.org/10.1016/j.elecom.2017.03.001.
(153) Kühnel, R.-S.; Reber, D.; Battaglia, C. Perspective—Electrochemical Stability of
Water-in-Salt Electrolytes. J. Electrochem. Soc. 2020, 167 (7), 070544.
https://doi.org/10.1149/1945-7111/ab7c6f.
(154) Takenaka, N.; Inagaki, T.; Shimada, T.; Yamada, Y.; Nagaoka, M.; Yamada, A.
Theoretical Analysis of Electrode-Dependent Interfacial Structures on Hydrate-
Melt Electrolytes. J Chem. Phys. 2020, 152 (12), 124706.
https://doi.org/10.1063/5.0003196.

References 173
(155) McEldrew, M.; Goodwin, Z. A. H.; Kornyshev, A. A.; Bazant, M. Z. Theory of the
Double Layer in Water-in-Salt Electrolytes. The Journal of Physical Chemistry
Letters 2018, 9 (19), 5840–5846. https://doi.org/10.1021/acs.jpclett.8b02543.
(156) Liu, S.; Liu, D.; Wang, S.; Cai, X.; Qian, K.; Kang, F.; Li, B. Understanding the
Cathode Electrolyte Interface Formation in Aqueous Electrolyte by Scanning
Electrochemical Microscopy. J. Mater. Chem. A 2019, 7 (21), 12993–12996.
https://doi.org/10.1039/C9TA03199E.
(157) Sun, W.; Suo, L.; Wang, F.; Eidson, N.; Yang, C.; Han, F.; Ma, Z.; Gao, T.; Zhu,
M.; Wang, C. “Water-in-Salt” Electrolyte Enabled LiMn2O4/TiS2 Lithium-Ion
Batteries. Electrochemistry Communications 2017, 82, 71–74.
https://doi.org/10.1016/j.elecom.2017.07.016.
(158) Yue, J.; Lin, L.; Jiang, L.; Zhang, Q.; Tong, Y.; Suo, L.; Hu, Y.; Li, H.; Huang, X.;
Chen, L. Interface Concentrated‐Confinement Suppressing Cathode Dissolution in
Water‐in‐Salt Electrolyte. Adv. Energy Mater. 2020, 10 (36), 2000665.
https://doi.org/10.1002/aenm.202000665.
(159) Wang, F.; Lin, Y.; Suo, L.; Fan, X.; Gao, T.; Yang, C.; Han, F.; Qi, Y.; Xu, K.;
Wang, C. Stabilizing High Voltage LiCoO2 Cathode in Aqueous Electrolyte with
Interphase-Forming Additive. Energy & Environmental Science 2016, 9 (12),
3666–3673. https://doi.org/10.1039/C6EE02604D.
(160) Kühnel, R.-S.; Reber, D.; Remhof, A.; Figi, R.; Bleiner, D.; Battaglia, C. “Water-
in-Salt” Electrolytes Enable the Use of Cost-Effective Aluminum Current
Collectors for Aqueous High-Voltage Batteries. Chemical Communications 2016,
52 (68), 10435–10438. https://doi.org/10.1039/C6CC03969C.
(161) Han, J.; Zhang, H.; Varzi, A.; Passerini, S. Fluorine-Free Water-in-Salt Electrolyte
for Green and Low-Cost Aqueous Sodium-Ion Batteries. ChemSusChem 2018, 11
(21), 3704–3707. https://doi.org/10.1002/cssc.201801930.
(162) Jiang, L.; Liu, L.; Yue, J.; Zhang, Q.; Zhou, A.; Borodin, O.; Suo, L.; Li, H.; Chen,
L.; Xu, K.; Hu, Y. High‐Voltage Aqueous Na‐Ion Battery Enabled by Inert‐Cation‐
Assisted Water‐in‐Salt Electrolyte. Adv. Mater. 2020, 32 (2), 1904427.
https://doi.org/10.1002/adma.201904427.
(163) Reber, D.; Kühnel, R.-S.; Battaglia, C. Suppressing Crystallization of Water-in-
Salt Electrolytes by Asymmetric Anions Enables Low-Temperature Operation of
High-Voltage Aqueous Batteries. ACS Materials Lett. 2019, 1 (1), 44–51.
https://doi.org/10.1021/acsmaterialslett.9b00043.
(164) Suo, L.; Borodin, O.; Wang, Y.; Rong, X.; Sun, W.; Fan, X.; Xu, S.; Schroeder, M.
A.; Cresce, A. V.; Wang, F.; Yang, C.; Hu, Y.-S.; Xu, K.; Wang, C. “Water-in-
Salt” Electrolyte Makes Aqueous Sodium-Ion Battery Safe, Green, and Long-
Lasting. Advanced Energy Materials 2017, 7 (21), 1701189.
https://doi.org/10.1002/aenm.201701189.

174 References
(165) Zheng, Q.; Miura, S.; Miyazaki, K.; Ko, S.; Watanabe, E.; Okoshi, M.; Chou, C.-
P.; Nishimura, Y.; Nakai, H.; Kamiya, T.; Honda, T.; Akikusa, J.; Yamada, Y.;
Yamada, A. Sodium- and Potassium-Hydrate Melts Containing Asymmetric Imide
Anions for High-Voltage Aqueous Batteries. Angew. Chem. Int. Ed. 2019, 58 (40),
14202–14207. https://doi.org/10.1002/anie.201908830.
(166) Chen, H.; Zhang, Z.; Wei, Z.; Chen, G.; Yang, X.; Wang, C.; Du, F. Use of a Water-
in-Salt Electrolyte to Avoid Organic Material Dissolution and Enhance the
Kinetics of Aqueous Potassium Ion Batteries. Sustainable Energy Fuels 2020, 4
(1), 128–131. https://doi.org/10.1039/C9SE00545E.
(167) Jiang, L.; Lu, Y.; Zhao, C.; Liu, L.; Zhang, J.; Zhang, Q.; Shen, X.; Zhao, J.; Yu,
X.; Li, H.; Huang, X.; Chen, L.; Hu, Y.-S. Building Aqueous K-Ion Batteries for
Energy Storage. Nat Energy 2019. https://doi.org/10.1038/s41560-019-0388-0.
(168) Leonard, D. P.; Wei, Z.; Chen, G.; Du, F.; Ji, X. Water-in-Salt Electrolyte for
Potassium-Ion Batteries. ACS Energy Letters 2018, 3 (2), 373–374.
https://doi.org/10.1021/acsenergylett.8b00009.
(169) Liu, T.; Tang, L.; Luo, H.; Cheng, S.; Liu, M. A Promising Water-in-Salt
Electrolyte for Aqueous Based Electrochemical Energy Storage Cells with a Wide
Potential Window: Highly Concentrated HCOOK. Chem. Commun. 2019, 55 (85),
12817–12820. https://doi.org/10.1039/C9CC05927J.
(170) Cao, L.; Li, D.; Pollard, T.; Deng, T.; Zhang, B.; Yang, C.; Chen, L.; Vatamanu,
J.; Hu, E.; Hourwitz, M. J.; Ma, L.; Ding, M.; Li, Q.; Hou, S.; Gaskell, K.; Fourkas,
J. T.; Yang, X.-Q.; Xu, K.; Borodin, O.; Wang, C. Fluorinated Interphase Enables
Reversible Aqueous Zinc Battery Chemistries. Nat. Nanotechnol. 2021, 16 (8),
902–910. https://doi.org/10.1038/s41565-021-00905-4.
(171) Ni, Q.; Jiang, H.; Sandstrom, S.; Bai, Y.; Ren, H.; Wu, X.; Guo, Q.; Yu, D.; Wu,
C.; Ji, X. A Na3V2(PO4)2O1.6F1.4 Cathode of Zn‐Ion Battery Enabled by a Water‐
in‐Bisalt Electrolyte. Adv. Funct. Mater. 2020, 30 (36), 2003511.
https://doi.org/10.1002/adfm.202003511.
(172) Dong, Q.; Yao, X.; Zhao, Y.; Qi, M.; Zhang, X.; Sun, H.; He, Y.; Wang, D.
Cathodically Stable Li-O2 Battery Operations Using Water-in-Salt Electrolyte.
Chem 2018, 4 (6), 1345–1358. https://doi.org/10.1016/j.chempr.2018.02.015.
(173) Yang, C.; Suo, L.; Borodin, O.; Wang, F.; Sun, W.; Gao, T.; Fan, X.; Hou, S.; Ma,
Z.; Amine, K.; Xu, K.; Wang, C. Unique Aqueous Li-Ion/Sulfur Chemistry with
High Energy Density and Reversibility. Proc Natl Acad Sci USA 2017, 114 (24),
6197–6202. https://doi.org/10.1073/pnas.1703937114.
(174) Park, J. M.; Jana, M.; Nakhanivej, P.; Kim, B.-K.; Park, H. S. Facile Multivalent
Redox Chemistries in Water-in-Bisalt Hydrogel Electrolytes for Hybrid Energy
Storage Full Cells. ACS Energy Lett. 2020, 1054–1061.
https://doi.org/10.1021/acsenergylett.0c00059.
References 175
(175) Zhao, J.; Li, Y.; Peng, X.; Dong, S.; Ma, J.; Cui, G.; Chen, L. High-Voltage
Zn/LiMn0.8Fe0.2PO4 Aqueous Rechargeable Battery by Virtue of “Water-in-
Salt” Electrolyte. Electrochemistry Communications 2016, 69, 6–10.
https://doi.org/10.1016/j.elecom.2016.05.014.
(176) Wang, F.; Borodin, O.; Gao, T.; Fan, X.; Sun, W.; Han, F.; Faraone, A.; Dura, J.
A.; Xu, K.; Wang, C. Highly Reversible Zinc Metal Anode for Aqueous Batteries.
Nature Materials 2018, 17 (6), 543–549. https://doi.org/10.1038/s41563-018-
0063-z.
(177) Yang, C.; Chen, J.; Ji, X.; Pollard, T. P.; Lü, X.; Sun, C.-J.; Hou, S.; Liu, Q.; Liu,
C.; Qing, T.; Wang, Y.; Borodin, O.; Ren, Y.; Xu, K.; Wang, C. Aqueous Li-Ion
Battery Enabled by Halogen Conversion–Intercalation Chemistry in Graphite.
Nature 2019, 569 (7755), 245–250. https://doi.org/10.1038/s41586-019-1175-6.
(178) Guo, Q.; Kim, K.-I.; Li, S.; Scida, A. M.; Yu, P.; Sandstrom, S. K.; Zhang, L.; Sun,
S.; Jiang, H.; Ni, Q.; Yu, D.; Lerner, M. M.; Xia, H.; Ji, X. Reversible Insertion of
I–Cl Interhalogen in a Graphite Cathode for Aqueous Dual-Ion Batteries. ACS
Energy Lett. 2021, 6 (2), 459–467. https://doi.org/10.1021/acsenergylett.0c02575.
(179) Wu, X.; Xu, Y.; Zhang, C.; Leonard, D. P.; Markir, A.; Lu, J.; Ji, X. Reverse Dual-
Ion Battery via a ZnCl2 Water-in-Salt Electrolyte. J. Am. Chem. Soc. 2019, 141
(15), 6338–6344. https://doi.org/10.1021/jacs.9b00617.
(180) Forero-Saboya, J.; Hosseini-Bab-Anari, E.; Abdelhamid, M. E.; Moth-Poulsen, K.;
Johansson, P. Water-in-Bisalt Electrolyte with Record Salt Concentration and
Widened Electrochemical Stability Window. J. Phys. Chem. Lett. 2019, 10 (17),
4942–4946. https://doi.org/10.1021/acs.jpclett.9b01467.
(181) Ko, S.; Yamada, Y.; Miyazaki, K.; Shimada, T.; Watanabe, E.; Tateyama, Y.;
Kamiya, T.; Honda, T.; Akikusa, J.; Yamada, A. Lithium-Salt Monohydrate Melt:
A Stable Electrolyte for Aqueous Lithium-Ion Batteries. Electrochemistry
Communications 2019, 104, 106488.
https://doi.org/10.1016/j.elecom.2019.106488.
(182) Reber, D.; Grissa, R.; Becker, M.; Kühnel, R.; Battaglia, C. Anion Selection
Criteria for Water‐in‐Salt Electrolytes. Adv. Energy Mater. 2021, 11 (5), 2002913.
https://doi.org/10.1002/aenm.202002913.
(183) Chen, L.; Zhang, J.; Li, Q.; Vatamanu, J.; Ji, X.; Pollard, T. P.; Cui, C.; Hou, S.;
Chen, J.; Yang, C.; Ma, L.; Ding, M. S.; Garaga, M.; Greenbaum, S.; Lee, H.-S.;
Borodin, O.; Xu, K.; Wang, C. A 63 m Superconcentrated Aqueous Electrolyte for
High-Energy Li-Ion Batteries. ACS Energy Lett. 2020, 5 (3), 968–974.
https://doi.org/10.1021/acsenergylett.0c00348.
(184) Lukatskaya, M. R.; Feldblyum, J. I.; Mackanic, D. G.; Lissel, F.; Michels, D. L.;
Cui, Y.; Bao, Z. Concentrated Mixed Cation Acetate “Water-in-Salt” Solutions as
Green and Low-Cost High Voltage Electrolytes for Aqueous Batteries. Energy
Environ. Sci. 2018, 11 (10), 2876–2883. https://doi.org/10.1039/C8EE00833G.

176 References
(185) Becker, M.; Reber, D.; Aribia, A.; Battaglia, C.; Kühnel, R.-S. Hybrid Ionic
Liquid/Water-in-Salt Electrolytes Enable Stable Cycling of LTO/NMC811 Full
Cells. 13.
(186) Reber, D.; Takenaka, N.; Kühnel, R.-S.; Yamada, A.; Battaglia, C. Impact of Anion
Asymmetry on Local Structure and Supercooling Behavior of Water-in-Salt
Electrolytes. J. Phys. Chem. Lett. 2020, 11 (12), 4720–4725.
https://doi.org/10.1021/acs.jpclett.0c00806.
(187) Becker, M.; Kühnel, R.-S.; Battaglia, C. Water-in-Salt Electrolytes for Aqueous
Lithium-Ion Batteries with Liquidus Temperatures Below −10 °C. Chem.
Commun. 2019, 55 (80), 12032–12035. https://doi.org/10.1039/C9CC04495G.
(188) Nian, Q.; Zhang, X.; Feng, Y.; Liu, S.; Sun, T.; Zheng, S.; Ren, X.; Tao, Z.; Zhang,
D.; Chen, J. Designing Electrolyte Structure to Suppress Hydrogen Evolution
Reaction in Aqueous Batteries. ACS Energy Lett. 2021, 6 (6), 2174–2180.
https://doi.org/10.1021/acsenergylett.1c00833.
(189) Cao, L.; Li, D.; Hu, E. Solvation Structure Design for Aqueous Zn Metal Batteries.
Journal of the American Chemical Society 6.
(190) Hou, Z.; Dong, M.; Xiong, Y.; Zhang, X.; Zhu, Y.; Qian, Y. Formation of Solid–
Electrolyte Interfaces in Aqueous Electrolytes by Altering Cation‐Solvation Shell
Structure. Adv. Energy Mater. 2020, 1903665.
https://doi.org/10.1002/aenm.201903665.
(191) Wang, F.; Borodin, O.; Ding, M. S.; Gobet, M.; Vatamanu, J.; Fan, X.; Gao, T.;
Eidson, N.; Liang, Y.; Sun, W.; Greenbaum, S.; Xu, K.; Wang, C. Hybrid
Aqueous/Non-Aqueous Electrolyte for Safe and High-Energy Li-Ion Batteries.
Joule 2018, 2 (5), 927–937. https://doi.org/10.1016/j.joule.2018.02.011.
(192) Chen, J.; Vatamanu, J.; Xing, L.; Borodin, O.; Chen, H.; Guan, X.; Liu, X.; Xu,
K.; Li, W. Improving Electrochemical Stability and Low‐Temperature
Performance with Water/Acetonitrile Hybrid Electrolytes. Adv. Energy Mater.
2020, 10 (3), 1902654. https://doi.org/10.1002/aenm.201902654.
(193) Shang, Y.; Chen, N.; Li, Y.; Chen, S.; Lai, J.; Huang, Y.; Qu, W.; Wu, F.; Chen,
R. An “Ether‐In‐Water” Electrolyte Boosts Stable Interfacial Chemistry for
Aqueous Lithium‐Ion Batteries. Adv. Mater. 2020, 32 (40), 2004017.
https://doi.org/10.1002/adma.202004017.
(194) Hou, X.; Wang, R.; He, X.; Pollard, T. P.; Ju, X.; Du, L.; Paillard, E.; Frielinghaus,
H.; Barnsley, L. C.; Borodin, O.; Xu, K.; Winter, M.; Li, J. Stabilizing the Solid‐
Electrolyte Interphase with Polyacrylamide for High‐Voltage Aqueous Lithium‐
Ion Batteries. Angew. Chem. Int. Ed. 2021, anie.202107252.
https://doi.org/10.1002/anie.202107252.
(195) Jaumaux, P.; Yang, X.; Zhang, B.; Safaei, J.; Tang, X.; Zhou, D.; Wang, C.; Wang,
G. Localized Water‐In‐Salt Electrolyte for Aqueous Lithium‐Ion Batteries. Angew.

References 177
Chem. Int. Ed. 2021, 60 (36), 19965–19973.
https://doi.org/10.1002/anie.202107389.
(196) Liu, J.; Yang, C.; Chi, X.; Wen, B.; Wang, W.; Liu, Y. Water/Sulfolane Hybrid
Electrolyte Achieves Ultralow‐Temperature Operation for High‐Voltage Aqueous
Lithium‐Ion Batteries. Adv. Funct. Mater. 2021, 2106811.
https://doi.org/10.1002/adfm.202106811.
(197) Langevin, S. A.; Tan, B.; Freeman, A. W.; Gagnon, J. C.; Hoffman, C. M.; Logan,
M. W.; Maranchi, J. P.; Gerasopoulos, K. UV-Cured Gel Polymer Electrolytes with
Improved Stability for Advanced Aqueous Li-Ion Batteries. Chem. Commun. 2019,
55 (87), 13085–13088. https://doi.org/10.1039/C9CC06207F.
(198) Zhang, J.; Cui, C.; Wang, P.-F.; Li, Q.; Chen, L.; Han, F.; Jin, T.; Liu, S.;
Choudhary, H.; Raghavan, S. R.; Eidson, N.; von Cresce, A.; Ma, L.; Uddin, J.;
Addison, D.; Yang, C.; Wang, C. “Water-in-Salt” Polymer Electrolyte for Li-Ion
Batteries. Energy Environ. Sci. 2020, 13 (9), 2878–2887.
https://doi.org/10.1039/D0EE01510E.
(199) Cresce, A. Gel Electrolyte for a 4V Flexible Aqueous Lithium-Ion Battery. Journal
of Power Sources 2020, 10.
(200) He, X.; Yan, B.; Zhang, X.; Liu, Z.; Bresser, D.; Wang, J.; Wang, R.; Cao, X.; Su,
Y.; Jia, H.; Grey, C. P.; Frielinghaus, H.; Truhlar, D. G.; Winter, M.; Li, J.; Paillard,
E. Fluorine-Free Water-in-Ionomer Electrolytes for Sustainable Lithium-Ion
Batteries. Nature Communications 2018, 9 (1). https://doi.org/10.1038/s41467-
018-07331-6.
(201) Xie, J.; Liang, Z.; Lu, Y.-C. Molecular Crowding Electrolytes for High-Voltage
Aqueous Batteries. Nat. Mater. 2020, 19 (9), 1006–1011.
https://doi.org/10.1038/s41563-020-0667-y.
(202) Huang, M.; Yang, J.; Zhen, S.; Wan, C.; Jiang, X.; Ju, X. Fabrication of High
Li:Water Molar Ratio Electrolytes for Lithium-Ion Batteries. Chinese Chemical
Letters 2021, 32 (2), 834–837. https://doi.org/10.1016/j.cclet.2020.05.008.
(203) Widstrom, M. D.; Borodin, O.; Ludwig, K. B.; Matthews, J. E.; Bhattacharyya, S.;
Garaga, M.; V. Cresce, A.; Jarry, A.; Erdi, M.; Wang, C.; Greenbaum, S.; Kofinas,
P. Water Domain Enabled Transport in Polymer Electrolytes for Lithium-Ion
Batteries. Macromolecules 2021, 54 (6), 2882–2891.
https://doi.org/10.1021/acs.macromol.0c01960.
(204) Yang, C.; Chen, J.; Qing, T.; Fan, X.; Sun, W.; von Cresce, A.; Ding, M. S.;
Borodin, O.; Vatamanu, J.; Schroeder, M. A.; Eidson, N.; Wang, C.; Xu, K. 4.0 V
Aqueous Li-Ion Batteries. Joule 2017, 1 (1), 122–132.
https://doi.org/10.1016/j.joule.2017.08.009.

178 References
(205) Wang, F.; Lin, C.-F.; Ji, X.; Rubloff, G. W.; Wang, C. Suppression of Hydrogen
Evolution at Catalytic Surfaces in Aqueous Lithium Ion Batteries. J. Mater. Chem.
A 2020, 8 (30), 14921–14926. https://doi.org/10.1039/D0TA05568A.
(206) Sakai, S.; Yamada, I.; Miyahara, Y.; Kondo, Y.; Yokoyama, Y.; Abe, T.; Miyazaki,
K. Surface-Modified Li4Ti5O12 in Highly Concentrated Aqueous Solutions for Use
in Aqueous Rechargeable Lithium Batteries. J. Electrochem. Soc. 2020, 167 (12),
120512. https://doi.org/10.1149/1945-7111/ababd3.
(207) Chen, L.; Cao, L.; Ji, X.; Hou, S.; Li, Q.; Chen, J.; Yang, C.; Eidson, N.; Wang, C.
Enabling Safe Aqueous Lithium Ion Open Batteries by Suppressing Oxygen
Reduction Reaction. Nat Commun 2020, 1 (1), 2638.
https://doi.org/10.1038/s41467-020-16460-w.
(208) Hou, X.; Ju, X.; Zhao, W.; Wang, J.; He, X.; Du, L.; Yan, B.; Li, J.; Paillard, E.;
Sun, J.; Lin, H.; Winter, M.; Li, J. TiO2@LiTi2(PO4)3 Enabling Fast and Stable
Lithium Storage for High Voltage Aqueous Lithium-Ion Batteries. Journal of
Power Sources 2021, 484, 229255.
https://doi.org/10.1016/j.jpowsour.2020.229255.
(209) Subramanya, U. Carbon-Based Artificial SEI Layers for Aqueous Lithium-Ion
Battery Anodes. RSC Advances 2020, 8.
(210) Coustan, L.; Zaghib, K.; Bélanger, D. New Insight in the Electrochemical
Behaviour of Stainless Steel Electrode in Water-in-Salt Electrolyte. Journal of
Power Sources 2018, 399, 299–303.
https://doi.org/10.1016/j.jpowsour.2018.07.114.
(211) Hong, W. T.; Risch, M.; Stoerzinger, K. A.; Grimaud, A.; Suntivich, J.; Shao-Horn,
Y. Toward the Rational Design of Non-Precious Transition Metal Oxides for
Oxygen Electrocatalysis. Energy Environ. Sci. 2015, 8 (5), 1404–1427.
https://doi.org/10.1039/C4EE03869J.
(212) Dubouis, N.; Serva, A.; Salager, E.; Deschamps, M.; Salanne, M.; Grimaud, A.
The Fate of Water at the Electrochemical Interfaces: Electrochemical Behavior of
Free Water vs. Coordinating Water. 7.
(213) Suo, L.; Han, F.; Fan, X.; Liu, H.; Xu, K.; Wang, C. “Water-in-Salt” Electrolytes
Enable Green and Safe Li-Ion Batteries for Large Scale Electric Energy Storage
Applications. J. Mater. Chem. A 2016, 4 (17), 6639–6644.
https://doi.org/10.1039/C6TA00451B.
(214) Kunduraci, M.; Mutlu, R. N.; Gizir, A. M. Electrochemical Behavior of
LiNi0.6Mn0.2Co0.2O2 Cathode in Different Aqueous Electrolytes. Ionics 2020.
https://doi.org/10.1007/s11581-020-03490-z.
(215) Yang, C.; Rousse, G.; Louise Svane, K.; Pearce, P. E.; Abakumov, A. M.;
Deschamps, M.; Cibin, G.; Chadwick, A. V.; Dalla Corte, D. A.; Anton Hansen,
H.; Vegge, T.; Tarascon, J.-M.; Grimaud, A. Cation Insertion to Break the

References 179
Activity/Stability Relationship for Highly Active Oxygen Evolution Reaction
Catalyst. Nat Commun 2020, 11 (1), 1378. https://doi.org/10.1038/s41467-020-
15231-x.
(216) Laszczynski, N.; Solchenbach, S.; Gasteiger, H. A.; Lucht, B. L. Understanding
Electrolyte Decomposition of Graphite/NCM811 Cells at Elevated Operating
Voltage. J. Electrochem. Soc. 2019, 166 (10), A1853–A1859.
https://doi.org/10.1149/2.0571910jes.
(217) Xiong, D. J.; Ellis, L. D.; Li, J.; Li, H.; Hynes, T.; Allen, J. P.; Xia, J.; Hall, D. S.;
Hill, I. G.; Dahn, J. R. Measuring Oxygen Release from Delithiated LiNixMnyCo1-
x-yO2 and Its Effects on the Performance of High Voltage Li-Ion Cells. J.
Electrochem. Soc. 2017, 164 (13), A3025–A3037.
https://doi.org/10.1149/2.0291713jes.
(218) Jung, R.; Metzger, M.; Maglia, F.; Stinner, C.; Gasteiger, H. A. Oxygen Release
and Its Effect on the Cycling Stability of LiNixMnyCozO2 (NMC) Cathode
Materials for Li-Ion Batteries. J. Electrochem. Soc. 2017, 164 (7), A1361–A1377.
https://doi.org/10.1149/2.0021707jes.
(219) Zheng, J.; Xiao, J.; Xu, W.; Chen, X.; Gu, M.; Li, X.; Zhang, J.-G. Surface and
Structural Stabilities of Carbon Additives in High Voltage Lithium Ion Batteries.
Journal of Power Sources 2013, 227, 211–217.
https://doi.org/10.1016/j.jpowsour.2012.11.038.
(220) Gambou-Bosca, A.; Bélanger, D. Effect of the Formulation of the Electrode on the
Pore Texture and Electrochemical Performance of the Manganese Dioxide-Based
Electrode for Application in a Hybrid Electrochemical Capacitor. J. Mater. Chem.
A 2014, 2 (18), 6463. https://doi.org/10.1039/c3ta14910b.
(221) Betz, J.; Bieker, G.; Meister, P.; Placke, T.; Winter, M.; Schmuch, R. Theoretical
versus Practical Energy: A Plea for More Transparency in the Energy Calculation
of Different Rechargeable Battery Systems. Adv. Energy Mater. 2019, 9 (6),
1803170. https://doi.org/10.1002/aenm.201803170.
(222) Naik, K. M.; Sampath, S. Cubic Mo6S8-Efficient Electrocatalyst Towards
Hydrogen Evolution Over Wide PH Range. Electrochimica Acta 2017, 252, 408–
415. https://doi.org/10.1016/j.electacta.2017.09.015.
(223) Prigge, C.; Mueller-Warmuth, W.; Gocke, E.; Schoellhorn, R. Metallike Behavior
of Lithium Intercalated in Molybdenum Cluster Chalcogenides. Chem. Mater.
1993, 5 (10), 1493–1498. https://doi.org/10.1021/cm00034a020.
(224) Gocke, E.; Schoellhorn, R.; Aselmann, G.; Mueller-Warmuth, W. Molybdenum
Cluster Chalcogenides Mo6X8: Intercalation of Lithium via Electron/Ion Transfer.
Inorg. Chem. 1987, 26 (11), 1805–1812. https://doi.org/10.1021/ic00258a034.

180 References
(225) Xu, K.; von Wald Cresce, A. Li+-Solvation/Desolvation Dictates Interphasial
Processes on Graphitic Anode in Li Ion Cells. J. Mater. Res. 2012, 27 (18), 2327–
2341. https://doi.org/10.1557/jmr.2012.104.
(226) Xu, K.; von Cresce, A.; Lee, U. Differentiating Contributions to “Ion Transfer”
Barrier from Interphasial Resistance and Li + Desolvation at Electrolyte/Graphite
Interface. Langmuir 2010, 26 (13), 11538–11543.
https://doi.org/10.1021/la1009994.
(227) Lee, J.-W.; Pyun, S.-I. Investigation of Lithium Transport through LiMn2O4 Film
Electrode in Aqueous LiNO3 Solution. Electrochimica Acta 2004, 49 (5), 753–761.
https://doi.org/10.1016/j.electacta.2003.09.029.
(228) Abe, T.; Sagane, F.; Ohtsuka, M.; Iriyama, Y.; Ogumi, Z. Lithium-Ion Transfer at
the Interface Between Lithium-Ion Conductive Ceramic Electrolyte and Liquid
Electrolyte-A Key to Enhancing the Rate Capability of Lithium-Ion Batteries. J.
Electrochem. Soc. 2005, 152 (11), A2151. https://doi.org/10.1149/1.2042907.
(229) Hu, J.; Guo, H.; Li, Y.; Wang, H.; Wang, Z.; Huang, W.; Yang, L.; Chen, H.; Lin,
Y.; Pan, F. Understanding Li-Ion Thermodynamic and Kinetic Behaviors in
Concentrated Electrolyte for the Development of Aqueous Lithium-Ion Batteries.
Nano Energy 2021, 89, 106413. https://doi.org/10.1016/j.nanoen.2021.106413.
(230) Ayeb, A.; Otten, W. M.; Mank, A. J. G.; Notten, P. H. L. The Hydrogen Evolution
and Oxidation Kinetics during Overdischarging of Sealed Nickel-Metal Hydride
Batteries. J. Electrochem. Soc. 2006, 153 (11), A2055.
https://doi.org/10.1149/1.2336993.
(231) Ortiz-Rodríguez, J. C.; Singstock, N. R.; Perryman, J. T.; Hyler, F. P.; Jones, S. J.;
Holder, A. M.; Musgrave, C. B.; Velázquez, J. M. Stabilizing Hydrogen
Adsorption through Theory-Guided Chalcogen Substitution in Chevrel-Phase
Mo6X8 (X=S, Se, Te) Electrocatalysts. ACS Appl. Mater. Interfaces 2020, 12 (32),
35995–36003. https://doi.org/10.1021/acsami.0c07207.
(232) Alonso-Vante, N.; Schubert, B.; Tributsch, H. Transition Metal Cluster Materials
for Multi-Electron Transfer Catalysis. Materials Chemistry and Physics 1989, 22
(3–4), 281–307. https://doi.org/10.1016/0254-0584(89)90002-3.
(233) Dubouis, N.; Yang, C.; Beer, R.; Ries, L.; Voiry, D.; Grimaud, A. Interfacial
Interactions as an Electrochemical Tool To Understand Mo-Based Catalysts for the
Hydrogen Evolution Reaction. ACS Catal. 2018, 8 (2), 828–836.
https://doi.org/10.1021/acscatal.7b03684.
(234) Utsunomiya, T.; Hatozaki, O.; Yoshimoto, N.; Egashira, M.; Morita, M. Influence
of Particle Size on the Self-Discharge Behavior of Graphite Electrodes in Lithium-
Ion Batteries. Journal of Power Sources 2011, 196 (20), 8675–8682.
https://doi.org/10.1016/j.jpowsour.2011.06.070.

References 181
(235) Yazami, R.; Ozawa, Y. A Kinetics Study of Self-Discharge of Spinel Electrodes in
Li/LixMn2O4 Cells. Journal of Power Sources 2006, 153 (2), 251–257.
https://doi.org/10.1016/j.jpowsour.2005.10.012.
(236) Ozawa, Y.; Yazami, R.; Fultz, B. Self-Discharge Study of LiCoO2 Cathode
Materials. Journal of Power Sources 2003, 119–121, 918–923.
https://doi.org/10.1016/S0378-7753(03)00227-1.
(237) Notten, P. H. L.; Verbitskiy, E.; Kruijt, W. S.; Bergveld, H. J. Oxygen Evolution
and Recombination Kinetics Inside Sealed Rechargeable, Ni-Based Batteries. J.
Electrochem. Soc. 2005, 152 (7), A1423. https://doi.org/10.1149/1.1921849.
(238) Bullock, K. R.; McClelland, D. H. The Kinetics of the Self‐Discharge Reaction in
a Sealed Lead‐Acid Cell. J. Electrochem. Soc. 1976, 123 (3), 327–331.
https://doi.org/10.1149/1.2132819.
(239) Leblanc, P.; Blanchard, P.; Senyarich, S. Self‐Discharge of Sealed Nickel—Metal
Hydride Batteries: Mechanisms and Improvements. J. Electrochem. Soc. 1998, 145
(3), 844–847. https://doi.org/10.1149/1.1838355.
(240) Peled, E.; Golodnitsky, D.; Ardel, G. Advanced Model for Solid Electrolyte
Interphase Electrodes in Liquid and Polymer Electrolytes. J. Electrochem. Soc.
1997, 144 (8), L208–L210. https://doi.org/10.1149/1.1837858.
(241) Gauthier, M.; Carney, T. J.; Grimaud, A.; Giordano, L.; Pour, N.; Chang, H.-H.;
Fenning, D. P.; Lux, S. F.; Paschos, O.; Bauer, C.; Maglia, F.; Lupart, S.; Lamp,
P.; Shao-Horn, Y. Electrode–Electrolyte Interface in Li-Ion Batteries: Current
Understanding and New Insights. J. Phys. Chem. Lett. 2015, 6 (22), 4653–4672.
https://doi.org/10.1021/acs.jpclett.5b01727.
(242) Jones, J.; Anouti, M.; Caillon-Caravanier, M.; Willmann, P.; Lemordant, D.
Thermodynamic of LiF Dissolution in Alkylcarbonates and Some of Their
Mixtures with Water. Fluid Phase Equilibria 2009, 285 (1–2), 62–68.
https://doi.org/10.1016/j.fluid.2009.07.020.
(243) Tasaki, K.; Goldberg, A.; Lian, J.-J.; Walker, M.; Timmons, A.; Harris, S. J.
Solubility of Lithium Salts Formed on the Lithium-Ion Battery Negative Electrode
Surface in Organic Solvents. J. Electrochem. Soc. 2009, 156 (12), A1019.
https://doi.org/10.1149/1.3239850.
(244) Strmcnik, D.; Castelli, I. E.; Connell, J. G.; Haering, D.; Zorko, M.; Martins, P.;
Lopes, P. P.; Genorio, B.; Østergaard, T.; Gasteiger, H. A.; Maglia, F.;
Antonopoulos, B. K.; Stamenkovic, V. R.; Rossmeisl, J.; Markovic, N. M.
Electrocatalytic Transformation of HF Impurity to H2 and LiF in Lithium-Ion
Batteries. Nat Catal 2018, 1 (4), 255–262. https://doi.org/10.1038/s41929-018-
0047-z.
(245) Vincze, J.; Valiskó, M.; Boda, D. The Nonmonotonic Concentration Dependence
of the Mean Activity Coefficient of Electrolytes Is a Result of a Balance between

182 References
Solvation and Ion-Ion Correlations. The Journal of Chemical Physics 2010, 133
(15), 154507. https://doi.org/10.1063/1.3489418.
(246) McEldrew, M.; Goodwin, Z. A. H.; Bi, S.; Bazant, M. Z.; Kornyshev, A. A. Theory
of Ion Aggregation and Gelation in Super-Concentrated Electrolytes. J. Chem.
Phys. 2020, 152 (23), 234506. https://doi.org/10.1063/5.0006197.
(247) Liu, D.; Yu, Q.; Liu, S.; Qian, K.; Wang, S.; Sun, W.; Yang, X.-Q.; Kang, F.; Li,
B. Evolution of Solid Electrolyte Interface on TiO2 Electrodes in an Aqueous Li-
Ion Battery Studied Using Scanning Electrochemical Microscopy. J. Phys. Chem.
C 2019, acs.jpcc.9b01412. https://doi.org/10.1021/acs.jpcc.9b01412.
(248) Zhang, H.; Wang, D.; Shen, C. In-Situ EC-AFM and Ex-Situ XPS Characterization
to Investigate the Mechanism of SEI Formation in Highly Concentrated Aqueous
Electrolyte for Li-Ion Batteries. Applied Surface Science 2020, 507, 145059.
https://doi.org/10.1016/j.apsusc.2019.145059.
(249) He, M.; Guo, R.; Hobold, G. M.; Gao, H.; Gallant, B. M. The Intrinsic Behavior of
Lithium Fluoride in Solid Electrolyte Interphases on Lithium. Proc Natl Acad Sci
USA 2020, 117 (1), 73–79. https://doi.org/10.1073/pnas.1911017116.
(250) Aurbach, D.; Ein‐Ely, Y.; Zaban, A. The Surface Chemistry of Lithium Electrodes
in Alkyl Carbonate Solutions. J. Electrochem. Soc. 1994, 141 (1), L1–L3.
https://doi.org/10.1149/1.2054718.
(251) Guo, R.; Wang, D.; Zuin, L.; Gallant, B. M. Reactivity and Evolution of Ionic
Phases in the Lithium Solid–Electrolyte Interphase. ACS Energy Lett. 2021, 6 (3),
877–885. https://doi.org/10.1021/acsenergylett.1c00117.
(252) Zhang, X.-Q.; Cheng, X.-B.; Chen, X.; Yan, C.; Zhang, Q. Fluoroethylene
Carbonate Additives to Render Uniform Li Deposits in Lithium Metal Batteries.
Adv. Funct. Mater. 2017, 27 (10), 1605989.
https://doi.org/10.1002/adfm.201605989.
(253) Aurbach, D. A Short Review of Failure Mechanisms of Lithium Metal and
Lithiated Graphite Anodes in Liquid Electrolyte Solutions. Solid State Ionics 2002,
148 (3–4), 405–416. https://doi.org/10.1016/S0167-2738(02)00080-2.
(254) Li, C.; Lan, Q.; Yang, Y.; Shao, H.; Zhan, H. Flexible Artificial Solid Electrolyte
Interphase Formed by 1,3-Dioxolane Oxidation and Polymerization for Metallic
Lithium Anodes. ACS Appl. Mater. Interfaces 2019, 11 (2), 2479–2489.
https://doi.org/10.1021/acsami.8b16080.
(255) Wrogemann, J. M.; Künne, S.; Heckmann, A.; Rodríguez‐Pérez, I. A.; Siozios, V.;
Yan, B.; Li, J.; Winter, M.; Beltrop, K.; Placke, T. Development of Safe and
Sustainable Dual‐Ion Batteries Through Hybrid Aqueous/Nonaqueous
Electrolytes. Adv. Energy Mater. 2020, 10 (8), 1902709.
https://doi.org/10.1002/aenm.201902709.

References 183
(256) Zhang, X.; Dong, M.; Xiong, Y.; Hou, Z.; Ao, H.; Liu, M.; Zhu, Y.; Qian, Y.
Aqueous Rechargeable Li+/Na+ Hybrid Ion Battery with High Energy Density and
Long Cycle Life. Small 2020, 16 (41), 2003585.
https://doi.org/10.1002/smll.202003585.
(257) Miyazaki, K.; Takenaka, N.; Watanabe, E.; Iizuka, S.; Yamada, Y.; Tateyama, Y.;
Yamada, A. First-Principles Study on the Peculiar Water Environment in a
Hydrate-Melt Electrolyte. J. Phys. Chem. Lett. 2019, 10 (20), 6301–6305.
https://doi.org/10.1021/acs.jpclett.9b02207.
(258) Nikitina, V. A.; Zakharkin, M. V.; Vassiliev, S. Yu.; Yashina, L. V.; Antipov, E.
V.; Stevenson, K. J. Lithium Ion Coupled Electron-Transfer Rates in
Superconcentrated Electrolytes: Exploring the Bottlenecks for Fast Charge-
Transfer Rates with LiMn2O4 Cathode Materials. Langmuir 2017, 33 (37), 9378–
9389. https://doi.org/10.1021/acs.langmuir.7b01016.
(259) Brouillette, D.; Perron, G.; Desnoyers, J. E. Apparent Molar Volume, Heat
Capacity, and Conductance of Lithium Bis(Trifluoromethylsulfone)Imide in
Glymes and Other Aprotic Solvents. Canadian Journal of Physics 1997, No. 75,
1608–1614.
(260) Marković, N. M.; Grgur, B. N.; Ross, P. N. Temperature-Dependent Hydrogen
Electrochemistry on Platinum Low-Index Single-Crystal Surfaces in Acid
Solutions. J. Phys. Chem. B 1997, 101 (27), 5405–5413.
https://doi.org/10.1021/jp970930d.
(261) Tang, Y.; Zhang, Y.; Li, W.; Ma, B.; Chen, X. Rational Material Design for
Ultrafast Rechargeable Lithium-Ion Batteries. Chem. Soc. Rev. 2015, 44 (17),
5926–5940. https://doi.org/10.1039/C4CS00442F.
(262) Yoo, H. D.; Markevich, E.; Salitra, G.; Sharon, D.; Aurbach, D. On the Challenge
of Developing Advanced Technologies for Electrochemical Energy Storage and
Conversion. Materials Today 2014, 17 (3), 110–121.
https://doi.org/10.1016/j.mattod.2014.02.014.
(263) Köhler, U.; Antonius, C.; Bäuerlein, P. Advances in Alkaline Batteries. Journal of
Power Sources 2004, 127 (1–2), 45–52.
https://doi.org/10.1016/j.jpowsour.2003.09.006.
(264) Tarascon, J.-M.; Gozdz, A. S.; Schmutz, C.; Shokoohi, F.; Warren, P. C.
Performance of Bellcore’s Plastic Rechargeable Li-Ion Batteries. Solid State Ionics
1996, 86–88, 49–54. https://doi.org/10.1016/0167-2738(96)00330-X.
(265) Lepoivre, F.; Grimaud, A.; Larcher, D.; Tarascon, J.-M. Long-Time and Reliable
Gas Monitoring in Li-O 2 Batteries via a Swagelok Derived Electrochemical Cell.
J. Electrochem. Soc. 2016, 163 (6), A923–A929.
https://doi.org/10.1149/2.0421606jes.

184 References
(266) Lepoivre, F. Study and Improvement of Non-Aqueous Lithium-Air Batteries via
the Development of a Silicon-Based Anode. Thesis manuscript 2016.
(267) Wei Yin. Fundamental Understanding of High-Energy-Density Li-Ion Batteries
and beyond : Structure-Property Relationships and Reaction Chemistries. Thesis
manuscript 2019.
(268) Yin, W.; Mariyappan, S.; Grimaud, A.; Tarascon, J. M. Rotating Ring Disk
Electrode for Monitoring the Oxygen Release at High Potentials in Li-Rich
Layered Oxides. J. Electrochem. Soc. 2018, 165 (14), A3326–A3333.
https://doi.org/10.1149/2.0481814jes.
(269) Jones, J.; Anouti, M.; Caillon-Caravanier, M.; Willmann, P.; Sizaret, P.-Y.;
Lemordant, D. Solubilization of SEI Lithium Salts in Alkylcarbonate Solvents.
Fluid Phase Equilibria 2011, 305 (2), 121–126.
https://doi.org/10.1016/j.fluid.2011.03.007.
(270) Jones, J.; Anouti, M.; Caillon-Caravanier, M.; Willmann, P.; Lemordant, D.
Lithium Fluoride Dissolution Equilibria in Cyclic Alkylcarbonates and Water.
Journal of Molecular Liquids 2010, 153 (2–3), 146–152.
https://doi.org/10.1016/j.molliq.2010.02.006.
(271) Han, K. S.; Yu, Z.; Wang, H.; Redfern, P. C.; Ma, L.; Cheng, L.; Chen, Y.; Hu, J.
Z.; Curtiss, L. A.; Xu, K.; Murugesan, V.; Mueller, K. T. Origin of Unusual Acidity
and Li + Diffusivity in a Series of Water-in-Salt Electrolytes. J. Phys. Chem. B
2020, 124 (25), 5284–5291. https://doi.org/10.1021/acs.jpcb.0c02483.

APPENDIX

- APPENDIX - CHAPTER 1
Table A.1. 1 Summary of the main salts listed in Chapter 1.
Name Abbreviatio
n Chemical formula
Lithium hexafluorophosphate LiPF6
Lithium hexafluoroarsenate LiAsF6
Lithium acetate LiAc
Lithium triflouromethanesulfonate or
Lithium triflate LiOtf
Lithium bis(fluorosulfonyl)imide LiFSI
Lithium bis(trifluoromethanesulfonyl)imide LiTFSI
Lithium bis(pentafluoroethanesulfonyl)imide
LiBETI
Lithium pentafluoroethanesulfonyl) (trifluoromethanesulfonyl)imide
LiPTFSI
Lithium
(fluorosulfonyl)(trifluoromethylsulfonyl)imide
LiFTFSI
Lithium propylsulfonate-butylsulfonate-dimethyl-amine
LiMM3411
1-Ethyl-3-methylimidazolium bis(trifluoromethylsulfonyl)imide
EMim TFSI
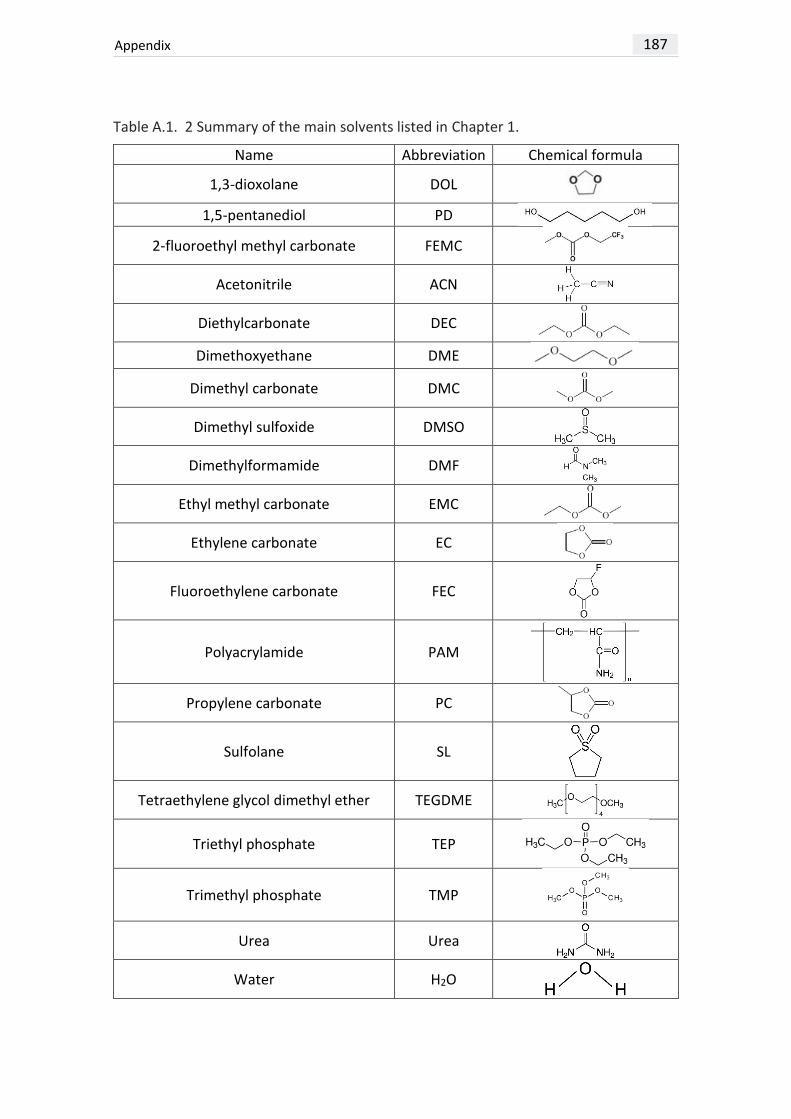
Appendix 187
Table A.1. 2 Summary of the main solvents listed in Chapter 1.
Name Abbreviation Chemical formula
1,3-dioxolane DOL
1,5-pentanediol PD
2-fluoroethyl methyl carbonate FEMC
Acetonitrile ACN
Diethylcarbonate DEC
Dimethoxyethane DME
Dimethyl carbonate DMC
Dimethyl sulfoxide DMSO
Dimethylformamide DMF
Ethyl methyl carbonate EMC
Ethylene carbonate EC
Fluoroethylene carbonate FEC
Polyacrylamide PAM
Propylene carbonate PC
Sulfolane SL
Tetraethylene glycol dimethyl ether TEGDME
Triethyl phosphate TEP
Trimethyl phosphate TMP
Urea Urea
Water H2O

188 Appendix
SEI formation mechanisms in Water-in-salt electrolyte
The first SEI formation mechanism reported relies on the direct electrochemical
reduction of anion or anion clusters, such as Li2(TFSI)+146.. Alike in organic
superconcentrated electrolyte, anions would partially donate electrons to Li+ to form
Li2(TFSI)+ complex, therefore lowering the anion LUMO and increasing its reduction
potential43,45,54, as revealed by quantum chemistry calculation146 (see Figure A.1. 1a).
Similarly, the electronic structure of water isolated monomers or clusters changes,
leading to an inversion of the LUMO levels between water and anion, thus promoting
anion reduction at low potential257. In addition, Li2CO3 and Li2O were determined as
contributors due to the complementary reduction of CO2 and O2 dissolved gases in the
electrolyte146 (Equation A.1. 1 and Equation A.1. 2). However, as discussed in section
1.2, the determination of HOMO/LUMO energy level is not sufficient to explain changes
in interfacial reactivity. Therefore, other SEI mechanisms were discussed in literature.
Dubouis et al.134 observed that the HER occurs at potential above 2 V vs Li+/Li in WiSE,
and that TFSI- anions chemically degrade in the strong alkaline environment produced
by HER (see Figure A.1. 1b). Based on this mechanism, LiOH and CFx elements were
found to contribute to the SEI composition. Eventually, complementary to the chemical
degradation path, Bouchal et al.149 suggested that a dynamic precipitation/dissolution
of LiTFSI salt also contributes to the SEI, as also reported by Nikitina et al.258.
Moreover, the SEI formation may be influence by the preferential adsorption of Li+
on the electrode surface. For instance, the strong Li+ adsorption on Pt surface brings
more water to the interface154 promoting water reduction as shown by observing almost
no changes in HER onset potential on Pt compared to Al, enabling a downshift of HER. A
part from the HER catalysis related to the electrode material and the Li+ cation,
hypothesis based on MD simulations proposed that the electrode material also
influences the anion orientation, thus modifying the SEI formation154. However, these
hypothesis remain under debate.

Appendix 189
Figure A.1. 1 (a) Predicted reduction potentials from quantum chemistry calculations. Adapted from Ref111. (b) Schematic illustration of the formation of the SEI following a ‘‘water reduction mediated mechanism’’ occurring in 20 m LiTFSI WiSE. Adapted from Ref134.
Equation A.1. 1: Electrochemical reduction of dissolved O2 (1) and CO2 (2) contributing to SEI formation.
𝑂2 + 4 ∙ 𝐿𝑖+ + 4 ∙ 𝑒− = 2 ∙ 𝐿𝑖2𝑂 (1)
2 ∙ 𝐶𝑂2 + 𝑂2 + 2 ∙ 𝐿𝑖+ + 2 ∙ 𝑒− = 𝐿𝑖2𝐶𝑂3 (2)
Equation A.1. 2: Chemical reaction contributing to SEI formation. 𝐶𝑂2 + 𝐿𝑖2𝑂 = 𝐿𝑖2𝐶𝑂3

190 Appendix
Table A.1. 3 Summary of the polymer coating used to prevent HER.
PGE
Abbreviation
Name Chemical formula
Role and (mass ratio)
Polymer matrix
to electrol
yte (mass ratio)
UV-curable
HEA 2-hydroxyethyl acrylate
Monomer (89)
25
MPEGA poly(ethylene glycol) methyl ether acrylate
Co-monomer
(9)
PEGDA poly(ethylene glycol)
diacrylate
Cross-linker(2)
DMPA 2,2-dimethoxy-2-
phenylacetophenoe
Photo-initiator
(0.2 wt%)
Electrolyte
75 LiTFSI:H2O:TMP199 37:40:23 (molar ratio)
21 m LiTFSI : 7 m LiOtf197
Molecular
crowding
PEG/PEO poly(ethylene
glycol)/poly(ethylene oxide)
Electrolyte
2 m LiTFSI in PEG0.94(H20)0.06

- APPENDIX - CHAPTER 3
Energy density and specific energy as function of
electrolyte volume
Figure A.3. 1 Specific energy and energy density as function of the electrolyte volume
calculated thanks to the model developed by Betz et al.221.

192 Appendix
Cycling behavior in 3-electrodes set up
Figure A.3. 2 (a-c) Illustration of the protocol used to assess SEI stability over self-discharge cycling. Potential as function of time for 3 cells using a 3-electrodes cell based on Mo6S8 as counter electrode, LFP as working electrode and a ring of Li0.5FePO4 as reference in 20 m LiTFSI. (d-f) Nyquist plot obtained by electrochemical impedance spectroscopy of LFP determined over cycling. (i-k) Nyquist plot obtained by electrochemical impedance spectroscopy of Mo6S8 determined over cycling. Frequency range was comprised between 1 MHz and 50 mHz with a signal amplitude of 20 mV.
Three cells were assembled to assess SEI stability over cycling. Despite the poor
performances obtained when using a 3-electrodes cell, their cycling curves show a
rather good reproducibility. In addition, electrochemical impedance spectroscopy
assessed on LFP gives similar response (see Figure A.3. 2d-f). Such observations are
further confirmed by the MO6S8 impedance spectra (see Figure A.3. 2g-i) that are only
affected by the cell SOC and not the SEI evolution. Therefore, as shown in Figure A.3. 3
showing detailed EIS spectra as function of the cell SOC, the contribution of the LFP
counter electrode to the cell impedance does not vary throughout the experiment, thus
confirming that the high capacity loading of LFP:Mo6S8 (4:1) is enough to consider our
set-up as a pseudo-half-cell and to prevent LFP impedance to be impacted by the cell

Appendix 193
SOC. However, a clear inductive loop is shown on the LFP spectra. Issues in positioning
the electrode toward the reference electrode may explain such behavior.
Figure A.3. 3 Nyquist plot obtained by electrochemical impedance spectroscopy of LFP working electrode over cycling. Frequency range was comprised between 1 MHz and 50 mHz with a signal amplitude of 20 mV. (a) Summary of Nyquist plot obtained during cycling, (b) Nyquist plot obtained at charged state, (c) Nyquist plot of LFP at discharged state.

194 Appendix
Differential scanning calorimetry (DSC)
Figure A.3. 4 Differential scanning calorimetry (DSC) experiments performed at 2 °C/min between 35 °C and -60 °C upon cooling and back to 60 °C on heating. (a) Electrolytes with different concentrations used for calibration (19.803 m, 20.591 m, 20.910 m, 21.992, 22.9983 m), (b) zoom on the crystallization peak of calibration data.
To assess the impact of water consumption by recording the evolution of water
content in the electrolyte as function of cycle number and self-discharge period, a
calibration curve is determined. To do so, separators are soaked with electrolytes with
known concentrations and DSC experiments are performed (see Figure A.3. 4a and b).
A first exothermic peak is observed between 0 °C and 20 °C, shifting to greater
temperature with increasing concentration, which is attributed to the beginning of the
H2O∙LiTFSI crystallization126. To be consistent between melting of pure components and
the liquidus of transition of adjacent phases, phase transitions in WiSE are assessed at
peak temperature, rather than onset temperature, as reported by Ding et al.126. A
second peak at ≈ -20 °C following the crystallization of (H2O)4Li∙TFSI 126 is then observed.
These two peaks could be related to the liquidus (between 0 °C to 20 °C) and solidus (≈
-20 °C) temperature of 20 m LiTFSI electrolyte, as reported in the phase diagram
proposed by Ding et al.126 (see Figure 1. 17). Nonetheless, the associated temperatures
measured in our experiments differ from the one reported by Ding et al., with the solidus
temperature reported at -8.7 °C for LiTFSI concentration comprised between 13.9 m and
55.5 m, while we observed a solidus temperature at ≈ -20 °C. Finally, upon heating, an
endothermic “wave” that corresponds to the melting point of H2O∙LiTFSI is observed, in
agreement with previous DSC experiments carried out on 21 m LITFSI111,163. This wave
shifts to higher temperature with increase in concentration in line with the trend
observed for crystallization.

Appendix 195
Besides, for the 22.993 m electrolyte an exothermic peak is observed at -46.4 °C upon
cooling, followed by an endothermic peak upon heating at ≈ -5 °C (see Figure A.3. 4a).
Based on the shape of the -46.4 °C peak, one can hypothesize that it is related to the
crystallization of a pure component, presumably water. However, the corresponding
endothermic peak (≈ -5 °C) does not correspond to the melting of a pure component.
This behavior could be related to the incongruent melting of unstable solvates, as
reported by Perron et al.259. Similar peaks were also observed by Reber et al.163 for a 21
m LiTFSI solution but at temperature lower than -60 °C for the exothermic peak.
However, considering the 20.910 and 21.992 m electrolyte, we did not observe this
peak. The difference may be related to the use of mesocarbon microbeads to promote
crystallization previously employed by Reber et al.163.
Based on the results shown in Figure A.3. 4, the following fit is obtained:
𝑇𝑐𝑟𝑦𝑠𝑡𝑎𝑙𝑙𝑖𝑧𝑎𝑡𝑖𝑜𝑛 𝑝𝑒𝑎𝑘 = 4.68 ∙ 𝐶𝐿𝑖𝑇𝐹𝑆𝐼𝑚𝑜𝑙 𝑘𝑔⁄
− 91.5 𝑤𝑖𝑡ℎ 𝑅2 = 0.997.

196 Appendix
Activation energy of direct HER in 20 m LiTFSI
Pressure cell experiments
Figure A.3. 5 Potential (black line) and pressure evolution (red line) as function of time for a cell cycled at 0.15 C at 45 °C. Prior to the cycling step, the cell was pre-cycled at 1C and 25 °C for 10 cycles.
Figure A.3. 5 shows the pressure evolution as function of time for a cell which is
cycled at 45 °C with a C-rate of 0.15C. Prior to this cycling test, the cell underwent a pre-
cycling step of 10 cycles performed at 1C, 25 °C. Contrary to what is observed at 25 °C
or 35 °C, a pure HER plateau appears above 1.4 V. Indeed, due to the low C-rate and the
manually-applied pressure in Swagelok cell, parasitic reactions are favored when
increasing temperature thus explaining the appearance of such plateau at 45 °C and 55
°C.
Gas calculations made to determine the activation energy of HER on Mo6S8 take into
consideration the pure HER plateau to calculate H2 evolution. In addition, the hydrogen
rate (𝐿𝑛 (∆𝑃
𝑃0⁄
∆𝑡)) calculated at 55 °C using two cells give close values ranging from -7 to
-7.3 suggesting that the experiments are reproducible.

Appendix 197
Figure A.3. 6 Arrhenius plot obtained from cycling of Mo6S8/LFP pressure cell in 20 m LiTFSI as function of temperature. The logarithm of the hydrogen rate ((ΔP/P0)/Δtime) as function of the inverse of temperature. Hydrogen rate is calculated considering charge time (full line) or charge and discharge time (dash line).
Eventually, Figure A.3. 6 shows the Arrhenius plot considering either the charge time
or the charge and discharge time as the time during which hydrogen is produced. The
rather close value of the slope (-8.62 and -9.79) found tend to confirm that hydrogen is
majorly produced during charge thus further confirming the hypothesis used in this
study.
Electrochemical cell: HER on Pt
Temperature-controlled CV were performed in an electrochemical cell to determine
HER activation energy on Pt in 20 m LiTFSI; the corresponding polarization curves and
Tafel plots are shown in Figure A.3. 7a and b. Looking into the polarization curves,
limitations regarding the experiment can be observed since an overpotential of 600 mV
must be applied to reach the potential range in which HER occurs.

198 Appendix
Figure A.3. 7 (a) Cyclic voltammetry performed at 50 mV/s in 20 m LiTFSI in a 3-electrodes cell using Pt disk connected to a rotating disk electrode (ω=1600 rpm) as working electrode, Pt wire as counter electrode and a leakless electrode as reference electrode. (b) Tafel representation of the cyclic voltammetry.
The most accurate approach to extract the activation energy for the HER relies on
analysis made in the so-called micropolarization region260, at potentials very close to the
equilibrium potential in order to reduce effects related to mass transport. To assess the
kinetic parameters, one need to verify that all the mass-transport limitation is not
influencing the electrochemistry. The effect of mass transport can be quantified thanks
to Koutecky-Levich equation (see Equation A.3. 1).
Equation A.3. 1
1
𝑗𝑚𝑒𝑎𝑠𝑢𝑟𝑒𝑑 =
1
𝑗𝑘 + (
1
0.62𝑛𝐹𝐴𝐷−23 𝜈
16𝐶𝑏𝑢𝑙𝑘
)𝜔−1/2
with jk the kinetic current (A), n the number of electron transferred, F the Faraday
constant (C/mol), A the electrode area (m²), D the diffusion coefficient for the reactant
(m²/s), ν the kinematic viscosity (m²/s), Cbulk the concentration in the bulk (mol/m3) and
ω the rotation speed (rad/s).
Thus, in the absence of mass transport control, the second term of the equation is
constant regardless of the rotation speed of the RDE. Figure A.3. 8 shows the inverse of
the forward current density determined at an overpotential of -600 mV as function of
the inverse of the square root of the rotation speed. One can note that from 25 °C to
45 °C, the reaction is mix-controlled by mass transport and kinetics both limiting the
current in the 600 mV overpotential range studied in this work. At 55 °C, Koutecky-Levich
analysis shows less influence of mass transport on the current density. Besides, changes

Appendix 199
in the active surface area of the Pt electrode occur upon polarization, due to the SEI
formation and the surface passivation. This effect is observed by the crossover of the
curves between the forward and the backward scan (see Figure A.3. 7).
Figure A.3. 8 Koutecky-Levich analysis. Inverse of the forward current assess at an overpotential η = -600 mV as function of the inverse of the square root of the rotating speed of the rotating disk electrode (RDE). Four rotating speed were considered: 400 rpm, 600 rpm, 900 rpm and 1600 rpm. All measurements were conducted in a 3-electrodes electrochemical cell using Pt disk as working electrode, Pt wire as counter electrode and a leakless reference. Temperature was controlled to 25 °C, 35 °C, 45 °C and 55 °C.
Altogether, these parameters suggest that caution must be taken when discussing
the activation energy measured to be ≈ 10 kJ/mol at an overpotential (η) of -600 mV and
a rotation speed (ω) of 1600 rpm (see Figure A.3. 9). Indeed, 58 kJ/mol must be added
to obtain the activation energy at the equilibrium potential.

200 Appendix
Figure A.3. 9 Arrhenius analysis made at an overpotential of -600 mV, a rotating speed of 1600 rpm. All measurements were conducted in a 3-electrodes electrochemical cell using Pt disk connected to a rotating disk electrode as working electrode, Pt wire as counter electrode and a leakless reference in 20 m LiTFSI electrolyte. Temperature was controlled to 25 °C, 35 °C, 45 °C and 55 °C.
Spider chart data
Data used to make the spider chart shown in Figure 3. 14 are either directly taken
from literature or experimentally assess (in the case of WiSE-based LIB) and then
calculated thanks to the model develop by Betz et al. 221 . Table A.3. 1, Table A.3. 2 and
Table A.3. 3 summarize the data used to draw the comparative spider chart. Rate
capability of Lead-acid, Ni-Cd, Ni-MH and LIB devices were extracted and calculated from
Ref8,221,261,262.

Appendix 201
Table A.3. 1 Summary of specific energy and energy density as function of the technology.
Specific energy (Wh/kgcell)
Energy density (Wh/Lcell)
Technology Devices Min Max Min Min
Lead-acid Grid/
Vehicles 30 9 60 5,6 80 6 130 6
Ni-Cd Portable/Vehicles
30 7 60 8 55 7 150 263
Ni-MH Portable/Vehicles
42 5 110 5 135 7 275 263
NMC111/graphite adapted from
Ref221 18650 196 422
Superconcentrated aqueous
adapted from Ref221
18650 54
Mo6S8/LFP (WiSE)
99 LTO/NMC
(WiBS)
161 Mo6S8/LFP
(WiSE)
247 LTO/NMC
(WiBS)
Table A.3. 2 Summary of Self-discharge rate as function of the technology.
Technology Self-discharge rate (%/month)
Ref 7 Min Max
Lead-acid 1 15
Ni-Cd 5 20
Ni-MH 15 30
NMC111/graphite 2 10
20m LiTFSI (experimental)
30 75

202 Appendix
Table A.3. 3 Summary of the operating temperature range as function of the technology.
Operating temperature (°C)
Technology Min Max
Lead-acid -40 5 60 5
Ni-Cd -20 7 70 7
Ni-MH -30 5 65 5
NMC111/graphite -20 5 60 5
20m LiTFSI (experimental)
20 40
Table A.3. 4 Summary of the energy efficiency as function of the technology.
Technology Energy efficiency Min Min
Lead-acid 70 5 85 6
Ni-Cd 72,5 8 85 6
Ni-MH 70 8 90 7
NMC111/graphite 90 6 95 5
20m LiTFSI (experimental)
92 92
In their study, Betz et al.221 split the energy density and specific energy calculations
in six steps from a theoretical point (Step 1) of view to a practical one (from Step 2 to
Step 6) as described in Figure A.3. 10.
Table A.3. 5, Table A.3. 6, Table A.3. 7, Table A.3. 8, Table A.3. 9 and Table A.3. 10
detail the parameter and calculations made thanks to the model developed by

Appendix 203
Figure A.3. 10 Illustration of the steps used in Ref. 221 to determine the energy density and specific energy of a LIB cell as function of the influence of the different cell component.
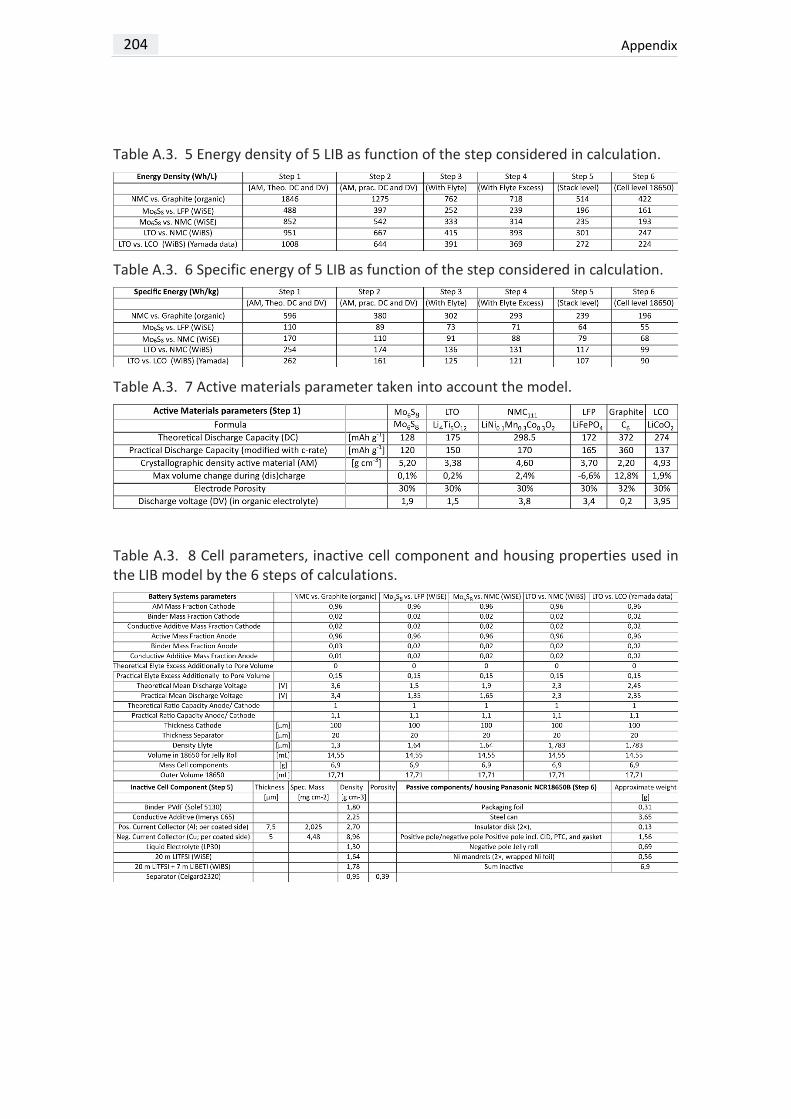
204 Appendix
Table A.3. 5 Energy density of 5 LIB as function of the step considered in calculation.
Table A.3. 6 Specific energy of 5 LIB as function of the step considered in calculation.
Table A.3. 7 Active materials parameter taken into account the model.
Table A.3. 8 Cell parameters, inactive cell component and housing properties used in the LIB model by the 6 steps of calculations.

Appendix 205
Table A.3. 9 Electrolyte properties used to describe a LIB cell in the model.
Table A.3. 10 Summary of the battery system calculation made with the model.


MATERIALS & METHODS

208 Materials & Methods
Material preparation
LiFePO4 (LFP) and LiNi0.6Mn0.2Co0.202 (NMC622) were purchased from Umicore.
LiTi2(PO4)3 (LTP) was prepared by solid-state reaction of stoichiometric amounts of
Li2CO3 (>99 %, Sigma Aldrich), TiO2 (>99 %, Sigma Aldrich) and NH4H2PO4 (98 %, Alfa
Aesar). The precursors were grinded and heated at 200 °C for 2 h and finally 930 °C for
24 h in air. Mo6S8 was either obtained from ISCR (Institut des Sciences Chimiques de
Rennes) or synthetized using the following protocol. Solid-state reaction was carried out
by grinding and heating to 1050 °C (2 °C/min) for 72 h in a sealed tube stoichiometric
amounts of Cu, Mo (99.95 %, Alfa Aesar) and S (99.98 %, Sigma Aldrich). An excess of
3.7 % (molar ratio) in Cu was then added and tube vacuum sealed and heated at 1050 °C
for 24 h (2 °C/min). When MoS2 impurities were detected, the as-synthetized powder
was treated under H2 reductive atmosphere in a boat crucible for 12 h (5 °C/min). The
resulting sample was then acid-leached overnight in HCl 6 M under oxygen bubbling.
The powder and the supernatant were separated by centrifugation and the samples
were washed with distilled water until pH=7, prior to being dried at 80 °C under vacuum
overnight.
X-ray diffraction (XRD) was performed to confirm the LTP and Mo6S8 phases purity
using a BRUKER D8 Advance diffractometer with Cu Kα radiation (λKα1 = 1.54056 Å, λKα2
= 1.54439 Å).
1.2.1 Bellcore technique
For battery assembly, Mo6S8, NMC622, LFP and LTP composite self-standing electrodes
are fabricated using Bellcore technique264. Active materials (AM), Carbon super P (Csp,
Timcal) and PVdF-HFP (Poly(vinylidenefluoride-hexafluoropropylene, Solvay) are
grinded with the following weight ratio: 73 wt% of AM, 8 wt% of Csp and 19 wt% of
PVdF-HFP for Mo6S8 and LFP and 60 wt% of AM, 20 wt% of Csp and 20 wt% of PVdF-HFP
for NMC622 and LTP. NMC622 and LTP are mixed with Csp for 20 min using the Spex miller
with a ball to powder weight ratio of 11 for LTP and 8 for NMC622 prior to be mixed with
PVdF-HFP. Targeted loadings are summarized in Table M.M. 1.

Materials & Methods 209
Table M.M. 1 Summary of the practical capacity and targeted loadings considered in the study and experimental ones used.
Active material Practical capacity (mA.h/g)
Targeted loading (mg/cm²)
Experimental loading (mg/cm²)
Mo6S8 128 7 5.10 ± 1.12
LFP 172 21 16.07 ± 1.60
LTP 138 9.6 10.76 ± 1.19
NMC622 170 7 7.60 ± 0.67
The mixture is then dissolved in acetone with in the proportion of
120 mgtotal mass of powder/mLacetone and sonicated during 30 min. DBP (Dibutylphtalate, 99 %
Sigma Aldrich) is added as plasticizer and the slurry heated at 50 °C for one hour under
stirring. Then, the slurry is casted in a petri-dish and left to dry at least one hour (see
Figure M.M. 1a).
Figure M.M. 1 (a) Photography of a Mo6S8 composite Bellcore electrode casted in a petri-dish. (b) Distribution of Mo6S8 (blue) and LFP (red) electrode loading. Lines corresponds to normal distribution.
Electrodes are washed 3 times for 30 min in diethyl ether (99 %min, Alfa Aesar) to
create porosity by removing DBP and dried at 80 °C under vacuum overnight. Finally,
electrodes are punched with a 0.5 inch diameter. Loading distribution is shown in Figure
M.M. 1b. for the ≈ 150 first electrodes, demonstrating good reproducibility. Despite the
differences between experimental loadings and targeted ones: ≈ 25 % lower for Mo6S8
and LFP and ≈ 10 % higher for NMC622 and LTP, the balancing between the electrodes is
maintained to 4.2 for LFP: Mo6S8 and 1.15 for LTP:NMC622.
1.2.2 Alternative process of electrode fabrication
For the overcapacitive carbon YP50 counter electrodes, self-standing PTFE electrodes
are prepared by mixing YP50 and PTFE (Polytetrafluoroethylene, 60 wt% dispersion in
water) at a mass ratio of 9:1 in isopropanol. Isopropanol volume is added gradually until
an appropriate slurry is obtained. Then, the slurry is laminated several times following a

210 Materials & Methods
puff pastry technique to obtain films of loadings around 20 mg/cm². Finally, electrodes
are dried at 80°C under vacuum.
NMC622 electrochemical signature in LP30 is obtained using the powder mixture of
NMC622 and Csp at a weight ratio of 8:2.
1.3.1 Aqueous electrolyte
Aqueous superconcentrated electrolytes mainly rely on the use of Lithium
bis(trifluoromethanesulfonyl)imide (LiTFSI, LiN(SO2CF3)2) which was obtained from
Solvay or Solvionic and used as received. Lithium bis(pentafluoroethanesulfonyl)imide
(LiBETI, LiN(SO2CF2CF3)2) was purchased from TCI Chemicals and used as received to
make Water-in-bisalt (WiBS) electrolyte.
20 m, 15 m, 10 m, 7 m, 5 m, 3m and 1 m (mol/kg) of LiTFSI or 20 m LiTFSI : 8 m LiBETI
electrolyte solutions were prepared by mixing LiTFSI and LiBETI salts with Milli-Q
ultrapure water following Equation M.M. 1.
Equation M.M. 1:
𝑚𝑤𝑎𝑡𝑒𝑟 = 𝑚𝑠𝑎𝑙𝑡
𝐶𝑚𝑜𝑙/𝑘𝑔 ∙ 𝑀
with mwater, the mass of water to be added (kg); msalt, the mass of salt (g); Cmol/kg, the
expected concentration (mol/kg) and M, the molar mass of the salt (g/mol).
Table M.M. 2 summarizes some physico-chemical properties for the two main
electrolyte used in this study: 20 m LiTFSI and 20 m LiTFSI : 8 m LiBETI.
Table M.M. 2 Electrolyte properties and amount of water available in 20 m LiTSFI or 20 m LiTSFI : 8 m LiBETI as function of the electrolyte volume considered.
Electrolyte Velectrolyte
[µL] 𝜌
[g/mL] m [g]
𝜔𝐻2𝑂 𝜔𝐿𝑖𝑇𝐹𝑆𝐼 𝑀𝐻2𝑂
[g/mol] 𝑛𝑤𝑎𝑡𝑒𝑟 [mmol]
20 m LiTFSI
200 1.696 0.339 0.148 0.852 18
2.79
20 m LiTFSI
250 1.696 0.424 3.49

Materials & Methods 211
with Velectrolyte, volume of 20 m LiTFSI electrolyte/cell (µL); ρ, density in (g/mL)
measured by densimeter; m, the mass of electrolyte (g); ωH2O, water mass fraction;
ωLiTFSI, LiTFSI mass fraction; MH2O, molar mass of water (g/mol); nwater, the total amount
of water available (mol).
The amount of water in these electrolytes can be calculated according to Equation
M.M. 2.
Equation M.M. 2:
𝑛𝑤𝑎𝑡𝑒𝑟 (𝑚𝑜𝑙) = 𝜔𝐻2𝑂 ∙ 𝑉𝑒𝑙𝑒𝑐𝑡𝑟𝑜𝑦𝑡𝑒 ∙ 𝜌
𝑀𝐻2𝑂
1.3.2 Organic electrolyte
Pure organic solvents EC (Ethylene carbonate), DMC (Dimethyl carbonate), 1,3-
dioxolane (DOL), 1,2-dimethoxyethane (DME) were purchased from Sigma Aldrich.
Fluoroethylene carbonate (FEC) was purchased from TCI Chemicals. EC:DMC (1:1 vol%)
and DOL:DME (1:1 vol%) were prepared by mixing the appropriate amount of solvents.
To prepare the electrolytes (7M LiFSI in FEC, 1M LiTFSI : 2M LiFSI in DOL:DME + 3%
LiNO3), salts were dried in a vacuum oven at 110 °C prior to mixing. As-prepared
electrolytes were dried over molecular sieves before use.
To perform the calibration for the fluoride ion selective electrode in organic
electrolyte, EC:DMC (1:1 %vol) from Dodochem was used. LP30 (1 mol/L LiPF6 in EC:DMC
(1:1 %vol)) used for cycling experiments was purchased from Dodochem. All pure
solvents were dried over molecular sieve prior to be used for solubility measurements.
1.4.1 LiF coating
LiF coating of approximately 30 nm thickness were deposited onto metallic Li
following by reacting NF3 with metallic Li (NF3 + 3 Li → 3 LiF + ½ N2) at 175 °C for
one hour, as described in He et al.249. Current collectors were made of stainless steel
(SS). SS/Li/LiF samples were 1.27 cm in diameter for E-SEM, SEM and XRD experiments.
SS/Li/LiF samples were 0.9 cm in diameter for GC-TCD tests.
20 m LiTFSI : 8 m LiBETI
1.78358 0.446 0.10 0.9 2.48

212 Materials & Methods
1.4.2 Al2O3 coating
The Al2O3 layers were deposited on the top of metallic Li samples using an atomic
layer deposition (ALD) Picosun R-200 Advanced reactor which is a hot wall, flow through
type reaction chamber operating in thermal ALD mode using O3 (ozone) deposition
process. The AC series (AC-bench 2025) ozone generator offers state-of-the-art silent
corona discharge ozone generating technology based on O2 (99.5 %) / N2 (0.5 %) mixing
gas. The deposition temperature range was set to 140 °C, i.e. at a threshold level well
below the metallic Li melting temperature (≈c 180 °C). Trimethylaluminium (TMA)
served as precursor (tTMA = 0.1 s) and O3 (tO3 = 0.6 s) as reactant (second precursor) to
achieve the deposition of homogenous and conformal Al2O3 layers (2 to 10 nm-thick).
Electrochemical characterizations
To perform electrochemical characterization, two set ups were used, either
Swagelok® type cells or coin cells, as described in Figure M.M. 2 and Figure M.M. 3,
respectively. Swagelok devices enable to easily recover the battery assembly
(electrode/active material, separator etc.). However, the mechanical pressure applied
to the cell is hardly reproducible due to the manual pressing of the plungers, which may
influence the electrochemical behavior of the Swagelok cells and hamper the
comparison from one cell to another. On the contrary, due to the sealing step using a
crimping machine, the pressure applied is constant for coin cells (0.8 T) and reproducible
between cells. Thus, coin cell 2032 were preferred for concentration, long-term cycling
and self-discharge experiments in 2-electrode set-up.
In both set-ups, the battery relies on the same assembly. Self-standing negative and
positive electrodes of 1.27 cm² surfaces were used. Two Whatman glass fibers are used
as separators and soaked with electrolyte. On one side, the electrode is directly placed
on the plunger or the coin cell casing. On the other side, a disk of stainless steel is placed
between the electrode and plunger/casing separated by a spring.

Materials & Methods 213
Figure M.M. 2 Swagelok photography and corresponding scheme of the battery assembly.
Figure M.M. 3 Coin cell photography and corresponding scheme of the battery assembly.
The three-electrode cells used in this study are based on Swagelok 3-way T-
connector. The third electrode is inserted by the side opening connection, as illustrated
in Figure M.M. 4 and in Figure M.M. 5. Two types of three-electrode design were used,
either PFA-based or stainless steel-based ones.
Li+ insertion/de-insertion reversibility in active material (see Chapter 2) was tested
using a three-electrode PFA-based Swagelok cell (see Figure M.M. 4) with two glassy
carbon rods as current collectors. Self-standing composite active material electrode
were used as working electrode and self-standing YP50 electrode as counter electrode.
An Ag/AgCl reference electrode was used as reference electrode. Two Whatman glass
fiber separators were used. Cyclic voltammetry was performed at 1 mV/s.

214 Materials & Methods
SEI stability during self-discharge protocol determined by electrochemical impedance
spectroscopy (EIS) was assessed using a stainless steel 3-electrode Swagelok (see
Chapter 3). Mo6S8 composite electrode was used as counter electrode and LFP
composite electrode as working electrode. The reference electrode was based on a ring
of Li0.5FePO4 deposited onto a stainless steel gauze (see picture in Figure M.M. 5b). Two
glass fibers separators were used between the negative and the reference electrode and
two glass fibers separators were placed between the reference electrode and the
positive electrode. 200 µL of electrolyte were injected in the cell. After a 10 cycles pre-
cycling step at 1C, 0.5C cycling steps with a 20 h OCV resting period after the 2nd charge
were carried out. Potentio-electrochemical impedance spectroscopy (PEIS) was
performed between 1 MHz and 50 mHz with an amplitude of 20 mV.
Li0.5FePO4 was obtained by electrochemical partial delithiation. Around 500 mg of LFP
was used in a big Swagelok cell with a foil of scratched metallic Li as negative. Two
Whatman glass fibers were soaked with LP30 electrolyte. LFP powder and glass fibers
separators were separated with a celgard separator, enabling the recovery of the
powder. The cell was cycled at C/40 until reaching half lithiated Li0.5FePO4 state
(assessed by time limitation). Once the partially delithiated LFP was recovered, the
powder was washed 3 times in DMC to remove electrolyte traces, and dried under
vacuum at 80 °C overnight. Bellcore composite electrode were then made.
Figure M.M. 4 (a) Three-electrode PFA Swagelok photography and the corresponding scheme of the battery assembly. (b) Photography of the third electrode.

Materials & Methods 215
Figure M.M. 5 (a) Three-electrode stainless steel Swagelok photography and the corresponding scheme of the battery assembly. (b) Photography of the third electrode.
Operando gas monitoring during cycling (see Chapter 2) was performed using
homemade pressure cell previously developed in the lab,265,266 as reported in Figure
M.M. 6. This cell consists of Swagelok cell in which the battery assembly is placed, a gas
reservoir of ≈ 10 mL separates the battery assembly from the pressure sensor (on the
top of the cell) directly connected and controlled by the potentiostat. The 10 mL gas
reservoir was chosen to obtain a good signal to noise ratio, as pressure increase from
gas production does not exceed 100 mbar. Moreover, to maximize the pressure sensed
by the gauge, the electrode at which gas is produced is placed on the top of the battery
assembly, facing the pressure sensor. All gas-monitoring experiments were performed
in a temperature-controlled oven. Besides, a 10-hours resting period was used before
starting the electrochemical protocol to enable the pressure to be stable.

216 Materials & Methods
Figure M.M. 6 Pressure cell photography and corresponding scheme of the cell assembly.
Furthermore, gas identification (see Chapter 2) is performed by connecting a
homemade battery cell to a mass spectrometer (MS), as detailed in Ref267,268. The MS is
an ExQ gas analysis system (Hiden Analytical, USA) composed of a HAL (Hiden Analytical)
series quadrupole mass spectrometer, an ultra-high vacuum (UHV) mass spectrometer
vacuum chamber, a vacuum pumping system and a QIC series capillary inlet. The whole
system is controlled by a MASsoft 7 professional software. A photography of the cell is
shown in Figure M.M. 7a. After assembly, the online electrochemical mass
spectrometry (OEMS) cell is transferred in a temperature-controlled oven (IPP260,
Memmert, see Figure M.M. 7b). Then, the gas line and the cell are flushed and

Materials & Methods 217
pressurized to ≈ 1.3 bar with pure argon to avoid any contamination from ambient air
or glove box atmosphere. Prior to perform the galvanostatic cycling, the OEMS cell valve
connected to the mass spectrometer capillary is opened and the cell is held at open
circuit voltage for ≈ 5 hours to reach a gas-liquid equilibrium inside the cell, and
therefore to obtain a stable baseline value for all the partial pressure signals. During the
OEMS measurements, the internal cell pressure was measured by the pressure sensor
fixed on the gas line and the produced gaseous species were continuously sampled from
the cell head space to the mass spectrometer via a thin capillary (1/16″ diameter) at a
leak rate of 12.5 µL/min. The partial pressures are eventually determined for each gas
based on their mass to charge ratio (m/z). Indeed, after ionization in the ionization
source of the MS, separation in the mass analyzer and further detection in the ion
detector, the partial pressures at m/z = 2, m/z= 32 and m/z = 44 were used to determine
the evolution of H2, O2 and CO2.
Figure M.M. 7 (a) Photography and scheme of the battery assembly used to perform online electrochemical mass spectrometry (OEMS). (b) Photography of the set-up used in th temperature-controlled oven.
All battery cells were assembled in an Ar-filled glovebox (MBRAUN). Electrolytes were
saturated with argon prior to any experiment and to get entered into the glove-box to
avoid oxygen contamination. Mo6S8/LFP (1:4) full cells were assembled using stainless
steel as current collectors. LTP/NMC622 (1.1:1) full cells were assembled using stainless
steel current collector for the negative electrode (LTP) and titanium for the positive one
(NMC622). Room temperature electrochemical tests were performed using a BCS-805
potentiostat (Bio-Logic). 55 °C galvanostatic cycling, pressure cells (25 °C) and OEMS (25
°C, 55 °C) experiments were performed in a temperature-controlled oven using a MPG2

218 Materials & Methods
multichannel potentiostat (Bio-Logic). C-rate was set as 1C being equal to one Li+ cation
inserted in one hour.
Figure M.M. 8 (a) Scheme of the electrochemical cell used for RDE measurements. (b) Photography of the set-up and (c) Scheme of the electrochemical cell used for electrochemical stability window (ESW) determination and SEI stability.
Figure M.M. 8 illustrates the three-electrode set-up using an electrochemical glass
cell for electrochemical characterizations. A jacked cell connected with a chiller was used
for temperature-dependent measurements. Working electrode was mirror polished
prior to any electrochemical measurements with a Presi® polishing machine using
alumina solution of 6 µm, 0.3 µm and 0.04 µm solutions were used. Clean working
electrodes were used for each measurement.
The activation energy for the hydrogen evolution reaction (HER) measurements,
shown in Chapter 3, were performed on a biologic VSP potentiostat with a glassy carbon
electrode mounted on a rotating disk electrode setup (RDE, PINE Inc, US.). Leakless
electrode (Edaq ET069) and Pt wire were used as reference and counter electrodes,
respectively. The leakless reference electrode is based on a Ag/AgCl reference electrode
separated from the solution by a conductive junction. Temperature was set to 25 °C,
35 °C, 45 °C and 55 °C. 4 mL of 20 m LiTFSI were added in the glass cell and fresh
electrolyte was used for each temperature to avoid electrolyte crystallization due to
repeated water reduction and degassing. The leakless reference electrode was
calibrated vs a reversible hydrogen electrode (RHE) as function of temperature before
each experiment. For that, after bubbling the solution under Argon flow for 5 min to
remove oxygen dissolved in the electrolyte, the cell was left at OCV for 50 min to ensure
homogeneous temperature. The solution was then bubbled under H2 flow for 5 min and

Materials & Methods 219
the potential of the leakless electrode measured against that of Pt. For each
temperature, rotating speed was set to 400, 600, 900 and 1600 tr/min. Cyclic
voltammetry experiments were performed at 50 mV/s from 0 V vs Ref to -1.2 V vs Ref.
Prior to perform cyclic voltammetry, ohmic drop determination was assessed at 200 kHz.
Table M.M. 3 summarizes the potential of the leakless reference electrode vs the RHE
and the ohmic drop determination found experimentally.
Table M.M. 3 Calibration parameters for the determination of HER activation energy on Pt in 20 m LiTFSI by electrochemical cell.
Temperature (°C) Eref vs RHE (mV) Ohmic drop (Ω)
25 237 77
35 243 50
45 268 48
55 235 46
Data analysis was performed by rescaling the potential toward RHE and removing
Ohmic drop contribution. Current density at an overpotential (η) of -600 mV was
determined. Only the forward current was used in the study.
Electrochemical stability window (ESW) (see Chapter 2) and SEI stability were
determined by cyclic voltammetry (see Chapter 3) experiments performed in a 3-
electrode electrochemical glass cell described in Figure M.M. 8b. The ESW was
determined by performing CV using current collector materials (stainless steel or
titanium) as working electrode. Pt wire was use as counter electrode and Ag/AgCl
reference was used as reference electrode. The SEI stability was studied using a PTFE
embedded glassy carbon disc (4 mm diameter, Pine Research Instrumentation) as
working electrode and Pt wire as counter electrode. Silver wire was used as pseudo-
reference. Cyclic voltammetry experiments were performed on a VMP3 potentiostat
(Bio-Logic). 100 mV/s scan rate was applied for ESW determination and 50 mV/s for SEI
stability. All potentials were converted vs Li+/Li scale.
Physico-chemical characterizations
The densities of solutions containing a precisely known amount of salt (msalt) and
water (mwater) were measured with an electronic densitometer (Anton Paar, DMA 35
Basic).

220 Materials & Methods
The differential scanning calorimetry (DSC) measurements were done using a
NETZSCH DSC 204F1 instrument. Calibration was done measuring samples prepared by
adding two droplets of LiTFSI-based electrolyte on a 5 mm-diameter glass fiber
separators (Whatman). Prior to any experiment, electrolytes are bubbled 15 min under
Ar and separators are kept in the glovebox. The addition of electrolyte and the transfer
in the aluminum pan were done in ambient atmosphere as fast as possible to reduce
exposure to air and contamination by water traces. Unlike in previous reports, no
mesocarbon microbeads (MCMB) were added in the calibration for promoting
crystallization and avoiding supercooling126. This choice was made to remain close to the
experimental conditions for which coin cells are assembled with no MCMB.
The concentrations of the electrolyte used for calibration were calculated thanks to
Equation M.M. 1 to be 19.803 m, 20.591 m, 20.910 m, 21.992 m and 22.9983 m. This
small range of concentration for calibration was chosen remain in a concentration region
in which the liquidus line can be consider as linear (as shown in Chapter 1, Figure 1.17).
For electrolyte samples analyzed after cycling, Mo6S8/LFP coin cells were cycled
during 15, 50 and 100 cycles at 0.5 C using 60 µL of 20 m LiTFSI electrolyte. Two glass
fiber separators were used. Coin cells samples were opened in glovebox atmosphere
and 5 mm diameter samples were punched in the middle of the two separators,
assuming that the electrolyte concentration is homogeneously distributed. Once
punched, the samples were transfer in the Al pan that is sealed outside the glovebox.
For the DSC measurements, the following protocol was applied. The temperature was
first set to increase from 25 °C to 35 °C to ensure liquid state of the electrolyte, followed
by a cool down step to - 60° °C and a heating step up to 60 °C, all at 2 °C/min under
nitrogen cooling.
3.3.1 Calibration of the ISE
To determine the solubility limit of fluoride in both aqueous and organic-based
solution, a fluoride ISE from Hach Lang (Intellical, ISEF121) was used. Prior to any
solubility measurements, the electrode was calibrated using the protocols described
below.

Materials & Methods 221
Figure M.M. 9 Calibration curve of the fluoride ion selective electrode (ISE) obtained for organic (orange line) and aqueous (blue line) standard.
3.3.1.1 Aqueous standard preparation
Standard aqueous solutions (25 mL minimum) were prepared by dissolving sodium
fluoride (NaF, Alfa Aesar) in pure mQ-water at a concentration of 1000 mg/L. From this
solution, solutions of concentration of 100 mg/L; 10 mg/L; 1 mg/L; 0.1 mg/L; 0.01 mg/L
were prepared by dilution. Measurements for high concentration levels (≥10 mg/L) were
conducted by adding one pillow of TISAB (ionic strength buffer -succinic acid- TISAB,
Hach) to 25 mL of NaF solution. Low-concentration measurements (from 1 mg/L and
below) were conducted according to the following protocol: a TISAB pillow was added
to 25 mL of milli-Q ultrapure water and 5 mL of the as-prepared solution was added to
the NaF solution. Solutions were stirred and [F-] was measured.
3.3.1.2 Organic standard preparation
Organic standard solutions were prepared by dilution of 1 mol/L of TBAF in THF
solution (tetrabutylammonium fluoride solution, 1.0 M in tetrahydrofuran, Sigma
Aldrich) in EC:DMC (Dodochem, 1:1 vol%) at an initial concentration of fluoride of 1900
mg/L. By continuous dilution of a factor 11, standards with lower concentration were
prepared adding 300 µL of the organic standard to 3 mL of EC:DMC solution. The

222 Materials & Methods
following standard concentrations were prepared: 157 mg/L; 14 mg/L; 1.30 mg/L; 0.12
mg/L and 0.011 mg/L. These organic standards were then diluted by adding 2 mL in a 20
mL TISAB:H2O aqueous solution (1 TISAB pillow for 20 mL mQ-water) to perform the
experiments. Solutions were stirred and [F-] was measured.
The potential and the temperature of the standard solutions were recorded by the F-
ISE under stirring in a plastic beaker. The calibration curve obtained in both aqueous and
organic media are presented in Figure M.M. 9. A slope of -55.8 mV/decade is obtained
at 23 °C in aqueous standards while slope of -53.8 mV/decade is found in organic
standard at 23 °C. The theoretical slope is -58.7 mV/decade, and both calibrations were
considered to be sufficiently accurate to perform LiF solubility measurements.
3.3.2 Solubility limit protocol and measurement
Commercial lithium fluoride (LiF powder, 300 mesh, Sigma Aldrich) was used in
solubility tests. Saturated solutions were prepared as follows: excess amount of LiF were
added to the solution. The solution was (i) let to stir overnight (or more) at constant
temperature and (ii) let to rest before the formation of a precipitate could be visually
observed. The solution was then centrifuged for 10 min at 6000 tr/min and the
supernatant filtered using a PTFE or a polypropylene 0.2 µm pores filter. Solubility limit
measurements were performed at the thermodynamic equilibrium. Therefore, we do
not expect the solubility measurements to be dependent on the particulate size neither
on their morphologies.
One may note that in the study by Jones et al.242,269,270 solutions were not filtered but
the LiF solubility was measured from the supernatant after 24 h of decantation. This
preparation led to a colloidal solution in which ion aggregation may be present. On the
contrary, Tasaki et al.243 used a 2 µm pores filter to avoid the presence of any
undissolved salt, and thus to obtain non-colloidal solution. As explained by Jones et
al.242,269,270, measuring colloidal solutions allows for the determination of the “real”
solubility, as it takes into consideration all species in solution, i.e. from solvated ions to
aggregates. Hence, their solubility value is said to be closer to the salt species behavior
in the electrolyte. However, in our case, measurements in colloidal solution gave poorly
reproducible results as the amounts of aggregates and remaining undissolved salt could
vary depending on the supernatant collected. Therefore, we decided to measure non-
colloidal solubility by filtering the supernatant with a 0.2 µm filter. Using our protocol,
the LiF solubility limit measured in pure water (0.93 g / L at 23 °C) is close from the 1.11
g / L at 25 °C reported in the literature without filtration242, thus validating our

Materials & Methods 223
measurement protocol. Moreover, bearing in mind that superconcentrated aqueous
electrolytes were reported to be acidic,271 our solubility measurements take into
account this effect and its potential impact on the LiF solubility. Indeed, the addition of
the ionic strength buffer and dilution protocol lead to pH value within the range of 5.5
to 6, as estimated with a glass pH electrode.
Regarding the samples measured at 55°C, all the laboratory equipment (pipettes,
centrifuge tube, filter etc.) were heated at 55°C to avoid temperature artefacts. 2 mL of
the saturated solutions were then diluted in 20 mL of milli-Q ultrapure water to prepare
a diluted LiF-saturated electrolyte. Once the dilution was performed, the LiF
concentration in solution was found far from the solubility limit. We therefore
concluded that temperature control was unnecessary.
Three measurements were performed for each sample tested, except for
20 m LiTFSI : 8 m LiBETI. The mean value and standard deviation (3σ) are shown.
3.3.3 Fluoride concentration in LiF layer
Theoretical concentration of fluoride in LiF layer was calculated as following.
Considering a LiF layer of 30 nm in thickness (as determined by SEM observation), 1.27
cm in diameter and considering the density of LiF to be 2.64 g/cm3, the mass of LiF is
expected to be 1.68 .10-5 g. For a 10 nm thick layer, the mass of LiF is expected to be
3.34 .10-6 g. The mass of LiF divided by the electrolyte volume in which it is dissolved
gives the theoretical concentration ([𝐹𝑡ℎ𝑒𝑜𝑟𝑒𝑡𝑖𝑐𝑎𝑙− ]).
Experimental fluoride concentration determination of Li/LiF sample was performed
as follow: a Li/LiF sample is dissolved in a certain amount (125 or 150 mL) of TISAB:H2O
buffer solution until pH is measured to be in the range 5.5 to 6. Then, [F-] is measured
and compared to the [F-] expected when considering complete dissolution of the entire
30 nm thickness.
Relative deviation is calculated following Equation M.M. 3.

224 Materials & Methods
Equation M.M. 3:
𝑟𝑒𝑙𝑎𝑡𝑖𝑣𝑒 𝑑𝑒𝑣𝑖𝑎𝑡𝑖𝑜𝑛 = [𝐹𝑡ℎ𝑒𝑜𝑟𝑒𝑡𝑖𝑐𝑎𝑙
− ] − [ 𝐹𝑒𝑥𝑝𝑒𝑟𝑖𝑚𝑒𝑛𝑡𝑎𝑙− ]
[𝐹𝑡ℎ𝑒𝑜𝑟𝑒𝑡𝑖𝑐𝑎𝑙− ]
𝑥 100
1.1 SEM and E-SEM
3.3.4 SEM
Scanning electron microscopy (SEM) images of the Li/LiF samples were taken with a
Zeiss Merlin scanning electron microscope at an accelerating voltage of 1 kV. Samples
were transferred to the SEM without exposure to air via a transfer vessel (Semilab Inc.)
built for the Zeiss SEM airlock. The average and standard deviation of the LiF layer
thickness were determined by measurements at five random positions on the edge of
LiF layer in the cross-section view with tilt angle correction.
3.3.5 E-SEM
Li, Li/LiF and Li/Al2O3 samples of 1.27 cm, 1.27 cm and 0.7 cm in diameter,
respectively, are affixed to sample holders using Cu tape in an Ar-filled glovebox (< 0.1
ppm O2, < 0.1 ppm H2O). The samples are transferred from the Ar-filled glovebox to an
environmental SEM (ESEM Quattro S by Thermo Fisher Scientific) with minimal exposure
to air and loaded into the chamber under high vacuum. The SEM is used in high-vacuum
(0 % relative humidity, RH) and environmental (5, 30, 45, 60, 75 and 90 % RH, see Figure
M.M. 10) mode for SEM imaging at 20 °C with a GSED detector in secondary electron
(topography) mode. After recording a reference image at 0 % RH in high-vacuum mode,
the SEM is operated in E-SEM mode at 5 % RH. The samples are then exposed to 15 %
RH for 2 minutes and imaged at 5 % RH; alternating between reaction (high RH for 2
minutes) and imaging (always 5 % RH) conditions and repeated for 30, 45, 60, 75 and 90
% RH (see depiction of samples exposed to 30, 60 and 90 % RH and imaged at 5 % RH in
Chapter 2). The SEM images are taken at 1.5/1.8 nA and 10/15 kV at a working distance
of 8 mm, and a resolution of 1536 x 1024 pixel with a horizontal field width of 207 µm.

Materials & Methods 225
Figure M.M. 10 Working principle of increasing humidity in E-SEM.
Inside an Ar-filled glovebox (< 0.1 ppm O2, < 0.1 ppm H2O), a gas-tight cell made from
chemically-inert polyetheretherketone (PEEK) was assembled with Li/LiF or Li/Al2O3
samples inside. The cell has a 5.5 mL gas headspace, inlet and outlet valves, and septa
through which liquids can be injected and gas from the headspace can be extracted with
gas-tight syringe. The gas-tight cell was then taken outside of the glovebox, connected
to an Ar tank (R300, Airgas) and purged for 5 min at 100 mgAr/min. The cell was then
filled with Ar to a pressure of 30 psi. 250 µL of electrolyte (20 m LiTFSI or 20 m LiTFSI : 8
m LiBETI) was then injected into the cell through a septum with a gas-tight syringe. Every
15 min, a 2.5 mL gas sample was collected with a gas-tight syringe and the remaining Ar
headspace was purged with fresh Ar at 100 mgAr/min for 1 minute and the pressure set
back to 30 psi. The gas samples were then injected into an Agilent 7890B gas
chromatography instrument equipped with thermal conductivity (TCD) and flame
ionization (FID) detectors for gas analysis, calibrated using 15 ppm and 1 vol% gas
standards in N2 (Supelco). The TCD detector was used for H2 and CO2 quantification, and
the FID detector was used for CH4, C2H2, C2H4, C2H6 and CO quantification.
The pre-soaking of the LiF-coated samples was done by pipetting 50 µL (or 2 mL for
pure FEC) of the organic electrolytes on LiF-coated Li samples inside a glovebox, which
was left to react for 1 h, and subsequently dried under antechamber vacuum for 1 h
before exposure to aqueous superconcentrated electrolytes. As the exposure to organic
FSI--based electrolytes lasts one hour followed by a one-hour drying step, FSI- is not
directly exposed to water. If so, the time during which (two hours) the remaining traces
226 Materials & Methods
of FSI- anions may be exposed to either WiSE or WiBS is far shorter than the time
necessary to detect a significant FSI- hydrolysis 27.
X-ray photoelectron spectroscopy (XPS) was conducted on a PHI VersaProbe II X-ray
Photoelectron Spectrometer. Samples were transferred to XPS in an air-sensitive
transfer vessel to minimize exposure to air. Binding energies were calibrated by the
adventitious carbon peak at 284.8 eV.
Data treatment
4.1.1 Contribution to direct HER in Mo6S8/LFP cell irreversible capacity
Calculations of the amount of gas evolved during cycling can be done using two
different experimental set-ups. The first one is using pressure cell data while the second
one is using OEMS data. Assumptions made are the following:
The HER mechanism considered during these calculations is the direct two electrons
HER (see Equation M.M. 4).
Equation M.M. 4: Direct HER
2𝐻2𝑂 + 2𝑒− → 2𝐻𝑂− + 𝐻2
We estimated that the pressure evolution occurs only during second insertion
plateau during charge, as observed in Figure M.M. 11.
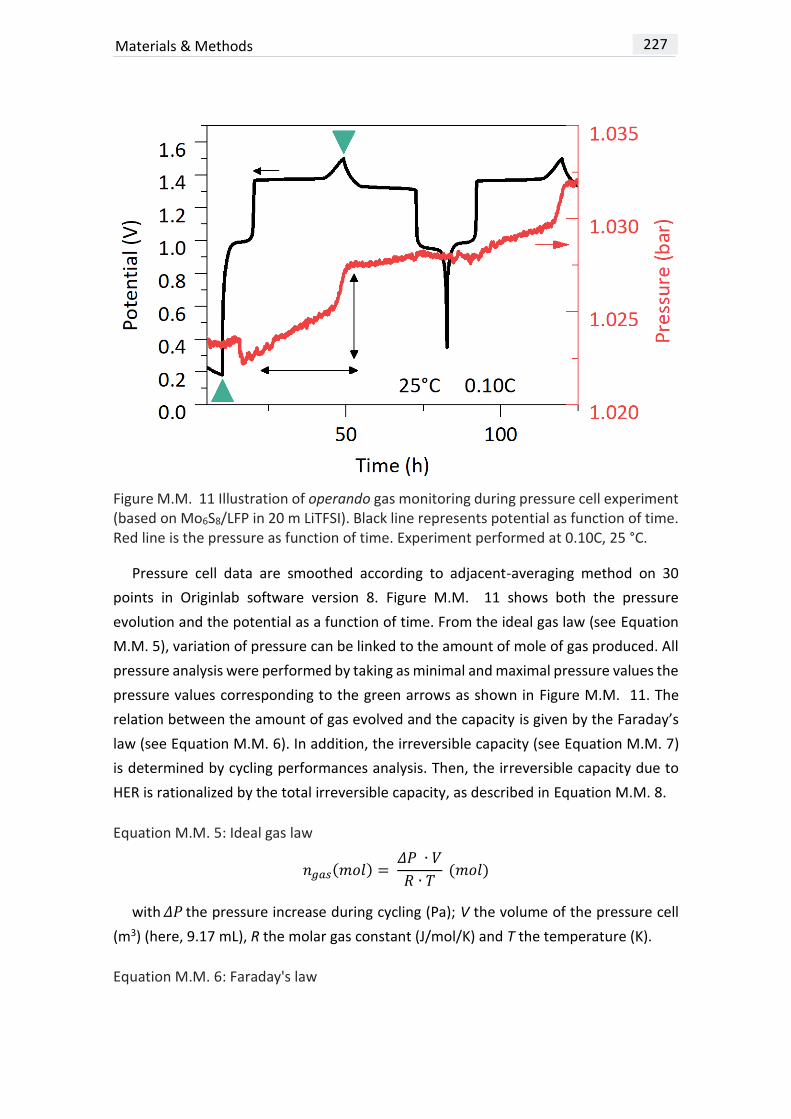
Materials & Methods 227
Figure M.M. 11 Illustration of operando gas monitoring during pressure cell experiment (based on Mo6S8/LFP in 20 m LiTFSI). Black line represents potential as function of time. Red line is the pressure as function of time. Experiment performed at 0.10C, 25 °C.
Pressure cell data are smoothed according to adjacent-averaging method on 30
points in Originlab software version 8. Figure M.M. 11 shows both the pressure
evolution and the potential as a function of time. From the ideal gas law (see Equation
M.M. 5), variation of pressure can be linked to the amount of mole of gas produced. All
pressure analysis were performed by taking as minimal and maximal pressure values the
pressure values corresponding to the green arrows as shown in Figure M.M. 11. The
relation between the amount of gas evolved and the capacity is given by the Faraday’s
law (see Equation M.M. 6). In addition, the irreversible capacity (see Equation M.M. 7)
is determined by cycling performances analysis. Then, the irreversible capacity due to
HER is rationalized by the total irreversible capacity, as described in Equation M.M. 8.
Equation M.M. 5: Ideal gas law
𝑛𝑔𝑎𝑠(𝑚𝑜𝑙) = 𝛥𝑃 ∙ 𝑉
𝑅 ∙ 𝑇 (𝑚𝑜𝑙)
with 𝛥𝑃 the pressure increase during cycling (Pa); V the volume of the pressure cell
(m3) (here, 9.17 mL), R the molar gas constant (J/mol/K) and T the temperature (K).
Equation M.M. 6: Faraday's law

228 Materials & Methods
𝑄𝐻𝐸𝑅(C) = 2𝑛𝑔𝑎𝑠𝐹
with ngas (mol) defined by Equation M.M. 5, F the Faraday constant (96500 C/mol), 2
the number of electron exchanged.
Equation M.M. 7: Irreversible capacity calculation
𝑄𝑖𝑟𝑟(𝐶) = 𝑄𝑐ℎ𝑎𝑟𝑔𝑒 − 𝑄𝑑𝑖𝑠𝑐ℎ𝑎𝑟𝑔𝑒
with Qcharge, the charge capacity of a cell, Qdischarge the discharge capacity.
Equation M.M. 8: 𝑄𝐻𝐸𝑅𝑄𝑖𝑟𝑟
4.1.2 Indirect HER in Mo6S8/LFP
The indirect HER mechanism can be expressed by the Equation M.M. 9, as being the
sum of the following two half reactions:
𝐿𝑖4𝑀𝑜6𝑆8 → 𝐿𝑖4−𝑥𝑀𝑜6𝑆8 + 𝑥 ∙ 𝐿𝑖+ + 𝑥 ∙ 𝑒−
+
𝑥 ∙ 𝐻2𝑂 + 𝑥 ∙ 𝑒− → 𝑥 ∙ 𝐻𝑂− + 𝑥
2∙ 𝐻2
___________________________________________________
Equation M.M. 9: Indirect HER
𝐿𝑖4𝑀𝑜6𝑆8 + 𝑥 ∙ 𝐻2𝑂 → 𝐿𝑖4−𝑥𝑀𝑜6𝑆8 + 𝑥 ∙ 𝐿𝑖+ + 𝑥 ∙ 𝐻𝑂− + 𝑥
2∙ 𝐻2
Figure M.M. 12 Illustration of pressure cell experiment using self-discharge protocol. Black line represents the potential as function of time. Pressure evolution as function of

Materials & Methods 229
time is shown by the red line. (a) Repeated self-discharge period. (b) Zoom on open circuit voltage (OCV) period. Experiments performed at 0.5C, 25 °C.
The amount of mole of hydrogen produced during self-discharge can be calculated
from the Equation M.M. 5 and related to a capacity loss by HER (𝑄𝐻𝐸𝑅 𝑑𝑢𝑒 𝑡𝑜 𝑟𝑒𝑠𝑡𝑖𝑛𝑔)
thanks to Equation M.M. 6. The capacity loss by parasitic reaction (𝑄𝑙𝑜𝑠𝑡 𝑏𝑦 𝐻𝐸𝑅) during
resting period was calculated according to Equation M.M. 10 from cycling data. Then,
the proportion of HER in the total capacity loss during self-discharge is calculated thanks
to Equation M.M. 11.
Equation M.M. 10:
𝑄𝑙𝑜𝑠𝑡 𝑏𝑦 𝐻𝐸𝑅 = 𝑄𝑑𝑖𝑠𝑐ℎ𝑎𝑟𝑔𝑒 𝑛 − 𝑄𝑑𝑖𝑠𝑐ℎ𝑎𝑟𝑔𝑒
𝑛+1 (𝐶)
Equation M.M. 11:
𝑟𝑎𝑡𝑖𝑜 = 𝑄𝐻𝐸𝑅 𝑑𝑢𝑒 𝑡𝑜 𝑟𝑒𝑠𝑡𝑖𝑛𝑔
𝑄𝑙𝑜𝑠𝑡 𝑏𝑦 𝐻𝐸𝑅
Two hydrogen evolution slopes are observed during charge (see red arrows, part 1
and 2 in Figure M.M. 13). At the end of charge (part 2), one can assume that the only
reaction occurring is the HER. Therefore, the capacity corresponds to the capacity due
to HER ( Δ𝑄𝐻𝐸𝑅 𝑝𝑎𝑟𝑡 2) . Two C-rate were used: 0.15C and 0.10C. Table M.M. 4
summarizes the parameters that enable to find the conversion constant between uma
and mole of hydrogen produced during cycling, following Equation M.M. 12 and
Equation M.M. 13. Once the conversion parameter found, the total amount of hydrogen
produced during charge can be calculated and compared to the irreversible capacity,
alike what is done to analyze results from pressure cells (see Equation M.M. 6, Equation
M.M. 7 and Equation M.M. 8).

230 Materials & Methods
Figure M.M. 13 Illustration of operando gas monitoring during OEMS experiment (based on Mo6S8/LFP in 20 m LiTFSI). Black line represents potential as function of time. Red line is the hydrogen evolution as function of time. Experiments performed at 0.15C, 25 °C.
Table M.M. 4 Summary of parameters used to obtain the conversion constant between uma and moles of hydrogen produced during cycling.
C-rate
Current (mA)
Δ𝑄𝐻𝐸𝑅 𝑝𝑎𝑟𝑡 2
(𝐶)
𝑛𝐻2 𝑝𝑎𝑟𝑡 2(µmol)
𝑛𝐻2 𝑝𝑎𝑟𝑡 2(uma) 1∙10-10 Uma
to µmol
𝑛𝐻2 𝑡𝑜𝑡𝑎𝑙
(µmol)
0.15C 0.0303 0.501 2.60
4.3∙10-10 0.605 3.48
0.10C 0.0117 0.216 1.117
8.712∙10-11 0.1822 0.216
Equation M.M. 12:
Δ𝑄𝐻𝐸𝑅 𝑝𝑎𝑟𝑡 2 = 𝑖Δ(𝑡)𝑝𝑎𝑟𝑡 2 (𝐶)
Equation M.M. 13:
𝑛𝐻2 = Δ𝑄𝐻𝐸𝑅 𝑝𝑎𝑟𝑡 2
2𝐹 (𝑚𝑜𝑙)
Metallic Li consumption during GC-TCD experiments were calculated by comparing
the initial amount of Li available in the sample with the amount of hydrogen produced,
which corresponds to a molar balance of one mole of H2 produced for two moles of

Materials & Methods 231
metallic Li consumed, according to Equation M.M. 14. Table M.M. 5 lists the
experimental parameters needed to calculate the amount of hydrogen produced. All the
calculations consider hydrogen as being solely produced by direct HER. Equation M.M.
15, Equation M.M. 16 and Equation M.M. 17 detail the calculations needed to determine
the ratio of metallic Li consumed by water reduction.
2𝐻2𝑂 + 2𝑒− → 2𝐻𝑂− + 𝐻2
+
𝐿𝑖 → 𝐿𝑖+ + 𝑒−
_____________________________________________________________
Equation M.M. 14:
𝐻2𝑂 + 𝐿𝑖 → 𝐿𝑖𝑂𝐻 + 1
2𝐻2
Table M.M. 5 Experimental parameters for GC-TCD/FID calculations.
*based on SEM observation
Equation M.M. 15: Amount of mole of gas available in the cell’s headspace.
𝑛𝑐𝑒𝑙𝑙𝑔𝑎𝑠
= 𝑃𝑡𝑜𝑡 (𝑃𝑎) ∙ 𝑉𝑐𝑒𝑙𝑙 (𝑚3)
𝑅 ∙ 𝑇= 689.8 µ𝑚𝑜𝑙
Equation M.M. 16: Amount of mole of metallic Li initially available.
𝑛𝐿𝑖 𝑓𝑜𝑖𝑙 = ρ ∙ 𝜋 ∙ Ø2 ∙ e
4 ∙ M= 489 µ𝑚𝑜𝑙 (𝐿𝑖𝐹) 𝑜𝑟 90 µ𝑚𝑜𝑙 (𝐴𝑙2𝑂3)
𝑛𝐻𝑦𝑑𝑟𝑜𝑔𝑒𝑛 = 𝑛𝑐𝑒𝑙𝑙𝑔𝑎𝑠
∙ 𝑥𝐻𝑦𝑑𝑟𝑜𝑔𝑒𝑛∗ (𝑚𝑜𝑙)
Equation M.M. 17:
𝑅𝑎𝑡𝑖𝑜 𝑜𝑓 𝐿𝑖 𝑐𝑜𝑛𝑠𝑢𝑚𝑒𝑑 = 2 ∙ 𝑛𝐻𝑦𝑑𝑟𝑜𝑔𝑒𝑛
𝑛𝐿𝑖 𝑓𝑜𝑖𝑙
*The molar ratio of hydrogen (𝑥𝐻𝑦𝑑𝑟𝑜𝑔𝑒𝑛∗ ) is obtained from the sum of the amount of
H2 measured after each 15 min interval.
Volume of the
cell 𝑉𝑐𝑒𝑙𝑙 (mL)
Total pres- sure 𝑃𝑡𝑜𝑡 (bar)
Tempe- rature T (°C)
Ideal gas
constant 𝑅
(J/mol/K)
Thick- ness of Li foil* e (µm)
Diameter of Li foil Ø (mm)
Li den- sity ρ
(g/cm3)
Molar mass of Li M
(g/mol)
5.5 3.06 20 8.314 LiF Al2O3 LiF Al2O3
0.534 6.941 100 30.5 9 7

232 Materials & Methods
Table M.M. 6 summarizes the cycling performances obtained during the pre-cycling
step at 25 °C prior to perform the temperature-dependence study. One can notice that
similar behaviors are obtained regardless the cell considered.
Table M.M. 6 Cycling performances obtained during pre-cycling step of Arrhenius study. Mean charge and discharge capacity obtained during 10 pre-cycling cycles at 25 °C for each temperature tested. Cells are based on Mo6S8/LFP full cells cycled using 20 m LiTFSI.
1.2 Impact of the electrolyte volume on cell performances: number of cycles before crystallization at 21 m LiTFSI
For the 20 m LiTFSI electrolyte with the properties described in Table M.M. 1, the
amount of mole of water in 20 m LiTFSI is defined according to Equation M.M. 18.
Protocol Number of cells
Temperature (°C) 15 25 35 45 55
HER direct by pressure
cell 1
Qchargepre−cycling at 25 °C
(mA.h/g)
103 ± 7
103 ± 7
108 ± 6
106 ± 6
Qdischargepre−cycling at 25 °C
(mA.h/g)
100 ± 4
95 ± 1.5
103 ± 3
102 ± 4
HER direct by CC-CV coin cells
2
Qchargepre−cycling at 25 °C
(mA.h/g)
117 ± 2
117 ± 2
112 ± 2
117 ± 2
Qdischargepre−cycling at 25 °C
(mA.h/g)
109 ± 1
112 ± 2
109 ± 1
115 ± 2
HER indirect by
self-discharge
on 2nd plateau
3 (except
2 at 15 °C)
Qchargepre−cycling at 25 °C
(mA.h/g)
106 ± 4
109 ± 3
108 ± 3.5
107 ± 3
109 ± 3
Qdischargepre−cycling at 25 °C
(mA.h/g)
103 ± 3
107 ± 2
105 ± 2
105 ± 2
106 ± 2
HER indirect by
self-discharge
on 1st plateau
3
Qchargepre−cycling at 25 °C
(mA.h/g)
113 ± 2
107 ± 4
118 ± 5
109 ± 4
Qdischargepre−cycling at 25 °C
(mA.h/g)
111 ± 1
103 ± 2
115 ± 4
106 ± 3

Materials & Methods 233
Equation M.M. 18:
𝑛20 𝑚 𝐿𝑖𝑇𝐹𝑆𝐼𝑤𝑎𝑡𝑒𝑟 =
𝜌20 𝑚 𝐿𝑖𝑇𝐹𝑆𝐼 ∙ 𝑉𝑒𝑙𝑒𝑐𝑡𝑟𝑜𝑙𝑦𝑡𝑒 ∙ 𝜔𝑤𝑎𝑡𝑒𝑟
𝑀𝑤𝑎𝑡𝑒𝑟 (𝑚𝑜𝑙)
with 𝜌20 𝑚 𝐿𝑖𝑇𝐹𝑆𝐼 , the density (g/cm3); 𝑉𝑒𝑙𝑒𝑐𝑡𝑟𝑜𝑙𝑦𝑡𝑒 , the electrolyte volume (cm3);
𝜔𝑤𝑎𝑡𝑒𝑟 , the mass fraction of water and 𝑀𝑤𝑎𝑡𝑒𝑟, the molar mass of water (g/mol).
Fixing the amount of salt between 21 m LiTFSI and in 20 m LITFSI (thus only
considering water consumption), the amount of mole of water in 21 m LiTFSI is defined
according to Equation M.M. 19.
Equation M.M. 19:
𝑛21 𝑚 𝐿𝑖𝑇𝐹𝑆𝐼𝑤𝑎𝑡𝑒𝑟 =
𝑚𝐿𝑖𝑇𝐹𝑆𝐼
𝐶 ∙ 𝑀𝐿𝑖𝑇𝐹𝑆𝐼 ∙ 𝑀𝑤𝑎𝑡𝑒𝑟 (𝑚𝑜𝑙)
with 𝑚𝐿𝑖𝑇𝐹𝑆𝐼, the mass of LiTFSI salt initially present in 20 m LiTFSI (g); 𝐶, the expected
concentration (here 21 m LiTFSI) (mol/kg); 𝑀𝐿𝑖𝑇𝐹𝑆𝐼, the molar mass of LiTFSI (g/mol).
One cycling protocol consists of 10 cycles performed at 1C as pre-cycling step
followed by a cycling step performed at 0.5C consisting of charge/discharge/charge
followed by 20 h of OCV and a discharge/charge/discharge. The amount of mole of water
consumed during such protocol is calculated by Equation M.M. 20, and values are
summarized in Table M.M. 7
Equation M.M. 20:
nduring protocolwater consumed = 2 ∙
𝑄𝑖𝑟𝑟𝐻𝐸𝑅
𝑧∙𝐹 (mol)
with 2, a factor corresponding to the stoichiometric coefficient between H2 and H2O
production; 𝑄𝑖𝑟𝑟𝐻𝐸𝑅, the irreversible capacity due to HER during both cycling and resting
period (C); z, the number of electron involved in the HER reaction; F, the faraday
constant (C/mol). 𝑄𝑖𝑟𝑟𝐻𝐸𝑅, the irreversible capacity due to HER is calculated assuming that
HER account for 70 % of the irreversible capacity during cycling and 100 % of the
irreversible capacity during self-discharge.
Equation M.M. 21 details the calculation made to determine the number of times the
protocol described above can be repeated before 21 m LiTFSI concentration is reached
due to water consumption.
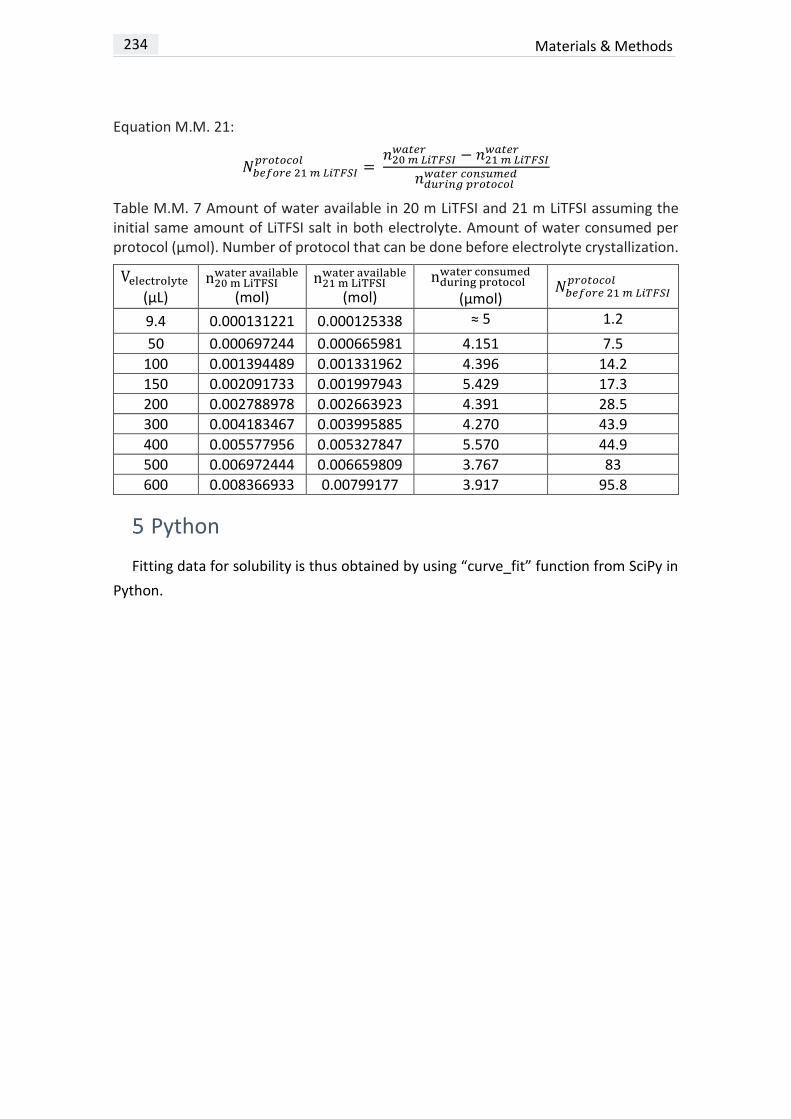
234 Materials & Methods
Equation M.M. 21:
𝑁𝑏𝑒𝑓𝑜𝑟𝑒 21 𝑚 𝐿𝑖𝑇𝐹𝑆𝐼𝑝𝑟𝑜𝑡𝑜𝑐𝑜𝑙 =
𝑛20 𝑚 𝐿𝑖𝑇𝐹𝑆𝐼𝑤𝑎𝑡𝑒𝑟 − 𝑛21 𝑚 𝐿𝑖𝑇𝐹𝑆𝐼
𝑤𝑎𝑡𝑒𝑟
𝑛𝑑𝑢𝑟𝑖𝑛𝑔 𝑝𝑟𝑜𝑡𝑜𝑐𝑜𝑙𝑤𝑎𝑡𝑒𝑟 𝑐𝑜𝑛𝑠𝑢𝑚𝑒𝑑
Table M.M. 7 Amount of water available in 20 m LiTFSI and 21 m LiTFSI assuming the initial same amount of LiTFSI salt in both electrolyte. Amount of water consumed per protocol (µmol). Number of protocol that can be done before electrolyte crystallization.
Velectrolyte
(µL) n20 m LiTFSIwater available
(mol) n21 m LiTFSIwater available
(mol)
nduring protocolwater consumed
(µmol) 𝑁𝑏𝑒𝑓𝑜𝑟𝑒 21 𝑚 𝐿𝑖𝑇𝐹𝑆𝐼𝑝𝑟𝑜𝑡𝑜𝑐𝑜𝑙
9.4 0.000131221 0.000125338 ≈ 5 1.2
50 0.000697244 0.000665981 4.151 7.5
100 0.001394489 0.001331962 4.396 14.2
150 0.002091733 0.001997943 5.429 17.3
200 0.002788978 0.002663923 4.391 28.5
300 0.004183467 0.003995885 4.270 43.9
400 0.005577956 0.005327847 5.570 44.9
500 0.006972444 0.006659809 3.767 83
600 0.008366933 0.00799177 3.917 95.8
Python
Fitting data for solubility is thus obtained by using “curve_fit” function from SciPy in
Python.

LIST OF ABBREVIATIONS

236 Abbreviations
𝑎𝐹− Activity of F-
𝑎𝐿𝑖+ Activity of Li+
Å Angstrom
AC Acetate
ACN Acetonitrile
Al(OH)3 Aluminum hydroxyde
Al2O3 Aluminum oxide
ALD Atomic layer deposition
AM Active material
CCCV Constant current constant voltage
Cd Cadmium
CE Coulombic efficiency
C-rate Cycling-rate
Csp Carbon super P
CV Cyclic voltametry
DBP Dibutylphtalate
DEC Diethylcarbonate
DMC Dimethyl carbonate
DME Dimethoxyethane
DMF Dimethylformamide
DMPA 2,2-dimethoxy-2-phenylacetophenoe
DMSO Dimethyl sulfoxide
DOL 1,3-dioxolane
DSC Differential scanning calorimetry
E Potential
e Thickness
EC Ethylene carbonate
EIS Electrochemical impedance spectroscopy
EMC Ethyl methyl carbonate
EMim TFSI 1-Ethyl-3-methylimidazolium bis(trifluoromethylsulfonyl)imide
E-SEM Environmental-scanning electron microscopy
ESW Electrochemical stability window
F Faraday constant
[F-]lim Maximum of F- concentration
FEC Fluoroethylene carbonate
FEMC 2-fluoroethyl methyl carbonate
GC Glassy carbon
GC-TCD/FID Gas chromatography-thermal conductivity/flame ionization
detectors
GPE Gel polymer electrolyte
H2O Water
H2SO4 Sulfuric acid
HEA 2-hydroxyethyl acrylate
HER Hydrogen evolution reaction
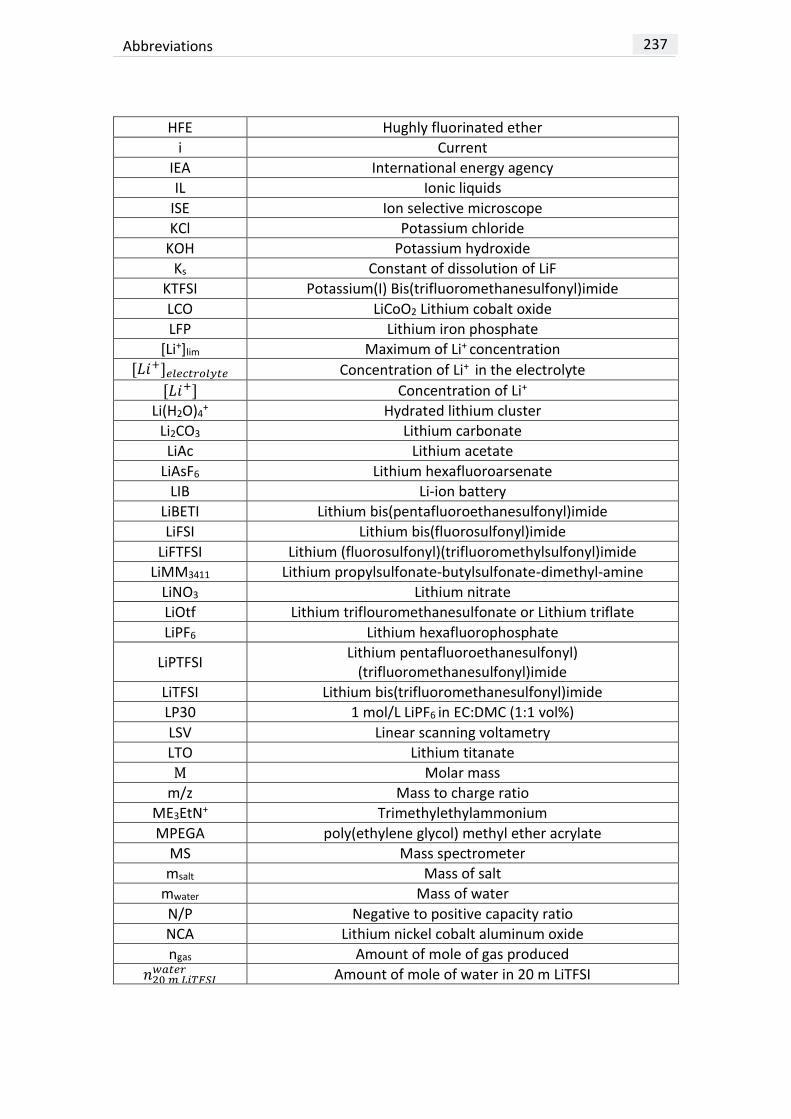
Abbreviations 237
HFE Hughly fluorinated ether
i Current
IEA International energy agency
IL Ionic liquids
ISE Ion selective microscope
KCl Potassium chloride
KOH Potassium hydroxide
Ks Constant of dissolution of LiF
KTFSI Potassium(I) Bis(trifluoromethanesulfonyl)imide
LCO LiCoO2 Lithium cobalt oxide
LFP Lithium iron phosphate
[Li+]lim Maximum of Li+ concentration [𝐿𝑖+]𝑒𝑙𝑒𝑐𝑡𝑟𝑜𝑙𝑦𝑡𝑒 Concentration of Li+ in the electrolyte
[𝐿𝑖+] Concentration of Li+
Li(H2O)4+ Hydrated lithium cluster
Li2CO3 Lithium carbonate
LiAc Lithium acetate
LiAsF6 Lithium hexafluoroarsenate
LIB Li-ion battery
LiBETI Lithium bis(pentafluoroethanesulfonyl)imide
LiFSI Lithium bis(fluorosulfonyl)imide
LiFTFSI Lithium (fluorosulfonyl)(trifluoromethylsulfonyl)imide
LiMM3411 Lithium propylsulfonate-butylsulfonate-dimethyl-amine
LiNO3 Lithium nitrate
LiOtf Lithium triflouromethanesulfonate or Lithium triflate
LiPF6 Lithium hexafluorophosphate
LiPTFSI Lithium pentafluoroethanesulfonyl)
(trifluoromethanesulfonyl)imide
LiTFSI Lithium bis(trifluoromethanesulfonyl)imide
LP30 1 mol/L LiPF6 in EC:DMC (1:1 vol%)
LSV Linear scanning voltametry
LTO Lithium titanate
M Molar mass
m/z Mass to charge ratio
ME3EtN+ Trimethylethylammonium
MPEGA poly(ethylene glycol) methyl ether acrylate
MS Mass spectrometer
msalt Mass of salt
mwater Mass of water
N/P Negative to positive capacity ratio
NCA Lithium nickel cobalt aluminum oxide
ngas Amount of mole of gas produced
𝑛20 𝑚 𝐿𝑖𝑇𝐹𝑆𝐼𝑤𝑎𝑡𝑒𝑟 Amount of mole of water in 20 m LiTFSI

238 Abbreviations
𝑛𝐻𝑦𝑑𝑟𝑜𝑔𝑒𝑛 Amount of mole of hydrogen
𝑛𝐿𝑖 𝑓𝑜𝑖𝑙 Amount of mole of metallic Li
𝑛𝑐𝑒𝑙𝑙𝑔𝑎𝑠
Amount of mole of gas in the cell
Ni-Cd Nickel-Cadmium
Ni-MH Nickel Metal Hydride
NiOOH Nickel oxide hydroxide
NMC/NCM Lithium nickel manganese cobalt oxide
Ø Diameter
OCV Open circuit voltage
OEMS Online electrochemical mass spectrometry
OER Oxygen evolution reaction
PAM Polyacrylamide
Pb Lead
PC Propylene carbonate
PEG/PEO poly(ethylene glycol)/poly(ethylene oxide)
PEGDA poly(ethylene glycol) diacrylate
PEIS Potentio-electrochemical impedance spectroscopy
PFA Perfluoroalkoxy alkane
PVdF-HFP Poly(vinylidenefluoride-hexafluoropropylene
Qcharge Charge capacity
Qdischarge Discharge capacity
QHER Capacity due to HER
Qirr Irreversible capacity 𝑄𝐻𝐸𝑅 𝑑𝑢𝑒 𝑡𝑜 𝑟𝑒𝑠𝑡𝑖𝑛𝑔 Capacity due to HER during resting
𝑄𝑑𝑖𝑠𝑐ℎ𝑎𝑟𝑔𝑒 𝑛 Discharge capacity at cycle number n
𝑄𝑑𝑖𝑠𝑐ℎ𝑎𝑟𝑔𝑒𝑛+1 Discharge capacity at cycle number n+1
𝑄𝑙𝑜𝑠𝑡 𝑏𝑦 𝐻𝐸𝑅 Capacity lost by HER
R Constant of ideal gas law
RDE Rotating disk electrode
RH Relative humidity
RHE Reversible hydrogen electrode
RT Room temperature
SEI Solid electrolyte interphase
SL Sulfolane
SLI Starting lighting ignition
SOC State-of-charge
SPE Solid polymer electrolyte
SS Stainless steel
T Temperature
TBAF in THF Tetrabutylammonium fluoride solution in Tetrahydrofuran
TEA+ Tetraethylammonium
TEGDME Tetraethylene glycol dimethyl ether
TEP Triethyl phosphate

Abbreviations 239
TISAB Total ionic strength adjustment buffer
TMA Trimethylaluminium
TMP Trimethyl phosphate
TMSB Tris(trimethylsilyl)borate
UHV Ultra-High Vacuum
UPS Unit power supply
USD United States Dollar
V Volume
VRLA Valve Regulated Lead Acid
WiSE Water-in-salt electroylte
XRD X-ray diffraction
Zn(TFSI)2 Zinc(II) Bis(trifluoromethanesulfonyl)imide
ΔP Pressure increase
�̅�𝐿𝑖+𝐹− Mean ionic activity coefficient of the LiF salt
𝛾𝐹− Ionic coefficient of F-
𝛾𝐿𝑖+ Ionic activity coefficient of Li+
η Viscosity
λKα1 Wave length of Cu Kα radiation
ρ Volumetric mass
σ Conductivity
𝜔 Mass fraction
𝑥𝐻𝑦𝑑𝑟𝑜𝑔𝑒𝑛∗ Mole fraction of hydrogen


RÉSUMÉ EN FRANÇAIS

242 Résumé en français
Le remplacement des énergies fossiles par leurs pendants renouvelables est au cœur
de la transition énergétique mise en place pour limiter le changement climatique.
Cependant, les limitations d’émissions de gaz à effet de serre (tels que le dioxyde de
carbone CO2 ou le méthane CH4) peuvent entrer en conflit avec la demande croissante
en énergie. Bien que la pandémie de la Covid 19 aie contracté la demande mondiale en
énergie de 4 % en 2020, l’augmentation attendue en 2021 est de 4.1 %, selon les
prévisions de l’IEA (Agence internationale de l’Energie). Ceci est notamment due à la
croissance de la consommation dans les pays émergents et dans les économies en
développement. La mise en place de politiques publiques efficaces et d’investissements
massifs (jusqu’à quatre mille milliards de dollars par an jusqu’en 2030 comme
mentionné dans le rapport sur les perspectives énergétiques mondiales publié par l’IEA
en 2021) est nécessaire pour atteindre les objectifs discutés lors de l’Accord de Paris
pour le climat, qui vise à limiter l’augmentation de température à 2 °C, voir 1.5 °C, d’ici
la fin du siècle. Des modifications dans les modes de production d’énergie, la réduction
de la consommation d’énergie des infrastructures déjà présentes et l’amélioration de
l’efficacité énergétique peuvent être vus comme les principaux axes de développement
permettant de réussir la transition énergétique. Pour atteindre ces objectifs, le
développement de l’électrification est l’un des moyens envisagés. Cette tendance est
confirmée par les prévisions de demande en électricité qui devrait augmenter de 4.5 %
en 2021, soit cinq fois plus que la baisse de consommation de 2020. Toutefois, la
production d’électricité par les énergies renouvelables telles que le solaire ou l’éolien
est intermittente rendant primordiale le développement de dispositifs de stockage.
Parmi les dispositifs de stockage, l’utilisation de batteries permet de stocker par voie
électrochimique l’énergie produite de manière intermittente. Ces dernières reposent
sur deux électrodes, une positive et une négative dont les potentiels redox sont
différents. Afin d’assurer le transport ionique, les deux électrodes sont séparées par un
électrolyte, composé d’un solvant et d’un sel support. Le passage des électrons et donc
du courant est assuré par le circuit électrique externe. Depuis la réalisation de la
première batterie acide-plomb en 1859 par Gaston Planté, de nombreuses avancées ont
été réalisées au niveau de la chimie de la batterie, de l’ingénierie et de l’optimisation de
la cellule ainsi que du développement des usines de production, permettant d’améliorer
les performances et la fiabilité tout en réduisant les coûts. Depuis sa première
commercialisation en 1991 pour des appareils électroniques, les dernières années ont
vu l’avènement de la technologie batterie Li-ion pour de nouveaux marchés comme les
véhicules électriques. Cette technologie repose sur le mécanisme dit « rocking chair »
d’intercalation des cations Li+ dans les électrodes, et les prévisions de croissance du

Résumé en français 243
marché des batteries Li-ion (LIB) montrent que la demande va continuer d’augmenter
dans les années à venir, avec des prévisions de marché atteignant 16 mille milliards de
dollars en 2050. L’anticipation des questions de recyclage des batteries ainsi que le
développement de matériaux plus durables sont donc des enjeux cruciaux. Or, l’un des
désavantages des LIB actuellement commercialisées concerne l’électrolyte. En effet,
celui-ci repose sur l’utilisation de solvants organiques, inflammables et toxiques qui
questionnent la sécurité et la durabilité de ces systèmes. Le remplacement ces solvants
par l’eau pourrait alors apporter une solution face à ces enjeux.
Les batteries rechargeables reposant sur un électrolyte aqueux sont connues et
commercialisées depuis de nombreuses années. On peut notamment citer les batteries
de type Acide-plomb utilisées comme batterie de démarrage dans les voitures, Nickel-
Cadmium (Ni-Cd), présentes dans les premiers téléphones portables ou Nickel-Métal
Hydrure (Ni-MH) commercialisées sous format AA ou AAA et dans les premiers véhicules
hybrides électriques (tel que la Toyota Prius). Cependant, leur densité d’énergie et leur
énergie spécifique sont limitées par l’étroitesse de la fenêtre électrochimique de l’eau
(1.23 V thermodynamiquement). Au-delà des limites de cette fenêtre, les réactions
parasites d’oxydation de l’eau (oxygen evolution reaction (OER), en anglais) et de
réduction de l’eau (hydrogen evolution reaction (HER), en anglais) ont lieu au détriment
de la stabilité de l’électrolyte, comme décrit par les Equation Résumé. 1 et Equation
Résumé. 2, respectivement.
Equation Résumé. 1: Réaction d’oxydation de l’eau
2 ∙ 𝐻2𝑂 = 𝑂2 + 4 ∙ 𝐻+ + 4 ∙ 𝑒−
Equation Résumé. 2: Réaction de réduction de l’eau
2 ∙ 𝐻2𝑂 + 2 ∙ 𝑒− → 2 ∙ 𝐻𝑂− + 𝐻2 𝑜𝑢 2 ∙ 𝐻+ + 2 ∙ 𝑒− = 𝐻2
Concernant les batteries LIB aqueuses, la dégradation de l’électrolyte a lieu avant
l’intercalation des cations Li+. Contrairement aux batteries LIB commerciales, la
formation d’une interphase solide/électrolyte (Solid electrolyte interphase, en anglais
(SEI)) n’est pas observée. Or, la formation de cette dernière est à l’origine de la plus
grande densité d’énergie des batteries LIB commerciales car elle permet d’opérer au-
delà des limites de la fenêtre électrochimique de stabilité. En effet, les électrolytes
organiques classiquement utilisés, et plus précisément les solvants, sont instables à bas
potentiels (E < 1 V vs Li+/Li), i.e., aux potentiels où opèrent les électrodes négatives telles
que le graphite. La dégradation de l’électrolyte au niveau de l‘électrode négative au
cours des premiers cycles d’utilisation forme une couche passivante, isolante

244 Résumé en français
électroniquement et conductrice ionique qui prévient la dégradation supplémentaire de
l’électrolyte et assure le maintien des performances. Cette couche est généralement
issue des produits de décomposition du solvant, structurée par une couche interne riche
en composés inorganiques et une couche externe riche en composés organiques. Pour
résumer, l’absence de formation de SEI est l’un des freins au déploiement à grande
échelle des batteries LIB reposant sur un électrolyte aqueux.
En 2015, le développement d’un électrolyte aqueux superconcentrés formé de 21
mol/kg de sel de LiTFSI, c’est-à-dire, un électrolyte dont la masse et le volume de sels
sont supérieurs à ceux du solvant, a permis d’étendre la fenêtre électrochimique jusqu’à
3 V. Ces travaux sont inspirés par des études préalablement conduites sur des
électrolytes organiques superconcentrés qui ont montré l’influence positive de
l’augmentation de la concentration sur les propriétés de l’électrolyte. Dans le cas d’un
électrolyte aqueux, l’augmentation de la concentration modifie la structure de
l’électrolyte en créant deux réseaux interpénétrés : un réseau riche en anion, ici TFSI-,
et un réseau riche en eau qui maintient le transport rapide des cations Li+ malgré la
diminution du nombre de porteurs de charges dissociés. La réactivité interfaciale est
aussi impactée. Au niveau de l’électrode positive, les anions TFSI- peuplent l’interface
par un effet de double couche permettant de repousser les molécules d’eau et donc de
prévenir l’oxydation de l’eau. Au niveau de l’électrode négative, le dépôt d’une couche
inorganique passivante par la dégradation du sel atteste de la formation d’une SEI. Ces
changements de propriétés physico-chimiques et de réactivité interfaciale laissent
penser que des batteries basées sur des électrolytes aqueux pourraient concurrencer
les performances des batteries commerciales tout en améliorant leur durabilité. Ainsi,
l’objectif de cette thèse est d’étudier la viabilité de l’utilisation d’électrolyte aqueux
superconcentrés pour une application dans les LIB.
Pour cela, la mise en place d’une étude systématique a été réalisée au niveau des
limites cathodiques (à l’électrode négative) et anodique (à l’électrode positive) afin de
déterminer la stabilité de l’électrolyte basé sur 20 m LiTFSI en fonction des conditions
d’opération. Bien que l’augmentation de la concentration ait montré un impact positif
sur les performances, ces résultats peuvent être nuancés lors de changements de vitesse
de cyclage qui mettent en évidence la présence de réactions parasites. Afin d’étudier la
nature des réactions parasites, l’association de mesures en cellule de pression et de
spectrométrie de masse couplée au cyclage électrochimique ont montré que la réaction
de réduction de l’eau a lieu, à la fois pendant le cyclage et pendant les périodes de repos,

Résumé en français 245
i.e. pendant l’autodécharge, comme décrit par les Equation Résumé. 3, Equation
Résumé. 4 et Equation Résumé. 5.
Equation Résumé. 3 : Réactions (a) d’insertion des cations Li+ dans l’électrode négative LixM déchargée en parallèle de la (b) réduction directe de l’eau lors d’un cyclage continu.
(𝑎) 𝐿𝑖𝑥𝑀+ 𝑦 ∙ 𝐿𝑖+ + 𝑦 ∙ 𝑒− = 𝐿𝑖𝑥+𝑦𝑀
𝑤𝑖𝑡ℎ 0 ≤ 𝑥, 0 < 𝑦, 𝐿𝑖𝑥𝑀, insertion material
(𝑏) 2 ∙ 𝐻2𝑂 + 2 ∙ 𝑒− = 2 ∙ 𝐻𝑂− + 𝐻2
Equation Résumé. 4 : Demi-réaction redox du mécanisme d’autodécharge. (a) Désinsertion du matériau de négative chargé Li(x+y)M. (b) Réduction de l’eau.
(𝑎) 𝐿𝑖(𝑥+𝑦)𝑀 → 𝐿𝑖(𝑥+𝑦)−𝑧𝑀+ 𝑧 ∙ 𝐿𝑖+ + 𝑧 ∙ 𝑒−
0 ≤ 𝑥, 0 < 𝑦, 0 < 𝑧 ≤ 𝑦
(𝑏) 𝑧 ∙ 𝐻2𝑂 + 𝑧 ∙ 𝑒− → 𝑧 ∙ 𝐻𝑂− + 𝑧
2∙ 𝐻2
Equation Résumé. 5 : Réaction global du mécanisme d’autodécharge.
𝐿𝑖(𝑥+𝑦)𝑀 + 𝑧 ∙ 𝐻2𝑂 → 𝐿𝑖(𝑥+𝑦)−𝑧𝑀 + 𝑧 ∙ 𝐿𝑖+ + 𝑧 ∙ 𝐻𝑂− + 𝑧
2∙ 𝐻2
De plus, bien que le mécanisme d’autodécharge soit en partie réversible vis-à-vis du
lithium, la consommation d’eau est préjudiciable car irréversible. Enfin, l’utilisation de
20 m LiTFSI : 8 m LiBETI permet de compléter l’étude afin d’appréhender le
comportement général des électrolytes aqueux superconcentrés. De la même manière
que pour l’électrolyte basé sur 20 m LiTFSI, la réduction de l’eau a lieu pendant le cyclage
et les périodes de repos, mais avec une moindre intensité. A l’électrode positive, des
mesures de gaz ont montré que l’impact de l’oxydation de l’eau était limité. Le principal
obstacle des électrolytes aqueux superconcentrés provient donc de l’électrode négative
et de la stabilité de la SEI.
L’étude de la stabilité de la SEI native a été mené par des caractérisations
électrochimiques (voltamétrie cyclique et spectroscopie d’impédance électrochimique).
Les résultats montrent la passivation de la surface, mais la faible efficacité de celle-ci vis-
à-vis de la réduction de l’eau. Cette dernière est mise en valeur par des expériences de
calorimétrie à balayage différentiel qui atteste d’un décalage du pic de cristallisation de
l’électrolyte après des phases de cyclage continu et d’autodécharge témoignant de
l’augmentation de concentration. Par ailleurs, pour comprendre la différence de vitesses
de consommation d’eau lors des phases de cyclage et d’autodécharge, les énergies
246 Résumé en français
d’activation de la réduction directe de l’eau lors du cyclage et des phénomènes
d’autodécharge ayant lieu pendant les phases de repos ont été étudiées. Les énergies
d’activation trouvées sont semblables pour les phénomènes d’autodécharge et de
réduction de l’eau (≈ 20 kJ/mol), suggérant que l’autodécharge est gouvernée par la
réduction de l’eau plutôt que par la désinsertion du lithium. Pour résumer, l’impact
néfaste de la réduction de l’eau pendant l’autodécharge et le cyclage soulignent
l’instabilité de la SEI.
Aussi, le composé inorganique de fluorure de lithium (LiF) a été reporté comme l’un
des contributeurs majeurs de la SEI. L’évaluation de la solubilité de LiF dans différents
milieux tels que l’eau pure, 1 mol/kg LiTFSI, 20 mol/kg LiTFSI et 20 mol/kg LiTFSI : 8
mol/kg LiTFSI montre que, en considérant une épaisseur de LiF de ≈ 10 nm, semblable à
l’épaisseur d’une SEI native, LiF ne devrait pas être dissout dans les électrolytes aqueux
superconcentrés. Par conséquent, une couche artificielle de LiF déposée sur une
électrode de lithium métal, dénotée par la suite Li/LiF, a été utilisée pour imiter le
comportement d’une SEI native et évaluer l’efficacité d’une couche inorganique pour
prévenir de la réduction de l’eau.
La technique de microscopie électronique à balayage environnementale permet
d’observer la réactivité des échantillons de Li/LiF à une augmentation graduelle de
l’humidité dans la chambre du microscope (de 0 % RH à 90 % RH). Ces observations,
couplées à des mesures de chromatographie en phase gazeuse, démontrent que la
couche de LiF n’empêche pas l’eau d’accéder à l’interface de Li. Contrairement à ce qui
est observé lors de l’exposition d’un échantillon de Li/LiF à un électrolyte organique tel
que LP30 (1 mol/L LiPF6 in EC:DMC (1 :1)), l’exposition à un électrolyte aqueux
superconcentré ne permet pas d’auto-passiver l’échantillon. Cette absence d’auto-
passivation est confirmée par la réalisation de mesures similaires sur des échantillons
protégés par une couche de Al2O3. En conclusion, ces résultats montrent que, bien que
LiF ne se dissout pas dans les électrolytes aqueux superconcentrés, l’absence d’auto-
passivation ne prévient pas la réaction de réduction de l’eau qui a lieu à travers les
défauts de structures de la couche de LiF comme des fissures ou de la microporosité.
Pour surmonter ces obstacles, une étape de pré-imprégnation dans deux électrolytes
organiques, 1 mol/L LiTFSI : 2 mol/L LiFSI dans DOL:DME + 3 % LiNO3 ou 7 mol/L LiFSI
dans FEC, connus pour former des SEI riches en LiF dans leur couche interne et des
composés organiques dans leur couche externe, a été réalisée. Les mesures de
chromatographie en phase gazeuse montrent une diminution de la production
Résumé en français 247
d’hydrogène lors de l’exposition aux électrolytes aqueux superconcentrés des
échantillons pré-imprégnés. La réalisation de mesures par spectrométrie photo
électronique par rayons X (XPS) met en lumière le dépôt de composés issu de la
dégradation du sel provenant de la solution de pré-imprégnation. Par conséquent,
l’utilisation d’une couche artificielle de LiF couplée à la pré-imprégnation dans un
électrolyte organique démontrent le caractère essentiel des propriétés auto-
réparatrices de la SEI pour l’utilisation d’électrode négative dont le potentiel se situe en
deçà de la limite de stabilité de la fenêtre électrochimique.
Enfin, la réalisation d’une figure de mérite permet de comparer les performances des
batteries LIB basées sur les électrolytes aqueux superconcentrés avec celles des
batteries LIB commerciales ainsi que les performances des batteries aqueuses
rechargeables telles que les batteries Acide-plomb, Ni-Cd ou Ni-MH. L’utilisation d’un
électrolyte tel que 20 m LiTFSI limite la fenêtre de fonctionnement d’une batterie à
environ 2 V, afin d’éviter la contribution néfaste des réactions parasites. Ceci se fait au
détriment de la densité d’énergie et de l’énergie spécifique (limitées au niveau des
batteries type Ni-MH). De plus, alors que des solutions d’ingénierie ont été mis en place
dans les batteries aqueuses rechargeable afin de gérer les gaz générés pendant le
cyclage (O2 ou H2), la superconcentration peut causer la cristallisation rapide de
l’électrolyte dans le cas de cellule type « vented » ou « flooded » qui évacue
l’augmentation de pression sans compensation de l’eau consommée. Par ailleurs,
paradoxalement, peu d’oxygène est produit au niveau de l’électrode positive tandis que
la production d’hydrogène a lieu en parallèle de l’insertion des Li+ à la négative, ce qui
empêche l’implémentation du cycle de recombinaison de l’eau. En effet, dans les
cellules types « sealed » ou certaines cellules types « vented », la batterie est
dimensionnée afin que l’électrode positive soit limitante. En cas de surcharge, seule la
réaction parasite d’oxydation de l’eau doit avoir lieu, l’oxygène produit à la positive
diffuse alors dans l’électrolyte jusqu’à la négative où il est recombiné en eau, évitant à
la fois la consommation irréversible d’eau et la production d’hydrogène.
En dehors des considérations énergétiques, un inconvénient majeur des électrolytes
aqueux superconcentrés est leur haut point de fusion qui provoque la cristallisation
rapide de l’électrolyte et empêche généralement leur utilisation à des températures
inférieures à la température ambiante. L’introduction d’ions asymétriques permet
d’abaisser cette température et de diminuer la quantité d’eau dite libre, c’est-à-dire non
liée à un cation lithium en augmentant la solubilité. L’utilisation de co-solvant organique
modifie la sphère de solvatation des cations Li+, en réduisant la quantité d’eau dans la

248 Résumé en français
sphère de solvatation tout en promouvant la décomposition du co-solvant organique
lors de la formation de la SEI. Cependant, l’eau reste l’une des composantes de la
première sphère de solvatation des cations Li+ laissant penser que ces stratégies ne
permettent pas pour l’instant de résoudre le challenge cathodique, qui atteste de la
présence de molécule d’eau à l’interface de l’électrode négative à bas potentiel
favorisant leur réduction. Pour résumer, les électrolytes aqueux superconcentrés font
encore face à de nombreux freins qui empêchent, à l’heure actuelle, leur
commercialisation. Parmi les stratégies envisagées pour améliorer ces systèmes, l’une
d’elle repose sur l’intégration d’une couche polymère sur l’électrode négative pour à la
fois empêcher physiquement l’accès de l’eau à l’interface négative et participer à la
formation de la SEI par décomposition partielle ou totale de cette couche polymère.
Malgré la publication de cellules basées sur une électrode de graphite recouverte d’un
gel composé de 0.5 mol/L de LiTFSI dans un électrolyte basé sur le mélange HFE:DMC
(1,1,2,2-tetrafluoroethyl-2’,2’,2’-trifluoroethyl ether :dimethylcarbonate), nous n’avons
pour l’heure pas encore réussi à reproduire ces résultats afin de tester la viabilité de
cette solution.


Towards aqueous superconcentrated electrolytes and their use in Li-ion
battery
The development of superconcentrated aqueous electrolytes, namely Water-in-salt electrolytes (WiSE), from 2015 onwards has renewed the interest for aqueous-based Li-ion battery (LIB). Indeed, they were proposed to overcome issues related to safety and sustainability of common carbonate-based organic solvent while solving the poor performances of diluted aqueous electrolyte due to the narrow electrochemical stability window (ESW) of water (1.23 V). Such achievements are largely attributed to modification of the electrolyte structure upon increase in concentration that changes the physico-chemical properties and the interfacial reactivity. An inorganic LiF-based solid electrolyte interphase (SEI) was reported to be formed, opening the path for the use of low potential negative electrodes, further increasing the energy density of these batteries.
This work aims to provide answers regarding the viability of WiSE in LIB. By conducting a systematic study of the impact of superconcentration on battery performances as function of the operating conditions, we demonstrate that the SEI is not able to prevent water reduction following the hydrogen evolution reaction (HER), neither during cycling nor during resting period, i.e. self-discharge. Indeed, the rates for water consumption calculated during cycling and resting period are found within the same order of magnitude, highlighting the SEI limitation to prevent water reduction although the surface is passivated. Determining the activation energies for HER during cycling and self-discharge, we suggest that self-discharge is more likely driven by water reduction than Li+ deintercalation. Eventually, LiF solubility measurements, gas chromatography tests and environmental scanning electron microscopy suggest that SEI instability is related to structural defects that cannot be self-passivated in WiSE. A presoaking step in organic electrolyte of an artificial Li/LiF layer reduces water consumption and thus confirms the need for the SEI to self-repair.
Keywords: aqueous Li-ion batteries, Water-in-salt, SEI stability, superconcentrated electrolyte
Vers des électrolytes aqueux superconcentrés et leur application pour
une utilisation batterie Li-ion
Depuis 2015, le développement des électrolytes aqueux superconcentrés, dénommés « Water-in-salt electrolytes » (WiSE), a suscité un regain d’intérêt pour les batteries Li-ion (LIB) aqueuses. Les WiSE proposent une alternative aux électrolytes organiques commerciaux qui posent des problèmes de sécurité et de durabilité, tout en résolvant les faibles performances des électrolytes aqueux dilués limitées par l’étroitesse de la fenêtre électrochimique (1 .23 V). En effet, la superconcentration influe sur les propriétés physico-chimiques et la réactivité interfaciale. La formation d’une interphase solide/électrolyte inorganique (SEI) riche en fluorure de lithium (LiF) ouvre la voie à l’utilisation d’électrode négative à bas potentiel et donc à l’augmentation de la densité d’énergie de ces batteries.
Cette thèse étudie la viabilité des électrolytes WiSE dans les LIB. Grâce à la mise en place d’une étude systématique, l’impact de la superconcentration sur les performances des batteries en fonction des conditions d’opération montre que la SEI formée ne prévient pas de la réduction de l’eau, appelée réaction d’évolution de l’hydrogène (HER) ni pendant le cyclage ni pendant les périodes de repos, i.e. l’autodécharge. L’évaluation des vitesses de consommation de l’eau souligne les limites des propriétés protectrices de la SEI malgré la passivation de l’interface. Par ailleurs, la détermination des énergies d’activation de la HER directe, ayant lieu pendant le cyclage, et du phénomène d’autodécharge suggère que l’autodécharge est gouvernée par la HER. Enfin, l’évaluation de la solubilité de LiF dans les WiSE, des observations au microscope environnemental à balayage électronique et des mesures de chromatographie en phase gaz suggèrent que l’instabilité de la SEI est d’avantage reliée à des défauts microstructuraux qui ne peuvent pas être comblés dû à l’absence d’auto-passivation de l’interface. Une étape de pré-imprégnation dans un électrolyte organique réduit la consommation d’eau, confirmant la nécessité de propriétés d’autoréparation de la SEI.
Mots-Clés : Batteries Li-ion aqueuses, Water-in-salt, stabilité de la SEI, électrolytes superconcentrés