Measuring Walking and Cycling Using ... - SJSU ScholarWorks
108
San Jose State University San Jose State University SJSU ScholarWorks SJSU ScholarWorks Mineta Transportation Institute Publications 12-1-2010 Measuring Walking and Cycling Using the PABS (Pedestrian and Measuring Walking and Cycling Using the PABS (Pedestrian and Bicycling Survey) Approach: A Low-Cost Survey Method for Local Bicycling Survey) Approach: A Low-Cost Survey Method for Local Communities Communities Ann Forsyth Follow this and additional works at: https://scholarworks.sjsu.edu/mti_publications Part of the Transportation Commons Recommended Citation Recommended Citation Ann Forsyth. "Measuring Walking and Cycling Using the PABS (Pedestrian and Bicycling Survey) Approach: A Low-Cost Survey Method for Local Communities" Mineta Transportation Institute Publications (2010). This Report is brought to you for free and open access by SJSU ScholarWorks. It has been accepted for inclusion in Mineta Transportation Institute Publications by an authorized administrator of SJSU ScholarWorks. For more information, please contact [email protected].
-
Upload
khangminh22 -
Category
Documents
-
view
1 -
download
0
Transcript of Measuring Walking and Cycling Using ... - SJSU ScholarWorks

San Jose State University San Jose State University
SJSU ScholarWorks SJSU ScholarWorks
Mineta Transportation Institute Publications
12-1-2010
Measuring Walking and Cycling Using the PABS (Pedestrian and Measuring Walking and Cycling Using the PABS (Pedestrian and
Bicycling Survey) Approach: A Low-Cost Survey Method for Local Bicycling Survey) Approach: A Low-Cost Survey Method for Local
Communities Communities
Ann Forsyth
Follow this and additional works at: https://scholarworks.sjsu.edu/mti_publications
Part of the Transportation Commons
Recommended Citation Recommended Citation Ann Forsyth. "Measuring Walking and Cycling Using the PABS (Pedestrian and Bicycling Survey) Approach: A Low-Cost Survey Method for Local Communities" Mineta Transportation Institute Publications (2010).
This Report is brought to you for free and open access by SJSU ScholarWorks. It has been accepted for inclusion in Mineta Transportation Institute Publications by an authorized administrator of SJSU ScholarWorks. For more information, please contact [email protected].
San Jose State UniversitySJSU ScholarWorks
All Mineta Transportation Institute Publications Mineta Transportation Institute Publications
12-1-2010
Measuring Walking and Cycling Using the PABS(Pedestrian and Bicycling Survey) Approach: ALow-Cost Survey Method for Local CommunitiesAnn Forsyth
Follow this and additional works at: http://scholarworks.sjsu.edu/mti_all
This Research Report is brought to you for free and open access by the Mineta Transportation Institute Publications at SJSU ScholarWorks. It has beenaccepted for inclusion in All Mineta Transportation Institute Publications by an authorized administrator of SJSU ScholarWorks. For moreinformation, please contact [email protected].
Recommended CitationForsyth, Ann, "Measuring Walking and Cycling Using the PABS (Pedestrian and Bicycling Survey) Approach: A Low-Cost SurveyMethod for Local Communities" (2010). All Mineta Transportation Institute Publications. Book 9.http://scholarworks.sjsu.edu/mti_all/9

Measuring Walking and Cycling Using the PABS (Pedestrian andBicycling Survey) Approach: A Low-Cost Survey Method forLocal Communities
MTI Report 10-03
Funded by U.S. Department of Transportation and California Department of Transportation
MT
IM
easuring Walking and C
ycling Using the PA
BS (P
edestrian and Bicycling Survey) A
pproachM
TI Report 10-03
June 2010

The Norman Y. Mineta International Institute for Surface Transportation Policy Studies (MTI) was established by Congress as part of the Intermodal Surface Transportation Efficiency Act of 1991. Reauthorized in 1998, MTI was selected by the U.S. Department of Transportation through a competitive process in 2002 as a national “Center of Excellence.” The Institute is funded by Con-gress through the United States Department of Transportation’s Research and Innovative Technology Administration, the Califor-nia Legislature through the Department of Transportation (Caltrans), and by private grants and donations.
The Institute receives oversight from an internationally respected Board of Trustees whose members represent all major surface transportation modes. MTI’s focus on policy and management resulted from a Board assessment of the industry’s unmet needs and led directly to the choice of the San José State University College of Business as the Institute’s home. The Board provides policy direction, assists with needs assessment, and connects the Institute and its programs with the international transportation community.
MTI’s transportation policy work is centered on three primary responsibilities:
MINETA TRANSPORTATION INSTITUTE
Research MTI works to provide policy-oriented research for all levels of government and the private sector to foster the development of optimum surface transportation systems. Research areas include: transportation security; planning and policy develop-ment; interrelationships among transportation, land use, and the environment; transportation finance; and collaborative labor-management relations. Certified Research Associates conduct the research. Certification requires an advanced degree, gener-ally a Ph.D., a record of academic publications, and professional references. Research projects culminate in a peer-reviewed publication, available both in hardcopy and on TransWeb, the MTI website (http://transweb.sjsu.edu).
Education The educational goal of the Institute is to provide graduate-level education to students seeking a career in the development and operation of surface transportation programs. MTI, through San José State University, offers an AACSB-accredited Master of Sci-ence in Transportation Management and a graduate Certificate in Transportation Management that serve to prepare the nation’s transportation managers for the 21st century. The master’s de-gree is the highest conferred by the California State University system. With the active assistance of the California Department
of Transportation, MTI delivers its classes over a state-of-the-art videoconference network throughout the state of California and via webcasting beyond, allowing working transportation professionals to pursue an advanced degree regardless of their location. To meet the needs of employ-ers seeking a diverse workforce, MTI’s education program promotes enrollment to under-represented groups.
Information and Technology Transfer MTI promotes the availability of completed research to professional organizations and journals and works to integrate the research findings into the graduate education program. In addition to publishing the studies, the Institute also sponsors symposia to disseminate research results to transportation professionals and encourages Research As-sociates to present their findings at conferences. The World in Motion, MTI’s quarterly newsletter, covers innovation in the Institute’s research and education programs. MTI’s extensive collection of transportation-related publications is integrated into San José State University’s world-class Martin Luther King, Jr. Library.
The contents of this report reflect the views of the authors, who are responsible for the facts and accuracy of the information presented here-in. This document is disseminated under the sponsorship of the U.S. Department of Transportation, University Transportation Centers Program and the California Department of Transportation, in the interest of information exchange. This report does not necessarily reflect the official views or policies of the U.S. government, State of California, or the Mineta Transportation Institute, who assume no liability for the contents or use thereof. This report does not constitute a standard specification, design standard, or regulation. The views and conclusions contained in this document are those of the authors and should not be interpreted as necessarily representing the official policies, either expressed or implied, of the U.S. Department of Homeland Security.
DISCLAIMER
MTI FOUNDER Hon. Norman Y. Mineta
MTI BOARD OF TRUSTEESHonorary Co-ChairHon. James Oberstar **
ChairHouse Transportation andInfrastructure CommitteeHouse of RepresentativesWashington, DC
Honorary Co-Chair
Hon. John L. Mica **
Ranking MemberHouse Transportation andInfrastructure CommitteeHouse of RepresentativesWashington, DC
David L. Turney *
Chair/President/CEODigital Recorders, Inc.Dallas, TX
William W. Millar ^
Vice Chair/PresidentAmerican Public TransportationAssociation (APTA)Washington, DC
Hon. Rod Diridon, Sr. #
Executive DirectorMineta Transportation InstituteSan Jose, CA
Ronald BarnesGeneral ManagerVeolia Transportation/EastValley RPTA
Mesa, AZ
Rebecca BrewsterPresident/COOAmerican TransportationResearch InstituteSmyrna, GA
Donald H. CamphPresidentCalifornia Institute for Technology ExchangeLos Angeles, CA
Anne P. CanbyPresidentSurface TransportationPolicy ProjectWashington, DC
Jane ChmielinskiPresidentDMJM Harris
New York, NY
William DoreyPresident/CEOGranite Construction, Inc.
Watsonville, CA
Mortimer DowneyChairmanPB Consult Inc.
Washington, DC
Nuria FernandezCommissionerCity of Chicago,Department of Aviation,
Chicago, IL
Steve HemingerExecutive DirectorMetropolitan TransportationCommissionOakland, CA
Hon. John Horsley #
Executive DirectorAmerican Association of StateHighway & TransportationOfficials (AASHTO)Washington, DC
Joseph BoardmanPresident/CEOAmtrak60 Massachusetts Ave., N.E.Washington, DC 20002
Will KemptonDirectorCalifornia Department of TransportationSacramento, CA
Brian MacleodSenior Vice PresidentGillig Corporation
Hayward, CA
Dr. Bruce MagidDeanCollege of BusinessSan José State UniversitySan José, CA
Stephanie PinsonPresident/COOGilbert Tweed Associates, Inc.New York, NY
Hans RatSecretary GeneralUnion Internationale desTransports PublicsBruxelles, Belgium
Vickie ShafferGeneral ManagerTri-State Transit AuthorityHuntington, WV
Paul Toliver #
PresidentNew Age IndustriesSeattle, WA
Michael S. Townes #
President/CEOTransportation DistrictCommission of Hampton Roads
Hampton, VA
Edward WytkindPresidentTransportation TradesDepartment, AFL-CIOWashington, DC
Hon. Rod Diridon, Sr.Executive Director
Karen E. Philbrick, Ph.D.Research Director
Peter Haas, Ph.D.Education Director
Donna MaurilloCommunications Director
Brian Michael JenkinsNational Transportation Security Center of Excellence
Asha Weinstein Agrawal, Ph.D.National Transportation Finance Center
Asha Weinstein Agrawal, Ph.D.Urban and Regional Planning San José State University
Jan Botha, Ph.D.Civil & Environmental EngineeringSan José State University
Katherine Kao Cushing, Ph.D.Enviromental Science San José State University
Dave Czerwinski, Ph.D.Marketing and Decision Science San José State University
Frances Edwards, Ph.D.Political Science San José State University
Taeho Park, Ph.D.Organization and Management San José State University
Diana WuMartin Luther King, Jr. LibrarySan José State University
Directors Research Associates Policy Oversight Committee
** Honorary* Chair^ Vice Chair# Past Chair

MTI Report 10-03
MEASURING WALKING AND CYCLING USING THE PABS (PEDESTRIAN AND BICYCLING SURVEY)
APPROACH: A LOW-COST SURVEY METHOD FOR LOCAL COMMUNITIES
Ann Forsyth, PhD
Kevin J. Krizek, PhDAsha Weinstein Agrawal, PhD
December 2010
a publication of the Mineta Transportation Institute
College of Business San José State University San José, CA 95192-0219 Created by Congress in 1991

TECHNICAL REPORT DOCUMENTATION PAGE
1. Report No. CA-MTI-10-2907
2. Government Accession No. 3. Recipients Catalog No.
4. Title and SubtitleMeasuring Walking and Cycling Using the PABS (Pedestrian and Bicycling Survey) Approach: A Low-Cost Survey Method for Local Communities
5. Report Date December 2010
6. Performing Organization Code
7. Authors Ann Forsyth, PhDKevin J. Krizek, PhDAsha Weinstein Agrawal, PhD
8. Performing Organization Report No. MTI Report 10-03
9. Performing Organization Name and AddressMineta Transportation InstituteCollege of BusinessSan José State UniversitySan José, CA 95192-0219
10. Work Unit No.
11. Contract or Grant No. DTRTO7-G-0054
12. Sponsoring Agency Name and Address 13. Type of Report and Period CoveredFinal Report
14. Sponsoring Agency CodeCalifornia Department of Transportation Sacramento, CA 94273-0001
U.S. Department of TransportationResearch and Innovative Technology Administration (RITA) 1200 New Jersey Avenue, SEWashington, DC 20590
15. Supplementary Notes
16. Abstract
To tackle the problems of greenhouse gas emissions, traffic congestion, resident quality of life, and public health concerns, communities are using initiatives to spur more walking and cycling. As local governments face hard choices about which programs to fund, decision makers, planners, and residents seek to understand if proposed policies to increase bicycling and walking—modes referred to as “active travel”— actually work. However, most communities have unreliable means to know how many active travel trips occur in their jurisdictions, let alone how the numbers may change over time. This project developed a low-budget survey method and related sampling strategy for communities to easily, affordably, and reliably document the amount of local walking and cycling happening among their residents. The Pedestrian and Bicycling Survey (PABS) approach allows communities to answer such questions as:• How much walking and cycling is occurring in my community?• What is the purpose of walking and cycling trips? • Who is completing the bulk of the walking and cycling trips?• How often are people walking and cycling?One of the most important contributions of this research project is that the Pedestrian and Bicycling Survey (PABS) instrument has been tested for reliability across administrations (test-retest reliability). The PABS tool achieved adequate to excellent reliability for most questions, creating a useful instrument and a baseline for future comparison with other instruments.
17. Key WordsPedestrian, Bicycling, Survey, Sampling
18. Distribution StatementNo restrictions. This document is available to the public through The National Technical Information Service, Springfield, VA 22161
19. Security Classif. (of this report)Unclassified
20. Security Classifi. (of this page) Unclassified
21. No. of Pages 92
22. Price$15.00
Form DOT F 1700.7 (8-72)

Copyright © 2010 by Mineta Transportation Institute
All rights reserved
Library of Congress Number: 2009943700
To order this publication, please contact the following: Mineta Transportation Institute
College of Business San José State University San José, CA 95192-0219
Tel (408) 924-7560 Fax (408) 924-7565
email: [email protected] http://transweb.sjsu.edu


ACKNOWLEDGMENTS
Projects such as these are the work of many hands. The authors wish to thank the following people for their help:
● The study’s statistical consultant, Françoise Vermeylen, Cornell University
● A set of stellar research assistants, including Ross Nakasone, San José State University (survey development and data collection); Victoria Demchak, Cornell (data entry), and Eric Stonebraker, University of Colorado (data analysis)
● Faculty who generously allowed us to test versions of the survey in their classes, including Katherine Crewe, Arizona State University; Gregory Newmark, San José State University; and Jeremy Nemeth, University of Colorado Denver
● An advisory group of practitioners who reviewed the draft survey and this report, including Cara Seiderman, City of Cambridge, Massachusetts; Chris Hagelin, City of Boulder, Colorado; Daniel Sauter, Urban Mobility Research, Zurich, Switzerland; and Michael Jones, Alta Planning + Design, San Rafael, California
● A group of academics and other experts agreed to have informal conversations with us about the issues involved: Kelly Clifton, Portland State University; Jennifer Dill, Portland State University; Thomas Gotschi, Rails to Trails Conservancy; Michael Greenwald, Urban Design 4 Health, Inc; Susan Handy, University of California, Davis; Paul Hess, University of Toronto; Christine Hoehner, Washington University; Chanam Lee, Texas A&M; Greg Lindsey, University of Minnesota; Anne Vernez Moudon, University of Washington; and Philip Troped, Purdue University.
● Charmaine Stanec translated the survey into Spanish and Fernando Montejo provided helpful comments on the translation.
Additional logistical assistance was provided by Bruce Waller of Sierra Office Supply and Dan Soriano in the San José State University mail room. The authors would like to thank the students and acquaintances who tested the survey.
The authors also thank MTI staff, including Research Director Karen Philbrick, Ph.D.; Director of Communications and Special Projects Donna Maurillo; Research Support Manager Meg A. Fitts; Student Publications Assistant Sahil Rahimi; Student Research Support Assistant Joey Mercado; Student Graphic Artists JP Flores and Vince Alindogan; and Webmaster Frances Cherman. Additional editorial and publication support was provided by Editorial Associates Catherine Frazier and Janet DeLand.

Acknowledgements

Mineta Transportat ion Inst i tute
i
TABLE OF CONTENTSEXECUTIVE SUMMARY 1
INTRODUCTION 3Documenting Walking and Cycling 3Overview of the Repor 4 Institutional Review 5
DESIGNING THE SURVEY AND SAMPLING APPROACH 7The PABS Objectives and Where PABS Fits in the Landscape of Travel Surveys 7Review of Existing Bicycle and Pedestrian Surveys and Diaries 8Survey Questionnaire Type Choice 9The Pedestrian and Bicycle Survey (PABS) Instrument: The Questions 11Developing the Sampling Design 18
FIELD TESTING IN SAN JOSÉ, CALIFORNIA 21Sampling Strategy in San José: The Details 21Mailing Out the Survey 25Data Entry 28
RESULTS 29
Reliability Testing 29Field Testing 32
LESSONS LEARNED 35Field Test 35Reliability Testing 36Issues for Future Research 36
APPENDIX A: THE FINAL SURVEY QUESTIONNAIRE IN ENGLISH AND SPANISH 39
APPENDIX B: SURVEYS EXAMINED 49
APPENDIX C: REVIEW OF OPTIONS FOR SAMPLING WITH EXAMPLES, PROS, AND CONS 51
APPENDIX D: COVER LETTER AND CONSENT FORM USED IN THE SAN JOSÉ FIELD TEST 53

Mineta Transportat ion Inst i tute
Table of Contentsii
APPENDIX E: TEST-RETEST RESULTS 55
APPENDIX F: FIELD TEST RESPONSES 63
APPENDIX G: ADDITIONAL COMMENTS FOR EACH SURVEY QUESTION IN FINAL PABS 71
ENDNOTES 75
ABBREVIATIONS AND ACRONYMS 79
REFERENCES 81
ABOUT THE AUTHORS 87
PUBLICATION PEER REVIEW 89

Mineta Transportat ion Inst i tute
iii
LIST OF FIGURES
1. Sample Carrier Routes from Ithaca, NY 23

Mineta Transportat ion Inst i tute
List of Figuresiv

Mineta Transportat ion Inst i tute
v
LIST OF TABLES
1. Survey Administration Approaches for Surveys of the General Population—Advantages and Disadvantages 13
2. PABS Questions and the Type of Data They Collect 15
3. Descriptions of Reliability and Field Test Samples 17
4. Sample Pricing and Other Information for Mailing Address List Vendors 22
5. Details of Obtaining Stratified Random Sample from Mailing Address Lists 24
6. Delivery and Response Rates for Different Approaches to Addressing the Envelopes 27
7. Responses in Initial and Field Test Versions that Did Not Achieve Acceptable Levels of Reliability 30
8. Comparison of Similar Questions with Substantial Differences in Reliability 31
9. San José Respondents Compared with the American Community Survey 32
10. Percent Walking or Cycling at Least Once in the Last Month 33

Mineta Transportat ion Inst i tute
List of Tablesvi

Mineta Transportat ion Inst i tute
1
EXECUTIVE SUMMARY
To tackle the problems of greenhouse gas emissions, traffic congestion, resident quality of life, and public health concerns, communities are relying on various initiatives to spur more walking and cycling. As local governments face hard choices about which programs to fund, decision makers, planners, and residents all seek to understand if proposed policies to increase bicycling and walking—modes referred to as “active travel”—will actually work. However, most communities have unreliable means to know how many active travel trips occur in their jurisdictions, let alone how the numbers may change over time. This project developed a low-budget survey method and related sampling strategy for communities to easily, affordably, and reliably document the amount of local walking and cycling happening among their residents.
There are of course already a number of excellent existing travel surveys, and the Pedestrian and Bicycle Survey (PABS) is designed to fill a gap between the more expensive travel diary and phone interview approach and a place-focused intercept survey best suited for collecting data on travel in a particular corridor. The authors propose that an inexpensive mail survey like PABS that documents active travel behavior among a community’s general population will be of considerable use to local communities for both planning and evaluation purposes.
PABS is designed to provide information about both the people who do and do not walk and cycle, document walking and cycling that might occur regularly but not in any given week or any specific place, and provide information about a wide variety of trip purposes. For example, the PABS tool allows communities to affordably answer such questions as:
● How much walking and cycling is occurring in my community?
● What are some general purposes for the walking and cycling trips?
● Who is completing the bulk of the walking and cycling trips?
● How often are people walking and cycling?
The PABS instrument includes questions to address these topics, as follows:
● Whether respondents have walked or cycled within the last 7 days, last month, or last year (Question 3). This question determines who uses those modes at all.
● On how many days they made walk or bicycle trips for different purposes in the past 7 days (Questions 4–11). The authors chose to ask about the number of days on which such trips were made, rather than the number of individual trips, to make the survey easier to complete. This question provides information about the frequency of walking and bicycling.
● On how many days a week they commute by foot or bicycle, on average (Question16). This question provides data on behavior that might be missed by questions focusing on the previous 7 days. Commute data is also of particular interest to most transportation planners, since these trips comprise about 15% of

Mineta Transportat ion Inst i tute
Executive Summary 2
all daily trips in the U.S.1 and comprise the richest data source for travel analysts.
● Typical socio-demographic information, information on key factors that might limit active travel, such as physical disabilities or weather, and information on whether the respondent has regular access to a bicycle or motor vehicle.
One of the most important contributions of this research project is that the Pedestrian and Bicycling Survey (PABS) instrument has been tested for reliability across separate administrations one week apart (known as “test-retest reliability” or repeatability). Compared with research in the field of public health, very few transportation surveys have been tested for such reliability.2 That is, researchers typically do not know how likely it is that survey respondents will provide similar answers at different times. Some design-related environmental audit tools have been tested for inter-rater reliability but there is need for additional reliability testing of surveys that collect travel behavior data.3 The PABS tool achieved adequate to excellent reliability for most questions, creating a useful instrument and a baseline for future comparison with other instruments.
A field test of PABS conducted in San José was designed to test and confirm that PABS is indeed a simple survey implementation process that local government staff could easily follow without specialized technical support. A number of aspects of this test were successful—obtaining mailing lists from widely available sources, drawing a random sample, using accessible copying and mailing providers to copy and distribute the survey, entering data, and conducting analysis. The test, using a single mailing of the survey instrument netted a low response rate that was nevertheless comparable to that for many similar surveys. The report suggests mechanisms that communities can use to improve the response rate to adequate levels. These generally involve multiple contacts with households, such as reminder postcards, additional survey mailings, and strategies for raising general public awareness of the survey and its importance.
Accompanying this report is a user-friendly manual that cities and nonprofit organizations can use to walk step-by-step through the survey implementation process.4

Mineta Transportat ion Inst i tute
3
INTRODUCTION
DOCUMENTING WALKING AND CYCLING
Initiatives to spur more walking and cycling have become increasingly prominent nationwide as one strategy communities are using to tackle issues of greenhouse gas emissions, traffic congestion, resident quality of life, and public health concerns.5 As local governments face hard choices about which programs to fund, decision makers, planners, and residents all seek to understand if proposed policies to increase bicycling and walking—modes referred to as “active travel”—are most effective.
Most communities have either incomplete data or unreliable means to know how many active travel trips occur in their jurisdictions, let alone where these trips occur, and how the numbers may change over time.6 Acknowledging this knowledge gap, in the spring of 2010 the United States Department of Transportation (U.S. DOT) issued a policy statement on bicycle and pedestrian accommodations that specifically called for collecting data on these modes:
The best way to improve transportation networks for any mode is to collect and analyze trip data to optimize investments. Walking and bicycling trip data for many communities are lacking. This data gap can be overcome by establishing routine collection of nonmotorized trip information. Communities that routinely collect walking and bicycling data are able to track trends and prioritize investments to ensure the success of new facilities. These data are also valuable in linking walking and bicycling with transit.7
To help communities to fill the knowledge gap about active travel, this project developed a low-budget survey method and related sampling strategy to easily, affordably, and reliably document the amount of local walking and cycling happening among their residents (see Appendix A). The new Pedestrian and Bicycling Survey (PABS) allows communities to answer such questions as:
● How much walking and cycling is occurring in my community?
● What is the purpose of walking and cycling trips?
● Who is completing the bulk of the walking and cycling trips?
● How often are people walking and cycling?
One of the most important contributions of this research project is that the PABS instrument has been tested for reliability across administrations one week apart (known as “test-retest reliability”). Compared with research in the field of public health, very few transportation surveys have been tested for such reliability.8 That is, researchers do not know how likely it is that survey respondents will give similar answers about stable characteristics or habitual behaviors at different times. Some design-related environmental audit tools have been tested for inter-rater reliability—that is whether two or more different auditors will provide similar responses in something like a checklist—but there is need for additional

Mineta Transportat ion Inst i tute
Introduction 4
reliability testing of surveys that collect travel behavior data.9 The PABS achieved adequate to excellent reliability for most questions, creating a useful instrument and a baseline for future comparison with other instruments.
OVERVIEW OF THE REPORT
The next chapter of this report, “Designing the Survey and Sampling Approach,” outlines how the survey and sampling approach were designed. Mail surveys were selected over travel diaries or face-to-face interviews because mail surveys tend to be more affordable to administer. Specific questions drew on a review of prior bicycle and pedestrian survey instruments, with questions selected and modified to best determine who is walking and cycling, how much they do so, for what purposes, and how often. The sampling strategy was developed to maximize the capacity to generalize the survey results to the full community under study, while still being cost effective. The survey was piloted multiple times, and both early and later versions of the survey were tested for reliability across different samples of 100 and 87 university students from four separate institutions. The survey instrument itself is presented in Appendix A.
The next chapter, “Field Testing in San José, California,” explains how the survey and sampling method were field tested with a sample of residents in San José, California. This chapter describes how the mailing list was constructed using commercial address databases and details how the surveys were assembled and disseminated.
Reliability and field test results are the focus of the following chapter, “Results.” The reliability tests showed that, in general, the questions about demographic factors and habitual behavior achieved adequate to excellent levels of reliability, with only a few exceptions. This finding is important, as few transportation surveys have been tested for reliability—to the authors’ knowledge, this is actually the first.
The field test in San José was designed to test and confirm that PABS is indeed a simple survey implementation process that local government staff could easily follow without specialized technical support. A number of aspects of this test were successful—obtaining mailing lists from widely available sources, drawing a random sample, using accessible copying and mailing providers to reproduce and distribute the survey, entering data, and conducting analysis. The test, using a single mailing of the survey instrument netted a relatively low response rate that was nevertheless comparable to that for many similar surveys. The report suggests mechanisms that communities can use to improve the response rate to adequate levels. These generally involve multiple contacts with households, such as reminder postcards, additional survey mailings, and strategies for raising general public awareness of the survey and its importance. Personalizing mailings—for example by hand writing addresses—and providing an option for completing the survey online can also increase response rates. Communities will need to assess which options for increasing response rates will provide most value in their context.
The final chapter, “Lessons Learned,” summarizes lessons learned from these tests, including some challenges inherent in examining behaviors such as cycling that, in most communities, relatively few people engage in on any particular day.

Mineta Transportat ion Inst i tute
Introduction 5
INSTITUTIONAL REVIEW
Permission to conduct this study was obtained from the San José State University Institutional Review Board.

Mineta Transportat ion Inst i tute
Introduction 6

Mineta Transportat ion Inst i tute
7
DESIGNING THE SURVEY AND SAMPLING APPROACH
THE PABS OBJECTIVES AND WHERE PABS FITS IN THE LANDSCAPE OF TRAVEL SURVEYSUrban and transportation planners quite often want to document the quantity of walking and cycling occurring in a particular community, the purposes of those active travel trips, and something about the people most and least likely to walk and cycle. Planners want to be able to track general trends in walking and cycling and to have information about how to target infrastructure upgrades, educational campaigns, and policy changes. Planners also want to be able evaluate the community-wide impacts that a suite of policy actions promoting cycling or walking may have had over time. To achieve these objectives, planners need to collect data on:
● Active travel patterns among the whole population, not just those already walking and cycling or who belong to similar social networks. For example, it is important to know about pedestrians beyond those who belong to a pedestrian club or internet listserv. As the authors explain below, collecting this type of data requires using some form of random (also called “probability”) sampling.
● Walking and cycling trips made by people who may use the modes regularly but not necessarily every day or even every week (for example, seasonal cyclists, or people who walk to a transit stop from time to time). Obtaining this information requires asking questions not just about trips made in the past few days or a typical week but also about activities that may have occurred in the past month or year.
● The purposes for which people make walking and cycling trips beyond the commute. In the U.S., the great majority of trips are not related to commuting. In addition, many are made as part of transit trips. Planners need to be able to identify these types of trips to get a complete picture their residents’ active travel patterns.
There are a number of excellent existing travel diary, intercept, and phone-based surveys that collect data on active travel, and so the authors started this research project anticipating that they could select an existing survey and modify it slightly, with the reliability testing being the authors’ primary contribution. As the authors describe shortly, however, through the study’s investigations they came to see that an entirely new questionnaire might be needed that could be combined with a sampling strategy using inexpensive mail surveys sent to a random sample of home addresses. Such a mail survey would fill a niche not covered by the existing survey options:
● Many of the existing instruments are designed as intercept surveys, and this is an option the authors investigated early in the project. This approach involves intercepting people at particular places and asking questions about that trip, and potentially others they may make. (The National Bicycle and Pedestrian Documentation Project has created intercept surveys and observation tools that are currently in wide-spread use.10) If one is interested in collecting data about users of a facility or place, intercept surveys can be an ideal method for data collection. What is more challenging is using this information to make inferences

Mineta Transportat ion Inst i tute
8
about the wider population, particularly people not using the facility or traveling in that place. Therefore, the authors concluded that intercept surveys would not be an appropriate method to collect the types of data described above as the PABS objectives, even though they agree that they can provide very useful information about travel at specific places.
● Counters such as infrared sensors can measure the level of use across time in different places but have little additional information about people that would help interpret the data.
● The gold standard for collecting travel behavior data has for many years been the trip-diary approach to surveying, where people are asked to give information on every trip they made over a short period, usually from one to three days. Such surveys can provide very complete and accurate data. However, these surveys typically combine many mailings to participants with a phone survey, making them relatively expensive to implement. They also may not capture data about infrequent trips particularly well.
● Phone-based surveys of any type (whether travel diaries or other types of questionnaires) tend to be quite expensive to conduct and also cannot be implemented without specialized support from survey firms. In addition, as more households replace land-line phones with cell phones, it is becoming harder to obtain a random sample of phone number within a community.11A very new approach is to ask people to wear tracking devices, such as global positioning system (GPS) units that trace location of movement. This method can provide quite precise information about the number, location, and distance of individual trips made. However, for nonmotorized measurement, these trackers are still somewhat expensive and cumbersome to use. Some lack long memories, others require battery recharging, all raise privacy concerns, and the costs of both the technology and analyzing the data are high. While this technology is developing fast, it is not yet ready for widespread local implementation.
● Finally, other methods can obtain qualitative information, for example focus groups, workshops, programs with youth, and internet surveys using snowball sampling techniques. These can provide very useful information to supplement data collected by other means, being particularly useful for probing people’s motivations for why they do or don’t use active travel modes or what infrastructure improvements they might like to see.
REVIEW OF EXISTING BICYCLE AND PEDESTRIAN SURVEYS AND DIARIES
To design the survey, the authors began with a careful review of more than 20 other surveys about bicycle and pedestrian travel. Some of these surveys focused just on bicycling and/or pedestrian activity, while others were travel diary surveys designed to capture travel by all modes.12 The surveys reviewed, which came from a wide variety of sources, included:
Designing the Survey and Sampling Approach

Mineta Transportat ion Inst i tute
9
● The 2008 National Household Travel Survey, administered by the Federal Highway Administration.
● Regional travel surveys administered by Metropolitan Planning Organizations.
● Surveys administered by local cities and counties.
● Surveys administered by academic researchers.
Appendix B lists the surveys examined. This is not an exhaustive list of all possible surveys but represents a wide range of those used in transportation and public health research.
For each survey, the authors reviewed the questionnaire design and created a master list of questions that focused on those that could answer the key PABS questions about walking and cycling: how much, for what purpose, by whom, and how often? The authors also focused on identifying questions that would be simple and clear to answer in a mail-out survey format and checked whether the survey designers had completed any reliability testing on the questionnaires.
In addition, the authors reviewed the sampling designs for all the surveys, assessing the strengths and weaknesses of the different approaches used. To supplement this assessment of sampling strategies used in active travel surveys, the authors also reviewed different types of literature on sampling methods, from textbooks and classic studies to works about more specific issues in creating a sample.13 Finally, the authors also conferred with Cornell statistical consultant Françoise Vermeylen about options for designing a sample that would produce data generalizable to the full residential population within a specific geographic boundary (for example, a city or county).
SURVEY QUESTIONNAIRE TYPE CHOICE
Diary vs. Survey
The authors used their review of the surveys to identify the different conceptual strategies used for measuring bicycle and pedestrian activity. These fell into two general questionnaire-design approaches:
● Questionnaires that gather information about specific trips that the respondents took. Travel diaries are the classic form of this questionnaire design. These surveys ask about all trips the respondent took over a specified day or longer time period. Often the surveys gather data from all members of the household.
● Questionnaires that gather information about respondents and their general patterns of trip making. These questionnaires ask about “typical” behavior or behavior over a specified period, with questions like “What is your usual commute mode?” or “How many walk trips did you make in the last seven days?”
The first approach, which gathers detailed information about individual trips, is considered the gold standard for assessing travel behavior, including pedestrian and bicycling travel.
Designing the Survey and Sampling Approach

Mineta Transportat ion Inst i tute
10
However, it has various practical drawbacks, particularly the high expense of administering such a survey, which typically combines multiple mailings and phone surveying. A 2009 review of travel survey costs by Hartgen and San Jose that looked at more than 125 surveys from a range of states and metropolitan areas, found the average price to be about $150 for each completed survey. In many cases the costs were considerably higher. This cost has remained stable, in real terms, since the 1990s.14 Surveys with a small sample size, such as those that a city or county might conduct, may well have higher costs. Even using just the conservative cost of $150 per completed survey, a survey netting 500 responses would cost $75,000, far too much money for most local governments to spend, especially if the survey is to be repeated in multiple years to assess trends.
A second cost-related problem with using a travel diary to collect information about bicycling and walking is that these modes, especially bicycling, are often not used every day or even every week and would therefore be missed by travel diaries. According to the 2009 Hartgen and San Jose review, 87% of the surveys cover only one week day. 15 At most, travel diaries in the U.S. ask about three days worth of trips. In many communities as few as one percent or two percent of people might make a bicycle trip within a three day period. As a result, a survey of 500 people might collect data on only five or 10 people who reported a bicycle trip, far too few to draw meaningful conclusions. To solve this problem would require greatly expanding the sample size—but that, of course, also greatly increases the survey cost. To gather data on 50 people who made bicycle trips, assuming that two percent of people made such a trip in the last few days, would require 2,500 respondents and cost around $375,000.
In contrast, as is explained below, printing and mailing a survey with a postage-paid reply envelope costs very little, approximately $1.75 for printing and mailing (including return postage for the survey). Even sending out advance and reminder post cards (at about $0.80 each) and a second mailing of the survey would only add $3.35 per person contacted for a cost of $5.10. Of course, in a mailed-out survey not everyone responds, but the cost difference is still substantial. To use an extremely conservative example, contacting 5,000 people at $5.10 each, with an expected response rate of 10%, would produce 500 completed surveys for a cost of $25,100.
To overcome the problem of few cycling trips in a one to three day travel dairy, one could expand the number of days that the diary covered. The British National Travel Survey, a continuous survey collecting data from over 5,000 households each year, has participants complete a seven-day diary.16 In public health research, many recent studies cover seven days. However, this added time period requires additional administrative work to monitor and check diaries and may well require the expensive of offering incentives, such as gift cards.17 It is still a costly alternative. Given these disadvantages and the expense associated with travel diaries, the authors decided that they were less suitable for the PABS goals and that it would be more efficient to design a survey asking people about their general rates of bicycling and walking.
Designing the Survey and Sampling Approach

Mineta Transportat ion Inst i tute
11
Contacting the General Population or Subgroups? Implications for the Survey Approach
While the question of whether to create a survey to assess the behavior of the general population or of subgroups such as cyclists may seem like a sampling issue, it also affects the survey questions asked. As outlined above, the authors proposed that a survey of behavior of the general population would be of most use to planners because it could provide information about people who do and do not walk and cycle, assess walking and cycling that might occur regularly but not in any given week or at any specific place, and provide information about a wide variety of trip purposes. For those wanting to find out about subgroups of the population, other methods such as focus groups and workshops, or monitoring trips using instruments such as global positioning system units, might be more helpful.
As previously noted, the intercept survey is one way to reach specific subgroups of the population, such as those cycling on a trail or walking in a downtown. For that purpose such surveys are excellent tools. However, it is very difficult to use this information to make inferences about the wider population. Initially the authors had hoped to use an intercept survey because they are simple to administer, but because their results are so hard to generalize to the full population, they realized they had to use a different kind of survey.
In-Person Interviews, Internet, Phone, and Mail-Back Approaches
Having decided on a survey of the general population, there was a final question about the medium or approach by which the sample would be contacted and their responses collected. There are several options, many of which can be used in combination (for example, if one method failed another could be tried). Table 1 outlines the options.
The authors selected the mail out/mail back approach as the best balance of cost, reach, and response rates. However, the mail-out with mail-back and Internet options may also be appropriate though the research on this approach shows a number of weaknesses and only modest gains in response. The issue of internet options for surveys using random samples has been studied by survey researchers, particularly in the medical field. Results are mixed. A recent review by Zeigenfuss and colleagues noted that while some had reported increases in response rate among younger participants, in their randomized trial of mail-only plus Internet options, having the internet option actually reduced response rates.18 Given the research, it is unclear if such an option should be provided. The authors leave it as an open question.
THE PEDESTRIAN AND BICYCLE SURVEY (PABS) INSTRUMENT: THE QUESTIONS
The authors crafted the core of the survey to collect data on bicycling and walking in several different ways, as well as to collect demographic questions. Given that the authors had selected a mail-out survey, they also developed questions that could take advantage of being presented as printed rather than spoken words. The specific wording used for the questions in the PABS drew on a variety of sources. A few questions were modified from
Designing the Survey and Sampling Approach

Mineta Transportat ion Inst i tute
12
other surveys, but many were developed from scratch.
The core questions about bicycling and walking are as follows:
● Question 3 asks whether respondents have walked or cycled within the last 7 days, last month, or last year. This question therefore determines who uses those modes at all. By asking people about their travel over relatively long periods of time, the survey captures information about people who use active travel modes only occasionally. For example, many people who might not have bicycled in the past day or two, the time period typically covered by a travel diary, might well have taken a bicycle trip within the last week or month or year.
● Other sets of questions (4–11) ask respondents to tell us on how many days out of the previous seven they made walk or bicycle trips. These questions builds on Question 3 by providing information about the frequency with which people walk and bicycle. The authors chose to ask about days on which such trips were made, rather than the number of trips, to reduce the burden on respondents and make the survey easier to fill out. (Also, the accuracy of the responses will likely be higher when asking about days rather than all trips, since respondents have to remember less detailed information.)
● Question 16 asks how many days a week respondents commute by foot or bicycle, on average. This question provides data on “average” behavior that might be missed by questions focusing on the previous 7 days. Commute data is also of particular interest to many transportation planners, since these trips tend to be relatively habitual.
The remainder of the survey questionnaire collects typical socio-demographic information; information on key factors that might limit active travel, such as physical disabilities or weather; and information on whether the respondent has regular access to a bicycle or motor vehicle.
Designing the Survey and Sampling Approach

Mineta Transportat ion Inst i tute
13
Table 1. Survey Administration Approaches for Surveys of the General Population—Advantages and Disadvantages
Survey Administration Approach Advantages Disadvantages
Mail out/mail back Relatively inexpensive. Need mailing list, and response rates can be low.
Mail out, with a both a mail back and an internet optionto complete it
Flexible—people who like paper can use it and those who want the internet can use that. internet response eases data entry.
Adds complexity for both survey team and respondents. Research evidence suggests that some people will use the internet option, but relatively few.
Drop off/mail back Surveyor can check addresses; may meet respondents and encourage response.
Dropping off is labor intensive; only viable for small areas or when using cluster sampling approaches (see below).
Mail out postcard, with internet response required
Relatively inexpensive. Requires multiple steps; difficult for those without ready access to internet Some research suggests that response rates will be extremely low.
Internet-only (the sample receives an email invitation to take a web-based survey)
Very inexpensive, assuming the sample of internet addresses are not costly to obtain.
To date, virtually impos-sible to obtain internet addresses for a random sample of people in a city or county.
Door to door (in person) Likely less missing data. Expensive; people may not answer door.
Telephone (Computer Assisted Telephone Interviewing)
Likely less missing data. Telephone listings by address are increasingly hard to find; not everyone has a telephone; no call lists; expensive; caller ID is an additional hurdle.
Internet
Note: The above approaches are all suitable for use with random samples (simple, stratified, or clustered, as described below). The list is not meant to cover other ways to collect data, for example, through observations, tracking devices, intercept surveys of people using facilities, focus groups, workshops, etc., that are not advised for surveys of the general population.
Table 2 lists the full set of questions the type of data each was designed to collect.
It is important to note that the PABS was initially conceived as a set of modules that could be dropped or added, with the questions under each major heading considered as a group or module. As the survey developed, it became more continuous. However, it is possible to shorten the survey by eliminating whole sections or specific questions. Such shortening would need to be piloted, as is explained in the companion manual.
Several types of questions that the authors considered including in this survey but eventually dropped were:
Designing the Survey and Sampling Approach

Mineta Transportat ion Inst i tute
14
● Questions about length of travel.
● Questions relating to details of specific trips, such as whether the respondent was alone or in a group or the time of day of the trip.
● Questions about other members of the household.
● Open ended questions, such as ones asking about options for improving the walking and cycling environment.
● Additional demographic questions such as the respondent’s educational level.
The authors considered putting various additional questions on these topics in extra modules but decided to keep the current survey as short as possible in order to improve response rates. The survey was formatted to fit on just four pages, to make it look like it could be completed reasonably quickly. It also uses a relatively large serif font (Garamond 13 points) to aid readability. Appendix A includes the survey at that font size with the survey in both English and Spanish.
Designing the Survey and Sampling Approach

Mineta Transportat ion Inst i tute
15
Table 2. PABS Questions and the Type of Data They Collect Question Number and Topic Purpose and Type of Data Collected
1. Date Controls for weather and season (and holidays, if needed).
2. Out of town in last seven days Identifies those whose travel may not have been in the location of interest, and/or whose travel patterns may have been particularly irregular in the last seven days.
3. Most recent time used certain modes.
Provides an overview of all modes the respondent uses. This ques-tion determines if someone uses the modes at all. Data on occa-sional use is particularly critical for cycling, a mode many people use infrequently, making it easy to miss in surveys that ask only about travel in the past day or week.
4-11. How often bicycled/walked for specific purposes in last seven days
Provides information on the frequency of nonmotorized trips over the last 7 days, as well as the trip purposes for which active travel trips are made. Asking about behavior within a short, recent time period is standard procedure in travel behavior research. By asking about how many days a mode was used the hoped to have more accurate re-sponses than if asking about how many trips—movements between destinations—a unit often used in transportation but time consuming to recall accurately.
12-13. Health problems limiting walking/cycling
Accounts for health status.
14-15. Access to bicycle/car Account for vehicular access.
16. Typical week commute (mode by days)
Collects data on typical commute mode. This provides information about “average” behavior that might not have occurred in the past 7 days. Commuting is of particular interest in transportation planning.
17-18. How much of the year weather prevents walking and cycling
Identifies whether and how much climate limits active travel.
19. Age Account for age.
20, 22. Cross streets and zip Allows for geographical analysis by neighborhood, if desired.
21. Time lived in neighborhood Accounts for people who have recently moved to the area and may not yet have established full-year travel patterns.
23-25. Gender, ethnicity, and employment status
Accounts for socioeconomic characteristics.
26. People in household Divided at age 16 to control for number of household members eli-gible to have a drivers license.
27. Vehicles in household To account for level of vehicular access.
28. Income To account for income.
Note: See Appendix A for the complete quesionnaire.
Designing the Survey and Sampling Approach

Mineta Transportat ion Inst i tute
16
Review, Piloting, Revision, and Reliability TestingThe survey questionnaire went through six stages of review. The authors were particularly interested in developing reliable questions, ones that achieved similar results across separate administrations at two different times with the same people. The stages of review and testing included:
Stage 1: Advisory Committee. A very preliminary version of the survey and sampling approach was sent to the study’s advisory committee in September 2009. This group provided helpful written feedback about all aspects of the survey. It was extensively revised.
Stage 2: Piloting. The initial draft was circulated among nine of the authors’ acquaintances, who were asked to complete the survey and provide feedback on any questions that confused them. The survey was again revised in accordance with the feedback received.
Stage 3: First Reliability Test—Version 1 (administered twice to the same people, 7–9 days apart, termed time 1 and time 2 of this test). In the next step, the questionnaire was tested with urban planning students enrolled in classes at Cornell, San José State University, and the University of Colorado. A total of 100 students completed Version 1 twice, with administrations a week to 9 days apart, as part of the test-retest reliability study. (This group constitutes reliability sample one.) An additional 36 students took the test once; their results were not included in the reliability assessment, but their comments were considered in revisions.* At the first administration, students were encouraged to note on the survey how to make the question wording clearer. After the second administration, the class typically discussed the survey content—this was to allow students to provide additional feedback, but meant that they did not discuss the survey in detail until after the “retest.”
Step 4: Second Reliability Test—Version 2 (survey administered twice to the same people, 7 days apart, again termed time 1 and time 2 of this test). The questionnaire was then refined further and, because a number of questions changed in potentially important ways, it was tested for reliability again, this time with a set of students at Arizona State University. These students were selected because they had not been involved with the earlier survey. A total of 87 students took the survey twice, one week apart. This group is called reliability sample two and they used the same survey as Version 2 (see next).
Step 5: Field Test (survey administered once to a sample of people in San José). After the survey questionnaire design was complete, the survey was implemented in the field in order to test out the sampling strategy and identify practical administrative kinks that might arise. This survey field test was conducted in San José, CA. It used the same survey as Version 2.
*The students completed the survey during class time and, for ethical reasons, their work completing the survey did not count toward their grades. To preserve students’ anonymity, surveys were matched using two questions: “In what city did you celebrate your 16th birthday?” and “What is the name of the high school from which you graduated?”
Designing the Survey and Sampling Approach
Mineta Transportat ion Inst i tute
17
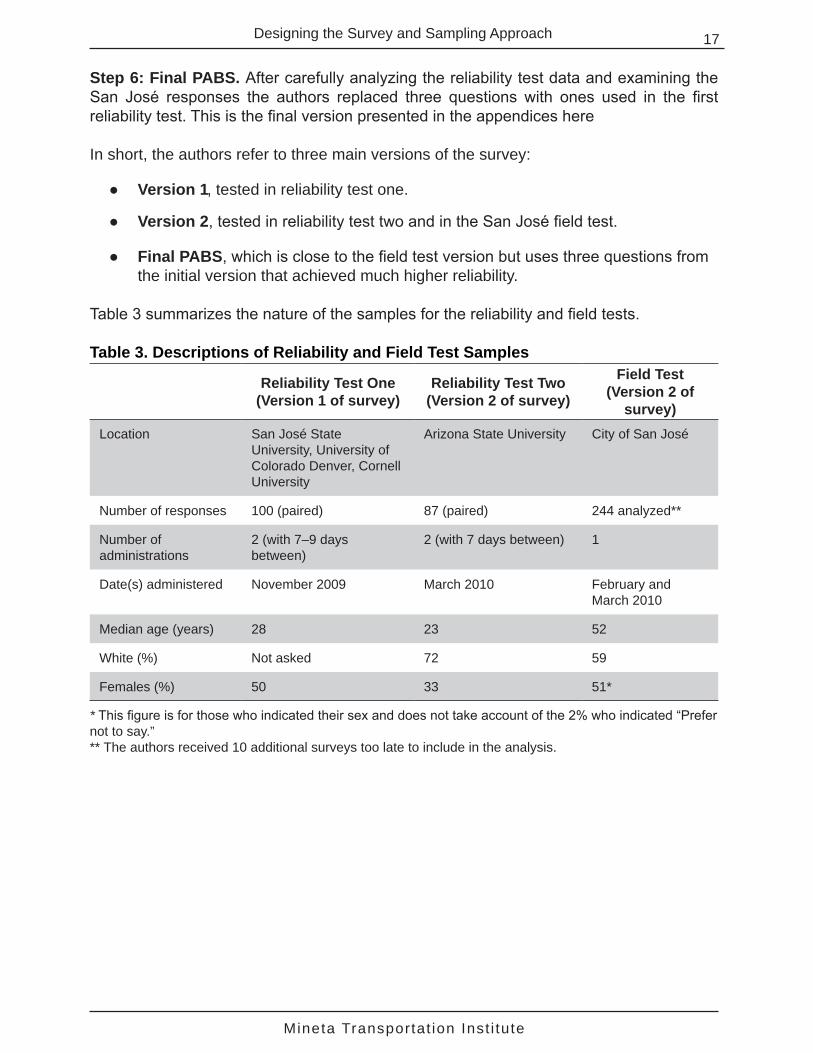
Step 6: Final PABS. After carefully analyzing the reliability test data and examining the San José responses the authors replaced three questions with ones used in the first reliability test. This is the final version presented in the appendices here
In short, the authors refer to three main versions of the survey:
● Version 1, tested in reliability test one.
● Version 2, tested in reliability test two and in the San José field test.
● Final PABS, which is close to the field test version but uses three questions from the initial version that achieved much higher reliability.
Table 3 summarizes the nature of the samples for the reliability and field tests.
Table 3. Descriptions of Reliability and Field Test Samples
Reliability Test One (Version 1 of survey)
Reliability Test Two (Version 2 of survey)
Field Test (Version 2 of
survey)Location San José State
University, University of Colorado Denver, Cornell University
Arizona State University City of San José
Number of responses 100 (paired) 87 (paired) 244 analyzed**
Number of administrations
2 (with 7–9 days between)
2 (with 7 days between) 1
Date(s) administered November 2009 March 2010 February and March 2010
Median age (years) 28 23 52
White (%) Not asked 72 59
Females (%) 50 33 51*
* This figure is for those who indicated their sex and does not take account of the 2% who indicated “Prefer not to say.” ** The authors received 10 additional surveys too late to include in the analysis.
Designing the Survey and Sampling Approach

Mineta Transportat ion Inst i tute
18
DEVELOPING THE SAMPLING DESIGN
The review of the surveys was used to identify the different conceptual strategies used for sampling bicycle and pedestrian activity. These fell into several different approaches that are explained in more detail in Appendix C:
1. Censuses are surveys of the entire population of interest, not a sample.
2. Simple random samples are samples where every individual or other unit of analysis in the full population has an equal chance of being selected. This would be a good strategy in a smaller city or in a larger city with a good mailing list of dwellings or a moderate budget for obtaining such a list.
3. Stratified random samples are random samples drawn from particular strata (categories) of the full population, such as high versus low poverty neighborhoods, or from sub-groups such as pedestrians and motorists. A key issue is coming up with the list for every individual or unit of analysis in a strata—for example, it may be difficult to obtain a list of all cyclists.
4. Cluster samples involve creating a list of smaller units, such as classes in a school or neighborhoods in a city, and sampling by those units. A one-stage model then obtains information from every person in the cluster. Multi-stage cluster models can also be designed where, for example, one takes a random sample within each cluster, for example, a sample of households in a neighborhood.
5. Quota samples are stratified nonrandom samples (chosen for convenience) where subjects are sampled until a particular number (quota) is reached. For example, an Internet survey might solicit responses until 200 cyclists have responded.
6. Snowball samples obtain names of survey respondents from prior respondents and can be a useful way of locating very specific types of people, for example, seniors who travel by bicycle or low-income people who don’t have access to an automobile.
7. Intercept surveys gather information on the use of, or the users of, specific facilities such as cycle tracks. These surveys require that attention be paid to location and time of survey, as well as to detailed characteristics of the users.
8. Observations such as cordon counts observe people using specific spaces or passing specific points. Some of these are conducted using instrumentation such as sensors. This approach can be helpful for identifying levels of use of specific infrastructure.19
After considering options that would focus on specific types of people (such as cyclists) versus the general population, the authors decided that a survey of the general population would be of most use to local planners. The last four sampling strategies (options five through eight) are such that it is extremely difficult to provide information from them that is generalizable to the entire population, even though they may generate very useful
Designing the Survey and Sampling Approach

Mineta Transportat ion Inst i tute
19
information about particular population groups or use of specific infrastructure.20 Therefore, the authors eliminated options five through eight from consideration for this project.*
That left the authors with options one through four. They decided that option three, drawing a stratified random sample by some key characteristic of interest, is unlikely to be practical because communities rarely have access to complete lists of the relevant strata of the population, which would be all cyclists or all pedestrians in the community. Therefore, the authors eliminated option three from further consideration. The first sampling approach above, a census, is desirable because it examines a complete population, but the authors rejected it as too expensive for any but the smallest (or richest) communities who can afford both to obtain a list of all residential addresses and also to send out surveys to the full population.
Through this process of elimination, the authors ended up with two recommended sampling options that provide generalizable data at a reasonable cost. The recommended strategies, depending on community size and budget, are:
1. Drawing a simple random sample from the entire population (option two). This in the simplest strategy and has a great deal of statistical backing.21 This would involve obtaining a list of all addresses for a city and then drawing a random sample (described below). As the authors note below, parcel data do not cover apartments well so commercial mailing list data based on postal delivery is a viable option. In testing this method in San José, however the authors could not find a vendor who would sell only a random sample of addresses. Purchasing all 300,000 plus residential addresses for San José and then sampling from them would have cost over $4,000. This was too expensive for this research project but would be a good strategy in a smaller city where purchasing a complete list of addresses would be inexpensive, in any city that already has a complete mailing list of all dwellings, or in a large city that can afford a larger budget for purchasing a complete list of residential addresses.
2. Conducting a cluster sample (option four). In this study’s case, as was noted above, the authors created a list of all small neighborhoods in a city—in this case postal carrier routes were the unit available—and randomly sampled from the entire list of over 600 routes with residential addresses. The authors purchased 65 routes with approximately 30,000 addresses ($400 approximately). They then randomly sampled 2,000 addresses from within those routes.† This process, known as a two-stage cluster sampling approach, is described in more detail below.‡
*All eight strategies can also be used with a number of different geographies—larger and smaller areas; randomly sampled or theoretically selected locations; key and convenient sites, or from groups that are not specifically related to an area (for example, members of a national organization). Such sampling strategies are outlined in Appendix C.†Note that a one-stage cluster sampling approach would just randomly sample neighborhoods and then sur-vey everyone in each of those neighborhoods; what makes it a two-stage approach is that the authors also randomly sampled within the sampled clusters.‡There is sometimes confusion about cluster versus stratified sampling, particularly in research on the ef-fects of neighborhoods on behavior. A neighborhood effects study might take carrier routes, block groups,
Designing the Survey and Sampling Approach

Mineta Transportat ion Inst i tute
20
More detail about the recommended cluster method is provided in the accompanying manual.
Key Dilemmas
Two issues are difficult for any such sampling design or any single survey effort to address in this day and age.
The first is that response rates to surveys around the world are relatively low, uneven across populations, and plummeting.22 In addition, pestering people to respond can be counterproductive and costly—these costs and benefits need to be weighed.23 The authors strongly considered various recruitment strategies and reviewed literature on this matter as part of their research efforts (see discussion below). Step 7, in Part III of the PABS User’s Manual, outlines some strategies for increasing response rates. In short, such strategies focus around raising awareness about the survey and elevating its importance via media campaigns, multiple mailings, personalized interactions (such as hand addressing envelopes), and endorsements from important locals in the community (for example, the mayor or the council). In the end, the authors’ research effort focused on test a method for reliability and feasibility, and not to maximize response rates—but they realize the importance of this element and provide specific guidance to communities in this regard.
The second is that—as mentioned in the PABS User’s Manual—some of the behaviors being surveyed are relatively infrequent, such as people who bicycle to get groceries or occasionally commute to work via bicycle. Outside of places with exceptionally high rates of cycling (for example, Cambridge, Portland, Boulder, Berkeley), it is challenging to obtain a large enough sample on which to perform robust analysis. The alternatives are making inferences from a small sample (always a bit risky) or not being able to say much about that portion of the population. In this case, the authors suggest obtaining additional data from such groups that may not be generalizable to the population but could still provide important information. Such strategies include counting how many people walk or cycle past a particular point, conducting a focus group or workshop, or getting the public to vote on options via the Internet. These approaches are outlined in more detail in the PABS User’s Manual, chapter 3, “Steps in Administering the Survey.”
or some more regular areas such as map grid cells and stratify by neighborhood characteristics of interest. So one might stratify “neighborhoods” by characteristics such as density and transit access (for example high density, high transit access; high density, low transit access etc), then randomly sample neighbor-hoods within each strata, and then randomly sample some number of people in each neighborhood. This approach is stratified because neighborhood characteristics are the focus of the study and constitute the strata; a cluster sample uses a complete list of clusters (like carrier routes or school classes) that are not stratified in order to make surveying either simpler or less expensive. The approach generates more error than simple and stratified random sampling but is still generalizable (Fowler 1993).
Designing the Survey and Sampling Approach
Mineta Transportat ion Inst i tute
21
FIELD TESTING IN SAN JOSÉ, CALIFORNIA
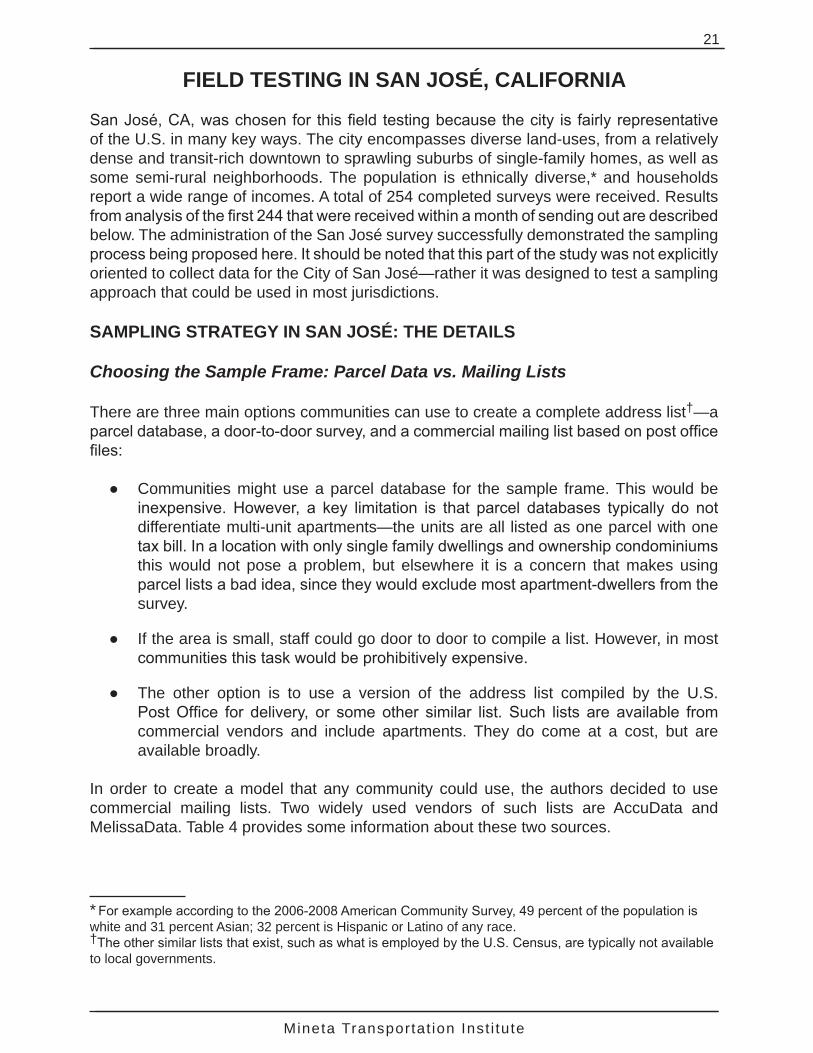
San José, CA, was chosen for this field testing because the city is fairly representative of the U.S. in many key ways. The city encompasses diverse land-uses, from a relatively dense and transit-rich downtown to sprawling suburbs of single-family homes, as well as some semi-rural neighborhoods. The population is ethnically diverse,* and households report a wide range of incomes. A total of 254 completed surveys were received. Results from analysis of the first 244 that were received within a month of sending out are described below. The administration of the San José survey successfully demonstrated the sampling process being proposed here. It should be noted that this part of the study was not explicitly oriented to collect data for the City of San José—rather it was designed to test a sampling approach that could be used in most jurisdictions.
SAMPLING STRATEGY IN SAN JOSÉ: THE DETAILS
Choosing the Sample Frame: Parcel Data vs. Mailing Lists
There are three main options communities can use to create a complete address list†—a parcel database, a door-to-door survey, and a commercial mailing list based on post office files:
● Communities might use a parcel database for the sample frame. This would be inexpensive. However, a key limitation is that parcel databases typically do not differentiate multi-unit apartments—the units are all listed as one parcel with one tax bill. In a location with only single family dwellings and ownership condominiums this would not pose a problem, but elsewhere it is a concern that makes using parcel lists a bad idea, since they would exclude most apartment-dwellers from the survey.
● If the area is small, staff could go door to door to compile a list. However, in most communities this task would be prohibitively expensive.
● The other option is to use a version of the address list compiled by the U.S. Post Office for delivery, or some other similar list. Such lists are available from commercial vendors and include apartments. They do come at a cost, but are available broadly.
In order to create a model that any community could use, the authors decided to use commercial mailing lists. Two widely used vendors of such lists are AccuData and MelissaData. Table 4 provides some information about these two sources.
* For example according to the 2006-2008 American Community Survey, 49 percent of the population is white and 31 percent Asian; 32 percent is Hispanic or Latino of any race.†The other similar lists that exist, such as what is employed by the U.S. Census, are typically not available to local governments.

Mineta Transportat ion Inst i tute
22
Table 4. Sample Pricing and Other Information for Mailing Address List VendorsAccuData MelissaData
Main web site http://www.accudata.com/ http://www.melissadata.com/
Data web site https://www.acculeads.com/cow1.max http://www.melissadata.com/lookups/ index.htm
Generic contact 800-732-3440 800-melissaRelevant file AccuData Residential Business
OccupantsOccupant Saturation
Web link about data
http://www.accudata.com/images/ dataCards/ResOcc/AmericanResOcc.pdf
http://www.melissadata.com/var/ productsheets/Occupant_Saturation.pdf
Pricing If done by a sales person the minimum is $300; if done online the minimum is $100; detailed pricing is linked to https://www.ac-culeads.com/cow1.max#; $15 per 1,000 for the simple saturation list. Lists with names add $10 per 1,000.
$9.50 per 1,000 for the simple satura-tion list and minimum $25 order. Lists with personal names available at an additional cost of $6.50 per 1,000.
The two vendors develop the address lists for bulk mail use. Because such mail is designed to be delivered to every address on a carrier route, the U.S. Postal Service overlooks some slight errors (for example “S. Main” instead of “Main South”). The address suppliers do not guarantee that every address will be deliverable using first class mail, but most addresses are deliverable.
Drawing the Sample
As noted above, the authors examined a number of options for sampling in San José, a city of 900,000 people and over 300,000 housing units.24 The authors ultimately decided on a cluster approach in the interest of cost. This approach enabled them to buy a limited number of postal carrier routes rather than every address in the city. Carrier routes are a small unit related to postal delivery. The carrier routes that were ultimately bought had an average of 460 addresses each, and the total cost was $437 for addresses with names; without names it would have been under $300). Carrier routes vary in physical size depending on density (see Figure 1, which uses Ithaca, NY for an example).
In summary the authors:
(1) Obtained a list of all carrier routes in San José, selected those with residential addresses, and then randomly sampled 65 routes for a total of over 30,000 addresses.
(2) They then randomly selected 2,000 addresses from within this list, using the random number generator function in Microsoft Excel. The authors selected 2,000, hoping for a maximum 30 percent response rate, which would have netted 600 responses.
Table 5 shows the details of how the authors generated the sample, with the generic steps listed in the left column and specifics about how these steps were operationalized in the San José field test in the right column.
Field Testing in San José, California

Mineta Transportat ion Inst i tute
23
Nineteenth and early twentieth century downtown area. Note that this route has several non-contiguous parts that are all part of the same route.
A more suburban carrier route that includes a “big box” retail area. Again, this route has several separate parts.
A neighborhood of mid-rise apartments that has a small carrier route due to its high density.
Figure 1. Sample Carrier Routes from Ithaca, NY (at the Same Scale)
Note: Carrier routes are outlined by heavier black lines: The authors use Ithaca as an example because the authors did not use it for the field test. Source: The maps were generated from MelissaData Lookups, available at http://www.melissadata.com/lookups/mapcarts.asp.
Field Testing in San José, California

Mineta Transportat ion Inst i tute
24
Table 5. Details of Obtaining Stratified Random Sample from Mailing Address ListsStep Details for San José Case
Step One Overview: Obtain a list of all carrier routes in San José, select those with residential ad-dresses, and then randomly sample 65 routes for a total of 30,129 addresses.
Compile a list of all the postal carrier routes in the city by iden-tifying zip codes and then actual carrier routes.
There were1,176 postal carrier routes, which contained 347,328 sin-gle family addresses and 57,329 apartments. The authors obtained the list from http://www.melissadata.com/lookups/cartzip.asp.
Eliminate Post Office Box-only routes.
There were 17,862 such P.O. addresses. The authors assumed that most were for businesses or were secondary addresses for privacy. That reduced the number of carrier routes to 829.
Eliminate those zip codes with fewer than 12% of addresses in the study area (the city).
A map of San José zip codes was visually inspected to double check that zip codes the authors eliminated as having a small number of San José addresses did indeed contain mostly addresses outside the city. There were five zip codes with less than 2% of addresses in the city; and one with 12%. One zip code where 57% were of ad-dresses were in the city was retained; 10 had 80–97% in the city; and the remainder were 98% or more. This brought the number of carrier routes down to 619 with 270,902 residences and 38,424 apartments.
Sort for and delete the routes without dwellings.
There are a number of carrier routes only serving businesses and the authors deleted these—a total of 13. This left a total of 606 car-rier routes.
Randomly select carrier routes and purchase them.
To randomly select carrier routes the authors listed them in one column of an Microsoft Excel spreadsheet and in a second column used Excel’s random number generating feature to generate a list of random numbers. The authors used the “paste special” feature to transform these to values that would not recalculate and sorted the two columns by the random number value. They then selected the carrier routes corresponding to the 65 lowest routes—a bit over 10%. The authors chose 65 routes as a relatively large number that was still cost effective given the authors were paying for each ad-dress (which even at about one cent per address did add up). They then purchased them from MelissaData. This was a total of 30,129 dwelling addresses.
Step Two Overview: Randomly select 2,000 addresses from within the complete set purchased.
Randomly select desired number of addresses across the entire set of carrier routes.
To do this the authors listed addresses in one column of a spread-sheet and in a second column used Excel’s random number gen-erating feature to generate a list of random numbers. They used the “paste special” feature to transform these to values that would not recalculate and sorted the two columns by the random number value. The authors selected addresses corresponding with the low-est 2,000 numbers.
Check that all addresses are in the study area (the city).
The authors visually scanned the 2,000 addressed to ensure all were in San Jose. They were, but if some had not been the authors would have removed them and replaced them with the next addresses in the sequence.
Field Testing in San José, California

Mineta Transportat ion Inst i tute
25
MAILING OUT THE SURVEY
The surveys were mailed out on February 10, 2010. Each address in the sample received an envelope that contained a cover letter, a consent form, the survey questionnaire, and an envelope in which to mail back the completed survey.
● The outer envelope: The outer envelope was a white, size-10 envelope printed with the San José State University logo and return address in the upper left-hand corner. Each envelope had a first-class stamp. Details about the addressing of the envelope are provided below.
● The cover letter: The text of the cover letter was chosen to emphasize to residents the value of the survey project, in order to increase the response rate. The letter also asked readers to have the survey filled out by the adult in the household with the most recent birthday. This method for selected respondents was used as a low-burden method to improve the randomness of the sample within the household.25
● The consent form: This form was printed on the back of the cover letter. This form, which is required by rules governing research conducted by San José State University researchers, explained to respondents their rights as participants in the research project and gave them contact information if they wished to learn more about the survey. The San José State Institutional Review Board allowed the authors to have an informally worded letter and to state that “By filling in the survey and returning it, we will know that you understand these rights and agree to be in this study.” Thus the authors did not require respondents to complete and return an additional form beyond the survey.
● The survey questionnaire: The questionnaire was formatted to fit on four 8.5 by 11 inch. To eliminate the cost of stapling multiple pages, the survey was printed double-sided on an 11 x 17 sheet of paper that was folded in half to form a “booklet.” The survey was printed on yellow paper.
● The return envelope: The envelope was a pre-printed, size 9, “business-reply” envelope that required no postage to be added by the respondent.
The envelopes were addressed in four different ways, so that the authors could test the degree to which response rates varied by the addressing technique. Five hundred envelopes were addressed in each of the following ways:
1. The address was written by hand, in blue ink, using the respondent’s name.
2. The address was written by hand, in blue ink, using “Resident” instead of a personal name.
3. The address was printed in black ink on the envelope, using the respondent’s name.
4. The address was printed in black ink on the envelope, using “Resident” instead of a personal name.
Field Testing in San José, California

Mineta Transportat ion Inst i tute
26
In order to track delivery rates (tested by how many letters were returned to sender) and response rates (how many people actually responded), the authors used slightly different capitalization in the survey heading and thank you lines coded according to addressing strategies one through four.
Table 6 shows the results of the experiment. The authors found that:
● Hand addressing did not improve delivery rates. Having a personal name only marginally helped for the hand addressed envelopes.
● While hand addressing increased response rates by approximately 50% (15% and 16% respectively versus 10% to 12 %), this difference did not prove statistically significant.
The total cost per survey mailed would be about $1.75 for those surveys sent in envelopes with hand-printed addresses. (The cost includes printing, mailing, and business reply postage paid for an estimated 30% of surveys. It does not include the cost of the mailing addresses.. However, the authors did not pay for the labor of hand-stamping and hand-addressing the outer envelopes, so these did not add to the cost per survey mailed.) The reader is reminded that this study was not designed to maximize the response rate but to test aspects of a survey sampling and administration approach that could be used by just about any local government.
While the results above are indicative only, there is a vibrant literature on increasing response rates and in the medical field, in particular, researchers have conducted controlled experiments on strategies for increasing responses. In 2002, Edwards and colleagues reviewed 292 randomized controlled trials of different strategies for incasing response rates in postal questionnaires, involving more than two hundred thousand participants.26 They found the following increased response rates, some doubling them. Some of these were used in the PABS trials but those that were not.
Field Testing in San José, California

Mineta Transportat ion Inst i tute
27
Table 6. Delivery and Response Rates for Different Approaches to Addressing the Envelopes
Number not returned to
senderPercent
Number completed (in analysis
sample)
Percent completed of those delivered (analysis sample)
Number completed
(total*)
Percent completed of
those delivered (all responses)
Hand, to resident 486 97% 69 14% 71 15%
Hand, to name 492 98% 75 15% 78 16%
Machine, to resident 485 97% 47 10% 49 10%
Machine, to name 484 97% 53 11% 56 12%
Total 1947 97% 244 13% 254 13%
* This includes those returned too late to form part of the analysis sample given the timing of this report. Note using a chi square test of hand vs. machine addressing and to resident vs. to an address only, the differences for number completed are not statistically significant. (Chi Square = 0.024, df=1, P=0.88)Aspects that were not used in the San José testing of the PABS:
● Monetary incentives (doubles response rate on average though other research shows response rates varying with amounts)27
● Questionnaires sent by recorded delivery (more than doubles response rate)
● Contacting participants before sending the survey
● Follow up contact
● Providing respondents with a second copy of the survey
Aspects that were used in PABS included:
● Shorter questionnaires (some in the medical field are very long—doubles response rate)
● Personalized questionnaires and letters (PABS used in some surveys)
● Colored ink (PABS used in some surveys)
● Stamped return envelopes
● Sent by first class post
● Questionnaire originating at a university versus a commercial source
In addition, questions designed to be interesting to the respondent and not asking for sensitive information were more likely to receive responses. Transportation surveys may
Field Testing in San José, California

Mineta Transportat ion Inst i tute
28
well have those features.
Mailing reminder postcards, or even second copies of the survey as the authors suggest in the PABS User’s Manual, and in the chapter titled “Lessons Learned,” would have been an inexpensive way to enhance the response rate, perhaps even doubling it, given findings from the research discussed above.28 For more expense, providing monetary incentives or using some kind of certified mail would have had an even more substantial effect on the response rate. These are issues to which the authors return to.
DATA ENTRY In order to facilitate data entry from the paper surveys, the authors precoded each answer with a small subscript number (in Appendix A, see the lower-right numbers below the check boxes).
During data entry the authors paid particular attention to questions for which there appeared to have been some confusion on the part of the respondents. This information was then used in the survey development process. Instructions about data entry are provided in the accompanying manual. The few cases where problems were observed during data entry indicate that survey questions may need to be modified are described in Appendix E.
Field Testing in San José, California

Mineta Transportat ion Inst i tute
29
RESULTS
RELIABILITY TESTING
Appendix E contains the complete results of the reliability testing. Few, if any, transportation surveys have been tested for reliability across administrations of the survey, making this study a unique contribution to the field.
The survey questionnaire changed between Version 1 and Version 2. Some changes were minor (for example, changes in capitalization) and some more substantial (for example, adding or deleting examples from the question). The tables in Appendix E present the final PABS except where noted. The columns present several correlation statistics, as some statistics are preferred for particular kinds of questions (for example, Pearson’s correlations for interval data, Spearman’s for ordinal data, and Kappa statistics for dichotomous information). However, to enhance comparison across studies, the authors have often provided two different measures so that others can select the comparison. A number of the study’s interval scales had a small number of options more like ordinal scales, making the selection of the most relevant statistic more difficult (for example, many asked how many days in the last week one did an activity, giving a range of 1–7).
The authors examined 56 potential responses. This number is different from the number of “numbered” questions in the survey, because some questions involved multiple parts or options, and we also did not do reliability assessment for some questions (for example, today’s date, and the cross streets of people’s homes).
In general, most questions achieved acceptable to excellent reliability, as indicated in bold in the tables in Appendix E. For this report the authors considered kappa statistics and correlation coefficients above 0.7 to be acceptable, correlations 0.8 and above very good, and 0.9 and above excellent.29
Low reliability can occur because questions are not well worded or because they are not about habitual behavior or stable characteristics. Table 7 presents those questions in the final survey that did not achieve acceptable reliability across administrations a week to 9 days apart, with the exception of some questions that did not represent relatively stable characteristics or habitual behavior (i.e., whether respondents were out of town the prior week), and questions for which there were no observations. In Question 3, some kappa statistics were low but the perhaps preferable Spearman’s rho values were acceptable, so the authors deemed these adequate. All reliability statistics are presented in Appendix E. Appendix F summarizes the discussion regarding potential changes to the survey.

Mineta Transportat ion Inst i tute
Results30
Tabl
e 7.
Res
pons
es in
Initi
al a
nd F
ield
Tes
t Ver
sion
s th
at D
id N
ot A
chie
ve A
ccep
tabl
e Le
vels
of R
elia
bilit
yQ
uest
ion
#Ve
rsio
n of
Su
rvey
*Pe
arso
n’s
rSp
earm
an’s
R
hoK
appa
Varie
s by
tim
eC
omm
ent
Mos
t rec
ent t
ime
used
mod
eP
asse
nger
or d
river
in a
veh
icle
(for
exa
mpl
e, a
car
, tru
ck, m
otor
-cy
cle,
or t
axi)
3aVe
rsio
n 1
0.30
0.34
Varie
sS
ee A
ppen
dix
F
Bic
ycle
to o
r fro
m p
ublic
tran
sit
3cVe
rsio
n 2
0.69
0.70
0.51
Varie
sO
n th
e m
argi
n of
relia
bilit
yW
alk
to a
des
tinat
ion
OTH
ER
TH
AN
pub
lic tr
ansi
t (fo
r exa
mpl
e, to
a
job,
sto
re, p
ark,
or f
riend
’s h
ouse
)3g
Vers
ion
2 0.
490.
430.
26Va
ries
Hig
her r
elia
bilit
y w
ith d
iffer
ent
wor
ding
—se
e Ta
ble
8W
alk
for r
ecre
atio
n, e
xerc
ise,
or t
o w
alk
the
dog
3hVe
rsio
n 1
0.65
0.58
Varie
sM
argi
nal r
elia
bilit
yW
alk
for r
ecre
atio
n, e
xerc
ise,
or t
o w
alk
the
dog
3hVe
rsio
n 2
0.72
0.64
0.50
Varie
sM
argi
nal r
elia
bilit
y
Num
bers
of d
ays
in la
st 7
day
s**
Bic
ycle
to O
R fr
om p
ublic
tran
sit (
for e
xam
ple,
to a
bus
or t
rain
st
op)
4Ve
rsio
n 2
0.30
0.52
Varie
sS
ee a
ppen
dix
Rid
e a
bicy
cle
for e
xerc
ise
or re
crea
tion,
with
out h
avin
g a
dest
ina-
tion
for t
he tr
ip7
Vers
ion
10.
700.
60Va
ries
Mar
gina
l rel
iabi
lity
Wal
k to
OR
from
pub
lic tr
ansi
t (fo
r exa
mpl
e, to
a b
us o
r tra
in s
top)
.8
Vers
ion
20.
690.
70Va
ries
Mar
gina
l rel
iabi
lity
Wal
k to
get
som
ewhe
re O
THE
R th
an w
ork,
sch
ool,
or p
ublic
tra
nsit.
10Ve
rsio
n 2
0.59
0.63
Varie
sLi
kely
var
ies
Do
you
curr
ently
hav
e an
y ph
ysic
al o
r oth
er h
ealth
con
ditio
n th
at
limits
the
amou
nt o
f wal
king
you
can
do?
12Ve
rsio
n 2
0.58
stab
leS
ee a
ppen
dix
Do
you
curr
ently
hav
e an
y ph
ysic
al o
r oth
er h
ealth
con
ditio
n th
at
limits
the
amou
nt o
f bic
yclin
g yo
u ca
n do
?13
Vers
ion
10.
69st
able
Mar
gina
l rel
iabi
lity
DU
RIN
G A
TY
PIC
AL
WE
EK
, how
man
y da
ys d
oes
your
com
mut
e to
wor
k or
sch
ool i
nclu
de a
ny o
f the
follo
win
g fo
rms
of tr
ansp
orta
-tio
n? If
you
don
’t co
mm
ute,
mar
k ea
ch o
ne a
s “0
.”Ve
rsio
n 2
Num
ber o
f day
s rid
ing
as a
pas
seng
er w
ith s
omeo
ne e
lse:
____
_16
eVe
rsio
n 1
0.53
0.66
stab
leS
ee m
ain
text
How
man
y m
onth
s in
a y
ear d
o yo
u ty
pica
lly N
OT
mak
e tri
ps b
y bi
cycl
e be
caus
e of
you
r loc
al w
eath
er?
17Ve
rsio
n 2
0.
700.
60st
able
See
app
endi
x
How
man
y m
onth
s in
a y
ear d
o yo
u ty
pica
lly N
OT
mak
e tri
ps b
y w
alki
ng b
ecau
se o
f you
r loc
al w
eath
er?
18Ve
rsio
n 2
0.65
0.54
stab
leS
ee a
ppen
dix
Whi
ch c
ateg
orie
s be
st d
escr
ibe
you?
(Che
ck a
ll th
at a
pply.
) W
orki
ng fo
r pay
INS
IDE
the
hom
e 25
Vers
ion
2 0.
65st
able
Mar
gina
l rel
iabi
lity
Look
ing
for w
ork
25Ve
rsio
n 2
0.69
stab
leM
argi
nal r
elia
bilit
yO
ther
,25
Vers
ion
2-0
.01
stab
leS
ee a
ppen
dix
A ho
mem
aker
25Ve
rsio
n 2
-0.0
2st
able
See
app
endi
xG
oing
to s
choo
l25
Vers
ion
20.
40st
able
Do
you
live
in a
dor
mito
ry, i
n a
boar
ding
hou
se, o
r with
room
-m
ates
?N
AVe
rsio
n 2
0.60
stab
leM
argi
nal r
elia
bilit
y
Not
es: C
onfid
ence
inte
rval
s an
d st
anda
rd e
rror
s ar
e pr
esen
ted
in A
ppen
dix
E. U
nder
linin
g in
dica
tes
mar
gina
l rel
iabi
lity
(i.e.
, 0.6
and
abo
ve).
Bol
d in
dica
tes
acce
ptab
le re
liabi
lity.
*The
re w
ere
two
vers
ions
of t
he s
urve
y te
sted
for r
elia
bilit
y—Ve
rsio
n 1
and
2 . V
ersi
on 2
was
als
o te
sted
in te
rms
of a
dmin
istra
tion
in th
e C
ity o
f San
Jos
é (r
esul
ts in
App
endi
x F)
.**
See
full
ques
tion
in A
ppen
dix
A.

Mineta Transportat ion Inst i tute
Results 31
In Table 7, underlining indicates marginally acceptable reliability (0.6 and above). In general, the questions with lower reliability are ones where it is plausible that behavior changes from week to week, so it is entirely conceivable that the behavior being surveyed would indeed change. (Examples of such questions are the most recent time cycling to transit; walking for various purposes; being a passenger in a vehicle; and the number of times in last seven days cycling for various purposes or walking to destinations other than work, school, or transit). The authors judge that for activities that vary somewhat from week to week, 0.60 is marginally acceptable as reliability.
However, some questions about what should be habitual or stable activity achieved reliability scores below 0.69, and some questions about activities that varied somewhat from week to week received scores below 0.60. The questions of concern are discussed in more detail in appendix G. In general the authors kept most of the questions as the underlying behavior they were assessing might vary (and thus people could give different but equally correct answers when asked the same question twice). Many were also on the margin of acceptable reliability, comparable to other similar surveys.
Finally, there were two questions for which Version 1 achieved substantially higher reliability than Version 2 (where substantial is defined as a difference of 0.2 or more in the correlation or kappa statistics). These question are listed in Table 8. In both cases the question wording used in Version 1 across three universities had higher reliability than the version used in Version 2. In one case, the question wording was revised to add examples (lengthened) and reliability decreased; in the other case, the question wording was simplified (shortened) and reliability also went down. The authors changed both back to the initial version and have done so in the final PABS as presented in Appendix A.
Table 8. Comparison of Similar Questions with Substantial Differences in Reliability
Version Question Pearson’sr
Spearman’sRho
Preamble to both versions
3. Check one box for each line below to tell us THE MOST RECENT TIME you used each type of travel. Note that some trips you make may fit into multiple categories below. For example, if you walked to the store yesterday to get exercise AND to buy bread, then you would check “Last 7 Days” for both row “g” and row “h.”
Version 1 g) Walk to a destination OTHER THAN public transportation 0.81 0.74
Version 2 g) Walk to a destination OTHER THAN public transit (for example, to a job, store, park, or friend’s house)
0.49 0.43
Version 1 14. If you ever bicycle, how many months in a year do you TYPICALLY NOT make trips by bicycle because of your lo-cal climate (bad weather)?
0.91 0.89
Version 2 17. How many months in a year do you typically NOT make trips by bicycle because of your local weather?
0.70 0.60
FIELD TESTING

Mineta Transportat ion Inst i tute
Results32
Appendix F contains the complete survey results from Version 2. Table 9 compares the results of the demographic questions asked with data from the American Community Survey for San Jose (2006-2008). Compared with the ACS, field test survey respondents were older, more white, and less likely to be employed. It should be noted that both the ACS and survey had notable margins of error. This project was primarily oriented to test the survey for reliability (see for example, Appendix E) and to test and describe a sampling strategy; it was not intended to create substantial data for the field test site. As such, the lessons learned involve the steps necessary to create a sample, the logistics of administering a survey using resources available to local governments, and to test some methods for improving response rates. Details about these issues are described in the accompanying PABS User’s Manual.
Table 9. San José Respondents Compared with the American Community Survey
Variable San José Sample
American Community
SurveyDifference
Income $92,500 $79,796 $12,704Employed (including work inside and outside home) 61% 68% -6%Female 51% 50% 1%White 59 49 10%Asian 20 31 -11%Hispanic or Latino 16 32 -16%Median Age 52 36 16Commute by walking in the last/a typical week 16%* 1.9% +/0.3*
* See text for explanation of wording differences between the two surveys.
Field Test Strengths
The field test from San José was able to measure walking and cycling modes well, detecting more active travel than the American Community Survey, which are often used as a metric of walking and cycling. Table 9 compares the results for one question about walking to highlight the way in which this survey is designed to locate walk trips better than the ACS. The ACS asks one question about walking:
“How did this person usually get to work LAST WEEK? If this person usually used more than one method of transportation during the trip, mark (X) the box of the one used for most of the distance” (http://www.census.gov/acs/www/Downloads/SQuest08.pdf).” ”Walked” was one of 12 options.
The PABS question about commuting is worded differently:
16. DURING A TYPICAL WEEK, how many days does your commute to work or school include any of the following forms of transportation? If you don’t commute, mark each one as “0.” a) Number of days walking: ___ (count walking to or from a parked car or transit stop IF the walk was at least 10 minutes).

Mineta Transportat ion Inst i tute
Results 33
The ACS reports 1.9% of people in San José usually walking to work, with walking used for most of the distance. PABS indicates 16 percent of people walked to work or school for at least ten minutes as part of their commute on at least one day out of seven, and 9% walked at least 10 minutes as part of their commute on five or more days (see Appendix F). PABS thus uncovers a considerable amount of walking that the ACS question by design excludes. It is likely that one major reason for the difference in responses to the ACS and PABS questions is that many trips combine walking with other modes, and the ACS therefore misses this walking.
Table 10 provides another view of this strength, indicating the number of people who had participated in cycling and walking for various purposes in the past month. This indicates that most people walk for recreation or to some destination at least from time to time, although in this case 66 percent had walked for recreation and 48 percent to a destination in the past 7 days alone. A policy implication might be to see if these current walkers could walk further.
Table 10. Percent Walking or Cycling at Least Once in the Last Month
Type of Travelc. Bicycle to or from public transit 4%
d. Bicycle to a destination OTHER THAN public transit (for example, to a job, store, park, or friend’s house)
14%
e. Bicycle for recreation or exercise (not including riding a stationary bicycle) 17%
f. Walk to or from public transit 13%
g. Walk to a destination OTHER THAN public transit (for example, to a job, store, park, or friend’s house)
60%
h. Walk for recreation, exercise, or to walk the dog 80%
Source: San José Field Test, Question 3. Includes those whose most recent time doing the activity was in the last 7 days or the last month.
Field Test Areas for More Consideration
The survey results indicate that people were able to record their travel patterns and the survey questions were able to capture occasional activity (such as infrequent cycling). However, not everyone filled in the forms perfectly. For example in Question 3f, 21 people said that they had walked to or from transit in the last 7 days, but 27 people did so when adding up the frequencies in Question 8. There are other places where responses don’t quite add up. While this is likely a common problem in surveys, this survey format allows such checking for consistency. This can be monitored in future administrations and alternative wordings tested. In addition as the authors note in Appendix H, a few questions may have been confusing while achieving high reliability. This includes the question about being out of town (where 25% indicated they had been away for an average of three days, perhaps indicating that some people interpreted it as being outside the city limits or similar. Eight percent or respondents (all adults) left blank the question about the number of people 16 or older in their household when there was obviously at least one person. In addition to questions identified as problematic in the reliability testing, several people were also confused about Question 21, which asked the number of years OR months living in a neighborhood. Some

Mineta Transportat ion Inst i tute
Results34
interpreted it as years and months. It might be possible to make this a 2-part question and to distinguish between those living in the area less than a year or more than a year (a year being relevant as the timeframe for some questions).
However, in these cases most people managed to answer correctly, so the authors suggest leaving the questions for now.

Mineta Transportat ion Inst i tute
35
LESSONS LEARNED
FIELD TEST
The survey captured walking and cycling well, including people who do not walk and cycle each week.
The field test also provided a number of lessons about administering a random sample survey.
● The survey can effectively be administered and analyzed without considerable resources. While the amount and type of personnel will vary by location, the San José pilot was administered and analyzed, generally, by a local coordinator and supervisor, a local research assistant, a collection of volunteers to address and mail, a research assistant to enter the data, and a research assistant to analyze the data. (The research assistants each worked, on average, 100 or so hours on their respective tasks).
● The two stage cluster sampling approach was cost-effective in a large city. In a smaller city, a simple random sample might be as appropriate and would ensure that there would not be any missing areas.
● A good strategy for increasing recruitment is essential. Response rates for any of these types of survey are always an issue, even more in today’s environments. As is outlined in the accompanying manual, a number of other strategies can help increase responses:
○ Hand addressing the envelope and hand signing the cover letter in blue ink.
○ Having the mayor or another prominent person or entity such as a city council endorse the survey.
○ Publicizing the survey in the local press, so that people recognize the survey when it arrives.
○ Sending additional reminder postcards. In the manual we propose three main levels of survey administration that are practical in a municipal level. Obviously the medium and deluxe are likely to gain additional responses at a modest cost and are backed up by substantial research evidence described above:
▪ Low (the test the authors ran) = just mail the survey
▪ Medium (recommended) = advance notice post-card, followed by the survey mailing, followed by follow-up postcard
▪ Deluxe: Advance post-card, survey, 2 follow-up postcards, 2nd survey
▪ Research findings on the effect of response rates of providing an Internet option are mixed. The authors cannot currently recommend that it be

Mineta Transportat ion Inst i tute
Lessons Learned36
provided but the situation may change over time. In the manual the authors provide instructions about integrating an Internet option with the mail-out version.
RELIABILITY TESTING
Given the dearth of relatively robust, consistent, and transferable walking and bicycling survey instruments, the PABS approach offers several major lessons:
● Most questions achieved adequate, high, or excellent reliability. These results from the reliability testing show that the questionnaire produces quality data. Also, this survey is one of the first the authors are aware of in the field of transportation to have had such reliability testing. This survey can provide a baseline for other research—other researchers who develop their own instruments will be able to compare the reliability.
● Some minor wording differences affected reliability but in ways that are hard to interpret. For example, in one question adding an explanation made it more reliable, in another, it was less reliable.
ISSUES FOR FUTURE RESEARCH
Several additional issues would be worthy of investigation for additional modules that could themselves be tested for reliability. A number of these were considered in parts of early versions of the survey but dropped in order to keep the survey brief; others were suggested by various reviewers, including.
● Testing a shorter version of the PABS or breaking it more clearly into modules. The original intent was to create modules and the structure of the survey lends itself to that.
● Trip characteristics such as length and specific destinations. This survey focuses on person-level data. Many transportation surveys focus on trips—how long they were, their origins and destinations (including purpose of travel), whether alone or with others. Adding to PABS a module of questions focusing on the characteristics of a few recent active travel trips might help compare the data from this survey to those other surveys.
● Travel of other members of the household, particularly children. This might warrant an additional module.
● Collecting information from self-selected individuals. Surveys in which respondents self-select to participate are notorious for possibly containing information that may not be representative of the population; in other words, those with transportation, travel, or cycling interests may be more likely to complete the PABS survey. It is therefore suggested to compare the characteristics (for example, demographics) of respondents versus a gold standard such as the census.

Mineta Transportat ion Inst i tute
Lessons Learned 37
● Open-ended questions asking respondents to suggest improvements to the local walking and bicycling infrastructure. Such questions might be engaging for the respondent and provide interesting ideas.
● Validating the answers from an administration of PABS against some gold standard. A next phase of developing this survey would be to validate it against some well-developed and well-tested measure such as a travel diary or even a GPS monitoring device. This could help further refine questions.

Mineta Transportat ion Inst i tute
Lessons Learned38

Mineta Transportat ion Inst i tute
39
APPENDIX A: THE FINAL SURVEY QUESTIONNAIRE IN ENGLISH AND SPANISH
The following survey instrument was administered in the second reliability study and the field test with the following exceptions, where we reverted to the survey Version 1 because it achieved higher reliability.
● Question 3g: Version 2: Walk to a destination OTHER THAN public transit (for example, to a job, store, park, or friend’s house)
Final PABS: Walk to a destination OTHER THAN public transit
● Questions 17 and 18: Version 2: How many months in a year do you typically NOT make trips by bicycle because of your local weather?
Final PABS: If you ever bicycle, how many months in a year do you TYPICALLY NOT make trips by bicycle because of your local climate (bad weather)?
Version 2: How many months in a year do you typically NOT make trips by walking because of your local weather?
Final PABS: If you ever walk, how many months in a year do you TYPICALLY NOT make trips by walking because of your local climate (bad weather)?
Comments about specific questions are summarized in Appendix F.

Mineta Transportat ion Inst i tute
Appendix A: The Final Survey Questionnaire in English and Spanish40
How Do You Get Around Town?This survey asks you questions about how you get around for your daily travel, with a focus on how often you bicycle and walk. Even if you never walk or bicycle, we are still very interested in your responses. Thank you for taking the time to complete this survey!
Questions about your recent travel
1. What is today’s date? ____________/______________ Month Day
2. Were you out of town during the last 7 days?
8 No OR 9 Yes (If yes, how many days? _______)
3. Check one box for each line below to tell us THE MOST RECENT TIME you used each type of travel. Note that some trips you make may fit into multiple categories below. For example, if you walked to the store yesterday to get exercise AND to buy bread, then you would check “Last 7 Days” for both row “g” and row “h.”
Type of TravelLast 7 Days
Last Month
Last 3 Months
Last Year
Not Used in the
Last Yeara) Passenger or driver in a vehicle (for
example, a car, truck, motorcycle, or taxi)
1 2 3 4 5
b) Public transit (for example, bus, train, or ferry) 1 2 3 4 5
c) Bicycle to or from public transit 1 2 3 4 5
d) Bicycle to a destination OTHER THAN public transit (for example, to a job, store, park, or friend’s house)
1 2 3 4 5
e) Bicycle for recreation or exercise (do not include riding a stationary bicycle) 1 2 3 4 5
f) Walk to or from public transit 1 2 3 4 5
g) Walk to a destination OTHER THAN public transit 1 2 3 4 5
h) Walk for recreation, exercise, or to walk the dog 1 2 3 4 5

Mineta Transportat ion Inst i tute
Appendix A: The Final Survey Questionnaire in English and Spanish 41
Questions about HOW OFTEN you BICYCLED in the last 7 days
In the last 7 days (up to yesterday), on how many days did you:
4. Bicycle to OR from public transit (for example, to a bus or train stop) . . . . . . . . . . . . . . . . . . . . . . . . . . . . . . . . . . . . . . . . . . . . . . . . . . Number of days ___5. Bicycle to OR from work or school.. . . . . . . . . . . . . . . . . . . . . . . . . Number of days ___6. Bicycle to get somewhere OTHER than work, school, or public
transit. (For example, to go shopping, see a friend, or eat a meal. Do NOT include trips with no destination, such as a bike ride solely for exercise.) . . . . . . . . . . . . . . . . . . . . . . . . . . . . . . . . . . . . . . Number of days ___
7. Ride a bicycle for exercise or recreation, without having a destination for the trip. . . . . . . . . . . . . . . . . . . . . . . . . . . . . . . . . . . . . . . . . . . . . . Number of days ___
Questions about HOW OFTEN you WALKED in the last 7 days
In the last 7 days (up to yesterday), on how many days did you:8. Walk to OR from public transit (for example, to a bus or train stop) . . . . . . . . . . . . . . . . . . . . . . . . . . . . . . . . . . . . . . . . . . . . . . . . Number of days ___
9. Walk to OR from work or school. . . . . . . . . . . . . . . . . . . . . . . . . Number of days ___10. Walk to get somewhere OTHER than work, school, or public transit.
(For example, to go shopping, see a friend, or eat a meal. Do NOT include trips with no destination, such as a walk solely for exercise.) . . . . . . . . . . . . . . . . . . . . . . . . . . . . . . . . . . . . . . . . . . . . . Number of days ___
11. Walk for exercise or recreation, without having a destination for the trip. . . . . . . . . . . . . . . . . . . . . . . . . . . . . . . . . . . . . . . . . . . . . . .
Number of days ___
Questions about your general travel
Yes NoPrefer not to
say12. Do you currently have any physical or other health
condition that limits the amount of walking you can do? 1 2 3
13. Do you currently have any physical or other health condition that limits the amount of bicycling you can do? 1 2 3

Mineta Transportat ion Inst i tute
Appendix A: The Final Survey Questionnaire in English and Spanish42
14. In the last 7 days, did you have access to a working BICYCLE?
1 2 3 4 5Always Most of the time Sometimes Rarely Never
15. In the last 7 days, did you have access to a working MOTOR VEHICLE like a car, truck, or motorcycle that you can use either as a driver or passenger? (Exclude taxis.)
1 2 3 4 5Always Most of the time Sometimes Rarely Never
16. DURING A TYPICAL WEEK, how many days does your commute to work or school include any of the following forms of transportation? If you don’t commute, mark each one as “0.”
a) Number of days walking: ___ (count walking to or from a parked car or transit stop IF the walk was at least 10 minutes)b) Number of days bicycling: ___c) Number of days taking public transit (for example, a bus, train, or ferry): ___d) Number of days driving myself: ___e) Number of days riding as a passenger with someone else: ___
17. If you ever bicycle, how many months in a year do you TYPICALLY NOT make trips by bicycle because of your local climate (bad weather)?
Number of months: _______ OR 77 I never bicycle OR 99 I don’t know
18. If you ever walk, how many months in a year do you TYPICALLY NOT make trips by walking because of your local climate (bad weather)?
Number of months: _______ OR 77 I never walk OR 99 I don’t know
Some questions about you and your household19. In what year were you born? Year: ______
20. What two streets intersect closest to your home?
______________________________ and _________________________________(First street name) (Second street name)
21. How many years OR months have you lived in this neighborhood? Years______ OR Months _____

Mineta Transportat ion Inst i tute
Appendix A: The Final Survey Questionnaire in English and Spanish 43
22. What zip code do you live in? __________
23. What is your legal gender?
1 Male 2 Female 3 Prefer not to say
24. What is your race or ethnicity? (Check all that apply.)
1 African American or Black 5 Native Hawaiian or other Pacific Islander 2 American Indian or Alaskan Native 6 White 3 Asian 7 Don’t know 4 Hispanic or Latino 8Other (please explain:_____________)
25. Which categories best describe you? (Check all that apply.)
1 Working for pay OUTSIDE the home 5 A homemaker 2 Working for pay INSIDE the home 6 Going to school 3 Looking for work 7 Retired 4 Other, please explain: ________________________________
Some final questions ask about your household. By “household” we mean all the people who currently live with you in your home. Please do not include renters or tenants. If you live in a dormitory, in a boarding house, or with roommates, just answer the following questions for yourself AND CHECK HERE .
26. How many people live in your household, including you?
Number of people under 16: ___ Number of people 16 years and older: ___
27. How many working motor vehicles are there in your household? (For example, cars, trucks, or motorcycles.)
0 1 2 3 4 or more
28. To understand travel choices, and for statistical purposes, we need an idea of your total household income. Please mark an “X” on the scale below to indicate the APPROXIMATE TOTAL ANNUAL COMBINED income of all the working adults in your household.
0 $20,000 $40,000 $60,000 $80,000 $100,000 $120,000 or more
Thank you!

Mineta Transportat ion Inst i tute
Appendix A: The Final Survey Questionnaire in English and Spanish44
¿Como se transporta por la cuidad?Esta encuesta le hace preguntas sobre cómo viaja diariamente por la cuidad, específicamente la frecuencia en que camina o utiliza la bicicleta. Aun si nunca camina o utiliza la bicicleta, estamos muy interesados en conocer su respuesta. ¡Gracias por tomar el tiempo para completar esta encuesta!
Preguntas sobre sus viajes recientes
1. ¿Cuál es la fecha de hoy? ____________/______________ Mes Día
2. ¿Estuvo fuera de la cuidad en los últimos 7 días?
8 No O 9 Sí (¿Si sí, cuantos días? _______)
3. Marque una casilla en cada línea abajo para decirnos LA VEZ MAS RECIENTE que utilizó este tipo de transporte. Note que algunos de los viajes que haga serian apropiados en varias categorías indicadas abajo. Por ejemplo, si ayer caminó a la tienda para hacer ejercicio Y comprar pan, usted marcaría “Últimos 7 días” en la línea “g” y la línea “h.”
Tipo de transporteÚltimos 7 días
Último Mes
Últimos 3 meses
Último Año
No utilizado en último
añoa) Pasajero(a) o conductor(a) en un
vehiculo (por ejemplo un carro, camioneta, motocicleta o taxi)
1 2 3 4 5
b) Transporte público (por ejemplo autobús, tren, o ferry) 1 2 3 4 5
c) Bicicleta para ir o regresar de transporte público 1 2 3 4 5
d) Bicicleta para llegar a destino QUE NO SEA transporte público (por ejemplo a su trabajo, a la tienda, a un parque o a casa de un amigo(a))
1 2 3 4 5
e) Bicicleta por diversión o ejercicio (no incluya el uso de bicicleta de ejercicios)
1 2 3 4 5
f) Caminar para ir o regresar de transporte público 1 2 3 4 5
g) Caminar para llegar a destino QUE NO SEA transporte publico 1 2 3 4 5
h) Caminar por diversión, hacer ejercicios, o pasear al perro. 1 2 3 4 5
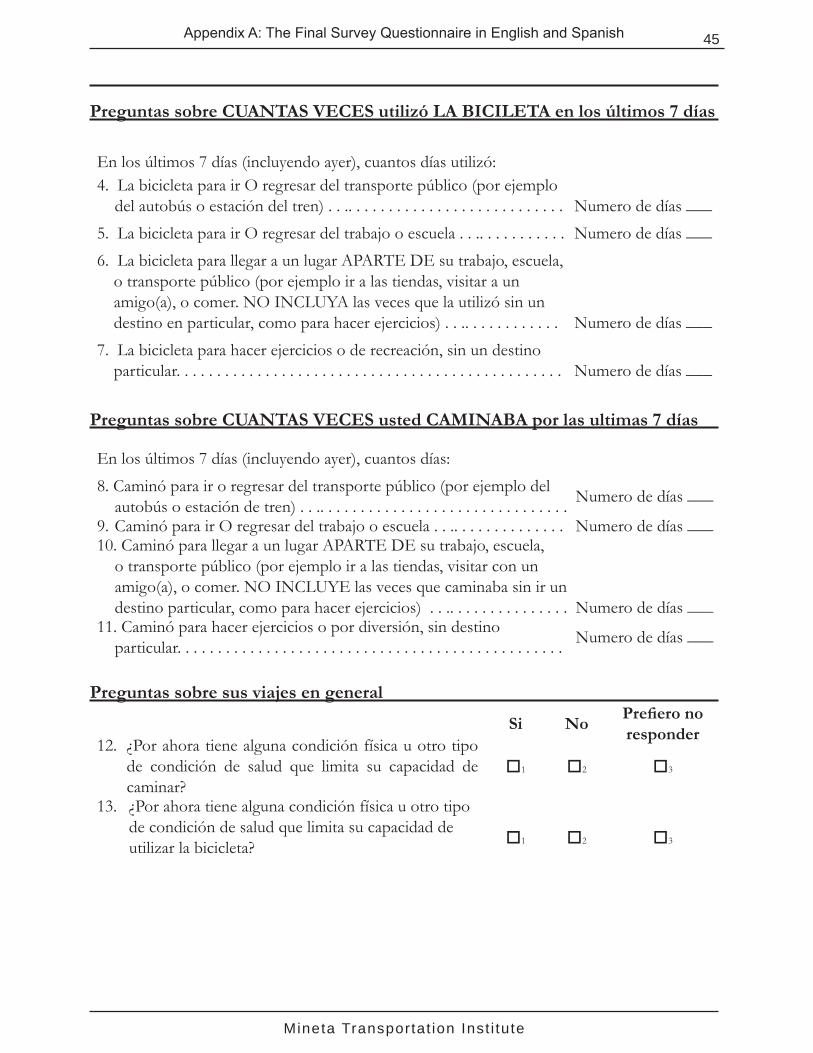
Mineta Transportat ion Inst i tute
Appendix A: The Final Survey Questionnaire in English and Spanish 45
Preguntas sobre CUANTAS VECES utilizó LA BICILETA en los últimos 7 días
En los últimos 7 días (incluyendo ayer), cuantos días utilizó: 4. La bicicleta para ir O regresar del transporte público (por ejemplo
del autobús o estación del tren) . . .. . . . . . . . . . . . . . . . . . . . . . . . . . . Numero de días ___
5. La bicicleta para ir O regresar del trabajo o escuela . . .. . . . . . . . . . . Numero de días ___
6. La bicicleta para llegar a un lugar APARTE DE su trabajo, escuela, o transporte público (por ejemplo ir a las tiendas, visitar a un amigo(a), o comer. NO INCLUYA las veces que la utilizó sin un destino en particular, como para hacer ejercicios) . . .. . . . . . . . . . . . Numero de días ___
7. La bicicleta para hacer ejercicios o de recreación, sin un destino particular. . . . . . . . . . . . . . . . . . . . . . . . . . . . . . . . . . . . . . . . . . . . . . . . Numero de días ___
Preguntas sobre CUANTAS VECES usted CAMINABA por las ultimas 7 días
En los últimos 7 días (incluyendo ayer), cuantos días:
8. Caminó para ir o regresar del transporte público (por ejemplo del autobús o estación de tren) . . .. . . . . . . . . . . . . . . . . . . . . . . . . . . . . . .
Numero de días ___
9. Caminó para ir O regresar del trabajo o escuela . . .. . . . . . . . . . . . . . Numero de días ___10. Caminó para llegar a un lugar APARTE DE su trabajo, escuela,
o transporte público (por ejemplo ir a las tiendas, visitar con un amigo(a), o comer. NO INCLUYE las veces que caminaba sin ir un destino particular, como para hacer ejercicios) . . .. . . . . . . . . . . . . . . Numero de días ___
11. Caminó para hacer ejercicios o por diversión, sin destino particular. . . . . . . . . . . . . . . . . . . . . . . . . . . . . . . . . . . . . . . . . . . . . . . .
Numero de días ___
Preguntas sobre sus viajes en general
Si NoPrefiero no responder
12. ¿Por ahora tiene alguna condición física u otro tipo de condición de salud que limita su capacidad de caminar?
1 2 3
13. ¿Por ahora tiene alguna condición física u otro tipo de condición de salud que limita su capacidad de utilizar la bicicleta? 1 2 3

Mineta Transportat ion Inst i tute
Appendix A: The Final Survey Questionnaire in English and Spanish46
14. ¿En los ultimas 7 días, tuvo acceso a una BICICLETA que funciona? 1 2 3 4 5
Siempre Mayor parte del tiempo
A veces Rara vez Nunca
15. ¿En los últimos 7 días, tuvo acceso a un vehículo, como un carro, una camioneta, o una motocicleta que pueda manejar o ser pasajero(a)? (Excluyendo los taxis) 1 2 3 4 5
Siempre Mayor parte del tiempo
A veces Rara vez Nunca
16. ¿DURANTE UNA SEMANA TÍPICA, cuantos días incluye algunas de las formas de transporte mencionadas abajo en sus viajes diarios al trabajo o la escuela? Si no viaja diariamente, marque cada una como “0.”
a) Numero de días que camina: ___ (cuente también caminando hacia o regresando de un carro estacionado, si la caminada fue por lo menos de 10 minutos.)
b) Numero de días que utiliza la bicicleta:___c) Numero de días que usa transporte público (por ejemplo el autobús, el tren, o un ferry):___d) Numero de días que manejo yo mismo: ___e) Numero de días que soy pasajero(a) con alguien mas:___
17. ¿Si alguna vez utiliza la bicicleta, en general por cuantos meses durante un año NO HACE viajes en bicicleta por el mal clima?
Numero de meses: _______ O 77 Nunca uso la bicicleta O 99 No se
18. ¿Si alguna vez camina, en general por cuantos meses durante un año NO HACE viajes a pie por el mal clima?
Numero de meses: _______ O 77 Nunca camino O 99 No se
Algunas preguntas sobre usted y su casa19. ¿En que año nació?
Año: ______
20. ¿Cuales son las calles que cruzan cerca de su casa?
______________________________ y _________________________________(Nombre de la primera calle) (Nombre de la segunda calle)
21. ¿Por cuantos años O meses ha vivido en este vecindario?
Años______ O Meses ____ 22. ¿A que código postal vive? __________

Mineta Transportat ion Inst i tute
Appendix A: The Final Survey Questionnaire in English and Spanish 47
23. ¿Cuál es su género? 1 Masculino 2 Femenino 3 Prefiero no contestar
24. ¿Que es su raza o origen étnico? (Marque todas las que correspondan)
1 Afroamericano o Negro 5 Hawaiano nativo o isleño del Pacifico 2 Indio americano o nativo de Alaska 6 Blanco 3 Asiático 7 No lo se 4 Hispano o Latino 8 Otro (por favor explique:___________)
25. ¿Cuales son las categorías que mejor lo/la describen? (Marque todas las que correspondan)
1 Trabajo por pago FUERA de casa 5 Ama de casa 2 Trabajo por pago DENTRO de casa 6 Asisto a la escuela 3 Busco trabajo 7 Retirado(a) 4 Otro, por favor explique: ________________________________
Algunas últimas preguntas sobre su hogar. En este caso, “hogar” se refiere a todas las personas que actualmente viven con usted en su casa. Por favor, no incluya a inquilinos o arrendatarios. Si vive en un dormitorio, en una casa de huéspedes, o con compañeros de cuarto, solo responda por si mismo a las siguientes preguntas Y MARQUE ESTA CASILLA .
26. ¿Cuantas personas viven en su hogar, incluyendo a usted?
Numero de personas que son menores de 16 años: ___ Número de personas que tienen 16 años o más: ___
27. ¿Cuantos vehículos que funcionan tiene en su casa? (por ejemplo carros, camionetas, o motocicletas.)
0 1 2 3 4 o mas
28. Para entender sus elecciones de transporte, y con fines estadísticos, necesitamos tener una idea de los ingresos totales de su hogar. Por favor, marque una “X” en la escala abajo para indicar el TOTAL APROXIMADO INGRESO ANUAL COMBINADO de todos los adultos que trabajan y viven en su hogar.
0 $20,000 $40,000 $60,000 $80,000 $100,000 $120,000 o más
¡GRACIAS!

Mineta Transportat ion Inst i tute
Appendix A: The Final Survey Questionnaire in English and Spanish48

Mineta Transportat ion Inst i tute
49
APPENDIX B: SURVEYS EXAMINED
This set of surveys is not an exhaustive list of all possible surveys but indicates some of those the authors examined in developing the PABS.
Survey Source CommentNational Bicycle and Pedestrian Documentation Project
Alta Planning and Design and Institute of Transportation Engineers (2009)
Includes 1 page intercept interview surveys and observation tools (for general spaces and intersections). Separate tools for pedestrians and cyclists.
Ottawa and Toronto Bicycle route and safety questionnaire
Aultman-Hall and Hall (1998)
3-page fold out with mail back envelope, put in plastic bag and attached to bicycle handlebars in bicycle parking areas.
Safe Routes to School Boarnet (no date) Six-page survey sent home with children for parents to fill in. Available from author.
Global Physical Activity Questionnaire (PPAQ)
Bull et al. (2009); Trinh et al. (2009)
Questionnaire designed for self administration has been tested for reliability; 19 total questions with 3 focused on walking and cycling.
Behavioral Risk Factor Surveillance System
Centers for Disease Control and Prevention (2008)
In this 80 page interview script, 5 questions refer to walking.
Annual Transportation Survey
City of Boulder (2001, 2002) Phone survey with 9-page script.
Boulder Valley Employee Survey for Travel
City of Boulder (2009) Questionnaire—drop off, pick up; 2 stage sampling—randomly sampled businesses and then randomly sampled within businesses; of 350 businesses sampled (out of 1,138), 52 had at least one employee answer.
Twin Cities Walking Survey/International Physical Activity Questionnaire (IPAQ Long Form)
Forsyth et al. (2009a) Phone survey with respondents also looking at printed copy. Tested for reliability. http://www.activelivingresearch.org/ node/10619. Printed survey for participants to follow along is 35 pages. Included the long form of the IPAQ.
Soles and Spokes Web-Based Survey
Chicago Area Transportation Study (2004)
Short survey—one screen, with some scrolling needed—with the majority of questions open-ended.
Travel Tracker Survey Chicago Metropolitan Agency for Planning (2008)
Web site contains several background reports; includes 9-page phone interview survey and 1 and 2-day travel logs.
Cambridgeport Social Marketing Survey
City of Cambridge (WBA Marketing 2009)
Pre and post phone interview surveys about transportation—6 and 7 pages long. First survey achieved 24% response rate.
Portland Survey Dill and Voros (2007): 100-page telephone survey script, available from author with a response rate of 23%.

Mineta Transportat ion Inst i tute
Appendix B: Surveys Examined50
Online Survey, District of Columbia Pedestrian Master Plan
District of Columbia (2007) Document provides 5-pages of results indicating questions asked in survey.
Neighborhood Physical Activity Questionnaire (NPAQ)
Giles Corti et al. (2006a, 2006b)
Questionnaire tested for reliability; 35 items; 8 pages for walking only, 14 pages if asking about cycling as well.
Hennepin County Rail User Survey
Hennepin County (2005) 4-page, 47-question intercept survey filled in by respondent focused on use of one specific trail.
Non-Motorized Transportation Pilot Program Evaluation Study
Hubert H. Humphrey Institute of Public Affairs (2007)
Used 1 page mail or fax back survey with Internet option (and email option if the form is scanned). Participants could provide contact information to volunteer to participate in a longer telephone survey with a 9-page script.
Survey of Regular Bicycle Commuters
Moritz (1997) Internet and mail back survey with most participants contacted via email lists; Mail back version is 4-pages.
New York City Bicycle Survey
New York City, Department of City Planning (2007)
Survey posted online for 6 months. The survey as reproduced in the report is approximately 11-pages long—although it was on multiple screens of different sizes when online.
Household Activity Survey
Puget Sound Regional Council (2007)
Most respondents (4,746 households) completed a 2-day travel diary (screened using an 18-page phone interview; then data retrieved from the diary with a 37-page phone interview referring to a very clearly laid out travel diary form); subsamples had GPS units in their cars and/or completed a follow-up survey on attitudes, preferences, and perceptions (14-page documents given to participant including complicated scenarios and scales retrieved with a 7-page phone interview form).
User Survey Template Rails to Trails conservancy (2005)
Manual provides four 1-page model surveys for people using different trail types e.g. suburban, rural non-motorized.
Bicycle Transportation Survey
Transitworks (2009) Online survey with 47 questions; used snowball sampling focused on bicycle and transportation advocates and transportation management associations.
National Household Travel Survey (2008)
U.S. DoT (2008a) http://nhts.ornl.gov/2008/doc/NHTS_2008_Questionnaire.pdf,
Phone survey. California asked additional questions on walking including walking in the last week. This analysis also looked at earlier surveys in this series (2001, 1995, 1990, 1983, 1977, 1969).
National Survey of Bicyclist and Pedestrian Attitudes and Behavior
U.S. DoT (2008b) Telephone survey using random sampling method and up to seven calls to each household with a 27% response rate. Printed telephone script is 102 pages.
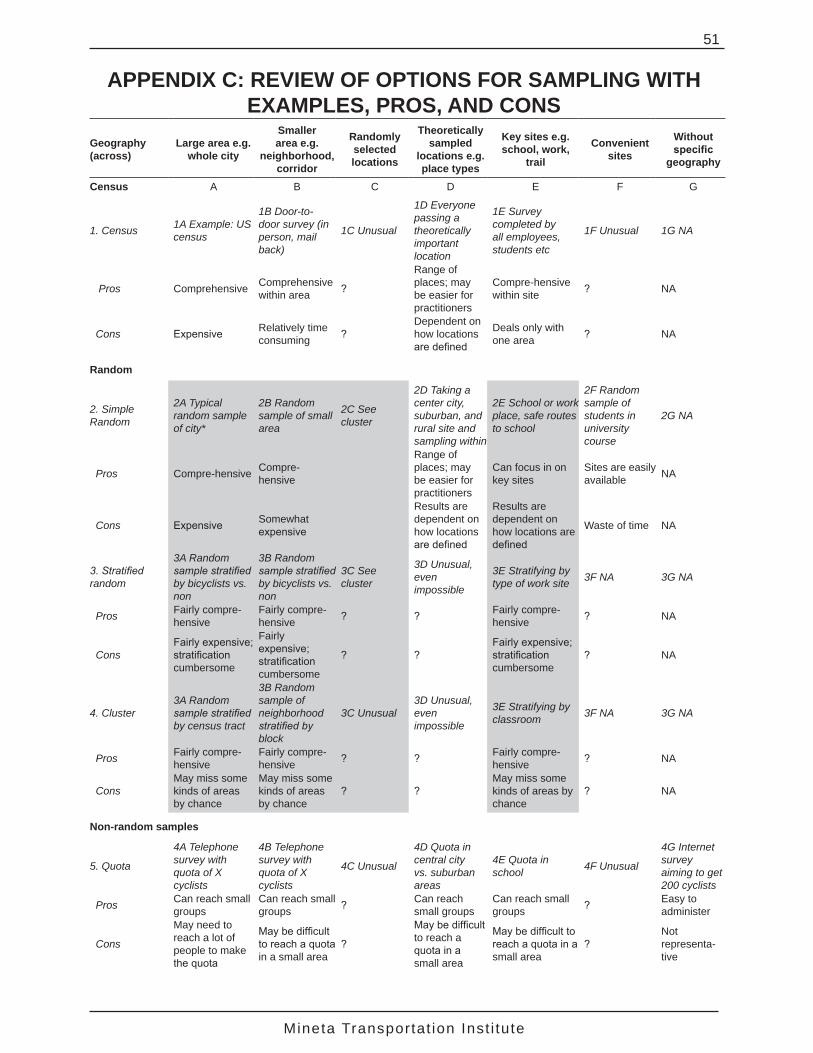
Mineta Transportat ion Inst i tute
51
APPENDIX C: REVIEW OF OPTIONS FOR SAMPLING WITH EXAMPLES, PROS, AND CONS
Geography (across)
Large area e.g. whole city
Smaller area e.g.
neighborhood, corridor
Randomly selected locations
Theoretically sampled
locations e.g. place types
Key sites e.g. school, work,
trail
Convenient sites
Without specific
geography
Census A B C D E F G
1. Census 1A Example: US census
1B Door-to-door survey (in person, mail back)
1C Unusual
1D Everyone passing a theoretically important location
1E Survey completed by all employees, students etc
1F Unusual 1G NA
Pros Comprehensive Comprehensive within area ?
Range of places; may be easier for practitioners
Compre-hensive within site ? NA
Cons Expensive Relatively time consuming ?
Dependent on how locations are defined
Deals only with one area ? NA
Random
2. Simple Random
2A Typical random sample of city*
2B Random sample of small area
2C See cluster
2D Taking a center city, suburban, and rural site and sampling within
2E School or work place, safe routes to school
2F Random sample of students in university course
2G NA
Pros Compre-hensive Compre-hensive
Range of places; may be easier for practitioners
Can focus in on key sites
Sites are easily available NA
Cons Expensive Somewhat expensive
Results are dependent on how locations are defined
Results are dependent on how locations are defined
Waste of time NA
3. Stratified random
3A Random sample stratified by bicyclists vs. non
3B Random sample stratified by bicyclists vs. non
3C See cluster
3D Unusual, even impossible
3E Stratifying by type of work site 3F NA 3G NA
Pros Fairly compre-hensive
Fairly compre-hensive ? ? Fairly compre-
hensive ? NA
ConsFairly expensive; stratification cumbersome
Fairly expensive; stratification cumbersome
? ?Fairly expensive; stratification cumbersome
? NA
4. Cluster3A Random sample stratified by census tract
3B Random sample of neighborhood stratified by block
3C Unusual3D Unusual, even impossible
3E Stratifying by classroom 3F NA 3G NA
Pros Fairly compre-hensive
Fairly compre-hensive ? ? Fairly compre-
hensive ? NA
ConsMay miss some kinds of areas by chance
May miss some kinds of areas by chance
? ?May miss some kinds of areas by chance
? NA
Non-random samples
5. Quota
4A Telephone survey with quota of X cyclists
4B Telephone survey with quota of X cyclists
4C Unusual
4D Quota in central city vs. suburban areas
4E Quota in school 4F Unusual
4G Internet survey aiming to get 200 cyclists
Pros Can reach small groups
Can reach small groups ? Can reach
small groupsCan reach small groups ? Easy to
administer
Cons
May need to reach a lot of people to make the quota
May be difficult to reach a quota in a small area
?
May be difficult to reach a quota in a small area
May be difficult to reach a quota in a small area
?Not representa- tive

Mineta Transportat ion Inst i tute
Appendix C: Review of Options for Sampling with Examples, Pros, and Cons52
Geography (across)
Large area e.g. whole city
Smaller area e.g.
neighborhood, corridor
Randomly selected locations
Theoretically sampled
locations e.g. place types
Key sites e.g. school, work,
trail
Convenient sites
Without specific
geography
6. Snowball5A Snowball approach to finding cyclists
5B Snowball approach to finding cyclists
5C Unusual5D Snowball in high vs. low density areas
5E Snowball in workplaces
5F Snowball starting from university course
5G Snowball starting from university course
Pros Easy to administer
Easy to administer ? Easy to
administerEasy to administer
Easy to administer
Easy to administer
Cons
Biased by starting points; may miss unaffiliated; likely won’t work for peds
Biased by starting points; may miss unaffiliated; likely won’t work for peds
?
Biased by starting points; may miss unaffiliated; likely won’t work for peds
Representative- ness depends on coverage
Not repres-entative
Not repres-entative
7. Intercept (without random sampling)
6A Massive multi-person intercept approach
6B Multi-person intercept cordon
6C Random or census intercept on randomly selected areas
6D Random or census intercept approach on 100% corners or key trails
6E Intercept on key entrance(s) to school or work
6F Intercept on nearby trail 6G NA
Pros
Could reach everyone out and about on a particular day or days
Could reach everyone out and about on a particular day or days
Easy to find people
Easy to find people
Could reach everyone out and about on a particular day or days
Could reach everyone out and about on a particular day or days
NA
Cons
Cumbersome and expensive; temporal/ seasonal coverage?
Requires a fair bit of coordination; temporal coverage?
Some sites may have no NMT; temporal coverage?
Not representative; temporal coverage?
Temporal coverage--typical vs. other NMT?
Not repres-entative; temporal coverage?
NA
8. Observation/ instrumentation
8A Cordon count, infrared sensor
8B Cordon count
8C Cordon count
8D Cordon count 8E Cordon count 8F Cordon
count 8G NA
Pros Comprehensive Compre-hensive
Potentially representative
Can provide information about differences between places
Comprehensive in terms of specific sites
Comprehen- sive in terms of specific sites
NA
ConsCumbersome; data difficult to interpret
Relatively shallow data; instrumentation can be cumbersome
Relatively shallow data; some areas may have no NMT
Relatively shallow data; some areas may have no NMT
Relatively shallow data
A waste of time NA
Note: Gray shading represents recommended sources.
Several additional methods are often used but we have not examined them here—convenience samples, worn instruments such as GPS, and existing records (not the focus of this study).

Mineta Transportat ion Inst i tute
53
APPENDIX D: COVER LETTER AND CONSENT FORM USED IN THE SAN JOSÉ FIELD TEST
For the field test, each envelope mailed out contained a cover letter and an informal consent form. Both documents were printed on San José State letterhead on either side of a single sheet of paper.
For the reliability tests, a similar but more “academic” consent form requiring a signature was used.
[Date]
Dear San José resident:
How do you get around San Jose on a daily basis? Your household has been randomly selected to participate in a survey studying how people travel around the city. The survey is being conducted by researchers at San José State University. We will share the results with city planners in San Jose, to help them improve local transportation for everyone.
Please have the survey completed by the adult in your household who had the most recent birthday. (By “adult,” I mean anyone 18 years or older.)
The survey must be completed and mailed back within two weeks. A postage-paid envelope is included.
The back of this letter has information explaining your rights as a subject of research conducted through San José State University. We appreciate your taking time to read this information.
Thank you very much for completing this important survey. Your response will help improve local transportation in San José!
Sincerely,
Asha W. AgrawalAssociate Professor

Mineta Transportat ion Inst i tute
Appendix D: Cover Letter and Consent Form Used in the San José Field Test54
Agreement to Participate in Research
“Non-Motorized Transportation Survey”(Responsible Investigator: Asha W. Agrawal
You are invited to participate in a survey study on how people get around in their daily transportation. The survey involves questions about your travel, how often you bicycle and walk, for what purposes you make these trips, and some demographic information about yourself.There is no anticipated risk to you from participating in this project. There are no direct benefits for participating in this study either! You may, however, learn a little bit about how and where you travel. The results of this study may be published, but no information that could identify you will be included. Participation in the study is voluntary. If you decide to participate in the study, you are free to not answer any question and to withdraw at any time without any negative effect on your relations with San José State University or with any other participating institutions or agencies.No service of any kind, to which you are otherwise entitled, will be lost or jeopardized if you choose to not participate in the study.By filling in the survey and returning it we will know that you have agreed to be in this study. Thanks for doing this!
___________________________________ _______________Investigator’s Signature Date
Questions about this research may be addressed to Asha W. Agrawal at 408-924-5853. Complaints about the research may be presented to Dayana Salazar, Chair, Department of Urban and Regional Planning, SJSU, at 408-924-5458. Questions about a research subjects’ rights or research-related injury may be presented to Pamela Stacks, Ph.D., Associate Vice President, Graduate Studies and Research, SJSU, at 408-924-2427.

Mineta Transportat ion Inst i tute
55
APPENDIX E: TEST-RETEST RESULTS
RELIABILITY—VERSION 1Sample 1: Correlations (Pearson r and Spearman rho) and Kappas Between Time 1 and Time 2; Version 1 (with multiple tests to allow comparison)Note: Missing questions were dropped from the final survey.
Question Pear- son’s r***
Lower Limit
Upper Limit*
Spear- man’s
rho
Lower Limit
Upper Limit* Kappa SE
(Kappa)Data
form***
1. What are today’s month and day? int
2. Most recent time used mode
a) Passenger or driver in a vehicle (for example, a car, truck, motorcycle, or taxi)
0.30 0.11 0.47 0.34 0.15 0.50 cat
b) Public transportation (for example, bus, light rail, train, or ferry)
0.92 0.88 0.94 0.86 0.80 0.91 cat
c) Bicycle to or from public transportation
0.86 0.80 0.90 0.81 0.73 0.87 cat
d) Bicycle to a destination OTHER THAN public transportation (for example, to a job, store, park, or friend’s house)
0.95 0.93 0.97 0.94 0.91 0.96 cat
e) Bicycle for recreation, exercise, or to walk the dog
0.75 0.65 0.82 0.74 0.64 0.82 cat
f) Walk to or from public transportation
0.85 0.78 0.90 0.73 0.63 0.81 cat
g) Walk to a destination OTHER THAN public transportation
0.81 0.72 0.87 0.74 0.64 0.82 cat
h) Walk for recreation, exercise, or to walk the dog
0.65 0.52 0.75 0.58 0.44 0.70 cat
Number of days in last 7 days* int
3. Bicycle to OR from work or school 0.92 0.88 0.94 0.87 0.82 0.91 int
4.Bicycle to get somewhere OTHER than work or school.(For example, to go shopping, see a friend, or eat a meal. Do NOT include trips with no destination, such as a bike ride solely for exercise.)
0.85 0.78 0.90 0.75 0.65 0.82 int
5. Ride a bicycle for exercise or recreation, without having a destination for the trip
0.70 0.58 0.79 0.60 0.46 0.71 int
6. Walk to OR from work or school 0.77 0.68 0.84 0.76 0.66 0.83 int
7.Walk to get somewhere OTHER than work, school, or public transit (For example, to go shopping, see a friend, or eat a meal. Do NOT include trips with no destination, such as a walk solely for exercise.).
0.72 0.61 0.80 0.73 0.62 0.81 int

Mineta Transportat ion Inst i tute
Appendix E: Test-Retest Results56
Question Pear- son’s r***
Lower Limit
Upper Limit*
Spear- man’s
rho
Lower Limit
Upper Limit* Kappa SE
(Kappa)Data
form***
8. Walk for exercise or recreation, without having a destination for the trip.
0.81 0.73 0.87 0.77 0.67 0.84 int
Questions about your general travel
9. Do you currently have any physical or other health condition that limits the amount of walking you can do?
0.85 0.11 yes/ no
10. Do you currently have any physical or other health condition that limits the amount of bicycling you can do?
0.69 0.10 yes/ no
11.How often do you have ready and convenient access to a BICYCLE you can use?
0.96 0.94 0.97 0.98 0.97 0.98 cat
12. How often do you have ready and convenient access to a MOTOR VEHICLE like a car, truck, or motorcycle that you can use either as a driver or passenger? (Exclude taxis & vehicles for hire.)
0.89 0.84 0.92 0.87 0.82 0.91 cat
13. During a typical week, how many days does your commute to WORK or SCHOOL include any of the following forms of transportation? If you don’t commute, mark each one as “0.”
Number of days walking ____ 0.83 0.76 0.88 0.82 0.74 0.87 int
Number of days bicycling: ___ 0.98 0.98 0.99 0.96 0.95 0.98 int
Number of days take public transportation (for example, a bus, train, or ferry):___
0.96 0.94 0.97 0.97 0.95 0.98 int
Number of days driving myself:_____ 0.84 0.77 0.89 0.88 0.82 0.91 int
Number of days riding as a passenger with someone else:_____
0.53 0.37 0.65 0.66 0.53 0.75 int
14. If you ever bicycle, how many months in a year do you TYPICALLY NOT make trips by bicycle because of your local climate (bad weather)?
0.85 0.78 0.90 0.83 0.75 0.88 int
15. If you ever walk, how many months in a year do you TYPICALLY NOT make trips by walking because of your local climate (bad weather)?
0.90 0.86 0.93 0.72 0.61 0.80 int
16. How many children under the age of 16 live in your household?
1.00 1.00 int

Mineta Transportat ion Inst i tute
Appendix E: Test-Retest Results 57
Question Pear- son’s r***
Lower Limit
Upper Limit*
Spear- man’s
rho
Lower Limit
Upper Limit* Kappa SE
(Kappa)Data
form***
17. How many people (16 years or older) live in your household, including yourself?
0.98 0.96 0.98 0.94 0.91 0.96 int
19. How many working motor vehicles are there in your household? (For example, cars, trucks, or motorcycles.)
0.91 0.87 0.94 0.92 0.88 0.94 int
20. In what year were you born? 1.00 1.00 int
21. What two streets intersect closest to your home?
nominal
23. What is your legal gender? 1.00 1.00 int
24. Which categories best describe you (employment)? (Check all that apply.)
1.00 0.89 0.84 0.92
25. To understand travel choices, and for statistical purposes, we need an idea of your total household income. Please mark an “X” on the scale below to indicate the APPROXIMATE TOTAL ANNUAL COMBINED income of all the working adults in your household.
0.99 0.98 0.99 0.98 0.98 0.99 int
Note: Bold indicates acceptable, very good, or excellent reliability.+ = no variance (everyone gave the same answer). * Question not complete in this table—see survey appendix for full question.**95% CI for r (using Fisher R-to-Z technique).*** int = interval data, cat = categorical, nom = nominal
RELIABILITY SAMPLE TWO
Sample 2: Correlations (Pearson’s r and Spearman’s rho) and Kappas Between Time 1 and Time 2 (Version 2)
Question Pearson’s r
Lower Limit*
Upper Limit*
Spearman’s rho
Lower Limit*
Upper Limit* Kappa SE
(Kappa)Data
Type***
1. What is today’s date?
2. Were you out of town during the last 7 days?
0.30 0.12 dich
If Yes, how many days? 0.23 0.04 0.41 0.31 0.12 0.48 int
3. Most recent time used mode*a) Passenger or driver
in a vehicle (for example, a car, truck, motorcycle, or taxi)
+ + cat
b) Public transit (for example, bus, train, or ferry)
0.71 0.60 0.80 0.51 0.07 cat

Mineta Transportat ion Inst i tute
Appendix E: Test-Retest Results58
Question Pearson’s r
Lower Limit*
Upper Limit*
Spearman’s rho
Lower Limit*
Upper Limit* Kappa SE
(Kappa)Data
Type***
c) Bicycle to or from public transit
0.70 0.58 0.79 0.49 0.07 cat
d) Bicycle to a destination OTHER THAN public transit (for example, to a job, store, park, or friend’s house)
0.91 0.87 0.94 0.73 0.06 cat
e) Bicycle for recreation or exercise (do not include riding a stationary bicycle)
0.81 0.74 0.87 0.55 0.06 cat
f) Walk to or from public transit
0.73 0.62 0.81 0.38 0.07 cat
g) Walk to a destination OTHER THAN public transit (for example, to a job, store, park, or friend’s house)
0.43 0.25 0.57 0.26 0.08 cat
h) Walk for recreation, exercise, or to walk the dog
0.64 0.50 0.74 0.50 0.08 cat
Number of days in last 7 days*4. Bicycle to OR from public
transit (for example, to a bus or train stop) .
0.30 0.11 0.47 0.52 0.50 0.74 int
5. Bicycle to OR from work or school.
0.87 0.81 0.91 0.90 0.85 0.93 int
6. Bicycle to get somewhere OTHER than work, school, or public transit. ….
0.82 0.74 0.88 0.78 0.69 0.85 int
7. Ride a bicycle for exercise or recreation, without having a destination for the trip
0.76 0.67 0.83 0.74 0.64 0.82 int
8. Walk to OR from public transit (for example, to a bus or train stop) . . .
0.69 0.58 0.78 0.70 0.58 0.79 int
9. Walk to OR from work or school. .
0.82 0.74 0.88 0.77 0.68 0.84 int
10. Walk to get somewhere OTHER than work, school, or public transit.
0.59 0.45 0.71 0.63 0.50 0.74 int
11. Walk for exercise or recreation, without having a destination for the trip. .
0.79 0.70 0.85 0.81 0.73 0.87 int

Mineta Transportat ion Inst i tute
Appendix E: Test-Retest Results 59
Question Pearson’s r
Lower Limit*
Upper Limit*
Spearman’s rho
Lower Limit*
Upper Limit* Kappa SE
(Kappa)Data
Type***
12. Do you currently have any physical or other health condition that limits the amount of walking you can do?
.58 0.15 dich
13. Do you currently have any physical or other health condition that limits the amount of bicycling you can do?
1.00 0.00 dich
14. In the last 7 days, did you have access to a working BICYCLE?
0.90 0.86 0.93 0.68 0.06 cat
15. In the last 7 days, did you have access to a working MOTOR VEHICLE like a car, truck, or motorcycle that you can use either as a driver or passenger? (Exclude taxis.)
0.85 0.79 0.90 0.69 0.10 cat
16. DURING A TYPICAL WEEK, how many days does your commute to work or school include any of the following forms of transportation? If you don’t commute, mark each one as “0.”
a) Number of days walking: ___ (count walking to or from a parked car or transit stop….
0.72 0.61 0.80 0.72 0.61 0.80 int
b) Number of days bicycling: ___
0.91 0.87 0.94 0.84 0.77 0.89 int
c) Number of days taking public transit (for example, a bus, train, or ferry): ___
0.92 0.88 0.94 0.88 0.82 0.91 int
d) Number of days driving myself: ___
0.79 0.71 0.86 0.76 0.66 0.83 int
e) Number of days riding as a passenger with someone else: ___
0.60 0.46 0.71 0.69 0.57 0.78 int

Mineta Transportat ion Inst i tute
Appendix E: Test-Retest Results60
Question Pearson’s r
Lower Limit*
Upper Limit*
Spearman’s rho
Lower Limit*
Upper Limit* Kappa SE
(Kappa)Data
Type***
17. How many months in a year do you typically NOT make trips by bicycle because of your local weather?
0.70 0.59 0.79 0.60 0.46 0.71 int
18. How many months in a year do you typically NOT make trips by walking because of your local weather?
0.65 0.52 0.75 0.54 0.38 0.66 int
19. In what year were you born?
1.00 0.99 1.00 0.97 0.96 0.98 int
20a. Intersection street 1 nominal
20b. Intersection street 2 nominal
21a. How many years have you lived in this neighborhood?
0.93 0.90 0.95 0.95 0.92 0.96 int
21b. How many months have you lived in this neighborhood?
0.79 0.70 0.85 0.78 0.68 0.84 int
22. What zip code do you live in? __________
0.73 0.62 0.81 0.94 0.92 0.96 ordinal
23. What is your legal gender?
1.00 1.00 int
24. What is your race or ethnicity? (Check all that apply.) 1 African American or
Black 1.00 0.00 dich
2 American Indian or Alaskan Native
1.00 0.00 dich
3 Asian 1.00 0.00 dich
4 Hispanic or Latino 1.00 0.00 dich
5 Native Hawaiian or other Pacific Islander
+ dich
6 White 0.94 0.04 dich
7 Don’t know + dich
8 Other 1.00 0.00 dich
(please explain:____) dich
25. Which categories best describe you? (Check all that apply.) 1 Working for pay
OUTSIDE the home 0.90 0.05 dich

Mineta Transportat ion Inst i tute
Appendix E: Test-Retest Results 61
Question Pearson’s r
Lower Limit*
Upper Limit*
Spearman’s rho
Lower Limit*
Upper Limit* Kappa SE
(Kappa)Data
Type***
2 Working for pay INSIDE the home
0.65 0.19 dich
3 Looking for work 0.69 0.11 dich
4 Other, -0.01 0.01 dich
5 A homemaker -0.02 0.01 dich
6 Going to school 0.40 0.13 dich
7 Retired 0.79 0.20 dichDo you live with roommates?
0.60 0.09 dich
26. Number of people under 16: ___
0.84 0.77 0.89 0.86 0.79 0.90 int
Number of people 16 years and older: ___
0.88 0.83 0.92 0.89 0.84 0.92 int
27. How many working motor vehicles are there in your household? (For example, cars, trucks, or motorcycles.)
0.87 0.81 0.91 0.86 0.80 0.90 int
28. Household income 0.99 0.99 0.99 0.98 0.97 0.99 int
Note: Bold indicates acceptable, very good, or excellent reliability.+ = no variance (everyone gave the same answer). * Question not complete in this table—see survey appendix for full question.**95% CI for r (Using Fisher R-to-Z technique).*** int = interval data, cat = categorical, nom = nominal, dich = dichotomous

Mineta Transportat ion Inst i tute
Appendix F: Field Test Responses62
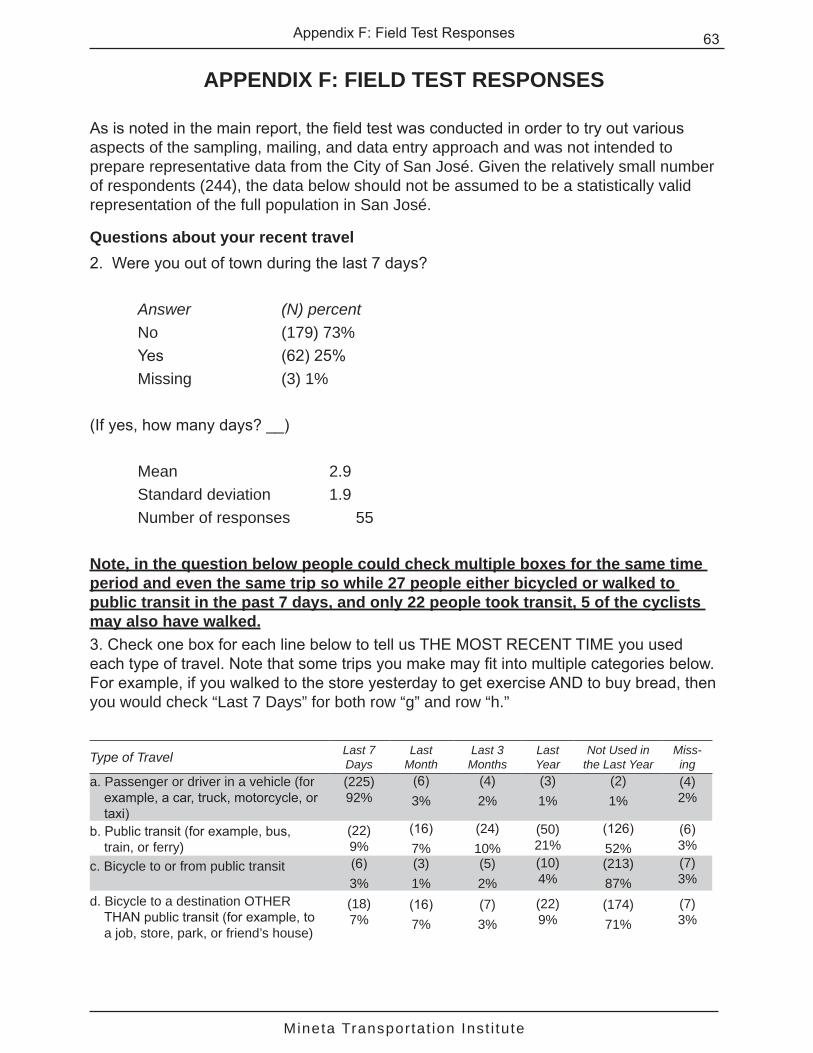
Mineta Transportat ion Inst i tute
Appendix F: Field Test Responses 63
APPENDIX F: FIELD TEST RESPONSES
As is noted in the main report, the field test was conducted in order to try out various aspects of the sampling, mailing, and data entry approach and was not intended to prepare representative data from the City of San José. Given the relatively small number of respondents (244), the data below should not be assumed to be a statistically valid representation of the full population in San José.
Questions about your recent travel2. Were you out of town during the last 7 days?
Answer (N) percentNo (179) 73%Yes (62) 25% Missing (3) 1%
(If yes, how many days? __)
Mean 2.9Standard deviation 1.9Number of responses 55
Note, in the question below people could check multiple boxes for the same time period and even the same trip so while 27 people either bicycled or walked to public transit in the past 7 days, and only 22 people took transit, 5 of the cyclists may also have walked.3. Check one box for each line below to tell us THE MOST RECENT TIME you used each type of travel. Note that some trips you make may fit into multiple categories below. For example, if you walked to the store yesterday to get exercise AND to buy bread, then you would check “Last 7 Days” for both row “g” and row “h.”
Type of Travel Last 7 Days
Last Month
Last 3 Months
Last Year
Not Used in the Last Year
Miss-ing
a. Passenger or driver in a vehicle (for example, a car, truck, motorcycle, or taxi)
(225) 92%
(6) 3%
(4) 2%
(3)1%
(2) 1%
(4) 2%
b. Public transit (for example, bus, train, or ferry)
(22) 9%
(16) 7%
(24) 10%
(50) 21%
(126) 52%
(6) 3%
c. Bicycle to or from public transit (6) 3%
(3) 1%
(5) 2%
(10) 4%
(213) 87%
(7) 3%
d. Bicycle to a destination OTHER THAN public transit (for example, to a job, store, park, or friend’s house)
(18) 7%
(16) 7%
(7) 3%
(22) 9%
(174) 71%
(7) 3%

Mineta Transportat ion Inst i tute
Appendix F: Field Test Responses64
Type of Travel Last 7 Days
Last Month
Last 3 Months
Last Year
Not Used in the Last Year
Miss-ing
e. Bicycle for recreation or exercise (not including riding a stationary bicycle)
(25) 10%
(16) 7%
(13) 5%
(26) 11%
(157) 64%
(7) 3%
f. Walk to or from public transit (21) 9%
(9) 4%
(17) 7%
(33) 14%
(157) 64%
(7) 3%
g. Walk to a destination OTHER THAN public transit (for example, to a job, store, park, or friend’s house)
(118) 48%
(30) 12%
(20) 8%
(17) 7%
(54)22%
(5) 2%
h. Walk for recreation, exercise, or to walk the dog
(160) 66%
(33) 14%
(14) 6%
(11) 5%
(21)9%
(5) 2%
Questions about HOW OFTEN you BICYCLED in the last 7 daysIn the last 7 days (up to yesterday), on how many days did you: Number of days ___
Number of Days > 0 1 2 3 4 5 6 7 Missing
4. Bicycle to OR from public transit (for example, to a bus or train stop)
(219) 90%
(1) 0%
(2) 1%
(0) 0%
(0) 0%
(2) 1%
(0) 0%
(7)3%
(3) 1%
5. Bicycle to OR from work or school(219) 90%
(2) 1%
(1) 0%
(0) 0%
(1) 0%
(1) 0%
(1) 0%
(1) 0% (7) 1%
6. Bicycle to get somewhere OTHER than work, school, or public transit. (For example, to go shopping, see a friend, or eat a meal. Do NOT include trips with no destination, such as a bike ride solely for exercise.)
(207) 85%
(10) 4%
(6) 3%
(3) 1%
(2) 1%
(0) 0%
(0) 0% (3) 1% (13)
5%
7. Ride a bicycle for exercise or recreation, without having a destination for the trip.
(197) 81%
(13) 5%
(10) 4%
(4) 2%
(3) 2%
(0) 0%
(1) 0%
(2) 1% (14) 6%
Questions about HOW OFTEN you WALKED in the last 7 days
In the last 7 days (up to yesterday), on how many days did you: Number of days ___
Number of Days > 0 1 2 3 4 5 6 7 Missing8. Walk to OR from public transit
(for example, to a bus or train stop) .
(203) 83%
(9) 4%
(5) 2%
(0) 0%
(2) 1%
(3) 1%
(1) 0%
(7)3%
(14) 5.7%
9. Walk to OR from work or school. (209) 86%
(3) 1%
(1) 0%
(3) 1%
(1) 0%
(4) 2%
(2) 1%
(7) 3%
(14) 6%
10. Walk to get somewhere OTHER
than work, school, or public transit. (For example, to go shopping, see a friend, or eat a meal. Do NOT include trips with no destination, such as a walk solely for exercise.)
(110) 45%
(33) 14%
(26) 11%
(23) 9%
(8) 3%
(8) 3%
(2) 1%
(24) 10 %
(10) 4%
11. Walk for exercise or recreation, without having a destination for the trip.
(68) 28%
(29) 12%
(42) 17%
(27) 11%
(13) 5%
(14) 6%
(6) 3%
(40) 16%
(5) 2%
Questions about your general travel

Mineta Transportat ion Inst i tute
Appendix F: Field Test Responses 65
12. Do you currently have any physical or other health condition that limits the amount of walking you can do?
Yes (36) 15%No (204) 84%Prefer not to say (4) 2%Missing (0) 0%
13. Do you currently have any physical or other health condition that limits the amount of bicycling you can do?
Yes (33) 14%No (204) 84%Prefer not to say (5) 2%Missing (2) 1%
14. In the last 7 days, did you have access to a working BICYCLE?Always (92) 38%Most of the time (11) 5%Sometimes (6) 3%Rarely (11) 5%Never (122) 50%Missing (2) 1%
15. In the last 7 days, did you have access to a working MOTOR VEHICLE like a car, truck, or motorcycle that you can use either as a driver or passenger? (Exclude taxis.)
Always (218) 89%Most of the time (7) 3%Sometimes (1) 0%Rarely (4) 2%Never (14) 6%Missing (0) 0%
16. DURING A TYPICAL WEEK, how many days does your commute to work or school include any of the following forms of transportation? If you don’t commute, mark each one as “0.”
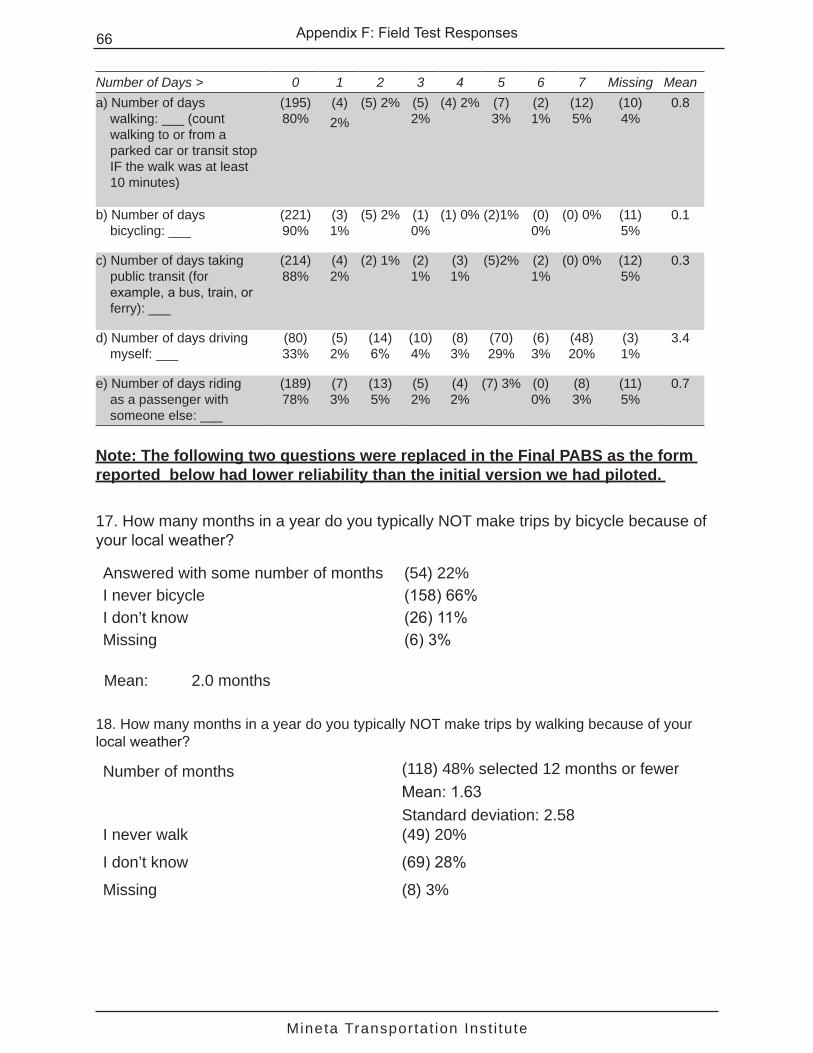
Mineta Transportat ion Inst i tute
Appendix F: Field Test Responses66
Number of Days > 0 1 2 3 4 5 6 7 Missing Meana) Number of days
walking: ___ (count walking to or from a parked car or transit stop IF the walk was at least 10 minutes)
(195) 80%
(4)2%
(5) 2% (5) 2%
(4) 2% (7) 3%
(2) 1%
(12) 5%
(10) 4%
0.8
b) Number of days bicycling: ___
(221) 90%
(3) 1%
(5) 2% (1) 0%
(1) 0% (2)1% (0) 0%
(0) 0% (11) 5%
0.1
c) Number of days taking public transit (for example, a bus, train, or ferry): ___
(214) 88%
(4) 2%
(2) 1% (2) 1%
(3) 1%
(5)2% (2) 1%
(0) 0% (12) 5%
0.3
d) Number of days driving myself: ___
(80) 33%
(5) 2%
(14) 6%
(10) 4%
(8) 3%
(70) 29%
(6) 3%
(48) 20%
(3) 1%
3.4
e) Number of days riding as a passenger with someone else: ___
(189) 78%
(7) 3%
(13) 5%
(5) 2%
(4) 2%
(7) 3% (0) 0%
(8) 3%
(11) 5%
0.7
Note: The following two questions were replaced in the Final PABS as the form reported below had lower reliability than the initial version we had piloted.
17. How many months in a year do you typically NOT make trips by bicycle because of your local weather?
Answered with some number of months (54) 22% I never bicycle (158) 66%I don’t know (26) 11%Missing (6) 3%
Mean: 2.0 months 18. How many months in a year do you typically NOT make trips by walking because of your local weather?
Number of months (118) 48% selected 12 months or fewer Mean: 1.63 Standard deviation: 2.58
I never walk (49) 20%
I don’t know (69) 28%
Missing (8) 3%

Mineta Transportat ion Inst i tute
Appendix F: Field Test Responses 67
Some questions about you and your household19. In what year were you born? Year: ______
Age Categories 15 to 19 years (2) 1%20 to 24 years (3) 1%25 to 34 years (22) 9%35 to 44 years (46) 19%45 to 54 years (59) 24%55 to 59 years (24) 10%60 to 64 years (19) 8%65 to 74 years (42) 17%75 to 84 years (15) 6%85 years and over (2) 1%Missing (10) 4%
Mean 52 yearsMedian 52 yearsYoungest respondent 18 yearsOldest respondent 94 years
20. What two streets intersect closest to your home? Not reported here due to privacy issues
21. How many years OR months have you lived in this neighborhood? 0–6 months (6) 2%7–11 months (5) 2%1–2 years (36) 15%3–4 years (24) 10%5–10 years (49) 20%11–20 years (52) 21%21–30 years (35) 14%31–40 years (25) 10%41 and more years (10) 4%Missing (2) 1%
Mean 15 yearsMedian 11 years
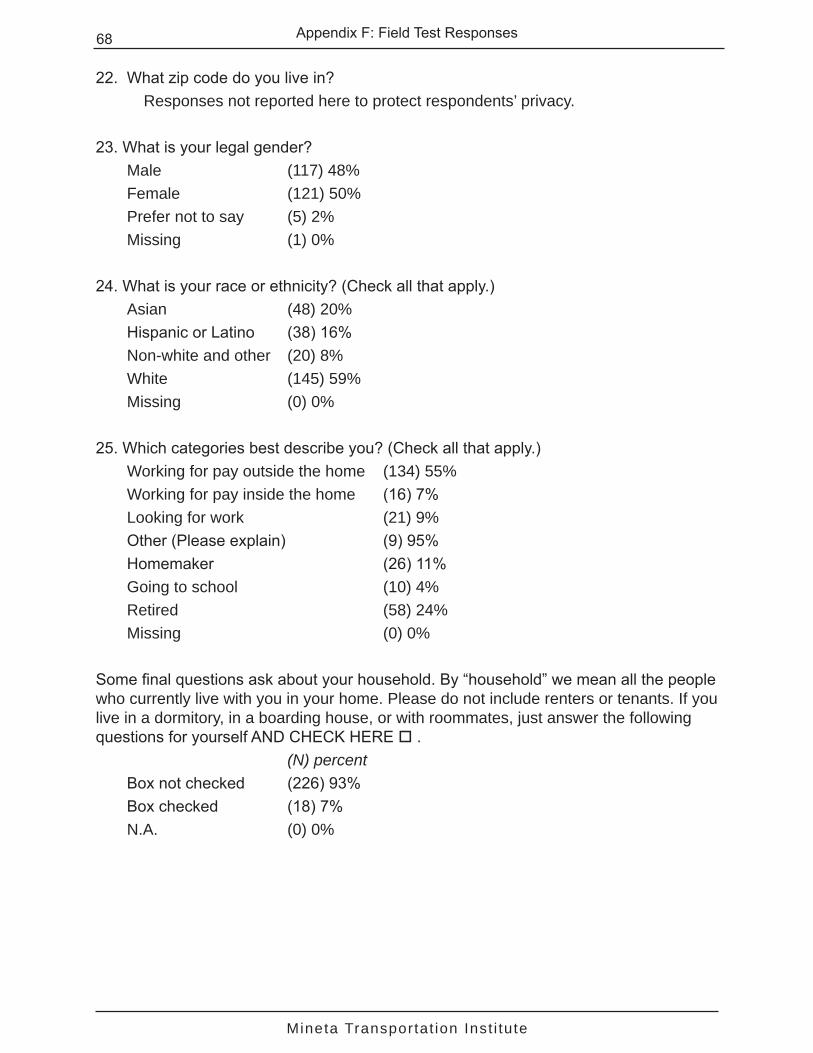
Mineta Transportat ion Inst i tute
Appendix F: Field Test Responses68
22. What zip code do you live in? Responses not reported here to protect respondents’ privacy.
23. What is your legal gender? Male (117) 48% Female (121) 50% Prefer not to say (5) 2% Missing (1) 0%
24. What is your race or ethnicity? (Check all that apply.)Asian (48) 20%Hispanic or Latino (38) 16%Non-white and other (20) 8%White (145) 59%Missing (0) 0%
25. Which categories best describe you? (Check all that apply.) Working for pay outside the home (134) 55%Working for pay inside the home (16) 7%Looking for work (21) 9%Other (Please explain) (9) 95%Homemaker (26) 11%Going to school (10) 4%Retired (58) 24%Missing (0) 0%
Some final questions ask about your household. By “household” we mean all the people who currently live with you in your home. Please do not include renters or tenants. If you live in a dormitory, in a boarding house, or with roommates, just answer the following questions for yourself AND CHECK HERE . (N) percent
Box not checked (226) 93%Box checked (18) 7%N.A. (0) 0%

Mineta Transportat ion Inst i tute
Appendix F: Field Test Responses 69
26. How many people live in your household, including you? Number of people under 16: ___
0 (114) 47%1 (29) 12%2 (39)16%3 (13)5%4 (1) 0%5 (1) 0%6 (0) 0%7 (1) 0%Missing (46) 19%
Number of people 16 years and older: ___ 1 (56) 23%2 (133) 55%3 (25) 10%4 (7) 3%5 (2) 1%6 (0) 0%7 (1) 0%Missing (20) 8%
27. How many working motor vehicles are there in your household? (For example, cars, trucks, or motorcycles.)
0 (10) 4%1 (64) 26%2 (104) 43%3 (37) 15%4 or more (25) 10%Missing (4) 2%
Mean 2 vehiclesMedian 2 vehicles
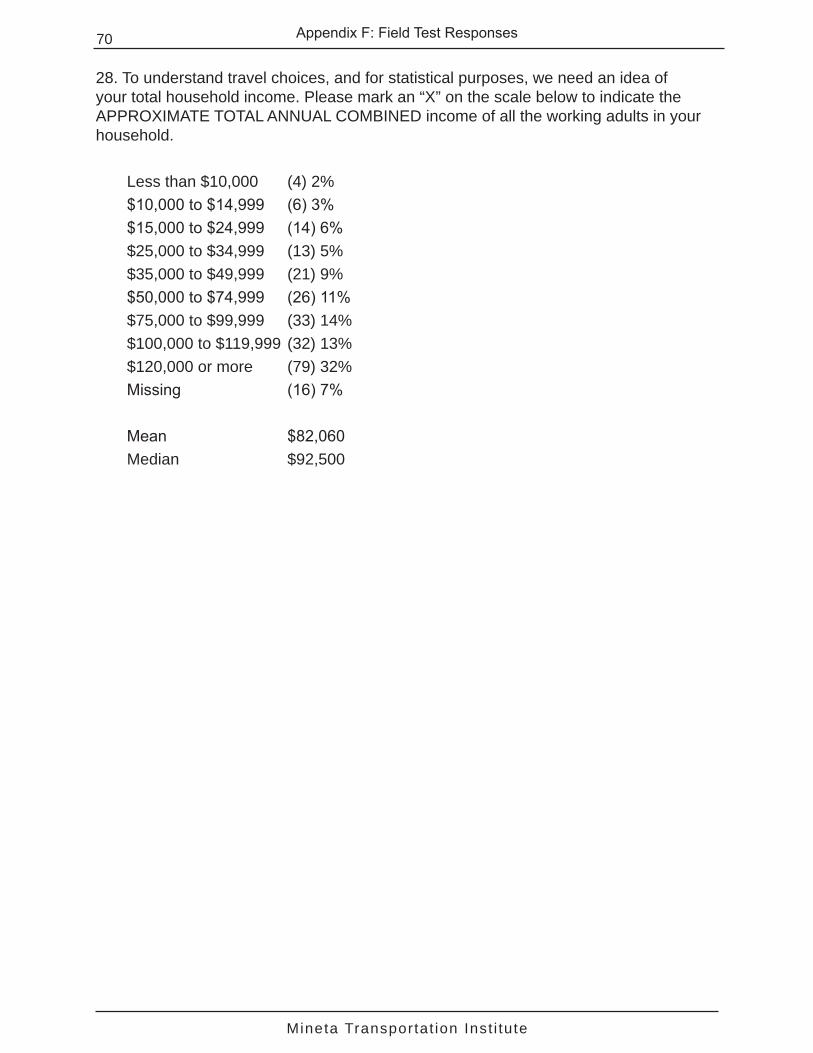
Mineta Transportat ion Inst i tute
Appendix F: Field Test Responses70
28. To understand travel choices, and for statistical purposes, we need an idea of your total household income. Please mark an “X” on the scale below to indicate the APPROXIMATE TOTAL ANNUAL COMBINED income of all the working adults in your household.
Less than $10,000 (4) 2%$10,000 to $14,999 (6) 3%$15,000 to $24,999 (14) 6%$25,000 to $34,999 (13) 5%$35,000 to $49,999 (21) 9%$50,000 to $74,999 (26) 11%$75,000 to $99,999 (33) 14%$100,000 to $119,999 (32) 13%$120,000 or more (79) 32%Missing (16) 7%
Mean $82,060Median $92,500

Mineta Transportat ion Inst i tute
Appendix G: Additional Comments for Each Survey Question in Final PABS 71
APPENDIX G: ADDITIONAL COMMENTS FOR EACH SURVEY QUESTION IN FINAL PABS
Final Wording for Question Comments or Description of Issues to Consider
1. Date None
2. Were you out of town during the last 7 days? The large proportion of people out of town in the field test (25%) may indicate some confusion. Some people might have interpreted the question to mean being out of the city for part of any day.The authors recommend keeping the question for now but doing future reliability testing on alternative versions.
3. Most recent time used mode None
a) Passenger or driver in a vehicle (for example, a car, truck, motorcycle, or taxi)
Low reliability in Version 1. In the second test, everyone gave the same answer (everyone drove recently). Looking at the frequencies of the response options in the initial reliability test revealed that 88 percent of people had been recent drivers or passengers in the past week at time 1 and 92 percent at time 2; in the second test 100 percent had been passengers or drivers both times. Thus the overall pattern, even if not individual behavior, is fairly consistent. The authors recommend keeping the question.
b) Public transit (for example, bus, train, or ferry) None
c) Bicycle to or from public transit Marginal reliability (0.69/0.70)
d) Bicycle to a destination OTHER THAN public transit (for example, to a job, store, park, or friend’s house)
None
e) Bicycle for recreation or exercise (do not include riding a stationary bicycle)
None
f) Walk to or from public transit None
g) Walk to a destination OTHER THAN public transit
Has been reworded
h) Walk for recreation, exercise, or to walk the dog
Marginal reliability, likely varies from week to week however
Numbers of days in last 7 days
4. Bicycle to OR from public transit (for example, to a bus or train stop) .
Low reliability but this behavior can be expected to vary somewhat from week to week. In terms of frequencies, 84 percent of people at time 1 (first administration) and 85 percent of people at time 2 had not cycled to and from transit. The overall pattern thus looks consistent, even though individuals varied in how many days they cycled to transit week to week. The authors recommend keeping the question.
5. Bicycle to OR from work or school. None
6. Bicycle to get somewhere OTHER than work, school, or public transit. ….
None
7. Ride a bicycle for exercise or recreation, without having a destination for the trip
None

Mineta Transportat ion Inst i tute
Appendix G: Additional Comments for Each Survey Question in Final PABS72
Final Wording for Question Comments or Description of Issues to Consider
8. Walk to OR from public transit (for example, to a bus or train stop) .
None
9. Walk to OR from work or school. . None
10. Walk to get somewhere OTHER than work, school, or public transit.
Marginal reliability. However, the behavior likely varies from week to week.
(For example, to go shopping, see a friend, or eat a meal. Do NOT include trips with no destination, such as a walk solely for exercise.) . . .
None
11. Walk for exercise or recreation, without having a destination for the trip.
None
Questions about your general travel None
12. Do you currently have any physical or other health condition that limits the amount of walking you can do?
While having a low Kappa statistic, answers to this question had little variation. All but three people said no both times. It is possible that the three changes were the result of actual changes to health status (e.g., recovery from illness or injury). The authors recommend keeping the question.
13. Do you currently have any physical or other health condition that limits the amount of bicycling you can do?
Marginal reliability (0.69)
14. In the last 7 days, did you have access to a working BICYCLE?
None
15. In the last 7 days, did you have access to a working MOTOR VEHICLE like a car, truck, or motorcycle that you can use either as a driver or passenger? (Exclude taxis.)
None
16. DURING A TYPICAL WEEK, how many days does your commute to work or school include any of the following forms of transportation? If you don’t commute, mark each one as “0.”
None
a) Number of days walking: ___ (count walking to or from a parked car or transit stop IF the
None
b) Number of days bicycling: ___ None
c) Number of days taking public transit (for example, a bus, train, or ferry): ___
None
d) Number of days driving myself: ___ None
e) Number of days riding as a passenger with someone else: ___
Marginal reliability
17. If you ever bicycle, how many months in a year do you TYPICALLY NOT make trips by bicycle because of your local climate (bad weather)?
None.”
18. If you ever walk, how many months in a year do you TYPICALLY NOT make trips by walking because of your local climate (bad weather)?
None. ”
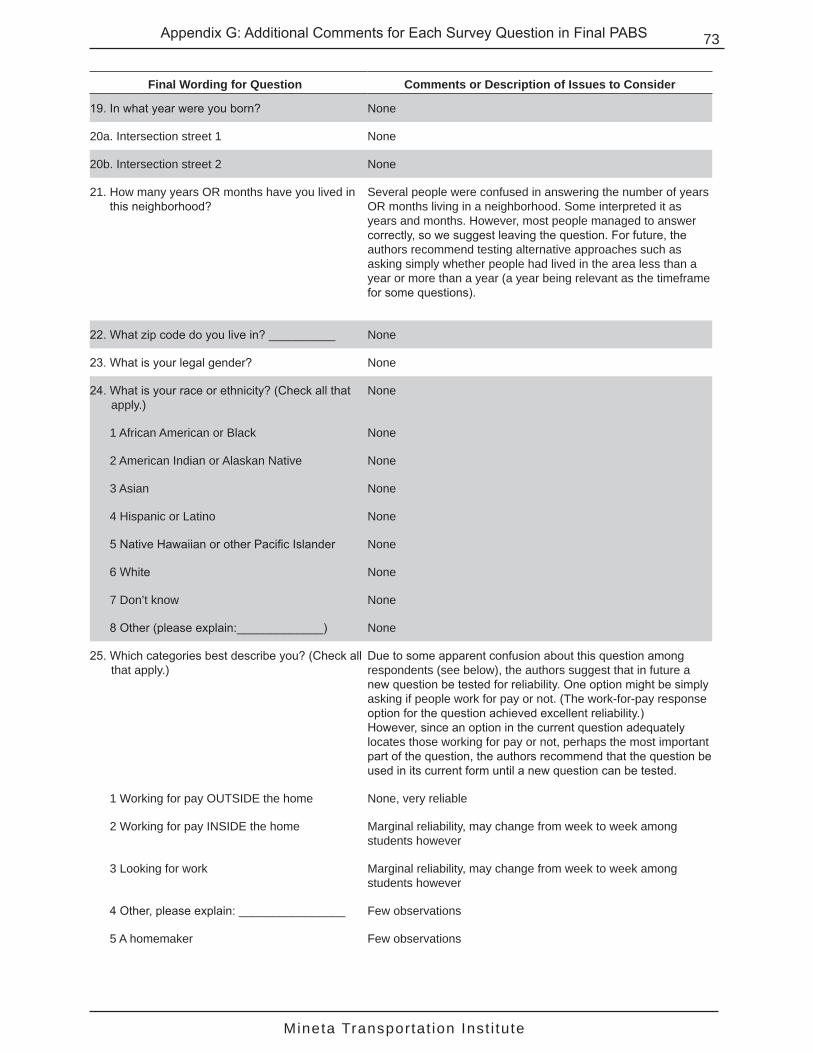
Mineta Transportat ion Inst i tute
Appendix G: Additional Comments for Each Survey Question in Final PABS 73
Final Wording for Question Comments or Description of Issues to Consider
19. In what year were you born? None
20a. Intersection street 1 None
20b. Intersection street 2 None
21. How many years OR months have you lived in this neighborhood?
Several people were confused in answering the number of years OR months living in a neighborhood. Some interpreted it as years and months. However, most people managed to answer correctly, so we suggest leaving the question. For future, the authors recommend testing alternative approaches such as asking simply whether people had lived in the area less than a year or more than a year (a year being relevant as the timeframe for some questions).
22. What zip code do you live in? __________ None
23. What is your legal gender? None
24. What is your race or ethnicity? (Check all that apply.)
None
1 African American or Black None
2 American Indian or Alaskan Native None
3 Asian None
4 Hispanic or Latino None
5 Native Hawaiian or other Pacific Islander None
6 White None
7 Don’t know None
8 Other (please explain:_____________) None
25. Which categories best describe you? (Check all that apply.)
Due to some apparent confusion about this question among respondents (see below), the authors suggest that in future a new question be tested for reliability. One option might be simply asking if people work for pay or not. (The work-for-pay response option for the question achieved excellent reliability.)However, since an option in the current question adequately locates those working for pay or not, perhaps the most important part of the question, the authors recommend that the question be used in its current form until a new question can be tested.
1 Working for pay OUTSIDE the home None, very reliable
2 Working for pay INSIDE the home Marginal reliability, may change from week to week among students however
3 Looking for work Marginal reliability, may change from week to week among students however
4 Other, please explain: ________________ Few observations
5 A homemaker Few observations

Mineta Transportat ion Inst i tute
Appendix G: Additional Comments for Each Survey Question in Final PABS74
Final Wording for Question Comments or Description of Issues to Consider
6 Going to school Some confusion; 80 responses the first administration but only 68 in the second. The discrepancy is odd in a university classroom setting
7 Retired None
Some final questions ask about your household. By “household” we mean all the people who currently live with you in your home. Please do not include renters or tenants. If you live in a dormitory, in a boarding house, or with roommates, just answer thefollowing questions for yourself AND CHECK HERE □.
The questionnaire asked respondents to mark a checkbox. Respondents may not have noticed these instructions (and the checkbox) because they were laid out as part of a paragraph of other text. Also, it may have been difficult for university students to classify such accommodations as fraternity and sorority houses. The authors suggest leaving this question as is until future reliability testing can be done on alternative ways to assess complex household arrangements.
26. How many people live in your household, including you?
Some respondents offered the total number of adults and children combined, but not the separate numbers of children and adults. Responses might be more reliable with a revised question wording such as “How many people live in your household? How many of these people are under 16?” The authors have not been able to test this alternate wording, however.
Number of people under 16: ___ Some confusion among respondents but reliability still high
Number of people 16 years and older: ___ Some confusion among respondents—8% of people in the field test left it blank which was clearly incorrect, as they were an adult answering the survey—but reliability was still high and most people answered correctly.
27. How many working motor vehicles are there in your household? (For example, cars, trucks, or motorcycles.)
None
28. Household income None

Mineta Transportat ion Inst i tute
75
ENDNOTES1. Bureau of Transportation Statistics, National Household Transportation Survey
Daily Travel Quick Facts (2001-2002). http://www.bts.gov/programs/national_household_travel_survey/ddaily_travel.html (accessed April 2010).
2. A. Forsyth, J. Michael Oakes, and Kathryn H. Schmitz, “Test-Retest Reliability of the Twin Cities Walking Survey,” Journal of Physical Activity and Health 6, no. 1 (2009).
3. K. Day, et al., “The Irvine Minnesota Inventory to Measure Built Environments: Development,” American Journal of Preventive Medicine 30, no. 2 (February 2006); M. Boarnet, et al., “The Irvine Minnesota Inventory to Measure Built Environments: Reliability Tests,” American Journal of Preventive Medicine 30, no. 2 (February 2006); Kelly J. Clifton, Andrea D. Livi Smith, and Daniel Rodriguez, “The Development and Testing of an Audit for the Pedestrian Environment,” Landscape and Urban Planning 80, no. 1-2 (March 28, 2007); and Ross C. Brownson, et al., “Measuring the Built Environment for Physical Activity: State of the Art,” American Journal of Preventive Medicine 36, no. 4s (April 2009).
4. Kevin J. Krizek, A. Forsyth, and A. W. Agrawal, Forthcoming Pedestrian and Bicycling Survey (PABS): User’s Manual. http//www.designforhealth.net/resources/PABS.html (forthcoming August 2010).
5. Kevin J. Krizek, Susan Handy, and Ann Forsyth, “Explaining Changes in Walking and Bicycling Behavior: Challenges for Transportation Research,” Environment and Planning B 36 (2009b); and A. Forsyth, J. Michael Oakes, and Kathryn H. Schmitz, “Test-Retest Reliability of the Twin Cities Walking Survey,” Journal of Physical Activity and Health 6, no. 1 (2009).
6. Kevin J. Krizek, Susan Handy, and Ann Forsyth, “Explaining Changes in Walking and Bicycling Behavior: Challenges for Transportation Research.” Environment and Planning B 36, (2009b): 725–740.
7. U.S. Department of Transportation, Federal Highway Administration, “United States Department of Transportation Policy Statement on Bicycle and Pedestrian Accommodation: Regulations and Recommendations,” U.S. Department of Transportation, March 11, 2010.http://www.fhwa.dot.gov/environment/bikeped/policy_accom.htm (accessed June 20, 2010).
8. A. Forsyth, J. Michael Oakes, and Kathryn H. Schmitz, “Test-Retest Reliability of the Twin Cities Walking Survey,” Journal of Physical Activity and Health 6, no. 1 (2009).
9. K. Day, et al., Irvine Minnesota Inventory: Development; M. Boarnet, et al., Oakes, Irvine Minnesota Inventory: Reliability; Kelly J. Clifton, Andrea D. Livi Smith, and Daniel Rodriguez, Audit for the Pedestrian Environment; and Ross C. Brownson, et

Mineta Transportat ion Inst i tute
Endnotes76
al., Measuring the Built Environment.
10. Alta Planning and Design, et al., “National Bicycle and Pedestrian Documentation Project.” Alta Planning and Design, and ITE Pedestrian and Bicycle Council. 2010, http://bikepeddocumentation.org/ (accessed June 20, 2010); U.C. Berkeley Safe Transportation Research and Education Center, Seamless Travel: Measuring Bicycle and Pedestrian Activity in San Diego County and its Relationship to Land Use, Transportation, Safety, and Facility Type, Institute for Transportation Studies, 2010, http://www.altaplanning.com/App_Content/files/Seamless-Final-Report-June-2010.pdf (accessed July 13, 2010).
11. Mike Mokrzycki, “Cord-Cutting Continues at Steady Pace,” Pollster.com, December 16, 2009, http://www.pollster.com/blogs/mokrzycki_cordcutting_continue.php (accessed July 23, 2010).
12. For examples or a fuller discussion, see Appendix B.
13. Don A. Dillman, Mail and Internet Surveys: The Tailored Design Method, 2nd ed. (New York: John Wiley & Sons, 2007); Floyd J. Fowler, Survey Research Methods, 2nd ed. (London: Sage Publications, 1993); Leslie Kish, Survey Sampling (New York: J. Wiley & Sons, 1965); Sharon L. Lohr, Sampling: Design and Analysis (Pacific Grove, CA: Duxbury Press, 1999);Thomas W. Mangione, Mail Surveys: Improving the Quality (Thousand Oaks, CA: Sage Publications, 1995); W. Paul Vogt, Dictionary of Statistics and Methodology: A Nontechnical Guide for the Social Sciences (Thousand Oaks, CA: Sage Publications, 1993).
14. David T. Hartgen and Elizabeth San Jose, Costs and Trip Rates of Recent Household Travel Surveys, November 11, 2009, page 2, http://www.hartgengroup.net/Projects/National/USA/household_travel_summary/2009-11-11_Final_Report_Revised.pdf (accessed June 20, 2010).
15. Ibid., page 2.
16. Stephanie Freeth, “Using a Range of Methods to Collect Travel Data: The Experience of the British National Travel Survey,” Transportation Research Circular 2000. http://onlinepubs.trb.org/onlinepubs/circulars/ec008/session_f.pdf (accessed July 10, 2010).
17. J. Michael Oakes, et al., “Recruiting a Participants for Neighborhood Effects Research: Strategies and Outcomes of the Twin Cities Walking Study,” Environment and Behavior 41, no. 6 (2009).
18. J. Ziegenfuss, T. J. Beebe, E. Rey, C. Schleck, G. R. Locke III, and N. J. Talley, “Internet Option in a Mail Survey: More Harm Than Good?” Epidemiology 4, no. 21 (2010), 485–586.
19. W. Paul Vogt, Dictionary of Statistics and Methodology: A Nontechnical Guide for

Endnotes
Mineta Transportat ion Inst i tute
77
the Social Sciences, (Thousand Oaks, CA: Sage Publications, 1993); and Floyd J. Fowler, Survey Research Methods, 2nd ed (London: Sage Publications, 1993).
20. Ibid.
21. Leslie Kish, Survey Sampling, (New York: J. Wiley & Sons, 1965).
22. Kasper M. Hansen, “The Effects of Incentives, Interview Length, and Interviewer Characteristics on Response Rates in a CATI Study,” International Journal of Public Opinion Research 19, no. 1 (2006); A. Rogers, et al., “Contacting Controls: Are We Working Harder for Similar Response Rates, and Does It Make a Difference?” American Journal of Epidemiology 160, no. 1 (2004); and J. Michael Oakes, et al., Recruiting a Participants.
23. Julien O. Teitler, Nancy E. Reichman, and Susan Sprachman, ”Costs and Benefits of Improving Response Rates for a Hard-to-Reach Population,” Public Opinion Quarterly. 67 (2003); and Eleanor Singer, “Confidentiality, Risk Perception, and Survey Participation,” Chance,17 (2004).
24. American Community Survey 2006–2008.
25. Louis J. Rizzo, Michael Brick, and Inho Park, “A Minimally Intrusive Method for Sampling Persons in Random Digit Dial Surveys,” Public Opinion Quarterly 68, no. 2 (2004).
26. P. Edwards., I. Roberts, M. Clarke, C. DiGuiseppi, S. Pratap, R. Wentz., and I Kwan, “Increasing Response Rates to Postal Questionnaires: A Systematic Review,” British Medical Journal 324, (2002): 1183.
27. Adam S. Willcox, William M. Giuliano, and Glenn D. Israel, “Effects of Token Financial Incentives on Response Rates and Item Nonresponse for Mail Surveys” Human Dimensions of Wildlife: An International Journal 15, no. 4 (2010), pages 288 – 295.
28. P. I. Edwards, et al., “Increasing Response Rates to Postal Questionnaires: A Systematic Review,” British Medical Journal 324 (2002): p 1183.
29. A. Forsyth, J. Michael Oakes, and Kathryn H. Schmitz, Twin Cities Walking Survey.

Mineta Transportat ion Inst i tute
Endnotes78

Mineta Transportat ion Inst i tute
79
ABBREVIATIONS AND ACRONYMS
ACS American Community Survey
PABS Pedestrian and Bicycling Survey

Mineta Transportat ion Inst i tute
Abbreviations and Acronyms80
Mineta Transportat ion Inst i tute
81
REFERENCES
Agrawal, Asha W., and Paul Schimek. “Extent and Correlates of Walking in the USA.” Transportation Research Part D: Transport and Environment 12, no. 8 (2007): 548—563.
Agrawal, Asha .W., Marc Schlossberg, and Katja. Irvin. “How Far, by Which Route and Why? A Spatial Analysis of Pedestrian Preference.” Journal of Urban Design 13, no. 1 (February 2008): 81—98.
Alta Planning and Design, and Institute of Transportation Engineers (ITE) Pedestrian and Bicycle Council. “National Bicycle and Pedestrian Documentation Project.” Alta Planning and Design, and ITE Pedestrian and Bicycle Council. http://bikepeddocumentation.org/ (accessed June 20, 2010).
Aultman-Hall, Lisa, and Fred L. Hall. “Research Design Insights from a Survey of Urban Bicycle Commuters.” Transportation Research Record 1636 (1998): 2–28.
Boarnet, M., A. Forsyth, J. M. Oakes, and K. Day. Irvine Minnesota Inventory: Using a Predictive Validity Study to Refine an Environmental Audit Instrument. Environment and Behavior (forthcoming 2010).
Boarnet, M., K. Day, M. Alfonzo, A. Forsyth, and J.M. Oakes. “The Irvine Minnesota Inventory to Measure Built Environments: Reliability Tests.” American Journal of Preventive Medicine 30, no. 2 (February 2006): 153–159.
Brownson, Ross C., Christine M. Hoehner, Kristen Day, Ann Forsyth, and James F. Sallis. “Measuring the Built Environment for Physical Activity: State of the Art.” American Journal of Preventive Medicine 36, no. 4s (April 2009): s99–s123.
Bull, F., T.S. Maslin, and T. Armstrong. “Global Physical Activity Questionnaire (GPAQ): Nine country reliability and validity study.” Journal of Physical Activity and Health 6 (2009): 790–804.
Bureau of Transportation Statistics. Research and Innovative Technology Administration. “National Household Transportation Survey Daily Travel Quick Facts.” http://www.bts.gov/programs/national_household_travel_survey/daily_travel.html (accessed June 15, 2010).
Centers for Disease Control and Prevention. 2009 “Behavioral Risk Factor Surveillance System Questionnaire”, December 30, 3008. http://www.transitworks.org/about/2009BikeReportFinalDraft.pdf.pdf (accessed July 2010).
Chicago Area Transportation Study. Plan Development Division. Soles & Spokes: The Pedestrian and Bicycle Plan for Chicago Area Transportation: Task 1 Report: Web-Based Survey. Chicago, October 2004. http://www.cmap.illinois.gov/uploadedFiles/planning_activities/transportation/bikeped/plan/WebSurveyFinalReport.pdf (accessed June 20, 2010).

Mineta Transportat ion Inst i tute
References82
Chicago Metropolitan Agency for Planning. Travel Tracker Survey. NuStats. Chicago, 2008. http://www.nustats.com/chicago/ (accessed June 20, 2010).
City of Boulder. 2008 Boulder Valley Employee Survey for Transportation. Prepared by National Research Center Inc. Boulder, CO, April 2009. http://www.bouldercolorado.gov/files/Transportation_Master_Plan/Measurements/tmp_bves_trans_results08.pdf (accessed June 20, 2010).
City of Boulder. Audit and Evaluation Division. 2000 Annual Transportation Survey of Residents (including Bicycle/Pedestrian Issues). Prepared by Diane (Dee) Baron. Boulder, CO, January 2001. http://www.bouldercolorado.gov/files/Transportation_Master_Plan/TRANSP00-rr.pdf (accessed August 26, 2009).
City of Boulder. Audit and Evaluation Division. 2001 Annual Transportation Survey of Residents, by Diane (Dee) Baron. Boulder, CO, January 2002. http://www.bouldercolorado.gov/files/Transportation_Master_Plan/Transp01.pdf (accessed June 20, 2010).
City of Kirkland. More People, More Places, More Often: An Active Transportation Plan. Kirkland, WA, March 2009. http://www.ci.kirkland.wa.us/Assets/Public+Works/ Public+Works+PDFs/Transportation/ATP+Final+Plan.pdf (accessed September 10, 2009).
Clifton, Kelly J., and Kevin J. Krizek. The Utility of the NHTS In Understanding Bicycle And Pedestrian Travel. Prepared for: National Household Travel Survey Conference: Understanding Our Nation’s Travel, Washington, DC, November 1-2, 2004.. http://onlinepubs.trb.org/onlinepubs/archive/conferences/nhts/Krizek.pdf (accessed June 20, 2010).
Clifton, Kelly J., Andrea D. Livi Smith, and Daniel Rodriguez. “The Development and Testing of an Audit for the Pedestrian Environment.” Landscape and Urban Planning 80, no. 1-2 (March 28, 2007): 95-110.
Day, K., M. Boarnet, M. Alfonzo, and A. Forsyth. “The Irvine Minnesota Inventory to Measure Built Environments: Development.” American Journal of Preventive Medicine 30, no. 2 (February 2006): 144-152.
Dill, Jennifer, and Kim Voros. “Factors Affecting Bicycling Demand: Initial Survey Findings from the Portland Region.” Transportation Research Record 2031 (2007): 9-17.
Dillman, Don A. Mail and Internet Surveys: the Tailored Design Method. 2nd ed. New York: John Wiley & Sons, 2007.

Mineta Transportat ion Inst i tute
References 83
District of Columbia. District Department of Transportation. District of Columbia Pedestrian Master Plan: Online Survey Results Summary - March 2007. Washington, D.C., March 2007. http://www.tooledesign.com/projects/dc/downloads/SurveyResultsSummary3_2_07.pdf (accessed June 20, 2010).
Edwards, P., I. Roberts, M. Clarke, C. DiGuiseppi, S. Pratap, R. Wentz., and I Kwan. “Increasing Response Rates to Postal Questionnaires: A Systematic Review. British Medical Journal 324 (2002): 1183.
Forsyth, Ann, Mary Hearst, J. Michael Oakes, and Kathryn H. Schmitz. “Design and Destinations: Factors Influencing Walking and Total Physical Activity.” Urban Studies 45, no. 9 (2008): 1973–1996.
Forsyth, Ann, Kevin J. Krizek, and Daniel A. Rodriguez. “Non-motorized Travel Research and Contemporary Planning Initiatives.” Progress in Planning 71 (2009): 170 –184.
Forsyth, A., J. Michael Oakes, and Kathryn H. Schmitz. “Test-Retest Reliability of the Twin Cities Walking Survey.” Journal of Physical Activity and Health 6, no. 1 (2009): 119–131.
Fowler, Floyd J. Survey Research Methods. 2nd ed. London: Sage Publications, 1993.
Giles-Corti B, H. Cutt, A. Timperio, T. J. Pikora, F. L. Bull, M. Knuiman, M. Bulsara, K. Van Niel, and T. Shilton. “Development of a Reliable Measure of Walking Within and
Outside the Local Neighborhood: RESIDE’s Neighbourhood Physical Activity Questionnaire.” Preventive Medicine 42 (2006a): 455–459.
Giles-Corti B, H. Cutt, A. Timperio, T. J. Pikora, F. L. Bull, M. Knuiman, M. Bulsara, K. Van Niel, and T. Shilton. “Neighbourhood Physical Activity Questionnaire Instrument“ (2006b). http://www.sph.uwa.edu.au/research/cbeh/projects/?a=382545 (accessed June 2010).
Hansen, Kasper M. “The Effects of Incentives, Interview Length, and Interviewer Characteristics on Response Rates in a CATI Study.” International Journal of Public Opinion Research 19, no. 1 (2006): 112–121.
Hartgen, David T., and Elizabeth San Jose. Costs and Trip Rates of Recent Household Travel Surveys. November 11, 2009. http://www.hartgengroup.net/Projects/National/USA/household_travel_summary/2009-11-11_Final_Report_Revised.pdf (accessed June 20, 2010).
Hennepin County. Department of Housing, Community Works & Transit. Hennepin County Trail User Survey, Summer 2005, Hennepin County, 2005. http://www.co.hennepin.mn.us/images/HCInternet/EPandT/Community%20Development/Transportation%20and%20Land%20Use%20Research/2005%20Trail%20User%20Survey.pdf (accessed August 26, 2009).

Mineta Transportat ion Inst i tute
References84
Hubert H. Humphrey Institute of Public Affairs and Center for Transportation Studies. Nonmotorized Transportation Pilot Program Evaluation Study: Final Report. by Kevin J. Krizek, Gary Barnes, Ryan Wilson, Bob Johns, and Laurie McGinnis. University of Minnesota, June 2007.
Kish, Leslie. Survey Sampling. New York: J. Wiley & Sons, 1965.
Krizek, Kevin, Ann Forsyth, and Laura Baum. Walking and Cycling International Literature Review. Melbourne: Victoria Department of Transport (2009a). http://www.transport.vic.gov.au/DOI/DOIElect.nsf/$UNIDS+for+Web+Display/70D43560D1141DDFCA2575E8000BA1EE/$FILE/WalkingCyclingLiteratureReview.pdf (accessed June 20, 2010).
Krizek, Kevin J., Susan Handy, and Ann Forsyth. “Explaining Changes in Walking and Bicycling Behavior: Challenges for Transportation Research.” Environment and Planning B 36, (2009b): 725–740.
Krizek, K. A. Forsyth, and A. W. Agrawal. Forthcoming 2010. Pedestrian and Bicycling Survey (PABS): User’s Manual. http//www.designforhealth.net/resources/PABS.html.
Lohr, Sharon L. Sampling: Design and Analysis. Pacific Grove, CA: Duxbury Press, 1999.
Mangione, Thomas W. Mail Surveys: Improving the Quality. Thousand Oaks, CA: Sage Publications, 1995.
Mokrzycki, Mike. “Cord-Cutting Continues at Steady Pace.” Pollster.com, December 16, 2009. http://www.pollster.com/blogs/mokrzycki_cordcutting_continue.php (accessed July 23, 2010).
Moritz, William E. “Survey of North American Bicycle Commuters: Design and Aggregate Results.” Transportation Research Record 1578 (1997): 91–101.
New York City. Department of City Planning. The New York City Bicycle Survey: A Report Based on the Online Public Opinion Questionnaire Conducted for Bike Month 2006. by Amanda M. Burden. New York, NY, May 2007. http://www.nyc.gov/html/dcp/pdf/transportation/bike_survey.pdf (accessed June 20, 2010).
Oakes J. Michael, Ann Forsyth, Mary Hearst, and Kathryn. H. Schmitz. “Recruiting Participants for Neighborhood Effects Research: Strategies and Outcomes of the Twin Cities Walking Study.” Environment and Behavior 41, no. 6 (2009): 787–805.

Mineta Transportat ion Inst i tute
85
Puget Sound Regional Council. PSRC 2006 Household Activity Survey Analysis Report: Final Report, by Cambridge Systematics, Inc. Sammamish, WA, April 2007. http://www.psrc.org/assets/1979/hhactivitysurvey.pdf (accessed June 20, 2010).
Puget Sound Regional Council. PSRC 2006 Household Activity Survey Analysis Report: Final Report, by Cambridge Systematics, Inc. Sammamish, WA, April 2007. http://www.psrc.org/data/surveys/2006-household (accessed July 2010).
Rails-to-Trails Conservancy, Northeast Regional Field Office and Trail Facts, Interactive Marketing. Trail User Survey Workbook: How to Conduct a Survey and Win Support for Your Trail: Sample Surveys and Methods - 2005. Camp Hill, PA, 2005. http://www.railstotrails.org/resources/documents/resource_docs/UserSurveyMethodology.pdf (accessed June 20, 2010).
Rizzo, Louis, J. Michael Brick, and Inho Park. “A Minimally Intrusive Method for Sampling Persons in Random Digit Dial Surveys.” Public Opinion Quarterly 68, no. 2 (2004): 267–274.
Rogers, A., M. A. Murtaugh, S. Edwards, and M. L. Slattery. “Contacting Controls: Are We Working Harder for Similar Response Rates, and Does It Make a Difference?” American Journal of Epidemiology 160, no. 1 (2004): 85–90.
Schneider, Robert, Robert Patton, Jennifer Toole (Toole Design Group), and Raborn, Craig (PBIC/UNC-CH) Pedestrian and Bicycle Data Collection in United States Communities: Quantifying Use, Surveying Users, and Documenting Facility Extent. Federal Highway Administration’s Office of Natural and Human Environment. Washington D.C.: January2005. http://drusilla.hsrc.unc.edu/cms/downloads/ PBIC_Data_Collection_Case_Studies2005.pdf (accessed June 20, 2010).
Singer, Eleanor. “Confidentiality, Risk Perception, and Survey Participation.” Chance, 17 (2004): 31-5.
Teitler Julien O., Nancy E. Reichman, and Susan Sprachman. “Costs and Benefits of Improving Response Rates for a Hard-to-Reach Population.” Public Opinion Quarterly 67, no. 1 (2003): 126–138.
Transitworks. Bicycle Transportation Survey. Boston: Transitworks, 2009. http://www.transitworks.org/about/2009BikeReportFinalDraft.pdf.pdf (accessed July, 2010).
Trinh, O.T.H., N.D. Nguyen, H.P. van der Ploeg, M.J. Dibley, and A. Bauman, “Test-Retest Repeatability and Relative Validity of the Global Physical Activity Questionnaire in a Developing Country Context.” Journal of Physical Activity and Health 6, nSppl.1 (2009): s46–s53.
References

Mineta Transportat ion Inst i tute
86
U.C. Berkeley Safe Transportation Research and Education Center. Seamless Travel: Measuring Bicycle and Pedestrian Activity in San Diego County and its Relationship to Land Use, Transportation, Safety, and Facility Type. Institute for Transportation Studies, 2010, http://www.altaplanning.com/App_Content/files/Seamless-Final-Report-June-2010.pdf (accessed July 13, 2010)
U.S. Department of Transportation. Federal Highway Administration. “United States Department of Transportation Policy Statement on Bicycle and Pedestrian Accommodation: Regulations and Recommendations.” U.S. Department of Transportation March 11, 2010. http://www.fhwa.dot.gov/environment/bikeped/policy_accom.htm (accessed June 20, 2010).
U.S. Department of Transportation. Federal Highway Administration. I. 2008a. http://nhts.ornl.gov/2008/doc/NHTS_2008_Questionnaire.pdf (accessed September 15, 2009).
U.S. Department of Transportation. Federal Highway Administration. Guidebook on Methods to Estimate Non-Motorized Travel: Supporting Documentation, by Cambridge Systematics, Inc. Publication No. FHWA-RD-98-166. McLean, VA, July1999. http://www.fhwa.dot.gov/tfhrc/safety/pubs/vol2/title.htm (accessed June 20, 2010).
U.S. Department of Transportation. National Highway Traffic Safety Administration. Volume III: Methods Report National Survey of Bicycle and Pedestrian Attitudes and Behavior, by Dawn Royal and Darby Miller-Steiger. Office of Behavioral Safety & Research. Washington, DC, August 2008b. http://www.nhtsa.gov/DOT/NHTSA/Traffic%20Injury%20Control/Articles/Associated%20Files/810973.pdf (accessed June 20, 2010).
Vogt, W. Paul. Dictionary of Statistics and Methodology: A Nontechnical Guide for the Social Sciences. Thousand Oaks, CA: Sage Publications, 1993.
WBA Market Research, “City of Cambridge, Cambridgeport Social Marketing Survey”. Available from city.
Willcox, Adam S., Giuliano, William M., and Israel, Glenn D. “Effects of Token Financial Incentives on Response Rates and Item Nonresponse for Mail Surveys” Human Dimensions of Wildlife: An International Journal 15.4 (2010). 19 Jul. 2010 http://www.informaworld.com/10.1080/10871201003736047.
Ziegenfuss, J., T. J. Beebe, E. Rey, C. Schleck, G. R. Locke III, and N. J. Talley. “Internet Option in a Mail Survey: More Harm Than Good?” Epidemiology 4, no. 21 (2010): 485–586.
References

Mineta Transportat ion Inst i tute
87
ABOUT THE AUTHORS
ANN FORSYTH, Ph.D.
Ann Forsyth, Mineta Transportation Institute Research Associate, is professor of City and Regional Planning at Cornell University. Trained in planning and architecture, she is an expert in physical planning and urban design. Her particular expertise is in sustainable and healthy city design focusing on challenging issues: suburban design and planned communities, walkability, affordable housing, social diversity, and green space. She has also developed new tools for doing this work, including measuring design features of urban environments, assessing plan impacts, and helping the public participate in urban design and planning.
KEVIN KRIZEK, Ph.D.
Kevin J. Krizek, Mineta Transportation Institute Research Associate, is associate professor of Planning, Design, and Civil Engineering at the University of Colorado. He serves as director of the Ph.D. Program in Design and Planning and heads the Active Communities/Transportation (ACT) Research Group. His research focuses on travel behavior (specializing in cycling), neighborhood accessibility, health and planning, and sustainable development. Krizek is a founding editor of the Journal of Transport and Land Use, serves as chair of the Transportation Research Board Committee on Telecommunications and Travel, and is on the editorial board of the Journal of the American Planning Association. For more information, see www.kevinjkrizek.org.
ASHA WEINSTEIN AGRAWAL, Ph.D.
Asha Weinstein Agrawal, Mineta Transportation Institute Research Associate, is associate professor in the Department of Urban and Regional Planning at San José State University, and also director of the MTI National Transportation Finance Center. Her research interests in transportation policy and planning include pedestrian planning, urban street design, and transportation finance. She also works in the area of planning and transportation history. She has a BA from Harvard University, an MURP from the London School of Economics and Political Science, and a Ph.D. from the University of California at Berkeley. For a complete listing of her publications, see http://www.sjsu.edu/faculty/ weinstein.agrawal/.

Mineta Transportat ion Inst i tute
88About the Authors

Mineta Transportat ion Inst i tute
89
PEER REVIEW
San José State University, of the California State University system, and the MTI Board of Trustees have agreed upon a peer review process required for all research published by MTI. The purpose of the review process is to ensure that the results presented are based upon a professionally acceptable research protocol.
Research projects begin with the approval of a scope of work by the sponsoring entities, with in-process reviews by the MTI Reseach Director and the Research Associated Policy Oversight Committee (RAPOC). Review of the draft research product is conducted by the Research Committee of the Board of Trustees and may include invited critiques from other professionals in the subject field. The review is based on the professional propriety of the research methodology.

Mineta Transportat ion Inst i tute
90 Peer Review

The Norman Y. Mineta International Institute for Surface Transportation Policy Studies (MTI) was established by Congress as part of the Intermodal Surface Transportation Efficiency Act of 1991. Reauthorized in 1998, MTI was selected by the U.S. Department of Transportation through a competitive process in 2002 as a national “Center of Excellence.” The Institute is funded by Con-gress through the United States Department of Transportation’s Research and Innovative Technology Administration, the Califor-nia Legislature through the Department of Transportation (Caltrans), and by private grants and donations.
The Institute receives oversight from an internationally respected Board of Trustees whose members represent all major surface transportation modes. MTI’s focus on policy and management resulted from a Board assessment of the industry’s unmet needs and led directly to the choice of the San José State University College of Business as the Institute’s home. The Board provides policy direction, assists with needs assessment, and connects the Institute and its programs with the international transportation community.
MTI’s transportation policy work is centered on three primary responsibilities:
MINETA TRANSPORTATION INSTITUTE
Research MTI works to provide policy-oriented research for all levels of government and the private sector to foster the development of optimum surface transportation systems. Research areas include: transportation security; planning and policy develop-ment; interrelationships among transportation, land use, and the environment; transportation finance; and collaborative labor-management relations. Certified Research Associates conduct the research. Certification requires an advanced degree, gener-ally a Ph.D., a record of academic publications, and professional references. Research projects culminate in a peer-reviewed publication, available both in hardcopy and on TransWeb, the MTI website (http://transweb.sjsu.edu).
Education The educational goal of the Institute is to provide graduate-level education to students seeking a career in the development and operation of surface transportation programs. MTI, through San José State University, offers an AACSB-accredited Master of Sci-ence in Transportation Management and a graduate Certificate in Transportation Management that serve to prepare the nation’s transportation managers for the 21st century. The master’s de-gree is the highest conferred by the California State University system. With the active assistance of the California Department
of Transportation, MTI delivers its classes over a state-of-the-art videoconference network throughout the state of California and via webcasting beyond, allowing working transportation professionals to pursue an advanced degree regardless of their location. To meet the needs of employ-ers seeking a diverse workforce, MTI’s education program promotes enrollment to under-represented groups.
Information and Technology Transfer MTI promotes the availability of completed research to professional organizations and journals and works to integrate the research findings into the graduate education program. In addition to publishing the studies, the Institute also sponsors symposia to disseminate research results to transportation professionals and encourages Research As-sociates to present their findings at conferences. The World in Motion, MTI’s quarterly newsletter, covers innovation in the Institute’s research and education programs. MTI’s extensive collection of transportation-related publications is integrated into San José State University’s world-class Martin Luther King, Jr. Library.
The contents of this report reflect the views of the authors, who are responsible for the facts and accuracy of the information presented here-in. This document is disseminated under the sponsorship of the U.S. Department of Transportation, University Transportation Centers Program and the California Department of Transportation, in the interest of information exchange. This report does not necessarily reflect the official views or policies of the U.S. government, State of California, or the Mineta Transportation Institute, who assume no liability for the contents or use thereof. This report does not constitute a standard specification, design standard, or regulation. The views and conclusions contained in this document are those of the authors and should not be interpreted as necessarily representing the official policies, either expressed or implied, of the U.S. Department of Homeland Security.
DISCLAIMER
MTI FOUNDER Hon. Norman Y. Mineta
MTI BOARD OF TRUSTEESHonorary Co-ChairHon. James Oberstar **
ChairHouse Transportation andInfrastructure CommitteeHouse of RepresentativesWashington, DC
Honorary Co-Chair
Hon. John L. Mica **
Ranking MemberHouse Transportation andInfrastructure CommitteeHouse of RepresentativesWashington, DC
David L. Turney *
Chair/President/CEODigital Recorders, Inc.Dallas, TX
William W. Millar ^
Vice Chair/PresidentAmerican Public TransportationAssociation (APTA)Washington, DC
Hon. Rod Diridon, Sr. #
Executive DirectorMineta Transportation InstituteSan Jose, CA
Ronald BarnesGeneral ManagerVeolia Transportation/EastValley RPTA
Mesa, AZ
Rebecca BrewsterPresident/COOAmerican TransportationResearch InstituteSmyrna, GA
Donald H. CamphPresidentCalifornia Institute for Technology ExchangeLos Angeles, CA
Anne P. CanbyPresidentSurface TransportationPolicy ProjectWashington, DC
Jane ChmielinskiPresidentDMJM Harris
New York, NY
William DoreyPresident/CEOGranite Construction, Inc.
Watsonville, CA
Mortimer DowneyChairmanPB Consult Inc.
Washington, DC
Nuria FernandezCommissionerCity of Chicago,Department of Aviation,
Chicago, IL
Steve HemingerExecutive DirectorMetropolitan TransportationCommissionOakland, CA
Hon. John Horsley #
Executive DirectorAmerican Association of StateHighway & TransportationOfficials (AASHTO)Washington, DC
Joseph BoardmanPresident/CEOAmtrak60 Massachusetts Ave., N.E.Washington, DC 20002
Will KemptonDirectorCalifornia Department of TransportationSacramento, CA
Brian MacleodSenior Vice PresidentGillig Corporation
Hayward, CA
Dr. Bruce MagidDeanCollege of BusinessSan José State UniversitySan José, CA
Stephanie PinsonPresident/COOGilbert Tweed Associates, Inc.New York, NY
Hans RatSecretary GeneralUnion Internationale desTransports PublicsBruxelles, Belgium
Vickie ShafferGeneral ManagerTri-State Transit AuthorityHuntington, WV
Paul Toliver #
PresidentNew Age IndustriesSeattle, WA
Michael S. Townes #
President/CEOTransportation DistrictCommission of Hampton Roads
Hampton, VA
Edward WytkindPresidentTransportation TradesDepartment, AFL-CIOWashington, DC
Hon. Rod Diridon, Sr.Executive Director
Karen E. Philbrick, Ph.D.Research Director
Peter Haas, Ph.D.Education Director
Donna MaurilloCommunications Director
Brian Michael JenkinsNational Transportation Security Center of Excellence
Asha Weinstein Agrawal, Ph.D.National Transportation Finance Center
Asha Weinstein Agrawal, Ph.D.Urban and Regional Planning San José State University
Jan Botha, Ph.D.Civil & Environmental EngineeringSan José State University
Katherine Kao Cushing, Ph.D.Enviromental Science San José State University
Dave Czerwinski, Ph.D.Marketing and Decision Science San José State University
Frances Edwards, Ph.D.Political Science San José State University
Taeho Park, Ph.D.Organization and Management San José State University
Diana WuMartin Luther King, Jr. LibrarySan José State University
Directors Research Associates Policy Oversight Committee
** Honorary* Chair^ Vice Chair# Past Chair

Paving The Way: Recruiting Students into the Transportation Professions
MTI Report 08-03
Funded by U.S. Department of Transportation and California Department of Transportation
MT
IP
aving The W
ay: Recruiting Students into the T
ransportation Professions
MT
I Report 08-03June 2009