BioGeochemical Cycling of Carbon, Nitrogen, and ...
316
&ikm* P2 m&$ X& &&&g SS1 ^ W'% s^& •••*iV.i ii^% -•?^£'?& »^p*m &£?&p ^•s^yS^K AJW^W-^fr" »& I ONV II I S3HM0A SVX31 S3HSHVN H130 NAII H]ooaim mm 'AVfl V3VAV1 JO III SIMMON SnHQHJSOHd ONV JO 0NI13A3 lV3IN3H30]00lfl
-
Upload
khangminh22 -
Category
Documents
-
view
0 -
download
0
Transcript of BioGeochemical Cycling of Carbon, Nitrogen, and ...

&ikm*P2m&$
X&&&&gSS1
^W'%s^&•••*iV.i
ii^%-•?^£'?&
»^p*m&£?&p
^•s^yS^K AJW^W-^fr"»&
IONVIIIS3HM0A
SVX31S3HSHVNH130NAII
H]ooaimmm
'AVflV3VAV1JOIIISIMMONSnHQHJSOHdONVJO0NI13A3lV3IN3H30]00lfl

BIOGEOCHEMICAL CYCLING OF CARBON,NITROGEN, AND PHOSPHORUS NUTRIENTS IN
RIVER DELTA MARSHES OF LAVACA BAY, TEXAS
BAYS AND ESTUARIES PROGRAM
THREE TECHNICAL REPORTS
Submitted under interagency contracts tothe Texas Water Development Board by the Center for
Research in Water Resources, The University of Texas at Austin
Texas Department of Water Resources
LP-39
February, 1978
Originally Published by the Center for Research in Water Resourcesas Technical Reports CRWR-121, January 24, .1975; CRWR-129, August31, 1975; and CRWR-147, December 31, 1976. Reprinted by the TexasDepartment of Water Resources as part of their LP Series.

PREFACE
The Texas Water Development Board initiated the Bays and EstuariesProgram in 1967 to collect biological and hydrological data for the purpose of developing a working knowledge of the relationships that existamong freshwater inflows, tidal exchange, nutrients, and biological productivity of the bays and estuaries. At the time these studies werebegun, there were very little reliable data available on the Texas estua-rine systems. Although several limited programs were underway, theywere largely independent of one another, the data collected under anysingle program were not comprehensive, and since sampling and measurements of physical parameters under different programs were not accomplished simultaneously, the resulting data could not be reliably correlated.
The Texas Water Code directs the Texas Water Development Board (nowthe executive body of the Texas Department of Water Resources as a result of consolidation of state water agencies by the 65th Texas Legislature, 1977) to "prepare, develop, and formulate a comprehensive statewater plan", wherein, "the Board shall also give consideration in theplan to the effect of upstream development on the bays, estuaries, andarms of the Gulf of Mexico, and to the effect of the plan on navigation"(Chapter 11, Section 11.101, V.T.C.A.). Codified from the Texas WaterDevelopment Board Act (1957), these statute provisions were the firstlegislative directives to focus water resources planning and development on the real problems associated with alteration and/or depletionof riverine freshwater flows.
In 1975, the 64th Texas Legislature amended the Texas Water Codeto read:
"It is the public policy of the State to providefor the conservation and development of the State'snatural resources, including...the maintenance ofa proper ecological environment of the bays andestuaries of Texas and the health of related livingmarine resources" (Chapter 1, Section 1.003, V.T.C.A.).
In so doing, the Legislature further directed that,"the [Water Development] Board shall carry out comprehensive studies of the effects of freshwaterinflows upon the bays and estuaries of Texas,which studies shall include the development ofmethods of providing and maintaining the ecological environment thereof suitable to theirliving marine resources" (Chapter 11, Sub-ChapterD, Section 11.108, V.T.C.A.).
In response to the legislative mandate, the Board's Bays and Estuaries Program is seeking to establish a broad understanding of theTexas coastal environments and their natural processes. This report,entitled "Biogeochemical Cycling of Carbon, Nitrogen, and PhosphorusNutrients in River Delta Marshes of Lavaca Bay, Texas", is a consolidation
ii

of three related Bays and Estuaries Program studies performed by theCenter for Research in Water Resources, The University of Texas atAustin, under interagency contract with the Board.
The process of nutrient biogeochemical cycling is vital toestuarine productivity and basic to the natural assimilation ofnutritive wastes. Moreover, it is intimately tied to fluctuationsin freshwater inflows and the inundation and dewatering of the deltaicmarsh wetlands. Thus, these reported studies are in direct supportof the Board's legislative mandate and make a fundamental contribution to the ecology of Texas bays and estuaries.
m

CONTENTS
Part I:
Armstrong, N.E., M.O. Hinson, Jr., J.H. Collins, and E.G. Fruh.1975. Biochemical Cycling of Carbon, Nitrogen, and Phosphorus in Saltwater Marshes of Lavaca Bay, Texas. FinalReport to the Texas Water Development Board, January 24,1975. Center for Research in Water Resources, The University of Texas at Austin.
Part II:
Dawson, A.J., and N.E. Armstrong. 1975. The Role of Plantsin Nutrient Exchange in the Lavaca Bay Brackish MarshSystem. Final Report to the Texas Water Development Board,August 31, 1975. Center for Research in Water Resources,The University of Texas at Austin.
Part III:
Armstrong, N.E., and B.A. Brown. 1976. The Role of Sedimentsin Nutrient Exchange in the Lavaca Bay Brackish MarshSystem. Final Report to the Texas Water Development Board,December 31, 1976. Center for Research in Water Resources,The University of Texas at Austin.
iv


PART I:
BIOGEOCHEMICAL CYCLING OF CARBON, NITROGEN,AND PHOSPHORUS IN SALTWATER MARSHES
OF LAVACA BAY, TEXAS
by
Neal E. Armstrong, Melvin 0. Hinson, Jr.,James H. Collins, and E. Gus Fruh
FINAL REPORT
Submitted to the Texas Water Development Boardby the Center for Research in Water Resources, Environmental
Health Engineering Research Laboratory, Civil Engineering Department,The University of Texas at Austin
Interagency Contract No. IAC (74-75) - 0973
January 24, 1975


CHAPTER I
CHAPTER II
CHAPTER III
CHAPTER IV
CHAPTER V
CHAPTER VI
TABLE OF CONTENTS
Page
INTRODUCTION 1-1Need for Study 1-1Objectives 1-2Scope 1-2Report Organization 1-2Acknowledgments 1-3
PREVIOUS WORK n-iNature of Literature Review II-1Nutrient Exchange Studies n-iModel Marsh Ecosystems n-9
METHODS USED III-lNature of Studies Conducted III-lField Investigations m-iLaboratory Investigations III-6
RESULTS IV-1Introduction IV-1
Field Investigations IV-1Laboratory Investigations IV-11
DISCUSSION V-lField Investigations V-l
Laboratory Investigations V-3
CONCLUSIONS AND RECOMMENDATIONS VI-1
Conclusions VT-1
Recommendations VI-3
LIST OF REFERENCES
ii

LIST OF TABLES
Table Title Page
IV-1 Water Mass Movement Through Swan Lake IV-3Marsh Stations During Three Different Hydro-logic Conditions
IV-2 Movement of Carbon, Nitrogen, and Phosphorus IV-5at Swan Lake Marsh Stations - First Field Trip(June 27-28, 1974)
IV-3 Movement of Carbon, Nitrogen, and Phosphorus IV-8at Swan Lake Marsh Stations - Second Field Trip(July 11-12, 1974)
IV-4 Movement of Carbon, Nitrogen, and Phosphorus IV-10at Swan Lake Marsh Stations - Third Field Trip(July 30-August 1, 1974)
IV-5 Multiple Regression Statistics IV-13
LIST OF FIGURES
Number Title
III-l Location of Swan Lake Marsh Stations
III-2 Bayou Cross-Sections at Swan Lake Marsh Stations
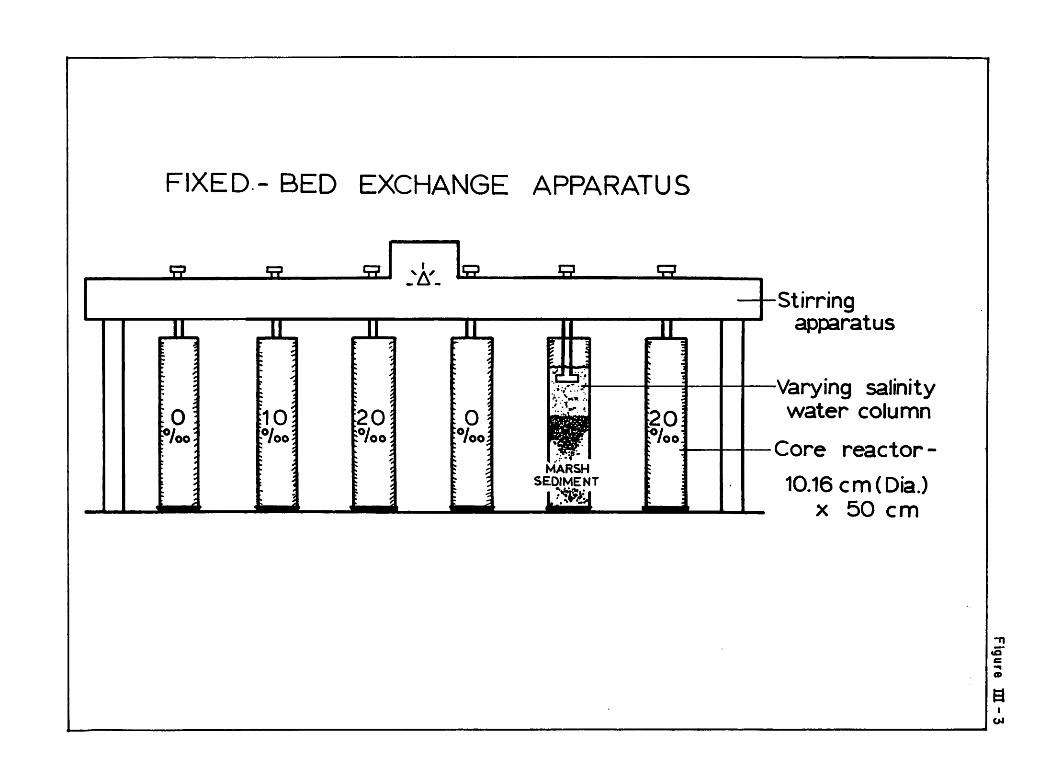
III-3 Fixed-Bed Exchange Apparatus
III-4 Schematic of Continuous Flow Reactor System
III—5 Reactor Detail
IV-1 Water Velocity and Distance Traveled in Swan Lake MarshBayou - June 27-28, 1974
IV-2 Water Temperature and Dissolved Oxygen Changes in SwanLake Marsh - June 27-28, 1974
IV-3 Total Organic Carbon and Nitrogen Changes in Swan LakeMarsh - June 27-18, 1974
IV-4 Phosphorus Changes in Swan Lake Marsh Bayou - June 27-28, 1974
IV-5 Water Velocity and Distance Traveled in Swan Lake MarshBayou - July 11-12, 1974
IV-6 Water Temperature and Dissolved Oxygen Changes in SwanLake Marsh Bayou - July 11-12, 1974
IV-7 Organic Carbon Changes in Swan Lake Marsh Bayou - July11-12, 1974
iii

LIST OF FIGURES (continued)
Number Title
IV-8 Nitrogen and Phosphorus Changes in Swan Lake MarshBayou - July 11-12, 1974
IV-9 Water Velocity and Distance Traveled in Swan Lake MarshBayou - July 30-August 30, 1974
IV-10 Temperature Changes in Swan Lake Marsh Bayou - July 30-August 1, 1974
IV-11 Dissolved Oxygen in Swan Lake Marsh Bayou - July 30-August 1, 1974
IV-12 Total Organic Carbon Changes in Swan Lake Marsh Bayou -July 30-August 1, 1974
IV-13 Organic Material (Volatile Suspended Solids) in Swan LakeMarsh Bayou - July 30-August 1, 1974
IV-14 Nitrogen Changes in Swan Lake Marsh - July 30-August 1,1974
IV-15 Total and Orthophosphorus Changes in Swan Lake MarshBayou - July 30-August 1, 1974
IV-16 Salinity Effects on Ammonia Leaching from Sediments
IV-17 Temperature Effects on Ammonia Leaching from Sediments
IV-18 Effects of Salinity on Ammonia Uptake by Sediments
IV-19 Effects of Temperature on Ammonia Uptake by Sediments
IV-20 Salinity Effects on Ammonia Leaching from Sediments
IV-21 Salinity Effects on Ammonia Uptake by Sediments
IV

CHAPTER I
INTRODUCTION
NEED FOR STUDY
Saltwater marshes and grassflats have been shown to play an extremely
important role in providing organic and inorganic food material to a variety
of biota in estuaries. Numerous studies along the Atlantic coast of the United
States have delineated the pathways of marsh-produced detritus, measured
the productivity of the emergent vegetation and associated periphyton of
the marsh, and shown the effect of organic waste and associated nutrients
on the growth and species composition of the saltwater marsh system.
Saltwater marshes in the Texas coastal zone are presumed to be just as
important to the Texas Bays as they are elsewhere; however, little work
has been conducted on any of the Texas marshes to measure their productivity,
their contributions of organic and inorganic nutrients to the adjacent estuarine
waters, or the importance of tidal action and/or freshwater flows to the marsh.
The areal distribution of saltwater and freshwater marshes is being mapped in
the Texas coastal zone by the Bureau of Economic Geology (e.g. Fisher, et al.
1972). Some work has been done on submerged grassflats in Texas, but only
to define their overall distribution, function and importance as habitats for
fish and shellfish.
Too, there is a dearth of information on the possible impact of water
resouce development on marshes and grassfL.ts. Modifications to fresh
water flows and flow periods can effect the function of, nutrient supplies for,
and geochemical cycling in these natural systems. These effects are not fully
understood at the present time, but they are receiving considerable attention.
The Texas Water Development Board is now developing a hydrodynamic-
water quality mathematical model of the Lavaca River-Lavaca Bay-Matagorda
Bay system to aid in assessing the impact of water resource development
in the Lavaca River and Garcitas Creek basins. The marshes and grassflats
of Lavaca Bay are integral parts of the models, but information on the biogeo-
chemical cycles of carbon (organic nutrient) and nitrogen and phosphorus
(inorganic nutrients) are needed, especially the exchange rates between the
sediments and biota of the marsh and grassflat systems and the water flowing
through them.
1-1

OBTECTIVES
It was the purpose of this project to perform studies leading to descrip
tions of the biogeochemical cycles of carbon (C), nitrogen (N), and phos
phorus (P) in the saltwater marshes of Lavaca Bay and to state these descrip
tions in a quantitative form suitable for inclusion in the Board's mathematical
model.
SCOPE
Both laboratory and field tests were conducted. Special sediment slurry
uptake studies were performed for the purpose of developing Freundlich-like
isotherms relating sediment concentrations of C, N. P to the equilibrium con
centrations in water and to show the effects of sediment composition, salinity,
and temperature on uptake. The flux of N and P into and out of sediment were
studied in fixed-bed systems by continuously adding various amounts of N
and P to these systems and following uptake in the sediments until equilibrium
conditions were established, then stopping the additions and following the
release of nutrients from the sediments. Also, portions of the marsh were
isolated in several cylindrical plexiglass chambers in the laboratory and
nutrient exchange studies performed. Mass balances were made for C, N,
and P added in spiked and non-spiked Bay water, and productivity measure
ments were taken to determine the stimulatory effects of these nutrient
additions.
The field studies involved the collection of hydraulic and nutrient data
at several stations in a bayou off Swan Lake in Lavaca Bay to determine net
nutrient transport and exchange from and in the saltwater marshes. Three
field trips were made covering flooded, dry, and moderately wet conditions
in the marsh.
From these studies, mathematical models describing the sediment uptake
of C, N, and P as a function of the mass transfer coefficient and the difference
between equilibrium (as related to the sediments) and ambient nutrient con
centrations were to be developed. These models were to be of such form as
to be used directly in the Board's larger water quality model.
REPORT ORGANIZATION
The organization of this report is as follows. Chapters are numbered
by Roman numerals, and pages, tables, and figures are numbered within
1-2

individual chapters using the chapter Roman numeral followed by an Arabic
numeral (e.g. II-l, IV-2, etc.). Figures are placed at the end of each
chapter.
The results of the literature review are presented in Chapter II followed
by the methods used in this study in Chapter III. Results of the field and
laboratory investigations are contained in Chapter IV, and the results are
discussed in Chapter V. Finally, the conclusions of this study and rec
ommendations for future work are given in Chapter VI.
ACKNOWLEDGMENTS
The authors are indebted to a number of individuals for their help during
the course of this project. First, the authors thank the Texas Water Develop
ment Board for the interagency contract funding and Mr. Jack Nelson of the
Board for his guidance and help. Also, the assistance of Mr. Don Schwartz
and Mr. Wiley Haydon of the Texas Water Development Board and Mr. Gill
Gilmore and Mr. George Clemens of the Texas Department of Parks and
Wildlife, Coastal Fisheries Division, Seadrift Office, was appreciated.
Next, the authors thank Mr. Robert Leshber and his staff of the Texas State
Health Department Laboratory for their careful chemical analysis of the
samples collected. Finally, the authors are indebted to Mr. Kenneth Aicklen,
Mrs. Julie G. Collins, Mrs. Nadine Gordon, Mr. Frank Hulsey and
Mr. Alan Goldstein for their able and unselfish assistance in the laboratory
and field, and to Mrs. Sharon Thornhill for her very able secretarial and
clerical work throughout the project.
1-3


CHAPTER II
PREVIOUS WORK
NATURE OF LITERATURE REVIEW
The review of previous work in the literature was limited specifically
to two areas: nutrient exchange studies with sediments and marsh plants;
and laboratory models or microcosms of marsh ecosystems. The two areas
of study were chosen since this project focused on the biogeochemical
cycling of nutrients in the marsh and hence a determination of the rate of
nutrient movement from one marsh component to another - in this case
from the sediment to the overlying water and vice versa. Since a portion of
the marsh was also to be returned to the laboratory for detailed study, it
was desirable to have the experience of other such attempts before pro
ceeding .
Not only was the literature review limited in scope but also in time.
Since the project period was relatively short and most of the effort was
expended in the experimental work, the effort available for the literature
review did not permit an exhaustive search of the pertinent literature.
Yet, the work reviewed and cited herein constitutes the best and more
reliable of the previous work as far as the authors could determine.
NUTRIENT EXCHANGE STUDIES
Exchange With Sediments
Introduction
The biogeochemical cycling of nutrients in the marsh ecosystem is a
subject of vast complexity. It is well known that the primary productivity
of marshes is quite high compared to most terrestrial communities (Odum,
1959), and an integral part of this phenomenon is the cycling of nutrients,
primarily carbon, nitrogen and phosphorus. The identification of nutrient
sources and sinks and the quantification of rates of exchange between the
two are imperative to a thorough understanding of the system. In addition,
effects of controlling and/or limiting factors (e.g. temperature, salinity,
season, pH, redox potentials, water and sediment chemical characteristics,
etc.) on rates of exchange should be considered.
II-l

Two important sources and sinks for nutrients are the sediments with
their own peculiar biogeochemical characteristics and the overlying water
column. Interactions between the two are exceedingly complex and hence
have been the subject of numerous investigations. Conceptual models of
internal pools and pathways of exchange between these two pools have
been suggested (e.g. Fenchel, et al., 1973).
Phosphorus
Phosphorus exists in various states: (1) as minerals, primarily apatite,
sorbed to the surfaces of other minerals; (2) in solution in the interstitial
waters of most sediments; and (3) as organic phosphorus in dissolved form or
in detrital and protoplasmic pools (Porcella, et al., 1970). The exchange
of phosphate between water and sediments in natural systems is a complex
process involving not only physico-chemical reactions, but also biological
processes. The controversy concerning the degree of importance ascribed
to the latter has been reviewed by Pomeroy, et al. (1965).
An investigation of phosphate exchange between shaken bottom sediments
and lake water led Olsen (1958) to the conclusion that biological processes
were relatively unimportant, amounting to 5 percent or less of the total flux.
Hayes and Phillips (1958) on the other hand, employing both cores and shaken
sediments, found exchange rates to be reduced by competing bacteria tying
up a significant amount of phosphate in a protoplasmic pool. Pomeroy, et al.
(1965) found that the rates of exchange in core samples were not significantly
different from unpoisoned samples. In suspended sediment experiments,
biological eschange may move nearly as much phosphorus as physico-chemical
exchange with clay minerals. These investigators suggest that in their core
samples, bacterial populations were primarily restricted to interstitial waters.
Any bacterial effects would therefore be minimized due to comparatively slow
rates of diffusion into the undisturbed water column above. The bacterial
populations characteristic of the experiments of Hayes and Phillips (1958)
were active in the water overlying undisturbed cores as well, removing
phosphate from the water itself and reducing loss to the sediments.
Other biological phenomena may influence rates of phosphorus exchange
with the sediments. The effects of both micro- and macroflora and fauna
should be considered. Among these are mixing, translocation, and other
modifications of sediments by burrowing species (e.g. annelids); consump
tion, assimilation and excretion of nutrients; production of gases; alterations
II-2
of chemical and physical conditions (e.g. pH); and others. In experiments
on algal growth with sediments serving as the sole source of phosphorus,
Porcella et al. (1970) found that soluble orthophosphate was accumulated
immediately by the algae and utilized for growth. Using radioactive phos
phorus, Pomeroy (1963) found rapid turnover rates of phosphate in coastal
waters of from one to seventy hours. Odum et al. (1958) found uptake32
rates of P by marine benthic algae exposed to light to be similar to those
maintained in dark conditions in a given tissue. Similar results were
found by Teal (1962) in blue-green algae of a Georgia salt marsh. "Luxury
consumption" of nutrients from sediments has been shown in emergent aquatic
plants in addition to their release of phosphates to the water column (McRoy
and Barsdate, 1970).
The exchange of phosphorus between the water column and sediments
is governed in part by physical and chemical conditions. Maximum sorption
of phosphate occurs when pH is neutral or slightly acidic, with a rapid
decrease in percent P sorbed above and below this range (Wentz and Lee,
1969). These investigators found that drying of the sediment increases
phosphate availability. Anaerobic conditions with accompanhing lower redox
potentials and lower pH values has been found to solubilize more phos
phorus than under oxidizing conditions (Mortimer, 1941 and 1942). Organic
matter serving as a substrate for anaerobic bacteria can lower pH causing
enhanced solubilization of phosphate (Porcella, et al., 1970). The effects
of hydrogen sulfide production on inorganic phosphate release from the
sediments have likewise been explored (Gooch, 1968).
The geological and chemical properties of the sediments themselves
are integral to the inevestigation of exchanges of nutrients. Obviously,
sediments of higher silt and clay fractions are a greater source of phos
phorus than, for example, sandy sediments (Pomeroy, et al., 1965).
The porosity and permeability of sediments affect the nature and degree of
exchange. Flow rates, tidal amplitudes, channelization, scour, aeration,
mixing and turbidity in the marsh are all important factors which influence
exchange rates. The actual depth of the sediment which is involved in
exchange processes is a matter of some controversy; this also is of course
dependent to some degree on the geological and biological structure of the
sediments involved.
Laboratory investigations of the exchange of phosphorus between sedi
ments and overlying waters have involved at least four primary techniques:
II-3
(1) slurry tests involving agitation of known concentrations of sediments
suspended in known volumes of water; (2) fixed-bed experiments involving
undisturbed or semi-disturbed cores with an overlying water column;
(3) microcosm analyses involving either steady-state or continuous flow
systems; and (4) continuous flow through integral or differential beds.
In these studies, both sorption and desorption of phosphorus from the sediment
and/or the water column were followed through various lengths of time and
under different conditions. Some of these experiments have been alluded to
previously. Pomeroy, et al. (1965), for example, employed both slurry tests
and fixed-bed, undisturbed sediment studies. From slurry experiments these
investigators determined that at least two very rapid processes were involved,
one with a half-life of fifteen seconds or less and the other of approximately
fifteen minutes. Influence of biological activity on this kind of technique was
highly significant. Fixed-bed tests, on the other hand, disclosed a much
slower leaching rate independent of biological activity. An equilibrium in
the fixed-bed cores seems to have been achieved after about forty hours.
Tests continued after this time showed no additional effects. Similar findings
are documented by the works of Keup, et al. (1970) and others.
Uptake or sorption processes have been similarly investigated. A
measurable phosphate-solids sorption reaction could not be determined in
studies on Chesapeake Bay waters and sediments (Carritt and Goodgal, 1954).
These findings complement those of Pomeroy (1963). Although Gessner (1960)
found adsorption of phosphate on sediments with increasing water concen
trations, all of these investigations seem to agree that sediments in situ act
as a buffer on the concentrations of phosphate in the water column.
Continuous-flow microcosms seem to have been designed to study
primarily biological processes coupled with manipulation of environmental . ,
factors. Continuous flow differential or integral bed techniques have been
developed for investigation of solid adsorbents in conjunction with wastewater
treatment (Winkler and Thodos, 1971; Gangoli and Thodos, 1973). The
later experiments are interesting in that equilibrium relationships and
Freundlich-type isotherms are employed in data analysis.
It appears that more detailed investigations of the various factors
involved in the exchange of phosphorus between sediments and overlying
waters would be useful, not only to define the exact sources and sinks
of this nutrient, but also, to establish the exchange rates between these
various sources and sinks under simulated natural environmental conditions.
II-4
Nitrogen
Laboratory investigations concerning leaching and uptake of nitrogen
compounds were found to be sparse. Most experiments have been concerned
with biological activities involving uptake and release of varying nitrogen
species in the nitrogen cycle. Rates of nitrogen fixation by epiphytes on sea
grasses have been reported (Goering and Parker, 1972). Stewart (1969)
explored aspects of nitrogen fixation by free-living microorganisms.
Regeneration rates of nitrogen and soluble phosphates accompanying decay of
aquatic weeds were investigated by Jewell (1971). In these experiments,
particle size of detrital materials was shown to affect rates of decomposition
and nutrient regeneration. Fixed-bed experiments were performed by Keup,
et al. (1970) monitoring ammonia, nitrate, and organic nitrogen leached from
various types of soils. Only total nitrogen levels are reported, however,
and little conclusive results were obtained.
Rates of organic N sedimentation, exchange rates of ammonia, nitrate,
nitrite, and elemental nitrogen denitrification and fixation rates of exchange
with biological pools need intensive study.
Exchange With Marsh Plants
Carbon
The coastal marshes that develop along the periphery of Texas estuaries
represent a significant contributor of fixed carbon (organic matter) into
the nearby estuarine waters . Approximately one-half of the annual marsh pro
duction is exported to estuaries. Teal (1962) estimated that 45 percent of
Georgia Spartina marsh production is exported into surrounding aquatic systems,
while Day, et al. (1972) found that 51 percent of marsh-produced organics
enter Louisiana estuarine and coastal waters. This carbon is transported
out of the marshes directly as dissolved organic substances, fine organic
particles, or detritus, and indirectly as biomass of the numerous secondary
consumers (fish, mollusks, crustaceans) that feed in the marsh as juveniles
and migrate back to estuarine systems during maturity.
Fragments from decomposition of Spartina grasses and algal mats and
fecal material from marsh consumers (amphipods to Nutria) contribute to the
tremendous amount of organic matter that supports estuarine detritus-based
foodwebs. Armstrong and Hinson (1973) estimated that daily production from
55.2 sq mi of marsh around Galveston Bay, Texas introduced more organic
II-5

matter into this system than waste discharges and river inflow combined,
while phytoplankton production in the entire Bay was 25 times greater.
Odum, Zieman, and Heald (1973) characterized the degradation of macro-
phyte bascular plants to detritus particles as a three-step process:
(1) loss of soluble compounds shortly after death; (2) microbial coloniza
tion (bacteria and fungus); and (3) mechanical fragmentation of the more
resistant tissue.
The loss of soluble organic components within the dead plant tissue
generally occurs within a few days and can proceed while the leaves and
stems are still upright in the marsh. Up to 25 percent of the initial dry weight
may be lost during the first stage of degradation (Odum et al., 1973). The
amount of this soluble material for transport out of the marsh is supplemented
by the products of the relatively-easy decomposition process for marsh benthic
and epiphytic algae. Since marsh algae are subjected to rapid dessication
during periods of low tide or reduced river inflow, the dead algae can release
significant amounts of soluble organics (sugars, organic acids, etc.) during
subsequent inundations. Indeed, Gallagher and Daiber (1974) found that gross
algal production was about one-third of the net production for vascular plants
in a Delaware salt marsh.
The solubilization of dead plant tissue may be facilitated by sapro
phytic fungi. Gessner, Goos, and Sieburth (1972) found that the intemodes
of lower stems and leaves (submerged) of Spartina alterniflora were colonized
by mycelium of the fungus, Sphaerulina pedicellata. Sexual stages of this
fungus developed rapidly as the plants senesced in the late summer and
fall. The fungal biomass served as a source of nutrients for other micro
organisms and resident consumers (nematodes and mites).
The availability of soluble organic decomposition products leads to
a rapid proliferation of microbes on the dead Spartina leaves. Burkholder
and Bomside (1957) found numerous aerobic, heterotrophic bacteria that
actively help to decompose Spartina and estimated that 11 percent of the
annual marsh crop was converted to bacterial biomass. Their work with
decomposition of Spartina leaves submerged in litter boxes showed that all
but the most resistant stems of these marsh plants were decomposed within
six months. The microbial activity proceeds rapidly on the protein and
carbohydrate fractions, but the more resistant cellulose and lignin fibers
of aquatic macrophytes may remain in the sediments for many months
(Jewell, 1971). Conversion of decomposition products by microbes into
II-6
more stable organic molecules (i.e. branched chain fatty acids), has been
noted (Schultz and Quinn, 1973), and these products often remain in marsh
sediments for some time.
Fragmentation of decomposing leaves occurs due to wind and tidal
action, water currents, and the feeding activities of marsh animals (both
terrestrial and aquatic). Fenchel (1972) found that Thalassia detritus
passed through the guts of amphipods unchanged. Apparently, these
microcrustaceans ingest only the bacteria associated with plant fragments,
but mechanically grind the detritus into smaller particles. Jewell (1971)
found that single fragmentation and breakage did represent a significant
detritus-forming mechanism for aquatic macrophyte systems.
Phosphorus
The phosphorus cycle in marsh and marine seagrass ecosystems has
been studied extensively (Pomeroy, 1959; McRoy and Barsdate, 1970; McRoy,
Barsdate, and Nebert, 1972). According to Pomeroy, et al. (1972), "there is
no evidence that phosphorus ever is limiting to the productivity of the estuaries
of the Southeastern U. S." If one assumes that Texas estuaries function
similarly to these shallow, turbid bays along the Georgia coast, normal
exchange processes would seem to be rapid enough to prevent depletion.
The relatively constant aqueous levels result from the rapid reestablishment of
phosphorus equilibrium between water and suspended sediments due to bio
logical exchange and physical sorption mechanisms (Pomeroy, et al., 1965).
The mechanisms of phosphorus exchange with vascular plants differ
somewhat between the constantly submerged species and emergent species.
Emergent plant species, such as Spartina, are exposed to changing water
levels where the amount of direct contact with the water is variable. Box
and Chamrad (1966) describe the biome occupied by a pure strand of Gulf
cordgrass (Spartina spartinae) in south Texas as being a stable climax con
dition. The distribution of this common marshgrass is apparently edaphically
controlled, i.e. related to soil properties, such as salinity, nutrient con
tent, alkalinity, and drainage. This relationship to soil type and content
is important to nutrient cycling, since Pomeroy, et al. (1972) found that
Spartina removes all or most of its subsurface sediments.
Blum (1969) advanced the hypothesis that the structure of Spartina
patens clumps (both living and decomposing leaves) acted as a fine mesh
that traps and removes nutrients during period of inundation. Depressed
II-7

total phosphorus levels were found when flooding of the upper marsh by high
spring tides reached its peak. However, this drop in phosphorus content
resulted from dilution of phosphorus-rich waters around the Spartina vegetation,
rather than uptake by the extensive mesh of plant stems.
Completely-submerged marine grasses, such as Zostera (Alaska) were
shown to take up phosphate through both leaves and roots, although the
direction of transport can be reversed when external concentrations decrease
(McRoy and Barsdate, 1970). Patriquin (1972) found a similar pathway for
Thalassia (the typical seagrass in Texas estuaries) and estimated that the
available phosphate (interstitial and adsorbed) in the root layer sediments
constituted a 300 to 1000 day supply. Furthermore, he determined that the
nutrients which maintain the root layer supply are indigenous and do not
come from regeneration of organic matter deposited in sediments or diffusion
through the sediment-water interface. Excretion of phosphorus by most
marsh and seagrasses occurs due to excessive uptake from the phosphorus-
rich sediments and subsequent release into surrounding waters.
According to the previously described mechanisms, phosphorus exchange
for Spartina begins with absorption of soluble sedimentary phosphorus by
roots and rhizomes, becomes incorporated in the plant biomass, and is returned
to the water by the leaves (generally as particulate phosphorus). Soluble
and particulate phosphorus excreted by the vascular plants is available to
epiphytic and benthic algae, which are primarily responsible for removing
phosphate from the marsh waters (Pomeroy, et al., 1972).
Nitrogen
The nitrogen cycle in a Spartina marsh seems to be based on the
decomposition of senescent vegetation. The proteinaceous component of
cordgrass is quickly converted to organic nitrogen and then deaminated to
produce ammonia. Ammonia is oxidized to produce nitrite and finally the
stable, aqueous form, nitrate.
Rooted plants can utilize the ammonia, nitrite, and nitrate in the sedi
ments (interstitial water) or surface waters for production of additional
biomass. However, the available supply of nitrogen is much less than
observed for phosphorus, and could well become limiting to plant growth.
Patriquin (1972) reported that the available supply of inorganic nitrogen in
a Thalassia bed could only support 5 to 15 days growth - less than 1 percent
of the in situ phosphorus supply
II-8

A valuable source of inorganic nitrogen for macrophyte growth appears
to be the nitrogen (N«) fixed by blue-green periphyton which grow on the
submerged leaves and stems or on the sediment surface as algal mats.
Patriquin (1972) and Goering and Parker (1972) both concluded that nitrogen
fixation was essential to submerged marine grasses. Nitrogen fixation by
bacteria may also occur in sediments with high reduction potential, where
organics released by plant roots are utilized by N-fixing bacteria which
in turn release ammonia needed for plant growth.
MODEL MARSH ECOSYSTEMS
Spartina-Based Microcosms
The vast majority of marsh-related studies are conducted in the field;
however, it is also practical to remove a portion of that biome and transfer
it to the laboratory for controlled experimentation. Nadeau and Roush (1973)
utilized a saltmarsh microcosm to demonstrate the impact of an oil spill on
a marsh community. Their large model ecosystem (4x5 feet) contained
intact sod sections of both Spartina alterniflora and S. patens, snails, and
fiddler crabs. Water level was maintained at high tide level and did not
fluctuate. These investigators used growth of the marsh plants in the
microcosm unit and at the original marsh site as the comparative variables,
but found no significant difference during the growing season. They did note
that normal salinity and tidal regimes were essential for optimum growth
of these marsh macrophytes in microcosms. Spilled oil did not adversely
affect the marsh grasses, since it degraded on the surface of submerged
leaves and sediment without incorporation into the plants themselves.
The Nadeau and Roush study (1973) appears to be the first attempt at
using a Spartina-dominant community in the lab for experimental purposes.
However, the epiphytic and benthic algae present on the partially-submerged
Spartina alterniflora were not monitored, even though they are known to
contribute substantially to total marsh productivity. In order to accurately
simulate an inundated marsh area, the algal component must be analyzed
since it responds directly to water quality parameters (nutrients, toxic
substances, etc.).
Algal Microcosms
Because the Aufwuchs mat community that commonly develops in micro
cosms closely resembles those algal mats common in Lavaca Bay marshes,
II-9

this discussion will include some pertinent observations relating to microcosm
algae and nutrient exchange processes. Investigations using saline micro
cosms (simulations of estuaries) include Abbott (1967), Cooper (1970), and
Armstrong and Hinson (1973). Porcella, Kumagai, and Middlebrooks (1970)
used an experimental setup very similar to that used in this study, although
they were looking at the exchange of phosphorus between freshwater and
lake sediments.
Abbott (1967) tested the effect of single doses of phosphate (1-100 micro-
moles/1) and nitrate (10-100 \i moles/1) on the autotrophic algal community
in estuarine carboy microcosms. He observed that each macronutrient
stimulated production independently, and that mixtures did not produce
substantially higher community metabolism rates. Apparently, the micro
cosm algae produced luxuriant mats when nutrient levels were high and
maintained their large biomass even when concentrations were very low and
no further inputs were made.
Cooper (1970) found that microcosm algal production actually increased
when freshwater inputs were cut off during "drought" simulation in his
continuous-series Trinity Bay microecosystems. Although actual nutrient
concentrations were not monitored, the production increase appears to
occur in spite of the lack of potential nutrient input (in the freshwater).
However, the algal mats in successionally-advanced microcosm communities
appear to be nutrient-starved and are capable of rapid uptake of added
nutrients with little observed production increase (Armstrong and Hinson,
1973; Hinson, 1974). Flushing of these nutrient-depleted microcosms (very
low nitrogen and normal phosphorus) with nutrient-free water did spur addi
tional algal growth and production in those systems (models of Galveston
Bay) not limited by other water quality parameters (i.e. wastewater toxicity).
Nutrient inputs, especially nitrogen, are rapidly removed from microcosm
waters by the algal mats and converted to additional algal biomass.
For their Plexiglass reactors containing sediment, algal mat, and over
lying freshwater, Porcella, et al. (1970) determined that "the soluble ortho-
phosphate is accumulated immediately by the algae and then utilized for
growth." Phosphorus exchange with the sediments probably relates to the
extensive microbial and algal activities at the sediment-water interface
and within the top few centimeters of the lake sediments.
11-10

CHAPTER HI
METHODS USED
NATURE OF STUDIES CONDUCTED
Two major types of studies were conducted during the course of this
project. First, field investigations were carried out to assess the move
ment of tidal waters into and out of the marsh system and the accompanying
mass flows of carbon, nitrogen, and phosphorus. From these studies, it
was anticipated that exchange rates of nutrients from the marshes to the
surrounding bays could be determined. Along with these nutrient mass flow
estimates, measurements were made of other water quality parameters,
such as dissolved oxygen and pH, to determine the natural fluctuations of
these parameters as well as the computation of community productivity and
respiration.
The other studies in this project were performed in the laboratory to
delineate in more detail the exchange rates of nutrients from marsh sedi
ments. Three types of tests were performed to determine these rates: slurry
tests using a suspension of sediments obtained from the marsh system; fixed-
bed tests using cores of sediment from the marsh system; and reactor tests
in which a portion of the intact marsh system was brought into the laboratory
for nutrient exchange tests.
FIELD INVESTIGATIONS
Sampling and Sample Analysis Procedures
Sampling Stations
A total of five sampling stations were utilized at various times during the
summer field program (see Figure III-l for map with marsh station locations).
Four stations were located along the major bayou and its tributaries that drain
the extensive marshes on the peninsula between Swan Lake and the Lavaca
River. The other sampling site, Station 5, was established in Swan Lake
approximately 100 feet from the mouth of the main bayou, but measurements
here were restricted to those times during the second field trip when a boat
was available. Sampling at this point in the four-foot deep Swan Lake was
used to verify that the water entering the marsh during flood tide did come
from the Swan Lake "reservoir".
III-l

Figure HC - 1
LOCATION OF SWAN LAKEMARSH STATIONS
SWAN
I LAKE
isLr.... \ n-run-rur
.... *'l r-— a\
**r
\
-ifiL ^S&.^siau.• *vi>•-•••
Scale: 1" = 280'
:4fc* #*
A-BB-CC-D
= 1120'= 220'= 890'
M.'jf/''' <Station site: —
-^A"Larg* pond"\

Station 1 was located on a well-defined section of the major marsh bayou
where the channel sidewalls are steep and distinct and the entire bed is
composed of smooth clay scoured by rapid water movements. Here the bayou
is 12 feet wide and 2 to 3 feet deep, depending on the prevailing tide stage.
Figure III-2 illustrates the channel cross-sections at the various marsh sites,
including Station 1. Since a temporary bridge spanned the bayou at each
station, water samples, flow measurements, and other water quality parameters
could be taken at the exact same point each time. These sampling points
were determined by a preliminary stream rating which revealed the particular
location where water movement approximated the average water velocity for
the entire stream profile.
Station 2 was established on a small feeder channel that enters the
main bayou between Station 1 and Swan Lake. However, this small and
shallow (less than one foot deep) channel was abandoned after the first field
trip when it became apparent that even a slight drop in overall water level
would leave no water in the channel and completely isolate the algal mat
potholes that it drained. In addition, water entering this portion of the marsh
during a flooding tide completely overflowed this small channel and entered
through other ill-defined channels, thereby making accurate determination of
total water influx impossible.
Station 3 was established on a small distinct bayou that drains a sub
stantial vegetated area and a series of algae-rich potholes between the
major bayou and Swan Lake. The cross-section at this point is essentially
U-shaped with a 3-foot width and a maximum depth of 1.5 feet. A flooding
tide often caused water to infiltrate into the marsh along the Swan Lake
shoreline, flow through this channel, and supplement the water moving into
the back reaches of the marsh upstream of the main bayou channel. This
small channel did empty completely at the sampling site during the third field
trip when a long slack tide was coupled with overall low water conditions.
Station 4 was situated on the main bayou channel after it narrows "down
stream" from a large pothole (see Figure III-l for map details). From this
sampling site, the channel continues toward a large bi-lobed pond and
extensive slightly-vegetated mudflats which serve as the alternate water
reservoir for the main bayou with its oscillating-flow characteristics. The
bayou cross-section at this station had nearly the same dimensions as Station
1 (refer to Figure III—2). Measurements at this station began on the second
III-2

Figure JH-2
BAYOU CROSS-SECTION AT SWAN LAKEMARSH STATIONS
"N
STATION I.j
2.60 ft
STATION 2.
0.75 ft
STATION 3.
1.38 ft
STATION 4.
SCALE- 1/2" = T12 3 4 5
| SAMPLING POINT(2.00) DEPTH AT SAMPLING
POINT
field trip to quantify the contributions of the back marsh areas which exhibit
the most extreme variations in exposure and inundation.
Measurement of Hydrologlc Parameters
Flow measurements were taken with a manually-held Pygmy meter
#R-720. Velocity in feet per second is calculated from the number of
revolutions of the meter cone wheel that occur in 40-70 seconds. Each
revolution produces an audible click in the headset, and these clicks
are counted by the operator during the allotted period (monitored with a
stopwatch). For this particular meter, velocity data are obtained through
the use of the following standard equation:
V= 0.956 N +0.04 (III-l)
where:
N = Revolutions of the wheel (number per second)
V = Velocity (fps)
Field velocity measurements are taken at 0.2, 0.6, and 0.8 total depth
for a representative sampling point. The actual depth of measurement
changed as water depth fluctuated. The sampling point at each station
was determined by constructing a complete velocity profile for the bayou
cross-section and selecting the channel section (1 foot wide) that exhibits
water velocities closest to the entire stream mean velocity. See Figure III—2
for the bayou cross-section at the field stations and location of flow measure
ment sites.
Water depth at the representative sampling points was taken regularly
with the Pygmy meter staff which is marked with 0.1 foot graduations. These
data provide a continual picture of relative tidal effects on the actual marsh
area, even though the TWDB tide stage gauges located nearby in Swan Lake
give rated delineation of tidal amplitude.
Measurement ofWater Quality Parameters
During the field sampling, physical water quality parameters, such as
temperature, pH, conductivity, and dissolved oxygen, were monitored in
situ at the various marsh stations. The dissolved oxygen levels were
measured with a YSI model 51A Oxygen Meter that has manual temperature
and salinity compensation. The probe is submerged about one foot into
the bayou waters and moved continually to insure stable readings. Both
air and water temperature (°C) were measured using the thermistor in the
III-3

oxygen probe during the normal oxygen procedure. Readings were taken at
the same point in the bayou cross-section as the flow measurements.
A portable Beckman pH Meter was used to monitor pH. Grab samples
of the marsh water were collected in glass bottles and run immediately
after sampling all field stations. A Beckman conductivity meter was available
for some sampling periods during the second and third field trips, but the
conductivity data were not continuous. Readings of conductance were taken
in situ by inserting the large electrode unit directly into the bayou waters.
Water samples for laboratory analyses were collected approximately
six inches below the water surface when water depth permitted. All water
samples are essentially surface grab samples - taken to exclude organic
surface films. Bulk samples were normally collected in new one quart
Cubitainers*, although acid-cleaned glass bottles were used during the
first field trip.
Analyses for carbon content of the marsh waters were performed at the
Center for Research in Water Resources laboratory following each field
trip. Both total organic carbon (TOC) and volatile suspended solids (VSS)
were measured to show the relative proportion of dissolved and particulate
carbon. TOC samples were collected in 50-ml Nalgene vials and stored on
ice with no preservative added. Upon return from the field, these samples
were stored in a 4°C cold room until they could be run on a Beckman TotalOrganic Carbon Analyzer Model 915. Injected samples yielded estimates
of total carbon and inorganic carbon, and the difference represented the
TOC content. All TOC measurements were completed within two days of
returning.
The determination of volatile suspended solids (labile particulate
organic component) required a different procedure than TOC. A 100-ml water
sample was removed from the phosphorus Cubitainer (preserved with chloroform)
after it was vigorously shaken. This water was vacuum-filtered through
RA glass fiber filters (tarred). The resultant filter containing the particulate
component (wet weight) was dessicated overnight in a 100°C oven. Thefilter was reweighed to obtain the dry weight, and then the organic matter
was combusted in a furnace at 550°C for 20 minutes. The difference betweendry and combusted weights represented the VSS fraction.
*Hedwin Corporation Cubitainers
III-4

Phosphorus samples were collected in the quart-size Cubitainers
and preserved i by the addition of 2 ml chloroform to stop biological degra
dation and nutrient regeneration. The bulk samples, after removal of
100 ml for VSS analysis, were stored in a 4°C cold room until delivery tothe State Health Department Laboratory for analysis of total phosphorus
and orthophosphorus content. Nitrogen samples were handled the same
way, except that 2 ml of concentration sulfuric acid (36N) was used as
preservative. The State Health Department Laboratory analyzed for organic
nitrogen, ammonia, nitrite, and nitrate to reveal the complete series of
aqueous nitrogen forms. Refrigeration of bulk samples took place only after
return to the laboratory.
Methodology for Data Analysis
Hydrologic Parameters
Since the marsh bayou acted as an oscillating stream system, capable
of switching the direction of water flow, it was important to know the sources
of the waters in the bayou, that is, whether the water moving through the bayou
monitored could have come from Swan Lake or the standing waters of the
upstream marsh. This hydrologic parameter was obtained by calculating
the cumulative distance traveled by a single water mass during the period
of measurement which was over at least one tidal cycle. The period of
measurement was divided into time intervals, At, and the distance, r,
that a water mass would travel in that time interval was calculated as:
r = v . At (III-2)
where v was the average velocity of the water during the time period.
Cumulative sums were computed for the total distance traversed by the
water mass from the start of the measurement period to the end of that
period. Plots of the cumulative distance traveled revealed the total
distance upstream and downstream that a water mass would have moved over
the measurement period and thus whether water from Swan Lake, for
example, could have reached Stations 1 or 4 during the tidal cycle.
Additional hydrologic data on the quantity of water movement was
essential for subsequent analyses of material flows (nutrients). The mass
flow of marsh water through each station (in cfs) was calculated by multi
plying the average water velocity by the cross-sectional area of the stream
III-5

channel. Changes in channel area occurred in response to changing tidal
amplitude (stage differences), but the appropriate increase or decrease in area
area was utilized when calculating the actual water flow.
Water Quality Parameters
Changes in the quality and quantity of carbon, nitrogen, and phos
phorus were analyzed to determine the mass nutrient exchange between the
marsh and adjacent estuarine waters (Swan Lake). Variation in the ambient
concentration of each nutrient species was monitored over both ebb and
flood tides. Hydrologic effects on nutrient concentrations were revealed
by plotting nutrient levels during an entire 24-hour study period (at least
one complete tide cycle).
Since the volume of water moving through each station was known,
determination of nutrient mass flows only required the quantity of nutrient
mass (per unit volume) in the marsh water. Mass flows during both flood
(entering marsh) and ebb (leaving marsh) periods were compared to illustrate
the overall mass balance, and this difference was indicative of the marsh's
role as source or sink for the particular substance.
LABORATORY INVESTIGATIONS
Introduction
In order to investigate the magnitude and nature of exchange rates of
nutrients between marsh sediments and the water column, three basic
experimental techniques were employed: (1) slurry tests simulating con
ditions of extreme mixing; (2) fixed-bed tests simulating calm to slight
conditions of agitation; and (3) reactor tests simulating natural continuous-
flow conditions through different marsh communities. In each of these
experiments, environmental conditions of temperature, salinity, and nutrient
levels were controlled at different levels. In addition, in each experi
ment an effort was made to determine both uptake and release of nutrients
by the sediment and its associated flora and fauna by varying nutrient con
centrations in the water column. In order to more closely approach a natural
situation, no poisoning of samples was attempted.
In the sediment sorption investigations, extractions of sediment inter
stitial waters were not completed, but analyses of nutrient concentrations
in the water column were carried out. With this procedure, some idea could
III-6

be gleaned concerning the processes predominantly involved in exchanges
between the various sources and sinks in the experimental systems. In all
experiments, samples of water were analyzed for ammonia, nitrate, and ortho-
phosphate at the Texas State Department of Health Laboratory. Ammonia
was determined utilizing a specific ion electrode followed by a distillation
and direct Nesslerization. Nitrate analyses were performed using the brucine
method, and orthophosphate was analyzed using the ascorbic acid method,
both according to procedures set forth in Standard Methods (1971).
In the reactor experiments, organic nitrogen, ammonia, nitrite, nitrate
and total phosphate were measured; supplemental measurements of TSS, VSS,
and TOC were made for many of the experiments. Diurnal changes in pH,
temperature, and dissolved oxygen were closely monitored in the reactors
during the experiments. All samples taken for nutrient analyses were quickly
preserved using either concentrated sulfuric acid or chloroform in accordance
with Standard Methods (1971) and kept at 4°C until analyses could be performed .
Slurry Tests
During the first field trip, samples of sediment were collected from
the marsh and transported to the laboratory where they were stored at 4 C
until experiments commenced. A sample of sediment was removed at the
beginning of these experiments and sent to the Texas A&M University Soil
Testing Laboratory for detailed soil analysis. Analyses of sediment samples
revealed that they were approximately 67 percent interstitial water, 5 per
cent organic combustible matter, and 28 percent noncombustible material.
The slurry experiments were conducted to define two exchange rates:
leaching and uptake. These studies were performed at room temperature
(approximately 22°C) and were duplicated using distilled water and anINSTANT OCEAN* adjusted medium of 20 ppt.
Leaching Tests
Leaching experiments were performed according to the following
procedure. Approximately 50 grams of sediment were removed from the 4 C
room and spread on a glass plate to a thickness of approximately 1 centi
meter. An attempt was made to insure a homogeneous mixture by carefully
mixing the sediment with a clean spatula. This sample was then allowed
to air dry for one hour. At the end of this period, portions were weighed
III-7

to obtain the following amounts: 4, 40, 400, and 4000 mg. Each weighed
aliquot of sediment was replicated to give three samples of the corresponding
weights. Each portion of sediment was then washed into a 500-ml Erlen-
meyer flask and covered with 400 ml of of distilled water (0 ppt salinity).
Hence, relative concentrations of sediment to water considered were 10,
100, 1000 and 10,000 mg/1. The flasks were sealed with rubber stoppers,
attached to a shaker table and violently agitated along with an additional
flask containing a distilled water blank.
One flask of each sediment/water concentration was removed at the
end of 12, 24, and 72 hours of shaking. Samples were filtered using a
spun glass filter (pore size approximately 4 p.) and the filtrate preserved for
later analysis of ammonia, nitrate, orthophosphate, inorganic carbon (IC),
total carbon (TC), and TOC. The two samples of highest concentration
(i.e. 1000 and 10,000 mg/1) were centrifuged at 7,500 RPM for thirty
minutes prior to filtration. Although centrifugation removed most of the
filtrable fraction of the sediment, a colloidal fraction in the water persisted.
This phenomenon has also been noted in the literature and is thought to be
due to the disruption of bonding between clay particles by distilled water
(Pomeroy, et al., 1967).
Simultaneous daily agitation, centrifugation, and distilled water
washing of a large (approximately 100 mg) aliquot of sediment was con
ducted for subsequent uptake experiments. Ten washes were conducted in
this manner, and at the end of the period the supernatant water was filtered
and nutrient analyses performed on the filtrate. Pomeroy, et al (1965) found
that nine distilled water washings of Georgian estuary sediment showed only
slight reduction in the mass of phosphate removed (averaging 4.7 ^g P/gram
of sediment) with each successive wash.
Leaching experiments at 20 ppt were performed in a like manner.
Distilled water dilutions of full strength INSTANT OCEAN* were made to
achieve a salinity of 20 ppt. Blanks were analyzed before and after the
experiments, and it was found that nutrient levels in INSTANT OCEAN*
preparations varied considerably as did those of the distilled water blanks.
Uptake Tests
Sediment washed with distilled water was centrifuged following the
tenth wash, removed, and air dried for one hour in preparation for the uptake
experiments. The effects of successive centrifugation and washing on the
III-8

integrity of the sediment was of some concern. Not only was a colloidal
fraction lost with each washing, but also a goodly portion of organic and
other matter of low density not retained by centrifuging. Furthermore, effects
on any organisms inhabiting the sediments should be considerable.
Aliquots of sediment and volumes of water were the same as in the
leaching experiments. Distilled water (0 ppt salinity) was spiked with
nutrients (ammonium chloride and monobasic potassium phosphate) to
achieve a solution containing 5 mg NH.-N/liter and 2 mg P04-P/literrespectively. Appropriate flasks were removed and their contents centrifuged,
filtered and preserved for subsequent analysis of nutrients. Time intervals
were lengthened for these experiments such that samples were taken after
24, 48, and 120 hours. Sorption processes, particularly for phosphates, are
known to proceed at a rate much more slowly than desorption. By lengthening
the contact time, a better estimation of rates of exchange could be determined.
Slurry uptake tests were repeated using spiked water with a salinity of 20 ppt.
In none of the above preliminary tests were pH values checked; this was
unfortunate in view of the fact that many sorption rates of exchange can be
highly correlated with changes in pH. However, the well known buffering
capacity of seawater may have limited changes in pH.
Data Analysis
In order to establish exchange rates between suspended sediments and
overlying water, the following model was employed:
dC l7—^=k [aC1/n-C 1 (III-3)
dt L w
where:
dC /dt = rate of change of concentration in the water of a given nutrientthrough time,
k = mass transfer coefficient,
a, n = constants, and
C = equilibrium concentration of the nutrient in the presenceof sediment.
1/nThe water-sediment relationship, x/m = aC , can be derived by knowing
the mass of nutrient sorbed (x), the mass of the sediment (m) and the con
centration of the nutrient (C) in the water after equilibrium conditions have
been established. By regressing In (x/m) on In (c), a family of curves with
slopes 1/n result for each time of successive sampling periods. Freundlich-type
III-9

isotherms can be derived, and these in turn can be related to environmental
factors (e.g. temperature and salinity). As long as the value of x/m is knownthen C may be estimated for use in Equation III-3. A similar equation could
be developed for nutrient concentrations in sediments to make both the
water and the sediment nutrient reservoirs dynamic. For phosphorus at
least, it may be possible to assume that x/m is constant, and therefore C
would vary only with environmental variable changes.
Rates of exchange, either sorption or desorption, and equilibrium
conditions can be quantified and defined for the marsh system under con
ditions of extreme turbulence. If the mass of sediment suspended in the
water column is known during such periods, the preceding model may help
predict the sign and the magnitude of the nutrient exchange.
Fixed Bed Tests
On June 28, 1974, core samples were removed from the marsh from the
same general area as the sediment for the slurry tests. This area was one
of periodic inundation and at the time of sampling was covered with a layer
of quiet water to depths of 10-15 cm. Fourteen core samples were taken
avoiding areas of intensive algal and emergent macrophyte colonization.
Although the cores were taken at random throughout the area, there were
noticeable differences in their flora and fauna upon return to the laboratory.
Varying numbers of juvenile fish, annelids and crustaceans were noted.
The cores were extracted by pressing 50-cm sections of white PVC
pipe with an inside diameter of 10.16 cm into the sediment to give a sedi
ment depth of approximately 25 cm (see Figure III-3). The base of each core
was then sealed with a rubber sheet fastened around the pipe by a flexible
clamp, and all were returned to the laboratory. The cores were then allowed
to sit for three days at room temperature (approximately 22°C) during whichtime dissolved oxygen was monitored daily. By the afternoon of July 1, all
cores had become essentially anaerobic with dissolved oxygen readings of the
overlying waters averaging 0.5 mg/1. The original water was removed at this
time, carefully noting its volume of water, and analyzed for ammonia, nitrate,
and phosphorus. This original volume of water was replaced with distilled
water to the same volume except for two cores which had lost a considerable
portion of their water. In these, the volume of replacement water was doubled.
The experimental design of the fixed-bed experiments involved a basic
draw and refill technique in order to follow processes of leaching and uptake
III-10
FIXED- BED EXCHANGE APPARATUS
s.
0*/oo1
3.
n
;10i:0/ooi
3.
n
20!;%oi
:k. s.
0 =Vooi
s.
£?iV.v-».;.
MARSHSEDIMENT
S.
2,0oo?v.
Stirringapparatus
-Varying salinitywater column
Core reactor-
10.16 cm (Dia.)x 50 cm


of nutrients. Overlying water was withdrawn using a siphon with the intake
as close as possible to the sediment-water interface, but avoiding the
removal of the sediment with the sample. Refill was accomplished by
gently and slowly pouring the new water down the side of the slightly
tilted container. Each refill procedure, however, did disturb tfre sediment
to a certain degree.
These experiments involved three different salinities (0, 10 and 20
ppt) at three different temperatures. Mean water temperatures over the time
of sampling were 24.6, 22.5 and 10.1 C. Cores at room temperature
were replicated at each salinity. Six cores, therefore, were kept at 22.5 C
(two at each level of salinity) with three cores kept at the high temperature
and three at the low temperature. High temperature cores were maintained in
an unairconditioned room and were subject to some diurnal temperature
fluctuations (+ 2.5°C). Cold temperature cores were kept in a thermallyregulated water bath. Thus twelve cores were maintained under these conditions
and leaching experiments commenced. The two remaining cores were also
maintained at room temperature and received uptake water spiked with nutrients
for uptake tests as in the slurry tests (5 mg NH3~N/1 and 2 mg P04-P/1).One of these cores was covered with distilled water while the other was
covered with 10 ppt brackish water.
Both leaching and uptake experiments covered a span of either four or
five days with draw and refill taking place every twenty-four hours at 1800
hours. After termination of the first set of experiments, all cores were
allowed to sit for three days before the water was removed and analyzed.
At this time the procedures were reversed, so that the twelve leached cores
each received spiked water for the uptake tests. The two remaining cores
at room temperature were simultaneously started on a leaching program.
After four days of successive draw and refill procedure, the cores were
allowed to sit for twelve days. After that time leaching experiments were
again performed on the twelve and uptake on the two for another four day
period.
The six cores at room temperature involved in the original leaching
studies were each slowly stirred (approximately 14 PRM) by a bank of
stirring paddles driven by a variable speed motor. Warm temperature cores
were similarly stirred commencing with the second set of experiments.
Vibration from the cooling bath stirrer kept the cold temperature cores in a
similar state of agitation. Cold temperature cores, however, showed some
III-11

signs of temperature stratification and were, therefore, covered with loose
fitting caps of styrofoam. Cores at room temperature and high temperature
were exposed to a light-dark cycle approximating natural conditions.
After initial replacement of water covering all cores on July 1, the
experiments involved draw and refile with all of the three salinity waters.
Volumes exchanged were always measured and one liter of replacement
water was added each time. Although not all of the water was removed at
each draw and refill procedure, the replacement with one liter made the
volume remaining comparatively insignificant. Although typical evaporation
rates varied for cores at different temperatures, they still exceed any
cumulative increase in water volume due to constant conditions.
For the duration of the experiments, dissolved oxygen and temperature
of the water columns were checked in the early morning and in the late
afternoon prior to draw and refill procedures. The pH was measured only
once during experimental procedures. Other parameters were noted in a
qualified manner but not quantified (e.g. hydrogen sulfide concentrations
and turbidity).
Reactor Tests
The general experimental apparatus for physical marsh simulation is
shown in Figure III-4. Figure III-5 depicts an individual marsh reactor.
Six plexiglass tubes about 1.8 meters in length and with an inside diameter
of 29.3 cm were secured as containers for the marsh microcosm reactors.
These tubes were taken to the marsh in mid-July and samples obtained by
pressing the tubes into the sediment, removing an intact core, and sealing
the base of each tube. Three samples of a typical algal mat community were
taken (Reactors 1, 2 and 3) and three of a salt marsh bulrush community
(Scirpus maritimus macrostachyus) with healthy emergent plants (Reactors
4, 5 and 6). All samples were taken in the same general area as the previously
mentioned cores for fixed-bed experiments. Sediment depths averaged roughly
50 cm. During this trip to the marsh, water was also collected in the 1800
liter boxes shown in Figure III-4.
Upon return to the laboratory, the reactors were placed in a large tank
with continuous flowing water as a temperature buffer. They were then
fitted with inflow ports about 15 cm above the sediment and outflow ports
about 3 to 5 cm above the sediment. These ports were opposingly situated
on each reactor to insure proper internal holomixis. Each inflow port was
III-12

SCHEMATIC OF CONTINUOUS FLOWREACTOR SYSTEM
SPIKEDRESERVOIR
(1800 liter cap.)
Spartina & Algal matReactors (6)
[29.3cm (dia) x 1.8m],£
t\ Infbw to^ water bath -
I
Sample collection sites
p—CONTROL
RESERVOIR(1800 liter cap.)
Interim, siphonj? bottle
c
CO
HI
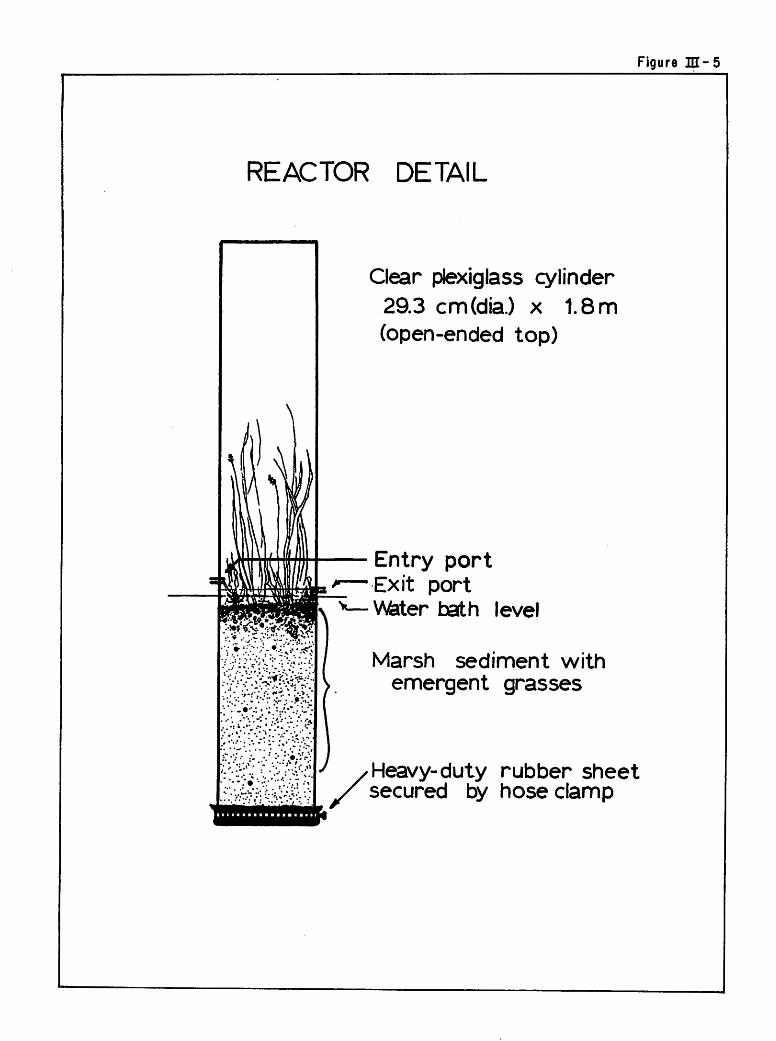
Figure JJI-5
REACTOR DETAIL
:?«Y?#£v.*k
Clear plexiglass cylinder29.3 cm(dia.) x 1.8 m
(open-ended top)
Entry portExit portW&ter bath level
Marsh sediment withemergent grasses
Heavy-duty rubber sheetsecured by hose clamp

connected to an intermediate 16-liter siphon bottle so that the flow rate into
each reactor could be regulated. Reactors 1, 2 and 6 received marsh water
which had been artificially spiked with ammonium chloride and potassium
phosphate (monobasic) to provide levels of 5 mg NHg-N/1 and 2 mg P04~P/1in excess of the marsh water content. Reactors 3, 4 and 5 received unmodified
marsh water.
Measurements of dissolved oxygen, temperature, pH, and flow rates
were taken over a ten day period at 0800 and at 1630 hours in the reactors
and boxes. Flow rates during this period were adjusted to a residence
time of 2-3 hours. Water samples were taken about two hours prior to these
measurements to ensure a proper diel pattern. Sampling commencing at 0600
hours terminated about sunrise, a period of predominate respiration. The
afternoon sampling covered a period of considerable photosynthetic activity.
Water samples were analyzed for organic nitrogen, ammonia, nitrate, nitrite,
total phosphate, orthophosphate, TOC, TSS, and VSS.
Ill-13


CHAPTER IV
RESULTS
INTRODUCTION
The results obtained from the field investigations in the Swan Lake
marsh in upper Lavaca Bay and from the laboratory studies are presented below.
It should be noted that some results for the slurry tests, a minor portion of
the total data collected, are not presented because of the delay in receiving
the results of nutrient laboratory analyses. These will be presented in a
subsequent report, however.
FIELD INVESTIGATIONS
Early in June a one-day aerial survey was made of the study area by
helicopter to locate suitable areas for the field studies in the Lavaca Bay
system. A bayou with associated marshes was noted on the southwest
shore of Swan Lake in upper Lavaca Bay, and this area was eventually chosen
as the study site. It was evident too during the aerial survey that water
levels were very high throughout the area because of recent high rainfalls in
drainage basins for the area.
Three field investigations were conducted at two week intervals during
the summer to define the hydrologic and water quality characteristics of
the selected marsh area. The first two sampling runs lasted for 24 hours
each (June 27-28, July 11-12), while the third trip covered 48 hours (July 30-
August 1). Normal semi-diurnal tides persisted during the shorter trips, but
a diurnal tidal regime during the final field trip required twice the time to
complete a single tide cycle.
Field Trip on June 27-28, 1974
Field and Weather Conditions
Although the water level had dropped considerably since the initial
aerial survey of the study area, the marsh area was still extensively inundated.
The bases of saltmarsh bulrush clumps (Sclrpus maritimus) were partially
submerged during both flood and ebb tides. Weather conditions during this
first field trip included clear skies, air temperatures between 20 C and
29.5°C, and a slight easterly breeze that never surpassed 10 mph. Water
IV-1

temperatures were slightly higher than air temperatures, reaching a maxi
mum of 31.7°C and dropping as low as 23.2°C
Hydrologic Conditions
Monitoring of the various hydrologic (water depth and velocity) and
water quality parameters began during ebb slack and proceeded through
one and one-half tidal cycles. The changes in magnitude and direction of
water velocities measured at Stations 1,2, and 3 responded to tidal level
changes (see Figure IV-1). Maximum ebb and flood velocities in the main
bayou (at Station 1) released 0.7 fps; velocities at other stations were
roughly half that amount.
Water particle movement through the major bayou (Station 1) showed
(Ln Figure IV-1) that the distance traveled by a water parcel between flood
and ebb slacks equaled or exceeded 17,000 feet. This distance far exceeded
the actual distance between Swan Lake and the fartherest reaches of the marsh
(over 2500 ft). Thus,the origin of the water passing through the marsh bayou
system was Swan Lake water during the fldod periods, whereas the larger ponds
and pot-holes in the inundated marsh supplied most of the water during the
ebbing flow.
The flows computed at each station for all three field trips are given
in Table IV-1. During the tidal cycle under study, water exiting the marsh
at Station 1 (10.9 x 10 1) more than doubled the quantity entering during
the preceding flood period (4.5 x 10 1). This pattern also prevailed at the
stations on minor tributaries, reflecting the large amount of water draining
from the marsh and the non-uniformity of tidal exchange.
Water Quality Conditions
Water temperature and dissolved oxygen levels exhibited a disrupted
diurnal pattern that was affected by the direction of flow (see Figure IV-2).
Flow changes during the night brought warmer and more highly oxygenated
water into the marsh from Swan Lake during the period when oxygen levels
normally would have continued downward in response to sediment and biota
respiratory demands. At Stations 2 and 3, a considerable decrease in dissolved
oxygen during the night demonstrated the high benthic uptake rates along these
small intra-marsh channels. Without the infusion of oxygenated water during
the floodtide, standing water in these areas may have become toxic. Reliable
estimates of production using the single dissolved oxygen diurnal curve
procedures are not possible due to the disrupted diurnal patterns.
IV-2

WATERPARCELMOVEMENTFROMWATERVELOCITY(fps)STATION1(lOOO'Soffeet)i
-L,•
Oo_.
oenoc*oCJIOCXIo
iiiiiiiiiiiii|iiii|i1111111iIiIliIIiz
f^COoo-31
o3>3>c—oZ-H3\°"mCD
COC^ roJ>j^i_—
QO^
—^<—00
yrz-\mm
<£>o<j^^^
_r~5!°
—^JOrg_
So -^
-yXf
CITY ARSH
2400
f~17,000ftofTravel
o
—
ANDDBAYO
~~^^^c
—
czcn-m^^c^o
—
,-HO"^^N
-♦»13> -O"^^^
s"
c_Z
£ro-CO^^Q—CO
600me\
—oo
—3S*
zmm-i
rv>.^o 00ro>
—
-^<CO->l-
\
roIim
\c0cx>mrooo
•|II111M1iiii1iIIl1111111iiiii1iiii"
CO


iCO
TABLE IV-1
WATER MASS MOVEMENT THROUGH SWAN LAKE MARSH STATIONSDURING THREE DIFFERENT HYDROLOGIC CONDITIONS
TripNo.
Date Station
Water movement (liters/tidal cycle)CommentsInto .Marsh
(1061)Out of Marsh
(1061)Net Out
(106l)
1 June 2 7-28,1974
1 4.527 10.886 6.359 Marsh
Inundated
2* 0.066 0.077 0.011
3 0.381 0.517 0.136
4**- - -
2 July 11-12,1974
1
3
7.386
0.454
7.550
0.891
0.176
0.437
Marsh
PartiallyInundated
4 7.010 5.199 -1.811
3 July 30-Aug. 1, 1974
1
3
3.116
0.749
4.477
0.419
1.361;*
-0.330
MarshDry
4 2.269 3.354 1.085
♦Station discontinued after first field trip .**Station not established until second field trip

Figure IV-2
•JO
1 J-aLJ 1 • 1 1 1 1 1 1 • i 1 1 1 1 •Stotion ?>~^k/s\\
1 \ \ WATER TEMPERATURE AND -Station l-J a \ \ DISS0LVED OXYGEN CHANGES
//\ \\ IN SWAN LAKE MARSH f 30
f \\\ JUNE 27"28, l974 /-
12 —/ Station 2—"A \ \ AJ "
00
28 ~LUor
l-
10 \a\\ tTYv -
ro TEMPERS
—
o> 8"S/Rawz^ i24 £
<
OXYGENCD
7/ \\\ff\J~- 22
O
LU>
i 4 ° Station 3^^V\ / J
20
0
\\ //2
Station 2.^\^J
0 1 1 1 1 1 1 1 1 1 1 1 1 1 1 1 1 1 1 1 1 1 1 1 1 1 1 11200 1800 24 30 0600 1200
June 27,1974 June 28,1974

Total organic carbon and organic nitrogen measurements showed slight
increases in ambient concentrations during the later stages of outward flow
(Figure IV-3). Ammonia levels increased significantly during ebb flow, as
would be expected, during washout of this decomposition product while
nitrite and nitrate levels remained at the minimum detectable level throughout
the sampling period (Figure IV-3). Phosphorus, in both total and soluble
forms, exhibited variable concentrations that cannot be correlated directly
to specific hydrologic change, although maximum levels were reached at the
later stages of ebb flow (Figure IV-4).
Mass flux tabulations for all carbon, nitrogen, and phosphorus nutrient
species are given in Table IV-2 and show that more nutrients left the marsh
during ebb flow than entered during the preceding flood period. However,
this imbalance may be due primarily to the larger volume of water exported
during the ebb period, rather than any significantly higher concentrations
in marsh outflow waters. As noted above, such higher concentrations were
not always evident. The exit of organic nitrogen amounted to three times
the inflow quantity, and this magnitude of exchange far exceeded any other
nutrient species under study.
Field Trip On Tuly 11-12, 1974
Field and Weather Conditions
During this sampling period, it was found that water levels had receded
from the high levels found in June. The marsh vegetation was only partially
submerged during the flooding period, but emergent (dry) during the final
stages of ebb flow. Clear weather was prevalent on July 11, but early
morning cloudiness produced a short but heavy rainstorm at 9 a.m. near
the end of sampling on July 12. Air temperatures ranged from 24.1 to 29.3 C,
while water temperatures fluctuated between 23.1 and 31.8 C. Winds from
the southeast blew at 15-20 mph during the day (July 11), but fell off after
sunset and were very light during the early morning hours (0-5 mph) of July 12,
Hydrologic Conditions
Sampling began near the start of a flooding tide, proceeded through one
normal tide cycle (15 hours), and then passed through one abbreviated cycle
(7 hours) where flow magnitude was much less. Water velocities measured
at Stations 1,3, and 4 (Station 2 was discontinued) are given in Figure IV-5.
Like the June data, maximum velocities reached 0.7 fps.
IV-4

Figure IV-3
TOTAL ORGANIC CARBON AND NITROGEN CHANGES
IN SWAN LAKE MARSH - JUNE 27-28,1974
P 30
E
OGO
* 20<o
o
<
§ 10
<
o
01-
£ - 1.5
H- —
^ LU
ot
LU
o= £05<CDaco
Station 2
- Organic-N
- Ammonia-N
Station
Nitrite-N (All Stations)'
- a-
jjEi01200 1800
June 27, 1974
r~i i i i i i i i i i
Station 3
Station
Station 2
Nitrate-N(All Stations)
!±=_L
2400 0600 1200
June 28,1974

~ .25
PHOSPHORUS CHANGES INSWAN LAKE MARSH BAYOU -JUNE 27-28, 1974
I I I I I I I I I I I
i i i i i i i i i i i i i i i i i
Figure IV-4
1200 1800 2400
June 27, 1974
0600 1200
June 28,1974

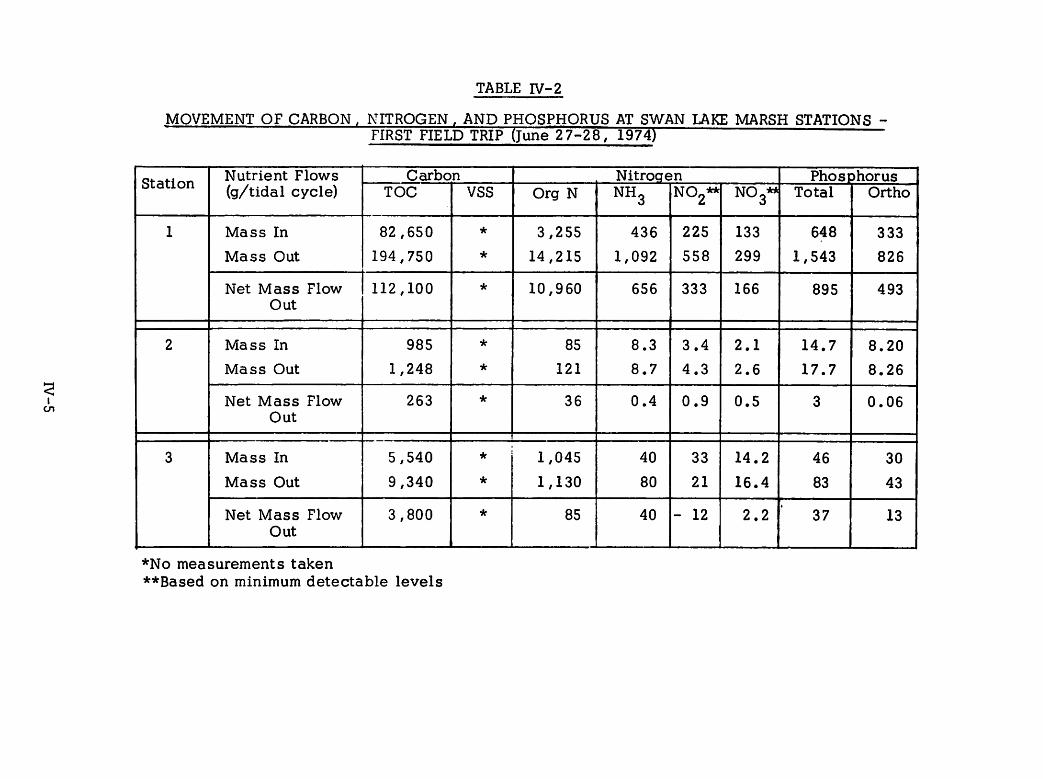
icn
TABLE IV-2
MOVEMENT OF CARBON , NITROGEN , AND PHOSPHORUS AT SWAN LAKE MARSH STATIONS -FIRST FIELD TRIP (June 27-28, 1974)
StationNutrient Flows
(g/tidal cycle)Carbon Nitrogen Phosphorus
TOC VSS Org N NH3 NOz** N03** Total Ortho
1 Mass In
Mass Out
82,650
194,750
*
*
3,255
14,215
436
1,092
225
558
133
299
648
1,543
333
826
Net Mass FlowOut
112,100 * 10,960 656 333 166 895 493
2 Mass In
Mass Out
985
1,248
*
*
85
121
8.3
8.7
3.4
4.3
2.1
2.6
14.7
17.7
8.20
8.26
Net Mass Flow
Out
263 * 36 0.4 0.9 0.5 3 0.06
3 Mass In
Mass Out
5,540
9,340
*
*
1,045
1,130
40
80
33
21
14.2
16.4
46
83
30
43
Net Mass Flow
Out
3,800 * 85 40 - 12 2.2 37 13
*No measurements taken
**Based on minimum detectable levels

The maximum distance traveled by a water particle upstream or down
stream (10,000 ft) was somewhat less than for the first field trip (Figure IV-5),but was still far enough to indicate complete movement of water from Swan
Lake into the interior marsh.
It is noted in Table IV-1 that water exchange through Station 1 in the
main bayou channel was essentially equal for both phases of the normal tide
cycle. Other sampling sites exhibited different patterns of water movement.
Station 3 in the tributary bayou discharged twice as much water to the main
bayou on the ebb tide as it received from the bayou on the flood tide, indi
cating that water movemement from Swan Lake to the drainage arch of this
small tributary may be a major exchange route at this water level. However,
the back marsh bayou channel (Station 4) received more water on the flooding
tide than it released on the ebb tide. High evaporation and transpiration
rates on this hot, windy day may have been responsible for most of the water
loss observed.
Water Quality Conditions
Diurnal water temperature and dissolved oxygen patterns were much more
"normal" than during the first sampling trip (see Figure IV-6), but the incoming
water did alter the magnitude of change slightly. The diurnal pattern waso
stable enough to calculate a daily gross production rate of 12.8 g/m /day
for Station 1 on the main bayou channel. For the average depth of 2.6 ft,o
the areal gross production rate is 10.2 g/m /day. Since the total respira
tion rate was the same, the P/R ratio equaled one. However, these pro
ductivity estimates result only from benthic algae and phytoplankton activity,
rather than rooted vegetation.
Carbon, measured as TOC and VSS, remained relatively stable throughout
the entire 24 hours period for all stations as can be seen in Figure IV-7,
except for several excessive VSS peaks at Station 4. These peaks in VSS
seemed to occur during changes in direction of water flow when thick surface
films became most apparent. TOC levels tended to decrease during flood tide
and increase during ebb tide, but remained between 8 and 24 mg/1.
Ambient concentrations of ammonia and organic nitrogen peaked at the end
of marsh outflow, but levels of nitrite and nitrate remained constant regard
less of the direction of water movement (Figure IV-8). Total phosphorus and
orthophosphorus persisted at low levels (less than 0.17 mg/1) throughout
the entire sampling period (Figure IV-8).
IV-6

1
WATERPARCELMOVEMENTFROMSTATION1(1000'Soffeet)
WATERVELOCITY(fps)6or-^ oCJiOOiocnocnOX>
111—I
—1OL111a1-mJO
•—
^SSV^V>>>^v~
<
rom
O1—*—
r™
o^^—
oco
-
^3JO^—
-•
COJ>"•
—IC2!
ss——
00°2°3
-
SE —
oco-
O-cz—1
1Q
ro
oJo1——1
o-<J0e
——J>
o
——<im
^
—*•^0*Tv^—.i—c_
cO—
s\Arorn
rrtr>obCi-o*<o"^\>>^1—orozr\J
^_4*CO
CD—
^wmmOIV—J>
4^2:
rooo
11111mcn
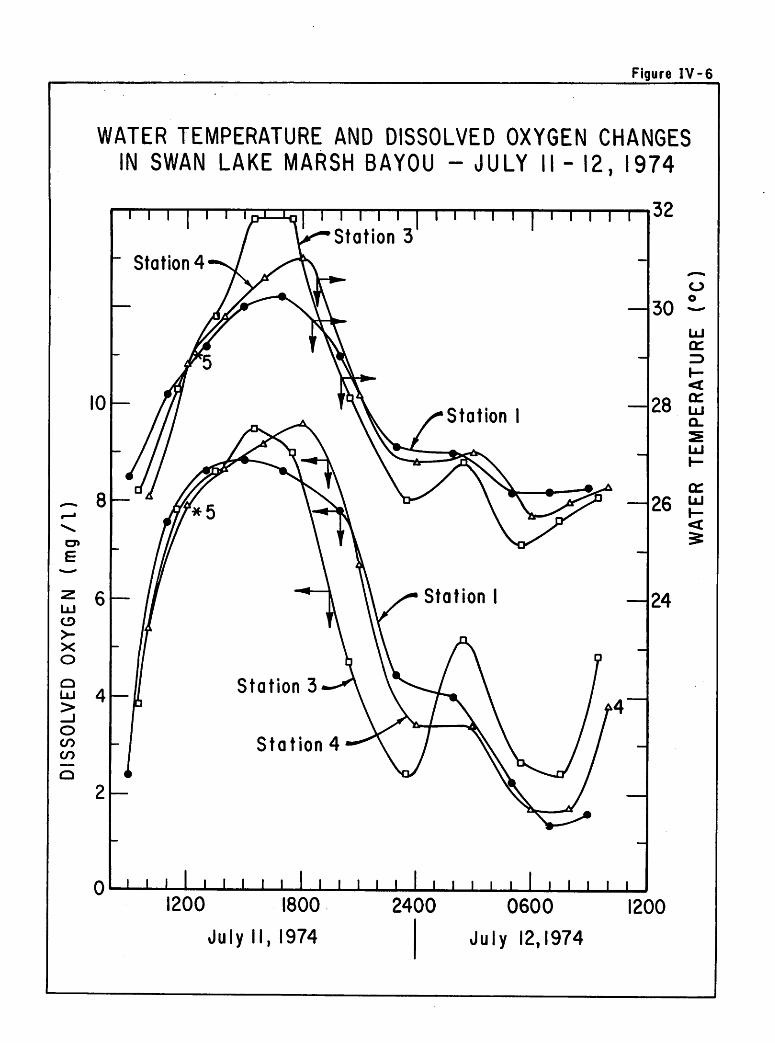
Figure IV-6
WATER TEMPERATURE AND DISSOLVED OXYGEN CHANGESIN SWAN LAKE MARSH BAYOU - JULY II - 12, 1974
0
i i i i i i i i i i i i i i 32
o
30 ~LU
28
<
cr
26 £<
24
i i i 1 • i i ' ' 1 i i i » i i i i i i i i i i » i i
1200 1800
July II, 1974
2400 0600
July 12,1974
1200

*Z 30
<i-o
COCO
>
CO*o
oCO
QLUO
Q.COz>CO
LU
0
Figure IV- 7
ORGANIC CARBON CHANGES IN
SWAN LAKE MARSH BAYOU -JULY 11-12,1974
I I i I I l l I i I i1 | i i i I i | i i I l I |
Station 3
Station 4
Station 3
Station
O> „t • i I ' i ' ' » 1 ' » i ' '
1200 1800 2400
July II, 1974
I I I I I
0600 1200
July 12,1974

E .20
:ra.
o
Figure IV-8
NITROGEN AND PHOSPHORUS CHANGES IN
SWAN LAKE MARSH BAYOU - JULY 11-12, 1974
i i i i r
ite - N(All Stations) ^-Nitrate-N (All Stations)
-. .. • - Station 3Station 4
LT Total P \ Station
Ortho-P ^Station I
Station 4
4 i 9nt i 9n+ I 9°1200 1800
July II, 1974
Station 3
2400 0600 1200
July 12,1974

Mass flux data (Table IV-3) showed that organic nutrients (TOC, VSS,
organic nitrogen) showed greater outflows from the marsh during the tidal cycle.
Inorganic nutrients (NH3, NO«, NCL) needed for algal and vascular plantgrowth exhibited a slight loss to the marsh. Orthophosphorus exhibited a
distinct loss to the marsh, as did total phosphorus in the back region of the
marsh. However, a small net transport out of the marsh for total phosphorus
was observed through Station 1.
Field Trip On July 30-August 1, 1974
Field and Weather Conditions
This final field trip (48 hours duration) was originally conceived to
delineate the water and nutrient mass flows over several tidal cycles instead
of only one cycle as the previous two field trips had been. However, in
the interim period the tidal regime had changed from semi-diurnal to diurnal,
so the same number of tidal cycles was investigated. Water levels had dropped
below levels recorded during previous trips, and the bayou channels almost
emptied completely during ebb tide in this sampling period. The marsh was
almost dry, with the water mainly confined to the marsh channels and larger
pot-holes during both blood and ebb periods. Marsh vegetation was almost
exclusively emergent. The weather during this 48-hour trip varied consider
ably from clear skies to imposing thunderhead formations. However, only a
slight drizzle fell to break the chronic summertime drought during the second
day. Air temperatures reached a maximum of 32.8 C during the late after
noon, and this contributed to raising the bayou water temperature as high as
34.9°C. Winds were generally calm (slight breezes from the north) during
periods of precipitation, but, as skies cleared, they switched to the south
east with a velocity of 10-15 mph.
Hydrologic Conditions
Water movement was restricted exclusively to the bayou channel, larger
tributaries, and contiguous pot-holes between Swan Lake and the interior
bi-lobed pond system. Water velocities were generally lower in the main
bayou than on previous field trips, and a trend toward net movement into
the marsh is evident from the velocity data plotted in Figure IV-9. Even
though the time of directional flow was increased under the prevailing tidal
regime, the volume of water exchanged was much smaller (roughly one-half)
than that observed on earlier field trips (Table IV-1). Also, the distance
IV-7

i
00
TABLE IV-3
MOVEMENT OF CARBON . NITROGEN, AND PHOSPHORUS AT SWAN LAKE MARSH STATIONS -SECOND FIELD TRIP (July 11-12, 1974)
StationNutrient Flows
(g/tidal cycle)Car Don Nitrogen Phosphorus
TOC VSS Org N NH3 NO/ NOs* Total Ortho
1 Mass In
Mass Out
97,600
104,750
99,450
111,100
6,800
8,390
771
748
366
384
226
231
742
802
100
75
Net Mass Flow
Out
7,150 11,650 1,590 - 23 18 5 60 - 25
3 Mass In
Mass Out
4,340
7,080
6,370
6,220
8,080
10,240
49.5
54.2
24.5
26
22.7
26
48.4
50.2
10.7
5
Net Mass Flow
Out
2,740 150 2,160 4.7 1.5 3.3 1.8 -5.7
4 Mass In
Mass Out
142,400
129,100
471,500
153,500
6,240
6,420
964
759
360
296
231
147
837
721
129
57
Net Mass Flow
Out
-13,300 -318,000 180 -205 - 64 - 84 -116 - 72
* Based on minimum detectable levels

WATERPARCELMOVEMENTFROMSTATION1CO
(lOOO'Soffeet)WATERVELOCITY(fps)
3>
1Po:Z« OcnOoioiOcjiC
3>-H C_1111111111i1\J)»iiiiiiii*i«iiiiiii1c
11jy^1^yXi1^:m»"<jT\Miii^^^mjoOJS\\,,>°rv>
\^^i°-
s<Kj>m
o^.*r-- ^^v|1-P^z*C o—aCOo
0600Jul
A
•kA\CM
CITY AHBAYi
a8-^^^=3
_
o2
1-o1
CO->l_-^00
o
XT&^K
DIST •JUL
oCO-<i>
K-ovP31
o
>2—QY"*—
cCD—
2<
001gust
-T5^—
^m
-18711>J"o
0180974
—11i1....iii11111
CDZ-J
o11111111111|||iiii1ii1iiii_lJ


traveled upstream or downstream by a water parcel continued to decrease
from previous field trips (see Figure IV-9).
Water Quality Conditions
Temperature and dissolved oxygen fluctuated drastically each day,
reaching 34.9°C and 10 mg/l during the day and dropping to 24°C and nearzero mg/l during the early morning hours as the marsh emptied on the ebb
tide (see Figures IV-10 and IV-11). Calculated community respiration in
the marsh water (Station 1) amounted to 18.6 g/m /day gross production2 3 2
(14.7 g/m /day) and 18.4 g/m /day total respiration (14.6 g/m /day).
The combination of low water level and high respiratory demand resulted in
anoxic conditions which adversely affected the marsh biota. Fish kills
of mullet and various sciaenid fishes occurred during these stressful con
ditions . Blue crabs adjusted to the oxygen depletion by migrating out of the
water as the oxygen level dropped. When rapid photosynthesis and wind-
aided reaeration restored a reasonable concentration after sunrise, the crabs
moved back into the marsh waters.
TOC and VSS levels greatly exceeded concentrations found in previous
trips, as TOC levels reached 60 mg/l (Figure IV-12) and VSS concentrations
exceeded 100 mg/l (Figure IV-13). Carbon concentrations varied directly
with the direction of flow, increasing significantly as the marsh drained on
the ebb tide.
Organic nitrogen concentrations exhibited a similar tide-related pattern,
and several values above 4 mg/l surpassed previous maximum concentrations
(see Figure IV-14). Ammonia variation closely followed the organic nitrogen
pattern and also reached higher concentrations than noted before (Figure IV-
14). Nitrite and nitrate remained at minimum detection levels (Figure IV-14).
Both orthophosphorus and total phosphorus reached peak levels of 0.32 and
0.72 mg/l respectively (Figure IV-15).
Mass balances for all carbon, nitrogen, and phosphorus species under
study showed a larger exodus of material than was transported into the
marsh (Table IV-4). This outward transport was greatest for the organic
nutrients, but was also considerable for inorganic nitrogen and phosphorus
forms.
IV-9

22 J—L
TEMPERATURE CHANGESN SWAN LAKE MARSH BAYOU
JULY 30-AUGUST I, 1974
Station 3
JL_L J__L I—L J__L J—L J I
Figure IV- 10
±_1
1800 2400 0600 1200 1800 2400 0600 1200 1800
July 30 July 31,1974 August I, 1974

Figure IV - II
DISSOLVED OXYGEN IN SWAN LAKE MARSH BAYOUJULY 30-AUGUST I, 1974
£
LU
O>-Xo
oCOCO
12 I I I I I I I I I I I I I I I I I
10 -,
1800 2400 0600 1200 1800 2400 0600 1200 1800
July 30 July 31, 1974 August 1,1974

- 50
10
0
TOTAL ORGANIC CARBON CHANGES INSWAN LAKE MARSH BAYOUJULY 30-AUGUST I, 1974
i i i i i I i i i i
Station 3
J I I • • I I I J_l I I
Figure IV-12
1800 2400 0600 1200 1800 2400 0600 1200 1800
July 30 July 31,1974 August 1,1974

Figure IV-13
ORGANIC MATERIAL (VOLATILE SUSPENDED SOLIDS)IN SWAN LAKE MARSH BAYOU
JULY 30 -AUGUST 1,1974
250
£ 200 -CO>
COo
o 150
oLUo
&I00£Vcn
LU
o>
50?-
i i i r
1800 2400 0600 1200 1800 2400 0600 1200 1800
July 30 July 31,1974 August 1,1974

E
o
oor
o
<tCDor
o
Figure IV-14
r^m1 ' L ' fi I ' ' I ' ' I I I I I I I I I I I I
7.7.1 ,*,« nitrogen changes in swan
a/mum-vi/(All1 Stations)
J_L
LAKE MARSHJULY 30- AAUG. 1,1974 / \
J I
//"NitratetIaiI Stations)
±_1
Station 4
i—L J-JL
1800 2400 0600 1200 1800 2400 0600 1200 1800
July 30 July 31, 1974 August I, 1974
10 _
.8
.6
.4
.2
0
LUCDOor
<a:
<
<or
<
o

Figure IV -15
E
COIDoro
Q_COO
Q_
O
oro
1800 2400 0600 1200 1800 2400 0600 1200 1800
July 30 July 31,1974 August 1,1974

3i
TABLE IV-4
MOVEMENT OF CARBON . NITROGEN . AND PHOSPHORUS AT SWAN LAKE MARgff STATIONS -THIRD FIELD TRIP (July 30-August 1, 1974)
StationNutrient Flows
(g/tidal cycle)Carbon Nitroqen Phosp horus
TOC VSS Org N NH3 NO,* N03* Total Ortho
1 Mass In
Mass Out
82,600
152,600
222,000
436,000
6,540
9,390
679
831
152.9
229.6
94
136
733
1,140
136
329
Net Mass Flow
Out
70,000 214,000 2,850 152 76.7 42 407 193
3 Mass In
Mass Out
720
720
1,700
2,740
341
47.8
3.90
3.97
1.34
1.43
0.67
0.83
3.44
5.36
0.75
0.35
Net Mass Flow
Out
0 1,040 13.7 0.07 0.09 0.16 1.92 -0.40
4 Mass In
Mass Out
63,100
136,300
200,000
458,000
4,940
7,380
708
745
103.3
165.1
61.5
102.6
396
1,017
51
185
Net Mass Flow
Out
13,200 258,000 2,440 37 61.8 41.1 621 134
*Based on minimum detectable levels

LABORATORY INVESTIGATIONS
Slurry Tests
As mentioned earlier, the results for the slurry tests will not be pre
sented here because the laboratory analyses of nitrogen and phosphorus were
not completed by the Health Department Laboratory in time for inclusion.
These results will be included in a subsequent report which will be prepared
for the continuing work on the Lavaca Bay marsh reactor studies.
Fixed Bed Results
Leaching and Spiking Results
Analysis of the fixed bed exchange data was confounded because of
two principle problems. The unanticipated poor quality and variability in
tap water during the experimental period severely affected the quality of the
distilled water used during draw and refill procedures. Additional varia
bility in nutrient levels characterizing different batches of INSTANT OCEAN*
and subsequent analysis of blanks have presented inconsistent results.
An analysis of the data was carried out; however, it presented here only
as a description of an approach and to reveal trends which may or may not
be realistic.
The presentation of results will be limited to the leaching and uptake
of ammonia. Figures IV-16 and IV-17 show concentrations leached from the
sediments to the water column through time (leaching period) at three different
salinities and three different temperatures respectively. Note that each data
point represents the ammonia concentration at the end of a one day leaching
period; the concentrations observed leached from the sediment during that
time. Also, each data point represents the ruean of results from several cores.
Similarly, Figures IV-18 and IV-19 show uptake for the same environmental
conditions. These data have not been corrected for background concentrations
of ammonia or differences in water volumes. In order to correct for water
volume differences and to determine the actual mass of the nutrient in the
water column after leaching, the following equation is used:
Cw •V=MNH3-N <*-«
where:
C = concentration of NH, expressed as NH«-N (mg/l)
V = volume of water removed (liters), and
M =mass of NH3 removed expressed as NH3~N (mg).IV-11

as
3.0
2.5
on
£~20
1.5
1.0
0.5
SALINITYEFFECTSONAMMONIA
LEACHINGFROMSEDIMENTS
45
TIME(DAYS)
8
c
a>
<i

3.5
3D
2.5
E
2.0
roX
1.5
1.0
0.5
TEMPERATUREEFFECTSONAMMONIA
LEACHINGFROMSEDIMENTS
345
TIME(DAYS)
27°j»:
o
8
C
<

EFFECTSOFSALINITYONAMMONIAUPTAKEBYSEDIMENTS
U)
E
00I
y
3-
20%oo
I,uS=-.^f1010°/,
„sioo
TIME(DAYS)c
<D
<I
CO

EFFECTSOFTEMPERATUREONAMMONIAUPTAKEBYSEDIMENTS
C5
E
z:i
COX
o*
23
TIME(DAYS)
~7-~-*P'*
c-^
<D
•—•
<I

Amounts (mass) of ammonia removed from the system during the leaching
experiments and taken up during the uptake tests may then be expressed
on a cumulative basis through time (Figures IV-20 and IV-21 respectively).2
These data are expressed as mg NH3~N leached or taken up per m usingthe core sediment surface area as the appropriate divisor.
Exchange Rates
In order to investigate more thoroughly interactions of parameters
measured and their respective effects on leaching and uptake processes,
data collected were entered into a stepwise multiple regression computer
program of the following general form:
In y = a + bT x~ + b. x. + b xe + b + x^, + . . . + b xnTxttssc c nn
o o
where
In y = the natural logarithm of any nutrient ("y")either sprbed or leached expressed asmg Y/mZ
a = a constant
xT,x.,x,x ,...,x = the independent variables temperature,1 l s co T (°C); time, t (days; salinity, s (%o);
initial concentration of the nutrient in the
water column, c ; and an n variablerespectively, ana
bT, b., b , b , . . . , b = the respective coefficients for the corre-o sponding independent variables.
In addition, any interactions between variables could be delineated using
an analysis of variance and a correlation matrix.2
Leaching data (as cumulative mg/m leached, the data shown in Figures
IV-20 and IV-21) was entered into the regression model with the independent
variables of time, temperature, and salinity. Both time and salinity were
significant (p < 0.005 and p < 0.01 respectively) with positive coefficients.
Temperature, however, was not significant (p > 0.10). The following model
resulted:
In y = 4.406 + 0.408 x + 0.028 x . (IV-2)
Similar results were found with uptake data for ammonia:
In y= 6.435 + 0.200 x¥ - 0.029 x . (IV-3)t s
Here salinity is inversely related to uptake and the same order of magnitude.
Table IV-5 summarizes pertinent multiple regression statistics.
IV-12

1500
1000
CM
O)
E
COXz.
500
100
50
Figure IV-20
20°A>o^x
SALINITY EFFECTS ON AMMONIA
LEACHING FROM SEDIMENTS
I 1 1
3 4 5 6
TIME (DAYS)8
t

SALINITY EFFECTS ON AMMONIAUPTAKE BY SEDIMENTS
1000
C\J
D) 500
E^ 400
CO 300
200
100
>(
ys
ss
iff
1
10%0
-•*—?20°/<»^*
2 3
TIME (DAYS)
Figure IV-21

TABLE IV-5
MULTIPLE REGRESSION STATISTICS
Equation # N
Mult. Reg.Coefficient
Std. Error of
Estimate
Std. Error of Reqression Coefficients (Sbn)
btP
b„P Sb
s
P k P
IV-2 60 0.933 0.244 0.022 < .001 NS* 0.004 < .01 NA**
521 IV-3 40 0.898 0.185 0.021 < .001 NS 0.004 < .01 NA
CO
IV-4 12 0.673 0.065 NA NS 0.002 < .10 NS
IV-5 12 0.748 0.051 NAi
.003 <.10 NS NS
*NA meaning not available or not entered**NS meaning not significant (P > .05)

In order to examine effects of various parameters on the rates of
cumulative leaching and uptake, a "best" line (sum of squares method)
fit was determined for each core individually for each experiment. Only
the first five days of data were included for leaching as it appeared that
the slopes between the fifth and eighth days were generally significantly
lower (see Figures IV-16 and IV-17). This may have been due to an approach
to equilibrium conditions or this may in part have been an artifact of the
experimental procedure. By calculating the slope of the line a rate of leaching2
(in mg nutrient/m /day) for each core was established. As it was suspected
that rates of leaching could be effected by the initial concentration of the
nutrient in the water, the twelve cores involved in the first leaching exper
iment were analyzed as a group.
Rates of leaching and uptake calculated as described above were
regressed against the independent variables of temperature, salinity, and the
initial concentration of the overlying water. For leaching experiments, the
following regression equation resulted:
y = 0.3085 +0.0066 xc . (IV-4)
where:2
y =rate of cumulative leaching (mg NH3/m /day), andx = independent variable of salinity (ppt).
Salinity was found to be significant at the 10 percent level of probability.
Other independent variables were not significant (p > 0.10). Likewise
rates of cumulative uptake were regressed against the same independent
variables as above yielding the following equation:
y = 0.1491 + 0.0084 x^ - 0.07846 x . (IV-5)T co
where:2
y = rate of cumulative uptake (mg NH«/m /day),
x,- = mean temperature value over the five day period, and
x = initial concentration of the water column.
Temperature and the initial concentration are barely significant at p < 0.10.
Salinity was not significant although it was found to be correlated with the
initial concentration of ammonia in the overlying water.
IV-14

As can be seen from Table IV-5 neither of these equations show very
significant correlations. Trends are indicated, however, which need to
be verified by increasing the sample size.
Data analysis on nitrate and phosphate was not completed due to delays
in receiving results from the State Health Department Laboratory. Nitrate
levels during the first set of leaching and uptake experiments were quite low,
generally less than 0.03 mg NOo-N/1. Any increases in these levels were
short-lived dropping to their former levels within twenty-four hours. This
was not true, however, of a few cores during the second phase of leaching.
These cores show initially a very high concentration of N03 in overlying waterwith accompanying low concentrations of ammonia, indicating possible
biological denitrification. Phosphate exchange patterns were obscured by
erratic behavior, a situation found by other investigators (Pomeroy, et al. ,
1965).
Marsh Reactor Studies
Flow Conditions
Flow into the reactors was measured at 0830 and 1630 each day and read
justed, if necessary, to approximately 14 ml/min. However, the gravity-
feed siphon system for inflow water did not maintain uniform flow, since
particulate matter often clogged hose constrictions where clamps were placed.
Water levels were not always constant within the reactors because floating
algae mats would block the overflow tube and the water level would rise.
Actual water input rates ranged from 0-60 ml/min, although mean flows generally
occurred within + 10 ml of the standard flow. These variations upset the
daily exchange rate which should have provided 10 complete water exchanges
through each system, or a detention time of 0.1 days.
Water Quality Conditions
Since the reactors were installed outside to take advantage of the
intense summer sunlight, the model systems were exposed to take advantage
of the intense summer sunlight, the model systems were exposed to optimum
photosynthetic conditions as indicated by large dial fluctuations in dissolved
oxygen and pH. Daytime pH conditions fluctuated from less than 8.0 to
more than 10.0 within the reactors as C02 was assimilated rapidly by the systemautotrophs. Dissolved oxygen concentrations varied most spectacularly for
Reactors 1,2, and 3 which contained dense algal mats. Reactors 4,5,
IV-15
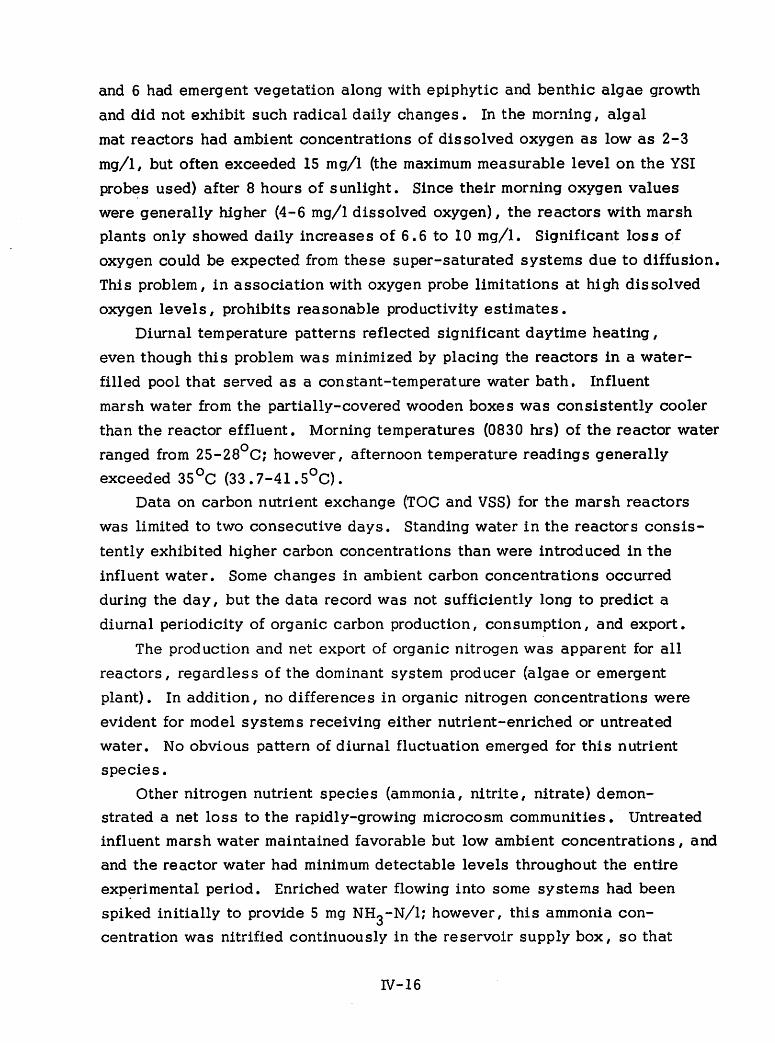
and 6 had emergent vegetation along with epiphytic and benthic algae growth
and did not exhibit such radical daily changes. In the morning, algal
mat reactors had ambient concentrations of dissolved oxygen as low as 2-3
mg/l, but often exceeded 15 mg/l (the maximum measurable level on the YSI
probes used) after 8 hours of sunlight. Since their morning oxygen values
were generally higher (4-6 mg/l dissolved oxygen), the reactors with marsh
plants only showed daily increases of 6.6 to 10 mg/l. Significant loss of
oxygen could be expected from these super-saturated systems due to diffusion.
This problem, in association with oxygen probe limitations at high dissolved
oxygen levels, prohibits reasonable productivity estimates.
Diurnal temperature patterns reflected significant daytime heating,
even though this problem was minimized by placing the reactors in a water-
filled pool that served as a constant-temperature water bath. Influent
marsh water from the partially-covered wooden boxes was consistently cooler
than the reactor effluent. Morning temperatures (0830 hrs) of the reactor water
ranged from 25-28°C; however, afternoon temperature readings generallyexceeded 35°C (33 .7-41,5°C).
Data on carbon nutrient exchange (TOC and VSS) for the marsh reactors
was limited to two consecutive days. Standing water in the reactors consis
tently exhibited higher carbon concentrations than were introduced in the
influent water. Some changes in ambient carbon concentrations occurred
during the day, but the data record was not sufficiently long to predict a
diurnal periodicity of organic carbon production, consumption, and export.
The production and net export of organic nitrogen was apparent for all
reactors, regardless of the dominant system producer (algae or emergent
plant). In addition, no differences in organic nitrogen concentrations were
evident for model systems receiving either nutrient-enriched or untreated
water. No obvious pattern of diurnal fluctuation emerged for this nutrient
species.
Other nitrogen nutrient species (ammonia, nitrite, nitrate) demon
strated a net loss to the rapidly-growing microcosm communities. Untreated
influent marsh water maintained favorable but low ambient concentrations, and
and the reactor water had minimum detectable levels throughout the entire
experimental period. Enriched water flowing into some systems had been
spiked initially to provide 5 mg NH3-N/1; however, this ammonia concentration was nitrified continuously in the reservoir supply box, so that
IV-16

considerably less was actually available in the influent. At the same
time, nitrate concentrations in the enriched influent rose during the test
period.
Concentrations of total phosphorus and orthophosphorus remained stable
in the supply reservoir, regardless of the prevailing water condition (enriched
or natural). Total and ortho phosphorus levels in the spiked reservoir ranged
ranged from 2.9-3.7 mg/l, even though only 2 mg PO^-P/l was the targetconcentration. Natural marsh water had nutrient levels approximately
30 times less than the enriched water. Due to uptake by the microcosm
communities, phosphorus levels (both forms) in the reactor standing water
were lower than the influent concentrations.
IV-17

CHAPTER V
DISCUSSION
HELD INVESTIGATIONS
The water exchange between the marsh and Swan Lake occurs in response
to tidal influences. Flooding tides carry Swan Lake waters into the marsh,
while an ebb flow partially drains the marsh. Stage of the water depth in
bayou channels varies in response to daily tidal fluctuations, as well as
hydrologic conditions in the adjacent estuarine areas (i.e. decreased river
flow, strong changes in wind direction, and velocity). No direct inputs of
Lavaca River water into the marsh were noted during the field sampling,
although increased river inflow would probably breech the low natural levees
along the river and flood the back of the marsh.
Prevailing hydrologic conditions in the marsh differed during each visit
to the Swan Lake system. Three initial reconnaissance trips to the experi
mental area (one by helicopter) were made in early June when abnormally high
tides had completely flooded the marsh. Continually receding water levels
were encountered on subsequent sampling trips. For instance, the first
field trip (June 28-29) occurred under flooded conditions (marsh vegetation
inundated during both flood and ebb periods), whereas during the third
sampling session (July 30-Aug. 1) water in the marsh was restricted to
the bayou channel and major tributaries (vegetation was entirely emergent).
The second experimental period (July 11-12) represented an intermediate
hydrologic condition where a flooding tide left vegetation partially sub
merged and ebb generally resulted in exposed sediment.
Weather conditions in the Lavaca Bay area remained relatively constant
throughout the summer. Although light local showers were noted on occasion,
a chronic drought persisted over this portion of Texas, and it was not broken
until after the termination of field sampling. The wind appeared to have some
effect on the magnitude of tidal inundation as strong southeastern breezes
pushed additional water into Swan Lake and winds from the north produced the
opposite effect (decreased marsh water exchange). Decreasing river inflow
due to the lack of precipitation in the Lavaca-Navidad basins may have
been primarily responsible for the overall water level changes observed.
Changes in water quality parameters, such as dissolved oxygen and
temperature, follow a normal diurnal pattern, but it may be disrupted depending
V-l

upon the source of the water. Diurnal curves tended to become steeper as
the water level dropped and biological activity became more concentrated.
Strong oxygen demands from the sediments (both algal and bacterial respira-
tion)rapidly removed oxygen from the marsh water during the nighttime,
although flood tides sometimes renewed the supply with oxygenated Swan
Lake water. Extensive algal production during the day was capable of
raising the in situ oxygen level far above saturation.
The dense growths of algae and rooted vegetation in the marsh pro
vide a rich source of organic-based nutrients. Decomposition of dead
plant material provides various grades of particulate and dissolved organic
matter and nutrients for support of intra-marsh consumers and transport to
adjoining estuarine systems. The rapid decomposition implied by the
observed oxygen demand and supplied the organic carbon, organic nitrogen,
and ammonia that were generally transported out of the marsh. Ambient
concentrations of these degradation products fluctuated with the direction
of flow, especially with low water levels in the marsh, decreasing when
Swan Lake waters entered the marsh and increasing as ebb flows drained the
area. Inorganic nitrogen forms (NO«, N03) remained at low levels duringall field trips regardless of the origin of water being sampled. The reduced
state of marsh sediments may have inhibited production of these oxidized
nutrients, but more likely the algal mats and attached algae removed these
forms as they became available in the marsh.
For the first two field trips when water level was moderately high,
ortho phosphorus levels exhibited only slight variation in response to flow
direction changes. Total phosphorus measurements, which include a sizeable
organic-related component, responded more like other degradation products,
increasing in concentration with the exodus of marsh water. When the plants
were totally emergent during the July 30-August 1 sampling trip and com
pletely relied on soil-associated phosphorus, levels of both forms tested
showed distinct pulses related to the stage of the tidal cycle. Thus,
leaching of phosphorus from the sediments may be an important and major
source of phosphorus for attached and benthic algae in the marsh.
Mass balances for the various nutrient species show that the marsh
under study acts as a source of nutrients for the Swan Lake and upper Lavaca
Bay systems. Although the quantity of outward material flow differs with
marsh hydrologic conditions, water moving through Station 1 on the main
V-2

bayou always carried more nutrients out during ebb flow than were brought
in during the preceding flood period. This evidence appears to justify
the role of this marsh as a net exporter of nutrients.
The outward movement of organic-based substances is greatest,
particularly carbon (measured as TOC or VSS) and organic nitrogen; total
phosphorus is exported to a lesser extent. Observed difference in mass trans
port between ebb and flood portions of the tidal cycle have amounted to as
much as 112 kg of total organic carbon or 214 kg of volatile suspended
solids (see Tables IV-2, 3, and 4). The mass flow of organic nitrogen
compounds out of Swan Lake marsh ranged from 1.6 to 10.9 kilograms per
tidal cycle. Inorganic nutrients (NH3, NO«, N03, and ortho phosphorus)rarely exceeded a 0.5 kg mass transfer difference, and the difference often
amounted to only a few grams. Further, the nitrite and nitrate were always
at minimum detectable concentrations. This would imply that the marsh does
not actively take up inorganic nutrient species from incoming estuarine water,
or these nutrients are removed rapidly in the marsh and in Swan Lake causing
their concentrations to be low continually. The latter situation is the most
likely.
It is interesting to note that the highest export of TOC and organic
nitrogen occured when the water levels were highest and lowest, and the
lowest export occured with water levels under more or less normal water
levels. The attached algae and algal mats slough after drying and are trans
ported easily even under low water conditions with minimum inundation.
Flood conditions following a dry period would also dislodge and transport
this material in large quantities out of the marsh. For the first two sampling
periods conducted in this study, a reduction in exported material with the
decrease in water level would be expected; the large export during the dry
period would also be expected. Marsh areas experiencing periodic drying
and flooding may be adapted to export material in this manner.
LABORATORY INVESTIGATIONS
Fixed-Bed Investigations
Data from the core experiments indicate the complexities involved in
leaching and uptake exchange processes. The good correlations between
ammonia mass leached and sorbed versus time indicate fairly steady rates
over a four to five day period, but leaching of ammonia from marsh sediments
V-3
is shown to proceed at a much faster rate than uptake. However, this pattern
is to a large degree influenced by salinity. Increasing salinity enhances
cumulative leaching and likewise depresses cumulative uptake. Although
no significant effect of salinity on rates of leaching or uptake was shown,
this may be due to the small sample size at each salinity and temperature.
If salinity does have a significant effect on nutrient exchange, anthro
pogenic or natural alterations of salinity regimes affecting the river-marsh-
estuary complex should be thoroughly reviewed. Comparative studies involving
different systems and concerning mass and energy flows through these
systems would be highly desirable.
Marsh Reactor Studies
The marsh reactors served as adequate physical models of the Swan Lake
marsh community. Emergent plants (Scirpus maritima macrostachyus) collected
with the original cores continued to thrive and some plants even bloomed
during the late summer experimentation. Dense benthic algae mats grew in
all marsh reactors during the developmental phase when nutrient-rich marsh
water was continuously added. During the experimental phase, the reaction
of algae to nutrient inputs could be ascertained visually. Algae mats turned
bright green in color when enriched water was fed into the reactors, while
"natural" marsh water produced olive-colored algae.
Clogging problems within the water supply system resulted in extremely
variable daily flow rates into the reactors. Even though mean flows between
readjustments were fairly similar, the lack of consistent flow measurements
makes the construction of a nutrient mass balance difficult. In addition,
volume changes due to clogged reactor ports permitted excess nutrient
availability to community autotrophs.
Abundant summer sunlight provided excellent conditions for photosynthesis
within the reactors. Large diurnal fluctuations in dissolved oxygen and pH
demonstrated the rapid rates of production and assimilation for the essential
photosynthetic gases. In fact, primary production by the benthic algae mats
introduced too much oxygen to be accurately measured by the YSI oxygen
probes employed for such analysis. Due to the nature of the sampling
program (only two samples per day), this problem precluded reasonable esti
mates of community metabolism via the diurnal curve method.
V-4
Although water quality measurements were collected over a 10-day
period, the continuous data record was limited to 2-3 days. Still, some
trends were evident for the various nutrient parameters. Net export of
organic nitrogen was obvious throughout the study period. All other
nitrogen forms (NH3, NO«, NO«) appeared to be taken up by the reactorautotrophic communities, as did both forms of phosphorus. The data
on carbon inputs and outflows was not sufficient to demonstrate the direction
of exchange, although one would expect the rapidly-growing autotrophs to
release excess dissolved organics which could be transported out of the
microcosms.
Maintenance of a particular enriched nutrient level in the reactor water
supply was not as straightforward as originally thought. Some biological
activity in the supply reservoirs, as indicated by diurnal dissolved oxygen
changes, could utilize some inorganic nutrients for photosynthesis, as well
as release others through decomposition. Phosphorus concentrations were
relatively stable in the reactor influent throughout the study period, although
this level was higher than the proposed concentration. The water supply
enriched with ammonia exhibited a different pattern. Ammonia levels dropped
continuously, while the nitrate concentration increased simultaneously.
Apparently, ammonia was being oxidized, so that uptake by reactors must
be considered in terms of both nutrient types.
V-5


CHAPTER VI
CONCLUSIONS AND RECOMMENDATIONS
CONCLUSIONS
Despite the brevity of this study and the difficulties encountered in the
laboratory work and nutrient analysis time schedule, several important con
clusions may be drawn from the results as follows.
Field Studies
1. The study area in Swan Lake marsh acts as an oscillating-flow system;
Swan Lake serves as one water source, while the large bi-lobed
ponds and numerous pot-holes in the interior marsh area contain a
large portion of the marsh water supply. Since one major bayou
drains this entire region, Station 1 effectively monitors the total
water and nutrient exchange.
2. The hydrologic regime is essential to the mass transport of nutrient
material from the marsh to adjoining estuarine areas. Local tides
provided the prime mechanism for water movement through the marsh
system during the period of study (June 28-August 1, 1974). How
ever, overall water stage will also vary with changes in river flow
and the wind-generated seiches in the upper Lavaca Bay system.
3. Nutrients derived from the degradation of organic matter show the
greatest exodus from the marsh. Various carbon forms (both measured
as TOC and VSS), nitrogen as organic nitrogen and ammonia, and
total phosphorus (organic component) are produced rapidly following
the death of emergent vegetation or algal mats. Ambient concentra
tions of these nutrients generally rise during the later stages of
ebb flow as they are flushed out of detritus on the sediment surface.
4. The low concentrations of nitrite, nitrate, and orthophosphorus in
both flood and ebb tide waters indicates that marsh vegetation, mainly
attached and benthic algae, is removing these nutrients as soon as
they become available from whatever source. Indeed, those nutrient
forms may be limiting in the marsh. Emergent plants, which must
face alternating periods of partial submersion and air exposure,
appear to obtain their nutrient requirements from sediments.
VI-1
5. Computation of aquatic primary production by the diurnal curve
method is drastically limited by the presence of additional sources
and sinks for dissolved oxygen in the marsh. High sediment oxygen
demand, changes in water mass oxygenation (due to origin of water
mass), and oxygen supersaturation generated by rapid phytosynthetic
activity all inhibit the application of this method. Even under
optimum conditions, the diurnal method would only account for pro
duction due to submerged benthic, mat, and epiphytic algae.
Measurement of the growth and production rates for the emergent
saltmarsh bullrush was not attempted within this phase of the pro
ject.
6. Periodic drying of the marsh area studied may be an important
mechanism for enhancing organic nutrient release. Plants in this
marsh, especially the algal mat, are adapted for periodic drying,
high temperatures, and a widely varying salinity regime; high waters
(flood conditions) tend to flush sloughed mat materials from the marsh
as well as to revive the mat, low waters permit drying and sloughing,
and normal water levels permit a steady but reduced exchange of
nutrients from the marsh.
Laboratory Studies
Fixed-Bed Sediments
1. Ammonia was released from the sediment surface in the core reactors
at a high rate. The rate of release increased with salinity ranging
from 90 mg NH3-N/m2/day at Oppt to 500 mg NHg-N/m /day at20 ppt.
2. Ammonia was taken up by the sediments at a slightly lower rate than
released; the uptake rate was inversely dependent on the salinity
3
2of the overlying water ranging from 45 mg NH«-N/m /day at 20 ppt
to 325 mg NH3-N/m2/day at 0ppt.Marsh Reactor Studies
1. The marsh reactors served as adequate physical and biological models
of the Swan Lake marsh community. The algal mat and emergent
vegetation in the reactors survived and grew well.
VI-2

2. In the uptake studies organic nitrogen was exported from the reactors
as it is in the field while ammonia, nitrite, nitrate, and phosphorus
were removed by the vegetation in the reactors, again as is the case
for the field.
RECOMMENDATIONS
Field Investigations
1. The investigation of nutrient exchange in the Swan Lake marsh should
continue to better define the rates of net nutrient export and the
influence of water level and dry periods on these rates. Similar
studies should be done elsewhere on the Texas coast to delineate
the differences between marsh structure and function in "water
rich" areas and "water poor" areas. Different techniques may well
be needed to manage marshes in these different areas.
2. Future nutrient export studies should be coupled with marsh pro
ductivity studies to better define the sources and sinks of organic
and inorganic nutrients. Such studies should be conducted for a
variety of water level conditions and over several tidal cycles to
dampen erratic water level fluctuations.
Laboratory Investigations
Slurry Tests
1. The nutrient uptake and release tests data should be analyzed and
presented in the final report for the continuing study on nutrient
exchange in the marsh reactors. They should also be used to
direct further investigations.
2. The effects of pH and a wider range of salinity than used in these
tests should be investigated as well as the effects of drying.
Fixed-Bed Tests
1. A portion of the results for these tests are yet to be analyzed and
should be presented in the final report for the continuing studies.
2. Continuing studies should emphasize development of terms for the
nutrient exchange model, namely:
VI-3

a. Isotherms should be developed to relate sediment nutrient
concentrations to those in overlying water at equilibrium under
varying temperature and salinity conditions;
b. Uptake and release of nutrients from the sediments in the cores
should be carried out in a stirred, flow-through reactor to obtain
rate data;
c. The mass transfer coefficient for each nutrient should be cal
culated using the above information.
3. The influence of drying on the mass transfer coefficient should also
be investigated.
Marsh Reactor Tests
1. The marsh reactors should be moved to an indoor location so that
light and especially temperature can be controlled. Also, water
flows should be metered in by a pump rather than by gravity flow to
obtain more consistent flow rates.
2. Nutrient exchange studies should continue with the following objec
tives:
a. To determine nutrient exchange rates for systems with emergent
vegetation and attached algae and those with algal mats;
b. To determine nutrient exchange rates with continuous (flood),
intermittant (tidal), and low (drought) flows under different
temperature and salinity conditions;
c. To determine the comparative magnitude of the various nutrient
sources and sinks in the marsh system, namely emergent vege
tation, attached algae, algal mat, and sediment.
VI-4
LIST OF REFERENCES
Abbott, Walter. "Microcosm studies of estuarine waters. II. The effectsof single doses of nitrate and phosphate." ]WPCF 3.9:113-122 (1967).
American Public Health Association. Standard Methods for the Examinationof Water and Wastewater. Twelfth edition (1965).
Armstrong, N. E., and M.O. Hinson, Jr. "Galveston Bay EcosystemFreshwater Requirements and Phytoplankton Productivity." Final Report,Galveston Bay Toxicity Study, Texas Water Quality Board, pp. II-l-90(1973).
Blum, J. L. "Nutrient changes in water flooding the high saltmarsh."Hydrobiologica 34:95-99 (1969).
Box, T. W., and A. D. Chamrad. "Plant Communities of the Welder Wildlife Refuge." Welder Wildlife Foundation Contribution No. 5, Series B(1966).
Burkholder, P. R., and Bornside, G. H. "Decomposition of marsh grassby aerobic marine bacteria." Bull. Torrey Bot. Club, 84:366-383 (1957).
Carritt, D. E., and S. Goodgal. "Sorption reactions and some ecologicalimplications." Deep Sea Res. 1^:224-243 (1954).
Cooper, David. "River Input Studies Using Continuous-Series Microeco-systems. " Final Report, Galveston Bay Study Program, Texas Water QualityBoard, pp. 259-336 (1970).
Day, J. W., Jr., W. G. Smith, P. R. Wagner, and W. C. Stowe."Community structure and energy flow in a saltmarsh and shallow bayestuarine system in Louisiana." Office of Sea Grant Development Publication, L.S.U., Baton Rouge, La. 170 p. (1972).
Fenchel, T. "Studies on the decomposition of organic detritus derived fromthe turtle grass Thallassia testudinum." Limno. and Oceano. ,15:14-20 (1972).
Fenchel, T. J. Goering, A. Hattori, M. Klug, D. Patriquin, and R. Wetzel."Decomposition working group - research recommendations." InternationalSeagrass Workshop: October 22-26 (1973).
Fisher, W. L., J. H. McGowen, L. F. Brown, Jr., and C. G. Groat."Environmental Geologic Atlas of the Texas Coastal Zone - Galveston-Houston Area," Bureau of Economic Geology, The University of Texas atAustin, Austin, Texas (1972).
Gallagher, J. L., and F. C. Daiber. "Primary production of edaphic algalcommunities in a Delaware saltmarsh." Limno. and Oceanog. 19:390-3896(1974).
Gangoli, N., and G. Thodos. "Phosphate adsorption studies." JWPCF45:842-849 (1973).
Gessner, F. "Untersuchungen uber den phosphathaushalt des Amazonas."Intern. Rev. ges. Hydrobiol. 45:339-345 (1960).
Gessner, R. V., R. D. Goos, and J. McN. Sierburth. "The Fungal Microcosm of the Internodes of Spartina alterniflora," Marine Biology, 16:269-273 (1971). —
Goering, J. J., and P. L. Parker. "Nitrogen fixation by epiphytes on seagrasses." Limno. andOceano. 17:320-323 (1972).
Gooch, E. L. "Hydrogen Sulfide Production and Its Effect on InorganicPhosphate Release from the Sediments of Canary Creek Marsh." MastersThesis, Univ. of Delaware, 61 pp. (1968).
Hayes, F. R., and J. E. Phillips. "Radiophosphorus equilibrium with mud,plants, and bacteria under oxidized and reduced conditions." Limno. andOceanog. 3:459-475 (1958).
Hinson, M. O., Jr. "The Use of Aquarium Microcosms to Evaluate WaterQuality Effects on Galveston Bay Productivity. " Masters Thesis, Universityof Texas-Austin, 104 pp. (1974).
Jewell, W. J. "Aquatic weed decay: Dissolved oxygen utilization andnitrogen and phosphorus regeneration." ]WPCF 43:1457-1467 (1971).
Keup, L. E., G. D. McKee, E. W. Raabe, and R. W. Warner. "Water qualityeffects of leaching from submerged soils." Journal Amer. Water Works Assoc.62:391-396 (1970).
McRoy, C. P., andR. J. Barsdate. "Phosphate absorption in eelgrass."Limno. and Oceano. ^5:6-13 (1970).
McRoy, C. P., R. J. Barsdate, and M. Nebert. "Phosphorus cycling in aneelgrass (Zostera marina 1.) ecosystem." Limno. andOceano. 17:58-67(1972).
Mortimer, C. H. "Exchange of dissolved xubstances between mud andwater in lakes. " J. Ecology 29:280-329 (1941).
Mortimer, C. H. "Exchange of dissolved substances between mud andwater in lakes. " J. Ecology 30:147-201 (1942).
Nadeau, R. J., and T. H. Roush. "A Salt-marsh Microcosm: An Experimental Unit for Marine Pollution Studies." Proc. of Joint Conf. on Prevention and Control of Oil Spills, March 13-15, 1973. pp. 671-684 (1973).
Odum, E. P. Fundamentals of Ecology. W. B. Saunders Co., (1959).
32Odum, E. P., E. J. Kuenzler, and M. X. Blunt. "Uptake of p andprimary productivity in marine benthic algae." Limno. and Oceanog. 3:340-345 (1958).

Odum, W. E., J. C. Zieman, and E. J. Heald. "The Importance of VascularPlant Detritus to Estuaries." Proceedings of the Coastal Marsh and EstuaryManagement Symposium, L.S.U.-Baton Rouge, La. July 17-18, 1972 (1973).
Olsen, S. "Phosphate adsorption and isotopic exchange in lake muds.Esperiments with 32p." Verhandl. Intern. Ver. Limnol. 13:915-922 (1958).
Patriquin, D. G. "The origin of nitrogen and phosphorus for growth ofthe marine angiosperm Thalassia testudinum." Mar. Biol. 15_:35-46 (1972).
Pomeroy, L. R. "Algal productivity in salt marshes of Georgia." Limno.and Oceano. 4:386-397 (1959).
Pomeroy, L. R. "Experimental studies of the turnover of phosphate in marineenvironments." In V. Schultz and A. W. Klement (eds.) Radioecology, pp.163-166 (1963).
Pomeroy, L. R., L. R. Shenton, R. D. H. Jones, and R. J. Reimold. "NutrientFlux in Estuaries." Nutrients and Eutrophication - ASLO Special SymposiaVolume I, pp. 274-291 (1972).
Porcella, D. B., J. S. Kumagai, and E. J. Middlebrooks. "Biological effectson sediment-water nutrient interchange. " Journal of the Sanitary EngineeringDivision, Proc. ASCE 4:911-926 (1970).
Schultz, D. M., and J. G. Quinn. "Fatty acid composition of organic detritusfrom Spartina alterniflora." Estuarine and Coastal Marine Science ,1:177-190(1973).
Stewart, W. D. P. "Biological and ecological aspects of nitrogen fixationby free-living microorganisms." Proc. Roy. Soc. Ser. B172:367-388 (1969).
Teal, J. M. "Energy flow in the salt marsh ecosystem of Georgia." Ecology43:614-624 (1962).
Wentz, D. A., and G. F. Lee. "Sedimentary phosphorus in lake cores-analytical procedure. " Env. Sci. and Tech. 3_:750-754 (1969).
Winkler, B. F., and G. Thodos. "Kinetics of orthophosphate removal fromaqueous solutions with activated alumina." JWPCF 43:474 (1971).


PART II:
THE ROLE OF PLANTS IN NUTRIENT EXCHANGEIN THE LAVACA BAY BRACKISH MARSH SYSTEM
by
Anita J. Dawson and Neal E. Armstrong
FINAL REPORT
Submitted to the Texas Water Development Boardby the Center for Research in Water Resources, Environmental
Health Engineering Research Laboratory, Civil Engineering Department,The University of Texas at Austin
Interagency Contract No. IAC (74-75) - 1217
August 31, 1975


TABLE OF CONTENTS
TABLE OF CONTENTS
LIST OF TABLES
LIST OF FIGURES
CHAPTER 1 INTRODUCTION
Need for StudyObjectivesScope
CHAPTER 2 LITERATURE REVIEW
Introduction
Marsh Grasses
Attached Algae and Algal MatsSuspended OrganismsSediments
Saltmarshes
CHAPTER 3 EXPERIMENTAL PROCEDURES
Introduction
The Lavaca Bay Saltmarsh Area
Laboratory Simulation of the SaltmarshReactor Hydraulics
Productivity of MicrocosmsSamplingAnalysis of Data
CHAPTER 4 RESULTS
Introduction
Marsh Grass Microcosms
Algal Mat Microcosms
v
Page
v
vii
vili
1
1
2
2
4
4
5
11
15
17
23
26
26
26
29
34
37
39
40
45
45
45
59

TABLE OF CONTENTS (CONTINUED)
CHAPTER 4 RESULTS (CONTINUED)Rate and Cumulative Mass of Nutrients
ExchangedAdditional Parameters
Summary
vl
Page
69
90
90
CHAPTER 5 DISCUSSION 95
Introduction 95
Major Pathways of Nutrient Exchange Withinthe Marsh System 95
Effects of the Higher Concentration Gradient 101Effects of the Drying Period 103Comparison with Previous Studies 104
CHAPTER 6 CONCLUSIONS AND RECOMMENDATIONS
Conclusions
Recommendations
BIBLIOGRAPHY
VITA
106
106
107
109
xl

LIST OF TABLES
Table Title Page
1 Description of Microcosms 32
2 Light Intensities In the Microcosms 33
3 Instant Ocean Synthetic Sea Salts Solution 35
4 Nutrient Content of Distilled Water Used for Dilution 36
5 Experimental Schedule 38
6 Daily Exchange Rates of Nutrients in Brackish MarshMicrocosms 88
7 Mass of Nutrients Exchanged During Given HydraulicConditions 91
vll


LIST OF FIGURES
Figure Title Page
1 Location of Lavaca Bay Marsh Sampling Site 27
2 Microcosm Apparatus 30
3 Nitrogen Exchange In Microcosm 1 (Marsh Grass-Sediment - Unspiked) 47
4 Nitrogen Exchange in Microcosm 1 (Marsh Grass-Sediment - Unspiked) 48
5 Carbon and Phosphorus Exchange In Microcosm 1(Marsh Grass-Sediment - Unspiked) 49
6 Nitrogen Exchange In Microcosm 2 (Marsh Grass-Sediment - Spiked) 51
7 Nitrogen Exchange In Microcosm 2 (Marsh Grass-Sediment - Spiked) 52
8 Carbon and Phosphorus Exchange In Microcosm 2(Marsh Grass-Sediment - Spiked) 54
9 Nitrogen Exchange In Microcosm 3 (Marsh Grass-Paraffin - Unspiked) 55
10 Carbon and Phosphorus Exchange In Microcosm 3(Marsh Grass-Paraffin - Unspiked) 57
11 Nitrogen Exchange In Microcosm 4 (Marsh Grass-Paraffin - Spiked) 58
12 Carbon and Phosphorus Exchange in Microcosm 4(Marsh Grass-Paraffin - Spiked) 60
viil

lx
LIST OF FIGURES (CONTINUED)
Figure Title Page
13 Nitrogen Exchange In Microcosm 5 (Algal Mat -Unspiked) 61
14 Nitrogen Exchange In Microcosm 5 (Algal Mat -Unspiked) 63
15 Carbon and Phosphorus Exchange In Microcosm 5(Algal Mat - Unspiked) 64
16 Nitrogen Exchange In Microcosm 6 (Algal Mat -Spiked) 66
17 Nitrogen Exchange In Microcosm 6 (Algal Mat -Spiked) 67
18 Carbon and Phosphorus Exchange In Microcosm 6(Algal Mat - Spiked) 68
19 Cumulative Nitrogen Exchange In Microcosm 1 •(Marsh Grass-Sediment - Unspiked) 70
20 Cumulative Carbon and Phosphorus Exchange InMicrocosm 1 (Marsh Grass-Sediment - Unspiked) 71
21 Cumulative Nitrogen Exchange In Microcosm 2(Marsh Grass-Sediment - Spiked) 73
22 Cumulative Carbon and Phosphorus Exchange inMicrocosm 2 (Marsh Grass-Sediment - Spiked) 75
23 Cumulative Nitrogen Exchange In Microcosm 3(Marsh Grass-Paraffin - Unspiked) 76
24 Cumulative Carbon and Phosphorus Exchange InMicrocosm 3 (Marsh Grass-Paraffin - Unspiked) 77

LIST OF FIGURES (CONTINUED)
Figure Title Page
25 Cumulative Nitrogen Exchange In Microcosm 4 (MarshGrass-Paraffin - Spiked) 79
26 Cumulative Carbon and Phosphorus Exchange InMicrocosm 4 (Marsh Grass-Paraffin - Spiked) 81
27 Cumulative Nitrogen Exchange In Microcosm 5(Algal Mat - Unspiked) 82
28 Cumulative Carbon and Phosphorus Exchange InMicrocosm 5 (Algal Mat - Unspiked) 83
29 Cumulative Nitrogen Exchange in Microcosm 6(Algal Mat - Spiked) 85
30 Cumulative Carbon and Phosphorus Exchange inMicrocosm 6 (Algal Mat - Spiked) 86
31. Pathways of Nitrogen Exchange 96
32 Pathways of Phosphorus Exchange 97
33 Pathways of Carbon Exchange 98


CHAPTER 1
INTRODUCTION
NEED FOR STUDY
Estuaries are known to be highly productive areas. They are
often more productive than adjacent saltwater or freshwater areas
and serve as nursery grounds for neritic species. The saltwater
marsh is an important component of the estuary, contributing organic
and Inorganic nutrients to the waters which enables them to support
such an abundance of life.
Several studies of saltmarshes on the eastern coast have been
done but little work has been done to date on the Texas saltmarsh
system in regard to productivity, the effects of freshwater and tidal
flows, or nutrient cycling. A mathematical model of the Lavaca
River - Lavaca Bay - Matagorda Bay ecosystem is being developedc
by the Texas Water Development Board to enable the assessment of
the possible impacts of water resources development In the Lavaea
River and Garcitas Creek basins. A preliminary study of the cycling
of nutrients in the Lavaca Bay saltmarsh has been done to provide
Information on the exchange rates (of nutrients) which occur in the
marsh (Armstrong et al., 1975). This work Included field and labora
tory studies of the nutrient exchanges occurring, but additional work
was shown to be needed to further define the role of the plants of the
saltmarsh in this important cycling process.

OBTECTIVES
This study was undertaken to determine the role of plants in
nutrient exchange in the Lavaca Bay saltmarsh. The exchange was
studied at two water levels and at two concentrations of nutrients
(low and spiked) in the Influent water to determine the rate of
nutrient exchange and to determine the magnitude of nutrients con
tributed by the various components of the marsh system. Since
periods of drying occur in the Lavaca Bay saltmarsh during the summer,
the effects of drying on the exchange of nutrients also was determined.
SCOPE
Laboratory tests were conducted on two algal mat community and
four marsh grass community microcosms. (In two of the marsh grass
systems the sediments were covered by a layer of paraffin essen
tially sealing them from the overlying water. By so doing the con
tributions of the emergent vegetation to the exchange were determined.)
Constant flow was maintained through each microcosm at a rate simu
lating the diurnal effects of the tides and all microcosms were stirred.
Nutrients were added to half of the microcosms in low concentra
tions and to the remaining half in higher concentrations. Samples
of the water In each of the microcosms were taken periodically and
analyzed for various forms of carbon, nitrogen, and phosphorus.
Mass balances were computed to determine the exchange of each of
the nutrients by the various communities. In order to determine the
effect of dessicatlon on the exchange rate the microcosms were dried

for a period of time, then reinundated with water and samples were
again taken periodically.

CHAPTER 2
LITERATURE REVIEW
INTRODUCTION
Nutrient cycling In saltwater marshes has been found to be very
complex due to the interactions of the many marsh components as well
as the influences exerted by freshwater and tidal flow. The compo
nents of the area include: plants (marsh grasses, algal mats, phyto-
plankton, and diatoms); bacteria; animals (zooplankton, crustaceans,
molluscs, and insects); the overlying water column; and the sediments.
The species of plants and animals present In a marsh are strongly
influenced by several variable factors such as pH, salinity, meteoro
logical conditions, succession, and nutrient availability. Biological,
physical, and chemical interactions among the plants, animals,
sediments, and the overlying water column are the primary components
contributing to the constant cycling of nutrients in the saltwater marsh
(Keeney, 1973; Zobell, 1946; Pomeroy et al., 1972; Armstrong et al.,
1975).
Little work has been done to date on nutrient cycling in the
saltwater marsh ecosystem as a whole. However, many studies have
been done concerning nutrient cycling within various components of
the system.

The first section of this chapter will consider, studies concern
ing marsh grasses; the second, studies of algae and algal mats; the
third, suspended organisms; the fourth, the sediments; and the fifth,
the saltmarsh ecosystem.
MARSH GRASSES
The grasses (emergent vegetation) in the Lavaca Bay saltmarsh
are normally partially submerged. The amount of direct contact that
they have with the water varies with the tidal fluctuations of the
area. During the summer months there are periods during which the
water level recedes considerably leaving the vegetation completely
emergent (dry).
Productivity
Several factors have been found to influence the productivity
of the macrophytes of the saltmarsh. Light intensity, temperature,
and nutrient availability are known to be important factors in plant
productivity. Plants of the saltmarsh are also Influenced by salinity
and variations In both tidal and freshwater flow. These plants can
normally tolerate fluctuations in both salinity and temperature.
Zostera marina, a completely submerged seagrass, can exist in
waters with salinities from 0 ppt to 56 ppt (maximum productivity
occurs at 36 ppt) and temperature ranges of -6°C to 40°C (Blebl and
McRoy, 1971). Spartina alterniflora can withstand salinities of
40 ppt - 50 ppt (Hoese, 1967). Gross photosynthesis Increases with
temperature to 35°C and then decreases sharply.

In marshes, the growing season of the plants is longer than
it is for cultivated crops. This contributes to the higher production
of marsh areas when compared to terrestrial communities. In addi
tion, plants in the marsh have become well adapted to the extreme
conditions of anaerobic soil (Laing, 1940). Another reason for high
productivity is the vertical orientation of the leaves of most marsh
plants. This reduces intense heating, exposes the maximum leaf
surface to sunlight and minimizes neutral shading (Jervis, 1964).
The plants in marsh areas have an abundant supply of water in the
soil as well as the water flowing past (under inundated conditions)
which supplies more nutrients than standing water (Schelske and
Odum, 1961) and supports greater productivity. The marsh plants,
as obstructions of water flow, trap and retain nutrient-rich particles
in the marsh area (Blum, 1969; Ranwell, 1964). Enough phosphorus
was present in the sediment of one Spartina alterniflora marsh to
support growth for five hundred years (Pomeroy et al., 1969). In
the salt marshes of Georgia and Delaware, the water flooding the
marsh is the ultimate source of nutrients (Odum and de la Cruz, 1967;
Reimold and Daiber, 1970). Net production of a Spartina alterniflora
marsh in Georgia was measured by Odum (1959,1961) and found to2
range from 2000 - 3300 g (dry)/m /yr. The biomass of a Texas Typha
latlfolia and Typha domingensls community was measured and deter-2
mined to be 3982 g (dry)/m (McNaughton, 1966).
Spartina alterniflora marshes have been found to be highly pro
ductive and have a photosynthesis to respiration rate greater than
one (Teal, 1962). This excess production is an important nutrient
source for surrounding areas (Odum and de la Cruz, 1967). This is
supported by Teal's (1962) work in which he found that approximately

45% of the production of a Georgia Spartina marsh was exported to
surrounding waters.
The salt marsh plants are the primary producers supporting two
food chains. In the first, the primary consumers feed directly on
growing plants and In the second, detritus of marsh plants supports
the primary consumers (Keefe, 1972).
Boyd and Hess (1970) studied correlations between nutrient
level and shoot production in Typha latlfolla (bulrush). A positive
correlation exists between standing crop and the concentrations of
dilute acid-soluble phosphorus in hydrosoils and dissolved phos
phorus in waters. The concentrations of most nutrients in plant
tissues are positively correlated with nitrogen content. Standing
crop is the decisive factor In determining the quantities of nutrients
in a given area.
Grasses are Important as primary producers of the estuarine
marsh. In the Gulf, productivity of the attached algae has been
found to be only a small fraction of that of the grasses (Humm,
1956). In considering marine plants for aquaculture, Stengel (1974)
also found macrophytes to be considerably more productive than
algae.
Nutrient Absorption
McRoy and Barsdate (1970) in working with the completely sub
merged marine grass, Zostera, found that it is capable of absorbing32 32
P through both its leaves and its roots. Absorption of P by the

roots led subsequently to its release to the surrounding waters by
the leaves. Once In the surrounding waters this phosphorus Is avail
able to epiphytic and benthic algae, which are primarily responsible
for the removal of phosphorus from marsh waters (Pomeroy, et al.,
1972)i. The reverse of this process was also found to occur but was
of less intensity. The relative concentrations of phosphate In the water
and in the sediment were found to be the factors determining the direc-32
tion of translocation of P by the plants. In further work, the cycling
of phosphorus was studied in the eelgrass ecosystem of Alaska
(McRoy, Barsdate, and Nebert, 1972). Translocation of phosphorus
from sediments to water by the eelgrass was determined to occur at2
a rate of 62.4 mg P/m -day. In addition to the phosphorus released
through the leaves, export of floating eelgrass was estimated to con-2
tribute 25.86 mg P/m -day to the nearby sea. In later studies,
Relmold (1970) found the salt marsh cordgrass, Spartina alterniflora,
to act in the same way. The nutrient flux from sediment to water was
determined to be at a maximum during the summer months and at a
minimum during winter indicating an association with productivity
of the grass. Pomeroy et al. (1972) and others have also noted this
seemingly unlikely maximum of phosphorus during the summer months.
The findings of Patriquin (1972) in studying the origin of nitrogen
and phosphorus for growth of Thalassia testudlnum suggest that sig
nificant amounts of phosphate and nearly all nitrogen utilized for
growth are obtained from the sediments. The supply of readily
available phosphate in the root layer is estimated to be equivalent
to that required for three hundred to a thousand days growth while
the supply of nitrogen Is estimated to be equivalent to that required
for five to fifteen days growth. It Is believed that the sediments may
buffer the phosphate supply by storing sea water phosphate excreted
by Thalassia testudinum. The nitrogen is postulated to be derived
from fixation by anaerobic bacteria.
Blum (1969) suggested that the Spartina patens marsh acts as
a filtering system which removes nutrients when flooded by high
spring tides. Total phosphorus concentration was found to decrease
during flood tides, but this was as a result of dilution of the
phosphorus-rich waters surrounding the Spartina rather than absorp
tion by the mesh of stems.
An additional source of inorganic nitrogen has been determined
by Goering and Parker (1972) who found epiphytic algae to be nitro
gen fixers. Bacterial nitrogen fixation can also occur in sediments
with high reduction potential. Organic materials released by plant
roots are utilized by the bacteria which release ammonia needed for
plant growth.
Decomposition and Nutrient Regeneration
Spartina alterniflora marshes usually have a photosynthesis
to respiration ratio greater than one (Teal, 1962). This excess pro
duction is an important source of organic energy to the nearby
estuarine waters (Odum and de la Garza, 1967).
Decomposition of organic matter causes a release of soluble
organics to the surrounding waters as well as an increase in microbial
biomass. The proteinaceous component of marsh plants is converted
to organic nitrogen and then undergoes deaminatlon to ammonia. The

10
ammonia is oxided to nitrite and then to nitrate.
Fenchel (1970) studied the decomposition of detritus derived
primarily from Thalassia testudinum. Generally only the outermost
or two outermost cell layers were populated by microbial communities.
These communities consisted of bacteria, small zooflagellates and
diatoms and to a lesser degree, other unicellular algae and ciliates.
The bacteria and fungi decomposed the detritus to materials more
readily available to the larger plants and animals. In turn, the
bacteria were consumed by flagellates and dilates and the fungi by
nematodes. This conversion of low protein marsh grass to high protein
microbial mass is an important link In the estuarine food chain
(Gossellnk and Kirby, 1974).
Aerobic heterotrophic bacteria participate actively In the de
composition of Spartina (Burkholder and Bornslde, 1957). Decomposi
tion and utilization of the protein and soluble carbohydrate components
of marsh grass proceed rapidly while the crude fiber material (cellulose
and lignin of the stems) is decomposed more slowly. Jewell (1971)
found a refractory fraction of the plants from 1 - 50%, depending upon
species, to resist decomposition over a period of three to six months.
The average refractory fraction for healthy plants Is 24%. This is
approximately half that of algae.
Decomposition of detrltal material In situ occurs slowly in
winter and more rapidly in spring and summer (Burkholder and Bornside,
1957). Gosselink and Kirby (1974) found conversion efficiency to
decrease with increasing particle size. This may be due to the de
crease in surface area per unit mass with increasing particle size
11
which reduces heterotroph access to the particles. This is supported
by the studies of Fenchel (1970) which found microbial communities
on only the outermost cell layers of particles and accordingly found
the number of microorganisms present to be proportional to the surface
area.
Jewell (1971) found the regeneration of nitrogen and phosphorus
during decomposition to vary from 0% - 100% of the particulate
nutrients initially present. The nutrients not regenerated are those
remaining in the particulate refractory material. Aquatic plants have
the potential to regenerate more nutrients through decomposition than
phytoplankton since the plants decay more rapidly and more com
pletely.
Saprophytic fungi have been found to aid in the decomposition
process. Gessner, Goos and Sleburth (1972) found Spaerullna pedlcel-
lata to colonize in the internodal area of living Spartina alterniflora
and to rapidly form a significant biomass during the plant's senescence
along with other fungi. This fungal biomass was colonized by bac
teria and grazed upon by nematodes and mites.
ATTACHED ALGAE AND ALGAL MATS
Productivity
Optimal light intensity plays an important role in algal produc
tivity. Pomeroy (1959) in studying algae of the Georgia saltmarsh
found photosynthesis to occur only with optimal light intensity, this
ranging between 350 and 3000 foot candles (depending to some extent
12
on the major taxonomic group present). With light in the optimal
range, algal photosynthesis is temperature dependent. Conover
(1958) found these same factors to be of primary importance to ben
thic marine plants in Massachusetts.
Total dally production of algae in the Georgia saltmarsh does
not vary significantly from season to season (Pomeroy, 1959). The
gross annual algal production for this saltmarsh is estimated to be2
200 gms of C/m . Gallagher and Daiber (1974), in studying edaphic
algal communities in a Delaware saltmarsh, determined the gross2
annual production there to be 160 gms of C/m of ash-free dry
weight, which is approximately one-third of the anglosperm produc
tivity of that marsh.
In addition to adequate light and temperature, nutrients are
also required for algal productivity. Odum, Kuenzler, and Blunt
(1958) studied the uptake of phosphorus in marine benthic algae.
The rate of uptake was found to be independent of light conditions
and to vary between species. Both phosphorus uptake and productivity
were proportional to the surface to volume ratio of the algae. Thus,
the inherent surface area features of the algae are the determining
factors for productivity and phosphorus uptake. Conover (1958)
noted that the abundance of benthic plant species followed changes
of phosphorus in the spring and nitrogen In the fall (phosphorus con
centrations were low in spring; nitrogen concentrations were low in
fall). Within the area studied, sections having larger concentrations
of nitrate and phosphate were more productive.

13
Nutrient Cycling
The biomass of algae is immediately available to algae-detritus
feeders in the marsh as opposed to the macrophytes which must first
die and undergo decomposition (Gallagher and Daiber, 1974). Dead
algal cells will undergo decomposition in the same manner as pre
viously described for the macrophytes. However, the algae have a
larger refractory fraction than the macrophytes and also decay at a
slower rate (Jewell, 1971). Recycling of organic matter from benthic
marine plants occurs primarily in situ (Conover, 1966). Armstrong
and Hinson (1973) found organic matter to be rapidly produced and
released from the marsh following death of emergent plants or algal
mats.
The Algal Mat Community
Algal mats have been observed to occur in areas with tempera
tures ranging from near freezing to 70 C and salinities from less than
1 ppt to greater than 20 ppt (Sorenson and Conover, 1962). The mats
in the bays of South Texas are a vibrant green throughout the summer,
disappear in winter and reappear in March (Odum, 1967). They are
composed of a laminar arrangement of plants and animals. Sorenson
and Conover (1962) identified five distinct zones in the algal mats
of southern Texas, which was composed mainly of Lvngbya confervoides
The zones are: Zone A, consists of algae with blackened sheaths sug
gesting that this layer acts as a temperature and light shield for under
lying microorganisms; Zone B, is a transition zone having some addi
tive growth; Zone C, is a region of vigorous algal growth; Zone D,
consists of remains of microorganisms and an increasing number of

14
colorless flagellates and bacteria; and Zone E, is an area of decompo
sition and anaerobic processes. The photosynthetic products of this
laminar arrangement may often remain unconsumed since few consumers
are adapted to contend with the organic matter In the extreme anaerobic
and briny conditions existing before and after deposition (Odum, 1967).
Systematic changes in fatty acids occur throughout the layers of these
algal mats (Parker and Leo, 1965).
An oxidation-reduction potential gradient capable of reacting
to a platinum electrode exists among the ions of the algal mat
(Armstrong and Odum, 1964). This is caused by photosynthesis and
separation of the rising oxygen. The voltage gradient is In the
direction to produce an electrophoresis of negative ions toward the
positive upper surface and this may serve to pump nitrates and phos
phates to the upper algae. Since nutrients have been found to accum
ulate on the surface of mats It appears that this does occur (Oppen-
heimer and Ward, 1962). The voltage gradient may also produce an
organization among the blue-green algae which become positioned
in accordance with their charge.
The effect of single doses of phosphate (1 - 100 micromoles/
liter) and nitrate (10 - 100 micromoles/liter) on a marine algal com
munity have been determined (Abbott, 1967). Consumption of each
nutrient and Its effect on productivity Is independent of the other.
All nutrients added to the ecosystems, were eventually consumed and
excess nutrient levels produced the expected luxuriant growth. A
first-order mechanism for phosphate utilization was associated with
the limiting maximum rate of uptake. The rate of uptake of nitrogen
indicates a more complex reaction sequence with uptake velocity
15
depressed at high concentrations of dissolved nitrate.
In Cooper's study (1970), microcosm algal production Increased
when drought conditions were simulated by stopping the inflow of
freshwater. However, algal microcosms in more advanced successlonal
stages become nutrient starved and can utilize nutrients rapidly with
little noticeable increase in productivity (Armstrong and Hinson,-1973).
Nutrient Inputs to algal systems are rapidly utilized and converted
to additional biomass. Porcella et al. (1970) found that soluble
orthophosphate was immediately accumulated by the algal community
and was utilized for growth.
SUSPENDED ORGANISMS
The primary producers in saltmarsh ecosystems are the higher
plants, the algae in and on the sediments, and phytoplankton found
in estuarine waters (Pomeroy, 1959). The higher plants and the
phytoplankton are the two major sources of organic material In the
estuarine waters (Jewell, 1971).
Phytoplankton utilize inorganic phosphorus converting it to
organic phosphorus during photosynthesis. The organic form Is re
generated back to the inorganic form via the metabolism of bacteria,
phytoplankton, zooplankton and higher organisms in the water (Bruce
and Hood, 1959). Phytoplankton may also utilize ammonia, as a
source of nitrogen (Zobell, 1946) and are a source of amino acids for
the decomposers.

16
Marine algae have been found to excrete extracellular products
to the surrounding water. Four to sixteen percent of photoasslmllated
carbon Is released in this manner by a healthy phytoplankton popula
tion (Hellebust, 1965). Evidence has been found that considerable
amounts of organic phosphate derivatives and perhaps even Inorganic
phosphate are excreted (Bruee and Hood, 1959). Diurnal variations
of Inorganic phosphate In Texas bays are greatest when heavy popula
tions of phytoplankton undergoing rapid growth are present. Within
normal light intensities release of extracellular products by phyto
plankton Is proportional to the amount of carbon fixed. At low light
intensities release of these products is relatively greater and at light
intensities high enough to inhibit photosynthesis, as much as ninety-
five percent of the assimilated carbon may be released as extra
cellular products (Fogg et al., 1965). In this way, the excreted
extracellular products may later serve as a carbon source for phyto
plankton and may permit better growth than an inorganic source alone
would at low light intensities.
Phosphates are known to be concentrated by algal cells (Round,
1965). This may explain their ability to grow in a medium that be
comes devoid of phosphates (Baalsrud, 1967). Nitrogen can also be
economized in this way during periods of shortage. When present
in low concentrations, the amount of nitrogen apparently determines
the rate of growth (Baalsrud, 1967). Pomeroy et al. (1965) found the
exchange capacity of the sediments to provide an ample supply of
phosphate for phytoplankton during high growth periods when It Is
needed In larger amounts.

17
Zooplankton, depending primarily on plant life for nutrition,
are also present in estuarine water (Zobell, 1946). They either serve
as a food source for larger marine animals and the nutrients they
assimilate continue along the food chain or they eventually die and
their nutrients are returned to the ecosystem via decay.
SEDIMENTS
Sedimentation is an important process in the saltmarsh. The
main components of the sediment are derived from the nearby estuarine
environment and upland discharge (Eagleson et al., 1966). The period
of maximum accretion occurs in August, except in higher areas of the
marsh where accretion is fairly continuous (Ranwell, 1964). The ac
cretion rate in European and Northeastern American coastal marshes
was found to be in the range of 0.2 - 1.0 cm/yr. The average rate
of sedimentation in Texas bays is 3 ft/century (0.9 cm/yr) (Shepard,
1953). Shoaling in Lavaca Bay occurs at a rate of 0 .46 ft/century
(0.14 cm/yr) and in East Matagorda Bay it occurs at a rate of 3.5
ft/century (1.1 cm/yr). Lavaca River serves as a sediment source
for Lavaca Bay by carrying approximately 160,000 tons of sediment
to the Bay exchange (Shepard, 1953). The rate of formation of
marsh level high enough for colonization of higher plants in England
has been occurring more rapidly than colonization by the plants.
Sediments deposited in estuaries contain organic matter from
terrestrial erosion, agricultural runoff, marine debris, and fresh
water debris. Ranwell (1964) found sedimentation to supply nutrients
at the rate of 800 kg of N/ha-yr and 250 kg of P/ha-yr. The results
of the studies of the England saltmarsh suggested that the sediment

18
supply to marsh zones is derived from lower (more seaward) marsh
zones and that these are in turn fed by the bare mud zones to the
seaward of them.
The upper layers of saltmarsh sediment are inhabited by bacteria,
algae, diatoms, protozoa, and small marine animals. Annelids and
other burrowing species will be found in lower layers. Bacterial
populations decrease from the surface downward, the decrease
occurring most rapidly in the uppermost few centimeters (Zobell, 1946).
Bacteria are of importance In the decomposition of organic detrital
material in which nutrients are regenerated to the saltmarsh. Products
of decomposition lead to nutritionally rich sediments. The bacterial
biomass can be assimilated by filter-feeding and mud-eating animals.
The burrowing species can cause mixing and translocation of the
sediments. Chemical conditions are also affected by the micro
organisms in the sediments. Seasonal cycles in organic productivity
and meteorological conditions cause seasonal changes in the species
inhabiting the bottom in shallow waters (Zobell, 1946).
Nutrient Exchange
The exchange of nutrients between the sediments and the over
lying water column occurs as a result of complex interactions of
biological, physical, and chemical processes. Microbial processes
effect the nutrient exchange occurring at the sediment-water interface
directly through assimilation and release as well as Indirectly by
alteration of pH and the oxidation-reduction status of the sediments,
and the production of gas. Lee (1970) regards hydrodynamic effects
such as currents to be rate-controlling since they alter the concentration

19
gradient and cause exchanges to occur in order for the sediment-
water interface to return to equilibrium. Nutrient exchange across
intertidal sediment surfaces may be further enhanced by the vertical
movement of the water as it evaporates during low tide and Is re
placed during high tide (Pomeroy et al., 1965). Actual quantities
of carbon, nitrogen and phosphorus retained In the sediments are in
fluenced by the oxidative capacity of the water (Serruya, 1971).
Phosphorus
Phosphorus in the sediments may be in several forms: calcium
phosphate, organic phosphate, orthophosphate dissolved in the
interstitial water, aluminum and iron phosphate compounds or as
phosphate adsorbed on silicates. Phosphorus in organic forms is
released from the sediments through dephosphorylatlon by phosphatase
enzymes of various microorganisms (Fillos and Swanson, 1975).
During the degradation of organic matter, organic and inorganic
acids are formed which may dissolve inorganic phosphate compounds.
The phosphorus may be released to the overlying water or retained by
the sediments.
Porcella et al. (1970) have conducted studies of the biological
effects on sediment-water nutrient exchange. The sediments served
as the phosphorus source for algae and the amount of growth was
found to vary with the amount of phosphorus in the sediments. More
productive systems were generally those with greater phosphorus
concentrations in the sediments.
20
Hayes and Phillips (1958) In studying phosphorus exchange be
tween lake sediments and water found their results to suggest that
in small, shallow lakes phosphorus exchange Is dominated by the
growth and bacterial decomposition of rooted aquatic plants. Both
Zostera marina (eelgrass) and Spartina alterniflora have been found
to absorb excess phosphorus from sediments and release them to
surrounding waters (McRoy, Barsdate, and Nebest, 1972; Reimold,
1972). Pomeroy et al. (1972) found Spartina to remove all or most
of its phosphorus from subsurface sediments.
Phosphate exchange combines a sorption reaction and a bio
logically controlled exchange (Pomeroy et al., 1965). The sorption
reaction consists of a rapidly occurring surface sorption and a
slower, secondary combination of phosphate with the clay lattice.
The biological process occurred at the same rate as the faster sorp
tion process Indicating an exchange across cell membranes rather
than assimilation. The concentration gradient of phosphorus at the
sediment-water interface is the driving force of the sorption process
(Carritt, 1954).
Gooch (1968) proposed a mechanism for the seasonal variation
of inorganic phosphate (high summer concentrations and low winter
concentrations). Water conditions In autumn (pH greater than 7.0,
minimal hydrogen sulfide production) cause the formation of ferric
phosphate which removes dissolved phosphorus from the water and
keeps it bound in the compound throughout the winter. As the pH
decreases in spring, ferric ion is reduced to ferrous, sulfide produc
tion increases and pyrites are formed, all of which lead to the release
of phosphorus from the precipitated to the dissolved form. As sulfide

21
production increases during the summer months the phosphorus release
increases. Serruya (1971) found a good correlation between phos
phorus and iron in the sediments of Lake Kinneret. Precipitation has
been found to contribute significantly to the nutrient concentration
of saltwater marshes and may be a contributing factor to high summer
concentrations (Reimold and Daiber, 1970) since higher salinities and
temperatures in summer affect the solubility product. The high sum
mer concentrations may also be associated with aerial application of
insecticides and agricultural utilization.
The cycling of phosphorus in estuarine waters of Georgia Is
primarily controlled by metabolic processes and secondarily by
physical-chemical processes (Pomeroy et al., 1972). The sediments
are able to supply sufficient phosphorus to phytoplankton and benthic
plants during periods of high productivity or temporarily increased
flushing (Pomeroy et al., 1965).
Nitrogen
Nitrogen is present in sediments mainly in organic forms but
may also be present as ammonia-nitrogen, nitrate-nitrogen, or
nitrite-nitrogen. The concentration of each of the species that is
present is dependent upon rates of immobilization, mineralization,
nitrification, and denitriflcatlon. Ammonium and organic nitrogen
compounds are known to be readily sorbed by clay and other inorganic
colloids. Shapiro (1970) and Ryther and Dunstan (1971) suggest that
nitrogen in coastal marine waters is the critical limiting factor to
algal growth and eutrophication.

22
32 15Rapid turnover rates of P and N indicate that assimilation
and regeneration by the plankton and protozoans occurs rapidly.
Although bacteria are normally considered to be of importance in
releasing nutrients from organic matter, studies by Johannes (1968)
have indicated that aquatic animals may dominate the process. Due
to the high metabolic rates of herbivorous zooplankton, they are able
to consume and release back to the water an amount of nutrients
several times greater than their body weight. Autolysis and solubili
zation are also rapid mechanisms of nutrient release (Fenchel, 1970).
Under aerobic conditions a higher rate of nitrogen mineraliza
tion will occur than under anaerobic conditions (Jewell, 1971).
Increase in temperature will increase the rates of regeneration, turn
over, and assimilation.
The rate of nitrification in sediment-water systems doubles with
each 10 C increase in temperature (from 0 C to 40 C). Most nitrifi
cation is attributed to autotrophs (Chen et al., 1972a). Nitrate was
found to be released to overlying water in appreciable amounts only
in well oxidized, stirred situations such as those which may occur
in shallow water. Nitrification has been found to occur in surface
layers of lake sediment with subsequent denitriflcatlon occurring In
the reduced subsurface zone of the sediments. Denitriflcatlon in
marine sediments varies widely and appears to be inversely related
to the carbon to phosphorus ratio of the sediment (Chamroux, 1965).
Nitrogen fixation rates in lake and estuarine sediments are
normally low and fixation may be only of minor importance in these
environments (Brezonik, 1971). However, in studying the source of

23
nitrogen for growth of Thalassia testudinum. Patriquin (1972) postu
lated that nitrogen In the sediments Is derived primarily from fixation
by anaerobic bacteria.
SALTMARSHES
In studying a saltmarsh of Delaware, Reimold and Daiber (1970)
found a linear relationship to exist between salinity and total and
inorganic phosphorus. Phosphorus concentrations are high compared
to other saltmarshes on the east coast and are attributed to residence
time, turnover rates, and abundant supply of the nutrient. The phos
phorus concentration reaches a maximum in summer and a minimum in
winter in this area.
The productivity of a saltmarsh in Georgia was determined and
found to be high. Forty-five percent of the net production was
exported to surrounding water by the tides. In this manner the salt
marsh supports an abundance of life found beyond its immediate
boundaries (Teal, 1962). Pomeroy et al. (1972) also studied marshes
in Georgia. Phosphorus was never found to be a limiting factor of
productivity in these studies. Respiratory processes were found to
remain constant throughout the year. (Higher phytoplankton produc
tion in spring and summer Is balanced by higher production of Inter
tidal microflora and larger algae in winter.)
Maurer and Parker (1972) studied the concentration of dissolved
organic carbon in the coastal waters of Texas (both estuaries and the
Gulf near the coast overlying the continental shelf). The concentra
tion of dissolved organic carbon was determined at a point toward

24
north Lavaca Bay and found to be 4.9 mg/l and at a point in south
Lavaca Bay it was 4.6 mg/l. Dissolved organic carbon concentrations
in Matagorda Bay (to the south of and connected with Lavaca Bay)
ranged from 3.6 mg/l to 4.2 mg/l. As with all other Texas bays these
values exceed those of the Gulf waters (1.0 - 3.7 mg/l DOC) Indicating
the high productivity of the estuarine area. Wilson (1962) studied
total organic carbon in Texas bays and found it to be five to ten times
that in the Gulf. These values are higher than those of Maurer and
Parker due to the high amount of particulate matter (total organic carbon
is the sum of particulate and dissolved organic matter) In the bay
waters. The samples In this study were taken during a drought so
evaporation may have Increased the dissolved organic carbon content
(Maurer and Parker, 1972).
It appears that either rapid cycling of inorganic phosphorus or
a dynamic exchange with sediment and suspended materials exists
to provide sufficient phosphorus for the observed productivity (Bruce
and Hood, 1959). Inorganic phosphate increases following sunset
and decreases beginning with sunrise indicating the existence of a
relationship between the inorganic phosphate variation and photo-
synthetic activity. This appears to be the case since largest diurnal
fluctuations were found to occur in areas of heavy phytoplankton popu
lations undergoing rapid growth. The turnover rate for phosphorus
in Texas bays was determined to be ten to twenty days. Pomeroy
(1963) found the turnover rate of phosphorus to decrease in periods
of darkness which also suggests the importance of photosynthetic
organisms in turnover.

25
Initial studies of cycling of nutrients in saltwater marshes of
Lavaca Bay were done by Armstrong et al. (1975). In field studies
in July (emergent vegetation was partially submerged during the
flooding period and dry towards the end of the ebbing period) organic
nitrogen and total organic carbon were found to be exported from the
marsh area while small amounts of inorganic nitrogen and larger
amounts of orthophosphorus were taken up by the marsh. Additional
field studies were done in August at which time flow was confined
to the main channels and larger depressions in the area, leaving the
marsh almost dry. All forms of nitrogen, phosphorus, and carbon
were exported from the marsh with the export of organic materials being
greater than inorganic. Marsh reactor studies were also done on
portions of the marsh which had been removed (both algal mat and
emergent plant communities). Total organic carbon and organic nitrogen
were exported from the reactors. The inorganic nitrogen species
(ammonia, nitrate, nitrite) and total and orthophosphorus exhibited
a net loss to both plant communities.

CHAPTER 3
EXPERIMENTAL PROCEDURES
INTRODUCTION
This chapter describes the laboratory apparatus and work done
as well as the methods of analyzing the resulting data. First, the
area of Lavaca Bay from which marsh samples were obtained and the
acquisition of these samples are described; second, the laboratory
microcosms and marsh simulation are described; third, the sampling
methods and schedule are given; and fourth, the methods used in
analyzing the data are explained.
THE LAVACA BAY SALTMARSH AREA
A series of bays are located along the Texas Coast. The trans
ition from these brackish water bays to the land freshwater flows
occurs through areas of marsh formed by deposition of sediment.
The water in these areas is normally shallow and brackish and vege
tation abounds. An area of the Lavaca Bay Marsh was utilized in this
study. It is located 9.5 miles NNE of the City of Port Lavaca.
Samples of the marsh system were removed from a peninsular area
(about two miles long) located between Swan Lake and Lavaca River
which both flow into Lavaca Bay. The location of the sampling site
in relation to Swan Lake can be seen in Figure 1 (as the core and
reactor sites).
26

27
FIG. 1. LOCATION OF LAVACA BAY MARSH SAMPUNG SITE
Scale: 1lnch-2000feet
8 e wage [Disposal .
N.

28
The saltmarsh area was visited for procurement of portions of
the marsh system for use in the laboratory microcosms in mid-March,
1975. At this time the area was covered with approximately eight to
eleven Inches of water and marsh grasses present were a healthy
green. The algal mat had not yet formed but algae were present both
floating on the water and resting on the sediments.
During summer, 1974 (Armstrong etal., 1975) dissolved oxygen
in this area ranged from 0-12 mg/l; ammonia nitrogen from 0.1 - 1.7
mg/l; organic nitrogen from 0.5 - 3.8 mg/l; nitrate nitrogen from 0.03 -
0.06 mg/l; nitrite nitrogen from 0.03 - 0.06 mg/l (although same range
as nitrate, nitrite values always exceeded nitrate values); orthophos
phate from 0.01 - 0.26 mg/l; total phosphate from 0.05 - 0.7 mg/l;
and TOC from 3-63 mg/l.
Acquisition of Saltmarsh Plants and Sediments
Plastic pails (Rubbermaid - 13.5 inch diameter, 15.5 inch depth),
which were used as containers for the microcosms in the laboratory,
were taken to the marsh area and portions of the marsh system were
placed directly in them. Marsh grasses and their roots were removed
with a shovel and placed in the pails on top of a few inches of sedi
ment (to allow for additional root extension). The total sediment depth
in these pails was about eight inches. Four pails were filled in this
manner with representative portions of the marsh grasses and their
underlying sediments. Although algal mats had not yet formed,
samples of the algae present were placed in two pails over a layer
of sediment about four inches deep. (Algal mats formed from this
algae in the laboratory.)

29
Two to four inches of water from the marsh were placed in each
pail to maintain the partially inundated conditions present in the field
during transport back to the laboratory. The microcosms were taken
to the laboratory late in the day, placed under lights, and maintained
in this way for three days. After this time, a constant flow of saline
water containing low nutrient concentrations was pumped through the
reactors at a low flow rate. (The concentrations described as low
are: 0.2 mg/l of NH -N, <0.1 mg/l of Org-N, <0.02 mg/l of NO -o 3
N, <0.01 mg/l of NO -N, 0.05 mg/l of Ortho-P04, and 0.05 mg/lof Total PO„.) This was continued for three and a half weeks in order
4
to allow the plants to become acclimated to the laboratory conditions.
LABORATORY SIMULATION OF THE SALTMARSH
The Marsh Microcosms
Influent water for each microcosm was kept in an individual
five gallon carboy. The water was pumped from the carboy through
plastic tubing by a Cole Parmer pump and entered the microcosm above
the water surface. Water drained from the microcosm through a con
stant water level glass-tubing siphon. The influent and effluent
points were opposite each other to minimize short-circuiting. Each
microcosm was continuously stirred by a T-Line Laboratory Stirrer*
to simulate the stirring of water in the saltmarsh by the wind and tides
A diagram of this apparatus is presented in Figure 2. The microcosms
were numbered from one to six and the marsh or algal system and
* Talboys Engineering Corp., Emerson, N. J.
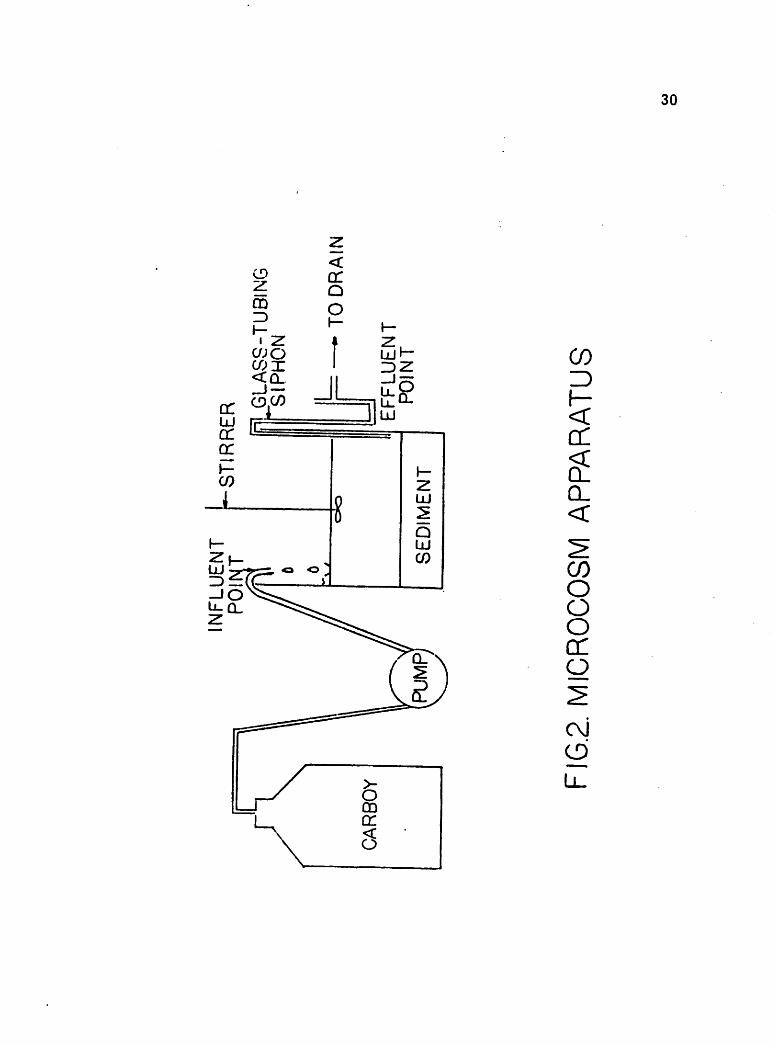
NFLUENTPOINTi-STIRRER
jLGLASS-TUBINGSIPHON
F=—TODRAIN
EFFLUENTPOINT
F1G.2.MICROCOSMAPPARATUS
COo

31
nutrient conditions maintained in each are described in Table 1.
Lighting
Lights were mounted in a rectangular frame which was placed
over the six microcosms. Four Ken Rad 25 watt incandescent bulbs
were in the center along the length of the frame. To either side were
four 40 watt daylight Ken Rad fluorescent bulbs> also placed length
wise. By using both incandescent and fluorescent lights, the plants
received wavelengths of light in both the near infra red and blues.
The lights remained on from 0800 to 2000 at which time the
microcosms were covered with an opaque material to prevent the
reception of any further light by the plants. To facilitate the drying
process (a period of drying was simulated during the study) the incan
descent bulbs were replaced by 250 watt Sylvanla infrared heat bulbs
for the initial thirteen days of the drying period. A listing of the
intensity of light reaching each microcosm from the incandescent
and fluorescent bulbs as well as from the heat and fluorescent bulbs
is given in Table 2. According to Pomeroy (1959) the optimum light
intensity for algae of the Georgia saltmarsh ranged from 350 - 3000
foot candles. Thus, there is a possibility (refer to Table 2) that light
intensity was a limiting factor to the productivity of algae.
Influent Water
Instant Ocean Synthetic Sea Salts* were mixed with distilled
♦Aquarium Systems, Inc., Eastlake, Ohio

32
TABLE 1
DESCRIPTION OF MICROCOSMS
Microcosm Primary Flora
1 marsh grass
2 marsh grass
3 marsh grass
(sediments coveredby paraffin layer)
4 marsh grass
(sediments coveredby paraffin layer)
5 algal mat
6 algal mat
Influent Nutrient Level
low
additional nutrients
low
additional nutrients
low
additional nutrients

TABLE 2
UGHT INTENSITIES IN THE MICROCOSMS
Incandescent and Fluorescent Lights
Microcosm At Sediment
Surface
(foot-candles)
1 320
2 320
3 280
4 260
5 150
6 180
1" Above 4" Above
Sediment Sediment
(foot-candles) (foot-candle s)
340 440
345 420
300 430
290 400
160 230
190 260
Heat and
Fluorescent
At Sediment
Surface
(foot-candles)
770
770
900
850
580
610
CO
co
34
water to attain a salinity of 5 ppt. The chemical analysis of the
Instant Ocean water is given in Table 3 and the laboratory analysis
of the amounts of nitrogen and phosphorus present in the distilled
water is given in Table 4. The Instant Ocean Water was mixed in a
one hundred fifty gallon container and the five gallon carboys were
filled from it. Mixing this large quantity provided a consistent
salinity throughout the study.
When the Instant Ocean water was transferred to the individual
carboys, the trace element solution was added to all of them, and
additional nitrogen and phosphorus were added to the carboys
supplying microcosms 2,4, and 6. Ammonium chloride was added
to provide an additional 5 mg/l of nitrogen and potassium phosphate
monobasic provided an additional 2 mg/l of phosphorus.
REACTOR HYDRAULICS
Water Level
Initially, the level of water in the microcosms was set at four
inches above the sediment surface in Microcosms 1, 2, 5, and 6 and
at four inches above the paraffin surface in Microcosms 3 and 4.
(After the acclimation period the sediments in Microcosms 3 and 4
were covered with a layer of paraffin which sealed the sediments
from the overlying water column preventing nutrient exchange between
the sediments and water. Nutrient exchanges occurring in these micro
cosms then must take place between the plants, suspended organisms
and water column with the exception of the possible transport of
nutrients from sediments by the roots of the plants). Over a period

TABLE 3
INSTANT OCEAN SYNTHETIC SEA SALTS SOLUTION
Element
CI
Na
S04Mg
K
Ca
HCO3H3BO3Br
Sr
S1O3P04Mn
M0O4
S2O3Li
*Rb
*EDTA
*A1
*K
*Zn
*V
*Fe
*Co
*Cu
*so4*I
*C1
* Present in trace elements solution.
Final Concentration
(ppm)
18400
10200
2500
1200
370
370
140
25
20
8
3
1
1
0..7
0.,4
0,,2
0,,100
0.,050
0..040
0,,020
0,,020
0,,020
0.,010
0,,010
0,.003
0.,298
0,,073
0.,050
35

TABLE 4
NUTRIENT CONTENT OF DISTILLED WATER
USED FOR DILUTION
Nutrient Concentration
(mg/l)
NH -N4
. 0.2
NO -N3
<0.02
NO -N <0.01
Ortho-PO.-P 0.02
36

37
of three weeks the water level was gradually lowered until no water
remained, at which time the period of drying was begun. After the
drying period of five weeks, the microcosms were filled to the initial
four-inch water level and nutrient exchange was monitored for the re
maining two weeks. (See Table 5 for the schedule of the study.)
Thus, the nutrient exchange rate under conditions of partial inundation
was studied as well as the effects of summer drying.
Influent Flow
Constant flow conditions were maintained throughout the study.
The flow rate was set to provide a twelve-hour residence time and,
therefore, was changed in accordance with changes in the water level.
It was necessary to change the tubing In the pump heads frequently
to avoid fatigue of the tubing which would cause variations in the
flow rate. The flow rate was checked regularly and maintained
within 1.5 ml/min of the desired flow rate at high flow (13 ml/mln)
and within 1 ml/min at medium flow (3 ml/min). Deviation of the
flow rate was not determined at the low water level since no analyses
could be done at that time.
PRODUCTIVITY OF MICROCOSMS
The microcosms fluorished throughout the study. It was neces
sary to trim the emergent vegetation periodically as it approached
the level of the lights in its growth. Snails were present in all the
microcosms but were apparently most abundant in the algal mat micro
cosms. Algal growth appeared to be more Intense in microcosms which
received water enriched with additional nutrients than in those

TABLE 5
EXPERIMENTAL SCHEDULE
38
Week Water Level
(in.)
Sampling Frequency Sampling Time
1 4 Daily 1200
2 1 Twice Daily 0800
2000
3 0.25 - 0.5
0
4
None
None
Daily
4-8
9 - 10 1200
39
receiving low concentrations of nutrients. During the period of
drying much of the emergent vegetation died and the algal mat was
reduced to a papery crust. When reinundated to the initial water
level, all of the microcosms recovered and returned to their original
states of productivity. New shoots of marsh grass appeared periodi
cally and grew rapidly, normally reaching the height of the original
plants within about a week. Algal mats also began to regenerate and
were approaching their former level of productivity by the second week.
SAMPLING
Nutrients
Water samples for nutrient analyses were taken in accordance
with the schedule in Table 5. (Samples were taken In random order.)
Thus, samples were taken during a two-week period before drying and
a two-week period after drying. They were taken both in the morning
and evening during the second week of the study to determine whether
any significant diurnal variation in nutrient exchange occurred.
Samples were taken from each microcosm as well as from one influent
water source with low nutrient concentrations and one with additional
nutrients to permit the calculation of nutrient mass balances. The
samples were analyzed for organic nitrogen, ammonia, nitrate, nitrite,
orthophosphate and total phosphate at the Texas State Health Labora
tory and for total organic carbon (TOC) at the Center for Research in
Water Resources, Balcones Research Center. The samples were pre
served by adding concentrated sulfuric acid to the nitrogen samples
and chloroform to the phosphorus samples and storing the samples
at 4 C (as specified in Standard Methods, 1971) until they were

40
transported to the Texas State Health Laboratory for analysis. The
samples taken for analysis of TOC were frozen until this analysis
was performed.
Additional Parameters
When nutrient samples were taken, the pH of each microcosm
and the influent waters was determined using a Beckman pH meter.
Temperature of the water in the microcosms was determined periodi
cally throughout the study and was found to remain almost constant
(approximately 23 C). Dissolved oxygen measurements were taken
in the morning and evening for several consecutive days using a YSI
dissolved oxygen probe. This data did not show the expected diurnal
effects and portrayed no definite pattern. The fact that so many of
the components of the microcosms affect the dissolved oxygen concen
tration makes it difficult at best to determine what occurred.
ANALYSIS OF DATA
The overall nutrient exchange in the microcosms is described
by the following equation:
4r = ? (S - S) - f(sediments) - f(plants) - f(pail) (1)at V o
w ere' — = rate of change of nutrient concentrationat
with time,

41
7~ (S - S) = rate of change of nutrient concentrationv o
due to influent gains and effluent losses,
f (sediments) = nutrient exchange with sediments,
f(plants) = nutrient exchange with plants,
f(pail) = nutrient exchange with pail surface.
If no sediments or plants are present:
^ =J (SQ - S) - f(pail) (2)
By eliminating the plants and sediments, that is, by analyzing
samples of water from pails receiving a constant flow of Instant
Ocean water, f(pail) was determined. This was done with Instant
Ocean water containing both low nutrient concentrations and additional
nutrients. Since two of the reactors contained paraffin layers which
were in contact with the water, f(pail) was determined for Instant Ocean
water (both low nutrient concentrations and additional nutrients) over
lying a paraffin layer.
The pail receiving Instant Ocean water with low nutrient con
centration s took up slight amounts of ammonia nitrogen and phosphate
for three days after which no further uptake was noted. When spiked
Instant Ocean water was added to this system no additional nutrient
uptake was observed despite the increased concentration gradient.
The pail with paraffin receiving Instant Ocean water with low nutrient

42
concentrations also took up slight amounts of ammonia nitrogen and
phosphate for three days. When spiked Instant Ocean water was
added to this system, further uptake of ammonia nitrogen and phos
phate occurred. This was in small amounts and after three days no
further uptake occurred. Essentially all uptake of nutrients by the
pails or by the pails and paraffin occurred within five to six days.
Since all the microcosms received a constant flow of Instant Ocean
water for three and a half weeks prior to the beginning of sampling,
it can be assumed that the pails or pails and paraffin had already taken
up as much of the nutrients as they could. Thus, the term, f(palls),
was essentially zero during the experimental work and Equation (1)
becomes:
^ =^ (S - S) - f(sediments) - f(plants) (3)Since (S - S) Indicates the net change in nutrient concentration based
on influent and effluent concentrations, the value of this term also
represents the net change In nutrients due to sediment and plant ex
change. This value was plotted vs. time for each nutrient species
in each microcosm throughout the study. From these graphs, trends
In net exchange can be determined prior to and after the drying period,
and the nutrient exchange of the microcosms can be compared.
Rather than calculate the exchange rate per unit volume of water
(77 (S -S)), which would require a knowledge of the depth of waterV o
overlying a marsh in order to compare these values with other marsh
areas, the mass of nutrients exchanged per unit area of the marsh
was calculated. That is, Equation (3) was multiplied by the depth
of water, H, yielding:

43
Hdf = A (So ~S) "•Hf (s6d) "Hf <Piants> (4)
Rearranging this becomes:
7" (S - S) = H ^7 +f(sediments) +f(plants) (5)a o at
By integrating the result of calculations of the left-hand term
of Equation (5) (plotting the mass of nutrients absorbed or released
per unit area cumulatively vs. time), the amount of nutrients ex
changed during the study could be determined. The slope of this
plot will give the rate of exchange per unit area. As with the plotting
of (S - S) vs. time, the exchange of the microcosms can be comparedo
to one another and by doing so the comparative magnitudes of the
primary sources and sinks determined.
Thus, integrating Equation (5) by a modified, simple numerical
procedure:
EAM (VS) At = H [Z At" At +E f(sed)At +S f kDAt] (6)
Examination of the raw data reveals the fact that ~~ is essen-At
tially zero after an initial period of adjustment of the microcosms to
new water level conditions (as occurs at the beginning of week one,
week two, and after the period of drying). This initial period of ad
justment occurred within about two days during weeks one and two
and within a little longer time interval after the drying period. Thus,
^ was zero during a majority of the study and the microcosms wereAtat steady state. At steady state, the final equation describing the

44
nutrient exchange In the microcosms is:
SA At" (S0~S)At = HCSf(sed)At+2 f(plants)At] (7)
In the case of Microcosms 3 and 4, where sediments are sealed from
the overlying water by the paraffin layer, essentially eliminating ex
change between sediments and water, Equation (7) becomes:
7 7 77 (S -S)At = He f(plants)At (8)^ A A* °

CHAPTER 4
RESULTS
INTRODUCTION
The results of the laboratory studies are presented below.
Results of the marsh grass microcosms are presented first followed
by those of the algal mat microcosms. Nutrient exchange (mg/l)
throughout the study and exchange of nutrient per unit area through
out the study have been plotted for each nutrient in each microcosm.
The slope of the plot of nutrient exchange per unit area vs. time
gives the exchange rate of the nutrients. The first section of this
chapter describes the exchange of nutrients (mg/l) In each microcosm
throughout the study; the second, describes the rate of exchange and
the cumulative mass of nutrients exchanged by each microcosm; the
third, discusses the rates of exchange; the fourth, gives information
on the additional parameters which were measured; and the final
section, summarizes the exchange of nutrients by the microcosms.
MARSH GRASS MICROCOSMS
Marsh Grass - Sediment Community : Microcosm 1
This community contained marsh grass and sediments along with
the microorganisms present when the system was removed from the
Lavaca Bay saltmarsh in March.
45

46
Ammonia-nitrogen was taken up (0.0 - 0.2 mg/l) during the
first week and released during the second (0.0 - 0.4 mg/l) (see
Figure 3). After the period of drying, larger amounts f^0.3 mg/l)
were released for eight days and after this time release remained
between 0.0 and 0.3 mg/l. Organic nitrogen was released through
out the first two weeks (0.0 - 0.5 mg/l) (see Figure 3). Following
the drying period concentrations greater than 0.5 mg/l were released
for one and a half days with release remaining less than that for the
remainder of the after drying period. Low amounts of nitrate and
nitrite were released during the first two weeks (see Figure 4).
Nitrite was released at a higher rate for twelve hours after the end
of the drying period and nitrate for twenty-four hours. Release of
nitrite and nitrate began to increase slightly at the end of the recovery
period. Overall, the net nitrogen exchange was a release to the
water (Figure 3). This was at a constant rate by day 4, with a higher
rate occurring for the first ten days of relnundatlon after drying.
Orthophosphate and total phosphate were released throughout
the first two weeks (0.0 - 0.2 mg/l) (see Figure 5). The orthophos
phate concentrations paralleled total phosphate and comprised a fairly
consistent portion of It. After the drying period larger amounts were
released for twenty-four hours, and by day 65 slight amounts of
phosphorus were taken up by the ecosystem and this continued
throughout the remainder of the two weeks following the drying
period.
From 1-6 mg/l of TOC were released during the second week*
* No values are given for TOC in the first week for any reactor dueto analytical difficulties.
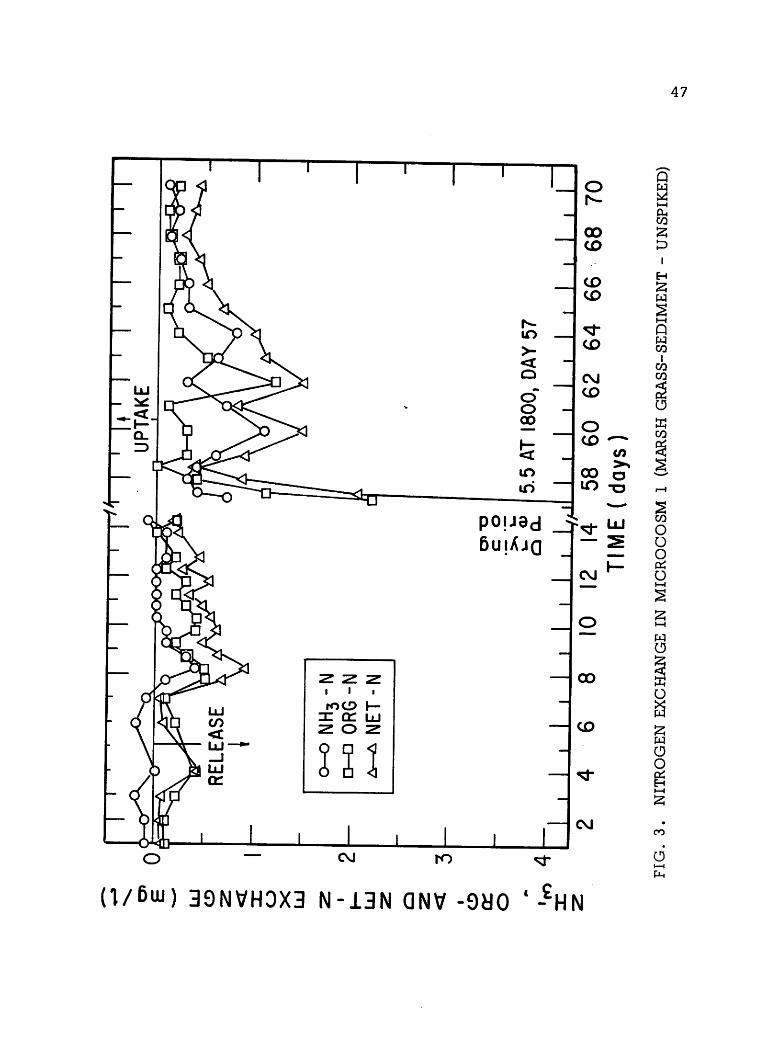
Z 2T Zi I i
tOCD 1—nz rr luz o z
m
CVJ ro
in
>-<Q
OO00
<
ID
pouad6uiXjq
o
ooCD
CDCD
CD
CVJ
CD
OCD —*
00 olO -o
LU
CVJ
00
CD
CVJ
(1/Bui) 39NVH0X3 N-13N QNV -9U0 ' -£HN
47
pw
t—I
CO
H
w
pwCO
ICOCO
o
CO
CO
OOO05O
w
O
O
w
OO
00
di—i
PL,
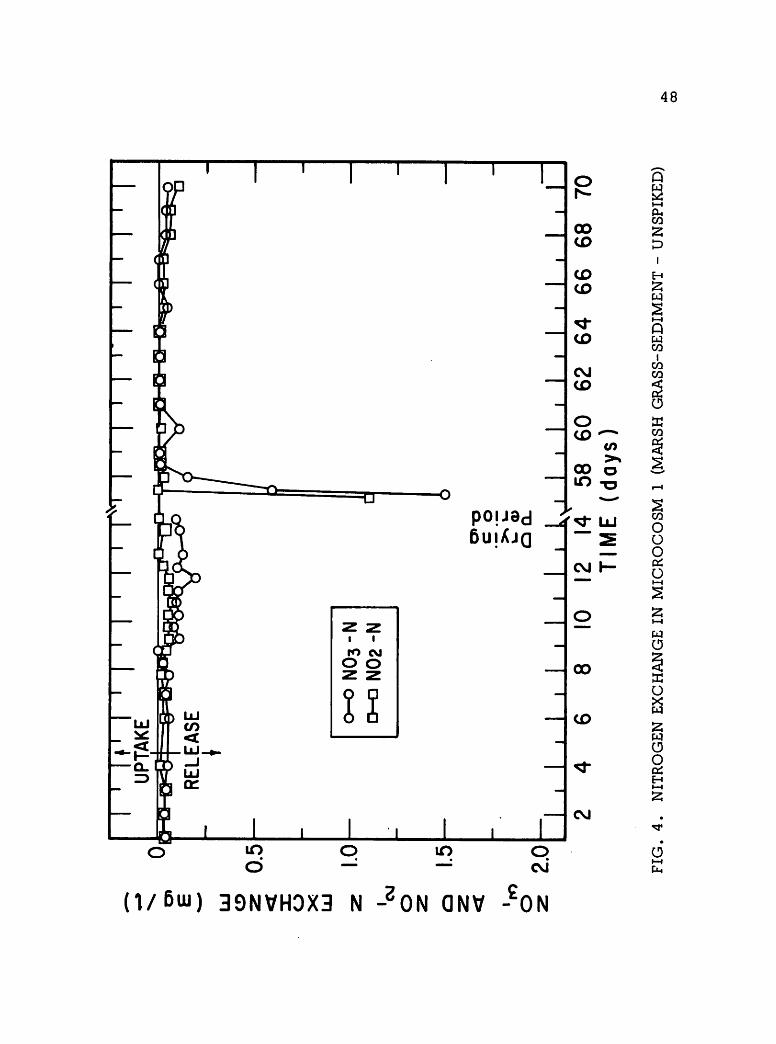
EXCHANGE(mg/t)oCJi
o11u1i•i'i
UPTAKEi-T-4
-———.r-lf^O
1|1|'«l
•iTL_i
n1
1'11'1•1
prti
RELEASE
A—
c0_
0a.
.1.l.,
1,1,1.1,1,1,r
z10
'cm
o-oNO3-N
D-DN02
"N
o
Q1.5
<
z2.0
11I 1,1.1
246810I214586062646668
TIME(days)70
FIG.4.NITROGENEXCHANGEINMICROCOSM1(MARSHGRASS-SEDIMENT-UNSPIKED)oo

cvj ro <tf- in cd Is-
(t/Buj)
39NVH0X3 *0d-0HiU0 QNV "IViOl '001
49
CO
OOOOSO
Z Q
O co5 £
HIo
co
§O
co
i
H
55w
QwCO
ICO
O coX0u
Q
OCQ
sO
u->
6l—l
o
co

50
(Figure 5). Following the drying period, greater than 5 mg/l were
released for twelve hours, and release remained between 2 and 5
mg/l for the rest of the two week period after drying.
Marsh Grass - Sediment Community : Microcosm 2
This microcosm contained the same components as the first,
the only difference being that Influent water In this case, contained
additional amounts of nitrogen (additional 5 mg/l NHJ and phosphorus
(additional 2 mg/l P04).
Ammonia nitrogen was taken up during the first two weeks
(Figure 6). From 0.0 to 2.2 mg/l were taken up during the first week
and this Increased to as much as 4.9 mg/l the second week. After
drying, ammonia was released for a seven-day period after which it
was again taken up. By the end of this two-week recovery period,
the amount of ammonia being taken up was In the same range as that
taken up previous to the drying period. Organic nitrogen was Inter
mittently released and taken up during the first two weeks (Figure 6).
There was a high release of organic nitrogen for two days after the
drying period followed by a continued release at a lower rate. Low
concentrations of nitrate and nitrite were released during the first
week, followed by an increasing release in the second week (Figure
7). After drying, nitrate was released for twenty-four hours and no
further release of nitrate or nitrite occurred until the beginning of the
second week after which time the release increased. (Increasing
release of nitrite and nitrate coincided with increasing uptake of
ammonia.) The net exchange of nitrogen was one of uptake prior to
drying, release for a nine-day period after drying and a return to net

ro cj —
51
l_ oQ
1—4
00
a.CO
i
CD H
CO SCO
— w
<tf- CO1
co COCO
5CVJ aCO HI
— CO
o §CO *— 2
LO *~*
>•» cm
—
00lO
o
CO
>^* O1' . o
<£ UJ os OS
o
CVJ1—
\—1
2""••"
z—
»—1
w
o O^^^
§•^
K
— 00O
CO OOOS
i—»
<a- S3
~
CD
CVJ6
(1/Buj) 39NVH0X3 N-13N QNV -DUO ' -£HN

0
F0.2
LU
CD0.4
<
O0.6XLU
0.82
1
CVJ1.0Oz
Q1.22!
<1.4
»K>O
1.6
Ml11'1'I*11'UPTAKE
I
|*l|1i'i'i11'1'1
—\
.1-o-°"iRELEASE
V*11
—
LJ1^^^m
o-oN03-Na-aN02-N
—
•-DryingPeriod
\
"hii11111l11i/iiiiiii,1.1.1"810121458606264666870
TIME(days)
FIG.7.NITROGENEXCHANGEINMICROCOSM2(MARSHGRASS-SEDIMENT-SPIKED)cn
to
53
uptake (Figure 6).
Phosphorus was taken up by the microcosm for the first two
weeks (0.0 - 1.0 mg/l) (Figure 8). It was released for three to four
days after the drying period after which uptake resumed.
Release of TOC during week two remained in the range of 2 - 4
mg/1 (Figure 8). A high release was observed during the first twelve
hours of reinundation after drying. After this time release returned
to its initial range.
Marsh Grass Community : Microcosm 3
This microcosm consisted of the same components as the pre
vious ones; however, the sediments were sealed from the overlying
water by a layer of paraffin. (Nutrient concentrations were low.)
Ammonia nitrogen was taken up throughout the initial two-week
period (Figure 9). By day 5, all ammonia in the Influent was being
taken up by the system. There was a release of ammonia for eighteen
hours following the drying period after which ammonia was again taken
up as it was prior to drying. Organic nitrogen was released during
the entire study with an increase in the amount released for the initial
twenty-four hours following the period of drying (Figure 9). There
was a release of nitrite immediately after the drying period (Figure
9). Aside from this, no nitrite or nitrate were detected in the micro
cosm. The net exchange of nitrogen with the water was one of release
except during the first forty-eight hours of reinundation after the
"drought" (Figure 9).
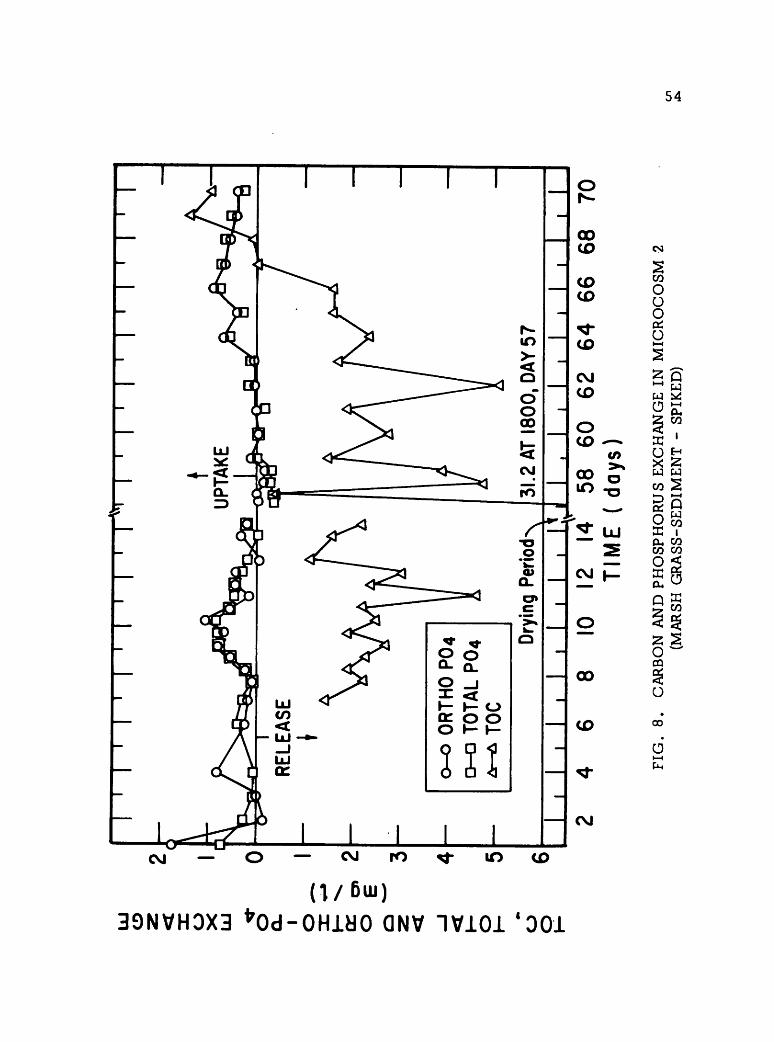
LUO
oXill
oQ.
I
o
oe
<
O
o
4
5
6
i'i•i'i'i'r«i•i1II1I1'1'1»1
o-oORTHOPO4
o-aTOTALPO4a-^TOC
DryingPeriod
*31.2AT1800,DAY57
1•I•I•I•1•
246810121458606264666870TIME(days)
FIG.8.CARBONANDPHOSPHORUSEXCHANGEINMICROCOSM2
(MARSHGRASS-SEDIMENT-SPIKED)

1
h-LlI
2
<
iE
Ow*
zLU
^CD1
ro
O<X
o
CDrr
XLU
o
»»
'roX
0.5
I'I'I'I'I'I'lV''I'I'I'I'I'I'I
I-tUPTAKE
0-ONH3-ND-aOR6-N
£*-*NET-N
DryingPeriod
I.I.
N03-N=0.03,DAY6I
NET-N=2.5I,N02-N=2.0IAT1800DAY57
1d246810121458606264666870
TIME(days)
FIG.9.NITROGENEXCHANGEINMICROCOSM3(MARSHGRASS-PARAFFIN-UNSPIKED)CnCn

56
Slight amounts of phosphorus were Intermittently released and
taken up In the Initial two-week period (Figure 10). There was an
Initial release of phosphorus after the drying period for twelve hours,
after which low amounts of phosphorus (0.0 - 0.04 mg/l) were taken
up.
Carbon release was In the range of 0.1 - 6.8 mg/l during the
second week (Figure 10). Following the drying period there was a
large release for twelve hours followed by continuing release of from
0.1 - 3.9 mg/l during the remainder of the study.
Marsh Grass Community : Microcosm 4
This microcosm was the same as the previous one with the
exception that additional nutrients were In the Inflow water (additional
5 mg/l NH3; 2 mg/l P04).
Initially, ammonia nitrogen was released from this system for
a four-day period (In the first two weeks of the study) (Figure 11).
Beginning on day 5 from 0.8 - 2.2 mg/l of ammonia were taken up
for the remainder of the two weeks prior to drying. Immediately
following the drying period, ammonia was released for twelve hours
and then taken up. The amount of ammonia taken up decreased
during the last week and on the last day ammonia was released.
Organic nitrogen was taken up in the beginning of the study (Figure
11). For the remainder of the study, Including the two-week recovery
period after drying, It was Intermittently released. Slight Increases
of nitrate were observed within the first three days following the
drying period (Figure 11). Nitrate was not detected In this microcosm

U/&W) 39NVH0X3 001o
(1/6ui) 39NVH0X3 *0d -0H1U0 QNV "IV101
57
CO
CO
oOO0£O
O

58
o Qw
h- i4
a.CO
00 i
CDi—i
PL,
COCO
%a,
*-i
CO
CO CO
<
OJO
COCO
sio sco ^^
</>^
00 >•% slO o CO
"O UpOU8d
6uiAjq ~k *-* ooOSO
C>J1 1 1 I 1
ro CD h- ro CMIqjUJOO2 O Z 2 2
nm_ O
U/6uj ) 39NVH0X3
N-13N QNV -20N -£0N -9U0 '-£HN
00
CO
CvJ
w
O
oXw
w
OOOSH
o
59
at any other time, and nitrite was not detected at all during the study.
Phosphorus was taken up the first week, released for twenty-
four hours when the water level was lowered at the beginning of week
two and then taken up again (Figure 12). After the drying period,
release and uptake were Intermittent for the first five days. Following
this time, phosphorus was again taken up but at a lower rate than was
observed before the drying period.
From 0.3 - 4.2 mg/l of TOC were released In the second week
of the study (Figure 12). Immediately following the drying period,
release was higher for twelve hours and then returned to the range
observed In week two.
ALGAL MAT MICROCOSMS
Algal Mat Community : Microcosm 5
This microcosm contained the algal mat (Lvngbya confervoides
primarily) and underlying sediment as well as the microorganisms
that were present In either the sediment, algae, or water when the
sample was removed from the marsh.
On the sixth day of the study, a slight amount of ammonia was
released (Figure 13). No other ammonia exchange was observed during
the first week. During the second week, ammonia was released.
After the drying period it was released in amounts exceeding those
previous to drying. Organic nitrogen was released for the first two
weeks with the release being higher during the second week (Figure 13).

<
O
I'III'1^IIIII'I'I'I'I
o-oORTHO-PO4
d-dTOTAL-PO4*-*TOC
Hz^^A^^^ RELEASE!
1.0-DryingPeriod
JQJI11I8101214586062
TIME(days)64666870
FIG.12.CARBONANDPHOSPHORUSEXCHANGEINMICROCOSM4(MARSHGRASS-PARAFFIN-SPIKED)
E
UJCD
<
5x
108
o

(1/6iu) 39NVH0X3 N-13N QNV -9U0 '-£HN
61
Qw
1—1
CO
a
LO
CO
OOO
O
— s
O
KOXw
w
Oo
H
i—i
d
62
Following the period of drying 0.4 - 0.8 mg/l of organic nitrogen were
released for the Initial twelve-hours after which less was released
for the remainder of the recovery period. Nitrite was released In
small amounts (0.0 - 0.04 mg/l) In the first two-week period (Figure
14). Nitrate was also released during this time with the amount of
release Increasing In the second week (Figure 14). After the drying
period, small amounts of nitrite were released for eighteen hours
after which no further release was noted. Nitrate was Initially re
leased at a higher rate than during the wet period for twelve hours,
at a lower rate for two days, and no exchange occurred again until
day 68 when release was resumed. The net exchange of nitrogen was
one of release throughout the study (Figure 13).
From 0.0 - 0.2 mg/l of phosphorus were released during the
first two-week period (Figure 15). Phosphorus was released again
for ten days following the drought period, no exchange occurred for
two days and a slight amount was taken up on the last day.
Carbon was released during the second week of the study (1.0 -
3.5 mg/l) (Figure 15). Following the drying period, 4.5 - 9.5 mg/l
were released for twelve hours and 0.6 - 4.5 mg/l of TOC were re
leased throughout the remainder of the post-drying period.
Algal Mat Community : Microcosm 6
This microcosm contained the same components as the previous
one, the only difference being that the influent water in this case
contained additional amounts of nitrogen and phosphorus (additional
5 mg/l NH3; 2 mg/l PQ4).

»—I
o
o0w
tn
o
.o
ro
oo
ro
o mOOoco
>I"1
25
•T3
D
S9
o. oiQ 00
CO
o
cnro
cn
oo
o
N03- AND N02- N EXCHANGE (mg/t)ro
CD cn
no o
ro cm
I i
Drying Period
O
m
cnm
>
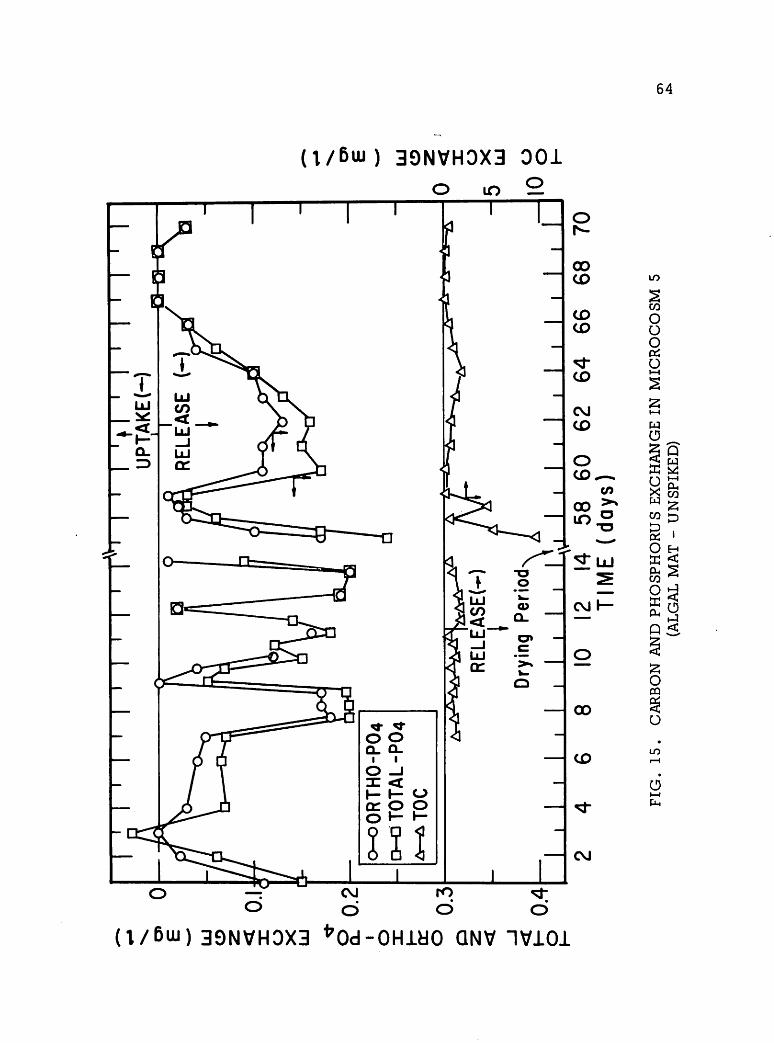
E
UJO
<0.1oXLU
20.2I
OX
rr
o0.3
<
g0.41-
0-0ORTHO-PO4d-dTOTAL-PO4a-^TOC
RELEASEH1
DryingPeriod
1_L_L
"6—£*=E"
1•1•1•1•1•1"81012145860626466
TIME(days)6870
FIG.15.CARBONANDPHOSPHORUSEXCHANGEINMICROCOSM5
(ALGALMAT-UNSPIKED)
o>
E^
UJ02
0<X0
5XUJ
100
0
CD

65
Ammonia was taken up during the first two weeks (Flguro 16).
The amount taken up increased during the second week (except for
a low release when the water level was changed). Following the
drying period, ammonia was intermittently released and taken up for
seven days after which uptake occurred and continued to Increase
reaching 3.0 mg/l by the end of the recovery period. Organic nitrogen
was intermittently released and taken up during the first two-week
period (Figure 16). In the two weeks following the drying period,
its exchange alternated between release and no exchange. Both
nitrate and nitrite were released in the first two weeks (Figure 17).
A large amount of nitrate was released for twelve hours following the
drying period and a decreasing amount was released for the next
twenty-four hours. After this initial release, no nitrate release
occurred until the beginning of the second week. From that time on
nitrate release increased to the end of the study. Nitrite was re
leased from twelve to twenty-four hours after the end of the drying
period. There was no subsequent nitrite release until the end of the
first week after drying from which time on the amount of nitrite released
increased. The net exchange of nitrogen was primarily one of uptake
for the first two weeks, release for the nine days Immediately fol
lowing the drying period, and returned to uptake at the end (Figure
16).
Phosphorus was taken up for the first three days of the study
and not exchanged for the remainder of the first week (Figure 18).
Total phosphate and orthophosphate were both taken up and released
during the second week. After the drying period, phosphorus was
alternately released and taken up for a four-day period. After this
initial four-day period, it was taken up increasingly to the end of

E
CD
<
OXUJ
I
I-UJ
I
CDtr
o
ro
—r\Vi r—rNH3=3.7,0800DAYI I ' I ' I ' I ' I
RELEASEt
NET-N^.TJSOODAYSDrying Period
0 12 14 58 60 62 64 66 68 70TIME (days)
o—o 0R6-N
o-aNH3-Na-a NET-N
NH3lNET-N =2.0DAY6li i i I i 1 i i
FIG. 16. NITROGEN EXCHANGE IN MICROCOSM 6 (ALGAL MAT - SPIKED) CD

E
UJ
o
<JOoX
I
CVJ
o
'roo
1.5
TT
0-0NO3-Nd-oN02-N
111
246810
IIK\nr,Ti
iUPTAKE
iiir-n
DryingPeriod
ii1I1I1l1
1214586062646668
TIME(days)
FIG.17.NITROGENEXCHANGEINMICROCOSM6(ALGALMAT-SPIKED)
70

(1/Buj) 39NVH0X3 001o 10 Q. *£
a. a.
ORTHO- TOTAL-TOCIII
©
k-
0>Q.
k.
Q
0/6w) 39NVH0X3 *0d-0HlU0 QNV "1V101
68
Q
oh- i—i
a.CO
00i
CO S2
CO •J
CD sj
<tf-<
co co
2C\JCD
CO
OOO
O oCD^^ i—i
LO2
00 g*
O
^ LU
oS—— X
cvjl-w
CO
£><*
oOXCUCO
O
00 a.
Q2
CD<
SOCQ
OJ
o
coi-H
6i—i
69
that week and then uptake decreased slightly but continued.
Release of carbon ranged from 0.2 - 2.25 mg/l of TOC during
the second week of the study prior to drying (Figure 18). After the
drying period there was an initially higher release for twenty-four
hours after which release remained from 0.0 - 5.7 mg/l. (At two
points following the drying period, organic carbon was taken up.
This may be due to organic growth in the influent water or to laboratory
error.)
RATE AND CUMULATIVE MASS OF NUTRIENTS EXCHANGED
Marsh Grass - Sediment Community : Microcosm 1 (Unspiked)
Ammonia nitrogen and organic nitrogen were exchanged at fairly
constant rates during week one (four-inch water level) and appeared
to be at steady state conditions (Figure 19). Both these rates were
lower during week two (water level was lowered to one inch at the
beginning of week two). After the drying period, ammonia and organic
nitrogen exchange appeared to reach steady state by day 63. Nitrate
and nitrite nitrogen were exchanged at constant rates (steady state)
throughout the study except during the first week after the drying
period when no exchange occurred. The net nitrogen exchange reached
steady state by day 4 during the initial two week period and by day
62 after the drying period.
Orthophosphate and total phosphate were exchanged at constant
rates (steady state) during the first two weeks, with the rate of ex
change being lower the second week (Figure 20). After the drying

-n
o•
I—•
CO•
O
§cCO f
«s
> wco S!co 1-1
co 3H °2Q
m
o
^ B^ 3co O
I-H
OpoOOOco
oz
CUMULATIVE NHj, ORG; NOjAND N02EXCHANGE ( mg / m* x 100)
ro ro ro — —oo.4>ocr>rooo.4>oro
.4> oj ro — o
CUMULATIVE NET-N EXCHANGE
(mg/m2xl000)
-N

(000I*2UJ/6uj)39NVH0X3 DOl 3AllViniMnOO — CM rO ^ IT) CD h- 00 CD
LUCO<
OJ
? °
ORTHO- TOTAL-TOC
m
CD— __ ° *•(01 x2uj/6uj) 39NVH0X3
^Od-OHlcdO QNV lV1013AUViniAinO
COOJ
OJro
OJ
00
CD
OJ
UJ
71
CO
OOOOSO
w
O
HI £
Sgco r>
s.O HX £a. u
ssffi Q(X, w
*z CO
^ <
OCQ i-H
3c5
IDO
Ocm
6

72
period both were released for a week after which uptake occurred and
both appeared to reach equilibrium at the end of the second week after
drying.
Total organic carbon was released at a constant rate (steady
state) throughout the study except during the initial twenty-four hours
after drying when release was much higher than at any other time
(Figure 20). The rate of release was lower during the second week
than it was after the drying period.
Marsh Grass - Sediment Community : Microcosm 2 (Spiked)
Ammonia nitrogen was taken up at a relatively constant rate
(steady state) during the first two weeks (Figure 21). This rate was
slightly lower during the second week than the first (water level was
lower during week two). After the drying period ammonia was released
for a week after which uptake occurred at a constant rate (steady state)
for the remainder of the study. Organic nitrogen exchange was inter
mittent the first week but appeared to be at equilibrium the second.
After drying, organic nitrogen was released at a high rate for three
days and was released at a constant rate (steady state) for the re
mainder of the study. Nitrate and nitrite were released at a constant
rate (steady state) during weeks one and two (lower rate during week
two). After drying, there was an Initial release of nitrate and nitrite,
no release for several days, and on day 65 release was resumed and
continued at a constant rate (steady state) to the end of the study.
This final nitrate and nitrite release coincided with the final uptake
of ammonia. The net nitrogen exchange paralleled that of ammonia
throughout the study.

73
or^
COCD
•»
CDCM
CD 2CO
O
<3-<0
OO
Ol-H
OJ SCD
55 Q
OW Pi
CD g CO
*—^ X C_|CO cn
lO >*
o W S^ "O £ «<tf- w Q
O KLU o7
OJ2
NITR RASS-
"~™
I—w U
CD
MULATIV (MARSHCO
O
CD•
rH
CM
6<tf-
(OOlx 3uj/6uj) 39NVH0X3 N-13NQNV -30N 'iON -9U0 *^HN 3AllV1flWnO
OJ

74
Orthophosphate was taken up at a relatively high, constant rate
from day 4 to day 7 (Figure 22). Uptake continued during week two,
but was at a lower rate during the second week than the first. Both
orthophosphate and total phosphate were initially released for several
days after the drying period. Uptake of both occurred from day 62 to
the end of the study at a constant rate (steady state) comparable to
that of week one.
Total organic carbon was released at a lower rate during week
two than it was after the drying period (Figure 22). By day 66 its
exchange appeared to be approaching equilibrium.
Marsh Grass Community : Microcosm 3 (Unspiked)
Ammonia nitrogen was taken up at a constant rate (steady state)
by day 3 (Figure 23). The rate of uptake was lower the second week
but remained constant. The rate of release of ammonia was constant
after the drying period and approximately the same as it had been at
the end of week one. Organic nitrogen was released at a constant
rate (steady state) by day 3 of the first week and continued at that
rate for the remainder of the week. The release rate was lower the
second week but remained constant. After the drying period, the re
lease of organic'nitrogen occurred at a constant rate by day 58. The
net nitrogen exchange appeared to be at equilibrium by day 6 of the
study before drying and by day 60 after the drying period.
Orthophosphate was not exchanged for the first six days of the
study (Figure 24). It was taken up during the second week and this
uptake occurred at a constant rate (steady state) by day 9. After

Itoa.
i »i-«.
oX
oo
r- Xtro CVJ
Eo \
2! o>
< E
—1 *-*
<H LU
O CD
r- z
LU <
> Xo
_l
X
3
2Z>o
8
7
6
5
4
3
2H
I
Ol-
AV
o o ORTHO -P04a d TOTAL P04a a TOC
tUPTAKE H
RELEASER
H—1—I—|—| ' r
0RTH0-P04 =965, DAY 70
tUPTAKE H
0 2 4 6 8 10 12 14 58 60 62 64 66 68 70
TIME (days)FIG. 22. CUMULATIVE CARBON AND PHOSPHORUS EXCHANGE IN MICROCOSM 2
(MARSH GRASS-SEDIMENT - SPIKED)
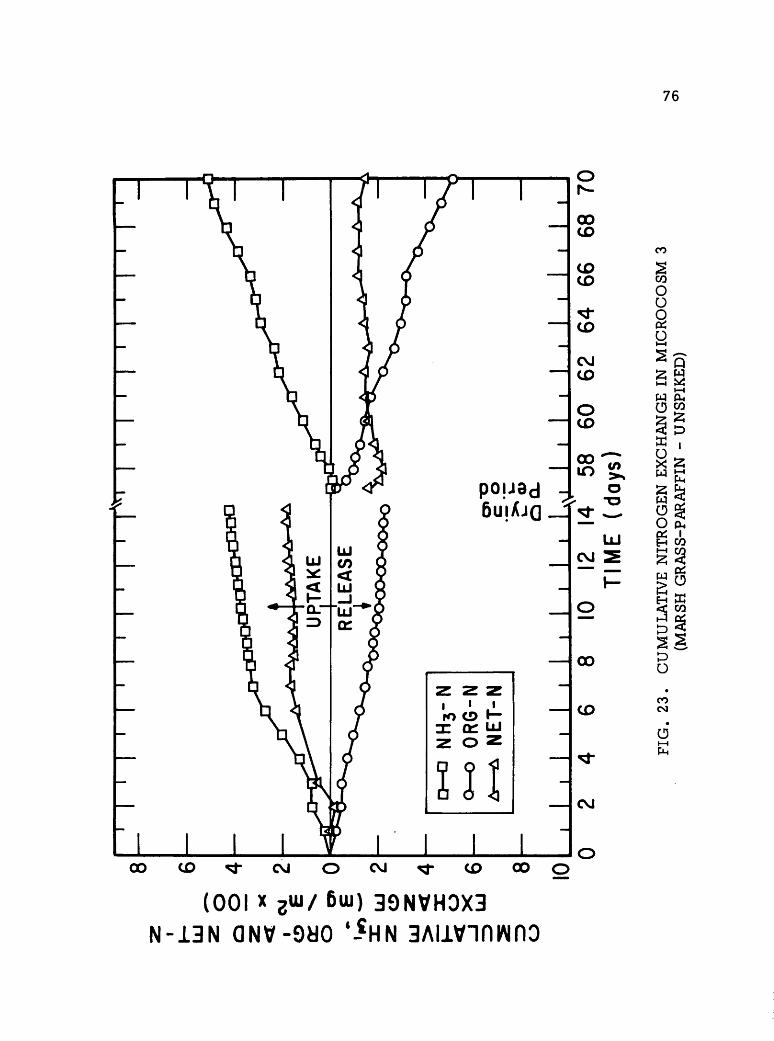
-4I—I
o
toCO
oa
££CO >X H
2£«P32 o^25§I-H fj
1 Ka >
£ o•—1
ss»—i
O50oooco
CO
9L
CUMULATIVE NH3, ORG-AND NET-NEXCHANGE (mg /m2 x 100)
o 00 cd 4^
m
ro
-P>
cx>
00
ro
III2 O Z
-HOW1 1 1
— DryingO - Period
zL 00
CDO
CDro
—
CD—
CDCD
CDCD
-nI 1 1.
ro ro a> 00

O
to
O
g
X co
5CO x?CO ±J
gS2 co
is^ COCO MTJ X
£°
2 gO
O?o
OOOCO
3CO
LL
ro
CD
o
CUMULATIVE TOTAL AND 0RTH0-P04EXCHANGE (mg/m2)
OJoO
OJo
cd cn ^ w ro — o
CUMULATIVE TOC EXCHANGE (mg/m2 x 1000)
roo o
III
ORTHO-TOTAL-TOC
•0 -00 0

78
drying, a higher constant rate of uptake occurred following the initial
twenty-four hour period. Total phosphate exchange was one of re
lease during the first two weeks, a constant release rate being
reached by day 9. After drying, total phosphate was released for
twenty-four hours and taken up at a constant rate (steady state)
beginning on day 59. The total phosphate exchange reached equili
brium during the last four days of the study.
Total organic carbon was released at a constant rate (steady
state) throughout the study except for the initial twelve-hour period
after drying (Figure 24). This occurred at a lower rate during week
two than it did after drying.
Marsh Grass Community ; Microcosm 4 (Spiked)
Ammonia nitrogen was released in the beginning of week one
and taken up at a constant rate (steady state) the last three days of
the week (Figure 25). Uptake continued at a constant rate during week
two, but this was a lower exchange rate than that of week one. Ammon
ia was taken up at a constant rate (steady state) after the drying period
and appeared to approach equilibrium at the end of the study. Organic
nitrogen was intermittently taken up and released during week one
and was released at a constant rate (steady state) during week two.
After drying, it was again released. Net nitrogen exchange occurred
at a constant rate (steady state) the second week and by day 63 after
the drying period. It appeared to approach equilibrium at the end of
the study.

(001 x 2ui/ 6iu) 39NVH0X3N-13N QNV-OyO *-£HN 3AllViniMn0
79
CD
CD^
CD 2CO
O^J- O
CD O
o
OJ sCD s Q
t®OCD g CO
CO CO 8sIT) >H X &H
o w£'Kt
X3
UJ
NITRO 3RASS-
OJ 2— —
1—> X
O
ULATI (MARSCO
2IDO
CD•
m<M
6<tf-
t—1
Pi
OJ

80
Orthophosphate and total phosphate were initially taken up at
a relatively high constant rate (steady state) (Figure 26). Both wore
taken up at a lower constant rate the second week. After drying,
a constant rate of uptake was attained by day 62.
Total organic carbon was released at a constant rate (steady
state) during week two and after the drying period except during the
initial twelve hours immediately following the drying period (Figure
26). The release rate during week two was lower than the release
rate which occurred after drying.
Algal Mat Community : Microcosm 5 (Unspiked)
Little exchange of ammonia occurred during the first two weeks
(Figure 27). After drying, it was released at a constant rate (steady
state) from day 59 to the end of the study. Organic nitrogen and
nitrate were released at a constant rate (steady state) the first week
and the second week. The rate of release was lower during the second
week. After drying, organic nitrogen was released at a constant rate
by day 60 . After drying, nitrate was initially released and no further
release occurred until day 68. Little exchange of nitrite occurred
during the study. Net nitrogen exchange was at a constant rate
(steady state) during weeks one and two, but the rate of exchange was
lower during week two. After drying, the net nitrogen exchange was
at a constant rate by day 59.
Orthophosphate and total phosphate were released at constant
rates (steady state) during the first two weeks (Figure 28). This rate
was lower during the second week than the first. After drying, both
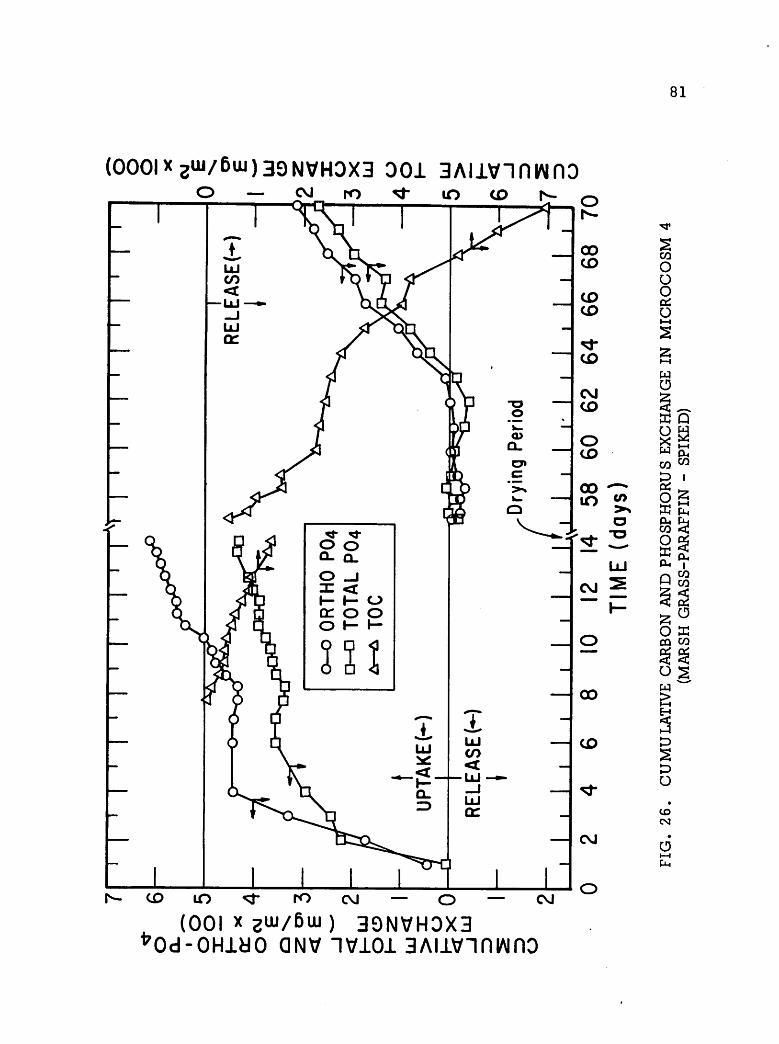
i—i
O•
to
CD•
Ocj
So££co co
X
o
>COCO
I
O2
d
3 o•t] no
goi C
co co
So
Otd
O?o
OOOCO
18
ro
cd
00
ro
ST*:Q
w cn^ 00
CDo
CDro
CD4*
CDCD
CD00
-^1O
CUMULATIVE TOTAL AND 0RTH0-P04EXCHANGE (mg/m2 x 100)
ro — o — rooj ^ 01 a) ^1
J 1 II 1 1 1 1
—
JOmr-
-m —
c=•D _-
>c/> m
*™
-
m
x T-
—
HI-
—-H -H OO O 3D r> "
—O H H
> IE D —
—r- 0
3 "oQ. -
:"*-^\ 0 0*
0
-*
- 3* _
to
— "U —
CD
5"O.
—
^S J0—
>< r——
ITQ «*—m—I \ >
—
— CL lQ* CO ^^
^^3^ mH H 4
It^t | i\\ l 1*->j cd 01 4* oj ro — o
CUMULATIVE TOC EXCHANGE(mg/m2 xlOOO)

CVJ O
(OQI x 2ui/ 6ui) 39NVH0X3 N-13N
qnv -zon *?on loao '-£hn aAiivinwno
82
Q
co
ID
a
10
sco
OOOOS
O
O
Xo
5w
OO
>
O
6Cm

»—I
o•
CO
00
oa
Sa
o
>
.a
CO
1—1
d
d
Xo
Xo
CO
wXoX
Q
o
OooCO
es
-nJO *-J 'cd 01 .4>~ oj ro _
CUMULATIVE TOC EXCHANGE (mg/m2x (000)
CUMULATIVE TOTAL AND ORTHO-P04EXCHANGE (mg/m2 x 10)
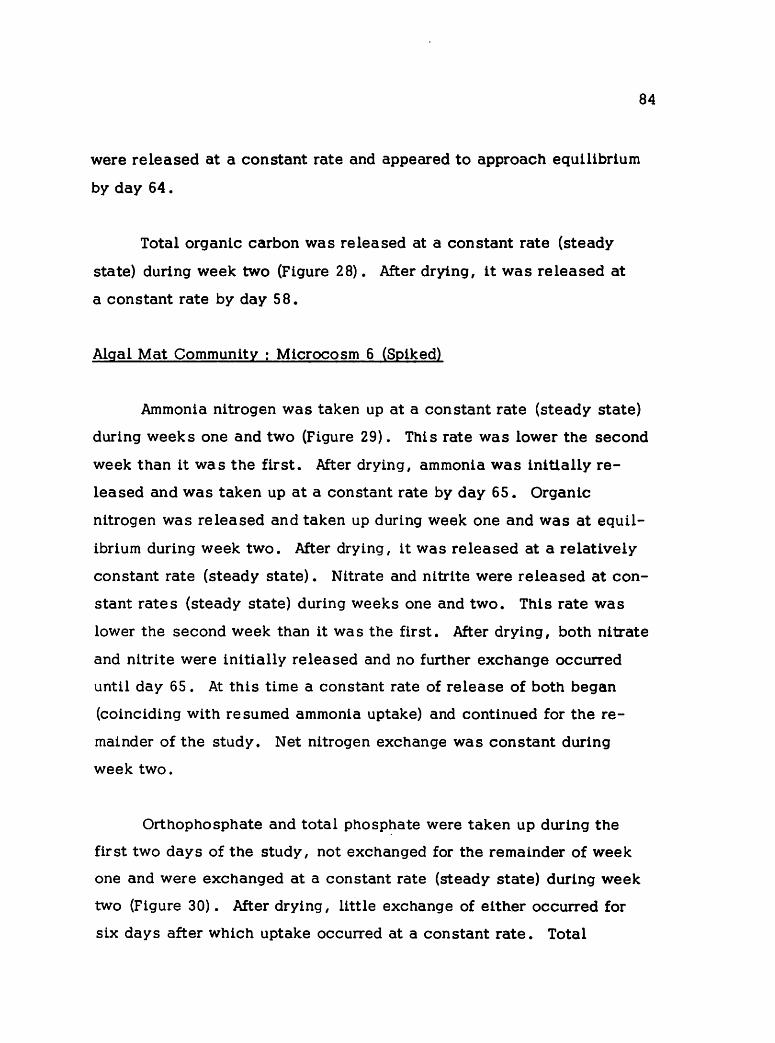
84
were released at a constant rate and appeared to approach equilibrium
by day 64.
Total organic carbon was released at a constant rate (steady
state) during week two (Figure 28). After drying, it was released at
a constant rate by day 58.
Algal Mat Community : Microcosm 6 (Spiked)
Ammonia nitrogen was taken up at a constant rate (steady state)
during weeks one and two (Figure 29). This rate was lower the second
week than it was the first. After drying, ammonia was initially re
leased and was taken up at a constant rate by day 65. Organic
nitrogen was released and taken up during week one and was at equil
ibrium during week two. After drying, it was released at a relatively
constant rate (steady state). Nitrate and nitrite were released at con
stant rates (steady state) during weeks one and two. This rate was
lower the second week than it was the first. After drying, both nitrate
and nitrite were initially released and no further exchange occurred
until day 65. At this time a constant rate of release of both began
(coinciding with resumed ammonia uptake) and continued for the re
mainder of the study. Net nitrogen exchange was constant during
week two.
Orthophosphate and total phosphate were taken up during the
first two days of the study, not exchanged for the remainder of week
one and were exchanged at a constant rate (steady state) during week
two (Figure 30). After drying, little exchange of either occurred for
six days after which uptake occurred at a constant rate. Total

(001 x 2uj/6uj) 39NVH0X3 N-13N
qnv -2on 'Son -9ao '£hn 3Aiivinwno
85
o ^^
f<- Qw^
00CO CO
1
CD aCO 2
•j
** sCO g<\J
LO
CO 2CO
Oo OCO O
cc:
O^*H^ t—t
<5 in 2
'*'w
O
LU
CMS XOXw
So w
OOOSEn
CO1—4
w>t—t
CO %t>
^fIDo
OJ o>CM
6o
i—<

l-H
PCO
o
ocj
s
<w
O
00
6£ --
s
s EoCO
XO
§CO
CO
H-l
w
d
O
O
OJOOOOCO
£CD
98
o
CUMULATIVE TOTAL AND ORTHO-PO4(mg/m2x 100)
o — nooi-J>cjio->iooco
a> 011 -j> oj ro
CUMULATIVE TOC EXCHANGE (mg/m2 x 1000)— o

87
phosphate appeared to reach equilibrium at the end of the study.
Total organic carbon was released at a constant rate (steady
state) during week two (Figure 30). After drying, It was released at
a constant rate until day 67 when It appeared to approach equilibrium.
RATES OF NUTRIENT EXCHANGE
As was seen In the previous section, In most cases the rate
of exchange decreased from week one to week two when the water
level was lowered from four inches to one inch. As was expected,
the rates of exchange of nutrients differed between microcosms.
The rates also varied with the productivity of the systems as seen
In the period after drying. Constant rates of release were normally
achieved soon after changes in water level occurred with the excep
tion of the reinundation period after drying. Since a majority of the
plants had died during the drying period, a longer period of time was
needed for the microcosms to approach steady state. The exchange
rates for the microcosms are complied In Table 6.
The Increase In nitrogen and in some cases phosphorus ex
change resulting from the higher concentration gradient can be
easily seen by comparing the cumulative graphs for Microcosms 1
(Figures 19,20) and 2(Figures 21,22), 3(Figures 23,24) and 4 (Figures
25,26), and 5 (Figures 27,28) and 6 (Figures 29,30).
To aid in determining the comparative magnitude of the contri
butions of emergent vegetation, algal mat, and sediments to nutrient
exchange, the mass of nutrients released or taken up by each microcosm

TABLE 6
DAILY EXCHANGE RATES OF NUTRIENTS IN BRACKISH MARSH MICROCOSMS
Rate of Nutrient Exchange
Phosphorus(mq/m2-day)
Microcosm Week Water Level Nitrogentinches) (mq/m2-dav)
1 1 4 - 37.2
2 1 - 32.3
9-10 4 -209.4
2 1 4 173.9
2 1 156.5
9-10 4 - 66.4
3 1 4 24.0
2 1 2.0
9-10 4 - 11.3
4 1 4 21.4
2 1 71.3
9-10 4 59.0
- 7.8
- 5.9
-18.9
68.6
26.2
66.4
- 1.4
- 0.2
0.8
50.8
11.8
20.8
Carbon
(mg/m2L
-dav)
-285..5
-700,,9
-159.,3
-498.,5
-155.,5
-415.,3
-190.,8
-535.,6
0000

TABLE 6 (CONTINUED)
Rate of Nutrient Exchange
Phosphorus(mq/m2-day)
Microcosm Week Water Level Nitrogen(inches) (mg/m^-day)
5 1 4 - 71.0
2 1 - 47.6
9-10 4 -208.5
6 1 4 104.3
2 1 120.9
9-10 4 - 80.8
Carbon
(mq/m^-day)
-17.2
-11.3
-19.1
79.4
- 3.5
57.8
-178.5
-484.6
-150.4
-367.8
00CO

90
during the various periods of the study were complied and are pre
sented in Table 7. The mass of nutrients exchanged was subject
to the same factors that were discussed regarding the rate of ex
change .
ADDITIONAL PARAMETERS
Along with analyses of nutrients, pH and temperature were
monitored. The pH did not exceed 8 or fall below 6 In any microcosm.
Temperature remained almost constant during the study (near 23 C)
except during the Initial thirteen days of the drying period when the
heat lamps Increased the temperature to as much as 40 C. No sig
nificant diurnal variations In nutrient exchange occurred during the
second week.
SUMMARY
Communities Which Received Low Nutrient Concentrations : Reactors
1, 3, 5
In general, organic nitrogen, nitrate and nitrite were released
by all of these microcosms throughout the study. During week one
ammonia was taken up by the marsh grass - sediment microcosm, not
exchanged in the algal mat community and was released by both for
the remainder of the study. The marsh grass community took up am
monia throughout the study. Nitrate and nitrite were rarely observed
in the marsh grass community. The release of nitrogen in the marsh
grass - sediment reactor occurred mainly In the ammonia and organic
forms. Organic release exceeded ammonia release before the drying
period; the reverse was true after the drying period. This was also

TABLE 7
MASS OF NUTRIENTS EXCHANGED DURING GIVEN HYDRAULIC CONDITIONS
Mass of Nutrients Exchanged
Microcosm Week Water Level
(inches)
4
Nitrogen
(ma/m2)
1 1 - 260.2
2 1 - 225.7
9-10 4 -2722.1
2 1 4 1217.9
2 1 1095.5
9-10 4 - 863.5
3 1 4 167.8
2 1 - 14.3
9-10 4 - 147.1
4 1 4 150.2
2 1 499.5
9-10 4 766.7
Phosphorus
(mq/m2)
• 54.37
- 41.6
-245.9
480.5
183.2
862.7
• 10.0
• 1.5
10.8
355.5
83.1
270.5
Carbon
(mq/m2)
-1998.4
-9111.7
•1115.3
•6480.2
-1088.2
•5398.7
•1335.5
•6963.6
CO

TABLE 7 (CONTINUED)
Mass of Nutrients Exchanqed
Microcosm Week Water Level
(Inches)
4
Nitrogen
(mq/m2)
- 496.8
Phosphorus
(ma/m2)
-120.2
Carbon
(mq/m2)
5 1
2 1 - 333.6 - 78.9 -1250.0
9-10 4 -2711.2 -248.8 -6299.9
6 1 4 730.3 556.2
2 1 846.6 - 24.7 -1053.0
9-10 4 -1050.0 751.2 -4780.9
COro

93
true for the algal mat microcosm, but in the algal mat system the am
monia release after drying was more than twice the organic nitrogen
release whereas In the marsh grass - sediment system ammonia re
lease exceeded organic release by only a small amount.
Phosphorus was released by the marsh grass - sediment and
algal mat communities and was intermittently released and taken up
by the marsh grass community.
Total organic carbon was released by all microcosms. The
marsh grass - sediment and marsh grass communities released larger
amounts of TOC than did the algal mat community.
Communities Which Received Additional Nutrients : Reactors 2. 4, 6
All nutrients were released during the Initial period of reinunda
tion following the drying period. Ammonia was taken up by all the
microcosms with the exception of an Initial release by the marsh
grass system. Organic nitrogen was intermittently released and
taken up. Organic nitrogen fluctuated considerably more in these
systems than in those which received low concentrations of nutrients
Nitrate and nitrite were released by the marsh grass - sediment and
algal mat communities and were rarely observed in the marsh grass
community.
Phosphorus was taken up by the marsh grass - sediment and
marsh grass systems. The algal mat reactor took up phosphorus for
three days, did not exchange it for four days, then released and took
it up during the second week and took up phosphorus after the initial

94
reinundation period.
Total organic carbon was released by all microcosms at the same
rate as in the microcosms which received low nutrient concentrations.

INTRODUCTION
CHAPTER 5
DISCUSSION
The significance of the results In regard to the pathways and
the effects of drying and concentration gradients on the exchanges
which occur are discussed in this chapter. Also, the results of this
study are compared with those of previous studies.
MATOR PATHWAYS OF NUTRIENT EXCHANGE WITHIN THE MARSH
SYSTEM
By considering the constituents of the saltmarsh microcosms
and consulting the available literature on the utilization of nutrients
by these components, pathways of exchange of carbon, nitrogen,
and phosphorus within the system were summarized and are presented
in Figures 31, 32, and 33.
The main pathways of nutrients within the marsh system are:
1. nutrients in the sediment -» macrophytes -•
detrltu s -» bacteria -• overlying water -» export
2. nutrients In the sediment or overlying water-* algae -»
detritus -» bacteria -» water-* export
Additional exchanges occur between the sediments and the overlying
water column. Nitrogen fixation may also occur within the marsh
95
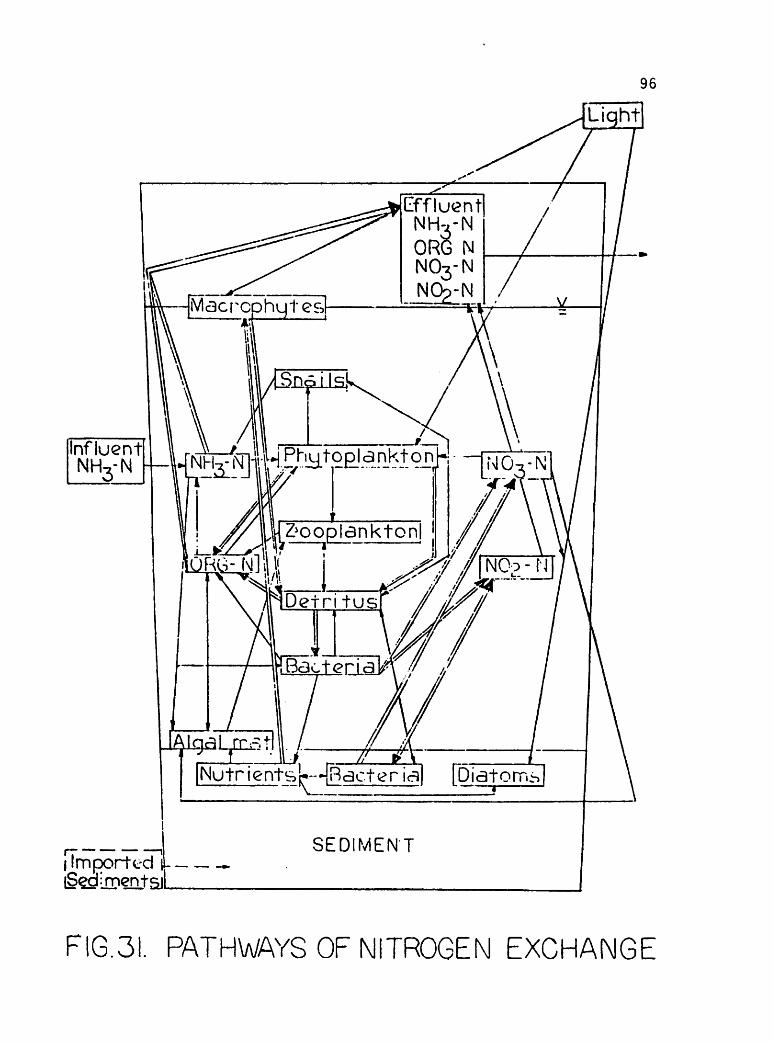
InfluentNH3-N
Nutr ientsr--4Bacter \a\ fDjatomi
IImported |L —Sediment^)!
SEDIMENT
96
FIG.31. PATHWAYS OF NITROGEN EXCHANGE
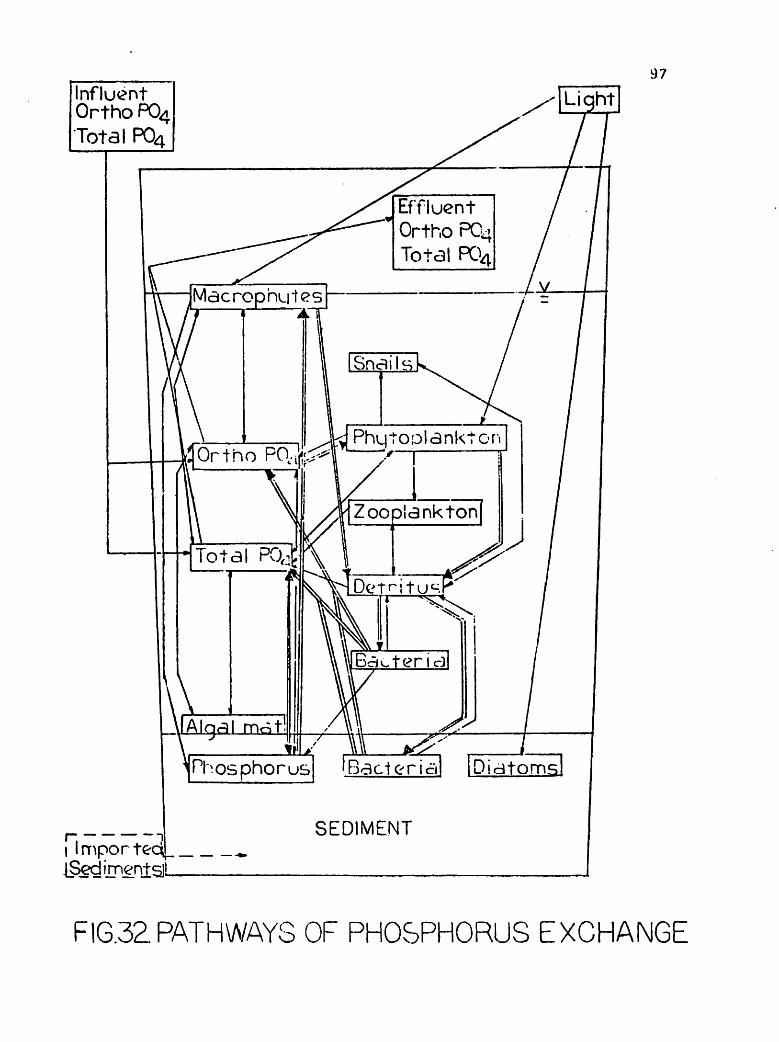
InfluentOrtho P04Total P04
1Impor teql ^iSed innentsll—
, , < _Phosphorus 'Bacterial IDiatoms
SEDIMENT
97
Light
FIG.3ZPATHWAYS OF PHOSPHORUS EXCHANGE

InfluentTQC
Light
Carhorr—H^acterial [biatomsl
[imported1,]. _Sedimentq.1
SEDIMENT
98
FIG.33. PATHWAYS OF CARBON EXCHANGE

99
system. Other pathways of nutrient exchange in the marsh are con
sidered to be of minor importance in comparison with these.
Nitrogen Exchange
The net flow of nitrogen out of the marsh grass - sediment and
algal mat communities indicates a source of nitrogen other than the
water column, presumably the sediments, indicating an exchange from
the sediments to the plants. The nitrogen from the sediments may be
due to either nitrogen fixation or the mineralization of materials in
the sediments. In the marsh grass microcosm in which the sediments
were sealed from the overlying water column, the net exchange of
nitrogen fluctuated between release and uptake with ammonia-nitrogen
being taken up (0.1 - 0.3 mg/l) and organic-nitrogen being released
(0 - 0.2 mg/l) in varying amounts. (Ammonia nitrogen was released
(0-0.4 mg/l) in the marsh grass - sediment microcosm as well as
in the algal mat microcosm (0 - 0.2 mg/l).) It seems that the
sediment - water interface is an important site of exchange and that
by eliminating it, ammonia nitrogen which would otherwise be avail
able from the sediments Is unavailable. (The marsh grasses can ex
tract phosphorus from the sediments through their roots, transport it
through the plant and release it through the leaves. This may or may
not occur with nitrogen in this case.) Since algae are known to
utilize ammonia-nitrogen, it is possible that algae consumed the
ammonia. It is also possible that the ammonia was taken up by the
marsh grasses. In either case, it is apparent that nitrogen is utilized
by organisms in the water column or partially submerged in it and that
the source of this nitrogen is normally the sediments.

100
Although net exchange of nitrogen is one of release in the
marsh grass - sediment and algal mat microcosms, during the first
week of the study ammonia was noted to be taken up or not exchanged
at all, while it was released during the remainder of the study. It
may be that organisms causing a release of ammonia had not yet
become well developed.
The absence of nitrate-nitrogen and nitrite-nitrogen in the
marsh grass microcosm with a layer of paraffin sealing the sediments
from the water indicates that nitrification Is carried on primarily by
bacteria in or on the sediments. The lack of this additional nitrogen
source may have been the sediment-associated factor causing an
uptake of ammonia in those microcosms.
Prior to the drying period, the nitrogen released was mainly
organic nitrogen. The source of this nitrogen may be either suspended
organisms or the release of organic materials during decomposition.
Phosphorus Exchange
Low amounts of exchange of phosphorus were observed in all of
the microcosms. The marsh grass - sediment and algal mat commun
ities both released phosphorus. The marsh grass microcosm with
paraffin released a small amount of phosphorus initially and from
that time forward acted as a sink for small amounts of phosphorus.
As with the nitrogen, the sediment-water interface appears to be an
important site of release of phosphorus from the sediments. The
plants may or may not take up phosphorus from the sediments and
release it to the overlying water.

101
Carbon Exchange
Total organic carbon was released from all of the microcosms
throughout the study. The release was greater from the marsh grass-
sediment community than from the algal mat. The carbon sources in
these systems are the suspended organisms and the release of
organic compounds during decomposition. Since it is likely that the
marsh grass - sediment system would contain a larger population of
suspended organisms than the algal mat system, the difference in re
lease may be due to suspended organisms or decomposition of plants;
no differentiation was possible with the analytical techniques used,
but visual observations indicated large amounts of marsh grass decom
position. This is In accord with the fact that the algae have a larger
refractory portion than the marsh grasses.
The marsh grass microcosm with sealed sediments released
slightly less organic carbon than did the marsh grass - sediment
system. Apparently, decomposition was occurring in the water
column and the sediments serve as an additional site of decomposi
tion. That is, the sediments are a minor source of organic carbon
and the plants are the primary source.
EFFECTS OF THE HIGHER CONCENTRATION GRADIENT
The large concentration gradient created by the addition of
nutrients resulted in the uptake of ammonia-nitrogen by all the
microcosms. This uptake of ammonia caused the net nitrogen ex
change to be one of uptake. The release of nitrate-nitrogen and
nitrite-nitrogen in the marsh grass - sediment and algal mat reactors

102
was increased simultaneously indicating an increased utilization of
ammonia-nitrogen in nitrification processes.
The marsh grass - sediment microcosm took up approximately
twice as much ammonia-nitrogen as the marsh grass microcosm with
paraffin. Thus, approximately half of the ammonia taken up in the
marsh grass - sediment system may have been absorbed by the sedi
ment layer. This was probably either a sorption (physical) exchange
or the assimilation of the nitrogen by the organisms In the sediments
as Implied by the increased release of nitrate-nitrogen and nitrite-
nitrogen.
The increased concentration of phosphorus in the influent
water caused an increase in uptake by both the marsh grass-sediment
and marsh grass with paraffin reactors. The increase was in the same
range in both, suggesting that the sediments were not a significant
phosphorus sink despite the higher concentration gradient.
The algal mat community initially consumed higher amounts of
phosphorus, then did not exchange phosphorus for several days, and
finally released phosphorus within the same range as the algal mat
community which received a low concentration of nutrients in the
inflow water. Algae are known to concentrate phosphorus when it
is available in excess amounts. The initial uptake of phosphorus
by the algal mat suggests that this occurred at first. Since the
marsh grass systems continued to take up phosphorus throughout the
study it seems that a large portion of this excess phosphorus was
utilized by the macrophytes or taken up by the sediments rather than
algae. A fluorishing algal community became established in the

103
marsh grass system with paraffin and utilized some of the excess
phosphorus in that reactor. It appears that little additional phos
phorus was required to sustain high algal productivity because the
algae continued to fluorish when the study was completed and
nutrient addition was stopped. This is in accord with the findings
of Cooper (1970) in his studies of algal mat production in micro-
ecosystems of Trinity Bay.
The increased concentration gradient had no effect on the re
lease of organic carbon.
EFFECTS OF THE DRYING PERIOD
The drying period caused an initially high release of nutrients
from the microcosms upon reinstatement of flow. Ammonia-nitrogen
releases occurred at this higher level for approximately a week
(except in the marsh grass system with paraffin in which the release
occurred for only 12-18 hours); nitrate-nitrogen and nitrite-nitrogen
for 12 - 24 hours; organic-nitrogen for 12-48 hours; phosphorus for
approximately 24 hours; and, carbon for 12 - 24 hours. This effect
of the drying period was most apparent in the large amounts of carbon
initially released. This must have been present in materials which
were rapidly washed out of the system. The ammonia-nitrogen release
occurred over a longer period of time than the release of the other
nutrients and only occurred in the marsh grass - sediment and algal
mat communities suggesting a slow release of ammonia from the sedi
ments. The ammonia may have been held in interstitial water which
exchanged slowly with the overlying water or may have been held by
clay particles. The release of ammonia-nitrogen after the drying

104
period exceeded that of organic nitrogen in the marsh grass - sediment
microcosm by a small amount and was more than twice that of the
organic nitrogen released from the algal mat community. Apparently,
a greater amount of ammonia was released from algal decomposition
than from decomposition of marsh grasses during the dry period.
The additional nutrients in the marsh grass - sediment micro
cosm caused phosphorus to be taken up rather than released. In the
marsh grass - paraffin microcosm the additional nutrients caused in
creased release of orthophosphate and release rather than uptake
(as occurred with low nutrient concentrations) of total phosphorus.
In the algal mat microcosm receiving additional nutrients there was
an initial uptake of phosphorus (did not occur in algal mat microcosm
receiving low nutrient concentrations) followed by release at a lower
rate prior to drying than occurred with low nutrient concentrations.
Both algal mat communities exchanged phosphorus In approximately
the same manner after drying.
Additional nutrient concentrations did not appear to have any
effect on the release of total organic carbon.
Due to the nature of the studies, it Is not possible to determine
whether these initially high releases compensate for the lack of re
lease during the period when the marsh is dry.
COMPARISON WITH PREVIOUS STUDIES
The results of this study compare favorably with those of the
study of the same area of Lavaca Bay by Armstrong et al. (1975).

105
The levels of nitrogen and carbon released from the marsh area are
similar to those released from the microcosms. Little phosphorus
exchange was noted in either study. These low amounts of phosphorus
also concur with the findings of Bruce and Hood (1962) in their study
of Texas Bays. In the field studies by Armstrong et al. (1975) as well
as in microcosm studies done at that time results indicated an uptake
of phosphorus by the salt marsh. In contrast, evidence from this
study indicates a release of phosphorus from the marsh system. In
addition, in the previous marsh reactor studies, nitrate-nitrogen and
nitrite-nitrogen were lost to the system whereas in this study there
was an apparent release of these nitrogen forms. This is probably
due to physical differences between the two microcosm studies such
as temperature or concentrations of nutrients in the influent water.
The release of organic nitrogen exceeded that of ammonia-
nitrogen in the previous field studies. This was found to be true in
this study only prior to the drying period. Afterwards, the ammonia
release was greater. This situation may reverse itself with time but
did not do so during the two weeks of the study after the drying period.
The previous study (Armstrong et al., 1975) resulted in the con
clusion that the marsh acts as a source of nutrients for the surround
ing area and the results of this study firmly support that conclusion.

CHAPTER 6
CONCLUSIONS AND RECOMMENDATIONS
CONCLUSIONS
The analysis of the results of this study lead to the following
conclusions:
1. The exchange rates of nutrients varied with changes in water
level as seen in the cumulative mass graphs. The higher con
centration gradient (in microcosms with additional nutrients
in the influent flow) caused higher exchange rates of nitrogen
and, in some cases, phosphorus but did not affect total organic
carbon release.
2. Periods of drying during the summer cause an abnormally high
release of nutrients when flows initially reinundate the area
due to the sloughing off of detrital material which had accum
ulated, the release of accumulated products of decomposition,
and the apparent lack of nutrient demand at normal levels by
the marsh grasses and algae since the populations had been
greatly decreased by the drying process.
3. During periods of normal inundation, algal mat communities
release a greater amount of phosphorus and nitrogen than do
marsh grass communities. The release of total organic carbon,
however, Is greater from the marsh grass communities.
4. The release of nitrogen from the marsh system occurs mainly
in organic nitrogen and ammonia-nitrogen forms and Is likely
106

107
to be primarily the result of decomposition. Export of total
organic carbon Is also attributed primarily to the products of
decomposition.
5. The sediments are an important source of nitrogen and phos
phorus In the salt marsh system and also serve as the primary
area In which nitrification occurs.
6. The saltmarsh system exports nitrogen, phosphorus and carbon
to the surrounding waters via the tides enabling estuarine areas
to be considerably more productive than adjacent areas.
RECOMMENDATIONS
There are several additions which could be made to this study:
1. Replicates of microcosms could be utilized to provide the neces
sary data for error analysis.
2. By measuring the amount of nutrients in the sediment before
and after experiments are conducted, the amount of uptake or
release by the sediment could be determined. In addition, a
comparison of these results for the marsh grass microcosm
with sediment and the marsh grass microcosm with a paraffin
layer sealing the sediment from the overlying water, could
determine whether or not nitrogen fixation occurs in the sedi
ment.
3. Similarly, a measurement of the standing crop and nutrient
content of the macrophytes and algae before and after experi
ments are conducted would enable the determination of the
amount of uptake or release by these components of the marsh
system.

108
4. Nutrient tracers in the influent flow could be utilized to deter
mine the amounts and directions of exchanges occurring
between the water column and the major components of the
marsh system (macrophytes, algae, sediment).
5. Further analysis of the data could be done. A statistical ana
lysis would enable the determination of the significance of the
results. Since several of the graphs Indicate a linear response
with time, a kinetic approach could also be used in further
analysis, thus enabling a determination of the mechanisms
of the nutrient exchanges which occurred in the microcosms.
BIBLIOGRAPHY
Abbott, Walter. "Microcosm studies of estuarine waters. II. Theeffects of single does of nitrate and phosphate." JWPCF 39:113-122 (1967).
American Public Health Association. Standard Methods for the Exam
ination of Water and Wastewater. Twelfth edition (1965).
Armstrong, Neal E., and Howard T. Odum. "Photoelectric ecosystem."Science 143:256-258 (1964).
Armstrong, N. E., and M. O. Hinson, Jr. "Galveston Bay Ecosystemfreshwater requirements and phytoplankton productivity." FinalReport, Galveston Bay Toxicity Study, Texas Water QualityBoard, pp. II-l - 90 (1973).
Armstrong, Neal E., Melvin O. Hinson, James H. Collins, and E.Gus Fruh. Biogeochemical Cycling of Carbon, Nitrogen, and
Phosphorus in Saltwater Marshes of Lavaca Bay, Texas.Center for Research in Water Resources, The University ofTexas at Austin (1975).
Baalsrud, Kjell. "Influence of nutrient concentrations on primaryproduction." Pollution and Marine Ecology (proceedings) pp.159-169, Intersclence Publishers (1967).
Biebl, R., and C. P. McRoy. "Plasmatic resistance and rate of respiration and photosynthesis of Zostera marina at different salinitiesand temperatures." Mar. Biol. 1:48-56 (1971).
Blum, J. L. "Nutrient changes in water flooding the high saltmarsh."Hydrobiologica 34:95-99 (1969).
Boyd, Claude E., and L. W. Hess. "Factors influencing shoot production and mineral nutrient levels in Typha latifolla."
Ecology 51:296-300 (1970).
Brezonik, P. L. "Nitrogen: Sources and transformations in natural
waters." Presented at Amer. Chem. Soc, Los Angeles,
April 1971.
109

110
Bruce, Herbert E., and Donald W. Hood. "Diurnal inorganic phosphate variations in Texas bays." Publ. Inst. Mar. Sci. Univ.Tex. 6:133-145 (1959).
Burkholder, P. R., and G. H. Bornslde. "Decomposition of marshgrass by aerobic marine bacteria." Bull. Torrey Bot. Club 84.:366-383 (1957).
Carritt, Dayton E., and Sol Goodgal. "Sorption reactions and someecological implications." Deep Sea Res. 1:224-243 (1954).
Chamroux, M.S. "Contribution a 1'etude du purvoir denitrifiant dessediments marine " Ann. L'Instltut Pasteur 109:424-442 (1965),
Chen, R. L., D. R. Keeney, and J. G. Konrad. "Nitrification ofsediments of selected Wisconsin lakes." Journal of Env.Quality 1:151-154 (1972a).
Chen, R. L., D. R. Keeney, J. G. Konrad, A. J. Holding, and D. A.Graetz. "Gas production in sediments of Lake Mendota,Wisconson." Journal of Env. Quality 1:155-158 (1972b).
Chen, R. L., D. R. Keeney, D. A. Graetz, and A. J. Holding. "De-nitrification and nitrate reduction in Wisconsin lake sedi
ments." Journal of Env. Quality 1:158-162 (1972c).
Conover, John T. "Seasonal growth of benthic marine plants asrelated to environmental factors in an estuary." Publ. Inst.Mar. Sci. Univ. Tex. .5:97-147 (1958).
Conover, Robert J. "Assimilation of organic matter by zooplankton."Limno. and Oceano. H338-345 (1966).
Cooper, David. "River input studies using continuous-series micro-ecosystems" Final Report, Galveston Bay Study Program,Texas Water Quality Board, pp. 259-336 (1970).
Dawson, E. Y. Marine Botany. Holt, Rlnehart and Winston, NewYork. 1966.
Devlin, Robert M. Plant Physiology. Relnhold Book Corp., NewYork, Amsterdam, London. 1966.

Ill
Eagleson, P. S., and others. Estuary and Coastline Hydrodynamics.McGraw-Hill Book Company, Inc., New York. 1966.
Fenchel, T. "Studies on the decomposition of organic detritus derivedfrom the turtle grass Thalassia testudinum." Limno. andOceano. 11:14-20 (1970).
Fillos, John, and William R. Swanson. "The release rate of nutrientsfrom river and lake sediments." JWPCF 47.:1032-1042 (1975).
Fogg, G. E., Czeslawa Nalewajko, and W. D. Watt. "Extracellularproducts of phytoplankton photosynthesis." Proc. of RoyalSociety of London Ser. B 162:517-534 (1965).
Gallagher, H. L., and F. C. Daiber. "Primary production of edaphicalgal communities in a Delaware saltmarsh." Limno. andOceano. 19:3890-3896 (1974).
Gessner, R. V., R. D. Goos, and J. McN. Sieburth. "The fungalmicrocosm of the internodes of Spartina alterniflora." Mar.
Biol. 16:269-273 (1972).
Goering, J. J., and P. L. Parker. "Nitrogen fixation by epiphyteson sea grasses." Limno. and Oceano. .17:320-323 (1972).
Gooch, E. L. "Hydrogen sulfide production and its effect on inorganic phosphate release from the sediments of Canary CreekMarsh." Masters Thesis, Univ. of Delaware, 61 pp. (1968).
Gosselink, James G., and Conrad J. Kirby. "Decomposition of saltmarsh grass, Spartina alterniflora, Loisel." Limno. andOceano. 19:825-832 (1974).
Hayes, F. R., and J. E. Phillips. "Radiophosphorus equilibrium withmud, plants, and bacteria under oxidized and reduced conditions." Limno. and Oceano. 3.:459-475 (1958).
Hellebust, J. A. "Excretion of some organic compounds by marinephytoplankton." Limno. and Oceano. 10:192-206 (1965).
Hoese, H. D. "Effect of higher than normal salinities on saltmarshes." Contr. Mar. Sci. Univ. Tex. 12:249-261 (1967).

112
Humm, Harold J. "Sea grasses of the Northern Gulf Coast." Bull.Mar. Sci. Gulf and Carlbb. 6:305-308 (1956).
Jervls, R. A. "Primary production in a freshwater marine ecosystem."Thesis, Rutgers Univ. (1964).
Jewell, W. J. "Aquatic weed decay:Dissolved oxygen utilization andnitrogen and phosphorus regeneration." JWPCF 43:1457-1467(1971).
Johannes, R. E. "Nutrient regeneration in lakes and oceans." Adv.
Microbial. Sea 1:203-212 (1968).
Keefe, Carolyn W. "Marsh production: a summary of the literature."Contrib. In Mar. Sci. Univ. Tex. JL6.:163-181 (1972).
Keeney, D. R. "The nitrogen cycle In sediment-water systems."Journal of Env. Quality 2:15-29 (1973).
Keup, L. E., G. D. MdKee, E. W. Raabe, and R. W. Warner. "Waterquality effects of leaching from submerged soils." Journal ofAm. Water Works Assoc. .62:391-396 (1970).
Lalng, H. E. "Respiration of the leaves of Nuphur advenum andother aquatic plants." Am. J. Bot. 27.:583-586 (1940).
Lee, G. F. "Factors affecting the transfer of material between waterand sediments." Eutrophication Information Program, Univ.Wisconsin, Madison. Occasional Paper 1, 50 pp. (1970).
Martin, D. Collins, and David A. Bella. "Effects of mixing onoxygen uptake rate of estuarine bottom deposits." JWPCF 43.:1865-1876 (1971).
Maurer, Larry G., and P. L. Parker. "The distribution of dissolvedorganic matter In the near-shore waters of the Texas Coast."Publ. Inst. Mar. Sci. Univ. Tex. 16:109-124 (1972).
McLusky, Donald S. Ecology of Estuaries. Heinemann EducationalBooks Ltd., London. 1971.
McNaughton, S. J. "Ecotype function in the Typha community-type. "Ecol. Monogr. 36.:297-325 (1966).

113
McRoy, C. P., and R. J. Barsdate. "Phosphate absorption in eelgrass."Limno. and Oceano. 15:6-13 (1970).
McRoy, C. P., R. J. Barsdate, and M. Nebert. "Phosphorus cyclingin an eelgrass (Zostera marina L.) ecosystem." Limno. andOceano. 17.:58-67 (1972).
Nalawajko, C. "Photosynthesis and excretion In various planktonic
algae." Limno. and Oceano. LI: 1-9 (1966).
32Odum, E. P., E. J. Kuenzler, and M. X. Blunt. "Uptake of P and
primary productivity in marine benthic algae." Limno. andOceano. 1:340-345 (1958).
Odum, E. P. Fundamentals of Ecology. W. B. Saunders Co.,Philadelphia and London. 1959.
Odum, E. P. "The role of tidal marshes in estuarine production."N.Y. St. Conserv. H(6):12-15, 35 (1961).
Odum, E. P., and A. A. de la Cruz. "Particulate organic detritusin a Georgia salt-marsh-estuarine ecosystem." In G. Lauff(ed.) Estuaries, pp. 383-388 (1967).
Odum, Howard T., and Ronald F. Wilson. "Further studies on reaeration and metabolism of Texas Bays." Publ. Inst. Mar.Sci. Univ. Tex. 1:23-55 (1961).
Odum, Howard T. "Biological circuits and the marine systems ofTexas." Pollution and Marine Ecology (proceedings), pp. 99-159, Interscience Publishers, 1967.
Oppenheimer, C. H., and R. A. Ward. "Release and capillary movement of phosphorus in exposed tidal sediments." In Symposiumon Marine Microbiology. Thomas, C. C. (ed.), Springfield,111. pp. 664-673. 1963.
Parker, Patrick, and Richard F. Leo. "Fatty acids in blue-green algalmat communities." Science 148:373-374 (1965).
Parker, Patrick, and Richard F. Leo. "Branched-chain fatty acidsin sediments." Science 152:649-650 (1966).
114
Patriquin, D. G. "The origin of nitrogen and phosphorus for growthof the marine anglosperm Thalassia testudinum." Mar. Biol.
15:35-46 (1972).
Pomeroy, Lawrence R. "Algal productivity in salt marshes ofGeorgia." Limno. and Oceano. 4:386-397 (1959).
Pomeroy, Lawrence R. "Experimental studies of the turnover of phosphate in marine environments." In V. Schultz and A. W.Klement (eds.) Radloecology, pp. 163-166 (1963).
Pomeroy, Lawrence R., E. E. Smith, andC. M. Grant. "The exchangeof phosphate between estuarine water and sediments." Limno.and Oceano. 11:167-172 (1965).
Pomeroy, Lawrence R., R. E. Johannes, E. P. Odum, and B. Roffman."The phosphorus and zinc cycles and productivity of the saltmarsh." In Proc. Sec. Natl. Symp. on Radloecology. D. J.Nelson and F. C. Evans (eds.) pp. 412-419 (1969).
Pomeroy, Lawrence R., L. R. Shenton, R. D. H. Jones, and R. J.Reimold. "Nutrient flux in estuaries." In Nutrients and Eutro-
phication, ASLO Spec. Symp. Vol. I, pp. 274-291 (1972).
Porcella, D. B., J. S. Kumagai, and E. J. Middlebrooks. "Biologicaleffects on sediment-water nutrient Interchange." Journal ofSan. Engrg. Dlv., Proc. ASCE 4:911-926 (1970).
Ragotskle, R. A. "Plankton productivity In estuarine waters ofGeorgia." Publ. Inst. Mar. Sci. Univ. Tex. 1:146-158 (1959).
Ranwell, D. S. "Spartina salt marshes In Southern England. II. Rateand seasonal pattern of sediment accretion." Journal ofEcology 52:79-94 (1964).
Ranwell, D. S. "Spartina salt marshes in Southern England. III.Rates of establishment, succession and nutrient supply at
Bridgewater Bay, Somerset." Journal of Ecology 52:95-105(1964).
Reimold, Robert J., and Franklin C. Daiber. "Dissolved phosphorusconcentrations in a natural salt marsh of Delaware."
Hydrobiol. 36:361-371 (1970).

115
Reimold, Robert J. "The movement of phosphorus through the saltmarsh cord grass, Spartina alterniflora, Loisel." Limno. andOceano. 17:606-611 (1972).
Round, F. E. The Biology of the Algae. Edward Arnold (Publishers)Ltd., London. 1965.
Ryther, J. H., and W. M. Dunstan. "Nitrogen, phosphorus, andeutrophication in the coastal marine environment." Science
171:1008-1013 (1971).
Schelske, C. L., and E. P. Odum. "Mechanisms maintaining highproductivity In Georgia estuaries." Proc. Gulf Caribb. FishInst. 14:75-80 (1961).
Serruya, C. "Lake Klnneret: The nutrient chemistry of the sediments."Limno. andOceano. 16:510-522 (1971).
Shapiro, J. "A statement on phosphorus." JWPCF 42:772-775 (1970).
Shepard, F. P. "Sedimentation rates in Texas estuaries and lagoons."Bull. Amer. Assoc. Petrol. Geol. 3.7:1919-1934 (1953).
Sorenson, Lazern O., and John T. Conover. "Algal mat communitiesof Lyngbya confervoides (c. Agardh) Gomont." Publ. Inst. Mar.Sci. Univ. Tex. 1:61-74 (1962).
Stengel, Eberhard. "Higher plants as the basis for alternate foodchains: Their potentialities in relation to mass culture ofmicroalgae." Workshop on Waste Heat and Nutrient LoadedEffluent in the Aquaculture, Bergen, Norway, Feb. 24-28, 1974.
Teal, J. M. "Energy flow in the salt marsh ecosystem of Georgia."Ecology 43:614-624 (1962).
Wentz, D. A., and G. F. Lee. "Sedimentary phosphorus In lake cores-analytical procedure." Env. Sci. and Tech. 1:750-754 (1969).
Wilson, Ronald F. "Organic carbon levels in some aquatic ecosystems."Publ. Inst. Mar. Sci. Univ. Tex. 9:64-76 (1962).
Zobell, Claude E. Marine Microbiology. Chronica Botanica Co.,Mass. 1946.


PART III:
THE ROLE OF SEDIMENTS IN NUTRIENT EXCHANGEIN THE LAVACA BAY BRACKISH MARSH SYSTEM
by
Neal E. Armstrong and Billy A. Brown
FINAL REPORTSubmitted to the Texas Water Development Board
by the Center for Research in Water Resources, EnvironmentalHealth Engineering Research Laboratory, Civil Engineering Department,
The University of Texas at Austin
Interagency Contract No. IAC (74-75) - 1217
December 31, 1976


TABLE OF CONTENTS
Page
TABLE OF CONTENTS ii
LIST OF TABLES ill
LIST OF FIGURES iv
CHAPTER I INTRODUCTION 1-1
Need for the Study 1-1
Purpose 1-2
Scope 1-2
CHAPTER II LITERATURE REVIEW II-l
Introduction II-l
Nutrient-sediment Exchange Studies II-l
CHAPTER III MATERIALS AND METHODS III-l
Introduction III-l
Materials III-l
Methods Used III-9
CHAPTER IV RESULTS IV-1
Introduction IV-1
Boundary Conditions for Reactors IV-1
Nutrient Exchange Concentrations IV-2
Cumulative Nutrient Exchange IV-11
CHAPTER V DISCUSSION V-l
Introduction V-l
Nutrient Exchange between Water & Sediments V-2
Comparison with Previous Results V-6
CHAPTER VI CONCLUSIONS AND RECOMMENDATIONS VI-1
Conclusions VI-1
Recommendations VI-2
BIBLIOGRAPHY
ii

LIST OF TABLES
Table Page
IV-1 Soil Analysis for Random Sediment Samples IV-3
IV-2 Water Quality in Sediment Reactors during LeachingPhase IV-4
IV-3 Water Quality in Sediment Reactors during UptakePhase IV-5
IV-4 Temperature Effects on Leaching Rates of Nitrogenfrom Sediments IV-16
IV-5 Temperature Effects on Uptake Rates of Nitrogenby Sediments IV-18
IV-6 Temperature Effects on Leaching Rates of Phosphorusfrom Sediments IV-21
IV-7 Temperature Effects on Uptake Rates of Phosphorusby Sediments IV-23
IV-8 Salinity Effects on Leaching Rates of Nitrogen bySediments IV-26
IV-9 Salinity Effects on Uptake Rates of Nitrogen bySediments IV-2 8
IV-10 Salinity Effects on Leaching Rates of Phosphorusfrom Sediments IV-30
IV-11 Salinity Effects on Uptake Rates of Phosphorus bySediments IV-32
V-l Temperature and Salinity Effects on Leaching andUptake Rates of Nutrients V-3
iii

LIST OF FIGURES
Figure Page
II-l The Nitrogen Cycle in Sediments and Waters II-4
II-2 A Sediment-Water Interchange Model 11-10
II-3 A Phosphorus Cycle in Sediments and Waters 11-12
III-l Location of Fixed-Bed Sample Site III-2
III-2 The Microcosm Fixed-Bed Exchange Apparatus III-6
IV-1 Release of Nitrogen by Marsh Sediments IV-6
IV-2 Uptake of Nitrogen by Marsh Sediments IV-7
IV-3 Release of Phosphorus by Marsh Sediments IV-8
IV-4 Uptake of Phosphorus by Marsh Sediments IV-9
IV-5 Cumulative Nitrogen and Phosphorus Leached fromMarsh Sediments IV-12
IV-6 Cumulative Uptake of Nitrogen and Phosphorus byMarsh Sediments IV-13
IV-7 Temperature Effects on Nitrogen Leached from Sediments IV-15
IV-8 Temperature Effects on Nitrogen Taken Up by Sediments IV-17
IV-9 Temperature Effects on Phosphorus Leached fromSediments IV-20
IV-10 Temperature Effects on Phosphorus Taken up bySediments IV-22
IV-11 Salinity Effects on Nitrogen Leached from Sediments IV-24
IV-12 Salinity Effects on Nitrogen Taken Up by Sediments IV-27
IV-13 Salinity Effects on Phosphorus Leached from Sediments IV-29
IV-14 Salinity Effects on Phosphorus Taken Up by Sediments IV-31
IV


CHAPTER I
INTRODUCTION
NEED FOR THE STUDY
The brackish water marshes associated with many Texas estuaries
store nutrients in large amounts as they become trapped within the marsh
through buildup of sediments. These sediment deposits accumulate in
the estuarine systems in appreciable quantities, primarily when seasonal
river flood flows occur. Soil nutrients in marshy areas are thus accumu
lated, used by marsh plants and microorganisms, stored in the biomass
of the marsh flora and the sediment for use in later seasons. The storage
and release of nutrients used by plants and animals living in brackish
marshes must be understood in order to properly plan for the development
of the source streams which feed the bays and marshes.
The biological cycling of nutrients, mainly nitrogen and phosphorus,
in marshes has been the subject of numerous investigations and studies,
particularly along the Atlantic coast of the United States. Marsh produc
tivity, pathways of nutrients, and the generation of detritus have been
studied in detail. However, studies of Texas marshes have been
neglected with regard to their contributions of inorganic nutrients and
organic materials to estuarine systems.
It is fundamental that a sufficient nutrient supply is necessary for
the maintenance of maximum production in any biological system. This
is usually accomplished in natural systems by the recycling of nutrients
released during the respiration of consumers and decomposers. In
Texas bays, three types of systems yield nutrient levels sufficient for
high productivity. These are: (1) hypersaline regimes, (2) bottom
grass-algal systems, and (3) systems receiving nutrient enriched waters.
In hypersaline bays which are stable with little flushing, higher
1-1

productivity occurs; these bays are believed to be nutrient self-
regenerating. In bottom grass-algal areas where flushing action is
minimal, the bottom system conserves nutrients for sustained high pro
duction. In areas with high-transport inflow of nutrients, flushing may
not diminish nutrient supplies (Odum,_et al_., 1962). As part of the bay
systems noted above, the marsh area contributes to the estuarine nutrient
supply and nutrient cycle.
The Texas Water Development Board is developing a mathematical
model of the Lavaca River, Lavaca Bay, and Matagorda Bay system.
This model will be used to determine what effects development of the
river and its streams would have on future productivity of this system in
particular and Texas baysystems in general. While assembling data for
this model, however, the Board found that information was lacking on the
concentrations of nutrients imported by rivers and from biogeochemical
cycles of carbon, nitrogen and phosphorus in the marshes. To identify
nutrient pathways and the possible role of sediments as a temporary
storage site for nutrients, the estimation of nutrient exchange rates
between sediment and water became of paramount importance. To pro
vide these data, the Center for Research in Water Resources, University
of Texas at Austin, supported by contracts with the Board, began field
and laboratory investigations in 1974. This study is a portion of this
overall contract.
PURPOSE
The purpose of this research was to determine the rates of release
and uptake of nitrogen and phosphorus by sediments of the Lavaca Bay
brackish marsh system and the effects of temperature and salinity on
these rates.
SCOPE
To achieve the principal objectives of determining the release and
uptake rates of nitrogen and phosphorus from marsh sediments and the
effects of environmental variables on those rates, the scope of this
1-2

project required investigation of the relationship between temperature,
salinity, and nutrient exchange rates. These exchange rates had been in
vestigated earlier using fixed-bed, static, reactor systems by continuously
adding varied amounts of nitrogen and phosphorus to the system and moni
toring the uptake into the sediments until equilibrium conditions were
attained (Armstrong, et al., 1975). The nutrient uptake phase was fol
lowed by monitoring the release of nutrients from the sediments. Results
from the previous project indicated that uptake and release (leaching) of
nutrients from sediments in the fixed-bed cores should be carried out in
constantly stirred, flow-through reactors to arrive at rate data.
This project was carried out in the laboratory and was designed to
provide comparable rates of release and uptake under varied temperature
and salinity conditions. Fixed-bed reactors containing cores of marsh
sediment were collected and operated as completely-mixed, flow-through
reactors.
As part of this overall project, another investigation using larger por
tions of the marsh and involving nutrient exchange between the waters and
the marsh grass, algal mat, and sediment was carried out (Dawson, 1975).
ACKNOWLEDGEMENTS
We wish to express our appreciation first to the Texas Water Devel
opment Board for the interagency contract which suppprted this work and
to the Board's staff for the help and support throughout the project. In
particular we would like to single out Mr. Jack Nelson, Mr. Donald
Rauschuber, Mr. Don Schwartz, and Mr. Wiley Haydon of the Board for
special thanks. The junior author is also appreciative of the financial
aid provided by the U. S. Environmental Protection Agency in the form
of a traineeship. We also thank Mr. Robert Leshber and his staff at the
Texas State Department of Human Resources Laboratory for their careful
analytical work on our samples. Finally, we are indebted to Mrs. Nadine
Gordon, Mr. Alan Goldstein, Miss Anita Dawson, Mr. Frank Halsey and
Mr. Blake Eskew for their very able assistance in the laboratory and field.
1-3


CHAPTER II
LITERATURE REVIEW
INTRODUCTION
Much work has been performed in the past to identify to what extent
river, lake, and estuarine sediments affect nutrient concentrations of the
overlying waters and to identify and confirm the roles of nitrogen and
phosphorus as the controlling nutrients for production rates in these
waters. In this chapter this literature and especially that pertinent to
brackish water areas is reviewed.
NUTRIENT-SEDIMENT EXCHANGE STUDIES
Introduction
The literature review was carried out in four primary areas:
(1) general nutrient exchange studies; (2) nitrogen exchange; (3) phos
phorus exchange; and (4) effects of environmental conditions on exchange
rates. Most of these have dealt with the uptake and release of phosphorus
as a limiting nutrient. However, in recent years, nitrogen exchange with
sediments has received much attention. The publications cited and re
viewed in this chapter cover some of the literature bearing on this subject.
General Nutrient Exchange
The pathways of nutrients from fresh water into brackish waters are
complex and somewhat speculative. One of the primary paths for nutrient
transport into a marsh is with the stream flow; the nutrients are attached
to suspended sediments, or are in the soluble form. Following floculation
of colloids and deposition of sediments in brackish marshes, the exchange
of nutrients becomes a constant renewal and depletion process. Gardner
(1975) investigated the runoff from marsh areas during tidal exposure and
found it rich in dissolved silica, phosphate, bicarbonate and probably
II-l
ammonia. He concluded that nutrient diffusion from the active sediment
layer was the major mechanism by which nutrients are transferred to the
overlying water during low tide, while upward seepage of marsh water
through the sediments during high tide was relatively minor. His
analysis was based on numerous interstitial water samples collected
from creek banks and interior areas of the marsh, and it appeared that
the enrichment pattern was the result of slow drainage from puddles on
the marsh flats into the channel system. He also found that marsh
runoff contained much higher nutrient concentrations than fresh waters
entering the marsh.
Abbott (1967) investigated the "spill situation" discharge of a single
nutrient into receiving waters, observing luxuriant algal blooms com
parable to those occurring under sewage pollution conditions. In his
experiments microcosms were used, and they became autotrophic and
aerobic for up to twenty-five weeks. Jewell (1971) and Teal (1962)
pointed out that the major sources of natural organic materials in
marsh systems are emergent plants and phytoplankton. They also
showed that nutrients are released during decay and that plants sup
ported an abundance of aquatic animal life in estuaries because tides
remove up to forty-five percent of the production to the adjacent waters
before the terrestrial marsh consumers have a chance to use it.
Fillos (1972) investigated the mechanism of long-term nutrient release
from benthal sediments under both aerobic and anaerobic conditions.
Results indicated, as other investigators had suggested before, that
aerobic and anaerobic bacterial activity seemed to be contained mostly
in the upper ten centimeters of bottom deposits. He also confirmed
that benthal deposits create a dissolved oxygen sink and an immediate
oxygen demand for the reduced substances such as ferrous and sulfide
ions coming from the anaerobic layers. He found, moreover, that benthal
deposits release organic materials and various nutrients to the overlying
waters. These released nutrients in turn promote considerable biotic
growth. Fillos (1972) then concluded that in any water quality management
program the sediments must be considered as intermittent sources of
nutrients as well as a continuous sink for dissolved oxygen.
II-2

Porcella et al. (1970) commented that, although chemical and physi
cal factors affect nutrient equilibria, biota also have a significant effect.
He pointed out that biological effects cannot easily be separated from
the physical and chemical relationships which control the availability
of nutrients since increased nutrient concentrations can lead to increased
biomass and thus increased use of nutrients.
Nitrogen Exchange
Available literature on the movement of nitrogen in waters and sedi
ments was reviewed by Keeney (1973) with emphasis on the importance
of nitrogen to aquatic productivity, the pathways leading to nitrogen
gains or losses in aquatic ecosystems and the availability of nitrogen
in sediments to overlying waters. He noted that the nitrogen cycle in
sediment and water systems is more complex than in terrestrial systems.
A much simplified diagram of the sediment and water nitrogen cycle is
shown in Figure II-l as a guide to the following discussions.
Forms of Production
The dominant species of nitrogen in waters are ammonia, nitrite,
nitrate, dissolved and particulate organic nitrogen. The concentrations
of the various nitrogen species in water is the net result of nitrogen
deamination, hydrolysis, nitrification and denitriflcatlon. Several
investigators, including Copeland and Fruh (1970), Keeney (1973), and
Ryther and Dunstan (1971) quote accumulating evidence that nitrogen
rather than phosphorus may be the limiting nutrient for algal growth in
coastal waters, especially where large amounts of available phosphorus
remain within the sediments and are released slowly over long periods.
Evidence also indicates that algae use primarily inorganic forms of
nitrogen and that ammonia may be used preferentially (Syrett, 19 62).
Nitrogen in sediments is present largely as organic nitrogen. In general,
the total nitrogen contents of surface sediments ranged from one-tenth
percent to as high as four percent nitrogen (Keeney et al., 1970).
II-3

i
FIGUREII-l
THENITROGENCYCLEINSEDIMENTSANDWATERS,AFTERKEENEY(1973).

Assimilation and Release
Assimilation, or the incorporation of molecular nitrogen, ammonia,
nitrate, or organic nitrogen in living biomass, is a necessary life pro
cess. The reverse (release or mineralization) processes are occurring
simultaneously in most systems, and the net change in nitrogen is re
flected in the biomass level of nitrogen at any given time (Keeney,
1973). Another dominant factor, especially for heterotrophic bacteria,
is the available energy in organic material. If excess energy material
is present, available nitrogen will be utilized until the C:N ratio is in
favor of the net mineralization of nitrogen; and, conversely, if nitrogen
rich residues are being decomposed, inorganic nitrogen is released to
the waters. Nitrogen is also excreted by aquatic animals as ammonia,
free amino acids, and other organic compounds which are then available
for use by phytoplankton and bacteria. Detritus is also decomposed
through bacterial action, and from twenty-five to seventy-five percent
of the nutrients are released rapidly. Temperature will also markedly
influence regeneration, turnover, and assimilation processes. Increasing
temperature increases biochemical processes, but it is generally con
cluded that, at least in terrestrial systems, higher temperatures favor
decomposition over assimilation because microbial activity rates at
lower temperatures decrease more rapidly than does the photosynthetic
rates of plants (Senstius, 1958). It is assumed that the reverse occurs
with increasing temperatures in aquatic systems.
Environmental variables play a key role in the assimilation-release-
ammonification processes. The decay of nitrogenous organic matter
with the production of ammonia or ammonium compounds (especially by
the action of bacteria) is ammonification. Ammonificati'on proceeds at a
measurable rate at low temperatures when assimilation is usually low.
Under anoxic conditions, net mineralization of nitrogen is character
istically greater than under aerated conditions, due to the lower efficiency
of converting organic carbon to cell carbon by heterotrophic anaerobes
compared to the high efficiency of autotrophic aerobes.
II-5

Nitrification
Nitrification is defined as the biological conversion of nitrogen in
organic or inorganic compounds from a reduced or partially oxidized state
to a more oxidized state. Nitrification refers to the biological oxidation
(needing only carbon dioxide or carbonates as a source of carbon) of
ammonia to nitrate with ammonium hydroxide and nitrite as intermediates
with the net reaction being
NH^ + 202 —> N03 + H20 + 2H+.
Nitrification is a key process affecting the nitrogen budget and pro
ductivity in aquatic ecosystems. Because preferential uptake of nitrate
over ammonia (and vice versa) occurs among various algae, the presence
of nitrate has a great influence on the productivity of the water system.
Also nitrate formed in hypolymnetic waters and at the sediment-water
interface is subject to denitriflcatlon during anoxic conditions following
density stratification. Recent investigations by Chenjet aj_. (1972a)
showed that nitrification occurred rapidly in well-buffered calcareous
sediment interstitial waters when well-stirred such as in shallow waters.
Nitrification rates were much lower for unbuffered sediments (those
formed under acidic conditions and not containing CaCOj. On the
other hand, under quiescent conditions (compared to well-stirred con
ditions) much less nitrate accumulated while ammonia decreased
indicating that nitrification, nitrate assimilation, and denitrification
occurred at the same time. The nitrate which was produced in the upper
sediment layer was being immediately denitrified or immobilized adjacent
to the oxidized zone in the anaerobic zone. This indiciated that sediments
do not add nitrate to water except in well-oxidized, well-stirred situations,
such as might occur in shallow waters or at lake turnover. Chen et al.
(1972a) showed that nitrification rates in sediment-water systems showed
a doubling with each 10 C increase in temperature. A temperature increase
of 15 C increased the nitrification rate 2.7 times.
II-6

Denitrification
Denitrification is defined as the biochemical reduction of nitrate or
nitrite to gases (molecular N« or nitrogen oxides). Microorganisms may
reduce nitrate to protoplasm (assimilatory reduction) or to gaseous
nitrogen compounds (denitrification). Several investigations have con
firmed that the sequence
NO~ —> NO~ —> N20 > N2
represents true biochemical denitrification and will occur in any microbial
environment that is essentially anaerobic. Water stagnation or any means
of limiting oxygen diffusion, coupled with oxidizable substrate allows
denitrification to occur.
Numerous investigations have shown the rate of denitrification in
submerged soils is related to the organic matter content. The rate of
denitrification is influenced by pH, being lower in acid than neutral or
alkaline systems. It is also influenced by temperature with the optimum
rate at 60-65 C and slow rates at lower temperatures (Bremner et al. ,1958).
Recent work by Chen_et ah (1972b) has shown that in lake sediments,
assimilatory nitrate reduction and denitrification occur at the same time.
Chen et al. (1972c) indicated that denitrification is a significant nitrogen
sink in lakes. In their work, nitrate added to sediments disappeared
rapidly from lake sediments; within two hours up to 90 percent of added
nitrate injected under the sediment surface disappeared from a 100 ml
sample of Lake Mendota sediment.
Nitrogen Fixation
Until recently, the aerobic blue-green algae were believed to be
the significant nitrogen-fixing organisms in water. However, evidence of
nitrogen fixation in anoxic waters and sediments, presumably by anaerobic
heterotrophs, has been reported (Chen et al., 1972c). The authors indicate
that nitrogen fixation in sediments might be significant. The hypothesis
II-7

is that some of the nitrogen gas formed in denitrification is subsequently
fixed by bacteria. The significance of nitrogen fixation to the nitrogen
economy of lakes is as yet largely unknown. In general nitrogen-fixing
algae appear to be more prominent in eutrophic lakes, especially those
high in phosphorus (Sawyer and Ferrulo, 1960). The present opinion is
that blue-green algae are the dominant nitrogen fixers in surface waters,
with bacteria playing an insignificant role (Kuznetsov, 1968). Nitrogen
fixation rates in estuarine sediments are usually low and probably of
minor importance to nitrogen budgets of waters, but the process possi
bly has important biogeochemical implications (Keeney, 1973).
Role of Sediments
Physical, chemical, and biological processes are involved in deter
mining the net uptake or release of nutrients and other materials at the
sediment-water interface. These are often interrelated, and the overall
process of sediment-water interchange is complex. An understanding of
these processes is needed to evaluate the role of estuarine sediments in
estuarine production and to properly evaluate laboratory results simulating
in situ conditions.
Austin and Lee (1973) found that biochemical and physiochemical
activity can release nitrogen from sediments in the form of ammonium
which accumulates under anaerobic conditions but will be oxidized to
nitrate under aerobic conditions. Both forms are then usable by algae in
primary production. This study showed that a substantial fraction of
nitrogen compounds can be released from the sediments under completely
mixed aerobic conditions. It was proposed that one of the primary reasons
lake sediments act as a nitrogen sink is because of the relatively poor
mixing which occurs within the overlying waters. Shallow waters with
greater mixing promote organic nitrogen solubilization and mineralization
which results in a relatively low concentration of organic nitrogen in
the sample.
A working model for nitrogen uptake or release by sediments must
include the processes that control the nitrogen content of the interstitial
II-8
water and the release of nitrogen from the interstitial water to the over
lying waters. The model presented by Keeney (1973) (see Figure II-2)
is simple but illustrates the interrelated complexities involved. The
historical (unmixed) sediments are overlain by a homogeneous layer of
active sediments several centimeters thick which is constantly reworked
by physical and biological processes. This active sediment remains
relatively constant in thickness, and layers of historical sediment
accumulate at a rate dependent on the sedimentation rate.
Lee (1970) regards hydrodynamic effects to be the rate-controlling
step in exchange reactions. Included are wind-induced gradient cur
rents and hydraulic head which transport released materials from the
sediment-water interface allowing concentration-dependent exchange
reactions to proceed towards re-establishing equilibrium. He cites
results from his investigations indicating that the depth of mixing into
the sediments is on the order of five to twenty centimeters, a conclusion
that has been confirmed by other investigators (Davis, 1968; Hynes and
Greib, 1970; Veith and Lee, 1971). Mixing of sediments is generally
attributed to activities of benthic organisms, rough fish, gases, and
wind-induced currents.
Microbiological reactions play an important role in sediment-water
exchange of nitrogen. Besides the obvious mineralization-immobilization
and denitrification processes, microbes also exert several indirect
effects. These include alteration of pH and oxidation-reduction levels,
consumption of oxygen, production of gases, and formation of soluble
cations which may compete for ammonia on the soil exchange sites as
interstitial water ammonia is depleted. Clays and other inorganic
colloids readily sorb organic nitrogenous compounds. Sorption of
soluble organics by sediment particles controls their future release
to interstitial waters and probably retards decomposition by biochemical
reactions. Other losses of nitrogen in association with sediments in
clude: loss of nitrite in nitrification and loss of ammonia in alkaline
waters (pH greater than 8.5 to 9) by volatilization from surface layers
(Straton, 1969).
II-9

i
o
FIGUREII-2
ASEDIMENT-WATERINTERCHANGEMODEL,AFTERKEENEY(1973).

Phosphorus Exchange
Role of Phosphorus
Phosphorus is an essential element in the formation of protein and
is considered a major nutrient. Phosphorus exists in soluble and in
soluble forms and has several pathways between sediment and water.
The general interactions of phosphorus can be represented schemati
cally in terms of a sediment-water system (see Figure II-3). Porcella
_et_al. (1970) discussed the forms of phosphorus as minerals in sedi
ments, as solute in interstitial waters, and as organic phosphorus. The
availability of soluble orthophosphate (usable form by plants and micro
organisms) in overlying waters in a sterile environment is dependent
upon complex chemical, biochemical, and physical reactions. They
noted that in natural ecosystems growing life forms affect mixing,
translocation of sediments, gas production, and alteration of chemical
conditions which may overshadow the non-biological reactions. Produc
tivity may be increased through greater phosphorus solubilization than
would be expected from a pure non-biological reaction. They also sug
gest the possibility that organic materials would increase the release
of phosphorus from sediments by serving as substrate for anaerobic
bacteria that would in turn lower the sediment pH and increase phos
phorus solubilization.
Mechanisms of Phosphorus Exchange
Syers et al. (1973) considered dissolved inorganic phosphorus in
sediment interstitial waters completely mobile, 'whereas inorganic phos
phorus sorbed onto sediment in equilibrium with inorganic phosphorus
in solution was potentially mobile. Inorganic phosphorus exists in two
general forms: (1) phosphorus within discrete phosphorus compounds
such as apatite Ca FCa4(PO.)«; and (2) phosphorus sorbed onto sedimentsurfaces or present within the matrices of iron, aluminum, or calcium
component of sediments. They state that the mobility of phosphorus in
these discrete compounds is predicted by solubility product relationships
and is mainly influenced by ionic concentrations in solution and by pH.
11-11

ii—•
ro
ATMOSPHERE
V
WATER
SEDIMENT
FIGURE II-3
A PHOSPHORUC CYCLE IN SEDIMENTS AND WATERS(After Syers, et al., 1973)
Inorganic P Dissolvedi Organic P
Biomass
Phosphorus
Biomass
Phosphorus
EXTERNAL SOURCES
ParticulateOrganic P_
op
I
I
SettlingI
I
Solid Inorganic Pip
Dissolved
Incraanic PSEDIMENTS
POOL
Dissolved Organic P
Particulate Organic Pop
IPhosphorusOut J

Recent work by Lee (1970) has shown that release of dissolved
inorganic phosphorus can occur under aerobic conditions, although the
rate of release was significantly slower than under anaerobic conditions.
Whether this release under aerobic conditions is due to desorption is
uncertain. Adsorption involves a process in which there is a tendency
for the free energy of a solid surface to decrease, which results in the
accumulation on the solid surface of some constituent at a greater con
centration than exists at a distance from the surface. Absorption is the
process by which solids take up a portion of a solution (much the same
as a sponge soaking up water). Carritt and Goodgal (1954) examined
the phosphate-solids exchange system of Chesapeake Bay sediments
using a slurry system and suggested that exchange might by of ecological
importance because of the quantity of phosphate sorbed per unit weight
of sediment, the reversible nature of the reaction, and the variations in
the amount of phosphate sorbed under different conditions of pH, temper
ature, salinity, and phosphate concentration. The effect of pH on the
uptake of phosphorus was measured in the range of pH 2 to 10. For a
contact time of 21 hours, at a pH of 4.5 peak of 85 percent phosphorus
was sorbed while only 24 percent of phosphorus was sorbed at a pH of
8.5. The effect of temperature on sorption was measured by following
uptake of phosphorus at 0 , 23°, and 50°C. After two hours exposure,the results showed sorption of less than 10 percent of phosphorus at
0 C, 30 percent of phosphorus at 23°C, and 55 percent of phosphorusat 50 C. The uptake of phosphorus was measured for sea water systems
with salinities of 17 and 34 ppt. Removal of phosphorus from solution
was found to be less in sea water than in fresh water systems although
reduction in uptake was not in direct proportion to the salinity. This
was thought to be attributable to the agglomeration of solids, noted
especially at 34 ppt salinity. The effects of salinity on uptake of phos
phorus at the end of two hours were reported as 55 percent for 0 ppt, 28
percent for 17 ppt, and 23 percent for 34 ppt salinity. The effects of
variations in pH, temperature, and salinity were neglected in treatment
of field date by Carritt and Goodgal (1954), since no convenient way of
measuring them in the field could be found at that time. Their results were
inconclusive in obtaining a measurable phosphate-solids sorption reaction.
11-13

Role of Sediments
Total phosphorus levels in sediments are determined by the levels
of inorganic and organic phosphorus which are probably controlled by
largely independent factors (Williams et al., 1971c). Inorganic phos
phorus frequently constitutes the major portion of the total phosphorus
in sediments.
Sorption and Desorption: The ability of sediments to sorb inorganic
phosphorus added in the laboratory has been studied in recent years with
a view of understanding the role of sediments in the removal of dissolved
phosphorus from, or the release of dissolved phosphorus to interstitial
waters. Laboratory studies have shown that inorganic phosphorus,
added at concentrations considerably greater than those present in the
interstitial waters of sediments, is retained by oxides and hydrous oxides
of iron and aluminum (Muljadi_et_ah, 1966) and CaC03 (Cole_et ah , 1953)by sorption rather than a precipitation mechanism. It may be expected
that similar sorption mechanisms are responsible for the removal of in
organic phosphorus from solution in sediment-water systems. The exten
sive and rapid exchange of inorganic phosphorus between the solid and
solution phases (Hayes and Phillips, 1958) provides further evidence of
a sorption rather than a precipitation reaction. In general, high phosphate
adsorption by clays is favored by a lower pH. Maximum sorption of ortho
phosphate on montmorillonite occurs at pH 5-6. Sorption by kaolinite is
maximum at a pH near 3. Sediments are frequently able to sorb large
amounts of added inorganic phosphorus (Carritt and Goodgal, 1954).
Although this suggests that many sediments are not saturated with inor
ganic phosphorus, it is important to recognize that the levels of dissolved
inorganic phosphorus sustained by the solid phase at high levels of
phosphorus addition are usually considerably greater than those which
exist in the interstitial waters of. sediments.
Sorption studies have shown that some sediments, for example those
from Lake Wingra (a eutrophic lake in Wisconsin), are virtually saturated
with inorganic phosphorus (Williams _et ah , 1970). An inverse relation
ship has been reported (Williams et ah, 1970) between the amount of
11-14

added inorganic phosphorus sorbed and that de sorbed in a subsequent
desorption step. The laboratory studies reported by Shukla et ah (1971)
indicate that the ability of a sediment to sorb inorganic phosphorus
added in the laboratory is closely related to the level of native inorganic
phosphorus which accumulates in the sediment in the lake environment.
The adsorption isotherms of phosphate have been determined (Muljadi et
al. , 1966) at pH 5 on potassium phosphate using three types of clays at
2 , 20 , and 40 C. The extent of adsorption increased with temperature
largely because of an irreversible increase in the number of adsorption
sites. Adsorption is usually exothermic, leading to a decrease in ad
sorption increase in temperature. This did not follow for the sorption of
phosphate. The level of dissolved Inorganic phosphorus in the inter
stitial water of sediments should be controlled by sorption and desorption
reactions. It may be expected that surficial sediments which are nearly
saturated with inorganic phosphorus are more likely to release inorganic
phosphorus to the overlying water. The fact that there was no obvious
relationship between the ability of a sediment to sorb added inorganic
phosphorus and the trophic state of the lake (Williams et ah , 1970)
demonstrates the complexity of the factors controlling eutrophication.
Mobility Of Inorganic Phosphorus: Chemical mobility is a function
of the rate and extent of sediment inorganic phosphorus interactions
with the surrounding water and is determined by the forms of sediment
inorganic phosphorus. Chemical mobility prediction and evaluation are
based on the forms of sediment inorganic phosphorus, the sorption and
desorption of inorganic phosphorus by sediments, and measurements of
inorganic phosphorus exchanged between the solution and sediment32
phases, using P-labeled phosphate. Early experiments demonstrated
the occurrence of phosphorus exchange between solution and sediment
phases. Hayes et al. (1952) calculated turnover times after adding32
P-labeled phosphate to small lakes, assuming that exchange was a
simple two-directional, first-order process. Turnover times of 5.4 to
40 days were estimated for dissolved inorganic phosphorus, and 30 to
176 days for phosphorus in solids, including sediments. Using a similar
approach in laboratory experiments, Hayes and Phillips (1958) calculated
turnover times ranging from 2 to 22 days for sediment inorganic phosphorus
11-15

in nonmixed systems. Results obtained after adding antibiotics to
sediment-water systems were interpreted to show that sediment micro
organisms were partially involved in the exchange process (Pomeroy et
al. , 1965).
The assessment of phosphorus exchange between sediments and
waters is complicated by a number of factors, including the difficulty
in obtaining accurate lake phosphorus budgets, redox reactions of iron
components at the sediment-water interface, and the complexity of lake
water circulation. Although a considerable amount of research on exchange
has been done, the role of sediments in the uptake and release of sediment
phosphorus, as influenced by sediment properties and environmental prop
erties and environmental factors, is not fully understood (Syers et ah ,
1973).
Biochemical Availability
Hayes and Phillips (1958) used radio phosphorus and lake sediments
to follow the phosphorus equilibrium relationships and rate of exchange
between mud and water. They proposed that physiochemical and biolo
gical layering (undisturbed sample versus artificially mixed mud samples)
of surface muds of lakes was unimportant to the exchange of phosphorus.
They also pointed out that, both in the laboratory and in the field, the
absence of oxygen in water overlying sediment would allow inorganic
phosphorus to be released from the mud or sediment. They found the
final level of total exchangeable phosphorus in waters is eventually
determined by import of phosphorus by river inflow and the rate at which
phosphorus is lost by incorporation into inorganic insoluable precipitates
and undecayed organic matter. Therefore, detritus helps to determine
the turnover rate for phosphorus in mud, bacteria, and plants; thus, in
shallow waters the growth and bacterial decay of rooted aquatic plants
dominates the phosphorus exchange. Also observed was a remarkable
ability for bacteria to hold phosphorus in water; this might be accomplished32
in two ways: (1) by an acceleration of the rate P was returned from the
sediment to the water by bacteria in the mud; or (2) by the rapid uptake
11-16

of radiophosphorus by bacteria in the water and their ability to hold the
radiophosphorus from the chemical or colloidal adsorption mechanism
of the mud.
Release of sediment phosphorus to the overlying water occurs
through suspension of particulate forms or transport of dissolved forms
through turbulent mixing and diffusion. Release to the overlying water
of dissolved inorganic phosphorus can occur if the concentration of
interstitial dissolved inorganic phosphorus exceeds that in the over
lying water (Stumm and Leckie, 1971). Keup et al. (1970) investigated
the susceptibility of flood plain sediments to the release of nutrients.
They found that the more organic phosphorus present in the soil, the
greater the increase in leachate phosphorus concentration. They also
observed that anaerobic water increased the rate of release of total
phosphorus over that of aerobic water.
Odum et ah (1958) found it difficult to distinguish between biolo
gical assimilation and "physical uptake" because phosphorus in various
forms is readily taken up through sorption by sediments and by organisms
without being immediately incorporated into the protoplasm.
Pomeroy et al. (1965) suggested that sediments are a buffer (sorbing,
storing, and gradually releasing) of phosphate content of the water and
that the top ten centimeters of sediment contained sufficient phosphorus
to replace that in water twenty-five times. He found that release of
phosphorus from sediment could support a phytoplankton bloom, al
though only enough phosphorus was present in the water to support the
photosynthetic rate for such a bloom for one day. Borchardt and Azad
(1968) found that the critical phosphate concentration required for maxi
mum algal growth decreased linearly with increasing temperature from
10°C to 30°C. They hypothesized that this relationship may explainthe sudden blooming of plankton after a warm spring day or after a warm
rainfall.
The exchange of phosphorus between sediment and water combines
the sorption reaction and the biologically controlled exchange, which
11-17

is probably between microorganisms and water. In a suspended sediment
experiment on several Wisconsin lakes, Williams et al. (1970) found
that sediments which adsorbed the most phosphorus during the first step
(uptake step) usually released the least phosphorus during the subse
quent desorption step regardless of how much phosphorus was added to
suspended sediment samples.
Although several investigators (Williams, 1970? Armstrong et ah ,
1975; Fillos et al., 1972; and Fillos et al., 1975) arrived at phosphorus
release and uptake rates, more detailed information is needed to estab
lish sources and sinks of phosphorus and to establish the correct
exchange rates between the various sources and sinks under actual or
simulated natural environmental conditions.
Temperature And Salinity Effects On Nutrient Exchange
Marsh productivity and pathways of nutrients have been studied in
detail by many investigators. However, studies concerning the investi
gation of the relationship between temperature, salinity, and nutrient
exchange rates have been seriously neglected.
Temperature Effects On Exchange
Some mention of temperature effects on nutrient exchange has been
included in the works of such investigators as Garritt and Goodgal
(1954), Senstius (1958), Bremner et ah (1958), Keeney (1973), Muljadi et
ah (1966), Foreeetad. (1971), Lee (1970), and possibly others. From a
review of these works, it may be seen that increased temperatures affect
nutrient exchange rates by causing: (1) increased chemical reaction rates;
(2) increased or decreased adsorption rates; (3) increased biological
reaction rates; and (4) increased diffusion rates. Investigations which
have established credence to some of the above temperature effects on
nitrogen and phosphorus exchange rates are reviewed below.
It is generally concluded that higher temperatures favor decom
position over assimilation which influences regeneration, turnover, and
assimilation of nitrogen. Foree et al. (1971) found that ammonification
11-18
proceeds at a measurable rate at low temperatures when assimilation is
usually low. Nitrification rates in sediment-water systems have been
shown by Chen et al. (1972a) to double with each 10°C increase intemperature. Investigation by Bremner et ah (1958) has revealed the
rate of denitrification in submerged soils was influenced by temperature
with the optimum rate at 60-65 C and slower rates at lower temperatures.
Higher temperatures favor sorption (uptake) of phosphorus, at least
in suspension of sediment tests, as was pointed out by Carritt and
Goodgal (1954). The extent of phosphorus adsorption was reported by
Muljadi et ah (1966) to increase with temperature; however, adsorption
is usually exothermic, leading to a decrease in adsorption with increased
temperature.
Salinity Effects On Exchange
The only investigation which indicated conclusive results regarding
salinity effects on nutrient exchange (using a slurry system) was reported
by Carritt and Goodgal (1954). They found that removal of phosphorus was
less in sea water than in fresh water although not in direct proportion to
salinity. From this work and others along with text references on this
subject, it appears that the increase in salinity affects nutrient exchange
as follows: (1) decrease in diffusion rates, (2) decrease in sorption and
desorption rates, (3) decrease of (or competition effect on) ion exchange
sites of clay, and (4) increase or decrease in tolerance limit effects on
biomass adaptation.
Summary
From the above it would appear there is a shortage of material in
the literature on the temperature and salinity effects on nutrient exchange,
and that additional work is needed in this area. Since little has been
proven about the effects of temperature and salinity on rates or release
from and uptake by sediments for nitrogen and phosphorus, the results
obtained from this investigation and other recent experiments should
provide a departure point from which more detailed study may determine
exactly what mechanisms are affected by salinity and temperature in
sediment-water nutrient exchange.
11-19


CHAPTER HI
MATERIALS AND METHODS
INTRODUCTION
The experiments carried out in this study were confined to labor
atory microcosm investigations and conducted at the Environmental
Health Engineering Laboratory, The University of Texas at Austin,
Austin, Texas. Continuous-flow reactors were operated using two
modes of nutrient exchange, leaching and uptake, to determine ex
change rates between sediment-water systems. Replicate microcosm
reactors were exposed to three different temperature and salinity con
ditions each for a total of nine temperature-salinity combinations.
MATERIALS
Source of Sediment Cores
The Texas-Gulf coast has many estuaries which are fairly extensive
in area, shallow, and generally well-mixed. Many have islands and
marshy areas along the land-water boundary. The previously selected
study area (Armstrong jet al., 1975) adjacent to Swan Lake is a low, wet
marsh on a two-mile peninsula situated between the Lavaca River and
Swan Lake (see Figure III-l).
Samples were collected from the study area on 12 March 1975. The
weather at the time was fair and warm with a daytime high temperature
of 75 F. The marsh was relatively dry with no evidence of recent
flooding. Water levels were such that most of the marsh grasses were
periodically inundated.
A total of 14 sediment core samples were removed from an area (5 by
10 meters) of quiet water with a depth of 30 to 50 centimeters. This area
was adjacent to an established flow channel leading to a tributary that
in turn feeds Swan Lake (see Figure III-l).
III-l
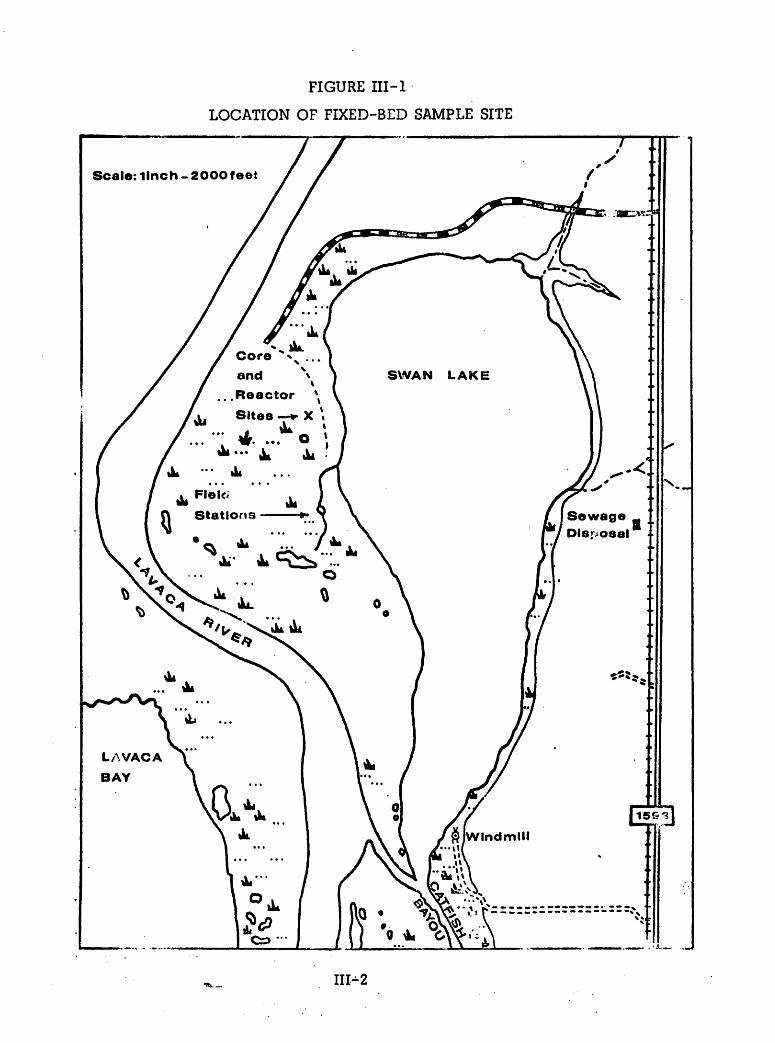
FIGURE III-l
LOCATION OF FIXED-BED SAMPLE SITE
III-2

Slightly turbid, brackish water was noted at the site. The pH of
the water overlying the core samples taken on arrival at the laboratory
ranged from 7.6 to 8.0. Analysis of a composite sample of this same
water gave the following results: ammonia-N - 1.7 mg/l; nitrate-N =
0.08 mg/l; nitrite-N = 0.04 mg/l; and orthophosphate-P = 0.72mg/h
Microcosm Design
Establishment of Microcosms
Sediment was removed from the field site by pushing six 40-cm
long cylindrical (13.8 cm diameter) sections of plexiglas and eight
50-cm long PVC pipe (10.2 cm diameter) sections into the bottom sedi
ment in shallow water, avoiding emergent grasses and algal mat areas,
then carefully lifting and stoppering the cylinders with rubber sheeting
at the bottom. Although the cores were taken from a relatively small
area, there were noticeable differences in soil consistency, especially
the loosely-mixed top layer of sediment. Depths of sediment averaged
12 cm in the plexiglas reactors and 16 cm in the PVC reactors. These
fixed-bed reactors were brought to the laboratory, and existing water
was maintained over the sediment until laboratory experiments were
started. Additional estuarine water collected at the site was used to
maintain selected levels until all leaks were stopped and to replace
evaporated water. To prevent anaerobic conditions, air was bubbled
through the water of all reactors periodically.
All 12 reactors were placed in an air conditioned laboratory and
maintained at 23°C to 26°C until two days prior to the beginning of theleaching experiment. At that time three PVC reactors (Reactors 1,2,
and 3) were placed in a 4 C constant temperature room and three PVC
reactors (Reactors 4,5, and 6) were placed in a 15 C constant tempera
ture room. Three salinity levels were used in these tests, 0, 10, and
20 ppt; reactor sets 1 and 4, 2 and 5, 3 and 6 were maintained at these
three salinity levels, respectively. The plexiglas reactors (Reactors 7
through 12) remained in the 23°C to 26°C laboratory throughout thefirst series of the leaching experiments. Reactor sets 7 and 8, 9 and
III-3

10, and 11 and 12 were kept at salinities of 20, 10, and 0 ppt, respective
ly. After the leaching experiments, all reactors were placed in the 4 C
room for storage until the start of the uptake experiments three weeks
later.
Equipment
Reactors: The reactors contained ample amounts of sediment to inter
act with the overlying waters. The larger diameter plexiglas reactors
were provided with 2 liters of overlying water, while the smaller diameter
PVC reactors were provided 1 liter. Water depths were 13.3 cm in the
plexiglas and 12.33 cm in the PVC reactors. The areas of the two sedi-2 2
ment surfaces were 150.4 cm and 81.07 cm respectively for the two
sizes of reactors and thus the sediment surface area to water volume
ratios were approximately the same for both size reactors.
Other Components: Flow-through systems were established with a
detention time of 12 hours in all reactors. Cole-Parmer Instrument Com
pany pumps were used to maintain rates of flow of four liters per day for
the plexiglas reactors and two liters per day for the PVC reactors. Flow
rates were checked and adjusted if necessary at each sampling time.
Drip feed lines were run to the reactors from the pumps and a constant-
level siphon was installed in each reactor to maintain established water
volumes in the reactors.
Five-gallon (18.93 liter) glass carboys were used for influent water
storage and had level gauges on the side used to monitor rates of removal
of water. As a water quality control measure, the large reactor feed
bottles were connected three in series. Water drawn from these feed
bottles was split into two lines for pumping to the two reactors with
identical salinity (see below). In addition, another series of containers
was used to collect each reactor's effluent for exact flow measurement.
Adequate stirring was maintained for the six plexiglas reactors by a
bank of jar stirrers turning at approximately 15 rpm. Individual, slow-
mixing stirrers with rhetfstat speed controls were installed on each of
the PVC reactors.
III-4

Physical Controls
Temperatures remained constant within two degrees for the 4 C and
15 C reactors, while the temperature in the air conditioned laboratory
fluctuated between 23 C and 26 C. The six plexiglas reactors were
kept in a well-lighted laboratory with western window exposure to day
light. The six PVC reactors were kept in dark conditions throughout the
experiments and all reactors were maintained in the 4°C dark room forthe three weeks between the leaching and uptake experiments. This was
done to discourage algal and bacterial growth between experiments.
Assembly
Figure III-2 illustrates the overall layout of the two reactor systems.
The six plexiglas reactors (Reactors 7 through 12) are pictured in the top
photograph while the PVC reactors (Reactors 1 through 3 and another
identical system with Reactors 4 through 6) is shown in the bottom
photograph.
Description of Operation
The objective of providing a constantly-stirred, flow-through
reactor system for each water-sediment microcosm was met by the
physical setup described. The initial leaching experiment was con
ducted for five days, followed by a three-week equalization interval and
then a second five-day uptake experiment. Since all sediment samples
were removed from the field site without visible algal mat or plant
growth, photosynthetic activity in the laboratory was not desired. Light
regimes, therefore, were not imposed on the systems, although some
light effects were present in the laboratory. In a later, thirty-day
experiment, a light regime was imposed on the six plexiglas reactors.
Results of that experiment indicated strong responses by bacterial and
algal communities in the microcosms to the varied salinities. Large
growths of algae and bacteria occurred at 10 ppt salinity, followed
closely by growth in the 20 ppt salinity reactor. Little algal and bac
terial productivity was apparent in the reactors with 0 ppt salinity through
the first 15 days, but a more noticeable growth occurred by the end of 30
days.Ill-5


As estuarine water from the field was present initially in all reac
tors, the beginning step was to drain and replace this water with the
test influent waters which contained 0 ppt, 10 ppt, and 20 ppt salinity.
Because the tap water contained varying amounts of ammonia which
persisted in the distilled water, water that had been distilled and de-
ionized was used to make up simulated brackish water of 10 ppt and 20
ppt salinities using *INSTANT OCEAN* salts. Some variation in the
phosphorus and nitrogen levels was noted in different batches of this
simulated brackish water during leaching experiments. Later, the up
take experiments were provided simulated brackish water that had been
pooled before being aliquoted into bottles for storage and use. Nutrients
were added to the influent waters during the uptake experiments to
achieve final concentrations of 5 mg/l ammonia-N and 2 mg/l of ortho-
phosphate-P.
Sampling Procedures
Schedule
The frequency of sampling was controlled by two factors: (1) the
large sample volumes required for analyses (400 ml each or 40 percent of
the volume of the small reactors); and (2) the anticipated Initial rapid
rates of leaching and uptake for the first one to two days and the fre
quent sampling needed to detect and measure these rates. These demands
were conflicting, so a compromise schedule and procedure was developed
in which samples were taken at 3, 6, 12, 24, 36, and 48 yours followed
by daily sampling up to five days for both leaching and uptake modes.
To compensate for the large volume removed initially, the small reactors
were filled with makeup water after the first 3-hour sampling.
In order to determine the concentration of nutrients in the influent
water, samples were taken at 0, 2.5 and 5 days after the start of the ex
periments .
* Aquarium Systems, Incorporated, Eastlake, Ohio.
Ill-7

Other Samples
Samples of sediments from the two spare reactors were removed,
dried and sent to the Texas A&M University Soils Testing Laboratory
for detailed soil analysis. After completion of the uptake experiments,
another sample was made up from the top 10 centimeters of Reactor 4
for use in a simple, suspended-sediment leaching experiment which
lasted for six days. Results of these tests are given in Chapter IV.
Laboratory Tests
The sampling schedule described above was designed to give
nitrogen and phosphorus concentrations from all the reactors at their
various temperatures and salinities and under different modes of opera
tion. Chemical analyses were performed by the Texas State Department
of Human Resources Laboratory.
Samples were initially checked for pH in the laboratory using a
Beckman Zeromatic pH meter. For the leaching experiments, samples
were preserved with 2 mg/l of sulfuric acid and stored at 4°C until takento the Laboratory where they were analyzed usually on the same day re
ceived. For the uptake experiments, samples were not chemically pre
served but merely stored at 4°C until analyzed (again on the same daydelivered) in an attempt to improve analysis accuracy.
Physical variables monitored during the experiment were: sample
water temperature, ambient air temperature, flow rate, and dissolved
oxygen concentrations in reactors. At times, visual observations were
made of reactors as well as equipment, and records were kept of equip
ment malfunctions. Dissolved oxygen was monitored utilizing a Precision
Scientific Company galvanic cell oxygen analyzer. Temperature and
salinity corrections were applied to observed dissolved oxygen levels
based on nomograph tables provided by the manufacturer, and conduc
tivity measurements were used to determine effluent salinity levels.
Ill-8

METHODS USED
Experimental Rationale
Basically no new methods were used in these experiments that have
not been reported by others; however, the use of flow-through water-
sediment microcosms to obtain nutrient exchange rates and the effects
of temperature and salinity on those rates had not been applied in
exactly the same way as used in these studies. The imposition of
controls on influent nutrient concentrations and flow rates was felt to
be requisite to achieving accurate results.
To calculate the nutrient release and uptake rates from the sedi
ments, a materials balance was computed for each reactor. For2
example, the nitrogen release rate in mg/m /day was calculated using
the mass balance model represented by the following equation
dSdt
where
= Slv (S - S) - f(sediment) - f (algae and bacteria) (III-l)
dS
dt
V lSo - S)
f (sediment)
f (algae and bacteria) =
Q
V
S
the change in nutrient concentration in
the reactor with time (mg/l/day)
concentration change due to influent gains
and effluent losses
nutrient concentration changes due to
exchange with sediments
nutrient concentration changes due to
exchange with algae and bacteria com
munities
flow-thro ugh rate (liters/day)
reactor water volume (liters)
influent nutrient concentration (mg/l)
effluent nutrient concentration (mg/l).
Ill-9

For steady-state conditions
dS
and
at = °
S- (S - S) = f (sediment, algae and bacteria). (III-2)v o
Equation III—2 will also hold when dS/dt approaches zero even though
non-steady state conditions prevail. Assuming that dS/dt is small compared
to Q/V (S - S) but that dS/dt ^ 0, Equation III-l may be modified too
Equation JJI-2 and integrated numerically (using the technique of a modi
fied trapezoidal rule for approximating the area between an arc of the
nutrient concentration curve and the base,, or zero, concentration) to
obtain the nutrient exchange rates due to sediments and algae and bac
teria combined. Using the modified trapezoidal rule, a numerical
solution to obtain the mass exchanged between the sediment-algae-
bacteria system and the overlying water was approximated by the general
equation
Mass of nutrient . . Average n a JL.exchanged concentration area
orIII-3
L =
where
L = Mass exchanged from time t, to t«with the sediment surface
area (mg/m /day),
C = observed concentration at time t, or t„ corrected for influent
concentration (mg/l),
Q = flow rate through reactor (1/d),2
A = sediment surface area in reactor (m ),
T = time between nutrient sampling periods (t2~V ^ays).
111-10

CHAPTER IV
RESULTS
INTRODUCTION
The data obtained from the nutrient uptake and release experiments
described in Chapter III were carried through mass exchange calculations
to determine nutrient exchange rates. These concentration and mass
exchange data are presented in this chapter in sections on temperature
and salinity effects on release and uptake modes.
BOUNDARY CONDITIONS FOR REACTORS
Influent Water
Control of influent water quality was a major problem. Influent
water, although stored in glass bottles, often showed a slight ammonia
loss (in both spiked and unspiked waters). The average loss for all
reactor feed systems for the uptake experiment was 0.04 mg/l of nitro
gen over a five-day period. High concentrations of nitrogen and phos
phorus were found in influent water in which low background concentra
tions were desired. These occurred in the brackish water mixtures of
INSTANT OCEAN and caused uptake to take place during the leaching
experiment. Other changes were apparent when concentration levels in
ammonia-spiked waters either changed or laboratory errors indicated
that effect. The nutrient background changes in turn required some
correction. For the leaching experiments, background levels of nitro
gen and phophorus were present in proportion to the concentration of
INSTANT OCEAN used. The backgound ammonia-N concentrations for
20, 10, and 0 ppt salinities were 0.011 mg/l, 0.006 mg/l and none,
respectively.
Sediment Characteristics
Two sediment microcosms were not utilized in the experiments and
were dismantled, quartered, and used for soil analysis. The soil
IV-1

analyses were made by The Agricultural Extension Service Soil Testing
Laboratory at Texas A&M University. The results are given in Table
IV-1.
Reactor pH and Dissolved Oxygen
Dissolved oxygen concentration and pH of the water samples from
the reactors were determined at the scheduled sampling times during
the two laboratory experiments. The results of the analyses are sum
marized in Table IV-2 (leaching phase) and Table IV-3 (uptake phase).
Results for Table IV-2 show aerobic conditions (4.3-12 mg/l of dis
solved oxygen) throughout the experiment and overall pH ranges of 7.1
to 8.6. The uptake phase results (Table IV-3) show a range of 4.5-
11.5 mg/l of dissolved oxygen and pH ranges of 6.1 to 8.2.
NUTRIENT EXCHANGE CONCENTRATIONS
The following presentation of results of the exchange experiments
includes a representative number of example graphs of concentration
levels versus time since the more meaningful results are those con
cerning mass of nutrients exchanged.
Nitrogen
Figure IV-1 presents results of exchanged nitrogen concentration
levels, (S -S), for selected representative reactors during the leaching
mode of the experiment. The reactor effluent nitrogen concentration, S,
has been subtracted from the influent nitrogen concentration, S , to
obtain these results. Results for the three temperature and salinity
conditions are shown in these graphs. The four reactors (Reactors 3,
6, and 11 and 12) with 0 ppt salinity were lacking in buffering, at least
initially, until leaching from the sediment cores gradually increased
both the buffering and the pH values. Changes in concentrations of
nitrogen and phosphorus shown in the next four figures (Figures IV-1
through IV-4) are attributed to increase (leaching) or depletion (uptake)
of nutrients in flow through waters. Results were obtained from anal
yses of frequent sampling over the five days of the two experiments and
IV-2

TABLEIV-1
CORE SAMPLE SOIL NUTRIENT ANALYSIS
Analysis
Sampli-
1 2
PH 7.1 7.0
Magnesium (ppm) > 250 > 250
Potassium (ppm) 600 600
Organic Material (%) 4.2 4.0
Iron (ppm) > 20 > 20
Copper (ppm) 1.66 1.66
Calcium (ppm) >3000 >3000
Phosphorus (ppm) 46 21
Sodium (ppm) >1250 >1250
Zinc (ppm) 2 2
Manganese (ppm) > 10 > 10
IV-3

TABLE IV-2
WATPR C)UALjlTY IN SEDIMENT REACTORS DUiaNG LEAPHING PHASE
Rea ctor
No.Sa' inity
(. pt)Temperatu.e
(°C)
Dissolved OxygenRange(mg/1)
PHRange
1 20 4 8.3-10 3 8.15-8.7
2 10 4 7.2-10.6 7.3-8.7
3 0 4 7.7-12.0 7.1-8.0
4 20 15 5.1- 5.9 7.7-8.2
5 10 15 5.4- 6.9 7.6-8.4
6 0 15 6.7- 7.7 7.6-8.2
7 20 23 4.3- 6.4 7.9-8.3
8 20 23 4.5- 6.4 8.1-8.5
9 10 23 4.7- 6.0 7.5-8.5
10 10 23 4.8- 6.8 7.6-8.5
11 0 23 5.8- 6.8 7.2-8.6
12 0 23 5.7- 6.7 7.3-8.1
IV-4

TABLE IV-3
WATER QUALITY IN SEDIMENT REACTORS DURING UPTAKE PHASE
Reactor
No.
Salinity(ppt)
Temperature(°C)
Dissolved OxygenRange(mg/l)
RangePH
1 20 4 7.4-10 7.9-8.2
2 10 4 8.0-10.7 7.2-7.5
3 0 4 8.4-11.5 6.1-7.1
4 20 15 5.8- 8.1 7.8-8.0
5 10 15 6.2- 8.8 7.2-7.5
6 0 15 6.1-10.3 6.1 6.9
7 20 23 4.8- 6.0X 7.3-7.9
8 20 23 4.8- 6.4 7.4-7.8
9 10 23 5.2- 6.8 7.0-7.4
10 10 23 4.5- 6.8 6.8-7.4
11 0 23 5.8- 7.2 5.9-6.8
12 0 23 5.5- 7.2 5.8-6.6 j
IV-5
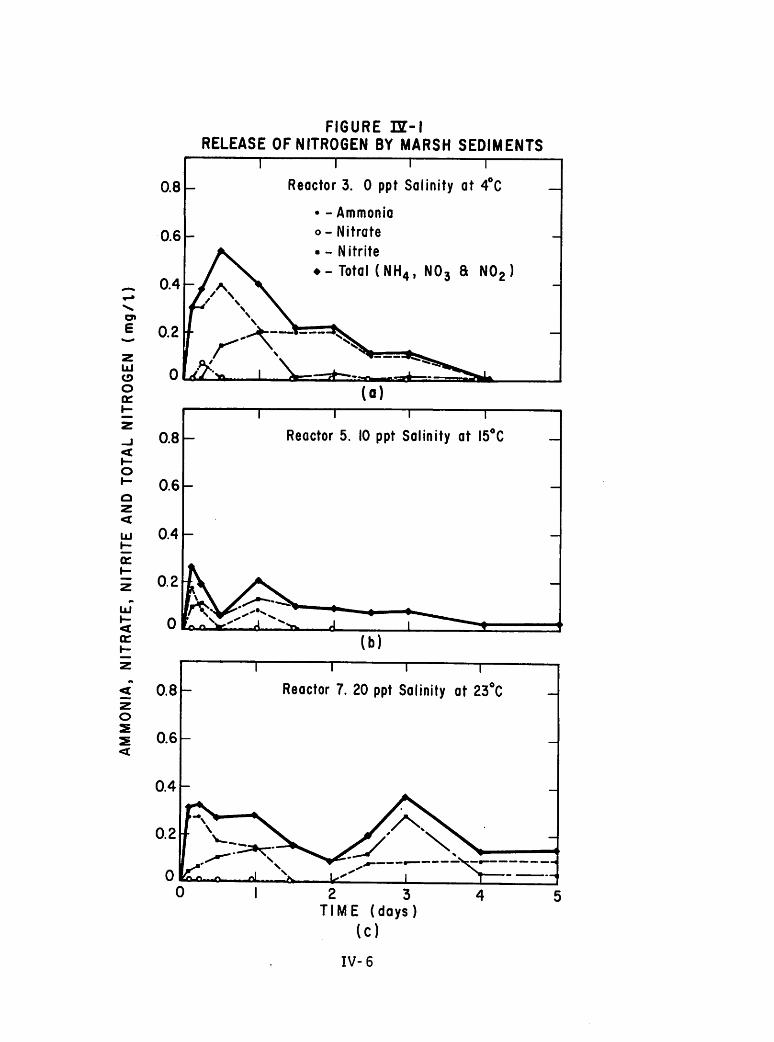
0.8
0.6
0.4«-»
V*
cn
E 0.2*-*
zUJCD 0OOZ1-
Z
_J 0.8<1-oh- 0.6o
z
<
UJ 0.4h-
cei-
z0.2
LU
< 0Cd
< 0.8z
o
I 0.6
FIGURE EM
RELEASE OF NITROGEN BY MARSH SEDIMENTS
Reactor 3. 0 ppt Salinity at 4°C
• -Ammonia
o- Nitrate
• - Nitrite
♦ - Total (NH4t N03 8 N02
Reactor 5. 10 ppt Salinity at I5°C
Reactor 7. 20 ppt Salinity at 23°C
2 3TIME (days)
(O
IV-6

E
LUCD
Oor
<
o
<
LU
LU
<or
<
o
FIGURE ET-2UPTAKE OF NITROGEN BY MARSH SEDIMENTS
+ 1.0 - Reactor 3.
I 1 1
0 ppt Salinity at 4°C
0Release
I Uptake
-1.0• -Ammonia
-2.0° - Nitrate
• - Nitrite
-30 i
♦ - Total (NH4, N03 8 N02 )
+ 1.0-
2.0-
3.0
Release
(a)1 1 r
Reactor 5. 10 ppt Salinity at I5°C
• -Ammonia
° - Nitrate
• - Nitrite
♦- Total (NH4, N03 8 N02 )I I
(b)
2 3
TIME (days)(O
IV-7

0>
E
a.
i
M"Oa.
co
<
LU
<XQ_(O
OXa.
o
or
o
FIGURE ET-3
RELEASE OF PHOSPHORUS BY MARSH SEDIMENTS
0.4 -
" 1 1 '
Reactor 3. 0 ppt Salinity at 4°C-
0.3 -
-
0.2 -
0.1 -
0 r^^^'^T^^n a d
0.4
0.3 h
0.2
(a)
Reactor 5. 10 ppt Salinity at I5°C
2 3
TIME (days)(O
IV-8

E
a.
i
oQ_
CO
<
LU
<Xa.co
Oxa.
o
or
o
FIGURE 33T-4
UPTAKE OF PHOSPHORUS BY MARSH SEDIMENTS
+ 0.5
1 i
Reactor 3.
1 1
0 ppt Salinity at 4°C—
0Release
V Uptake
-0.5 - -
-1.0 -
-1.5 i i 1 1
(a)
+ 0.5
1 i i i
Reactor 5. 10 ppt Salinity at I5°C-
0Release
{ Uptake
-0.5
-1.0 -
-15 " i i i
(b)
+ 0.5
1 i i i
Reactor 8. 20 ppt Salinity at 23°C—
0Release
I Uptake
-0.5
-1.0 -
-15 i 1 i i
2 3
TIME (days)(O
IV-9

are not directly due to temperature or salinity conditions of the various
reactors. Leaching rates were affected slightly in Reactors 7 through 12
when a stirrer malfunctioned and was replaced by another which would
not function at low speed settings. This caused sediment scour and
increased leaching concentrations for nitrogen and phosphorus from day
two through five. The increased stirring at two days will be noted as
a second peak in the leaching curves for Reactor 7 (Figure IV-lc).
Reactors generally reached equilibrium or zero leaching levels by the
end of the fourth or fifth day.
The three graphs in Figure IV-2 are examples of observed nitrogen
uptake concentrations which have been corrected for influent levels of
ammonia-N. It is apparent that nitrification is occurring, especially
in Reactor 8 (Figure IV-2c). Nitrification was greatest at the higher
temperatures and salinities and did not occur in 0 ppt salinity reactors
at 4°C and 15 C. A small concentration of nitrites did build up in thetwo 20 ppt, 23 C reactors. Uptake reactions generally did not reach
equilibrium and only passed through zero uptake as a transient condi
tion. Most reactors reached a transitory zero uptake level at 2 to 2.5
days, but the 0 ppt salinity reactors were less consistent in approaching
zero.
Phosphorus
Example graphs of the phosphorus exchanged in the leaching ex
periments are shown in Figure IV-3. Because dissolved inorganic
phosphorus is the "available" form of phosphorus for aquatic plants and
frequently constitutes the major portion of the total phosphorus in sedi
ments, orthophosphate was the form examined with a view to under
standing the role of sediments in removing dissolved phosphorus from,
and releasing dissolved phosphorus to, overlying waters. Again
effluent concentrations were subtracted from influent concentrations to
obtain the exchanged concentrations. Generally, equilibrium conditions
for phosphorus leaching were reached in four or five days, but some
microcosms released for longer times, particularly two of the six large
reactors (Reactors 11 and 12 with 0 ppt salinity) which was probably due
to increased stirring action at the two-day time. Most phosphorus
leaching was completed by 2 to 2.5 days.
IV-10

Figure IV-4 contains results of phosphorus uptake concentrations with
time. A fairly steady uptake reaction is apparent through five-days. Only
two reactors indicated conditions approaching zero uptake. Some reactors
showed higher uptake concentrations for about 1.5 days, then reduced
somewhat and leveled off for the remainder of the five days.
CUMULATIVE NUTRIENT EXCHANGE
Mass Balance Model
In order to arrive at nutrient release and uptake rates, results from
the reactors were used in the nutrient mass balance model discussed in
Chapter III. After the influent concentrations were subtracted from the
reactor concentrations according to Equation III-3, the mass exchange
of each nutrient was calculated. These mass exchange rates were in
turn cumulatively added (integrated) and graphed. Example graphs of
the cumulative mass of nutrients released are shown in Figure IV-5 and
taken up in Figure IV-6. The curves will exhibit a negative slope or
loss of mass if uptake occurs during the release mode or if release occurs
during the uptake mode.
These results were used further to calculate the daily mean nutrient
mass leached and taken up for each successive day, and they were then
applied as data points or ranges to construct the graphs of temperature
and salinity effects on nutrient concentrations which will be shown
later in this chapter.
Temperature Effects
In order to compare the effects of temperature on the rates of
nutrient exchange between the sediment and water, two analyses were
performed. First, the nutrient exchange data were compiled for each
reactor and each day of the experiment, the daily mean and range cal
culated and grouped according to the temperature at which the reactors
were operated, and these mean values and ranges graphed versus time.
Second, the nutrient cumulative mass data were compiled and graphed.
Third, the mass exchange rates were calculated for successive days in
the experiment and tabulated.
IV-11

U- LUOh
2<r
400
CO — ^.Ll. oj
o q E 300o z ^
ILU E
<«5~ 200-J t LlIUjZ o> "O
j=<* 100<3! z r-
= °z§25fo<
0
FIGURE W- 5a
CUMULATIVE LEACHED NITROGENFROM MARSH SEDIMENTS
0 2 3TIME (days)
CM
E
0
FIGURE ET-5b
CUMULATIVE LEACHED PHOSPHORUSFROM MARSH SEDIMENTS
I 2 3TIME (days)
IV-12
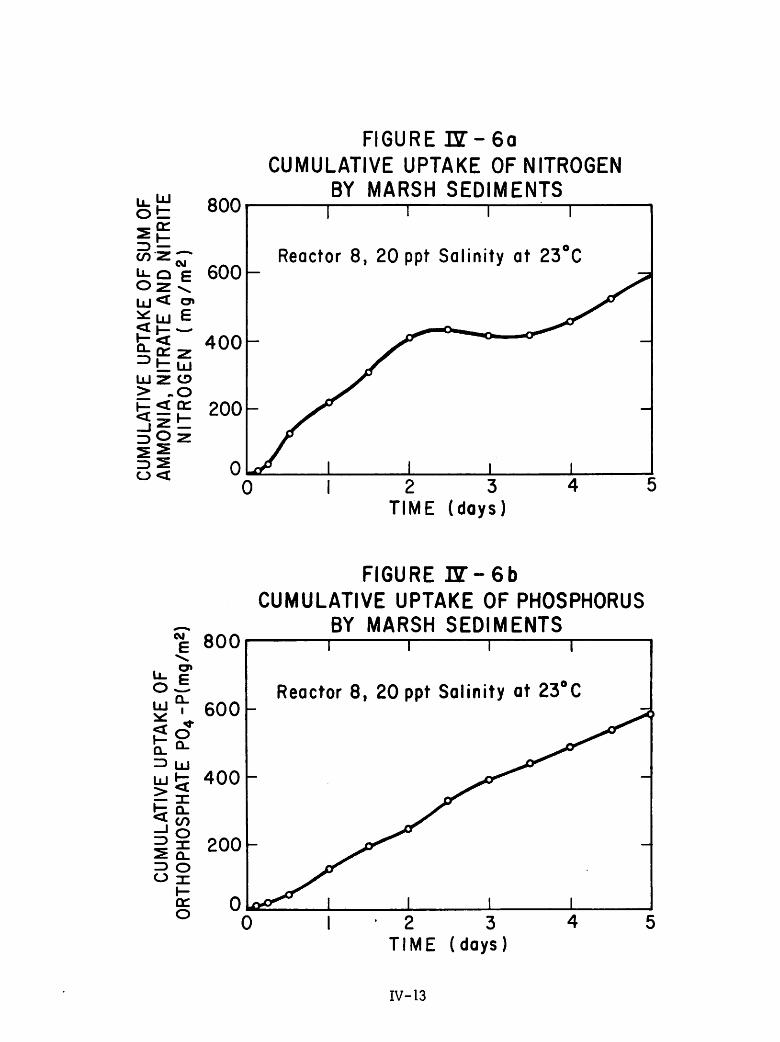
E
=> LU
^ O
\-
O
0
FIGURE H-Sa
CUMULATIVE UPTAKE OF NITROGEN
BY MARSH SEDIMENTS
2 3
TIME (days)
FIGURE IZ-6b
CUMULATIVE UPTAKE OF PHOSPHORUS
BY MARSH SEDIMENTS
600
1 1 1 1
Reactor 8, 20 ppt Salinity at 23°C-j
400 - j&^^ -
200 -
0 **^ i i i i0 2 3
TIME (days)
IV-13

The same procedure was used to compile data for an examination of
salinity effects.
Nitrogen
Results of temperature effects on the release of nitrogen are pre
sented in Figure IV-7 and Table IV-4. Little temperature effect on
nitrogen leaching rates is apparent at 4°C and 15 C. The higher nitrogen concentrations and cumulative mass at 23 C may reflect increased
biomass productivity at higher temperature resulting in more ammonia
produced from mineralization and ammonification as noted earlier in
Keeney (1973). The 15 C curve which should fit in mid-range, does
not follow this rationale; its displacement could be caused either by
less organic substance available for ammonification and mineralization
or by a tighter clay sediment which could result in a net release less
than the 4 C reactors .
The temperature effects on nitrogen taken up by the sediments are
shown in Figure IV-8 and Table IV-5. The curves for all reactors
started at nearly equal concentrations and are nearly parallel until the
third day. The 4 C reactors reached equilibrium (mean of concentrations)
at three days and stayed at that level for one day, then approached the
23°C reactors uptake curve at five days. The highest concentrationlevels were maintained by the 14 C reactors and are ascribed to less
availability of organic materials. The depletion of organic material
provides less ammonia through ammonification and mineralization re
sulting in a depleted nitrogen pool which in turn places a continued
demand on the spiked waters throughout the five days. The slightlyo o
higher nitrogen concentrations in the 23 C reactors over the 4 C reactors
at the third and fourth days is probably due to differences in biomass
production and net effects from increased ammonia utilization at the
higher temperature. The effects of temperature on mass of nitrogen
taken up by the sedi ments follows the trends shown by the concentra
tion curves.
IV-14
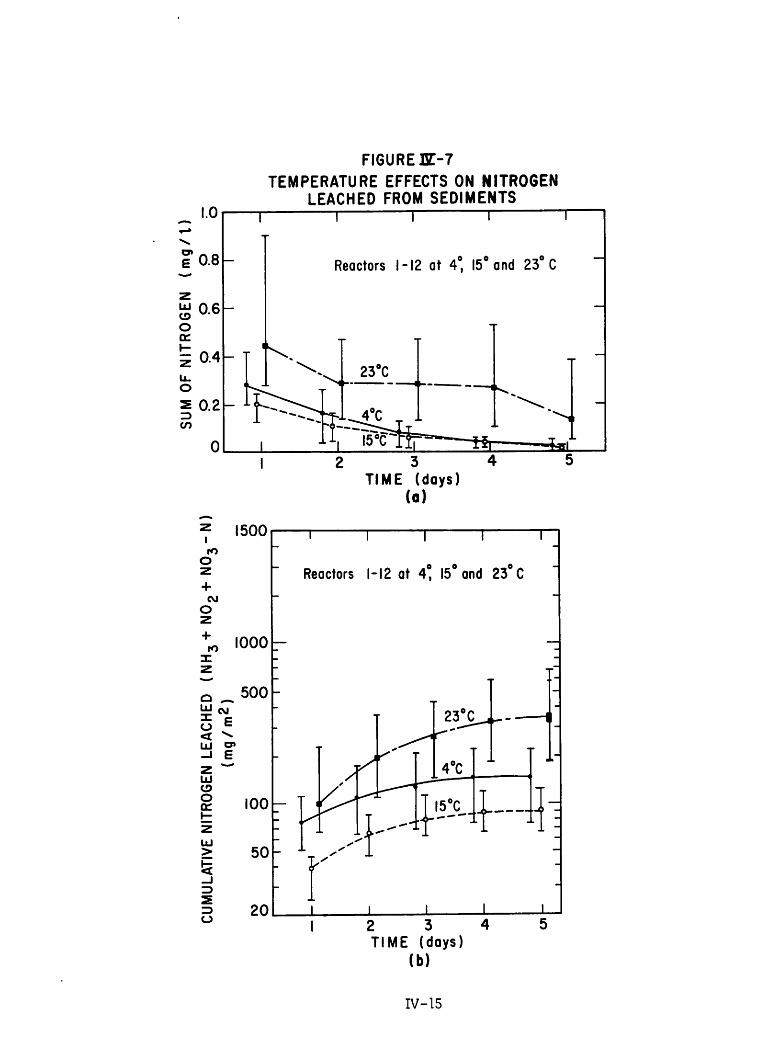
FIGURE JI-7
TEMPERATURE EFFECTS ON NITROGENLEACHED FROM SEDIMENTS
2 3TIME (days)
(a)
i
ro
Oz
+CVJ
O
1500
ro 1000-
^ CVJ
< ^LU CT»
-j e
z wLUCDO
LU>
_l3
500-
100-
2 3 4TIME (days)
(b)
IV-15

TABLE IV-4
TEMPERATURE EFFECTS ON LEACHING RATES
OF NITROGEN FROM SEDIMENTS
Reactor
Ten.perature(°C)
Time
(days)
N j .roger.' Leaching ]ReVes
Range
(mg/m2/d)Average
(mg/m2/d)Daily Average
(mg/m2/d)
4 1
2
3
4
5
51-114
34-87
23-69
19-5615-45
75
58
45
37
30
15 1
2
3
4
5
25-4624-42
21-36
17-31
13-25
39
32
2622
18
23 1
2
3
4
5
68-227
54-175
51-15345-148
38-138
113
94
85
81
74
All
Temperatures1
2
3
4
5
75
61
5247 141 1
Nitrogen = NH4 - N +N02 - N + N03 - N
IV-16

FIGURE K-8
TEMPERATURE EFFECTS ON NITROGENTAKEN UP BY SEDIMENTS
1500
i
ro
Oz
+
2 1000cvj
ro
^> 500E
LU 5CD -DO Zor lui- ^zz <
>
=>o
100
50
20
2 3 4TIME (days)
(a)
T I5°C -
4°Chi
• €<,23WC
Reactors 1-12 at 4°, 15° and 23° C
2 3 4TIME (days)
(b)
IV-17
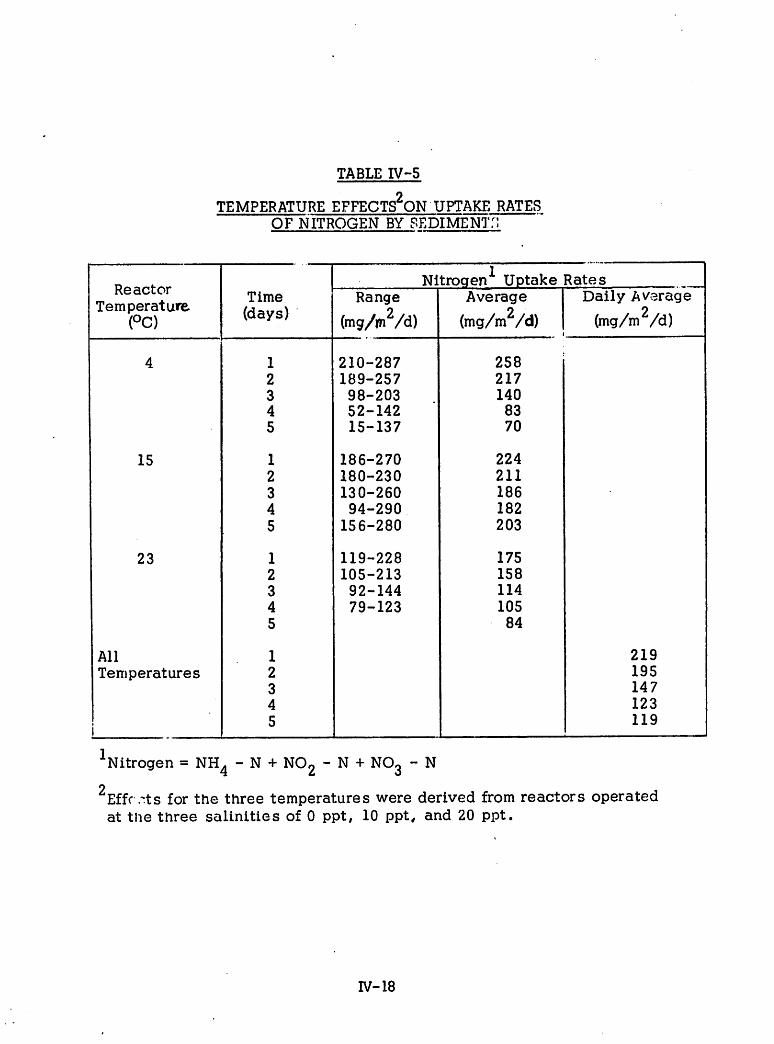
TABLE IV-5
TEMPERATURE EFFECTS ON UPTAKE RATESOF NITROGEN BY SEDIMENT.!
Reactor
Temperature(°C)
Time
(days)
- i-Nitrogen Uptake Rates
Range
(mg/m2/d)Average
(mg/m2/d)Daily Average
(mg/m2/d)
4
15
23
All
Temperatures
i
1
2
34
5
1
2
3
4
5
1
2
3
4
5
1
2
3
4
5
210-287
189-257
98-20352-14215-137
186-270
180-230
130-260
94-290
156-280
119-228
105-21392-144
79-123
258217
140
8370
224
211
186
182
203
175158
114
10584
219
195147
123119
1 Nitrogen = NH4 - N + NOz - N +N03 - N
'Efff\Tts for the three temperatures were derived from reactors operatedat the three salinities of 0 ppt, 10 ppt, and 20 ppt.
IV-18
Phosphorus
The effect of temperature on phosphorus release is shown in Figure
IV-9 and Table IV-6. Temperature effects were small and the initial
unequal concentrations became equal by the third day. By the fifth day,
the 15 c reactors were at equilibrium, the 4 C reactors were at very
low concentrations, and the 23°C reactors were still releasing at afairly steady rate. The mass of phosphorus released was very low for
all temperature conditions and the 15°G reactor curve was nearly zero.The main mechanism affecting differential phosphorus release appeared
to be different soil characteristics and nutrient contents of the various
reactors.
The effect of temperature on phosphorus uptake is shown in Figure
IV-10. Some temperature effect is evident as indicated by the higher
uptake in the 23 C reactors. The biomass present in the plexiglas
reactors may have caused the 23 C and 4 C reactors to follow the
classic phosphorus leaching versus uptake response; that is, high
uptake rates of phosphorus by a sediment may be indicative of a low
release rate by the same sediment. Comparison of Figures IV-9a and
IV-lOa reveal this pattern was found in the 4 C and 23° reactors, butthe 15 c reactors did not follow this pattern. Temperature effects on
mass of phosphorus taken up appear to be small.
Salinity Effects
The same graphical presentation used for temperature effects was
used to compare the effects of salinities on the uptake and release of
nutrients. The twelve reactors were grouped according to the salinity
conditions of influent waters, and nutrient exchange rates were deter
mined. It was realized that this analysis masked the temperature
effects on the release and uptake rates for reactors operated at differ
ent temperatures.
Nitrogen
Salinity effects on the release of nitrogen is depicted in Figure
IV-11. A salinity effect is not clear, but it is apparent that the
IV-19

FIGURE ET-9
TEMPERATURE EFFECTS ON PHOSPHORUSLEACHED FROM SEDIMENTS
IOOO
oj 500
E
a.
i
o
a- 100
S 50xo<LU
>
_)
2
I0r-
5
3
2 3 4TIME (days)
(a)
Reactors 1-12 at 4°, 15° and 23° C
Z
23"C
/' 2 34-
/
J-TIM
•^>c-
9 J"*"
E (days)(b)
IV-20
5-X-L
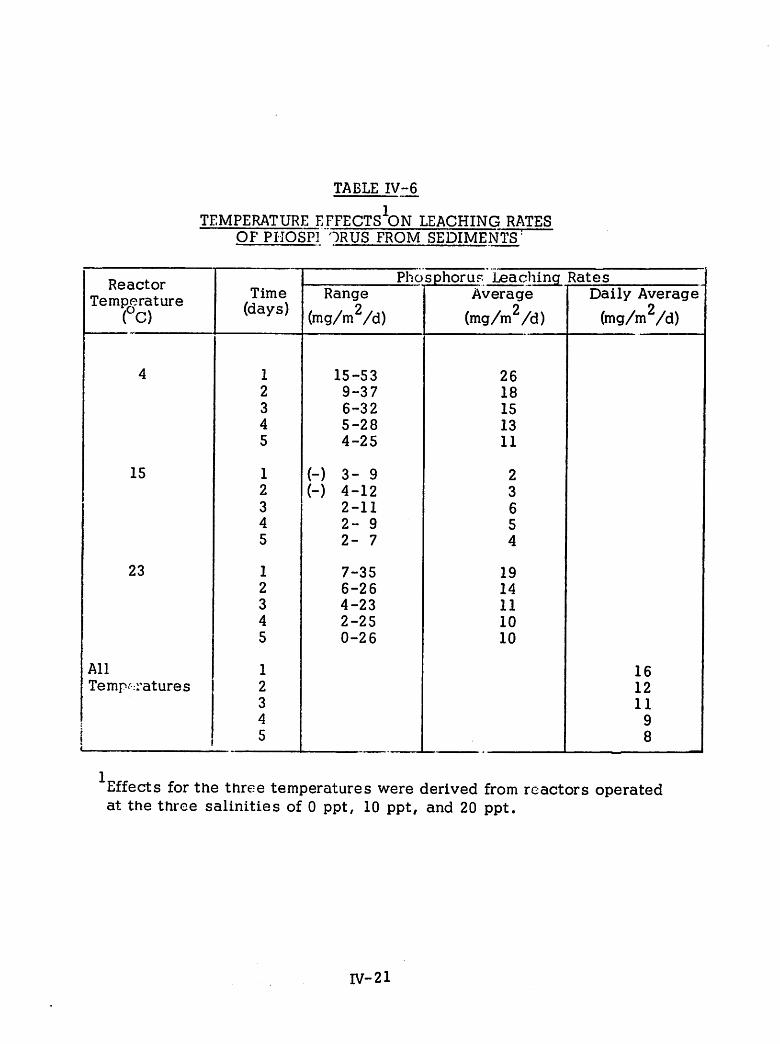
Reactor
Temperature(°C)
15
23
All
Temp.--.ratures
TABLE IV-6
TEMPERATURE EFFECTsW LEACHING RATESOF PHOSP1 ORUS FROM SEDIMENTS1
Time
(days)Range
(mg/m2/d)
Phosphorus Leaching RatesDaily Average
(mg/m2/d)
1
2
3
4
5
1
2
3
4
5
1
2
3
4
5
1
2
3
4
5
(-)(-)
15-539-37
6-32
5-28
4-25
3- 9
4-122-11
2- 9
2- 7
7-35
6-26
4-23
2-25
0-26
Average
(mg/m2/d)
26
18
15
13
11
2
3
6
5
4
19
14
11
10
10
1612
119
8
Effects for the three temperatures were derived from reactors operatedat the three salinities of 0 ppt, 10 ppt, and 20 ppt.
IV-21

FIGURE ET-IO
TEMPERATURE EFFECTS ON PHOSPHORUSTAKEN UP BY SEDIMENTS
IOOO
CM
E*>.
Oi
E
500
< 100
a.
L 50oa.
i
o
LU>
10
o
TIME (days)(a)
Reactors 1-12 at 4°, 15° and 23° C
2 3 4TIME (days)
(b)
IV-22
•n

TABLE IV-7
TEMPERATUPK EFFECTS ON UPTAKE RATESOF PHOSPHORUS BY SEDIMENTS'
Reactor
Temperature<°C)
Time
(days)
Phosphorus Uptr':e Rcites
Range
(mg/m /d)
Average
(mg/m2/d)Daily Average
(mg/m2/d)
4 1 75-121 922 67- 92 763 67- 75 704 64- 70 665 56- 63 59
15 1 53- 83 682 45- 84 653 44- 83 654 41- 80 625 40- 74 59
23 1 53-193 1162 42-186 1133 37-167 1014 32-145 945 26-134 87
All 1 92Temperatures 2
3
4
5
85
79
74
68
Effects for the three temperatures were derived from reactors operatedat the three salinities of 0 ppt, 10 ppt, and 20 ppt.
IV-23

iro
O
+CM
Oz
+
ro
X
1500
1000
lu ~500x E
QJ °*-I E
FIGURE EMI
SALINITY EFFECTS ON NITROGENLEACHED FROM SEDIMENTS
2 3TIME (days)
(a)
Reactors 1-12 at 0, 10 and 20 ppt Salinity
«—•—4l—T*
LUCOOor
100 —
LU>
-I
50-
202 3 4TIME (days)
(b)
IV-2 4

greatest exchange was found in the 10 ppt salinity with lesser rates
in the 20 and 0 ppt salinities. The mechanism which may have caused
the difference in salinity effects was ammonification and mineraliza
tion due to the greater accumulation of the biomass in the 10 ppt
reactors at 23°C. Nitrogen release rates through the five-day leachingperiod at the three leaching salinities are tabulated in Table IV-8.
The effects of salinity on nitrogen uptake are shown in Figure IV-12
and in Table IV-9. The initial uptake mechanism was probably sorption
and biomass uptake because initially the greatest amount of uptake was
in the biologically active sediments which sorbed large quantities of
nitrogen at all three salinities. From day two on, ammonification and
nitrification produced equilibrium conditions for the 10 and 20 ppt reac
tors, and the release of nitrogen for a short time by the 10 ppt reactors.
Phosphorus
Salinity effects on phosphorus release are shown in Figure IV-13
and Table IV-10. These results indicated that salinity effects were
not quantitatively significant. One mechanism which appeared to
cause salinity effects was the biological or chemical oxidation block
age of phosphorus release at the sediment-water interface (Fillos et_
al. , 1975). Under aerobic conditions the overlying water concentrations
due to release were low as expected. Another mechanism could be the
uptake of phosphorus by the biota present in the reactors, especially
the plexiglas reactors at 23 C.
The effects of salinity on phosphorus taken up by the sediments
is shown in Figure IV-14 and Table IV-11. Some marked differences
were noted which were most likely due to the biota in the 10 and 20
ppt salinity reactors at 23°C. The probable mechanisms involved wereabsorption (or uptake) by the biota and adsorption by the sediment.
IV-2 5

TABLE IV-8
SALINITY EFFECTS ON LEACHING RATESOF NITROGEN FROM SEDIMENTS
Reactor
Salinity(ppt)
Time
(days)
Ni trogen Leaching RatesRange
(mg/m /d)
Average
. (m,/m2/d)Daily Average
(mg/m /d).... ...
0
10
20
All
Salinities
ii
1
2
3
4
5
1
2
34
5
1
2
3
4
5
1
2
3
4
5
46-11429- 99
21- 98
17- 86
13- 72
25-227
24-17521-15319-148
16 138
46- 82
42- 72
36- 58
31- 58
25- 55
83
69
60
5142
108
84
73
70
65
64
55
48
45
41
85
70
60
55
50
IV-26

E
LU
CO
Oor
1.5
JO
0.5
FIGURE EM2
SALINITY EFFECTS ON NITROGEN
TAKEN UP BY SEDIMENTS
1 1 c
5 0Uptake
Release
O\<" 10%
-0.5
CO
-1.0
Reactors 1-12 at 0, 10 and 20 ppt Salinity
I I I
500
i
ro
OZ
+
g _iooo
+ °Ero v.
x ^> 500Z E
LU ^
o zLT LU
LU>
-J
z>
IDo
100
50
20
Reactors
2 3 4TIME (days)
(a)
—i 1 1 r
12 at 0,10 and 20 ppt Salinity
2 3 4TIME (days)
(b)
IV-2 7

Reactor
Salinity(ppt)
0
10
20
All
Salinities
TABLE IV-9
SAU'TITY EFFECTS ON UPTAKE RATESOF NITROGEN BY SEDIMENTS
Time
(days)
Nitrogen Uptake RatesDaily Average
(mg/m /d)
Range
(mg/m2/d)
119-287
105-257
94-260
109-290
108-280
146-276136-224
92-16754-163
58-172
145-213
156-204
93-138
52-115
15-156
IV-2 8
Average
(mg/m /d)
219
182
170
165
163
217
195
125
105
101
189
182
120
87
94
208
186
138
119
119

~ 0.4
FIGURE J3M3
SALINITY EFFECTS ON PHOSPHORUSLEACHED FROM SEDIMENTS
T 1 1 r
Z 0.3 Reactors 1-12 at 0, 10 and 20 ppt Salinity
Q_
I
CLCO
OXQ_
OX
I-tr
o
0.2
0.1
.. Release
Uptake L
-0.1
1000
TIME (days)(a)
0% T
m+*.
TU
cT 500E
V.
o»
E
Reactors 1-12 at 0, 10 and 20 ppt Salinity
a.
i
oa- 100
i
o
Xo<LU
5
Z>o
50
10
5
3
IV-2 9
2 x3 4TIME (days)
(b)
i -
J I

TABLE IV-10
SALINITY EFFECTS ON LEACHING RATESOF PHOSPHORUS FROM SEDIMENTS
Reactor
Salinity(ppt)
Time
(days)
Phosphorus Leaching RatesRange
(mg/m2/d)Averse
(mg/m2/d)Daily Average
(mg/m2/d)
0
10
20
All
Salinities
1
2
3
4
5
1
2
3
4
5
1
2
34
5
1
2
3
4
5
7- 35
6- 26
6- 23
5- 26
4- 26
1- 261- 22
2- 27
2- 18
2- 11
(-) 3- 53(-) 4- 37
4- 32
2- 28
0- 25
1613
12
12
12
15
11
9
7
6
19
13
1210
8
17
12
11
10
9
IV-30

~ 1.0
Z 0.8
FIGURE H-14
SALINITY EFFECTS ON PHOSPHORUSTAKEN UP BY SEDIMENTS
Reactors 1-12 at 0, 10 and 20 ppt Salinity
0.6 - , k 10% -,LU
XQ_
CO
OX0_
o
oro
0.4 20%
0.2
1000
CM
E
o>
E
CL
I
Oa.
i
o
Q
LU
Xo<LU
LU>
6*
3O
500-
^.
TIME (days)(a)
IV-31
2 3 4TIME (days)
(b)
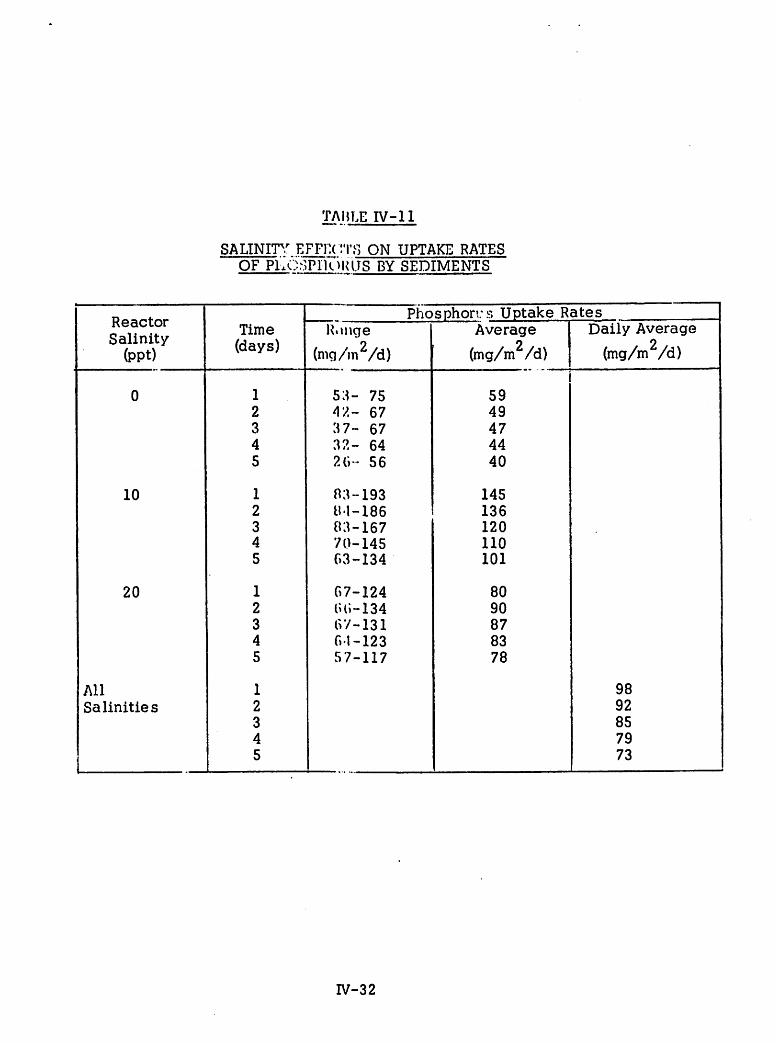
Reactor
Salinity(ppt)
10
20
All
Salinities
TAHLE IV-11
SALINITY EFFECTS ON UPTAKE RATES
OF PLOSPIlOU'lTS BY SEDIMENTS
Time
(days)
Phosphor',:s Uptake Rates ^Daily Average
(mg/m /d)
1
2
3
4
5
1
2
34
5
1
2
3
4
5
1
2
3
4
5
R.inge
(mg/m2/d)
53- 75
4X- 673 7- 6732- 64
20- 56
83-193
111-186
03-16770-14503-134
67-124
60-134
67-131
0-1-123
57-117
IV-3 2
Average
(mg/m2/d)
59
49
47
44
40
145
136
120
110
101
80
90
87
83
78
98
92
85
79
73

CHAPTER V
DISCUSSION
INTRODUCTION
The exchange of nitrogen and phosphorus- between the marsh sedi
ments and overlying water has been investigated to determine the rates
of exchange and the effects of temperature and salinity on these rates.
It was found that release and uptake do occur between the sediments
and overlying waters, that temperature and salinity influence those
rates somewhat, and that organisms (bacteria and plants) may also
exert some influences on these rates.
In order for physical (sorption-desorption) nutrient exchange to oc
cur, a concentration gradient must exist between the sediment and the
overlying waters. Factors affecting the physical exchange rates include
diffusion in the sediment interstitial water, mixing of water overlying
the sediment, flow characteristics, diurnal effects, seasonal changes,
and others; these factors cause nutrient concentrations to change con
tinuously in sediment and overlying waters. Interacting with these
physical factors acting near the water-sediment interface are plants,
animals, bacteria, and so forth. It is apparent that steady-state con
ditions seldom exist at the sediment-water interface. Even with these
complexities, the portions of the marsh system transplanted into the
constantly-stirred, flow-through reactors in the laboratory nevertheless
appeared to reproduce the field conditions. The major variable, however,
was the difference in replicate microcosm sediment characteristics.
These variable sediment characteristics, in order of significance, were:
organic matter content, available nitrogen and phosphorus, and indig
enous biomass. This problem was apparent in the analysis of exchange
rate data as well as in the appearance of the sediment. Nevertheless,
the results obtained indicated evidence of temperature and salinity
effects.
V-l

NUTRIENT EXCHANGE BETWEEN WATER AND SEDIMENTS
A summary table of leaching and uptake rates for nitrogen and phos
phorus at various temperature and salinity conditions was assembled
from the results for reference purposes. Rates at one, three, and five
days are combined in Table V-l.
Nitrogen Exchange
Release.
Nitrogen may be released at the sediment-water interface as
detritus is decomposed. Under anoxic conditions, the mineralization
of nitrogen takes place at a greater rate than under aerated conditions
(Sawyer et al., 1967). High nitrogen levels in the sediment interstitial
waters may produce a concentration gradient between the sediment and
the overlying water which will result in nitrogen transport to the over
lying waters by diffusion. Several indirect effects on the sediment-
water interchange occur such as change in pH, oxygen consumption,
clay sorption of organic nitrogen and others (Keeney, 1973). Informa
tion on temperature and salinity effects on nitrogen release was not
found in the literature.
From an analysis of the results of this study, it appeared that sig
nificant differences in mineralization rates were caused by temperature
since nitrogen was released at 23 C at almost twice the rate as at 4 C
using rates at five days.
Salinity effects on nitrogen release indicated that the organisms
which grew especially well in those reactors with 10 ppt salinity
exerted a major influence on the release rates. The rate differences
were significant as the 10 ppt salinity release rate of 65 mg/m /day
was fifty percent greater than the 0 and 20 ppt salinity release rates2
of 42 and 41 mg/m /day of nitrogen, respectively.
Uptake
The uptake of nitrogen by the sediments is primarily due to sorption
by the sediment and to the organisms present. When enriched nitrogen
V-2
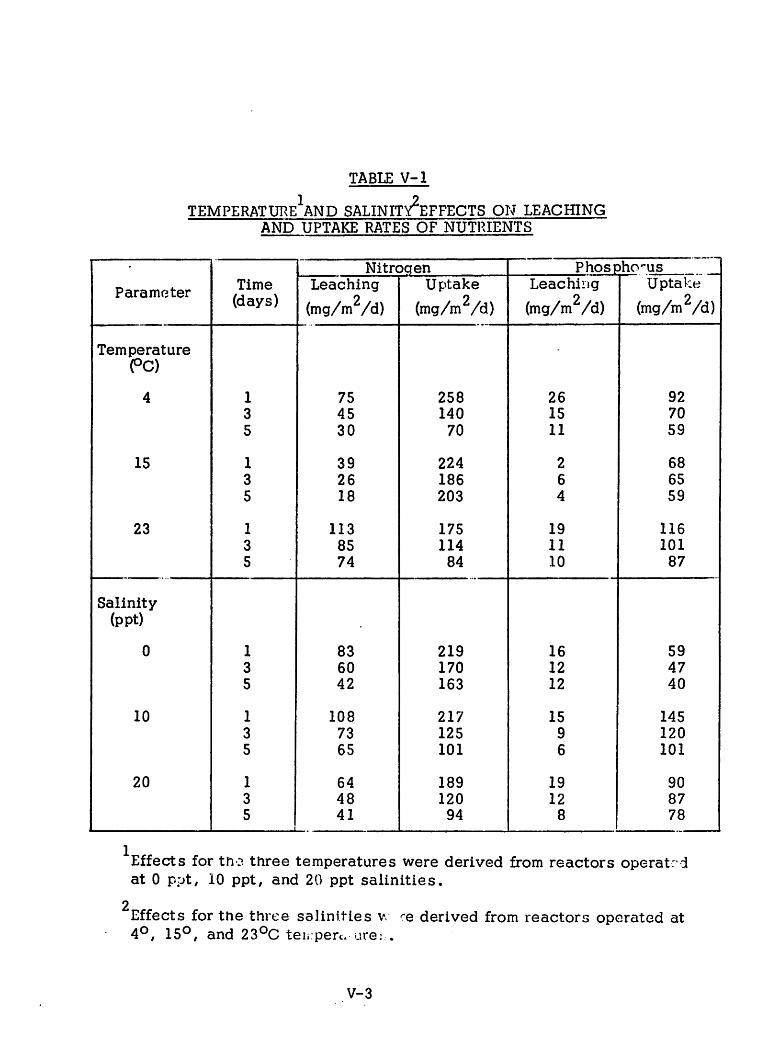
TABLE V-l
TEMPERATURE^ND SALINIT^EFFECTS ON LEACHINGAND UPTAKE RATES OF NUTRIENTS
ParameterTime
(days)
Nitrogen PhosphcusLeaching
(mg/m2/d)Uptake
(mg/m2/d)Leaching
(mg/m /d)
Uptake
(mg/m2/d)
TemperaturePC)
4
15
23
1
3
5
1
3
5
1
3
5
75
45
30
39
26
18
113
85
74
258
140
70
224
186
203
175
114
84
26
15
11
2
6
4
19
11
10
92
70
59
68
65
59
116101
87
Salinity(ppt)
0
10
20
1
3
5
1
3
5
1
3
5i
83
6042
108
73
65
64
48
41
219
170
163
217
125
101
189
120
94
16
12
12
159
6
19
128
59
47
40
145
120
101
90
87
78
l
"Effects for tho. three temperatures were derived from reactors operatedat 0 ppt, 10 ppt, and 20 ppt salinities.
>
'Effects for the three salinities w --e derived from reactors operated at4°, 15°, and 23°C ten perc.-ure.v .
V-3

conditions exist in the overlying waters, nitrogen diffusion occurs
into the sediments to bring about equilibrium conditions. Information
on temperature effects on nitrogen uptake pertinent to this investiga
tion was not mentioned in the literature.
Results of these experiments indicated only minor temperature
effects on nitrogen uptake. In comparing the nitrogen release rates
with those experienced during uptake, it was found that both rates were
quite different as might be expected because of the influent conditions
imposed, but those reactors with high sediment organic matter released
at higher rates than other reactors and took up nitrogen at lower rates
than other reactors. The overall mean nitrogen release rate at five days2 2was 41 mg/m /day compared to that of uptake at 119 mg/m /day of
nitrogen in the organically rich sediments. The organically poor 15°C2
reactor group showed only 18 mg/m /day of nitrogen released while the2
uptake rate was (high for the three temperature groups) 203 mg/m /day
of nitrogen, all at the five day point.
The salinity effects on nitrogen uptake was shown by data analysis
to be masked by the organisms present, especially, in the 20 ppt salin
ity reactors. After three days, conditions in the 20 ppt and 10 ppt *
salinity reactors indicated that mineralization was occurring in the more
bacterially active reactors. At the same time, the least biologically
active reactors (0 ppt salinity) continued to take up nitrogen. The re
sults of salinity effects on uptake rates at five days were as follows-:2 2
0 ppt salinity, 163 mg/m /day; 10 ppt salinity, 101 mg/m /day; and 202
ppt salinity, 94 mg/m /day of nitrogen.
Phosphorus Exchange
Release
Phosphorus is released from the sediment primarily by desorption
into interstitial waters and diffusion into the overlying waters. Release
also occurs due to microbial decomposition of detritus at the sediment-
water interface.
V-4

Salinity effects on the physical (sorption-desorption) release rates
of phosphorus were masked by the organisms at the sediment surface.
The more biologically active reactors had lower release rates as follows:2 20 ppt salinity, 12 mg/m /day; 20 ppt salinity, 8 mg/m /day; and 10 ppt
2salinity, 6 mg/m /day of phosphorus over the five day period. The 10
ppt salinity reactors contained an abundance of plants apparently adapted
to brackish water conditions which took up phosphorus as it was released
by other mechanisms, thus lowering the net release rate.
Uptake
Sorption is the primary mechanism for uptake of inorganic phosphorus
by the sediment-water system. It has also been observed that bacteria
have the ability to store phosphorus (Hayes and Phillips, 1958), thus
bacteria in the sediment may take up and store phosphorus temporarily.
Since the transport of phosphorus and other materials between the sedi
ment interstitial water and overlying water depend on rates of diffusion
and extent of mixing action (Lee, 1970), these must also be added to
physical sorption and biological activity as controlling factors in phos
phorus mobility.
Uptake rates for phosphorus in this experiment were not found to be
affected by temperature. The expected opposite rate effect (i.e., high
rate of release reactors show low rate of uptake) was generally observed
except in the 15 C reactors. This deviation may have been related to
stirring-rate differences since precise stirrer rpm was not monitored, or
more likely this was due to the initial nutrient conditions in the sedi
ments themselves. Rates of uptake for the five day test period were
noted for the temperature-grouped reactors as follows: 23 C, 87 mg/m /_. o _. o
day; 15 C, 59 mg/m /day; and 4 C, 59,mg/m /day of orthosphosphate-P.
Salinity conditions did not follow the patterns reported in the litera
ture of keeping the phosphorus available in the water. In fact, a reverse
pattern was noted and depended on the abundance of organisms in the 10
ppt, 20 ppt, and 0 ppt salinity reactors. Phosphorus appeared to be
taken up more readily in the more biologically active sediments. Uptake
rates were also found to be quite high compared to release rates. This
V-5

indicated that, overall, low inorganic phosphorus levels were originally
present in the sediment core samples. Uptake rates observed for the2
five day test period were as follows: 10 ppt salinity, 101 mg/m /day;2 220 ppt salinity, 78 mg/m /day; and 0 ppt salinity, 40 mg/m /day of
orthophos phate-P.
COMPARISON WITH PREVIOUS RESULTS
The literature contains the results of numerous nutrient exchange
experiments concerned with release while few dealt with uptake. The
methods utilized in studies reported in the literature are varied with
batch water systems used more frequently than continuously-mixed
flow-through water systems. In most cases, results obtained have been
reported on a mass per volume basis rather than as a mass exchange
rate over time for a sediment or bottom area (e.g., Hayes and Phillips,
1958; Austin and Lee, 1973; Porcella et al., 1970; and Odum et al.,
1958). In only a few instances have conclusive results been reported
concerning environmental factors which may have influenced the ex
change rates (e.g,, Chen et al., 1972a; Carrit and Goddgal, 1954;
Keeney, 1973). A comparison of previous analyses of release and up
take rate data is given below, but studies of brackish water marsh
sediment nutrient exchange under different temperature conditions with
similar objectives and scope were not found in the literature.
Previous Results
Release Rates
In a recent experiment by Fillos et al. (1975), conducted to determine
the release rates of nutrients from river and lake sediments, the release
mechanism was investigated under aerobic and anaerobic conditions.
Nitrogen release rates for two sediment samples were reported for aero
bic conditions as follows:
2NITROGEN (for Lake Warner ~5 mg/m /hr or
2sediments ) 120 mg/m /day of ammonia-N
V-6
2NITROGEN (for Muddy River ~15 mg/m /hr or
2sediments ) 360 mg/m /day of ammonia-N
From the same experiment, the release rate for phosphate was reported
after ten days under aerobic conditions as follows:
2PHOSPHORUS (for Muddy River ~0.3 mg/m /hr or
2sediments ) 7.2 mg/m /day of PO.-P
The effect of simulated benthal deposits on nutrient budget was also
studied by Fillos et al. (1972) under both aerobic and anaerobic condi
tions. Nitrogen and phosphorus release rates were reported for aerobic
conditions as follows:
PHOSPHORUS (for relatively aged 3 mg/m2/day of po psediments at 4 months)
2NITROGEN (for relatively aged 62 mg/m /day of ammonia-N
sediments at 4 months)
Uptake Rates
Although rates of nitrite mineralization were reported by Graetz et
al. (1973) in a study of lake sediment-water systems, ammonia uptake
investigations were not reported in the literature. Neither did the
literature contain information on phosphorus uptake that was useful for
comparison with the studies in this investigation.
Comparison
Overall the results of this study indicated high phosphorus uptake
rates and extremely low release rates. This was expected and was
reported in the literature by Williams (1970). The overall high uptake
rates indicated the sediment phosphorus levels were low and that the
sediment had acted as a significant inorganic phosphorus sink. Temper
ature effects on phosphorus release or uptake were not found to be sig
nificant, and salinity effects were related, in reality to biological
effects, a feature found by Fillos et al. (1975).
V-7
The nitrogen release rates reported by Fillos et al. (1975) for lake2
and river waters of from 120 to 360 mg/m /day of nitrogen were two to
four times higher than those found in this investigation. This was most
likely due to the source of the benthal deposits used in their tests; the
river sediments came from an area near an untreated sewage outfall and
the lake deposits came from a eutrophic lake surrounded by farm land.
Also their samples were thoroughly mixed prior to the experiment.
In a previous experiment by Fillos et al. (1972), simulated benthalo
deposits released orthophosphorus at 3 mg/m /day. This was lower
than the 9 mg/m /day of phosphorus for five day test period found in
these studies; however, the comparisons appeared to be reasonable.
From that same study, the nitrogen release rate was reported at 62 mg/2
m /day which compared favorably with the rate found in this investiga-2
tion of 50 mg/m /day at the five day period. The two studies by Fillos
gave different results since sediment characteristics were dissimilar;
in fact, the earlier experiment made use of a simulated sludge made from
a mixture of raw primary wastewater solids and fine sand.
V-8

CHAPTER VI
CONCLUSIONS AND RECOMMENDATIONS
CONCLUSIONS
Based on the results of this study, the following conclusions have
been drawn.
General
1. The completely-mixed, flow-through, fixed-bed reactors provided
an adequate representation of those areas in the field dominated
by bare sediments and adequate rate exchange data for salinity
and temperature effect analyses.
2. The principal control problem experienced during this investigation
was variability of sediment, nutrient, and organic matter content.
3. Generally, salinity effects were masked by biological activity at
the sediment-water interface.
Nitrogen
4. Ammonia was taken up by the active sediment layer at about 2.42
times higher rate than it was released (119 mg/m /day as compared2
to 41 mg/m /day).
5. Tolerance limit effects of salinity on biomass adaptation influenced
the nitrogen exchange rates for both release and uptake of nitrogen.
Leaching was directly related to the biomass activity while uptake
was inversely proportional to biomass activity.
6. Temperature effects were indicated in nitrogen leaching from the
sediment but were not apparent in uptake.
Phosphorus
27. Phosphorus uptake rates by the sediments were high (73 mg/m /day
2of phosphorus) overall while the release rates were low (9 mg/m /
VI-1

day of phosphorus) indicating that phosphorus levels in the ac
tive sediment layer were extremely low initially.
8. Tolerance limit effects of salinity on biomass adaptation influ
enced the phosphorus release from and uptake by the sediments.
These leaching effects were inversely proportional to the biomass
activity while uptake was directly related to biomass activity.
9. Phosphorus release from the active sediment layer was unaffected
by temperature while uptake was affected to some minor amount
by temperature conditions.
RECOMMENDATIONS
1. The effects of the initial organic material content of the sediments
on release rates of nitrogen, phosphorus, and carbon should be
investigated.
2. The sediment core samples should be replicated so that more
accurate temperature and salinity effects on nutrient exchange
evaluations could be made.
VI-2

BIBLIOGRAPHY
Abbott, W. 1967. "Microcosm studies of estuarine waters and theeffects of single dose of nitrate and phosphate". JWPCF 3_9:(1),113-122.
Armstrong, N. E., Melvin O. Hinson, Jr., James E. Collins, and E. G.Fruh. 1975. "Biogeochemical cycling of carbon, nitrogen, andphosphorus in saltwater marshes of Lavaca Bay, Texas". TechnicalReport to Texas Water Development Board, Center For Research inWater Resources, The University of Texas at Austin.
Austin, E. R., and G. F. Lee. 1973. "Nitrogen release from lake sediments". JWPCF 45:870-879.
Borchardt, J. A., and H. S. Azad. 1968. "Biological extraction ofnutrients ". JWPCF 40:1739-1754.
Bremner, J. M. , and K. Shaw. 1958. "Denitrification: II. Factorsaffecting denitrification". Journal Agr. Sci. 5_1: 40-52.
Carritt, D. E. and S. Goodgal. 1954. "Sorption reactions and someecological implications" . Deep Sea Res . _1: 224-243 .
Chen, R. L. , D. R. Keeney, and J. G. Konrad. 1972a. "Nitrificationin sediments of selected Wisconsin lakes". J. Environ. Qual. U151-154.
Chen, R. L., D. R. Keeney, D. A. Graetz, and A. J. Holding. 1972b."Denitrification and nitrate reduction in Wisconsin lake sediments". J. Environ. Qual. _1: 158-162.
Chen, R. L. , D. R. Keeney, J. G. Konrad, A. J. Holding, and D. A.Graetz. 1972c. "Gas production of Lake Mendota, Wisconsin".J. Environ. Qual. 1: 155-158.
Cole, C. V. , S. R. Olsen, and CO. Scott. 1953. "The nature ofphosphate sorption by calcium carbonate". Soil Sci. Soc. Amer.Proc. Ill 352-356.
Copeland, B. J. and E. G. Fruh. 1970. "Ecological studies ofGalveston Bay - 1967". Final report, Galveston Bay StudyProgram, Texas Water Quality Board.
Davis, M. B. 1968. "Pollen grains in lake sediments: Redepositioncaused by seasonal water circulation". Science 162: 796-799.

Dawson, A. J. 1975. "The role of marsh plants in nutrient exchange inthe Lavaca Bay brackish marsh system". Masters Thesis, Univ. ofTexas, Austin.
Fillos, J. 1972. "Effects of benthal deposits on oxygen and nutrienteconomy of flowing waters". JWPCF 44: 644.
Fillos, J. andW. R. Swanson. 1975. "The release rate of nutrientsfrom river and lake sediments". J. Environ. Qual. _5: 1032-1042.
Foree, E. G. , W. J. Jewell, and P. L. McCarty. 1971. "The extent ofnitrogen and phosphorus regeneration from decomposing algae".Water Resources 111-27, p. 1-15.
Gardner, L. R. 1975. "Runoff from an intertidal marsh during tidalexposure—recession curves and chemical characteristics". Limnol.and Oceanogr. 20 (1): 81.
Graetz, D. A. 1973. "Eh status of lake sediment - water systems inrelation to nitrogen transformations". Limnol. and Oceanogr. 18: 908.
Hayes, F. R., J. A. McCarter, M. L. Cameron, and D. A. Livingston,1952. "On the kinetics of phosphorus exchange in lakes". J. Ecol.40: 202-216.
Hayes, F. R. and J. E. Phillips. 1958. "Radiophosphorus equilibriumwith mud, plants, and bacteria under oxidized and reduced conditions". Limnol. and Oceanogr. 3: 459-475.
Hutchinson, G. E. 1957. A treatise on Limnology. Vol I Geography,Physics and Chemistry. John Wiley, N. Y.
Hynes, H. B. N., and B. J. Greib. 1970. "Movement of phosphateand other ions from and through lake muds". J. Fish. Res. Bd.Canada 27: 653-668.
Jewell, W. J. 1971. "Aquatic weed decay: Dissolved oxygen utilization and nitrigen and phosphorus regeneration". JWPCF 43: 1457-1467.
Keeney, D. R., J. G. Konrad, and G. Chesters. 1970. "Nitrogendistribution in some Wisconsin lake sediments". JWPCF 42: 411-417.
Keup, L. E., G. D. McKee, E. W. Raabe, and R. W. Warner. 1970."Water quality effects of leaching from submerged soils". JournalAmer. Waterworks Assoc, 62: 391-396.
Kuznetsov, S.I. 1968. "Recent studies on the role of microorganismsin the cycling of substances in lakes". Limnol. and Oceanogr. 13:211-224.
Lee, G. F. 1970. "Factors affecting the transfer of material betweenwater and the sediments". Eutrophication Info. Prog., Univ.Wise, Madison. Occasional Paper 1. 50 p.

Muljadi, D., A. A. Posner, and J. P. Quirk. 1966. "The mechanism ofphosphate adsorption by kaolinite, gibbsite, and pseudoboehmite".J. Soil Sci. 17: 212-229.
32Odum, E. P., E. J. Kuenzler, and M. X. Blunt. 1958. "Uptake of P
and primary productivity in marine benthic algae". Limnol. andOceanogr. 3; 340-345.
Odum, H. T. and R. F. Wilson. 1962. "Further studies of reaerationand metabolism of Texas bays, 1958-1960". Publ Inst. Mar. Sci.8:23-55.
Pomeroy, L. R., E. E. Smith, and CM. Grant. 1965. "The exchangeof phosphate between estuarine water and sediments". Limnol.and Oceanogr. JJ): 167-172.
Porcella, D. B., J. S. Kumagai, and E. J. Mlddlebrooks. 1970. "Biological effects on sediment-water nutrient interchange". Journalof the Sanitary Eng. Div., Proc. ASCE 4: 911-926.
Ryther, J. H. and W. M. Dunstan. 1971. "Nitrogen, phosphorus, andeutrophication in the coastal marine environment". Science 171:1008-1013.
Sawyer, C N., and A. F. Ferulo. 1960. "Nitrogen fixation in naturalwaters under controlled laboratory conditions ". Seminar on Algaeand Metropolitan Waters, 1960. Trans. Robert A. Taft SanitaryEngineer. Cent. (Cincinnati Ohio) U. S. Public Serv.
Sawyer, C N., and P. L. McCarthy. 1967. Chemistry for SanitaryEngineers. Second Edition, McGraw-Hill Book Co.
Senstius, M. W. 1958. "Climax terms of rock weathering". AmericanScientist 46: 355-367.
Shukla, S. S., J. K. Syers, J. D. H. Williams, D. E. Armstrong, andR.F.Harris. 1971. "Sorption of inorganic phosphate by lakesediments". Soil Sci. Soc. Amer. Proc. 35: 244-249.
Straton, F. E. 1969. "Nitrogen losses from alkaline water impoundments".J. Sanitary Eng. 9£: 223-231.
Stumm, W. and J. O. Leckie. 1971. Phosphate exchange with sediments:Its role in the productivity of surface waters". Fifth Int. WaterPoll. Res. Conf.
Stumm, W. and J. J. Morgan. 1970. Aquatic Chemistry. Wiley-Interscience, N. Y.
Syers, J. K., R. F. Harris, and D. E. Armstrong. 1973. "Phosphatechemistry in lake sediments". J. Environ. Qual. 2: 1-13.

Syrett, P. J. 1962. "Nitrogen assimilation". In Physiology and Biochemistry of Algae. Academic Press, N. Y.
Teal, J. M. 1962. "Energy flow in the salt marsh ecosystem of Georgia".Ecology 43: 614-624.
Veith, G. D. and G. F. Lee. 1971. "Water chemistry of toxaphene:role of lake sediments". Environ. Sci. Technol. 5; 230-234.
Wentz, D. R., and G. F. Lee. 1969. "Sedimentary phosphorus inlake cores: Observations on depositional pattern in Lake Mendota".Environ. Sci. Technol. 3: 754-759.
Williams, J. D. H., J. K. Syers, and R. F. Harris. 1970. "Adsorptionand desorption of inorganic phosphorus by lake sediments in a0.1 M NaCl system". Environ. Sci. and Technol., 4: 517.
Williams, J. D. H., J. K. Syers, R. F. Harris, and D. E. Armstrong.1971a. "Fractionation of inorganic phosphate in calcareous lakesediments". Soil Sci. Soc. Amer. Proc. 35.: 250-255.
Williams, J. D. H., J. K. Syers, D. E. Armstrong, and R. F. Harris.1971b. "Characterization of inorganic phosphate in noncalcareouslake sediments". Soil Sci. Soc. Amer. Proc. j35: 55 6-561.
Williams, J. D. H., J. K. Syers, S. S. Shukla, R. F. Harris, and D. E.Armstrong. 1971c. "Levels of inorganic and total phosphorus inlake sediments as related to other sediment parameters". Environ.Sci. Technol. 5: 1113-1120.