Nitrogen, Carbon, and Sulfur Metabolism in NaturalThioploca Samples
Upload
independentCategory
view
4download
0
Marine Chemistry 127 (2011) 144–154
Contents lists available at SciVerse ScienceDirect
Marine Chemistry
j ourna l homepage: www.e lsev ie r .com/ locate /marchem
Biogeochemical sulfur cycling in the water column of a shallow stratifiedsea-water lake: Speciation and quadruple sulfur isotope composition
Alexey Kamyshny Jr. a,b,c,⁎, Aubrey L. Zerkle a,1, Zahra F. Mansaray a, Irena Ciglenečki d,Elvira Bura-Nakić d, James Farquhar a, Timothy G. Ferdelman b
a Department of Geology and Earth Systems Science Interdisciplinary Center, University of Maryland, College Park, MD 20742, USAb Department of Biogeochemistry, Max Planck Institute for Marine Microbiology, Celsuisstrasse 1, D-28359 Bremen, Germanyc Department of Geological and Environmental Sciences, Ben-Gurion University of the Negev, P.O. Box 653, Beer Sheva 84105, Israeld Center for Marine and Environmental Research, Ruđer Bošković Institute, Bijenička 54, 10000 Zagreb, Croatia
⁎ Corresponding author at: Department of GeologicaBen-Gurion University of the Negev, P.O. Box 653, Beer S8 647 2655; fax: +972 8 647 2997.
E-mail address: [email protected] (A. Kamyshny)1 Current address: School of Civil Engineering and Geo
Drummond Building, Newcastle upon Tyne, NE1 7RU Eng
0304-4203/$ – see front matter © 2011 Elsevier B.V. Alldoi:10.1016/j.marchem.2011.09.001
a b s t r a c t
a r t i c l e i n f oArticle history:Received 14 May 2011Received in revised form 30 August 2011Accepted 1 September 2011Available online 7 September 2011
Keywords:Lake RogoznicaStratified lakeMultiple sulfur isotopesMicrobial sulfate reductionPhototrophic sulfide oxidationZero-valent sulfurThiocyanate
Concentrations of sulfate, sulfide and intermediate sulfur species as well as quadruple sulfur isotope compo-sitions of sulfate, sulfide and zero-valent sulfur (ZVS) were analyzed in the water column of Lake Rogoznica(Croatia), a stratified marine euxinic lake. The chemocline in the lake, which was located at 8.5–9.5 m depth,supports a dense population of purple phototrophic sulfide oxidizing bacteria from the genus Chromatium.The highest ZVS (5.42 μmol L−1) and sulfite (1.13 μmol L−1) concentrations were detected at the chemocline.Thiocyanate concentrations up to 288 nmol L−1 were detected near the bottom of the lake. The thiocyanateprofile suggests that it diffuses up from the sediment, where it may be produced by the reaction of cyanidewith sulfide oxidation intermediates. Multiple sulfur isotope fractionations between sulfate and sulfidewere consistent with a model finding that disproportionation is not a dominant process below the chemo-cline. Microbial sulfide oxidation was found to be the dominant process of the reoxidative part of the sulfurcycle. Despite the absence of a clear signal for sulfur disproportionation in multiple sulfur isotope values, δ34Sfractionations between sulfate and sulfide were in the range of 43.8–45.2‰, is relatively large in comparisonto most laboratory culturing studies. Our results suggest that such fractionation is achieved by microbial sulfatereduction alone, which is in agreement with metabolic models and recent laboratory studies.
l and Environmental Sciences,heva 84105, Israel. Tel.: +972
.sciences, Newcastle University,land, UK.
rights reserved.
© 2011 Elsevier B.V. All rights reserved.
1. Introduction
The formation and reduction of sulfate is one of the most signifi-cant biogeochemical processes regulating the redox state of theoceans both presently and over Earth history. In modern seawaterand near-surface sediment porewaters, sulfate is the most abundantsoluble electron acceptor, with concentrations of 28.24 mmol L−1 atsalinity of 35.00. Reduction of sulfate in the absence of dissolved oxy-gen is an important energy source for microorganisms (Eq. (1)).
SO2−4 þ 2CH2O þ 2H
þ→H2S þ 2CO2 þ 2H2O ð1Þ
A complicated web of sulfide oxidation reactions partially replen-ishes the pool of available sulfate, and maintains sulfate reducing ac-tivity. This oxidative part of the sulfur cycle proceeds, in part, through
the formation of various intermediate sulfur compounds (inorganicpolysulfides and their protonated forms, particulate and dissolved el-emental sulfur, thiosulfate, polythionates and sulfite) utilizing differ-ent electron acceptors (oxygen, nitrate, iron(III), manganese(III),manganese(IV)) (Zopfi et al., 2004, and references therein).
In stratified water columns hydrogen sulfide can be oxidized tozero-valent sulfur (ZVS) and other intermediate sulfur compoundsby phototrophic sulfur oxidizing bacteria (Eq. (2)) (e.g., Overmannet al., 1991; Canfield et al., 2005)
2H2Sþ CO2→CH2O þ H2O þ 2S0 ð2Þ
These organisms (primarily green and purple sulfur bacteria) canalso reoxidize ZVS and a number of other reduced sulfur compounds(including thiosulfate) to sulfate.
Bacteria can alsomediate the disproportionation of elemental sulfur(Bak and Cypionka, 1987; Thamdrup et al., 1993; Canfield andThamdrup, 1994) (Eq. (3)) as well as thiosulfate and sulfite (Bak andCypionka, 1987; Cypionka et al., 1998; Jørgensen, 1990; Habicht et al.,1998) (Eqs. (4) and (5)). At sulfide concentrations of N1 mmol L−1,the bacterial disproportionation of elemental sulfur (Eq. (3)) only

145A. Kamyshny Jr. et al. / Marine Chemistry 127 (2011) 144–154
occurs in the presence of an external sulfide sink (Thamdrup et al.,1993).
4S0 þ 4H2O→3H2S þ SO
2−4 þ 2H
þ ð3Þ
S2O2−3 þ H2O→H2S þ SO
2−4 ð4Þ
4SO23 þ 2H
þ→H2S þ 3SO2−4 ð5Þ
In sulfide-rich waters polluted by cyanide, formation of thiocyanateoccurs by reaction of cyanide with sulfide oxidation intermediates suchas colloidal sulfur (Kamyshny, 2009a), polysulfides (Luthy and Bruce,1979; Kamyshny et al., 2009), thiosulfate and tetrathionate (Szekeres,1974; Dzombak et al., 2006; Kamyshny et al., 2011a) (Eqs. (6)–(9))via reactions such as:
S2−n þ ðn−1ÞCN− þ H
þ→ðn−1ÞSCN− þ HS− ð6Þ
S2O2−3 þ CN
−→SO2−3 þ SCN
− ð7Þ
SnO2−6 þ ðn−3ÞCN− þ H2O→S2O
2−3 þ SO
2−4 þ 2H
þ þ ðn−3ÞSCN− ð8Þ
S8ðcolloidalÞ þ 8CN−→8SCN
− ð9Þ
Formation of thiocyanate has never been previously documentedin stratified non-polluted aquatic systems.
Typically, speciation and isotope composition analyses alone arenot sufficient to understand the relative importance of various pro-cesses in element cycling. The chemical and microbial transformationsof sulfur species lead to measurable fractionations of sulfur isotopesbetween reactants and reaction products, and these fractionationsprovide insight into reductive and oxidative sulfur pathways, consid-ered in the context of chemical speciation. Sulfide produced in exper-iments with cultures and natural populations of sulfate reducers hasbeen found to be up to 70‰ depleted in 34S with respect to sulfate(Harrison and Thode, 1958; Bolliger et al., 2001; Canfield et al.,2010; Sim et al., 2011). Li et al. (2010) recently argued that the differ-ences between sulfate and sulfide δ34S (~54‰) in the Cariaco Basinwater column were consistent with the activity of sulfate reductionalone, based on multiple sulfur isotope fractionation.
The magnitude of sulfur isotope fractionation by sulfate reductionis known to depend on substrate type and substrate concentrations.Oxidation of hydrogen as well as incomplete oxidation of lactate, pro-pionate, or pyruvate to acetate leads to relatively small fractionation(Kaplan and Rittenberg, 1964; Brüchert et al., 2001). Oxidation of ac-etate to CO2 leads to larger sulfur isotope fractionations, possibly dueto lower cell specific sulfate reduction rates (Brüchert et al., 2001).The largest fractionations were observed during oxidation of complexsubstrates, such as crude oil (Bolliger et al., 2001). Lower, but stillnon-limiting electron donor concentrations lead to larger fraction-ations (Chambers et al., 1975; Canfield, 2001).
In somenatural aquatic systems, large fractionations between sulfideand sulfate greater than 48‰ (Fry et al., 1991; Canfield and Teske, 1996;Neretin et al., 2003) have been explained by repeated step-wise frac-tionations imparted during oxidative sulfur cycling, including sulfide ox-idation and the disproportionation of product sulfur intermediates(especially ZVS) to producemore 34S-depleted sulfide and 34S-enrichedsulfate (e.g., Canfield and Thamdrup, 1994). Unidirectional sulfate re-duction in sediments, however, was also argued to create sulfur isotopefractionation exceeding 65‰ (Wortmann et al., 2001; Rudnicki et al.,2001) as has been shown in recent experiments (Sim et al., 2011).
Nevertheless, even analysis of 34S to 32S ratios is often insufficientto quantify the oxidative part of the sulfur cycle, since the majority ofthe fractionation is imparted during sulfate reduction (e.g. Brunnerand Bernasconi, 2005). Analysis of multiple sulfur isotope values is
an emerging tool for the study of biogeochemical sulfur cycling inmodern aquatic (Canfield et al., 2010; Li et al., 2010; Zerkle et al.,2010) and ancient sedimentary (Johnston et al., 2005a; Philippotet al., 2007; Shen et al., 2009; Wacey et al., 2010) systems. Small var-iations in mass dependent fractionation of 33S and 36S isotopes wereshown to have a diagnostic pattern for biogeochemical transforma-tions of sulfur compounds, such as sulfate reduction (Farquhar et al.,2003, 2007; Ono et al., 2006), sulfide oxidation (Zerkle et al., 2009,2010) and sulfur compound disproportionation (Johnston et al.,2005b). Although a limited amount of data for quadruple sulfur iso-tope fractionation by various biological and chemical processes isavailable, this approach has already been successfully applied to de-termine the origin of sulfide (sulfate reduction alone vs. sulfide oxida-tion and sulfur disproportionation), elemental sulfur (chemical vs.microbial sulfide oxidation) and sulfate (consumption by sulfate re-duction vs. production by sulfur disproportionation and/or sulfide ox-idation) in natural aquatic systems (Canfield et al., 2010; Li et al.,2010; Zerkle et al., 2010). Patterns in minor sulfur isotopes (33S inparticular) have revealed that very large fractionations between sul-fate and sulfide may be produced via sulfate reduction in natural sys-tems, both with and without the additional overlay of oxidative sulfurcycling (Li et al., 2010; Zerkle et al., 2010).
In this paper we studied the sulfur cycle in the stratified watercolumn of seasonally anoxic seawater Lake Rogoznica, Croatia, aunique marine anoxic environment on the Adriatic coast (Fig. 1).Lake Rogoznica provides the opportunity to study sulfur dynamicsin a stratified anoxic basin where the deep basin is sulfidic, and dis-cernible rates of sulfur cycling dominate at the chemocline, in anotherwise normal seawater environment. We were especially inter-ested to see how such a close to marine situation compares withother well-studied sulfidic lakes such as Green Lake or Lago diCadagno. Here we present concentrations of sulfur species, includingsulfur intermediates such as thiocyanate, sulfite, thiosulfate, and ZVSin the lake. Moreover, we present data on the distribution of quadru-ple sulfur isotopes in a stratified sea-water lake, in order to under-stand the processes which control isotopic fractionation betweensulfur species.
2. Materials and methods
2.1. Study site
Lake Rogoznica is a seawater lake located on the Gradina Peninsula(43°32′N, 15°58′E) approximately 100 m from the open Adriatic Sea,close to village Rogoznica on the Dalmatian coast (Fig. 1). The lake hasa circular shape with an area of 10,276 m2, maximum length of143 m, and a maximum depth of 15 m. It is sheltered from the windby 4–23 m high cliffs that prevent wind-shear mixing. Lake Rogoznicacan be characterized as a typical euxinic environment (Ciglenečkiet al., 2006). Very limited water exchange with the open sea throughporous karsts leads to a visible push-and-pull water movement associ-ated with Adriatic Sea tidal cycle (Žic and Branica, 2006 and referencestherein). Comparedwith the open Adriatic Sea, Lake Rogoznica is eutro-phic. Nitrate, phosphate and silicate concentrations are up to19 μmol L−1, 22 μmol L−1, 400 μmol L−1 respectively (Ciglenečki et al.,2005). Lake Rogoznica is thermo-haline stratified from spring to au-tumn (Ciglenečki et al., 1998, 2005). In years with cold and dry autumnandwinter, mixing of the lakewater layers takes place (Ciglenečki et al.,1998, 2005).
We can define three geochemically-distinct water layers in thelake. The epilimnion is the upper, oxic water layer. At the chemoclinethe hydrogen sulfide concentration is below 1 μmol L−1 and oxygenconcentration is below 5 μmol L−1. In Lake Rogoznica this layer isc.a. 50 cm thick. The chemocline of the lake hosts a dense populationof purple phototrophic sulfur bacteria (up to 4.3×10⁸ cells mL−1 inJuly 1997) Chromatium that comprises up to 51% of total bacteria

Fig. 1. Location and bathymetry map of Rogoznica Lake, modified from Žic and Branica(2006) and Ciglenečki et al. (2006). The contours in the bathymetry map refer to thedepth in meters.
146 A. Kamyshny Jr. et al. / Marine Chemistry 127 (2011) 144–154
(Ciglenečki et al., 1998; Ciglenečki, unpubl.). The hypolimnion, thedeepest water layer, is anoxic and hydrogen sulfide rich (up to5 mmol L−1; Bura-Nakić et al., 2009). Iodide concentrations in the hy-polimnion are as high as 2.27 μmol L−1 (Žic and Branica, 2006), indi-cating rapid remineralization of organic matter in the sediment(Ullman and Aller, 1983; Ullman et al., 1988).
2.2. Sampling
Lake Rogoznica depth profiles were sampled on the 16 and 19September 2009. Water was sampled with a peristaltic environmen-tal pump (Masterflex E/S Variable Speed Water Pump, EnviroTech,CA). Temperature, pH (during the second sampling only), redox po-tential, and dissolved oxygen concentration were recorded by CTDprobe (Hach Lange HQ40D). Salinity was measured by hand-heldrefractometer (Atago, Japan) during the first sampling only.
2.3. Sample preservation and analysis: Speciation
Samples for analysis of sulfate, sulfide and total ZVS concentra-tions were preserved by addition of 49 mL sample to 50 mL falcontubes pre-filled with 1 mL of 200 g L−1 zinc acetate solution, frozenwithin 12 h and stored frozen until analysis. Samples for the analysisof sulfide and total ZVS concentrations, and some samples for theanalysis of sulfate concentrations, were taken in triplicates.
Sulfide was measured spectrophotometrically according to Cline(1969). Total ZVS was analyzed by chloroform extraction followedby HPLC-UV analysis according to Kamyshny et al. (2009). Duringthe second sampling some samples were filtered through 1.2 μmpore size Minisart filters before preservation for total ZVS analysis. In-organic polysulfides were assayed by fast single-phase derivatizationwith methyl trifluoromethanesulfonate, followed by HPLC-UV analy-sis according to Kamyshny et al. (2006). Samples for thiosulfate andsulfite analysis (0.5 mL) were derivatized by monobromobimaneand analyzed by HPLC using a fluorescence detector according tothe method of Zopfi et al. (2004), with modification by using a250 mm Prevail C18 Alltech column and longer (95 min) gradientprogram for separation. An Agilent Technologies 1200 HPLC systemwith multiple wavelength UV–vis and fluorescence detectors wasused for these chromatographic analyses. Sulfate concentrationswere measured by ion-chromatography. A 761 Compakt MetrohmIon Chromatograph with Metrosep A Supp 5 Metrohm column and3.2 mmol L−1 Na2CO3/1 mmol L−1 NaHCO3 mobile phase with flowrate 0.7 mL min−1 was used for sulfate concentration measurements.
2.4. Sample preservation and analysis: Quadruple sulfur isotopecomposition
Ten liter samples were collected from each depth for sulfur isotopeanalyses of sulfate, acid volatile sulfide (AVS) and total ZVS, and pre-served in a similar manner. Samples were pumped straight into zincacetate solution (250 mL of 200 g L−1 zinc acetate per sample). Inthe laboratory, the samples were homogenized by vigorous shaking,and 5 to 9.5 L of sample was extracted thrice by 30 mL chloroformper liter of sample. The rest of the sample (0.5 to 5 L, depending onthe hydrogen sulfide concentration) was filtered through Whatmanglass fiber filters with 0.2 μm pore size and 47 mm diameter. Filterswere immediately frozen. Filtrate (10–20 mL) was treated by 2 mLof 1 mol L−1 BaCl2 solution to precipitate sulfate. BaSO4 was collectedon 0.2 μm filter and immediately frozen.
Zinc sulfide was converted to silver sulfide by boiling for 3 h with5 mol L−1 HCl under slow flow of nitrogen. Evolving hydrogen sulfidewas trapped in silver nitrate–nitric acid solution containing 2 mL of0.3 mol L−1 AgNO3, 2 mL of 1.55 mol L−1 HNO3 and 15 mL Milli Qwater.
Barium sulfate was reduced to hydrogen sulfide by boiling for 3 hwith 25 mL of solution prepared from 500 mL 47% HI, 820 mL12 mol L−1 HCl and 242 mL 50% H3PO2 under slow flow of nitrogenaccording to Forrest and Newman (1977). Hydrogen sulfide wastrapped in silver nitrate–nitric acid solution.
The chloroform extracts were dried with anhydrous calcium chlo-ride, filtered, and evaporated to dryness, first on a rotor evaporator(to 10–20 mL volume) and then in the round-bottom flask of a reduc-tion apparatus under gentle flow of nitrogen. The zero-valent sulfurwas reduced to H2S gas by boiling for 2 h in a solution of 10 mL12 mol L−1 HCl, 40 mL 99.98% ethanol, and 20 mL CrCl2 solution fil-tered through 0.20 μm filter (Gröger et al., 2009). This method allowsquantitative selective reduction of elemental sulfur in the presence oforgano-sulfur compounds.
Raney-nickel reduction was performed sequentially on the sampleafter reduction of chloroform extract for ZVS analysis. This techniquereduces organic sulfur to hydrogen sulfide. After ZVS reduction wasaccomplished, the excess of HCl and ethanol was evaporated by boil-ing for 2 h, and reactionmixture was cooled to room temperature. Re-duction methodology was adopted from Oduro et al. (2011).
Conversion of silver sulfide to sulfur hexafluoride and analysis forquadruple sulfur isotope composition was performed according toZerkle et al. (2010). Silver sulfide was quantitatively converted toSF6 by reaction with 10-fold excess of F2 gas at ~250 °C for ~8 h inNi bombs. SF6 was purified cryogenically by distillation in a liquidN2–ethanol slurry at −115 °C, and by gas chromatography on a 12′

147A. Kamyshny Jr. et al. / Marine Chemistry 127 (2011) 144–154
molecular sieve 5 Å/Hasep Q column with thermal conductivity de-tector. The isotopic abundance of the purified SF6 was analyzed on aFinnigan MAT 253 dual inlet mass spectrometer at m/e− values of127, 128, 129, and 131 (32SF5+, 33SF5+, 34SF5+, and 36SF5+). Analyticaluncertainties on sulfur isotope measurements, estimated from long-term reproducibility of Ag2S fluorinations, are 0.14, 0.008, and 0.20(1σ) for δ34S, Δ33S, and Δ36S, respectively. Typical standard devia-tions between analyses of δ34S, Δ33S and Δ36S were 0.02–0.05‰,0.01–0.02‰, and 0.1–0.2‰, respectively.
Isotopic measurements are reported on a VCDT scale, assumingthe composition of IAEA S-1 is δ34S=−0.30‰, Δ33S=0.094‰, andΔ36S=−0.70‰.
2.5. Reagents
All reagents were purchased from industrial suppliers and usedwithout further purification.
2.6. Isotope notation
We report 3XS isotopic composition of sulfur species in permil (‰)using standard delta (δ) notation:
δ3XS ¼�3XR sample
.3X R
VCDT
�− 1
� �ð10Þ
where 3XRsample is the isotopic ratio of a sample:
3XR¼3XS=32S for 3X ¼ 33;34; or 36ð Þ ð11Þ
and 3XRVCDT is the isotopic ratio of Vienna-Cañon Diabolo Troilite(VCDT).
We define the fractionation between two sulfur species, A and B,as δ34SA–δ34SB.
The minor isotope compositions of sulfur species are presentedusing the Δ3XS notation, which describes the deviation of a sampledatum in 33S or 36S (in ‰) from a reference fractionation line:
Δ33S ¼ δ33S−�34R sample
.34 R
VCDT
�0:515− 1� �
ð12Þ
and
Δ36S ¼ δ36S−�34R sample
.34 R
VCDT
�1:90− 1� �
ð13Þ
The exponents 0.515 and 1.90 are reference values assigned to ap-proximate mass-dependent fractionations during thermodynamicequilibrium isotope exchange at low temperature (Hulston andThode, 1965; Farquhar et al., 2003; Johnston et al., 2007). Small devi-ations from these reference values, which occur in biogeochemical
Table 1Parameters for the 1D sulfide models (models B and C shown in Fig. 7). Diffusion rates are gi
Process Depth (m) Rate 34α 33λ Result
A. Transport onlyDiffusion 9.5–13 0.0864 1.000 0.515 Model caUpwelling 9.5–13 0.01 1.000 0.515
B. Transport+phototrophic H2S oxidation+sulfate reduction in sedimentsDiffusion 9.5–13 0.0864 1.000 0.515 Model caUpwelling 9.5–13 0.01 1.000 0.515FotoSox 9.5–11.5 17 1.006 0.518SR 12.5–13 43 0.956 0.512
C. Transport+phototrophic H2S oxidation+sulfate reduction in sediments and water coDiffusion 9.5–13 0.0864 1.000 0.515 Model caUpwelling 9.5–13 0.01 1.000 0.515FotoSox 9.5–11.5 13 1.006 0.518SR 9.5–13 8 0.956 0.512
systems due to the redistribution of mass between sulfur pools, bymixing or Rayleigh processes, results in the variation of isotope ratiosof sulfur pools in a linear fashion. These deviations differ from thatcalculated for reference fractionation arrays, which follows an expo-nential trend. For a more detailed explanation of how these signa-tures are produced in natural systems see Farquhar et al. (2003,2007) and Johnston et al. (2007).
The exponent characterizing these deviations, λ, is defined theo-retically as:
3Xλ ¼ ln3Xαln34α
ð14Þ
for 33λ and 36λ, where α is defined as:
3XαA−B ¼ δ3XSA þ 1δ3XSB þ 1
: ð15Þ
This exponent can also be calculated from experimental data orenvironmental samples (e.g., between sulfide and sulfate pairs)using the equation:
3XλA−B ¼ln δ3XSA þ 1� �
− ln δ3XSB þ 1� �
ln δ34SA þ 1� �
− ln δ34SB þ 1� � : ð16Þ
2.7. Model
We constructed a one-dimensional depth-derived model of sulfidein the deep waters of Rogoznica Lake, modified from Zerkle et al.(2010). The model includes diffusion, advection, phototrophic sulfideoxidation (FotoSox) and sulfate reduction (SR) (Table 1), and considerssulfide concentrations as well as the δ34S and Δ33S of sulfide. Sulfideconcentrations were calculated by the following equation:
∂C∂t þ D
∂2C∂z2
−U∂C∂z þ qSR−qFotoSox ¼ 0 ð17Þ
where C is the concentration, D is the vertical diffusivity, U is the up-welling velocity, and q terms are the various metabolic rates. We alsocalculated sulfide δ34S and δ33S using the equation:
∂δ3XS∂t ¼ ∑n
i¼1Fi⋅δ3XSi−δ3XS
∂C∂t
� C ð18Þ
where Fi refers to the different sulfur mass fluxes (e.g., via diffusion, up-welling, phototrophic sulfide oxidation and sulfate reduction; Table 1).We solved the system of equations using a FTCS (forward in time cen-tered in space) finite difference approximation, with a time step of 12 hand a spatial step of 0.5 m. The bottom boundary condition for sulfide
ven in m2 day−1, upwelling rates in m day−1, and metabolic rates in mmol m−3 day−1.
n fit concentration but not isotope profiles.
n fit both concentration and isotope profiles with reasonable sulfate reduction rates.
lumnn fit both concentration and isotope profiles with reasonable sulfate reduction rates.
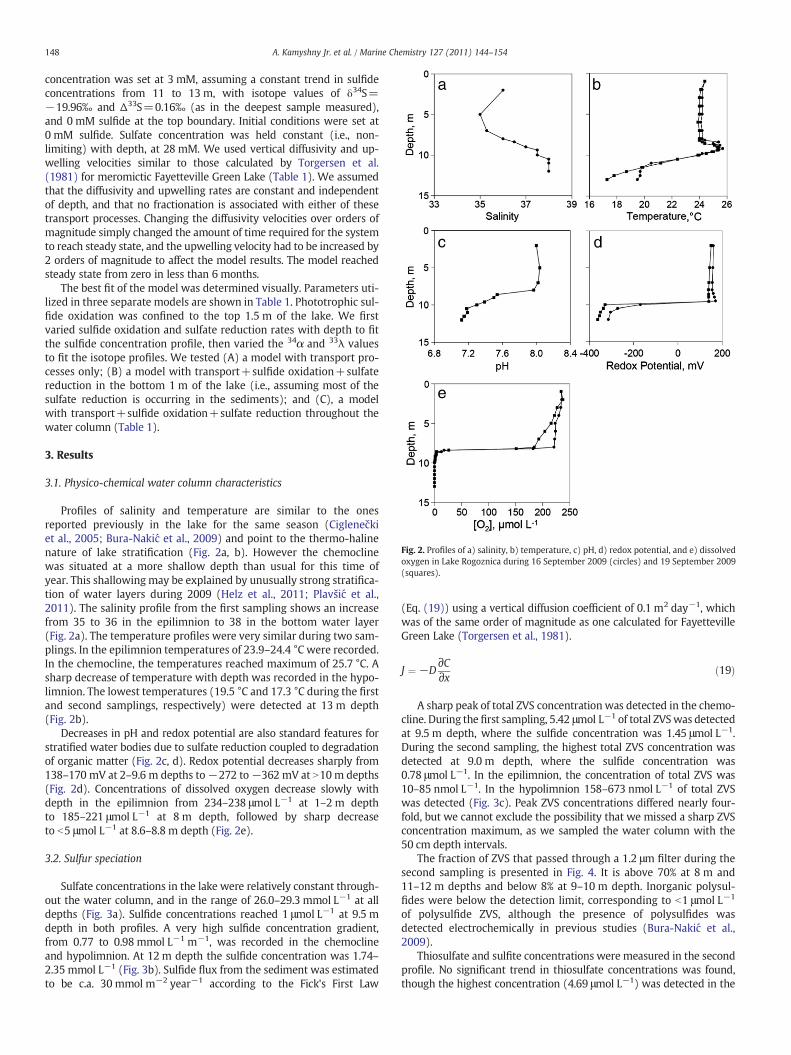
Fig. 2. Profiles of a) salinity, b) temperature, c) pH, d) redox potential, and e) dissolvedoxygen in Lake Rogoznica during 16 September 2009 (circles) and 19 September 2009(squares).
148 A. Kamyshny Jr. et al. / Marine Chemistry 127 (2011) 144–154
concentration was set at 3 mM, assuming a constant trend in sulfideconcentrations from 11 to 13 m, with isotope values of δ34S=−19.96‰ and Δ33S=0.16‰ (as in the deepest sample measured),and 0 mM sulfide at the top boundary. Initial conditions were set at0 mM sulfide. Sulfate concentration was held constant (i.e., non-limiting) with depth, at 28 mM. We used vertical diffusivity and up-welling velocities similar to those calculated by Torgersen et al.(1981) for meromictic Fayetteville Green Lake (Table 1). We assumedthat the diffusivity and upwelling rates are constant and independentof depth, and that no fractionation is associated with either of thesetransport processes. Changing the diffusivity velocities over orders ofmagnitude simply changed the amount of time required for the systemto reach steady state, and the upwelling velocity had to be increased by2 orders of magnitude to affect the model results. The model reachedsteady state from zero in less than 6 months.
The best fit of the model was determined visually. Parameters uti-lized in three separate models are shown in Table 1. Phototrophic sul-fide oxidation was confined to the top 1.5 m of the lake. We firstvaried sulfide oxidation and sulfate reduction rates with depth to fitthe sulfide concentration profile, then varied the 34α and 33λ valuesto fit the isotope profiles. We tested (A) a model with transport pro-cesses only; (B) a model with transport+sulfide oxidation+sulfatereduction in the bottom 1 m of the lake (i.e., assuming most of thesulfate reduction is occurring in the sediments); and (C), a modelwith transport+sulfide oxidation+sulfate reduction throughout thewater column (Table 1).
3. Results
3.1. Physico-chemical water column characteristics
Profiles of salinity and temperature are similar to the onesreported previously in the lake for the same season (Ciglenečkiet al., 2005; Bura-Nakić et al., 2009) and point to the thermo-halinenature of lake stratification (Fig. 2a, b). However the chemoclinewas situated at a more shallow depth than usual for this time ofyear. This shallowing may be explained by unusually strong stratifica-tion of water layers during 2009 (Helz et al., 2011; Plavšić et al.,2011). The salinity profile from the first sampling shows an increasefrom 35 to 36 in the epilimnion to 38 in the bottom water layer(Fig. 2a). The temperature profiles were very similar during two sam-plings. In the epilimnion temperatures of 23.9–24.4 °C were recorded.In the chemocline, the temperatures reached maximum of 25.7 °C. Asharp decrease of temperature with depth was recorded in the hypo-limnion. The lowest temperatures (19.5 °C and 17.3 °C during the firstand second samplings, respectively) were detected at 13 m depth(Fig. 2b).
Decreases in pH and redox potential are also standard features forstratified water bodies due to sulfate reduction coupled to degradationof organic matter (Fig. 2c, d). Redox potential decreases sharply from138–170 mV at 2–9.6 m depths to−272 to−362 mV at N10m depths(Fig. 2d). Concentrations of dissolved oxygen decrease slowly withdepth in the epilimnion from 234–238 μmol L−1 at 1–2 m depthto 185–221 μmol L−1 at 8 m depth, followed by sharp decreaseto b5 μmol L−1 at 8.6–8.8 m depth (Fig. 2e).
3.2. Sulfur speciation
Sulfate concentrations in the lake were relatively constant through-out the water column, and in the range of 26.0–29.3 mmol L−1 at alldepths (Fig. 3a). Sulfide concentrations reached 1 μmol L−1 at 9.5 mdepth in both profiles. A very high sulfide concentration gradient,from 0.77 to 0.98 mmol L−1 m−1, was recorded in the chemoclineand hypolimnion. At 12 m depth the sulfide concentration was 1.74–2.35 mmol L−1 (Fig. 3b). Sulfide flux from the sediment was estimatedto be c.a. 30 mmol m−2 year−1 according to the Fick's First Law
(Eq. (19)) using a vertical diffusion coefficient of 0.1 m2 day−1, whichwas of the same order of magnitude as one calculated for FayettevilleGreen Lake (Torgersen et al., 1981).
J ¼ −D∂C∂x ð19Þ
A sharp peak of total ZVS concentration was detected in the chemo-cline. During the first sampling, 5.42 μmol L−1 of total ZVSwas detectedat 9.5 m depth, where the sulfide concentration was 1.45 μmol L−1.During the second sampling, the highest total ZVS concentration wasdetected at 9.0 m depth, where the sulfide concentration was0.78 μmol L−1. In the epilimnion, the concentration of total ZVS was10–85 nmol L−1. In the hypolimnion 158–673 nmol L−1 of total ZVSwas detected (Fig. 3c). Peak ZVS concentrations differed nearly four-fold, but we cannot exclude the possibility that we missed a sharp ZVSconcentration maximum, as we sampled the water column with the50 cm depth intervals.
The fraction of ZVS that passed through a 1.2 μm filter during thesecond sampling is presented in Fig. 4. It is above 70% at 8 m and11–12 m depths and below 8% at 9–10 m depth. Inorganic polysul-fides were below the detection limit, corresponding to b1 μmol L−1
of polysulfide ZVS, although the presence of polysulfides wasdetected electrochemically in previous studies (Bura-Nakić et al.,2009).
Thiosulfate and sulfite concentrations were measured in the secondprofile. No significant trend in thiosulfate concentrations was found,though the highest concentration (4.69 μmol L−1) was detected in the

Fig. 3. Concentrations of a) sulfate, b) total S(II), c) total ZVS, d) thiosulfate, e) sulfite, andf) thiocyanate in Lake Rogoznica during 16 September 2009 (circles) and 19 September2009 (squares).
Fig. 5. Isotope composition of sulfur species in Lake Rogoznica: a) δ34S, b) Δ33S, andc) Δ36S. Closed circles — AVS (16 September 2009), closed squares — AVS (19 September2009), opened circles— ZVS (16 September 2009), opened squares— ZVS (19 September2009), closed diamonds — sulfate (16 September 2009), closed triangles — sulfate (19September 2009).
149A. Kamyshny Jr. et al. / Marine Chemistry 127 (2011) 144–154
chemocline at 9 m depth (Fig. 3d). Sulfite concentrations in the range of0.06–1.13 μmol L−1 were detected with the highest concentration at9.5 m, 0.5 m below the onset of sulfide (Fig. 3e).
Thiocyanate was detected only in the sulfidic waters with [S(II)]N7 μmol L−1. Thiocyanate concentrations linearly increased withdepth, and reached 255–288 nmol L−1 at 12 m depth (Fig. 3f). Thio-cyanate concentrations differed nearly twice at 10 m between twosamplings, but the difference between these values is less than thesum of standard deviations calculated from triplicate analyses.
3.3. Quadruple sulfur isotope composition
Sulfate δ34S values were 20.4–21.5‰ in the epilimnion and che-mocline (≤9.5 m depth) with one outliner (19.6‰). In the hypolim-nion, sulfate became heavier with depth, reaching δ34S values of24.7–25.5‰ at 12 m (Fig. 5a, Table 2). AVS δ34S values increase withdepth from −23.1 to −22.5‰ at 9.5 m to −20.5 to −19.4‰ at12 m depth. ZVS was 2.8 to 4.8‰ more enriched in 34S than sulfide.
Fig. 4. Fraction of ZVS which passes 1.2 μm pore-size filter (closed circles and solid line)and calculated maximum fraction of soluble ZVS (opened circles and dashed line) (seedetails in text).
During the first sampling, ZVS above the sulfidic zone was more34S-enriched (6.8–13.4‰) than AVS in the chemocline.
The only sample which contained enough organic sulfur for isotopeanalysis after Raney-nickel reduction was collected, was a combinedsample from 8.5 to 10 m depths from the second profile. The samplesize was too small for precise determination of minor sulfur isotopevalues (117 μg Ag2S). The δ34S value for this sample was −3.45±0.13‰.
Sulfate, AVS and ZVS showed no clear Δ33S trends with depth. Sul-fate had the lowest Δ33S values, from −0.026 to 0.056‰. ZVS Δ33Svalues were higher, from 0.094 to 0.127‰. The highest Δ33S valueswere those of AVS, from 0.141 to 0.178‰ (Fig. 5b, Table 2). Δ36Svalues were more scattered, showing similar trends to Δ33S values.Sulfate had the highest range (−0.69 to 0.07‰), followed by ZVS(−0.65 to −1.64‰), and AVS had the lowest range of Δ36S values(−1.11 to −2.03‰) (Fig. 5c, Table 2).
Variability of the isotope compositions between the samplingtimes was minimal. Average values for δ34S for sulfate–AVS fraction-ation were 44.54‰ during the first and 44.31‰ during the secondsampling. The difference of 0.23‰ is larger than the standard devia-tion of analysis, but smaller than the fractionation variability withdepth at the same sampling (c.a. 0.5‰). Average values for Δ33S forsulfate–AVS fractionation were 0.131‰ during first and 0.113‰ dur-ing second sampling. The difference of 0.018‰ lies in the range ofstandard deviation for Δ33S determination (0.01–0.02‰). Differences
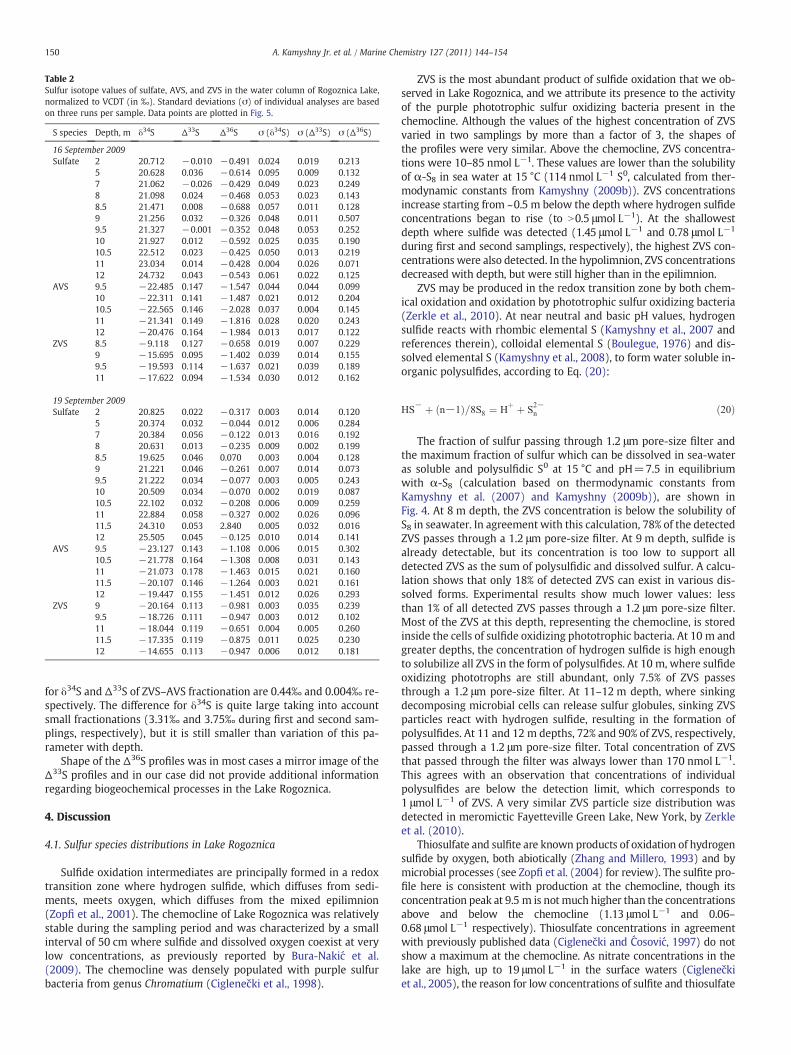
Table 2Sulfur isotope values of sulfate, AVS, and ZVS in the water column of Rogoznica Lake,normalized to VCDT (in ‰). Standard deviations (σ) of individual analyses are basedon three runs per sample. Data points are plotted in Fig. 5.
S species Depth, m δ34S Δ33S Δ36S σ (δ34S) σ (Δ33S) σ (Δ36S)
16 September 2009Sulfate 2 20.712 −0.010 −0.491 0.024 0.019 0.213
5 20.628 0.036 −0.614 0.095 0.009 0.1327 21.062 −0.026 −0.429 0.049 0.023 0.2498 21.098 0.024 −0.468 0.053 0.023 0.1438.5 21.471 0.008 −0.688 0.057 0.011 0.1289 21.256 0.032 −0.326 0.048 0.011 0.5079.5 21.327 −0.001 −0.352 0.048 0.053 0.25210 21.927 0.012 −0.592 0.025 0.035 0.19010.5 22.512 0.023 −0.425 0.050 0.013 0.21911 23.034 0.014 −0.428 0.004 0.026 0.07112 24.732 0.043 −0.543 0.061 0.022 0.125
AVS 9.5 −22.485 0.147 −1.547 0.044 0.044 0.09910 −22.311 0.141 −1.487 0.021 0.012 0.20410.5 −22.565 0.146 −2.028 0.037 0.004 0.14511 −21.341 0.149 −1.816 0.028 0.020 0.24312 −20.476 0.164 −1.984 0.013 0.017 0.122
ZVS 8.5 −9.118 0.127 −0.658 0.019 0.007 0.2299 −15.695 0.095 −1.402 0.039 0.014 0.1559.5 −19.593 0.114 −1.637 0.021 0.039 0.18911 −17.622 0.094 −1.534 0.030 0.012 0.162
19 September 2009Sulfate 2 20.825 0.022 −0.317 0.003 0.014 0.120
5 20.374 0.032 −0.044 0.012 0.006 0.2847 20.384 0.056 −0.122 0.013 0.016 0.1928 20.631 0.013 −0.235 0.009 0.002 0.1998.5 19.625 0.046 0.070 0.003 0.004 0.1289 21.221 0.046 −0.261 0.007 0.014 0.0739.5 21.222 0.034 −0.077 0.003 0.005 0.24310 20.509 0.034 −0.070 0.002 0.019 0.08710.5 22.102 0.032 −0.208 0.006 0.009 0.25911 22.884 0.058 −0.327 0.002 0.026 0.09611.5 24.310 0.053 2.840 0.005 0.032 0.01612 25.505 0.045 −0.125 0.010 0.014 0.141
AVS 9.5 −23.127 0.143 −1.108 0.006 0.015 0.30210.5 −21.778 0.164 −1.308 0.008 0.031 0.14311 −21.073 0.178 −1.463 0.015 0.021 0.16011.5 −20.107 0.146 −1.264 0.003 0.021 0.16112 −19.447 0.155 −1.451 0.012 0.026 0.293
ZVS 9 −20.164 0.113 −0.981 0.003 0.035 0.2399.5 −18.726 0.111 −0.947 0.003 0.012 0.10211 −18.044 0.119 −0.651 0.004 0.005 0.26011.5 −17.335 0.119 −0.875 0.011 0.025 0.23012 −14.655 0.113 −0.947 0.006 0.012 0.181
150 A. Kamyshny Jr. et al. / Marine Chemistry 127 (2011) 144–154
for δ34S and Δ33S of ZVS–AVS fractionation are 0.44‰ and 0.004‰ re-spectively. The difference for δ34S is quite large taking into accountsmall fractionations (3.31‰ and 3.75‰ during first and second sam-plings, respectively), but it is still smaller than variation of this pa-rameter with depth.
Shape of the Δ36S profiles was in most cases a mirror image of theΔ33S profiles and in our case did not provide additional informationregarding biogeochemical processes in the Lake Rogoznica.
4. Discussion
4.1. Sulfur species distributions in Lake Rogoznica
Sulfide oxidation intermediates are principally formed in a redoxtransition zone where hydrogen sulfide, which diffuses from sedi-ments, meets oxygen, which diffuses from the mixed epilimnion(Zopfi et al., 2001). The chemocline of Lake Rogoznica was relativelystable during the sampling period and was characterized by a smallinterval of 50 cm where sulfide and dissolved oxygen coexist at verylow concentrations, as previously reported by Bura-Nakić et al.(2009). The chemocline was densely populated with purple sulfurbacteria from genus Chromatium (Ciglenečki et al., 1998).
ZVS is the most abundant product of sulfide oxidation that we ob-served in Lake Rogoznica, and we attribute its presence to the activityof the purple phototrophic sulfur oxidizing bacteria present in thechemocline. Although the values of the highest concentration of ZVSvaried in two samplings by more than a factor of 3, the shapes ofthe profiles were very similar. Above the chemocline, ZVS concentra-tions were 10–85 nmol L−1. These values are lower than the solubilityof α-S8 in sea water at 15 °C (114 nmol L−1 S0, calculated from ther-modynamic constants from Kamyshny (2009b)). ZVS concentrationsincrease starting from ~0.5 m below the depth where hydrogen sulfideconcentrations began to rise (to N0.5 μmol L−1). At the shallowestdepth where sulfide was detected (1.45 μmol L−1 and 0.78 μmol L−1
during first and second samplings, respectively), the highest ZVS con-centrations were also detected. In the hypolimnion, ZVS concentrationsdecreased with depth, but were still higher than in the epilimnion.
ZVS may be produced in the redox transition zone by both chem-ical oxidation and oxidation by phototrophic sulfur oxidizing bacteria(Zerkle et al., 2010). At near neutral and basic pH values, hydrogensulfide reacts with rhombic elemental S (Kamyshny et al., 2007 andreferences therein), colloidal elemental S (Boulegue, 1976) and dis-solved elemental S (Kamyshny et al., 2008), to form water soluble in-organic polysulfides, according to Eq. (20):
HS− þ ðn−1Þ=8S8 ¼ H
þ þ S2−n ð20Þ
The fraction of sulfur passing through 1.2 μm pore-size filter andthe maximum fraction of sulfur which can be dissolved in sea-wateras soluble and polysulfidic S0 at 15 °C and pH=7.5 in equilibriumwith α-S8 (calculation based on thermodynamic constants fromKamyshny et al. (2007) and Kamyshny (2009b)), are shown inFig. 4. At 8 m depth, the ZVS concentration is below the solubility ofS8 in seawater. In agreement with this calculation, 78% of the detectedZVS passes through a 1.2 μm pore-size filter. At 9 m depth, sulfide isalready detectable, but its concentration is too low to support alldetected ZVS as the sum of polysulfidic and dissolved sulfur. A calcu-lation shows that only 18% of detected ZVS can exist in various dis-solved forms. Experimental results show much lower values: lessthan 1% of all detected ZVS passes through a 1.2 μm pore-size filter.Most of the ZVS at this depth, representing the chemocline, is storedinside the cells of sulfide oxidizing phototrophic bacteria. At 10 m andgreater depths, the concentration of hydrogen sulfide is high enoughto solubilize all ZVS in the form of polysulfides. At 10 m, where sulfideoxidizing phototrophs are still abundant, only 7.5% of ZVS passesthrough a 1.2 μm pore-size filter. At 11–12 m depth, where sinkingdecomposing microbial cells can release sulfur globules, sinking ZVSparticles react with hydrogen sulfide, resulting in the formation ofpolysulfides. At 11 and 12 m depths, 72% and 90% of ZVS, respectively,passed through a 1.2 μm pore-size filter. Total concentration of ZVSthat passed through the filter was always lower than 170 nmol L−1.This agrees with an observation that concentrations of individualpolysulfides are below the detection limit, which corresponds to1 μmol L−1 of ZVS. A very similar ZVS particle size distribution wasdetected in meromictic Fayetteville Green Lake, New York, by Zerkleet al. (2010).
Thiosulfate and sulfite are known products of oxidation of hydrogensulfide by oxygen, both abiotically (Zhang and Millero, 1993) and bymicrobial processes (see Zopfi et al. (2004) for review). The sulfite pro-file here is consistent with production at the chemocline, though itsconcentration peak at 9.5 m is notmuch higher than the concentrationsabove and below the chemocline (1.13 μmol L−1 and 0.06–0.68 μmol L−1 respectively). Thiosulfate concentrations in agreementwith previously published data (Ciglenečki and Ćosović, 1997) do notshow a maximum at the chemocline. As nitrate concentrations in thelake are high, up to 19 μmol L−1 in the surface waters (Ciglenečkiet al., 2005), the reason for low concentrations of sulfite and thiosulfate

Fig. 6. Δ33S vs. δ34S of AVS–sulfate fractionation (closed symbols) and Δ33S vs. δ34S ofZVS–AVS fractionation (opened symbols). Circles — 16 September 2009 sampling,squares — 19 September 2009 sampling. Dotted area depicts values for sulfate reductioncalculated by Farquhar et al. (2007) for the Brunner and Bernasconi (2005) model. Lightgray area shows values for AVS–sulfate fractionation during sulfate reduction measuredin bacterial cultures (Johnston et al., 2005a, 2007; Zerkle et al., 2010) (but see recentwork by Sim et al. (2011), which expands the field for microbial sulfate reduction).Dark gray area represents values for ZVS–AVS fractionation during sulfide oxidationby phototrophic bacteria (Zerkle et al., 2009 and references therein). See text for de-tailed explanation.
151A. Kamyshny Jr. et al. / Marine Chemistry 127 (2011) 144–154
in the chemocline may be bacterial nitrate reduction coupled to sulfiteand thiosulfate oxidation (e.g., Kamyshny et al., 2011b).
Another sulfur compound, whose distribution in stratified aquaticsystems has thus far not been studied, is thiocyanate. The develop-ment of a sensitive and robust technique for thiocyanate analysis byRong et al. (2005) opened a way for detailed study of thiocyanate dis-tribution in natural aquatic systems. Previous reports showed thatconcentrations of thiocyanate up to 140 nmol L−1 were detected inmarine systems strongly affected by pollution, such as Nagoya Port(Rong et al., 2005). Only 13 nmol L−1 of SCN− was detected in non-polluted North Sea water (Kamyshny, 2009a).
We report here for the first time the presence of up to288 nmol L−1 of thiocyanate in a non-polluted natural highly eutro-phicated marine system. Like hydrogen sulfide, thiocyanate appearsto be produced in the sediment and diffuse towards the chemocline,where it is consumed by abiotic or biologically enhanced oxidation.(The thiocyanate flux from the sediment was estimated similarly tosulfide flux and was found to be c.a. 4 μmol m−2 year−1.) A very sim-ilar profile of thiocyanate characterized by SCN− concentrations up to274 nmol L−1 near the bottom and an absence of SCN− in the epilim-nion was detected in the meromictic Fayetteville Green Lake, NewYork, in July 2009 (A. Kamyshny, unpubl.) though flux from theGreen Lake sediment was lower (c.a. 0.2 μmol m−2 year−1).
The most realistic pathway for thiocyanate formation in LakeRogoznica sediments is the reaction of cyanide, which can be pro-duced by various biotic processes (Wong-Chong et al., 2006), withsulfide oxidation intermediates such as colloidal sulfur, polysulfides,thiosulfate and tetrathionate (6–9). Thiosulfate is available in LakeRogoznica deep waters (up to 4.7 μmol L−1). Polysulfides, which areespecially reactive toward cyanide, were not detected, although thepresence of polysulfides was documented during earlier research onRogoznica Lake by Bura-Nakić et al. (2009). Attempts to measure cy-anide concentration in sediments of Lake Rogoznica were not madeso far, but high concentrations of iodide (up to 2.27 μmol L−1) arefound near the bottom of the lake (Žic and Branica, 2006). Iodide isusually released during remineralization of organic matter (Ullmanand Aller, 1983; Ullman et al., 1988), by the same process that is pos-sibly responsible for cyanide release.
As thiocyanate is a relatively stable compound and its solutionscan be stored for weeks at room temperature (Kamyshny, 2009a),we suggest that thiocyanate consumption in the chemocline proceedsdue to bacterial processes. Biological oxidation of thiocyanate isknown to produce ammonia, carbonate and sulfate (Ghosh et al.,2006). We can also not rule out assimilatory uptake of thiocyanate.Thiocyanate may represent an important link between the carbon, ni-trogen and sulfur cycles in stratified euxinic lake systems. Furthermechanistic and quantitative studies of thiocyanate cycling in anoxicsediments are required for understanding the importance of thiscompound for sulfur, nitrogen and carbon cycles in anoxic sediments.
4.2. Sulfur isotope composition
In Lake Rogoznica at 2 m depth, the δ34S, Δ33S and Δ36S values ofsulfate are 20.71 to 20.83‰, 0.019 to 0.022‰ and −0.49 to −0.32‰,respectively. In the Adriatic Sea over the cliff from the lake, sulfateδ34S, Δ33S and Δ36S values were found to be 21.93, 0.009‰ and0.03‰, respectively (sampled at the Rogoznica Marina on October28, 2010). At 100 m depth in the Cariaco basin these values are21.36‰, 0.034‰ and −0.21‰, respectively (Li et al., 2010).
Fractionation between AVS and sulfate in Lake Rogoznica rangesfrom 43.8 to 45.2‰ (Fig. 6), within the range of fractionations mea-sured in the laboratory by pure cultures and natural populations ofsulfate reducers (e.g., Kaplan and Rittenberg, 1964; Canfield et al.,2010; Zerkle et al., 2010 and references therein).
Canfield and Thamdrup (1994) argued that sulfur disproportion-ation can lead to high fractionations between sulfate and sulfide in
stratified water bodies and sediments. Recent works, utilizing a mul-tiple sulfur isotope analysis approach, showed that presence of dis-proportionation is not necessary for fractionations as high as 54‰ inthe Cariaco Basin (Li et al., 2010) and up to 45‰ in Lago di Cadagno(Canfield et al., 2010). It is highly unlikely that bacterial sulfur dispro-portionation occurs in sulfidic waters of Lake Rogoznica as sulfideconcentration reaches 1 mmol L−1 1 m below the redox-transitionzone.
Large sulfur isotope fractionation between sulfate and AVS in thelake may be explained by complete oxidation of highly refractory or-ganic matter, which is known to be present in the Lake Rogoznicawater column (Ćosović et al., 2000), to CO2 (Brüchert, 2004 and refer-ences therein). Dissolved organic carbon (DOC) concentrations in thewater column of the lake are usually in the range of 1–3 mg L−1 (butvalues as high as 6 mg L−1 were documented) with higher concentra-tions at and below the chemocline (Ćosović et al., 2000; Penezić et al.,2010). Particulate organic carbon (POC) is 0.28–1.5 mg L−1 (Penezićet al., 2010).
In Lake Rogoznica, the AVS and ZVS multiple sulfur isotope com-position is consistent with phototrophic sulfide oxidation at the che-mocline (e.g., with sulfide becoming enriched in 34S with depthacross the chemocline). In the chemocline of Fayetteville GreenLake, a sulfide S isotope signal related to abiotic sulfide oxidationwas recorded instead (e.g., with sulfide becoming depleted in 34Swith depth across the chemocline). This difference can be explainedby the stronger overlap between hydrogen sulfide and dissolved oxy-gen concentrations in Fayetteville Green Lake (Zerkle et al., 2010).
The relative differences between the isotopic compositions of sul-fide and ZVS may be affected by variety of biogeochemical processes.Extracellular and intracellular sulfur is known to exchange isotopeswith inorganic polysulfides (Amrani et al., 2006; Zerkle et al., 2009).In equilibrium between sulfide, polysulfide and cyclooctasulfur, poly-sulfidic ZVS is enriched in 34S by up to 3.4 to 4‰. The exact enrichmentis dependent on the average polysulfide chain length (Amrani andAizenshtat, 2004; Amrani et al., 2006). These results agree with calcu-lations based on chemical equilibrium between sulfide and elementalsulfur, which predict enrichment in 34S of elemental sulfur relative toH2S by 3‰ at 25 °C (Tudge and Thode, 1950). Fry et al. (1988a), onthe other hand, reported that sulfide became 4 to 8‰ depleted in 34Sduring oxidation by oxygen at conditions which allow polysulfide for-mation (pH=8.2). One important difference is that significant amountsof other intermediate sulfur species (namely sulfite and thiosulfate)were also produced in the experiments reported by Fry et al. (1988a).Overall, isotope fractionation produced during sulfide–polysulfide–cyclooctasulfur equilibrium tend to be larger than some fractionationsthat have been measured in pure cultures of phototrophic bacterial sul-fide oxidation (1 to 4‰) (Kaplan and Rittenberg, 1964; Fry et al., 1988b;
152 A. Kamyshny Jr. et al. / Marine Chemistry 127 (2011) 144–154
Zerkle et al., 2009), although measurements of bacterially-associatedZVS in natural systems suggest that phototrophs can produce larger iso-tope effects, likely due to internal sulfide–polysulfide–cyclooctasulfurequilibration (Zerkle et al., 2009, 2010).
Negative Δ33S values for fractionation between elemental sulfurand sulfide (Fig. 6) contradict positive or slightly negative values forfractionation between ZVS and sulfide by the culture of phototrophicsulfide-oxidizing bacteria Chlorobium tepidum during oxidation ofsulfide to ZVS, although negative Δ33S values for ZVS were producedby these organisms during reoxidation of ZVS to sulfate (Zerkle et al.,2009). Since quadruple sulfur isotope fractionation was studied onlyfor one cultured organism and quadruple sulfur isotope fractionationfor sulfide–polysulfide–cyclooctasulfur equilibrium is unknown wecannot rule out phototrophic sulfide oxidation (likely with reoxida-tion of ZVS to sulfate) as the primary oxidation reaction in the chemo-cline. This sulfide oxidation pathway is further supported bymodeling of the sulfide concentrations and S isotopes (Fig. 7; Table 1).
We detected ZVS strongly enriched in 34S during the first samplingat 8.5 m and 9.0 m depths. Sulfide concentration at these depths wasbelow the detection limit (b0.5 μmol L−1). Since sulfide concentrationsof b1 μmol L−1 do not allow collection of sample large enough for iso-tope composition analysis, we have no data for AVS δ34S for compari-son. δ34S values for ZVS were −15.7‰ and −9.1‰ at 9.0 and 8.5 m,respectively, compared to δ34S=−22.5‰ for AVS at 9.5 m depth. Wehave two feasible explanations for the 34S-enriched values. First, wecannot rule out the possibility that ZVSmay have been produced by ox-idation of heavier sulfide at 8.5–9 m depth during recent chemoclinedepth fluctuations. A second, andwe believemore feasible, explanationis that due to the small sample size contamination by heavier organicsulfur during Cr(II) reduction is possible. Although many organic sulfurcompounds are thought not to release H2S during Cr(II) reduction(Canfield et al., 1987; Gröger et al., 2009) sulfur–sulfur and sulfur–oxygen bonds are known to be reactive toward Cr(II) (Kamyshny et al.,2009). Organic compounds cross-linked by –Sn– bridgeswill be assayedby Cr(II) reduction (Ferdelman, 1994). Reduction of certain fraction ofsedimentary organic sulfur by Cr(II) was reported by Canfield et al.(1998). Thus after Cr(II) reduction, we performed sequential Raney-nickel reduction of chloroform extracts, to check the presence and iso-topic composition of organic sulfur. A combined sample (8.5–10mdepth, second sampling) yielded enough silver sulfide for isotope com-position analysis. Although the sample was collected at the same depth,but three days later than the high δ34S ZVS sample, a high value of or-ganic sulfur δ34S (−3.45±0.13‰)was observed, supporting an organic
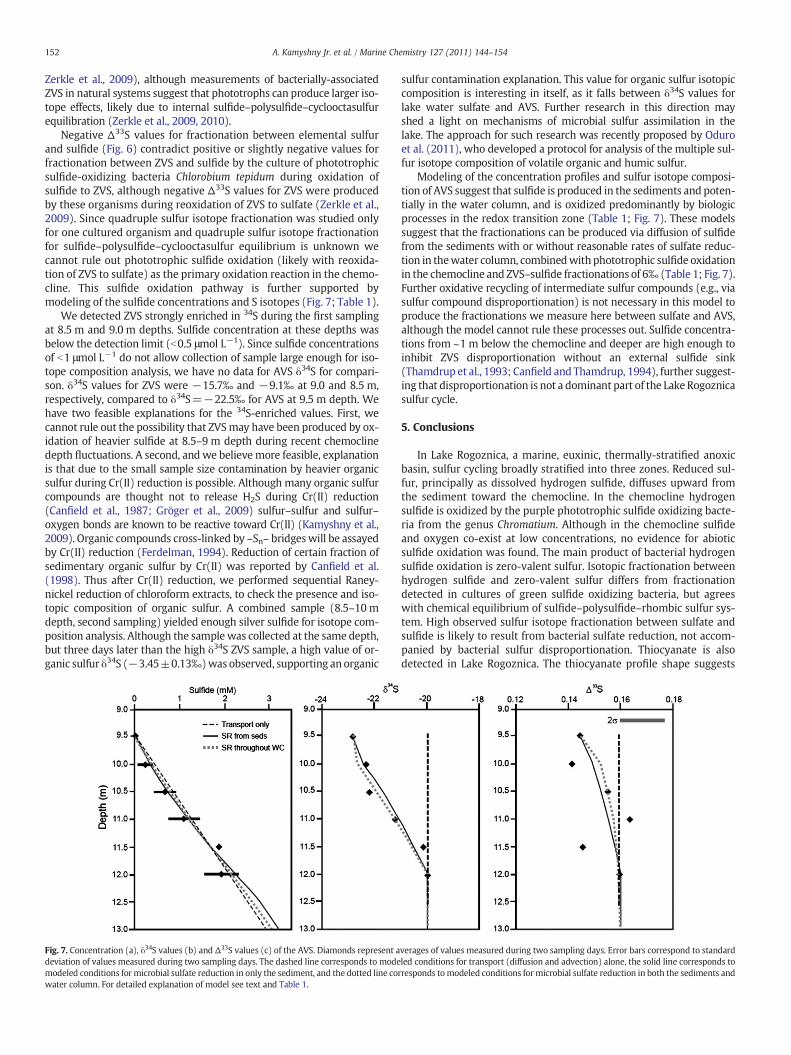
Fig. 7. Concentration (a), δ34S values (b) and Δ33S values (c) of the AVS. Diamonds represent adeviation of values measured during two sampling days. The dashed line corresponds to modemodeled conditions for microbial sulfate reduction in only the sediment, and the dotted line cowater column. For detailed explanation of model see text and Table 1.
sulfur contamination explanation. This value for organic sulfur isotopiccomposition is interesting in itself, as it falls between δ34S values forlake water sulfate and AVS. Further research in this direction mayshed a light on mechanisms of microbial sulfur assimilation in thelake. The approach for such research was recently proposed by Oduroet al. (2011), who developed a protocol for analysis of the multiple sul-fur isotope composition of volatile organic and humic sulfur.
Modeling of the concentration profiles and sulfur isotope composi-tion of AVS suggest that sulfide is produced in the sediments and poten-tially in the water column, and is oxidized predominantly by biologicprocesses in the redox transition zone (Table 1; Fig. 7). These modelssuggest that the fractionations can be produced via diffusion of sulfidefrom the sediments with or without reasonable rates of sulfate reduc-tion in thewater column, combinedwith phototrophic sulfide oxidationin the chemocline and ZVS–sulfide fractionations of 6‰ (Table 1; Fig. 7).Further oxidative recycling of intermediate sulfur compounds (e.g., viasulfur compound disproportionation) is not necessary in this model toproduce the fractionations we measure here between sulfate and AVS,although the model cannot rule these processes out. Sulfide concentra-tions from ~1 m below the chemocline and deeper are high enough toinhibit ZVS disproportionation without an external sulfide sink(Thamdrup et al., 1993; Canfield and Thamdrup, 1994), further suggest-ing that disproportionation is not a dominant part of the Lake Rogoznicasulfur cycle.
5. Conclusions
In Lake Rogoznica, a marine, euxinic, thermally-stratified anoxicbasin, sulfur cycling broadly stratified into three zones. Reduced sul-fur, principally as dissolved hydrogen sulfide, diffuses upward fromthe sediment toward the chemocline. In the chemocline hydrogensulfide is oxidized by the purple phototrophic sulfide oxidizing bacte-ria from the genus Chromatium. Although in the chemocline sulfideand oxygen co-exist at low concentrations, no evidence for abioticsulfide oxidation was found. The main product of bacterial hydrogensulfide oxidation is zero-valent sulfur. Isotopic fractionation betweenhydrogen sulfide and zero-valent sulfur differs from fractionationdetected in cultures of green sulfide oxidizing bacteria, but agreeswith chemical equilibrium of sulfide–polysulfide–rhombic sulfur sys-tem. High observed sulfur isotope fractionation between sulfate andsulfide is likely to result from bacterial sulfate reduction, not accom-panied by bacterial sulfur disproportionation. Thiocyanate is alsodetected in Lake Rogoznica. The thiocyanate profile shape suggests
verages of values measured during two sampling days. Error bars correspond to standardled conditions for transport (diffusion and advection) alone, the solid line corresponds torresponds tomodeled conditions formicrobial sulfate reduction in both the sediments and
153A. Kamyshny Jr. et al. / Marine Chemistry 127 (2011) 144–154
that it diffuses from the sediment and is consumed or oxidized at thechemocline. Reactions of sulfide oxidation intermediates with hydro-gen cyanide are a possible source of thiocyanate in the sediment.Thus, thiocyanate provides a link between the sulfur, carbon and ni-trogen cycles both in reducing sediments and at the oxidativechemocline.
Acknowledgments
This work was supported by the Max Planck Society (T.G.F. andA.K.), Marie Curie Outgoing International Fellowship SULFUTOPESnumber POIF-GA-2008-219586 (to A.K.); NASA-EXB grant numberNNX07AV54G and NERC Research Grant NE/H016805/1 (to A.Z.);Croatian-Germany (DAAD) bilateral cooperation “Study of biogeo-chemical sulfur cycling in water column of Rogoznica Lake (Croatia)by combination of chromatographic and electrochemical techniques”(to T.G.F., I.C., A.K., E.B.-N.). Support from theNASAAstrobiology Instituteis acknowledged by J.F. We thank Harry Oduro and Kirsten Imhofffor technical support, Zdeslav Zovko for logistics and assistance dur-ing sampling, and Milan Čanković for assistance during sampling. Weappreciate very much the constructive comments from Bill Gilhooly,an anonymous reviewer and the handling editor, George W. Luther.
References
Amrani, A., Aizenshtat, Z., 2004. Mechanisms of sulfur introduction chemically con-trolled: δ34S imprint. Org. Geochem. 35, 1319–1336.
Amrani, A., Kamyshny Jr., A., Lev, O., Aizenshtat, Z., 2006. Sulfur stable isotope distribu-tion of polysulfide anions in (NH4)2Sn aqueous solution. Inorg. Chem. 45,1427–1429.
Bak, F., Cypionka, H., 1987. A novel type of energy metabolism involving fermentationof inorganic sulphur compounds. Nature 326, 891–892.
Bolliger, C., Schroth, M.H., Bernasconi, S.M., Kleikemper, J., Zeyer, J., 2001. Sulfur isotopefractionation during microbial sulfate reduction by toluene-degrading bacteria.Geochim. Cosmochim. Acta 65, 3289–3298.
Boulegue, J., 1976. Equilibres dans le systeme H2S–S8 colloïde-H2O. CR Acad. Sci. 283D,591–594.
Brüchert, V., 2004. Physiological and ecological aspects of sulfur isotope fractionationduring bacterial sulfate reduction. In: Amend, J.P., Edwards, K., Lyons, T.W. (Eds.),Sulfur Biogeochemistry — Past and Present: Geological Society of America SpecialPaper, 379, pp. 1–16.
Brüchert, V., Knoblauch, C., Jørgensen, B.B., 2001. Microbial controls on the stable sulfurisotope fractionation during bacterial sulfate reduction in Arctic sediments.Geochim. Cosmochim. Acta 65, 753–766.
Brunner, B., Bernasconi, S.M., 2005. A revised isotope fractionation model for dissimila-tory sulfate reduction in sulfate reducing bacteria. Geochim. Cosmochim. Acta 69,4759–4771.
Bura-Nakić, E., Helz, G.R., Ciglenečki, I., Ćosović, B., 2009. Reduced sulfur species in astratified seawater lake (Rogoznica Lake, Croatia); seasonal variations and argumentfor organic carriers of reactive sulfur. Geochim. Cosmochim. Acta 73, 3738–3751.
Canfield, D.E., 2001. Isotope fractionation by natural populations of sulfate-reducingbacteria. Geochim. Cosmochim. Acta 65, 1117–1124.
Canfield, D.E., Teske, A., 1996. Late Proterozoic rise in atmospheric oxygen concentra-tion inferred from phylogenetic and sulphur-isotope studies. Nature 382, 127–132.
Canfield, D.E., Thamdrup, B., 1994. The production of 34S-depleted sulfide during bacte-rial disproportionation of elemental sulfur. Science 266, 1973–1975.
Canfield, D.E., Raiswell, R., Westrich, J.T., Reaves, C.M., Berner, R.A., 1987. The use ofcrhromium reduction in the analysis of reduced sulfur in sediments and shales.Chem. Geol. 54, 149–155.
Canfield, D.E., Boudreau, B.P., Mucci, A., Gundersen, J.K., 1998. The early diagenetic for-mation of organic sulfur in the sediments of Mangrove Lake, Bermuda. Geochim.Cosmochim. Acta 62, 767–781.
Canfield, D.E., Thamdrup, B., Kristensen, E., 2005. Aquatic Geomicrobiology. Elsevier.Canfield, D.E., Farquhar, J., Zerkle, A.L., 2010. High isotope fractionation during sulfate
reduction in a low-sulfate euxinic ocean analog. Geology 38, 415–418.Chambers, L.A., Trudinger, P.A., Smith, J.W., Burns, M.S., 1975. Fractionation of sulfur
isotopes by continuous cultures of Desulfovibrio desulfuricans. Can. J. Microbiol.21, 1602–1607.
Ciglenečki, I., Ćosović, B., 1997. Electrochemical determination of thiosulfate in seawa-ter in the presence of elemental sulfur and sulfide. Electroanalytical 9, 1–7.
Ciglenečki, I., Kodba, Z., Viličić, D., Ćosović, B., 1998. Seasonal variation of anoxic condi-tions in the Rogoznica Lake. Croat. Chem. Acta 71, 217–232.
Ciglenečki, I., Carić, M., Kršinić, F., Viličić, D., Ćosović, B., 2005. The extinction by sulfide-turnover and recovery of a naturally eutrophic, meromictic seawater lake. J. MarineSyst. 56, 29–44.
Ciglenečki, I., Pichler, S., Prohić, E., Ćosović, B., 2006. Distribution of redox-sensitiveelements in bottom waters, porewaters and sediments of Rogoznica Lake (Croatia)in both oxic and anoxic conditions. Water Air Soil Pollut. Focus 6, 537–545.
Cline, J.D., 1969. Spectrophotometric determination of hydrogen sulfide in natural wa-ters. Limnol. Oceanogr. 14, 454–458.
Ćosović, B., Ciglenečki, I., Viličić, D., Ahel, M., 2000. Distribution and seasonal variabilityof organic matter in a small eutrophicated salt lake. Estuar. Coast. Shelf Sci. 51,705–715.
Cypionka, H., Smock, A., Böttcher, M.E., 1998. A combined pathway of sulfur compounddisproportionation in Desulfovibrio desulfuricans. FEMS Microbiol. Lett. 166,181–186.
Dzombak, D.A., Ghosh, R.S., Young, T.C., 2006. Physical–chemical properties and reac-tivity of cyanide in water and soil. In: Dzombak, D.A., Ghosh, R.S., Wong-Chong,G.M. (Eds.), Cyanide in Water and Soil. CRC Press, pp. 57–92.
Farquhar, J., Johnston, D.T., Wing, B.A., Habicht, K.S., Canfield, D.E., Airieau, S., Thiemens,M.H., 2003. Multiple sulphur isotopic interpretations of biosynthetic pathways:implications for biological signatures in the sulphur isotope record. Geobiology 1,27–36.
Farquhar, J., Johnston, D.T., Wing, B.A., 2007. Implications of conservation of mass ef-fects on mass-dependent isotope fractionations: influence of network structureon sulfur isotope phase space of dissimilatory sulfate reduction. Geochim. Cosmo-chim. Acta 71, 5862–5875.
Ferdelman, T.G., 1994. Oceanographic and geochemical controls on sulfur diagenesis incoastal sediments. Ph.D. Thesis, Univ. Delaware.
Forrest, J., Newman, L., 1977. Ag-110 microgram sulfate analysis for short time resolu-tion of ambient levels of sulfur aerosol. Anal. Chem. 49, 1579–1584.
Fry, B., Ruf, W., Gest, H., Hayes, J.M., 1988a. Sulfur isotope effects associated with oxida-tion of sulfide by O2 in aqueous solution. Chem. Geol. 73, 205–210.
Fry, B., Gest, H., Hayes, J.M., 1988b. 34S/32S Fractionation in sulfur cycles catalyzed byanaerobic bacteria. Appl. Environ. Microbiol. 54, 250–256.
Fry, B., Jannasch, H.W., Molyneaux, S.J., Wirsen, C.O., Muramoto, J.A., King, S., 1991. Stableisotope studies of the carbon, nitrogen and sulfur cycles in the Black-Sea and theCariaco Trench. Deep-Sea Res. A 38, S1003–S1019.
Ghosh, R.S., Ebbs, S.D., Bushey, J.T., Neuhauser, E.F., Wong-Chong, G.M., 2006. Analysis ofcyanide in water. In: Dzombak, D.A., Ghosh, R.S., Wong-Chong, G.M. (Eds.), Cyanidein Water and Soil. CRC Press, pp. 225–236.
Gröger, J., Franke, J., Hamer, K., Schulz, H.D., 2009. Quantitative recovery of elemental sul-fur and improved selectivity in a chromium-reducible sulfur distillation. Geostand.Geoanal. Res. 33, 17–27.
Kamyshny Jr., A., Zilberbrand, M., Ekeltchik, I., Voitsekovski, T., Gun, J., Lev, O., 2008.Speciation of polysulfides and zero-valent sulfur in sulfide-rich water wells insouthern and central Israel. Aquat. Geochem. 14, 171–192.
Habicht, K.S., Canfield, D.E., Rethmeier, J., 1998. Sulfur isotope fractionation during bac-terial reduction and disproportionation of thiosulfate and sulfite. Geochim. Cosmo-chim. Acta 62, 2585–2595.
Harrison, A.G., Thode, H.G., 1958. Mechanism of the bacterial reduction of sulphatefrom isotope fractionation studies. Trans. Faraday Soc. 54, 84–92.
Helz, G.R., Bura-Nakić, E., Mikac, N., Ciglenečki, I., 2011. New model for molybdenumbehavior in euxinic basins. Chem. Geol. 284, 323–333.
Hulston, J.R., Thode, H.G., 1965. Cosmic ray produced 36S and 33S in metallic phase ofiron meteorites. J. Geophys. Res. 70, 4435–4442.
Johnston, D.T., Wing, B.A., Farquhar, J., Kaufman, A.J., Strauss, H., Lyons, T.W., Kah, L.C.,Canfield, D.E., 2005a. Active microbial sulfur disproportionation in the Mesoproter-ozoic. Science 310, 1477–1479.
Johnston, D.T., Farquhar, J., Wing, B.A., Kaufman, A., Canfield, D.E., Habicht, K.S., 2005b.Multiple sulfur isotope fractionations in biological systems: a case study with sul-fate reducers and sulfur disproportionators. Am. J. Sci. 305, 645–660.
Johnston, D.T., Farquhar, J., Canfield, D.E., 2007. Sulfur isotope insights into microbialsulfate reduction: when microbes meet models. Geochim. Cosmochim. Acta 71,3929–3947.
Jørgensen, B.B., 1990. A thiosulfate shunt in the sulfur cycle of marine sediments. Science249, 152–154.
Kamyshny Jr., A., 2009a. Improved cyanolysis protocol for detection of zero-valent sul-fur in natural aquatic systems. Limnol. Oceanogr. Methods 7, 442–448.
Kamyshny Jr., A., 2009b. Solubility of cyclooctasulfur in pure water and sea water at dif-ferent temperatures. Geochim. Cosmochim. Acta 73, 6022–6028.
Kamyshny Jr., A., Ekeltchik, I., Gun, J., Lev, O., 2006. Method for the determination of in-organic polysulfide distribution in aquatic systems. Anal. Chem. 78, 2631–2639.
Kamyshny Jr., A., Gun, J., Rizkov, D., Voitsekovski, T., Lev, O., 2007. Equilibrium distribu-tion of polysulfide ions in aqueous solutions at different temperatures by rapid sin-gle phase derivatization. Environ. Sci. Technol. 41, 6633–6644.
Kamyshny Jr., A., Borkenstein, C.G., Ferdelman, T.G., 2009. Protocol for quantitative de-tection of elemental sulfur and polysulfide zero-valent sulfur distribution in natu-ral aquatic samples. Geostand. Geoanal. Res. 33, 415–435.
Kamyshny Jr., A., Oduro, H., Farquhar, J., 2011a. Quantification of free and metal-complexed cyanide by tetrathionate derivatization. Int. J. Environ. Anal. Chem.doi:10.1080/03067319.2011.561339 (in print).
Kamyshny Jr., A., Yakushev, E.V., Jost, G., Podymov, O.I., 2011b. Role of sulfide oxidationintermediates in the redox balance of the oxic–anoxic interface of the Gotland Deep,Baltic Sea. In: Yakushev, E.V. (Ed.), Chemical Structure of Pelagic Redox Interfaces:Observation and Modeling, Handbook of Environmental Chemistry. Springer-Verlag,Berlin, Heidelberg. doi:10.1007/698_2010_83 (in print).
Kaplan, I.R., Rittenberg, S.C., 1964. Microbiological fractionation of sulphur isotopes.J. Gen. Microbiol. 34, 195–212.
Li, X., Gilhooly, W.P., Zerkle, A.L., Lyons, T.W., Farquhar, J., Werne, J.P., Varela, R., Scranton,M.I., 2010. Stable sulfur isotopes in water column of the Cariaco Basin. Geochim.Cosmochim. Acta 74, 6764–6778.
Luthy, R.G., Bruce Jr., S.G., 1979. Kinetics of reaction of cyanide and reduced sulfur spe-cies in aqueous solutions. Environ. Sci. Technol. 13, 1481–1487.
154 A. Kamyshny Jr. et al. / Marine Chemistry 127 (2011) 144–154
Neretin, L.N., Böttcher, M.E., Grinenko, V.A., 2003. Sulfur isotope geochemistry of theBlack Sea water column. Chem. Geol. 200, 59–69.
Oduro, H., Kamyshny Jr., A., Guo, W., Farquhar, J., 2011. Multiple sulfur isotope analysisof volatile organic sulfur compounds and their sulfonium precursors in coastal ma-rine environments. Mar. Chem. 124, 78–89.
Ono, S., Wing, B., Johnston, D., Farquhar, J., Rumble, D., 2006. Mass-dependent fraction-ation of quadruple stable sulfur isotope system as a new tracer of sulfur biogeo-chemical cycles. Geochim. Cosmochim. Acta 70, 2238–2252.
Overmann, J., Beatty, J.T., Hall, K.J., Pfennig, N., Northcote, T.G., 1991. Characterization ofa dense, purple sulfur bacterial layer in a meromictic salt lake. Limnol. Oceanogr.36, 846–859.
Penezić, A., Gašparović, B., Burić, Z., Frka, S., 2010. Distribution of marine lipid classes insalty Rogoznica Lake (Croatia). Estuar. Coast. Shelf Sci. 86, 625–636.
Philippot, P., Van Zuilen, M., Lepot, K., Thomazo, C., Farquhar, J., Van Kranendonk, M.J.,2007. Early Archaeanmicroorganisms preferred elemental sulfur, not sulfate. Science317, 1534–1537.
Plavšić, M., Ciglenečki, I., Strmečki, S., Bura-Nakić, E., 2011. Seasonal distribution of or-ganic matter and copper under stratified conditions in the karstic, marine, sulfiderich environment (Rogoznica Lake, Croatia). Estuar. Coast. Shelf Sci. 92, 277–285.
Rong, L., Lim, L.W., Takeuchi, T., 2005. Determination of iodide and thiocyanate in sea-water by liquid chromatography with poly(ethylene glycol) stationary phase.Chromatographia 61, 371–374.
Rudnicki, M.D., Elderfield, H., Spiro, B., 2001. Fractionation of sulfur isotopes duringbacterial sulfate reduction in deep ocean sediments at elevated temperatures. Geo-chim. Cosmochim. Acta 65, 777–789.
Shen, Y.N., Farquhar, J., Masterson, A., Kaufman, A.J., Buick, R., 2009. Evaluating the roleof microbial sulfate reduction in the early Archean using quadruple isotopic sys-tematic. Earth Planet. Sci. Lett. 279, 381–393.
Sim, M.S., Bosak, T., Ono, S., 2011. Large sulfur isotope fractionation does not requirefractionation. Science 333, 74–77.
Szekeres, L., 1974. Analytical chemistry of sulfur acids. Talanta 21, 1–44.Thamdrup, B., Finster, K., Hansen, J.W., Bak, F., 1993. Bacterial disproportionation of el-
emental sulfur coupled to chemical reduction of iron or manganese. Appl. Environ.Microb. 59, 101–108.
Torgersen, T., Hammond, D.E., Clarke, W.B., Peng, T.-H., 1981. Fayetteville Green Lake,New York: 3H–3He water mass ages and secondary chemocline structure. Limnol.Oceanogr. 26, 110–122.
Tudge, A.P., Thode, H.G., 1950. Thermodynamic properties of isotopic composition ofsulphur. Can. J. Res. B Chem. Sci. 28, 567–578.
Ullman, W.J., Aller, R.C., 1983. Rates of iodine remineralization in terrigenous near-shore sediments. Geochim. Cosmochim. Acta 47, 1423–1432.
Ullman, W.J., Luther III, G.W., Aller, R.C., Mackin, J.E., 1988. Dissolved iodine behavior inestuaries along the East Coast of the United States. Mar. Chem. 25, 95–106.
Wacey, D., McLoughlin, N., Whitehouse, M.J., Kilburn, M.R., 2010. Two coexisting sulfurmetabolisms in ca. 3400 Ma sandstone. Geology 38, 1115–1118.
Wong-Chong, G.M., Ghosh, R.S., Bushey, J.T., Ebbs, S.D., Neuhauser, E.F., 2006. Naturalsources of cyanide. In: Dzombak, D.A., Ghosh, R.S., Wong-Chong, G.M. (Eds.), Cyanidein Water and Soil. CRC Press, pp. 25–40.
Wortmann, U.G., Bernasconi, S.M., Böttcher, M.E., 2001. Hypersulfidic deep biosphereindicates extreme sulfur isotope fractionation during single-step microbial sulfatereduction. Geology 29, 647–650.
Zerkle, A.L., Farquhar, J., Johnston, D.T., Cox, R.P., Canfield, D.E., 2009. Fractionation ofmultiple sulfur isotopes during phototrophic oxidation of sulfide and elementalsulfur by a green sulfur bacterium. Geochim. Cosmochim. Acta 73, 291–306.
Zerkle, A.L., Kamyshny Jr., A., Kump, L.R., Farquhar, J., Oduro, H., Arthur, M.A., 2010. Sulfurcycling in a stratified euxinic lakewithmoderately high sulfate: constraints from qua-druple S isotopes. Geochim. Cosmochim. Acta 74, 4953–4970.
Zhang, J.-Z., Millero, F.J., 1993. The products from the oxidation of H2S in seawater.Geochim. Cosmochim. Acta 57, 1705–1718.
Žic, V., Branica, M., 2006. The distribution of iodate and iodide in Rogoznica Lake (EastAdriatic coast). Estuar. Coast Shelf S. 66, 55–66.
Zopfi, J., Ferdelman, T., Jørgensen, B.B., Teske, A., Thamdrup, B., 2001. Influence of watercolumn dynamics on sulfide oxidation and other major biogeochemical processesin the chemocline of Mariager Fjord (Denmark). Mar. Chem. 74, 29–51.
Zopfi, J., Ferdelman, T.G., Fossing, H., 2004. Distribution and fate of sulfur intermediates –sulfite, tetrathionate, thiosulfate, and elemental sulfur – in marine sediments. In:Amend, J.P., Edwards, K., Lyons, T.W. (Eds.), Sulfur Biogeochemistry—Past and Present:Geological Society of America Special Paper, 379, pp. 97–116.
Copyright © 2022 FDOKUMEN