The Aboriginal and Torres Strait Islander student in the classroom
Continental Shelf Research 18 (1998) 773—789
Biogeochemical fluxes through the Straitof Otranto (Eastern Mediterranean)
G. Civitarese!,*, M. Gac\ ic", A. Vetrano#, A. Boldrin$,D. Bregant!, S. Rabitti$, E. Souvermezoglou%
!CNR-Istituto Talassografico, di Trieste, Viale R. Gessi, 2 I-34123 Trieste, Italy"Osservatorio Geofisico Sperimentale, Trieste, Italy
#North Carolina State University, Raleigh, USA$CNR-Istituto di Biologia del Mare, Venezia, Italy
%National Center of Marine Research, Athens, Greece
Received 12 March 1997; received in revised form 14 October 1997; accepted 19 February 1998
Abstract
A series of seasonal cruises and Eulerian current measurements in the Otranto Strait werecarried out to study the biogeochemical characteristics of the strait and to estimate theexchange of water, dissolved and particulate matter between the Adriatic and the Ionian Sea.Analysis of data shows that on an annual scale, the Adriatic Sea exports dissolved nutrients(nitrate and phosphate) to the Ionian, and imports particulate organic carbon and nitrogen.Estimate of the mean annual water flux for the first time based on direct Eulerian currentmeasurements gives value of 0.9 Sv that is appreciably higher than those found in literature.Calculations of the ratio of new and total primary production based on an annual phosphatesubsurface export suggest that the trophic status of the Adriatic Sea on the whole is close to thatof an oligotrophic sea. From the biogeochemical distributions obtained, an active role for theAdriatic in supporting the well-known N :P ratio anomaly of the Mediterranean is hy-pothesized. Further studies are needed to estimate the contribution of the dissolved organicforms to the nutrient exchanges through the strait, and to establish the total budget of N andP in the Adriatic Sea. ( 1998 Elsevier Science Ltd. All rights reserved
1. Introduction
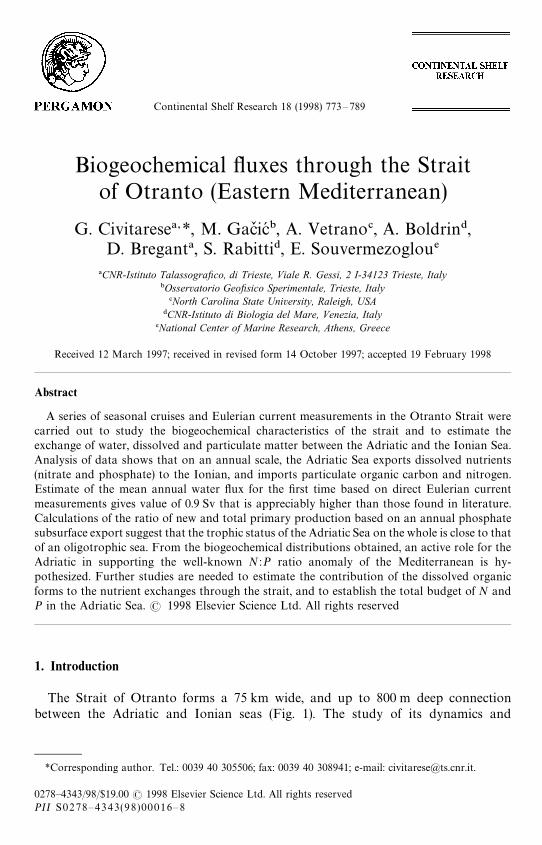
The Strait of Otranto forms a 75 km wide, and up to 800 m deep connectionbetween the Adriatic and Ionian seas (Fig. 1). The study of its dynamics and
*Corresponding author. Tel.: 0039 40 305506; fax: 0039 40 308941; e-mail: [email protected].
0278—4343/98/$19.00 ( 1998 Elsevier Science Ltd. All rights reservedPII S0278—4343(98)00016—8

Fig. 1. Study area and station locations. Currentmeter mooring positions are denoted by dots.
biogeochemistry is crucial for estimating budgets and long-term trends in the EasternMediterranean. The Adriatic Sea is considered important for the whole Mediterra-nean: it contains one of the most eutrophic regions (the Northern Adriatic) of theMediterranean; moreover, the Adriatic Sea is the site of convective processes generat-ing cold, dense and oxygenated deep waters, which feed, through the Strait of Otranto,the deep layers of the Eastern Mediterranean.
The strait is characterized by the presence of four main water masses (Gac\ ic et al.,1996): the Adriatic surface water (ASW), with a temperature minimum of about 11°Cin winter, flowing out of the Adriatic Sea along the western side of the strait; theIonian surface water (ISW), saltier (S'38.25 psu) and warmer (¹'15°C) than theASW, flowing into the Adriatic along the eastern side; the Levantine intermediatewater (LIW), which flows into the Adriatic at intermediate depths, and is defined bya core of S'38.75 psu centered in the eastern half of the section; finally, the Adriaticdeep water (ADW) at the bottom, defined by ph'29.2 kgm~3, which flows out of the
774 G. Civitarese et al./Continental Shelf Research 18 (1998) 773—789

Adriatic, feeding the deep layers of the Eastern Mediterranean Sea (Hopkins, 1978). Inthe stratified season the two surface water masses are not so easily distinguished bytheir thermohaline properties. The signal associated with the ADW is always evidenteither in temperature, salinity or density; in fact, it occurs as a bottom temperatureand salinity minimum corresponding to a density increase. In contrast, the signalassociated with LIW is only evident as a maximum in the salinity field.
In spite of its importance, the Strait of Otranto has received little attention in thepast, and knowledge of the water exchange patterns and biogeochemistry cannot beconsidered either exhaustive and definitive. This is due to the fact that prior to the lastdecade, the water circulation through the strait was mainly studied from dataobtained using surface drift bottles and hydrographic measurements, together withcalculations of geostrophic currents. Only recently, have direct current measurementexperiments been carried out, but their short duration (up to a month) does not allowany detailed study of long-term variability of the water exchange regime in the strait(Michelato and Kovacevic, 1991; Ferentinos and Kastanos, 1988). Moreover, thedistribution of biogeochemical properties in the strait and surrounding area isscarcely documented, and the net exchange of materials between the Adriatic andIonian is very poorly known. The only work available in literature giving estimates ofchemical fluxes through the strait is by Zore-Armanda and Pucher-Petkovic (1976).Assuming that resultant current velocities in the strait were the same as those in theCentral Adriatic where data were available, and using nutrient data (nitrate, phos-phate and silicate) from McGill (1965), the authors computed an annual budget for theAdriatic Sea.
In this paper, for the first time, an extensive description of the principal bio-geochemical distributions, together with average annual estimates of fluxes of water,dissolved and particulate matter across the Strait of Otranto, obtained from long-term measurements of current velocities and seasonal samplings of chemical para-meters, are given.
2. Materials and methods
The grid of stations occupied during six seasonal cruises (OTR1-February 94,OTR2-May 94, OTR3-August 94, OTR4-November 94, OTR5-February 95, OTR6-May 95) is presented in Fig. 1.
2.1. Dissolved oxygen and nutrients
Dissolved oxygen was determined by means of a Metrohm automatic burette usingfor the Winkler procedure (Carpenter, 1965). During some of the cruises the finalpoint was determined automatically by means of a redox electrode. During the OTR1and OTR3 cruises, all nutrient determinations were done on board using a hybridautoanalyzer equipped with a Chemlab flow colorimeter, following the proceduredescribed by Grasshoff et al. (1983) with some modifications. In the rest of the cruises,samples were collected in 100 ml polyethylene bottles, stored in a deep freezer at
G. Civitarese et al./Continental Shelf Research 18 (1998) 773—789 775

!20°C, and subsequently transported to the laboratory where they were analyzed.For the OTR4 and OTR5 campaigns, phosphate was measured with of a Perkin-Elmer Lambda 2S UV/VIS Spectrophotometer using the procedure described byMurphy and Riley (1962).
2.2. Total dissolved nitrogen and total dissolved phosphorus
During the OTR-6 cruise, total dissolved nitrogen (TDN) and phosphorus (TDP)were also measured. TDN and TDP determinations were done on filtered frozensamples by a photo-oxidation (UV) method using an irradiation unit (Thalassia mod.RFC 239) equipped with a high-energy 900 W, UV lamp (Heareus TQ 1200). Themethod is a slightly modified version of the procedure reported by Walsh (1989).
2.3. Particulate matter
Water samples (about 10 l) were collected for particulate organic carbon (POC) andparticulate nitrogen (PN) determinations.
For POC and PN determinations, prewashed and precombusted (at 500°C for 4 h)fiber glass Whatmann GF/F (25 mm diameter) filters were used. Samples wereimmediately stored at !20°C. Dry weight filters were subsequently measured by thegravimetric method (Strickland and Parson, 1972). POC and PN were determinedwith a Perkin-Elmer 2400 CHN elemental analyzer. The inorganic carbon wasremoved by vapor phase acidification (Hedges and Stern, 1984). The analyticaldetection limits are 0.08 and 0.07 lM for C and N, respectively. The precision(replicability of a homogeneous standard material) is within 5%.
2.4. Current field and flux computation
The experimental setup for long-term monitoring of the water flow across the Straitconsisted of six currentmeter moorings. They were deployed along Section 3, at39°50@ N in the southernmost portion of the strait, and maintained from February1994 to November 1995. The north current component across the section was takenas representative of the flow perpendicular to the section across the strait, thussuitable for water transport computation. Tidal and inertial oscillations were filteredout by applying a digital filter to the mean hourly currents. The resulting hourly northcurrent component field formed the basis for the water flux calculations.
The measured current field exhibited high variability at synoptic time scales, thatcan be partly associated to transient mesoscale eddies (Gac\ ic et al., 1996). The scale ofthese eddies formed in the shear zone between the inflow and outflow, is about 10 km(Ferentinos and Kastanos, 1988) and the spatial resolution of the current mooringnetwork was not high enough to resolve satisfactorily these features. It is probably forthis reason that the water transports calculated from the mean daily and seasonalcurrent field was not balanced. Namely, according to some recent estimates (Artegianiet al., 1997), the Adriatic Sea gains on the yearly basis freshwater of about 1 m whichshould then result in a net outflow of only 0.006 Sv. This value is so small that the
776 G. Civitarese et al./Continental Shelf Research 18 (1998) 773—789

water transport through the Strait of Otranto can be considered in a balance, i.e. thenet transport is zero in the first approximation. As mentioned earlier the net balancecomputed from the mean daily and seasonal currents was not zero, moreover, it isunrealistically large. On the other hand, the balanced water exchange is an essentialprerequisite for reliable estimates of the net exchange rate of dissolved and suspendedmatter through the strait. Thus, the balanced water flow was sought by extending theaveraging time interval as much as possible, i.e. to the entire available time series of
Fig. 2. Available Eulerian time-series for the Otranto transect (upper panel) and mooring array structure(lower panel). Vertical arrows on the time axis in the upper panel denote hydrographic surveys.
G. Civitarese et al./Continental Shelf Research 18 (1998) 773—789 777

currentmeter data. In that case the net exchange rate was appreciably reduced but stillnon-zero, which is due to interpolation errors, high temporal variability about thelong-term means and to the contamination by the mesoscale eddies.
During the deployment period (22 months), different instrumental problems andlosses were encountered. Thus, the data span variable time intervals ranging from53 days at station 308 at surface to 597 days at station 304 at intermediate level (seeFig. 2 for a closer insight into the length of the available currentmeter data series).Mean current values were calculated by averaging all available time series at eachmeasurement location. The averaged current field was then interpolated over a regu-lar grid, and the fluxes of water across the strait calculated.
The same interpolation procedure was applied to the annual averaged chemicalconcentrations, obtained by using the distributions from seasonal OTR3, OTR4, OTR5and OTR6 cruises along transect 3, the same transect where current meter mooringswere deployed. These four seasonal situations out of the six available were chosenbecause they were approximately centered on the Eulerian current measurement interval(February 1994—November 1995). Due to the low seasonal variability of the distributionpatterns over the major portion of the water column except for the surface layer, the useof annual averages does not introduce any significant error into the flux computations.
The resulting current and chemical concentration data interpolated to the sameregular grid were then multiplied to estimate the fluxes of the dissolved and suspendedmatter.
3. Results
Spatial distribution of the overall average north current components (Fig. 3) showsthat the western portion of the strait is characterized by a steady outflow (southward)which occupies the entire water column including the western continental shelf andslope areas. Station 306 displays a vertical shear with the inflowing current at thesurface and the outflow in the intermediate and bottom layers. In the eastern portionof the strait (stations 308 and 309) the inflow takes place over the greater part of thewater column. Thus, it can be concluded that the annual average water exchangepattern shows a two-layer structure only in the central part of the strait. In addition,the residual water flow through the strait is characterized by the cyclonic shear whichis present over the entire water column.
Standard deviations are larger than the corresponding mean current components,suggesting that the amplitude of the time-varying water flow throughout the majorportion of the strait is larger than the residual steady flow (Fig. 3). Only at the bottomof the central mooring (306) where the outflow of the ADW occurs, is the averagesouthward (outflowing) current component larger than its standard deviation.A stable current with a standard deviation smaller than the mean value, also occurs inthe surface layer of the eastern portion of the strait (stations 308 and 309) wherepersistent ISW inflow takes place.
The annual average vertical distributions of the biogeochemical parameters (Fig. 4)reveal a four-layer structure of the section through the strait. This is evident for
778 G. Civitarese et al./Continental Shelf Research 18 (1998) 773—789

Fig. 3. Vertical distribution of the average inflowing north component (a), and of the ratio of the averagecurrent and its standard deviation (b). Current speed is given in cm s~1.
dissolved oxygen and nutrients, while the presence of the various layers in the POCand PN vertical distributions is not always clear.(1) ¹he surface layer: The first 50 m of the water column are characterized by
a significant seasonal variability both in dissolved nutrients and particulate matterdistributions, due to the seasonal modulation of the physical forcing mechanismand of the biological processes (see, for example, Fig. 5). As in the winterdistribution (Fig. 5a), the annual average distribution (Fig. 4) show an east—westgradient for nitrate, the western side being richer (up to 1.5 lM) than the eastern,which is almost completely depleted (less than 0.5 lM). The east—west gradient isnot evident for phosphate. The particulate matter (POC and PN), with valuesranging from 2.5 to 4.0 lM and from 0.30 to 0.6 lM, respectively, exhibit weakeast—west horizontal gradient.
(2) ¹he gradient zone: This extends from 50 to 200 m. Here the concentrationsrise from 0.5 to 5.0 lM for nitrate, and from 0.05 to about 0.22 lM for phosphate.On the other hand, POC and PN values decrease to about 0.5 and 0.1 lM,respectively.
G. Civitarese et al./Continental Shelf Research 18 (1998) 773—789 779

Fig. 4. Annual average distribution of biogeochemicals.
Fig. 5. Upper layer vertical distribution of NO3
in winter 1994 (a) and summer 1994 (b).
780 G. Civitarese et al./Continental Shelf Research 18 (1998) 773—789

Fig. 6. Dissolved oxygen vertical distribution in winter 1994.
(3) ¹he intermediate layer: The large body of water extending from 200 to about600—800 m is characterized by the presence of the LIW occupying the eastern halfof the section, with a core having salinity higher than 38.75 psu (Gacic et al., 1996).Nutrients increase in concentration to more than 5.0 lM for nitrate and 0.22 lMfor phosphate. This layer is characterized by almost constant concentrations ofPOC (less than 0.5 lM) and PN (less 0.1 lM), the minimum values recorded in thearea.
(4) ¹he bottom layer: The bottom layer is occupied by the ADW, which is character-ized by higher concentrations of dissolved oxygen (Fig. 6) and lower values ofnutrients (less than 5.0 and 0.22 lM for nitrate and phosphate, respectively). Thevertical oxygen gradient layer is sometimes particularly prominent and delimitsthe bottom layer occupied by the ADW.
POC and PN do not show any significant vertical gradient.
3.1. Dissolved organic matter
A preliminary investigation on the total dissolved nitrogen (TDN) and phosphorus(TDP) pool in the area of the strait was carried out during the OTR-6 (May 1995)cruise. TDN distribution (Fig. 7) has its maximum in deeper layers (up to 12 lM),from 300 to 800 m, showing a significant level of organic nitrogen. The distributionof TDP (Fig. 7) suggests that, as far as phosphorus is concerned, organic compo-nents are present in significant levels particularly in the surface layer (compare theTDN and TDP distributions with the NO
3and PO
4ones, respectively). Interestingly,
most of the variation in TDP and TDN seems to be caused by their inorganiccomponent.
G. Civitarese et al./Continental Shelf Research 18 (1998) 773—789 781

Fig. 7. TDN and TDP vertical distributions in May 1995.
4. Discussion
4.1. The fluxes through the strait
Annual flux computations (Fig. 8) show a net export of 29500 Mmol yr~1 (Mmol"106 mol) of nitrate and 950 Mmol yr~1 phosphate from the Adriatic, representing 26and 21% of the total export, respectively. Particulate organic carbon and nitrogenexhibit a net import of 16,100 and 2170 Mmol yr~1 respectively, representing in bothcases about 30% of the total import. As said earlier the estimate of the net waterexchange rate is still an order of magnitude larger than what one should obtain fromthe water balance calculations in the Adriatic. Thus, the net water flux value reportedin the table does not have a physical meaning and it is simply due to uncertainties ofthe water transport estimate. In any case, it is reported in the table in order to checkwhether it has some influences on the estimates of the matter flux or not. Indeed onesees that the error in the water flux estimates does not influence appreciably thematter fluxes since they are of different signs in the case of phosphates and nitratesand, in addition, the net matter fluxes represent much larger percentages of the totalfluxes than it is the case of the water exchange rate.
782 G. Civitarese et al./Continental Shelf Research 18 (1998) 773—789

Fig. 8. Annual biogeochemical fluxes with the contribution of the layers to the exchange (Mmoles"106mol).
A more detailed analysis of the contributions of the various layers to the exchange isreported in Fig. 8. The loss in the layer between 200 m depth and the bottom isresponsible for the net annual nutrient export from the Adriatic. On the other hand,for the particulate matter, the most active layers in terms of the transport are theuppermost (from the surface down to 200 m). POC and PN flux computations resultin a net positive imbalance (particulate matter gain for the Adriatic by exchangethrough the Strait of Otranto). This seems surprising because we know that the
G. Civitarese et al./Continental Shelf Research 18 (1998) 773—789 783

western part of the strait, occupied by waters of Adriatic origin, is richer in particulatematter than the eastern. We must, however, take into account that the transport is theresult of the combined action of water transport and mass distribution. Consideringthe annual average fluxes of water (Fig. 8), it is evident that the layer from 0 to 200mshows a net positive imbalance, giving rise to the corresponding particulate netpositive transport. On the other hand, the higher water flux out of the Adriatic in thelayer from 200 m down to the bottom cannot compensate for the imbalance ofparticulate matter in the first 200 m of the water column, due to the low concentra-tions of particulate matter in deeper layers. This is not the case with dissolvednutrients, in which the net negative transport in the layer from 200 m to the bottomcounterbalances and even exceeds the intermediate positive imbalance.
The nutrient fluxes differ from those previously estimated by Zore-Armanda andPucher-Petkovic (1976) and are 5—10 times larger. This discrepancy derives eitherfrom the current velocity estimates or from the concentration values used for the fluxcomputations. As stated by the authors, the current velocities are probably under-estimated, since they refer to the Central Adriatic. Moreover, the nutrient concentra-tions from McGill (1965) used by the authors are lower than those found in this study,especially in the layer between the surface depleted zone and the depth of the nutrientmaximum.
Considering the nutrient advective fluxes, Degobbis and Gilmartin (1990) estimateda net loss of N and P of 9220 and 430 Mmoles yr~1, respectively, from the NorthernAdriatic. Both values, representing about 20% of the total inputs, point out that thecontribution of the Northern Adriatic to the rest of the Adriatic Sea is relatively small,because of the restricted water exchange and the losses due to denitrification (for N )and burial in the sediment (for P ) (Degobbis and Gilmartin, 1990). The total input inthe rest of the Adriatic Sea from various sources along boundaries is difficult to assessbecause of the scarcity of the available data.
In this study, we have considered only the nutrients in their highest oxidation state,namely nitrate and phosphate. This is probably reasonable for phosphorus, but mightnot be for nitrogen. As we have shown in the section on the results, the organicnitrogen component is present in appreciable amounts throughout the water column.The contribution of this component to the active transport of additional amounts ofnutrient across the strait and along the path of the principal water masses of theMediterranean is an open question, and it is linked to its degradability. The inclusionof all the forms of N and P was demonstrated as crucial for estimating correctly thebudget at the Strait of Gibraltar (Coste et al., 1988), where the deficit previouslycalculated appeared to be balanced, and where the dissolved organic nitrogen andphosphorus were about 50% of the total nitrogen and phosphorus inflow into theMediterranean. Investigations carried out in the Ionian Sea and in the LevantineBasin (unpublished data) suggest not only that the amount of dissolved organicnitrogen in the water column is comparable with that of nitrate, but also that the totalnitrogen pool changes in relative contents of nitrate and organic forms moving fromthe Eastern to the Western Mediterranean. In Fig. 9 we report the contribution ofnitrate and dissolved organic nitrogen (DON) to the TDN in the LIW in four regionsof the Mediterranean. The prominent feature is a strong east—west differentiation,
784 G. Civitarese et al./Continental Shelf Research 18 (1998) 773—789
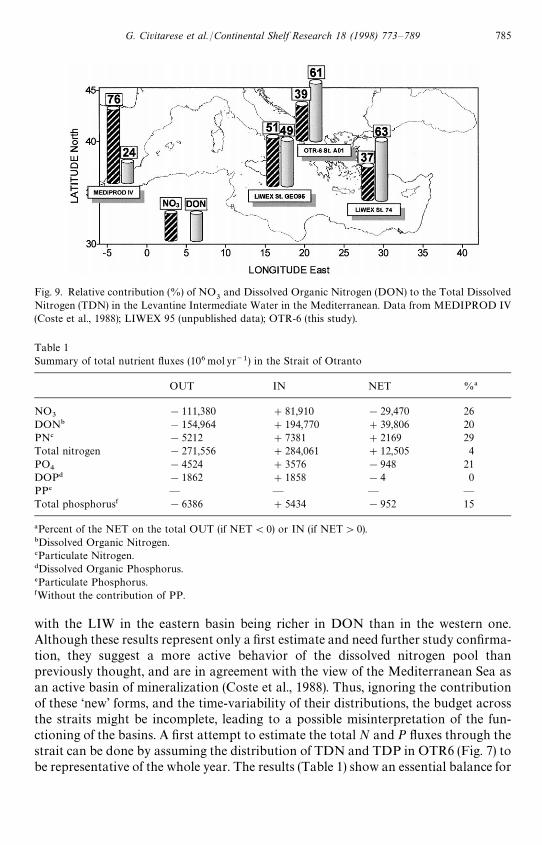
Fig. 9. Relative contribution (%) of NO3
and Dissolved Organic Nitrogen (DON) to the Total DissolvedNitrogen (TDN) in the Levantine Intermediate Water in the Mediterranean. Data from MEDIPROD IV(Coste et al., 1988); LIWEX 95 (unpublished data); OTR-6 (this study).
Table 1Summary of total nutrient fluxes (106mol yr~1) in the Strait of Otranto
OUT IN NET %!
NO3
!111,380 #81,910 !29,470 26DON" !154,964 #194,770 #39,806 20PN# !5212 #7381 #2169 29Total nitrogen !271,556 #284,061 #12,505 4PO
4!4524 #3576 !948 21
DOP$ !1862 #1858 !4 0PP% — — — —Total phosphorus& !6386 #5434 !952 15
!Percent of the NET on the total OUT (if NET(0) or IN (if NET'0)."Dissolved Organic Nitrogen.#Particulate Nitrogen.$Dissolved Organic Phosphorus.%Particulate Phosphorus.&Without the contribution of PP.
with the LIW in the eastern basin being richer in DON than in the western one.Although these results represent only a first estimate and need further study confirma-tion, they suggest a more active behavior of the dissolved nitrogen pool thanpreviously thought, and are in agreement with the view of the Mediterranean Sea asan active basin of mineralization (Coste et al., 1988). Thus, ignoring the contributionof these ‘new’ forms, and the time-variability of their distributions, the budget acrossthe straits might be incomplete, leading to a possible misinterpretation of the fun-ctioning of the basins. A first attempt to estimate the total N and P fluxes through thestrait can be done by assuming the distribution of TDN and TDP in OTR6 (Fig. 7) tobe representative of the whole year. The results (Table 1) show an essential balance for
G. Civitarese et al./Continental Shelf Research 18 (1998) 773—789 785

N and a decrease of the net outflow for P, in terms of the fraction of the total output(21—15%). Note that the particulate phosphorus is not included in the computation.The lack of an extensive set of this kind of data in the Strait of Otranto does not allowus to be more definite.
4.2. Basin-scale implications
Assuming that all the outflowing phosphorus (Total Phosphorus"PO4#DOP)
from the intermediate and deep layers (from 200 m to the bottom) was involved in theprimary production, we are able to estimate the average new production of the wholebasin on an annual scale. We choose P because it is probably a limiting factor for theAdriatic. Through the strait, about 4500]106moles yr~1 of P exit from the Adriatic.Considering that 260]106mol yr~1 of P are lost by sedimentation in the NorthernAdriatic (Degobbis and Gilmartin, 1990) and assuming all other losses are negligible,we obtain a P-based new production of about 44 gC m~2 yr~1, using the classical C/Pratio of 106. This value lies in the range of 26—70 gCm~2 yr~1 found by Dugdale andWilkerson (1988) using an averaged primary production of 87.5 g Cm~2 yr~1 for theentire Adriatic from Zore-Armanda and Pucher-Petkovic (1976) and considering twodifferent trophic states: oligotrophic with f (new production/total production)"0.3,and eutrophic with f"0.8. Due to our assumption that all the outflowing phos-phorus was involved in the primary production, our estimate of new productionrepresents an upper limit. To summarize, according to our estimates, the trophicstatus of the Adriatic basin, on the whole, seems to be closer to that of an oligotrophicbasin. The restricted water exchange between the Northern and Southern Adriaticdue to the circulation regime and a shallow sill between the two areas, together withthe processes of nutrient removal from the water column, reduce the influence of theNorthern Adriatic on the rest of the basin.
4.3. The Adriatic Sea and the N:P ratio anomaly of the Eastern Mediterranean
As previously stated, only the surface layer exhibits a significant seasonal variabilityin suspended and dissolved matter, associated either with the hydrological regime orthe biological activity changes. One of the most noticeable feature emerging fromanalysis of the distributions of dissolved and particulate matter is the presence of asignificant asymmetry in nitrate levels between the geographical extremes of the sectionin February (Fig. 5a), also recognizable in the annual average distribution (Fig. 4).
During winter, the shelf along the Italian coast is occupied by a relatively fresh andcold water stream of ASW flowing southward. ASW is selectively enriched in NO
3, as
also shown in Fig. 10. The relative excess of nitrate in comparison with phosphate onthe western side, and in a small lens in the center of the section, due to the cyclonicrecirculation is clearly recognizable from the vertical pattern of the NO
3:PO
4ratio.
Also, the area occupied by the ADW outflow shows a slight but significant increase inthe ratio. This behavior is supported by previous investigations carried out in theSouthern Adriatic (unpublished data) and is always associated with strong outflows ofwater types of Adriatic origin, i.e. ASW and ADW.
786 G. Civitarese et al./Continental Shelf Research 18 (1998) 773—789

Fig. 10. The NO3:PO
4ratio in winter 1994 at the transect 2 (see Fig. 1).
The N :P ratio anomaly of the Mediterranean, that is its deviation in comparisonwith the oceans (21—25 in the Mediterranean vs 16 in the oceans), is one of the mostintriguing biogeochemical peculiarities of the Mediterranean Sea. Recently, theorieshave been developed to explain this deviation: for examples, nitrogen fixation(Bethoux and Copin-Montegut, 1986) and phosphate removal from the water columnby adsorption onto Saharan dust particles blown across the Mediterranean (Krommet al., 1991). The selective enrichment in NO
3of waters of Adriatic origin is parti-
cularly noteworthy because it suggests a possible role of the Adriatic Sea in contribu-ting to support the N :P ratio anomaly in the Eastern Mediterranean. Our resultssuggest that the anomaly in the N :P ratio could originate, at least in part, directly inthe formation sites of the Eastern Mediterranean Deep Water, i.e. the Adriatic Sea,because of a selective enrichment in nitrate due to freshwater inputs, and the activerole of the Adriatic shelf in the efficient removal of phosphorus from the water columnvia burial in the bottom sediments (Degobbis and Gilmartin, 1990). Thus, the coastaland shelf areas of the Adriatic could influence the entire Eastern Mediterranean, thebiogeochemical imprint being carried within the closed deep conveyor belt.
5. Conclusions
On an annual scale, a net loss of nitrate and phosphate through the Strait ofOtranto occurs. This loss represents 20—30% of the total outflow, but in terms of totalN and P, the inclusion of organic forms could lead to a balance of the fluxes. Futurestudies will establish if the Adriatic Sea can be considered as a site of mineralizationfor the rest of the Eastern Mediterranean.
Due to the circulation regime and processes of nutrient removal in the NorthernAdriatic, the trophic status of the Adriatic Sea, on the whole, seems to be close to thatof an oligotrophic basin.
G. Civitarese et al./Continental Shelf Research 18 (1998) 773—789 787

In the Southern Adriatic and in the area of the strait, nutrient distributions suggesta possible role of the Adriatic in supporting the N :P ratio anomaly of the Mediterra-nean. The nitrate excess could be the most prominent biogeochemical signaturecoming from the Adriatic that can be found in the Eastern Mediterranean.
Acknowledgements
This research was part of the Mediterranean Targeted Project, MAST 2 program,contract MAS2-CT93-0068, ‘‘Hydrodynamics and Geochemical Fluxes in the Straitof Otranto’’ from the European Union. Part of the currentmeter data come from theproject ‘‘Otranto Gap’’ carried out by the NATO SACLANT Undersea ResearchCentre, La Spezia, Italy.
References
Artegiani, A., Bregant, D., Paschini, E., Pinardi, N., Raicich, F., Russo, A., 1997. The Adriatic Sea generalcirculation. Part I: Air—sea interactions and water mass structure. Journal of Physical Oceanography27(8), 1492—1514.
Bethoux, J.P., 1980. Mean water fluxes across sections in the Mediterranean Sea, evaluated on the basis ofwater and salt budgets and of observed salinities. Oceanologica Acta 3(1), 79—88.
Bethoux, J.P., Copin-Montegut, G., 1986. Biological fixation of atmospheric nitrogen in the MediterraneanSea. Limnology and Oceanography 31, 1353—1358.
Bethoux, J.P., 1989. Oxygen consumption, new production, vertical advection and environmental evolutionin the Mediterranean Sea. Deep-Sea Research 36(5), 769—781.
Boldrin, A., Bregant, D., Rabitti, S., 1990. Hydrochemistry and suspended matter distribution in the Ioniansea—POEM V (September 1987). Fourth POEM Scientific Workshop, Venice, August 27—September 1,1990. Abstract of presentations, edited by Istituto Studio Dinamica Grandi Masse and Istituto Veneto diScienze, Lettere ed Arti, pp. 32.1—32.13.
Boldrin, A., De Lazzari, A., Rabitti, S., Turchetto, M.M., 1996. Vertical fluxes of particulate matter inthe Otranto Strait. Second Workshop of the Mediterranean Targeted Project, Extended Abstracts,pp. 185—188.
Carpenter, J.H., 1965. The accuracy of the Winkler method for the dissolved oxygen analysis. Limnololyand Oceanography 10, 135—140.
Coste, B., Le Corre, P., Minas, H.J., 1988. Re-evaluation of the nutrient exchanges in the Strait of Gibraltar.Deep-Sea Research 35, 767—775.
Degobbis, D., Gilmartin, M., 1990. Nitrogen, phosphorus, and biogenic silicon budgets for the northernAdriatic Sea. Oceanologica Acta 13(1), 31—45.
Dugdale, R.C., Wilkerson, F.P., 1988. Nutrient sources and primary production in the Eastern Mediterra-nean. Oceanologica Acta, n. sp. 9, 179—184.
Ferentinos, G., Kastanos, N., 1988. Water circulation patterns in the Otranto Straits. Continental ShelfResearch 8, 1025—1041.
Gac\ ic, M., Kovac\ evic, V., Manca, B., Papageorgiou, E., Poulain, P.M., Scarazzato, P., Vetrano, A., 1996.Thermohaline properties and circulation in the Strait of Otranto. In: Briand, F. (Ed.), Dynamics ofMediterranean Straits and Channels Bulletin de l’Instut Oce&anographique, Monaco, n. special 17,CIESM Science Series no. 2, pp. 117—145.
Grasshoff, K., Eharhardt, M., Kremlig, K. (Eds.), 1983. Methods of Seawater Analysis, 2nd ed. VerlagChemie, Weinheim.
Hedges, J.I., Stern, J.H., 1984. Carbon and nitrogen determination of carbonate-containing solids. Limnol-ogy and Oceanography 29(3), 657—663.
788 G. Civitarese et al./Continental Shelf Research 18 (1998) 773—789

Hopkins, T.S., 1978. Physical processes in the Mediterranean basins. In: Kjerfve, B. (Ed.), EstuarineTransport Processes. Univ. of South Carolina Press, 269—310.
Kromm, M.D., Kress, N., Brenner, S., Gordon, L.I., 1991. Phosphorus limitation of primary productivity inthe eastern Mediterranean Sea.Limnology and Oceanography 36(3), 424—432.
McGill, D.A., 1965. The relative supplies of phosphate, nitrate and silicate in the Mediterranean. Rapportset proces-verbaux des reunions Commission Internationale pour l’Exploration Scientifique de la merMediterranee 18(3), 737—744.
Murphy, J., Riley, J.P., 1962. A modified single solution method for the determination of phosphate innatural waters. Analitica. Chimica Acta 27, 31—36.
Michelato, A., Kovacevic, V., 1991. Some dynamic features of the flow through the Otranto Strait.Bollettino Oceanologia Teorica ed Applicata 9, 39—51.
Pollak, M.J., 1951. The sources of the deep water of the Eastern Mediterranean Sea. Journal of MarineResearch 10, 128—152.
Poulain, P.M., Gac\ ic, M., Vetrano, A., 1996. Current Measurements in the Strait of Otranto revealunforeseen aspects of its hydrodynamics. EOS Transactions, AGU 77(3), 345—348.
Rabitti, S., Bianchi, F., Boldrin, A., Da Ros, L., Socal, G., Totti, C., 1994. Particulate matter andphytoplankton in the Ionian Sea. Oceanologica Acta 17(3), 297—307.
Schlitzer, R., Roether, W., Oster, H., Junghans, H.-G., Hausmann, M., Johannsen, H., Michelato, A., 1991.Chlorofluoromethane and oxygen in the Eastern Mediterranean. Deep-Sea Research 38(12), 1531—1551.
Strickland, J.D.H., Parsons, T.R., 1972. A practical handbook of seawater analyses. Bulletin of FisheriesResearch Board of Canada 167, 310 pp.
Utermohl, H., 1958. Zur Vervollkommnung der quantitativen Phytoplankton-Methodik. Mitteilungen derInternationalen Vereinigung fur theoretische und angewandte Limnologie 9, 1—38.
Walsh, T.W., 1989. Total dissolved nitrogen in seawater: a new high-temperature combustion method anda comparison with photo-oxidation. Marine Chemistry 26, 295—311.
Zore-Armanda, M., Pucher-Petkovic, T., 1976. Some dynamic and biological characteristics of the Adriaticand other basins of the Eastern Mediterranean Sea. Acta Adriatica 18(1), 17—27.
G. Civitarese et al./Continental Shelf Research 18 (1998) 773—789 789
Copyright © 2022 FDOKUMEN