Anomalous seismic crustal structure of oceanic fracture zones
Upload
khangminh22Category
view
0download
0
ORI GIN AL PA PER
Biogeochemical Zones Within a Macrotidal,Dry-Tropical Fluvial-Marine Transition Area:A Dry-Season Perspective
L. C. Radke Æ P. W. Ford Æ I. T. Webster Æ I. Atkinson ÆG. Douglas Æ K. Oubelkheir Æ J. Li Æ B. Robson Æ B. Brooke
Received: 22 April 2008 / Accepted: 22 July 2009 / Published online: 19 August 2009� Springer Science+Business Media B.V. 2009
Abstract The Fitzroy River delivers large amounts of nutrients and fine sediments to
Keppel Bay (contiguous with the Great Barrier Reef Lagoon) during intermittent flow
events. This study explores sources, forms and transformations of nutrients in Keppel Bay,
and develops a functional process zonation that integrates seabed geochemistry and water
column nutrient characteristics which are controlled by suspended sediment. The water
column and seabed properties were investigated over two dry seasons, with supplementary
core incubations taken to measure carbon decomposition rates and nutrient fluxes. Keppel
Bay can be divided into three zones, the: zone of maximum resuspension (ZMR); coastal
transitional zone (CTZ); and blue water zone (BWZ). Mineralisation of predominantly
terrestrial organic matter occurs in the ZMR where nutrient uptake by phytoplankton is
light limited. The CTZ and BWZ had higher light penetration and phytoplankton growth
was likely limited by N and P, respectively. The identified zones conform to the
bathymetry and hydrodynamic characteristics of the bay, allowing for the development of
an integrated conceptual model accounting for the benthic and pelagic biogeochemical
processes. Recognition of these different zones shows that considerable variation in ben-
thic and water column properties is possible within a small system with the bathymetric
and hydrodynamic characteristics of the fluidized bed reactor.
Keywords Resuspension � Dissolved nutrients � Seabed geochemistry �Nutrient limitation � Tide-dominated embayment � Sub-oxic fluidized bed reactor
L. C. Radke (&) � I. Atkinson � J. Li � B. BrookeMarine and Coastal Environment Group, Geoscience Australia, Canberra, ACT 2601, Australiae-mail: [email protected]
P. W. Ford � I. T. Webster � K. Oubelkheir � B. RobsonCSIRO Land & Water, Canberra, ACT 2601, Australia
G. DouglasCSIRO Land & Water, Private Bag No. 5, Wembley, WA 6913, Australia
123
Aquat Geochem (2010) 16:1–29DOI 10.1007/s10498-009-9070-7

1 Introduction
Coastal zones play a dominant role in the storage and cycling of sedimentary organic
carbon (Hedges and Keil 1995; Jahnke 1996). Tropical coastal regions are of especial
importance as 60–70% of the world’s delivery of sedimentary organic carbon occurs in
these regions (Milliman and Syvitski 1992; Ludwig and Probst 1996). A major charac-
teristic of these regions is massive subaqueous deltaic complexes of mud banks, both at the
mouth, and further down current. The best studied examples are: the Amazon (Keuhl et al.
1986), the Fly and neighbouring rivers in the Gulf of Papua (Milliman 1995; Aller et al.
2004); and the subtropical Yangtze and Huanghe Rivers entering the East China Sea (Liu
et al. 2006). These tropical zones are not only areas of high deposition (at least on a
seasonal time scale) but can also be highly efficient sites for remineralisation of terrestrial
organic matter as well as in situ primary production leading to productive fisheries (Alongi
1995). The specific mechanism responsible for this extensive and highly efficient remin-
eralisation has been characterised as a ‘‘sub-oxic fluidized bed reactor’’ (Aller 1998; Aller
and Michalopoulos 1999) and requires frequent cycles of resuspension and deposition of
the fine sediments so that the attached organic carbon is repeatedly exposed to oxic and
sub-oxic environments. There is thus a strong nexus between the geomorphic character-
istics of the initial deposition zone especially the depth of deposition and extent of
exposure to tide, wave and storm action causing repeated resuspension of the initially
deposited sediments, and the mineralisation of particulate nutrients.
Keppel Bay, the seaward embayment adjoining the mouth of the Fitzroy estuary, in
Queensland, Australia, shares many of the common physical characteristics of the para-
diagmatic fluidized bed reactors of the Amazon and the French Guyanian mud banks and
the Gulf of Papua. It receives large quantities of terrestrial sediments, possesses a relatively
shallow topset deposition zone bisected by several distributary channels, and is macrotidal.
It has been recognised physiographically as being a semi-tropical example (Flemming
2002) of a ‘‘muddy coast’’—a hall mark of the Amazon and Gulf of Papua also. The
biogeochemical behaviour of this area has not been investigated so far despite the intrinsic
scientific interest as a relatively small scale fluidized bed reactor, as well as the important
practical consequences. In the context of nutrients and sediments having potentially del-
eterious impacts on in-shore corals (Fabricius and De’Ath 2004), understanding the bio-
geochemical function of Keppel Bay, especially the storage, transformation and
remineralisation of land-derived particulate nutrients, is of direct relevance to the man-
agement of the Great Barrier Reef and its preservation.
Keppel Bay is a macrotidal sediment-starved embayment (Ryan et al. 2007). Net shore-
normal transport of particulates enhances sediment accumulation in the inter-tidal and
shallow sub-tidal areas near the estuary mouth (Ryan et al. 2007). The shoreward transport
also produces shore-normal gradients in seabed physical characteristics (i.e. grain size and
sorting coefficients; Ryan et al. 2007) and water column optical properties (Oubelkheir
et al. 2006). Superimposed on this spatial variability are semi-diurnal tides with a maxi-
mum range of *5 m which impose short-timescale variability on water column properties
through advection of water masses and resuspension of the seabed sediment (Webster et al.
2006). This variability makes the design of effective monitoring programs and the analysis
of data much more difficult than in most aquatic systems. Moreover, there remain gaps in
our understanding of the biogeochemical functioning of dry-tropical environments (Eyre
1994), particularly in relation to the processing and storage of biogeochemically reactive
elements (carbon, nitrogen, phosphorus and iron) in the near-shore zone in the intervening
periods between flood events.
2 Aquat Geochem (2010) 16:1–29
123

Here we explore the sources, forms, availability (for primary production) and trans-
formations of nutrients in Keppel Bay, and develop a functional process zonation that
integrates seabed geochemical characteristics and the water column properties which are
controlled by suspended sediment. From a consideration of the inherent water column
optical properties, Oubelkheir et al. (2006) alluded to three zones in the estuary–coast–
ocean transition: turbid estuarine waters, coastal mixed turbid waters and ocean blue
waters. However, these zones, which are evident in Landsat images (e.g. Fig. 2a), were not
specifically defined nor were their biogeochemical characteristics elucidated. The zones
have the potential to provide an organising and simplifying structure for describing the
interactions between the geochemistry and biogeochemistry of the seabed, and spatial and
temporal variation in water column characteristics, and are referred to as the zone of
maximum resuspension (ZMR), blue water zone (BWZ) and coastal transition zone (CTZ).
However, the combination of interacting physical and biogeochemical processes, espe-
cially macrotidal sediment resuspension and episodic inputs of terrestrial soils and nutri-
ents is not unique to Keppel Bay. The process conceptualisation and descriptive zonation
we develop is likely relevant to other coastal systems. We draw particular attention to the
many northward facing bays in the Great Barrier Reef catchment area (Larcombe and
Woolfe 1999).
2 Study Area
The Fitzroy River Basin covers an area of *144,000 km2 (Fig. 1), and is the largest
Queensland catchment discharging to the Great Barrier Reef Lagoon. Situated in the dry
tropics, the climate of the catchment is described as sub-tropical. The geology of the
Fitzroy River Basin is complex with more than 100 different types of rocks and has been
ROCKHAMPTON
150°30' 151°00'
K E P P E LB A Y
mk 020
150°45'
Yeppoon
Keppel Sands
Port Alma
Cattle Point
Hummocky Island
WESTERN
AUST R A LI A
NORTHERNT ERR ITORY
SOUTHAUSTRA LI A
QUEENSLAND
NEW SOUTHWALES
VICTORIA
TASMA NIA
ACT
151°15'
Curtis Island
Great Keppel Island
Emu Park
Fi t z r o y
Ri v e r
Co
nn
ors
Cre
ek
Long
Beach
23°15'
23°30'
Inkerman Creek R
agla
nC
reek
Creek
Casuarina
Quartz Rock
07-1889-1
Fig. 1 Location map of the Fitzroy Estuary, Keppel Bay and tidal creeks
Aquat Geochem (2010) 16:1–29 3
123
divided into five major structural units (Douglas et al. 2006). Approximately 60% of the
native vegetation cover in the catchment has either been cleared or has been subject to
thinning (Furnas 2003). Rangeland beef grazing occurs over at least 80% of the total area
of the Fitzroy River Basin and is the principal land use in the catchment (Furnas 2003). The
Fitzroy River Basin is divided into five large river sub-catchments. During the infrequent
flood events the Fitzroy River carries high concentrations of fine suspended sediments
([1,000 mg l-1; Packett et al. 2009). Consequently the river is one of the largest sources of
sediment to the Great Barrier Reef Lagoon (Furnas 2003).
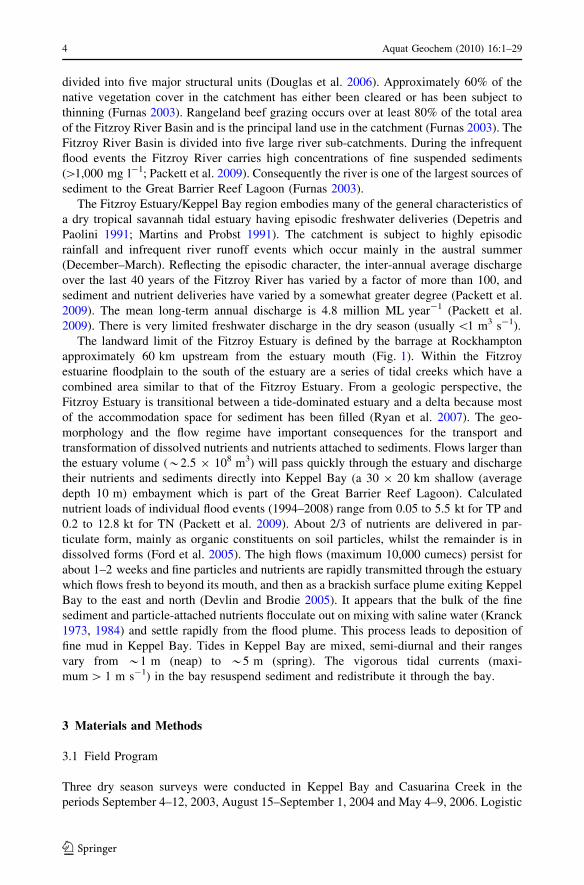
The Fitzroy Estuary/Keppel Bay region embodies many of the general characteristics of
a dry tropical savannah tidal estuary having episodic freshwater deliveries (Depetris and
Paolini 1991; Martins and Probst 1991). The catchment is subject to highly episodic
rainfall and infrequent river runoff events which occur mainly in the austral summer
(December–March). Reflecting the episodic character, the inter-annual average discharge
over the last 40 years of the Fitzroy River has varied by a factor of more than 100, and
sediment and nutrient deliveries have varied by a somewhat greater degree (Packett et al.
2009). The mean long-term annual discharge is 4.8 million ML year-1 (Packett et al.
2009). There is very limited freshwater discharge in the dry season (usually \1 m3 s-1).
The landward limit of the Fitzroy Estuary is defined by the barrage at Rockhampton
approximately 60 km upstream from the estuary mouth (Fig. 1). Within the Fitzroy
estuarine floodplain to the south of the estuary are a series of tidal creeks which have a
combined area similar to that of the Fitzroy Estuary. From a geologic perspective, the
Fitzroy Estuary is transitional between a tide-dominated estuary and a delta because most
of the accommodation space for sediment has been filled (Ryan et al. 2007). The geo-
morphology and the flow regime have important consequences for the transport and
transformation of dissolved nutrients and nutrients attached to sediments. Flows larger than
the estuary volume (*2.5 9 108 m3) will pass quickly through the estuary and discharge
their nutrients and sediments directly into Keppel Bay (a 30 9 20 km shallow (average
depth 10 m) embayment which is part of the Great Barrier Reef Lagoon). Calculated
nutrient loads of individual flood events (1994–2008) range from 0.05 to 5.5 kt for TP and
0.2 to 12.8 kt for TN (Packett et al. 2009). About 2/3 of nutrients are delivered in par-
ticulate form, mainly as organic constituents on soil particles, whilst the remainder is in
dissolved forms (Ford et al. 2005). The high flows (maximum 10,000 cumecs) persist for
about 1–2 weeks and fine particles and nutrients are rapidly transmitted through the estuary
which flows fresh to beyond its mouth, and then as a brackish surface plume exiting Keppel
Bay to the east and north (Devlin and Brodie 2005). It appears that the bulk of the fine
sediment and particle-attached nutrients flocculate out on mixing with saline water (Kranck
1973, 1984) and settle rapidly from the flood plume. This process leads to deposition of
fine mud in Keppel Bay. Tides in Keppel Bay are mixed, semi-diurnal and their ranges
vary from *1 m (neap) to *5 m (spring). The vigorous tidal currents (maxi-
mum [ 1 m s-1) in the bay resuspend sediment and redistribute it through the bay.
3 Materials and Methods
3.1 Field Program
Three dry season surveys were conducted in Keppel Bay and Casuarina Creek in the
periods September 4–12, 2003, August 15–September 1, 2004 and May 4–9, 2006. Logistic
4 Aquat Geochem (2010) 16:1–29
123
and safety considerations as well as the long shallow sand bars radiating from the mouth of
the estuary prevented sampling on a regular grid. The sampling strategy adopted covers all
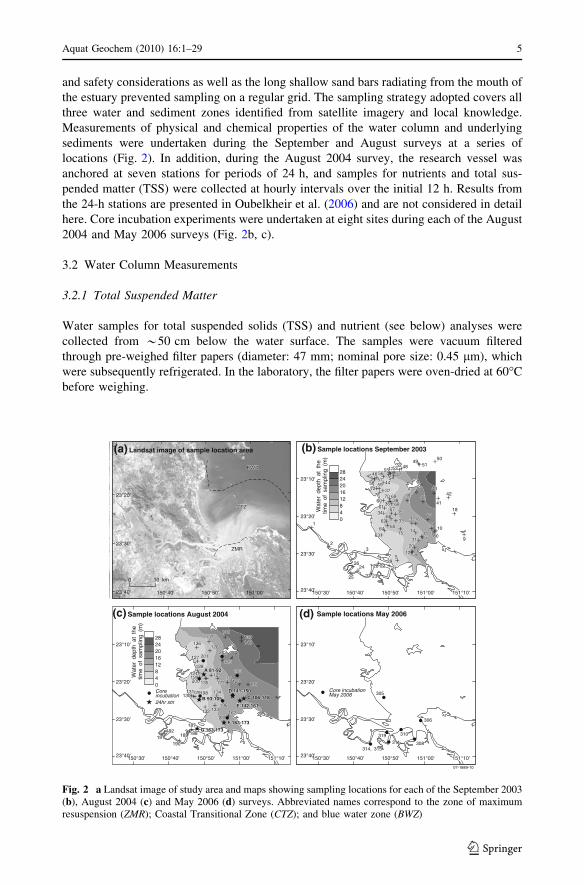
three water and sediment zones identified from satellite imagery and local knowledge.
Measurements of physical and chemical properties of the water column and underlying
sediments were undertaken during the September and August surveys at a series of
locations (Fig. 2). In addition, during the August 2004 survey, the research vessel was
anchored at seven stations for periods of 24 h, and samples for nutrients and total sus-
pended matter (TSS) were collected at hourly intervals over the initial 12 h. Results from
the 24-h stations are presented in Oubelkheir et al. (2006) and are not considered in detail
here. Core incubation experiments were undertaken at eight sites during each of the August
2004 and May 2006 surveys (Fig. 2b, c).
3.2 Water Column Measurements
3.2.1 Total Suspended Matter
Water samples for total suspended solids (TSS) and nutrient (see below) analyses were
collected from *50 cm below the water surface. The samples were vacuum filtered
through pre-weighed filter papers (diameter: 47 mm; nominal pore size: 0.45 lm), which
were subsequently refrigerated. In the laboratory, the filter papers were oven-dried at 60�C
before weighing.
11
2299
1818
4242
50504949
5151
190190
189189191191192192
2626
2525 23232727
2121
33
44
2424
45454646 5656
6262
63636464
5959
2828 2222
34346161
4848
55
1515
3333
3535
6565
52524747
5454
696938386868
6767
4444
5555
37377070
3636
6666
5353
31312020
111177
30301212
8080
66
40403939
4141
4343
171732321616
1414 10101919
3737
2929
58587272
5757
71716060
C 106-118C 106-118
139139140140
203203
120120
188188
133133196196
134134
123123
122122
162162
121121
198198
199199
205205
187187
135135
D 141-150D 141-150
E 142-161E 142-161B 93-105B 93-105
F 163-173F 163-173
200200119119
138138
126126202202
125125
136136
127127
128128
201201
137137
A 81-92A 81-92
G 163-173G 163-173
129129131131130130
124124
132132
23°30'
23°10'
23°20'
23°40' 151°00'150°50'150°40'150°30'
23°30'
23°10'
23°20'
23°40' 151°00'150°50'150°40'150°30'
0
282420161284
0
282420161284
24hr stn
Coreincubation
07-1889-10
23°20'
23°30'
151°00'150°50'150°40'
23°30'
23°10'
23°20'
23°40' 151°00'150°50'150°40'150°30'
Core incubationMay 2006 305305
306306
308308
310310
311311319319
(a) Landsat image of sample location area
23°40'
151°10'151°10'151°10'151°10'
151°10'
6002 yaM snoitacol elpmaS (d)4002 tsuguA snoitacol elpmaS (c)
(b) Sample locations September 2003
Wat
er d
epth
at
the
time
of s
ampl
ing
(m)
Wat
er d
epth
at
the
time
of s
ampl
ing
(m)
314, 315314, 315
0 10 km
BWZBWZ
CTZCTZ
ZMRZMR
Fig. 2 a Landsat image of study area and maps showing sampling locations for each of the September 2003(b), August 2004 (c) and May 2006 (d) surveys. Abbreviated names correspond to the zone of maximumresuspension (ZMR); Coastal Transitional Zone (CTZ); and blue water zone (BWZ)
Aquat Geochem (2010) 16:1–29 5
123

3.2.2 Nutrients
Collected 1 L water samples were vigorously mixed. Water for filterable reactive dissolved
nutrient analyses was syringe-filtered through 0.45 lm nylon membrane filters into clean
environmental-grade HDPE bottles. A component of the remaining unfiltered water was
analysed for total nutrients. The samples were stored on ice immediately after collection, and
were frozen on the evening of collection for transport to the laboratory. The filtered samples
were analysed for filterable reactive phosphorus (FRP), total oxidised nitrogen (NOx),
ammonia (NH4?) and silicate (SiO4
2-) simultaneously using an automated LACHAT
8000QC flow injection system and by the following Standard Methods (Anonymous 1998:
4500-P G (FRP); 4500-NO3 I; 4500-NH3 H and 4500-SiO2 F). The uncertainties on TN, TP
and dissolved inorganic nutrient analyses were 0.005, 0.002 and 0.001 mg L-1, based on In-
House Reference Materials that were prepared at varying concentrations across the analysis
range, and that were analysed with every analytical run. Samples for total nitrogen (TN) and
total phosphorus (TP; unfiltered water), and total dissolved nitrogen (TDN) and total dis-
solved phosphorus (TDP; filtered water) were digested using a modified version of the
simultaneous persulfate procedure (Hosomi and Sudo 1986). The digests were then analysed
using the same instruments and procedures as those described for NOx and FRP. Dissolved
organic nitrogen (DON) and dissolved organic phosphorus (DOP) concentrations were
calculated as follows: DON = TDN - (NOx ? NH4?); DOP = TDP - FRP. Total par-
ticulate nitrogen (PN) and total particulate phosphorus (PP) concentrations were calculated
from: PN = TN - TDN; and PP = TP - TDP. The uncertainty on DON, DOP, PN and PP
concentrations are 0.005, 0.002, 0.007 and 0.003 mg L-1, respectively.
3.3 Bottom Sediment Properties
3.3.1 Sample Collection and Preparation
Undisturbed bottom sediment samples (top 2 cm) were collected using a hand-deployed
sediment grab sampler. A sub-sample of this sediment was removed for grain size and
carbonate analysis. The remaining sample was first centrifuged (and the supernatant was
decanted), and then freeze-dried and ground prior to the determinations outlined in Sects.
3.3.2–3.3.4.
3.3.2 Major and Minor Element Oxides
Major and minor element concentrations (including TP) were determined by X-ray fluo-
rescence (XRF) using a modified version of Norrish and Hutton’s (1969) method, whereby no
heavy absorber was added to the flux. The instrumentation used was a Philips PW2404 4 kW
sequential spectrometer, and was calibrated using a range of USGS and SARM (South
African Reference Material) international standards. Ferrous iron (FeO, Fe(II), Fe2?) was
determined using a modified version of the Shapiro and Brannock (1962) method.
3.3.3 Sediment Organic Carbon and Nutrients
Total organic carbon (TOC) concentrations were determined from finely ground sediments
using a LECO combustion furnace (RC412) after acid pre-treatment. Sediment samples for
nitrogen analysis were digested in an automated process based on Standard Methods 1998–
4500-Norg D (Anonymous 1998), with modifications to allow analysis for freshwater,
6 Aquat Geochem (2010) 16:1–29
123

saline waters and sediments. Analyses for total kjeldahl nitrogen (TKN) were then per-
formed on the digest using a segmented flow instrument (BRAN?LUEBBE) and Standard
Methods 1998–4500-NH3 H, using sodium salicylate instead of phenol. A subset of sed-
iment samples (25) were analysed at Primary Industries Research Victoria, for the fol-
lowing P fractions: total P, organic P, Fe/Al bound P including loosely exchangeable
phosphate (non-apatite phosphorus), Ca-bound P (apatite-P) and residual inorganic P using
a modification of the extraction schemes of Strom and Biggs (1982). The scheme differed
from the Strom and Biggs scheme in the first and last extractions. 2 M NaCl was used in
place of NH4F to estimate exchangeable P because Strom and Biggs (1982) indicated that
NH4F is inappropriate in calcareous sediments. In addition, boiling H2SO4 and H2O2
(a modified Kjeldahl digest) were used in the final extraction to determine residual-P,
whereas Strom and Biggs (1982) used warm nitric/perchloric/sulphuric acids. Extraction of
standard sediments demonstrated that the digest was quantitative.
3.3.4 d13C
Sediments (after acidification with 6% HCl twice) were analysed for d13C at Geoscience
Australia using a Thermo Finnigan Flash EA series 1112 interfaced to a Thermo Finnigan
Conflo (II)I. The isotopic measurements were carried out on a Finnigan Mat 252 using
ISODAT NT software. The Flash EA (operated with EAGER software) was packed with
copper oxide and silver cobaltous oxide and operated at 900�C. The reduction furnace was
packed with pure copper and operated at 600�C. Combustion products were separated on a
packed GC column run isothermically at 400�C. The acidified samples were weighed into tin
foil cups and placed in an auto-sampler alongside a series of blanks and standards used for the
isotope correction. The standards ANU Sucrose and TO2 were used along with caffeine for
isotopic calibration. Samples were corrected for the apparent offsets of reference materials
(as measured against the working gas) from their expected value on an international scale
(i.e. dsample/international scale = dsample/working standard ? doffset ? dsample/
working standard 9 doffset/1,000). Samples were run in duplicate or triplicate. The standard
deviations on the replicate analyses ranged from 0.01 to 0.38% (average 0.12%).
3.3.5 Surface Area Analysis
The surface area of a small number of samples (Keppel Bay seabed sediments and riverine
flood and weirs sediments from Douglas et al. (2006)) was determined by methods outlined
in Keil et al. (1997) using a Quantachrome Quantasorb Analyser at CSIRO Land and
Water, Adelaide.
3.3.6 Core Incubations
One sediment box core was collected at each of eight sites in August 2004 and May 2006
(Fig. 2b, c) for measurement of dark respiration rates (as an indicator of carbon reactivity).
Cylindrical cores of sediment were extracted from the box cores by hand-pushing poly-
carbonate tubes (*400 mm length; 80 mm diameter) into the captured sediment. The core
barrels were sealed at the bottom, and contained 200–240 mm of sediment. Each core
barrel was filled to capacity (i.e. 200–250 mm) with bottom water collected with the box
core. A gas-tight lid sealed the top of each core, and the lid was fitted on the underside with
a magnetic stirrer rotating at 7 rpm to avoid stratification. Following a pre-incubation
Aquat Geochem (2010) 16:1–29 7
123

period of 1–2 h, core incubations proceeded in darkness and at near in situ water tem-
peratures for approximately 24 h.
Measurements and samples were taken at the beginning and end of each experiment in
August 2004 and at approximately 6 h intervals in May 2006. As a sample was withdrawn, it
was replaced with an equivalent amount of site water (maintained in the dark at the same
temperature as the incubated core) from a gravity-feed reservoir. Samples for alkalinity were
filtered through 0.45 lm disposable filters into gas-tight, glass scintillation bottles (no head
space), and were refrigerated prior to analysis. Alkalinity was determined by Gran titration,
whilst the carbonate alkalinity (CA) was estimated by subtracting the alkalinity contribution
of B(OH)4-. Carbon dioxide (TCO2) was estimated from pH and carbonate alkalinity (Me-
hrbach et al. 1973). Nutrient samples were collected and processed as outlined in Sect. 3.2.2.
Oxygen and CO2 fluxes were calculated from the slopes of the linear regressions of (all
five points) with time. Apart from samples 314 and 315, the slope of the full five-point
regressions and that obtained using only the beginning (0 h) and end (24 h) points were
identical.
3.3.7 Carbonate Content
Surface sediment samples were analysed for percentage mud, sand and gravel (dry weight)
after wet sieving through nested 2 mm and 63 lm sieves. Carbonate contents were
determined on bulk sediments using the carbonate bomb method of (Muller and Gastner
1971). Twenty percent orthophosphoric acid, warmed to 50�C, was placed in a warm
(35�C) Perspex container. Dried and crushed sediment samples, weighing 0.9 g, were
introduced to the chambers. Pressure gauges were screwed onto the top of the chambers,
forming a seal. The chambers were then agitated until all the carbonate dissolved, pro-
ducing CO2 gas. The mass of carbonate is determined by a calibration curve of the CO2 gas
pressure as a function of carbonate content. The accuracy of the method is ±0.5%.
3.4 Data Analysis
Spatial patterns and significant relationships between the physical and chemical variables
in the bottom sediment data set were investigated by principal components analysis (PCA)
using STATISTICA 6TM. The input variables for the PCA included the major and minor
element concentrations, percent mud, carbon and nutrient concentrations. Al2O3/K2O
ratios were used as weathering indices (Smith et al. 2008). FeII/FeIII, TS:FeII and
Fe(II):TOC ratios and TOC, TS and FeII as molar percentages of TOC ? TS ? FeII were
used as indicators of sediment redox condition. Data were transformed (log10) prior to
analysis to produce approximately normal distributions. Contour maps of the distributions
of various physical and chemical parameters were generated using the default kriging
options in SURFER7�.
4 Results
4.1 Seabed Geochemistry
The PCA identified three main groups of seabed samples (Fig. 3a). One pair, the mud and
sandy-mud (-M&sM), muddy-sand (-mS) and sand (-S) samples form a band from negative
8 Aquat Geochem (2010) 16:1–29
123

(a)
-12
6
4
2
0
-2
-4
-8 -4 0 4 8 12
cc1acc1acc3acc3a
44a44a
204204
188188136136
123123
126126201201
575743a43a
6868
6969138138
137137cc2acc2a8585
7070
197197 183183
192192190190
636355
2424
4242 5050
444456565151
1818 55554848
40405252
5353
35353838
3030
992222 140140
195195202202
1251256060
135135139139
33a33a cc4acc4a
32a32a42a42acc7acc7a
133133198198
34a34a203203
110110 196196
41a41a39a39acc6acc6a40a40a cc5acc5acc8acc8a
cc5acc5a22132132200200128128
11115959119119
61614646
131131
3232
1211211201207171
5858
37a37a
129129
2626
23232121
1891893434 165165
1515187187
62621010
1221221931937272
127127
64646565162162
20520535a35a 36a36a
1341341991996666
38a38a9898141141124124153153
1911914545
Axi
s 2
Axis 1
-8-6-4-202468
-10
44
44
66
66
22
22
22
00
00
-2-2-2-2
-4-4-6-6
-8-8
-4-4
PCA bottom sediments MFR-M&sM MFR-mS MFR-S REL-S
23°30'
23°10'
23°20'
23°40' 151°00'150°50'150°40'150°30' 151°10'151°10'
(b) Axis 1 site scores
(c)
0.0 0.2 0.4 0.6 0.8 1.0
1.0
0.8
0.6
0.4
0.2
0.0 1.0
0.8
0.6
0.4
0.2
0.0
Fell
TOC
TS
REL-S MFR-S
07-1889-4
++
site
sco
res
Fig. 3 Results of the PCA onbottom sediment geochemistryand grain size data: a axis 1versus axis 2 site scores; b mapshowing the distribution of sitescores for axis 1; c triplot ofTOC, FeII and TS in sandysediments. Indicated grain sizesare based on Folk et al. (1970)and include mud and sandy-mud(M&sM), muddy sand (mS) andsands (S) of the modern FitzroyRiver (MFR) and relict sands(REL-S)
Aquat Geochem (2010) 16:1–29 9
123

to positive loadings across both axis 1 and 2 (Fig. 3a) and are derived from the modern
Fitzroy River (MFR; Ryan et al. 2007). These MFR sediments are mainly found on the
landward side of the zero-contour on the map of axis 1 site scores (Fig. 3b), and occur in
the ZMR and in two distinct lobes in the CTZ (i.e. the near-shore areas along the northern
part of Curtis Island and along the western coastal margin). The 3rd group are sands with
negative scores on axis 2 and positive scores on axis 1 called Outer Bay Relict Sands
(REL-S) in the terminology of Ryan et al. (2007). They are found in the BWZ.
Axis 1 explained 53% of the variance in the data set, and differentiated seabed sedi-
ments on the basis of grain-size, major and minor element, nutrient and TOC concentra-
tions and Al2O3/K2O ratios (Table 1). The correlations between total iron, Al and the
weathering index (Al2O3/K2O) with axis 1 were particularly strong.
Hydrodynamic sorting has created the dispersion of axis 1 site scores indicative of the
degree of weathering of the seabed sediment (e.g. Fe and Al2O3/K2O ratio; Table 1). Axis
2 explained 11.1% of the variance, and identified two groups of sands (MFR-S and REL-S)
Table 1 Factor coordinatesof variables on axes 1, 2 and 3of the bottom sediment PCA
Variables with loadings greaterthan 0.7 (absolute value) areshown in bold
Variables Axis 1 Axis 2 Axis 3
Al2O3:K2O -0.97 0.07 -0.06
Fe(tot) -0.97 0.10 0.03
Al -0.96 0.10 0.08
TOC -0.92 -0.17 0.16
TP -0.92 0.08 -0.02
TN -0.90 -0.20 -0.13
Zn -0.90 0.14 -0.01
FeIII -0.89 -0.17 0.20
Mg -0.89 0.05 -0.32
Na -0.89 0.08 -0.06
%Mud -0.88 -0.14 -0.04
S -0.86 -0.27 0.02
Ti -0.85 0.19 -0.12
K -0.85 0.19 0.14
Cr -0.84 0.07 0.01
Ni -0.81 -0.13 0.21
Cu -0.79 0.28 0.16
TN:TP -0.75 -0.33 -0.18
FeII -0.69 0.59 0.02
%TOC-(TOC?TS?FeII) -0.50 -0.58 0.17
Mn -0.48 0.24 0.03
TS:FeII -0.42 0.05 0.19
FeII:FeIII -0.26 0.72 0.03
Ca -0.21 0.11 -0.89
Carbonate -0.12 -0.01 -0.92
FeII:TOC 0.11 0.86 -0.13
%FeII-(TOC?TS?FeII) 0.25 0.83 -0.09
%S-(TOC?TS?FeII) 0.46 -0.51 -0.15
Quartz 0.77 0.05 0.47
Si 0.87 0.04 0.32
10 Aquat Geochem (2010) 16:1–29
123
with different values for the redox indicators (Table 1). Figure 3c confirms that Fe(II)
varied systematically with TOC in the sandy seabed sediments, causing the differentiation
of sands on axis 2.
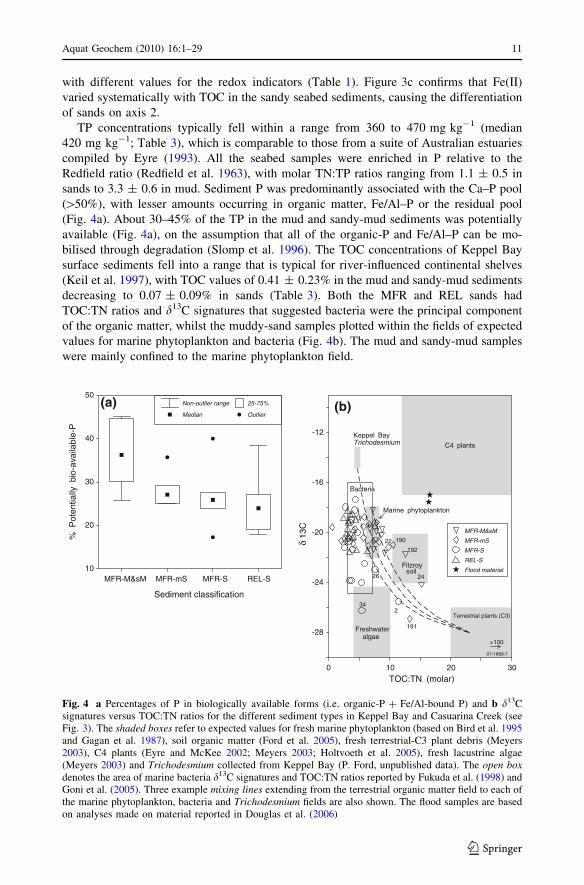
TP concentrations typically fell within a range from 360 to 470 mg kg-1 (median
420 mg kg-1; Table 3), which is comparable to those from a suite of Australian estuaries
compiled by Eyre (1993). All the seabed samples were enriched in P relative to the
Redfield ratio (Redfield et al. 1963), with molar TN:TP ratios ranging from 1.1 ± 0.5 in
sands to 3.3 ± 0.6 in mud. Sediment P was predominantly associated with the Ca–P pool
([50%), with lesser amounts occurring in organic matter, Fe/Al–P or the residual pool
(Fig. 4a). About 30–45% of the TP in the mud and sandy-mud sediments was potentially
available (Fig. 4a), on the assumption that all of the organic-P and Fe/Al–P can be mo-
bilised through degradation (Slomp et al. 1996). The TOC concentrations of Keppel Bay
surface sediments fell into a range that is typical for river-influenced continental shelves
(Keil et al. 1997), with TOC values of 0.41 ± 0.23% in the mud and sandy-mud sediments
decreasing to 0.07 ± 0.09% in sands (Table 3). Both the MFR and REL sands had
TOC:TN ratios and d13C signatures that suggested bacteria were the principal component
of the organic matter, whilst the muddy-sand samples plotted within the fields of expected
values for marine phytoplankton and bacteria (Fig. 4b). The mud and sandy-mud samples
were mainly confined to the marine phytoplankton field.
MFR-S REL-SMFR-M&sM MFR-mS
50
40
30
20
10
(a)
Sediment classification
Median
25-75%Non-outlier range
Outlier
% P
oten
tially
bio
-ava
ilabl
e-P
(b)
-12
Marine phytoplankton
Terrestrial plants (C3)2
191
24
192
-28
-24
-20
-16
200 3010
TOC:TN (molar)
13C
δ
Freshwateralgae
34
MFR-mS
MFR-M&sM
Flood material
REL-S
MFR-S
Keppel BayTrichodesmium
19022
26
Fitzroysoil
C4 plants
07-1889-7
>100
BacteriaBacteria
Fig. 4 a Percentages of P in biologically available forms (i.e. organic-P ? Fe/Al-bound P) and b d13Csignatures versus TOC:TN ratios for the different sediment types in Keppel Bay and Casuarina Creek (seeFig. 3). The shaded boxes refer to expected values for fresh marine phytoplankton (based on Bird et al. 1995and Gagan et al. 1987), soil organic matter (Ford et al. 2005), fresh terrestrial-C3 plant debris (Meyers2003), C4 plants (Eyre and McKee 2002; Meyers 2003; Holtvoeth et al. 2005), fresh lacustrine algae(Meyers 2003) and Trichodesmium collected from Keppel Bay (P. Ford, unpublished data). The open boxdenotes the area of marine bacteria d13C signatures and TOC:TN ratios reported by Fukuda et al. (1998) andGoni et al. (2005). Three example mixing lines extending from the terrestrial organic matter field to each ofthe marine phytoplankton, bacteria and Trichodesmium fields are also shown. The flood samples are basedon analyses made on material reported in Douglas et al. (2006)
Aquat Geochem (2010) 16:1–29 11
123
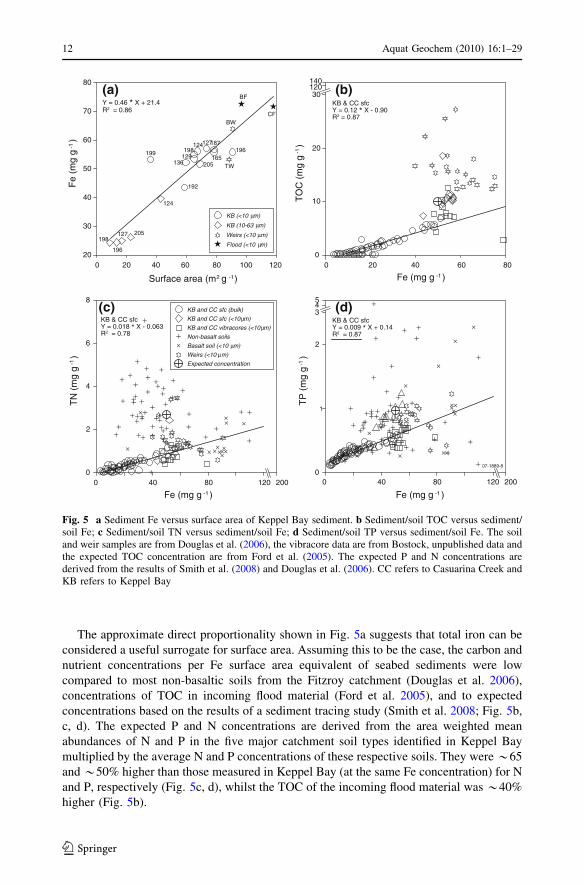
The approximate direct proportionality shown in Fig. 5a suggests that total iron can be
considered a useful surrogate for surface area. Assuming this to be the case, the carbon and
nutrient concentrations per Fe surface area equivalent of seabed sediments were low
compared to most non-basaltic soils from the Fitzroy catchment (Douglas et al. 2006),
concentrations of TOC in incoming flood material (Ford et al. 2005), and to expected
concentrations based on the results of a sediment tracing study (Smith et al. 2008; Fig. 5b,
c, d). The expected P and N concentrations are derived from the area weighted mean
abundances of N and P in the five major catchment soil types identified in Keppel Bay
multiplied by the average N and P concentrations of these respective soils. They were *65
and *50% higher than those measured in Keppel Bay (at the same Fe concentration) for N
and P, respectively (Fig. 5c, d), whilst the TOC of the incoming flood material was *40%
higher (Fig. 5b).
124
192
199
198
196
127 205
BF
BWCF
TW
196
136 205
127187
165198
129
124
20
80
70
60
50
40
30
0 20 40 60 80 100 120
Fe
(mg
g )
Surface area (m g )
-1
2 -1
KB (<10 m)
KB (10-63 m)µµ
µ
Y = 0.46 * X + 21.4R2 = 0.86
Flood (<10 m)
(a)140120
TO
C (
mg
g )-1
KB & CC sfcY = 0.12 * X - 0.90R2 = 0.87
00 20 40 60 80
Fe (mg g )-1
(b)
µ
4
6
8
TN
(m
g g
)-1
0
2
0 40 80 120 200 0 40 80 120 200
Fe (mg g )-1
(c) KB and CC sfc (bulk)
KB and CC sfc (<10 m)
KB and CC vibracores (<10 m)
Basalt soil (<10 m)µWeirs (<10 m)µExpected concentration
543
2
1
TP
(m
g g
)-1
0
Fe (mg g )-1
(d)µ
µ
Weirs (<10 m)
07-1889-8
KB & CC sfcY = 0.018 * X - 0.063R2 = 0.78 Non-basalt soils
KB & CC sfcY = 0.009 * X + 0.14R2 = 0.87
10
20
30
Fig. 5 a Sediment Fe versus surface area of Keppel Bay sediment. b Sediment/soil TOC versus sediment/soil Fe; c Sediment/soil TN versus sediment/soil Fe; d Sediment/soil TP versus sediment/soil Fe. The soiland weir samples are from Douglas et al. (2006), the vibracore data are from Bostock, unpublished data andthe expected TOC concentration are from Ford et al. (2005). The expected P and N concentrations arederived from the results of Smith et al. (2008) and Douglas et al. (2006). CC refers to Casuarina Creek andKB refers to Keppel Bay
12 Aquat Geochem (2010) 16:1–29
123

4.2 Benthic Processes
Results of the core incubation experiments are shown in Table 2. Most benthic CO2 fluxes
were \48 mmol m-2 day-1, and thus fell in a range that is considered oligotrophic for
Australian coastal ecosystems (Eyre and Ferguson 2002). Oxygen concentrations dropped
between 0.96 and 3.78 mg L-1 over the course of the incubations, and oxygen uptake
fluxes ranged from -15.9 to -6 mmol m-2 day-1. Most of the O2 and TCO2 fluxes
formed a roughly curve (Fig. 6), which peaked in samples 203 and 205 and declined in
samples 314 and 315. With one exception (305), O2:CO2 flux ratios were less than 1.3,
which is the ratio expected from aerobic degradation with complete nitrification. There was
net release of DIN to the water column in all the samples from the ZMR, net uptake of DIN
in the three samples from the BWZ and a mixture of uptake and release in the CTZ
(Table 2). There was no distinct regional pattern in either the O2 or CO2 fluxes (Fig. 6a).
There was reasonable agreement between the DIN fluxes into the ZMR water column
measured in the core incubations (0.7 (SD 0.8) mmol m-2 day-1) and the flux inferred
from changes in salinity and NOx concentration in ZMR (0.38 mmol m-2 day-1; descri-
bed below).
4.3 Water Column Properties
During the dry season, the salinity in the study region tended to be highest in the Fitzroy
estuary, tidal creeks and in the eastern reaches of Keppel Bay and along its western shore.
This salinity enhancement over offshore waters is attributed to evaporation. NOx and FRP
concentrations measured in the ZMR increased approximately linearly with salinity. This
increase was much greater than that expected due to concentration by evaporation (Fig. 7).
Table 2 O2, CO2 and nutrient fluxes from the core incubation experiments
Zone Sample O2 flux(mM m-2 day-1)
CO2
(mM m-2 day -1)O2 drop(mg L-1)
DIN Flux(mM m-2 day-1)
FRP flux(mM m-2 day-1)
CTZ 196 -10.7 18.1 1.91 -0.16 -0.02
CTZ 198 -18.5 21.3 3.78 -0.05 -0.01
CTZ 200 -8.5 9.9 0.96 -0.04 0.02
CTZ 204 -10.9 9.8 2.33 N/A N/A
CTZ 205 -15.9 41.2 1.74 N/A N/A
CTZ 305 -6.3 3.6 1.05 0.05 0.01
CTZ 306 -11.7 22.9 1.88 1.77 -0.02
BWZ 201 -7.5 19.3 1.4 -0.53 -0.01
BWZ 202 -8.7 8.0 1.91 -0.94 -0.08
BWZ 203 -15.0 31.2 2.28 -0.15 0.01
ZMR 308 -6 11.9 1.07 0.22 0.06
ZMR 310 -8.3 15.9 1.49 0.07 -0.01
ZMR 311 -7.5 17.7 1.21 0.33 -0.04
ZMR 314 -8.3 49.5 1.39 1.99 -0.07
ZMR 315 -6.8 53.6 1.15 0.39 -0.03
ZMR 319 -6.9 12.5 1.13 0.42 -0.02
Negative fluxes imply uptake by sediment and positive fluxes imply release from sediment
Aquat Geochem (2010) 16:1–29 13
123
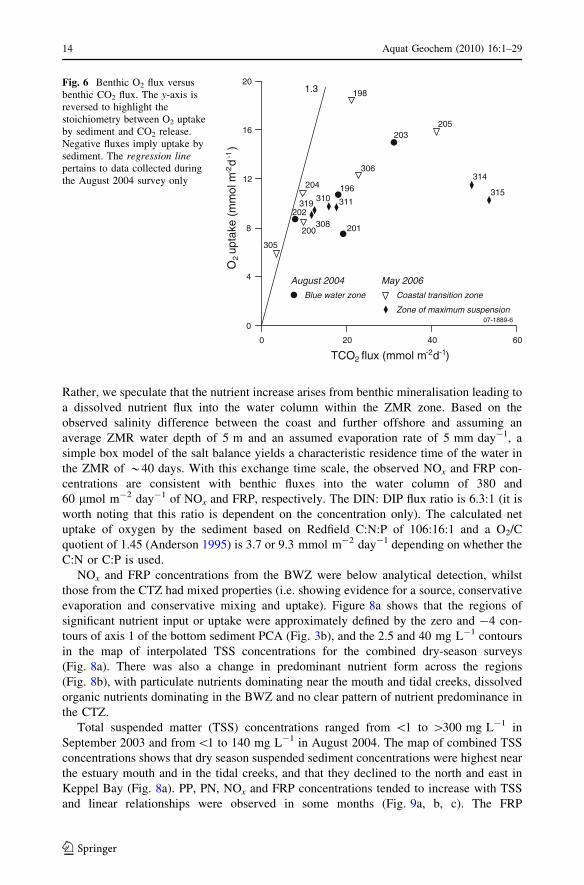
Rather, we speculate that the nutrient increase arises from benthic mineralisation leading to
a dissolved nutrient flux into the water column within the ZMR zone. Based on the
observed salinity difference between the coast and further offshore and assuming an
average ZMR water depth of 5 m and an assumed evaporation rate of 5 mm day-1, a
simple box model of the salt balance yields a characteristic residence time of the water in
the ZMR of *40 days. With this exchange time scale, the observed NOx and FRP con-
centrations are consistent with benthic fluxes into the water column of 380 and
60 lmol m-2 day-1 of NOx and FRP, respectively. The DIN: DIP flux ratio is 6.3:1 (it is
worth noting that this ratio is dependent on the concentration only). The calculated net
uptake of oxygen by the sediment based on Redfield C:N:P of 106:16:1 and a O2/C
quotient of 1.45 (Anderson 1995) is 3.7 or 9.3 mmol m-2 day-1 depending on whether the
C:N or C:P is used.
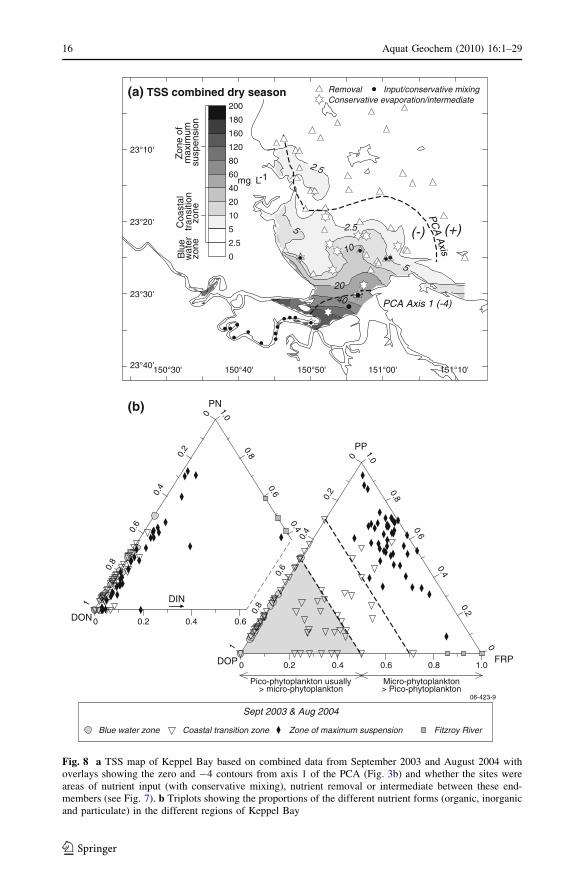
NOx and FRP concentrations from the BWZ were below analytical detection, whilst
those from the CTZ had mixed properties (i.e. showing evidence for a source, conservative
evaporation and conservative mixing and uptake). Figure 8a shows that the regions of
significant nutrient input or uptake were approximately defined by the zero and -4 con-
tours of axis 1 of the bottom sediment PCA (Fig. 3b), and the 2.5 and 40 mg L-1 contours
in the map of interpolated TSS concentrations for the combined dry-season surveys
(Fig. 8a). There was also a change in predominant nutrient form across the regions
(Fig. 8b), with particulate nutrients dominating near the mouth and tidal creeks, dissolved
organic nutrients dominating in the BWZ and no clear pattern of nutrient predominance in
the CTZ.
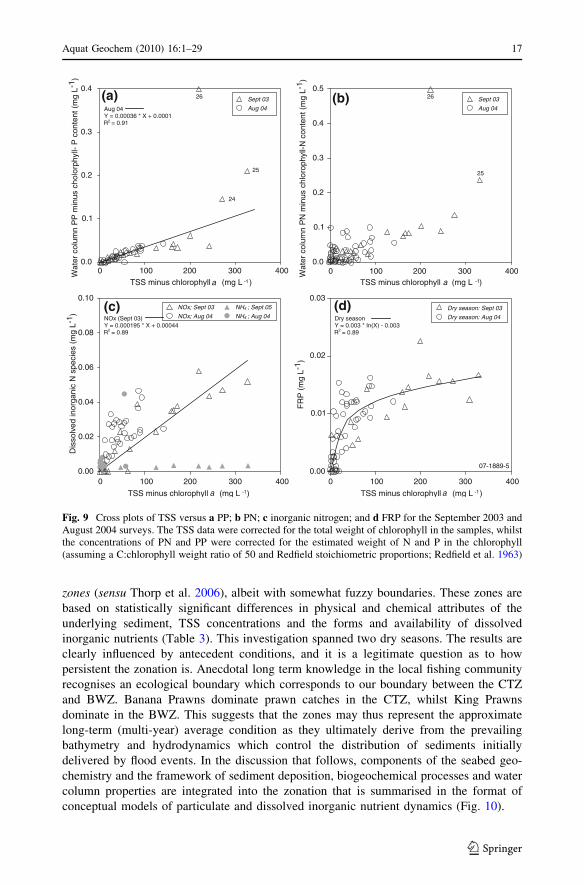
Total suspended matter (TSS) concentrations ranged from \1 to [300 mg L-1 in
September 2003 and from\1 to 140 mg L-1 in August 2004. The map of combined TSS
concentrations shows that dry season suspended sediment concentrations were highest near
the estuary mouth and in the tidal creeks, and that they declined to the north and east in
Keppel Bay (Fig. 8a). PP, PN, NOx and FRP concentrations tended to increase with TSS
and linear relationships were observed in some months (Fig. 9a, b, c). The FRP
6040200
0
4
8
12
16
20
306
196
305
201
204
202
200308
319310 311
2-2
-
1
-2 -12TCO flux (mmol m d )
May 2006August 2004
198
203205
314
315
Blue water zone
O u
ptak
e (m
mol
m d
)
1.3
07-1889-6
Coastal transition zone
Zone of maximum suspension
Fig. 6 Benthic O2 flux versusbenthic CO2 flux. The y-axis isreversed to highlight thestoichiometry between O2 uptakeby sediment and CO2 release.Negative fluxes imply uptake bysediment. The regression linepertains to data collected duringthe August 2004 survey only
14 Aquat Geochem (2010) 16:1–29
123

concentrations were near constant when TSS was higher than *30 mg L-1 (Fig. 9d;
samples 1, 2, 227–229 from the Fitzroy Estuary excluded).
5 Discussion
5.1 Biogeochemical Zonation
Despite the inherent complexity of the system, there were distinct patterns in most bio-
physical characteristics, allowing Keppel Bay to be divided into three functional process
38373635
0
-1
(a)
0
35
(b)
Blue water zone
07-1889-11
Zone of maximum resuspension
NO
x (m
g L
)
Salinity
0.01
0.02
0.03
0.04
0.05
0.004
0.008
0.012
0.016
-1F
RP
(m
g L
)
Salinity
Coastal transition zone
36 37 38
Conservative evaporation (GBR inshore)
Conservative mixing
Fig. 7 Mixing diagrams(nutrients versus salinity) forNOx and FRP data sets (August2004 only). Average of data forthe inner GBR waters (SwainsReefs; Furnas and Brodie 1996)is also shown and forms the basisof the conservative evaporationtrend which extends through theorigin
Aquat Geochem (2010) 16:1–29 15
123
5
2040
Sept 2003 & Aug 2004
FRP0 0.2 0.4 0.6 0.8 1.0
0
1.0
0.8
0.6
0.4
0.2
DOP
PP
0
1
0.8
0.6
0.4
0.2
1.0
0.8
0.6
PN
0
0.2
0.4
0 0.2DON
1
0.8
0.6
0.4
Pico-phytoplankton usually> micro-phytoplankton
Micro-phytoplankton> Pico-phytoplankton
06-423-9
Blue water zone
PCA Axis 1 (-4)
2.5
2.5
5
10
PC
A A
xis
(-) (+)
150°30 150°40 150°50 151°00 151°10'151°1023°40
23°30
23°20
23°10
200
180
160
120
80
40
60
20
10
5
2.5
0
(a) TSS combined dry season
Fitzroy River
0.6
0.4
mg L-1
DIN
Coastal transition zone Zone of maximum suspension
Blu
ew
ater
zone
Coa
stal
tran
sitio
nzo
ne
Zon
e of
max
imum
susp
ensi
on
RemovalConservative evaporation/intermediate
Input/conservative mixing
(b)
Fig. 8 a TSS map of Keppel Bay based on combined data from September 2003 and August 2004 withoverlays showing the zero and -4 contours from axis 1 of the PCA (Fig. 3b) and whether the sites wereareas of nutrient input (with conservative mixing), nutrient removal or intermediate between these end-members (see Fig. 7). b Triplots showing the proportions of the different nutrient forms (organic, inorganicand particulate) in the different regions of Keppel Bay
16 Aquat Geochem (2010) 16:1–29
123
zones (sensu Thorp et al. 2006), albeit with somewhat fuzzy boundaries. These zones are
based on statistically significant differences in physical and chemical attributes of the
underlying sediment, TSS concentrations and the forms and availability of dissolved
inorganic nutrients (Table 3). This investigation spanned two dry seasons. The results are
clearly influenced by antecedent conditions, and it is a legitimate question as to how
persistent the zonation is. Anecdotal long term knowledge in the local fishing community
recognises an ecological boundary which corresponds to our boundary between the CTZ
and BWZ. Banana Prawns dominate prawn catches in the CTZ, whilst King Prawns
dominate in the BWZ. This suggests that the zones may thus represent the approximate
long-term (multi-year) average condition as they ultimately derive from the prevailing
bathymetry and hydrodynamics which control the distribution of sediments initially
delivered by flood events. In the discussion that follows, components of the seabed geo-
chemistry and the framework of sediment deposition, biogeochemical processes and water
column properties are integrated into the zonation that is summarised in the format of
conceptual models of particulate and dissolved inorganic nutrient dynamics (Fig. 10).
25
24
26 26
25
NH ; Sept 05NOx; Sept 03
NOx; Aug 04 NH ; Aug 044
4
0 100 200 300 400
0.10
0.08
0.06
0.04
0.02
0.00 0.00
0.0
0.1
0.2
0.3
0.4
0.50.4
0.3
0.2
0.1
0.0
Wat
er c
olum
n P
P m
inus
cho
lorp
hyll-
P c
onte
nt (
mg
L-1 )
Wat
er c
olum
n P
N m
inus
chl
orop
hyll-
N c
onte
nt (
mg
L-1 )
F
RP
(m
g L-
1 )
TSS minus chlorophyll (mg L )a -1
a -1 a -1
aTSS minus chlorophyll (mg L )
TSS minus chlorophyll (mg L ) TSS minus chlorophyll (mg L )
-1
NOx (Sept 03)Y = 0.000195 * X + 0.00044R = 0.89
Dry seasonY = 0.003 * In(X) - 0.003R = 0.89
Aug 04Y = 0.00036 * X + 0.0001R = 0.912
2 2
(a) (b)
(d)(c) Dry season: Sept 03
Dry season: Aug 04
Sept 03
Aug 04
Sept 03
Aug 04
07-1889-5
0.03
0.02
0.01
Dis
solv
ed in
orga
nic
N s
peci
es (
mg
L-1 )
0 100 200 300 400
0 100 200 300 4000 100 200 300 400
Fig. 9 Cross plots of TSS versus a PP; b PN; c inorganic nitrogen; and d FRP for the September 2003 andAugust 2004 surveys. The TSS data were corrected for the total weight of chlorophyll in the samples, whilstthe concentrations of PN and PP were corrected for the estimated weight of N and P in the chlorophyll(assuming a C:chlorophyll weight ratio of 50 and Redfield stoichiometric proportions; Redfield et al. 1963)
Aquat Geochem (2010) 16:1–29 17
123
Tab
le3
Som
ephysi
cal,
chem
ical
and
ecolo
gic
alch
arac
teri
stic
sof
the
wat
erco
lum
nan
dbott
om
sedim
ents
of
dif
fere
nt
regio
ns
of
Kep
pel
Bay
:F
itzr
oy
mouth
and
app
roac
hes
(ZM
R);
inn
erK
epp
elB
ay(C
TZ
);an
do
ute
rK
epp
elB
ay(B
WZ
)
Var
iab
leF
itzr
oy
mou
than
dap
pro
ach
es(Z
MR
)In
ner
Kep
pel
Bay
(CT
Z)
Ou
ter
Kep
pel
Bay
(BW
Z)
Wa
ter
colu
mn
nu
trie
nts
an
dT
SS
(med
ian
s;2
5th
–7
5th
per
cen
tile
ran
ge;
min
imu
m—
ma
xim
um
)
Nu
trie
nt
beh
avio
ur
Inp
ut;
con
serv
ativ
em
ixin
gIn
pu
t;re
mo
val
;co
nse
rvat
ive
evap
ora
tio
nR
emo
val
Lim
itin
gfa
cto
rL
igh
tN
itro
gen
Ph
osp
horu
s
TS
S(m
gL
-1)
56
;3
1–
90
;1
3–
32
6*
**
4.5
;2
.0–7
.6;\
1–
45.5
**
*0
.9;
0.6
–1
.6;\
1–
4
NO
x(m
gL
-1)
0.0
26
;0
.018
–0
.03
5;
0.0
07
–0
.05
8?
BD
;B
D;
BD
-0.0
23
?B
D;
BD
;B
D
FR
P(m
gL
-1)
0.0
12
;0
.009
–0
.01
4;
0.0
05
–0
.17
?B
D;
BD
-0.0
02
;B
D-0
.01
?B
D;
BD
;B
D
TN
:TP
(mo
lar)
12
;1
0–
15
;4
–2
7*
**
30
;2
4–
36
;1
0–
58
**
*4
1;
30
–50
;1
8–
10
3
DIN
:FR
P(m
ola
r)4
.9;
4.4
–6
.1;
2.2
–1
4.2
**
*2
.2;
2.2
–5
.2;
1.7
–6
.2?
N/A
Wa
ter
colu
mn
pig
men
ts(m
edia
ns;
25
th–
75th
per
cen
tile
ran
ge;
min
imu
m—
max
imu
m)
Ch
loro
ph
yll
a(l
gL
-1)
1.6
;1
.4–1
.9;
0.8
–2
.6*
**
0.2
;0
.2–0
.2;
0.0
–0
.9*
**
0.1
8;
0.1
5–
0.2
3;
0.0
–0
.94
%P
ico
phy
top
lan
kto
n2
2;
20
–24
;1
6–
26
*4
3;
25
–47
;2
2–
53
**
47
;4
4–
53
;3
3–
76
%M
icro
ph
yto
pla
nkto
n7
1;
69
–74
;6
6–
79
**
46
;4
3–
65
;3
8–
70
**
38
;3
5–
45
;1
1–
53
Bott
omse
dim
ent
data
(med
ians;
25th
–75
thper
centi
lera
nge
;m
inim
um
—m
axim
um
)
Sed
imen
tg
rou
pM
FR
–M
&sM
MF
R–m
S&
SR
EL
–S
%M
ud
45
;1
2–
78
;1
–9
6*
13
;2
–3
1;\
1–
96
**
*\
1;\
1–
2;\
1–
19
Fe
(mg
g-
1)
37
;1
9–
44
;8
–4
8*
*1
8;
13
–23
;9
–5
1*
**
7;
5–
10;
3–
17
Av
aila
ble
P(m
gg
-1)
0.1
6;
0.1
6–
0.1
9;
0.1
1–
0.2
**
0.0
7;
0.0
6–
0.0
9;
0.0
3–
0.2
1*
**
0.0
2;
0.0
2–
0.0
3;
0.0
1–
0.0
7
TO
C(m
gg
-1)
3.9
;2
.5–5
.3;
0.3
8–
6.0
1*
**
0.8
9;
0.3
6–
1.8
4;
0.1
3–
6.9
5*
**
0.2
3;
0.2
1–
0.3
6;
0.1
3–
0.7
5
TN
(mg
g-
1)
0.5
1;
0.3
1–
0.7
;0
.08–
0.9
3*
*0
.31
;0
.15–
0.3
9;
0.0
6–
1.1
5*
**
0.0
9;
0.0
7–
0.1
1;
0.0
7–
0.2
5
TP
(mg
g-
1)
0.4
2;
0.3
6–
0.4
7;
0.2
1–
0.5
5*
**
0.3
2;
0.2
5–
0.3
6;
0.2
–0
.59
**
*0
.19
;0
.16–
0.2
3;
0.1
2–
0.3
1
TO
C:T
N(m
ola
r)3
.4;
2.7
–3
.8;
1.9
–7
.6*
**
5.3
;3
.7–5
.5;
0.5
–4
9.8
**
*8
;5
.9–9
.9;
4.6
–1
3.4
Th
ed
iffe
ren
ceb
etw
een
two
sam
ple
mea
ns
(ZM
Rv
ersu
sC
TZ
and
CT
Zv
ersu
sB
WZ
)fo
ral
lv
aria
ble
sw
asan
aly
sed
usi
ng
aW
ilco
xo
nra
nk
sum
test
inR
(RD
evel
op
men
tC
ore
Tea
m2
00
7),
asth
esa
mp
les
are
eith
ern
on
-no
rmal
ind
istr
ibu
tio
no
rh
eter
ogen
eou
sin
var
ian
ce.
Th
ere
sult
ssh
ow
that
the
dif
fere
nce
bet
wee
ntw
osa
mp
les
isst
atis
tica
lly
sign
ifica
nt
for
all
var
iab
les.
Res
ult
s(p
val
ues
)ar
esh
ow
nin
the
CT
Zco
lum
n:
pB
0.0
5(*
);p
B0
.01
(**
);p
B0
.00
1(*
**
);an
din
det
erm
inab
le(?
).S
ym
bo
lso
nth
ele
fth
and
side
of
the
nu
mb
ers
inth
eC
TZ
colu
mn
refe
rto
com
par
iso
ns
mad
eb
etw
een
the
ZM
Ran
dth
eC
TZ
,an
dsy
mb
ols
on
the
rig
ht
han
dsi
de
refe
rto
com
par
iso
ns
bet
wee
nth
eC
TZ
and
the
BW
Z.
BD
refe
rsto
nu
trie
nt
con
cen
trat
ion
sth
atw
ere
bel
ow
the
lim
its
of
anal
yti
cal
det
ecti
on
18 Aquat Geochem (2010) 16:1–29
123

5.1.1 The Zone of Maximum Resuspension
Processes occurring in turbidity maximum zones exert a fundamental control on nutrient
cycling in coastal areas (Abril et al. 2000; Goni et al. 2005). This zone arises in Keppel
Bay, because of the large currents, geomorphic factors and asymmetric tides. In other
systems, tidal asymmetries, gravitational circulation and stratification all contribute
(reviewed in Goni et al. 2005). MFR sediments form the seabed near the estuary mouth and
in the near-shore area between Cattle Point and Keppel Sands (Fig. 3b). Sediment transport
modelling has shown that these are the regions where the highest deposition rates of
sediments occur under low- and moderate flood conditions (Webster et al. 2006). However,
the ZMR encompassing the Fitzroy mouth (delta) and tidal creeks is shallow and had the
highest percentage of sediment in the mud size fraction (Table 3). The co-occurrence of
fine grain sizes with very high shear velocities was first described in the high-energy
Severn Estuary (Hamilton 1979).
07-1889-2
Zone of maximumresuspension
Fitzroy mouth & approches
Costal transitionzone
Inner Keppel Bay
Zone of maximumresuspension
Fitzroy mouth & approches Outer Keppel Bay
Sands
Muddy sands
Muds andsandy muds
Uptake by phytoplankton
Muddy sands
Sands
Mineralisation
Wave resuspension
Burial
Burial
2N
net n fixation
2(b) Fitzroy low flow - dissolved inorganic nutrients (and N )
net denitrification
net denitrification
Blue waterzone
Blue waterzone
Mixing transport
Resuspension
Inner Keppel Bay
Outer Keppel Bay
Mixing transport
(a) Fitzroy low flow - sediment-bound nutrients
DIN
Mineralisation in bed
Decomposition inwater column
Net baywardtransport
Muds andsandy muds
Net shorewardtransport
Costal transitionzone
Fig. 10 Conceptual models of a particulate nutrient dynamics; and b dissolved inorganic nutrient dynamicsin Keppel Bay. The diagrams are divided into three functional process regions: the Zone of MaximumResuspension; the coastal transition zone; and the blue water zone which correspond to the Fitzroy mouthand approaches to the tidal creeks, and near-shore Keppel Bay, respectively. The elements pertaining to N-fixation are from Webster and Radke (2006)
Aquat Geochem (2010) 16:1–29 19
123

Fine sediments are delivered to Keppel Bay during floods, but most of these settle out
near the mouth of the Fitzroy estuary due to flocculation. Subsequently, these sediments
undergo cycles of settling and resuspension due to the strong tidal currents. Some sediment
escapes and is transported towards the north-west by the prevailing current. Much of the
sediment is pumped back into the Fitzroy estuary and tidal creeks through tidal asymmetry
where it is ultimately buried (Ryan et al. 2007). The flood-tide is shorter in the estuary and
thus faster than the ebb-tide, and resuspends more sediment on the inflow than the outflow.
A study of Chesapeake Bay has highlighted that retention of PP and PN in an estuary
depends critically on the retention of particulate organic matter (POM), which is controlled
by geomorphology and circulation patterns (Boynton et al. 1995). Based on measured
sedimentation rates and nutrient concentrations within the sediment column, the amount of
nutrient buried appears to be approximately 30% and 50% of the modern inputs of TN and
TP by the Fitzroy River to its estuary (Webster et al. 2006). Most of the sediment accu-
mulation occurs on the floodplain and in the ZMR (Bostock et al. unpublished data).
Indeed, deltas are the most important depocenters for organic carbon (Corg; and nutrients)
in marine environments, accounting for about 50% of the global burial flux (Hedges and
Keil 1995).
The dry season mixing diagrams had an inverse structure with the highest inorganic
nutrient concentrations occurring at the highest salinity levels in the near-shore areas of the
ZMR (Fig. 7). These inshore salinity levels were elevated by as much as one over values
further offshore and are attributed to evaporation. Such conditions (evaporation exceeds
precipitation giving rise to elevated salinity) typify inverse estuaries such as Shark Bay
(Smith and Atkinson 1983), Spencer Gulf (Smith and Veeh 1989) and San Quintin Bay
(Camacho-Ibar et al. 2003), which are found in the arid tropical to subtropical regions
(Eyre 1998).
Both the core incubation experiments, and the simple box model based on the spatial
distribution of salinity in the ZMR, show fluxes of NOx and FRP from the sediments in this
ZMR. In contrast the core incubation flux data in the other two zones (Table 2) indicates
net up-take of DIN probably by benthic phytoplankton growing in the better (vis a vis
ZMR) light climate. The FRP fluxes are too small to draw any valid conclusions. The
measured O2 fluxes for ZMR (average 7.9 (SD 0.9) mmol m-2 day-1) fall between the
values estimated from the DIN and DIP fluxes. The differences in O2 fluxes between the
different zones are slight and, if anything, the CTZ zone actually has a higher O2 flux than
the other two zones. This is contrary to the fluidized bed sub-oxic reactor paradigm as the
mud zone with greatest resuspension usually has the highest metabolic rate. The benthic O2
fluxes throughout Keppel Bay are all substantially less than those measured in the mud
zone of the Gulf of Papua (Alongi 1995). This suggests that the reactivity of the organic
matter is less in Keppel Bay.
Soil organic carbon is the principle form of organic matter entering the Fitzroy Estuary
(Ford et al. 2005), and a mineral sediment also dominates TSS in the ZMR (Oubelkheir
et al. 2006). Likewise, sediment-bound nutrients were the main form of nutrients near the
Fitzroy mouth at the time of the dry season surveys (Figs. 8, 9). The ZMR seabed sedi-
ments had the highest carbon and nutrient concentrations for the bay because the delivery
of mineral with high surface area is a key control on organic matter preservation in coastal
margin settings (Keil et al. 1997). Terrestrial weathering has caused progressive fining of
soil and increases in the specific surface area and secondary (reactive) iron mineral con-
centrations. The observed linear increase in Fe concentrations per unit mass of sediment
with the specific area of these sediments (i.e. 0.46 mg Fe m2 sediment; Fig. 5a) is con-
sistent with the weathering process. The amount of carbon and nutrients per Fe surface area
20 Aquat Geochem (2010) 16:1–29
123
equivalent of the Keppel Bay surface sediments were similar to those of underlying
Holocene age sediment (vibracores in Fig. 5b, c, d), suggesting that most of the organic
matter we see in surface sediments is refractory. Indeed, the carbon and nutrient con-
centrations of the seabed sediments were *40–65% lower than those of the parent sedi-
ments/soils from the catchment (Fig. 5b, c, d) suggesting that there has been desorption or
degradation of a significant component of the terrestrial POM. This result is consistent with
global patterns: POM is delivered by rivers at approximately twice the rate that it accu-
mulates in marine sediment (Keil et al. 1997). The ZMR is thus a zone where dissolved
nutrients are being released from particulate terrestrially sourced sediments.
Terrestrial particles undergo major transitions in surface characteristics, chemistry and
microbiology when they enter seawater, and even seemingly recalcitrant organic sub-
stances can be degraded in energetic deltaic settings and replaced with recently formed
marine substances (Fig 4b; Aller et al. 1996). Physical disturbance and re-working of
sediments, when coupled with the input of Fe-oxide rich debris, produces a particularly
efficient decomposition system characterised by repetitive redox successions (oxic to sub-
oxic, temporarily sulfidic), iron re-oxidation and metabolite exchange (i.e. the sub-oxic
batch reactor; Aller et al. 1996).
The O2:CO2 in core incubation experiments on ZMR sediments (Fig. 6) lie substantially
below 1.3 suggesting the involvement of sub-oxic processes in the remineralisation of the
sediment organic matter. Iron-oxyhydroxide reduction is likely a dominant process because
TS concentrations \0.1% and Fe concentrations in the range of 42.8–50 mg g-1 are
geochemical features that ZMR muddy sediments share with Amazon shelf sediments
where the sub-oxic batch reactor concept was developed (Aller et al. 1986). The ZMR
bottom sediments are an important source of nitrate to the water column (Table 2) as in
other tropical systems (Eyre 1994). Release of inorganic nitrogen to the water column
would likely be facilitated by resuspension, as demonstrated in nearby Bowling Green Bay
(Ullman and Sandstrom 1987).
Water column NOx concentrations in the ZMR typically ranged from 0.018 to
0.035 mg L-1 (Table 3), which is higher than those observed during the dry-season in
some tropical Australian estuaries with near-pristine catchments (Annan, Daintree and
Jardine; Eyre and Balls 1999). These concentrations were also higher than those measured
at the seaward end (salinity [30) of the Moresby Estuary, which is another tropical tide-
dominated system with significant disturbance in the catchment (Eyre 1994). The median
NOx concentration (0.026 mg L-1; Table 3) was also similar to those found in nine wave-
dominated, subtropical deltas (Australia) subject to discharge of varying amounts of
wastewater DIN (Eyre 2000). It is likely that some NOx was derived from the nitrification
of NH4? previously adsorbed onto sediment particles because a cross-plot of sediment TN
versus TOC (not shown) had a y-intercept of 0.32 mg g-1 TN for muddy sediments,
indicating that there was an inorganic sediment N pool as well as another pool involving
organic matter. In addition, NOx concentrations correlated with TSS in September 2003
when the sampling of Casuarina Creek coincided with spring-tide conditions and higher
TSS levels were observed (Fig. 9c). Chemical studies of the Tamar Estuary have shown
that nitrification rates are often high in resuspension zones because waters over there are
highly oxygenated and nitrifying bacteria occur attached to sediment particles (Owens
1986).
FRP concentrations in the ZMR typically ranged from 0.009 to 0.014 mg L-1
(Table 3). These concentrations are considerably higher than those observed in the near-
pristine tropical estuaries during both the wet and dry seasons (Eyre and Balls 1999). The
median concentration was 0.012 mg L-1 (Table 3) and was similar to average dry-season
Aquat Geochem (2010) 16:1–29 21
123

concentrations reported for some wave- and tide-dominated deltas with greater catchment
modification (Eyre 1994; Eyre and Balls 1999). Except at a few sites, the FRP concen-
trations tended to stabilize, with increasing TSS, at *0.015 mg L-1 (Fig. 9d). This was
likely due to the phosphate buffer mechanism (Froelich 1988) because the shape of the
FRP relationship with TSS resembled a Langmuir isotherm for phosphorus adsorption
(Webster et al. 2001; Fig. 9d), and the role of adsorption to Fitzroy marine sediments in
controlling phosphate concentration has been demonstrated (Payne et al. 2002). The strong
correlation between TP and Fe in the underlying sediment (Figure 5d) also suggests that
equilibration with solid phase ferric iron is an important control on FRP concentrations.
The partially reversible adsorption of phosphate onto sediment usually regulates concen-
trations in estuaries at higher levels than we observed (i.e. 0.019–0.043 mg L-1; reviewed
in Eyre 1994). Many factors can influence the nature phosphate buffering including pH,
ionic strength and sediment composition (reviewed in Eyre 1994).
Total suspended matter (TSS) concentrations were high (Table 3) compared to wet- and
dry-season concentrations from other tropical tide-dominated systems (Eyre 1994; Eyre
and Balls 1999), and undergo a pronounced semi-diurnal variation whose amplitude varies
over the 14-day spring-neap tidal cycle. Interestingly, chlorophyll a concentrations were
highest for Keppel Bay in the Fitzroy mouth region (Table 3; Oubelkheir et al. 2006),
whilst estimated production rates, which varied by only a factor of three in Keppel Bay
(August 2004), were comparatively low (Ford, unpublished data). The chlorophyll may
have been derived from algae washed from the mud banks. Presumably, production was
limited by the availability of light allowing dissolved inorganic nutrients to build up in the
water column to the extent that the estimated timescale of dissolved inorganic nitrogen
utilisation was in the order of a few days (Ford, unpublished data). This effect of TSS in
delaying nutrient utilisation by phytoplankton has been observed in many rivers including
the Mississippi (Lohrenz et al. 1999), the Changjiang (Tian et al. 1993) and the Amazon
(Smith and DeMaster 1996). The ZMR thus appears to represent a zone in which inorganic
nutrients are generated and then transported by tidal and wind-driven currents to further
offshore where the light climate is more conducive to their biological utilisation.
5.1.2 The Blue Water Zone
The second zone in our classification is the clear blue low inorganic nutrient waters of
outer Keppel Bay. The BWZ (Fig. 10) is roughly coincident with the distribution of relict
sands (Fig. 3b). Ryan et al. (2007) sees the relict sands (REL-S) as a former sandy coastal
plain that was drowned by rising sea levels in the early Holocene. These sediments have
lower Fe, carbon and nutrient concentrations due to their extended presence in the marine
environment (Table 3): the feldspars have broken down into clays, which have winnowed
out of the seabed by hydrodynamic processes, whilst more resistant quartz has been
retained. The effect of waves on resuspension is diminished due to larger depths ([10 m)
and particle sizes, and TSS is mainly less than 2 mg L-1 (Table 3).
Phytoplankton dominate TSS in these clear offshore waters (Oubelkheir et al. 2006), and
dissolved N and P pools were strongly dominated by organic nutrients (Fig. 8b). The tran-
sition to the BWZ may constitute a domain shift in the terminology of Karl et al. (2001)
because it was marked by a parallel increase in phytoplankton diagnostic pigments indicative
of cyanobacteria, and in the overall dominance of pico-phytoplankton (Table 3; Oubelkheir
et al. 2006). The pico-cyanobacteria genera Synechococcus and Prochlorococcus usually
dominate primary production and phytoplankton biomass in offshore Great Barrier
Reef waters (Furnas et al. 2005), and likely also in Keppel Bay. Tufts of nitrogen-fixing
22 Aquat Geochem (2010) 16:1–29
123
Trichodesmium were also frequently observed in near-surface waters. Trichodesmium is
known to supply nitrogen to the GBR in amounts similar to those entering from the GBR
catchment area, and community dynamics are expected to shift towards phosphorus limi-
tation in the presence of such large amounts of fixed-N (Bell et al. 1999). Indeed, pico-
phytoplankton biomass tends to be highest in oligotrophic and especially P-limited waters
(Joint 1986; Agawin et al. 2004), whilst micro-phytoplankton are known to out-compete
smaller species in areas of high nutrient supply (Donald et al. 1997). P-limitation has been
documented in Moreton Bay (Eyre and McKee 2002) and in several estuaries in subtropical
eastern Australia (Eyre 2000), whilst nutrient limitation was evident in the BWZ in NOx and
FRP concentrations that were always below the limits of analytic detection (Table 3).
Positive correlations between pico-phytoplankton biomass and TN:TP supply ratios
have been observed in a few studies (Stockner and Shortreed 1988; Suttle and Harrison
1988; Takamura and Nojiri 1994), and are consistent with our observations. Most TN:TP
ratios were in a range from 30 to 50 in outer Keppel Bay, compared to 24–36 in the CTZ
and 10–15 near the estuary mouth (Table 3). The success of pico-phytoplankton in
nutrient-depleted waters may in part rely on their ability to utilise numerous and sometimes
novel organic P and N sources including cyanates and phosphonates (Fuller et al. 2005),
and in part on their different uptake efficiencies. For example, Donald et al. (1997)
demonstrated that P-starved Synechococcus possessed a lower half saturation concentration
for inorganic-P uptake than certain diatoms, although the uptake of P by diatoms was faster
under P-replete conditions. Moreover, some Trichodesmium are known to utilise compo-
nents of the DOP pool for their P-nutrition (Mulholland et al. 2002), and that includes
species found in Great Barrier Reef waters (Bell et al. 2005). Trichodesmium are also
known to excrete up to 50% of the nitrogen they fix in the form of DON (Glibert and Bronk
1994). Therefore, uptake of DOP and/or release of DON by Trichodesmium (and other
species) are possible explanations for higher TN:TP ratios in outer Keppel Bay (Table 3).
The apparent P-limitation may be related to the low bio-available P concentrations of the
seabed sediments (Fig. 4a; Table 3). The relict sands found in this region had the highest
proportions of residual-P. The minerals that make up the residual-P pool may include
resistant rare-earth phosphates such as xenotime and monazite. These minerals are likely to
occur in the granitic terrain of the New England Fold Belt, and can contain as much as 25%
phosphate by weight.
Based on very limited data (Table 3) the sediments of the BWZ were a net sink for DIN,
and to a lesser extent FRP. Competition for water column DIN for heterotrophic and
autotrophic metabolism increases with light availability (Ferguson et al. 2007), and may
explain why only net uptake of nitrogen was observed in BWZ sediments but not else-
where in the Bay. As with most GBR waters, the bulk of phytoplankton N and P demand in
the BWZ is probably met by microbial cycling in the water column (Furnas and Brodie
1996).
5.1.3 The Coastal Transition Zone
The CTZ (Fig. 10) covers inner Keppel Bay, and is characterised by smaller tidal currents
then the ZMR. However, being relatively shallow it is subject to resuspension due to the
combined effects of tidal currents and waves. The CTZ was approximately coincident with
the distributions of MFR sand and muddy-sand sediments (Fig. 3b) and the distribution of
turquoise-coloured waters. MFR muddy-sand sediments are confined to near the coast of
inner Keppel Bay by waves approaching from the east and southeast, and are transported
Aquat Geochem (2010) 16:1–29 23
123

towards the north with the prevailing currents. Episodic winds from the north in summer
and tidal mixing, account for the spread of these sediments in the direction of Hummocky
Island (Fig. 3b).
Except at a few sites, nutrient concentrations in the CTZ tended to lie below the
conservative mixing line evident in the ZMR (Fig. 7). Consequently, one might surmise
that in this region nutrients are being utilised from the water column. The lower turbidity
levels in this zone as compared to the ZMR would favour more vigorous uptake by primary
producers in the water column and on the seabed here. TSS concentrations need to drop
below about 10 mg L-1 in order that there is sufficient light for abundant phytoplankton
growth (reviewed in Devlin and Brodie 2005). TSS in the CTZ was usually in a range from
2 to 8 mg L-1, and the timescale of water column N-utilisation assuming that the mea-
sured photosynthesis rate was associated with nitrogen utilisation at Redfield, ratio (August
2004) ranged from\0.05–0.3 days (Ford, unpublished data). However, tidal advection and
resuspension of sediment caused TSS to fluctuate to as high as 46 mg L-1 (Table 3). As a
consequence, TSS concentrations in CTZ resuspension plumes could increase to above
levels that are generally considered limiting to primary production. This would allow
dissolved nutrients (mainly P) to in some cases follow the conservative mixing lines
(Fig 7a) and move further offshore, as in river flood plumes (Devlin and Brodie 2005).
The CTZ was also unique in the respect that there was no clear pattern in the dominant
form of P (i.e. dissolved organic, inorganic or particulate; Fig. 8b). This was also due to the
fluctuations in TSS (and likewise PP concentrations) modulating light levels and the extent
to which water column FRP could be utilised. The wide tidal excursion prevents any
simple demarcation between the two end-members, and may have also allowed for the
apparent co-dominance of pico-phytoplankton (mainly cyanobacteria) and micro-phyto-
plankton (mainly diatoms; Fig. 8b and Table 3; Oubelkheir et al. 2006). Nitrogen was
probably the limiting nutrient during times of light sufficiency because DIN:FRP ratios
were always less than 10:1 (reviewed in Eyre 2000; Table 3). Low inorganic nitrogen
concentrations in the water column together with moderate concentrations of iron and
available-P in the sediment (Table 3), may account for the apparent occurrence of benthic
N-fixation in this region. Webster and Radke (2006) have estimated that benthic N-fixation
supplies 3,200 ± 1,700 t N year-1 to inner Keppel Bay, which is nearly half of the
amount delivered from the catchment (Brooke et al. 2008). However, the implied N-
fixation rates in this study were high (up to 3.5 mmol day-1), and were based on corre-
lations between sediment Fe3? concentrations and net uptake of di-nitrogen observed in
dark incubation experiments (no light incubations were undertaken). In addition, the
negative N2 fluxes were measured with the N2/Ar method, and are the subject of contro-
versy (C. Smith, written communication, Dec 5/2008). Notwithstanding, N-fixation con-
tributes importantly to the N budgets of other tropical and sub-tropical coastal areas (Eyre
and McKee 2002 and references therein). Thus, it is reasonable to assume that it also has an
important role in Keppel Bay.
Sediment Fe(II) concentrations were high relative to TS and TOC (Fig. 3c). This
relationship points to the widespread occurrence of iron oxyhydroxide reduction in the
CTZ. Particularly high loadings (PCA axis 2) of FeII:FeIII were observed along the
western beach fringe (Fig. 3) where wave-induced reworking of the bottom sediment likely
leads to reoxidation of previously reduced Fe (and Mn) oxides, regenerating a readily
available oxidant for further sub-oxic reactions. The sediments in this region are, by far,
the best sorted in Keppel Bay (Ryan et al. 2007) supporting our hypothesised frequent
reworking. Bacteria rather than macrofauna dominate benthic biomass where there is
24 Aquat Geochem (2010) 16:1–29
123
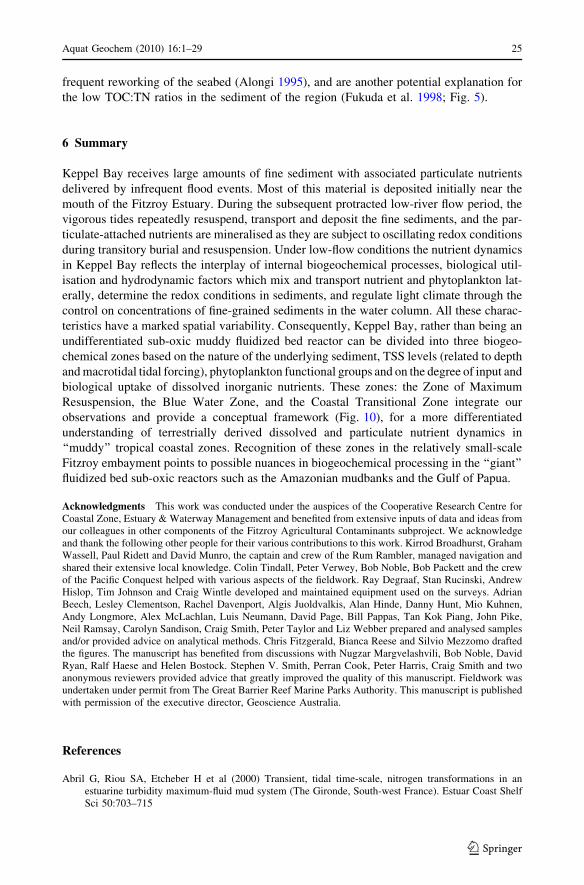
frequent reworking of the seabed (Alongi 1995), and are another potential explanation for
the low TOC:TN ratios in the sediment of the region (Fukuda et al. 1998; Fig. 5).
6 Summary
Keppel Bay receives large amounts of fine sediment with associated particulate nutrients
delivered by infrequent flood events. Most of this material is deposited initially near the
mouth of the Fitzroy Estuary. During the subsequent protracted low-river flow period, the
vigorous tides repeatedly resuspend, transport and deposit the fine sediments, and the par-
ticulate-attached nutrients are mineralised as they are subject to oscillating redox conditions
during transitory burial and resuspension. Under low-flow conditions the nutrient dynamics
in Keppel Bay reflects the interplay of internal biogeochemical processes, biological util-
isation and hydrodynamic factors which mix and transport nutrient and phytoplankton lat-
erally, determine the redox conditions in sediments, and regulate light climate through the
control on concentrations of fine-grained sediments in the water column. All these charac-
teristics have a marked spatial variability. Consequently, Keppel Bay, rather than being an
undifferentiated sub-oxic muddy fluidized bed reactor can be divided into three biogeo-
chemical zones based on the nature of the underlying sediment, TSS levels (related to depth
and macrotidal tidal forcing), phytoplankton functional groups and on the degree of input and
biological uptake of dissolved inorganic nutrients. These zones: the Zone of Maximum
Resuspension, the Blue Water Zone, and the Coastal Transitional Zone integrate our
observations and provide a conceptual framework (Fig. 10), for a more differentiated
understanding of terrestrially derived dissolved and particulate nutrient dynamics in
‘‘muddy’’ tropical coastal zones. Recognition of these zones in the relatively small-scale
Fitzroy embayment points to possible nuances in biogeochemical processing in the ‘‘giant’’
fluidized bed sub-oxic reactors such as the Amazonian mudbanks and the Gulf of Papua.
Acknowledgments This work was conducted under the auspices of the Cooperative Research Centre forCoastal Zone, Estuary & Waterway Management and benefited from extensive inputs of data and ideas fromour colleagues in other components of the Fitzroy Agricultural Contaminants subproject. We acknowledgeand thank the following other people for their various contributions to this work. Kirrod Broadhurst, GrahamWassell, Paul Ridett and David Munro, the captain and crew of the Rum Rambler, managed navigation andshared their extensive local knowledge. Colin Tindall, Peter Verwey, Bob Noble, Bob Packett and the crewof the Pacific Conquest helped with various aspects of the fieldwork. Ray Degraaf, Stan Rucinski, AndrewHislop, Tim Johnson and Craig Wintle developed and maintained equipment used on the surveys. AdrianBeech, Lesley Clementson, Rachel Davenport, Algis Juoldvalkis, Alan Hinde, Danny Hunt, Mio Kuhnen,Andy Longmore, Alex McLachlan, Luis Neumann, David Page, Bill Pappas, Tan Kok Piang, John Pike,Neil Ramsay, Carolyn Sandison, Craig Smith, Peter Taylor and Liz Webber prepared and analysed samplesand/or provided advice on analytical methods. Chris Fitzgerald, Bianca Reese and Silvio Mezzomo draftedthe figures. The manuscript has benefited from discussions with Nugzar Margvelashvili, Bob Noble, DavidRyan, Ralf Haese and Helen Bostock. Stephen V. Smith, Perran Cook, Peter Harris, Craig Smith and twoanonymous reviewers provided advice that greatly improved the quality of this manuscript. Fieldwork wasundertaken under permit from The Great Barrier Reef Marine Parks Authority. This manuscript is publishedwith permission of the executive director, Geoscience Australia.
References
Abril G, Riou SA, Etcheber H et al (2000) Transient, tidal time-scale, nitrogen transformations in anestuarine turbidity maximum-fluid mud system (The Gironde, South-west France). Estuar Coast ShelfSci 50:703–715
Aquat Geochem (2010) 16:1–29 25
123
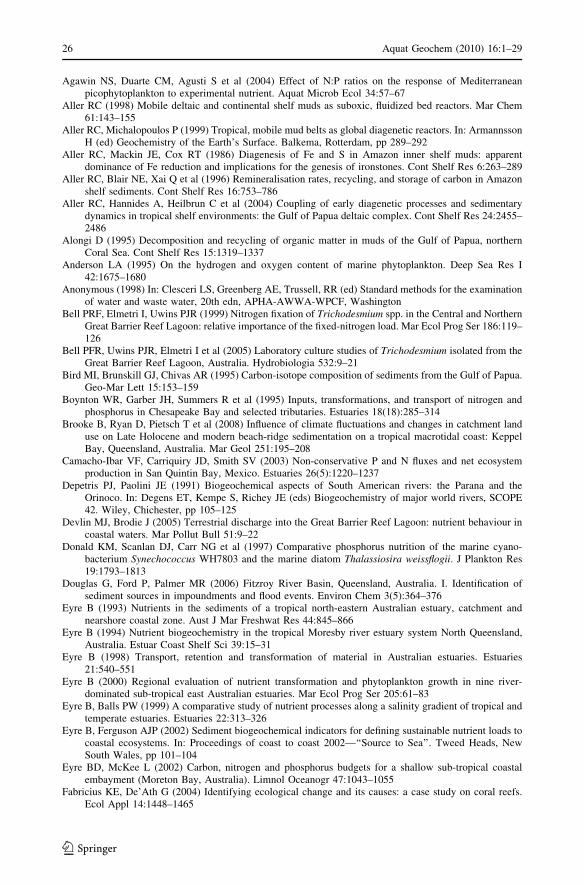
Agawin NS, Duarte CM, Agusti S et al (2004) Effect of N:P ratios on the response of Mediterraneanpicophytoplankton to experimental nutrient. Aquat Microb Ecol 34:57–67
Aller RC (1998) Mobile deltaic and continental shelf muds as suboxic, fluidized bed reactors. Mar Chem61:143–155
Aller RC, Michalopoulos P (1999) Tropical, mobile mud belts as global diagenetic reactors. In: ArmannssonH (ed) Geochemistry of the Earth’s Surface. Balkema, Rotterdam, pp 289–292
Aller RC, Mackin JE, Cox RT (1986) Diagenesis of Fe and S in Amazon inner shelf muds: apparentdominance of Fe reduction and implications for the genesis of ironstones. Cont Shelf Res 6:263–289
Aller RC, Blair NE, Xai Q et al (1996) Remineralisation rates, recycling, and storage of carbon in Amazonshelf sediments. Cont Shelf Res 16:753–786
Aller RC, Hannides A, Heilbrun C et al (2004) Coupling of early diagenetic processes and sedimentarydynamics in tropical shelf environments: the Gulf of Papua deltaic complex. Cont Shelf Res 24:2455–2486
Alongi D (1995) Decomposition and recycling of organic matter in muds of the Gulf of Papua, northernCoral Sea. Cont Shelf Res 15:1319–1337
Anderson LA (1995) On the hydrogen and oxygen content of marine phytoplankton. Deep Sea Res I42:1675–1680
Anonymous (1998) In: Clesceri LS, Greenberg AE, Trussell, RR (ed) Standard methods for the examinationof water and waste water, 20th edn, APHA-AWWA-WPCF, Washington
Bell PRF, Elmetri I, Uwins PJR (1999) Nitrogen fixation of Trichodesmium spp. in the Central and NorthernGreat Barrier Reef Lagoon: relative importance of the fixed-nitrogen load. Mar Ecol Prog Ser 186:119–126
Bell PFR, Uwins PJR, Elmetri I et al (2005) Laboratory culture studies of Trichodesmium isolated from theGreat Barrier Reef Lagoon, Australia. Hydrobiologia 532:9–21
Bird MI, Brunskill GJ, Chivas AR (1995) Carbon-isotope composition of sediments from the Gulf of Papua.Geo-Mar Lett 15:153–159
Boynton WR, Garber JH, Summers R et al (1995) Inputs, transformations, and transport of nitrogen andphosphorus in Chesapeake Bay and selected tributaries. Estuaries 18(18):285–314
Brooke B, Ryan D, Pietsch T et al (2008) Influence of climate fluctuations and changes in catchment landuse on Late Holocene and modern beach-ridge sedimentation on a tropical macrotidal coast: KeppelBay, Queensland, Australia. Mar Geol 251:195–208
Camacho-Ibar VF, Carriquiry JD, Smith SV (2003) Non-conservative P and N fluxes and net ecosystemproduction in San Quintin Bay, Mexico. Estuaries 26(5):1220–1237
Depetris PJ, Paolini JE (1991) Biogeochemical aspects of South American rivers: the Parana and theOrinoco. In: Degens ET, Kempe S, Richey JE (eds) Biogeochemistry of major world rivers, SCOPE42. Wiley, Chichester, pp 105–125
Devlin MJ, Brodie J (2005) Terrestrial discharge into the Great Barrier Reef Lagoon: nutrient behaviour incoastal waters. Mar Pollut Bull 51:9–22
Donald KM, Scanlan DJ, Carr NG et al (1997) Comparative phosphorus nutrition of the marine cyano-bacterium Synechococcus WH7803 and the marine diatom Thalassiosira weissflogii. J Plankton Res19:1793–1813
Douglas G, Ford P, Palmer MR (2006) Fitzroy River Basin, Queensland, Australia. I. Identification ofsediment sources in impoundments and flood events. Environ Chem 3(5):364–376
Eyre B (1993) Nutrients in the sediments of a tropical north-eastern Australian estuary, catchment andnearshore coastal zone. Aust J Mar Freshwat Res 44:845–866
Eyre B (1994) Nutrient biogeochemistry in the tropical Moresby river estuary system North Queensland,Australia. Estuar Coast Shelf Sci 39:15–31
Eyre B (1998) Transport, retention and transformation of material in Australian estuaries. Estuaries21:540–551
Eyre B (2000) Regional evaluation of nutrient transformation and phytoplankton growth in nine river-dominated sub-tropical east Australian estuaries. Mar Ecol Prog Ser 205:61–83
Eyre B, Balls PW (1999) A comparative study of nutrient processes along a salinity gradient of tropical andtemperate estuaries. Estuaries 22:313–326
Eyre B, Ferguson AJP (2002) Sediment biogeochemical indicators for defining sustainable nutrient loads tocoastal ecosystems. In: Proceedings of coast to coast 2002—‘‘Source to Sea’’. Tweed Heads, NewSouth Wales, pp 101–104
Eyre BD, McKee L (2002) Carbon, nitrogen and phosphorus budgets for a shallow sub-tropical coastalembayment (Moreton Bay, Australia). Limnol Oceanogr 47:1043–1055
Fabricius KE, De’Ath G (2004) Identifying ecological change and its causes: a case study on coral reefs.Ecol Appl 14:1448–1465
26 Aquat Geochem (2010) 16:1–29
123
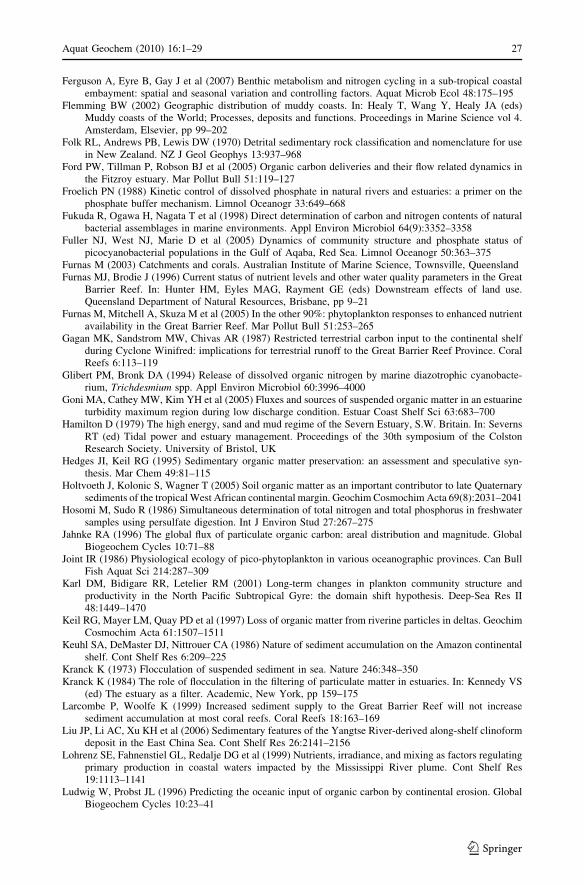
Ferguson A, Eyre B, Gay J et al (2007) Benthic metabolism and nitrogen cycling in a sub-tropical coastalembayment: spatial and seasonal variation and controlling factors. Aquat Microb Ecol 48:175–195
Flemming BW (2002) Geographic distribution of muddy coasts. In: Healy T, Wang Y, Healy JA (eds)Muddy coasts of the World; Processes, deposits and functions. Proceedings in Marine Science vol 4.Amsterdam, Elsevier, pp 99–202
Folk RL, Andrews PB, Lewis DW (1970) Detrital sedimentary rock classification and nomenclature for usein New Zealand. NZ J Geol Geophys 13:937–968
Ford PW, Tillman P, Robson BJ et al (2005) Organic carbon deliveries and their flow related dynamics inthe Fitzroy estuary. Mar Pollut Bull 51:119–127
Froelich PN (1988) Kinetic control of dissolved phosphate in natural rivers and estuaries: a primer on thephosphate buffer mechanism. Limnol Oceanogr 33:649–668
Fukuda R, Ogawa H, Nagata T et al (1998) Direct determination of carbon and nitrogen contents of naturalbacterial assemblages in marine environments. Appl Environ Microbiol 64(9):3352–3358
Fuller NJ, West NJ, Marie D et al (2005) Dynamics of community structure and phosphate status ofpicocyanobacterial populations in the Gulf of Aqaba, Red Sea. Limnol Oceanogr 50:363–375
Furnas M (2003) Catchments and corals. Australian Institute of Marine Science, Townsville, QueenslandFurnas MJ, Brodie J (1996) Current status of nutrient levels and other water quality parameters in the Great
Barrier Reef. In: Hunter HM, Eyles MAG, Rayment GE (eds) Downstream effects of land use.Queensland Department of Natural Resources, Brisbane, pp 9–21
Furnas M, Mitchell A, Skuza M et al (2005) In the other 90%: phytoplankton responses to enhanced nutrientavailability in the Great Barrier Reef. Mar Pollut Bull 51:253–265
Gagan MK, Sandstrom MW, Chivas AR (1987) Restricted terrestrial carbon input to the continental shelfduring Cyclone Winifred: implications for terrestrial runoff to the Great Barrier Reef Province. CoralReefs 6:113–119
Glibert PM, Bronk DA (1994) Release of dissolved organic nitrogen by marine diazotrophic cyanobacte-rium, Trichdesmium spp. Appl Environ Microbiol 60:3996–4000
Goni MA, Cathey MW, Kim YH et al (2005) Fluxes and sources of suspended organic matter in an estuarineturbidity maximum region during low discharge condition. Estuar Coast Shelf Sci 63:683–700
Hamilton D (1979) The high energy, sand and mud regime of the Severn Estuary, S.W. Britain. In: SevernsRT (ed) Tidal power and estuary management. Proceedings of the 30th symposium of the ColstonResearch Society. University of Bristol, UK
Hedges JI, Keil RG (1995) Sedimentary organic matter preservation: an assessment and speculative syn-thesis. Mar Chem 49:81–115
Holtvoeth J, Kolonic S, Wagner T (2005) Soil organic matter as an important contributor to late Quaternarysediments of the tropical West African continental margin. Geochim Cosmochim Acta 69(8):2031–2041
Hosomi M, Sudo R (1986) Simultaneous determination of total nitrogen and total phosphorus in freshwatersamples using persulfate digestion. Int J Environ Stud 27:267–275
Jahnke RA (1996) The global flux of particulate organic carbon: areal distribution and magnitude. GlobalBiogeochem Cycles 10:71–88
Joint IR (1986) Physiological ecology of pico-phytoplankton in various oceanographic provinces. Can BullFish Aquat Sci 214:287–309
Karl DM, Bidigare RR, Letelier RM (2001) Long-term changes in plankton community structure andproductivity in the North Pacific Subtropical Gyre: the domain shift hypothesis. Deep-Sea Res II48:1449–1470
Keil RG, Mayer LM, Quay PD et al (1997) Loss of organic matter from riverine particles in deltas. GeochimCosmochim Acta 61:1507–1511
Keuhl SA, DeMaster DJ, Nittrouer CA (1986) Nature of sediment accumulation on the Amazon continentalshelf. Cont Shelf Res 6:209–225
Kranck K (1973) Flocculation of suspended sediment in sea. Nature 246:348–350Kranck K (1984) The role of flocculation in the filtering of particulate matter in estuaries. In: Kennedy VS
(ed) The estuary as a filter. Academic, New York, pp 159–175Larcombe P, Woolfe K (1999) Increased sediment supply to the Great Barrier Reef will not increase
sediment accumulation at most coral reefs. Coral Reefs 18:163–169Liu JP, Li AC, Xu KH et al (2006) Sedimentary features of the Yangtse River-derived along-shelf clinoform
deposit in the East China Sea. Cont Shelf Res 26:2141–2156Lohrenz SE, Fahnenstiel GL, Redalje DG et al (1999) Nutrients, irradiance, and mixing as factors regulating
primary production in coastal waters impacted by the Mississippi River plume. Cont Shelf Res19:1113–1141
Ludwig W, Probst JL (1996) Predicting the oceanic input of organic carbon by continental erosion. GlobalBiogeochem Cycles 10:23–41
Aquat Geochem (2010) 16:1–29 27
123

Martins O, Probst J-L (1991) Biogeochemistry of Major African Rivers: carbon and mineral transport. In: DegensET, Kempe S, Richey JC (eds) Biogeochemistry of major world rivers. Wiley, Chichester, pp 127–155
Mehrbach C, Culberson CH, Hawley JE (1973) Measurement of the apparent dissociation constants ofcarbonic acid in seawater at atmospheric pressure. Limnol Oceanogr 18(6):897–907
Meyers PA (2003) Applications of organic geochemistry to palaeolimnological reconstruction: a summaryof examples from the Laurentian Great Lakes. Org Geochem 34:261–289
Milliman JD (1995) Sediment discharge to the ocean from small mountainous rivers: the New Guineaexample. Geo-Mar Lett 15:127–133
Milliman JD, Syvitski JPM (1992) Geomorphic/tectonic control of sediment discharge to the ocean: theimportance of small mountainous rivers. J Geol 100:525–544
Mulholland MR, Floge S, Carpenter EJ et al (2002) Phosphorus dynamics in cultures and natural popula-tions of Trichodesmium spp. Mar Ecol Prog Ser 239:45–55
Muller G, Gastner M (1971) The ‘‘karonate bombe’’ a simple device for the determination of the carbonatecontent in sediments, soils and other materials. Neues Jahrbuch Mineral Monatsh 10:466–469
Norrish K, Hutton IT (1969) An accurate X-Ray spectrographic method for the analysis of a wide range ofgeological samples. Geochim Cosmochim Acta 33:431–453
Oubelkheir K, Clementson LA, Webster IT et al (2006) Using inherent optical properties to investigatebiogeochemical dynamics in a tropical macrotidal coastal system. J Geophys Res 111:C07021. doi:10.1029/2005JC003113
Owens NPJ (1986) Estuarine nutrification: a naturally occurring fluidised bed reaction? Estuarine. CoastShelf Sci 22:31–44
Packett R, Dougall C, Rohde K, Noble R (2009) Agricultural lands are hot-spots for annual runoff pollutingthe southern Great Barrier Reef lagoon. Mar Pollut Bull 58:976–986
Payne TE, Szymczak R, Wait TD (2002) Interactions between dissolved phosphorus and suspended sedi-ments in a tropical estuary. In: Brebbia CA (ed) Coastal environment: environmental problems incoastal regions. WIT Press, Southhampton, pp 219–230
R Development Core Team (2007) R: a language and environment for statistical computing. R Foundationfor Statistical Computing, Vienna
Redfield AC, Ketchum BJ, Richards FA (1963) The influence of organisms on the composition of sea water.In: Hill MN (ed) The sea vol 2. Wiley, New York, pp 26–77
Ryan DA, Brooke BP, Bostock H et al (2007) Bedload sediment transport dynamics in a macrotidal embay-ment, and implications for export to the southern Great Barrier Reef Shelf. Mar Geol 240:197–215
Shapiro L, Brannock WW (1962) Rapid analysis of silicate, carbonate and phosphate rocks. USGS Bulletin1144-A
Slomp CP, Epping EHG, Helder W et al (1996) A key role for iron-bound phosphorus in authigenic apatiteformation in North Atlantic continental platform sediments. J Mar Res 54:1179–1205
Smith SV, Atkinson MJ (1983) Mass balance of carbon and phosphorus in Shark Bay, Western Australia.Limnol Oceanogr 28(4):625–639
Smith WO, DeMaster DJ (1996) Phytoplankton biomass and productivity in the Amazon River plume:correlation with seasonal river discharge. Cont Shelf Res 16:291–319
Smith SV, Veeh HH (1989) Mass balance of biogeochemically active materials (C, N, P) in a hypersalinegulf. Estuar Coast Shelf Sci 29:195–215
Smith J, Douglas GB, Radke LC et al (2008) Fitzroy River Basin, Queensland, Australia. III Identification ofSediment Sources in the Coastal Zone. Environ Chem 5:231–242
Stockner JG, Shortreed KS (1988) Response of Anabaena and Syechoccus to manipulation of nitro-gen:phosphorus ratios in a lake fertilization experiment. Limnol Oceanogr 33:1348–1361
Strom RN, Biggs RG (1982) Phosphorus distribution in sediments of the Delaware River estuary. Estuaries5:95–101
Suttle CA, Harrison PA (1988) Ammonium and phosphate uptake rates, N:P supply ratios, and evidence forN and P limitation in some oligotrophic lakes. Limnol Oceanogr 33:186–202
Takamura N, Nojiri Y (1994) Picoplankton biomass in relation to lake trophic state and the TN:TP ratio oflake water in Japan. J Phycol 30:439–444
Thorp JH, Thoms M, Delong MD (2006) The riverine ecosystem synthesis: biocomplexity in river networksacross space and time. River Res Appl 22:123–147
Tian RC, Hu FX, Martin JM (1993) Summer nutrient fronts in the Changjiang (Yantze) River Estuary.Estuar Coast Shelf Sci 37:27–41
Ullman WJ, Sandstrom MW (1987) Dissolved nutrient fluxes from the nearshore sediments of BowlingGreen Bay, Central Great Barrier Reef Lagoon (Australia). Estuar Coast Shelf Sci 24:289–303
Webster I, Radke L (2006) Estimating system-wide nitrogen fixation rates in Keppel Bay from linearregression and spatial analysis: a comment on potential calculation errors. In: Abstracts of the 7th
28 Aquat Geochem (2010) 16:1–29
123

International Symposium on GIS and Computer Cartography for Coastal Zone Management, Uni-versity of Wollongong, Wollongong, 13–16 July 2006
Webster IT, Ford PW, Hancock G (2001) Phosphorus dynamics in Australian lowland rivers. Mar FreshwRes 52:127–137
Webster IT, Atkinson I, Bostock H et al (2006) The fitzroy contaminants project—a study of the nutrient andfine-sediment dynamics of the Fitzroy Estuary and Keppel Bay. Cooperative research centre for coastalzone, estuary & waterway management technical report #42. Brisbane, Queensland
Aquat Geochem (2010) 16:1–29 29
123
Copyright © 2022 FDOKUMEN