2020 ISP Appendix 5. Renewable Energy Zones
132
2020 ISP Appendix 5. Renewable Energy Zones July 2020
-
Upload
khangminh22 -
Category
Documents
-
view
2 -
download
0
Transcript of 2020 ISP Appendix 5. Renewable Energy Zones

2020 ISP Appendix 5. Renewable Energy Zones
July 2020

Important notice
PURPOSE
This is Appendix 5 to the 2020 Integrated System Plan (ISP), available at https://aemo.com.au/energy-
systems/major-publications/integrated-system-plan-isp.
AEMO publishes this 2020 ISP pursuant to its functions under section 49(2) of the National Electricity Law
(which defines AEMO’s functions as National Transmission Planner) and its broader functions under the
National Electricity Rules to maintain and improve power system security. In addition, AEMO has had regard
to the National Electricity Amendment (Integrated System Planning) Rule 2020 which commenced on 1 July
2020 during the development of the 2020 ISP.
DISCLAIMER
This document or the information in it may be subsequently updated or amended. This document does not
constitute legal or business advice, and should not be relied on as a substitute for obtaining detailed advice
about the National Electricity Law, the National Electricity Rules, or any other applicable laws, procedures or
policies. AEMO has made every effort to ensure the quality of the information in this document but cannot
guarantee its accuracy or completeness.
Accordingly, to the maximum extent permitted by law, AEMO and its officers, employees and consultants
involved in the preparation of this document:
• make no representation or warranty, express or implied, as to the currency, accuracy, reliability or
completeness of the information in this document; and
• are not liable (whether by reason of negligence or otherwise) for any statements or representations in this
document, or any omissions from it, or for any use or reliance on the information in it.
VERSION CONTROL
Version Release date Changes
1.0 30/7/2020 Initial release
© 2020 Australian Energy Market Operator Limited. The material in this publication may be used in
accordance with the copyright permissions on AEMO’s website.

© AEMO 2020 | 2020 ISP Appendix 5. Renewable Energy Zones 3
Contents Summary 6
A5.1. Introduction 7
A5.2. Integrating large volumes of variable renewable energy 8
A5.2.1 REZ identification 8
A5.2.2 REZ candidates 9
A5.2.3 Resource quality and correlation 11
A5.3. REZ framework and design principles 13
A5.3.1 Network and non-network requirements in the future power system 13
A5.3.2 Regulatory framework 14
A5.3.3 Stages in the life of a REZ 14
A5.3.4 Network topology 16
A5.3.5 Managing local power system requirements 17
A5.4. ISP REZ development 19
A5.4.1 ISP development opportunities – REZs 20
A5.4.2 New South Wales REZ assessment 21
A5.4.3 Queensland REZ assessment 28
A5.4.4 South Australia REZ assessment 33
A5.4.5 Tasmania REZ assessment 36
A5.4.6 Victoria REZ assessment 37
A5.5. REZ scorecards 41
A5.5.1 REZ scorecard details 41
A5.5.2 New South Wales REZ scorecards 45
A5.5.3 Queensland REZ scorecards 68
A5.5.4 South Australia REZ scorecards 89
A5.5.5 Tasmania REZ scorecards 109
A5.5.6 Victoria REZ scorecards 117
Tables Table 1 ISP REZ developments 21
Table 2 New South Wales REZ report card 23

© AEMO 2020 | 2020 ISP Appendix 5. Renewable Energy Zones 4
Table 3 North West New South Wales REZ network expansion 25
Table 4 North West New South Wales REZ parameters 26
Table 5 New England REZ network expansion 26
Table 6 New England REZ parameters 28
Table 7 Queensland REZ report card 29
Table 8 Proposed network development options for Far North Queensland REZ 31
Table 9 CQ-SQ transmission project 32
Table 10 Gladstone Grid Reinforcement transmission augmentation 33
Table 11 South Australia REZ report card 34
Table 12 Mid-North South Australia Network Project 35
Table 13 South East South Australia proposed REZ development 36
Table 14 Tasmania REZ report card 37
Table 15 Victoria REZ report card 39
Table 16 Committed Western Victoria Transmission Network Project 39
Figures Figure 1 Weighted wind (left) and solar (right) resource areas 9
Figure 2 2020 Renewable Energy Zone candidates 10
Figure 3 Stages in the life of a renewable energy zone, as of June 2020 15
Figure 4 Variable renewable energy developed by 2039-40 for all scenarios based on the
least-cost development paths* 19
Figure 5 New South Wales projected wind (left) and solar (right) capacity build (MW) across
all scenarios 22
Figure 6 Projected capacity build (MW) for North West New South Wales REZ across all
scenarios 24
Figure 7 Projected capacity build (MW) for New England REZ across all scenarios 28
Figure 8 Queensland’s projected wind (left) and solar (right) capacity build (MW) across all
scenarios 29
Figure 9 South Australia’s projected wind (left) and solar (right) capacity build (MW) across all
scenarios 34
Figure 10 Tasmania’s projected wind (left) and solar (right) capacity build (MW) across all
scenarios 37
Figure 11 Victoria’s projected wind (left) and solar (right) capacity build (MW) across all
scenarios 38
Figure 12 Projected capacity build (MW) for Western Victoria REZ across all scenarios 40

© AEMO 2020 | 2020 ISP Appendix 5. Renewable Energy Zones 5
2020 ISP Appendices
Appendix 1. Stakeholder Engagement
Stakeholder engagement program and timelines
Consultation on Draft 2020 ISP
Appendix 2. Cost Benefit Analysis
An economically efficient development path
Appendix 3. Network Investments
Network investments in the optimal
development path
Committed ISP projects
Actionable ISP projects
Future ISP projects recommended with
preparatory activities
Other future ISP projects
Addressing network congestion
Alternatives considered
Appendix 4. Energy Outlook
Future energy supplies for a resilient power
system
Unlocking VRE through REZs
Managing variable energy supplies through
energy storages and firming technologies
Development outlooks across scenarios
NEM emission intensity with the least-cost
optimal development path
Appendix 5. Renewable Energy Zones
Integrating large volumes of VRE
REZ framework and design principles
ISP REZ development
REZ scorecards
Appendix 6. Future Power System Operability
Power system operability models and input
NEM-wide operability outlook
Regional risks and insights
Appendix 7. Future Power System Security
Renewable Integration Study
System strength outlook
Inertia outlook
REZ opportunities
South Australia in transition
Appendix 8. Resilience and Climate Change
Resilience in the 2020 ISP
Forecasting climate impacts on energy systems
Planning for a climate-resilient network
Next steps
Appendix 9. ISP Methodology
Overview of ISP methodology
Inputs
Engineering assessment
Model outputs
Appendix 10. Sector Coupling
Hydrogen
EVs
Gas
Energy efficiency
Bioenergy

© AEMO 2020 | 2020 ISP Appendix 5. Renewable Energy Zones 6
Summary
This Renewable Energy Zones (REZs) appendix provides technical details on the determination of the 35
candidate REZs. It discusses VRE development opportunities within REZs and highlights transmission network
augmentations required to support this VRE development.
AEMO has assessed 35 candidate REZs across the NEM through consideration of a mix of resources,
current and future transmission network capacities and cost, and other technical and engineering
considerations. Stakeholder engagement – with traditional owners, residents, broader communities, and
local governments – will be essential prior to and during any large-scale development of a REZ. The
co-ordination of generation and transmission development is key to the success of a REZ.
• The ideal near-term REZ locations take advantage of both attractive renewable resources and existing
transmission capacities. Early development of VRE is primarily driven by regional energy targets (RETs)
and other government policies.
• To connect VRE beyond the current transmission capacity, network investment will be required. The ISP
considers how to best develop future REZs in a way that is optimised with necessary transmission
developments, identifying indicative timing and staging that will best coordinate REZ developments
with identified transmission developments to reduce the overall costs.
– It will generally be most efficient to increase network capacity in REZs that are aligned with identified
interconnector upgrades such as the already committed ISP projects, actionable ISP projects, and
future ISP projects (see Appendix 3).
• The development of large-scale REZs is required prior to the expected retirement of power stations
from the late 2020s and mid-2030s.
• Targeted grid augmentations are required to balance resources and unlock REZ potential. These are
described in the optimal development path: see Appendix 3.
© AEMO 2020 | 2020 ISP Appendix 5. Renewable Energy Zones 7
A5.1. Introduction
This appendix is part of the 2020 ISP, providing more detail on the REZ development across various
scenarios (see ISP Section D3).
The NEM is a long and sparsely connected power system, with concentrated load centres that are distant
from one another. The current NEM transmission network was primarily designed to connect large centres of
thermal and hydro generation to major demand centres some distance away.
The ISP re-confirms that the NEM power system will continue its significant transformation away from thermal
generation and towards VRE. There are good wind and solar resources across all the NEM regions. There is
already 8.7 GW of VRE installed1, and another 5.1 GW expected to be operational in the next two years, as
either committed or anticipated projects. Allowing for the strong growth in DER, Australia will still need an
additional 34 to 47 GW of new VRE, depending on the scenario, much of it built in REZs. In the Slow Change
scenario, only 4 GW would be needed by 2039-40.
The analysis of the ISP focuses on 35 short-listed candidate REZs. These REZ candidates are high-resource
areas in the NEM where clusters of large-scale renewable energy projects can capture economies of scale as
well as geographic and technological diversity in renewable resources. Each candidate REZ has potential for
future VRE development.
Only some REZs need to be developed to facilitate additional VRE. The ISP’s optimal development path is
based on a robust cost-benefit analysis (see Appendix 2). The costs of upgrading the network and developing
generation in each REZ is considered. Then only the highest value REZs are identified for possible network
upgrades and new generation development. The integrated approach of the ISP also co-optimises major
network projects that would unlock VRE capacity in some REZs.
Appendix 5 is set out in the following sections:
• A5.2 – REZ candidates shortlisted for the ISP. AEMO has identified and mapped 35 areas across eastern
Australia as candidate REZs. This section sets out how these candidates were developed, and their
respective advantages.
• A5.3 – REZ framework and design principles. These principles support robust and reliable
REZs and are used to determine functional network designs, and preliminary costs to integrate the REZ to
the transmission network. The insights from this process form inputs into the ISP to assist in identifying the
co-optimised cost-effective REZ development pathway.
• A5.4 – prioritisation and staging of REZ development. This describes the outcomes of the ISP for REZ
development, prioritisations of REZ developments and staging, timing across scenarios, and the
identification of actionable REZ transmission projects (being the associated network and non-network
infrastructure required to implement the REZ). Functional network designs that integrate the REZs with the
wider network are highlighted together with preliminary costing.
• A5.5 – scorecards for each REZ arranged by state. This includes assessments of resource quality,
network capability, preferred timing across scenarios, and system strength.
1 Data is current as at April 2020, AEMO Generation Information Page, at https://www.aemo.com.au/energy-systems/electricity/national-
electricity-market-nem/nem-forecasting-and-planning/forecasting-and-planning-data/generation-information.

© AEMO 2020 | 2020 ISP Appendix 5. Renewable Energy Zones 8
A5.2. Integrating large volumes of variable renewable energy
This section of the appendix describes the elements considered in the identification of REZs. It also describes
the 35 REZ candidates in the 2020 ISP.
AEMO has used information about resource quality and REZ development criteria developed for the 2018 ISP
(outlined in A5.2.1), as well as feedback received through consultation for the 2020 ISP, to create the list of 35
REZ candidates.
A5.2.1 REZ identification
AEMO engaged consultants DNV-GL to provide information on the resource quality for potential REZs in the
2018 ISP. The wind resource quality assessment was based on mesoscale wind flow modelling at a height of
150 m above ground level (typical wind turbine height). Solar resource quality was assessed using Global
Horizontal Irradiance (GHI) and Direct Normal Irradiance (DNI) data from the Bureau of Meteorology (BOM).
The work undertaken for the ISP is not intended in any way to replace the specific site assessment of potential
wind and solar farm sites by developers.
These 10 development criteria were used to identify candidate REZs:
• Wind resource – a measure of high wind speeds (above 6 m/s).
• Solar resource – a measure of high solar irradiation (above 1,600 kW/m2).
• Demand matching – the degree to which the local resources correlate with demand.
• Electrical network – the distance to the nearest transmission line.
• Cadastral parcel density – an estimate of the average property size.
• Land cover – a measure of the vegetation, waterbodies, and urbanisation of areas.
• Roads – the distance to the nearest road.
• Terrain complexity – a measure of terrain slope.
• Population density – the population within the area.
• Protected areas – exclusion areas where development is restricted.
Figure 1 shows the results of this DVN-GL analysis, with the highest rating potential areas for development of
wind and solar farms in green.

© AEMO 2020 | 2020 ISP Appendix 5. Renewable Energy Zones 9
Figure 1 Weighted wind (left) and solar (right) resource areas
A5.2.2 REZ candidates
Using the resource quality and the development criteria together with feedback received throughout the
2020 ISP consultation, AEMO has identified 35 candidate REZs for the 2020 ISP.
Figure 2 shows the geographic locations of the 35 final REZ candidates.

© AEMO 2020 | 2020 ISP Appendix 5. Renewable Energy Zones 10
Figure 2 2020 Renewable Energy Zone candidates
Brisbane
Sydney
Hobart
Bundaberg
Rockhampton
Mackay
Proserpine
Forsayth
Cairns
Armidale
Dubbo
Newcastle
Wollongong
Broken Hill
Coober Pedy
Ceduna
Be ndigo
Launceston
Queenstown
Canberra
Longreach
N5
N6
N9
N8
N4
N3
N1 N2
Q7
Q6
Q5
Q4
Q3
Q2
Q1
V1
V2
V3
V4V5
T1T2
T3
S6
S9
S8
S4
S5
S2
S1
S3
S7
Queensland
Q1 Far North QLDQ2 North Qld Clean Energy HubQ3 Northern QldQ4 IsaacQ5 BarcaldineQ6 FitzroyQ7 Wide BayQ8 Darling Downs
New South Wales
N1 North West NSWN2 New EnglandN3 Central-West OranaN4 Southern NSW TablelandsN5 Broken HillN6 South West NSWN7 Wagga WaggaN8 TumutN9 Cooma-Monaro
Victoria
V1 Ovens MurrayV2 Murray RiverV3 Western VictoriaV4 South West VictoriaV5 GippslandV6 Central North Victoria
South Australia
S1 South East SAS2 RiverlandS3 Mid-North SAS4 Yorke PeninsulaS5 Northern SAS6 Leigh CreekS7 Roxby DownsS8 Eastern Eyre PeninsulaS9 Western Eyre Peninsula
Tasmania
T1 North East TasmaniaT2 North West TasmaniaT3 Tasmania Midlands
V6
N7
Q8
MelbourneBallarat
AdelaidePort Lincoln
Mount Gambier
Gladstone
Townsville
Candidate Renewable Energy Zone (REZ)
Indicative wind farm
Indicative solar farm
Indicative pumped hydro
Indicative battery storage
© AEMO 2020 | 2020 ISP Appendix 5. Renewable Energy Zones 11
The 2020 ISP has made several updates to the REZ candidates used in the 2018 ISP, based on further analysis
and consultation:
1. The following new REZs are included in the analysis:
– Wide Bay in Queensland (Q7).
– Wagga Wagga in New South Wales (N7).
– Central North Victoria (V6).
2. The former Murray River REZ, capturing resources to the west of New South Wales and Victoria, has been
separated to form the:
– Murray River REZ in Victoria (V2), and
– South West New South Wales REZ in New South Wales (N6).
3. The New England and Northern New South Wales Tablelands REZs have been combined in the New
England REZ (N2).
4. The former Central New South Wales Tablelands and Central-West New South Wales were refined to form
the Central-West REZ (N3). Following the recent announcement by the New South Wales Government2,
this REZ’s name has changed to Central-West Orana REZ (N3).
5. The Far North Queensland REZ (Q1) has been extended north to include wind resource capacity.
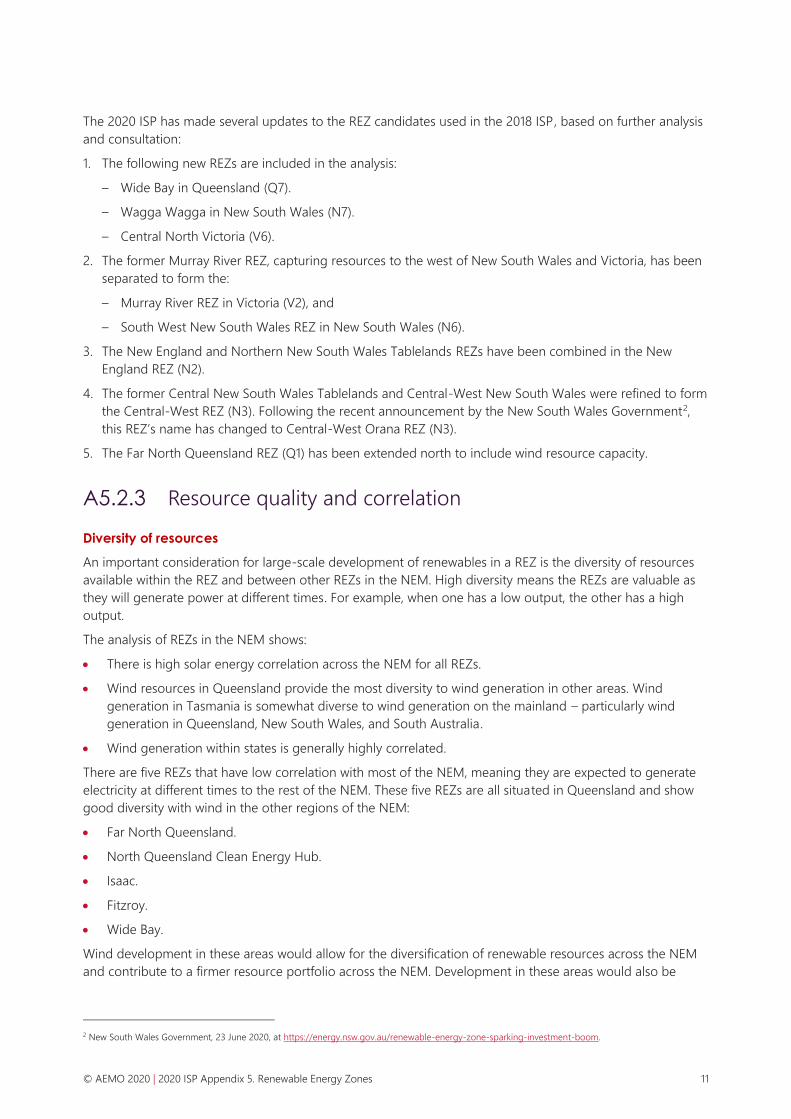
A5.2.3 Resource quality and correlation
Diversity of resources
An important consideration for large-scale development of renewables in a REZ is the diversity of resources
available within the REZ and between other REZs in the NEM. High diversity means the REZs are valuable as
they will generate power at different times. For example, when one has a low output, the other has a high
output.
The analysis of REZs in the NEM shows:
• There is high solar energy correlation across the NEM for all REZs.
• Wind resources in Queensland provide the most diversity to wind generation in other areas. Wind
generation in Tasmania is somewhat diverse to wind generation on the mainland – particularly wind
generation in Queensland, New South Wales, and South Australia.
• Wind generation within states is generally highly correlated.
There are five REZs that have low correlation with most of the NEM, meaning they are expected to generate
electricity at different times to the rest of the NEM. These five REZs are all situated in Queensland and show
good diversity with wind in the other regions of the NEM:
• Far North Queensland.
• North Queensland Clean Energy Hub.
• Isaac.
• Fitzroy.
• Wide Bay.
Wind development in these areas would allow for the diversification of renewable resources across the NEM
and contribute to a firmer resource portfolio across the NEM. Development in these areas would also be
2 New South Wales Government, 23 June 2020, at https://energy.nsw.gov.au/renewable-energy-zone-sparking-investment-boom.

© AEMO 2020 | 2020 ISP Appendix 5. Renewable Energy Zones 12
impacted less by wind generation in other REZs, as the transmission paths to load centres would be less
congested.
Generation diversity and demand matching
Integrating a large amount of highly correlated variable renewable generation can be more complicated for
managing power system reliability than connecting poorly correlated generation. High levels of correlation –
when a lot of nearby variable generation is producing (or not producing) energy at the same time – will
increase congestion on the transmission network and volatility in electricity market dispatch.
Generation correlation can be influenced by technology, location, and time of day.
There are several ways to achieve diversity with renewable generation, and improve system efficiency:
• Diversify the type of renewable generation built. For example, wind generation within a REZ is likely to be
highly correlated to other wind generation within the same REZ, whereas solar generation is likely to be
relatively uncorrelated to wind generation in the same area.
• Diversify the geographical location of the renewable generation built. For example, wind generation
located in different geographical areas is likely to be less correlated than wind generation within the same
geographical area.
• Select REZs where the combined output from renewable resources is positively correlated with grid
demand.
• Co-develop energy storage and variable renewable generation in the same REZ, to allow the net REZ
output to be more correlated with demand or within transmission capacity. Resource and demand are
both variable, based on seasons and time of the day. If the availability of energy is coincident with the
demand, it can be accommodated more economically. In assessing the REZs for analysis in the ISP, the
optimisation considered the correlation of REZ resource with demand.

© AEMO 2020 | 2020 ISP Appendix 5. Renewable Energy Zones 13
A5.3. REZ framework and design principles
The ideal near-term REZ locations would take advantage of both attractive renewable resources and spare
transmission capacity. VRE in these REZs will be cheaper than building the network infrastructure needed to
unlock a new REZ.
As the existing network reaches capacity, large-scale transmission infrastructure extensions, into new regions
with good diverse resource capacity, will be required to connect REZs. Any new transmission network built to
connect REZs should be cost-effective while:
• Providing reliability and security.
• Minimising environmental impacts during and after construction.
• Adhering to relevant design standards.
• Meeting regulatory requirements.
• Creating maximum flexibility and expandability.
• Addressing future needs of the power system.
• Maximising efficiencies through coordination of the various development needs within the REZ together
with the integration of needs for augmentations to the shared network.
This section discusses the frameworks and design principles in planning network augmentations for REZs.
A5.3.1 Network and non-network requirements in the future
power system
Transmission connection in the NEM is currently open access. That means, subject to meeting connection
requirements (including generation performance standards and other technical, legal, and financial
requirements) a new development is permitted to connect to any part of the transmission network. The
connection may be conditional upon the project remediating any negative impact on system strength.
Further development of renewable resources in the REZ may require additional augmentation of the shared
network. An incremental approach risks an overall higher cost of developing the REZ. For example, it is
generally less expensive to build one high capacity transmission line than to build one lower capacity
transmission line which is later duplicated. These risks to generators could be reduced through effective REZ
development, aligning the development of transmission network capacity with likely renewable energy build
in the REZ, with a view to both current and future requirements.
This highlights the importance of coordinated staging of generation and transmission development that
minimises risks of under- and over-utilisation while ensuring reliability and security of the power system is
maintained. Ways to stage a transmission development include, but are not limited to:
• Acquiring strategic easements ahead of their build.
• Building a double-circuit tower but stringing a single-circuit initially.

© AEMO 2020 | 2020 ISP Appendix 5. Renewable Energy Zones 14
• Developing a substation incrementally but having a footprint that accounts for an ultimate development.
It will be essential in the development of transmission to support REZs that these options are explored, to
minimise any stranding risk and maximise option value. In the development of the ISP, AEMO has sought to
optimise REZs in conjunction with transmission development to achieve the lowest overall cost of
development.
A5.3.2 Regulatory framework
In developing the ISP, AEMO recognises work the AEMC is undertaking into the Coordination of Generation
and Transmission Investment (COGATI) review including improved access arrangements, and also the work
that the ESB is undertaking on interim options for coordinated development of REZs. The COAG Energy
Council on 20 March 2020 asked the ESB to support the development of REZs with a two-stage approach
that includes rules for an Interim REZ Framework and later a REZ Connection Hub development:
• Stage 1 rules would require TNSPs to prepare detailed staged plans for each priority REZ identified in the
ISP. These detailed designs would consider the required transmission infrastructure and the best place to
locate the connection hubs within the REZ.
• Stage 2 rules are intended to provide for REZ Connection Hub Development, described as the
development of stages (or connection hubs) within REZ development plans. In this stage, the ESB will also
consider how access is defined and how costs related to augmentation of the shared network should be
recovered.
The intention of these programs is to apply the outcomes of the ISP for REZ development. This ISP identifies
and prioritises REZs for development as part of the optimal development path.
AEMO also recognises the initiative by the New South Wales Government to accelerate the development of
the Central-West Orana REZ together with arrangements to provide firmer connection access. This ISP
incorporates the consequential shared transmission network upgrades as an actionable ISP project. Finally,
AEMO recognises the proposals by TransGrid to accelerate development of the New England REZ. These
proposals were only in the early stages of development when this ISP was finalised and are therefore not
included.
A5.3.3 Stages in the life of a REZ
In June 2020, AEMO published information outlining the developmental stages of a REZ3. Figure 3 outlines
the stages in the life of a REZ under the current regulatory frameworks.
The process outlines activities currently carried out by AEMO as part of the ISP and those carried out by the
TNSP through the RIT-T and the contingent project application.
3 AEMO, 15 June 2020, at https://aemo.com.au/en/news/isp-rez.

© AEMO 2020 | 2020 ISP Appendix 5. Renewable Energy Zones 15
Figure 3 Stages in the life of a renewable energy zone, as of June 2020

© AEMO 2020 | 2020 ISP Appendix 5. Renewable Energy Zones 16
A5.3.4 Network topology
Network topology refers to how various substations, generators, loads and other electrical transmission
devices are physically or logically arranged in relation to each other. The network topology is important as it
directly influences how well the network will function during system normal conditions and under credible
and non-credible contingencies.
The following should be considered in the design of a reliable REZ:
• Staging and interconnection.
– Where possible, the REZ design should leverage off and/or contribute to the efficient and optimised
design of the shared transmission network. REZs should be staged to increase transmission capacity at
appropriate levels to co-optimise investment in transmission and generation. For example, staging can
be achieved by building a double-circuit tower but stringing a single-circuit initially and early
acquisition of strategic easements for later stages. The design would be enhanced by understanding
the long-term strategic transmission development in the area such that the staging of the REZ
development and costs can be optimised. Where REZs have the capability to form part of
interconnectors, the REZ design should take this into account, to enable efficient interconnector
development.
• Number of connections to the main grid and route diversity.
– When a REZ reaches a certain critical capacity, it should connect to the main transmission network with
at least two connection points. This looping allows for additional network reliability and route diversity.
This would increase resilience, for example, to climate impact and bushfires.
• Network architecture.
– Well-designed REZs should consider the architecture of the network needed to avoid the application of
constraints on generation for contingency size. For example, if single easement radial connections were
applied to large a REZ, this would imply a large single critical contingency size (possibly in excess of the
current largest single contingency in the NEM). Contingency size is critical to the security of the NEM to
manage frequency within the operating standards post a single contingency. A looped or more
meshed integration, if designed well, could reduce the potential contingency size and reduce or avoid
potential operational limits that may otherwise need to be applied to generation in the REZ.
• Sharing of connection assets.
– Allowing for the connection of proponents at hubs, rather than connecting on a stand-alone basis
along transmission lines, has the potential to provide a more reliable and cost-effective network
connection. The hub connection reduces capital expenditure by minimising the duplication of
connection infrastructure.
• Switching arrangements.
– Adequate switching arrangements to allow for outage flexibility of equipment, minimising the impact
on the transmission network.
• Adequate sizing and voltage levels selected.
– The long-term ultimate arrangement for transmission development in the area can inform the
appropriate site sizing and voltage levels at the relevant substations connecting proponents to the
transmission network. In this way costs can be optimised through gains in economies of scale when
executing major construction projects, like substations. Most of the substation engineering,
procurement and construction work can happen at one time. This limits the exponential costs of
retrofitted expansion projects that would be required into the future, if proper design principles were
not considered.

© AEMO 2020 | 2020 ISP Appendix 5. Renewable Energy Zones 17
A5.3.5 Managing local power system requirements
AEMO’s Power System Requirements Reference Paper4 sets out the operational prerequisites which give
AEMO the levers needed to operate the system securely and reliably. It also summarises the fundamental
technical attributes for a resilient power system. These technical attributes should be considered when
designing a REZ.
System operability
Under system normal conditions, in a well-designed REZ, generators should be able to operate and transfer
energy to the shared network and thereon to consumers without undue thermal, voltage, or stability issues
limiting their output. A well-designed REZ will also have a robust marginal loss factor (MLF) that will not
deteriorate rapidly as more generation connects.
The REZ itself, being a cluster of varied types of resources, must remain stable following a credible single
contingency and within the thermal, voltage, and frequency limits of the network. Further, AEMO must also
be able to restore the system to a secure operating state within 30 minutes following a contingency event.
Therefore, the design of a REZ needs to also consider the network topology both within the REZ and to the
shared network, as well as contingency sizes that arise from its network design. Otherwise, AEMO may be
forced to constrain generation within the REZ to manage the risks from a contingency.
Thermal capacity
The thermal capacity of a REZ is its maximum output without exceeding the ratings of a network elements
following a credible contingency. It may be possible under certain circumstances to install generation in
excess of this thermal level, provided that a fast-acting special protection scheme, such as a runback scheme,
is implemented. The runback scheme would very quickly reduce and limit generation following a contingency
to avoid thermal overloads (and thereby create safety hazards). Runback schemes allow the network to
operate closer to its technical limits, reducing the need for network expansions.
The following should be considered for runback schemes:
• The loading of the network during system normal should remain within thermal limits.
• The impact on MLFs due to increased loading on the transmission network.
• The amount of generation to be reduced by the runback scheme must consider the effects it may have on
the frequency. All relevant standards must be met.
• The need for close coordination with other schemes within the area.
Frequency
The REZ should be designed such that the loss of a single credible contingency does not cause the loss of
significant generation that would result in frequency excursions exceeding the safe limits of the frequency
operating standards.
Furthermore, following a contingency, AEMO is required to return the network to a secure operating state
within 30 minutes. The deployment of runback schemes and the design of the network to and within the REZ
should consider the implications for frequency, as very large quantities of generation are being projected in
this ISP. Some REZs in the next decade are projected to be in excess of not just the largest unit in the current
NEM, but the largest power station. Accordingly, the design of the REZ will need to ensure that contingency
size is manageable.
4 AEMO, Power System Requirements Reference Paper, updated July 2020, at https://aemo.com.au/-/media/Files/Electricity/NEM/Security_and_Reliability/
Power-system-requirements.pdf.

© AEMO 2020 | 2020 ISP Appendix 5. Renewable Energy Zones 18
Voltage management
The power flow and voltage profile on the transmission network is determined by both generation and load.
Large fluctuations in load and/or generation can have impacts on the transmission voltages. The
intermittency of solar and wind generation will have an impact on voltages across the REZ as well as on the
network where the REZ connects. Furthermore, the loss of a contingency such as transmission line can also
impact the network voltages.
To manage fluctuating generation outputs and network contingencies, REZs should include the combination
of active and passive voltage control equipment to manage voltages within acceptable levels. The reactive
support required for the REZ would be dependent on the network topology and the technology mix within
the REZ and can be provided through capacitor banks, reactors, Static Var Compensators (SVCs), and/or
synchronous condensers.
System strength is a critical requirement for a stable and secure power system. A minimum level of system
strength is required for the power system to remain stable under normal conditions and to return to a steady
state following a disturbance. AEMO defines system strength as the ability of the power system to maintain
and control the voltage waveform at any given location in the power system, both during steady state
operation and following a disturbance5.
A REZ must comply with system strength requirements: see Appendix 7. The system strength requirements
can be staged as the capacity of the generation connecting to the REZ increases over time. System strength
requirements can be provided by synchronous condensers (individual or shared), synchronous generators,
and/or other technologies, including appropriately designed or retro fitted inverter-based resources.
Resource adequacy
The variability of VRE resources is an important factor when considering the integration of REZ within the
larger network, to reduce overall costs to consumers for additional firming supplies. When developing a REZ,
dispatchable services (controllability, firmness and flexibility) should be considered. This may include firming
up every MW of variable renewable generation with some ratio of firm generation. Co-developing energy
storage and variable renewable generation in the same REZ, to allow the net REZ output to be more
correlated with demand, may reduce the size of the network augmentation required and increase the
utilisation of the REZ network.
System restoration
REZs must not inhibit the ability of AEMO and the local TNSP to restart the system under a black system
event. Where technology within the REZ has capability to assist in system restart, it would be beneficial that
the design of the network would be an enabler for this plant to support system restart if required.
5 AEMO, System Strength, March 2020, at https://aemo.com.au/-/media/files/electricity/nem/system-strength-explained.pdf?la=en#:~:text=AEMO%20
sees%20system%20strength%20as,operation%20and%20following%20a%20disturbance.&text=Unlike%20 Most%20IBR%2C%20synchronous%20
Machines,coupled%20to%20the%20power%20system.

© AEMO 2020 | 2020 ISP Appendix 5. Renewable Energy Zones 19
ISP REZ development
The following section presents AEMO’s prioritisation and development of identified REZs within each NEM
region. Factors that affect the development of a REZ include, but are not limited to:
• Energy targets, policies and scenarios.
• Resource quality.
• Existing network capacity.
• Demand correlation and correlation with other favourable REZs.
• Cost of developing or augmenting the transmission network.
• Proximity to the load centre.
Under every ISP scenario – Central, High DER, Step Change, Fast Change and Slow Change6 – the NEM’s
least-cost future features large increases in VRE generation. The increases are in both large-scale wind and
solar connected to the grid and distributed PV installed by households and businesses. Targeted and strategic
investment in the grid is needed to balance resources across states and to unlock much-needed REZs.
During the first 10 years of the forecast horizon, modest ongoing growth in VRE generation is forecast, driven
by relative cost advantages and government policies, as seen in Figure 4. From 2029-30 onwards, large
growth in VRE generation is forecast, driven by the need to replace energy from retiring thermal generation.
Figure 4 Variable renewable energy developed by 2039-40 for all scenarios based on the least-cost
development paths*
* Except for the Slow Change scenario, which is based on the transmission investment with the low-regret, which includes all
interconnectors that are developed in every other scenario with a fixed timing.
6 AEMO, 2019 forecasting and planning scenarios, inputs, and assumptions, at https://aemo.com.au/-/media/files/electricity/nem/planning_and_forecasting/
inputs-assumptions-methodologies/2019/2019-20-forecasting-and-planning-scenarios-inputs-and-assumptions-report.pdf?la=en.
© AEMO 2020 | 2020 ISP Appendix 5. Renewable Energy Zones 20
Each region is forecast to develop several REZs to enable the scale of VRE developments, providing an
opportunity for diversely located renewable developments and storage projects to meet the needs of future
customer demand. The ISP identifies the mix of REZ developments that maximises the efficient connection of
these modelled ISP projects.
In this section, the ISP development opportunities for REZs are described. The sections that follow present the
assessments of a REZ within these phases for each state in turn.
The REZs were assessed according to the defined criteria for assessment7. All VRE projections are based on
the least-cost development paths, except for the Slow Change scenario. The Slow Change scenario is based
on the transmission investment with the low regret, which includes all interconnectors that are developed in
every other scenario with a fixed timing.
Proponents of new generation or storage should conduct their own due diligence, to understand how
technical requirements might influence their connection. Engagement with traditional owners, residents,
broader communities, and local governments will be essential prior to any large-scale development of a REZ.
Timings presented are indicative only. It is important to note immediate actions identified in this ISP do not
lock out opportunities for earlier development of any REZ, if economical in future.
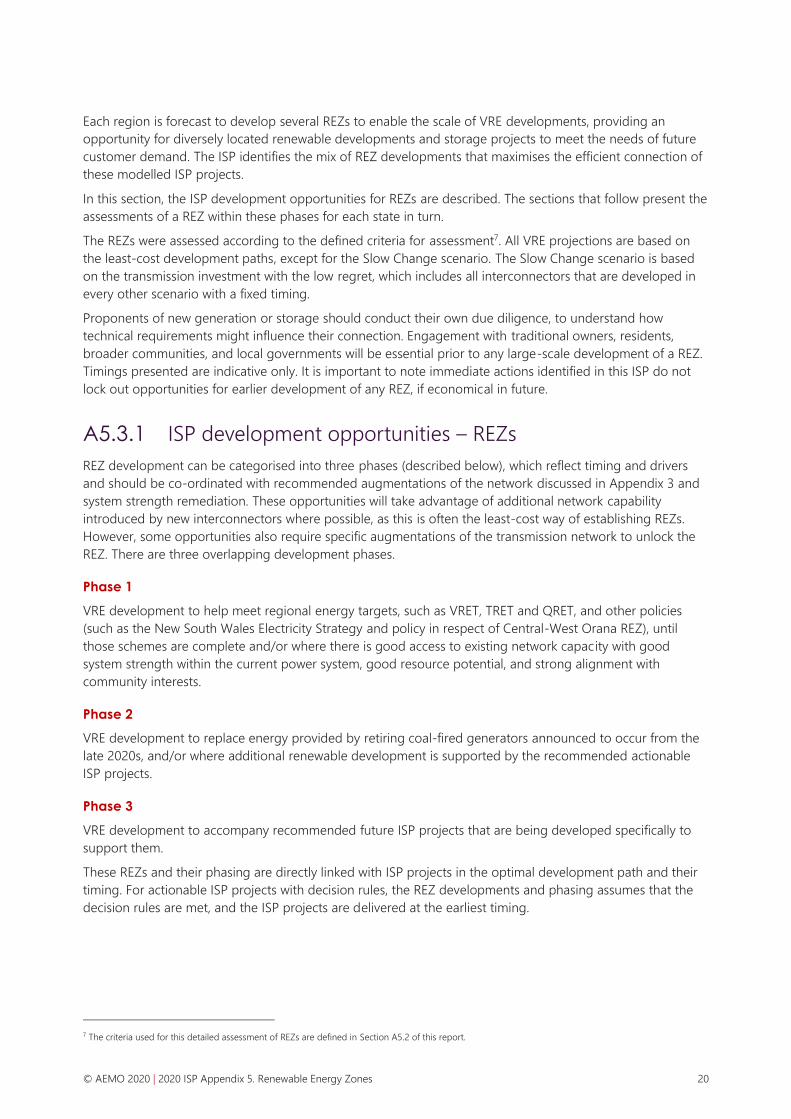
A5.3.1 ISP development opportunities – REZs
REZ development can be categorised into three phases (described below), which reflect timing and drivers
and should be co-ordinated with recommended augmentations of the network discussed in Appendix 3 and
system strength remediation. These opportunities will take advantage of additional network capability
introduced by new interconnectors where possible, as this is often the least-cost way of establishing REZs.
However, some opportunities also require specific augmentations of the transmission network to unlock the
REZ. There are three overlapping development phases.
Phase 1
VRE development to help meet regional energy targets, such as VRET, TRET and QRET, and other policies
(such as the New South Wales Electricity Strategy and policy in respect of Central-West Orana REZ), until
those schemes are complete and/or where there is good access to existing network capacity with good
system strength within the current power system, good resource potential, and strong alignment with
community interests.
Phase 2
VRE development to replace energy provided by retiring coal-fired generators announced to occur from the
late 2020s, and/or where additional renewable development is supported by the recommended actionable
ISP projects.
Phase 3
VRE development to accompany recommended future ISP projects that are being developed specifically to
support them.
These REZs and their phasing are directly linked with ISP projects in the optimal development path and their
timing. For actionable ISP projects with decision rules, the REZ developments and phasing assumes that the
decision rules are met, and the ISP projects are delivered at the earliest timing.
7 The criteria used for this detailed assessment of REZs are defined in Section A5.2 of this report.
© AEMO 2020 | 2020 ISP Appendix 5. Renewable Energy Zones 21
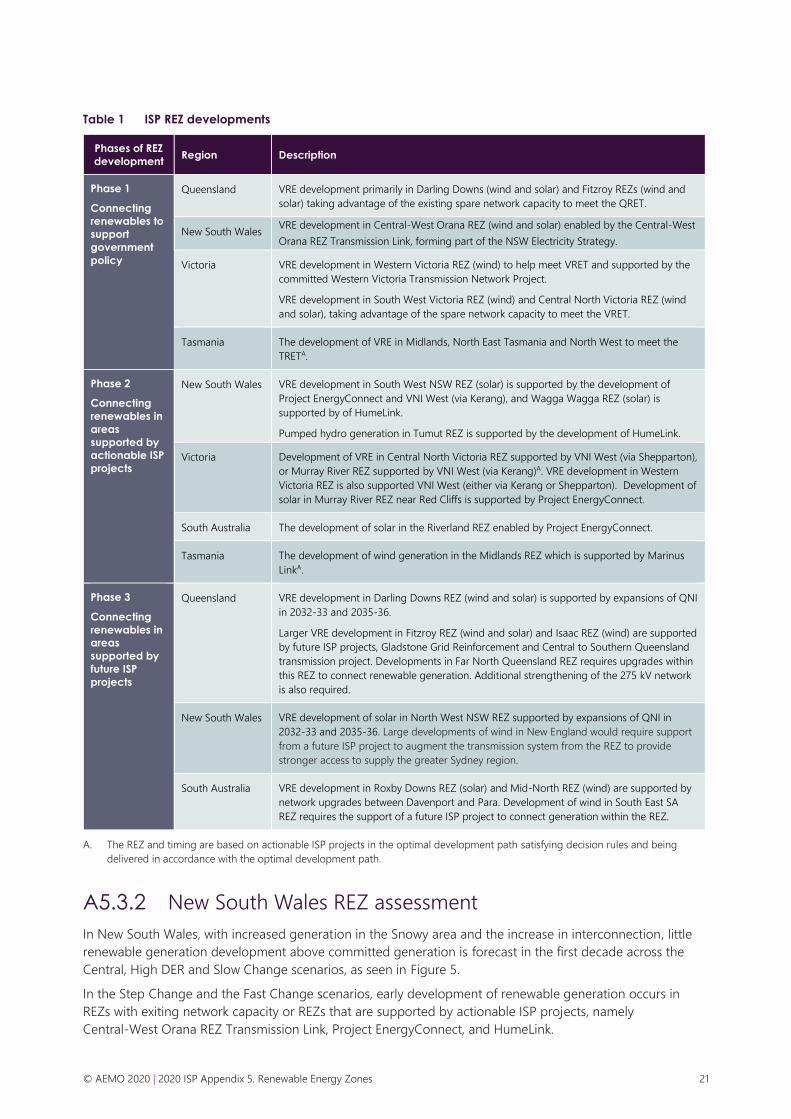
Table 1 ISP REZ developments
Phases of REZ
development Region Description
Phase 1
Connecting
renewables to
support
government
policy
Queensland VRE development primarily in Darling Downs (wind and solar) and Fitzroy REZs (wind and
solar) taking advantage of the existing spare network capacity to meet the QRET.
New South Wales VRE development in Central-West Orana REZ (wind and solar) enabled by the Central-West
Orana REZ Transmission Link, forming part of the NSW Electricity Strategy.
Victoria VRE development in Western Victoria REZ (wind) to help meet VRET and supported by the
committed Western Victoria Transmission Network Project.
VRE development in South West Victoria REZ (wind) and Central North Victoria REZ (wind
and solar), taking advantage of the spare network capacity to meet the VRET.
Tasmania The development of VRE in Midlands, North East Tasmania and North West to meet the
TRETA.
Phase 2
Connecting
renewables in
areas
supported by
actionable ISP
projects
New South Wales VRE development in South West NSW REZ (solar) is supported by the development of
Project EnergyConnect and VNI West (via Kerang), and Wagga Wagga REZ (solar) is
supported by of HumeLink.
Pumped hydro generation in Tumut REZ is supported by the development of HumeLink.
Victoria Development of VRE in Central North Victoria REZ supported by VNI West (via Shepparton),
or Murray River REZ supported by VNI West (via Kerang)A. VRE development in Western
Victoria REZ is also supported VNI West (either via Kerang or Shepparton). Development of
solar in Murray River REZ near Red Cliffs is supported by Project EnergyConnect.
South Australia The development of solar in the Riverland REZ enabled by Project EnergyConnect.
Tasmania The development of wind generation in the Midlands REZ which is supported by Marinus
LinkA.
Phase 3
Connecting
renewables in
areas
supported by
future ISP
projects
Queensland VRE development in Darling Downs REZ (wind and solar) is supported by expansions of QNI
in 2032-33 and 2035-36.
Larger VRE development in Fitzroy REZ (wind and solar) and Isaac REZ (wind) are supported
by future ISP projects, Gladstone Grid Reinforcement and Central to Southern Queensland
transmission project. Developments in Far North Queensland REZ requires upgrades within
this REZ to connect renewable generation. Additional strengthening of the 275 kV network
is also required.
New South Wales VRE development of solar in North West NSW REZ supported by expansions of QNI in
2032-33 and 2035-36. Large developments of wind in New England would require support
from a future ISP project to augment the transmission system from the REZ to provide
stronger access to supply the greater Sydney region.
South Australia VRE development in Roxby Downs REZ (solar) and Mid-North REZ (wind) are supported by
network upgrades between Davenport and Para. Development of wind in South East SA
REZ requires the support of a future ISP project to connect generation within the REZ.
A. The REZ and timing are based on actionable ISP projects in the optimal development path satisfying decision rules and being
delivered in accordance with the optimal development path.
A5.3.2 New South Wales REZ assessment
In New South Wales, with increased generation in the Snowy area and the increase in interconnection, little
renewable generation development above committed generation is forecast in the first decade across the
Central, High DER and Slow Change scenarios, as seen in Figure 5.
In the Step Change and the Fast Change scenarios, early development of renewable generation occurs in
REZs with exiting network capacity or REZs that are supported by actionable ISP projects, namely
Central-West Orana REZ Transmission Link, Project EnergyConnect, and HumeLink.

© AEMO 2020 | 2020 ISP Appendix 5. Renewable Energy Zones 22
Figure 5 New South Wales projected wind (left) and solar (right) capacity build (MW) across all scenarios
AEMO assessed nine candidate REZs in New South Wales. The report card in Table 2 shows the transmission
network upgrade timing and REZ phasing.
This assessment projects that it will be most efficient to:
• Increase network capacity in REZs that are aligned with identified interconnector upgrades such as:
– The actionable ISP project, Project EnergyConnect, supporting South West New South Wales REZ.
– The actionable ISP project HumeLink, supporting Wagga Wagga REZ.
• Undertake preparatory activities for the future QNI Medium and QNI Large upgrades to support
development of the North West New South Wales REZ and New England REZ.
• Develop large-scale REZs prior to the closure of Eraring and Bayswater. The end-of-life retirement of
Eraring is expected in early to mid-2030s and Bayswater in the mid-2030s.
– Development of Central-West Orana REZ, New England and North West New South Wales REZs is
required to assist meeting the energy needs of New South Wales.
From AEMO’s analysis of the REZs for New South Wales, AEMO requires TransGrid to:
• Carry out preparatory activities for the New England REZ network expansions and the North West New
South Wales REZ network expansion, including the publishing of a report required by 30 June 2021 (see
Appendix 3).
0
2,000
4,000
6,000
8,000
10,000
12,000202
0-2
1
202
2-2
3
202
4-2
5
202
6-2
7
202
8-2
9
203
0-3
1
203
2-3
3
203
4-3
5
203
6-3
7
203
8-3
9Ad
dit
ional W
ind C
apac
ity
(MW
)
Slow Change Central
High DER Fast Change
Step Change
0
2,000
4,000
6,000
8,000
10,000
12,000
202
0-2
1
202
2-2
3
202
4-2
5
202
6-2
7
202
8-2
9
203
0-3
1
203
2-3
3
203
4-3
5
203
6-3
7
203
8-3
9Ad
dit
ional S
ola
r C
ap
acity
(MW
)
Slow Change Central
High DER Fast Change
Step Change

© AEMO 2020 | 2020 ISP Appendix 5. Renewable Energy Zones 23
Table 2 New South Wales REZ report card
REZ Existing
network
capacity
(MW)
Hosting capacity
increase with
new IC or future
ISP projects
Priority for
generation
connection
Network upgrade timing
Central Step Fast High
DER
Slow
N1 – North West
NSW 100 QNI Medium
+1,000 MW
QNI Large
+2,000 MW
Phase 3 Upgrades occur with QNI Medium in 2032-33
and QNI Large in 2035-36, additional
upgrades may be required:
-
2037-38 2035-36 2035-36 2040-41
N2 – New
England 300 - Phase 3 2035-36 2030-31 2030-31 2035-36 -
N3 – Central-
West Orana NSW 3,000A Actionable ISP
project
Central-West
Orana REZ
Transmission Link
project
Phase 1 2024-25B 2024-25 2024-25 2024-25 2024-25
N4 – Southern
NSW Tablelands 1,000 - - - - - - -
N5 – Broken Hill - - - - - - - -
N6 – South West
NSW - Project
EnergyConnect
+600 MW
Phase 2 Upgrades occur with Project EnergyConnect in 2024-25
N7 – Wagga
Wagga - HumeLink
+1,000 MW
Phase 2 Upgrades occur with HumeLink in 2025-26
N8 – Tumut - HumeLink
+2,040 MW (Hydro
generation)
Phase 2 Upgrades occur with HumeLink in 2025-26
N9 – Cooma-
Monaro 200 - - 2033-34 2031-32 2033-34 2037-38 -
A. This includes transmission capacity from Central-West Orana NSW REZ development with NSW Government.
B. Timed with expected completion of Central-West Orana REZ
A5.3.2.1 Central-West Orana REZ
Central-West Orana REZ, previously known as Central West REZ, has been identified by the New South Wales
Government as the state’s first pilot REZ8. The REZ is expected to provide 3,000 MW of transmission hosting
capacity within the Central-West Orana region of the state by the mid-2020s.
Construction of the REZ is expected to begin in 2022. In May 2020, the New South Wales Department of
Planning, Industry and Environment called for renewable energy, energy storage, and emerging energy
project proponents to register their interest in being part of the first pilot REZ9. The registration of interest
closed in the first week of June 2020, attracting 113 registrations of interest for projects, totalling
approximately 27 GW10.
8 New South Wales Government, at https://energy.nsw.gov.au/renewables/renewable-energy-zones.
9 New South Wales Government, at https://energy.nsw.gov.au/renewables/renewable-energy-zones.
10 New South Wales Government, at https://energy.nsw.gov.au/renewable-energy-zone-sparking-investment-boom.

© AEMO 2020 | 2020 ISP Appendix 5. Renewable Energy Zones 24
AEMO identifies the transmission augmentation Central-West Orana REZ Transmission Link as an actionable
ISP project which is required to support generation with the Central-West Orana REZ. The transmission
network11 includes a 500 kV (or 330 kV) loop which traverses the Central-West region. The final transmission
augmentation topology will depend on secured generator investment interest within the zone as part of a
generator contracting process to be run by the New South Wales Government.
The development is expected to cost approximately $450 to $850 million. For more information please refer
to Appendix 3.
A5.3.2.2 North West New South Wales
Development in North West New South Wales is supported by QNI Medium and QNI Large upgrade
proposals. The additional capacity provided by QNI is utilised immediately in the Central and High DER
scenarios. Under the Step and Fast Change scenarios, the network between Boggabri and Wollar/Bayswater
would need to be brought forward a year to accommodate the increase in generation projected.
As projected VRE in the North West New South Wales REZ increases beyond 2,000 MW from 2035-36, seen
in Figure 6, the utilisation of storage can minimise the network build in this area. As generation further
increases in North West New South Wales and New England REZs, a new 500 kV connection between the two
REZs is proposed to share network capacity. North West New South Wales is predominately a solar zone,
whereas New England is predominately a wind zone with interest for pumped hydro generation. The sharing
of these resources across the network augmentation would allow for better transmission utilisation and
reduction in transmission build. Table 3 details the proposed development for North West New South Wales.
Figure 6 shows the projected VRE in this REZ for each scenario’s least-cost development path.
Figure 6 Projected capacity build (MW) for North West New South Wales REZ across all scenarios
11 Augmentation details to be developed as part of the RIT-T.
0
1,000
2,000
3,000
4,000
5,000
Ad
dit
ional C
apac
ity
(MW
)
Slow Change Central High DER Fast Change Step Change

© AEMO 2020 | 2020 ISP Appendix 5. Renewable Energy Zones 25
Table 3 North West New South Wales REZ network expansion
Stage 1 (Approximate capacity ~ 1,000 MW):
Bring forward QNI Medium
• Establish a new 500/330 kV substation at
Boggabri
• A new single-circuit Boggabri–Tamworth
330 kV line
• A new double-circuit 500 kV line, strung
one side, from this new substation via
Central-West Orana to Boggabri
• 500/330 kV transformation at Boggabri
Estimated cost is ~ $320 million to $590 million
Stage 2:
This occurs after the development of QNI
Medium and Large
• Establish additional 500/330 kV
transformation at Boggabri
• Establish additional 500/330 kV
transformation at West of Dumaresq
Estimated cost is ~ $70 million to $140 million
Stage 3 (3,000 MW including stage 2A):
• A new single-circuit Boggabri–Uralla 500 kV
lineB
Estimated cost is ~ $220 million to $420 million
A. This includes parts of QNI Medium and Large that were not constructed in Stage 2.
B. Common with both New England and North West New South Wales REZs.
North West New South Wales REZ network expansion preparatory activities
The transmission infrastructure required to integrate the North West New South Wales REZ with the greater
transmission network is identified as a future ISP project. This project would reduce costs, and enhance
system resilience and optionality. It is not yet ‘actionable’ under the new ISP Rules, but is expected to be so in
the future and is part of the optimal development path.
AEMO requires TransGrid to carry out preparatory activities for the North West New South Wales REZ
network expansion including publishing a report on the outcome of these activities by 30 June 2021. The
preparatory activities required include:
• Preliminary engineering design.
• Desktop easement assessment.
• Cost estimates based on preliminary engineering design and route selection.
• Preliminary assessment of environmental and planning approvals.
• Appropriate stakeholder engagement.
Central-West Orana REZ
Boggabri (Stage 1) Armidale
Bulli Creek
Wollar
Dumaresq
Sapphire
Proposed augmentation Existing network500 kV network330 kV networkCentral-West Orana Transmission Link, network configuration to be determined through the RIT-T
Transformer
Tamworth
SV
CSV
C
Bayswater
North West NSW Stage 1
West of Dumaresq
Boggabri Armidale
Bulli Creek
Western Downs
Wollar
Dumaresq
Sapphire
Tamworth
SVC
SVC
SVC
Bayswater
(Stage 2)
(Stage 2)
Proposed augmentation Existing network500 kV network330 kV network275 kV networkCentral-West Orana Transmission Link, network configuration to be determined through the RIT-T
Transformer
Mount Piper
Uralla
(Stage 3)
North West NSW Stage 2 and 3
Central-West Orana REZ

© AEMO 2020 | 2020 ISP Appendix 5. Renewable Energy Zones 26
The following REZ parameters should be considered when undertaking preparatory activities.
Table 4 North West New South Wales REZ parameters
REZ design parameter North West New South Wales
Geographical location See North West New South Wales scorecard in section A5.4.2.
Notional REZ hosting
capacity Stage 1: 1,000 MW
Stage 2: 3,000 MW (including stage 1)
Stage 3: >5,000 MW (including stage 1 and 2)
Forecast expansion in the
least-cost development
paths
See Figure 6
Proposed connection points
between the REZ and the
rest of the shared network
The network between Dumaresq/West of Dumaresq and Tamworth and the network between
Bayswater and Wollar.
Delivery date for the
preparatory activities and
report
30 June 2021
Additional matters for
consideration Consideration should be given to the possibility for the QNI interconnector to traverse through
this REZ and assist with connection of generation along the path. Considerations should also be
given to the possible development of New England REZ. See Appendix 3 for further details.
A5.3.2.3 New England REZ
The New South Wales Electricity Strategy12 sets out a plan to prioritise three REZs – the New England REZ,
South West New South Wales REZ, and Central-West Orana REZ – which will become a driving force to
deliver affordable energy into the future.
Across all scenarios, except for Slow Change, large transmission augmentation is required to connect the
projected VRE in New England to the Sydney load centre. The proposed future ISP project for the New
England REZ is summarised in Table 5. Additional to the expansion noted in Table 5, as VRE within North
West New South Wales, New England and Central-West Orana increases and coal retirements occur in New
South Wales, network augmentation will be required between Bayswater, Newcastle and Sydney. The 500 kV
network between Bayswater and Eraring would need to be linked to alleviate congestion on the 330 kV
network between Tamworth, Newcastle and Sydney. Details of this required augmentation are discussed
more in Appendix 3, under the ISP project Reinforcing Sydney, Newcastle and Wollongong Supply.
Table 5 New England REZ network expansion
Stage 1A (Approximate 3,000-4,000 MWB):
• Uprate Armidale–Tamworth 330 kV lines 85 and 86
• Establish a new Uralla 500/330 kV substation
• Turn both Armidale–Tamworth 330 kV lines 85 and
86 into Uralla
• A new double-circuit Uralla–Bayswater 500 kV line
• Two 500/330 kV 1,500 MVA Uralla transformers
• Additional reactive support
12New South Wales Government, New South Wales Electricity Strategy, at https://energy.nsw.gov.au/media/1921/download.

© AEMO 2020 | 2020 ISP Appendix 5. Renewable Energy Zones 27
• Establish a new 500/300 kV substation at Walcha
• Cut Uralla–Bayswater 500 kV lines into Walcha
• Two 500/330 kV 1,500 MVA Walcha transformers
• One 500/330 kV 1,500 MVA Bayswater transformer
Estimated cost is ~ $720 million to $1,330 million
Stage 2:
• A new single-circuit Boggabri–Uralla 500 kV lineC
Estimated cost is ~ $220 million to $420 million
Approximate capacity: 4,000-5,000 MW including stage 1D
A. In addition to the REZ expansion listed in Table 5, this assumes that the network augmentation between Bayswater, Newcastle and
Sydney is in place. This augmentation is required with the increase of VRE in North West New South Wales, New England, and
Central-West Orana New South Wales and due to retirement of coal generation.
B. Capacity is dependent on the development of QNI Medium and Large, resource diversity, and network upgrades between New
England and the Sydney load centre. Storage is also utilised to reduce network build requirements and store excess energy.
C. Common between North West New South Wales REZ and New England REZ.
D. Capacity is dependent on development of North West New South Wales REZ and QNI flow, resource diversity, and the amount of
storage to connect in this area. Storage was assumed for this zone. Options to increase this to 8,000 MW to match the target from
the New South Wales Government will be explored in the preparatory activities for QNI Medium and Large, North West New South
Wales REZ, and New England REZ. See Appendix 3 for further details.
The delivery of New England network expansion is required from mid-2030s in the Central, and High DER
scenarios and 2030-31 in the Step and Fast change scenarios when VRE projections exceed 300 MW (see
Figure 7). The timing of the New England network expansion may be accelerated by the New South Wales
Government as part of its announced policy to support development of VRE in this REZ13. On 10 July 2020, the
New South Wales Government announced a $79 million plan to develop a REZ, of 8,000 MW size, in this
region. TransGrid has also announced, just before release of this ISP, a proposed approach to further
accelerate the development of this REZ.
New England REZ network expansion preparatory activities
The transmission infrastructure required to integrate the New England REZ with the greater transmission
network is identified as a future ISP Project (see Appendix 3). It is not yet ‘actionable’ under the new ISP Rules,
but is expected to be so in the future and is part of the optimal development path.
AEMO requires TransGrid to carry out preparatory activities for the New England REZ network expansion
including publishing a report on the outcome of these activities by 30 June 2021.
The following REZ parameters should be considered when undertaking preparatory activities.
13 NSW Government. New England to light up with second NSW Renewable Energy Zone, available at https://www.nsw.gov.au/media-releases/new-england-
to-light-up-second-nsw-renewable-energy-zone.

© AEMO 2020 | 2020 ISP Appendix 5. Renewable Energy Zones 28
Table 6 New England REZ parameters
REZ parameter New England
Geographical location See New England scorecard in section A5.4.2.
Notional REZ hosting capacity Stage 1: 3,000-4,000 MW
Stage 2: 8,000 MW (including stage 1)
Forecast expansion in the least-
cost development paths See Figure 7
Proposed connection points
between the REZ and the rest of the
shared network
The network between Sapphire and Tamworth and the network between Liddell and
Bayswater.
Delivery date for the REZ design
report 30 June 2021
Additional matters for
consideration Consideration should be given to the possibility for the QNI Medium and Large
interconnector to traverse through this REZ and assist with connection of generation
along the path. Consideration should also be given to the REZ design for North West
New South Wales. See Appendix 3 for further details.
Figure 7 shows the projected VRE in this REZ for each scenario’s least-cost development path.
Figure 7 Projected capacity build (MW) for New England REZ across all scenarios
A5.3.3 Queensland REZ assessment
Renewable generator connections in Queensland in the 2020s are driven by the state-based QRET under the
Central, High DER and Step Change scenarios. The Queensland Government has committed to a 50%
renewable energy target by 2030. This target is measured against Queensland energy consumption, including
renewable DER. Queensland generator connections, to meet the energy target, occur in REZs that have both
existing network capacity and good quality resources.
After QRET, development of renewable generation connection is forecast to continue growing rapidly in all
scenarios, except the Slow Change which does not consider this QRET, as seen in Figure 8.
0
1,000
2,000
3,000
4,000
5,000
6,000
Ad
dit
ional C
apac
ity
(MW
)
Slow Change Central High DER Fast Change Step Change

© AEMO 2020 | 2020 ISP Appendix 5. Renewable Energy Zones 29
Figure 8 Queensland’s projected wind (left) and solar (right) capacity build (MW) across all scenarios
AEMO assessed eight candidate REZs in Queensland. The report card in Table 7 shows the transmission
network upgrade timing and REZ phasing.
Table 7 Queensland REZ report card
REZ Existing
network
capacity
(MW)
Hosting capacity
increase with ISP
projects
Priority for
generation
connection
Network upgrade timing
Central Step
Change
Fast High
DER
Slow
Q1 – FNQ 700 Future ISP project
+800-1,500 MW
Phase 3 2037-38 2030-31 2035-36 2037-38 -
Q2 – North QLD
Clean Energy
Hub
- - - - - - - -
Q3 – Northern
Queensland Q1+Q2+Q3
<
1,800 MWA
- - - - - - -
Q4 – Isaac Q1+Q2+Q3+
Q4+Q5
<
2,000 –
2,500 MWB
Intra-regional
augmentation
future ISP
Gladstone project
and CQ-SQ +800-
900 MW
Phase 3 Early to
mid-
2030s
Late
2020s
Early to
mid-
2030s
Mid-
2030s
-
Q5 –
Barcaldine - - - - - - - -
Q6 – Fitzroy Q1+Q2+Q3+
Q4+Q5+Q6
<
2,000 –
2,500C
Intra-regional
augmentation
future ISP CQ-SQ
and Gladstone
project +800-
900 MW
Phase 1 and
phase 3
Early to
mid-
2030s
Late
2020s
Early to
mid-
2030s
Mid-
2030s
-
Q7 – Wide Bay 500 - - - - - -
0
2,000
4,000
6,000
8,000
10,000202
0-2
1
202
2-2
3
202
4-2
5
202
6-2
7
202
8-2
9
203
0-3
1
203
2-3
3
203
4-3
5
203
6-3
7
203
8-3
9Ad
dit
ional W
ind C
apac
ity
(MW
)
Slow Change Central
High DER Fast Change
Step Change
0
2,000
4,000
6,000
8,000
10,000
202
0-2
1
202
2-2
3
202
4-2
5
202
6-2
7
202
8-2
9
203
0-3
1
203
2-3
3
203
4-3
5
203
6-3
7
203
8-3
9Ad
dit
ional S
ola
r C
ap
acity
(M
W)
Slow Change Central
High DER Fast Change
Step Change

© AEMO 2020 | 2020 ISP Appendix 5. Renewable Energy Zones 30
REZ Existing
network
capacity
(MW)
Hosting capacity
increase with ISP
projects
Priority for
generation
connection
Network upgrade timing
Central Step
Change
Fast High
DER
Slow
Q8 – Darling
Downs 3,000 Future ISP Project
QNI Medium +
1,000 MW
QNI Large
+2,000 MW
Phase 1 and
phase 3
Upgrades occur with QNI Medium in 2032-33 and QNI
Large in 2035-36, additional upgrades may be required:
>2039-
40
>2039-
40
>2039-
40
>2039-
40
-
A. This REZ is subject to group constraint, where the sum of generation developed in Q1, Q2 and Q3 should be less than 1,800 MW.
B. This REZ is subject to group constraint, where the sum of generation developed in Q1, Q2, Q3, Q4 and Q5 should be less than
2,000-2,500 MW.
C. This REZ is subject to group constraint, where the sum of generation developed in Q1, Q2, Q3, Q4, Q5 and Q6 should be less than
2,000-2,500 MW.
AEMO’s REZ analysis for Queensland projects that it will be most efficient to:
• Meet the QRET with large VRE development within Fitzroy REZ and Darling Downs REZ utilising existing
spare network capacity. Smaller VRE developments are projected to be efficient in Far North Queensland
REZ and Isaac REZ. The QRET of 50% VRE by 2030 is forecast to require approximately 5.1 GW of
additional large scale VRE capacity, above existing and committed generation projects. The first 900 MW
of this is expected to come from the announced projects Broadsound Solar Farm, Cape Yorke Solar &
Storage, and Macintyre Wind Farm.
• Increase network capacity in Darling Downs REZ aligned with QNI Medium and QNI Large interconnector
upgrades.
• Utilise storage to decrease the size of transmission augmentations required to transfer renewable
generation from Northern Queensland to the load centres.
• Prepare for the closure of coal and gas generation in Queensland in the mid-late 2030s by developing
renewable generation in Far North Queensland, Isaac, Fitzroy, Wide Bay, and Darling Downs REZs.
– With significant projected VRE development in Far North Queensland, Isaac, and Fitzroy REZs, and the
retirement of Gladstone generation, strengthening of the 275 kV network is required between
Bouldercombe and Calliope River, Calvale to Larcom Creek, and on the Central to Southern
Queensland cut-set.
– Additional to the augmentation above, the projected VRE development in Far North Queensland
requires strengthening of the 275 kV network between Chalumbin and Strathmore via Ross and
network expansion to areas of high renewable interest.
– AEMO requires Powerlink to carry out preparatory activities for the Gladstone Grid Reinforcements and
for the Central to Southern Queensland (CQ-SQ) transmission project.
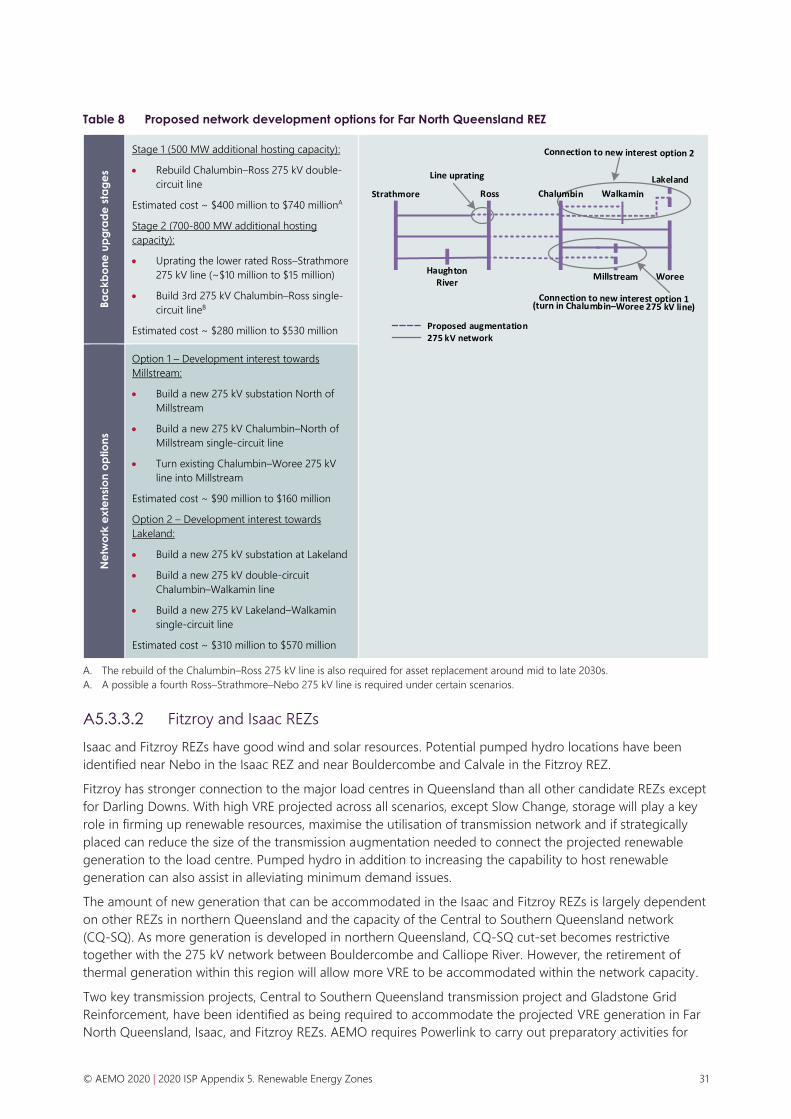
A5.3.3.1 Far North Queensland
Far North Queensland has excellent wind resources. There is some existing spare network capacity to connect
utility-scale wind generation before upgrades are required. This spare capacity is location-specific within the
REZ and system strength remediation is likely for connection of generation in this area.
Although the cost of upgrades is high in this REZ, it has a good capacity factor and high diversity of wind
resources with other REZs. Its development is timed in the least-cost development paths in the mid to late-
2030s, or as possibly as early as 2031 if the Step Change scenario. The network upgrades are required when
VRE in this zone exceeds 700 MW. Table 8 shows two possible options, depending on the area within the
REZ. Option 1 is to strengthen the network for wind generation in the Millstream area and Option 2 is to
extend the 275 kV network towards the Lakeland area: see Appendix 3.
© AEMO 2020 | 2020 ISP Appendix 5. Renewable Energy Zones 31
Table 8 Proposed network development options for Far North Queensland REZ
Ba
ck
bo
ne
up
gra
de
sta
ge
s
Stage 1 (500 MW additional hosting capacity):
• Rebuild Chalumbin–Ross 275 kV double-
circuit line
Estimated cost ~ $400 million to $740 millionA
Stage 2 (700-800 MW additional hosting
capacity):
• Uprating the lower rated Ross–Strathmore
275 kV line (~$10 million to $15 million)
• Build 3rd 275 kV Chalumbin–Ross single-
circuit lineB
Estimated cost ~ $280 million to $530 million
Ne
two
rk e
xte
nsi
on
op
tio
ns
Option 1 – Development interest towards
Millstream:
• Build a new 275 kV substation North of
Millstream
• Build a new 275 kV Chalumbin–North of
Millstream single-circuit line
• Turn existing Chalumbin–Woree 275 kV
line into Millstream
Estimated cost ~ $90 million to $160 million
Option 2 – Development interest towards
Lakeland:
• Build a new 275 kV substation at Lakeland
• Build a new 275 kV double-circuit
Chalumbin–Walkamin line
• Build a new 275 kV Lakeland–Walkamin
single-circuit line
Estimated cost ~ $310 million to $570 million
A. The rebuild of the Chalumbin–Ross 275 kV line is also required for asset replacement around mid to late 2030s.
A. A possible a fourth Ross–Strathmore–Nebo 275 kV line is required under certain scenarios.
A5.3.3.2 Fitzroy and Isaac REZs
Isaac and Fitzroy REZs have good wind and solar resources. Potential pumped hydro locations have been
identified near Nebo in the Isaac REZ and near Bouldercombe and Calvale in the Fitzroy REZ.
Fitzroy has stronger connection to the major load centres in Queensland than all other candidate REZs except
for Darling Downs. With high VRE projected across all scenarios, except Slow Change, storage will play a key
role in firming up renewable resources, maximise the utilisation of transmission network and if strategically
placed can reduce the size of the transmission augmentation needed to connect the projected renewable
generation to the load centre. Pumped hydro in addition to increasing the capability to host renewable
generation can also assist in alleviating minimum demand issues.
The amount of new generation that can be accommodated in the Isaac and Fitzroy REZs is largely dependent
on other REZs in northern Queensland and the capacity of the Central to Southern Queensland network
(CQ-SQ). As more generation is developed in northern Queensland, CQ-SQ cut-set becomes restrictive
together with the 275 kV network between Bouldercombe and Calliope River. However, the retirement of
thermal generation within this region will allow more VRE to be accommodated within the network capacity.
Two key transmission projects, Central to Southern Queensland transmission project and Gladstone Grid
Reinforcement, have been identified as being required to accommodate the projected VRE generation in Far
North Queensland, Isaac, and Fitzroy REZs. AEMO requires Powerlink to carry out preparatory activities for
Proposed augmentation275 kV network
Strathmore

© AEMO 2020 | 2020 ISP Appendix 5. Renewable Energy Zones 32
both projects to investigate the costs and benefits of these projects. Future stages of for the Central to
Southern Queensland cut-set for further capability improvements should be investigated.
Central to Southern Queensland
The Central to Southern Queensland cut-set is defined as the power flow on the Calvale–Halys 275 kV lines,
the Calliope River–Gin Gin 275 kV lines, and the Wurdong–Teebar Creek14 275 kV line. Currently, power flow
in the southerly direction is limited to prevent voltage and transient instability under fault conditions. These
stability limits will need to be addressed to increase the transfer across the CQ-SQ cut-set. The need is
realised when generation in the north of this cut-set exceeds 2,000-2,500 MW above the existing and
committed generation. This network augmentation, detailed in Table 9, is projected to be required in the
early to mid-2030s.
Table 9 CQ-SQ transmission project
The proposed CQ-SQ augmentation is:
• A new double-circuit Calvale – Wandoan South 275 kV
line
Estimated costA ~ $300 million to $560 million
A. $432 million is used for the market modelling inputs.
Gladstone Grid Reinforcement
The need for the Gladstone Grid Reinforcement is driven by various aspects which include asset renewal,
retirement of Gladstone Power Station, and high renewable generation connection in northern Queensland.
Upgrading the Central to Southern Queensland cut-set, detailed in Table 10, will further highlight the need for
the upgrade on this network, as addressing this limitation will shift the limitations further north under high
VRE output.
14 Soon to be Rodds Bay – Teebar Creek around 2022-23.
Proposed augmentation275 kV network

© AEMO 2020 | 2020 ISP Appendix 5. Renewable Energy Zones 33
Table 10 Gladstone Grid Reinforcement transmission augmentation
Gladstone proposed augmentation is as follows:
• Rebuild the Bouldercombe–Raglan–Larcom Creek–
Calliope River and the Bouldercombe–Calliope River
275 kV lines as a high capacity double-circuit lines, for
a gain of approximately 700-800 MW of additional
hosting capacity, required in early to mid-2030sA
• A new double-circuit Calvale–Larcom Creek 275 kV
line (required in mid-2030s)
• A third Calliope River 275/132 kV transformer
(required in mid-2030s)
Estimated cost ~ $300 million to $560 million
A. For development of generation north of Bouldercombe, some scenarios require an additional line Bouldercombe–Larcom Creek
275 kV line.
A5.3.4 South Australia REZ assessment
South Australia connects to Victoria via two interconnectors, Heywood and Murraylink. Over the last two
years, South Australia has been a net energy exporter to Victoria15. This has been driven by the continued
increase in wind and solar generation in South Australia and the decrease of coal-fired generation in Victoria
following the closure of Hazelwood Power Station in March 2017 and outages of the remaining coal-fired
generators over the 2018-19 period.
Figure 9 shows the projected new utility solar and wind development across each scenario in the next two
decades. No new wind generation is projected to be efficient in South Australia until the 2030s, except in the
Step Change scenario. Similarly, no new utility-scale solar is projected to be efficient in South Australia until
the 2030s except in the Step and Fast Change scenarios.
• Projected solar generation sharply increases post 2030 before settling at approximately 1,500-2,000 MW in
2035-36.
• The Riverland and Roxby Down REZs have been highlighted for this solar development; development
beyond approximately 1,900 MW of solar generation would require significant transmission infrastructure
investment.
• Wind generation is projected to increase post 2034-35 to replace retiring generation. South Australia is
forecast to feature the highest share of renewable energy of all NEM regions in the Central scenario.
15 AEMO, 2019 South Australia Report, page 38, at https://www.aemo.com.au/-/media/Files/Electricity/NEM/Planning_and_Forecasting/SA_Advisory/2019/
2019-South-Australian-Electricity-Report.pdf.
Raglan
Bouldercombe
New connection to existing busbar
Proposed augmentation275 kV network132 kV network
Transformer

© AEMO 2020 | 2020 ISP Appendix 5. Renewable Energy Zones 34
Figure 9 South Australia’s projected wind (left) and solar (right) capacity build (MW) across all scenarios
AEMO assessed nine candidate REZs in South Australia. AEMO’s REZ analysis for South Australia projects that
it will be most efficient to:
• Co-ordinate REZ development in areas supported by interconnector upgrade Project EnergyConnect and
HumeLink.
• Co-ordinate REZ development in areas with good resource and existing network capacity.
• Strengthen the Mid-North 275 kV network to increase capacity to numerous REZs.
AEMO recommends timing VRE development with interconnector upgrade and recommends Riverland,
Mid-North South Australia, South East South Australia, and Roxby Downs for medium to long-term
large-scale VRE connections.
Table 11 South Australia REZ report card
REZ Existing
network
capacity
(MW)
Hosting capacity
increase with ISP
projects
Priority for
generation
connection
Network upgrade timing
Central Step Fast High
DER
Slow
S1 – South East SA 55 - Phase 3 2037-38 2030-31 2037-38 2039-40 -
S2 – Riverland 200 Project
EnergyConnect
+800 MWA
Phase 2 2032-33 2026-27 2030-31 2037-38 2037-38
S3 – Mid-North SA 1,000 Future ISP project
Mid-North
+1,000 MWB
Phase 3 2035-36 2035-36 2035-36 - -
S4 – Yorke
Peninsula - - - 2035-36 2037-38 2035-36 - -
S5 – Northern SA 1,000 - - - - - - -
S6 – Leigh Creek - - - - - - - -
0
500
1,000
1,500
2,000
2,500
3,000202
0-2
1
202
2-2
3
202
4-2
5
202
6-2
7
202
8-2
9
203
0-3
1
203
2-3
3
203
4-3
5
203
6-3
7
203
8-3
9Ad
dit
ional W
ind C
apaci
ty (M
W)
Slow Change Central
High DER Fast Change
Step Change
0
500
1,000
1,500
2,000
2,500
3,000
202
0-2
1
202
2-2
3
202
4-2
5
202
6-2
7
202
8-2
9
203
0-3
1
203
2-3
3
203
4-3
5
203
6-3
7
203
8-3
9Ad
dit
ional S
ola
r C
ap
acity
(MW
)
Slow Change Central
High DER Fast Change
Step Change

© AEMO 2020 | 2020 ISP Appendix 5. Renewable Energy Zones 35
REZ Existing
network
capacity
(MW)
Hosting capacity
increase with ISP
projects
Priority for
generation
connection
Network upgrade timing
Central Step Fast High
DER
Slow
S7 – Roxby Downs 960C Future ISP project
Mid-NorthD
+1,000 MW
Phase 3 2036-38 2036-38 2035-36 - -
S8 – Eastern Eyre
Peninsula 470E - - - - - - -
S9 – Western Eyre
Peninsula - - - - - - - -
A. Requires a minor transmission build over and above Project EnergyConnect to accommodate 800 MW. Timing associated with minor
upgrade.
B. Mid-North increases generation capacity of 1,000 MW shared by generation connections in S3, S5, S6, S7, S8 and S9.
C. Includes capacity for new 275 kV line from Davenport to Mount Gunson South.
D. The existing network in Mid-North can accommodate up to 1,000 MW from REZ S3, S4, S5, S6, S7, S8 and S9, if the sum of the
generation from these REZs exceeds 1,000 MW, expansion of Mid-North would be required (this is referred to as the “South Australia
group constraint”.
E. Includes the upgrades from the Eastern Eyre Electricity Supply RIT-T.
A5.3.4.1 Mid-North South Australia REZ
The Mid-North South Australia REZ has moderate wind and solar resources. Due to the nature of the South
Australian network, VRE development in the north, west and south west of Davenport contributes to
congestion in the Mid-North REZ along the 275 kV corridor between Davenport and Para. If this congestion is
addressed, then capacity could be unlocked in all of these zones (S5, S6, S7, S8 and S9), assuming they can be
connected to Davenport. The proposed future ISP project augmentation is detailed in Table 12.
Table 12 Mid-North South Australia Network Project
• Rebuild the single-circuit Davenport–Brinkworth–Templers
West–ParaA 275 kV line at a high capacity double-circuit
line, and/or
• Reconfiguration of 132 kV network in the Mid-North REZ to
ensure balance flows between the 275 kV and the 132 kV
networks
Estimated cost ~ $420 million to $770 millionB
A. Depending on connection interest within Mid-North, the network augmentation may not need to extend to Davenport.
B. $657 million is used for the market modelling inputs.
A5.3.4.2 South East South Australia
The South East South Australia REZ has moderate to good wind resources. This REZ lies on the major 275 kV
path linking South Australia with Victoria (Heywood interconnector). The existing network can only effectively
accommodate a small amount of additional generation. Beyond this 55 MW hosting capacity, transmission
network expansions would be required to accommodate generation within this zone.
South East South Australia has been projected for VRE development greater than the current hosting
capacity. This VRE development is timed in 2030-31 under the Step Change scenario and between 2037-38
and 2039-40 for the Central, Fast Change and High DER scenarios. The proposed network augmentation is
highlighted in Table 13.
Proposed augmentation275 kV network
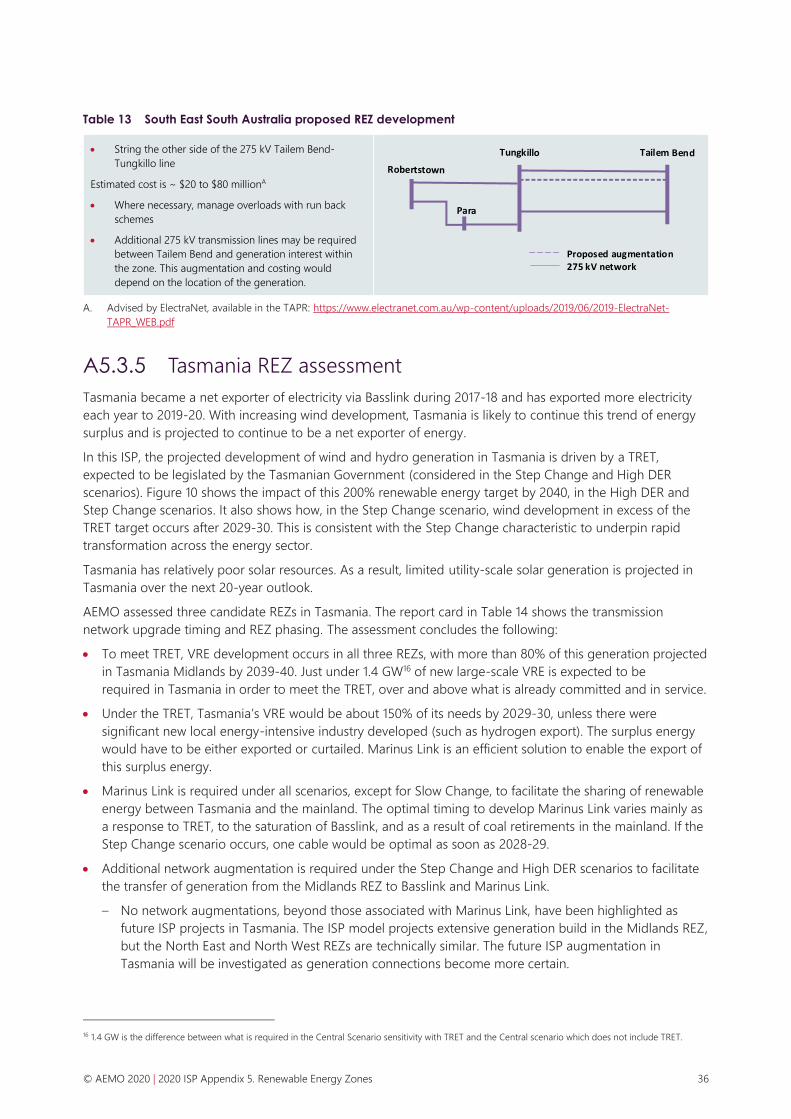
© AEMO 2020 | 2020 ISP Appendix 5. Renewable Energy Zones 36
Table 13 South East South Australia proposed REZ development
• String the other side of the 275 kV Tailem Bend-
Tungkillo line
Estimated cost is ~ $20 to $80 millionA
• Where necessary, manage overloads with run back
schemes
• Additional 275 kV transmission lines may be required
between Tailem Bend and generation interest within
the zone. This augmentation and costing would
depend on the location of the generation.
A. Advised by ElectraNet, available in the TAPR: https://www.electranet.com.au/wp-content/uploads/2019/06/2019-ElectraNet-
TAPR_WEB.pdf
A5.3.5 Tasmania REZ assessment
Tasmania became a net exporter of electricity via Basslink during 2017-18 and has exported more electricity
each year to 2019-20. With increasing wind development, Tasmania is likely to continue this trend of energy
surplus and is projected to continue to be a net exporter of energy.
In this ISP, the projected development of wind and hydro generation in Tasmania is driven by a TRET,
expected to be legislated by the Tasmanian Government (considered in the Step Change and High DER
scenarios). Figure 10 shows the impact of this 200% renewable energy target by 2040, in the High DER and
Step Change scenarios. It also shows how, in the Step Change scenario, wind development in excess of the
TRET target occurs after 2029-30. This is consistent with the Step Change characteristic to underpin rapid
transformation across the energy sector.
Tasmania has relatively poor solar resources. As a result, limited utility-scale solar generation is projected in
Tasmania over the next 20-year outlook.
AEMO assessed three candidate REZs in Tasmania. The report card in Table 14 shows the transmission
network upgrade timing and REZ phasing. The assessment concludes the following:
• To meet TRET, VRE development occurs in all three REZs, with more than 80% of this generation projected
in Tasmania Midlands by 2039-40. Just under 1.4 GW16 of new large-scale VRE is expected to be
required in Tasmania in order to meet the TRET, over and above what is already committed and in service.
• Under the TRET, Tasmania’s VRE would be about 150% of its needs by 2029-30, unless there were
significant new local energy-intensive industry developed (such as hydrogen export). The surplus energy
would have to be either exported or curtailed. Marinus Link is an efficient solution to enable the export of
this surplus energy.
• Marinus Link is required under all scenarios, except for Slow Change, to facilitate the sharing of renewable
energy between Tasmania and the mainland. The optimal timing to develop Marinus Link varies mainly as
a response to TRET, to the saturation of Basslink, and as a result of coal retirements in the mainland. If the
Step Change scenario occurs, one cable would be optimal as soon as 2028-29.
• Additional network augmentation is required under the Step Change and High DER scenarios to facilitate
the transfer of generation from the Midlands REZ to Basslink and Marinus Link.
– No network augmentations, beyond those associated with Marinus Link, have been highlighted as
future ISP projects in Tasmania. The ISP model projects extensive generation build in the Midlands REZ,
but the North East and North West REZs are technically similar. The future ISP augmentation in
Tasmania will be investigated as generation connections become more certain.
16 1.4 GW is the difference between what is required in the Central Scenario sensitivity with TRET and the Central scenario which does not include TRET.
Proposed augmentation275 kV network

© AEMO 2020 | 2020 ISP Appendix 5. Renewable Energy Zones 37
Figure 10 Tasmania’s projected wind (left) and solar (right) capacity build (MW) across all scenarios
Table 14 Tasmania REZ report card
REZ Existing
network
capacity
(MW)
Hosting capacity
increase with ISP
projects
Priority for
generation
connection
Network upgrade timing
Central Step Fast High
DER
Slow
T1 – North East
Tasmania 250 - Phase 1A - - - - -
T2 – North West
Tasmania 340 Marinus LinkB
+600 MWC stage 2
Phase 1A Timed with Marinus Link, timing varies across scenarios,
however VRE projections does not utilise capacity.
T3 – Tasmania
Midlands 480 Marinus Link
+540 MWD stage 1
Phase 1 A and
phase 2
Timed with Marinus Link, timing and stages varies across
scenarios. Additional to the capacity supported by
Marinus Link additional augmentation is required:
- 2030-31 - 2037-38 -
A. Phase 1 classification is subject to TRET becoming legislated.
B. Marinus Link stage 1 refers to the first 750 MW HVDC interconnector between Victoria and Tasmania and the 220 kV network
augmentation within Tasmania to support it Stage 2 refers to the second 750 MW HVDC interconnector and the 220 kV
augmentations within Tasmania to support it.
C. Increase hosting capacity in this REZ is supported by the 220 kV transmission network between Burnie – Hampshire – Staverton, as
part of the Marinus Link Stage 2
D. Increase hosting capacity in this REZ supported by the 220 kV transmission network between Burnie – Sheffield – Palmerston, as part
of Marinus Link stage 1.
A5.3.6 Victoria REZ assessment
VRE connections in Victoria in the first decade are projected to be driven by high quality wind and solar
resources and the state-based renewable energy target. The VRET mandates 25% of the region’s generation
be sourced from renewable sources by 2020, 40% by 2025 and 50% by 203017. This target is measured
against Victorian generation, including renewable DER.
17 Victoria State Government, Environmental, Land, Water and Planning, Victoria Renewable Energy Target 2018-2019 Progress Report, at
https://www.energy.vic.gov.au/__data/assets/pdf_file/0030/439950/Victorian-Renewable-Energy-Target-2018-19-Progress-Report.pdf.
0
500
1,000
1,500
2,000
2,500
3,000
202
0-2
1
202
2-2
3
202
4-2
5
202
6-2
7
202
8-2
9
203
0-3
1
203
2-3
3
203
4-3
5
203
6-3
7
203
8-3
9Ad
dit
ional W
ind C
apac
ity
(MW
)
Slow Change Central
High DER Fast Change
Step Change
0
500
1,000
1,500
2,000
2,500
3,000
202
0-2
1
202
2-2
3
202
4-2
5
202
6-2
7
202
8-2
9
203
0-3
1
203
2-3
3
203
4-3
5
203
6-3
7
203
8-3
9Ad
dit
ional S
ola
r C
ap
acity
(MW
)
Slow Change Central
High DER Fast Change
Step Change
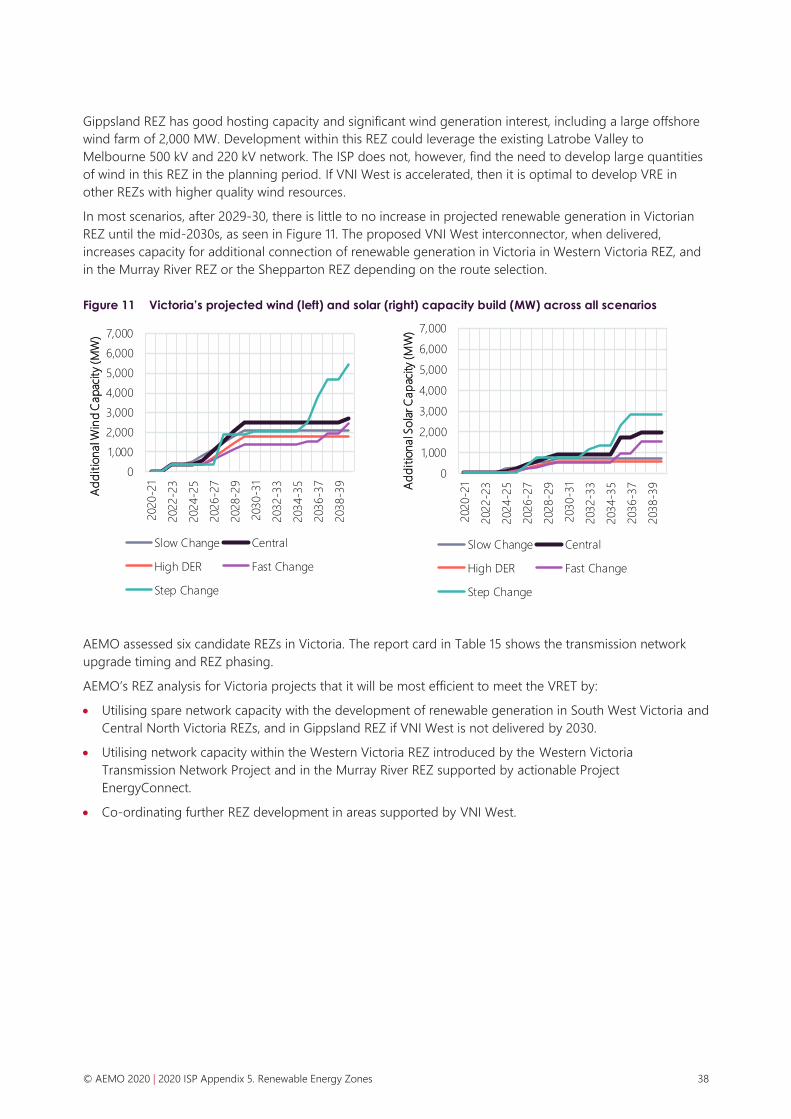
© AEMO 2020 | 2020 ISP Appendix 5. Renewable Energy Zones 38
Gippsland REZ has good hosting capacity and significant wind generation interest, including a large offshore
wind farm of 2,000 MW. Development within this REZ could leverage the existing Latrobe Valley to
Melbourne 500 kV and 220 kV network. The ISP does not, however, find the need to develop large quantities
of wind in this REZ in the planning period. If VNI West is accelerated, then it is optimal to develop VRE in
other REZs with higher quality wind resources.
In most scenarios, after 2029-30, there is little to no increase in projected renewable generation in Victorian
REZ until the mid-2030s, as seen in Figure 11. The proposed VNI West interconnector, when delivered,
increases capacity for additional connection of renewable generation in Victoria in Western Victoria REZ, and
in the Murray River REZ or the Shepparton REZ depending on the route selection.
Figure 11 Victoria’s projected wind (left) and solar (right) capacity build (MW) across all scenarios
AEMO assessed six candidate REZs in Victoria. The report card in Table 15 shows the transmission network
upgrade timing and REZ phasing.
AEMO’s REZ analysis for Victoria projects that it will be most efficient to meet the VRET by:
• Utilising spare network capacity with the development of renewable generation in South West Victoria and
Central North Victoria REZs, and in Gippsland REZ if VNI West is not delivered by 2030.
• Utilising network capacity within the Western Victoria REZ introduced by the Western Victoria
Transmission Network Project and in the Murray River REZ supported by actionable Project
EnergyConnect.
• Co-ordinating further REZ development in areas supported by VNI West.
0
1,000
2,000
3,000
4,000
5,000
6,000
7,000
202
0-2
1
202
2-2
3
202
4-2
5
202
6-2
7
202
8-2
9
203
0-3
1
203
2-3
3
203
4-3
5
203
6-3
7
203
8-3
9
Ad
dit
ional W
ind C
apac
ity
(MW
)
Slow Change Central
High DER Fast Change
Step Change
0
1,000
2,000
3,000
4,000
5,000
6,000
7,000
202
0-2
1
202
2-2
3
202
4-2
5
202
6-2
7
202
8-2
9
203
0-3
1
203
2-3
3
203
4-3
5
203
6-3
7
203
8-3
9Ad
dit
ional S
ola
r C
ap
acity
(M
W)
Slow Change Central
High DER Fast Change
Step Change

© AEMO 2020 | 2020 ISP Appendix 5. Renewable Energy Zones 39
Table 15 Victoria REZ report card
REZ Existing
network
capacity
(MW)
Hosting capacity
increase with ISP
projects
Priority for
generation
connection
Network upgrade timing
Central Step Fast High
DER
Slow
V1 – Ovens Murray 300 - - - - - - -
V2 – Murray River - Project
EnergyConnect
+380 MW
Phase 2 2024-25 2024-25 2024-25 2024-25 2024-25
V3 – Western
Victoria 450A VNI West
+1,000 MW
Phase 1 and
phase 2
Timed with Western Victoria Transmission Network
Project in 2025-26 and VNI West in 2027-28 or later
V4 – South West
Victoria 750 - Phase 1 - 2036-37 2040-41 - -
V5 – Gippsland 2,000 - - - - - - -
V6 – Central North
Victoria 800 VNI West (Option
6) +2,000 MW
Phase 1 and
phase 2
Upgrades occur with VNI West - -
A. Includes capacity gained after Western Victoria Transmission Network Project.
A5.3.6.1 Western Victoria REZ
Western Victoria REZ is identified for VRE development in phase 1 and phase 2, supported by the committed
Western Victoria Transmission Network Project and the actionable VNI West project. Currently, generation
interest within the Western Victoria REZ exceeds the capacity of the transmission network. This means
generation is being constrained due to thermal and stability limitations.
The VRE development in phase 1 is the Western Victoria Transmission Network Project, which seeks to reduce
the emerging constraints on the network, unlock renewable energy resources, reduce congestion, and
improve the productivity of existing assets.
The Western Victoria Transmission Network Project, detailed in Table 16, is a committed project. The
short-term augmentation is expected to be complete by 2020-21, and the medium-term augmentation is
currently on track to be commissioned in 2025-26.
Connections in this REZ should be monitored and possibly managed with a control scheme if necessary – for
example, it may be necessary in the future to implement a run back scheme.
There are currently automated control schemes in the area, and their interactions need to be carefully
monitored. Regular review all automated control schemes in the area may be required to ensure their
operation can provide a secure network following 220 kV line contingencies as more generation connects
within Western Victoria.
Table 16 Committed Western Victoria Transmission Network Project
Stage 1:
The installation of wind monitoring equipment and the
upgrade of station limiting transmission plant on the:
• Red Cliffs–Wemen 220 kV line
• Wemen–Kerang 220 kV line
• Kerang–Bendigo 220 kV line
• Moorabool–Terang 220 kV line
• Ballarat–Terang 220 kV line

© AEMO 2020 | 2020 ISP Appendix 5. Renewable Energy Zones 40
Stage 2:
• A new substation north of BallaratA
• A new 500 kV double-circuit transmission line from
Sydenham to the new substation north of BallaratA
• A new 220 kV double-circuit transmission line from
substation north of Ballarat to Bulgana (via Waubra)
• 2 x 500/220 kV transformers at the new substation
north of BallaratA
• Cut-in the existing Ballarat–Bendigo 220 kV line at a
new substation north of Ballarat
• Moving the Waubra Terminal Station connection
from the existing Ballarat–Ararat 220 kV line to a new
220 kV line connecting the substation north of
Ballarat to Bulgana
• Cut-in the existing Moorabool–Ballarat No. 2 220 kV
line at Elaine Terminal Station
A. New terminal station north of Ballarat which will be established through Western Victoria Transmission Network Project
Figure 12 Projected capacity build (MW) for Western Victoria REZ across all scenarios
0
250
500
750
1,000
1,250
1,500
Ad
dit
ional C
apac
ity
(MW
)
Slow Change Central High DER Fast Change Step Change

© AEMO 2020 | 2020 ISP Appendix 5. Renewable Energy Zones 41
A5.4. REZ scorecards
A5.4.1 REZ scorecard details
The REZ scorecards provide an overview of the characteristics of each REZ so an assessment can be made as
the development opportunities arise. The following explains the criteria in the scorecards.
REZ Report Card Details
REZ Assessments
REZ Phases REZs are classified into phases (see section A5.3.1). If a REZ has more than one phase, the earliest
applicable phase is used. REZ phases have been colour coded:
Phase 1 Connecting renewables to support government policy
Phase 2 Connecting renewables in areas supported by actionable ISP projects
Phase 3 Connecting renewables in areas supported by future ISP projects
N/A REZ is not listed for a REZ phased development.
Renewable Resources
Map Legend
Indicative generation is shown based on the resource availability:
Wind
Solar
Hydro
Geothermal
Battery
The green shading shows the indicative geographic
area of the Renewable Energy Zone.
Resource Quality
Solar average capacity factor based on 9 reference years.
≥30% ≥28% ≥26% ≥24% ≥22% <22%
A B C D E F
Wind average capacity factor based on 9 reference years.
≥45% ≥40% ≥35% ≥30% <30%
A B C D E
Correlation between demand describes whether the REZ resources are available at the same time
as the regional demand, using a statistical correlation factor. A higher correlation represents that
the resource is more available at regional demand.
≥0.3 ≥0.15 ≥0.0 ≥-0.15 <-0.15

© AEMO 2020 | 2020 ISP Appendix 5. Renewable Energy Zones 42
A B C D E
Renewable Resources
Estimated potential REZ size in MW based on the geographical size and resource quality in the
REZ. Social license and community support may impact the ability to deliver projects up to the
renewable resource limit.
Climate Hazard
Temperature
The REZ temperature score is based on the projected 1 in 10-year maximum temperaturesA
for the years 2030 and 2050.
Score Description
A Once in 10-year maximum temperature projections range between 28 and 38
degrees Celsius for the years 2030 and 2050. for the years 2030 and 2050.
B Once in 10-year maximum temperature projections range between 30 and 44
degrees Celsius for the years 2030 and 2050.
C Once in 10-year maximum temperature projections range between 32 and 48
degrees Celsius for the years 2030 and 2050.
D Once in 10-year maximum temperature projections range between 34 and 50
degrees Celsius for the years 2030 and 2050.
E Once in 10-year maximum temperature projections range between 44 and 52
degrees Celsius for the years 2030 and 2050.
A. 1 in 10-year maximum temperature data was provided by the Commonwealth Scientific and
Industrial Research Organisation (CSIRO) for 2030 and 2050.
Bushfire
The REZ bushfire score is based on the projection of annual average FFDI "high" fire
danger daysB around the years 2030 and 2050 and the probability of large bush fires
occurring (a dominant input).
Score Description
A Model projections associate less than half the days of a year with high fire
danger days and a probability of zero large fires in 20 years.
B Model projections associate less than half the days of a year with high fire
danger days and a probability of 1 large fire in 20 years.
C Model projections associate more than half the days of a year with high fire
danger days and a probability of 1 large fire in 20 years.
D Model projections associate more than half the days of a year with high fire
danger days and a probability of between 1 and 4 large fires in 20 years.
E Model projections associate more than half the days of a year with high fire
danger days and a probability of 1 large fire in 3 years.
FFDI - Forest Fire Danger Index
B. A "high" fire danger day is defined as any day where the FFDI is greater than 12.

© AEMO 2020 | 2020 ISP Appendix 5. Renewable Energy Zones 43
Variable Generation Outlook
Scenario Long term market simulations of different scenarios named Central, Slow Change, Fast Change,
Step Change and High DER.
Existing/Committed
Generation
The existing and committed generation as of the 31/01/2020. Solar and wind generation is
captured for existing and committed generation >10 MW.
Projected Variable
Generation
Long-term market simulations projected variable generation outlook for solar and wind generation
at different times intervals across all scenarios. All VRE projections are based on the least-cost
development paths except for the Slow Change scenario. The Slow Change scenario is based on
the transmission investment with the lowest regret, which includes all interconnectors that are
developed in every other scenario with a fixed timing.
Storage
Storage, in each dispatchable depth category: shallow, medium and deep, has been projected at a
state level. The REZ scorecards’ use the state level storage projections to suggest storage at a REZ
level in proportions that would benefit the network taking into consideration pumped hydro
interest in the REZs.
Shallow Storage
Shallow storage includes VPP battery and 2-hour large-scale batteries. The value of this category
of storage is more for capacity, fast ramping, and FCAS (not included in AEMO’s modelling) than it
is for its energy value. For the purpose of the REZ scorecards, only 2 hour battery is captured.
Medium Storage
Medium Storage includes 4-hour batteries, 6-hour pumped hydro, 12-hour pumped hydro, and
the existing pumped hydro stations, Shoalhaven and Wivenhoe. The value of this category of
storage is in its intra-day shifting capability, driven by demand and solar cycles.
Deep Storage
Deep storage includes 24-hour pumped hydro and 48-hour pumped hydro, and includes Snowy
2.0 and Tumut 3. The value of this category of storage is in covering VRE ‘droughts’ (that is, long
periods of lower-than-expected VRE availability), and seasonal smoothing of energy over weeks or
months.
Network Capability
Hosting Capacity (MW)
The approximate scale of additional generation (MW) that can be transported from the REZ to the
load centre considering network limitations (excluding system strength) and REZs’ current and
committed generation as of the 31/01/2020. Diversity of resources and storage can affect the
hosting capacity and these assumptions change between scenarios. For any REZ and
interconnector augmentation options, the figure listed as the hosting capacity is the increase in
hosting capacity above the current hosting capacity provided by the augmentation.
Loss Robustness Factors
The loss factor robustness is the sensitivity of Marginal Loss Factor (MLF) to additional generation
inside the REZ. The current loss factor robustness is calculated for the year 2022. The future loss
factor robustness is calculated in 2041 for future network augmentation unless staging requires an
assessment of an earlier year. Loss robustness factors are only calculated for augmentations built
in the optimal development path, improvement of MLF robustness is linked to an uncertain
investment. The measure used is the additional generation (MW) that can be added before the
MLF changes by -0.05:
≥1000 ≥800 ≥600 ≥400 ≥200 <200
A B C D E F
Interconnector
Augmentations
Recommended interconnector augmentations of the optimal development path are presented
where it may influence the REZ network hosting capacity. Where appropriate, alternative
interconnector options including route variations are presented. See Appendix 3 and the Input and
Assumptions Workbook18 for more information on transmission projects.
18 AEMO. Input and Assumptions Workbook, available at https://aemo.com.au/energy-systems/major-publications/integrated-system-plan-isp/2020-
integrated-system-plan-isp/2019-isp-database.

© AEMO 2020 | 2020 ISP Appendix 5. Renewable Energy Zones 44
Possible REZ
Augmentations Possible REZ augmentations that can increase the hosting capacity of the REZ.
ISP Development Lists the scenarios that required the REZ augmentation to increase the hosting capacity of the REZ
to accommodate projected growth in variable generation within the REZ.
System Strength
Available Fault Level
(MVA)
Captures the approximate available fault level in MVA for the Central and Step Change scenarios
for 2030 and 2035 assuming minimum fault level node requirements continue to be maintained by
the TNSP. Committed system strength projects have been considered for future years. The
available fault level calculations have been performed in order to indicate when fault level
remediation by connecting generators may be required in the REZ. A negative value indicates
remediation may be required, with the approximate amount required detailed in the ‘System
Strength remediation’ section. An assumed short circuit ratio requirement of 3 has been used for
these calculations, which may be considered conservative especially for the later years. The
methodology used for calculation the available fault level can be found in Appendix 7.
This is only a first pass review and does not negate the need for individual impact assessments as
part of standard generator connection processes. Investors and developers should conduct their
own due diligence to understand how technical requirements might influence their connection.
System Strength
Remediation
Approximate system strength remediation was calculated to restore the available fault level in the
REZ to a positive value using synchronous condensers. Where synchronous pumped hydro has
been planted in the REZ, it is expected this could form part of the system strength remediation. If
alternative services, like synchronous generation is available for contract at reasonable price, it
could offset the need for synchronous condensers or other forms of system strength remediation
listed in this section.
In the NEM, the division of responsibilities for the provision of system strength is:
• AEMO is required to determine the fault level requirements across the NEM and identify
whether a fault level shortfall is likely to exist now or in the future. The System Strength
Requirements Methodology19 defines the process AEMO must apply to determine the system
strength requirement at each node.
• The local TNSP is required to provide system strength services to meet the minimum three
phase fault levels at relevant fault level nodes if AEMO has declared a shortfall.
• A connecting generator is required to implement or fund system strength remediation, such
that its connection (or altered connection) does not have an adverse impact on system
strength, assessed in accordance with AEMO’s system strength impact assessment guidelines.
Investors and developers should conduct their own due diligence to understand how technical
requirements might influence their connection. See Appendix 7 for more information on system
strength.
19 AEMO. System Strength Requirements Methodology, at http://www.aemo.com.au/-/media/Files/Electricity/NEM/Security_and_Reliability/System-Security-
Market-Frameworks-Review/2018/System_Strength_Requirements_Methodology_PUBLISHED.pdf.

© AEMO 2020 | 2020 ISP Appendix 5. Renewable Energy Zones 45
A5.4.2 New South Wales REZ scorecards
N1 – North West New South Wales
Summary Phase 3 REZ
The North West New South Wales REZ is situated to the west of Tamworth,
Armidale and Dumaresq. This REZ encompasses the 132 kV network between
Armidale and Tamworth towards Inverell, Moree, Boggabri, Narrabri and
Gunnedah. The existing 132 kV network is weak and would require significant
network upgrades to accommodate VRE greater than the current hosting
capacity of 100 MW. Since the 2018 ISP, there have been no additional
committed and commissioned renewable generation projects in this REZ. The
currently preferred upgrades to the Queensland – New South Wales
interconnector, QNI Medium and QNI Large, increase the hosting capacity
within this REZ.
While this zone has high quality solar resources, the wind resource is
estimated to be inadequate for wind farm development.
REZ Assessment
Phase 3
Development of North West NSW REZ is projected in phase 3. Development in this region could be supported
by QNI Medium and Large augmentations. The additional capacity provided by QNI Medium and QNI Large
project is utilised immediately in the Central and High DER scenarios, and only in the late 2030s in the Slow
Change scenario. Under the Step Change and Fast Change scenarios, the network between Wollar and Boggabri
of QNI Medium would need to be brought forward a year to accommodate the increase in generation projected.
Renewable Resources
Resource Solar Wind
Resource Quality A D
Renewable Potential (MW) 6,500 0
Demand Correlation
2020 2030 2040 2020 2030 2040
E E E D D D
Climate Hazard
Temperature Score D Bush Fire Score E
Variable Renewable Energy Outlook
Solar PV (MW) Wind (MW)
Existing/
committed
Projected Existing/
committed
Projected
2029-30 2034-35 2039-40 2029-30 2034-35 2039-40
Central
56
100 1,100 3,450
There are no existing wind generators in this REZ, and no
wind projects progressed to the anticipated or committed
level in last 2 years. The modelling outcomes, for all
scenarios, did not project additional wind generation for
this REZ.
Step 100 1,850 4,200
Fast 100 1,100 3,250
High DER 100 1,100 2,100
Slow 100 100 1,000

© AEMO 2020 | 2020 ISP Appendix 5. Renewable Energy Zones 46
Storage
ISP modelling has generally demonstrated benefits
in co-locating solar generation with shallow-to-
medium storages. There is a large projection of
solar generation for this REZ which makes it a
great candidate for storage. Locating storage
within this REZ will firm up supply within the North
West New South Wales REZ and reduce the scale
of network augmentations required to transfer this
energy to the load centres.
Storage development in this REZ can support firm
energy exports to both New South Wales and
Queensland load centres via the proposed
development of the QNI upgrades.
Suggested Storage for REZ (MW)
Depth
Projected
2029-30 2034-35 2039-40
Central
Shallow
0 0 50
Step 0 0 0
Fast 0 0 0
High DER 0 0 0
Slow 0 0 0
Central
Medium
0 200 200
Step 0 0 0
Fast 0 300 300
High DER 0 0 0
Slow 0 0 0
Existing Network Capability
Description Approximate Existing
Hosting Capacity
Loss Factor
Robustness
The existing 132 kV network connects Armidale to Tamworth via Inverell, Moree,
Narrabri, Boggabri East and Gunnedah. 100 MW F
Associated Interconnector Augmentations
Description Additional Hosting Capacity Loss Factor
Robustness
QNI Medium Option 2E (Preparatory Activities Required):
A new 500 kV interconnector from Western Downs in Queensland via Boggabri
to a new substation near Wollar in New South Wales.
+1,000 MW A
QNI Large Option 3E (Preparatory Activities Required):
A second 500 kV interconnector from Western Downs in Queensland via
Boggabri to the new substation near Wollar in New South Wales.
+1,000 MW A
Possible REZ Augmentations
Description
Additional
Hosting
Capacity
Upgrade
Cost
Estimate
ISP
Development
Loss Factor
Robustness
Augmentation Option 1 (Bring forward of QNI Medium):
Parts of QNI Medium are required earlier under the Step and
Fast scenarios. These augmentations involve:
• Establish a new 500/330 kV at Boggabri
• A new Boggabri–Tamworth 330 kV line (for sharing capacity
with New England and allowing solar generation access to
possible pumped hydro)
• Establish a new substation on Bayswater–Wollar 500 kV line
+1,000 MW Part of QNI Fast, Step
Change -

© AEMO 2020 | 2020 ISP Appendix 5. Renewable Energy Zones 47
• A new double-circuit 500 kV line from this new substation
to Boggabri
• 500/330 kV transformation at Boggabri
Augmentation Option 2:
• Establish a new 330 kV at Gunnedah
• A new double-circuit Gunnedah–Tamworth 330 kV line
• A new double-circuit Gunnedah–Wollar 330 kV line
+1,350 MW
$390 million
to $730
million
Not identified
as being
required under
any ISP
scenario
-
Augmentation Option 3 (if augmenting before QNI):
This augmentation is required to connect generation within
North West New South Wales and New England, and opens for
further extensions on QNI along either the west or eastern path:
• Establish a new 500/330 kV substation at Uralla
• Establish a new 330 kV substation just west of Gunnedah
• Turn both Armidale–Tamworth 330 kV lines into Uralla
• A new single-circuit 500 kV line from Uralla to Bayswater
• 500/330 kV transformation at Uralla and new substation
near Gunnedah
• Build a new 500 kV Uralla–west of Gunnedah–Wollar single-
circuit line
• Build a new 330 kV Uralla–Tamworth–Liddell single-circuit
line
• Build a new 330 kV west of Gunnedah–Tamworth double-
circuit line
+4,000 MWA
$1,340
million to
$2,500
million
Not identified
as being
required under
any ISP
scenario
-
Augmentation Option 4:
Additional to QNI Medium and Large, the following is required:
• Two 500/330 kV transformers at Boggabri
• 500/330 kV transformer at West of Dumaresq
• Connection to New England REZ with a 500 kV line
between Boggabri and UrallaB.
+3,000 MWC
$300 million
to $550
million
Central, High
DER, Fast and
Step Change
scenarios
(2035-36)
A
A. Additional hosting capacity gained in North West NSW and New England.
B. Timing on 500 kV line is dependent on build in both North West NSW and New England, which varies across scenarios.
C. Depends on augmentation for New England, New England REZ generation and QNI flows.
Available Fault Level (MVA)
Available fault level in this REZ is influenced by planting of solar
PV from the mid-2030s.
Scenario Existing 2029-30 2034-35
Central 1,900 1,600 300
Step 1,900 1,550 -3,550
System Strength Remediation Augmentation
Description
Date
Required Cost
Central Remediation not required with forecast level of VRE. - -
Step Establish 2 x 250 MVAr synchronous condensers. 2033-34 $95 million to $120 million
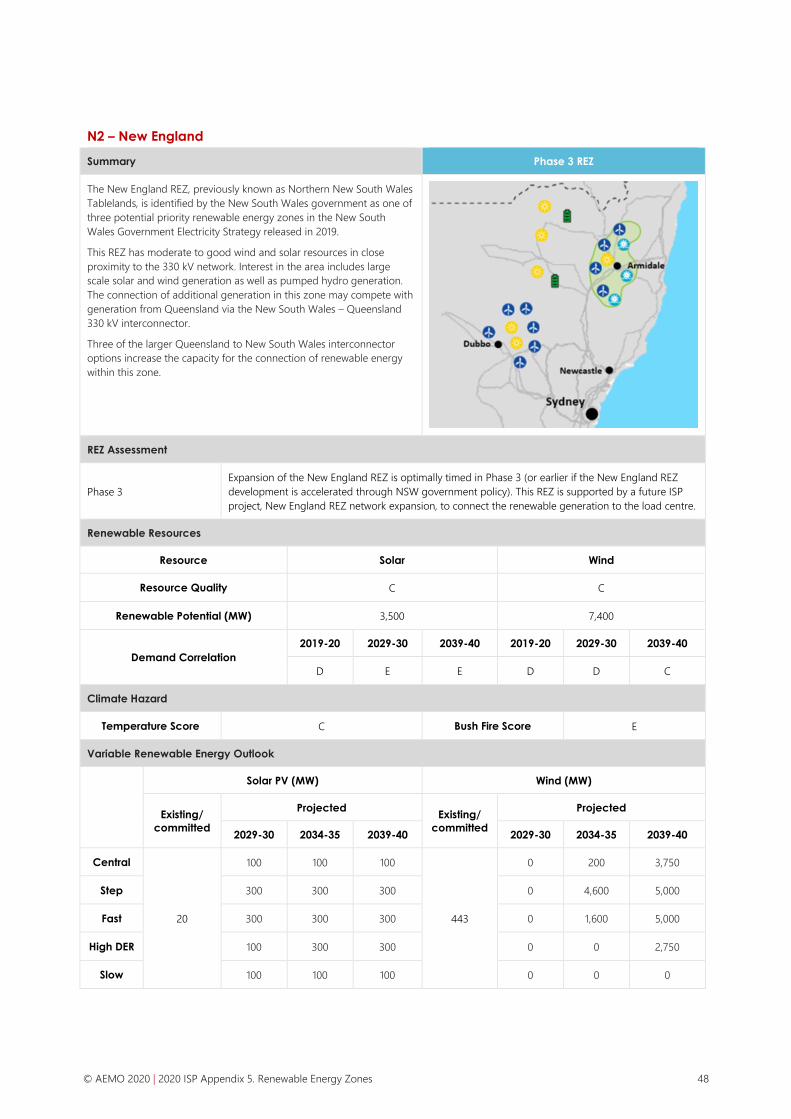
© AEMO 2020 | 2020 ISP Appendix 5. Renewable Energy Zones 48
N2 – New England
Summary Phase 3 REZ
The New England REZ, previously known as Northern New South Wales
Tablelands, is identified by the New South Wales government as one of
three potential priority renewable energy zones in the New South
Wales Government Electricity Strategy released in 2019.
This REZ has moderate to good wind and solar resources in close
proximity to the 330 kV network. Interest in the area includes large
scale solar and wind generation as well as pumped hydro generation.
The connection of additional generation in this zone may compete with
generation from Queensland via the New South Wales – Queensland
330 kV interconnector.
Three of the larger Queensland to New South Wales interconnector
options increase the capacity for the connection of renewable energy
within this zone.
REZ Assessment
Phase 3
Expansion of the New England REZ is optimally timed in Phase 3 (or earlier if the New England REZ
development is accelerated through NSW government policy). This REZ is supported by a future ISP
project, New England REZ network expansion, to connect the renewable generation to the load centre.
Renewable Resources
Resource Solar Wind
Resource Quality C C
Renewable Potential (MW) 3,500 7,400
Demand Correlation
2019-20 2029-30 2039-40 2019-20 2029-30 2039-40
D E E D D C
Climate Hazard
Temperature Score C Bush Fire Score E
Variable Renewable Energy Outlook
Solar PV (MW) Wind (MW)
Existing/
committed
Projected Existing/
committed
Projected
2029-30 2034-35 2039-40 2029-30 2034-35 2039-40
Central
20
100 100 100
443
0 200 3,750
Step 300 300 300 0 4,600 5,000
Fast 300 300 300 0 1,600 5,000
High DER 100 300 300 0 0 2,750
Slow 100 100 100 0 0 0

© AEMO 2020 | 2020 ISP Appendix 5. Renewable Energy Zones 49
Storage
Given the large projected solar and wind
generation for the New England, North West
New South Wales and Darling Downs REZs,
there is a need for large scale storage under all
scenarios except Slow Change. The development
of pumped hydro and battery storage within the
New England and North West New South Wales
REZs could assist in not only firming up the VRE
but also deferring or reducing the scale of
transmission augmentation required. Storage
has been suggested for this region under all
scenarios except for the Slow Change scenario
whereby little VRE is projected in the REZ.
New England REZ has good potential for
pumped hydro. The pumped hydro resources
are situated close to the 330 kV network, just
east of Armidale and Uralla. There are also
pumped hydro resources along the Armidale–
Coffs Harbour 330 kV line.
In April 2020, on behalf of the Australian
Government, ARENA announced that it is
providing $951,000 to the Oven Mountain
Pumped Hydro Project to undertake a study to
analyse the benefits that 600 MW/7,200 MWh
pumped hydro energy would have on the New
England REZ20.
Suggested Storage for REZ (MW)
Depth
Projected
2029-30 2034-35 2039-40
Central
Medium
0 0 1,150
Step 0 200 350
Fast 0 0 500
High DER 0 0 350
Slow 0 0 0
Central
Deep
0 0 0
Step 0 0 1,100
Fast 0 0 0
High DER 0 0 0
Slow 0 0 0
Existing Network Capability
Description Approximate Existing Hosting
Capacity
Loss Factor
Robustness
The existing 330 kV network can support around 300 MW of new
connections in and around Tamworth 330 kV substation. 300 MW A
Associated Interconnector Augmentations
Description Additional Hosting Capacity Loss Factor
Robustness
QNI (Preparatory Activities Required):
A second 500 kV interconnector from Western Downs in Queensland via
Boggabri and Uralla, to Bayswater in New South Wales. This is an alternative
option to QNI medium and large captured in North West NSW scorecard
(see Appendix 3).
+2,000 MW A -
A. The 2,000 MW is shared between North West NSW and the New England REZ.
Possible REZ Augmentations
Description
Additional
Hosting
Capacity
Upgrade
Cost
Estimate
ISP
Development
Loss Factor
Robustness
Augmentation Option 1
Stage 1:
For generation interest at Uralla:
• Establish a new 500/330 kV substation at Uralla
• Turn both Armidale–Tamworth 330 kV lines into Uralla
+4,000-
5,000 MWC
$940 million
to $1,750
million
Step and Fast
Change (from
2030-31), Central
and High DER
(from 2035-36)D
A
20 Arena, available at: https://arena.gov.au/news/pumped-hydro-plant-could-unlock-new-england-renewable-energy-zone/

© AEMO 2020 | 2020 ISP Appendix 5. Renewable Energy Zones 50
• Uprate Armidale–Uralla–Tamworth 330 kV lines
• A new double-circuit 500 kV line from Uralla to
Bayswater
• 500/330 kV 1,500 MVA transformation at Uralla
Stage 2:
For generation interest in and around the Walcha area:
• Establish a new 500/330 kV substation near Walcha
• Turn both Bayswater–Uralla lines into Walcha
• 500/330 kV 1,500 MVA transformation at Walcha
• A new Bayswater 500/330 kV 1,500 MVA transformer
• A new Uralla–Boggabri 500 kV single-circuit lineB
Augmentation Option 2 (If augmented before QNI):
This augmentation is to connect generation within North West
New South Wales and New England, and opens for further
extensions on QNI along either the west or eastern path:
• Establish a new 500/330 kV substation at Uralla
• Establish a new 330 kV substation just west of Gunnedah
• Turn both Armidale–Tamworth 330 kV lines into Uralla
• A new single-circuit 500 kV line from Uralla to Bayswater
• 500/330 kV transformation at Uralla and new substation
near Gunnedah
• Build a new 500 kV Uralla–west of Gunnedah–Wollar
single-circuit line
• Build a new 330 kV Uralla–Tamworth–Liddell single-
circuit line
• Build a new 330 kV west of Gunnedah–Tamworth
double-circuit line
+4,000
MW
$1,340
million to
$2,500
million
Larger build
required in the
ISP
-
Augmentation Option 3:
• Establish a new Uralla 500/330 kV substation
• Uprate and turn Armidale–Tamworth 330 kV lines 85 and
86 into Uralla
• Build a new 500 kV Bayswater–Uralla single-circuit line
• 500/330 kV transformation at Uralla
+1,000 MW
$460 million
to $860
million
Larger build
required in ISP
scenarios
-
B. Timing is dependent on the growth in both North West NSW and New England REZ which varies across scenarios.
C. Capacity gained depend of resources, location of storage and QNI transfers within this REZ. It assumes QNI Medium and Large in place.
Options to increase this to 8,000 MW to match the target from NSW Government will be explored in the preparatory activities for QNI
Medium and Large, North West NSW REZ and New England REZ. See Appendix 5. for further details.
D. Additional network augmentation may be required with large VRE build in North West New South Wales, Central West NSW and New
England, and coal retirement in NSW to strengthen the network between Bayswater, New Castle and Sydney.
Available Fault Level (MVA)
Pumped hydro from the late 2030s is expected to form part of
the system strength solution for this (and surrounding) REZs.
Scenario Existing 2029-30 2034-35
Central 550 550 550
Step 550 1,200 -10,950

© AEMO 2020 | 2020 ISP Appendix 5. Renewable Energy Zones 51
System Strength Remediation Augmentation
Description Date
Required Cost
Central Remediation not required with forecast level of VRE. - -
Step Establish 4 x 250 MVAr synchronous condensers. 2031-32 $180 million to $230 million

© AEMO 2020 | 2020 ISP Appendix 5. Renewable Energy Zones 52
N3 – Central-West Orana
Summary Phase 1 REZ
The Central–West Orana REZ is electrically close to the Sydney load
centre and has moderate wind and solar resources. Currently there is
more than 700 MW of commissioned and committed generation within
Central–West Orana REZ, most of this generation is derived from solar
energy.
With significant existing investment and investor interest, the Central–
West Orana REZ has been identified by the New South Wales
Government as the state’s first pilot REZ – expected to unlock
3,000 MW of transmission hosting capacity by the mid–2020s21.
Construction of the pilot REZ is expected in begin in 2022. In May, the
NSW Department of Planning, Industry and Environment called for
renewable energy, energy storage and emerging energy project
proponents to register their interest in being part of the first pilot REZ.
The registration of interest closed the first week of June.
REZ Assessment
Phase 1 REZ Central–West Orana REZ has development in phase 1. Generation development within the Central–
West Orana REZ is facilitated by the actionable Central–West Orana REZ Transmission Link project.
Renewable Resources
Resource Solar Wind
Resource Quality C C
Renewable Potential (MW) 7,200 3,000
Demand Correlation
2019-20 2029-30 2039-40 2019-20 2029-30 2039-40
E F F E D D
Climate Hazard
Temperature Score C Bush Fire Score E
Variable Renewable Energy Outlook
Solar PV (MW) Wind (MW)
Existing/
committed
Projected Existing/
committed
Projected
2029-30 2034-35 2039-40 2029-30 2034-35 2039-40
Central
520
150 2,150 2,200
251
0 800 800
Step 1,550 2,200 4,800 750 800 2,200
Fast 950 2,200 2,200 0 800 800
High DER 150 150 2,100 0 0 900
Slow 150 150 150 0 0 0
21 New South Wales Government, Renewable Energy Zones, at https://energy.nsw.gov.au/renewables/renewable-energy-zones

© AEMO 2020 | 2020 ISP Appendix 5. Renewable Energy Zones 53
Storage
Central-West Orana has high quality solar and
moderate quality wind resources. The Central-West
Orana REZ has good pumped hydro resources
which could be used to firm solar and wind
generation. Potential storage sites are situated
predominately to the east of the Wellington–Mount
Piper 330 kV line. Developing pumped hydro or
battery storage in this zone would increase the
hosting capacity of solar generation within the
network by smoothing and firming the profile of
energy production across the REZ.
Due to the large VRE projection within Central-West
Orana REZ, storage has been suggested an efficient
solution to firm energy production in the Step and
Fast Change scenarios.
Suggested Storage for REZ (MW)
Depth Projected
2029-30 2034-35 2039-40
Central
Medium
0 0 0
Step 0 200 350
Fast 0 0 500
High DER 0 0 0
Slow 0 0 0
Central
Deep
0 0 0
Step 0 0 100
Fast 0 0 0
High DER 0 0 0
Slow 0 0 0
Existing Network Capability
Description Approximate Existing Hosting
Capacity
Loss Factor
Robustness
The Central–West Orana REZ is connected via a 330 kV circuit between
Wellington–Wollar and Mount Piper–Wellington. A 132 kV network
connects Wellington, Mount Piper and Yass. A 132 kV network further
extends from Wellington to Dubbo area.
3,000 MW A
Associated Interconnector Augmentations
Description Additional Hosting Capacity Loss Factor
Robustness
There are no associated interconnector augmentations with this REZ.
Possible REZ Augmentations
Description
Additional
Hosting
Capacity
Upgrade
Cost
Estimate
ISP
Development
Loss Factor
Robustness
Augmentation Option 1:
• A 500 kV (or 330kV) loop which traverses the Central-
West region
+3,000 MW
$450
million to
$850
million
Central, Step,
Fast, Slow and
High DER
A
Augmentation Option 2:
Develop a Central West hub:
• A new Central West Hub 330 kV substation
• A new double-circuit Wollar–Central Hub 330 kV line
• A new Central West Hub–Wellington 330 kV line
• 500/330 kV Wollar transformer
+1,000 MW
$390
million to
$720
million
Larger build
required in the
ISP
-

© AEMO 2020 | 2020 ISP Appendix 5. Renewable Energy Zones 54
Available Fault Level (MVA)
Available fault level in this REZ is influenced by planting of
wind and solar PV from the late 2020s.
Scenario Existing 2029-30 2034-35
Central 1,200 1,300 -700
Step 1,200 -5,650 -5,600
System Strength Remediation Augmentation
Description Date
Required Cost
Central Establish 1 x 250 MVAr synchronous condenser. 2032-33 $45 million to $60 million
Step Establish 2 x 250 MVAr synchronous condensers. 2027-28 $95 million to $120 million

© AEMO 2020 | 2020 ISP Appendix 5. Renewable Energy Zones 55
N4 – Southern New South Wales Tablelands
Summary
The Southern New South Wales Tablelands REZ has excellent wind
resources. There is currently just over 640 MW of renewable generation
installed within this zone – over 630 MW of which is wind generation.
Southern New South Wales Tablelands has one of the highest wind
capacity factors within New South Wales. However, there has been
significant opposition from the community within this area for the
connection of any additional wind generation, and the proposed
extension of Crookwell 3 Wind Farm was rejected by the New South
Wales Independent Planning Commission22.
REZ Assessment
N/A Southern NSW Tablelands REZ does not have REZ phase development.
Renewable Resources
Resource Solar Wind
Resource Quality D B
Renewable Potential (MW) – –
Demand Correlation
2019-20 2029-30 2039-40 2019-20 2029-30 2039-40
E E F C C C
Climate Hazard
Temperature Score C Bush Fire Score E
Variable Renewable Energy Outlook
Solar PV (MW) Wind (MW)
Existing/
committed
Projected Existing/
committed
Projected
2029-30 2034-35 2039-40 2029-30 2034-35 2039-40
Central
10
The modelling outcomes, for all
scenarios, did not project additional
solar generation for this REZ.
635
250 250 250
Step 250 250 250
Fast 250 250 250
High DER 250 250 250
Slow 250 250 250
22 New South Wales Independent Planning Commission, Statement of reasons for decisions Crookwell 3 wind farm (SSD 6695) available at,
https://www.ipcn.nsw.gov.au/resources/pac/media/files/pac/projects/2015/02/crookwell-iii-wind-farm/determination/crookwell-3-wind-farm-ssd-6695--
statement-of-reasons.pdf

© AEMO 2020 | 2020 ISP Appendix 5. Renewable Energy Zones 56
Storage
Southern NSW Tablelands has identified pumped hydro locations close to the
330 kV network between Marulan and Dapto. With more than 2,000 MW of
storage developed in the Tumut REZ and little projections of VRE in the Southern
NSW Tablelands area, no storage has been suggested in the region.
Suggested Storage for REZ (MW)
Southern NSW Tablelands has not been
suggested for storage across any scenario in the
2020 ISP.
Existing Network Capability
Description Approximate Existing
Hosting Capacity
Loss Factor
Robustness
This REZ is close to four 330 kV transmission lines and two 500 kV transmission
lines supporting Sydney. The existing network could support approximately
1,000 MW of new connections.
1,000 MW A
Associated Interconnector Augmentations
Description Additional Hosting Capacity Loss Factor
Robustness
There are no associated interconnector augmentations with this REZ.
Available Fault Level (MVA)
Available fault level in this REZ is influenced by planting of wind
from the mid-2020s.
Scenario Existing 2029-30 2034-35
Central 2,700 1,300 1,350
Step 2,700 2,650 2,250
System Strength Remediation Augmentation
Remediation not required with forecast level of VRE in the Central and Step Change scenarios.

© AEMO 2020 | 2020 ISP Appendix 5. Renewable Energy Zones 57
N5 – Broken Hill
Summary
Broken Hill REZ has excellent solar resources. It is connected to the
New South Wales grid via a 220 kV line from Buronga with an
approximate length of 270 km. The current capacity of this 220 kV line
is utilised by the existing solar, wind and gas generation in the area.
With little local load and the long distance to the load centres, the MLF
robustness for this REZ is one of the worst in the NEM. Significant
development of VRE in this REZ could prove costly as it would require
significant transmission network augmentation due to the distance of
the REZ from the main transmission paths of the shared network. For
this reason, the ISP has prioritised other REZ for development ahead of
this REZ.
REZ Assessment
N/A Broken Hill REZ does not have any projected development.
Renewable Resources
Resource Solar Wind
Resource Quality A C
Renewable Potential (MW) 8,000 5,100
Demand Correlation
2020 2030 2040 2020 2030 2040
E F F E E E
Climate Hazard
Temperature Score E Bush Fire Score C
Variable Renewable Energy Outlook
Solar PV (MW) Wind (MW)
Existing/
committed
Projected Existing/
committed
Projected
2029-30 2034-35 2039-40 2029-30 2034-35 2039-40
Central
54
The modelling outcomes, for all
scenarios, did not project additional
solar generation for this REZ.
199
The modelling outcomes, for all scenarios,
did not project additional wind generation
for this REZ.
Step
Fast
High DER
Slow
Storage
Broken Hill REZ has not been identified as having significant potential pumped
hydro capability. Furthermore, no VRE is projected for this REZ, in any scenario,
due to the large costs required to extend additional transmission infrastructure
to this zone. For these reasons, no storage has been suggested for this zone.
Suggested Storage for REZ (MW)
Broken Hill has not been suggested for storage
across any scenario in the 2020 ISP.

© AEMO 2020 | 2020 ISP Appendix 5. Renewable Energy Zones 58
Existing Network Capability
Description Approximate Existing Hosting
Capacity
Loss Factor
Robustness
Broken Hill REZ is connected via a 270 km 220 kV line from Buronga to Broken
Hill. With 253 MW of generation already connected within this zone, there is no
additional spare hosting capacity available.
– F
Associated Interconnector Augmentations
Description Additional Hosting Capacity Loss Factor
Robustness
There are no associated interconnector augmentations with this REZ.
Possible REZ Augmentations
Description
Additional
Hosting
Capacity
Upgrade
Cost
Estimate
ISP
Development
Loss Factor
Robustness
Due to the location of this REZ and distance of network augmentation required, it is difficult to meet the REZ design principles
economically. Possible future consideration should include options to connect to Central-West Orana REZ/QNI Medium and Large.
Available Fault Level (MVA)
Available fault level in this REZ is influenced by development of
nearby REZs.
Scenario Existing 2029-30 2034-35
Central At limitA -300 -300
Step At limitA -250 -300
A. Existing system strength limits in this area are already requiring remediation by connecting generation.
System Strength Remediation Augmentation
Remediation requirements shown for this REZ are due to expansion of VRE in neighbouring REZs, and are met through a joint solution
reported in REZ N6.

© AEMO 2020 | 2020 ISP Appendix 5. Renewable Energy Zones 59
N6 – South West New South Wales
Summary Phase 2 REZ
In the 2018 ISP, the South West New South Wales REZ formed part of
the Murry River REZ which covered the western part of New South
Wales and Victoria. The New South Wales portion of the Murray River
REZ now forms the South West New South Wales REZ.
This zone has over 1,000 MW of generation currently in service and
committed, all of which is solar generation. For any further large scale
renewable generation to connect in this area, additional transmission
infrastructure would be required to get the generation from this REZ to
the Sydney load centre. The capacity within this REZ and ability to
transfer energy from the REZ to the main load centres in the greater
Sydney area will be improved by the proposed New South Wales and
South Australia interconnector, Project EnergyConnect, together with
HumeLink. One option for VNI West (Kerang route) would further
increase the hosting capacity of this REZ.
REZ Assessment
Phase 2 REZ
South West NSW REZ has development in phase 2. The full commissioning of the Project
EnergyConnect expected by 2024-25, will increase the hosting capacity within this REZ. The additional
capacity released through Project EnergyConnect is fully utilised in all scenarios except for the Slow
Change scenario. In the Fast Change and Step Change scenario the capacity is utilised in the mid–late
2020s. In the Central and High DER scenarios, it is utilised in the mid-late 2030s.
Renewable Resources
Resource Solar Wind
Resource Quality B D
Renewable Potential (MW) 4,000 4,300
Demand Correlation
2019-20 2029-30 2039-40 2019-20 2029-30 2039-40
E F F D D D
Climate Hazard
Temperature Score E Bush Fire Score D
Variable Renewable Energy Outlook
Solar PV (MW) Wind (MW)
Existing/
committed
Projected Existing/
committed
Projected
2029-30 2034-35 2039-40 2029-30 2034-35 2039-40
Central
1,034
0 600 600
There is no existing or committed wind generation in this
REZ. The modelling outcomes, for all scenarios, did not
project additional wind generation for this REZ.
Step 600 600 600
Fast 600 600 600
High DER 0 0 600
Slow 0 0 0

© AEMO 2020 | 2020 ISP Appendix 5. Renewable Energy Zones 60
Storage
South West New South Wales REZ has not
been identified as having significant
potential pumped hydro capability. For this
reason, no pumped hydro has been
suggested for this region.
With over 1,000 MW of solar generation in
service and committed within this zone,
and another 600 MW projected, this REZ
would be a good location for storage.
Medium storage is suggested for South
West New South Wales in the Central and
Fast Change scenarios.
Suggested Storage for REZ (MW)
Depth
Projected
2029-30 2034-35 2039-40
Central
Medium
0 150 150
Step 0 0 0
Fast 0 200 200
High DER 0 0 0
Slow 0 0 0
Existing Network Capability
Description Approximate Existing Hosting
Capacity
Loss Factor
Robustness
The 220 kV network within this REZ is weak and currently has no spare
hosting capacity to connect large scale renewable energy. – E
Associated Interconnector Augmentations
Description Additional Hosting Capacity Loss Factor
Robustness
Project EnergyConnect (Actionable ISP project):
A new 330 kV interconnector between Robertstown in South Australia and
Wagga Wagga in New South Wales, via Buronga.
+600 MW A
VNI West (Actionable ISP Project):
A new 500 kV interconnector between Victoria and NSW. There are
multiple alternative corridors for VNI West of which one option, via
Kerang, opens capacity within this REZ: see Appendix 3.
+1,000 MW -
Possible REZ Augmentations
Description
Additional
Hosting
Capacity
Upgrade
Cost Estimate
ISP
Development
Augmentation Option 1A:
• Build a new double/single-circuit Darlington Point–Wagga 330 kV
line
• Establish 330 kV substation at HayB
• Build a double-circuit 330 kV line from Darlington Point to Hay
substationB
• Install 1,500 MVA, 500/330 kV transformation at Wagga
+1,400 MW $450 million to
$840 million
Not identified
as being
required under
any ISP scenario
A. Assumes HumeLink is built.
B. Only if significant interest lies around Hay.
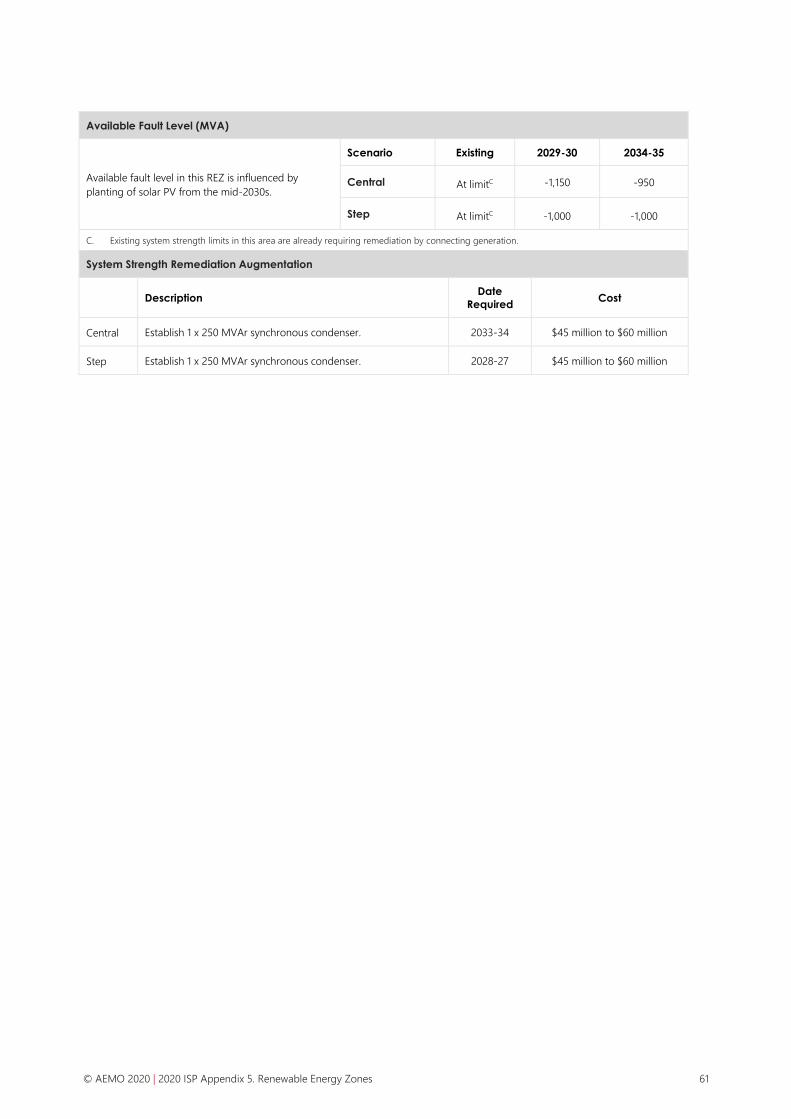
© AEMO 2020 | 2020 ISP Appendix 5. Renewable Energy Zones 61
Available Fault Level (MVA)
Available fault level in this REZ is influenced by
planting of solar PV from the mid-2030s.
Scenario Existing 2029-30 2034-35
Central At limitC -1,150 -950
Step At limitC -1,000 -1,000
C. Existing system strength limits in this area are already requiring remediation by connecting generation.
System Strength Remediation Augmentation
Description
Date
Required Cost
Central Establish 1 x 250 MVAr synchronous condenser. 2033-34 $45 million to $60 million
Step Establish 1 x 250 MVAr synchronous condenser. 2028-27 $45 million to $60 million

© AEMO 2020 | 2020 ISP Appendix 5. Renewable Energy Zones 62
N7 – Wagga Wagga
Summary Phase 2 REZ
The Wagga Wagga REZ is a new addition to the New South Wales REZ
candidates for the 2020 ISP. The need to identify this area as a
candidate REZ has been driven by interest in the area. This REZ extends
north of Wagga Wagga and south past Hume. This REZ has moderate
wind and solar resources. Bomen Solar Farm, 100 MW, is committed
and will connect to the network north of Wagga Wagga.
REZ Assessment
Phase 2 REZ
Wagga Wagga REZ has development in phase 2. The commissioning of HumeLink will increase the
hosting capacity within this REZ by approximately 1,000 MW in 2025-26. The additional hosting
capacity provided by HumeLink is fully utilised in all scenarios except the Slow Scenario; the Step and
Fast Change scenarios make full use of the additional capacity from the late 2020s and the Central
scenario from 2032-33. The High DER scenario develop Wagga Wagga REZ in 2032-33, but only
maximises the capacity available into the 2040s.
Renewable Resources
Resource Solar Wind
Resource Quality C E
Renewable Potential (MW) 1,100 1,100
Demand Correlation
2019-20 2029-30 2039-40 2019-20 2029-30 2039-40
E F F D D D
Climate Hazard
Temperature Score D Bush Fire Score D
Variable Renewable Energy Outlook
Solar PV (MW) Wind (MW)
Existing/
committed
Projected Existing/
committed
Projected
2029-30 2034-35 2039-40 2029-30 2034-35 2039-40
Central
100
0 1,000 1,000
There is no existing or committed wind generation in this
REZ. The modelling outcomes, for all scenarios, did not
project additional wind generation for this REZ.
Step 1,000 1,000 1,000
Fast 1,000 1,000 1,000
High DER 0 400 1,000
Slow 0 0 0

© AEMO 2020 | 2020 ISP Appendix 5. Renewable Energy Zones 63
Storage
Wagga Wagga REZ has not been identified as having significant potential
pumped hydro capability. Across all scenarios, moderate to high levels of
solar generation is projected to grow in this REZ. However, no storage is
suggested for this REZ due to it being located electrically close to the storage
in the snowy region.
Suggested Storage for REZ (MW)
Wagga Wagga REZ has not been suggested for
storage across any scenario in the 2020 ISP.
Existing Network Capability
Description Approximate Existing
Hosting Capacity
Loss Factor
Robustness
The 330 kV and the 132 kV network around Wagga Wagga has no additional
spare hosting capacity available. – C
Associated Interconnector Augmentations
Description Additional Hosting
Capacity
Loss Factor
Robustness
HumeLink (Actionable ISP project):
A new 500 kV transmission line connection between Wagga, Maragle in the
Snowy area and Bannaby.
+1,000 MW A
Possible REZ Augmentations
Description
Additional
Hosting
Capacity
Upgrade
Cost
Estimate
ISP
Development
Augmentation Option 1:
• Build a new 500 kV substation at Wagga
• Build a new 500 kV Bannaby–Wagga single-circuit line
• Install 1,500 MVA of 500/330 kV transformation at Wagga
+1,000 MW
$480 million
to $890
million
Not identified
as being
required under
any ISP scenario
Available Fault Level (MVA)
Available fault level in this REZ is influenced by planting of
solar PV from the mid-2030s.
Scenario Existing 2029-30 2034-35
Central At limitA 1,350 300
Step At limitA 1,400 800
A. Existing system strength limits in this area are already requiring remediation by connecting generation.
System Strength Remediation Augmentation
Remediation not required with forecast level of VRE in the Central and Step Change scenarios.

© AEMO 2020 | 2020 ISP Appendix 5. Renewable Energy Zones 64
N8 – Tumut
Summary Phase 2
The Tumut REZ has been identified due to the potential for additional
pumped hydro generation. The proposed HumeLink, an actionable ISP
project currently undergoing a RIT–T, will enable the connection of just
over 2,000 MW of pumped hydro generation (Snowy 2.0) in this area.
On the 31st of January 2020, the New South Wales and Commonwealth
governments signed a memorandum of understanding (MOU) that sets
out a clear, long–term path to help the state meet its targets of net
zero emissions by 205023. Key initiatives of this MOU include improving
transmission interconnections and network access including
accelerating and delivering the HumeLink project to unlock existing and
future generation from the Snowy area within the Tumut REZ.
REZ Assessment
Phase 2 Tumut REZ does not have any VRE projected. The actionable ISP project HumeLink is expected to
unlock existing and future generation from Snowy Hydro.
Renewable Resources
Resource Solar Wind
Resource Quality C B
Renewable Potential (MW) – –
Demand Correlation
2019-20 2029-30 2039-40 2019-20 2029-30 2039-40
E E F C C C
Climate Hazard
Temperature Score C Bush Fire Score E
Variable Renewable Energy Outlook
Solar PV (MW) Wind (MW)
Existing/
committed
Projected Existing/
committed
Projected
2029-30 2034-35 2039-40 2029-30 2034-35 2039-40
Central
There is no existing or committed solar generation for this
REZ. The modelling outcomes, for all scenarios, did not
project additional solar generation for this REZ.
There is no existing or committed wind generation in this
REZ. The modelling outcomes, for all scenarios, did not
project additional wind generation for this REZ.
Step
Fast
High DER
Slow
23 New South Wales Government Memorandum of Understanding, at https://energy.nsw.gov.au/government-and-regulation/electricity-
strategy/memorandum-understanding

© AEMO 2020 | 2020 ISP Appendix 5. Renewable Energy Zones 65
Storage
Tumut REZ has excellent pumped hydro
resources. Snowy 2.024, has been considered
committed, across all scenarios, with the timing
in 2025.
The HumeLink RIT–T, which is currently
underway, will unlock existing and future
generation within this area. This project
proposes the addition of 500 kV transmission
between Wagga Wagga, the Tumut area and
Bannaby. In late February 2019, the
Commonwealth Government approved Snowy
2.0 as part of its plan to support renewable
energy transformation delivering affordable,
reliable power25.
Suggested Storage for REZ (MW)
Depth
Projected
2029-30 2034-35 2039-40
Central
Committed
Snowy 2.0
(Deep)
2,040 2,040 2,040
Step 2,040 2,040 2,040
Fast 2,040 2,040 2,040
High DER 2,040 2,040 2,040
Slow 2,040 2,040 2,040
Existing Network Capability
Description
Approximate
Existing Hosting
Capacity
Loss Factor
Robustness
Currently the 330 kV transmission network around Lower and Upper Tumut is congested
during peak demand periods. A careful balance of generation from the existing hydro units
and flow between Victoria and New South Wales is required to prevent overloads within this
area.
– N/A
Associated Interconnector Augmentations
Description
Additional
Hosting
Capacity
Loss Factor
Robustness
HumeLink (Actionable ISP project):
A new 500 kV transmission line connection between Wagga, Maragle in the Snowy area and
Bannaby.
+2,040 MW26 N/A
Available Fault Level (MVA)
Available fault level in this REZ is influenced by development of
nearby REZs.
Scenario Existing 2029-30 2034-35
Central At limit 1,700 300
Step At limit 1,750 800
System Strength Remediation Augmentation
Remediation not required with forecast level of VRE in the Central and Step Change scenarios.
24 About Snowy Hydro, available at https://www.snowyhydro.com.au/snowy-20/about/
25 Prime Minister of Australia, media release 26 February 2019, available at https://www.pm.gov.au/media/historic-snowy-20-plan-approved
26 Unlocking new generation capacity of 2,040 MW for Snowy 2.0

© AEMO 2020 | 2020 ISP Appendix 5. Renewable Energy Zones 66
N9 – Cooma-Monaro
Summary
The Cooma-Monaro REZ has been identified for its pumped hydro
potential. This REZ has moderate to good quality wind resources with one
wind farm, Boco Rock Wind Farm (113 MW), connecting within this REZ
since the 2018 ISP.
REZ Assessment
N/A Cooma-Monaro REZ does not have any REZ phase development.
Renewable Resources
Resource Solar Wind
Resource Quality D C
Renewable Potential (MW) – 300
Demand Correlation
2019-20 2029-30 2039-40 2019-20 2029-30 2039-40
E E F C C C
Climate Hazard
Temperature Score B Bush Fire Score E
Variable Renewable Energy Outlook
Solar PV (MW) Wind (MW)
Existing/
committed
Projected Existing/
committed
Projected
2029-30 2034-35 2039-40 2029-30 2034-35 2039-40
Central
There is no existing or committed solar generation in this
REZ. The modelling outcomes, for all scenarios, did not
project additional solar generation for this REZ.
113
0 300 300
Step 100 300 300
Fast 0 300 300
High DER 0 0 300
Slow 0 0 0

© AEMO 2020 | 2020 ISP Appendix 5. Renewable Energy Zones 67
Storage
Cooma-Monaro REZ was identified due to its pumped hydro capacity. The
network connection at Cooma-Monaro is weak, to accommodate any
large scale pumped hydro this network would need to be augmented.
Suggested Storage for REZ (MW)
Cooma-Monaro has not been suggested for storage
across any scenario in the 2020 ISP.
Existing Network Capability
Description Approximate Existing Hosting
Capacity
Loss Factor
Robustness
The existing 132 kV network connecting Cooma-Monaro REZ to Canberra,
Williamsdale and Munyang can accommodate approximately 200 MW of
generation.
200 MW F
Associated Interconnector Augmentations
Description Additional Hosting Capacity Loss Factor
Robustness
There are no associated interconnector augmentations with this REZ.
Possible REZ Augmentations
Description
Additional
Hosting
Capacity
Upgrade Cost
Estimate
ISP
Development
Loss Factor
Robustness
Augmentation Option 1:
• Build new 132 kV REZ substation
• Build a new single-circuit 132 kV
Canberra/Williamsdale to a new substation
located near generation interest
+200 MW $90 million to
$160 million
Step Change
(2031-32)
Central and
Fast Change
(2033-34)
High DER
(2037-38)
F
Available Fault Level (MVA)
Available fault level in this REZ is influenced by
planting of wind from the mid-2030s.
Scenario Existing 2029-30 2034-35
Central At limit 200 -700
Step At limit -100 -700
System Strength Remediation Augmentation
Description Date Required Cost
Central Establish 1 x 125 MVAr synchronous condenser. 2031-32 $40 million to $55 million
Step Establish 1 x 125 MVAr synchronous condenser. 2031-32 $40 million to $55 million

© AEMO 2020 | 2020 ISP Appendix 5. Renewable Energy Zones 68
A5.4.3 Queensland REZ scorecards
Q1 – Far North Queensland
Summary Phase 3 REZ
Far North Queensland REZ is at the most northerly section of Powerlink's
network. It has excellent wind and moderate solar resources.
This REZ contains two hydro power stations, Barron Gorge and Kareeya,
with a combined capacity of 152 MW. Two renewable generation projects
have been commissioned since the 2018 ISP: Lakeland Solar and Storage
(12 MW) and Mt Emerald Wind Farm (180 MW).
Far North Queensland has a moderate 275 kV network connection
capacity, however, its distance makes it prone to losses with the addition
of generation.
AEMO recommends the installation of dedicated wind monitoring
equipment or partnering with interested parties to measure the wind
potential and quantify its potential in greater detail to inform future
assessment.
REZ Assessment
Phase 3 Far North Queensland has development in phase 3. In the mid to late 2030s the future ISP
transmission augmentation project will be required to support the VRE projected for this zone.
Renewable Resources
Resource Solar Wind
Resource Quality C A
Renewable Potential (MW) 1,100 2,400
Demand Correlation
2020 2030 2040 2020 2030 2040
F F F E D D
Climate Hazard
Temperature Score B Bush Fire Score A
Variable Renewable Energy Outlook
Solar PV (MW) Wind (MW)
Existing/
committed
Projected Existing/
committed
Projected
2029-30 2034-35 2039-40 2029-30 2034-35 2039-40
Central
10
50 50 50
193
650 650 1,600
Step 50 50 50 650 1,100 2,400
Fast 50 50 50 600 650 1,900
High DER 50 50 50 650 650 1,950
Slow 50 50 50 0 0 650

© AEMO 2020 | 2020 ISP Appendix 5. Renewable Energy Zones 69
Storage
Far North Queensland has good potential pumped hydro locations just north of
Cairns, towards the north east around Desailly and around Tully. The
transmission network near this location is weak and upgrades would be required
to accommodate large scale pumped hydro generation. There are also potential
pumped hydro locations near Herberton within proximity of the Chalumbin–
Walkamin/Woree 275 kV lines.
Far North Queensland has good wind resource capacity that has a diverse
correlation compared to other REZs.
Suggested Storage for REZ (MW)
Far North Queensland has not been suggested
for storage across any scenario in the 2020 ISP.
Existing Network Capability
Description Approximate Existing
Hosting Capacity
Loss Factor
Robustness
Far North Queensland REZ connection is to the 275 kV network connecting
Woree to Ross via Chalumbin and Walkamin. 700 MW E
Associated Interconnector Augmentations
Description Additional Hosting Capacity Loss Factor
Robustness
There are no associated interconnector augmentations with this REZ.
Possible REZ Augmentations
Description
Additional
Hosting
Capacity
Upgrade
Cost
Estimate
ISP
Development
Loss Factor
Robustness
Augmentation Option 1:
To connect generation in the northern part of Far North
Queensland REZ:
• Establish a new 275 kV substation in the Lakeland area
• Build a 275 kV line from Walkamin to the new substation
• Build a new 275 kV Chalumbin–Walkamin single-circuit line
To increase capacity on the 275 kV transmission backbone
towards Townsville:
• Rebuild the double-circuit Chalumbin–Ross 275 kV line at a
higher capacity (possibly timed with asset replacement)
+500 MW
$280 million
to $520
millionA
Not identified
as required in
any ISP
scenario
-
Augmentation Option 2:
To connect generation in the Ravenshoe, Evelyn and Tumoulin
area:
• Establish a new 275 kV substation north of Millstream
• Build a 275 kV single-circuit line from Chalumbin to
Millstream
• Turn Chalumbin–Woree 275 kV line into Millstream
To increase capacity on the 275 kV transmission backbone
towards Townsville:
• Rebuild the double-circuit Chalumbin–Ross 275 kV line at a
higher capacity (possibly timed with asset replacement)
+500 MW
$90 million
to $160
millionA
Not identified
as required in
any ISP
scenario
-

© AEMO 2020 | 2020 ISP Appendix 5. Renewable Energy Zones 70
Augmentation Option 3B:
To connect generation in the Ravenshoe, Evelyn and Tumoulin area:
• Establish a new 275 kV substation north of Millstream
• Build a 275 kV single/double-circuit line from Chalumbin to
Millstream
• Turn Chalumbin–Woree 275 kV line into Millstream
To increase capacity on the 275 kV transmission backbone towards
Townsville:
• Rebuild the double-circuit Chalumbin–Ross 275 kV line at a
higher capacity (possibly timed with asset replacement)
• Build an additional Chalumbin–Ross 275 kV single-circuit line
+1,200 –
1,300 MW
$360 million
to $660
millionA
Central
(2037-38),
High DER
(2037-38),
Fast
(2035-36)
E
Augmentation Option 4B:
To connect generation in the Ravenshoe, Evelyn and Tumoulin area:
• Establish a new 275 kV substation north of Millstream
• Build a 275 kV double-circuit line from Chalumbin to Millstream
• Turn Chalumbin–Woree 275 kV line into Millstream
To connect generation in the northern part of Far North Queensland
REZ:
• Establish a new 275 kV substation near Lakeland
• Build a 275 kV line from Walkamin to the new substation
• Build a new Chalumbin–Walkamin 275 kV line
To increase capacity on the 275 kV transmission backbone towards
Townsville:
• Rebuild the double-circuit Chalumbin–Ross 275 kV line at a
higher capacity (possibly timed with asset replacement)
• Build an additional double-circuit Chalumbin–Ross 275 kV line
+1,800 –
2,000 MW
$710 million
to $1,310
millionA
Step
(2030-31)C -
A. The rebuild of the Chalumbin–Ross 275 kV line is required for asset replacement around mid to late 2030s, therefore the cost of the augmentation was not
included.
B. Please refer to North Queensland REZ for additional augmentation required to transfer generation to load areas, south of Townsville.
C. A staged approach to have the full build by 2038.
Available Fault Level (MVA)
Available fault level in this REZ is influenced by planting of wind
from the late 2020s.
Scenario Existing 2029-30 2034-35
Central At limitsD -800 -750
Step At limitsD -400 -900
D. Powerlink is currently finalising mitigation to meet the declared system strength shortfall at Ross, and this may offset some of the later shortfalls shown
System Strength Remediation Augmentation
Description
Date
Required Cost
Central Establish 1 x 250 MVAr synchronous condenser. 2027-28 $45 million to $60 million
Step Establish 1 x 250 MVAr synchronous condenser. 2025-26 $45 million to $60 million

© AEMO 2020 | 2020 ISP Appendix 5. Renewable Energy Zones 71
Q2 – North Queensland Clean Energy Hub
Summary
North Queensland Clean Energy Hub is in north Queensland. It has
excellent solar and wind resources. The existing 132 kV line to the North
Queensland Clean Energy Hub from Ross cannot accommodate large-
scale generation developments.
Significant transmission infrastructure would be required to connect
large-scale generation in this area which would include building a 200
km double/single-circuit line.
One renewable generation project has been commissioned since the
2018 ISP – Kidston Solar Project Phase 1 (50 MW), and two additional
projects have been committed: Hughenden Sun Farm (18 MW) and
Kennedy Energy Park Phase 1 (60 MW). In addition, there is interest of
more than 1,200 MW consisting of wind, solar and pumped hydro within
this REZ.
REZ Assessment
N/A North Queensland Clean Energy Hub REZ does not have any projected development.
Renewable Resources
Resource Solar Wind
Resource Quality A A
Renewable Potential (MW) 8,000 18,600
Demand Correlation
2019-20 2029-30 2039-40 2019-20 2029-30 2039-40
F F F E D D
Climate Hazard
Temperature Score D Bush Fire Score C
Variable Renewable Energy Outlook
Solar PV (MW) Wind (MW)
Existing/
committed
Projected Existing/
committed
Projected
2029-30 2034-35 2039-40 2029-30 2034-35 2039-40
Central
83
The modelling outcomes, for all scenarios,
did not project additional solar generation
for this REZ.
43
The modelling outcomes, for all
scenarios, did not project additional
wind generation for this REZ.
Step
Fast
High DER
Slow

© AEMO 2020 | 2020 ISP Appendix 5. Renewable Energy Zones 72
Storage
North Queensland Clean Energy Hub REZ has not been identified as
having significant potential pumped hydro capability. There is
interest to develop a 250 MW pumped hydro scheme at Kidston;
converting the Kidston Gold mine upper and lower reservoirs into a
pumped hydro scheme27. Additional transmission infrastructure
would be required to connect pumped hydro in this area. This zone
has not been identified for storage in the ISP, since the VRE outlook
does not project wind or solar within this REZ.
Suggested Storage for REZ (MW)
North Queensland Clean Energy Hub has not been
suggested for storage across any scenario in the 2020 ISP.
Existing Network Capability
Description Approximate Existing
Hosting Capacity Loss Factor Robustness
This REZ's connection is via a single 132 kV line from Ross–Kidston–
George Town. – F
Associated Interconnector Augmentations
Description Additional Hosting
Capacity Loss Factor Robustness
There are no associated interconnector augmentations with this REZ.
Possible REZ Augmentations
Description
Additional
Hosting
Capacity
Upgrade Cost
Estimate
ISP
Development
Augmentation Option 1:
For generation interest near Kidston:
• Establish a new 275 kV substation mid–point Chalumbin–Ross
275 kV line
• Turn in both Chalumbin–Ross 275 kV lines into the new
substation
• Establish a new 275 kV substation near Kidston or area with
high renewable energy interest
• Build a new double-circuit 275 kV line from the substation near
Kidston to the substation mid–point Ross and Chalumbin
• Upgrades between the new mid-point substation and Ross
would be required if Q1 REZ is also developed
+800 MW $310 million to $580
millionA
Not identified as
required in any
scenario
Augmentation Option 2:
For generation interest near Kidston and Hughenden
• Establish a new 275 kV substation mid–point Chalumbin–Ross
275 kV line
• Turn in both Chalumbin–Ross 275 kV lines into the new
substation
• Build a new 275 kV substation near Kidston
• Build a new 275 kV substation near Hughenden
• Build a new single-circuit from mid–point Ross and Chalumbin
to Kidston, to Hughenden and back to Ross/Strathmore
• Including relevant reactive power support equipment
+900-1,000 MW $880 million to
$1,630 millionA
Not identified as
required in any
scenario
27 Genex Power Limited Kidston pumped storage hydro project available at: https://www.genexpower.com.au/250 Mw-kidston-pumped-storage-hydro-
project.html

© AEMO 2020 | 2020 ISP Appendix 5. Renewable Energy Zones 73
• Upgrades between the new mid-point substation and Ross
would be required if Q1 REZ is also developed
Augmentation Option 3:
• Build a new 275 kV substation near Kidston
• Build a new 275 kV substation near Hughenden
• Establish a new 275 kV substation mid–point between Kidston
and Hughenden
• Build a new double-circuit from mid–point Kidston and
Hughenden to Ross
• Build a new single-circuit from mid–point substation to Kidston
• Build a new single-circuit from mid–point substation to
Hughenden
• Reactive power support equipment
+1,000 MW $670 million to
$1,250 millionA
Not identified as
required in any
scenario
A. The rebuild of the Chalumbin–Ross 275 kV line is required for asset replacement around mid to late 2030s, therefore the cost of the augmentation was not
included.
Available Fault Level (MVA)
Available fault level in this REZ is influenced by
VRE development and remediation of nearby
REZs.
Scenario Existing 2029-30 2034-35
Central
At limitsB
-800 -750
Step -400 -550
B. Powerlink is currently finalising mitigation to meet the declared system strength shortfall at Ross, and this may offset some of the later shortfalls shown
System Strength Remediation Augmentation
The system strength remediation augmentation proposed for nearby REZ Q1 would also resolve the remediation requirements,
assuming no further VRE development in this REZ.

© AEMO 2020 | 2020 ISP Appendix 5. Renewable Energy Zones 74
Q3 – Northern Queensland
Summary
The North Queensland REZ encompasses Townsville and the surrounding
area. It has good quality solar and wind resources and is situated close to
the 275 kV corridor. Clare Solar Farm (100 MW), Haughton Solar Farm
(100 MW), Ross River Solar Farm (116 MW), and Sun Metals Solar Farm
(107 MW) are operational.
The existing 275 kV network has good capacity, but this is shared with
the REZs in North and Central Queensland. Even though there is good
network capacity, the MLF will decline sharply due to the distance from
major load centres. Further connections of inverter-based resources in
this area is likely to require system strength remediation.
REZ Assessment
N/A Northern Queensland REZ does not have any projected development.
Renewable Resources
Resource Solar Wind
Resource Quality A B
Renewable Potential (MW) 3,400 –
Demand Correlation
2019-20 2029-30 2039-40 2019-20 2029-30 2039-40
F F F D C C
Climate Hazard
Temperature Score C Bush Fire Score E
Variable Renewable Energy Outlook
Solar PV (MW) Wind (MW)
Existing/
committed
Projected Existing/
committed
Projected
2029-30 2034-35 2039-40 2029-30 2034-35 2039-40
Central
423
The modelling outcomes, for all scenarios,
did not project additional solar generation
for this REZ.
There is no existing or committed wind generation in this
REZ. The modelling outcomes, for all scenarios, did not
project additional wind generation for this REZ.
Step
Fast
High DER
Slow

© AEMO 2020 | 2020 ISP Appendix 5. Renewable Energy Zones 75
Storage
Northern Queensland has good potential pumped hydro locations to the north
east (near the Chalumbin–Ross 275 kV lines) and just east of Townsville. There is
no projected VRE for this zone and for this reason, no storage has been
suggested.
Suggested Storage for REZ (MW)
Northern Queensland REZ has not been
suggested for storage across any scenario in the
2020 ISP.
Existing Network Capability
Description Approximate Existing
Hosting Capacity
Loss Factor
Robustness
The current network connects to Far North QLD via two Ross–Chalumbin 275 kV
lines and to Strathmore via three Ross–Strathmore 275 kV lines. The current spare
hosting capacity of approximately 1,800 MW is for all the generation to be located
within REZs Q1, Q2 and Q3.
1,800 MW D
Associated Interconnector Augmentations
Description Additional Hosting
Capacity
Loss Factor
Robustness
There are no associated interconnector augmentations with this REZ.
Possible REZ Augmentations
Description
Additional
Hosting
Capacity
Upgrade
Cost
Estimate
ISP
Development
Loss Factor
Robustness
Augmentation Option 1:
• Upgrade lower rated Ross–Strathmore 275 kV line
+400 -
600 MW
$10 million
to $15
millionA
Central, High
DER and Fast
(2037-38)
Step
(2035-36)B
D
Augmentation Option 2:
• Build an additional 275 kV line between Ross and Nebo via
Strathmore
+700 -
800 MW
$360
million to
$670
million
Step
(2035-36)B -
A. Cost provided by Powerlink B. Augmentation required for the increase in VRE in Far North Queensland.
Available Fault Level (MVA)
Available fault level in this REZ is influenced by VRE
development and remediation of nearby REZs.
Scenario Existing 2029-30 2034-35
Central
At limitsC
-800 -750
Step -400 -550
C. Powerlink is currently finalising mitigation to meet the declared system strength shortfall at Ross, and this may offset some of the later shortfalls shown
System Strength Remediation Augmentation
The system strength remediation augmentation proposed for nearby REZ Q1 would also resolve the remediation requirements,
assuming no further VRE development in this REZ.

© AEMO 2020 | 2020 ISP Appendix 5. Renewable Energy Zones 76
Q4 – Isaac
Summary Phase 3
The Isaac REZ has good wind and solar resources covering Collinsville
and Mackay. Daydream Solar Farm (150 MW), Hayman Solar Farm (50
MW), Collinsville PV (41 MW), Clermont Solar Farm (75 MW), Emerald
Solar Farm (72 MW), Hamilton Solar Farm (57 MW), Lilyvale Solar Farm
(100 MW), Rugby Run (65 MW) and Whitsunday Solar Farm (57.5 MW)
are operational. The existing 275 kV network has spare capacity, but this
is shared with the REZs in North and Central Queensland.
REZ Assessment
Phase 3
Isaac REZ has development in phase 3. For large scale VRE development in this region, upgrades are
required to transmission network between Central to Southern Queensland and between
Bouldercombe and Calliope River. The future ISP projects, Central to Southern Queensland
transmission project and Gladstone Reinforcement, will facilitate development of this REZ.
Renewable Resources
Resource Solar Wind
Resource Quality B B
Renewable Potential (MW) 6,900 3,800
Demand Correlation
2019-20 2029-30 2039-40 2019-20 2029-30 2039-40
F F F C B B
Climate Hazard
Temperature Score C Bush Fire Score C
Variable Renewable Energy Outlook
Solar PV (MW) Wind (MW)
Existing/
committed
Projected Existing/
committed
Projected
2029-30 2034-35 2039-40 2029-30 2034-35 2039-40
Central
666
450 450 450
There is no
existing or
committed
wind
generation in
this REZ.
0 0 1,000
Step 350 350 350 1,000 1,000 1,000
Fast 350 350 350 0 1,000 1,000
High DER 350 350 350 0 0 1,000
Slow 350 350 350 0 0 0

© AEMO 2020 | 2020 ISP Appendix 5. Renewable Energy Zones 77
Storage
There are numerous potential pumped hydro
locations to the north east and south east of
Nebo.
This REZ has a good diversity of resources -
wind, solar and storage. Locating storage in
this zone could maximise transmission
utilisation. Pumped hydro, if synchronous,
could also further improve system strength
within the area when in service.
The Isaac REZ is well located, close to other
REZs in North and Central Queensland with
high projected VRE. Strategic development of
large scale storage could defer some costly
transmission network augmentations. Shallow,
medium and deep storage has been
suggested for this zone.
Suggested Storage for REZ (MW)
Depth
Projected
2029-30 2034-35 2039-40
Central
Shallow
0 0 850
Step 50 50 50
Fast 0 0 200
High DER 0 0 0
Slow 0 0 150
Central
Medium
0 250 250
Step 600 1,100 1,100
Fast 0 200 250
High DER 0 0 0
Slow 0 0 0
Central
Deep
0 0 0
Step 0 50 450
Fast 0 0 500
High DER 0 0 150
Slow 0 0 0
Existing Network Capability
Description Approximate Existing Hosting
Capacity
Loss Factor
Robustness
275 kV and 132 kV circuits pass through this REZ. The hosting capacity along
this corridor is approximately 2,000 to 2,500 MW which includes any
generation that connects in Q1, Q2, Q3, Q4 and Q5.
2,000 MW – 2,500 MW B
Associated Interconnector Augmentations
Description Additional Hosting Capacity Loss Factor
Robustness
There are no associated interconnector augmentations with this REZ.

© AEMO 2020 | 2020 ISP Appendix 5. Renewable Energy Zones 78
Possible REZ Augmentations
Description
Additional
Hosting
Capacity
Upgrade
Cost Estimate
ISP
Development
Loss Factor
Robustness
Augmentation Option 1:
• Rebuild the Bouldercombe–Calliope River and the
Bouldercombe–Raglan–Larcom Creek–Calliope River
275 kV lines as a high capacity double-circuit lines (may
be possible to bring forward the end of life condition
replacement)A
• A new double-circuit Calvale–Larcom Creek 275 kV line
• 275/132 kV Calliope River transformer
+700 MW -
800 MW
$300 to $560
million
Central, Step,
Slow, Fast and
High DER
(early to mid-
2030s)
A
Augmentation Option 2:
• Build an additional 275 kV line between Bouldercombe
and Calliope River
+1,000 MW $130 million to
$240 million
Central, Step,
Slow, Fast and
High DER (mid
to late-2030s)
-
Augmentation Option 3:
• Build an additional Bouldercombe – Nebo 275 kV
single-circuit line
+700 MW -
800 MW
$320 million to
$600 million
Step, Fast,
High DER
(mid to late-
2030s)
-
A. Cost assumes full cost of the full rebuild (and not the cost of the bring forward)
Available Fault Level (MVA)
Available fault level in this REZ is dominated by planting of
solar PV from the mid-2019-20s and influenced by VRE
development and remediation of nearby REZs.
Scenario Existing 2029-30 2034-35
Central
At limit
-800 -850
Step -500 -800
System Strength Remediation Augmentation
The system strength remediation augmentation proposed for nearby REZ Q1 would also resolve the remediation requirements.

© AEMO 2020 | 2020 ISP Appendix 5. Renewable Energy Zones 79
Q5 – Barcaldine
Summary
The Barcaldine REZ is situated in Central Queensland. This REZ has
excellent solar resources and moderate wind resources. The existing
350 km 132 kV line to Barcaldine from Lilyvale, via Clermont, cannot
support any large–scale generation developments. A possible
investment option is to build a double-circuit 275 kV line from the main
backbone at Lilyvale extending inland to Barcaldine.
Even after this upgrade, the MLFs will decline sharply because the
generation is located a significant distance from load.
REZ Assessment
N/A Barcaldine REZ does not have any projected development.
Renewable Resources
Resource Solar Wind
Resource Quality A C
Renewable Potential (MW) 8,000 3,900
Demand Correlation
2019-20 2029-30 2039-40 2019-20 2029-30 2039-40
F F F E D C
Climate Hazard
Temperature Score D Bush Fire Score C
Variable Renewable Energy Outlook
Solar PV (MW) Wind (MW)
Existing/
committed
Projected Existing/
committed
Projected
2029-30 2034-35 2039-40 2029-30 2034-35 2039-40
Central
34
The modelling outcomes, for all
scenarios, did not project additional
solar generation for this REZ.
There is no existing or committed wind generation in this
REZ. The modelling outcomes, for all scenarios, did not
project additional wind generation for this REZ.
Step
Fast
High DER
Slow

© AEMO 2020 | 2020 ISP Appendix 5. Renewable Energy Zones 80
Storage
Barcaldine REZ has not been identified as having significant potential pumped
hydro capability. ISP modelling does not project any VRE for this REZ due to the
large cost required to augment this network. For this reason, no storage is
suggested within this zone.
Suggested Storage for REZ (MW)
Barcaldine REZ has not been suggested for
storage across any scenario in the 2020 ISP.
Existing Network Capability
Description Approximate Existing
Hosting Capacity
Loss Factor
Robustness
This REZ is connected with a Lilyvale–Clermont–Barcaldine 132 kV line. The total
line length is approximately 350 km. – F
Associated Interconnector Augmentations
Description Additional Hosting Capacity Loss Factor
Robustness
There are no associated interconnector augmentations with this REZ.
Possible REZ Augmentations
Description Additional Hosting
Capacity
Upgrade Cost
Estimate ISP Development
Augmentation Option 1:
To connect generation within Barcaldine REZ:
• Establish a new 275 kV substation within Barcaldine
REZ, location to be determined by interest in the
area
• A new double-circuit 275 kV line connecting the
new substation to Lilyvale
+700 – 900 MW $490 million to
$910 million
Not identified as required
in any scenario
Available Fault Level (MVA)
Available fault level in this REZ is influenced by
development of nearby REZs.
Scenario Existing 2029-30 2034-35
Central 600 350 350
Step 600 400 -50
System Strength Remediation Augmentation
Remediation not required with forecast level of VRE in the Central and Step Change scenarios.

© AEMO 2020 | 2020 ISP Appendix 5. Renewable Energy Zones 81
Q6 – Fitzroy
Summary Phase 1 and phase 3 REZ
The Fitzroy REZ is in Central Queensland and covers a strong part of
the network where Gladstone and Callide generators are connected.
This REZ has good solar and wind resources. There is no wind or solar
generation in service or committed in this REZ.
Currently the limitation for connection within this REZ and REZ Q1 to
Q4 is due to voltage and transient stability along the cut-set CQ–SQ
(Central Queensland to Southern Queensland). This is projected to limit
optimal generation expansion connected north of this cut-set to 2,000
to 2,500 MW. This limit could be increased by the exit of Callide B
(expected in the late 2020s) and Gladstone (in the mid–late 2030s).
See Appendix 3 for more information on the Central to Southern
Queensland network expansion project.
REZ Assessment
Phase 1 and phase 3 REZ
Fitzroy REZ has development in phase 1 and phase 3. The development in Fitzroy in phase 1 occurs to
meet the QRET. Further development in this region is facilitated by upgrades to the Central to
Southern Queensland (CQ–SQ) cut-set and the Gladstone Grid Reinforcement.
Renewable Resources
Resource Solar Wind
Resource Quality B B
Renewable Potential (MW) 7,700 3,500
Demand Correlation
2019-20 2029-30 2039-40 2019-20 2029-30 2039-40
F F F C B B
Climate Hazard
Temperature Score C Bush Fire Score B
Variable Renewable Energy Outlook
Solar PV (MW) Wind (MW)
Existing/
committed
Projected Existing/
committed
Projected
2029-30 2034-35 2039-40 2029-30 2034-35 2039-40
Central
There is no
existing or
committed
solar
generation in
this REZ.
1,350 1,350 1,350
There is no
existing or
committed
wind
generation in
this REZ.
800 800 900
Step 0 0 0 500 900 900
Fast 0 0 0 0 900 900
High DER 800 800 800 650 650 900
Slow 0 0 0 0 0 0

© AEMO 2020 | 2020 ISP Appendix 5. Renewable Energy Zones 82
Storage
Potential pumped hydro locations have been
identified near Bouldercombe and Calvale. There
is a significant projection in solar and wind
generation north of the CQ–SQ cut-set.
Significant transmission build would be required
to accommodate such a large projection of VRE
generation. Having storage located within this
REZ would assist in reducing the capacity
required for the transmission augmentation to
connect the VRE in northern and central
Queensland, to the load in southern
Queensland. Storage would also assist in firming
up the VRE generation.
Storage, of all depth classes, including batteries
and pumped hydro, has been suggested for this
zone, except for High DER.
Suggested Storage for REZ (MW)
Depth
Projected
2029-30 2034-35 2039-40
Central
Shallow
0 0 1,250
Step 50 50 50
Fast 0 0 300
High DER 0 0 0
Slow 0 0 200
Central
Medium
0 400 400
Step 250 550 550
Fast 0 50 50
High DER 0 0 0
Slow 0 0 0
Central
Deep
0 0 0
Step 0 50 450
Fast 0 0 0
High DER 0 0 0
Slow 0 0 0
Existing Network Capability
Description Approximate Existing
Hosting Capacity
Loss Factor
Robustness
This REZ is connected via a meshed 275 kV network ranging between
Bouldercombe, Gladstone and Callide/Calvale. The spare hosting capacity of
approximately 2,000 - 2,500 MW includes any generation that would connect to
Q1, Q2, Q3, Q4, Q5 and Q6.
2,000 MW - 2,500 MW A
Associated Interconnector Augmentations
Description Additional Hosting Capacity Loss Factor
Robustness
There are no associated interconnector augmentations with this REZ.

© AEMO 2020 | 2020 ISP Appendix 5. Renewable Energy Zones 83
Possible REZ Augmentations
Description
Additional
Hosting
Capacity
Upgrade
Cost
Estimate
ISP
Development
Loss Factor
Robustness
Augmentation Option 1:
Central to Southern Queensland minor augmentation
(increasing the transient stability limit +300 MW)
• Establish a new 275 kV Auburn River substation mid–
point between Calvale and Halys
• Turn both Calvale–Halys 275 kV lines into the Auburn
River substation
+300 MW
$30 million
to $60
million
Not identified
as being
required under
any ISP
scenario
-
Augmentation Option 2:
Central to Southern Queensland augmentation
• Build a double-circuit 275 kV line from Calvale to
Wandoan South
+900 MW
$300 million
to $560
million
Central, High
DER, Fast and
Step change
(early to
mid2030s)
A
Available Fault Level (MVA)
Available fault level in this REZ is dominated by planting of
wind and solar PV from the late 2020s. Pumped hydro in the
step change scenario is expected to form part of the system
strength remediation.
Scenario Existing 2029-30 2034-35
Central 600 -400 -200
Step 600 400 200
System Strength Remediation Augmentation
Description
Date
Required Cost
Central Establish 1 x 125 MVAr synchronous condenser. 2027-28 $40 million to $55 million
Step Remediation not required with forecast level of VRE in the Step
Change scenario. - -
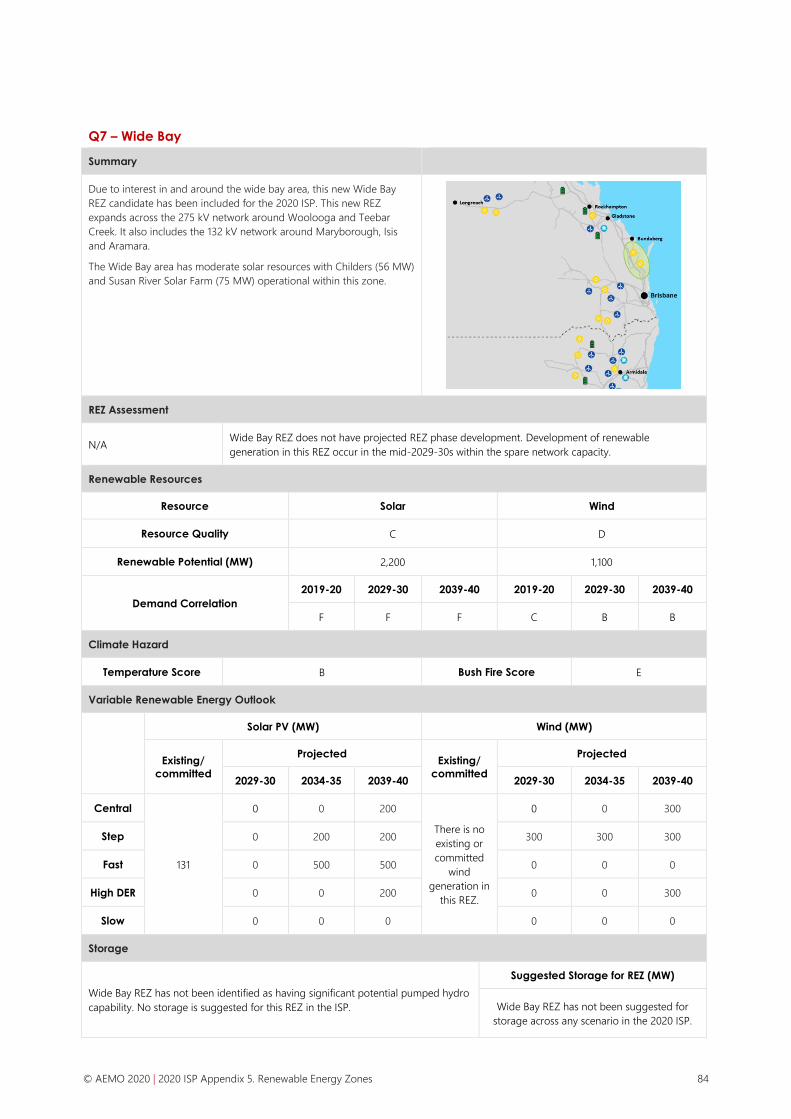
© AEMO 2020 | 2020 ISP Appendix 5. Renewable Energy Zones 84
Q7 – Wide Bay
Summary
Due to interest in and around the wide bay area, this new Wide Bay
REZ candidate has been included for the 2020 ISP. This new REZ
expands across the 275 kV network around Woolooga and Teebar
Creek. It also includes the 132 kV network around Maryborough, Isis
and Aramara.
The Wide Bay area has moderate solar resources with Childers (56 MW)
and Susan River Solar Farm (75 MW) operational within this zone.
REZ Assessment
N/A Wide Bay REZ does not have projected REZ phase development. Development of renewable
generation in this REZ occur in the mid-2029-30s within the spare network capacity.
Renewable Resources
Resource Solar Wind
Resource Quality C D
Renewable Potential (MW) 2,200 1,100
Demand Correlation
2019-20 2029-30 2039-40 2019-20 2029-30 2039-40
F F F C B B
Climate Hazard
Temperature Score B Bush Fire Score E
Variable Renewable Energy Outlook
Solar PV (MW) Wind (MW)
Existing/
committed
Projected Existing/
committed
Projected
2029-30 2034-35 2039-40 2029-30 2034-35 2039-40
Central
131
0 0 200
There is no
existing or
committed
wind
generation in
this REZ.
0 0 300
Step 0 200 200 300 300 300
Fast 0 500 500 0 0 0
High DER 0 0 200 0 0 300
Slow 0 0 0 0 0 0
Storage
Wide Bay REZ has not been identified as having significant potential pumped hydro
capability. No storage is suggested for this REZ in the ISP.
Suggested Storage for REZ (MW)
Wide Bay REZ has not been suggested for
storage across any scenario in the 2020 ISP.

© AEMO 2020 | 2020 ISP Appendix 5. Renewable Energy Zones 85
Existing Network Capability
Description
Approximate
Existing Hosting
Capacity
Loss Factor
Robustness
The Wide Bay REZ is connected via 275 kV lines between Woolooga, South Pine,
Teebar Creek and Gin Gin. 500 MW A
Associated Interconnector Augmentations
Description Additional Hosting
Capacity
Loss Factor
Robustness
There are no associated interconnector augmentations with this REZ.
Possible REZ Augmentations
Description Additional
Hosting Capacity
Upgrade Cost
Estimate ISP Development
Augmentation Option 1:
• Rebuild Woolooga–Palmwoods–South Pine as a
double-circuit 275 kV line
+900 MW $270 million to $510
million
Not identified as
being required under
any ISP scenario
Augmentation Option 2:
• Rebuild Woolooga–South Pine as a double-circuit
275 kV line
+900 MW $250 million to $470
million
Not identified as
being required under
any ISP scenario
Available Fault Level (MVA)
Available fault level in this REZ is influenced by development
of nearby REZs.
Scenario Existing 2029-30 2034-35
Central 1,000 900 950
Step 1,000 1,600 850
System Strength Remediation Augmentation
Remediation not required with forecast level of VRE in the Central and Step Change.

© AEMO 2020 | 2020 ISP Appendix 5. Renewable Energy Zones 86
Q8 – Darling Downs
Summary Phase 1 and phase 3 REZ
The Darling Downs REZ covers a wide area in Southern Queensland.
This REZ not only has good solar and wind resources, it also has a
strong network with good potential to connect renewable generation.
Currently this REZ has approximately 840 MW of generation connected
or committed, almost evenly split between wind and solar.
The Darling Downs REZ is situated close to the Brisbane load centre
and has good access to the New South Wales – Queensland
interconnector. Upgrades to the New South Wales – Queensland
interconnector, such as QNI Medium and QNI Large would further
improve this REZ's ability to connect renewable generation.
REZ Assessment
Phase 1 and phase 3 REZ
Darling Downs REZ has development in phase 1 and phase 3. The development in Darling Downs in
phase 1 occurs to meet the QRET, utilising existing network capacity. Further development in this
region is supported by QNI Medium and QNI Large.
Renewable Resources
Resource Solar Wind
Resource Quality B B
Renewable Potential (MW) 7,700 5,600
Demand Correlation
2019-20 2029-30 2039-40 2019-20 2029-30 2039-40
F F F C C B
Climate Hazard
Temperature Score C Bush Fire Score E
Variable Renewable Energy Outlook
Solar PV (MW) Wind (MW)
Existing/
committed
Projected Existing/
committed
Projected
2029-30 2034-35 2039-40 2029-30 2034-35 2039-40
Central
399
350 350 1,150
440
1,400 1,400 3,950
Step 1,150 4,950 7,100 1,650 3,850 5,300
Fast 0 1,000 4,400 500 1,650 5,150
High DER 1,700 1,700 2,200 500 500 2,950
Slow 0 0 0 500 500 500

© AEMO 2020 | 2020 ISP Appendix 5. Renewable Energy Zones 87
Storage
Large-scale solar and wind generation is projected in
the Darling Downs area. Darling Downs has good
network access to the Brisbane load centre as well as
the load in New South Wales via the Queensland to
New South Wales interconnector.
Storage in this location would be beneficial to help
firm the solar generation projected for this REZ.
No storage is suggested under the Slow Change and
High DER scenarios for Darling Downs, under the
Slow Change no storage is projected for Queensland
and very limited storage is projected for High DER.
Suggested Storage for REZ (MW)
Depth
Projected
2029-30 2034-35 2039-40
Central
Medium
0 0 550
Step 250 300 300
Fast 0 500 600
High DER 0 0 0
Slow 0 0 0
Central
Deep
0 0 0
Step 0 0 0
Fast 0 0 500
High DER 0 0 0
Slow 0 0 0
Existing Network Capability
Description Approximate Existing Hosting
Capacity
Loss Factor
Robustness
This is the only REZ in Queensland that has access to the transmission
network at 330 kV. The Darling Downs REZ also connects to the Brisbane
load centre via three 275 kV lines: one from Middle Ridge to Greenbank,
one from Tarong to Blackwall and one from Tarong to South Pine.
3,000 MW A
Associated Interconnector Augmentations
Description Additional Hosting Capacity Loss Factor
Robustness
QNI Medium Option 2E (Preparatory Activities Required):
A new 500 kV interconnector from Western Downs in Queensland via
Boggabri to a new substation near Wollar in New South Wales.
+1,000 MW A
QNI Large Option 3E (Preparatory Activities Required):
A second 500 kV interconnector from Western Downs in Queensland via
Boggabri to the Wollar area in New South Wales.
+1,000 MW A
Possible REZ Augmentations
Description Additional
Hosting Capacity
Upgrade Cost
Estimate ISP Development
Augmentation Option 1:
• 3rd 330/275 kV transformer at Middle Ridge +1,000 - 1,300 MW
$180 million to
$340 million
Not identified as required under
any 2020 ISP scenario

© AEMO 2020 | 2020 ISP Appendix 5. Renewable Energy Zones 88
• Bulli Creek–Millmerran–Middle Ridge 330 kV
line
Available Fault Level (MVA)
Available fault level in this REZ is dominated by planting of
wind and solar PV from the late 2020s. Pumped hydro in the
step is expected to form part of the system strength solution
for this REZ.
Scenario Existing 2029-30 2034-35
Central 1,650 -200 1,650
Step 1,650 1,100 -5,350
System Strength Remediation Augmentation
Description Date Required Cost
Central Remediation not required with forecast level of VRE in the
Central scenario. - -
Step Establish 4 x 250 MVAr synchronous condensers. 2032-33 $180 million to $230 million

© AEMO 2020 | 2020 ISP Appendix 5. Renewable Energy Zones 89
A5.4.4 South Australia REZ scorecards
S1 – South East SA
Summary Phase 3 REZ
The South East South Australia REZ has moderate to good quality wind
resources. Over 300 MW of wind farms at Canunda and Lake Bonney
are in service.
This REZ lies on the major 275 kV route of the South Australia-Victoria
Heywood interconnector. The existing network can only effectively
accommodate a small amount of additional generation. Beyond this
55 MW hosting capacity, transmission network expansions would be
required to accommodate generation within this zone. Network
augmentations would be smaller if generation is located relatively close
to Adelaide, and larger if located further south towards Mount
Gambier.
The MLF is sensitive to additional generation because the REZ is not
close to any major load centres.
REZ Assessment
Phase 3 REZ South East SA has development in phase 3. A future grid project within the South East REZ will need to
be developed to facilitate the VRE development projected within this zone.
Renewable Resources
Resource Solar Wind
Resource Quality D C
Renewable Potential (MW) 100 3,200
Demand Correlation
2019-20 2029-30 2039-40 2019-20 2029-30 2039-40
F F F C C C
Climate Hazard
Temperature Score D Bush Fire Score D
Variable Renewable Energy Outlook
Solar PV (MW) Wind (MW)
Existing/
committed
Projected Existing/
committed
Projected
2029-30 2034-35 2039-40 2029-30 2034-35 2039-40
Central
95
The modelling outcomes, for all
scenarios, did not project additional
solar generation for this REZ.
325
0 0 800
Step 50 300 800
Fast 0 50 800
High DER 0 0 600
Slow 0 0 0
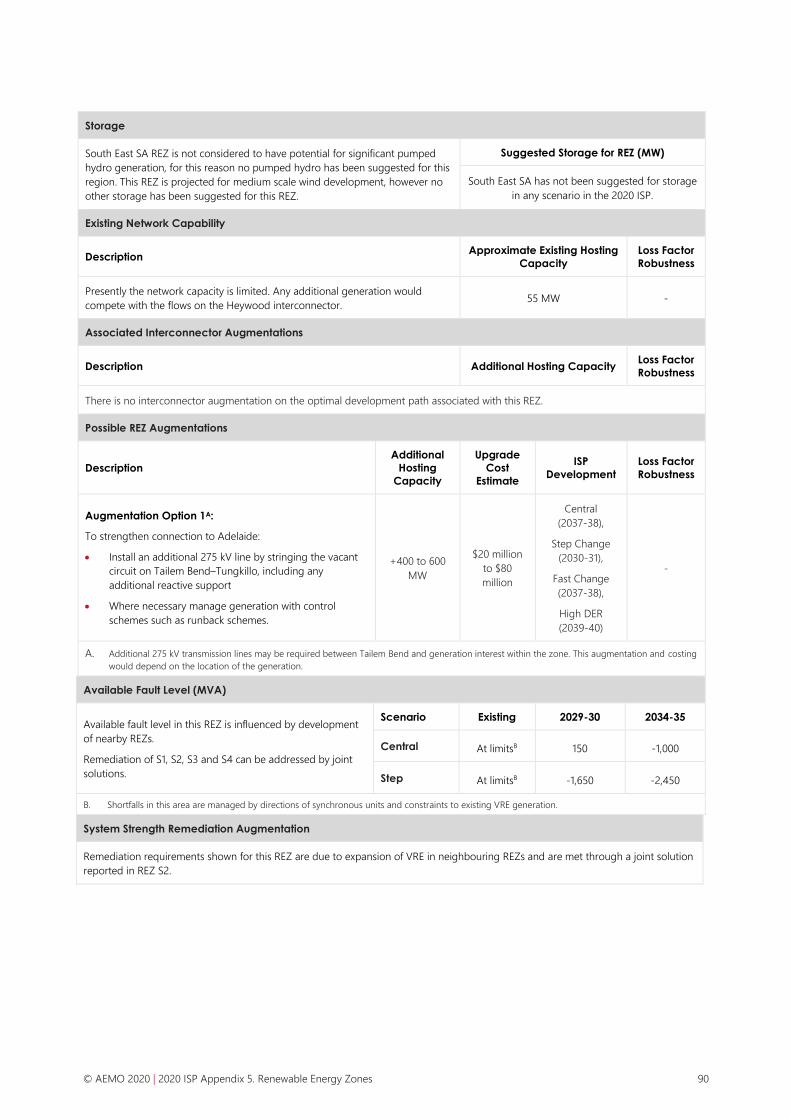
© AEMO 2020 | 2020 ISP Appendix 5. Renewable Energy Zones 90
Storage
South East SA REZ is not considered to have potential for significant pumped
hydro generation, for this reason no pumped hydro has been suggested for this
region. This REZ is projected for medium scale wind development, however no
other storage has been suggested for this REZ.
Suggested Storage for REZ (MW)
South East SA has not been suggested for storage
in any scenario in the 2020 ISP.
Existing Network Capability
Description Approximate Existing Hosting
Capacity
Loss Factor
Robustness
Presently the network capacity is limited. Any additional generation would
compete with the flows on the Heywood interconnector. 55 MW -
Associated Interconnector Augmentations
Description Additional Hosting Capacity Loss Factor
Robustness
There is no interconnector augmentation on the optimal development path associated with this REZ.
Possible REZ Augmentations
Description
Additional
Hosting
Capacity
Upgrade
Cost
Estimate
ISP
Development
Loss Factor
Robustness
Augmentation Option 1A:
To strengthen connection to Adelaide:
• Install an additional 275 kV line by stringing the vacant
circuit on Tailem Bend–Tungkillo, including any
additional reactive support
• Where necessary manage generation with control
schemes such as runback schemes.
+400 to 600
MW
$20 million
to $80
million
Central
(2037-38),
Step Change
(2030-31),
Fast Change
(2037-38),
High DER
(2039-40)
-
A. Additional 275 kV transmission lines may be required between Tailem Bend and generation interest within the zone. This augmentation and costing
would depend on the location of the generation.
Available Fault Level (MVA)
Available fault level in this REZ is influenced by development
of nearby REZs.
Remediation of S1, S2, S3 and S4 can be addressed by joint
solutions.
Scenario Existing 2029-30 2034-35
Central At limitsB 150 -1,000
Step At limitsB -1,650 -2,450
B. Shortfalls in this area are managed by directions of synchronous units and constraints to existing VRE generation.
System Strength Remediation Augmentation
Remediation requirements shown for this REZ are due to expansion of VRE in neighbouring REZs and are met through a joint solution
reported in REZ S2.

© AEMO 2020 | 2020 ISP Appendix 5. Renewable Energy Zones 91
S2 – Riverland
Summary Phase 2 REZ
The Riverland REZ is on the South Australian side of the proposed
Project EnergyConnect route. It has good solar quality resources. There
is minimal existing renewable generation in the zone.
Prior to Project EnergyConnect, approximately 200 MW can be
connected in this REZ. Once Project EnergyConnect is commissioned
(2024-25), approximately 800 MW can be accommodated. Additional
generation beyond 1,000 MW is not practical without extensive further
network upgrades between Riverland and South Australia’s
neighbouring states.
REZ Assessment
Phase 2 REZ Riverland REZ has development in phase 2. VRE development in this REZ is supported by the
commissioning of Project EnergyConnect by 2024-25, an actionable ISP project.
Renewable Resources
Resource Solar Wind
Resource Quality B E
Renewable Potential (MW) 4,000 1,400
Demand Correlation
2019-20 2029-30 2039-40 2019-20 2029-30 2039-40
F F F C C C
Climate Hazard
Temperature Score E Bush Fire Score C
Variable Renewable Energy Outlook
Solar PV (MW) Wind (MW)
Existing/
committed
Projected Existing/
committed
Projected
2029-30 2034-35 2039-40 2029-30 2034-35 2039-40
Central
There is no
existing or
committed
solar
generation in
this REZ.
0 1,000 1,000
There is no existing or committed wind generation in this
REZ. The modelling outcomes, for all scenarios, did not
project additional wind generation for this REZ.
Step 1,000 1,000 1,000
Fast 0 1,000 1,000
High DER 0 0 1,000
Slow 0 0 1,000

© AEMO 2020 | 2020 ISP Appendix 5. Renewable Energy Zones 92
Storage
ISP modelling has generally demonstrated
benefits in co-locating solar generation with
shallow-to-medium storages. There is a large
projection of solar generation for this REZ
which makes it a great candidate for storage.
Locating storage within this REZ will firm up
supply within the area and reduce the scale of
network augmentations required to transfer
this energy to the load centres.
Since this REZ does not have significant
potential for pumped hydro, battery storage of
shallow and medium depth has been
suggested, for this REZ across all scenarios
except for High DER. Under the High DER
scenario, no storage is projected for South
Australia.
Suggested Storage for REZ (MW)
Depth
Projected
2029-30 2034-35 2039-40
Central
Shallow
0 100 150
Step 0 0 0
Fast 0 0 100
High DER 0 0 0
Slow 0 0 150
Central
Medium
0 0 150
Step 0 0 50
Fast 0 0 150
High DER 0 0 0
Slow 0 0 200
Existing Network Capability
Description Approximate Existing Hosting
Capacity
Loss Factor
Robustness
Presently the network capacity is limited, any additional generation would
effectively be competing with the flows on the Murraylink interconnector. 200 MW F
Associated Interconnector Augmentations
Description Additional Hosting Capacity Loss Factor
Robustness
Project EnergyConnect (Actionable ISP project):
A new 330 kV interconnector between Robertstown in South Australia and
Wagga Wagga in New South Wales, via Buronga.
+800 MW A
Possible REZ Augmentations
Description
Additional
Hosting
Capacity
Upgrade
Cost
Estimate
ISP
Development
Loss Factor
Robustness
Augmentation Option 1A:
Assumes new interconnector Project EnergyConnect in
service:
• Establish a new substation in the Riverland REZ close to
the new interconnector
• Turn both Robertstown–Bundey–Buronga 330 kV lines
into the new substation
• Install necessary transformation
+800 MW
$60 million
to $110
million
Central
(2032-33),
Step Change
(2026-27),
Fast Change
(2030-31),
High DER and
Slow Change
(2037-38)
A
A. Control schemes may be required to manage network conditions after a contingency.
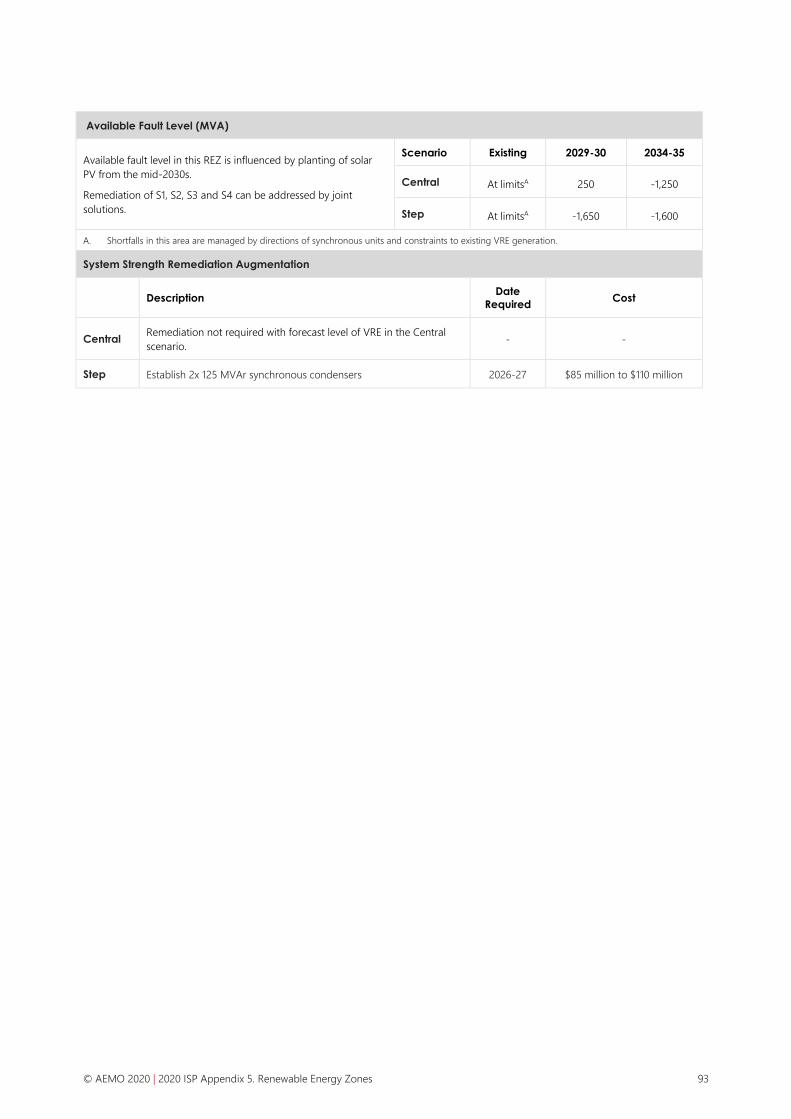
© AEMO 2020 | 2020 ISP Appendix 5. Renewable Energy Zones 93
Available Fault Level (MVA)
Available fault level in this REZ is influenced by planting of solar
PV from the mid-2030s.
Remediation of S1, S2, S3 and S4 can be addressed by joint
solutions.
Scenario Existing 2029-30 2034-35
Central At limitsA 250 -1,250
Step At limitsA -1,650 -1,600
A. Shortfalls in this area are managed by directions of synchronous units and constraints to existing VRE generation.
System Strength Remediation Augmentation
Description
Date
Required Cost
Central Remediation not required with forecast level of VRE in the Central
scenario. - -
Step Establish 2x 125 MVAr synchronous condensers 2026-27 $85 million to $110 million
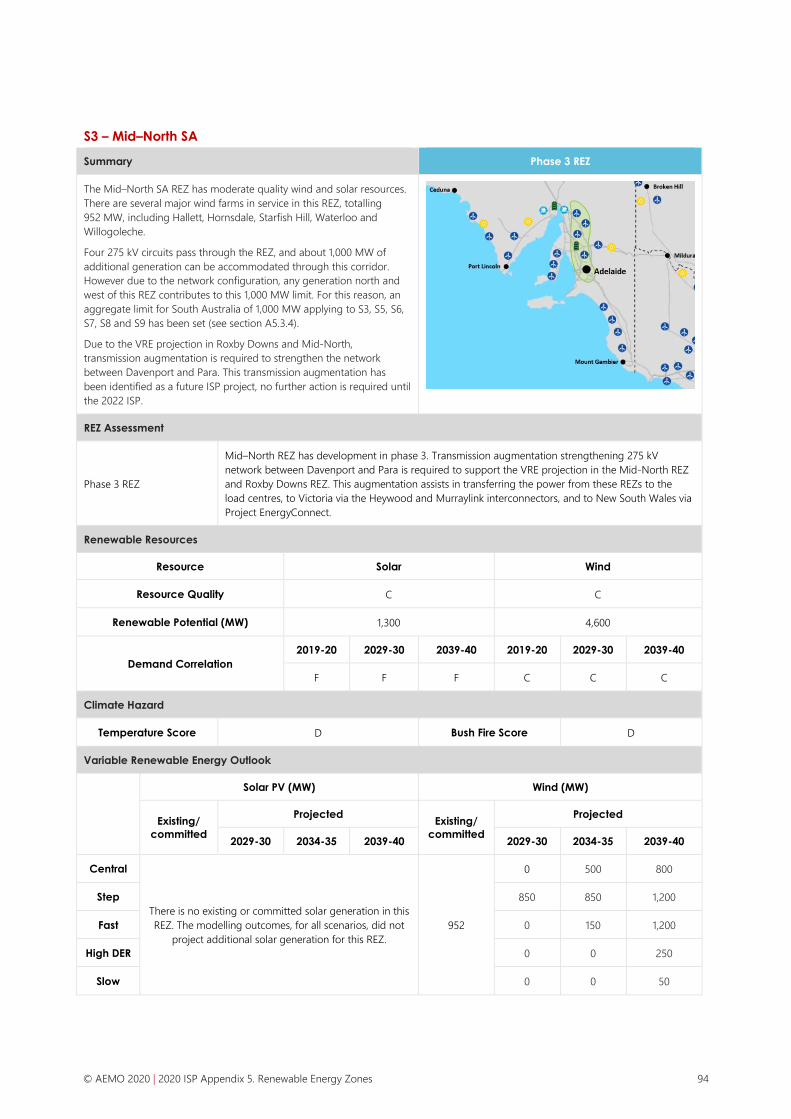
© AEMO 2020 | 2020 ISP Appendix 5. Renewable Energy Zones 94
S3 – Mid–North SA
Summary Phase 3 REZ
The Mid–North SA REZ has moderate quality wind and solar resources.
There are several major wind farms in service in this REZ, totalling
952 MW, including Hallett, Hornsdale, Starfish Hill, Waterloo and
Willogoleche.
Four 275 kV circuits pass through the REZ, and about 1,000 MW of
additional generation can be accommodated through this corridor.
However due to the network configuration, any generation north and
west of this REZ contributes to this 1,000 MW limit. For this reason, an
aggregate limit for South Australia of 1,000 MW applying to S3, S5, S6,
S7, S8 and S9 has been set (see section A5.3.4).
Due to the VRE projection in Roxby Downs and Mid-North,
transmission augmentation is required to strengthen the network
between Davenport and Para. This transmission augmentation has
been identified as a future ISP project, no further action is required until
the 2022 ISP.
REZ Assessment
Phase 3 REZ
Mid–North REZ has development in phase 3. Transmission augmentation strengthening 275 kV
network between Davenport and Para is required to support the VRE projection in the Mid-North REZ
and Roxby Downs REZ. This augmentation assists in transferring the power from these REZs to the
load centres, to Victoria via the Heywood and Murraylink interconnectors, and to New South Wales via
Project EnergyConnect.
Renewable Resources
Resource Solar Wind
Resource Quality C C
Renewable Potential (MW) 1,300 4,600
Demand Correlation
2019-20 2029-30 2039-40 2019-20 2029-30 2039-40
F F F C C C
Climate Hazard
Temperature Score D Bush Fire Score D
Variable Renewable Energy Outlook
Solar PV (MW) Wind (MW)
Existing/
committed
Projected Existing/
committed
Projected
2029-30 2034-35 2039-40 2029-30 2034-35 2039-40
Central
There is no existing or committed solar generation in this
REZ. The modelling outcomes, for all scenarios, did not
project additional solar generation for this REZ.
952
0 500 800
Step 850 850 1,200
Fast 0 150 1,200
High DER 0 0 250
Slow 0 0 50

© AEMO 2020 | 2020 ISP Appendix 5. Renewable Energy Zones 95
Storage
Mid–North SA has moderate wind projections across all ISP scenarios. Mid-
North does not have significant potential for pumped hydro generation.
There is on operational battery in the Mid-North REZ – Hornsdale
(100 MW/129 MWh).
Suggested Storage for REZ (MW)
Mid–North SA has not been suggested for storage
in any scenario in the 2020 ISP.
Existing Network Capability
Description Approximate Existing Hosting
Capacity
Loss Factor
Robustness
The present network is limited by the 275 kV lines which supply the Adelaide
load centre and provides a transfer path to the Heywood interconnector and
the future Project EnergyConnect interconnector. The current spare network
capacity of approximately 1,000 MW is for all the generation connecting in S3,
S5, S6, S7, S8 and S9.
1,000 MW A
Associated Interconnector Augmentations
Description Additional Hosting Capacity Loss Factor
Robustness
There are no associated interconnector augmentations with this REZ.
Possible REZ Augmentations
Description
Additional
Hosting
Capacity
Upgrade
Cost
Estimate
ISP
Development
Loss Factor
Robustness
Augmentation Option 1:
Mid–North SA 275 kV network connects REZs S3, S5, S6, S7,
S8 and S9 to the Adelaide load centre as well as provides a
path to both the Heywood and Project EnergyConnect
interconnectors. When the combination of generation in
these REZs exceeds 1,000 MW the following upgrade is
required:
• Rebuild Davenport–Brinkworth–Templers West–Para
275 kV line as a high capacity double-circuit line
• Reconfigure the 132 kV network in the Mid–North
region to balance flows
+1,000 MW $420 million
to $770
million
Central, Step
and Fast
(2036-2038)
A
Available Fault Level (MVA)
Available fault level in this REZ is influenced by projected
development utility solar from the mid-2030s and wind from
the late-2020s in the step.
Remediation of S1, S2, S3 and S4 can be addressed by joint
solutions.
Scenario Existing 2029-30 2034-35
Central At limitsA -550 -1,000
Step At limitsA -1,650 -2,450
A. Shortfalls in this area are managed by directions of synchronous units and constraints to existing VRE generation.
System Strength Remediation Augmentation
Description
Date
Required Cost
Central Establish 3 x 125 MVAr synchronous condensers. 2032-33 $130 million to $165 million
Step Establish 2 x 125 MVAr synchronous condensers. 2027-28 $85 million to $110 million

© AEMO 2020 | 2020 ISP Appendix 5. Renewable Energy Zones 96
S4 – Yorke Peninsula
Summary
The Yorke Peninsula REZ has good quality wind resources. The Wattle
Point (90 MW) wind farm lies within this REZ.
A single 132 kV line extends from Hummocks to Wattle Point (towards
the end of Yorke Peninsula). Transmission augmentation would be
required to connect any significant additional generation in this REZ.
This REZ is part of the South Australia group constraint (see section
A5.3.4).
REZ Assessment
N/A The VRE development in Yorke Peninsula REZ has not been identified in any REZ phase development.
Renewable Resources
Resource Solar Wind
Resource Quality C C
Renewable Potential (MW) – 1,400
Demand Correlation
2019-20 2029-30 2039-40 2019-20 2029-30 2039-40
F F F C C C
Climate Hazard
Temperature Score D Bush Fire Score C
Variable Renewable Energy Outlook
Solar PV (MW) Wind (MW)
Existing/
committed
Projected Existing/
committed
Projected
2029-30 2034-35 2039-40 2029-30 2034-35 2039-40
Central
There is no existing or committed solar generation in this
REZ. The modelling outcomes, for all scenarios, did not
project additional solar generation for this REZ.
460A
0 0 600
Step 0 0 600
Fast 0 0 400
High DER 0 0 0
Slow 0 0 0
A. Includes Snowtown wind farm which lies just outside this REZ

© AEMO 2020 | 2020 ISP Appendix 5. Renewable Energy Zones 97
Storage
Yorke Peninsula does not have potential for significant pumped hydro
generation. Small to medium scale wind development occurs within this
zone and hence no storage has been suggested for this REZ in the ISP.
Suggested Storage for REZ (MW)
Yorke Peninsula has not been suggested for storage
under any scenario for the 2020 ISP.
Existing Network Capability
Description Approximate Existing Hosting
Capacity
Loss Factor
Robustness
The REZ connection is via the 132 kV circuit from Hummocks. Currently,
there is no spare capacity available on this network. – F
Associated Interconnector Augmentations
Description Additional Hosting Capacity Loss Factor
Robustness
There are no associated interconnector augmentations with this REZ.
Possible REZ Augmentations
Description
Additional
Hosting
Capacity
Upgrade
Cost
Estimate
ISP
Development
Loss Factor
Robustness
Augmentation Option 1:
Increase capacity to Yorke Peninsula:
• Establish a 275 kV substation near connection
interest in Yorke Peninsula
• Build a double-circuit 275 kV line from Blythe West
into Yorke Peninsula (location would be dependent
on wind connection interest)
+800 -
1,000 MW $190 million to
$350 millionB
Central and Fast
ChangeC
(2035-36),
Step Change
(2037-38)
C
Augmentation Option 2:
Increase capacity to Yorke Peninsula:
• Establish a 132 kV substation at Blythe West
• Establish a new 132 kV substation near generation
interest within Yorke Peninsula (location would be
dependent on wind connection interest)
• Build a double-circuit 132 kV Blythe West to the new
substation
+400 -
450 MW
$160 million to
$300 millionB
Not identified as
being required
under any ISP
scenario
-
B. Cost dependant on the location of the wind generation interest.
C. Fast Change Scenario only requires a single-circuit line.
Available Fault Level (MVA)
Available fault level in this REZ is influenced by planting of
wind in the step from the late 2020s.
Remediation of S1, S2, S3 and S4 can be addressed by joint
solutions.
Scenario Existing 2029-30 2034-35
Central At limitsD -150 -1,250
Step At limitsD -1,550 -1,550
D. Shortfalls in this area are managed by directions of synchronous units and constraints to existing VRE generation.
System Strength Remediation Augmentation
Remediation requirements shown for this REZ are due to expansion of VRE in neighbouring REZs, and are met through a joint solution
reported in REZ S3.

© AEMO 2020 | 2020 ISP Appendix 5. Renewable Energy Zones 98
S5 – Northern SA
Summary
The Northern SA REZ has good solar and moderate wind resources.
Over 1,100 MW of new generation has been proposed, with a diverse
mix of solar thermal, wind, solar PV, and pumped hydro.
About 1,000 MW of additional generation can be accommodated in this
REZ. The capability of this zone to accommodate new generation is also
subject to the Mid-North group constraints. This REZ is part of the
South Australia group constraint (see section A5.3.4).The REZ is close to
the major load centre at Adelaide and the MLFs are robust to increases
in generation.
REZ Assessment
N/A Northern SA REZ does not have any projected development.
Renewable Resources
Resource Solar Wind
Resource Quality B C
Renewable Potential (MW) 3,000 200
Demand Correlation
2019-20 2029-30 2039-40 2019-20 2029-30 2039-40
F F F C C C
Climate Hazard
Temperature Score E Bush Fire Score D
Variable Renewable Energy Outlook
Solar PV (MW) Wind (MW)
Existing/
committed
Projected Existing/
committed
Projected
2029-30 2034-35 2039-40 2029-30 2034-35 2039-40
Central
220
The modelling outcomes, for all
scenarios, did not project additional
solar generation for this REZ.
212
The modelling outcomes, for all scenarios,
did not project additional wind generation
for this REZ.
Step
Fast
High DER
Slow

© AEMO 2020 | 2020 ISP Appendix 5. Renewable Energy Zones 99
Storage
Northern SA and Leigh Creek are the only REZs in
SA with substantial pumped hydro resources.
South Australia does not have any pumped hydro
storage projected across any scenario.
Despite no projection of wind or solar generation
growth, this REZ is favourably located with
respect to other REZs and the management of
the Mid–North group limit. As a result, this REZ is
an ideal candidate for storage and is suggested
for storage in all scenarios except for the High
DER scenario, (no storage is projected in South
Australia for the High DER scenario).
Suggested Storage for REZ (MW)
Depth
Projected
2029-30 2034-35 2039-40
Central
Shallow
0 150 250
Step 0 0 0
Fast 0 0 150
High DER 0 0 0
Slow 0 0 200
Central
Medium
0 0 250
Step 0 0 100
Fast 0 0 250
High DER 0 0 0
Slow 0 0 250
Existing Network Capability
Description Approximate Existing
Hosting Capacity
Loss Factor
Robustness
The current 275 kV network around Davenport and Cultana can accommodate
approximately 1,000 MW. 1,000 MWA C
A. This assumes minor network augmentation and appropriate control schemes will be in place
Associated Interconnector Augmentations
Description Additional Hosting
Capacity
Loss Factor
Robustness
There are no associated interconnector augmentations with this REZ.
Possible REZ Augmentations
Description
Additional
Hosting
Capacity
Upgrade
Cost
Estimate
ISP
Development
Augmentation Option 1A:
For generation interest around Cultana:
• Uprate the existing 275 kV lines between Cultana and Davenport
+200 MW $35 millionA
Not identified as
being required
under any ISP
scenario
Augmentation Option 2B:
• Build a new 275 kV Davenport–Cultana double-circuit line +1,200 MW
$110 million
to $200
million
Not identified as
being required
under any ISP
scenario
Augmentation Option 3A:
• Build a new 275 kV Davenport–Cultana single-circuit line +600 MW
$90 million
to 170 million
Not identified as
being required
under any ISP
scenario

© AEMO 2020 | 2020 ISP Appendix 5. Renewable Energy Zones 100
A. Advised by ElectraNet.
B. Additional augmentation is required in Mid-North when the combination of generation in S3, S5, S6, S7, S8 and S9 >1,000 MW.
Available Fault Level (MVA)
Available fault level in this REZ is influenced by development of
nearby REZs.
Scenario Existing 2029-30 2034-35
Central At limitsC -750 -1,950
Step At limitsC -1,400 -1,700
C. Shortfalls in this area are managed by directions of synchronous units and constraints to existing VRE generation.
System Strength Remediation Augmentation
Remediation not required with forecast level of VRE in the Central and Step Change scenarios.

© AEMO 2020 | 2020 ISP Appendix 5. Renewable Energy Zones 101
S6 – Leigh Creek
Summary
The Leigh Creek REZ is located between 150 and 350 km north east of
Davenport. It has excellent solar resources and good wind resources.
There has also been high-level consideration of the potential for
geothermal in this REZ.
This REZ is currently supplied with a single 132 kV line that does not
have material spare capacity. A possible augmentation could involve
extending the 275 kV network from Davenport to this REZ.
The MLF would still decline rapidly with new generation, due to the
distance from any major load centre.
This REZ is part of the South Australia group constraint (see section
A5.3.4).
REZ Assessment
N/A Leigh Creek REZ does not have any projected development.
Renewable Resources
Resource Solar Wind
Resource Quality A B
Renewable Potential (MW) 6,500 2,400
Demand Correlation
2019-20 2029-30 2039-40 2019-20 2029-30 2039-40
F F F C C D
Climate Hazard
Temperature Score D Bush Fire Score C
Variable Renewable Energy Outlook
Solar PV (MW) Wind (MW)
Existing/
committed
Projected Existing/
committed
Projected
2029-30 2034-35 2039-40 2029-30 2034-35 2039-40
Central
There is no existing or committed solar generation in this
REZ. The modelling outcomes, for all scenarios, did not
project additional solar generation for this REZ.
There is no existing or committed wind generation in this
REZ. The modelling outcomes, for all scenarios, did not
project additional wind generation for this REZ.
Step
Fast
High DER
Slow
Storage
Leigh Creek REZ has potential for pumped hydro generation. The
network however is weak and cannot accommodate large scale
developments without significant transmission augmentation. There is
also no VRE projected for Leigh Creek, for these reasons no storage has
been suggested.
Suggested Storage for REZ (MW)
Leigh Creek has not been suggested for storage under any
scenario for the 2020 ISP.
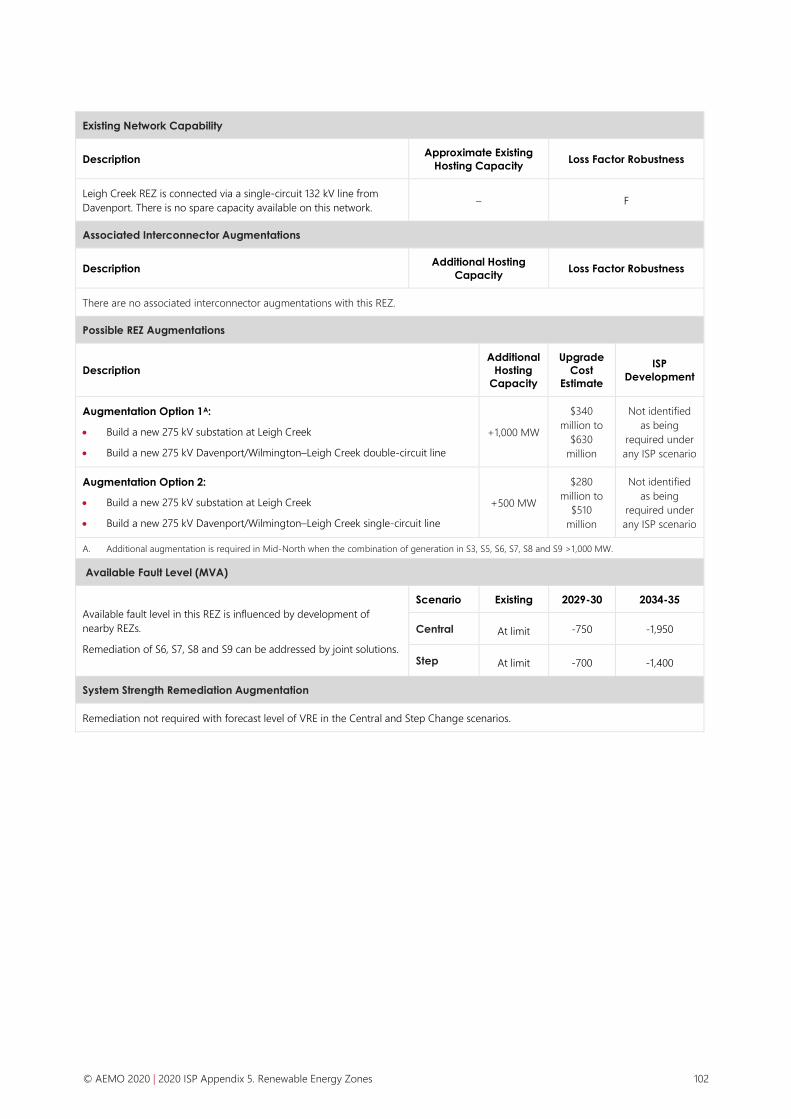
© AEMO 2020 | 2020 ISP Appendix 5. Renewable Energy Zones 102
Existing Network Capability
Description Approximate Existing
Hosting Capacity Loss Factor Robustness
Leigh Creek REZ is connected via a single-circuit 132 kV line from
Davenport. There is no spare capacity available on this network. – F
Associated Interconnector Augmentations
Description Additional Hosting
Capacity Loss Factor Robustness
There are no associated interconnector augmentations with this REZ.
Possible REZ Augmentations
Description
Additional
Hosting
Capacity
Upgrade
Cost
Estimate
ISP
Development
Augmentation Option 1A:
• Build a new 275 kV substation at Leigh Creek
• Build a new 275 kV Davenport/Wilmington–Leigh Creek double-circuit line
+1,000 MW
$340
million to
$630
million
Not identified
as being
required under
any ISP scenario
Augmentation Option 2:
• Build a new 275 kV substation at Leigh Creek
• Build a new 275 kV Davenport/Wilmington–Leigh Creek single-circuit line
+500 MW
$280
million to
$510
million
Not identified
as being
required under
any ISP scenario
A. Additional augmentation is required in Mid-North when the combination of generation in S3, S5, S6, S7, S8 and S9 >1,000 MW.
Available Fault Level (MVA)
Available fault level in this REZ is influenced by development of
nearby REZs.
Remediation of S6, S7, S8 and S9 can be addressed by joint solutions.
Scenario Existing 2029-30 2034-35
Central At limit -750 -1,950
Step At limit -700 -1,400
System Strength Remediation Augmentation
Remediation not required with forecast level of VRE in the Central and Step Change scenarios.

© AEMO 2020 | 2020 ISP Appendix 5. Renewable Energy Zones 103
S7 – Roxby Downs
Summary Phase 3 REZ
The Roxby Downs REZ is located a few hundred kilometres north west
of Davenport. It has excellent solar resources. The only significant load
in the area is the Olympic Dam and Carrapateena mines. This REZ is
currently connected with a 132 kV line and privately owned 275 kV line
from Davenport. ElectraNet is in the process extending the 275 kV
system to develop a new 275/132 kV connection point at Mount
Gunson South to service OZ Minerals’ new and existing mines in the
area.
Once new generation exceeds the major size of the load in the area,
the MLF in this area is likely to decline rapidly due to the distance from
any major load.
This REZ also forms part of the South Australia group constraint (see
section A5.3.4).
REZ Assessment
Phase 3 REZ
Roxby Downs REZ has development in phase 3. Transmission augmentation strengthening 275 kV
network between Davenport and Para is required to support the VRE projection in the Mid-North REZ
and Roxby Downs REZ.
Renewable Resources
Resource Solar Wind
Resource Quality A D
Renewable Potential (MW) 3,400 –
Demand Correlation
2019-20 2029-30 2039-40 2019-20 2029-30 2039-40
F F F C C C
Climate Hazard
Temperature Score E Bush Fire Score C
Variable Renewable Energy Outlook
Solar PV (MW) Wind (MW)
Existing/
committed
Projected Existing/
committed
Projected
2029-30 2034-35 2039-40 2029-30 2034-35 2039-40
Central
There is no
existing or
committed
solar
generation in
this REZ.
0 500 500
There is no existing or committed wind generation in this
REZ. The modelling outcomes, for all scenarios, did not
project additional wind generation for this REZ.
Step 150 150 350
Fast 850 850 850
High DER 0 750 750
Slow 0 0 950

© AEMO 2020 | 2020 ISP Appendix 5. Renewable Energy Zones 104
Storage
Roxby Downs REZ is not considered to have potential for significant pumped
hydro generation. Roxby Downs is projected to have moderate solar generation
growth across all ISP scenarios. No storage has been suggested for this REZ,
storage has been projected nearby in the Northern SA REZ.
Suggested Storage for REZ (MW)
Roxby Downs REZ has not been suggested for
storage across any scenario in the 2020 ISP.
Existing Network Capability
Description Approximate Existing Hosting
Capacity
Loss Factor
Robustness
The existing network together with a new 275 kV line between Davenport and
Mount Gunson South, has a hosting capacity of 960 MW. 960 MW E
Associated Interconnector Augmentations
Description Additional Hosting Capacity Loss Factor
Robustness
There are no associated interconnector augmentations with this REZ.
Possible REZ Augmentations
Description
Additional
Hosting
Capacity
Upgrade
Cost
Estimate
ISP
Development
Augmentation Option 1:
• Build a new 275 kV substation near generation interest in Roxby Downs
• Build a new 275 kV Davenport–Roxby Downs double-circuit line
+1,000 MW
$400 million
to $740
million
Not identified
as being
required under
any ISP scenario
Augmentation Option 2:
Following the above augmentation when the combination of generation in S3,
S5, S6, S7, S8 and S9 >1,000 MW the following upgrade is required:
• Rebuild Davenport–Brinkworth–Templers West–Para 275 kV line as a high
capacity double-circuit line.
• Reconfigure the 132 kV network in the mid north region to balance network
loading.
+1,000 MW
$420 million
to $770
million
Central, Step
and Fast (2036-
2038)
Available Fault Level (MVA)
Available fault level in this REZ is influenced by planting of solar
PV from the mid-2030s.
Remediation of S6, S7, S8 and S9 can be addressed by joint
solutions.
Scenario Existing 2029-30 2034-35
Central At limit -750 -1,950
Step At limit -1,400 -1,700
System Strength Remediation Augmentation
Description
Date
Required Cost
Central Establish 2 x 125 MVAr synchronous condensers. 2030-31 $85 million to $110 million
Step Establish 2 x 125 MVAr synchronous condensers. 2030-31 $85 million to $110 million

© AEMO 2020 | 2020 ISP Appendix 5. Renewable Energy Zones 105
S8 – Eastern Eyre Peninsula
Summary
The Eastern Eyre Peninsula REZ has moderate to good quality wind
resources. Wind farms in service include Cathedral Rocks (66 MW) and
Mt Millar (70 MW) wind farms. ElectraNet has completed the Eyre
Peninsula Electricity Supply RIT–T for transmission development to
support this area. The AER has determined that the preferred option
satisfies the requirements of the RIT–T.
The REZ is currently supplied by a single 132 kV line extending 250 km
south of Cultana. Following the successful conclusion of the Eyre
Peninsula Electricity Supply RIT–T in 2019, ElectraNet plans to replace
the existing Cultana–Yadnarie–Port Lincoln 132 kV single-circuit line
with a new double-circuit 132 kV line built at 275 kV for the Cultana to
Yadnarie section.
The MLF is likely to decline rapidly with any additional generation. Even
with upgrading the network halfway along the Peninsula to 275 kV and
augmenting the remaining 132 kV lines, the MLF does not improve
much.
This REZ is part of the South Australia group constraint (see section
A5.3.4).
REZ Assessment
N/A Eastern Eyre Peninsula does not have any projected development.
Renewable Resources
Resource Solar Wind
Resource Quality C C
Renewable Potential (MW) 5,000 2,300
Demand Correlation
2019-20 2029-30 2039-40 2019-20 2029-30 2039-40
F F F C C C
Climate Hazard
Temperature Score D Bush Fire Score D
Variable Renewable Energy Outlook
Solar PV (MW) Wind (MW)
Existing/
committed
Projected Existing/
committed
Projected
2029-30 2034-35 2039-40 2029-30 2034-35 2039-40
Central
There is no existing or committed solar generation in this
REZ. The modelling outcomes, for all scenarios, did not
project additional solar generation for this REZ.
136
The modelling outcomes, for all scenarios,
did not project additional wind generation
for this REZ.
Step
Fast
High DER
Slow

© AEMO 2020 | 2020 ISP Appendix 5. Renewable Energy Zones 106
Storage
This REZ is not considered to have potential for significant pumped
hydro generation. Since no VRE is projected for this zone, no storage
has been suggested for this REZ.
Suggested Storage for REZ (MW)
Eastern Eyre Peninsula REZ has not been suggested for
storage across any scenario in the 2020 ISP.
Existing Network Capability
Description
Approximate
Existing
Hosting
Capacity
Loss Factor
Robustness
This REZ is connected via the 132 kV network from Cultana to Port Lincoln. The spare hosting
capacity includes the committed rebuild of the 132 kV line from Cultana–Yadnarie–Port
Lincoln as a double-circuit line.
470 MW D
Associated Interconnector Augmentations
Description
Additional
Hosting
Capacity
Loss Factor
Robustness
There are no associated interconnector augmentations with this REZ.
Possible REZ Augmentations
Description
Additional
Hosting
Capacity
Upgrade
Cost Estimate
ISP
Development
Augmentation Option 1:
Operate the Cultana–Yadnarie 132 kV line (built at 275 kV) at 275 kV by:
• Establishing a 275 kV substation at Yadnarie
• 275/132 kV transformation
+300 MW $45 million to
$85 million
Not identified as
being required
under any ISP
scenario
Available Fault Level (MVA)
Available fault level in this REZ is influenced by development
of nearby REZs.
Remediation of S6, S7, S8 and S9 can be addressed by joint
solutions.
Scenario Existing 2029-30 2034-35
Central At limitsA -750 -1,950
Step At limitsA -750 -1,400
A. Shortfalls in this area are managed by directions of synchronous units and constraints to existing VRE generation.
System Strength Remediation Augmentation
Remediation requirements shown for this REZ are due to expansion of VRE in neighbouring REZs, and are met through a joint
solution reported in REZ S7.
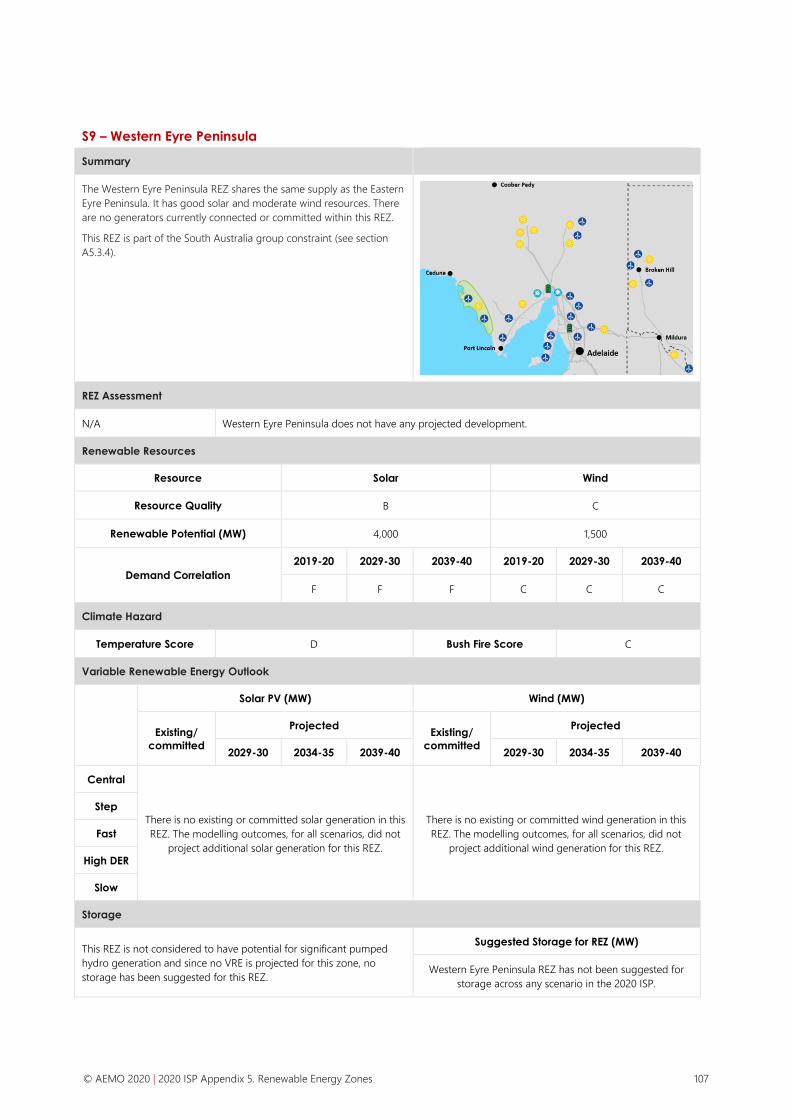
© AEMO 2020 | 2020 ISP Appendix 5. Renewable Energy Zones 107
S9 – Western Eyre Peninsula
Summary
The Western Eyre Peninsula REZ shares the same supply as the Eastern
Eyre Peninsula. It has good solar and moderate wind resources. There
are no generators currently connected or committed within this REZ.
This REZ is part of the South Australia group constraint (see section
A5.3.4).
REZ Assessment
N/A Western Eyre Peninsula does not have any projected development.
Renewable Resources
Resource Solar Wind
Resource Quality B C
Renewable Potential (MW) 4,000 1,500
Demand Correlation
2019-20 2029-30 2039-40 2019-20 2029-30 2039-40
F F F C C C
Climate Hazard
Temperature Score D Bush Fire Score C
Variable Renewable Energy Outlook
Solar PV (MW) Wind (MW)
Existing/
committed
Projected Existing/
committed
Projected
2029-30 2034-35 2039-40 2029-30 2034-35 2039-40
Central
There is no existing or committed solar generation in this
REZ. The modelling outcomes, for all scenarios, did not
project additional solar generation for this REZ.
There is no existing or committed wind generation in this
REZ. The modelling outcomes, for all scenarios, did not
project additional wind generation for this REZ.
Step
Fast
High DER
Slow
Storage
This REZ is not considered to have potential for significant pumped
hydro generation and since no VRE is projected for this zone, no
storage has been suggested for this REZ.
Suggested Storage for REZ (MW)
Western Eyre Peninsula REZ has not been suggested for
storage across any scenario in the 2020 ISP.

© AEMO 2020 | 2020 ISP Appendix 5. Renewable Energy Zones 108
Existing Network Capability
Description Approximate Existing
Hosting Capacity
Loss Factor
Robustness
There is no transmission network built to this REZ. – N/A
Associated Interconnector Augmentations
Description Additional Hosting
Capacity
Loss Factor
Robustness
There are no associated interconnector augmentations with this REZ.
Possible REZ Augmentations
Description
Additional
Hosting
CapacityA
Upgrade
Cost
Estimate
ISP
Development
Augmentation Option 1:
Establish REZ by establishing 275 kV network from Cultana/Corraberra Hill:
• Build a new 275 kV substation at Elliston
• Build a new 275 kV Cultana/Corraberra Hill–Elliston double-circuit line
+1,050 MW
$380 million
to $700
million
Not identified
as being
required under
any ISP scenario
Augmentation Option 2:
Establish the REZ by establishing 275 kV network from Yadnarie:
• Build a new 275 kV substation at Elliston
• Build a new 275 kV Elliston–Yadnarie single-circuit line
+300-
500 MW
$250 million
to $460
millionB
Not identified
as being
required under
any ISP scenario
Augmentation Option 3:
Establish REZ by establishing diverse routes from the 275 kV network:
• Build a new 275 kV substation at Elliston
• Build a new 275 kV Cultana/Corraberra Hill–Elliston single-circuit line
• Build a new 275 kV Elliston–Yadnarie single-circuit line
+1,200 MW
$560 million
to $1,040
millionB
Not identified
as being
required under
any ISP scenario
A. Augmentation hosting capacity dependant on generation within Eastern Eyre Peninsula, additional augmentation may be required between Yadnarie and
Cultana.
B. Includes the cost for the upgrade of Cultana–Yadnarie 132 kV line to 275 kV.
Available Fault Level (MVA)
Available fault level in this REZ is influenced by development of
nearby REZs.
Remediation of S6, S7, S8 and S9 can be addressed by joint
solutions.
Scenario Existing 2029-30 2034-35
Central At limitsC -750 -1,950
Step At limitsC -750 -1,400
C. Shortfalls in this area are managed by directions of synchronous units and constraints to existing VRE generation.
System Strength Remediation Augmentation
Remediation requirements shown for this REZ are due to expansion of VRE in neighbouring REZs, and are met through a joint
solution reported in REZ S7.

© AEMO 2020 | 2020 ISP Appendix 5. Renewable Energy Zones 109
A5.4.5 Tasmania REZ scorecards
T1 – North East Tasmania
Summary Phase 1 REZ
The North East Tasmania REZ has one wind farm of 168 MW (Musselroe
Wind Farm) in service. After consultation, this REZ has been extended in
the 2020 ISP to encompass George Town. A sufficient three phase fault
level must be maintained to ensure stable operation of the Basslink
HVDC interconnector. In November 2019, AEMO declared a fault level
shortfall for Tasmania, including George Town in this shortfall. The fault
level at George Town is likely to deteriorate as more inverter-based
resources connect within this area.
REZ Assessment
Phase 1 REZ
Subject to TRET becoming legislated, the development of VRE in North East Tasmania REZ has been
highlighted in phase 1. VRE development utilises the spare network capacity in this REZ and is driven
by TRET which is considered in the Step and High DER scenarios. Under the TRET, Tasmania’s VRE
would be about 150% of its needs by 2030, unless significant new local energy-intensive industry was
developed. The surplus would have to be either exported or curtailed.
Renewable Resources
Resource Solar Wind
Resource Quality D B
Renewable Potential (MW) – 1,400
Demand Correlation
2019-20 2029-30 2039-40 2019-20 2029-30 2039-40
F F F C C C
Climate Hazard
Temperature Score A Bush Fire Score B
Variable Renewable Energy Outlook
Solar PV (MW) Wind (MW)
Existing/
committed
Projected Existing/
committed
Projected
2029-30 2034-35 2039-40 2029-30 2034-35 2039-40
Central
There is no existing or committed solar generation in this
REZ. The modelling outcomes, for all scenarios, did not
project additional solar generation for this REZ.
168
0 0 0
Step 0 250 250
Fast 0 0 0
High DER 0 250 250
Slow 0 0 0

© AEMO 2020 | 2020 ISP Appendix 5. Renewable Energy Zones 110
Storage
This REZ is not considered to have potential for significant pumped hydro
generation. As a result, no storage has been suggested in this REZ, as
only deep storage was projected for Tasmania and only under the Step
Change scenario.
Suggested Storage for REZ (MW)
North East Tasmania REZ has not been suggested for
storage across any scenario in the 2020 ISP.
Existing Network Capability
Description Approximate Existing Hosting
Capacity
Loss Factor
Robustness
Approximately 250 MW of hosting capacity remains in and around the
220 kV network at George Town. 250 MW AA
A. Loss factor robustness has been calculated at the 220 kV connection near George Town as there is currently no capacity left of the 110 kV network.
Associated Interconnector Augmentations
Description Additional Hosting Capacity Loss Factor
Robustness
There are no associated interconnector augmentations with this REZ.
Possible REZ Augmentations
Description
Additional
Hosting
Capacity
Upgrade
Cost
Estimate
ISP Development
Augmentation Option 1:
To increase capacity within the North East Tasmania REZ the following is
proposed:
• Establish a new 220 kV substation in an area with generation interest
to the north east
• Connect the new substation to George Town with a double-circuit
220 kV line
+800 MW $130 million to
$230 million
Not identified as
being required
under any ISP
scenario
Available Fault Level (MVA)
Available fault level in this REZ is influenced by
development of nearby REZs.
Remediation of T1, T2 and T3 can be addressed by joint
solution.
Scenario Existing 2029-30 2034-35
Central At limitsA 350 -350
Step At limitsA 700 -400
A. Shortfalls in this area are managed by system strength services procured by TasNetworks.
System Strength Remediation Augmentation
Remediation requirements shown for this REZ are due to expansion of VRE in neighbouring REZs, and are met through a joint
solution reported in REZ T3.

© AEMO 2020 | 2020 ISP Appendix 5. Renewable Energy Zones 111
T2 – North West Tasmania
Summary Phase 1 REZ
The North West REZ covers the north west and west coast of
Tasmania. With good quality wind resources, a significant portion of
the projected new wind development in Tasmania is located within
the North West REZ.
In this ISP, this REZ has been extended to encompass Sheffield. The
REZ has two load centres, one at Burnie and one at Sheffield.
Additional to the good quality wind resources, this REZ is a good
location for pumped hydro development.
The North West Tasmania REZ is a favourable connection point for
Marinus Link, with the connection point proposed near Burnie.
REZ Assessment
Phase 1
Subject to TRET becoming legislated, the VRE development in North West Tasmania REZ has been
highlighted in phase 1. VRE development in this REZ, utilising the spare network capacity, is driven by
TRET which is considered in the Step Change and high DER scenarios. Under the TRET, Tasmania’s VRE
would be about 150% of its needs by 2030, unless significant new local energy-intensive industry was
developed. The surplus would have to be either exported or constrained off.
Renewable Resources
Resource Solar Wind
Resource Quality E A
Renewable Potential (MW) 150 5,000
Demand Correlation
2019-20 2029-30 2039-40 2019-20 2029-30 2039-40
F F F C C C
Climate Hazard
Temperature Score A Bush Fire Score A
Variable Renewable Energy Outlook
Solar PV (MW) Wind (MW)
Existing/
committed
Projected Existing/
committed
Projected
2029-30 2034-35 2039-40 2029-30 2034-35 2039-40
Central
There is no
existing or
committed
solar
generation in
this REZ.
0 0 0
252
The modelling outcomes, for all scenarios,
did not project additional wind generation
for this REZ.
Step 150 150 150
Fast 0 0 0
High DER 150 150 150
Slow 0 0 0

© AEMO 2020 | 2020 ISP Appendix 5. Renewable Energy Zones 112
Storage
North West Tasmania REZ has high potential to
host pumped hydro storage. Hydro Tasmania
has announced the most promising sites for the
development of pumped hydro. All three sites
are located within the North West REZ, two
connecting around Sheffield and the third
around Farrell. The only storage projected for
Tasmania is deep storage under the Step
Change scenario, of which all is assumed to
connect within this REZ.
Suggested Storage for REZ (MW)
Depth
Projected
2029-30 2034-35 2039-40
Central
Deep
0 0 0
Step 0 200 350
Fast 0 0 0
High DER 0 0 0
Slow 0 0 0
Existing Network Capability
Description Approximate Existing
Hosting Capacity
Loss Factor
Robustness
There is currently no spare capacity available on the 110 kV circuits west of
Burnie. There is still approximately 340 MW of spare capacity on the 220 kV
network from Sheffield.
340 MW A (Solar) /
D (Wind)A
A. The loss factor robustness for this REZ has two values due to the different connection points for wind and solar. Connection of solar is assumed
around Sheffield, and wind around Farrell.
Associated Interconnector Augmentations
Description Additional Hosting Capacity Loss Factor
Robustness
Marinus Link Stage 1 (Early Works):
A new 750 MW HVDC interconnector between the Burnie area in Tasmania
and the Latrobe Valley in Victoria. Marinus Link Stage 1 does not increase the
REZ hosting capacity within this REZ, as it does not extend the current 220 kV
transmission network towards Hampshire or Montague
- -
Marinus Link Stage 2 (Early Works):
A new second 750 MW HVDC interconnector between the Burnie area in
Tasmania and the Latrobe Valley in Victoria.
+600 MW A (Solar) /
D (Wind)B
B. The loss factor robustness for this REZ has two values due to the different connection points for wind and solar. Connection of solar is assumed
around Sheffield, and wind around Farrell.
Possible REZ Augmentations
Description
Additional
Hosting
Capacity
Upgrade
Cost
Estimate
ISP
Development
Augmentation Option 1:
To allow for the connection of generation in the Hampshire area, the following
is proposed:
• Rebuild Burnie–Sheffield 220 kV line as a double-circuit
• Establish a new 220 kV substation at Hampshire
• A new double-circuit Burnie–Hampshire 220 kV line
+800 MW
$150 million
to $280
million
This is built as
part of Marinus
Link in Step
Change and
High DER
scenarios

© AEMO 2020 | 2020 ISP Appendix 5. Renewable Energy Zones 113
Augmentation Option 2:
To allow for the connection of generation in the West Montague area,
the following is proposed:
• Rebuild Burnie–Sheffield 220 kV line as a double-circuit
• Establish a new 220 kV substation at West Montague
• A new double-circuit Burnie–West Montague 220 kV line
+800 MW
$210
million to
$400
million
Not identified as being
required under any ISP
scenario
Available Fault Level (MVA)
Available fault level in this REZ is influenced by development of
nearby REZs.
Remediation of T1, T2 and T3 can be addressed by joint solution.
Scenario Existing 2029-30 2034-35
Central At limitsC -50 -750
Step At limitsC 50 -1,800
C. Shortfalls in this area are managed by system strength services procured by TasNetworks.
System Strength Remediation Augmentation
Remediation requirements for this REZ are due to expansion of VRE in neighbouring REZs, and are met through a joint solution
reported in REZ T3.

© AEMO 2020 | 2020 ISP Appendix 5. Renewable Energy Zones 114
T3 – Tasmania Midlands
Summary Phase 1 and phase 2
The Tasmania Midlands REZ has one of the best wind capacities within
the NEM and has good pumped hydro resources. It is located close to
major load centres at Hobart.
The double-circuit Palmerston–Waddamana–Liapootah and
Waddamana–Lindisfarne 220 kV lines pass through this REZ. Cattle Hill
wind farm (144 MW) is the only committed variable generation within
this zone.
Additional to transmission network limitations within Tasmania, as more
generation connects, export to the mainland becomes a limiting factor.
REZ Assessment
Phase 1 and phase 2
Subject to TRET becoming legislated, Midlands is identified for development in phase 1. VRE
development in this REZ exceeds the existing spare network capacity before 2030. Under the TRET,
Tasmania’s VRE would be about 150% of its needs by 2030, unless significant new local energy-
intensive industry was developed. The surplus would have to be either exported or curtailed.
The development of this REZ in phase 2 is further supported by Marinus Link which increases the
hosting capacity of this REZ by 540 MW in each stage. VRE development occurs in all scenarios
including those without TRET, except for the Slow Change scenario.
Renewable Resources
Resource Solar Wind
Resource Quality E A
Renewable Potential (MW) – 3,400
Demand Correlation
2019-20 2029-30 2039-40 2019-20 2029-30 2039-40
F F F C C C
Climate Hazard
Temperature Score A Bush Fire Score D
Variable Renewable Energy Outlook
Solar PV (MW) Wind (MW)
Existing/
committed
Projected Existing/
committed
Projected
2029-30 2034-35 2039-40 2029-30 2034-35 2039-40
Central
There is no existing or committed solar generation in this
REZ. The modelling outcomes, for all scenarios, did not
project additional solar generation for this REZ.
144
50 250 1,200
Step 1,150 2,550 2,550
Fast 500 1,000 1,200
High DER 850 1,250 1,900
Slow 0 0 0

© AEMO 2020 | 2020 ISP Appendix 5. Renewable Energy Zones 115
Storage
The Tasmania Midlands REZ has potential to host pumped hydro storage.
Hydro Tasmania has not included any pumped hydro options in the
Midlands REZ in its latest review of promising pumped hydro sites. The
only storage projected for Tasmania is deep storage under the Step
Change scenario which is assumed to connect in the North West Tasmania
REZ.
Suggested Storage for REZ (MW)
Tasmania Midlands REZ has not been suggested for
storage across any scenario in the 2020 ISP.
Existing Network Capability
Description Approximate Existing Hosting
Capacity
Loss Factor
Robustness
The existing 220 kV network which extends from Palmerston to
Waddamana to Liapootah and from Waddamana to Lindisfarne has a
hosting capacity of approximately 480 MW.
480 MW A
Associated Interconnector Augmentations
Description Additional Hosting Capacity Loss Factor
Robustness
Marinus Link Stage 1 (Early Works):
A new 750 MW HVDC interconnector between the Burnie area in Tasmania
and the Latrobe Valley in Victoria.
+540 MW A
Marinus Link Stage 2 (Early Works):
A new second 750 MW HVDC interconnector between the Burnie area in
Tasmania and the Latrobe Valley in Victoria.
- A
Possible REZ Augmentations
Description
Additional
Hosting
Capacity
Upgrade
Cost
Estimate
ISP
Development
Loss Factor
Robustness
Augmentation Option 1:
To increase capacity within the Tasmania Midlands REZ
the following is proposed:
• A new double-circuit Palmerston–Sheffield 220 kV line
+800 MW $110 million to
$200 million
Built as part of
Marinus Link in
Central and Fast
Change. Brough
forward Fast
Change and High
DER (2027-28/
2028-29)
A
Augmentation Option 2:
To increase capacity to generation connection over and
above the build of Palmerston-Sheffield 220 kV line:
• A new double-circuit Palmerston–Waddamana 220 kV
line
- $60 million to
$120 million
Depends on the
location of
generation
interest within this
zone
-
Available Fault Level (MVA)
Available fault level in this REZ is influenced by planting
of wind from the late 2020s.
Remediation of T1, T2 and T3 can be addressed by joint
solution.
Scenario Existing 2029-30 2034-35
Central At limitsA -150 -800
Step At limitsA 150 -3,750
A. Shortfalls in this area are managed by system strength services procured by TasNetworks.
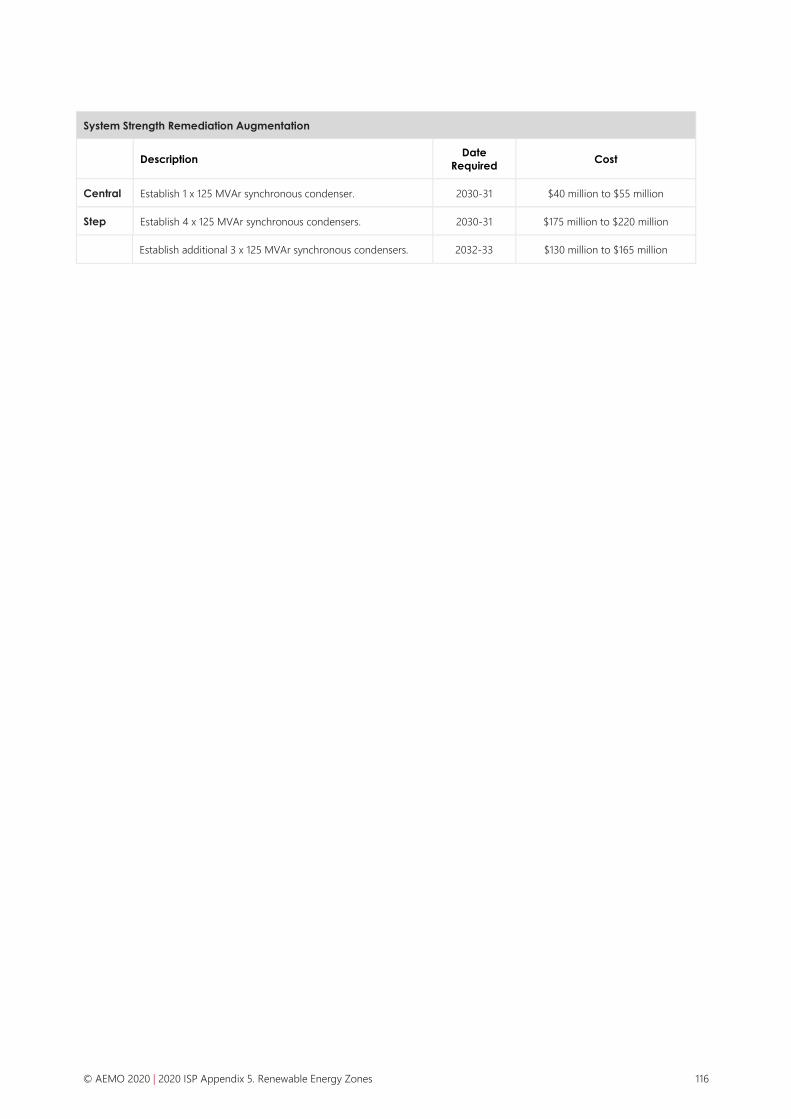
© AEMO 2020 | 2020 ISP Appendix 5. Renewable Energy Zones 116
System Strength Remediation Augmentation
Description
Date
Required Cost
Central Establish 1 x 125 MVAr synchronous condenser. 2030-31 $40 million to $55 million
Step Establish 4 x 125 MVAr synchronous condensers. 2030-31 $175 million to $220 million
Establish additional 3 x 125 MVAr synchronous condensers. 2032-33 $130 million to $165 million

© AEMO 2020 | 2020 ISP Appendix 5. Renewable Energy Zones 117
A5.4.6 Victoria REZ scorecards
V1 – Ovens Murray
Summary
The Ovens Murray REZ has been identified as a candidate REZ due to
this REZ having good pumped hydro resources. There is currently
770 MW of installed hydro generation within this zone. Good potential
pumped hydro locations within this zone and the proximity of this REZ
to good solar resources, makes Ovens Murray REZ a good candidate
for meeting some of the pumped hydro needs in Victoria.
REZ Assessment
N/A Ovens Murray REZ does not have any projected VRE development. It has not been highlighted for any
REZ phase development.
Renewable Resources
Resource Solar Wind
Resource Quality D B
Renewable Potential (MW) – –
Demand Correlation
2019-20 2029-30 2039-40 2019-20 2029-30 2039-40
F F F C C C
Climate Hazard
Temperature Score B Bush Fire Score E
Variable Renewable Energy Outlook
Solar PV (MW) Wind (MW)
Existing/
committed
Projected Existing/
committed
Projected
2029-30 2034-35 2039-40 2029-30 2034-35 2039-40
Central
There is no existing or committed solar generation in this
REZ. The modelling outcomes, for all scenarios, did not
project additional solar generation for this REZ.
There is no existing or committed wind generation in this
REZ. The modelling outcomes, for all scenarios, did not
project additional wind generation for this REZ.
Step
Fast
High DER
Slow

© AEMO 2020 | 2020 ISP Appendix 5. Renewable Energy Zones 118
Storage
Ovens Murray has been highlighted as having
significant potential for pumped hydro generation
within Victoria.
Ovens Murray is connected to the Victoria load centre
via two 330 kV lines from Dederang to South Morang.
It also lies on the interconnector flow path between
New South Wales and Victoria.
No storage has been projected in Victoria in the
Central, Fast Change and the High VRE scenarios
before 2040.
Storage, due to this zone’s pumped hydro potential,
has been suggested for the Step Change scenario.
Ovens Murray is close to both the Melbourne load
centre and the solar generation projected for Central
North Victoria and has thus been suggested for storage
under this scenario.
Suggested Storage for REZ (MW)
Depth
Projected
2029-30 2034-35 2039-40
Central
Medium
0 0 0
Step 100 100 300
Fast 0 0 0
High DER 0 0 0
Slow 0 0 0
Existing Network Capability
Description Approximate Existing
Hosting Capacity
Loss Factor
Robustness
Ovens Murray REZ lies along the path of the existing Victoria - New South Wales
interconnector. 300 MW N/A
Associated Interconnector Augmentations
Description Additional Hosting
Capacity
Loss Factor
Robustness
There are no associated interconnector augmentations on the optimal development path with this REZ.
Available Fault Level (MVA)
Available fault level in this REZ is influenced by pumped hydro in the
step from the late 2020s.
Scenario Existing 2029-30 2034-35
Central 900 950 950
Step 900 2,050 2,150
System Strength Remediation Augmentation
Remediation not required with forecast level of VRE in the Central and Step Change scenarios.

© AEMO 2020 | 2020 ISP Appendix 5. Renewable Energy Zones 119
V2 – Murray River
Summary Phase 2 REZ
The Murray River REZ has solar resources. Despite being remote and
electrically weak, this REZ has attracted significant investment in solar
generation with more than 640 MW of generation installed and
committed. The existing 220 kV network between Bendigo and Red
Cliffs is electrically weak, with MLFs declining sharply as new generators
connect. Voltage stability and thermal limits currently restrict the output
of generators within this REZ.
The VNI West project is recommended to upgrade transfer capability
between Victoria and New South Wales via either Kerang or
Shepparton. The development of VNI West via Kerang would
significantly increase the ability for renewable generation to connect in
this zone. The proposed new interconnector between New South Wales
and South Australia (Project EnergyConnect) will facilitate a small
improvement in capacity within Murray River REZ.
Note: In the 2018 ISP, the Murray River candidate REZ spanned
over North West Victoria and South West New South Wales
towards Darlington Point. In the 2020 ISP, the 2018 Murray River
candidate REZ has been split into two REZs, one in New South
Wales and one in Victoria.
REZ Assessment
Phase 2 REZ
Murray River REZ has development in phase 2. Phase 2 VRE development is supported by Project
EnergyConnect, an actionable ISP project. Project EnergyConnect facilitates a small increase in
generation hosting capacity in the Red Cliffs area. VNI West (Kerang route) will further support VRE
development within this zone.
Renewable Resources
Resource Solar Wind
Resource Quality C D
Renewable Potential (MW) 4,700 –
Demand Correlation
2019-20 2029-30 2039-40 2019-20 2029-30 2039-40
F F F D C C
Climate Hazard
Temperature Score E Bush Fire Score C
Variable Renewable Energy Outlook
Solar PV (MW) Wind (MW)
Existing/
committed
Projected Existing/
committed
Projected
2029-30 2034-35 2039-40 2029-30 2034-35 2039-40
Central
641
400 400 400
There is no existing or committed wind generation in this
REZ. The modelling outcomes, for all scenarios, did not
project additional wind generation for this REZ.
Step 400 600 600
Fast 400 400 400
High DER 400 400 400
Slow 400 400 400

© AEMO 2020 | 2020 ISP Appendix 5. Renewable Energy Zones 120
Storage
Murray River REZ is not considered to have potential for
significant pumped hydro generation. Due to this lack of
potential pumped hydro generation, shallow and
medium storage has been suggested for this REZ.
Suggested Storage for REZ (MW)
Depth
Projected
2029-30 2034-35 2039-40
Central
Shallow
0 0 0
Step 0 0 0
Fast 0 0 0
High DER 0 0 0
Slow 0 100 100
Central
Medium
0 0 0
Step 0 0 0
Fast 0 0 0
High DER 0 0 0
Slow 0 0 150
Existing Network Capability
Description Approximate Existing Hosting
Capacity
Loss Factor
Robustness
Murray River REZ, which has no additional hosting capacity, is
connected via a weak 220 kV line from Bendigo to Red Cliffs via Kerang
and Wemen.
– E
Associated Interconnector Augmentations
Description Additional Hosting Capacity Loss Factor
Robustness
Project EnergyConnect (Actionable ISP project):
A new 330 kV interconnector between Robertstown in South Australia
and Wagga Wagga in New South Wales, via Buronga.
+380 MW C
VNI West (Actionable ISP Project):
A new 500 kV interconnector between Victoria and NSW. There are
multiple credible corridors for VNI West of which one option, via
Kerang, opens capacity within this REZ (see Appendix 3).
+2,000 MW -
Possible REZ Augmentations
Description
Additional
Hosting
Capacity
Upgrade
Cost Estimate ISP Development

© AEMO 2020 | 2020 ISP Appendix 5. Renewable Energy Zones 121
Augmentation Option 1:
Extend Murray River REZ by augmenting the 220 kV network:
• Build a new double-circuit 220 kV Kerang–Red Cliffs 220 kV line,
via Wemen
• Build a new double-circuit Bendigo–Kerang 220 kV line
• Build a new double-circuit Bendigo–BallaratA 220 kV line
• A new BallaratA 500/220 kV 1,000 MVA transformer
+1,200 MW
$600 million
to $1,120
million
Not identified as being
required under any ISP
scenario
Augmentation Option 2:
Extend Murray River REZ if VNI West (Shepparton route) is developed
and interest for Murray River REZ is around Kerang:
• Establish a new 500 kV substation at Bendigo
• Turn both BallaratA–Shepparton 500 kV lines into Bendigo
• Build a double-circuit Bendigo–Kerang 500 kV line
• Establish 2 x 500/220 kV transformers at Kerang
+1,500 –
2,000 MWB
$360 million to
$680 million
Not identified as being
required under any ISP
scenario
A. A new terminal substation north of Ballarat which will be established through Western Victoria Transmission Network Project
B. Augmentation hosting capacity dependant on generation within Western Victoria, Central North Victoria, and South West Victoria.
Available Fault Level (MVA)
Available fault level in this REZ is influenced by
planting of solar PV from the late 2020s.
Scenario Existing 2029-30 2034-35
Central At limitB 200 -300
Step At limitB -250 -1,650
C. Existing system strength limits in this area already requiring remediation by connecting generation. Shortfall already declared for Red Cliffs.
System Strength Remediation Augmentation
Description Date
Required Cost
Central Remediation not required with forecast level of VRE in the
Central scenario. - -
Step Establish 1 x 250 MVAr synchronous condenser. 2033-34 $45 million to $60 million

© AEMO 2020 | 2020 ISP Appendix 5. Renewable Energy Zones 122
V3 – Western Victoria
Summary Phase 1 and phase 2 REZ
The Western Victoria REZ has good to excellent quality wind resources.
The existing and committed renewable generation within this REZ
exceeds 1 GW, all of which is from wind generation. The current
network is constrained and cannot support any further connection of
renewable generation without transmission augmentation.
The Western Victoria Transmission Network Project is a committed ISP
project, with the preferred option to expand generation within this
zone as follows:
• A new substation north of Ballarat
• A new 220 kV double-circuit line from Bulgana to the new
substation north of Ballarat (Via Waubra)
• A new 500 kV double-circuit line from a new substation north of
Ballarat to Sydenham
• 2 x 500/220 kV 1,000 MVA transformers at the new substation
north of Ballarat
REZ Assessment
Phase 1 and phase 2 REZ
This REZ has development in phase 1 and phase 2. Early development of generation in Western
Victoria is supported by the committed Western Victoria Transmission Network Project. The phase 1
development is driven in this REZ to help meet VRET. Phase 2 development is supported by VNI West.
Renewable Resources
Resource Solar Wind
Resource Quality D B
Renewable Potential (MW) 400 2,800
Demand Correlation
2019-20 2029-30 2039-40 2019-20 2029-30 2039-40
F F F D C C
Climate Hazard
Temperature Score D Bush Fire Score D
Variable Renewable Energy Outlook
Solar PV (MW) Wind (MW)
Existing/
committed
Projected Existing/
committed
Projected
2029-30 2034-35 2039-40 2029-30 2034-35 2039-40
Central
There is no
existing or
committed
solar
generation in
this REZ.
100 100 400
1,631
700 700 850
Step 0 400 400 700 700 1,050
Fast 0 0 400 700 700 1,050
High DER 0 0 0 450 450 450
Slow 0 0 0 450 450 450

© AEMO 2020 | 2020 ISP Appendix 5. Renewable Energy Zones 123
Storage
Western Victoria REZ is not considered to have
potential for significant pumped hydro
generation. Due to this lack of potential
pumped hydro generation, shallow and
medium storage has been recommended for
this REZ.
Suggested Storage for REZ (MW)
Depth
Projected
2029-30 2034-35 2039-40
Central
Shallow
0 0 0
Step 0 0 0
Fast 0 0 0
High DER 0 0 0
Slow 0 100 100
Central
Medium
0 0 0
Step 0 0 0
Fast 0 0 0
High DER 0 0 0
Slow 0 0 150
Existing Network Capability
Description
Approximate
Existing Hosting
Capacity
Loss Factor
Robustness
The hosting capacity within Western Victoria REZ will be approximately 450 MW after
completion of the committed Western Victoria Transmission Network Project. 450 MW A
Associated Interconnector Augmentations
Description Additional Hosting Capacity Loss Factor
Robustness
VNI West (Actionable ISP Project):
A new 500 kV interconnector between Victoria and NSW. There are
multiple credible corridors for VNI West of which two options, one
via Kerang and one via Shepparton, increases capacity within this
REZ. See Appendix 3 for more information.
+1,000 MW A
Possible REZ Augmentations
Description
Additional
Hosting
Capacity
Upgrade Cost
Estimate
ISP
Development
Augmentation Option 1:
Extend Western Victoria REZ by augmenting the 500 kV network:
• Build a new single-circuit 500 kV line from Tarrone/Mortlake to
the new 500 kV substation north of BallaratA.
• Build new 500/132 kV substations between Tarrone/Mortlake
and the Ballarat area.
• 500/132 kV transformation
1,500 MW $490 million to $920
million
Not identified
as being
required under
any ISP
scenario

© AEMO 2020 | 2020 ISP Appendix 5. Renewable Energy Zones 124
Augmentation Option 2:
Extend Western Victoria REZ by augmenting the 220 kV network:
• Build a new double-circuit 220 kV line from new substation
North of BallaratA to Bulgana turning one circuit into Ararat
and Crowlands
• Build new single-circuit 220 kV line between the existing
Ballarat substation and the new substation north of BallaratA.
• Install a series reactor on the Crowlands–Ararat–Ballarat 220
kV line
• 500/220 kV transformer at the new substation north of
BallaratA
+1,000 MW $170 million to
$320 million
Not identified as being
required under any ISP
scenario
A. A new terminal substation north of Ballarat which will be established through Western Victoria Transmission Network Project
Available Fault Level (MVA)
Available fault level in this REZ is influenced by
planting of wind from the late 2020s.
Scenario Existing 2029-30 2034-35
Central At limitB -1,350 -250
Step At limitB -250 -1,650
B. Existing system strength limits in this area are already requiring remediation by connecting generation. Shortfall already declared for Red Cliffs
System Strength Remediation Augmentation
Description Date
Required Cost
Central Establish 1 x 250 MVAr synchronous condenser. 2025-26 $45 million to $60 million
Step Establish 1 x 250 MVAr synchronous condenser. 2027-28 $45 million to $60 million

© AEMO 2020 | 2020 ISP Appendix 5. Renewable Energy Zones 125
V4 – South West Victoria
Summary Phase 1 REZ
The South West Victoria REZ has moderate to good quality wind
resource in close proximity to the 500 kV and the 220 kV networks in
the area.
Currently the 220 kV network is congested, however there is still
approximately 750 MW of hosting capacity remaining on the 500 kV
network.
There are several large wind farms already in service including
Macarthur (420 MW) and Portland (149 MW). The total committed and
in service wind generation in the area exceeds 1.7 GW.
REZ Assessment
Phase 1 REZ South West Victoria REZ has development in phase 1. The development in this REZ in phase 1 uses the
existing network capacity to help meet the VRET.
Renewable Resources
Resource Solar Wind
Resource Quality E C
Renewable Potential (MW) – 3,900
Demand Correlation
2019-20 2029-30 2039-40 2019-20 2029-30 2039-40
E F F C C C
Climate Hazard
Temperature Score C Bush Fire Score D
Variable Renewable Energy Outlook
Solar PV (MW) Wind (MW)
Existing/
committed
Projected Existing/
committed
Projected
2029-30 2034-35 2039-40 2029-30 2034-35 2039-40
Central
There is no existing or committed solar generation in this
REZ. The modelling outcomes, for all scenarios, did not
project additional solar generation for this REZ.
1,739
750 750 750
Step 750 850 2,600
Fast 300 300 1,000
High DER 750 750 750
Slow 750 750 750

© AEMO 2020 | 2020 ISP Appendix 5. Renewable Energy Zones 126
Storage
The South West Victoria REZ is not
considered to have potential for significant
pumped hydro generation. Due to this lack of
potential pumped hydro generation, shallow
and medium storage has been suggested for
this REZ.
Suggested Storage for REZ (MW)
Depth
Projected
2029-30 2034-35 2039-40
Central
Shallow
0 0 0
Step 0 0 0
Fast 0 0 0
High DER 0 0 0
Slow 0 100 100
Central
Medium
0 0 0
Step 0 0 0
Fast 0 0 0
High DER 0 0 0
Slow 0 0 150
Existing Network Capability
Description Approximate Existing
Hosting Capacity
Loss Factor
Robustness
The current hosting capacity of 750 MW within this REZ is on the 500 kV
network between Moorabool and Heywood. The 220 kV and 66 kV network
between Moorabool and Terang is currently congested.
750 MW AA
A. Loss factor robustness has been calculated on the 500 kV network.
Associated Interconnector Augmentations
Description Additional Hosting Capacity Loss Factor
Robustness
There are no associated interconnector augmentations with this REZ.
Possible REZ Augmentations
Description
Additional
Hosting
Capacity
Upgrade
Cost
Estimate
ISP
Development
Loss Factor
Robustness
Augmentation Option 1:
Extend South West Victoria REZ by augmenting the 500 kV
network:
• Build a new 500 kV Mortlake–Moorabool–Sydenham
single-circuit line
+3,000 MW
$360 million
to $660
million
Not identified
as being
required under
any ISP scenario
-
Augmentation Option 2:
Extend South West Victoria REZ by augmenting the 500 kV
network to a new substation north of Ballarat:
• Build a new 500 kV single-circuit line from Mortlake to a
new substation north of Ballarat
• Turn Tyrone – Hunter Gully into Mortlake substation
+2,500 MWB
$270 million
to $510
million
Step (2036-37),
Fast (2040-41) -
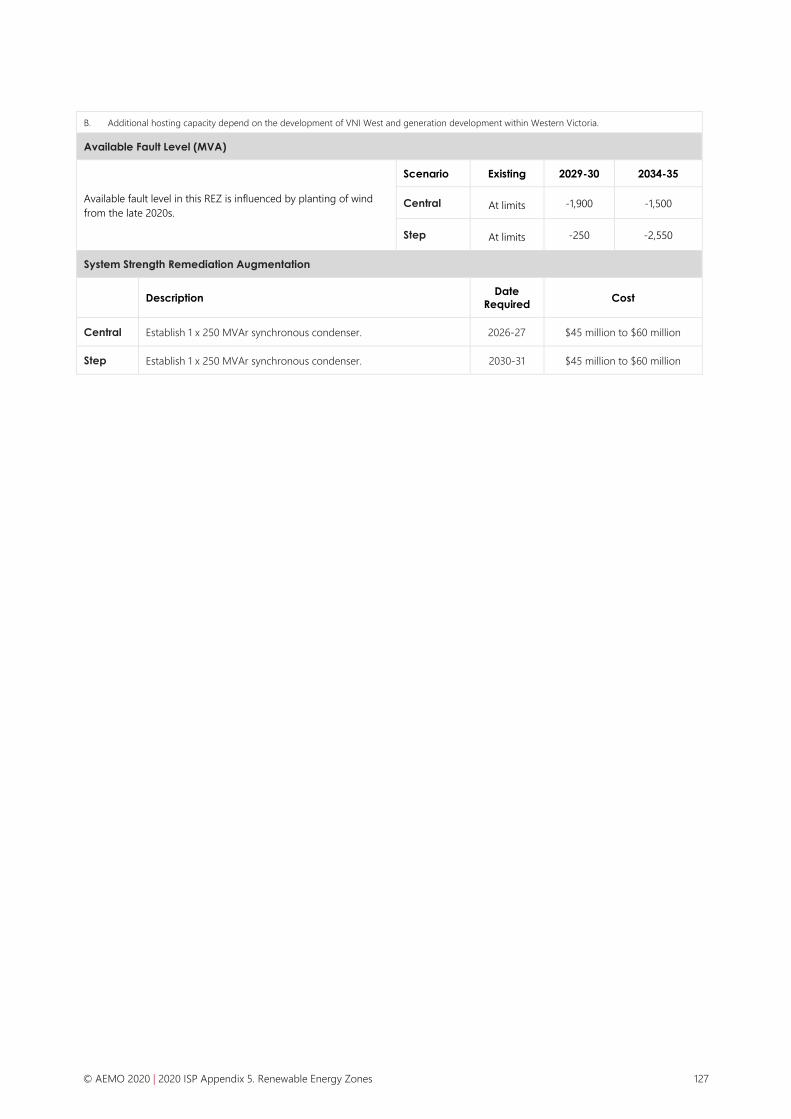
© AEMO 2020 | 2020 ISP Appendix 5. Renewable Energy Zones 127
B. Additional hosting capacity depend on the development of VNI West and generation development within Western Victoria.
Available Fault Level (MVA)
Available fault level in this REZ is influenced by planting of wind
from the late 2020s.
Scenario Existing 2029-30 2034-35
Central At limits -1,900 -1,500
Step At limits -250 -2,550
System Strength Remediation Augmentation
Description
Date
Required Cost
Central Establish 1 x 250 MVAr synchronous condenser. 2026-27 $45 million to $60 million
Step Establish 1 x 250 MVAr synchronous condenser. 2030-31 $45 million to $60 million

© AEMO 2020 | 2020 ISP Appendix 5. Renewable Energy Zones 128
V5 – Gippsland
Summary
Two wind farms are in service in the Gippsland REZ: Bald Hill Wind Farm
(106 MW) and Wonthaggi Wind Farm (12 MW). There is currently
significant wind generation interest in this area, including a large
offshore wind farm of 2,000 MW.
Due to the strong network in this REZ (with multiple 500kV and 220kV
lines from Latrobe Valley to Melbourne designed to transport energy
from major Victorian brown coal power stations), significant generation
can be accommodated with the retirements of coal fired generation in
this area.
REZ Assessment
N/A Wind development is projected in Gippsland REZ if VNI West is not developed by 2030. Development
in this REZ could makes use of existing network capacity to help meet the VRET.
Renewable Resources
Resource Solar Wind
Resource Quality D D (on–shore)
B (off–shore)
Renewable Potential (MW) – 2,000 (on–shore)
4,000 (off–shore)
Demand Correlation
2019-20 2029-30 2039-40 2019-20 2029-30 2039-40
E F F C C C
Climate Hazard
Temperature Score C Bush Fire Score D
Variable Renewable Energy Outlook
Solar PV (MW) Wind (MW)
Existing/
committed
Projected Existing/
committed
Projected
2029-30 2034-35 2039-40 2029-30 2034-35 2039-40
Central
There is no existing or committed solar generation in this
REZ. The modelling outcomes, for all scenarios, did not
project additional solar generation for this REZ.
119
650 650 650
Step 50 50 1,150
Fast 0 0 0
High DER 200 200 200
Slow 900 900 900

© AEMO 2020 | 2020 ISP Appendix 5. Renewable Energy Zones 129
Storage
Gippsland REZ has a strong 500 kV network
connecting coal fired power stations to the
Melbourne load centre as well as
interconnection to Tasmania via Basslink. Due
to the high network capacity, Gippsland REZ is
a good candidate for storage.
Storage has been projected in this REZ for the
Step Change and Slow Change scenario.
Suggested Storage for REZ (MW)
Depth
Projected
2029-30 2034-35 2039-40
Central
Shallow
0 0 0
Step 0 0 0
Fast 0 0 0
High DER 0 0 0
Slow 0 100 100
Central
Medium
0 0 0
Step 100 100 550
Fast 0 0 0
High DER 0 0 0
Slow 0 0 150
Existing Network Capability
Description Approximate Existing
Hosting Capacity
Loss Factor
Robustness
There is significant 500 kV and 220 kV network connecting the Gippsland REZ
to the Melbourne load centre. 2,000 MW AA
A. Loss factor robustness has been projected for connection at 500 kV.
Associated Interconnector Augmentations
Description Additional Hosting Capacity Loss Factor
Robustness
There are no associated interconnector augmentations with this REZ.
Available Fault Level (MVA)
Available fault level in this REZ is influenced by planting of wind
from the late 2020s.
Pumped hydro in the step is expected to form part of the system
strength solution for this REZ.
Scenario Existing 2029-30 2034-35
Central 4,850 2,950 3,850
Step 4,850 5,200 1,950
System Strength Remediation Augmentation
Remediation not required with forecast level of VRE in the Central and Step Change scenarios.

© AEMO 2020 | 2020 ISP Appendix 5. Renewable Energy Zones 130
V6 – Central North Victoria
Summary Phase 1 and phase 2
The Central North Victoria REZ, after careful assessment and
consultation, was included in the 2020 ISP as a new REZ candidate. This
REZ has moderate quality wind and solar resources.
In addition to the currently in service and committed solar farms,
Numurkah (100 MW) and Winton Solar Farm (85 MW), the solar
generation applications exceed 200 MW whilst the enquiries within this
zone exceeds 2.5 GW.
The VNI West project is recommended to upgrade transfer capability
between Victoria and New South Wales via either Kerang or
Shepparton. The development of VNI West via Shepparton would
significantly increase the ability for renewable generation to connect in
this zone.
REZ Assessment
Phase 1 and phase 2
Central North Victoria REZ has development in phase 1 and phase 2. The development in this REZ in
phase 1 uses the existing network capacity to help meet the VRET. VNI West (Shepparton route)
supports the development of wind and solar within this region beyond the existing hosting capacity.
Renewable Resources
Resource Solar Wind
Resource Quality C D
Renewable Potential (MW) 1,900 1,600
Demand Correlation
2019-20 2029-30 2039-40 2019-20 2029-30 2039-40
F F F D D D
Climate Hazard
Temperature Score D Bush Fire Score D
Variable Renewable Energy Outlook
Solar PV (MW) Wind (MW)
Existing/
committed
Projected Existing/
committed
Projected
2029-30 2034-35 2039-40 2029-30 2034-35 2039-40
Central
185
400 400 1,200
There is no
existing or
committed
wind
generation in
this REZ.
400 400 400
Step 400 400 1,900 400 400 650
Fast 100 100 750 400 400 400
High DER 200 200 200 400 400 400
Slow 300 300 300 0 0 0

© AEMO 2020 | 2020 ISP Appendix 5. Renewable Energy Zones 131
Storage
Central North Victoria REZ is not considered to
have potential for significant pumped hydro
generation. Due to the lack of potential
pumped hydro generation, shallow and
medium storage has been suggested for this
REZ.
Suggested Storage for REZ (MW)
Depth
Projected
2029-30 2034-35 2039-40
Central
Shallow
0 0 0
Step 0 0 0
Fast 0 0 0
High DER 0 0 0
Slow 0 100 100
Central
Medium
0 0 0
Step 0 0 0
Fast 0 0 0
High DER 0 0 0
Slow 0 0 150
Existing Network Capability
Description Approximate Existing Hosting
Capacity
Loss Factor
Robustness
The current hosting capacity of the 220 kV network between Dederang–
Glenrowan–Shepparton–Bendigo is approximately 800 MW. 800 MW D
Associated Interconnector Augmentations
Description Additional Hosting Capacity Loss Factor
Robustness
VNI West (of which early works are actionable):
A new 500 kV interconnector from a substation north of Ballarat in Victoria
to Wagga Wagga in New South Wales, via Shepparton.
+2,000 MWA A
A. Only if VNI West traverses through Shepparton.
Possible REZ Augmentations
Description
Additional
Hosting
Capacity
Upgrade
Cost Estimate
ISP
Development
Augmentation Option 1 (If built before VNI West):
Extend Central North Victoria by augmenting the 500 kV network:
• Build a new 500 kV substation near Shepparton
• Build a new 500 kV double-circuit line from a new substation north of
Ballarat to Shepparton
• Install 2 x 500/220kV transformers at Shepparton
+1,700 MW $490 million to
$900 million
Not identified as
required under
any ISP scenario
Augmentation Option 2:
Extend Central North Victoria with additional 220 kV lines: + 600 MW
$270 million to
$500 million
Not identified as
required under
any ISP scenario

© AEMO 2020 | 2020 ISP Appendix 5. Renewable Energy Zones 132
• A new double-circuit 220 kV line from Bendigo to a new substation
north of Ballarat.
• A new double-circuit Bendigo–Shepparton 220 kV line
Augmentation Option 3:
Extend Central North Victoria with additional 220 kV lines:
• A new double-circuit 220 kV line from Bendigo to a new substation
north of Ballarat
• A new double-circuit Bendigo–Shepparton–Glenrowan 220 kV line
+800 MW $390 million to
$730 million
Not identified as
required under
any ISP scenario
Available Fault Level (MVA)
Available fault level in this REZ is influenced by planting
of wind from the late 2020s.
Scenario Existing 2029-30 2034-35
Central 250 -500 -500
Step 250 950 -500
System Strength Remediation Augmentation
Description
Date
Required Cost
Central Establish 1 x 125 MVAr synchronous condenser. 2028-29 $40 million to $55 million
Step Establish 1 x 125 MVAr synchronous condenser. 2030-31 $40 million to $55 million